strategic cost management - decision making
TRANSCRIPT
FINAL : PAPER - 15
FINAL
STUDY NOTES
The Institute of Cost Accountants of IndiaCMA Bhawan, 12, Sudder Street, Kolkata - 700 016
STRATEGIC COSTMANAGEMENT - DECISION MAKING
SYLLA
BUS -
2016
First Edition : August 2016 Reprint : January 2018Revised Edition : December 2018 Edition : August 2019Reprint : January 2020Reprint : October 2020Reprint: April 2021Reprint: January 2022
Published by :Directorate of StudiesThe Institute of Cost Accountants of India (ICAI)CMA Bhawan, 12, Sudder Street, Kolkata - 700 016www.icmai.in
Printed at :M/s. Aravali Printers & Publishers (P) Ltd.W-30, Okhla Industrial Area, Phase - IINew Delhi - 110 020.
Copyright of these Study Notes is reserved by the Institute of Cost Accountants of India and prior permission from the Institute is necessary
for reproduction of the whole or any part thereof.
PAPER 15 : STRATEGIC COST MANAGEMENT - DECISION MAKING (SCMD)
Syllabus Structure
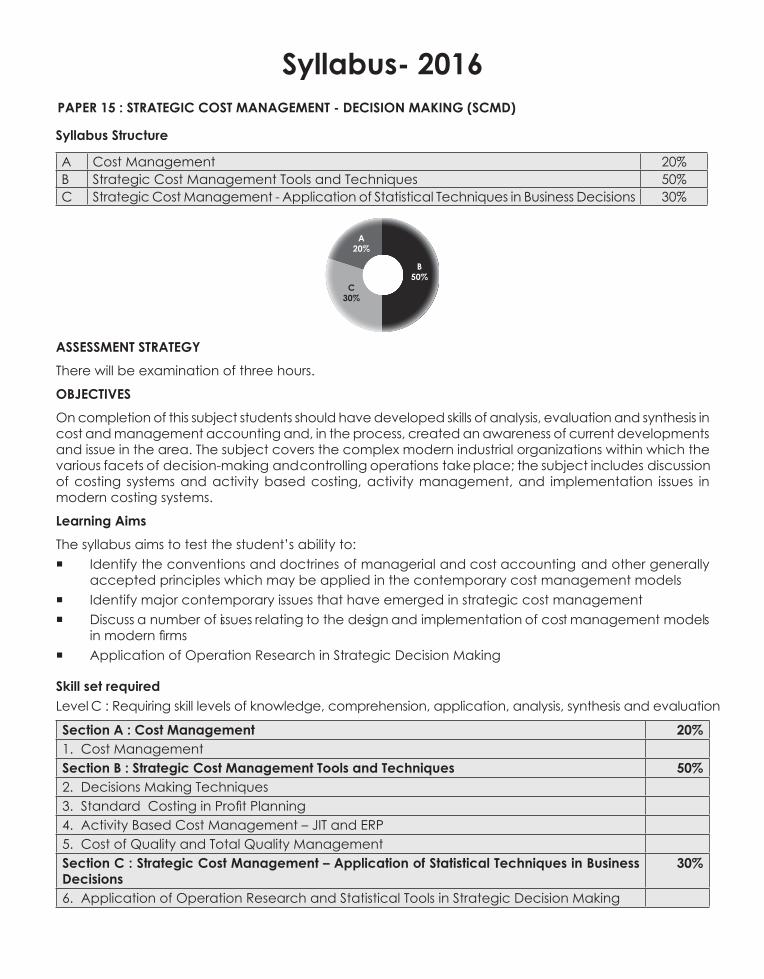
A Cost Management 20%B Strategic Cost Management Tools and Techniques 50%C Strategic Cost Management - Application of Statistical Techniques in Business Decisions 30%
B50%
A20%
C30%
ASSESSMENT STRATEGYThere will be examination of three hours.
OBJECTIVESOn completion of this subject students should have developed skills of analysis, evaluation and synthesis in cost and management accounting and, in the process, created an awareness of current developments and issue in the area. The subject covers the complex modern industrial organizations within which the various facets of decision-making and controlling operations take place; the subject includes discussion of costing systems and activity based costing, activity management, and implementation issues in modern costing systems.
Learning AimsThe syllabus aims to test the student’s ability to: Identify the conventions and doctrines of managerial and cost accounting and other generally
accepted principles which may be applied in the contemporary cost management models Identify major contemporary issues that have emerged in strategic cost management Discuss a number of issues relating to the design and implementation of cost management models
in modern firms Application of Operation Research in Strategic Decision Making
Skill set requiredLevel C : Requiring skill levels of knowledge, comprehension, application, analysis, synthesis and evaluation
Section A : Cost Management 20%1. Cost ManagementSection B : Strategic Cost Management Tools and Techniques 50%2. Decisions Making Techniques3. Standard Costing in Profit Planning4. Activity Based Cost Management – JIT and ERP5. Cost of Quality and Total Quality ManagementSection C : Strategic Cost Management – Application of Statistical Techniques in Business Decisions
30%
6. Application of Operation Research and Statistical Tools in Strategic Decision Making
Syllabus- 2016
SECTION A: COST MANAGEMENT [20 MARKS]1. Cost Management (a) Developments in Cost Management:
(i) Life Cycle costing (ii) Target costing (iii) Kaizen Costing (iv) Value Analysis and Value Engineering (v) Throughput Costing (vi) Business Process Re-engineering (vii) Back-flush Accounting (viii) Lean Accounting (ix) Socio Economic Costing
(b) Cost Control and Cost Reduction – Basics, Process, Methods and Techniques of Cost Reduction programme.
SECTION B: STRATEGIC COST MANAGEMENT TOOLS AND TECHNIQUES [50 MARKS]2. Decision Making Techniques (a) Marginal Costing- Differential costing-CVP Analysis – Profit Volume Graphs – Contribution
Approach
(b) Decisions involving alternative choices – Optimum utilization of resources – Make or Buy – Evaluation of Orders – Multiple scarce resource problems- Product sales pricing….. etc
(c) Pricing Decisions and Strategies – New Product Pricing, Use of Costs in Pricing, Sensitivity Analysis in Pricing Decisions; Monopoly Pricing vs. Competitive Pricing; Bottom Line Pricing
(d) Costing of Service Sector – methods, pricing, performance measurement
(e) Transfer Pricing - Objectives, Methods ( Cost Based, Market Price Based, Negotiated Pricing), Advantages and Disadvantages, Criteria for setting Transfer Prices, Transfer Price in different situations, Situations causing Conflicts and resolving the Conflicts;
(f) Relevant Cost Analysis : Relevant Cost, Irrelevant Costs - Sunk or Historical Cost, Committed Cost, Absorbed Cost, Situations where Fixed Costs become relevant for decision – making and its related implications
(g) Profitability Analysis – Product wise / Segment Wise / Customer wise
3. StandardCostinginProfitPlanning (a) Variance Analysis - Investigation of Variances, Planning and Operating Variances, Controllable
/ Non-controllable Variances, Relevant Cost Approach to Variance Analysis; Variance analysis under marginal costing and absorption costing; Activity Ratios; Application of budgetary control and Standard Costing in Profit planning, Standard Costing Vs Budgetary Control, Reconciliation of Actual Profit with Standard Profit and /or Budgeted Profit.
(b) Uniform Costing and Inter-firm comparison.
4. Activity Based Cost Management – JIT and ERP (a) Activity Based Cost Management - Concept , purpose, benefits, stages, relevance in decision-
making and its application in Budgeting, Responsibility accounting, Traditional Vs. ABC System – comparative analysis
(b) JIT – introduction, Benefits, Use of JIT in measuring the Performance
(c) ERP and its applications in strategic cost management
(d) Bench Marking
5. Cost of Quality and Total Quality Managment (a) TQM - Basics, Stages, Principles, Control, Corrective actions
(b) PRAISE-Steps, Problems, implementation
(c) PARETO Analysis
(d) Quality Costs
SECTION C: STRATEGIC COST MANAGEMENT – APPLICATION OF STATISTICAL TECHNIQUES IN BUSINESS DECISIONS [30 MARKS]6. Application of Operation Research and Statistical Tools in Strategic Decision Making (a) Learning Curve,
(b) Linear Programming (Formulation only)
(c) Assignment,
(d) Transportation
(e) Simulation
(f) Network Analysis – CPM / PERT

SECTION A – COST MANAGEMENT
Study Note 1 : Cost Management
1.1 Life Cycle Costing 11.2 Target Costing 81.3 Kaizen Costing 141.4 Value Analysis and Value Engineering 151.5 Throughput Costing 211.6 Business Process Re-engineering 331.7 Back-flush Accounting 341.8 Lean Accounting 401.9 Socio Economic Costing 431.10 Cost Control and Cost Reduction – Basics, Process, Methods and Techniques of Cost Reduction Programme 47
SECTION B – STRATEGIC COST MANAGEMENT TOOLS AND TECHNIQUES
Study Note 2 : Decision Making Techniquesti
2.1 Marginal Costing 512.2 Transfer Pricing 143
StudyNote3:StandardCostinginProfitPlanning
3.1 Variance Analysis 1653.2 Uniform Costing in Profit Planning 2263.3 Inter Firm Comparison 228
Study Note 4 : Activity Based Cost Management - JIT and ERP4.1 Activity Based Cost Management 231
4.2 Just-In-Time (JIT) 245
4.3 Enterprise Resource Planning (ERP) 251
4.4 Bench Marking 254
Contents
Study Note 5 : Cost of Quality and Total Quality Management.15.1 Total Quality Management (TQM) 259
5.2 Praise Analysis 261
5.3 Six Sigma 263
5.4 Pareto Analysis 264
5.5 Quality Costs 267
SECTION C – STRATEGIC COST MANAGEMENT –APPLICATION OF STATISTICAL TECHNIQUES IN
BUSINESS DECISIONS
Study Note 6 : Application of Operation Research and Statistical Tools in Strategic Decisions Making
6.1 Learning Curve 281
6.2 Linear Programming 289
6.3 Assignment 296
6.4 Transportation 307
6.5 Simulation 3276.6 Network Analysis – CPM/PERT 342
Section ACost Management
(Syllabus - 2016)

THE INSTITUTE OF COST ACCOUNTANTS OF INDIA 1
Cost Management
This Study Note includes
1.1 Life Cycle Costing
1.2 Target Costing
1.3 Kaizen Costing
1.4 Value Analysis and Value Engineering
1.5 Throughput Costing
1.6 Business Process Re-engineering
1.7 Back-flushAccounting
1.8 Lean Accounting
1.9 Socio Economic Costing
1.10 Cost Control and Cost Reduction – Basics, Process, Methods and Techniques of Cost Reduction Programme
Study Note - 1COST MANAGEMENT
1.1 LIFE CYCLE COSTING
Meaning of Life Cycle Costing(a) Life Cycle Costing; aims at cost ascertainment of a product, project etc. over its projected life.
(b) It is a system that tracts and accumulates the actual costs snd revenues attributable to cost object (i.e.; product) from its inception to its abandonment.
(c) Sometimes the terms; cradle-to-grave costing and womb-to-tomb costing convey the meaning of fully capturing all costs associated with the product from its initial to final stages.
Meaning of Product Life Cycle
(a) Product Life Cycle is a pattern of expenditure, sale level, revenue and profit over the period from new idea generation to the deletion of product from product range.
(b) Product Life Cycle spans the time from initial R&D on a product to when customer servicing and support is no longer offered for the product. For products like motor vehicles, this time-span may range from 5 to 7 years. For some basic pharmaceuticals, the time-span be 7 to 10 years.
Characteristic of PLCC
(a) Involves tracing of costs and revenues of each product over several calendar periods throughout their entire life cycle.
(b) Traces research, design and development costs and total magnitude of these costs for each individual product and compared with product revenue.
(c) Assists report generation for costs and revenues.
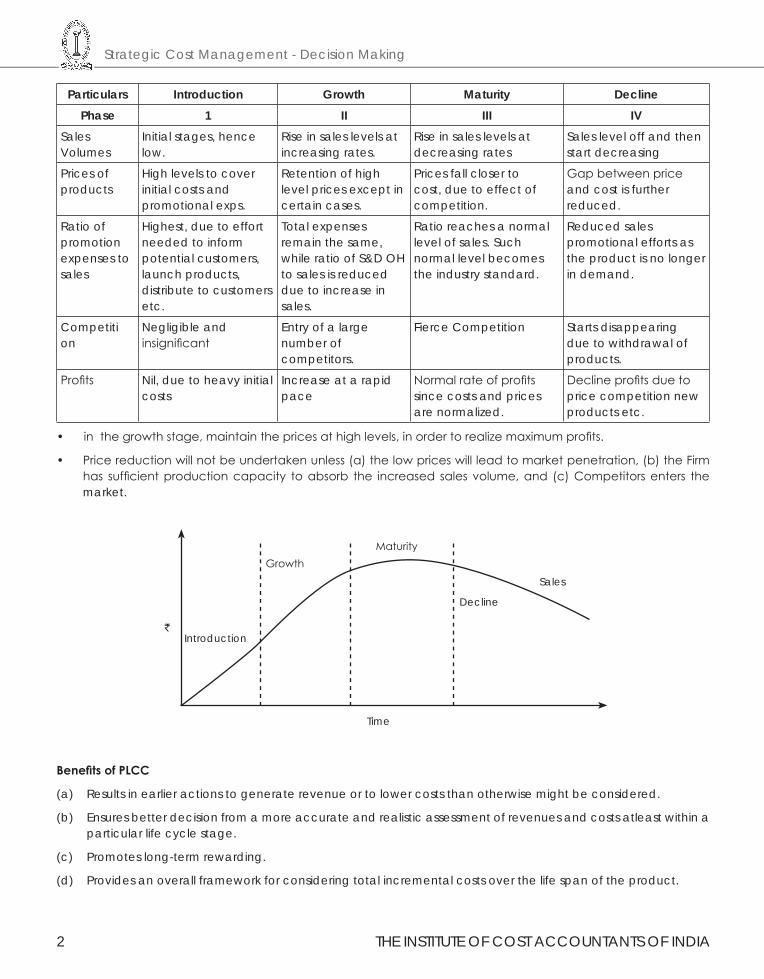
Phases in Product Life Cycle:
The 4 identifiable phases in the product Life Cycle are — (a) Introduction (b) Growth (c) Maturity and (d) Decline. A comparative analysis of these phases is given below —
Strategic Cost Management - Decision Making
2 THE INSTITUTE OF COST ACCOUNTANTS OF INDIA
Particulars Introduction Growth Maturity DeclinePhase 1 II III IV
Sales Volumes
Initial stages, hence low.
Rise in sales levels at increasing rates.
Rise in sales levels at decreasing rates
Sales level off and then start decreasing
Prices of products
High levels to cover initial costs and promotional exps.
Retention of high level prices except in certain cases.
Prices fall closer to cost, due to effect of competition.
Gap between price and cost is further reduced.
Ratio of promotion expenses to sales
Highest, due to effort needed to inform potential customers, launch products, distribute to customers etc.
Total expenses remain the same, while ratio of S&D OH to sales is reduced due to increase in sales.
Ratio reaches a normal level of sales. Such normal level becomes the industry standard.
Reduced sales promotional efforts as the product is no longer in demand.
Competiti on
Negligible and insignificant
Entry of a large number of competitors.
Fierce Competition Starts disappearing due to withdrawal of products.
Profits Nil, due to heavy initial costs
Increase at a rapid pace
Normal rate of profits since costs and prices are normalized.
Decline profits due to price competition new products etc.
• in the growth stage, maintain the prices at high levels, in order to realize maximum profits.
• Price reduction will not be undertaken unless (a) the low prices will lead to market penetration, (b) the Firm has sufficient production capacity to absorb the increased sales volume, and (c) Competitors enters the market.
`Introduction
GrowthMaturity
Decline
Sales
Time
BenefitsofPLCC
(a) Results in earlier actions to generate revenue or to lower costs than otherwise might be considered.
(b) Ensures better decision from a more accurate and realistic assessment of revenues and costs atleast within a particular life cycle stage.
(c) Promotes long-term rewarding.
(d) Provides an overall framework for considering total incremental costs over the life span of the product.
THE INSTITUTE OF COST ACCOUNTANTS OF INDIA 3
Cost Management
Importance of Product Life Cycle Costing:
Product Life Cycle Costing is considered important due to the following reasons —
(a) Time based analysis: Life cycle costing involves tracing of costs and revenues of each product over several calendar periods throughout their life cycle. Costs and revenues can analysed by time periods. The total magnitude of costs for each individual product can be reported and compared with product revenues generated in various time periods.
(b) Overall Cost Analysis: Production Costs are accounted and recognized by the routine accounting system. However non-production costs like R&D; design; marketing; distribution; customer service etc. are less visible on a product — by — product basis. Product Life Cycle Costing focuses on recognizing both production and non-production costs.
(c) Pre-production costs analysis: The development period of R&D and design is long and costly. A high percentage of total product costs maybe incurred before commercial production begin. Hence; the Company needs accurate information on such costs for deciding whether to continue with the R&D or not.
(d) Effective Pricing Decisions: Pricing Decisions; in order to be effective; should include market considerations on one hand and cost considerations on the other. Product Life Cycle Costing and Target Costing help analyze both these considerations and arrive at optimal price decisions.
(e) Better Decision Making: Based on a more accurate and realistic assessment ot revenues and costs, at least within a particular life cycle stage, better decisions can be taken.
(f) Long Run Holistic view: Product Life Cycle Costing can promote long-term rewarding in contrast to short-term profitability rewarding. It provides an overall framework for considering total incremental costs over the entire life span of a product, which in turn facilitates analysis of parts of the whole where cost effectiveness might be improved.
(g) Life Cycle Budgeting: Life Cycle Budgeting, i.e., Life Cycle Costing with Target Costing principles, facilitates scope for cost reduction at the design stage itself. Since costs are avoided before they are committed or locked in the Company is benefited.
(h) Review: Life Cycle Costing provides scope for analysis of long term picture of product line profitability, feedback on the effectiveness of life cycle planning and cost data to clarify the economic impact of alternatives chosen in the design, engineering phase etc.
Illustration 1.
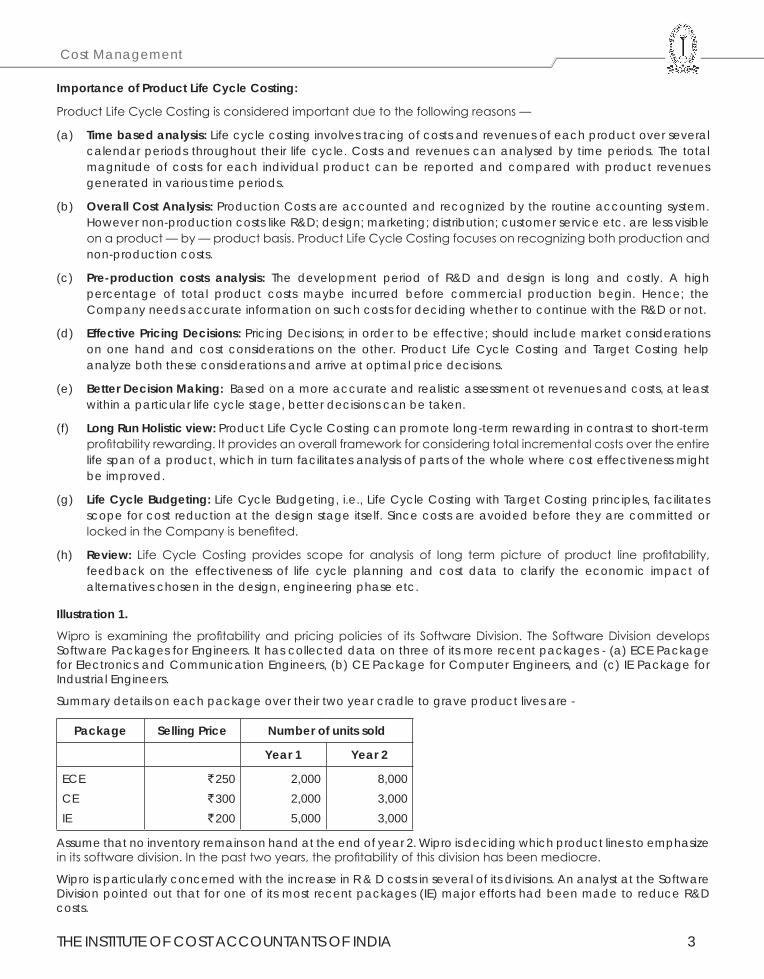
Wipro is examining the profitability and pricing policies of its Software Division. The Software Division develops Software Packages for Engineers. It has collected data on three of its more recent packages - (a) ECE Package for Electronics and Communication Engineers, (b) CE Package for Computer Engineers, and (c) IE Package for Industrial Engineers.
Summary details on each package over their two year cradle to grave product lives are -
Package Selling Price Number of units sold
Year 1 Year 2
ECECEIE
` 250` 300` 200
2,0002,0005,000
8,0003,0003,000
Assume that no inventory remains on hand at the end of year 2. Wipro is deciding which product lines to emphasize in its software division. In the past two years, the profitability of this division has been mediocre.
Wipro is particularly concerned with the increase in R & D costs in several of its divisions. An analyst at the Software Division pointed out that for one of its most recent packages (IE) major efforts had been made to reduce R&D costs.
Strategic Cost Management - Decision Making
4 THE INSTITUTE OF COST ACCOUNTANTS OF INDIA
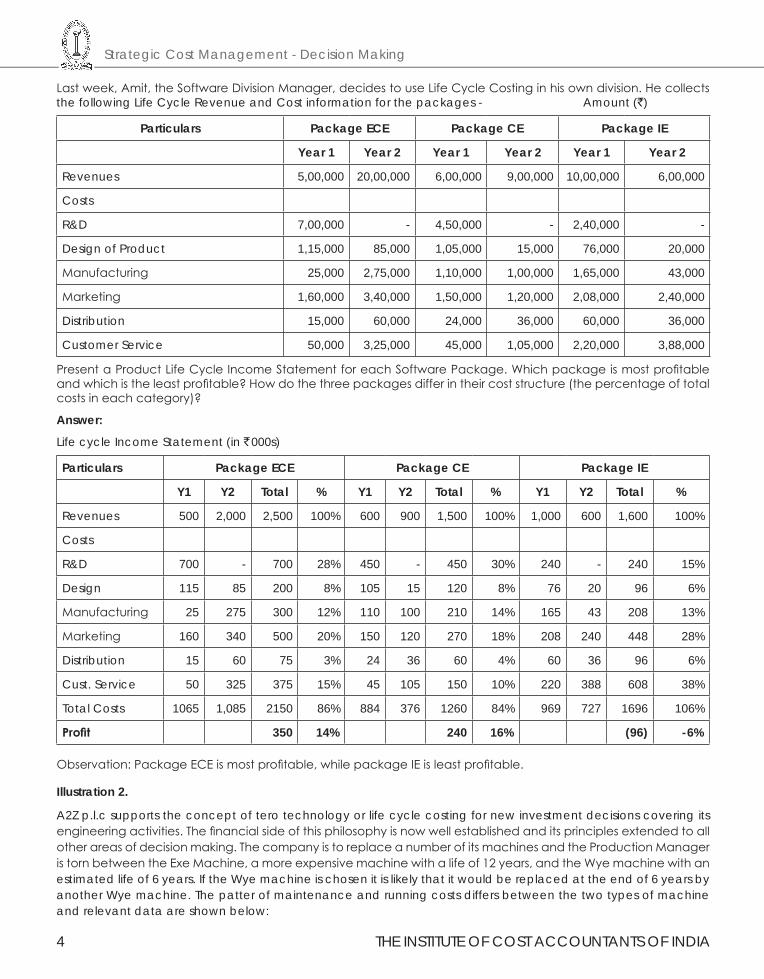
Last week, Amit, the Software Division Manager, decides to use Life Cycle Costing in his own division. He collects the following Life Cycle Revenue and Cost information for the packages - Amount (`)
Particulars Package ECE Package CE Package IE
Year 1 Year 2 Year 1 Year 2 Year 1 Year 2
Revenues 5,00,000 20,00,000 6,00,000 9,00,000 10,00,000 6,00,000
Costs
R&D 7,00,000 - 4,50,000 - 2,40,000 -
Design of Product 1,15,000 85,000 1,05,000 15,000 76,000 20,000
Manufacturing 25,000 2,75,000 1,10,000 1,00,000 1,65,000 43,000
Marketing 1,60,000 3,40,000 1,50,000 1,20,000 2,08,000 2,40,000
Distribution 15,000 60,000 24,000 36,000 60,000 36,000
Customer Service 50,000 3,25,000 45,000 1,05,000 2,20,000 3,88,000
Present a Product Life Cycle Income Statement for each Software Package. Which package is most profitable and which is the least profitable? How do the three packages differ in their cost structure (the percentage of total costs in each category)?
Answer:
Life cycle Income Statement (in ` 000s)
Particulars Package ECE Package CE Package IE
Y1 Y2 Total % Y1 Y2 Total % Y1 Y2 Total %
Revenues 500 2,000 2,500 100% 600 900 1,500 100% 1,000 600 1,600 100%
Costs
R&D 700 - 700 28% 450 - 450 30% 240 - 240 15%
Design 115 85 200 8% 105 15 120 8% 76 20 96 6%
Manufacturing 25 275 300 12% 110 100 210 14% 165 43 208 13%
Marketing 160 340 500 20% 150 120 270 18% 208 240 448 28%
Distribution 15 60 75 3% 24 36 60 4% 60 36 96 6%
Cust. Service 50 325 375 15% 45 105 150 10% 220 388 608 38%
Total Costs 1065 1,085 2150 86% 884 376 1260 84% 969 727 1696 106%
Profit 350 14% 240 16% (96) -6%
Observation: Package ECE is most profitable, while package IE is least profitable.
Illustration 2.
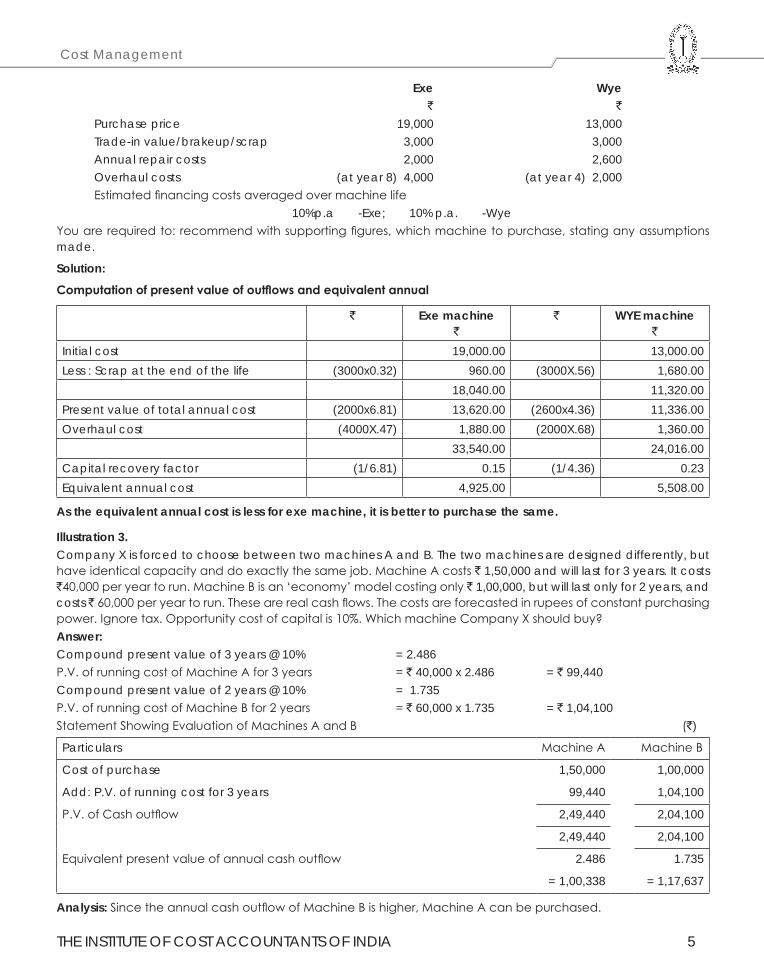
A2Z p.l.c supports the concept of tero technology or life cycle costing for new investment decisions covering its engineering activities. The financial side of this philosophy is now well established and its principles extended to all other areas of decision making. The company is to replace a number of its machines and the Production Manager is torn between the Exe Machine, a more expensive machine with a life of 12 years, and the Wye machine with an estimated life of 6 years. If the Wye machine is chosen it is likely that it would be replaced at the end of 6 years by another Wye machine. The patter of maintenance and running costs differs between the two types of machine and relevant data are shown below:
THE INSTITUTE OF COST ACCOUNTANTS OF INDIA 5
Cost Management
Exe Wye ` `
Purchase price 19,000 13,000Trade-in value/brakeup/scrap 3,000 3,000Annual repair costs 2,000 2,600Overhaul costs (at year 8) 4,000 (at year 4) 2,000Estimated financing costs averaged over machine life
10%p.a -Exe; 10% p.a. -WyeYou are required to: recommend with supporting figures, which machine to purchase, stating any assumptions made.
Solution:
Computationofpresentvalueofoutflowsandequivalentannual
` Exe machine`
` WYE machine`
Initial cost 19,000.00 13,000.00Less : Scrap at the end of the life (3000x0.32) 960.00 (3000X.56) 1,680.00
18,040.00 11,320.00Present value of total annual cost (2000x6.81) 13,620.00 (2600x4.36) 11,336.00Overhaul cost (4000X.47) 1,880.00 (2000X.68) 1,360.00
33,540.00 24,016.00Capital recovery factor (1/6.81) 0.15 (1/4.36) 0.23Equivalent annual cost 4,925.00 5,508.00
As the equivalent annual cost is less for exe machine, it is better to purchase the same.
Illustration 3.Company X is forced to choose between two machines A and B. The two machines are designed differently, but have identical capacity and do exactly the same job. Machine A costs ` 1,50,000 and will last for 3 years. It costs `40,000 per year to run. Machine B is an ‘economy’ model costing only ` 1,00,000, but will last only for 2 years, and costs ` 60,000 per year to run. These are real cash flows. The costs are forecasted in rupees of constant purchasing power. Ignore tax. Opportunity cost of capital is 10%. Which machine Company X should buy?Answer:Compound present value of 3 years @ 10% = 2.486P.V. of running cost of Machine A for 3 years = ` 40,000 x 2.486 = ` 99,440Compound present value of 2 years @ 10% = 1.735P.V. of running cost of Machine B for 2 years = ` 60,000 x 1.735 = ` 1,04,100Statement Showing Evaluation of Machines A and B (`)
Particulars Machine A Machine B
Cost of purchase 1,50,000 1,00,000
Add: P.V. of running cost for 3 years 99,440 1,04,100
P.V. of Cash outflow 2,49,440 2,04,100
2,49,440 2,04,100
Equivalent present value of annual cash outflow 2.486 1.735
= 1,00,338 = 1,17,637
Analysis: Since the annual cash outflow of Machine B is higher, Machine A can be purchased.
Strategic Cost Management - Decision Making
6 THE INSTITUTE OF COST ACCOUNTANTS OF INDIA
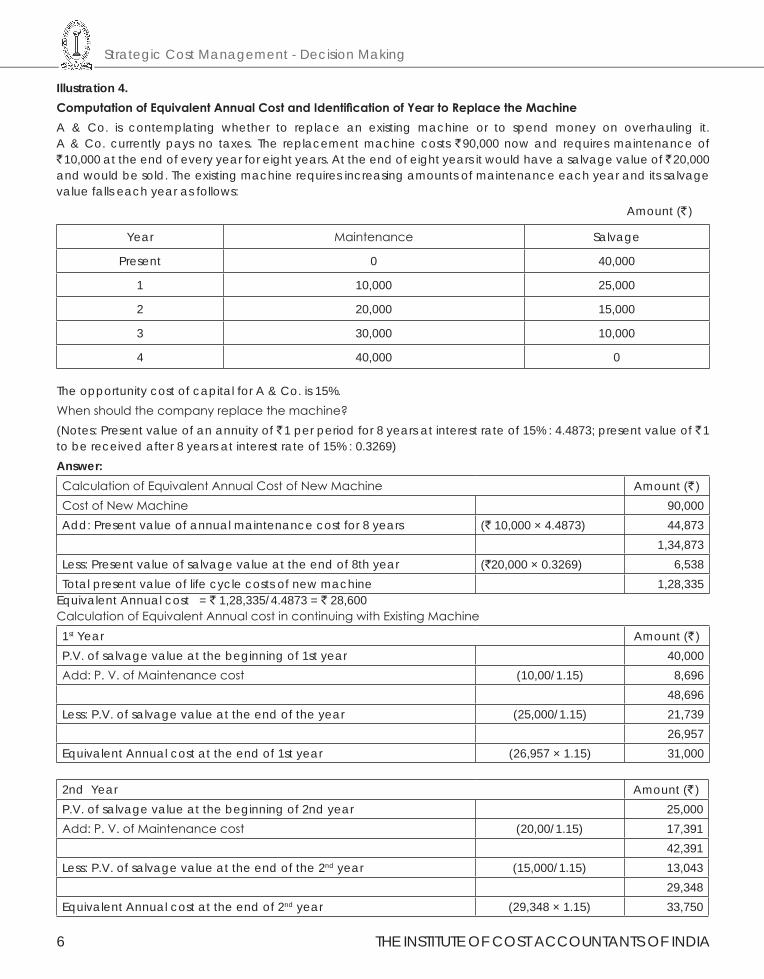
Illustration 4.ComputationofEquivalentAnnualCostandIdentificationofYeartoReplacetheMachineA & Co. is contemplating whether to replace an existing machine or to spend money on overhauling it. A & Co. currently pays no taxes. The replacement machine costs ` 90,000 now and requires maintenance of ` 10,000 at the end of every year for eight years. At the end of eight years it would have a salvage value of ` 20,000 and would be sold. The existing machine requires increasing amounts of maintenance each year and its salvage value falls each year as follows: Amount (` )
Year Maintenance Salvage
Present 0 40,000
1 10,000 25,000
2 20,000 15,000
3 30,000 10,000
4 40,000 0
The opportunity cost of capital for A & Co. is 15%.When should the company replace the machine?(Notes: Present value of an annuity of ` 1 per period for 8 years at interest rate of 15% : 4.4873; present value of ` 1 to be received after 8 years at interest rate of 15% : 0.3269)Answer:Calculation of Equivalent Annual Cost of New Machine Amount (` )Cost of New Machine 90,000Add: Present value of annual maintenance cost for 8 years (` 10,000 × 4.4873) 44,873
1,34,873Less: Present value of salvage value at the end of 8th year (`20,000 × 0.3269) 6,538Total present value of life cycle costs of new machine 1,28,335
Equivalent Annual cost = ` 1,28,335/4.4873 = ` 28,600Calculation of Equivalent Annual cost in continuing with Existing Machine1st Year Amount (` )P.V. of salvage value at the beginning of 1st year 40,000Add: P. V. of Maintenance cost (10,00/1.15) 8,696
48,696Less: P.V. of salvage value at the end of the year (25,000/1.15) 21,739
26,957Equivalent Annual cost at the end of 1st year (26,957 × 1.15) 31,000
2nd Year Amount (` )P.V. of salvage value at the beginning of 2nd year 25,000Add: P. V. of Maintenance cost (20,00/1.15) 17,391
42,391Less: P.V. of salvage value at the end of the 2nd year (15,000/1.15) 13,043
29,348Equivalent Annual cost at the end of 2nd year (29,348 × 1.15) 33,750
THE INSTITUTE OF COST ACCOUNTANTS OF INDIA 7
Cost Management
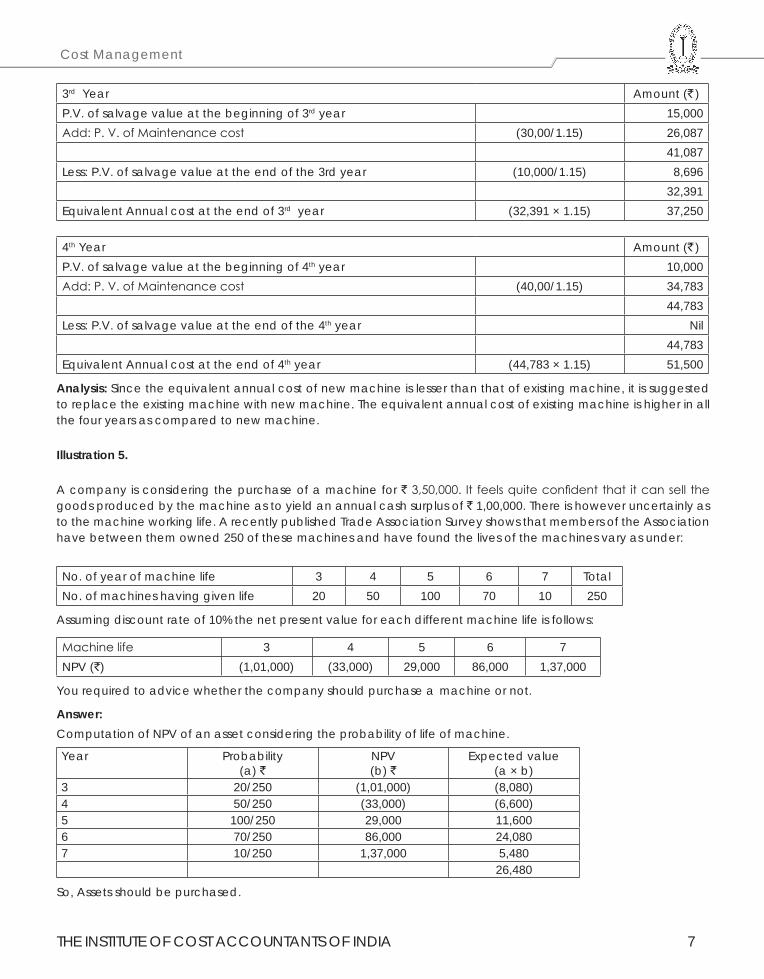
3rd Year Amount (` )P.V. of salvage value at the beginning of 3rd year 15,000Add: P. V. of Maintenance cost (30,00/1.15) 26,087
41,087Less: P.V. of salvage value at the end of the 3rd year (10,000/1.15) 8,696
32,391Equivalent Annual cost at the end of 3rd year (32,391 × 1.15) 37,250
4th Year Amount (` )P.V. of salvage value at the beginning of 4th year 10,000Add: P. V. of Maintenance cost (40,00/1.15) 34,783
44,783Less: P.V. of salvage value at the end of the 4th year Nil
44,783Equivalent Annual cost at the end of 4th year (44,783 × 1.15) 51,500
Analysis: Since the equivalent annual cost of new machine is lesser than that of existing machine, it is suggested to replace the existing machine with new machine. The equivalent annual cost of existing machine is higher in all the four years as compared to new machine.
Illustration 5.
A company is considering the purchase of a machine for ` 3,50,000. It feels quite confident that it can sell the goods produced by the machine as to yield an annual cash surplus of ` 1,00,000. There is however uncertainly as to the machine working life. A recently published Trade Association Survey shows that members of the Association have between them owned 250 of these machines and have found the lives of the machines vary as under:
No. of year of machine life 3 4 5 6 7 TotalNo. of machines having given life 20 50 100 70 10 250
Assuming discount rate of 10% the net present value for each different machine life is follows:
Machine life 3 4 5 6 7NPV (`) (1,01,000) (33,000) 29,000 86,000 1,37,000
You required to advice whether the company should purchase a machine or not.
Answer:Computation of NPV of an asset considering the probability of life of machine.
Year Probability(a) `
NPV(b) `
Expected value(a × b)
3 20/250 (1,01,000) (8,080)4 50/250 (33,000) (6,600)5 100/250 29,000 11,6006 70/250 86,000 24,0807 10/250 1,37,000 5,480
26,480
So, Assets should be purchased.
Strategic Cost Management - Decision Making
8 THE INSTITUTE OF COST ACCOUNTANTS OF INDIA
1.2 TARGET COSTING
Target Costing.
Target Costing: This technique has been developed in Japan. It aims at profit planning. It is a device to continuously control costs and manage profit over a product’s life cycle. In short, it is a part of a comprehensive strategic profit management system. For a decision to enter a market prices of the competitors’ products are given due consideration. Target Costing initiates cost management at the earliest stages of product development and applies it throughout the product life cycle by actively involving the entire value chain. In the product concept stage selling price and required profit are set after consideration of the medium term profit plans, which links the operational strategy to the long term strategic plans.
Target Cost = Planned Selling Price - Required Profit.
From this, the necessary target cost can be arrived at. Target cost, then, becomes the residual or allowable sum. If it is thought that the product cannot generate the required profit, it will not be produced as such and aspects of the product would be redesigned until the target is met. Value engineering and value analysis may be used to identify innovative and cost effective product features in the planning and concept stages. Throughout the product’s life target costing continues to be used to control costs. After the initial start up stage target costs will be set through short-period budget. Thus all costs including both variable and fixed overheads are expected to reduce on a regular (monthly) basis. Target profit is a commitment agreed by all the people in a firm, who have any part to play in achieving it.
Features of Target Costing
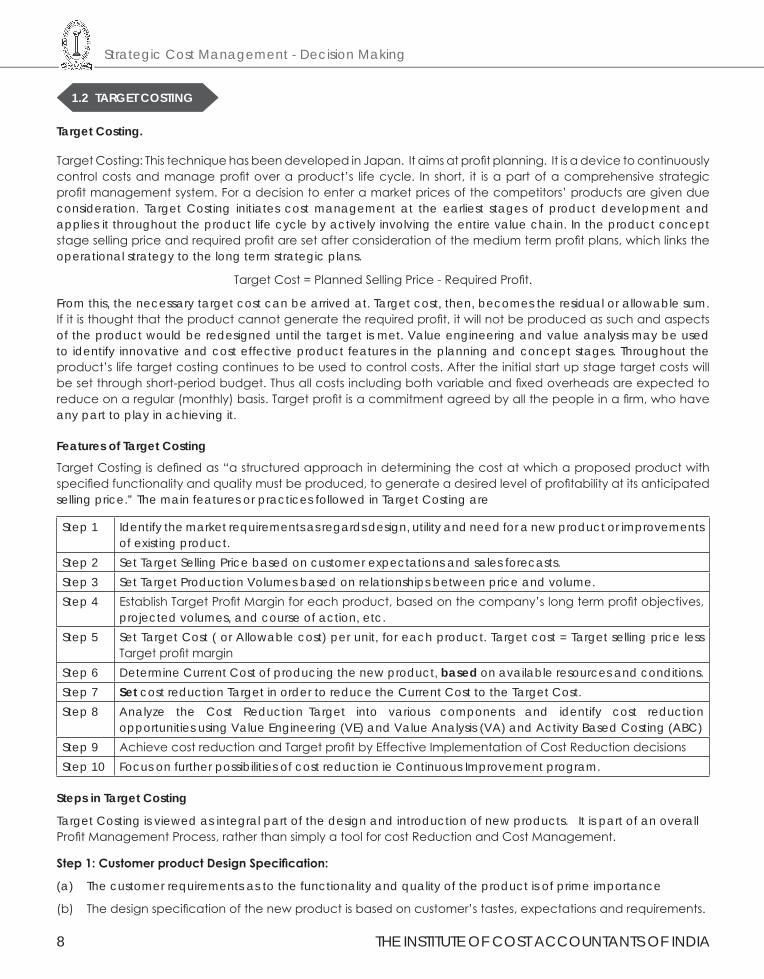
Target Costing is defined as “a structured approach in determining the cost at which a proposed product with specified functionality and quality must be produced, to generate a desired level of profitability at its anticipated selling price.” The main features or practices followed in Target Costing are
Step 1 Identify the market requirements as regards design, utility and need for a new product or improvements of existing product.
Step 2 Set Target Selling Price based on customer expectations and sales forecasts.Step 3 Set Target Production Volumes based on relationships between price and volume.Step 4 Establish Target Profit Margin for each product, based on the company’s long term profit objectives,
projected volumes, and course of action, etc.Step 5 Set Target Cost ( or Allowable cost) per unit, for each product. Target cost = Target selling price less
Target profit marginStep 6 Determine Current Cost of producing the new product, based on available resources and conditions.Step 7 Set cost reduction Target in order to reduce the Current Cost to the Target Cost.Step 8 Analyze the Cost Reduction Target into various components and identify cost reduction
opportunities using Value Engineering (VE) and Value Analysis (VA) and Activity Based Costing (ABC)Step 9 Achieve cost reduction and Target profit by Effective Implementation of Cost Reduction decisionsStep 10 Focus on further possibilities of cost reduction ie Continuous Improvement program.
Steps in Target Costing
Target Costing is viewed as integral part of the design and introduction of new products. It is part of an overall Profit Management Process, rather than simply a tool for cost Reduction and Cost Management.
Step1:CustomerproductDesignSpecification:
(a) The customer requirements as to the functionality and quality of the product is of prime importance
(b) The design specification of the new product is based on customer’s tastes, expectations and requirements.
THE INSTITUTE OF COST ACCOUNTANTS OF INDIA 9
Cost Management
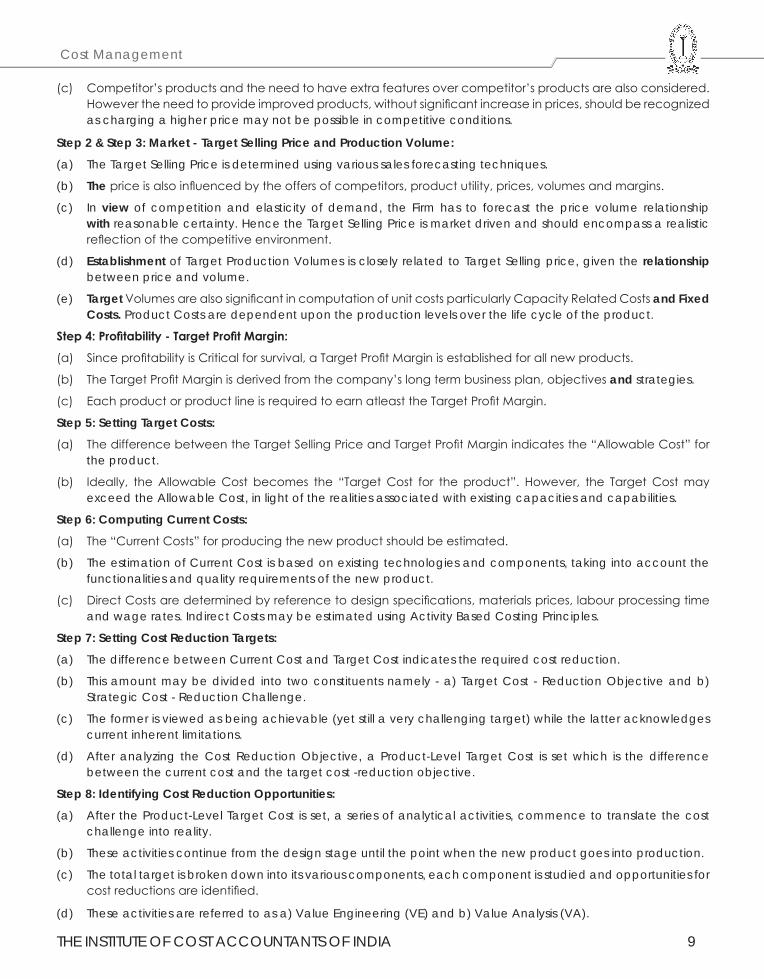
(c) Competitor’s products and the need to have extra features over competitor’s products are also considered. However the need to provide improved products, without significant increase in prices, should be recognized as charging a higher price may not be possible in competitive conditions.
Step 2 & Step 3: Market - Target Selling Price and Production Volume:
(a) The Target Selling Price is determined using various sales forecasting techniques.
(b) The price is also influenced by the offers of competitors, product utility, prices, volumes and margins.
(c) In view of competition and elasticity of demand, the Firm has to forecast the price volume relationship with reasonable certainty. Hence the Target Selling Price is market driven and should encompass a realistic reflection of the competitive environment.
(d) Establishment of Target Production Volumes is closely related to Target Selling price, given the relationship between price and volume.
(e) Target Volumes are also significant in computation of unit costs particularly Capacity Related Costs and Fixed Costs. Product Costs are dependent upon the production levels over the life cycle of the product.
Step4:Profitability-TargetProfitMargin:
(a) Since profitability is Critical for survival, a Target Profit Margin is established for all new products.
(b) The Target Profit Margin is derived from the company’s long term business plan, objectives and strategies.
(c) Each product or product line is required to earn atleast the Target Profit Margin.
Step 5: Setting Target Costs:
(a) The difference between the Target Selling Price and Target Profit Margin indicates the “Allowable Cost” for the product.
(b) Ideally, the Allowable Cost becomes the “Target Cost for the product”. However, the Target Cost may exceed the Allowable Cost, in light of the realities associated with existing capacities and capabilities.
Step 6: Computing Current Costs:
(a) The “Current Costs” for producing the new product should be estimated.
(b) The estimation of Current Cost is based on existing technologies and components, taking into account the functionalities and quality requirements of the new product.
(c) Direct Costs are determined by reference to design specifications, materials prices, labour processing time and wage rates. Indirect Costs may be estimated using Activity Based Costing Principles.
Step 7: Setting Cost Reduction Targets:
(a) The difference between Current Cost and Target Cost indicates the required cost reduction.
(b) This amount may be divided into two constituents namely - a) Target Cost - Reduction Objective and b) Strategic Cost - Reduction Challenge.
(c) The former is viewed as being achievable (yet still a very challenging target) while the latter acknowledges current inherent limitations.
(d) After analyzing the Cost Reduction Objective, a Product-Level Target Cost is set which is the difference between the current cost and the target cost -reduction objective.
Step 8: Identifying Cost Reduction Opportunities:
(a) After the Product-Level Target Cost is set, a series of analytical activities, commence to translate the cost challenge into reality.
(b) These activities continue from the design stage until the point when the new product goes into production.
(c) The total target is broken down into its various components, each component is studied and opportunities for cost reductions are identified.
(d) These activities are referred to as a) Value Engineering (VE) and b) Value Analysis (VA).
Strategic Cost Management - Decision Making
10 THE INSTITUTE OF COST ACCOUNTANTS OF INDIA
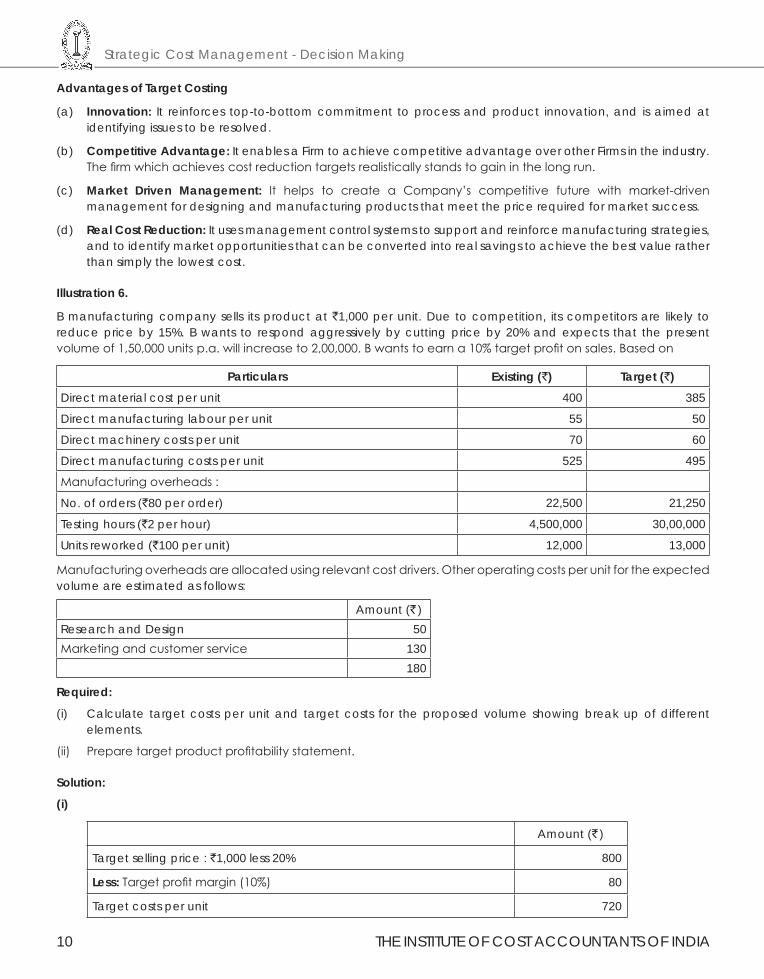
Advantages of Target Costing
(a) Innovation: It reinforces top-to-bottom commitment to process and product innovation, and is aimed at identifying issues to be resolved.
(b) Competitive Advantage: It enables a Firm to achieve competitive advantage over other Firms in the industry. The firm which achieves cost reduction targets realistically stands to gain in the long run.
(c) Market Driven Management: It helps to create a Company’s competitive future with market-driven management for designing and manufacturing products that meet the price required for market success.
(d) Real Cost Reduction: It uses management control systems to support and reinforce manufacturing strategies, and to identify market opportunities that can be converted into real savings to achieve the best value rather than simply the lowest cost.
Illustration 6.
B manufacturing company sells its product at `1,000 per unit. Due to competition, its competitors are likely to reduce price by 15%. B wants to respond aggressively by cutting price by 20% and expects that the present volume of 1,50,000 units p.a. will increase to 2,00,000. B wants to earn a 10% target profit on sales. Based on
Particulars Existing (`) Target (`)Direct material cost per unit 400 385
Direct manufacturing labour per unit 55 50
Direct machinery costs per unit 70 60
Direct manufacturing costs per unit 525 495
Manufacturing overheads :
No. of orders (`80 per order) 22,500 21,250
Testing hours (`2 per hour) 4,500,000 30,00,000
Units reworked (`100 per unit) 12,000 13,000
Manufacturing overheads are allocated using relevant cost drivers. Other operating costs per unit for the expected volume are estimated as follows:
Amount (` )Research and Design 50Marketing and customer service 130
180
Required:
(i) Calculate target costs per unit and target costs for the proposed volume showing break up of different elements.
(ii) Prepare target product profitability statement.
Solution:
(i)
Amount (` )
Target selling price : `1,000 less 20% 800
Less: Target profit margin (10%) 80
Target costs per unit 720
THE INSTITUTE OF COST ACCOUNTANTS OF INDIA 11
Cost Management
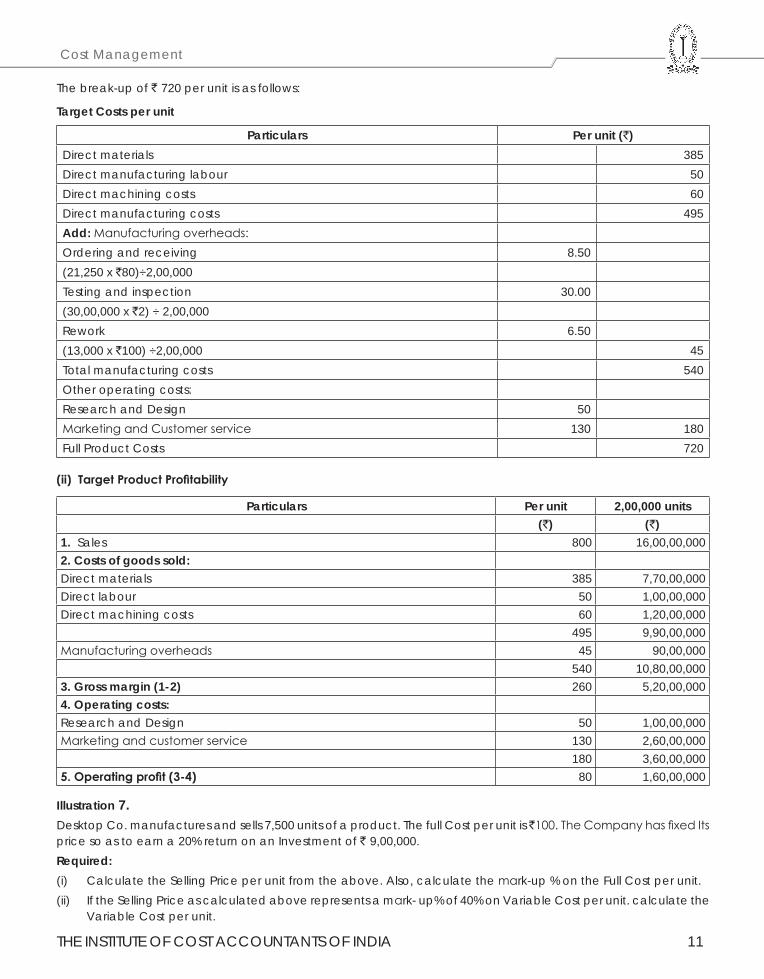
The break-up of ` 720 per unit is as follows:
Target Costs per unit
Particulars Per unit (`)Direct materials 385Direct manufacturing labour 50Direct machining costs 60Direct manufacturing costs 495Add: Manufacturing overheads:Ordering and receiving 8.50(21,250 x `80)÷2,00,000Testing and inspection 30.00(30,00,000 x `2) ÷ 2,00,000Rework 6.50(13,000 x `100) ÷2,00,000 45Total manufacturing costs 540Other operating costs:Research and Design 50Marketing and Customer service 130 180Full Product Costs 720
(ii)TargetProductProfitability
Particulars Per unit 2,00,000 units(`) (`)
1. Sales 800 16,00,00,0002. Costs of goods sold:Direct materials 385 7,70,00,000Direct labour 50 1,00,00,000Direct machining costs 60 1,20,00,000
495 9,90,00,000Manufacturing overheads 45 90,00,000
540 10,80,00,0003. Gross margin (1-2) 260 5,20,00,0004. Operating costs:Research and Design 50 1,00,00,000Marketing and customer service 130 2,60,00,000
180 3,60,00,0005.Operatingprofit(3-4) 80 1,60,00,000
Illustration 7.Desktop Co. manufactures and sells 7,500 units of a product. The full Cost per unit is ̀ 100. The Company has fixed Its price so as to earn a 20% return on an Investment of ` 9,00,000.Required:(i) Calculate the Selling Price per unit from the above. Also, calculate the mark-up % on the Full Cost per unit. (ii) If the Selling Price as calculated above represents a mark- up% of 40% on Variable Cost per unit. calculate the
Variable Cost per unit.

Strategic Cost Management - Decision Making
12 THE INSTITUTE OF COST ACCOUNTANTS OF INDIA
(iii) Calculate the Company’s Income if it had changed the Selling Price to ̀ 115. At this price, the Company would have sold 6,750 units.
(iv) In response to competitive pressures, the Company must reduce the price to ̀ 105 next year, in order to achieve sales of 7,500 units. The company also plans to reduce its investment to ̀ 8,25,000. If a 20% return on Investment should be maintained, what is the Target Cost per unit for the next year?
Answer:
(i) Computation of Selling Price and mark - up % on the Full Cost per unit
Target Sale Price per unit = Full Cost + Target Profit = `100 + 24
So, Martk – up price is
`124
24%
(ii) Computation of Variable Cost per unit:
Above sale Price `124 = VC + 40% thereon, i.e. 140% on VC. So, Var. Cost = 124140%` = ` 89
(iii) Calculate the company’s Income if selling price are increased
Present Contribution at 7,500 units = (`124 – ` 89) × 7,500 units = ` 2,62,500Revised Contribution at 6,750 units = (`115 – `89) × 6,750 units = ` 1,75,500 ` 87,000
Hence, Increase in Sale Price is not beneficial. due to reduction in Contribution by ` 87,000
(iv) Calculate the company’sTargetProfitifsellingpricearereducedandTargetcostifinvestmentis` 8,25,000
Target Profit for next year = 8,25,000 ×20%
7500 units
`= `24
Target cost = 105 - 24 = ` 83/unit
Illustration 8.ABC Enterprises has prepared a draft budget for the next year follows:
Quantity 10,000 units(`)
Sales price per unit 30Variable costs per unit:Direct Materials 8Direct Labour 6Variable overhead (2 hrs × 0.50) 1Contribution per unit 15Budgeted Contribution 1,50,000Budgeted Fixed costs 1,40,000Budgeted Profit 10,000
The Board of Directors is dissatisfied with this budget, and asks working party to com up with alternate budget with higher target profit figures.
The working party reports back with he following suggestions that will lead to budgeted profit of ` 25,000. The company should spend ` 28,500 on advertising, & set the target sales price up to ` 32 per unit. It is expected that the sales volume will also rise, inspite of the price rise, to 12,000 units.
In order to achieve the extra production capacity, however, the workforce must be able to reduce the time taken to make each unit of the product. It is proposed to offer a pay and productivity deal in which the wage rate per hour in increased to ` 4. The hourly rate for variable overhead will be unaffected.
Ascertain the target labour time required to achieve the target profit.
THE INSTITUTE OF COST ACCOUNTANTS OF INDIA 13
Cost Management
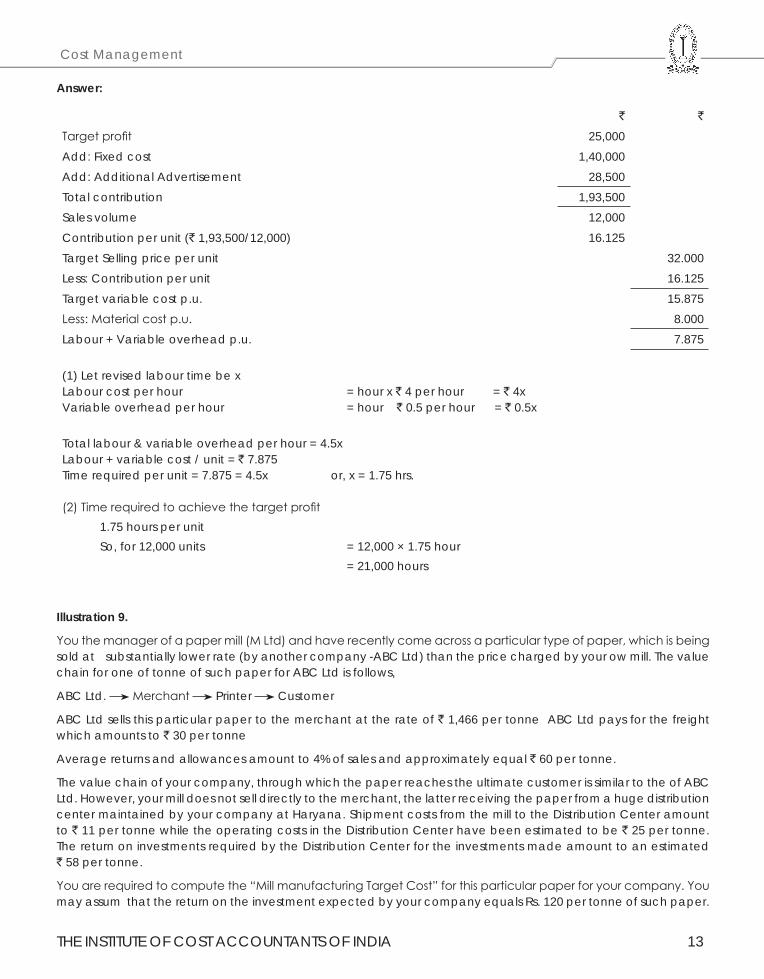
Answer:
` `
Target profit 25,000Add: Fixed cost 1,40,000Add: Additional Advertisement 28,500Total contribution 1,93,500Sales volume 12,000Contribution per unit (` 1,93,500/12,000) 16.125Target Selling price per unit 32.000Less: Contribution per unit 16.125Target variable cost p.u. 15.875Less: Material cost p.u. 8.000Labour + Variable overhead p.u. 7.875
(1) Let revised labour time be xLabour cost per hour = hour x ` 4 per hour = ` 4xVariable overhead per hour = hour ` 0.5 per hour = ` 0.5x
Total labour & variable overhead per hour = 4.5xLabour + variable cost / unit = ` 7.875Time required per unit = 7.875 = 4.5x or, x = 1.75 hrs.
(2) Time required to achieve the target profit1.75 hours per unitSo, for 12,000 units = 12,000 × 1.75 hour
= 21,000 hours
Illustration 9.
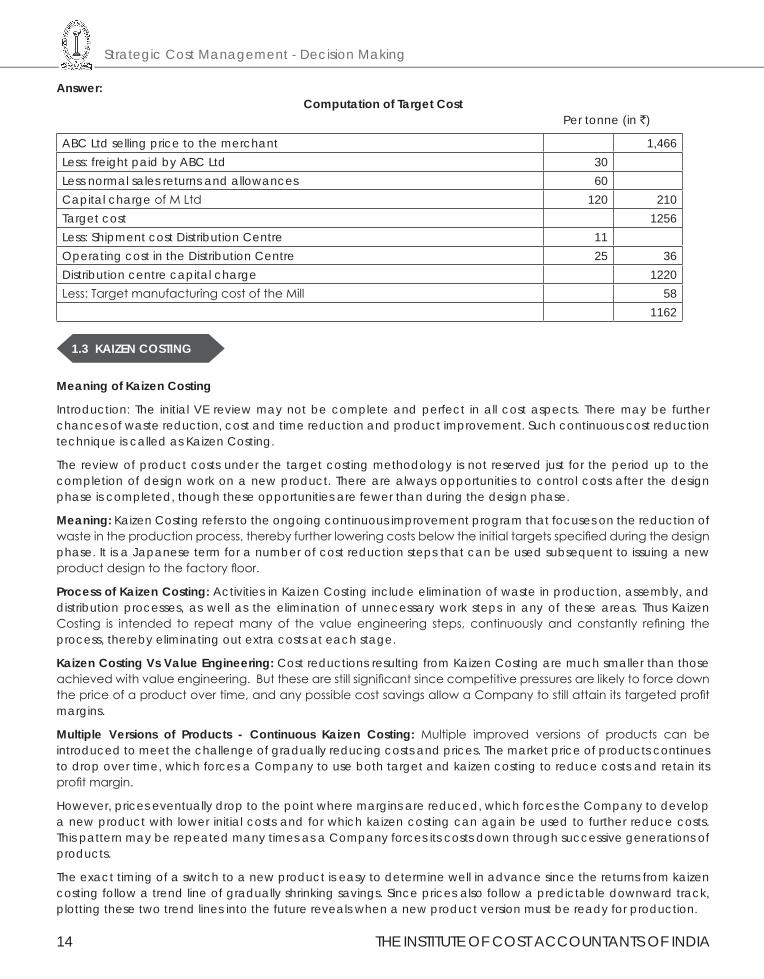
You the manager of a paper mill (M Ltd) and have recently come across a particular type of paper, which is being sold at substantially lower rate (by another company -ABC Ltd) than the price charged by your ow mill. The value chain for one of tonne of such paper for ABC Ltd is follows,
ABC Ltd. Merchant Printer Customer
ABC Ltd sells this particular paper to the merchant at the rate of ` 1,466 per tonne ABC Ltd pays for the freight which amounts to ` 30 per tonne
Average returns and allowances amount to 4% of sales and approximately equal ` 60 per tonne.
The value chain of your company, through which the paper reaches the ultimate customer is similar to the of ABC Ltd. However, your mill does not sell directly to the merchant, the latter receiving the paper from a huge distribution center maintained by your company at Haryana. Shipment costs from the mill to the Distribution Center amount to ` 11 per tonne while the operating costs in the Distribution Center have been estimated to be ` 25 per tonne. The return on investments required by the Distribution Center for the investments made amount to an estimated ` 58 per tonne.
You are required to compute the “Mill manufacturing Target Cost” for this particular paper for your company. You may assum that the return on the investment expected by your company equals Rs. 120 per tonne of such paper.
Strategic Cost Management - Decision Making
14 THE INSTITUTE OF COST ACCOUNTANTS OF INDIA
Answer:Computation of Target Cost
Per tonne (in `)
ABC Ltd selling price to the merchant 1,466Less: freight paid by ABC Ltd 30Less normal sales returns and allowances 60Capital charge of M Ltd 120 210Target cost 1256Less: Shipment cost Distribution Centre 11Operating cost in the Distribution Centre 25 36Distribution centre capital charge 1220Less: Target manufacturing cost of the Mill 58
1162
1.3 KAIZEN COSTING
Meaning of Kaizen Costing
Introduction: The initial VE review may not be complete and perfect in all cost aspects. There may be further chances of waste reduction, cost and time reduction and product improvement. Such continuous cost reduction technique is called as Kaizen Costing.
The review of product costs under the target costing methodology is not reserved just for the period up to the completion of design work on a new product. There are always opportunities to control costs after the design phase is completed, though these opportunities are fewer than during the design phase.
Meaning: Kaizen Costing refers to the ongoing continuous improvement program that focuses on the reduction of waste in the production process, thereby further lowering costs below the initial targets specified during the design phase. It is a Japanese term for a number of cost reduction steps that can be used subsequent to issuing a new product design to the factory floor.
Process of Kaizen Costing: Activities in Kaizen Costing include elimination of waste in production, assembly, and distribution processes, as well as the elimination of unnecessary work steps in any of these areas. Thus Kaizen Costing is intended to repeat many of the value engineering steps, continuously and constantly refining the process, thereby eliminating out extra costs at each stage.
Kaizen Costing Vs Value Engineering: Cost reductions resulting from Kaizen Costing are much smaller than those achieved with value engineering. But these are still significant since competitive pressures are likely to force down the price of a product over time, and any possible cost savings allow a Company to still attain its targeted profit margins.
Multiple Versions of Products - Continuous Kaizen Costing: Multiple improved versions of products can be introduced to meet the challenge of gradually reducing costs and prices. The market price of products continues to drop over time, which forces a Company to use both target and kaizen costing to reduce costs and retain its profit margin.
However, prices eventually drop to the point where margins are reduced, which forces the Company to develop a new product with lower initial costs and for which kaizen costing can again be used to further reduce costs. This pattern may be repeated many times as a Company forces its costs down through successive generations of products.
The exact timing of a switch to a new product is easy to determine well in advance since the returns from kaizen costing follow a trend line of gradually shrinking savings. Since prices also follow a predictable downward track, plotting these two trend lines into the future reveals when a new product version must be ready for production.
THE INSTITUTE OF COST ACCOUNTANTS OF INDIA 15
Cost Management
Experience of Kaizen Costing in Toyota.
Toyota’s Experience of Kaizen Costing: Toyota aggressively pursued Kaizen Costing to reduce costs in the manufacturing phase. In July and January, Plant Managers submit six months plan for attaining their kaizen goal. Methods for achieving these goals include cutting material costs per unit and improvement in standard operating procedures. These are pursued based on employee’s suggestions. For improvements involving industrial engineering and value engineering, employees often receive support from technical staff. To draw up a Kaizen plan after Kaizen goals have been set by top management, employees look for ways to contribute to Kaizen in their daily work. About two million suggestion were received from Toyota employees in t\one recent year alone roughly thirty-five per employee. Ninety-seven percent of them were adopted. This is really a prime example of concept of employee empowerment in which workers are encouraged to take their own initiatives to improve operations, reduce costs, and improve product quality and customer service.
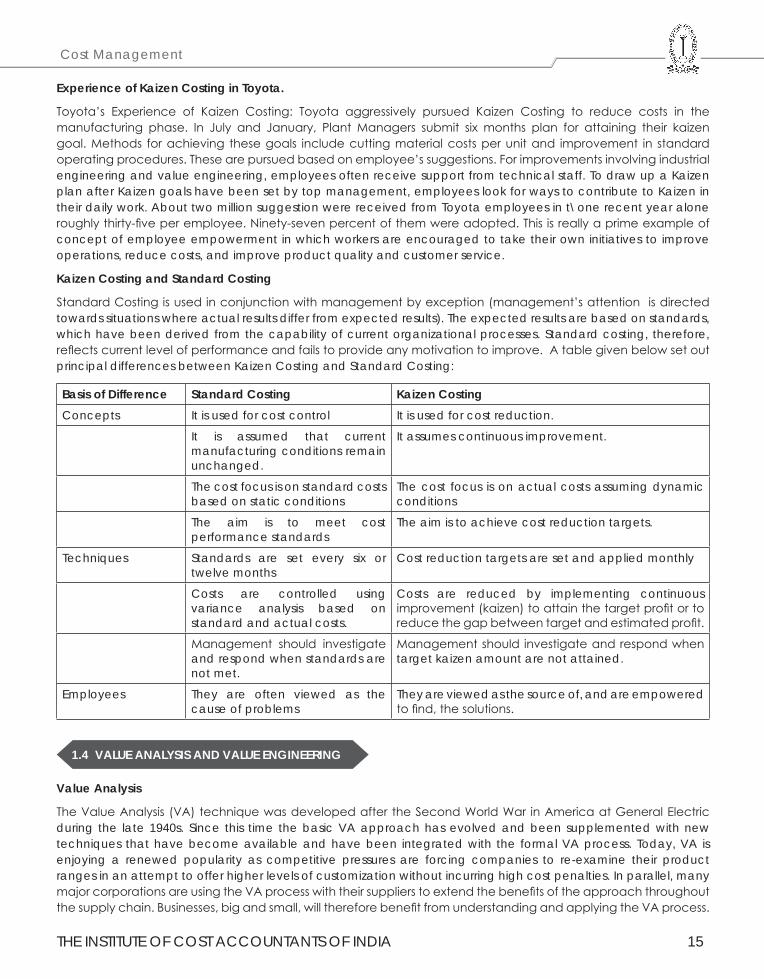
Kaizen Costing and Standard Costing
Standard Costing is used in conjunction with management by exception (management’s attention is directed towards situations where actual results differ from expected results). The expected results are based on standards, which have been derived from the capability of current organizational processes. Standard costing, therefore, reflects current level of performance and fails to provide any motivation to improve. A table given below set out principal differences between Kaizen Costing and Standard Costing:
Basis of Difference Standard Costing Kaizen CostingConcepts It is used for cost control It is used for cost reduction.
It is assumed that current manufacturing conditions remain unchanged.
It assumes continuous improvement.
The cost focus is on standard costs based on static conditions
The cost focus is on actual costs assuming dynamic conditions
The aim is to meet cost performance standards
The aim is to achieve cost reduction targets.
Techniques Standards are set every six or twelve months
Cost reduction targets are set and applied monthly
Costs are controlled using variance analysis based on standard and actual costs.
Costs are reduced by implementing continuous improvement (kaizen) to attain the target profit or to reduce the gap between target and estimated profit.
Management should investigate and respond when standards are not met.
Management should investigate and respond when target kaizen amount are not attained.
Employees They are often viewed as the cause of problems
They are viewed as the source of, and are empowered to find, the solutions.
1.4 VALUE ANALYSIS AND VALUE ENGINEERING
Value Analysis
The Value Analysis (VA) technique was developed after the Second World War in America at General Electric during the late 1940s. Since this time the basic VA approach has evolved and been supplemented with new techniques that have become available and have been integrated with the formal VA process. Today, VA is enjoying a renewed popularity as competitive pressures are forcing companies to re-examine their product ranges in an attempt to offer higher levels of customization without incurring high cost penalties. In parallel, many major corporations are using the VA process with their suppliers to extend the benefits of the approach throughout the supply chain. Businesses, big and small, will therefore benefit from understanding and applying the VA process.
Strategic Cost Management - Decision Making
16 THE INSTITUTE OF COST ACCOUNTANTS OF INDIA
It is likely that those companies that do not take the time to develop this capability will face an uncertain future as the lessons and problems of the past are redesigned into the products of the future.
DefinitionofValueAnalysis
Value Analysis (VA) or Value Engineering (VE) is a function-oriented, structured, multi-disciplinary team approach to solving problems or identifying improvements. The goal of any VA Study is to:
-Improve value by sustaining or improving performance attributes
(of the project, product, and/or service being studied)
-while at the same time reducing overall cost
(including lifecycle operations and maintenance expenses).
Value Analysis can be defined as a process of systematic review that is applied to existing product designs in order to compare the function of the product required by a customer to meet their requirements at the lowest cost consistent with the specified performance and reliability needed.
This is a rather complicated definition and it is worth reducing the definition to key points and elements:
(i) Value Analysis (and Value Engineering) is a systematic, formal and organized process of analysis and evaluation. It is not haphazard or informal and it is a management activity that requires planning, control and co-ordination.
(ii) The analysis concerns the function of a product to meet the demands or application needed by a customer. To meet this functional requirement the review process must include an understanding of the purpose to which the product is used.
(iii) Understanding the use of a product implies that specifications can be established to assess the level of fit between the product and the value derived by the customer or consumer.
(iv) To succeed, the formalmanagementprocessmustmeetthesefunctionalspecificationand performance criteria consistently in order to give value to the customer.
(v) In order to yield a benefit to the company, the formal review process must result in a process of design improvements that serve to lower the production costs of that product whilst maintaining this level of value through function.
DefiningCostandValue
Any attempt to improve the value of a product must consider two elements, the first concerns the use of the product (known as Use value) and the second source of value comes from ownership (Esteem value). This can be shown as the difference between a luxury car and a basic small car that each has the same engine. From a use point of view both cars conduct the same function – they both offer safe economical travel (Use value) – but the luxury car has a greater esteem value. The difference between a gold-plated ball pen and a disposable pen is another example. However, use value and the price paid for a product are rarely the same, the difference is actually the esteem value, so even though the disposable pen is priced at X the use value may be far less.
It is important for all managers to understand the nature of costs in the factory and for any given product. Whilst there is no direct relationship between ‘Cost’ (for the factory) and customer ‘Value’ in use and esteem, this education process is important. A shocking figure, that is often used as a general measure, is that typically 80% of the manufacturing costs of a product will be determined once the design drawing has been released for manufacturing.
The costs of production are therefore ‘frozen’ and determined at this point. These costs include the materials used, the technology employed, the time required to manufacture the product and such like. Therefore, the design process creates many constraints for the business and fixes a high degree of the total product cost. It is therefore a process that demands periodic review in order to recover any ‘avoidable’ costs that can be removed throughout
THE INSTITUTE OF COST ACCOUNTANTS OF INDIA 17
Cost Management
the life of the product (by correcting weaknesses or exploiting new processes, materials or methods) and lowering the costs of production whilst maintaining its Use value to the customer.
Basically, there are three key costs of a product:
• Cost of the parts purchased: These are costs associated with the supply of parts and materials.
• Cost of direct labour used to convert products.
• Cost of factory overheads that recover the expenses of production.
Although there are three elements of total cost accumulation it is traditionally the case that cost reduction activities have focused on the labour element of a product. Activities such as work-study, incentive payments and automation have compressed labour costs and as a result there is little to be gained, for most companies, in attempting to reduce this further. Instead, comparatively greater gains and opportunities lie in the redesign and review of the products themselves to remove unnecessary materials and overhead costs. This approach to the ‘total costs’ of a product involves taking a much broader look at the way costs in the factory accumulate and the relationship between costs and value generation. These new sources of costs and evaluations would therefore include such sources as:
• Cost of manufacture
• Cost of assembly
• Cost of poor quality
• Cost of warranty
A detailed understanding of how costs are rapidly accumulated throughout the process of design to the despatch of the product is key to exploiting the process of VA. All VA activities are aimed at the reduction of avoidable and unnecessary costs, without compromising customer value, and therefore the VA process should target the largest sources of potential cost reduction rather being and indiscriminate or unsystematic process (such as focusing on labour alone). It is therefore preferable to take the holistic approach to understanding costs and losses in the ‘entire system’ of design and conversion of value in order to determine how to achieve customer service ‘functionality’ at a minimal cost per unit.
The Focus of Value Analysis
The key focus of the VA approach is therefore the management of ‘functionality’ to yield value for the customer. Let us emphasize this point a little. Not that long ago, consumers of electric kettles were offered a variety of different types of metal-based boiling device. The value of a kettle is derived through heating water and therefore its functionality can be determined (temperature, capacity, reliability, safety etc.). Now faced with the same functionality (to boil water), designers would probably look towards a kettle made of plastic.
Plastic has the same functionality as metal in terms of containing and boiling water. The action to boil water is conducted by the same part - known as the element. However the switch from metal to plastic does not impair this value and functionality with the customer – they still want to boil water - but it does result in a cost saving for the manufacturing company. If a company that traditionally made metal kettles did not review its design process then it would be severely disadvantaged when attempting to compete against the lower cost plastic alternative. This is a simple example used only to provide an illustration of the VA concept but it does demonstrate the point of maintaining value whilst reducing costs.
If a company seeks to reduce the costs of producing a product then it must seek out costs that are unnecessary or items of the product that provide no functional value to the customer. If you adopt this approach then the VA process is concerned with removing a specific type of cost. This cost is one that can be removed without negatively affecting the function, quality, reliability, maintainability or benefit required by the customer. As such, the target for all VA activities is to find these costs as opposed to simply re-engineering a product design with no real purpose to the re-engineering exercise. The VA approach is therefore formal and systematic because it is directed towards highlighting and dealing with these ‘recoverable costs’ of production. The objective is to create
Strategic Cost Management - Decision Making
18 THE INSTITUTE OF COST ACCOUNTANTS OF INDIA
value for money as opposed to creating new products that do not provide customer satisfaction but are relatively inexpensive.
The rules governing the application of the VA approach are therefore simple:
• No cost can be removed if it compromises the quality of the product or its reliability, as this would lower customer value, create complaints and inevitably lead to the withdrawal of the product or lost sales.
• Saleability is another issue that cannot be compromised, as this is an aspect of the product that makes it attractive to the market and gives it appeal value.
• Any activity that reduces the maintainability of the product increases the cost of ownership to the customer and can lower the value attached to the product.
Types of Value Analysis Exercises
VA for Existing Products
One of the best approaches to VA is simply to select an existing product that is sold in relatively large volumes. This product, or product family, will tend to have a great deal of the basic information, and documented history, which can be used quickly as opposed to a newly introduced product where such a history is not available. An existing product unites all the different managers in a business, each with an opinion and list of complaints concerning the ability to convert the design into a ‘saleable’ product. Therefore any team that is created for the purpose of VA will understand their own problems but not necessarily the cause of these problems across the entire business. These opinions regarding poor performance (and documented evidence of failures) are vital to the discussions and understanding of how the product attracts costs as it is converted from a drawing to a finished product. These discussions therefore allow learning to take place and allow all managers to understand the limitations to the scope of product redesign and re-engineering activities. These issues include:
• The inability to change existing product designs due to the need to redesign tooling and the expense of such an initiative.
• The project team may have a finite duration before the project is concluded and therefore time will dictate what can be achieved.
• The high levels of purchased costs may imply a need to engage with suppliers in the VA process. This initiative will be constrained by a number of issues such as the timing of the project, the availability of resources from the supplier, the location of the suppliers, and other constraints.
VA for New Products – Value Engineering
For new products, the team will need to modify the VA approach and will operate in an environment that is less certain and has poor levels of available information upon which to make decisions. In this case, the analysis and systematic process of review for new products is known as Value Engineering (VE). The VE approach is similar to that of Value Analysis but requires a much greater level of investment by the organization in terms of the skilled, experienced and proficient human resources seconded to the group.
VA for Product Families- Horizontal Deployment
The final form of VA is results when there is scope for the ‘horizontal deployment’ of the results of a VA exercise with a single product or family of products. Under conditions where the value analysis project team finds commonalties with many products manufactured by the company, then it is possible to extend the benefits to all these other products concurrently. In this manner, all affected products can be changed quickly to bring major commercial benefits and to introduce the improvement on a ‘factory-wide basis’. This is particularly the case when supplying companies offer improvements that affect all the products to which their materials or parts are used. The horizontal deployment activity has many advantages both in terms of financial savings and also the relatively short amount of time required to introduce the required changes to the product design.
THE INSTITUTE OF COST ACCOUNTANTS OF INDIA 19
Cost Management
Competitive VA
VA techniques are not simply the prerogative of the business that designed the product. Instead VA is often used as a competitive weapon and applied to the analysis of competitor products in order to calculate the costs of other company’s products. This is often termed ‘strip down’ but is effectively the reverse value analysis. Here the VA team are applied to understanding the design and conversion costs of a competitor product. The results of the analysis is to understand how competitor products are made, what weaknesses exist, and at what costs of production together with an understanding of what innovations have been incorporated by the competitor company.
It is recommended that the best initial approach, for companies with no real experience of VA, is to select a single product that is currently in production and has a long life ahead. This approach offers the ability to gain experience, to learn as a team, and to test the tools and techniques with a product that has known characteristics and failings. In the short term it is most important to develop the skills of VA, including understanding the right questions to ask, and finally to develop a skeleton but formal process for all VA groups to follow and refine.
How to use Value Analysis
Keys to Success
There are many keys to the success of a VA programme and it is wise to consider these issues before commencing the project, as errors in the project plan are difficult to correct, without causing frustration, once the VA project has started. One of the most important initial steps in developing the VA process is to create a formal team of individuals to conduct the exercise. These individuals must be drawn from different parts of the business that affect the costs associated with design, manufacturing, supply and other relevant functions. In addition, the team must be focused on a product or product family in order to begin the exercise. Further key success factors include:
• Gain approval of senior management to conduct a Value Analysis exercise. Senior management support, endorsement and mandate for the VA project provides legitimacy and importance to the project within the business. This approval process also removes many of the obstacles that can prevent progress from being made by the team.
• Enlist a senior manager as a champion of the project to report back directly to the board of directors and also to act as the programme leader.
• Once a programme team has been developed it is important to select an operational leader to co-ordinate the efforts, monitor progress and to support the project champion.
This leader will remain with the VA team throughout the life of the project and will be the central linking pin between the team and the senior management champion.
• Establish the reporting procedure for the team and the timing of the project. This project plan needs to be formal and displayed as a means of controlling and evaluating achievements against time.
• Present the VA concept and objectives of the team to all the middle and senior managers in the business. Widespread communication of the VA project is important so that other employees, particularly managers (who may not be involved directly with the process) understand the need to support the project either directly by assigning staff or indirectly through the provision of data.
• Maintain a list of those business functions that should receive a regular communication of progress even though they may not be directly involved with the project. This process allows other individuals in the business to be informed about the progress and findings of the group. This form of promotion is important as it maintains a momentum and communicates the findings of the team as widely as possible.
• Provideanofficespaceandco-locatetheteammemberswhere practical and possible to do so. The ability to locate a VA improvement group in one area of the business is important and assists the communication within the group. A convenient area can also be used to dismantle the product and also the walls of the area can be used to record, on paper charts, the issues that have been discovered by the team (and the associated actions that must be undertaken).
Strategic Cost Management - Decision Making
20 THE INSTITUTE OF COST ACCOUNTANTS OF INDIA
• Select the product for the first study. Ideally the existing product, or family of products, will be one that is established, sells in volume and has a relatively long life expectancy.
As such any improvement in the cost performance of the product will provide a large financial saving to the business.
• Write down the objectives of the project and the key project review points. Estimate the targets to be achieved by the project. These objectives provide a reference point and framework for the exercise. The objectives also focus attention on the outputs and achievements required by the company.
• Select and inform any personnel who will act in a part time or temporary role during the project. This process is used to schedule the availability of key specialist human resources to support the team throughout the duration of the project.
• Train the team in both the process of VA and also in basic team building activities. It is important that all members understand the nature of the project and its importance. The initial team building exercises are also a good way of understanding the attitude of all members to the project – especially those with reservations or a negative attitude to what can be achieved. As with most team exercises there is a requirement to allow the team to build and bond as a unit. It is often difficult for individuals, drawn from throughout the factory, to understand the language that is used throughout the business and also to understand the ‘design to market’ process when their own role impacts on a small section of this large and complex process.
Value Engineering
Value Engineering is an organized/systematic approach directed at analyzing the function of systems, equipment, facilities, services, and supplies for the purpose of achieving their essential functions at the lowest life-cycle cost consistent with required performance, reliability, quality, and safety. Society of Japanese Value Engineering defines VE as:
“A systematic approach to analyzing functional requirements of products or services for the purposes of achieving the essential functions at the lowest total cost”.
Value Engineering is an effective problem solving technique. Value engineering is essentially a process which uses function analysis, team- work and creativity to improve value. Value Engineering is not just “good engineering.” It is not a suggestion program and it is not routine project or plan review. It is not typical cost reduction in that it doesn’t “cheapen” the product or service, nor does it “cut corners.”
Value Engineering simply answers the question “what else will accomplish the purpose of the product, service, or process we are studying?”. VE technique is applicable to all type of sectors. Initially, VE technique was introduced in manufacturing industries. This technique is then expanded to all type of business or economic sector, which includes construction, service, government, agriculture, education and healthcare.
Aadarsh Instruments, located in Ambala, is a medical instrument manufacturing company considered to apply Value Engineering in to the Focus Adjustment Knob in one of their model SL 250 for Slit Lamp in microscope. This microscope has found application in the field of eye inspection. The value engineering analysis may help company in running its export business of medical microscope. This firm is producing different types of microscopes which they export to various countries around the globe. All of the products manufactured here are conforming to the international standards. It is an ISO certified company.
The total savings after the implementation of value engineering are as given below:
• Cost before analysis — ` 29.99
• Total Cost of Nylon Knob — ` 18.40
• Saving per product — ` 11.59
• Percentage saving per product — 38.64%
• Annual Demand of the product — 8,000
THE INSTITUTE OF COST ACCOUNTANTS OF INDIA 21
Cost Management
• Total Annual Saving — ` 92,720
• Value Improvement — ` 62.98%
What are the steps to be followed for doing Value Engineering? How can you conclude the decision on the basis of the above Value Engineering?
Answer:
The following are the steps to be used for carrying out the Value Engineering exercise by Aadarsh Instruments in their model SL 250 for Slit Lamp in Microscope for the Focus Adjustment Knob:
(i) Selection of the Product Plan.
(ii) Gathering Product Information
(iii) Functional Analysis
(iv) Creativity Phase and preparing the work-sheet
(v) Evaluation Sheet
(vi) Cost Analysis
(vii) Result and Conclusion
(viii) Implementation.
Conclusion: Value Engineering methodology is a powerful tool for resolving system failures and designing improvements in performance of any process, product, service or organization. In the Case Study discussed under the question, we have used the concept of Value Engineering to analyze the Focus Adjustment Knob of SL 250 Slit Lamp Microscope. With a critical evaluation of this study, we have been able to increase the value of the product by substituting another material in place of the one currently in use. The% value improvement is to the tune of 62.98% and the total annual saving has been ` 92,720.
The various advantages have been observed in terms of:
� Cost Reduction
� Increase in overall production
� Reduction in man-power
� Reduction in scrap.
Thus the cost has been brought down by a substantial margin and thereby the value of the product has been increased.
1.5 THROUGHPUT COSTING
Throughput Accounting is a management accounting technique used as a performance measure in the theory of constraints. It is the business intelligence used for maximizing profits. It focuses importance on generating more throughput. It seeks to increase the velocity or speed of production of products and services keeping in view of constraints. It is based on the concept that a company must determine its overriding goal and then it should create a system that clearly defines the main capacity constraint that allows it to maximize that goal. The changes that this concept causes are startling.
Throughput accounting is a system of performance measurement and costing which traces costs to throughput time. It is claimed that it complements JIT principles and forces attention to the true determinants of profitability. Throughput accounting is defined as follows:
“A management accounting system which focuses on ways by which the maximum return per unit of bottleneck activity can be achieved” – CIMA Terminology.
Strategic Cost Management - Decision Making
22 THE INSTITUTE OF COST ACCOUNTANTS OF INDIA
Throughput Concepts:
A few new terms are used in throughput accounting. They are explained as below:
Throughput:
Throughput is the excess of sales value over the totally variable cost. That is nothing but contribution margin left after a product’s price is reduced by the amount of its totally variable cost.
Totally Variable Cost:
This cost is incurred only if a product is produced. In many cases only direct materials are considered as totally variable cost. Direct labour is not totally variable, unless piece rate wages are paid.
Capacity Constraints:
It is a resource within a company, that limits its total output. For example, it can be a machine that can produce only a specified amount of a key component in a given time period, thereby keeping overall sales from expanding beyond the maximum capacity of that machine. There may be more than one capacity constraint in a company, but rarely more than one for a specified product or product line.
Throughput (or Cycle) Time:
Throughput (or cycle) time is the average time required to convert raw materials into finished goods ready to be shipped to customer. It includes the time required for activities such as material handling, production processing, inspecting and packaging.
ThroughputEfficiency:
Throughput efficiency is the relation of throughput achieved to resources used.
Throughput efficiency = (Throughput cost)
(Actual factory cost)
Throughput Time Ratio:
It is the ratio of time spent adding customer value to products and services divided by total cycle time. It is also known as the ‘ratio of work content to lead time’.
Operating Expenses:
This is sum total of all company expenses including totally variable expenses. It should be noted that throughput accounting does not care, if a cost is semi-variable, fixed or allocated – all costs that are not totally variable is lumped together for throughput accounting purpose. This group of expenses is considered the price that a company pays to ensure that it maintains its current level of capacity.
Investment:
This term is used here also, as it is used in common parlance, i.e. any application of funds, which is intended to provide a return by way of interest, dividend or capital appreciation. However, there is a particular emphasis on company’s investment in working capital. This is discussed subsequently in discussion about throughput model.
Total Factory Cost:
With the exception of material costs, in the short run, most factory costs (including direct labour) are fixed. These fixed costs can be grouped together and called total factory costs (TFC).
Manufacturing Response Time:
With JIT, products should not be made, unless there is a customer waiting for them, because the ideal inventory level is zero. The effect of this will be that there will be idle capacity in some operations except the operation, which is bottleneck of the moment. Working on output just to increase WIP or Finished Goods stocks creates no profit and so would not be encouraged. This means that profit is inversely proportional to the level of inventory in the system. It can be expressed as follows:
THE INSTITUTE OF COST ACCOUNTANTS OF INDIA 23
Cost Management
Profit = f = 1
MRT3 4
where, MRT = Manufacturing Response Time
Profitability:
This concept emphasis that profitability is determined by how quickly goods can be produced to satisfy customer’s orde` Production for stock does not create profits. Improving the throughput of bottleneck operations will increase the rate at which customer demand can be met and this will improve profitability. Contribution in its traditional form (sales – variable costs) is not good guide or profitability because it ignores capacity factors and rate of production.
Return per facrory hour = Sales Prices – material Cost
Time on key resource i.e., the bottleneck3 4
Product costs are measured thus:
Cost per factory hour = Total factory costs (TFC)
Total time available on the key resource3 4
The return and cost per factory hour are combined into the throughput accounting ratio as follows:
TA = Return per factory hour (or minute)
Cost per factory hour (or minute)3 4
The TA ratio should be greater than 1. If it is less than 1 the product will lose money for the company and the company should consider withdrawing it from the market.
Using TA, value is not created until products are sold. Thus items made for stock produce no return and depress the TA ratio. This should prompt managers to use them limited bottleneck resource to produce products for which customer demand exists. The TA ratio can be considered in total terms and compares the total return from the throughput to TFC, i.e.,
3 4Primary TA Ratio = Return from total throughput (i.e.,Sales-Material Costs)
(TFC (i.e.,all costs other than materials)
Throughput Accounting and Contribution Approach:
Throughput accounting has certain similarities with the traditional approach of maximizing contribution per unit of scarce resource. However, there are certain differences. In throughput accounting, return is defined as sales less material costs in contrast to contribution, which is sales less all variable costs, i.e., material, labour, overheads. The assumption (i.e., emphasis) in throughput accounting is that all costs except material are fixed in relation to throughput in short run. Eminent management accountants like Kaplan and Shank have criticized TA for its short-term emphasis. Besides, TA does not appear to be useful in JIT environment. Throughput helps to direct attention to bottlenecks and forces management to concentrate on the key elements in making profits and approach adopted to gain this objective is reduction in inventory and reducing response time to customer demand.
Basic logic of throughput costing and comparison with absorption costing:
Throughput costing assigns only unit level spending for direct costs as the cost of products or services. Advocates of throughput costing argue that adding any other indirect cost, past or committed cost, to product cost creates improper incentives to drive down the average cost per unit by making more products than can be used or sold. Since these are committed costs, making more units with the same level of spending arithmetically reduces the average cost per unit and makes the production process appear to be more efficient. Throughput accounting (costing) avoids this incentive because the cost per unit depends only on the unit level spending (i.e., cost of materials) not how many units are made. Using throughput accounting (costing) means that cost management analyst must distinguish between
Strategic Cost Management - Decision Making
24 THE INSTITUTE OF COST ACCOUNTANTS OF INDIA
(a) Spending for resources caused by the decision to produce different levels of products and services, and
(b) The use of resources that organisation has committed to supply regardless of level of products and services provided.
Steps to be followed to increase the throughput:
The theory of constraints is applied within an organisation by following what are called ‘the five focusing steps.’ These are a tool that Goldratt developed to help organisations deal with constraints, otherwise known as bottlenecks, within the system as a whole (rather than any discrete unit within the organisation.) The steps are as follows:
(a) Identify the bottle neck in the system i.e., identification of the limiting factor of the production (or) process such as installing capacity or hours etc.
(b) Decide how to exploit the systems bottleneck that means bottleneck resource should be actively and effectively used as much as possible to produce as many goods as possible.
(c) Subordinate everything else to the decision made in step (b). The production capacity of the bottleneck resource should determined production schedule.
(d) Augment the capacity of the bottleneck resource with the minimum capital input.
(e) Identify the new bottlenecks in the process and repeat the same above steps to address the bottlenecks.
Problems with throughput accounting:
1. When throughput accounting is the driving force behind all production scheduling, a customer that has already placed an order for a product, which will result in a sub-optimal profit level for the manufacturing, may find that its order is never filled.
2. The company’s ability to create the highest level of profitability is now dependent on the production scheduling staff, who decides, what products are to be manufactured and in what order.
3. Another issue is that all costs are totally variable in the long-run since the management then, has the time to adjust them to long-range production volumes.
Reporting under throughput accounting:
When the throughput model is used for financial reporting purposes, the format appears slightly different. The income statement includes only direct materials in the cost of goods sold, which results in a ‘throughput contribution instead of gross margin. All other costs are jumped into an ‘Operating Expenses’ category below the throughput contribution margin, yielding a net income figure at the bottom. All other financial reports stay the same. Though this single change appears relatively minor, it has significant impact. The primary change is that throughput accounting does not charge any operating expenses to inventory so that they can be expressed in future period. Instead, all operating expenses are realized during the current period. As a result, any incentive for managers to over produce is completely eliminated because they cannot use the excess amount to shift expenses out of current period, thereby making their financial results look better than they would otherwise. Though this is a desirable result, such a report can be used only for internal reporting because of the requirement of generally accepted accounting principles that some overheads should be charged to excess production.
Systematic changes required for acceptance of the throughput accounting:
Throughput accounting does not have a logical linkage with the more traditional form of cost accounting. This makes it difficult for it to gain acceptance. The main problem is that this method does not use cost as the basis for the most optimal production decisions. This is entirely contrary to the teachings of any other type of accounting, which holds that the highest margin products should always be produced first. Now question is whether the enterprise should either use throughput or traditional costing exclusively or is there any way to merge the two. Following discussion relates to this issue:
(a) Inventory Valuation:
Generally accepted accounting principles clearly state that cost of overhead must be apportioned to inventory. Throughput accounting states that none of the overhead cost should be so assigned. In this case, since the rules are so clear, it is apparent that throughput accounting loses. The existing system must continue to assign costs irrespective of how throughput principles are used for other decision making (short-range) activities.
THE INSTITUTE OF COST ACCOUNTANTS OF INDIA 25
Cost Management
(b) Inventory Investment Analysis:
There are fundamental differences between the two methodologies. Both hold that the objective is always to keep one’s investment at a minimum. In the case of traditional cost accounting, this is because the return on investment is higher when the total amount of investment is forced to the lowest possible level. Throughput accounting, however, wants to shrink the amount of investment because it includes work-in-progress inventory in this category. It tries to keep WIP levels down so that waste is reduced in the production system. In short, first system advocates a small investment for financial reasons, while later system favours it because it makes more operational sense. Despite the differences in reasoning, the same conclusion is reached by both methodologies. However, throughput approach is still better, for it forces one to analyse all inventory reduction projects in light of how they together will impact the capacity constraint rather than individually.
(c) Capital Investment Analysis:
Traditional cost accounting only analyses each investment proposal on its own rather than considering its impact on the production processes as a whole. It tends to recommend investments that will result in an incremental investment but no overall change in the level of corporate capacity, which is driven by capacity constraint. Throughput accounting, however, has a tight focus on investment only in areas that impact capacity constraint – to other investment proposals are rejected. In this instance, it is best to reject the traditional system and conduct analysis based on throughput principles.
(d) Product Costing: Under throughput accounting, a product has only a totally variable cost, which may be far lower than the
fully absorbed cost, that would be assigned to it under more traditional costing system. This totally variable cost is almost always direct materials, which is an easily calculated figure. Full absorption costing, however, requires a large amount of calculation effort, before a detailed cost can be compiled for a product. For companies selling to Government under cost-plus contracts, there are lengthy detailed requirement as to what variable and overhead costs should be assigned to each product manufactured. These rules virtually require the use of absorption costing – throughput costing is not a viable solution. For companies, that do not require detailed costing justifications while selling their products, it may be possible to use the much simpler throughput accounting approach.
(e) Production Scheduling: Traditional systems do not include any kind of throughput accounting, that tells production planners which
orders should be produced first. These days with throughput accounting, it is possible to customize existing systems or to upgrade packaged software so that this option is available to planne` This would allow them to produce the items that result in the highest throughput per minute of the capacity constraint. Here it is difficult to fully support the throughput approach. Any company that has already received a customer has an obligation to fill it, even if the resulting sale will reduce its overall level of profit from the theoretical maximum that can be calculated with throughput accounting. Maximising short-term profit by ignoring orders is tantamount to long-term suicide since customers will leave in droves. Consequently, production planners should be left alone to schedule production in the traditional manner rather than basing their decisions on short-term profit maximisation.
(f) Long-term planning: This is the main application area of throughput accounting. The enterprise should estimate the approximate
sales levels for each product for a long-time frame enter into a throughput model and determine what mix of prospective sales will result in the highest level of profitability. This method is much superior to use of throughput costing for short-term production decisions, since long-term planning sidesteps problems by avoiding existing customer orders that will result in low profits. Long-term planning does not involve existing customer orders so that decisions to produce various types of products at different price points can be made before the sales force goes out to obtain ordes.
(g) Price Setting: Throughput accounting is favoured by the sales and marketing staff favours throughput accounting because
the margin on products is simple to obtain-just subtract totally variable costs from the price. This beats the incomprehensible image of allocations accompanying activity based costing. Price setting in throughput environment focuses more on what products can be inserted into the existing production mix at a price that
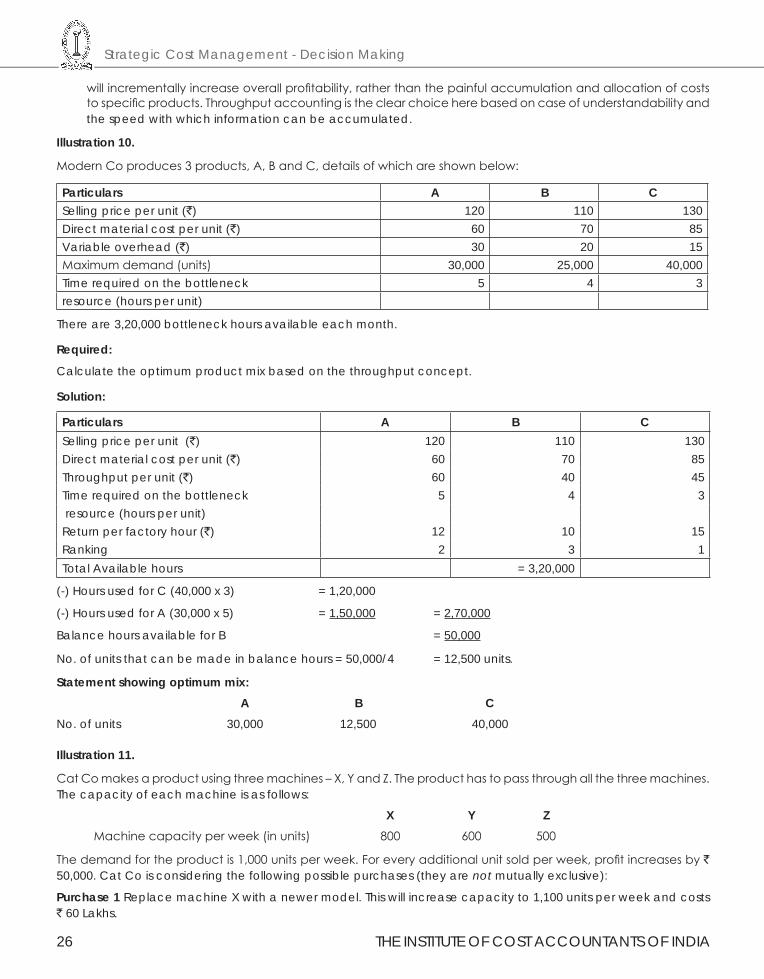
Strategic Cost Management - Decision Making
26 THE INSTITUTE OF COST ACCOUNTANTS OF INDIA
will incrementally increase overall profitability, rather than the painful accumulation and allocation of costs to specific products. Throughput accounting is the clear choice here based on case of understandability and the speed with which information can be accumulated.
Illustration 10.
Modern Co produces 3 products, A, B and C, details of which are shown below:
Particulars A B CSelling price per unit (`) 120 110 130Direct material cost per unit (`) 60 70 85Variable overhead (`) 30 20 15Maximum demand (units) 30,000 25,000 40,000Time required on the bottleneck 5 4 3resource (hours per unit)
There are 3,20,000 bottleneck hours available each month.
Required:
Calculate the optimum product mix based on the throughput concept.
Solution:
Particulars A B CSelling price per unit (`) 120 110 130Direct material cost per unit (`) 60 70 85Throughput per unit (`) 60 40 45Time required on the bottleneck 5 4 3 resource (hours per unit)Return per factory hour (`) 12 10 15Ranking 2 3 1Total Available hours = 3,20,000
(-) Hours used for C (40,000 x 3) = 1,20,000
(-) Hours used for A (30,000 x 5) = 1,50,000 = 2,70,000
Balance hours available for B = 50,000
No. of units that can be made in balance hours = 50,000/4 = 12,500 units.
Statement showing optimum mix: A B CNo. of units 30,000 12,500 40,000
Illustration 11.
Cat Co makes a product using three machines – X, Y and Z. The product has to pass through all the three machines. The capacity of each machine is as follows:
X Y Z Machine capacity per week (in units) 800 600 500
The demand for the product is 1,000 units per week. For every additional unit sold per week, profit increases by ` 50,000. Cat Co is considering the following possible purchases (they are not mutually exclusive):
Purchase 1 Replace machine X with a newer model. This will increase capacity to 1,100 units per week and costs ` 60 Lakhs.
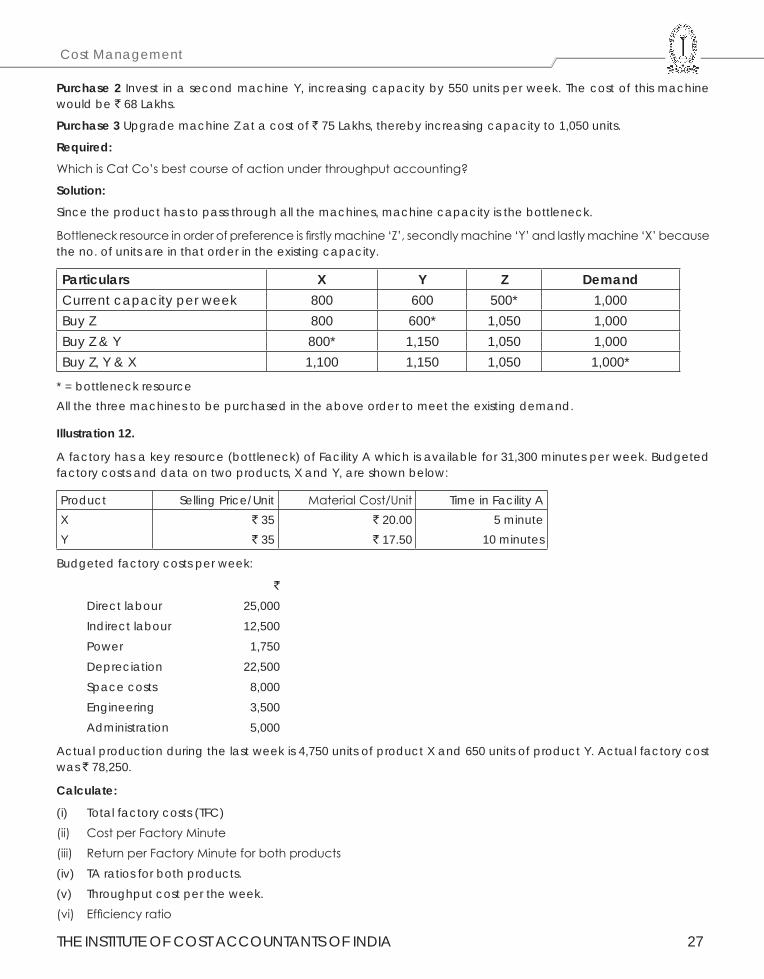
THE INSTITUTE OF COST ACCOUNTANTS OF INDIA 27
Cost Management
Purchase 2 Invest in a second machine Y, increasing capacity by 550 units per week. The cost of this machine would be ` 68 Lakhs.
Purchase 3 Upgrade machine Z at a cost of ` 75 Lakhs, thereby increasing capacity to 1,050 units.
Required:
Which is Cat Co’s best course of action under throughput accounting?
Solution:
Since the product has to pass through all the machines, machine capacity is the bottleneck.
Bottleneck resource in order of preference is firstly machine ‘Z’, secondly machine ‘Y’ and lastly machine ‘X’ because the no. of units are in that order in the existing capacity.
Particulars X Y Z DemandCurrent capacity per week 800 600 500* 1,000Buy Z 800 600* 1,050 1,000Buy Z & Y 800* 1,150 1,050 1,000Buy Z, Y & X 1,100 1,150 1,050 1,000*
* = bottleneck resourceAll the three machines to be purchased in the above order to meet the existing demand.
Illustration 12.
A factory has a key resource (bottleneck) of Facility A which is available for 31,300 minutes per week. Budgeted factory costs and data on two products, X and Y, are shown below:
Product Selling Price/Unit Material Cost/Unit Time in Facility AXY
` 35` 35
` 20.00` 17.50
5 minute10 minutes
Budgeted factory costs per week:
`
Direct labour 25,000Indirect labour 12,500Power 1,750Depreciation 22,500Space costs 8,000Engineering 3,500Administration 5,000
Actual production during the last week is 4,750 units of product X and 650 units of product Y. Actual factory cost was ` 78,250.
Calculate:
(i) Total factory costs (TFC)(ii) Cost per Factory Minute(iii) Return per Factory Minute for both products(iv) TA ratios for both products.(v) Throughput cost per the week.(vi) Efficiency ratio
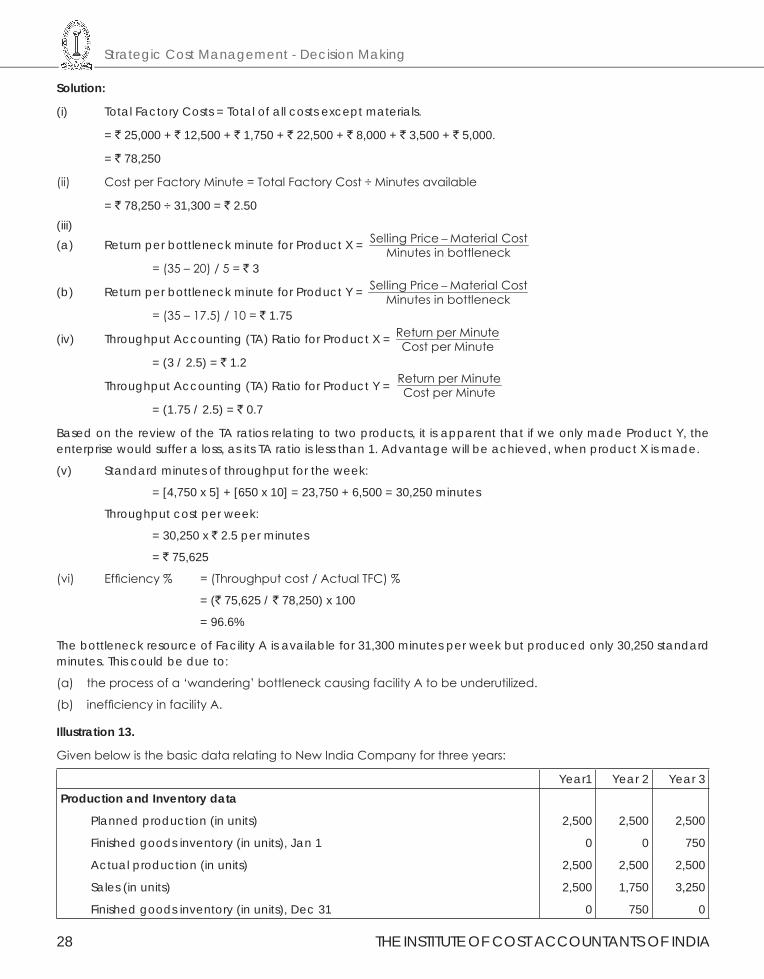
Strategic Cost Management - Decision Making
28 THE INSTITUTE OF COST ACCOUNTANTS OF INDIA
Solution:
(i) Total Factory Costs = Total of all costs except materials.
= ` 25,000 + ` 12,500 + ` 1,750 + ` 22,500 + ` 8,000 + ` 3,500 + ` 5,000.
= ` 78,250
(ii) Cost per Factory Minute = Total Factory Cost ÷ Minutes available
= ` 78,250 ÷ 31,300 = ` 2.50(iii)(a) Return per bottleneck minute for Product X = Selling Price Material Cost
Minutes in bottleneck−
= (35 – 20) / 5 = ` 3
(b) Return per bottleneck minute for Product Y = Selling Price Material CostMinutes in bottleneck
−
= (35 – 17.5) / 10 = ` 1.75
(iv) Throughput Accounting (TA) Ratio for Product X = Return per MinuteCost per Minute
= (3 / 2.5) = ` 1.2
Throughput Accounting (TA) Ratio for Product Y = Return per MinuteCost per Minute
= (1.75 / 2.5) = ` 0.7
Based on the review of the TA ratios relating to two products, it is apparent that if we only made Product Y, the enterprise would suffer a loss, as its TA ratio is less than 1. Advantage will be achieved, when product X is made.
(v) Standard minutes of throughput for the week:
= [4,750 x 5] + [650 x 10] = 23,750 + 6,500 = 30,250 minutes
Throughput cost per week:
= 30,250 x ` 2.5 per minutes
= ` 75,625
(vi) Efficiency % = (Throughput cost / Actual TFC) %
= (` 75,625 / ` 78,250) x 100
= 96.6%
The bottleneck resource of Facility A is available for 31,300 minutes per week but produced only 30,250 standard minutes. This could be due to:
(a) the process of a ‘wandering’ bottleneck causing facility A to be underutilized.
(b) inefficiency in facility A.
Illustration 13.
Given below is the basic data relating to New India Company for three years:
Year1 Year 2 Year 3Production and Inventory data
Planned production (in units)
Finished goods inventory (in units), Jan 1
Actual production (in units)
Sales (in units)
Finished goods inventory (in units), Dec 31
2,500
0
2,500
2,500
0
2,500
0
2,500
1,750
750
2,500
750
2,500
3,250
0
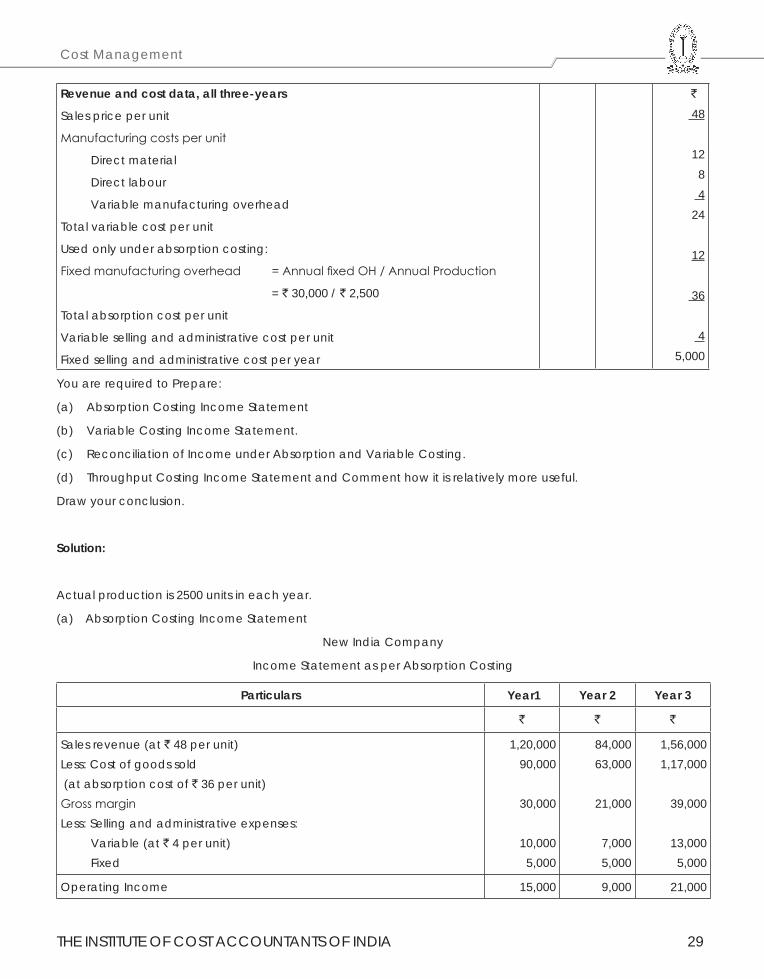
THE INSTITUTE OF COST ACCOUNTANTS OF INDIA 29
Cost Management
Revenue and cost data, all three-years
Sales price per unit
Manufacturing costs per unit
Direct material
Direct labour
Variable manufacturing overhead
Total variable cost per unit
Used only under absorption costing:
Fixed manufacturing overhead = Annual fixed OH / Annual Production
= ` 30,000 / ` 2,500
Total absorption cost per unit
Variable selling and administrative cost per unit
Fixed selling and administrative cost per year
`
48
128 424
12
36
4 5,000
You are required to Prepare:
(a) Absorption Costing Income Statement
(b) Variable Costing Income Statement.
(c) Reconciliation of Income under Absorption and Variable Costing.
(d) Throughput Costing Income Statement and Comment how it is relatively more useful.
Draw your conclusion.
Solution:
Actual production is 2500 units in each year.
(a) Absorption Costing Income Statement
New India Company
Income Statement as per Absorption Costing
Particulars Year1 Year 2 Year 3
` ` `
Sales revenue (at ` 48 per unit)Less: Cost of goods sold (at absorption cost of ` 36 per unit)Gross marginLess: Selling and administrative expenses: Variable (at ` 4 per unit) Fixed
1,20,00090,000
30,000
10,0005,000
84,00063,000
21,000
7,0005,000
1,56,0001,17,000
39,000
13,0005,000
Operating Income 15,000 9,000 21,000
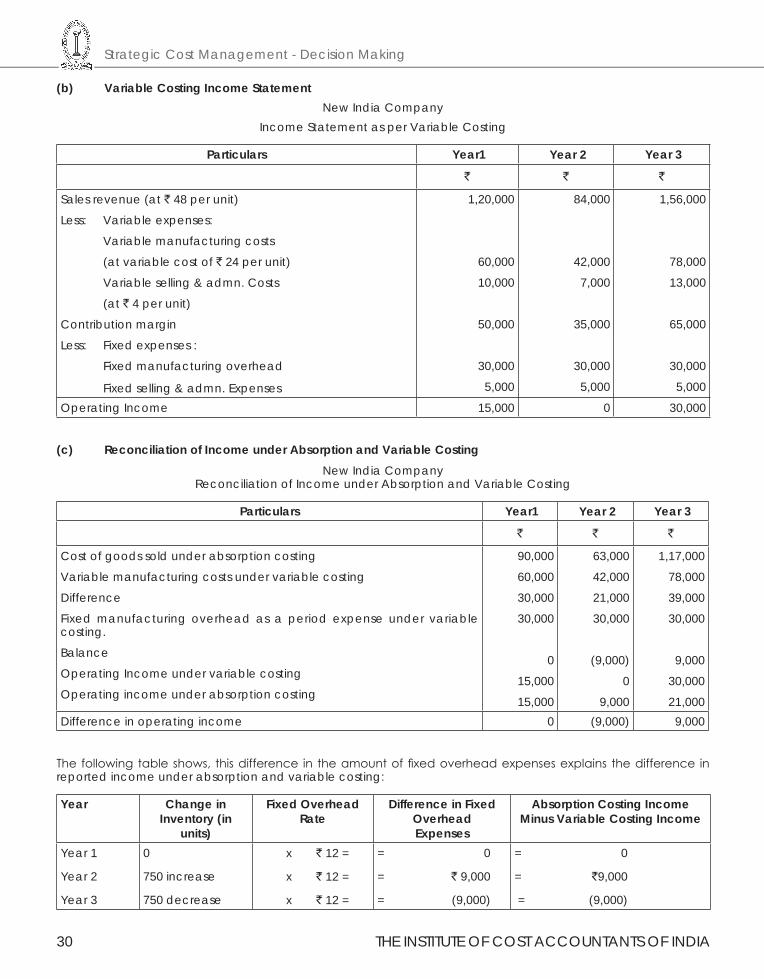
Strategic Cost Management - Decision Making
30 THE INSTITUTE OF COST ACCOUNTANTS OF INDIA
(b) Variable Costing Income StatementNew India Company
Income Statement as per Variable Costing
Particulars Year1 Year 2 Year 3
` ` `
Sales revenue (at ` 48 per unit)
Less: Variable expenses:
Variable manufacturing costs
(at variable cost of ` 24 per unit)
Variable selling & admn. Costs
(at ` 4 per unit)
Contribution margin
Less: Fixed expenses :
Fixed manufacturing overhead
Fixed selling & admn. Expenses
1,20,000
60,000
10,000
50,000
30,000
5,000
84,000
42,000
7,000
35,000
30,000
5,000
1,56,000
78,000
13,000
65,000
30,000
5,000
Operating Income 15,000 0 30,000
(c) Reconciliation of Income under Absorption and Variable CostingNew India Company
Reconciliation of Income under Absorption and Variable Costing
Particulars Year1 Year 2 Year 3
` ` `
Cost of goods sold under absorption costing
Variable manufacturing costs under variable costing
Difference
Fixed manufacturing overhead as a period expense under variable costing.
Balance
Operating Income under variable costing
Operating income under absorption costing
90,000
60,000
30,000
30,000
0
15,000
15,000
63,000
42,000
21,000
30,000
(9,000)
0
9,000
1,17,000
78,000
39,000
30,000
9,000
30,000
21,000Difference in operating income 0 (9,000) 9,000
The following table shows, this difference in the amount of fixed overhead expenses explains the difference in reported income under absorption and variable costing:
Year Change in Inventory (in
units)
Fixed OverheadRate
Difference in Fixed OverheadExpenses
Absorption Costing Income Minus Variable Costing Income
Year 1
Year 2
Year 3
0
750 increase
750 decrease
x ` 12 =
x ` 12 =
x ` 12 =
= 0
= ` 9,000
= (9,000)
= 0
= `9,000
= (9,000)
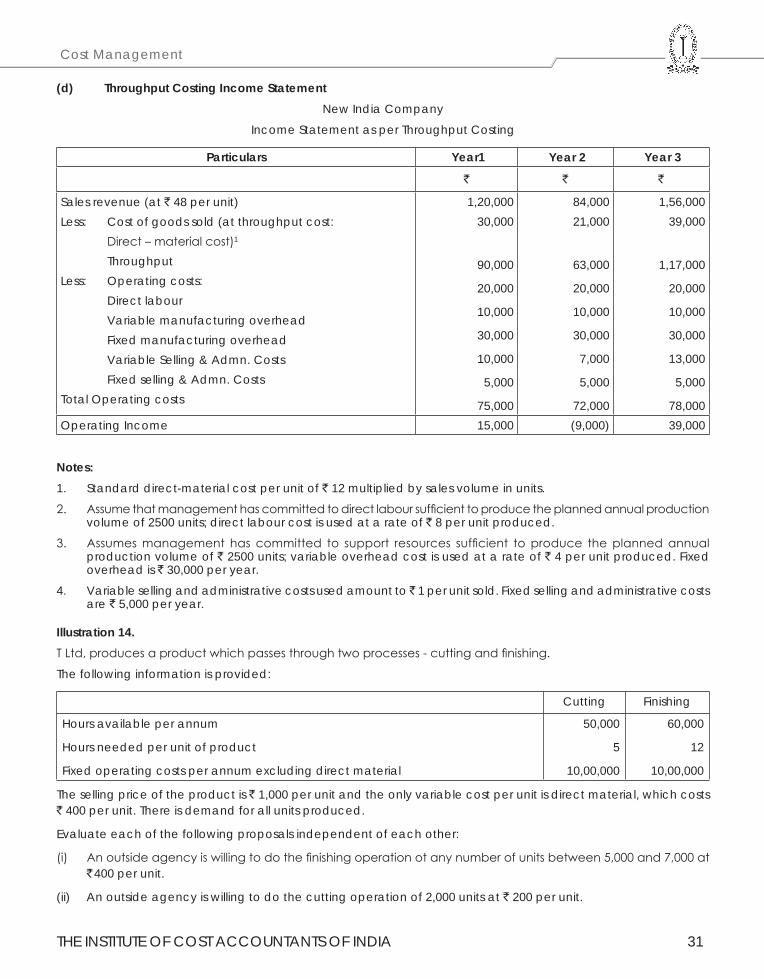
THE INSTITUTE OF COST ACCOUNTANTS OF INDIA 31
Cost Management
(d) Throughput Costing Income StatementNew India Company
Income Statement as per Throughput Costing
Particulars Year1 Year 2 Year 3
` ` `
Sales revenue (at ` 48 per unit)Less: Cost of goods sold (at throughput cost: Direct – material cost)1
ThroughputLess: Operating costs: Direct labour Variable manufacturing overhead Fixed manufacturing overhead Variable Selling & Admn. Costs Fixed selling & Admn. CostsTotal Operating costs
1,20,00030,000
90,000
20,000
10,000
30,000
10,000
5,000
75,000
84,00021,000
63,000
20,000
10,000
30,000
7,000
5,000
72,000
1,56,00039,000
1,17,000
20,000
10,000
30,000
13,000
5,000
78,000Operating Income 15,000 (9,000) 39,000
Notes:1. Standard direct-material cost per unit of ` 12 multiplied by sales volume in units.
2. Assume that management has committed to direct labour sufficient to produce the planned annual production volume of 2500 units; direct labour cost is used at a rate of ` 8 per unit produced.
3. Assumes management has committed to support resources sufficient to produce the planned annual production volume of ` 2500 units; variable overhead cost is used at a rate of ` 4 per unit produced. Fixed overhead is ` 30,000 per year.
4. Variable selling and administrative costs used amount to ̀ 1 per unit sold. Fixed selling and administrative costs are ` 5,000 per year.
Illustration 14.T Ltd, produces a product which passes through two processes - cutting and finishing.
The following information is provided:
Cutting Finishing
Hours available per annum
Hours needed per unit of product
Fixed operating costs per annum excluding direct material
50,000
5
10,00,000
60,000
12
10,00,000
The selling price of the product is ` 1,000 per unit and the only variable cost per unit is direct material, which costs ` 400 per unit. There is demand for all units produced.
Evaluate each of the following proposals independent of each other:
(i) An outside agency is willing to do the finishing operation ot any number of units between 5,000 and 7,000 at ` 400 per unit.
(ii) An outside agency is willing to do the cutting operation of 2,000 units at ` 200 per unit.
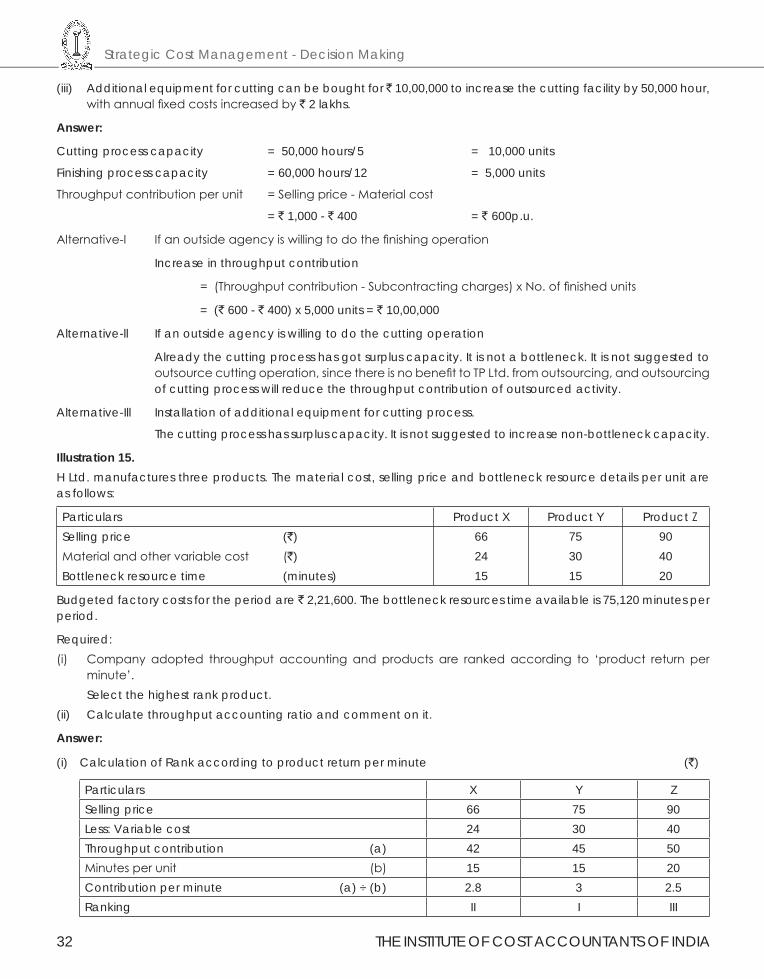
Strategic Cost Management - Decision Making
32 THE INSTITUTE OF COST ACCOUNTANTS OF INDIA
(iii) Additional equipment for cutting can be bought for ̀ 10,00,000 to increase the cutting facility by 50,000 hour, with annual fixed costs increased by ` 2 lakhs.
Answer:
Cutting process capacity = 50,000 hours/5 = 10,000 units
Finishing process capacity = 60,000 hours/12 = 5,000 units
Throughput contribution per unit = Selling price - Material cost
= ` 1,000 - ` 400 = ` 600p.u.
Alternative-I If an outside agency is willing to do the finishing operation
Increase in throughput contribution
= (Throughput contribution - Subcontracting charges) x No. of finished units
= (` 600 - ` 400) x 5,000 units = ` 10,00,000
Alternative-ll If an outside agency is willing to do the cutting operation
Already the cutting process has got surplus capacity. It is not a bottleneck. It is not suggested to outsource cutting operation, since there is no benefit to TP Ltd. from outsourcing, and outsourcing of cutting process will reduce the throughput contribution of outsourced activity.
Alternative-Ill Installation of additional equipment for cutting process.
The cutting process has surplus capacity. It is not suggested to increase non-bottleneck capacity.
Illustration 15.H Ltd. manufactures three products. The material cost, selling price and bottleneck resource details per unit are as follows:
Particulars Product X Product Y Product ZSelling price (`)Material and other variable cost (`)Bottleneck resource time (minutes)
662415
753015
904020
Budgeted factory costs for the period are ` 2,21,600. The bottleneck resources time available is 75,120 minutes per period.
Required:(i) Company adopted throughput accounting and products are ranked according to ‘product return per
minute’. Select the highest rank product.(ii) Calculate throughput accounting ratio and comment on it.
Answer:
(i) Calculation of Rank according to product return per minute (`)
Particulars X Y ZSelling price 66 75 90Less: Variable cost 24 30 40Throughput contribution (a) 42 45 50Minutes per unit (b) 15 15 20Contribution per minute (a) ÷ (b) 2.8 3 2.5Ranking II I III
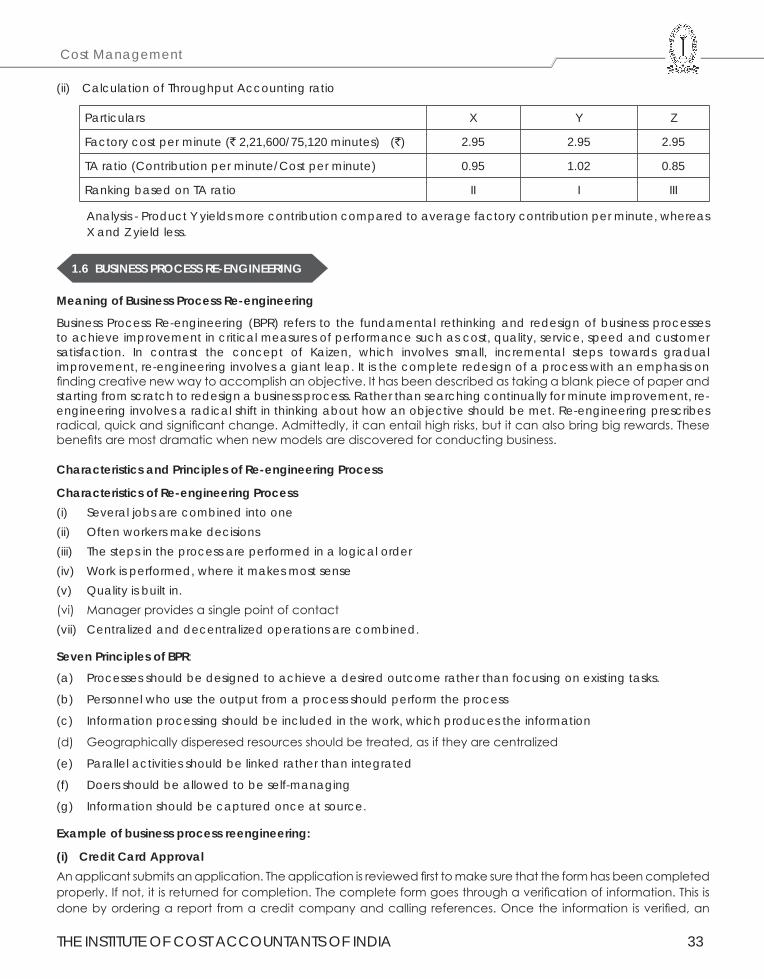
THE INSTITUTE OF COST ACCOUNTANTS OF INDIA 33
Cost Management
(ii) Calculation of Throughput Accounting ratio
Particulars X Y Z
Factory cost per minute (` 2,21,600/75,120 minutes) (`) 2.95 2.95 2.95
TA ratio (Contribution per minute/Cost per minute) 0.95 1.02 0.85
Ranking based on TA ratio II I III
Analysis - Product Y yields more contribution compared to average factory contribution per minute, whereas X and Z yield less.
1.6 BUSINESS PROCESS RE-ENGINEERING
Meaning of Business Process Re-engineering
Business Process Re-engineering (BPR) refers to the fundamental rethinking and redesign of business processes to achieve improvement in critical measures of performance such as cost, quality, service, speed and customer satisfaction. In contrast the concept of Kaizen, which involves small, incremental steps towards gradual improvement, re-engineering involves a giant leap. It is the complete redesign of a process with an emphasis on finding creative new way to accomplish an objective. It has been described as taking a blank piece of paper and starting from scratch to redesign a business process. Rather than searching continually for minute improvement, re-engineering involves a radical shift in thinking about how an objective should be met. Re-engineering prescribes radical, quick and significant change. Admittedly, it can entail high risks, but it can also bring big rewards. These benefits are most dramatic when new models are discovered for conducting business.
Characteristics and Principles of Re-engineering Process
Characteristics of Re-engineering Process(i) Several jobs are combined into one(ii) Often workers make decisions(iii) The steps in the process are performed in a logical order(iv) Work is performed, where it makes most sense(v) Quality is built in.(vi) Manager provides a single point of contact(vii) Centralized and decentralized operations are combined.
Seven Principles of BPR:
(a) Processes should be designed to achieve a desired outcome rather than focusing on existing tasks.
(b) Personnel who use the output from a process should perform the process
(c) Information processing should be included in the work, which produces the information
(d) Geographically disperesed resources should be treated, as if they are centralized
(e) Parallel activities should be linked rather than integrated
(f) Doers should be allowed to be self-managing
(g) Information should be captured once at source.
Example of business process reengineering:
(i) Credit Card ApprovalAn applicant submits an application. The application is reviewed first to make sure that the form has been completed properly. If not, it is returned for completion. The complete form goes through a verification of information. This is done by ordering a report from a credit company and calling references. Once the information is verified, an
Strategic Cost Management - Decision Making
34 THE INSTITUTE OF COST ACCOUNTANTS OF INDIA
evaluation is done. Then, a decision (yes or no) is made. If the decision is negative, an appropriate rejection letter is composed. If the decision is positive, an account is opened, and a card is issued and mailed to the customer. The process, which may take a few weeks due to workload and waiting time for the verifications, is usually done by several individuals. Business processes are characterized by three elements:
• Theinputs, (data such customer inquiries or materials),
• Theprocessingof the data or materials (which usually go through several stages and may necessary stops that turns out to be time and money consuming), and
• Theoutcome(the delivery of the expected result).
The problematic part of the process is processing. Business process reengineering mainly intervenes in the processing part, which is reengineered in order to become less time and money consuming.
(ii) Ford Motors
One of the best-known examples of organisations that used BPR in an effort to become more efficient is Ford Motors, a car manufacturer. Ford Motor Company is the world’s second largest manufacturer of cars and trucks with products sold in more than 200 markets.
With inherent large-scale growth issues, more demanding customers, and mounting cost pressures, Ford needed to transform from a linear, top-down bureaucratic business model to an Internet ready, nimble organization that engages and integrates customers, suppliers, and employees. Working with Cisco, Ford integrated and leveraged their supplier base by designing Covisint, an end-to-end infrastructure that enables an online, centralized marketplace connecting the automotive industry supply chain. Ford also enhanced the customer buying experience through redesigned and more user friendly Web sites.
As a result, Ford is enjoying an increase in customer satisfaction, sees huge revenue opportunities for developing and retaining loyal product advocates, and has taken both complexity and cost out of the supply chain.
The term “Business Process Reengineering” has, over the past couple of year, gained Increasing circulation. As a result, many find themselves faced with the prospect of having to learn, plan, implement and successfully conduct a real Business Process Reengineering endeavor, whatever that might entail within their own business organization. Hammer and Champy (1993) define business process reengineering (BPR) as:
“ the fundamental rethinking and radical redesign of the business processes to achieve dramatic improvements in critical, contemporary measures of performance, such as cost, quality, service and speed”.
1.7 BACK-FLUSH ACCOUNTING
Backflushaccounting is when you wait until the manufacture of a product has been completed, and then record all of the related issuances of inventory from stock that were required to create the product. This approach has the advantage of avoiding all manual assignments of costs to products during the various production stages, thereby eliminating a large number of transactions and the associated labor.
This system records the transaction only at the termination of the production and sales cycle. The emphasis is to measure cost at the beginning and at the end with greater emphasis on the end or outputs. Since back flushing is usually employed in parallel with JIT, there is no work-in-progress to considered nor, does work –in-progress materially fluctuate. What is essential, however, is an accurate bill materials goods measures of yield generally effective production control and accurate engineering change notice when yields do change.
The principle of a just-in-time system is that production is pulled by customer demand and this in turn pulls the purchasing procedures. Thus, theoretically there are zero stocks of raw materials. Work-in-progress and finished goods. For such a situation to exist there needs to be an excellent system of production planning ad communication with materials suppliers.
Backflush accounting is entirely automated, with a computer handling all transactions. The backflushing formula is:
Number of units produced x unit count listed in the bill of materials for each component
Backflushing is a theoretically elegant solution to the complexities of assigning costs to products and relieving inventory, but it is difficult to implement. Backflush accounting is subject to the following problems:
THE INSTITUTE OF COST ACCOUNTANTS OF INDIA 35
Cost Management
• Requires an accurate production count. The number of finished goods produced is the multiplier in the backflush equation, so an incorrect count will relieve an incorrect amount of components and raw materials from stock.
• Requiresanaccuratebillofmaterials. The bill of materials contains a complete itemization of the components and raw materials used to construct a product. If the items in the bill are inaccurate, the backflush equation will relieve an incorrect amount of components and raw materials from stock.
• Requires excellent scrap reporting.There will inevitably be unusual amounts of scrap or rework in a production process that are not anticipated in a bill of materials. If you do not separately delete these items from inventory, they will remain in the inventory records, since the backflush equation does not account for them.
• Requires a fast production cycle time.Backflushing does not remove items from inventory until after a product has been completed, so the inventory records will remain incomplete until such time as the backflushing occurs. Thus, a very rapid production cycle time is the best way to keep this interval as short as possible. Under a backflushing system, there is no recorded amount of work-in-process inventory.
Backflushing is not suitable for long production processes, since it takes too long for the inventory records to be reduced after the eventual completion of products. It is also not suitable for the production of customized products, since this would require the creation of a unique bill of materials for each item produced.
The cautions raised here do not mean that it is impossible to use backflush accounting. Usually, a manufacturing planning system allows you to use backflush accounting for just certain products, so you can run it on a compartmentalized basis. This is useful not just to pilot test the concept, but also to use it only under those circumstances where it is most likely to succeed. Thus, backflush accounting can be incorporated into a hybrid system in which multiple methods of production accounting may be used.
TheVariantsofBackflushAccountingThere are a number of variants of the Backflush system, each differing as to the ‘trigger points’ at which costs are recognized within the cost accounts and thus associated with products. All variants, however, have the following common features :
• the focus is on output – costs are first associated with output (measured as either sales or completed production) and then allocated between stocks and costs of goods sold by working back.
• Conversion costs (labour and overheads) are never attached to products until they are complete (or even sold ) – thus the traditional WIP account doesn’t exist. Materials are recognized at different points according to the variant used, but only to the extent of being either stock of raw materials or part of the cost of stock of finished goods. Again, materials are not attached to WIP.
Two variants of the Backflush system are summarized below. Note that in each as conversion costs (labour and overheads) are incurred they will be recorded in a conversion cost (CC) account.
Variant 1This has two trigger points (TP) :
TP 1 - purchase of raw materials / components. A ‘raw and in process (RIP)’ account will be debited with the actual cost of materials purchased, and creditors credited.
TP 2 - completion of good units. The finished goods (FG) account will be debited with the standard cost of unit produced and the RIP and CC account will be credited with the standard cost.
Under this variant, then, there will be two stock accounts :• raw materials (which may, in fact, be incorporated into WIP)• finished goods
Variant 2This has only one trigger point – the completion of good units. The FG account is debited with the standard cost of units produced, with corresponding credits to the CC account and the creditors account.
Thus the cost records exclude :
• raw materials purchased but not yet used for complete production
• the creditors for these materials (and any price variance )
and there is only stock account, carrying the standard cost of finished goods stock.
Other variants include those using the sale of complete goods units as a trigger point for the attachment of conversion cost to unit -- thus there is no finished goods account, just a raw materials stock account, carrying the materials cost of raw materials, WIP and finished goods.
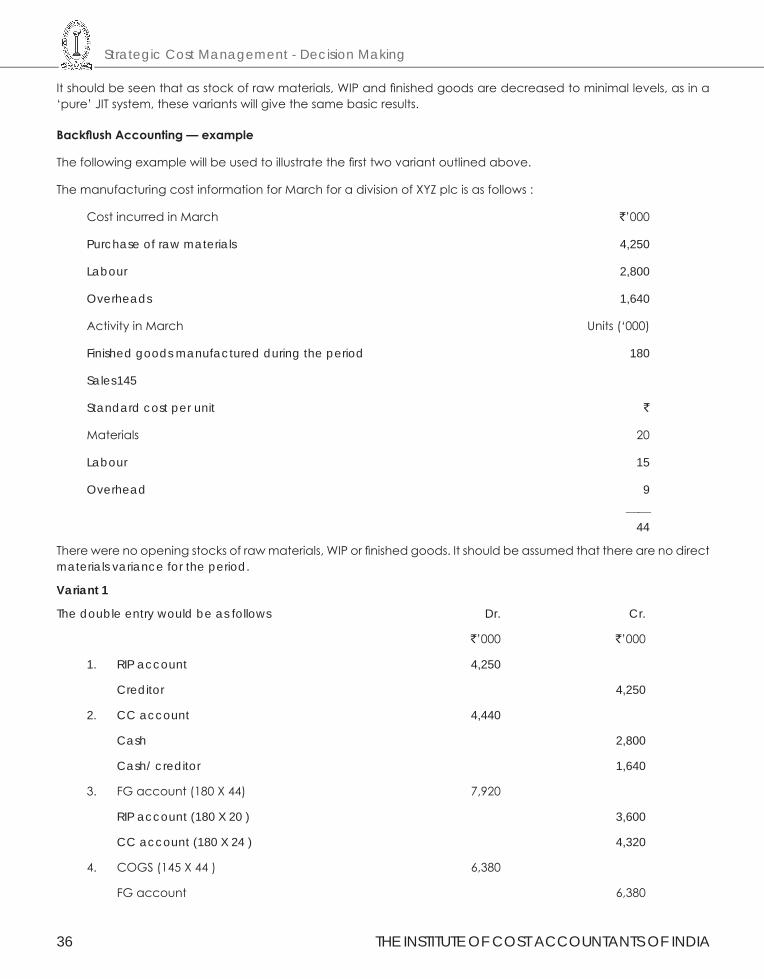
Strategic Cost Management - Decision Making
36 THE INSTITUTE OF COST ACCOUNTANTS OF INDIA
It should be seen that as stock of raw materials, WIP and finished goods are decreased to minimal levels, as in a ‘pure’ JIT system, these variants will give the same basic results.
BackflushAccounting—example
The following example will be used to illustrate the first two variant outlined above.
The manufacturing cost information for March for a division of XYZ plc is as follows :
Cost incurred in March `’000
Purchase of raw materials 4,250
Labour 2,800
Overheads 1,640
Activity in March Units (‘000)
Finished goods manufactured during the period 180
Sales 145
Standard cost per unit `
Materials 20
Labour 15
Overhead 9
44
There were no opening stocks of raw materials, WIP or finished goods. It should be assumed that there are no direct materials variance for the period.
Variant 1
The double entry would be as follows Dr. Cr.
`’000 `’000
1. RIP account 4,250
Creditor 4,250
2. CC account 4,440
Cash 2,800
Cash/ creditor 1,640
3. FG account (180 X 44) 7,920
RIP account (180 X 20 ) 3,600
CC account (180 X 24 ) 4,320
4. COGS (145 X 44 ) 6,380
FG account 6,380
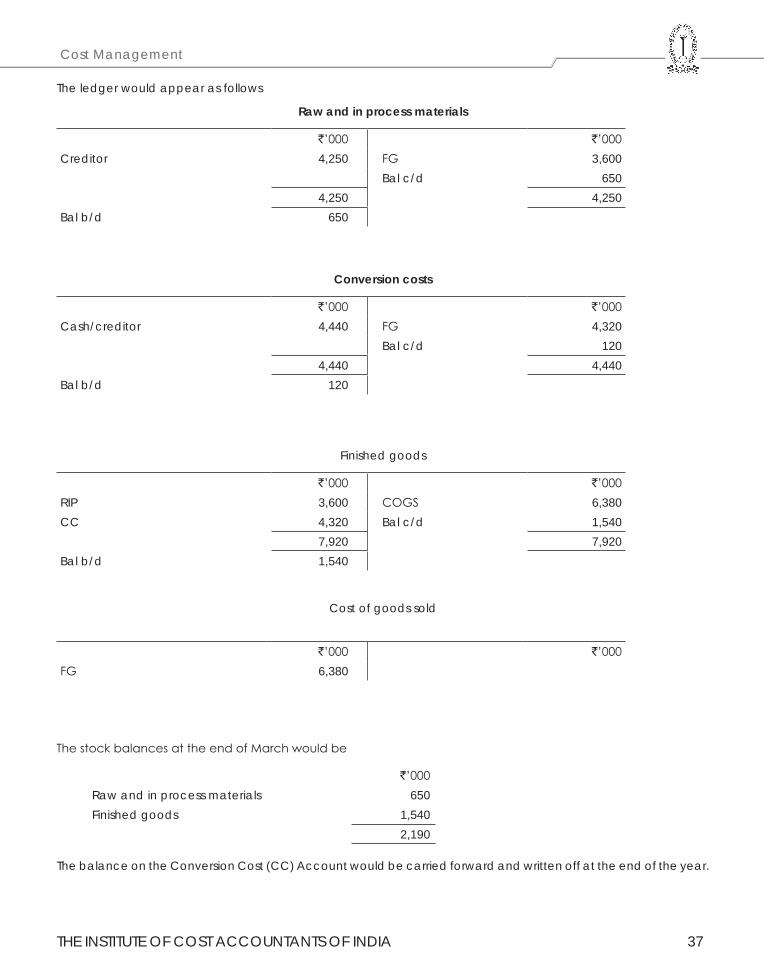
THE INSTITUTE OF COST ACCOUNTANTS OF INDIA 37
Cost Management
The ledger would appear as follows
Raw and in process materials
`’000 `’000Creditor 4,250 FG 3,600
Bal c/d 6504,250 4,250
Bal b/d 650
Conversion costs
`’000 `’000Cash/creditor 4,440 FG 4,320
Bal c/d 1204,440 4,440
Bal b/d 120
Finished goods
`’000 `’000RIP 3,600 COGS 6,380CC 4,320 Bal c/d 1,540
7,920 7,920Bal b/d 1,540
Cost of goods sold
`’000 `’000
FG 6,380
The stock balances at the end of March would be
`’000Raw and in process materials 650Finished goods 1,540
2,190
The balance on the Conversion Cost (CC) Account would be carried forward and written off at the end of the year.
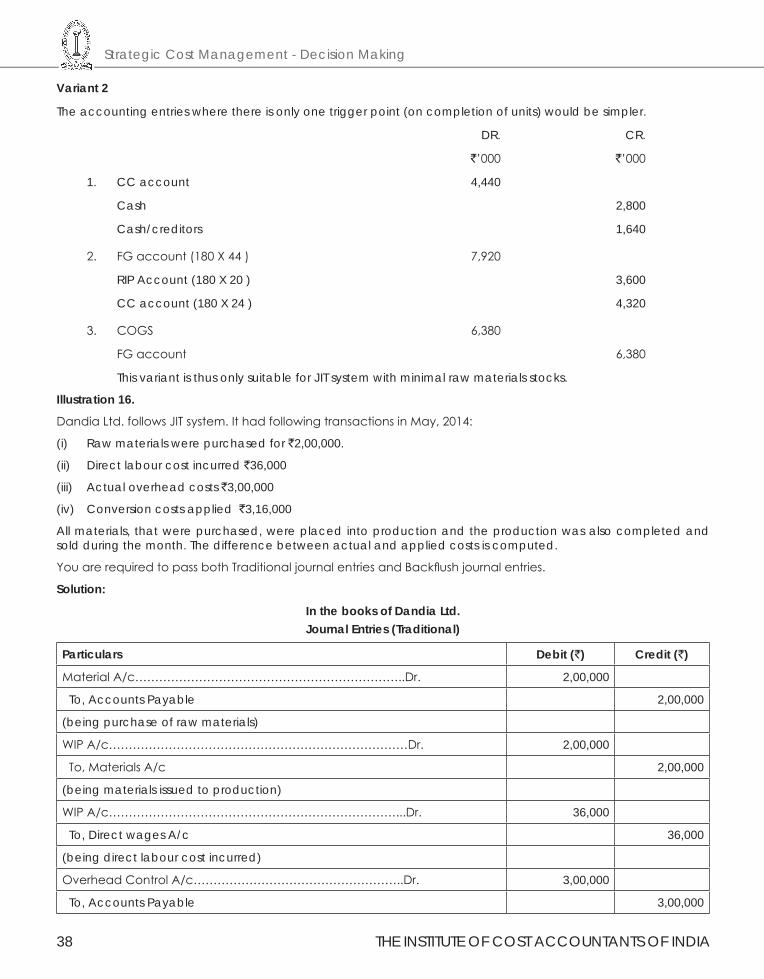
Strategic Cost Management - Decision Making
38 THE INSTITUTE OF COST ACCOUNTANTS OF INDIA
Variant 2
The accounting entries where there is only one trigger point (on completion of units) would be simpler.
DR. CR.
`’000 `’000
1. CC account 4,440
Cash 2,800
Cash/creditors 1,640
2. FG account (180 X 44 ) 7,920
RIP Account (180 X 20 ) 3,600
CC account (180 X 24 ) 4,320
3. COGS 6,380
FG account 6,380
This variant is thus only suitable for JIT system with minimal raw materials stocks.
Illustration 16.
Dandia Ltd. follows JIT system. It had following transactions in May, 2014:
(i) Raw materials were purchased for `2,00,000.
(ii) Direct labour cost incurred `36,000
(iii) Actual overhead costs `3,00,000
(iv) Conversion costs applied `3,16,000
All materials, that were purchased, were placed into production and the production was also completed and sold during the month. The difference between actual and applied costs is computed.
You are required to pass both Traditional journal entries and Backflush journal entries.
Solution:
In the books of Dandia Ltd.Journal Entries (Traditional)
Particulars Debit (`) Credit (`)
Material A/c…………………………………………………………..Dr. 2,00,000
To, Accounts Payable 2,00,000
(being purchase of raw materials)
WIP A/c…………………………………………………………………Dr. 2,00,000
To, Materials A/c 2,00,000
(being materials issued to production)
WIP A/c………………………………………………………………...Dr. 36,000
To, Direct wages A/c 36,000
(being direct labour cost incurred)
Overhead Control A/c……………………………………………..Dr. 3,00,000
To, Accounts Payable 3,00,000
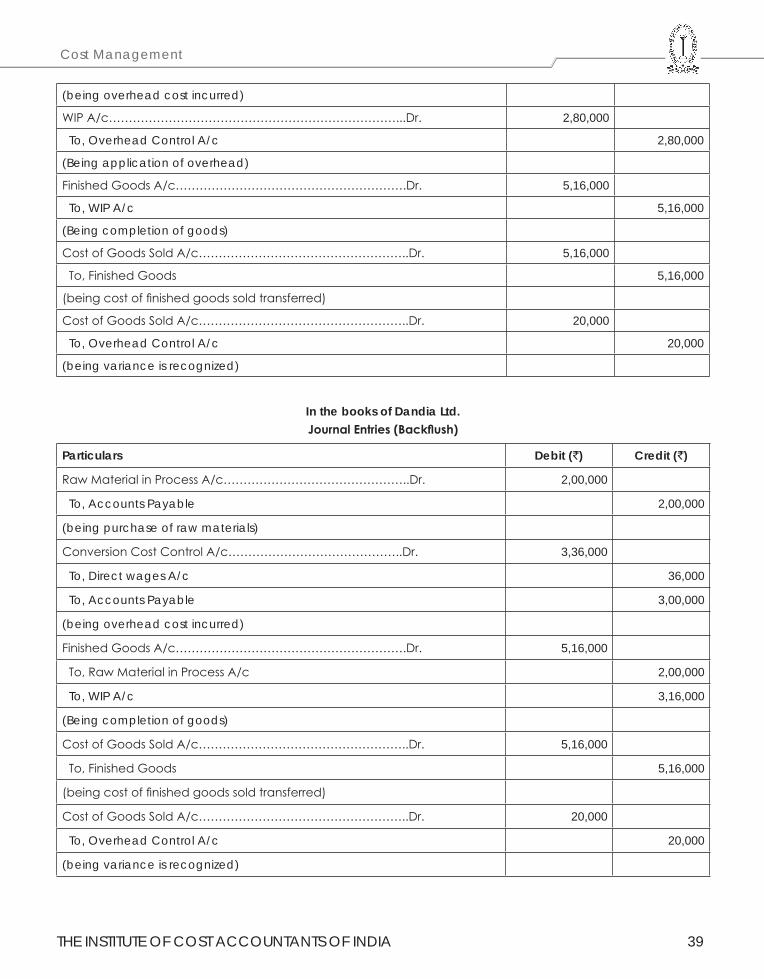
THE INSTITUTE OF COST ACCOUNTANTS OF INDIA 39
Cost Management
(being overhead cost incurred)
WIP A/c………………………………………………………………...Dr. 2,80,000
To, Overhead Control A/c 2,80,000
(Being application of overhead)
Finished Goods A/c………………………………………………….Dr. 5,16,000
To, WIP A/c 5,16,000
(Being completion of goods)
Cost of Goods Sold A/c……………………………………………..Dr. 5,16,000
To, Finished Goods 5,16,000
(being cost of finished goods sold transferred)
Cost of Goods Sold A/c……………………………………………..Dr. 20,000
To, Overhead Control A/c 20,000
(being variance is recognized)
In the books of Dandia Ltd.JournalEntries(Backflush)
Particulars Debit (`) Credit (`)
Raw Material in Process A/c………………………………………..Dr. 2,00,000
To, Accounts Payable 2,00,000
(being purchase of raw materials)
Conversion Cost Control A/c……………………………………..Dr. 3,36,000
To, Direct wages A/c 36,000
To, Accounts Payable 3,00,000
(being overhead cost incurred)
Finished Goods A/c………………………………………………….Dr. 5,16,000
To, Raw Material in Process A/c 2,00,000
To, WIP A/c 3,16,000
(Being completion of goods)
Cost of Goods Sold A/c……………………………………………..Dr. 5,16,000
To, Finished Goods 5,16,000
(being cost of finished goods sold transferred)
Cost of Goods Sold A/c……………………………………………..Dr. 20,000
To, Overhead Control A/c 20,000
(being variance is recognized)
Strategic Cost Management - Decision Making
40 THE INSTITUTE OF COST ACCOUNTANTS OF INDIA
1.8 LEAN ACCOUNTING
What we now call lean manufacturing was developed by Toyota and other Japanese companies. Toyota executives claim that the famed Toyota Production System was inspired by what they learned during visits to the Ford Motor Company in the 1920s and developed by Toyota leaders such as Taiichi Ohno and consultant Shigeo Shingo after World War II. As pioneer American and European companies embraced lean manufacturing methods in the late 1980s, they discovered that lean thinking must be applied to every aspect of the company including the financial and management accounting processes.
Lean Accounting is the general term used for the changes required to a company’s accounting, control, measurement, and management processes to support lean manufacturing and lean thinking. Most companies embarking on lean manufacturing soon find that their accounting processes and management methods are at odds with the lean changes they are making. The reason for this is that traditional accounting and management methods were designed to support traditional manufacturing; they are based upon mass production thinking. Lean manufacturing breaks the rules of mass production, and so the traditional accounting and management methods are (at best) unsuitable and usually actively hostile to the lean changes the company is making.
Classic examples of these kinds of problems are:
• Lean improvements showing cost increases as a result of the way standard costing applies labor and overhead costs. There is many an excellent lean strategy that has been cancelled or held back because the standard costing system shows a negative impact.
• Traditional performance measurements motivating the people to take anti-lean actions like building inventory, running large batches, “cherry picking” production jobs to maximize earned hours, combining jobs into more “efficient” runs, buying large (so called) economic order quantities of raw materials & components, and so forth. These problems are caused by measurements like labor efficiency, machine utilization, purchase price variance, and perhaps worst of all-overhead absorption variance (and other variances).
The lean team working hard to eliminate waste from the value stream only to find that profitability goes down owing to the adjustments made by significant inventory reduction. Looking at the other side of this same problem, the finance people are told about all the savings being made in operations but they see (at best) no financial improvement; and often a negative impact.
What is Lean Accounting? Is an oft-asked question. Everybody working seriously to implement lean thinking in their company eventually bumps up against their accounting systems. It soon becomes clear that traditional accounting systems are actively anti-lean.
• They are large, complex, wasteful processes requiring a great deal of non-value work.
• They provide measurements and reports like labor efficiency and overhead absorption that motivate large batch production and high inventory levels.
• They have no good way to identify the financial impact of the lean improvements taking place throughout the company. On the contrary, the financial reports will often show that bad things are happening when very good lean change is being made.
• Very few people in the company understand the reports that emanate from the accounting systems, and yet they are used to make important and far-reaching decisions.
• They use standard product (or service) costs which can be misleading when making decisions related to quoting, profitability, make/buy, sourcing, product rationalization, and so forth. Almost all companies implementing lean accounting are making poor decisions, turning down highly profitable work, out-sourcing products or components that should be made in house, manufacturing overseas products that can be competitively manufactured here at home etc.
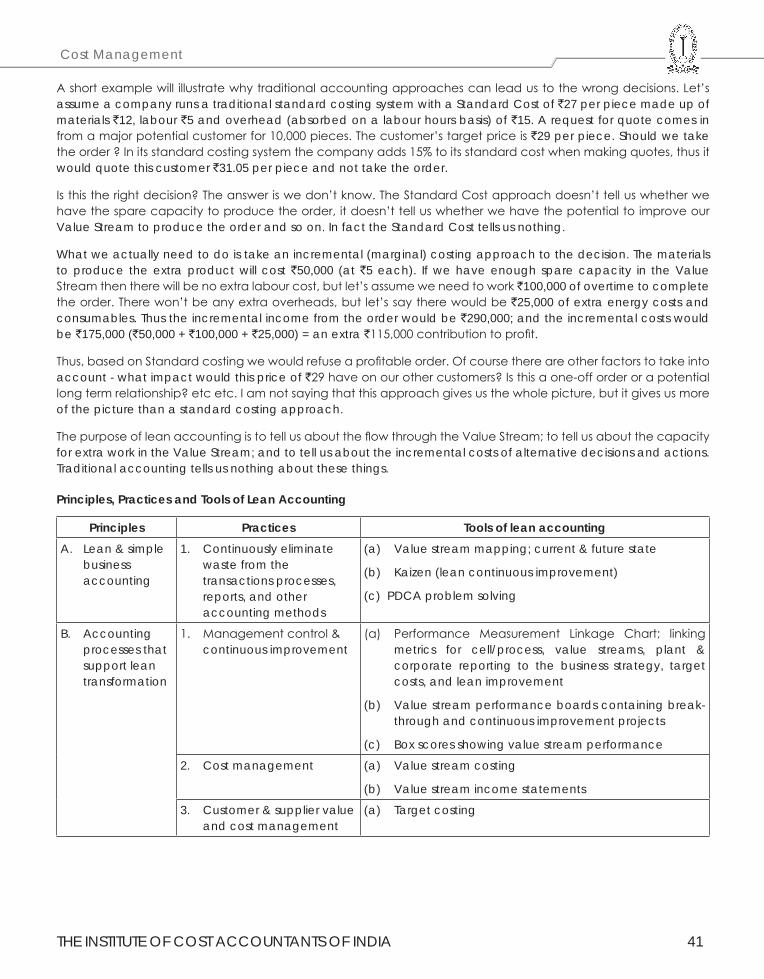
THE INSTITUTE OF COST ACCOUNTANTS OF INDIA 41
Cost Management
A short example will illustrate why traditional accounting approaches can lead us to the wrong decisions. Let’s assume a company runs a traditional standard costing system with a Standard Cost of `27 per piece made up of materials `12, labour `5 and overhead (absorbed on a labour hours basis) of `15. A request for quote comes in from a major potential customer for 10,000 pieces. The customer’s target price is `29 per piece. Should we take the order ? In its standard costing system the company adds 15% to its standard cost when making quotes, thus it would quote this customer `31.05 per piece and not take the order.
Is this the right decision? The answer is we don’t know. The Standard Cost approach doesn’t tell us whether we have the spare capacity to produce the order, it doesn’t tell us whether we have the potential to improve our Value Stream to produce the order and so on. In fact the Standard Cost tells us nothing.
What we actually need to do is take an incremental (marginal) costing approach to the decision. The materials to produce the extra product will cost `50,000 (at `5 each). If we have enough spare capacity in the Value Stream then there will be no extra labour cost, but let’s assume we need to work `100,000 of overtime to complete the order. There won’t be any extra overheads, but let’s say there would be `25,000 of extra energy costs and consumables. Thus the incremental income from the order would be `290,000; and the incremental costs would be `175,000 (`50,000 + `100,000 + `25,000) = an extra `115,000 contribution to profit.
Thus, based on Standard costing we would refuse a profitable order. Of course there are other factors to take into account - what impact would this price of `29 have on our other customers? Is this a one-off order or a potential long term relationship? etc etc. I am not saying that this approach gives us the whole picture, but it gives us more of the picture than a standard costing approach.
The purpose of lean accounting is to tell us about the flow through the Value Stream; to tell us about the capacity for extra work in the Value Stream; and to tell us about the incremental costs of alternative decisions and actions. Traditional accounting tells us nothing about these things.
Principles, Practices and Tools of Lean Accounting
Principles Practices Tools of lean accountingA. Lean & simple
business accounting
1. Continuously eliminate waste from the transactions processes, reports, and other accounting methods
(a) Value stream mapping; current & future state
(b) Kaizen (lean continuous improvement)
(c) PDCA problem solving
B. Accounting processes that support lean transformation
1. Management control & continuous improvement
(a) Performance Measurement Linkage Chart; linking metrics for cell/process, value streams, plant & corporate reporting to the business strategy, target costs, and lean improvement
(b) Value stream performance boards containing break-through and continuous improvement projects
(c) Box scores showing value stream performance
2. Cost management (a) Value stream costing
(b) Value stream income statements
3. Customer & supplier value and cost management
(a) Target costing
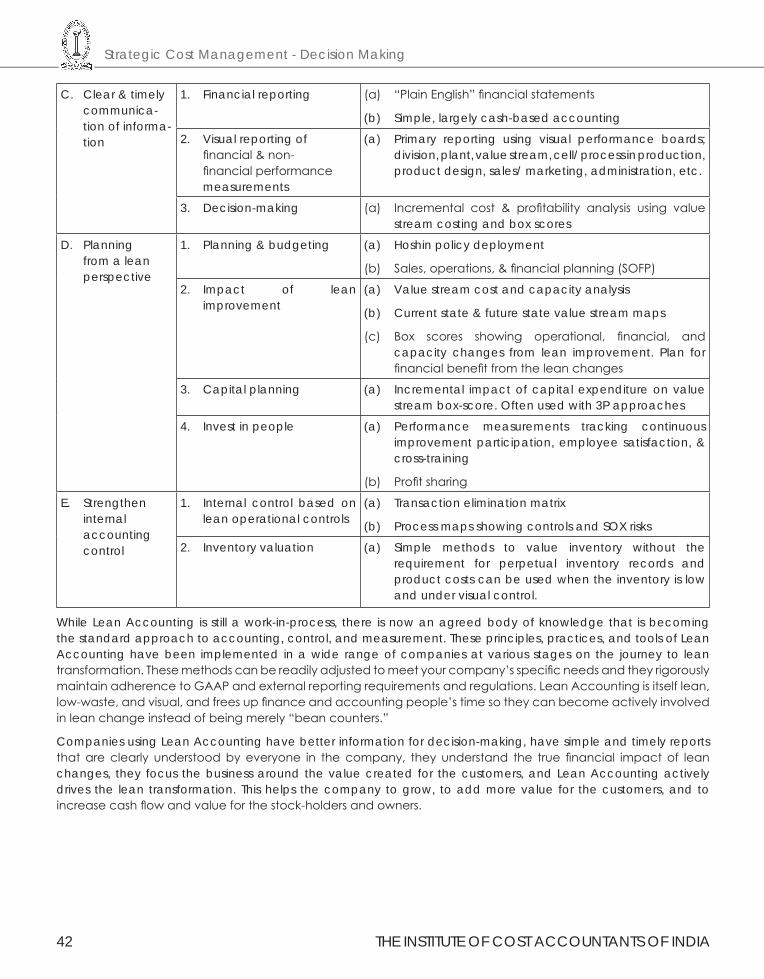
Strategic Cost Management - Decision Making
42 THE INSTITUTE OF COST ACCOUNTANTS OF INDIA
C. Clear & timely communica-tion of informa-tion
1. Financial reporting (a) “Plain English” financial statements
(b) Simple, largely cash-based accounting
2. Visual reporting of financial & non- financial performance measurements
(a) Primary reporting using visual performance boards; division, plant, value stream, cell/ process in production, product design, sales/ marketing, administration, etc.
3. Decision-making (a) Incremental cost & profitability analysis using value stream costing and box scores
D. Planning from a lean perspective
1. Planning & budgeting (a) Hoshin policy deployment
(b) Sales, operations, & financial planning (SOFP)
2. Impact of lean improvement
(a) Value stream cost and capacity analysis
(b) Current state & future state value stream maps
(c) Box scores showing operational, financial, and capacity changes from lean improvement. Plan for financial benefit from the lean changes
3. Capital planning (a) Incremental impact of capital expenditure on value stream box-score. Often used with 3P approaches
4. Invest in people (a) Performance measurements tracking continuous improvement participation, employee satisfaction, & cross-training
(b) Profit sharing
E. Strengthen internal accounting control
1. Internal control based on lean operational controls
(a) Transaction elimination matrix
(b) Process maps showing controls and SOX risks
2. Inventory valuation (a) Simple methods to value inventory without the requirement for perpetual inventory records and product costs can be used when the inventory is low and under visual control.
While Lean Accounting is still a work-in-process, there is now an agreed body of knowledge that is becoming the standard approach to accounting, control, and measurement. These principles, practices, and tools of Lean Accounting have been implemented in a wide range of companies at various stages on the journey to lean transformation. These methods can be readily adjusted to meet your company’s specific needs and they rigorously maintain adherence to GAAP and external reporting requirements and regulations. Lean Accounting is itself lean, low-waste, and visual, and frees up finance and accounting people’s time so they can become actively involved in lean change instead of being merely “bean counters.”
Companies using Lean Accounting have better information for decision-making, have simple and timely reports that are clearly understood by everyone in the company, they understand the true financial impact of lean changes, they focus the business around the value created for the customers, and Lean Accounting actively drives the lean transformation. This helps the company to grow, to add more value for the customers, and to increase cash flow and value for the stock-holders and owners.
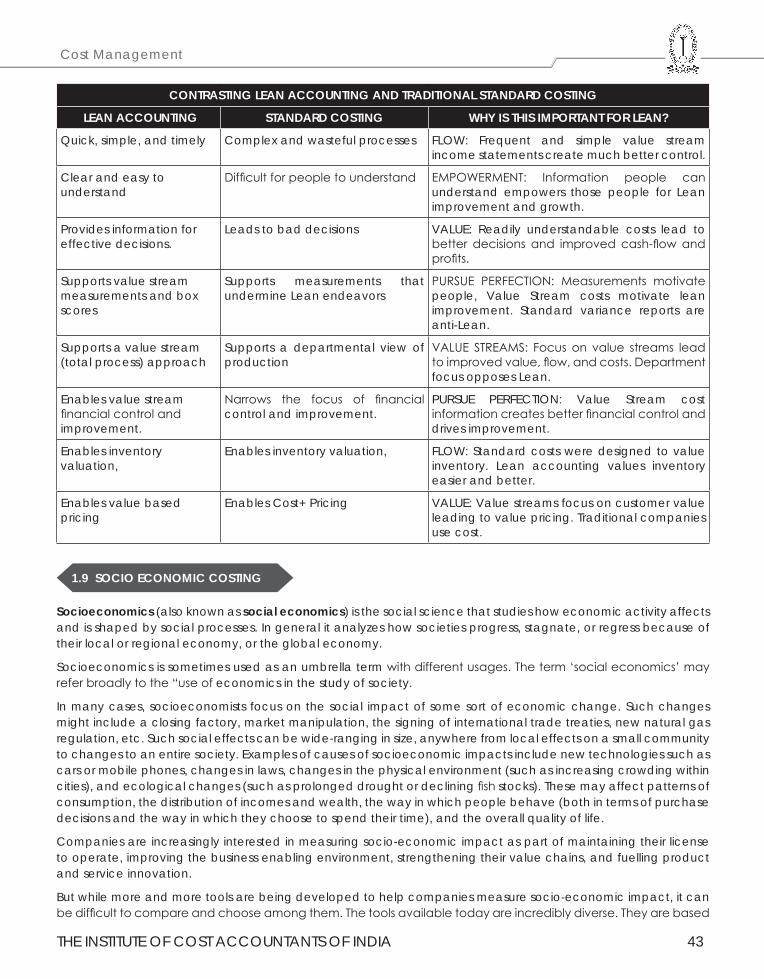
THE INSTITUTE OF COST ACCOUNTANTS OF INDIA 43
Cost Management
CONTRASTING LEAN ACCOUNTING AND TRADITIONAL STANDARD COSTING
LEAN ACCOUNTING STANDARD COSTING WHY IS THIS IMPORTANT FOR LEAN?
Quick, simple, and timely Complex and wasteful processes FLOW: Frequent and simple value stream income statements create much better control.
Clear and easy to understand
Difficult for people to understand EMPOWERMENT: Information people can understand empowers those people for Lean improvement and growth.
Provides information for effective decisions.
Leads to bad decisions VALUE: Readily understandable costs lead to better decisions and improved cash-flow and profits.
Supports value stream measurements and box scores
Supports measurements that undermine Lean endeavors
PURSUE PERFECTION: Measurements motivate people, Value Stream costs motivate lean improvement. Standard variance reports are anti-Lean.
Supports a value stream (total process) approach
Supports a departmental view of production
VALUE STREAMS: Focus on value streams lead to improved value, flow, and costs. Department focus opposes Lean.
Enables value stream financial control and improvement.
Narrows the focus of financial control and improvement.
PURSUE PERFECTION: Value Stream cost information creates better financial control and drives improvement.
Enables inventory valuation,
Enables inventory valuation, FLOW: Standard costs were designed to value inventory. Lean accounting values inventory easier and better.
Enables value based pricing
Enables Cost+ Pricing VALUE: Value streams focus on customer value leading to value pricing. Traditional companies use cost.
1.9 SOCIO ECONOMIC COSTING
Socioeconomics (also known as social economics) is the social science that studies how economic activity affects and is shaped by social processes. In general it analyzes how societies progress, stagnate, or regress because of their local or regional economy, or the global economy.
Socioeconomics is sometimes used as an umbrella term with different usages. The term ‘social economics’ may refer broadly to the “use of economics in the study of society.
In many cases, socioeconomists focus on the social impact of some sort of economic change. Such changes might include a closing factory, market manipulation, the signing of international trade treaties, new natural gas regulation, etc. Such social effects can be wide-ranging in size, anywhere from local effects on a small community to changes to an entire society. Examples of causes of socioeconomic impacts include new technologies such as cars or mobile phones, changes in laws, changes in the physical environment (such as increasing crowding within cities), and ecological changes (such as prolonged drought or declining fish stocks). These may affect patterns of consumption, the distribution of incomes and wealth, the way in which people behave (both in terms of purchase decisions and the way in which they choose to spend their time), and the overall quality of life.
Companies are increasingly interested in measuring socio-economic impact as part of maintaining their license to operate, improving the business enabling environment, strengthening their value chains, and fuelling product and service innovation.
But while more and more tools are being developed to help companies measure socio-economic impact, it can be difficult to compare and choose among them. The tools available today are incredibly diverse. They are based
Strategic Cost Management - Decision Making
44 THE INSTITUTE OF COST ACCOUNTANTS OF INDIA
on different assumptions, they offer different functionality, they focus on different types of impact, and they suit different purposes.
Business is a major driver of socio-economic impact – and socioeconomic impact is a major predictor of business success, especially in the long term. By creating jobs, training workers, building physical infrastructure, procuring raw materials, transferring technology, paying taxes, and expanding access to products and services ranging from food and healthcare to energy and information technology, companies affect
people’s assets, capabilities, opportunities, and standards of living – sometimes positively, sometimes negatively. And because these people are companies’ employees, customers, suppliers, distributors, retailers, and neighbours, their growth and well-being matters to the bottom line. It influences whether or not companies have happy customers, healthy value chains, contented local communities, and supportive governments and other stakeholders now and into the future.
As a result, companies are increasingly interested in measuring their socio-economic impact for a variety of reasons, ranging from reducing cost and risk to creating and capturing new opportunities. These reasons include:
1. Obtaining or maintaining license to operate: Measuring socio-economic impact can help companies show communities, government authorities, and other stakeholders, like donors and civil society groups, that their activities create net benefits for the economies and societies in which they operate – and mitigate the risk of negative publicity, protest, and declining government support for current and future operations. It can help companies answer questions like;
Are we fulfilling our commitments and the expectations our stakeholders have of us?
Is there a gap between our impacts and our stakeholders’ perceptions?
To what extent do our activities create social risk or conflict?
Where should we invest our corporate social responsibility budget?
Where do we need help from external stakeholders – like governments, donors, and civil society groups?
2. Improving the business enabling environment: Measuring socio-economic impact can help companies show policymakers what and how they contribute to public policy goals through profitable business activity – helping those policymakers develop the right mix of rules, incentives, and public services needed to maximize the business contribution. It can help companies answer-
To what extent are our business activities contributing to local, national, or international public policy goals? What negative impacts should we be aware of?
How are our business activities contributing? What are the critical levers of impact (such as procurement, training, or consumption of our products and services)?
Are there external constraints on those levers that policymakers could help change?
3. Strengthening value chains: Measuring socio-economic impact can help companies predict the loyalty, performance, stability, and capacity for growth of suppliers, distributors, and retail partners – identifying vulnerabilities and opportunities to address them. It can help companies answer questions like:
Are we at risk of side-selling by smallholder farmers?
Do our suppliers have what it takes to attract other big customers, expand production capacity, and achieve economies of scale?
Can our retail partners afford to invest in added shelf space and inventory?
4. Fueling product and service innovation: Measuring socio-economic impact can help companies understand the needs, aspirations, resources, and incentives of their customers – enabling them to develop winning new products and services and improve existing offerings. It can help companies answer questions like:
Why haven’t our sales grown as expected?
THE INSTITUTE OF COST ACCOUNTANTS OF INDIA 45
Cost Management
What is the best way to segment new “base of the pyramid” markets?
How can we create demand for a product or service we know would add value?
Where do we need help from external stakeholders – like governments, donors, and civil society groups?
Tools available with the company for measuring the Socio economic impact:
The various tools available to the company for measuring the socio economy impact are enumerated below;
1. Strategicfit: Many socio-economic impact measurement tools are flexible, and can be used in support of company efforts to obtain or maintain license to operate, engage policymakers to improve the business enabling environment, strengthen their value chains, or fuel product and service development to capture new markets and grow revenues – depending on specific design and implementation choices made by the user. Examples include the Base of the Pyramid (BOP) Impact Assessment Framework, the Initiative for Global Development’s (IGD) Impact Measurement Framework, the Global Environmental Management Initiative (GEMI) Metrics Navigator, and the WBCSD Measuring Impact Framework. Other tools are more targeted. For example, Anglo American’s Socio-Economic Assessment Toolbox (SEAT) has been designed with social license to operate and the business enabling environment in mind, and it can help strengthen value chains to the extent local procurement is part of the business strategy. An important factor in strategic fit is the extent to which a tool generates relevant, credible information for those who need it – whether they be company managers, local community members, governments, or NGOs. This is a function of scope, the specific metrics chosen, the credibility of the measurement process and how quickly it can be carried out, and whether or not negative impacts are included as well as positive ones.
Strategic objectives include:
Secure license to operate
Improve business enabling environment
Strengthen value chains
Fuel product and service innovation
2. Applicable level(s) of analysis: Most frameworks are designed to be flexible and can be applied at many different levels. For example, the GEMI Metrics Navigator and WBCSD Measuring Impact Framework can be applied at the site, value chain, business line, or company level, depending on the company’s needs. However, several frameworks are designed to be applied at specific levels and yield better or more meaningful results at those levels. For example, Anglo American’s SEAT is designed for use at the site level and the MDG Scan works best at the company level.
Levels of analysis include:
Site
Value chain
Business line
Company operations at the national level
Company
3. Guidance included: Frameworks vary in the nature of the guidance they offer. Some are very comprehensive, helping the user to set the scope for a socioeconomic impact measurement exercise, select indicators/metrics, gather and/or generate data, and interpret the results. Others are very specific. For example, the Impact Reporting and Investment Standards (IRIS) only help select indicators/metrics and the Progress out of Poverty Index (PPI) generates a single, albeit important, metric.
Guidance is available for:
Setting scope
Selecting indicators/metrics
Strategic Cost Management - Decision Making
46 THE INSTITUTE OF COST ACCOUNTANTS OF INDIA
Gathering and/or generating data
Interpreting results
4. Metrics: Some frameworks are agnostic as to the specific metrics companies should choose, focusing instead on the process of choosing relevant ones (e.g. GEMI Metrics Navigator and WBCSD Measuring Impact Framework). Others propose specific metrics – some at the “input,” “activity,” and “output” end of the spectrum (like IGD and IRIS) and others pushing toward “outcomes” and “impacts” (like the BOP Impact Assessment Framework and the Poverty Footprint). Still other frameworks focus on generating a small number of specific metrics (like the MDG Scan, which estimates the numbers of people reached in the eight Millennium Development Goal areas, and the Progress out of Poverty Index, which calculates the percentage of people below the poverty line).
Types of metrics covered include:
Input, activity and output metrics
Outcome and impact metrics
Flexible – can be tailored to business needs
5. Data requirements: Data requirements vary depending on the metrics in question. As a result, it is impossible to generalize about the data requirements of frameworks that are agnostic about metrics. Frameworks that focus on “input,” “activity,” and “output” metrics tend to rely more heavily on data a company already has or can easily collect. Those that push toward “outcomes” and “impacts” require more external data collection, including from stakeholders on the ground.
Data requirements include:
Internal company data
External data collection
Flexible – can be tailored to business needs
6. Key audiences: Which audiences find socio-economic impact measurement relevant depends on the type of information it generates and nature of the process (including whether or not it is credible in their eyes). Companies should make sure that the audiences for their socioeconomic impact measurement work align with the strategic fit they are hoping to achieve. For example, a company measuring to support efforts to improve the business enabling environment must make sure the data is relevant and credible to government policymakers.
Target audiences include:
Company managers
Civil society groups
Donors
Impact investors
Governments
7. Level of effort: Frameworks vary in the level of effort required to implement. They involve different sets of tasks and have different cost and time implications. While available cost and time data are patchy, factors include the scope of the exercise and specific metrics selected; the extent to which external data must be collected from stakeholders on the ground; the level of stakeholder engagement conducted; whether or not a public report must be prepared; the cost of third party services; and company staff time required. There is a need to build the knowledge base on the level of effort involved in implementing these as user experience grows. It should be stressed that it is not appropriate to compare these frameworks on the basis of level of effort alone, since they offer different value in return.
THE INSTITUTE OF COST ACCOUNTANTS OF INDIA 47
Cost Management
The level of effort can vary by:
Tasks required
Cost
Time required
8. Developer services: While socio-economic impact measurement frameworks offer guidance in and of themselves, many developers offer services that expand or deepen the guidance available. They may also offer to implement their frameworks on behalf of or in collaboration with companies, and to write public reports on the results.
1.10 COST CONTROL AND COST REDUCTION – BASICS, PROCESS, METHODS AND TECHNIQUES OF COST REDUCTION PROGRAMME
Cost Control and the various steps involved in it.
Cost Control is defined as the regulation by executive action of the costs of operating an undertaking, particularly where such action is guided by cost accounting.
Cost control involves the following steps and covers the various facets of the management:
(a) Planning: First step in cost control is established plans/targets. The plan/target may be in the form of budgets, standards, estimates and even past actual may be expressed in physical as well as monetary terms. These serves as yardsticks by which the planned objective can be assessed.
(b) Communication: The plan and the policy laid down by the management are made known to all those responsible for carrying them out. Communication is established in two directions; directives are issued by higher level of management to the lower level for compliance and the lower level executives report performances to the higher level.
(c) Motivation: The plan is given effect to and performances starts. The performance is evaluated, costs are ascertained and information about results achieved are collected and reported. The fact that costs are being complied for measuring performances acts as a motivating force and makes individuals endeavour to better their performances.
(d) Appraisal and Reporting: The actual performance is compared with the predetermined plan and variances, i.e deviations from the plan are analyzed as to their causes. The variances are reported to the proper level of management.
(e) Decision Making: The variances are reviewed and decisions taken. Corrective actions and remedial measures or revision of the target, as required, are taken.
Advantages of cost control system.
The advantages of cost control are mainly as follows:
(a) Achieving the expected return on capital employed by maxirnising or optimizing profit
(b) Increase in productivity of the available resources
(c) Reasonable price of the customers
(b) Continued employment and job opportunity for the workers
(c) Economic use of limited resources of production
(f) Increased credit worthiness
(g) Prosperity and economic stability of the industry
Strategic Cost Management - Decision Making
48 THE INSTITUTE OF COST ACCOUNTANTS OF INDIA
Cost Reduction:
Profit is the resultaf of two varying factors, viz., sales and cost. The wider the gap between these two factors, the larger is the profit. Thus, profit can be maximised either by increasing sales or by reducing cost. In a competition loss market or in case of monopoly products, it may perhaps be possible increase price to earn more profits and the need for reducing costs may not be feIt. Such conditions cannot, however, exist paramount and when competition comes into play, it may not be possible to increase the sale price without having its adverse ffect on the ale volume, which, in turn, reduces profit. Besides, increase in price of products has the ultimate effect of pushing up the raw material prices, wages of employees and other expenses all of which tend to increase costs. In the long run, substitute products may come up in the market, resulting in loss of business. Avenues have, therefore, to be explored and method devised to cut down expenditure and thereby reduce the cost of products. In short, c st reduction would mean maximization of profits by reducing cost through economics and savings in costs of manufacture, administration, selling and distribution.
Cost reduction may be defined as the real and permanent reduction in the unit costs of goods manufactured or services rendered without impairing their suitability for the use intended. As will be seen from the definition, the reduction in costs should be real and permanent. Reductions due to windfalls, fortuities receipts, changes in government policy like reduction in taxes or duties, or due t6 temporary measures taken for tiding over the financial difficulties do not strictly come under the purview of cost reduction. At the same time a programmer of cost reduction should in no way affect the quality of the products nor should it lower the standards of performance of the business.
Broadly speaking reduction in cost per unit of production may be affected in two ways viz.,
1. By reducing expenditure, the volume of output remaining constant, and
2. By increasing productivity, i.e., by increasing volume of output and the level of expenditure remains unchanged.
These aspects of cost reduction are closely linked and they act together - there may be a reduction in the expenditure and the same time, an increase in productivity.
Differences between Cost Control and Cost Reduction.
Cost Control VS Cost Reduction: Both cost reduction and cost control are efficient tools of management but their concepts and procedure are widely different. The differences are summarised below:
Cost Control Cost Reduction(a) Cost Control represents efforts made towards
achieving target or goal.(a) Cost reduction represents the achievement in
reduction of cost(b) The process of cost control is to set up a target,
ascertain the actual performance and compare it with the target, Investigate the variances, and take remedial measures.
(b) Cost reduction is not concern with maintenance of performance according to standard
(c) Cost control assumes the existence of standards or norms which are not challenged
(c) Cost reduction assumes the existence of concealed potential savings in standards or norms which are therefore subjected to a constant challenge with a view to improvement by bringing out savings
(d) Cost Control is a preventive function. Costs are optimized before they are incurred
(d) Cost reduction is a corrective function. It operates even when an efficient cost control system exists. There is room for reduction in the achieved costs under controlled conditions
(e) Cost control lacks dynamic approach
(e) Cost reduction is a continuous process of analysis by various methods of all the factors affecting costs, efforts and functions in an organization. The main stress is upon the why of a thing and the aim is to have continual economy in costs
THE INSTITUTE OF COST ACCOUNTANTS OF INDIA 49
Cost Management
Illustration 17.
Ever Forward Ltd is manufacturing and selling two products: Splash and Flash, at selling prices of `3 and `4 respectively. The following sales strategy has been outlined for the year 2015.
(i) Sales planned for year will be `7.20 lakhs in the case of Splash and ` 3.50 lakhs in the case of Flash.
(ii) Break-even is planned at 60% of-the total sales of each product.
(iii) Profit for the year to be achieved is planned at `69,120 in the case of Splash and `17,500 in the case of Flash. This would be possible by launching a cost reduction programme and reducing the present annual fixed expenses of `1,35,000 allocated as `1,08,000 to Splash and `27,000 to Flash.
The selling price of Splash and Flash will be reduced by 20% and 12.5% respectively to meet the competition.
You are required to present the proposal in financial terms giving clearly the following information.
(a) Number of units to be sold of Splash and Flash to break-even as well as the total number of units of Splash and Flash to be sold during the year.
(b) Reduction in fixed expenses product-wise that is envisaged by the cost Reduction Program.
S. S. Computation of Breakeven, total no of units to be sold & reduction in costs
Splash Flash Total
I Sales (`) 7,20,000 3,50,000 10,70,000
II SP (`) 2.4 3.5
III No. of units to be sold 7,20,0002.4
3,00,000 1,00,000 4,00,000
IV Break even units 60% 1,80,000 60,000
V Break even sales (`) 4,32,000 2,10,000 6,42,000
VI M/s (`) 2,88,000 1,40,000 4,28,000
VII Project Planned 69,120 17,500 86,620
VIII P/V Ratio 24% 12.5%
IX FC (Break even sales × P/V Ratio) (`) 1,03,680 26,250 1,29,930
X Previous FC (`) 1,08,000 27,000 1,35,000
XI Reduction in FC (X – IX) (`) 4320 750 5070
Strategic Cost Management - Decision Making
50 THE INSTITUTE OF COST ACCOUNTANTS OF INDIA
Section BStrategic Cost Management Tools
and Techniques(Syllabus - 2016)

THE INSTITUTE OF COST ACCOUNTANTS OF INDIA 51
Decision Making Techniques
This Study Note includes
2.1 Marginal Costing – Decisions involving alternative choice – Pricing Decisions and Strategies – Costing of Service Sector – Relevant Cost Analysis – ProfitabilityAnalysis2.2 Transfer Pricing
Study Note - 2DECISION MAKING TECHNIQUES
2.1 MARGINAL COSTING
The cost of a product or process can be ascertained using different elements of cost using any of the following two techniques viz., 1. Absorption Costing2. Marginal Costing
AbsorptionCosting:
Under this method, the cost of the product is determined after considering the total cost i.e., both fixed and variable costs. Thus this technique is also called traditional or total costing. The variable costs are directly charged to the products where as the fixed costs are apportioned over different products on a suitable basis, manufactured during a period. Thus under absorption costing, all costs are identified with the manufactured products. However, this technique suffers from the following limitations:
LimitationsofAbsorptionCosting:1. Being dependent on levels of output which vary from period to period, costs are vitiated due to the existence
of fixed overhead. This renders them useless for purposes of comparison and control. (If, however, overhead recovery rate is based on normal capacity, this situation will not arise).
2. Carryover of a portion of fixed costs, i.e., period costs to subsequent accounting periods as part of the cost of inventory is a unsound practice because costs pertaining to a period should not be allowed to be vitiated by the inclusion of costs pertaining to the previous period.
3. Profits and losses in the accounts are related not only to sales but also to production, including the production which is unsold. This is contrary to the principle that profits are made not at the stage when products are manufactured but only when they are sold.
4. There is no uniformity in the methods of application of overhead in absorption costing. These problems have, no doubt, to be faced in the case of marginal costing also but to a less extent because of the exclusion of fixed costs, as different assumptions made in the matter of application of fixed overhead will not arise in the case of marginal costing.
5. Absorption costing is not always suitable for decision making solutions to various types of problems of management decision making, where the absorption cost method would be practically ineffective, such as selection of production volume and optimum capacity utilisation, selection of production mix, whether to buy or manufacture, choice of alternatives and evaluation of performance can be had with the help of marginal cost analysis. Sometimes, the conclusion drawn from absorption cost data in this regard may be misleading and lead to losses.
Strategic Cost Management - Decision Making
52 THE INSTITUTE OF COST ACCOUNTANTS OF INDIA
MarginalCosting:
Marginal costing is “the ascertainment of marginal costs and of the effect on profit of changes in volume or type of output by differentiating between fixed costs and variable costs.” Several other terms in use like direct costing, contributory costing, variable costing, comparative costing, differential costing and incremental costing are used more or less synonymously with marginal costing.
It is a process whereby costs are classified into fixed and variable and with such a division so many managerial decisions are taken. The essential feature of marginal costing is division of total costs into fixed and variable, without which this could not have existed. Variable costs vary with volume of production or output, whereas fixed costs remains unchanged irrespective of changes in the volume of output. It is to be understood that unit variable cost remains same at different levels of output and total variable cost changes in direct proportion with the number of units. On the other hand, total fixed cost remains same disregard of changes in units, while there is inverse relationship between the fixed cost per unit and the number of units.
FeaturesofMarginalCosting:
The main features of Marginal Costing may be summed up as follows:1. Appropriate and accurate division of total cost into fixed and variable by picking out variable portion of semi
variable costs also.2. Valuation of stocks such as finished goods, work-in-progress is valued at variable cost only.3. The fixed costs are written off soon after they are incurred and do not find place in product cost or inventories.4. Prices are based on Marginal Cost and Marginal Contribution.5. It combines the techniques of cost recording and cost reporting.
AdvantagesorMeritsorApplicationsofMarginalCosting:1. Marginal costing system is simple to operate than absorption costing because they do not involve the problems
of overhead apportionment and recovery.2. Marginal costing avoids, the difficulties of having to explain the purpose and basis of overhead absorption to
management that accompany absorption costing. Fluctuations in profit are easier to explain because they result from cost volume interactions and not from changes in inventory valuation.
3. It is easier to make decisions on the basis of marginal cost presentations, e.g., marginal costing shows which products are making a contribution and which are failing to cover their avoidable (i.e., variable) costs. Under absorption costing the relevant information is difficult to gather, and there is the added danger that management may be misled by reliance on unit costs that contain an element of fixed cost.
4. Marginal costing is essentially useful to management as a technique in cost analysis and cost presentation. It enables the presentation of data in a manner useful to different levels of management for the purpose of controlling costs. Therefore, it is an important technique in cost control.
5. Future profit planning of the business enterprises can well be carried out by marginal costing. The contribution ratio and marginal cost ratios are very useful to ascertain the changes in selling price, variable cost etc. Thus, marginal costing is greatly helpful in profit planning.
6. When a business concern consists of several units and produces several products and evaluation of performance of such components can well be made with the help of marginal costing.
7. It is helpful in forecasting.8. When there are different products, the determination of number of units of each product, called Optimum
Product Mix, is made with the help of marginal costing.9. Similarly, optimum sales mix i.e., sales of each and every product to get maximum profit can also be determined
with the help of marginal costing.10. Apart from the above, numerous managerial decisions can be taken with the help of marginal costing, some
of which, may be as follows:-(a) Make or buy decisions,(b) Exploring foreign markets,(c) Accept an order or not,
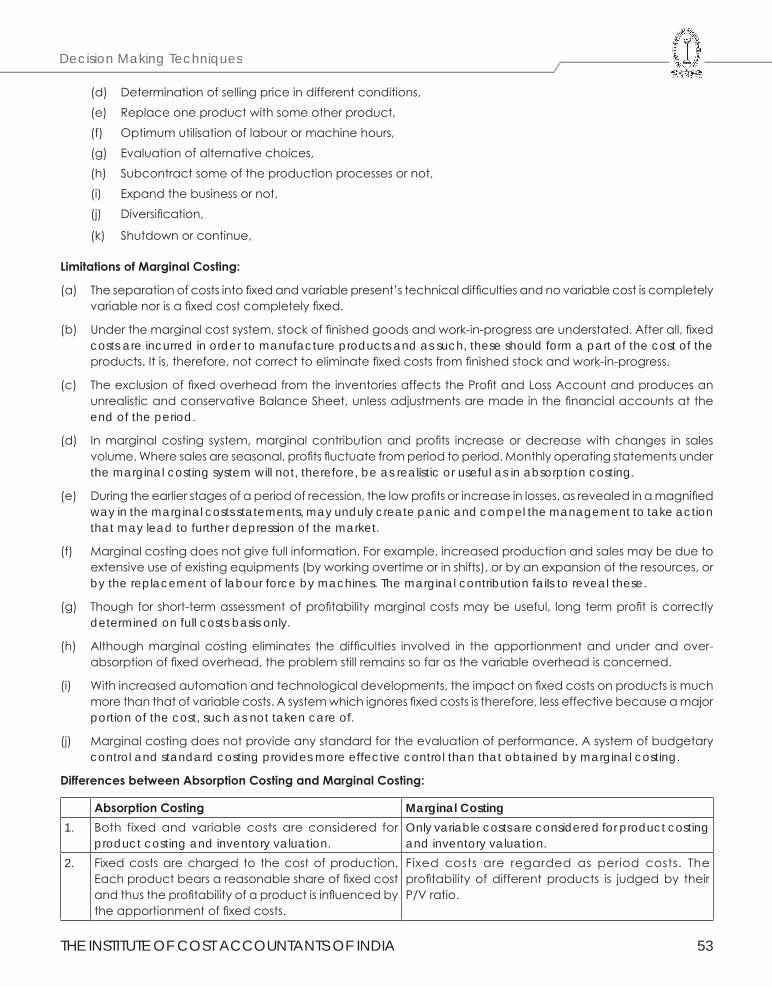
THE INSTITUTE OF COST ACCOUNTANTS OF INDIA 53
Decision Making Techniques
(d) Determination of selling price in different conditions, (e) Replace one product with some other product,(f) Optimum utilisation of labour or machine hours,(g) Evaluation of alternative choices,(h) Subcontract some of the production processes or not,(i) Expand the business or not,(j) Diversification,
(k) Shutdown or continue,
LimitationsofMarginalCosting:
(a) The separation of costs into fixed and variable present’s technical difficulties and no variable cost is completely variable nor is a fixed cost completely fixed.
(b) Under the marginal cost system, stock of finished goods and work-in-progress are understated. After all, fixed costs are incurred in order to manufacture products and as such, these should form a part of the cost of the products. It is, therefore, not correct to eliminate fixed costs from finished stock and work-in-progress.
(c) The exclusion of fixed overhead from the inventories affects the Profit and Loss Account and produces an unrealistic and conservative Balance Sheet, unless adjustments are made in the financial accounts at the end of the period.
(d) In marginal costing system, marginal contribution and profits increase or decrease with changes in sales volume. Where sales are seasonal, profits fluctuate from period to period. Monthly operating statements under the marginal costing system will not, therefore, be as realistic or useful as in absorption costing.
(e) During the earlier stages of a period of recession, the low profits or increase in losses, as revealed in a magnified way in the marginal costs statements, may unduly create panic and compel the management to take action that may lead to further depression of the market.
(f) Marginal costing does not give full information. For example, increased production and sales may be due to extensive use of existing equipments (by working overtime or in shifts), or by an expansion of the resources, or by the replacement of labour force by machines. The marginal contribution fails to reveal these.
(g) Though for short-term assessment of profitability marginal costs may be useful, long term profit is correctly determined on full costs basis only.
(h) Although marginal costing eliminates the difficulties involved in the apportionment and under and over-absorption of fixed overhead, the problem still remains so far as the variable overhead is concerned.
(i) With increased automation and technological developments, the impact on fixed costs on products is much more than that of variable costs. A system which ignores fixed costs is therefore, less effective because a major portion of the cost, such as not taken care of.
(j) Marginal costing does not provide any standard for the evaluation of performance. A system of budgetary control and standard costing provides more effective control than that obtained by marginal costing.
DifferencesbetweenAbsorptionCostingandMarginalCosting:
AbsorptionCosting Marginal Costing1. Both fixed and variable costs are considered for
product costing and inventory valuation.Only variable costs are considered for product costing and inventory valuation.
2. Fixed costs are charged to the cost of production. Each product bears a reasonable share of fixed cost and thus the profitability of a product is influenced by the apportionment of fixed costs.
Fixed costs are regarded as period costs. The profitability of different products is judged by their P/V ratio.
Strategic Cost Management - Decision Making
54 THE INSTITUTE OF COST ACCOUNTANTS OF INDIA
3. Cost data are presented in conventional pattern. Net profit of each product is determined after subtracting fixed cost along with their variable cost.
Cost data are presented to highlight the total contribution of each product.
4. The difference in the magnitude of opening stock and closing stock affects the unit cost of production due to the impact of related fixed cost.
The difference in the magnitude of opening stock and closing stock does not affect the unit cost of production.
5. In case of absorption costing the cost per unit reduces, as the production increases as it is fixed cost which reduces, whereas, the variable cost remains the same per unit.
In case of marginal costing the cost per unit remains the same, irrespective of the production as it is valued at variable cost.
DifferenceinprofitunderMarginalandAbsorptionCosting:
(i) No opening and closing stock: In this case, profit/loss under absorption and marginal costing will be equal.
(ii) When opening stock is equal to closing stock: In this case, profit/loss under two approaches will be equal provided the fixed cost element in both the stocks is same amount.
(iii) When closing stock is more than opening stock: In other words, when production during a period is more than sales, then profit as per absorption approach will be more than that by marginal approach. The reason behind this difference is that a part of fixed overhead included in closing stock value is carried forward to next accounting period.
(iv) When opening stock is more than the closing stock: In other words when production is less than the sales, profit shown by marginal costing will be more than that shown by absorption costing. This is because a part of fixed cost from the preceding period is added to the current year’s cost of goods sold in the form of opening stock.
MARGINALCOST:
Marginal Cost is defined as “the amount at any given volume of output by which aggregate costs are changed if the volume of output is increased or decreased by one unit.” Marginal Cost also means Prime Cost plus Variable Overheads. Marginal Cost is a constant ratio which may be expressed in terms of an amount per unit of output. On the other hand, fixed cost which is not normally traceable to particular unit denotes a fixed amount of expenditure incurred during an accounting period. Fixed cost is, therefore, also called time cost, period cost, standby cost, capacity cost, or constant cost. Variable cost or marginal cost is also termed as direct cost, activity cost, volume cost or out-of-pocket cost.
From the above definition and analysis of marginal cost, we can understand that is the cost which varies according to the variations in the volumes of output. However, by definition marginal cost is the change in the total cost for addition of one unit. It is to be noted that for an economist marginal cost and variable cost would be different. But for an accountant both marginal cost and variable cost are same and are interchangeably used. Therefore, for our study, we use marginal cost and variable cost synonymously.
Differential Cost Analysis
Differential Cost is the change in the costs which results from the adoption of an alternative course of action. The alternative actions may arise due to change in sales volume, price, product mix (by increasing, reducing or stopping the production of certain items), or methods of production, sales, or sales promotion, or they may be due to ‘make or buy’ or ‘take or refuse’ decisions. When the change in costs occurs due to change in the activity from one level to another, differential cost is referred to as incremental cost or decremental cost, if a decrease in output is being considered, i.e. total increase in cost divided by the total increase in output. However, accountants generally do not distinguish between differential cost and incremental cost and the two terms are used to mean one and the same thing.
The computation of differential cost provides an useful method of analysis for the management for anticipating the results of any contemplated changes in the level or nature of activity. When policy decisions have to be taken, differential costs worked out on the basis of alternative proposals are of great assistance.
THE INSTITUTE OF COST ACCOUNTANTS OF INDIA 55
Decision Making Techniques
The determination of differential cost is simple. Differential cost represents the algebraic difference between the relevant costs for the alternatives being considered. Thus, when two levels of activities are being considered, the differential cost is obtained by subtracting the cost at one level from the cost of another level.
Theessentialfeaturesofdifferentialcostsareasfollows:-
1. The basis data used for differential cost analysis are costs, revenue and the investment factors which are relevant in the problem for which the analysis is undertaken.
2. Total differential costs rather than the costs per unit are considered.
3. Differential cost analysis is made outside the accounting records.
4. As the differences in the costs at two levels are considered, absolute costs at each level are not as relevant as the difference between the two. Thus, items of costs which do not change but are identical for the alternatives under consideration, are ignored.
5. The differentials are measured from a common base point or position.
6. The stage at which the difference between the revenue and the cost is the highest, measured from the common base point, determines the choice from amongst a number of alternative actions.
7. In computing differential costs, historical or standard costs may be used but they should be adjusted to the requirements of future conditions.
8. The elements and items of cost to be considered in differential cost analysis will depend upon the nature of the problem and the alternatives being considered.
DifferentialCostsAnalysisandMarginalCosting:
Although the techniques of differential costs analysis are similar to those of marginal costing, the two should not be confused. The points of similarity and difference between differential costs analysis and marginal costing are summarized below:
Similarity:
(a) Both the techniques of cost analysis and cost presentation.
(b) Both are made use of by the management in decision making and in formulating policies.
(c) The concepts of differential costs and marginal costs mainly arise out of the difference in the behaviour of fixed and variable costs.
(d) Differential costs compare favourably with the economist’s definition of marginal cost, viz. that marginal cost is the amount which at any given volume of output is changed if output is increased or decreased by one unit.
Difference:
(a) Differential cost analysis can be made in the case of both absorption costing as well as marginal costing.
(b) While marginal costing excludes the entire fixed costs, some of the fixed costs may be taken into account as being relevant for the purpose of differential cost analysis.
(c) Marginal costs may be embodied in the accounting system whereas differential costs are worked out separately as analysis statements.
(d) In marginal costing, margin of contribution and contribution ratio are the main yardsticks for performance evaluation and for decision making. In differential cost analysis, differential costs are compared with the incremental or decremental revenues, as the case may be.
PracticalApplicationofDifferentialCosts:
They are useful in managerial decisions, which are enumerated below:
(i) Determination of most profitable levels of production and price.
(ii) Acceptance of offer at a lower price or offering a quotation at lower selling price in order to increase capacity.
Strategic Cost Management - Decision Making
56 THE INSTITUTE OF COST ACCOUNTANTS OF INDIA
(iii) It is used to decide whether it will be more profitable to sell a product as it is or to process it further into a different product to be sold at an increased price.
(iv) Determining the suitable price at which raw material may be purchased.
(v) Decision of adding a new product or business segment.
(vi) Discontinuing a product or business segment in order to avoid or reduce the present loss or increase profit.
(vii) Changing the product mix.
(viii) Make or buy decisions.
(ix) Decision regarding alternative capital investment and plant replacement.
(x) Decision regarding change in method of production.
ToolsandTechniquesofMarginalCosting:
1. Contribution:
In common parlance, contribution is the reward for the efforts of the entrepreneur or owner of a business concern. From this, one can get in his mind that contribution means profit. But it is not so. Technically or in Costing terminology, contribution means not only profit but also fixed cost. That is why; it is defined as the amount recovered towards fixed cost and profit.
Contribution can be computed by subtracting variable cost from sales or by adding fixed costs and profit.
Symbolically, C = S - V (1)
Where C = Contribution
S = Selling Price
V = Variable Cost
Also C = F + P (2)
Where F = Fixed Cost
P = Profit
From (1) and (2) above, we may deduce the following equation called Fundamental Equation of Marginal Costing i.e.
S-V = F + P (3)
Contribution is helpful in determination of profitability of the products and/or priorities for profitabilities of the products. When there are two or more products, the product having more contribution is more profitable.
For example: The following are the three products with selling price and cost details:
Amount (`)
Particulars A B CSelling price 100 150 200Variable cost 50 70 100Contribution 50 80 100
In the above example, one can say that the product ‘C’ is more profitable because, it has more contribution. This proposition of product having more contribution is more profitable is valid, as long as, there are no limitations on any factor of production. In this context, factors of production means, the factors that are responsible for producing the products such as material, labour, machine hours, demand for sales etc..
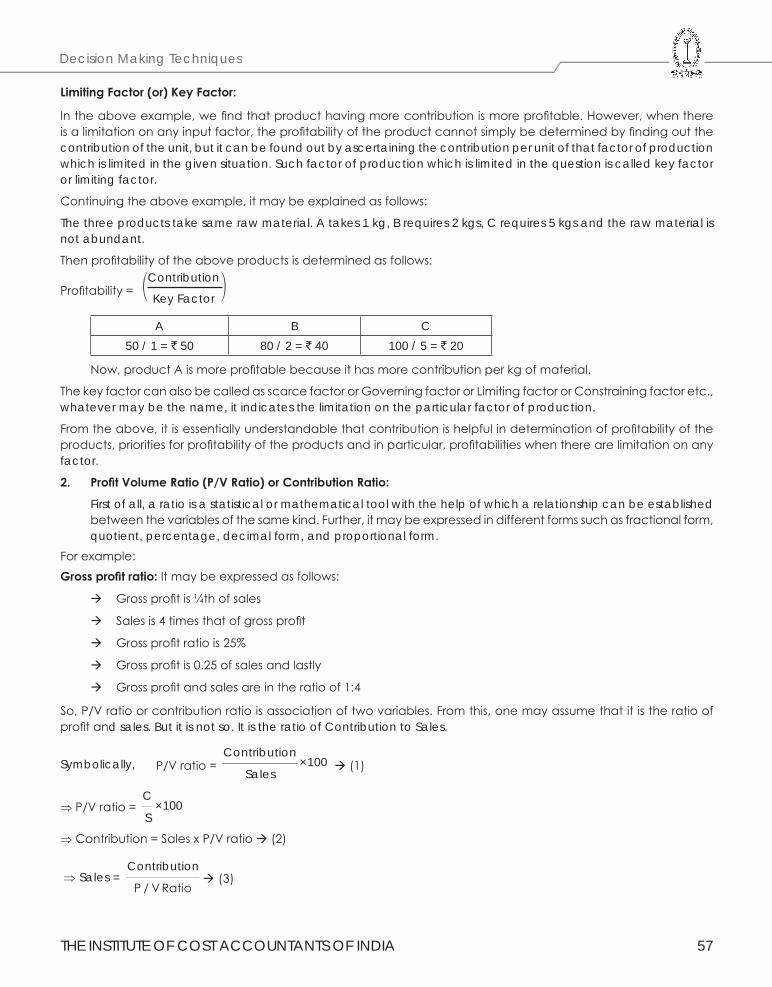
THE INSTITUTE OF COST ACCOUNTANTS OF INDIA 57
Decision Making Techniques
LimitingFactor(or)KeyFactor:
In the above example, we find that product having more contribution is more profitable. However, when there is a limitation on any input factor, the profitability of the product cannot simply be determined by finding out the contribution of the unit, but it can be found out by ascertaining the contribution per unit of that factor of production which is limited in the given situation. Such factor of production which is limited in the question is called key factor or limiting factor.
Continuing the above example, it may be explained as follows:
The three products take same raw material. A takes 1 kg, B requires 2 kgs, C requires 5 kgs and the raw material is not abundant.
Then profitability of the above products is determined as follows:
Profitability =
Contribution
Key Factor1 2
A B C50 / 1 = ` 50 80 / 2 = ` 40 100 / 5 = ` 20
Now, product A is more profitable because it has more contribution per kg of material.
The key factor can also be called as scarce factor or Governing factor or Limiting factor or Constraining factor etc., whatever may be the name, it indicates the limitation on the particular factor of production.
From the above, it is essentially understandable that contribution is helpful in determination of profitability of the products, priorities for profitability of the products and in particular, profitabilities when there are limitation on any factor.
2. ProfitVolumeRatio(P/VRatio)orContributionRatio:
First of all, a ratio is a statistical or mathematical tool with the help of which a relationship can be established between the variables of the same kind. Further, it may be expressed in different forms such as fractional form, quotient, percentage, decimal form, and proportional form.
For example:Grossprofitratio:It may be expressed as follows:
Gross profit is ¼th of sales
Sales is 4 times that of gross profit
Gross profit ratio is 25%
Gross profit is 0.25 of sales and lastly
Gross profit and sales are in the ratio of 1:4
So, P/V ratio or contribution ratio is association of two variables. From this, one may assume that it is the ratio of profit and sales. But it is not so. It is the ratio of Contribution to Sales.
Symbolically,
P/V ratio = Contribution
×100Sales
(1)
⇒ P/V ratio =
C×100
S
⇒ Contribution = Sales x P/V ratio (2)
⇒ Sales =
Contribution
P / V Ratio (3)
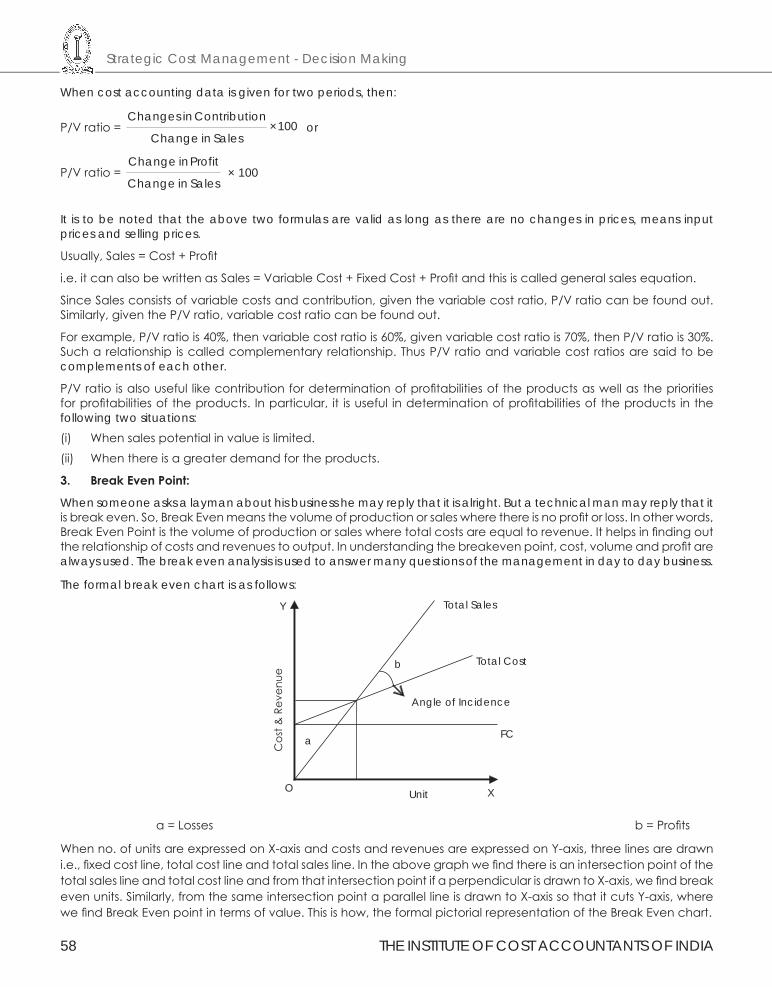
Strategic Cost Management - Decision Making
58 THE INSTITUTE OF COST ACCOUNTANTS OF INDIA
When cost accounting data is given for two periods, then:
P/V ratio =
Changes in Contribution×100
Change in Sales
or
P/V ratio =
Change in Profit
Change in Sales
× 100
It is to be noted that the above two formulas are valid as long as there are no changes in prices, means input prices and selling prices.
Usually, Sales = Cost + Profit
i.e. it can also be written as Sales = Variable Cost + Fixed Cost + Profit and this is called general sales equation.
Since Sales consists of variable costs and contribution, given the variable cost ratio, P/V ratio can be found out. Similarly, given the P/V ratio, variable cost ratio can be found out.
For example, P/V ratio is 40%, then variable cost ratio is 60%, given variable cost ratio is 70%, then P/V ratio is 30%. Such a relationship is called complementary relationship. Thus P/V ratio and variable cost ratios are said to be complements of each other.
P/V ratio is also useful like contribution for determination of profitabilities of the products as well as the priorities for profitabilities of the products. In particular, it is useful in determination of profitabilities of the products in the following two situations:(i) When sales potential in value is limited.(ii) When there is a greater demand for the products.
3. BreakEvenPoint:
When someone asks a layman about his business he may reply that it is alright. But a technical man may reply that it is break even. So, Break Even means the volume of production or sales where there is no profit or loss. In other words, Break Even Point is the volume of production or sales where total costs are equal to revenue. It helps in finding out the relationship of costs and revenues to output. In understanding the breakeven point, cost, volume and profit are always used. The break even analysis is used to answer many questions of the management in day to day business.
The formal break even chart is as follows:
FC
Cos
t & R
even
ue
Angle of Incidence
Total Cost
Unit
Total Sales
X
Y
O
a
b
a = Losses b = Profits
When no. of units are expressed on X-axis and costs and revenues are expressed on Y-axis, three lines are drawn i.e., fixed cost line, total cost line and total sales line. In the above graph we find there is an intersection point of the total sales line and total cost line and from that intersection point if a perpendicular is drawn to X-axis, we find break even units. Similarly, from the same intersection point a parallel line is drawn to X-axis so that it cuts Y-axis, where we find Break Even point in terms of value. This is how, the formal pictorial representation of the Break Even chart.
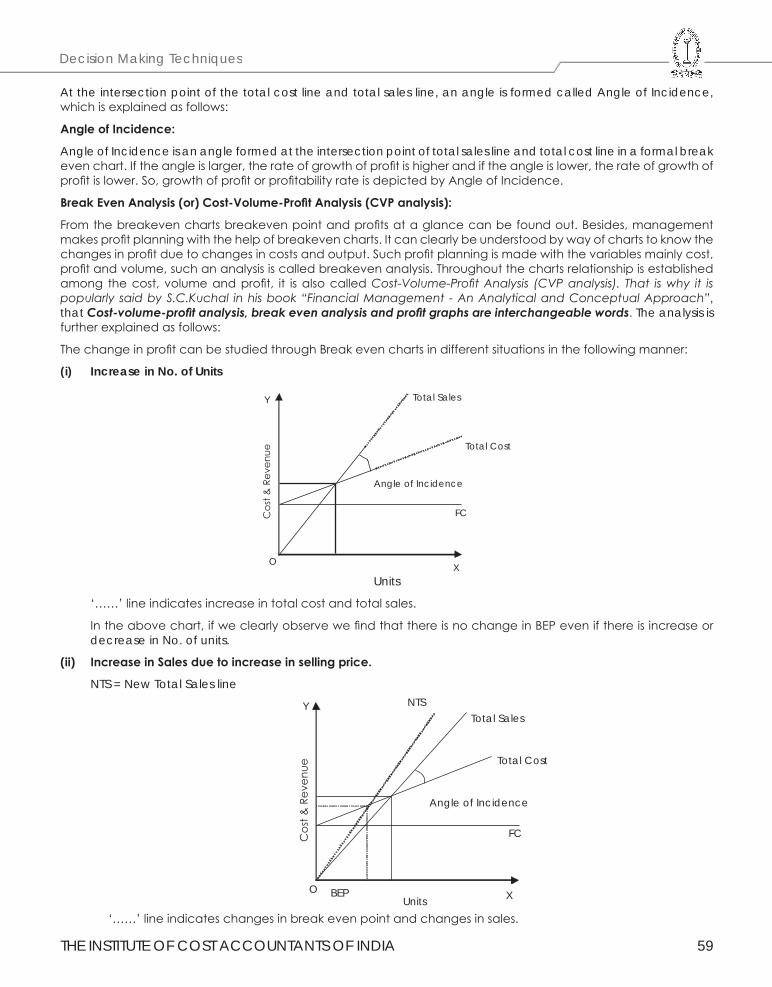
THE INSTITUTE OF COST ACCOUNTANTS OF INDIA 59
Decision Making Techniques
At the intersection point of the total cost line and total sales line, an angle is formed called Angle of Incidence, which is explained as follows:
AngleofIncidence:
Angle of Incidence is an angle formed at the intersection point of total sales line and total cost line in a formal break even chart. If the angle is larger, the rate of growth of profit is higher and if the angle is lower, the rate of growth of profit is lower. So, growth of profit or profitability rate is depicted by Angle of Incidence.
BreakEvenAnalysis(or)Cost-Volume-ProfitAnalysis(CVPanalysis):
From the breakeven charts breakeven point and profits at a glance can be found out. Besides, management makes profit planning with the help of breakeven charts. It can clearly be understood by way of charts to know the changes in profit due to changes in costs and output. Such profit planning is made with the variables mainly cost, profit and volume, such an analysis is called breakeven analysis. Throughout the charts relationship is established among the cost, volume and profit, it is also called Cost-Volume-Profit Analysis (CVP analysis). That is why it is popularly said by S.C.Kuchal in his book “Financial Management - An Analytical and Conceptual Approach”, that Cost-volume-profit analysis, break even analysis and profit graphs are interchangeable words. The analysis is further explained as follows:
The change in profit can be studied through Break even charts in different situations in the following manner:
(i) Increase in No. of Units
FCCos
t & R
even
ue
Angle
of
Incidence
Total Sales
Total
Cost
X
Y
O
Unitso ‘……’ line indicates increase in total cost and total sales.
In the above chart, if we clearly observe we find that there is no change in BEP even if there is increase or decrease in No. of units.
(ii) IncreaseinSalesduetoincreaseinsellingprice.
NTS = New Total Sales line
FCCos
t & R
even
ue
Angle of Incidence
Total Cost
Units
Total SalesNTS
BEP X
Y
O
‘……’ line indicates changes in break even point and changes in sales.
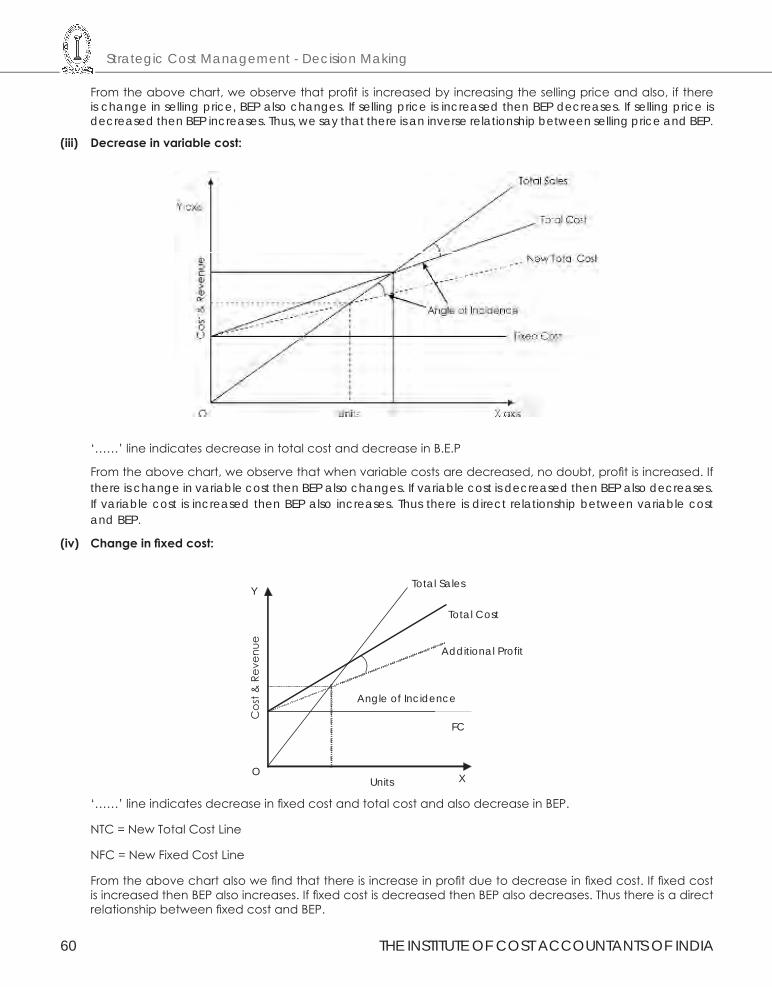
Strategic Cost Management - Decision Making
60 THE INSTITUTE OF COST ACCOUNTANTS OF INDIA
From the above chart, we observe that profit is increased by increasing the selling price and also, if there is change in selling price, BEP also changes. If selling price is increased then BEP decreases. If selling price is decreased then BEP increases. Thus, we say that there is an inverse relationship between selling price and BEP.
(iii) Decreaseinvariablecost:
‘……’ line indicates decrease in total cost and decrease in B.E.P
From the above chart, we observe that when variable costs are decreased, no doubt, profit is increased. If there is change in variable cost then BEP also changes. If variable cost is decreased then BEP also decreases. If variable cost is increased then BEP also increases. Thus there is direct relationship between variable cost and BEP.
(iv) Changeinfixedcost:
FC
Cos
t & R
even
ue
Angle of Incidence
Additional Profit
Units
Total Sales
Total Cost
X
Y
O
‘……’ line indicates decrease in fixed cost and total cost and also decrease in BEP.
NTC = New Total Cost Line
NFC = New Fixed Cost Line
From the above chart also we find that there is increase in profit due to decrease in fixed cost. If fixed cost is increased then BEP also increases. If fixed cost is decreased then BEP also decreases. Thus there is a direct relationship between fixed cost and BEP.
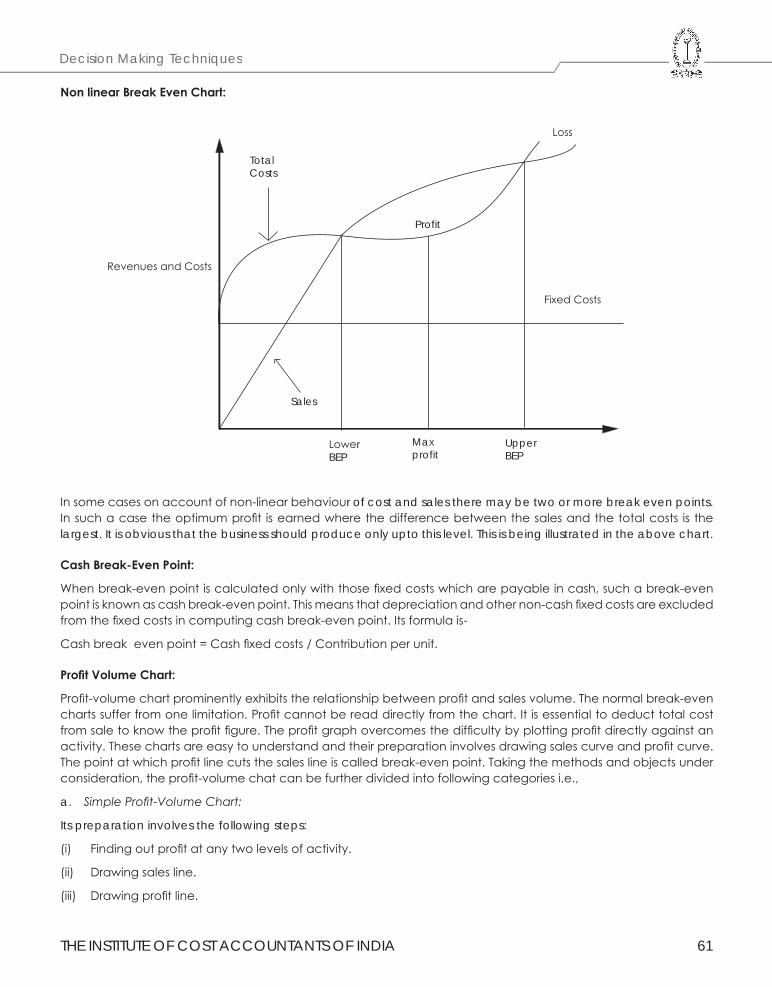
THE INSTITUTE OF COST ACCOUNTANTS OF INDIA 61
Decision Making Techniques
NonlinearBreakEvenChart:
Revenues and Costs
TotalCosts
Profit
Loss
LowerBEP
Maxprofit
Sales
Fixed Costs
UpperBEP
In some cases on account of non-linear behaviour of cost and sales there may be two or more break even points. In such a case the optimum profit is earned where the difference between the sales and the total costs is the largest. It is obvious that the business should produce only upto this level. This is being illustrated in the above chart.
CashBreak-EvenPoint:
When break-even point is calculated only with those fixed costs which are payable in cash, such a break-even point is known as cash break-even point. This means that depreciation and other non-cash fixed costs are excluded from the fixed costs in computing cash break-even point. Its formula is-
Cash break even point = Cash fixed costs / Contribution per unit.
ProfitVolumeChart:
Profit-volume chart prominently exhibits the relationship between profit and sales volume. The normal break-even charts suffer from one limitation. Profit cannot be read directly from the chart. It is essential to deduct total cost from sale to know the profit figure. The profit graph overcomes the difficulty by plotting profit directly against an activity. These charts are easy to understand and their preparation involves drawing sales curve and profit curve. The point at which profit line cuts the sales line is called break-even point. Taking the methods and objects under consideration, the profit-volume chat can be further divided into following categories i.e.,
a. Simple Profit-Volume Chart:
Its preparation involves the following steps:
(i) Finding out profit at any two levels of activity.
(ii) Drawing sales line.
(iii) Drawing profit line.
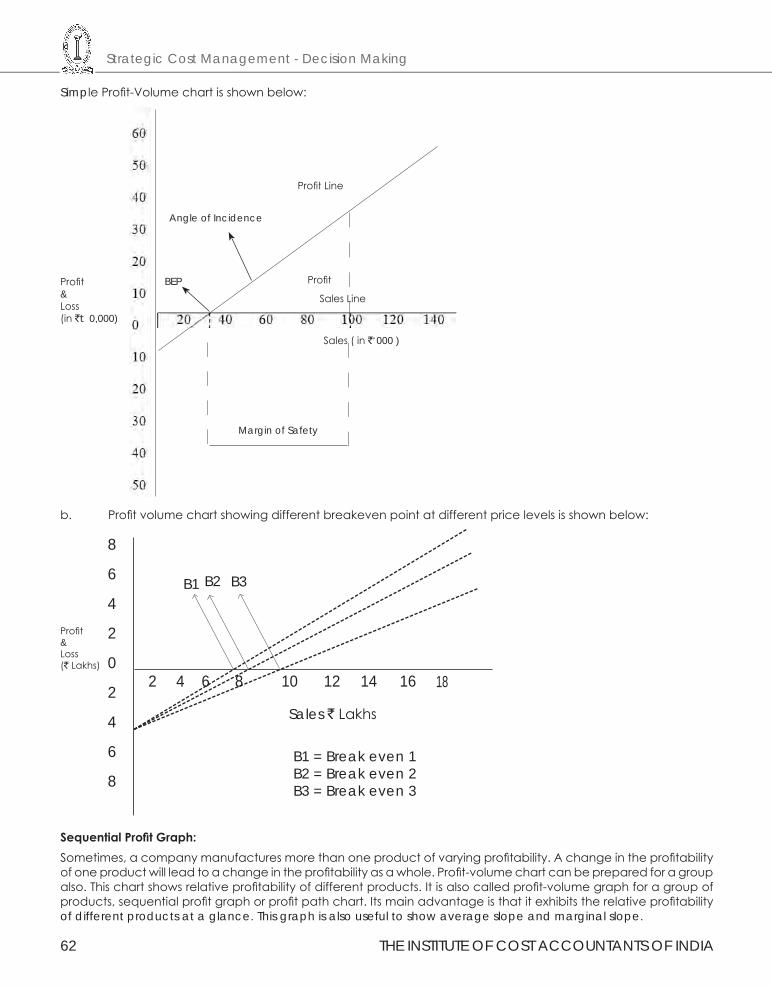
Strategic Cost Management - Decision Making
62 THE INSTITUTE OF COST ACCOUNTANTS OF INDIA
Simple Profit-Volume chart is shown below:
Profit&Loss(in `t 0,000)
Profit Line
Profit BEPSales Line
Sales ( in `‘000 )
Margin of Safety
Angle of Incidence
b. Profit volume chart showing different breakeven point at different price levels is shown below:
Sales ` Lakhs
B1 = Break even 1B2 = Break even 2B3 = Break even 3
Profit&Loss(` Lakhs)
B1 B2 B3
8
6
4
2
0
2
4
6
8
2 4 6 8 10 12 14 16 18
SequentialProfitGraph:Sometimes, a company manufactures more than one product of varying profitability. A change in the profitability of one product will lead to a change in the profitability as a whole. Profit-volume chart can be prepared for a group also. This chart shows relative profitability of different products. It is also called profit-volume graph for a group of products, sequential profit graph or profit path chart. Its main advantage is that it exhibits the relative profitability of different products at a glance. This graph is also useful to show average slope and marginal slope.
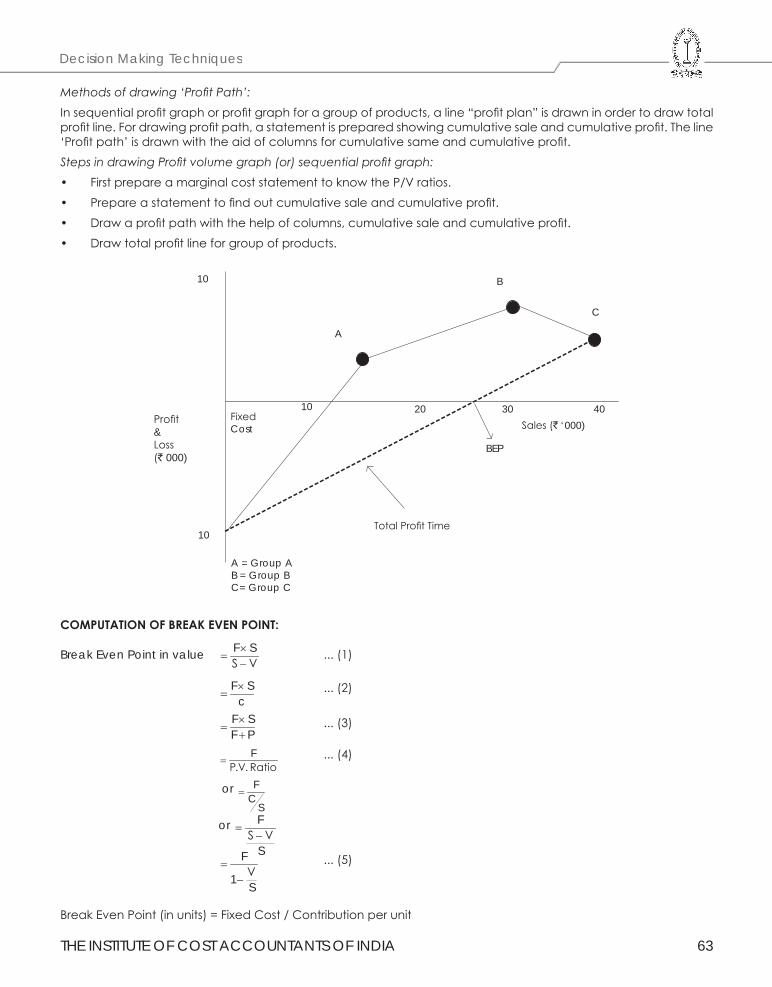
THE INSTITUTE OF COST ACCOUNTANTS OF INDIA 63
Decision Making Techniques
Methods of drawing ‘Profit Path’:In sequential profit graph or profit graph for a group of products, a line “profit plan” is drawn in order to draw total profit line. For drawing profit path, a statement is prepared showing cumulative sale and cumulative profit. The line ‘Profit path’ is drawn with the aid of columns for cumulative same and cumulative profit.Steps in drawing Profit volume graph (or) sequential profit graph:• First prepare a marginal cost statement to know the P/V ratios.• Prepare a statement to find out cumulative sale and cumulative profit.• Draw a profit path with the help of columns, cumulative sale and cumulative profit.• Draw total profit line for group of products.
10
10
10 20 30 40
Total Profit Time
A = Group AB = Group BC= Group C
FixedCost
BEP
Sales (` ‘000)
A
B
C
Profit&Loss(` 000)
COMPUTATIONOFBREAKEVENPOINT:
Break Even Point in value F SS V×
=−
... (1)
F Sc×
= ... (2)
F SF P×
=+
... (3)
FP.V. Ratio
= ... (4)
or FC
S=
or FS V
S
=−
FV1 S
=−
... (5)
Break Even Point (in units) = Fixed Cost / Contribution per unit
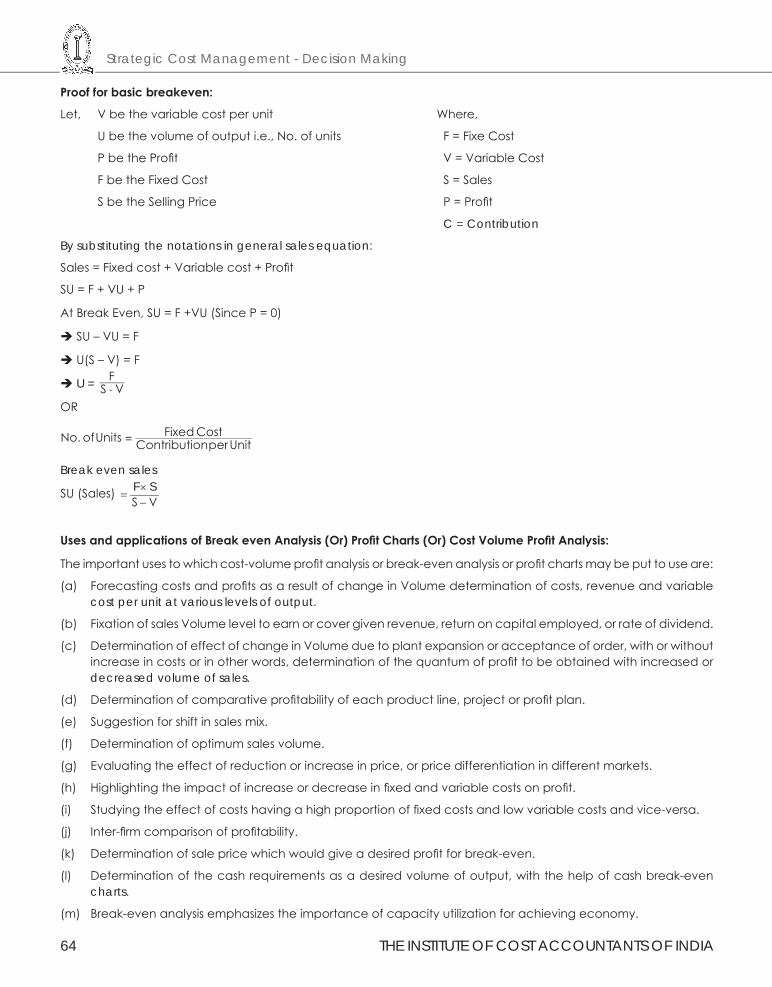
Strategic Cost Management - Decision Making
64 THE INSTITUTE OF COST ACCOUNTANTS OF INDIA
Proofforbasicbreakeven:
Let, V be the variable cost per unit Where,
U be the volume of output i.e., No. of units F = Fixe Cost
P be the Profit V = Variable Cost
F be the Fixed Cost S = Sales
S be the Selling Price P = Profit
C = Contribution
By substituting the notations in general sales equation:
Sales = Fixed cost + Variable cost + Profit
SU = F + VU + P
At Break Even, SU = F +VU (Since P = 0)
SU – VU = F
U(S – V) = F
U = S VF-
OR
No. ofUnits ContributionperUnitFixedCost=
Break even sales
SU (Sales) F SS V×
=−
UsesandapplicationsofBreakevenAnalysis(Or)ProfitCharts(Or)CostVolumeProfitAnalysis:
The important uses to which cost-volume profit analysis or break-even analysis or profit charts may be put to use are:
(a) Forecasting costs and profits as a result of change in Volume determination of costs, revenue and variable cost per unit at various levels of output.
(b) Fixation of sales Volume level to earn or cover given revenue, return on capital employed, or rate of dividend.
(c) Determination of effect of change in Volume due to plant expansion or acceptance of order, with or without increase in costs or in other words, determination of the quantum of profit to be obtained with increased or decreased volume of sales.
(d) Determination of comparative profitability of each product line, project or profit plan.
(e) Suggestion for shift in sales mix.
(f) Determination of optimum sales volume.
(g) Evaluating the effect of reduction or increase in price, or price differentiation in different markets.
(h) Highlighting the impact of increase or decrease in fixed and variable costs on profit.
(i) Studying the effect of costs having a high proportion of fixed costs and low variable costs and vice-versa.
(j) Inter-firm comparison of profitability.
(k) Determination of sale price which would give a desired profit for break-even.
(l) Determination of the cash requirements as a desired volume of output, with the help of cash break-even charts.
(m) Break-even analysis emphasizes the importance of capacity utilization for achieving economy.
THE INSTITUTE OF COST ACCOUNTANTS OF INDIA 65
Decision Making Techniques
(n) During severe recession, the comparative effects of a shutdown or continued operation at a loss are indicated.
(o) The effect on total cost of a change in the fixed overhead is more clearly demonstrated through break-even charts.
LimitationsofBreak-evenAnalysis:
(a) That Costs are either fixed or variable and all costs are clearly segregated into their fixed and variable elements. This cannot possibly be done accurately and the difficulties and complications involved in such segregation make the break-even point inaccurate.
(b) That the behavior of both costs and revenue is not entirely related to changes in volume.
(c) That costs and revenue patterns are linear over levels of output being considered. In practice, this is not always so and the linear relationship is true only within a short run relevant range.
(d) That fixed costs remain constant and variable costs vary in proportion to the volume. Fixed costs are constant only within a limited range and are liable to change at varying levels of activity and also over a long period, particularly when additional plants and equipments are introduced.
(e) That sales mix is constant or only one product is manufactured. A combined analysis taking all the products of the mix does not reflect the correct position regarding individual products.
(f) That production and sales figures are identical or the change in opening and closing stocks of the finished product is not significant.
(g) That the units of production on the various product range are identical. Otherwise, it is difficult to find a homogeneous factor to represent volume.
(h) That the activities and productivity of the concern remain unchanged during the period of study.
(i) As output is continuously varied within a limited range, the contribution margin remains relatively constant. This is possible mainly where the output is more or less homogeneous as in the case of process industries.
4. MarginofSafety:
It is the sales point beyond the breakeven point. Margin of safety can be obtained by subtracting break even sales from Total sales. It is useful to determine financial soundness of business enterprise. If margin of safety is high, then the financial position of the enterprise is sound.
Margin of Safety = Total Sales – Break Even Sales (1)
Total Sales = Break Even Sales + Margin of Safety Sales (2)
Margin of safety can also be computed as follows:
Margin of Safety = Profit / P/V ratio (3)
A relative measure to the margin of safety is its ratio to total sales.
Margin of safety ratio is the ratio of Margin of safety sales to Total sales.
Margin of safety ratio = [Margin of safety / Total sales] x 100 (4)
Margin of safety ratio and Break even sales ratios are complements of each other.
If the sales amount, P/V ratio and M/S ratio are given, then profit can be computed as follows:
Profit = Total sales x P/V ratio x M/S ratio (5)
Apart from the above formulae, various formulae that are used in the chapter to find out different results are as follows:
Profit = (Sales x P/V ratio) – Fixed Cost
Strategic Cost Management - Decision Making
66 THE INSTITUTE OF COST ACCOUNTANTS OF INDIA
Sales value to earn desired profit = Fixed Cost + desired profitP ratioV
and
Required units to earn desired profit =Fixed Cost + desired profit
Contribution per unit
Fixed cost = (Sales x P/V ratio) – Profit
Total sales = Break even sales + Margin of safety sales
Break even sales = Total sales – Margin of safety sales
Margin of safety sales = Total sales – Break even sales
Fixed cost = Break even sales x P/V ratio
Shut down sales = Fixed Cost Shut down costsP ratioV
−
Shut down Units = Fixed Cost Shut down costsContribution per unit
−
The level at which profits are same or the level at which costs are same for two methods or two alternatives
i.e., Indifference Point = Difference in fixed costs
Difference in variable costs per unit
OperatingorServiceCosting
Cost Accounting has been traditionally associated with manufacturing companies. However in the modern competitive market, cost accounting has been increasingly applied in service industries like banks, insurance companies, transportation organizations, electricity generating companies, hospitals, passenger transport and railways, hotels, road maintenance, educational institutions, road lighting, canteens, port trusts and several other service organizations. The costing method applied in these industries is known as ‘Operating Costing’.
According to CIMA [London] operating costing is, ‘that form of operating costing which applies where standardized services are provided either by an undertaking or by a service cost center within an undertaking’.
NatureofOperatingCosting:
The main objective of operating costing is to compute the cost of the services offered by the organization. For doing this, it is necessary to decide the unit of cost in such cases. The cost units vary from industry to industry. For example, in goods transport industry, cost per ton kilometer is to be ascertained while in case of passenger transport, cost per passenger kilometer is to be computed. Cost units used in different service units are explained in detail later in chapter. The next step is to collect and identify various costs under different headings.
The headings used are,
(a) Fixed or standing charges
(b) Semi-fixed or maintenance charges
(c) Variable or running charges.
One of the important features of operating costing is that mostly such costs are fixed in nature. For example, in case of passenger transport organization, most of the costs are fixed while few costs like diesel and oil are variable and dependent on the kilometers run.
Because of the diverse nature of activities carried out in service undertakings, the cost system used is obviously different from that of manufacturing concern. Let us discuss the method of computing costs in various service organisations .
THE INSTITUTE OF COST ACCOUNTANTS OF INDIA 67
Decision Making Techniques
TransportOrganisation: Costing in a transport industry consists of determining the operating cost of each vehicle and applying this cost to find out the cost per unit of service rendered by a vehicle. The cost unit is selected with proper care keeping in view the needs of each concern, the weight, bulk, volume and type of goods carried and distance covered in each trip. Transport undertakings include goods transport organizations as well as passenger transport organizations. The cost unit is either ton kilometer or passenger kilometer. The meaning is cost of carrying one ton over a distance of one kilometer or cost of carrying one passenger for a distance of one kilometer.
Collection of Costs: A log book is maintained for each vehicle to record details of trips made by the vehicle during a specified period of time. Log book is maintained usually on a daily basis. The details shown in the log book enables the management to make suitable allocation of vehicles, to avoid the duplicate trips, or to avoid idle running capacity. The log book also provides the information relating to the fuel consumed, distance travelled, no of hours travelled, chargeable kilo meters. The log book provide the data for proper allocation of cost and in this respect these may be compared with the production details available in a manufacturing concern
ClassificationofCosts:
The costs of a transport organisation can be classified and accumulated under the following heads:-
(a) Fixed or stand-by costs: These costs which include garage charges, insurance, taxes, license, depreciation, wages of drivers, cleaner’s salary, establishment cost of workshop and office. Out of the above some of the costs are directly identifiable for each vehicle such as license fee and some are apportioned such as office expenses
(b) Maintenance Charges: These costs are in the nature of semi-variable nature includes expenditure on maintenance, repairs, tyres, tubes and other charges.
(c) Operating and Running costs: These costs are variable in nature, includes fuel, lubricating oil, wages of drivers/ cleaners (if paid on per trip / kilometer). These costs can be easily identifiable with each of the vehicle.
SignificanceofOperatingorRunningCosts:
(i) Control of operating and running cost and avoidance of waste of fuel and other consumable material.
(ii) Cost of running own vehicles may compared with the hired or other forms of transport.
(iii) Facilitates quotation of hiring rates to outside parties who ask for the transport service.
(iv) If transport service is treated as a separate department or service cost center, the costs to be charged to the requesting department may be easily determined.
(v) Suitable information is obtained for efficient routing of vehicles.
(vi) Cost of idle vehicles and lost running time is easily obtained.
Relevant Cost Analysis
For decision making purpose, it is necessary to classify costs and revenues based on whether they are relevant or irrelevant to the decisions. Relevant costs and revenues are those, that are influenced by the decisions. Irrelevant costs and revenues are those, that are not affected or influenced by the decisions.
Relevant costs are those expected future costs that are essential but differ for alternative courses of action. It is a future cost that would arise as a direct consequence of the decision under review.
Relevant costing is a management accounting toolkit that helps managers reach decisions when they are posed with the following questions:
1. Whether to buy a component from an external vendor or manufacture it in house?
2. Whether to accept a special order?
3. What price to charge on a special order?
4. Whether to discontinue a product line?
5. How to utilize the scarce resource optimally?, etc.
Strategic Cost Management - Decision Making
68 THE INSTITUTE OF COST ACCOUNTANTS OF INDIA
Relevant costing is an incremental analysis which means that it considers only relevant costs i.e. costs that differ between alternatives and ignores sunk costs i.e. costs which have been incurred, which cannot be changed and hence are irrelevant to the scenario.
The costs which should be used for decision making are often referred to as “relevant costs”. CIMA defines relevant costs as ‘costs appropriate to aiding the making of specific management decisions’.
Toaffectadecisionacostmustbe:
(a) Future: Past costs are irrelevant, as we cannot affect them by current decisions and they are common to all alternatives that we may choose.
(b) Incremental: Expenditure which will be incurred or avoided as a result of making a decision. Any costs which would be incurred whether or not the decision is made are not said to be incremental to the decision.
(c) Cashflow: Expenses such as depreciation are not cash flows and are therefore not relevant. Similarly, the book value of existing equipment is irrelevant, but the disposal value is relevant.
Example
Company A manufactures bicycles. It can produce 1,000 units in a month for a fixed cost of ̀ 3,00,000 and variable cost of ` 500 per unit. Its current demand is 600 units which it sells at ` 1,000 per unit. It is approached by Company B for an order of 200 units at ` 700 per unit. Should the company accept the order?
Solution:
A layman would reject the order because he would think that the order is leading to loss of ` 100 per unit assuming that the total cost per unit is ̀ 800 (fixed cost of ̀ 3,00,000/1,000 and variable cost of ̀ 500 as compared to revenue of ` 700).
On the other hand, a management accountant will go ahead with the order because in his opinion the special order will yield ̀ 200 per unit. He knows that the fixed cost of ̀ 300,000 is irrelevant because it is going to be incurred regardless of whether the order is accepted or not. Effectively, the additional cost which Company A would have to incur is the variable cost of ̀ 500 per unit. Hence, the order will yield ̀ 200 per unit (` 700 minus ̀ 500 of variable cost).
Normally, the following are relevant Costs:
Differential Cost
(i) A differential cost is the difference in cost items under two or more decision alternatives specifically two different projects or situations. Where same item with the same amount appears in all alternatives, it is irrelevant. For example, a plot of land can be used for a shopping mall or entertainment park. The plot is irrelevant since it would be used in both the cases.
(ii) An example of differential cost would be of a company which is selling its products through distributors. It is paying them a commission of ` 16 million. Any alternate which costs lesser would be considered. Let us suppose that the company is planning to appoint salespersons to sell its products and cancels the contracts with distributors. In this case, the selling expense is expected to be to ` 12 million. There is cost differential ` 4 million ` (16 m - 12m). This is a good sign but the risk would have to considered for changing the channel of distribution. If there is low risk, it would be prudent to go for own arrangements for sales.
Differential costs must be compared to differential revenues. In case, switching over to direct sales bring additional revenues of ` 2 million, it would increase the net benefit to ` 6 million. This would provide more comfort to the decision maker while considering a change in the distribution channel.
Incremental or Marginal Cost
(i) Whereas differential cost is a difference between the cost of two independent alternatives, incremental or marginal cost is a cost associated with producing an additional unit. In case of a university, it could be cost of admitting another student. Even operating a second shift is an example of incremental cost. It would be noted that the two decisions are not independent as second shift depends upon first shift.
(ii) Increamental cost must be compared with incremental revenues to arrive at a decision.
THE INSTITUTE OF COST ACCOUNTANTS OF INDIA 69
Decision Making Techniques
OpportunityCost
(i) It is cost of opportunity foregone. Mr. Ahmed Shah left a bank job which was paying him ` 15,000 per month and got admission in a University. Monthly fee-charge in the university is ` 10,000 per month. For Ahmed Shah, this would be ` 25,000 per month (` 10,000 + ` 15,000).
(ii) Farhana is a fresh graduate from a business university. She got two offers, one of ` 25,000 from an investment bank and another of ̀ 15,000 for a teaching-assistant in a university. Another of her class-fellow, Shabana got the same offer from the same university. While Shabana would be happy to join the university, Faraha would not be as she would lose an opportunity to serve at the bank for ` 25,000.
(iii) Whenever an organization is deciding to go for a particular project, it should not ignore opportunities for other projects. It should consider (i) what alternative opportunities are there? (2) Which is the best of these alternative opportunities?
Avoidablecosts
These are costs that can be eliminated in whole or in part by choosing one alternative over another. Avoidable costs are relevant costs.
ReplacementCost: It is the cost at which there could be purchase of an asset or material identical to that which is being replaced or revalued. It is the cost of replacement at current market price and is relevant for decision-making.
ImputedCosts
These are Notional Costs appearing in the Cost Accounts only e.g. notional rent charges, interest on capital for which no interest has actually been paid. These are relevant costs for decision-making. Where alternative capital investment projects are being evaluated, it is necessary to consider the imputed interest on capital before a decision is arrived at as to which is the most profitable project.
Out-of-Pocket Cost
These are costs that entail current or near future cash outlays for the decision at hand. Such costs are relevant for decision - making, as these will occur in near future. This cost concept is a short-run concept and is used in decisions on fixing Selling Price in recession, Make or Buy, etc. Out-of-Pocket costs can be avoided or saved if a particular proposal under consideration is not accepted.
SpecialDecisions
There are special decisions where relevant costs and benefits are to identified before proceeding further. Such decisions are:
(i) Accept or reject an order when there is excess capacity
(ii) Accept or reject an order when there is no excess capacity
(iii) Outsource a product or service
(iv) Add, drop a product, service or department
(v) Sell or process further
(vi) Optimization of limited resources or working under constraint.
Irrelevant Costs
Sunk Costs
Sunk costs are costs that were incurred in the past. Committed costs are costs that will occur in the future, but that cannot be changed. As a practical matter, sunk costs and committed costs are equivalent with respect to their decision-relevance; neither is relevant with respect to any decision, because neither can be changed. Sometimes, accountants use the term “sunk costs” to encompass committed costs as well.
Experiments have been conducted that identify situations in which individuals, including professional managers, incorporate sunk costs in their decisions. One common example from business is that a manager will often continue to
Strategic Cost Management - Decision Making
70 THE INSTITUTE OF COST ACCOUNTANTS OF INDIA
support a project that the manager initiated, long after any objective examination of the project seems to indicate that the best course of action is to abandon it. A possible explanation for why managers exhibit this behavior is that there may be negative repercussions to poor decisions, and the manager might prefer to attempt to make the project look successful, than to admit to a mistake.
Here is an example. Consider a student who is between her junior and senior year in college, deciding whether to complete her degree. From a financial point of view (ignoring nonfinancial factors) her situation is as follows. She has paid for three years of tuition. She can pay for one more year of tuition and earn her degree, or she can drop out of school. If her market value is greater with the degree than without the degree, then her decision should depend on the cost of tuition for next year and the opportunity cost of lost earnings related to one more year of school, on the one hand; and the increased earnings throughout her career that are made possible by having a college degree, on the other hand. In making this comparison, the tuition paid for her first three years is a sunk cost, and it is entirely irrelevant to her decision. In fact, consider three individuals who all face this same decision, but one paid ` 24,000 for three years of in-state tuition, one paid ` 48,000 for out-of-state tuition, and one paid nothing because she had a scholarship for three years. Now assume that the student who paid out-of-state tuition qualifies for in-state tuition for her last year, and the student who had the three-year scholarship now must pay in-state tuition for her last year. Although these three students have paid significantly different amounts for three years of college (` 0, ` 24,000 and ` 48,000), all of those expenditures are sunk and irrelevant, and they all face exactly the same decision with respect to whether to attend one more year to complete their degrees. It would be wrong to reason that the student who paid ` 48,000 should be more likely to stay and finish, than the student who had the scholarship.
Committed Cost
A committed cost is an investment that a business entity has already made and cannot recover by any means, as well as obligations already made that the business cannot get out of.
For example, if a company buys a machine for ̀ 40,000 and also issues a purchase order to pay for a maintenance contract for `2,000 in each of the next three years, all `46,000 is a committed cost, because the company has already bought the machine, and has a legal obligation to pay for the maintenance. A multi-year property lease agreement is also a committed cost for the full term of the lease, since it is extremely difficult to terminate a lease agreement.
AbsorbedCost
The indirect costs that are associated with manufacturing. Absorbed costs include such expenses as insurance, or property taxes for the building in which the manufacturing process occurs. When the total manufacturing costs are determined, the implicit absorbed costs are not considered, but will be included in a separate account.
AbsorbedFixedCost: Fixed Costs which do not change due to increase or decrease in activity is irrelevant to decision-making. Although Fixed Costs are absorbed in cost of production on a normal rate, they are irrelevant for managerial decision-making. However if Fixed Costs are specific, they become relevant for decision-making.
FixedCostsareunrelatedtooutputandaregenerally irrelevant fordecision-makingpurpose.However, in thefollowingcircumstances,FixedCostsbecomerelevantfordecision-making-
1. When Fixed Costs are specifically incurred for any contract,
2. When Fixed Costs are incremental in nature.
3. When the fixed portion of Semi-Variable Cost increases due to change in level of activity consequent to acceptance of a contract.
4 When Fixed Costs are avoidable or discretionary,
5. When Fixed Costs are such that one cost is incurred in lieu of another (the difference in costs will be relevant for decision-making.)
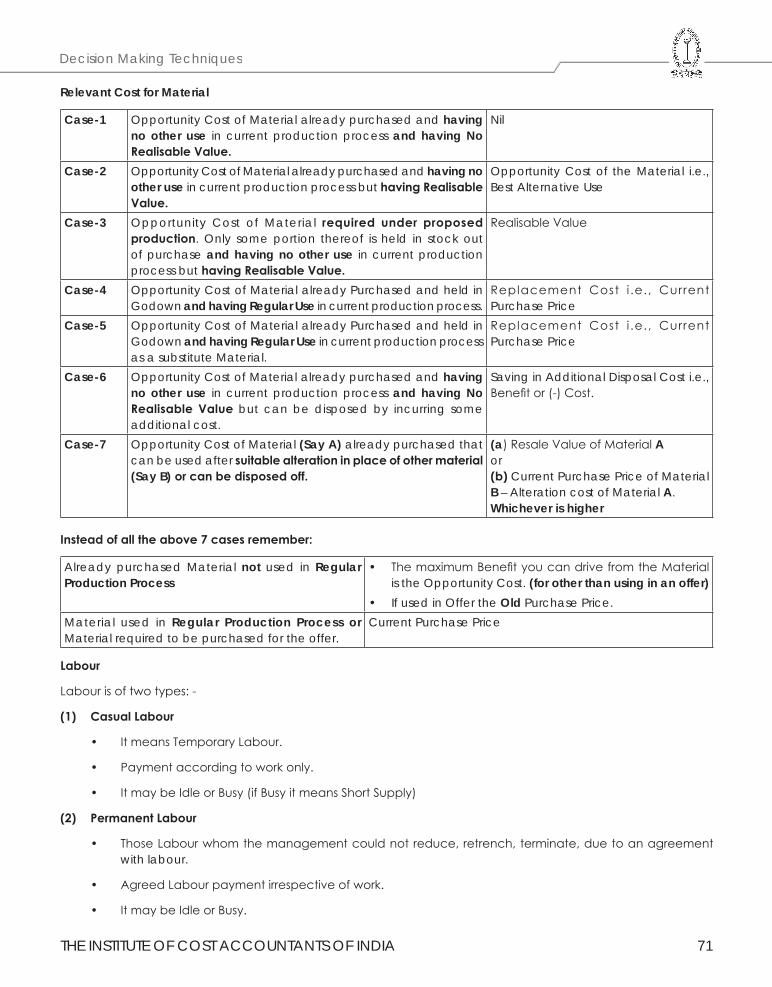
THE INSTITUTE OF COST ACCOUNTANTS OF INDIA 71
Decision Making Techniques
Relevant Cost for Material
Case-1 Opportunity Cost of Material already purchased and having no other use in current production process and having No RealisableValue.
Nil
Case-2 Opportunity Cost of Material already purchased and having no other use in current production process buthavingRealisableValue.
Opportunity Cost of the Material i.e., Best Alternative Use
Case-3 Opportunity Cost of Material required under proposedproduction. Only some portion thereof is held in stock out of purchase and having no other use in current production process buthavingRealisableValue.
Realisable Value
Case-4 Opportunity Cost of Material already Purchased and held in Godown and having Regular Use in current production process.
Replacement Cost i .e., Current Purchase Price
Case-5 Opportunity Cost of Material already Purchased and held in Godown and having Regular Use in current production process as a substitute Material.
Replacement Cost i .e., Current Purchase Price
Case-6 Opportunity Cost of Material already purchased and having no other use in current production process and having No RealisableValue but can be disposed by incurring some additional cost.
Saving in Additional Disposal Cost i.e., Benefit or (-) Cost.
Case-7 Opportunity Cost of Material (Say A) already purchased that can be used after suitablealterationinplaceofothermaterial(Say B) orcanbedisposedoff.
(a) Resale Value of Material Aor(b) Current Purchase Price of Material B – Alteration cost of Material A.Whichever is higher
Insteadofalltheabove7casesremember:
Already purchased Material not used in Regular Production Process
• The maximum Benefit you can drive from the Material is the Opportunity Cost. (for other than using in an offer)
• If used in Offer the Old Purchase Price.Material used in Regular Production Process or Material required to be purchased for the offer.
Current Purchase Price
Labour
Labour is of two types: -
(1) CasualLabour
• It means Temporary Labour.
• Payment according to work only.
• It may be Idle or Busy (if Busy it means Short Supply)
(2) PermanentLabour
• Those Labour whom the management could not reduce, retrench, terminate, due to an agreement with labour.
• Agreed Labour payment irrespective of work.
• It may be Idle or Busy.
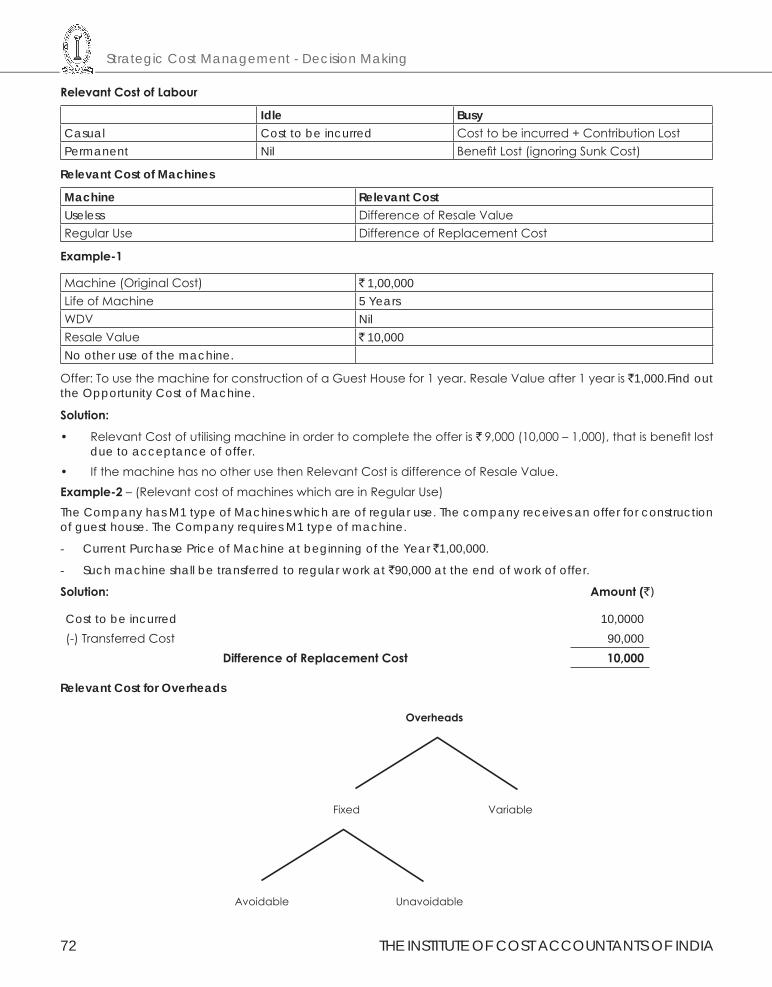
Strategic Cost Management - Decision Making
72 THE INSTITUTE OF COST ACCOUNTANTS OF INDIA
RelevantCostofLabour
Idle BusyCasual Cost to be incurred Cost to be incurred + Contribution LostPermanent Nil Benefit Lost (ignoring Sunk Cost)
Relevant Cost of Machines
Machine Relevant CostUseless Difference of Resale ValueRegular Use Difference of Replacement Cost
Example-1
Machine (Original Cost) ` 1,00,000Life of Machine 5 YearsWDV NilResale Value ` 10,000No other use of the machine.
Offer: To use the machine for construction of a Guest House for 1 year. Resale Value after 1 year is `1,000.Find out the Opportunity Cost of Machine.
Solution:
• Relevant Cost of utilising machine in order to complete the offer is ` 9,000 (10,000 – 1,000), that is benefit lost due to acceptance of offer.
• If the machine has no other use then Relevant Cost is difference of Resale Value.Example-2 – (Relevant cost of machines which are in Regular Use)The Company has M1 type of Machines which are of regular use. The company receives an offer for construction of guest house. The Company requires M1 type of machine.
- Current Purchase Price of Machine at beginning of the Year `1,00,000.
- Such machine shall be transferred to regular work at `90,000 at the end of work of offer.
Solution: Amount(`)
Cost to be incurred 10,0000(-) Transferred Cost 90,000
DifferenceofReplacementCost 10,000
Relevant Cost for Overheads
THE INSTITUTE OF COST ACCOUNTANTS OF INDIA 73
Decision Making Techniques
FixedOverheads
(1) AvoidableFixedCosts:arealwaysrelevantforthedecision(costtobeincurred)likeextramachinerent,extrasupervisorsalary.
(2) UnavoidableFixedCosts:AlwaystobeignoredduetoSunkCost(futureobligationalreadydecided).
• Change in apportionment does not change in cash outflow.
• For Decision Making Fixed Costs are always to be expressed in totality instead of unit wise.
VariableOverheads
(i) Variable Overheads to be incurred due to acceptance of offer, hence relevant for decision making.
(ii) If Variable Overheads include IndirectMaterial,IndirectLabour then such Variable Overheads to be linked with Production.
(iii) If Variable Overheads include IndirectExpenses (Power, Electricity, Energy) then Variable Overheads always linked with Working Hours.
(iv) If the break-up of Variable Overheads are not given in question then always presume Variable Overheads include Indirect Expenses like power, electricity, basedonhours.
IftheQuestionissilentaboutnatureofResources:-(i) Material Slow Moving(ii) Labour Casual(iii) Casual + Busy Short Supply(iv) Overheads Fixed – Unavoidable (allocated, absorbed, recovered, apportioned, added
to products, General Overheads)
ClassificationbasedonCostsforManagementDecisionMaking
Ascertainment of cost is essential for making managerial decisions. On this basis costing may be classified into the following types
MarginalCosting: Marginal Cost is the aggregate of variable costs, i.e. prime cost plus variable overhead. Marginal cost per unit is the change in the amount at any given volume of output by which the aggregate cost changes if the volume of output is increased or decreased by one unit. Marginal Costing system is based on the system of classification of costs into fixed and variable. The fixed costs are excluded and only the marginal costs, i.e the variable costs are taken into consideration for determining the cost of products and the inventory of work-in-progress and completed products.
DifferentialCost: Differential cost is the change in the cost due to change in activity from one level to another.
OpportunityCost: Opportunity cost is the value of alternatives foregone by adopting a particular strategy or employing resources in specific manner. It is the return expected from an investment other than the present one. These refer to costs which result from the use or application of material, labour or other facilities in a particular manner which has been foregone due to not using the facilities in the manner originally planned. Resources (or input) like men, materials, plant and machinery, finance etc., when utilized in one particulars way, yield a particular return (or output). If the same input is utilized in another way, yielding the same or a different return, the original return on the forsaken alternative that is no longer obtainable is the opportunity cost. For example, if fixed deposits in the bank are proposed to be withdrawn for financing project, the opportunity cost would be the loss of interest on the deposits. Similarly when a building leased out on rent to a party is got vacated for own purpose or a vacant space is not leased out but used inter nally, say, for expansion of the production programme, the rent so forgone is the opportunity cost.
Replacement Cost: Replacement cost is the cost of an asset in the current market for the purpose of replacement. Replacement cost is used for determining the optimum time of replacement of an equipment or machine in
Strategic Cost Management - Decision Making
74 THE INSTITUTE OF COST ACCOUNTANTS OF INDIA
consideration of maintenance cost of the existing one and its productive capacity. This is the cost in the current market of replacing an asset. For example, when replacement cost of material or an asset is being considered, it means that the cost that would be incurred if the material or the asset was to be purchased at the current market price and not the cost at which it was actually purchased earlier, should be take into account.
RelevantCosts: Relevant costs are costs which are relevant for a specific purpose or situation. In the context of decision making, only those costs are relevant which are pertinent to the decision at hand. Since we are concerned with future costs only while making a decision, historical costs, unless they remain unchanged in the future period are irrelevant to the decision making process.
ImputedCosts: Imputed costs are hypothetical or notional costs, not involving cash outlay computed only for the purpose of decision making. In this respect, imputed costs are similar to opportunity costs. Interest on funds generated internally, payment for which is not actually made is an example of imputed cost. When alternative capital investment projects are being considered out of which one or more are to be financed from internal funds, it is necessary to take into account the imputed interest on own funds before a decision is arrived at.
SunkCosts: Sunk costs are historical costs which are incurred i.e sunk in the past and are not relevant to the particular decision making problem being considered. Sunk costs are those that have been incurred for a project and which will not be recovered if the project is terminated. While considering the replacement of a plant, the depreciated book value of the old asset is irrelevant as the amount is sunk cost which is to be written-off at the time of replacement.
NormalCost&AbnormalCost: Normal Cost is a cost that is normally incurred at a given level of output in the conditions in which that level of output is achieved. Abnormal Cost is an unusual and typical cost whose occurrence is usually irregular and unexpected and due to some abnormal situation of the production.
AvoidableCosts&UnavoidableCosts: Avoidable Costs are those which under given conditions of performance efficiency should not have been incurred. Unavoidable Costs which are inescapable costs, which are essentially to be incurred, within the limits or norms provided for. It is the cost that must be incurred under a programme of business restriction. It is fixed in nature and inescapable.
UniformCosting: This is not a distinct system of costing. The term applies to the costing principles and procedures which are adopted in common by a number of undertakings which desire to have the benefits of a uniform system. The methods of Uniform Costing may be extended so as to be useful in inter-firm comparison.
EngineeredCost: Engineered Cost relates to an item where the input has an explicit physical relationship with the output. For instance in the manufacture of a product, there is a definite relationship between the units of raw material and labour time consumed and the amount of variable manufacturing overhead on the one hand and units of the products produced on the other. The input-output relationship can be established the form of standards by engineering analysis or by an analysis of the historical data. It should be noted that the variable costs are not engineered cost but some administration and selling expenses may be categorized as engineered cost.
Out-of-PocketCost: This is the portion of the cost associated with an activity that involve cash payment to other parties, as opposed to costs which do not require any cash outlay, such as depreciation and certain allocated costs. Out-of-Pocket Costs are very much relevant in the consid eration of price fixation during trade recession or when a make-or-buy decision is to be made.
ManagedCost: Managed (Programmed or Discretionary) Costs all op posed to engineering costs, relate to such items where no accurate rela tionship between the amount spent on input and the output can be estab lished and sometimes it is difficult to measure the output. Examples are advertisement cost, research and development costs, etc.,
CommonCosts: These are costs which are incurred collectively for a number of cost centres and are required to be suitably apportioned for determining the cost of individual cost centres. Examples are: Combined purchase cost of several materials in one consignment, and overhead ex penses incurred for the factory as a whole.
ControllableandNon-ControllableCosts: Controllable Cost is that cost which is subject to direct control at some level of managerial supervision. Non-controllable Cost is the cost which is not sub ject to control at any level of managerial supervision.
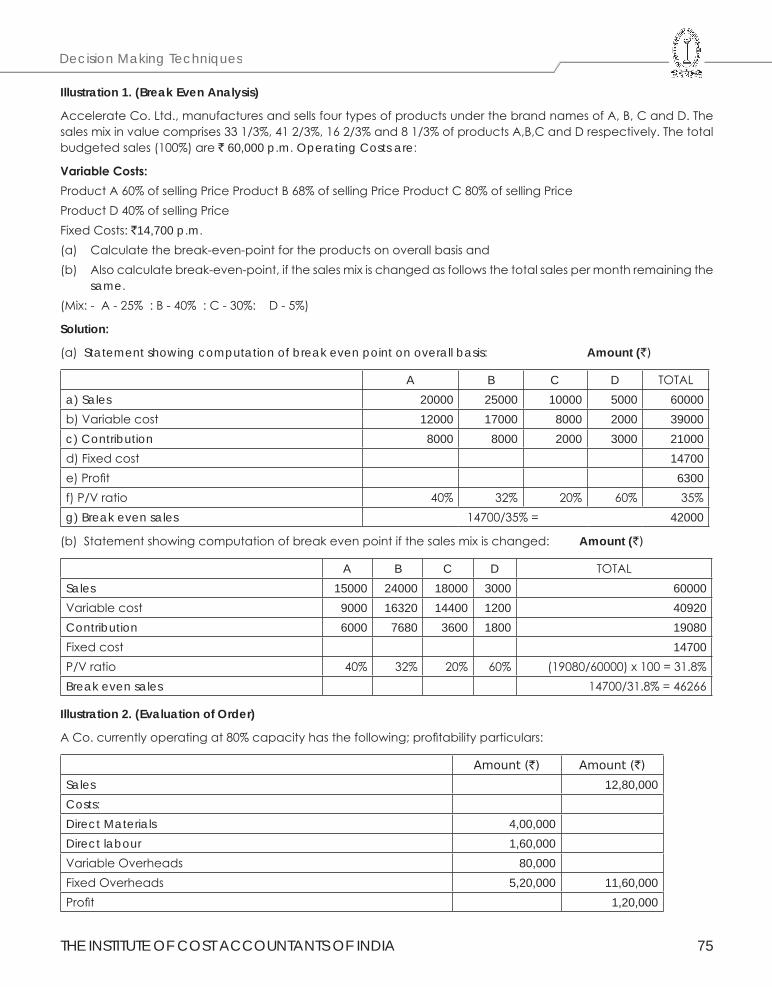
THE INSTITUTE OF COST ACCOUNTANTS OF INDIA 75
Decision Making Techniques
Illustration 1. (Break Even Analysis)
Accelerate Co. Ltd., manufactures and sells four types of products under the brand names of A, B, C and D. The sales mix in value comprises 33 1/3%, 41 2/3%, 16 2/3% and 8 1/3% of products A,B,C and D respectively. The total budgeted sales (100%) are ` 60,000 p.m. Operating Costs are:
VariableCosts:Product A 60% of selling Price Product B 68% of selling Price Product C 80% of selling PriceProduct D 40% of selling PriceFixed Costs: `14,700 p.m.(a) Calculate the break-even-point for the products on overall basis and(b) Also calculate break-even-point, if the sales mix is changed as follows the total sales per month remaining the
same.(Mix: - A - 25% : B - 40% : C - 30%: D - 5%)
Solution:
(a) Statement showing computation of break even point on overall basis: Amount (`)
A B C D TOTALa) Sales 20000 25000 10000 5000 60000b) Variable cost 12000 17000 8000 2000 39000c) Contribution 8000 8000 2000 3000 21000d) Fixed cost 14700e) Profit 6300f) P/V ratio 40% 32% 20% 60% 35%g) Break even sales 14700/35% = 42000
(b) Statement showing computation of break even point if the sales mix is changed: Amount (`)
A B C D TOTALSales 15000 24000 18000 3000 60000Variable cost 9000 16320 14400 1200 40920Contribution 6000 7680 3600 1800 19080Fixed cost 14700P/V ratio 40% 32% 20% 60% (19080/60000) x 100 = 31.8%Break even sales 14700/31.8% = 46266
Illustration 2. (Evaluation of Order)
A Co. currently operating at 80% capacity has the following; profitability particulars:
Amount (`) Amount (`)
Sales 12,80,000Costs:Direct Materials 4,00,000Direct labour 1,60,000Variable Overheads 80,000Fixed Overheads 5,20,000 11,60,000Profit 1,20,000
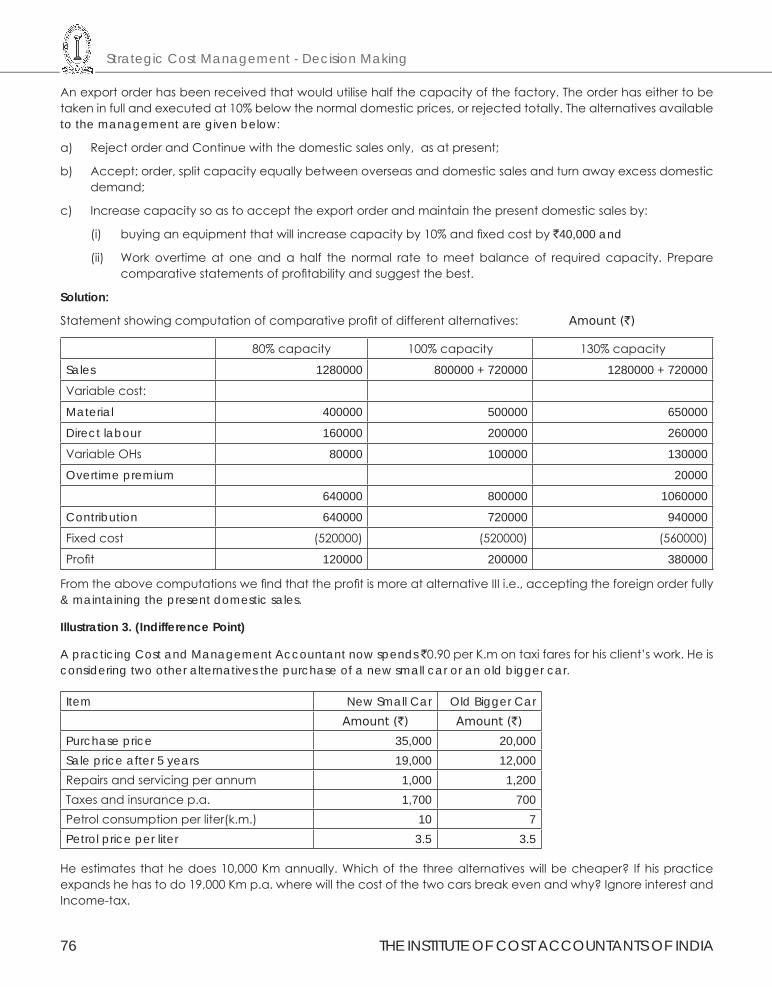
Strategic Cost Management - Decision Making
76 THE INSTITUTE OF COST ACCOUNTANTS OF INDIA
An export order has been received that would utilise half the capacity of the factory. The order has either to be taken in full and executed at 10% below the normal domestic prices, or rejected totally. The alternatives available to the management are given below:
a) Reject order and Continue with the domestic sales only, as at present;
b) Accept; order, split capacity equally between overseas and domestic sales and turn away excess domestic demand;
c) Increase capacity so as to accept the export order and maintain the present domestic sales by:
(i) buying an equipment that will increase capacity by 10% and fixed cost by `40,000 and
(ii) Work overtime at one and a half the normal rate to meet balance of required capacity. Prepare comparative statements of profitability and suggest the best.
Solution:
Statement showing computation of comparative profit of different alternatives: Amount (`)
80% capacity 100% capacity 130% capacity
Sales 1280000 800000 + 720000 1280000 + 720000
Variable cost:
Material 400000 500000 650000
Direct labour 160000 200000 260000
Variable OHs 80000 100000 130000
Overtime premium 20000
640000 800000 1060000
Contribution 640000 720000 940000
Fixed cost (520000) (520000) (560000)
Profit 120000 200000 380000
From the above computations we find that the profit is more at alternative III i.e., accepting the foreign order fully & maintaining the present domestic sales.
Illustration 3. (Indifference Point)
A practicing Cost and Management Accountant now spends `0.90 per K.m on taxi fares for his client’s work. He is considering two other alternatives the purchase of a new small car or an old bigger car.
Item New Small Car Old Bigger CarAmount (`) Amount (`)
Purchase price 35,000 20,000Sale price after 5 years 19,000 12,000Repairs and servicing per annum 1,000 1,200Taxes and insurance p.a. 1,700 700Petrol consumption per liter(k.m.) 10 7Petrol price per liter 3.5 3.5
He estimates that he does 10,000 Km annually. Which of the three alternatives will be cheaper? If his practice expands he has to do 19,000 Km p.a. where will the cost of the two cars break even and why? Ignore interest and Income-tax.
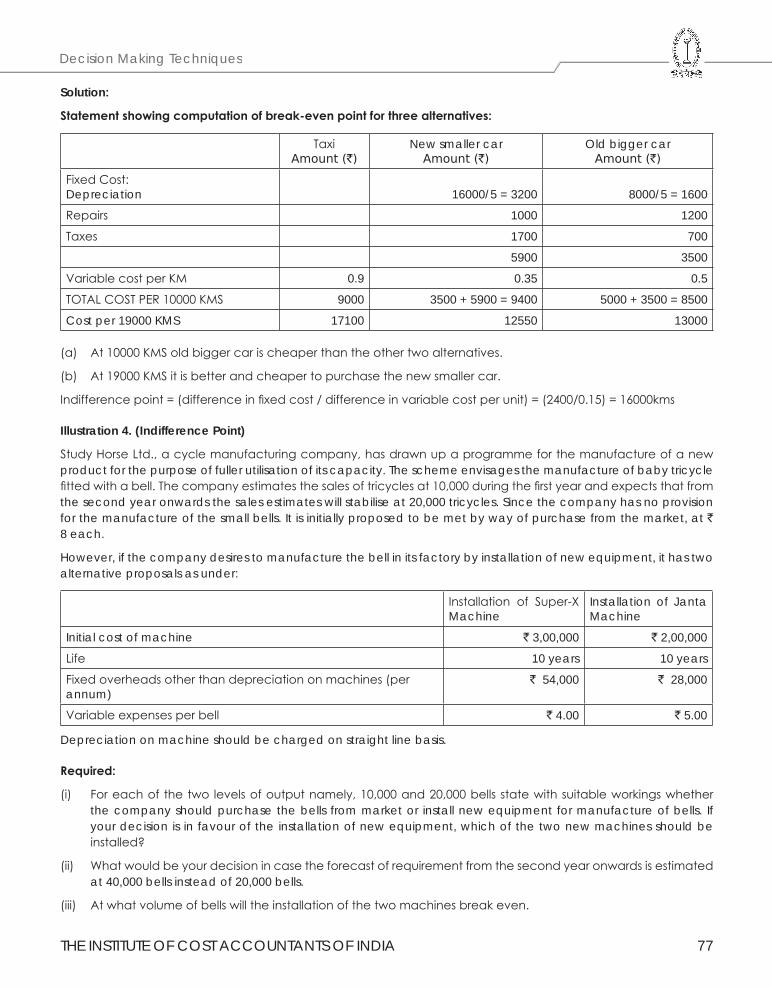
THE INSTITUTE OF COST ACCOUNTANTS OF INDIA 77
Decision Making Techniques
Solution:
Statementshowingcomputationofbreak-evenpointforthreealternatives:
TaxiAmount (`)
New smaller carAmount (`)
Old bigger carAmount (`)
Fixed Cost:Depreciation 16000/5 = 3200 8000/5 = 1600
Repairs 1000 1200
Taxes 1700 700
5900 3500
Variable cost per KM 0.9 0.35 0.5
TOTAL COST PER 10000 KMS 9000 3500 + 5900 = 9400 5000 + 3500 = 8500
Cost per 19000 KMS 17100 12550 13000
(a) At 10000 KMS old bigger car is cheaper than the other two alternatives.
(b) At 19000 KMS it is better and cheaper to purchase the new smaller car.
Indifference point = (difference in fixed cost / difference in variable cost per unit) = (2400/0.15) = 16000kms
Illustration 4. (Indifference Point)
Study Horse Ltd., a cycle manufacturing company, has drawn up a programme for the manufacture of a new product for the purpose of fuller utilisation of its capacity. The scheme envisages the manufacture of baby tricycle fitted with a bell. The company estimates the sales of tricycles at 10,000 during the first year and expects that from the second year onwards the sales estimates will stabilise at 20,000 tricycles. Since the company has no provision for the manufacture of the small bells. It is initially proposed to be met by way of purchase from the market, at ` 8 each.
However, if the company desires to manufacture the bell in its factory by installation of new equipment, it has two alternative proposals as under:
Installation of Super-X Machine
Installation of Janta Machine
Initial cost of machine ` 3,00,000 ` 2,00,000
Life 10 years 10 years
Fixed overheads other than depreciation on machines (per annum)
` 54,000 ` 28,000
Variable expenses per bell ` 4.00 ` 5.00
Depreciation on machine should be charged on straight line basis.
Required:
(i) For each of the two levels of output namely, 10,000 and 20,000 bells state with suitable workings whether the company should purchase the bells from market or install new equipment for manufacture of bells. If your decision is in favour of the installation of new equipment, which of the two new machines should be installed?
(ii) What would be your decision in case the forecast of requirement from the second year onwards is estimated at 40,000 bells instead of 20,000 bells.
(iii) At what volume of bells will the installation of the two machines break even.
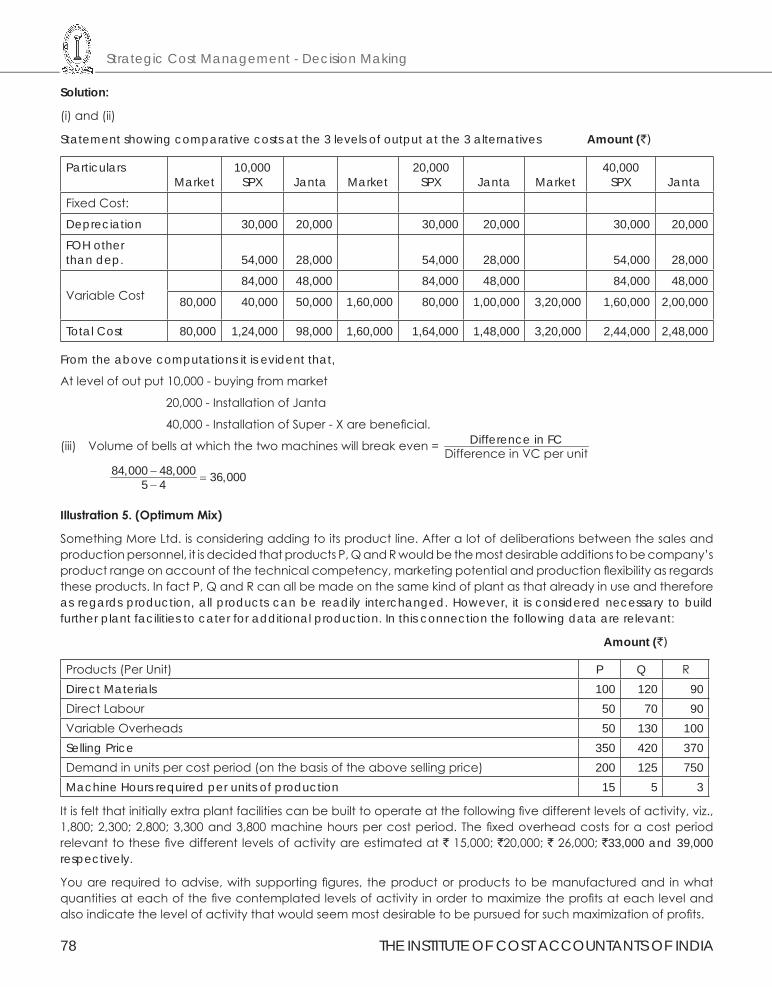
Strategic Cost Management - Decision Making
78 THE INSTITUTE OF COST ACCOUNTANTS OF INDIA
Solution:
(i) and (ii)
Statement showing comparative costs at the 3 levels of output at the 3 alternatives Amount (`)
ParticularsMarket
10,000SPX Janta Market
20,000SPX Janta Market
40,000SPX Janta
Fixed Cost:
Depreciation 30,000 20,000 30,000 20,000 30,000 20,000
FOH otherthan dep. 54,000 28,000 54,000 28,000 54,000 28,000
Variable Cost 84,000 48,000 84,000 48,000 84,000 48,000
80,000 40,000 50,000 1,60,000 80,000 1,00,000 3,20,000 1,60,000 2,00,000
Total Cost 80,000 1,24,000 98,000 1,60,000 1,64,000 1,48,000 3,20,000 2,44,000 2,48,000
From the above computations it is evident that,
At level of out put 10,000 - buying from market
20,000 - Installation of Janta
40,000 - Installation of Super - X are beneficial.
(iii) Volume of bells at which the two machines will break even = Difference in FCDifference in VC per unit
84,000 48,000 36,0005 4− =−
Illustration5.(OptimumMix)
Something More Ltd. is considering adding to its product line. After a lot of deliberations between the sales and production personnel, it is decided that products P, Q and R would be the most desirable additions to be company’s product range on account of the technical competency, marketing potential and production flexibility as regards these products. In fact P, Q and R can all be made on the same kind of plant as that already in use and therefore as regards production, all products can be readily interchanged. However, it is considered necessary to build further plant facilities to cater for additional production. In this connection the following data are relevant:
Amount (`)
Products (Per Unit) P Q RDirect Materials 100 120 90Direct Labour 50 70 90Variable Overheads 50 130 100Selling Price 350 420 370Demand in units per cost period (on the basis of the above selling price) 200 125 750Machine Hours required per units of production 15 5 3
It is felt that initially extra plant facilities can be built to operate at the following five different levels of activity, viz., 1,800; 2,300; 2,800; 3,300 and 3,800 machine hours per cost period. The fixed overhead costs for a cost period relevant to these five different levels of activity are estimated at ` 15,000; `20,000; ` 26,000; `33,000 and 39,000 respectively.
You are required to advise, with supporting figures, the product or products to be manufactured and in what quantities at each of the five contemplated levels of activity in order to maximize the profits at each level and also indicate the level of activity that would seem most desirable to be pursued for such maximization of profits.
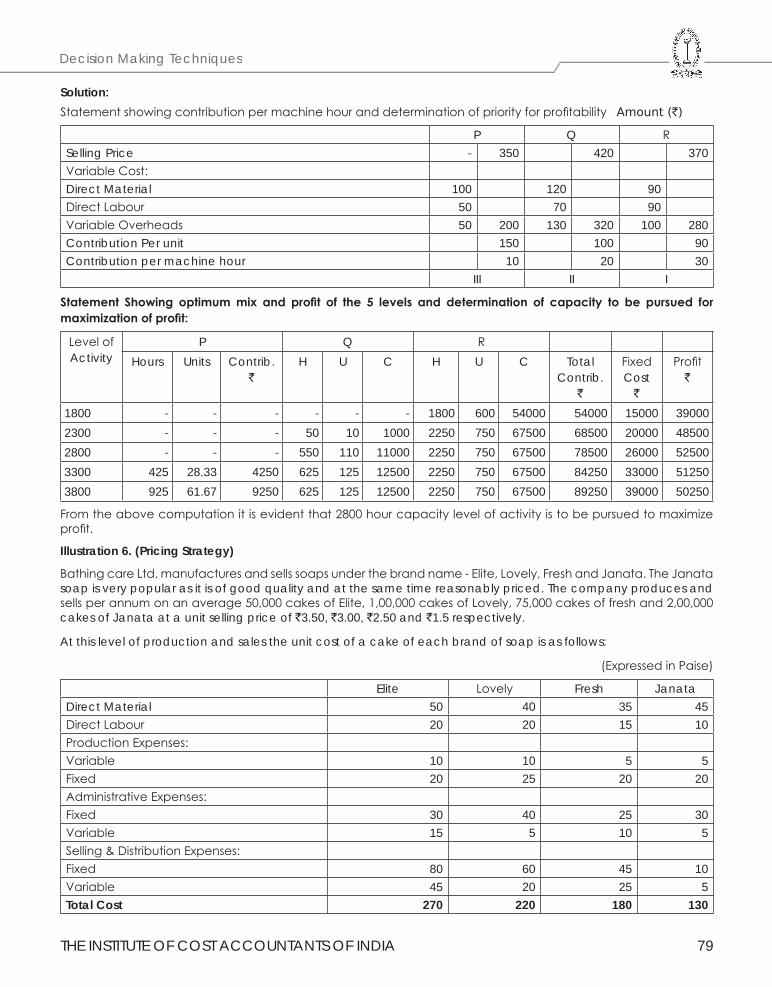
THE INSTITUTE OF COST ACCOUNTANTS OF INDIA 79
Decision Making Techniques
Solution:Statement showing contribution per machine hour and determination of priority for profitability Amount (`)
P Q RSelling Price - 350 420 370Variable Cost:Direct Material 100 120 90Direct Labour 50 70 90Variable Overheads 50 200 130 320 100 280Contribution Per unit 150 100 90Contribution per machine hour 10 20 30
III II I
Statement Showing optimummix and profit of the 5 levels and determination of capacity to be pursued formaximizationofprofit:
Level of Activity
P Q RHours Units Contrib.
`H U C H U C Total
Contrib. `
Fixed Cost
`
Profit`
1800 - - - - - - 1800 600 54000 54000 15000 390002300 - - - 50 10 1000 2250 750 67500 68500 20000 485002800 - - - 550 110 11000 2250 750 67500 78500 26000 525003300 425 28.33 4250 625 125 12500 2250 750 67500 84250 33000 512503800 925 61.67 9250 625 125 12500 2250 750 67500 89250 39000 50250
From the above computation it is evident that 2800 hour capacity level of activity is to be pursued to maximize profit.
Illustration 6. (Pricing Strategy)
Bathing care Ltd. manufactures and sells soaps under the brand name - Elite, Lovely, Fresh and Janata. The Janata soap is very popular as it is of good quality and at the same time reasonably priced. The company produces and sells per annum on an average 50,000 cakes of Elite, 1,00,000 cakes of Lovely, 75,000 cakes of fresh and 2,00,000 cakes of Janata at a unit selling price of `3.50, `3.00, `2.50 and `1.5 respectively.
At this level of production and sales the unit cost of a cake of each brand of soap is as follows:
(Expressed in Paise)
Elite Lovely Fresh JanataDirect Material 50 40 35 45Direct Labour 20 20 15 10Production Expenses:Variable 10 10 5 5Fixed 20 25 20 20Administrative Expenses:Fixed 30 40 25 30Variable 15 5 10 5Selling & Distribution Expenses:Fixed 80 60 45 10Variable 45 20 25 5Total Cost 270 220 180 130
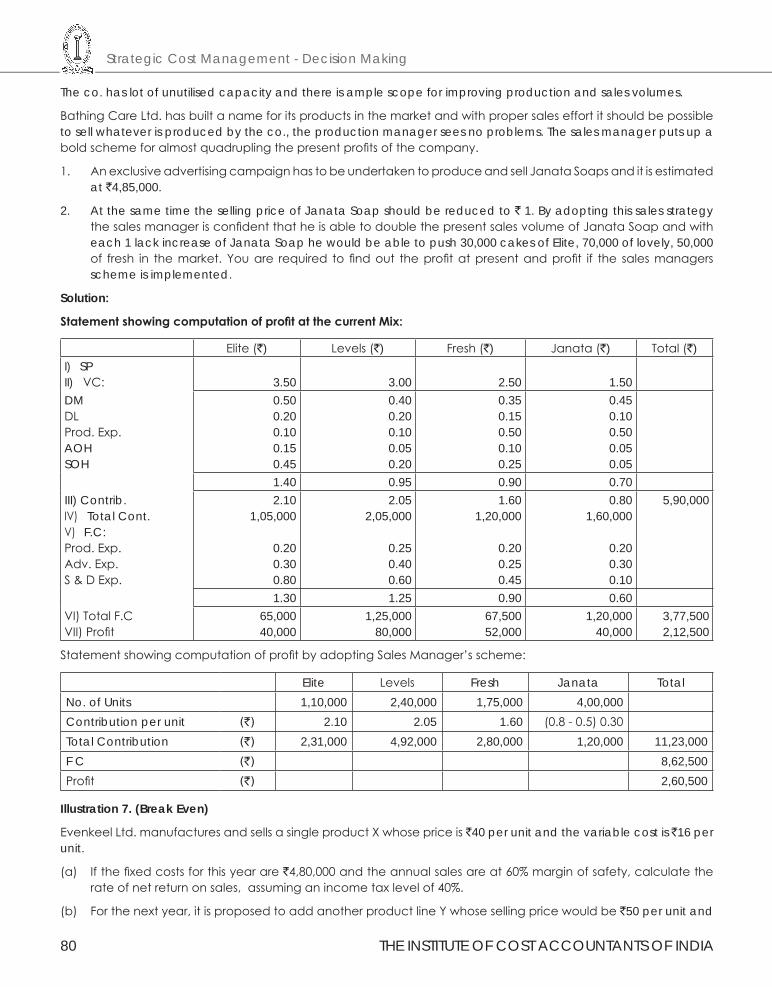
Strategic Cost Management - Decision Making
80 THE INSTITUTE OF COST ACCOUNTANTS OF INDIA
The co. has lot of unutilised capacity and there is ample scope for improving production and sales volumes.
Bathing Care Ltd. has built a name for its products in the market and with proper sales effort it should be possible to sell whatever is produced by the co., the production manager sees no problems. The sales manager puts up a bold scheme for almost quadrupling the present profits of the company.
1. An exclusive advertising campaign has to be undertaken to produce and sell Janata Soaps and it is estimated at `4,85,000.
2. At the same time the selling price of Janata Soap should be reduced to ` 1. By adopting this sales strategy the sales manager is confident that he is able to double the present sales volume of Janata Soap and with each 1 lack increase of Janata Soap he would be able to push 30,000 cakes of Elite, 70,000 of lovely, 50,000 of fresh in the market. You are required to find out the profit at present and profit if the sales managers scheme is implemented.
Solution:
StatementshowingcomputationofprofitatthecurrentMix:
Elite (`) Levels (`) Fresh (`) Janata (`) Total (`)I) SPII) VC: 3.50 3.00 2.50 1.50DMDLProd. Exp.AOHSOH
0.500.200.100.150.45
0.400.200.100.050.20
0.350.150.500.100.25
0.450.100.500.050.05
1.40 0.95 0.90 0.70III) Contrib.IV) Total Cont.V) F.C:Prod. Exp.Adv. Exp.S & D Exp.
2.101,05,000
0.200.300.80
2.052,05,000
0.250.400.60
1.601,20,000
0.200.250.45
0.801,60,000
0.200.300.10
5,90,000
1.30 1.25 0.90 0.60VI) Total F.CVII) Profit
65,00040,000
1,25,00080,000
67,50052,000
1,20,00040,000
3,77,5002,12,500
Statement showing computation of profit by adopting Sales Manager’s scheme:
Elite Levels Fresh Janata TotalNo. of Units 1,10,000 2,40,000 1,75,000 4,00,000Contribution per unit (`) 2.10 2.05 1.60 (0.8 - 0.5) 0.30Total Contribution (`) 2,31,000 4,92,000 2,80,000 1,20,000 11,23,000F C (`) 8,62,500Profit (`) 2,60,500
Illustration 7. (Break Even)
Evenkeel Ltd. manufactures and sells a single product X whose price is `40 per unit and the variable cost is `16 per unit.
(a) If the fixed costs for this year are `4,80,000 and the annual sales are at 60% margin of safety, calculate the rate of net return on sales, assuming an income tax level of 40%.
(b) For the next year, it is proposed to add another product line Y whose selling price would be `50 per unit and
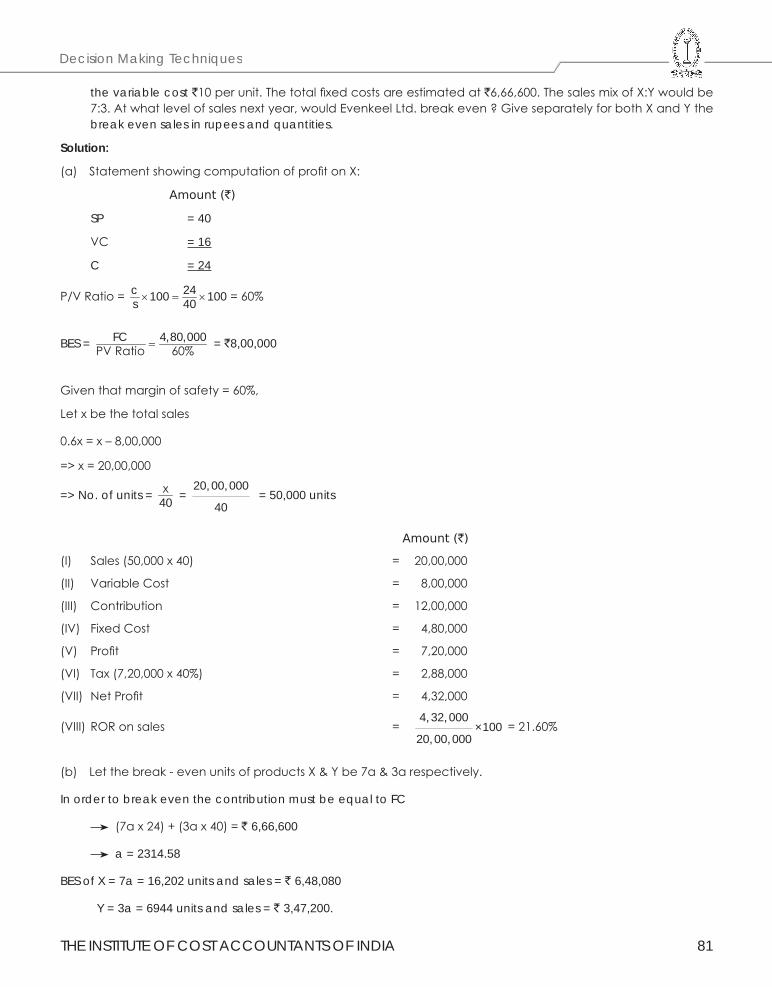
THE INSTITUTE OF COST ACCOUNTANTS OF INDIA 81
Decision Making Techniques
the variable cost `10 per unit. The total fixed costs are estimated at `6,66,600. The sales mix of X:Y would be 7:3. At what level of sales next year, would Evenkeel Ltd. break even ? Give separately for both X and Y the break even sales in rupees and quantities.
Solution:
(a) Statement showing computation of profit on X:
Amount (`)
SP = 40
VC = 16
C = 24
P/V Ratio = c 24100 100s 40× = × = 60%
BES = FC 4,80,000PV Ratio 60%= = `8,00,000
Given that margin of safety = 60%,
Let x be the total sales
0.6x = x – 8,00,000
=> x = 20,00,000
=> No. of units = x40 =
20,00,000
40 = 50,000 units
Amount (`)
(I) Sales (50,000 x 40) = 20,00,000
(II) Variable Cost = 8,00,000
(III) Contribution = 12,00,000
(IV) Fixed Cost = 4,80,000
(V) Profit = 7,20,000
(VI) Tax (7,20,000 x 40%) = 2,88,000
(VII) Net Profit = 4,32,000
(VIII) ROR on sales = 4,32,000
×10020,00,000
= 21.60%
(b) Let the break - even units of products X & Y be 7a & 3a respectively.
In order to break even the contribution must be equal to FC
(7a x 24) + (3a x 40) = ` 6,66,600
a = 2314.58
BES of X = 7a = 16,202 units and sales = ` 6,48,080
Y = 3a = 6944 units and sales = ` 3,47,200.
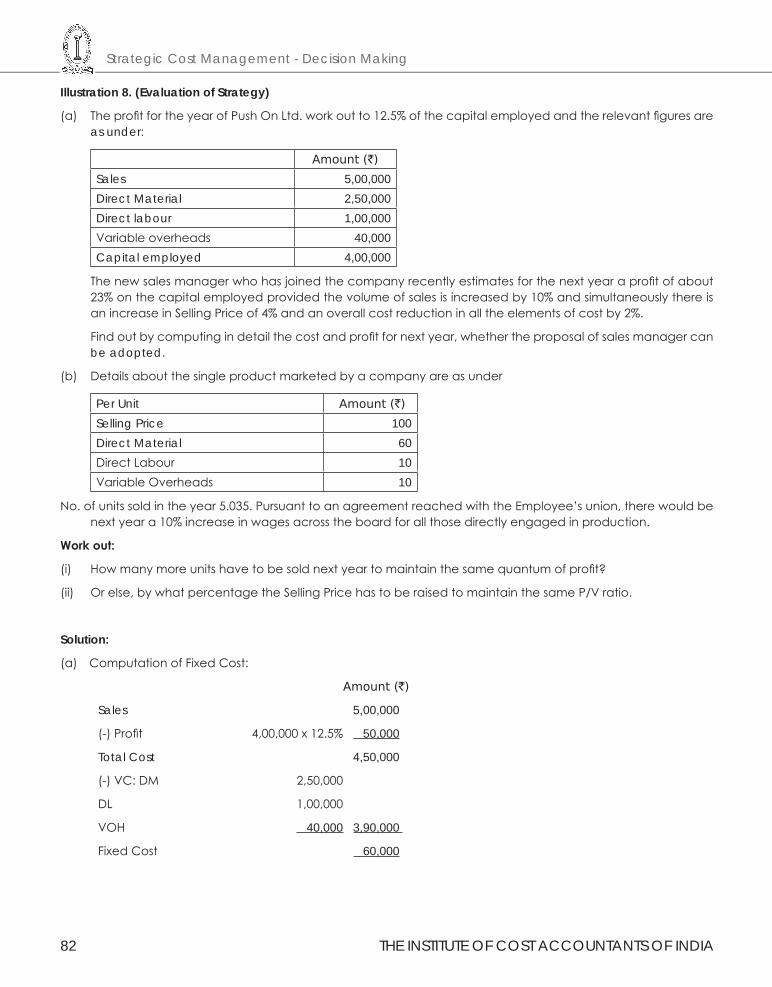
Strategic Cost Management - Decision Making
82 THE INSTITUTE OF COST ACCOUNTANTS OF INDIA
Illustration 8. (Evaluation of Strategy)
(a) The profit for the year of Push On Ltd. work out to 12.5% of the capital employed and the relevant figures are as under:
Amount (`)
Sales 5,00,000Direct Material 2,50,000Direct labour 1,00,000Variable overheads 40,000Capital employed 4,00,000
The new sales manager who has joined the company recently estimates for the next year a profit of about 23% on the capital employed provided the volume of sales is increased by 10% and simultaneously there is an increase in Selling Price of 4% and an overall cost reduction in all the elements of cost by 2%.
Find out by computing in detail the cost and profit for next year, whether the proposal of sales manager can be adopted.
(b) Details about the single product marketed by a company are as under
Per Unit Amount (`)
Selling Price 100Direct Material 60Direct Labour 10Variable Overheads 10
No. of units sold in the year 5.035. Pursuant to an agreement reached with the Employee’s union, there would be next year a 10% increase in wages across the board for all those directly engaged in production.
Workout:
(i) How many more units have to be sold next year to maintain the same quantum of profit?
(ii) Or else, by what percentage the Selling Price has to be raised to maintain the same P/V ratio.
Solution:
(a) Computation of Fixed Cost:
Amount (`)
Sales 5,00,000
(-) Profit 4,00,000 x 12.5% 50,000
Total Cost 4,50,000
(-) VC: DM 2,50,000
DL 1,00,000
VOH 40,000 3,90,000
Fixed Cost 60,000
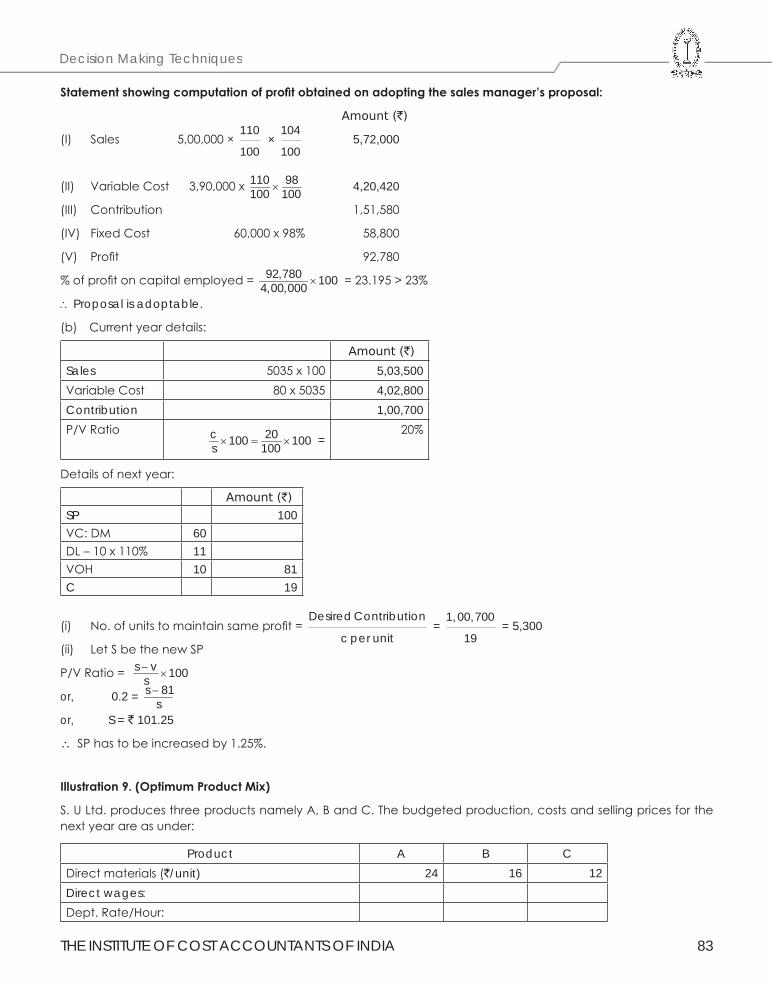
THE INSTITUTE OF COST ACCOUNTANTS OF INDIA 83
Decision Making Techniques
Statementshowingcomputationofprofitobtainedonadoptingthesalesmanager’sproposal:
Amount (`)
(I) Sales 5,00,000 × 110
100 ×
104
100 5,72,000
(II) Variable Cost 3,90,000 x 110 98100 100× 4,20,420
(III) Contribution 1,51,580
(IV) Fixed Cost 60,000 x 98% 58,800
(V) Profit 92,780
% of profit on capital employed = 92,780 1004,00,000 × = 23.195 > 23%
∴ Proposal is adoptable.
(b) Current year details:
Amount (`)
Sales 5035 x 100 5,03,500Variable Cost 80 x 5035 4,02,800Contribution 1,00,700P/V Ratio c 20100 100s 100× = × =
20%
Details of next year:
Amount (`)
SP 100VC: DM 60DL – 10 x 110% 11VOH 10 81C 19
(i) No. of units to maintain same profit = Desired Contribution
c per unit =
1,00,700
19 = 5,300
(ii) Let S be the new SP
P/V Ratio = s v 100s− ×
or, 0.2 = s 81s−
or, S = ` 101.25
∴ SP has to be increased by 1.25%.
Illustration9.(OptimumProductMix)
S. U Ltd. produces three products namely A, B and C. The budgeted production, costs and selling prices for the next year are as under:
Product A B CDirect materials (`/unit) 24 16 12Direct wages:Dept. Rate/Hour:
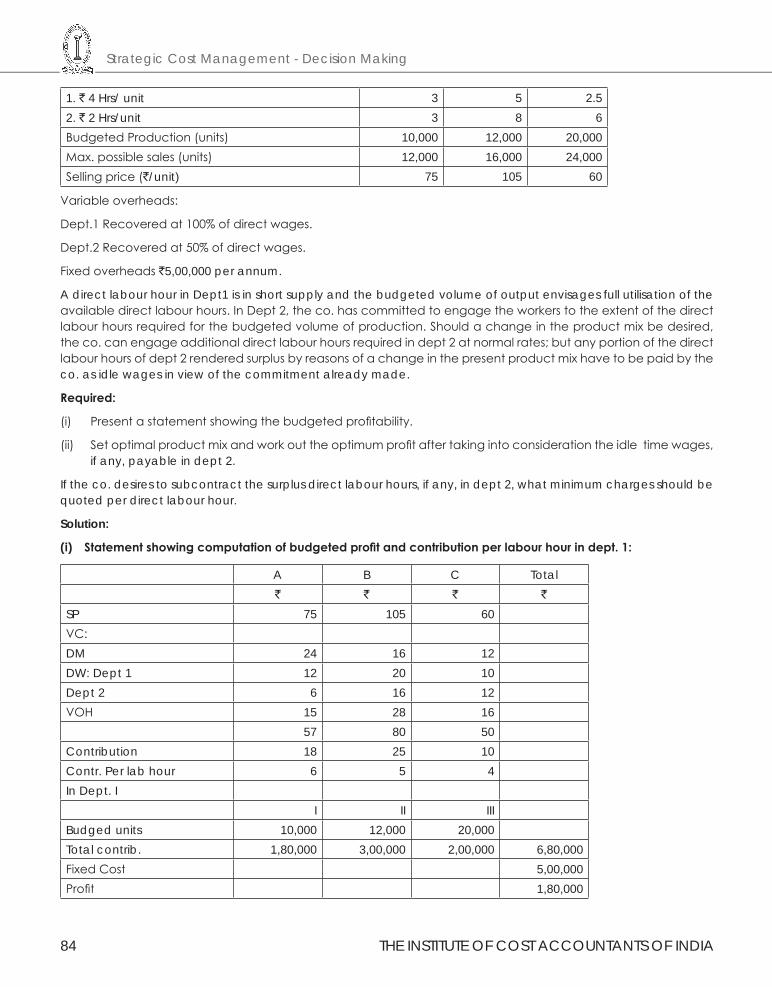
Strategic Cost Management - Decision Making
84 THE INSTITUTE OF COST ACCOUNTANTS OF INDIA
1. ` 4 Hrs/ unit 3 5 2.52. ` 2 Hrs/unit 3 8 6Budgeted Production (units) 10,000 12,000 20,000Max. possible sales (units) 12,000 16,000 24,000Selling price (`/unit) 75 105 60
Variable overheads:
Dept.1 Recovered at 100% of direct wages.
Dept.2 Recovered at 50% of direct wages.
Fixed overheads `5,00,000 per annum.
A direct labour hour in Dept1 is in short supply and the budgeted volume of output envisages full utilisation of the available direct labour hours. In Dept 2, the co. has committed to engage the workers to the extent of the direct labour hours required for the budgeted volume of production. Should a change in the product mix be desired, the co. can engage additional direct labour hours required in dept 2 at normal rates; but any portion of the direct labour hours of dept 2 rendered surplus by reasons of a change in the present product mix have to be paid by the co. as idle wages in view of the commitment already made.
Required:
(i) Present a statement showing the budgeted profitability.
(ii) Set optimal product mix and work out the optimum profit after taking into consideration the idle time wages, if any, payable in dept 2.
If the co. desires to subcontract the surplus direct labour hours, if any, in dept 2, what minimum charges should be quoted per direct labour hour.
Solution:
(i) Statementshowingcomputationofbudgetedprofitandcontributionperlabourhourindept.1:
A B C Total` ` ` `
SP 75 105 60VC:DM 24 16 12DW: Dept 1 12 20 10Dept 2 6 16 12VOH 15 28 16
57 80 50Contribution 18 25 10Contr. Per lab hour 6 5 4In Dept. I
I II IIIBudged units 10,000 12,000 20,000Total contrib. 1,80,000 3,00,000 2,00,000 6,80,000Fixed Cost 5,00,000Profit 1,80,000
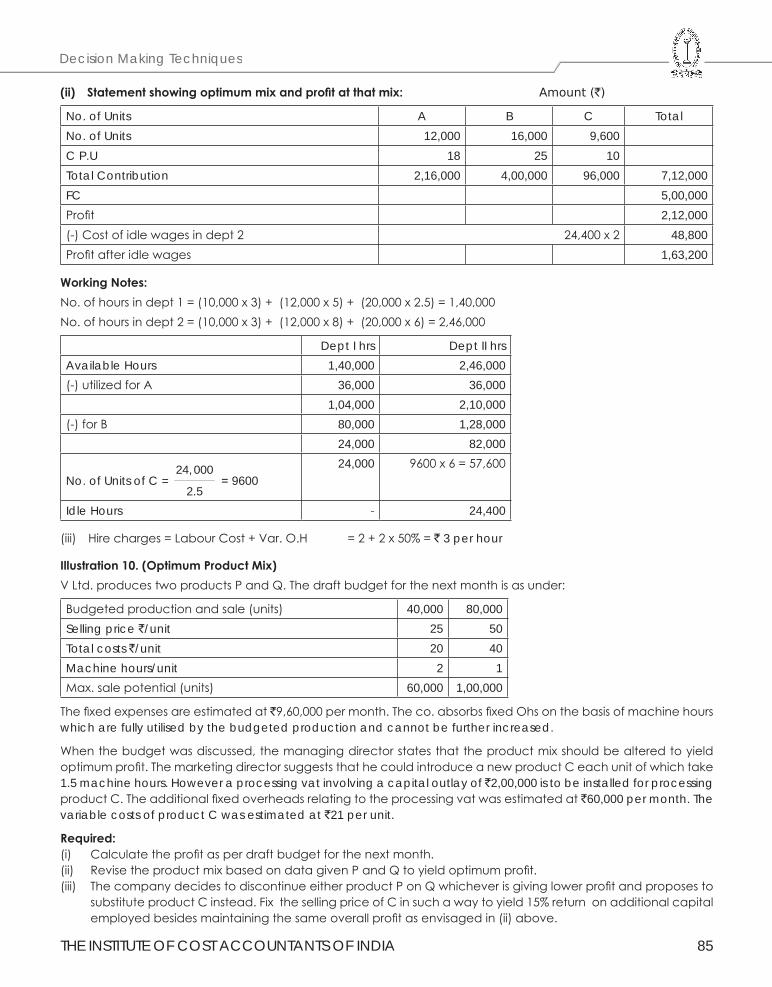
THE INSTITUTE OF COST ACCOUNTANTS OF INDIA 85
Decision Making Techniques
(ii) Statementshowingoptimummixandprofitatthatmix: Amount (`)
No. of Units A B C TotalNo. of Units 12,000 16,000 9,600C P.U 18 25 10Total Contribution 2,16,000 4,00,000 96,000 7,12,000FC 5,00,000Profit 2,12,000(-) Cost of idle wages in dept 2 24,400 x 2 48,800Profit after idle wages 1,63,200
WorkingNotes:No. of hours in dept 1 = (10,000 x 3) + (12,000 x 5) + (20,000 x 2.5) = 1,40,000No. of hours in dept 2 = (10,000 x 3) + (12,000 x 8) + (20,000 x 6) = 2,46,000
Dept I hrs Dept II hrsAvailable Hours 1,40,000 2,46,000(-) utilized for A 36,000 36,000
1,04,000 2,10,000(-) for B 80,000 1,28,000
24,000 82,000
No. of Units of C = 24,000
2.5 = 9600
24,000 9600 x 6 = 57,600
Idle Hours - 24,400
(iii) Hire charges = Labour Cost + Var. O.H = 2 + 2 x 50% = ` 3 per hour
Illustration10.(OptimumProductMix)V Ltd. produces two products P and Q. The draft budget for the next month is as under:
Budgeted production and sale (units) 40,000 80,000Selling price `/unit 25 50Total costs `/unit 20 40Machine hours/unit 2 1Max. sale potential (units) 60,000 1,00,000
The fixed expenses are estimated at `9,60,000 per month. The co. absorbs fixed Ohs on the basis of machine hours which are fully utilised by the budgeted production and cannot be further increased.
When the budget was discussed, the managing director states that the product mix should be altered to yield optimum profit. The marketing director suggests that he could introduce a new product C each unit of which take 1.5 machine hours. However a processing vat involving a capital outlay of ̀ 2,00,000 is to be installed for processing product C. The additional fixed overheads relating to the processing vat was estimated at `60,000 per month. The variable costs of product C was estimated at `21 per unit.
Required:(i) Calculate the profit as per draft budget for the next month.(ii) Revise the product mix based on data given P and Q to yield optimum profit.(iii) The company decides to discontinue either product P on Q whichever is giving lower profit and proposes to
substitute product C instead. Fix the selling price of C in such a way to yield 15% return on additional capital employed besides maintaining the same overall profit as envisaged in (ii) above.
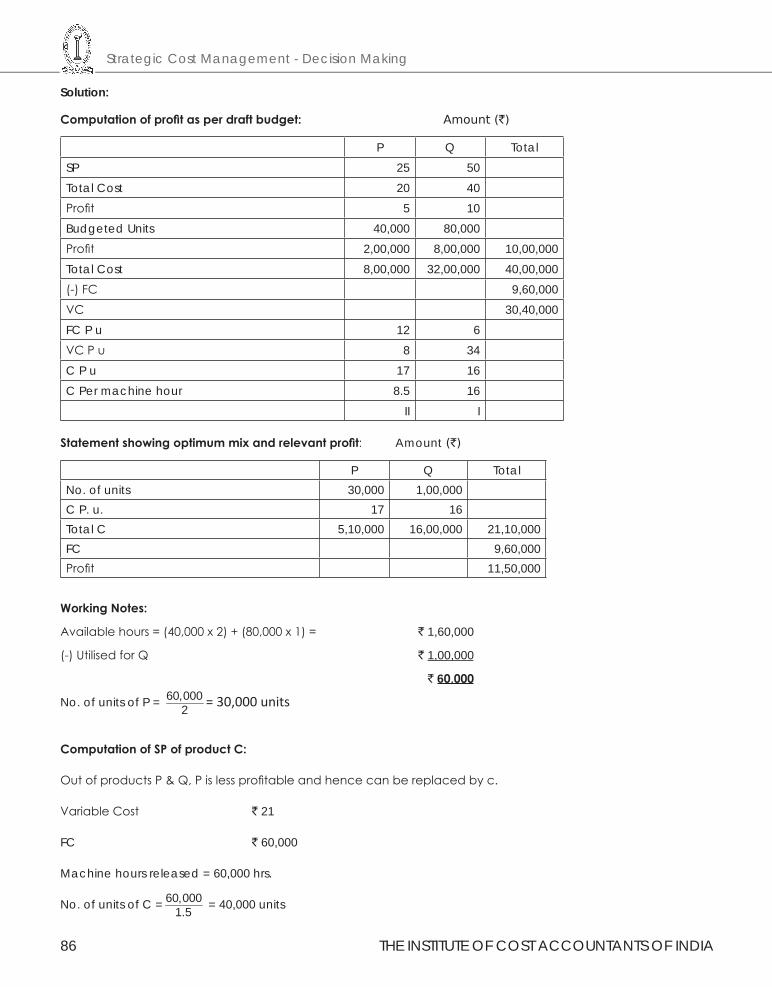
Strategic Cost Management - Decision Making
86 THE INSTITUTE OF COST ACCOUNTANTS OF INDIA
Solution:
Computationofprofitasperdraftbudget: Amount (`)
P Q TotalSP 25 50Total Cost 20 40Profit 5 10Budgeted Units 40,000 80,000Profit 2,00,000 8,00,000 10,00,000Total Cost 8,00,000 32,00,000 40,00,000(-) FC 9,60,000VC 30,40,000FC P u 12 6VC P u 8 34C P u 17 16C Per machine hour 8.5 16
II I
Statementshowingoptimummixandrelevantprofit: Amount (`)
P Q TotalNo. of units 30,000 1,00,000C P. u. 17 16Total C 5,10,000 16,00,000 21,10,000FC 9,60,000Profit 11,50,000
WorkingNotes:
Available hours = (40,000 x 2) + (80,000 x 1) = ` 1,60,000
(-) Utilised for Q ` 1,00,000
` 60,000
No. of units of P = 60,0002 = 30,000 units
ComputationofSPofproductC:
Out of products P & Q, P is less profitable and hence can be replaced by c.
Variable Cost ` 21
FC ` 60,000
Machine hours released = 60,000 hrs.
No. of units of C = 60,0001.5 = 40,000 units
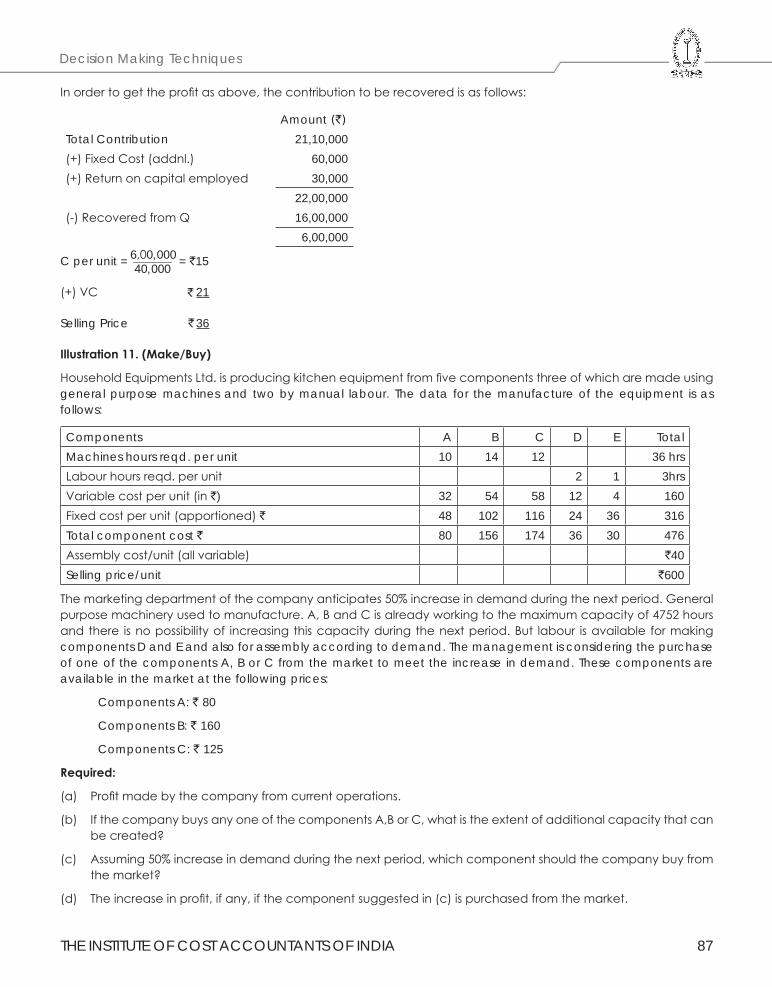
THE INSTITUTE OF COST ACCOUNTANTS OF INDIA 87
Decision Making Techniques
In order to get the profit as above, the contribution to be recovered is as follows:
Amount (`)
Total Contribution 21,10,000(+) Fixed Cost (addnl.) 60,000(+) Return on capital employed 30,000
22,00,000(-) Recovered from Q 16,00,000
6,00,000
C per unit = 6,00,00040,000 = `15
(+) VC 21 `
Selling Price 36 `
Illustration11.(Make/Buy)
Household Equipments Ltd. is producing kitchen equipment from five components three of which are made using general purpose machines and two by manual labour. The data for the manufacture of the equipment is as follows:
Components A B C D E TotalMachines hours reqd. per unit 10 14 12 36 hrsLabour hours reqd. per unit 2 1 3hrsVariable cost per unit (in `) 32 54 58 12 4 160Fixed cost per unit (apportioned) ` 48 102 116 24 36 316Total component cost ` 80 156 174 36 30 476Assembly cost/unit (all variable) `40Selling price/unit `600
The marketing department of the company anticipates 50% increase in demand during the next period. General purpose machinery used to manufacture. A, B and C is already working to the maximum capacity of 4752 hours and there is no possibility of increasing this capacity during the next period. But labour is available for making components D and E and also for assembly according to demand. The management is considering the purchase of one of the components A, B or C from the market to meet the increase in demand. These components are available in the market at the following prices:
Components A: ` 80
Components B: ` 160
Components C: ` 125
Required:
(a) Profit made by the company from current operations.
(b) If the company buys any one of the components A,B or C, what is the extent of additional capacity that can be created?
(c) Assuming 50% increase in demand during the next period, which component should the company buy from the market?
(d) The increase in profit, if any, if the component suggested in (c) is purchased from the market.
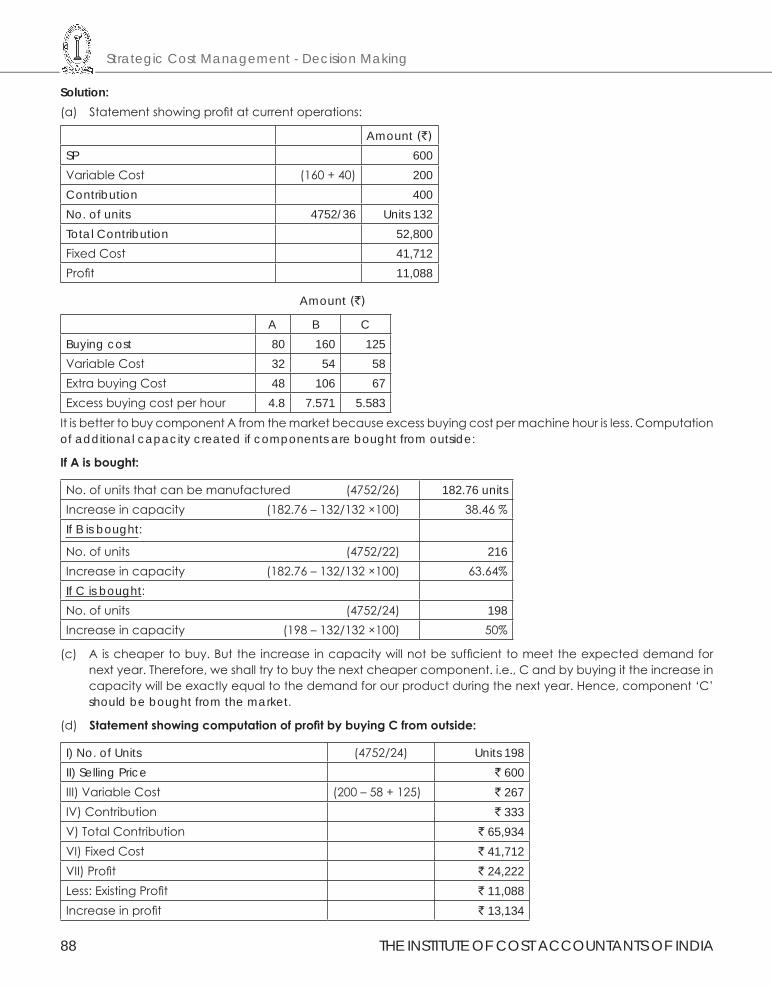
Strategic Cost Management - Decision Making
88 THE INSTITUTE OF COST ACCOUNTANTS OF INDIA
Solution:(a) Statement showing profit at current operations:
Amount (`)
SP 600Variable Cost (160 + 40) 200Contribution 400No. of units 4752/36 Units 132 Total Contribution 52,800Fixed Cost 41,712Profit 11,088
Amount (`)
A B CBuying cost 80 160 125Variable Cost 32 54 58Extra buying Cost 48 106 67Excess buying cost per hour 4.8 7.571 5.583
It is better to buy component A from the market because excess buying cost per machine hour is less. Computation of additional capacity created if components are bought from outside:
IfAisbought:
No. of units that can be manufactured (4752/26) 182.76 unitsIncrease in capacity (182.76 – 132/132 ×100) 38.46 %If B is bought:
No. of units (4752/22) 216Increase in capacity (182.76 – 132/132 ×100) 63.64%If C is bought:No. of units (4752/24) 198Increase in capacity (198 – 132/132 ×100) 50%
(c) A is cheaper to buy. But the increase in capacity will not be sufficient to meet the expected demand for next year. Therefore, we shall try to buy the next cheaper component. i.e., C and by buying it the increase in capacity will be exactly equal to the demand for our product during the next year. Hence, component ‘C’ should be bought from the market.
(d) StatementshowingcomputationofprofitbybuyingCfromoutside:
I) No. of Units (4752/24) Units 198 II) Selling Price ` 600III) Variable Cost (200 – 58 + 125) ` 267IV) Contribution ` 333V) Total Contribution ` 65,934VI) Fixed Cost ` 41,712VII) Profit ` 24,222Less: Existing Profit ` 11,088Increase in profit ` 13,134
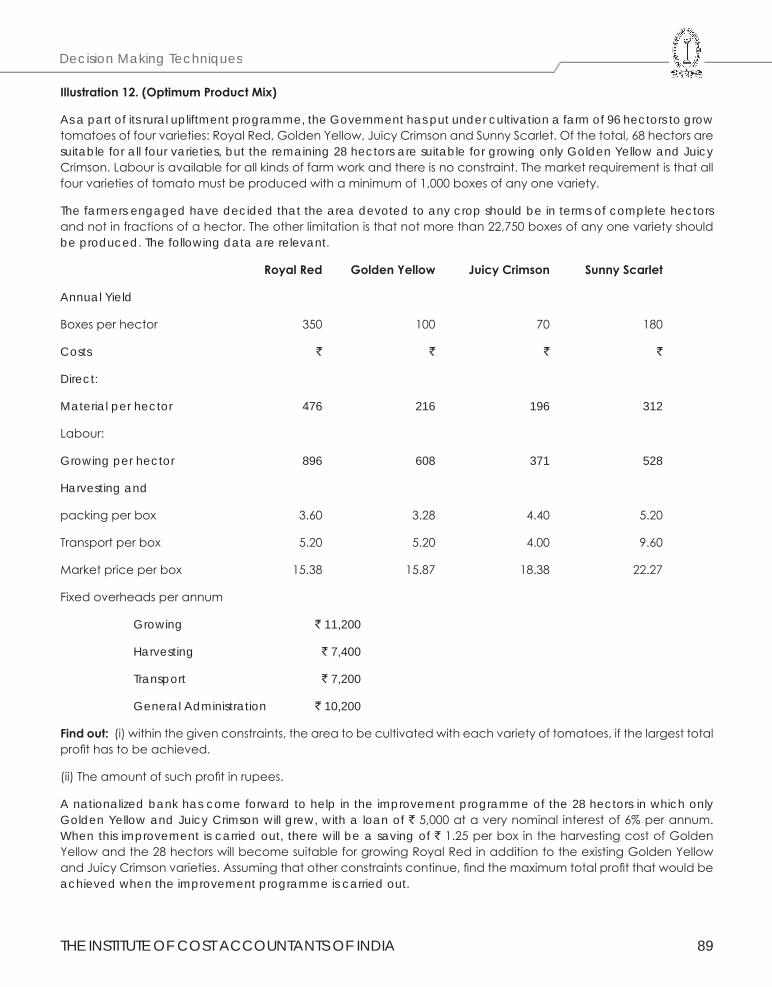
THE INSTITUTE OF COST ACCOUNTANTS OF INDIA 89
Decision Making Techniques
Illustration12.(OptimumProductMix)
As a part of its rural upliftment programme, the Government has put under cultivation a farm of 96 hectors to grow tomatoes of four varieties: Royal Red, Golden Yellow, Juicy Crimson and Sunny Scarlet. Of the total, 68 hectors are suitable for all four varieties, but the remaining 28 hectors are suitable for growing only Golden Yellow and Juicy Crimson. Labour is available for all kinds of farm work and there is no constraint. The market requirement is that all four varieties of tomato must be produced with a minimum of 1,000 boxes of any one variety.
The farmers engaged have decided that the area devoted to any crop should be in terms of complete hectors and not in fractions of a hector. The other limitation is that not more than 22,750 boxes of any one variety should be produced. The following data are relevant.
RoyalRed GoldenYellow JuicyCrimson SunnyScarlet
Annual Yield
Boxes per hector 350 100 70 180
Costs ` ` ` `
Direct:
Material per hector 476 216 196 312
Labour:
Growing per hector 896 608 371 528
Harvesting and
packing per box 3.60 3.28 4.40 5.20
Transport per box 5.20 5.20 4.00 9.60
Market price per box 15.38 15.87 18.38 22.27
Fixed overheads per annum
Growing ` 11,200
Harvesting ` 7,400
Transport ` 7,200
General Administration ` 10,200
Findout: (i) within the given constraints, the area to be cultivated with each variety of tomatoes, if the largest total profit has to be achieved.
(ii) The amount of such profit in rupees.
A nationalized bank has come forward to help in the improvement programme of the 28 hectors in which only Golden Yellow and Juicy Crimson will grew, with a loan of ` 5,000 at a very nominal interest of 6% per annum. When this improvement is carried out, there will be a saving of ` 1.25 per box in the harvesting cost of Golden Yellow and the 28 hectors will become suitable for growing Royal Red in addition to the existing Golden Yellow and Juicy Crimson varieties. Assuming that other constraints continue, find the maximum total profit that would be achieved when the improvement programme is carried out.
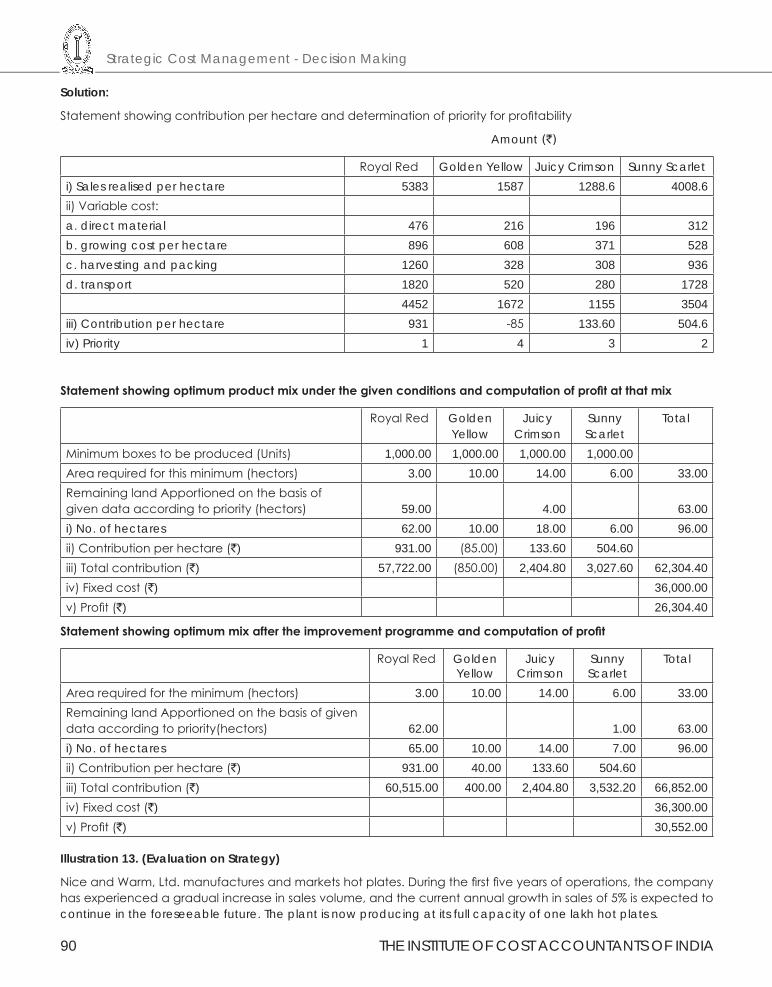
Strategic Cost Management - Decision Making
90 THE INSTITUTE OF COST ACCOUNTANTS OF INDIA
Solution:
Statement showing contribution per hectare and determination of priority for profitability
Amount (`)
Royal Red Golden Yellow Juicy Crimson Sunny Scarleti) Sales realised per hectare 5383 1587 1288.6 4008.6ii) Variable cost:a. direct material 476 216 196 312b. growing cost per hectare 896 608 371 528c. harvesting and packing 1260 328 308 936d. transport 1820 520 280 1728
4452 1672 1155 3504iii) Contribution per hectare 931 -85 133.60 504.6iv) Priority 1 4 3 2
Statementshowingoptimumproductmixunderthegivenconditionsandcomputationofprofitatthatmix
Royal Red Golden Yellow
Juicy Crimson
Sunny Scarlet
Total
Minimum boxes to be produced (Units) 1,000.00 1,000.00 1,000.00 1,000.00Area required for this minimum (hectors) 3.00 10.00 14.00 6.00 33.00Remaining land Apportioned on the basis of given data according to priority (hectors) 59.00 4.00 63.00i) No. of hectares 62.00 10.00 18.00 6.00 96.00ii) Contribution per hectare (`) 931.00 (85.00) 133.60 504.60iii) Total contribution (`) 57,722.00 (850.00) 2,404.80 3,027.60 62,304.40iv) Fixed cost (`) 36,000.00v) Profit (`) 26,304.40
Statementshowingoptimummixaftertheimprovementprogrammeandcomputationofprofit
Royal Red Golden Yellow
Juicy Crimson
Sunny Scarlet
Total
Area required for the minimum (hectors) 3.00 10.00 14.00 6.00 33.00Remaining land Apportioned on the basis of given data according to priority(hectors) 62.00 1.00 63.00i) No. of hectares 65.00 10.00 14.00 7.00 96.00ii) Contribution per hectare (`) 931.00 40.00 133.60 504.60iii) Total contribution (`) 60,515.00 400.00 2,404.80 3,532.20 66,852.00iv) Fixed cost (`) 36,300.00v) Profit (`) 30,552.00
Illustration 13. (Evaluation on Strategy)
Nice and Warm, Ltd. manufactures and markets hot plates. During the first five years of operations, the company has experienced a gradual increase in sales volume, and the current annual growth in sales of 5% is expected to continue in the foreseeable future. The plant is now producing at its full capacity of one lakh hot plates.
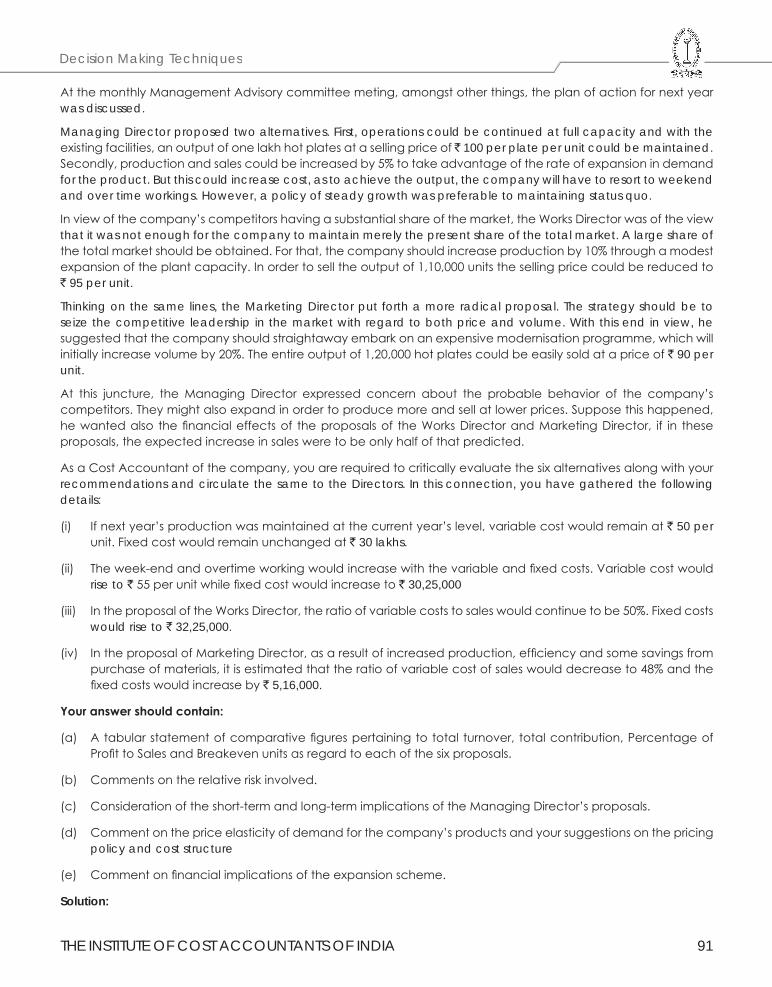
THE INSTITUTE OF COST ACCOUNTANTS OF INDIA 91
Decision Making Techniques
At the monthly Management Advisory committee meting, amongst other things, the plan of action for next year was discussed.
Managing Director proposed two alternatives. First, operations could be continued at full capacity and with the existing facilities, an output of one lakh hot plates at a selling price of ̀ 100 per plate per unit could be maintained. Secondly, production and sales could be increased by 5% to take advantage of the rate of expansion in demand for the product. But this could increase cost, as to achieve the output, the company will have to resort to weekend and over time workings. However, a policy of steady growth was preferable to maintaining status quo.
In view of the company’s competitors having a substantial share of the market, the Works Director was of the view that it was not enough for the company to maintain merely the present share of the total market. A large share of the total market should be obtained. For that, the company should increase production by 10% through a modest expansion of the plant capacity. In order to sell the output of 1,10,000 units the selling price could be reduced to ` 95 per unit.
Thinking on the same lines, the Marketing Director put forth a more radical proposal. The strategy should be to seize the competitive leadership in the market with regard to both price and volume. With this end in view, he suggested that the company should straightaway embark on an expensive modernisation programme, which will initially increase volume by 20%. The entire output of 1,20,000 hot plates could be easily sold at a price of ` 90 per unit.
At this juncture, the Managing Director expressed concern about the probable behavior of the company’s competitors. They might also expand in order to produce more and sell at lower prices. Suppose this happened, he wanted also the financial effects of the proposals of the Works Director and Marketing Director, if in these proposals, the expected increase in sales were to be only half of that predicted.
As a Cost Accountant of the company, you are required to critically evaluate the six alternatives along with your recommendations and circulate the same to the Directors. In this connection, you have gathered the following details:
(i) If next year’s production was maintained at the current year’s level, variable cost would remain at ` 50 per unit. Fixed cost would remain unchanged at ` 30 lakhs.
(ii) The week-end and overtime working would increase with the variable and fixed costs. Variable cost would rise to ` 55 per unit while fixed cost would increase to ` 30,25,000
(iii) In the proposal of the Works Director, the ratio of variable costs to sales would continue to be 50%. Fixed costs would rise to ` 32,25,000.
(iv) In the proposal of Marketing Director, as a result of increased production, efficiency and some savings from purchase of materials, it is estimated that the ratio of variable cost of sales would decrease to 48% and the fixed costs would increase by ` 5,16,000.
Youranswershouldcontain:
(a) A tabular statement of comparative figures pertaining to total turnover, total contribution, Percentage of Profit to Sales and Breakeven units as regard to each of the six proposals.
(b) Comments on the relative risk involved.
(c) Consideration of the short-term and long-term implications of the Managing Director’s proposals.
(d) Comment on the price elasticity of demand for the company’s products and your suggestions on the pricing policy and cost structure
(e) Comment on financial implications of the expansion scheme.
Solution:
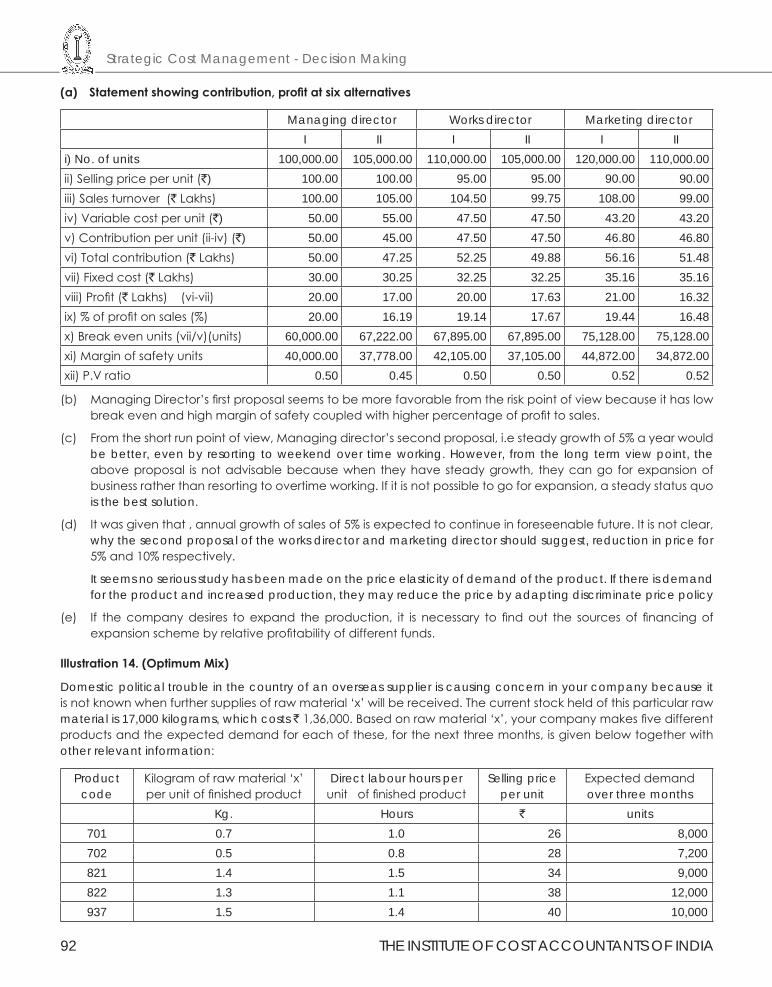
Strategic Cost Management - Decision Making
92 THE INSTITUTE OF COST ACCOUNTANTS OF INDIA
(a) Statementshowingcontribution,profitatsixalternatives
Managing director Works director Marketing directorI II I II I II
i) No. of units 100,000.00 105,000.00 110,000.00 105,000.00 120,000.00 110,000.00 ii) Selling price per unit (`) 100.00 100.00 95.00 95.00 90.00 90.00 iii) Sales turnover (` Lakhs) 100.00 105.00 104.50 99.75 108.00 99.00 iv) Variable cost per unit (`) 50.00 55.00 47.50 47.50 43.20 43.20 v) Contribution per unit (ii-iv) (`) 50.00 45.00 47.50 47.50 46.80 46.80 vi) Total contribution (` Lakhs) 50.00 47.25 52.25 49.88 56.16 51.48 vii) Fixed cost (` Lakhs) 30.00 30.25 32.25 32.25 35.16 35.16 viii) Profit (` Lakhs) (vi-vii) 20.00 17.00 20.00 17.63 21.00 16.32 ix) % of profit on sales (%) 20.00 16.19 19.14 17.67 19.44 16.48 x) Break even units (vii/v)(units) 60,000.00 67,222.00 67,895.00 67,895.00 75,128.00 75,128.00 xi) Margin of safety units 40,000.00 37,778.00 42,105.00 37,105.00 44,872.00 34,872.00 xii) P.V ratio 0.50 0.45 0.50 0.50 0.52 0.52
(b) Managing Director’s first proposal seems to be more favorable from the risk point of view because it has low break even and high margin of safety coupled with higher percentage of profit to sales.
(c) From the short run point of view, Managing director’s second proposal, i.e steady growth of 5% a year would be better, even by resorting to weekend over time working. However, from the long term view point, the above proposal is not advisable because when they have steady growth, they can go for expansion of business rather than resorting to overtime working. If it is not possible to go for expansion, a steady status quo is the best solution.
(d) It was given that , annual growth of sales of 5% is expected to continue in foreseenable future. It is not clear, why the second proposal of the works director and marketing director should suggest, reduction in price for 5% and 10% respectively.
It seems no serious study has been made on the price elasticity of demand of the product. If there is demand for the product and increased production, they may reduce the price by adapting discriminate price policy
(e) If the company desires to expand the production, it is necessary to find out the sources of financing of expansion scheme by relative profitability of different funds.
Illustration14.(OptimumMix)
Domestic political trouble in the country of an overseas supplier is causing concern in your company because it is not known when further supplies of raw material ‘x’ will be received. The current stock held of this particular raw material is 17,000 kilograms, which costs ` 1,36,000. Based on raw material ‘x’, your company makes five different products and the expected demand for each of these, for the next three months, is given below together with other relevant information:
Product code
Kilogram of raw material ‘x’ per unit of finished product
Direct labour hours per unit of finished product
Selling price per unit
Expected demand over three months
Kg. Hours ` units701 0.7 1.0 26 8,000 702 0.5 0.8 28 7,200 821 1.4 1.5 34 9,000 822 1.3 1.1 38 12,000 937 1.5 1.4 40 10,000
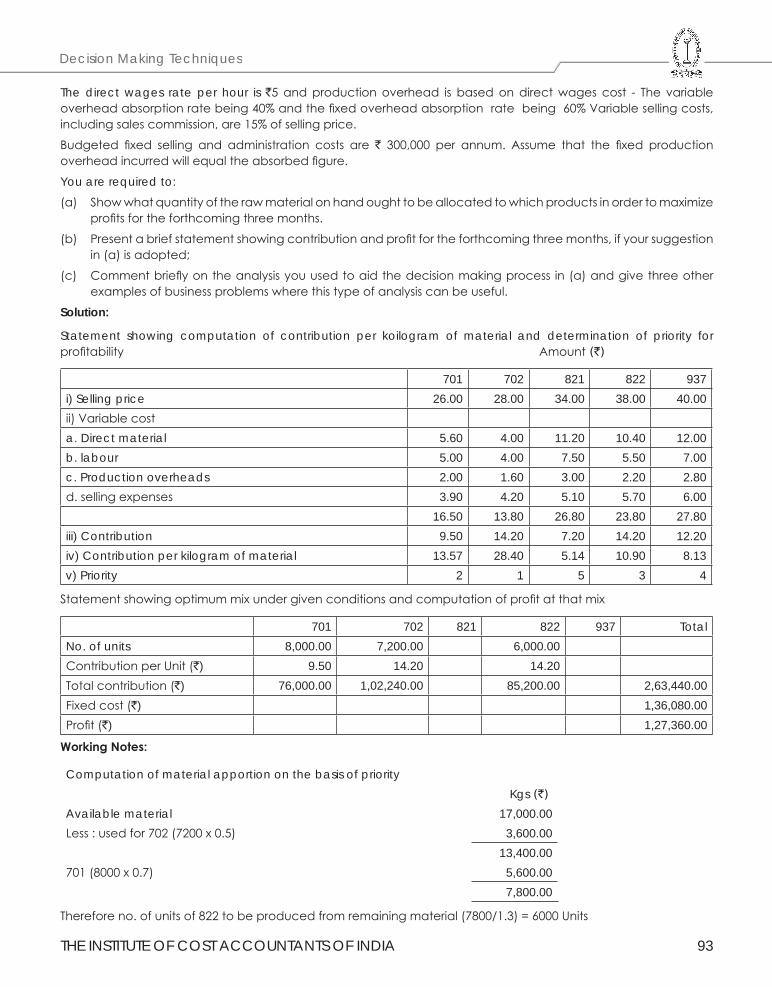
THE INSTITUTE OF COST ACCOUNTANTS OF INDIA 93
Decision Making Techniques
The direct wages rate per hour is `5 and production overhead is based on direct wages cost - The variable overhead absorption rate being 40% and the fixed overhead absorption rate being 60% Variable selling costs, including sales commission, are 15% of selling price.
Budgeted fixed selling and administration costs are ` 300,000 per annum. Assume that the fixed production overhead incurred will equal the absorbed figure.
You are required to:
(a) Show what quantity of the raw material on hand ought to be allocated to which products in order to maximize profits for the forthcoming three months.
(b) Present a brief statement showing contribution and profit for the forthcoming three months, if your suggestion in (a) is adopted;
(c) Comment briefly on the analysis you used to aid the decision making process in (a) and give three other examples of business problems where this type of analysis can be useful.
Solution:
Statement showing computation of contribution per koilogram of material and determination of priority for profitability Amount (`)
701 702 821 822 937i) Selling price 26.00 28.00 34.00 38.00 40.00ii) Variable costa. Direct material 5.60 4.00 11.20 10.40 12.00b. labour 5.00 4.00 7.50 5.50 7.00c. Production overheads 2.00 1.60 3.00 2.20 2.80d. selling expenses 3.90 4.20 5.10 5.70 6.00
16.50 13.80 26.80 23.80 27.80iii) Contribution 9.50 14.20 7.20 14.20 12.20iv) Contribution per kilogram of material 13.57 28.40 5.14 10.90 8.13v) Priority 2 1 5 3 4
Statement showing optimum mix under given conditions and computation of profit at that mix
701 702 821 822 937 TotalNo. of units 8,000.00 7,200.00 6,000.00Contribution per Unit (`) 9.50 14.20 14.20Total contribution (`) 76,000.00 1,02,240.00 85,200.00 2,63,440.00Fixed cost (`) 1,36,080.00Profit (`) 1,27,360.00
WorkingNotes:
Computation of material apportion on the basis of priority Kgs (`)
Available material 17,000.00Less : used for 702 (7200 x 0.5) 3,600.00
13,400.00701 (8000 x 0.7) 5,600.00
7,800.00
Therefore no. of units of 822 to be produced from remaining material (7800/1.3) = 6000 Units
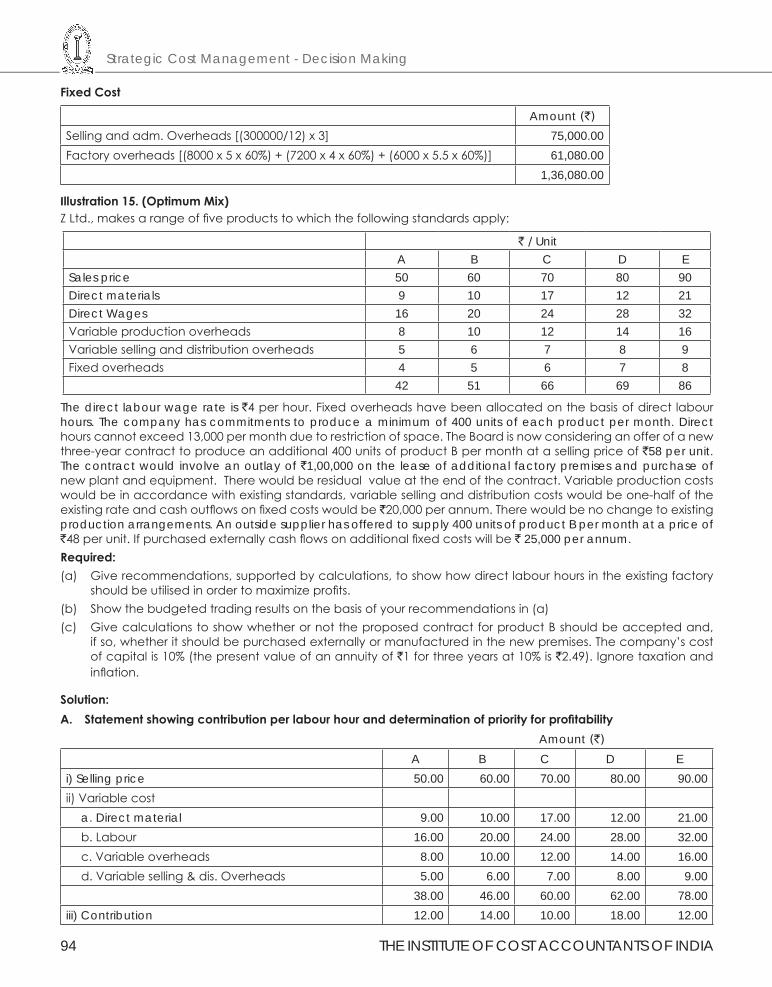
Strategic Cost Management - Decision Making
94 THE INSTITUTE OF COST ACCOUNTANTS OF INDIA
FixedCost
Amount (`)
Selling and adm. Overheads [(300000/12) x 3] 75,000.00Factory overheads [(8000 x 5 x 60%) + (7200 x 4 x 60%) + (6000 x 5.5 x 60%)] 61,080.00
1,36,080.00
Illustration15.(OptimumMix)Z Ltd., makes a range of five products to which the following standards apply:
` / UnitA B C D E
Sales price 50 60 70 80 90Direct materials 9 10 17 12 21Direct Wages 16 20 24 28 32Variable production overheads 8 10 12 14 16Variable selling and distribution overheads 5 6 7 8 9Fixed overheads 4 5 6 7 8
42 51 66 69 86
The direct labour wage rate is `4 per hour. Fixed overheads have been allocated on the basis of direct labour hours. The company has commitments to produce a minimum of 400 units of each product per month. Direct hours cannot exceed 13,000 per month due to restriction of space. The Board is now considering an offer of a new three-year contract to produce an additional 400 units of product B per month at a selling price of `58 per unit. The contract would involve an outlay of `1,00,000 on the lease of additional factory premises and purchase of new plant and equipment. There would be residual value at the end of the contract. Variable production costs would be in accordance with existing standards, variable selling and distribution costs would be one-half of the existing rate and cash outflows on fixed costs would be `20,000 per annum. There would be no change to existing production arrangements. An outside supplier has offered to supply 400 units of product B per month at a price of `48 per unit. If purchased externally cash flows on additional fixed costs will be ` 25,000 per annum.Required:(a) Give recommendations, supported by calculations, to show how direct labour hours in the existing factory
should be utilised in order to maximize profits.(b) Show the budgeted trading results on the basis of your recommendations in (a)(c) Give calculations to show whether or not the proposed contract for product B should be accepted and,
if so, whether it should be purchased externally or manufactured in the new premises. The company’s cost of capital is 10% (the present value of an annuity of `1 for three years at 10% is `2.49). Ignore taxation and inflation.
Solution:A. Statementshowingcontributionperlabourhouranddeterminationofpriorityforprofitability Amount (`)
A B C D Ei) Selling price 50.00 60.00 70.00 80.00 90.00ii) Variable cost
a. Direct material 9.00 10.00 17.00 12.00 21.00b. Labour 16.00 20.00 24.00 28.00 32.00c. Variable overheads 8.00 10.00 12.00 14.00 16.00d. Variable selling & dis. Overheads 5.00 6.00 7.00 8.00 9.00
38.00 46.00 60.00 62.00 78.00iii) Contribution 12.00 14.00 10.00 18.00 12.00
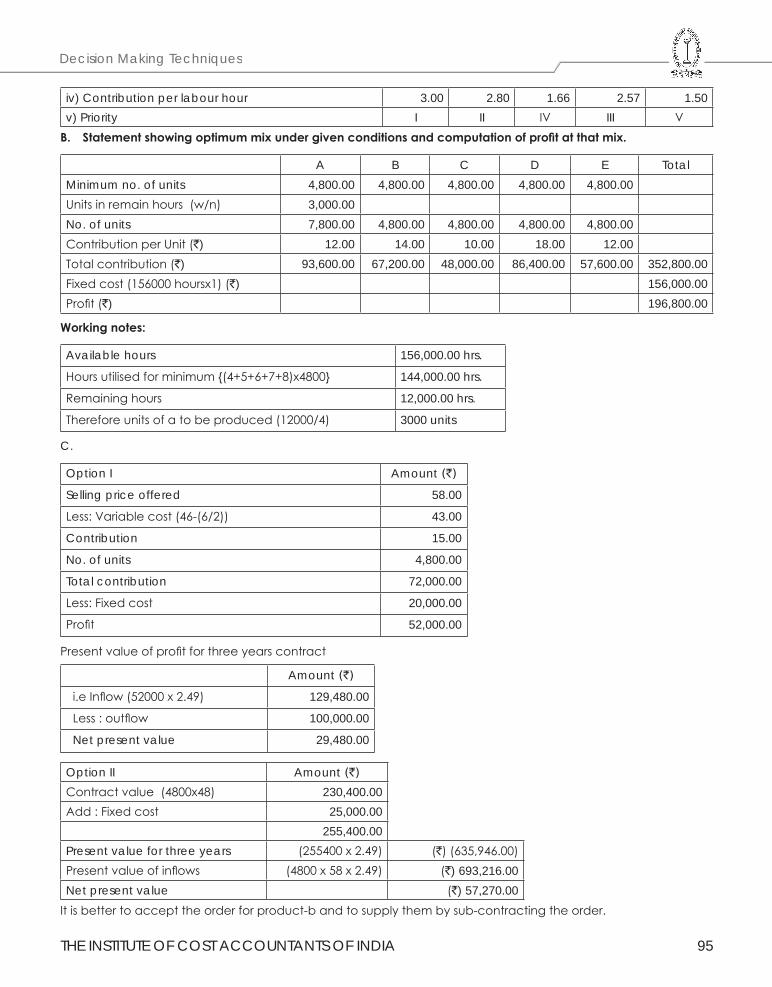
THE INSTITUTE OF COST ACCOUNTANTS OF INDIA 95
Decision Making Techniques
iv) Contribution per labour hour 3.00 2.80 1.66 2.57 1.50v) Priority I II IV III VB. Statementshowingoptimummixundergivenconditionsandcomputationofprofitatthatmix.
A B C D E TotalMinimum no. of units 4,800.00 4,800.00 4,800.00 4,800.00 4,800.00Units in remain hours (w/n) 3,000.00No. of units 7,800.00 4,800.00 4,800.00 4,800.00 4,800.00Contribution per Unit (`) 12.00 14.00 10.00 18.00 12.00Total contribution (`) 93,600.00 67,200.00 48,000.00 86,400.00 57,600.00 352,800.00Fixed cost (156000 hoursx1) (`) 156,000.00Profit (`) 196,800.00
Workingnotes:
Available hours 156,000.00 hrs.
Hours utilised for minimum {(4+5+6+7+8)x4800} 144,000.00 hrs.
Remaining hours 12,000.00 hrs.
Therefore units of a to be produced (12000/4) 3000 units
C.
Option I Amount (`)
Selling price offered 58.00
Less: Variable cost (46-(6/2)) 43.00
Contribution 15.00
No. of units 4,800.00
Total contribution 72,000.00
Less: Fixed cost 20,000.00
Profit 52,000.00
Present value of profit for three years contract
Amount (`)
i.e Inflow (52000 x 2.49) 129,480.00
Less : outflow 100,000.00
Net present value 29,480.00
Option II Amount (`)
Contract value (4800x48) 230,400.00Add : Fixed cost 25,000.00
255,400.00Present value for three years (255400 x 2.49) (`) (635,946.00)Present value of inflows (4800 x 58 x 2.49) (`) 693,216.00Net present value (`) 57,270.00
It is better to accept the order for product-b and to supply them by sub-contracting the order.
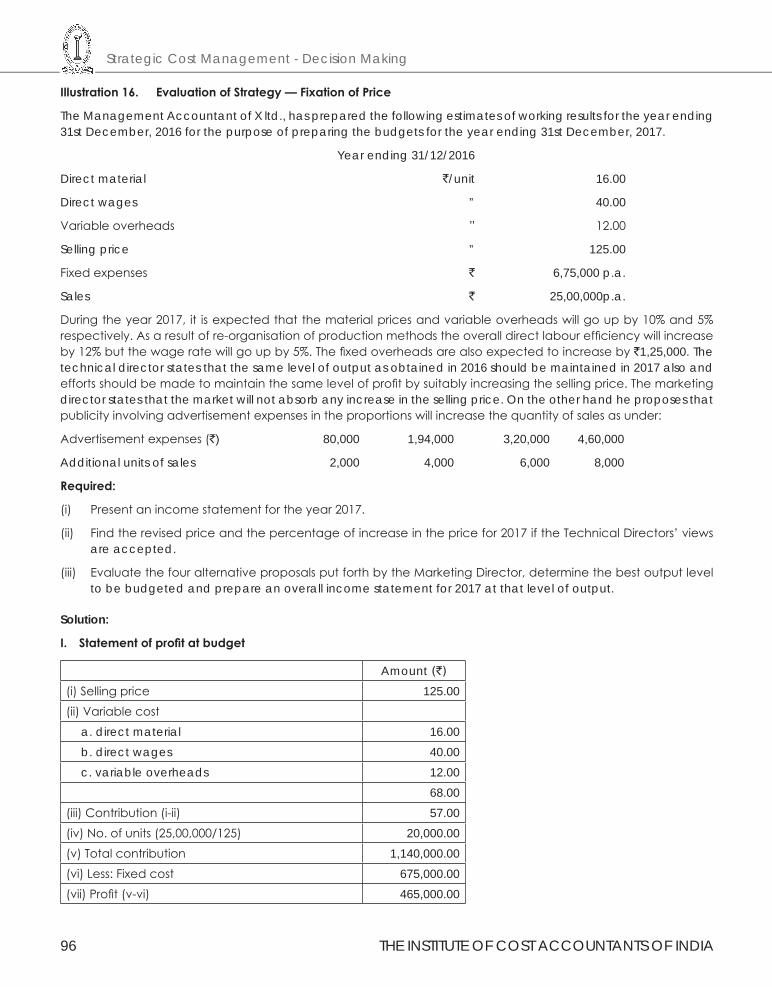
Strategic Cost Management - Decision Making
96 THE INSTITUTE OF COST ACCOUNTANTS OF INDIA
Illustration16. EvaluationofStrategy—FixationofPrice
The Management Accountant of X ltd., has prepared the following estimates of working results for the year ending 31st December, 2016 for the purpose of preparing the budgets for the year ending 31st December, 2017.
Year ending 31/12/2016
Direct material `/unit 16.00
Direct wages ” 40.00
Variable overheads ” 12.00
Selling price ” 125.00
Fixed expenses ` 6,75,000 p.a.
Sales ` 25,00,000p.a.
During the year 2017, it is expected that the material prices and variable overheads will go up by 10% and 5% respectively. As a result of re-organisation of production methods the overall direct labour efficiency will increase by 12% but the wage rate will go up by 5%. The fixed overheads are also expected to increase by `1,25,000. The technical director states that the same level of output as obtained in 2016 should be maintained in 2017 also and efforts should be made to maintain the same level of profit by suitably increasing the selling price. The marketing director states that the market will not absorb any increase in the selling price. On the other hand he proposes that publicity involving advertisement expenses in the proportions will increase the quantity of sales as under:
Advertisement expenses (`) 80,000 1,94,000 3,20,000 4,60,000
Additional units of sales 2,000 4,000 6,000 8,000
Required:
(i) Present an income statement for the year 2017.
(ii) Find the revised price and the percentage of increase in the price for 2017 if the Technical Directors’ views are accepted.
(iii) Evaluate the four alternative proposals put forth by the Marketing Director, determine the best output level to be budgeted and prepare an overall income statement for 2017 at that level of output.
Solution:
I. Statementofprofitatbudget
Amount (`)
(i) Selling price 125.00 (ii) Variable cost
a. direct material 16.00 b. direct wages 40.00 c. variable overheads 12.00
68.00 (iii) Contribution (i-ii) 57.00 (iv) No. of units (25,00,000/125) 20,000.00 (v) Total contribution 1,140,000.00 (vi) Less: Fixed cost 675,000.00 (vii) Profit (v-vi) 465,000.00
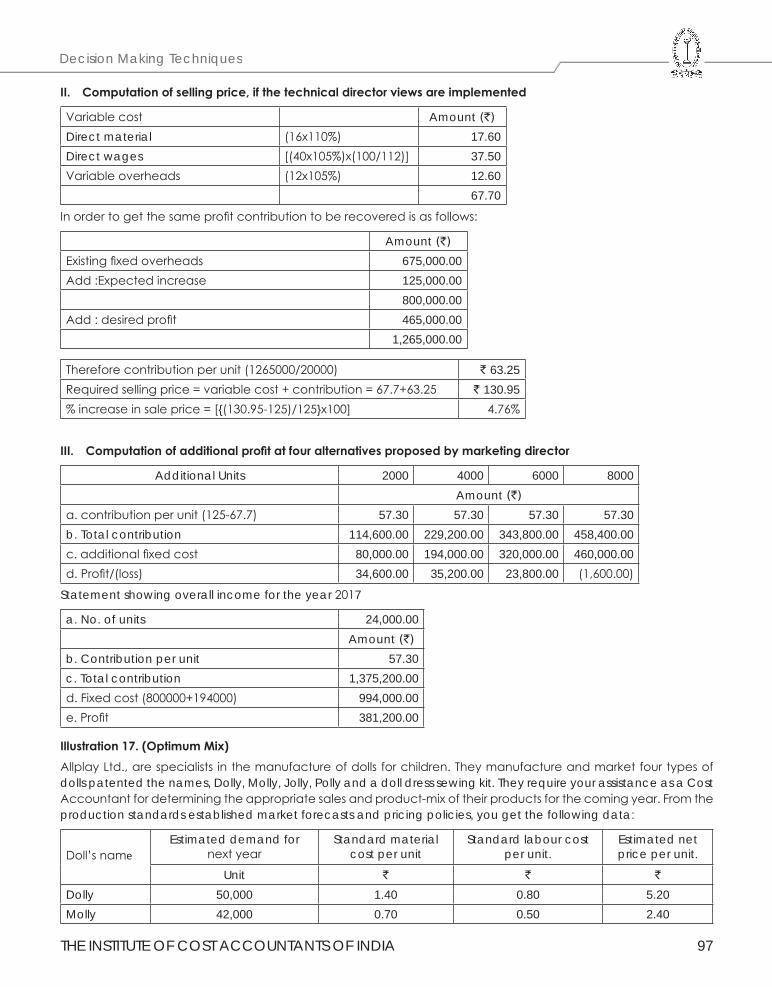
THE INSTITUTE OF COST ACCOUNTANTS OF INDIA 97
Decision Making Techniques
II. Computationofsellingprice,ifthetechnicaldirectorviewsareimplemented
Variable cost Amount (`)
Direct material (16x110%) 17.60Direct wages [(40x105%)x(100/112)] 37.50Variable overheads (12x105%) 12.60
67.70
In order to get the same profit contribution to be recovered is as follows:
Amount (`)
Existing fixed overheads 675,000.00 Add :Expected increase 125,000.00
800,000.00 Add : desired profit 465,000.00
1,265,000.00
Therefore contribution per unit (1265000/20000) ` 63.25Required selling price = variable cost + contribution = 67.7+63.25 ` 130.95% increase in sale price = [{(130.95-125)/125}x100] 4.76%
III. Computationofadditionalprofitatfouralternativesproposedbymarketingdirector
Additional Units 2000 4000 6000 8000Amount (`)
a. contribution per unit (125-67.7) 57.30 57.30 57.30 57.30b. Total contribution 114,600.00 229,200.00 343,800.00 458,400.00c. additional fixed cost 80,000.00 194,000.00 320,000.00 460,000.00d. Profit/(loss) 34,600.00 35,200.00 23,800.00 (1,600.00)
Statement showing overall income for the year 2017
a. No. of units 24,000.00Amount (`)
b. Contribution per unit 57.30c. Total contribution 1,375,200.00d. Fixed cost (800000+194000) 994,000.00e. Profit 381,200.00
Illustration17.(OptimumMix)Allplay Ltd., are specialists in the manufacture of dolls for children. They manufacture and market four types of dolls patented the names, Dolly, Molly, Jolly, Polly and a doll dress sewing kit. They require your assistance as a Cost Accountant for determining the appropriate sales and product-mix of their products for the coming year. From the production standards established market forecasts and pricing policies, you get the following data:
Doll’s nameEstimated demand for
next yearStandard material
cost per unitStandard labour cost
per unit.Estimated net price per unit.
Unit ` ` `
Dolly 50,000 1.40 0.80 5.20Molly 42,000 0.70 0.50 2.40
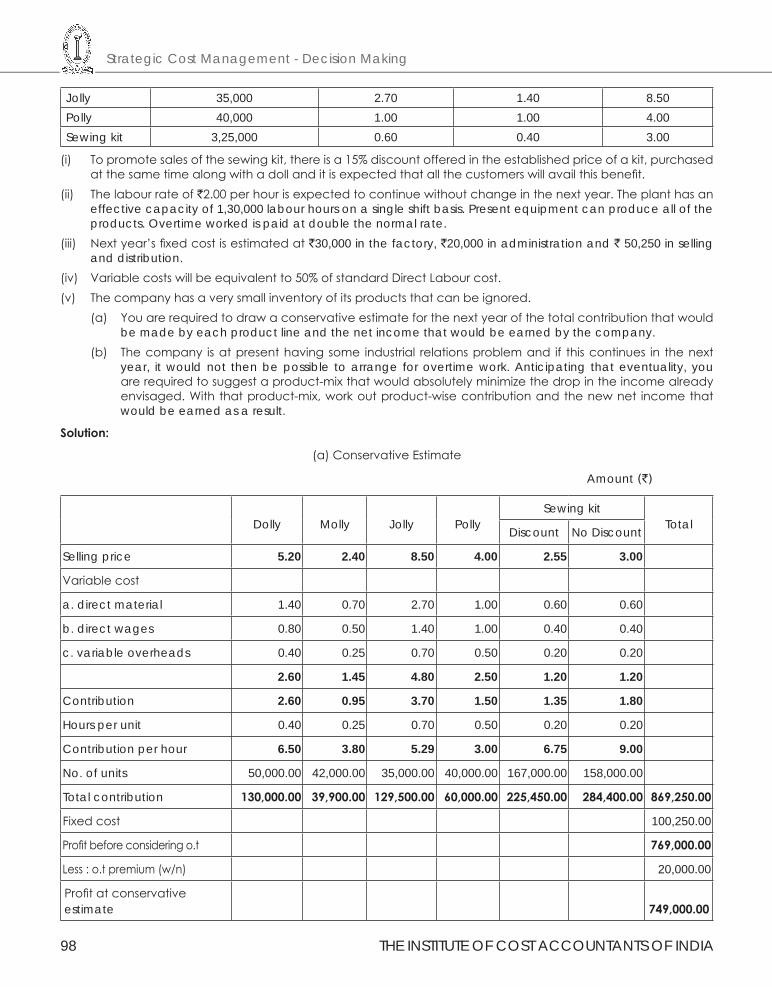
Strategic Cost Management - Decision Making
98 THE INSTITUTE OF COST ACCOUNTANTS OF INDIA
Jolly 35,000 2.70 1.40 8.50Polly 40,000 1.00 1.00 4.00Sewing kit 3,25,000 0.60 0.40 3.00
(i) To promote sales of the sewing kit, there is a 15% discount offered in the established price of a kit, purchased at the same time along with a doll and it is expected that all the customers will avail this benefit.
(ii) The labour rate of `2.00 per hour is expected to continue without change in the next year. The plant has an effective capacity of 1,30,000 labour hours on a single shift basis. Present equipment can produce all of the products. Overtime worked is paid at double the normal rate.
(iii) Next year’s fixed cost is estimated at `30,000 in the factory, `20,000 in administration and ` 50,250 in selling and distribution.
(iv) Variable costs will be equivalent to 50% of standard Direct Labour cost.(v) The company has a very small inventory of its products that can be ignored.
(a) You are required to draw a conservative estimate for the next year of the total contribution that would be made by each product line and the net income that would be earned by the company.
(b) The company is at present having some industrial relations problem and if this continues in the next year, it would not then be possible to arrange for overtime work. Anticipating that eventuality, you are required to suggest a product-mix that would absolutely minimize the drop in the income already envisaged. With that product-mix, work out product-wise contribution and the new net income that would be earned as a result.
Solution:
(a) Conservative Estimate
Amount (`)
Dolly Molly Jolly PollySewing kit
TotalDiscount No Discount
Selling price 5.20 2.40 8.50 4.00 2.55 3.00
Variable cost
a. direct material 1.40 0.70 2.70 1.00 0.60 0.60
b. direct wages 0.80 0.50 1.40 1.00 0.40 0.40
c. variable overheads 0.40 0.25 0.70 0.50 0.20 0.20
2.60 1.45 4.80 2.50 1.20 1.20
Contribution 2.60 0.95 3.70 1.50 1.35 1.80
Hours per unit 0.40 0.25 0.70 0.50 0.20 0.20
Contribution per hour 6.50 3.80 5.29 3.00 6.75 9.00
No. of units 50,000.00 42,000.00 35,000.00 40,000.00 167,000.00 158,000.00
Total contribution 130,000.00 39,900.00 129,500.00 60,000.00 225,450.00 284,400.00 869,250.00
Fixed cost 100,250.00
Profit before considering o.t 769,000.00
Less : o.t premium (w/n) 20,000.00
Profit at conservativeestimate 749,000.00
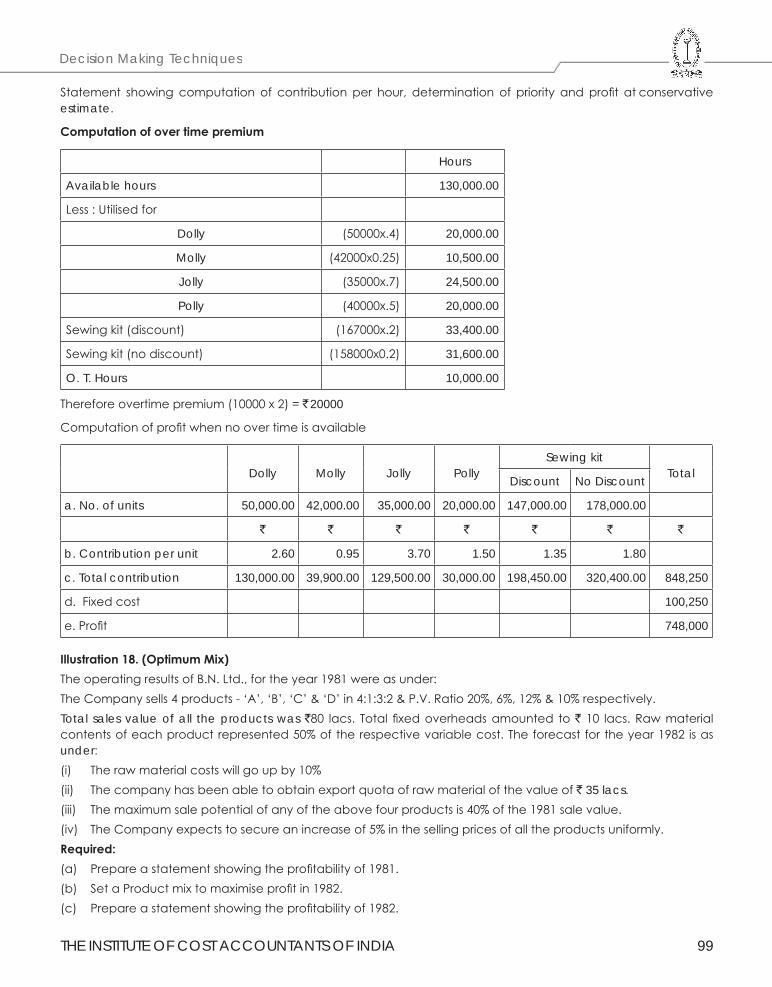
THE INSTITUTE OF COST ACCOUNTANTS OF INDIA 99
Decision Making Techniques
Statement showing computation of contribution per hour, determination of priority and profit at conservative estimate.
Computationofovertimepremium
Hours
Available hours 130,000.00
Less : Utilised for
Dolly (50000x.4) 20,000.00
Molly (42000x0.25) 10,500.00
Jolly (35000x.7) 24,500.00
Polly (40000x.5) 20,000.00
Sewing kit (discount) (167000x.2) 33,400.00
Sewing kit (no discount) (158000x0.2) 31,600.00
O. T. Hours 10,000.00
Therefore overtime premium (10000 x 2) = ` 20000
Computation of profit when no over time is available
Dolly Molly Jolly PollySewing kit
TotalDiscount No Discount
a. No. of units 50,000.00 42,000.00 35,000.00 20,000.00 147,000.00 178,000.00
` ` ` ` ` ` `
b. Contribution per unit 2.60 0.95 3.70 1.50 1.35 1.80
c. Total contribution 130,000.00 39,900.00 129,500.00 30,000.00 198,450.00 320,400.00 848,250
d. Fixed cost 100,250
e. Profit 748,000
Illustration18.(OptimumMix)The operating results of B.N. Ltd., for the year 1981 were as under:The Company sells 4 products - ‘A’, ‘B’, ‘C’ & ‘D’ in 4:1:3:2 & P.V. Ratio 20%, 6%, 12% & 10% respectively.Total sales value of all the products was `80 lacs. Total fixed overheads amounted to ` 10 lacs. Raw material contents of each product represented 50% of the respective variable cost. The forecast for the year 1982 is as under:(i) The raw material costs will go up by 10%(ii) The company has been able to obtain export quota of raw material of the value of ` 35 lacs.(iii) The maximum sale potential of any of the above four products is 40% of the 1981 sale value.(iv) The Company expects to secure an increase of 5% in the selling prices of all the products uniformly.Required:(a) Prepare a statement showing the profitability of 1981.(b) Set a Product mix to maximise profit in 1982.(c) Prepare a statement showing the profitability of 1982.
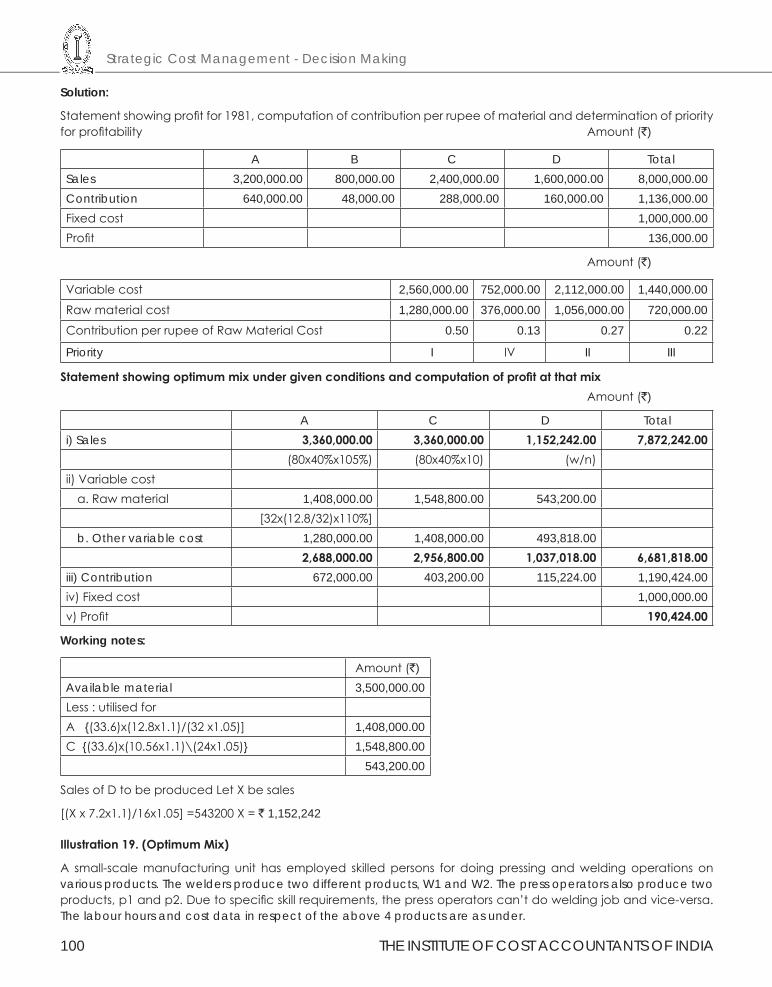
Strategic Cost Management - Decision Making
100 THE INSTITUTE OF COST ACCOUNTANTS OF INDIA
Solution:
Statement showing profit for 1981, computation of contribution per rupee of material and determination of priority for profitability Amount (`)
A B C D TotalSales 3,200,000.00 800,000.00 2,400,000.00 1,600,000.00 8,000,000.00Contribution 640,000.00 48,000.00 288,000.00 160,000.00 1,136,000.00Fixed cost 1,000,000.00Profit 136,000.00
Amount (`)
Variable cost 2,560,000.00 752,000.00 2,112,000.00 1,440,000.00
Raw material cost 1,280,000.00 376,000.00 1,056,000.00 720,000.00
Contribution per rupee of Raw Material Cost 0.50 0.13 0.27 0.22
Priority I IV II III
Statementshowingoptimummixundergivenconditionsandcomputationofprofitatthatmix Amount (`)
A C D Totali) Sales 3,360,000.00 3,360,000.00 1,152,242.00 7,872,242.00
(80x40%x105%) (80x40%x10) (w/n)ii) Variable cost
a. Raw material 1,408,000.00 1,548,800.00 543,200.00[32x(12.8/32)x110%]
b. Other variable cost 1,280,000.00 1,408,000.00 493,818.002,688,000.00 2,956,800.00 1,037,018.00 6,681,818.00
iii) Contribution 672,000.00 403,200.00 115,224.00 1,190,424.00iv) Fixed cost 1,000,000.00v) Profit 190,424.00
Working notes:
Amount (`)Available material 3,500,000.00Less : utilised forA {(33.6)x(12.8x1.1)/(32 x1.05)] 1,408,000.00C {(33.6)x(10.56x1.1)\(24x1.05)} 1,548,800.00
543,200.00
Sales of D to be produced Let X be sales
[(X x 7.2x1.1)/16x1.05] =543200 X = ` 1,152,242
Illustration19.(OptimumMix)
A small-scale manufacturing unit has employed skilled persons for doing pressing and welding operations on various products. The welders produce two different products, W1 and W2. The press operators also produce two products, p1 and p2. Due to specific skill requirements, the press operators can’t do welding job and vice-versa. The labour hours and cost data in respect of the above 4 products are as under.
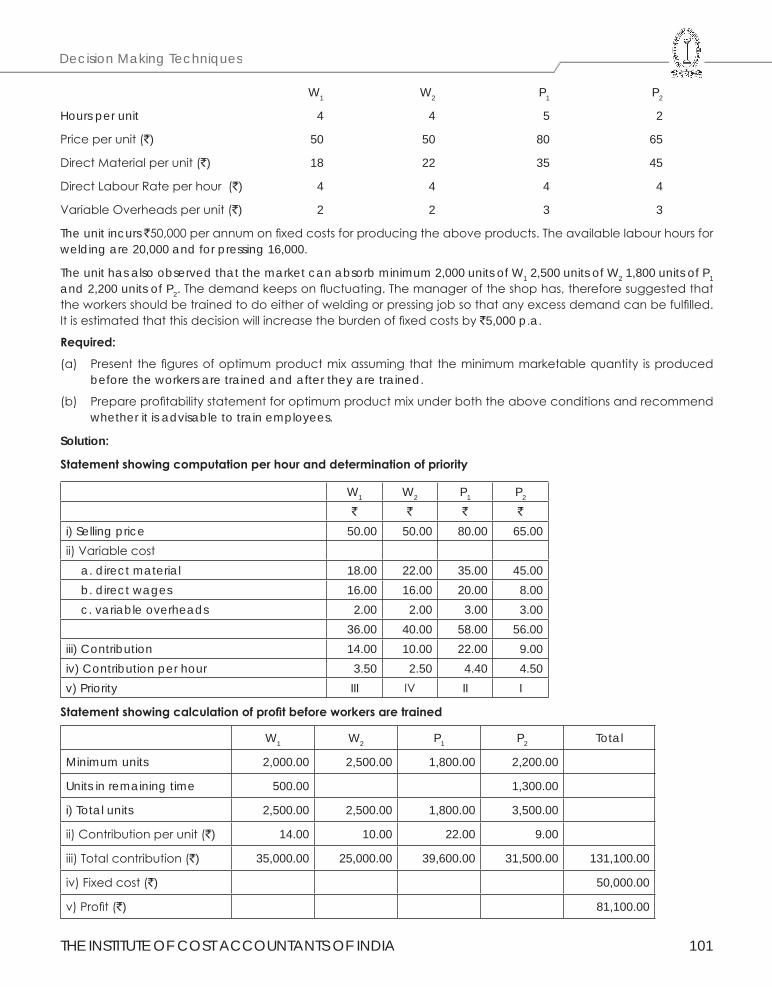
THE INSTITUTE OF COST ACCOUNTANTS OF INDIA 101
Decision Making Techniques
W1 W2 P1 P2
Hours per unit 4 4 5 2
Price per unit (`) 50 50 80 65
Direct Material per unit (`) 18 22 35 45
Direct Labour Rate per hour (`) 4 4 4 4
Variable Overheads per unit (`) 2 2 3 3
The unit incurs `50,000 per annum on fixed costs for producing the above products. The available labour hours for welding are 20,000 and for pressing 16,000.
The unit has also observed that the market can absorb minimum 2,000 units of W1 2,500 units of W2 1,800 units of P1 and 2,200 units of P2. The demand keeps on fluctuating. The manager of the shop has, therefore suggested that the workers should be trained to do either of welding or pressing job so that any excess demand can be fulfilled. It is estimated that this decision will increase the burden of fixed costs by `5,000 p.a.
Required:
(a) Present the figures of optimum product mix assuming that the minimum marketable quantity is produced before the workers are trained and after they are trained.
(b) Prepare profitability statement for optimum product mix under both the above conditions and recommend whether it is advisable to train employees.
Solution:
Statementshowingcomputationperhouranddeterminationofpriority
W1 W2 P1 P2
` ` ` `
i) Selling price 50.00 50.00 80.00 65.00ii) Variable cost
a. direct material 18.00 22.00 35.00 45.00b. direct wages 16.00 16.00 20.00 8.00c. variable overheads 2.00 2.00 3.00 3.00
36.00 40.00 58.00 56.00iii) Contribution 14.00 10.00 22.00 9.00iv) Contribution per hour 3.50 2.50 4.40 4.50v) Priority III IV II I
Statementshowingcalculationofprofitbeforeworkersaretrained
W1 W2 P1 P2 Total
Minimum units 2,000.00 2,500.00 1,800.00 2,200.00
Units in remaining time 500.00 1,300.00
i) Total units 2,500.00 2,500.00 1,800.00 3,500.00
ii) Contribution per unit (`) 14.00 10.00 22.00 9.00
iii) Total contribution (`) 35,000.00 25,000.00 39,600.00 31,500.00 131,100.00
iv) Fixed cost (`) 50,000.00
v) Profit (`) 81,100.00
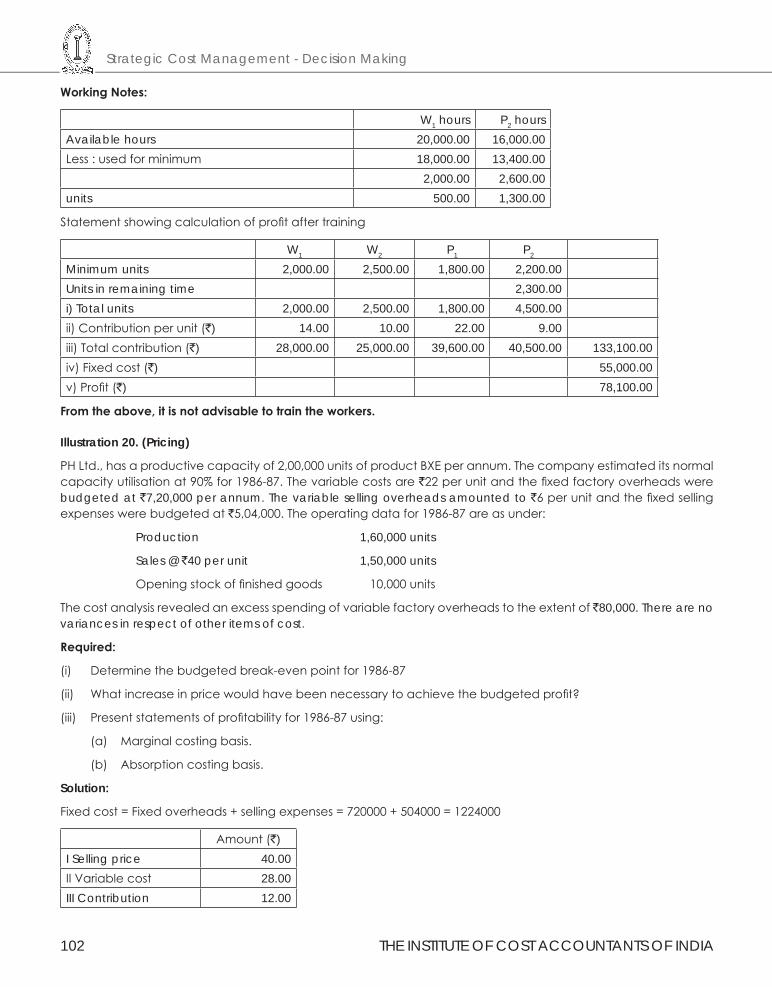
Strategic Cost Management - Decision Making
102 THE INSTITUTE OF COST ACCOUNTANTS OF INDIA
WorkingNotes:
W1 hours P2 hoursAvailable hours 20,000.00 16,000.00Less : used for minimum 18,000.00 13,400.00
2,000.00 2,600.00units 500.00 1,300.00
Statement showing calculation of profit after training
W1 W2 P1 P2
Minimum units 2,000.00 2,500.00 1,800.00 2,200.00Units in remaining time 2,300.00i) Total units 2,000.00 2,500.00 1,800.00 4,500.00ii) Contribution per unit (`) 14.00 10.00 22.00 9.00iii) Total contribution (`) 28,000.00 25,000.00 39,600.00 40,500.00 133,100.00iv) Fixed cost (`) 55,000.00v) Profit (`) 78,100.00
Fromtheabove,itisnotadvisabletotraintheworkers.
Illustration 20. (Pricing)
PH Ltd., has a productive capacity of 2,00,000 units of product BXE per annum. The company estimated its normal capacity utilisation at 90% for 1986-87. The variable costs are `22 per unit and the fixed factory overheads were budgeted at `7,20,000 per annum. The variable selling overheads amounted to `6 per unit and the fixed selling expenses were budgeted at `5,04,000. The operating data for 1986-87 are as under:
Production 1,60,000 units
Sales @ `40 per unit 1,50,000 units
Opening stock of finished goods 10,000 units
The cost analysis revealed an excess spending of variable factory overheads to the extent of `80,000. There are no variances in respect of other items of cost.
Required:
(i) Determine the budgeted break-even point for 1986-87
(ii) What increase in price would have been necessary to achieve the budgeted profit?
(iii) Present statements of profitability for 1986-87 using:
(a) Marginal costing basis.
(b) Absorption costing basis.
Solution:
Fixed cost = Fixed overheads + selling expenses = 720000 + 504000 = 1224000
Amount (`)I Selling price 40.00II Variable cost 28.00III Contribution 12.00
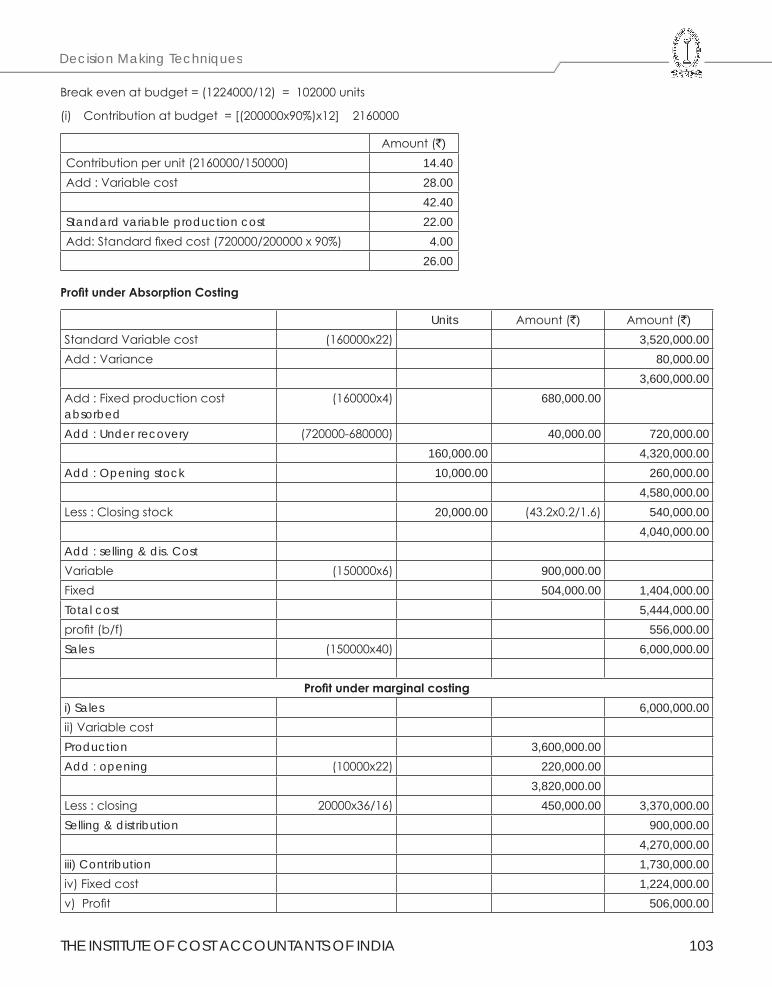
THE INSTITUTE OF COST ACCOUNTANTS OF INDIA 103
Decision Making Techniques
Break even at budget = (1224000/12) = 102000 units
(i) Contribution at budget = [(200000x90%)x12] 2160000
Amount (`)Contribution per unit (2160000/150000) 14.40Add : Variable cost 28.00
42.40Standard variable production cost 22.00Add: Standard fixed cost (720000/200000 x 90%) 4.00
26.00
ProfitunderAbsorptionCosting
Units Amount (`) Amount (`)Standard Variable cost (160000x22) 3,520,000.00 Add : Variance 80,000.00
3,600,000.00 Add : Fixed production cost absorbed
(160000x4) 680,000.00
Add : Under recovery (720000-680000) 40,000.00 720,000.00 160,000.00 4,320,000.00
Add : Opening stock 10,000.00 260,000.00 4,580,000.00
Less : Closing stock 20,000.00 (43.2x0.2/1.6) 540,000.00 4,040,000.00
Add : selling & dis. CostVariable (150000x6) 900,000.00 Fixed 504,000.00 1,404,000.00 Total cost 5,444,000.00 profit (b/f) 556,000.00 Sales (150000x40) 6,000,000.00
Profitundermarginalcostingi) Sales 6,000,000.00 ii) Variable costProduction 3,600,000.00 Add : opening (10000x22) 220,000.00
3,820,000.00 Less : closing 20000x36/16) 450,000.00 3,370,000.00 Selling & distribution 900,000.00
4,270,000.00 iii) Contribution 1,730,000.00 iv) Fixed cost 1,224,000.00 v) Profit 506,000.00
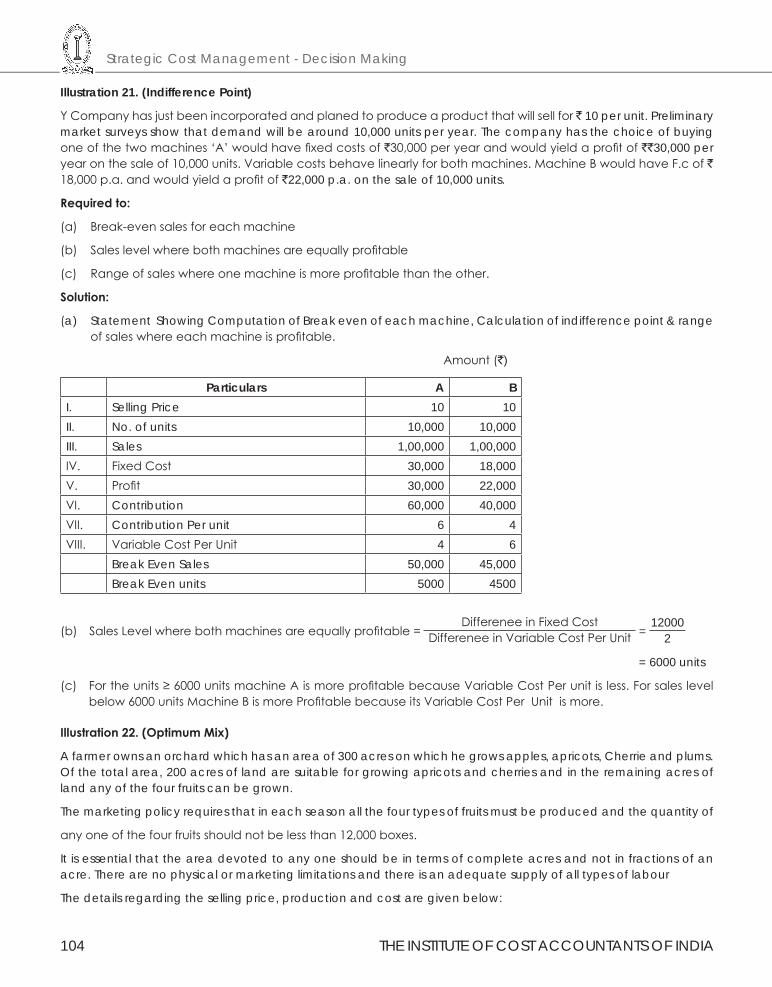
Strategic Cost Management - Decision Making
104 THE INSTITUTE OF COST ACCOUNTANTS OF INDIA
Illustration 21. (Indifference Point)
Y Company has just been incorporated and planed to produce a product that will sell for ` 10 per unit. Preliminary market surveys show that demand will be around 10,000 units per year. The company has the choice of buying one of the two machines ‘A’ would have fixed costs of `30,000 per year and would yield a profit of ``30,000 per year on the sale of 10,000 units. Variable costs behave linearly for both machines. Machine B would have F.c of ` 18,000 p.a. and would yield a profit of `22,000 p.a. on the sale of 10,000 units.
Requiredto:
(a) Break-even sales for each machine
(b) Sales level where both machines are equally profitable
(c) Range of sales where one machine is more profitable than the other.
Solution:
(a) Statement Showing Computation of Break even of each machine, Calculation of indifference point & range of sales where each machine is profitable.
Amount (`)
Particulars A BI. Selling Price 10 10II. No. of units 10,000 10,000III. Sales 1,00,000 1,00,000IV. Fixed Cost 30,000 18,000V. Profit 30,000 22,000VI. Contribution 60,000 40,000VII. Contribution Per unit 6 4VIII. Variable Cost Per Unit 4 6
Break Even Sales 50,000 45,000Break Even units 5000 4500
(b) Sales Level where both machines are equally profitable = Differenee in Fixed Cost
Differenee in Variable Cost Per Unit = 12000
2
= 6000 units
(c) For the units ≥ 6000 units machine A is more profitable because Variable Cost Per unit is less. For sales level below 6000 units Machine B is more Profitable because its Variable Cost Per Unit is more.
Illustration22.(OptimumMix)
A farmer owns an orchard which has an area of 300 acres on which he grows apples, apricots, Cherrie and plums. Of the total area, 200 acres of land are suitable for growing apricots and cherries and in the remaining acres of land any of the four fruits can be grown.
The marketing policy requires that in each season all the four types of fruits must be produced and the quantity of
any one of the four fruits should not be less than 12,000 boxes.
It is essential that the area devoted to any one should be in terms of complete acres and not in fractions of an acre. There are no physical or marketing limitations and there is an adequate supply of all types of labour
The details regarding the selling price, production and cost are given below:
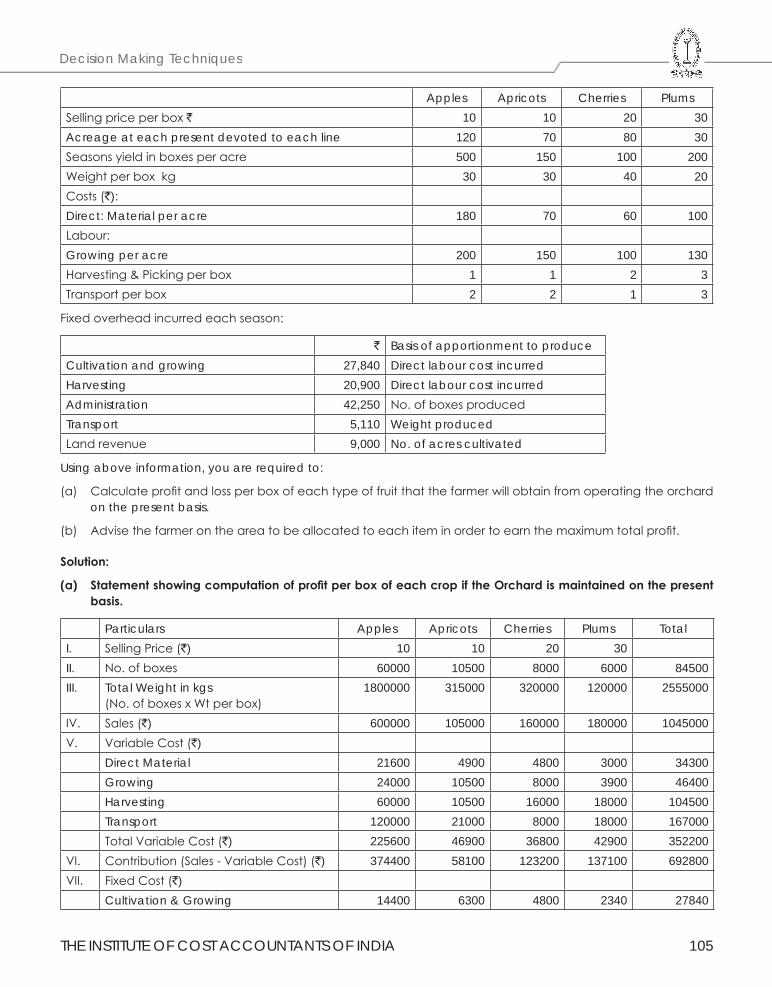
THE INSTITUTE OF COST ACCOUNTANTS OF INDIA 105
Decision Making Techniques
Apples Apricots Cherries PlumsSelling price per box ` 10 10 20 30Acreage at each present devoted to each line 120 70 80 30Seasons yield in boxes per acre 500 150 100 200Weight per box kg 30 30 40 20Costs (`):Direct: Material per acre 180 70 60 100Labour:Growing per acre 200 150 100 130Harvesting & Picking per box 1 1 2 3Transport per box 2 2 1 3
Fixed overhead incurred each season:
` Basis of apportionment to produceCultivation and growing 27,840 Direct labour cost incurredHarvesting 20,900 Direct labour cost incurredAdministration 42,250 No. of boxes producedTransport 5,110 Weight producedLand revenue 9,000 No. of acres cultivated
Using above information, you are required to:
(a) Calculate profit and loss per box of each type of fruit that the farmer will obtain from operating the orchard on the present basis.
(b) Advise the farmer on the area to be allocated to each item in order to earn the maximum total profit.
Solution:
(a) StatementshowingcomputationofprofitperboxofeachcropiftheOrchardismaintainedonthepresentbasis.
Particulars Apples Apricots Cherries Plums TotalI. Selling Price (`) 10 10 20 30II. No. of boxes 60000 10500 8000 6000 84500III. Total Weight in kgs
(No. of boxes x Wt per box)1800000 315000 320000 120000 2555000
IV. Sales (`) 600000 105000 160000 180000 1045000V. Variable Cost (`)
Direct Material 21600 4900 4800 3000 34300Growing 24000 10500 8000 3900 46400Harvesting 60000 10500 16000 18000 104500Transport 120000 21000 8000 18000 167000Total Variable Cost (`) 225600 46900 36800 42900 352200
VI. Contribution (Sales - Variable Cost) (`) 374400 58100 123200 137100 692800VII. Fixed Cost (`)
Cultivation & Growing 14400 6300 4800 2340 27840
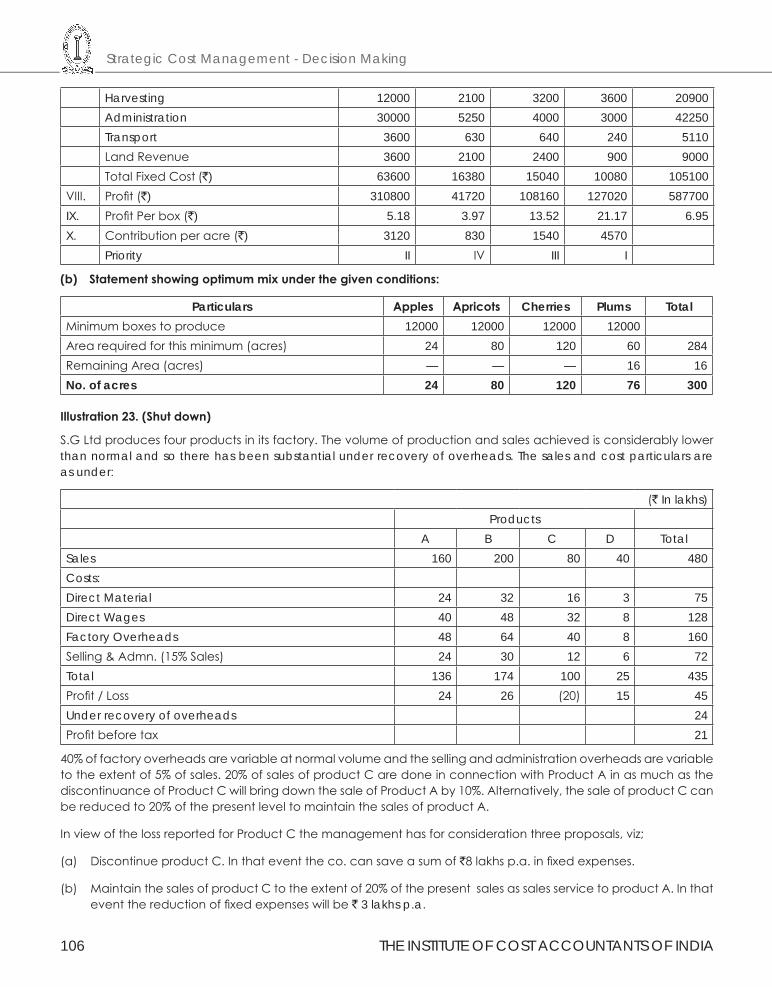
Strategic Cost Management - Decision Making
106 THE INSTITUTE OF COST ACCOUNTANTS OF INDIA
Harvesting 12000 2100 3200 3600 20900Administration 30000 5250 4000 3000 42250Transport 3600 630 640 240 5110Land Revenue 3600 2100 2400 900 9000Total Fixed Cost (`) 63600 16380 15040 10080 105100
VIII. Profit (`) 310800 41720 108160 127020 587700IX. Profit Per box (`) 5.18 3.97 13.52 21.17 6.95X. Contribution per acre (`) 3120 830 1540 4570
Priority II IV III I
(b) Statementshowingoptimummixunderthegivenconditions:
Particulars Apples Apricots Cherries Plums TotalMinimum boxes to produce 12000 12000 12000 12000Area required for this minimum (acres) 24 80 120 60 284Remaining Area (acres) — — — 16 16No. of acres 24 80 120 76 300
Illustration23.(Shutdown)
S.G Ltd produces four products in its factory. The volume of production and sales achieved is considerably lower than normal and so there has been substantial under recovery of overheads. The sales and cost particulars are as under:
(` In lakhs)Products
A B C D TotalSales 160 200 80 40 480Costs:Direct Material 24 32 16 3 75Direct Wages 40 48 32 8 128Factory Overheads 48 64 40 8 160Selling & Admn. (15% Sales) 24 30 12 6 72Total 136 174 100 25 435Profit / Loss 24 26 (20) 15 45Under recovery of overheads 24Profit before tax 21
40% of factory overheads are variable at normal volume and the selling and administration overheads are variable to the extent of 5% of sales. 20% of sales of product C are done in connection with Product A in as much as the discontinuance of Product C will bring down the sale of Product A by 10%. Alternatively, the sale of product C can be reduced to 20% of the present level to maintain the sales of product A.
In view of the loss reported for Product C the management has for consideration three proposals, viz;
(a) Discontinue product C. In that event the co. can save a sum of `8 lakhs p.a. in fixed expenses.
(b) Maintain the sales of product C to the extent of 20% of the present sales as sales service to product A. In that event the reduction of fixed expenses will be ` 3 lakhs p.a.
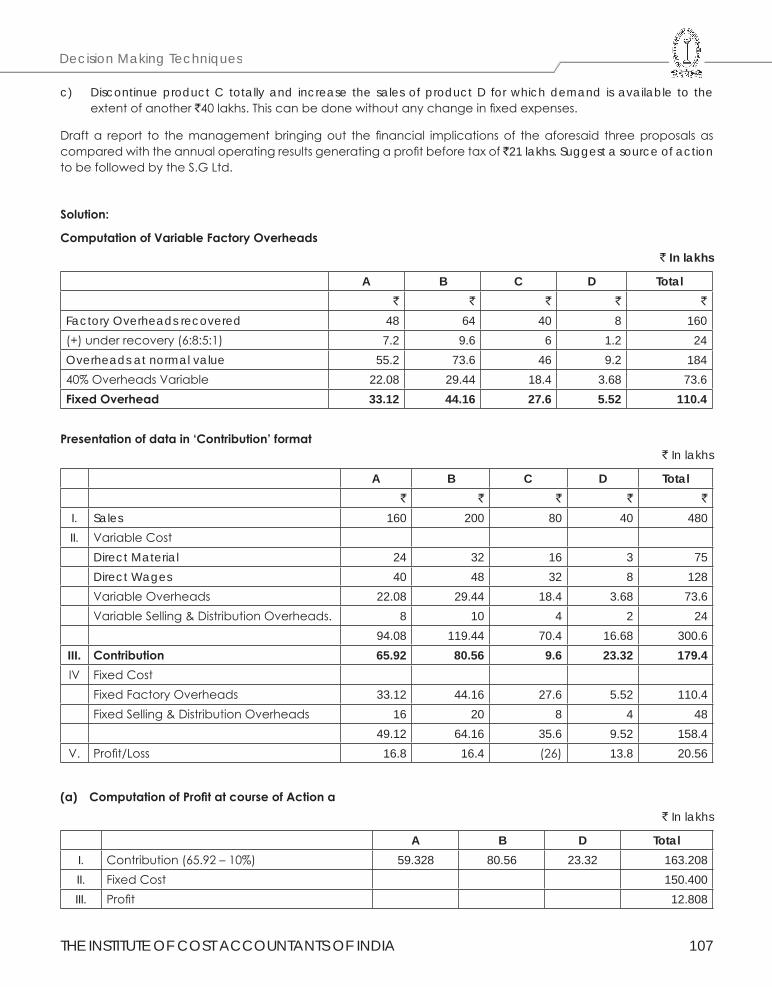
THE INSTITUTE OF COST ACCOUNTANTS OF INDIA 107
Decision Making Techniques
c) Discontinue product C totally and increase the sales of product D for which demand is available to the extent of another `40 lakhs. This can be done without any change in fixed expenses.
Draft a report to the management bringing out the financial implications of the aforesaid three proposals as compared with the annual operating results generating a profit before tax of `21 lakhs. Suggest a source of action to be followed by the S.G Ltd.
Solution:
ComputationofVariableFactoryOverheads` In lakhs
A B C D Total` ` ` ` `
Factory Overheads recovered 48 64 40 8 160(+) under recovery (6:8:5:1) 7.2 9.6 6 1.2 24Overheads at normal value 55.2 73.6 46 9.2 18440% Overheads Variable 22.08 29.44 18.4 3.68 73.6FixedOverhead 33.12 44.16 27.6 5.52 110.4
Presentationofdatain‘Contribution’format` In lakhs
A B C D Total` ` ` ` `
I. Sales 160 200 80 40 480II. Variable Cost
Direct Material 24 32 16 3 75Direct Wages 40 48 32 8 128Variable Overheads 22.08 29.44 18.4 3.68 73.6Variable Selling & Distribution Overheads. 8 10 4 2 24
94.08 119.44 70.4 16.68 300.6III. Contribution 65.92 80.56 9.6 23.32 179.4IV Fixed Cost
Fixed Factory Overheads 33.12 44.16 27.6 5.52 110.4Fixed Selling & Distribution Overheads 16 20 8 4 48
49.12 64.16 35.6 9.52 158.4V. Profit/Loss 16.8 16.4 (26) 13.8 20.56
(a) ComputationofProfitatcourseofActiona` In lakhs
A B D TotalI. Contribution (65.92 – 10%) 59.328 80.56 23.32 163.208II. Fixed Cost 150.400III. Profit 12.808
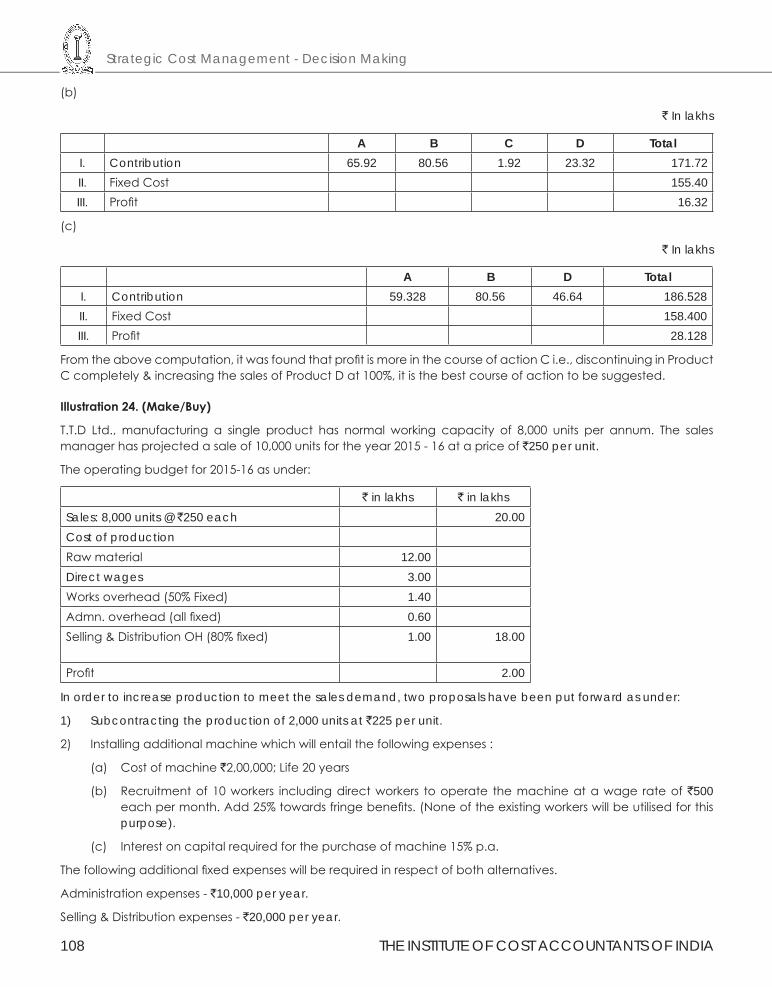
Strategic Cost Management - Decision Making
108 THE INSTITUTE OF COST ACCOUNTANTS OF INDIA
(b)
` In lakhs
A B C D TotalI. Contribution 65.92 80.56 1.92 23.32 171.72II. Fixed Cost 155.40III. Profit 16.32
(c)
` In lakhs
A B D TotalI. Contribution 59.328 80.56 46.64 186.528II. Fixed Cost 158.400III. Profit 28.128
From the above computation, it was found that profit is more in the course of action C i.e., discontinuing in Product C completely & increasing the sales of Product D at 100%, it is the best course of action to be suggested.
Illustration24.(Make/Buy)
T.T.D Ltd., manufacturing a single product has normal working capacity of 8,000 units per annum. The sales manager has projected a sale of 10,000 units for the year 2015 - 16 at a price of `250 per unit.
The operating budget for 2015-16 as under:
` in lakhs ` in lakhsSales: 8,000 units @ `250 each 20.00Cost of productionRaw material 12.00Direct wages 3.00Works overhead (50% Fixed) 1.40Admn. overhead (all fixed) 0.60Selling & Distribution OH (80% fixed) 1.00 18.00
Profit 2.00
In order to increase production to meet the sales demand, two proposals have been put forward as under:
1) Subcontracting the production of 2,000 units at `225 per unit.
2) Installing additional machine which will entail the following expenses :
(a) Cost of machine `2,00,000; Life 20 years
(b) Recruitment of 10 workers including direct workers to operate the machine at a wage rate of `500 each per month. Add 25% towards fringe benefits. (None of the existing workers will be utilised for this purpose).
(c) Interest on capital required for the purchase of machine 15% p.a.
The following additional fixed expenses will be required in respect of both alternatives.
Administration expenses - `10,000 per year.
Selling & Distribution expenses - `20,000 per year.
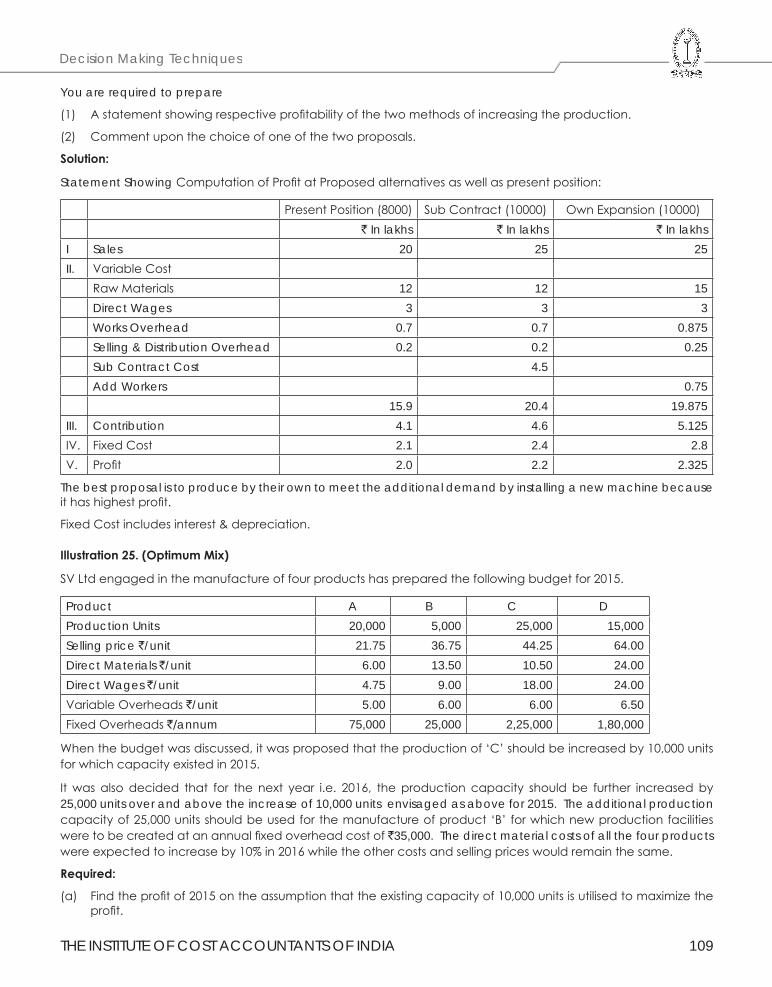
THE INSTITUTE OF COST ACCOUNTANTS OF INDIA 109
Decision Making Techniques
You are required to prepare
(1) A statement showing respective profitability of the two methods of increasing the production.
(2) Comment upon the choice of one of the two proposals.
Solution:
Statement Showing Computation of Profit at Proposed alternatives as well as present position:
Present Position (8000) Sub Contract (10000) Own Expansion (10000)` In lakhs ` In lakhs ` In lakhs
I Sales 20 25 25II. Variable Cost
Raw Materials 12 12 15Direct Wages 3 3 3Works Overhead 0.7 0.7 0.875Selling & Distribution Overhead 0.2 0.2 0.25Sub Contract Cost 4.5 Add Workers 0.75
15.9 20.4 19.875III. Contribution 4.1 4.6 5.125IV. Fixed Cost 2.1 2.4 2.8V. Profit 2.0 2.2 2.325
The best proposal is to produce by their own to meet the additional demand by installing a new machine because it has highest profit.
Fixed Cost includes interest & depreciation.
Illustration25.(OptimumMix)
SV Ltd engaged in the manufacture of four products has prepared the following budget for 2015.
Product A B C DProduction Units 20,000 5,000 25,000 15,000Selling price `/unit 21.75 36.75 44.25 64.00Direct Materials `/unit 6.00 13.50 10.50 24.00Direct Wages `/unit 4.75 9.00 18.00 24.00Variable Overheads `/unit 5.00 6.00 6.00 6.50Fixed Overheads `/annum 75,000 25,000 2,25,000 1,80,000
When the budget was discussed, it was proposed that the production of ‘C’ should be increased by 10,000 units for which capacity existed in 2015.
It was also decided that for the next year i.e. 2016, the production capacity should be further increased by 25,000 units over and above the increase of 10,000 units envisaged as above for 2015. The additional production capacity of 25,000 units should be used for the manufacture of product ‘B’ for which new production facilities were to be created at an annual fixed overhead cost of `35,000. The direct material costs of all the four products were expected to increase by 10% in 2016 while the other costs and selling prices would remain the same.
Required:
(a) Find the profit of 2015 on the assumption that the existing capacity of 10,000 units is utilised to maximize the profit.
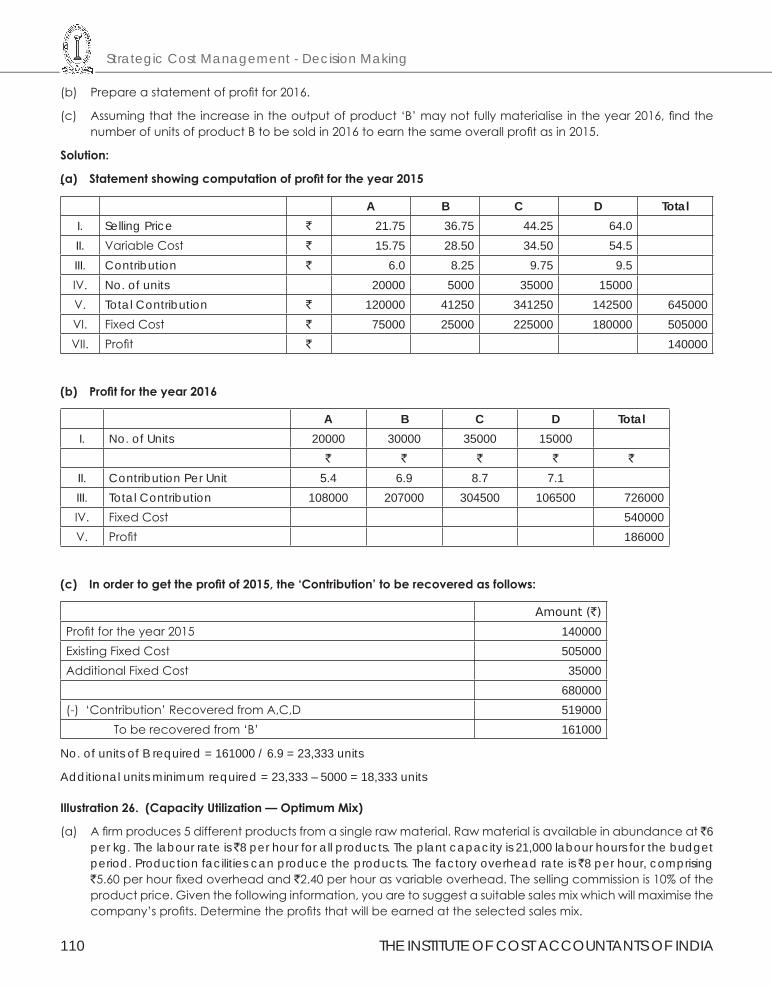
Strategic Cost Management - Decision Making
110 THE INSTITUTE OF COST ACCOUNTANTS OF INDIA
(b) Prepare a statement of profit for 2016.
(c) Assuming that the increase in the output of product ‘B’ may not fully materialise in the year 2016, find the number of units of product B to be sold in 2016 to earn the same overall profit as in 2015.
Solution:
(a) Statementshowingcomputationofprofitfortheyear2015
A B C D TotalI. Selling Price ` 21.75 36.75 44.25 64.0II. Variable Cost ` 15.75 28.50 34.50 54.5III. Contribution ` 6.0 8.25 9.75 9.5IV. No. of units 20000 5000 35000 15000V. Total Contribution ` 120000 41250 341250 142500 645000VI. Fixed Cost ` 75000 25000 225000 180000 505000VII. Profit ` 140000
(b) Profitfortheyear2016
A B C D TotalI. No. of Units 20000 30000 35000 15000
` ` ` ` `
II. Contribution Per Unit 5.4 6.9 8.7 7.1III. Total Contribution 108000 207000 304500 106500 726000IV. Fixed Cost 540000V. Profit 186000
(c) Inordertogettheprofitof2015,the‘Contribution’toberecoveredasfollows:
Amount (`)
Profit for the year 2015 140000Existing Fixed Cost 505000Additional Fixed Cost 35000
680000(-) ‘Contribution’ Recovered from A,C,D 519000 To be recovered from ‘B’ 161000
No. of units of B required = 161000 / 6.9 = 23,333 units
Additional units minimum required = 23,333 – 5000 = 18,333 units
Illustration26.(CapacityUtilization—OptimumMix)
(a) A firm produces 5 different products from a single raw material. Raw material is available in abundance at `6 per kg. The labour rate is `8 per hour for all products. The plant capacity is 21,000 labour hours for the budget period. Production facilities can produce the products. The factory overhead rate is `8 per hour, comprising `5.60 per hour fixed overhead and `2.40 per hour as variable overhead. The selling commission is 10% of the product price. Given the following information, you are to suggest a suitable sales mix which will maximise the company’s profits. Determine the profits that will be earned at the selected sales mix.
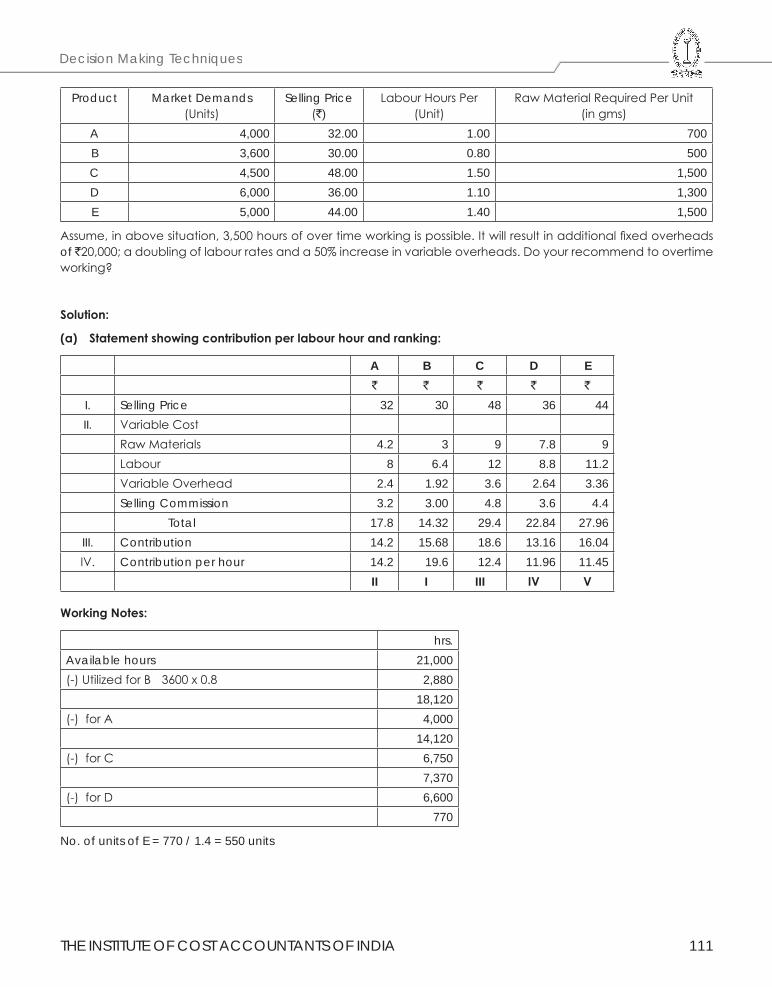
THE INSTITUTE OF COST ACCOUNTANTS OF INDIA 111
Decision Making Techniques
Product Market Demands (Units)
Selling Price (`)
Labour Hours Per (Unit)
Raw Material Required Per Unit (in gms)
A 4,000 32.00 1.00 700B 3,600 30.00 0.80 500C 4,500 48.00 1.50 1,500D 6,000 36.00 1.10 1,300E 5,000 44.00 1.40 1,500
Assume, in above situation, 3,500 hours of over time working is possible. It will result in additional fixed overheads of `20,000; a doubling of labour rates and a 50% increase in variable overheads. Do your recommend to overtime working?
Solution:
(a) Statementshowingcontributionperlabourhourandranking:
A B C D E` ` ` ` `
I. Selling Price 32 30 48 36 44II. Variable Cost
Raw Materials 4.2 3 9 7.8 9Labour 8 6.4 12 8.8 11.2Variable Overhead 2.4 1.92 3.6 2.64 3.36Selling Commission 3.2 3.00 4.8 3.6 4.4 Total 17.8 14.32 29.4 22.84 27.96
III. Contribution 14.2 15.68 18.6 13.16 16.04IV. Contribution per hour 14.2 19.6 12.4 11.96 11.45
II I III IV V
WorkingNotes:
hrs.Available hours 21,000(-) Utilized for B 3600 x 0.8 2,880
18,120(-) for A 4,000
14,120(-) for C 6,750
7,370(-) for D 6,600
770
No. of units of E = 770 / 1.4 = 550 units
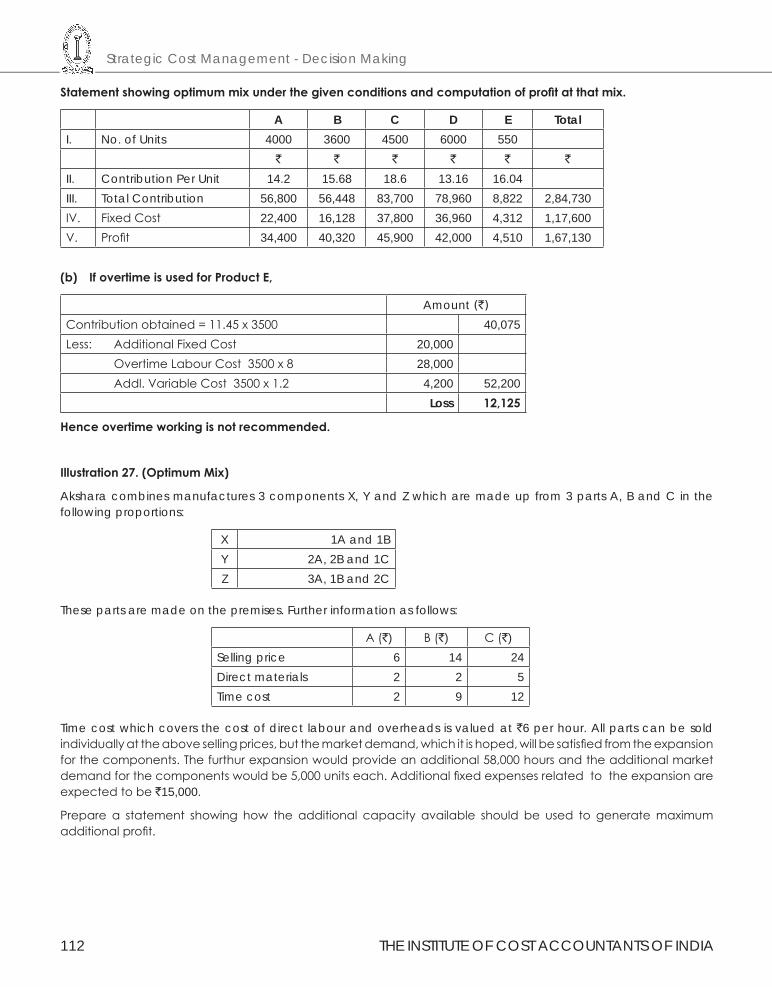
Strategic Cost Management - Decision Making
112 THE INSTITUTE OF COST ACCOUNTANTS OF INDIA
Statementshowingoptimummixunderthegivenconditionsandcomputationofprofitatthatmix.
A B C D E TotalI. No. of Units 4000 3600 4500 6000 550
` ` ` ` ` `
II. Contribution Per Unit 14.2 15.68 18.6 13.16 16.04III. Total Contribution 56,800 56,448 83,700 78,960 8,822 2,84,730IV. Fixed Cost 22,400 16,128 37,800 36,960 4,312 1,17,600V. Profit 34,400 40,320 45,900 42,000 4,510 1,67,130
(b) IfovertimeisusedforProductE,
Amount (`)
Contribution obtained = 11.45 x 3500 40,075Less: Additional Fixed Cost 20,000 Overtime Labour Cost 3500 x 8 28,000 Addl. Variable Cost 3500 x 1.2 4,200 52,200
Loss 12,125
Henceovertimeworkingisnotrecommended.
Illustration27.(OptimumMix)
Akshara combines manufactures 3 components X, Y and Z which are made up from 3 parts A, B and C in the following proportions:
X 1A and 1BY 2A, 2B and 1CZ 3A, 1B and 2C
These parts are made on the premises. Further information as follows:
A (`) B (`) C (`)Selling price 6 14 24Direct materials 2 2 5Time cost 2 9 12
Time cost which covers the cost of direct labour and overheads is valued at `6 per hour. All parts can be sold individually at the above selling prices, but the market demand, which it is hoped, will be satisfied from the expansion for the components. The furthur expansion would provide an additional 58,000 hours and the additional market demand for the components would be 5,000 units each. Additional fixed expenses related to the expansion are expected to be `15,000.
Prepare a statement showing how the additional capacity available should be used to generate maximum additional profit.
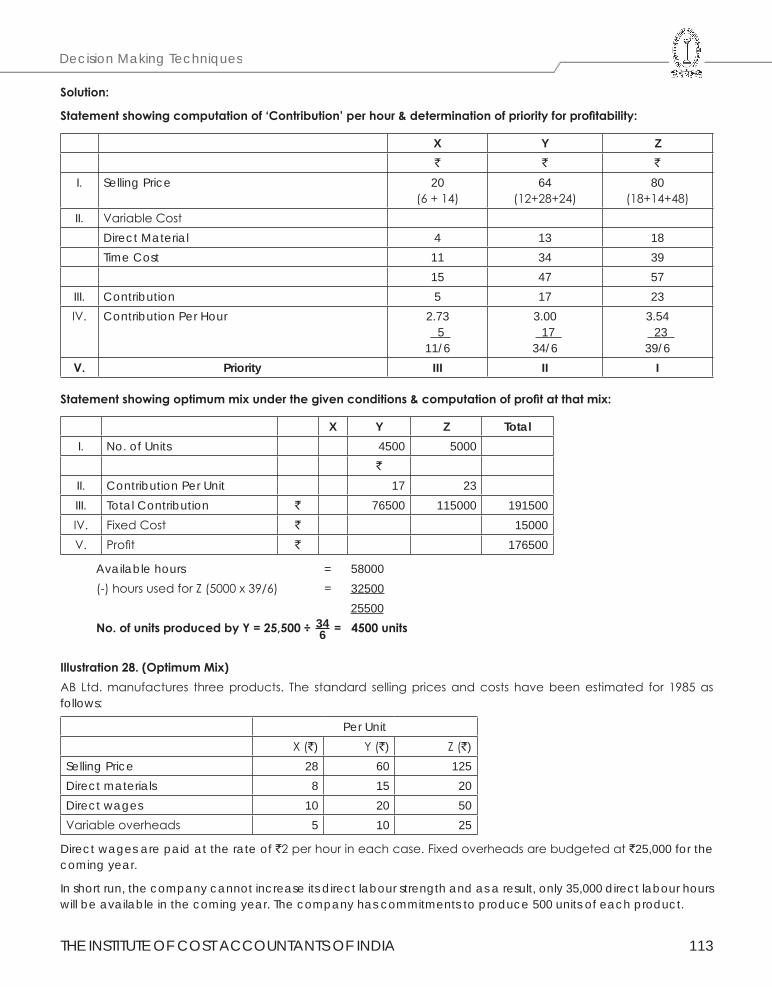
THE INSTITUTE OF COST ACCOUNTANTS OF INDIA 113
Decision Making Techniques
Solution:
Statementshowingcomputationof‘Contribution’perhour&determinationofpriorityforprofitability:
X Y Z` ` `
I. Selling Price 20(6 + 14)
64(12+28+24)
80(18+14+48)
II. Variable CostDirect Material 4 13 18Time Cost 11 34 39
15 47 57III. Contribution 5 17 23IV. Contribution Per Hour 2.73
5 11/6
3.00 17 34/6
3.54 23 39/6
V. Priority III II I
Statementshowingoptimummixunderthegivenconditions&computationofprofitatthatmix:
X Y Z TotalI. No. of Units 4500 5000
`
II. Contribution Per Unit 17 23III. Total Contribution ` 76500 115000 191500IV. Fixed Cost ` 15000V. Profit ` 176500
Available hours = 58000 (-) hours used for Z (5000 x 39/6) = 32500 25500 No.ofunitsproducedbyY=25,500÷=4500units Illustration28.(OptimumMix)AB Ltd. manufactures three products. The standard selling prices and costs have been estimated for 1985 as follows:
Per UnitX (`) Y (`) Z (`)
Selling Price 28 60 125Direct materials 8 15 20Direct wages 10 20 50Variable overheads 5 10 25
Direct wages are paid at the rate of `2 per hour in each case. Fixed overheads are budgeted at `25,000 for the coming year.
In short run, the company cannot increase its direct labour strength and as a result, only 35,000 direct labour hours will be available in the coming year. The company has commitments to produce 500 units of each product.
346
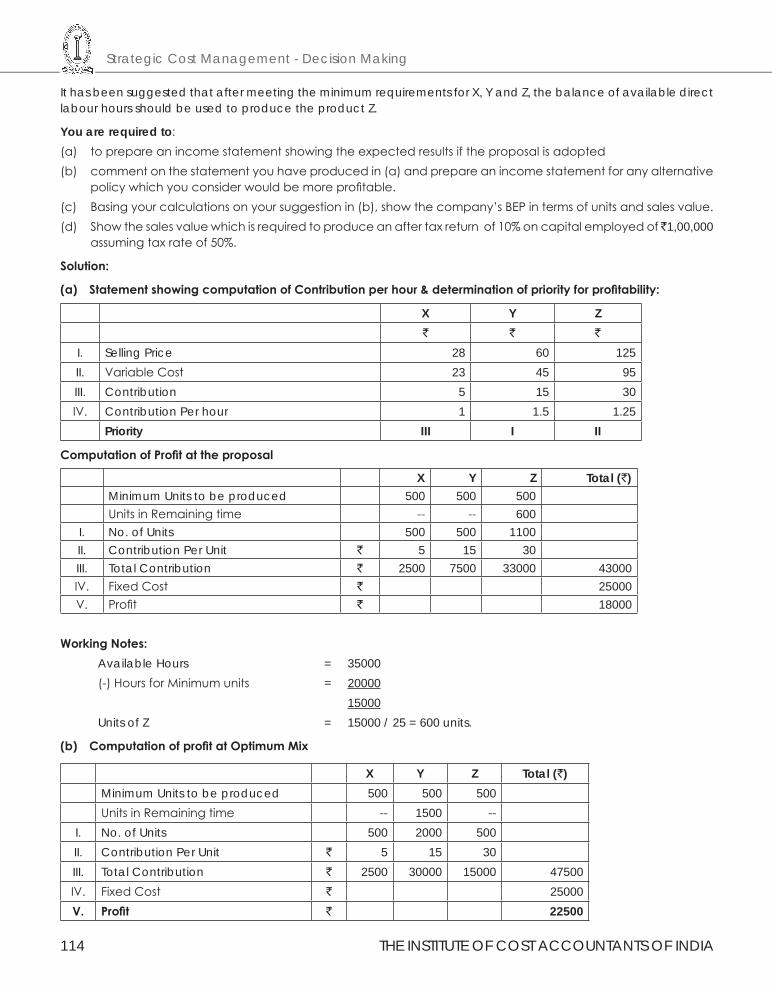
Strategic Cost Management - Decision Making
114 THE INSTITUTE OF COST ACCOUNTANTS OF INDIA
It has been suggested that after meeting the minimum requirements for X, Y and Z, the balance of available direct labour hours should be used to produce the product Z.
You are required to:(a) to prepare an income statement showing the expected results if the proposal is adopted(b) comment on the statement you have produced in (a) and prepare an income statement for any alternative
policy which you consider would be more profitable.(c) Basing your calculations on your suggestion in (b), show the company’s BEP in terms of units and sales value.(d) Show the sales value which is required to produce an after tax return of 10% on capital employed of ̀ 1,00,000
assuming tax rate of 50%.
Solution:
(a) StatementshowingcomputationofContributionperhour&determinationofpriorityforprofitability:
X Y Z` ` `
I. Selling Price 28 60 125II. Variable Cost 23 45 95III. Contribution 5 15 30IV. Contribution Per hour 1 1.5 1.25
Priority III I II
ComputationofProfitattheproposal
X Y Z Total (`)Minimum Units to be produced 500 500 500Units in Remaining time -- -- 600
I. No. of Units 500 500 1100II. Contribution Per Unit ` 5 15 30III. Total Contribution ` 2500 7500 33000 43000IV. Fixed Cost ` 25000V. Profit ` 18000
WorkingNotes:Available Hours = 35000(-) Hours for Minimum units = 20000 15000Units of Z = 15000 / 25 = 600 units.
(b) ComputationofprofitatOptimumMix
X Y Z Total (`)Minimum Units to be produced 500 500 500Units in Remaining time -- 1500 --
I. No. of Units 500 2000 500II. Contribution Per Unit ` 5 15 30III. Total Contribution ` 2500 30000 15000 47500IV. Fixed Cost ` 25000V. Profit ` 22500
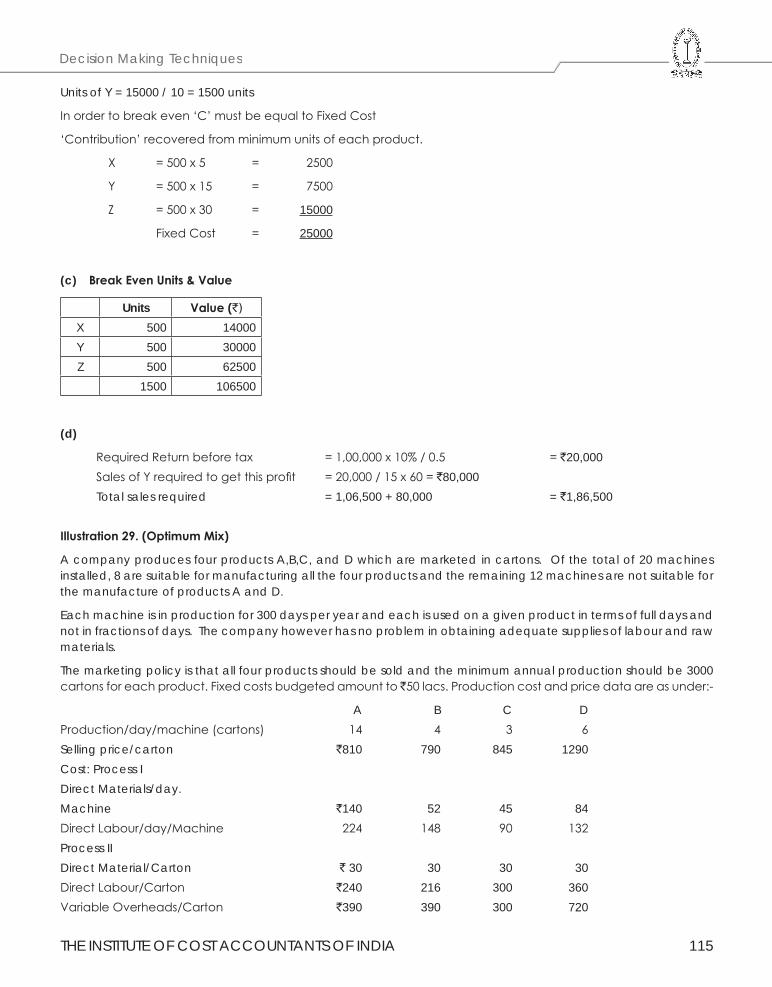
THE INSTITUTE OF COST ACCOUNTANTS OF INDIA 115
Decision Making Techniques
Units of Y = 15000 / 10 = 1500 units
In order to break even ‘C’ must be equal to Fixed Cost
‘Contribution’ recovered from minimum units of each product.
X = 500 x 5 = 2500
Y = 500 x 15 = 7500
Z = 500 x 30 = 15000
Fixed Cost = 25000
(c) BreakEvenUnits&Value
Units Value(`)
X 500 14000Y 500 30000Z 500 62500
1500 106500
(d)
Required Return before tax = 1,00,000 x 10% / 0.5 = `20,000 Sales of Y required to get this profit = 20,000 / 15 x 60 = `80,000 Total sales required = 1,06,500 + 80,000 = `1,86,500
Illustration29.(OptimumMix)
A company produces four products A,B,C, and D which are marketed in cartons. Of the total of 20 machines installed, 8 are suitable for manufacturing all the four products and the remaining 12 machines are not suitable for the manufacture of products A and D.
Each machine is in production for 300 days per year and each is used on a given product in terms of full days and not in fractions of days. The company however has no problem in obtaining adequate supplies of labour and raw materials.
The marketing policy is that all four products should be sold and the minimum annual production should be 3000 cartons for each product. Fixed costs budgeted amount to ̀ 50 lacs. Production cost and price data are as under:-
A B C DProduction/day/machine (cartons) 14 4 3 6Selling price/carton `810 790 845 1290Cost: Process IDirect Materials/day.Machine `140 52 45 84Direct Labour/day/Machine 224 148 90 132Process IIDirect Material/Carton ` 30 30 30 30Direct Labour/Carton `240 216 300 360Variable Overheads/Carton `390 390 300 720
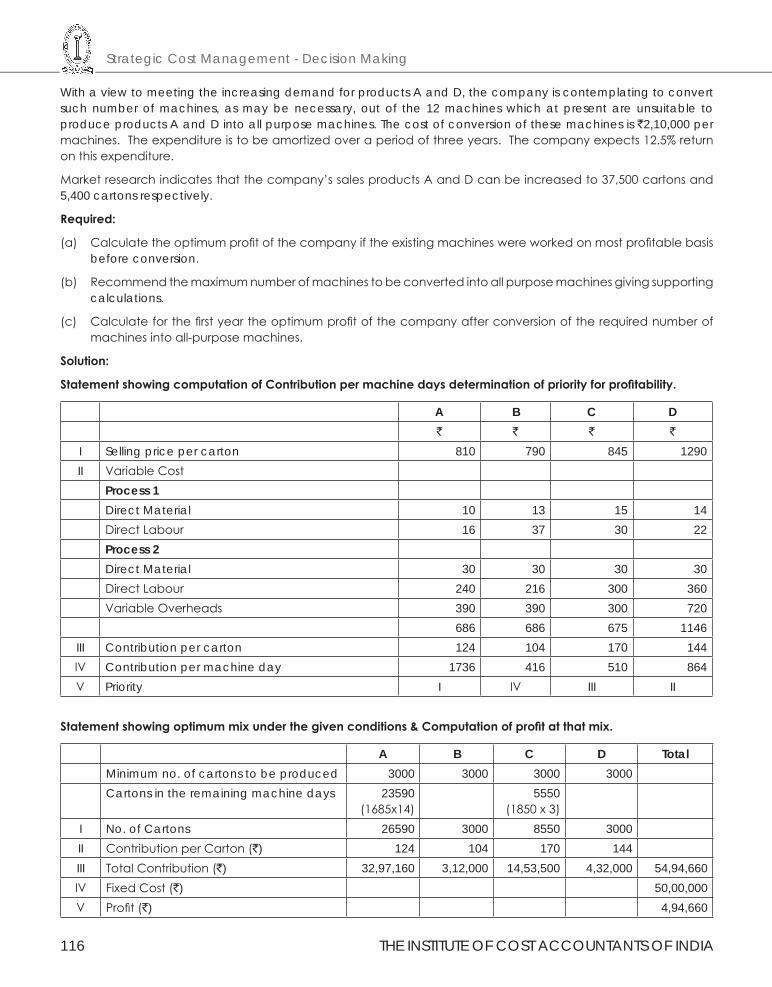
Strategic Cost Management - Decision Making
116 THE INSTITUTE OF COST ACCOUNTANTS OF INDIA
With a view to meeting the increasing demand for products A and D, the company is contemplating to convert such number of machines, as may be necessary, out of the 12 machines which at present are unsuitable to produce products A and D into all purpose machines. The cost of conversion of these machines is `2,10,000 per machines. The expenditure is to be amortized over a period of three years. The company expects 12.5% return on this expenditure.
Market research indicates that the company’s sales products A and D can be increased to 37,500 cartons and 5,400 cartons respectively.
Required:
(a) Calculate the optimum profit of the company if the existing machines were worked on most profitable basis before conversion.
(b) Recommend the maximum number of machines to be converted into all purpose machines giving supporting calculations.
(c) Calculate for the first year the optimum profit of the company after conversion of the required number of machines into all-purpose machines.
Solution:
StatementshowingcomputationofContributionpermachinedaysdeterminationofpriorityforprofitability.
A B C D` ` ` `
I Selling price per carton 810 790 845 1290II Variable Cost
Process 1Direct Material 10 13 15 14Direct Labour 16 37 30 22Process 2Direct Material 30 30 30 30Direct Labour 240 216 300 360Variable Overheads 390 390 300 720
686 686 675 1146III Contribution per carton 124 104 170 144IV Contribution per machine day 1736 416 510 864V Priority I IV III II
Statementshowingoptimummixunderthegivenconditions&Computationofprofitatthatmix.
A B C D TotalMinimum no. of cartons to be produced 3000 3000 3000 3000Cartons in the remaining machine days 23590
(1685x14)5550
(1850 x 3)I No. of Cartons 26590 3000 8550 3000II Contribution per Carton (`) 124 104 170 144III Total Contribution (`) 32,97,160 3,12,000 14,53,500 4,32,000 54,94,660IV Fixed Cost (`) 50,00,000V Profit (`) 4,94,660
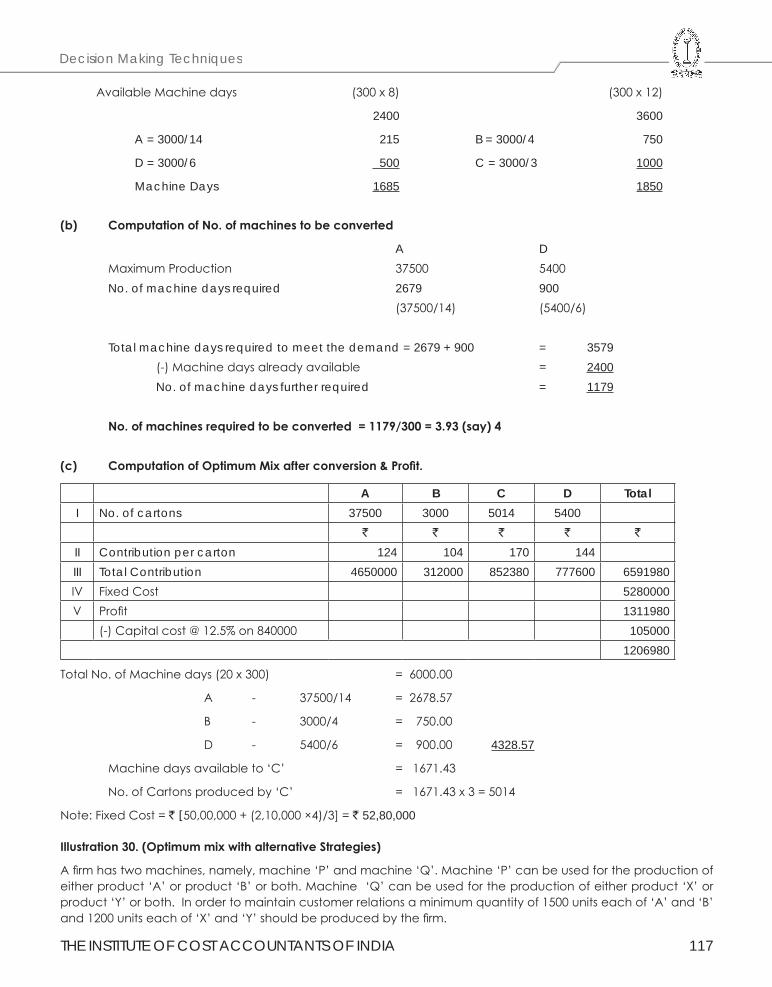
THE INSTITUTE OF COST ACCOUNTANTS OF INDIA 117
Decision Making Techniques
Available Machine days (300 x 8) (300 x 12)
2400 3600
A = 3000/14 215 B = 3000/4 750
D = 3000/6 500 C = 3000/3 1000
Machine Days 1685 1850
(b) ComputationofNo.ofmachinestobeconverted
A D Maximum Production 37500 5400 No. of machine days required 2679 900 (37500/14) (5400/6)
Total machine days required to meet the demand = 2679 + 900 = 3579 (-) Machine days already available = 2400 No. of machine days further required = 1179
No.ofmachinesrequiredtobeconverted=1179/300=3.93(say)4
(c) ComputationofOptimumMixafterconversion&Profit.
A B C D TotalI No. of cartons 37500 3000 5014 5400
` ` ` ` `
II Contribution per carton 124 104 170 144III Total Contribution 4650000 312000 852380 777600 6591980IV Fixed Cost 5280000V Profit 1311980
(-) Capital cost @ 12.5% on 840000 1050001206980
Total No. of Machine days (20 x 300) = 6000.00
A - 37500/14 = 2678.57
B - 3000/4 = 750.00
D - 5400/6 = 900.00 4328.57
Machine days available to ‘C’ = 1671.43
No. of Cartons produced by ‘C’ = 1671.43 x 3 = 5014
Note: Fixed Cost = ` [50,00,000 + (2,10,000 ×4)/3] = ` 52,80,000 Illustration30.(OptimummixwithalternativeStrategies)
A firm has two machines, namely, machine ‘P’ and machine ‘Q’. Machine ‘P’ can be used for the production of either product ‘A’ or product ‘B’ or both. Machine ‘Q’ can be used for the production of either product ‘X’ or product ‘Y’ or both. In order to maintain customer relations a minimum quantity of 1500 units each of ‘A’ and ‘B’ and 1200 units each of ‘X’ and ‘Y’ should be produced by the firm.
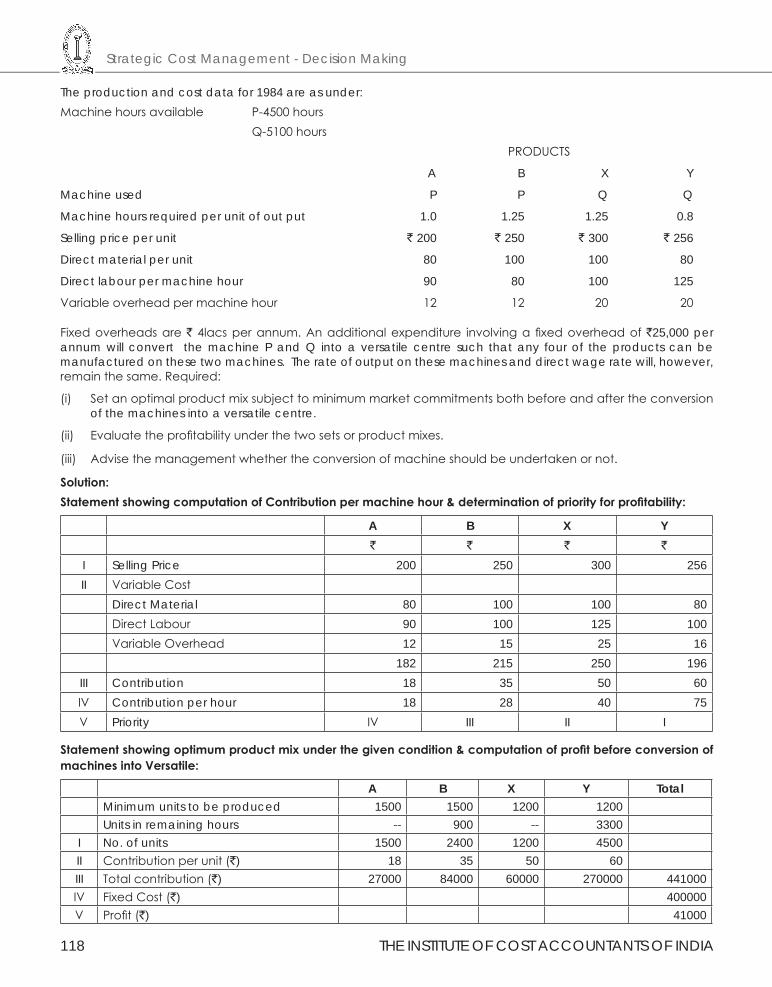
Strategic Cost Management - Decision Making
118 THE INSTITUTE OF COST ACCOUNTANTS OF INDIA
The production and cost data for 1984 are as under: Machine hours available P-4500 hours Q-5100 hours PRODUCTS
A B X Y
Machine used P P Q Q
Machine hours required per unit of out put 1.0 1.25 1.25 0.8
Selling price per unit ` 200 ` 250 ` 300 ` 256
Direct material per unit 80 100 100 80
Direct labour per machine hour 90 80 100 125
Variable overhead per machine hour 12 12 20 20
Fixed overheads are ` 4lacs per annum. An additional expenditure involving a fixed overhead of `25,000 per annum will convert the machine P and Q into a versatile centre such that any four of the products can be manufactured on these two machines. The rate of output on these machines and direct wage rate will, however, remain the same. Required:
(i) Set an optimal product mix subject to minimum market commitments both before and after the conversion of the machines into a versatile centre.
(ii) Evaluate the profitability under the two sets or product mixes.
(iii) Advise the management whether the conversion of machine should be undertaken or not.
Solution:StatementshowingcomputationofContributionpermachinehour&determinationofpriorityforprofitability:
A B X Y` ` ` `
I Selling Price 200 250 300 256II Variable Cost
Direct Material 80 100 100 80Direct Labour 90 100 125 100Variable Overhead 12 15 25 16
182 215 250 196III Contribution 18 35 50 60IV Contribution per hour 18 28 40 75V Priority IV III II I
Statementshowingoptimumproductmixunderthegivencondition&computationofprofitbeforeconversionofmachinesintoVersatile:
A B X Y TotalMinimum units to be produced 1500 1500 1200 1200Units in remaining hours -- 900 -- 3300
I No. of units 1500 2400 1200 4500II Contribution per unit (`) 18 35 50 60III Total contribution (`) 27000 84000 60000 270000 441000IV Fixed Cost (`) 400000V Profit (`) 41000
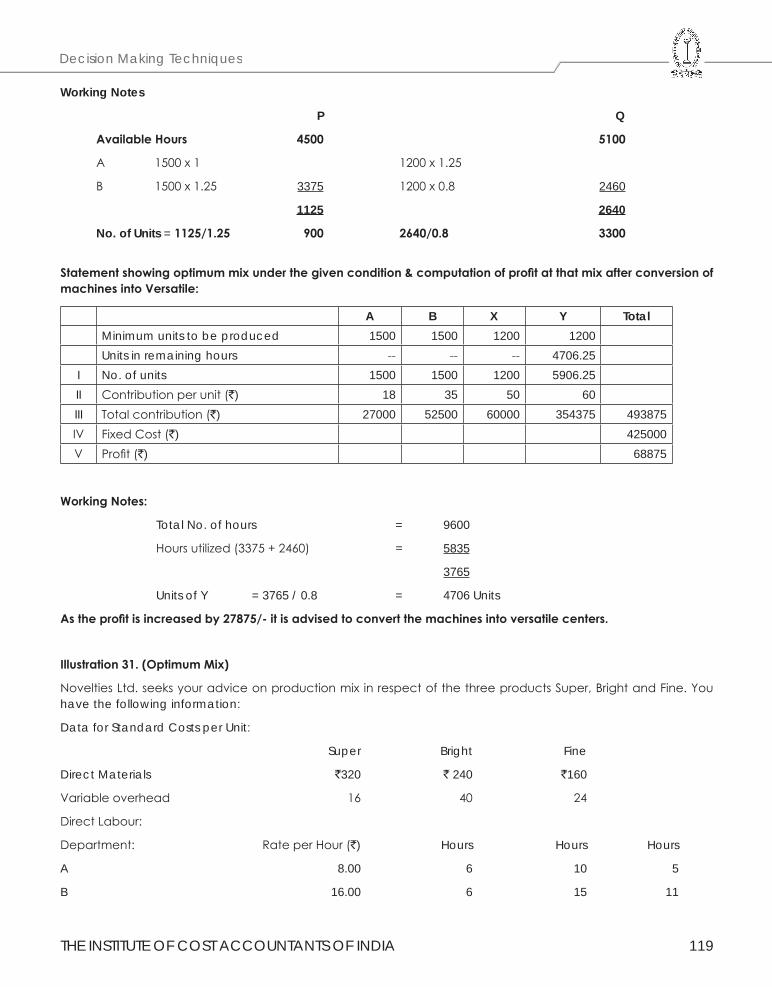
THE INSTITUTE OF COST ACCOUNTANTS OF INDIA 119
Decision Making Techniques
Working Notes
P Q
AvailableHours 4500 5100
A 1500 x 1 1200 x 1.25
B 1500 x 1.25 3375 1200 x 0.8 2460
1125 2640
No. of Units =1125/1.25 900 2640/0.8 3300
Statementshowingoptimummixunderthegivencondition&computationofprofitatthatmixafterconversionofmachinesintoVersatile:
A B X Y TotalMinimum units to be produced 1500 1500 1200 1200Units in remaining hours -- -- -- 4706.25
I No. of units 1500 1500 1200 5906.25II Contribution per unit (`) 18 35 50 60III Total contribution (`) 27000 52500 60000 354375 493875IV Fixed Cost (`) 425000V Profit (`) 68875
WorkingNotes:
Total No. of hours = 9600
Hours utilized (3375 + 2460) = 5835
3765
Units of Y = 3765 / 0.8 = 4706 Units
Astheprofitisincreasedby27875/-itisadvisedtoconvertthemachinesintoversatilecenters.
Illustration31.(OptimumMix)
Novelties Ltd. seeks your advice on production mix in respect of the three products Super, Bright and Fine. You have the following information:
Data for Standard Costs per Unit:
Super Bright Fine
Direct Materials `320 ` 240 `160
Variable overhead 16 40 24
Direct Labour:
Department: Rate per Hour (`) Hours Hours Hours
A 8.00 6 10 5
B 16.00 6 15 11
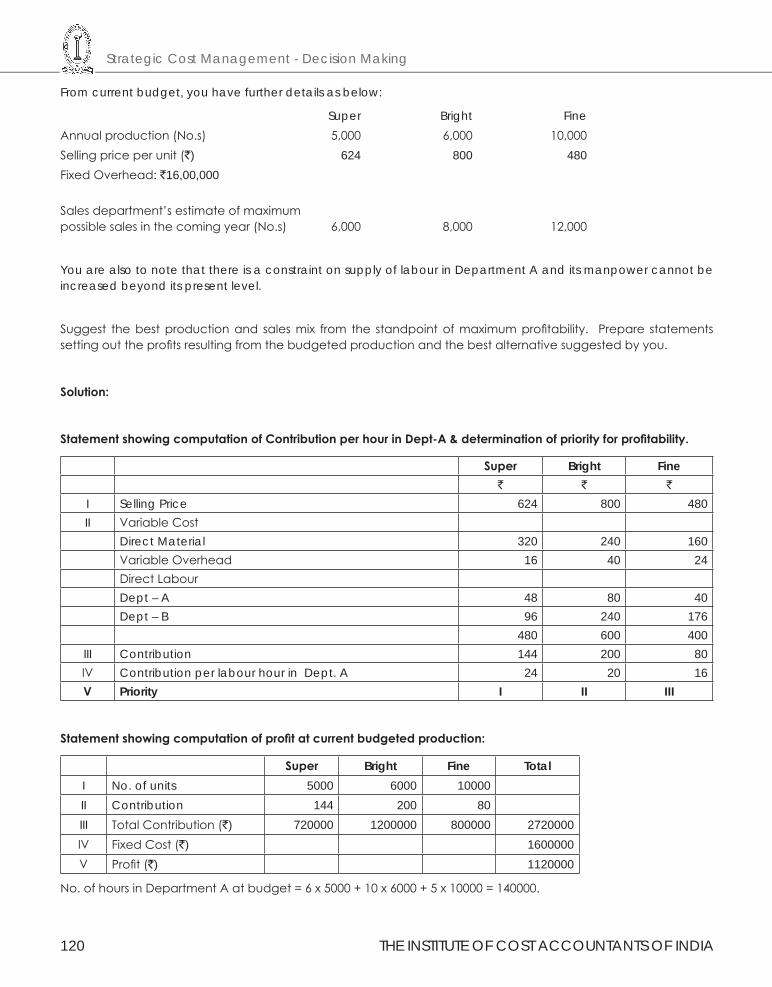
Strategic Cost Management - Decision Making
120 THE INSTITUTE OF COST ACCOUNTANTS OF INDIA
From current budget, you have further details as below:
Super Bright FineAnnual production (No.s) 5,000 6,000 10,000Selling price per unit (`) 624 800 480Fixed Overhead: `16,00,000
Sales department’s estimate of maximum possible sales in the coming year (No.s) 6,000 8,000 12,000
You are also to note that there is a constraint on supply of labour in Department A and its manpower cannot be increased beyond its present level.
Suggest the best production and sales mix from the standpoint of maximum profitability. Prepare statements setting out the profits resulting from the budgeted production and the best alternative suggested by you.
Solution:
StatementshowingcomputationofContributionperhourinDept-A&determinationofpriorityforprofitability.
Super Bright Fine` ` `
I Selling Price 624 800 480II Variable Cost
Direct Material 320 240 160Variable Overhead 16 40 24Direct LabourDept – A 48 80 40Dept – B 96 240 176
480 600 400III Contribution 144 200 80IV Contribution per labour hour in Dept. A 24 20 16V Priority I II III
Statementshowingcomputationofprofitatcurrentbudgetedproduction:
Super Bright Fine TotalI No. of units 5000 6000 10000II Contribution 144 200 80III Total Contribution (`) 720000 1200000 800000 2720000IV Fixed Cost (`) 1600000V Profit (`) 1120000
No. of hours in Department A at budget = 6 x 5000 + 10 x 6000 + 5 x 10000 = 140000.
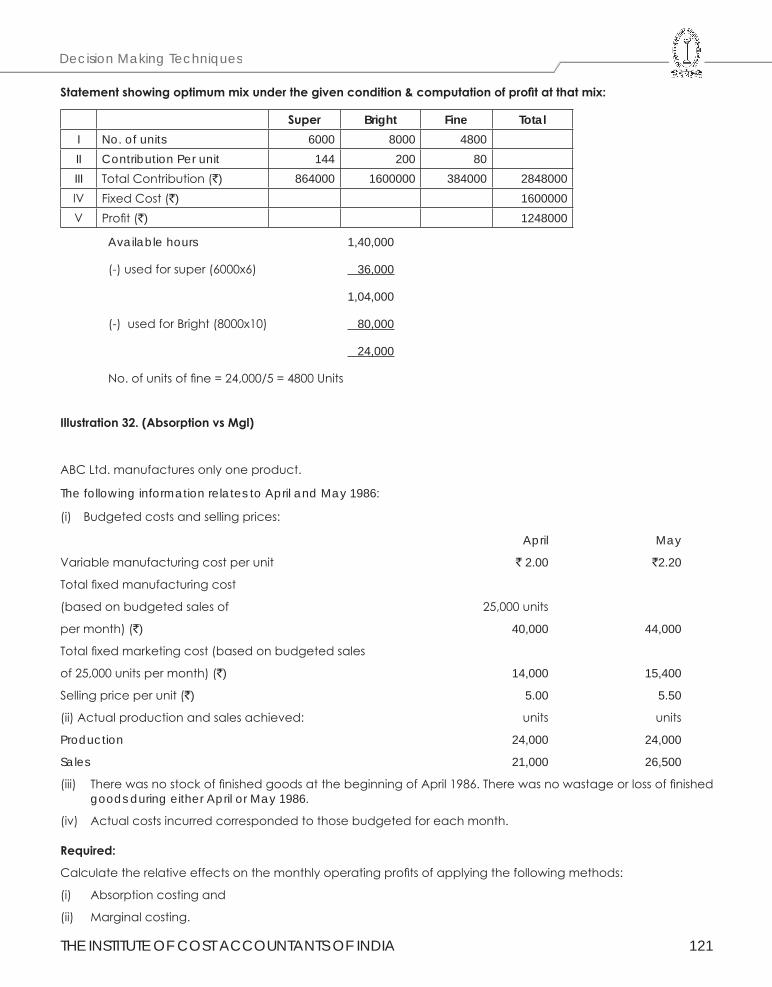
THE INSTITUTE OF COST ACCOUNTANTS OF INDIA 121
Decision Making Techniques
Statementshowingoptimummixunderthegivencondition&computationofprofitatthatmix:
Super Bright Fine TotalI No. of units 6000 8000 4800II Contribution Per unit 144 200 80III Total Contribution (`) 864000 1600000 384000 2848000IV Fixed Cost (`) 1600000V Profit (`) 1248000
Available hours 1,40,000
(-) used for super (6000x6) 36,000
1,04,000
(-) used for Bright (8000x10) 80,000
24,000
No. of units of fine = 24,000/5 = 4800 Units
Illustration32.(AbsorptionvsMgl)
ABC Ltd. manufactures only one product.
The following information relates to April and May 1986:
(i) Budgeted costs and selling prices:
April May
Variable manufacturing cost per unit ` 2.00 `2.20
Total fixed manufacturing cost
(based on budgeted sales of 25,000 units
per month) (`) 40,000 44,000
Total fixed marketing cost (based on budgeted sales
of 25,000 units per month) (`) 14,000 15,400
Selling price per unit (`) 5.00 5.50
(ii) Actual production and sales achieved: units units
Production 24,000 24,000
Sales 21,000 26,500
(iii) There was no stock of finished goods at the beginning of April 1986. There was no wastage or loss of finished goods during either April or May 1986.
(iv) Actual costs incurred corresponded to those budgeted for each month.
Required:
Calculate the relative effects on the monthly operating profits of applying the following methods:
(i) Absorption costing and
(ii) Marginal costing.
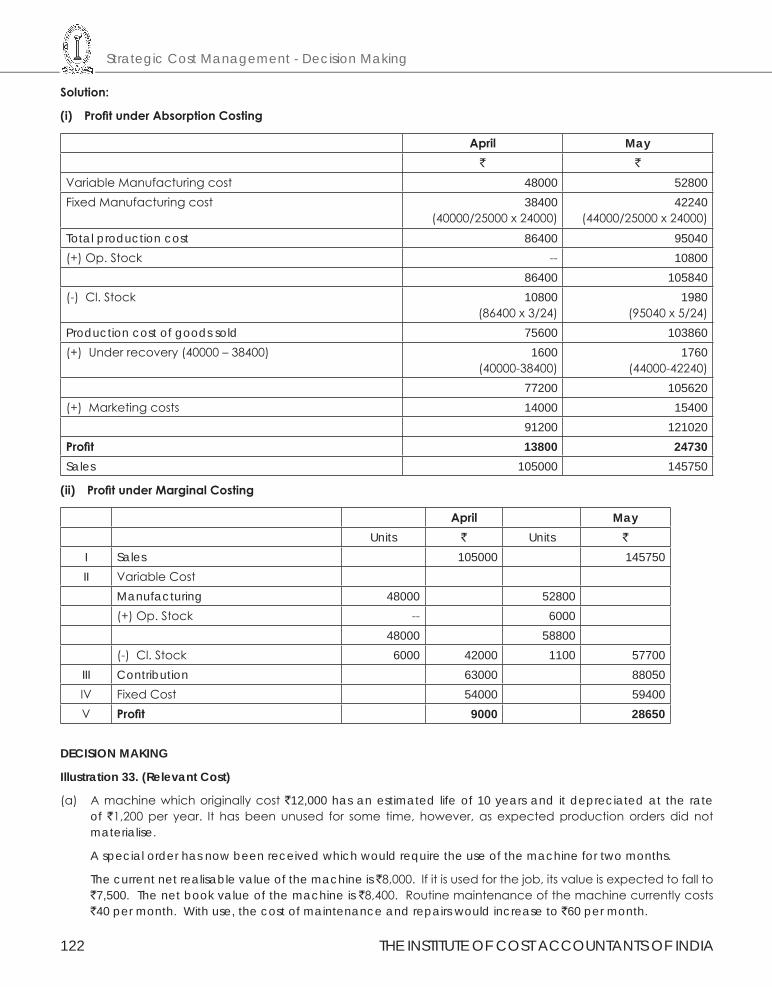
Strategic Cost Management - Decision Making
122 THE INSTITUTE OF COST ACCOUNTANTS OF INDIA
Solution:
(i) ProfitunderAbsorptionCosting
April May` `
Variable Manufacturing cost 48000 52800Fixed Manufacturing cost 38400
(40000/25000 x 24000)42240
(44000/25000 x 24000)Total production cost 86400 95040(+) Op. Stock -- 10800
86400 105840(-) Cl. Stock 10800
(86400 x 3/24)1980
(95040 x 5/24)Production cost of goods sold 75600 103860(+) Under recovery (40000 – 38400) 1600
(40000-38400)1760
(44000-42240)77200 105620
(+) Marketing costs 14000 1540091200 121020
Profit 13800 24730Sales 105000 145750
(ii) ProfitunderMarginalCosting
April MayUnits ` Units `
I Sales 105000 145750II Variable Cost
Manufacturing 48000 52800(+) Op. Stock -- 6000
48000 58800(-) Cl. Stock 6000 42000 1100 57700
III Contribution 63000 88050IV Fixed Cost 54000 59400V Profit 9000 28650
DECISION MAKING
Illustration 33. (Relevant Cost)
(a) A machine which originally cost `12,000 has an estimated life of 10 years and it depreciated at the rate of `1,200 per year. It has been unused for some time, however, as expected production orders did not materialise.
A special order has now been received which would require the use of the machine for two months.
The current net realisable value of the machine is `8,000. If it is used for the job, its value is expected to fall to `7,500. The net book value of the machine is `8,400. Routine maintenance of the machine currently costs `40 per month. With use, the cost of maintenance and repairs would increase to `60 per month.
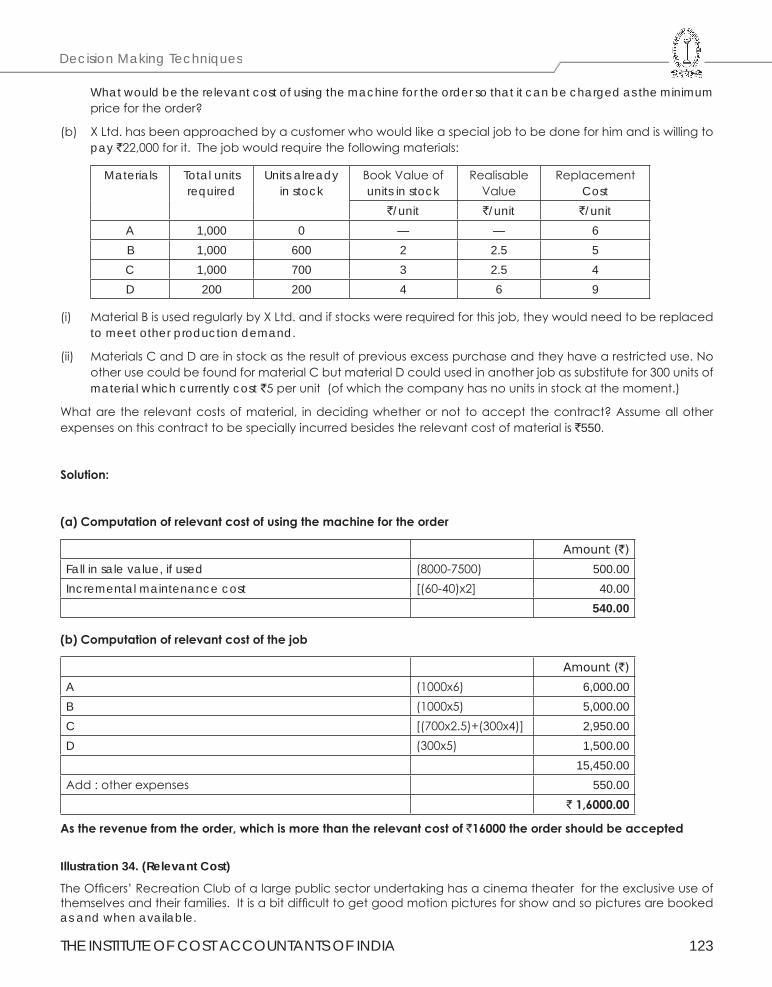
THE INSTITUTE OF COST ACCOUNTANTS OF INDIA 123
Decision Making Techniques
What would be the relevant cost of using the machine for the order so that it can be charged as the minimum price for the order?
(b) X Ltd. has been approached by a customer who would like a special job to be done for him and is willing to pay `22,000 for it. The job would require the following materials:
Materials Total units required
Units already in stock
Book Value of units in stock
Realisable Value
Replacement Cost
`/unit `/unit `/unitA 1,000 0 — — 6B 1,000 600 2 2.5 5C 1,000 700 3 2.5 4D 200 200 4 6 9
(i) Material B is used regularly by X Ltd. and if stocks were required for this job, they would need to be replaced to meet other production demand.
(ii) Materials C and D are in stock as the result of previous excess purchase and they have a restricted use. No other use could be found for material C but material D could used in another job as substitute for 300 units of material which currently cost `5 per unit (of which the company has no units in stock at the moment.)
What are the relevant costs of material, in deciding whether or not to accept the contract? Assume all other expenses on this contract to be specially incurred besides the relevant cost of material is `550.
Solution:
(a)Computationofrelevantcostofusingthemachinefortheorder
Amount (`)
Fall in sale value, if used (8000-7500) 500.00 Incremental maintenance cost [(60-40)x2] 40.00
540.00
(b)Computationofrelevantcostofthejob
Amount (`)
A (1000x6) 6,000.00 B (1000x5) 5,000.00 C [(700x2.5)+(300x4)] 2,950.00 D (300x5) 1,500.00
15,450.00 Add : other expenses 550.00
`1,6000.00
Astherevenuefromtheorder,whichismorethantherelevantcostof`16000theordershouldbeaccepted
Illustration 34. (Relevant Cost)
The Officers’ Recreation Club of a large public sector undertaking has a cinema theater for the exclusive use of themselves and their families. It is a bit difficult to get good motion pictures for show and so pictures are booked as and when available.
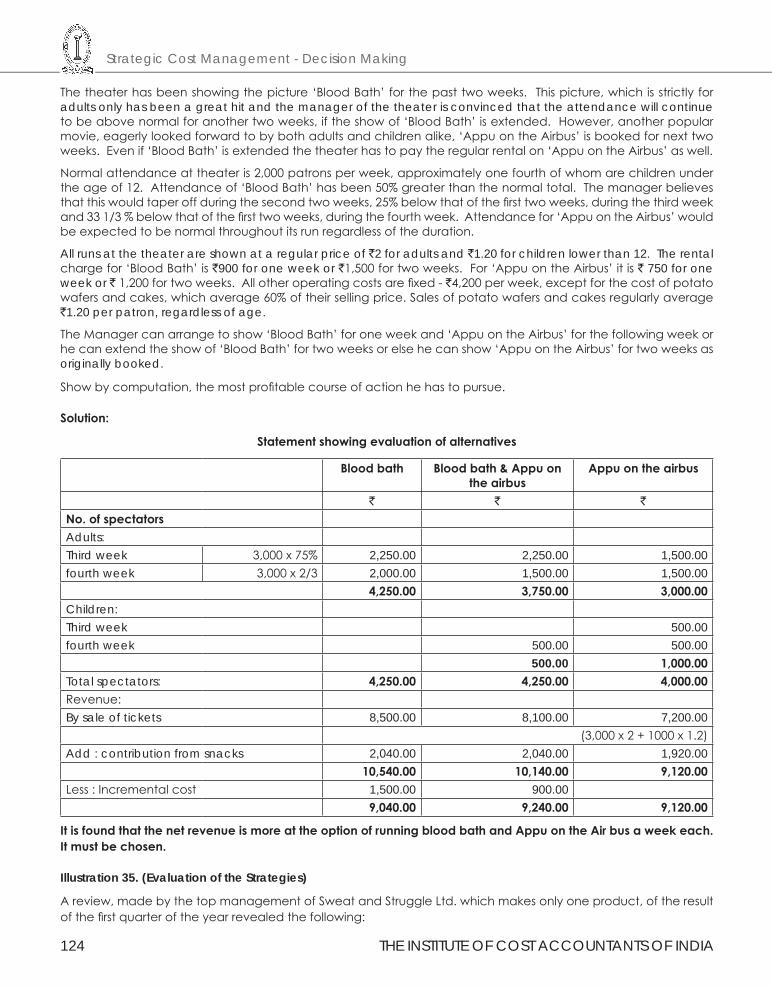
Strategic Cost Management - Decision Making
124 THE INSTITUTE OF COST ACCOUNTANTS OF INDIA
The theater has been showing the picture ‘Blood Bath’ for the past two weeks. This picture, which is strictly for adults only has been a great hit and the manager of the theater is convinced that the attendance will continue to be above normal for another two weeks, if the show of ‘Blood Bath’ is extended. However, another popular movie, eagerly looked forward to by both adults and children alike, ‘Appu on the Airbus’ is booked for next two weeks. Even if ‘Blood Bath’ is extended the theater has to pay the regular rental on ‘Appu on the Airbus’ as well.
Normal attendance at theater is 2,000 patrons per week, approximately one fourth of whom are children under the age of 12. Attendance of ‘Blood Bath’ has been 50% greater than the normal total. The manager believes that this would taper off during the second two weeks, 25% below that of the first two weeks, during the third week and 33 1/3 % below that of the first two weeks, during the fourth week. Attendance for ‘Appu on the Airbus’ would be expected to be normal throughout its run regardless of the duration.
All runs at the theater are shown at a regular price of `2 for adults and `1.20 for children lower than 12. The rental charge for ‘Blood Bath’ is `900 for one week or `1,500 for two weeks. For ‘Appu on the Airbus’ it is ` 750 for one week or ` 1,200 for two weeks. All other operating costs are fixed - `4,200 per week, except for the cost of potato wafers and cakes, which average 60% of their selling price. Sales of potato wafers and cakes regularly average `1.20 per patron, regardless of age.
The Manager can arrange to show ‘Blood Bath’ for one week and ‘Appu on the Airbus’ for the following week or he can extend the show of ‘Blood Bath’ for two weeks or else he can show ‘Appu on the Airbus’ for two weeks as originally booked.
Show by computation, the most profitable course of action he has to pursue.
Solution:
Statementshowingevaluationofalternatives
Bloodbath Bloodbath&Appuontheairbus
Appuontheairbus
` ` `
No.ofspectatorsAdults:Third week 3,000 x 75% 2,250.00 2,250.00 1,500.00 fourth week 3,000 x 2/3 2,000.00 1,500.00 1,500.00
4,250.00 3,750.00 3,000.00Children:Third week 500.00 fourth week 500.00 500.00
500.00 1,000.00Total spectators: 4,250.00 4,250.00 4,000.00Revenue:By sale of tickets 8,500.00 8,100.00 7,200.00
(3,000 x 2 + 1000 x 1.2)Add : contribution from snacks 2,040.00 2,040.00 1,920.00
10,540.00 10,140.00 9,120.00Less : Incremental cost 1,500.00 900.00
9,040.00 9,240.00 9,120.00
ItisfoundthatthenetrevenueismoreattheoptionofrunningbloodbathandAppuontheAirbusaweekeach.Itmustbechosen.
Illustration 35. (Evaluation of the Strategies)
A review, made by the top management of Sweat and Struggle Ltd. which makes only one product, of the result of the first quarter of the year revealed the following:
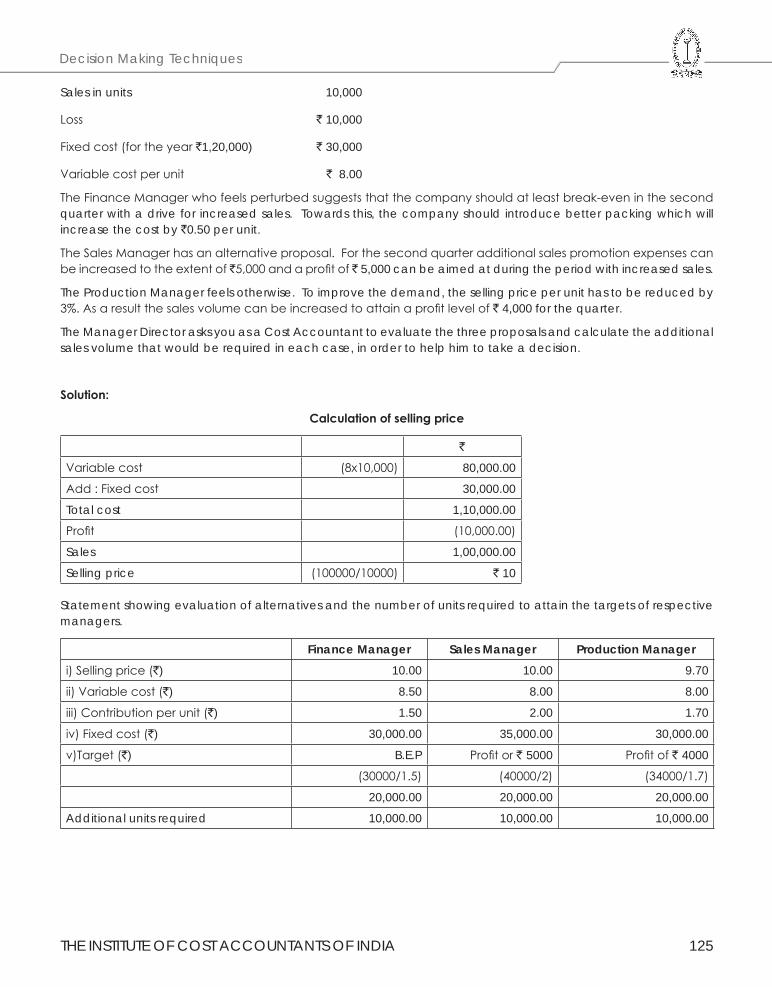
THE INSTITUTE OF COST ACCOUNTANTS OF INDIA 125
Decision Making Techniques
Sales in units 10,000
Loss ` 10,000
Fixed cost (for the year `1,20,000) ` 30,000
Variable cost per unit ` 8.00
The Finance Manager who feels perturbed suggests that the company should at least break-even in the second quarter with a drive for increased sales. Towards this, the company should introduce better packing which will increase the cost by `0.50 per unit.
The Sales Manager has an alternative proposal. For the second quarter additional sales promotion expenses can be increased to the extent of ̀ 5,000 and a profit of ̀ 5,000 can be aimed at during the period with increased sales.
The Production Manager feels otherwise. To improve the demand, the selling price per unit has to be reduced by 3%. As a result the sales volume can be increased to attain a profit level of ` 4,000 for the quarter.
The Manager Director asks you as a Cost Accountant to evaluate the three proposals and calculate the additional sales volume that would be required in each case, in order to help him to take a decision.
Solution:
Calculationofsellingprice
`
Variable cost (8x10,000) 80,000.00
Add : Fixed cost 30,000.00
Total cost 1,10,000.00
Profit (10,000.00)
Sales 1,00,000.00
Selling price (100000/10000) ` 10
Statement showing evaluation of alternatives and the number of units required to attain the targets of respective managers.
Finance Manager Sales Manager Production Manageri) Selling price (`) 10.00 10.00 9.70
ii) Variable cost (`) 8.50 8.00 8.00
iii) Contribution per unit (`) 1.50 2.00 1.70
iv) Fixed cost (`) 30,000.00 35,000.00 30,000.00
v)Target (`) B.E.P Profit or ` 5000 Profit of ` 4000
(30000/1.5) (40000/2) (34000/1.7)
20,000.00 20,000.00 20,000.00
Additional units required 10,000.00 10,000.00 10,000.00
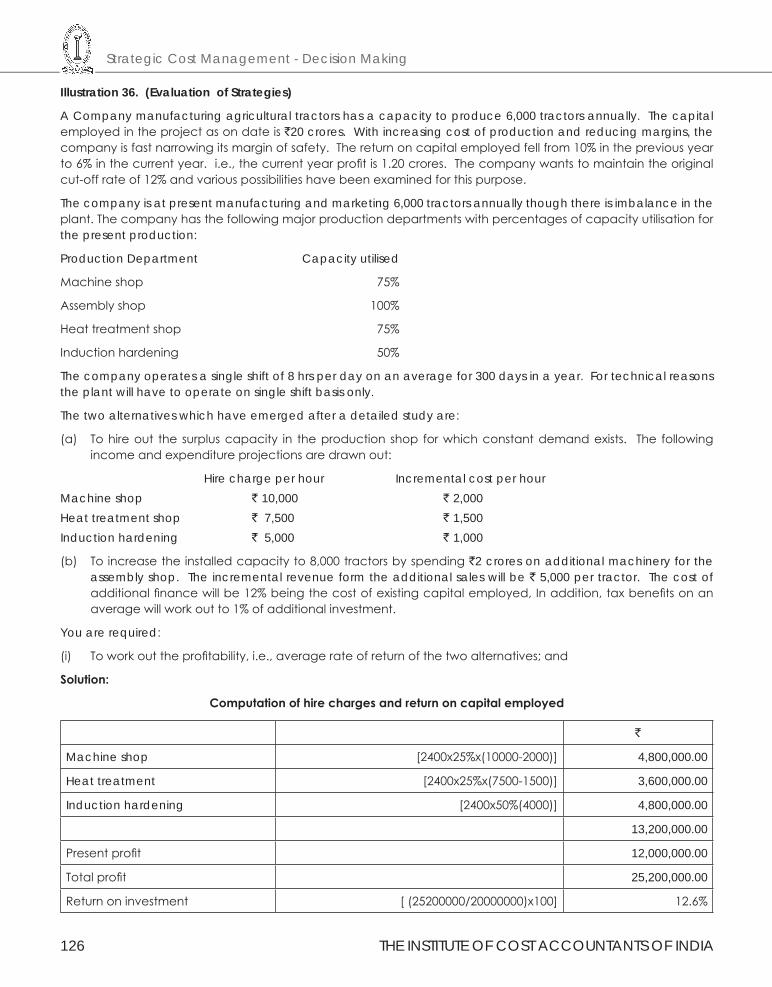
Strategic Cost Management - Decision Making
126 THE INSTITUTE OF COST ACCOUNTANTS OF INDIA
Illustration 36. (Evaluation of Strategies)
A Company manufacturing agricultural tractors has a capacity to produce 6,000 tractors annually. The capital employed in the project as on date is `20 crores. With increasing cost of production and reducing margins, the company is fast narrowing its margin of safety. The return on capital employed fell from 10% in the previous year to 6% in the current year. i.e., the current year profit is 1.20 crores. The company wants to maintain the original cut-off rate of 12% and various possibilities have been examined for this purpose.
The company is at present manufacturing and marketing 6,000 tractors annually though there is imbalance in the plant. The company has the following major production departments with percentages of capacity utilisation for the present production:
Production Department Capacity utilised
Machine shop 75%
Assembly shop 100%
Heat treatment shop 75%
Induction hardening 50%
The company operates a single shift of 8 hrs per day on an average for 300 days in a year. For technical reasons the plant will have to operate on single shift basis only.
The two alternatives which have emerged after a detailed study are:
(a) To hire out the surplus capacity in the production shop for which constant demand exists. The following income and expenditure projections are drawn out:
Hire charge per hour Incremental cost per hourMachine shop ` 10,000 ` 2,000Heat treatment shop ` 7,500 ` 1,500Induction hardening ` 5,000 ` 1,000
(b) To increase the installed capacity to 8,000 tractors by spending `2 crores on additional machinery for the assembly shop. The incremental revenue form the additional sales will be ` 5,000 per tractor. The cost of additional finance will be 12% being the cost of existing capital employed, In addition, tax benefits on an average will work out to 1% of additional investment.
You are required:
(i) To work out the profitability, i.e., average rate of return of the two alternatives; and
Solution:
Computationofhirechargesandreturnoncapitalemployed
`
Machine shop [2400x25%x(10000-2000)] 4,800,000.00
Heat treatment [2400x25%x(7500-1500)] 3,600,000.00
Induction hardening [2400x50%(4000)] 4,800,000.00
13,200,000.00
Present profit 12,000,000.00
Total profit 25,200,000.00
Return on investment [ (25200000/20000000)x100] 12.6%
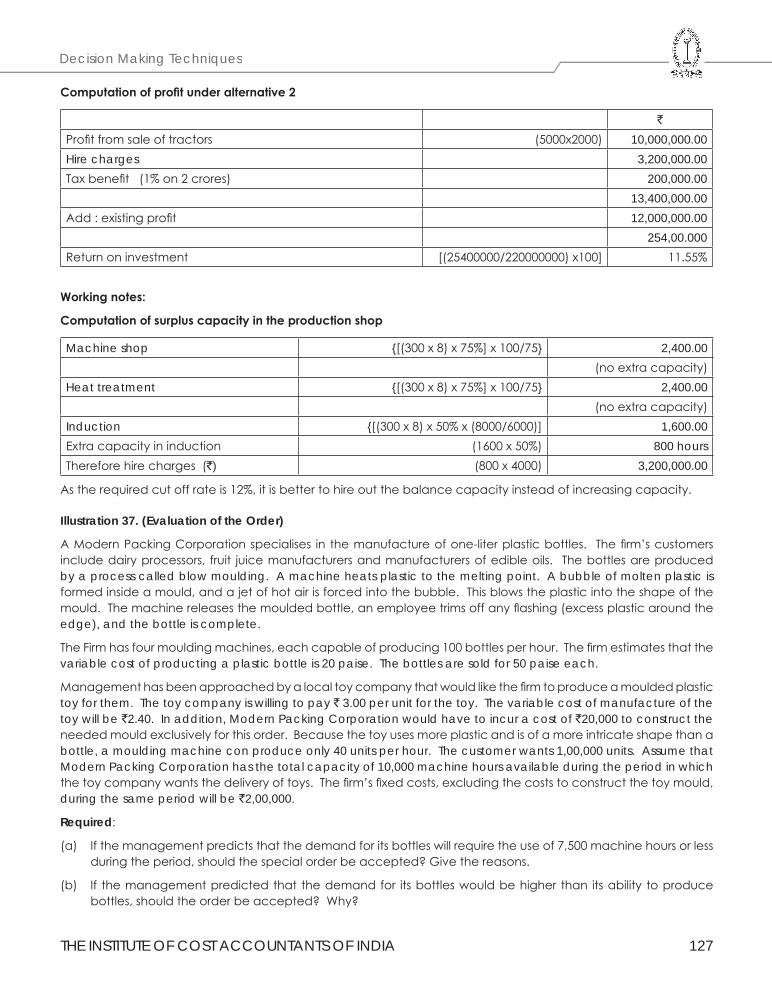
THE INSTITUTE OF COST ACCOUNTANTS OF INDIA 127
Decision Making Techniques
Computationofprofitunderalternative2
`
Profit from sale of tractors (5000x2000) 10,000,000.00 Hire charges 3,200,000.00 Tax benefit (1% on 2 crores) 200,000.00
13,400,000.00 Add : existing profit 12,000,000.00
254,00.000Return on investment [(25400000/220000000) x100] 11.55%
Workingnotes:
Computationofsurpluscapacityintheproductionshop
Machine shop {[(300 x 8) x 75%] x 100/75} 2,400.00 (no extra capacity)
Heat treatment {[(300 x 8) x 75%] x 100/75} 2,400.00 (no extra capacity)
Induction {[(300 x 8) x 50% x (8000/6000)] 1,600.00 Extra capacity in induction (1600 x 50%) 800 hoursTherefore hire charges (`) (800 x 4000) 3,200,000.00
As the required cut off rate is 12%, it is better to hire out the balance capacity instead of increasing capacity.
Illustration 37. (Evaluation of the Order)
A Modern Packing Corporation specialises in the manufacture of one-liter plastic bottles. The firm’s customers include dairy processors, fruit juice manufacturers and manufacturers of edible oils. The bottles are produced by a process called blow moulding. A machine heats plastic to the melting point. A bubble of molten plastic is formed inside a mould, and a jet of hot air is forced into the bubble. This blows the plastic into the shape of the mould. The machine releases the moulded bottle, an employee trims off any flashing (excess plastic around the edge), and the bottle is complete.
The Firm has four moulding machines, each capable of producing 100 bottles per hour. The firm estimates that the variable cost of producting a plastic bottle is 20 paise. The bottles are sold for 50 paise each.
Management has been approached by a local toy company that would like the firm to produce a moulded plastic toy for them. The toy company is willing to pay ` 3.00 per unit for the toy. The variable cost of manufacture of the toy will be `2.40. In addition, Modern Packing Corporation would have to incur a cost of `20,000 to construct the needed mould exclusively for this order. Because the toy uses more plastic and is of a more intricate shape than a bottle, a moulding machine con produce only 40 units per hour. The customer wants 1,00,000 units. Assume that Modern Packing Corporation has the total capacity of 10,000 machine hours available during the period in which the toy company wants the delivery of toys. The firm’s fixed costs, excluding the costs to construct the toy mould, during the same period will be `2,00,000.
Required:
(a) If the management predicts that the demand for its bottles will require the use of 7,500 machine hours or less during the period, should the special order be accepted? Give the reasons.
(b) If the management predicted that the demand for its bottles would be higher than its ability to produce bottles, should the order be accepted? Why?
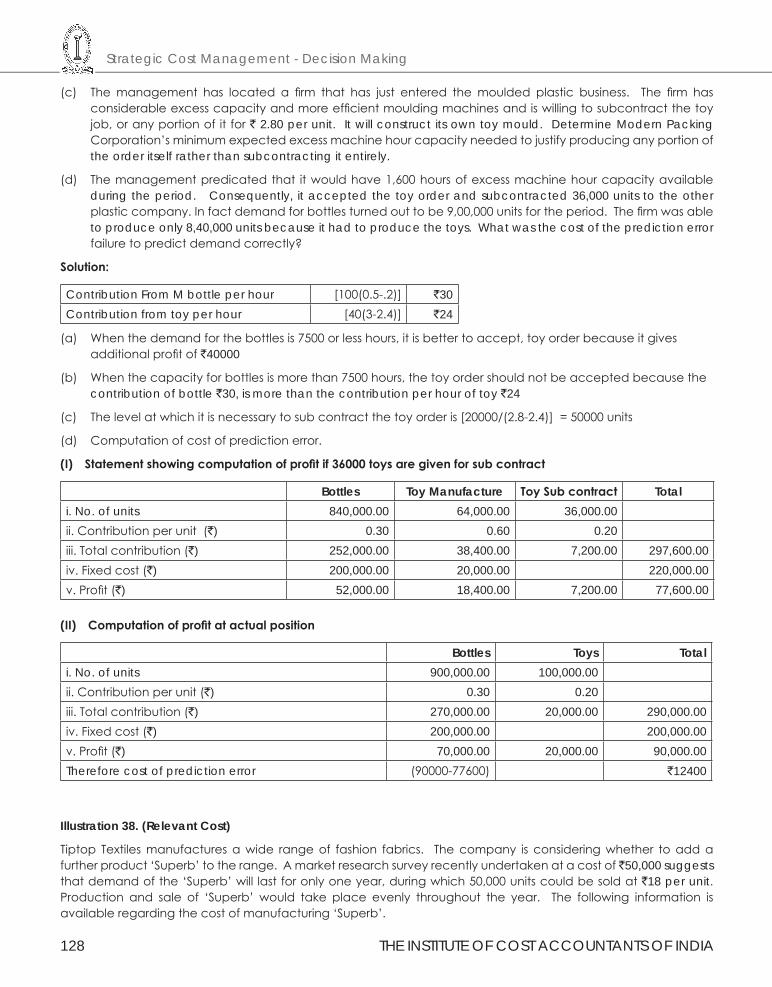
Strategic Cost Management - Decision Making
128 THE INSTITUTE OF COST ACCOUNTANTS OF INDIA
(c) The management has located a firm that has just entered the moulded plastic business. The firm has considerable excess capacity and more efficient moulding machines and is willing to subcontract the toy job, or any portion of it for ` 2.80 per unit. It will construct its own toy mould. Determine Modern Packing Corporation’s minimum expected excess machine hour capacity needed to justify producing any portion of the order itself rather than subcontracting it entirely.
(d) The management predicated that it would have 1,600 hours of excess machine hour capacity available during the period. Consequently, it accepted the toy order and subcontracted 36,000 units to the other plastic company. In fact demand for bottles turned out to be 9,00,000 units for the period. The firm was able to produce only 8,40,000 units because it had to produce the toys. What was the cost of the prediction error failure to predict demand correctly?
Solution:
Contribution From M bottle per hour [100(0.5-.2)] `30Contribution from toy per hour [40(3-2.4)] `24
(a) When the demand for the bottles is 7500 or less hours, it is better to accept, toy order because it gives additional profit of `40000
(b) When the capacity for bottles is more than 7500 hours, the toy order should not be accepted because the contribution of bottle `30, is more than the contribution per hour of toy `24
(c) The level at which it is necessary to sub contract the toy order is [20000/(2.8-2.4)] = 50000 units
(d) Computation of cost of prediction error.
(I) Statementshowingcomputationofprofitif36000toysaregivenforsubcontract
Bottles Toy Manufacture ToySubcontract Totali. No. of units 840,000.00 64,000.00 36,000.00 ii. Contribution per unit (`) 0.30 0.60 0.20 iii. Total contribution (`) 252,000.00 38,400.00 7,200.00 297,600.00 iv. Fixed cost (`) 200,000.00 20,000.00 220,000.00 v. Profit (`) 52,000.00 18,400.00 7,200.00 77,600.00
(II) Computationofprofitatactualposition
Bottles Toys Total i. No. of units 900,000.00 100,000.00 ii. Contribution per unit (`) 0.30 0.20 iii. Total contribution (`) 270,000.00 20,000.00 290,000.00 iv. Fixed cost (`) 200,000.00 200,000.00 v. Profit (`) 70,000.00 20,000.00 90,000.00 Therefore cost of prediction error (90000-77600) `12400
Illustration 38. (Relevant Cost)
Tiptop Textiles manufactures a wide range of fashion fabrics. The company is considering whether to add a further product ‘Superb’ to the range. A market research survey recently undertaken at a cost of `50,000 suggests that demand of the ‘Superb’ will last for only one year, during which 50,000 units could be sold at `18 per unit. Production and sale of ‘Superb’ would take place evenly throughout the year. The following information is available regarding the cost of manufacturing ‘Superb’.
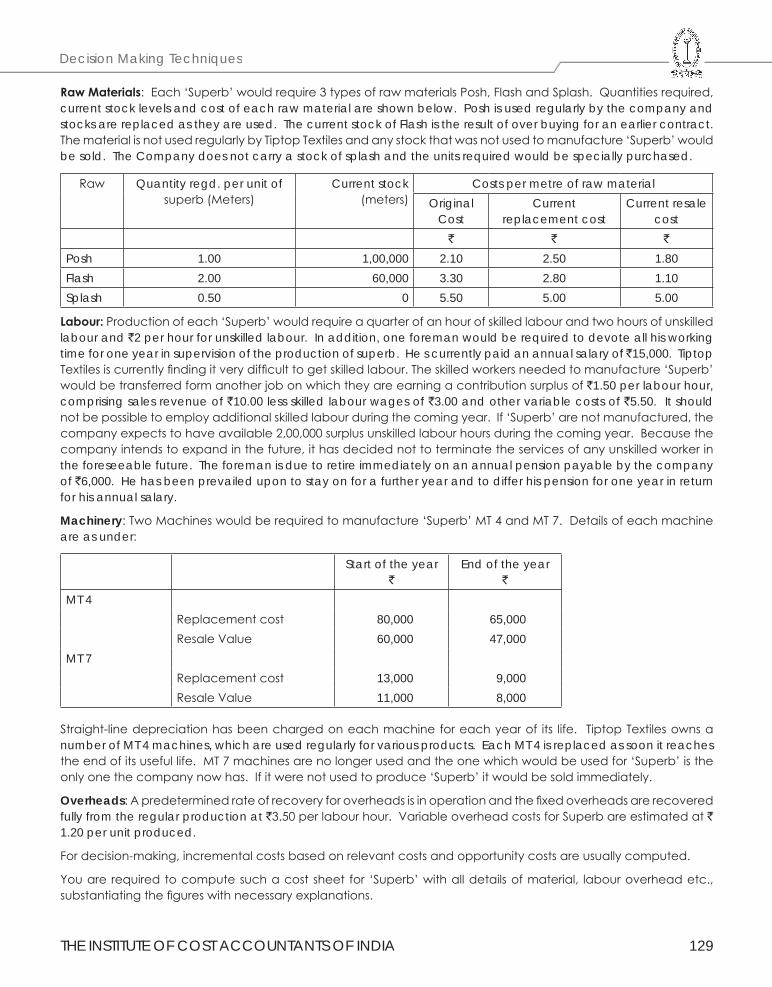
THE INSTITUTE OF COST ACCOUNTANTS OF INDIA 129
Decision Making Techniques
RawMaterials: Each ‘Superb’ would require 3 types of raw materials Posh, Flash and Splash. Quantities required, current stock levels and cost of each raw material are shown below. Posh is used regularly by the company and stocks are replaced as they are used. The current stock of Flash is the result of over buying for an earlier contract. The material is not used regularly by Tiptop Textiles and any stock that was not used to manufacture ‘Superb’ would be sold. The Company does not carry a stock of splash and the units required would be specially purchased.
Raw Quantity regd. per unit of superb (Meters)
Current stock (meters)
Costs per metre of raw materialOriginal
CostCurrent
replacement costCurrent resale
cost` ` `
Posh 1.00 1,00,000 2.10 2.50 1.80Flash 2.00 60,000 3.30 2.80 1.10Splash 0.50 0 5.50 5.00 5.00
Labour: Production of each ‘Superb’ would require a quarter of an hour of skilled labour and two hours of unskilled labour and `2 per hour for unskilled labour. In addition, one foreman would be required to devote all his working time for one year in supervision of the production of superb. He s currently paid an annual salary of ̀ 15,000. Tiptop Textiles is currently finding it very difficult to get skilled labour. The skilled workers needed to manufacture ‘Superb’ would be transferred form another job on which they are earning a contribution surplus of `1.50 per labour hour, comprising sales revenue of `10.00 less skilled labour wages of `3.00 and other variable costs of `5.50. It should not be possible to employ additional skilled labour during the coming year. If ‘Superb’ are not manufactured, the company expects to have available 2,00,000 surplus unskilled labour hours during the coming year. Because the company intends to expand in the future, it has decided not to terminate the services of any unskilled worker in the foreseeable future. The foreman is due to retire immediately on an annual pension payable by the company of `6,000. He has been prevailed upon to stay on for a further year and to differ his pension for one year in return for his annual salary.
Machinery: Two Machines would be required to manufacture ‘Superb’ MT 4 and MT 7. Details of each machine are as under:
Start of the year `
End of the year`
MT 4Replacement cost 80,000 65,000Resale Value 60,000 47,000
MT 7Replacement cost 13,000 9,000Resale Value 11,000 8,000
Straight-line depreciation has been charged on each machine for each year of its life. Tiptop Textiles owns a number of MT 4 machines, which are used regularly for various products. Each MT 4 is replaced as soon it reaches the end of its useful life. MT 7 machines are no longer used and the one which would be used for ‘Superb’ is the only one the company now has. If it were not used to produce ‘Superb’ it would be sold immediately.
Overheads: A predetermined rate of recovery for overheads is in operation and the fixed overheads are recovered fully from the regular production at `3.50 per labour hour. Variable overhead costs for Superb are estimated at ` 1.20 per unit produced.
For decision-making, incremental costs based on relevant costs and opportunity costs are usually computed.
You are required to compute such a cost sheet for ‘Superb’ with all details of material, labour overhead etc., substantiating the figures with necessary explanations.
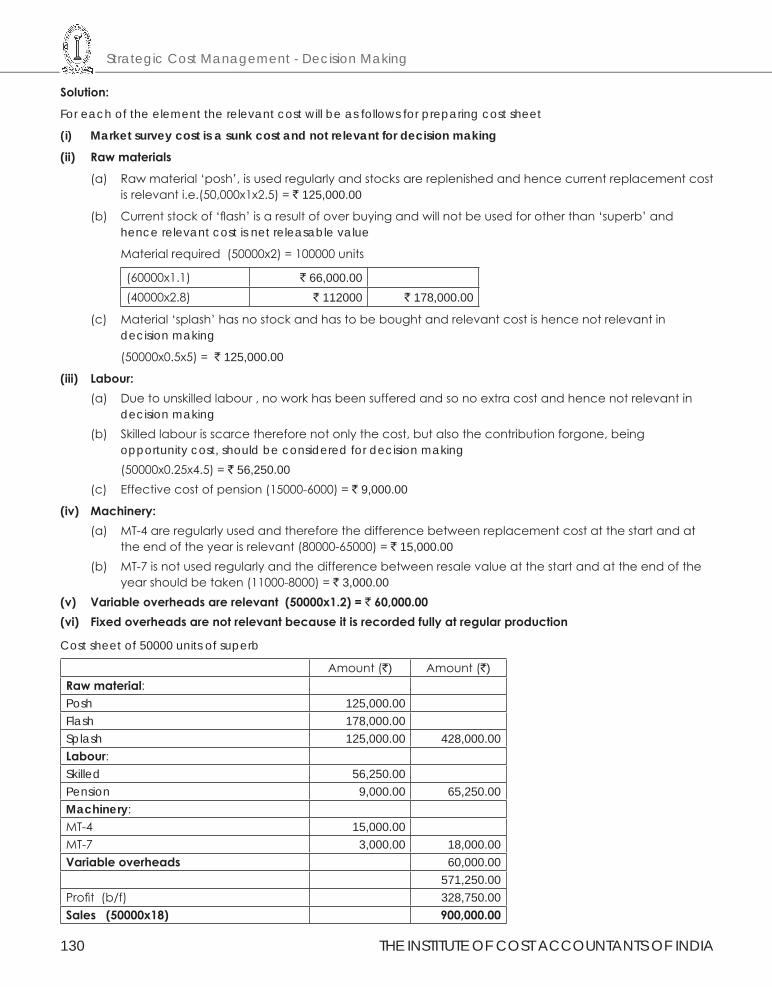
Strategic Cost Management - Decision Making
130 THE INSTITUTE OF COST ACCOUNTANTS OF INDIA
Solution:
For each of the element the relevant cost will be as follows for preparing cost sheet
(i) Market survey cost is a sunk cost and not relevant for decision making
(ii) Rawmaterials
(a) Raw material ‘posh’, is used regularly and stocks are replenished and hence current replacement cost is relevant i.e.(50,000x1x2.5) = ` 125,000.00
(b) Current stock of ‘flash’ is a result of over buying and will not be used for other than ‘superb’ and hence relevant cost is net releasable value
Material required (50000x2) = 100000 units
(60000x1.1) ` 66,000.00 (40000x2.8) ` 112000 ` 178,000.00
(c) Material ‘splash’ has no stock and has to be bought and relevant cost is hence not relevant in decision making
(50000x0.5x5) = ` 125,000.00
(iii) Labour:(a) Due to unskilled labour , no work has been suffered and so no extra cost and hence not relevant in
decision making(b) Skilled labour is scarce therefore not only the cost, but also the contribution forgone, being
opportunity cost, should be considered for decision making (50000x0.25x4.5) = ` 56,250.00(c) Effective cost of pension (15000-6000) = ` 9,000.00
(iv) Machinery:(a) MT-4 are regularly used and therefore the difference between replacement cost at the start and at
the end of the year is relevant (80000-65000) = ` 15,000.00(b) MT-7 is not used regularly and the difference between resale value at the start and at the end of the
year should be taken (11000-8000) = ` 3,000.00(v) Variableoverheadsarerelevant(50000x1.2)=`60,000.00(vi) Fixedoverheadsarenotrelevantbecauseitisrecordedfullyatregularproduction
Cost sheet of 50000 units of superb
Amount (`) Amount (`)Rawmaterial:Posh 125,000.00 Flash 178,000.00 Splash 125,000.00 428,000.00 Labour:Skilled 56,250.00Pension 9,000.00 65,250.00Machinery:MT-4 15,000.00MT-7 3,000.00 18,000.00Variableoverheads 60,000.00
571,250.00 Profit (b/f) 328,750.00Sales(50000x18) 900,000.00
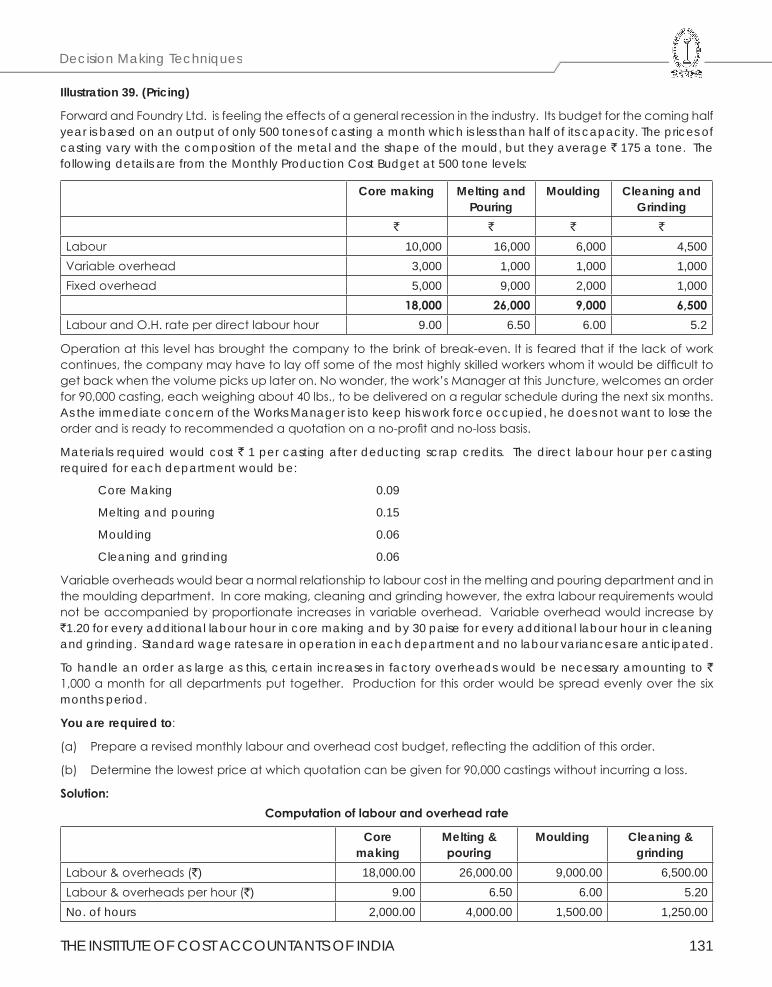
THE INSTITUTE OF COST ACCOUNTANTS OF INDIA 131
Decision Making Techniques
Illustration 39. (Pricing)
Forward and Foundry Ltd. is feeling the effects of a general recession in the industry. Its budget for the coming half year is based on an output of only 500 tones of casting a month which is less than half of its capacity. The prices of casting vary with the composition of the metal and the shape of the mould, but they average ` 175 a tone. The following details are from the Monthly Production Cost Budget at 500 tone levels:
Core making Melting andPouring
Moulding Cleaning andGrinding
` ` ` `
Labour 10,000 16,000 6,000 4,500Variable overhead 3,000 1,000 1,000 1,000Fixed overhead 5,000 9,000 2,000 1,000
18,000 26,000 9,000 6,500Labour and O.H. rate per direct labour hour 9.00 6.50 6.00 5.2
Operation at this level has brought the company to the brink of break-even. It is feared that if the lack of work continues, the company may have to lay off some of the most highly skilled workers whom it would be difficult to get back when the volume picks up later on. No wonder, the work’s Manager at this Juncture, welcomes an order for 90,000 casting, each weighing about 40 lbs., to be delivered on a regular schedule during the next six months. As the immediate concern of the Works Manager is to keep his work force occupied, he does not want to lose the order and is ready to recommended a quotation on a no-profit and no-loss basis.
Materials required would cost ` 1 per casting after deducting scrap credits. The direct labour hour per casting required for each department would be:
Core Making 0.09
Melting and pouring 0.15
Moulding 0.06
Cleaning and grinding 0.06
Variable overheads would bear a normal relationship to labour cost in the melting and pouring department and in the moulding department. In core making, cleaning and grinding however, the extra labour requirements would not be accompanied by proportionate increases in variable overhead. Variable overhead would increase by `1.20 for every additional labour hour in core making and by 30 paise for every additional labour hour in cleaning and grinding. Standard wage rates are in operation in each department and no labour variances are anticipated.
To handle an order as large as this, certain increases in factory overheads would be necessary amounting to ` 1,000 a month for all departments put together. Production for this order would be spread evenly over the six months period.
You are required to:
(a) Prepare a revised monthly labour and overhead cost budget, reflecting the addition of this order.
(b) Determine the lowest price at which quotation can be given for 90,000 castings without incurring a loss.
Solution:Computationoflabourandoverheadrate
Core making
Melting & pouring
Moulding Cleaning & grinding
Labour & overheads (`) 18,000.00 26,000.00 9,000.00 6,500.00 Labour & overheads per hour (`) 9.00 6.50 6.00 5.20 No. of hours 2,000.00 4,000.00 1,500.00 1,250.00
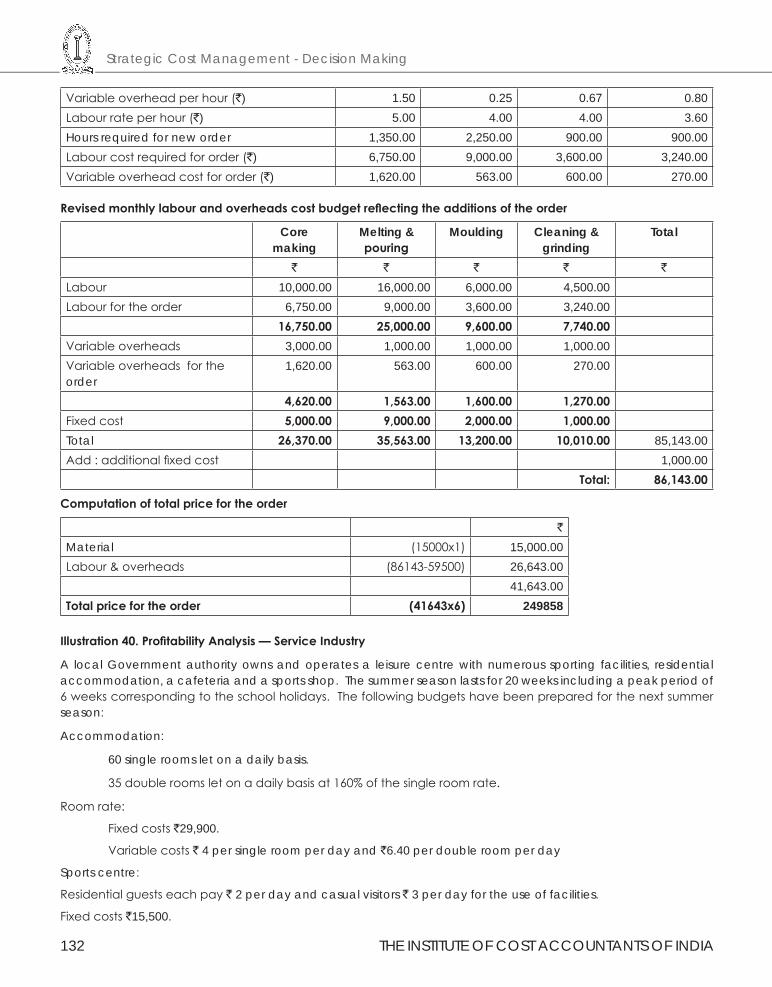
Strategic Cost Management - Decision Making
132 THE INSTITUTE OF COST ACCOUNTANTS OF INDIA
Variable overhead per hour (`) 1.50 0.25 0.67 0.80 Labour rate per hour (`) 5.00 4.00 4.00 3.60 Hours required for new order 1,350.00 2,250.00 900.00 900.00 Labour cost required for order (`) 6,750.00 9,000.00 3,600.00 3,240.00 Variable overhead cost for order (`) 1,620.00 563.00 600.00 270.00
Revisedmonthlylabourandoverheadscostbudgetreflectingtheadditionsoftheorder
Core making
Melting & pouring
Moulding Cleaning & grinding
Total
` ` ` ` `
Labour 10,000.00 16,000.00 6,000.00 4,500.00 Labour for the order 6,750.00 9,000.00 3,600.00 3,240.00
16,750.00 25,000.00 9,600.00 7,740.00Variable overheads 3,000.00 1,000.00 1,000.00 1,000.00 Variable overheads for the order
1,620.00 563.00 600.00 270.00
4,620.00 1,563.00 1,600.00 1,270.00Fixed cost 5,000.00 9,000.00 2,000.00 1,000.00Total 26,370.00 35,563.00 13,200.00 10,010.00 85,143.00 Add : additional fixed cost 1,000.00
Total: 86,143.00
Computationoftotalpricefortheorder
`
Material (15000x1) 15,000.00 Labour & overheads (86143-59500) 26,643.00
41,643.00 Totalpricefortheorder (41643x6) 249858
Illustration40.ProfitabilityAnalysis—ServiceIndustry
A local Government authority owns and operates a leisure centre with numerous sporting facilities, residential accommodation, a cafeteria and a sports shop. The summer season lasts for 20 weeks including a peak period of 6 weeks corresponding to the school holidays. The following budgets have been prepared for the next summer season:
Accommodation:
60 single rooms let on a daily basis.
35 double rooms let on a daily basis at 160% of the single room rate.
Room rate:
Fixed costs `29,900.
Variable costs ` 4 per single room per day and `6.40 per double room per day
Sports centre:
Residential guests each pay ` 2 per day and casual visitors ` 3 per day for the use of facilities.
Fixed costs `15,500.

THE INSTITUTE OF COST ACCOUNTANTS OF INDIA 133
Decision Making Techniques
Sports Shop:
Estimated contribution `1 per person per day.
Fixed costs ` 8,250.
Cafeteria:
Estimated contribution ` 1.50 per person per day.
Fixed costs `12,750.
During the summer season the centre is open7 day a week and the
Following activity levels are anticipated.
Double rooms fully booked for the whole season.
Single rooms fully booked for the peak period but at only 80% of
Capacity during the rest of the season.
30 casual visitors per day on average.
You are required to:
(a) Calculate the charges for single and double rooms assuming that the authority wishes to make a ` 10,000 profit on accommodation.
(b) Calculate the anticipated total profit for the leisure centre as a whole for the season.
(c) Advise the authority whether an offer of `2,50,000 form a private leisure company to operate the centre for five years is worth while, assuming that the authority uses a 10% cost of capital and operations continue as outlined above.
Solution:
Computationofusageofroomdays
`
Single room(60x7x6) 2,520.00 (60x7x14x80%) 4,704.00
7,224.00Double room (35x7x20) 4,900.00i) Total sale value of accommodationVariable costSingle room (7224x4) 28,896.00 Double room (4900x6.4) 31,360.00 60,256.00Fixed cost 29,900.00 Required profit 10,000.00
100,156.00
Let ‘S’ be the room rent of single room and 1.6’S’ is the rent of double room Therefore
7224S + 4900(1.6S) = 100516
7224S + 7840S = 100516 = S = 6.65
Double room rent =(6.65x1.6) = 10.64

Strategic Cost Management - Decision Making
134 THE INSTITUTE OF COST ACCOUNTANTS OF INDIA
(ii) Statementshowingcomputationoftotalprofittoleisurecentre
`
a. Accommodation 10,000.00b. sports centre:Total [(7224x2)+(4900x2x2)+(30x7x20x3)] 46,648.00 Less : fixed 15,500.00 31,148.00 c. Sports Shop:Contribution [(7224x1)+(4900x2x1)+(30x7x20x1)] 21,224.00 Less : fixed 8,250.00 12,974.00 d. cafeteriaContribution [(7224x1.5)+(4900x2x1.5)+(30x7x20x1.5)] 31,836.00 Less : fixed 12,750.00 19,086.00
73,208.00
(iii) Present values
Present value compound factor @ 10% for 5 years 3.79 P.V. of profit for 5 years (73208x3.7906) ` 277,500.00
As the present value of profit for 5 years is ` 277500, which is more than the lease rent of ` 250000, it is not worthwhile to give leisure centre for lease
Illustration 41. (Relevant Cost)
Chakra Ltd. manufactures Mixer Grinders. The manufacture involves an assembly of various parts which are proceeds in the machine shop and purchased components. The on/off switch is presently being purchased form a vendor at ` 4.50 each, annual requirement being 20,000 pieces.
The production manager has put up a proposal two months back to make the switch in the machine shop. He had suggested that the company would make profit and save taxes on bought out switch. The costing department was asked to make an estimate of making the item which showed that the cost of making was ` 4.73. The purchase department continues buying the item on the basis of the cost estimate given to them. Recently, the Vendor has sent a letter requesting the purchase department to grant increase in price of 10% minimum per switch as the input costs had gone up. The costing department was once again requested to estimate cost of making the switch.
The costing department re-estimated the costs using current prices and observed that the cost of making has gone up to ` 5.33. Purchase department again decided to continue buying as it was cheaper to buy than make. The cost estimate prepared by the costing department was as under:
Annual costsPrevious (`) Current (`)
Direct Materials 40,000 48,000Direct Labour `2 per hour 20,000 22,000Overheads at `3 per hour 30,000 31,500Total cost at current price 90,000 1,01,500Add: expected increase 5% 4,500 5,075Expected manufacturing cost 94,500 1,06.575Cost per price 4.73 5.33
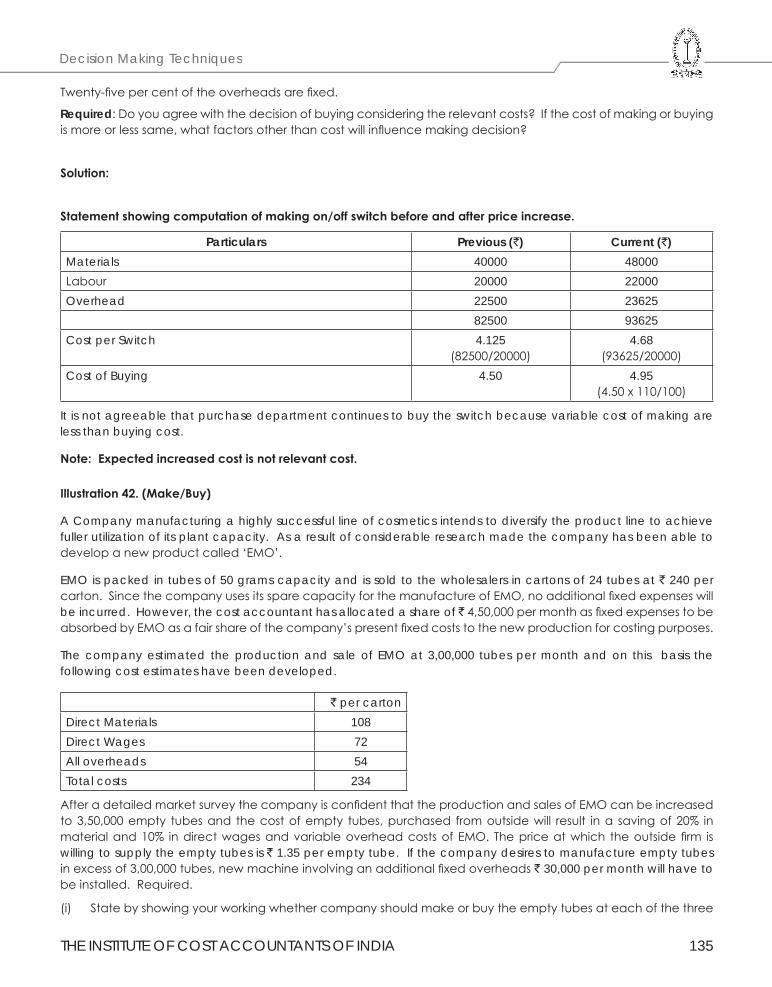
THE INSTITUTE OF COST ACCOUNTANTS OF INDIA 135
Decision Making Techniques
Twenty-five per cent of the overheads are fixed.
Required: Do you agree with the decision of buying considering the relevant costs? If the cost of making or buying is more or less same, what factors other than cost will influence making decision?
Solution:
Statementshowingcomputationofmakingon/offswitchbeforeandafterpriceincrease.
Particulars Previous (`) Current (`)Materials 40000 48000Labour 20000 22000Overhead 22500 23625
82500 93625Cost per Switch 4.125
(82500/20000)4.68
(93625/20000)Cost of Buying 4.50 4.95
(4.50 x 110/100)
It is not agreeable that purchase department continues to buy the switch because variable cost of making are less than buying cost.
Note:Expectedincreasedcostisnotrelevantcost.
Illustration42.(Make/Buy)
A Company manufacturing a highly successful line of cosmetics intends to diversify the product line to achieve fuller utilization of its plant capacity. As a result of considerable research made the company has been able to develop a new product called ‘EMO’.
EMO is packed in tubes of 50 grams capacity and is sold to the wholesalers in cartons of 24 tubes at ` 240 per carton. Since the company uses its spare capacity for the manufacture of EMO, no additional fixed expenses will be incurred. However, the cost accountant has allocated a share of ` 4,50,000 per month as fixed expenses to be absorbed by EMO as a fair share of the company’s present fixed costs to the new production for costing purposes.
The company estimated the production and sale of EMO at 3,00,000 tubes per month and on this basis the following cost estimates have been developed.
` per cartonDirect Materials 108Direct Wages 72All overheads 54Total costs 234
After a detailed market survey the company is confident that the production and sales of EMO can be increased to 3,50,000 empty tubes and the cost of empty tubes, purchased from outside will result in a saving of 20% in material and 10% in direct wages and variable overhead costs of EMO. The price at which the outside firm is willing to supply the empty tubes is ` 1.35 per empty tube. If the company desires to manufacture empty tubes in excess of 3,00,000 tubes, new machine involving an additional fixed overheads ` 30,000 per month will have to be installed. Required.
(i) State by showing your working whether company should make or buy the empty tubes at each of the three
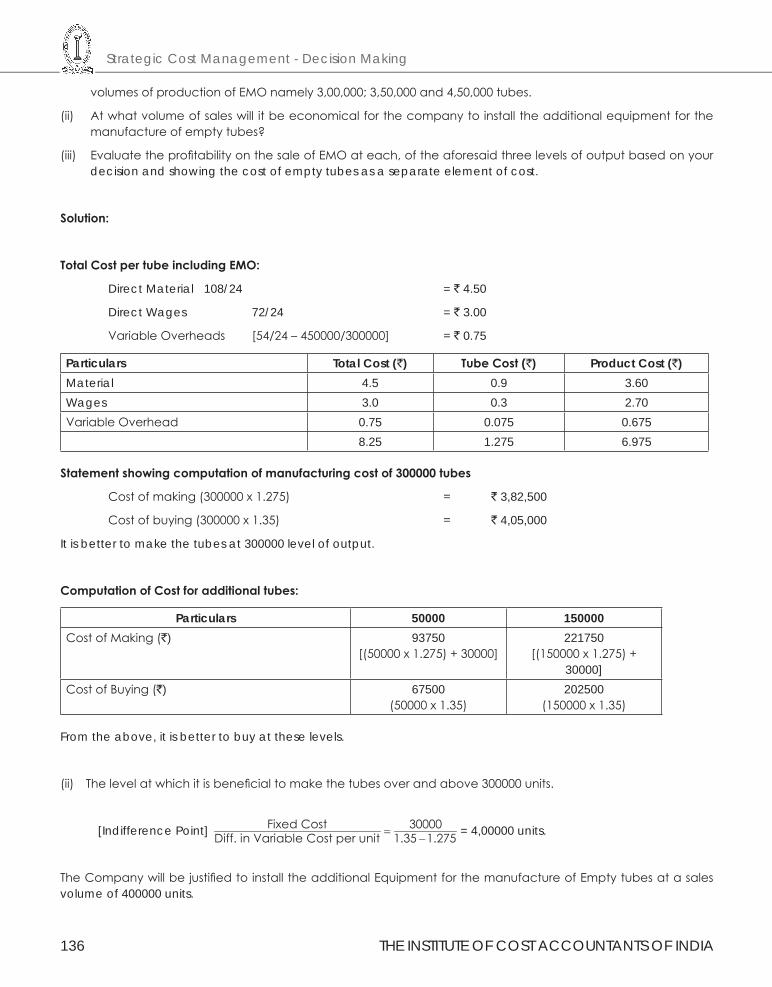
Strategic Cost Management - Decision Making
136 THE INSTITUTE OF COST ACCOUNTANTS OF INDIA
volumes of production of EMO namely 3,00,000; 3,50,000 and 4,50,000 tubes.
(ii) At what volume of sales will it be economical for the company to install the additional equipment for the manufacture of empty tubes?
(iii) Evaluate the profitability on the sale of EMO at each, of the aforesaid three levels of output based on your decision and showing the cost of empty tubes as a separate element of cost.
Solution:
TotalCostpertubeincludingEMO:
Direct Material 108/24 = ` 4.50
Direct Wages 72/24 = ` 3.00
Variable Overheads [54/24 – 450000/300000] = ` 0.75
Particulars Total Cost (`) TubeCost(`) Product Cost (`)Material 4.5 0.9 3.60Wages 3.0 0.3 2.70Variable Overhead 0.75 0.075 0.675
8.25 1.275 6.975
Statementshowingcomputationofmanufacturingcostof300000tubes
Cost of making (300000 x 1.275) = ` 3,82,500
Cost of buying (300000 x 1.35) = ` 4,05,000
It is better to make the tubes at 300000 level of output.
ComputationofCostforadditionaltubes:
Particulars 50000 150000Cost of Making (`) 93750
[(50000 x 1.275) + 30000]221750
[(150000 x 1.275) + 30000]
Cost of Buying (`) 67500(50000 x 1.35)
202500(150000 x 1.35)
From the above, it is better to buy at these levels.
(ii) The level at which it is beneficial to make the tubes over and above 300000 units.
[Indifference Point] Fixed Cost 30000Diff. in Variable Cost per unit 1.35 1.275=
−= 4,00000 units.
The Company will be justified to install the additional Equipment for the manufacture of Empty tubes at a sales volume of 400000 units.
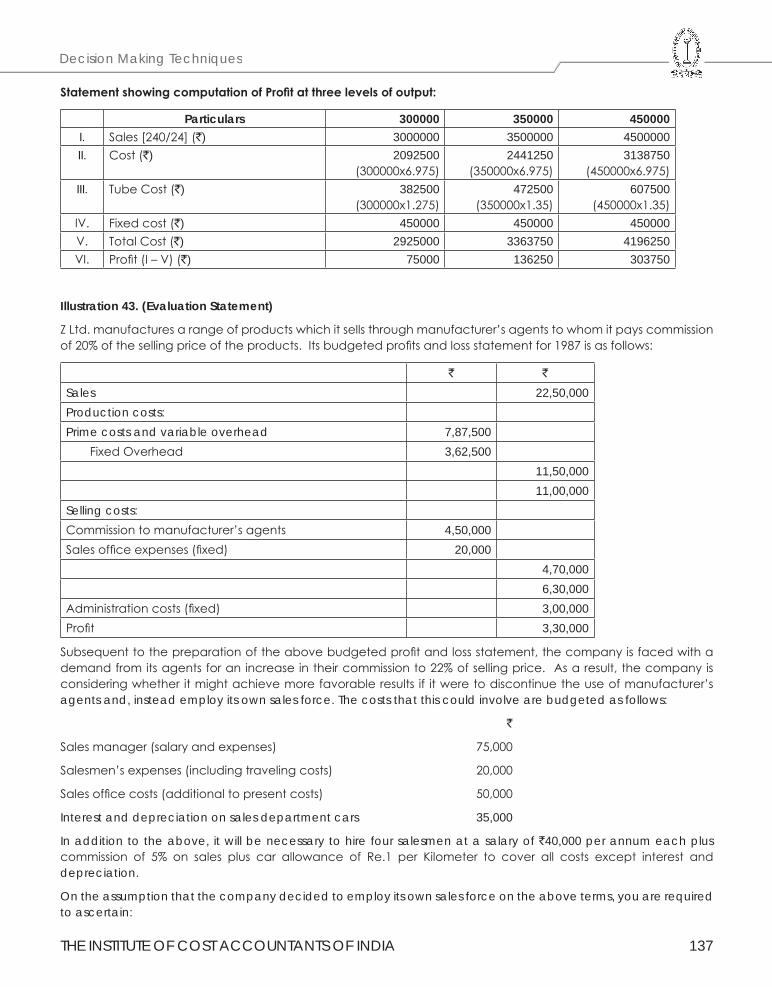
THE INSTITUTE OF COST ACCOUNTANTS OF INDIA 137
Decision Making Techniques
StatementshowingcomputationofProfitatthreelevelsofoutput:
Particulars 300000 350000 450000I. Sales [240/24] (`) 3000000 3500000 4500000II. Cost (`) 2092500
(300000x6.975)2441250
(350000x6.975)3138750
(450000x6.975)III. Tube Cost (`) 382500
(300000x1.275)472500
(350000x1.35)607500
(450000x1.35)IV. Fixed cost (`) 450000 450000 450000V. Total Cost (`) 2925000 3363750 4196250VI. Profit (I – V) (`) 75000 136250 303750
Illustration 43. (Evaluation Statement)
Z Ltd. manufactures a range of products which it sells through manufacturer’s agents to whom it pays commission of 20% of the selling price of the products. Its budgeted profits and loss statement for 1987 is as follows:
` `
Sales 22,50,000Production costs:Prime costs and variable overhead 7,87,500
Fixed Overhead 3,62,50011,50,00011,00,000
Selling costs:Commission to manufacturer’s agents 4,50,000Sales office expenses (fixed) 20,000
4,70,0006,30,000
Administration costs (fixed) 3,00,000Profit 3,30,000
Subsequent to the preparation of the above budgeted profit and loss statement, the company is faced with a demand from its agents for an increase in their commission to 22% of selling price. As a result, the company is considering whether it might achieve more favorable results if it were to discontinue the use of manufacturer’s agents and, instead employ its own sales force. The costs that this could involve are budgeted as follows:
`
Sales manager (salary and expenses) 75,000
Salesmen’s expenses (including traveling costs) 20,000
Sales office costs (additional to present costs) 50,000
Interest and depreciation on sales department cars 35,000
In addition to the above, it will be necessary to hire four salesmen at a salary of `40,000 per annum each plus commission of 5% on sales plus car allowance of Re.1 per Kilometer to cover all costs except interest and depreciation.
On the assumption that the company decided to employ its own sales force on the above terms, you are required to ascertain:
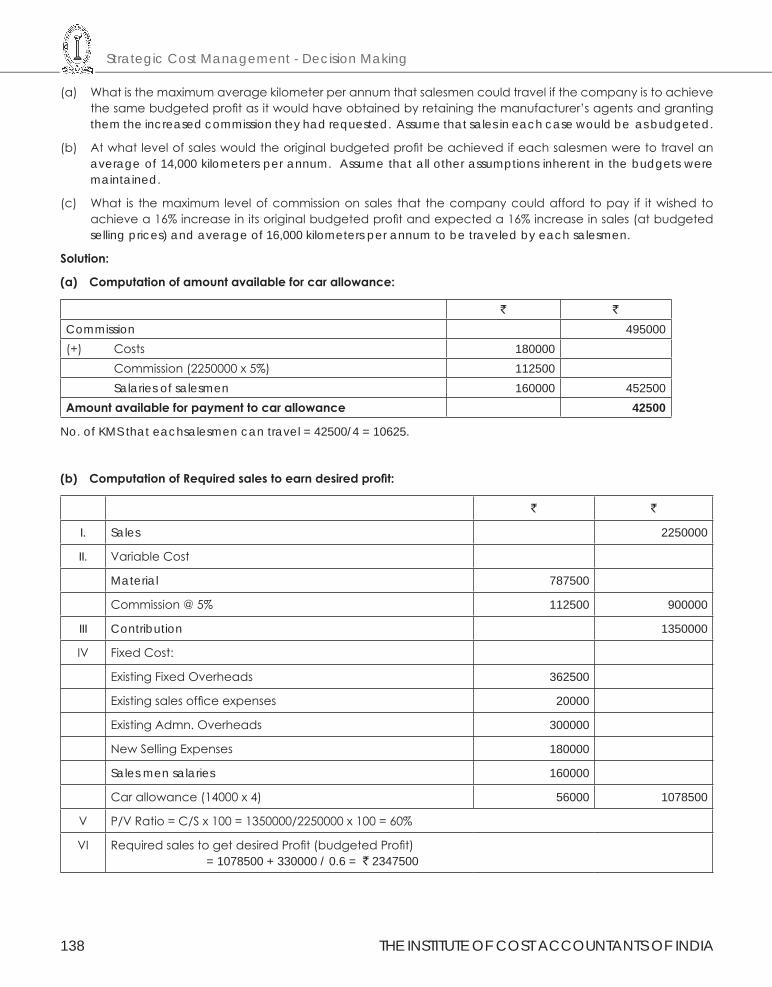
Strategic Cost Management - Decision Making
138 THE INSTITUTE OF COST ACCOUNTANTS OF INDIA
(a) What is the maximum average kilometer per annum that salesmen could travel if the company is to achieve the same budgeted profit as it would have obtained by retaining the manufacturer’s agents and granting them the increased commission they had requested. Assume that sales in each case would be as budgeted.
(b) At what level of sales would the original budgeted profit be achieved if each salesmen were to travel an average of 14,000 kilometers per annum. Assume that all other assumptions inherent in the budgets were maintained.
(c) What is the maximum level of commission on sales that the company could afford to pay if it wished to achieve a 16% increase in its original budgeted profit and expected a 16% increase in sales (at budgeted selling prices) and average of 16,000 kilometers per annum to be traveled by each salesmen.
Solution:
(a) Computationofamountavailableforcarallowance:
` `
Commission 495000(+) Costs 180000 Commission (2250000 x 5%) 112500 Salaries of salesmen 160000 452500Amountavailableforpaymenttocarallowance 42500
No. of KMS that eachsalesmen can travel = 42500/4 = 10625.
(b) ComputationofRequiredsalestoearndesiredprofit:
` `
I. Sales 2250000
II. Variable Cost
Material 787500
Commission @ 5% 112500 900000
III Contribution 1350000
IV Fixed Cost:
Existing Fixed Overheads 362500
Existing sales office expenses 20000
Existing Admn. Overheads 300000
New Selling Expenses 180000
Sales men salaries 160000
Car allowance (14000 x 4) 56000 1078500
V P/V Ratio = C/S x 100 = 1350000/2250000 x 100 = 60%
VI Required sales to get desired Profit (budgeted Profit) = 1078500 + 330000 / 0.6 = ` 2347500
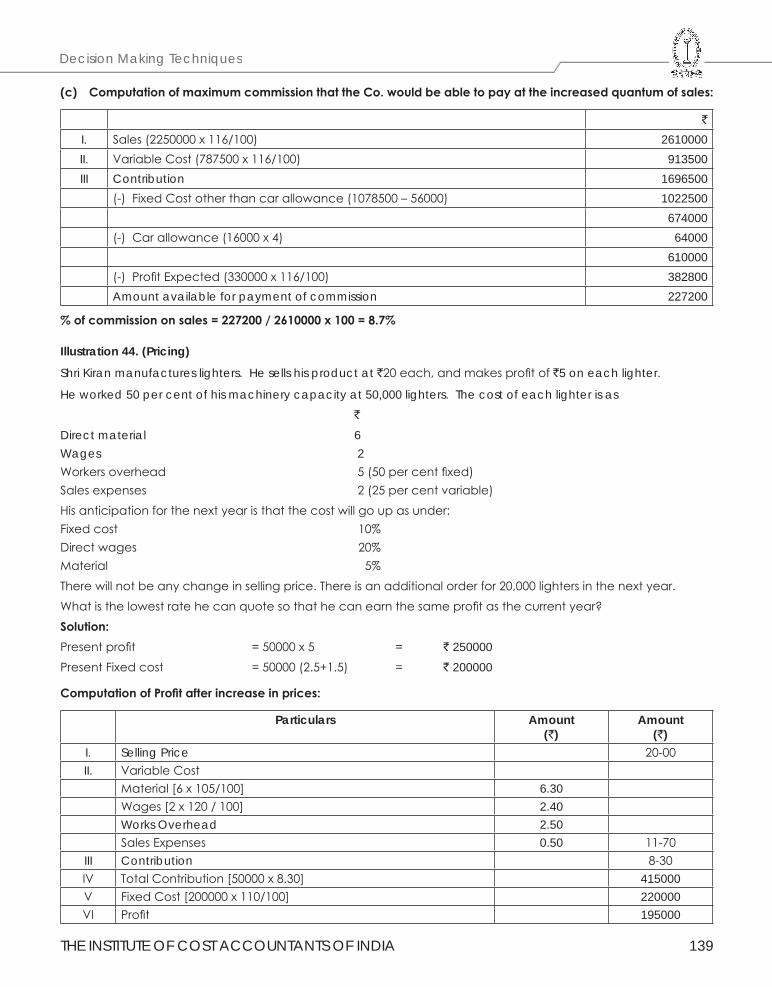
THE INSTITUTE OF COST ACCOUNTANTS OF INDIA 139
Decision Making Techniques
(c) ComputationofmaximumcommissionthattheCo.wouldbeabletopayattheincreasedquantumofsales:
`
I. Sales (2250000 x 116/100) 2610000II. Variable Cost (787500 x 116/100) 913500III Contribution 1696500
(-) Fixed Cost other than car allowance (1078500 – 56000) 1022500674000
(-) Car allowance (16000 x 4) 64000610000
(-) Profit Expected (330000 x 116/100) 382800Amount available for payment of commission 227200
%ofcommissiononsales=227200/2610000x100=8.7%
Illustration 44. (Pricing)
Shri Kiran manufactures lighters. He sells his product at `20 each, and makes profit of `5 on each lighter.
He worked 50 per cent of his machinery capacity at 50,000 lighters. The cost of each lighter is as `Direct material 6Wages 2Workers overhead 5 (50 per cent fixed) Sales expenses 2 (25 per cent variable)His anticipation for the next year is that the cost will go up as under:Fixed cost 10%Direct wages 20%Material 5%There will not be any change in selling price. There is an additional order for 20,000 lighters in the next year.What is the lowest rate he can quote so that he can earn the same profit as the current year?Solution:Present profit = 50000 x 5 = ` 250000Present Fixed cost = 50000 (2.5+1.5) = ` 200000
ComputationofProfitafterincreaseinprices:
Particulars Amount (`)
Amount (`)
I. Selling Price 20-00II. Variable Cost
Material [6 x 10⁵/100] 6.30Wages [2 x 120 / 100] 2.40Works Overhead 2.50Sales Expenses 0.50 11-70
III Contribution 8-30IV Total Contribution [50000 x 8.30] 415000V Fixed Cost [200000 x 110/100] 220000VI Profit 195000
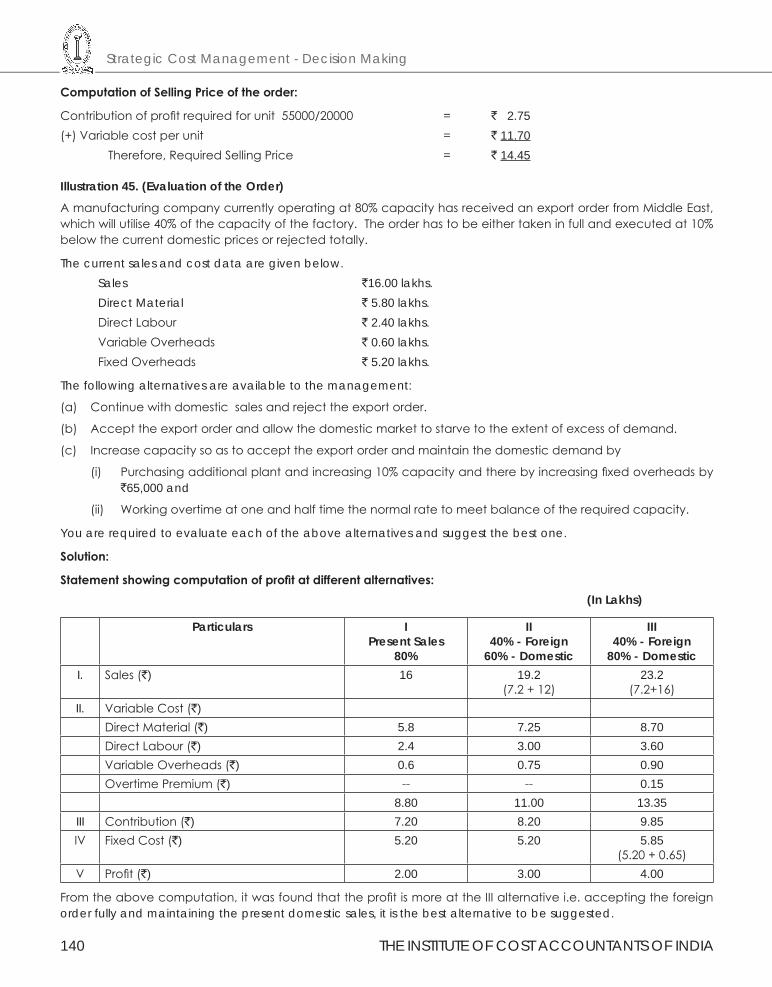
Strategic Cost Management - Decision Making
140 THE INSTITUTE OF COST ACCOUNTANTS OF INDIA
ComputationofSellingPriceoftheorder:
Contribution of profit required for unit 55000/20000 = ` 2.75(+) Variable cost per unit = ` 11.70 Therefore, Required Selling Price = ` 14.45
Illustration 45. (Evaluation of the Order)
A manufacturing company currently operating at 80% capacity has received an export order from Middle East, which will utilise 40% of the capacity of the factory. The order has to be either taken in full and executed at 10% below the current domestic prices or rejected totally.
The current sales and cost data are given below. Sales `16.00 lakhs. Direct Material ` 5.80 lakhs. Direct Labour ` 2.40 lakhs. Variable Overheads ` 0.60 lakhs. Fixed Overheads ` 5.20 lakhs.
The following alternatives are available to the management:
(a) Continue with domestic sales and reject the export order.
(b) Accept the export order and allow the domestic market to starve to the extent of excess of demand.
(c) Increase capacity so as to accept the export order and maintain the domestic demand by
(i) Purchasing additional plant and increasing 10% capacity and there by increasing fixed overheads by `65,000 and
(ii) Working overtime at one and half time the normal rate to meet balance of the required capacity.
You are required to evaluate each of the above alternatives and suggest the best one.
Solution:
Statementshowingcomputationofprofitatdifferentalternatives: (In Lakhs)
Particulars IPresent Sales
80%
II40% - Foreign
60% - Domestic
III40% - Foreign
80% - DomesticI. Sales (`) 16 19.2
(7.2 + 12)23.2
(7.2+16)II. Variable Cost (`)
Direct Material (`) 5.8 7.25 8.70Direct Labour (`) 2.4 3.00 3.60Variable Overheads (`) 0.6 0.75 0.90Overtime Premium (`) -- -- 0.15
8.80 11.00 13.35III Contribution (`) 7.20 8.20 9.85IV Fixed Cost (`) 5.20 5.20 5.85
(5.20 + 0.65)V Profit (`) 2.00 3.00 4.00
From the above computation, it was found that the profit is more at the III alternative i.e. accepting the foreign order fully and maintaining the present domestic sales, it is the best alternative to be suggested.
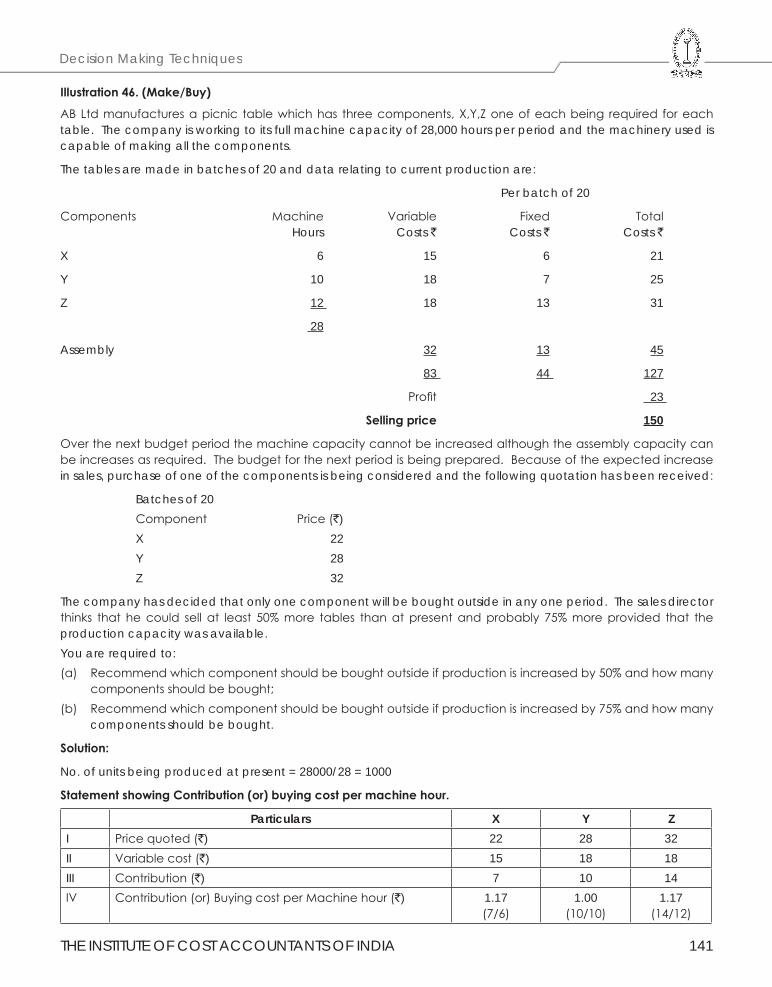
THE INSTITUTE OF COST ACCOUNTANTS OF INDIA 141
Decision Making Techniques
Illustration46.(Make/Buy)
AB Ltd manufactures a picnic table which has three components, X,Y,Z one of each being required for each table. The company is working to its full machine capacity of 28,000 hours per period and the machinery used is capable of making all the components.
The tables are made in batches of 20 and data relating to current production are:
Per batch of 20
Components Machine Variable Fixed Total Hours Costs ` Costs ` Costs `
X 6 15 6 21
Y 10 18 7 25
Z 12 18 13 31
28
Assembly 32 13 45
83 44 127
Profit 23
Sellingprice 150
Over the next budget period the machine capacity cannot be increased although the assembly capacity can be increases as required. The budget for the next period is being prepared. Because of the expected increase in sales, purchase of one of the components is being considered and the following quotation has been received:
Batches of 20Component Price (`)X 22Y 28Z 32
The company has decided that only one component will be bought outside in any one period. The sales director thinks that he could sell at least 50% more tables than at present and probably 75% more provided that the production capacity was available.You are required to:(a) Recommend which component should be bought outside if production is increased by 50% and how many
components should be bought;(b) Recommend which component should be bought outside if production is increased by 75% and how many
components should be bought.
Solution:
No. of units being produced at present = 28000/28 = 1000
StatementshowingContribution(or)buyingcostpermachinehour.
Particulars X Y ZI Price quoted (`) 22 28 32II Variable cost (`) 15 18 18III Contribution (`) 7 10 14IV Contribution (or) Buying cost per Machine hour (`) 1.17
(7/6)1.00
(10/10)1.17
(14/12)
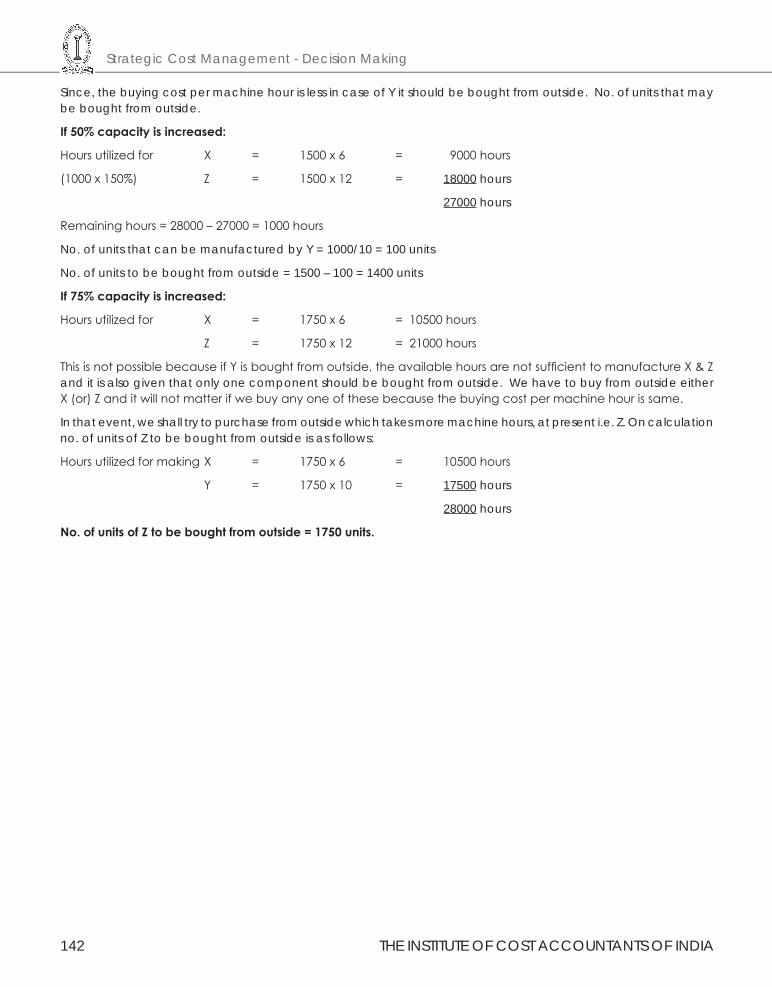
Strategic Cost Management - Decision Making
142 THE INSTITUTE OF COST ACCOUNTANTS OF INDIA
Since, the buying cost per machine hour is less in case of Y it should be bought from outside. No. of units that may be bought from outside.
If50%capacityisincreased:
Hours utilized for X = 1500 x 6 = 9000 hours
(1000 x 150%) Z = 1500 x 12 = 18000 hours
27000 hours
Remaining hours = 28000 – 27000 = 1000 hours
No. of units that can be manufactured by Y = 1000/10 = 100 units
No. of units to be bought from outside = 1500 – 100 = 1400 units
If75%capacityisincreased:
Hours utilized for X = 1750 x 6 = 10500 hours
Z = 1750 x 12 = 21000 hours
This is not possible because if Y is bought from outside, the available hours are not sufficient to manufacture X & Z and it is also given that only one component should be bought from outside. We have to buy from outside either X (or) Z and it will not matter if we buy any one of these because the buying cost per machine hour is same.
In that event, we shall try to purchase from outside which takes more machine hours, at present i.e. Z. On calculation no. of units of Z to be bought from outside is as follows:
Hours utilized for making X = 1750 x 6 = 10500 hours
Y = 1750 x 10 = 17500 hours
28000 hours
No.ofunitsofZtobeboughtfromoutside=1750units.
THE INSTITUTE OF COST ACCOUNTANTS OF INDIA 143
Decision Making Techniques
2.2 TRANSFER PRICING
IntroductionandMeaning:
In the modern days, production is on the mass scale due to technological advancement and upgradation. Organisations grow in course of time and for such growing organisations, decentralization becomes absolutely necessary. It becomes inevitable for such organisations to establish separate divisions and departments to ensure smooth working. Transfer pricing has become necessary in highly decentralized companies where number of divisions/departments are created as a part and parcel of the decentralized organisation. Transfer pricing is one of the tools in the hands of management for measuring the performance of divisions or departments.
A ‘Transfer Price’ is that notional value at which goods and services are transferred between divisions in a decentralized organisation. Transfer prices are normally set for intermediate products, which are goods, and services that are supplied by the selling division to the buying division. In large organisations, each division is treated as a ‘profit center’ as a part and parcel of decentralization. Their profitability is measured by fixation of ‘transfer price’ for inter divisional transfers.
The transfer price can have impact on the division’s performance and hence lot of care is to be taken in fixation of the same. The following factors should be taken into consideration before fixing the transfer prices.
1. Transfer price should help in the accurate measurement of divisional performance.
2. It should motivate the divisional managers to maximize the profitability of their divisions.
3. Autonomy and authority of a division should be ensured.
4. Transfer Price should allow ‘Goal Congruence’ which means that the objectives of divisional managers match with those of the organisation.
ObjectivesofInterCompanyTransferPricing:
The following are the main objectives of intercompany transfer pricing scheme:
1. Toevaluatethecurrentperformanceandprofitabilityofeachindividualunit : This is necessary in order to determine whether a particular unit is competitive and can stand on its working. When the goods are transferred from one department to another, the revenue of one department becomes the cost of another and such inter transfer price affects the reported profits.
2. To improve theprofitposition : Intercompany transfer price will make the unit competitive so that it may maximize its profits and contribute to the overall profits of the organisation.
3. Toassistindecisionmaking: Correct intercompany transfer price will make the costs of both the units realistic in order to take decisions relating to such problems as make or buy, sell or process further, choice between alternative methods of production.
4. Foraccurateestimationofearningsonproposed investmentdecisions : When finance is scarce and it is required to determine the allocation of scarce resources between various divisions of the concern taking into consideration their competing claims, then this technique is useful.
MethodsofTransferPricing:
It is the notional value of goods and services transferred from one division to other division. In other words, when internal exchange of goods and services take place between the different divisions of a firm, they have to be expressed in monetary terms. The monetary amount for those inter divisional exchanges is called as ‘transfer price’. The determination of transfer prices is an extremely difficult and delicate task as lot of complicated issues are involved in the same. Inter division conflicts are also possible. There are several methods of fixation of ‘Transfer Price’. They are discussed below.
1. Pricing based on cost.
(a) Actual cost
(b) Cost plus
Strategic Cost Management - Decision Making
144 THE INSTITUTE OF COST ACCOUNTANTS OF INDIA
(c) Standard cost
(d) Marginal cost
2. Market price as transfer price.
3. Negotiated pricing.
4. Pricing based on Opportunity cost.
1. Pricingbasedoncost:In these methods, ‘cost’ is the base and the following methods fall under this category.
(a) ActualCost:Under this method the actual cost of production is taken as transfer price for inter divisional transfrers. Such actual cost may consist of variable cost or sometimes total costs including fixed costs.
(b) CostPlus:Under this method, transfer price is fixed by adding a reasonable return on capital employed to the total cost. Thereby the measurement of profit becomes easy.
(c) StandardCost:Under this method, transfer price is fixed on the basis of standard cost. The difference between the standard cost and the actual cost being variance is absorbed by transferring division. This method is simple and easy to follow, but the constant revision of standards is necessary at regular intervals.
(d) MarginalCost: Under this method, the transfer price is determined on the basis of marginal cost. The reason being fixed cost is in any case unavoidable and hence should not be charged to the buying division. That is why only marginal cost will be taken as transfer price
2. Marketpriceastransferprice:Under this method, the transfer price will be determined according to the market price prevailing in the market. It acts as a good incentive for efficient production to the selling division and any inefficiency in production and abnormal costs will not be borne by the buying division. The logic used in this method is that if the buying division would have purchased the goods/services from the open market, they would have paid the market price and hence the same price should be paid to the selling division. One of the variation of this method is that from the market price, selling and distribution overheads should be deducted and price thus arrived should be charged as transfer price. The reason behind this is that no selling efforts are required to sale the goods/services to the buying division and therefore these costs should not be charged to the buying division. Market price based transfer price has the following advantages :
1. Actual costs are fluctuating and hence difficult to ascertain. On the other hand market prices can be easily ascertained.
2. Profits resulting from market price based transfer prices are good parameters for performance evaluation of selling and buying divisions.
3. It avoids extensive arbitration system in fixing the transfer prices between the divisions.
However, the market price based transfer pricing has the following limitations :
1. There may be resistance from the buying division. They may question buying from the selling division if in any way they have to pay the market prices.
2. Like cost based prices, market prices may also be fluctuating and hence there may be difficulties in fixation of these prices.
3. Market price is a rather vague term as such prices may be ex-factory price, wholesale price, retail price etc.
4. Market prices may not be available for intermediate products, as these products may not have any market.
5. This method may be difficult to operate if the intermediate product is for captive consumption.
6. Market price may change frequently.
7. Market prices may not be ascertained easily.
THE INSTITUTE OF COST ACCOUNTANTS OF INDIA 145
Decision Making Techniques
3. NegotiatedPricing:Under this method, the transfer prices may be fixed through negotiations between the selling and the buying division. Sometimes it may happen that the concerned product may be available in the market at a cheaper price than charged by the selling division. In this situation the buying division may be tempted to purchase the product from outside sellers rather than the selling division. Alternatively the selling division may notice that in the outside market, the product is sold at a higher price but the buying division is not ready to pay the market price. Here, the selling division may be reluctant to sell the product to the buying division at a price, which is less than the market price. In all these conflicts, the overall profitability of the firm may be affected adversely. Therefore it becomes beneficial for both the divisions to negotiate the prices and arrive at a price, which is mutually beneficial to both the divisions. Such prices are called as ‘Negotiated Prices’. In order to make these prices effective care should be taken that both, the buyers and sellers should have access to the available data including about the alternatives available if any. Similarly buyers and sellers should be free to deal outside the company, but care should be taken that the overall interest of the organisation is not affected.
• The main limitation of this method is that lot of time is spent by both the negotiating parties in fixation of the negotiated prices.
• Negotiating skills are required for the managers for arriving at a mutually acceptable price, otherwise there is a possibility of conflicts between the divisions.
4. Pricingbasedonopportunitycost:This pricing recognizes the minimum price that the selling division is ready to accept and the maximum price that the buying division is ready to pay. The final transfer price may be based on these minimum expectations of both the divisions. The most ideal situation will be when the minimum price expected by the selling division is less than the maximum price accepted by the buying division. However in practice, it may happen very rarely and there is possibility of conflicts over the opportunity cost.
It is very clear that fixation of transfer prices is a very delicate decision. There might be clash of interests between the selling and buying division and hence while fixing the transfer price, overall interests of the organisation should be taken into consideration and overall ‘Goal Congruence’ should be given utmost importance rather than interests of the selling or buying division.
Illustration 47.
Your company fixes the inter-divisional transfer prices for its products on the basis of cost, plus a return on investment in the division. The Budget for Division A for 1981-82 appears as under:
`
Fixed Assets 5,00,000Current assets 3,00,000Debtors 2,00,000Annual Fixed Cost of the Division 8,00,000Variable Cost per unit of Product 10
Budgeted Volume 4,00,000 units per yearDesired ROI 28%
Determine the transfer Price for Division A.
Solution:
`
Variable Cost 10.00Fixed Cost per unit 8,00,000 ÷ 4,00,000 2.00required Return 10,00,000 × 28%
4,00,0000.70
Total cost or Transfer price 12.70
Strategic Cost Management - Decision Making
146 THE INSTITUTE OF COST ACCOUNTANTS OF INDIA
Illustration 48.
Transferor Ltd. has two processes Preparing and Finishing. The normal output per week is 7,500 units (Completed) at a capacity of 75%
Transferee Ltd. had production problems in preparing and requires 2,000 units per week of prepared material for their finishing processes.
The existing cost structure of one prepared unit of Transferor Ltd. at existing capacity
Material ` 2.00 (variable 100%)
Labour ` 2.00 (Variable 50%)
Overhead ` 4.00 (variable 25%)
The sale price of a completed unit of Transferor Ltd is `16 with a profit of `4 per unit.
Construct the effect on the profits Transferor Ltd., for six months (25 weeks) of supplying units to Transferee Ltd. with the following alternative transfer prices per unit:
(i) Marginal Cost
(ii) Marginal Cost + 25%
(iii) Marginal Cost + 15% Return on capital(assume capital employed `20 lakhs)
(iv) Existing Cost
(v) Existing Cost + a portion of profit on the basis of (preparing cost / Total Cost) x Unit Profit
(vi) At an agreed market price of `8.50 Assume no increase in fixed cost.
Solution:
Transferred units 25 x 2000 = 50000Existing profit 7500 x 25 x 4 = ` 750000
Effectonprofitiftransferpriceis
(i) Marginal cost
`
Material 2.00Labour 1.00OHs 1.00
4.00
At this transfer price there is no effect on profit of transferor ltd.
(ii) Profit = 50000
(iii) Price per unit = 4 + {(2000000 x 15% x 0.5)/50000} = 7
Under this method profit of transferor ltd is increases by 150000 i.e., 50000 x (7-4)
(iv) Profit increases by 50000 x (8-4) = 200000
(v) Transfer price: `
{8 + (8/12)4} = 10.67
Marginal Cost = 4.00
Profit = 6.67
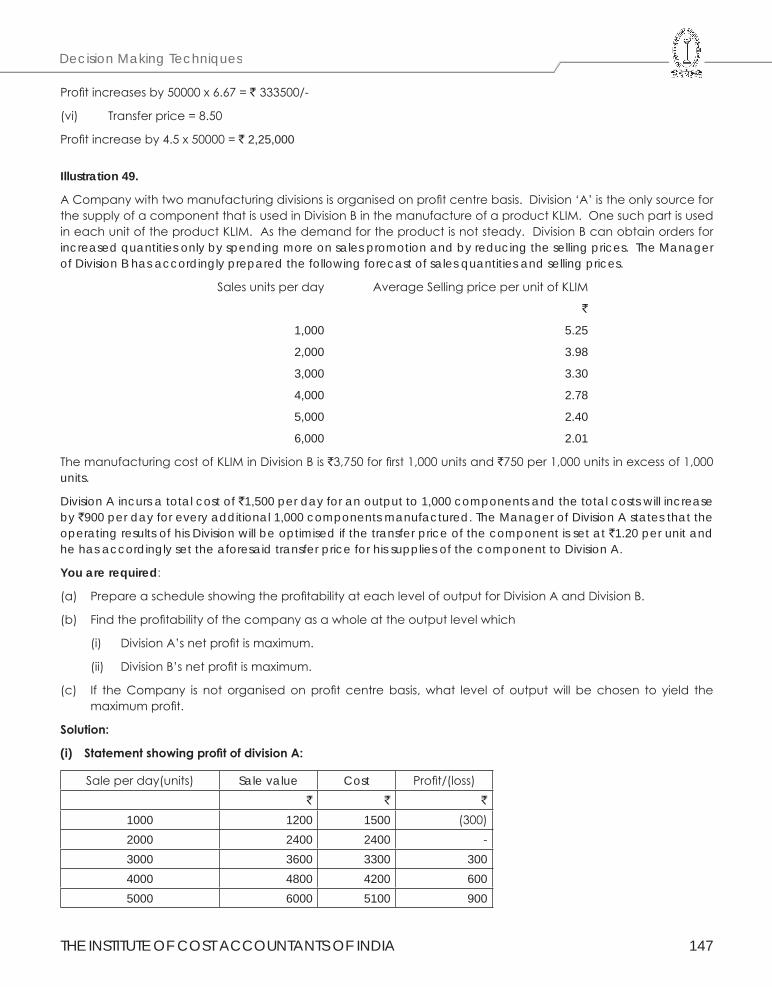
THE INSTITUTE OF COST ACCOUNTANTS OF INDIA 147
Decision Making Techniques
Profit increases by 50000 x 6.67 = ` 333500/-
(vi) Transfer price = 8.50
Profit increase by 4.5 x 50000 = ` 2,25,000
Illustration 49.
A Company with two manufacturing divisions is organised on profit centre basis. Division ‘A’ is the only source for the supply of a component that is used in Division B in the manufacture of a product KLIM. One such part is used in each unit of the product KLIM. As the demand for the product is not steady. Division B can obtain orders for increased quantities only by spending more on sales promotion and by reducing the selling prices. The Manager of Division B has accordingly prepared the following forecast of sales quantities and selling prices.
Sales units per day Average Selling price per unit of KLIM
`
1,000 5.25
2,000 3.98
3,000 3.30
4,000 2.78
5,000 2.40
6,000 2.01
The manufacturing cost of KLIM in Division B is `3,750 for first 1,000 units and `750 per 1,000 units in excess of 1,000 units.
Division A incurs a total cost of `1,500 per day for an output to 1,000 components and the total costs will increase by `900 per day for every additional 1,000 components manufactured. The Manager of Division A states that the operating results of his Division will be optimised if the transfer price of the component is set at `1.20 per unit and he has accordingly set the aforesaid transfer price for his supplies of the component to Division A.
You are required:
(a) Prepare a schedule showing the profitability at each level of output for Division A and Division B.
(b) Find the profitability of the company as a whole at the output level which
(i) Division A’s net profit is maximum.
(ii) Division B’s net profit is maximum.
(c) If the Company is not organised on profit centre basis, what level of output will be chosen to yield the maximum profit.
Solution:
(i) StatementshowingprofitofdivisionA:
Sale per day(units) Sale value Cost Profit/(loss)` ` `
1000 1200 1500 (300)2000 2400 2400 -3000 3600 3300 3004000 4800 4200 6005000 6000 5100 900
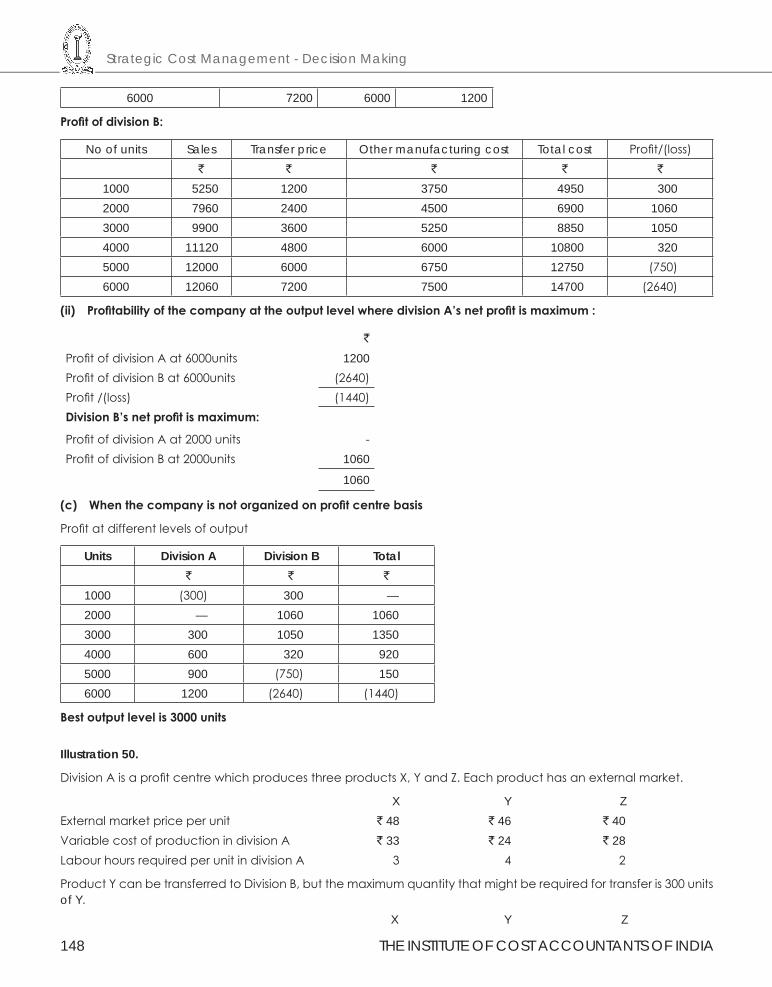
Strategic Cost Management - Decision Making
148 THE INSTITUTE OF COST ACCOUNTANTS OF INDIA
6000 7200 6000 1200
ProfitofdivisionB:
No of units Sales Transfer price Other manufacturing cost Total cost Profit/(loss)` ` ` ` `
1000 5250 1200 3750 4950 3002000 7960 2400 4500 6900 10603000 9900 3600 5250 8850 10504000 11120 4800 6000 10800 3205000 12000 6000 6750 12750 (750)6000 12060 7200 7500 14700 (2640)
(ii) ProfitabilityofthecompanyattheoutputlevelwheredivisionA’snetprofitismaximum:
`
Profit of division A at 6000units 1200Profit of division B at 6000units (2640)Profit /(loss) (1440)DivisionB’snetprofitismaximum:
Profit of division A at 2000 units -Profit of division B at 2000units 1060
1060
(c) Whenthecompanyisnotorganizedonprofitcentrebasis
Profit at different levels of output
Units Division A Division B Total` ` `
1000 (300) 300 —2000 — 1060 10603000 300 1050 13504000 600 320 9205000 900 (750) 1506000 1200 (2640) (1440)
Bestoutputlevelis3000units
Illustration 50.
Division A is a profit centre which produces three products X, Y and Z. Each product has an external market.
X Y ZExternal market price per unit ` 48 ` 46 ` 40Variable cost of production in division A ` 33 ` 24 ` 28Labour hours required per unit in division A 3 4 2
Product Y can be transferred to Division B, but the maximum quantity that might be required for transfer is 300 units of Y. X Y Z
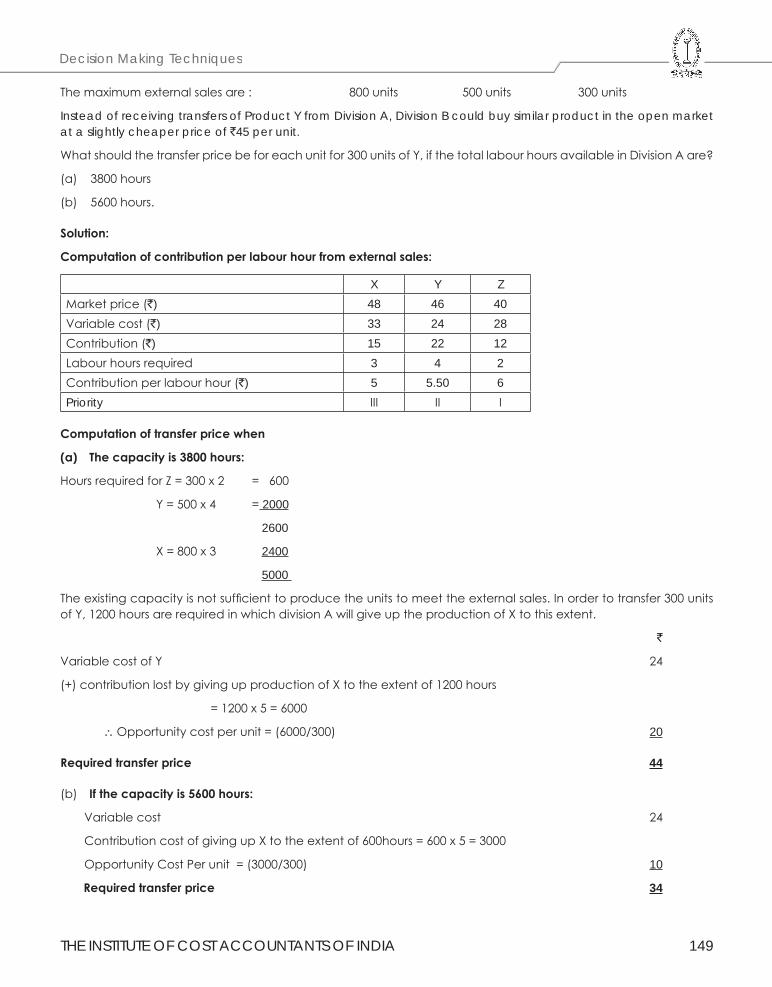
THE INSTITUTE OF COST ACCOUNTANTS OF INDIA 149
Decision Making Techniques
The maximum external sales are : 800 units 500 units 300 units
Instead of receiving transfers of Product Y from Division A, Division B could buy similar product in the open market at a slightly cheaper price of `45 per unit.
What should the transfer price be for each unit for 300 units of Y, if the total labour hours available in Division A are?
(a) 3800 hours
(b) 5600 hours.
Solution:
Computationofcontributionperlabourhourfromexternalsales:
X Y ZMarket price (`) 48 46 40Variable cost (`) 33 24 28Contribution (`) 15 22 12Labour hours required 3 4 2Contribution per labour hour (`) 5 5.50 6Priority ΙΙΙ ΙΙ Ι
Computationoftransferpricewhen
(a) Thecapacityis3800hours:
Hours required for Z = 300 x 2 = 600
Y = 500 x 4 = 2000
2600
X = 800 x 3 2400
5000
The existing capacity is not sufficient to produce the units to meet the external sales. In order to transfer 300 units of Y, 1200 hours are required in which division A will give up the production of X to this extent.
`
Variable cost of Y 24
(+) contribution lost by giving up production of X to the extent of 1200 hours
= 1200 x 5 = 6000
∴ Opportunity cost per unit = (6000/300) 20
Requiredtransferprice 44
(b) Ifthecapacityis5600hours:
Variable cost 24
Contribution cost of giving up X to the extent of 600hours = 600 x 5 = 3000
Opportunity Cost Per unit = (3000/300) 10
Requiredtransferprice 34
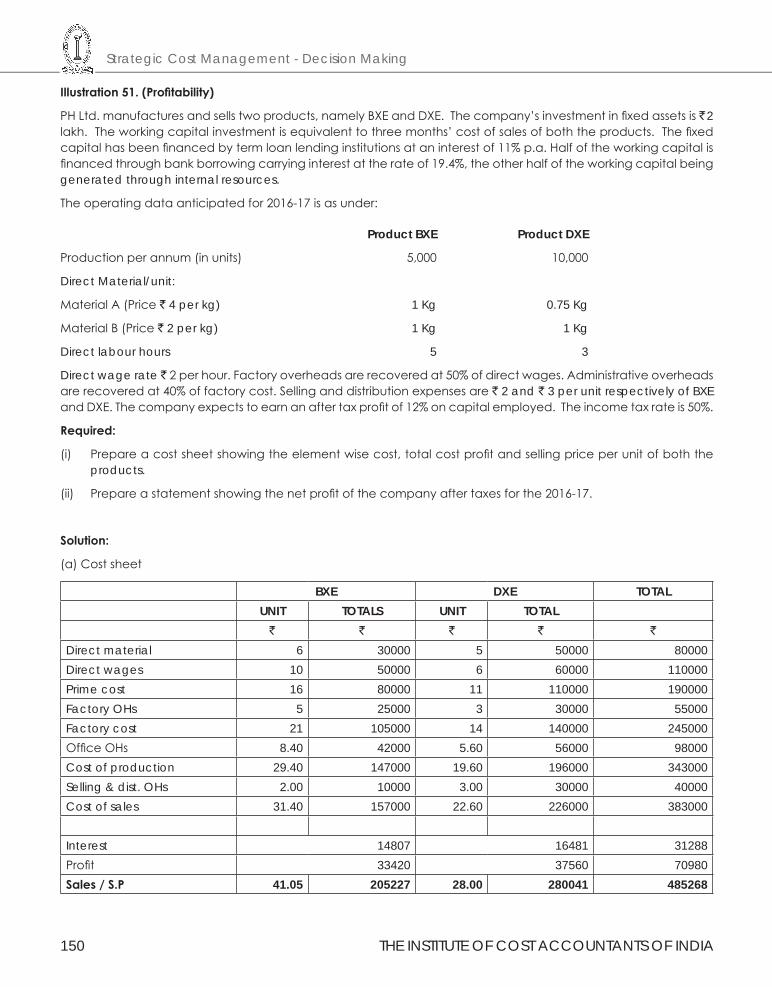
Strategic Cost Management - Decision Making
150 THE INSTITUTE OF COST ACCOUNTANTS OF INDIA
Illustration51.(Profitability)
PH Ltd. manufactures and sells two products, namely BXE and DXE. The company’s investment in fixed assets is ` 2 lakh. The working capital investment is equivalent to three months’ cost of sales of both the products. The fixed capital has been financed by term loan lending institutions at an interest of 11% p.a. Half of the working capital is financed through bank borrowing carrying interest at the rate of 19.4%, the other half of the working capital being generated through internal resources.
The operating data anticipated for 2016-17 is as under:
Product BXE Product DXE
Production per annum (in units) 5,000 10,000
Direct Material/unit:
Material A (Price ` 4 per kg) 1 Kg 0.75 Kg
Material B (Price ` 2 per kg) 1 Kg 1 Kg
Direct labour hours 5 3
Direct wage rate ̀ 2 per hour. Factory overheads are recovered at 50% of direct wages. Administrative overheads are recovered at 40% of factory cost. Selling and distribution expenses are ` 2 and ` 3 per unit respectively of BXE and DXE. The company expects to earn an after tax profit of 12% on capital employed. The income tax rate is 50%.
Required:
(i) Prepare a cost sheet showing the element wise cost, total cost profit and selling price per unit of both the products.
(ii) Prepare a statement showing the net profit of the company after taxes for the 2016-17.
Solution:
(a) Cost sheet
BXE DXE TOTALUNIT TOTALS UNIT TOTAL
` ` ` ` `
Direct material 6 30000 5 50000 80000Direct wages 10 50000 6 60000 110000Prime cost 16 80000 11 110000 190000Factory OHs 5 25000 3 30000 55000Factory cost 21 105000 14 140000 245000Office OHs 8.40 42000 5.60 56000 98000Cost of production 29.40 147000 19.60 196000 343000Selling & dist. OHs 2.00 10000 3.00 30000 40000Cost of sales 31.40 157000 22.60 226000 383000
Interest 14807 16481 31288Profit 33420 37560 70980Sales/S.P 41.05 205227 28.00 280041 485268
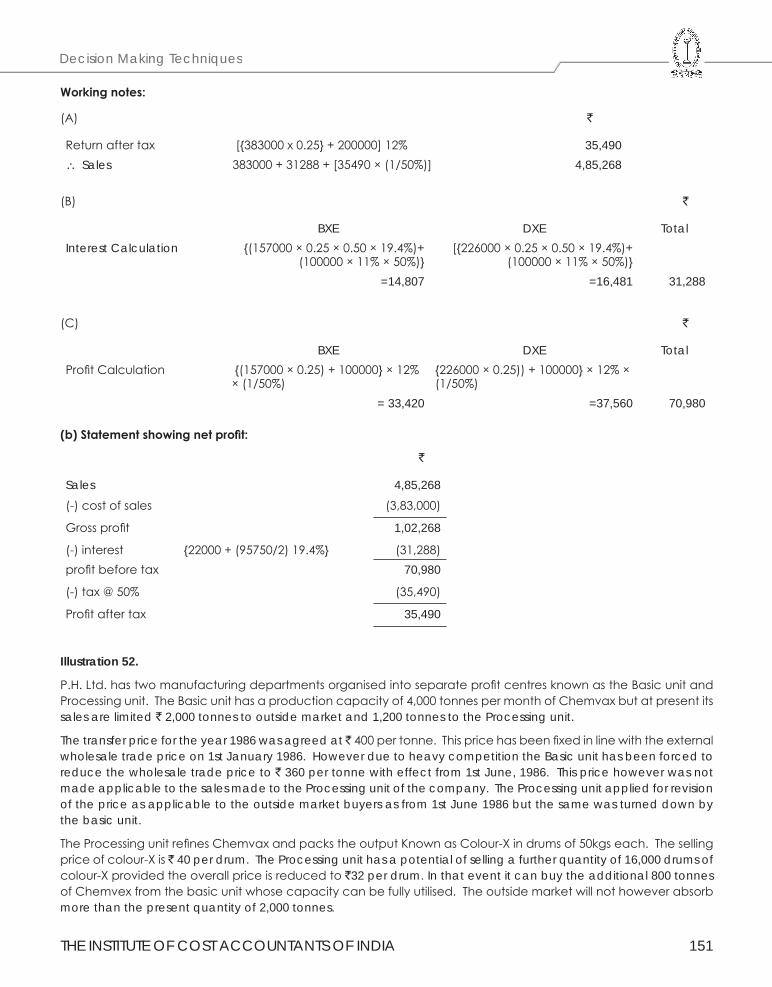
THE INSTITUTE OF COST ACCOUNTANTS OF INDIA 151
Decision Making Techniques
Workingnotes:
(A) `
Return after tax [{383000 x 0.25} + 200000] 12% 35,490∴ Sales 383000 + 31288 + [35490 × (1/50%)] 4,85,268
(B) `
BXE DXE Total Interest Calculation {(157000 × 0.25 × 0.50 × 19.4%)+
(100000 × 11% × 50%)} [{226000 × 0.25 × 0.50 × 19.4%)+
(100000 × 11% × 50%)}=14,807 =16,481 31,288
(C) `
BXE DXE Total Profit Calculation {(157000 × 0.25) + 100000} × 12%
× (1/50%){226000 × 0.25)) + 100000} × 12% × (1/50%)
= 33,420 =37,560 70,980
(b)Statementshowingnetprofit:
`
Sales 4,85,268
(-) cost of sales (3,83,000)
Gross profit 1,02,268
(-) interest {22000 + (95750/2) 19.4%} (31,288)profit before tax 70,980
(-) tax @ 50% (35,490)
Profit after tax 35,490
Illustration 52.
P.H. Ltd. has two manufacturing departments organised into separate profit centres known as the Basic unit and Processing unit. The Basic unit has a production capacity of 4,000 tonnes per month of Chemvax but at present its sales are limited ` 2,000 tonnes to outside market and 1,200 tonnes to the Processing unit.
The transfer price for the year 1986 was agreed at ̀ 400 per tonne. This price has been fixed in line with the external wholesale trade price on 1st January 1986. However due to heavy competition the Basic unit has been forced to reduce the wholesale trade price to ` 360 per tonne with effect from 1st June, 1986. This price however was not made applicable to the sales made to the Processing unit of the company. The Processing unit applied for revision of the price as applicable to the outside market buyers as from 1st June 1986 but the same was turned down by the basic unit.
The Processing unit refines Chemvax and packs the output Known as Colour-X in drums of 50kgs each. The selling price of colour-X is ` 40 per drum. The Processing unit has a potential of selling a further quantity of 16,000 drums of colour-X provided the overall price is reduced to `32 per drum. In that event it can buy the additional 800 tonnes of Chemvex from the basic unit whose capacity can be fully utilised. The outside market will not however absorb more than the present quantity of 2,000 tonnes.
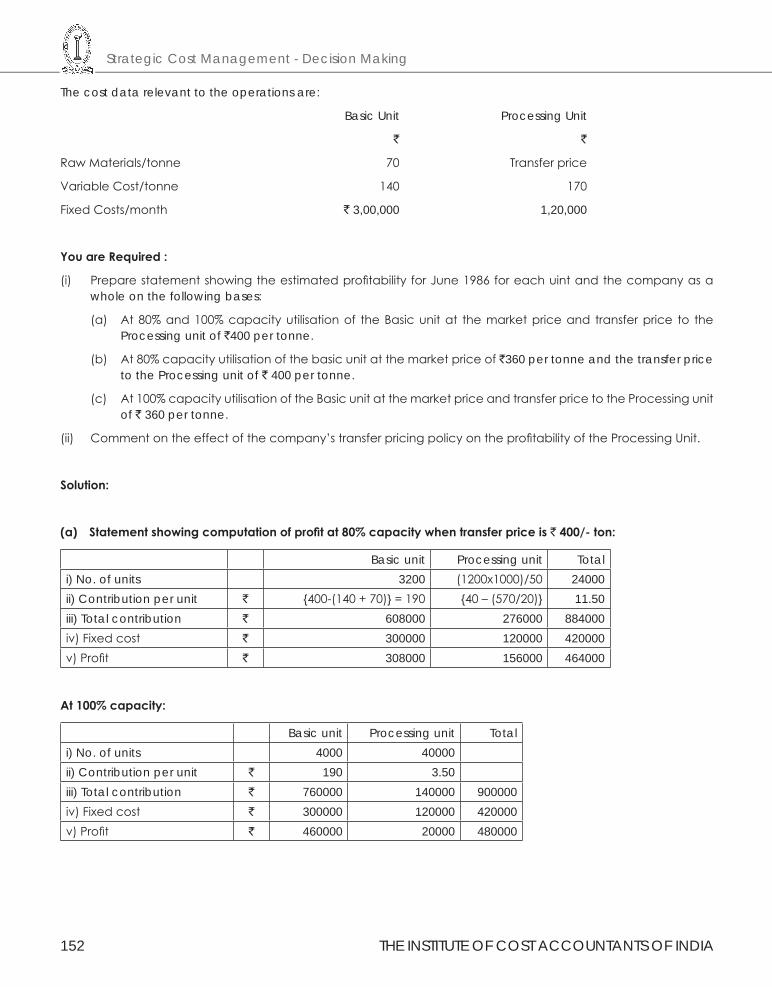
Strategic Cost Management - Decision Making
152 THE INSTITUTE OF COST ACCOUNTANTS OF INDIA
The cost data relevant to the operations are:
Basic Unit Processing Unit
` `
Raw Materials/tonne 70 Transfer price
Variable Cost/tonne 140 170
Fixed Costs/month ` 3,00,000 1,20,000
YouareRequired:
(i) Prepare statement showing the estimated profitability for June 1986 for each uint and the company as a whole on the following bases:
(a) At 80% and 100% capacity utilisation of the Basic unit at the market price and transfer price to the Processing unit of `400 per tonne.
(b) At 80% capacity utilisation of the basic unit at the market price of `360 per tonne and the transfer price to the Processing unit of ` 400 per tonne.
(c) At 100% capacity utilisation of the Basic unit at the market price and transfer price to the Processing unit of ` 360 per tonne.
(ii) Comment on the effect of the company’s transfer pricing policy on the profitability of the Processing Unit.
Solution:
(a) Statementshowingcomputationofprofitat80%capacitywhentransferpriceis`400/-ton:
Basic unit Processing unit Totali) No. of units 3200 (1200x1000)/50 24000ii) Contribution per unit ` {400-(140 + 70)} = 190 {40 – (570/20)} 11.50iii) Total contribution ` 608000 276000 884000iv) Fixed cost ` 300000 120000 420000v) Profit ` 308000 156000 464000
At100%capacity:
Basic unit Processing unit Totali) No. of units 4000 40000ii) Contribution per unit ` 190 3.50iii) Total contribution ` 760000 140000 900000iv) Fixed cost ` 300000 120000 420000v) Profit ` 460000 20000 480000
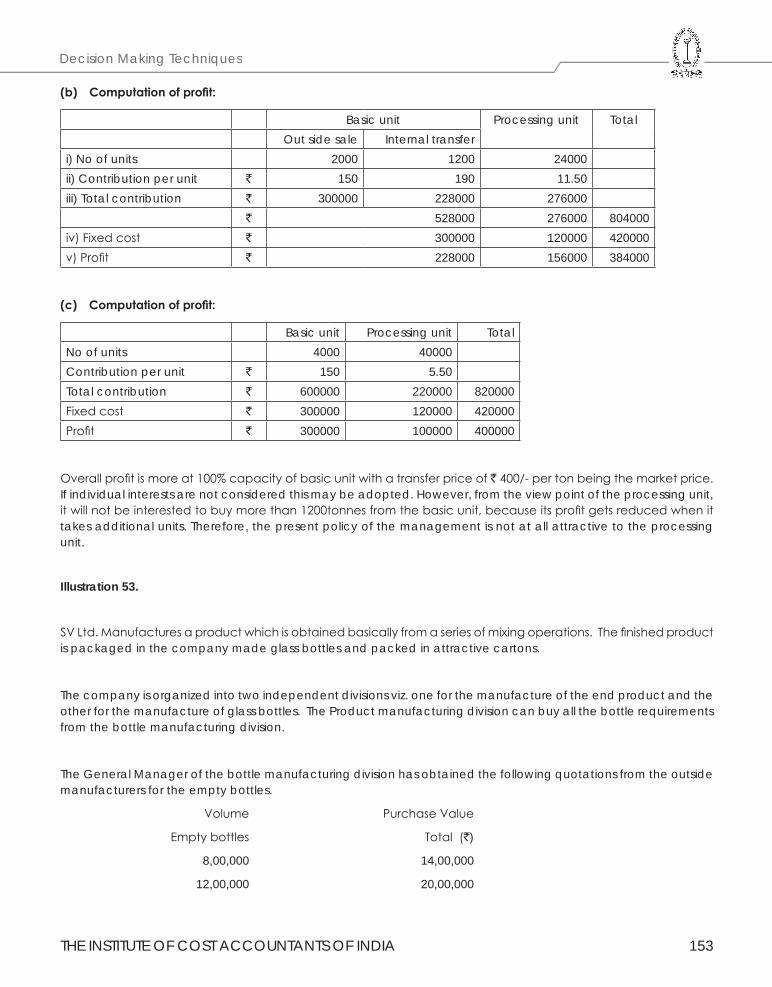
THE INSTITUTE OF COST ACCOUNTANTS OF INDIA 153
Decision Making Techniques
(b) Computationofprofit:
Basic unit Processing unit TotalOut side sale Internal transfer
i) No of units 2000 1200 24000ii) Contribution per unit ` 150 190 11.50iii) Total contribution ` 300000 228000 276000
` 528000 276000 804000iv) Fixed cost ` 300000 120000 420000v) Profit ` 228000 156000 384000
(c) Computationofprofit:
Basic unit Processing unit TotalNo of units 4000 40000Contribution per unit ` 150 5.50Total contribution ` 600000 220000 820000Fixed cost ` 300000 120000 420000Profit ` 300000 100000 400000
Overall profit is more at 100% capacity of basic unit with a transfer price of ` 400/- per ton being the market price. If individual interests are not considered this may be adopted. However, from the view point of the processing unit, it will not be interested to buy more than 1200tonnes from the basic unit, because its profit gets reduced when it takes additional units. Therefore, the present policy of the management is not at all attractive to the processing unit.
Illustration 53.
SV Ltd. Manufactures a product which is obtained basically from a series of mixing operations. The finished product is packaged in the company made glass bottles and packed in attractive cartons.
The company is organized into two independent divisions viz. one for the manufacture of the end product and the other for the manufacture of glass bottles. The Product manufacturing division can buy all the bottle requirements from the bottle manufacturing division.
The General Manager of the bottle manufacturing division has obtained the following quotations from the outside manufacturers for the empty bottles.
Volume Purchase Value
Empty bottles Total (`)
8,00,000 14,00,000
12,00,000 20,00,000
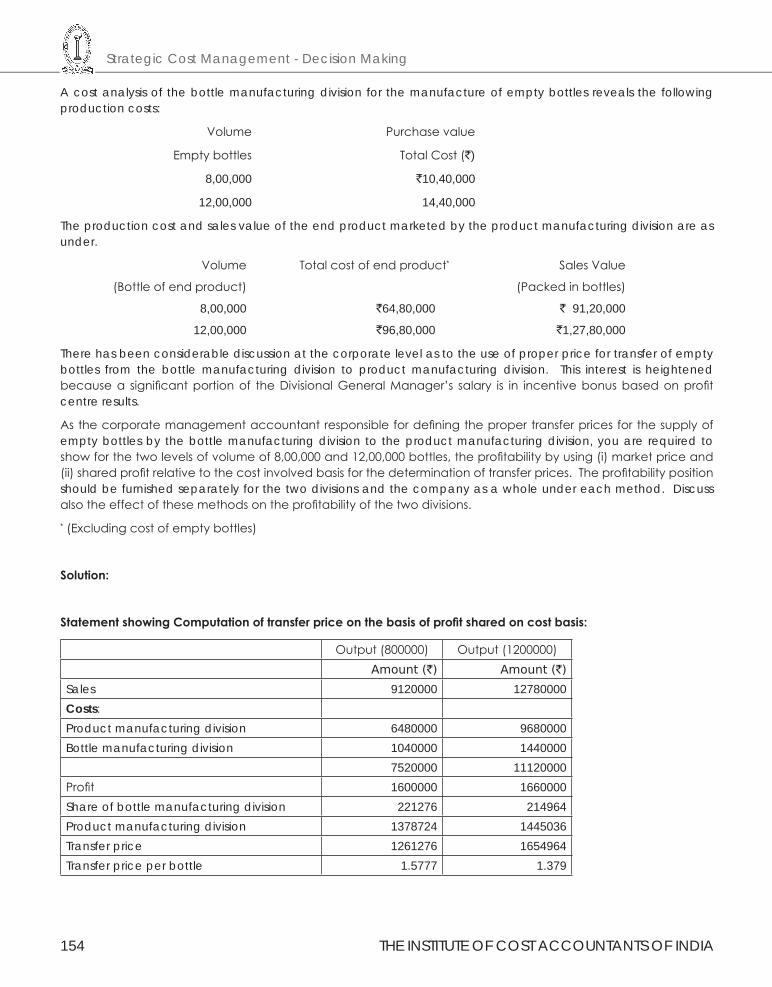
Strategic Cost Management - Decision Making
154 THE INSTITUTE OF COST ACCOUNTANTS OF INDIA
A cost analysis of the bottle manufacturing division for the manufacture of empty bottles reveals the following production costs:
Volume Purchase value
Empty bottles Total Cost (`)
8,00,000 `10,40,000
12,00,000 14,40,000
The production cost and sales value of the end product marketed by the product manufacturing division are as under.
Volume Total cost of end product* Sales Value
(Bottle of end product) (Packed in bottles)
8,00,000 `64,80,000 ` 91,20,000
12,00,000 `96,80,000 `1,27,80,000
There has been considerable discussion at the corporate level as to the use of proper price for transfer of empty bottles from the bottle manufacturing division to product manufacturing division. This interest is heightened because a significant portion of the Divisional General Manager’s salary is in incentive bonus based on profit centre results.
As the corporate management accountant responsible for defining the proper transfer prices for the supply of empty bottles by the bottle manufacturing division to the product manufacturing division, you are required to show for the two levels of volume of 8,00,000 and 12,00,000 bottles, the profitability by using (i) market price and (ii) shared profit relative to the cost involved basis for the determination of transfer prices. The profitability position should be furnished separately for the two divisions and the company as a whole under each method. Discuss also the effect of these methods on the profitability of the two divisions.* (Excluding cost of empty bottles)
Solution:
StatementshowingComputationoftransferpriceonthebasisofprofitsharedoncostbasis:
Output (800000) Output (1200000)Amount (`) Amount (`)
Sales 9120000 12780000Costs:Product manufacturing division 6480000 9680000Bottle manufacturing division 1040000 1440000
7520000 11120000Profit 1600000 1660000Share of bottle manufacturing division 221276 214964Product manufacturing division 1378724 1445036Transfer price 1261276 1654964Transfer price per bottle 1.5777 1.379
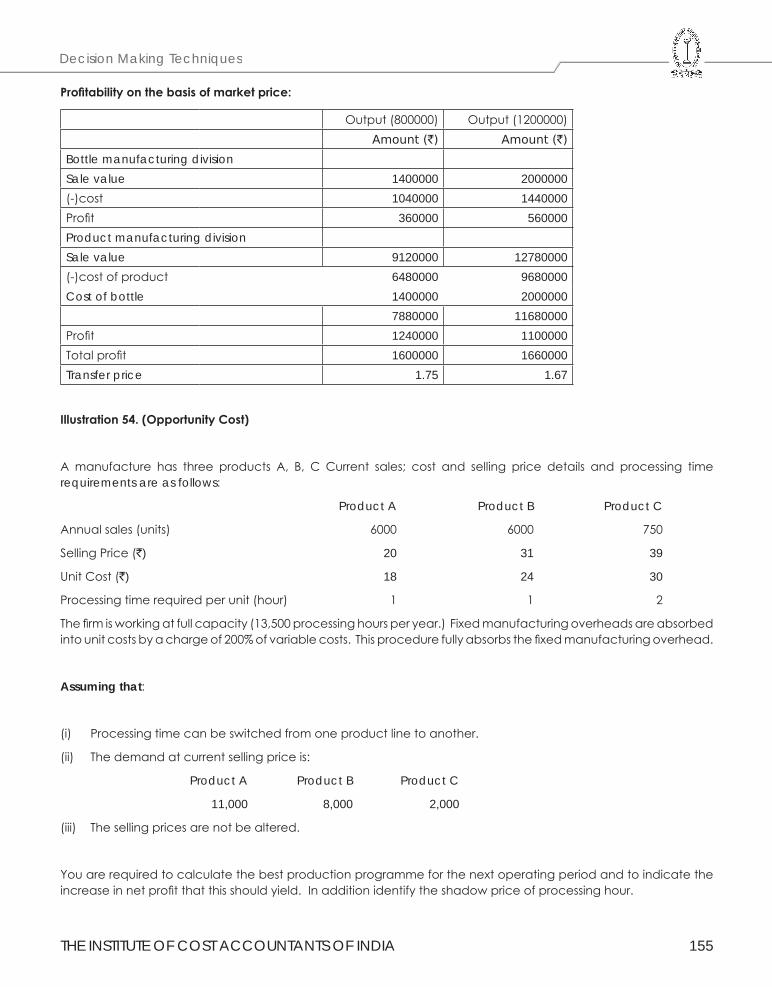
THE INSTITUTE OF COST ACCOUNTANTS OF INDIA 155
Decision Making Techniques
Profitabilityonthebasisofmarketprice:
Output (800000) Output (1200000)Amount (`) Amount (`)
Bottle manufacturing divisionSale value 1400000 2000000(-)cost 1040000 1440000Profit 360000 560000Product manufacturing divisionSale value 9120000 12780000(-)cost of product 6480000 9680000Cost of bottle 1400000 2000000
7880000 11680000Profit 1240000 1100000Total profit 1600000 1660000Transfer price 1.75 1.67
Illustration54.(OpportunityCost)
A manufacture has three products A, B, C Current sales; cost and selling price details and processing time requirements are as follows:
Product A Product B Product C
Annual sales (units) 6000 6000 750
Selling Price (`) 20 31 39
Unit Cost (`) 18 24 30
Processing time required per unit (hour) 1 1 2
The firm is working at full capacity (13,500 processing hours per year.) Fixed manufacturing overheads are absorbed into unit costs by a charge of 200% of variable costs. This procedure fully absorbs the fixed manufacturing overhead.
Assuming that:
(i) Processing time can be switched from one product line to another.
(ii) The demand at current selling price is:
Product A Product B Product C
11,000 8,000 2,000
(iii) The selling prices are not be altered.
You are required to calculate the best production programme for the next operating period and to indicate the increase in net profit that this should yield. In addition identify the shadow price of processing hour.
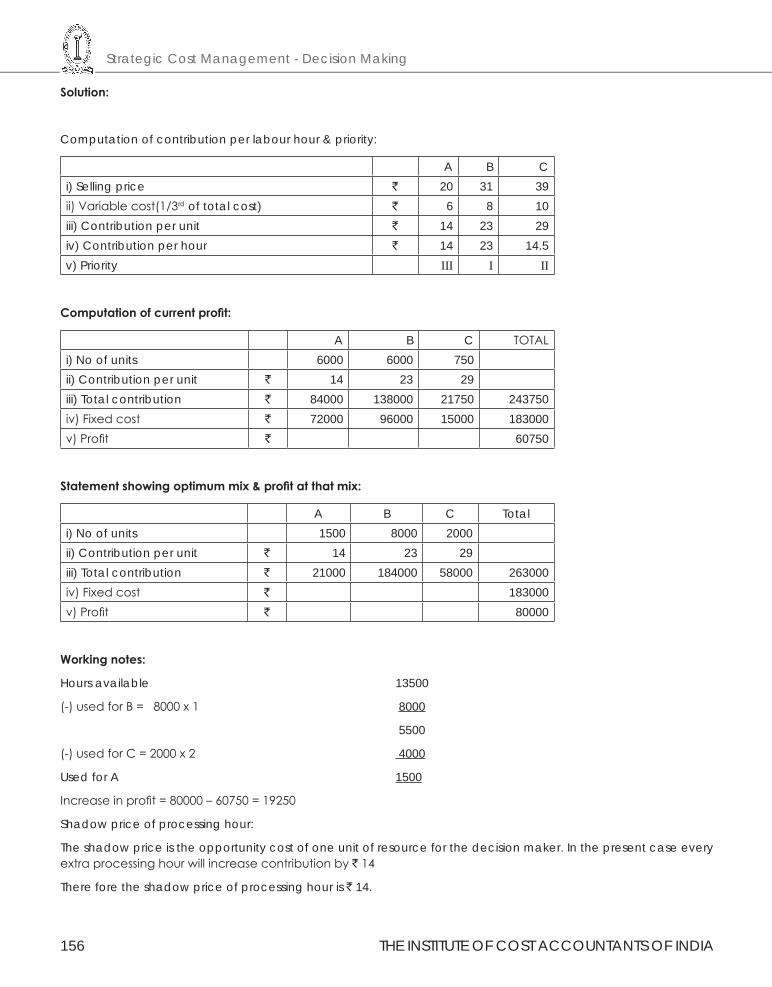
Strategic Cost Management - Decision Making
156 THE INSTITUTE OF COST ACCOUNTANTS OF INDIA
Solution:
Computation of contribution per labour hour & priority:
A B Ci) Selling price ` 20 31 39ii) Variable cost(1/3rd of total cost) ` 6 8 10iii) Contribution per unit ` 14 23 29iv) Contribution per hour ` 14 23 14.5v) Priority ΙΙΙ Ι ΙΙ
Computationofcurrentprofit:
A B C TOTALi) No of units 6000 6000 750ii) Contribution per unit ` 14 23 29iii) Total contribution ` 84000 138000 21750 243750iv) Fixed cost ` 72000 96000 15000 183000v) Profit ` 60750
Statementshowingoptimummix&profitatthatmix:
A B C Totali) No of units 1500 8000 2000ii) Contribution per unit ` 14 23 29iii) Total contribution ` 21000 184000 58000 263000iv) Fixed cost ` 183000v) Profit ` 80000
Workingnotes:
Hours available 13500
(-) used for B = 8000 x 1 8000
5500
(-) used for C = 2000 x 2 4000
Used for A 1500
Increase in profit = 80000 – 60750 = 19250
Shadow price of processing hour:
The shadow price is the opportunity cost of one unit of resource for the decision maker. In the present case every extra processing hour will increase contribution by ` 14
There fore the shadow price of processing hour is ` 14.
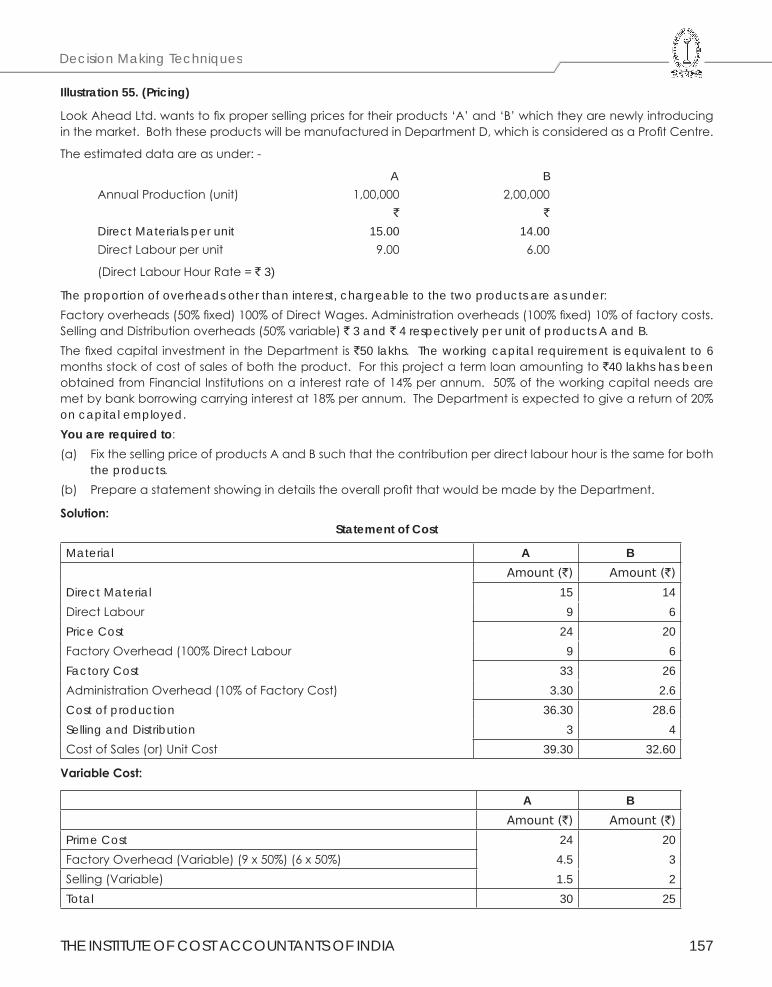
THE INSTITUTE OF COST ACCOUNTANTS OF INDIA 157
Decision Making Techniques
Illustration 55. (Pricing)
Look Ahead Ltd. wants to fix proper selling prices for their products ‘A’ and ‘B’ which they are newly introducing in the market. Both these products will be manufactured in Department D, which is considered as a Profit Centre.
The estimated data are as under: -
A B Annual Production (unit) 1,00,000 2,00,000 ` `
Direct Materials per unit 15.00 14.00 Direct Labour per unit 9.00 6.00
(Direct Labour Hour Rate = ` 3)
The proportion of overheads other than interest, chargeable to the two products are as under:Factory overheads (50% fixed) 100% of Direct Wages. Administration overheads (100% fixed) 10% of factory costs. Selling and Distribution overheads (50% variable) ` 3 and ` 4 respectively per unit of products A and B.The fixed capital investment in the Department is `50 lakhs. The working capital requirement is equivalent to 6 months stock of cost of sales of both the product. For this project a term loan amounting to `40 lakhs has been obtained from Financial Institutions on a interest rate of 14% per annum. 50% of the working capital needs are met by bank borrowing carrying interest at 18% per annum. The Department is expected to give a return of 20% on capital employed.You are required to:(a) Fix the selling price of products A and B such that the contribution per direct labour hour is the same for both
the products.(b) Prepare a statement showing in details the overall profit that would be made by the Department.
Solution:Statement of Cost
Material A BAmount (`) Amount (`)
Direct Material 15 14Direct Labour 9 6Price Cost 24 20Factory Overhead (100% Direct Labour 9 6Factory Cost 33 26Administration Overhead (10% of Factory Cost) 3.30 2.6Cost of production 36.30 28.6Selling and Distribution 3 4Cost of Sales (or) Unit Cost 39.30 32.60
VariableCost:
A BAmount (`) Amount (`)
Prime Cost 24 20Factory Overhead (Variable) (9 x 50%) (6 x 50%) 4.5 3Selling (Variable) 1.5 2Total 30 25
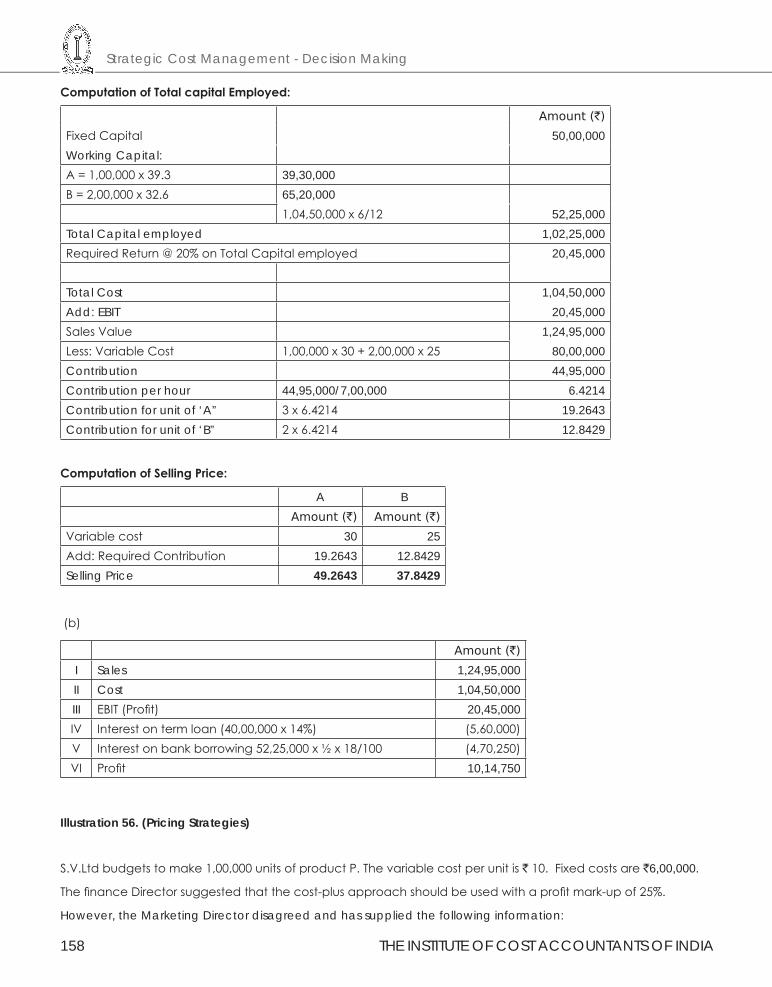
Strategic Cost Management - Decision Making
158 THE INSTITUTE OF COST ACCOUNTANTS OF INDIA
ComputationofTotalcapitalEmployed:
Amount (`)
Fixed Capital 50,00,000Working Capital:A = 1,00,000 x 39.3 39,30,000B = 2,00,000 x 32.6 65,20,000
1,04,50,000 x 6/12 52,25,000Total Capital employed 1,02,25,000Required Return @ 20% on Total Capital employed 20,45,000
Total Cost 1,04,50,000Add: EBIT 20,45,000Sales Value 1,24,95,000Less: Variable Cost 1,00,000 x 30 + 2,00,000 x 25 80,00,000Contribution 44,95,000Contribution per hour 44,95,000/7,00,000 6.4214Contribution for unit of ‘A” 3 x 6.4214 19.2643Contribution for unit of ‘B” 2 x 6.4214 12.8429
ComputationofSellingPrice:
A BAmount (`) Amount (`)
Variable cost 30 25Add: Required Contribution 19.2643 12.8429Selling Price 49.2643 37.8429
(b)
Amount (`)
I Sales 1,24,95,000II Cost 1,04,50,000III EBIT (Profit) 20,45,000IV Interest on term loan (40,00,000 x 14%) (5,60,000)V Interest on bank borrowing 52,25,000 x ½ x 18/100 (4,70,250)VI Profit 10,14,750
Illustration 56. (Pricing Strategies)
S.V.Ltd budgets to make 1,00,000 units of product P. The variable cost per unit is ` 10. Fixed costs are `6,00,000.
The finance Director suggested that the cost-plus approach should be used with a profit mark-up of 25%.
However, the Marketing Director disagreed and has supplied the following information:
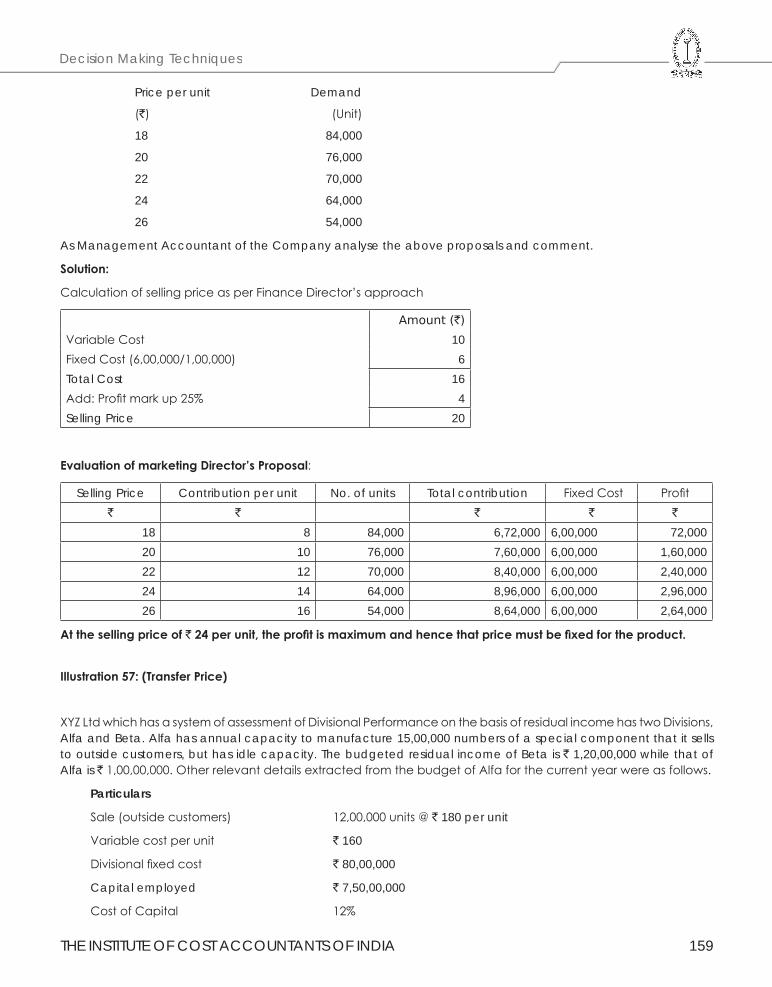
THE INSTITUTE OF COST ACCOUNTANTS OF INDIA 159
Decision Making Techniques
Price per unit Demand
(`) (Unit)
18 84,000
20 76,000
22 70,000
24 64,000
26 54,000
As Management Accountant of the Company analyse the above proposals and comment.
Solution:
Calculation of selling price as per Finance Director’s approach
Amount (`)
Variable Cost 10Fixed Cost (6,00,000/1,00,000) 6Total Cost 16Add: Profit mark up 25% 4Selling Price 20
EvaluationofmarketingDirector’sProposal:
Selling Price Contribution per unit No. of units Total contribution Fixed Cost Profit` ` ` ` `
18 8 84,000 6,72,000 6,00,000 72,00020 10 76,000 7,60,000 6,00,000 1,60,00022 12 70,000 8,40,000 6,00,000 2,40,00024 14 64,000 8,96,000 6,00,000 2,96,00026 16 54,000 8,64,000 6,00,000 2,64,000
Atthesellingpriceof`24perunit,theprofitismaximumandhencethatpricemustbefixedfortheproduct.
Illustration57:(TransferPrice)
XYZ Ltd which has a system of assessment of Divisional Performance on the basis of residual income has two Divisions, Alfa and Beta. Alfa has annual capacity to manufacture 15,00,000 numbers of a special component that it sells to outside customers, but has idle capacity. The budgeted residual income of Beta is ` 1,20,00,000 while that of Alfa is ` 1,00,00,000. Other relevant details extracted from the budget of Alfa for the current year were as follows.
Particulars
Sale (outside customers) 12,00,000 units @ ` 180 per unit
Variable cost per unit ` 160
Divisional fixed cost ` 80,00,000
Capital employed ` 7,50,00,000
Cost of Capital 12%
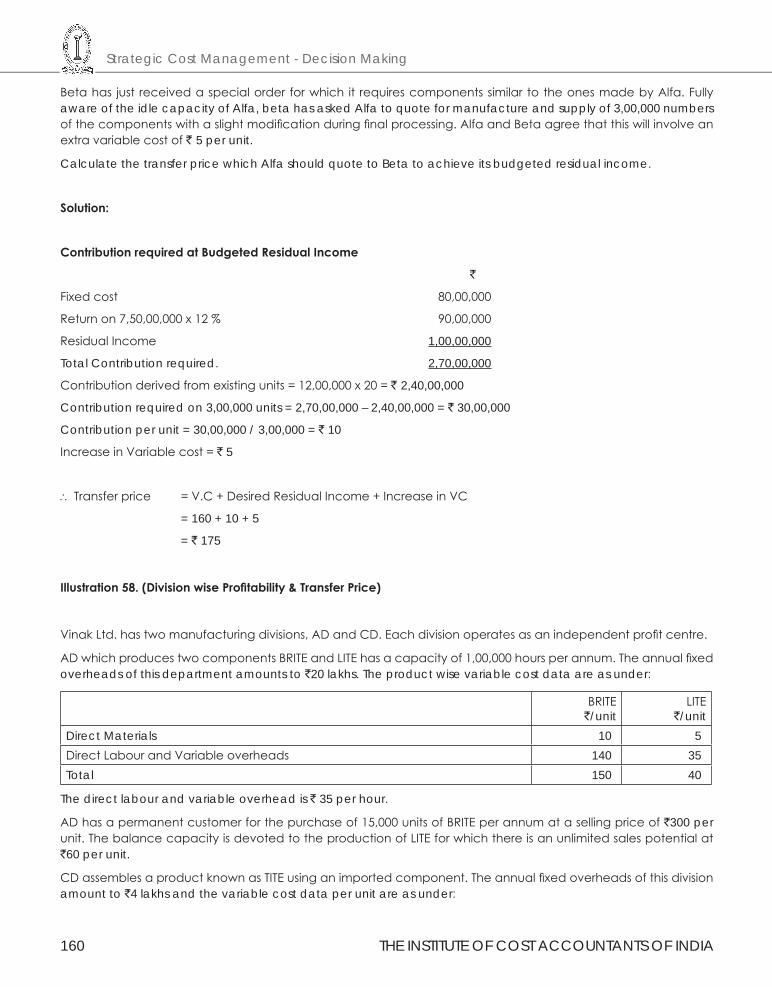
Strategic Cost Management - Decision Making
160 THE INSTITUTE OF COST ACCOUNTANTS OF INDIA
Beta has just received a special order for which it requires components similar to the ones made by Alfa. Fully aware of the idle capacity of Alfa, beta has asked Alfa to quote for manufacture and supply of 3,00,000 numbers of the components with a slight modification during final processing. Alfa and Beta agree that this will involve an extra variable cost of ` 5 per unit.
Calculate the transfer price which Alfa should quote to Beta to achieve its budgeted residual income.
Solution:
ContributionrequiredatBudgetedResidualIncome
`
Fixed cost 80,00,000
Return on 7,50,00,000 x 12 % 90,00,000
Residual Income 1,00,00,000
Total Contribution required. 2,70,00,000
Contribution derived from existing units = 12,00,000 x 20 = ` 2,40,00,000
Contribution required on 3,00,000 units = 2,70,00,000 – 2,40,00,000 = ` 30,00,000
Contribution per unit = 30,00,000 / 3,00,000 = ` 10
Increase in Variable cost = ` 5
∴ Transfer price = V.C + Desired Residual Income + Increase in VC
= 160 + 10 + 5
= ` 175
Illustration58.(DivisionwiseProfitability&TransferPrice)
Vinak Ltd. has two manufacturing divisions, AD and CD. Each division operates as an independent profit centre.
AD which produces two components BRITE and LITE has a capacity of 1,00,000 hours per annum. The annual fixed overheads of this department amounts to `20 lakhs. The product wise variable cost data are as under:
BRITE`/unit
LITE`/unit
Direct Materials 10 5Direct Labour and Variable overheads 140 35Total 150 40
The direct labour and variable overhead is ` 35 per hour.
AD has a permanent customer for the purchase of 15,000 units of BRITE per annum at a selling price of `300 per unit. The balance capacity is devoted to the production of LITE for which there is an unlimited sales potential at `60 per unit.
CD assembles a product known as TITE using an imported component. The annual fixed overheads of this division amount to `4 lakhs and the variable cost data per unit are as under:
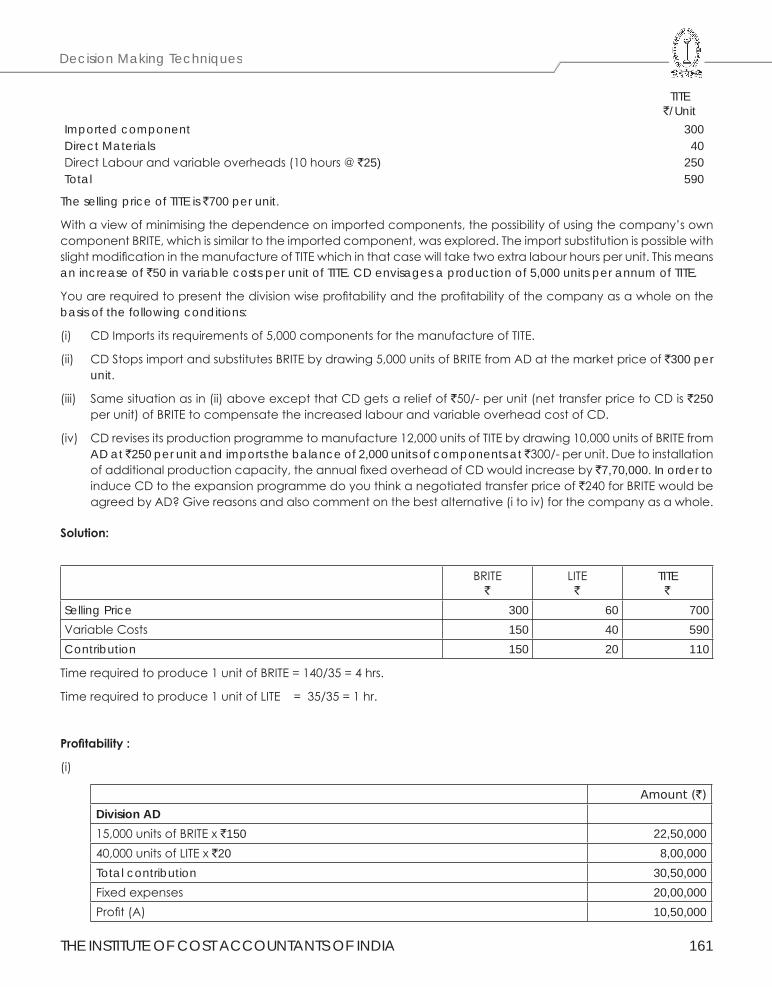
THE INSTITUTE OF COST ACCOUNTANTS OF INDIA 161
Decision Making Techniques
TITE `/Unit
Imported component 300Direct Materials 40Direct Labour and variable overheads (10 hours @ `25) 250Total 590
The selling price of TITE is `700 per unit.
With a view of minimising the dependence on imported components, the possibility of using the company’s own component BRITE, which is similar to the imported component, was explored. The import substitution is possible with slight modification in the manufacture of TITE which in that case will take two extra labour hours per unit. This means an increase of `50 in variable costs per unit of TITE. CD envisages a production of 5,000 units per annum of TITE.
You are required to present the division wise profitability and the profitability of the company as a whole on the basis of the following conditions:
(i) CD Imports its requirements of 5,000 components for the manufacture of TITE.
(ii) CD Stops import and substitutes BRITE by drawing 5,000 units of BRITE from AD at the market price of `300 per unit.
(iii) Same situation as in (ii) above except that CD gets a relief of `50/- per unit (net transfer price to CD is `250 per unit) of BRITE to compensate the increased labour and variable overhead cost of CD.
(iv) CD revises its production programme to manufacture 12,000 units of TITE by drawing 10,000 units of BRITE from AD at ̀ 250 per unit and imports the balance of 2,000 units of components at ̀ 300/- per unit. Due to installation of additional production capacity, the annual fixed overhead of CD would increase by `7,70,000. In order to induce CD to the expansion programme do you think a negotiated transfer price of `240 for BRITE would be agreed by AD? Give reasons and also comment on the best alternative (i to iv) for the company as a whole.
Solution:
BRITE`
LITE`
TITE`
Selling Price 300 60 700Variable Costs 150 40 590Contribution 150 20 110
Time required to produce 1 unit of BRITE = 140/35 = 4 hrs.
Time required to produce 1 unit of LITE = 35/35 = 1 hr.
Profitability:
(i)
Amount (`)
Division AD15,000 units of BRITE x `150 22,50,00040,000 units of LITE x `20 8,00,000Total contribution 30,50,000Fixed expenses 20,00,000Profit (A) 10,50,000
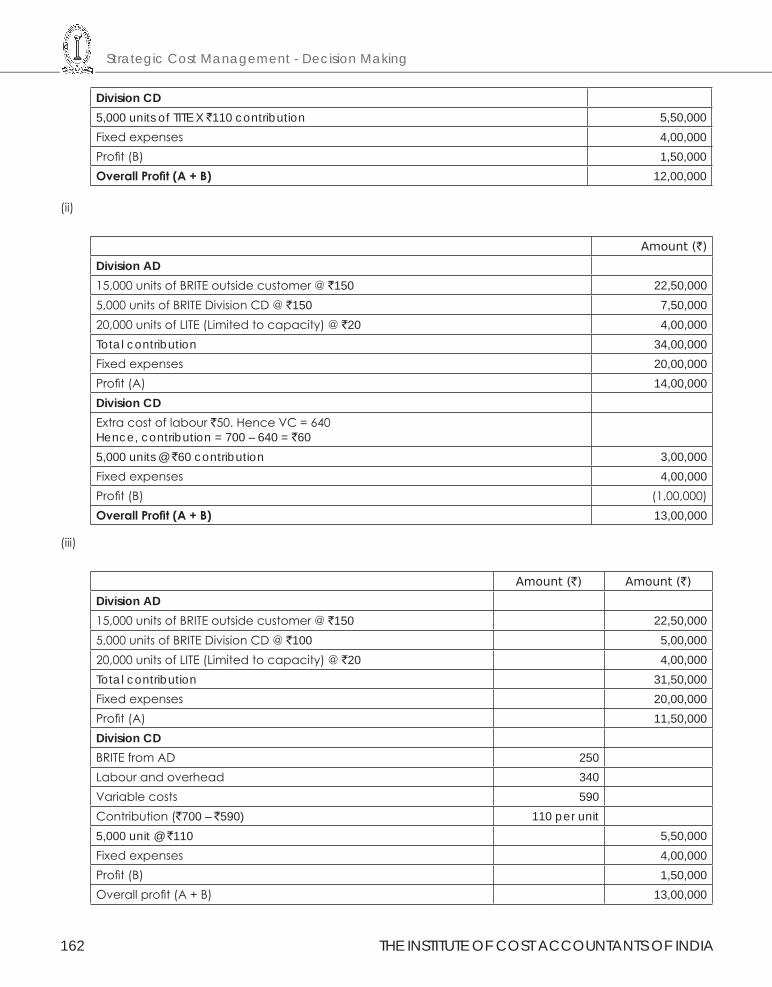
Strategic Cost Management - Decision Making
162 THE INSTITUTE OF COST ACCOUNTANTS OF INDIA
Division CD5,000 units of TITE X `110 contribution 5,50,000Fixed expenses 4,00,000Profit (B) 1,50,000OverallProfit(A+B) 12,00,000
(ii)
Amount (`)
Division AD15,000 units of BRITE outside customer @ `150 22,50,0005,000 units of BRITE Division CD @ `150 7,50,00020,000 units of LITE (Limited to capacity) @ `20 4,00,000Total contribution 34,00,000Fixed expenses 20,00,000Profit (A) 14,00,000Division CDExtra cost of labour `50. Hence VC = 640Hence, contribution = 700 – 640 = `605,000 units @ `60 contribution 3,00,000Fixed expenses 4,00,000Profit (B) (1,00,000)OverallProfit(A+B) 13,00,000
(iii)
Amount (`) Amount (`)
Division AD15,000 units of BRITE outside customer @ `150 22,50,0005,000 units of BRITE Division CD @ `100 5,00,00020,000 units of LITE (Limited to capacity) @ `20 4,00,000Total contribution 31,50,000Fixed expenses 20,00,000Profit (A) 11,50,000Division CDBRITE from AD 250Labour and overhead 340Variable costs 590Contribution (`700 – `590) 110 per unit5,000 unit @ `110 5,50,000Fixed expenses 4,00,000Profit (B) 1,50,000 Overall profit (A + B) 13,00,000
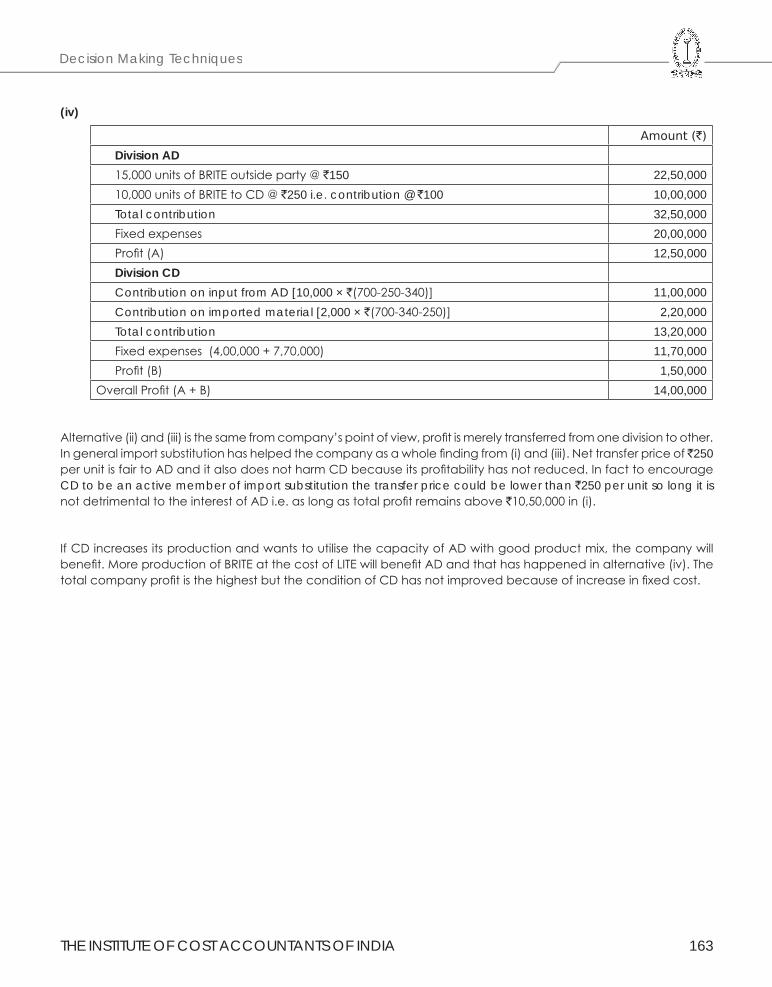
THE INSTITUTE OF COST ACCOUNTANTS OF INDIA 163
Decision Making Techniques
(iv)
Amount (`)
Division AD15,000 units of BRITE outside party @ `150 22,50,00010,000 units of BRITE to CD @ `250 i.e. contribution @ `100 10,00,000Total contribution 32,50,000Fixed expenses 20,00,000Profit (A) 12,50,000Division CDContribution on input from AD [10,000 × `(700-250-340)] 11,00,000Contribution on imported material [2,000 × `(700-340-250)] 2,20,000Total contribution 13,20,000Fixed expenses (4,00,000 + 7,70,000) 11,70,000Profit (B) 1,50,000
Overall Profit (A + B) 14,00,000
Alternative (ii) and (iii) is the same from company’s point of view, profit is merely transferred from one division to other. In general import substitution has helped the company as a whole finding from (i) and (iii). Net transfer price of ̀ 250 per unit is fair to AD and it also does not harm CD because its profitability has not reduced. In fact to encourage CD to be an active member of import substitution the transfer price could be lower than `250 per unit so long it is not detrimental to the interest of AD i.e. as long as total profit remains above `10,50,000 in (i).
If CD increases its production and wants to utilise the capacity of AD with good product mix, the company will benefit. More production of BRITE at the cost of LITE will benefit AD and that has happened in alternative (iv). The total company profit is the highest but the condition of CD has not improved because of increase in fixed cost.

Strategic Cost Management - Decision Making
164 THE INSTITUTE OF COST ACCOUNTANTS OF INDIA
THE INSTITUTE OF COST ACCOUNTANTS OF INDIA 165
Standard Costing in Profit Planning
This Study Note includes
3.1 Variance Analysis
3.2 UniformCostinginProfitPlanning
3.3 Inter Firm Comparison
Study Note - 3STANDARD COSTING IN PROFIT PLANNING
3.1 VARIANCE ANALYSIS
Introduction:
During the first stages of development of cost accounting, historical costing was the only method available for ascertaining and presenting costs. Historical costs have, however, the following limitations:
(a) Historical cost is valid only for one accounting period, during which the particular manufacturing operation took place.
(b) Data is obtained too late for price quotations and production planning.
(c) Historical cost relating to one batch or lot of production is not a true guide for fixing price.
(d) Past actual are affected by the level of working efficiencies.
(e) Historical costing is comparatively expensive as it involves the maintenance of a large volume of records and forms.
The limitations and disadvantages attached to historical costing system led to further thinking on the subject and resulted in the emergence of standard costing which makes use of scientifically pre-determined standard costs under each element.
Definition:
Standard Costing is defined as “the preparation and use of standard cost, their comparison with actual costs and the measurement and analysis of variances to their causes and points of incidence.”
General Principles of Standard Costing:
1. Predetermination of technical data related to production. i.e., details of materials and labour operations required for each product, the quantum of inevitable losses, efficiencies expected, level of activity, etc.
2. Predetermination of standard costs in full details under each element of cost, viz., labour, material and overhead.
3. Comparison of the actual performance and costs with the standards and working out the variances, i.e., the differences between the actuals and the standards.
4. Analysis of the variances in order to determine the reasons for deviations of actuals from the standards.
5. Presentation of information to the appropriate level of management to enable suitable action (remedial measures or revision of the standards) being taken.
Difference between Standard Costing and Budgetary Control:
Like Budgetary Control, Standard Costing assume that costs are controllable along definite lines of supervision and responsibility and it aims at managerial control by comparison of actual performances with suitable predetermined yardsticks. The basic principles of cost control, viz., setting up of targets or standards, measurement of performance,
Strategic Cost Management - Decision Making
166 THE INSTITUTE OF COST ACCOUNTANTS OF INDIA
comparison of actual with the targets and analysis and reporting of variances are common to both standard costing and budgetary control systems. Both techniques are of importance in their respective fields are complementary to each other. Thus, conceptually there is not much of a difference between standard costs and budgeted and the terms budgeted performance and standard performance mean, for many concerns one and the same thing.
Budgets are usually based on past costs adjusted for anticipated future changes but standard costs are of help in the preparation of production costs budgets. In fact, standards are often indispensable in the establishment of budgets. On the other hand, while setting standard overhead rates of standard costing purposes, the budgets framed for the overhead costs may be made use of with modifications, if necessary. Thus, standard costs and budgets are interrelated but not inter-dependent.
Despite the similarity in the basic principles of Standard Costing and Budgetary Control, the two systems vary in scope and in the matter of detailed techniques. The difference may be summarized as follows:
1. A system of Budgetary Control may be operated even if no Standard Costing system is in use in the concern.
2. While standard is an unit concept, budget is a total concept.
3. Budgets are the ceilings or limits of expenses above which the actual expenditure should not normally rise; if it does, the planned profits will be reduced. Standards are minimum targets to be attained by actual performance at specified efficiency.
4. Budgets are complete in as much as they are framed for all the activities and functions of a concern such as production, purchase, selling and distribution, research and development, capital utilisation, etc. Standard Costing relates mainly to the function of production and the related manufacturing costs.
5. A more searching analysis of the variances from standards is necessary than in the case of variations from the budget.
6. Budgets are indices, adherence to which keeps a business out of difficulties. Standards are pointers to further possible improvements.
Advantages of Standard Costing:
The advantages derived from a system of standard costing are tabulated below:
1. Standard Costing system establishes yard-sticks against which the efficiency of actual performances is measured.
2. The standards provide incentive and motivation to work with greater effort and vigilance for achieving the standard. This increase efficiency and productivity all round.
3. At the very stage of setting the standards, simplification and standardisation of products, methods, and operations are effected and waste of time and materials is eliminated. This assists in managerial planning for efficient operation and benefits all the divisions of the concern.
4. Costing procedure is simplified. There is a reduction in paper work in accounting and less number of forms and records are required.
5. Cost are available with promptitude for various purposes like fixation of selling prices, pricing of inter-departmental transfers, ascertaining the value of costing stocks of work-in-progress and finished stock and determining idle capacity.
6. Standard Costing is an exercise in planning - it can be very easily fitted into and used for budgetary planning.
7. Standard Costing system facilities delegation of authority and fixation of responsibility for each department or individual. This also tones up the general organisation of the concern.
8. Variance analysis and reporting is based on the principles of management by exception. The top management may not be interested in details of actual performance but only in the variances form the standards, so that corrective measures may be taken in time.
THE INSTITUTE OF COST ACCOUNTANTS OF INDIA 167
Standard Costing in Profit Planning
9. When constantly reviewed, the standards provide means for achieving cost reduction.
10. Standard costs assist in performance analysis by providing ready means for preparation of information.
11. Production and pricing policies may be formulated in advance before production starts. This helps in prompt decision-making.
12. Standard costing facilitates the integration of accounts so that reconciliation between cost accounts and financial accounts may be eliminated.
13. Standard Costing optimizes the use of plant capacities, current assets and working capital.
Limitations of standard costing:
1. Establishment of standard costs is difficult in practice.
2. In course of time, sometimes even in a short period the standards become rigid.
3. Inaccurate, unreliable and out of date standards do more harm than benefit.
4. Sometimes, standards create adverse psychological effects. If the standard is set at high level, its non achievement would result in frustration and build-up of resistance.
5. Due to the play of random factors, variances cannot sometimes be properly explained, and it is difficult to distinguish between controllable and non-controllable expenses.
6. Standard costing may not sometimes be suitable for some small concerns. Where production cannot be carefully scheduled, frequent changes in production conditions result in variances. Detailed analysis of all of which would be meaningless, superfluous and costly.
7. Standard costing may not, sometimes, be suitable and costly in the case of industries dealing with non-standardized products and for repair jobs which keep on changing in accordance with customer’s specifications.
8. Lack of interest in standard costing on the part of the management makes the system practically ineffective. This limitation, of course, applies equally in the case of any other system which the management does not accept wholeheartedly.
Standard Cost:
Standard Cost is defined as “the predetermined cost that is calculated at the management’s standards of efficient operations and the relevant necessary expenditure”.
From this we understand that it is the cost calculated when all the people working in the organisation to their utmost, the expenditure incurred for producing the product can be taken as standard cost. The optimum efficiency can not at all time exists. Therefore, optimum efficiency is assumed and that is why standard cost is called assumed cost. Further, all the inputs of cost scientifically analysed using so many industrial engineering techniques such as work measurement, method study, time and motion study, merit rating, job evaluation and other scientific techniques, it can also be called as Scientific Cost.
Standard Costs and Estimated Costs:
The distinction between Standard Costs and Estimated Costs should be clearly understood. While both Standard Costs and Estimated Costs are predetermined costs, their objectives are different. The main differences between the two types of costs are:
1. Estimated Costs are intended to determine what the costs ‘will’ be. Standard Costs aim at what costs ‘should’ be.
2. Estimated Costs are based on average of past actual figures adjusted for anticipated changes in future. Anticipated wastes, spoilage and inefficiencies, all of which tend to increase costs are included in estimated costs. Standard Costs are planned costs determined on a scientific basis and they are based upon certain assumed conditions of efficiency and other factors.
Strategic Cost Management - Decision Making
168 THE INSTITUTE OF COST ACCOUNTANTS OF INDIA
3. In Estimated Costing Systems, stress is not so much on cost control, but costs are used for other purposes such as fixation of prices to be quoted in advance. Standard Costs serve as effective tools for cost control.
Setting of Standard Costs:
While setting production costs standards, the following preliminaries should be considered:
(a) Study of the technical and operational aspects of the concern, such as methods of manufacture and the processes involved, management of organisation and line of assignment of responsibilities, division of the organisation into cost centres, units of measurement of input and output, anticipation of wastes, rejections and losses, expected efficiency, and capacity likely to be utilized.
(b) Review of the existing costing system and the cost records and forms in use.
(c) The type of standard to be used, i.e, whether current, basic, or normal standard costs are to be set. The choice of a particular type of standard will depend upon two factors, viz. which type would be most effective for cost control in the organization, and whether the standards will be merged in the accounting system or kept outside the accounts as statistical data.
(d) Proper classification of the accounts so that variances may be determined in the manner desired.
(e) Fixation of responsibility for setting standards. As definite responsibility for variances from standards is ultimately to be laid on individuals or departments, it is but natural that all those individuals or departments should be associated with the setting of standards.
Stock Valuation:
The function of a Balance Sheet is to give a true and fair view of the state of affairs of a company on a particular date. A true and fair view also implies the consistent application of generally accepted principles. Stocks valued at standard costs are required to be adjusted at actual costs in the following circumstances:
(a) As per Accounting Standards – 2, closing stock to be valued either at cost price or at net realisable value (NRV) whichever is less.
(b) The standard costing system introduced is still in an experimental stage and the variances merely represent deviations from poorly set standards.
(c) Occurrence of certain variances which are beyond the control of the management. (Unless the stocks are adjusted for uncontrollable factors, the values are not correctly started).
Maintenance of Raw Material Stock at Standard Cost:
In the single plan, the inventory in the stores ledger may be carried either at standard costs or at actual. Although both the methods are in use, the consensus is in favour of standard costs. The advantages of adopting standard costs for inventory valuation are as follows:
(a) Stores ledger may be maintained in quantities only and the standard price noted at the top in the ledger sheets. This economises the use of forms as well as reduces clerical costs as no columns for rates need be maintained.
(b) Pricing of materials requisitions is simplified as only one standard price for each item of material is required to be used.
(c) Price variance is promptly revealed at the time of purchase of material.
The disadvantages are:
(a) The stores ledger does not reveal the current prices.
(b) If the material stock is shown in the Balance Sheet at standard costs, the variances have the effect of distorting the profit or loss. Standard cost of the closing inventory is required to be adjusted to actual cost based on price variance to comply with the statutory requirement of the Companies Act, 2013.
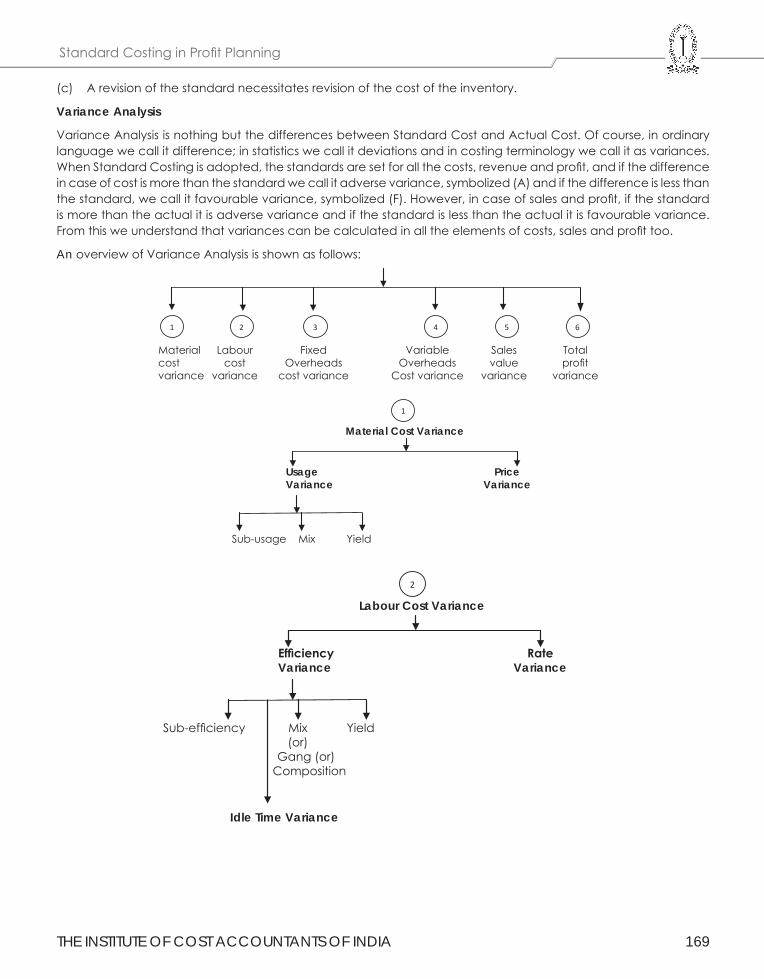
THE INSTITUTE OF COST ACCOUNTANTS OF INDIA 169
Standard Costing in Profit Planning
(c) A revision of the standard necessitates revision of the cost of the inventory.
Variance Analysis
Variance Analysis is nothing but the differences between Standard Cost and Actual Cost. Of course, in ordinary language we call it difference; in statistics we call it deviations and in costing terminology we call it as variances. When Standard Costing is adopted, the standards are set for all the costs, revenue and profit, and if the difference in case of cost is more than the standard we call it adverse variance, symbolized (A) and if the difference is less than the standard, we call it favourable variance, symbolized (F). However, in case of sales and profit, if the standard is more than the actual it is adverse variance and if the standard is less than the actual it is favourable variance. From this we understand that variances can be calculated in all the elements of costs, sales and profit too.
An overview of Variance Analysis is shown as follows:
1 2 3 4 5 6
Material Labour Fixed Variable Sales Totalcost cost Overheads Overheads value profitvariance variance cost variance Cost variance variance variance
1
Material Cost Variance
Usage Price Variance Variance
Sub-usage Mix Yield
2
Labour Cost Variance
Efficiency RateVariance Variance
Idle Time Variance
Sub-efficiency Mix Yield (or) Gang (or) Composition
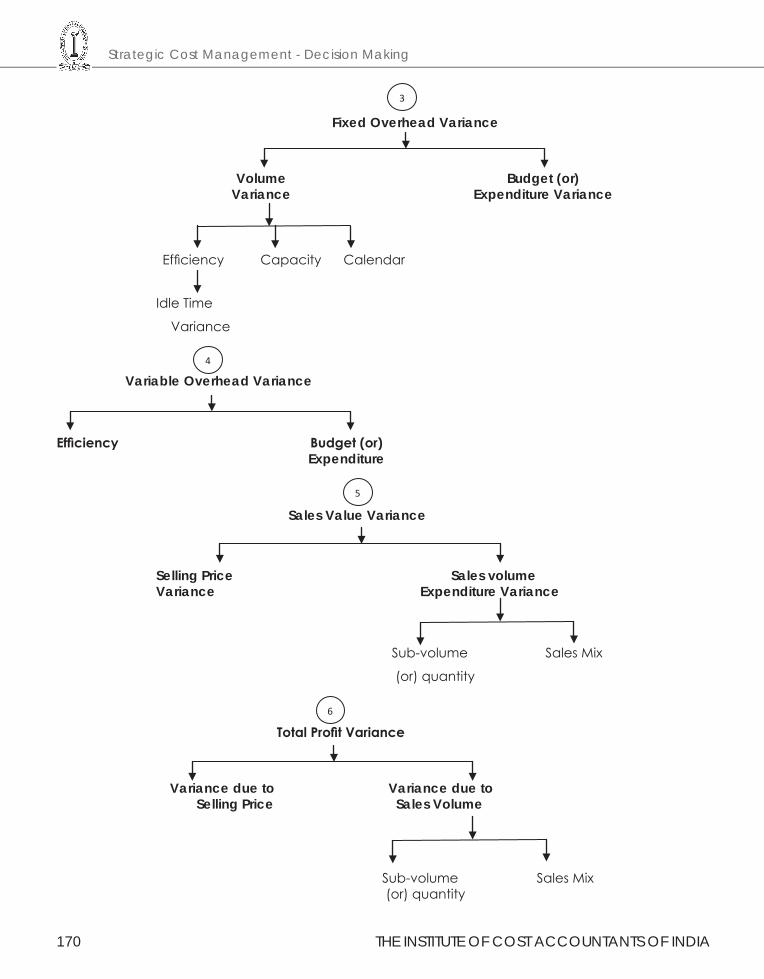
Strategic Cost Management - Decision Making
170 THE INSTITUTE OF COST ACCOUNTANTS OF INDIA
3
Fixed Overhead Variance
Volume Budget (or) Variance Expenditure Variance
Efficiency Capacity Calendar
Idle Time
Variance
4
Variable Overhead Variance
Efficiency Budget(or) Expenditure
5
Sales Value Variance
Selling Price Sales volumeVariance Expenditure Variance
Sub-volume Sales Mix
(or) quantity
6
TotalProfitVariance
Variance due to Variance due to Selling Price Sales Volume
Sub-volume Sales Mix (or) quantity
THE INSTITUTE OF COST ACCOUNTANTS OF INDIA 171
Standard Costing in Profit Planning
I. Material Variance:
1. Direct Materials Cost Variance: Direct materials cost variance is the difference between the actual direct material cost incurred and the standard direct material cost specified for the production achieved.
1. Direct Materials Price Variance: The difference between the actual and standard price per unit of the material applied to the actual quantity of material purchased or used.
Direct materials price variance = (Standard Price minus Actual Price) x Actual Quantity, or
= (SP-AP) AQ
= (Standard Price x Actual Quantity) minus (Actual Price x Actual Quantity)
= (AQSP-AQAP)
Causes of Material Price Variance:
a. Change in basic purchase price of material.
b. Change in quantity of purchase or uneconomical size of purchase order.
c. Rush order to meet shortage of supply, or purchase in less or more favourable market.
d. Failure to take advantage of off-season price, or failure to purchase when price is cheaper.
e. Failure to obtain (or availability of) cash and trade discounts or change in the discount rates.
f. Weak purchase organisation.
g. Payment of excess or less freight.
h. Transit losses and discrepancies, if purchase price is inflated to include the loss.
i. Change in quality or specification of material purchased.
j. Use of substitute material having a higher or lower unit price.
k. Change in materials purchase, upkeep, and store-keeping cost. (This is applicable only when such changes are allocated to direct material costs on a predetermined or standard cost basis.)
l. Change in the pattern or amounts of taxes and duties.
2. Direct Materials Usage Variance: The difference between the actual quantity used and the amount which should have been used, valued at standard price.
Direct materials usage variance = (Standard Quantity for actual output x Standard Price) minus (Standard Price x Actual Quantity)
= SQSP-AQSP or
= Standard Price x (Standard Quantity for actual output minus Actual Quantity)
= SP (SQ-AQ)
Causes of Materials Usage Variance:
a. Variation in usage of materials due to inefficient or careless use, or economic use of materials.
b. Change in specification or design of product.
c. Inefficient and inadequate inspection of raw materials.
d. Purchase of inferior materials or change in quality of materials
e. Rigid technical specifications and strict inspection leading to more rejections which require more materials for rectification.
f. Inefficiency in production resulting in wastages
g. Use of substitute materials.
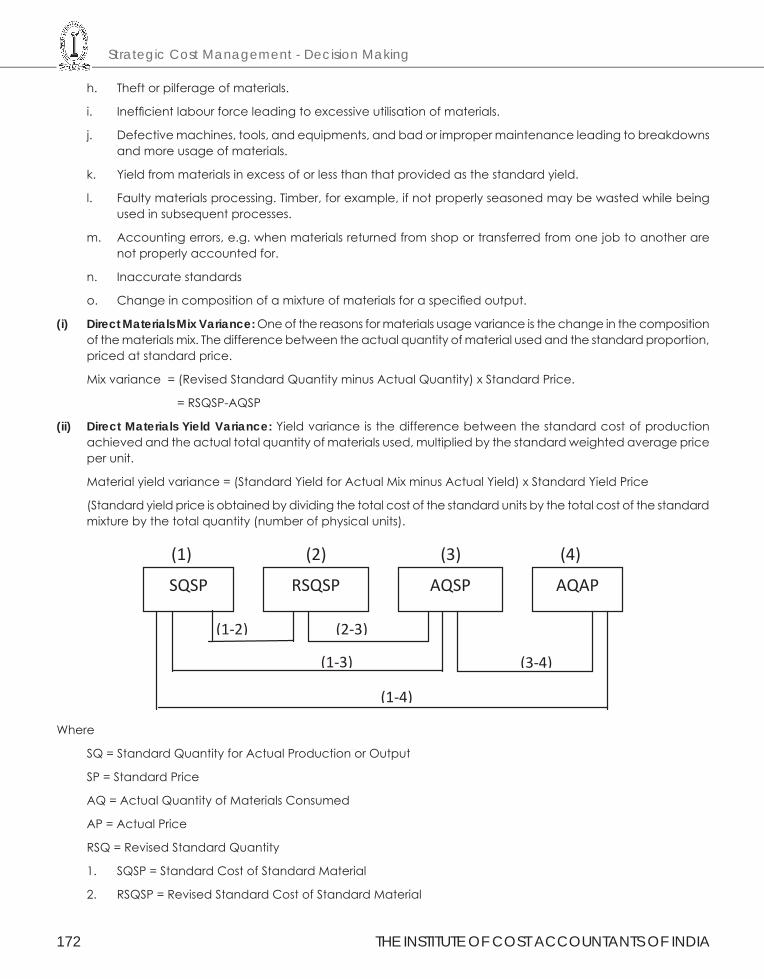
Strategic Cost Management - Decision Making
172 THE INSTITUTE OF COST ACCOUNTANTS OF INDIA
h. Theft or pilferage of materials.
i. Inefficient labour force leading to excessive utilisation of materials.
j. Defective machines, tools, and equipments, and bad or improper maintenance leading to breakdowns and more usage of materials.
k. Yield from materials in excess of or less than that provided as the standard yield.
l. Faulty materials processing. Timber, for example, if not properly seasoned may be wasted while being used in subsequent processes.
m. Accounting errors, e.g. when materials returned from shop or transferred from one job to another are not properly accounted for.
n. Inaccurate standards
o. Change in composition of a mixture of materials for a specified output.
(i) Direct Materials Mix Variance: One of the reasons for materials usage variance is the change in the composition of the materials mix. The difference between the actual quantity of material used and the standard proportion, priced at standard price.
Mix variance = (Revised Standard Quantity minus Actual Quantity) x Standard Price.
= RSQSP-AQSP
(ii) Direct Materials Yield Variance: Yield variance is the difference between the standard cost of production achieved and the actual total quantity of materials used, multiplied by the standard weighted average price per unit.
Material yield variance = (Standard Yield for Actual Mix minus Actual Yield) x Standard Yield Price
(Standard yield price is obtained by dividing the total cost of the standard units by the total cost of the standard mixture by the total quantity (number of physical units).
(2) (3) (4) (1)
(1-3)
(1-4)
(1-2) (2-3)
(3-4)
SQSP RSQSP AQSP AQAP
Where
SQ = Standard Quantity for Actual Production or Output
SP = Standard Price
AQ = Actual Quantity of Materials Consumed
AP = Actual Price
RSQ = Revised Standard Quantity
1. SQSP = Standard Cost of Standard Material
2. RSQSP = Revised Standard Cost of Standard Material
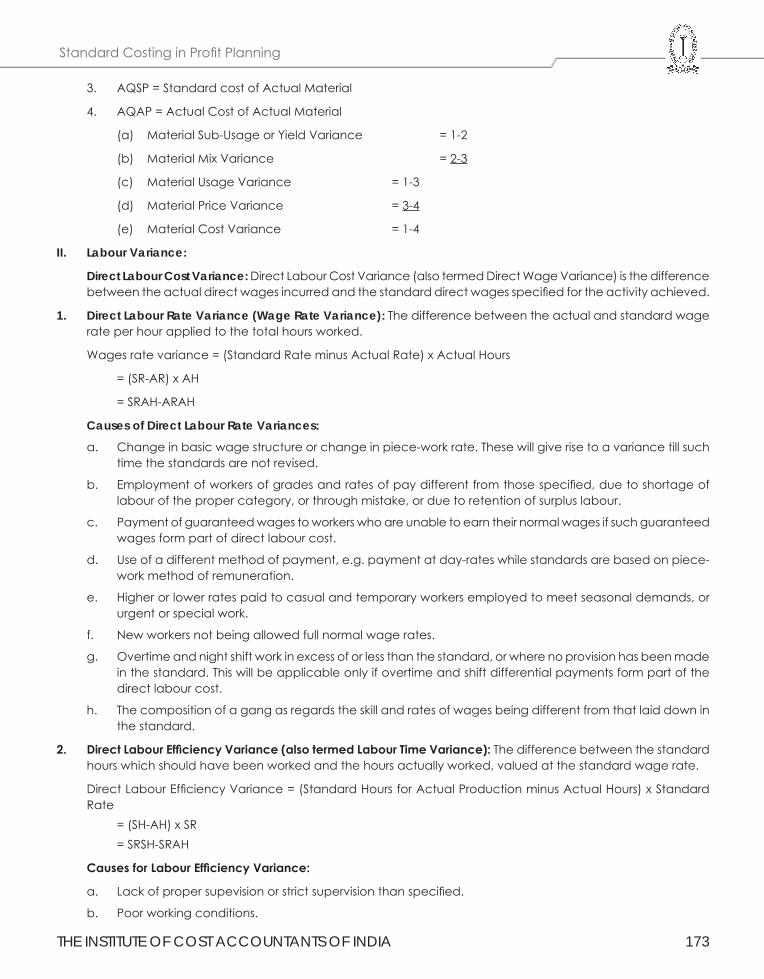
THE INSTITUTE OF COST ACCOUNTANTS OF INDIA 173
Standard Costing in Profit Planning
3. AQSP = Standard cost of Actual Material
4. AQAP = Actual Cost of Actual Material
(a) Material Sub-Usage or Yield Variance = 1-2
(b) Material Mix Variance = 2-3
(c) Material Usage Variance = 1-3
(d) Material Price Variance = 3-4
(e) Material Cost Variance = 1-4
II. Labour Variance:
Direct Labour Cost Variance: Direct Labour Cost Variance (also termed Direct Wage Variance) is the difference between the actual direct wages incurred and the standard direct wages specified for the activity achieved.
1. Direct Labour Rate Variance (Wage Rate Variance): The difference between the actual and standard wage rate per hour applied to the total hours worked.
Wages rate variance = (Standard Rate minus Actual Rate) x Actual Hours
= (SR-AR) x AH
= SRAH-ARAH
Causes of Direct Labour Rate Variances:
a. Change in basic wage structure or change in piece-work rate. These will give rise to a variance till such time the standards are not revised.
b. Employment of workers of grades and rates of pay different from those specified, due to shortage of labour of the proper category, or through mistake, or due to retention of surplus labour.
c. Payment of guaranteed wages to workers who are unable to earn their normal wages if such guaranteed wages form part of direct labour cost.
d. Use of a different method of payment, e.g. payment at day-rates while standards are based on piece-work method of remuneration.
e. Higher or lower rates paid to casual and temporary workers employed to meet seasonal demands, or urgent or special work.
f. New workers not being allowed full normal wage rates.
g. Overtime and night shift work in excess of or less than the standard, or where no provision has been made in the standard. This will be applicable only if overtime and shift differential payments form part of the direct labour cost.
h. The composition of a gang as regards the skill and rates of wages being different from that laid down in the standard.
2. DirectLabourEfficiencyVariance(alsotermedLabourTimeVariance):The difference between the standard hours which should have been worked and the hours actually worked, valued at the standard wage rate.
Direct Labour Efficiency Variance = (Standard Hours for Actual Production minus Actual Hours) x Standard Rate
= (SH-AH) x SR = SRSH-SRAH
CausesforLabourEfficiencyVariance:
a. Lack of proper supevision or strict supervision than specified.
b. Poor working conditions.
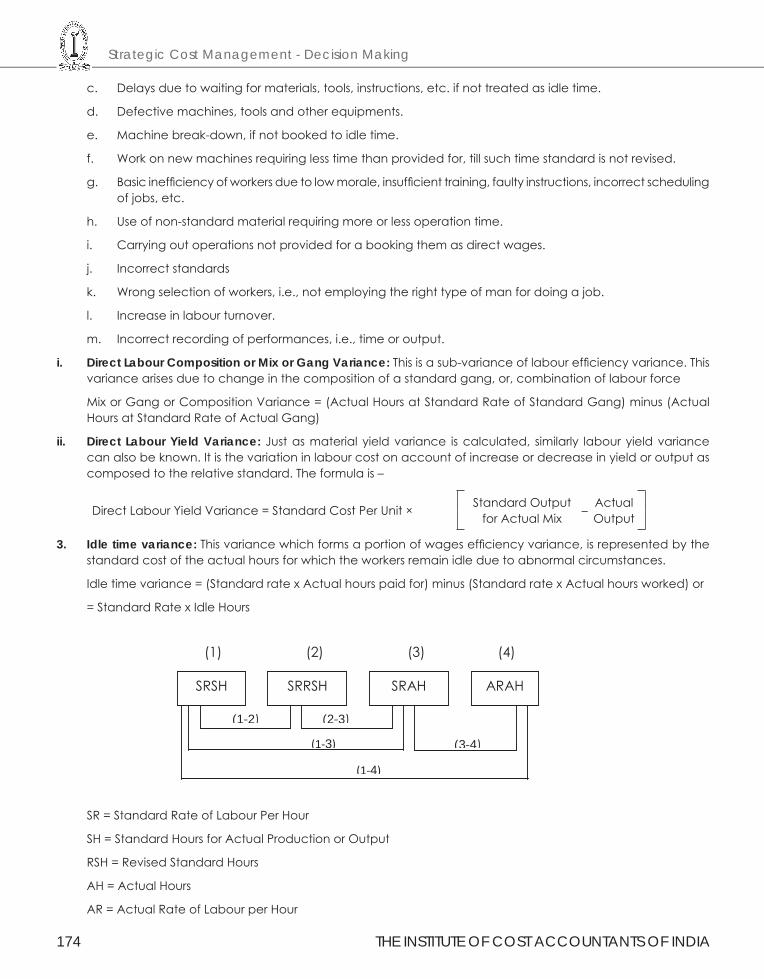
Strategic Cost Management - Decision Making
174 THE INSTITUTE OF COST ACCOUNTANTS OF INDIA
c. Delays due to waiting for materials, tools, instructions, etc. if not treated as idle time.
d. Defective machines, tools and other equipments.
e. Machine break-down, if not booked to idle time.
f. Work on new machines requiring less time than provided for, till such time standard is not revised.
g. Basic inefficiency of workers due to low morale, insufficient training, faulty instructions, incorrect scheduling of jobs, etc.
h. Use of non-standard material requiring more or less operation time.
i. Carrying out operations not provided for a booking them as direct wages.
j. Incorrect standards
k. Wrong selection of workers, i.e., not employing the right type of man for doing a job.
l. Increase in labour turnover.
m. Incorrect recording of performances, i.e., time or output.
i. Direct Labour Composition or Mix or Gang Variance: This is a sub-variance of labour efficiency variance. This variance arises due to change in the composition of a standard gang, or, combination of labour force
Mix or Gang or Composition Variance = (Actual Hours at Standard Rate of Standard Gang) minus (Actual Hours at Standard Rate of Actual Gang)
ii. Direct Labour Yield Variance: Just as material yield variance is calculated, similarly labour yield variance can also be known. It is the variation in labour cost on account of increase or decrease in yield or output as composed to the relative standard. The formula is –
Direct Labour Yield Variance = Standard Cost Per Unit × Standard Output for Actual Mix – Actual
Output
3. Idle time variance: This variance which forms a portion of wages efficiency variance, is represented by the standard cost of the actual hours for which the workers remain idle due to abnormal circumstances.
Idle time variance = (Standard rate x Actual hours paid for) minus (Standard rate x Actual hours worked) or
= Standard Rate x Idle Hours
(2)
(3) (4) (1)
(1-3)
(1-4)
(1-2) (2-3)
(3-4)
SRSH SRRSH SRAH ARAH
SR = Standard Rate of Labour Per Hour
SH = Standard Hours for Actual Production or Output
RSH = Revised Standard Hours
AH = Actual Hours
AR = Actual Rate of Labour per Hour
THE INSTITUTE OF COST ACCOUNTANTS OF INDIA 175
Standard Costing in Profit Planning
1. SRSH = Standard Cost of Standard Labour
2. SRRSH = Revised Standard Cost of Labour
3. SRAH = Standard Cost of Actual Labour
4. ARAH = Actual Cost of Labour
a. Labour Sub-Efficiency or Yield Variance = 1-2
b. Labour Mix or Gang or Composition Variance = 2-3
c. Labour Efficiency Variance = 1-3
d. Labour Rate Variance = 3-4
e. Labour Cost Variance = 1-4
Idle Time Variance = Idle Time Hours x Standard Rate per Hour.
It is to be noted that this is the part and parcel of efficiency ratio and always it is adverse.
III. Overhaed Variance
Overhead Cost Variance: Overhead cost variance or Overall (or net) overhead variance is the difference between the actual overhead incurred and the overhead charged or applied into the job or process at the standard overhead rate.
1. Fixed Overhead Variance:
Fixed overhead cost variance is the difference between the standard cost of fixed overhead allowed for the actual output achieved and the actual fixed overhead cost incurred. The fixed overhead variance is analysed as below:
(i) Budget (or) Expenditure (or) Spending Variance:
Fixed overhead variance which arises due to the difference between the budgeted fixed overheads and the actual fixed overheads incurred during a particular period. It shows the efficiency in spending. Expenditure variance arises due to the following:
• Rise in general price level.
• Changes in production methods.
• Ineffective control.
Fixed Overhead Expenditure or Budget Variance = Budgeted Fixed Overhead – Actual Fixed Overhead
(ii) Volume Variance:
Fixed overhead volume variance is the difference between standard cost of fixed overhead allowed for actual output and the budgeted fixed overheads for the period. This variance shows the over (or) under absorption of fixed overheads during a particular period. If the actual output is more than the budgeted output then there will be over recovery of fixed overheads and volume variance will be favourable and vice-versa. This is so because fixed overheads are not expected to change with the change in output. Volume variance arises due to the following reasons:
• Poor efficiency of workers.
• Poor efficiency of machinery.
• Lack of orders.
• Shortage of power.
• Ineffective supervision.
• More or less working days.
Volume variance (Fixed Overhead) = Recovered Fixed Overhead – Budgeted Fixed Overhead
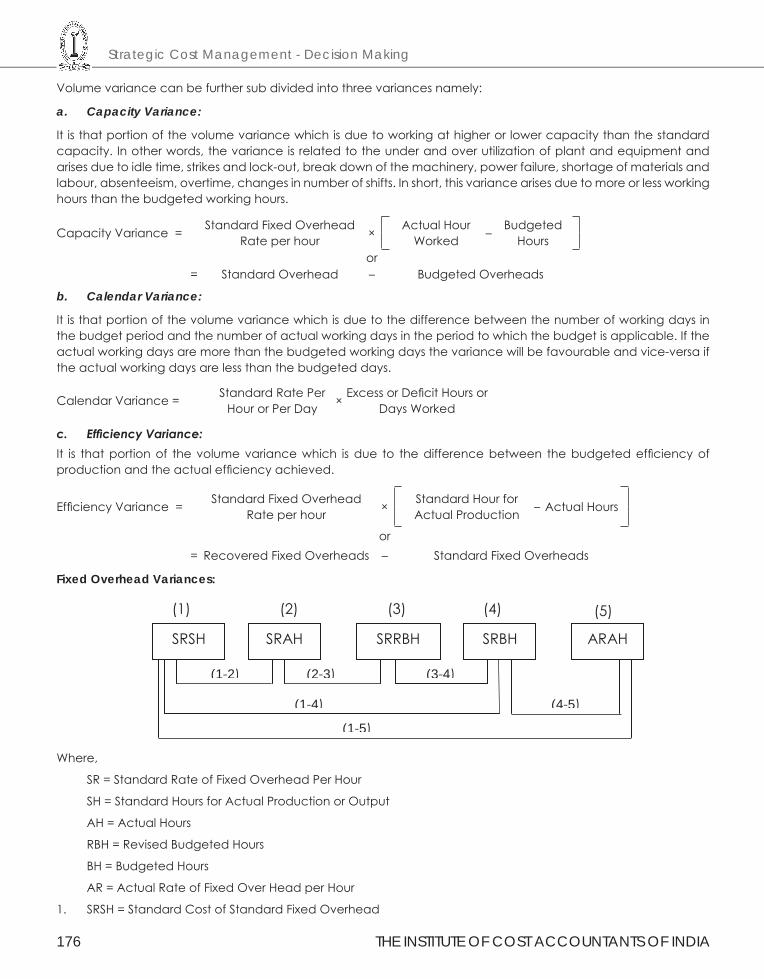
Strategic Cost Management - Decision Making
176 THE INSTITUTE OF COST ACCOUNTANTS OF INDIA
Volume variance can be further sub divided into three variances namely:
a. Capacity Variance:
It is that portion of the volume variance which is due to working at higher or lower capacity than the standard capacity. In other words, the variance is related to the under and over utilization of plant and equipment and arises due to idle time, strikes and lock-out, break down of the machinery, power failure, shortage of materials and labour, absenteeism, overtime, changes in number of shifts. In short, this variance arises due to more or less working hours than the budgeted working hours.
Capacity Variance = Standard Fixed Overhead Rate per hour × Actual Hour
Worked – Budgeted Hours
or= Standard Overhead – Budgeted Overheads
b. Calendar Variance:
It is that portion of the volume variance which is due to the difference between the number of working days in the budget period and the number of actual working days in the period to which the budget is applicable. If the actual working days are more than the budgeted working days the variance will be favourable and vice-versa if the actual working days are less than the budgeted days.
Calendar Variance = Standard Rate Per Hour or Per Day × Excess or Deficit Hours or
Days Worked
c. EfficiencyVariance:It is that portion of the volume variance which is due to the difference between the budgeted efficiency of production and the actual efficiency achieved.
Efficiency Variance = Standard Fixed Overhead Rate per hour × Standard Hour for
Actual Production – Actual Hours
or= Recovered Fixed Overheads – Standard Fixed Overheads
Fixed Overhead Variances:
(5) (2) (3) (4) (1)
(1-4)
(1-5)
(1-2) (2-3) (3-4)
(4-5)
SRSH SRAH SRRBH SRBH ARAH
Where,
SR = Standard Rate of Fixed Overhead Per Hour
SH = Standard Hours for Actual Production or Output
AH = Actual Hours
RBH = Revised Budgeted Hours
BH = Budgeted Hours
AR = Actual Rate of Fixed Over Head per Hour
1. SRSH = Standard Cost of Standard Fixed Overhead
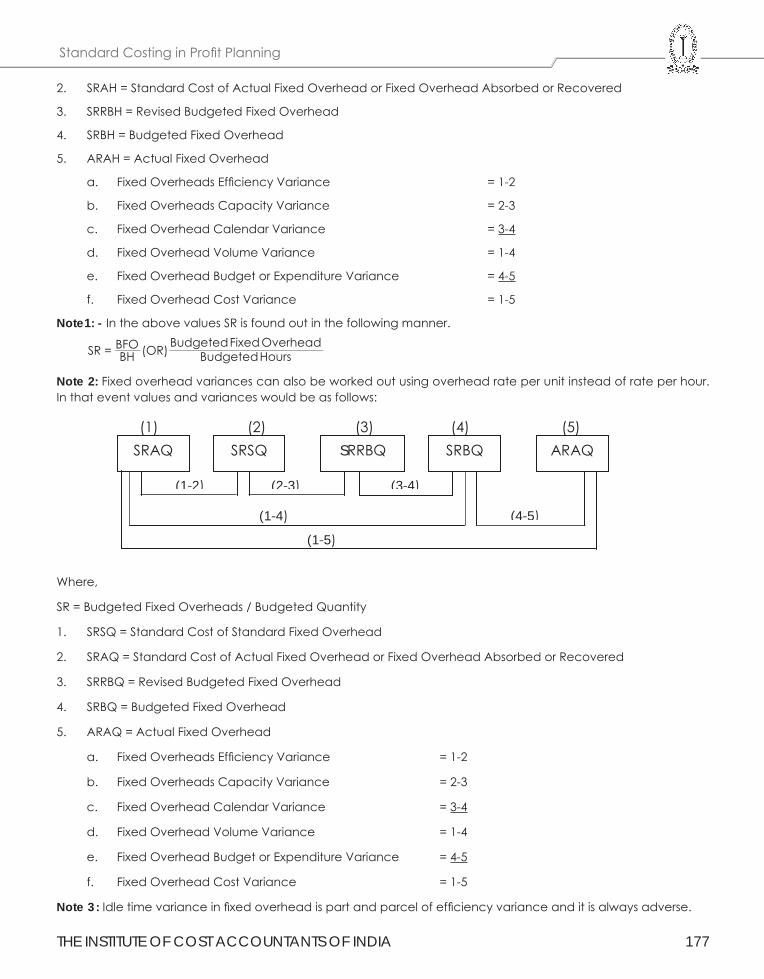
THE INSTITUTE OF COST ACCOUNTANTS OF INDIA 177
Standard Costing in Profit Planning
2. SRAH = Standard Cost of Actual Fixed Overhead or Fixed Overhead Absorbed or Recovered
3. SRRBH = Revised Budgeted Fixed Overhead
4. SRBH = Budgeted Fixed Overhead
5. ARAH = Actual Fixed Overhead
a. Fixed Overheads Efficiency Variance = 1-2
b. Fixed Overheads Capacity Variance = 2-3
c. Fixed Overhead Calendar Variance = 3-4
d. Fixed Overhead Volume Variance = 1-4
e. Fixed Overhead Budget or Expenditure Variance = 4-5
f. Fixed Overhead Cost Variance = 1-5
Note1: - In the above values SR is found out in the following manner.
( )SR BHBFO OR BudgetedHours
BudgetedFixedOverhead=
Note 2: Fixed overhead variances can also be worked out using overhead rate per unit instead of rate per hour. In that event values and variances would be as follows:
(5) (2) (3) (4) (1)
(1-4)
(1-5)
(1-2) (2-3) (3-4)
(4-5)
SRAQ SRSQ SRRBQ SRBQ ARAQ
Where,
SR = Budgeted Fixed Overheads / Budgeted Quantity
1. SRSQ = Standard Cost of Standard Fixed Overhead
2. SRAQ = Standard Cost of Actual Fixed Overhead or Fixed Overhead Absorbed or Recovered
3. SRRBQ = Revised Budgeted Fixed Overhead
4. SRBQ = Budgeted Fixed Overhead
5. ARAQ = Actual Fixed Overhead
a. Fixed Overheads Efficiency Variance = 1-2
b. Fixed Overheads Capacity Variance = 2-3
c. Fixed Overhead Calendar Variance = 3-4
d. Fixed Overhead Volume Variance = 1-4
e. Fixed Overhead Budget or Expenditure Variance = 4-5
f. Fixed Overhead Cost Variance = 1-5
Note 3 : Idle time variance in fixed overhead is part and parcel of efficiency variance and it is always adverse.
Strategic Cost Management - Decision Making
178 THE INSTITUTE OF COST ACCOUNTANTS OF INDIA
2. Variable overhead variance:
This is the difference between the standard variable overhead cost allowed for the actual output achieved and the actual variable overhead cost. The variance is represented by expenditure variance only because variable overhead cost will vary in proportion to output so that only a change in expenditure can cause such variance.
Sometimes, variable overhead efficiency variance can also be calculated just like labour efficiency variance. Variable overhead efficiency can be calculated if information relating to actual time taken and time allowed is given. In that event variable overhead variance can be divided into two parts.
(i) Variable overhead efficiency variance.
(ii) Variable overhead expenditure (or) budget (or) price variance.
Idle Time Variance = Idle Time Hours x Fixed Overhead Rate per Hour
(i) EfficiencyVariance:This variance is due to the difference between standard hours for actual output and the actual hours taken at the standard variable overhead rate. In other words, Variable Overhead Efficiency Variance is a measure of the extra overhead (or saving) incurred solely because direct labour usage exceeded (or was less than) the standard direct labour hours allowed.
Efficiency Variance= Standard Variable Overhead Rate per Hour × [Standard Hours for Actual production – Actual Hours ]
= Recovered Variable overheads - Standards Variable Overheads
(ii) Expenditure or Budget or Price Variance: This variance is due to the difference between standard variable overhead rate and actual variable overhead rate for the actual time taken. It is calculated on the pattern of Direct Labour rate Variance.
Expenditure Variance = Actual Time × [ Standard Variable Overhead Rateper Hour – Actual Variable Overhead rate per hour ]
= Standard Variable Overheads – Actual Variable overheads
IV. Sales Variance:
(iii) Sales Variance: The analysis of variances will be complete only when the difference between the actual profit and standard profit is fully analysed. It is necessary to make an analysis of sales variances to have a complete analysis of profit variance, because profit is the difference between sales and cost. Thus, in addition to the analysis of cost variances i.e., material cost variance, labour cost variance and overhead variance, an analysis of sales variance should be made. Sales variances analysis may be categorized into two:
1. Sales Value (or) Revenue variance.
2. Sales Margin (or) Profit variance.
Sales Value Variance is the difference between the budgeted value of sales and the actual value of sales during a period. Sales Value Variance may arise due to the following reasons:
• Actual selling price may be higher or lower than the standard price.
• Actual quantity of goods sold may be more or less than the standard.
• Actual mix of the sales may be different than the standard mix.
Sales Margin Variance is the difference between the budgeted profit and actual profit and this is also the sum total of all variances. Sales Margin Variance may arise due to the following reasons:
• Raise in general price level.
• Unexpected competition.
• Ineffective sales promotion.
1. Sales Value Variance: The difference between budgeted sales and actual sales results in Sales Value Variance. If the actual sales are more than the budgeted sales, a favourable variance would be shown and vice versa.
THE INSTITUTE OF COST ACCOUNTANTS OF INDIA 179
Standard Costing in Profit Planning
The formula is:
Sales Value variance = Budgeted Sales – Actual Sales
(i) Price Variance: This can be calculated just like Material Price Variance. It is an account of the difference in actual selling price and the standard selling price for actual quantity of sales. The formula for this is:
Price variance = Actual Quantity Sold × (Standard Price – Actual Price)
Or
= Standard Sales – Actual Sales
(ii) Volume Variance: It can be computed as Material Usage Variance. Budgeted sales may be different from the standard sales. In other words, budgeted quantity of sales at standard prices may vary from the actual quantity of sales at standard prices. Thus, the variance is as a result of difference in budgeted and actual quantities of goods sold. The formula is:
Volume Variance = Standard Price × (Budgeted Quantity – Actual Quantity)
Or
= Budgeted Sales – Standard Sales
(a) Mix variance: When more than one product is manufactured and sold, the budgeted sales of different products are in a given ratio. If the actual quantities sold are not in the same proportion as budgeted, it would cause a mix variance.
It can be calculated according to two methods:
• Based on Quantity: This method is followed on those cases where products are homogenous. In case the formula for calculating Sales Mix Variance is on the same pattern as is used in case of Material Mix Variance.
Mix Variance = Standard Price × (Revised Standard Quantity – Actual Quantity)
= Revised Standard Sales – Standard Sales
If actual quantity is more than the revised standard quantity, it will result in favourable variance or vice versa.
Revised Standard Quantity = TotalQuantityof StandardMixTotalQuantityofActualMix ×Standard Quantity
• Based on Value: This method is followed in those cases where products are not homogeneous. In such a case, the actual sales at standard prices, i.e. standard sales are to be expressed in budgeted ratios so as to calculate ‘revised standard sales’ and then is compared with the actual sales at standard prices. The formula is:
Mix Variance = Revised Standard Sales × Standard Sales
Revised Standard Sales = Budgeted Ratio of Sales × Standard Sales
Budgeted Ratio of Sales = Total Budgeted Sales
Budgeted Sales Of aProduct
(b) Quantity Variance: It is the difference between budgeted sales and the revised standard sales. The formula is:
Quantity variance = Budgeted Sales – Revised Standard Sales
Sales (or) Revenue Variances
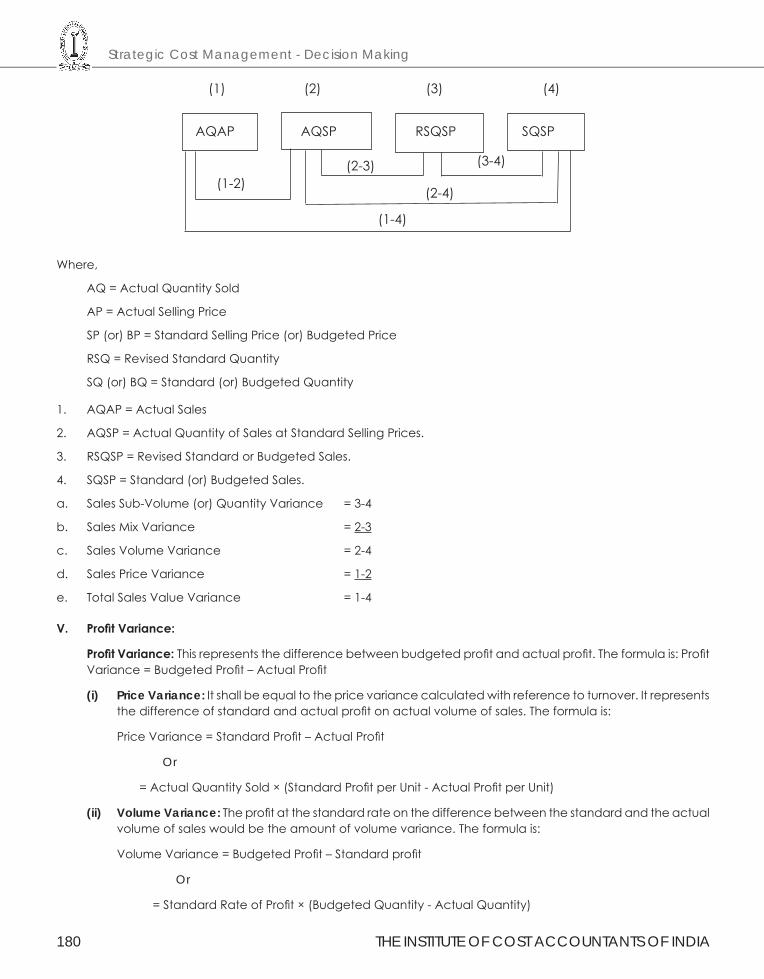
Strategic Cost Management - Decision Making
180 THE INSTITUTE OF COST ACCOUNTANTS OF INDIA
AQAP AQSP RSQSP SQSP
(1-2)(2-3) (3-4)
(2-4)
(1-4)
(1) (2) (3) (4)
Where,
AQ = Actual Quantity Sold
AP = Actual Selling Price
SP (or) BP = Standard Selling Price (or) Budgeted Price
RSQ = Revised Standard Quantity
SQ (or) BQ = Standard (or) Budgeted Quantity
1. AQAP = Actual Sales
2. AQSP = Actual Quantity of Sales at Standard Selling Prices.
3. RSQSP = Revised Standard or Budgeted Sales.
4. SQSP = Standard (or) Budgeted Sales.
a. Sales Sub-Volume (or) Quantity Variance = 3-4
b. Sales Mix Variance = 2-3
c. Sales Volume Variance = 2-4
d. Sales Price Variance = 1-2
e. Total Sales Value Variance = 1-4
V. ProfitVariance:
ProfitVariance:This represents the difference between budgeted profit and actual profit. The formula is: Profit Variance = Budgeted Profit – Actual Profit
(i) Price Variance: It shall be equal to the price variance calculated with reference to turnover. It represents the difference of standard and actual profit on actual volume of sales. The formula is:
Price Variance = Standard Profit – Actual Profit
Or
= Actual Quantity Sold × (Standard Profit per Unit - Actual Profit per Unit)
(ii) Volume Variance: The profit at the standard rate on the difference between the standard and the actual volume of sales would be the amount of volume variance. The formula is:
Volume Variance = Budgeted Profit – Standard profit
Or
= Standard Rate of Profit × (Budgeted Quantity - Actual Quantity)
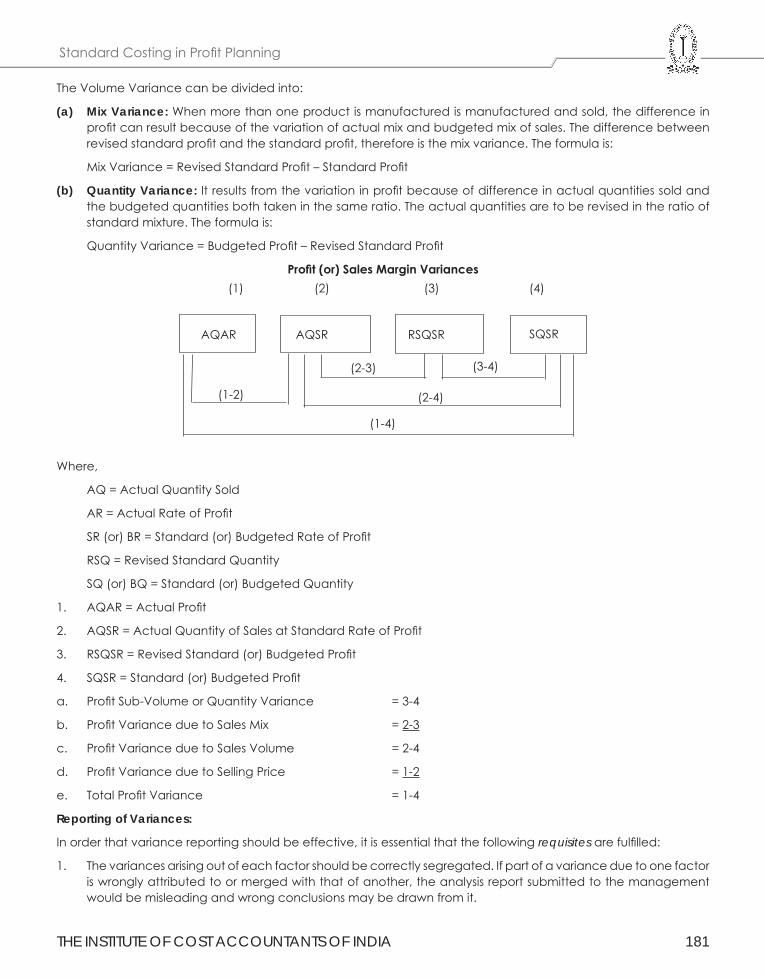
THE INSTITUTE OF COST ACCOUNTANTS OF INDIA 181
Standard Costing in Profit Planning
The Volume Variance can be divided into:
(a) Mix Variance: When more than one product is manufactured is manufactured and sold, the difference in profit can result because of the variation of actual mix and budgeted mix of sales. The difference between revised standard profit and the standard profit, therefore is the mix variance. The formula is:
Mix Variance = Revised Standard Profit – Standard Profit
(b) Quantity Variance: It results from the variation in profit because of difference in actual quantities sold and the budgeted quantities both taken in the same ratio. The actual quantities are to be revised in the ratio of standard mixture. The formula is:
Quantity Variance = Budgeted Profit – Revised Standard Profit
Profit(or)SalesMarginVariances
AQAR AQSR RSQSR SQSR
(1-2)
(2-3) (3-4)
(2-4)
(1-4)
(1) (2) (3) (4)
Where,
AQ = Actual Quantity Sold
AR = Actual Rate of Profit
SR (or) BR = Standard (or) Budgeted Rate of Profit
RSQ = Revised Standard Quantity
SQ (or) BQ = Standard (or) Budgeted Quantity
1. AQAR = Actual Profit
2. AQSR = Actual Quantity of Sales at Standard Rate of Profit
3. RSQSR = Revised Standard (or) Budgeted Profit
4. SQSR = Standard (or) Budgeted Profit
a. Profit Sub-Volume or Quantity Variance = 3-4
b. Profit Variance due to Sales Mix = 2-3
c. Profit Variance due to Sales Volume = 2-4
d. Profit Variance due to Selling Price = 1-2
e. Total Profit Variance = 1-4
Reporting of Variances:
In order that variance reporting should be effective, it is essential that the following requisites are fulfilled:
1. The variances arising out of each factor should be correctly segregated. If part of a variance due to one factor is wrongly attributed to or merged with that of another, the analysis report submitted to the management would be misleading and wrong conclusions may be drawn from it.
Strategic Cost Management - Decision Making
182 THE INSTITUTE OF COST ACCOUNTANTS OF INDIA
2. Variances, particularly the controllable variances should be reported with promptness as soon as they occur. Mere operation of Standard Costing and reporting of variances is of no avail. The success of a Standard Costing system depends on the extent of responsibility which the management assumes in correcting the conditions which cause variances from standard. In order to assist the management in assuming this responsibility, the variances should be reported frequently and on time. This would enable corrective action being taken for future production while work is in progress and before the project or job is completed.
3. For effective control, the line of organisation should be properly defined and the authority and responsibility of each individual should be laid down in clear terms. This will avoid ‘passing on the buck’ and shirking of responsibility and will enable the tracing of the causes of variances to the appropriate levels of management.
4. In certain cases, a particular variance may be the joint responsibility of more than one individual or department. It is obvious that if corrective action has to be effective in such cases, it should be taken jointly.
5. Analysis of uncontrollable variances should be made with the same care as for controllable variances. Though a particular variance may not be controllable at the lower level of management, a detailed analysis of the off-standard situation may reveal far reaching effects on the economy of the concern. This should compel the top management to take corrective action, say, by changing the policy which gave rise to the uncontrollable variance.
Forms of Variance Reports:
The forms of reports for the different types of variances should be designed keeping in view the needs of the management and the size of the concern, and no standard forms are, therefore, suggested. Variance Analysis Reports prepared for the top management would obviously be more formal and would contain broad details only, while those meant for presentation to the lower levels would contain details showing the causes of each variance and the specific responsibilities of the individuals concerned.
Variance Ratios and Cost Ratios:
We have so far considered the various cost variances in absolute monetary terms. Although these show the extent of the variances, the information is insufficient if the management wants to study the trend of variances from period to period. Absolute figures in themselves do not give the full picture and it is only by comparison of one item with another that their correct relationship is obtained. Variance Ratios serve this need and comparison of these ratios from one period to another can be gainfully made. Another advantage of Variance Ratio is in regard to its applicability in the dual plan of standard cost accounting. With the help of the Cost Variance Ratios, standard costs of production and the standard values of inventory can be easily converted into actual costs for the purpose of incorporation in the financial accounts.
A number of ratios are used for reporting to the management the effective use of capacity, material, labour and other resources of a concern. Some of these are considered below:
1. Efficiency Ratio.
2. Activity Ratio.
3. Calendar Ratio.
4. Capacity Usage Ratio
5. Capacity Utilization Ratio.
6. Idle Time Ratio.
1. Efficiency Ratio: It is the standard hours equivalent to the work produced, expressed as a percentage of the actual hours spent in producing that work.
Efficiency Ratio = (Standard Hours)
(Actual Hours ) x 100
THE INSTITUTE OF COST ACCOUNTANTS OF INDIA 183
Standard Costing in Profit Planning
2. Activity Ratio: It is the number of standard hours equivalent to the work produced, expressed as a percentage of the budgeted standard hours.
Activity Ratio = Standard Hours for Acutal Work
Budgeted standard hours x 100
3. Calendar Ratio: It is the relationship between the number of working days in a period and the number of working days in the relative budget period.
Calendar Ratio = Available Working Days
Budgeted Working Days x 100
4. Capacity Usage Ratio: It is the relationship between the budgeted number of working hours and the maximum possible number of working hours in a budget period.
Capacity Usage Ratio = Budgeted Hours
Maximum Possible Hours in Budget Period x 100
5. Capacity Utilisation Ratio: It is the relationship between actual hours in a budget period and the budgeted working hours in the period.
Capacity Utilisation Ratio = Actual Hours
Budgeted Hours x 100
6. Idle Time ratio: It is the ratio of idle time hours to the total hours budgeted.
Idle Time Ratio = Ideal Time Hours
Budgeted Hours x 100
Treatment of Cost Variances in Accounts:
In Standard Cost Accounting Systems which contain both actual and standard costs in the accounting records and financial statements, the question of adjustment of the cost variances at the end of the accounting period arises. Three methods of disposal of variances and the advantages and disadvantages of each are discussed below:
1. Transfer to Profit and Loss Account.
2. Allocation of Variances to Finished Stock, Work-in-Progress and Cost of Sales Account.
3. Transfer of Variances to the Reserve Account.
1. TransfertoProfitandLossAccount:
In this method, the stocks of work-in-process and finished goods and cost of sales are maintained at standard costs and all variances are closed to the Profit and Loss Account at the end of the accounting period.
The opinions advanced in favour of transfer of variances to profit or loss are:
a. Standard costs are considered to be the correct or real costs. Any variances from the standard costs should, therefore, be taken to mean deviations from the ‘should be’ costs due to the efficiencies or inefficiencies, abnormal activity, excessive or less spending etc. The variances cannot, therefore, be considered as the normal increases or decreases in costs and should be debited or credited to the Profit and Loss Account.
b. The method ensures conservative inventory valuation as all extraneous factors like costs of inefficiencies, waste and losses are eliminated.
c. Exclusion of variations makes gross profit for different periods comparable.
d. Standard costs facilitate prompt inventory valuation.
Strategic Cost Management - Decision Making
184 THE INSTITUTE OF COST ACCOUNTANTS OF INDIA
e. Variances separated out and reflected as profit or loss attracts the management’s attention.
f. Distribution of variances to product costs is difficult where a large number of diverse products is manufactured.
Some Accountants prefer to transfer only the debit variances, and credit variances are not credited to the Profit and Loss Account. Another practice is to adjust a proportionate part of the Material Price Variance to the closing stock of materials when price variance at the point of purchase is worked out.
2. Allocation of variances to Finished Stock, Work-in-Progress and Cost of Sales Account:
Under this method, the variances are distributed over stocks of finished and partly finished products and to the cost of sales. The distribution of each variance is made to the three accounts on a percentage basis according to the closing balance (value) of each account.
The opinions put forth in support of this method are, in brief, as follows:
a. Standard costs are only tools of control and they do not represent true or correct costs. Only actual costs should, therefore, be reflected in the financial statements.
b. Variances are not actual losses and as such, they should not be allowed to distort profits.
c. Unless the standards are accurate and up-to-date, inventory valuation on the basis of standard costs will be inaccurate.
d. Variances when credited to the Profit and Loss Account inflate the Work-in-Progress Account to the extent of the unrealized profit.
3. Transfer of variances to the Reserve Account:
In this method, the various costs variances are carried over to the subsequent financial year as deferred credits or charges. Thus, variance losses and gains may be set off against the gains and losses in the subsequent years. This method is not in common use but it might be useful in cases where seasonal fluctuations occur so that the favourable and adverse variances may cancel each other in a complete business cycle covering more than one financial year.
Investigation of Variances:
Since the analysis of variances costs money, not all variances are investigated, and management takes up only the significant variances for probing. As a common practice, minor deviations from budgets and standards and random or variances are not considered for investigation. A cost benefit analysis is necessary to decide whether or not an item should be taken up for detailed analysis and investigation. The costs of investigation consist of (i) cost of investigating a variance, and (ii) cost of action taken to correct the process and to bring it back in control. The benefit is represented by the cost of allowing the process to continue as it is, i. e. in an out-of-control state. Investigation is taken only if the cost of allowing the present state to continue exceeds the costs of investigation and correction.
Three different methods to decide whether a variance should be investigated are discussed in the following sections.
(i) Managerial intuition and judgment: Most companies prescribe limits of variances expressed as, (i) absolute rupee amount, or (ii) percentage of budget amount, or both, as guidelines for investigation. Variances falling within the limits are considered to be in-control state and hence not investigated. Variances beyond the limits are out-of-control variances that need investigation. The practice in some companies is to prescribe such limits separately for each element of costs and for revenue.
The limits are not fixed arbitrarily but are based partly on historical experience and partly on intuition. The basic assumptions are that variances within the limits fixed will be in-control and that the costs of investigation of such variances and bringing back the process into control will be higher than the cost of allowing the present state to continue.
The intuition method is simple and inexpensive and though not statistically justified like the other two methods described below the limits, if fixed with proper care, may be reasonably accurate.
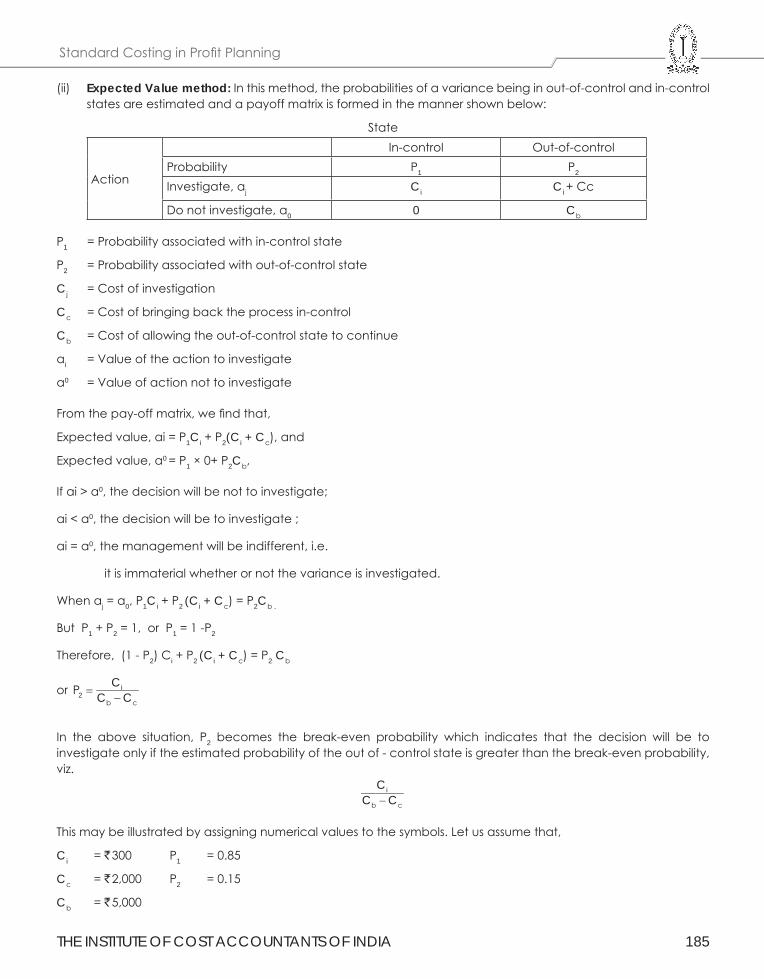
THE INSTITUTE OF COST ACCOUNTANTS OF INDIA 185
Standard Costing in Profit Planning
(ii) Expected Value method: In this method, the probabilities of a variance being in out-of-control and in-control states are estimated and a payoff matrix is formed in the manner shown below:
State
Action
In-control Out-of-controlProbability P1 P2
Investigate, aj Ci Ci + Cc
Do not investigate, a0 0 Cb
P1 = Probability associated with in-control state
P2 = Probability associated with out-of-control state
Cj = Cost of investigation
Cc = Cost of bringing back the process in-control
Cb = Cost of allowing the out-of-control state to continue
ai = Value of the action to investigate
a0 = Value of action not to investigate
From the pay-off matrix, we find that,
Expected value, ai = P1Ci + P2(Ci + Cc), and
Expected value, a0 = P1 × 0+ P2Cb,
If ai > a0, the decision will be not to investigate;
ai < a0, the decision will be to investigate ;
ai = a0, the management will be indifferent, i.e.
it is immaterial whether or not the variance is investigated.
When aj = a0, P1Ci + P2 (Ci + Cc) = P2Cb .
But P1 + P2 = 1, or P1 = 1 -P2
Therefore, (1 - P2) Ci + P2 (Ci + Cc) = P2 Cb
or i2
b c
CP C C=−
In the above situation, P2 becomes the break-even probability which indicates that the decision will be to investigate only if the estimated probability of the out of - control state is greater than the break-even probability, viz.
i
b c
CC C−
This may be illustrated by assigning numerical values to the symbols. Let us assume that,
Ci = ` 300 P1 = 0.85
Cc = ` 2,000 P2 = 0.15
Cb = ` 5,000
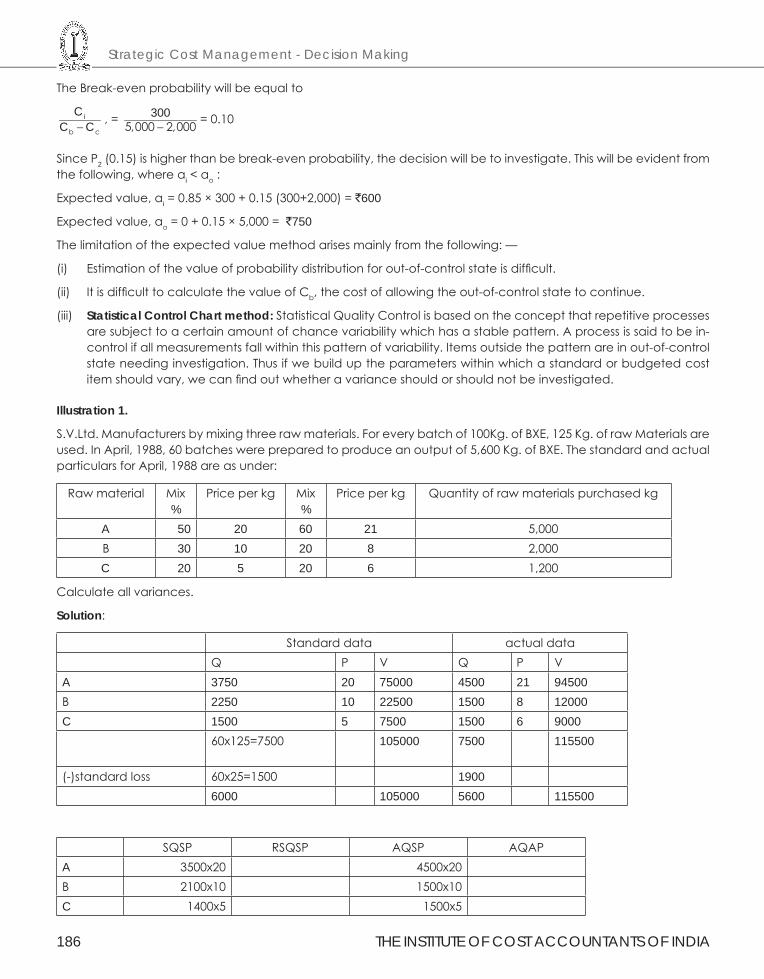
Strategic Cost Management - Decision Making
186 THE INSTITUTE OF COST ACCOUNTANTS OF INDIA
The Break-even probability will be equal to
i
b c
CC C− , = 300
5,000 2,000−= 0.10
Since P2 (0.15) is higher than be break-even probability, the decision will be to investigate. This will be evident from the following, where ai < ao :
Expected value, ai = 0.85 × 300 + 0.15 (300+2,000) = `600
Expected value, ao = 0 + 0.15 × 5,000 = `750
The limitation of the expected value method arises mainly from the following: —
(i) Estimation of the value of probability distribution for out-of-control state is difficult.
(ii) It is difficult to calculate the value of Cb, the cost of allowing the out-of-control state to continue.
(iii) Statistical Control Chart method: Statistical Quality Control is based on the concept that repetitive processes are subject to a certain amount of chance variability which has a stable pattern. A process is said to be in-control if all measurements fall within this pattern of variability. Items outside the pattern are in out-of-control state needing investigation. Thus if we build up the parameters within which a standard or budgeted cost item should vary, we can find out whether a variance should or should not be investigated.
Illustration 1.
S.V.Ltd. Manufacturers by mixing three raw materials. For every batch of 100Kg. of BXE, 125 Kg. of raw Materials are used. In April, 1988, 60 batches were prepared to produce an output of 5,600 Kg. of BXE. The standard and actual particulars for April, 1988 are as under:
Raw material Mix%
Price per kg Mix%
Price per kg Quantity of raw materials purchased kg
A 50 20 60 21 5,000B 30 10 20 8 2,000C 20 5 20 6 1,200
Calculate all variances.
Solution:
Standard data actual dataQ P V Q P V
A 3750 20 75000 4500 21 94500B 2250 10 22500 1500 8 12000C 1500 5 7500 1500 6 9000
60x125=7500 105000 7500 115500
(-)standard loss 60x25=1500 19006000 105000 5600 115500
SQSP RSQSP AQSP AQAPA 3500x20 4500x20B 2100x10 1500x10C 1400x5 1500x5
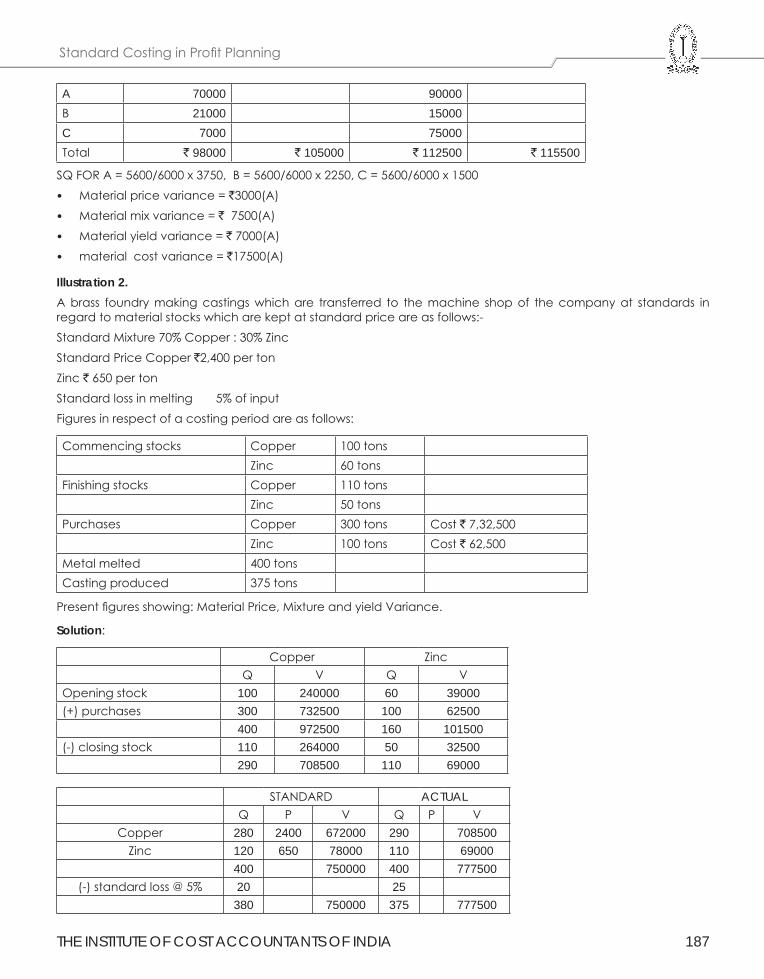
THE INSTITUTE OF COST ACCOUNTANTS OF INDIA 187
Standard Costing in Profit Planning
A 70000 90000B 21000 15000C 7000 75000Total ` 98000 ` 105000 ` 112500 ` 115500
SQ FOR A = 5600/6000 x 3750, B = 5600/6000 x 2250, C = 5600/6000 x 1500• Material price variance = `3000(A)• Material mix variance = ` 7500(A)• Material yield variance = ` 7000(A)• material cost variance = `17500(A)
Illustration 2.A brass foundry making castings which are transferred to the machine shop of the company at standards in regard to material stocks which are kept at standard price are as follows:-Standard Mixture 70% Copper : 30% ZincStandard Price Copper `2,400 per tonZinc ` 650 per tonStandard loss in melting 5% of inputFigures in respect of a costing period are as follows:
Commencing stocks Copper 100 tonsZinc 60 tons
Finishing stocks Copper 110 tonsZinc 50 tons
Purchases Copper 300 tons Cost ` 7,32,500Zinc 100 tons Cost ` 62,500
Metal melted 400 tonsCasting produced 375 tons
Present figures showing: Material Price, Mixture and yield Variance.
Solution:
Copper ZincQ V Q V
Opening stock 100 240000 60 39000(+) purchases 300 732500 100 62500
400 972500 160 101500(-) closing stock 110 264000 50 32500
290 708500 110 69000
STANDARD ACTUALQ P V Q P V
Copper 280 2400 672000 290 708500Zinc 120 650 78000 110 69000
400 750000 400 777500(-) standard loss @ 5% 20 25
380 750000 375 777500
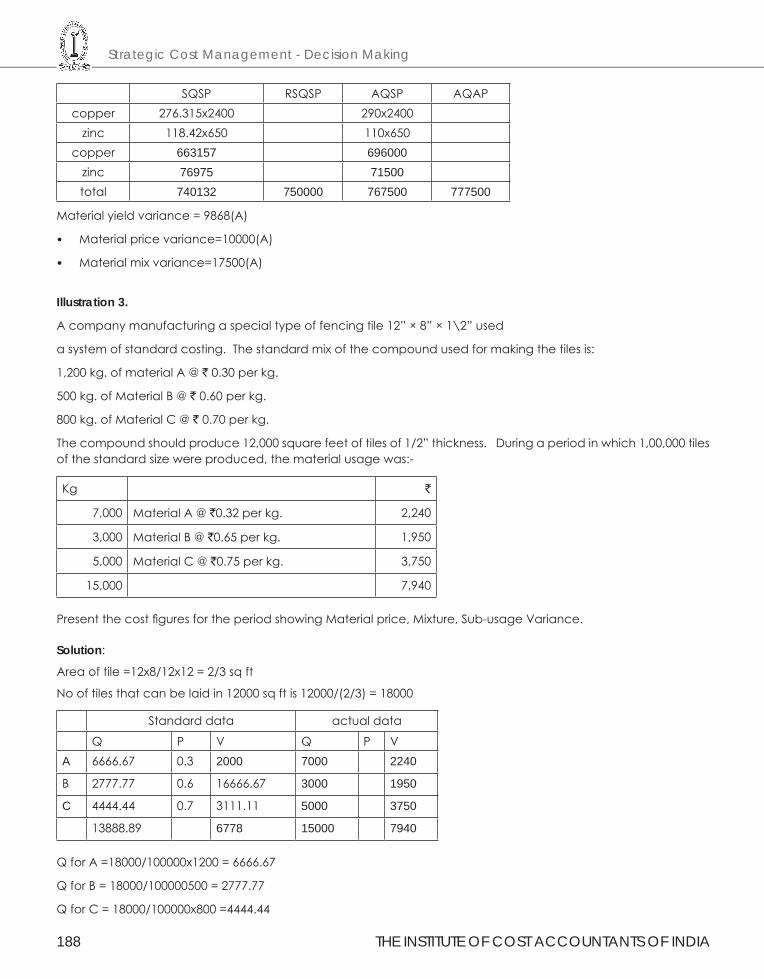
Strategic Cost Management - Decision Making
188 THE INSTITUTE OF COST ACCOUNTANTS OF INDIA
SQSP RSQSP AQSP AQAPcopper 276.315x2400 290x2400
zinc 118.42x650 110x650copper 663157 696000
zinc 76975 71500total 740132 750000 767500 777500
Material yield variance = 9868(A)
• Material price variance=10000(A)
• Material mix variance=17500(A)
Illustration 3.
A company manufacturing a special type of fencing tile 12” × 8” × 1\2” used
a system of standard costing. The standard mix of the compound used for making the tiles is:
1,200 kg. of material A @ ` 0.30 per kg.
500 kg. of Material B @ ` 0.60 per kg.
800 kg. of Material C @ ` 0.70 per kg.
The compound should produce 12,000 square feet of tiles of 1/2” thickness. During a period in which 1,00,000 tiles of the standard size were produced, the material usage was:-
Kg `
7,000 Material A @ `0.32 per kg. 2,240
3,000 Material B @ `0.65 per kg. 1,950
5,000 Material C @ `0.75 per kg. 3,750
15,000 7,940
Present the cost figures for the period showing Material price, Mixture, Sub-usage Variance.
Solution:
Area of tile =12x8/12x12 = 2/3 sq ft
No of tiles that can be laid in 12000 sq ft is 12000/(2/3) = 18000
Standard data actual data
Q P V Q P VA 6666.67 0.3 2000 7000 2240
B 2777.77 0.6 16666.67 3000 1950
C 4444.44 0.7 3111.11 5000 3750
13888.89 6778 15000 7940
Q for A =18000/100000x1200 = 6666.67
Q for B = 18000/100000500 = 2777.77
Q for C = 18000/100000x800 =4444.44
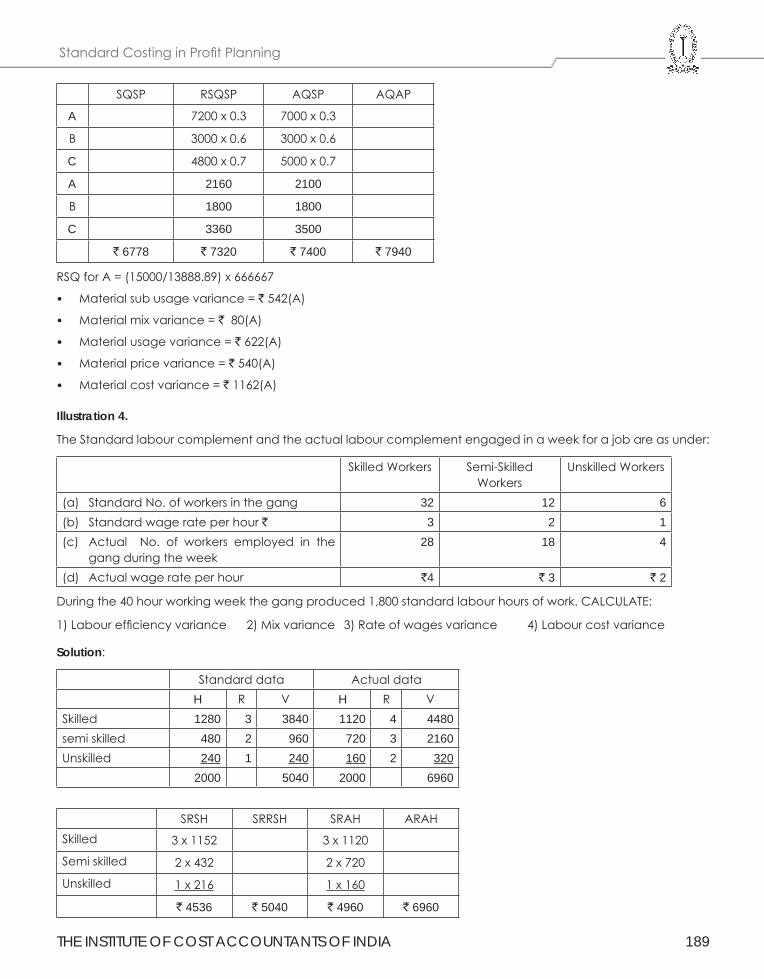
THE INSTITUTE OF COST ACCOUNTANTS OF INDIA 189
Standard Costing in Profit Planning
SQSP RSQSP AQSP AQAP
A 7200 x 0.3 7000 x 0.3
B 3000 x 0.6 3000 x 0.6
C 4800 x 0.7 5000 x 0.7
A 2160 2100
B 1800 1800
C 3360 3500
` 6778 ` 7320 ` 7400 ` 7940
RSQ for A = (15000/13888.89) x 666667
• Material sub usage variance = ` 542(A)
• Material mix variance = ` 80(A)
• Material usage variance = ` 622(A)
• Material price variance = ` 540(A)
• Material cost variance = ` 1162(A)
Illustration 4.
The Standard labour complement and the actual labour complement engaged in a week for a job are as under:
Skilled Workers Semi-Skilled Workers
Unskilled Workers
(a) Standard No. of workers in the gang 32 12 6(b) Standard wage rate per hour ` 3 2 1(c) Actual No. of workers employed in the
gang during the week28 18 4
(d) Actual wage rate per hour `4 ` 3 ` 2
During the 40 hour working week the gang produced 1,800 standard labour hours of work. CALCULATE:
1) Labour efficiency variance 2) Mix variance 3) Rate of wages variance 4) Labour cost variance
Solution:
Standard data Actual dataH R V H R V
Skilled 1280 3 3840 1120 4 4480semi skilled 480 2 960 720 3 2160Unskilled 240 1 240 160 2 320
2000 5040 2000 6960
SRSH SRRSH SRAH ARAHSkilled 3 x 1152 3 x 1120
Semi skilled 2 x 432 2 x 720
Unskilled 1 x 216 1 x 160
` 4536 ` 5040 ` 4960 ` 6960
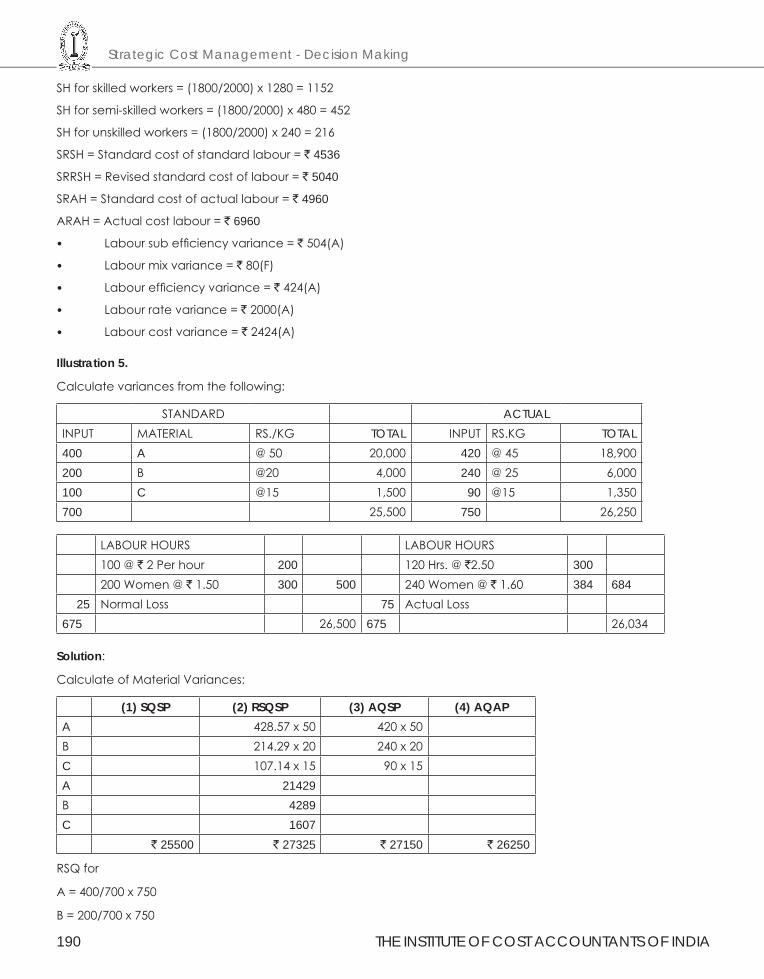
Strategic Cost Management - Decision Making
190 THE INSTITUTE OF COST ACCOUNTANTS OF INDIA
SH for skilled workers = (1800/2000) x 1280 = 1152
SH for semi-skilled workers = (1800/2000) x 480 = 452
SH for unskilled workers = (1800/2000) x 240 = 216
SRSH = Standard cost of standard labour = ` 4536
SRRSH = Revised standard cost of labour = ` 5040
SRAH = Standard cost of actual labour = ` 4960
ARAH = Actual cost labour = ` 6960
• Labour sub efficiency variance = ` 504(A)
• Labour mix variance = ` 80(F)
• Labour efficiency variance = ` 424(A)
• Labour rate variance = ` 2000(A)
• Labour cost variance = ` 2424(A)
Illustration 5.
Calculate variances from the following:
STANDARD ACTUALINPUT MATERIAL RS./KG TOTAL INPUT RS.KG TOTAL400 A @ 50 20,000 420 @ 45 18,900200 B @20 4,000 240 @ 25 6,000100 C @15 1,500 90 @15 1,350700 25,500 750 26,250
LABOUR HOURS LABOUR HOURS100 @ ` 2 Per hour 200 120 Hrs. @ `2.50 300200 Women @ ` 1.50 300 500 240 Women @ ` 1.60 384 684
25 Normal Loss 75 Actual Loss675 26,500 675 26,034
Solution:
Calculate of Material Variances:
(1) SQSP (2) RSQSP (3) AQSP (4) AQAPA 428.57 x 50 420 x 50B 214.29 x 20 240 x 20C 107.14 x 15 90 x 15A 21429B 4289C 1607
` 25500 ` 27325 ` 27150 ` 26250
RSQ for
A = 400/700 x 750
B = 200/700 x 750
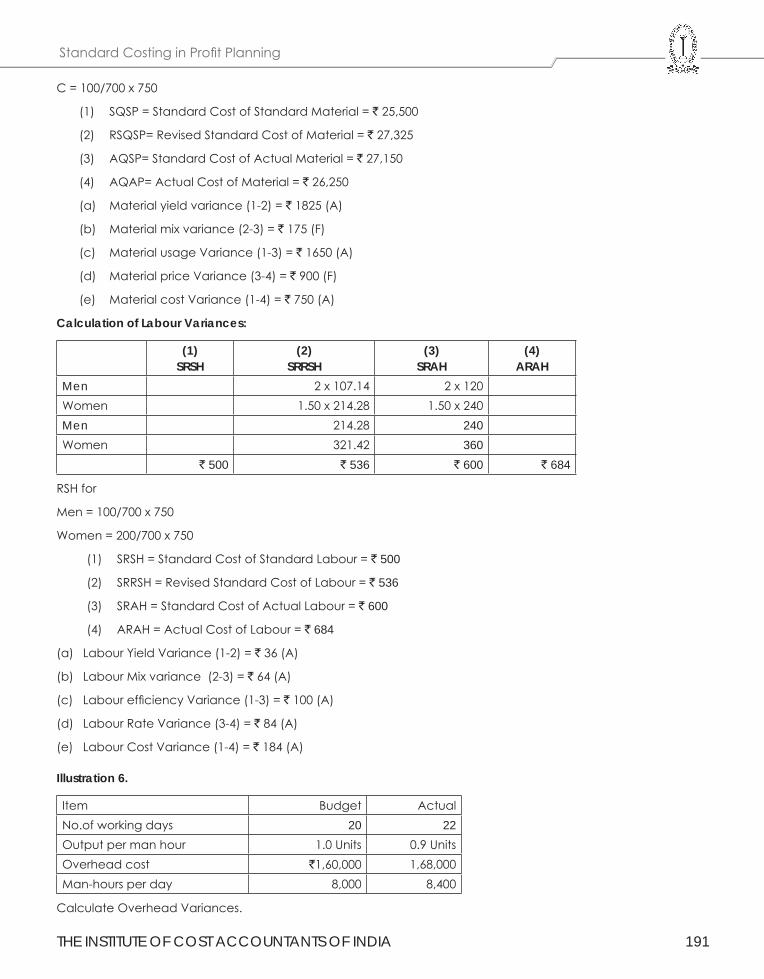
THE INSTITUTE OF COST ACCOUNTANTS OF INDIA 191
Standard Costing in Profit Planning
C = 100/700 x 750
(1) SQSP = Standard Cost of Standard Material = ` 25,500
(2) RSQSP= Revised Standard Cost of Material = ` 27,325
(3) AQSP= Standard Cost of Actual Material = ` 27,150
(4) AQAP= Actual Cost of Material = ` 26,250
(a) Material yield variance (1-2) = ` 1825 (A)
(b) Material mix variance (2-3) = ` 175 (F)
(c) Material usage Variance (1-3) = ` 1650 (A)
(d) Material price Variance (3-4) = ` 900 (F)
(e) Material cost Variance (1-4) = ` 750 (A)
Calculation of Labour Variances:
(1)SRSH
(2)SRRSH
(3)SRAH
(4)ARAH
Men 2 x 107.14 2 x 120Women 1.50 x 214.28 1.50 x 240Men 214.28 240Women 321.42 360
` 500 ` 536 ` 600 ` 684
RSH for
Men = 100/700 x 750
Women = 200/700 x 750
(1) SRSH = Standard Cost of Standard Labour = ` 500
(2) SRRSH = Revised Standard Cost of Labour = ` 536
(3) SRAH = Standard Cost of Actual Labour = ` 600
(4) ARAH = Actual Cost of Labour = ` 684
(a) Labour Yield Variance (1-2) = ` 36 (A)
(b) Labour Mix variance (2-3) = ` 64 (A)
(c) Labour efficiency Variance (1-3) = ` 100 (A)
(d) Labour Rate Variance (3-4) = ` 84 (A)
(e) Labour Cost Variance (1-4) = ` 184 (A)
Illustration 6.
Item Budget ActualNo.of working days 20 22Output per man hour 1.0 Units 0.9 UnitsOverhead cost `1,60,000 1,68,000Man-hours per day 8,000 8,400
Calculate Overhead Variances.
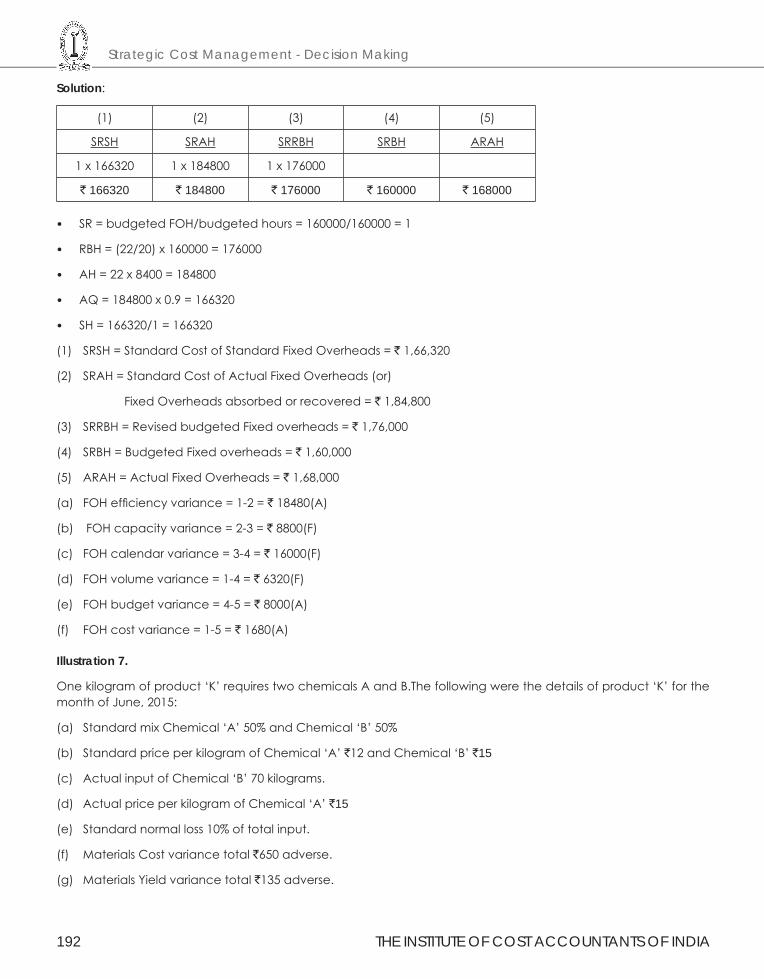
Strategic Cost Management - Decision Making
192 THE INSTITUTE OF COST ACCOUNTANTS OF INDIA
Solution:
(1) (2) (3) (4) (5)
SRSH SRAH SRRBH SRBH ARAH
1 x 166320 1 x 184800 1 x 176000
` 166320 ` 184800 ` 176000 ` 160000 ` 168000
• SR = budgeted FOH/budgeted hours = 160000/160000 = 1
• RBH = (22/20) x 160000 = 176000
• AH = 22 x 8400 = 184800
• AQ = 184800 x 0.9 = 166320
• SH = 166320/1 = 166320
(1) SRSH = Standard Cost of Standard Fixed Overheads = ` 1,66,320
(2) SRAH = Standard Cost of Actual Fixed Overheads (or)
Fixed Overheads absorbed or recovered = ` 1,84,800
(3) SRRBH = Revised budgeted Fixed overheads = ` 1,76,000
(4) SRBH = Budgeted Fixed overheads = ` 1,60,000
(5) ARAH = Actual Fixed Overheads = ` 1,68,000
(a) FOH efficiency variance = 1-2 = ` 18480(A)
(b) FOH capacity variance = 2-3 = ` 8800(F)
(c) FOH calendar variance = 3-4 = ` 16000(F)
(d) FOH volume variance = 1-4 = ` 6320(F)
(e) FOH budget variance = 4-5 = ` 8000(A)
(f) FOH cost variance = 1-5 = ` 1680(A)
Illustration 7.
One kilogram of product ‘K’ requires two chemicals A and B.The following were the details of product ‘K’ for the month of June, 2015:
(a) Standard mix Chemical ‘A’ 50% and Chemical ‘B’ 50%
(b) Standard price per kilogram of Chemical ‘A’ `12 and Chemical ‘B’ `15
(c) Actual input of Chemical ‘B’ 70 kilograms.
(d) Actual price per kilogram of Chemical ‘A’ `15
(e) Standard normal loss 10% of total input.
(f) Materials Cost variance total `650 adverse.
(g) Materials Yield variance total `135 adverse.
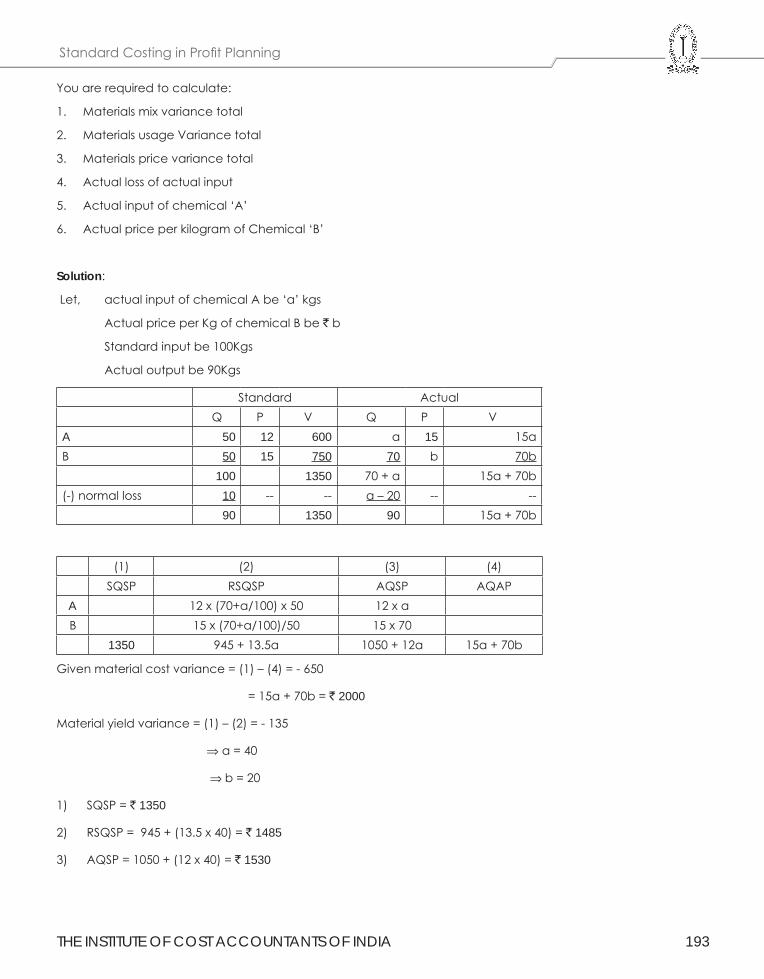
THE INSTITUTE OF COST ACCOUNTANTS OF INDIA 193
Standard Costing in Profit Planning
You are required to calculate:
1. Materials mix variance total
2. Materials usage Variance total
3. Materials price variance total
4. Actual loss of actual input
5. Actual input of chemical ‘A’
6. Actual price per kilogram of Chemical ‘B’
Solution:
Let, actual input of chemical A be ‘a’ kgs
Actual price per Kg of chemical B be ` b
Standard input be 100Kgs
Actual output be 90Kgs
Standard ActualQ P V Q P V
A 50 12 600 a 15 15aB 50 15 750 70 b 70b
100 1350 70 + a 15a + 70b(-) normal loss 10 -- -- a – 20 -- --
90 1350 90 15a + 70b
(1) (2) (3) (4)SQSP RSQSP AQSP AQAP
A 12 x (70+a/100) x 50 12 x a B 15 x (70+a/100)/50 15 x 70
1350 945 + 13.5a 1050 + 12a 15a + 70b
Given material cost variance = (1) – (4) = - 650
= 15a + 70b = ` 2000
Material yield variance = (1) – (2) = - 135
⇒ a = 40
⇒ b = 20
1) SQSP = ` 1350
2) RSQSP = 945 + (13.5 x 40) = ` 1485
3) AQSP = 1050 + (12 x 40) = ` 1530
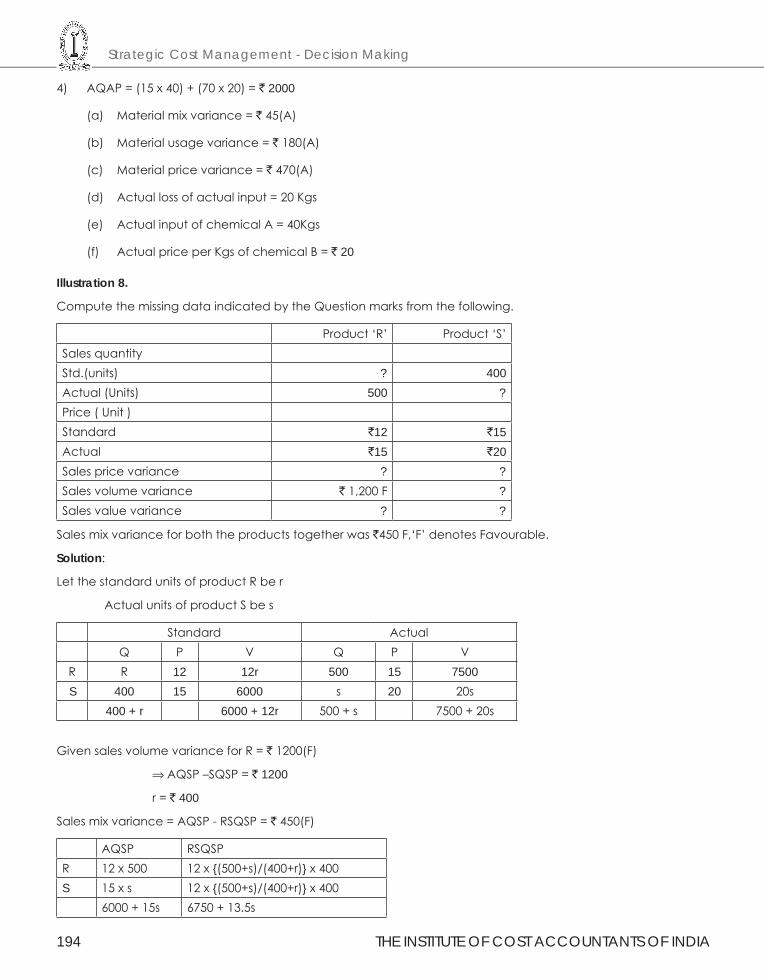
Strategic Cost Management - Decision Making
194 THE INSTITUTE OF COST ACCOUNTANTS OF INDIA
4) AQAP = (15 x 40) + (70 x 20) = ` 2000
(a) Material mix variance = ` 45(A)
(b) Material usage variance = ` 180(A)
(c) Material price variance = ` 470(A)
(d) Actual loss of actual input = 20 Kgs
(e) Actual input of chemical A = 40Kgs
(f) Actual price per Kgs of chemical B = ` 20
Illustration 8.
Compute the missing data indicated by the Question marks from the following.
Product ‘R’ Product ‘S’Sales quantityStd.(units) ? 400Actual (Units) 500 ?Price ( Unit )Standard `12 `15Actual `15 `20Sales price variance ? ?Sales volume variance ` 1,200 F ?Sales value variance ? ?
Sales mix variance for both the products together was `450 F,‘F’ denotes Favourable.
Solution:
Let the standard units of product R be r
Actual units of product S be s
Standard ActualQ P V Q P V
R R 12 12r 500 15 7500S 400 15 6000 s 20 20s
400 + r 6000 + 12r 500 + s 7500 + 20s
Given sales volume variance for R = ` 1200(F)
⇒ AQSP –SQSP = ` 1200
r = ` 400
Sales mix variance = AQSP - RSQSP = ` 450(F)
AQSP RSQSPR 12 x 500 12 x {(500+s)/(400+r)} x 400S 15 x s 12 x {(500+s)/(400+r)} x 400
6000 + 15s 6750 + 13.5s
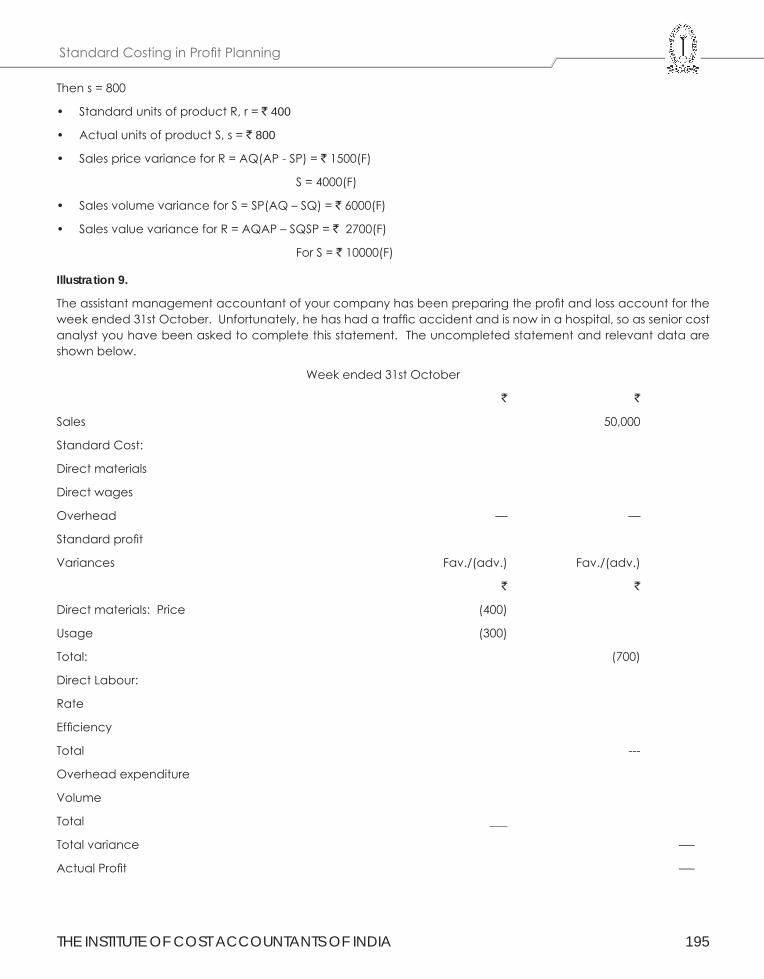
THE INSTITUTE OF COST ACCOUNTANTS OF INDIA 195
Standard Costing in Profit Planning
Then s = 800
• Standard units of product R, r = ` 400
• Actual units of product S, s = ` 800
• Sales price variance for R = AQ(AP - SP) = ` 1500(F)
S = 4000(F)
• Sales volume variance for S = SP(AQ – SQ) = ` 6000(F)
• Sales value variance for R = AQAP – SQSP = ` 2700(F)
For S = ` 10000(F)
Illustration 9.
The assistant management accountant of your company has been preparing the profit and loss account for the week ended 31st October. Unfortunately, he has had a traffic accident and is now in a hospital, so as senior cost analyst you have been asked to complete this statement. The uncompleted statement and relevant data are shown below.
Week ended 31st October
` `
Sales 50,000
Standard Cost:
Direct materials
Direct wages
Overhead — —
Standard profit
Variances Fav./(adv.) Fav./(adv.)
` `
Direct materials: Price (400)
Usage (300)
Total: (700)
Direct Labour:
Rate
Efficiency
Total ---
Overhead expenditure
Volume
Total ___
Total variance —-
Actual Profit —-
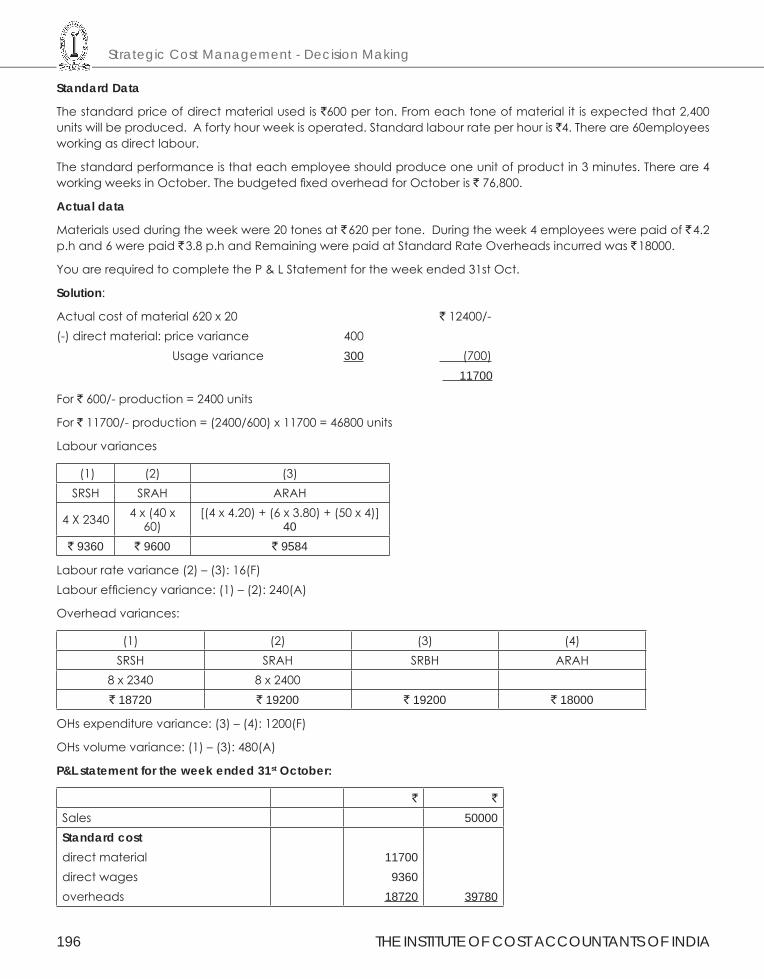
Strategic Cost Management - Decision Making
196 THE INSTITUTE OF COST ACCOUNTANTS OF INDIA
Standard Data
The standard price of direct material used is `600 per ton. From each tone of material it is expected that 2,400 units will be produced. A forty hour week is operated. Standard labour rate per hour is `4. There are 60employees working as direct labour.
The standard performance is that each employee should produce one unit of product in 3 minutes. There are 4 working weeks in October. The budgeted fixed overhead for October is ` 76,800.
Actual data
Materials used during the week were 20 tones at ` 620 per tone. During the week 4 employees were paid of ` 4.2 p.h and 6 were paid ` 3.8 p.h and Remaining were paid at Standard Rate Overheads incurred was ` 18000.
You are required to complete the P & L Statement for the week ended 31st Oct.
Solution:
Actual cost of material 620 x 20 ` 12400/-(-) direct material: price variance 400 Usage variance 300 (700) 11700
For ` 600/- production = 2400 units
For ` 11700/- production = (2400/600) x 11700 = 46800 units
Labour variances
(1) (2) (3)SRSH SRAH ARAH
4 X 2340 4 x (40 x 60)
[(4 x 4.20) + (6 x 3.80) + (50 x 4)] 40
` 9360 ` 9600 ` 9584
Labour rate variance (2) – (3): 16(F)Labour efficiency variance: (1) – (2): 240(A)
Overhead variances:
(1) (2) (3) (4)SRSH SRAH SRBH ARAH
8 x 2340 8 x 2400` 18720 ` 19200 ` 19200 ` 18000
OHs expenditure variance: (3) – (4): 1200(F)
OHs volume variance: (1) – (3): 480(A)
P&L statement for the week ended 31st October:
` `
Sales 50000Standard costdirect materialdirect wages overheads
117009360
18720 39780
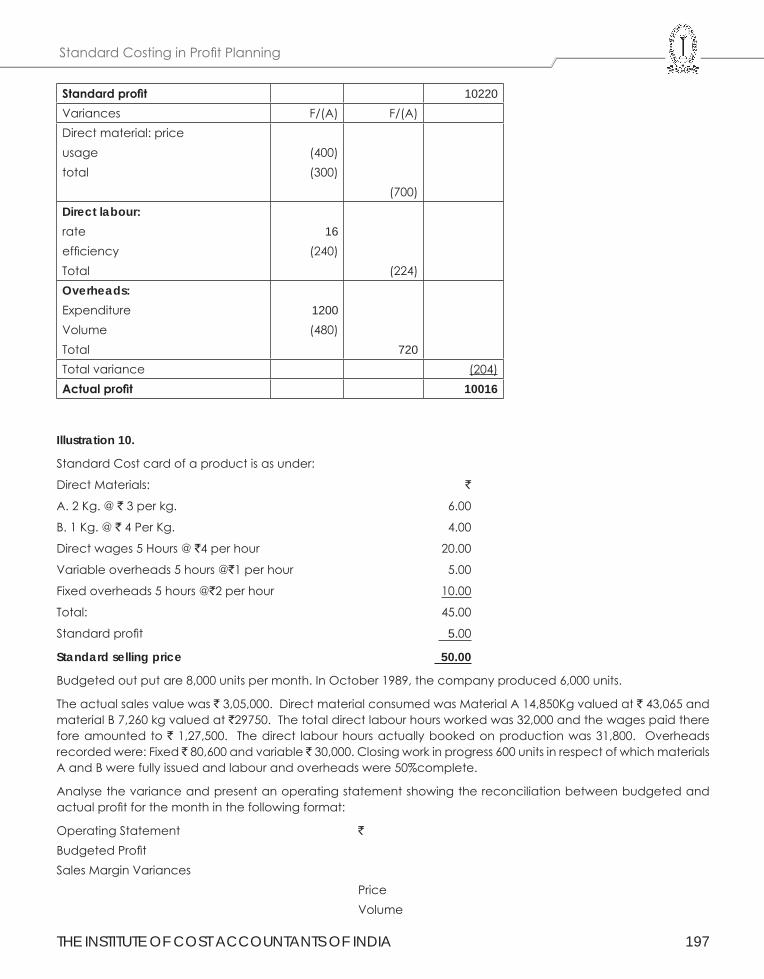
THE INSTITUTE OF COST ACCOUNTANTS OF INDIA 197
Standard Costing in Profit Planning
Standardprofit 10220Variances F/(A) F/(A)Direct material: priceusagetotal
(400)(300)
(700)Direct labour: rateefficiencyTotal
16(240)
(224)Overheads:ExpenditureVolume Total
1200(480)
720Total variance (204)Actualprofit 10016
Illustration 10.
Standard Cost card of a product is as under:
Direct Materials: `
A. 2 Kg. @ ` 3 per kg. 6.00
B. 1 Kg. @ ` 4 Per Kg. 4.00
Direct wages 5 Hours @ `4 per hour 20.00
Variable overheads 5 hours @`1 per hour 5.00
Fixed overheads 5 hours @`2 per hour 10.00
Total: 45.00
Standard profit 5.00
Standard selling price 50.00
Budgeted out put are 8,000 units per month. In October 1989, the company produced 6,000 units.
The actual sales value was ` 3,05,000. Direct material consumed was Material A 14,850Kg valued at ` 43,065 and material B 7,260 kg valued at `29750. The total direct labour hours worked was 32,000 and the wages paid there fore amounted to ` 1,27,500. The direct labour hours actually booked on production was 31,800. Overheads recorded were: Fixed ̀ 80,600 and variable ̀ 30,000. Closing work in progress 600 units in respect of which materials A and B were fully issued and labour and overheads were 50%complete.
Analyse the variance and present an operating statement showing the reconciliation between budgeted and actual profit for the month in the following format:
Operating Statement `
Budgeted ProfitSales Margin Variances Price Volume
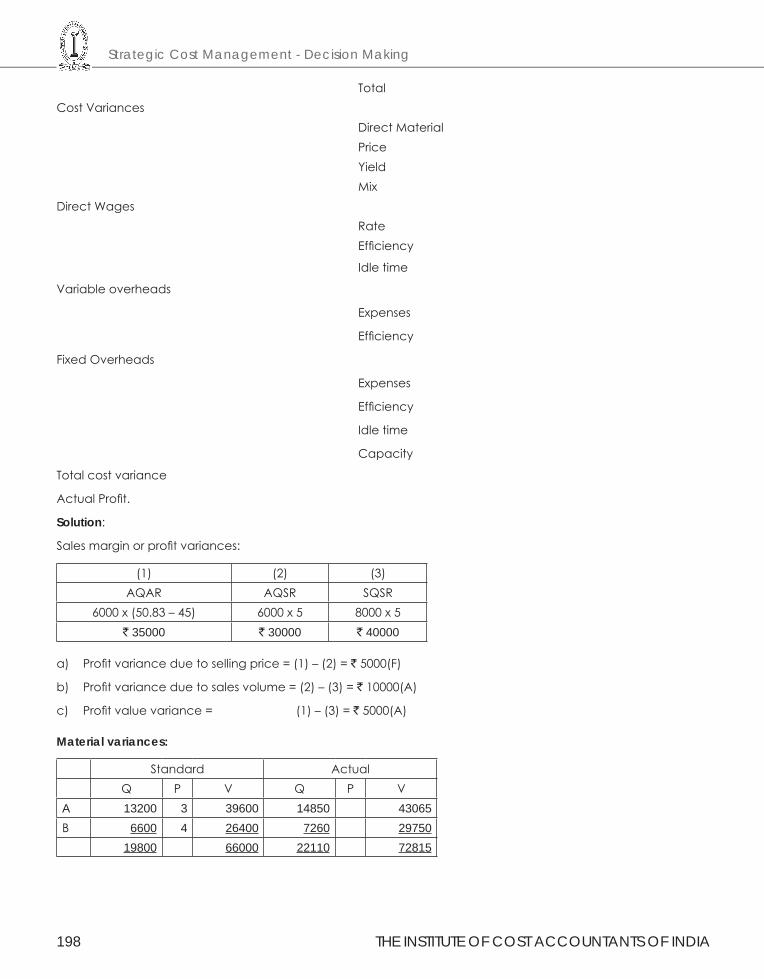
Strategic Cost Management - Decision Making
198 THE INSTITUTE OF COST ACCOUNTANTS OF INDIA
TotalCost Variances Direct Material Price Yield MixDirect Wages Rate Efficiency
Idle time
Variable overheads
Expenses
Efficiency
Fixed Overheads
Expenses
Efficiency
Idle time
Capacity
Total cost variance
Actual Profit.
Solution:
Sales margin or profit variances:
(1) (2) (3)AQAR AQSR SQSR
6000 x (50.83 – 45) 6000 x 5 8000 x 5` 35000 ` 30000 ` 40000
a) Profit variance due to selling price = (1) – (2) = ` 5000(F)
b) Profit variance due to sales volume = (2) – (3) = ` 10000(A)
c) Profit value variance = (1) – (3) = ` 5000(A)
Material variances:
Standard ActualQ P V Q P V
A 13200 3 39600 14850 43065B 6600 4 26400 7260 29750
19800 66000 22110 72815
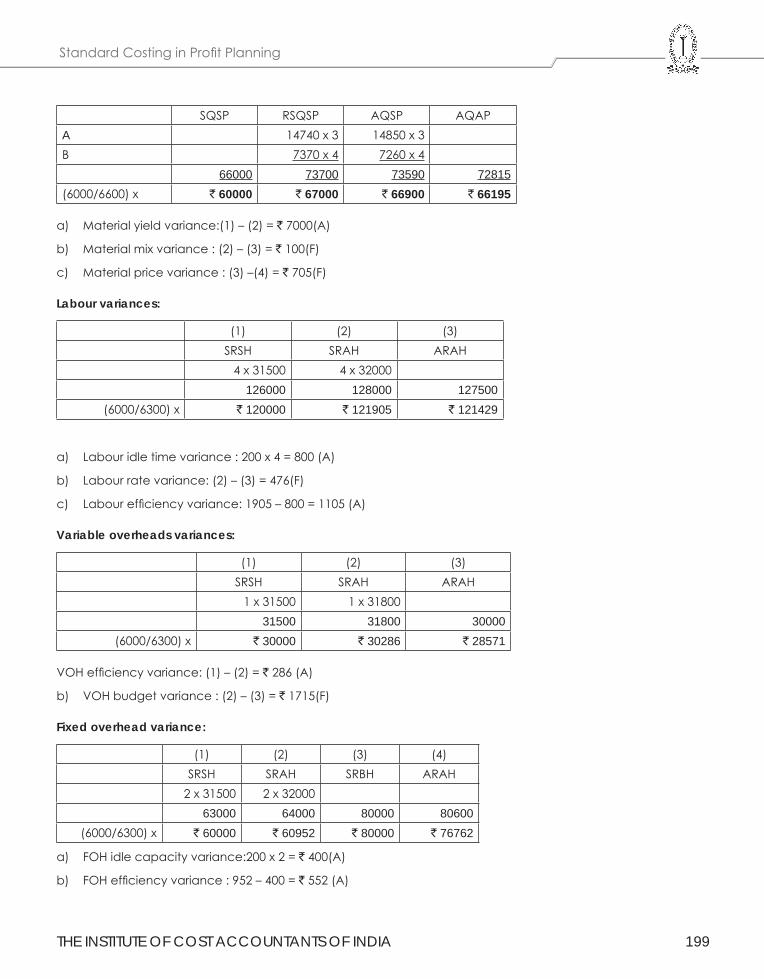
THE INSTITUTE OF COST ACCOUNTANTS OF INDIA 199
Standard Costing in Profit Planning
SQSP RSQSP AQSP AQAPA 14740 x 3 14850 x 3 B 7370 x 4 7260 x 4
66000 73700 73590 72815(6000/6600) x ` 60000 ` 67000 ` 66900 ` 66195
a) Material yield variance:(1) – (2) = ` 7000(A)
b) Material mix variance : (2) – (3) = ` 100(F)
c) Material price variance : (3) –(4) = ` 705(F)
Labour variances:
(1) (2) (3)SRSH SRAH ARAH
4 x 31500 4 x 32000126000 128000 127500
(6000/6300) x ` 120000 ` 121905 ` 121429
a) Labour idle time variance : 200 x 4 = 800 (A)
b) Labour rate variance: (2) – (3) = 476(F)
c) Labour efficiency variance: 1905 – 800 = 1105 (A)
Variable overheads variances:
(1) (2) (3)SRSH SRAH ARAH
1 x 31500 1 x 3180031500 31800 30000
(6000/6300) x ` 30000 ` 30286 ` 28571
VOH efficiency variance: (1) – (2) = ` 286 (A)
b) VOH budget variance : (2) – (3) = ` 1715(F)
Fixed overhead variance:
(1) (2) (3) (4)SRSH SRAH SRBH ARAH
2 x 31500 2 x 3200063000 64000 80000 80600
(6000/6300) x ` 60000 ` 60952 ` 80000 ` 76762
a) FOH idle capacity variance:200 x 2 = ` 400(A)
b) FOH efficiency variance : 952 – 400 = ` 552 (A)
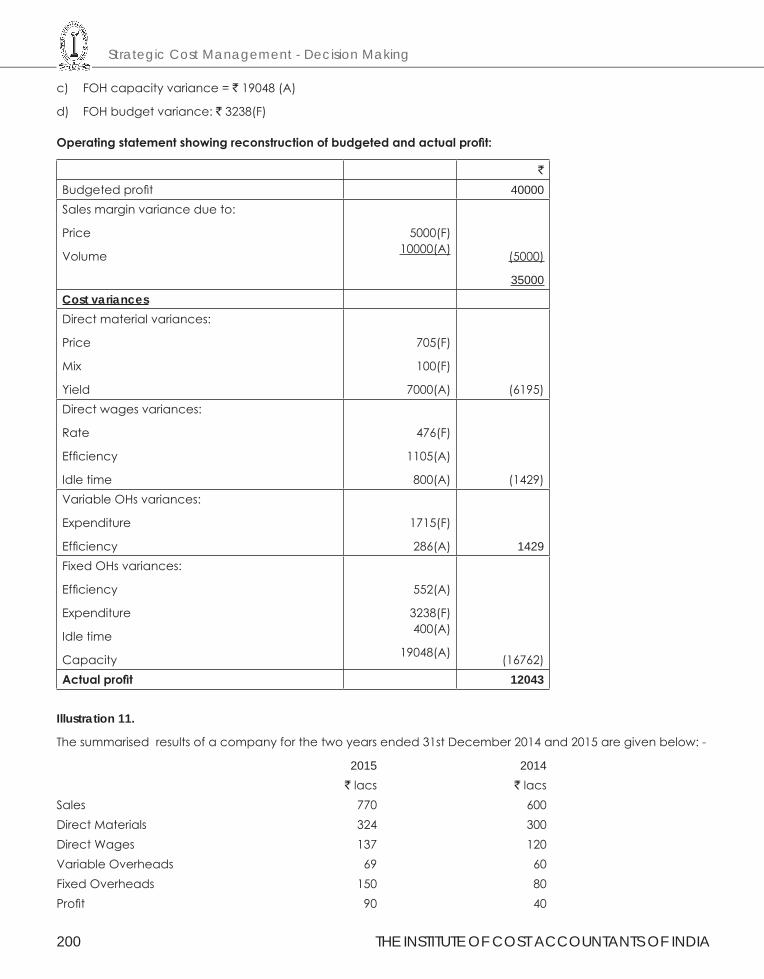
Strategic Cost Management - Decision Making
200 THE INSTITUTE OF COST ACCOUNTANTS OF INDIA
c) FOH capacity variance = ` 19048 (A)
d) FOH budget variance: ` 3238(F)
Operatingstatementshowingreconstructionofbudgetedandactualprofit:
`
Budgeted profit 40000Sales margin variance due to:
Price
Volume
5000(F) 10000(A) (5000)
35000Cost variancesDirect material variances:
Price
Mix
Yield
705(F)
100(F)
7000(A) (6195)Direct wages variances:
Rate
Efficiency
Idle time
476(F)
1105(A)
800(A) (1429)Variable OHs variances:
Expenditure
Efficiency
1715(F)
286(A) 1429Fixed OHs variances:
Efficiency
Expenditure
Idle time
Capacity
552(A)
3238(F) 400(A)
19048(A) (16762)Actualprofit 12043
Illustration 11.
The summarised results of a company for the two years ended 31st December 2014 and 2015 are given below: -
2015 2014 ` lacs ` lacs Sales 770 600 Direct Materials 324 300 Direct Wages 137 120 Variable Overheads 69 60 Fixed Overheads 150 80 Profit 90 40
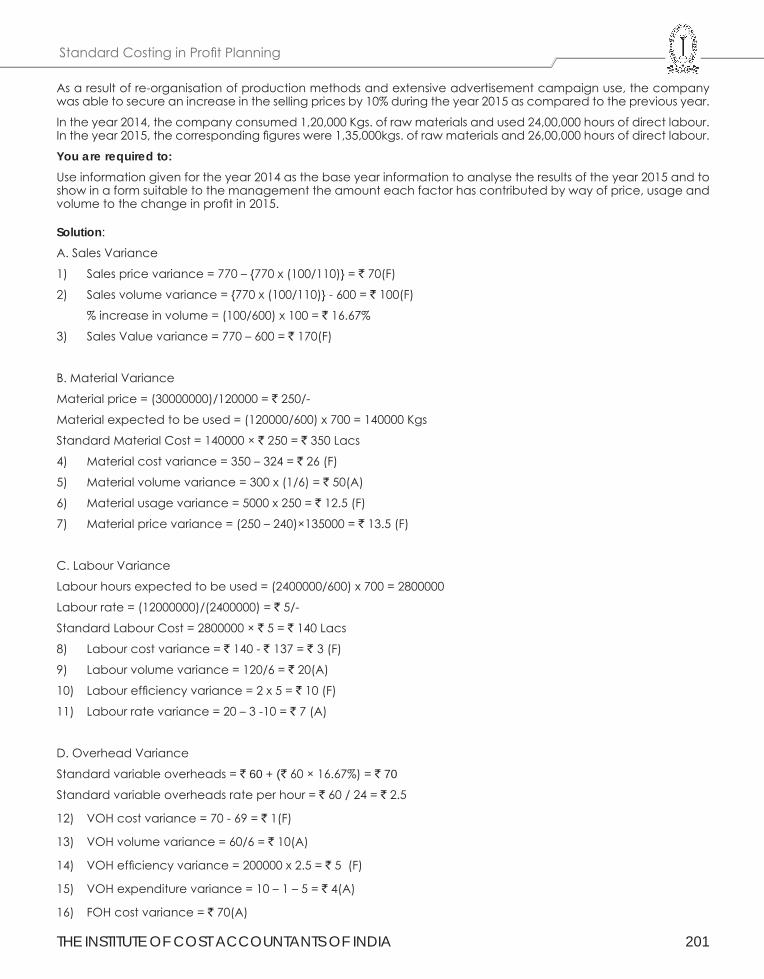
THE INSTITUTE OF COST ACCOUNTANTS OF INDIA 201
Standard Costing in Profit Planning
As a result of re-organisation of production methods and extensive advertisement campaign use, the company was able to secure an increase in the selling prices by 10% during the year 2015 as compared to the previous year.
In the year 2014, the company consumed 1,20,000 Kgs. of raw materials and used 24,00,000 hours of direct labour. In the year 2015, the corresponding figures were 1,35,000kgs. of raw materials and 26,00,000 hours of direct labour.
You are required to:Use information given for the year 2014 as the base year information to analyse the results of the year 2015 and to show in a form suitable to the management the amount each factor has contributed by way of price, usage and volume to the change in profit in 2015.
Solution:
A. Sales Variance
1) Sales price variance = 770 – {770 x (100/110)} = ` 70(F)
2) Sales volume variance = {770 x (100/110)} - 600 = ` 100(F)
% increase in volume = (100/600) x 100 = ` 16.67%
3) Sales Value variance = 770 – 600 = ` 170(F)
B. Material Variance
Material price = (30000000)/120000 = ` 250/-
Material expected to be used = (120000/600) x 700 = 140000 Kgs
Standard Material Cost = 140000 × ` 250 = ` 350 Lacs
4) Material cost variance = 350 – 324 = ` 26 (F)
5) Material volume variance = 300 x (1/6) = ` 50(A)
6) Material usage variance = 5000 x 250 = ` 12.5 (F)
7) Material price variance = (250 – 240)×135000 = ` 13.5 (F)
C. Labour Variance
Labour hours expected to be used = (2400000/600) x 700 = 2800000
Labour rate = (12000000)/(2400000) = ` 5/-
Standard Labour Cost = 2800000 × ` 5 = ` 140 Lacs
8) Labour cost variance = ` 140 - ` 137 = ` 3 (F)
9) Labour volume variance = 120/6 = ` 20(A)
10) Labour efficiency variance = 2 x 5 = ` 10 (F)
11) Labour rate variance = 20 – 3 -10 = ` 7 (A)
D. Overhead Variance
Standard variable overheads = ` 60 + (` 60 × 16.67%) = ` 70
Standard variable overheads rate per hour = ` 60 / 24 = ` 2.5
12) VOH cost variance = 70 - 69 = ` 1(F)
13) VOH volume variance = 60/6 = ` 10(A)
14) VOH efficiency variance = 200000 x 2.5 = ` 5 (F)
15) VOH expenditure variance = 10 – 1 – 5 = ` 4(A)
16) FOH cost variance = ` 70(A)
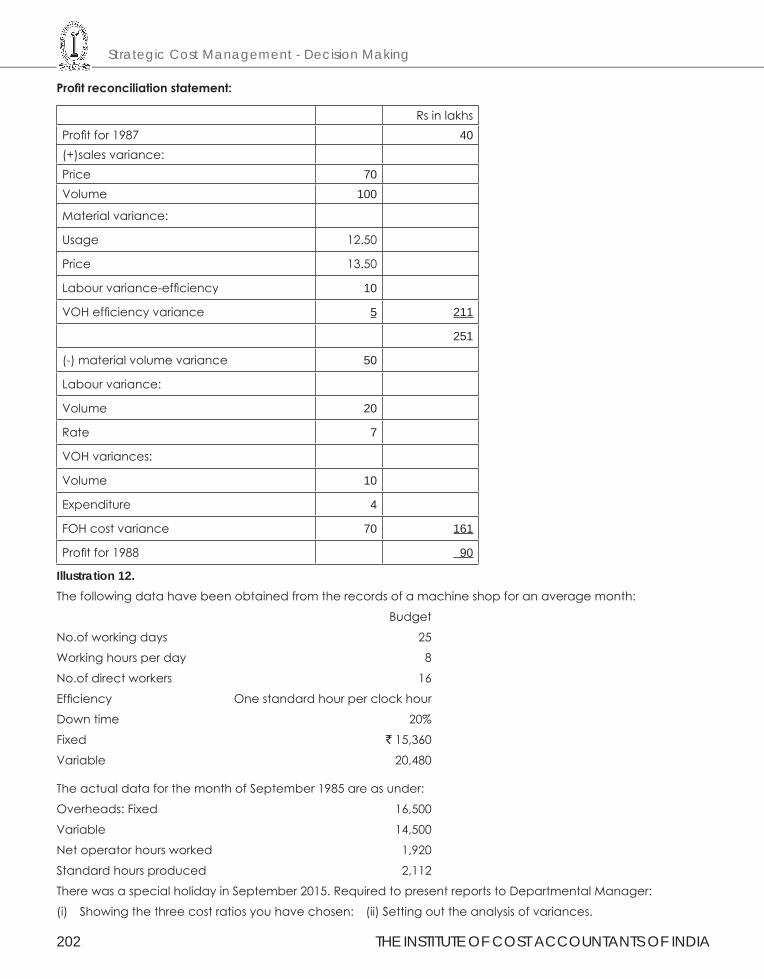
Strategic Cost Management - Decision Making
202 THE INSTITUTE OF COST ACCOUNTANTS OF INDIA
Profitreconciliationstatement:
Rs in lakhsProfit for 1987 40(+)sales variance:Price 70Volume 100
Material variance:
Usage 12.50
Price 13.50
Labour variance-efficiency 10
VOH efficiency variance 5 211
251
(-) material volume variance 50
Labour variance:
Volume 20
Rate 7
VOH variances:
Volume 10
Expenditure 4
FOH cost variance 70 161
Profit for 1988 90
Illustration 12.The following data have been obtained from the records of a machine shop for an average month:
Budget
No.of working days 25
Working hours per day 8
No.of direct workers 16
Efficiency One standard hour per clock hour
Down time 20%
Fixed ` 15,360
Variable 20,480
The actual data for the month of September 1985 are as under:
Overheads: Fixed 16,500
Variable 14,500
Net operator hours worked 1,920
Standard hours produced 2,112
There was a special holiday in September 2015. Required to present reports to Departmental Manager:
(i) Showing the three cost ratios you have chosen: (ii) Setting out the analysis of variances.
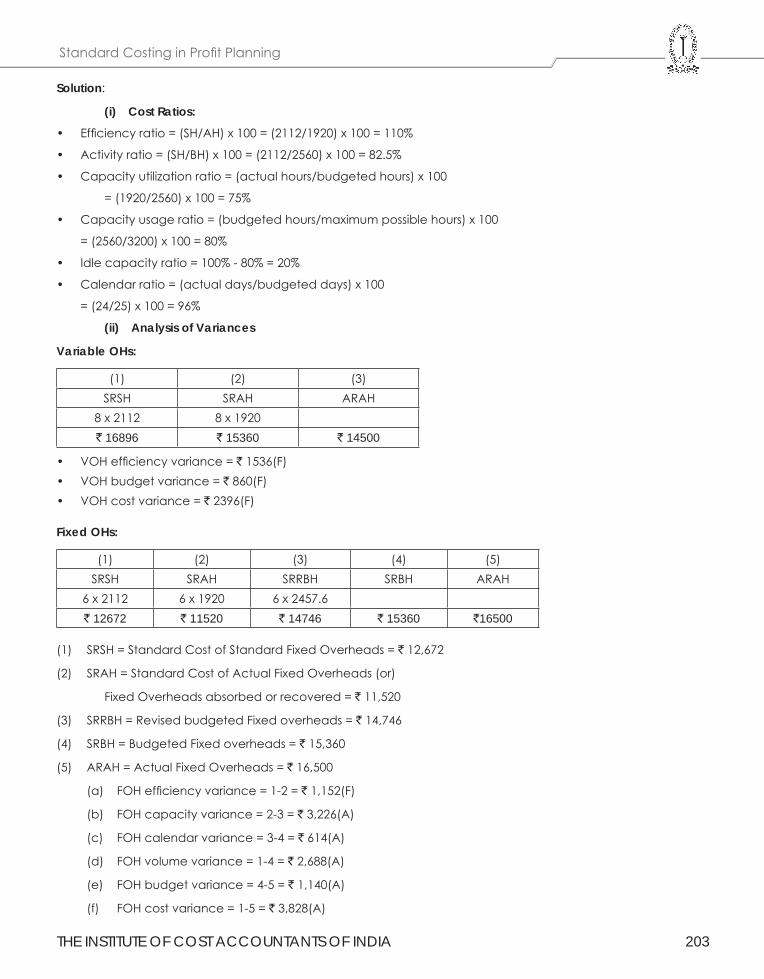
THE INSTITUTE OF COST ACCOUNTANTS OF INDIA 203
Standard Costing in Profit Planning
Solution:
(i) Cost Ratios:
• Efficiency ratio = (SH/AH) x 100 = (2112/1920) x 100 = 110%
• Activity ratio = (SH/BH) x 100 = (2112/2560) x 100 = 82.5%
• Capacity utilization ratio = (actual hours/budgeted hours) x 100
= (1920/2560) x 100 = 75%
• Capacity usage ratio = (budgeted hours/maximum possible hours) x 100
= (2560/3200) x 100 = 80%
• Idle capacity ratio = 100% - 80% = 20%
• Calendar ratio = (actual days/budgeted days) x 100
= (24/25) x 100 = 96%
(ii) Analysis of Variances
Variable OHs:
(1) (2) (3)SRSH SRAH ARAH
8 x 2112 8 x 1920` 16896 ` 15360 ` 14500
• VOH efficiency variance = ` 1536(F)• VOH budget variance = ` 860(F)• VOH cost variance = ` 2396(F)
Fixed OHs:
(1) (2) (3) (4) (5)SRSH SRAH SRRBH SRBH ARAH
6 x 2112 6 x 1920 6 x 2457.6` 12672 ` 11520 ` 14746 ` 15360 `16500
(1) SRSH = Standard Cost of Standard Fixed Overheads = ` 12,672
(2) SRAH = Standard Cost of Actual Fixed Overheads (or)
Fixed Overheads absorbed or recovered = ` 11,520
(3) SRRBH = Revised budgeted Fixed overheads = ` 14,746
(4) SRBH = Budgeted Fixed overheads = ` 15,360
(5) ARAH = Actual Fixed Overheads = ` 16,500
(a) FOH efficiency variance = 1-2 = ` 1,152(F)
(b) FOH capacity variance = 2-3 = ` 3,226(A)
(c) FOH calendar variance = 3-4 = ` 614(A)
(d) FOH volume variance = 1-4 = ` 2,688(A)
(e) FOH budget variance = 4-5 = ` 1,140(A)
(f) FOH cost variance = 1-5 = ` 3,828(A)
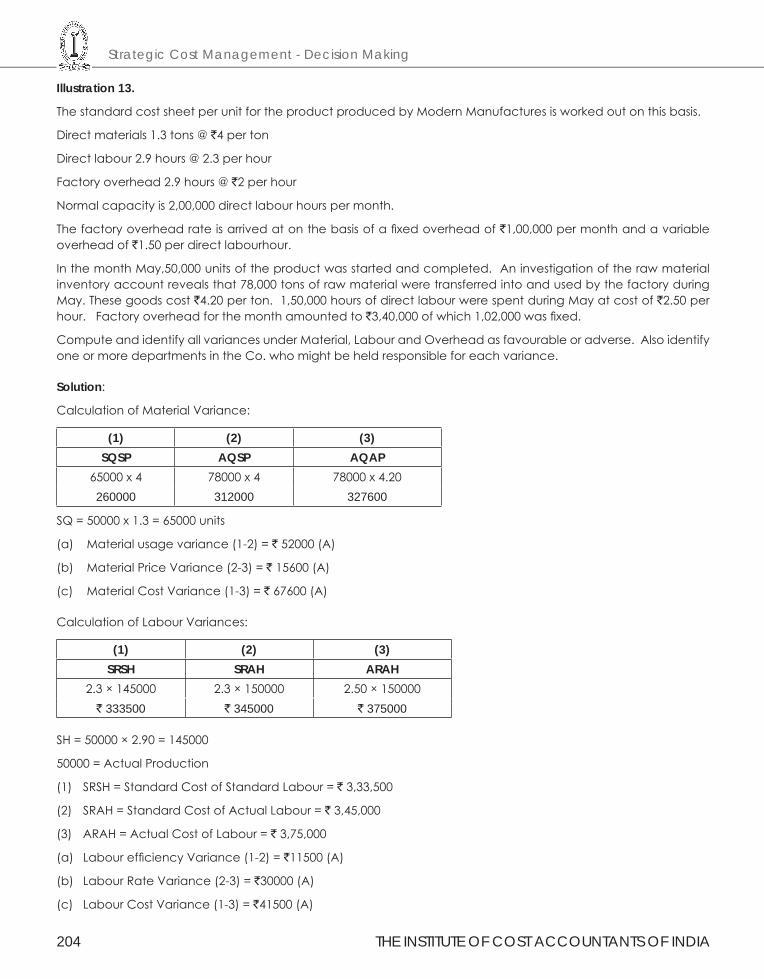
Strategic Cost Management - Decision Making
204 THE INSTITUTE OF COST ACCOUNTANTS OF INDIA
Illustration 13.
The standard cost sheet per unit for the product produced by Modern Manufactures is worked out on this basis.
Direct materials 1.3 tons @ `4 per ton
Direct labour 2.9 hours @ 2.3 per hour
Factory overhead 2.9 hours @ `2 per hour
Normal capacity is 2,00,000 direct labour hours per month.
The factory overhead rate is arrived at on the basis of a fixed overhead of `1,00,000 per month and a variable overhead of `1.50 per direct labourhour.
In the month May,50,000 units of the product was started and completed. An investigation of the raw material inventory account reveals that 78,000 tons of raw material were transferred into and used by the factory during May. These goods cost `4.20 per ton. 1,50,000 hours of direct labour were spent during May at cost of `2.50 per hour. Factory overhead for the month amounted to `3,40,000 of which 1,02,000 was fixed.
Compute and identify all variances under Material, Labour and Overhead as favourable or adverse. Also identify one or more departments in the Co. who might be held responsible for each variance.
Solution:
Calculation of Material Variance:
(1) (2) (3)SQSP AQSP AQAP
65000 x 4 78000 x 4 78000 x 4.20260000 312000 327600
SQ = 50000 x 1.3 = 65000 units
(a) Material usage variance (1-2) = ` 52000 (A)
(b) Material Price Variance (2-3) = ` 15600 (A)
(c) Material Cost Variance (1-3) = ` 67600 (A)
Calculation of Labour Variances:
(1) (2) (3)SRSH SRAH ARAH
2.3 × 145000 2.3 × 150000 2.50 × 150000` 333500 ` 345000 ` 375000
SH = 50000 × 2.90 = 145000
50000 = Actual Production
(1) SRSH = Standard Cost of Standard Labour = ` 3,33,500
(2) SRAH = Standard Cost of Actual Labour = ` 3,45,000
(3) ARAH = Actual Cost of Labour = ` 3,75,000
(a) Labour efficiency Variance (1-2) = `11500 (A)
(b) Labour Rate Variance (2-3) = `30000 (A)
(c) Labour Cost Variance (1-3) = `41500 (A)
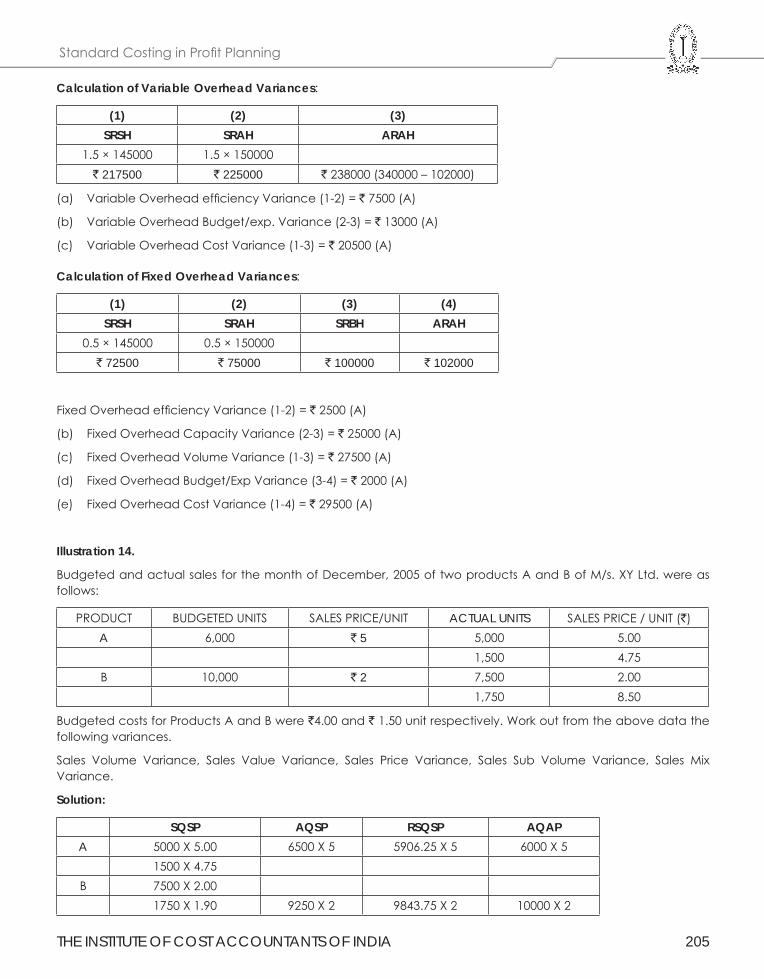
THE INSTITUTE OF COST ACCOUNTANTS OF INDIA 205
Standard Costing in Profit Planning
Calculation of Variable Overhead Variances:
(1) (2) (3)SRSH SRAH ARAH
1.5 × 145000 1.5 × 150000` 217500 ` 225000 ` 238000 (340000 – 102000)
(a) Variable Overhead efficiency Variance (1-2) = ` 7500 (A)
(b) Variable Overhead Budget/exp. Variance (2-3) = ` 13000 (A)
(c) Variable Overhead Cost Variance (1-3) = ` 20500 (A)
Calculation of Fixed Overhead Variances:
(1) (2) (3) (4)SRSH SRAH SRBH ARAH
0.5 × 145000 0.5 × 150000` 72500 ` 75000 ` 100000 ` 102000
Fixed Overhead efficiency Variance (1-2) = ` 2500 (A)
(b) Fixed Overhead Capacity Variance (2-3) = ` 25000 (A)
(c) Fixed Overhead Volume Variance (1-3) = ` 27500 (A)
(d) Fixed Overhead Budget/Exp Variance (3-4) = ` 2000 (A)
(e) Fixed Overhead Cost Variance (1-4) = ` 29500 (A)
Illustration 14.
Budgeted and actual sales for the month of December, 2005 of two products A and B of M/s. XY Ltd. were as follows:
PRODUCT BUDGETED UNITS SALES PRICE/UNIT ACTUAL UNITS SALES PRICE / UNIT (`)A 6,000 ` 5 5,000 5.00
1,500 4.75B 10,000 ` 2 7,500 2.00
1,750 8.50
Budgeted costs for Products A and B were `4.00 and ` 1.50 unit respectively. Work out from the above data the following variances.
Sales Volume Variance, Sales Value Variance, Sales Price Variance, Sales Sub Volume Variance, Sales Mix Variance.
Solution:
SQSP AQSP RSQSP AQAPA 5000 X 5.00 6500 X 5 5906.25 X 5 6000 X 5
1500 X 4.75B 7500 X 2.00
1750 X 1.90 9250 X 2 9843.75 X 2 10000 X 2
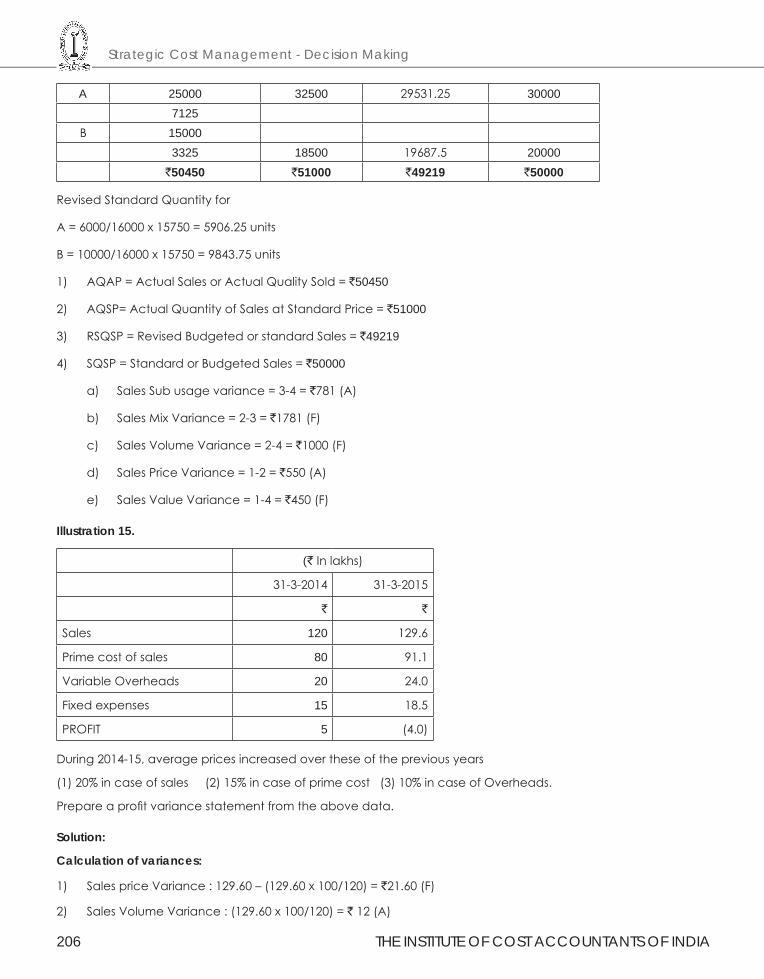
Strategic Cost Management - Decision Making
206 THE INSTITUTE OF COST ACCOUNTANTS OF INDIA
A 25000 32500 29531.25 300007125
B 150003325 18500 19687.5 20000
`50450 `51000 `49219 `50000
Revised Standard Quantity for
A = 6000/16000 x 15750 = 5906.25 units
B = 10000/16000 x 15750 = 9843.75 units
1) AQAP = Actual Sales or Actual Quality Sold = `50450
2) AQSP= Actual Quantity of Sales at Standard Price = `51000
3) RSQSP = Revised Budgeted or standard Sales = `49219
4) SQSP = Standard or Budgeted Sales = `50000
a) Sales Sub usage variance = 3-4 = `781 (A)
b) Sales Mix Variance = 2-3 = `1781 (F)
c) Sales Volume Variance = 2-4 = `1000 (F)
d) Sales Price Variance = 1-2 = `550 (A)
e) Sales Value Variance = 1-4 = `450 (F)
Illustration 15.
(` In lakhs)
31-3-2014 31-3-2015
` `
Sales 120 129.6
Prime cost of sales 80 91.1
Variable Overheads 20 24.0
Fixed expenses 15 18.5
PROFIT 5 (4.0)
During 2014-15, average prices increased over these of the previous years
(1) 20% in case of sales (2) 15% in case of prime cost (3) 10% in case of Overheads.
Prepare a profit variance statement from the above data.
Solution:
Calculation of variances:
1) Sales price Variance : 129.60 – (129.60 x 100/120) = `21.60 (F)
2) Sales Volume Variance : (129.60 x 100/120) = ` 12 (A)
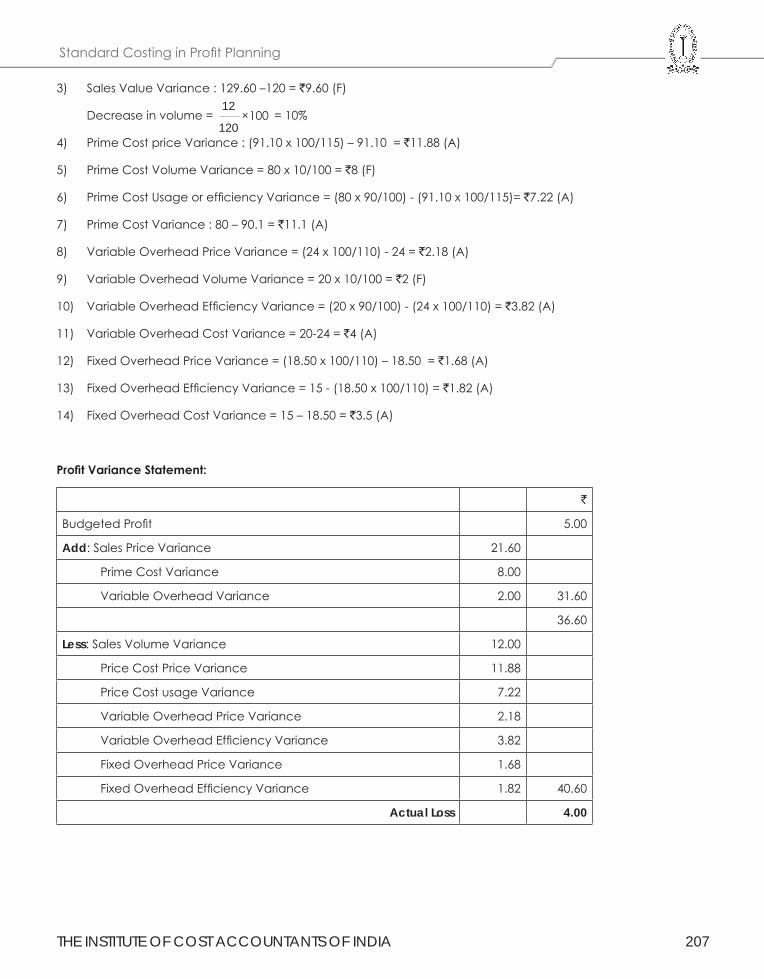
THE INSTITUTE OF COST ACCOUNTANTS OF INDIA 207
Standard Costing in Profit Planning
3) Sales Value Variance : 129.60 –120 = `9.60 (F)
Decrease in volume = 12
× 100120
= 10%
4) Prime Cost price Variance : (91.10 x 100/115) – 91.10 = `11.88 (A)
5) Prime Cost Volume Variance = 80 x 10/100 = `8 (F)
6) Prime Cost Usage or efficiency Variance = (80 x 90/100) - (91.10 x 100/115)= `7.22 (A)
7) Prime Cost Variance : 80 – 90.1 = `11.1 (A)
8) Variable Overhead Price Variance = (24 x 100/110) - 24 = `2.18 (A)
9) Variable Overhead Volume Variance = 20 x 10/100 = `2 (F)
10) Variable Overhead Efficiency Variance = (20 x 90/100) - (24 x 100/110) = `3.82 (A)
11) Variable Overhead Cost Variance = 20-24 = `4 (A)
12) Fixed Overhead Price Variance = (18.50 x 100/110) – 18.50 = `1.68 (A)
13) Fixed Overhead Efficiency Variance = 15 - (18.50 x 100/110) = `1.82 (A)
14) Fixed Overhead Cost Variance = 15 – 18.50 = `3.5 (A)
ProfitVarianceStatement:
`
Budgeted Profit 5.00
Add: Sales Price Variance 21.60
Prime Cost Variance 8.00
Variable Overhead Variance 2.00 31.60
36.60
Less: Sales Volume Variance 12.00
Price Cost Price Variance 11.88
Price Cost usage Variance 7.22
Variable Overhead Price Variance 2.18
Variable Overhead Efficiency Variance 3.82
Fixed Overhead Price Variance 1.68
Fixed Overhead Efficiency Variance 1.82 40.60
Actual Loss 4.00
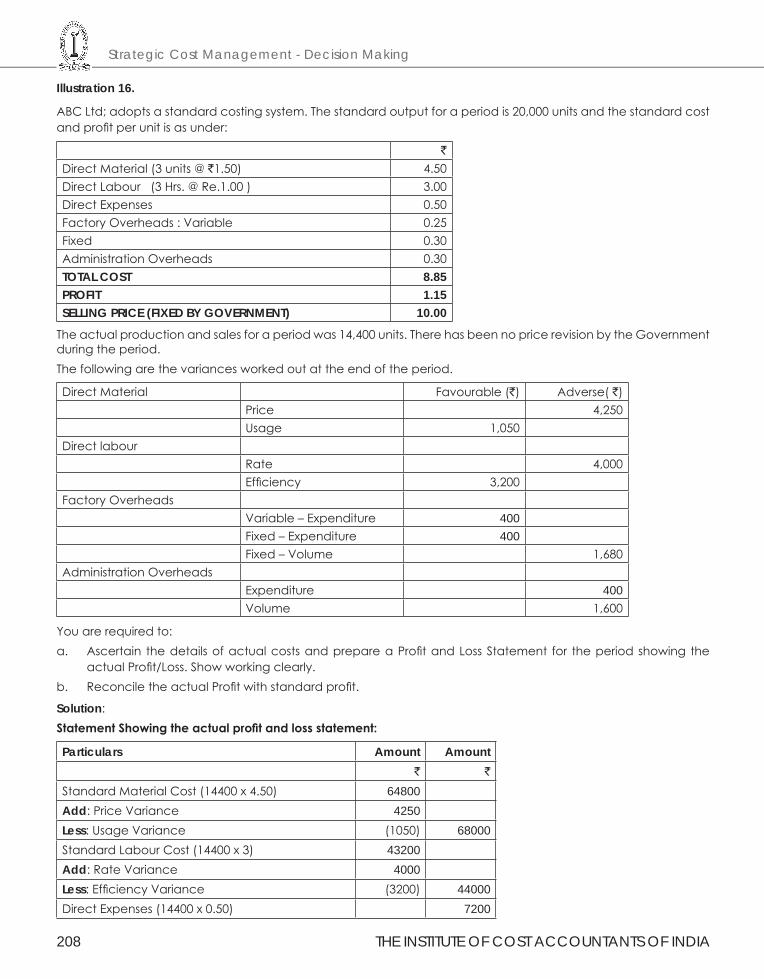
Strategic Cost Management - Decision Making
208 THE INSTITUTE OF COST ACCOUNTANTS OF INDIA
Illustration 16.
ABC Ltd; adopts a standard costing system. The standard output for a period is 20,000 units and the standard cost and profit per unit is as under:
`
Direct Material (3 units @ `1.50) 4.50Direct Labour (3 Hrs. @ Re.1.00 ) 3.00Direct Expenses 0.50Factory Overheads : Variable 0.25Fixed 0.30Administration Overheads 0.30TOTAL COST 8.85PROFIT 1.15SELLING PRICE (FIXED BY GOVERNMENT) 10.00
The actual production and sales for a period was 14,400 units. There has been no price revision by the Government during the period.The following are the variances worked out at the end of the period.
Direct Material Favourable (`) Adverse( `)Price 4,250Usage 1,050
Direct labourRate 4,000Efficiency 3,200
Factory OverheadsVariable – Expenditure 400Fixed – Expenditure 400Fixed – Volume 1,680
Administration OverheadsExpenditure 400Volume 1,600
You are required to:a. Ascertain the details of actual costs and prepare a Profit and Loss Statement for the period showing the
actual Profit/Loss. Show working clearly.b. Reconcile the actual Profit with standard profit.
Solution:StatementShowingtheactualprofitandlossstatement:
Particulars Amount Amount` `
Standard Material Cost (14400 x 4.50) 64800Add: Price Variance 4250Less: Usage Variance (1050) 68000Standard Labour Cost (14400 x 3) 43200Add: Rate Variance 4000Less: Efficiency Variance (3200) 44000Direct Expenses (14400 x 0.50) 7200
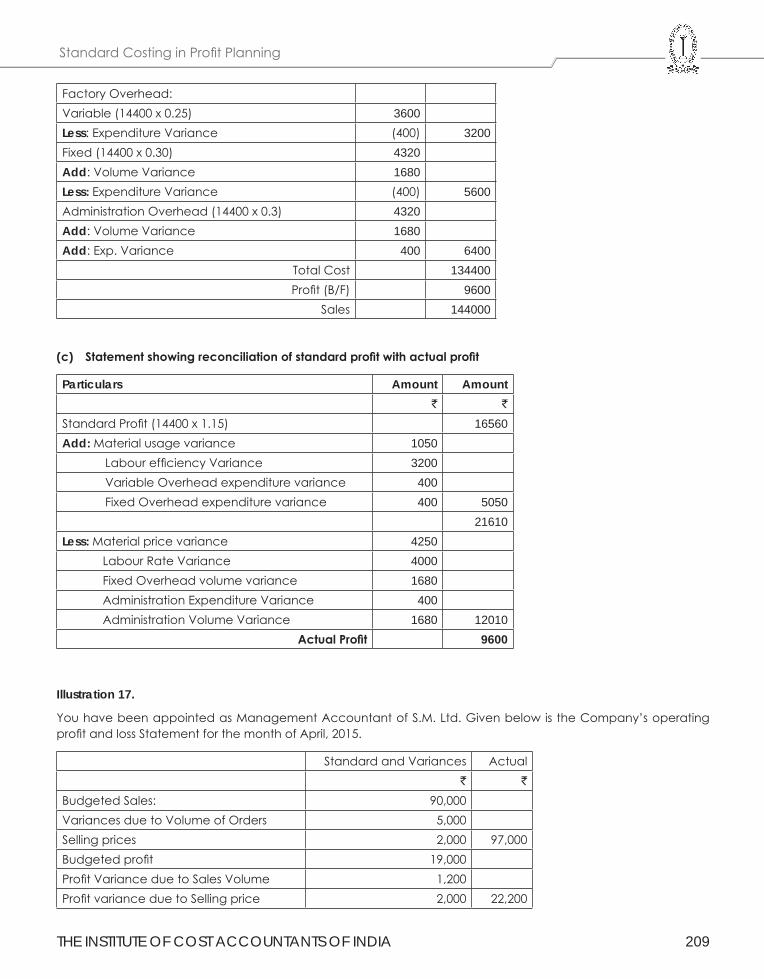
THE INSTITUTE OF COST ACCOUNTANTS OF INDIA 209
Standard Costing in Profit Planning
Factory Overhead:Variable (14400 x 0.25) 3600Less: Expenditure Variance (400) 3200Fixed (14400 x 0.30) 4320Add: Volume Variance 1680Less: Expenditure Variance (400) 5600Administration Overhead (14400 x 0.3) 4320Add: Volume Variance 1680Add: Exp. Variance 400 6400
Total Cost 134400Profit (B/F) 9600
Sales 144000
(c) Statementshowingreconciliationofstandardprofitwithactualprofit
Particulars Amount Amount` `
Standard Profit (14400 x 1.15) 16560Add: Material usage variance 1050
Labour efficiency Variance 3200Variable Overhead expenditure variance 400Fixed Overhead expenditure variance 400 5050
21610Less: Material price variance 4250
Labour Rate Variance 4000Fixed Overhead volume variance 1680Administration Expenditure Variance 400Administration Volume Variance 1680 12010
ActualProfit 9600
Illustration 17.
You have been appointed as Management Accountant of S.M. Ltd. Given below is the Company’s operating profit and loss Statement for the month of April, 2015.
Standard and Variances Actual` `
Budgeted Sales: 90,000Variances due to Volume of Orders 5,000Selling prices 2,000 97,000Budgeted profit 19,000Profit Variance due to Sales Volume 1,200Profit variance due to Selling price 2,000 22,200
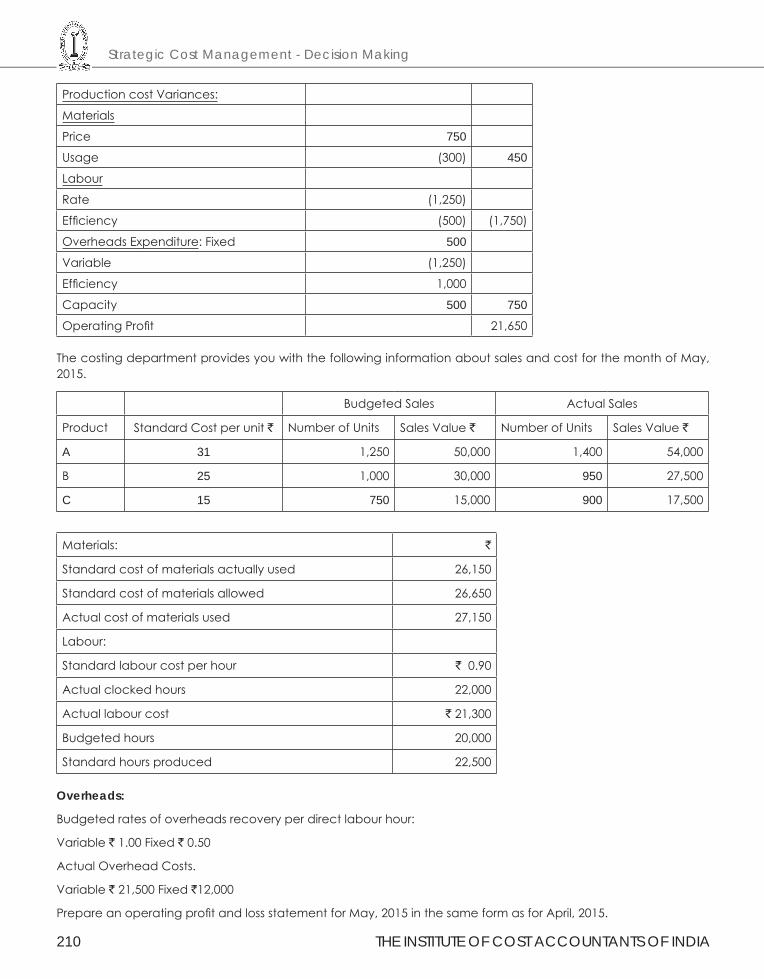
Strategic Cost Management - Decision Making
210 THE INSTITUTE OF COST ACCOUNTANTS OF INDIA
Production cost Variances:
Materials
Price 750
Usage (300) 450
Labour
Rate (1,250)
Efficiency (500) (1,750)
Overheads Expenditure: Fixed 500
Variable (1,250)
Efficiency 1,000
Capacity 500 750
Operating Profit 21,650
The costing department provides you with the following information about sales and cost for the month of May, 2015.
Budgeted Sales Actual Sales
Product Standard Cost per unit ` Number of Units Sales Value ` Number of Units Sales Value `
A 31 1,250 50,000 1,400 54,000
B 25 1,000 30,000 950 27,500
C 15 750 15,000 900 17,500
Materials: `
Standard cost of materials actually used 26,150
Standard cost of materials allowed 26,650
Actual cost of materials used 27,150
Labour:
Standard labour cost per hour ` 0.90
Actual clocked hours 22,000
Actual labour cost ` 21,300
Budgeted hours 20,000
Standard hours produced 22,500
Overheads:
Budgeted rates of overheads recovery per direct labour hour:
Variable ` 1.00 Fixed ` 0.50
Actual Overhead Costs.
Variable ` 21,500 Fixed `12,000
Prepare an operating profit and loss statement for May, 2015 in the same form as for April, 2015.
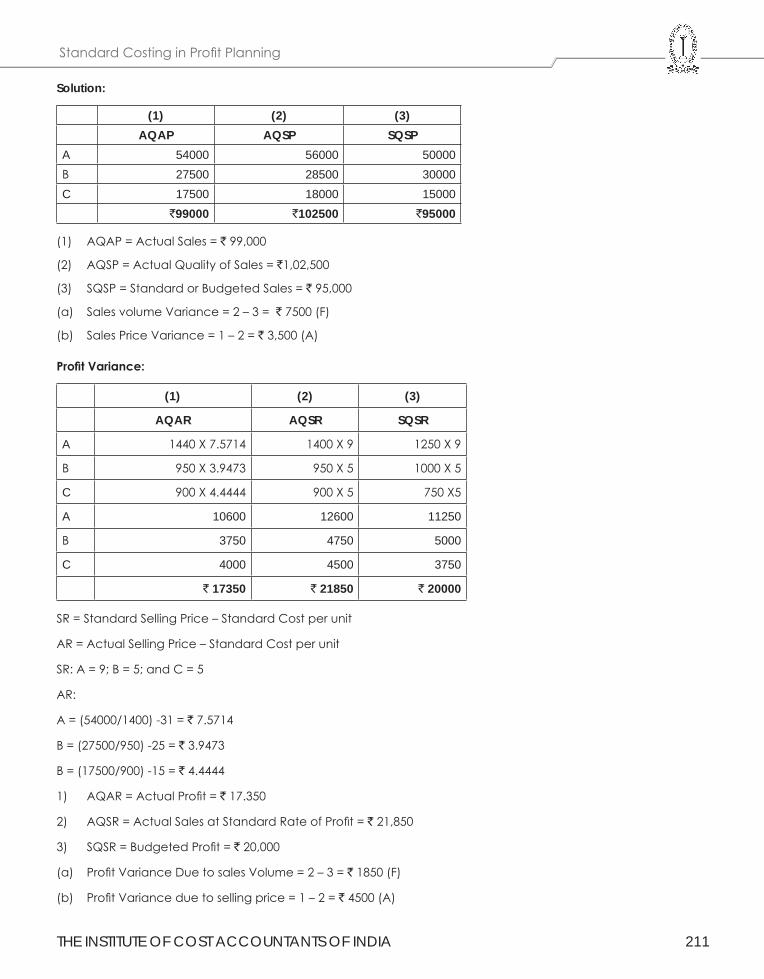
THE INSTITUTE OF COST ACCOUNTANTS OF INDIA 211
Standard Costing in Profit Planning
Solution:
(1) (2) (3)AQAP AQSP SQSP
A 54000 56000 50000B 27500 28500 30000C 17500 18000 15000
`99000 `102500 `95000
(1) AQAP = Actual Sales = ` 99,000
(2) AQSP = Actual Quality of Sales = `1,02,500
(3) SQSP = Standard or Budgeted Sales = ` 95,000
(a) Sales volume Variance = 2 – 3 = ` 7500 (F)
(b) Sales Price Variance = 1 – 2 = ` 3,500 (A)
ProfitVariance:
(1) (2) (3)
AQAR AQSR SQSR
A 1440 X 7.5714 1400 X 9 1250 X 9
B 950 X 3.9473 950 X 5 1000 X 5
C 900 X 4.4444 900 X 5 750 X5
A 10600 12600 11250
B 3750 4750 5000
C 4000 4500 3750
` 17350 ` 21850 ` 20000
SR = Standard Selling Price – Standard Cost per unit
AR = Actual Selling Price – Standard Cost per unit
SR: A = 9; B = 5; and C = 5
AR:
A = (54000/1400) -31 = ` 7.5714
B = (27500/950) -25 = ` 3.9473
B = (17500/900) -15 = ` 4.4444
1) AQAR = Actual Profit = ` 17.350
2) AQSR = Actual Sales at Standard Rate of Profit = ` 21,850
3) SQSR = Budgeted Profit = ` 20,000
(a) Profit Variance Due to sales Volume = 2 – 3 = ` 1850 (F)
(b) Profit Variance due to selling price = 1 – 2 = ` 4500 (A)
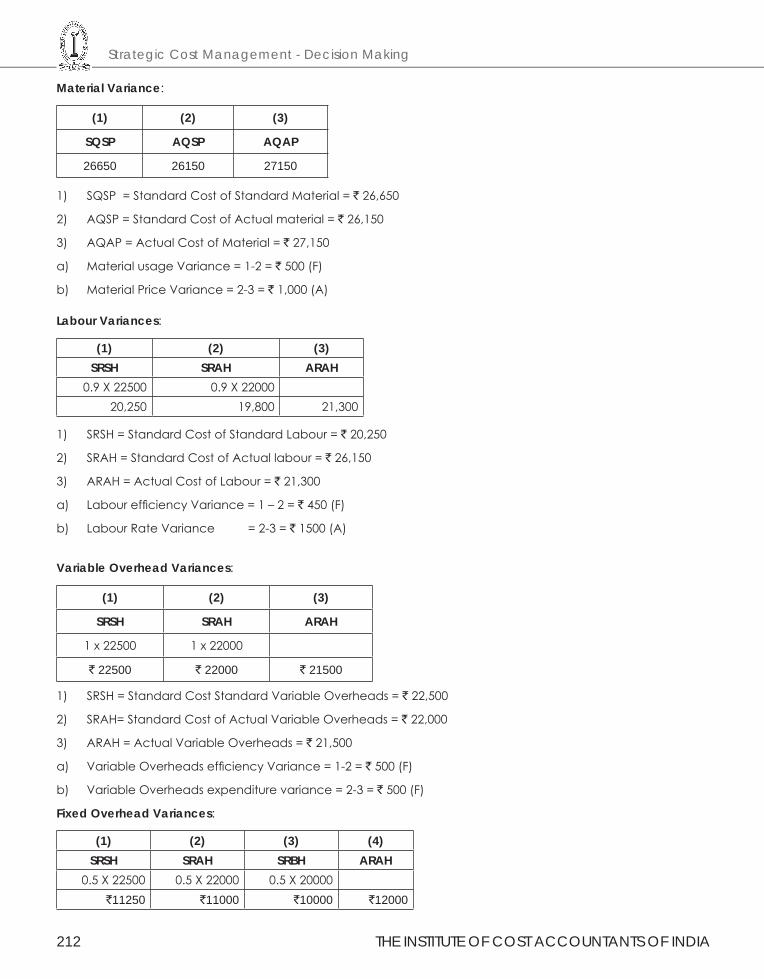
Strategic Cost Management - Decision Making
212 THE INSTITUTE OF COST ACCOUNTANTS OF INDIA
Material Variance:
(1) (2) (3)
SQSP AQSP AQAP
26650 26150 27150
1) SQSP = Standard Cost of Standard Material = ` 26,650
2) AQSP = Standard Cost of Actual material = ` 26,150
3) AQAP = Actual Cost of Material = ` 27,150
a) Material usage Variance = 1-2 = ` 500 (F)
b) Material Price Variance = 2-3 = ` 1,000 (A)
Labour Variances:
(1) (2) (3)SRSH SRAH ARAH
0.9 X 22500 0.9 X 2200020,250 19,800 21,300
1) SRSH = Standard Cost of Standard Labour = ` 20,250
2) SRAH = Standard Cost of Actual labour = ` 26,150
3) ARAH = Actual Cost of Labour = ` 21,300
a) Labour efficiency Variance = 1 – 2 = ` 450 (F)
b) Labour Rate Variance = 2-3 = ` 1500 (A)
Variable Overhead Variances:
(1) (2) (3)
SRSH SRAH ARAH
1 x 22500 1 x 22000
` 22500 ` 22000 ` 21500
1) SRSH = Standard Cost Standard Variable Overheads = ` 22,500
2) SRAH= Standard Cost of Actual Variable Overheads = ` 22,000
3) ARAH = Actual Variable Overheads = ` 21,500
a) Variable Overheads efficiency Variance = 1-2 = ` 500 (F)
b) Variable Overheads expenditure variance = 2-3 = ` 500 (F)
Fixed Overhead Variances:
(1) (2) (3) (4)SRSH SRAH SRBH ARAH
0.5 X 22500 0.5 X 22000 0.5 X 20000`11250 `11000 `10000 `12000
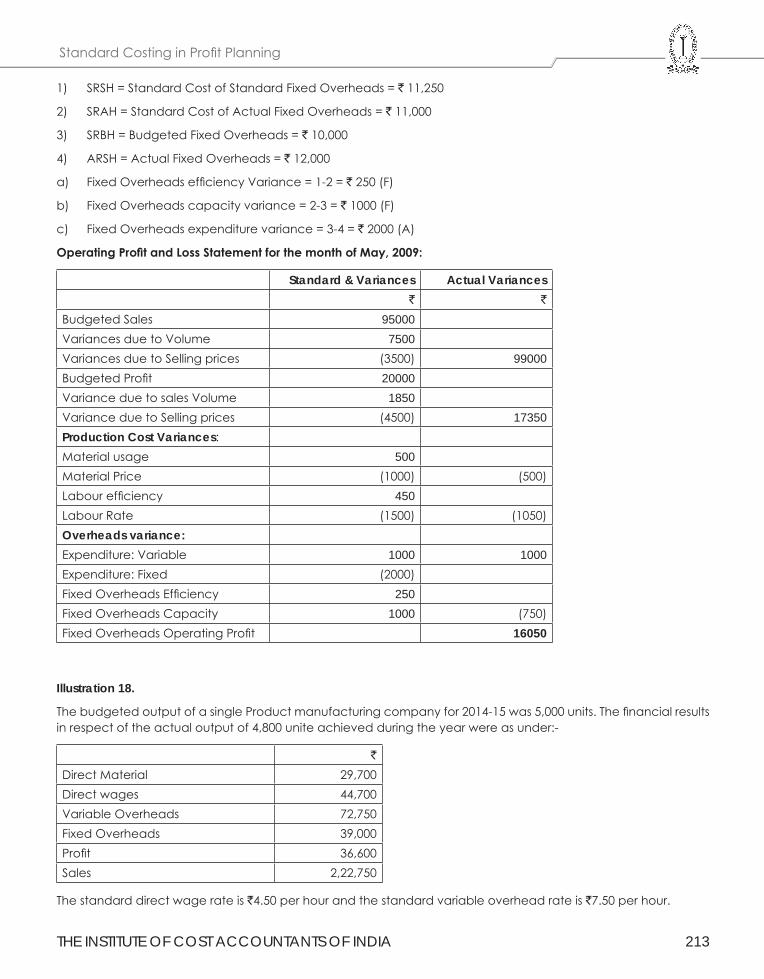
THE INSTITUTE OF COST ACCOUNTANTS OF INDIA 213
Standard Costing in Profit Planning
1) SRSH = Standard Cost of Standard Fixed Overheads = ` 11,250
2) SRAH = Standard Cost of Actual Fixed Overheads = ` 11,000
3) SRBH = Budgeted Fixed Overheads = ` 10,000
4) ARSH = Actual Fixed Overheads = ` 12,000
a) Fixed Overheads efficiency Variance = 1-2 = ` 250 (F)
b) Fixed Overheads capacity variance = 2-3 = ` 1000 (F)
c) Fixed Overheads expenditure variance = 3-4 = ` 2000 (A)
OperatingProfitandLossStatementforthemonthofMay,2009:
Standard & Variances Actual Variances` `
Budgeted Sales 95000Variances due to Volume 7500Variances due to Selling prices (3500) 99000Budgeted Profit 20000Variance due to sales Volume 1850Variance due to Selling prices (4500) 17350Production Cost Variances:Material usage 500Material Price (1000) (500)Labour efficiency 450Labour Rate (1500) (1050)Overheads variance:Expenditure: Variable 1000 1000Expenditure: Fixed (2000)Fixed Overheads Efficiency 250Fixed Overheads Capacity 1000 (750)Fixed Overheads Operating Profit 16050
Illustration 18.
The budgeted output of a single Product manufacturing company for 2014-15 was 5,000 units. The financial results in respect of the actual output of 4,800 unite achieved during the year were as under:-
`
Direct Material 29,700Direct wages 44,700Variable Overheads 72,750Fixed Overheads 39,000Profit 36,600Sales 2,22,750
The standard direct wage rate is `4.50 per hour and the standard variable overhead rate is `7.50 per hour.
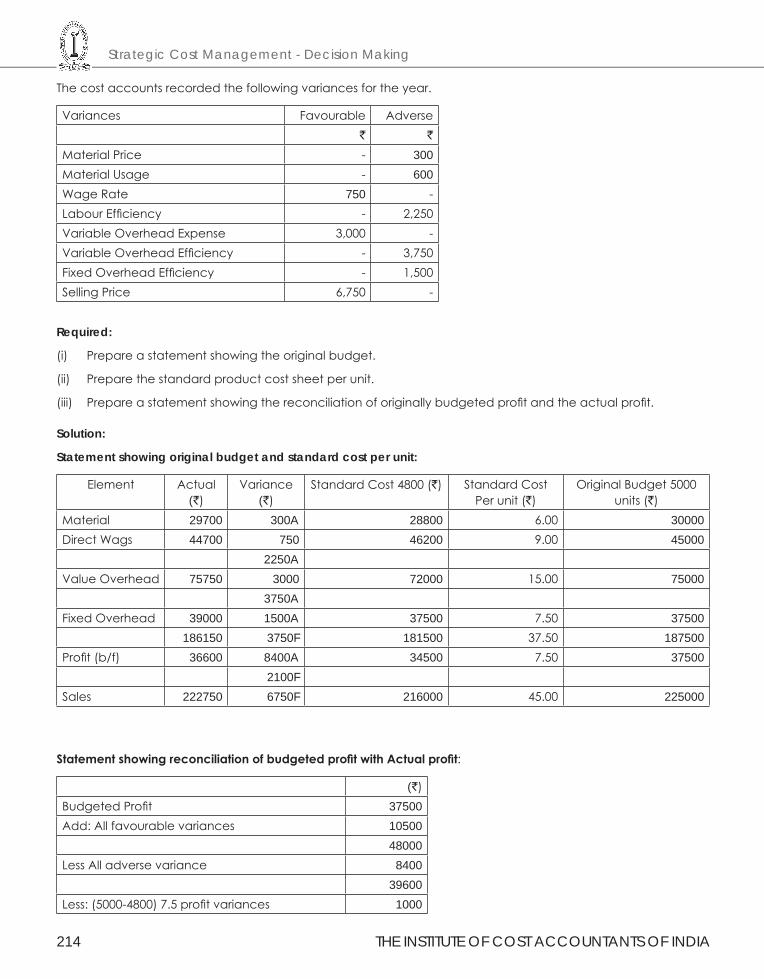
Strategic Cost Management - Decision Making
214 THE INSTITUTE OF COST ACCOUNTANTS OF INDIA
The cost accounts recorded the following variances for the year.
Variances Favourable Adverse` `
Material Price - 300Material Usage - 600Wage Rate 750 -Labour Efficiency - 2,250Variable Overhead Expense 3,000 -Variable Overhead Efficiency - 3,750Fixed Overhead Efficiency - 1,500Selling Price 6,750 -
Required:
(i) Prepare a statement showing the original budget.
(ii) Prepare the standard product cost sheet per unit.
(iii) Prepare a statement showing the reconciliation of originally budgeted profit and the actual profit.
Solution:
Statement showing original budget and standard cost per unit:
Element Actual(`)
Variance(`)
Standard Cost 4800 (`) Standard Cost Per unit (`)
Original Budget 5000 units (`)
Material 29700 300A 28800 6.00 30000Direct Wags 44700 750 46200 9.00 45000
2250AValue Overhead 75750 3000 72000 15.00 75000
3750AFixed Overhead 39000 1500A 37500 7.50 37500
186150 3750F 181500 37.50 187500Profit (b/f) 36600 8400A 34500 7.50 37500
2100FSales 222750 6750F 216000 45.00 225000
StatementshowingreconciliationofbudgetedprofitwithActualprofit:
(`)Budgeted Profit 37500Add: All favourable variances 10500
48000Less All adverse variance 8400
39600Less: (5000-4800) 7.5 profit variances 1000
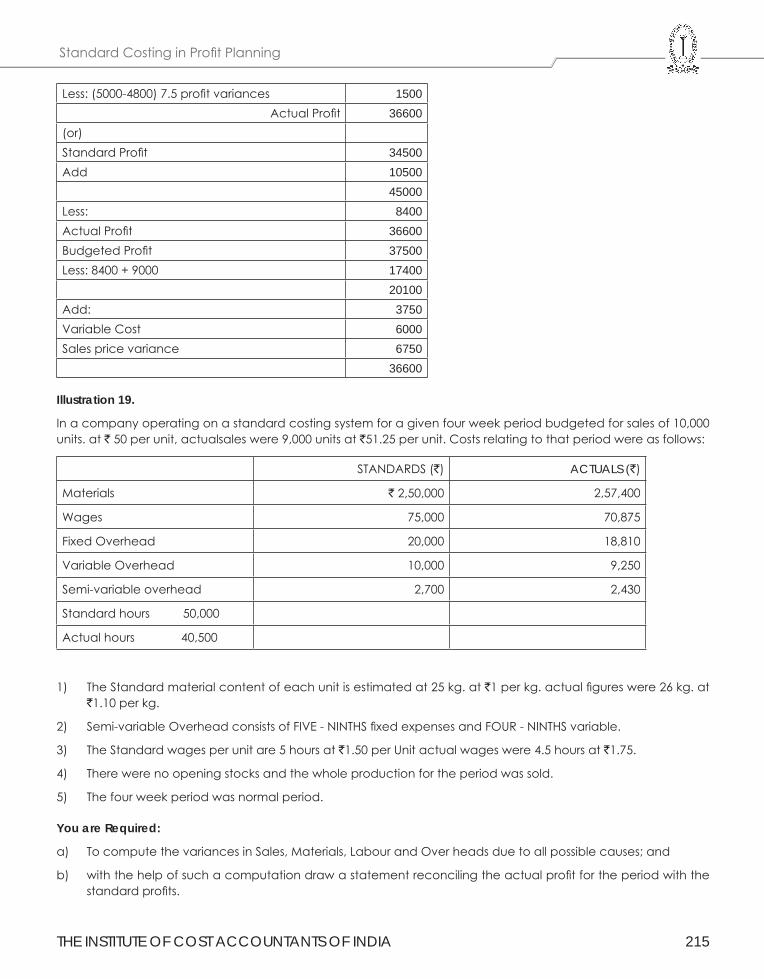
THE INSTITUTE OF COST ACCOUNTANTS OF INDIA 215
Standard Costing in Profit Planning
Less: (5000-4800) 7.5 profit variances 1500Actual Profit 36600
(or)Standard Profit 34500Add 10500
45000Less: 8400Actual Profit 36600Budgeted Profit 37500Less: 8400 + 9000 17400
20100Add: 3750Variable Cost 6000Sales price variance 6750
36600
Illustration 19.
In a company operating on a standard costing system for a given four week period budgeted for sales of 10,000 units. at ` 50 per unit, actualsales were 9,000 units at `51.25 per unit. Costs relating to that period were as follows:
STANDARDS (`) ACTUALS (`)
Materials ` 2,50,000 2,57,400
Wages 75,000 70,875
Fixed Overhead 20,000 18,810
Variable Overhead 10,000 9,250
Semi-variable overhead 2,700 2,430
Standard hours 50,000
Actual hours 40,500
1) The Standard material content of each unit is estimated at 25 kg. at `1 per kg. actual figures were 26 kg. at `1.10 per kg.
2) Semi-variable Overhead consists of FIVE - NINTHS fixed expenses and FOUR - NINTHS variable.
3) The Standard wages per unit are 5 hours at `1.50 per Unit actual wages were 4.5 hours at `1.75.
4) There were no opening stocks and the whole production for the period was sold.
5) The four week period was normal period.
You are Required:
a) To compute the variances in Sales, Materials, Labour and Over heads due to all possible causes; and
b) with the help of such a computation draw a statement reconciling the actual profit for the period with the standard profits.
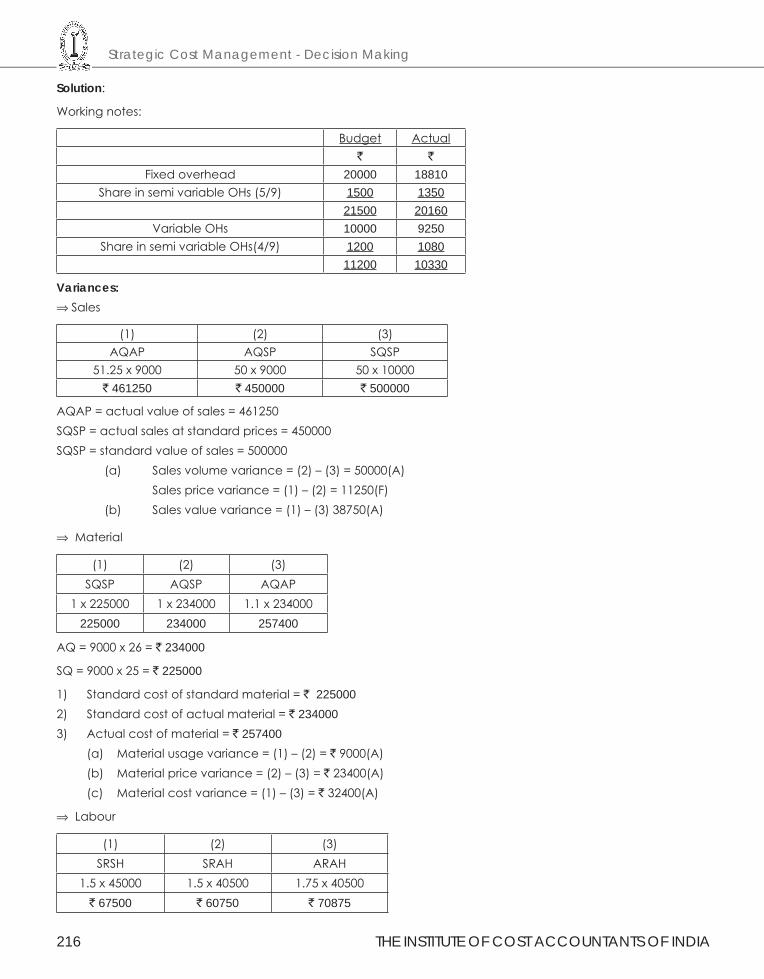
Strategic Cost Management - Decision Making
216 THE INSTITUTE OF COST ACCOUNTANTS OF INDIA
Solution:
Working notes:
Budget Actual` `
Fixed overhead 20000 18810Share in semi variable OHs (5/9) 1500 1350
21500 20160Variable OHs 10000 9250
Share in semi variable OHs(4/9) 1200 108011200 10330
Variances:⇒ Sales
(1) (2) (3)AQAP AQSP SQSP
51.25 x 9000 50 x 9000 50 x 10000` 461250 ` 450000 ` 500000
AQAP = actual value of sales = 461250SQSP = actual sales at standard prices = 450000SQSP = standard value of sales = 500000 (a) Sales volume variance = (2) – (3) = 50000(A) Sales price variance = (1) – (2) = 11250(F) (b) Sales value variance = (1) – (3) 38750(A)
⇒ Material
(1) (2) (3)SQSP AQSP AQAP
1 x 225000 1 x 234000 1.1 x 234000225000 234000 257400
AQ = 9000 x 26 = ` 234000
SQ = 9000 x 25 = ` 225000
1) Standard cost of standard material = ` 2250002) Standard cost of actual material = ` 2340003) Actual cost of material = ` 257400
(a) Material usage variance = (1) – (2) = ` 9000(A)(b) Material price variance = (2) – (3) = ` 23400(A)(c) Material cost variance = (1) – (3) = ` 32400(A)
⇒ Labour
(1) (2) (3)SRSH SRAH ARAH
1.5 x 45000 1.5 x 40500 1.75 x 40500` 67500 ` 60750 ` 70875
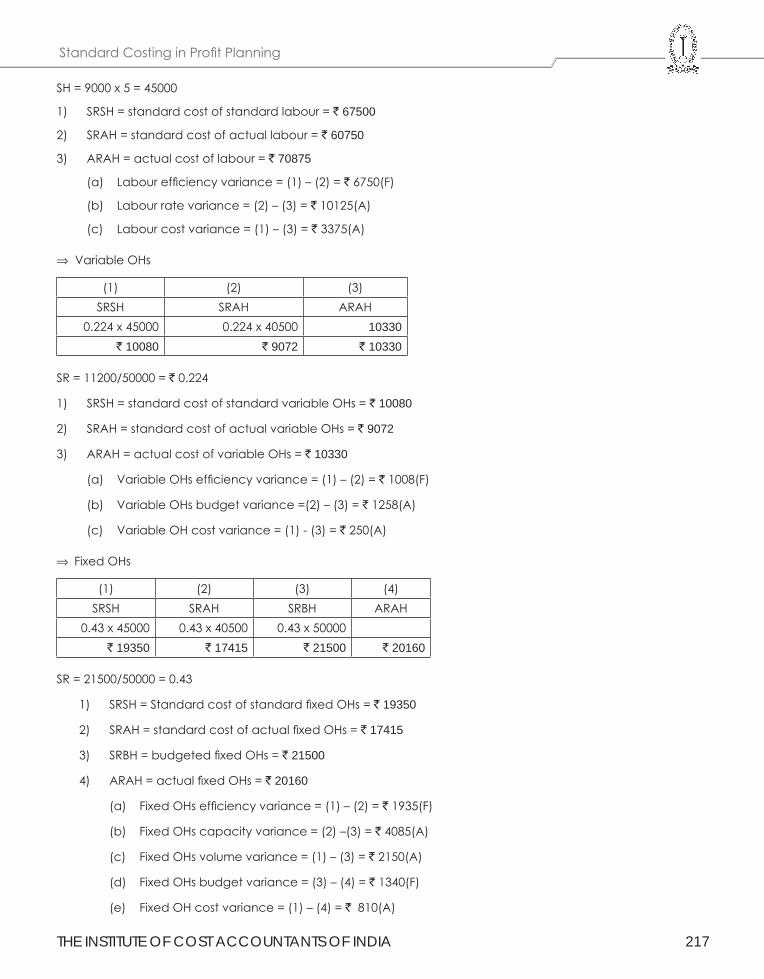
THE INSTITUTE OF COST ACCOUNTANTS OF INDIA 217
Standard Costing in Profit Planning
SH = 9000 x 5 = 45000
1) SRSH = standard cost of standard labour = ` 67500
2) SRAH = standard cost of actual labour = ` 60750
3) ARAH = actual cost of labour = ` 70875
(a) Labour efficiency variance = (1) – (2) = ` 6750(F)
(b) Labour rate variance = (2) – (3) = ` 10125(A)
(c) Labour cost variance = (1) – (3) = ` 3375(A)
⇒ Variable OHs
(1) (2) (3)SRSH SRAH ARAH
0.224 x 45000 0.224 x 40500 10330` 10080 ` 9072 ` 10330
SR = 11200/50000 = ` 0.224
1) SRSH = standard cost of standard variable OHs = ` 10080
2) SRAH = standard cost of actual variable OHs = ` 9072
3) ARAH = actual cost of variable OHs = ` 10330
(a) Variable OHs efficiency variance = (1) – (2) = ` 1008(F)
(b) Variable OHs budget variance =(2) – (3) = ` 1258(A)
(c) Variable OH cost variance = (1) - (3) = ` 250(A)
⇒ Fixed OHs
(1) (2) (3) (4)SRSH SRAH SRBH ARAH
0.43 x 45000 0.43 x 40500 0.43 x 50000 ` 19350 ` 17415 ` 21500 ` 20160
SR = 21500/50000 = 0.43
1) SRSH = Standard cost of standard fixed OHs = ` 19350
2) SRAH = standard cost of actual fixed OHs = ` 17415
3) SRBH = budgeted fixed OHs = ` 21500
4) ARAH = actual fixed OHs = ` 20160
(a) Fixed OHs efficiency variance = (1) – (2) = ` 1935(F)
(b) Fixed OHs capacity variance = (2) –(3) = ` 4085(A)
(c) Fixed OHs volume variance = (1) – (3) = ` 2150(A)
(d) Fixed OHs budget variance = (3) – (4) = ` 1340(F)
(e) Fixed OH cost variance = (1) – (4) = ` 810(A)
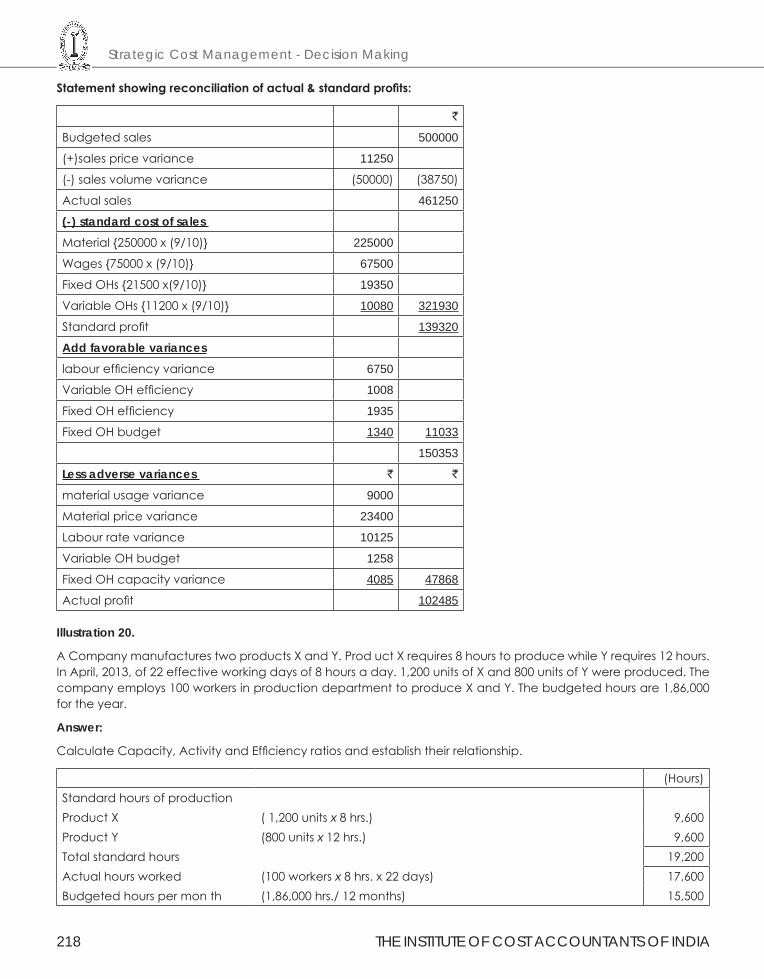
Strategic Cost Management - Decision Making
218 THE INSTITUTE OF COST ACCOUNTANTS OF INDIA
Statementshowingreconciliationofactual&standardprofits:
`
Budgeted sales 500000
(+)sales price variance 11250
(-) sales volume variance (50000) (38750)
Actual sales 461250
(-) standard cost of sales Material {250000 x (9/10)} 225000
Wages {75000 x (9/10)} 67500
Fixed OHs {21500 x(9/10)} 19350
Variable OHs {11200 x (9/10)} 10080 321930
Standard profit 139320
Add favorable varianceslabour efficiency variance 6750
Variable OH efficiency 1008
Fixed OH efficiency 1935
Fixed OH budget 1340 11033
150353
Less adverse variances ` `
material usage variance 9000
Material price variance 23400
Labour rate variance 10125
Variable OH budget 1258
Fixed OH capacity variance 4085 47868
Actual profit 102485
Illustration 20.
A Company manufactures two products X and Y. Prod uct X requires 8 hours to produce while Y requires 12 hours. In April, 2013, of 22 effective working days of 8 hours a day. 1,200 units of X and 800 units of Y were produced. The company employs 100 workers in production department to produce X and Y. The budgeted hours are 1,86,000 for the year.
Answer:
Calculate Capacity, Activity and Efficiency ratios and establish their relationship.
(Hours)Standard hours of productionProduct X ( 1,200 units x 8 hrs.) 9,600Product Y (800 units x 12 hrs.) 9,600Total standard hours 19,200Actual hours worked (100 workers x 8 hrs. x 22 days) 17,600Budgeted hours per mon th (1,86,000 hrs./ 12 months) 15,500
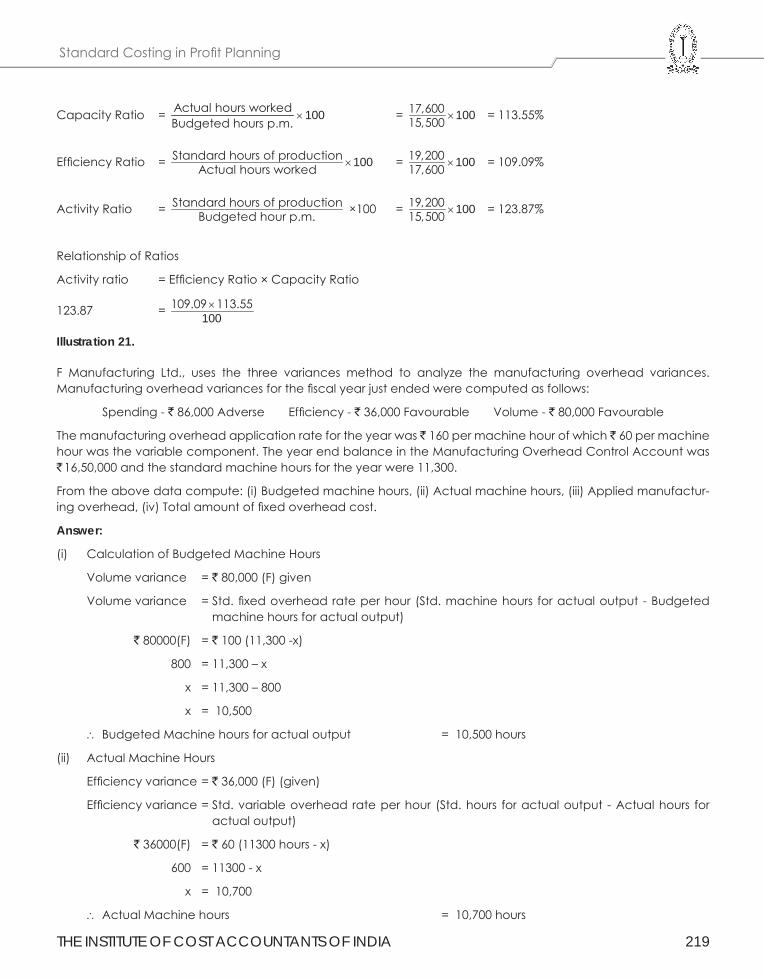
THE INSTITUTE OF COST ACCOUNTANTS OF INDIA 219
Standard Costing in Profit Planning
Capacity Ratio = Actual hours worked 100Budgeted hours p.m.
× = 17,600 10015,500 × = 113.55%
Efficiency Ratio = Standard hours of production 100Actual hours worked × = 19,200 10017,600 × = 109.09%
Activity Ratio = Standard hours of productionBudgeted hour p.m.
×100 = 19,200 10015,500 × = 123.87%
Relationship of Ratios
Activity ratio = Efficiency Ratio × Capacity Ratio
123.87 = 109.09 113.55100×
Illustration 21.
F Manufacturing Ltd., uses the three variances method to analyze the manufacturing overhead variances. Manufacturing overhead variances for the fiscal year just ended were computed as follows:
Spending - ` 86,000 Adverse Efficiency - ` 36,000 Favourable Volume - ` 80,000 Favourable
The manufacturing overhead application rate for the year was ` 160 per machine hour of which ` 60 per machine hour was the variable component. The year end balance in the Manufacturing Overhead Control Account was ` 16,50,000 and the standard machine hours for the year were 11,300.
From the above data compute: (i) Budgeted machine hours, (ii) Actual machine hours, (iii) Applied manufactur-ing overhead, (iv) Total amount of fixed overhead cost.
Answer:
(i) Calculation of Budgeted Machine Hours
Volume variance = ` 80,000 (F) given
Volume variance = Std. fixed overhead rate per hour (Std. machine hours for actual output - Budgeted machine hours for actual output)
` 80000(F) = ` 100 (11,300 -x)
800 = 11,300 – x
x = 11,300 – 800
x = 10,500
∴ Budgeted Machine hours for actual output = 10,500 hours
(ii) Actual Machine Hours
Efficiency variance = ` 36,000 (F) (given)
Efficiency variance = Std. variable overhead rate per hour (Std. hours for actual output - Actual hours for actual output)
` 36000(F) = ` 60 (11300 hours - x)
600 = 11300 - x
x = 10,700
∴ Actual Machine hours = 10,700 hours
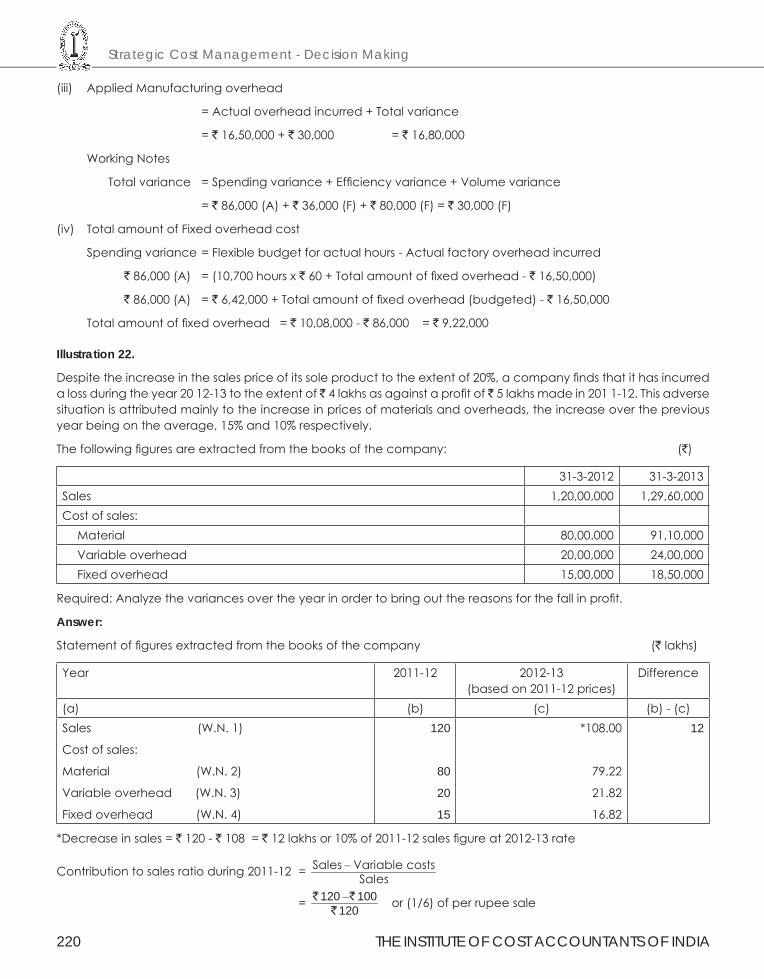
Strategic Cost Management - Decision Making
220 THE INSTITUTE OF COST ACCOUNTANTS OF INDIA
(iii) Applied Manufacturing overhead
= Actual overhead incurred + Total variance
= ` 16,50,000 + ` 30,000 = ` 16,80,000
Working Notes
Total variance = Spending variance + Efficiency variance + Volume variance
= ` 86,000 (A) + ` 36,000 (F) + ` 80,000 (F) = ` 30,000 (F)
(iv) Total amount of Fixed overhead cost
Spending variance = Flexible budget for actual hours - Actual factory overhead incurred
` 86,000 (A) = (10,700 hours x ` 60 + Total amount of fixed overhead - ` 16,50,000)
` 86,000 (A) = ` 6,42,000 + Total amount of fixed overhead (budgeted) - ` 16,50,000
Total amount of fixed overhead = ` 10,08,000 - ` 86,000 = ` 9,22,000
Illustration 22.
Despite the increase in the sales price of its sole product to the extent of 20%, a company finds that it has incurred a loss during the year 20 12-13 to the extent of ̀ 4 lakhs as against a profit of ̀ 5 lakhs made in 201 1-12. This adverse situation is attributed mainly to the increase in prices of materials and overheads, the increase over the previous year being on the average, 15% and 10% respectively.
The following figures are extracted from the books of the company: (`)
31-3-2012 31-3-2013Sales 1,20,00,000 1,29,60,000Cost of sales:
Material 80,00.000 91,10,000Variable overhead 20,00,000 24,00,000Fixed overhead 15,00,000 18,50,000
Required: Analyze the variances over the year in order to bring out the reasons for the fall in profit.
Answer:
Statement of figures extracted from the books of the company (` lakhs)
Year 2011-12 2012-13(based on 2011-12 prices)
Difference
(a) (b) (c) (b) - (c)Sales (W.N. 1)
Cost of sales:
Material (W.N. 2)
Variable overhead (W.N. 3)
Fixed overhead (W.N. 4)
120
80
20
15
*108.00
79.22
21.82
16.82
12
*Decrease in sales = ` 120 - ` 108 = ` 12 lakhs or 10% of 2011-12 sales figure at 2012-13 rate
Contribution to sales ratio during 2011-12 = Sales Variable costsSales
−
= 120 100120−` `
` or (1/6) of per rupee sale
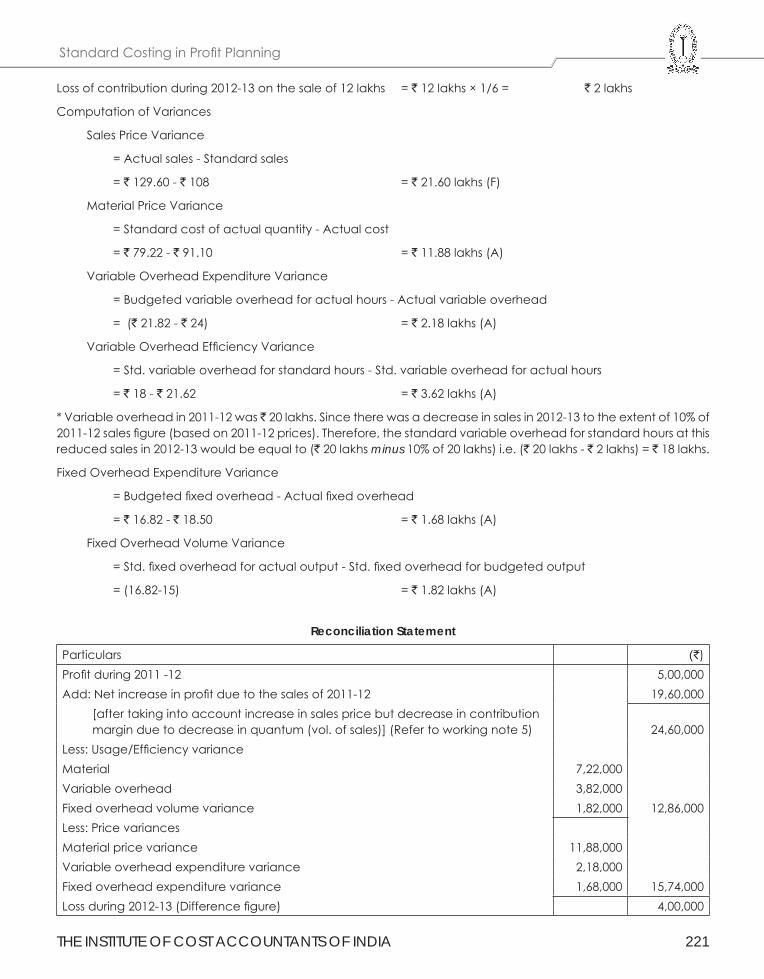
THE INSTITUTE OF COST ACCOUNTANTS OF INDIA 221
Standard Costing in Profit Planning
Loss of contribution during 2012-13 on the sale of 12 lakhs = ` 12 lakhs × 1/6 = ` 2 lakhs
Computation of Variances
Sales Price Variance
= Actual sales - Standard sales
= ` 129.60 - ` 108 = ` 21.60 lakhs (F)
Material Price Variance
= Standard cost of actual quantity - Actual cost
= ` 79.22 - ` 91.10 = ` 11.88 lakhs (A)
Variable Overhead Expenditure Variance
= Budgeted variable overhead for actual hours - Actual variable overhead
= (` 21.82 - ` 24) = ` 2.18 lakhs (A)
Variable Overhead Efficiency Variance
= Std. variable overhead for standard hours - Std. variable overhead for actual hours
= ` 18 - ` 21.62 = ` 3.62 lakhs (A)
* Variable overhead in 2011-12 was ̀ 20 lakhs. Since there was a decrease in sales in 2012-13 to the extent of 10% of 2011-12 sales figure (based on 2011-12 prices). Therefore, the standard variable overhead for standard hours at this reduced sales in 2012-13 would be equal to (` 20 lakhs minus 10% of 20 lakhs) i.e. (` 20 lakhs - ` 2 lakhs) = ` 18 lakhs.
Fixed Overhead Expenditure Variance
= Budgeted fixed overhead - Actual fixed overhead
= ` 16.82 - ` 18.50 = ` 1.68 lakhs (A)
Fixed Overhead Volume Variance
= Std. fixed overhead for actual output - Std. fixed overhead for budgeted output
= (16.82-15) = ` 1.82 lakhs (A)
Reconciliation Statement
Particulars (`)Profit during 2011 -12 5,00,000Add: Net increase in profit due to the sales of 2011-12 19,60,000
[after taking into account increase in sales price but decrease in contribution margin due to decrease in quantum (vol. of sales)] (Refer to working note 5) 24,60,000
Less: Usage/Efficiency varianceMaterial 7,22,000Variable overhead 3,82,000Fixed overhead volume variance 1,82,000 12,86,000Less: Price variancesMaterial price variance 11,88,000Variable overhead expenditure variance 2,18,000Fixed overhead expenditure variance 1,68,000 15,74,000Loss during 2012-13 (Difference figure) 4,00,000
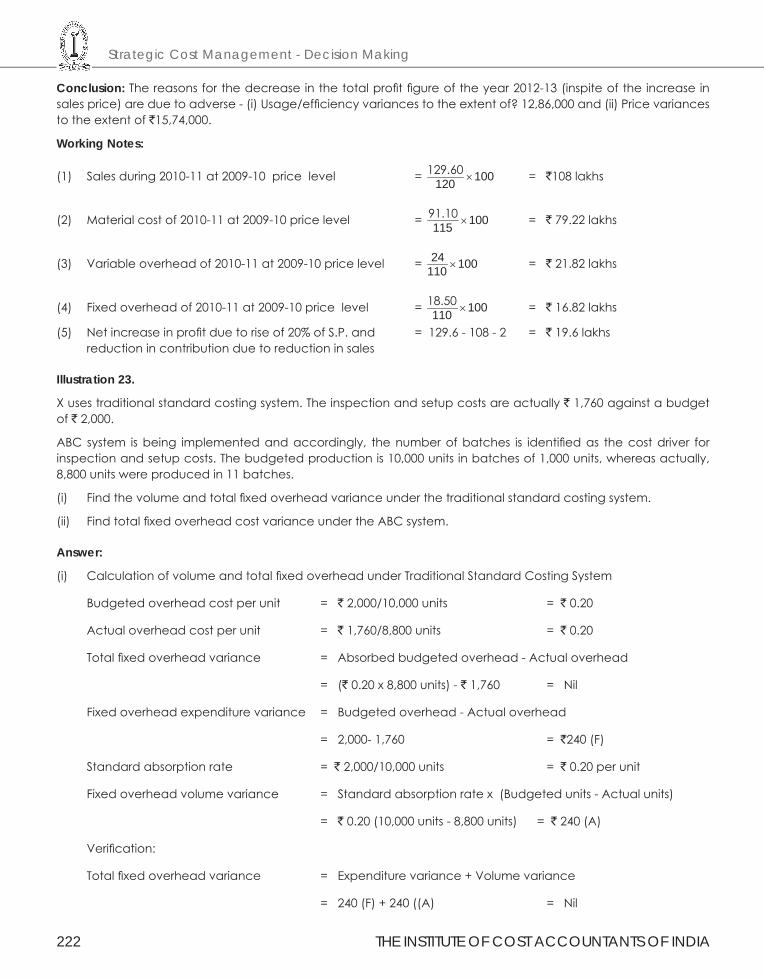
Strategic Cost Management - Decision Making
222 THE INSTITUTE OF COST ACCOUNTANTS OF INDIA
Conclusion: The reasons for the decrease in the total profit figure of the year 2012-13 (inspite of the increase in sales price) are due to adverse - (i) Usage/efficiency variances to the extent of? 12,86,000 and (ii) Price variances to the extent of `15,74,000.
Working Notes:
(1) Sales during 2010-11 at 2009-10 price level = 129.60 100120 × = `108 lakhs
(2) Material cost of 2010-11 at 2009-10 price level = 91.10 100115 × = ` 79.22 lakhs
(3) Variable overhead of 2010-11 at 2009-10 price level = 24 100110 × = ` 21.82 lakhs
(4) Fixed overhead of 2010-11 at 2009-10 price level = 18.50 100110 × = ` 16.82 lakhs
(5) Net increase in profit due to rise of 20% of S.P. and = 129.6 - 108 - 2 = ` 19.6 lakhs reduction in contribution due to reduction in sales
Illustration 23.
X uses traditional standard costing system. The inspection and setup costs are actually ` 1,760 against a budget of ` 2,000.
ABC system is being implemented and accordingly, the number of batches is identified as the cost driver for inspection and setup costs. The budgeted production is 10,000 units in batches of 1,000 units, whereas actually, 8,800 units were produced in 11 batches.
(i) Find the volume and total fixed overhead variance under the traditional standard costing system.
(ii) Find total fixed overhead cost variance under the ABC system.
Answer:
(i) Calculation of volume and total fixed overhead under Traditional Standard Costing System
Budgeted overhead cost per unit = ` 2,000/10,000 units = ` 0.20
Actual overhead cost per unit = ` 1,760/8,800 units = ` 0.20
Total fixed overhead variance = Absorbed budgeted overhead - Actual overhead
= (` 0.20 x 8,800 units) - ` 1,760 = Nil
Fixed overhead expenditure variance = Budgeted overhead - Actual overhead
= 2,000- 1,760 = `240 (F)
Standard absorption rate = ` 2,000/10,000 units = ` 0.20 per unit
Fixed overhead volume variance = Standard absorption rate x (Budgeted units - Actual units)
= ` 0.20 (10,000 units - 8,800 units) = ` 240 (A)
Verification:
Total fixed overhead variance = Expenditure variance + Volume variance
= 240 (F) + 240 ((A) = Nil
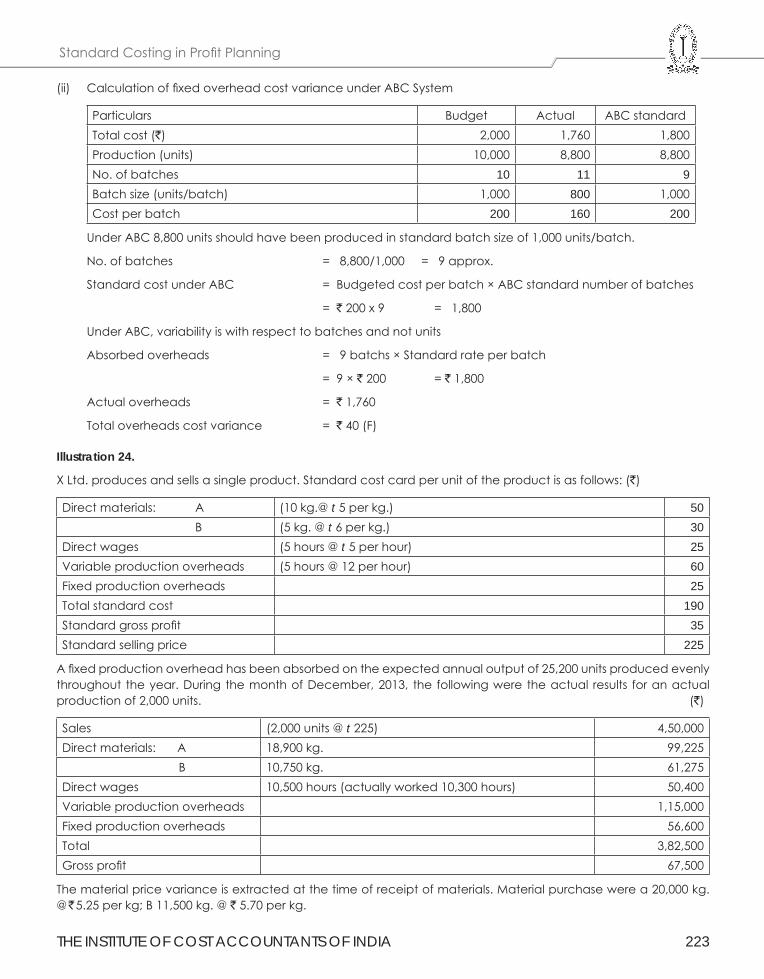
THE INSTITUTE OF COST ACCOUNTANTS OF INDIA 223
Standard Costing in Profit Planning
(ii) Calculation of fixed overhead cost variance under ABC System
Particulars Budget Actual ABC standardTotal cost (`) 2,000 1,760 1,800Production (units) 10,000 8,800 8,800No. of batches 10 11 9Batch size (units/batch) 1,000 800 1,000Cost per batch 200 160 200
Under ABC 8,800 units should have been produced in standard batch size of 1,000 units/batch.
No. of batches = 8,800/1,000 = 9 approx.
Standard cost under ABC = Budgeted cost per batch × ABC standard number of batches
= ` 200 x 9 = 1,800
Under ABC, variability is with respect to batches and not units
Absorbed overheads = 9 batchs × Standard rate per batch
= 9 × ` 200 = ` 1,800
Actual overheads = ` 1,760
Total overheads cost variance = ` 40 (F)
Illustration 24.
X Ltd. produces and sells a single product. Standard cost card per unit of the product is as follows: (`)
Direct materials: A (10 kg.@ t 5 per kg.) 50 B (5 kg. @ t 6 per kg.) 30Direct wages (5 hours @ t 5 per hour) 25Variable production overheads (5 hours @ 12 per hour) 60Fixed production overheads 25Total standard cost 190Standard gross profit 35Standard selling price 225
A fixed production overhead has been absorbed on the expected annual output of 25,200 units produced evenly throughout the year. During the month of December, 2013, the following were the actual results for an actual production of 2,000 units. (`)
Sales (2,000 units @ t 225) 4,50,000Direct materials: A 18,900 kg. 99,225
B 10,750 kg. 61,275Direct wages 10,500 hours (actually worked 10,300 hours) 50,400Variable production overheads 1,15,000Fixed production overheads 56,600Total 3,82,500Gross profit 67,500
The material price variance is extracted at the time of receipt of materials. Material purchase were a 20,000 kg. @ ̀ 5.25 per kg; B 11,500 kg. @ ` 5.70 per kg.
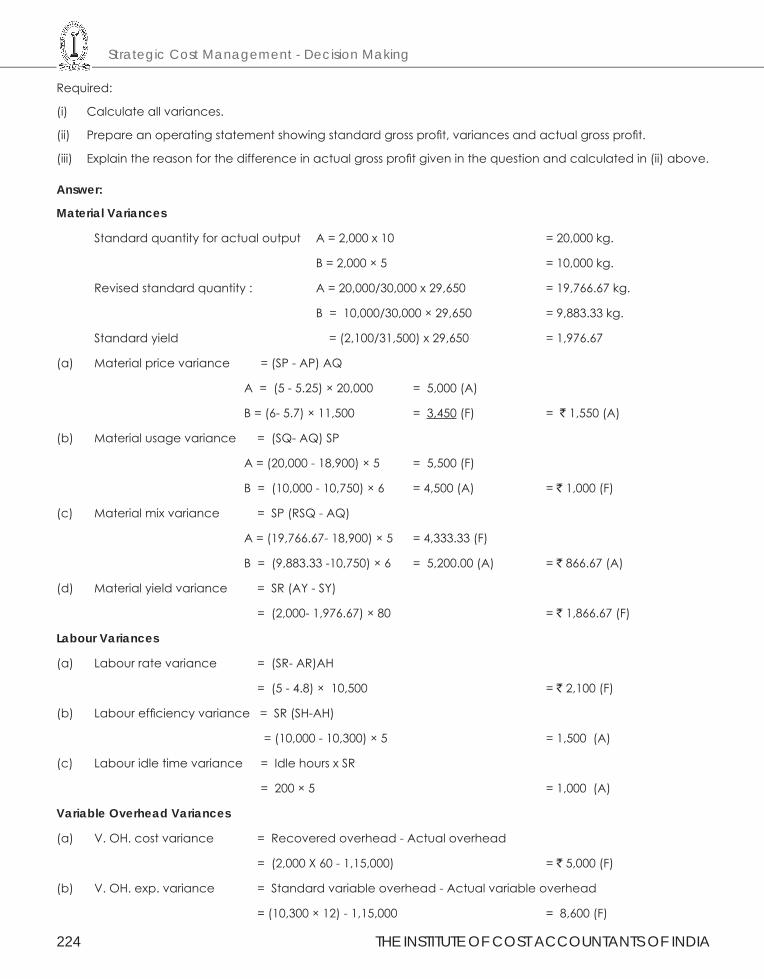
Strategic Cost Management - Decision Making
224 THE INSTITUTE OF COST ACCOUNTANTS OF INDIA
Required:
(i) Calculate all variances.
(ii) Prepare an operating statement showing standard gross profit, variances and actual gross profit.
(iii) Explain the reason for the difference in actual gross profit given in the question and calculated in (ii) above.
Answer:
Material Variances
Standard quantity for actual output A = 2,000 x 10 = 20,000 kg.
B = 2,000 × 5 = 10,000 kg.
Revised standard quantity : A = 20,000/30,000 x 29,650 = 19,766.67 kg.
B = 10,000/30,000 × 29,650 = 9,883.33 kg.
Standard yield = (2,100/31,500) x 29,650 = 1,976.67
(a) Material price variance = (SP - AP) AQ
A = (5 - 5.25) × 20,000 = 5,000 (A)
B = (6- 5.7) × 11,500 = 3,450 (F) = ` 1,550 (A)
(b) Material usage variance = (SQ- AQ) SP
A = (20,000 - 18,900) × 5 = 5,500 (F)
B = (10,000 - 10,750) × 6 = 4,500 (A) = ` 1,000 (F)
(c) Material mix variance = SP (RSQ - AQ)
A = (19,766.67- 18,900) × 5 = 4,333.33 (F)
B = (9,883.33 -10,750) × 6 = 5,200.00 (A) = ` 866.67 (A)
(d) Material yield variance = SR (AY - SY)
= (2,000- 1,976.67) × 80 = ` 1,866.67 (F)
Labour Variances
(a) Labour rate variance = (SR- AR)AH
= (5 - 4.8) × 10,500 = ` 2,100 (F)
(b) Labour efficiency variance = SR (SH-AH)
= (10,000 - 10,300) × 5 = 1,500 (A)
(c) Labour idle time variance = Idle hours x SR
= 200 × 5 = 1,000 (A)
Variable Overhead Variances
(a) V. OH. cost variance = Recovered overhead - Actual overhead
= (2,000 X 60 - 1,15,000) = ` 5,000 (F)
(b) V. OH. exp. variance = Standard variable overhead - Actual variable overhead
= (10,300 × 12) - 1,15,000 = 8,600 (F)
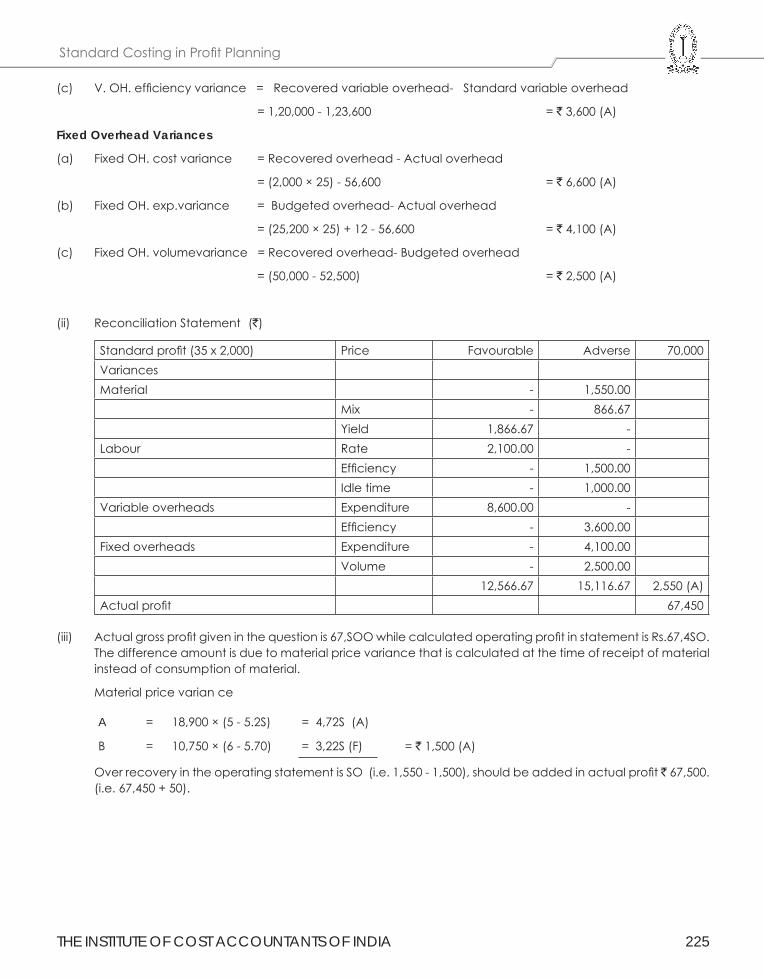
THE INSTITUTE OF COST ACCOUNTANTS OF INDIA 225
Standard Costing in Profit Planning
(c) V. OH. efficiency variance = Recovered variable overhead- Standard variable overhead
= 1,20,000 - 1,23,600 = ` 3,600 (A)
Fixed Overhead Variances
(a) Fixed OH. cost variance = Recovered overhead - Actual overhead
= (2,000 × 25) - 56,600 = ` 6,600 (A)
(b) Fixed OH. exp.variance = Budgeted overhead- Actual overhead
= (25,200 × 25) + 12 - 56,600 = ` 4,100 (A)
(c) Fixed OH. volumevariance = Recovered overhead- Budgeted overhead
= (50,000 - 52,500) = ` 2,500 (A)
(ii) Reconciliation Statement (`)
Standard profit (35 x 2,000) Price Favourable Adverse 70,000VariancesMaterial - 1,550.00
Mix - 866.67Yield 1,866.67 -
Labour Rate 2,100.00 -Efficiency - 1,500.00Idle time - 1,000.00
Variable overheads Expenditure 8,600.00 -Efficiency - 3,600.00
Fixed overheads Expenditure - 4,100.00Volume - 2,500.00
12,566.67 15,116.67 2,550 (A)Actual profit 67,450
(iii) Actual gross profit given in the question is 67,SOO while calculated operating profit in statement is Rs.67,4SO. The difference amount is due to material price variance that is calculated at the time of receipt of material instead of consumption of material.
Material price varian ce
A = 18,900 × (5 - 5.2S) = 4,72S (A)
B = 10,750 × (6 - 5.70) = 3,22S (F) = ` 1,500 (A)
Over recovery in the operating statement is SO (i.e. 1,550 - 1,500), should be added in actual profit ` 67,500. (i.e. 67,450 + 50).
Strategic Cost Management - Decision Making
226 THE INSTITUTE OF COST ACCOUNTANTS OF INDIA
3.2 UNIFORM COSTING IN PROFIT PLANNING
Introduction:
Uniform Costing is not a separate method or type of Costing. It is a technique of Costing and can be applied to any industry. Uniform Costing may be defined as the application and use of the same costing principles and procedures by different organisations under the same management or on a common understanding between members of an association. The main feature of uniform costing is that whatever be the method of costing used, it is applied uniformly in a number of concerns in the same industry, or even in different but similar industries. This enables cost and accounting data of the member undertakings to be compiled on a comparable basis so that useful and crucial decisions can be taken. The principles and methods adopted for the accumulation, analysis, apportionment and allocation of costs vary so widely from concern to concern that comparison of costs is rendered difficult and unrealistic. Uniform Costing attempts to establish uniform methods so that comparison of performances in the various undertakings can be made to the common advantage of all the constituent units.
Scope of Uniform Costing:
Uniform Costing methods may be advantageously applied:
(a) In a single enterprise having a number of branches or units, each of which may be a separate manufacturing unit.
(b) In a number of concerns in the same industry bound together through a trade association or otherwise, and
(c) In industries which are similar in nature such as gas and electricity, various types of transport, and cotton, jute and woolen textiles.
The need for application of Uniform Costing System exists in a business, irrespective of the circumstances and conditions prevailing therein. In concerns which are members of a trade association, the procedure for Uniform Costing may be devised and controlled by the association or by any other central body specially formed for the purpose.
Requisites for Installation of a Uniform Costing System:
The organisational set up for implementing the principles and methods of Uniform Costing may take different forms. It may range from a small association of a number of concerns who agree to have uniform information regarding a few specific cost accounting respects, to be a large organisation which has a fully developed scheme covering all the aspects of costing. The success of a uniform costing system will depend upon the following:
(a) There should be a spirit of mutual trust, co-operation and a policy of give and take amongst the participating members.
(b) There should be a free exchange of ideas and methods.
(c) The bigger units should be prepared to share with the smaller ones, improvements, achievements of efficiency, benefits of research and know-how.
(d) There should not be any hiding or withholding of information.
(e) There should be no rivalry or sense of jealousy amongst the members.
In the application of Uniform Costing, the fundamental requirement is, therefore, to locate such differences and to eliminate or overcome, as far as practicable, the causes giving rise to such differences. The basic reasons for the differences may be as follows:
(a) Size and organisational set up of the business:
The number and size of the departments, sections and services also vary from one concern to another according to their size and organisation. The difficulty in operating Uniform Cost Systems for concerns which
THE INSTITUTE OF COST ACCOUNTANTS OF INDIA 227
Standard Costing in Profit Planning
vary widely in regard to size and type of business may to some extent be overcome by arranging the various units in a number of size or type ranges, and applying different uniform systems for each such type.
(b) Methods of production:
The use of different types of machines, plant and equipments, degree of mechanization, difference in materials mix and sequence and nature of operations and processes are mainly responsible for the difference in costs.
(c) Methods and principles of cost accounting applied:
It is in this sphere that the largest degree of difference arises. Undertakings manufacturing identical or similar products and having the same system of cost accounting would generally employ different methods of treatment of expenditure on buying, storage and issue of materials, pricing of stores issues, payment to workers, basis of classification and absorption of overhead, calculation of depreciation, charging rent on freehold or leasehold assets etc.
Fields covered by Uniform Costing:
There is no system of Uniform Costing which may be found to fit in all circumstances. The system to be installed should be tailored to meet the needs of each individual case. The essential points on which uniformity is normally required may be summarized as follows:
(a) Whether costs are required for the individual products i.e for the cost units or for cost centres.
(b) The method of costing to be applied.
(c) The technique employed such as Standard Costing, Marginal Costing.
(d) Items to be excluded from costs.
(e) The basis of departmentalization.
(f) The basis of allocation of costs to departments and/or service department costs to production departments.
(g) The methods of application administration, selling and distribution overhead to cost of sales.
(h) The method of valuation of work-in-progress.
(i) Methods of treating cost of spoilage, defective work, scrap and wastage.
(j) Methods of accounting of overtime pay bonus and other miscellaneous allowances paid to workers.
(k) Whether purchase, material handling and upkeep expenses are added to the cost of stores or are treated as overhead expenses.
(l) The system of materials control-pricing of issues and valuation of stock.
(m) The system of classification and coding of accounts.
(n) The method of recording accounting information.
Advantages of Uniform Costing:
Main advantages of a Uniform Costing System are summarised below:
(i) It provides comparative information to the members of the organisation / association which may by them to reduce or eliminate the evil effects of competition and unnecessary expenses arising from competition.
(ii) It enables the industry to submit the statutory bodies reliable and accurate data which might be required to regulate pricing policy or for other purposes.
Strategic Cost Management - Decision Making
228 THE INSTITUTE OF COST ACCOUNTANTS OF INDIA
(iii) It enables the member concerns to compare their own cost data with that of the others detect the weakness and to take corrective steps for improvement in efficiency.
(iv) The benefits of research and development can be passed on the smaller members of the association lead to economy of the industry as a whole.
(v) It provides all valuable features of sound cost accounting such as valued and efficiency of the workers, machines, methods, etc., current reports of comparing major cost items with the predetermined standards, etc.
(vi) It serves as a prerequisite to Cost Audit and inter firm comparison.
(vii) Uniform Costing is a useful tool for management control. Performance of individual units can be measured against norms set for the industry as a whole.
(viii) It avoids cut-throat completion by ensuring that competition among member units proceeds on healthy lines.
(ix) The process of pricing policy becomes easier when Uniform Costing is adopted.
(x) By showing the one best way of doing things, Uniform Costing creates cost consciousness and provides the best system of cost control and cost presentation in the entire industry.
(xi) Uniform costing simplifies the work of wage boards set up to fix minimum wages and fair wages for an industry.
Limitations of Uniform Costing:
(i) Uniform costing presumes the application of same principles and methods of Costing in each of the member firms. But individual units generally differ in respect of certain key factors and methods.
(ii) For smaller units the cost of installation and operation of Uniform Costing System may be more than the benefits derived by them.
(iii) Uniform costing may create conditions that are likely to develop monopolistic tendencies within the industry. Prices may be raised artificially and supplies curtailed.
(iv) If complete agreement between the members is not forthcoming, the statistics presented cannot be relied upon. This weakens the Uniform Costing System and reduces its usefulness.
3.3 INTER FIRM COMPARISON
Inter-firm comparison as the name denotes means the techniques of evaluating the performances, efficiencies, deficiencies, costs and profits of similar nature of firms engaged in the same industry or business. It consists of exchange of information, voluntarily of course, concerning production, sales cost with various types of break-up, prices, profits, etc., among the firms who are interested of willing to make the device a success. The basic purposes of such comparison are to find out the work points in an organisation and to improve the efficiency by taking appropriate measures to wipe out the weakness gradually over a period of time.
The benefits which are derived from Inter-firm Comparison are appended below :
(a) Inter-firm Comparison makes the management of the organisation aware of strengths and weakness in relation to other organisations in same industry.
(b) As only the significant items are reported to the Management time and efforts are not unnecessary wasted.
(c) The management is able to keep up to data information of the trends and ratios and it becomes easier for them to take the necessary steps for improvement.
(d) It develops cost consciousness among the members of the industry.
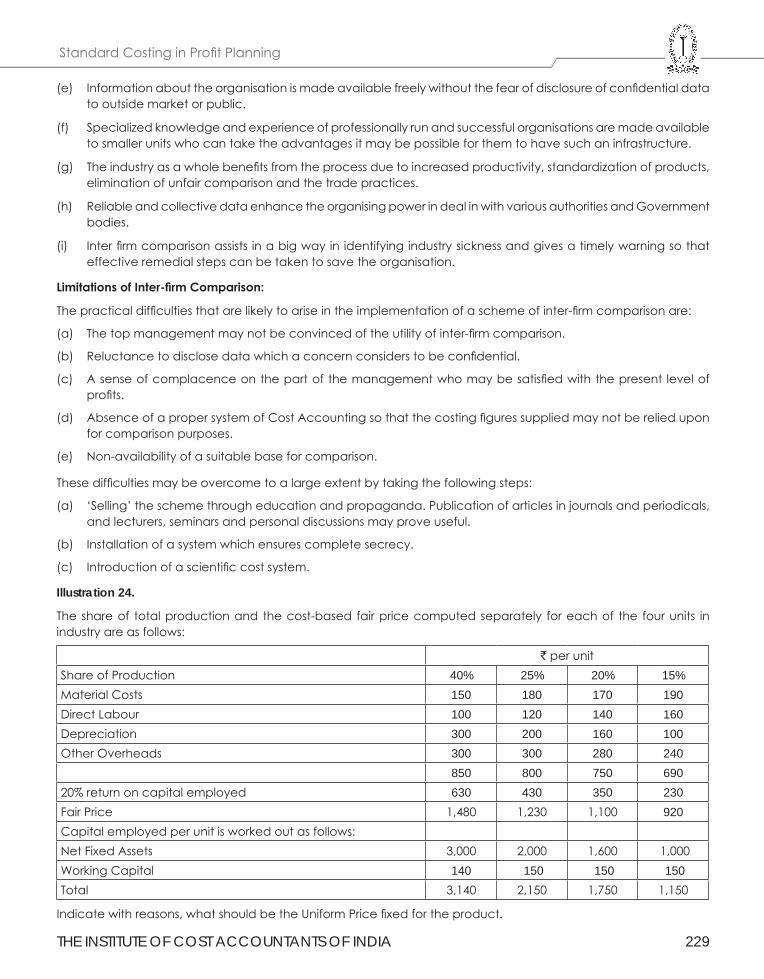
THE INSTITUTE OF COST ACCOUNTANTS OF INDIA 229
Standard Costing in Profit Planning
(e) Information about the organisation is made available freely without the fear of disclosure of confidential data to outside market or public.
(f) Specialized knowledge and experience of professionally run and successful organisations are made available to smaller units who can take the advantages it may be possible for them to have such an infrastructure.
(g) The industry as a whole benefits from the process due to increased productivity, standardization of products, elimination of unfair comparison and the trade practices.
(h) Reliable and collective data enhance the organising power in deal in with various authorities and Government bodies.
(i) Inter firm comparison assists in a big way in identifying industry sickness and gives a timely warning so that effective remedial steps can be taken to save the organisation.
LimitationsofInter-firmComparison:
The practical difficulties that are likely to arise in the implementation of a scheme of inter-firm comparison are:
(a) The top management may not be convinced of the utility of inter-firm comparison.
(b) Reluctance to disclose data which a concern considers to be confidential.
(c) A sense of complacence on the part of the management who may be satisfied with the present level of profits.
(d) Absence of a proper system of Cost Accounting so that the costing figures supplied may not be relied upon for comparison purposes.
(e) Non-availability of a suitable base for comparison.
These difficulties may be overcome to a large extent by taking the following steps:
(a) ‘Selling’ the scheme through education and propaganda. Publication of articles in journals and periodicals, and lecturers, seminars and personal discussions may prove useful.
(b) Installation of a system which ensures complete secrecy.
(c) Introduction of a scientific cost system.
Illustration 24.
The share of total production and the cost-based fair price computed separately for each of the four units in industry are as follows:
` per unitShare of Production 40% 25% 20% 15%Material Costs 150 180 170 190Direct Labour 100 120 140 160Depreciation 300 200 160 100Other Overheads 300 300 280 240
850 800 750 69020% return on capital employed 630 430 350 230Fair Price 1,480 1,230 1,100 920Capital employed per unit is worked out as follows:Net Fixed Assets 3,000 2,000 1,600 1,000Working Capital 140 150 150 150Total 3,140 2,150 1,750 1,150
Indicate with reasons, what should be the Uniform Price fixed for the product.
Strategic Cost Management - Decision Making
230 THE INSTITUTE OF COST ACCOUNTANTS OF INDIA
Solution:
Computation of Uniform Price :
Weighted Average Cost= [850 x 40%] + [800 x 25%] + [750 x 20%] + [690 x 15%]
= 340 + 200 + 150 + 103.5
= ` 793.5
Weighted Average Return on Capital Employed (profit)
= [630 x 40%] + [430 x 25%] + [350 x 20%] + [230 x 15%]
= 252 + 107.5 + 70 + 34.5
= `464
Uniform Price = 793.5 + 464 = ` 1,257.5
THE INSTITUTE OF COST ACCOUNTANTS OF INDIA 231
Activity Based Cost Management - JIT and ERP
This Study Note includes
4.1 Activity Based Cost Management
4.2 Just-In-Time (JIT)
4.3 Enterprise Resource Planning (ERP)
4.4 Bench Marking
Study Note - 4ACTIVITY BASED COST MANAGEMENT - JIT AND ERP
4.1 ACTIVITY BASED COST MANAGEMENT
Introduction
A powerful tool for measuring performance, Activity-Based Costing (ABC) is used to identify, describe, assign costs to, and report on agency operations. A more accurate cost management system than traditional cost accounting; ABC identifies opportunities to improve business process effectiveness and efficiency by determining the “true” cost of a product or service. Activity Based Costing is a method for developing cost estimates in which the project is subdivided into discrete, quantifiable activities or a work unit. ABC systems calculate the costs of individual activities and assign costs to cost objects such as products and services on the basis of the activities undertaken to produce each product or services. It accurately identifies sources of profit and loss.
Limitations of Traditional Costing System
The cost of product arrived in traditional accounting system is not so accurate due to following reasons :
(i) The present Costing system has developed convenient overhead recovery basis and blanket overhead recovery are acceptable when valuing stocks for financial reporting, but they are inappropriate when used for decision making and typical product strategy decisions. Such decisions have implications over 3-5 years and over this period many fixed costs become variable.
(ii) The traditional fixed verses variable cost split is often unrealistic since, as business grows they often become more complex.
(iii) In case of companies manufacturing and selling multiple products usually make decisions on pricing, product-mix, process technology etc., based on distorted cost information due to difficulties in traditional costing system in collection, classification, allocation and recovery of overheads to individual products.
(iv) The cost structure is changing especially when making direct labour component to small proportion.
(v) Traditional accounting was confined merely to furnishing information at product level. The new manufacturing technology demands the feed back of performance while production is still in progress rather than history.
(v) There is also an urgent need to integrate the activity measurement and financial measurement.
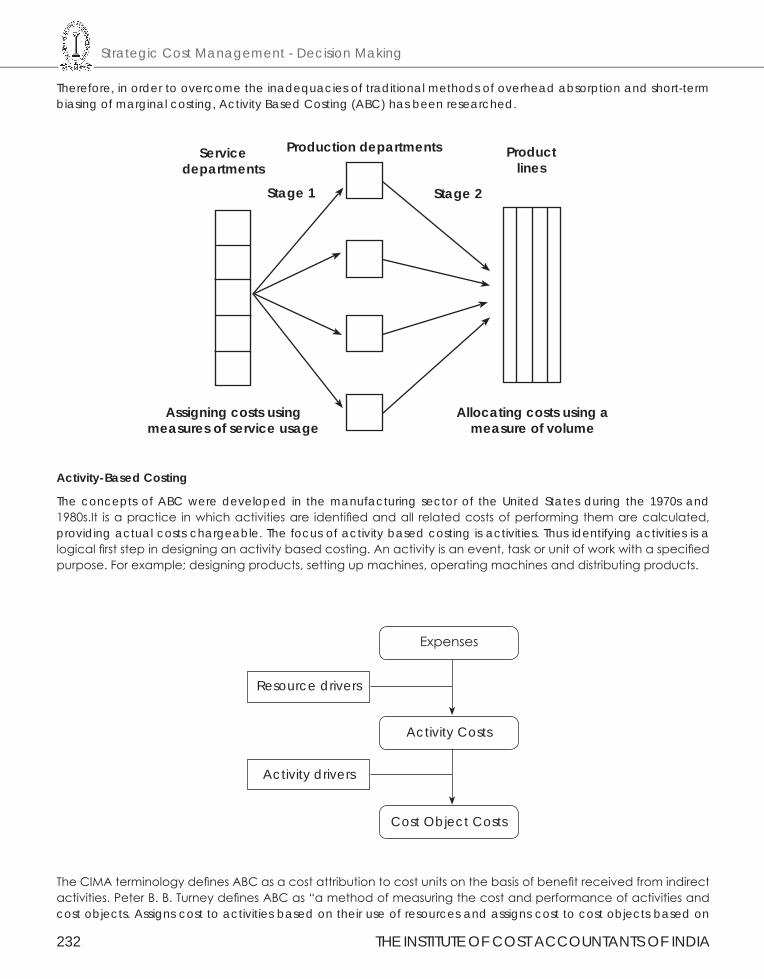
Strategic Cost Management - Decision Making
232 THE INSTITUTE OF COST ACCOUNTANTS OF INDIA
Therefore, in order to overcome the inadequacies of traditional methods of overhead absorption and short-term biasing of marginal costing, Activity Based Costing (ABC) has been researched.
Stage 1 Stage 2
Production departments Product lines
Servicedepartments
Assigning costs usingmeasures of service usage
Allocating costs using a measure of volume
Activity-Based Costing
The concepts of ABC were developed in the manufacturing sector of the United States during the 1970s and 1980s.It is a practice in which activities are identified and all related costs of performing them are calculated, providing actual costs chargeable. The focus of activity based costing is activities. Thus identifying activities is a logical first step in designing an activity based costing. An activity is an event, task or unit of work with a specified purpose. For example; designing products, setting up machines, operating machines and distributing products.
Expenses
Activity Costs
Cost Object Costs
Resource drivers
Activity drivers
The CIMA terminology defines ABC as a cost attribution to cost units on the basis of benefit received from indirect activities. Peter B. B. Turney defines ABC as “a method of measuring the cost and performance of activities and cost objects. Assigns cost to activities based on their use of resources and assigns cost to cost objects based on
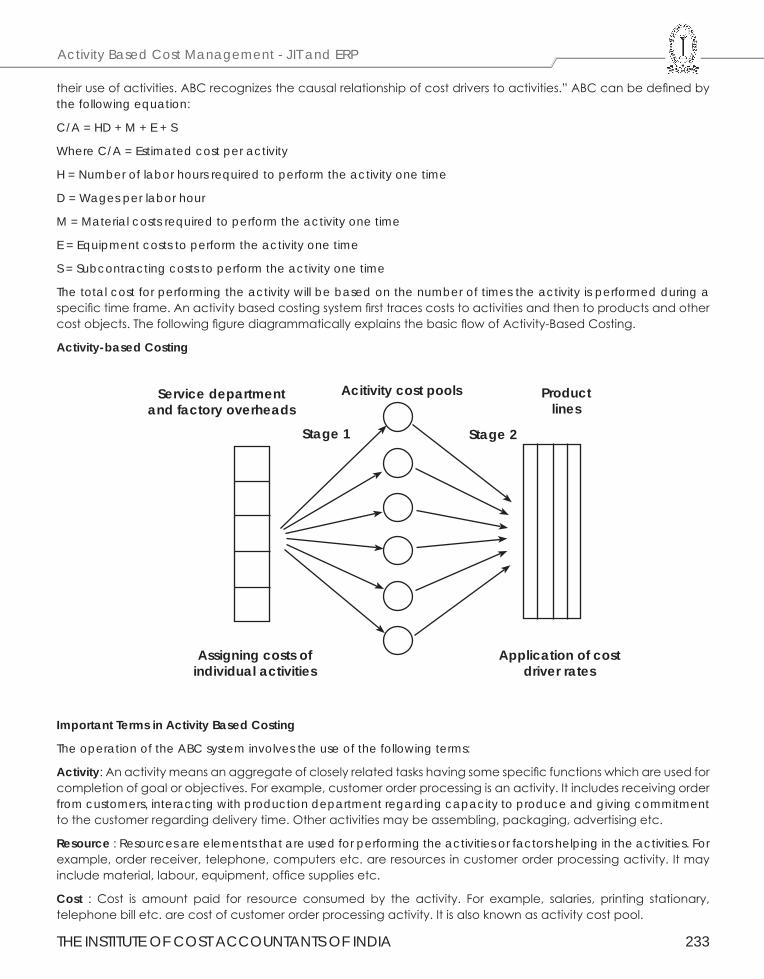
THE INSTITUTE OF COST ACCOUNTANTS OF INDIA 233
Activity Based Cost Management - JIT and ERP
their use of activities. ABC recognizes the causal relationship of cost drivers to activities.” ABC can be defined by the following equation:
C/A = HD + M + E + S
Where C/A = Estimated cost per activity
H = Number of labor hours required to perform the activity one time
D = Wages per labor hour
M = Material costs required to perform the activity one time
E = Equipment costs to perform the activity one time
S = Subcontracting costs to perform the activity one time
The total cost for performing the activity will be based on the number of times the activity is performed during a specific time frame. An activity based costing system first traces costs to activities and then to products and other cost objects. The following figure diagrammatically explains the basic flow of Activity-Based Costing.
Activity-based Costing
Stage 1 Stage 2
Acitivity cost pools Product lines
Service departmentand factory overheads
Assigning costs ofindividual activities
Application of costdriver rates
Important Terms in Activity Based Costing
The operation of the ABC system involves the use of the following terms:
Activity: An activity means an aggregate of closely related tasks having some specific functions which are used for completion of goal or objectives. For example, customer order processing is an activity. It includes receiving order from customers, interacting with production department regarding capacity to produce and giving commitment to the customer regarding delivery time. Other activities may be assembling, packaging, advertising etc.
Resource : Resources are elements that are used for performing the activities or factors helping in the activities. For example, order receiver, telephone, computers etc. are resources in customer order processing activity. It may include material, labour, equipment, office supplies etc.
Cost : Cost is amount paid for resource consumed by the activity. For example, salaries, printing stationary, telephone bill etc. are cost of customer order processing activity. It is also known as activity cost pool.
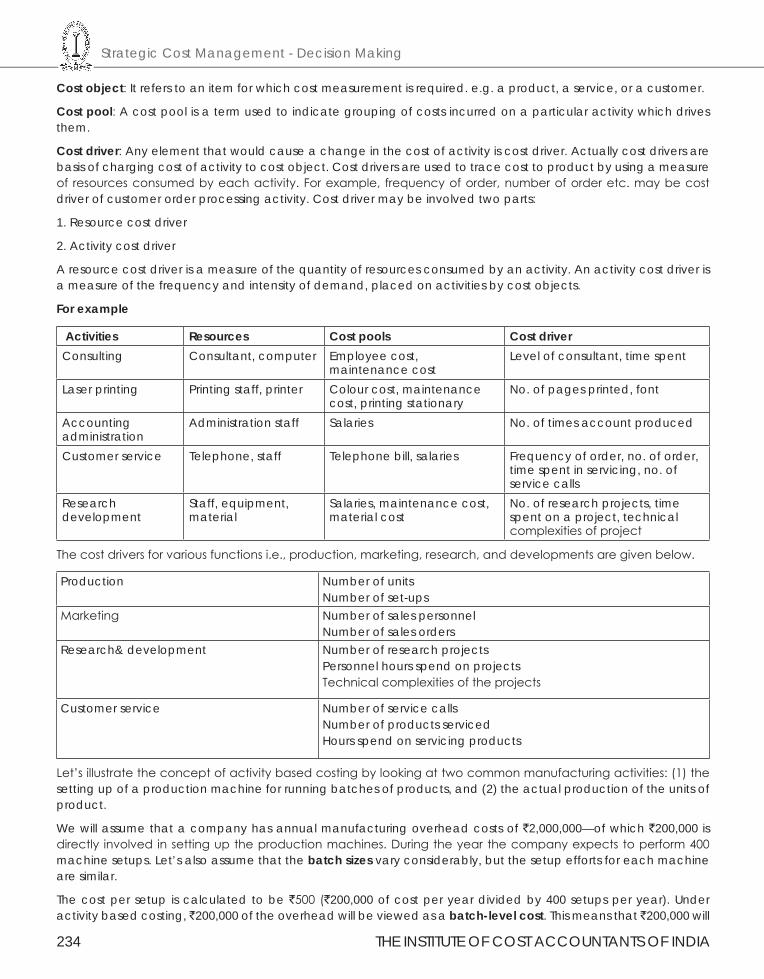
Strategic Cost Management - Decision Making
234 THE INSTITUTE OF COST ACCOUNTANTS OF INDIA
Cost object: It refers to an item for which cost measurement is required. e.g. a product, a service, or a customer.
Cost pool: A cost pool is a term used to indicate grouping of costs incurred on a particular activity which drives them.
Cost driver: Any element that would cause a change in the cost of activity is cost driver. Actually cost drivers are basis of charging cost of activity to cost object. Cost drivers are used to trace cost to product by using a measure of resources consumed by each activity. For example, frequency of order, number of order etc. may be cost driver of customer order processing activity. Cost driver may be involved two parts:
1. Resource cost driver
2. Activity cost driver
A resource cost driver is a measure of the quantity of resources consumed by an activity. An activity cost driver is a measure of the frequency and intensity of demand, placed on activities by cost objects.
For example
Activities Resources Cost pools Cost driverConsulting Consultant, computer Employee cost,
maintenance costLevel of consultant, time spent
Laser printing Printing staff, printer Colour cost, maintenance cost, printing stationary
No. of pages printed, font
Accounting administration
Administration staff Salaries No. of times account produced
Customer service Telephone, staff Telephone bill, salaries Frequency of order, no. of order, time spent in servicing, no. of service calls
Research development
Staff, equipment, material
Salaries, maintenance cost, material cost
No. of research projects, time spent on a project, technical complexities of project
The cost drivers for various functions i.e., production, marketing, research, and developments are given below.
Production Number of unitsNumber of set-ups
Marketing Number of sales personnelNumber of sales orders
Research& development Number of research projectsPersonnel hours spend on projectsTechnical complexities of the projects
Customer service Number of service callsNumber of products servicedHours spend on servicing products
Let’s illustrate the concept of activity based costing by looking at two common manufacturing activities: (1) the setting up of a production machine for running batches of products, and (2) the actual production of the units of product.
We will assume that a company has annual manufacturing overhead costs of `2,000,000—of which `200,000 is directly involved in setting up the production machines. During the year the company expects to perform 400 machine setups. Let’s also assume that the batch sizes vary considerably, but the setup efforts for each machine are similar.
The cost per setup is calculated to be `500 (`200,000 of cost per year divided by 400 setups per year). Under activity based costing, `200,000 of the overhead will be viewed as a batch-level cost. This means that `200,000 will
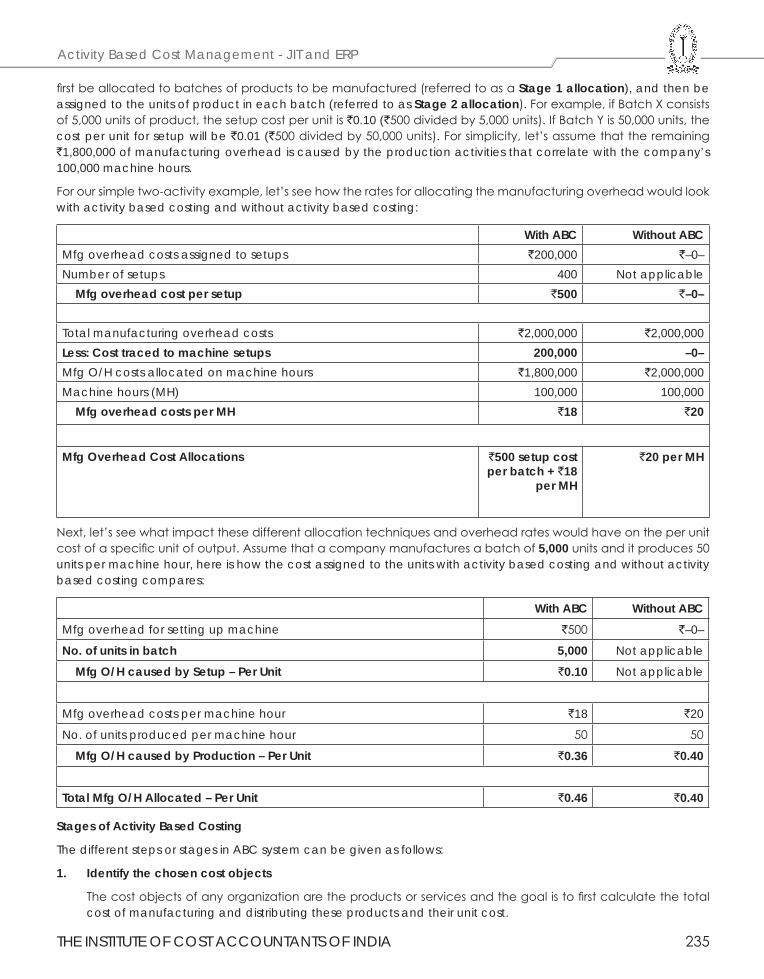
THE INSTITUTE OF COST ACCOUNTANTS OF INDIA 235
Activity Based Cost Management - JIT and ERP
first be allocated to batches of products to be manufactured (referred to as a Stage 1 allocation), and then be assigned to the units of product in each batch (referred to as Stage 2 allocation). For example, if Batch X consists of 5,000 units of product, the setup cost per unit is `0.10 (`500 divided by 5,000 units). If Batch Y is 50,000 units, the cost per unit for setup will be `0.01 (`500 divided by 50,000 units). For simplicity, let’s assume that the remaining `1,800,000 of manufacturing overhead is caused by the production activities that correlate with the company’s 100,000 machine hours.
For our simple two-activity example, let’s see how the rates for allocating the manufacturing overhead would look with activity based costing and without activity based costing:
With ABC Without ABCMfg overhead costs assigned to setups `200,000 `–0–Number of setups 400 Not applicable Mfg overhead cost per setup `500 `–0–
Total manufacturing overhead costs `2,000,000 `2,000,000Less: Cost traced to machine setups 200,000 –0–Mfg O/H costs allocated on machine hours `1,800,000 `2,000,000Machine hours (MH) 100,000 100,000 Mfg overhead costs per MH `18 `20
Mfg Overhead Cost Allocations `500 setup cost per batch + `18
per MH
`20 per MH
Next, let’s see what impact these different allocation techniques and overhead rates would have on the per unit cost of a specific unit of output. Assume that a company manufactures a batch of 5,000 units and it produces 50 units per machine hour, here is how the cost assigned to the units with activity based costing and without activity based costing compares:
With ABC Without ABCMfg overhead for setting up machine `500 `–0–
No. of units in batch 5,000 Not applicable
Mfg O/H caused by Setup – Per Unit `0.10 Not applicable
Mfg overhead costs per machine hour `18 `20
No. of units produced per machine hour 50 50
Mfg O/H caused by Production – Per Unit `0.36 `0.40
Total Mfg O/H Allocated – Per Unit `0.46 `0.40
Stages of Activity Based Costing
The different steps or stages in ABC system can be given as follows:
1. Identify the chosen cost objects
The cost objects of any organization are the products or services and the goal is to first calculate the total cost of manufacturing and distributing these products and their unit cost.
Strategic Cost Management - Decision Making
236 THE INSTITUTE OF COST ACCOUNTANTS OF INDIA
2. Identify the different activities within the organization
After the identification of cost objects, the main activities, which are being performed in the organization, have to be identified. Usually the number of activities over cost centers in ABC will be much more as compared to traditional overhead system. The exact number will depend on how the management subdivides the organizations activities.
3. Identifying the direct cost of products
The direct cost of products or objects may comprise direct material cost, direct labor cost and direct expenses. Classification of as many of the total costs as direct costs as is economically feasible should be made. It reduces the amount of costs classified as indirect.
4. Relating the overhead to the activities
After identifying the organizations activities, the various items of overhead are related to activities both support and primary, that caused them. As a result of relating the items of overhead to various activities, cost pool or cost buckets are created.
5. Spreading the support activities across the primary activities
The spreading of support activities (i.e., activities which support or assist manufacturing) across the primary activities (correlated to the number of units produced) is done on some suitable base which reflects the use of support activity. The base is the cost driver and is measured of how the support activities are used.
6. Determining the activity cost drivers
The determination of the activity cost drivers is done in order to relate the overhead collected in cost pools to the cost objects of products. It is done on the basis of the factor that drives the consumption of the activities.
7. Calculating the activity cost driver rates
The activity cost rates for each activity are calculated in the way in which overhead absorption rates would be calculated under the traditional system. It can be presented as follows:
Activity cost driver rate = Total cost of activity/Activity driver
These activity cost driver rates are to be used for ascertaining the amount of overhead chargeable to various cost objects or products.
8. Computing the total cost of products or cost objects
The total costs of the products shall be computed by adding all direct and indirect costs assigned to them. The amount of overhead chargeable to a product or cost object shall be calculated by multiplying the activity cost drivers rates by different amounts of each activity that each product or other cost object consumes.
Significance of Activity Based Costing
The following list reflects the results of several surveys of practice in the United States, the United Kingdom, and Canada to determine why companies choose ABC.
• Cost Reduction: ABC measures how much activities that are costly and then take steps to reduce their costs by changing the productions process or outsourcing those activities.
• Product pricing and decisions of whether to continue producing a product or keeping a particular customer. ABC implementers generally believe that ABC provides more accurate cost information than conventional costing does. Management can use this information to negotiate price increases with customers or to drop unprofitable products.
• Budgeting and performance measurement: Management can use more accurate cost information to improve budgets and measures of department and division performance.
THE INSTITUTE OF COST ACCOUNTANTS OF INDIA 237
Activity Based Cost Management - JIT and ERP
Advantages of Activity Based Costing
(i) It provides more accurate product costing information by reducing arbitrary cost allocations.
(ii) It improves the quality of information available for decision making by answering the questions such as what activities and events are driving cost and where efforts should be made to control cost ?
(iii) It is easiest way to allocate overhead in the product.
(iv) It helps to identify the activities that can be eliminated.
(v) It links up cause and effect relationship.
(vi) ABC helps to identify the value added activities (that increase the customer’s satisfaction) and non- value added activities (that creates the problems in customer’s satisfaction)
(vii) ABC translates cost in to a language that people can understand and that can be linked up to business activities.
Limitations of Activity Based Costing
(i) More time consuming to collect data
(ii) Cost of buying, implementing and maintaining activity based system
(iii) In some cases, the establishment of cause and effect relationship between cost driver and costs not be a simple affair.
(iv) ABC does not conform to generally accepted accounting principles in some areas.
Conclusion
Activity based costing has revolutionized product costing, planning, and forecasting in the last decade. It is based on a philosophy of estimation that: “it is better to be approximately right, than precisely wrong.” In summary, activity-based costing is a management decision-making tool. It provides financial support data structured in a fashion fundamentally different from accounting data provided in the general ledger. By associating cost to the activity, a clear relationship can be established between sources of activity demand and the related costs. This association can benefit the distributor in determining where costs are being incurred, what is initiating the costs and where to apply efforts to curb inflationary costs. This can be of particular value in tracking new products or customers.
Traditional vs. Activity Based Costing
Activity-Based Costing (ABC) is a system that focuses on activities as the fundamental cost objects and uses the cost of these activities for computing the costs of products. There are several reasons why managers are preferring ABC to traditional system.
(i) In the traditional system cost analysis is done by product. In ABC managers focus attention on activities rather than products because activities in various departments may be combined and costs of similar activities ascertained, e.g. quality control, handling of materials, repairs to machines etc. If detailed costs are kept by activities, the total company costs for each activity can be obtained, analysed, planned and controlled.
(ii) Managers manage activities and not products. Changes in activities lead to changes in costs. Therefore, if the activities are managed well, costs will fall and resulting products will be more competitive.
(iii) Allocating overhead cost to production based on a single cost driver (allocation base, such as unit basis, percentage of material, percentage of prime cost, labour hour rate, machine hour rate etc.) can result in an unrealistic product cost because the traditional system fails to capture cause-and-effect relationships. To manage activities better and to make wiser economic decisions, managers need to identify the relationships of causes (activities) and effects (costs) in a more detailed and accurate manner.
(iv) ABC highlights problem areas that deserve management’s attention and more detailed analysis. Many actions are possible, on pricing, on process technology, on product design, on operational movements and on product mix.
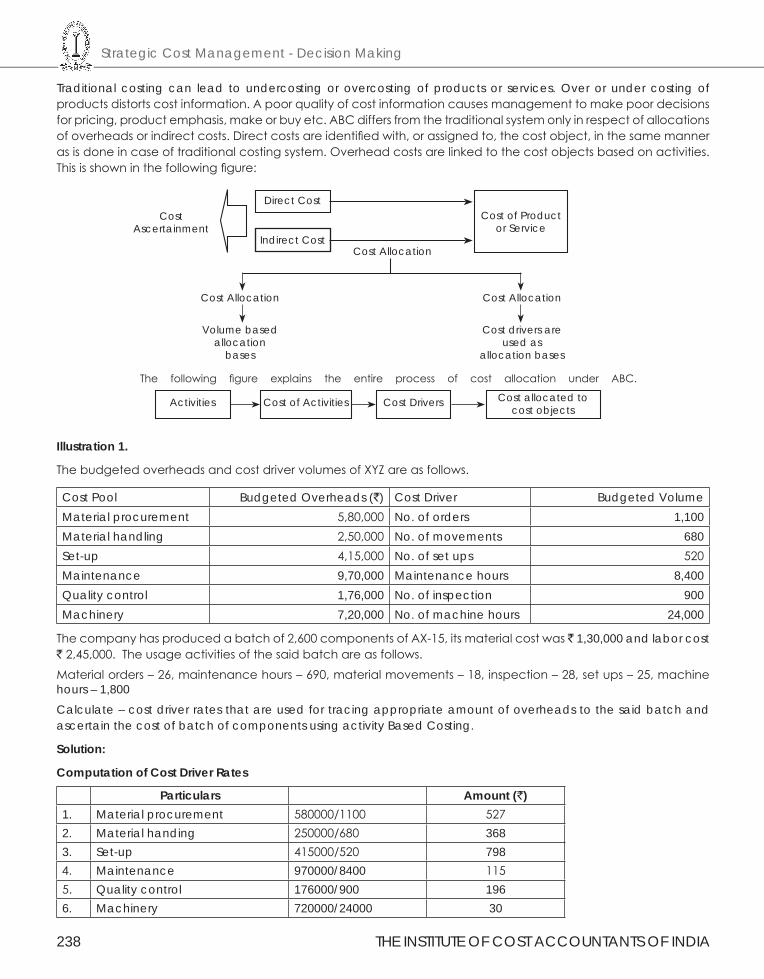
Strategic Cost Management - Decision Making
238 THE INSTITUTE OF COST ACCOUNTANTS OF INDIA
Traditional costing can lead to undercosting or overcosting of products or services. Over or under costing of products distorts cost information. A poor quality of cost information causes management to make poor decisions for pricing, product emphasis, make or buy etc. ABC differs from the traditional system only in respect of allocations of overheads or indirect costs. Direct costs are identified with, or assigned to, the cost object, in the same manner as is done in case of traditional costing system. Overhead costs are linked to the cost objects based on activities. This is shown in the following figure:
CostAscertainment
Direct Cost
Indirect CostCost Allocation
Cost of Productor Service
The following figure explains the entire process of cost allocation under ABC.
Cost Allocation Cost Allocation
Volume based allocation
bases
Cost drivers are used as
allocation bases
Activities Cost of Activities Cost Drivers Cost allocated to cost objects
Illustration 1.
The budgeted overheads and cost driver volumes of XYZ are as follows.
Cost Pool Budgeted Overheads (`) Cost Driver Budgeted VolumeMaterial procurement 5,80,000 No. of orders 1,100Material handling 2,50,000 No. of movements 680Set-up 4,15,000 No. of set ups 520Maintenance 9,70,000 Maintenance hours 8,400Quality control 1,76,000 No. of inspection 900Machinery 7,20,000 No. of machine hours 24,000
The company has produced a batch of 2,600 components of AX-15, its material cost was ̀ 1,30,000 and labor cost ` 2,45,000. The usage activities of the said batch are as follows.Material orders – 26, maintenance hours – 690, material movements – 18, inspection – 28, set ups – 25, machine hours – 1,800Calculate – cost driver rates that are used for tracing appropriate amount of overheads to the said batch and ascertain the cost of batch of components using activity Based Costing.
Solution:
Computation of Cost Driver Rates
Particulars Amount (`)1. Material procurement 580000/1100 5272. Material handing 250000/680 3683. Set-up 415000/520 7984. Maintenance 970000/8400 1155. Quality control 176000/900 1966. Machinery 720000/24000 30
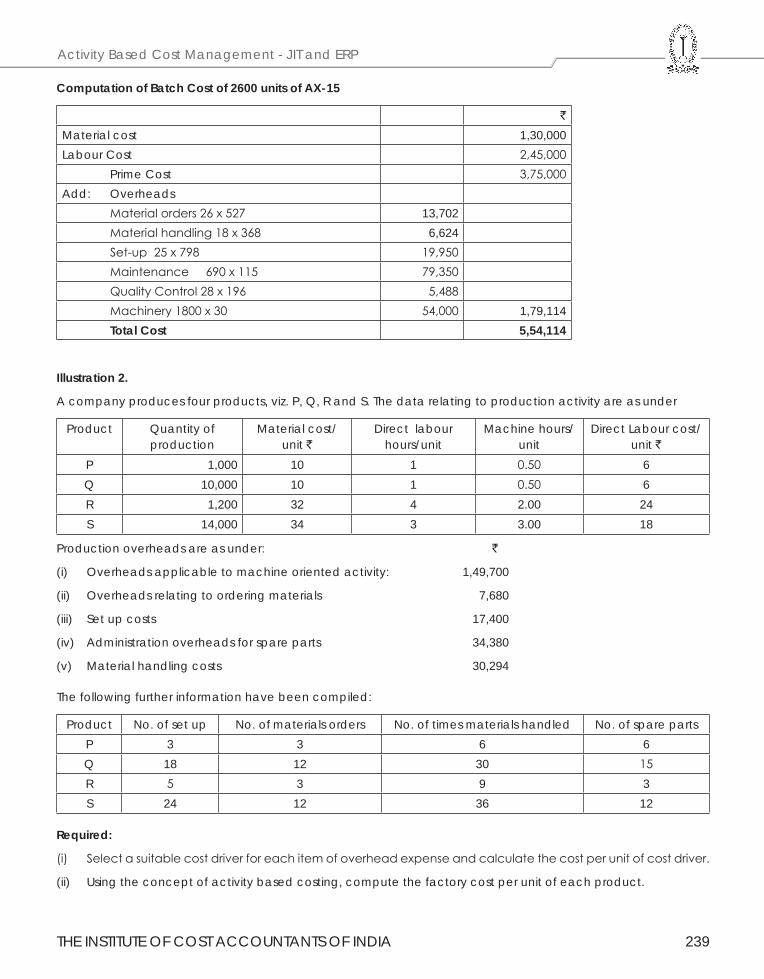
THE INSTITUTE OF COST ACCOUNTANTS OF INDIA 239
Activity Based Cost Management - JIT and ERP
Computation of Batch Cost of 2600 units of AX-15
`
Material cost 1,30,000Labour Cost 2,45,000 Prime Cost 3,75,000Add: Overheads Material orders 26 x 527 13,702 Material handling 18 x 368 6,624 Set-up 25 x 798 19,950 Maintenance 690 x 115 79,350 Quality Control 28 x 196 5,488 Machinery 1800 x 30 54,000 1,79,114 Total Cost 5,54,114
Illustration 2.
A company produces four products, viz. P, Q, R and S. The data relating to production activity are as under
Product Quantity of production
Material cost/unit `
Direct labour hours/unit
Machine hours/unit
Direct Labour cost/unit `
P 1,000 10 1 0.50 6Q 10,000 10 1 0.50 6R 1,200 32 4 2.00 24S 14,000 34 3 3.00 18
Production overheads are as under: `
(i) Overheads applicable to machine oriented activity: 1,49,700
(ii) Overheads relating to ordering materials 7,680
(iii) Set up costs 17,400
(iv) Administration overheads for spare parts 34,380
(v) Material handling costs 30,294
The following further information have been compiled:
Product No. of set up No. of materials orders No. of times materials handled No. of spare partsP 3 3 6 6Q 18 12 30 15R 5 3 9 3S 24 12 36 12
Required:
(i) Select a suitable cost driver for each item of overhead expense and calculate the cost per unit of cost driver.
(ii) Using the concept of activity based costing, compute the factory cost per unit of each product.
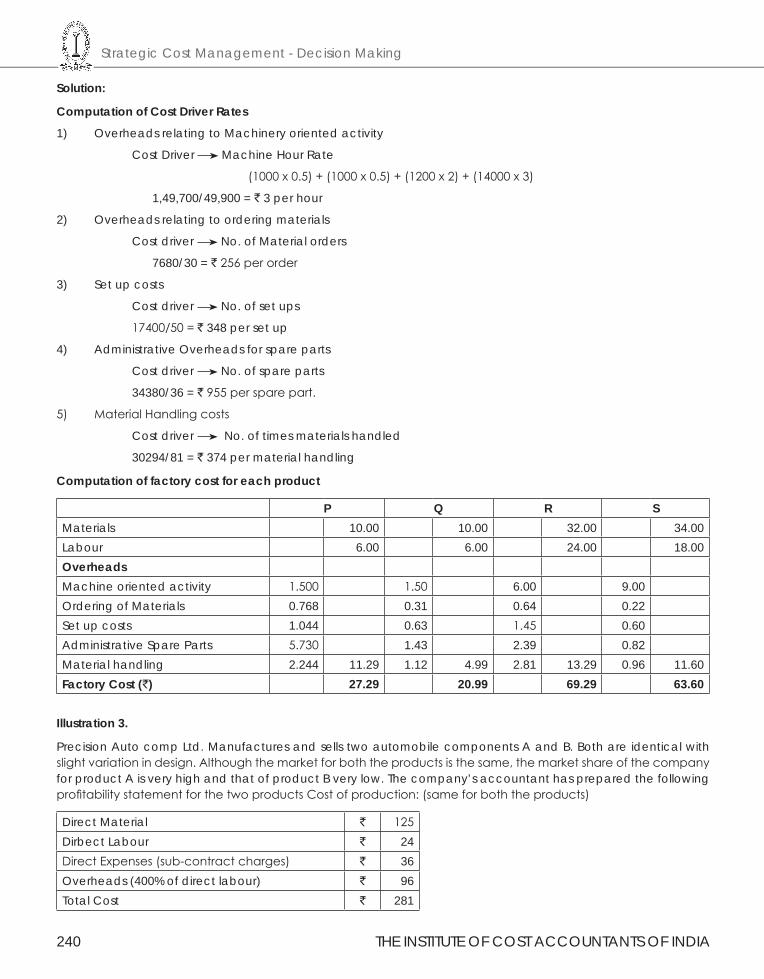
Strategic Cost Management - Decision Making
240 THE INSTITUTE OF COST ACCOUNTANTS OF INDIA
Solution:
Computation of Cost Driver Rates
1) Overheads relating to Machinery oriented activity
Cost Driver Machine Hour Rate
(1000 x 0.5) + (1000 x 0.5) + (1200 x 2) + (14000 x 3)
1,49,700/49,900 = ` 3 per hour
2) Overheads relating to ordering materials
Cost driver No. of Material orders
7680/30 = ` 256 per order
3) Set up costs
Cost driver No. of set ups
17400/50 = ` 348 per set up
4) Administrative Overheads for spare parts
Cost driver No. of spare parts
34380/36 = ` 955 per spare part.
5) Material Handling costs
Cost driver No. of times materials handled
30294/81 = ` 374 per material handling
Computation of factory cost for each product
P Q R SMaterials 10.00 10.00 32.00 34.00Labour 6.00 6.00 24.00 18.00OverheadsMachine oriented activity 1.500 1.50 6.00 9.00Ordering of Materials 0.768 0.31 0.64 0.22Set up costs 1.044 0.63 1.45 0.60Administrative Spare Parts 5.730 1.43 2.39 0.82Material handling 2.244 11.29 1.12 4.99 2.81 13.29 0.96 11.60Factory Cost (`) 27.29 20.99 69.29 63.60
Illustration 3.
Precision Auto comp Ltd. Manufactures and sells two automobile components A and B. Both are identical with slight variation in design. Although the market for both the products is the same, the market share of the company for product A is very high and that of product B very low. The company’s accountant has prepared the following profitability statement for the two products Cost of production: (same for both the products)
Direct Material ` 125Dirbect Labour ` 24Direct Expenses (sub-contract charges) ` 36Overheads (400% of direct labour) ` 96Total Cost ` 281
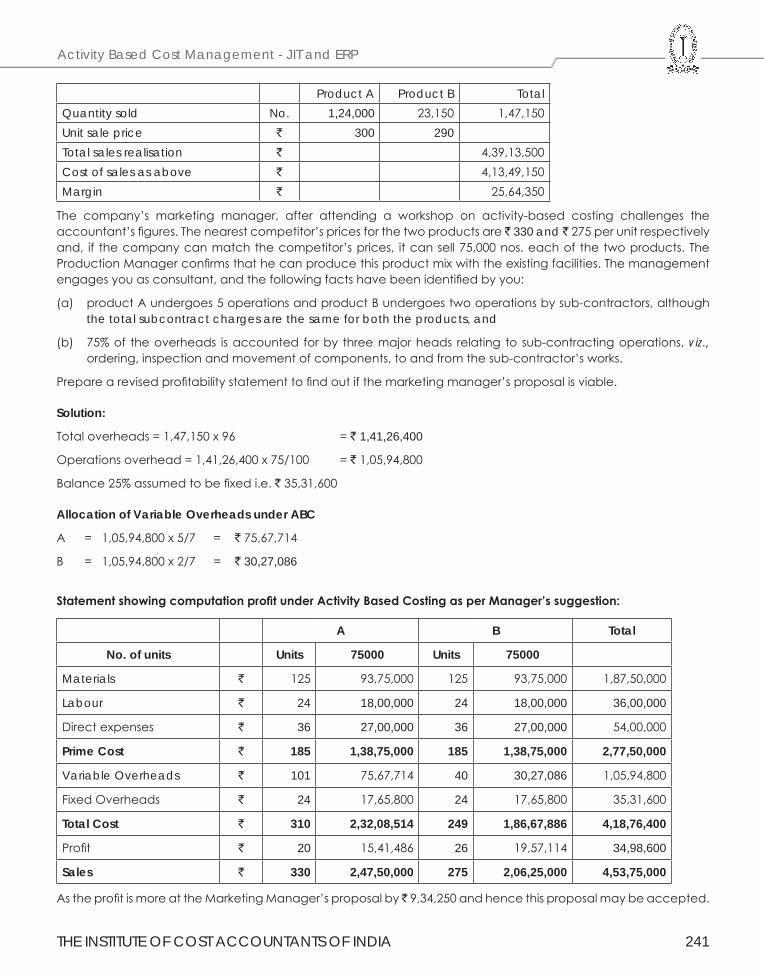
THE INSTITUTE OF COST ACCOUNTANTS OF INDIA 241
Activity Based Cost Management - JIT and ERP
Product A Product B TotalQuantity sold No. 1,24,000 23,150 1,47,150Unit sale price ` 300 290Total sales realisation ` 4,39,13,500Cost of sales as above ` 4,13,49,150Margin ` 25,64,350
The company’s marketing manager, after attending a workshop on activity-based costing challenges the accountant’s figures. The nearest competitor’s prices for the two products are ̀ 330 and ̀ 275 per unit respectively and, if the company can match the competitor’s prices, it can sell 75,000 nos. each of the two products. The Production Manager confirms that he can produce this product mix with the existing facilities. The management engages you as consultant, and the following facts have been identified by you:
(a) product A undergoes 5 operations and product B undergoes two operations by sub-contractors, although the total sub contract charges are the same for both the products, and
(b) 75% of the overheads is accounted for by three major heads relating to sub-contracting operations, viz., ordering, inspection and movement of components, to and from the sub-contractor’s works.
Prepare a revised profitability statement to find out if the marketing manager’s proposal is viable.
Solution:
Total overheads = 1,47,150 x 96 = ` 1,41,26,400
Operations overhead = 1,41,26,400 x 75/100 = ` 1,05,94,800
Balance 25% assumed to be fixed i.e. ` 35,31,600
Allocation of Variable Overheads under ABC
A = 1,05,94,800 x 5/7 = ` 75,67,714
B = 1,05,94,800 x 2/7 = ` 30,27,086
Statement showing computation profit under Activity Based Costing as per Manager’s suggestion:
A B Total
No. of units Units 75000 Units 75000
Materials ` 125 93,75,000 125 93,75,000 1,87,50,000
Labour ` 24 18,00,000 24 18,00,000 36,00,000
Direct expenses ` 36 27,00,000 36 27,00,000 54,00,000
Prime Cost ` 185 1,38,75,000 185 1,38,75,000 2,77,50,000
Variable Overheads ` 101 75,67,714 40 30,27,086 1,05,94,800
Fixed Overheads ` 24 17,65,800 24 17,65,800 35,31,600
Total Cost ` 310 2,32,08,514 249 1,86,67,886 4,18,76,400
Profit ` 20 15,41,486 26 19,57,114 34,98,600
Sales ` 330 2,47,50,000 275 2,06,25,000 4,53,75,000
As the profit is more at the Marketing Manager’s proposal by ̀ 9,34,250 and hence this proposal may be accepted.
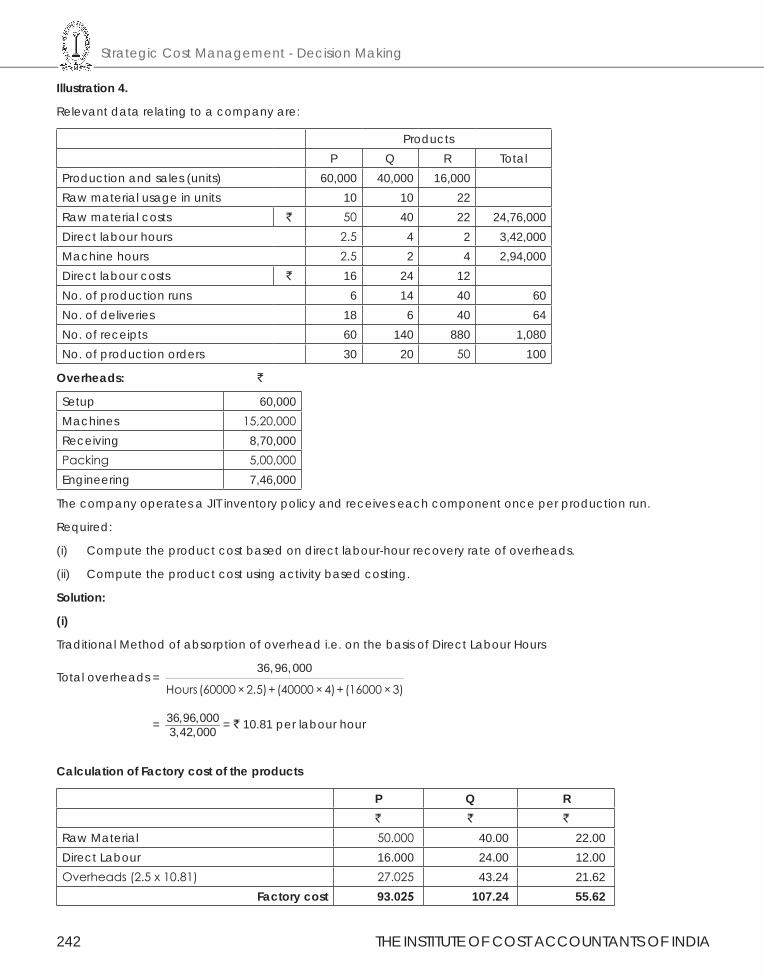
Strategic Cost Management - Decision Making
242 THE INSTITUTE OF COST ACCOUNTANTS OF INDIA
Illustration 4.
Relevant data relating to a company are:
ProductsP Q R Total
Production and sales (units) 60,000 40,000 16,000Raw material usage in units 10 10 22Raw material costs ` 50 40 22 24,76,000Direct labour hours 2.5 4 2 3,42,000Machine hours 2.5 2 4 2,94,000Direct labour costs ` 16 24 12No. of production runs 6 14 40 60No. of deliveries 18 6 40 64No. of receipts 60 140 880 1,080No. of production orders 30 20 50 100
Overheads: `
Setup 60,000Machines 15,20,000Receiving 8,70,000Packing 5,00,000Engineering 7,46,000
The company operates a JIT inventory policy and receives each component once per production run.
Required:
(i) Compute the product cost based on direct labour-hour recovery rate of overheads.
(ii) Compute the product cost using activity based costing.
Solution:
(i)
Traditional Method of absorption of overhead i.e. on the basis of Direct Labour Hours
Total overheads = 36,96,000
Hours (60000 × 2.5)+(40000 ×4)+(16000 ×3)
= 36,96,0003,42,000 = ` 10.81 per labour hour
Calculation of Factory cost of the products
P Q R` ` `
Raw Material 50.000 40.00 22.00Direct Labour 16.000 24.00 12.00Overheads (2.5 x 10.81) 27.025 43.24 21.62
Factory cost 93.025 107.24 55.62
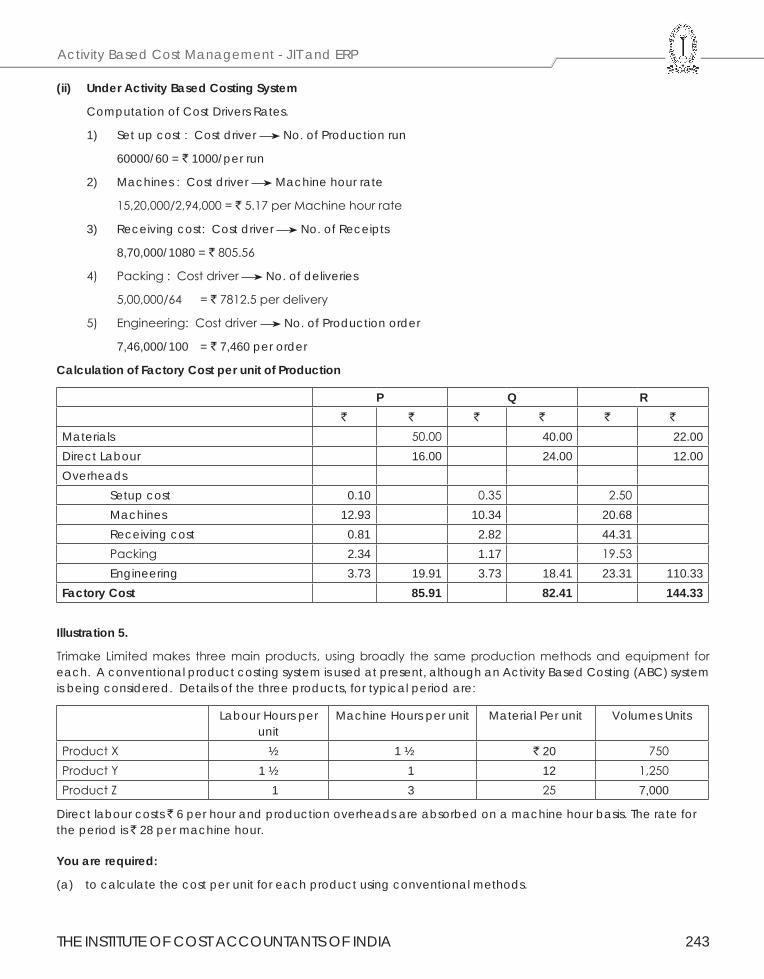
THE INSTITUTE OF COST ACCOUNTANTS OF INDIA 243
Activity Based Cost Management - JIT and ERP
(ii) Under Activity Based Costing System
Computation of Cost Drivers Rates.
1) Set up cost : Cost driver No. of Production run
60000/60 = ` 1000/per run
2) Machines : Cost driver Machine hour rate
15,20,000/2,94,000 = ` 5.17 per Machine hour rate
3) Receiving cost: Cost driver No. of Receipts
8,70,000/1080 = ` 805.56
4) Packing : Cost driver No. of deliveries
5,00,000/64 = ` 7812.5 per delivery
5) Engineering: Cost driver No. of Production order
7,46,000/100 = ` 7,460 per order
Calculation of Factory Cost per unit of Production
P Q R` ` ` ` ` `
Materials 50.00 40.00 22.00Direct Labour 16.00 24.00 12.00Overheads Setup cost 0.10 0.35 2.50 Machines 12.93 10.34 20.68 Receiving cost 0.81 2.82 44.31 Packing 2.34 1.17 19.53 Engineering 3.73 19.91 3.73 18.41 23.31 110.33Factory Cost 85.91 82.41 144.33
Illustration 5.
Trimake Limited makes three main products, using broadly the same production methods and equipment for each. A conventional product costing system is used at present, although an Activity Based Costing (ABC) system is being considered. Details of the three products, for typical period are:
Labour Hours per unit
Machine Hours per unit Material Per unit Volumes Units
Product X ½ 1 ½ ` 20 750Product Y 1 ½ 1 12 1,250Product Z 1 3 25 7,000
Direct labour costs ` 6 per hour and production overheads are absorbed on a machine hour basis. The rate for the period is ` 28 per machine hour.
You are required:
(a) to calculate the cost per unit for each product using conventional methods.
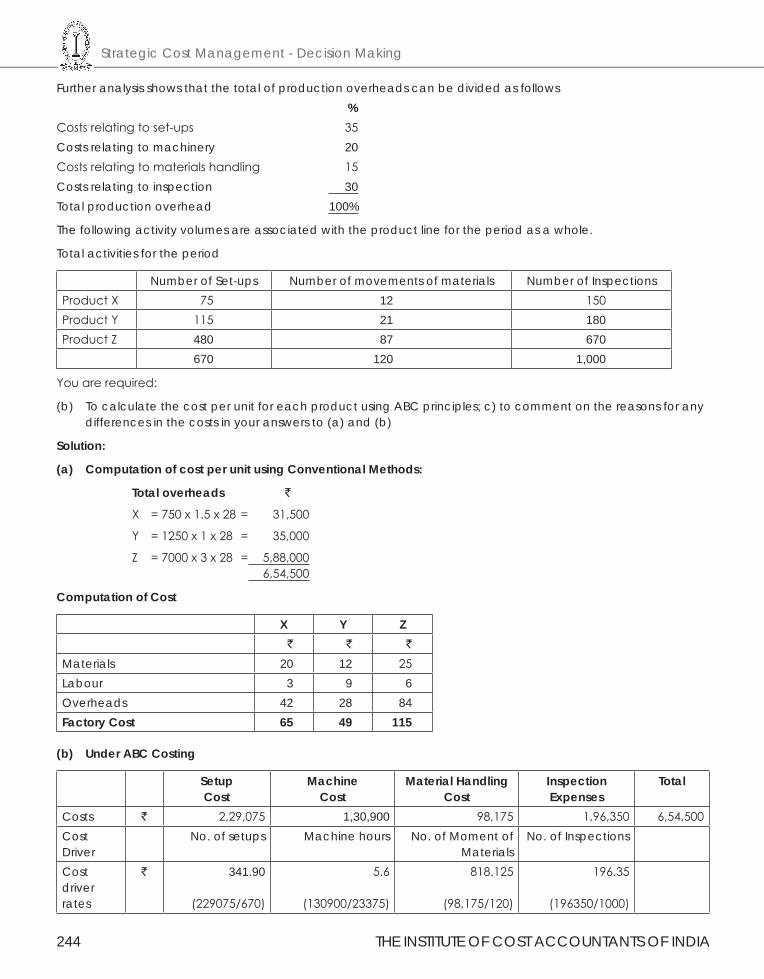
Strategic Cost Management - Decision Making
244 THE INSTITUTE OF COST ACCOUNTANTS OF INDIA
Further analysis shows that the total of production overheads can be divided as follows %Costs relating to set-ups 35Costs relating to machinery 20Costs relating to materials handling 15Costs relating to inspection 30Total production overhead 100%
The following activity volumes are associated with the product line for the period as a whole.
Total activities for the period
Number of Set-ups Number of movements of materials Number of InspectionsProduct X 75 12 150Product Y 115 21 180Product Z 480 87 670
670 120 1,000
You are required:
(b) To calculate the cost per unit for each product using ABC principles; c) to comment on the reasons for any differences in the costs in your answers to (a) and (b)
Solution:
(a) Computation of cost per unit using Conventional Methods:
Total overheads `
X = 750 x 1.5 x 28 = 31,500
Y = 1250 x 1 x 28 = 35,000
Z = 7000 x 3 x 28 = 5,88,000 6,54,500
Computation of Cost
X Y Z` ` `
Materials 20 12 25Labour 3 9 6Overheads 42 28 84Factory Cost 65 49 115
(b) Under ABC Costing
SetupCost
MachineCost
Material Handling Cost
Inspection Expenses
Total
Costs ` 2,29,075 1,30,900 98,175 1,96,350 6,54,500Cost Driver
No. of setups Machine hours No. of Moment of Materials
No. of Inspections
Cost driver rates
` 341.90
(229075/670)
5.6
(130900/23375)
818.125
(98,175/120)
196.35
(196350/1000)
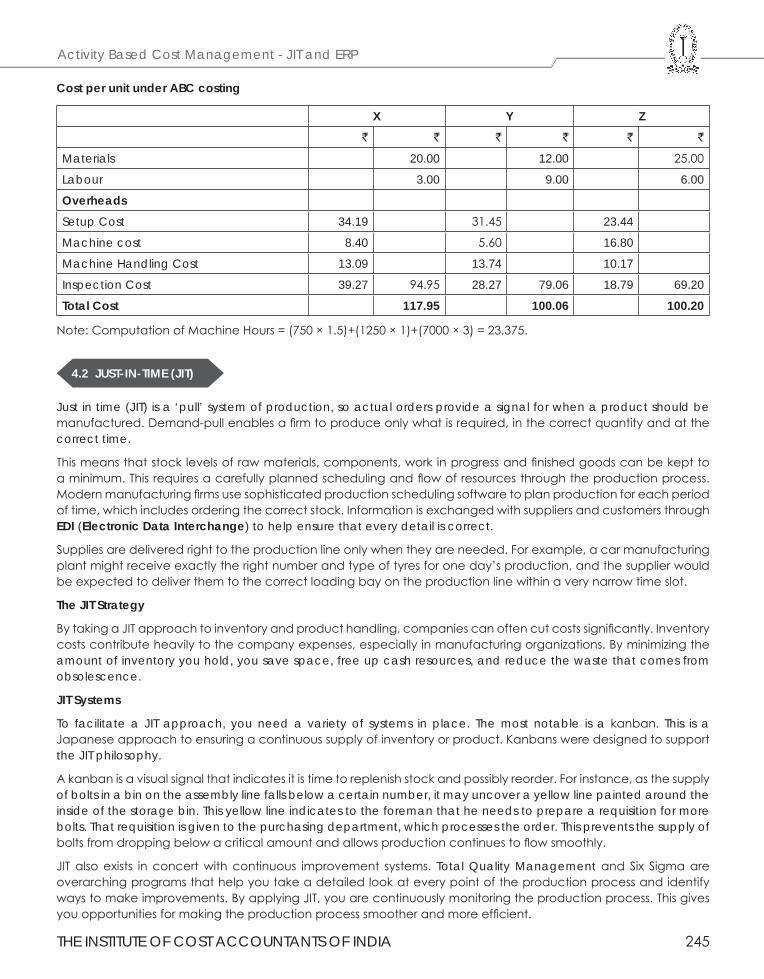
THE INSTITUTE OF COST ACCOUNTANTS OF INDIA 245
Activity Based Cost Management - JIT and ERP
Cost per unit under ABC costing
X Y Z` ` ` ` ` `
Materials 20.00 12.00 25.00
Labour 3.00 9.00 6.00
OverheadsSetup Cost 34.19 31.45 23.44
Machine cost 8.40 5.60 16.80
Machine Handling Cost 13.09 13.74 10.17
Inspection Cost 39.27 94.95 28.27 79.06 18.79 69.20
Total Cost 117.95 100.06 100.20
Note: Computation of Machine Hours = (750 × 1.5)+(1250 × 1)+(7000 × 3) = 23,375.
4.2 JUST-IN-TIME (JIT)
Just in time (JIT) is a ‘pull’ system of production, so actual orders provide a signal for when a product should be manufactured. Demand-pull enables a firm to produce only what is required, in the correct quantity and at the correct time.
This means that stock levels of raw materials, components, work in progress and finished goods can be kept to a minimum. This requires a carefully planned scheduling and flow of resources through the production process. Modern manufacturing firms use sophisticated production scheduling software to plan production for each period of time, which includes ordering the correct stock. Information is exchanged with suppliers and customers through EDI (Electronic Data Interchange) to help ensure that every detail is correct.
Supplies are delivered right to the production line only when they are needed. For example, a car manufacturing plant might receive exactly the right number and type of tyres for one day’s production, and the supplier would be expected to deliver them to the correct loading bay on the production line within a very narrow time slot.
The JIT Strategy
By taking a JIT approach to inventory and product handling, companies can often cut costs significantly. Inventory costs contribute heavily to the company expenses, especially in manufacturing organizations. By minimizing the amount of inventory you hold, you save space, free up cash resources, and reduce the waste that comes from obsolescence.
JIT Systems
To facilitate a JIT approach, you need a variety of systems in place. The most notable is a kanban. This is a Japanese approach to ensuring a continuous supply of inventory or product. Kanbans were designed to support the JIT philosophy.
A kanban is a visual signal that indicates it is time to replenish stock and possibly reorder. For instance, as the supply of bolts in a bin on the assembly line falls below a certain number, it may uncover a yellow line painted around the inside of the storage bin. This yellow line indicates to the foreman that he needs to prepare a requisition for more bolts. That requisition is given to the purchasing department, which processes the order. This prevents the supply of bolts from dropping below a critical amount and allows production continues to flow smoothly.
JIT also exists in concert with continuous improvement systems. Total Quality Management and Six Sigma are overarching programs that help you take a detailed look at every point of the production process and identify ways to make improvements. By applying JIT, you are continuously monitoring the production process. This gives you opportunities for making the production process smoother and more efficient.
Strategic Cost Management - Decision Making
246 THE INSTITUTE OF COST ACCOUNTANTS OF INDIA
Because JIT is intended to spread throughout the organization, it can have an impact on many areas through improvements in processes. When the emphasis is on lean production, systems tend to be made simpler and more predictable. From how a product moves through the building to ways to increase worker involvement in system design, JIT improves efficiency.
Advantages of Just-In-Time System
Following are the advantages of adopting Just-In-Time Manufacturing System:
(i) Just-in-time manufacturing keeps stock holding costs to a bare minimum. The release of storage space results in better utilization of space and thereby bears a favorable impact on the rent paid and on any insurance premiums that would otherwise need to be made.
(ii) Just-in-time manufacturing eliminates waste, as out-of-date or expired product; do not enter into this equation at all.
(iii) As under this technique, only essential stocks are obtained, less working capital is required to finance procurement. Here, a minimum re-order level is set, and only once that mark is reached fresh stocks are ordered, making this a boon to inventory management too.
(iv) Due to the afore-mentioned low level of stocks held, the organization’s return on investment (referred to as ROI, in management parlance) would generally be high.
(v) As just-in-time production works on a demand-pull basis, all goods made would be sold, and thus it incorporates changes in demand with surprising ease. This makes it especially appealing today, where the market demand is volatile and somewhat unpredictable.
(vi) Just-in-time manufacturing encourages the right first time concept, so that inspection costs and cost of rework is minimized.
(vii) High quality products and greater efficiency can be derived from following a just-in-time production system.
(viii) Close relationships are fostered along the production chain under a just-in-time manufacturing system.
(ix) Constant communication with the customer results in high customer satisfaction.
(x) Over production is eliminated, when just-in-time manufacturing is adopted.
Disadvantages:
Following are the disadvantages of adopting Just-In-Time Manufacturing Systems:
(i) Just-in-time manufacturing provides zero tolerance for mistakes, as it makes re-working very difficult in practice, as inventory is kept to a bare minimum.
(ii) There is a high reliance on suppliers, whose performance is generally outside the purview of the manufacturer.
(iii) As there will be no buffers for delays, production downtime and line idling can occur, which would bear a detrimental effect on finances and on the equilibrium of the production process.
(iv) The organization would not be able to meet an unexpected increase in orders, due to the fact that there are no excess finish goods.
(v) Transaction costs would be relatively high, as frequent transactions would be made.
(vi) Just-in-time manufacturing may have certain detrimental effects on the environment, due to the frequent deliveries that would result in increased use of transportation which in turn would consume more fossil fuels.
Precautions:
Following are the things to Remember When Implementing a Just-In-Time Manufacturing System:
(i) Management buy-in and support at all levels of the organization are required; if a just-in-time manufacturing system is to be successfully adopted.
THE INSTITUTE OF COST ACCOUNTANTS OF INDIA 247
Activity Based Cost Management - JIT and ERP
(ii) Adequate resources should be allocated, so as to obtain technologically advanced software, that is generally required if a just-in-time system is to be a success.
(iii) Building a close, trusting relationship with reputed and time-tested suppliers will minimize unexpected delays in the receipt of inventory.
(iv) Just-in-time manufacturing cannot be adopted overnight. It requires commitment in terms of time and adjustments to corporate culture would be required, as it is starkly different to traditional production processes.
(v) The design flow process needs to be redesigned and layouts need to be re-formatted, so as to incorporate just-in-time manufacturing.
(vi) Lot sizes need to be minimized.
(vii) Work station capacity should be balanced whenever possible.
(viii) Preventive maintenance should be carried out, so as to minimize machine breakdowns.
(ix) Set up times should be reduced wherever possible.
(x) Quality enhancement programs should be adopted, so that total quality control practices can be adopted.
(xi) Reduction in lead times and frequent deliveries should be incorporated.
(xii) Motion waste should be minimized, so the incorporation of conveyor belts might prove to be a good idea when implementing a just-in-time manufacturing system.
Just-in-time manufacturing is a philosophy that has been successfully implemented in many manufacturing organizations.
It is an optimal system that reduces inventory whilst being increasingly responsive to customer needs, This is not to say that it is not without its pitfalls.
However, these disadvantages can be overcome, with a little forethought and a lot of commitment at all levels of the organization.
Illustration 6.
B Ltd. has decided to adopt JIT policy for materials. The following effects of JIT policy are identified-
(1) To implement JIT, the company has to modify its production and material receipt facilities at a capital cost of `10,00,000. The new machine will require a cash operating cost `1,08,000 p.a. The capital cost will be depreciated over 5 years.
(2) Raw material stockholding will be reduced from `40,00,000 to `10,00,000.
(3) The company can earn 15% on its long-term investments.
(4) The company can avoid rental expenditure on storage facilities amounting to `33,000 per annum. Property Taxes and insurance amounting to `22,000 will be saved due to JIT programme.
(5) Presently there are 7 workers in the store department at a salary of ̀ 5,000 each per month. After implementing JIT scheme, only 5 workers will be required in this department. Balance 2 workers’ employment will be terminated.
(6) Due to receipt of smaller lots of Raw Materials, there will be some disruption of production. The costs of stock-outs are estimated at `77,000 per annum.
Determine the financial impact of the JIT policy. Is it advisable for the company to implement JIT system?
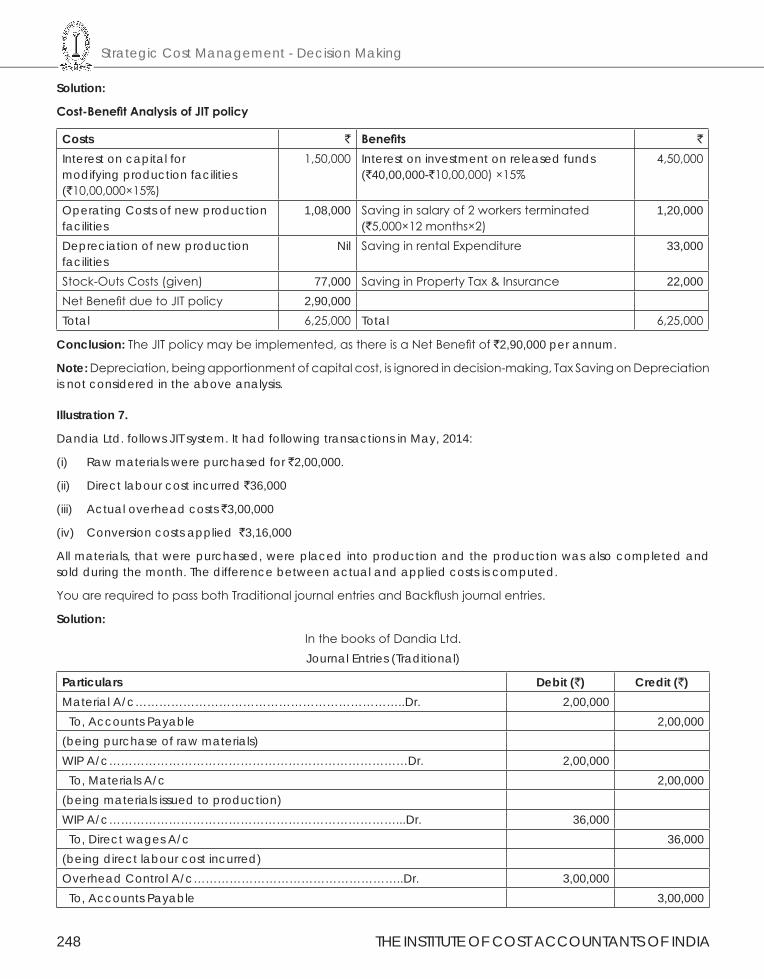
Strategic Cost Management - Decision Making
248 THE INSTITUTE OF COST ACCOUNTANTS OF INDIA
Solution:
Cost-Benefit Analysis of JIT policy
Costs ` Benefits `
Interest on capital for modifying production facilities (`10,00,000×15%)
1,50,000 Interest on investment on released funds (`40,00,000-`10,00,000) ×15%
4,50,000
Operating Costs of new production facilities
1,08,000 Saving in salary of 2 workers terminated (`5,000×12 months×2)
1,20,000
Depreciation of new production facilities
Nil Saving in rental Expenditure 33,000
Stock-Outs Costs (given) 77,000 Saving in Property Tax & Insurance 22,000Net Benefit due to JIT policy 2,90,000Total 6,25,000 Total 6,25,000
Conclusion: The JIT policy may be implemented, as there is a Net Benefit of `2,90,000 per annum.
Note: Depreciation, being apportionment of capital cost, is ignored in decision-making, Tax Saving on Depreciation is not considered in the above analysis.
Illustration 7.
Dandia Ltd. follows JIT system. It had following transactions in May, 2014:
(i) Raw materials were purchased for `2,00,000.
(ii) Direct labour cost incurred `36,000
(iii) Actual overhead costs `3,00,000
(iv) Conversion costs applied `3,16,000
All materials, that were purchased, were placed into production and the production was also completed and sold during the month. The difference between actual and applied costs is computed.
You are required to pass both Traditional journal entries and Backflush journal entries.
Solution:In the books of Dandia Ltd.Journal Entries (Traditional)
Particulars Debit (`) Credit (`)Material A/c…………………………………………………………..Dr. 2,00,000 To, Accounts Payable 2,00,000(being purchase of raw materials)WIP A/c…………………………………………………………………Dr. 2,00,000 To, Materials A/c 2,00,000(being materials issued to production)WIP A/c………………………………………………………………...Dr. 36,000 To, Direct wages A/c 36,000(being direct labour cost incurred)Overhead Control A/c……………………………………………..Dr. 3,00,000 To, Accounts Payable 3,00,000
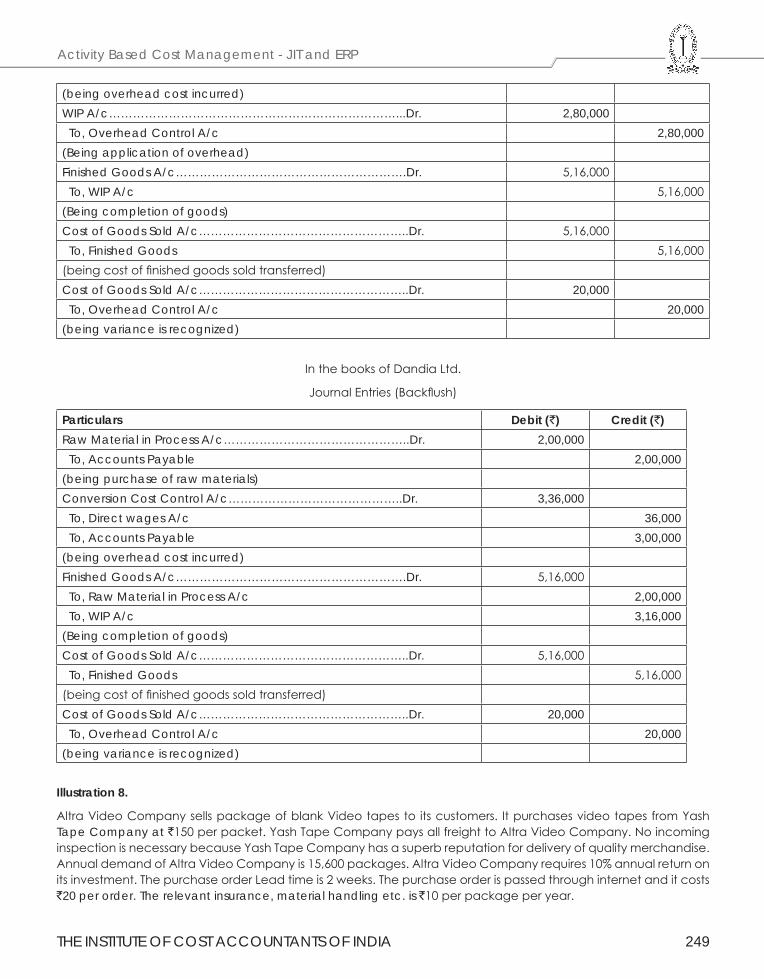
THE INSTITUTE OF COST ACCOUNTANTS OF INDIA 249
Activity Based Cost Management - JIT and ERP
(being overhead cost incurred)WIP A/c………………………………………………………………...Dr. 2,80,000 To, Overhead Control A/c 2,80,000(Being application of overhead)Finished Goods A/c………………………………………………….Dr. 5,16,000 To, WIP A/c 5,16,000(Being completion of goods)Cost of Goods Sold A/c……………………………………………..Dr. 5,16,000 To, Finished Goods 5,16,000(being cost of finished goods sold transferred)Cost of Goods Sold A/c……………………………………………..Dr. 20,000 To, Overhead Control A/c 20,000(being variance is recognized)
In the books of Dandia Ltd.
Journal Entries (Backflush)
Particulars Debit (`) Credit (`)Raw Material in Process A/c………………………………………..Dr. 2,00,000 To, Accounts Payable 2,00,000(being purchase of raw materials)Conversion Cost Control A/c……………………………………..Dr. 3,36,000 To, Direct wages A/c 36,000 To, Accounts Payable 3,00,000(being overhead cost incurred)Finished Goods A/c………………………………………………….Dr. 5,16,000 To, Raw Material in Process A/c 2,00,000 To, WIP A/c 3,16,000(Being completion of goods)Cost of Goods Sold A/c……………………………………………..Dr. 5,16,000 To, Finished Goods 5,16,000(being cost of finished goods sold transferred)Cost of Goods Sold A/c……………………………………………..Dr. 20,000 To, Overhead Control A/c 20,000(being variance is recognized)
Illustration 8.
Altra Video Company sells package of blank Video tapes to its customers. It purchases video tapes from Yash Tape Company at `150 per packet. Yash Tape Company pays all freight to Altra Video Company. No incoming inspection is necessary because Yash Tape Company has a superb reputation for delivery of quality merchandise. Annual demand of Altra Video Company is 15,600 packages. Altra Video Company requires 10% annual return on its investment. The purchase order Lead time is 2 weeks. The purchase order is passed through internet and it costs `20 per order. The relevant insurance, material handling etc. is `10 per package per year.
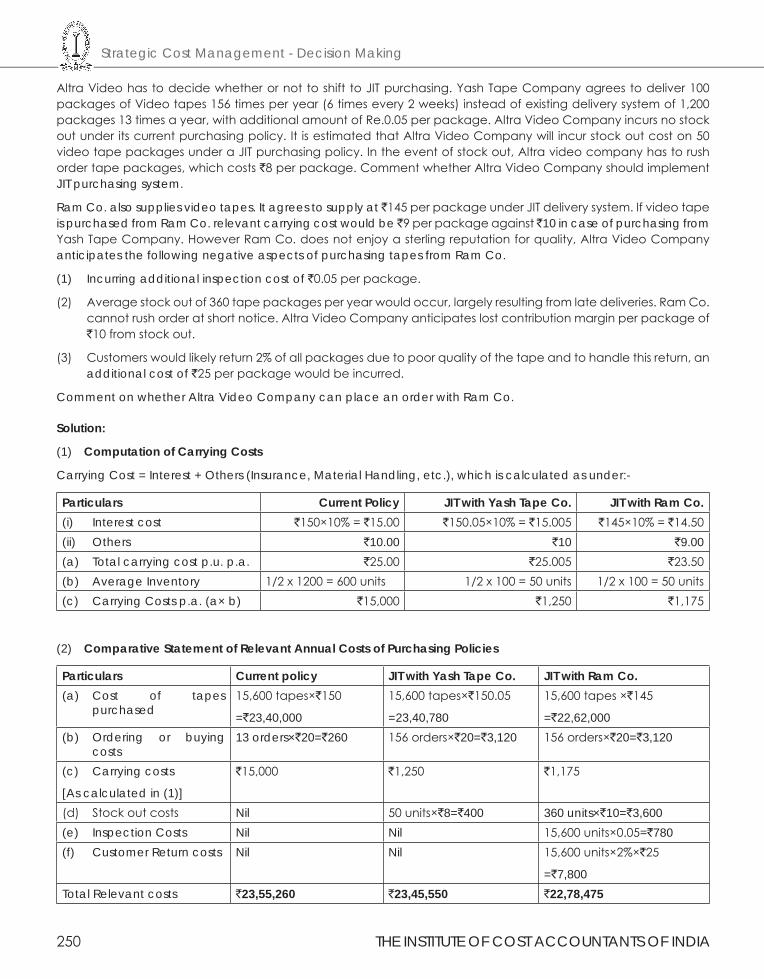
Strategic Cost Management - Decision Making
250 THE INSTITUTE OF COST ACCOUNTANTS OF INDIA
Altra Video has to decide whether or not to shift to JIT purchasing. Yash Tape Company agrees to deliver 100 packages of Video tapes 156 times per year (6 times every 2 weeks) instead of existing delivery system of 1,200 packages 13 times a year, with additional amount of Re.0.05 per package. Altra Video Company incurs no stock out under its current purchasing policy. It is estimated that Altra Video Company will incur stock out cost on 50 video tape packages under a JIT purchasing policy. In the event of stock out, Altra video company has to rush order tape packages, which costs `8 per package. Comment whether Altra Video Company should implement JIT purchasing system.
Ram Co. also supplies video tapes. It agrees to supply at `145 per package under JIT delivery system. If video tape is purchased from Ram Co. relevant carrying cost would be ̀ 9 per package against ̀ 10 in case of purchasing from Yash Tape Company. However Ram Co. does not enjoy a sterling reputation for quality, Altra Video Company anticipates the following negative aspects of purchasing tapes from Ram Co.
(1) Incurring additional inspection cost of `0.05 per package.
(2) Average stock out of 360 tape packages per year would occur, largely resulting from late deliveries. Ram Co. cannot rush order at short notice. Altra Video Company anticipates lost contribution margin per package of `10 from stock out.
(3) Customers would likely return 2% of all packages due to poor quality of the tape and to handle this return, an additional cost of `25 per package would be incurred.
Comment on whether Altra Video Company can place an order with Ram Co.
Solution:
(1) Computation of Carrying Costs
Carrying Cost = Interest + Others (Insurance, Material Handling, etc.), which is calculated as under:-
Particulars Current Policy JIT with Yash Tape Co. JIT with Ram Co.(i) Interest cost `150×10% = `15.00 `150.05×10% = `15.005 `145×10% = `14.50(ii) Others `10.00 `10 `9.00(a) Total carrying cost p.u. p.a. `25.00 `25.005 `23.50(b) Average Inventory 1/2 x 1200 = 600 units 1/2 x 100 = 50 units 1/2 x 100 = 50 units(c) Carrying Costs p.a. (a× b) `15,000 `1,250 `1,175
(2) Comparative Statement of Relevant Annual Costs of Purchasing Policies
Particulars Current policy JIT with Yash Tape Co. JIT with Ram Co.(a) Cost of tapes
purchased15,600 tapes×`150
=`23,40,000
15,600 tapes×`150.05
=23,40,780
15,600 tapes ×`145
=`22,62,000(b) Ordering or buying
costs13 orders×`20=`260 156 orders×`20=`3,120 156 orders×`20=`3,120
(c) Carrying costs
[As calculated in (1)]
`15,000 `1,250 `1,175
(d) Stock out costs Nil 50 units×`8=`400 360 units×`10=`3,600(e) Inspection Costs Nil Nil 15,600 units×0.05=`780(f) Customer Return costs Nil Nil 15,600 units×2%×`25
=`7,800Total Relevant costs `23,55,260 `23,45,550 `22,78,475
THE INSTITUTE OF COST ACCOUNTANTS OF INDIA 251
Activity Based Cost Management - JIT and ERP
Conclusions:
(1) Compared to present system, JIT with Yash Tape Co. will result in cost saving of `23,55,260 - `23,45,550 = `9,710. Hence, JIT system may be implemented.
(2) Comparing present system, JIT with Yash Tape Co and Ram Co., JIT with Ram Co. results in the least total cost. Hence, the packages may be bought from Ram Co.
4.3 ENTERPRISE RESOURCE PLANNING (ERP)
Enterprise Resource Planning (ERP) is the latest high-end solution which information technology has lent to business application. The ERP solution seek to streamline and integrate operation process and information flows in the company to synergies the resources of an organisation namely men, material, money and machine though information. Initially implementation of an ERP packages was possible only for large multinationals and infrastructure companies due to high cost. Today, many companies in India have gone in for implementation of ERP. It is expected that in the next future, 60 per cent of the companies will be implementing one or the other ERP packages since this will become a must for gaining competitive advantage.
Meaning of ERP : Enterprise resource planning software or ERP attempts to integrate all departments and functions across a company into a single computer system that can serve all those different departments particular needs. In fact ERP combines all computerised departments together with the help of a single integrate software program that runs off as single database so that various department can more easily share information and commission with each other.
The need for ERP : Most organisation across the world have realised that in a rapidly changing environment, it is impossible to creates and maintain customer designed software package which will cater to all their requirements and be up-to-date. Realising the requirement of user organisations, some of the leading software companies have designed Enterprise Resource Planning software, which offers an integrated software solution to all the function of an organisation.
Components of ERP : To enable the easy handling of the system, ERP has been divided the following core subsystems, sales and marketing, master scheduling, materials requirements planning, capacity requirement planning, bill of materials, purchasing, shop floor control, accounts payable/receivable , logistic, assets management and financial accounting.
Features of Enterprise Resource Planning
Some of the major features of ERP and What ERP can do for the business system are :
(i) ERP facilities company—wide Integrated Information System covering all functional areas like manufacturing, selling and distribution, payables, receivables, inventory, accounts, human resources, purchases etc.
(ii) ERP perform core activities and increases customers service, thereby augmenting the corporate image.
(iii) ERP bridge the information gap across organisations.
(iv) ERP provides complete integration of system not only across departments but also across companies under the same management.
(v) ERP is the solution for better project management.
(vi) ERP allows automatic introduction of the latest technologies like Electronic Fund Transfer (EFT). Electronic Data Interchange (EDI), Internet, Intranet, Video conferencing, E—commerce etc.
(vii) ERP eliminates most business problems like materials shortages, productivity enhancements, customer service, cash management, inventory problems, quality problems, prompt delivery etc.
(viii) ERP not only addresses the current requirement of the company but also provide the opportunity of continually improving and refining business Processes.
Strategic Cost Management - Decision Making
252 THE INSTITUTE OF COST ACCOUNTANTS OF INDIA
(ix) ERP provides business intelligence tools like Decision Support Systems (DSS), Executive Information System (EIS), Reporting. Data Mining and Early warning systems (Robots) for enabling people to make better decisions and thus improve their business processes.
Benefits of Enterprise Resource Planning
In an industry this is sensitive to dynamic market forces, cost fluctuations and manufacturing responsiveness, there are many benefits to be gained from investing in ERP. ERP application have shifted from assisting after—the—fact monitoring to real –time analysis, control and forecasting and from facilitating standardization, economies to scale and cost reduction in product, to enabling fast, flexible and accurate response and customization.
The benefits accruing to any business enterprise by implementing an ERP package are unlimited.
1. Product Costing : Determination of cost of products correctly, is quite critical for every industry. ERP supports advance costing methods, including standard costing, actual costing and activity –based costing. Additionally, all costing methods and information can be fully integrated with finance. This provides the company with essential financial information for monitoring controlling costs.
2. Inventory Management : ERP can be used in multi-national, multi – company, and multi—site manufacturing and distribution environments. This system simplifies complicated logistics by allowing one to plan and manage companies in different countries as a single unit and its advanced functionality allows one to process product and financial information flows in several different ways.
Enterprise and managing the basis data required to effectively run one’s business is an important start for effective warehouse management. The basis data includes warehouse, locations, items containers, lot and serial number, units of measures (including conversion), alias numbers, replacement and substitute items and more.
Inventory reporting supports all reporting of specific and general types of stock transaction such as various types of stock transfers, re-classification, ID changes and physical inventory results. Additionally, functions are available for managing different stock and purchase requisitions as well as supporting the selection of appropriate locations for receipts. Inventory valuation involves both warehouse management and cost accounting. ERP supports several valuation methods including standard cost, average cost, FIFO and batch—specific prices.
3. Distribution & Delivery : Delivery and distribution in ERP lets one to define logistics processes, flexibly and efficiently to deliver the right product from the right warehouse to the right customer at the right time –every time. To the customer, the most important element of quality is one-time delivery. It doesn’t matter how well a product is made if arrives late. Processing distribution or acquisition orders involves several closely related activities.
4. E – Commerce : Internet enables ERP offers Internet, Intranet and extranet solutions for business, business to consumer, employee self-service and more.
5. Automatic Control : It ensure automatic quality control procedure.
6. After Sales Service : It ensures better after sales service.
7. Improvement in Production Planning : It improved production planning.
8. Quick response : It enables quick response to change in business operations & market conditions.
9. Cumulative Edge’s : It helps to achieve competitive advantages by improving business process.
Reasons for the Implemention of ERP by Companies
1. Improve a company’s business performance : ERP automates the tasks involved in performing a business process – such as order fulfillment which involves taking an order from a customer, shipping it and billing for it. With ERP, When a customer service representative takes an order from a customer, he or she has all the
THE INSTITUTE OF COST ACCOUNTANTS OF INDIA 253
Activity Based Cost Management - JIT and ERP
information necessary to complete the order ( the customer’s credit rating and order history, the company’s inventory levels and the shipping dock’s trucking schedule). Everyone else in the company sees the same computer screen and has access to the single database that holds the customer’s new order. When one departments finishes with the order it automatically routed via the ERP system to the next department. To find out where the order is at any point, one need only to log into the ERP system and track it down. With luck, the order process moves like a bolt of lightning through the organisation, and customers get their orders faster and with fewer errors than before. ERP can apply that same magic to the other major business processes, such as employee benefits or financial reporting.
2. Standardize manufacturing processes : Manufacturing companies --- especially those with an appetite for mergers and acquisitions --- often find that multiple business units across the company make the same widget using different methods and computer systems, Standardizing those processes and using a single, integrated computer system can save time, increase productivity & reduce headcount.
3. Integrate Financial data : As the CEO tries to understand the company’s overall performance, he or she may find many different versions of the truth. Finance has its own set of revenue numbers, sales has another version, and the different business units may each have their own versions of how much they contributed to revenues. ERP creates a single version of the truth that cannot be questioned because everyone is using the same system.
4. To standardise HR information : Especially in companies with multiple business units, HR may not have a unified, simple method for tracking employee time and communicating with them about benefits and services. ERP can fix that.
5. Reduction in cycle time : Cycle time is the time between receipt of the order and delivery of the product. ERP systems are helpful in both make-to -order and make-to-stock situations. In both cases, cycle time can be reduced by the ERP systems, but the reduction will be more in the case of make-to-order systems. ERP packages go a long way in reducing the cycle times due to automation achieved in material procurement, production planning and the efficiency achieved through the plant maintenance and production systems of the ERP packages.
6. Improved Resource Utilization : As manufacturing processes become more sophisticated and as the philosophies of elimination of waste and constraint management achieve broader acceptance, manufacturer place increased emphasis upon planning and controlling capacity. The capacity planning feature of ERP systems offer both rough-cut and detailed capacity planning. The system loads each resource with production requirements from Master Production Scheduling, Materials Requirements Planning and Shop-floor Control. The ERP systems have simulation capabilities that help the capacity and resource planners to simulate the various capacity and resource utilization scenarios and choose the best option. The ERP systems help the organisation in drastically improving the capacity and resource utilization.
7. Better Customer Satisfaction : Customer satisfaction means meeting or exceeding customer’s requirements for a product or service. The customer could get technical support by either accessing the company’s technical support knowledge base (help desk) or by calling the technical support. Since all the details of the product and the customer are available to the person at the technical support department, the company will be able to better support the customer. All this is possible because of use of latest developments in information technology by the ERP systems.
8. Improved Supplier Performance : The quality of the raw materials or components and the capability of the vendor to deliver them ontime are of critical importance for the success of any organisation. For this reason, an organisation chooses its suppliers or vendors very carefully and monitor their activities very closely. To realise these benefits, corporations rely heavily on supplier management and control systems to help, plan, manage and control the complex processes associated with global supplier partnerships.
Strategic Cost Management - Decision Making
254 THE INSTITUTE OF COST ACCOUNTANTS OF INDIA
4.4 BENCH MARKING
Definitions:
Benching Marking: Traditionally control involves comparison of the actual results with an established standard or target. The practice of setting targets using external information is known as ‘Bench marking’.
Benching marking is the establishment - through data gathering of targets and comparatives, with which performance is sought to be assessed.
After examining the firm’s present position, benchmarking may provide a basis for establishing better standards of performance. It focuses on improvement in key areas and sets targets which are challenging but evidently achievable. Bench marking implies that there is one best way of doing business and orients the firm accordingly. It is a catching-up exercise and depends on the accurate information about the comparative company – be it inside the group or an outside firm.
Benchmark is the continuous process of enlisting the best practices in the world for the process, goals and objectives leading to world-class levels of achievement.
Types of Benchmarking:
The different types of Benchmarking are:
(i) Product Benchmarking (Reverse Engineering)
(ii) Competitive Benchmarking
(iii) Process Benchmarking
(iv) Internal Benchmarking
(v) Strategic Benchmarking
(vi) Global Benchmarking
(i) Product Benchmarking (Reverse Engineering): is an age old practice of product oriented reverse engineering. Every organization buys its rival’s products and tears down to find out how the features and performances etc., compare with its products. This could be the starting point for improvement.
(ii) Competitive Benchmarking: This has moved beyond product-oriented comparisons to include comparisons of process with those of competitors. In this type, the process studied may include marketing, finance, HR, R&D etc.,
(iii) Process Benchmarking: is the activity of measuring discrete performance and functionality against organization through performance in excellent analoguous business process e.g. for supply chain management – the best practice would be that of Mumbai Dubbawallas.
(iv) Internal Benchmarking: is an application of process benchmarking, within an organization by comparing the performance of similar business units or business process.
(v) Strategic Benchmarking: differs from operational benchmarking in its scope. It helps to develop a vision of the changed organizations. It will develop core competencies that will help sustained competitive advantage.
(vi) Global Benchmarking: is an extension of Strategic Benchmarking to include benchmarking partners on a global scale. E.g. Ford Co. of USA benchmarked its A/c payable functions with that of Mazada in Japan and found to its astonishment that the entire function was managed by 5 persons as against 500 in Ford.
Bench Trending and difference with Bench Marking
Bench Trending: Continuous monitoring of specific process performance with a selected group of benchmarking is a systematic and continuous measurement process of comparing through measuring an organization business processes against business leaders (role models) anywhere in the world, to gain information that will help
THE INSTITUTE OF COST ACCOUNTANTS OF INDIA 255
Activity Based Cost Management - JIT and ERP
organization take action to improve its performance. The continuous process of enlisting the best practices in the world for the processes, goals and objectives leading to world class levels of achievement.
Benchmarking is the process of comparing the cost, time or quality of what one organization does against what another organization does. The result is often a business case for making changes in order to make improvements.
Benchmarking is a powerful management tool because it overcomes “paradigm blindness”. Paradigm Blindness can be summed up as the mode of thinking, “the way we do it is the best because this is the way we’ve always done it”. Bench Marking opens organizations to new methods, ideas and tools to improve their effectiveness. It helps crack through resistance to change by demonstrating other methods of solving problems than the one currently employed and demonstrating that they work, because they are being used by others.
(a) Identify your problem areas.
(b) Identify other industries that have similar processes.
(c) Identify organizations that are leaders in these areas.
(d) Survey companies for measures and practices
(e) Visit the “best practice” companies to identify leading edge practices.
(f) Implement new and improved business practices.
Stages in the process of Bench Marking
The process of benchmarking involves the following stages:
Stage Description1 Planning -
a) Determination of Benchmarking goal statement,b) Identification of best performancec) Establishment of the benchmarking or process improvement team, andd) Defining the relevant benchmarking measures
2 Collection of Data and Information3 Analysis of the findings based on the data collected in Stage 24 Formulation and implementation of recommendations5 Constant monitoring and reviewing
Various stages in the process of Bench Marking detailed understanding
Stage 1: Planning
(a) Determination of benchmarking goal statement: This requires identification of areas to be benchmarked, which uses the following criteria –
Benchmark for Customer Satisfaction Benchmark for improving Bottom line (Profit)• Consistency of product or service • Waste and reject levels• Process cycle time • Inventory levels• Delivery performance • Work-in-progress• Responsiveness to customer requirements • Cost of Sales• Adaptability to special needs • Sales per employee
(c) Identification of best performance: The next step is seeking the “best”. To arrive at the best is both expensive and time consuming, so it is better to identify a Company which has recorded performance success in a similar area.
Strategic Cost Management - Decision Making
256 THE INSTITUTE OF COST ACCOUNTANTS OF INDIA
(d) Establishment of the benchmarking or process improvement team: This should include persons who are most knowledgeable about the internal operations and will be directly affected by changes due to benchmarking.
(e) Defining the relevant benchmarking measures: Relevant measures will not be restricted to include the measures used by the Firm today, but they will be refined into measures that comprehend the true performance differences. Developing good measurement is key or critical to successful benchmarking.
Stage 2: Collection of data and information: This involves the following steps –
(a) Compile information and data on performance. They may include mapping processes.
(b) Select and contact partners.
(c) Develop a mutual understanding about the procedures to be followed and, if necessary, prepare a Benchmarking Protocol with partners.
(d) Prepare questions and agree terminology and performance measures to be used.
(e) Distribute a schedule of questions to each partner.
(f) Undertake information and data collection by chosen method for example, interviews, site-visits, telephone tax and e-mail.
(g) Collect the findings to enable analysis.
Stage 3: Analysis of findings:
(a) Review the findings and produce tables, charts and graphs to support the analysis
(b) Identify gaps in performance between out Firm and better performers.
(c) Seek explanations for the gaps in performance. The performance gaps can be positive, negative or zero.
(d) Ensure that comparisons are meaningful and credible
(e) Communicate the findings to those who are affected.
(f) Identify realistic opportunities for improvements. The negative performance gap indicates an undesirable competitive position and provides a basis for performance improvement. If there is no gap it may indicate a neutral position relative to the performance being benchmarked. The zero position should be analysed for identifying means to transform its performance to a level of superiority or positive gap.
Stage 4: Recommendations:
Making recommendations Implementing recommendations• Deciding the feasibility of making the improvements in
the light of conditions that apply within own FirmImplement the action plans
• Agreement on the improvements that are likely to be feasible
Monitor performance
• Producing a report on the Benchmarking in which the recommendations are included
Reward and communicate success.
• Obtaining the support of owners/management for making the changes needed.
Keep owners/management informed of progress
• Developing action plan(s) for implementation.
Stage 5: Monitoring and reviewing: This involves –
(a) Evaluating the benchmarking process undertaken and the results of the improvements against objectives and success criteria plus overall efficiency and effectiveness.
(b) Documenting the lessons learnt and make them available to others.
(c) Periodically re-considering the benchmarks for continuous improvement.
THE INSTITUTE OF COST ACCOUNTANTS OF INDIA 257
Activity Based Cost Management - JIT and ERP
Pre-requisites of Bench Marking Pre-requisites of Bench Marking
1. Commitment: Senior Managers should support benchmarking fully and must be omitted to continuous improvements.
2. Clarity of Objectives: The objectives should be clearly defined at the preliminary stage. Benchmarking teams have a clear picture of their Firm’s performance before approaching others for comparisons.
3. Appropriate Scope: The scope of the work should be appropriate in the light of the objectives, resources, time available and the experience level of those involved.
4. Resources: Sufficient resources must be available to complete projects within the required time scale.
5. Skills: Benchmarking teams should have appropriate skills and competencies.
6. Communication: Stakeholders, and also staff and their representatives, are to be kept informed of the reasons for benchmarking.
Define difficulties in implementation of Bench Marking
1. Time consuming: Benchmarking is time consuming and at times difficult. It has significant requirement of staff time and Company resources. Companies may waste time in benchmarking non-critical functions.
2. Lack of management Support: Benchmarking implementation requires the direct involvement of all managers. The drive to be best in the industry or world cannot be delegated.
3. Resistance from employees: It is likely that their maybe resistance from employees.
4. Paper Goals: Companies can become pre-occupied with the measures. The goal becomes not to improve process, but to match the best practices at any cost.
5. Copy-paste attitude: The key element in benchmarking is the adaptation of a best practice to tailor it to a company’s needs and culture. Without that step, a company merely adopts another company’s process. This approach condemns benchmarking to fail leading to a failure of bench marking goals.

Strategic Cost Management - Decision Making
258 THE INSTITUTE OF COST ACCOUNTANTS OF INDIA
THE INSTITUTE OF COST ACCOUNTANTS OF INDIA 259
Cost of Quality and Total Quality Management
This Study Note includes
5.1 Total Quality Management (TQM)
5.2 Praise Analysis
5.3 Six Sigma
5.4 Pareto Analysis
5.5 Quality Costs
Study Note - 5COST OF QUALITY AND TOTAL QUALITY MANAGEMENT
5.1 TOTAL QUALITY MANAGEMENT (TQM)
Total Quality Management is a philosophy of continuously improving the quality of all the products and processes in response to continuous feedback for meeting the customers’ requirements. It aims to do things right the first time, rather than need to fix problems after they emerge (A company should avoid defects rather than correct them). Its basic objective is customer satisfaction.
The elements of TQM are:
Total Quality involves everyone and all activities in the company (Mobilizing the whole organization to achieve quality continuously and economically)
Quality Understanding and meeting the customers’ requirements. (Satisfying the customers first time every time)
Management Quality can and must be managed (Avoid defects rather than correct them)
TQM is a vision based, customer focused, prevention oriented, continuously improvement strategy based on scientific approach adopted by cost conscious people committed to satisfy the customers first time every time. It aims at Managing an organization so that it excels in areas important to the customer.
The underlying principles of TQM:
The philosophy of TQM rest on the following principles which are enlisted below:
1. Clear exposition of the benefits of a project.
2. Total Employee involvement (TEI).
3. Process measurement.
4. Involvement of all customers and contributors.
5. Elimination of irrelevant data.
6. Understanding the needs of the whole process.
7. Use of graphical and pictorial techniques to achieve understanding.
8. Establishment of performance specifications and targets.
9. Use of errors to prompt continuous improvement.
10. Use of statistics to tell people how well they are doing
Strategic Cost Management - Decision Making
260 THE INSTITUTE OF COST ACCOUNTANTS OF INDIA
Steps in Total Quality Management:
Step 1: Identification of customers/customer groups:
Through a team approach (a technique called Multi-Voting), the Firm should identify major customer groups. This helps in generating priorities in the identification of customers and critical issues in the provision of decision-support information.
Step 2: Identifying customer expectations:
Once the major customer groups are identified, their expectations are listed. The question to be answered is - What does the customer expect from the Firm?
Step 3: Identifying customer decision-making requirements and product utilities:
By identifying the need to stay close to the customers and follow their suggestions, a decision-support system can be developed, incorporating both financial and non-financial and non-financial information, which seeks to satisfy user requirements. Hence, the Firm finds out the answer to - What are the customer’s decision-making requirements and product utilities? The answer is sought by listing out managerial perceptions and not by actual interaction with the customers.
Step 4: Identifying perceived problems in decision-making process and product utilities:
Using participative processes such as brainstorming and multi-voting, the Firm seeks to list out its perception of problem areas and shortcomings in meeting customer requirements. This will list out areas of weakness where the greatest impact could be achieved through the implementation of improvements. The Firm identifies the answer to the question - What problem areas do we perceive in the decision-making process?
Step 5: Comparison with other Firms and benchmarking:
Detailed and systematic internal deliberations allow the Firm to develop a clear idea of their own strengths and weaknesses and of the areas of most significant deficiency. Benchmarking exercise allows the Firm to see how other Companies are coping with similar problems and opportunities.
Step 6: Customer Feedback:
Steps 1 to 5 provide a information base developed without reference to the customer. This is rectified at Steps 6 with a survey of representative customers, which embraces their views on perceived problem areas. Interaction with the customers and obtaining their views helps the Firm in correcting its own perceptions and refining its processes.
Steps 7 & 8: Identification of improvement opportunities and implementation of Quality Improvement Process:
The outcomes of the customer survey, benchmarking and internal analysis, provides the inputs for Steps 7 and 8, i.e. the identification of improvement opportunities and the implementation of a formal improvement process. This is done through a six-step process called PRAISE, for short.
6C’s and 4P’s
The essential requirements for successful implementation are described as the six C’s of TQM. These are:
The 6C’sCommitment If a TQM culture is to be developed, total commitment must come from top management.
It is not sufficient to delegate ‘quality’ issues to a single person. Quality expectations must be made clear by the top management, together with the support and training required for its achievement.
Culture Training lies at the centre of effecting a change in culture and attitudes. Negative perceptions must be changed to encourage individual contributions and to make ‘quality’ a normal part of everyone’s job.
THE INSTITUTE OF COST ACCOUNTANTS OF INDIA 261
Cost of Quality and Total Quality Management
Continuous improvement
TQM should be recognised as a ‘continuous process’. It is not a ‘one-time programme’. There will always be room for improvement, however small it may be.
Co-operation TQM visualises Total Employee Involvement (TEI). Employee involvement and co-operation should be sought in the development of improvement strategies and associated performance measures.
Customer focus The needs of external customers (in receipt of the final product or service) and also the internal customers (colleagues who receive and supply goods, services or information), should be the prime focus.
Control Documentation, procedures and awareness of current best practice are essential if TQM implementations are to function appropriately. Unless control procedures are in place, improvements cannot be monitored and measured nor deficiencies corrected.
It is possible that the organisation is led to Total Quality Paralysis, instead of improvement, by improper implementation of TQM. To avoid such disruption and paralysis the following principles (called the four P’s) of TQM should be followed:
The 4P’sPeople To avoid misdirection, TQM teams should consist of team spirited individuals who have a flair for
accepting and meeting challenges. Individuals who are not ideally suited to the participatory process of TQM, should not be involved at all, e.g. lack of enthusiasm, non-attendance at TQM meetings, failure to complete delegated work, remaining a “Mute Spectator” at TQM meetings, etc.
Process It is essential to approach problem-solving practically and to regard the formal process as a system designed to prevent participants from jumping to conclusions. As such, it will provide a means to facilitate the generation of alternatives while ensuring that important discussion stages are not omitted.
Problem Problems need to be approached in a systematic manner, with teams tackling solvable problems with a direct economic impact, allowing for immediate feedback together with recognition of the contribution made by individual participants.
Preparation Additional training on creative thinking and statistical processes are needed in order to give participants a greater appreciation of the diversity of the process. This training must quickly be extended beyond the immediate accounting circle to include employees at supervisory levels and also who are involved at the data input stagey
5.2 PRAISE ANALYSIS
Identification of improvement opportunities and implementation of quality improvement process, of the TQM Process is through a six-step activity sequence, identified by the acronym ‘PRAISE’.
Step Activity Elements 1 Problem
Identification • Areas of customer dissatisfaction. • Absence of competitive advantage.
2 Ranking • Prioritise problems and opportunities by –1. Perceived importance, and 2. Ease of measurement and solution.
3 Analysis • Ask “Why?” to identify possible causes. Keep asking ‘Why?’ beyond to the move symptoms and to avoid jumping to premature conclusion;,.
• Ask ‘What?’ to consider potential implications. • Ask ‘How much?’ to quantify cause and effect.
Strategic Cost Management - Decision Making
262 THE INSTITUTE OF COST ACCOUNTANTS OF INDIA
4 Innovation • Use creative thinking to generate potential solutions. • Operationalise these solutions by identifying – 1. Barriers to implementation, 2. Available enablers, and 3. People whose co-operation must be sought.
5 Solution • Implement the preferred solution. • Take appropriate action to bring about the required changes. • Reinforce with training and documentation back-up.
6 Evaluation • Monitor the effectiveness of actions. • Establish and interpret performance indicators to track progress towards objectives • Identify the potential for further improvements and return to Step 1.
Difficulties in PRAISE Analysis
Step Activity Difficulties Remedies 1 Problem
Identification • Effects of a problem are apparent, but the
problems themselves are difficult to identify.• Problem may be identifiable, but it is difficult
to identify a measurable improvement opportunity.
• Some problems are too vague to define e.g. morale, communication, productivity etc.
• Participative approaches like brainstorming, multi-voting, panel discussion.
• Quantification and precise definition of problems.
2 Ranking • Difference in perception of individuals in ranking • Difference in preferences based on functions,
e.g. production, finance, marketing etc. • Lack of consensus between individuals.
• Participative Approach. • Subordination of individual
to group interest.
3 Analysis • Adoption of adhoc approaches and quick-fix solutions.
• Lateral Thinking. • Brainstorming.
4 Innovation • Lack of creativity or expertise. • Inability to operationalise ideas, i.e. convert
thoughts into action points.
• Systematic evaluation of all aspects of each strategy.
5 Solution • Resistance from middle managers. • Effective internal communication.
• Training of personnel and managers.
• Participative approach. 6 Evaluation • Problems in implementation.
• Lack of measurable data for comparison of expectations with actuals.
• Effective Control System to track actuals.
• Feedback system.
Central to the PRAISE system are - (a) Quality Control - the search for continuous improvements in quality -and (b) Total Employee Involvement - the co-operation and commitment of employees. This dual approach provides a single focus - the customer - whose increased satisfaction remains the primary goal of the procedure.
Implementation of PRAISE ProcessA three-point action plan for implementation of the process is -1. Small to Big Issues: Big improvement opportunities are generally complex and require extensive
interdepartmental co-operation. The choice of a relatively small problem in the first instance provides a greater chance of success. Therefore, the TQM team has to proceed from small to big issues gradually.
THE INSTITUTE OF COST ACCOUNTANTS OF INDIA 263
Cost of Quality and Total Quality Management
2. Solvable problem: The problem selected should not be trivial, but it should be one with a potential impact and a clear improvement opportunity. Measurable progress towards implementation should be accomplished within a reasonable time in order to maintain the motivation of participants and advertise the success of the improvement itself.
3. Recognition of participants: The successful projects and team members should receive appropriate recognition. Prominent individuals should be rewarded for their efforts through monetary / non-monetary prices as a measure of personal recognition and as encouragement to others.
5.3 SIX SIGMA
Six Sigma has two key methodologies: DMAIC and DMADV, both inspired by W. Edwards Deming’s Plan-Do-Check-Act Cycle: DMAIC is used to improve an existing business process, and DMADV is used to create new product or process designs for predictable, defect-free performance.
DMAIC
� Basic methodology consists of the following five (5) steps:
� Definethe process improvement goals that are consistent with customer demands and enterprise strategy.
� Measure the current process and collect relevant data for future comparison.
� Analyze to verify relationship and causality of factors. Determine what the relationship is, and attempt to ensure that all factors have been considered.
� Improve or optimize the process based upon the analysis using techniques like Design of Experiments.
� Controlto ensure that any variances are corrected before they result in defects. Set up pilot runs to establish process capability, transition to production and thereafter continuously measure the process and institute control mechanisms.
DMIADV
Basic methodology consists of the following five steps:
� Definethe goals of the design activity that are consistent with customer demands and enterprise strategy.
� Measure and identify CTQs (critical to qualities), product capabilities, production process capability, and risk assessments.
� Analyze to develop and design alternatives, create high-level design and evaluate design capability to select the best design.
� Designdetails, optimize the design, and plan for design verification. This phase may require simulations.
� Verifythe design, set up pilot runs, implement production process and handover to process owners.
Some people have used DMAICR (Realize). Others contend that focusing on the financial gains realized through Six Sigma is counter-productive and that said financial gains are simply byproducts of a good process improvement.
Key roles required for successful implementation of Six Sigma
Six Sigma identifies several key roles for its successful implementation:
1. Executive Leadership includes CEO and other key top management team members. They are responsible for setting up a vision for Six Sigma implementation. They also empower the other role holders with the freedom and resources to explore new ideas for breakthrough improvements.
2. Champions are responsible for the Six Sigma implementation across the organization in an integrated manner. The Executive Leadership draws them from the upper management. Champions also act as mentors to Black Belts. At GE this level of certification is now called “Quality Leader”.
Strategic Cost Management - Decision Making
264 THE INSTITUTE OF COST ACCOUNTANTS OF INDIA
3. Master Black Belts, identified by champions, act as in-house expert coaches for the organization on Six Sigma. They devote 100% of their time to Six Sigma. They assist champions and guide Black Belts and Green Belts. Apart from the usual rigour of statistics, their time is spent on ensuring integrated deployment of Six Sigma across various functions and departments.
4. Experts this level of skill is used primarily within Aerospace and Defense Business Sectors. Experts work across company boundaries, improving services, processes, and products for their suppliers, their entire campuses, and for their customers. Raytheon Incorporated was one of the first companies to introduce Experts to their organizations. At Raytheon, Experts work not only across multiple sites, but across business divisions, incorporating lessons learned throughout the company.
5. Black Belts operate under Master Black Belts to apply Six Sigma methodology to specific projects. They devote 100% of their time to Six Sigma. They primarily focus on Six Sigma project execution, whereas Champions and Master Black Belts focus on identifying projects/functions for Six Sigma.
6. Green Belts are the employees who take up Six Sigma implementation along with their other job responsibilities. They operate under the guidance of Black Belts and support them in achieving the overall results.
7. Yellow Belts are employees who have been trained in Six Sigma techniques as part of a corporate-wide initiative, but have not completed a Six Sigma project and are not expected to actively engage in quality improvement activities.
Six Sigma process in Quality Control Process.
Six Sigma is a set of practices originally developed by Motorola to systematically improve processes by eliminating defects. A defect is defined as non-conformity of a product or service to its specifications.
While the particulars of the methodology were originally formulated by Bill Smith at Motorola in 1986, Six Sigma was heavily inspired by six preceding decades of quality improvement methodologies such as quality control, TQM, and Zero Defects. Like its predecessors, Six Sigma asserts the following:
(a) Continuous efforts to reduce variation in process outputs is key to business success
(b) Manufacturing and business processes can be measured, analyzed, improved and controlled
(c) Succeeding at achieving sustained quality improvement requires commitment from the entire organization, particularly from top-level management.
The term “Six Sigma” refers to the ability of highly capable processes to produce output within specification. In particular, processes that operate with six sigma quality produce at defect levels below 3.4 defects per (one) million opportunities (DPMO). Six Sigma’s implicit goal is to improve all processes to that level of quality or better.
5.4 PARETO ANALYSIS
Pareto Analysis is a rule that recommends focus on the most important aspects of the decision making in order to simplify the process of decision making. It is based on the 80 : 20 rule that was a phenomenon first observed by Vilfredo Pareto, a nineteenth century Italian economist. He noticed that 80% of the wealth of Milan was owned by 20% of its citizens. This phenomenon, or some kind of approximation of it say, (70: 30 etc.) can be observed in many different business situations. The management can use it in a number of different circumstances to direct management attention to the key control mechanism or planning aspects. It helps to clearly establish top priorities and to identify both profitable and unprofitable targets.
Usefulness of Pareto Analysis: It provides the mechanism to control and direct effort by fact, not by emotions. It helps to clearly establish top priorities and to identify both profitable and unprofitable targets.
Pareto analysis is useful to:
(i) Prioritize problems, goals, and objectives to Identify root causes.
(ii) Select and define key quality improvement programs.
(iii) Select key customer relations and service programs.(iv) Select key employee relations improvement programs.
THE INSTITUTE OF COST ACCOUNTANTS OF INDIA 265
Cost of Quality and Total Quality Management
(v) Select and define key performance improvement programs.(vi) Maximize research and product development time.(vii) Verify operating procedures and manufacturing processes.(viii) Product or services sales and distribution.(ix) Allocate physical, financial and human resources.
Application of Pareto Analysis:
Pareto analysis may be applicable in the presentation of Performance Indicators data through selection of representative process characteristics that truly determine or directly or indirectly influence or conform the desired quality or performance result or outcome. The Pareto Analysis is generally applicable to the following business situations:
(i) Pricing of a product:• In the case of a firm dealing with multi products, it would not be possible for it to analyse cost-profit- price
-volume relationships for all of them. In practice, in case of such firm approximately 20% of products may account for about 80% of total sales revenue. Pareto Analysis is used for analysing the firm estimated sales revenues from various products and it might indicate that approximately 80% of its total sales revenue is earned from about 20% of its products.
• Such analysis helps the top management to delegate the pricing decision for approximately 80% of its products to the lower levels of management, thus freeing themselves to concentrate on the pricing decisions for products approximately 20% which are essential for the company’s survival.
• Thus, a firm can adopt more sophisticated pricing methods for small proportion of products that jointly accounts for approximately 80% of total sales revenue. For the remaining 80% of the products which account for 20% of total sales revenue the firm may use cost based pricing method.
(ii) Customer Profitability analysis:• Instead of analysing products, customers can be analysed for their relative profitability to the organisation.• Again it is often found that approximately 20% of customers generate 80% of the profit.. There will always
be some customers who are less profitable than others, just as some products are less profitable than others.
• Such an analysis is useful too! for evaluation of the portfolio of customer profile and decision making such as whether to continue serving a same customer group, what is the extent of promotion expenses to be incurred.
(iii) ABC analysis- Stock Control: Another application of Pareto analysis is in stock control where it may be found that only a few of the goods in stock make up most of the value. In practice approximately 20% of the total quantity of stock may account for about 80% of its value. The outcome of such analysis is that by concentrating on small proportion of stock items that jointly accounts for 80% of the total value, a firm may well be able to control most of monetary investment in stocks.
(iv) Application in Activity Based Costing: In Activity Based Costing it is often said that 20% of an organisation cost drivers are responsible for 80% of the total cost. By analysing, monitoring and controlling those cost drivers that cause most cost, a better control and understanding of overheads will be obtained.
(v) Quality Control:• Pareto analysis seeks to discover from an analysis of defect report or customer complaints which “vital
few” causes are responsible for most of the reported problems.
• Often, 80% of reported problems can usually be traced to 20% of the various underlying causes. By concentrating once efforts on rectifying the vital 20%, one can have the greatest immediate impact on product quality.
• The Pareto Analysis indicates how frequently each type of failure (defect) occurs. The purpose of the analysis is to direct management attention to the area where the best returns can be achieved by solving most of quality problems, perhaps just with a single action.
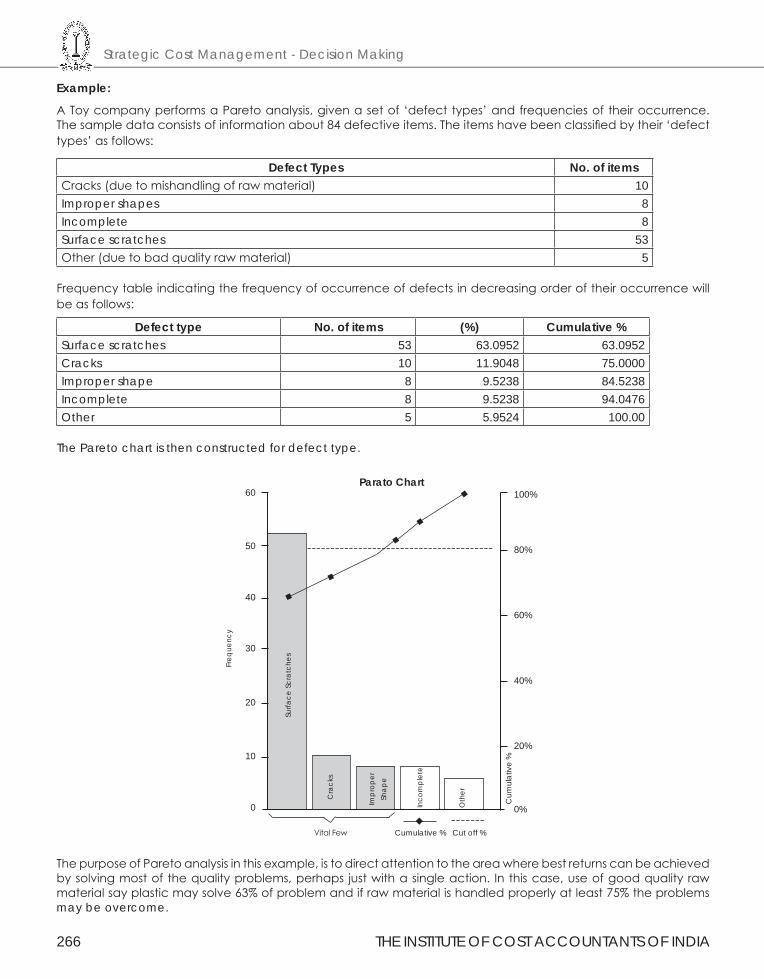
Strategic Cost Management - Decision Making
266 THE INSTITUTE OF COST ACCOUNTANTS OF INDIA
Example:
A Toy company performs a Pareto analysis, given a set of ‘defect types’ and frequencies of their occurrence. The sample data consists of information about 84 defective items. The items have been classified by their ‘defect types’ as follows:
Defect Types No. of itemsCracks (due to mishandling of raw material) 10Improper shapes 8Incomplete 8Surface scratches 53Other (due to bad quality raw material) 5
Frequency table indicating the frequency of occurrence of defects in decreasing order of their occurrence will be as follows:
Defect type No. of items (%) Cumulative %Surface scratches 53 63.0952 63.0952Cracks 10 11.9048 75.0000Improper shape 8 9.5238 84.5238Incomplete 8 9.5238 94.0476 Other 5 5.9524 100.00
The Pareto chart is then constructed for defect type.
60
50
40
20
10
0
30
100%
80%
60%
40%
20%
0%
Cum
ulat
ive
%
Parato Chart
Oth
er
Inco
mpl
ete
Impr
oper
Shap
e
Cra
cks
Surfa
ce S
crat
ches
Freq
uenc
y
Vital Few Cumulative % Cut off %
The purpose of Pareto analysis in this example, is to direct attention to the area where best returns can be achieved by solving most of the quality problems, perhaps just with a single action. In this case, use of good quality raw material say plastic may solve 63% of problem and if raw material is handled properly at least 75% the problems may be overcome.
THE INSTITUTE OF COST ACCOUNTANTS OF INDIA 267
Cost of Quality and Total Quality Management
5.5 QUALITY COSTS
Quality of product or service is decided by the customer and is built into the service on product through the design for it. A customer has certain needs or requirements for product or service. It is the design of product or service which builds these requirements as product or service specifications into the product or service–including the way the product or service would be delivered to the customer. The way the product is made or the service is delivered is according to a set of processes which are in sequence. This set of processes, their sequence and interdependence gets defined while the design activity is performed and the design of process has a direct impact on the outcome, that is, the extent to which the outcome meets the specifications developed during design. Process design also contributes to quality.
Concept of Quality
Quality as perception: You will not be wrong when you state that the term quality is a perception which is personal to an individual. In plain terms, quality is “features” or “worth” or “value”. You will realise how this is true when you read the following phrases picked from literature on quality.(i) “Quality is not an act. It is a habit”- Aristotle. This is true and applicable to any act of a human being.(ii) “Quality is conformance to requirements”: This in line with the concept that quality is decided by the customer.(iii) “Quality is zero defects”: No customer wants defects in the products or services he or she pays for. This is a
totally different idea on quality and is true when you make quality a habit.(iv) “Quality is free” - Phil Crosby. This is the utopian situation. When there are no defects then there is no wastage
and thus quality becomes free.(v) “Quality is the degree to which a set of inherent characteristics fulfils requirements”- ISO 9000. This is an
attempt to give universality to the term quality.
Today, there is no single universal definition of quality. Some people view quality as “performance to standards.”Others view it as “meeting the customer’s needs” or “satisfying the customer.” Let’s look at some of the more common definitions of quality.
• Conformance to specifications measures how well the product or service meets the targets and tolerances determined by its designers. For example, the dimensions of a machine part may be specified by its design engineers as 3 + .05 inches. This would mean that the target dimension is 3 inches but the dimensions can vary between 2.95 and 3.05 inches. Similarly, the wait for hotel room service may be specified as 20 minutes, but there may be an acceptable delay of an additional 10 minutes. Also, consider the amount of light delivered by a 60 watt light bulb. If the bulb delivers 50 watts it does not conform to specifications. As these examples illustrate, conformance to specification is directly measurable, though it may not be directly related to the consumer’s idea of quality.
• Fitness for use focuses on how well the product performs its intended function or use. For example, a Mercedes Benz and a Jeep Cherokee both meet a fitness for use definition if one considers transportation as the intended function. However, if the definition becomes more specific and assumes that the intended use is for transportation on mountain roads and carrying fishing gear, the Jeep Cherokee has a greater fitness for use. You can also see that fitness for use is a user-based definition in that it is intended to meet the needs of a specific user group.
• Value for price paid is a definition of quality that consumers often use for product or service usefulness. This is the only definition that combines economics with consumer criteria; it assumes that the definition of quality is price sensitive. For example, suppose that you wish to sign up for a personal finance seminar and discover that the same class is being taught at two different colleges at significantly different tuition rates. If you take the less expensive seminar, you will feel that you have received greater value for the price.
• Support services provided are often how the quality of a product or service is judged. Quality does not apply only to the product or service itself; it also applies to the people, processes, and organizational environment associated with it. For example, the quality of a university is judged not only by the quality of staff and course offerings, but also by the efficiency and accuracy of processing paperwork.
Strategic Cost Management - Decision Making
268 THE INSTITUTE OF COST ACCOUNTANTS OF INDIA
• Psychological criteria is a subjective definition that focuses on the judgmental evaluation of what constitutes product or service quality. Different factors contribute to the evaluation, such as the atmosphere of the environment or the perceived prestige of the product. For example, a hospital patient may receive average health care, but a very friendly staff may leave the impression of high quality. Similarly, we commonly associate certain products with excellence because of their reputation; Rolex watches and Mercedes-Benz automobiles are examples.
Differences Between Manufacturing and Service OrganizationsDefining quality in manufacturing organizations is often different from that of services. Manufacturing organizations produce a tangible product that can be seen, touched, and directly measured. Examples include cars, CD players, clothes, computers, and food items. Therefore, quality definitions in manufacturing usually focus on tangible product features. The most common quality definition in manufacturing is conformance, which is the degree to which a product characteristic meets preset standards. Other common definitions of quality in manufacturing include performance—such as acceleration of a vehicle; reliability—that the product will function as expected without failure; features—the extras that are included beyond the basic characteristics; durability— expected operational life of the product; and serviceability—how readily a product can be repaired. The relative importance of these definitions is based on the preferences of each individual customer. It is easy to see how different customers can have different definitions in mind when they speak of high product quality.In contrast to manufacturing, service organizations produce a product that is intangible. Usually, the complete product cannot be seen or touched. Rather, it is experienced. Examples include delivery of health care, experience of staying at a vacation resort, and learning at a university. The intangible nature of the product makes defining quality difficult. Also, since a service is experienced, perceptions can be highly subjective. In addition to tangible factors, quality of services is often defined by perceptual factors. These include responsiveness to customer needs, courtesyand friendlinessof staff, promptnessin resolving complaints, and atmosphere.Other definitions of quality in services include time—the amount of time a customer has to wait for the service; and consistency—the degree to which the service is the same each time. For these reasons, defining quality in services can be especially challenging. Dimensions of quality for manufacturing versus service organizations are shown in the Table.Dimensions of Quality for Manufacturing Versus Service Organizations
Manufacturing organizations Service organizationsConformance to specifications Tangible factorsPerformance ConsistencyReliability Responsiveness to customer needsFeatures Courtesy/friendlinessDurability Timeliness/ promptnessServiceability Atmosphere
Concepts of Quality ManagementQuality management is defined as “coordinated activities to direct and control an organization with regard to quality”(ISO 9000:2000). The activities are normally integrated into a system.This is known as the systems approach to managing quality and the same approach needs to be adapted to business operations. Starting from early 60s and migrating to the 70s, the practices of quality management have shown an evolution. In the following paragraphs, you will get an overview of the way these evolution started from the activity or process of “Inspection”.Inspection: Inspection is defined as “Activities such as measuring, testing and gauging one or more characteristics of a product or service and comparing with specifications as in design to determine its conformity”. This approach is the “after the event” approach, meaning the things which have happened and then which you verify by, measuring or testing and screen out those which do not meet specifications. Organisation is said to be working in a “detection” mode, having things or events which have happened! The result is that the nonconforming products are cost as they are a waste of material and as well as that of efforts or needing some rework or being sold as “seconds” at a lower price all resulting into a dent in profits. This also creates the culture of “somebody else will check my outcome and it is that somebody’s responsibility to give the conforming product”. This approach had several limitations and had to be replaced by another effective way of attaining quality and the concept of Quality Control was the result.
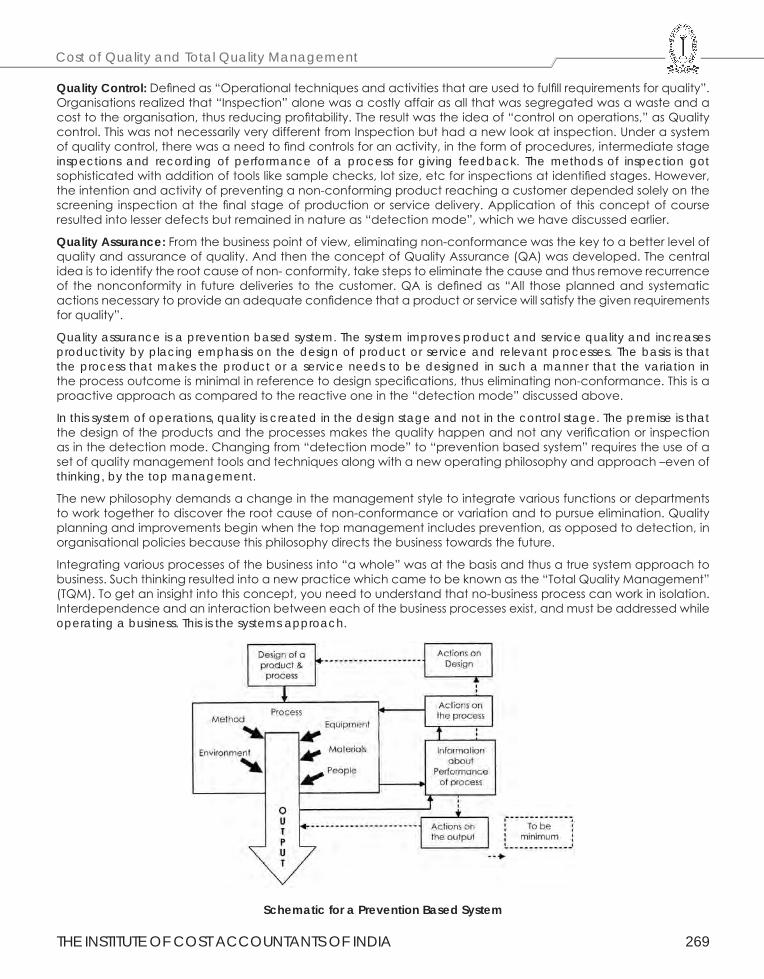
THE INSTITUTE OF COST ACCOUNTANTS OF INDIA 269
Cost of Quality and Total Quality Management
Quality Control: Defined as “Operational techniques and activities that are used to fulfill requirements for quality”. Organisations realized that “Inspection” alone was a costly affair as all that was segregated was a waste and a cost to the organisation, thus reducing profitability. The result was the idea of “control on operations,” as Quality control. This was not necessarily very different from Inspection but had a new look at inspection. Under a system of quality control, there was a need to find controls for an activity, in the form of procedures, intermediate stage inspections and recording of performance of a process for giving feedback. The methods of inspection got sophisticated with addition of tools like sample checks, lot size, etc for inspections at identified stages. However, the intention and activity of preventing a non-conforming product reaching a customer depended solely on the screening inspection at the final stage of production or service delivery. Application of this concept of course resulted into lesser defects but remained in nature as “detection mode”, which we have discussed earlier.
Quality Assurance: From the business point of view, eliminating non-conformance was the key to a better level of quality and assurance of quality. And then the concept of Quality Assurance (QA) was developed. The central idea is to identify the root cause of non- conformity, take steps to eliminate the cause and thus remove recurrence of the nonconformity in future deliveries to the customer. QA is defined as “All those planned and systematic actions necessary to provide an adequate confidence that a product or service will satisfy the given requirements for quality”.
Quality assurance is a prevention based system. The system improves product and service quality and increases productivity by placing emphasis on the design of product or service and relevant processes. The basis is that the process that makes the product or a service needs to be designed in such a manner that the variation in the process outcome is minimal in reference to design specifications, thus eliminating non-conformance. This is a proactive approach as compared to the reactive one in the “detection mode” discussed above.
In this system of operations, quality is created in the design stage and not in the control stage. The premise is that the design of the products and the processes makes the quality happen and not any verification or inspection as in the detection mode. Changing from “detection mode” to “prevention based system” requires the use of a set of quality management tools and techniques along with a new operating philosophy and approach –even of thinking, by the top management.
The new philosophy demands a change in the management style to integrate various functions or departments to work together to discover the root cause of non-conformance or variation and to pursue elimination. Quality planning and improvements begin when the top management includes prevention, as opposed to detection, in organisational policies because this philosophy directs the business towards the future.
Integrating various processes of the business into “a whole” was at the basis and thus a true system approach to business. Such thinking resulted into a new practice which came to be known as the “Total Quality Management” (TQM). To get an insight into this concept, you need to understand that no-business process can work in isolation. Interdependence and an interaction between each of the business processes exist, and must be addressed while operating a business. This is the systems approach.
Schematic for a Prevention Based System
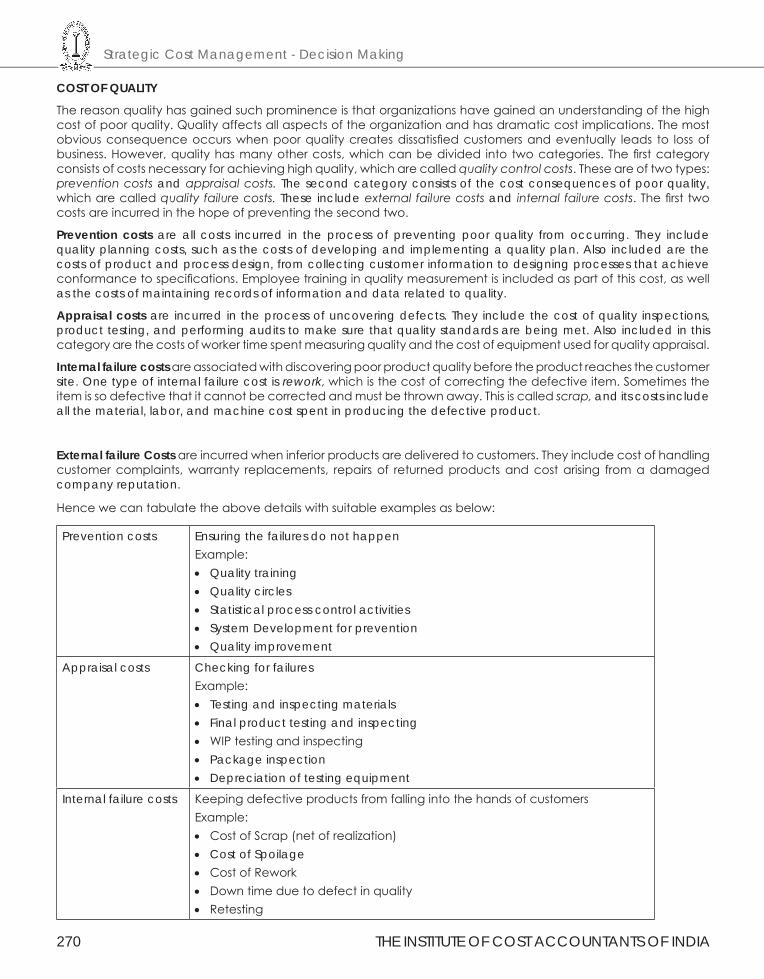
Strategic Cost Management - Decision Making
270 THE INSTITUTE OF COST ACCOUNTANTS OF INDIA
COST OF QUALITY
The reason quality has gained such prominence is that organizations have gained an understanding of the high cost of poor quality. Quality affects all aspects of the organization and has dramatic cost implications. The most obvious consequence occurs when poor quality creates dissatisfied customers and eventually leads to loss of business. However, quality has many other costs, which can be divided into two categories. The first category consists of costs necessary for achieving high quality, which are called qualitycontrolcosts. These are of two types: preventioncostsand appraisalcosts.The second category consists of the cost consequences of poor quality, which are called qualityfailurecosts.These include externalfailurecostsand internalfailurecosts. The first two costs are incurred in the hope of preventing the second two.
Prevention costs are all costs incurred in the process of preventing poor quality from occurring. They include quality planning costs, such as the costs of developing and implementing a quality plan. Also included are the costs of product and process design, from collecting customer information to designing processes that achieve conformance to specifications. Employee training in quality measurement is included as part of this cost, as well as the costs of maintaining records of information and data related to quality.
Appraisal costs are incurred in the process of uncovering defects. They include the cost of quality inspections, product testing, and performing audits to make sure that quality standards are being met. Also included in this category are the costs of worker time spent measuring quality and the cost of equipment used for quality appraisal.
Internal failure costs are associated with discovering poor product quality before the product reaches the customer site. One type of internal failure cost is rework, which is the cost of correcting the defective item. Sometimes the item is so defective that it cannot be corrected and must be thrown away. This is called scrap,and its costs include all the material, labor, and machine cost spent in producing the defective product.
External failure Costs are incurred when inferior products are delivered to customers. They include cost of handling customer complaints, warranty replacements, repairs of returned products and cost arising from a damaged company reputation.
Hence we can tabulate the above details with suitable examples as below:
Prevention costs Ensuring the failures do not happenExample: • Quality training • Quality circles • Statistical process control activities• System Development for prevention • Quality improvement
Appraisal costs Checking for failures Example:• Testing and inspecting materials • Final product testing and inspecting • WIP testing and inspecting • Package inspection• Depreciation of testing equipment
Internal failure costs Keeping defective products from falling into the hands of customers Example:• Cost of Scrap (net of realization)• Cost of Spoilage • Cost of Rework • Down time due to defect in quality • Retesting
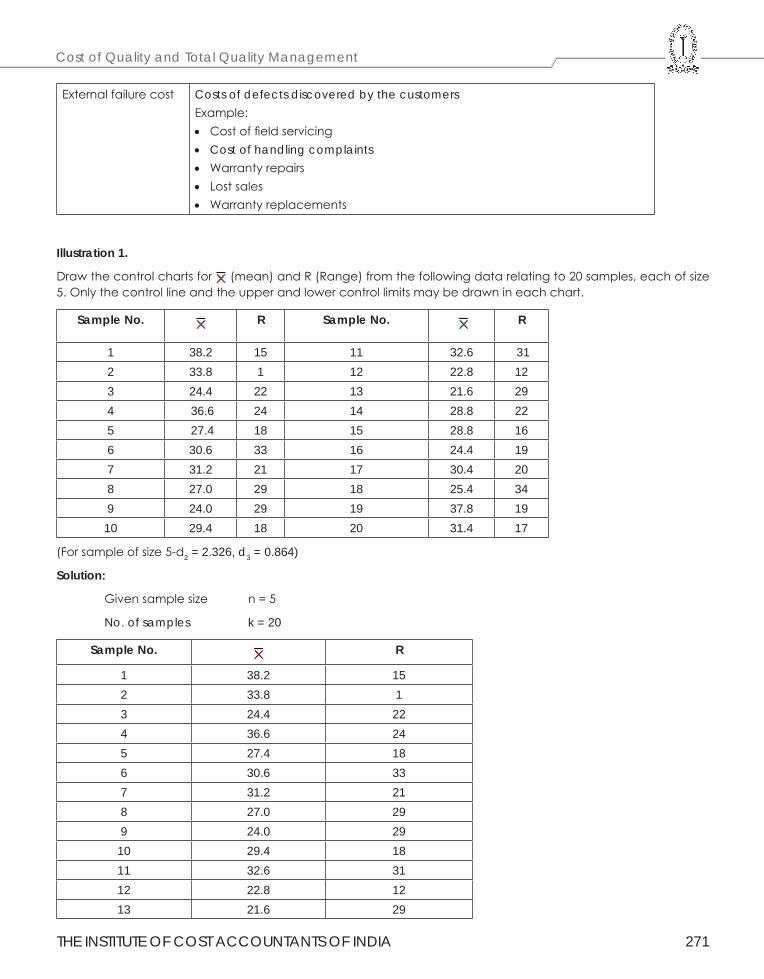
THE INSTITUTE OF COST ACCOUNTANTS OF INDIA 271
Cost of Quality and Total Quality Management
External failure cost Costs of defects discovered by the customersExample:• Cost of field servicing • Cost of handling complaints • Warranty repairs • Lost sales • Warranty replacements
Illustration 1.
Draw the control charts for (mean) and R (Range) from the following data relating to 20 samples, each of size 5. Only the control line and the upper and lower control limits may be drawn in each chart.
Sample No. R Sample No.
R
1 38.2 15 11 32.6 312 33.8 1 12 22.8 123 24.4 22 13 21.6 294 36.6 24 14 28.8 225 27.4 18 15 28.8 166 30.6 33 16 24.4 197 31.2 21 17 30.4 208 27.0 29 18 25.4 349 24.0 29 19 37.8 19
10 29.4 18 20 31.4 17
(For sample of size 5-d2 = 2.326, d3 = 0.864)
Solution:
Given sample size n = 5
No. of samples k = 20
Sample No. R
1 38.2 152 33.8 13 24.4 224 36.6 245 27.4 186 30.6 337 31.2 218 27.0 299 24.0 2910 29.4 1811 32.6 3112 22.8 1213 21.6 29
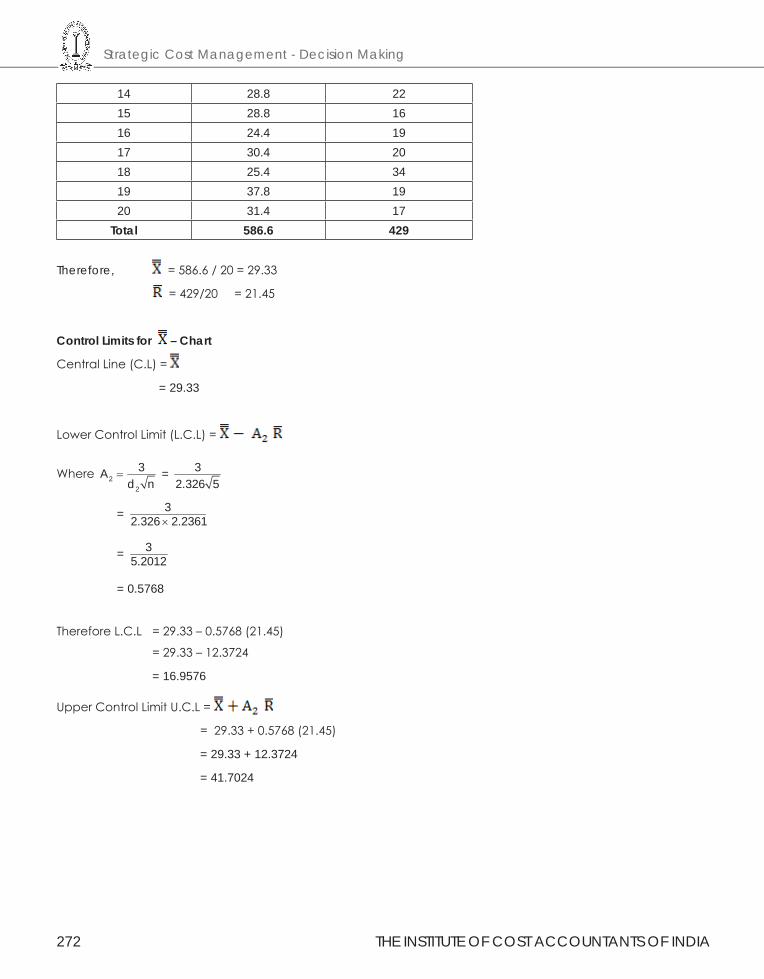
Strategic Cost Management - Decision Making
272 THE INSTITUTE OF COST ACCOUNTANTS OF INDIA
14 28.8 2215 28.8 1616 24.4 1917 30.4 2018 25.4 3419 37.8 1920 31.4 17
Total 586.6 429
Therefore, = 586.6 / 20 = 29.33
= 429/20 = 21.45
Control Limits for – Chart
Central Line (C.L) =
= 29.33
Lower Control Limit (L.C.L) =
Where 22
3Ad n
= = 3
2.326 5
= 32.326 2.2361×
= 35.2012
= 0.5768
Therefore L.C.L = 29.33 – 0.5768 (21.45)
= 29.33 – 12.3724
= 16.9576
Upper Control Limit U.C.L =
= 29.33 + 0.5768 (21.45)
= 29.33 + 12.3724
= 41.7024
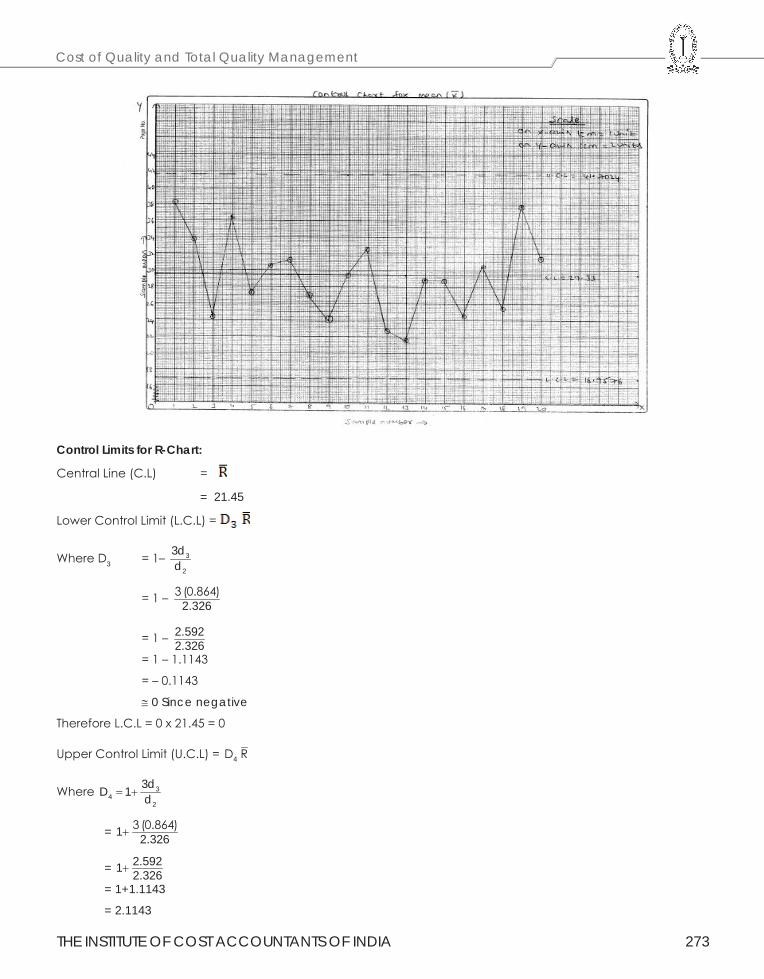
THE INSTITUTE OF COST ACCOUNTANTS OF INDIA 273
Cost of Quality and Total Quality Management
Control Limits for R-Chart:
Central Line (C.L) =
= 21.45
Lower Control Limit (L.C.L) =
Where D3 = 1– 3
2
3dd
= 1 – 3 (0.864)2.326
= 1 – 2.5922.326
= 1 – 1.1143
= – 0.1143
@ 0 Since negative
Therefore L.C.L = 0 x 21.45 = 0
Upper Control Limit (U.C.L) = 4D R
Where 34
2
3dD 1 d= +
= 3 (0.864)1 2.326+
= 2.5921 2.326+
= 1+1.1143
= 2.1143
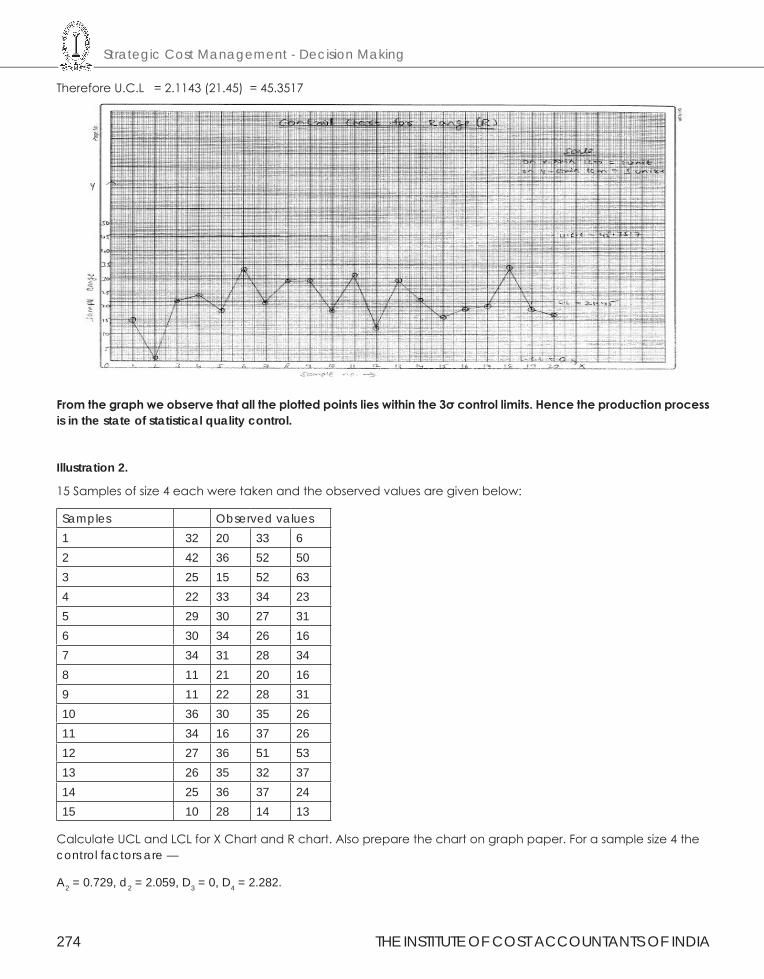
Strategic Cost Management - Decision Making
274 THE INSTITUTE OF COST ACCOUNTANTS OF INDIA
Therefore U.C.L = 2.1143 (21.45) = 45.3517
From the graph we observe that all the plotted points lies within the 3σ control limits. Hence the production process is in the state of statistical quality control.
Illustration 2.
15 Samples of size 4 each were taken and the observed values are given below:
Samples Observed values1 32 20 33 62 42 36 52 503 25 15 52 634 22 33 34 235 29 30 27 316 30 34 26 167 34 31 28 348 11 21 20 169 11 22 28 3110 36 30 35 2611 34 16 37 2612 27 36 51 5313 26 35 32 3714 25 36 37 2415 10 28 14 13
Calculate UCL and LCL for X Chart and R chart. Also prepare the chart on graph paper. For a sample size 4 the control factors are —
A2 = 0.729, d2 = 2.059, D3 = 0, D4 = 2.282.
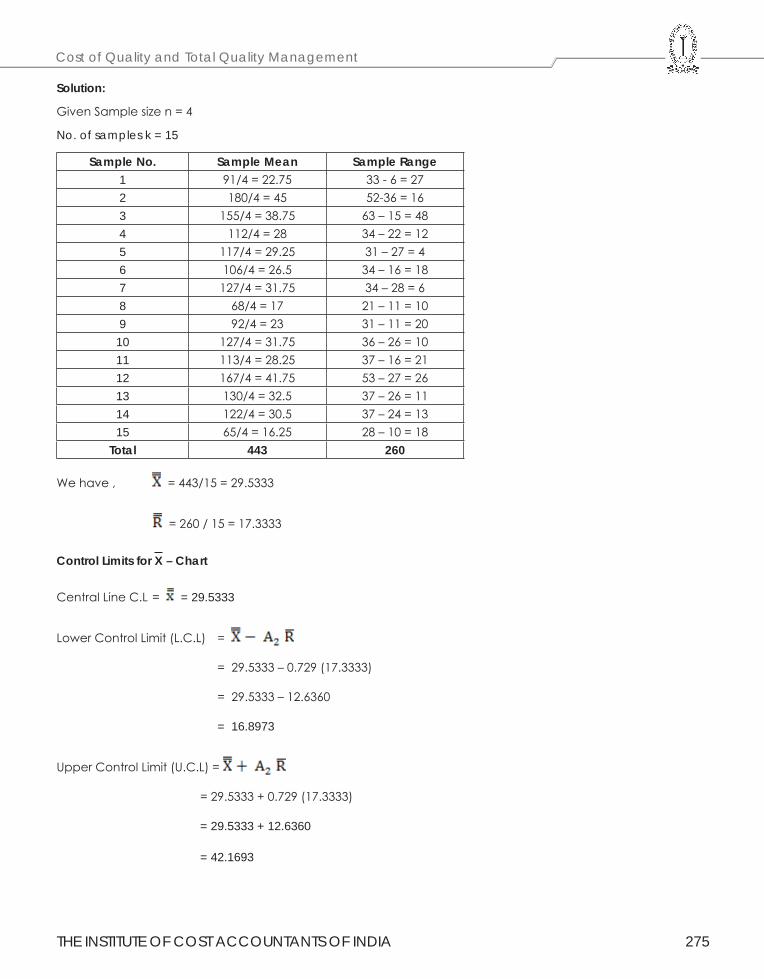
THE INSTITUTE OF COST ACCOUNTANTS OF INDIA 275
Cost of Quality and Total Quality Management
Solution:
Given Sample size n = 4
No. of samples k = 15
Sample No. Sample Mean Sample Range1 91/4 = 22.75 33 - 6 = 272 180/4 = 45 52-36 = 163 155/4 = 38.75 63 – 15 = 484 112/4 = 28 34 – 22 = 125 117/4 = 29.25 31 – 27 = 46 106/4 = 26.5 34 – 16 = 187 127/4 = 31.75 34 – 28 = 68 68/4 = 17 21 – 11 = 109 92/4 = 23 31 – 11 = 20
10 127/4 = 31.75 36 – 26 = 1011 113/4 = 28.25 37 – 16 = 2112 167/4 = 41.75 53 – 27 = 2613 130/4 = 32.5 37 – 26 = 1114 122/4 = 30.5 37 – 24 = 1315 65/4 = 16.25 28 – 10 = 18
Total 443 260
We have , = 443/15 = 29.5333
= 260 / 15 = 17.3333
Control Limits for X – Chart
Central Line C.L = = 29.5333
Lower Control Limit (L.C.L) =
= 29.5333 – 0.729 (17.3333)
= 29.5333 – 12.6360
= 16.8973
Upper Control Limit (U.C.L) =
= 29.5333 + 0.729 (17.3333)
= 29.5333 + 12.6360
= 42.1693
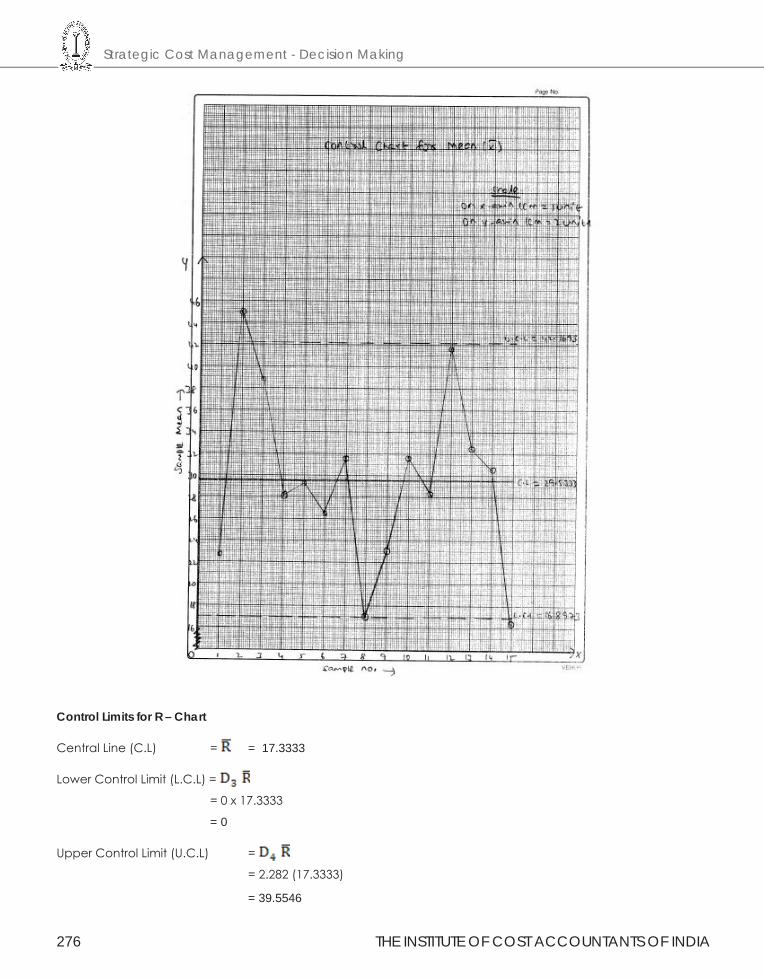
Strategic Cost Management - Decision Making
276 THE INSTITUTE OF COST ACCOUNTANTS OF INDIA
Control Limits for R – Chart
Central Line (C.L) = = 17.3333
Lower Control Limit (L.C.L) =
= 0 x 17.3333
= 0
Upper Control Limit (U.C.L) =
= 2.282 (17.3333)
= 39.5546
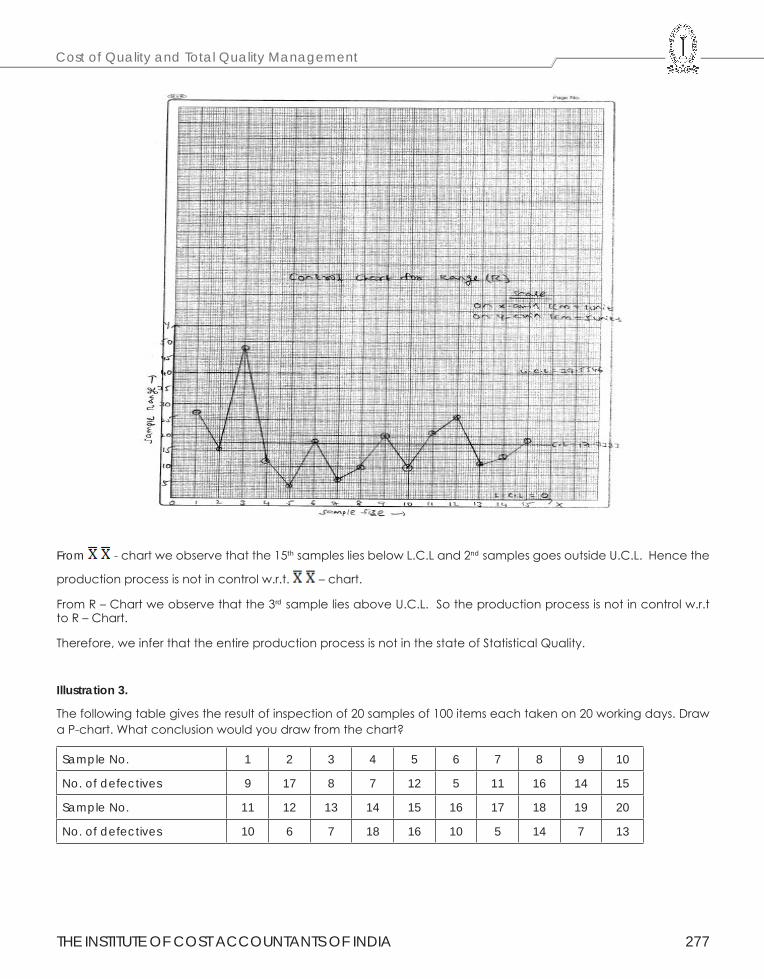
THE INSTITUTE OF COST ACCOUNTANTS OF INDIA 277
Cost of Quality and Total Quality Management
From - chart we observe that the 15th samples lies below L.C.L and 2nd samples goes outside U.C.L. Hence the
production process is not in control w.r.t. – chart.
From R – Chart we observe that the 3rd sample lies above U.C.L. So the production process is not in control w.r.t to R – Chart.
Therefore, we infer that the entire production process is not in the state of Statistical Quality.
Illustration 3.
The following table gives the result of inspection of 20 samples of 100 items each taken on 20 working days. Draw a P-chart. What conclusion would you draw from the chart?
Sample No. 1 2 3 4 5 6 7 8 9 10
No. of defectives 9 17 8 7 12 5 11 16 14 15
Sample No. 11 12 13 14 15 16 17 18 19 20
No. of defectives 10 6 7 18 16 10 5 14 7 13
Strategic Cost Management - Decision Making
278 THE INSTITUTE OF COST ACCOUNTANTS OF INDIA
Answer:
Given sample size n = 100
Sample No. di pi = di/1001 9 0.092 17 0.173 8 0.084 7 0.075 12 0.126 5 0.057 11 0.118 16 0.169 14 0.1410 15 0.1511 10 0.1012 6 0.0613 7 0.0714 18 0.1815 16 0.1616 10 0.1017 5 0.0518 14 0.1419 7 0.0720 13 0.13
Total -- 2.20
We have P = 2.2/20 = 0.11
q = 1 - p = 0.89
Therefore, the 3σ control limits for P – chart are
pqp 3 n±Therefore Central Line C. L = P = 0.11
Lower Control Limit (L.C.L) = pqp 3 n−
= 0.11 – (0.11)(0.89)3100
= 0.11 – 0.09387
= 0.01613
Upper Control Limit (U.C.L) = pqp 3 n±
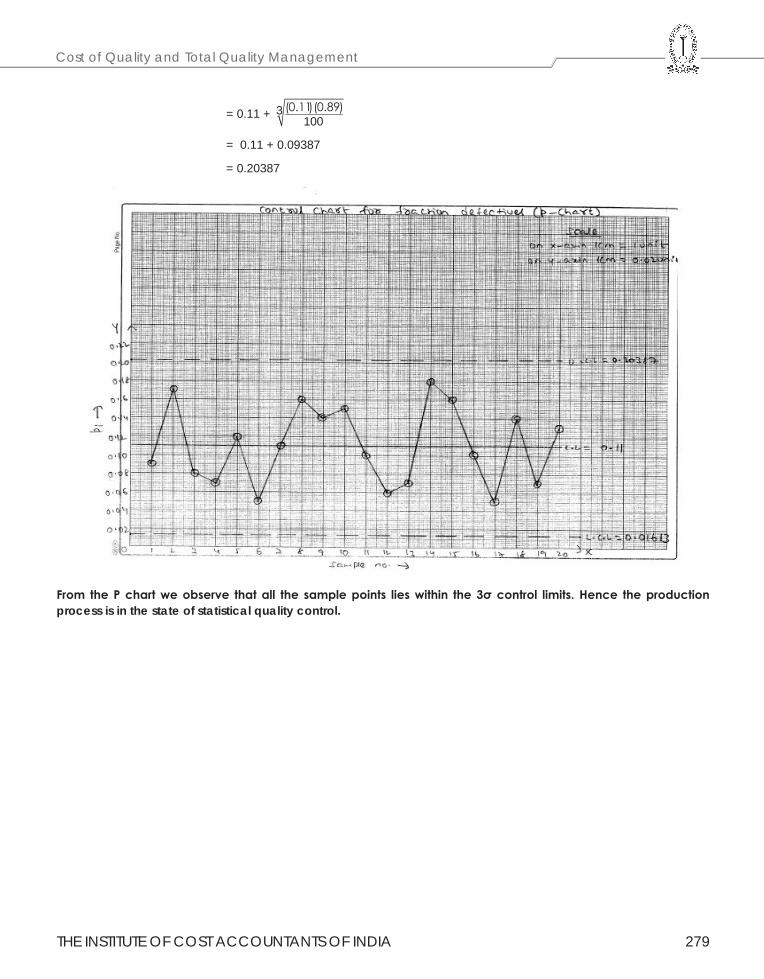
THE INSTITUTE OF COST ACCOUNTANTS OF INDIA 279
Cost of Quality and Total Quality Management
= 0.11 + (0.11)(0.89)3100
= 0.11 + 0.09387
= 0.20387
From the P chart we observe that all the sample points lies within the 3σ control limits. Hence the production process is in the state of statistical quality control.
Strategic Cost Management - Decision Making
280 THE INSTITUTE OF COST ACCOUNTANTS OF INDIA
Section CStrategic Cost Management –
Application of Statistical Techniquesin Business Decisions
(Syllabus - 2016)

THE INSTITUTE OF COST ACCOUNTANTS OF INDIA 281
Application of Operation Research and Statistical Tools in Strategic Decisions Making
This Study Note includes
6.1 Learning Curve6.2 Linear Programming6.3 Assignment6.4 Transportation6.5 Simulation6.6 Network Analysis – CPM/PERT
Study Note - 6APPLICATION OF OPRATION RESEARCH ANDSTATISTICAL TOOLS IN STRATEGIC DECISIONS MAKING
6.1 LEARNING CURVE
Learning Curve Theory is concerned with the idea that when a new job, process or activity commences for the first time it is likely that the workforce involved will not achieve maximum efficiency immediately. Repetition of the task is likely to make the people more confident and knowledgeable and will eventually result in a more efficient and rapid operation. Eventually the learning process will stop after continually repeating the job. As a consequence the time to complete a task will initially decline and then stabilise once efficient working is achieved. The cumulative average time per unit is assumed to decrease by a constant percentage every time that output doubles. Cumulative average time refers to the average time per unit for all units produced so far, from and including the first one made.
Learning is the process by which an individual acquires skill, knowledge and ability. When a new product or process is started, the performance of a worker is not at its best and learning phenomenon takes place. As the experience is gained, the performance of a worker improves, time taken per unit of activity reduces and his productivity goes up. This improvement in productivity of a worker is due to learning effect. Cost predictions especially those relating to direct labour cost must allow for the effect of learning process. This technique is a mathematical technique. It can be very much used to accurately and graphically predict cost. It is a geometrical progression, which reveals that there is steadily decreasing cost for the accomplishment of a given repetitive operation, as the identical operation is increasingly repeated. The amount of decrease is less and less with each successive unit produced. The slope of the decision curve can be expressed as a percentage. Experience curve, improvement curve and progress curve are other terms which can be synonymously used. Learning curve is essentially a measure of the experience gained in production of an article by an individual or organization. As more units are produced, people involved in production become more efficient than before. Each subsequent unit takes fewer man-hours to produce. The amount of improvement will differ with each type of article produced. This improvement or experience gain is reflected in a decrease in man-hours or cost.
Phases in Learning Curve
The learning curve will pass through three different phases. In the first phase, there will be gradual increase in production rate until the maximum expected rate is reached and this phase is generally steep. In the second phase, the learning rate will gradually deteriorate because of the limitations of equipment. In the third phase, the production rate begins to decrease due to a reduction in customer requirements and increase in costs.
Under the Learning curve model, the cumulative average time per unit produced is assumed to fall by a constant percentage every time total output of the unit doubles. Learning curve is a geometrical operation, as the identical operation is increasingly repeated.
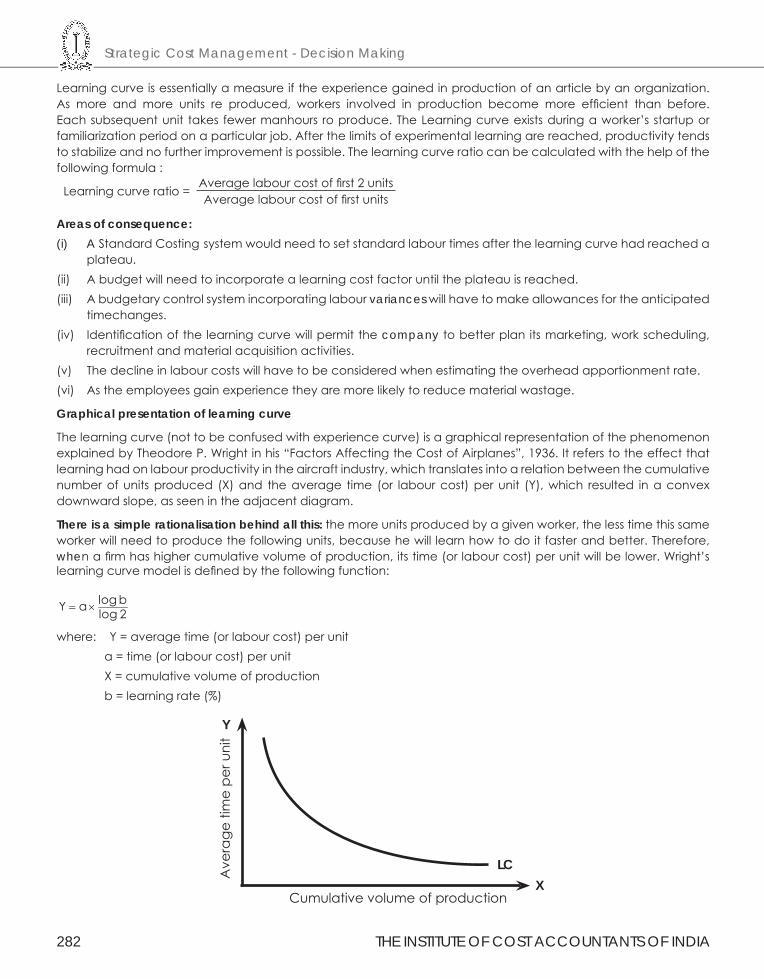
Strategic Cost Management - Decision Making
282 THE INSTITUTE OF COST ACCOUNTANTS OF INDIA
Learning curve is essentially a measure if the experience gained in production of an article by an organization. As more and more units re produced, workers involved in production become more efficient than before. Each subsequent unit takes fewer manhours ro produce. The Learning curve exists during a worker’s startup or familiarization period on a particular job. After the limits of experimental learning are reached, productivity tends to stabilize and no further improvement is possible. The learning curve ratio can be calculated with the help of the following formula :
Learning curve ratio =Average labour cost of first 2 unitsAverage labour cost of first units
Areas of consequence:(i) A Standard Costing system would need to set standard labour times after the learning curve had reached a
plateau.(ii) A budget will need to incorporate a learning cost factor until the plateau is reached.(iii) A budgetary control system incorporating labour variances will have to make allowances for the anticipated
timechanges.(iv) Identification of the learning curve will permit the company to better plan its marketing, work scheduling,
recruitment and material acquisition activities.(v) The decline in labour costs will have to be considered when estimating the overhead apportionment rate.(vi) As the employees gain experience they are more likely to reduce material wastage.
Graphical presentation of learning curve
The learning curve (not to be confused with experience curve) is a graphical representation of the phenomenon explained by Theodore P. Wright in his “Factors Affecting the Cost of Airplanes”, 1936. It refers to the effect that learning had on labour productivity in the aircraft industry, which translates into a relation between the cumulative number of units produced (X) and the average time (or labour cost) per unit (Y), which resulted in a convex downward slope, as seen in the adjacent diagram.
There is a simple rationalisation behind all this: the more units produced by a given worker, the less time this same worker will need to produce the following units, because he will learn how to do it faster and better. Therefore, when a firm has higher cumulative volume of production, its time (or labour cost) per unit will be lower. Wright’s learning curve model is defined by the following function:
log bY a log 2= ×
where: Y = average time (or labour cost) per unit a = time (or labour cost) per unit X = cumulative volume of production b = learning rate (%)
Y
XCumulative volume of production
Ave
rage
tim
e pe
r uni
t
LC
THE INSTITUTE OF COST ACCOUNTANTS OF INDIA 283
Application of Operation Research and Statistical Tools in Strategic Decisions Making
Some important implications arise from this curve. If the time (or labour cost) per unit decreases as the cumulative output increases, this will mean that firms that have been producing more and for a longer period, will have lower average time per unit and thus dominate the market.
Uses of Learning curve.
Learning curve is now being widely issued in business. Some of the uses are as follows:
1. Where applicable the learning curve suggest great opportunities for cost reduction to be achieved by improving learning.
2. The learning curve concept suggests a basis for correct staffing in continuously expanding production. The curve shows that the work force need not be increased at the same rate as the prospective output. This also helps in proper production planning through proper scheduling of work; providing manpower at the right moment permitting more accurate forecast of delivery dates.
3. Learning curve concept provides a means of evaluating the effectiveness of training programs. What level of cumulative cost reduction do they accomplish? How does the learning curve for this group or shop compare with others? Whether any of the employees who lack the aptitude to meet normal learning curve should be eliminated.
4. Learning curve is frequently used in conjunction with establishing bid price for contracts. Usually, the bid price is based on the cumulative average unit cost for all the units to be produced for a given contract. If production is not interrupted. Additional units beyond this quantity should be costed at the increment costs incurred, and not at the previous cumulative average. If the contract agreement so provides, a contract may be cancelled and production stopped before the expected efficiency is reached. This would mean that the company having quoted on the basis of cumulative average unit cost is at a disadvantage because it can not reap the benefit of leaning. The contractor must provide for these contingencies so that it will be reimbursed for such loss.
5. The use of learning curve, where applicable, is important in the working capital required. If the requirement is based on average cumulative unit cost, the revenues from the first few units may not cover the actual expenditures. For instance, if the price was based on the average cumulative unit cost of 328 hours the first unit when produced and sold will cause a deficit of 4.72 hours (8.00 – 3.28). Provision should therefore, be made to cover the deficit of working capital in the initial stages of production.
6. As employees become more efficient, the rate of production increases and so more materials are needed, the work-in-progress inventory turns over faster, and finished goods inventory grows at an accelerated rate. A knowledge of the learning curve assists in planning the inventories of materials. Work-in-progress, and finished goods.
7. Learning curve techniques are useful in exercising control, Variable norms can be established for each situation, and a comparison between these norms and actual expenses can be made. Specific or average incremental unit cost should be used for this purpose.
8. The learning curve may be used for make-or- buy decisions especially if the outside manufacturer has reached the maximum on the learning curve. Help to calculate the sensitive rates in wage bargaining.
Limitations to the usefulness of the learning curve:
The following points limiting the usefulness of learning curves should be noted:-
1. The learning curve is useful only for new operations where machines do not constitute a major part of the production process. It is not applicable to all productions. E.g. new and experienced workmen.
2. The learning curve assumes that the production will continue without any major interruptions. If for any reason the work in interrupted, the curve may be deflected or assume a new slopes
3. Charges other than learning may effect the learning curve. For example, improvement in facilities, arrangements, and equipment as well as personnel morale and performance may be factors influencing
Strategic Cost Management - Decision Making
284 THE INSTITUTE OF COST ACCOUNTANTS OF INDIA
the curve. On the other hand, negative developments in employee attitudes may also affect the curve and reverse or retard the progress of improvement.
4. The characteristic 80 percent learning curve as originally obtaining in the air force industry in U.S. A. has been usually accepted as the percentage applicable to all industries. Studies show that there cannot be a unique percentage which can be universally applied.
Factors affecting Learning Curve:
1. While pricing for bids, general tendency is to set up a very high initial labour cost so as to show a high learning curve. This should the learning curve useless and sometimes misleading.
2. The method of production, i.e. whether it is labour oriented or machine oriented influences the slop of the learning.
3. When labour turnover rate is high management has to train new workers frequently. In such situations the company may never reach its maximum efficiency potential. One of the important requisites of the learning curve concept is that there should be uninterrupted flow of work. The fewer the interruptions, the grater will be the improvement in efficiency.
4. Changes in a product or in the methods of production, designs, machinery, or the tools/used affect the slope of the learning curve. All these have the effect of starting learning a fresh because of new conditions If the changes are frequent, there may be no learning at all.
5. Also other factors influencing the learning curve are labour strikes, lock outs and shut downs due to other cause also/affect the learning curve. In each such case there is interruption in the progress of learning.
As far as possible the effects of above factors should be carefully separated from the data used to establish the curve. The effects of these factors must also be separated from the actual costs used to measure the performance. Unless this is done analysis of the projected cost or the actual cost will not be meaningful.
The experience curve
The more experience a firm has in producing a particular product, the lower its costs.
The experience curve is an idea developed by the Boston Consulting Group (BCG) in the mid-1960s. Working with a leading manufacturer of semiconductors, the consultants noticed that the company’s unit cost of manufacturing fell by about 25% for each doubling of the volume that it produced. This relationship they called the experience curve: the more experience a firm has in producing a particular product, the lower are its costs. Bruce Henderson, the founder of BCG, put it as follows:
Costs characteristically decline by 20-30% in real terms each time accumulated experience doubles. This means that when inflation is factored out, costs should always decline. The decline is fast if growth is fast and slow if growth is slow.
There is no fundamental economic law that can predict the existence of the experience curve, even though it has been shown to apply to industries across the board. Its truth has been proven inductively, not deductively. And if it is true in service industries such as investment banking or legal advice, the lower costs are clearly not passed on to customers.
By itself, the curve is not particularly earth shattering. Even when BCG first expounded the relationship, it had been known since the second world war that it applied to direct labour costs. Less labour was needed for a given output depending on the experience of that labour. In aircraft production, for instance, labour input decreased by some 10–15% for every doubling of that labour’s experience.
The strategic implications of the experience curve came closer to shattering earth. For if costs fell (fairly predictably) with experience, and if experience was closely related to market share (as it seemed it must be), then the competitor with the biggest market share was going to have a big cost advantage over its rivals. QED: being market leader is a valuable asset that a firm relinquishes at its peril.
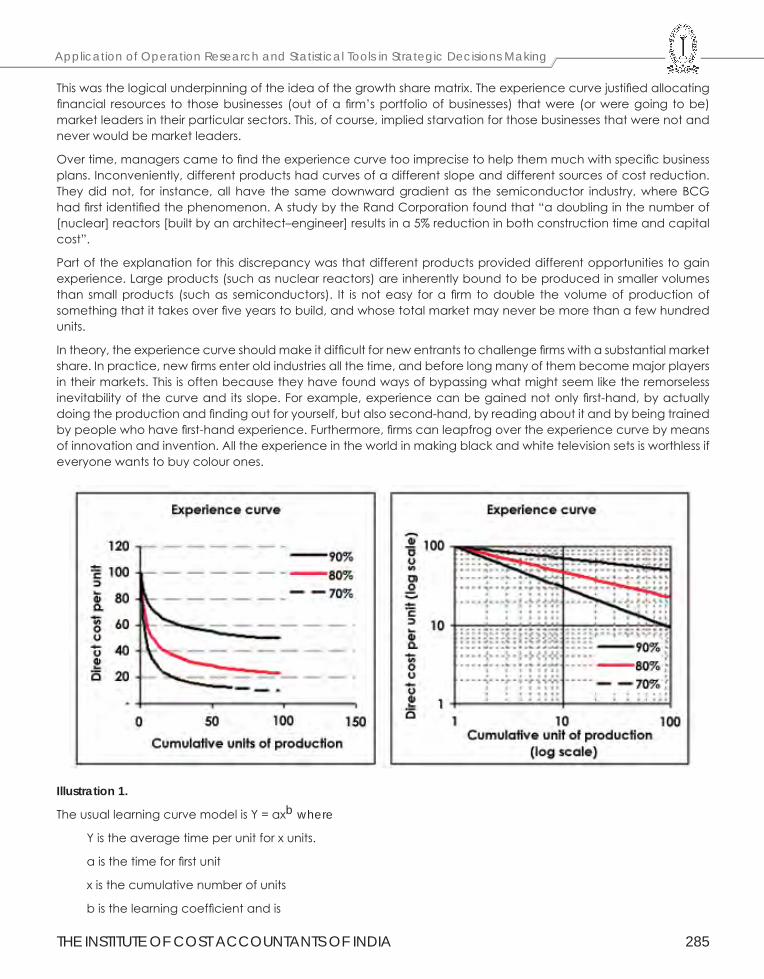
THE INSTITUTE OF COST ACCOUNTANTS OF INDIA 285
Application of Operation Research and Statistical Tools in Strategic Decisions Making
This was the logical underpinning of the idea of the growth share matrix. The experience curve justified allocating financial resources to those businesses (out of a firm’s portfolio of businesses) that were (or were going to be) market leaders in their particular sectors. This, of course, implied starvation for those businesses that were not and never would be market leaders.
Over time, managers came to find the experience curve too imprecise to help them much with specific business plans. Inconveniently, different products had curves of a different slope and different sources of cost reduction. They did not, for instance, all have the same downward gradient as the semiconductor industry, where BCG had first identified the phenomenon. A study by the Rand Corporation found that “a doubling in the number of [nuclear] reactors [built by an architect–engineer] results in a 5% reduction in both construction time and capital cost”.
Part of the explanation for this discrepancy was that different products provided different opportunities to gain experience. Large products (such as nuclear reactors) are inherently bound to be produced in smaller volumes than small products (such as semiconductors). It is not easy for a firm to double the volume of production of something that it takes over five years to build, and whose total market may never be more than a few hundred units.
In theory, the experience curve should make it difficult for new entrants to challenge firms with a substantial market share. In practice, new firms enter old industries all the time, and before long many of them become major players in their markets. This is often because they have found ways of bypassing what might seem like the remorseless inevitability of the curve and its slope. For example, experience can be gained not only first-hand, by actually doing the production and finding out for yourself, but also second-hand, by reading about it and by being trained by people who have first-hand experience. Furthermore, firms can leapfrog over the experience curve by means of innovation and invention. All the experience in the world in making black and white television sets is worthless if everyone wants to buy colour ones.
Illustration 1.
The usual learning curve model is Y = axb where
Y is the average time per unit for x units.
a is the time for first unit
x is the cumulative number of units
b is the learning coefficient and is
Strategic Cost Management - Decision Making
286 THE INSTITUTE OF COST ACCOUNTANTS OF INDIA
equal to log 0.8log 2 = – 0.322 fo a learning rate of 80%
Given that a = 10 hours and learning rare 80%, you are required to Calculate:
(i) The average time for 20 units.
(ii) The total time for 30 units.
(iii) The time for units 31 to 40.
Given that log 2 = 0.301, Antilog of 0.5811 = 3.812
log 3 = 0.4771,Antilog of 0.5244 = 3.345.
log 4 = 0.6021,Antilog of 0.4841 = 3.049.
Solution:
(i) Y = AX b
Y = 10(20)-0.322
Taking log on both sides
Logy = log 10 + log 20(-0.322)
Logy = log 10 – (0.322) log 20
= 1 – (0.322) log 20
= 1- (0.322) x (1.3010)
= 1-0.41892 = 0.5811
Log y = 0.5811
Y = Anti log (0.5811) = 3.812 hrs (average time)
Total Time = 3.812 × 20 = 76.24 hours
(ii) Log y = log 10 + log 30(-0.322)
Log y = 1-(0.322) x (1.4771)
= 1 - (0.4756) = 0.5244
Y = anti log (0.5244) = 3.345 hrs (average time)
Total time = 3.345 x 30 = 100.35 hrs
(iii) Log y = log 10 + log40(-0.322)
= 1-(0.322) x (1.6021)
Log y = 0.4841
Y = anti log (0.4841) = 3.049hrs
Total time = 40 x 3.049 = 121.96hrs
Time from 31 to 40 units = 121.96 – (100.35) = 21.61 hrs
THE INSTITUTE OF COST ACCOUNTANTS OF INDIA 287
Application of Operation Research and Statistical Tools in Strategic Decisions Making
Illustration 2.
The learning curve as a management accounting has now become or going to become an accepted tool in industry, for its applications are almost unlim ited. When it is used correctly, it can lead to increase business and higher profits; when used without proper knowledge, it can lead to lost business and bankruptcy. State precisely:
(i) Your understanding of the learning curve:
(ii) The theory of learning curve;
(iii) The areas where learning curves may assist in management accounting; and
(iv) Illustrate the use of learning curves for calculating the expected average units cost of making.
(a) 4 machines (b) 8 machines
Using the data below:
Data:
Direct Labour need to make first machine = 1000 hrs.Learning curve = 90%Direct Labour cost = `15/- per hour.Direct materials cost = `1,50,000Fixed cost for either size orders = `60,000.
Solution:
Statement showing computation of cost of making 4 machines & 8 machines:
No of machines Average time Labour cost Material Fixed cost TotalHours ` ` ` `
1 1000 15000 150000 60000 2250002 900 13500 150000 30000 1935004 810 12150 150000 15000 1771508 729 10935 150000 7500 168435
Average cost of making 4 machines ` 177150Average cost of making 8 machines ` 168435
Illustration 3.
Z.P.L.C experience difficulty in its budgeting process because it finds it necessary to qualify the learning effect as new products are introduced.
Substantial product changes occur and result in the need for retraining.
An order for 30 units of a new product has been received by Z.P.L.C So far, 14 have been completed; the first unit required 40 direct labour hours and a total of 240 direct labour has been recorded for the 14 units. The produc tion manager expects an 80% learning effect for this type of work.
The company use standard absorption costing. The direct costs attributed to the centre in which the unit is manufactured and its direct materials costs are as follows:
` Direct material 30.00 per unit. Direct Labour 6.00 per hour. Variable overhead 0.50 per direct labour hour. Fixed overhead 6,000 per four-week operating period.
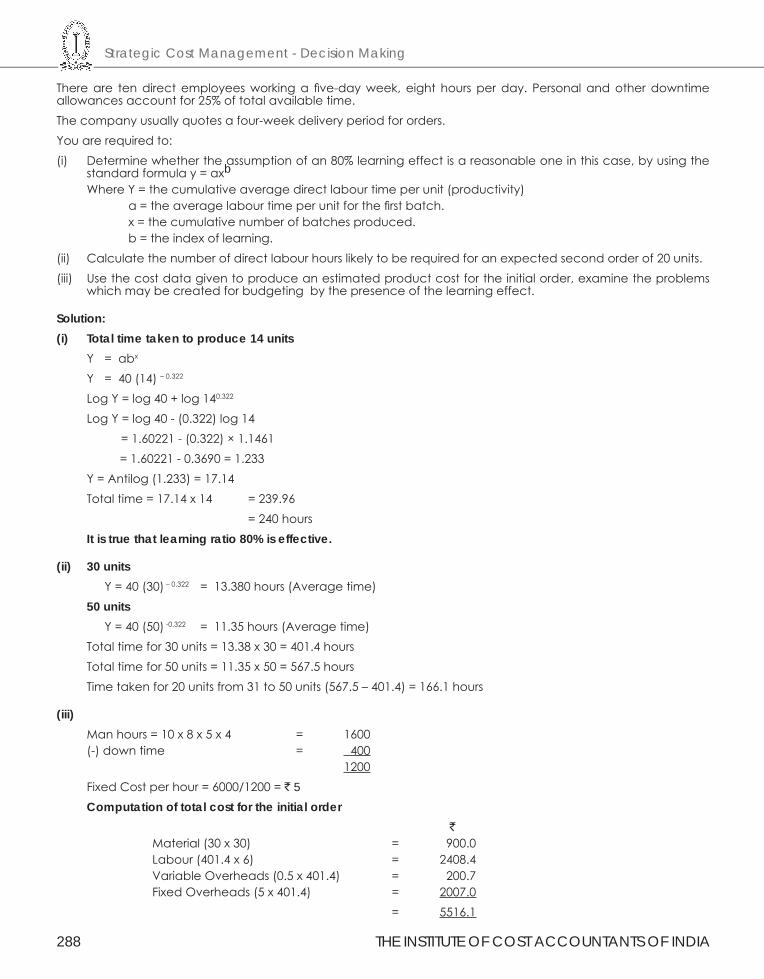
Strategic Cost Management - Decision Making
288 THE INSTITUTE OF COST ACCOUNTANTS OF INDIA
There are ten direct employees working a five-day week, eight hours per day. Personal and other downtime allowances account for 25% of total available time.The company usually quotes a four-week delivery period for orders.You are required to:(i) Determine whether the assumption of an 80% learning effect is a reasonable one in this case, by using the
standard formula y = axb
Where Y = the cumulative average direct labour time per unit (productivity) a = the average labour time per unit for the first batch. x = the cumulative number of batches produced. b = the index of learning.(ii) Calculate the number of direct labour hours likely to be required for an expected second order of 20 units.(iii) Use the cost data given to produce an estimated product cost for the initial order, examine the problems
which may be created for budgeting by the presence of the learning effect.
Solution:(i) Total time taken to produce 14 units Y = abx
Y = 40 (14) – 0.322
Log Y = log 40 + log 140.322
Log Y = log 40 - (0.322) log 14 = 1.60221 - (0.322) × 1.1461 = 1.60221 - 0.3690 = 1.233Y = Antilog (1.233) = 17.14
Total time = 17.14 x 14 = 239.96 = 240 hours It is true that learning ratio 80% is effective.
(ii) 30 units Y = 40 (30) – 0.322 = 13.380 hours (Average time) 50 units Y = 40 (50) -0.322 = 11.35 hours (Average time) Total time for 30 units = 13.38 x 30 = 401.4 hours Total time for 50 units = 11.35 x 50 = 567.5 hours Time taken for 20 units from 31 to 50 units (567.5 – 401.4) = 166.1 hours
(iii) Man hours = 10 x 8 x 5 x 4 = 1600 (-) down time = 400 1200
Fixed Cost per hour = 6000/1200 = ` 5Computation of total cost for the initial order ` Material (30 x 30) = 900.0 Labour (401.4 x 6) = 2408.4 Variable Overheads (0.5 x 401.4) = 200.7 Fixed Overheads (5 x 401.4) = 2007.0 = 5516.1
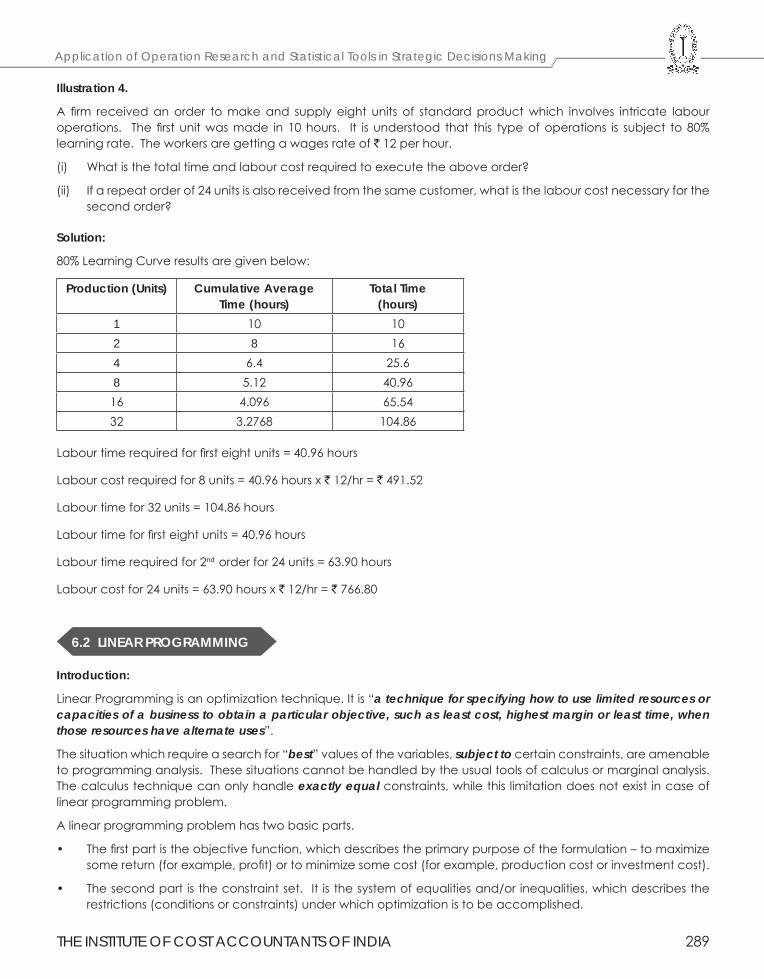
THE INSTITUTE OF COST ACCOUNTANTS OF INDIA 289
Application of Operation Research and Statistical Tools in Strategic Decisions Making
Illustration 4.
A firm received an order to make and supply eight units of standard product which involves intricate labour operations. The first unit was made in 10 hours. It is understood that this type of operations is subject to 80% learning rate. The workers are getting a wages rate of ` 12 per hour.
(i) What is the total time and labour cost required to execute the above order?
(ii) If a repeat order of 24 units is also received from the same customer, what is the labour cost necessary for the second order?
Solution:
80% Learning Curve results are given below:
Production (Units) Cumulative Average Time (hours)
Total Time (hours)
1 10 102 8 164 6.4 25.68 5.12 40.96
16 4.096 65.5432 3.2768 104.86
Labour time required for first eight units = 40.96 hours
Labour cost required for 8 units = 40.96 hours x ` 12/hr = ` 491.52
Labour time for 32 units = 104.86 hours
Labour time for first eight units = 40.96 hours
Labour time required for 2nd order for 24 units = 63.90 hours
Labour cost for 24 units = 63.90 hours x ` 12/hr = ` 766.80
6.2 LINEAR PROGRAMMING
Introduction:
Linear Programming is an optimization technique. It is “a technique for specifying how to use limited resources or capacities of a business to obtain a particular objective, such as least cost, highest margin or least time, when those resources have alternate uses”.
The situation which require a search for “best” values of the variables, subject to certain constraints, are amenable to programming analysis. These situations cannot be handled by the usual tools of calculus or marginal analysis. The calculus technique can only handle exactly equal constraints, while this limitation does not exist in case of linear programming problem.
A linear programming problem has two basic parts.
• The first part is the objective function, which describes the primary purpose of the formulation – to maximize some return (for example, profit) or to minimize some cost (for example, production cost or investment cost).
• The second part is the constraint set. It is the system of equalities and/or inequalities, which describes the restrictions (conditions or constraints) under which optimization is to be accomplished.
Strategic Cost Management - Decision Making
290 THE INSTITUTE OF COST ACCOUNTANTS OF INDIA
Definition of Linear Programming:
According to Kohlar “A method of planning and operation involved in the construction of a model of a real situation containing the following elements: (a) variables representing the available choices, and (b) mathematical expressions (i) relating the variables to the controlling conditions, and (ii) reflecting the criteria to be used in measuring the benefits derivable from each of the several possible plans, and (iii) establishing the objective. The method may be so devised as to ensure the selection of the best of a large number of alternatives”.
Samuelson, Dorfman and Solow defines LP as “The analysis of problems in which a linear function of a number of variables is to be maximized (or minimized) when those variables are subject to a number of restraints in the form of linear inequalities”.
In the words of Loomba, “LP is only one aspect of what has been called a system approach to management wherein all programmes are designed and evaluated in terms of their ultimate affects in the realization of business objectives”.
Limitations of Linear Programming:
Although linear programming is a very useful technique for solving optimization problems, there are certain important limitations in the application of linear programming. Some of these are discussed below:
1. Firstly, the linear programming models can be applied only in those situations where the constraints and the objective function can be stated in terms of linear expressions.
2. In linear programming problems, coefficients in the objective function and the constraint equations must be completely known and they should not change during the period of study.
3. Yet another important limitation of linear programming is that it may give fractional valued answers.
4. Linear programming will fail to give a solution if management have conflicting multiple goals.
5. Linear programming problem requires that the total measure of effectiveness and total resource usage resulting from the joint performance of the activities must equal the respective sums of these quantities resulting from each activity being performed individually.
6. Many real-world problems are so complex, in terms of the number of variables and relationships constrained in them, that they tax the capacity of even the largest computer.
7. Other limitations of LP includes:-
- Does not take into consideration the effect of time and uncertainty.
- Parameters appearing in the model are assumed to be constants but in real-life situations they are frequently neither known nor constants.
APPLICATION AREAS OF LINEAR PROGRAMMING:
In practice linear programming has proved to be one of the most widely used technique of managerial decision making in business, industry and numerous other fields.
1. Industrial Applications:
Linear programming is extensively used to solve a variety of industrial problems. In each of these applications, the general objective is to determine a plan for production and procurement in the time period under consideration. It is necessary to satisfy all demand requirements without violating any of the constraints. Few examples of industrial applications are as follows:
(a) Product Mix-Problem.
(b) Production Scheduling.
(c) Production Smoothing Problem.
THE INSTITUTE OF COST ACCOUNTANTS OF INDIA 291
Application of Operation Research and Statistical Tools in Strategic Decisions Making
(d) Blending Problems.
(e) Transportation Problems.
(f) Production distribution problems.
(g) Trim Loss.
(h) Linear programming is also used by oil refineries to determine the optimal mix of products to be produced by the refinery during a given period.
(i) Communication Industry. LP methods are used in solving problems involving facilities for transmission, switching, relaying etc.
(j) Rail Road Industry: An LP model for optimal programming of railway freight, and train movements has been formulated to handle scheduling problems as found at large terminal switching rail points.
2. Management Applications:
(a) Portfolio Selection.
(b) Financial Mix Strategy.
(c) Profit Planning.
(d) Media Selection.
(e) Travelling Salesmen Problem.
(f) Determination of equitable salaries.
(g) Staffing problem.
3. Miscellaneous Applications:
The additional application of Linear Programming are as follows:
(a) Form planning.
- The particular crops to be grown or cattle to keep during a period
- The acreage to be devoted to each, and
- The particular production methods to be used.
(b) Airline routine.
(c) Administration, Education and Politics have also employed linear programming to solve their problems.
(d) Diet Problems. The diet problem, one of the earliest applications of linear programming was originally used by hospitals to determine the most economical diet for patients.
4. Administrative applications of Linear Programming:
Linear programming can be used for administrative applications. Administrative applications of Linear Programming are concerned with optimal usage of resources like men, machine and material.
5. Non-Industrial applications of linear programming:
Linear programming techniques/tools can be applied in the case of non-industrial applications as well. Examples of the use of L.P techniques for non-industrial applications are given below:
• Agriculture.
• Environmental Protection.
• Urban Department.
• Facilities Location.
Strategic Cost Management - Decision Making
292 THE INSTITUTE OF COST ACCOUNTANTS OF INDIA
6. Further applications of Linear Programming are:
(i) In structural design for maximum product.
(ii) In balancing assembly lines.
(iii) In scheduling of a military tanker fleet.
(iv) In determining which parts to make and which to buy to obtain maximum profit margin.
(v) In selecting equipment and evaluating methods improvements that maximize profit margin.
(vi) In planning most profitable match of sales requirements to plant capacity that obtains a fair share of the market.
(vii) In design of optimal purchasing policies.
FORMULATION OF LINEAR PROGRAMMING PROBLEM:
The formulation of linear programming problem as a mathematical model involves the following basic steps:
Step 1: Find the key-decision to be made from the study of the solution. (In this connection, looking for variables helps considerably).
Step 2: Identify the variables and assume symbols x1, x2 …… for variable quantities noticed in step 1.
Step 3: Express the possible alternatives mathematically in terms of variables. The set of feasible alternatives generally in the given situation is:
[(x1, x2); x1 > 0, x2 > 0]
Step 4: Mention the objective quantitatively and express it as a linear function of variables.
Step 5: Express the constraints also as linear equalities/inequalities in terms of variables.
Some Definition:
(a) Solution:
Values of decision variables xj (j = 1, 2 ….., n) which satisfy the constraints of a general L.P.P., is called the solution to that L.P.P.
(b) Feasible Solution:
Any solution that also satisfies the non-negative restrictions of the general L.P.P., is called a feasible solution.
(c) Basic Solution:
For a set of m simultaneous equations in n unknowns (n>m), a solution obtained by setting (n-m) of the variables equal to zero and solving the remaining m equations in m unknowns is called a basic solution. Zero variables (n-m) are called non basic variables and remaining m are called basic variables and constitute a basic solution.
(d) Basic Feasible Solution:
A feasible solution to a general L.P. problem which is also basic solution is called a basic feasible solution.
(e) Optimal Feasible Solution:
Any basic feasible solution which optimize (maximize or minimize) the objective function of a general L.P.P. is called an optimal feasible solution to that L.P. problem.
(f) Degenerate Solution:
A basic solution to the system of equations is called degenerate if one or more of the basic variables become equal to zero.
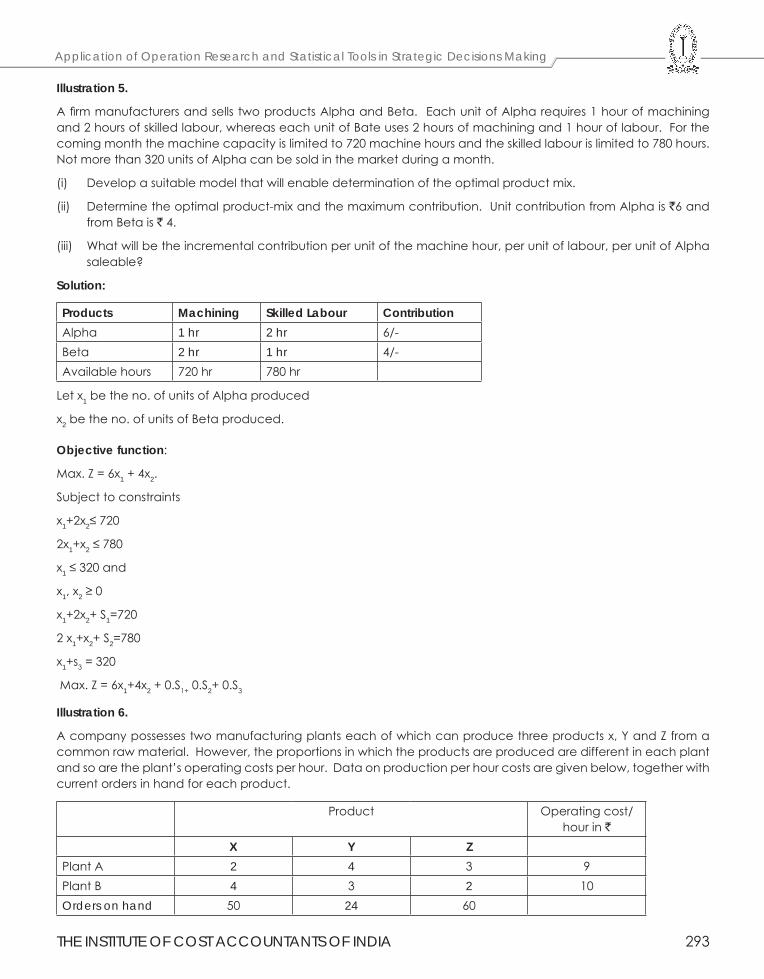
THE INSTITUTE OF COST ACCOUNTANTS OF INDIA 293
Application of Operation Research and Statistical Tools in Strategic Decisions Making
Illustration 5.
A firm manufacturers and sells two products Alpha and Beta. Each unit of Alpha requires 1 hour of machining and 2 hours of skilled labour, whereas each unit of Bate uses 2 hours of machining and 1 hour of labour. For the coming month the machine capacity is limited to 720 machine hours and the skilled labour is limited to 780 hours. Not more than 320 units of Alpha can be sold in the market during a month.
(i) Develop a suitable model that will enable determination of the optimal product mix.
(ii) Determine the optimal product-mix and the maximum contribution. Unit contribution from Alpha is `6 and from Beta is ` 4.
(iii) What will be the incremental contribution per unit of the machine hour, per unit of labour, per unit of Alpha saleable?
Solution:
Products Machining Skilled Labour ContributionAlpha 1 hr 2 hr 6/-Beta 2 hr 1 hr 4/-Available hours 720 hr 780 hr
Let x1 be the no. of units of Alpha produced
x2 be the no. of units of Beta produced.
Objective function:
Max. Z = 6x1 + 4x2.
Subject to constraints
x1+2x2≤ 720
2x1+x2 ≤ 780
x1 ≤ 320 and
x1, x2 ≥ 0
x1+2x2+ S1=720
2 x1+x2+ S2=780
x1+s3 = 320
Max. Z = 6x1+4x2 + 0.S1+ 0.S2+ 0.S3
Illustration 6.
A company possesses two manufacturing plants each of which can produce three products x, Y and Z from a common raw material. However, the proportions in which the products are produced are different in each plant and so are the plant’s operating costs per hour. Data on production per hour costs are given below, together with current orders in hand for each product.
Product Operating cost/hour in `
X Y Z Plant A 2 4 3 9Plant B 4 3 2 10Orders on hand 50 24 60
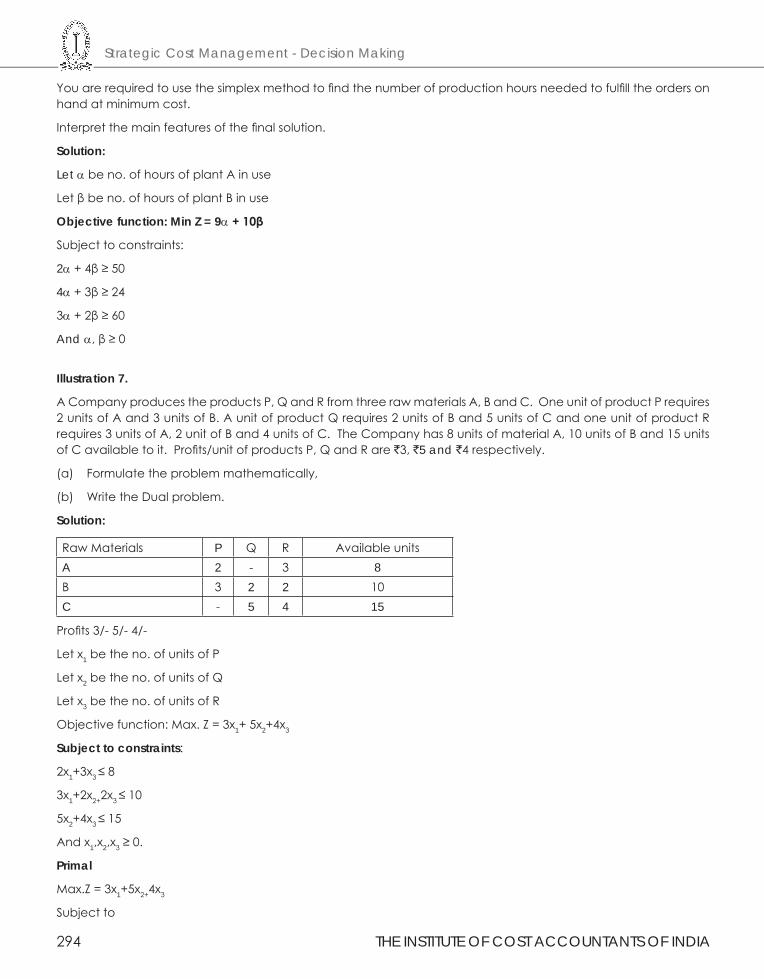
Strategic Cost Management - Decision Making
294 THE INSTITUTE OF COST ACCOUNTANTS OF INDIA
You are required to use the simplex method to find the number of production hours needed to fulfill the orders on hand at minimum cost.
Interpret the main features of the final solution.
Solution:
Let α be no. of hours of plant A in use
Let β be no. of hours of plant B in use
Objective function: Min Z = 9α + 10β
Subject to constraints:
2α + 4β ≥ 50
4α + 3β ≥ 24
3α + 2β ≥ 60
And α, β ≥ 0
Illustration 7.
A Company produces the products P, Q and R from three raw materials A, B and C. One unit of product P requires 2 units of A and 3 units of B. A unit of product Q requires 2 units of B and 5 units of C and one unit of product R requires 3 units of A, 2 unit of B and 4 units of C. The Company has 8 units of material A, 10 units of B and 15 units of C available to it. Profits/unit of products P, Q and R are `3, `5 and `4 respectively.
(a) Formulate the problem mathematically,
(b) Write the Dual problem.
Solution:
Raw Materials P Q R Available unitsA 2 - 3 8B 3 2 2 10C - 5 4 15
Profits 3/- 5/- 4/-
Let x1 be the no. of units of P
Let x2 be the no. of units of Q
Let x3 be the no. of units of R
Objective function: Max. Z = 3x1+ 5x2+4x3
Subject to constraints:
2x1+3x3 ≤ 8
3x1+2x2+2x3 ≤ 10
5x2+4x3 ≤ 15
And x1,x2,x3 ≥ 0.
Primal
Max.Z = 3x1+5x2+4x3
Subject to
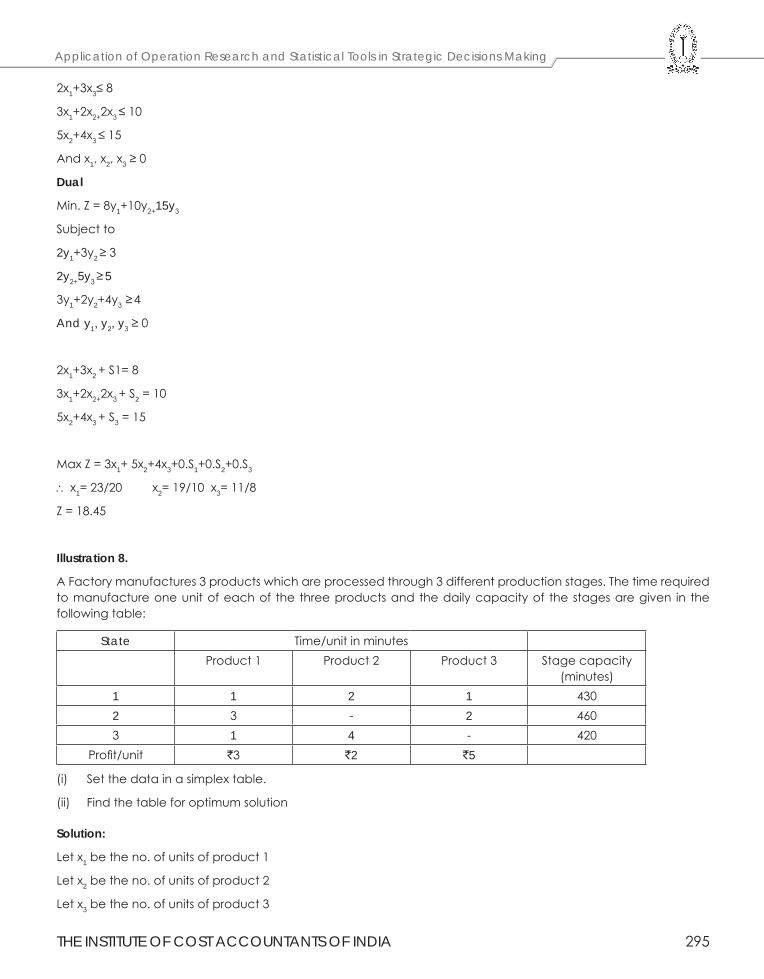
THE INSTITUTE OF COST ACCOUNTANTS OF INDIA 295
Application of Operation Research and Statistical Tools in Strategic Decisions Making
2x1+3x3≤ 8
3x1+2x2+2x3 ≤ 10
5x2+4x3 ≤ 15
And x1, x2, x3 ≥ 0
Dual
Min. Z = 8y1+10y2+15y3
Subject to
2y1+3y2 ≥ 3
2y2+5y3 ≥ 5
3y1+2y2+4y3 ≥ 4
And y1, y2, y3 ≥ 0
2x1+3x2 + S1= 8
3x1+2x2+2x3 + S2 = 10
5x2+4x3 + S3 = 15
Max Z = 3x1+ 5x2+4x3+0.S1+0.S2+0.S3
∴ x1= 23/20 x2= 19/10 x3= 11/8
Z = 18.45
Illustration 8.
A Factory manufactures 3 products which are processed through 3 different production stages. The time required to manufacture one unit of each of the three products and the daily capacity of the stages are given in the following table:
State Time/unit in minutesProduct 1 Product 2 Product 3 Stage capacity
(minutes)1 1 2 1 4302 3 - 2 4603 1 4 - 420
Profit/unit `3 `2 `5
(i) Set the data in a simplex table.
(ii) Find the table for optimum solution
Solution:
Let x1 be the no. of units of product 1
Let x2 be the no. of units of product 2
Let x3 be the no. of units of product 3
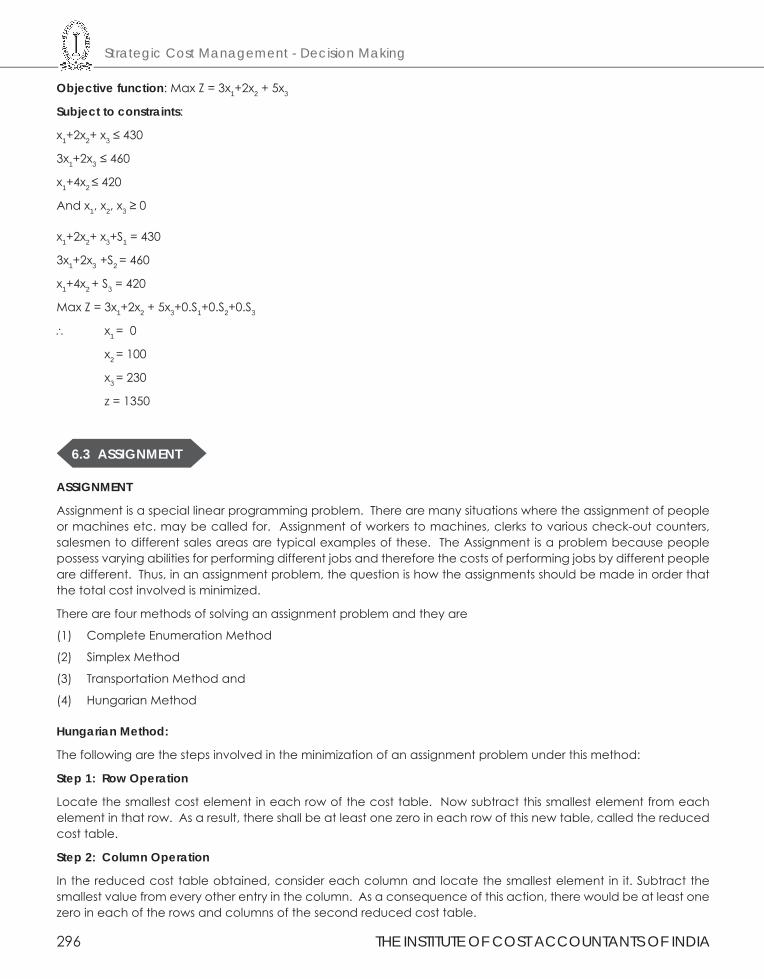
Strategic Cost Management - Decision Making
296 THE INSTITUTE OF COST ACCOUNTANTS OF INDIA
Objective function: Max Z = 3x1+2x2 + 5x3
Subject to constraints:
x1+2x2+ x3 ≤ 430
3x1+2x3 ≤ 460
x1+4x2 ≤ 420
And x1, x2, x3 ≥ 0
x1+2x2+ x3+S1 = 430
3x1+2x3 +S2 = 460
x1+4x2 + S3 = 420
Max Z = 3x1+2x2 + 5x3+0.S1+0.S2+0.S3
∴ x1 = 0
x2 = 100
x3 = 230
z = 1350
6.3 ASSIGNMENT
ASSIGNMENT
Assignment is a special linear programming problem. There are many situations where the assignment of people or machines etc. may be called for. Assignment of workers to machines, clerks to various check-out counters, salesmen to different sales areas are typical examples of these. The Assignment is a problem because people possess varying abilities for performing different jobs and therefore the costs of performing jobs by different people are different. Thus, in an assignment problem, the question is how the assignments should be made in order that the total cost involved is minimized.
There are four methods of solving an assignment problem and they are
(1) Complete Enumeration Method
(2) Simplex Method
(3) Transportation Method and
(4) Hungarian Method
Hungarian Method:
The following are the steps involved in the minimization of an assignment problem under this method:
Step 1: Row Operation
Locate the smallest cost element in each row of the cost table. Now subtract this smallest element from each element in that row. As a result, there shall be at least one zero in each row of this new table, called the reduced cost table.
Step 2: Column Operation
In the reduced cost table obtained, consider each column and locate the smallest element in it. Subtract the smallest value from every other entry in the column. As a consequence of this action, there would be at least one zero in each of the rows and columns of the second reduced cost table.
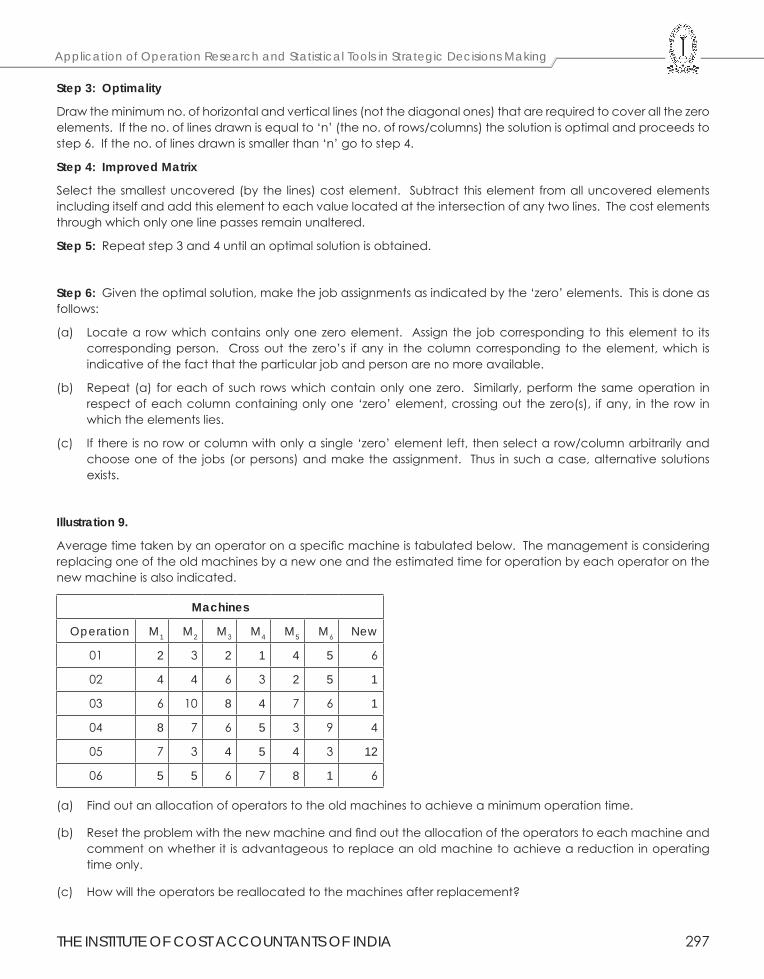
THE INSTITUTE OF COST ACCOUNTANTS OF INDIA 297
Application of Operation Research and Statistical Tools in Strategic Decisions Making
Step 3: Optimality
Draw the minimum no. of horizontal and vertical lines (not the diagonal ones) that are required to cover all the zero elements. If the no. of lines drawn is equal to ‘n’ (the no. of rows/columns) the solution is optimal and proceeds to step 6. If the no. of lines drawn is smaller than ‘n’ go to step 4.
Step 4: Improved Matrix
Select the smallest uncovered (by the lines) cost element. Subtract this element from all uncovered elements including itself and add this element to each value located at the intersection of any two lines. The cost elements through which only one line passes remain unaltered.
Step 5: Repeat step 3 and 4 until an optimal solution is obtained.
Step 6: Given the optimal solution, make the job assignments as indicated by the ‘zero’ elements. This is done as follows:
(a) Locate a row which contains only one zero element. Assign the job corresponding to this element to its corresponding person. Cross out the zero’s if any in the column corresponding to the element, which is indicative of the fact that the particular job and person are no more available.
(b) Repeat (a) for each of such rows which contain only one zero. Similarly, perform the same operation in respect of each column containing only one ‘zero’ element, crossing out the zero(s), if any, in the row in which the elements lies.
(c) If there is no row or column with only a single ‘zero’ element left, then select a row/column arbitrarily and choose one of the jobs (or persons) and make the assignment. Thus in such a case, alternative solutions exists.
Illustration 9.
Average time taken by an operator on a specific machine is tabulated below. The management is considering replacing one of the old machines by a new one and the estimated time for operation by each operator on the new machine is also indicated.
Machines
Operation M1 M2 M3 M4 M5 M6 New
01 2 3 2 1 4 5 6
02 4 4 6 3 2 5 1
03 6 10 8 4 7 6 1
04 8 7 6 5 3 9 4
05 7 3 4 5 4 3 12
06 5 5 6 7 8 1 6
(a) Find out an allocation of operators to the old machines to achieve a minimum operation time.
(b) Reset the problem with the new machine and find out the allocation of the operators to each machine and comment on whether it is advantageous to replace an old machine to achieve a reduction in operating time only.
(c) How will the operators be reallocated to the machines after replacement?
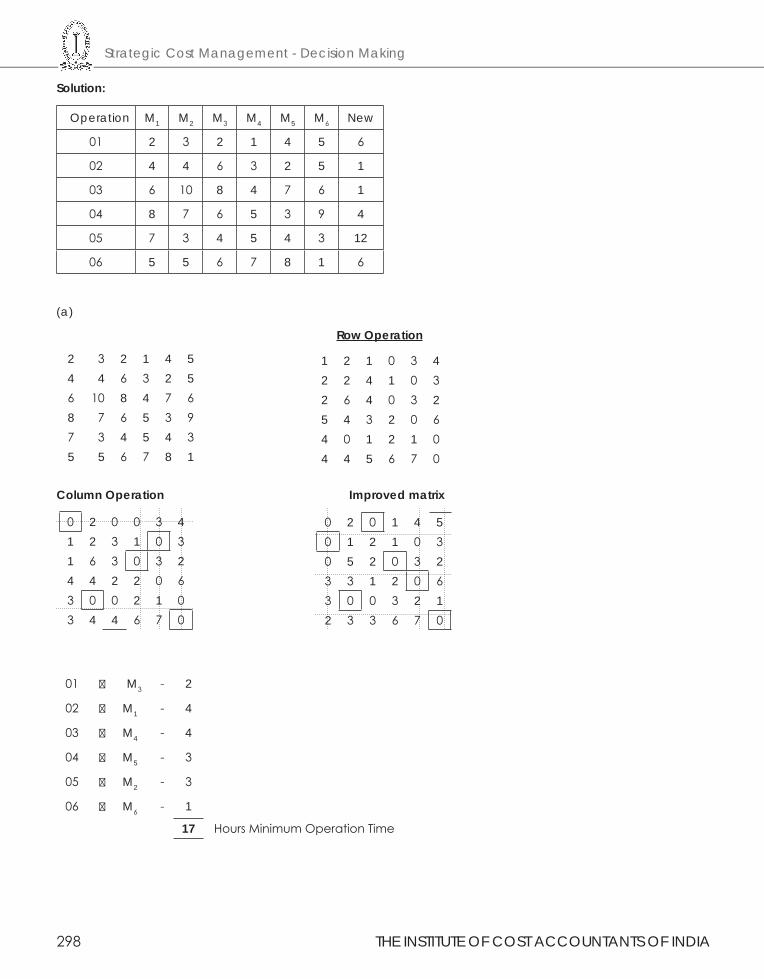
Strategic Cost Management - Decision Making
298 THE INSTITUTE OF COST ACCOUNTANTS OF INDIA
Solution:
Operation M1 M2 M3 M4 M5 M6 New
01 2 3 2 1 4 5 6
02 4 4 6 3 2 5 1
03 6 10 8 4 7 6 1
04 8 7 6 5 3 9 4
05 7 3 4 5 4 3 12
06 5 5 6 7 8 1 6
(a)
Row Operation
2 3 2 1 4 54 4 6 3 2 56 10 8 4 7 68 7 6 5 3 97 3 4 5 4 35 5 6 7 8 1
1 2 1 0 3 42 2 4 1 0 32 6 4 0 3 25 4 3 2 0 64 0 1 2 1 04 4 5 6 7 0
Column Operation Improved matrix
0 2 0 0 3 41 2 3 1 0 31 6 3 0 3 24 4 2 2 0 63 0 0 2 1 03 4 4 6 7 0
0 2 0 1 4 50 1 2 1 0 30 5 2 0 3 23 3 1 2 0 63 0 0 3 2 12 3 3 6 7 0
01 M3 - 2
02 M1 - 4
03 M4 - 4
04 M5 - 3
05 M2 - 3
06 M6 - 1
17 Hours Minimum Operation Time
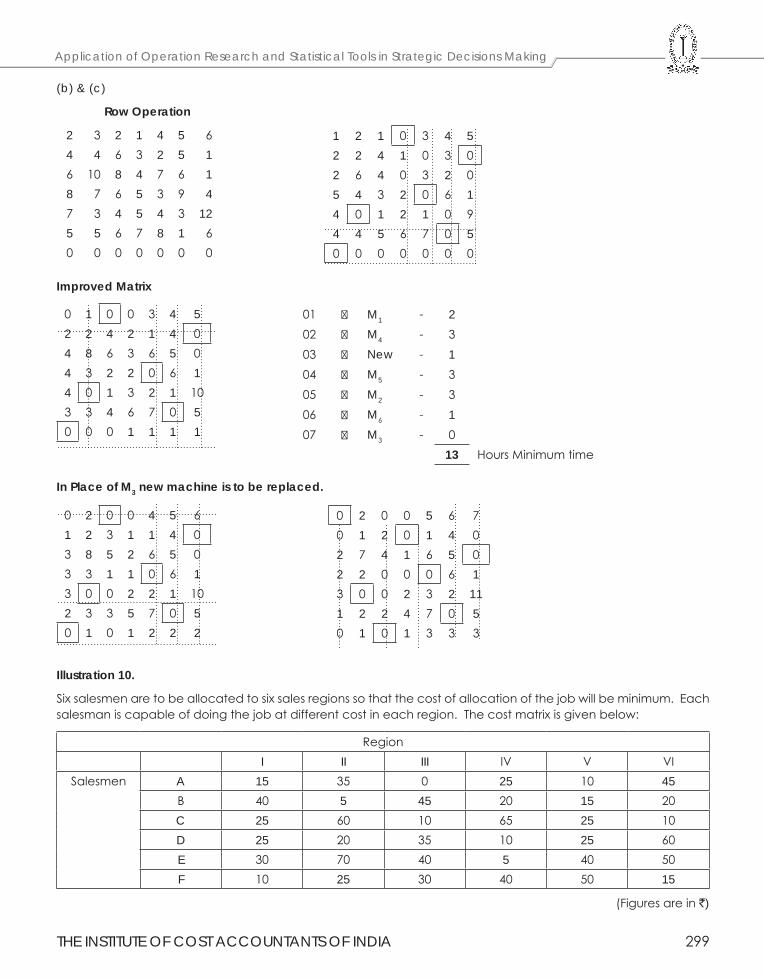
THE INSTITUTE OF COST ACCOUNTANTS OF INDIA 299
Application of Operation Research and Statistical Tools in Strategic Decisions Making
(b) & (c)
Row Operation
2 3 2 1 4 5 64 4 6 3 2 5 16 10 8 4 7 6 18 7 6 5 3 9 47 3 4 5 4 3 125 5 6 7 8 1 60 0 0 0 0 0 0
1 2 1 0 3 4 52 2 4 1 0 3 02 6 4 0 3 2 05 4 3 2 0 6 14 0 1 2 1 0 94 4 5 6 7 0 50 0 0 0 0 0 0
Improved Matrix
0 1 0 0 3 4 52 2 4 2 1 4 04 8 6 3 6 5 04 3 2 2 0 6 14 0 1 3 2 1 103 3 4 6 7 0 50 0 0 1 1 1 1
01 M1 - 202 M4 - 303 New - 104 M5 - 305 M2 - 306 M6 - 107 M3 - 0
13 Hours Minimum time
In Place of M3 new machine is to be replaced.
0 2 0 0 4 5 61 2 3 1 1 4 03 8 5 2 6 5 03 3 1 1 0 6 13 0 0 2 2 1 102 3 3 5 7 0 50 1 0 1 2 2 2
0 2 0 0 5 6 70 1 2 0 1 4 02 7 4 1 6 5 02 2 0 0 0 6 13 0 0 2 3 2 111 2 2 4 7 0 50 1 0 1 3 3 3
Illustration 10.
Six salesmen are to be allocated to six sales regions so that the cost of allocation of the job will be minimum. Each salesman is capable of doing the job at different cost in each region. The cost matrix is given below:
Region I II III IV V VI
Salesmen A 15 35 0 25 10 45B 40 5 45 20 15 20C 25 60 10 65 25 10D 25 20 35 10 25 60E 30 70 40 5 40 50F 10 25 30 40 50 15
(Figures are in `)
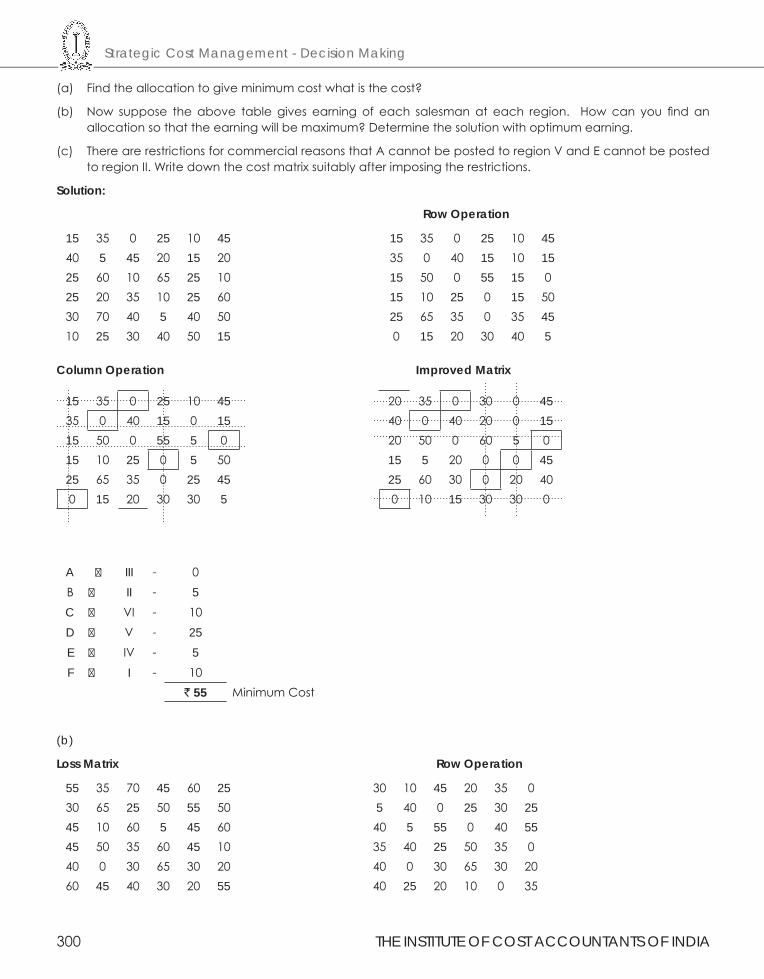
Strategic Cost Management - Decision Making
300 THE INSTITUTE OF COST ACCOUNTANTS OF INDIA
(a) Find the allocation to give minimum cost what is the cost?
(b) Now suppose the above table gives earning of each salesman at each region. How can you find an allocation so that the earning will be maximum? Determine the solution with optimum earning.
(c) There are restrictions for commercial reasons that A cannot be posted to region V and E cannot be posted to region II. Write down the cost matrix suitably after imposing the restrictions.
Solution:
Row Operation
15 35 0 25 10 4540 5 45 20 15 2025 60 10 65 25 1025 20 35 10 25 6030 70 40 5 40 5010 25 30 40 50 15
15 35 0 25 10 4535 0 40 15 10 1515 50 0 55 15 015 10 25 0 15 5025 65 35 0 35 450 15 20 30 40 5
Column Operation Improved Matrix
15 35 0 25 10 4535 0 40 15 0 1515 50 0 55 5 015 10 25 0 5 5025 65 35 0 25 450 15 20 30 30 5
20 35 0 30 0 4540 0 40 20 0 1520 50 0 60 5 015 5 20 0 0 4525 60 30 0 20 400 10 15 30 30 0
A III - 0B II - 5C VI - 10D V - 25E IV - 5F I - 10
` 55 Minimum Cost
(b)
Loss Matrix Row Operation
55 35 70 45 60 2530 65 25 50 55 5045 10 60 5 45 6045 50 35 60 45 1040 0 30 65 30 2060 45 40 30 20 55
30 10 45 20 35 05 40 0 25 30 25
40 5 55 0 40 5535 40 25 50 35 040 0 30 65 30 2040 25 20 10 0 35
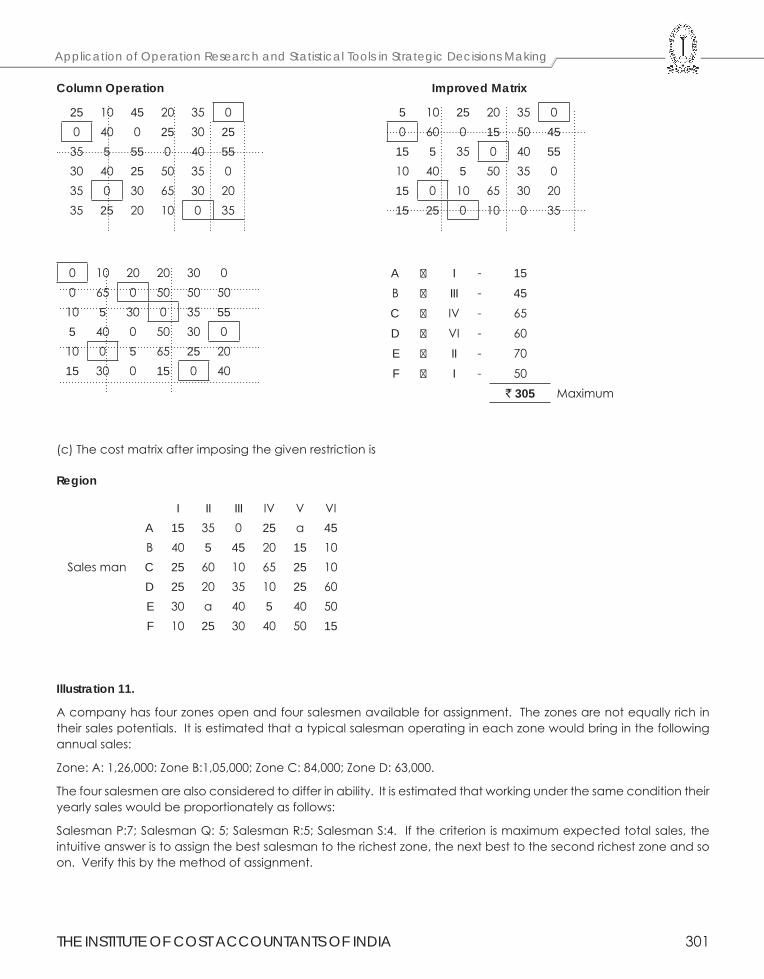
THE INSTITUTE OF COST ACCOUNTANTS OF INDIA 301
Application of Operation Research and Statistical Tools in Strategic Decisions Making
Column Operation Improved Matrix
5 10 25 20 35 00 60 0 15 50 45
15 5 35 0 40 5510 40 5 50 35 015 0 10 65 30 2015 25 0 10 0 35
25 10 45 20 35 00 40 0 25 30 25
35 5 55 0 40 5530 40 25 50 35 035 0 30 65 30 2035 25 20 10 0 35
0 10 20 20 30 00 65 0 50 50 50
10 5 30 0 35 555 40 0 50 30 0
10 0 5 65 25 2015 30 0 15 0 40
A I - 15B III - 45C IV - 65D VI - 60E II - 70F I - 50
` 305 Maximum
(c) The cost matrix after imposing the given restriction is
Region
I II III IV V VIA 15 35 0 25 α 45B 40 5 45 20 15 10
Sales man C 25 60 10 65 25 10D 25 20 35 10 25 60E 30 α 40 5 40 50F 10 25 30 40 50 15
Illustration 11.
A company has four zones open and four salesmen available for assignment. The zones are not equally rich in their sales potentials. It is estimated that a typical salesman operating in each zone would bring in the following annual sales:
Zone: A: 1,26,000: Zone B:1,05,000; Zone C: 84,000; Zone D: 63,000.
The four salesmen are also considered to differ in ability. It is estimated that working under the same condition their yearly sales would be proportionately as follows:
Salesman P:7; Salesman Q: 5; Salesman R:5; Salesman S:4. If the criterion is maximum expected total sales, the intuitive answer is to assign the best salesman to the richest zone, the next best to the second richest zone and so on. Verify this by the method of assignment.
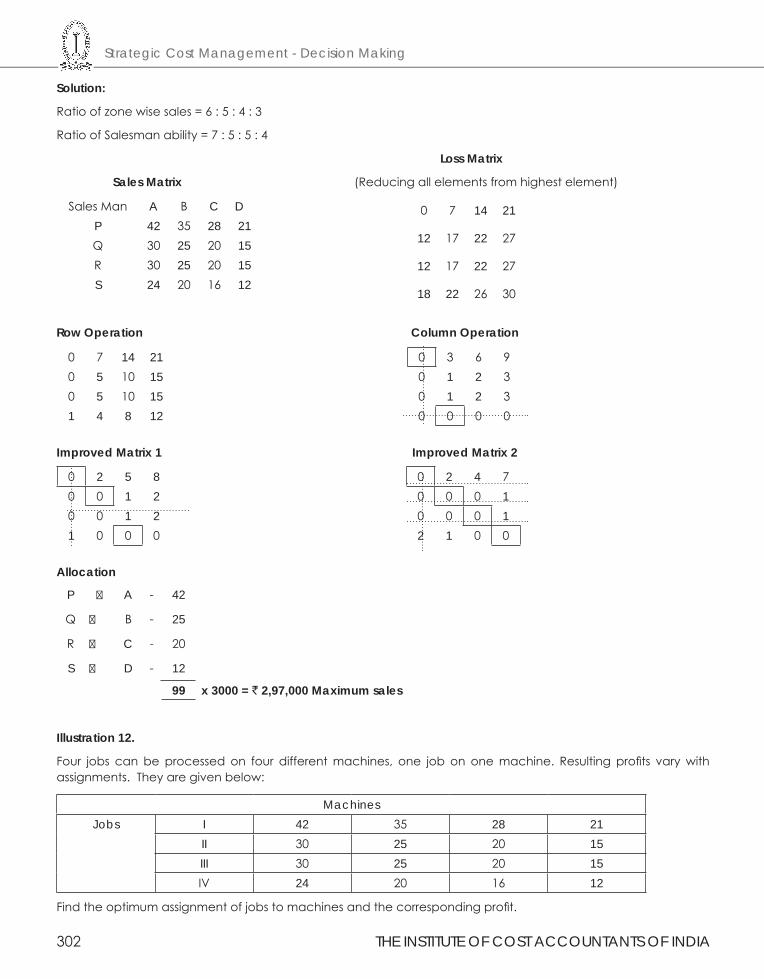
Strategic Cost Management - Decision Making
302 THE INSTITUTE OF COST ACCOUNTANTS OF INDIA
Solution:
Ratio of zone wise sales = 6 : 5 : 4 : 3
Ratio of Salesman ability = 7 : 5 : 5 : 4
Loss Matrix
Sales Matrix (Reducing all elements from highest element)
Sales Man A B C DP 42 35 28 21Q 30 25 20 15R 30 25 20 15S 24 20 16 12
0 7 14 21
12 17 22 27
12 17 22 27
18 22 26 30
Row Operation Column Operation
0 7 14 210 5 10 150 5 10 151 4 8 12
0 3 6 90 1 2 30 1 2 30 0 0 0
Improved Matrix 1 Improved Matrix 2
0 2 5 80 0 1 20 0 1 21 0 0 0
0 2 4 70 0 0 10 0 0 12 1 0 0
Allocation
P A - 42
Q B - 25
R C - 20
S D - 12
99 x 3000 = ` 2,97,000 Maximum sales
Illustration 12.
Four jobs can be processed on four different machines, one job on one machine. Resulting profits vary with assignments. They are given below:
MachinesJobs I 42 35 28 21
II 30 25 20 15III 30 25 20 15IV 24 20 16 12
Find the optimum assignment of jobs to machines and the corresponding profit.
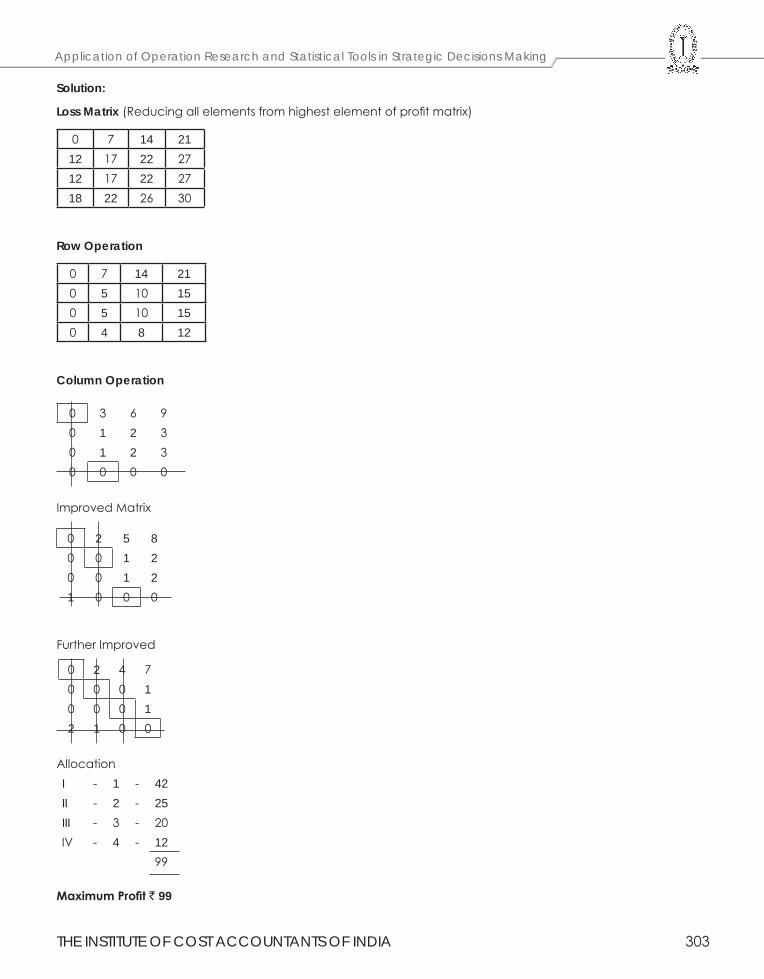
THE INSTITUTE OF COST ACCOUNTANTS OF INDIA 303
Application of Operation Research and Statistical Tools in Strategic Decisions Making
Solution:
Loss Matrix (Reducing all elements from highest element of profit matrix)
0 7 14 2112 17 22 2712 17 22 2718 22 26 30
Row Operation
0 7 14 210 5 10 150 5 10 150 4 8 12
Column Operation
0 3 6 90 1 2 30 1 2 30 0 0 0
Improved Matrix
0 2 5 80 0 1 20 0 1 21 0 0 0
Further Improved
0 2 4 70 0 0 10 0 0 12 1 0 0
AllocationI - 1 - 42II - 2 - 25III - 3 - 20IV - 4 - 12
99
Maximum Profit ` 99
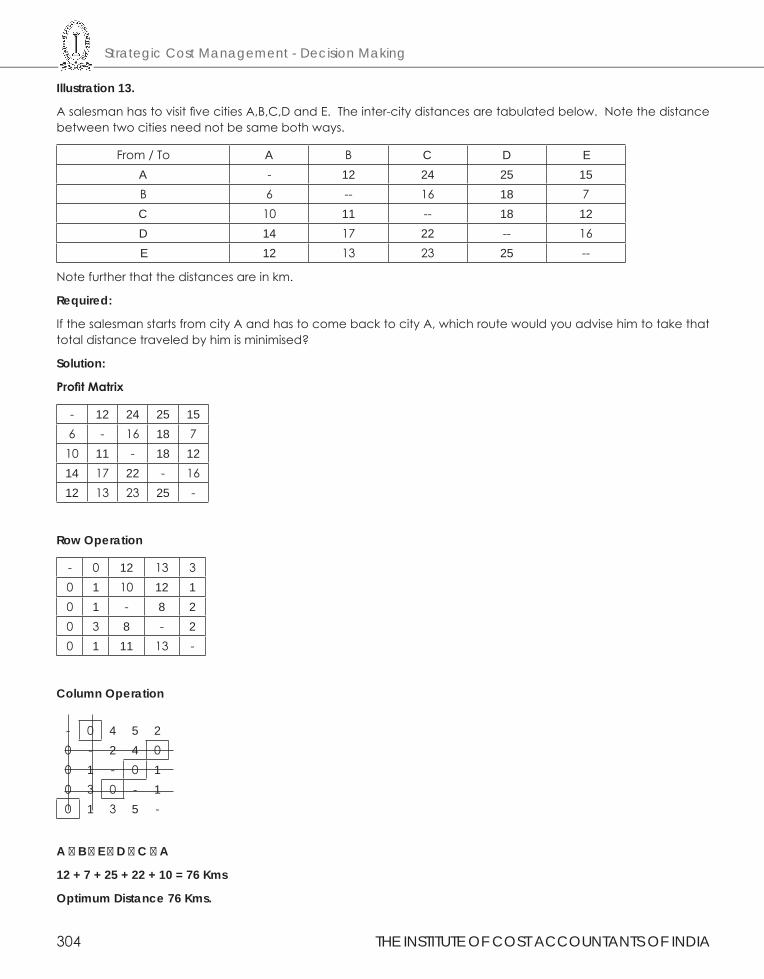
Strategic Cost Management - Decision Making
304 THE INSTITUTE OF COST ACCOUNTANTS OF INDIA
Illustration 13.
A salesman has to visit five cities A,B,C,D and E. The inter-city distances are tabulated below. Note the distance between two cities need not be same both ways.
From / To A B C D EA - 12 24 25 15B 6 -- 16 18 7C 10 11 -- 18 12D 14 17 22 -- 16E 12 13 23 25 --
Note further that the distances are in km.
Required:
If the salesman starts from city A and has to come back to city A, which route would you advise him to take that total distance traveled by him is minimised?
Solution:
Profit Matrix
- 12 24 25 156 - 16 18 7
10 11 - 18 1214 17 22 - 1612 13 23 25 -
Row Operation
- 0 12 13 30 1 10 12 10 1 - 8 20 3 8 - 20 1 11 13 -
Column Operation
- 0 4 5 20 - 2 4 00 1 - 0 10 3 0 - 10 1 3 5 -
A B E D C A
12 + 7 + 25 + 22 + 10 = 76 Kms
Optimum Distance 76 Kms.
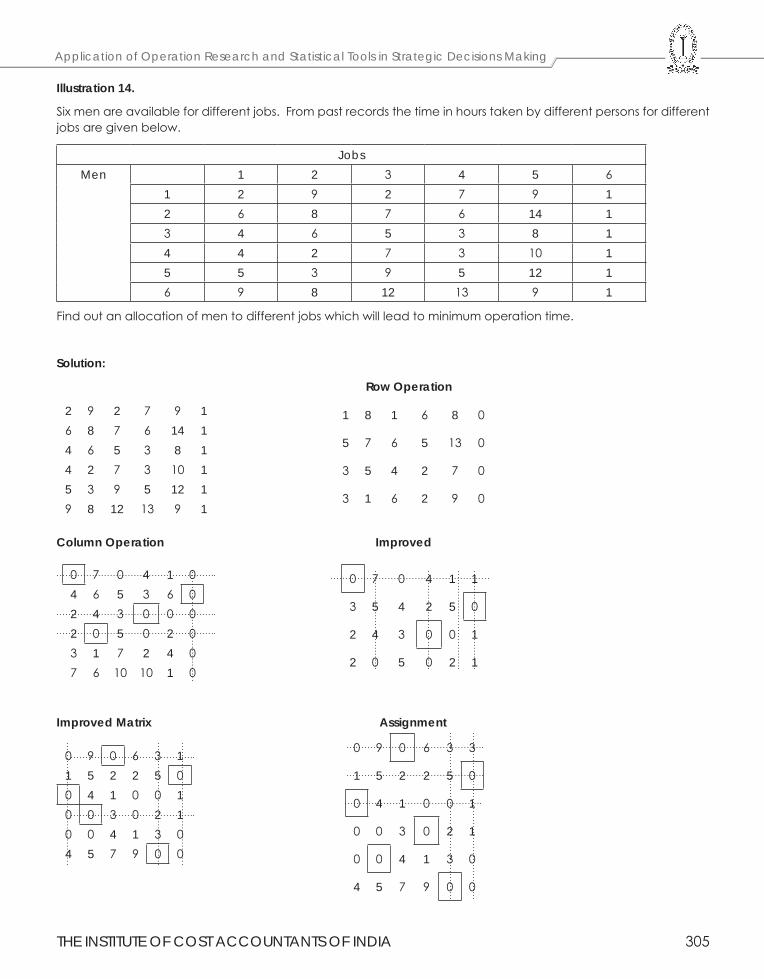
THE INSTITUTE OF COST ACCOUNTANTS OF INDIA 305
Application of Operation Research and Statistical Tools in Strategic Decisions Making
Illustration 14.
Six men are available for different jobs. From past records the time in hours taken by different persons for different jobs are given below.
Jobs Men 1 2 3 4 5 6
1 2 9 2 7 9 12 6 8 7 6 14 13 4 6 5 3 8 14 4 2 7 3 10 15 5 3 9 5 12 16 9 8 12 13 9 1
Find out an allocation of men to different jobs which will lead to minimum operation time.
Solution:
Row Operation
2 9 2 7 9 16 8 7 6 14 14 6 5 3 8 14 2 7 3 10 15 3 9 5 12 19 8 12 13 9 1
1 8 1 6 8 0
5 7 6 5 13 0
3 5 4 2 7 0
3 1 6 2 9 0
Column Operation Improved
0 7 0 4 1 04 6 5 3 6 02 4 3 0 0 02 0 5 0 2 03 1 7 2 4 07 6 10 10 1 0
0 7 0 4 1 1
3 5 4 2 5 0
2 4 3 0 0 1
2 0 5 0 2 1
Improved Matrix Assignment
0 9 0 6 3 11 5 2 2 5 00 4 1 0 0 10 0 3 0 2 10 0 4 1 3 04 5 7 9 0 0
0 9 0 6 3 3
1 5 2 2 5 0
0 4 1 0 0 1
0 0 3 0 2 1
0 0 4 1 3 0
4 5 7 9 0 0
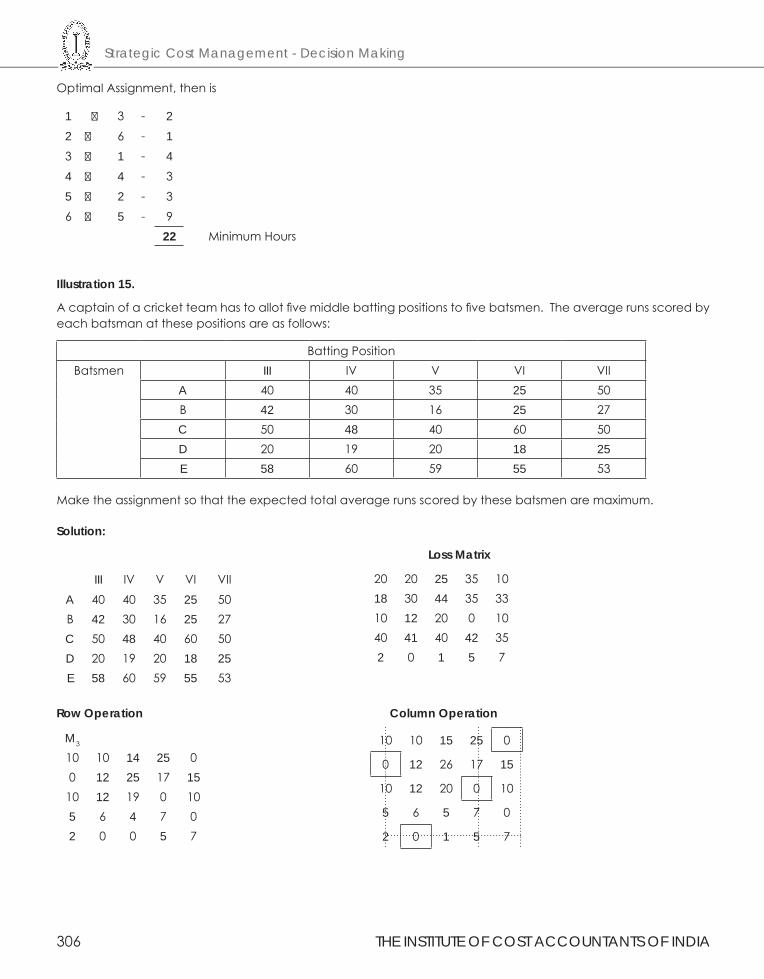
Strategic Cost Management - Decision Making
306 THE INSTITUTE OF COST ACCOUNTANTS OF INDIA
Optimal Assignment, then is
1 3 - 22 6 - 13 1 - 44 4 - 35 2 - 36 5 - 9
22 Minimum Hours
Illustration 15.
A captain of a cricket team has to allot five middle batting positions to five batsmen. The average runs scored by each batsman at these positions are as follows:
Batting PositionBatsmen III IV V VI VII
A 40 40 35 25 50B 42 30 16 25 27C 50 48 40 60 50D 20 19 20 18 25E 58 60 59 55 53
Make the assignment so that the expected total average runs scored by these batsmen are maximum.
Solution:
Loss Matrix
III IV V VI VIIA 40 40 35 25 50B 42 30 16 25 27C 50 48 40 60 50D 20 19 20 18 25E 58 60 59 55 53
20 20 25 35 1018 30 44 35 3310 12 20 0 1040 41 40 42 352 0 1 5 7
Row Operation Column Operation
M3
10 10 14 25 00 12 25 17 15
10 12 19 0 105 6 4 7 02 0 0 5 7
10 10 15 25 0
0 12 26 17 15
10 12 20 0 10
5 6 5 7 0
2 0 1 5 7
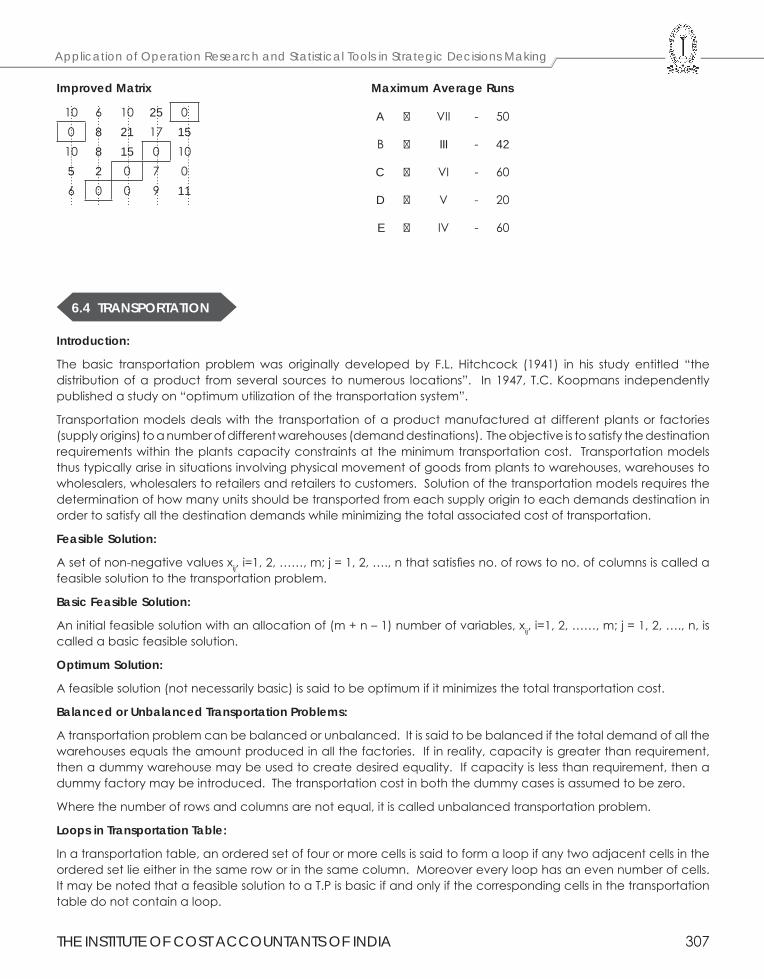
THE INSTITUTE OF COST ACCOUNTANTS OF INDIA 307
Application of Operation Research and Statistical Tools in Strategic Decisions Making
Improved Matrix Maximum Average Runs
A VII - 50
B III - 42
C VI - 60
D V - 20
E IV - 60
10 6 10 25 00 8 21 17 1510 8 15 0 105 2 0 7 06 0 0 9 11
6.4 TRANSPORTATION
Introduction:
The basic transportation problem was originally developed by F.L. Hitchcock (1941) in his study entitled “the distribution of a product from several sources to numerous locations”. In 1947, T.C. Koopmans independently published a study on “optimum utilization of the transportation system”.
Transportation models deals with the transportation of a product manufactured at different plants or factories (supply origins) to a number of different warehouses (demand destinations). The objective is to satisfy the destination requirements within the plants capacity constraints at the minimum transportation cost. Transportation models thus typically arise in situations involving physical movement of goods from plants to warehouses, warehouses to wholesalers, wholesalers to retailers and retailers to customers. Solution of the transportation models requires the determination of how many units should be transported from each supply origin to each demands destination in order to satisfy all the destination demands while minimizing the total associated cost of transportation.
Feasible Solution:
A set of non-negative values xij, i=1, 2, ……, m; j = 1, 2, …., n that satisfies no. of rows to no. of columns is called a feasible solution to the transportation problem.
Basic Feasible Solution:
An initial feasible solution with an allocation of (m + n – 1) number of variables, xij, i=1, 2, ……, m; j = 1, 2, …., n, is called a basic feasible solution.
Optimum Solution:
A feasible solution (not necessarily basic) is said to be optimum if it minimizes the total transportation cost.
Balanced or Unbalanced Transportation Problems:
A transportation problem can be balanced or unbalanced. It is said to be balanced if the total demand of all the warehouses equals the amount produced in all the factories. If in reality, capacity is greater than requirement, then a dummy warehouse may be used to create desired equality. If capacity is less than requirement, then a dummy factory may be introduced. The transportation cost in both the dummy cases is assumed to be zero.
Where the number of rows and columns are not equal, it is called unbalanced transportation problem.
Loops in Transportation Table:
In a transportation table, an ordered set of four or more cells is said to form a loop if any two adjacent cells in the ordered set lie either in the same row or in the same column. Moreover every loop has an even number of cells. It may be noted that a feasible solution to a T.P is basic if and only if the corresponding cells in the transportation table do not contain a loop.
Strategic Cost Management - Decision Making
308 THE INSTITUTE OF COST ACCOUNTANTS OF INDIA
Degeneracy of a Transportation Problem:
When the quantities are allocated to cost cells within the matrix and if such allocations are less than m + n -1 allocations (where ‘m’ stands for no. of rows and ‘n’ stands for no. of columns), such a situation is said to be Degeneracy of a Transportation Problem.
METHODS OF SOLVING TRANSPORTATION PROBLEM:
The following are the methods of solving transportation problem:
1. The north-west corner rule
2. Lowest cost entry method
3. Vogel’s approximation method
1. North West Corner Method (NWCM):
The simplest of the procedures used to generate an initial feasible solution is NWCM. It is so called because we begin with the north west or upper left corner cell of our transportation table. Various steps of this method can be summarized as under:
Step 1:
Select the north west (upper left-hand) corner cell of the transportation table and allocate as many units as possible equal to the minimum between available supply and demand requirement, i.e., min (s1, d1).
Step 2:
Adjust the supply and demand numbers in the respective rows and columns allocation.
Step 3:
(a) If the supply for the first row is exhausted, then move down to the first cell in the second row and first column and go to step 2.
(b) If the demand for the first column is satisfied, then move horizontally to the next cell in the second column and first row and go to step 2.
Step 4:
If for any cell, supply equals demand, then the next allocation can be made in cell either in the next row or column.
Step 5:
Continue the procedure until the total available quantity is fully allocated to the cells required.
2. Least Cost Method (LCM):
The allocation according to this method is very useful as it takes into consideration the lowest cost and therefore, reduces the computation as well as the amount of time necessary to arrive at the optimum solution. Various steps of this method can be summarized as under:
Step 1:
(a) Select the cell with the lowest transportation cost among all the rows or columns of the transportation table.
(b) If the minimum cost is not unique, then select arbitrarily any cell with this minimum cost.
Step 2:
Allocate as many units as possible to the cell determined in step 1 and eliminate that row (column) in which either supply is exhausted or demand is satisfied.
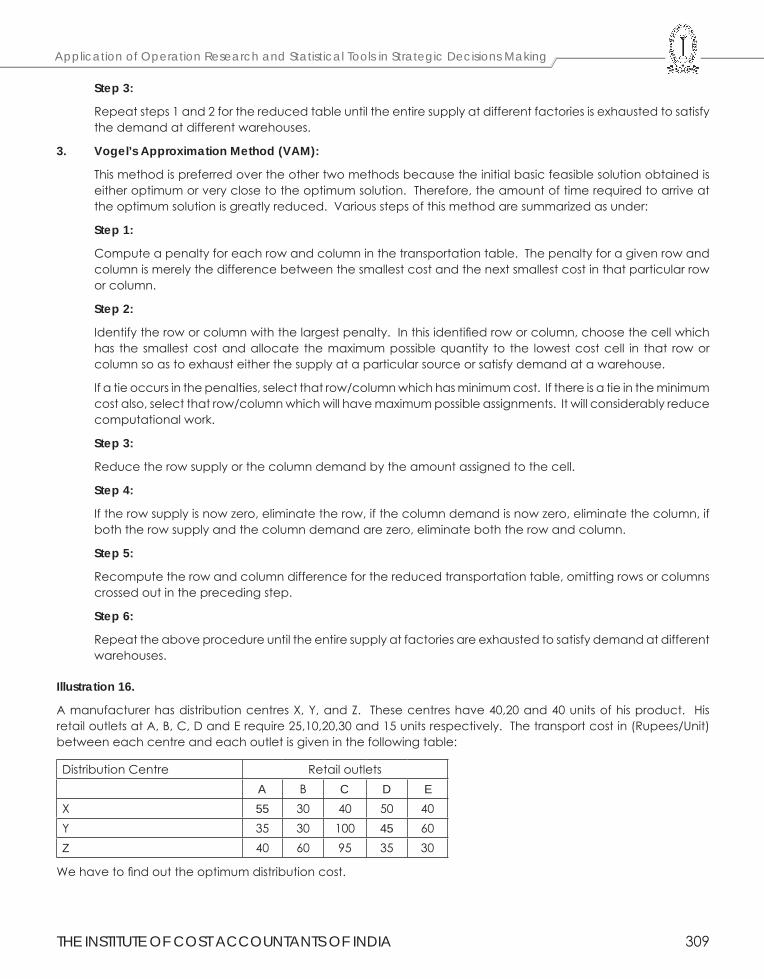
THE INSTITUTE OF COST ACCOUNTANTS OF INDIA 309
Application of Operation Research and Statistical Tools in Strategic Decisions Making
Step 3:
Repeat steps 1 and 2 for the reduced table until the entire supply at different factories is exhausted to satisfy the demand at different warehouses.
3. Vogel’s Approximation Method (VAM):
This method is preferred over the other two methods because the initial basic feasible solution obtained is either optimum or very close to the optimum solution. Therefore, the amount of time required to arrive at the optimum solution is greatly reduced. Various steps of this method are summarized as under:
Step 1:
Compute a penalty for each row and column in the transportation table. The penalty for a given row and column is merely the difference between the smallest cost and the next smallest cost in that particular row or column.
Step 2:
Identify the row or column with the largest penalty. In this identified row or column, choose the cell which has the smallest cost and allocate the maximum possible quantity to the lowest cost cell in that row or column so as to exhaust either the supply at a particular source or satisfy demand at a warehouse.
If a tie occurs in the penalties, select that row/column which has minimum cost. If there is a tie in the minimum cost also, select that row/column which will have maximum possible assignments. It will considerably reduce computational work.
Step 3:
Reduce the row supply or the column demand by the amount assigned to the cell.
Step 4:
If the row supply is now zero, eliminate the row, if the column demand is now zero, eliminate the column, if both the row supply and the column demand are zero, eliminate both the row and column.
Step 5:
Recompute the row and column difference for the reduced transportation table, omitting rows or columns crossed out in the preceding step.
Step 6:
Repeat the above procedure until the entire supply at factories are exhausted to satisfy demand at different warehouses.
Illustration 16.
A manufacturer has distribution centres X, Y, and Z. These centres have 40,20 and 40 units of his product. His retail outlets at A, B, C, D and E require 25,10,20,30 and 15 units respectively. The transport cost in (Rupees/Unit) between each centre and each outlet is given in the following table:
Distribution Centre Retail outletsA B C D E
X 55 30 40 50 40Y 35 30 100 45 60Z 40 60 95 35 30
We have to find out the optimum distribution cost.
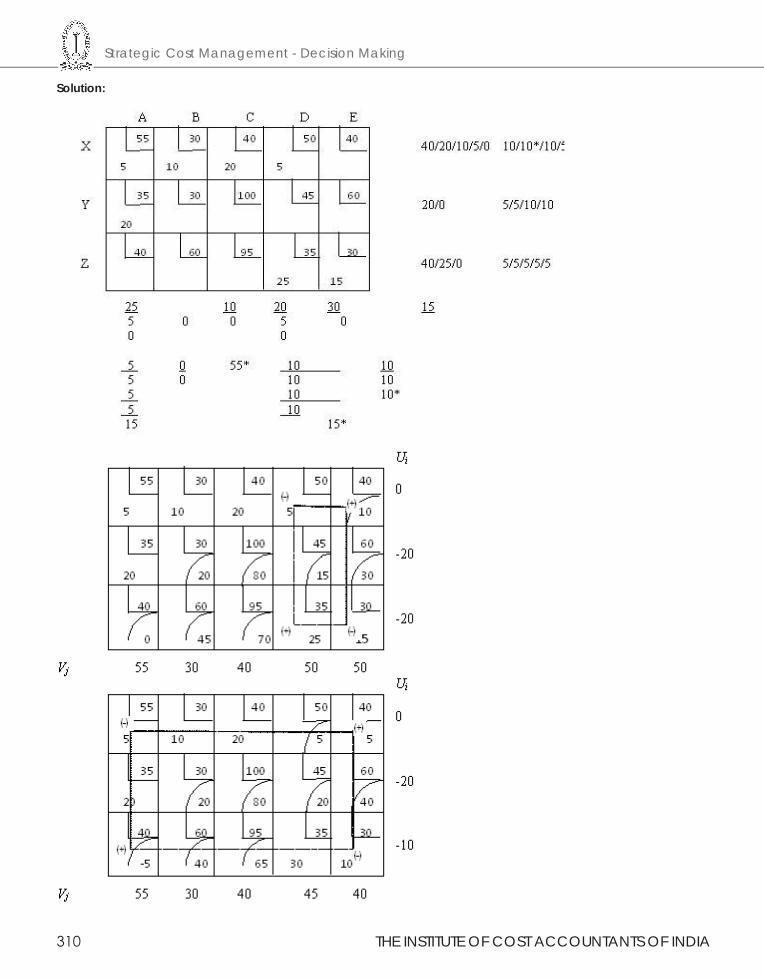
Strategic Cost Management - Decision Making
310 THE INSTITUTE OF COST ACCOUNTANTS OF INDIA
Solution:
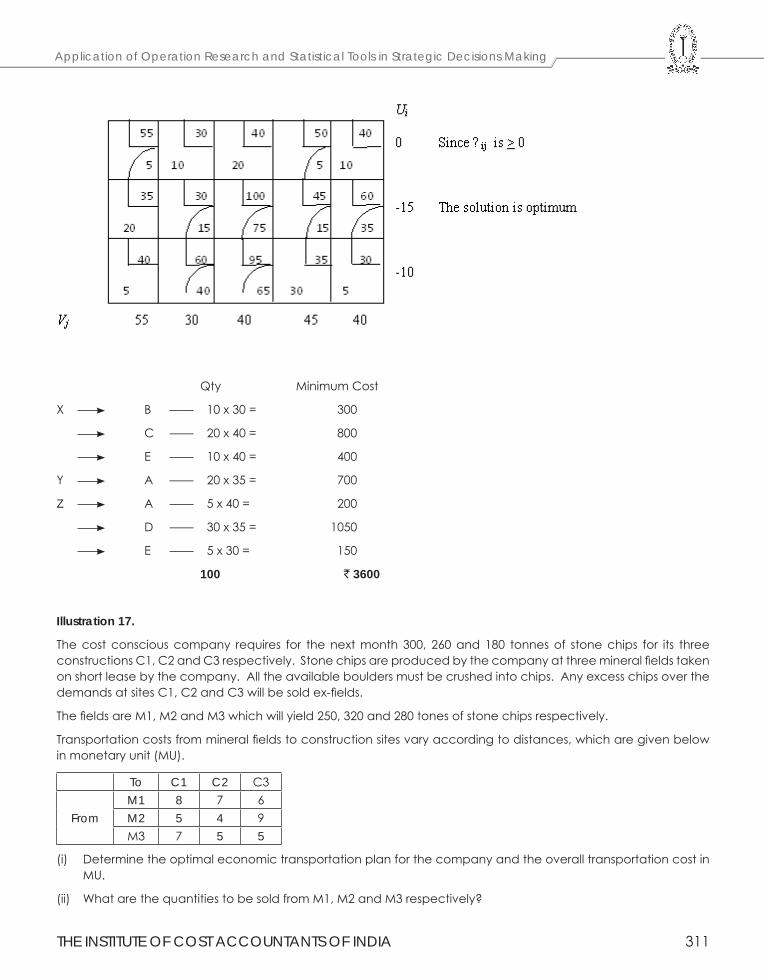
THE INSTITUTE OF COST ACCOUNTANTS OF INDIA 311
Application of Operation Research and Statistical Tools in Strategic Decisions Making
Qty Minimum Cost
X B —— 10 x 30 = 300
C —— 20 x 40 = 800
E —— 10 x 40 = 400
Y A —— 20 x 35 = 700
Z A —— 5 x 40 = 200
D —— 30 x 35 = 1050
E —— 5 x 30 = 150
100 ` 3600
Illustration 17.
The cost conscious company requires for the next month 300, 260 and 180 tonnes of stone chips for its three constructions C1, C2 and C3 respectively. Stone chips are produced by the company at three mineral fields taken on short lease by the company. All the available boulders must be crushed into chips. Any excess chips over the demands at sites C1, C2 and C3 will be sold ex-fields.
The fields are M1, M2 and M3 which will yield 250, 320 and 280 tones of stone chips respectively.
Transportation costs from mineral fields to construction sites vary according to distances, which are given below in monetary unit (MU).
To C1 C2 C3
FromM1 8 7 6M2 5 4 9M3 7 5 5
(i) Determine the optimal economic transportation plan for the company and the overall transportation cost in MU.
(ii) What are the quantities to be sold from M1, M2 and M3 respectively?
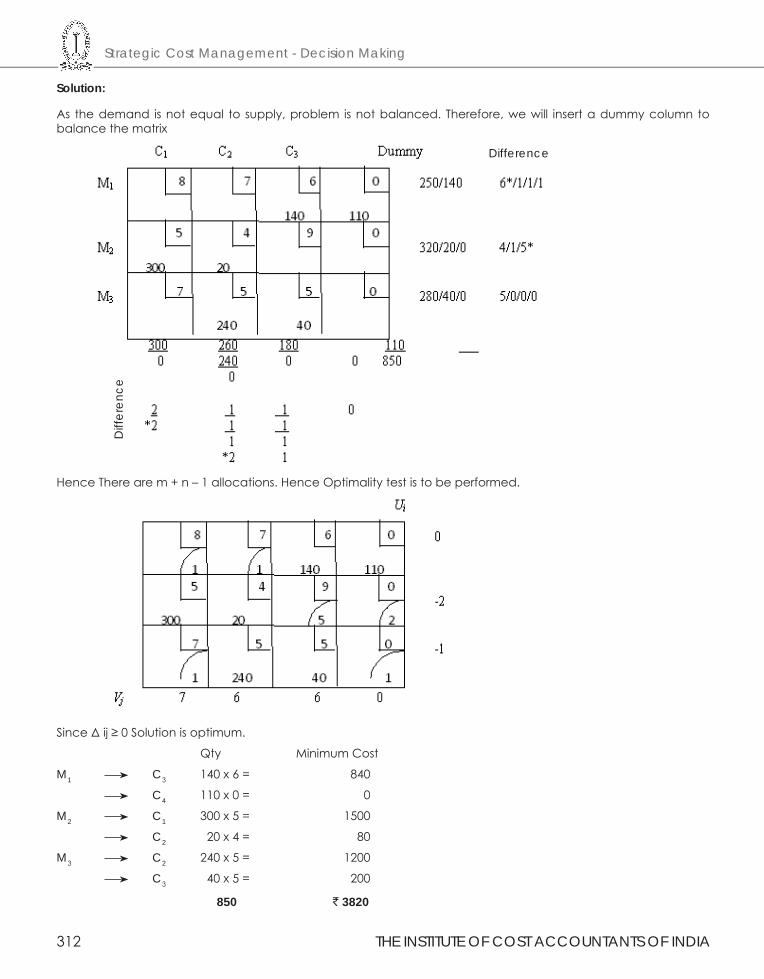
Strategic Cost Management - Decision Making
312 THE INSTITUTE OF COST ACCOUNTANTS OF INDIA
Solution:
As the demand is not equal to supply, problem is not balanced. Therefore, we will insert a dummy column to balance the matrix
Hence There are m + n – 1 allocations. Hence Optimality test is to be performed.
Since Δ ij ≥ 0 Solution is optimum.
Qty Minimum Cost
M1 C3 140 x 6 = 840
C4 110 x 0 = 0
M2 C1 300 x 5 = 1500
C2 20 x 4 = 80
M3 C2 240 x 5 = 1200
C3 40 x 5 = 200
850 ` 3820
Difference
Diff
eren
ce
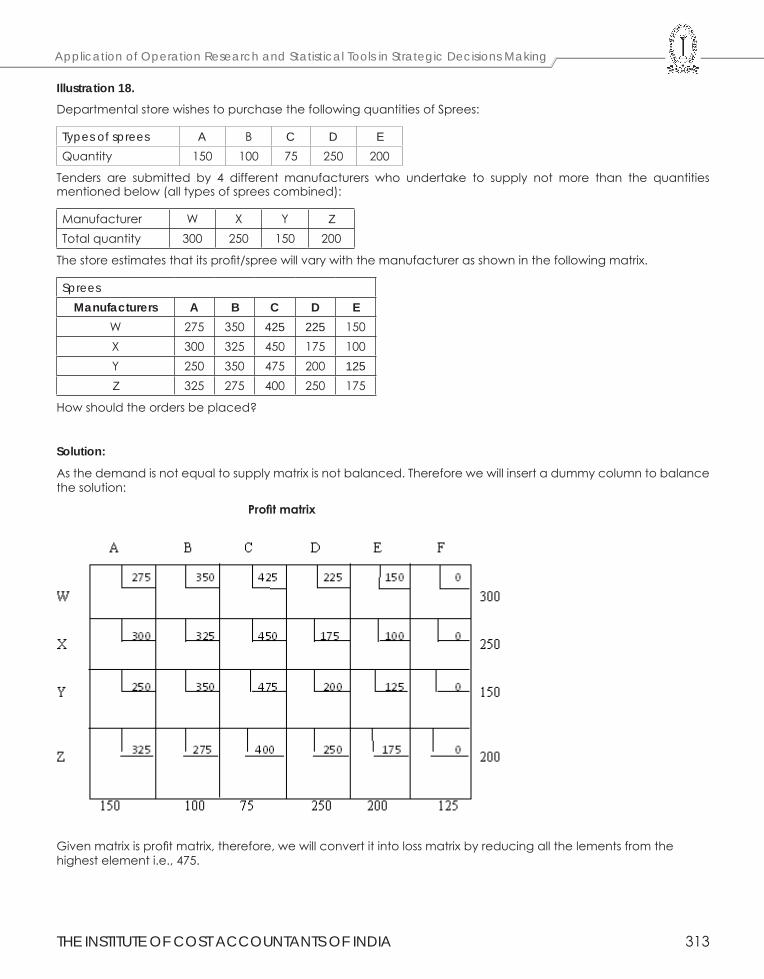
THE INSTITUTE OF COST ACCOUNTANTS OF INDIA 313
Application of Operation Research and Statistical Tools in Strategic Decisions Making
Illustration 18.Departmental store wishes to purchase the following quantities of Sprees:
Types of sprees A B C D EQuantity 150 100 75 250 200
Tenders are submitted by 4 different manufacturers who undertake to supply not more than the quantities mentioned below (all types of sprees combined):
Manufacturer W X Y ZTotal quantity 300 250 150 200
The store estimates that its profit/spree will vary with the manufacturer as shown in the following matrix.
SpreesManufacturers A B C D E
W 275 350 425 225 150X 300 325 450 175 100Y 250 350 475 200 125Z 325 275 400 250 175
How should the orders be placed?
Solution:
As the demand is not equal to supply matrix is not balanced. Therefore we will insert a dummy column to balance the solution:
Profit matrix
Given matrix is profit matrix, therefore, we will convert it into loss matrix by reducing all the lements from the highest element i.e., 475.
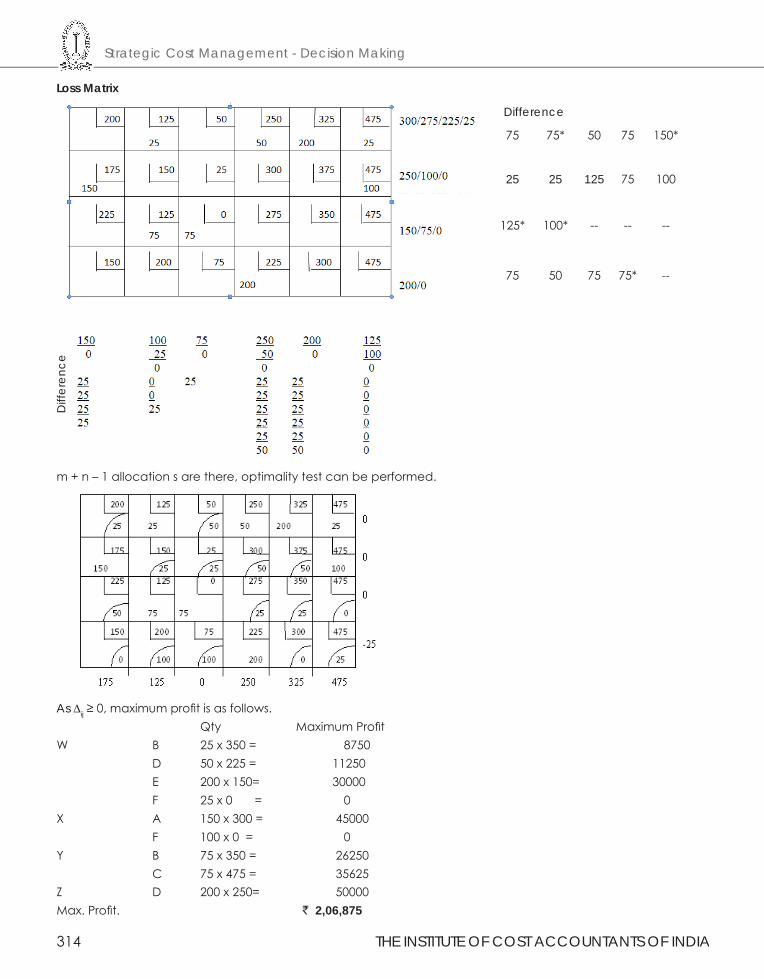
Strategic Cost Management - Decision Making
314 THE INSTITUTE OF COST ACCOUNTANTS OF INDIA
Loss Matrix
m + n – 1 allocation s are there, optimality test can be performed.
As ∆ij ≥ 0, maximum profit is as follows. Qty Maximum ProfitW B 25 x 350 = 8750 D 50 x 225 = 11250 E 200 x 150= 30000 F 25 x 0 = 0X A 150 x 300 = 45000 F 100 x 0 = 0Y B 75 x 350 = 26250 C 75 x 475 = 35625Z D 200 x 250= 50000Max. Profit. ` 2,06,875
Diff
eren
ce
75 75* 50 75 150*
25 25 125 75 100
125* 100* -- -- --
75 50 75 75* --
Difference
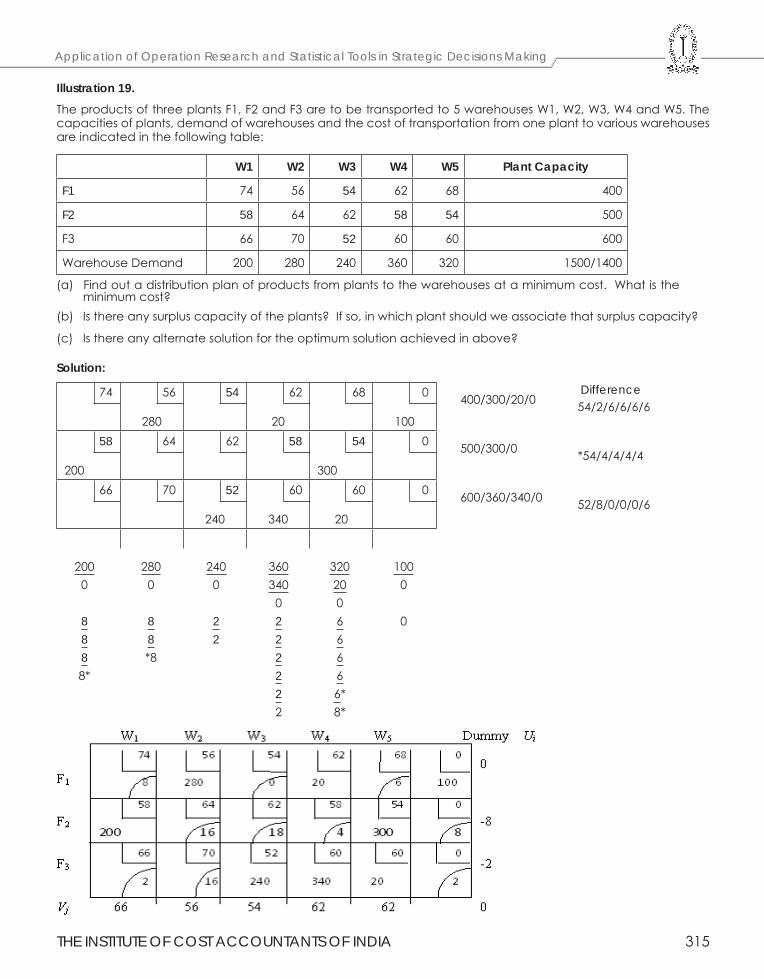
THE INSTITUTE OF COST ACCOUNTANTS OF INDIA 315
Application of Operation Research and Statistical Tools in Strategic Decisions Making
Illustration 19.The products of three plants F1, F2 and F3 are to be transported to 5 warehouses W1, W2, W3, W4 and W5. The capacities of plants, demand of warehouses and the cost of transportation from one plant to various warehouses are indicated in the following table:
W1 W2 W3 W4 W5 Plant Capacity
F1 74 56 54 62 68 400
F2 58 64 62 58 54 500
F3 66 70 52 60 60 600
Warehouse Demand 200 280 240 360 320 1500/1400
(a) Find out a distribution plan of products from plants to the warehouses at a minimum cost. What is the minimum cost?(b) Is there any surplus capacity of the plants? If so, in which plant should we associate that surplus capacity?
(c) Is there any alternate solution for the optimum solution achieved in above?
Solution:
74 56
280
54 62
20
68 0
100
400/300/20/0 54/2/6/6/6/6
58
200
64 62 58 54
300
0 500/300/0 *54/4/4/4/4
66 70 52
240
60
340
60
20
0 600/360/340/0 52/8/0/0/0/6
200 280 240 360 320 100 0 0 0 340 20 0 0 0 8 8 2 2 6 0 8 8 2 2 6 8 *8 2 6 8* 2 6 2 6* 2 8*
Difference
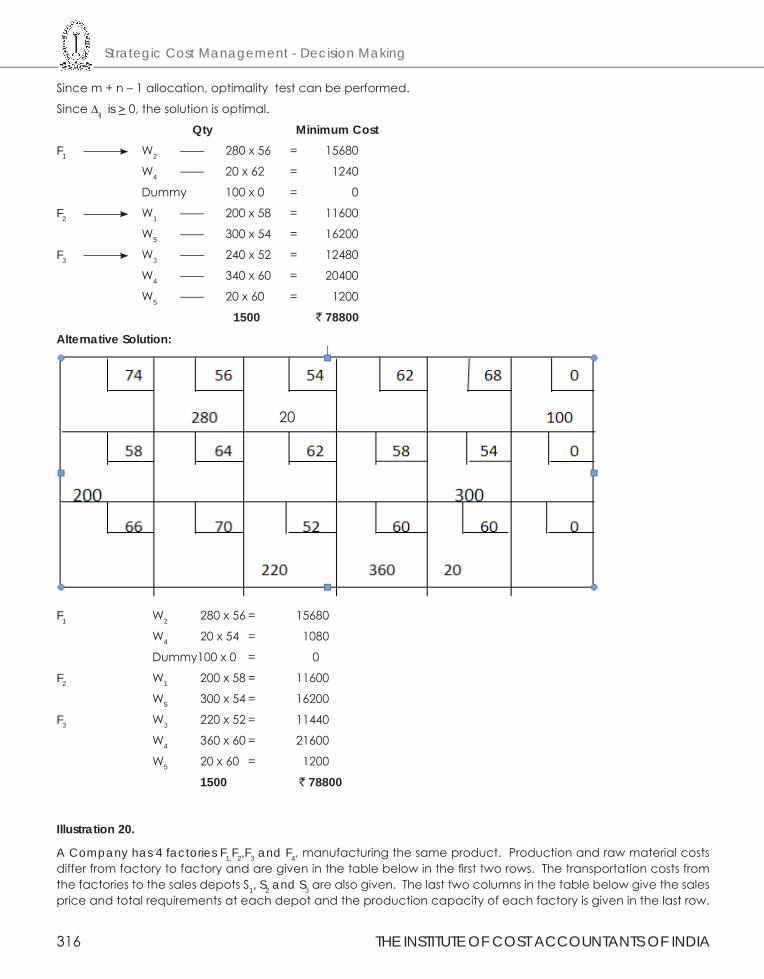
Strategic Cost Management - Decision Making
316 THE INSTITUTE OF COST ACCOUNTANTS OF INDIA
Since m + n – 1 allocation, optimality test can be performed.
Since ∆ij is > 0, the solution is optimal.
Qty Minimum CostF1 W2 —— 280 x 56 = 15680
W4 —— 20 x 62 = 1240
Dummy 100 x 0 = 0
F2 W1 —— 200 x 58 = 11600
W5 —— 300 x 54 = 16200
F3 W3 —— 240 x 52 = 12480
W4 —— 340 x 60 = 20400
W5 —— 20 x 60 = 1200
1500 ` 78800
Alternative Solution:
F1 W2 280 x 56 = 15680
W4 20 x 54 = 1080
Dummy100 x 0 = 0
F2 W1 200 x 58 = 11600
W5 300 x 54 = 16200
F3 W3 220 x 52 = 11440
W4 360 x 60 = 21600
W5 20 x 60 = 1200
1500 ` 78800
Illustration 20.
A Company has 4 factories F1,F2,F3 and F4, manufacturing the same product. Production and raw material costs differ from factory to factory and are given in the table below in the first two rows. The transportation costs from the factories to the sales depots S1, S2 and S3 are also given. The last two columns in the table below give the sales price and total requirements at each depot and the production capacity of each factory is given in the last row.
20
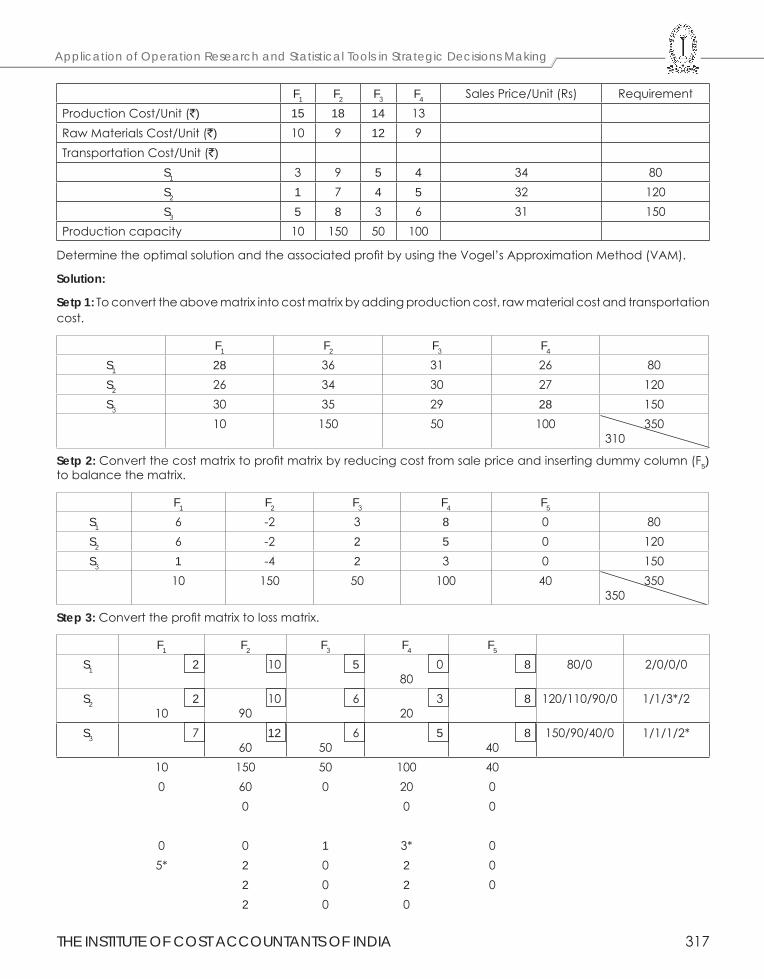
THE INSTITUTE OF COST ACCOUNTANTS OF INDIA 317
Application of Operation Research and Statistical Tools in Strategic Decisions Making
F1 F2 F3 F4 Sales Price/Unit (Rs) RequirementProduction Cost/Unit (`) 15 18 14 13Raw Materials Cost/Unit (`) 10 9 12 9Transportation Cost/Unit (`)
S1 3 9 5 4 34 80S2 1 7 4 5 32 120S3 5 8 3 6 31 150
Production capacity 10 150 50 100
Determine the optimal solution and the associated profit by using the Vogel’s Approximation Method (VAM).
Solution:
Setp 1: To convert the above matrix into cost matrix by adding production cost, raw material cost and transportation cost.
F1 F2 F3 F4
S1 28 36 31 26 80S2 26 34 30 27 120S3 30 35 29 28 150
10 150 50 100 350310
Setp 2: Convert the cost matrix to profit matrix by reducing cost from sale price and inserting dummy column (F5) to balance the matrix.
F1 F2 F3 F4 F5
S1 6 -2 3 8 0 80S2 6 -2 2 5 0 120S3 1 -4 2 3 0 150
10 150 50 100 40 350350
Step 3: Convert the profit matrix to loss matrix.
F1 F2 F3 F4 F5
S1 2 10 5 080
8 80/0 2/0/0/0
S2 210
1090
6 320
8 120/110/90/0 1/1/3*/2
S3 7 1260
650
5 840
150/90/40/0 1/1/1/2*
10 150 50 100 400 60 0 20 0
0 0 0
0 0 1 3* 05* 2 0 2 0
2 0 2 02 0 0
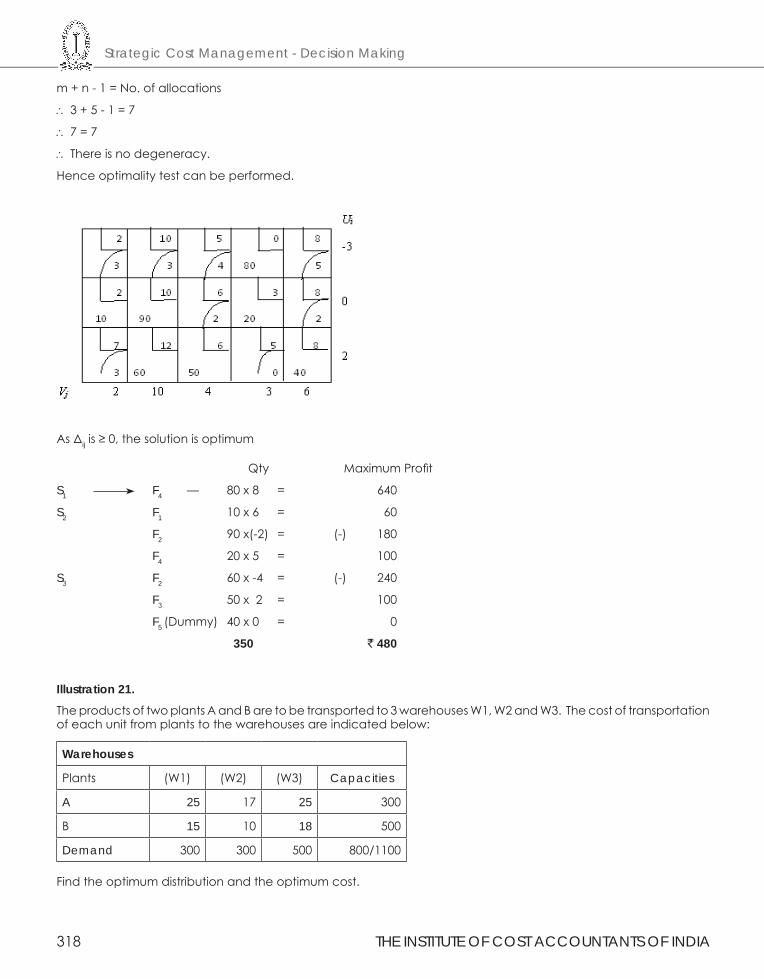
Strategic Cost Management - Decision Making
318 THE INSTITUTE OF COST ACCOUNTANTS OF INDIA
m + n - 1 = No. of allocations
∴ 3 + 5 - 1 = 7
∴ 7 = 7
∴ There is no degeneracy.
Hence optimality test can be performed.
As Δij is ≥ 0, the solution is optimum
Qty Maximum Profit
S1 F4 — 80 x 8 = 640
S2 F1 10 x 6 = 60
F2 90 x(-2) = (-) 180
F4 20 x 5 = 100
S3 F2 60 x -4 = (-) 240
F3 50 x 2 = 100
F5 (Dummy) 40 x 0 = 0
350 ` 480
Illustration 21.The products of two plants A and B are to be transported to 3 warehouses W1, W2 and W3. The cost of transportation of each unit from plants to the warehouses are indicated below:
Warehouses
Plants (W1) (W2) (W3) Capacities
A 25 17 25 300
B 15 10 18 500
Demand 300 300 500 800/1100
Find the optimum distribution and the optimum cost.
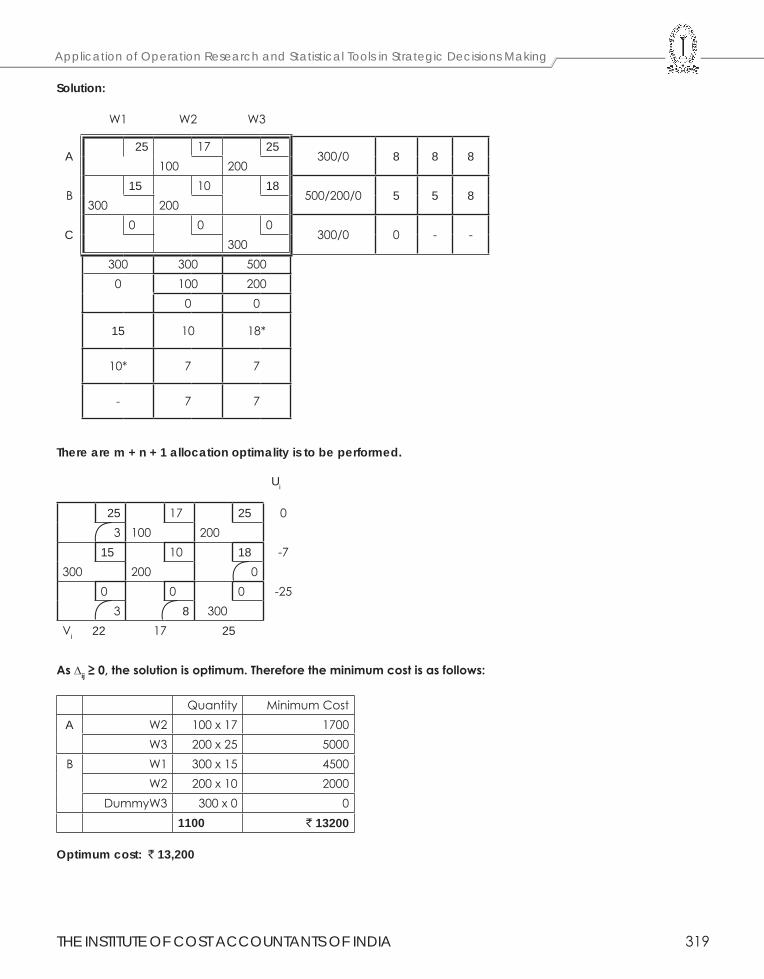
THE INSTITUTE OF COST ACCOUNTANTS OF INDIA 319
Application of Operation Research and Statistical Tools in Strategic Decisions Making
Solution:
W1 W2 W3
A25 17 25
300/0 8 8 8100 200
B15 10 18
500/200/0 5 5 8300 200
C0 0 0
300/0 0 - -300
300 300 5000 100 200
0 0
15 10 18*
10* 7 7
- 7 7
There are m + n + 1 allocation optimality is to be performed.
Ui
25 17 25 03 100 200
15 10 18 -7300 200 0
0 0 0 -253 8 300
Vi 22 17 25
As ∆ij ≥ 0, the solution is optimum. Therefore the minimum cost is as follows:
Quantity Minimum CostA W2 100 x 17 1700
W3 200 x 25 5000B W1 300 x 15 4500
W2 200 x 10 2000DummyW3 300 x 0 0
1100 ` 13200
Optimum cost: ` 13,200
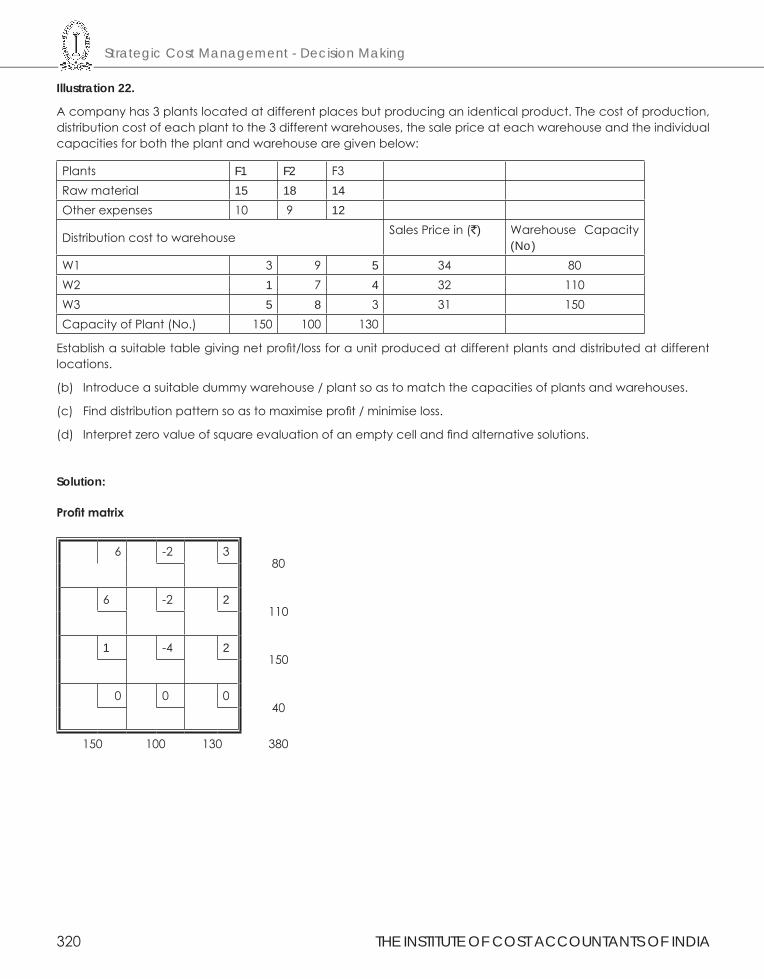
Strategic Cost Management - Decision Making
320 THE INSTITUTE OF COST ACCOUNTANTS OF INDIA
Illustration 22.
A company has 3 plants located at different places but producing an identical product. The cost of production, distribution cost of each plant to the 3 different warehouses, the sale price at each warehouse and the individual capacities for both the plant and warehouse are given below:
Plants F1 F2 F3Raw material 15 18 14Other expenses 10 9 12
Distribution cost to warehouse Sales Price in (`) Warehouse Capacity (No)
W1 3 9 5 34 80W2 1 7 4 32 110W3 5 8 3 31 150Capacity of Plant (No.) 150 100 130
Establish a suitable table giving net profit/loss for a unit produced at different plants and distributed at different locations.
(b) Introduce a suitable dummy warehouse / plant so as to match the capacities of plants and warehouses.
(c) Find distribution pattern so as to maximise profit / minimise loss.
(d) Interpret zero value of square evaluation of an empty cell and find alternative solutions.
Solution:
Profit matrix
6 -2 380
6 -2 2110
1 -4 2150
0 0 040
150 100 130 380
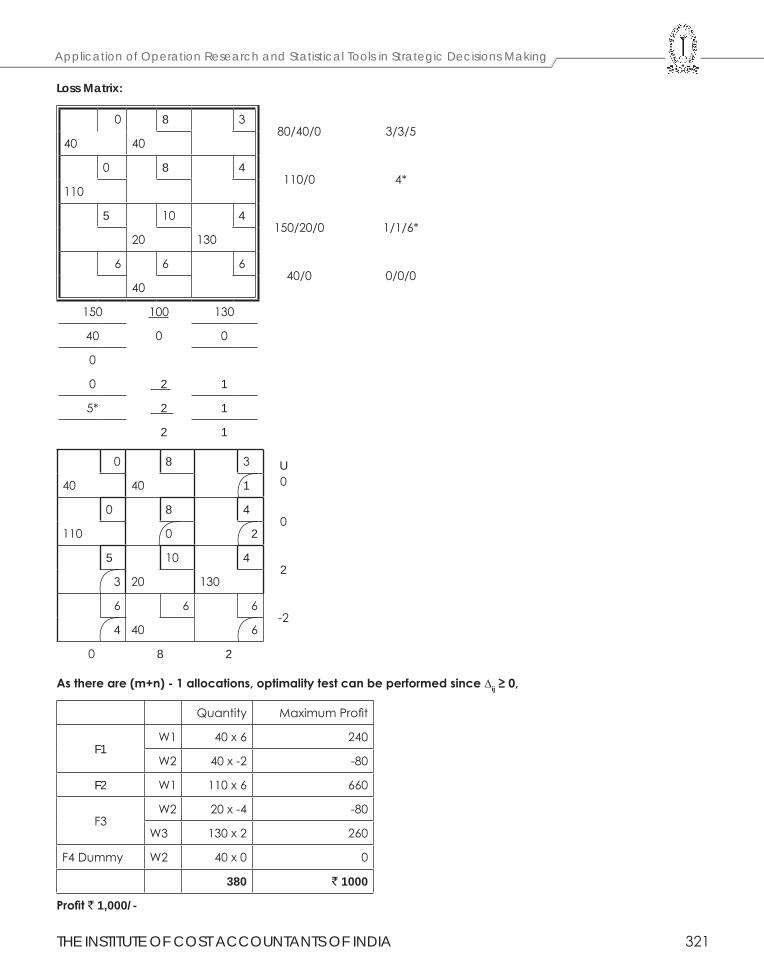
THE INSTITUTE OF COST ACCOUNTANTS OF INDIA 321
Application of Operation Research and Statistical Tools in Strategic Decisions Making
Loss Matrix:
0 8 380/40/0 3/3/5
40 40
0 8 4110/0 4*
110
5 10 4150/20/0 1/1/6*
20 130
6 6 640/0 0/0/0
40
150 100 130
40 0 0
0
0 2 1
5* 2 1
2 1
0 8 3 U040 40 1
0 8 40
110 0 2
5 10 42
3 20 130
6 6 6-2
4 40 6
0 8 2
As there are (m+n) - 1 allocations, optimality test can be performed since ∆ij ≥ 0,
Quantity Maximum Profit
F1W1 40 x 6 240
W2 40 x -2 -80
F2 W1 110 x 6 660
F3W2 20 x -4 -80
W3 130 x 2 260
F4 Dummy W2 40 x 0 0
380 ` 1000
Profit ` 1,000/-
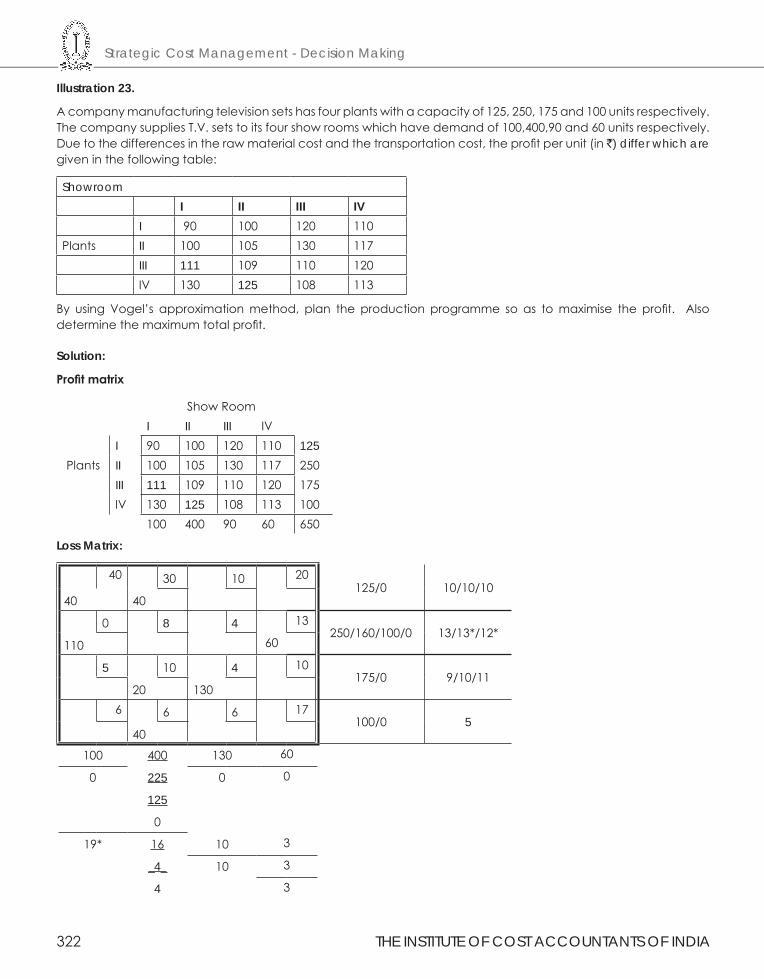
Strategic Cost Management - Decision Making
322 THE INSTITUTE OF COST ACCOUNTANTS OF INDIA
Illustration 23.
A company manufacturing television sets has four plants with a capacity of 125, 250, 175 and 100 units respectively. The company supplies T.V. sets to its four show rooms which have demand of 100,400,90 and 60 units respectively. Due to the differences in the raw material cost and the transportation cost, the profit per unit (in `) differ which are given in the following table:
ShowroomI II III IV
I 90 100 120 110Plants II 100 105 130 117
III 111 109 110 120IV 130 125 108 113
By using Vogel’s approximation method, plan the production programme so as to maximise the profit. Also determine the maximum total profit.
Solution:
Profit matrix
Show Room
Plants
I II III IVI 90 100 120 110 125II 100 105 130 117 250III 111 109 110 120 175IV 130 125 108 113 100
100 400 90 60 650
Loss Matrix:
40 30 10 20125/0 10/10/10
40 40
0 8 4 13250/160/100/0 13/13*/12*
110 60
5 10 4 10175/0 9/10/11
20 1306 6 6 17
100/0 540
100 400 130 60
0 225 0 0
125
0
19* 16 10 3
_4_ 10 3
4 3
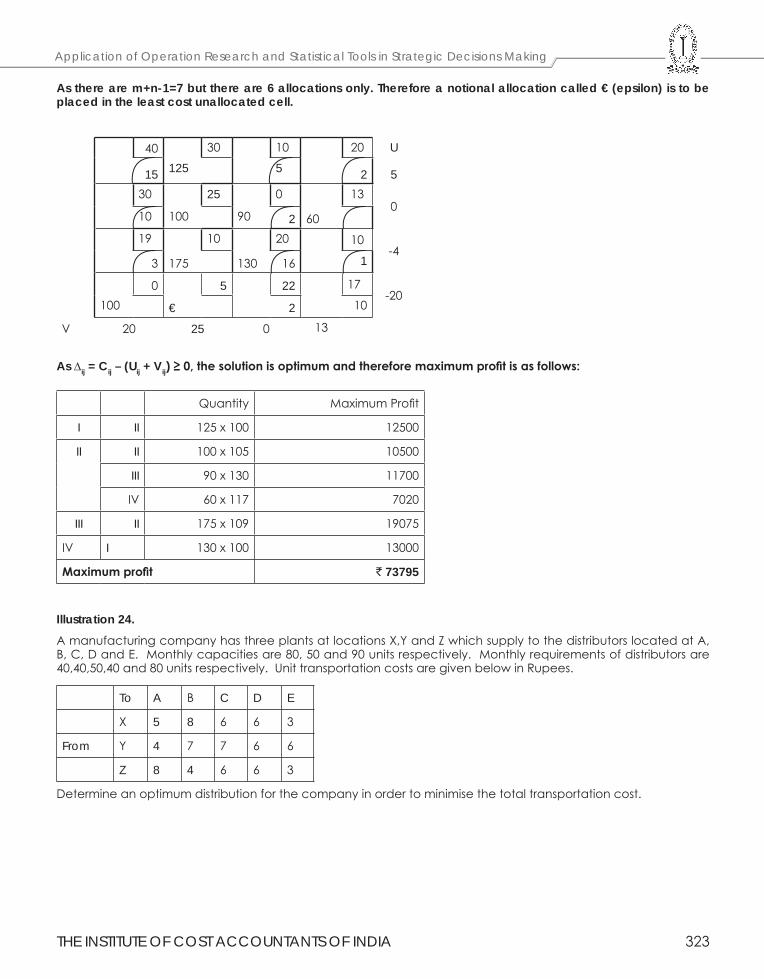
THE INSTITUTE OF COST ACCOUNTANTS OF INDIA 323
Application of Operation Research and Statistical Tools in Strategic Decisions Making
As there are m+n-1=7 but there are 6 allocations only. Therefore a notional allocation called € (epsilon) is to be placed in the least cost unallocated cell.
40 30 10 20 U
515 125 5 230 25 0 13
010 100 90 2 6019 10 20 10
-43 175 130 16 1
0 5 22 17-20
100 € 2 10
V 20 25 0 13
As ∆ij = Cij – (Uij + Vij) ≥ 0, the solution is optimum and therefore maximum profit is as follows:
Quantity Maximum Profit
I II 125 x 100 12500
II II 100 x 105 10500
III 90 x 130 11700
IV 60 x 117 7020
III II 175 x 109 19075
IV I 130 x 100 13000
Maximum profit ` 73795
Illustration 24.A manufacturing company has three plants at locations X,Y and Z which supply to the distributors located at A, B, C, D and E. Monthly capacities are 80, 50 and 90 units respectively. Monthly requirements of distributors are 40,40,50,40 and 80 units respectively. Unit transportation costs are given below in Rupees.
To A B C D E
X 5 8 6 6 3
From Y 4 7 7 6 6
Z 8 4 6 6 3
Determine an optimum distribution for the company in order to minimise the total transportation cost.
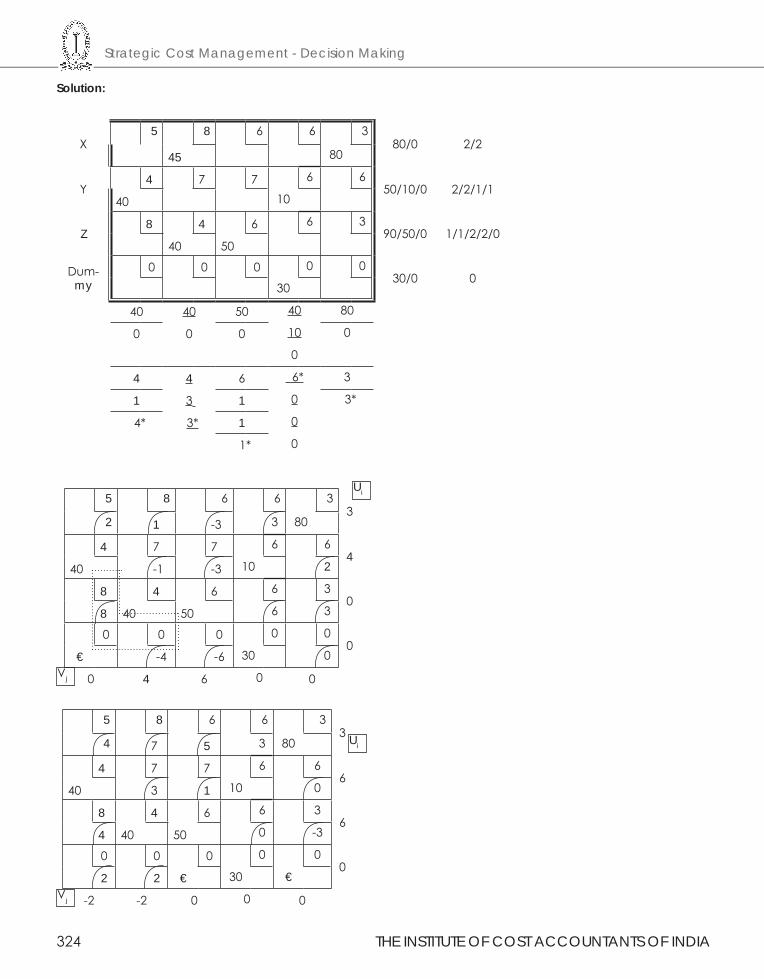
Strategic Cost Management - Decision Making
324 THE INSTITUTE OF COST ACCOUNTANTS OF INDIA
Solution:
X5 8 6 6 3
80/0 2/245 80
Y4 7 7 6 6
50/10/0 2/2/1/140 10
Z8 4 6 6 3
90/50/0 1/1/2/2/040 50
Dum-my
0 0 0 0 030/0 0
30
40 40 50 40 80
0 0 0 10 0
0
4 4 6 6* 3
1 3 1 0 3*
4* 3* 1 0
1* 0
Ui
Vj
5 8 6 6 33
2 1 -3 3 80
4 7 7 6 64
40 -1 -3 10 2
8 4 6 6 30
8 40 50 6 3
0 0 0 0 00
€ -4 -6 30 0
0 4 6 0 0
5 8 6 6 33
4 7 5 3 80
4 7 7 6 66
40 3 1 10 0
8 4 6 6 36
4 40 50 0 -3
0 0 0 0 00
2 2 € 30 €
-2 -2 0 0 0Vj
Ui
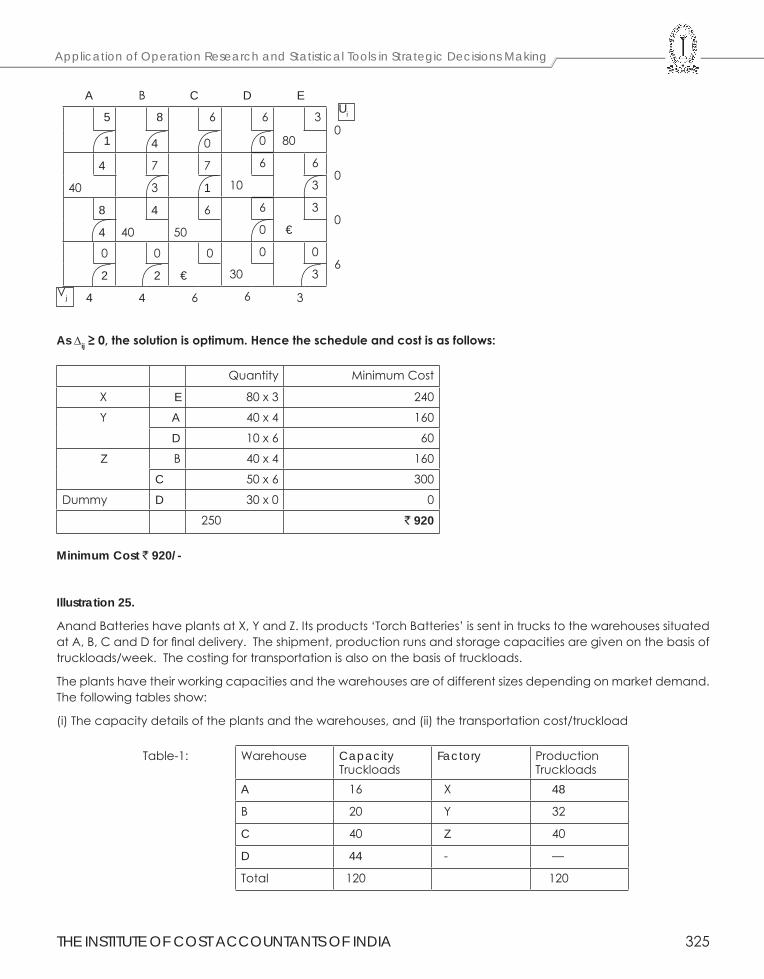
THE INSTITUTE OF COST ACCOUNTANTS OF INDIA 325
Application of Operation Research and Statistical Tools in Strategic Decisions Making
A B C D E
5 8 6 6 30
1 4 0 0 80
4 7 7 6 60
40 3 1 10 3
8 4 6 6 30
4 40 50 0 €
0 0 0 0 06
2 2 € 30 3
4 4 6 6 3Vj
Ui
As ∆ij ≥ 0, the solution is optimum. Hence the schedule and cost is as follows:
Quantity Minimum Cost
X E 80 x 3 240
Y A 40 x 4 160
D 10 x 6 60
Z B 40 x 4 160
C 50 x 6 300
Dummy D 30 x 0 0
250 ` 920
Minimum Cost ` 920/-
Illustration 25.
Anand Batteries have plants at X, Y and Z. Its products ‘Torch Batteries’ is sent in trucks to the warehouses situated at A, B, C and D for final delivery. The shipment, production runs and storage capacities are given on the basis of truckloads/week. The costing for transportation is also on the basis of truckloads.
The plants have their working capacities and the warehouses are of different sizes depending on market demand. The following tables show:
(i) The capacity details of the plants and the warehouses, and (ii) the transportation cost/truckload
Table-1: Warehouse Capacity Truckloads
Factory Production Truckloads
A 16 X 48
B 20 Y 32
C 40 Z 40
D 44 - —
Total 120 120
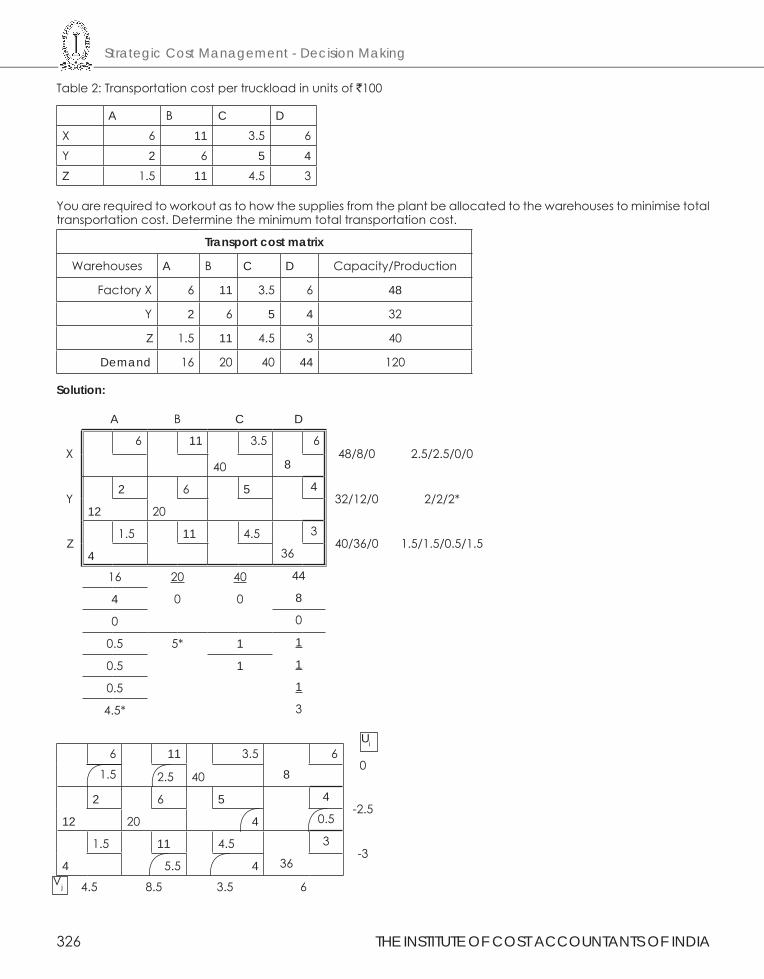
Strategic Cost Management - Decision Making
326 THE INSTITUTE OF COST ACCOUNTANTS OF INDIA
Table 2: Transportation cost per truckload in units of `100
A B C DX 6 11 3.5 6Y 2 6 5 4Z 1.5 11 4.5 3
You are required to workout as to how the supplies from the plant be allocated to the warehouses to minimise total transportation cost. Determine the minimum total transportation cost.
Transport cost matrix
Warehouses A B C D Capacity/Production
Factory X 6 11 3.5 6 48
Y 2 6 5 4 32
Z 1.5 11 4.5 3 40
Demand 16 20 40 44 120
Solution:
A B C D
X6 11 3.5 6
48/8/0 2.5/2.5/0/040 8
Y2 6 5 4
32/12/0 2/2/2*12 20
Z1.5 11 4.5 3
40/36/0 1.5/1.5/0.5/1.54 36
16 20 40 44
4 0 0 8
0 0
0.5 5* 1 1
0.5 1 1
0.5 1
4.5* 3
Ui6 11 3.5 6
01.5 2.5 40 8
2 6 5 4-2.5
12 20 4 0.5
1.5 11 4.5 3-3
4 5.5 4 36
4.5 8.5 3.5 6Vj
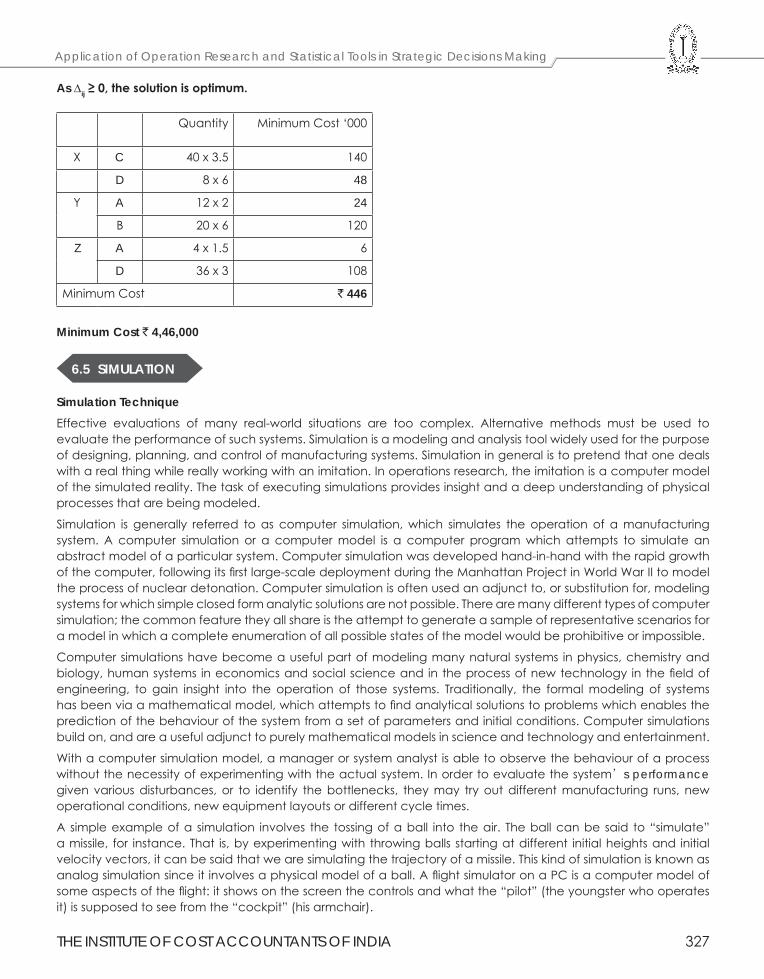
THE INSTITUTE OF COST ACCOUNTANTS OF INDIA 327
Application of Operation Research and Statistical Tools in Strategic Decisions Making
As ∆ij ≥ 0, the solution is optimum.
Quantity Minimum Cost ‘000
X C 40 x 3.5 140
D 8 x 6 48
Y A 12 x 2 24
B 20 x 6 120
Z A 4 x 1.5 6
D 36 x 3 108
Minimum Cost ` 446 Minimum Cost ` 4,46,000
6.5 SIMULATION
Simulation Technique Effective evaluations of many real-world situations are too complex. Alternative methods must be used to evaluate the performance of such systems. Simulation is a modeling and analysis tool widely used for the purpose of designing, planning, and control of manufacturing systems. Simulation in general is to pretend that one deals with a real thing while really working with an imitation. In operations research, the imitation is a computer model of the simulated reality. The task of executing simulations provides insight and a deep understanding of physical processes that are being modeled.
Simulation is generally referred to as computer simulation, which simulates the operation of a manufacturing system. A computer simulation or a computer model is a computer program which attempts to simulate an abstract model of a particular system. Computer simulation was developed hand-in-hand with the rapid growth of the computer, following its first large-scale deployment during the Manhattan Project in World War II to model the process of nuclear detonation. Computer simulation is often used an adjunct to, or substitution for, modeling systems for which simple closed form analytic solutions are not possible. There are many different types of computer simulation; the common feature they all share is the attempt to generate a sample of representative scenarios for a model in which a complete enumeration of all possible states of the model would be prohibitive or impossible.
Computer simulations have become a useful part of modeling many natural systems in physics, chemistry and biology, human systems in economics and social science and in the process of new technology in the field of engineering, to gain insight into the operation of those systems. Traditionally, the formal modeling of systems has been via a mathematical model, which attempts to find analytical solutions to problems which enables the prediction of the behaviour of the system from a set of parameters and initial conditions. Computer simulations build on, and are a useful adjunct to purely mathematical models in science and technology and entertainment.
With a computer simulation model, a manager or system analyst is able to observe the behaviour of a process without the necessity of experimenting with the actual system. In order to evaluate the system’s performance given various disturbances, or to identify the bottlenecks, they may try out different manufacturing runs, new operational conditions, new equipment layouts or different cycle times.
A simple example of a simulation involves the tossing of a ball into the air. The ball can be said to “simulate” a missile, for instance. That is, by experimenting with throwing balls starting at different initial heights and initial velocity vectors, it can be said that we are simulating the trajectory of a missile. This kind of simulation is known as analog simulation since it involves a physical model of a ball. A flight simulator on a PC is a computer model of some aspects of the flight: it shows on the screen the controls and what the “pilot” (the youngster who operates it) is supposed to see from the “cockpit” (his armchair).
Strategic Cost Management - Decision Making
328 THE INSTITUTE OF COST ACCOUNTANTS OF INDIA
Application of Simulation
(i) Scheduling aircraft,
(ii) Job-ship scheduling and personnel scheduling,
(iii) Manpower-hiring decisions,
(iv) Traffic light-timing,
(v) Transport-scheduling,
(vi) Evaluating alternative investment opportunities, and
(vii) Design of parking lots, harbor, and communication systems etc.
Advantages of Simulation
(a) Enables to experiment and study complex interactions of a system (e.g. company operations, economic policies).
(b) Possible to study the effects of organizational environment informational changes in the operations of a system (e.g. number of stocking points, industrial policies).
(c) Better insight and understanding of a complex system to indication for improvement.
(d) Assists in teaching and training (management games).
(e) New situations policies can be protested.
(f) Probabilistic features can be easily incorporated.
(g) A process can be studies in extended or compressed time.
(h) Risks involved in experimenting with real problems can be eliminated.
Limitations of Simulations
(a) Simulated results are not precise. Unlike mathematical models, it does not give optimum solutions. At times one may not be able to assess the extent of error in a simulated result.
(b) Some situations are not amenable to simulation.
(c) Simulation may be expensive needing advanced computer supports
(d) Simulation by itself does not generate solutions, but only indicates a way of evaluating solutions.
(e) It is often a long, complicated process to develop a model.
Steps involved in constructing and using a Simulation Model
All simulation projects follow the following steps :
(i) Define the problem
(ii) Data collection
(iii) Problem analysis
(iv) Simulation model specification
(v) Model programming
(vi) Model validation
(vii) Simulation experimentation
(viii) Evaluation and interpretation of simulation results
(ix) Report generation and plans for implementation of the results
THE INSTITUTE OF COST ACCOUNTANTS OF INDIA 329
Application of Operation Research and Statistical Tools in Strategic Decisions Making
Design of Simulation Model
One should consider the characteristic of the system in question and the nature of the problems to be tackled while choosing a modeling approach. In general the simulation model used in the area of Manufacturing Systems Engineering (MSE) can be classified as :
(i) Static and Dynamic Simulation Models
(ii) Continuous and Discrete Simulation Model
(iii) Stochastic and Deterministic Simulation Model
(iv) Social Simulation
(v) Web based Simulation
(vi) Parallel and Distributed Simulation
Types of Simulation
Simulators are usually divided into the following categories or simulation modes :
(i) Behavioral simulation
(ii) Functional simulation
(iii) Static timing analysis
(iv) Gate-level simulation
(v) Switch-level simulation
(vi) Transistor-level or circuit-level simulation
This list is ordered from high-level to low-level simulation (high-level being more abstract, and low-level being more detailed). Proceeding from high-level to low-level simulation, the simulations become more accurate, but they also become progressively more complex and take longer to run. While it is just possible to perform a behavioral-level simulation of a complete system, it is impossible to perform a circuit-level simulation of more than a few hundred transistors.
There are several ways to create an imaginary simulation model of a system. One method models large pieces of a system as black boxes with inputs and outputs. This type of simulation (often using VHDL or Verilog) is called behavioral simulation . Functional simulation ignores timing and includes unit-delay simulation , which sets delays to a fixed value (for example, 1 ns). Once a behavioral or functional simulation predicts that a system works correctly, the next step is to check the timing performance. At this point a system is partitioned into ASICs and a timing simulation is performed for each ASIC separately (otherwise the simulation run times become too long). One class of timing simulators employs timing analysis that analyzes logic in a static manner, computing the delay times for each path. This is called static timing analysis because it does not require the creation of a set of test (or stimulus) vectors (an enormous job for a large ASIC). Timing analysis works best with synchronous systems whose maximum operating frequency is determined by the longest path delay between successive flip-flops. The path with the longest delay is the critical path .
Logic simulation or gate-level simulation can also be used to check the timing performance of an ASIC. In a gate-level simulator a logic gate or logic cell (NAND, NOR, and so on) is treated as a black box modeled by a function whose variables are the input signals. The function may also model the delay through the logic cell. Setting all the delays to unit value is the equivalent of functional simulation. If the timing simulation provided by a black-box model of a logic gate is not accurate enough, the next, more detailed, level of simulation is switch-level simulation which models transistors as switches—on or off. Switch-level simulation can provide more accurate timing predictions than gate-level simulation, but without the ability to use logic-cell delays as parameters of the models. The most accurate, but also the most complex and time-consuming, form of simulation is transistor-level simulation . A transistor-level simulator requires models of transistors, describing their nonlinear voltage and current characteristics.
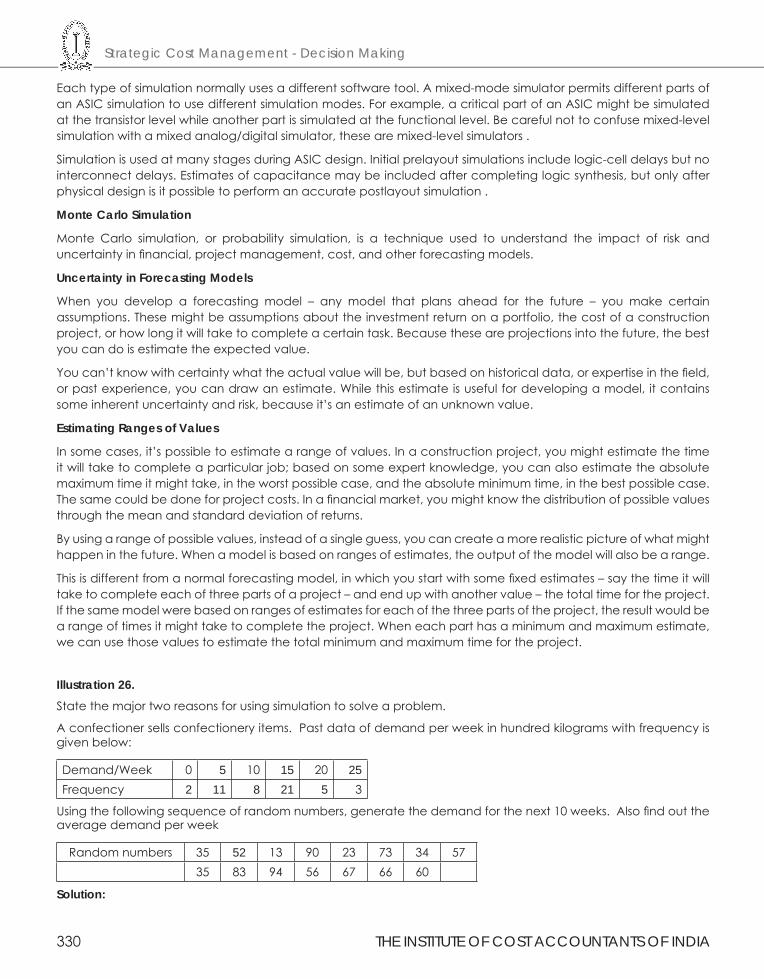
Strategic Cost Management - Decision Making
330 THE INSTITUTE OF COST ACCOUNTANTS OF INDIA
Each type of simulation normally uses a different software tool. A mixed-mode simulator permits different parts of an ASIC simulation to use different simulation modes. For example, a critical part of an ASIC might be simulated at the transistor level while another part is simulated at the functional level. Be careful not to confuse mixed-level simulation with a mixed analog/digital simulator, these are mixed-level simulators .
Simulation is used at many stages during ASIC design. Initial prelayout simulations include logic-cell delays but no interconnect delays. Estimates of capacitance may be included after completing logic synthesis, but only after physical design is it possible to perform an accurate postlayout simulation .
Monte Carlo Simulation
Monte Carlo simulation, or probability simulation, is a technique used to understand the impact of risk and uncertainty in financial, project management, cost, and other forecasting models.
Uncertainty in Forecasting Models
When you develop a forecasting model – any model that plans ahead for the future – you make certain assumptions. These might be assumptions about the investment return on a portfolio, the cost of a construction project, or how long it will take to complete a certain task. Because these are projections into the future, the best you can do is estimate the expected value.
You can’t know with certainty what the actual value will be, but based on historical data, or expertise in the field, or past experience, you can draw an estimate. While this estimate is useful for developing a model, it contains some inherent uncertainty and risk, because it’s an estimate of an unknown value.
Estimating Ranges of Values
In some cases, it’s possible to estimate a range of values. In a construction project, you might estimate the time it will take to complete a particular job; based on some expert knowledge, you can also estimate the absolute maximum time it might take, in the worst possible case, and the absolute minimum time, in the best possible case. The same could be done for project costs. In a financial market, you might know the distribution of possible values through the mean and standard deviation of returns.
By using a range of possible values, instead of a single guess, you can create a more realistic picture of what might happen in the future. When a model is based on ranges of estimates, the output of the model will also be a range.
This is different from a normal forecasting model, in which you start with some fixed estimates – say the time it will take to complete each of three parts of a project – and end up with another value – the total time for the project. If the same model were based on ranges of estimates for each of the three parts of the project, the result would be a range of times it might take to complete the project. When each part has a minimum and maximum estimate, we can use those values to estimate the total minimum and maximum time for the project.
Illustration 26.State the major two reasons for using simulation to solve a problem.
A confectioner sells confectionery items. Past data of demand per week in hundred kilograms with frequency is given below:
Demand/Week 0 5 10 15 20 25Frequency 2 11 8 21 5 3
Using the following sequence of random numbers, generate the demand for the next 10 weeks. Also find out the average demand per week
Random numbers 35 52 13 90 23 73 34 5735 83 94 56 67 66 60
Solution:
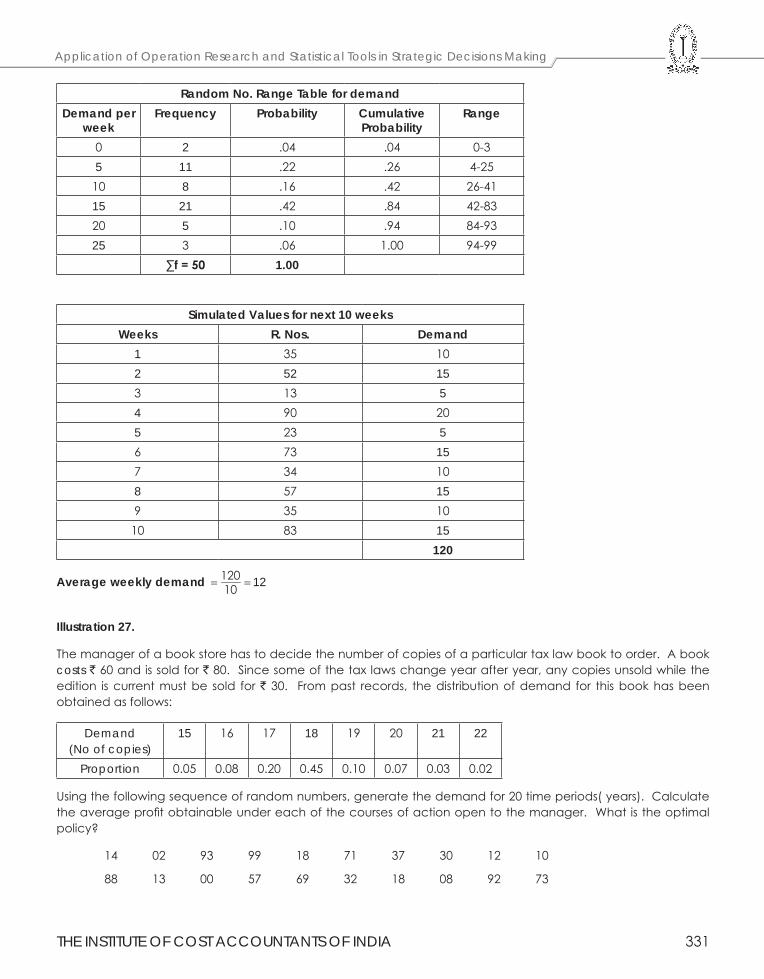
THE INSTITUTE OF COST ACCOUNTANTS OF INDIA 331
Application of Operation Research and Statistical Tools in Strategic Decisions Making
Random No. Range Table for demandDemand per
weekFrequency Probability Cumulative
ProbabilityRange
0 2 .04 .04 0-35 11 .22 .26 4-2510 8 .16 .42 26-4115 21 .42 .84 42-8320 5 .10 .94 84-9325 3 .06 1.00 94-99
∑f = 50 1.00
Simulated Values for next 10 weeksWeeks R. Nos. Demand
1 35 102 52 153 13 54 90 205 23 56 73 157 34 108 57 159 35 10
10 83 15120
Average weekly demand 120 1210= =
Illustration 27.
The manager of a book store has to decide the number of copies of a particular tax law book to order. A book costs ` 60 and is sold for ` 80. Since some of the tax laws change year after year, any copies unsold while the edition is current must be sold for ` 30. From past records, the distribution of demand for this book has been obtained as follows:
Demand(No of copies)
15 16 17 18 19 20 21 22
Proportion 0.05 0.08 0.20 0.45 0.10 0.07 0.03 0.02
Using the following sequence of random numbers, generate the demand for 20 time periods( years). Calculate the average profit obtainable under each of the courses of action open to the manager. What is the optimal policy?
14 02 93 99 18 71 37 30 12 10
88 13 00 57 69 32 18 08 92 73
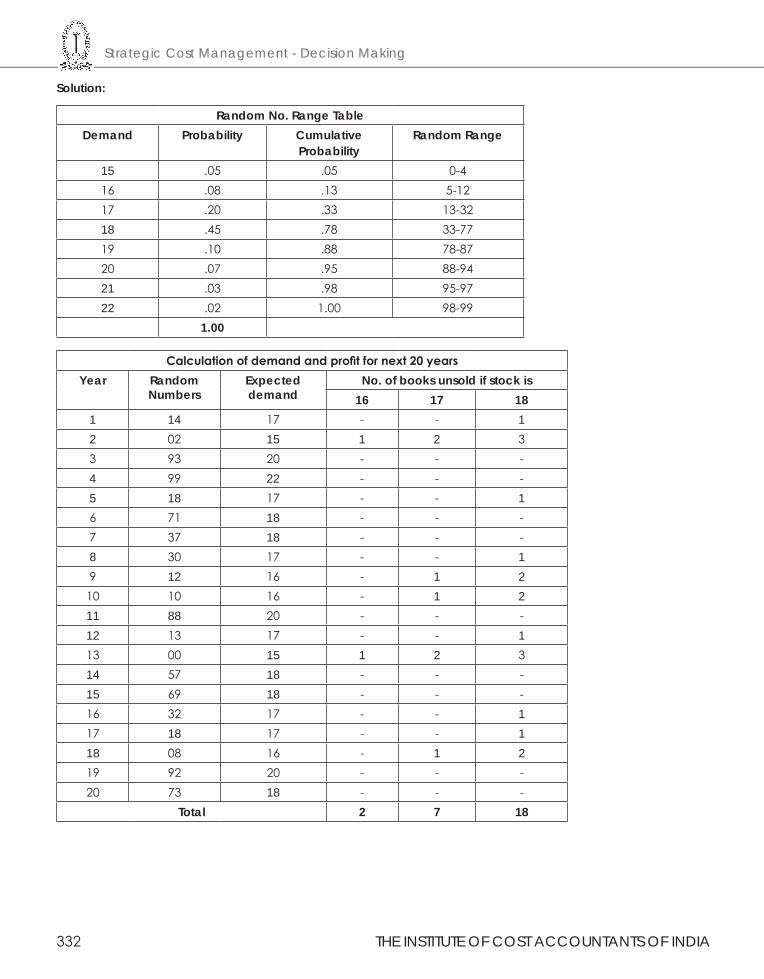
Strategic Cost Management - Decision Making
332 THE INSTITUTE OF COST ACCOUNTANTS OF INDIA
Solution:
Random No. Range TableDemand Probability Cumulative
ProbabilityRandom Range
15 .05 .05 0-416 .08 .13 5-1217 .20 .33 13-3218 .45 .78 33-7719 .10 .88 78-8720 .07 .95 88-9421 .03 .98 95-9722 .02 1.00 98-99
1.00
Calculation of demand and profit for next 20 yearsYear Random
NumbersExpected demand
No. of books unsold if stock is 16 17 18
1 14 17 - - 12 02 15 1 2 33 93 20 - - -4 99 22 - - -5 18 17 - - 16 71 18 - - -7 37 18 - - -8 30 17 - - 19 12 16 - 1 210 10 16 - 1 211 88 20 - - -12 13 17 - - 113 00 15 1 2 314 57 18 - - -15 69 18 - - -16 32 17 - - 117 18 17 - - 118 08 16 - 1 219 92 20 - - -20 73 18 - - -
Total 2 7 18
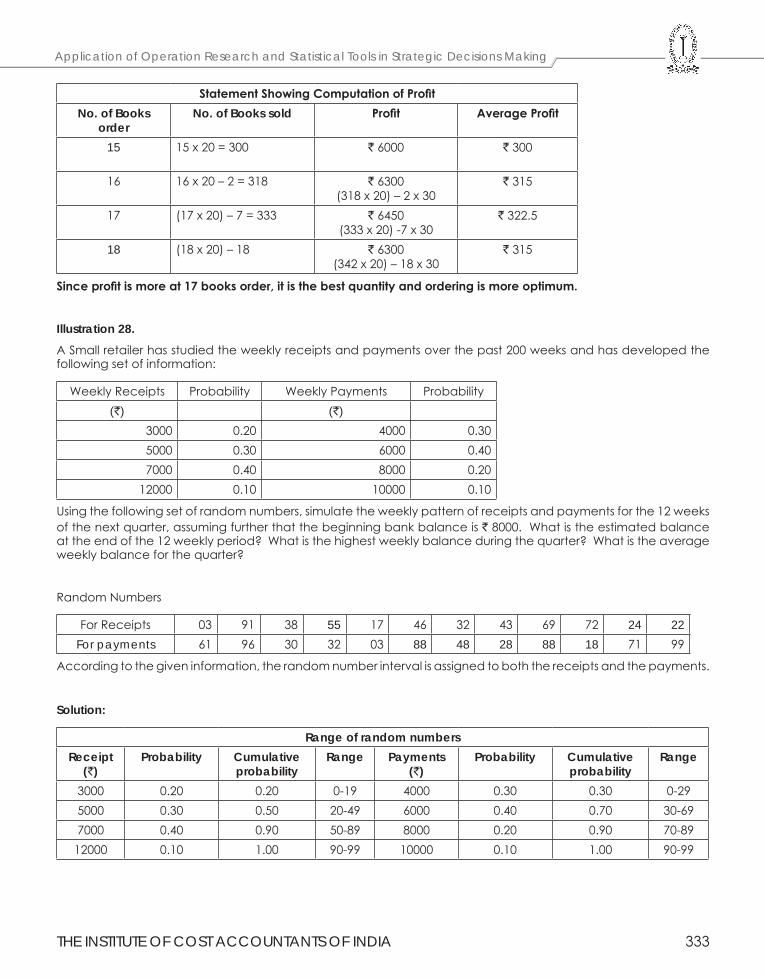
THE INSTITUTE OF COST ACCOUNTANTS OF INDIA 333
Application of Operation Research and Statistical Tools in Strategic Decisions Making
Statement Showing Computation of ProfitNo. of Books
orderNo. of Books sold Profit Average Profit
15 15 x 20 = 300 ` 6000 ` 300
16 16 x 20 – 2 = 318 ` 6300(318 x 20) – 2 x 30
` 315
17 (17 x 20) – 7 = 333 ` 6450(333 x 20) -7 x 30
` 322.5
18 (18 x 20) – 18 ` 6300(342 x 20) – 18 x 30
` 315
Since profit is more at 17 books order, it is the best quantity and ordering is more optimum.
Illustration 28.A Small retailer has studied the weekly receipts and payments over the past 200 weeks and has developed the following set of information:
Weekly Receipts Probability Weekly Payments Probability(`) (`)
3000 0.20 4000 0.305000 0.30 6000 0.407000 0.40 8000 0.20
12000 0.10 10000 0.10
Using the following set of random numbers, simulate the weekly pattern of receipts and payments for the 12 weeks of the next quarter, assuming further that the beginning bank balance is ` 8000. What is the estimated balance at the end of the 12 weekly period? What is the highest weekly balance during the quarter? What is the average weekly balance for the quarter?
Random Numbers
For Receipts 03 91 38 55 17 46 32 43 69 72 24 22For payments 61 96 30 32 03 88 48 28 88 18 71 99
According to the given information, the random number interval is assigned to both the receipts and the payments.
Solution:
Range of random numbersReceipt
(`)Probability Cumulative
probabilityRange Payments
(`)Probability Cumulative
probabilityRange
3000 0.20 0.20 0-19 4000 0.30 0.30 0-295000 0.30 0.50 20-49 6000 0.40 0.70 30-697000 0.40 0.90 50-89 8000 0.20 0.90 70-89
12000 0.10 1.00 90-99 10000 0.10 1.00 90-99
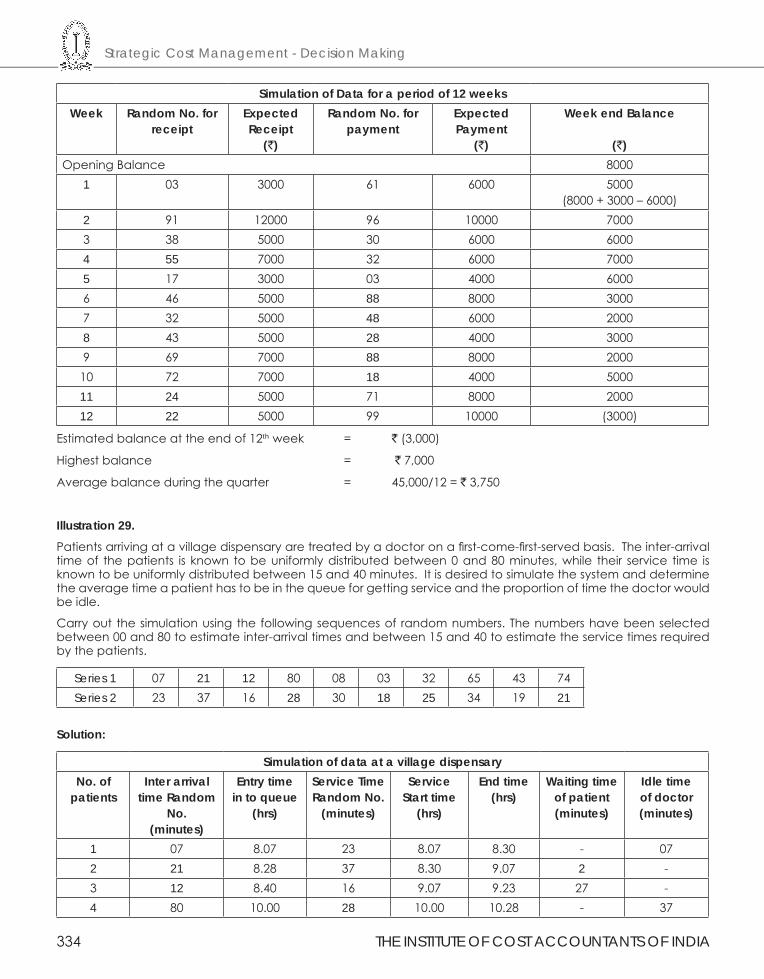
Strategic Cost Management - Decision Making
334 THE INSTITUTE OF COST ACCOUNTANTS OF INDIA
Simulation of Data for a period of 12 weeksWeek Random No. for
receiptExpected Receipt
(`)
Random No. for payment
Expected Payment
(`)
Week end Balance
(`)Opening Balance 8000
1 03 3000 61 6000 5000 (8000 + 3000 – 6000)
2 91 12000 96 10000 70003 38 5000 30 6000 60004 55 7000 32 6000 70005 17 3000 03 4000 60006 46 5000 88 8000 30007 32 5000 48 6000 20008 43 5000 28 4000 30009 69 7000 88 8000 2000
10 72 7000 18 4000 500011 24 5000 71 8000 200012 22 5000 99 10000 (3000)
Estimated balance at the end of 12th week = ` (3,000)
Highest balance = ` 7,000
Average balance during the quarter = 45,000/12 = ` 3,750
Illustration 29.Patients arriving at a village dispensary are treated by a doctor on a first-come-first-served basis. The inter-arrival time of the patients is known to be uniformly distributed between 0 and 80 minutes, while their service time is known to be uniformly distributed between 15 and 40 minutes. It is desired to simulate the system and determine the average time a patient has to be in the queue for getting service and the proportion of time the doctor would be idle.
Carry out the simulation using the following sequences of random numbers. The numbers have been selected between 00 and 80 to estimate inter-arrival times and between 15 and 40 to estimate the service times required by the patients.
Series 1 07 21 12 80 08 03 32 65 43 74Series 2 23 37 16 28 30 18 25 34 19 21
Solution:
Simulation of data at a village dispensaryNo. of
patients Inter arrival
time Random No.
(minutes)
Entry time in to queue
(hrs)
Service Time Random No.
(minutes)
Service Start time
(hrs)
End time (hrs)
Waiting time of patient (minutes)
Idle time of doctor (minutes)
1 07 8.07 23 8.07 8.30 - 072 21 8.28 37 8.30 9.07 2 -3 12 8.40 16 9.07 9.23 27 -4 80 10.00 28 10.00 10.28 - 37
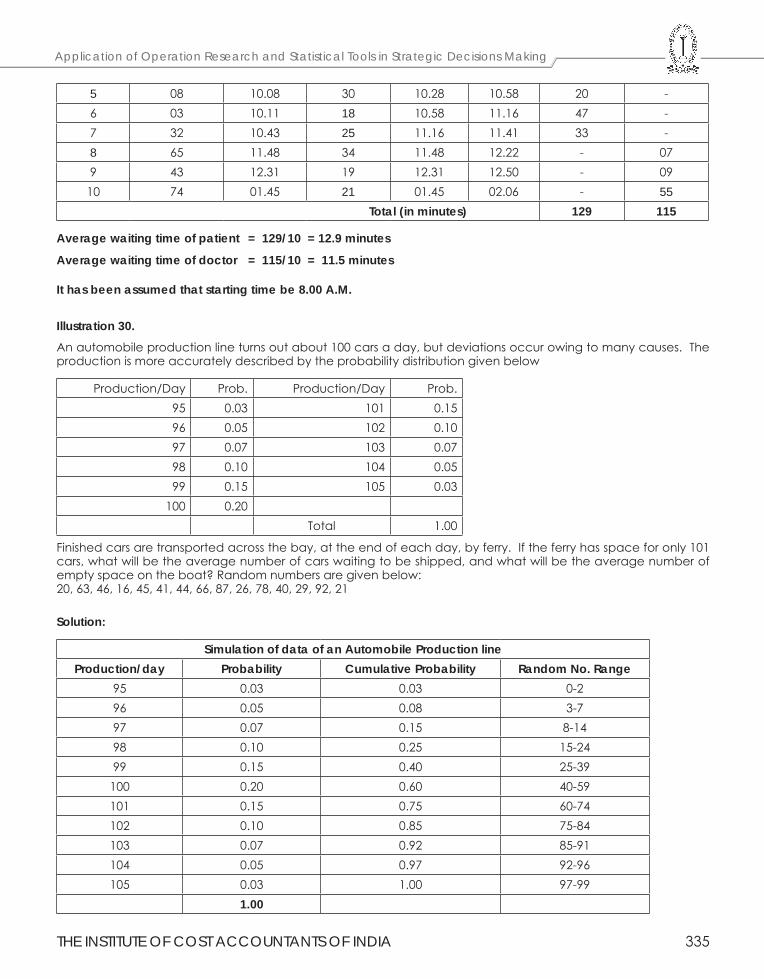
THE INSTITUTE OF COST ACCOUNTANTS OF INDIA 335
Application of Operation Research and Statistical Tools in Strategic Decisions Making
5 08 10.08 30 10.28 10.58 20 -6 03 10.11 18 10.58 11.16 47 -7 32 10.43 25 11.16 11.41 33 -8 65 11.48 34 11.48 12.22 - 079 43 12.31 19 12.31 12.50 - 09
10 74 01.45 21 01.45 02.06 - 55 Total (in minutes) 129 115
Average waiting time of patient = 129/10 = 12.9 minutes
Average waiting time of doctor = 115/10 = 11.5 minutes
It has been assumed that starting time be 8.00 A.M.
Illustration 30.An automobile production line turns out about 100 cars a day, but deviations occur owing to many causes. The production is more accurately described by the probability distribution given below
Production/Day Prob. Production/Day Prob.95 0.03 101 0.1596 0.05 102 0.1097 0.07 103 0.0798 0.10 104 0.0599 0.15 105 0.03
100 0.20Total 1.00
Finished cars are transported across the bay, at the end of each day, by ferry. If the ferry has space for only 101 cars, what will be the average number of cars waiting to be shipped, and what will be the average number of empty space on the boat? Random numbers are given below:20, 63, 46, 16, 45, 41, 44, 66, 87, 26, 78, 40, 29, 92, 21
Solution:
Simulation of data of an Automobile Production lineProduction/day Probability Cumulative Probability Random No. Range
95 0.03 0.03 0-296 0.05 0.08 3-797 0.07 0.15 8-1498 0.10 0.25 15-2499 0.15 0.40 25-39100 0.20 0.60 40-59101 0.15 0.75 60-74102 0.10 0.85 75-84103 0.07 0.92 85-91104 0.05 0.97 92-96105 0.03 1.00 97-99
1.00
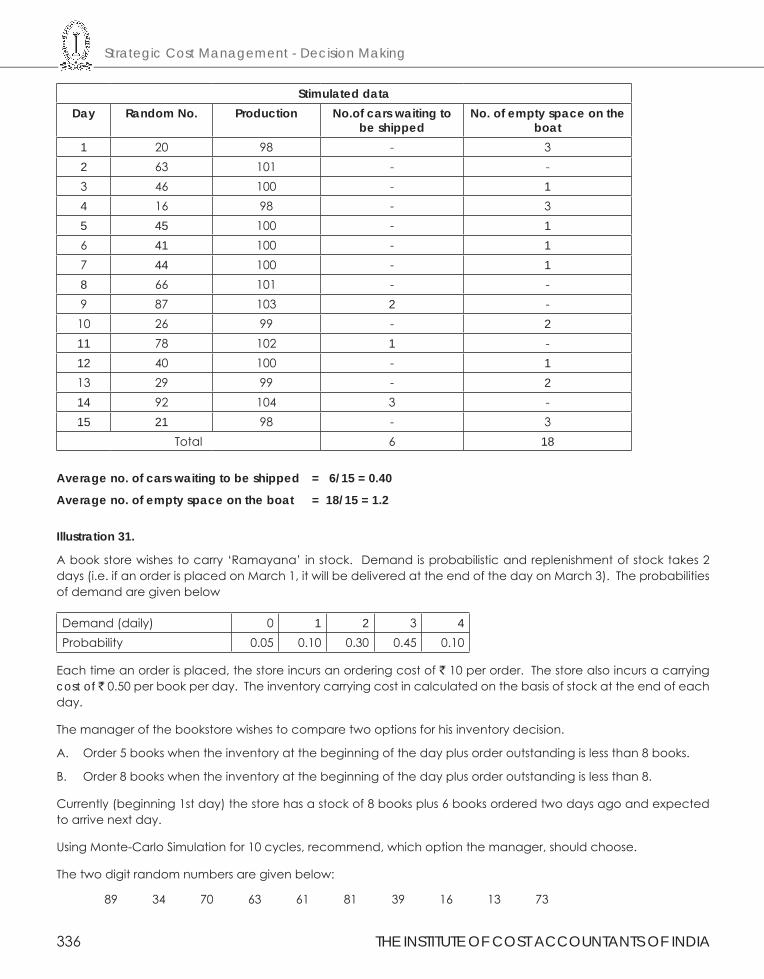
Strategic Cost Management - Decision Making
336 THE INSTITUTE OF COST ACCOUNTANTS OF INDIA
Stimulated dataDay Random No. Production No.of cars waiting to
be shippedNo. of empty space on the
boat1 20 98 - 32 63 101 - -3 46 100 - 14 16 98 - 35 45 100 - 16 41 100 - 17 44 100 - 18 66 101 - -9 87 103 2 -
10 26 99 - 211 78 102 1 -12 40 100 - 113 29 99 - 214 92 104 3 -15 21 98 - 3
Total 6 18
Average no. of cars waiting to be shipped = 6/15 = 0.40
Average no. of empty space on the boat = 18/15 = 1.2
Illustration 31.
A book store wishes to carry ‘Ramayana’ in stock. Demand is probabilistic and replenishment of stock takes 2 days (i.e. if an order is placed on March 1, it will be delivered at the end of the day on March 3). The probabilities of demand are given below
Demand (daily) 0 1 2 3 4Probability 0.05 0.10 0.30 0.45 0.10
Each time an order is placed, the store incurs an ordering cost of ` 10 per order. The store also incurs a carrying cost of ` 0.50 per book per day. The inventory carrying cost in calculated on the basis of stock at the end of each day.
The manager of the bookstore wishes to compare two options for his inventory decision.
A. Order 5 books when the inventory at the beginning of the day plus order outstanding is less than 8 books.
B. Order 8 books when the inventory at the beginning of the day plus order outstanding is less than 8.
Currently (beginning 1st day) the store has a stock of 8 books plus 6 books ordered two days ago and expected to arrive next day.
Using Monte-Carlo Simulation for 10 cycles, recommend, which option the manager, should choose.
The two digit random numbers are given below:
89 34 70 63 61 81 39 16 13 73
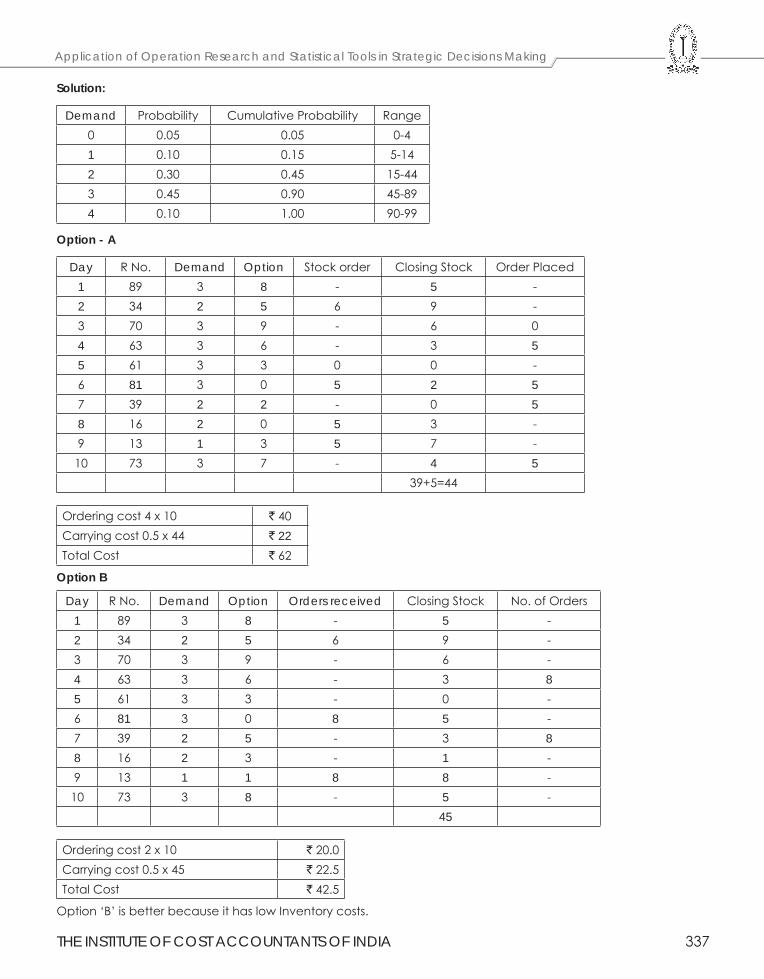
THE INSTITUTE OF COST ACCOUNTANTS OF INDIA 337
Application of Operation Research and Statistical Tools in Strategic Decisions Making
Solution:
Demand Probability Cumulative Probability Range 0 0.05 0.05 0-41 0.10 0.15 5-142 0.30 0.45 15-443 0.45 0.90 45-894 0.10 1.00 90-99
Option - A
Day R No. Demand Option Stock order Closing Stock Order Placed1 89 3 8 - 5 -2 34 2 5 6 9 -3 70 3 9 - 6 04 63 3 6 - 3 55 61 3 3 0 0 -6 81 3 0 5 2 57 39 2 2 - 0 58 16 2 0 5 3 -9 13 1 3 5 7 -
10 73 3 7 - 4 539+5=44
Ordering cost 4 x 10 ` 40Carrying cost 0.5 x 44 ` 22Total Cost ` 62
Option B
Day R No. Demand Option Orders received Closing Stock No. of Orders1 89 3 8 - 5 -2 34 2 5 6 9 -3 70 3 9 - 6 -4 63 3 6 - 3 85 61 3 3 - 0 -6 81 3 0 8 5 -7 39 2 5 - 3 88 16 2 3 - 1 -9 13 1 1 8 8 -10 73 3 8 - 5 -
45
Ordering cost 2 x 10 ` 20.0Carrying cost 0.5 x 45 ` 22.5Total Cost ` 42.5
Option ‘B’ is better because it has low Inventory costs.
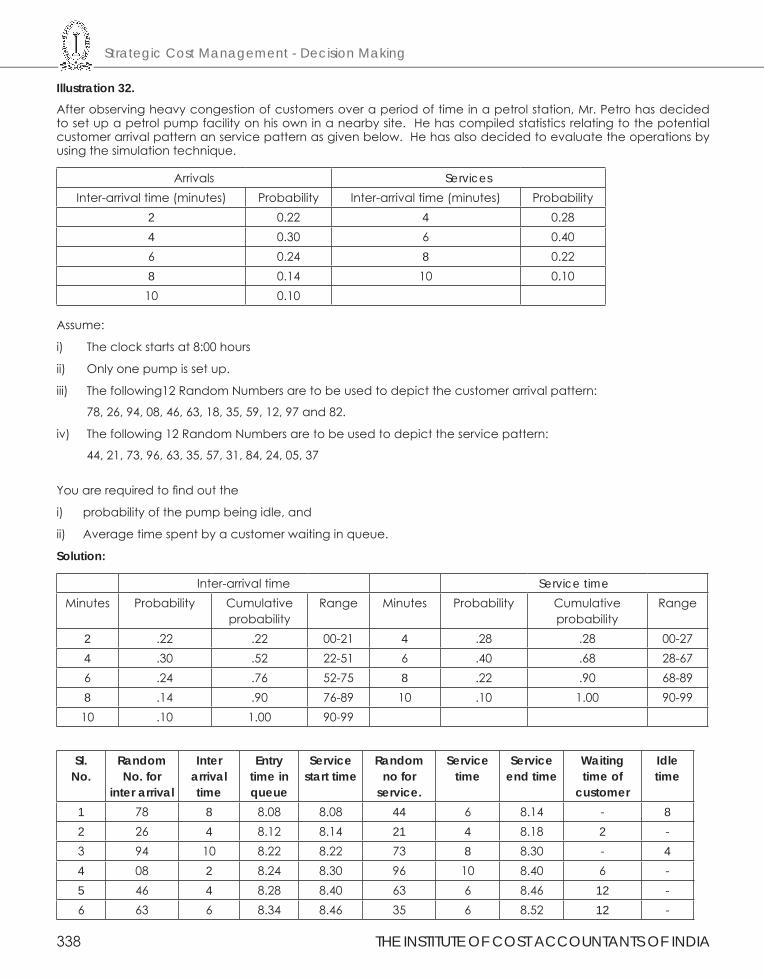
Strategic Cost Management - Decision Making
338 THE INSTITUTE OF COST ACCOUNTANTS OF INDIA
Illustration 32.After observing heavy congestion of customers over a period of time in a petrol station, Mr. Petro has decided to set up a petrol pump facility on his own in a nearby site. He has compiled statistics relating to the potential customer arrival pattern an service pattern as given below. He has also decided to evaluate the operations by using the simulation technique.
Arrivals ServicesInter-arrival time (minutes) Probability Inter-arrival time (minutes) Probability
2 0.22 4 0.284 0.30 6 0.406 0.24 8 0.228 0.14 10 0.1010 0.10
Assume:
i) The clock starts at 8:00 hours
ii) Only one pump is set up.
iii) The following12 Random Numbers are to be used to depict the customer arrival pattern:
78, 26, 94, 08, 46, 63, 18, 35, 59, 12, 97 and 82.
iv) The following 12 Random Numbers are to be used to depict the service pattern:
44, 21, 73, 96, 63, 35, 57, 31, 84, 24, 05, 37
You are required to find out the
i) probability of the pump being idle, and
ii) Average time spent by a customer waiting in queue.
Solution:
Inter-arrival time Service timeMinutes Probability Cumulative
probabilityRange Minutes Probability Cumulative
probabilityRange
2 .22 .22 00-21 4 .28 .28 00-274 .30 .52 22-51 6 .40 .68 28-676 .24 .76 52-75 8 .22 .90 68-898 .14 .90 76-89 10 .10 1.00 90-99
10 .10 1.00 90-99
Sl.No.
Random No. for
inter arrival
Inter arrival time
Entry time in queue
Service start time
Random no for
service.
Service time
Service end time
Waiting time of
customer
Idle time
1 78 8 8.08 8.08 44 6 8.14 - 82 26 4 8.12 8.14 21 4 8.18 2 -3 94 10 8.22 8.22 73 8 8.30 - 44 08 2 8.24 8.30 96 10 8.40 6 -5 46 4 8.28 8.40 63 6 8.46 12 -6 63 6 8.34 8.46 35 6 8.52 12 -
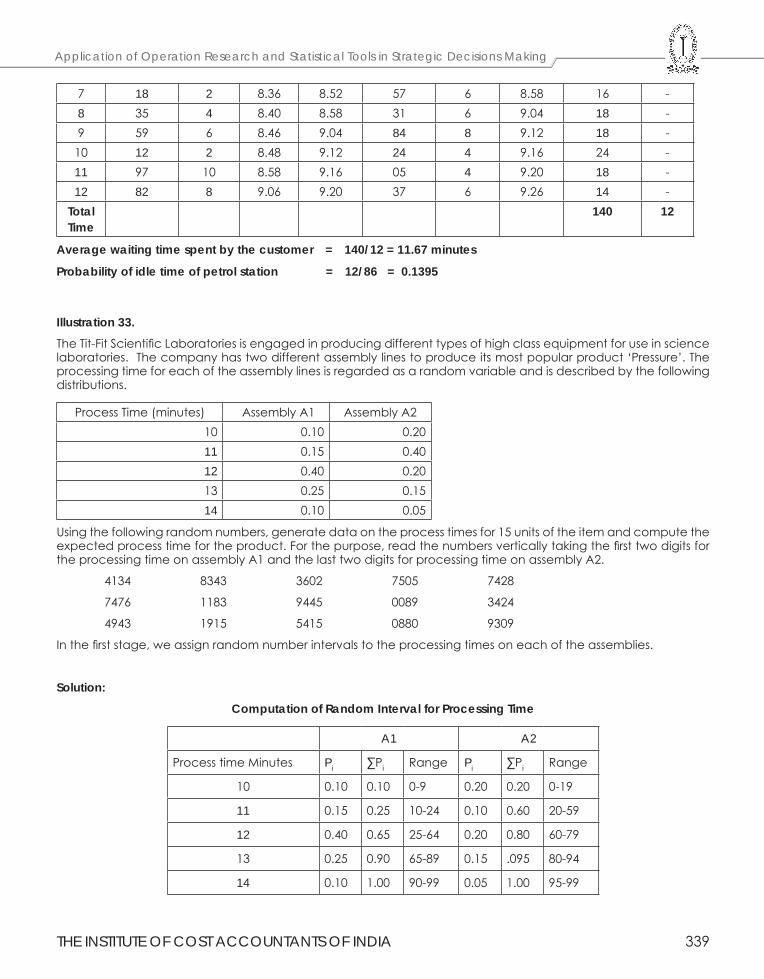
THE INSTITUTE OF COST ACCOUNTANTS OF INDIA 339
Application of Operation Research and Statistical Tools in Strategic Decisions Making
7 18 2 8.36 8.52 57 6 8.58 16 -8 35 4 8.40 8.58 31 6 9.04 18 -9 59 6 8.46 9.04 84 8 9.12 18 -
10 12 2 8.48 9.12 24 4 9.16 24 -11 97 10 8.58 9.16 05 4 9.20 18 -12 82 8 9.06 9.20 37 6 9.26 14 -
Total Time
140 12
Average waiting time spent by the customer = 140/12 = 11.67 minutes
Probability of idle time of petrol station = 12/86 = 0.1395
Illustration 33.The Tit-Fit Scientific Laboratories is engaged in producing different types of high class equipment for use in science laboratories. The company has two different assembly lines to produce its most popular product ‘Pressure’. The processing time for each of the assembly lines is regarded as a random variable and is described by the following distributions.
Process Time (minutes) Assembly A1 Assembly A210 0.10 0.2011 0.15 0.4012 0.40 0.2013 0.25 0.1514 0.10 0.05
Using the following random numbers, generate data on the process times for 15 units of the item and compute the expected process time for the product. For the purpose, read the numbers vertically taking the first two digits for the processing time on assembly A1 and the last two digits for processing time on assembly A2.
4134 8343 3602 7505 7428
7476 1183 9445 0089 3424
4943 1915 5415 0880 9309
In the first stage, we assign random number intervals to the processing times on each of the assemblies.
Solution:Computation of Random Interval for Processing Time
A1 A2
Process time Minutes Pi ∑Pi Range Pi ∑Pi Range
10 0.10 0.10 0-9 0.20 0.20 0-19
11 0.15 0.25 10-24 0.10 0.60 20-59
12 0.40 0.65 25-64 0.20 0.80 60-79
13 0.25 0.90 65-89 0.15 .095 80-94
14 0.10 1.00 90-99 0.05 1.00 95-99
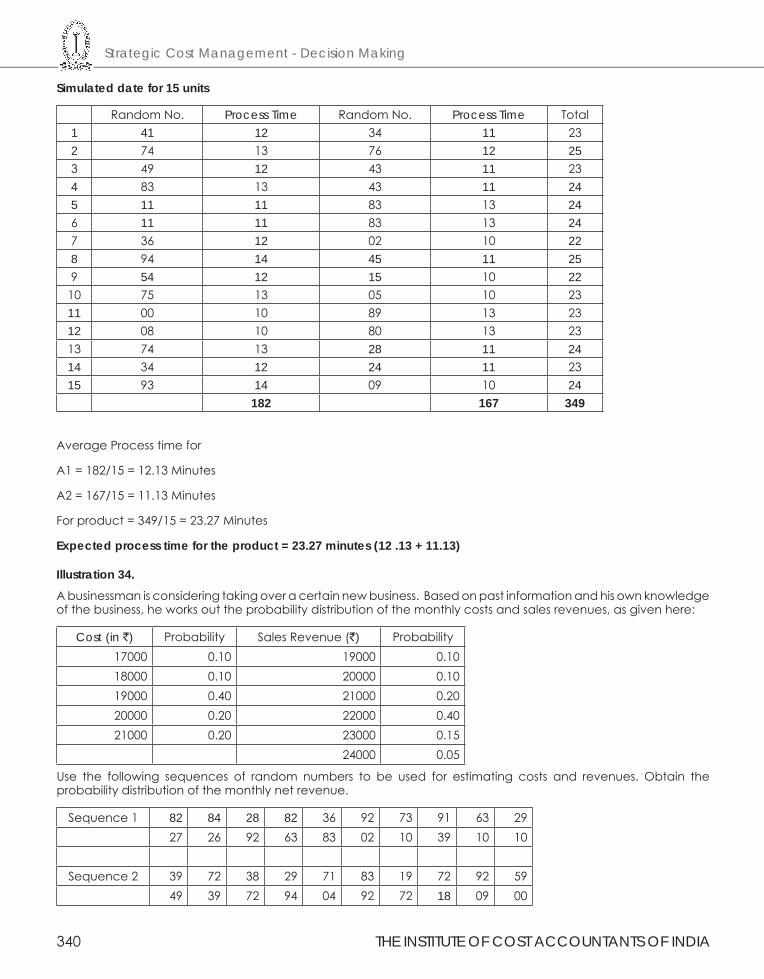
Strategic Cost Management - Decision Making
340 THE INSTITUTE OF COST ACCOUNTANTS OF INDIA
Simulated date for 15 units
Random No. Process Time Random No. Process Time Total1 41 12 34 11 232 74 13 76 12 253 49 12 43 11 234 83 13 43 11 245 11 11 83 13 246 11 11 83 13 247 36 12 02 10 228 94 14 45 11 259 54 12 15 10 22
10 75 13 05 10 2311 00 10 89 13 2312 08 10 80 13 2313 74 13 28 11 2414 34 12 24 11 2315 93 14 09 10 24
182 167 349
Average Process time for
A1 = 182/15 = 12.13 Minutes
A2 = 167/15 = 11.13 Minutes
For product = 349/15 = 23.27 Minutes
Expected process time for the product = 23.27 minutes (12 .13 + 11.13)
Illustration 34.A businessman is considering taking over a certain new business. Based on past information and his own knowledge of the business, he works out the probability distribution of the monthly costs and sales revenues, as given here:
Cost (in `) Probability Sales Revenue (`) Probability17000 0.10 19000 0.1018000 0.10 20000 0.1019000 0.40 21000 0.2020000 0.20 22000 0.4021000 0.20 23000 0.15
24000 0.05
Use the following sequences of random numbers to be used for estimating costs and revenues. Obtain the probability distribution of the monthly net revenue.
Sequence 1 82 84 28 82 36 92 73 91 63 2927 26 92 63 83 02 10 39 10 10
Sequence 2 39 72 38 29 71 83 19 72 92 5949 39 72 94 04 92 72 18 09 00
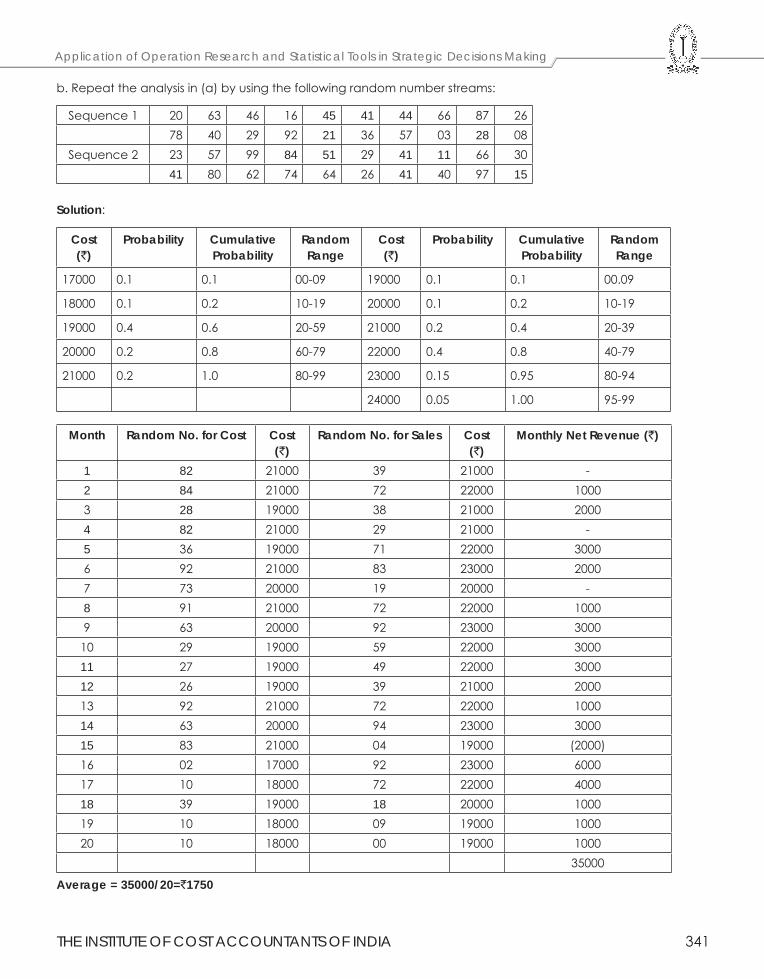
THE INSTITUTE OF COST ACCOUNTANTS OF INDIA 341
Application of Operation Research and Statistical Tools in Strategic Decisions Making
b. Repeat the analysis in (a) by using the following random number streams:
Sequence 1 20 63 46 16 45 41 44 66 87 2678 40 29 92 21 36 57 03 28 08
Sequence 2 23 57 99 84 51 29 41 11 66 3041 80 62 74 64 26 41 40 97 15
Solution:
Cost(`)
Probability Cumulative Probability
Random Range
Cost(`)
Probability Cumulative Probability
Random Range
17000 0.1 0.1 00-09 19000 0.1 0.1 00.09
18000 0.1 0.2 10-19 20000 0.1 0.2 10-19
19000 0.4 0.6 20-59 21000 0.2 0.4 20-39
20000 0.2 0.8 60-79 22000 0.4 0.8 40-79
21000 0.2 1.0 80-99 23000 0.15 0.95 80-94
24000 0.05 1.00 95-99
Month Random No. for Cost Cost(`)
Random No. for Sales Cost(`)
Monthly Net Revenue (`)
1 82 21000 39 21000 -2 84 21000 72 22000 10003 28 19000 38 21000 20004 82 21000 29 21000 -5 36 19000 71 22000 30006 92 21000 83 23000 20007 73 20000 19 20000 -8 91 21000 72 22000 10009 63 20000 92 23000 3000
10 29 19000 59 22000 300011 27 19000 49 22000 300012 26 19000 39 21000 200013 92 21000 72 22000 100014 63 20000 94 23000 300015 83 21000 04 19000 (2000)16 02 17000 92 23000 600017 10 18000 72 22000 400018 39 19000 18 20000 100019 10 18000 09 19000 100020 10 18000 00 19000 1000
35000
Average = 35000/20=`1750
Strategic Cost Management - Decision Making
342 THE INSTITUTE OF COST ACCOUNTANTS OF INDIA
6.6 NETWORK ANALYSIS – CPM/PERT
Network Analysis
Network analysis is the general name given to certain specific techniques which can be used for planning, management and control of project. It often acts as a network management tool for breaking down projects into components or individual activities and recording the result on a flow chart or network diagram. These results generally reveal information that is used to determine duration, resource limitations and cost estimates associated with the project.
It offers insight into what is occurring at each critical point of the network. Project management and efficient resource allocation are two critical aspects of the production and operations managers’ responsibilities. Since a project is non-repetitive and temporal in nature, the mode of management differs from the usual job shop or other related types of scheduling.
Network analysis enables us to take a systematic quantitative structural approach to the problem of managing a project through to successful completion. Also, since it has a graphical representation, it can be easily understood and used by those with a less technical background.
Network is a graphical representation of all the Activities and Events arranged in a logical and sequential order. Network analysis plays an important role in project management. A project is a combination of interrelated activities all of which must be executed in a certain order for its completion. Activity is the actual performance of the job. This consumes resources (Time, human resources, money, and material. An event refers to start or completion of a job. This does not consume any resources.
Applications:
(i) Construction of a Residential complex,
(ii) Commercial complex,
(iii) Petro-chemical complex
(iv) Ship building
(v) Satellite mission development
(vi) Installation of a pipe line project etc...
The procedure of drawing a network is:
1. Specify the Individual Activities: From the work breakdown structure, a listing can be made of all the activities in the project. This listing can be used as the basis for adding sequence and duration information in later steps.
2. Determine the Sequence of the Activities: Some activities are dependent on the completion of others. A listing of the immediate predecessors of each activity is useful for constructing the CPM network diagram.
3. Draw the Network Diagram: Once the activities and their sequencing have been defined, the CPM diagram can be drawn. CPM originally was developed as an activity on node (AON) network, but some project planners prefer to specify the activities on the arcs.
4. Estimate Activity Completion Time: The time required to complete each activity can be estimated using past experience or the estimates of knowledgeable persons. CPM is a deterministic model that does not take into account variation in the completion time, so only one number is used for an activity’s time estimate.
5. Identify the Critical Path: The critical path is the longest-duration path through the network. The significance of the critical path is that the activities that lie on it cannot be delayed without delaying the project. Because of its impact on the entire project, critical path analysis is an important aspect of project planning.
The critical path can be identified by determining the four parameters for each activity. The four parameters are Earliest Start, Earliest Finish, Latest Finish and Latest Start.
THE INSTITUTE OF COST ACCOUNTANTS OF INDIA 343
Application of Operation Research and Statistical Tools in Strategic Decisions Making
Rules for drawing the network diagrams.In a network diagram, arrows represent the activities and circles represent the events.
(i) The tail of an arrow represents the start of an activity and the head represent the completion of the activity.
(ii) The event numbered 1 denotes the start of the project and is called initial event.
(iii) Event carrying the highest number in the network denotes the completion of the project and is called terminal event.
(iv) Each defined activity is represented by one and only arrow in the network.
(v) Determine which operation must be completed immediately before other can start.
(vi) Determine which other operation must follow the other given operation.
(vii) The network should be developed on the basis of logical, analytical and technical dependencies between various activities of the project.
The basic network construction – Terminology used.
Network representation: There are two types of systems –
AOA system(Activity on Arrow system)
AON system(Activity on Node system)
In this activities are represented by an arrows. In this method activities are represented in the circles.
A project consists of tasks with definite starting and ultimate ending points and hence a project manager is saddled with the responsibilities of getting job done on schedule within allowable cost and time constraint specified by the management. Typically all projects can be broken into:
Separate activities – where each activity has an associated completion time (time from the start of the activity to its finish).
Precedence relationships – which govern order in which we may perform the activities.
The main problem is to bring all these activities together in a coherent fashion to complete the project at a required time.
Apart from the traditional method of adding activity durations, these exist two different techniques for network analysis namely the PERT – Program Evaluation and Review Technique and CPM – Critical Path Management.
PERT has the ability to cope with uncertainty in activity completion times while CPM emphasized on the trade-off between cost of the project and its overall completion time.
The CPM has the advantage of decreasing completion times by probably spending more money.
Differences between PERT & CPM
PERT CPM1. It is a technique for planning scheduling &
controlling of projects whose activities are subject to uncertainty in the performance time. Hence it is a probabilistic model.
1. It is a technique for planning scheduling & controlling of projects whose activities not subjected to any uncertainty and the performance times are fixed. Hence it is a deterministic model.
2. It is an Event oriented system 2. It is an Activity oriented system3. Basically does not differentiate critical and non-
critical activities.3. Differentiates clearly the critical activities from the
other activities.4. Used in projects where resources (men, materials,
money) are always available when required.4. Used in projects where overall costs is of primarily
important. Therefore better utilized resources.5. Suitable for Research and Development projects
where times cannot be predicted.5. Suitable for civil constructions.
Strategic Cost Management - Decision Making
344 THE INSTITUTE OF COST ACCOUNTANTS OF INDIA
Critical Path Analysis and PERT are powerful tools that help you to schedule and manage complex projects. They were developed in the 1950s to control large defense projects, and have been used routinely since then.
As with Gantt Charts, Critical Path Analysis (CPA) or the Critical Path Method (CPM) helps you to plan all tasks that must be completed as part of a project. They act as the basis both for preparation of a schedule, and of resource planning. During management of a project, they allow you to monitor achievement of project goals. They help you to see where remedial action needs to be taken to get a project back on course.
Within a project it is likely that you will display your final project plan as a Gantt Chart (using Microsoft Project or other software for projects of medium complexity or an excel spreadsheet for projects of low complexity).The benefit of using CPA within the planning process is to help you develop and test your plan to ensure that it is robust. Critical Path Analysis formally identifies tasks which must be completed on time for the whole project to be completed on time. It also identifies which tasks can be delayed if resource needs to be reallocated to catch up on missed or overrunning tasks. The disadvantage of CPA, if you use it as the technique by which your project plans are communicated and managed against, is that the relation of tasks to time is not as immediately obvious as with Gantt Charts. This can make them more difficult to understand.
A further benefit of Critical Path Analysis is that it helps you to identify the minimum length of time needed to complete a project. Where you need to run an accelerated project, it helps you to identify which project steps you should accelerate to complete the project within the available time.
Critical Path Analysis (CPA) is a project management tool that:
(i) Sets out all the individual activities that make up a larger project.
(ii) Shows the order in which activities have to be undertaken.
(iii) Shows which activities can only taken place once other activities have been completed.
(iv) Shows which activities can be undertaken simultaneously, thereby reducing the overall time taken to complete the whole project.
(v) Shows when certain resources will be needed – for example, a crane to be hired for a building site.
In order to construct a CPA, it is necessary to estimate the elapsed time for each activity – that is the time taken from commencement to completion.
Then the CPA is drawn up based on dependencies such as:
(i) The availability of labour and other resources
(ii) Lead times for delivery of materials and other services
(iii) Seasonal factors – such as dry weather required in a building project
Once the CPA is drawn up, it is possible to see the CRITICAL PATH itself – this is a route through the CPA, which has no spare time (called ‘FLOAT’ or ‘slack’) in any of the activities. In other words, if there is any delay to any of the activities on the critical path, the whole project will be delayed unless the firm makes other changes to bring the project back on track.
The total time along this critical path is also the minimum time in which the whole project can be completed.
Some branches on the CPA may have FLOAT, which means that there is some spare time available for these activities.
What can a business do if a project is delayed? (i) Firstly, the CPA is helpful because it shows the likely impact on the whole project if no action were taken.(ii) Secondly, if there is float elsewhere, it might be possible to switch staff from another activity to help catch up
on the delayed activity.(iii) As a rule, most projects can be brought back on track by using extra labour – either by hiring additional
people or overtime. Note, there will be usually be an extra cost. Alternative suppliers can usually be found – but again, it might cost more to get urgent help.
(iv) Nodes are numbered to identify each one and show the Earliest Start Time (EST) of the activities that immediately follow the node, and the Latest Finish Time (LFT) of the immediately preceding activities
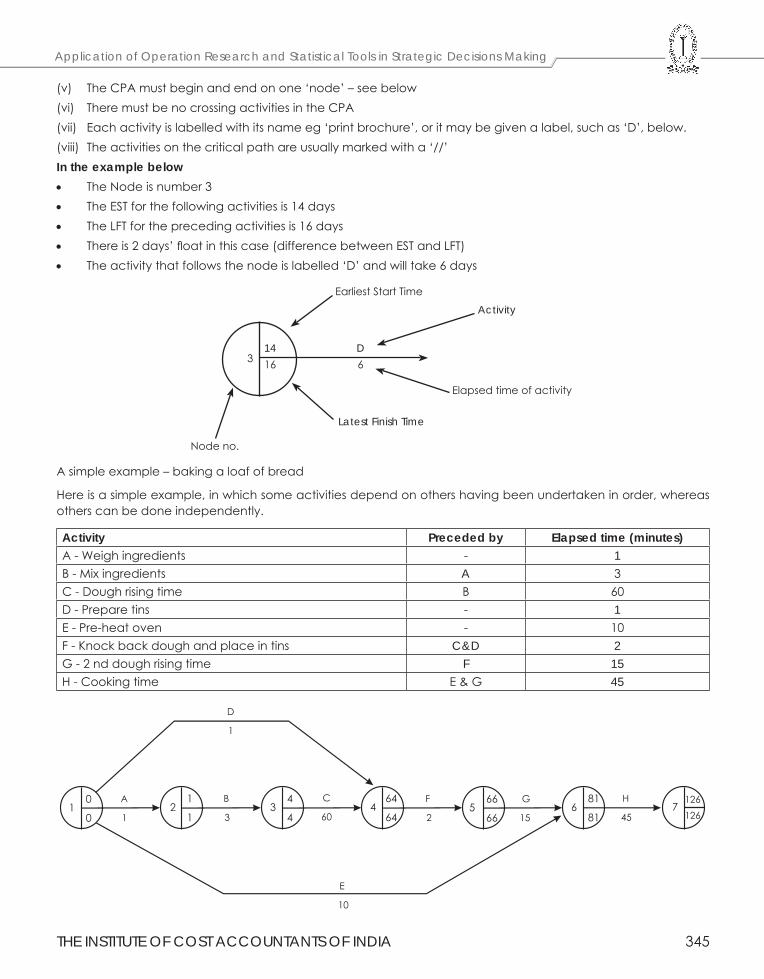
THE INSTITUTE OF COST ACCOUNTANTS OF INDIA 345
Application of Operation Research and Statistical Tools in Strategic Decisions Making
(v) The CPA must begin and end on one ‘node’ – see below (vi) There must be no crossing activities in the CPA (vii) Each activity is labelled with its name eg ‘print brochure’, or it may be given a label, such as ‘D’, below. (viii) The activities on the critical path are usually marked with a ‘//’ In the example below• The Node is number 3 • The EST for the following activities is 14 days • The LFT for the preceding activities is 16 days • There is 2 days’ float in this case (difference between EST and LFT) • The activity that follows the node is labelled ‘D’ and will take 6 days
Earliest Start Time
Elapsed time of activity
Node no.
Latest Finish Time
Activity
D6
14163
A simple example – baking a loaf of bread
Here is a simple example, in which some activities depend on others having been undertaken in order, whereas others can be done independently.
Activity Preceded by Elapsed time (minutes) A - Weigh ingredients - 1 B - Mix ingredients A 3 C - Dough rising time B 60 D - Prepare tins - 1 E - Pre-heat oven - 10 F - Knock back dough and place in tins C&D 2 G - 2 nd dough rising time F 15 H - Cooking time E & G 45
10
02
1
13
4
44
64
645
66
666
81
817
126
126
A
1
D
1
E
10
B
3
C
60
F
2
G
15
H
45
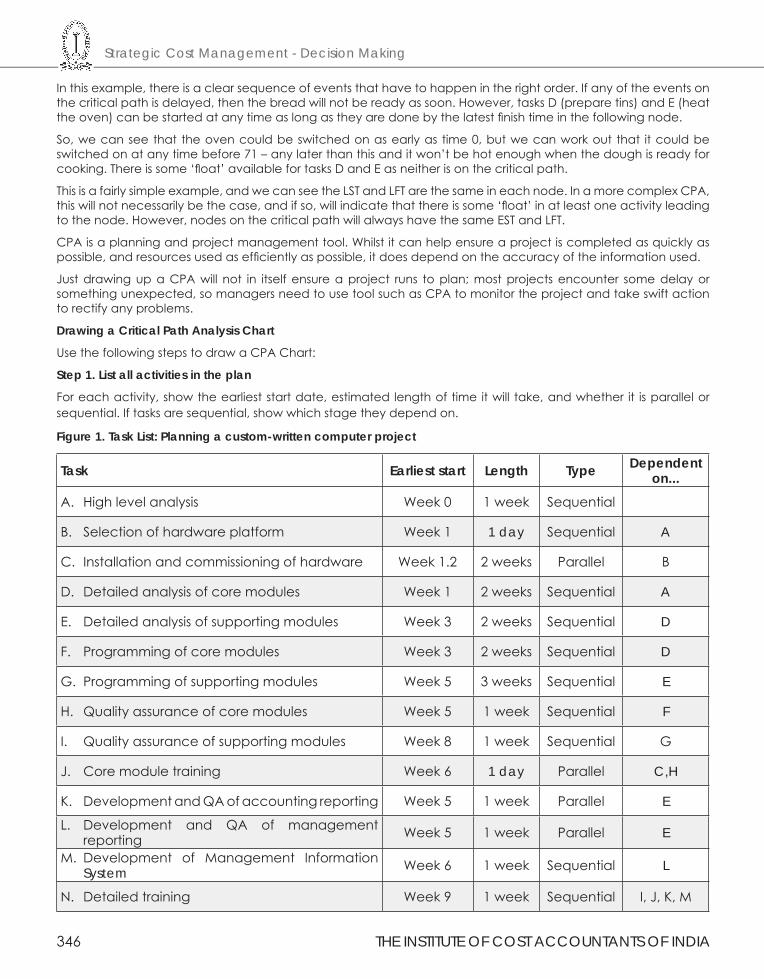
Strategic Cost Management - Decision Making
346 THE INSTITUTE OF COST ACCOUNTANTS OF INDIA
In this example, there is a clear sequence of events that have to happen in the right order. If any of the events on the critical path is delayed, then the bread will not be ready as soon. However, tasks D (prepare tins) and E (heat the oven) can be started at any time as long as they are done by the latest finish time in the following node.
So, we can see that the oven could be switched on as early as time 0, but we can work out that it could be switched on at any time before 71 – any later than this and it won’t be hot enough when the dough is ready for cooking. There is some ‘float’ available for tasks D and E as neither is on the critical path.
This is a fairly simple example, and we can see the LST and LFT are the same in each node. In a more complex CPA, this will not necessarily be the case, and if so, will indicate that there is some ‘float’ in at least one activity leading to the node. However, nodes on the critical path will always have the same EST and LFT.
CPA is a planning and project management tool. Whilst it can help ensure a project is completed as quickly as possible, and resources used as efficiently as possible, it does depend on the accuracy of the information used.
Just drawing up a CPA will not in itself ensure a project runs to plan; most projects encounter some delay or something unexpected, so managers need to use tool such as CPA to monitor the project and take swift action to rectify any problems.
Drawing a Critical Path Analysis Chart
Use the following steps to draw a CPA Chart:
Step 1. List all activities in the plan
For each activity, show the earliest start date, estimated length of time it will take, and whether it is parallel or sequential. If tasks are sequential, show which stage they depend on.
Figure 1. Task List: Planning a custom-written computer project
Task Earliest start Length Type Dependent on...
A. High level analysis Week 0 1 week Sequential
B. Selection of hardware platform Week 1 1 day Sequential A
C. Installation and commissioning of hardware Week 1.2 2 weeks Parallel B
D. Detailed analysis of core modules Week 1 2 weeks Sequential A
E. Detailed analysis of supporting modules Week 3 2 weeks Sequential D
F. Programming of core modules Week 3 2 weeks Sequential D
G. Programming of supporting modules Week 5 3 weeks Sequential E
H. Quality assurance of core modules Week 5 1 week Sequential F
I. Quality assurance of supporting modules Week 8 1 week Sequential G
J. Core module training Week 6 1 day Parallel C,H
K. Development and QA of accounting reporting Week 5 1 week Parallel E
L. Development and QA of management reporting Week 5 1 week Parallel E
M. Development of Management Information System Week 6 1 week Sequential L
N. Detailed training Week 9 1 week Sequential I, J, K, M
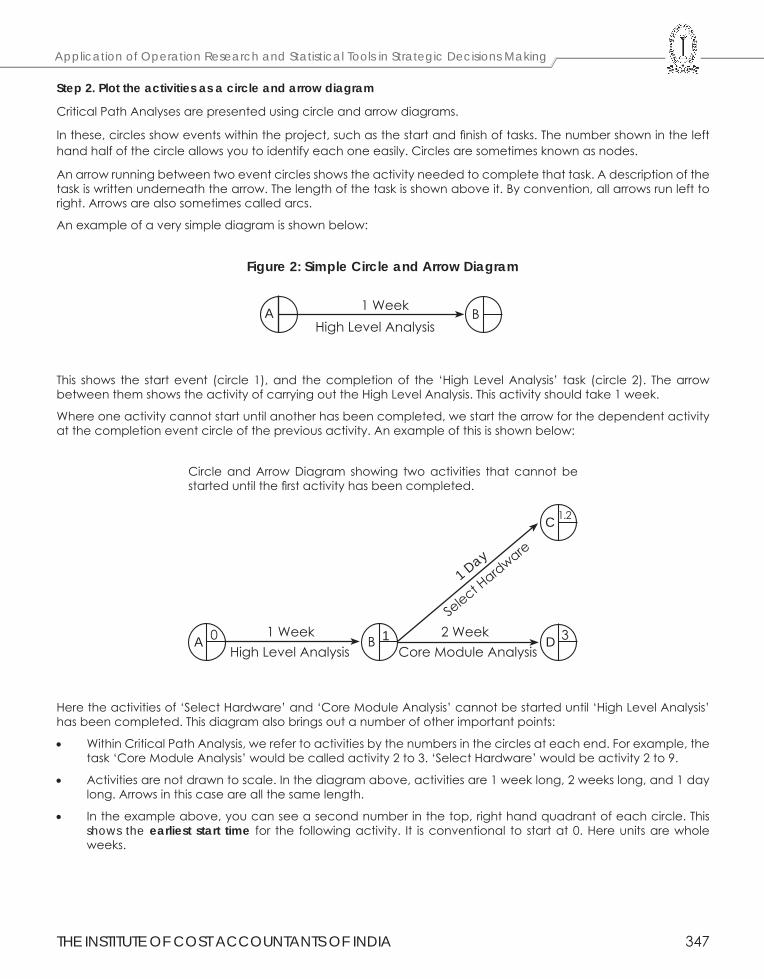
THE INSTITUTE OF COST ACCOUNTANTS OF INDIA 347
Application of Operation Research and Statistical Tools in Strategic Decisions Making
Step 2. Plot the activities as a circle and arrow diagram
Critical Path Analyses are presented using circle and arrow diagrams.
In these, circles show events within the project, such as the start and finish of tasks. The number shown in the left hand half of the circle allows you to identify each one easily. Circles are sometimes known as nodes.
An arrow running between two event circles shows the activity needed to complete that task. A description of the task is written underneath the arrow. The length of the task is shown above it. By convention, all arrows run left to right. Arrows are also sometimes called arcs.
An example of a very simple diagram is shown below:
Figure 2: Simple Circle and Arrow Diagram
1 WeekHigh Level Analysis
A B
This shows the start event (circle 1), and the completion of the ‘High Level Analysis’ task (circle 2). The arrow between them shows the activity of carrying out the High Level Analysis. This activity should take 1 week.
Where one activity cannot start until another has been completed, we start the arrow for the dependent activity at the completion event circle of the previous activity. An example of this is shown below:
Circle and Arrow Diagram showing two activities that cannot be started until the first activity has been completed.
1 WeekHigh Level Analysis
A B0 1 D 3
C 1.2
2 WeekCore Module Analysis
1 Day
Select H
ardware
Here the activities of ‘Select Hardware’ and ‘Core Module Analysis’ cannot be started until ‘High Level Analysis’ has been completed. This diagram also brings out a number of other important points:
• Within Critical Path Analysis, we refer to activities by the numbers in the circles at each end. For example, the task ‘Core Module Analysis’ would be called activity 2 to 3. ‘Select Hardware’ would be activity 2 to 9.
• Activities are not drawn to scale. In the diagram above, activities are 1 week long, 2 weeks long, and 1 day long. Arrows in this case are all the same length.
• In the example above, you can see a second number in the top, right hand quadrant of each circle. This shows the earliest start time for the following activity. It is conventional to start at 0. Here units are whole weeks.
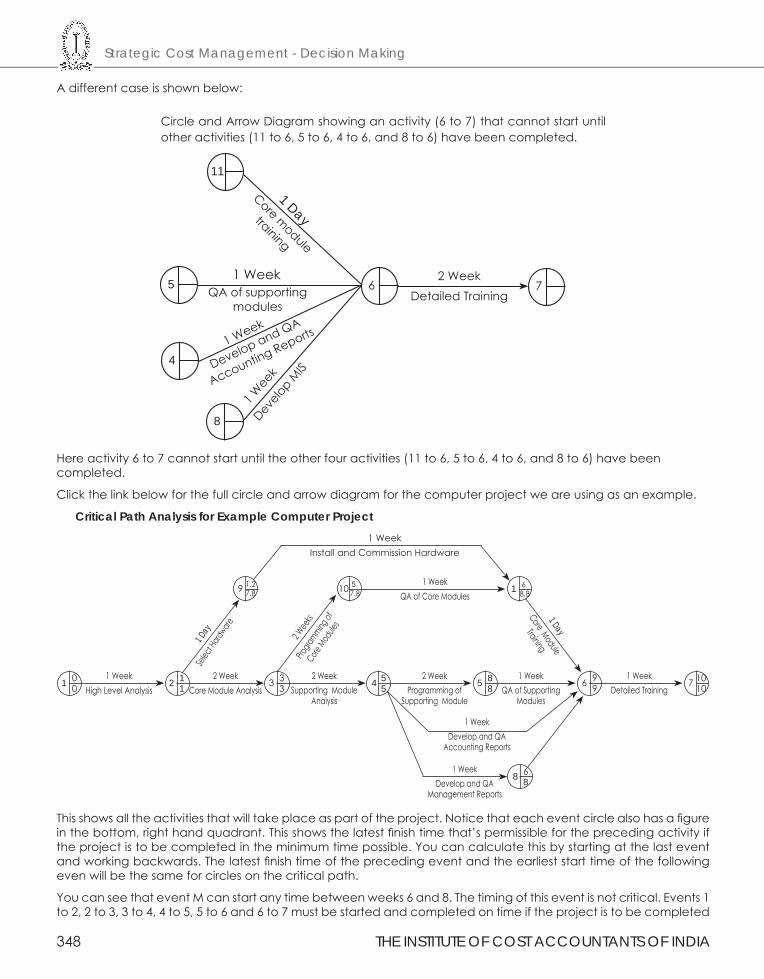
Strategic Cost Management - Decision Making
348 THE INSTITUTE OF COST ACCOUNTANTS OF INDIA
A different case is shown below:
1 WeekQA of supporting
modules
2 WeekDetailed Training
1 Week
Develop M
IS
Circle and Arrow Diagram showing an activity (6 to 7) that cannot start until other activities (11 to 6, 5 to 6, 4 to 6, and 8 to 6) have been completed.
11
65
4
8
7
1 Week
Develop and QA
Accounting Reports
1 DayCore module
training
Here activity 6 to 7 cannot start until the other four activities (11 to 6, 5 to 6, 4 to 6, and 8 to 6) have been completed.
Click the link below for the full circle and arrow diagram for the computer project we are using as an example.
Critical Path Analysis for Example Computer Project 1 Week
Install and Commission Hardware
1 WeekHigh Level Analysis
001 1
12 333 5
54 885 9
96 10107
688
68.815
7.8101.27.89
2 WeekCore Module Analysis
2 WeekSupporting Module
Analysis
2 WeekProgramming of
Supporting Module
1 WeekQA of Supporting
Modules
1 WeekDetailed Training
1 Day
Core Module
Training
1 WeekDevelop and QA
Management Reports
1 WeekDevelop and QA
Accounting Reports
2 Wee
ksPro
gramming
of
Core M
odule
s
1 Day
Selec
t Hard
ware
1 WeekQA of Core Modules
This shows all the activities that will take place as part of the project. Notice that each event circle also has a figure in the bottom, right hand quadrant. This shows the latest finish time that’s permissible for the preceding activity if the project is to be completed in the minimum time possible. You can calculate this by starting at the last event and working backwards. The latest finish time of the preceding event and the earliest start time of the following even will be the same for circles on the critical path.
You can see that event M can start any time between weeks 6 and 8. The timing of this event is not critical. Events 1 to 2, 2 to 3, 3 to 4, 4 to 5, 5 to 6 and 6 to 7 must be started and completed on time if the project is to be completed
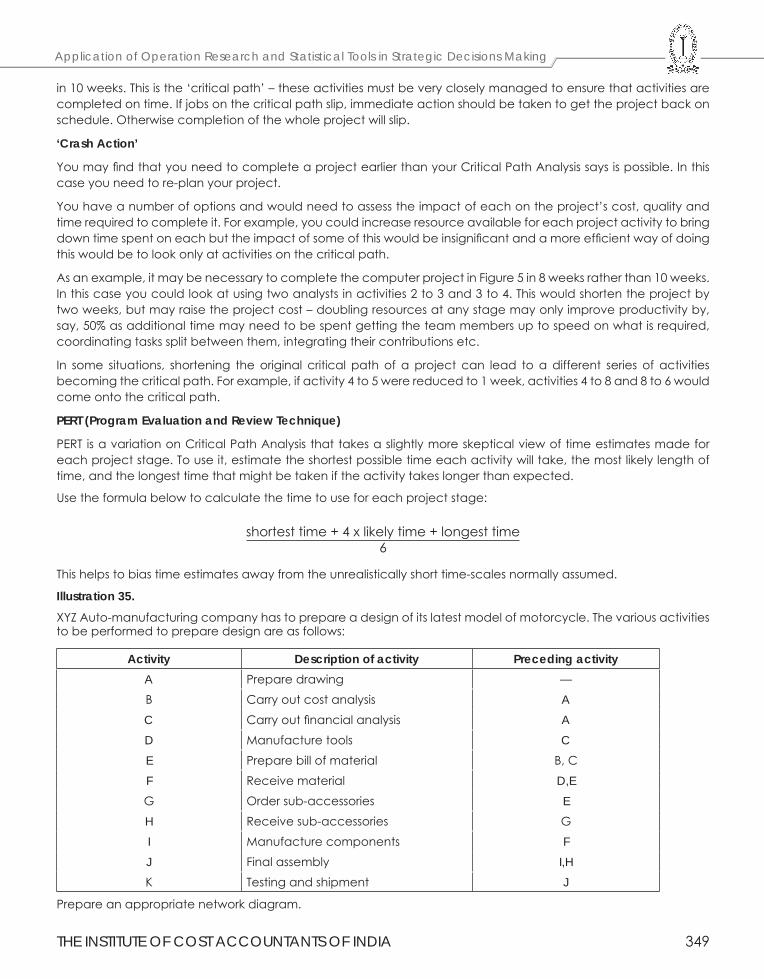
THE INSTITUTE OF COST ACCOUNTANTS OF INDIA 349
Application of Operation Research and Statistical Tools in Strategic Decisions Making
in 10 weeks. This is the ‘critical path’ – these activities must be very closely managed to ensure that activities are completed on time. If jobs on the critical path slip, immediate action should be taken to get the project back on schedule. Otherwise completion of the whole project will slip.
‘Crash Action’
You may find that you need to complete a project earlier than your Critical Path Analysis says is possible. In this case you need to re-plan your project.
You have a number of options and would need to assess the impact of each on the project’s cost, quality and time required to complete it. For example, you could increase resource available for each project activity to bring down time spent on each but the impact of some of this would be insignificant and a more efficient way of doing this would be to look only at activities on the critical path.
As an example, it may be necessary to complete the computer project in Figure 5 in 8 weeks rather than 10 weeks. In this case you could look at using two analysts in activities 2 to 3 and 3 to 4. This would shorten the project by two weeks, but may raise the project cost – doubling resources at any stage may only improve productivity by, say, 50% as additional time may need to be spent getting the team members up to speed on what is required, coordinating tasks split between them, integrating their contributions etc.
In some situations, shortening the original critical path of a project can lead to a different series of activities becoming the critical path. For example, if activity 4 to 5 were reduced to 1 week, activities 4 to 8 and 8 to 6 would come onto the critical path.
PERT (Program Evaluation and Review Technique)
PERT is a variation on Critical Path Analysis that takes a slightly more skeptical view of time estimates made for each project stage. To use it, estimate the shortest possible time each activity will take, the most likely length of time, and the longest time that might be taken if the activity takes longer than expected.
Use the formula below to calculate the time to use for each project stage:
shortest time + 4 x likely time + longest time 6
This helps to bias time estimates away from the unrealistically short time-scales normally assumed.
Illustration 35.XYZ Auto-manufacturing company has to prepare a design of its latest model of motorcycle. The various activities to be performed to prepare design are as follows:
Activity Description of activity Preceding activityA Prepare drawing —B Carry out cost analysis AC Carry out financial analysis AD Manufacture tools CE Prepare bill of material B, CF Receive material D,EG Order sub-accessories EH Receive sub-accessories GI Manufacture components FJ Final assembly I,HK Testing and shipment J
Prepare an appropriate network diagram.
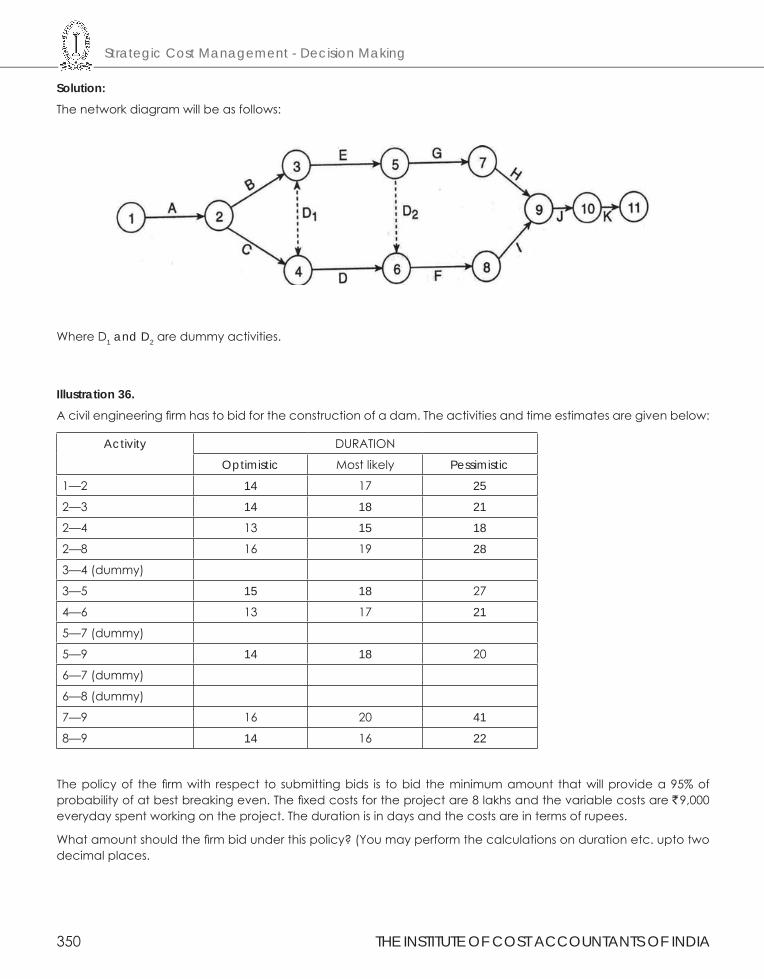
Strategic Cost Management - Decision Making
350 THE INSTITUTE OF COST ACCOUNTANTS OF INDIA
Solution: The network diagram will be as follows:
Where D1 and D2 are dummy activities.
Illustration 36.A civil engineering firm has to bid for the construction of a dam. The activities and time estimates are given below:
Activity DURATION
Optimistic Most likely Pessimistic
1—2 14 17 25
2—3 14 18 21
2—4 13 15 18
2—8 16 19 28
3—4 (dummy)
3—5 15 18 27
4—6 13 17 21
5—7 (dummy)
5—9 14 18 20
6—7 (dummy)
6—8 (dummy)
7—9 16 20 41
8—9 14 16 22
The policy of the firm with respect to submitting bids is to bid the minimum amount that will provide a 95% of probability of at best breaking even. The fixed costs for the project are 8 lakhs and the variable costs are ` 9,000 everyday spent working on the project. The duration is in days and the costs are in terms of rupees.
What amount should the firm bid under this policy? (You may perform the calculations on duration etc. upto two decimal places.
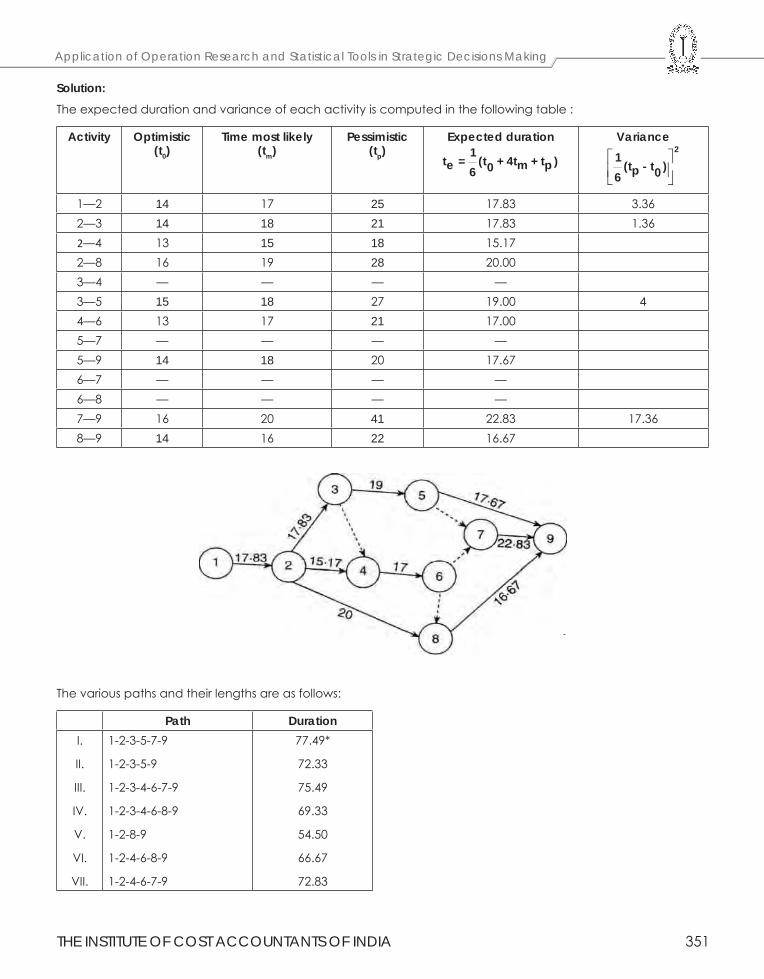
THE INSTITUTE OF COST ACCOUNTANTS OF INDIA 351
Application of Operation Research and Statistical Tools in Strategic Decisions Making
Solution:The expected duration and variance of each activity is computed in the following table :
Activity Optimistic(t0)
Time most likely(tm)
Pessimistic(tp)
Expected duration1
t = (t + 4t + t )e m p06
Variance
21
(t - t )p 06
1—2 14 17 25 17.83 3.362—3 14 18 21 17.83 1.362—4 13 15 18 15.172—8 16 19 28 20.003—4 — — — —3—5 15 18 27 19.00 44—6 13 17 21 17.005—7 — — — —5—9 14 18 20 17.676—7 — — — —6—8 — — — —7—9 16 20 41 22.83 17.368—9 14 16 22 16.67
The various paths and their lengths are as follows:
Path DurationI.
II.
III.
IV.
V.
VI.
VII.
1-2-3-5-7-9
1-2-3-5-9
1-2-3-4-6-7-9
1-2-3-4-6-8-9
1-2-8-9
1-2-4-6-8-9
1-2-4-6-7-9
77.49*
72.33
75.49
69.33
54.50
66.67
72.83
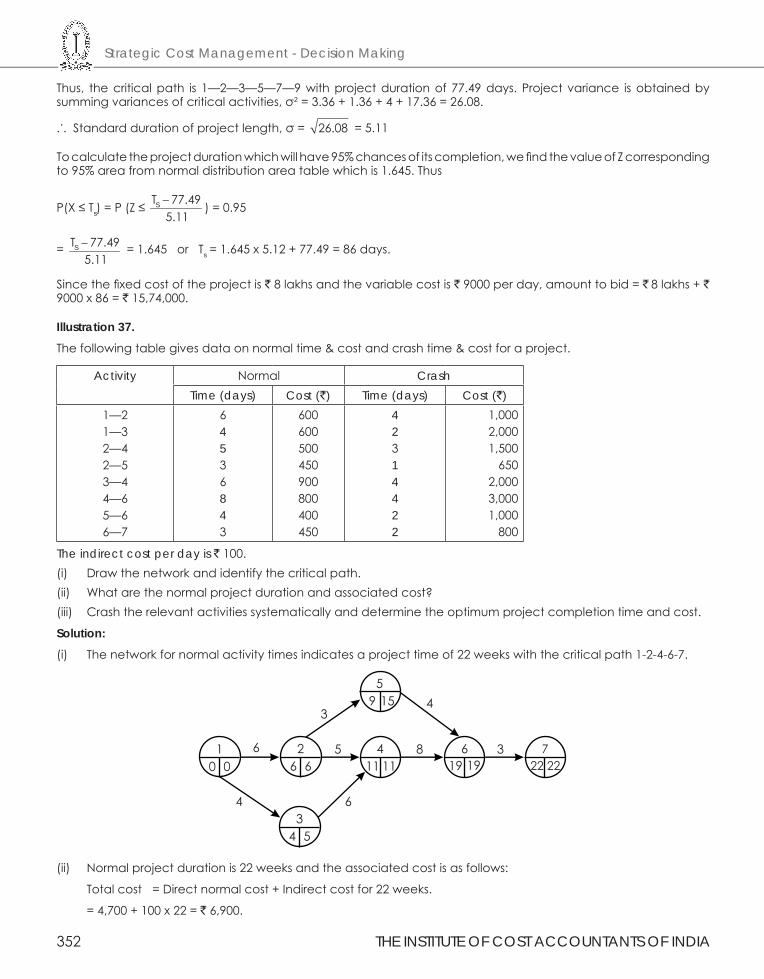
Strategic Cost Management - Decision Making
352 THE INSTITUTE OF COST ACCOUNTANTS OF INDIA
Thus, the critical path is 1—2—3—5—7—9 with project duration of 77.49 days. Project variance is obtained by summing variances of critical activities, σ2 = 3.36 + 1.36 + 4 + 17.36 = 26.08.
... Standard duration of project length, σ = 26.08 = 5.11
To calculate the project duration which will have 95% chances of its completion, we find the value of Z corresponding to 95% area from normal distribution area table which is 1.645. Thus
P(X ≤ Ts) = P (Z ≤ ST 77.495.11− ) = 0.95
= ST 77.495.11− = 1.645 or Ts = 1.645 x 5.12 + 77.49 = 86 days.
Since the fixed cost of the project is ` 8 lakhs and the variable cost is ` 9000 per day, amount to bid = ` 8 lakhs + ` 9000 x 86 = ` 15,74,000.
Illustration 37.The following table gives data on normal time & cost and crash time & cost for a project.
Activity Normal CrashTime (days) Cost (`) Time (days) Cost (`)
1—21—32—42—53—44—65—66—7
64536843
600600500450900800400450
42314422
1,0002,0001,500
6502,0003,0001,000
800
The indirect cost per day is ` 100.(i) Draw the network and identify the critical path.(ii) What are the normal project duration and associated cost?(iii) Crash the relevant activities systematically and determine the optimum project completion time and cost.
Solution:(i) The network for normal activity times indicates a project time of 22 weeks with the critical path 1-2-4-6-7.
1
0 0
2
6 6
4
11 11
6
19 19
7
22 22
5
34
36
4
9 15
3
4 5
85
6
(ii) Normal project duration is 22 weeks and the associated cost is as follows:
Total cost = Direct normal cost + Indirect cost for 22 weeks.
= 4,700 + 100 x 22 = ` 6,900.
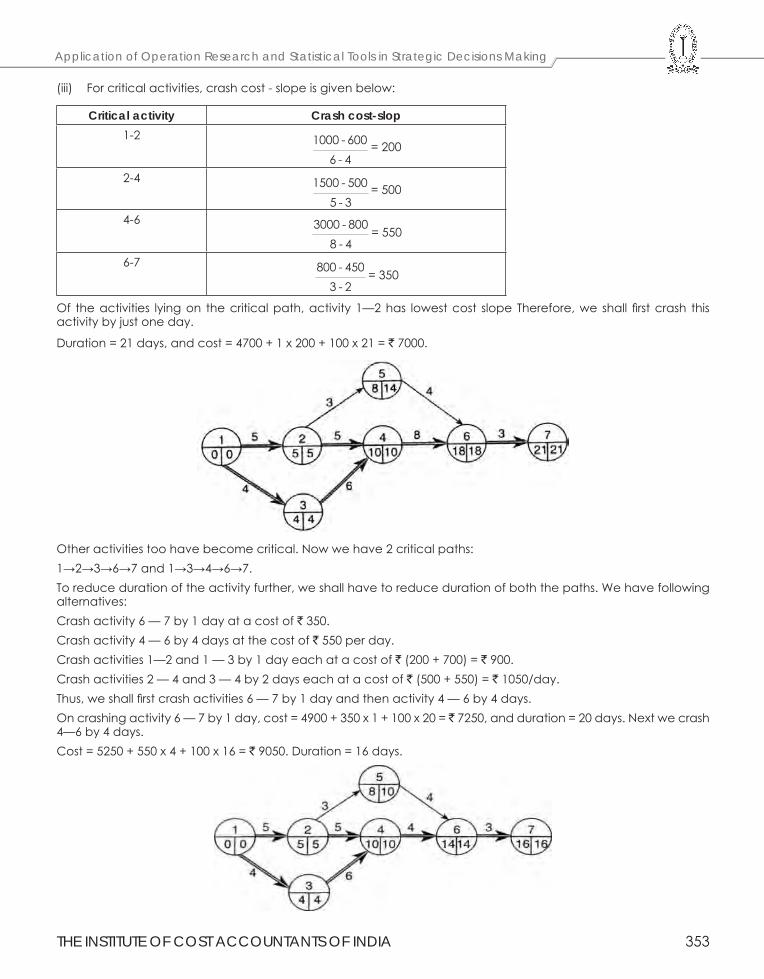
THE INSTITUTE OF COST ACCOUNTANTS OF INDIA 353
Application of Operation Research and Statistical Tools in Strategic Decisions Making
(iii) For critical activities, crash cost - slope is given below:
Critical activity Crash cost-slop1-2 1000 - 600
6 - 4= 200
2-4 1500 - 5005 - 3
= 500
4-6 3000 - 8008 - 4
= 550
6-7 800 - 4503 - 2
= 350
Of the activities lying on the critical path, activity 1—2 has lowest cost slope Therefore, we shall first crash this activity by just one day.
Duration = 21 days, and cost = 4700 + 1 x 200 + 100 x 21 = ` 7000.
Other activities too have become critical. Now we have 2 critical paths: 1→2→3→6→7 and 1→3→4→6→7.To reduce duration of the activity further, we shall have to reduce duration of both the paths. We have following alternatives:Crash activity 6 — 7 by 1 day at a cost of ` 350.Crash activity 4 — 6 by 4 days at the cost of ` 550 per day.Crash activities 1—2 and 1 — 3 by 1 day each at a cost of ` (200 + 700) = ` 900.Crash activities 2 — 4 and 3 — 4 by 2 days each at a cost of ` (500 + 550) = ` 1050/day.Thus, we shall first crash activities 6 — 7 by 1 day and then activity 4 — 6 by 4 days.On crashing activity 6 — 7 by 1 day, cost = 4900 + 350 x 1 + 100 x 20 = ` 7250, and duration = 20 days. Next we crash 4—6 by 4 days.Cost = 5250 + 550 x 4 + 100 x 16 = ` 9050. Duration = 16 days.
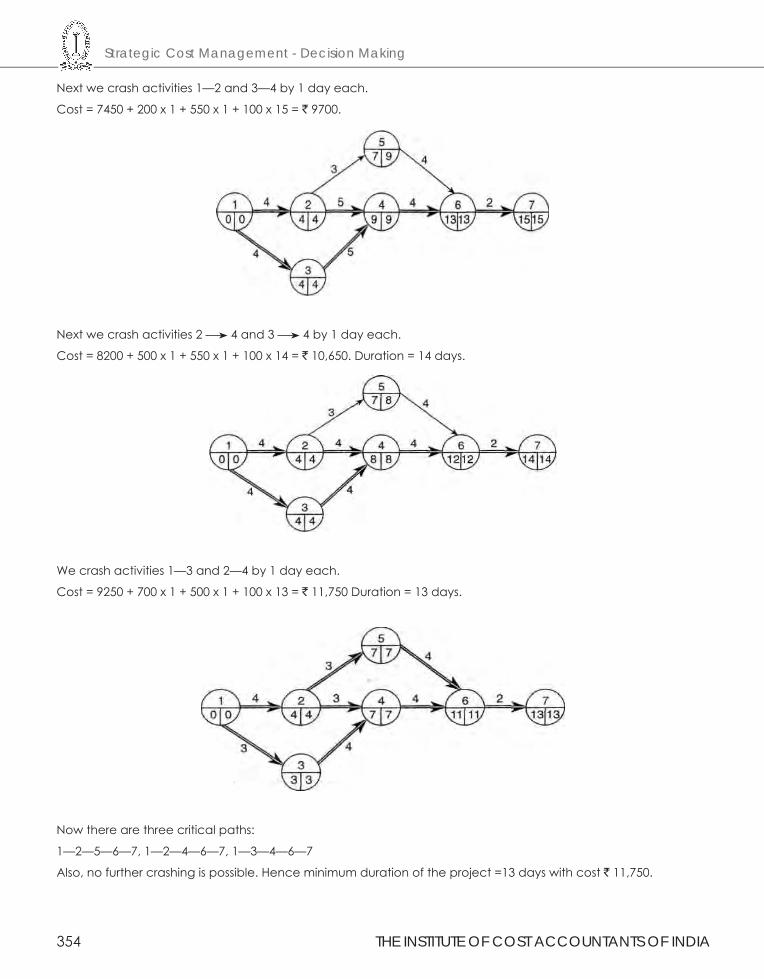
Strategic Cost Management - Decision Making
354 THE INSTITUTE OF COST ACCOUNTANTS OF INDIA
Next we crash activities 1—2 and 3—4 by 1 day each.
Cost = 7450 + 200 x 1 + 550 x 1 + 100 x 15 = ` 9700.
Next we crash activities 2 4 and 3 4 by 1 day each.
Cost = 8200 + 500 x 1 + 550 x 1 + 100 x 14 = ` 10,650. Duration = 14 days.
We crash activities 1—3 and 2—4 by 1 day each.
Cost = 9250 + 700 x 1 + 500 x 1 + 100 x 13 = ` 11,750 Duration = 13 days.
Now there are three critical paths:
1—2—5—6—7, 1—2—4—6—7, 1—3—4—6—7
Also, no further crashing is possible. Hence minimum duration of the project =13 days with cost ` 11,750.
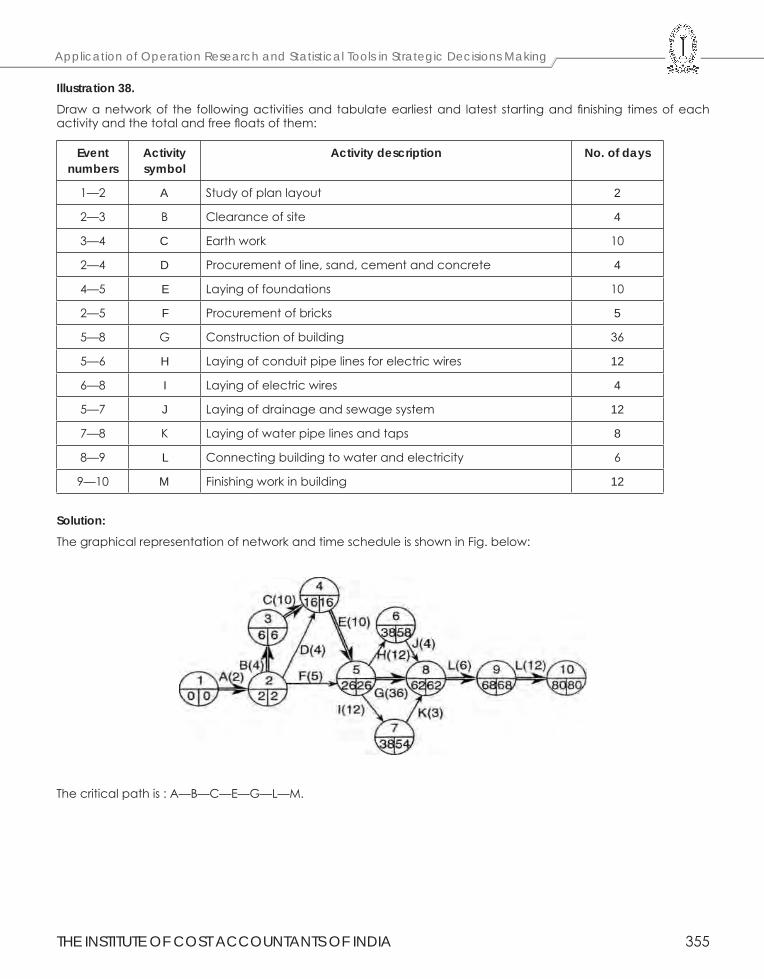
THE INSTITUTE OF COST ACCOUNTANTS OF INDIA 355
Application of Operation Research and Statistical Tools in Strategic Decisions Making
Illustration 38.Draw a network of the following activities and tabulate earliest and latest starting and finishing times of each activity and the total and free floats of them:
Event numbers
Activity symbol
Activity description No. of days
1—2 A Study of plan layout 2
2—3 B Clearance of site 4
3—4 C Earth work 10
2—4 D Procurement of line, sand, cement and concrete 4
4—5 E Laying of foundations 10
2—5 F Procurement of bricks 5
5—8 G Construction of building 36
5—6 H Laying of conduit pipe lines for electric wires 12
6—8 I Laying of electric wires 4
5—7 J Laying of drainage and sewage system 12
7—8 K Laying of water pipe lines and taps 8
8—9 L Connecting building to water and electricity 6
9—10 M Finishing work in building 12
Solution:The graphical representation of network and time schedule is shown in Fig. below:
The critical path is : A—B—C—E—G—L—M.
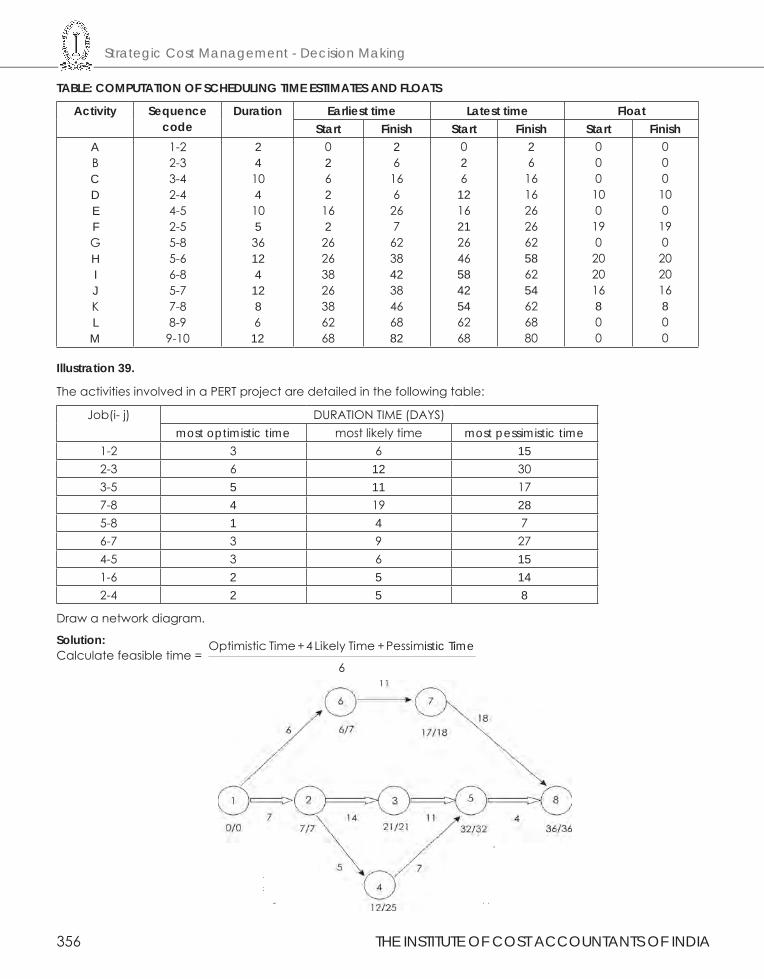
Strategic Cost Management - Decision Making
356 THE INSTITUTE OF COST ACCOUNTANTS OF INDIA
TABLE: COMPUTATION OF SCHEDULING TIME ESTIMATES AND FLOATS
Activity Sequence code
Duration Earliest time Latest time Float Start Finish Start Finish Start Finish
ABCDEFGHIJKLM
1-22-33-42-44-52-55-85-66-85-77-88-99-10
2410410536124128612
0262
162
26263826386268
26
166
267
62384238466882
026
12162126465842546268
26
1616262662586254626880
000
100
190
202016800
000100190202016800
Illustration 39.
The activities involved in a PERT project are detailed in the following table:
Job(i- j) DURATION TIME (DAYS)most optimistic time most likely time most pessimistic time
1-2 3 6 152-3 6 12 303-5 5 11 177-8 4 19 285-8 1 4 76-7 3 9 274-5 3 6 151-6 2 5 142-4 2 5 8
Draw a network diagram.
Solution:Calculate feasible time =
Optimistic Time + 4 Likely Time + Pessimistic Time
6
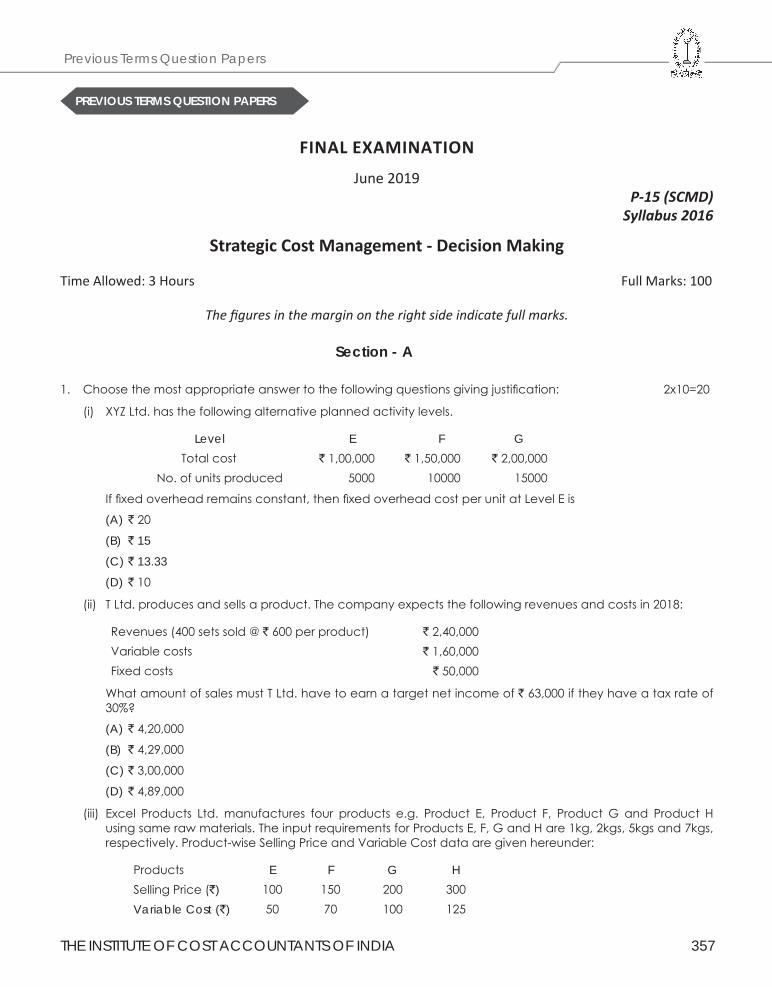
THE INSTITUTE OF COST ACCOUNTANTS OF INDIA 357
Previous Terms Question Papers
PREVIOUS TERMS QUESTION PAPERS
FINAL EXAMINATION
June 2019P-15 (SCMD)
Syllabus 2016
Strategic Cost Management - Decision Making
Time Allowed: 3 Hours Full Marks: 100
The figures in the margin on the right side indicate full marks.
Section - A
1. Choosethemostappropriateanswertothefollowingquestionsgivingjustification: 2x10=20
(i) XYZLtd.hasthefollowingalternativeplannedactivitylevels.
Level E F G
Totalcost `1,00,000 `1,50,000 `2,00,000
No.ofunitsproduced 5000 10000 15000
Iffixedoverheadremainsconstant,thenfixedoverheadcostperunitatLevelEis
(A) `20
(B) ` 15
(C) ` 13.33
(D) `10
(ii) TLtd.producesandsellsaproduct.Thecompanyexpectsthefollowingrevenuesandcostsin2018:
Revenues(400setssold@`600perproduct) `2,40,000Variablecosts `1,60,000Fixedcosts `50,000
WhatamountofsalesmustTLtd.havetoearnatargetnetincomeof`63,000iftheyhaveataxrateof30%?
(A) `4,20,000
(B) `4,29,000
(C) `3,00,000
(D) `4,89,000
(iii) Excel Products Ltd. manufactures four products e.g. Product E, Product F, Product G and Product Husingsamerawmaterials.TheinputrequirementsforProductsE,F,GandHare1kg,2kgs,5kgsand7kgs,respectively.Product-wiseSellingPriceandVariableCostdataaregivenhereunder:
Products E F G HSellingPrice(`) 100 150 200 300Variable Cost (`) 50 70 100 125
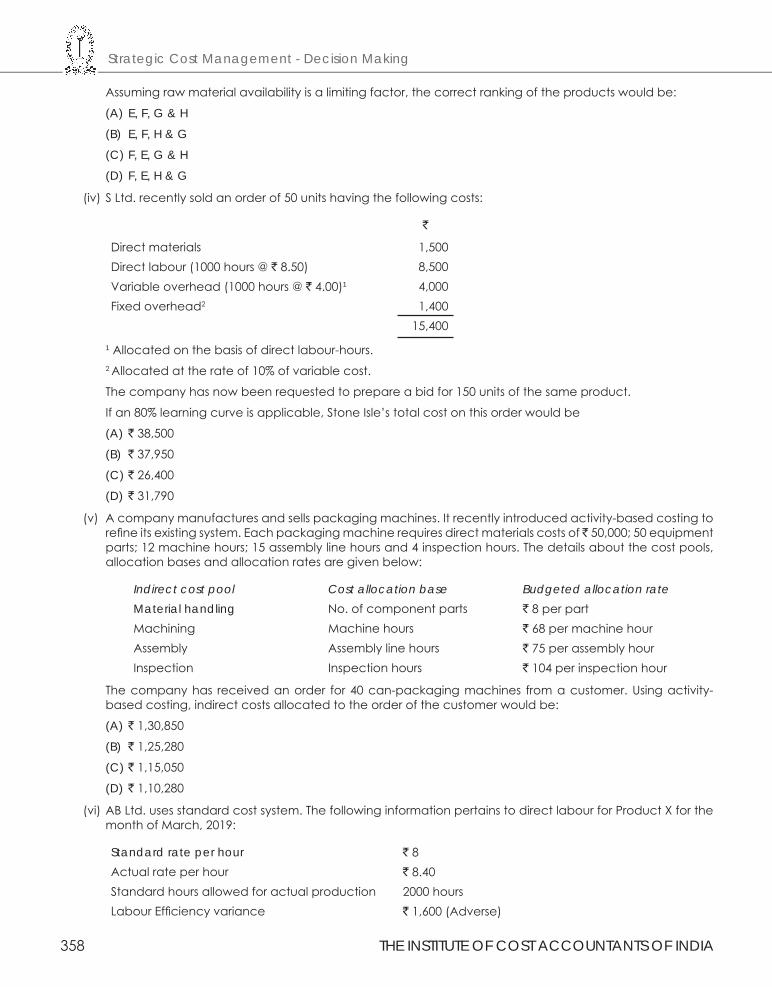
Strategic Cost Management - Decision Making
358 THE INSTITUTE OF COST ACCOUNTANTS OF INDIA
Assumingrawmaterialavailabilityisalimitingfactor,thecorrectrankingoftheproductswouldbe:
(A) E, F, G & H
(B) E, F, H & G
(C) F, E, G & H
(D) F, E, H & G
(iv)SLtd.recentlysoldanorderof50unitshavingthefollowingcosts:
`
Directmaterials 1,500Directlabour(1000hours@`8.50) 8,500Variableoverhead(1000hours@`4.00)1 4,000Fixedoverhead2 1,400
15,4001Allocatedonthebasisofdirectlabour-hours.2Allocatedattherateof10%ofvariablecost.
Thecompanyhasnowbeenrequestedtoprepareabidfor150unitsofthesameproduct.
Ifan80%learningcurveisapplicable,StoneIsle’stotalcostonthisorderwouldbe
(A) `38,500
(B) `37,950
(C) `26,400
(D) `31,790
(v) Acompanymanufacturesandsellspackagingmachines.Itrecentlyintroducedactivity-basedcostingtorefineitsexistingsystem.Eachpackagingmachinerequiresdirectmaterialscostsof̀ 50,000;50equipmentparts;12machinehours;15assemblylinehoursand4inspectionhours.Thedetailsaboutthecostpools,allocationbasesandallocationratesaregivenbelow:
Indirect cost pool Cost allocation base Budgeted allocation rateMaterial handling No.ofcomponentparts `8perpartMachining Machinehours `68permachinehourAssembly Assemblylinehours `75perassemblyhourInspection Inspectionhours `104perinspectionhour
Thecompanyhas receivedanorder for40can-packagingmachines fromacustomer.Usingactivity-basedcosting,indirectcostsallocatedtotheorderofthecustomerwouldbe:
(A) `1,30,850
(B) `1,25,280
(C) `1,15,050
(D) `1,10,280
(vi)ABLtd.usesstandardcostsystem.ThefollowinginformationpertainstodirectlabourforProductXforthemonthofMarch,2019:
Standard rate per hour `8Actualrateperhour `8.40Standardhoursallowedforactualproduction 2000hoursLabourEfficiencyvariance `1,600(Adverse)
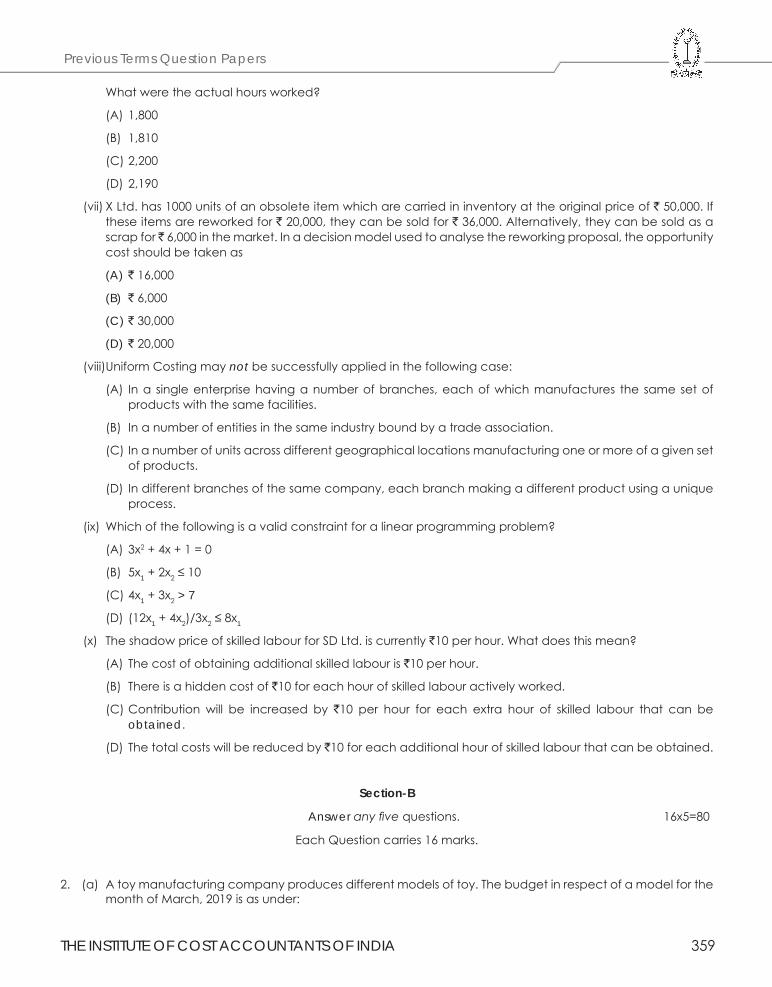
THE INSTITUTE OF COST ACCOUNTANTS OF INDIA 359
Previous Terms Question Papers
Whatweretheactualhoursworked?
(A)1,800
(B) 1,810
(C)2,200
(D)2,190
(vii)XLtd.has1000unitsofanobsoleteitemwhicharecarriedininventoryattheoriginalpriceof`50,000.Iftheseitemsarereworkedfor`20,000,theycanbesoldfor`36,000.Alternatively,theycanbesoldasascrapfor̀ 6,000inthemarket.Inadecisionmodelusedtoanalysethereworkingproposal,theopportunitycostshouldbetakenas
(A) `16,000
(B) `6,000
(C) `30,000
(D) `20,000
(viii)UniformCostingmaynot besuccessfullyappliedinthefollowingcase:
(A) Ina singleenterprisehavinganumberofbranches,eachofwhichmanufactures the samesetofproductswiththesamefacilities.
(B) Inanumberofentitiesinthesameindustryboundbyatradeassociation.
(C)Inanumberofunitsacrossdifferentgeographicallocationsmanufacturingoneormoreofagivensetofproducts.
(D) Indifferentbranchesofthesamecompany,eachbranchmakingadifferentproductusingauniqueprocess.
(ix) Whichofthefollowingisavalidconstraintforalinearprogrammingproblem?
(A)3x2+4x+1=0
(B) 5x1+2x2≤10
(C)4x1+3x2 > 7
(D) (12x1+4x2)/3x2≤8x1
(x) TheshadowpriceofskilledlabourforSDLtd.iscurrently`10perhour.Whatdoesthismean?
(A) Thecostofobtainingadditionalskilledlabouris`10perhour.
(B) Thereisahiddencostof`10foreachhourofskilledlabouractivelyworked.
(C)Contribution will be increased by `10 per hour for each extra hour of skilled labour that can beobtained.
(D) Thetotalcostswillbereducedby`10foreachadditionalhourofskilledlabourthatcanbeobtained.
Section-B
Answer any fivequestions. 16x5=80
EachQuestioncarries16marks.
2. (a) Atoymanufacturingcompanyproducesdifferentmodelsoftoy.ThebudgetinrespectofamodelforthemonthofMarch,2019isasunder:
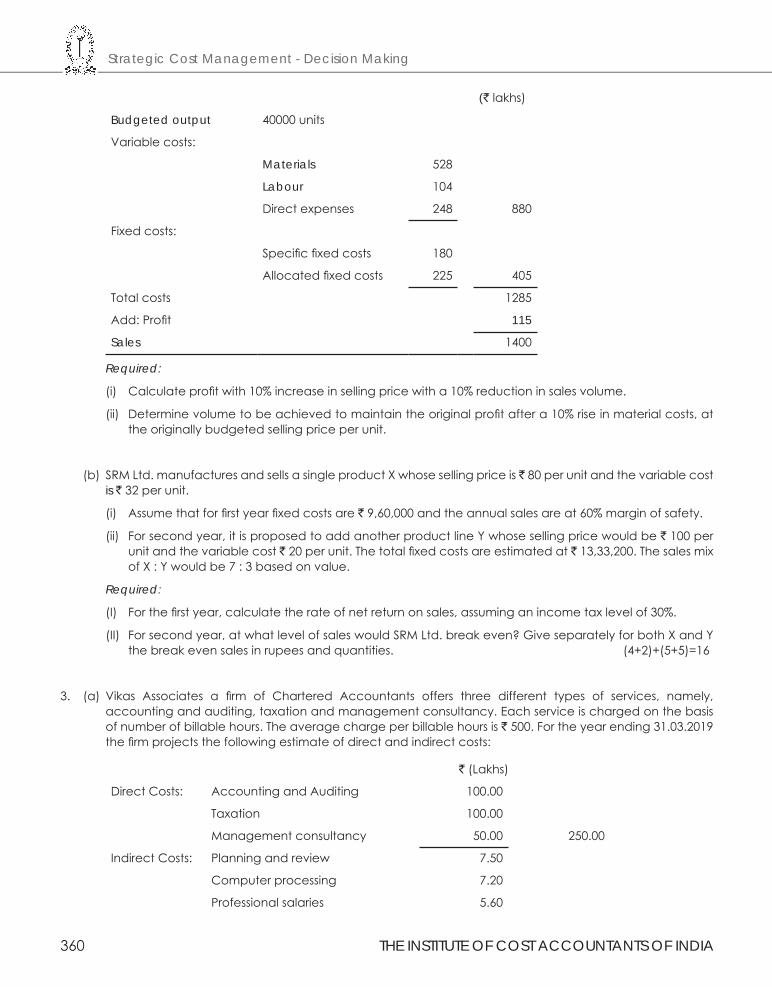
Strategic Cost Management - Decision Making
360 THE INSTITUTE OF COST ACCOUNTANTS OF INDIA
(`lakhs)
Budgeted output 40000units
Variablecosts:
Materials 528
Labour 104
Directexpenses 248 880
Fixedcosts:
Specificfixedcosts 180
Allocatedfixedcosts 225 405
Totalcosts 1285
Add:Profit 115
Sales 1400
Required:
(i) Calculateprofitwith10%increaseinsellingpricewitha10%reductioninsalesvolume.
(ii) Determinevolumetobeachievedtomaintaintheoriginalprofitaftera10%riseinmaterialcosts,attheoriginallybudgetedsellingpriceperunit.
(b) SRMLtd.manufacturesandsellsasingleproductXwhosesellingpriceis`80perunitandthevariablecostis `32perunit.
(i) Assumethatforfirstyearfixedcostsare`9,60,000andtheannualsalesareat60%marginofsafety.
(ii) Forsecondyear,itisproposedtoaddanotherproductlineYwhosesellingpricewouldbe`100perunitandthevariablecost`20perunit.Thetotalfixedcostsareestimatedat`13,33,200.ThesalesmixofX:Ywouldbe7:3basedonvalue.
Required:
(I) Forthefirstyear,calculatetherateofnetreturnonsales,assuminganincometaxlevelof30%.
(II) Forsecondyear,atwhatlevelofsaleswouldSRMLtd.breakeven?GiveseparatelyforbothXandYthebreakevensalesinrupeesandquantities. (4+2)+(5+5)=16
3. (a) Vikas Associates a firm of Chartered Accountants offers three different types of services, namely,accountingandauditing,taxationandmanagementconsultancy.Eachserviceischargedonthebasisofnumberofbillablehours.Theaveragechargeperbillablehoursis`500.Fortheyearending31.03.2019thefirmprojectsthefollowingestimateofdirectandindirectcosts:
`(Lakhs)
DirectCosts: AccountingandAuditing 100.00
Taxation 100.00
Managementconsultancy 50.00 250.00
IndirectCosts: Planningandreview 7.50
Computerprocessing 7.20
Professionalsalaries 5.60
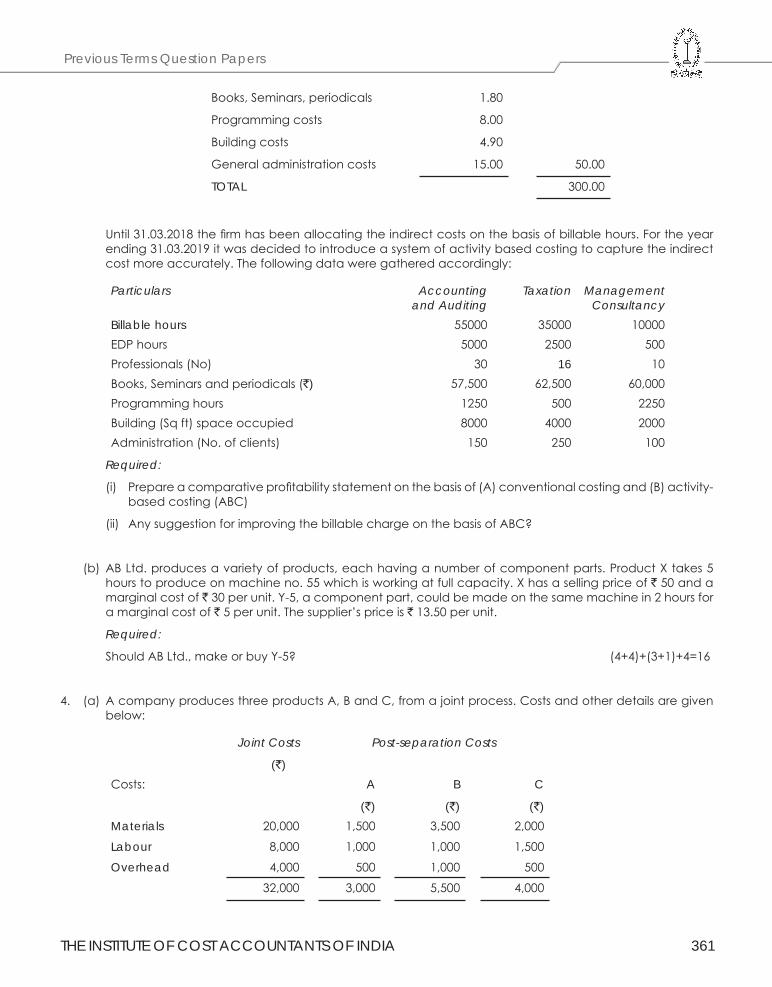
THE INSTITUTE OF COST ACCOUNTANTS OF INDIA 361
Previous Terms Question Papers
Books,Seminars,periodicals 1.80
Programmingcosts 8.00
Buildingcosts 4.90
Generaladministrationcosts 15.00 50.00
TOTAL 300.00
Until31.03.2018thefirmhasbeenallocatingtheindirectcostsonthebasisofbillablehours.Fortheyearending31.03.2019itwasdecidedtointroduceasystemofactivitybasedcostingtocapturetheindirectcostmoreaccurately.Thefollowingdataweregatheredaccordingly:
Particulars Accounting and Auditing
Taxation Management Consultancy
Billable hours 55000 35000 10000EDPhours 5000 2500 500Professionals(No) 30 16 10Books,Seminarsandperiodicals(`) 57,500 62,500 60,000Programminghours 1250 500 2250Building(Sqft)spaceoccupied 8000 4000 2000Administration(No.ofclients) 150 250 100
Required:
(i) Prepareacomparativeprofitabilitystatementonthebasisof(A)conventionalcostingand(B)activity-basedcosting(ABC)
(ii) AnysuggestionforimprovingthebillablechargeonthebasisofABC?
(b) ABLtd.producesavarietyofproducts,eachhavinganumberofcomponentparts.ProductXtakes5hourstoproduceonmachineno.55whichisworkingatfullcapacity.Xhasasellingpriceof`50andamarginalcostof`30perunit.Y-5,acomponentpart,couldbemadeonthesamemachinein2hoursforamarginalcostof`5perunit.Thesupplier’spriceis`13.50perunit.
Required:
ShouldABLtd.,makeorbuyY-5? (4+4)+(3+1)+4=16
4. (a) AcompanyproducesthreeproductsA,BandC,fromajointprocess.Costsandotherdetailsaregivenbelow:
Joint Costs
(`)
Post-separation Costs
Costs: A
(`)
B
(`)
C
(`)Materials 20,000 1,500 3,500 2,000
Labour 8,000 1,000 1,000 1,500
Overhead 4,000 500 1,000 500
32,000 3,000 5,500 4,000
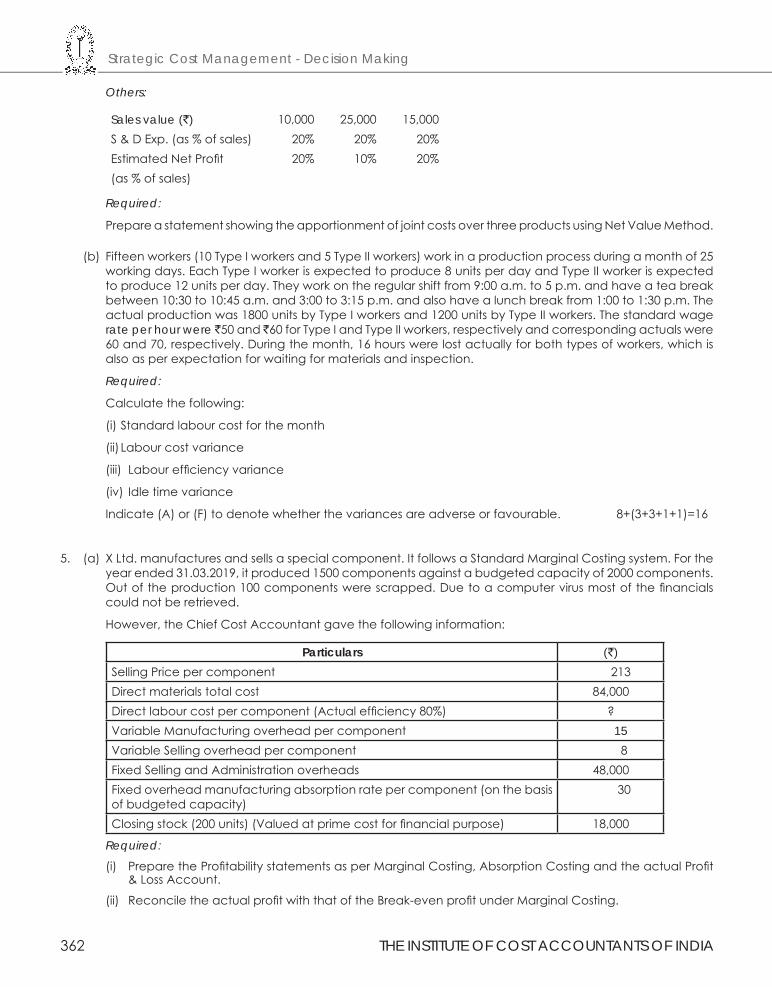
Strategic Cost Management - Decision Making
362 THE INSTITUTE OF COST ACCOUNTANTS OF INDIA
Others:
Sales value (`) 10,000 25,000 15,000S&DExp.(as%ofsales) 20% 20% 20%EstimatedNetProfit 20% 10% 20%(as%ofsales)
Required:
PrepareastatementshowingtheapportionmentofjointcostsoverthreeproductsusingNetValueMethod.
(b) Fifteenworkers(10TypeIworkersand5TypeIIworkers)workinaproductionprocessduringamonthof25workingdays.EachTypeIworkerisexpectedtoproduce8unitsperdayandTypeIIworkerisexpectedtoproduce12unitsperday.Theyworkontheregularshiftfrom9:00a.m.to5p.m.andhaveateabreakbetween10:30to10:45a.m.and3:00to3:15p.m.andalsohavealunchbreakfrom1:00to1:30p.m.Theactualproductionwas1800unitsbyTypeIworkersand1200unitsbyTypeIIworkers.Thestandardwagerate per hour were ̀ 50and̀ 60forTypeIandTypeIIworkers,respectivelyandcorrespondingactualswere60and70,respectively.Duringthemonth,16hourswerelostactuallyforbothtypesofworkers,whichisalsoasperexpectationforwaitingformaterialsandinspection.
Required:
Calculatethefollowing:
(i)Standardlabourcostforthemonth
(ii)Labourcostvariance
(iii) Labourefficiencyvariance
(iv) Idletimevariance
Indicate(A)or(F)todenotewhetherthevariancesareadverseorfavourable. 8+(3+3+1+1)=16
5. (a) XLtd.manufacturesandsellsaspecialcomponent.ItfollowsaStandardMarginalCostingsystem.Fortheyearended31.03.2019,itproduced1500componentsagainstabudgetedcapacityof2000components.Outoftheproduction100componentswerescrapped.Duetoacomputervirusmostofthefinancialscouldnotberetrieved.
However,theChiefCostAccountantgavethefollowinginformation:
Particulars (`)SellingPricepercomponent 213Directmaterialstotalcost 84,000Directlabourcostpercomponent(Actualefficiency80%) ?VariableManufacturingoverheadpercomponent 15VariableSellingoverheadpercomponent 8FixedSellingandAdministrationoverheads 48,000Fixedoverheadmanufacturingabsorptionratepercomponent(onthebasisofbudgetedcapacity)
30
Closingstock(200units)(Valuedatprimecostforfinancialpurpose) 18,000
Required:
(i) PreparetheProfitabilitystatementsasperMarginalCosting,AbsorptionCostingandtheactualProfit&LossAccount.
(ii) ReconciletheactualprofitwiththatoftheBreak-evenprofitunderMarginalCosting.
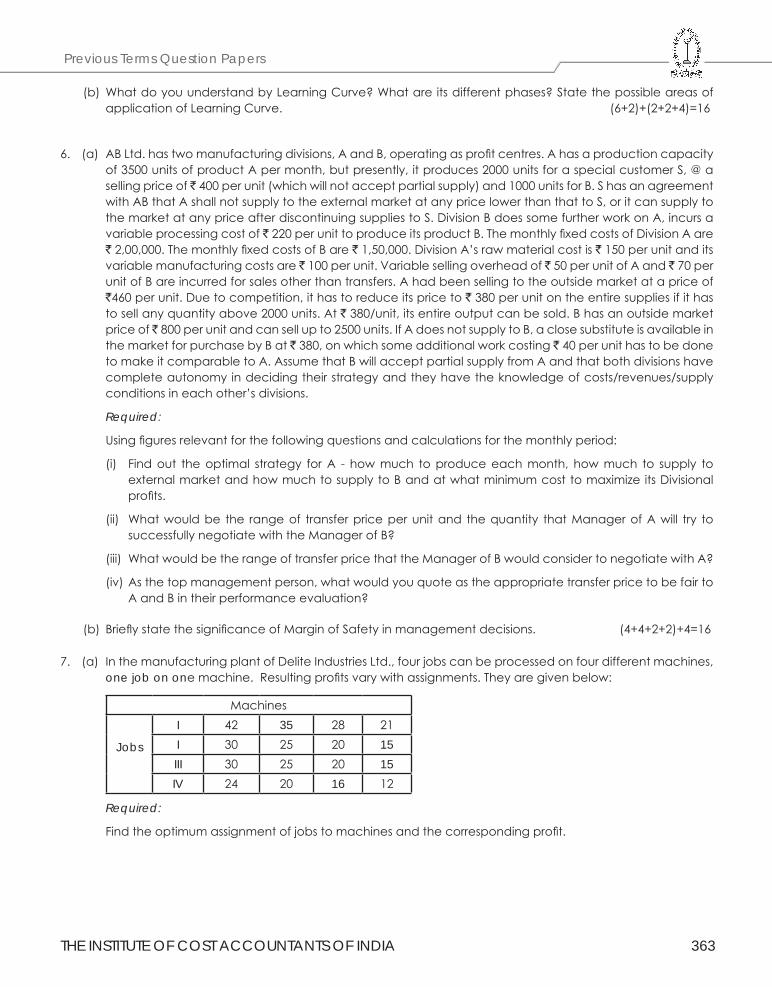
THE INSTITUTE OF COST ACCOUNTANTS OF INDIA 363
Previous Terms Question Papers
(b)WhatdoyouunderstandbyLearningCurve?Whatareitsdifferentphases?StatethepossibleareasofapplicationofLearningCurve. (6+2)+(2+2+4)=16
6. (a) ABLtd.hastwomanufacturingdivisions,AandB,operatingasprofitcentres.Ahasaproductioncapacityof3500unitsofproductApermonth,butpresently,itproduces2000unitsforaspecialcustomerS,@asellingpriceof̀ 400perunit(whichwillnotacceptpartialsupply)and1000unitsforB.ShasanagreementwithABthatAshallnotsupplytotheexternalmarketatanypricelowerthanthattoS,oritcansupplytothemarketatanypriceafterdiscontinuingsuppliestoS.DivisionBdoessomefurtherworkonA,incursavariableprocessingcostof`220perunittoproduceitsproductB.ThemonthlyfixedcostsofDivisionAare`2,00,000.ThemonthlyfixedcostsofBare`1,50,000.DivisionA’srawmaterialcostis`150perunitanditsvariablemanufacturingcostsare`100perunit.Variablesellingoverheadof`50perunitofAand`70perunitofBareincurredforsalesotherthantransfers.Ahadbeensellingtotheoutsidemarketatapriceof`460perunit.Duetocompetition,ithastoreduceitspriceto`380perunitontheentiresuppliesifithastosellanyquantityabove2000units.At`380/unit,itsentireoutputcanbesold.Bhasanoutsidemarketpriceof̀ 800perunitandcansellupto2500units.IfAdoesnotsupplytoB,aclosesubstituteisavailableinthemarketforpurchasebyBat`380,onwhichsomeadditionalworkcosting`40perunithastobedonetomakeitcomparabletoA.AssumethatBwillacceptpartialsupplyfromAandthatbothdivisionshavecompleteautonomyindecidingtheirstrategyandtheyhavetheknowledgeofcosts/revenues/supplyconditionsineachother’sdivisions.
Required:
Usingfiguresrelevantforthefollowingquestionsandcalculationsforthemonthlyperiod:
(i) Findout theoptimal strategy forA - howmuch toproduceeachmonth, howmuch to supply toexternalmarketandhowmuchtosupplytoBandatwhatminimumcosttomaximizeitsDivisionalprofits.
(ii) Whatwouldbe the rangeof transferpriceperunitand thequantity thatManagerofAwill try tosuccessfullynegotiatewiththeManagerofB?
(iii) WhatwouldbetherangeoftransferpricethattheManagerofBwouldconsidertonegotiatewithA?
(iv)Asthetopmanagementperson,whatwouldyouquoteastheappropriatetransferpricetobefairtoAandBintheirperformanceevaluation?
(b) BrieflystatethesignificanceofMarginofSafetyinmanagementdecisions. (4+4+2+2)+4=16
7. (a) InthemanufacturingplantofDeliteIndustriesLtd.,fourjobscanbeprocessedonfourdifferentmachines,one job on onemachine.Resultingprofitsvarywithassignments.Theyaregivenbelow:
Machines
Jobs
I 42 35 28 21I 30 25 20 15III 30 25 20 15IV 24 20 16 12
Required:
Findtheoptimumassignmentofjobstomachinesandthecorrespondingprofit.
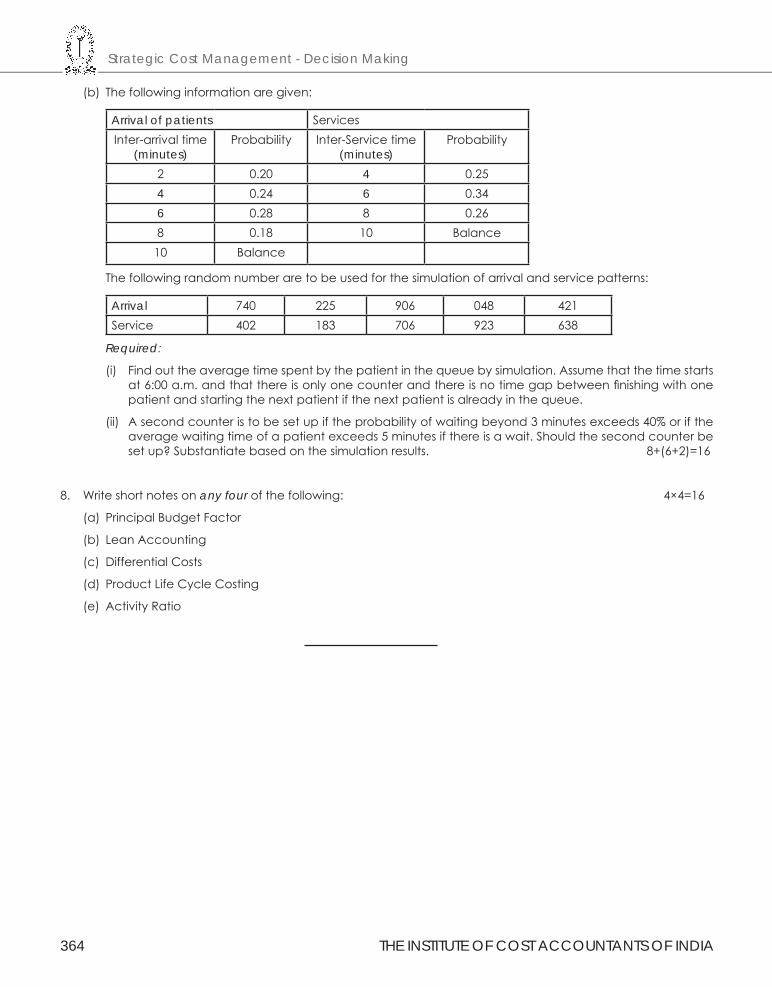
Strategic Cost Management - Decision Making
364 THE INSTITUTE OF COST ACCOUNTANTS OF INDIA
(b) Thefollowinginformationaregiven:
Arrival of patients ServicesInter-arrivaltime
(minutes)Probability Inter-Servicetime
(minutes)Probability
2 0.20 4 0.254 0.24 6 0.346 0.28 8 0.268 0.18 10 Balance10 Balance
Thefollowingrandomnumberaretobeusedforthesimulationofarrivalandservicepatterns:
Arrival 740 225 906 048 421Service 402 183 706 923 638
Required:
(i) Findouttheaveragetimespentbythepatientinthequeuebysimulation.Assumethatthetimestartsat6:00a.m.andthatthereisonlyonecounterandthereisnotimegapbetweenfinishingwithonepatientandstartingthenextpatientifthenextpatientisalreadyinthequeue.
(ii) Asecondcounteristobesetupiftheprobabilityofwaitingbeyond3minutesexceeds40%oriftheaveragewaitingtimeofapatientexceeds5minutesifthereisawait.Shouldthesecondcounterbesetup?Substantiatebasedonthesimulationresults. 8+(6+2)=16
8. Writeshortnotesonany fourofthefollowing: 4×4=16
(a) PrincipalBudgetFactor
(b) LeanAccounting
(c) DifferentialCosts
(d) ProductLifeCycleCosting
(e) ActivityRatio
THE INSTITUTE OF COST ACCOUNTANTS OF INDIA 365
Previous Terms Question Papers
FINAL EXAMINATION
December 2018 P-15 (SCMD) Syllabus 2016
Strategic Cost Management - Decision Making
Time Allowed: 3 Hours Full Marks: 100
The figures in the margin on the right side indicate full marks. Answer Question No. 1 in Section A, which is compulsory, carrying 20 marks.
Further, answer any 5(five) Questions from Section B, each carrying 16 marks.
Section - A
(20 marks)
1. Choosethemostappropriateanswertothefollowingquestionsgivingjustification:2x10=20
(i) Acompanyhasabreakevenpointwhensalesare`3,20,000andvariablecostatthatlevelofsalesare`2,00,000.Howmuchwouldcontributionmarginincreaseordecreaseifvariableexpensesaredroppedby`30,000?.
(A) Increaseby27.5%
(B) Increaseby9.375%
(C)Decreaseby9.375%
(D) Increaseby37.5%
(ii) TwinLtd.usesJITandbackflushaccounting.Itdoesnotusearawmaterialstockcontrolaccount.DuringSeptember2018,10000unitswereproducedandsold.Thestandardcostperunitis`150whichincludesmaterials of `60.DuringSeptember2018,`9,90,000ofconversioncostswereincurred.ThedebitbalanceincostofgoodssoldaccountforSeptember2018was
(A) `14,00,000
(B) `14,80,000
(C) `15,90,000
(D) `16,20,000
(iii) Acompanyoperatesastandardabsorptioncostingsystem.Thebudgetedfixedproductionoverheadsforthecompanyforlastyearwere`3,30,000andbudgetedoutputwas220,000units.Attheendofthecompany’sfinancialyear,thetotalofthefixedproductionoverheadsdebitedtotheFixedProductionOverheadControlAccountwas`2,60,000andtheactualoutputachievedwas2,00,000units.Theunder/over absorption of overhead was
(A) `40,000overabsorbed
(B) `40,000underabsorbed
(C) `50,000overabsorbed
(D) `50,000underabsorbed
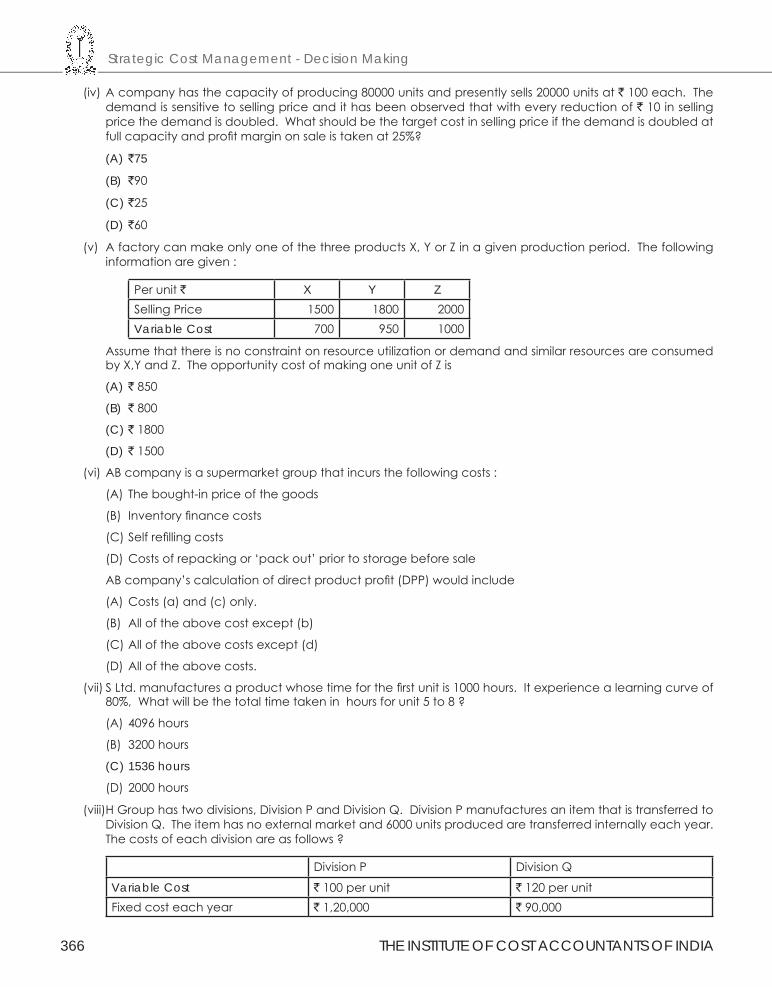
Strategic Cost Management - Decision Making
366 THE INSTITUTE OF COST ACCOUNTANTS OF INDIA
(iv)Acompanyhasthecapacityofproducing80000unitsandpresentlysells20000unitsat`100each.Thedemandissensitivetosellingpriceandithasbeenobservedthatwitheveryreductionof`10insellingpricethedemandisdoubled.Whatshouldbethetargetcostinsellingpriceifthedemandisdoubledatfullcapacityandprofitmarginonsaleistakenat25%?
(A) `75
(B) `90
(C) `25
(D) `60
(v) AfactorycanmakeonlyoneofthethreeproductsX,YorZinagivenproductionperiod.Thefollowinginformationaregiven:
Perunit` X Y ZSellingPrice 1500 1800 2000Variable Cost 700 950 1000
AssumethatthereisnoconstraintonresourceutilizationordemandandsimilarresourcesareconsumedbyX,YandZ.TheopportunitycostofmakingoneunitofZis
(A) `850
(B) `800
(C) `1800
(D) `1500
(vi)ABcompanyisasupermarketgroupthatincursthefollowingcosts:
(A) Thebought-inpriceofthegoods
(B) Inventoryfinancecosts
(C)Selfrefillingcosts
(D)Costsofrepackingor‘packout’priortostoragebeforesale
ABcompany’scalculationofdirectproductprofit(DPP)wouldinclude
(A)Costs(a)and(c)only.
(B) Alloftheabovecostexcept(b)
(C)Alloftheabovecostsexcept(d)
(D)Alloftheabovecosts.
(vii)SLtd.manufacturesaproductwhosetimeforthefirstunitis1000hours.Itexperiencealearningcurveof80%,Whatwillbethetotaltimetakeninhoursforunit5to8?
(A)4096hours
(B) 3200hours
(C) 1536 hours
(D)2000hours
(viii)HGrouphastwodivisions,DivisionPandDivisionQ.DivisionPmanufacturesanitemthatistransferredtoDivisionQ.Theitemhasnoexternalmarketand6000unitsproducedaretransferredinternallyeachyear.Thecostsofeachdivisionareasfollows?
DivisionP DivisionQ
Variable Cost `100perunit `120perunitFixedcosteachyear `1,20,000 `90,000
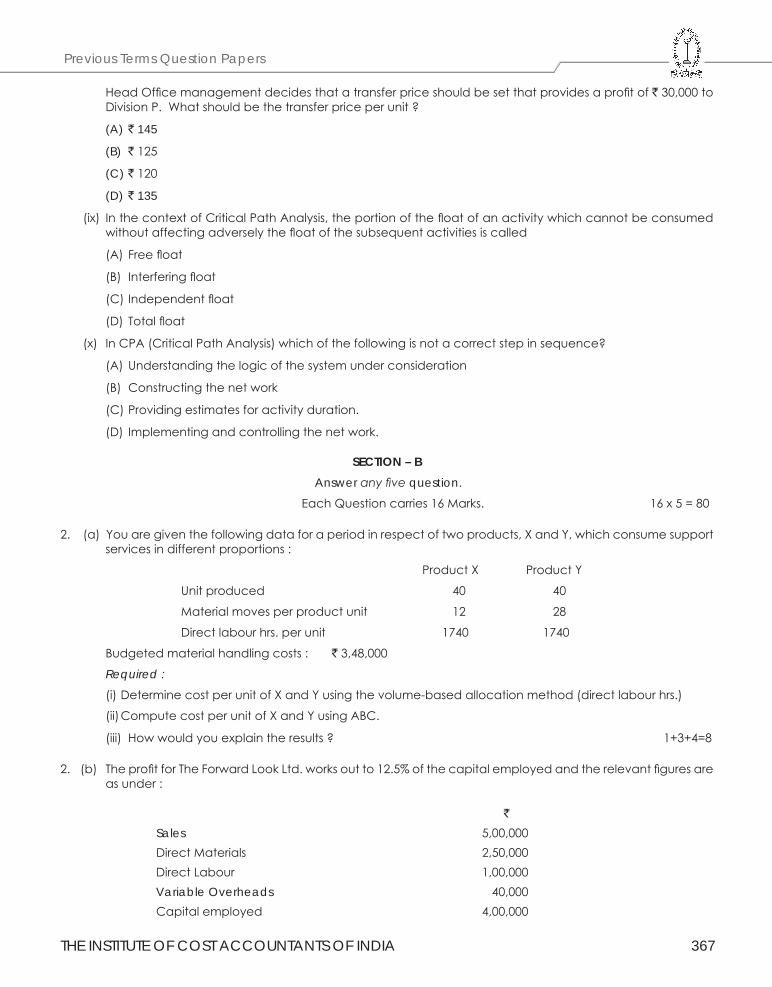
THE INSTITUTE OF COST ACCOUNTANTS OF INDIA 367
Previous Terms Question Papers
HeadOfficemanagementdecidesthatatransferpriceshouldbesetthatprovidesaprofitof`30,000toDivisionP.Whatshouldbethetransferpriceperunit?
(A) ` 145
(B) `125
(C) `120
(D) ` 135
(ix) InthecontextofCriticalPathAnalysis,theportionofthefloatofanactivitywhichcannotbeconsumedwithoutaffectingadverselythefloatofthesubsequentactivitiesiscalled
(A) Freefloat
(B) Interferingfloat
(C)Independentfloat
(D) Totalfloat
(x) InCPA(CriticalPathAnalysis)whichofthefollowingisnotacorrectstepinsequence?
(A)Understandingthelogicofthesystemunderconsideration
(B) Constructingthenetwork
(C)Providingestimatesforactivityduration.
(D) Implementingandcontrollingthenetwork.
SECTION – BAnswer any five question.
EachQuestioncarries16Marks. 16x5=80
2. (a)Youaregiventhefollowingdataforaperiodinrespectoftwoproducts,XandY,whichconsumesupportservicesindifferentproportions:
ProductX ProductY
Unitproduced 40 40
Materialmovesperproductunit 12 28
Directlabourhrs.perunit 1740 1740
Budgetedmaterialhandlingcosts: `3,48,000
Required :
(i)DeterminecostperunitofXandYusingthevolume-basedallocationmethod(directlabourhrs.)
(ii)ComputecostperunitofXandYusingABC.
(iii) Howwouldyouexplaintheresults? 1+3+4=8
2.(b) TheprofitforTheForwardLookLtd.worksoutto12.5%ofthecapitalemployedandtherelevantfiguresareasunder:
`Sales 5,00,000DirectMaterials 2,50,000DirectLabour 1,00,000Variable Overheads 40,000Capitalemployed 4,00,000
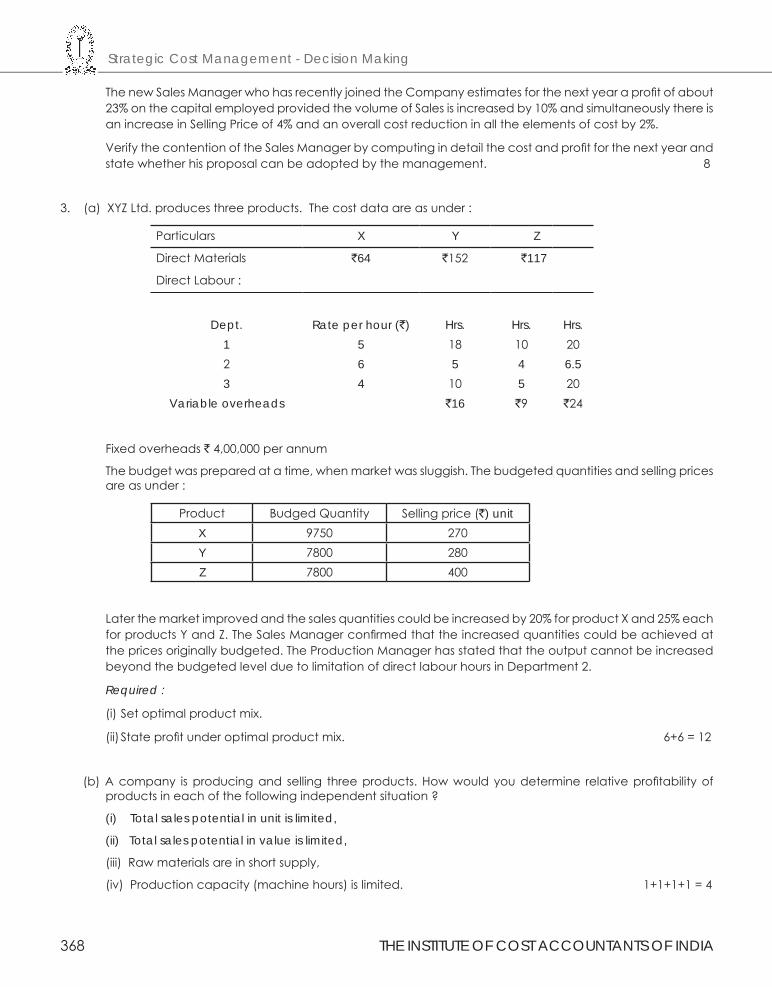
Strategic Cost Management - Decision Making
368 THE INSTITUTE OF COST ACCOUNTANTS OF INDIA
ThenewSalesManagerwhohasrecentlyjoinedtheCompanyestimatesforthenextyearaprofitofabout23%onthecapitalemployedprovidedthevolumeofSalesisincreasedby10%andsimultaneouslythereisanincreaseinSellingPriceof4%andanoverallcostreductioninalltheelementsofcostby2%.
VerifythecontentionoftheSalesManagerbycomputingindetailthecostandprofitforthenextyearandstatewhetherhisproposalcanbeadoptedbythemanagement. 8
3.(a)XYZLtd.producesthreeproducts.Thecostdataareasunder:
Particulars X Y Z
DirectMaterials `64 `152 ̀ 117
DirectLabour:
Dept. Rate per hour (`) Hrs. Hrs. Hrs.1 5 18 10 202 6 5 4 6.53 4 10 5 20
Variable overheads `16 `9 `24
Fixedoverheads`4,00,000perannum
Thebudgetwaspreparedatatime,whenmarketwassluggish.Thebudgetedquantitiesandsellingpricesareasunder:
Product BudgedQuantity Sellingprice(`) unitX 9750 270Y 7800 280Z 7800 400
Laterthemarketimprovedandthesalesquantitiescouldbeincreasedby20%forproductXand25%eachforproductsYandZ.TheSalesManagerconfirmedthattheincreasedquantitiescouldbeachievedatthepricesoriginallybudgeted.TheProductionManagerhasstatedthattheoutputcannotbeincreasedbeyondthebudgetedlevelduetolimitationofdirectlabourhoursinDepartment2.
Required :
(i)Setoptimalproductmix.
(ii)Stateprofitunderoptimalproductmix. 6+6=12
(b)Acompany isproducingand selling threeproducts.Howwouldyoudetermine relativeprofitabilityofproductsineachofthefollowingindependentsituation?
(i) Total sales potential in unit is limited,
(ii) Total sales potential in value is limited,
(iii)Rawmaterialsareinshortsupply,
(iv)Productioncapacity(machinehours)islimited. 1+1+1+1=4
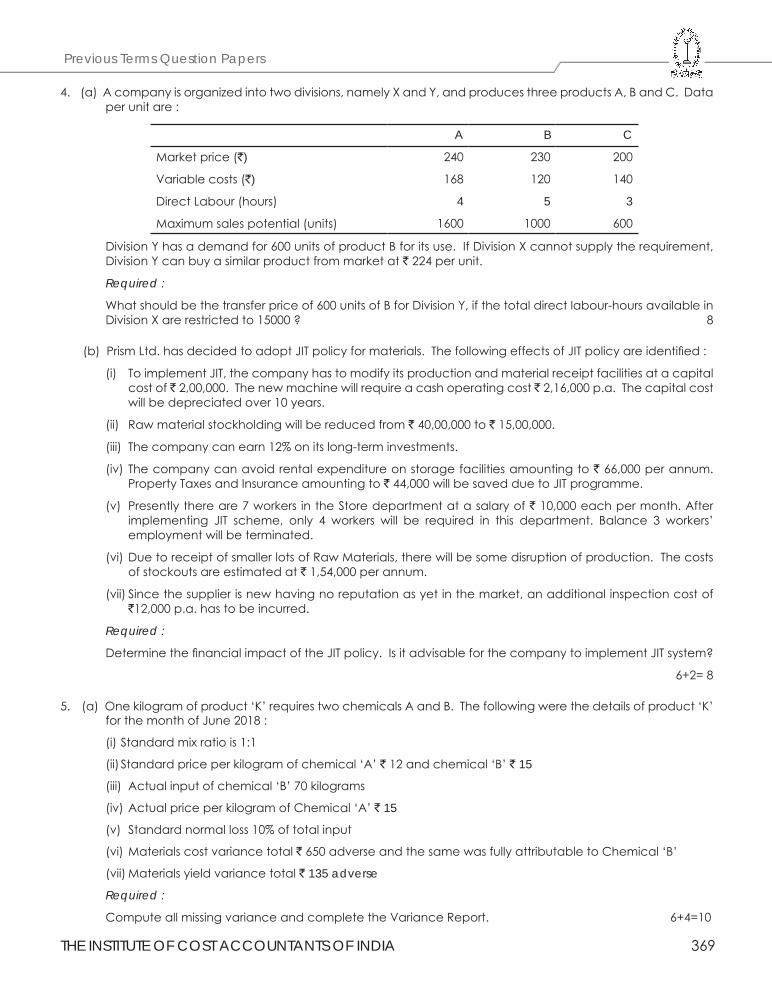
THE INSTITUTE OF COST ACCOUNTANTS OF INDIA 369
Previous Terms Question Papers
4. (a)Acompanyisorganizedintotwodivisions,namelyXandY,andproducesthreeproductsA,BandC.Dataperunitare:
A B C
Marketprice(`)
Variablecosts(`)
DirectLabour(hours)
Maximumsalespotential(units)
240
168
4
1600
230
120
5
1000
200
140
3
600
DivisionYhasademandfor600unitsofproductBforitsuse.IfDivisionXcannotsupplytherequirement,DivisionYcanbuyasimilarproductfrommarketat`224perunit.
Required :
Whatshouldbethetransferpriceof600unitsofBforDivisionY,ifthetotaldirectlabour-hoursavailableinDivisionXarerestrictedto15000? 8
(b)PrismLtd.hasdecidedtoadoptJITpolicyformaterials.ThefollowingeffectsofJITpolicyareidentified:
(i) ToimplementJIT,thecompanyhastomodifyitsproductionandmaterialreceiptfacilitiesatacapitalcostof`2,00,000.Thenewmachinewillrequireacashoperatingcost`2,16,000p.a.Thecapitalcostwillbedepreciatedover10years.
(ii) Rawmaterialstockholdingwillbereducedfrom`40,00,000to`15,00,000.
(iii) Thecompanycanearn12%onitslong-terminvestments.
(iv) Thecompanycanavoidrentalexpenditureonstoragefacilitiesamountingto`66,000perannum.PropertyTaxesandInsuranceamountingto`44,000willbesavedduetoJITprogramme.
(v) Presentlythereare7workers intheStoredepartmentatasalaryof`10,000eachpermonth.Afterimplementing JIT scheme, only 4 workers will be required in this department. Balance 3 workers’employmentwillbeterminated.
(vi)DuetoreceiptofsmallerlotsofRawMaterials,therewillbesomedisruptionofproduction.Thecostsofstockoutsareestimatedat`1,54,000perannum.
(vii)Sincethesupplierisnewhavingnoreputationasyetinthemarket,anadditionalinspectioncostof`12,000p.a.hastobeincurred.
Required :
DeterminethefinancialimpactoftheJITpolicy.IsitadvisableforthecompanytoimplementJITsystem?
6+2=8
5. (a)Onekilogramofproduct‘K’requirestwochemicalsAandB.Thefollowingwerethedetailsofproduct‘K’forthemonthofJune2018:
(i)Standardmixratiois1:1
(ii)Standardpriceperkilogramofchemical‘A’`12andchemical‘B’` 15
(iii) Actualinputofchemical‘B’70kilograms
(iv)ActualpriceperkilogramofChemical‘A’` 15
(v) Standardnormalloss10%oftotalinput
(vi)Materialscostvariancetotal`650adverseandthesamewasfullyattributabletoChemical‘B’
(vii)Materialsyieldvariancetotal` 135 adverse
Required :
ComputeallmissingvarianceandcompletetheVarianceReport. 6+4=10
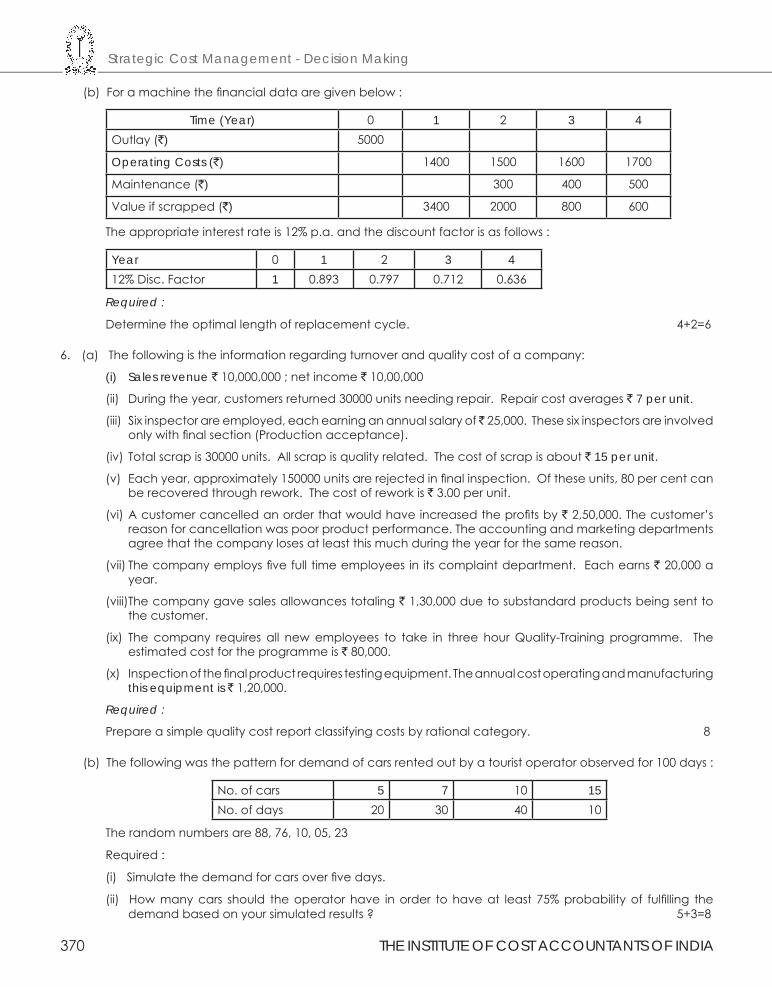
Strategic Cost Management - Decision Making
370 THE INSTITUTE OF COST ACCOUNTANTS OF INDIA
(b)Foramachinethefinancialdataaregivenbelow:
Time (Year) 0 1 2 3 4Outlay(`) 5000
Operating Costs (`) 1400 1500 1600 1700
Maintenance(`) 300 400 500
Valueifscrapped(`) 3400 2000 800 600
Theappropriateinterestrateis12%p.a.andthediscountfactorisasfollows:
Year 0 1 2 3 412%Disc.Factor 1 0.893 0.797 0.712 0.636
Required :
Determinetheoptimallengthofreplacementcycle. 4+2=6
6. (a)Thefollowingistheinformationregardingturnoverandqualitycostofacompany:
(i) Sales revenue `10,000,000;netincome`10,00,000
(ii) Duringtheyear,customersreturned30000unitsneedingrepair.Repaircostaverages` 7 per unit.
(iii) Sixinspectorareemployed,eachearninganannualsalaryof̀ 25,000.Thesesixinspectorsareinvolvedonlywithfinalsection(Productionacceptance).
(iv) Totalscrapis30000units.Allscrapisqualityrelated.Thecostofscrapisabout` 15 per unit.
(v) Eachyear,approximately150000unitsarerejectedinfinalinspection.Oftheseunits,80percentcanberecoveredthroughrework.Thecostofreworkis`3.00perunit.
(vi)Acustomercancelledanorderthatwouldhaveincreasedtheprofitsby`2,50,000.Thecustomer’sreasonforcancellationwaspoorproductperformance.Theaccountingandmarketingdepartmentsagreethatthecompanylosesatleastthismuchduringtheyearforthesamereason.
(vii)Thecompanyemploysfivefulltimeemployeesinitscomplaintdepartment.Eachearns`20,000ayear.
(viii)Thecompanygavesalesallowancestotaling`1,30,000duetosubstandardproductsbeingsenttothecustomer.
(ix) The company requires all newemployees to take in three hourQuality-Trainingprogramme. Theestimatedcostfortheprogrammeis`80,000.
(x) Inspectionofthefinalproductrequirestestingequipment.Theannualcostoperatingandmanufacturingthis equipment is `1,20,000.
Required :
Prepareasimplequalitycostreportclassifyingcostsbyrationalcategory. 8
(b)Thefollowingwasthepatternfordemandofcarsrentedoutbyatouristoperatorobservedfor100days:
No.ofcars 5 7 10 15No.ofdays 20 30 40 10
Therandomnumbersare88,76,10,05,23
Required:
(i)Simulatethedemandforcarsoverfivedays.
(ii) Howmanycars should theoperatorhave inorder tohaveat least 75%probabilityof fulfilling thedemandbasedonyoursimulatedresults? 5+3=8
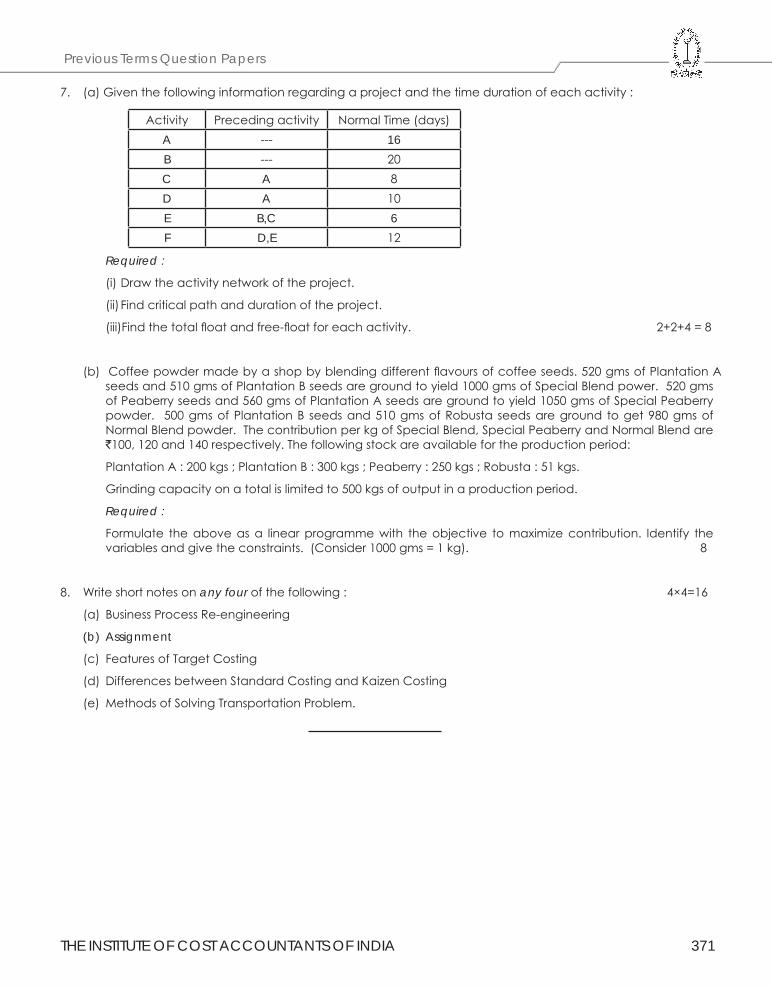
THE INSTITUTE OF COST ACCOUNTANTS OF INDIA 371
Previous Terms Question Papers
7. (a)Giventhefollowinginformationregardingaprojectandthetimedurationofeachactivity:
Activity Precedingactivity NormalTime(days)A --- 16B --- 20C A 8D A 10E B,C 6F D,E 12
Required :
(i)Drawtheactivitynetworkoftheproject.
(ii)Findcriticalpathanddurationoftheproject.
(iii)Findthetotalfloatandfree-floatforeachactivity. 2+2+4=8
(b)Coffeepowdermadebyashopbyblendingdifferentflavoursofcoffeeseeds.520gmsofPlantationAseedsand510gmsofPlantationBseedsaregroundtoyield1000gmsofSpecialBlendpower.520gmsofPeaberryseedsand560gmsofPlantationAseedsaregroundtoyield1050gmsofSpecialPeaberrypowder. 500gmsofPlantationB seedsand510gmsofRobusta seedsareground toget980gmsofNormalBlendpowder.ThecontributionperkgofSpecialBlend,SpecialPeaberryandNormalBlendare`100,120and140respectively.Thefollowingstockareavailablefortheproductionperiod:
PlantationA:200kgs;PlantationB:300kgs;Peaberry:250kgs;Robusta:51kgs.
Grindingcapacityonatotalislimitedto500kgsofoutputinaproductionperiod.
Required :
Formulate theaboveasa linearprogrammewith theobjective tomaximizecontribution. Identify thevariablesandgivetheconstraints.(Consider1000gms=1kg). 8
8. Writeshortnotesonany fourofthefollowing: 4×4=16
(a) BusinessProcessRe-engineering
(b) Assignment
(c) FeaturesofTargetCosting
(d) DifferencesbetweenStandardCostingandKaizenCosting
(e) MethodsofSolvingTransportationProblem.
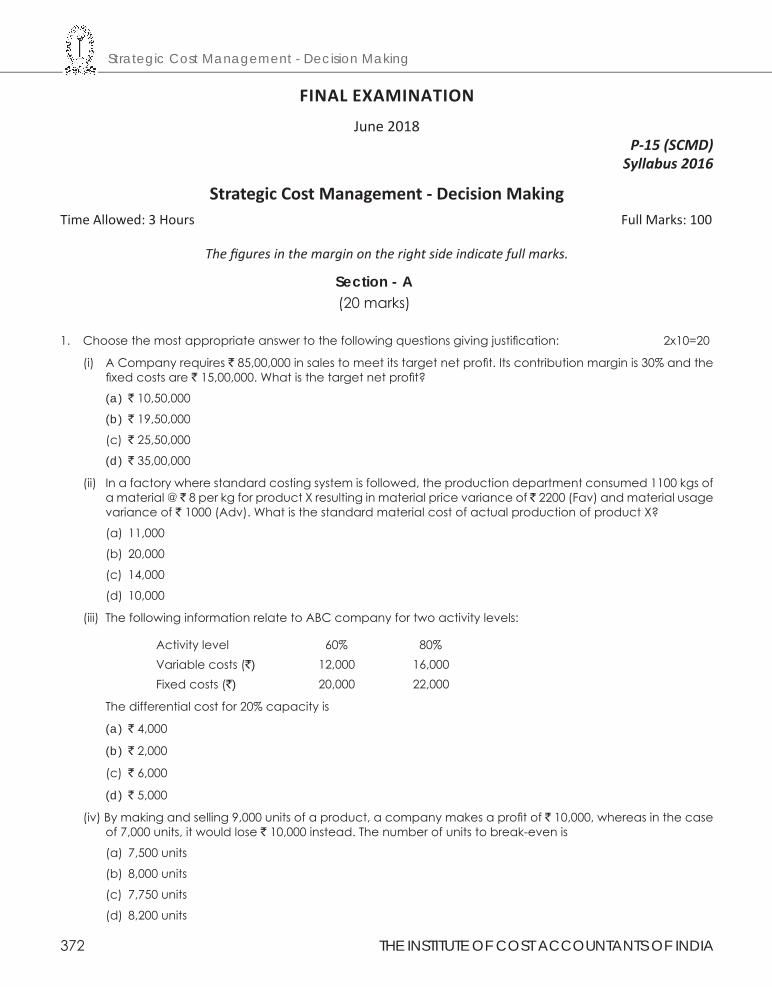
Strategic Cost Management - Decision Making
372 THE INSTITUTE OF COST ACCOUNTANTS OF INDIA
FINAL EXAMINATION
June 2018P-15 (SCMD)
Syllabus 2016
Strategic Cost Management - Decision MakingTime Allowed: 3 Hours Full Marks: 100
The figures in the margin on the right side indicate full marks.
Section - A(20marks)
1. Choosethemostappropriateanswertothefollowingquestionsgivingjustification: 2x10=20
(i) ACompanyrequires`85,00,000insalestomeetitstargetnetprofit.Itscontributionmarginis30%andthefixedcostsare`15,00,000.Whatisthetargetnetprofit?
(a) `10,50,000
(b) `19,50,000
(c) `25,50,000
(d) `35,00,000
(ii) Inafactorywherestandardcostingsystemisfollowed,theproductiondepartmentconsumed1100kgsofamaterial@̀ 8perkgforproductXresultinginmaterialpricevarianceof̀ 2200(Fav)andmaterialusagevarianceof`1000(Adv).WhatisthestandardmaterialcostofactualproductionofproductX?
(a) 11,000
(b) 20,000
(c) 14,000
(d) 10,000
(iii)ThefollowinginformationrelatetoABCcompanyfortwoactivitylevels:
Activitylevel 60% 80%Variablecosts(`) 12,000 16,000Fixedcosts(`) 20,000 22,000
Thedifferentialcostfor20%capacityis
(a) `4,000
(b) `2,000
(c) `6,000
(d) `5,000
(iv)Bymakingandselling9,000unitsofaproduct,acompanymakesaprofitof`10,000,whereasinthecaseof7,000units,itwouldlose`10,000instead.Thenumberofunitstobreak-evenis
(a) 7,500units
(b) 8,000units
(c) 7,750units
(d) 8,200units
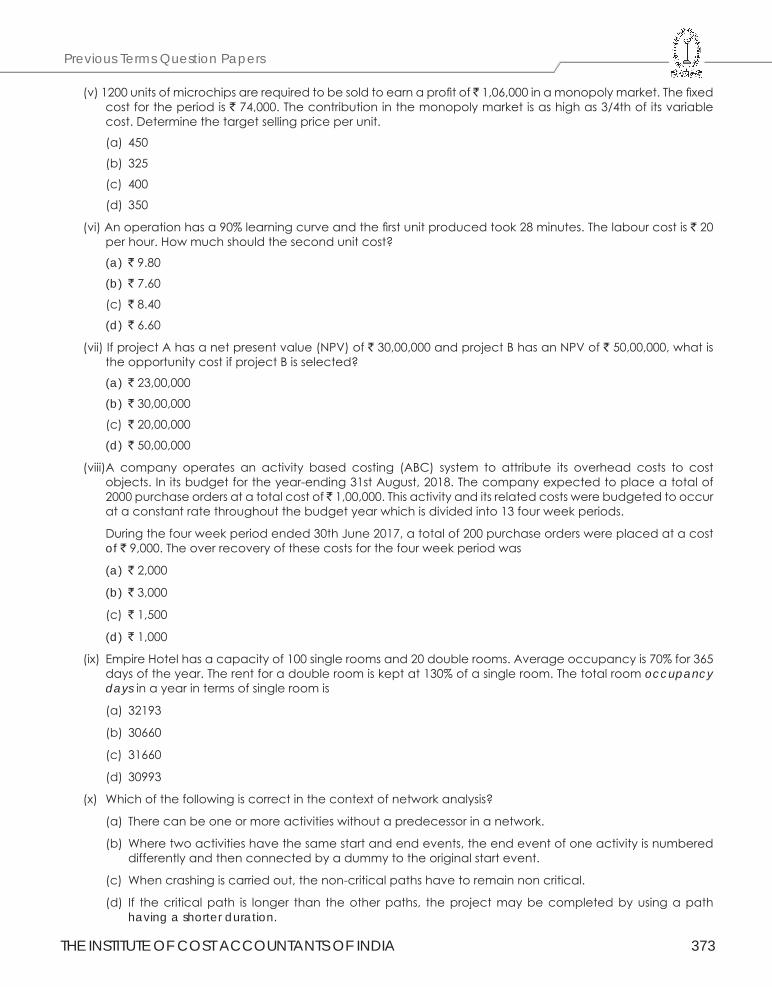
THE INSTITUTE OF COST ACCOUNTANTS OF INDIA 373
Previous Terms Question Papers
(v)1200unitsofmicrochipsarerequiredtobesoldtoearnaprofitof̀ 1,06,000inamonopolymarket.Thefixedcostfortheperiodis`74,000.Thecontributioninthemonopolymarketisashighas3/4thofitsvariablecost.Determinethetargetsellingpriceperunit.
(a) 450
(b) 325
(c) 400
(d) 350
(vi)Anoperationhasa90%learningcurveandthefirstunitproducedtook28minutes.Thelabourcostis`20perhour.Howmuchshouldthesecondunitcost?
(a) `9.80
(b) `7.60
(c) `8.40
(d) `6.60
(vii)IfprojectAhasanetpresentvalue(NPV)of`30,00,000andprojectBhasanNPVof`50,00,000,whatistheopportunitycostifprojectBisselected?
(a) `23,00,000
(b) `30,00,000
(c) `20,00,000
(d) `50,00,000
(viii)A company operates an activity based costing (ABC) system to attribute its overhead costs to costobjects.Initsbudgetfortheyear-ending31stAugust,2018.Thecompanyexpectedtoplaceatotalof2000purchaseordersatatotalcostof̀ 1,00,000.Thisactivityanditsrelatedcostswerebudgetedtooccurataconstantratethroughoutthebudgetyearwhichisdividedinto13fourweekperiods.
Duringthefourweekperiodended30thJune2017,atotalof200purchaseorderswereplacedatacostof `9,000.Theoverrecoveryofthesecostsforthefourweekperiodwas
(a) `2,000
(b) `3,000
(c) `1,500
(d) `1,000
(ix) EmpireHotelhasacapacityof100singleroomsand20doublerooms.Averageoccupancyis70%for365daysoftheyear.Therentforadoubleroomiskeptat130%ofasingleroom.Thetotalroomoccupancy daysinayearintermsofsingleroomis
(a) 32193
(b) 30660
(c) 31660
(d) 30993
(x)Whichofthefollowingiscorrectinthecontextofnetworkanalysis?
(a) Therecanbeoneormoreactivitieswithoutapredecessorinanetwork.
(b)Wheretwoactivitieshavethesamestartandendevents,theendeventofoneactivityisnumbereddifferentlyandthenconnectedbyadummytotheoriginalstartevent.
(c) Whencrashingiscarriedout,thenon-criticalpathshavetoremainnoncritical.
(d) If thecriticalpath is longer than theotherpaths, theprojectmaybecompletedbyusingapathhaving a shorter duration.
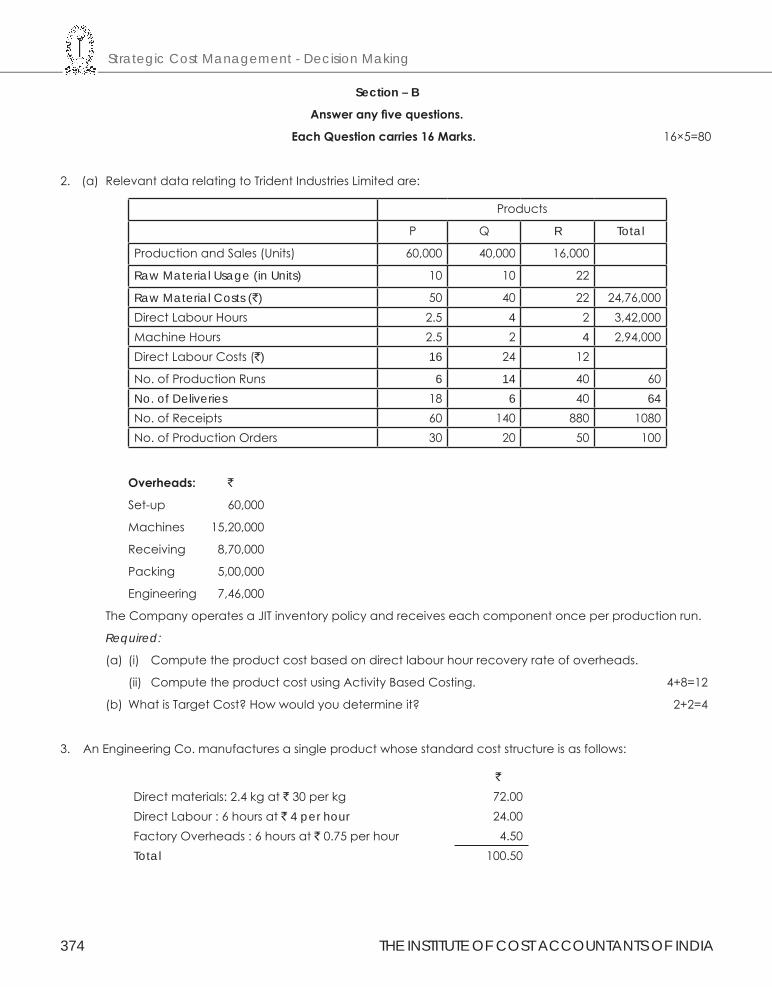
Strategic Cost Management - Decision Making
374 THE INSTITUTE OF COST ACCOUNTANTS OF INDIA
Section – B
Answer any five questions.
Each Question carries 16 Marks. 16×5=80
2. (a)RelevantdatarelatingtoTridentIndustriesLimitedare:
Products
P Q R Total
ProductionandSales(Units) 60,000 40,000 16,000
Raw Material Usage (in Units) 10 10 22
Raw Material Costs (`) 50 40 22 24,76,000DirectLabourHours 2.5 4 2 3,42,000MachineHours 2.5 2 4 2,94,000DirectLabourCosts(`) 16 24 12
No.ofProductionRuns 6 14 40 60No. of Deliveries 18 6 40 64No.ofReceipts 60 140 880 1080No.ofProductionOrders 30 20 50 100
Overheads: `
Set-up 60,000
Machines 15,20,000
Receiving 8,70,000
Packing 5,00,000
Engineering 7,46,000
TheCompanyoperatesaJITinventorypolicyandreceiveseachcomponentonceperproductionrun.
Required:
(a) (i) Computetheproductcostbasedondirectlabourhourrecoveryrateofoverheads.
(ii) ComputetheproductcostusingActivityBasedCosting. 4+8=12
(b)WhatisTargetCost?Howwouldyoudetermineit? 2+2=4
3. AnEngineeringCo.manufacturesasingleproductwhosestandardcoststructureisasfollows:
`Directmaterials:2.4kgat`30perkg 72.00DirectLabour:6hoursat` 4 per hour 24.00FactoryOverheads:6hoursat`0.75perhour 4.50Total 100.50
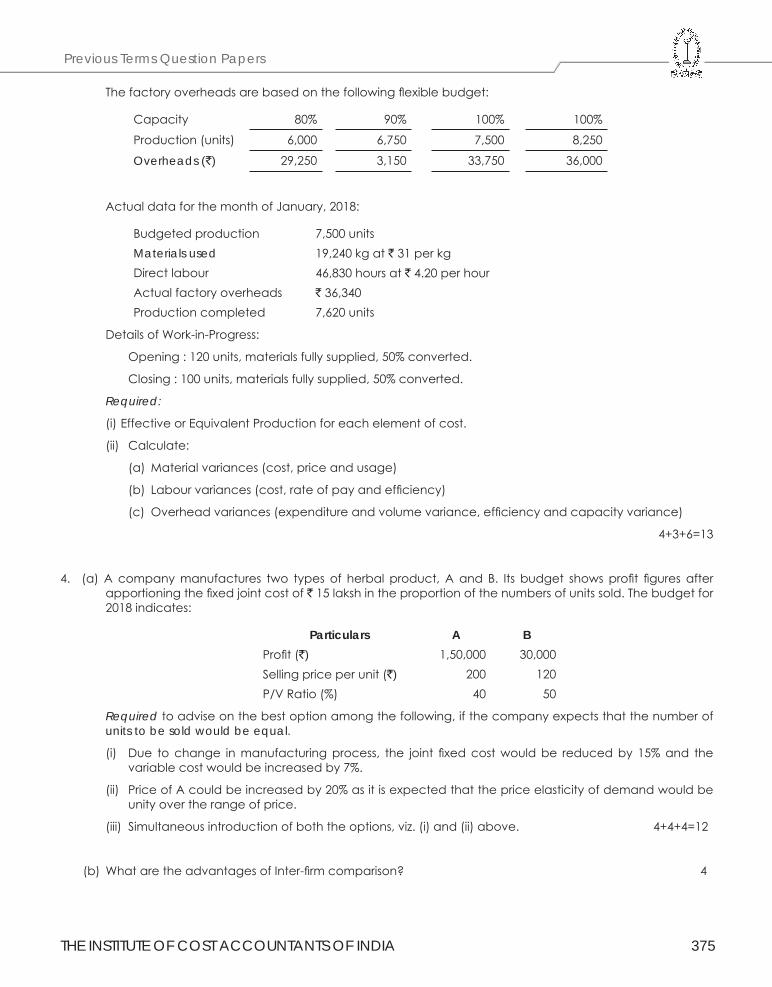
THE INSTITUTE OF COST ACCOUNTANTS OF INDIA 375
Previous Terms Question Papers
Thefactoryoverheadsarebasedonthefollowingflexiblebudget:
Capacity 80% 90% 100% 100%
Production(units) 6,000 6,750 7,500 8,250
Overheads (`) 29,250 3,150 33,750 36,000
ActualdataforthemonthofJanuary,2018:
Budgetedproduction 7,500unitsMaterials used 19,240kgat`31perkgDirectlabour 46,830hoursat`4.20perhourActualfactoryoverheads `36,340Productioncompleted 7,620units
DetailsofWork-in-Progress:
Opening:120units,materialsfullysupplied,50%converted.
Closing:100units,materialsfullysupplied,50%converted.
Required:
(i)EffectiveorEquivalentProductionforeachelementofcost.
(ii) Calculate:
(a)Materialvariances(cost,priceandusage)
(b) Labourvariances(cost,rateofpayandefficiency)
(c) Overheadvariances(expenditureandvolumevariance,efficiencyandcapacityvariance)
4+3+6=13
4. (a)A companymanufactures two types of herbal product, A and B. Its budget showsprofit figures afterapportioningthefixedjointcostof`15lakshintheproportionofthenumbersofunitssold.Thebudgetfor2018indicates:
Particulars A BProfit(`) 1,50,000 30,000Sellingpriceperunit(`) 200 120P/VRatio(%) 40 50
Requiredtoadviseonthebestoptionamongthefollowing,ifthecompanyexpectsthatthenumberofunits to be sold would be equal.
(i) Due tochange inmanufacturingprocess, the joint fixedcostwouldbe reducedby 15%and thevariablecostwouldbeincreasedby7%.
(ii) PriceofAcouldbeincreasedby20%asitisexpectedthatthepriceelasticityofdemandwouldbeunityovertherangeofprice.
(iii)Simultaneousintroductionofboththeoptions,viz.(i)and(ii)above. 4+4+4=12
(b)WhataretheadvantagesofInter-firmcomparison? 4
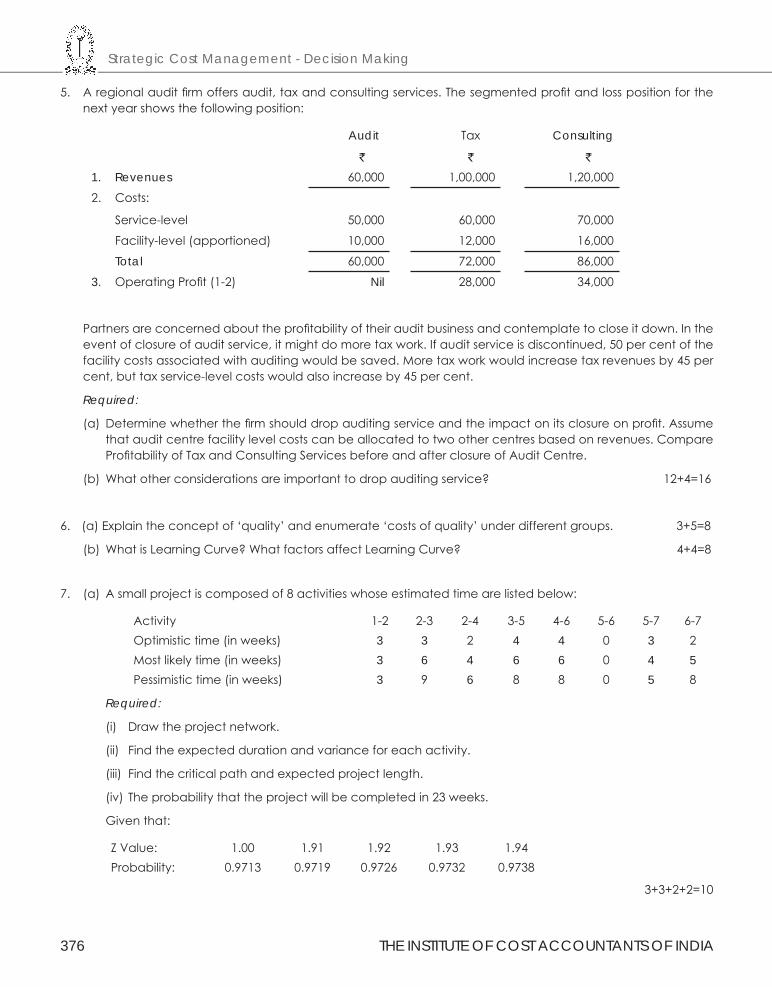
Strategic Cost Management - Decision Making
376 THE INSTITUTE OF COST ACCOUNTANTS OF INDIA
5. Aregionalauditfirmoffersaudit,taxandconsultingservices.Thesegmentedprofitandlosspositionforthenextyearshowsthefollowingposition:
Audit
`
Tax
`
Consulting
`
1. Revenues 60,000 1,00,000 1,20,000
2. Costs:
Service-level 50,000 60,000 70,000
Facility-level(apportioned) 10,000 12,000 16,000
Total 60,000 72,000 86,000
3. OperatingProfit(1-2) Nil 28,000 34,000
Partnersareconcernedabouttheprofitabilityoftheirauditbusinessandcontemplatetocloseitdown.Intheeventofclosureofauditservice,itmightdomoretaxwork.Ifauditserviceisdiscontinued,50percentofthefacilitycostsassociatedwithauditingwouldbesaved.Moretaxworkwouldincreasetaxrevenuesby45percent,buttaxservice-levelcostswouldalsoincreaseby45percent.
Required:
(a) Determinewhetherthefirmshoulddropauditingserviceandtheimpactonitsclosureonprofit.Assumethatauditcentrefacilitylevelcostscanbeallocatedtotwoothercentresbasedonrevenues.CompareProfitabilityofTaxandConsultingServicesbeforeandafterclosureofAuditCentre.
(b)Whatotherconsiderationsareimportanttodropauditingservice? 12+4=16
6. (a)Explaintheconceptof‘quality’andenumerate‘costsofquality’underdifferentgroups. 3+5=8
(b)WhatisLearningCurve?WhatfactorsaffectLearningCurve? 4+4=8
7. (a) Asmallprojectiscomposedof8activitieswhoseestimatedtimearelistedbelow:
Activity 1-2 2-3 2-4 3-5 4-6 5-6 5-7 6-7Optimistictime(inweeks) 3 3 2 4 4 0 3 2Mostlikelytime(inweeks) 3 6 4 6 6 0 4 5Pessimistictime(inweeks) 3 9 6 8 8 0 5 8
Required:
(i) Drawtheprojectnetwork.
(ii) Findtheexpecteddurationandvarianceforeachactivity.
(iii) Findthecriticalpathandexpectedprojectlength.
(iv) Theprobabilitythattheprojectwillbecompletedin23weeks.
Giventhat:
ZValue: 1.00 1.91 1.92 1.93 1.94Probability: 0.9713 0.9719 0.9726 0.9732 0.9738
3+3+2+2=10
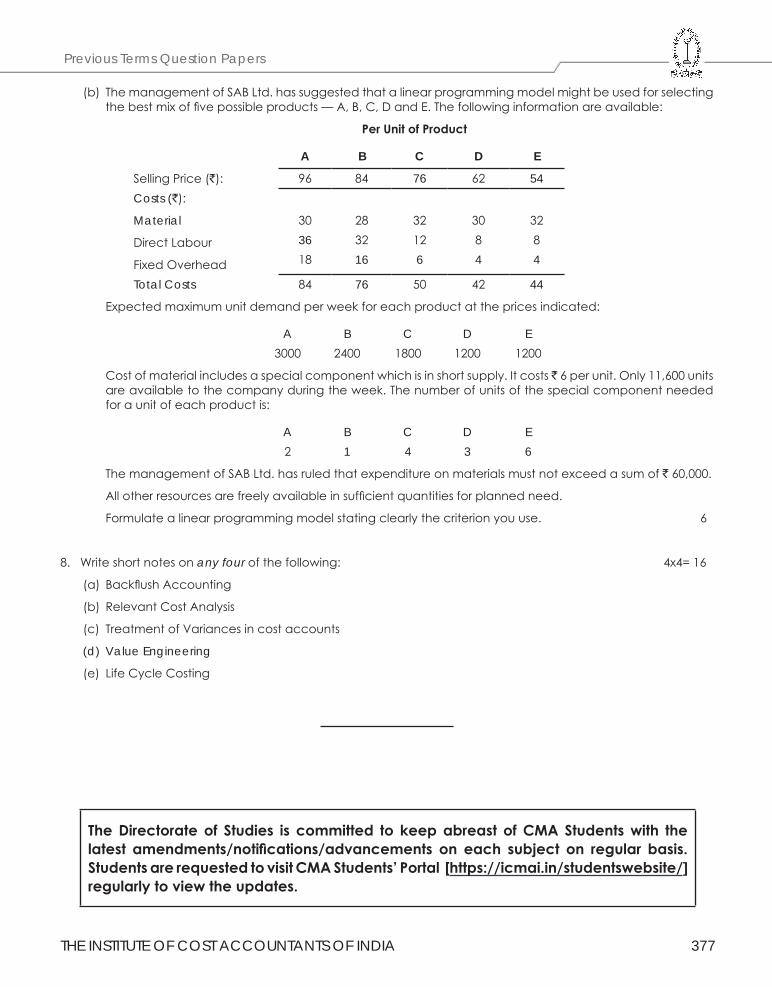
THE INSTITUTE OF COST ACCOUNTANTS OF INDIA 377
Previous Terms Question Papers
The Directorate of Studies is committed to keep abreast of CMA Students with the latest amendments/notifications/advancements on each subject on regular basis. Students are requested to visit CMA Students’ Portal [https://icmai.in/studentswebsite/] regularly to view the updates.
(b)ThemanagementofSABLtd.hassuggestedthatalinearprogrammingmodelmightbeusedforselectingthebestmixoffivepossibleproducts—A,B,C,DandE.Thefollowinginformationareavailable:
Per Unit of Product
A B C D E
SellingPrice(`): 96 84 76 62 54Costs (`):
Material
DirectLabour
FixedOverhead
30 28 32 30 3236 32 12 8 818 16 6 4 4
Total Costs 84 76 50 42 44
Expectedmaximumunitdemandperweekforeachproductatthepricesindicated:
A B C D E3000 2400 1800 1200 1200
Costofmaterialincludesaspecialcomponentwhichisinshortsupply.Itcosts̀ 6perunit.Only11,600unitsareavailabletothecompanyduringtheweek.Thenumberofunitsofthespecialcomponentneededforaunitofeachproductis:
A B C D E2 1 4 3 6
ThemanagementofSABLtd.hasruledthatexpenditureonmaterialsmustnotexceedasumof`60,000.
Allotherresourcesarefreelyavailableinsufficientquantitiesforplannedneed.
Formulatealinearprogrammingmodelstatingclearlythecriterionyouuse. 6
8.Writeshortnotesonany fourofthefollowing: 4x4=16
(a) BackflushAccounting
(b) RelevantCostAnalysis
(c) TreatmentofVariancesincostaccounts
(d) Value Engineering
(e) LifeCycleCosting
Notes