strategic decision making in business relationships: a dyadic agent-based simulation approach
TRANSCRIPT

AUTHOR QUERY FORM
Journal: IMM Please e-mail or fax your responses and any corrections to:E-mail: [email protected]: +1 619 699 6721
Article Number: 6770
Dear Author,
Please check your proof carefully and mark all corrections at the appropriate place in the proof (e.g., by using on-screen anno-
tation in the PDF file) or compile them in a separate list. Note: if you opt to annotate the file with software other than Adobe
Reader then please also highlight the appropriate place in the PDF file. To ensure fast publication of your paper please return
your corrections within 48 hours.
For correction or revision of any artwork, please consult http://www.elsevier.com/artworkinstructions.
Any queries or remarks that have arisen during the processing of your manuscript are listed below and highlighted by flags in
the proof. Click on the ‘Q’ link to go to the location in the proof.
Location in article Query / Remark: click on the Q link to goPlease insert your reply or correction at the corresponding line in the proof
Q1 Please confirm that given names and surnames have been identified correctly.
Q2 Please provide significance for italicized entries in the table body.
Q3 The number of keywords provided exceeds the maximum allowed by this journal. Please delete 3
keywords.
Q4 The original citations “competences” has been changed to “competencies". Please check if
appropriate.
Q5 The citation “Hoffman (2007)” has been changed to match the author name/date in the reference
list. Please check here and in subsequent occurrences, and correct if necessary.
Q6 Please check the page range in Ref. “Corsaro et al., 2011".
Please check this box if you have no
corrections to make to the PDF file. □
Thank you for your assistance.
Our reference: IMM 6770 P-authorquery-v11
Page 1 of 1

UNCO
RRECTED P
RO
OF
1 Strategic decision making in business relationships: A dyadic agent-based2 simulation approach
3 SebastianQ1 Forkmann a,⁎, Di Wang b,c, Stephan C. Henneberg a, Peter Naudé a, Alistair Sutcliffe b
4a Manchester IMP Research Group, Manchester Business School, The University of Manchester, Booth Street West, Manchester M15 6PB, UK
5b Manchester Business School, The University of Manchester, Booth Street East, Manchester M15 6PB, UK
6c Etisalat BT Innovation Center (EBTIC), Khalifa University, Abu Dhabi, United Arab Emirates
7
8
a b s t r a c ta r t i c l e i n f o
9 Article history:
10 Received 30 August 2011
11 Received in revised form 21 April 2012
12 Accepted 27 May 2012
13 Available online xxxx
141516
17 Keywords:
18 Strategic decision makingQ319 Strategy volatility
20 Network pictures
21 Networking
22 Power
23 Exploration
24 Exploitation
25 Agent-based simulation
26This study employs agent-based simulation to model strategic decision making in business relationships, exam-
27ining the influence of two important strategy drivers in business relationships (performance and power) on re-
28lationship success (relationship survival and performance). The study offers insights into the complex and
29evolutionary interaction and feedback effects between networking strategy choice, relationship performance
30and power. Findings show that although certain strategies may be desirable for firms to manage their business
31relationships, they are not necessarily as successful in all situations. Results indicate that a trade-off exists be-
32tween relationship context and performance which needs to be considered in strategic networking decisions.
33Further, the study shows that too many strategy changes cause relationships to become unstable and thus neg-
34atively affect performance. The authors refer to this phenomenon as strategy volatility— the rate at which actors
35change their networking strategieswithin relationships. This phenomenon ariseswhen toomany variables influ-
36ence firms' decisionmaking and thus cause firms to frequently change their strategy. Although strategy volatility
37has a relationship safeguarding effect in the short term, this effect diminishes over time.
38© 2012 Elsevier Inc. All rights reserved.
3940
41
42
43 1. Introduction
44 Understanding how to effectively manage in business relationships
45 has been a central topic for scholars in the area of business marketing
46 (Ford, Gadde, Håkansson, & Snehota, 2003a). An important aspect of
47 this issue relates to the way managers make decisions and choose cer-
48 tain strategies to affect business relationships, and in particular their
49 position in the surrounding business network (Baraldi, Brennan,
50 Harrison, Tunisini, & Zolkiewski, 2007; Gadde, Huemer, & Håkansson,
51 2003; Harrison, Holmen, & Pedersen, 2010). Such strategizing issues
52 are often linked to how actors understand the particular network in
53 which they are embedded (Holmen & Pedersen, 2003). To grasp such
54 aspects, research on sense-making in networks (e.g. using the concept
55 of network pictures) has recently aimed at gaining insights into how
56 managers perceive their surrounding business network and thereby
57 underpins their understanding of their strategic options for managing
58 in relationships as well as choices in complex systems (Ford, Gadde,
59 Håkansson, & Snehota, 2003b; Henneberg, Mouzas, & Naudé, 2006;
60 Ramos & Ford, 2011). According to Henneberg et al. (2006, p. 409),
61 “the notion of network pictures refers to the different understanding
62that players have of the network. It is based on their subjective, idiosyn-
63cratic sense-makingwith regard to themain constituting characteristics
64of the network in which their company is operating. These perceived
65network pictures form the backbone of managers' understanding of re-
66lationships, interactions and interdependencies, and therefore consti-
67tute an important component of their individual decision-making
68processes.” A recent study by Corsaro, Ramos, Henneberg, and Naudé
69(2011) empirically established the connection between managerial
70cognition in terms of managers' perceptions of their surrounding busi-
71ness network, and their subsequent propensity for engaging in specific
72strategic decision making about how to affect business relationships.
73The authors found significant associations between certain network
74picture characteristics (i.e. different expressions of power, dynamics,
75broadness, and indirectness of the subjective network pictures) and
76preferred networking strategies (understood as activities affecting a
77company's network position; Ford et al., 2003a).
78However, while this research has been essential in linking re-
79search on subjective perceptions of actors on the one hand, and man-
80agerial strategic decision making on the other, no strategic decision
81with respect to an organization's business relationships is likely to
82be made in isolation of the current and anticipated relationship per-
83formance (Hambrick & Snow, 1977). In fact, most of the time (poten-
84tial) performance in itself is a primary driver of strategizing decisions.
85Furthermore, such performance outcomes are invariably dependent
86on the relationship partner's actions, and so any consideration of
Industrial Marketing Management xxx (2012) xxx–xxx
⁎ Corresponding author. Tel.: +44 161 275 6559.
E-mail addresses: [email protected] (S. Forkmann),
[email protected] (D. Wang), [email protected] (S.C. Henneberg),
[email protected] (P. Naudé), [email protected] (A. Sutcliffe).
IMM-06770; No of Pages 15
0019-8501/$ – see front matter © 2012 Elsevier Inc. All rights reserved.
doi:10.1016/j.indmarman.2012.06.010
Contents lists available at SciVerse ScienceDirect
Industrial Marketing Management
Please cite this article as: Forkmann, S., et al., Strategic decision making in business relationships: A dyadic agent-basedsimulation approach, Industrial Marketing Management (2012), doi:10.1016/j.indmarman.2012.06.010

UNCO
RRECTED P
RO
OF
87 strategic decision making needs to be seen in a dyadic context
88 (Henneberg, Mouzas, & Naudé, 2010). It is therefore important to ex-
89 pand research on network pictures in a strategy context by incorpo-
90 rating other well-established drivers of strategy decision making,
91 e.g. performance, and to include an interactive, or dyadic perspective.
92 Furthermore, according to Ford et al. (2003a, 2003b), networking
93 (i.e. choosing and implementing a networking strategy), network pic-
94 tures, and network outcomes (i.e. performance) form an important
95 conceptually interlinked triangle for firms to do business and navi-
96 gate in relationships and networks.
97 Therefore, the objective of our research is to bring these three im-
98 portant elements together and provide a better understanding of the
99 interrelationships between managers' perceptions of their surround-
100 ing business networks, their networking choices as an outcome of
101 their strategic decision making, and relationship outcomes, particu-
102 larly performance. In order to capture these interrelationships be-
103 tween the constructs, we employ an agent-based dyadic simulation
104 as it allows us to combine previous findings about the focal con-
105 structs, and to systematically experiment and study the interaction
106 effects among them. Hence, simulation methods are particularly use-
107 ful for researchers in exploring and developing theories (Davis,
108 Eisenhardt, & Bingham, 2007). Although agent-based simulation is
109 a research technique that has received increasing attention in
110 the area of organization, strategy and management research
111 (e.g., Aggarwal, Siggelkow, & Singh, 2011; Davis et al., 2007; Fang,
112 Lee, & Schilling, 2010; Lazer & Friedman, 2007; Levinthal, 1997;
113 March, 1991; Miller, Zhao, & Calantone, 2006; Repenning, 2002;
114 Rivkin, 2000; Siggelkow & Rivkin, 2006; Zott, 2003), it is still in its in-
115 fancy with respect to studying business relationships and networks.
116 For the purpose of our study we develop a parsimonious evolu-
117 tionary simulation model of a business relationship that focuses on
118 network pictures with varying degrees of perceived power of the
119 focal company within the embedding network, as well as the net-
120 working strategy framework outlined in Hoffmann (2007). We derive
121 certain performance and power outcomes through the simulation.
122 The strategy framework by Hoffmann builds on the seminal work of
123 March (1991) in organizational learning and conceptualizes funda-
124 mental approaches which firms can adopt to interact in relationships,
125 and thus manage in their networks. We furthermore single out power
126 as our focal network picture variable due to its importance in affect-
127 ing business relationships as well as networks (Anderson & Narus,
128 1984; Anderson & Weitz, 1989; Håkansson & Ford, 2002; Levinthal
129 & March, 1993; Palmatier, Dant, Grewal, & Evans, 2006). We test
130 and contrast three simulation models to initially establish the validity
131 of our computational approach, and then to study step by step the in-
132 teraction effects between the focal constructs as well as the sensitiv-
133 ity of the model to key construct changes.
134 Our dyadic simulation approach contributes to the businessmarket-
135 ing and strategy literature in several ways. First, we introduce an
136 agent-based simulation to the study of business relationships and net-
137 works, and thereby demonstrate how simulation methods can be uti-
138 lized to gain insights into phenomena which are difficult to study
139 with traditional empirical researchmethods. Second,we contrast differ-
140 ent networking strategies and demonstrate that their success is context
141 dependent, hence providing an extension of existing research on strate-
142 gic decision making in business relationships. Finally, we demonstrate
143 the effects of performance and power- drivenmanagerial decisionmak-
144 ing on relationship success (i.e. relationship continuation, relationship
145 performance), thereby revealing essential interaction effects between
146 these two constructs that suggest that strategic relational decisions, es-
147 pecially the change of an existing strategy, need to be well justified, as
148 volatility in the strategic direction (i.e. changing networking choices
149 too often over time) causes relationships to become unstable, hence
150 negatively affecting relationship performance.
151 The article is structured as follows: first, strategic decisions within
152 relationships and business networks from an industrial network
153approach (INA) are discussed. This is followed by an overview of
154the conceptual framework and a parsimonious review of the network
155picture and networking strategy research. The agent-based simula-
156tion and computational design are introduced, followed by an over-
157view of the results and the main findings. Finally, the conclusions,
158implications, and limitations of our study are discussed.
1592. Conceptual framework
1602.1. Towards a network perspective of strategy
161Traditionally, organizational performance, particularly how to sus-
162tain and improve such performance, has been at the center of strategy
163research (Barney, 2002). Essential to this view is the notion that compa-
164nies are in constant competition with other organizations for market
165share and profits (Barney, 2002; Porter, 1980). According to Porter
166(1980), competitive pressure originates not only from firms' direct
167competitors, but also from their suppliers, customers, substitutes and
168potential entrants. Therefore, strategy is primarily concerned with un-
169derstanding howorganizations are able to achieve a competitive advan-
170tage (Barney, 2002) and to establish a defendable position within their
171industry (Porter, 1980). From this perspective, according to Gadde et al.
172(2003), strategy is about exerting power over business partners, while
173remaining as independent as possible. However, this view on strategy
174has been challenged by scholars working in the INA who emphasize
175that organizations are embedded in networks of exchange relationships
176(Ford et al., 2003a; Gulati, Nohria, & Zaheer, 2000). Gadde et al. (2003, p.
177358) argue that “in an industrial network perspective interdependence
178and coevolution are important characters, and the competitive aspect of
179strategy becomes less important.” They suggest shifting away from a
180narrow and atomistic focus of strategy on competition and perfor-
181mance, to strategic decisions in networks of business relationships in
182which a company is embedded, and with which it becomes
183interdependent (Harrison & Prenkert, 2009; Harrison et al., 2010).
184Such business networks include a range of different business partners
185that are of strategic importance for organizations — namely suppliers,
186customers, strategic alliance partners, agencies, contractors, competi-
187tors, etc. From this perspective, how firms initiate, maintain and devel-
188op business relationships and mobilize business networks in which
189they are embedded is central to their strategy (Gadde et al., 2003;
190Ritter, Wilkinson, & Johnston, 2004), as well as the actions/reaction of
191their interaction partners (Ford & Mouzas, 2010; Håkansson & Ford,
1922002). While the traditional economic perspective on strategy remains
193important, it is crucial to widen the scope of strategy to incorporate the
194relational dimensions as proposed by the INA (Ford et al., 2003a).
1952.2. Managing in networks — a conceptual guide
196The model proposed by Ford et al. (2003b) about ‘managing in
197networks’ can be understood as an attempt to integrate essential re-
198lational elements in the context of strategy as part of business rela-
199tionships. Thus, according to Ford and colleagues, network pictures
200(understood as the subjective understanding of the network, held
201by actors), networking (understood as interactions of a firm with net-
202work partners), and network outcomes (understood as the outcomes
203of the networking decisions by relational partners) are all mutually
204interlinked (Ford et al., 2003b). Networking, for example, addresses
205both the management in existing relationships and the formation of
206new business relationships, and thereby affects network outcomes
207as well as influences the position of a firmwithin its business network
208(and thereby also the position of other firms) (Ford & Mouzas, 2010).
209On the other hand, the way managers perceive their network posi-
210tion, and how well strategic networking expectations transform
211into network outcomes, affects future networking decisions
212(Henneberg et al., 2006). While Ford et al. (2003b) differentiate
213among three levels of outcomes, namely the level of the actor, the
2 S. Forkmann et al. / Industrial Marketing Management xxx (2012) xxx–xxx
Please cite this article as: Forkmann, S., et al., Strategic decision making in business relationships: A dyadic agent-basedsimulation approach, Industrial Marketing Management (2012), doi:10.1016/j.indmarman.2012.06.010

UNCO
RRECTED P
RO
OF
214 relationship, and the network, we focus in this study on actor and
215 relationship-based consequences of strategic decision making, more
216 specifically on firm and relationship performance as we are con-
217 cerned with developing a simulation framework modeling dyadic
218 business relationships. Our study aims at understanding the interde-
219 pendencies among the constructs of network pictures (in particular
220 the element of perceived power of the focal company), strategic deci-
221 sion making in relationships as explicated in networking strategies,
222 and performance, and we follow Ford et al.'s (2003b) model for ‘man-
223 aging in networks’ as a conceptual guide.
224 2.3. Proposed conceptual framework
225 The development of business networks and how they evolve over
226 time is primarily influenced by the interactions between the relevant
227 actors (Abrahamsen, Henneberg, & Naudé, 2012; Gadde et al., 2003).
228 In what direction networks develop and how well actors perform
229 within them is on the other hand contingent on the actors' ability to
230 relate their own strategic actions to those of their business partners.
231 According to Håkansson and Snehota (1989), strategy always has to
232 be developed in relation to other relevant actors and cannot be a
233 task that is performed in isolation of the surrounding business envi-
234 ronment. Håkansson and Ford (2002, p.137) emphasize that the
235 “strategy process is interactive, evolutionary and responsive.” Thus,
236 business relationships are characterized by mutual adaptation in the
237 sense that relationship partners “change their behavior vis-à-vis one
238 another” (Halinen, Salmi, & Havila, 1999, p.781). The success of a stra-
239 tegic activity, and the subsequent resulting firm performance, de-
240 pends on how well the strategy accounts for the actions and
241 interests of the other actors relevant to the organization (Gadde et
242 al., 2003). The strategic actions in turn result in changes of the net-
243 work positions of both the organizations involved in certain strategic
244 actions, as well as those affected by them (Håkansson & Ford, 2002;
245 Johanson & Mattsson, 1992).
246 Therefore, in line with INA assumptions, our conceptual frame-
247 work illustrated in Fig. 1 proposes that the constellation of network-
248 ing strategies followed by two actors (i.e. the relational strategies
249 which both have chosen vis-à-vis each other at a given point in
250 time) shapemanagers' perception of their surrounding business envi-
251 ronment, and on the other hand affect the performance of the rela-
252 tionship as a whole as well as the performance of each of the actors
253 individually. The impact of how managers perceive their business en-
254 vironment (i.e. their network pictures) on their networking strategy
255 decision making (i.e. their networking choice) has been posited by
256 Ford et al. (2003a), and demonstrated empirically by Corsaro et al.
257 (2011). Shifts in network positions perceived by a manager, as well
258 as changes in performance within the relationship, motivate man-
259 agers to rethink and adjust their strategies respectively (Ford et al.,
2602003b). While positive outcomes reinforce current strategies, nega-
261tive ones potentially cause managers to change their firm's strategic
262direction with the hope of achieving better results in the future
263(Ford et al., 2003b; Henneberg et al., 2006). This in turn affects the
264strategy constellation within the relationship dyad. The feedback
265loop in Fig. 1 visualizes this constant interrelationship between strat-
266egy choice and manager's perceptions about their surrounding busi-
267ness environment as well as the relationship performance. Halinen
268et al. (1999) describe this process in their punctuated equilibrium
269model where revolutionary periods of change interplay with periods
270of stability or equilibria in business relationships as well as networks.
271A relationship is continued as long as it is performing well as a whole,
272and as long as it provides value for both relationship partners (Dyer &
273Singh, 1998; Palmatier et al., 2006; Poppo, Zhou, & Ryu, 2008). Fur-
274ther, whether a relationship is continued or terminated is eventually
275determined by its overall performance as well as by how the benefits
276are distributed between the relationship partners (Ford et al., 2003b).
277While multiple strategy changes may be necessary to find the right
278approach to manage in a relationship, at some point a business rela-
279tionship will eventually be terminated if performance improvements
280do not accrue.
2812.4. Network pictures and networking strategies
282The study by Corsaro et al. (2011) focuses on the relational and
283network aspects of strategy choices, and shows that these constitute
284essential drivers of managerial decision making. In particular, they
285established the connections between certain network picture charac-
286teristics (managerial cognition as captured by subjective representa-
287tions of the network) vis-à-vis behavioral choices (networking
288options) by conducting an experimental study to test the associations
289between four dimensions of network pictures on the one hand
290(power of focal company, dynamics of network, broadness of net-
291work, and indirectness of relational portfolio), and three networking
292strategy models derived from Hoffmann (2007), Ford et al. (2003a)
293and Krapfel, Salmond, and Spekman (1991) on the other. The study
294demonstrated that managers' perceptions about the business net-
295work influence the way they manage their business relationships.
296The different strategic options relating to the model proposed by
297Hoffmann (2007) were consistently associated with all four tested
298network picture dimensions, and we therefore use this model in our
299study. On the other hand, the networking strategy models by Ford
300et al. (2003a) and Krapfel et al. (1991) showed only partially signifi-
301cant associations with some network picture characteristics. Overall,
302the power dimension consistently showed the strongest association
303levels (Corsaro et al., 2011), and we therefore concentrate in our
304study on this network dimension of power.
Fig. 1. Conceptual model.
3S. Forkmann et al. / Industrial Marketing Management xxx (2012) xxx–xxx
Please cite this article as: Forkmann, S., et al., Strategic decision making in business relationships: A dyadic agent-basedsimulation approach, Industrial Marketing Management (2012), doi:10.1016/j.indmarman.2012.06.010

UNCO
RRECTED P
RO
OF
305 While the initial study by Corsaro and colleagues was the first em-
306 pirical test of the connection between network pictures and network-
307 ing strategy (although the strategy and organizational behavior
308 literature had already established more generally the connection be-
309 tween cognition and strategic decision making, e.g., Daft & Weick,
310 1984; Gioia & Chittipeddi, 1991; Nadkarni & Barr, 2008; Thomas,
311 Clark, & Gioia, 1993; Walsh, 1995; Weick, Sutcliffe, & Obstfeld,
312 2005), we aim to advance their findings by incorporating perceived
313 relationship performance as an additional important driver of man-
314 agers' choices, and thereby incorporating the third component of
315 Ford et al. (2003b) framework of ‘managing in networks’. We have
316 thus designed an interactive agent-based simulation over time,
317 which allows us to study the interdependencies between the three
318 constructs (network pictures, networking strategy, and relationship
319 performance) as suggested by Ford et al. (2003b).
320 2.4.1. Network pictures and power
321 Network pictures, according to Henneberg et al. (2006), represent
322 managers' perceptions and subjective representation of these net-
323 works. Since the understanding of the business environment and
324 the actors involved and their interrelationships with each other are
325 essential for strategy decisions (Gadde et al., 2003), network pictures
326 provide managers with a foundation for decision making (Ford et al.,
327 2003b; Henneberg et al., 2006). According to Johanson and Mattsson
328 (1992), such networking decisions are aimed primarily at proactively
329 influencing an organization's network position, defined as “a conse-
330 quence of the cumulative nature of the use of resources to establish,
331 maintain and develop exchange relationships …The position charac-
332 terizes the actor's links to the environment and is therefore of strate-
333 gic significance” (Johanson & Mattsson, 1992, p. 181). Power, in
334 particular the power position of the focal company, represents a piv-
335 otal construct of an individual's network picture characteristics
336 (Henneberg et al., 2006). It is directly related to the network position
337 of a firm, and is therefore of clear strategic importance to organiza-
338 tions. Power can be defined as “the extent to which the actors
339 (companies)/activities/resources involved are perceived as being
340 (relatively) independent or (relatively) dependent upon each other
341 within their network of relationships” (Henneberg et al., 2006, p.
342 419). Additionally, power is characterized in terms of the strength
343 of relationship ties (Granovetter, 1973) and the strength of relation-
344 ship commitment (Ganesan, 1994) between a focal firm and its busi-
345 ness partners. While strategy from an INA perspective aims at
346 optimizing a firm's position and the interdependencies within the
347 net of business relationships, Håkansson and Ford (2002) draw atten-
348 tion to the potential negative effects of increasing power or control of
349 an organization on the innovativeness and effectiveness of the net-
350 work. Therefore, while the organization's power position within the
351 network is of strategic importance, firms need to act with care not
352 to create a power polarization that would drive the network into
353 long-term inertia at the expense of innovativeness and performance,
354 thereby threatening the organization's survival in the long term.
355 Levinthal and March (1993, p.102) also point to the inherent threat
356 that comes along with power: “Organizational power is a short-run
357 asset but potentially a long-run liability.” While power enables
358 firms to exert influence on their business surroundings, over time
359 they may lose the ability to adapt or respond to the changing and
360 evolving business environment (Levinthal & March, 1993).
361 Power is not only an important property on the network level as
362 described above, but also on the relationship level. In line with the
363 definition of power provided above, Emerson (1962, p. 32 and p.33)
364 points out that “power resides implicitly in the other's dependency”
365 and that therefore “the power of A over B is equal to, and based
366 upon, the dependence of B upon A”. Power is also frequently
367 explained in terms of one party's control over another party's behav-
368 ior, actions, or decisions (El-Ansary & Stern, 1972; Gaski, 1984;
369 Wilkinson, 1979). There are several studies which empirically
370examine the effects of power, dependency, or control on both rela-
371tionship properties and relationship performance. For example,
372Anderson and Narus (1984) show that manufacturers' control nega-
373tively affects cooperation and satisfaction of distributers. Anderson
374and Weitz's (1989) study indicates that power imbalances between
375manufacturers and independent sales representatives can have nega-
376tive effects on trust and intentions to continue the business relation-
377ship. Although Palmatier et al. (2006) find a strong positive direct
378effect of customer dependence on seller performance, the effect on
379trust is relatively weak, which suggests that “dependence is not an ef-
380fective relationship-building strategy but can improve performance
381in other ways, possibly by increasing switching costs and barriers to
382exit” (Palmatier et al., 2006, p.150). Thus, while the more powerful,
383less dependent relationship party is enjoying benefits in terms of
384higher sales and profits, the relationship is suffering in terms of de-
385creasing trust and satisfaction of the less powerful relationship
386party. Commitment of the more dependent relationship party may
387only last as long as switching costs and termination costs remain
388high (Morgan & Hunt, 1994; Palmatier et al., 2006), but start to dete-
389riorate as soon as other relationship options become feasible and
390therefore dependencies are reduced. From this perspective power
391provides an important starting point to explore the interrelationships
392between business networks, performance, and strategy.
3932.4.2. Networking strategy
394This study concentrates on the strategy framework derived from
395Hoffmann (2007) in order to model strategic decision making
396choices. According to this strategy framework, which aims at manag-
397ing an organization's portfolio of alliance partners, strategy selection
398is contingent on two main factors— the shaping potential of the orga-
399nization, and the perceived strategic uncertainty. Shaping potential
400refers to the organization's technical, commercial and social compe-
401tence and resource strength or resource endowment (Ahuja, 2000;
402Hoffmann, 2007). According to Hoffmann (2007, p. 832), “a firm's re-
403source endowment in a specific business determines its ability to in-
404fluence the strategic actions of important stakeholders and thereby its
405ability to shape the environment to fit its intended strategies.” From
406this perspective shaping potential is closely related to the concept
407of power and dependence as discussed earlier. Strategic uncertainty
408on the other hand refers to “the uncertainty perceived by the firm's
409senior executives concerning the consequences of strategic decisions
410resulting from unclear environmental developments” (Hoffmann,
4112007, p. 833). According to Hoffmann (2007), environmental uncer-
412tainty has multiple origins and can stem, for example, from regula-
413tion, technology, market characteristics, or competition. Depending
414on firms' shaping potential and the degree of strategic uncertainty,
415firms can choose to manage their business environment according
416to three main strategies — adapting, shaping, and exploiting (Fig. 2).
417March's (1991) seminal study on organizational learning provides
418the basis for Hoffmann's (2007) strategy framework. In particular,
419March (1991) distinguishes between two types of strategies —
420exploration and exploitation. “The essence of exploitation is the refine-
421ment and extension of existing competencies, technologies, and para-
422digms. Its returns are positive, proximate, and predictable. The
423essence of exploration is experimentation with new alternatives. Its
424returns are uncertain, distant, and often negative. Thus, the distance in
425time and space between the locus of learning and the locus of the real-
426ization of returns is generally greater in the case of exploration than in
427the case of exploitation, as is the uncertainty” (March, 1991, p. 85).
428This difference in the realization of outcomes of the two strategies as ei-
429ther in the short or long term creates the fundamental trade-off be-
430tween exploitation and exploration. Returns of exploiting strategies
431are primarily realized in the short term and start to fade in the long
432run as market and competition continue to evolve, while the outcomes
433of exploration are initially low and start to pay off in the future. The
434characteristic shapes of these outcome trajectories for exploitation
4 S. Forkmann et al. / Industrial Marketing Management xxx (2012) xxx–xxx
Please cite this article as: Forkmann, S., et al., Strategic decision making in business relationships: A dyadic agent-basedsimulation approach, Industrial Marketing Management (2012), doi:10.1016/j.indmarman.2012.06.010

UNCO
RRECTED P
RO
OF
435 and exploration are further enhanced by the self-reinforcing mecha-
436 nisms associated with both strategies (Levinthal & March, 1993). While
437 exploitation allows firms to strengthen their existing competenciesQ4 or
438 market position, the immediate returns reinforce the focus on exploita-
439 tion and thus may cause firms to lose sight of exploring new competen-
440 cies, which are crucial for their competitive position and survival in the
441 long run (Denrell & March, 2001; Levinthal & March, 1993; March,
442 1991). Levinthal and March (1993) refer to this situation as a ‘success
443 trap’ because the immediate success of the exploiting strategy makes
444 firms shortsighted and therefore less likely to engage in exploration.
445 Hence, firmsmiss out on exploringmore optimal positions by restricting
446 their focus too much on exploiting their current one (March, 1991). On
447 the other hand, according to Levinthal andMarch (1993), exploration, al-
448 though promising returns in the distant future,may trap the firm in a sit-
449 uation of constant change due to the higher likelihood of dissatisfying
450 short term results. Levinthal and March (1993) refer to this situation as
451 a ‘failure trap’ since the lack of short term results associated with explo-
452 ration may reinforce exploration efforts in search for better outcomes
453 and thereby restrain firms from developing and exploiting important or-
454 ganizational strengths and competitive advantages.
455 Considering the properties of both strategies, firms should aim for
456 an appropriate balance and interplay between exploitation and ex-
457 ploration (Levinthal & March, 1993; March, 1991). According to
458 Levinthal and March (1993, p. 105), “the basic problem confronting
459 an organization is to engage in sufficient exploitation to ensure cur-
460 rent viability and, at the same time, to devote enough energy to ex-
461 ploration to ensure its future viability.” However, both success trap
462 and failure trap make it hard for organizations to keep such a balance
463 between exploitation and exploration strategies (Levinthal & March,
464 1993; March, 1991). Thus, considerable research has been devoted
465 to the issue of the feasibility of an ambidextrous approach (i.e. an or-
466 ganization which balances exploration and exploitation at the same
467 time) or whether scarcity of resources and the self-reinforcing nature
468 of the strategies only permit a sequential evolution of the strategies
469 following a punctuated equilibrium (e.g., Fang et al., 2010; Gupta,
470 Smith, & Shalley, 2006; Katila & Ahuja, 2002; Kyriakopoulos &
471 Moorman, 2004; Sarkees, Hulland, & Prescott, 2010). For example,
472 Fang et al. (2010) find that organizational structure can function as
473 a mechanism to successfully balance exploitation and exploration.
474 On the other hand, in the context of alliance portfolios, Hoffmann's
475 (2007) findings suggest a main developmental path from exploring
476 to exploiting. However, Hoffmann (2007) also emphasizes that this
477 path may take various facets and evolves according to different
478paces or patterns depending on changes of a firm's shaping potential
479or environmental uncertainty.
480While the main differentiation between exploration and exploita-
481tion is consistent with March's (1991) heuristics for organizational
482learning, Hoffmann (2007) conceptualizes exploration strategies as
483consisting of the two sub-strategies: adapting and shaping (Fig. 2).
484Both shaping and adapting strategies are inherently open towards
485new relationships, either by proactively seeking and initiating them,
486or by adapting to them. Therefore, in linewithMarch (1991), both strat-
487egies aim to explore new relationship opportunities as means to gain
488access to new resources and capabilities and thereby expanding a
489firm's resource endowment. Hoffmann (2007) argues that adapting
490strategy aims at “broadening the resource base and increasing strategic
491flexibility by exploring new opportunities without making high and ir-
492reversible investments” (p. 831), while shaping on the other hand are
493proactive efforts by the organization towards “expanding and deepen-
494ing the company's resource endowment” (p. 830). Therefore, the essen-
495tial difference between shaping and adapting lies in the ability of firms
496to proactively exert influence over their business environment to
497broaden their resource endowment, or in cases of firms with less shap-
498ing potential to rely onmore reactive efforts to respond to trendswithin
499the business environment that may lead to ways of expanding resource
500bases. Both are exploration strategies and thus have in common the goal
501to explore new ways to broaden a firm's resource base. However, con-
502trary to Hoffmann (2007), we believe that in the context of industrial
503networks not only shaping but also adapting requires significant invest-
504ments (Brennan, Turnbull, & Wilson, 2003; Hallén, Johanson, &
505Seyed-Mohamed, 1991). According to Brennan et al. (2003, p. 1639),
506“dyadic adaptations are defined as behavioral or organizational modifi-
507cations at the individual, group or corporate level, carried out by one or-
508ganization, which are designed to meet the specific needs of one other
509organization.” Hallén et al. (1991) distinguish between two main
510types of adaptations — mutual and unilateral adaptation. While unilat-
511eral adaptations can be traced back to an imbalance of power and de-
512pendence (Heide, 1994), relationships characterized by mutual
513adaptations are governed by reciprocity (Gouldner, 1960; Nevin,
5141995), and therefore such adaptations can be interpreted as indicators
515of relationship commitment and trust (Palmatier, Jarvis, Bechkoff, &
516Kardes, 2009).
517While shaping and adapting strategies aim at expanding the re-
518source base and the business partner network by developing new op-
519portunities, exploitation, in line with March (1991), is fundamentally
520closed and static in the sense that firms take advantage of already
521existing business partner relationships and the existing mobilized re-
522source base. Overall, the three strategies are built upon both relation-
523al and economic principles of strategy. While shaping and adapting is
524about utilizing business partner networks to achieve a competitive
525position, exploiting is about protecting and sustaining an achieved
526competitive advantage.
527In their study, Corsaro et al. (2011) found significant associations
528between managers' perceptions of their surrounding business envi-
529ronment on the one hand, and their network strategy choices
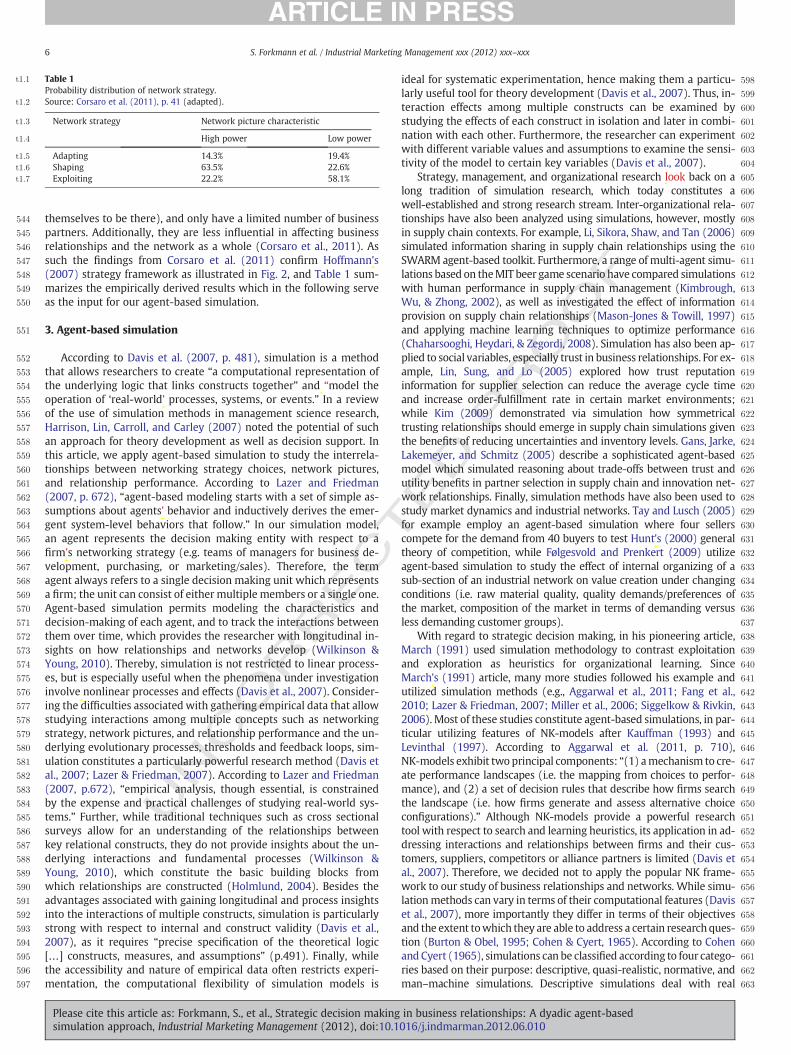
530modeled according to Q5Hoffmann (2007). As Table 1 demonstrates,
531when managers perceive their organization's position within the
532business network as rather powerful, they favor shaping (63.5%)
533and to a lesser extent exploiting (22.2%) as strategies to manage in
534their business network, i.e. their business relationships. An organiza-
535tion holds a powerful position if it has strong influence on the market,
536its business partners and the industry as a whole (Corsaro et al.,
5372011). Alternatively, when managers perceive their position as less
538powerful, they prefer exploiting (58.1%) as a strategic option. Addi-
539tionally, it can also be observed that the selection of shaping substan-
540tially decreases (from 63.5% to 22.6%), while the selection of adapting
541increases (from 14.3% to 19.4%) when moving from high to low
542power positions. Organizations that are less powerful network actors
543are positioned at the periphery of the network (or at least perceive
Source: Hoffmann (2007), p. 832 (adapted).
Fig. 2. Types of relational strategies.
Source: Hoffmann (2007), p. 832 (adapted).
5S. Forkmann et al. / Industrial Marketing Management xxx (2012) xxx–xxx
Please cite this article as: Forkmann, S., et al., Strategic decision making in business relationships: A dyadic agent-basedsimulation approach, Industrial Marketing Management (2012), doi:10.1016/j.indmarman.2012.06.010
UNCO
RRECTED P
RO
OF
544 themselves to be there), and only have a limited number of business
545 partners. Additionally, they are less influential in affecting business
546 relationships and the network as a whole (Corsaro et al., 2011). As
547 such the findings from Corsaro et al. (2011) confirm Hoffmann's
548 (2007) strategy framework as illustrated in Fig. 2, and Table 1 sum-
549 marizes the empirically derived results which in the following serve
550 as the input for our agent-based simulation.
551 3. Agent-based simulation
552 According to Davis et al. (2007, p. 481), simulation is a method
553 that allows researchers to create “a computational representation of
554 the underlying logic that links constructs together” and “model the
555 operation of ‘real-world’ processes, systems, or events.” In a review
556 of the use of simulation methods in management science research,
557 Harrison, Lin, Carroll, and Carley (2007) noted the potential of such
558 an approach for theory development as well as decision support. In
559 this article, we apply agent-based simulation to study the interrela-
560 tionships between networking strategy choices, network pictures,
561 and relationship performance. According to Lazer and Friedman
562 (2007, p. 672), “agent-based modeling starts with a set of simple as-
563 sumptions about agents' behavior and inductively derives the emer-
564 gent system-level behaviors that follow.” In our simulation model,
565 an agent represents the decision making entity with respect to a
566 firm's networking strategy (e.g. teams of managers for business de-
567 velopment, purchasing, or marketing/sales). Therefore, the term
568 agent always refers to a single decision making unit which represents
569 a firm; the unit can consist of either multiple members or a single one.
570 Agent-based simulation permits modeling the characteristics and
571 decision-making of each agent, and to track the interactions between
572 them over time, which provides the researcher with longitudinal in-
573 sights on how relationships and networks develop (Wilkinson &
574 Young, 2010). Thereby, simulation is not restricted to linear process-
575 es, but is especially useful when the phenomena under investigation
576 involve nonlinear processes and effects (Davis et al., 2007). Consider-
577 ing the difficulties associated with gathering empirical data that allow
578 studying interactions among multiple concepts such as networking
579 strategy, network pictures, and relationship performance and the un-
580 derlying evolutionary processes, thresholds and feedback loops, sim-
581 ulation constitutes a particularly powerful research method (Davis et
582 al., 2007; Lazer & Friedman, 2007). According to Lazer and Friedman
583 (2007, p.672), “empirical analysis, though essential, is constrained
584 by the expense and practical challenges of studying real-world sys-
585 tems.” Further, while traditional techniques such as cross sectional
586 surveys allow for an understanding of the relationships between
587 key relational constructs, they do not provide insights about the un-
588 derlying interactions and fundamental processes (Wilkinson &
589 Young, 2010), which constitute the basic building blocks from
590 which relationships are constructed (Holmlund, 2004). Besides the
591 advantages associated with gaining longitudinal and process insights
592 into the interactions of multiple constructs, simulation is particularly
593 strong with respect to internal and construct validity (Davis et al.,
594 2007), as it requires “precise specification of the theoretical logic
595 […] constructs, measures, and assumptions” (p.491). Finally, while
596 the accessibility and nature of empirical data often restricts experi-
597 mentation, the computational flexibility of simulation models is
598ideal for systematic experimentation, hence making them a particu-
599larly useful tool for theory development (Davis et al., 2007). Thus, in-
600teraction effects among multiple constructs can be examined by
601studying the effects of each construct in isolation and later in combi-
602nation with each other. Furthermore, the researcher can experiment
603with different variable values and assumptions to examine the sensi-
604tivity of the model to certain key variables (Davis et al., 2007).
605Strategy, management, and organizational research look back on a
606long tradition of simulation research, which today constitutes a
607well-established and strong research stream. Inter-organizational rela-
608tionships have also been analyzed using simulations, however, mostly
609in supply chain contexts. For example, Li, Sikora, Shaw, and Tan (2006)
610simulated information sharing in supply chain relationships using the
611SWARM agent-based toolkit. Furthermore, a range of multi-agent simu-
612lations based on theMIT beer game scenario have compared simulations
613with human performance in supply chain management (Kimbrough,
614Wu, & Zhong, 2002), as well as investigated the effect of information
615provision on supply chain relationships (Mason-Jones & Towill, 1997)
616and applying machine learning techniques to optimize performance
617(Chaharsooghi, Heydari, & Zegordi, 2008). Simulation has also been ap-
618plied to social variables, especially trust in business relationships. For ex-
619ample, Lin, Sung, and Lo (2005) explored how trust reputation
620information for supplier selection can reduce the average cycle time
621and increase order-fulfillment rate in certain market environments;
622while Kim (2009) demonstrated via simulation how symmetrical
623trusting relationships should emerge in supply chain simulations given
624the benefits of reducing uncertainties and inventory levels. Gans, Jarke,
625Lakemeyer, and Schmitz (2005) describe a sophisticated agent-based
626model which simulated reasoning about trade-offs between trust and
627utility benefits in partner selection in supply chain and innovation net-
628work relationships. Finally, simulation methods have also been used to
629study market dynamics and industrial networks. Tay and Lusch (2005)
630for example employ an agent-based simulation where four sellers
631compete for the demand from 40 buyers to test Hunt's (2000) general
632theory of competition, while Følgesvold and Prenkert (2009) utilize
633agent-based simulation to study the effect of internal organizing of a
634sub-section of an industrial network on value creation under changing
635conditions (i.e. raw material quality, quality demands/preferences of
636the market, composition of the market in terms of demanding versus
637less demanding customer groups).
638With regard to strategic decision making, in his pioneering article,
639March (1991) used simulation methodology to contrast exploitation
640and exploration as heuristics for organizational learning. Since
641March's (1991) article, many more studies followed his example and
642utilized simulation methods (e.g., Aggarwal et al., 2011; Fang et al.,
6432010; Lazer & Friedman, 2007; Miller et al., 2006; Siggelkow & Rivkin,
6442006). Most of these studies constitute agent-based simulations, in par-
645ticular utilizing features of NK-models after Kauffman (1993) and
646Levinthal (1997). According to Aggarwal et al. (2011, p. 710),
647NK-models exhibit two principal components: “(1) amechanism to cre-
648ate performance landscapes (i.e. the mapping from choices to perfor-
649mance), and (2) a set of decision rules that describe how firms search
650the landscape (i.e. how firms generate and assess alternative choice
651configurations).” Although NK-models provide a powerful research
652tool with respect to search and learning heuristics, its application in ad-
653dressing interactions and relationships between firms and their cus-
654tomers, suppliers, competitors or alliance partners is limited (Davis et
655al., 2007). Therefore, we decided not to apply the popular NK frame-
656work to our study of business relationships and networks. While simu-
657lationmethods can vary in terms of their computational features (Davis
658et al., 2007), more importantly they differ in terms of their objectives
659and the extent towhich they are able to address a certain researchques-
660tion (Burton & Obel, 1995; Cohen & Cyert, 1965). According to Cohen
661and Cyert (1965), simulations can be classified according to four catego-
662ries based on their purpose: descriptive, quasi-realistic, normative, and
663man–machine simulations. Descriptive simulations deal with real
Table 1t1:1
Probability distribution of network strategy.
t1:2 Source: Corsaro et al. (2011), p. 41 (adapted).
t1:3 Network strategy Network picture characteristic
t1:4 High power Low power
t1:5 Adapting 14.3% 19.4%
t1:6 Shaping 63.5% 22.6%
t1:7 Exploiting 22.2% 58.1%
6 S. Forkmann et al. / Industrial Marketing Management xxx (2012) xxx–xxx
Please cite this article as: Forkmann, S., et al., Strategic decision making in business relationships: A dyadic agent-basedsimulation approach, Industrial Marketing Management (2012), doi:10.1016/j.indmarman.2012.06.010

UNCO
RRECTED P
RO
OF
664 world phenomena observed at a specific firm level. The computational
665 model aims at developing and testing theory that explains these obser-
666 vations (Cohen & Cyert, 1965). Thereby, the outcomes of the simulation
667 and its predictions are compared to the real world phenomenon to as-
668 sess its explanatory power. As the name indicates, quasi-realistic simu-
669 lations dealwith abstract organizations instead of a specific one, and the
670 purpose of the computational model is not descriptive, but rather ex-
671 ploratory as it aims to understand what a phenomenon looks like and
672 how it has changed when the underlying assumptions are altered
673 (Burton & Obel, 1995; Cohen & Cyert, 1965). Normative simulations
674 are designed to compare the performance of different organizational
675 features (i.e. systems, structure, design, strategy, communication, etc.)
676 with respect to achieving a certain objective (Cohen & Cyert, 1965). Fi-
677 nally, man–machine simulations are more practically oriented as they
678 aid the training of managers in various aspects of their functional
679 decision-making authority (Burton & Obel, 1995; Cohen & Cyert, 1965).
680 In this study we employ dyadic agent-based simulation to under-
681 stand the interaction effects between networking (i.e. networking
682 strategy), network pictures (power position) and network outcomes
683 (i.e. performance) within the constraints of business relationships.
684 Therefore, we systematically experiment by altering assumptions as
685 well as the structure of our computational model to analyze the ef-
686 fects on relationship performance and relationship survival. Our sim-
687 ulation model has quasi-realistic elements, however, the focus of our
688 simulation lies on extending theory to provide managerial guidance
689 on how to manage business relationships and networks. Hence, our
690 simulation model would be characterized as a normative simulation
691 according to Burton and Obel (1995).
692 3.1. Simulation design
693 Following the conceptual framework introduced earlier, we devel-
694 oped a simulation that models dyadic business relationships. In the
695 simulation, each agent has the ability to evaluate its own (perceived)
696 network power position as well as the performance of the relation-
697 ship. Agents are also able to evaluate the distribution of performance
698 benefits between the two actors within a business relationship. At the
699 beginning of the simulation each agent is randomly assigned a high or
700 low power position perception within the business network. Based on
701 each agent's own network position, they chose an initial networking
702 strategy based on the probability distribution (Table 1) derived
703 from Corsaro et al. (2011). Following the conceptual framework,
704 each strategy combination has different effects on both agents in
705 terms of their performance and perceived power position. Therefore,
706 after each round of interaction, both agents evaluate their power po-
707 sition and relationship performance. Whenever an agent recognizes
708 that its power position has changed, the agent selects a new strategy
709 based on Corsaro et al. (2011). Agents monitor performance of the
710 business relationship in terms of their own performance, the perfor-
711 mance of their business partner, and the overall performance of the
712 business relationship. Strategy changes are triggered whenever an
713 agent receives zero or negative performance, when the overall rela-
714 tionship performance is too small, or whenever the difference be-
715 tween agents' performances suggests that one relationship partner
716 is taking advantage of the other. However, since actors may have dif-
717 ferent perceptions of what constitutes an inappropriate performance
718 imbalance within a relationship, we also examine the sensitivity of
719 the model to this variable. After each strategy change, a certain time
720 period is given to allow the performance or power values to adjust
721 to satisfactory levels. If the performance and power conditions are
722 still not satisfied after this period, the simulation allows one more
723 strategy change before the relationship is terminated if no satisfacto-
724 ry performance is achieved.
725 In summary, the model has three key components that influence
726 the development of business relationships — actors' networking
727 choices (i.e. their strategic decisions), relationship performance, and
728actors' perceived power position. Understanding the individual and
729combined effects of these components is at the center of our study.
7303.2. Strategy selection
731The selection of a new strategy is contingent on the probability
732table derived from Corsaro et al. (2011) and therefore empirically
733grounded. However, in this study we see high and low power as the
734ends of a continuum and therefore introduce medium power as a
735third state. Additionally, due to the fact that we are focusing on a re-
736lationship dyad, we always consider the power of one agent in rela-
737tion to the power of the other agent. Therefore, the relative power
738(p) of an agent (x) corresponds to:
px ¼ Powerx∑n
i¼1Poweri;n ¼ 2
739740
741While the probability table derived from Corsaro et al. (2011) only
742specifies high and low power, we employ fuzzy logic (Zadeh, 1965) to
743populate the probability tables for states of medium power so that the
744probability to choose a certain strategy always matches the degree of
745an agent's power. Medium power is a fuzzy definition and corresponds
746to some degree to high power as well as low power. Thus, the probabil-
747ity to select a certain strategy inmedium power situations lies between
748the original probabilities for high and low power, and is represented by
749continuous values which change depending on whether the relative
750power is more close to high power or low power. In our simulation
751we select 0.3 and 0.6 as boundaries for medium power [0.3,0.6]
752(see Fig. 3) as it permits three realistic power scenarios — high–low
753(i.e., [0.2,0.8]), medium–medium (i.e., [0.4,0.6]), and medium–high
754(i.e., [0.3,0.7]). Thus, agents for which the relative power is outside the
755boundaries for medium power would draw from the original probabil-
756ity table for high or low power as derived from Corsaro et al. (2011).
757However, when the relative power of an agent is between 0.3 and 0.6,
758the model would adjust the original probability tables to reflect that
759the relative power of the agent is medium — hence to some degree
760high as well as low, based on fuzzy logic. The degree to which an
761agent possesses a high and low power position in a medium state is
762translated into two factors, respectively, with which the original proba-
763bility tables for high and lowpower aremultiplied. For each of the three
764strategies the sum of the adjusted high and low power probabilities
765constitutes the new probabilities for the agent to select a new strategy
766in that particular medium state.
7673.3. Performance and power trajectories
768Our efforts in designing the shapes of performance and power
769trajectories for the different strategies have been guided by the
770extant management literature on exploration and exploitation
771(e.g., Levinthal &March, 1993;March, 1991) aswell as by the relationship
772life cycle research in marketing (e.g., Dwyer, Schurr, & Oh, 1987; Jap &
773Anderson, 2007). According to management and organization re-
774search, the returns of exploitation strategies are primarily realized
775in the short term and start to diminish over the long run as market
776and competition continue to develop. On the other hand, outcomes
777of exploration strategies are initially low and start to increase in the
778future. The self-reinforcing nature of both strategies (Levinthal &
779March, 1993) further enhances the characteristic shapes of these out-
780come trajectories for exploitation and exploration. Katila and Ahuja
781(2002) found partial evidence for a curvilinear (inverted-U shaped)
782relationships between two different search heuristics (search depth
783and search scope) which are closely related to exploitation and explo-
784ration strategies. Additionally, the relationship lifecycle literature
785suggests an inverted-U shaped evolution of business relationships
786(Dwyer et al., 1987; Jap & Anderson, 2007). Dwyer et al. (1987) and
787Ford (1980) were the first to provide conceptualizations proposing
7S. Forkmann et al. / Industrial Marketing Management xxx (2012) xxx–xxx
Please cite this article as: Forkmann, S., et al., Strategic decision making in business relationships: A dyadic agent-basedsimulation approach, Industrial Marketing Management (2012), doi:10.1016/j.indmarman.2012.06.010

UNCO
RRECTED P
RO
OF
788 a structured development process for buyer–seller relationships along
789 sequential stages. Although stages are labeled differently in these two
790 models, they follow a similar rationale. In either model, the criterion
791 for relationship development is based on the emergence and evolution
792 of certain relationship characteristics (i.e. commitment, trust, uncer-
793 tainty, dependence, satisfaction, mutual communication) and the asso-
794 ciated relationship performance. However, despite the structural
795 similarities of bothmodels, it is important to notice a key difference be-
796 tween them.While Ford's development process endswithwhat he calls
797 the ‘final stage’, a stage of relationship equilibrium,Dwyer et al.'s (1987)
798 framework accounts for relationship dissolution and thereby suggest an
799 inverted-U shape evolution of relationship characteristics and the
800 associated relationship performance across 5 sequential stages —
801 1)Awareness, 2) Exploration, 3) Expansion, 4) Commitment and 5)Dis-
802 solution. Jap and Anderson (2007) confirm this proposition and empir-
803 ically demonstrate the change of relationship characteristics across
804 relationship stages (exploration, build-up, maturity, and decline)
805 along an inverted-U shaped curve. Further, their findings provide em-
806 pirical support that relationship performance and power follow the
807 same U-shaped trajectory, but on different levels. Therefore, both the
808 marketing and management literature suggests adopting inverted-U
809 shaped outcome functions for performance and power. In order to ac-
810 count for the difference in levels of performance and power, we draw
811 critical values specifying the properties of the curves from probability
812 distributions and thereby allow for a range of different scenarios as
813 we would expect them in the real world.
814 Performance and power values for the different strategies are de-
815 rived from three basic functions. For exploitation, shaping, and
816 adapting strategies we choose the probability density functions of
817 the log normal distribution, as the property of a fat lower and upper
818tail, respectively, best represents the basic outcome characteristics
819of these strategies. Therefore, exploitation is represented by:
f x; μ; σð Þ ¼ 1
xσffiffiffi
2p e
−lnx−μð Þ2
2σ2 ; x > 0
820821
822For shaping, we adjust the function so that the fat tail of the curves
823moves up and therefore represents the realization of gains as more
824distant in time:
f x; μ; σð Þ ¼ 1
xþ 4ð Þσffiffiffiffiffiffi
2πp e
− ln xþ4ð Þ−μð Þ2
2σ2 ; x > 0
825826For both functions, we set μ=0. Since σ determines the basic shape of
827the functions (see Figs. 4 and 5) we vary σ depending on the respec-
828tive strategy combination (see Table 2). However, the exact value for
829σ is drawn from a normal distribution. Both curves asymptotically ap-
830proach y=0 approximately after x=4, which has been selected to
831represent 100 rounds of interactions, and no additional gains are real-
832ized anymore after that point in the simulation. Accordingly, the tra-
833jectories for exploiting and shaping can be pictured as shown.
834As adapting strategies aremore reactive, the outcome trajectories fol-
835low the basic shapes of those for exploiting and shaping as gains are real-
836ized in accordance with the relationship partner. However, while the
837shapes of the trajectories are congruent, adapting (due to its reactive na-
838ture) usually runs at lower levels of performance and power compared to
839those of their exploiting and shaping relationship partners. Therefore,
840when an adapter is in a relationshipwith an exploiter or a shaper, perfor-
841mance and power are discounted by factors that are randomly selected
842from a range (RFactor) of 0.6±0.1 and 0.7±0.1 respectively (see Fig. 6
Fig. 3. Medium power according to fuzzy logic.
Fig. 4. Outcome trajectories for exploiting. Fig. 5. Outcome trajectories for shaping.
8 S. Forkmann et al. / Industrial Marketing Management xxx (2012) xxx–xxx
Please cite this article as: Forkmann, S., et al., Strategic decision making in business relationships: A dyadic agent-basedsimulation approach, Industrial Marketing Management (2012), doi:10.1016/j.indmarman.2012.06.010
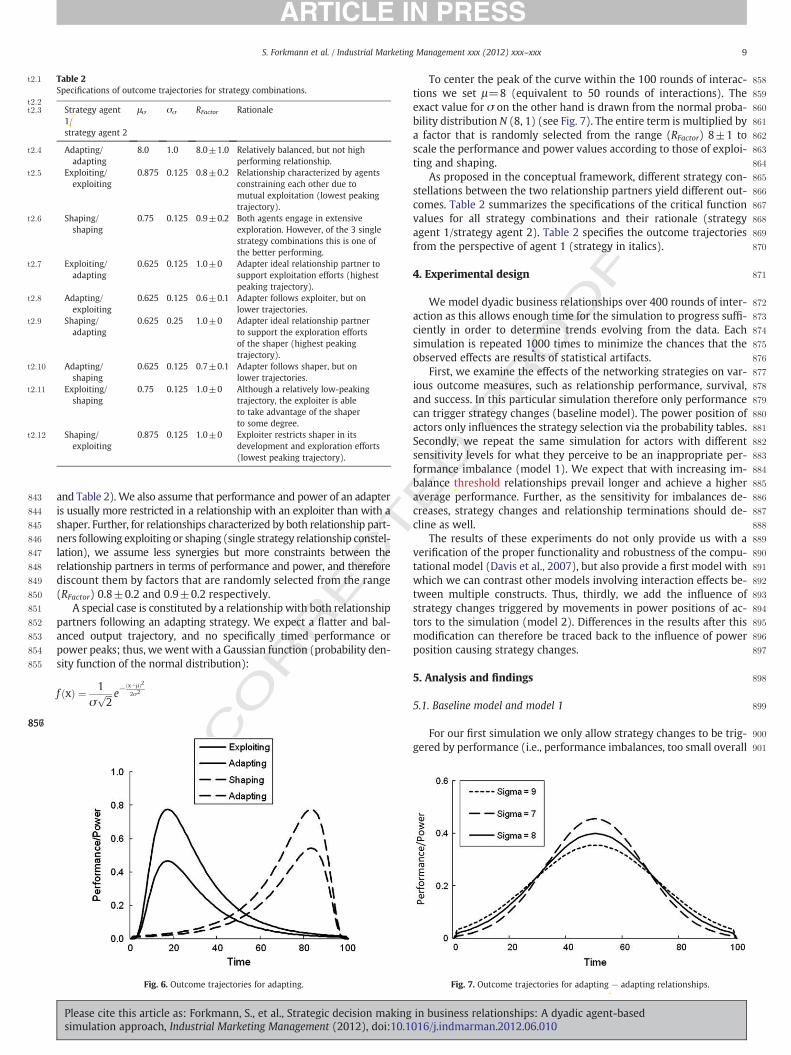
UNCO
RRECTED P
RO
OF
843 and Table 2). We also assume that performance and power of an adapter
844 is usually more restricted in a relationship with an exploiter than with a
845 shaper. Further, for relationships characterized by both relationship part-
846 ners following exploiting or shaping (single strategy relationship constel-
847 lation), we assume less synergies but more constraints between the
848 relationship partners in terms of performance and power, and therefore
849 discount them by factors that are randomly selected from the range
850 (RFactor) 0.8±0.2 and 0.9±0.2 respectively.
851 A special case is constituted by a relationship with both relationship
852 partners following an adapting strategy. We expect a flatter and bal-
853 anced output trajectory, and no specifically timed performance or
854 power peaks; thus, we went with a Gaussian function (probability den-
855 sity function of the normal distribution):
f xð Þ ¼ 1
σffiffiffi
2p e
−x−μð Þ2
2σ2
856857
858To center the peak of the curve within the 100 rounds of interac-
859tions we set μ=8 (equivalent to 50 rounds of interactions). The
860exact value for σ on the other hand is drawn from the normal proba-
861bility distribution N (8, 1) (see Fig. 7). The entire term is multiplied by
862a factor that is randomly selected from the range (RFactor) 8±1 to
863scale the performance and power values according to those of exploi-
864ting and shaping.
865As proposed in the conceptual framework, different strategy con-
866stellations between the two relationship partners yield different out-
867comes. Table 2 summarizes the specifications of the critical function
868values for all strategy combinations and their rationale (strategy
869agent 1/strategy agent 2). Table 2 specifies the outcome trajectories
870from the perspective of agent 1 (strategy in italics).
8714. Experimental design
872We model dyadic business relationships over 400 rounds of inter-
873action as this allows enough time for the simulation to progress suffi-
874ciently in order to determine trends evolving from the data. Each
875simulation is repeated 1000 times to minimize the chances that the
876observed effects are results of statistical artifacts.
877First, we examine the effects of the networking strategies on var-
878ious outcome measures, such as relationship performance, survival,
879and success. In this particular simulation therefore only performance
880can trigger strategy changes (baseline model). The power position of
881actors only influences the strategy selection via the probability tables.
882Secondly, we repeat the same simulation for actors with different
883sensitivity levels for what they perceive to be an inappropriate per-
884formance imbalance (model 1). We expect that with increasing im-
885balance threshold relationships prevail longer and achieve a higher
886average performance. Further, as the sensitivity for imbalances de-
887creases, strategy changes and relationship terminations should de-
888cline as well.
889The results of these experiments do not only provide us with a
890verification of the proper functionality and robustness of the compu-
891tational model (Davis et al., 2007), but also provide a first model with
892which we can contrast other models involving interaction effects be-
893tween multiple constructs. Thus, thirdly, we add the influence of
894strategy changes triggered by movements in power positions of ac-
895tors to the simulation (model 2). Differences in the results after this
896modification can therefore be traced back to the influence of power
897position causing strategy changes.
8985. Analysis and findings
8995.1. Baseline model and model 1
900For our first simulation we only allow strategy changes to be trig-
901gered by performance (i.e., performance imbalances, too small overall
Table 2t2:1
Specifications of outcome trajectories for strategy combinations.
t2:2
t2:3 Strategy agent
1/
strategy agent 2
μσ σσ RFactor Rationale
t2:4 Adapting/
adapting
8.0 1.0 8.0±1.0 Relatively balanced, but not high
performing relationship.
t2:5 Exploiting/
exploiting
0.875 0.125 0.8±0.2 Relationship characterized by agents
constraining each other due to
mutual exploitation (lowest peaking
trajectory).
t2:6 Shaping/
shaping
0.75 0.125 0.9±0.2 Both agents engage in extensive
exploration. However, of the 3 single
strategy combinations this is one of
the better performing.
t2:7 Exploiting/
adapting
0.625 0.125 1.0±0 Adapter ideal relationship partner to
support exploitation efforts (highest
peaking trajectory).
t2:8 Adapting/
exploiting
0.625 0.125 0.6±0.1 Adapter follows exploiter, but on
lower trajectories.
t2:9 Shaping/
adapting
0.625 0.25 1.0±0 Adapter ideal relationship partner
to support the exploration efforts
of the shaper (highest peaking
trajectory).
t2:10 Adapting/
shaping
0.625 0.125 0.7±0.1 Adapter follows shaper, but on
lower trajectories.
t2:11 Exploiting/
shaping
0.75 0.125 1.0±0 Although a relatively low-peaking
trajectory, the exploiter is able
to take advantage of the shaper
to some degree.
t2:12 Shaping/
exploiting
0.875 0.125 1.0±0 Exploiter restricts shaper in its
development and exploration efforts
(lowest peaking trajectory).
Fig. 6. Outcome trajectories for adapting. Fig. 7. Outcome trajectories for adapting — adapting relationships.
9S. Forkmann et al. / Industrial Marketing Management xxx (2012) xxx–xxx
Please cite this article as: Forkmann, S., et al., Strategic decision making in business relationships: A dyadic agent-basedsimulation approach, Industrial Marketing Management (2012), doi:10.1016/j.indmarman.2012.06.010

UNCO
RRECTED P
RO
OF
902 relationship performance, zero or negative performance). The selec-
903 tion of strategies depends on the empirically derived probability
904 table from Corsaro et al. (2011) and therefore based on the perceived
905 power positions of actors. Other than that, power position does not
906 influence the simulation at this stage. To determine the baseline
907 model we select an imbalance threshold of 10, which, as we will see
908 later, represents a medium imbalance threshold. In order to evaluate
909 the success of the relationships involving different strategy combina-
910 tions we contrast the percentages of strategies being selected over
911 the course of the simulation with the percentages those strategies
912 are still represented at the end of the simulation (see Table 3). At
913 the end of 400 simulation runs relationships involving exploiting
914 are represented under-proportionally compared to how much they
915 have been selected by actors. On the other hand, we can also see
916 that the empirically derived probability table favors exploiting
917 strategies (i.e., exploiting/exploiting=26.1%, adapting/exploiting=
918 17.7%, and shaping/exploiting=28.3%). Thus, while exploiting
919 seems attractive to managers as a strategy to manage their business
920 relationships, this networking strategy turns out to be less sustain-
921 able as it leads to terminations of relationships, primarily caused by
922 too large performance imbalances between relationship partners.
923 While exploiting strategies provide a successful strategy in the short
924 term, the constant exploitation of the business partner eventually
925 leads to a non-desirable performance imbalance. Since the actor
926 who is choosing exploitation as a networking strategy is enjoying im-
927 mediate benefits in terms of performance, this actor is less likely to
928 switch away from exploiting and thereby locks the business partner
929 in, giving it no other choice but to eventually terminate this relation-
930 ship. Hence, the simulation illustrates the essential trade-off between
931 performance on the one hand, and relationship quality on the other,
932 as represented by the willingness of actors to maintain a relationship
933 in the future. Strategy combinations of shaping and adapting evolve
934 disproportionally well as they focus more on coevolution and there-
935 fore keep the relationships more balanced compared to those involv-
936 ing exploiting.
937 Overall, the survival rate of relationships over 400 rounds of inter-
938 actions constitutes 26.2% with an average performance of 82.2. As we
939 start to repeat this simulation with varying degrees of actors' imbal-
940 ance thresholds for performance (model 1) we expect survival rates
941 as well as average performance to increase as we relax actors' sensi-
942 tivity to performance imbalances. Thus, the less sensitive actors are
943 with respect to performance imbalances in relationships, the longer
944 they stay in a relationship and the more performance this relation-
945 ship is able to accumulate over time. According to Table 4, survival
946 rates and average performance increase from 7.8% and 80.9 for the
947 most sensitive actors (imbalance threshold=5) to 82.3% and 85.6 re-
948 spectively for the least sensitive actors (imbalance threshold=20).
949 Hence, our results are in line with the underlying logic, which sug-
950 gests that the simulation is robust and valid representation of our
951 conceptual model.
952 Further, as we relax actors' sensitivity for performance imbalances
953 (see Table 5), we can also observe that the success of relationships in-
954 volving exploiting strategies increases (see Fig. 8), while that for
955 strategy combinations of adapting and shaping decreases (see
956Fig. 9). Thus, the less sensitive actors are with respect to performance
957imbalances, the more successful it is for them to follow exploiting
958strategies. On the other hand, although exploiting seems to be an at-
959tractive networking strategy for managers, if business partners are
960likely to be imbalance sensitive, managers should rather decide to
961manage these relationships following shaping or adapting strategies.
962This suggests that strategy selection should be not only contingent
963on power position, but also on individual characteristics of the rela-
964tionship partners as well as industry characteristics (i.e., managers
965perception of acceptable performance imbalances within a particular
966network) as relationships which are only tied together by dependen-
967cies are prone to dissolve once other viable options evolve for dissat-
968isfied relationship partners.
9695.2. Interaction effect of performance and power position (model 2)
970After we examined the effects of performance on networking
971strategies within business relationships, we extend the simulation
972by including power position as an additional driver of networking
973strategy change and thereby study its influence on the model. All
974other simulation specifications are held constant. Since actors' sensi-
975tivity to performance imbalances proved to be a very important vari-
976able, we will compare the results from model 1 with the new model
977(model 2), including the interaction effects between performance
978and power position across the four imbalance thresholds.
979Table 6 contrasts the number of surviving relationships at differ-
980ent times in the simulation between model 1 and model 2. While
981model 1 shows higher relationship survival rates over 400 simulation
982rounds compared to model 2 (see Fig. 10), in the short term (i.e., after
983100 simulation rounds) the survival rates of model 2 are considerably
984higher than those of model 1 (see Fig. 11). However, this short term
985advantage diminishes consistently over time. We can also observe
986that the survival rates for both models increase with decreasing sen-
987sitivity of actors for performance imbalance, which is consistent with
988our previous findings.
989With respect to performance, Fig. 12 illustrates that model 1 in
990most cases performs better than model 2. Contrary to model 1, per-
991formance of model 2 is decreasing from 81.4 (imbalance thresh-
992old=5) to 76.7 (imbalance threshold=20) as we relax the
993sensitivity of actors for performance imbalances.
994In an effort to explain these findings, we compare the two models
995in terms of their strategy volatility — the rate at which actors change
996strategies within relationships. While the strategy volatility is de-
997creasing for both models with increasing actor sensitivity and in-
998creasing simulation runs, model 2 shows considerably higher
Table 3t3:1
Baseline model.
t3:2
t3:3 Strategy combinations
t3:4 Adapting/adapting Exploiting/exploiting Shaping/shaping Adapting/exploiting Adapting/shaping Shaping/exploiting
t3:5 Strategies selected
t3:6 Total 157 1354 758 918 530 1,469
t3:7 In % 3.0% 26.1% 14.6% 17.7% 10.2% 28.3%
t3:8 Successful Relationships
t3:9 Total 10 39 79 37 45 55
t3:10 In % 3.8% 14.9% 29.0% 14.1% 17.2% 21.0%
t3:11 Success rate 126% 57% 198% 80% 168% 74%
Table 4 t4:1
Model 1: sensitivity analysis.
t4:2
t4:3Imbalance threshold
performance
t4:45 10 15 20
t4:5Survival rate 7.8% 26.2% 33.4% 82.3%
t4:6Average performance of surviving relationships 80.9 82.2 82.0 85.6
10 S. Forkmann et al. / Industrial Marketing Management xxx (2012) xxx–xxx
Please cite this article as: Forkmann, S., et al., Strategic decision making in business relationships: A dyadic agent-basedsimulation approach, Industrial Marketing Management (2012), doi:10.1016/j.indmarman.2012.06.010

UNCO
RRECTED P
RO
OF
999 strategy volatility compared to model 1 (see Table 7): additional
1000 strategy changes are permitted as relationships move among differ-
1001 ent states of power. Especially in the early rounds of model 2, a lot
1002 of strategy changes are triggered as actors move among different
1003 states of power. This high strategy volatility, which is primarily driven
1004 by power positions, prevents too large performance imbalances be-
1005 tween actors, thus leading to higher survival rates compared to
1006 model 1. However, as the simulation progresses in time this effect di-
1007 minishes and relationship survival rates of both models approach
1008 each other. While power position primarily governs strategy changes
1009 in the earlier rounds of model 2, its influence fades more and more as
1010 the simulation progresses. According to Table 7, strategy volatility in
1011 model 2 still remains much higher than that in model 1 even in the
1012 later simulation runs (i.e., 300 and 400), however, contrary to the
1013 early simulation runs, the higher strategy volatility of model 2 can
1014 be primarily traced back to strategy changes based on performance.
1015 Thus, once a power equilibrium has been found within the relation-
1016 ships, and the effect of power position on strategy changes dimin-
1017 ishes, actors' attention is drawn more and more to performance as
1018 imbalances are not prevented anymore by power position changes.
1019 Therefore, while power position changes have a positive effect on re-
1020 lationship survival in the short term, it cannot prevent performance
1021 imbalances in the long run and therefore does not serve as a
1022 safeguarding mechanism against relationship termination. Thus, al-
1023 though imbalances within relationships can be successfully avoided
1024 in the short term due to actors' sensitivity to power positions and as-
1025 sociated strategy choices, our results show that in the long run perfor-
1026 mance and its distribution among relationship partners continues to
1027 play a major role in determining the fate of business relationships.
1028 While relationship survival is improving congruently between the
1029 two models with decreasing imbalance sensitivity of actors, perfor-
1030 mance is not only evolving on a lower trajectory, but actually is stag-
1031 nating and decreasing when we start to relax the imbalance
1032thresholds of actors (see Fig. 12). As we move from low to high imbal-
1033ance thresholds for performance, the increasing range of imbalance
1034flexibility allows for more space in which relationships can evolve
1035and therefore permits relationships to more frequently move among
1036different states of power. Thus, strategy changes triggered by move-
1037ments in actors' perceived power position increase with less sensitiv-
1038ity in relation to performance based strategy changes (see Table 8).
1039Because power position-related strategy changes are not directly re-
1040lated to performance, they interrupt performance evolution within
1041the relationship. While this effect starts to diminish in the long run
1042as relationships move towards power equilibria, the losses made ear-
1043lier in the relationships cannot be recovered over time. With increas-
1044ing sensitivity these performance losses become more substantial,
1045which explains why the performance trajectories for both models di-
1046verge (see Fig. 12). Thus, the positive effects associated with lower
1047imbalance sensitivity of relationship partners observed in model 1
1048are diminished and even turned into negative ones when perfor-
1049mance insensitive actors start to adjust their strategies also according
1050to their power position (model 2). The earlier relationships achieve
1051acceptable power equilibria for both parties, the better firms are
1052able to concentrate on the operational and transactional aspects of
1053the relationships, which in turn positively affect performance. Volatil-
1054ity in strategic direction, i.e. frequent strategy changes, hinders rela-
1055tionships to evolve and therefore causes lower relationship
1056performance. Therefore, as managers consider altering their strate-
1057gies in response to power position movements of their firms or
1058those of other network partners, such decisions need to be made
1059with care and in accordance with other relevant factors. We have
1060learned from Corsaro et al. (2011) that managers change strategy
1061based on their perceived power position. However, as we analyze
1062the influence of power position sensitivity we start to see that it has
1063the potential to negatively affect performance, which suggests that
1064changing strategies always should be a deliberate decision, and
Table 5t5:1
Model 1: strategy success.Q2t5:2
t5:3 Imbalance threshold performance
t5:4 5 10 15 20
t5:5 Sel⁎ Su⁎⁎ SR⁎⁎⁎ Sel Su SR Sel Su SR Sel Su SR
t5:6 Adapting/adapting 2.4% 6.4% 265% 3.0% 3.8% 126% 3.2% 4.5% 142% 5.4% 6.2% 114%
t5:7 Exploiting/exploiting 28.2% 11.5% 41% 26.1% 14.9% 57% 27.5% 17.7% 64% 17.8% 13.6% 76%
t5:8 Shaping/shaping 14.5% 46.2% 319% 14.6% 29.0% 198% 15.8% 27.5% 174% 18.7% 21.3% 114%
t5:9 Adapting/exploiting 17.9% 11.5% 65% 17.7% 14.1% 80% 19.5% 19.2% 98% 17.8% 15.1% 85%
t5:10 Adapting/shaping 8.9% 15.4% 174% 10.2% 17.2% 168% 9.1% 15.0% 164% 16.7% 18.3% 110%
t5:11 Exploiting/shaping 28.2% 9.0% 32% 28.3% 21.0% 74% 24.9% 16.2% 65% 23.6% 25.5% 108%
⁎ Sel = strategies selected,t5:12⁎⁎ Su = successful relationships,t5:13⁎⁎⁎ Success rate.t5:14
Fig. 8. Success of relationships involving exploiting.
Fig. 9. Success of relationships involving strategy combinations of adapting and
shaping.
11S. Forkmann et al. / Industrial Marketing Management xxx (2012) xxx–xxx
Please cite this article as: Forkmann, S., et al., Strategic decision making in business relationships: A dyadic agent-basedsimulation approach, Industrial Marketing Management (2012), doi:10.1016/j.indmarman.2012.06.010

UNCO
RRECTED P
RO
OF
1065 power position – although important – should be considered as one
1066 part of a comprehensive evaluation process.
1067 6. Conclusion
1068 6.1. Summary and theoretical implications
1069 The objective of our study was to understand the interrelation-
1070 ships between strategic decision making regarding networking strat-
1071 egy, the perceived power position as a crucial aspect of an actor's
1072 network pictures, and network outcomes, particularly performance.
1073 Both power and the networking strategy framework derived from
1074 Hoffmann (2007) constitute essential elements for firms to manage
1075 in business relationships and networks, hence our study integrates
1076 two important streams of literature and investigates their combined
1077 effects on relationship success in terms of relationship continuation
1078 and performance. In order to reveal the interplay among these key
1079 constructs we developed a dyadic agent-based simulation model,
1080 which through systematic experimentation allowed us to gain a
1081 more refined view on existing theory. As our model assumptions
1082 and specifications are inherently grounded in empirical research, we
1083 enhance the validity of our findings. Further, the robustness of the
1084 computational model and the agreement of the baseline model re-
1085 sults with the underlying theoretical logic provide us with additional
1086 confidence in the validity of our findings. However, in order to keep
1087 the model complexity at a manageable level we had to balance parsi-
1088 mony and realism (Davis et al., 2007), hence external validity claims
1089 are limited and the findings require empirical validation (Lazer &
1090 Friedman, 2007). On the other hand, as simulation favors strong con-
1091 struct and internal validity, it allows us to derive conclusive findings
1092 about the individual and combined effects of our key constructs that
1093 have significant practical relevance and would be difficult to gauge
1094 from empirical studies. Thus, our research represents the essential re-
1095 quirements for simulation approaches as a theory development
1096 method (Lazer & Friedman, 2007).
1097 The contributions of this study to the business marketing and
1098 strategy literature are manifold. First, the initial model demonstrates
1099that although exploiting strategies are favored by managers they do
1100not necessarily yield the desired outcomes as relationship continua-
1101tion is disproportionally low compared to relationships characterized
1102by strategy combinations of adapting and shaping (baseline model).
1103These findings highlight an interesting disconnect between the em-
1104pirically derived networking strategy choices of managers (Corsaro
1105et al., 2011) and how these actually affect their business relationships.
1106However, as sensitivity of actors with respect to performance imbal-
1107ances reduces, exploiting strategies become more and more success-
1108ful for firms to manage business relationships (model 1). Thus, our
1109study raises awareness of the dyadic context dependency of relation-
1110ship management as it shows that the success of different strategies
1111varies fundamentally according to the sensitivity to imbalances of
1112the business partners. Second, studying the interaction effect be-
1113tween performance and power-driven strategy decision making, we
1114demonstrate that adding power position-based strategy changes
1115(model 2) to the model negatively affects relationship performance.
1116In order to explain these findings, we refer to the concept of strategy
1117volatility which is defined as the rate at which firms change their
1118strategies to manage business relationships. As strategy volatility in-
1119creases when power-driven strategy changes are allowed (model
11202), relationships become increasingly strategically unstable, and rela-
1121tionship performance suffers. Furthermore, as actors become less sen-
1122sitive to performance imbalances, this effect is compounded because
1123especially nonperformance related strategy changes increase, thus
1124inhibiting the development of relationship performance. While in
1125model 1 relaxing performance imbalance sensitivity caused relation-
1126ships to perform better, this effect is turned into a negative one as
1127we add power position-based strategy changes to the model (model
11282). Thus, finding power equilibrium early in the relationship in
1129which both relationship partners are satisfied is crucial for relation-
1130ship development.
Table 6t6:1
Comparison model 1 and 2: relationship survival.
t6:2
t6:3 Simulation
runs
Unbalance threshold performance
t6:4 5 10 15 20
t6:5 Model
1
Model
2
Model
1
Model
2
Model
1
Model
2
Model
1
Model
2
t6:6 100 399 592 545 750 537 876 962 962
t6:7 200 236 153 473 594 514 813 962 901
t6:8 300 144 90 369 265 428 542 884 763
t6:9 400 78 52 262 167 334 388 823 610
Fig. 10. Comparison model 1 and 2 (400 simulation runs): relationship survival.
Fig. 11. Comparison model 1 and model 2 (100 simulation runs): relationship survival.
Fig. 12. Comparison model 1 and model 2: performance.
12 S. Forkmann et al. / Industrial Marketing Management xxx (2012) xxx–xxx
Please cite this article as: Forkmann, S., et al., Strategic decision making in business relationships: A dyadic agent-basedsimulation approach, Industrial Marketing Management (2012), doi:10.1016/j.indmarman.2012.06.010

UNCO
RRECTED P
RO
OF
Table 7t7:1
Comparison model 1 and 2: Strategy changes.
t7:2
t7:3 Simulation
runs
Unbalance threshold performance
t7:4 5 10 15 20
t7:5 Model 1 Model 2 Model 1 Model 2 Model 1 Model 2 Model 1 Model 2
t7:6 Strategy
changes
Volatility Strategy
changes
Volatility Strategy
changes
Volatility Strategy
changes
Volatility Strategy
changes
Volatility Strategy
changes
Volatility Strategy
changes
Volatility Strategy
changes
Volatility
t7:7 100
t7:8 Performance 2692 1917 2630 1411 2585 1088 1940 811
t7:9 Power
position
0 4047 0 4959 0 5042 0 5291
t7:10 Total 2692 6.75 5964 10.07 2630 4.83 6370 8.49 2585 4.81 6130 7.00 1940 2.02 6102 6.34
t7:11 200
t7:12 Performance 1033 2045 1465 1623 1113 1389 1924 1469
t7:13 Power
position
0 586 0 1196 0 1522 0 1702
t7:14 Total 1033 4.38 2631 17.20 1465 3.10 2819 4.75 1113 2.17 2911 3.58 1924 2.00 3171 3.52
t7:15 300
t7:16 Performance 601 403 1230 1912 1115 2237 2039 2099
t7:17 Power
position
0 0 0 37 0 232 0 632
t7:18 Total 601 4.17 403 4.48 1230 3.33 1949 7.35 1115 2.69 2469 4.56 2039 2.31 2731 3.58
t7:19 400
t7:20 Performance 380 238 969 952 986 1,632 1,860 2,022
t7:21 Power
position
0 0 0 0 0 2 0 43
t7:22 Total 380 4.87 238 4.58 969 3.70 952 5.70 986 2.95 1634 4.21 1860 2.26 2065 3.39
13
S.Fo
rkmannet
al./Industria
lMarketin
gManagem
entxxx
(2012)xxx
–xxx
Please
citethis
articleas:
Forkman
n,S.,etal.,
Strate
gic
decisio
nmak
ingin
busin
ess
relatio
nsh
ips:
Adyad
icag
ent-b
ased
simulatio
nap
proach
,Industria
lMarketin
gManagem
ent(2
012),doi:1
0.1016/j.in
dmarm
an.2012.06.010

UNCO
RRECTED P
RO
OF
1131 6.2. Managerial implications
1132 Although managerial recommendations based on our simulation
1133 research should not be made without further empirical testing, in
1134 line with similar studies substantial practical implications can be
1135 tentatively posited (Lazer & Friedman, 2007). Our study demonstrates
1136 that networking strategies do not yield the same outcomes under vary-
1137 ing conditions and thereby draws attention to the context dependency
1138 of relationship management. Although certain strategies may be desir-
1139 able to firms to manage their business relationships it is important to
1140 take into consideration how business partners are affected by these
1141 strategic actions. This calls for a more relationship oriented segmenta-
1142 tion processes according to the different resilience levels of business
1143 partners with respect to key relational constructs (e.g. power). This in
1144 turn will allow firms to optimize their strategy accordingly and to suc-
1145 cessfully manage the trade-off between relationship atmosphere and
1146 performance.
1147 Further, as many variables seem to influence managers' strategic
1148 decision making process, arriving at an appropriate decision can be
1149 a difficult task for most managers. As our study has shown, too
1150 many changes in the strategic directions cause relationships to be-
1151 come unstable and thus have negative effects on relationship perfor-
1152 mance. On the other hand, strategic actions impact relationships on
1153 many different levels. Understanding the complexity of cause and ef-
1154 fect in strategic decision making can be daunting task for most man-
1155 agers. Simulation tools can offer aid to managers as a decision support
1156 tool to better understand how important variables interact with each
1157 other in certain situations and thus allow gauging how different stra-
1158 tegic choices may affect firms' business relationships and perfor-
1159 mance; eventually avoiding too many changes in strategic direction.
1160 6.3. Limitations and further research
1161 As indicated above, certain limitations apply to simulation research.
1162 First, any simulation can only be the reflection of its assumptions and
1163 underlying conceptual frameworks, and thus essentially represents an
1164 artificial world designed by its creators. Therefore, it is important that
1165 the assumptions and frameworks used are grounded in theory in
1166 order to be insightful for research. Secondly, as simulation requires ab-
1167 straction from the real world and therefore essentially simplifies real
1168 world phenomena, findings are limitedwith respect to external validity
1169 and claims for generalization beyond the simulation (Davis et al., 2007).
1170 In linewith other simulation research, our findings need to be validated
1171 through specific empirical research (Lazer & Friedman, 2007). Thus, our
1172simulation results provide testable propositions for future empirical re-
1173search (Miller et al., 2006).
1174Although our study provides an extended view on the theory of
1175networking strategy and its antecedents, the proposed model only
1176considers the interactions between two particular drivers of strategy
1177change, namely performance and managers' perception of their sur-
1178rounding business environment in terms of power. Thus, future re-
1179search should focus on including other variables to build a more
1180holistic picture of managerial strategic decision making. Such models
1181can also potentially provide aid to managers to cope with the com-
1182plexity of strategic decision making. However, with increasing com-
1183plexity of the model, it will become considerably more difficult for
1184researchers to draw meaningful and conclusive results from the sim-
1185ulation (Midgley, Marks, & Kunchamwar, 2007; Repenning, 2002) as
1186cause and effect relationships become more and more entangled
1187and twisted amongmultiple constructs. Furthermore, because we pri-
1188marily focus on dyadic business relationships in this study, future re-
1189search should expand the simulation framework beyond dyadic
1190relationships to include diverse and complex interactions in networks
1191with manifold actors.
1192References
1193Abrahamsen, M., Henneberg, S. C., & Naudé, P. (2012). Using actor's perceptions of net-1194work roles and positions to understand network dynamics. Industrial Marketing1195Management, 41(3).1196Aggarwal, V. A., Siggelkow, N., & Singh, H. (2011). Governing collaborative activity:1197Interdependence and the impact of coordination and exploration. Strategic Man-1198agement Journal, 32, 705–730.1199Ahuja, G. (2000). The duality of collaboration: Inducements and opportunities in the1200formation of interfirm linkages. Strategic Management Journal, 21, 317–343.1201Anderson, J. C., & Narus, J. A. (Fall). A model of the distributor's perspective of distrib-1202utor–manufacturer working relationships. The Journal of Marketing, 48, 62–74.1203Anderson, E., & Weitz, B. (Fall). Determinants of continuity in conventional industrial1204channel dyads. Marketing Science, 8, 310–323.1205Baraldi, E., Brennan, R., Harrison, D., Tunisini, A., & Zolkiewski, J. (2007). Strategic1206thinking in the IMP approach: A comparative perspective. Industrial Marketing1207Management, 36, 879–894.1208Barney, J. B. (2002).Gaining and sustaining competitive advantage (2nd ed.). NJ: Prentice Hall.1209Brennan, R. D., Turnbull, P. W., & Wilson, D. T. (2003). Dyadic adaptation in1210business-to-business markets. European Journal of Marketing, 73(11/12), 1636–1665.1211Burton, R. M., & Obel, B. (1995). The validity of computational models in organization1212science: From model realism to purpose of the model. Computational and Mathe-1213matical Organization Theory, 1(1), 57–71.1214Chaharsooghi, S. K., Heydari, J., & Zegordi, S. H. (2008). A reinforcement learning model1215for supply chain ordering management: An application to the beer game. Decision1216Support Systems, 45(4), 949–959.1217Cohen, K. J., & Cyert, R. M. (1965). Simulation of organizational behavior. In J. G. March1218(Ed.), Handbook of organizations (pp. 305–334). Chicago, IL: Rand McNally.
Table 8t8:1
Model 2: influence of power position on strategy changes.
t8:2
t8:3 Simulation runs Unbalance threshold performance
t8:4 5 10 15 20
t8:5 Strategy
changes
Power
position/total
Strategy
changes
Power
position/total
Strategy
changes
Power
position/total
Strategy changes Power
position/total
t8:6 100
t8:7 Performance 1917 1411 1088 811
t8:8 Power position 4047 0.68 4959 0.78 5042 0.82 5291 0.87
t8:9 Total 5964 6370 6130 6102
t8:10 200
t8:11 Performance 2045 1623 1389 1469
t8:12 Power position 586 0.22 1196 0.42 1522 0.52 1702 0.54
t8:13 Total 2631 2819 2911 3171
t8:14 300
t8:15 Performance 403 1912 2237 2099
t8:16 Power position 0 0 37 0.02 232 0.09 632 0.23
t8:17 Total 403 1949 2469 2731
t8:18 400
t8:19 Performance 238 952 1632 2022
t8:20 Power position 0 0 0 0 2 0.001 43 0.02
t8:21 Total 238 952 1634 2065
14 S. Forkmann et al. / Industrial Marketing Management xxx (2012) xxx–xxx
Please cite this article as: Forkmann, S., et al., Strategic decision making in business relationships: A dyadic agent-basedsimulation approach, Industrial Marketing Management (2012), doi:10.1016/j.indmarman.2012.06.010

UNCO
RRECTED P
RO
OF
1219 Corsaro, D., Ramos, C., Henneberg, S. C., & Naudé, P. (2011). Actor network pictures and1220 networking activities in business networks: An experimental study. Industrial Mar-1221 keting Management, 40(6), 919–932Q6 .1222 Daft, R. L., & Weick, K. E. (1984). Toward a model of organizations as interpretation sys-1223 tems. The Academy of Management Review, 9(2), 284–295.1224 Davis, J. P., Eisenhardt, K. M., & Bingham, C. B. (2007). Developing theory through sim-1225 ulation methods. The Academy of Management Review, 32(2), 480–499.1226 Denrell, J., & March, J. G. (2001). Adaptation as information restriction: The hot stove1227 effect. Organization Science, 12(5), 523–538.1228 Dwyer, F. R., Schurr, P. H., & Oh, S. (1987). Developing buyer–seller relationships. The1229 Journal of Marketing, 51(2), 11–27.1230 Dyer, J. H., & Singh, H. (1998). The relational view: Cooperative strategy and sources of1231 interorganizational competitive advantage. The Academy of Management Review,1232 23(4), 660–679.1233 El-Ansary, A. I., & Stern, L. W. (February). Power measurement in the distribution chan-1234 nel. Journal of Marketing Research, 8, 47–52.1235 Emerson, R. M. (February). Power-dependence relations. American Sociological Review,1236 27, 31–41.1237 Fang, C., Lee, J., & Schilling, M. A. (2010). Balancing exploration and exploitation1238 through structural design: The isolation of subgroups and organizational learning.1239 Organization Science, 21(3), 625–642.1240 Følgesvold, A., & Prenkert, F. (2009). Magic pelagic — An agent-based simulation of1241 20 years of emergent value accumulation in the North Atlantic herring exchange1242 system. Industrial Marketing Management, 38, 529–540.1243 Ford, I. D. (1980). The development of buyer–seller relationships in industrial markets.1244 European Journal of Marketing, 14(5/6), 339–353.1245 Ford, I. D., Gadde, L. -E., Håkansson, H., & Snehota, I. (2003a). Managing business rela-1246 tionships (2nd edition). Chichester: John Wiley and Sons.1247 Ford, I. D., Gadde, L. -E., Håkansson, H., & Snehota, I. (2003b). Managing networks.1248 Paper presented at the 18th IMP-conference, Perth, Australia.1249 Ford, I. D., & Mouzas, S. (2010). Networking under uncertainty: Concepts and research1250 agenda. Industrial Marketing Management, 39, 956–962.1251 Gadde, L. -E., Huemer, L., & Håkansson, H. (2003). Strategizing in industrial networks.1252 Industrial Marketing Management, 32, 337–354.1253 Ganesan, S. (1994). Determinants of long-term orientation in buyer–seller relation-1254 ships. The Journal of Marketing, 58, 1–19.1255 Gans, G., Jarke, M., Lakemeyer, G., & Schmitz, D. (2005). Deliberation in a metadata-based1256 modeling and simulation environment for inter-organizational networks. Informa-1257 tion Systems, 30(7), 587–607.1258 Gaski, J. (Summer). The theory of power and conflict in channels of distribution. The1259 Journal of Marketing, 48, 9–29.1260 Gioia, D. A., & Chittipeddi, K. (1991). Sensemaking and sensegiving in strategic change1261 initiation. Strategic Management Journal, 12(6), 433–448.1262 Gouldner, A. W. (April). The norm of reciprocity: A preliminary statement. American1263 Sociological Review, 25, 161–178.1264 Granovetter, M. S. (1973). The strength of weak ties. The American Journal of Sociology,1265 78(6), 1360–1380.1266 Gulati, R., Nohria, N., & Zaheer, A. (2000). Strategic networking. Strategic Management1267 Journal, 21, 203–215.1268 Gupta, A. K., Smith, K. G., & Shalley, C. E. (2006). The interplay between exploration and1269 exploitation. The Academy of Management Journal, 49(4), 693–706.1270 Håkansson, H., & Ford, I. D. (2002). How should companies interact in business net-1271 works? Journal of Business Research, 55, 133–139.1272 Håkansson, H., & Snehota, I. (1989). No business is an island: The network concept of1273 business strategy. Scandinavian Journal of Management, 5(3), 187–200.1274 Halinen, A., Salmi, A., & Havila, V. (1999). From dyadic change to changing business net-1275 works: An analytical framework. Journal of Management Studies, 36(6), 779–794.1276 Hallén, L., Johanson, J., & Seyed-Mohamed, N. (April). Interfirm adaptation in business1277 relationships. The Journal of Marketing, 55, 29–37.1278 Hambrick, D. C., & Snow, C. C. (1977). A contextual model of strategic decision making1279 in organizations. Academy of Management Proceedings, 27, 109–112.1280 Harrison, D., Holmen, E., & Pedersen, A. -C. (2010). How companies strategise deliber-1281 ately in networks using strategic initiatives. Industrial Marketing Management, 39,1282 947–955.1283 Harrison, J. R., Lin, Z., Carroll, G. R., & Carley, K. M. (2007). Simulation modeling in or-1284 ganizational and management research. The Academy of Management Review,1285 32(4), 1229–1245.1286 Harrison, D., & Prenkert, F. (2009). Network strategizing trajectories within a planned1287 strategy process. Industrial Marketing Management, 38, 662–670.1288 Heide, J. B. (January). Interorganizational governance in marketing channels. The Jour-1289 nal of Marketing, 58, 71–85.1290 Henneberg, S. C., Mouzas, S., & Naudé, P. (2006). Network pictures: Concepts and rep-1291 resentations. European Journal of Marketing, 40(3/4), 408–429.1292 Henneberg, S. C., Mouzas, S., & Naudé, P. (2010). Sense-making and management in1293 business networks — Some observations, considerations, and a research agenda.1294 Industrial Marketing Management, 39(3), 355–360.1295 Hoffmann, W. H. (2007). Strategies for managing a portfolio of alliances. Strategic Man-1296 agement Journal, 8(8), 827–856.1297 Holmen, E., & Pedersen, A. -C. (2003). Strategizing through analyzing and influencing1298 the network horizon. Industrial Marketing Management, 32, 409–418.1299 Holmlund, M. (2004). Analyzing business relationships and distinguishing different in-1300 teraction levels. Industrial Marketing Management, 33(4), 279–287.1301 Hunt, S. D. (2000). A general theory of competition. Thousand Oaks (CA): Sage Publications.1302 Jap, S. D., & Anderson, E. (2007). Testing a life-cycle theory of cooperative inter-1303 organizational relationships: Movement across stages and performance. Manage-1304 ment Science, 53(2), 260–275.
1305Johanson, J., & Mattsson, L. -G. (1992). Network positions and strategic action — An an-1306alytical framework. In D. Ford (Ed.), Understanding business markets (pp. 176–193).1307(2nd edition). London: The Dryden Press.1308Katila, R., & Ahuja, G. (2002). Something old, something new: A longitudinal study of1309search behavior and new product introduction. The Academy of Management Jour-1310nal, 45(6), 1183–1194.1311Kauffman, S. (1993). The origins of order: Self-organization and selection in evolution.1312New York: Oxford University Press.1313Kim,W. -S. (2009). Effects of a trust mechanism on complex adaptive supply networks:1314An agent-based social simulation study. Journal of Artificial Societies and Social Sim-1315ulation, 12(3), 4.1316Kimbrough, S. O., Wu, D. J., & Zhong, F. (2002). Computers play the beer game: Can ar-1317tificial agents manage supply chains? Decision Support Systems, 33(3), 323–333.1318Krapfel, R. E., Salmond, D., & Spekman, R. (1991). A strategic approach to managing1319buyer–seller relationships. European Journal of Marketing, 25(9), 22–37.1320Kyriakopoulos, K., & Moorman, C. (2004). Tradeoffs in marketing exploitation and ex-1321ploration strategies: The overlooked role of market orientation. International Jour-1322nal of Research in Marketing, 21, 219–240.1323Lazer, D., & Friedman, A. (2007). The network structure of exploration and exploitation.1324Administrative Science Quarterly, 52, 667–694.1325Levinthal, D. A. (1997). Adaptation on rugged landscapes. Management Science, 43(7),1326934–950.1327Levinthal, D. A., & March, J. G. (1993). The myopia of learning. Strategic Management1328Journal, 14, 95–112.1329Li, J., Sikora, R., Shaw, M. J., & Tan, G. W. (2006). A strategic analysis of inter organiza-1330tional information sharing. Decision Support Systems, 42(1), 251–266.1331Lin, F. -r., Sung, Y. -w, & Lo, Y. -p (2005). Effects of trust mechanisms on supply-chain1332performance: A multi-agent simulation study. International Journal of Electronic1333Commerce, 9(4), 9–112.1334March, J. G. (February). Exploration and exploitation in organizational learning. Organi-1335zation Science, 2, 71–87.1336Mason-Jones, R., & Towill, D. R. (1997). Information enrichment: Designing the supply1337chain for competitive advantage. Supply Chain Management, 2(4), 137–148.1338Midgley, D., Marks, R., & Kunchamwar, D. (2007). Building and assurance of agent-based1339models: An example and challenge to the field. Journal of Business Research, 60, 884–893.1340Miller, K. D., Zhao, M., & Calantone, R. J. (2006). Adding interpersonal learning and tacit1341knowledge to March's exploration–exploitation model. The Academy of Manage-1342ment Journal, 49(4), 709–722.1343Morgan, R. M., & Hunt, S. D. (July). The commitment-trust theory of relationship mar-1344keting. The Journal of Marketing, 58, 20–38.1345Nadkarni, S., & Barr, P. S. (2008). Environmental context, managerial cognition, and1346strategic action: An integrated view. Strategic Management Journal, 29, 1395–1427.1347Nevin, J. R. (1995). Relationship marketing and distribution channels: Exploring funda-1348mental issues. Journal of the Academy of Marketing Science, 23(4), 327–334.1349Palmatier, R. W., Dant, R. P., Grewal, D., & Evans, K. R. (October). Factors influencing the1350effectiveness of relationship marketing: A meta-analysis. The Journal of Marketing,135170, 136–153.1352Palmatier, R. W., Jarvis, C. B., Bechkoff, J. R., & Kardes, F. R. (September). The role of cus-1353tomer gratitude in relationship marketing. The Journal of Marketing, 73, 1–18.1354Poppo, L., Zhou, K. Z., & Ryu, S. (2008). Alternative origins to interorganizationl trust:1355An interdependence perspective on the shadow of the past and the shadow of1356the future. Organization Science, 19(1), 39–55.1357Porter, M. E. (1980). Competitive Strategy. New York: The Free Press.1358Ramos, C., & Ford, I. D. (2011). Network pictures as a research device: Developing a tool1359to capture actors' perceptions in organizational networks. Industrial Marketing1360Management, 40, 447–464.1361Repenning, N. P. (2002). A simulation-based approach to understanding the dynamics1362of innovation implementation. Organization Science, 13(2), 109–127.1363Ritter, T., Wilkinson, I. F., & Johnston, W. J. (2004). Managing in complex business net-1364works. Industrial Marketing Management, 33, 175–183.1365Rivkin, J.W. (2000). Imitation of complex strategies.Management Science, 46(6), 824–844.1366Sarkees, M., Hulland, J., & Prescott, J. (2010). Ambidextrous organizations and firm per-1367formance: the role of marketing function implementation. Journal of Strategic Mar-1368keting, 18(2), 165–184.1369Siggelkow, N., & Rivkin, J. W. (2006). When exploration backfires: Unintended conse-1370quences of a multilevel organizational search. The Academy of Management Journal,137149(4), 779–795.1372Tay, N. S. P., & Lusch, R. F. (2005). A preliminary test of Hunt's General Theory of Com-1373petition: Using artificial adaptive agents to study complex and ill-defined environ-1374ments. Journal of Business Research, 58, 1155–1168.1375Thomas, J. B., Clark, S. M., & Gioia, D. A. (1993). Strategic sensemaking and organiza-1376tional performance: Linkages among scanning, interpretation, action, and out-1377comes. The Academy of Management Journal, 36(2), 239–270.1378Walsh, J. P. (1995). Managerial and organizational cognition: Notes form a trip down1379memory lane. Organization Science, 6(3), 280–321.1380Weick, K. E., Sutcliffe, K. M., & Obstfeld, D. (2005). Organizing and the process of sen-1381semaking. Organization Science, 16(4), 409–421.1382Wilkinson, I. F. (Summer). Power and satisfaction in channels of distribution. Journal of1383Retailing, 55, 70–94.1384Wilkinson, I. F., & Young, L. (2010). Towards simulation models of the dynamics of busi-1385ness relations and networks. Paper presented at the 26th IMP Conference Hungary:1386Corvinus University of Budapest.1387Zadeh, L. A. (1965). Fuzzy sets. Information and Control, 8(3), 338–353.1388Zott, C. (2003). Dynamic capabilities and the emergence of intraindustry differential1389firm performance: Insights from a simulation study. Strategic Management Journal,139024, 97–125.
1391
15S. Forkmann et al. / Industrial Marketing Management xxx (2012) xxx–xxx
Please cite this article as: Forkmann, S., et al., Strategic decision making in business relationships: A dyadic agent-basedsimulation approach, Industrial Marketing Management (2012), doi:10.1016/j.indmarman.2012.06.010