a joint location and outsourcing sustainability analysis for a strategic offshoring decision
TRANSCRIPT

Electronic copy available at: http://ssrn.com/abstract=1125496
*Corresponding author. Phone: 508-793-7659, Fax: 508- 793-8822. Email: [email protected] (Joseph Sarkis). This work is supported by China Scholarship Council and the National Natural Science Foundation of China Project (70772085).
A Joint Location and Outsourcing Sustainability Analysis for a
Strategic Offshoring Decision
Yijie Dou
School of Management Dalian University of Technology
Dalian, Liaoning Province 116024, PR China Phone: (86) 411-8470-7351 Fax: (86) 411-8470-8342
Email: [email protected]
Joseph Sarkis*
Graduate School of Management Clark University 950 Main Street
Worcester, MA 01610-1477 Phone: 508-793-7659 Fax: 508- 793-8822
Email: [email protected]
April, 2008

Electronic copy available at: http://ssrn.com/abstract=1125496
1
A Joint Location and Outsourcing Sustainability Analysis for a
Strategic Offshoring Decision
Abstract
With economic globalization and the emergence of extended enterprises derived from interrelationship among organizations, there has been a steady increase in offshoring outsourcing activities. Subsequently, the strategic importance of offshoring decisions is important. Traditional offshoring decisions mainly emphasize outsourcee (supplier) selection problems, with their focus upon economic factors. Sustainability, which has recently been seen as a competitive necessity in most industry, rarely enters into the modeling or discussion. Furthermore, additional and integrated facility location factors need to be involved into the offshoring decision process. To help integrate these factors and concerns, this paper constructs a model for evaluation and selection of various offshoring alternatives by simultaneously considering facility location factors, supplier selection metrics, and sustainability factors. The model allows for input from a variety of managerial decision making levels and involves the dynamic perspectives of the competitive environment in evaluating process. An empirical case illustration is applied to demonstrate the efficacy of the model. The paper closes with a discussion of managerial implications and an outlook on aspects for further research.
Keywords: Offshoring decision; Facility location; Supplier selection; Sustainability; Analytic network process; Dynamic perspective
1. Introduction
The strategic importance of outsourcing in today’s business environment has been
recognized by managers and scholars (Quinn and Hilmler 1994, Quinn 1999, Nellore and
Söderquist 2000, Globerman and Vining 2006). In the context of economic globalization
and increasing organizational and technological capacity of companies (especially
multinational companies, (MNCs)), offshoring, i.e. offshore outsourcing, has recently
received signficant attention (Farrell 2005, Levy 2005). Subsequently, one critical
challenge faced by managers is a need for systematic analysis of the strategic offshoring
decision. Recent offshoring decisions by organizations and researchers has focused on
strategic outsourcing subcontractor selection. While subcontractor selection is mainly
2
based on factors such as cost, quality, delivery and flexibility; sustainability factors are
traditionally not given significant emphasis (Brown, 2008). Also, a more holistic
offshoring and outsourcing decision needs to take into account other metrics like facility
location factors, rather than a sole consideration of supplier or subcontractor selection
factors. To assist in the offshoring and outsourcing decision process we present a
strategic decision model that incorporates sustainability factors while simultaneously
considering facility location factors and supplier (subcontractor) selection factors.
Strategic decisions need to integrate both tangible, intangible, strategic and
operational factors into an analysis (Sarkis and Talluri 2002). Current literature in the
outsourcing decision does emphasize the importance of intangible factors especially those
that may utilize managers’ perceptions (Carter et al. 2008). This paper introduces a
framework based on Analytical Network Process (ANP) that could effectively and
synthetically incorporate broad-based set of relevant factors into the strategic offshoring
decision. ANP is a generalized form of the widely used multi-criteria decision making
technique the Analytical Hierarchy Process (AHP) (Saaty 1980). Given the limitations of
AHP such as sole consideration of one way hierarchical relationships among factors,
failure to consider interactions among the various factors and “rank reversal”, ANP is
applied as a more realistic modeling method for the offshoring and outsourcing decision,
albeit the disadvantage of ANP may arise when the number of factors and respective
interrelationships increases, requiring much more effort by analysts and decision makers
(Sarkis and Talluri 2002, Jharkharia and Shankar 2007).
Overall, the purpose and contribution of this paper is to introduce a
comprehensive set of decision factors that may be utilized for offshoring and outsourcing

3
decisions, construction of a strategic ANP decision model with a joint analysis of a
facility location, outsourcing, and sustainability-oriented decision. Firstly, we provide a
brief discussion on the offshoring decision process helping to position our paper in the
research literature further identifying its contribution. A description of different
offshoring decision models is summarized, which sets the stage for the need of a holistic
offshoring decision model. We then introduce and summarize various decision factors
and incorporate the factors into an ANP decision framework. The following section paper
proposes a case application of the proposed model. The results will be discussed and
managerial insights, implications, and possible directions for future research are put
forward in the conclusion.
2. Offshoring and Outsourcing Decisions, Factors and Models
2.1. The decision process
In recent years, outsourcing has been adopted as an important strategic option for
organizations seeking to simplify their operations while focusing on their core
competencies (Ash 2007). Offshoring is a specific form of outsourcing, specifically
outsourcing abroad (i.e. offshore outsourcing). It has evolved into an important source of
business renewal and corporate transformation (Li et al. 2008). There are a host of
descriptive models identifying the phases of an entire outsourcing process and its linkage
to strategic planning (Heikkilä and Cordon 2002, McIvor et al. 1997, Gottfredson et al.
2005, Greaver 1998, Grossman and Helpman 2005). Using this literature we can arrive
at an offshoring decision process that can be separated into three distinctive managerial
decision phases: pre-evaluation, evaluation of various alternatives, post-evaluation. Pre-

4
evaluation includes competence analysis, total cost analysis, identifying what to
outsource, and related information searching. The third stage post-evaluation pertains to
contract negotiating, relationship management, and dynamic adjustments. Our model and
discussion will focus on the second step: evaluation of various alternatives.
According to the OECD (2007) offshoring alternatives include offshoring to
newly constructed plants or companies (e.g. foreign direct investment (FDI)), offshoring
to an existing location, and outsourcing to a subcontractor abroad not affiliated with the
organization. Under this categorization, evaluation of various offshoring alternatives may
include evaluation and choice of offshoring locations using currently or newly built
affiliated (owned) subsidiaries or offshoring to external subcontractors abroad.
2.2. Models
The current literature on offshoring decision models can be classified into two groups:
the first group focuses on the firm’s choice of organizational forms (e.g. Mclaren 2000;
Grossman and Helpman 2002, 2004, 2005; Antràs and Helpman 2004; Antràs et al.
2006), which rests in the domain of international trade theory. The first group of models
is chiefly at a macroeconomic level and centers on the organizational form choice
between outsourcing and integration, and the location choice between at home and
abroad. While the macro-level models of offshoring decisions are particularly useful in
understanding the macroeconomics and broad choice of trade and foreign direct
investments (FDI), they do not address issues of the offshoring decision for a specific
firm. The second stream of models is at the firm level, few models can be found in this
second group (Ruiz-Torres and Mahmoodi 2008). Most of the current models focus on
outsourcer evaluation and selection (de Almeida 2007, Araz et al. 2007, Cao and Wang

5
2007), which are essentially theoretically close to supplier selection decision models
(Sarkis and Talluri 2002, Narasimhan et al. 2006). Locational factors are typically not
taken into account by these models. Although some models (e.g. Chan and Kumar, 2007)
do include some location factors like political stability and economic condition when
discussing global supplier selection criteria. Nevertheless, these location models’ facility
decision factors are limited. Overall, we have found that traditional firm-level offshoring
supplier selection models fail to holistically incorporate facility location factors while
facility location in the offshoring decision research seem to neglect supplier selection
factors.
The location of economic activities has been an important topic for economic
analysis since the seminal works of Alfred Weber (the impact of transportation costs on
the location decision), Johann Heinrich Von Thünen (land use model), Walter Christaller
(Central Place Theory) and William Alonso (Central Business District) (Carod 2005).
Although the institutional approach of facility location theory maintains the important
role of competitors, customers and suppliers in facility location decisions (Hayter 1997),
research on facility location decisions rarely incorporate supplier selection factors. Very
little research has modeled the joint offshoring decision (i.e., simultaneous evaluation of
offshoring location, different existing cross border affiliates, and various subcontractors
abroad). Hence a systematic evaluation model that integrates the factors of facility
location and supplier selection in offshoring decisions can contribute to better
management modeling and decision making.
The models for facility location and supplier selection decisions utilize a variety
of methodologies ranging from simple scoring and matrix methods to more advanced

6
mathematical programming and game modeling approaches. ANP falls some where in
the middle of these techniques, not requiring the complexity of mathematical modeling
for decisions, but offering a more robust solution than simple scoring methods (Sarkis
and Sundarraj 2000). Part of this complexity arises from the relationships and
interlinkages among decision factors. These interdependencies among factors can be
explicitly considered through pairwise comparisons in ANP modeling. The pairwise
comparisons used as the elemental inputs to ANP can incorporate intangible factors like
managers’ perception by allowing decision-makers to integrate their measurement of
relative importance among the factors. Further, ANP’s structuring factors in a
hierarchical (or clustering/network) relationship aids managers comprehension of the
various linkages among factors, especially strategic performance metrics that need to be
linked to operational level measures. To this end, the paper applies a model that
effectively considers facility location factors, supplier selection factors and the complex
relationship among them in strategically evaluating joint offshoring and outsourcing
alternatives. Also, as shown in the following section, we integrate relevant location,
supplier selection and sustainability factors in developing our model.
2.3. Factors
An in-depth offshoring decision making (OECD 2007) needs to simultaneously consider
both the facility location factors and outsourcee (subcontractor/supplier) selection factors.
As mentioned above, the outsourcee selection problem has strong similarities, if not
identical, to the supplier selection problem. Hence, the extant literature on supplier
selection can contribute to the construction of outsourcee selection factors. For the

7
remainder of our discussion the term “supplier selection factors” will be used as
representative of “outsourcee selection factors” or “subcontractor selection factors”.
2.3.1. Facility location factors
International facility location decisions have attracted much attention in recent years
(Mudambi 1995, Brush et al. 1999, Prasad et al. 2000). Three approaches have been
employed to explain industrial facility decisions: neo-classical, behavioral, and
institutional approaches (Hayter 1997). Subsequently, the facility location decision
primarily emphasizes economic, behavioral and institutional factors.
The neo-classical approach maintains that firms choose facilities to locate as a
result of cost minimization and profit maximization. Such location factors like labor
costs, transportation costs, market size and locational business climate are of central
importance. From this view, rationality and perfect information of decision makers are
often assumed, which are typically unrealistic assumptions. Realizing the limitation of
these assumptions, behavioral approaches consider firms as agents with bounded
rationality and imperfect information. The location of a facility is interpreted as a
decision-making process, and the key behavioral explanation of facility location is the
firms’ perception and evaluation for an ‘information bed’ (Hayter 1997). ANP can aid
this decision-making environment by allowing the incorporation of managers’
perceptions into the decision making process. Both neo-classical and behavioral
approaches have been subject to criticism due to their implicit assumption of a static
environment (Brouwer et al. 2004). Consequently, in the institutional approach, the
facility location decision is described in terms of factors that formulate strategy and
emphasis is placed upon strategic issues like competition, current facilities and market
8
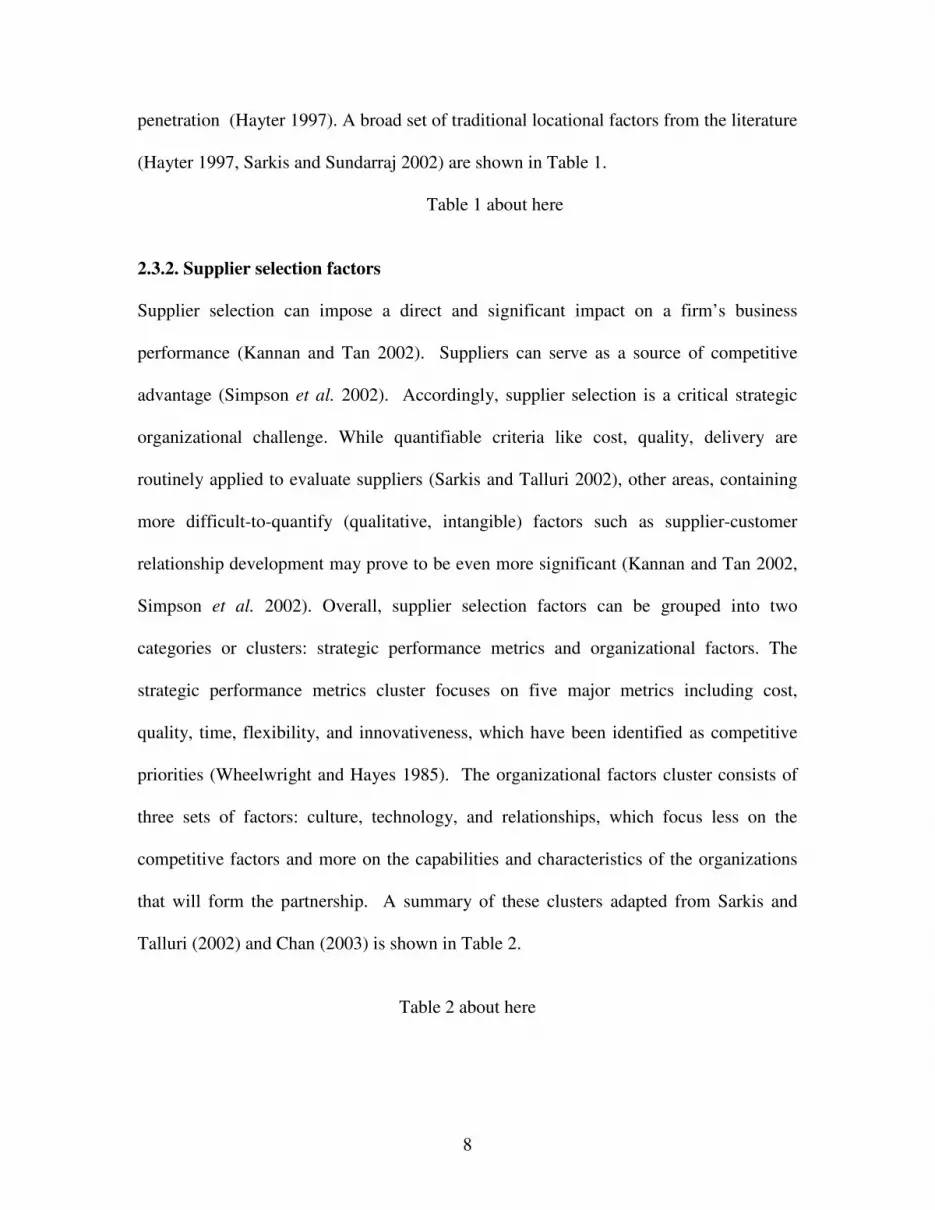
penetration (Hayter 1997). A broad set of traditional locational factors from the literature
(Hayter 1997, Sarkis and Sundarraj 2002) are shown in Table 1.
Table 1 about here
2.3.2. Supplier selection factors
Supplier selection can impose a direct and significant impact on a firm’s business
performance (Kannan and Tan 2002). Suppliers can serve as a source of competitive
advantage (Simpson et al. 2002). Accordingly, supplier selection is a critical strategic
organizational challenge. While quantifiable criteria like cost, quality, delivery are
routinely applied to evaluate suppliers (Sarkis and Talluri 2002), other areas, containing
more difficult-to-quantify (qualitative, intangible) factors such as supplier-customer
relationship development may prove to be even more significant (Kannan and Tan 2002,
Simpson et al. 2002). Overall, supplier selection factors can be grouped into two
categories or clusters: strategic performance metrics and organizational factors. The
strategic performance metrics cluster focuses on five major metrics including cost,
quality, time, flexibility, and innovativeness, which have been identified as competitive
priorities (Wheelwright and Hayes 1985). The organizational factors cluster consists of
three sets of factors: culture, technology, and relationships, which focus less on the
competitive factors and more on the capabilities and characteristics of the organizations
that will form the partnership. A summary of these clusters adapted from Sarkis and
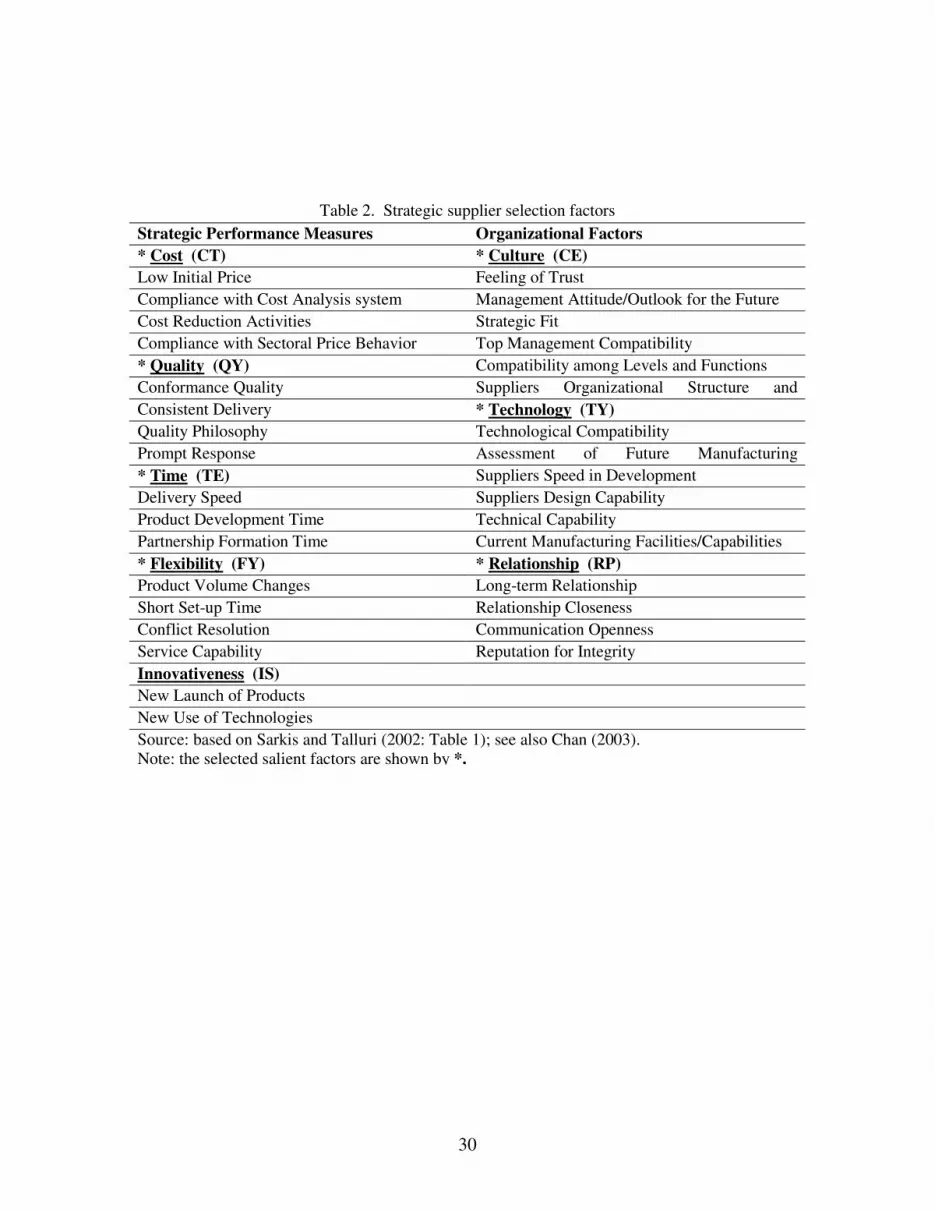
Talluri (2002) and Chan (2003) is shown in Table 2.
Table 2 about here

9
Among the conventional facility location research neither environmental nor
social sustainability factors are emphasized. The environmental consideration in location
research focuses on environmental regulations, i.e. “pollution havens” seeking behavior
(Daly 1995) and environmental amenity (Hayter 1997). Multi-national companies
offshoring location practices to developing countries have been criticized due to taking
advantage of low-wage workers, lax environmental regulations, weak workplace
standards, and contributing to social and environmental degradation (Doh 2005).
Companies seeking to manage these reputational considerations require a systematic
integration of sustainable factors into firms’ offshoring location decision-making
necessary. Increasingly more authors are addressing supplier selection issues in the light
of environmental aspects (Min and Galle 1997, Noci 1997, Handfield et al. 2002,
Humphreys et al. 2003, Sarkis 2006). Much of this literature has focused upon
environmental issues integration in the supplier and location decision processes. There
still exists a necessity to incorporate other, social, sustainability factors such as social
equity and employee health. A comprehensive overview of sustainability factors in
facility location and supplier selection will be presented next.
2.3.3. Sustainability factors
Historically, consideration of environmental issues in facility location decision research
has focused upon basic environmental aesthetics and compliance-oriented environmental
regulation (Hayter 1997). Correspondingly the supplier selection has seen efforts to
incorporate environmental factors into supplier selection. Much of the research has
shown that environmental concerns are chiefly associated with conformance to
environmental regulations and cost reduction orientation (Min and Galle 1997).

10
Sustainable development and sustainability is frequently interpreted as a synthesis
of economic, environmental and social development (Gauthier 2005). Even though
environmental considerations in facility location and supplier selection decisions have
existed, a more systematic inclusion of other sustainability factors should be incorporated
into the offshoring decision. The previous dual concerns of economic and environmental
aspects in offshoring decisions need to be expanded into a triad that involves social
factors, i.e. human rights abuses, child labor, and irresponsible investment. International
companies are increasingly acknowledging the importance of social issues like human
rights, labor and corruption (Rivoli 2003). Consequently, consideration of both
environmental and social factors need to be at the forefront of companies’ offshoring
decision agenda.
In terms of the supplier selection decision, environmental and social factors are
introduced from a firm level perspective (versus a regional locational perspective).
Environmental factors can be categorized into two categories: environmental
performance and environmental practices. According to Levy (1995), environmental
practices refer to policies and procedures, such as monitoring discharges and periodical
audits; while environmental performance is in reference to resource consumption and
pollution production. A well-accepted categorization of environmental practices
distinguishes between “pollution prevention” and “pollution control” (Gil et al. 2001).
Pollution control, pollution prevention and management system have also been used to
comprehensively describe environmental practices (Klassen and Whybark 1999). Table 3
summarizes these organizational level environmental factors (sources include Klassen
and Whybark 1999 and Gauthier 2005).

11
Table 3 about here
Gauthier (2005) groups social factors into two categories: internal social criteria
and external social criteria. Internal social criteria refer to employment practices such as
labor sources, gender diversity and occupational health and safety at work. External
social criteria regard the relationship with contractual stakeholders like suppliers and
customers, and relations with other stakeholders like local communities and NGOs. Table
4, summarizes the various social factors and sub-factors that may be utilized in supplier
selection decisions (sources of these factors include Gauthier 2005, GRI 2008,
Labuschagne et al. 2005, and Presley et al. 2007).
Table 4 about here
For facility location groupings and decisions, sustainable considerations would be
at the broader locational community and regional level of analysis. Sustainability and
sustainable development issues pertaining to cities, towns and settlement patterns has
created a variety of labels including sustainable cities, sustainable urban development,
and sustainable communities (Beatley 1998). The ultimate purpose of sustainable
development pertains to achieve the integrative combination of environmental symbiosis,
economic growth, and social equity (Lin and Lee 2005). Common features of sustainable
communities have been identified in the literature, including: compact, higher-density
development, more efficient use of land and space; the “greening” of communities with
greater emphasis on open space; highlighting public transit, and generating mixed-use
environments which are more amenable to walking and less dependent upon autos; and
efficient resource consumption, low pollution (Beatley 1998). Table 5 and Table 6

12
respectively introduces these environmental and social factors for locational decisions
(sources include Bossel 1999, ESI 2008, Lin and Lee 2005, UN 2007).
Tables 5 and 6 about here
2.4. The planning horizon
The planning horizon is pertinent to the dynamic and competitive nature of organizations.
Both facility location researchers (e.g. Brouwer et al. 2004) and supplier selection studies
(e.g. Sarkis and Talluri 2002) have recognized the importance of incorporating a dynamic
perspective to decision-making. Including planning horizon factors into a decision model
will aid to involve strategies of the organization, which are critical for short-term and
strategic decisions. For brevity while maintaining the essence of a planning horizon
consideration, this paper applies the dichotomous categorization of short-term (ST)
versus long-term planning horizons (LT).
3. The ANP model
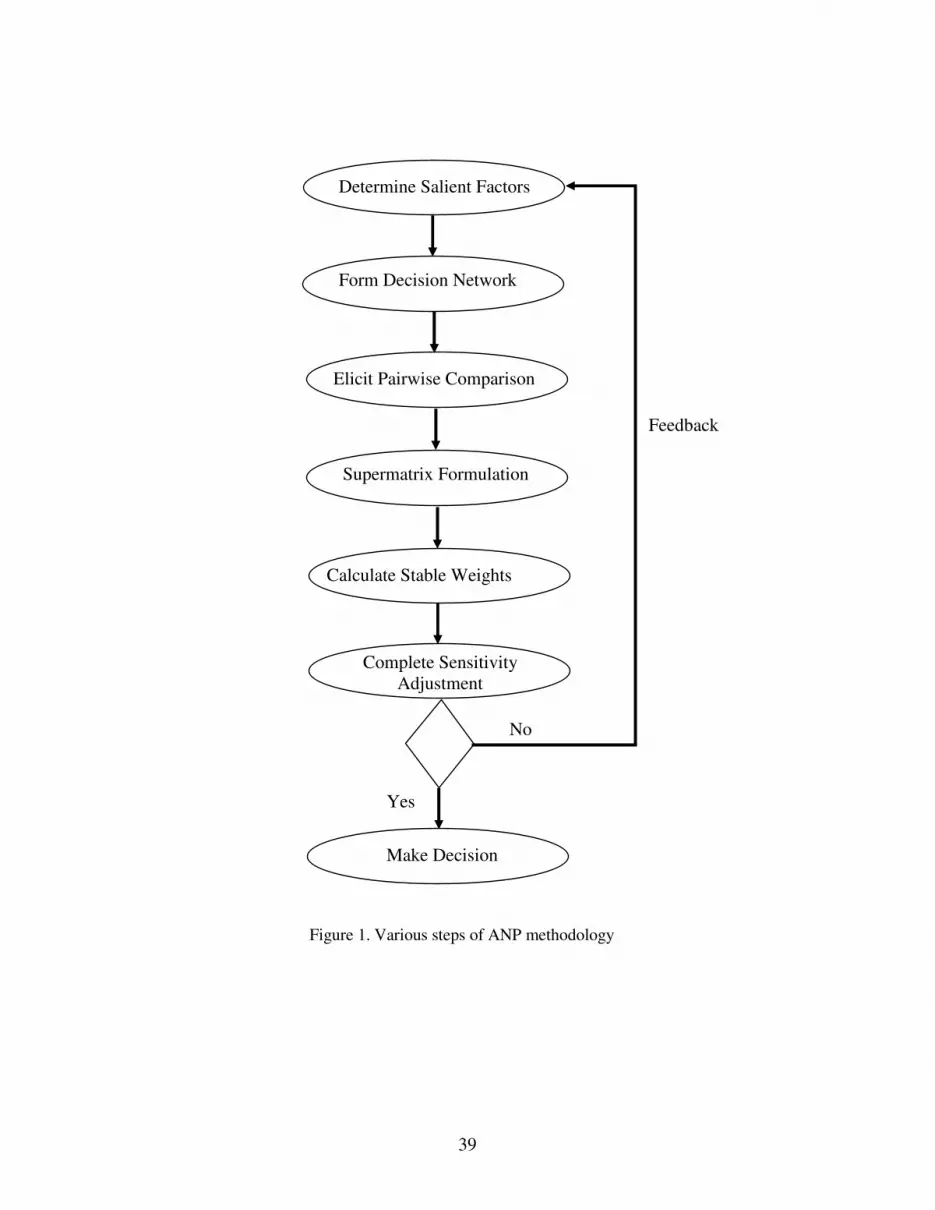
The ANP methodology we introduce in this paper is overviewed in Figure 1. The initial
step focuses on identification and selection of the most salient factors to be evaluated by
the organization. In our case illustration we complete we have identified the salient
factors with an asterisk in Tables 1-6. This determination of salient factors, typically
reduction of a larger set of factors, often needs to be executed so that the number of
pairwise comparison (the step after formulation of the decision network) is practicable.
The next step pertains to the construction of a decision network. Following the elicitation
of pairwise comparisons is the calculation of relative importance of the factors. A
formulation of a supermatrix and the calculation of stabilized weights from the

13
supermatrix are the final two steps to arrive at a solution to an evaluation of a set of
alternatives. A sensitivity analysis may need to be completed, in order to determine the
robustness of the alternative weights and whether to accept the result or to make
adjustments to the set of factors through a feedback loop.
4. Illustrative case
To detail the proposed methodology we provide an illustrative case example. Suppose a
company A is seeking to make an offshoring decision. Company A competes on factors
that include cost, quality, delivery time, and flexibility. In recent years, company A has
recognized the growing urgent competitive status that it is facing in its significant market
C. Top level managers of Company A are considering a comprehensive offshoring
decision that will involve simultaneous consideration of facility location factors and
supplier selection factors.
We can assume that some filtering process to reduce the number of alternative
locations and suppliers has been completed, to obtain an alternative set, an initial
threshold evaluation is applied. A multi-staged alternative choice approach is shown in
Figure 2 (in addition to the ANP methodology, which executed to identify a final
alternative choice). As seen in Figure 2, four alternatives are considered in ANP model
illustration in this paper: Affiliate A in Location A (AAA) which could be considered an
FDI and Supplier A in Location A (SAA), Supplier B in Location B (SBB), and Supplier
C in Location B (SCB), which would be considered a complete outsourcing to external
subcontractors. The four alternatives will be included in the final decision network.
4.1. Determination of salient factors

14
An original list of facility location and supplier selection factors, adapted from previous
literature and models, has been formulated and shown in Tables 1-6. Given the specific
business environment faced by Company A, salient factors will need to be determined.
Determination can be completed through many filtering and grouping tools such as
affinity diagrams. This step is implemented to help keep the number of pairwise
comparisons among the factors at a manageable level. The salient factors yielded in the
process are shown by an asterisk in Table1-6. Only the highest level factors are
incorporated for each of the clusters. The sub-factors can still play a role by helping
define the factors selected. If there is a cluster of factors that are deemed especially
important by management, they could be included in the analysis. In addition, the
feedback from earlier ANP iterations may help further refine the salient factors to be
included in the analysis.
4.2. Formulation of decision network
The construction of the hierarchical decision network is one of the important determinants
of the amount of complexity that will be required by the analysis. After formation of
clusters of salient factors, their relationships amongst each other and even within each other
will need to be determined. An initial discussion with the decision makers will be required
(or an evaluation of previous literature) to help determine the relationships. There are
formal tools available to aid in determining these structures and relationships such as
interpretative structural modeling (Sarkis et al. 2008). A proposed high-level ANP
decision network is shown in Figure 3. Central in this figure is the objective of
strategically selecting an alternative. Two sets of strategic clusters, facility location factors

15
and strategic supplier selection factors, form the core of this decision network and are a
culmination of factors in Tables 1-6.
Three clusters (i.e. the locational factors cluster in facility location factors cluster
set, and the strategic performance metrics and organizational factors clusters in the strategic
supplier selection metrics cluster set) are influenced by and influence the planning horizon
factors cluster. The two-way arrows among the levels mean there are interdependent
relationships amongst these clusters. For example, the first directional relationship would
determine if the locational factor is most important over a ‘short-term’ planning horizon,
which factor over the ‘long-term’. The other directional relationship would question a
specific locational factor’s relative importance in the short-term and the long-term. In the
strategic supplier selection metrics cluster set of Figure 3, the strategic performance metrics
cluster shows an internal interdependency (a curved arrow), which indicates that factors
within this cluster will influence each other and the impact of these factors amongst
themselves need to be considered in the evaluation process. For example, cost (a strategic
performance metric) may be influenced by other strategic metrics like quality factors.
Another important interdependency is the cross set relationships of social factors
and environmental factors in each of the cluster sets with corresponding social and
environmental clusters. The environmental and social factors for facility location cluster
set are influenced respectively by the social and environmental factors in the strategic
supplier selection cluster set, and vice versa. For example, the “consumption and
production patterns” location environmental factor may be variably influenced by supplier
environmental dimensions such as “resource consumption” or incorporating an
“environmental management system.” Conversely, supplier environmental dimensions

16
may be variably influenced by environmental location factors such as “environmental
health requirements” and “ecosystem vitality”.
Each of the alternatives, shown in the alternatives cluster, will be evaluated on each
of the various factors. These relationships are shown by the one-way arrows between the
alternatives selection set and the other clusters.
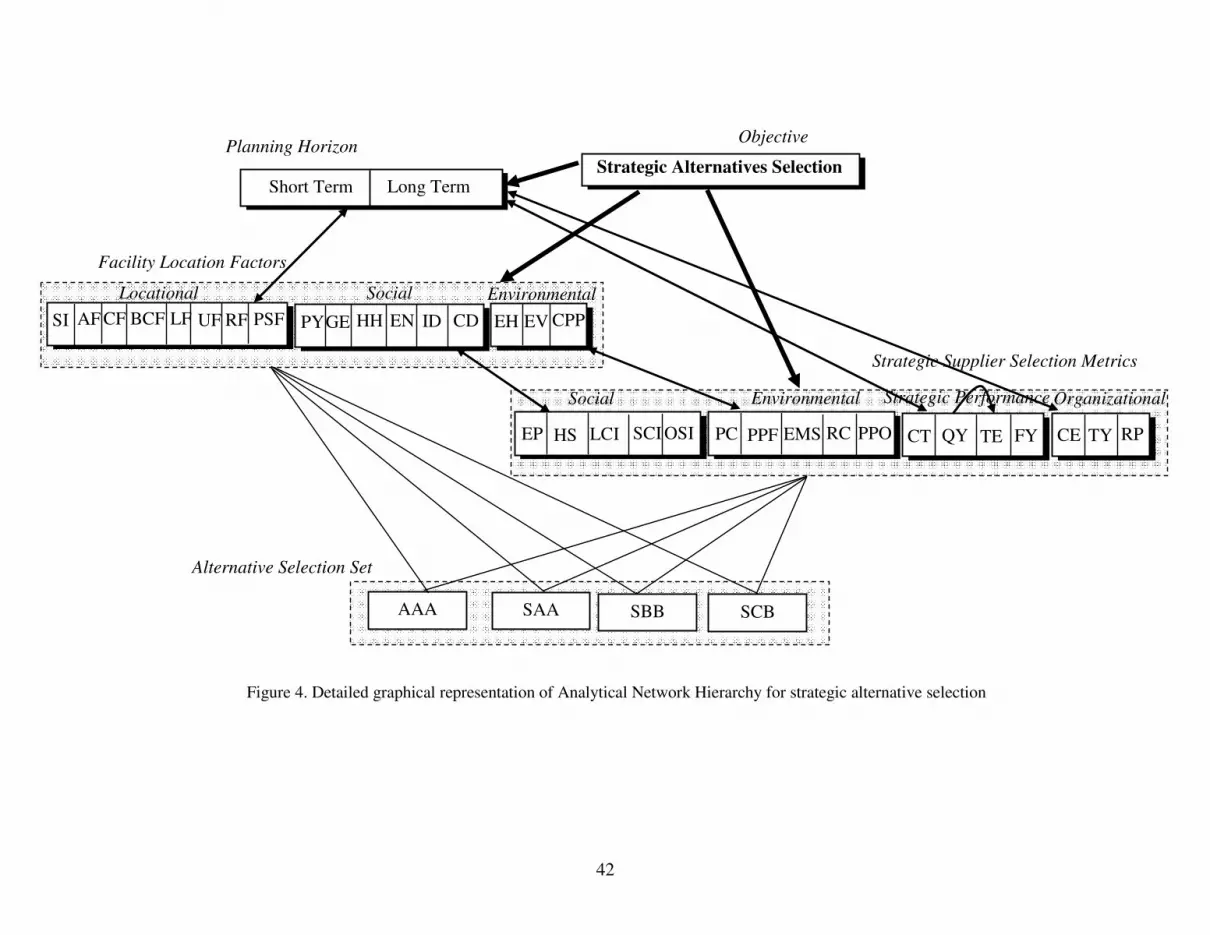
The letters identifying each of the arcs represent specific sub-matrices within the
supermatrix. A more detailed set of factors within the decision network, with those
specifically identified for each of the clusters, appears in Figure 4.
4.3. Elicitation of pairwise comparison
Pairwise comparisons will need to be elicited for this model. Typically, a team of decision
makers will need to be included in this type of strategic decision making exercise. The
team should probably include managers from a variety of functions including operations,
engineering, procurement, marketing, human resources and environmental areas, since
factors in each of these organizational functional areas will be evaluated.
Pairwise comparison questions examples include the following:
1) To assess the importance of the factors to the decision an example pairwise
comparison question would be: "with respect to the overall decision, how
much more important is Strategic Locational Issues (SI) when compared to
Labor Factors for a location (LF)?"
2) To assess the impact on a cluster from other clusters (interdependencies
among clusters) an example question would be: "How much more important
is the impact of “Cost” than “Quality” in the “Short Term” for the
organization?"
17
3) Pairwise comparison questions regarding the impact of the components
within its cluster set: For example for strategic performance metrics relative
importance on other strategic performance metrics, "How much more
influence does “Quality” have on “Cost” when compared to “Flexibility”?”
4) Pairwise comparison questions regarding the relative performance of
alternatives on the various factors: for example "With respect to Community
Factors (CF), how much better does AAA perform when compared to
SAA?").
These questions are usually answered in an anchored range of descriptions from
Extremely more (a value of 9) to Extremely less (a value of 1/9) (see Saaty 1980).
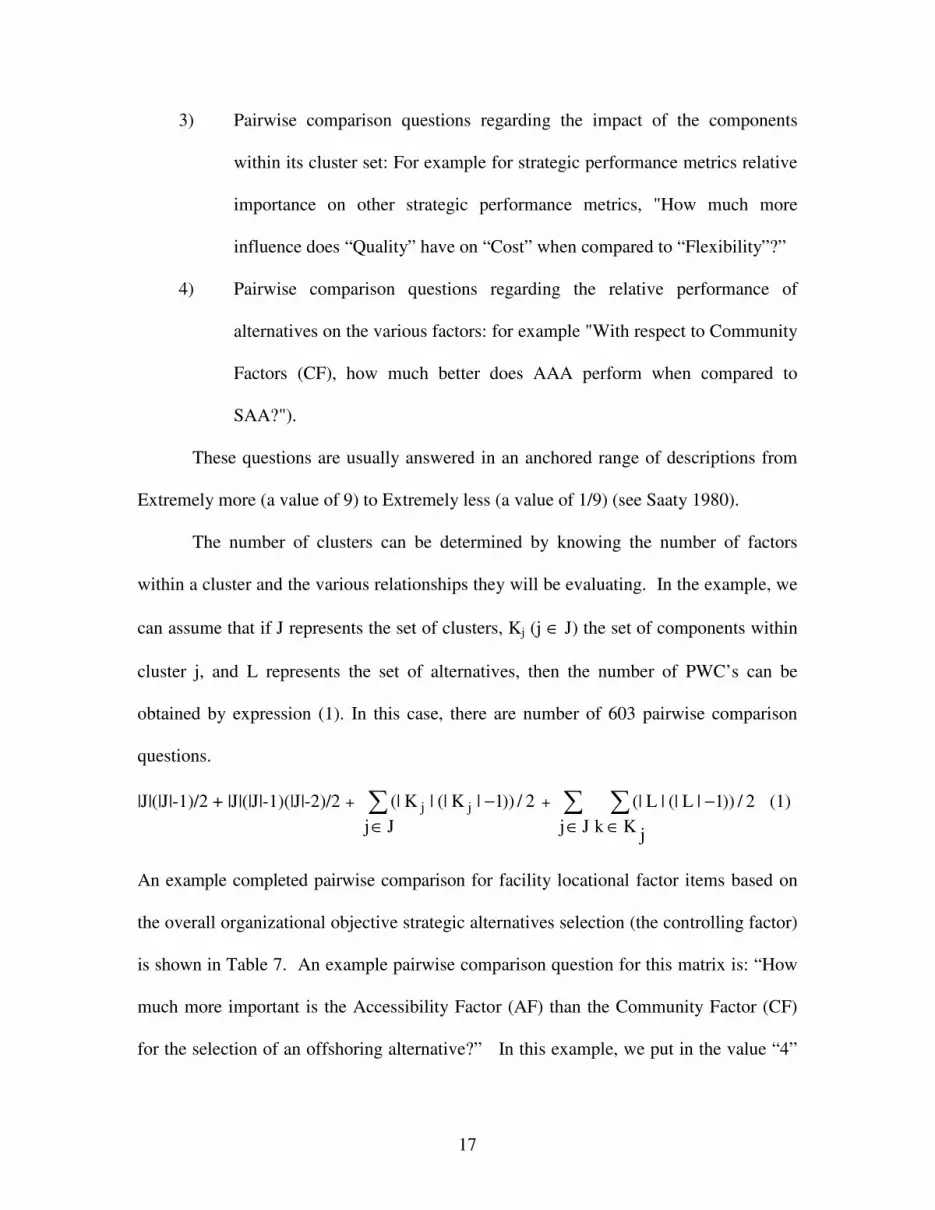
The number of clusters can be determined by knowing the number of factors
within a cluster and the various relationships they will be evaluating. In the example, we
can assume that if J represents the set of clusters, Kj (j ∈ J) the set of components within
cluster j, and L represents the set of alternatives, then the number of PWC’s can be
obtained by expression (1). In this case, there are number of 603 pairwise comparison
questions.
|J|(|J|-1)/2 + |J|(|J|-1)(|J|-2)/2 + ∑∈
−
Jj2/))1|K(||K(| jj + ∑∑
∈
−
∈ jKk2/))1|L(||L(|
Jj (1)
An example completed pairwise comparison for facility locational factor items based on
the overall organizational objective strategic alternatives selection (the controlling factor)
is shown in Table 7. An example pairwise comparison question for this matrix is: “How
much more important is the Accessibility Factor (AF) than the Community Factor (CF)
for the selection of an offshoring alternative?” In this example, we put in the value “4”

18
in Table 7 which means that management responded with AF as moderately more
important than CF.
4.4. Calculation of relative importance of the factors (“weights”)
Once the pairwise comparisons are completed, the local priority vector w (defined as the
eigenvector) is computed as the unique solution to:
,max wAw λ= (2)
Where λmax is the largest eigenvalue of A. The solution for the eigenvalues and relative
importance weights may be calculated from Web HIPRE3+ (Mustajoki and Hämäläinen
1999), an Internet interactive software available for decision analysis
(http://www.hipre.hut.fi/).
The results of the pairwise comparison matrix for the strategic performance
cluster (Table 7) show that strategic issues factor (SI) was perceived to be the most
important locational factor (0.273). The relative importance weights of this matrix are
then introduced into the supermatrix at a later stage.
4.5. Formulation of supermatrix from the weights
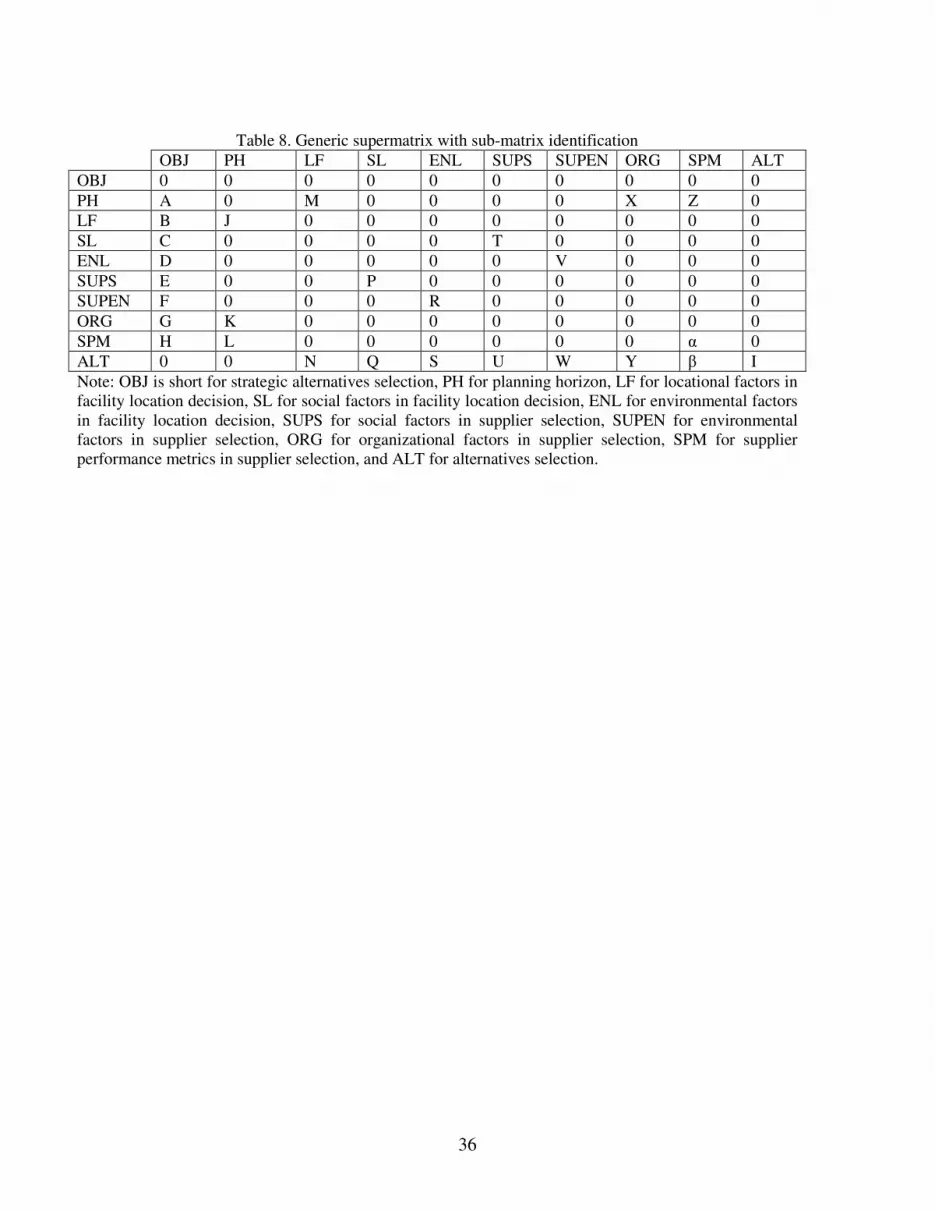
Table 8 shows the structure of the supermatrix for the ANP decision network that is
considered in the case. In Table 8, the second row (and column) represents the objective
or “decision” element (i.e. Strategic Offshoring Alternatives Selection). The next eight
rows (and columns) represent the clusters (i.e., planning horizon, locational factors in
facility location decision, social factors in facility location decision, environmental
factors in facility location decision, social factors in supplier selection, environmental
factors in supplier selection, strategic supplier performance factors, and organizational
factors in supplier selection), and the final one row (and column) represents the

19
alternatives cluster. Finally, to facilitate convergence (Section 4.6 below), Saaty (1996)
recommends the addition of the interdependence of each alternative on itself. Thus an
identity matrix (I) is included in the supermatrix for the alternatives cluster. The letters in
the cells are submatrices and match the letters on the arcs in Figure 3.
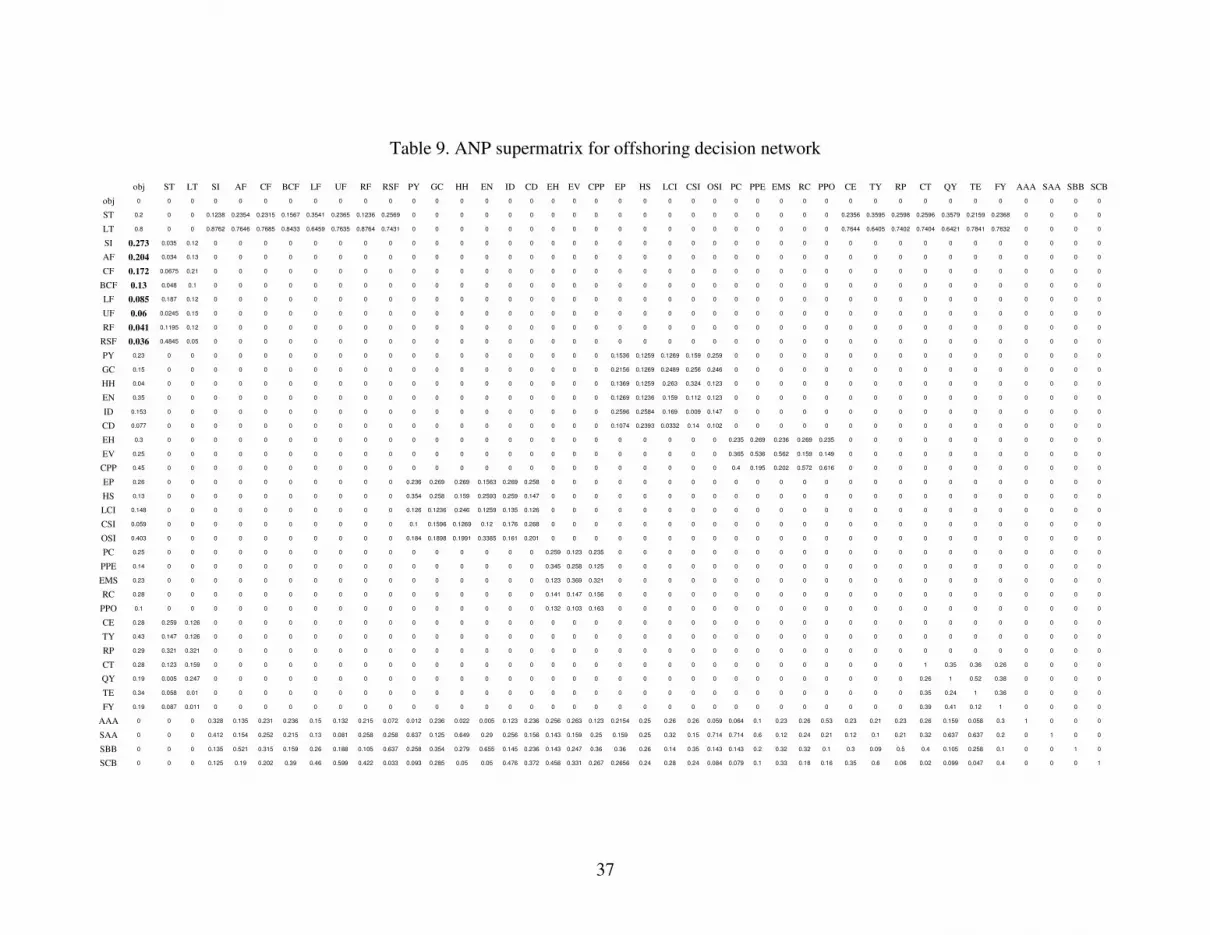
All the salient factors in this decision network (41 total factors in all) and their
respective relative importance weights are shown in Table 9. Notice that in Table 9 the
bolded numbers (also representing submatrix “B” from Table 8) are the same as the
relative importance weights for the locational factors on the overall offshoring decision
calculated in Table 7. This is the original unadjusted supermatrix that will be used in the
evaluation of the alternatives.
4.6. Calculation of long-term (“stable”) weights from the supermatrix
To arrive at the final solution, a set of stable weights will need to be determined. To do
this we initially have to normalize the supermatrix in Table 9 -- divide each element by
its column sum -- so that each column adds to one (making the supermatrix “column
stochastic”). This will help to guarantee convergence to a stable set of weights. The
normalized supermatrix is then raised to a significantly large power. This execution
provides the converged (or stable) weights of the elements of the network on one another,
similar to a Markovian analysis. The numbers of interest in the resulting supermatrix are
weights of the alternatives on the decision, i.e., the last 4 rows of the first column. The
final weights of the four alternatives, which were obtained after raising the supermatrix to
the 64th power, are WALT, OBJ = (0.188, 0.293, 0.28, 0.239). These results show that the

20
second alternative, Supplier A in Location A (SAA) would be the best overall location
and supplier to be selected.
4.7. Completing a sensitivity analysis
There is no one approach in applying sensitivity analysis within ANP. Typically, some
form of perturbation to the initial set of weights of one factor or cluster of factors can be
made to determine the sensitivity of the solution. A large supermatrix, such as this one,
with many existing relationships will usually result in relatively little change (a robust
solution) to the final results. The sensitivity analysis will inform us if our solution is
robust. To apply a sensitivity analysis evaluation to the decision network in Figure 3, we
will perturb sub-matrix M of Table 8 (weights of the PH cluster with respect to LF
cluster), other sub-matrices can be chosen.
To complete this analysis we specifically alter the weights of ST with respect to
various factors of LF cluster in the perturbation sub-matrix M. We do with three extreme
situations: the weight of ST with respect to all factors of LF cluster is 0 (represented by
WST=0), the weight of ST with respect to all factors of LF cluster is 0.5 (represented by
WST=0.5), and the weight of ST with respect to all factors of LF cluster is 1 (represented
by WST=1). Correspondingly, we have WLT=1 (when WST=0), WLT=0.5 (when WST=0.5),
and WLT=0 (when WST=1). To complete the analysis, the three perturbations are
introduced into the ANP supermatrix Table 9, the resulting supermatrix is normalized,
and then raised to a large power to obtain the final set of weights for each of the
perturbations (see Table 10). The results show that all levels the rank ordering of the four
alternatives has no changes (SAA is the best constantly, while SBB the second, SCB the
21
third, AAA the fourth), and the values of the four alternatives fluctuate very little.
Therefore, the original ANP solution WALT, OBJ
= (0.188, 0.293, 0.28, 0.239) can be
viewed as being robust. Additional perturbations, holding the remaining items constant
show similar results. Yet, additional evaluations may be completed by altering the
various factors and alternatives that should be considered. We will not do that at this
stage.
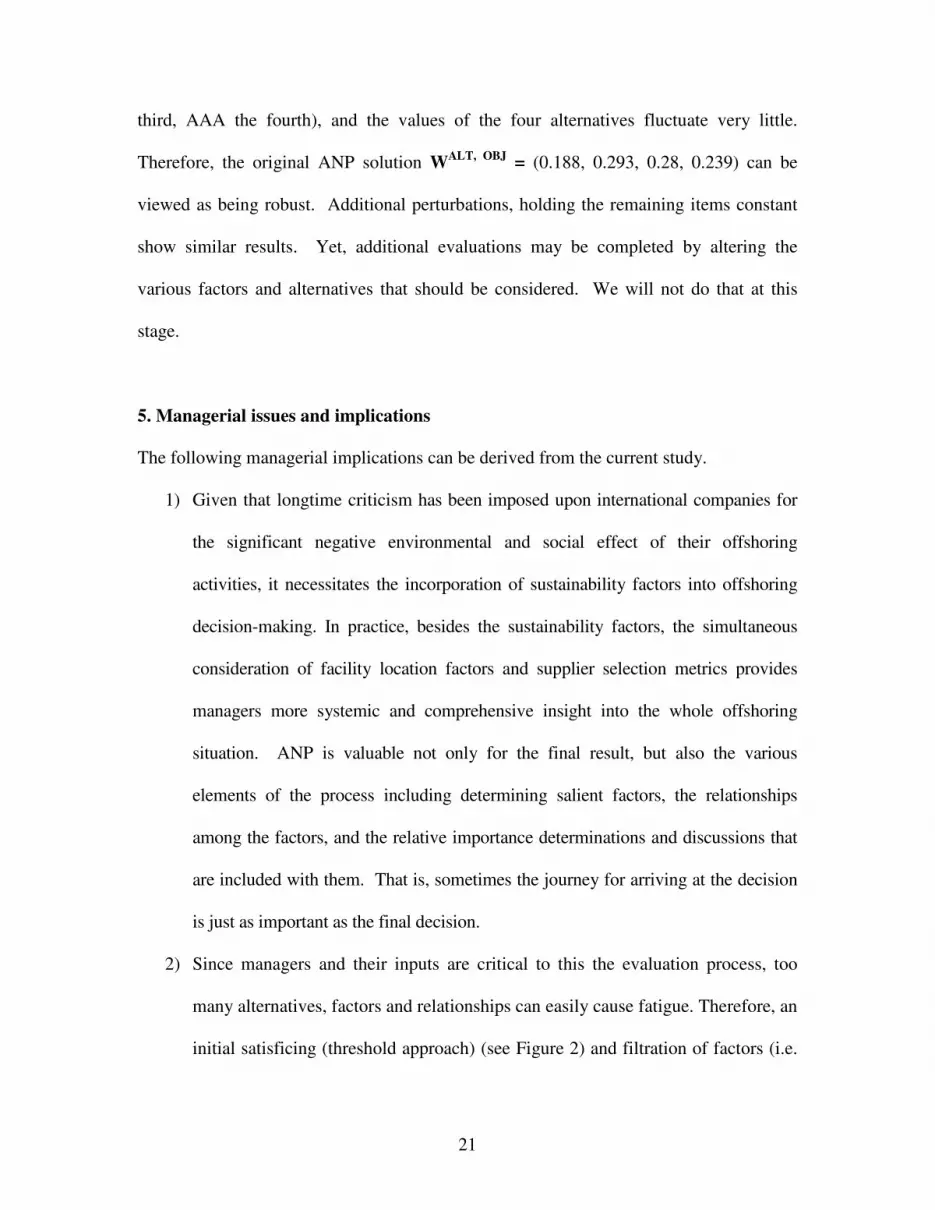
5. Managerial issues and implications
The following managerial implications can be derived from the current study.
1) Given that longtime criticism has been imposed upon international companies for
the significant negative environmental and social effect of their offshoring
activities, it necessitates the incorporation of sustainability factors into offshoring
decision-making. In practice, besides the sustainability factors, the simultaneous
consideration of facility location factors and supplier selection metrics provides
managers more systemic and comprehensive insight into the whole offshoring
situation. ANP is valuable not only for the final result, but also the various
elements of the process including determining salient factors, the relationships
among the factors, and the relative importance determinations and discussions that
are included with them. That is, sometimes the journey for arriving at the decision
is just as important as the final decision.
2) Since managers and their inputs are critical to this the evaluation process, too
many alternatives, factors and relationships can easily cause fatigue. Therefore, an
initial satisficing (threshold approach) (see Figure 2) and filtration of factors (i.e.

22
choice of salient factors, see section 4.1) is needed to make the decision-making
process less complex and more efficient. With 603 pairwise comparisons that
have to be completed the analysis may become too cumbersome. Dividing up the
discussion into phases over multiple days or by different groups may mitigate
some of the fatigue. But, a useful aspect of this analysis is that after an initial
application of the model, future iterations may only require changes in some of
the factors and relationships. That is, some scores will change very little over
time.
3) The technique provides a ranking of the final alternatives, which provides a
measure for performance gaps among various offshoring alternatives, which the
management can use effectively. For example, a comparison and evaluation
between affiliates and suppliers is captured, which may help create some
competition among affiliates and suppliers who may wish to benchmark their
organizations against each other. Further, the results can provide a negotiating
tool by the buyer to encourage the corresponding performance improvement of
unselected candidates.
6. Summary and conclusion
An ANP model for strategic offshoring decisions has been proposed in this paper. The
selection process effectively considered strategic, operational, tangible and intangible
measures; facility location factors and strategic supplier selection factors are also
incorporated simultaneously into the evaluation process. In addition to these typical
business and economic factors, sustainability factors including both environmental and
social sustainability metrics and factors were introduced. The model also integrated the

23
dynamic aspects of the competitive environment in evaluating various offshoring
alternatives. A case illustration is applied to demonstrate the applicability of the model. It
is shown that to obtain precise and accurate input from various managerial decision-
making levels in implementing the proposed methodology is significant.
There are a variety of managerial implications, some of which we touched upon,
related to the methodology proposed. The technique has significant flexibility to also act as
a benchmarking and process improvement tool, for supplier negotiation purposes, and
decisions regarding supplier development initiatives.
Even with all the advantages of this approach, there are some limitations and also
room for further research. The first major issue is that the example provided here is only
exemplary. An actual application to help validate the approach is necessary. We have
made some suppositions on the effort and complexity of the methodology, yet managers
may not necessarily view this approach as more complex than their current practices for
offshoring determination and selection. In addition, we did not fully develop early
threshold and filtering approaches which may be used with this methodology at the front
end. In addition the final results may be integrated with optimization tools at the back-end.
These two items provide ample opportunity for future research.

24
References
Antràs, P. and Helpman, E., 2004, Global Sourcing. Journal of Political Economy, 112, 552-580.
Antràs, P., Garicano, L. and Rossi-Hansberg, E., 2006, Offshoring in a knowledge economy. Quarterly Journal of Economics, 121, 31-77.
Araz, C., Ozfirat, P. M. and Ozkarahan, I., 2007, An integrated multicriteria decision-making methodology for outsourcing management. Computers and Operations Research, 34, 3738-3756.
Ash, C. G., 2007, Strategic planning and outsourcing, in Handbook of Information
Technology in Organizations and Electronic Markets, by Salazar, A. J. and Sawyer, S. (Editors) (New Jersey : World Scientific).
Beatley, T., 1998, The vision of sustainable communities. In Cooperating with Nature, by Burby, R. J. (Editor) (Washington D C: Joseph Henry Press). Bossel, H., 1999, Indicators for sustainable development: theory, method, applications, International Institute for Sustainable Development, Winnipeg, Manitoba Canada. Retrieved on 10 April 2008. Available from: http://www.iisd.org/pdf/balatonreport.pdf Brouwer, A. E., Mariotti, I. and van Ommeren, J. N., 2004, The firm relocation decision: an empirical investigation, The Annals of Regional Science, 38, 335-347. Brown, D., 2008, It is good to be green: environmentally friendly credentials are influencing business outsourcing decisions. Strategic Outsourcing: An international
Journal, 1, 87-95. Brush, T. H., Maritan, C. A. and Karnani, A., 1999, The plant location decision in multinational manufacturing firms: an empirical analysis of international business and manufacturing strategy perspectives. Production and Operations Management, 8, 109-132.
Cao, Q. and Wang, Q., 2007, Optimizing vendor selection in a two-stage outsourcing process. Computers and Operations Research, 34, 3757-3768.
Carod, J. M. A., 2005, Determinants of industrial location: an application for Catalan municipalities. Papers in Regional Science, 84, 105–120.
Carter J. R., Maltz A. and Maltz E., 2008, How procurement managers view low cost country sourcing: a comparative study of perceptions from Asia and North America. The
19th Annual North American Research and Teaching Symposium on Purchasing and
Supply Chain Management, Tempe, AZ, 2008.

25
Chan, F.T.S., 2003, Performance measurement in a supply chain. International Journal of
Advanced Manufacturing Technology, 21, 534-548. Chan, F. T. S. and Kumar, N., 2007, Global supplier development considering risk factors using fuzzy extended AHP-based approach. Omega, 35, 417-431.
Daly, H. E., 1995, Against free trade: neoclassical and steady-state perspectives. Journal
of Evolutionary Economics, 5, 313-326.
de Almeida, A. T., 2007, Multi-criteria decision model for outsourcing contracts selection based on utility function and ELECTRE method. Computers and Operations Research,
34, 3569-3574.
Doh, J. P., 2005, Offshore outsourcing: implications for international business and strategic management theory and practice. Journal of Management Studies, 42, 695–704.
Environmental Sustainability Index (ESI), 2008, World Leaders of Tomorrow, Yale University, Columbia University. Retrieved on 10 April 2008. Available from: http://sedac.ciesin.columbia.edu/es/esi/
Farrell, D., 2005, Offshoring: value creation through economic change. Journal of
Management Studies, 42, 675–683.
Gauthier, C., 2005, Measuring corporate social and environmental performance: the extended life-cycle assessment. Journal of Business Ethics, 59, 199-206.
Gil, M. J. Á., Jiménez, J. B. and Lorente, J. J. C., 2001, An analysis of environmental management, organizational context and performance of Spanish hotels. Omega, 29, 457-471.
Global Reporting Initiative (GRI), 2008, Retrieved on 10 April 2008. Available from: http://www.globalreporting.org/ReportingFramework/G3Guidelines/
Globerman, S. and Vining A. R., 2006, The outsourcing decision: a strategic framework, in Global Outsourcing Strategies: An International Reference on Effective Outsourcing
Relationships, by Barrar, P. and Gervais, R. (Editors) (Hampshire UK: Gower).
Gottfredson, M., Puryear, R. and Phillips, S., 2005, Strategic sourcing from periphery to the core. Harvard Business Review, 83, 132-139.
Greaver, M. F., 1998, Strategic Outsourcing: A Structured Approach to Outsourcing
Decisions and Initiatives (New York: American Management Association).
Grossman, G. M. and Helpman, E., 2005, Outsourcing in a global economy. Review of
Economic Studies, 72, 135–159.

26
Grossman, G. M. and Helpman, E., 2002, Integration versus outsourcing in industry equilibrium. Quarterly Journal of Economics, 117, 85-120.
Grossman, G. M and Helpman, E., 2004, Managerial incentives and the international organization of production. Journal of International Economics, 63, 237-262.
Handfield, R., Walton, S. V., Sroufe R. and Melnyk, S. A., 2002, Applying environmental criteria to supplier assessment: a study in the application of the Analytical Hierarchy Process. European Journal of Operational Research, 141, 70-87.
Hayter, R., 1997, The Dynamics of Industrial Location (NJ: John Wiley & Sons).
Heikkilä, J. and Cordon, C., 2002, Outsourcing: a core or non-core strategic management decision? Strategic Change, 11, 183-193.
Humphreys P. K., Wong Y. K. and Chan, F. T. S., 2003, Integrating environmental criteria into the supplier selection process. Journal of Materials Processing Technology, 138, 349-356.
Jharkharia, S. and Shankar, R., 2007, Selection of logistics service provider: an analytic network process (ANP) approach, Omega, 35, 274-289.
Kannan, V. and Tan, K. C., 2002, Supplier selection and assessment: their impact on business performance. Journal of Supply Chain Management, 38, 11-21.
Klassen, R. D. and Whybark, D. C., 1999, Environmental management in operations: the selection of environmental technologies. Decision Sciences, 30, 601-631.
Labuschagne, C., Brent, A.C. and Claasen, S.J., 2005, Environmental and social impact considerations for sustainable project life cycle management in the process industry. Corporate Social Responsibility and Environmental Management, 12, 38-54.
Levy, D. L., 1995, The environmental practices and performance of transnational corporations. Transnational Corporations, 4, 44-67.
Levy, D. L., 2005, Offshoring in the new global political economy. Journal of
Management Studies, 42, 685–693.
Li, Y., Liu, Y., Li, M. F. and Wu, H. B., 2008, Transformational offshore outsourcing: empirical evidence from alliances in China, Journal of Operations Management, 26, 257-274.
Lin, S. C. and Lee, Y. J., 2005, Sustainable community indicators: case of Mingshan community, Taipei, Taiwan. 8th International Conference of the Asian Planning Schools
Association, Penang, Malaysia, 2005.

27
McLaren, J. E., 2000, Globalization and vertical integration. American Economic Review,
90, 1239-1254.
McIvor, R. T., Humphreys, P. K. and McAleer, W. E., 1997, A strategic model for the formulation of an effective make or buy decision. Management Decision, 35, 169-178.
Min, H. and Galle, W. P., 1997, Green purchasing strategies: trends and implications. International Journal of Purchasing and Materials Management, 33, 10-17.
Moriarty, B. M., 1983, Industry Location and Community Development (Charlotte: University of North Carolina).
Mudambi, R., 1995, the MNE investment location decision: some empirical evidence. Managerial and Decision Economics, 16, 249-257.
Mustajoki, J. and Hämäläinen, R. P., 1999, Web-HIPRE - a Java applet for AHP and value tree analysis. 5th International Symposium on the Analytic Hierarchy Process,
Kobe, Japan, August 12-14, 1999.
Narasimhan, R., Talluri, S. and Mahapatra, S. K., 2006, Multiproduct, multicriteria model for supplier selection with product life-cycle considerations. Decision Sciences, 37, 577-603.
Nellore, R. and Söderquist, K., 2000, Strategic outsourcing through specifications. Omega, 28, 525-540.
Noci, G., 1997, Designing ‘green’ vendor rating systems for the assessment of a supplier's environmental performance. European Journal of Purchasing and Supply
Management, 3, 103-114.
OECD, 2007, Offshoring and Employment: Trends and Impacts (Paris: OECD).
Prasad, S., Babbar, S. and Calis, A., 2000, International operations management and operations management research: a comparative analysis. Omega, 28, 97-110.
Presley, A., Meade, L.M., and Sarkis, J., 2007, A strategic sustainability justification methodology for organizational decisions: a reverse logistics illustration. International
Journal of Production Research, 45, 4595-4620.
Quinn, J. B. and Hilmer, F.G., 1994, Strategic outsourcing. Sloan management review, 35, 43–55.
Quinn, J. B., 1999, Strategic outsourcing: leveraging knowledge capabilities. Sloan
management review, 40, 9–21.

28
Rivoli, P., 2003, Labor standards in the global economy: issues for investors. Journal of
Business Ethics, 43, 223–232.
Ruiz-Torres, A. J. and Mahmoodi, F., 2008, Outsourcing decision in manufacturing supply chains considering production failure and operating costs. International Journal of
Integrated Supply Management, 4, 141-158. Saaty, T. L., 1980, The Analytic Hierarchy Process: Planning, Priority Setting, Resource
Allocation (New York: McGraw Hill).
Saaty, T. L., 1996, Decision Making with Dependence and Feedback: The Analytic
Network Process (PA: RWS Publications).
Sarkis, J., ed., 2006, Greening the Supply Chain, (Berlin: Springer).
Sarkis, J., Hasan, A., and Shankar, R., (2008), Evaluating environmentally conscious manufacturing barriers with interpretive structural modeling. Environmental Conscious
Manufacturing, edited by Surendra Gupta, (UK: Taylor and Francis), 505-520.
Sarkis, J. and Sundarraj, J., 2000, “Factors for Strategic Evaluation of Enterprise Information Technologies,” International Journal of Physical Distribution and Logistics
Management, 30, 196-220.
Sarkis, J. and Sundarraj, R. P., 2002, Hub location at Digital Equipment Corporation: a comprehensive analysis of qualitative and quantitative factors. European Journal of
Operational Research, 137, 336-347. Sarkis, J. and Talluri, S., 2002, A model for strategic supplier selection. The Journal of Supply Chain Management, 38, 18–28. Simpson, P. M., Siguaw, J. A. and White, S. C., 2002, Measuring the performance of suppliers: an analysis of evaluation processes. The Journal of Supply Chain Management, 38, 29-41. UN, 2007, Indicators of Sustainable Development: Guidelines and Methodologies. The United Nations, New York. Retrieved on 10 April 2008. Available from: http://www.un.org/esa/sustdev/natlinfo/indicators/guidelines.pdf
Watts, H. D., 1987, Industry Geography (New York: Wiley).
Wheelwright, S. C. and Hayes, R. H., 1985, Competing through manufacturing. Harvard
Business Review, 63, 99-109.

29
Table 1. Locational factors in facility location decision * Strategic Issues (SI) * Labor Factors (LF)
Competition Labor Costs Current Facilities Availability of Semi and Unskilled Labor Market Size and Penetration Availability of Skilled Labor Expansion Capabilities Education System * Accessibility Factors (AF) Extent of Labor Unionization Accessibility of Suppliers Right-to-work Law Accessibility of Customers Training Support Accessibility of Transportation Service * Utility Factors (UF)
Proximity of Production Material Sources Suitability of Electrical Service Proximity of Natural Markets Suitability of Telephone Service Proximity of National Markets Availability of Natural Gas Proximity of Large Cities Adequacy of Cost of Water Supply * Community Factors (CF) Suitability of Waste Disposal Service Physical Attractiveness * Risk Factors (RF)
Community Attitude towards Industry Foreign Exchange Risk Social Make-up of Inhabitants Government Intervention Suitability of Houses Political Risk Community Race Relations Economic Risk Fire Protection and Insurance Legal Risk Police Protection Natural Disaster Risk Adequacy of Local School * Plant Site Factors (RSF)
Suitability of Environmental Amenity Suitability of Site Parking Facilities Suitability of Medical Facilities Site Development and Construction Costs Suitability of Shopping Facilities Room for Expansion * Business Climate Factors (BCF) Plant Site Topographic Features Suitability of Repair and Maintenance Services Plant Site Adequacy and Costs Suitability of Business, Facility and Legal Plant Building for Sale or Lease Compatibility of Other Industry Financial and Special Factors (FSF) Suitability of Building Zones Hometown of Company Official Suitability of Zoning Restrictions Tax Structure Suitability of Environmental Regulations Government Incentive Availability of Public Technical Training Repatriation Allowances State of Local Planning Assistance Source: compiled from Hayter (1997: 107) (Watts 1987:170 (adapted from Moriarty 1983:70-71)), Sarkis and Sundarraj (2002: Table 1). Note: the selected salient factors to appear in the ANP model in this paper are identified by *.
30
Table 2. Strategic supplier selection factors Strategic Performance Measures Organizational Factors
* Cost (CT) * Culture (CE) Low Initial Price Feeling of Trust Compliance with Cost Analysis system Management Attitude/Outlook for the Future Cost Reduction Activities Strategic Fit Compliance with Sectoral Price Behavior Top Management Compatibility * Quality (QY) Compatibility among Levels and Functions Conformance Quality Suppliers Organizational Structure and Consistent Delivery * Technology (TY) Quality Philosophy Technological Compatibility Prompt Response Assessment of Future Manufacturing * Time (TE) Suppliers Speed in Development Delivery Speed Suppliers Design Capability Product Development Time Technical Capability Partnership Formation Time Current Manufacturing Facilities/Capabilities * Flexibility (FY) * Relationship (RP) Product Volume Changes Long-term Relationship Short Set-up Time Relationship Closeness
Conflict Resolution Communication Openness Service Capability Reputation for Integrity Innovativeness (IS) New Launch of Products New Use of Technologies
Source: based on Sarkis and Talluri (2002: Table 1); see also Chan (2003). Note: the selected salient factors are shown by *.

31
Table 3. Environmental metrics in supplier selection decision Categories Factors Sub-factors
* Pollution Controls (PC) Remediation End-of-pipe Controls
* Pollution Prevention (PPE) Product Adaptation Process Adaptation
Environmental Practices
* Environmental Management
System (EMS)
Establishment of Environmental Commitment and Policy Identification of Environmental Aspects Planning of Environmental Objectives Assignment of Environmental Responsibility Checking and Evaluation of Environmental Activities
* Resource Consumption
(RC)
Consumption of Energy Consumption of Raw Material Consumption of Water Environmental
Performance * Pollution Production
(PPO)
Production of Polluting Agents Production of Toxic Products Production of Waste
Source: adapted from Klassen and Whybark (1999: 606), and Gauthier (2005: 200). Note: the selected salient factors are shown by *.

32
Table 4. Social metrics in supplier selection decision Categories Factors Sub-factors
* Employment Practices
(EP)
Disciplinary and Security Practices Employee Contracts Equity Labor Sources Diversity Discrimination Flexible Working Arrangements Job Opportunities Employment Compensation Research and Development Career Development
Internal Social Criteria
* Health and Safety
(HS)
Health and Safety Incidents Health and Safety Practices
* Local Communities
Influence
(LCI)
Health Education Housing Service Infrastructure Mobility Infrastructure Regulatory and Public Services Supporting Educational Institutions Sensory Stimuli Security Cultural Properties Economic Welfare and Growth Social Cohesion Social Pathologies Grants and Donations Supporting Community Projects
* Contractual Stakeholders
Influence
(CSI)
Procurement Standard Partnership Screens and Standards Consumers Education
External Social Criteria
* Other Stakeholders
Influence
(OSI)
Decision Influence Potential Stakeholder Empowerment Collective Audience Selected Audience Stakeholder Engagement
Source: complied from Gauthier (2005), social indicators of Global Reporting Initiative (GRI, 2008), Presley et al. (2007), and Labuschagne et al. (2005). Note: the selected salient factors are shown by *.

33
Table 5. Environmental factors and sub-factors in facility location decision Factors Sub-factors *Environmental
Health
(EH)
Environmental Burden of Disease Adequate Sanitation Drinking Water
Indoor Air Pollution Urban Particulates Local Ozone
*Ecosystem
Vitality
(EV)
Regional Ozone Sulfur Dioxide Emissions Water Quality Water Stress Conservation Risk Effective Conservation Critical Habitat Protection Marine Protected Areas Growing Stock of Forestry Marine Trophic
Trawling Intensity of Fishery Irrigation Stress Agricultural Subsidies Intensive Cropland Burned Land Area of Agriculture Pesticide Regulation Greenhouse Gas Emission/Capita Greenhouse Gas Emissions/Electricity Generated Industrial Carbon Intensity
*Consumption
and Production
Patterns
(CPP)
Materials Use Energy Use Depletion of Nonrenewable Resource Regeneration of Renewable Resource Green Consumption
Waste Generation Waste Treatment Waste Disposal Waste Recycling
Source: based on Environmental Performance Index (EPI, 2008); see also Lin and Lee (2005: Table 1), and UN (2007: 14). Note: the selected salient factors are shown by *.

34
Table 6. Social factors and sub-factors in facility location decision Factors Sub-factors
* Poverty (PY)
Income Poverty Income Inequality Sanitation Drinking Water Access to Energy Living Conditions
* Governance (GC) Corruption Crime
* Health (HH)
Life Expectation at Birth Health Care Delivery Nutritional Status Health Status and Risks Old Age Provisions
* Education (EN) Educational Level Literacy
Demographics (DS) Population Growth Tourism
Natural Hazards (NH) Vulnerability to Natural Hazards Disaster Preparedness and Response
* Individual Development
(ID)
Civil Liberties and Human Rights Equity Individual Autonomy and Self-determination Right to Work Social Integration and participation gender and class-specific role material standard of living qualification specialization family and life planning horizon leisure and recreation arts
* Community Development
(CD)
Security Sense Cultural Properties Social Cohesion Social Pathologies
Source: based on the revised CSD (the Commission on Sustainable Development) indicators (UN, 2007: 10-14); see also Bossel (1999: 17). Note: the selected salient factors are shown by *.

35
Table 7. Pairwise comparison matrix and relative importance weight results for facility locational factors cluster and impact on objective
Objective SI AF CF BCF LF UF RF RSF W
SI 1 2 4 5 2 5 4 2 0.273
AF 0.5 1 4 2 2 4 4 5 0.204
CF 0.25 0.25 1 4 4 5 2 5 0.172
BCF 0.2 0.5 0.25 1 5 4 4 4 0.13
LF 0.5 0.5 0.25 0.2 1 5 2 2 0.085
UF 0.2 0.25 0.2 0.25 0.2 1 5 4 0.06
RF 0.25 0.25 0.5 0.25 0.5 0.2 1 2 0.041
RSF 0.5 0.2 0.2 0.25 0.5 0.25 0.5 1 0.036
36
Table 8. Generic supermatrix with sub-matrix identification
OBJ PH LF SL ENL SUPS SUPEN ORG SPM ALT OBJ 0 0 0 0 0 0 0 0 0 0 PH A 0 M 0 0 0 0 X Z 0 LF B J 0 0 0 0 0 0 0 0 SL C 0 0 0 0 T 0 0 0 0 ENL D 0 0 0 0 0 V 0 0 0 SUPS E 0 0 P 0 0 0 0 0 0 SUPEN F 0 0 0 R 0 0 0 0 0 ORG G K 0 0 0 0 0 0 0 0 SPM H L 0 0 0 0 0 0 α 0 ALT 0 0 N Q S U W Y β I Note: OBJ is short for strategic alternatives selection, PH for planning horizon, LF for locational factors in facility location decision, SL for social factors in facility location decision, ENL for environmental factors in facility location decision, SUPS for social factors in supplier selection, SUPEN for environmental factors in supplier selection, ORG for organizational factors in supplier selection, SPM for supplier performance metrics in supplier selection, and ALT for alternatives selection.
37
Table 9. ANP supermatrix for offshoring decision network
obj ST LT SI AF CF BCF LF UF RF RSF PY GC HH EN ID CD EH EV CPP EP HS LCI CSI OSI PC PPE EMS RC PPO CE TY RP CT QY TE FY AAA SAA SBB SCB
obj 0 0 0 0 0 0 0 0 0 0 0 0 0 0 0 0 0 0 0 0 0 0 0 0 0 0 0 0 0 0 0 0 0 0 0 0 0 0 0 0 0
ST 0.2 0 0 0.1238 0.2354 0.2315 0.1567 0.3541 0.2365 0.1236 0.2569 0 0 0 0 0 0 0 0 0 0 0 0 0 0 0 0 0 0 0 0.2356 0.3595 0.2598 0.2596 0.3579 0.2159 0.2368 0 0 0 0
LT 0.8 0 0 0.8762 0.7646 0.7685 0.8433 0.6459 0.7635 0.8764 0.7431 0 0 0 0 0 0 0 0 0 0 0 0 0 0 0 0 0 0 0 0.7644 0.6405 0.7402 0.7404 0.6421 0.7841 0.7632 0 0 0 0
SI 0.273 0.035 0.12 0 0 0 0 0 0 0 0 0 0 0 0 0 0 0 0 0 0 0 0 0 0 0 0 0 0 0 0 0 0 0 0 0 0 0 0 0 0
AF 0.204 0.034 0.13 0 0 0 0 0 0 0 0 0 0 0 0 0 0 0 0 0 0 0 0 0 0 0 0 0 0 0 0 0 0 0 0 0 0 0 0 0 0
CF 0.172 0.0675 0.21 0 0 0 0 0 0 0 0 0 0 0 0 0 0 0 0 0 0 0 0 0 0 0 0 0 0 0 0 0 0 0 0 0 0 0 0 0 0
BCF 0.13 0.048 0.1 0 0 0 0 0 0 0 0 0 0 0 0 0 0 0 0 0 0 0 0 0 0 0 0 0 0 0 0 0 0 0 0 0 0 0 0 0 0
LF 0.085 0.187 0.12 0 0 0 0 0 0 0 0 0 0 0 0 0 0 0 0 0 0 0 0 0 0 0 0 0 0 0 0 0 0 0 0 0 0 0 0 0 0
UF 0.06 0.0245 0.15 0 0 0 0 0 0 0 0 0 0 0 0 0 0 0 0 0 0 0 0 0 0 0 0 0 0 0 0 0 0 0 0 0 0 0 0 0 0
RF 0.041 0.1195 0.12 0 0 0 0 0 0 0 0 0 0 0 0 0 0 0 0 0 0 0 0 0 0 0 0 0 0 0 0 0 0 0 0 0 0 0 0 0 0
RSF 0.036 0.4845 0.05 0 0 0 0 0 0 0 0 0 0 0 0 0 0 0 0 0 0 0 0 0 0 0 0 0 0 0 0 0 0 0 0 0 0 0 0 0 0
PY 0.23 0 0 0 0 0 0 0 0 0 0 0 0 0 0 0 0 0 0 0 0.1536 0.1259 0.1269 0.159 0.259 0 0 0 0 0 0 0 0 0 0 0 0 0 0 0 0
GC 0.15 0 0 0 0 0 0 0 0 0 0 0 0 0 0 0 0 0 0 0 0.2156 0.1269 0.2489 0.256 0.246 0 0 0 0 0 0 0 0 0 0 0 0 0 0 0 0
HH 0.04 0 0 0 0 0 0 0 0 0 0 0 0 0 0 0 0 0 0 0 0.1369 0.1259 0.263 0.324 0.123 0 0 0 0 0 0 0 0 0 0 0 0 0 0 0 0
EN 0.35 0 0 0 0 0 0 0 0 0 0 0 0 0 0 0 0 0 0 0 0.1269 0.1236 0.159 0.112 0.123 0 0 0 0 0 0 0 0 0 0 0 0 0 0 0 0
ID 0.153 0 0 0 0 0 0 0 0 0 0 0 0 0 0 0 0 0 0 0 0.2596 0.2584 0.169 0.009 0.147 0 0 0 0 0 0 0 0 0 0 0 0 0 0 0 0
CD 0.077 0 0 0 0 0 0 0 0 0 0 0 0 0 0 0 0 0 0 0 0.1074 0.2393 0.0332 0.14 0.102 0 0 0 0 0 0 0 0 0 0 0 0 0 0 0 0
EH 0.3 0 0 0 0 0 0 0 0 0 0 0 0 0 0 0 0 0 0 0 0 0 0 0 0 0.235 0.269 0.236 0.269 0.235 0 0 0 0 0 0 0 0 0 0 0
EV 0.25 0 0 0 0 0 0 0 0 0 0 0 0 0 0 0 0 0 0 0 0 0 0 0 0 0.365 0.536 0.562 0.159 0.149 0 0 0 0 0 0 0 0 0 0 0
CPP 0.45 0 0 0 0 0 0 0 0 0 0 0 0 0 0 0 0 0 0 0 0 0 0 0 0 0.4 0.195 0.202 0.572 0.616 0 0 0 0 0 0 0 0 0 0 0
EP 0.26 0 0 0 0 0 0 0 0 0 0 0.236 0.269 0.269 0.1563 0.269 0.258 0 0 0 0 0 0 0 0 0 0 0 0 0 0 0 0 0 0 0 0 0 0 0 0
HS 0.13 0 0 0 0 0 0 0 0 0 0 0.354 0.258 0.159 0.2593 0.259 0.147 0 0 0 0 0 0 0 0 0 0 0 0 0 0 0 0 0 0 0 0 0 0 0 0
LCI 0.148 0 0 0 0 0 0 0 0 0 0 0.126 0.1236 0.246 0.1259 0.135 0.126 0 0 0 0 0 0 0 0 0 0 0 0 0 0 0 0 0 0 0 0 0 0 0 0
CSI 0.059 0 0 0 0 0 0 0 0 0 0 0.1 0.1596 0.1269 0.12 0.176 0.268 0 0 0 0 0 0 0 0 0 0 0 0 0 0 0 0 0 0 0 0 0 0 0 0
OSI 0.403 0 0 0 0 0 0 0 0 0 0 0.184 0.1898 0.1991 0.3385 0.161 0.201 0 0 0 0 0 0 0 0 0 0 0 0 0 0 0 0 0 0 0 0 0 0 0 0
PC 0.25 0 0 0 0 0 0 0 0 0 0 0 0 0 0 0 0 0.259 0.123 0.235 0 0 0 0 0 0 0 0 0 0 0 0 0 0 0 0 0 0 0 0 0
PPE 0.14 0 0 0 0 0 0 0 0 0 0 0 0 0 0 0 0 0.345 0.258 0.125 0 0 0 0 0 0 0 0 0 0 0 0 0 0 0 0 0 0 0 0 0
EMS 0.23 0 0 0 0 0 0 0 0 0 0 0 0 0 0 0 0 0.123 0.369 0.321 0 0 0 0 0 0 0 0 0 0 0 0 0 0 0 0 0 0 0 0 0
RC 0.28 0 0 0 0 0 0 0 0 0 0 0 0 0 0 0 0 0.141 0.147 0.156 0 0 0 0 0 0 0 0 0 0 0 0 0 0 0 0 0 0 0 0 0
PPO 0.1 0 0 0 0 0 0 0 0 0 0 0 0 0 0 0 0 0.132 0.103 0.163 0 0 0 0 0 0 0 0 0 0 0 0 0 0 0 0 0 0 0 0 0
CE 0.28 0.259 0.126 0 0 0 0 0 0 0 0 0 0 0 0 0 0 0 0 0 0 0 0 0 0 0 0 0 0 0 0 0 0 0 0 0 0 0 0 0 0
TY 0.43 0.147 0.126 0 0 0 0 0 0 0 0 0 0 0 0 0 0 0 0 0 0 0 0 0 0 0 0 0 0 0 0 0 0 0 0 0 0 0 0 0 0
RP 0.29 0.321 0.321 0 0 0 0 0 0 0 0 0 0 0 0 0 0 0 0 0 0 0 0 0 0 0 0 0 0 0 0 0 0 0 0 0 0 0 0 0 0
CT 0.28 0.123 0.159 0 0 0 0 0 0 0 0 0 0 0 0 0 0 0 0 0 0 0 0 0 0 0 0 0 0 0 0 0 0 1 0.35 0.36 0.26 0 0 0 0
QY 0.19 0.005 0.247 0 0 0 0 0 0 0 0 0 0 0 0 0 0 0 0 0 0 0 0 0 0 0 0 0 0 0 0 0 0 0.26 1 0.52 0.38 0 0 0 0
TE 0.34 0.058 0.01 0 0 0 0 0 0 0 0 0 0 0 0 0 0 0 0 0 0 0 0 0 0 0 0 0 0 0 0 0 0 0.35 0.24 1 0.36 0 0 0 0
FY 0.19 0.087 0.011 0 0 0 0 0 0 0 0 0 0 0 0 0 0 0 0 0 0 0 0 0 0 0 0 0 0 0 0 0 0 0.39 0.41 0.12 1 0 0 0 0
AAA 0 0 0 0.328 0.135 0.231 0.236 0.15 0.132 0.215 0.072 0.012 0.236 0.022 0.005 0.123 0.236 0.256 0.263 0.123 0.2154 0.25 0.26 0.26 0.059 0.064 0.1 0.23 0.26 0.53 0.23 0.21 0.23 0.26 0.159 0.058 0.3 1 0 0 0
SAA 0 0 0 0.412 0.154 0.252 0.215 0.13 0.081 0.258 0.258 0.637 0.125 0.649 0.29 0.256 0.156 0.143 0.159 0.25 0.159 0.25 0.32 0.15 0.714 0.714 0.6 0.12 0.24 0.21 0.12 0.1 0.21 0.32 0.637 0.637 0.2 0 1 0 0
SBB 0 0 0 0.135 0.521 0.315 0.159 0.26 0.188 0.105 0.637 0.258 0.354 0.279 0.655 0.145 0.236 0.143 0.247 0.36 0.36 0.26 0.14 0.35 0.143 0.143 0.2 0.32 0.32 0.1 0.3 0.09 0.5 0.4 0.105 0.258 0.1 0 0 1 0
SCB 0 0 0 0.125 0.19 0.202 0.39 0.46 0.599 0.422 0.033 0.093 0.285 0.05 0.05 0.476 0.372 0.458 0.331 0.267 0.2656 0.24 0.28 0.24 0.084 0.079 0.1 0.33 0.18 0.16 0.35 0.6 0.06 0.02 0.099 0.047 0.4 0 0 0 1

38
Table 10. Sensitivity analysis of the illustrative case
Perturbations of matrix M
WST=0 WST=0.5 WST=1 Original
AAA (4th) 0.188 0.187 0.185 0.188
SAA (1st) 0.294 0.292 0.290 0.293
SBB (2nd) 0.278 0.283 0.280 0.280
Final weights
of the four alternatives
SCB (3rd) 0.240 0.238 0.237 0.239
39
Determine Salient Factors
Form Decision Network
Elicit Pairwise Comparison
Supermatrix Formulation
Calculate Stable Weights
Complete Sensitivity Adjustment
Yes
No
Make Decision
Figure 1. Various steps of ANP methodology
Feedback

40
All Potential
Alternatives
Four
Alternatives
One
Alternative
Threshold Evaluation ANP
Figure 2. Overview of the multi-staged alternative choice approach

41
Figure 3. A high level schematic of the network decision hierarchy for offshoring alternative selection
Planning
Horizon
Strategic
Performance
Metrics
Alternatives
Selection Set Strategic Offshoring
Alternatives Selection
Environmental
Factors
Locational
Factors
Social
Factors
Environmental
Factors
Social
Factors
Organizational
Factors
Facility
Location
Factors
Strategic Supplier
Selection Factors
J, M
P, T
A
L, Z
α
R, V
K, X
N Q
S
B, C, D
E, F, G, H
β
Y U
W
Note: The letters on the lines indicate sub-matrices in Table 8.
42
Strategic Alternatives Selection
DecSelection
Facility Location Factors
AAA
Alternative Selection Set
Figure 4. Detailed graphical representation of Analytical Network Hierarchy for strategic alternative selection
Planning Horizon
Short Term Long Term
Strategic Supplier Selection Metrics
Objective
SI AF CF BCF LF UF RF PSF PY GE HH EN ID CD EH EV CPP
PC PPF EMS RC PPO EP HS LCI SCI OSI CT QY TE FY CE TY RP
Locational Social Environmental
Social Environmental Strategic Performance Organizational
SAA SBB SCB