steel storage pallet racks in seismic zones
TRANSCRIPT
Steel storage pallet racks in seismic zones: Advanced vs. standard design strategies
Claudio Bernuzzi, Marco Simoncelli⁎
Department of Architecture, Built Environment and Construction Engineering, Politecnico di Milano, Milano, Italy
ABSTRACT
Steel storage pallet racks are used worldwide to efficiently store goods and products in situations where only limited space is available. Their use has increased remarkably in recent years, owing to the growing importance of the logistics services in the context of the global economy. Despite the quite limited costs of storage racks, essentially due to the extensive use of cold-formed members characterized by high levels of standardization, their safety is of paramount importance. An eventual collapse could in fact result in considerable economic losses and/or loss of human life. The design rules currently adopted, derived from those proposed for more conventional steel buildings, are unable to capture satisfactorily the overall rack response and hence need further improvements, especially for applications in seismic zones.
The paper reports the results of a study focussed on the development of more reliable approaches for designing racks against earthquakes. In particular, a wide range of cases of practical interest for routine design has been defined, which is comprised of racks that differ in terms of geometric layout and component performance. For each of them, the load carrying capacity corresponding to different values of the peak ground acceleration has been evaluated via two alternative design approaches: the well-known modal response spectrum analysis approach (MRSA) and an advanced strategy combining non-linear time-history analyses with the assessment of the damage in joints due to the cyclic excursions in plastic range (NLTH-LCF). Based on 56 design cases, requiring in total 1512 structural analyses, the proposed outcomes allow for a direct appraisal of the differences in load carrying capacity. At the same time, the influence of modelling the cyclic joint behavior is highlighted, with reference also to the change in key behavioural parameters, such as flexural strength and rotational stiffness.
1. Introduction
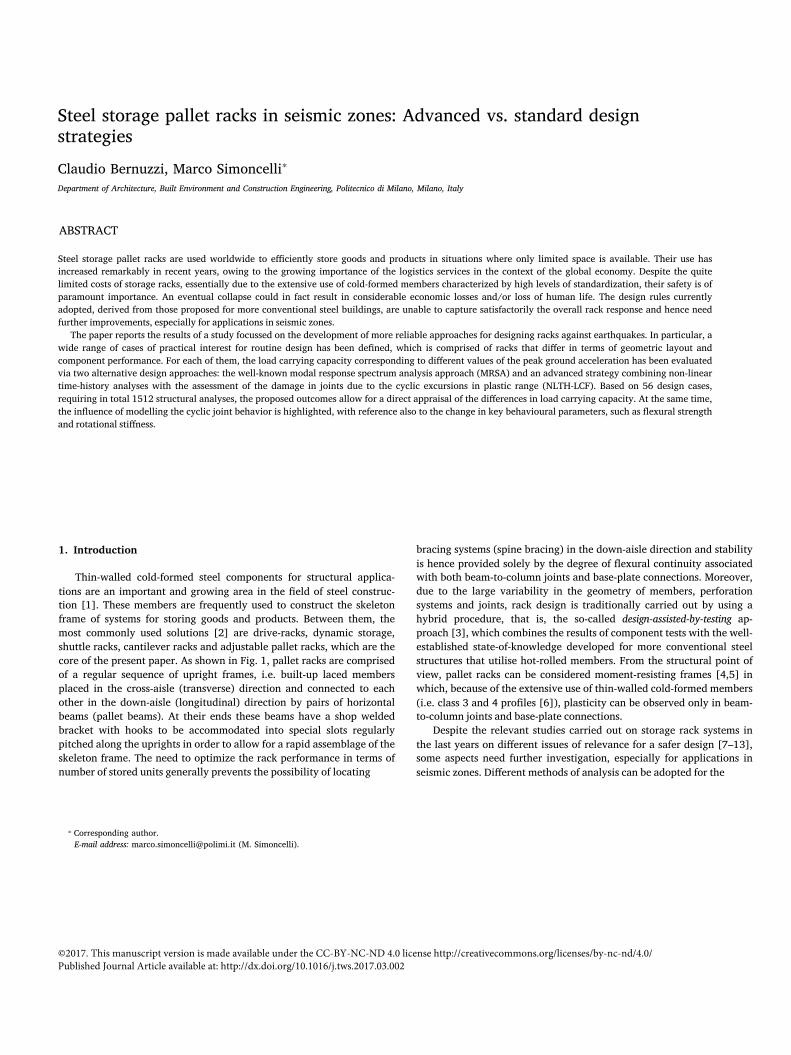
Thin-walled cold-formed steel components for structural applica-tions are an important and growing area in the field of steel construc-tion [1]. These members are frequently used to construct the skeleton frame of systems for storing goods and products. Between them, the most commonly used solutions [2] are drive-racks, dynamic storage, shuttle racks, cantilever racks and adjustable pallet racks, which are the core of the present paper. As shown in Fig. 1, pallet racks are comprised of a regular sequence of upright frames, i.e. built-up laced members placed in the cross-aisle (transverse) direction and connected to each other in the down-aisle (longitudinal) direction by pairs of horizontal beams (pallet beams). At their ends these beams have a shop welded bracket with hooks to be accommodated into special slots regularly pitched along the uprights in order to allow for a rapid assemblage of the skeleton frame. The need to optimize the rack performance in terms of number of stored units generally prevents the possibility of locating
bracing systems (spine bracing) in the down-aisle direction and stability is hence provided solely by the degree of flexural continuity associated with both beam-to-column joints and base-plate connections. Moreover, due to the large variability in the geometry of members, perforation systems and joints, rack design is traditionally carried out by using a hybrid procedure, that is, the so-called design-assisted-by-testing ap-proach [3], which combines the results of component tests with the well-established state-of-knowledge developed for more conventional steel structures that utilise hot-rolled members. From the structural point of view, pallet racks can be considered moment-resisting frames [4,5] in which, because of the extensive use of thin-walled cold-formed members (i.e. class 3 and 4 profiles [6]), plasticity can be observed only in beam-to-column joints and base-plate connections.
Despite the relevant studies carried out on storage rack systems in the last years on different issues of relevance for a safer design [7–13], some aspects need further investigation, especially for applications in seismic zones. Different methods of analysis can be adopted for the
⁎ Corresponding author.E-mail address: [email protected] (M. Simoncelli).
MARK
©2017. This manuscript version is made available under the CC-BY-NC-ND 4.0 license http://creativecommons.org/licenses/by-nc-nd/4.0/Published Journal Article available at: http://dx.doi.org/10.1016/j.tws.2017.03.002
seismic design of pallet racks, which are the same as those usually adopted for conventional buildings [14,15], i.e.:
• lateral force method of analysis (LFMA);• modal response spectrum analysis (MRSA);• non-linear static pushover analysis (NLSPA);• non-linear time history (dynamic) analysis (NLTH).
The European seismic design references are FEM 10.2.08 [16] andthe recent EN 16681 [17] provisions. With the exception of the NLTH approach, which can be always applied, the choice of the method of analysis, as it appears from Table 1, is governed by the value of the rack inter-story drift sensitivity coefficient (θ) defined as:
⎛⎝⎜
⎞⎠⎟
P dV h
ϑ = max⋅⋅
E i r i
E i i
, ,
, (1)
Fig. 1. Example of a selective pallet rack (a) and its main components (b-d).
where PE,i and VE,i are the total vertical load and the total shear at the base of the i-th story, respectively, hi is its height and dr,i is the lateral drift.
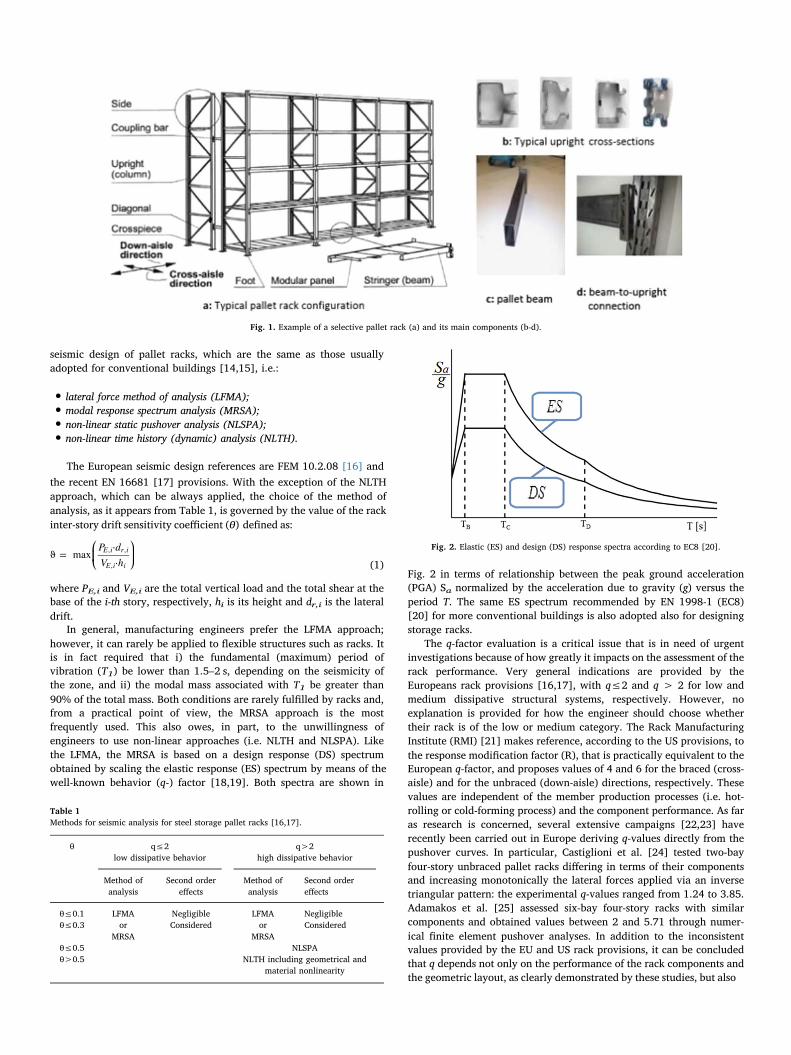
In general, manufacturing engineers prefer the LFMA approach; however, it can rarely be applied to flexible structures such as racks. It is in fact required that i) the fundamental (maximum) period of vibration (T1) be lower than 1.5–2 s, depending on the seismicity of the zone, and ii) the modal mass associated with T1 be greater than 90% of the total mass. Both conditions are rarely fulfilled by racks and, from a practical point of view, the MRSA approach is the most frequently used. This also owes, in part, to the unwillingness of engineers to use non-linear approaches (i.e. NLTH and NLSPA). Like the LFMA, the MRSA is based on a design response (DS) spectrum obtained by scaling the elastic response (ES) spectrum by means of the well-known behavior (q-) factor [18,19]. Both spectra are shown in
Table 1Methods for seismic analysis for steel storage pallet racks [16,17].
θ q≤2 q>2low dissipative behavior high dissipative behavior
Method ofanalysis
Second ordereffects
Method ofanalysis
Second ordereffects
θ≤0.1 LFMAor
MRSA
Negligible LFMAor
MRSA
Negligibleθ≤0.3 Considered Considered
θ≤0.5 NLSPAθ>0.5 NLTH including geometrical and
material nonlinearity
Fig. 2. Elastic (ES) and design (DS) response spectra according to EC8 [20].
Fig. 2 in terms of relationship between the peak ground acceleration (PGA) Sa normalized by the acceleration due to gravity (g) versus the period T. The same ES spectrum recommended by EN 1998-1 (EC8)[20] for more conventional buildings is also adopted also for designing storage racks.
The q-factor evaluation is a critical issue that is in need of urgent investigations because of how greatly it impacts on the assessment of the rack performance. Very general indications are provided by the Europeans rack provisions [16,17], with q≤2 and q > 2 for low and medium dissipative structural systems, respectively. However, no explanation is provided for how the engineer should choose whether their rack is of the low or medium category. The Rack Manufacturing Institute (RMI) [21] makes reference, according to the US provisions, to the response modification factor (R), that is practically equivalent to the European q-factor, and proposes values of 4 and 6 for the braced (cross-aisle) and for the unbraced (down-aisle) directions, respectively. These values are independent of the member production processes (i.e. hot-rolling or cold-forming process) and the component performance. As far as research is concerned, several extensive campaigns [22,23] have recently been carried out in Europe deriving q-values directly from the pushover curves. In particular, Castiglioni et al. [24] tested two-bay four-story unbraced pallet racks differing in terms of their components and increasing monotonically the lateral forces applied via an inverse triangular pattern: the experimental q-values ranged from 1.24 to 3.85. Adamakos et al. [25] assessed six-bay four-story racks with similar components and obtained values between 2 and 5.71 through numer-ical finite element pushover analyses. In addition to the inconsistent values provided by the EU and US rack provisions, it can be concluded that q depends not only on the performance of the rack components and the geometric layout, as clearly demonstrated by these studies, but also
2. Structural component verification checks
Routine design of racks, such as per conventional framed structures,is usually carried out following two separate and subsequent steps:
• structural analysis of the overall frame, aimed at evaluating the set ofgeneralized displacements and forces;
• component safety checks, strictly depending on suitable criteriaregarding deformability, resistance and stability.
Different alternatives are permitted by the European and American provisions, as discussed by Bernuzzi [30]. A promising European approach, which is described in the general part of EC3 [6], is the so-called General Method (GEM) [31,32]. It could be immediately sub-stituted for the method currently proposed in the EU standard rack provisions for static design [33,34], which is often unsafe because of the use of the system length as the effective length of the uprights. In particular, in the case of racks that are unbraced in the down-aisle direction, which is the most common situation, this assumption leads frequently to a significant over-estimation of the load carrying capacity. Furthermore, GEM is able to provide results that are fully consistent with those obtained via the US design procedures and this proves, once again, its adequacy for rack design. In particular, reference can be made to the safety index (SI), which is a coefficient of utilization of the structural components ranging from 0 to 1 (failure). Rack safety is guaranteed when:
SIγ
χ α= ≤ 1M
op ult k, (2)
where αult,k is the minimum load multiplier based on the resistance ofcomponents (members and joints), χop is the buckling reduction factorof the overall structural system and γM is the material safety coefficient.
In particular, in the case of members subjected to axial force NEdand bending moments along the principal direction My,Ed and Mz,Ed,which are typically the uprights but may also include the pallet beams,the ultimate load multiplier for member resistance, αult,k,m is theminimum of all the key rack components and it is evaluated as:
⎛
⎝⎜⎜⎜
⎞
⎠⎟⎟⎟α
N M M1 = + +ult k m
EdA f
γ
y EdW f
γ
z EdW f
γ, ,
⋅,
⋅,
⋅eff y
M
eff y y
M
eff z y
M0
,
0
,
0 (3)
where Aeff, is the effective cross-section area, γM0 is the safetycoefficient, fy is the material yield strength and Weff,y and Weff,z arethe effective section moduli along the principal axes.
Furthermore, indicating with Mj,Ed and Mj,Rd the design bendingmoment acting on the most highly stressed joint and its flexuralresistance, respectively, the associated joint multiplier αult,k,j isexpressed as:
αMM
1 =ult k j
j Ed
j Rd, ,
,
, (4)
The term αult,k has to be assumed as the minimum of αult,k,m and αult,k,j.
It is worth noting that the GEM method, like the other approaches that can be adopted for structural verification checks, must also be able to be used for the design of racks against earthquakes and this method leads, in general, to the definition of the most conservative design domain in terms of relationship between the axial force and the bending moment, as demonstrated in refs. [35,36] where the European design alternatives have been discussed and compared. Seismic provisions, in fact, give the rules required to simulate the effects due to ground motion, but the safety checks have to be carried out by using the same verification equations adopted for static design.
According to the EU standard provisions for static rack design, and considering the requirements for the combination of the actions regarding the ultimate limit states, it has to be underlined that:
• as to the static performance, the weight of the rack components (G)is amplified by a factor γG=1.3 while γQ=1.4 is recommended forthe weight of the pallets units (Q);
• as to the seismic performance, it is assumed that the effects of theearthquakes (E), the weight of the rack components and the weightof the pallets units need not be amplified when applied concur-rently, i.e. γE=γG=γQ=1.
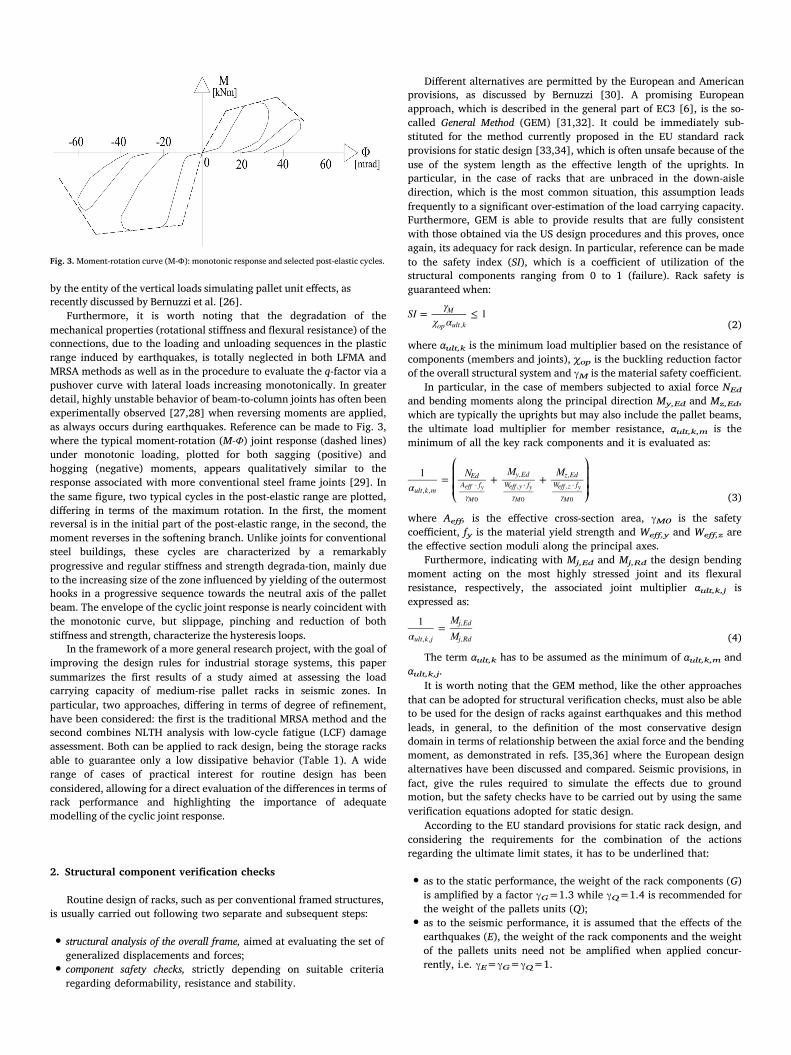
Fig. 3. Moment-rotation curve (M-Φ): monotonic response and selected post-elastic cycles.
by the entity of the vertical loads simulating pallet unit effects, as recently discussed by Bernuzzi et al. [26].
Furthermore, it is worth noting that the degradation of the mechanical properties (rotational stiffness and flexural resistance) of the connections, due to the loading and unloading sequences in the plastic range induced by earthquakes, is totally neglected in both LFMA and MRSA methods as well as in the procedure to evaluate the q-factor via a pushover curve with lateral loads increasing monotonically. In greater detail, highly unstable behavior of beam-to-column joints has often been experimentally observed [27,28] when reversing moments are applied, as always occurs during earthquakes. Reference can be made to Fig. 3, where the typical moment-rotation (M-Φ) joint response (dashed lines) under monotonic loading, plotted for both sagging (positive) and hogging (negative) moments, appears qualitatively similar to the response associated with more conventional steel frame joints [29]. In the same figure, two typical cycles in the post-elastic range are plotted, differing in terms of the maximum rotation. In the first, the moment reversal is in the initial part of the post-elastic range, in the second, the moment reverses in the softening branch. Unlike joints for conventional steel buildings, these cycles are characterized by a remarkably progressive and regular stiffness and strength degrada-tion, mainly due to the increasing size of the zone influenced by yielding of the outermost hooks in a progressive sequence towards the neutral axis of the pallet beam. The envelope of the cyclic joint response is nearly coincident with the monotonic curve, but slippage, pinching and reduction of both stiffness and strength, characterize the hysteresis loops.
In the framework of a more general research project, with the goal of improving the design rules for industrial storage systems, this paper summarizes the first results of a study aimed at assessing the load carrying capacity of medium-rise pallet racks in seismic zones. In particular, two approaches, differing in terms of degree of refinement, have been considered: the first is the traditional MRSA method and the second combines NLTH analysis with low-cycle fatigue (LCF) damage assessment. Both can be applied to rack design, being the storage racks able to guarantee only a low dissipative behavior (Table 1). A wide range of cases of practical interest for routine design has been considered, allowing for a direct evaluation of the differences in terms of rack performance and highlighting the importance of adequate modelling of the cyclic joint response.
3. Rack performance via the MRSA approach
An eigenvalue analysis is required by the MRSA approach to measure the contribution of each natural mode of vibration, by obtaining the associated peak value acceleration Sa(T) from the design spectrum (Fig. 4). As a consequence, it appears that the rack response is governed only by the elastic branch of the monotonic M-Φ joint curve and the presence of post-elastic branches, slippage, pinching and strength and stiffness drop (Fig. 3) are neglected. The number of the modes to include must be sufficient to achieve at least 90% mass participation. Different rules can be adopted to combine the effects of multiple modes of vibration in order to assess the overall rack response [37]: in the present study, the complete quadratic combination (CQC) rule has been adopted. The starting point is the choice of the q-factor, which, as previously mentioned, represents a critical issue in need of sub-stantial further research. Once the generalized forces are obtained from the modal analysis, they are added to the results of a static analysis, which considers directly the effects of the vertical load (weight) of the pallets, with γG=γQ=1. The combination of these two load cases consists of an envelope in which the contribution from the MRSA is considered with its absolute value (subscripts MRSA) and the contribu-tion from the static analysis (subscripts STAT) conserves its sign, as per the following equation:
r r r= ±SEISM STAT MRSA (5)
where rk indicates the parameter of interest belonging to the general-ized forces.
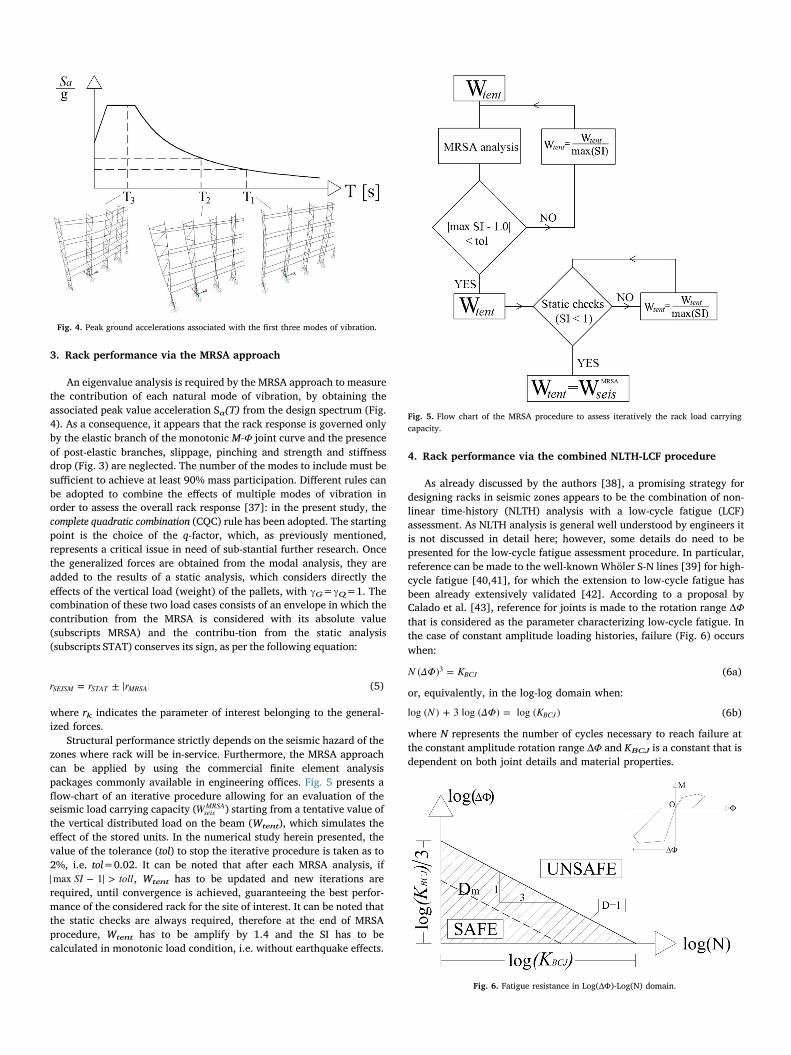
Structural performance strictly depends on the seismic hazard of thezones where rack will be in-service. Furthermore, the MRSA approachcan be applied by using the commercial finite element analysispackages commonly available in engineering offices. Fig. 5 presents aflow-chart of an iterative procedure allowing for an evaluation of theseismic load carrying capacity (Wseis
MRSA) starting from a tentative value ofthe vertical distributed load on the beam (Wtent), which simulates theeffect of the stored units. In the numerical study herein presented, thevalue of the tolerance (tol) to stop the iterative procedure is taken as to2%, i.e. tol=0.02. It can be noted that after each MRSA analysis, if
SI tollmax − 1 > , Wtent has to be updated and new iterations arerequired, until convergence is achieved, guaranteeing the best perfor-mance of the considered rack for the site of interest. It can be noted thatthe static checks are always required, therefore at the end of MRSAprocedure, Wtent has to be amplify by 1.4 and the SI has to becalculated in monotonic load condition, i.e. without earthquake effects.
4. Rack performance via the combined NLTH-LCF procedure
As already discussed by the authors [38], a promising strategy for designing racks in seismic zones appears to be the combination of non-linear time-history (NLTH) analysis with a low-cycle fatigue (LCF) assessment. As NLTH analysis is general well understood by engineers it is not discussed in detail here; however, some details do need to be presented for the low-cycle fatigue assessment procedure. In particular, reference can be made to the well-known Whöler S-N lines [39] for high-cycle fatigue [40,41], for which the extension to low-cycle fatigue has been already extensively validated [42]. According to a proposal by Calado et al. [43], reference for joints is made to the rotation range ΔΦ that is considered as the parameter characterizing low-cycle fatigue. In the case of constant amplitude loading histories, failure (Fig. 6) occurs when:
N ΔΦ K( ) = BCJ3 (6a)
or, equivalently, in the log-log domain when:
N ΔΦ Klog ( ) + 3 log ( ) = log ( )BCJ (6b)
where N represents the number of cycles necessary to reach failure atthe constant amplitude rotation range ΔΦ and KBCJ is a constant that isdependent on both joint details and material properties.
Fig. 4. Peak ground accelerations associated with the first three modes of vibration.
Fig. 5. Flow chart of the MRSA procedure to assess iteratively the rack load carryingcapacity.
Fig. 6. Fatigue resistance in Log(ΔΦ)-Log(N) domain.
∑n ΔΦ ΔΦ⋅ =eqi
n
i=1
33
(7)
where n is the number of cycles.As to the cycle counting methods, i.e. the approaches to evaluate
ΔΦeq, reference can be made to the well-known rainflow procedure, which is recommended also by the European fatigue design code [44]. Furthermore, it should also be of great interest for manufacturing engineers, especially in the case of existing racks, to measure the damage associated with each earthquake and/or with a set of sub-sequent seismic events occurring during the entire in-service life. The so-called Miner's rule [45,46] can be applied also to rack joints, making reference to the damage index Dm. It ranges from 0 (no damage) to 1 (failure for low-cycle fatigue) and its expression, in the case of a variable amplitude loading history composed by m cycles, is:
Dm ΔΦ
K
ΔΦ
K=
⋅=
∑m
eq
BCJ
im
i
BCJ
3=1
33
(8)
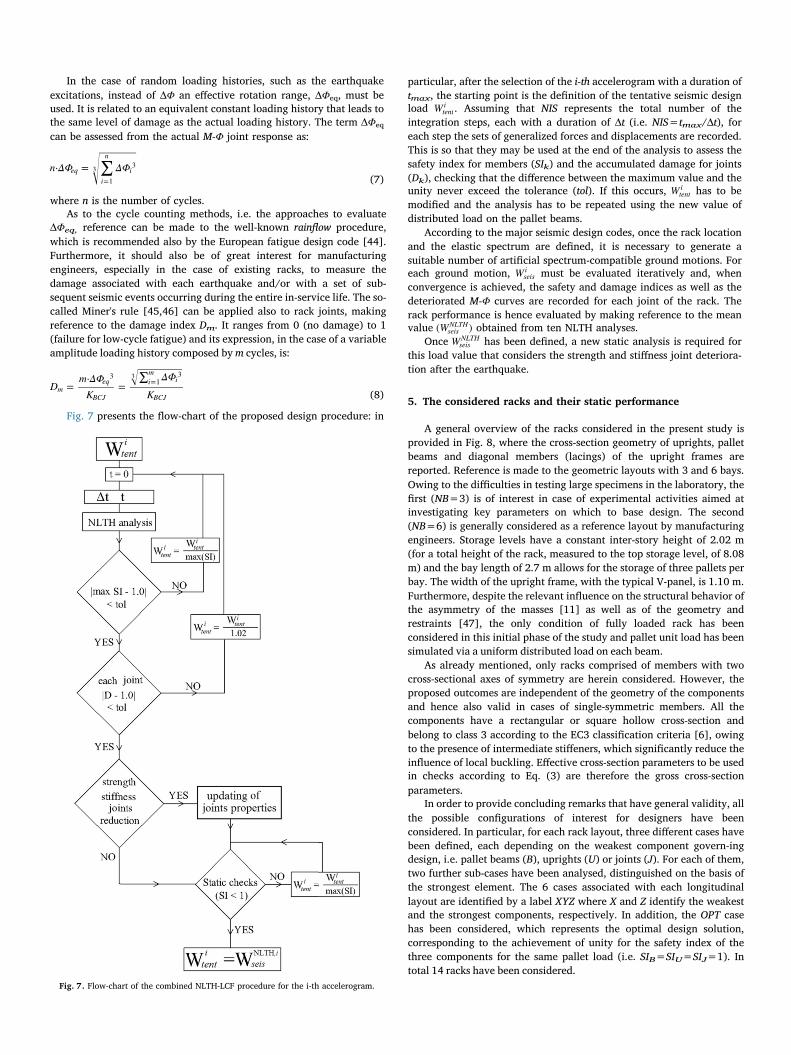
Fig. 7 presents the flow-chart of the proposed design procedure: in
particular, after the selection of the i-th accelerogram with a duration oftmax, the starting point is the definition of the tentative seismic designload Wtent
i . Assuming that NIS represents the total number of theintegration steps, each with a duration of Δt (i.e. NIS=tmax/Δt), foreach step the sets of generalized forces and displacements are recorded.This is so that they may be used at the end of the analysis to assess thesafety index for members (SIk) and the accumulated damage for joints(Dk), checking that the difference between the maximum value and theunity never exceed the tolerance (tol). If this occurs, Wtent
i has to bemodified and the analysis has to be repeated using the new value ofdistributed load on the pallet beams.
According to the major seismic design codes, once the rack locationand the elastic spectrum are defined, it is necessary to generate asuitable number of artificial spectrum-compatible ground motions. Foreach ground motion, Wseis
i must be evaluated iteratively and, whenconvergence is achieved, the safety and damage indices as well as thedeteriorated M-Φ curves are recorded for each joint of the rack. Therack performance is hence evaluated by making reference to the meanvalue W( )seis
NLTH obtained from ten NLTH analyses.Once Wseis
NLTH has been defined, a new static analysis is required forthis load value that considers the strength and stiffness joint deteriora-tion after the earthquake.
5. The considered racks and their static performance
A general overview of the racks considered in the present study is provided in Fig. 8, where the cross-section geometry of uprights, pallet beams and diagonal members (lacings) of the upright frames are reported. Reference is made to the geometric layouts with 3 and 6 bays. Owing to the difficulties in testing large specimens in the laboratory, the first (NB=3) is of interest in case of experimental activities aimed at investigating key parameters on which to base design. The second (NB=6) is generally considered as a reference layout by manufacturing engineers. Storage levels have a constant inter-story height of 2.02 m (for a total height of the rack, measured to the top storage level, of 8.08 m) and the bay length of 2.7 m allows for the storage of three pallets per bay. The width of the upright frame, with the typical V-panel, is 1.10 m. Furthermore, despite the relevant influence on the structural behavior of the asymmetry of the masses [11] as well as of the geometry and restraints [47], the only condition of fully loaded rack has been considered in this initial phase of the study and pallet unit load has been simulated via a uniform distributed load on each beam.
As already mentioned, only racks comprised of members with two cross-sectional axes of symmetry are herein considered. However, the proposed outcomes are independent of the geometry of the components and hence also valid in cases of single-symmetric members. All the components have a rectangular or square hollow cross-section and belong to class 3 according to the EC3 classification criteria [6], owing to the presence of intermediate stiffeners, which significantly reduce the influence of local buckling. Effective cross-section parameters to be used in checks according to Eq. (3) are therefore the gross cross-section parameters.
In order to provide concluding remarks that have general validity, all the possible configurations of interest for designers have been considered. In particular, for each rack layout, three different cases have been defined, each depending on the weakest component govern-ing design, i.e. pallet beams (B), uprights (U) or joints (J). For each of them, two further sub-cases have been analysed, distinguished on the basis of the strongest element. The 6 cases associated with each longitudinal layout are identified by a label XYZ where X and Z identify the weakest and the strongest components, respectively. In addition, the OPT case has been considered, which represents the optimal design solution, corresponding to the achievement of unity for the safety index of the three components for the same pallet load (i.e. SIB=SIU=SIJ=1). In total 14 racks have been considered.
Fig. 7. Flow-chart of the combined NLTH-LCF procedure for the i-th accelerogram.
In the case of random loading histories, such as the earthquake excitations, instead of ΔΦ an effective rotation range, ΔΦeq, must be used. It is related to an equivalent constant loading history that leads to the same level of damage as the actual loading history. The term ΔΦeq
can be assessed from the actual M-Φ joint response as:
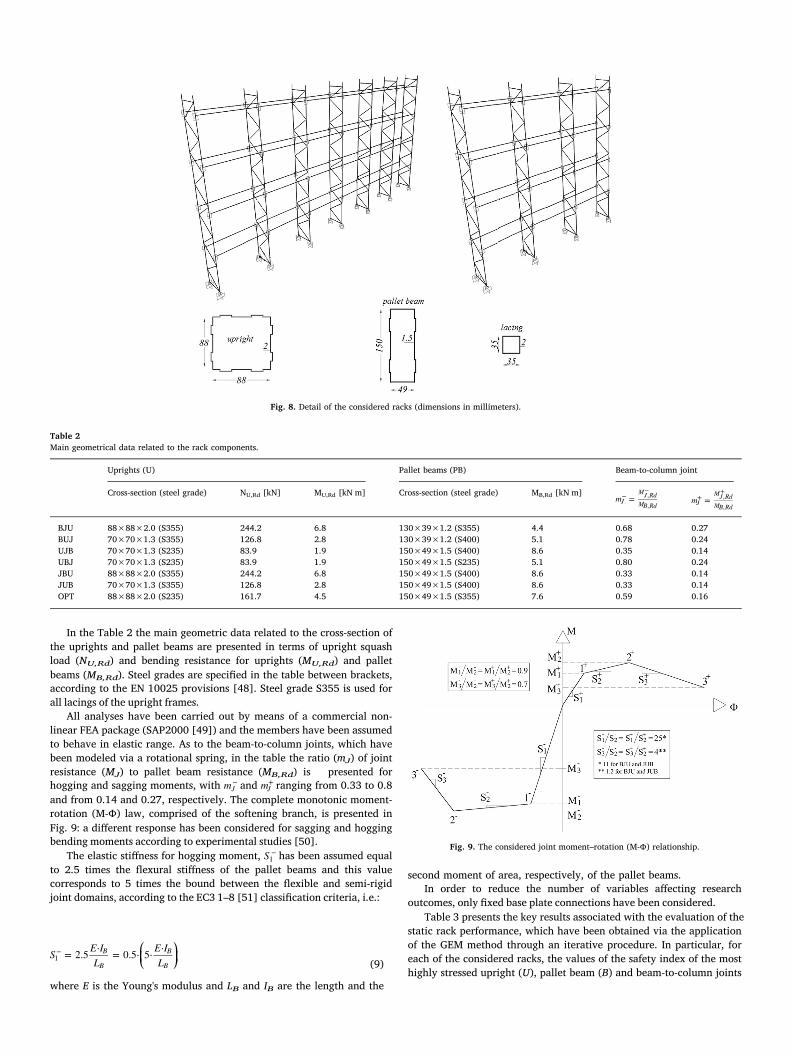
In the Table 2 the main geometric data related to the cross-section of the uprights and pallet beams are presented in terms of upright squash load (NU,Rd) and bending resistance for uprights (MU,Rd) and pallet beams (MB,Rd). Steel grades are specified in the table between brackets, according to the EN 10025 provisions [48]. Steel grade S355 is used for all lacings of the upright frames.
All analyses have been carried out by means of a commercial non-linear FEA package (SAP2000 [49]) and the members have been assumed to behave in elastic range. As to the beam-to-column joints, which have been modeled via a rotational spring, in the table the ratio (mJ) of joint resistance (MJ) to pallet beam resistance (MB,Rd) is presented for hogging and sagging moments, with mJ
− and mJ+ ranging from 0.33 to 0.8
and from 0.14 and 0.27, respectively. The complete monotonic moment-rotation (M-Φ) law, comprised of the softening branch, is presented in Fig. 9: a different response has been considered for sagging and hogging bending moments according to experimental studies [50].
The elastic stiffness for hogging moment, S1− has been assumed equal
to 2.5 times the flexural stiffness of the pallet beams and this value corresponds to 5 times the bound between the flexible and semi-rigid joint domains, according to the EC3 1–8 [51] classification criteria, i.e.:
⎛⎝⎜
⎞⎠⎟S E I
LE IL
= 2.5 ⋅ = 0.5⋅ 5⋅ ⋅B
B
B
B1−
(9)
where E is the Young's modulus and LB and IB are the length and the
Fig. 8. Detail of the considered racks (dimensions in millimeters).
Table 2Main geometrical data related to the rack components.
Uprights (U) Pallet beams (PB) Beam-to-column joint
Cross-section (steel grade) NU,Rd [kN] MU,Rd [kN m] Cross-section (steel grade) MB,Rd [kN m]m =J
MJ RdMB Rd
− ,−
,m =J
MJ RdMB Rd
+ ,+
,
BJU 88×88×2.0 (S355) 244.2 6.8 130×39×1.2 (S355) 4.4 0.68 0.27BUJ 70×70×1.3 (S355) 126.8 2.8 130×39×1.2 (S400) 5.1 0.78 0.24UJB 70×70×1.3 (S235) 83.9 1.9 150×49×1.5 (S400) 8.6 0.35 0.14UBJ 70×70×1.3 (S235) 83.9 1.9 150×49×1.5 (S235) 5.1 0.80 0.24JBU 88×88×2.0 (S355) 244.2 6.8 150×49×1.5 (S400) 8.6 0.33 0.14JUB 70×70×1.3 (S355) 126.8 2.8 150×49×1.5 (S400) 8.6 0.33 0.14OPT 88×88×2.0 (S235) 161.7 4.5 150×49×1.5 (S355) 7.6 0.59 0.16
Fig. 9. The considered joint moment–rotation (M-Φ) relationship.
second moment of area, respectively, of the pallet beams.In order to reduce the number of variables affecting research
outcomes, only fixed base plate connections have been considered.Table 3 presents the key results associated with the evaluation of the
static rack performance, which have been obtained via the application of the GEM method through an iterative procedure. In particular, for each of the considered racks, the values of the safety index of the most highly stressed upright (U), pallet beam (B) and beam-to-column joints
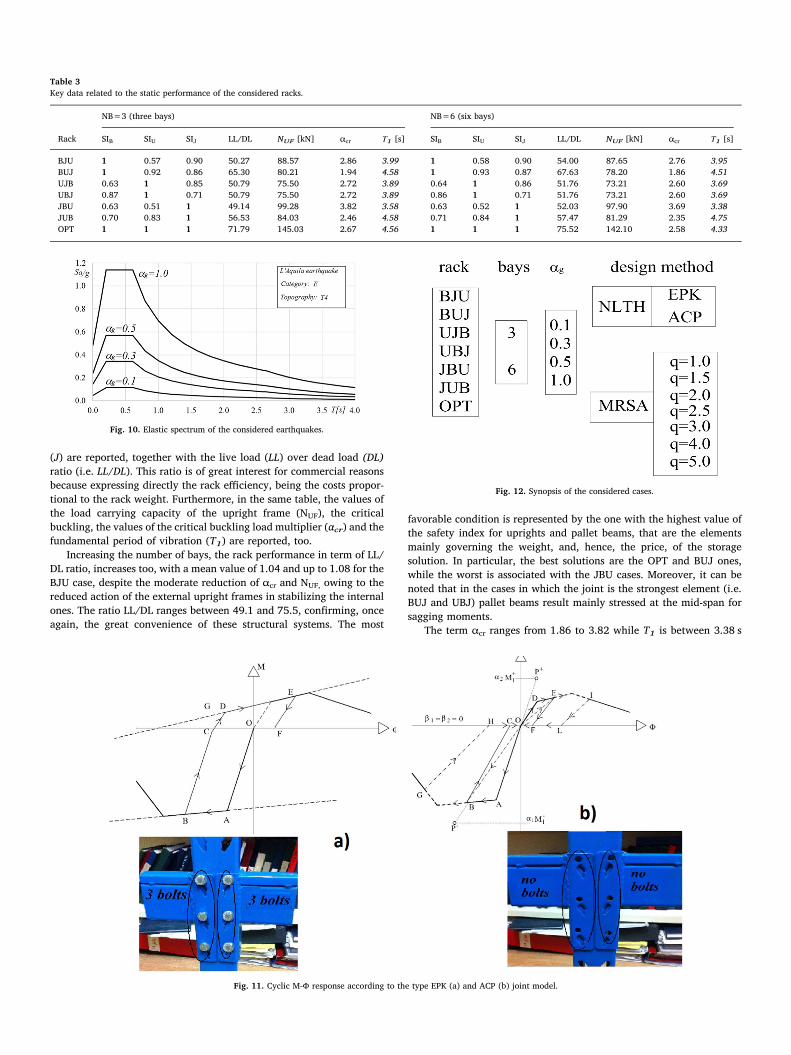
(J) are reported, together with the live load (LL) over dead load (DL)ratio (i.e. LL/DL). This ratio is of great interest for commercial reasonsbecause expressing directly the rack efficiency, being the costs propor-tional to the rack weight. Furthermore, in the same table, the values ofthe load carrying capacity of the upright frame (NUF), the criticalbuckling, the values of the critical buckling load multiplier (αcr) and thefundamental period of vibration (T1) are reported, too.
Increasing the number of bays, the rack performance in term of LL/DL ratio, increases too, with a mean value of 1.04 and up to 1.08 for theBJU case, despite the moderate reduction of αcr and NUF, owing to thereduced action of the external upright frames in stabilizing the internalones. The ratio LL/DL ranges between 49.1 and 75.5, confirming, onceagain, the great convenience of these structural systems. The most
favorable condition is represented by the one with the highest value ofthe safety index for uprights and pallet beams, that are the elementsmainly governing the weight, and, hence, the price, of the storagesolution. In particular, the best solutions are the OPT and BUJ ones,while the worst is associated with the JBU cases. Moreover, it can benoted that in the cases in which the joint is the strongest element (i.e.BUJ and UBJ) pallet beams result mainly stressed at the mid-span forsagging moments.
The term αcr ranges from 1.86 to 3.82 while T1 is between 3.38 s
NB=3 (three bays) NB=6 (six bays)
Rack SIB SIU SIJ LL/DL NUF [kN] αcr Τ1 [s] SIB SIU SIJ LL/DL NUF [kN] αcr Τ1 [s]
BJU 1 0.57 0.90 50.27 88.57 2.86 3.99 1 0.58 0.90 54.00 87.65 2.76 3.95BUJ 1 0.92 0.86 65.30 80.21 1.94 4.58 1 0.93 0.87 67.63 78.20 1.86 4.51UJB 0.63 1 0.85 50.79 75.50 2.72 3.89 0.64 1 0.86 51.76 73.21 2.60 3.69UBJ 0.87 1 0.71 50.79 75.50 2.72 3.89 0.86 1 0.71 51.76 73.21 2.60 3.69JBU 0.63 0.51 1 49.14 99.28 3.82 3.58 0.63 0.52 1 52.03 97.90 3.69 3.38JUB 0.70 0.83 1 56.53 84.03 2.46 4.58 0.71 0.84 1 57.47 81.29 2.35 4.75OPT 1 1 1 71.79 145.03 2.67 4.56 1 1 1 75.52 142.10 2.58 4.33
Fig. 10. Elastic spectrum of the considered earthquakes.
Fig. 11. Cyclic M-Φ response according to the type EPK (a) and ACP (b) joint model.
Fig. 12. Synopsis of the considered cases.
Table 3Key data related to the static performance of the considered racks.
and 4.75 s. It is worth noting that both parameters assume numericalvalues that are significantly different from those associated with themore conventional moment-resisting frames for civil and industrialbuildings, confirming, once again, the need of specific rules fordesigning pallet racks.
6. Assessment of the seismic performance
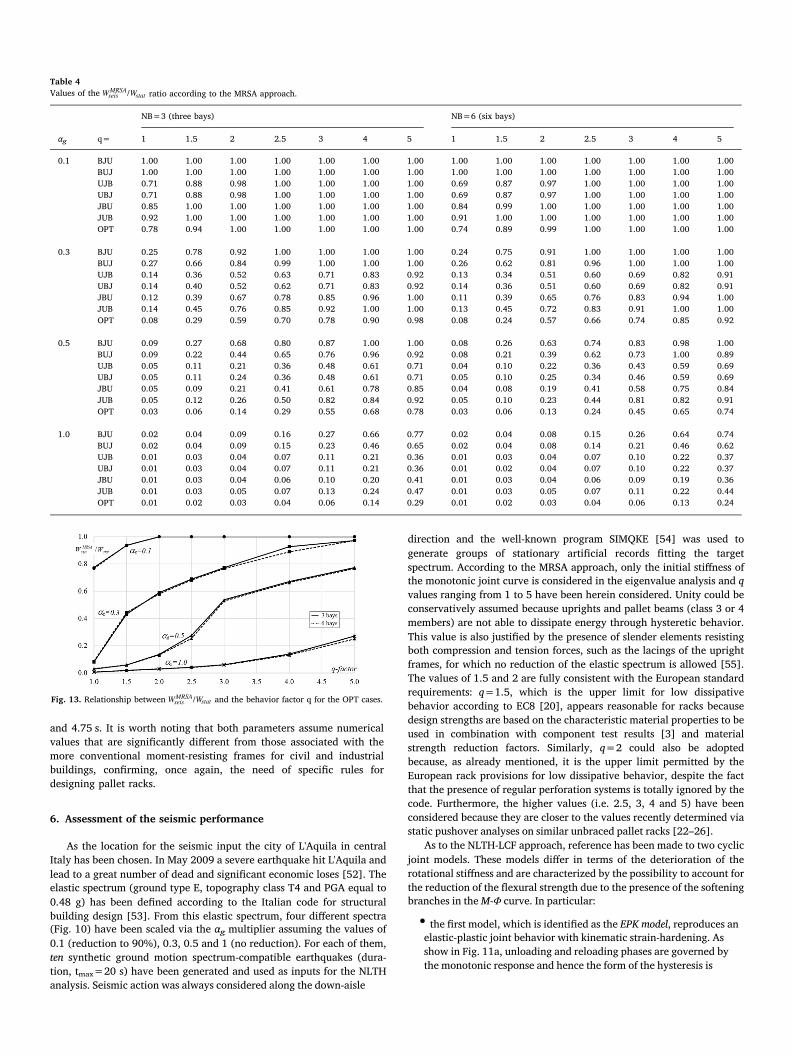
As the location for the seismic input the city of L'Aquila in central Italy has been chosen. In May 2009 a severe earthquake hit L'Aquila and lead to a great number of dead and significant economic loses [52]. The elastic spectrum (ground type E, topography class T4 and PGA equal to 0.48 g) has been defined according to the Italian code for structural building design [53]. From this elastic spectrum, four different spectra (Fig. 10) have been scaled via the αg multiplier assuming the values of 0.1 (reduction to 90%), 0.3, 0.5 and 1 (no reduction). For each of them, ten synthetic ground motion spectrum-compatible earthquakes (dura-tion, tmax=20 s) have been generated and used as inputs for the NLTH analysis. Seismic action was always considered along the down-aisle
direction and the well-known program SIMQKE [54] was used to generate groups of stationary artificial records fitting the target spectrum. According to the MRSA approach, only the initial stiffness of the monotonic joint curve is considered in the eigenvalue analysis and q values ranging from 1 to 5 have been herein considered. Unity could be conservatively assumed because uprights and pallet beams (class 3 or 4 members) are not able to dissipate energy through hysteretic behavior. This value is also justified by the presence of slender elements resisting both compression and tension forces, such as the lacings of the upright frames, for which no reduction of the elastic spectrum is allowed [55]. The values of 1.5 and 2 are fully consistent with the European standard requirements: q=1.5, which is the upper limit for low dissipative behavior according to EC8 [20], appears reasonable for racks because design strengths are based on the characteristic material properties to be used in combination with component test results [3] and material strength reduction factors. Similarly, q=2 could also be adopted because, as already mentioned, it is the upper limit permitted by the European rack provisions for low dissipative behavior, despite the fact that the presence of regular perforation systems is totally ignored by the code. Furthermore, the higher values (i.e. 2.5, 3, 4 and 5) have been considered because they are closer to the values recently determined via static pushover analyses on similar unbraced pallet racks [22–26].
As to the NLTH-LCF approach, reference has been made to two cyclic joint models. These models differ in terms of the deterioration of the rotational stiffness and are characterized by the possibility to account for the reduction of the flexural strength due to the presence of the softening branches in the M-Φ curve. In particular:
• the first model, which is identified as the EPK model, reproduces an elastic-plastic joint behavior with kinematic strain-hardening. As show in Fig. 11a, unloading and reloading phases are governed by the monotonic response and hence the form of the hysteresis is
stat ratio according to the MRSA approach.
NB=3 (three bays) NB=6 (six bays)
αg q= 1 1.5 2 2.5 3 4 5 1 1.5 2 2.5 3 4 5
0.1 BJU 1.00 1.00 1.00 1.00 1.00 1.00 1.00 1.00 1.00 1.00 1.00 1.00 1.00 1.00BUJ 1.00 1.00 1.00 1.00 1.00 1.00 1.00 1.00 1.00 1.00 1.00 1.00 1.00 1.00UJB 0.71 0.88 0.98 1.00 1.00 1.00 1.00 0.69 0.87 0.97 1.00 1.00 1.00 1.00UBJ 0.71 0.88 0.98 1.00 1.00 1.00 1.00 0.69 0.87 0.97 1.00 1.00 1.00 1.00JBU 0.85 1.00 1.00 1.00 1.00 1.00 1.00 0.84 0.99 1.00 1.00 1.00 1.00 1.00JUB 0.92 1.00 1.00 1.00 1.00 1.00 1.00 0.91 1.00 1.00 1.00 1.00 1.00 1.00OPT 0.78 0.94 1.00 1.00 1.00 1.00 1.00 0.74 0.89 0.99 1.00 1.00 1.00 1.00
0.3 BJU 0.25 0.78 0.92 1.00 1.00 1.00 1.00 0.24 0.75 0.91 1.00 1.00 1.00 1.00BUJ 0.27 0.66 0.84 0.99 1.00 1.00 1.00 0.26 0.62 0.81 0.96 1.00 1.00 1.00UJB 0.14 0.36 0.52 0.63 0.71 0.83 0.92 0.13 0.34 0.51 0.60 0.69 0.82 0.91UBJ 0.14 0.40 0.52 0.62 0.71 0.83 0.92 0.14 0.36 0.51 0.60 0.69 0.82 0.91JBU 0.12 0.39 0.67 0.78 0.85 0.96 1.00 0.11 0.39 0.65 0.76 0.83 0.94 1.00JUB 0.14 0.45 0.76 0.85 0.92 1.00 1.00 0.13 0.45 0.72 0.83 0.91 1.00 1.00OPT 0.08 0.29 0.59 0.70 0.78 0.90 0.98 0.08 0.24 0.57 0.66 0.74 0.85 0.92
0.5 BJU 0.09 0.27 0.68 0.80 0.87 1.00 1.00 0.08 0.26 0.63 0.74 0.83 0.98 1.00BUJ 0.09 0.22 0.44 0.65 0.76 0.96 0.92 0.08 0.21 0.39 0.62 0.73 1.00 0.89UJB 0.05 0.11 0.21 0.36 0.48 0.61 0.71 0.04 0.10 0.22 0.36 0.43 0.59 0.69UBJ 0.05 0.11 0.24 0.36 0.48 0.61 0.71 0.05 0.10 0.25 0.34 0.46 0.59 0.69JBU 0.05 0.09 0.21 0.41 0.61 0.78 0.85 0.04 0.08 0.19 0.41 0.58 0.75 0.84JUB 0.05 0.12 0.26 0.50 0.82 0.84 0.92 0.05 0.10 0.23 0.44 0.81 0.82 0.91OPT 0.03 0.06 0.14 0.29 0.55 0.68 0.78 0.03 0.06 0.13 0.24 0.45 0.65 0.74
1.0 BJU 0.02 0.04 0.09 0.16 0.27 0.66 0.77 0.02 0.04 0.08 0.15 0.26 0.64 0.74BUJ 0.02 0.04 0.09 0.15 0.23 0.46 0.65 0.02 0.04 0.08 0.14 0.21 0.46 0.62UJB 0.01 0.03 0.04 0.07 0.11 0.21 0.36 0.01 0.03 0.04 0.07 0.10 0.22 0.37UBJ 0.01 0.03 0.04 0.07 0.11 0.21 0.36 0.01 0.02 0.04 0.07 0.10 0.22 0.37JBU 0.01 0.03 0.04 0.06 0.10 0.20 0.41 0.01 0.03 0.04 0.06 0.09 0.19 0.36JUB 0.01 0.03 0.05 0.07 0.13 0.24 0.47 0.01 0.03 0.05 0.07 0.11 0.22 0.44OPT 0.01 0.02 0.03 0.04 0.06 0.14 0.29 0.01 0.02 0.03 0.04 0.06 0.13 0.24
Fig. 13. Relationship between W W/seisMRSA
stat and the behavior factor q for the OPT cases.
Table 4Values of the seis
MRSA/W W
stable. If the joint response is in the softening phase, the associated value of the bending moment immediately before unloading repre-sents the new limit for the joint resistance in the subsequent cycles. This cyclic response can be obtained, from the practical point of view, by adding mechanical fasteners (bolts or rivets) connecting the brackets of the pallet beam to the upright [56], but this is an additional cost that may not always be accepted by rack manufac-tures and owners;
• the second model, which in the following is identified as ACP model, is the typical Pivot-model [57], already used in a previous numerical study on racks [38], which is able to reproduce the typical response of boltless rack beam-to-column joints taking into account the stiffness reduction in the loading phase. In addition to the knowl-edge of the monotonic M-Φ joint curve, the values of α+ and α- are required, both herein assumed equal to 1.5. As shown in Fig. 11b, the intersections between the horizontal lines at α+M1
+ and α-M1-with
the initial stiffness S1 identify the points P+ and P-, respec-tively, which are the points defining the slope of the unloading branches. After the first hemi-cycle for hogging moments (OAB), the unloading phase is represented by the BC line, defined by points B and P+ until zero bending moment (point C) is achieved, followed then by the horizontal CO branch. Similarly, in the case of sagging moments, initially the elastic (OD) and post-elastic (DE) loading branches are based on the monotonic response. Unloading (branch
EF) is along the EP- line until zero moment (point F), followed byslippage to the origin (branch FO).
As to the fatigue resistance, a value of KBCJ=106 rad3 has been assumed to characterize the cyclic performance of all the considered types of beam-to-column joints. It is worth noting that this value is based on the Authors’ expertise and is considered acceptable given that the aim of the present section is to show the general procedure. It should not be used as a reference value for everyday practice.
In total 1512 iterative analyses have been executed according to the layout presented in Fig. 12. Research outcomes are proposed in the following sub-sections mainly with reference to the reduction of the load carrying capacity with respect to the static load carrying capacity (i.e. to the Wseis
MRSA/Wstat or WseisNLTH /Wstat ratios), which represents a
parameter of significant interest for rack designers, owing to its importance from the commercial point of view.
Due to the great amount of time require in preparing/updating each model, the OAPI (Open Application Programming Interface) tools [49] of SAP2000 has been used.
6.1. Rack performance according to the MRSA approach
As far as the MRSA outcomes are concerned, the WseisMRSA/Wstat ratio is
presented in Table 4 for the analyses associated with a behavior factor (q) ranging from 1 to 5.
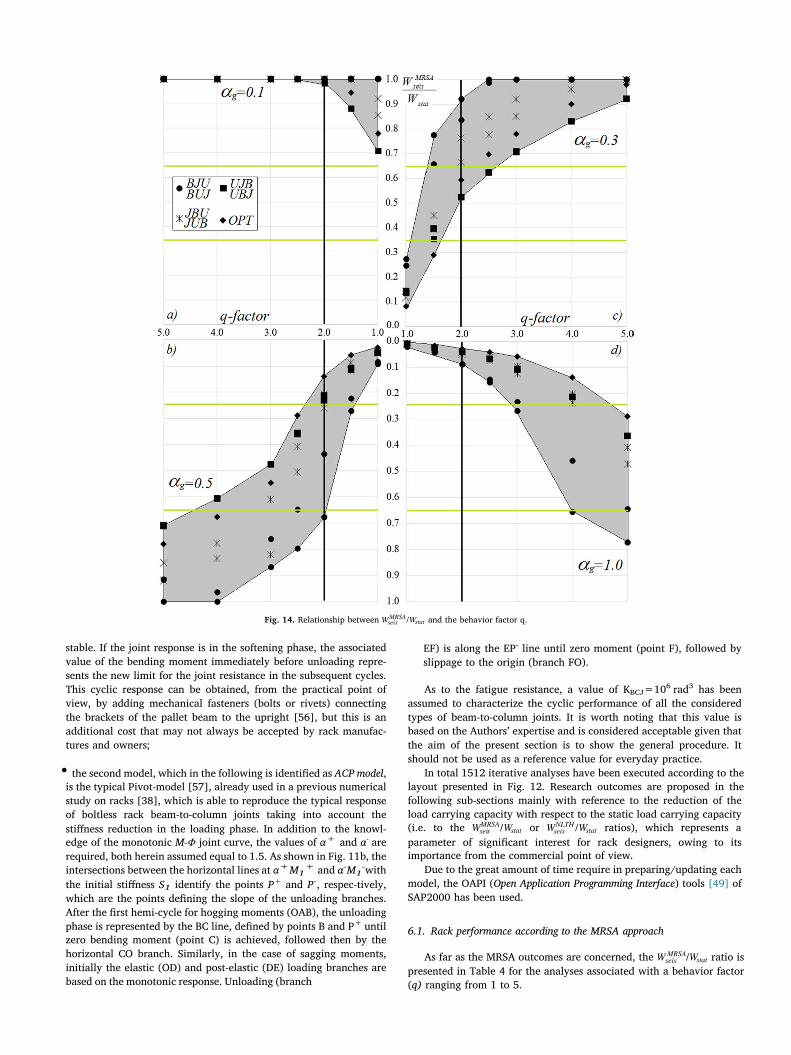
Fig. 14. Relationship between W W/seisMRSA
stat and the behavior factor q.
On the basis of 392 iterative analyses it can first be noted that thenumber of bays impacts significantly on the rack performance. Inparticular, making reference to the ratio W W/seis NB
MRSAseis NBMRSA
, =3 , =6, it appearsthat these values, quite independently of the component governingdesign, are in many cases different from unity. Independently of q, theratio W W/seis NB
MRSAseis NBMRSA
, =3 , =6, that is only in few cases lower than unity,ranges generally between 0.93 and 1.2 with a mean value of 1.03. Furthermore, it can be seen that the strong influence of the q-factor on the load carrying capacity of the rack increases with the increase of αg. As an example, reference can be made to Fig. 13, which plots theW W/seis
MRSAstat ratio versus q for the OPT cases: solid and dashed lines are
related to racks having three and six bays, respectively.A graphical summary of all the data reported in Table 4 is provided
in Fig. 14 where the WseisMRSA/Wstat ratio is plotted versus q for each αg
value. As expected, the data are comprised of regions whose amplitude and distance from unity increase with the increase of αg. In general, the greatest reductions are associated with the OPT cases and with racks
having the uprights as the weakest elements for static design (UJB and UBJ cases) for lower and higher values of αg, respectively. The best performance is associated with the BJU and BUJ racks, i.e. when static performance is governed by the pallet beams. Furthermore, the highest value of q allows for the use of racks also in case of severe earthquakes, as it appears by considering the non-negligible amount of data over the horizontal lines in correspondence of a load carrying capacity of 1/3 and 2/3 of the static one (Fig. 14). As an example, for αg=1, the load carrying capacity has to be reduced to approximately 95% of the static value if q=2 is adopted, this means that these racks cannot be conveniently employed in seismic zones. Otherwise, for the same racks, when q=5 is adopted, the minimum load carrying capacities corre-sponds at least to 46% of the static one, which could be of great interest for manufacturing designers and owners.
Finally, as to European choice, reference can be made to the performance assessed using q=2 instead of q=1.5 and this choice leads to appraise significantly different load carrying capacity. In particular, focusing attention on the cases associate with αg=0.3 andαg=0.5, theW W/seis q
MRSAseis qMRSA
, =2 , =1.5 ratio ranges between 1.19 and 2.5, with amean value of 1.86. These differences increase remarkably if theW W/seis q
MRSAseis qMRSA
, =1.5 , =1 ratio is considered: it falls between 1.83 and 3.63,with a mean value of 2.64.
6.2. Rack performance according to the NLTH-LCF approach
As to the NLTH-LCF approach, the considered cases have required intotal 1120 iterative analyses. Results are summarized in Table 5 wherethe W W/seis
NLTHstat ratio is presented, distinguished on the basis of joint
models and geometric layouts. Furthermore, the influence of the jointmodelling on the seismic rack performance can be directly appraised asthe ratio between the EPK and ACP load carrying capacity (EPK/ACPratio).
Like for MRSA, at first attention has been paid to the influence onthe number of bays on the rack performance. Making reference to theratioW W/seis NB
NLTHseis NBNLTH
, =3 , =6, it is observed that in the case of the EPK model,it ranges between 0.87 (case JUB with αg=0.3) and 1.11 (UBJ withαg=1), while for the ACP model it is between 0.72 (BJU with αg=0.3)and 1.26 (UJB with αg=0.3). These data, independently of the adoptedcyclic joint model, confirm once again the importance of the geometriclayout for an adequate design.
As to the reduction of the load carrying capacity with reference tothe static capacity, neglecting the cases where reduction is nil (mainlywith αg=0.1 for the cases in which pallet beams or joints are theweakest elements), it can be noted that the best performance is alwaysprovided by JBU cases, which is slightly greater than the BJU ones. Theworst is associated with the UJB and UBJ cases. It is expected thatincreasing αg, the use of pallet racks should result not convenient fromthe economical point of view, owing to the non–negligible reduction ofthe structural performance, i.e. to the reduction of the weight of thepallet units that can be sustained by racks in zones with high seismicity.Nevertheless, it can be noted that in case of αg=1 the load carryingcapacity for BJU and JBU cases is between 1/4 and 1/3 of thecorresponding static ones, confirming the relevant benefits associatedwith the use of advanced design strategies.
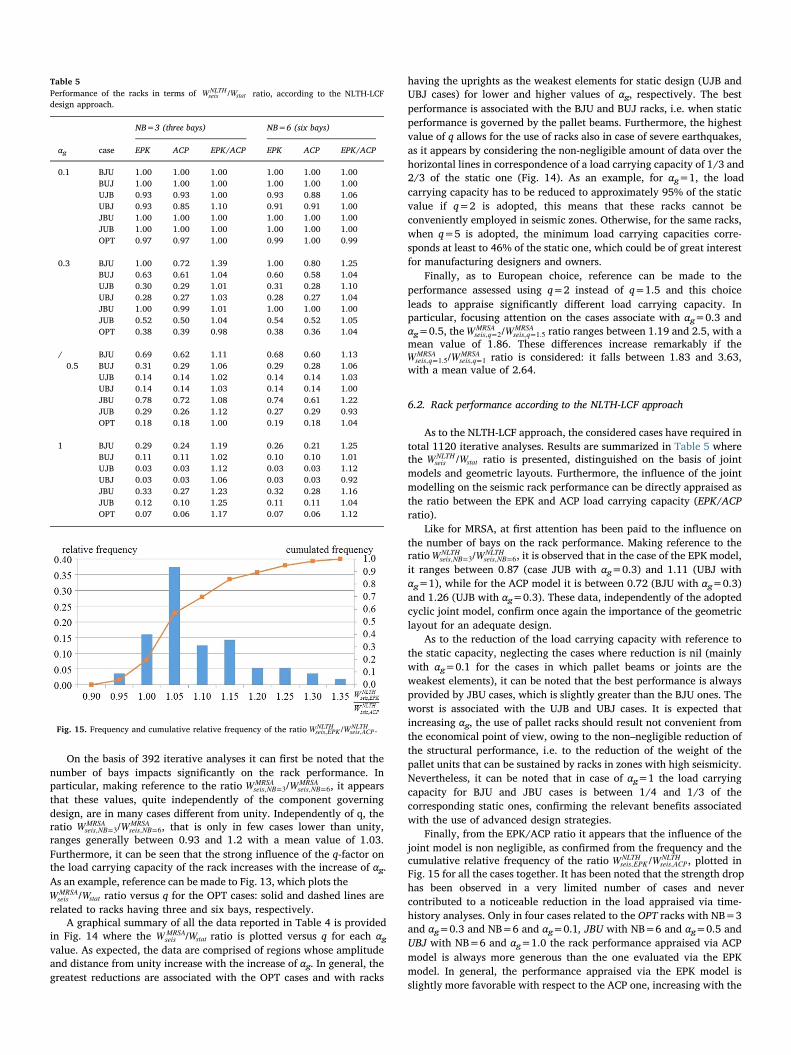
Finally, from the EPK/ACP ratio it appears that the influence of thejoint model is non negligible, as confirmed from the frequency and thecumulative relative frequency of the ratio W W/seis EPK
NLTHseis ACPNLTH
, , , plotted inFig. 15 for all the cases together. It has been noted that the strength drop has been observed in a very limited number of cases and never contributed to a noticeable reduction in the load appraised via time-history analyses. Only in four cases related to the OPT racks with NB=3 and αg=0.3 and NB=6 and αg=0.1, JBU with NB=6 and αg=0.5 and UBJ with NB=6 and αg=1.0 the rack performance appraised via ACP model is always more generous than the one evaluated via the EPK model. In general, the performance appraised via the EPK model is slightly more favorable with respect to the ACP one, increasing with the
stat ratio, according to the NLTH-LCF
NB=3 (three bays) NB=6 (six bays)
αg case EPK ACP EPK/ACP EPK ACP EPK/ACP
0.1 BJU 1.00 1.00 1.00 1.00 1.00 1.00BUJ 1.00 1.00 1.00 1.00 1.00 1.00UJB 0.93 0.93 1.00 0.93 0.88 1.06UBJ 0.93 0.85 1.10 0.91 0.91 1.00JBU 1.00 1.00 1.00 1.00 1.00 1.00JUB 1.00 1.00 1.00 1.00 1.00 1.00OPT 0.97 0.97 1.00 0.99 1.00 0.99
0.3 BJU 1.00 0.72 1.39 1.00 0.80 1.25BUJ 0.63 0.61 1.04 0.60 0.58 1.04UJB 0.30 0.29 1.01 0.31 0.28 1.10UBJ 0.28 0.27 1.03 0.28 0.27 1.04JBU 1.00 0.99 1.01 1.00 1.00 1.00JUB 0.52 0.50 1.04 0.54 0.52 1.05OPT 0.38 0.39 0.98 0.38 0.36 1.04
/0.5
BJU 0.69 0.62 1.11 0.68 0.60 1.13BUJ 0.31 0.29 1.06 0.29 0.28 1.06UJB 0.14 0.14 1.02 0.14 0.14 1.03UBJ 0.14 0.14 1.03 0.14 0.14 1.00JBU 0.78 0.72 1.08 0.74 0.61 1.22JUB 0.29 0.26 1.12 0.27 0.29 0.93OPT 0.18 0.18 1.00 0.19 0.18 1.04
1 BJU 0.29 0.24 1.19 0.26 0.21 1.25BUJ 0.11 0.11 1.02 0.10 0.10 1.01UJB 0.03 0.03 1.12 0.03 0.03 1.12UBJ 0.03 0.03 1.06 0.03 0.03 0.92JBU 0.33 0.27 1.23 0.32 0.28 1.16JUB 0.12 0.10 1.25 0.11 0.11 1.04OPT 0.07 0.06 1.17 0.07 0.06 1.12
Fig. 15. Frequency and cumulative relative frequency of the ratio W W/seis EPKNLTH
seis ACPNLTH
, , .
Table 5Performance of the racks in terms of seis
NLTH /W W design approach.
increase of αg. The mean values for the whole set of racks under thesame value of αg are to 1.01 (αg=0.1), 1.07 (αg=0.3), 1.06 (αg=0.5)and 1.12 (αg=1). The greatest increments are in general observed whenjoints govern design and the maximum values of this ratio are due tothe reduction of the joint stiffness making the rack too flexible to resistto the seismic load. In these cases, the live load after the non-linear timehistory analyses has to be significantly reduced because the structuralchecks associated with the static design provisions were not fulfilled,owing to the amplification (40%) required for the pallet unit loads.
A key feature of this combined NLTH-LCF approach is the possibilityof evaluating the damage in joints, which should be of great interest forcommercial reasons. The map of the residual fatigue life in each jointshould be in fact of great interest for re-using racks after each earth-quake as well as to define the commercial value of racks for selling/buying. For each rack case, the rotation ranges of each joint have beenmonitored during the analysis and the associated data re-elaboration,according to the described LCF procedure, has allowed for the devel-opment of a map related to the damage distribution in terms of meanvalue of each considered accelerograms. From the analysis of this great
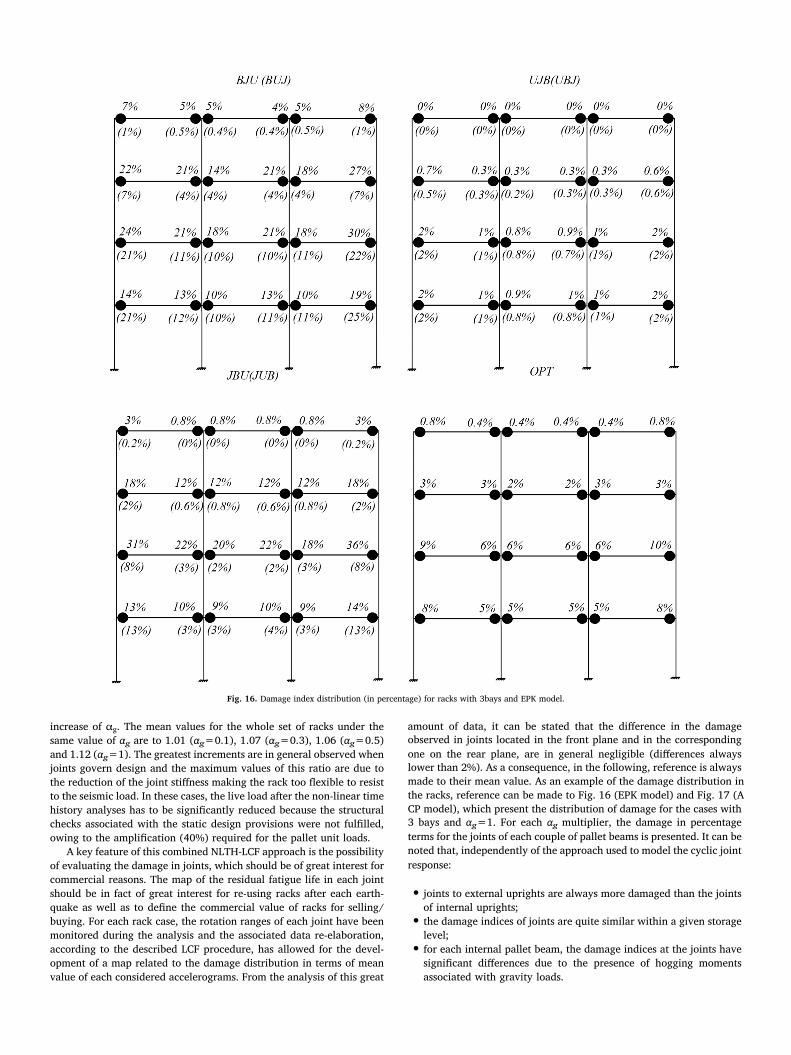
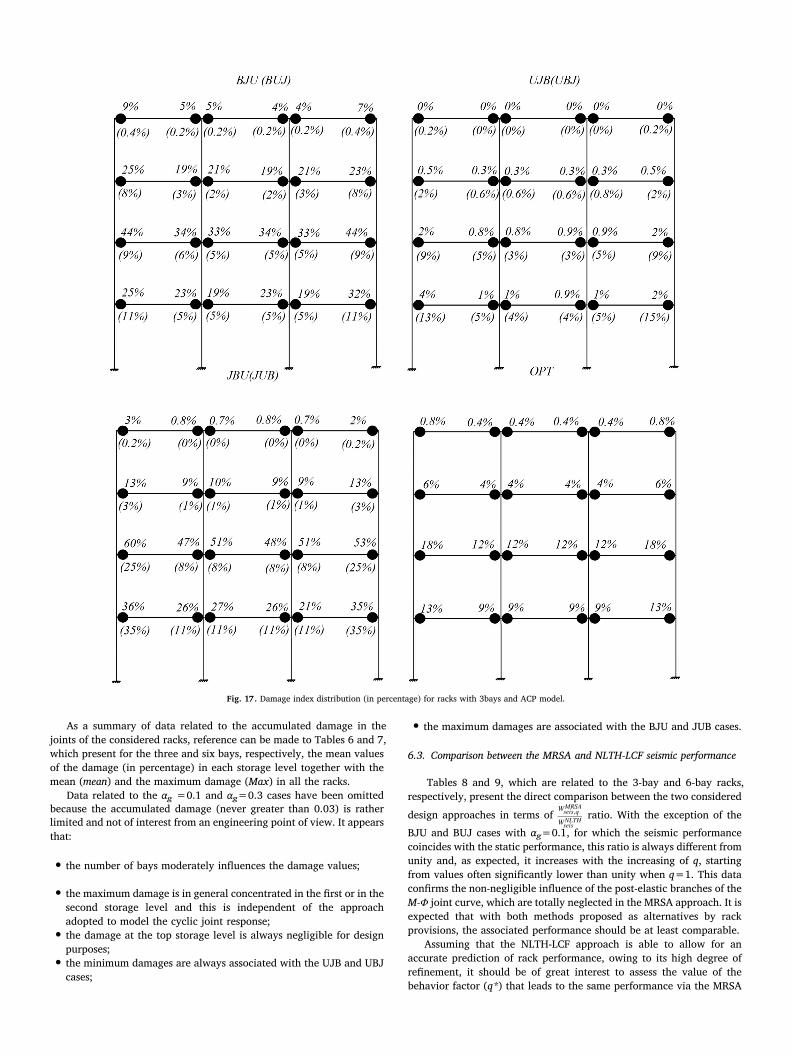
amount of data, it can be stated that the difference in the damage observed in joints located in the front plane and in the corresponding one on the rear plane, are in general negligible (differences always lower than 2%). As a consequence, in the following, reference is always made to their mean value. As an example of the damage distribution in the racks, reference can be made to Fig. 16 (EPK model) and Fig. 17 (A CP model), which present the distribution of damage for the cases with 3 bays and αg=1. For each αg multiplier, the damage in percentage terms for the joints of each couple of pallet beams is presented. It can be noted that, independently of the approach used to model the cyclic joint response:
• joints to external uprights are always more damaged than the jointsof internal uprights;
• the damage indices of joints are quite similar within a given storagelevel;
• for each internal pallet beam, the damage indices at the joints havesignificant differences due to the presence of hogging momentsassociated with gravity loads.
Fig. 16. Damage index distribution (in percentage) for racks with 3bays and EPK model.
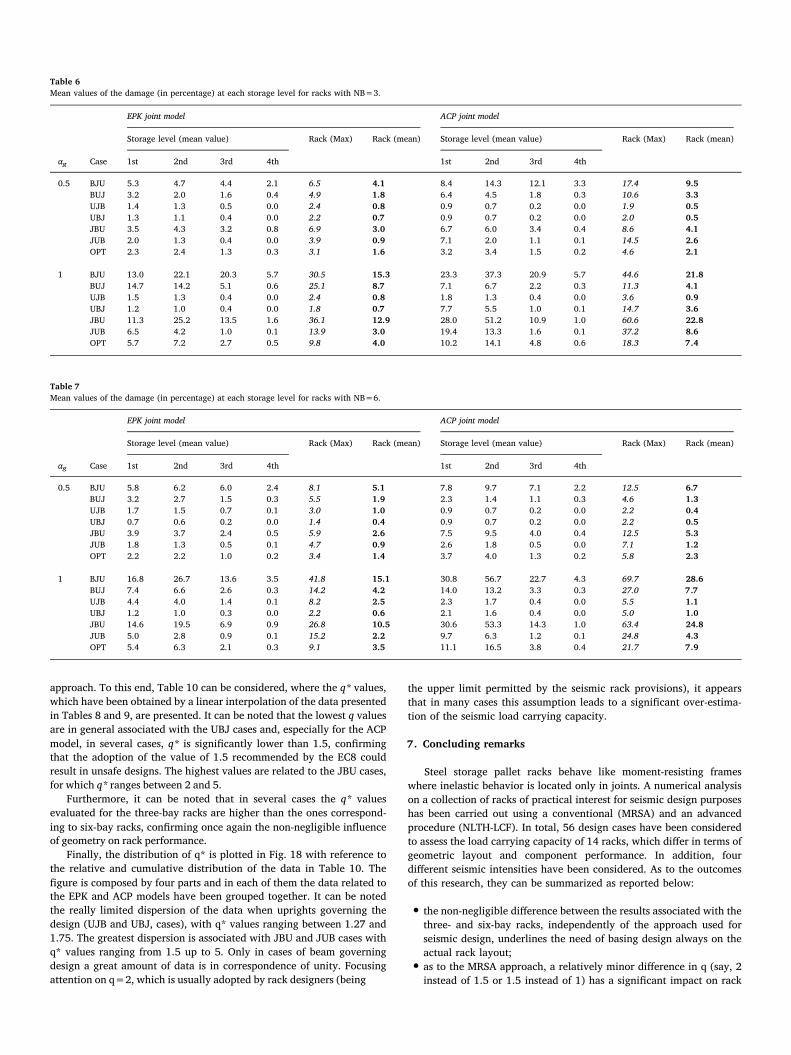
As a summary of data related to the accumulated damage in the joints of the considered racks, reference can be made to Tables 6 and 7, which present for the three and six bays, respectively, the mean values of the damage (in percentage) in each storage level together with the mean (mean) and the maximum damage (Max) in all the racks.
Data related to the αg =0.1 and αg=0.3 cases have been omitted because the accumulated damage (never greater than 0.03) is rather limited and not of interest from an engineering point of view. It appears that:
• the number of bays moderately influences the damage values;
• the maximum damage is in general concentrated in the first or in thesecond storage level and this is independent of the approachadopted to model the cyclic joint response;
• the damage at the top storage level is always negligible for designpurposes;
• the minimum damages are always associated with the UJB and UBJcases;
• the maximum damages are associated with the BJU and JUB cases.
6.3. Comparison between the MRSA and NLTH-LCF seismic performance
Tables 8 and 9, which are related to the 3-bay and 6-bay racks, respectively, present the direct comparison between the two considered
design approaches in terms ofW
Wseis qMRSA
seisNLTH
, ratio. With the exception of the
BJU and BUJ cases with αg=0.1, for which the seismic performancecoincides with the static performance, this ratio is always different fromunity and, as expected, it increases with the increasing of q, startingfrom values often significantly lower than unity when q=1. This dataconfirms the non-negligible influence of the post-elastic branches of theM-Φ joint curve, which are totally neglected in the MRSA approach. It isexpected that with both methods proposed as alternatives by rackprovisions, the associated performance should be at least comparable.
Assuming that the NLTH-LCF approach is able to allow for anaccurate prediction of rack performance, owing to its high degree ofrefinement, it should be of great interest to assess the value of thebehavior factor (q*) that leads to the same performance via the MRSA
Fig. 17. Damage index distribution (in percentage) for racks with 3bays and ACP model.
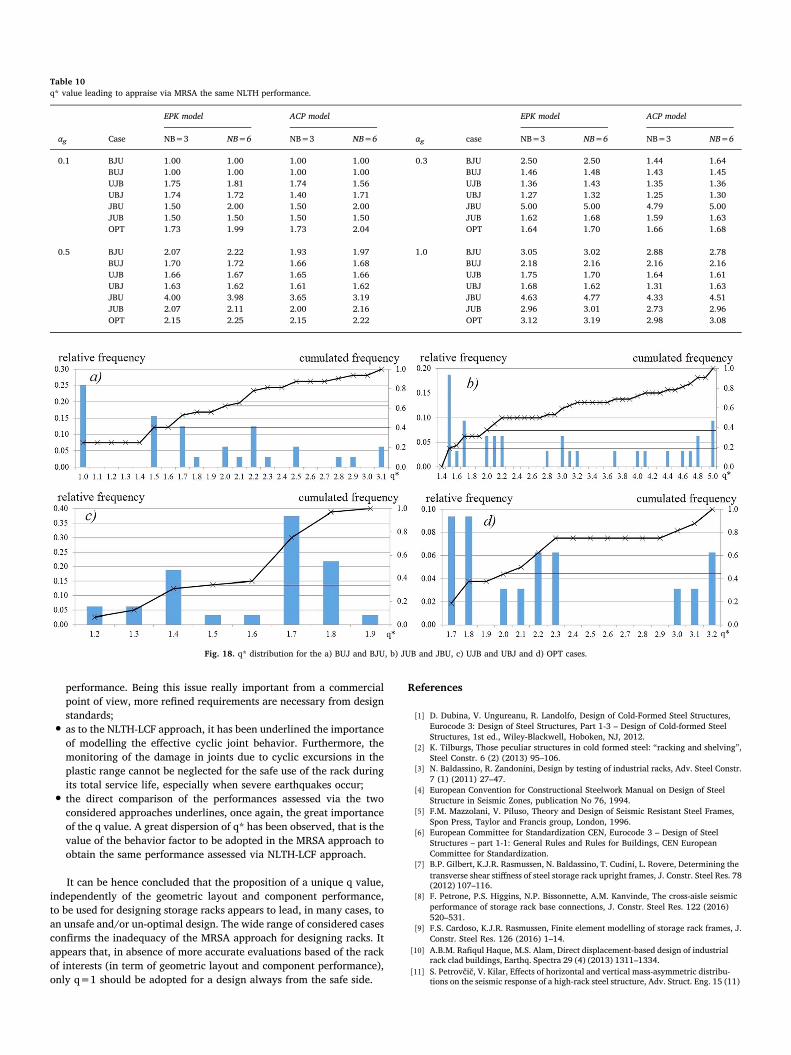
approach. To this end, Table 10 can be considered, where the q* values, which have been obtained by a linear interpolation of the data presented in Tables 8 and 9, are presented. It can be noted that the lowest q values are in general associated with the UBJ cases and, especially for the ACP model, in several cases, q* is significantly lower than 1.5, confirming that the adoption of the value of 1.5 recommended by the EC8 could result in unsafe designs. The highest values are related to the JBU cases, for which q* ranges between 2 and 5.
Furthermore, it can be noted that in several cases the q* values evaluated for the three-bay racks are higher than the ones correspond-ing to six-bay racks, confirming once again the non-negligible influence of geometry on rack performance.
Finally, the distribution of q* is plotted in Fig. 18 with reference to the relative and cumulative distribution of the data in Table 10. The figure is composed by four parts and in each of them the data related to the EPK and ACP models have been grouped together. It can be noted the really limited dispersion of the data when uprights governing the design (UJB and UBJ, cases), with q* values ranging between 1.27 and 1.75. The greatest dispersion is associated with JBU and JUB cases with q* values ranging from 1.5 up to 5. Only in cases of beam governing design a great amount of data is in correspondence of unity. Focusing attention on q=2, which is usually adopted by rack designers (being
the upper limit permitted by the seismic rack provisions), it appearsthat in many cases this assumption leads to a significant over-estima-tion of the seismic load carrying capacity.
7. Concluding remarks
Steel storage pallet racks behave like moment-resisting frameswhere inelastic behavior is located only in joints. A numerical analysison a collection of racks of practical interest for seismic design purposeshas been carried out using a conventional (MRSA) and an advancedprocedure (NLTH-LCF). In total, 56 design cases have been consideredto assess the load carrying capacity of 14 racks, which differ in terms ofgeometric layout and component performance. In addition, fourdifferent seismic intensities have been considered. As to the outcomesof this research, they can be summarized as reported below:
• the non-negligible difference between the results associated with thethree- and six-bay racks, independently of the approach used forseismic design, underlines the need of basing design always on theactual rack layout;
• as to the MRSA approach, a relatively minor difference in q (say, 2instead of 1.5 or 1.5 instead of 1) has a significant impact on rack
EPK joint model ACP joint model
Storage level (mean value) Rack (Max) Rack (mean) Storage level (mean value) Rack (Max) Rack (mean)
αg Case 1st 2nd 3rd 4th 1st 2nd 3rd 4th
0.5 BJU 5.3 4.7 4.4 2.1 6.5 4.1 8.4 14.3 12.1 3.3 17.4 9.5BUJ 3.2 2.0 1.6 0.4 4.9 1.8 6.4 4.5 1.8 0.3 10.6 3.3UJB 1.4 1.3 0.5 0.0 2.4 0.8 0.9 0.7 0.2 0.0 1.9 0.5UBJ 1.3 1.1 0.4 0.0 2.2 0.7 0.9 0.7 0.2 0.0 2.0 0.5JBU 3.5 4.3 3.2 0.8 6.9 3.0 6.7 6.0 3.4 0.4 8.6 4.1JUB 2.0 1.3 0.4 0.0 3.9 0.9 7.1 2.0 1.1 0.1 14.5 2.6OPT 2.3 2.4 1.3 0.3 3.1 1.6 3.2 3.4 1.5 0.2 4.6 2.1
1 BJU 13.0 22.1 20.3 5.7 30.5 15.3 23.3 37.3 20.9 5.7 44.6 21.8BUJ 14.7 14.2 5.1 0.6 25.1 8.7 7.1 6.7 2.2 0.3 11.3 4.1UJB 1.5 1.3 0.4 0.0 2.4 0.8 1.8 1.3 0.4 0.0 3.6 0.9UBJ 1.2 1.0 0.4 0.0 1.8 0.7 7.7 5.5 1.0 0.1 14.7 3.6JBU 11.3 25.2 13.5 1.6 36.1 12.9 28.0 51.2 10.9 1.0 60.6 22.8JUB 6.5 4.2 1.0 0.1 13.9 3.0 19.4 13.3 1.6 0.1 37.2 8.6OPT 5.7 7.2 2.7 0.5 9.8 4.0 10.2 14.1 4.8 0.6 18.3 7.4
Table 7Mean values of the damage (in percentage) at each storage level for racks with NB=6.
EPK joint model ACP joint model
Storage level (mean value) Rack (Max) Rack (mean) Storage level (mean value) Rack (Max) Rack (mean)
αg Case 1st 2nd 3rd 4th 1st 2nd 3rd 4th
0.5 BJU 5.8 6.2 6.0 2.4 8.1 5.1 7.8 9.7 7.1 2.2 12.5 6.7BUJ 3.2 2.7 1.5 0.3 5.5 1.9 2.3 1.4 1.1 0.3 4.6 1.3UJB 1.7 1.5 0.7 0.1 3.0 1.0 0.9 0.7 0.2 0.0 2.2 0.4UBJ 0.7 0.6 0.2 0.0 1.4 0.4 0.9 0.7 0.2 0.0 2.2 0.5JBU 3.9 3.7 2.4 0.5 5.9 2.6 7.5 9.5 4.0 0.4 12.5 5.3JUB 1.8 1.3 0.5 0.1 4.7 0.9 2.6 1.8 0.5 0.0 7.1 1.2OPT 2.2 2.2 1.0 0.2 3.4 1.4 3.7 4.0 1.3 0.2 5.8 2.3
1 BJU 16.8 26.7 13.6 3.5 41.8 15.1 30.8 56.7 22.7 4.3 69.7 28.6BUJ 7.4 6.6 2.6 0.3 14.2 4.2 14.0 13.2 3.3 0.3 27.0 7.7UJB 4.4 4.0 1.4 0.1 8.2 2.5 2.3 1.7 0.4 0.0 5.5 1.1UBJ 1.2 1.0 0.3 0.0 2.2 0.6 2.1 1.6 0.4 0.0 5.0 1.0JBU 14.6 19.5 6.9 0.9 26.8 10.5 30.6 53.3 14.3 1.0 63.4 24.8JUB 5.0 2.8 0.9 0.1 15.2 2.2 9.7 6.3 1.2 0.1 24.8 4.3OPT 5.4 6.3 2.1 0.3 9.1 3.5 11.1 16.5 3.8 0.4 21.7 7.9
Table 6Mean values of the damage (in percentage) at each storage level for racks with NB=3.
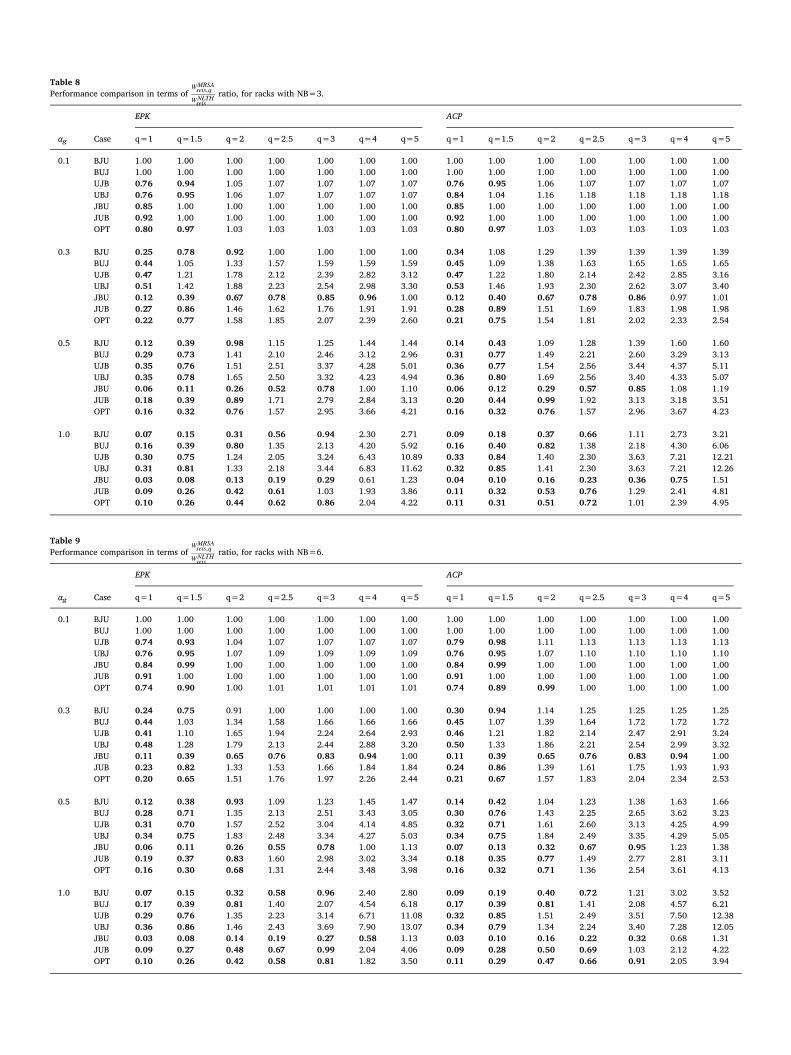
Table 8Performance comparison in terms of
Wseis qMRSA
WseisNLTH
, ratio, for racks with NB=3.
EPK ACP
αg Case q=1 q=1.5 q=2 q=2.5 q=3 q=4 q=5 q=1 q=1.5 q=2 q=2.5 q=3 q=4 q=5
0.1 BJU 1.00 1.00 1.00 1.00 1.00 1.00 1.00 1.00 1.00 1.00 1.00 1.00 1.00 1.00BUJ 1.00 1.00 1.00 1.00 1.00 1.00 1.00 1.00 1.00 1.00 1.00 1.00 1.00 1.00UJB 0.76 0.94 1.05 1.07 1.07 1.07 1.07 0.76 0.95 1.06 1.07 1.07 1.07 1.07UBJ 0.76 0.95 1.06 1.07 1.07 1.07 1.07 0.84 1.04 1.16 1.18 1.18 1.18 1.18JBU 0.85 1.00 1.00 1.00 1.00 1.00 1.00 0.85 1.00 1.00 1.00 1.00 1.00 1.00JUB 0.92 1.00 1.00 1.00 1.00 1.00 1.00 0.92 1.00 1.00 1.00 1.00 1.00 1.00OPT 0.80 0.97 1.03 1.03 1.03 1.03 1.03 0.80 0.97 1.03 1.03 1.03 1.03 1.03
0.3 BJU 0.25 0.78 0.92 1.00 1.00 1.00 1.00 0.34 1.08 1.29 1.39 1.39 1.39 1.39BUJ 0.44 1.05 1.33 1.57 1.59 1.59 1.59 0.45 1.09 1.38 1.63 1.65 1.65 1.65UJB 0.47 1.21 1.78 2.12 2.39 2.82 3.12 0.47 1.22 1.80 2.14 2.42 2.85 3.16UBJ 0.51 1.42 1.88 2.23 2.54 2.98 3.30 0.53 1.46 1.93 2.30 2.62 3.07 3.40JBU 0.12 0.39 0.67 0.78 0.85 0.96 1.00 0.12 0.40 0.67 0.78 0.86 0.97 1.01JUB 0.27 0.86 1.46 1.62 1.76 1.91 1.91 0.28 0.89 1.51 1.69 1.83 1.98 1.98OPT 0.22 0.77 1.58 1.85 2.07 2.39 2.60 0.21 0.75 1.54 1.81 2.02 2.33 2.54
0.5 BJU 0.12 0.39 0.98 1.15 1.25 1.44 1.44 0.14 0.43 1.09 1.28 1.39 1.60 1.60BUJ 0.29 0.73 1.41 2.10 2.46 3.12 2.96 0.31 0.77 1.49 2.21 2.60 3.29 3.13UJB 0.35 0.76 1.51 2.51 3.37 4.28 5.01 0.36 0.77 1.54 2.56 3.44 4.37 5.11UBJ 0.35 0.78 1.65 2.50 3.32 4.23 4.94 0.36 0.80 1.69 2.56 3.40 4.33 5.07JBU 0.06 0.11 0.26 0.52 0.78 1.00 1.10 0.06 0.12 0.29 0.57 0.85 1.08 1.19JUB 0.18 0.39 0.89 1.71 2.79 2.84 3.13 0.20 0.44 0.99 1.92 3.13 3.18 3.51OPT 0.16 0.32 0.76 1.57 2.95 3.66 4.21 0.16 0.32 0.76 1.57 2.96 3.67 4.23
1.0 BJU 0.07 0.15 0.31 0.56 0.94 2.30 2.71 0.09 0.18 0.37 0.66 1.11 2.73 3.21BUJ 0.16 0.39 0.80 1.35 2.13 4.20 5.92 0.16 0.40 0.82 1.38 2.18 4.30 6.06UJB 0.30 0.75 1.24 2.05 3.24 6.43 10.89 0.33 0.84 1.40 2.30 3.63 7.21 12.21UBJ 0.31 0.81 1.33 2.18 3.44 6.83 11.62 0.32 0.85 1.41 2.30 3.63 7.21 12.26JBU 0.03 0.08 0.13 0.19 0.29 0.61 1.23 0.04 0.10 0.16 0.23 0.36 0.75 1.51JUB 0.09 0.26 0.42 0.61 1.03 1.93 3.86 0.11 0.32 0.53 0.76 1.29 2.41 4.81OPT 0.10 0.26 0.44 0.62 0.86 2.04 4.22 0.11 0.31 0.51 0.72 1.01 2.39 4.95
Table 9Performance comparison in terms of
Wseis qMRSA
WseisNLTH
, ratio, for racks with NB=6.
EPK ACP
αg Case q=1 q=1.5 q=2 q=2.5 q=3 q=4 q=5 q=1 q=1.5 q=2 q=2.5 q=3 q=4 q=5
0.1 BJU 1.00 1.00 1.00 1.00 1.00 1.00 1.00 1.00 1.00 1.00 1.00 1.00 1.00 1.00BUJ 1.00 1.00 1.00 1.00 1.00 1.00 1.00 1.00 1.00 1.00 1.00 1.00 1.00 1.00UJB 0.74 0.93 1.04 1.07 1.07 1.07 1.07 0.79 0.98 1.11 1.13 1.13 1.13 1.13UBJ 0.76 0.95 1.07 1.09 1.09 1.09 1.09 0.76 0.95 1.07 1.10 1.10 1.10 1.10JBU 0.84 0.99 1.00 1.00 1.00 1.00 1.00 0.84 0.99 1.00 1.00 1.00 1.00 1.00JUB 0.91 1.00 1.00 1.00 1.00 1.00 1.00 0.91 1.00 1.00 1.00 1.00 1.00 1.00OPT 0.74 0.90 1.00 1.01 1.01 1.01 1.01 0.74 0.89 0.99 1.00 1.00 1.00 1.00
0.3 BJU 0.24 0.75 0.91 1.00 1.00 1.00 1.00 0.30 0.94 1.14 1.25 1.25 1.25 1.25BUJ 0.44 1.03 1.34 1.58 1.66 1.66 1.66 0.45 1.07 1.39 1.64 1.72 1.72 1.72UJB 0.41 1.10 1.65 1.94 2.24 2.64 2.93 0.46 1.21 1.82 2.14 2.47 2.91 3.24UBJ 0.48 1.28 1.79 2.13 2.44 2.88 3.20 0.50 1.33 1.86 2.21 2.54 2.99 3.32JBU 0.11 0.39 0.65 0.76 0.83 0.94 1.00 0.11 0.39 0.65 0.76 0.83 0.94 1.00JUB 0.23 0.82 1.33 1.53 1.66 1.84 1.84 0.24 0.86 1.39 1.61 1.75 1.93 1.93OPT 0.20 0.65 1.51 1.76 1.97 2.26 2.44 0.21 0.67 1.57 1.83 2.04 2.34 2.53
0.5 BJU 0.12 0.38 0.93 1.09 1.23 1.45 1.47 0.14 0.42 1.04 1.23 1.38 1.63 1.66BUJ 0.28 0.71 1.35 2.13 2.51 3.43 3.05 0.30 0.76 1.43 2.25 2.65 3.62 3.23UJB 0.31 0.70 1.57 2.52 3.04 4.14 4.85 0.32 0.71 1.61 2.60 3.13 4.25 4.99UBJ 0.34 0.75 1.83 2.48 3.34 4.27 5.03 0.34 0.75 1.84 2.49 3.35 4.29 5.05JBU 0.06 0.11 0.26 0.55 0.78 1.00 1.13 0.07 0.13 0.32 0.67 0.95 1.23 1.38JUB 0.19 0.37 0.83 1.60 2.98 3.02 3.34 0.18 0.35 0.77 1.49 2.77 2.81 3.11OPT 0.16 0.30 0.68 1.31 2.44 3.48 3.98 0.16 0.32 0.71 1.36 2.54 3.61 4.13
1.0 BJU 0.07 0.15 0.32 0.58 0.96 2.40 2.80 0.09 0.19 0.40 0.72 1.21 3.02 3.52BUJ 0.17 0.39 0.81 1.40 2.07 4.54 6.18 0.17 0.39 0.81 1.41 2.08 4.57 6.21UJB 0.29 0.76 1.35 2.23 3.14 6.71 11.08 0.32 0.85 1.51 2.49 3.51 7.50 12.38UBJ 0.36 0.86 1.46 2.43 3.69 7.90 13.07 0.34 0.79 1.34 2.24 3.40 7.28 12.05JBU 0.03 0.08 0.14 0.19 0.27 0.58 1.13 0.03 0.10 0.16 0.22 0.32 0.68 1.31JUB 0.09 0.27 0.48 0.67 0.99 2.04 4.06 0.09 0.28 0.50 0.69 1.03 2.12 4.22OPT 0.10 0.26 0.42 0.58 0.81 1.82 3.50 0.11 0.29 0.47 0.66 0.91 2.05 3.94
performance. Being this issue really important from a commercialpoint of view, more refined requirements are necessary from designstandards;
• as to the NLTH-LCF approach, it has been underlined the importanceof modelling the effective cyclic joint behavior. Furthermore, themonitoring of the damage in joints due to cyclic excursions in theplastic range cannot be neglected for the safe use of the rack duringits total service life, especially when severe earthquakes occur;
• the direct comparison of the performances assessed via the twoconsidered approaches underlines, once again, the great importanceof the q value. A great dispersion of q* has been observed, that is thevalue of the behavior factor to be adopted in the MRSA approach toobtain the same performance assessed via NLTH-LCF approach.
It can be hence concluded that the proposition of a unique q value,independently of the geometric layout and component performance,to be used for designing storage racks appears to lead, in many cases, toan unsafe and/or un-optimal design. The wide range of considered casesconfirms the inadequacy of the MRSA approach for designing racks. Itappears that, in absence of more accurate evaluations based of the rackof interests (in term of geometric layout and component performance),only q=1 should be adopted for a design always from the safe side.
References
[1] D. Dubina, V. Ungureanu, R. Landolfo, Design of Cold-Formed Steel Structures, Eurocode 3: Design of Steel Structures, Part 1-3 – Design of Cold-formed Steel Structures, 1st ed., Wiley-Blackwell, Hoboken, NJ, 2012.
[2] K. Tilburgs, Those peculiar structures in cold formed steel: “racking and shelving”, Steel Constr. 6 (2) (2013) 95–106.
[3] N. Baldassino, R. Zandonini, Design by testing of industrial racks, Adv. Steel Constr. 7 (1) (2011) 27–47.
[4] European Convention for Constructional Steelwork Manual on Design of Steel Structure in Seismic Zones, publication No 76, 1994.
[5] F.M. Mazzolani, V. Piluso, Theory and Design of Seismic Resistant Steel Frames, Spon Press, Taylor and Francis group, London, 1996.
[6] European Committee for Standardization CEN, Eurocode 3 – Design of Steel Structures – part 1-1: General Rules and Rules for Buildings, CEN European Committee for Standardization.
[7] B.P. Gilbert, K.J.R. Rasmussen, N. Baldassino, T. Cudini, L. Rovere, Determining the transverse shear stiffness of steel storage rack upright frames, J. Constr. Steel Res. 78 (2012) 107–116.
[8] F. Petrone, P.S. Higgins, N.P. Bissonnette, A.M. Kanvinde, The cross-aisle seismic performance of storage rack base connections, J. Constr. Steel Res. 122 (2016) 520–531.
[9] F.S. Cardoso, K.J.R. Rasmussen, Finite element modelling of storage rack frames, J. Constr. Steel Res. 126 (2016) 1–14.
[10] A.B.M. Rafiqul Haque, M.S. Alam, Direct displacement-based design of industrial rack clad buildings, Earthq. Spectra 29 (4) (2013) 1311–1334.
[11] S. Petrovčič, V. Kilar, Effects of horizontal and vertical mass-asymmetric distribu-tions on the seismic response of a high-rack steel structure, Adv. Struct. Eng. 15 (11)
EPK model ACP model EPK model ACP model
αg Case NB=3 NB=6 NB=3 NB=6 αg case NB=3 NB=6 NB=3 NB=6
0.1 BJU 1.00 1.00 1.00 1.00 0.3 BJU 2.50 2.50 1.44 1.64BUJ 1.00 1.00 1.00 1.00 BUJ 1.46 1.48 1.43 1.45UJB 1.75 1.81 1.74 1.56 UJB 1.36 1.43 1.35 1.36UBJ 1.74 1.72 1.40 1.71 UBJ 1.27 1.32 1.25 1.30JBU 1.50 2.00 1.50 2.00 JBU 5.00 5.00 4.79 5.00JUB 1.50 1.50 1.50 1.50 JUB 1.62 1.68 1.59 1.63OPT 1.73 1.99 1.73 2.04 OPT 1.64 1.70 1.66 1.68
0.5 BJU 2.07 2.22 1.93 1.97 1.0 BJU 3.05 3.02 2.88 2.78BUJ 1.70 1.72 1.66 1.68 BUJ 2.18 2.16 2.16 2.16UJB 1.66 1.67 1.65 1.66 UJB 1.75 1.70 1.64 1.61UBJ 1.63 1.62 1.61 1.62 UBJ 1.68 1.62 1.31 1.63JBU 4.00 3.98 3.65 3.19 JBU 4.63 4.77 4.33 4.51JUB 2.07 2.11 2.00 2.16 JUB 2.96 3.01 2.73 2.96OPT 2.15 2.25 2.15 2.22 OPT 3.12 3.19 2.98 3.08
Fig. 18. q* distribution for the a) BUJ and BJU, b) JUB and JBU, c) UJB and UBJ and d) OPT cases.
Table 10q* value leading to appraise via MRSA the same NLTH performance.
(2012) 1977–1988.[12] P. Sideris, A. Filiatrault, M. Leclerc, R. Tremblay, Experimental investigation on the
seismic behavior of palletized merchandise in steel storage racks, Earthq. Spectra 26(1) (2010) 209–233.
[13] C. Aguirre, Seismic behavior of rack structures, J. Constr. Steel Res. 61 (5) (2005) 607–624.
[14] A.K. Chopra, Dynamics of Structures, 4th ed., Prentice-Hall, International series in Civil Engineering and Engineering Mechanics, US, 2013.
[15] R.W. Clough, J. Penzien, Dynamics of Structures, McGraw-Hill, UK, 1993.[16] FEM 10.2.08, Recommendations for the Design of Static Steel Storage Pallet Racks
in Seismic Conditions, Federation Européenne de Manutention, version 1.00, 2010.[17] European Committee for Standardization CEN, EN 16681, Steel Static Storage
Systems – Adjustable Pallet Racking System – Principle for Seismic Design, 2016.[18] M. Ferraioli, A. Lavino, A. Mandara, Behaviour factor for seismic design of moment
resisting steel frames, in: Proceedings of the 15th World Conference on Earthquake Engineering, Lisboa, 2012.
[19] J. Kappos, Evaluation of behaviour factors on the basis of ductility and overstrength studies, Eng. Struct. 21 (1999) 823–835.
[20] European Committee for Standardization CEN, EN 1998-1. Eurocode 8 – Design of Structures for Earthquake Resistance, 2004.
[21] Rack Manufacturers Institute, RMI MH 16.1. Specification for the Design, Testing and Utilization of Industrial Steel Storage Racks, 2012, p. 59.
[22] C.A. Castiglioni, Seismic Behavior of Steel Storage Pallet Racking Systems, Springer International Publishing, Berlin, Germany, 2016 (ISSN 2198-7300).
[23] C.A. Castiglioni, A. Kanyilmaz, M. Angeretti, G. Brambilla, G.P. Chiarelli, C. Bernuzzi, Experimental results of full scale push over tests of project SEISRACK2 (seismic behaviour of steel storage pallet racking systems), in: Proceedings of the 2nd European Conference on Earthquake Engineering, Istanbul, August 2014, pp. 25–29.
[24] A. Kanyilmaz, C.A. Castiglioni, G. Brambilla, G.P. Chiarelli, Experimental assess-ment of the seismic behaviour of unbraced steel storage pallet racks, Thin-Walled Struct. 108 (2016) 391–405.
[25] K. Adamakos, S. Avgerinou, I. Vayas, ECCOMAS Thematic Conference – COMPDYN 2013: in: Proceedings of the 4th International Conference on Computational Methods in Structural Dynamics and Earthquake Engineering, Proceedings – An IA CM Special Interest Conference, 2013.
[26] C. Bernuzzi, A. Di Gioia, G. Gabbianelli, M. Simoncelli, Pushover analyses of hand-loaded steel storage shelving racks, J. Earthq. Eng. (2016) 1–27.
[27] C. Bernuzzi, C.A. Castiglioni, Experimental analysis on the cyclic behaviour of beam-to-column joints in steel storage pallet racks, Thin-Walled Struct. 39 (2001) 841–859.
[28] S.N.R. Shah, N.H.R. Sulong, M.Z. Jumaat, M. Shariati, State of the art review on the design and performance of steel pallet rack connections, Eng. Fail. Anal. 66 (2016) 240–258.
[29] R. Zandonini, C. Bernuzzi, O. Bursi, Steel and Steel-concrete composite joints subjected to seismic actions, in: Proceedings of Behaviour of Steel Structures in Seismic Areas, Kyoto, August, 1997.
[30] C. Bernuzzi, European and United States approaches for steel storage pallets rack design. Part 1: discussions and general comparisons, Thin-Walled Struct. 97 (2015) 308–320.
[31] F. Bijlard, M. Feldmann, J. Naumes, G. Sedlacek, in: Sohn Ernst, (Ed.), The General Method for Assessing the Out-of-plane Stability of Structural Members and Frames in Comparison with Alternative Rule in EN 1993 – Eurocode 3 – part 1-1, 3, Steel Construction [No. 1], 2010.
[32] F. Papp, Global Stability Analysis Using General Method. ⟨www.consteelsoftware. com/⟩.
[33] European Committee for Standardization (CEN), EN 15512 Steel Static Storage
Systems – Adjustable Pallet Racking Systems – Principles for Structural Design, 2009.
[34] Federation Européenne de Manutention, FEM 10.2.02 – Reccomendations for the Design of Static Steel Storage Pallet Racks, version1.00, September 2010.
[35] C. Bernuzzi, F. Maxenti, European alternatives to design perforated thin-walled cold-formed beam-columns for steel storage systems, J. Constr. Steel Res. 110(2015) 121–136.
[36] C. Bernuzzi, M. Simoncelli, European design approaches for isolated cold-formed thin-walled beam-columns with mono-symmetric cross-section, Eng. Struct. 86(2015) 225–241.
[37] A.D. Kiureghian, Structural response to stationary excitation, J. Eng. Mech. Div. ASCE 11 (1980).
[38] C. Bernuzzi, M. Simoncelli, An advanced design procedure for the safe use of steel storage pallet racks in seismic zone, Thin walled Struct. 109 (2016) 73–87.
[39] W. Schultz, A history of fatigue, Eng. Fract. Mech. 54 (2) (1996) 263–300.[40] J. Bannantine, J. Comer, G. Handrock, Fundamentals of Metal Fatigue Analyses,
Prentice hall, US, 1989.[41] International Welding institute JWG XIII-XV Fatigue Recommendations, Doc. XII
1539-94/XV-845-894 1994.[42] L. Calado, C.A. Castiglioni, Low cycle fatigue testing of semi-rigid beam-to column
connections, in: Proceedings of the 3rd International Workshop on Connections in Steel Structures, Trento, 28–31 May 1995, pp. 371–380.
[43] L. Calado, C.A. Castiglioni, C. Bernuzzi, Cyclic behaviour of structural steel elements, Method for re-elaboration of test data, in: Proceedings of the 1st National Colloquium on Steel and Composite Construction, Porto, Portugal, Nov. 1997, pp. 633–660.
[44] European Committee for Standardization CEN, EN1993-1-9, Eurocode 3 – Design of Steel Structures – Part 1-9: Fatigue, CEN European Committee for Standardization, 2005.
[45] M.A. Miner, Cumulative damage in fatigue, J. Appl. Mech. (1945).[46] R. Narayanan (Ed.), Structures Subjected to Repeated Loading, Elsevier Applied
Science, London, 1991.[47] V. Kilar, S. Petrovcic, D. Koren, S. Silih, Seismic analysis of an asymmetric fixed base
and base-isolated high-rack steel structure, Eng. Struct. 33 (2011) 3471–3482.[48] European Committee for Standardization CEN, EN 10025 Hot Rolled Products of
Structural Steels – Parts 1-6, 2004.[49] ⟨www.csiamerica.com/products/sap2000⟩. SAP2000 version 17.1 CSI America,
2015.[50] N. Baldassino, C. Bernuzzi, Analysis and behavior of steel storage pallet racks, Thin-
Walled Struct. 37 (4) (2000) 277–304.[51] European Committee for Standardization CEN, EN 1998-1, Eurocode 8 – Design of
Structures for Earthquake Resistance, CEN European Committee for Standardization, 2004.
[52] K. Kawashima, O. Aydan, T. Aoki, I. Kisimoto, K. Konagai, T. Matsui, J. Sakuta,N. Takahashi, S. Teodori, A. Yashima, Reconnaissance investigation on the damage of the 2009 L'Aquila, central Italy earthquake, J. Earthq. Eng. 14 (2010) 816–841.
[53] NTC 2008 – Norme tecniche per le costruzioni D.M. 14 Gennaio 2008, Italy, 2008.[54] D.A. Gasparini, E.H. Vanmarke, Simulated Earthquake Motions Compatible with
Prescribed Response Spectra, MIT Civil Engineering Research Report R76-4, Massachusetts Institute of Technology Cambridge, MA, 1976.
[55] A. Castellani, E. Faccioli E, Costruzioni in zona sismica, Metodi di analisi e criteri di progetto, Applicazioni – Aspetti normativi, II edizione Editore Ulrico, Milano, 2000 (In Italian).
[56] L. Yin, G. Tang, M. Zhang, B. Wang, B. Feng, Monotonic and cyclic response of speed-lock connections with bolts in storage racks, Eng. Struct. 116 (2016) 40–55.
[57] R.K. Dowell, F. Seible, E.L. Wilson, Pivot hysteresis model for reinforced concrete members, ACI Struct. J. (1998) 607–617.