state finances in india - world bank documents
TRANSCRIPT
State Finances in IndiaVolume 2
Studies in State Finances
Christine Wallich SWP523VOL.2
WORLD BANK STAFF WORKING PAPERSNumber 523
' ~ ~ ~
Pub
lic D
iscl
osur
e A
utho
rized
Pub
lic D
iscl
osur
e A
utho
rized
Pub
lic D
iscl
osur
e A
utho
rized
Pub
lic D
iscl
osur
e A
utho
rized

WORLD BANK STAFF WORKING PAPERSNumber 523
State Finances in IndiaVolume 2
Studies in State Finances
Christine Wallich
The World BankWashington, D.C., U.S.A.

Copyright © 1982The International Bank for Reconstructionand Development / THE WORLD BANK1818 H Street, I4.W.Washington, D.C. 20433, U.S.A.
All rights reservedManufactured in the United States of America
This is a working document published informally by The World Bank. Topresent the results of research with the least possible delay, the typescript hasnot been prepared in accordance with the procedures appropriate to formalprinted texts, anad The World Bank accepts no responsibility for errors. Thepublication is supplied at a token charge to defray part of the cost ofmanufacture and distribution.
The views and interpretations in this document are those of the author(s) andshould not be cttributed to The World Bank, to its affiliated organizations, or toany individual acting on their behalf. Any maps used have been preparedsolely for the convenience of the readers; the denominations used and theboundaries shown do not imply, on the part of The World Bank and itsaffiliates, any judgment on the legal status of any territory or any endorsement
or acceptance of such boundaries.The full range of The World Bank publications is described in the Catalog of
World Bank Publications; the continuing research program of the Bank is outlinedin World Bank 1'esearch Program: Abstracts of Current Studies. Both booklets areupdated annually; the most recent edition of each is available without chargefrom the Publications Distribution Unit of the Bank in Washington or from theEuropean Office of the Bank, 66, avenue d'lena, 75116 Paris, France.
Library of Congress Cataloging in Publication Data
Main entry under title:
State finances in India.
(World Bank staff working paper ; no. 523)"June 1982."Includes bibliographies.Contents: v. 1. Revenue sharing in India / Christine
Wallich -- v. 2. Studies in state finances / ChristineWallich, editor -- v. 3. The measurement of tax effortof state governments / Raja J. Chelliah, Narain Sinha.
1. Finance, Public--India--Collected works.I. Intergovernmental fiscal relations--India--collectedworks. I. Wallich, Christine, 1952-II. Chelliah, Raja Jesudoss. III. Sinha, Narain.IV. Series.HJ1334.S76 1982 336'.013'54 82-11087ISBN 0-8213-0013-X
ABSTRACT OF THE STUDY
Under India's federal structure, a strict division of expendi-ture responsibilities exists between Central and State levels of government,with many important activities the responsibility of State government. TheBank's attention has increasingly focused on these State sectors, for example,agriculture, irrigation, power generation, rural development and health, inits lending strategy to India. As Bank lending to these sectors increases,familiarity with State fiscal capacity and the resource or other constraintswhich may impede smooth implementation of State Plan projects--especially oflarge or costly projects--is necessary for lending to be effective. In thisseries of papers on State finances we have sought to shed some light on thefactors which determine the States' capacity and willingness to provide thebudgetary resources necessary for financing these projects. The papers focuson State fiscal capacity as well as growth prospects. A methodology is devel-oped through which consistency between the sectoral allocation of resourcesimplied by a large project and State development priorities and other expen-diture commitments can be assessed.
Raja J. Chelliah and Narain Sinha were affiliated with the NationalInstitute of Public Finance and Policy, New Delhi when this paper was prepared.

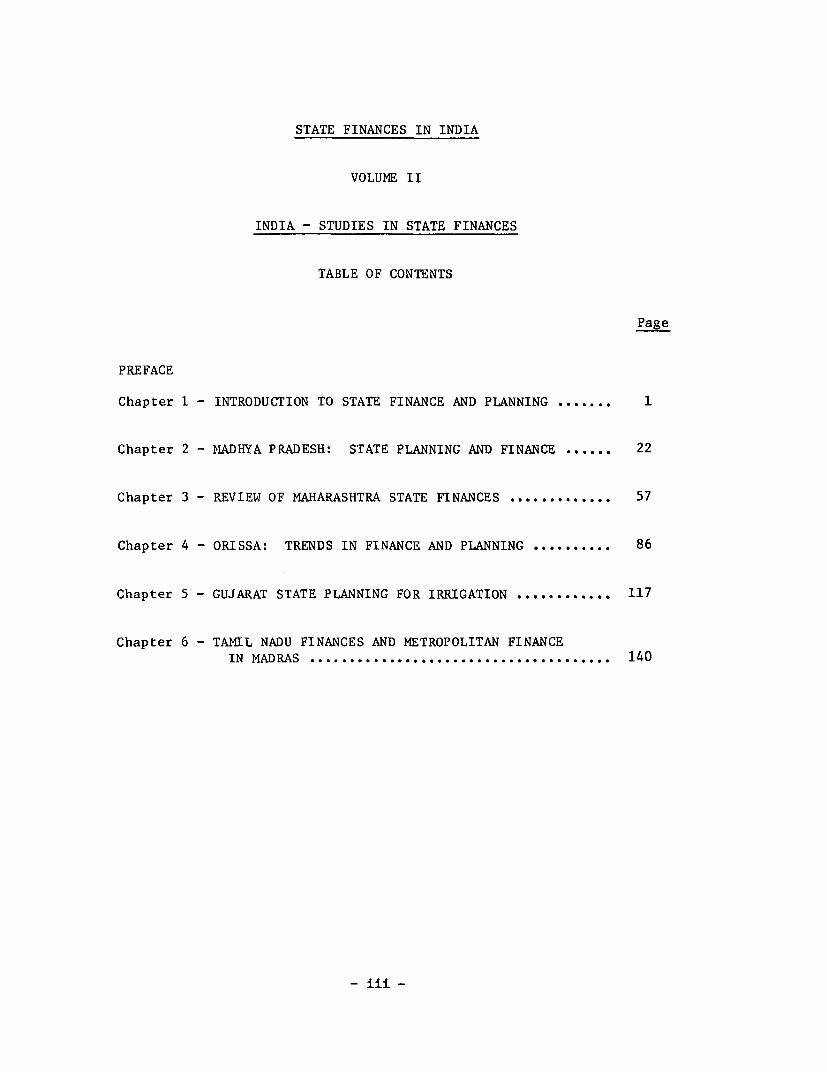
STATE FINANCES IN INDIA
VOLUME II
INDIA - STUDIES IN STATE FINANCES
TABLE OF CONTENTS
Page
PREFACE
Chapter 1 - INTRODUCTION TO STATE FINANCE AND PLANNING ....... 1
Chapter 2 - MADHYA PRADESH: STATE PLANNING AND FINANCE ...... 22
Chapter 3 - REVIEW OF MAHARASHTRA STATE FINANCES .... ......... 57
Chapter 4 - ORISSA: TRENDS IN FINANCE AND PLANNING .......... 86
Chapter 5 - GUJARAT STATE PLANNING FOR IRRIGATION ........... . 117
Chapter 6 - TAMIL NADU FINANCES AND METROPOLITAN FINANCE
IN MADRAS ...................................... 140
- iii -

PREFACE
1. Under India's federal structure, a strict division of expenditureresponsibilities exists between the Central government and the States. Manyimportant activities are the responsibility of state-level government with theCenter's role limited to providing some financial support and to coordinatingplan priorities between the Center and the States. The Bank's attention hasincreasingly focused on these state sectors of activity--agriculture, irriga-tion, power generation, rural development and health--in its lending strategyto India. As Bank lending in these sectors increases, familiarity with State'sfiscal capacity and the resource or other constraints which may impede smoothimplementation of Bank projects in the States--especially large or costlyprojects--is necessary for lending to be effective.
2. In this series of papers prepared by the India Programs division toassist in project appraisal on State finances, we have sought to shed some lighton the factors which determine the States' capacity and willingness to providethe budgetary resources necessary for financing projects in their Plans. Threeof the papers deal directly with the issues surrounding successful implementa-tion of single, large Bank projects in Madhya Pradesh, Maharastra and Gujarat,involving credits of up to $210 million. The other papers, Orissa and TamilNadu, deal with the budgetary impact of a cumulatively large lending program;in the case of Orissa, four projects amounting to $622 million and in TamilNadu, three projects involving approximately $376 million. Because theseprojects are so large in relation to overall State Plan spending, the State'sresource outlook must be examined carefully. The projects are also large inrelation to past spending in the sectors in question. The danger in this isthat if the needs of a single sector are considered in isolation from overallstate finances, the Bank and the concerned department of the State Government,in their eagerness to formulate and fund much-needed projects, may unwit-tingly commit the State to sector programs which could involve significantreallocations from other State activities. Thus, not only are questions ofthe State's fiscal capacity and growth prospects important, but the State'sdevelopment priorities must be scrutinized to insure that the resourcesavailable will indeed be allocated to the sector in question. The sectoralallocation implied by the project must be consistent with State development
priorities and its other expenditure commitments. The papers therefore attempt
to assess the degree to which resources will be available to implement theseprojects as planned.
3. One anomaly in our lending to India is that even for projects which
are in the State realm of competence--implemented by the States and financedby them--the Bank's loan agreement is with the Government of India, and all
disbursements are made to the Central Government. These are then passed onto the States in "accordance with the normal procedures for central assistanceto the States for development." These arrangements have recently been lib-eralized for the States, who now receive just over 70% of project disburse-ments--about 35% of project cost, assuming Bank assistance to be 50% ofproject cost. The onus on the States to come up with the remaining resourcesis still fairly high, 65% of project cost must be committed from State
- iv -
budgetary resources. An assessment of State resource capacity is thereforecrucial. Similar questions do not arise when the Bank lends for projects inthe central sector, for two reasons. Firstly, the Center's fiscal capacityis far more broadly based, and, therefore, more elastic; secondly, even forvery large projects, the Center's budgetary allocations to such projects arenot likely to interfere with its commitments in other areas as they are a farsmaller proportion of the Center's total budget.
4. The methodologies used in the papers are broadly similar. Fiscalcapacity is examined by analyzing the fiscal structure and the State's taxbase; the income elasticities of various tax and other revenue sources areestimated to project future resource availability. The question of State"willingness" is somewhat more difficult. The general approach has been toexamine the sectoral expenditure level implied by the projects, relative toexpenditures committed by the State to this sector in the past, and relativeto overall levels of Plan spending. Another indicator has been the imple-mentation ratio--the ratio of Plan outlays in a sector to actual Plan ex-penditures. Because the exercise is based on readily available data, and atthe level of generality dealt with, implies few conceptual problems, thistype of analysis has become a common feature of appraisal for large State-level projects in India.
5. The conclusions of this type of exercise are uncertain, at best,since it is always possible that some unforeseen demand may be made onstate resources which will divert the State's resources from the initialallocation. On the other hand, the exercise does provide some reassurancethat, other things being equal, the project size is quite manageable giventhe likely level of State income and the expenditure levels projected forthe sector.
6. The paper is organized as follows: The first chapter providesa general overview of the structure of Indian State finances--the budgetstructure, the sources of State revenue receipts, and the principles ofrevenue sharing. On the expenditure side, the categorization of expendi-ture, planning procedures and the earmarking of resources for the Planare discussed. Finally, the methodology used to evaluate project ex-penditures in the context of sectoral outlays and resources availablefor the Plan, its rationale and limitations is explained. In the secondthrough sixth chapters, the finances of Madhya Pradesh, Orissa, Maharastra,Tamil Nadu and Gujarat are reviewed in the context of the Bank assistedprojects.

CHAPTER I
Introduction to State Finances and Planning
Christine WallichIndia Division
INTRODUCTION TO STATE FINANCFS AND PLANNING
Christine Wallich
Page No.
I. The State Budget Framework ............................. I
II. Pevenue Receipts. 2
III (i) Tax Receipts. 2
(ii) Non-tax Receipts. 5
(iii) Grants and Other Assistance. 6
III. State Expenditures. 9
IV. Financial Resources for the Plan .11
V. The Planning Process in Brief .15
VI. Financing World Bank Projects .20
Tables
1. State Covernment Revenue Receipts. 3
2. Sources of State Revenues: Percentage Distribution 8
3. Resources for State Plans .13

Chapter 1: INTRODUCTION TO STATE FINANCES AND PLANNING
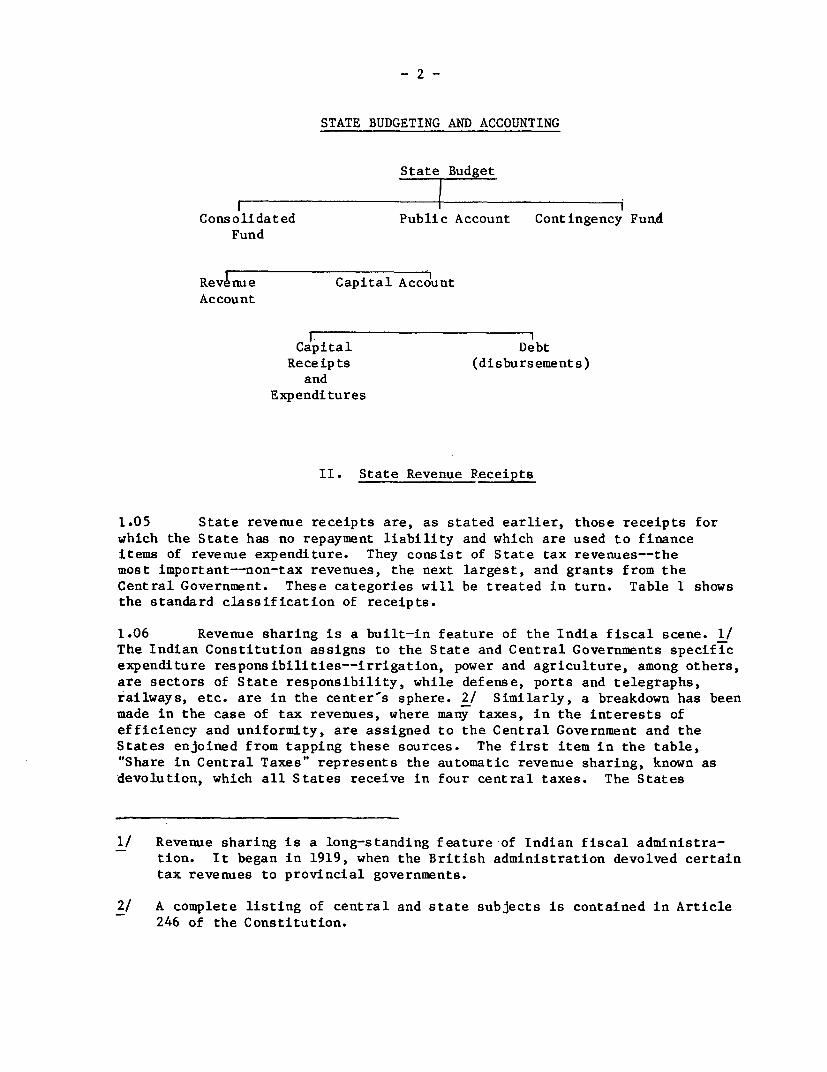
I. The Budget Framework
1.01 The budgets of all States are formulated on standard lines. Thebudget is broken down into the tripartite accounting classification of(1) Consolidated Fund; (2) Public Account and (3) Contingency Fund. Thediagram on the following page clarifies the relationships.
1.02 The Consolidated Fund is the source for all the "usual" budgetarytransactions whether of capital, revenue or loan nature. State tax and non-taxrevenues are entered into the Consolidated Fund and any expenditures which areto be met from the Consolidated Fund must be voted by the State legislature. 1/The Consolidated Fund itself is broken down into two parts: the revenueaccount, and the capital account. The revenue account comprises expenditurescovering the routine administration of the State, such as wages and salaries,vehicles, printing, etc. and other overheads. Expenditures relating to thecreation of assets--and this includes most (but not all) Plan expenditures--will be in the capital account. Revenue receipts are all those which do notincur repayment liability. This includes, in addition to the State's ownrevenues, grants from the Central Government for the financing of State Plans,as well as non-Plan grants. Capital receipts include internal debt, loansfrom the Center and the State's recovery of its own loans and advances toState corporations, cooperative societies, etc., and are entered in the capitalaccount. On the outlay side of the capital account, there are expenditures,corresponding to the States' own investment outlay, and disbursements, whichare comprised of repayment of State public debt, and the loans and advancesmade by the State to the various entities. Thus, both the capital and debtportions of the Consolidated Fund are under the capital budget.
1.03 The Public Account includes those funds which do not rightly belongto the State but which the State holds in trust for other entities. Thiswould include such items as deposits from municipal corporations, pensionfund accumulations of the employees' provident fund and reserve and depre-ciation funds. It could almost be characterized as the fund for which theState acts as "banker."
1.04 The Contingency Fund is, as its name implies, a fund for emer-gency use. It does not, in fact, contain any "real" money, but is anaccounting figure which is included in the Budget to cover unforeseen ex-penditures (such as a police strike for higher pay or some other emergency).Expenditures from the Contingency Fund can be made with Cabinet consensusalone and hence have the advantage that the budgetary procedure--involvinglegislative approval--is circumvented. The Contingency Fund in most statesis increased every few years in the budget process.
1/ There are some few exceptions to this, such as interest payments onstate debt which do not need to be voted on.
- 2 -
STATE BUDGETING AND ACCOUNTING
State Budget
Consolidated Public Account Contingency FundFund
Revenue Capital AccountAccount
Capital DebtReceipts (disbursements)
andExpenditures
II. State Revenue Receipts
1.05 State revenue receipts are, as stated earlier, those receipts for
which the State has no repayment liability and which are used to financeitems of revenue expenditure. They consist of State tax revenues--themost important--non-tax revenues, the next largest, and grants from theCentral Government. These categories will be treated in turn. Table 1 shows
the standard classification of receipts.
1.06 Revenue sharing is a built-in feature of the India fiscal scene. 1/The Indian Constitution assigns to the State and Central Governments specificexpenditure responsibilities--irrigation, power and agriculture, among others,
are sectors of State responsibility, while defense, ports and telegraphs,railways, etc. are in the center-s sphere. 2/ Similarly, a breakdown has been
made in the case of tax revenues, where many taxes, in the interests of
efficiency and uniformity, are assigned to the Central Government and the
States enjoined from tapping these sources. The first item in the table,
"Share in Central Taxes" represents the automatic revenue sharing, known as
devolution, which all States receive in four central taxes. The States
1/ Revenue sharing is a long-standing feature -of Indian fiscal administra-
tion. It began in 1919, when the British administration devolved certain
tax revenues to provincial governments.
2/ A complete listing of central and state subjects is contained in Article
246 of the Constitution.
- 3 -
receive a share in the income tax, the central excise duties, central addi-
tional excise duties and the estate duty. The proportion in which these taxes
are to be shared between the Center and the States, and amongst the States, is
determined by the quinqennial award of the Finance Commission, a statutory
body. This body most recently met in 1978, recommending that the States
receive a 40% share in union excise duties, 85% of the income tax and 100% of
the additional excise taxes and the estate duty. 1/
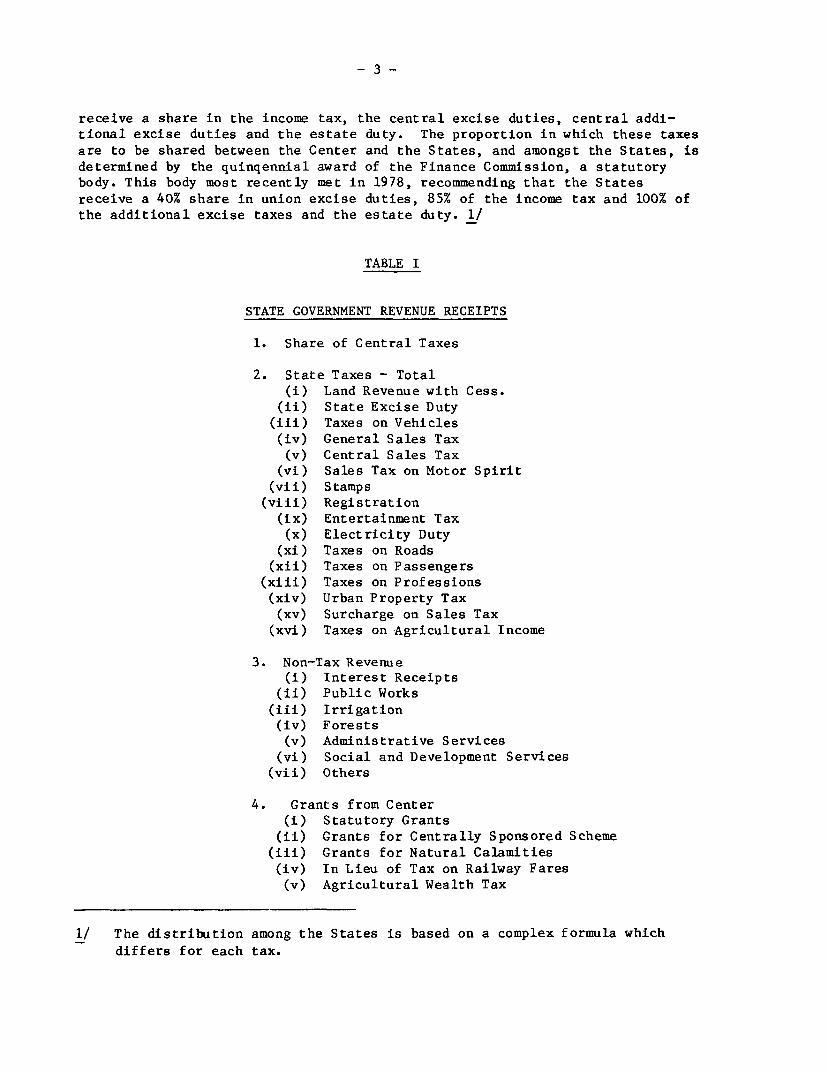
TABLE I
STATE GOVERNMENT REVENUE RECEIPTS
1. Share of Central Taxes
2. State Taxes - Total(i) Land Revenue with Cess.
(ii) State Excise Duty(iii) Taxes on Vehicles(iv) General Sales Tax(v) Central Sales Tax
(vi) Sales Tax on Motor Spirit(vii) Stamps(viii) Registration
(ix) Entertainment Tax(x) Electricity Duty
(xi) Taxes on Roads(xii) Taxes on Passengers
(xiii) Taxes on Professions(xiv) Urban Property Tax(xv) Surcharge on Sales Tax
(xvi) Taxes on Agricultural Income
3. Non-Tax Revenue(i) Interest Receipts
(ii) Public Works(iii) Irrigation(iv) Forests(v) Administrative Services
(vi) Social and Development Services(vii) Others
4. Grants from Center(i) Statutory Grants
(ii) Grants for Centrally Sponsored Scheme
(iii) Grants for Natural Calamities(iv) In Lieu of Tax on Railway Fares(v) Agricultural Wealth Tax
1/ The distribution among the States is based on a complex formula which
differs for each tax.
- 4 -
1.07 The second item is the States own taxes. In general, the mostimportant of the State taxes is the general sales tax, which is levied onmost non-food items sold including capital and intermediate goods andraw materials. Its growth is thus a function of increases in the volumeof trade, monetization and upwards movements in the price level.
1.08 For most States, the second largest contributor of tax revenuesis the central sales tax. 1/ This is a tax levied by the Center at a un-iform rate of 4% in all States, but assigned wholly to the States and col-lected by them as well. The central sales tax is levied on goods when thepurchase involves interstate trade. Receipts are a function, therefore, ofthe growth of interstate trade.
1.09 Land revenue is a tax which in most States has become a merenuisance levy with little contribution to revenue receipts. It is levied,in most States, on land holdings over a certain size and originally re-lated to the produce grown or net income of the land. In fact, suspensionof resettlement surveys in many States has left land revenue more like anacreage levy. In drought years, or years of scarcity, the tax is typicallyremitted or suspended. In some States, land revenue contains an irrigationcess. In general, land revenue is a declining source of revenue, poorlyadministered and collected. In the longer term, it may be replaced by anagricultural income tax.
1.11 The tax on motor vehicles is an annual registration fee, leviedon all motorized vehicles and at higher rates, in general, for buses andtrucks. Its buoyancy is a function of the number of vehicles, road andtransport infrastructure of the State.
1.12 The sales tax on motor spirits has, in some States been mergedwith the general State sales tax. It is levied on sales of Petroleum, oiland lubricants, and the growth of receipts is therefore dependant on thevolume of consumption of these commodities in the State. This, in turn,is a function of, among other things, transport infrastructure, trafficdensities and level of State income.
1.13 The stamp and registration taxes, like land revenue, in moststates, have become unimportant levies. They are levied on all legaltransactions and court cases initiated, and their growth is thus related tolegislative measures taken by the State Government. The ceiling on agricul-tural holdings, for example, results in partitioning of large holdings andtheir separate registration.
1.14 The State entertainment tax is generally one of the most buoyanttaxes. Levied on cinema tickets and other forms of entertainment (circuses,etc.), receipts are a function of the attendance at these places of entertain-ment, i.e., general increases in State income.
1/ Not to be confused with central excise duties.
-5 -
1.15 Electricity duty is akin to a surcharge on electricity rates, but
is not generally levied on units sold outside the State, nor on community
uses of electricity, such as street lighting. Consumption of energy is the
prime determinant of revenues from this source, although effectiveness of
collection and arrears are also important.
1.16 Taxes on goods carried by road are not levied by all States.
It is charged on truck cargoes, and receipts are thus a function of the
number of public carriers and out-of-State vehicles bringing goods.
1.17 Taxes on passengers carried by road are collected through a sur-
charge on bus tickets. Receipts are thus a function of the States general
transport infrastructure, including the number of buses, their route mile-
age, intensity of traffic, etc. This tax is plagued by enforcement problems,
but in those States where efficient collection is made easier thanks to
large and dense urban transport systems, it is a growing, modest source of
revenue.
1.18 The tax on professions, trades and callings is levied in only eight
out of the 15 major States. Although in principle a general tax, it is in
fact usually only collected in urban areas. Depending on the profession it
may be levied on salary or in the case of traders, collected along with sales
tax. In many States convenience of collection determines who is subject to
this tax: employees of government and government undertakings are usually the
first to be taxed.
1.19 Not all States levy the urban property tax--a tax which is diffi-
cult to administer at the State level and is usually left to cities. It is
charged on urban property and receipts are a function of assessment, effi-
ciency of collection and arrears.
1.20 Agricultural income tax is levied only in a few States in addition
to land revenue. The greatest part of the yield of this tax is obtained
from the taxation of plantations.
Non-Tax Receipts
1.21 Non-tax receipts play as great a role in state finances as tax
revenues. Properly exploited and managed, they could be a very elastic
source of income to the State Government. Moreover, in view of the growing
investments of most State Governments in capital works, these investments
should be generating an acceptable rate of return, through a correct struc-
ture of prices for the services provided by these assets.
1.22 Interest receipts represent the States interest income from loans
and advances they make to the various State corporations and undertakings.
In most States, the bulk of interest receipts is accounted for by interest
payments from the State Electricity Boards, the amount of which depends on
the amount of surplus the Boards are able to set aside for repayment to the
State Government. Interest due the State Government by the SEB's is a resi-
dual liability, payable only after the Boards other obligations have been
met.
1.23 Receipts under public works represent rents from government build-ings, tolls on roads and bridges, and other miscellaneous charges.
1.24 Irrigation receipts include the receipts from water rates chargedfor irrigation water, and frequently also receipts accruing from the sale ofwater to municipal corporations, and public sector undertakings, where theseare not supplied by a separate entity.
1.25 Forests receipts are the revenues from the sale of forest produce,timber pulp, etc. In general, investment which increases forest yields hasa high payoff, and States in which improvements have been made do well onthe receipts side.
1.26 Receipts from administrative services include (i) administrationof justice (income from sale of unclaimed property, court fees and fines);(ii) jails (income from sale of jail manufactures); (iii) police (this includesreimbursement for services rendered by the police to public departmentsgovernment undertakings and private companies); and (iv) supplies (primarilycollection of license fees).
1.27 Social and development services are the final category of non-tax receipts. Under this head is classified the following income: educa-tion (fees from schools and technical institutions); medical (fees frommedical colleges, hospitals, sale of medicines); public health (proceedsfrom sale of serums and vaccine, and preparation of town planning schemes,and water works, drainage and industrial housing schemes); agriculture(receipts from farms and fisheries operated by the State); and industriesand cooperatives (receipts from small scale industries and cooperatives).
Grants and Other Assistance
1.28 The final category of revenue receipts covers the grants which allStates receive from the Central Government. There are four kinds of grant.The first of these are the statutory grants, provided to the States throughthe Finance Commission's award. The grant is intended to help those Stateswhich, even after revenue sharing has taken place and expenditure economyeffected, are still expected to be in deficit. This deficit, forecast ex-anteby the Finance Commission on the basis of tax elasticities and revenue trends,is bridged by these statutory grants in aid.
1.29 Grants are also provided to the States for centrally sponsored andcentral sector schemes. Centrally-sponsored schemes are projects in sectorsconstitutionally assigned to the States (such as agriculture, irrigation,power) but which the Center feels are sufficiently important to warrant itsfinancing them in whole or in part, that is, subsidizing the States to do so.In general, they are projects of interstate importance, or which have researchor demonstration properties, although recently, they have grown to include abroader range of schemes. Family planning is an important example of acentrally sponsored scheme. This portion of central assistance is provided tothe States on a 30% grant, 70% loan basis. Included in table 2 is only thegrant element. The loan portion of the assistance is included in the capitalaccount of the State budget.
- 7 -
1.30 Grants for natural calamities are also available for the States.These are necessary because natural calamities occur unexpectedly and Statesbudgetary resources are not always able to cover the reconstruction expendi-tures and rehabilitation assistance required in the wake of a disaster.Present practice, suggested by the Seventh Finance Commission, is that theStates themselves are responsible for the relief works up to an amount of 5%of their total Plan expenditures, with the Center providing assistance forthe balance.
1.31 The grant in lieu of railway fares and the agricultural wealth taxoriginated as taxes to be shared between the Central and State Governments,much like the central income and sales taxes. They have now been converted togrants, for simplicity's sake.
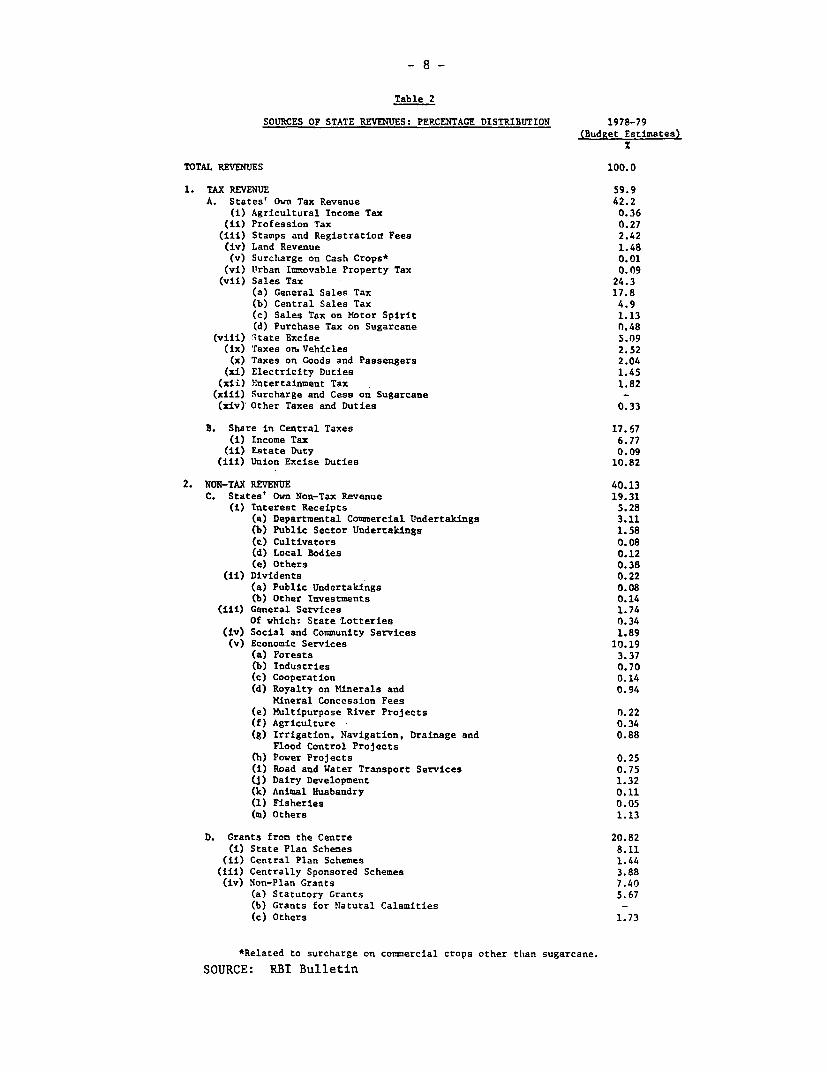
1.32 For all States taken together, the following table describesthe breakdown of receipts on revenue account.
- 8-
Table 2
SOURCES OF STATE REVENUES: PERCENTAGE DISTRIBUTION 1978-79(Budget Estimates)
X
TOTAL REVENUES 100.0
1. TAX REVENUE 59.9A. States' Own Tax Revenue 42.2
(i) Agricultural Income Tax 0.36(ii) Profession Tax 0.27
(iii) Stamps and Registration Fees 2.42(iv) Land Revenue 1.48-(v) Surcharge on Cash Crops* 0.01
(vi) Urban Immovable Property Tax 0.09(vii) Sales Tax 24.3
(a) General Sales Tax 17.8(b) Central Sales Tax 4.9(c) Sales Tax on Motor Spirit 1.13td) Purchase Tax on Sugarcane 0.48
(viii) State Excise 5.09(ix) Taxes on. Vehicles 2.52(x) Taxes on Goods and Passengers 2.04
(xi) Electricity Duties 1.45(xii) Yntertainment Tax 1.82
(xiii) Surcharge and Cess on Sugarcane -(xiv) Other Taxes and Duties 0.33
B. Share in Central Taxes 17.67(i) Income Tax 6.77
(ii) Estate Duty 0.09(iii) Union Excise Duties 10.82
2. NON-TAX REVENUE 40.13C. States' Own Non-Tax Revenue 19.31
Ci) Interest Receipts 5.28(a) Departmental Commercial Undertakings 3.11(b) Public Sector Undertakings 1.58(c) Cultivators 0.08(d) Local Bodies 0.12(e) Others 0.38
(ii) Dividents 0.22(a) Public Undertakings 0.08(b) Other Investments 0.14
(iii) General Services 1.74Of which: State Lotteries 0.34
(iv) Social and Community Services 1.89(v) Economic Services 10.19
(a) Forests 3.37(b) Industries 0.70(c) Cooperation 0.14(d) Royalty on Minerals and 0.94
Mineral Concession Fees(e) Multipurpose River Projects 0.22(f) Agriculture 0.34(g) Irrigation, Navigation, Drainage and 0.88
Flood Control Projectsth) Power Projects 0.25Ci) Road and Water Transport Services 0.75(j) Dairy Development 1.32(k) Animal Husbandry 0.11(1) Fisheries 0.05(m) Others 1.13
D. Grants from the Centre 20.82Ci) State Plan Schemes 8.11
(ii) Central Plan Schemes 1.44(iii) Centrally Sponsored Schemes 3.88(iv) Non-Plan Grants 7.40
(a) Statutory Grants 5.67(b) Grants for Natural Calamities -
(c) Others 1.73
*Related to surcharge on commercial crops other than sugarcane.
SOURCE: RBI Bulletin
- 9 -
III. State Expenditures
1.33 Expenditures are classified under two headings: revenue ex-penditures and capital expenditures. Broadly, there is a correspondencebetween revenue expenditures and 'current' expenditures, as they aregenerally understood, and between capital expenditures and investment.The correspondence, however, is not exact, as the chart below shows.There is some investment expenditure on revenue account, (basically capi-tal expenditures which are required for carrying out general administra-tion of the State, such as housing for civil servants); and likewise,current expenditures show up on the capital account. An example would bethe compensation payments to landlords on the abolition of the Zamindarisystem. Formally, the difference between revenue and capital expenditureis determined on the basis of whether the expenditures are financed fromrevenue or capital receipts. It is clear that this distinction is some-what artificial, since there is fungibility between State income from thevarious sources.
1.34 There is another dichotomy in the expenditure budget as between'developmental' and 'non-developmental' heads. The distinction is meantto indicate exactly what it implies, but the differences are sometimes abit fuzzy. Thus the budgetary heads for "administrative services" and "col-lection of taxes" refer to non-developmental expenditures, while "education,""public health" or "industry," for example, would be developmental expendi-tures. On the other hand, famine relief comes under the non-developmentcategory. Plan expenditures may be either revenue or capital expenditures,since the Plan finances expenditures of a non-capital nature during thePlan period (they become, non-Plan, committed, expenditures at the termina-tion of the Plan) but they are always "developmental."
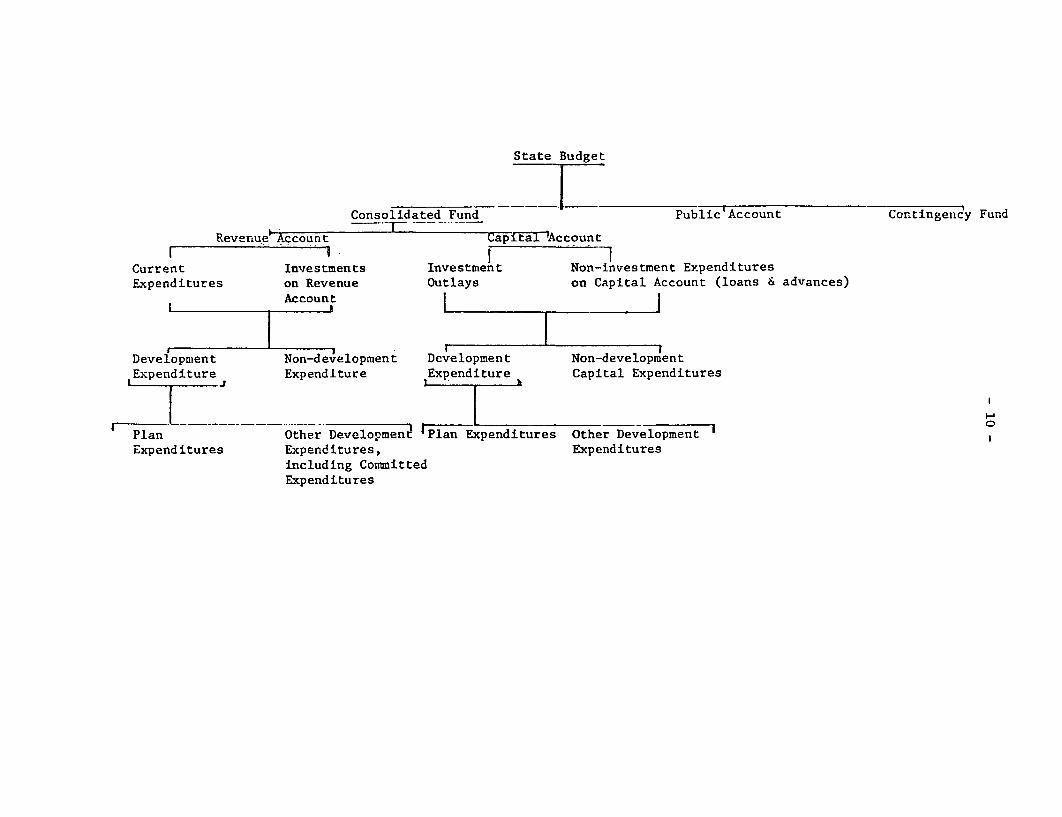
State Budget
Consolidated Fund Public'Account Contingency Fund
Revernue> Account Capital 'Account
Current Investments Investment Non-investment ExpendituresExpenditures on Revenue Outlays on Capital Account (loans & advances)
Account
Development Non-development Development Non-developmentExpenditure Expenditure Expenditure Capital Expenditures
Plan Other Development IPlan Expenditures Other DevelopmentExpenditures Expenditures, Expenditures
including CommittedExpenditures
- 11 -
1.35 In general, the States spend far more on current (revenue) ex-
penditures than on capital expenditure, the breakdown being about 80%:20%for all States taken as a whole. This purely financial aspect obscures
the fact that much of current expenditure is in fact development expendi-ture, such as extension, education, medical and the like. It is the category
of non-development revenue expenditures, such as general and administrative
services, debt service tax collection, pensions and miscellaneous which should
be sought to be kept to a minimum. Most States have attempted to compress
non-Plan revenue expenditures in order to make the surplus available for
financing the Plan as large as possible.
1.36 Among the economy measures which States typically implement are
postponement of increases in State employees pay scales, withholding of
dearness allowances, increases in the proportion of State employee salaries
held in escrow under compulsory savings schemes, restrictions on printing and
paper, cuts in expenditures on vehicles, telephones and furniture, reductions
in travelling allowances and official tours, reduction in new subjects to be
taught in schools, bans on filling of posts, to name just a few.
1.37 Capital expenditures are composed of (i) investment expenditures
(which may or may not be Plan expenditures), and (ii) loans and advances from
the State Government which fill the gaps in the requirements for credit notfilled by the banking sector. The State Government advances loans for avariety of purposes, ranging from pure consumption credit in times of distress
to development loans to local bodies and public sector undertakings. Examples
include loans to municipalities, loans to cultivators, loans to the State
Electricity Boards and loans to State Transport Corporations. Some of these
funds may be used for onlending. Recovery of loans and advances is a chronic
problem for most States. Moreover, the States also frequently charge less
than the Bank rate and less than their own cost of borrowing for the monies
they lend, so that from the financial point of view these operations are not
very profitable.
IV. Financial Resources for the Plan
1.38 Finance for the State Plan comes from five basic sources: (a) the
State-s surplus (if any) on current account, after all non-Plan expenditures
have been netted out from revenue receipts; (b) the contribution of publicsector enterprises; (c) central assistance; (d) negotiated and market loans,
unfunded debt and other miscellaneous capital receipts; and (e) additional
resources mobilized during the Plan period. Ex post, ad-hoc assistance from
the Central Government or Reserve Bank, an increase in floating debt, or sale
of state assets can also contribute to financing the Plan, but these are, of
course, not planned sources of revenue when the Plan is being drawn up.
1.39 Table 3 shows the standard format for Plan finance: the balancefrom current revenues is the difference between non-Plan revenue receipts
and non Plan revenue expenditures, and represents the States own contribu-tion to their Plans.
- 12 -
1.40 Additional resource mobilization is likewise a budgetary resource,conventionally accounted for apart from the ordinary revenue receipts becauseit is entirely earmarked for Plan finance. It refers to revenues from taxand non-tax sources, including public enterprises, over and above what wouldaccrue to the State at the rates of tax and tariffs prevailing in the finalyear of the previous Plan. These are always shown separately in the Stateaccounts and not merged with base levels of receipts. They derive fromchanges made in tax and tariff rates or base, improved collection techniquesor better administration. Typical examples of additional resource mobiliza-tion measures include such things as changes in the issue price of liquor,increases in the electricity tariff and bus fares, increases in the rate ofroyalty on minerals, amendments to check evasion of sales tax or to preventundervaluation of documents, higher retained receipts from district lotteries,an increase in court fee rates, higher sales tax rates, a reduction in con-cessionary rates and withdrawals of tax exemptions, to name just a few.Targets for additional resource mobilization are set by the State Governmentin consultation with the Planning Commission at the time of the annual orFive-Year Plan discussions.
1.41 The second item of Plan finance is the contribution of publicsector enterprises. This has been moderate throughout most Plan periods.In spite of the positive figures, there is, in fact, no "contribution" assuch: most public enterprises represent a net outflow from the States'revenue coffers. The figure represented here is simply an accountingnotion: it represents the net operating surplus of the state enterprises,which is the surplus gross of depreciation and certain interest paymentliabilities and is not equivalent to the net commercial profit or loss ofthe enterprises. This in most cases is negative. The rationale for thisaccounting is that a sinking fund is akin to the enterprises- own internalresource generation. Since these are public corporations and thereforetheir operations financed through the Plan, their sinking fund is in factPlan finance. Were it netted out, the State would have to provide the samefunds to the enterprise for replacement or expansion, but by other means.While this notional accounting is completely acceptable, it should be kept inmind that ,most public sector enterprises do not make a net contribution to theState's financial resources and do not generate funds for the public sector ina true sense. The figure simply represents the operating surplus and internalresources of the State corporations.
1.42 Loans from the market represent essentially State bond issues andare not market loans in a true sense, since their placement has been assigned,since the nationalization of the banks in 1969, between commercial banks andother financial institutions.
1.43 There are also market borrowings of the State enterprises, principal-ly the State Electricity Boards. These are again, placed by assignment tovarious lending institutions in the "market," and make a moderate contribu-tion to Plan resources. All of the public debt is allocated to the Statesby the Central Government, usually with lending ceilings increased in equalproportion for all States.
- 13 -
Table 3: RESOURCES FOR STATE PLANS
A. 1. Balance from Current Revenue2. Contribution of Public Enterprises
at Base Year Rates and Tariffs(i) State Electricity Board
(ii) State Transportation Corporation(iii) Mining Corporation(iv) Construction Corporation(v) State Investment Corporation
3. Loans from Market by State (Net)4. State's Share in Small Savings5. State's Provident Fund6. Miscellaneous Capital Receipts (Net)
B. Additional Resource Mobilization by StateGovernment and Public Undertakings
C. Negotiated Loans of the State Government and PublicUndertakings and Market Borrowings of the PublicUndertakings, Negotiated Borrowings
1. By State Government(i) Loans from LIC
(ii) Loans from RBI2. By State Enterprises
(i) Loans from LIC(ii) Loans from REC
3. By Local Bodies(i) Loans from LIC
4. Market Borrowing of State Enterprises (Net)
D. Net Interest Entitlement
E. Central Assistance (Normal)
F. Central Assistance (Advance)
G. Central Assistance (Additionality)
Total Resources for Plan
Expected Plan Outlay
Total Gap in Resources
(Opening Overdraft)
Total Gap in Resources
- 14 -
1.44 Negotiated loans are what their name implies and are negotiatedprincipally from the Life Insurance Corporation of India and the ReserveBank. State enterprises, principally the Electricity Board, also negotiateloans from the same sources.
1.45 Small savings loans are loans from the Central Government tothe States which the States receive automatically as a result of theirparticipation in the various schemes operated by the Center, primarilythrough the Post Office, to mobilize household savings. States receivetwo-thirds of whatever savings are made through these channels as an in-centive to encourage further savings. For most States, this is modest,though steady source of revenue, comprising about 5% of Plan resources.
1.46 Miscellaneous Capital Receipts are all the other net transactionsnot accounted for under the other headings, such as short-term loans from theCentral Government, recoveries of loans and advances to other institutions bythe State Government, net accretions under various sinking funds and other netaccounts including non-Plan loans. In general, this is a negative figure,since a substantial amount is repaid to the Central Government and financialinstitutions.
1.47 Central assistance on Plan account (as opposed to the assistanceon revenue account, discussed earlier) 1/ is composed of grants and loans, andis fixed by the Planning Commission. All States receive Plan assistance,which is distributed amongst them according to a formula known as the"Gadgil formula," in which State population and per capita income, amongother factors, are used as weights. For most States, the assistance isgiven on a 70% loan, 30% grant basis, except for the funds earmarked forPlan expenditures in tribal areas, which are given on a 10% loan, 90% grantbasis. Although it is not shown here, some States also receive special Planassistance from the Central Government under the heading of "assistance forspecial problems." (Orissa is one of these.)
1.48 Advance Plan assistance is assistance over and above normal Planassistance (through the Gadgil formula), given by the Planning Commission tospeed up implementation of projects in irrigation and power, both prioritysectors. The funds provide flexibility to pace Plan implementation acrossstates. Not all States receive advance Plan assistance in all years.
1.49 The final type of central assistance outside of the channels ofnormal (Gadgil) assistance is "additionality." This is a relatively newform of assistance, and is given to States on the basis of their participa-tion in foreign-aided projects. Seventy percent of the aid disbursementsare channelled to the State Government as an incentive for them to come for-ward with project proposals, and also, to insure that sufficient funds willbe available for carrying out the project in a timely fashion. Because ad-ditionality is a new arrangement in Center/State financial relations, givenis little historical experience to refer to in analyzing the extent to.which additionality does in fact affect recipient States. The first ques-tion is whether it is even an additional resource to the State.

- 15 -
1.50 Both with and without the additionality arrangement, Bank Group
disbursements form part of India's overall development expenditure and are
part of the pool of resources used to finance Plan projects and programs.Development funds channelled to States through the additionality arrangementcannot be used in other ways; some adjustment in other financial arrangementsnecessarily will take place. It is extremely difficult to identify theseadjustments and trace their impact on the finances of the States receivingthe additional funds. At the one extreme, additionality from Bank Group
disbursements to a State could be offset by adjusting other items in that
State's financial relations with the Center; at the other, the adjustmentscould be diffused through the Indian system of development finance so whatappears as additional funds to an individual State for all practical purposeis additional to that State's finances. The latter is the most likely oc-currence with any shortfalls in central resources, due to this new form ofrevenue sharing, coming at the cost of a larger central budget deficit.
1.51 Even if all additionality from Bank Group disbursements is treatedas truly additional to the State, a question remains as to the State-spriorities for the use of funds available to it and the extent which addi-
tionality does ease the burden on a department if implementing a large proj-
ect. Development funds will always be somewhat fungible; they no doubt are
sufficiently fungible that the State Government need not allow the ex postPlan expenditures to differ greatly from their own ex ante priorities. Theseissues will be discussed further in the separate chapters on project financial
implications.
1.52 Of the five items which make up the sources of revenue for the StatePlans, the first two are budgetary resources and to some degree in the States
control. The latter items, borrowing and central assistance, are relatively
fixed in terms of their interstate distribution. States ability to finance
a large Plan is, therefore, a function of their own budgetary resources.
Additional resource mobilization measures taken at the outset of the Plan
period are thus very important to ultimate fulfillment of Plan goals.
V. The Planning Process in Brief
1.53 The process of drawing up a five- year or annual Plan is essen-
tially the same for all States. Differences among the States arise es-
sentially from variations in in-house planning expertise and whether there
is a planning board or department responsible for providing a longer term
perspective framework to the programs in each sector, to assist the Finance
Department in its work.
1.54 All State Plans are drawn up in consultation with the CentralPlanning Commission. The procedure is the same for all States for five-
year and annual plans alike. Through a series of discussions, the overall
size of the State Plan is fixed by the Planning Commission in Delhi in
consultation with each State's Finance Department. The discussions, which
take place over the course of two to three months, focus on State resource
availability for the year, (which is a function of the balance from its cur-
rent revenues, capital receipts and additional resource mobilization efforts)
- 16 -
as well as the physical implementation capacity in the various sectors, in-cluding staffing and raw materials availability.
1.55 In its earliest stages, a State Plan consists of a set of proposalsfor outlays drawn up by each Department, detailing the program and strategyof Plan expenditure in that sector. This level of outlays which results gen-erally represents the absolute maximum which the Department could execute,and the program is often not very discriminating in terms of project content.State Departments usually consult their counterpart Ministry in Delhi on theformulation of their program. Even if not, the central Ministries will oftentry to influence the formulation of departmental proposals. These departmentalproposals are submitted to the State Planning Department, or if there is none,the Finance Department in August-September of each year. They are discussedby the State Cabinet and at the Secretariat level, and an attempt is madeto match the departmental proposals against the State's available resources.This first round aggregation of departmental proposals implies, in most States,a Plan far larger than what the State has resources for. In the State-levelfirst round exercise, the departmental proposals are inevitably whittled downso that the State Plan taken to the Planning Commission in Delhi is to someextent commensurate with the State's resource position, even if this has beengenerously and optimistically estimated. In these first round State leveldiscussions, it is not entirely clear which principles govern how the totalPlan size is whittled down. Since the intersectoral allocation of Planoutlays in most States has changed very little from year to year, since theFourth Plan, it is probably not far wide of the mark to conclude that therevised Plan outlay level is apportioned amongst the State Departments in linewith past expenditure trends, allowing for any lumpy requirements for ongoingschemes.
1.56 Once the revised Plan total has been allocated amongst Departments,giving them a revised figure for that year's Departmental outlays, the de-partments themselves are responsible drawing up a new set of proposals, makingup the Departmental Plan. Thus, the subsequent juggling of which projects toinclude in the program, to exclude, or to implement over a longer period oftime, is carried out at the department level. The Departments revised programmust simply be consistent with the revised State Cabinet allocation to them.The manner in which the Departments whittle down outlays is basically ad hoc.Adjustments can be made by including fewer new projects, by postponing proj-ects, or through slippage, allowing projects to be implemented over a longerperiod of time.
1.57 All new projects to be included must qualify under the cost benefitguidelines issued by the Planning Commission to select acceptable projects.In the irrigation sector, the required benefit-cost ratio is 1.5 (1.2 intribal areas), and projects which fulfill this criterion are acceptable andcan be given administrative approval by the State Finance Department. 1/
1/ Large projects, such as, in the Irrigation Department major schemescosting over Rs 5 crores must also undergo the technical appraisal ofthe Central Water Commission, and schemes costing from Rs 1-5 croresmust also be submitted for pro-forma examination. For the Agricultureand Power Departments, the ICAR and CEA play a similar role.
- 17 -
However, selection from this group follows no discernable criteria. There is
certainly no attempt to rank projects according to their benefit-cost ratio.
Since the project pipeline is in fact quite limited, projects are usually
included on a first-come, first-served basis, as soon as they are certified.
There is some attempt to ensure that some regional balance is maintained:
political pressures from local politicians are fairly strong. Many smaller
projects in fact have political origins. (In the irrigation sector, these
would be mostly minor irrigation schemes.) An MLA visiting a district will
respond to constituent pressures by proposing a certain project to the de-
partment concerned. If the scheme fulfills the benefit-cost criterion, it
is likely to be included, especially if its "regional" justification is
strong. Larger schemes, of course, originate differently: some, especially
inter-State schemes, may be suggested by a Ministry at the Center, while
others correspond to the States' needs as perceived by the operating depart-
ment of the State itself. In general, there is not that much room for inclu-
sion of new projects, since expenditures on continuing schemes absorb a good
part of a Department's allocation in most sectors.
1.58 It is also possible to whittle down outlays to meet the allocation
by stretching out the implementation period of the project. There are some
broad rules of thumb regarding the phasing of expenditures for a level con-
sistent with the allocation to the sector. In general, for those projects which
are near completion, or where other developments bring on the project's
completion (joint development of irrigation and power), slippage would be
avoided as much as possible. Nonetheless, if strong pressures are brought to
bear for smaller schemes, especially if the regional justification is strong,
slippage may be the manner in which the tradeoff takes place.
1.59 Postponement of projects on which works are yet to begin, for
completion in a later Plan period 1/ is based on similar considerations: does
postponement set off domino effects for other projects? Will the returns be
greatly reduced by postponement? These questions are not answered, of course,
in any scientific manner. No rate of return calculations, as a rule, are ever
done, and the decisions made, therefore, are very much on the subjective side.
This state of affairs is, however, more or less inevitable, since planning
capacity at Departmental level is very inadequate. Departments generally have
a small division responsible for planning, consisting of some 5-6 staff, and
frequently they are technical people. (In the Irrigation Department they are
all engineers.) Economists, therefore, still play a limited role in depart-
mental planning work.
1.60 In sum, the criterion for project selection and the considerations
on which the Departments resubmit their revised proposed outlays to the State
Planning or Finance Department is an intuiting of the projects' "importance,"
1/ This is distinct from slippage. Projects would still be completed in
the appropriate number of years, but the years would be, say two in
the Sixth Plan period, and three in the Seventh, instead of the entire
project being implemented in the earlier Plan period.
- 18 -
with a care for political exigencies, regional concerns, and interdependancebetween projects.
1.61 Coordination between the State's operating Departments takes placeas necessary" on a project by project basis. There is no formal inter-
departmental coordination of the perspective Plan program. Instead, at theproject levels, the initiating Department will pass a prepared scheme onto other Departments for information. In the case of the Irrigation Depart-ment, for example, this coordination is usually limited to the State Electri-city Board and the Agriculture Department although the Irrigation Secretarycould also coordinate with other departments (such as Tribal Welfare, if thisseemed appropriate) which then certify their clearance. Once the clearance isreceived, the project moves ahead for administrative approval of the FinanceDepartment.
1.62 It is this revised aggregation of departmental outlays, whichcomprises the State Plan presented to the Planning Commission in Delhi inDecember/January of each year and which forms the basis for the subsequentPlan discussions. The discussions in Delhi cover both micro and macro aspectsof the State Plan. Each Department, during the week or so spent in Delhi,sits with the corresponding central Ministry, and discusses its programwith them. The amount of central intervention in the State planning processduring this period of discussions varies from State to State, and also withinsectors. It is quite possible for the central Department or the PlanningCommission to scrutinize projects individually, and to suggest that a projectbe dropped, or to insist on the inclusion of some scheme which that State hasoverlooked. In other cases, the Planning Commission discussions with the StateDepartment may be more in the nature of a rubber stamp of the Department'sproject choice.
1.63 As the State Departments meet with their central ministerialcounterparts, the State Finance Department representatives, State Chief Secre-tary and others meet with the Planning Commission to discuss State resourceavailability and the size of a workable Plan. In these discussions, the onusis generally on the State to "prove" that it has sufficient resources for thesize Plan it has prepared. Initially, resource availability may be somewhatuncertain, since there are a number of unknowns, most importantly, the amountof central assistance. The Plan which the State is proposing at this firstjuncture is therefore a function of its best assessment of its own resourcesand the resources which are likely to be available from the Center. Thesediscussions result in final agreement between the State and the Center on theresources actually available to the State (including additional resourcemobilization) and the Plan size consistent with these resources. This isusually somewhat smaller than the State's Plan proposal to the PlanningCommission.
1.64 The sectoral allocation of the Plan is also discussed at thistime. National priorities find their way into State Plans via the guide-lines of the Planning Commission.
- 19 -
1.65 After the Delhi discussions, for the departments, the whole proce-dure of whittling down begins again. The sectoral allocation, agreed to by
the Planning Commission and State finance officials is returned to otherState Departments, who must now trim down their proposed outlays accordingto the new ceiling through the same procedure as earlier. The final trimmed-down version of each Department's program is then resubmitted to the StatePlanning or Finance Department, which compiles them into a draft Plan. Thisfinal draft Plan is submitted to the Cabinet for discussion, presented to
the legislature for approval and then finalized.
1.66 This planning procedure clearly has several weak links. One is theproject selection process at State level, including the coordination between
Departments, and the other is the involvement of the Center. Much more in theway of economic planning needs to be developed in the Departments, and at theState level.
1.67 The costs to the States of their weak planning capacity, resultingin sub-optimal project choices, responsiveness to political exigencies, anddelays in implementation can be quite high. In the irrigation sector, forexample, there is a chronic tendency for the Departments to begin expenditureson new schemes rather than to take stock and insure that investments necessaryfor full utilization of existing capacity have been made. Here, the finger
should not be pointed exclusively at any one State in particular; rather itis a comment on the general level of development of departmental planning inthe Indian States.
1.68 The Plan discussions with the Center do, in some measure, amelioratethis, since to some extent, the operating Departments learn from others'successes and failures in the course of the Plan discussions with the Center,
since the Center's recommendations are a function of lessons gleaned from theexperience of all States. In the end, of course, the development of strongplanning capacity, both at the State level and in the operating departments
as well is a sine qua non for States' progress.
Plan Evaluation
1.69 The capacity for evaluation of projects or monitoring Plan im-plementation is very limited. In the most superficial sense, there is no
"implementation problem" since Plans are almost always implemented in thesense that nominal financial targets are achieved. This is true of almost all
sectors. However, since the five-year ex-ante outlays are in constant prices,ex-post expenditures must exceed the nominal targets by the inflation ratecapitalized over the Plan period, in order for "real" targets to have been
implemented. Physical targets are, of course, another question again. FewStates have expertise in performance budgeting in their operating departments.This, too, is a necessary development for the quality of planning at the
departmental level.
- 20 -
VI. FINANCING WORLD BANK PROJECTS
1.70 The purpose of these papers is to review the financial position and
prospects of the State Governments in order to investigate whether the five
programs of expenditure currently proposed for Bank Group financing can be
carried out as planned. This requires looking at the capacity and willingnessof the governments to provide the necessary financial resources, which in turnrequires a view of the States' past and future economic situation. Althoughanalyzing a State's capacity and willingness to finance a particular sector'sdevelopment program is a difficult task, it is no more so than, say, analyzing
a country's creditworthiness and its capacity and willingness to pay foreigndebts. It is also entirely necessary since in all the cases, the projects inrelation to the State's budgets, and the Bank's overall exposure in eachState are very large.
1.71 The basic task at hand is to review the financial position andprospects of the five State Governments in relation to ongoing and proposed
projects assisted by the Bank Group to satisfy ourselves that these projects
can be carried out as planned. Our concern here is not with the economicjustification for the projects, the repayment capacity of the States, thephysical implementation capacity nor the impact of these projects on theStates' economy. Rather our interest is with the capacity and willingness ofthe State Government to provide the necessary financial resources for the
implementation of these projects. Satisfying our curiosity on this requiresat least a cursory look at the States' development and expenditure prioritiesand their financial outlook. The former requires some understanding of theState's economic situation; the latter calls for a view of its financialstructure, its economic growth prospects and the course of financial relationsbetween States and the Government of India.
1.72 In the papers which follow, different methodologies are developed toexamine these questions. The papers begin by outlining each State's basicrevenue position, the predominant sources of income, and "performance," to getan idea of each State's fiscal capacity and the degree to which it can be, orhas been, exploited.
1.73 Expenditure policies are also examined, to yield an impression of
the priorities of the State Governments with respect, to the different sectors.
On the non-Plan side, the studies assess the degree to which State Governments
have been able to control non-development expenditure commitments and to
prevent them from cutting into Plan uses of the monies. Using this informa-tion, projections of resource availability over the period of project imple-mentation and the funds available to each sector are made. Finally, theproject commitments are analyzed in the context of projected outlays in thesector in question to see whether or not the commitments can be easily accom-modated in the budgeted level of outlays.
1.74 The conclusions are not all the same. In the case of Gujarat,
Tamil Nadu and Madhya Pradesh, project commitments are easily accommodatedeven under ungenerous assumptions about levels of resource availability
- 21 -
and allocations to the sectors under review. In the case of Maharastra,the study concludes that there need be no cause for concern, but that themargin is almost being reached. The conclusions of the Orissa study were thatthe State is seriously over-committing itself to a program of expenditures inthe irrigation sector for which resources may not be available.
- 22 -
CHAPTER II
MADHYA PRADESH: STATE PLANNING AND FINANCE
Christine WallichIndia Division
October 1979
- 23 -
MADHYA PRADESH: TRENDS IN STATE FINANCE
Table of Contents
Page No.
Preface 24
I. The State .............................................. 25
(i) History ........................................... 25
(ii) Salient Economic Features .......................... 25
II. Financial Resources .......................... 28
(i) State Revenue Receipts ............................ 28
III. Review of State Expenditures ............ .. ............. 32
(i) Revenue Expenditure ............................... 32
(ii) Capital and Plan Expenditures ..................... 36
(iii) Composition of Plan Expenditures .... .............. 38
IV. The Plan: Financial Resources ......................... 41
V. The Planning Process ................................... 46
(i) Planning Machinery ................................ 46
(ii) Plan Evaluation ................................... 47
VI. Future Resources: Financing the Madhya Pradesh
Composite Irrigation Project ........... .. ............ 47
Tables
1. Madhya Pradesh Revenue Receipts ............................ 29
2. Madhya Pradesh Revenue Expenditures ........................ 34
3. Plan and Non-Plan Revenue Expenditures as a Proportion
of Revenue Budget ........................................ 35
4. Plan and Non-Plan Capital Expenditures as a Proportion
of the Capital Budget .................................... 37
5. Trend of Plan Expenditures ................................. 40
6. Sources of State Plan Finance .............................. 43
7. Percentage Breakdown of Sources of Plan Finances .... ....... 44
8. Madhya Pradesh Composite Irrigation Project in Relation
to State Plan Expenditures ............................... 50
9. Madhya Pradesh Plan Expenditures ........................... 54
10. Irrigation Sector Expenditures ............................. 55
- 24 -
MADHYA PRADESH: TRENDS IN STATE FINANCE
Preface
This study was undertaken as part of the preparation of Madhya
Pradesh Component Irrigation Project, as a result of the perceived need
for a systematic review of the project financial implications in the contextof State resource availability. Data for the study was obtained in thecourse of a mission to Madhya Pradesh in November 1979.
The paper is organized as follows: An introductory section pro-vides a brief overview and the State of Madhya Pradesh, its history andsalient features. Sections II and III review trends in State finances andexpenditures comparing the relevant financial magnitudes with those of otherStates. The State Plan, and the State planning process are dealt with insections IV and V. Finally, in section V the project investment programis discussed in the context of the resources likely to be available from thestate Plan over the project implementation period.

- 25 -
I. THE STATE
2.01 The State of Madhya Pradesh was constituted nine years afterindependence on November 1, 1956, by integrating the former States of VindhyaPradesh, Madhya Bharat, part of the former State of Madhya Pradesh and theprincely State of Bhopal. It lies, as its name implies (Madhya-central;Pradesh-State) in the Deccan plateau in the heart of the subcontinent, andis entirely land locked. Being on the plateau, there is hardly any portionof the State which is less than 1,000 feet above sea-level and in its easternhill region, large areas lie above 3000 feet.
2.02 The majority (80%) of the State is Hindi-speaking, as a result ofthe transfer, in 1956, of its eight Marathi-speaking districts to Bombay Stateunder the States' Reorganization Act. Hill and tribal districts such asBastar, where tribal dialects predominate, are an exception.
2.03 History. Tribal peoples, the ancestors of the modern Gond and Bhiltribes which still inhabit the easternmost region, were the earliest inhabit-ants of the Madhya Pradesh area. Since then, the area has featured in mostaspects of Indian history. Early references to the city of Ujjain, are foundin Buddhist scripture of the 6th century B.C. The region was part of theMauryan empire and it was at Sanchi, in the heart of Madhya Pradesh, thatAshoka, the Mauryan emperor and first unifier of India built the great complexof stupas. In the 13th century, Muslims first invaded Madhya Pradesh, and onehundred years later, under Tulugq, Madhya Pradesh was firmly under Muslimdominion. With the decline the Moghul empire, Madhya Pradesh was successivelyconquered by the Marathas and then fell prey like most of the rest of centralIndia from 1800-1830 to the thugee robber bands. The British pacified thearea during the first half of the nineteenth century and by 1853 most of whatis now in Madhya Pradesh was under British rule, forming, until 1947, theCentral Indian provinces.
Salient Economic Features
2.04 Madhya Pradesh is often characterized as a "rich State inhabitedby poor people." The State covers a vast geographical area - at 442,841square kilometers, it is the largest state in India, covering 13% of thenation's area. The northermost tip extends almost as far as Agra, the south-ern extremity reaches as far south as Hyderabad. Orissa and Gujarat defineits east-west extension. Madhya Pradesh is also a populous State. Its popu-lation at the 1971 census was 41.7 million, making it the sixth largest Statein terms of population. Just over 20% of this population is tribal, givingMadhya Pradesh the largest concentration of tribal peoples in India. Moreover,thirty-three percent of the State's inhabitants belong to the so-called"backward classes", which includes scheduled castes and tribes; this placesMadhya Pradesh just slightly behind Orissa in terms of the proportion ofdisadvantaged inhabitants of the State. This large population is distributedsparsely across the State. The density is 94 persons per square kilometer(in contrast to the all-India average of 167). This results in inadequateaccess to communication means and transport for many parts of the State. As
- 26 -
elsewhere in India, the bulk of the inhabitants live in rural areas, but the
proportion is significantly higher: 83.7% as opposed to 80.1% for the country
as a whole. The existing state infrastructure and development needs are put
under further strain by the distribution of the rural population. Madhya
Pradesh has the largest number of villages of any State (70,883) and the
villages, with an average population of 428, are very small. Only in Orissa
is the average population per village smaller, (408) while the all-India
average is 796. From the point of view of the Draft Sixth Plan, "resources
must cover a larger number of villages, more sparsely populated and more
widely scattered over a much wider area than most other States."
2.05 Madhya Pradesh is a poor State, almost regardless of what indicator
one chooses. Per capita income in 1975/76 was 80% of the all-India average
of Rs 981, so that Madhya Pradesh occupied the position of 13th out of
15 States in the three years ending in 1975/76. It has not strayed far from
this ranking in the past decade, having alternately placed 11th in 1964/65
and 14th in 1969/70. The differential between the incomes of Punjab, India's
richest state, and Madhya Pradesh have widened in this decade: in 1964/65,
per capita income of Punjab was 1.5 times the latters; by 1975/76 the gulf
had widened to 2.1 times.
2.06 Ironically, Madhya Pradesh has among the richest natural resource
bases of any State in India. The State is endowed with vast reserves of
many minerals, including coal, iron ore, bauxite, manganese, limestone and
copper, most located in the eastern region. The three very large rivers - the
Mahanadi, Narmada and Chambal - provide huge hydro-electric potential. Madhya
Pradesh is estimated at having 11% of the country's total hydro-electric
potential - the second largest capacity of any other State except Assam.
These same water resources could provide irrigation for agriculture as well.
Teak and pine forests also comprise part of the natural wealth of the State:
Madhya Pradesh has 26.7% of India'a total forest resources: The pine forests
are suitable for pulp and paper industries; the teak tracts provide potential
for the development of a high quality export-goods industry for which there
is a highly income elastic world demand and are among the potentially most
valuable resources of the State. But this is where the richness ends.
2.07 Madhya Pradesh's low per capita SDP is due, as might be expected,
to the excessive dependence of the State economy on low productivity agri-
culture. Few benefits of the "Green Revolution" have made their way yet to
Madhya Pradesh. In 1970/71, only 7% of net sown area was irrigated. This has
risen to 12% today, as compared with the all-India average of 23%, and 75% in
Punjab. Per hectare consumption of fertilizers is also extremely low: Madhya
Pradesh farmers applied 4.8 kg per hectare in 1974, 30% of the all-India
average, and one tenth of the amounts used in Punjab. Moreover, the low
population density, poor communication and transport infrastructure, and low
levels of education all conspire to make extension activity more difficult and
have also contributed to the slow development of agriculture in the State.
2.08 Industry in Madhya Pradesh has also developed slowly not with-
standing the potential for growth. The contribution of industry to SDP is
small, less than 20% in 1977. Employment in manufacturing accounted for only
- 27 -
6.6% of total workers, as compared with 9.4% in all-India, and percentages
ranging from 13-16% for Tamil Nadu, Maharashtra, West Bengal and Kerala.
2.09 The potential for a larger and more diversified industrial sector
is there: Madhya Pradesh's huge hydro-electric potential should serve to
attract industries which require an assured source of power. However, the
development of this power infrastructure is still far behind the rest of
India. Industrial power consumption is still very low: in Madhya Pradesh
it is only 49 kwh per capita compared with the figure of 61 kwh for India
as a whole, and with 130 kwh and 110 kwh for Maharashtra and Gujarat, respec-
tively. Household consumption of power is equally low: this is due to low
incomes, and to the very small fraction of villages electrified: only 17% of
Madhya Pradesh-s villages are electrified, compared with 33% in all-India, and
98% and 95% in Tamil Nadu and Kerala respectively. In sum, power development
lags far behind. This is the reason behind the great emphasis, in the Plan,
on the power sector.
2.10 Because of Madhya Pradesh's large population and its low density,
the communications network of the State is crucial for the success of the
State's development effort. At this point, unfortunately, the sector still
represents a major hindrance to the State's development and intensifies
problems in other sectors. There are few major highways in Madhya Pradesh:
Madhya Pradesh ranks 13th out of 15 States with respect to density of highway
length - 10.29 km of total highway length in the State per 100 sq. km. com-
pared with 30.0 km in the all-India figures. The result is that vast areas
of the State are virtually unaccessible, which in turn hinders exploitation
of mineral and forest resources, inhibits commercialization and modernization
of agriculture, not to mention the severe social problems (i.e., development
of tribal areas) engendered by the deficient transport network. Railways
are also seriously deficient: there is no comprehensive system linking all
parts of the State; instead, the railway links the major industrial area
with ports on the east coast and with one or two other large cities in other
States. An adequate communication network is thus crucial for success of
network is thus crucial for success of almost all other development efforts,
especially for the exploitation of Madhya Pradesh's tremendous natural
resource base.
2.11 The inhabitants of Madhya Pradesh are also vastly under-serviced
in areas such as education and health. Literacy rates in Madhya Pradesh are
amongst the lowest in India. While the percentage has risen substantially
since the 1951 census, it has risen similarly all over India, and Madhya
Pradesh's rank continues to be 12th-13th out of 15 States. Kerala, by con-
trast, has ranked in first place, with literacy rates of 40.7% and 60% in
the 1951 and 1971 census, respectively. Similarly, medical facilities are
poor, rural water supply is deficient, and many basic needs are far from
being met.
2.12 Notwithstanding the desperate lack in the basic needs sector and
that basic needs are very far from being met, the development strategy of the
State emphasizes--rightly so--the development of agriculture, irrigation and
power, as the only means of raising per capita incomes. The State's stress
on the development of the "production sectors" has left very little room for
developing social services infrastructure.
- 28 -
II. FINANCIAL RESOURCES
State Revenue Receipts
2.13 State revenue receipts are those receipts for which the State hasno repayment liability and which are used to finance items of revenue expend-iture. They consist of state tax revenues--the most important--non-taxrevenues, the next largest, and grants from the Central Government. Thesecategories will be treated in turn. Table 1 details the trends in eachcategory since the beginning of the Third Plan.
2.14 Revenues from taxes make up 60% of the State's total revenue receipts.About two thirds of the tax revenues are from taxes which the State imposesand collects itself, the remainder are taxes which the State receives throughrevenue sharing arrangements with the Central Government.
2.15 The States, Madhya Pradesh included, receive a share in four centraltaxes: the income tax, central excise duties, the Center's "additional"excise duties and the estate duty. These shared taxes, known as devolutions,have made up from 20 to 25% of Madhya Pradesh's total revenue receipts and35% of total tax receipts. Since the share of central taxes is a functionof the award made quinquennially by the Finance Commissions, their buoyancy,or elasticity is not a relevant concept here. Madhya Pradesh, has in general,done well by the Finance Commissions. Over the last 18 years; shared taxeshave provided a growing source of funds and the category has grown fasterthan the State's revenues from its own taxes.
2.16 The State's own taxes make up about 40% of its total revenueresources. Three taxes account for almost two-thirds of Madhya Pradesh's taxrevenues: the sales tax, the excuse duty and the central sales tax. Thesales tax alone contributes close to 40% of the State's tax receipts - aresult of the growth in the State of the volume of trade and increases inthe price level. With an elasticity 1.61, of it is the most responsive taxin the fiscal system.
2.17 Second in importance is the State excise duty which contributesabout 15% of State tax revenues. The excise duty is levied on narcotics andliquor and its growth is related to revision of rates, increases in the priceof county liquor and the end, in 1967, of prohibition in Madhya Pradesh. Thetax, with an income elasticity of 1.2 is also closely related to increasedState prosperity.
2.18 The central sales tax--levied by the Center, but assigned to theStates-is the third important tax, making up about 10% of total tax revenues.Receipts from this tax are a function of the volume of interstate trade. Thistax has grown nicely over the period. Its elasticity is 1.71%, part of whichis due to the increase in the tax rate in 1975, from 3 to 4%.
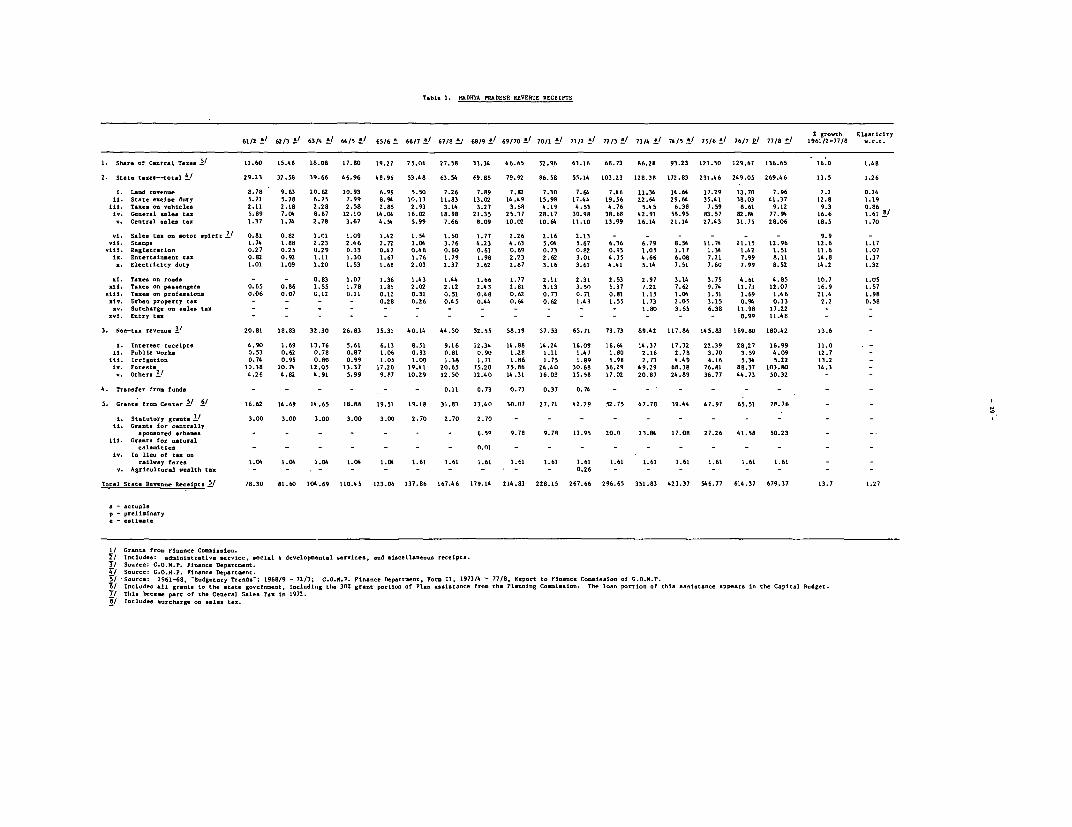
Table 1. MADHYA PRADESH RLEVENUE RECEIVES
61/2 ±/ 62/31 I/63/4 ±/ (A4/5 ±/ 65/6±1 66/7 ±i' 67/8 Li' 68/9± 1!69/70 2" 70/1±!/ 71/2 a/ 72 /3 ±/ 73/ A / 74 /5 1/ 75/6 1/ 76/7 Z' 77/8 m/ 19 61'/32'77h/8 a E.r.t.
1 . Share of Central Tens V 11.60 15.48 18.08 17. 80 19.2 7 7 5.06 2 7. 58 33.34 6 6.65 52 .96 63. 16 68. 73 86.28 93.2 3 121.50 12 9. 67 136.63 16.0 1.4 8
2. Sitale .... a te--tnIj 29.23 32.358 39.66 66.96 6 8. 96 33.4 8 63. 54 69.83 79. 92 86.058 35.16 103.23 12 8.398 172 .83 231 .4 6 24 9.05 269.6 6 13. 5 1.26
1. Laud revenue ~~~~~~8.78 9. 63 19. 62 10.93 6. 99 3.30 7.26 7.89 7.82 7.30 7.84 7.66 11 .34 14 .64 17.29 13.70 7.196 2 .2 0.24
11 tat retrdt5.71 3.78 6.75 7.99 8.96 10.13 11.83 13.02 1.9 598 7.n 956 22.64 29.64 35.4 1 38.03 1371. 1.19
158. Tones on vehlclea ~~~~2.11 2.18 2.28 2.58 2.5 2.93 31 3.7 3.698 .1 4.53 4.76 5.8 5 6.38 y3986 19.12 9.3' 0.8
Eu GIoca alsta 5.89 7.06 8.87 12.10 14 .06 16.02 18.88 31.33 25.37 28.17 30.98 30.69 62.91 58.95 62.57 92 .96 77.96 16.6 1.6 I-
u.Ceotro1 saUce lee 1.37 1.76 2.78 3.67 6 .3 34.99 7.66 8.09 10.02 10.64 11.10 13.99 16.16 21.14 2 7.63 31.75 28.06 18.3 1.70
yE. Sale ts oe -utu eplrit 21 .81 0.82 1.01 1.09 1.62 1. 56 1.60 1.77 2.26 2.16 2.13 - - - - - - 9.9 -
vi. Seps 1.76 1.88 2.23 2.4 6 2.72 3.06 3.76 6.23 6.63 5.06 5.67 6.36 6.79 8.56 11.74 11.15 12.96 12.6 1.17
R S.Esltr-tloe 0.27 0.235 0.29 0.33 0.47 0.681 0.60 0.61 0.69 0.73 0.97 0.95 1.03 1.17 1.34 1.42 1.31 11.6 1.07
Se..Etrouette08 .2 11 .0 16 1.76 1.79 1.8 2.23 2.62 3.01 4.35 4.66 6.08 7.21 7.99 8.11 14.8 1.37
E. lecittifty duty 1.01 1.09 1.20 1.53 1.68 2.03 2.37 2.62 2.67 3.16 3.61 4.61 5.14 7.51 7.60 7.99 8.52 16 .3 1.32
el Toe nrod - - 6.83 1.07 1.36 14 1.4 1.66 1.7 2.11 2.31 2.33 2.97 3.16 3.75 4.61 48 0710
3. Tes oopsegr 0.65 0.86 1.5 1.78 1.83 2 .02 2.13 2.43 7.81 3.13 3.50 3.37 7.22 7.62 9.76 1~1.73 12.07 16.9 1.57
.ill. Tons, rfsin 0.06 0.07 0.12' 0.11 0.12' 0.31 0..51 0.48 0.62 0.73 0.71 0.91 1.13 1.06 1.31 169 1.46 21.4 1.98
eiy. Irba tpropetyto- - - 0.28 0.26 0.645 0.44 0. 64 0. 62 1.4 3 1.55 1.73 2.05 3.15 0.96 0.13 2.2 0.58
o. S-hnboge so sales tao - - --.- 1.80 3.65 6.38 11.98 17.22--
ou.Entry's t - - - - - - 0.99 11.648 --
3. Nu-te Revenue... 20.81 18.03 32.30 26.83 35.31 40. 16 44.50 52.55 58.19 37.53 65.71 73.73 89.42 117.86 14 5.8a3 169.00 180.62 13.6
lo Iterest receIpts 6.90 1.69 13.76 5.61 6.15 8.51 9.16 12.36 14.881 14.24 16.09 16.64 14.37 17.32 22.39 28,27 16.99 1.
II uli eb 0.5 0.2 07 .7 106 0.93 0.81 0.90 1.9 1.1 1.4 7 1.910 2.16 2.78 3.70 3.59 4.09 127-
ItI. Seiaon0.74 0.95 0.80 0.99 1.05 1.00 1.38 1.71 1.86 1.75 1.89 1.98 2.73 4.49 6.16 5.34 5.22 13.2-
Eu.Forest. 10.38 10. 74 62.05 13.37 12.20 19.41 20.65 75.20 73.86 24.40 30.68 36.29 49.29 648.38 76.91 89.57 103.80 14.3-
O1hthesj 4.26 6.02 4.91 5.99 9.97 10.29 12.50 13.4 0 14 .31 16.07 15.58 17.02 20.87 24.89 36.77 44.73 30.32--
4. Itre..sfer fr foods - - - - - - 0.11 E.73 0.75 0.37 0. 74 - - - - ---
5. Greet feum Cente i!A 6.62 14 .69 14.65 10.84 19.51 19.18 31.91 23.4 0 30.07 27.71 42.79 52.75 47.79 39.44 47.97 65.51 79.76--
I. S:tatutoy gratel! 3.00 3.00 3.00 3.00 3.00 2.70 2.70 2.70 - - - - - - - - ---
ii. Graett for.. cetrallyapuosored scheess - - - - - - - 6.39 9.78 9.79 13.95 20.0 2 3.84 17.08 27.26 41.58 50.233
v- Ia lIeu of tea oecalio 7
face 1.06 1.06 1.06 1.06 1.06 1.61 1.61 1.61 1.61 1.61 1.61 1.61 1.61 1.61 1.61 1.61 1.61-
u. Etrloltrsleath tao - - - - - - 0.26 - - - - --
Tote State -.. evnu ...elpts Ž/ 79.30 81.60 100.69 110.6 5 123.06 137.84 167.6 6 179.14 214.83 228.15 267.66 296.65 351.83 623.37 54 6. 77 614.37 679.37 13.7 1.27
at-Iactoalt
e etleat
S/ rate Ren GFieaoPe Fio..i..lp.t-t
3/ Source: G.O.8.P. Plio- Duparteot.
3/Source 1961l68, '0odgstery Treeds:; 1968/9 - 72/3; G.0.M.P. F . -Sac span-me-, Pure 511 1973/6 '-77/8, Report to Fi ...cr Cu1oeisei of C.O.5.P.3/I_oldo aliro otestt uereu, IncldIng the 30% grte p-rttoe of PI.ease.lst..ce Itru the Plo..niog Coso.iseo. Th. luau portIon of thiaeueaneppear. iv the Copito1 Budget.
7/ThI hena P.~ of the General1 Sales Tao In 1972.a -locldes surharge us sales to..
- 30 -
2.19 There are a number of other taxes such as the stamp tax, the tax onpassenger transport and the entry tax which presently each contribute about5% or so to tax receipts. The stamp tax has grown more slowly than the totalof receipts and is gradually becoming unimportant. Passenger transport taxes,on the other hand, with the development of transport infrastructure, havegrown very rapidly, and have an elasticity of 1.57. This is likely to in-crease further in the future, as further expenditures are made in the trans-port and communications sector.
2.20 The remaining taxes, the entertainment tax, electricity duty--afunction of power development--taxes on vehicles and land revenue among others,each make up less than 3% of revenues. The last, land revenue, was a tradi-tional mainstay of the State's fiscal system: as recently as 1960, it madeup 30% of total tax receipts. Since then, however, it has grown at less than2.2% per annum and is fast becoming quite insignificant.
2.21 Overall, State tax revenues have grown at 13.5% per annum since1961. In real terms, this performance is diminished somewhat, since the pricelevel has risen also, by about 5% per annum. Nonetheless, an annual growthof 7-8% in real terms bespeaks good tax effort. Part of the explanation alsolies in the fact that Madhya Pradesh began, in the early 1960's with very lowlevels of taxation - own tax revenues as a fraction of SDP were only 3.3%.The proportion has risen to 6.1% in 1977, which, in relative terms, is better
than some states far wealthier than Madhya Pradesh. 1/
Non-Tax Revenues
2.22 Non-tax revenues have grown at the same rate as tax revenues, 13.6%per annum. Amongst the various types of non-tax receipts, as one might ex-pect, forest receipts have grown the most quickly, at 14.3% per annum. Forestsoccupy a very important place in the economy of Madhya Pradesh. Receipts fromforests accounted for 56% of total non-tax receipts in 1977/78. Madhya Pradeshearns twice as much from its forestry development than does Uttar Pradesh andalmost three times as much as Karnataka, although per hectare yields are nothigh due to the low level of investment in forests. If forestry receipts areto continue to grow as a source of non-tax revenues, investment is necessary.
2.23 Irrigation receipts have grown at 13.2%, more slowly than the Staterevenue receipts as a whole. Included here are both the water rates collectedunder the Madhya Pradesh Irrigation Act, as well as income from provision ofwater to municipal corporations and public sector undertakings in the State.
2.24 Non-tax income from public works, which derives basically frombuilding rentals and toll fees on government owned roads and bridges, hasalso been growing less rapidly than overall revenues, at 12.3% per annum.
1/ See R. Chelliah. "Tax Effort of Indian States."
- 31 -
2.25 Interest receipts have grown the most slowly of all, at just under
11%. The category is comprised mostly of interest payments to the State from
the State Electricity Board, this is a residual payment for the Board, being a
function of its repayment capacity, since interest due on other obligations
has priority.
2.26 The category "others" is a catch-all for administrative services,
social and development services and miscellaneous receipts. The first consists
of administration of justice (sale of unclaimed properties, court fees, etc.);
jails (income from sale of jail manufactures); police and supplies (collection
of license fees). Under social services income come education (fees from
schools); medical and public health (medical fees and sale of medicines, fees
for preparing town drainage plans); agriculture (receipts from fisheries and
farms operated by the State) and cottage industries and cooperation. Receipts
from mines and minerals also come under this head.
2.27 In general, the trend in non-tax receipts, unlike tax receipts, is
a function of the level of services provided, the development of the sector
and in the case of the State Government's commercial undertakings, the State's
management of these enterprises. It is not, in any way related to the growth
of SDP, and therefore, no elasticities have been calculated.
2.28 The final State revenue receipts to be discussed are the grants
from the Central Government. The first of these are statutory grants, which
are provided to the State through the Finance Commission's award, and for
which Madhya Pradesh has not been eligible since 1968, the last year in which
it had an ex-ante budget deficit. Since then, Madhya Pradesh, has had, after
revenue sharing, a budgetary surplus in each year.
2.29 On account of natural calamity, Madhya Pradesh has received one
grant in the period under review, in 1968/69.
2.30 Centrally-sponsored schemes have become increasingly important for
Madhya Pradesh. Receipts from this source have gone up 7-fold in less than 10
years, indicating the growing importance of these schemes in the State expend-
iture picture.
2.31 The grant in lieu of railway fares and the agricultural wealth tax,
which originated as shared taxes do not amount to very much.
2.32 To summarize, revenue receipts in Madhya Pradesh have been fairlybuoyant over the period, growing at almost 14% per annum in a period in which
prices increased at slightly over one-third that rate. Because revenue expen-
ditures have also been kept under control, this has enabled Madhya Pradesh to
have a hefty surplus on revenue account in the past decade, which has been
carried forward to help finance the State Plan. The following section dis-
cusses these trends in revenue expenditures.

- 32 -
III. REVIEW OF STATE EXPENDITURES
Revenue Expenditures
2.33 Expenditures in Madhya Pradesh, as in other States, are classifiedunder two headings: revenue expenditures and capital expenditures. MadhyaPradesh has an explicit strategy of containing non-Plan expenditures tomaximize the budgetary surplus and carry over for Plan finance. The State haspursued this strategy through numerous measures.
2.34 Economy measures have included postponement of or less than fulladjustment for increases in State employees' pay scales, withholding of dear-ness allowances, increases in the proportion of State employee salaries heldin escrow under compulsory savings schemes, restrictions on printing and paper,cuts in expenditures on vehicles, telephones and furniture, reductions intravelling allowances and official tours, reduction in new subjects to betaught in schools, and closing of polytechnics, and bans on filling of certainposts, to name just a few. It is frequently contended that expenditures arebeing squeezed to the point where it impinges on the efficiency of Stateadministration.
2.35 Madhya Pradesh's success in maintaining a large revenue accountsurplus is also a result of its emphasis, in its development strategy, onthe "production sectors", irrigation, power and agriculture. Since these arepriority sectors for the Central Government as well as being capital inten-sive, most expenditures in these sectors come under the Plan, and not undernon-Plan capital or revenue expenditure. Their capital intensity has anotherresult. Expenditures on Plan schemes, whether capital or current in nature,are financed through the Plan, continuing expenditures on completed Planschemes, such as maintenance and wages, become the responsibility of theState Government and must be financed as ordinary non-Plan revenue expendi-ture. Their capital intensity therefore means that upon completion, theygenerate very little in the way of continuing expenditure--such as on wagesor other ongoing costs--which must be borne by the State as committed expen-diture at the termination of the Plan. Thus, the State's surplus derivesalmost directly from the fact that expenditures in the social sectors arevery low: taken together expenditures on transport, communication, education,health and other social services make up less than 20% of Plan outlays. Theseare the sectors, of course, where the State committment after the Plan, wouldbe the largest. Continuing schemes (such as the continuing subsidy for pur-chase of medicines, in a health scheme, which would be an element of committedexpenditure in a health scheme in addition to wages and overheads) can bequite burdensome for the State, if a large proportion of State Plan expendi-tures is in sectors where committed expenditures are high.
2.36 In Madhya Pradesh, then, there is a less sunny side to the largesurplus on current account: it, and a larger Plan is achieved at the cost ofsocial infrastructure expenditures. This is a tradeoff about which much hasbeen said--this paper will not discuss it further.
- 33 -
2.37 Revenue expenditures are shown in table 2. Total revenue expendi-tures have grown at 12.4% since 1961, although in real terms this is, ofcourse, much lower, about 7%. 1/ The State spends far more on revenue thanon capital account: the present ratio is about 80:20. However, developmentalexpenditures have always made up the bulk of revenue expenditures throughoutthe two decades, and have also been the fastest growing. In 1978, education,public health, and agriculture and allied sectors together made up 42% ofthe total, and they have grown at 12%, 13.3%, and 16.7%, respectively. More-over, of these expenditures on revenue account, some 10-20% of revenue expen-ditures are Plan expenditures, as Table 3 shows. In the developmental sectorsalone, the Plan proportion has been 20-25% of revenue expenditure. Table 3also shows the phenomenon of a spurt in "committed" expenditures at the end ofevery Plan period as completed Plan schemes are continued under state aegis,generating additional expenditure to be met from the State's revenue account.At the end of each Plan period, non-plan expenditures jump: in 1965/66, from80.2% of the total to 88% immediately the following year. Again the samething in 1968:69: non-Plan expenditure rise discontinuously from 84.5% to 89%in 1969. A similar spurt can be observed at the end of the Fourth Plan periodwhen non-Plan expenditures go from 81% to 87% of the total.
1/ Based on an increase of the all Indian price level of about 5.5% perannum.
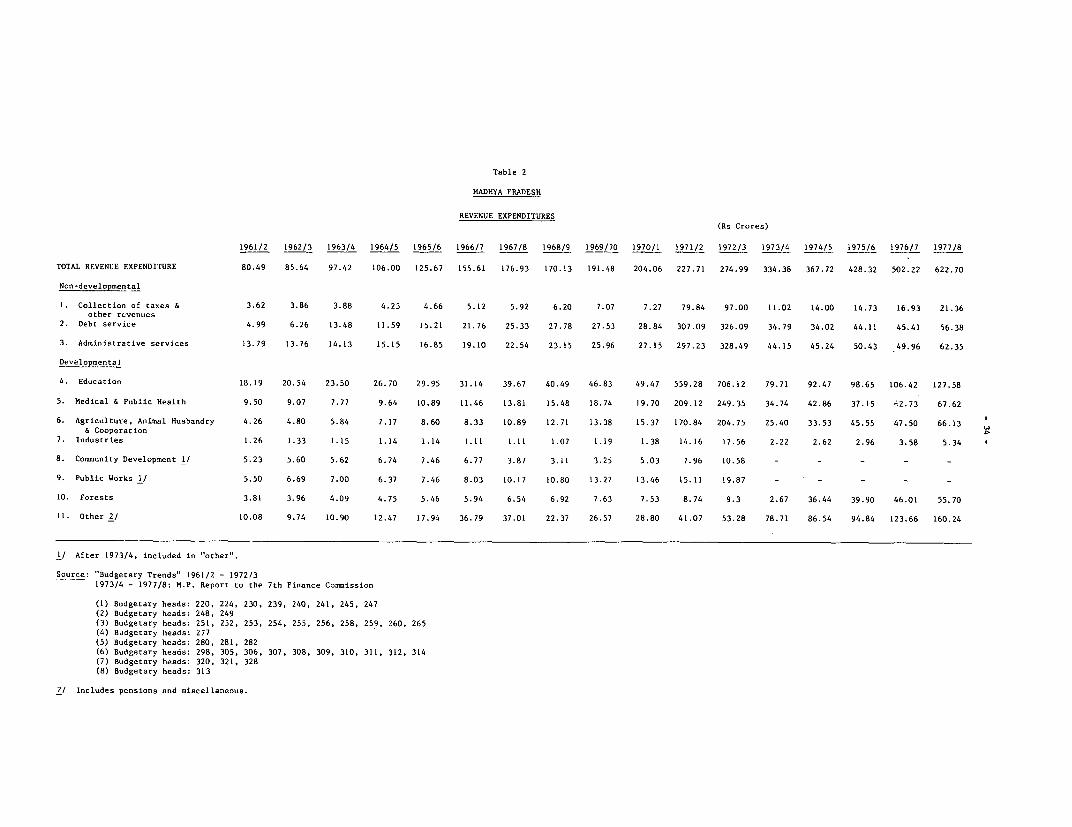
Table 2
MADHYA PRADlESH
REVENUE EXPENDITURES
(Rs Crores)
1961/2 1962/3 1963/4 1964/5 1965/6 1966/7 1967/8 1968/9 1969/70 1970/1 1971/2 1972/3 1973/4 1974/5 1975/6 1976/7 1977/8
TOTAL REVENUE EXPENDITURE 80.49 85.64 97.42 106.00 125.67 155.61 176.93 170.13 191.48 204.06 227.71 274.99 334.38 367.72 428.32 502.22 622.70
Non-developmental
1. Collection of taxes & 3.62 3.86 3.88 4.23 4.66 5.12 5.92 6.20 7.07 7.27 79.84 97.00 11.02 14.00 14.73 16.93 21.36
other revenues2. Debt service 4.99 6.26 13.48 11.59 15.21 21.76 25.33 27.78 27.53 28.84 307.09 326.09 34.79 34.02 44.11 45.41 56.38
3. Administrative services 13.79 13.76 14.13 15.15 16.85 19.10 22.54 23.15 25.96 27.15 297.23 328.49 44.15 45.24 50.43 49.96 62.35
Developmental
4. Education 18.19 20.54 23.50 26.70 29.95 31.14 39.67 40.49 46.83 49.47 559.28 706.12 79.71 92.47 98.65 106.42 127.58
5. Medical & Public Health 9.50 9.07 7.77 9.64 10.89 11.46 13.81 15.48 18.74 19.70 209.12 249.35 34.74 42.86 37.15 n2.73 67.62
6. Agriculture, Animal Husbandry 4.26 4.80 5.84 7.17 8.60 8.33 10.89 12.71 13.38 15.37 170.84 204.75 25.40 33.53 45.55 47.50 66.13
& Cooperation7. Industries 1.26 1.33 1.15 1.14 1.14 1.11 1.11 1.07 1.19 1.38 14.16 17.56 2.22 2.62 2.96 3.58 5.34
8. Comunity Development 1/ 5.23 5.60 5.62 6.74 7.46 6.77 3.87 3.11 3.25 5.03 7.96 10.58 - - - -
9. Public Works 1/ 5.50 6.69 7.00 6.37 7.46 8.03 10.17 10.80 13.27 13.46 15.11 19.87 - - - - -
10. Forests 3.81 3.96 4.09 4.75 5.46 5.94 6.54 6.92 7.63 7.53 8.74 9.3 2.67 36.44 39.90 46.01 55.70
11. Other 2/ 10.08 9.74 10.90 12.47 17.94 36.79 37.01 22.37 26.57 28.80 41.07 53.28 78.71 86.54 94.84 123.66 160.24
1/ After 1973/4, included in "other".
Source: "Budgetary Trends" 1961/2 - 1972/31973/4 - 1977/8: M.P. Report to the 7th Finance Commission
(1) Budgetary heads: 220, 224, 230, 239, 240, 241, 245, 247
(2) Budgetary heads: 248, 249(3) Budgetary heads: 251, 252, 253, 254, 255, 256, 258, 259, 260, 265
(4) Budgetary heads: 277(5) Budgetary heads: 280, 281, 282(6) Budgetary heads: 298, 305, 306, 307. 308, 309, 310, 311, 312, 314
(7) Budgetary heads: 320, 321, 328(8) Budgetary heads: 313
2/ Includes pensions and miscellaneous.
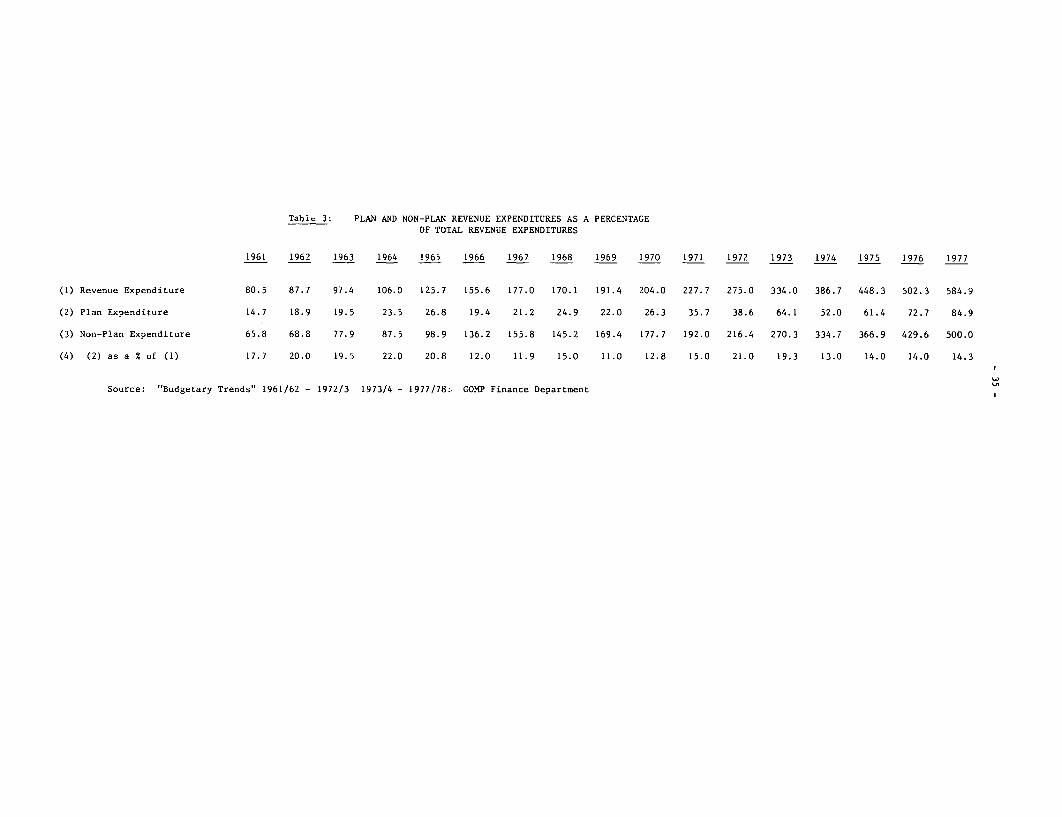
Table 3: PLAN AND NON-PLAN REVENUE EXPENDITURES AS A PERCENTAGEOF TOTAL REVENUE EXPENDITURES
1961 1962 1963 1964 1965 1966 1967 1968 1969 1970 1971 1972 1973 1974 1975 1976 1977
(1) Revenue Expenditure 80.5 87.7 97.4 106.0 125.7 155.6 177.0 170.1 191.4 204.0 227.7 275.0 334.0 386.7 448.3 502.3 584.9
(2) Plan Expenditure 14.7 18.9 19.5 23.5 26.8 19.4 21.2 24.9 22.0 26.3 35.7 38.6 64.1 52.0 61.4 72.7 84.9
(3) Non-Plan Expenditure 65.8 68.8 77.9 87.5 98.9 136.2 155.8 145.2 169.4 177.7 192.0 216.4 270.3 334.7 366.9 429.6 500.0
(4) (2) as a % of (1) 17.7 20.0 19.5 22.0 20.8 12.0 11.9 15.0 11.0 12.8 15.0 21.0 19.3 13.0 14.0 14.0 14.3
Source: "Budgetary Trends" 1961/62 - 1972/3 1973/4 - 1977/78:. GOMP Finance Department
- 36 -
2.38 Turning again to Table 2, to non-developmental expenditure catego-
ries, debt service has grown at the same rate as total revenue expenditures,and amounted in 1977/78 to 9% of the total. Expenditure on administrative
services has also been kept low. This category has grown at only 9.9% per
annum over the period, and makes up a declining fraction of total revenueexpenditures down from 17% in 1961, to 10% in 1977/78. Expenditures on
collection of taxes has equally been kept low: it has grown at only 10.9%,
and accounts for 3.3% of revenue expenditure. Expenditures in these twocategories have been tightly controlled by Madhya Pradesh government, in anattempt to minimize the current expenditures drain on Plan resources. In
general, the increases which have taken place are distributed across revision
of pay scales (which follow the central government adjustments), limitedrevision of dearness allowance 1/ and some growth in the number of Stateemployees. Given that the State Government has, over the past two decades,undertaken increased responsibility and increasing regulatory functions,these growth rates are very restrained.
2.39 Expenditures on forests and industries stand apart from others sincethey are expenditures on income-producing activities. Forest expenditure has
grown the most rapidly of all sectors, just over 17% per annum, 1-1/2 times
the rate of total expenditures as a whole. This growth rate cannot be eval-uated without taking into account the yields produced for the State sincewhatever is spent on reforestation and conservation will later be reflected,
many fold, in increased state revenues at a later date.
2.40 To summarize, developmental portion has always been larger than
non-development proportion. This indicates that Madhya Pradesh has beenquite successful in controlling those current expenditures on routine State
administration in the interests of a larger Plan size and emphasis on develop-
ment in the revenue budget.
Capital and Plan Expenditures
2.41 The bulk of capital expenditure is on Plan account. On average,
less than 3-5% of capital expenditures are on non-Plan items of expenditure,as the table below shows. Capital expenditures have grown at 13.6% per annum,faster than revenue expenditures, indicating that Madhya Pradesh has been suc-
cessful in its goal to maximize the resources put into development. The Plan
expenditures given in Table 4 show that they have grown slightly faster than
capital expenditures as a whole, at 14% per annum.
The Contingency Fund in Madhya Pradesh has been increased every few
years in the budget process, and now stands at Rs 20 crores, which is not
large by relative standards.
1/ Madhya Pradesh has deliberately withheld certain dearness allowances to
affect economies.

Table 4: Plan and Non-Plan Expenditures as a Proportionof the Capital Budget
1961/2 1962/3 1963/4 1964/5 1965/6 1966/7 1967/8 1968/9 1969/70 1970/1 1971/2 1972/3 1973/4 1974/5 1975/6 1976/7 1977/8
(1) Capital Expenditures 17.6 23.4 30.0 29.2 44.5 16.7 23.7 23.9 27.5 31.2 52.1 47.0 64.5 81.1 84.1 129.7 135.5 1
(2) Plan 16.7 20.5 26.4 25.5 30.3 26.8 23.4 22.4 24.0 27.8 44.9 54.0 60.9 76.9 79.3 127.7 135.9 9
(3) Non Plan -0.94 2.8 0.6 3.7 14.2 -10.1 0.3 1.5 3.5 3.4 7.3 -6.9 3.6 4.2 4.8 2.0 -0.4
- 38 -
Composition of Plan Expenditures
2.42 Throughout the period, but especially since the Fourth Plan, Madhya
Pradesh has focused its efforts on three sectors: irrigation, power and
agriculture. In the Sixth Plan period, the State expects to spend nearly 80%
of all Plan outlays in these three sectors combined. Power is being under-
taken with the greatest intensity, taking up 38% of Plan expenditure. All
other sectors--mineral and industrial development, transport and communication
and human resource development have received far lower priority. Expenditures
in the social service sector specifically have fallen from 20.2% of the Plan
in the 1961/62-1965/66 period to 14.5% in the last Plan period, with the
decline the largest in education and health. Industry and mineral development
has also been neglected in relative terms. In both these sectors, as well as
in transport and communication, expenditures between the Fourth and Fifth Plan
periods declined in real terms, although a real increase is likely in the next
Plan period.
2.43 It is very difficult to evaluate these levels of Plan expenditure
and the Plan strategy. They can be viewed in relation to deficiencies in
infrastructure in each sector, or in relation to per capita expenditures in
other States, or the Plan strategy can simply be taken as given.
2.44 As regards irrigation, there is no question that present levels
of infrastructure development in the sectors are very low. Madhya Pradeshhas vast irrigation potential both from major rivers as well as groundwater.
But inadequate development of irrigation facilities--less than 11% of net
sown area is presently irrigated--has led to low levels of productivity in
areas where the agricultural potential is immense. The goal in this sector
is to bring irrigated acreage up to the national average as soon as possible.
2.45 Intensive power development is appropriate according to all of the
above criteria--installed capacity is low by interstate standards, as is
consumption. But more important, it is felt that development of all other
sectors, and the concomitant development of the State, creation of employment,
and attraction of industries is crucially dependent on this essential input.
In the Sixth Plan, Rs 1,194 crores will be spent on power development. The
bulk of this will be spent on power generation, with the remainder split
between transmission and rural electrification. In reality, the latter is a
bit understated since institutional finance (mainly ARDC) will increase the
size of the rural electrification program. Although Madhya Pradesh had a
surplus of power until about 1973, it presently has a power deficit, 1/
estimated at about 200-300 MW in the peak season (1978), and the power short-
age is expected to continue through the end of the Plan period. The emphasis
in power development is on hydel; the goal is to achieve a hydel-thermal mix
of 25:75 by the end of the Seventh Plan.
1/ Due to delays in hydel projects which depended on interstate tribunals.

- 39 -
2.46 In industry, the State is focussing on the development of infra-structure facilities and development of industrial districts. Madhya Pradeshhas tremendous industrial potential--as is clear from the abundant mineraland forest resources. At the present time, 36 out of the 45 districts areindustrially backward and 21 districts are without a medium-sized industry.In short, Madhya Pradesh lags far behind other States in this sphere. ThePlan envisages developing more industrial estates in "growth points", contin-uing infrastructure development in existing industrial areas such as Indore,Bhopal, Jabalpur, Durg and Gwalior, among others, and assisting the promotionof new industries through medium- and long-term loans of the Madhya PradeshState Finance Corporation. To provide employment and help the economicallyweaker sections in rural areas, about 40% of the Plan expenditure in industrywill be spent on handlooms, sericulture, handicrafts, and village and smallscale industries. In addition, the fiscal incentives for industry such assales tax subsidy, sales tax loan, power subsidy and interest subsidies willbe continued.
2.47 Madhya Pradesh mineral resources are vast. It has been estimatedthat the State has 50% of India's total manganese, 44% of its bauxite resources,30% of high grade iron ore and 25% of its coal reserves. Copper and diamondsare also located there. Exploitation is still very underdeveloped, but theMadhya Pradesh State Mining Corporation has high hopes. The 15% of Plan ex-penditure for exploitation is intended to help expand its activities in thestate. The bulk (85%) of the Sixth Plan expenditures in this sector will goto exploration.
2.48 In view of the desperate needs of Madhya Pradesh in the transportsector, an urgent goal was to bring the level of pucca road construction(9.5 km per 100 sq km) up to the all India average (16.5 km) by 1983/84. Thequantum of funds and organizational weaknesses make this sort of an effortimpossible, and this goal will probably not be reached until the Seventh Planperiod. Development of passenger transport is also crucial since the Stateis so poorly served by the rail network--about 15% of Sixth Plan will go tothe further expansion of the Madhya Pradesh State Road Transport Corporation.Tourism development will take up less than 1% of this sector-s Plan expendi-tures.
Social Services
2.49 The principle of universal primary education is a very distantgoal in Madhya Pradesh. The national working group on universalization ofelementary education identified Madhya Pradesh among the eight States in whichthis target will be very difficult to meet. In the Sixth Plan, Rs 108 croreswill be allocated to this sector, the bulk of it to primary education.

- 40 -
Table 5: TREND OF PLAN EXPENDITURES - MADHYA PRADESH(in Rs Crores)
(% in parentheses)
II III Annual IV V VI(Draft Plan)
I. Agriculture & 41.56 70.78 51.93 106.22 182.97 548.48
Allied Sectors (27.9) (24.7) (23.2) (21.5) 17.4 17.4
II. Cooperation - - - 17.92 16.51 36.94(3.6) (1.6) (1.2)
III. Irrigation 29.17 37.02 20.58 78.00 205.00 681.72
(19.6) (12.9) (9.2) (15.1) (19.4) (21.6)
IV. Power 27.75 89.07 100.60 133.76 424.15 1,194.37
(18.6) (31.1) (44.9) (27.1) (40.2) (37.8)
V. Industry & 3.89 8.05 5.16 11.71 18.77 56.41
Mining (2.6) (7.8) (7.3) (2.4) (1.8) (1.8)
VI. Transport & 8.88 15.44 13.30 40.79 49.65 146.67
Communication (6.0) (5.4) (5.9) (8.2) (4.7) (4.6)
VII. Social Services 30.04 59.50 25.36 104.50 152.91 486.30
(20.2) (20.8) (11.3) 21.1 (14.5) (15.4)
i. education 14.74 27.23 7.88 25.3 27.58 108.89
(9.9) (9-5) (3.5) (5.1) (2.6) (3.5)
ii. health 9.58 21.53 12.01 46.01 70.95 207.10
(0.4) (7.5) (5.4) (9.3) (6.7) (6.6)
iii. housing 2.84 3.05 0.95 17.78 33.56 103.28
(1.9) (1.1) (0.4) (3.6) (3.2) (3.3)
iv. other 3.28 7.69 4.52 15.87 20.82 67.03
(2.2) (2.7) (2.0) (3.2) (2.0) (2.1)
VIII. EconomicServices ) 7.19 6.81 7.22 0.20 0.66 6.36
) (0.04) (0.6) (0.2)
IX. General ) (4.8) (2.5) (3.2) 1.21 3.73 1.00
Services ) (0.2) (0.4) (0.3)
Total PlanExpenditure 148.92 286.68 224.15 494.46 1,054.37 3,156.00
Source: II-Annual Plans: G.O.M.P., Finance Department Publication "State
Finances of Madhya Pradesh". IV-VI Plans: G.O.M.P. Planning
Department.
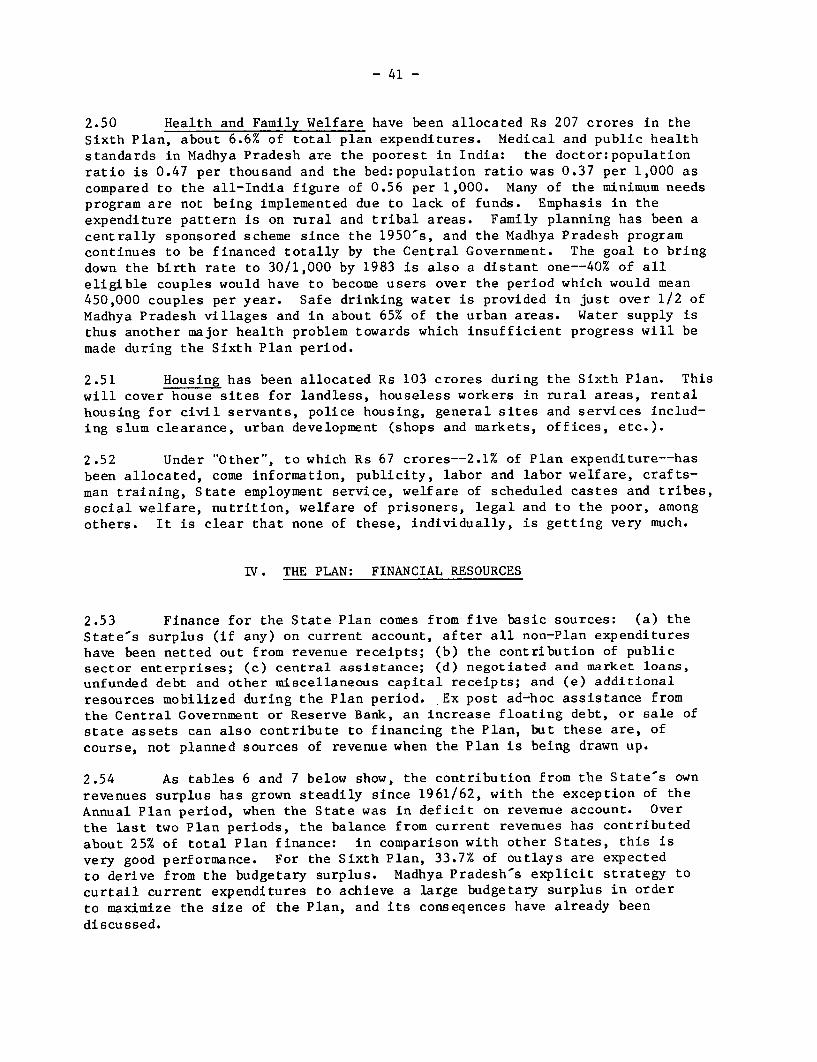
- 41 -
2.50 Health and Family Welfare have been allocated Rs 207 crores in the
Sixth Plan, about 6.6% of total plan expenditures. Medical and public health
standards in Madhya Pradesh are the poorest in India: the doctor:population
ratio is 0.47 per thousand and the bed:population ratio was 0.37 per 1,000 as
compared to the all-India figure of 0.56 per 1,000. Many of the minimum needsprogram are not being implemented due to lack of funds. Emphasis in the
expenditure pattern is on rural and tribal areas. Family planning has been a
centrally sponsored scheme since the 1950's, and the Madhya Pradesh programcontinues to be financed totally by the Central Government. The goal to bring
down the birth rate to 30/1,000 by 1983 is also a distant one--40% of all
eligible couples would have to become users over the period which would mean450,000 couples per year. Safe drinking water is provided in just over 1/2 ofMadhya Pradesh villages and in about 65% of the urban areas. Water supply is
thus another major health problem towards which insufficient progress will be
made during the Sixth Plan period.
2.51 Housing has been allocated Rs 103 crores during the Sixth Plan. This
will cover house sites for landless, houseless workers in rural areas, rental
housing for civil servants, police housing, general sites and services includ-ing slum clearance, urban development (shops and markets, offices, etc.).
2.52 Under "Other", to which Rs 67 crores--2.1% of Plan expenditure--has
been allocated, come information, publicity, labor and labor welfare, crafts-man training, State employment service, welfare of scheduled castes and tribes,social welfare, nutrition, welfare of prisoners, legal and to the poor, among
others. It is clear that none of these, individually, is getting very much.
IV. THE PLAN: FINANCIAL RESOURCES
2.53 Finance for the State Plan comes from five basic sources: (a) the
State's surplus (if any) on current account, after all non-Plan expenditures
have been netted out from revenue receipts; (b) the contribution of publicsector enterprises; (c) central assistance; (d) negotiated and market loans,
unfunded debt and other miscellaneous capital receipts; and (e) additional
resources mobilized during the Plan period. Ex post ad-hoc assistance from
the Central Government or Reserve Bank, an increase floating debt, or sale ofstate assets can also contribute to financing the Plan, but these are, of
course, not planned sources of revenue when the Plan is being drawn up.
2.54 As tables 6 and 7 below show, the contribution from the State's own
revenues surplus has grown steadily since 1961/62, with the exception of the
Annual Plan period, when the State was in deficit on revenue account. Over
the last two Plan periods, the balance from current revenues has contributed
about 25% of total Plan finance: in comparison with other States, this isvery good performance. For the Sixth Plan, 33.7% of outlays are expected
to derive from the budgetary surplus. Madhya Pradesh's explicit strategy tocurtail current expenditures to achieve a large budgetary surplus in orderto maximize the size of the Plan, and its conseqences have already beendiscussed.

- 42 -
2.55 The second item of Plan finance is the contribution of public
sector enterprises. This has been moderate in most Plan periods, but in
recent years, it has been negative. As pointed out in the introduction,
the figure represents the operating surplus and internal resources of the
State corporations, and is not a contribution to the State's financial
resources as such. 1/
1/ There have been exceptions, such as in 1975 and 1976 when the Madhya
Pradesh Electricity Board indeed had a commercial profit positive.
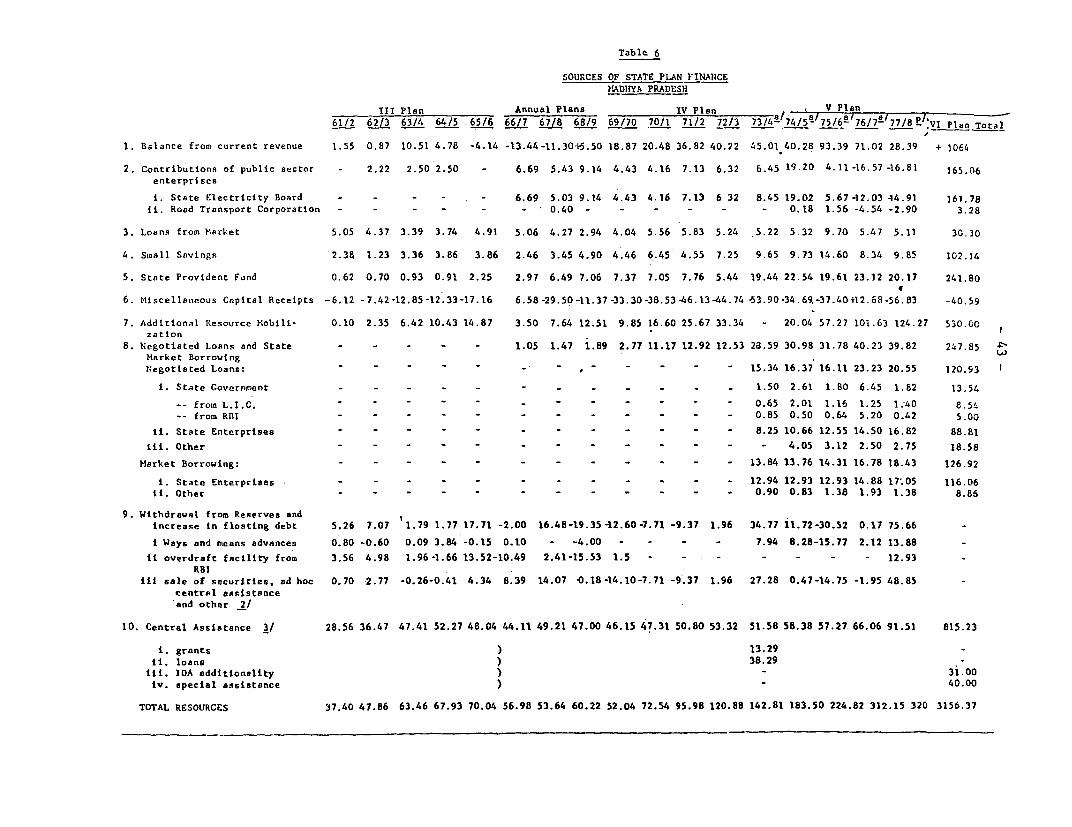
Table 6
SOURCES OF STATE PLAN FINANCEHADHYA PRADESH
III Plan Annual Plans IV Plan _ V Plan
61/2 62/3 63/4 64/5 .65/6 66/7 67/8 68/9 69/70 70/1 71/2 72/3 73/4! 74/5- 75/6- 76/ 8 -V7 I P lan Total
1. Balance from current revenue 1.55 0.87 10.51 4.78 -4.14 -13.44-11.30-F5.50 18.87 20.48 36.82 40.22 45.01 40.28 93.39 71.02 28.39 + 1064
2. Contributions of public seCtor - 2.22 2.50 2.50 - 6.69 5.43 9.14 4.43 4.16 7.13 6.32 6.45 19.20 4.11 -16.57 -16.81 165.06
enterprises
t. State Electricity Board - - - - - 6.69 5.03 9.14 4.43 4.16 7.13 6 32 8.45 19.02 5.67-12.03 14. 91 161.78
it. Road Transport Corporation - - - - _ 0.40 - - - - - - 0.18 1.56 -4.54 -2.90 3.28
3. Loans from Market 5.05 4.37 3.39 3.74 4.91 5.06 4.27 2.94 4.04 5.56 5.83 5.24 5.22 5.32 9.70 5.47 5.11 30.30
4. Small Savings 2.38 1.23 3.36 3.86 3.86 2.46 3.45 4.90 4.46 6.45 4.55 7.25 9.65 9.73 14.60 8.34 9.85 102.14
5. State Provident Fund 0.62 0.70 0.93 0.91 2.25 2.97 6.49 7.06 7.37 7.05 7.76 5.44 19.44 22.54 19.61 23.12 20.17 241.80
6. Miscellaneous Capital Receipts -6.12 -7.42-12.85-12.33-17.16 6.58-29.50-11.37-33.30-38.53-46.13-44.74 -53.90-34.69.-37.40412.68-56.83 -40.59
7. Additional Resource Mobili- 0.10 2.35 6.42 10.43 14.87 3.50 7.64 12.51 9.85 16.60 25.67 33.34 - 20.04 57.27 101.63 124.27 530.00
zation8. Negotiated Loans and State - - - - - 1.05 1.47 1.89 2.77 11.17 12.92 12.53 28.59 30.98 31.78 40.23 39.82 247.85 $
Market Borrowing U
Negotiated Loans: - - - - - - - - - 15.34 16.37 16.11 23.23 20.55 120.93 1
i. State Government - - - - - - - - - - - 1.50 2.61 1.80 6.45 1.82 13.54
-- fron L.I.C. - - - - 0.65 2.01 1.16 1.25 1.40 8.5~
-- from RBI - - - - - - - - - - - - 0.85 0.50 0.64 5.20 0.42 5.00
ii. State Enterprises - - - - - - - - - - - - 8.25 10.66 12.55 14.50 16.82 88.81
iii. Other - - - - - 4.05 3.12 2.50 2.75 18.58
Market Borrowing: - - - - - 13.84 13.76 14.31 16.78 18.43 126.92
i. State Enterprises - - - 12.94 12.93 12.93 14.88 17:05 116.06
ii. Other - - - - - 0.90 0.83 1.38 1.93 1.38 8.86
9. Withdrawal from Reserves and Iincrease tn floating debt 5.26 7.07 1.79 1.77 17.71 -2.00 16.48-19.35 42.60-7.71 -9.37 1.96 34.77 11.72-30.52 0.17 75.66 -
i Ways and means advances 0.80 -0.60 0.09 3.84 -0.15 0.10 - -4.00 - - - - 7.94 8.28-15.77 2.12 13.88 -
ii overdraft facility from 3.56 4.98 1.96-1.66 13.52-10.49 2.41-15.53 1.5 - - - - - - - 12.93 -
RBIiii sale of securities, ad hoc 0.70 2.77 -0.26-0.41 4.34 8.39 14.07 -0.18-14.10-7.71 -9.37 1.96 27.28 0.47-14.75 -1.95 48.85 -
central assistanceand other 2/
10. Central Assistance 3/ 28.56 36.47 47.41 52.27 48.04 44.11 49.21 47.00 46.15 47.31 50.80 53.32 51.58 58.38 57.27 66.06 91.51 815.23
i. grants ) 13.29 -
ii. loans ) 38.29
iit. IDA additionality ) 31.00
tv. special assistance ) 40.00
TOTAL RESOURCES 37.40 47.86 63.46 67.93 70.04 56.98 53.64 60.22 52.04 72.54 95.98 120.88 142.81 183.50 224.82 312.15 320 3156.37
Table 7
7 Breakdown of Sources of Plan Finances for Hadhya Pradesh
III Plan Annual Plans IV Plan V Plana/ a/ a/ a/ P. VI Plen
61/2 62/3 63/4 64/5 65/6 66/7 67/8 68/9 69/70 70/1 71/2 72/3 13/4 74/5 75/6 76/7 77/8 78/9 Total1. Balance from current revenue 4.1 1.8 16.6 7.0 -5.9 -23.6 -21.1 9.1 36.3 28.2 38.4 33.3 31.5 22.0 41.3 22.8 8.9 33.7
2. Contributions of public aector - 4.6 3.9 3.7 - 11.7 10.1 15.2 8.5 5.7 7.4 5.2 5.9 10.5 1.8 -5.3 -5.3 5.2enterprises
i. State Electricity Board - - - - - 11.7 9.4 15.2 8.5 5.7 7.4 5.2 5.9 10.4 2.5 -3.9 -4.7 5.1li. Road Transport Corporation - - - - - - 0.7 - - - - - - 0.1 -0.7 -1.5 -0.9 0.1
3. Loans from tMarket 13.5 9.1 5.3 5.5 7.0 8.9 8.0 4.9 7.8 7.7 6.1 4.3 3.7 2.9 4.3 1.8 1.6 1.0
4. Small Sa-iings 6.4 2.6 5.3 5.7 5.5 4.3 6.4 8.1 8.6 8.9 4.7 6.0 6.8 5.3 6.5 2.7 3.1 3.2
5. State Provident Funid 1.7 1.5 1.5 1.3 3.2 5.2 12.1 11.7 14.2 9.7 8.1 4.5 13.6 12.3 8.7 7.4 6.3 7.7
6. Miscellaneous Capital Receipts -16.4 -15.5 -20.2 -18.2 -24.5 11.5 -55.0-18.9 -64.0 -53.1 -48.1 -37.0 37.7 -18.9 -16:6 4.1-17.8 -1.3
7. Additional Resource Moblliza- 0.3 4.9 10.1 15.4 21.2 6.1 14.2 20.8 18.9 22.9 26.7 27.6 - 10.9 25.5 32.6 38.8 16.8tion
8. Negotiated Loans and StateMarket Borrowing - - - - - 1.8 2.7 3.1 5.3 15.4 13.5 10.4 20.0 16.9 14.1 12.9 12.4 7.9Negotiated Loans: - - - - - 10.7 8.9 7.2 7.4 6.4 3.8
L. State Government 1.1 1.4 0.8 2.1 0.6 0.4-- from L.I.C. 0.5 1.1 0.5 0.4 0.4 0.3-- from RBI 0.6 0.3 0.3 1.7 0.1 0.2
ii. State Enterprises 5.8 5.8 5.6 4.6 5.3 2.8
iii. Other - 2.2 1.4 0.8 0.9 0.6
Market Borrowing: - -- - - 9.7 7.5 6.4 5.4 5.8 4.0
-. State Enterprises 9.1 7.0 5.8 4.8 5.3 3.8ii. Other 0.6 0.5 0.6 0.6 0.4 0.3
9. Withdrawal from Reserves and 14.1 14.8 2.8 2.6 25.3 -3.5 30.7 -32.1 -24.2 -10.6 -9.8 1.6 24.3 6.4 -13.6 0.1 23.6 -Increases in floating debt
i. Wayr and means advances 2.1 -1.3 0.1 5.7 -0.2 0.2 - -6.6 - - - 5.6 4.5 -7.0 0.7 4.3ii. Overdraft facilities from 9.5 10.4 3.1 -2.4 19.3 -18.4 4.5 -25.8 2.9 - - - - - - - 4.0RBI
ill. Sale of securities ad hoc 1.9 5.8 -0.4 -0.6 6.2 14.7 26.2 0.3 -27.1 -10.6 -9.8 1.6 19.1 0.3 -6.6 -0.6 15.3central assistanceand other 2/
10. Central Assistance ! 76.4 76.2 74.7 76.9 68.6 77.4 91.7 78.0 88.7 65.2 52.9 44.1 36.1 31.8 25.5 21.2 28.6 25.8
i.Grants 9.3ii Loans 26.8
iii IDA 8dditionality 1.0iv Special assistance 1.0
TOTAL RESOURCES (100) (100) (100) (100) (100) (100) (100) (100) (100) (100) (100) (100) (100) (100; (100) (100) (100) (100)
- 45 -
2.56 Central assistance has been the largest source of Plan finance until
the Sixth Plan, but has declined considerably in importance over time. In the
Third Plan, it made up, on average, 72% of Plan resources; the contribution
remained high during the Annual Plans, but by the Fourth Plan, had fallen to
51%. Central assistance played an even smaller role in the last Plan - between
25-28% of the State Plan was financed through this source. Central assistance
is expected to cover about 25% of Plan expenditures in the Sixth Plan period.
This decline in the proportion of the State Plan financed by the Central Gov-
ernment is of some worry to Madhya Pradesh. There is a strong current of
thought in the Madhya Pradesh administration that its efforts on behalf of
large Plan outlays--maximal curtailment of revenue expenditure and additional
resource mobilization--are not receiving the encouragement they are due, but
rather, that because the efforts have been successful in increasing the
State's budget surplus, the Center ascribes to the State a prosperity which
is not there. 1/
2.57 Central assistance on Plan account, (as opposed to the assistanceon revenue account, discussed earlier) is composed of grants and loans, and
is fixed by the Planning Commission. For Madhya Pradesh, the assistance is
given on a 70% loan, 30% grant basis, except for the funds earmarked for Plan
expenditures in tribal areas, which are given on a 10% loan, 90% grant basis.
Additionality represents the foreign aid disbursement received by the Central
Government and passed on to the State for the project which is being funded.
Just about 1% of total Plan finance comes from this source, but at the margin
it represents a considerable incentive to the States to put forward projects
for foreign assistance, since additionality represents funds which they would
not ordinarily receive.
2.58 Targets for additional resource mobilization are set by the State
Government in consultation with the Planning Commission at the time of the
annual or 5-year Plan discussions. Madhya Pradesh has always done very well
on this score, and has more than achieved, the targets in the past decade.
Between the current balance and additional resource mobilization, the State
will finance, in the Sixth Plan, just over 50% of its Plan outlays. This indi-
cates a high level of self-sufficiency.
2.59 The next category is a compilation of a number of very different
items on the financing balance sheet. Loans from the market are fairly
insignificant as a contribution to the State's financial resources, less than
1% is expected from this source during the Sixth Plan period. There are
also market borrowings of the State enterprises, principally the Madhya
Pradesh Electricity Board. These are again, placed by assignment to various
lending institutions in the "market", and have made a moderate though declining
contribution to Plan resources--about 4% is expected from this source in the
Sixth Plan.
1/ This applies a fortiori to the assistance from the Finance Commission
from whom Madhya Pradesh has not received grants in aid since 1969,
because of its budget surplus.

- 46 -
2.60 Loans of the State and of State enterprises, principally the Electri-city Board negotiated from the Life Insurance Corporation of India, theReserve Bank and HUDCO have been growing as a category of finance, althoughas a fraction of total resources for the Plan, they are expected to contributeless in the Sixth Plan (8%) than in the Fifth (13%).
2.61 Small savings loans have proven to be a modest, though steady sourceof revenue, comprising some 3-5% of Plan resources.
2.62 "Miscellaneous capital receipts" are all the other net transactionsnot accounted for under the other headings, such as short-term loans from theCentral Government, recoveries of loans and advances to other institutions bythe State Government, net accretions under various sinking funds and othernet accounts including non-Plan loans. In general, this is a negative figure,since a substantial amount is repaid to the Central Government and financialinstitutions. The final item, the withdrawal from reserves and net increasein floating debt is an adjustment item. In it are entered the final closingbalance of the previous year s accounts, the proceeds from sales of securi-ties and treasury bills and the net change in ways and means advances fromthe Reserve Bank. This is, of course, not a planned resource for the StatePlan but results, ex-post, from the State Plan accounts.
V. THE PLANNING PROCESS
i. Planning Machinery
2.63 Planning in Madhya Pradesh is carried out by the State's PlanningDepartment. There is also a State Planning Board, which is intended to ad-vise the Planning Department on Plan priorities and project selection. ThisPlanning Board was originally set up in 1972, but did not function very effec-tively. As a result, the Board was reorganized and reconstituted in December1978 with the hope that the new body will better serve the purpose intended.The Board consists of a chairman (the Chief Minister) who also holds the port-folio for Planning, Economics and Statistics, a deputy chairman (the PlanningMinister), three part-time members (the Finance Minister, State Minister forPlanning and the Chief Secretary) and six full-time members responsible forfinance policy, projects, industry, regional planning, the minimum needs pro-gramme and the member secretary who is the Planning Secretary. The Board, ofcourse, is not a statutory body and therefore has no authority; in its advisoryrole, it is hoped that it will provide a broader planning perspective than thatof the Planning Department alone.
2.64 The Planning Department at present functions as coordinator betweenthe operational departments and is the ultimate financial arbiter of overallPlan outlays as well as their sectoral disposition. At present, the PlanningDepartment has insufficient manpower and technical resources to examine thestate Plan on a project by project basis or to assist the individual depart-ments in evaluating their projects and advising on the inclusion of specificprojects in the departmental Plan. A cell to carry out this sort of work--
- 47 -
including the evaluation of projects by different public investment criteria--
is being set up, and should be functioning by mid-1980. There is a great need
for this kind of social and economic evaluation, since at present none of the
individual departments do project evaluation.
The State Plan
2.65 In Madhya Pradesh, a five-year plan of Rs 4,500 crores expenditure
($5.3 billion) was put forward at the discussions with the Planning Commission.
Subsequently the Plan has been finalized at Rs 3,156 crores through the
whittling down process described in the introduction. Of this, Rs 815 crores
is from central assistance and the balance, Rs 2.341 crores the State's own
resources including borrowing. Additional resource mobilization is expected
to be 23% of own resources, a target which if not met, will have to be made up
through deficit finance such as overdrafts, accommodating loans from the
Central Government, or by not meeting outlay targets. 1/
2.66 The State Plan of Rs 3,150 crores is "final" in the sense that these
motions have all been completed. It remains formally, however, in the "draft"
stage, until the national Plan and central assistance are finalized. Changes
in the size or the sectoral breakdown of the Plan are, however, not expectedto the final version of the State's Sixth Plan.
(ii) Plan Evaluation
2.67 Madhya Pradesh has made some headway here. In the early 1970's the
Directorate of Statistics set up a cell consisting of two persons to do
studies of physical targets' achievements, and also, on a selective project by
project basis, post implementation evaluations of project benefits and imple-
mentation schedules. This trial experiment was discontinued due to fundingpressures, although a few studies are still available. Such an evaluation
unit is invaluable if departments are to learn from their mistakes and their
successes. It is hoped that the planning cell in the Planning Department may
make some headway here also.
VI. FUTURE RESROUCES: FINANCING THE MADHYA PRADESH
COMPOSITE IRRIGATION PROJECT
2.68 The purpose of this review of State revenues and expenditures has
been to provide the background for an assessment of the State's implementation
capacity of the composite irrigation project.
2.69 The proposed Madhya Pradesh Composite Irrigation consists of four
sub-projects: 2/
I/ In the past, Madhya Pradesh has usually achieved its additional resourcemobilization targets.
2/ Per Project Status Report of 6/25/79.
- 48-
(i) Mahanadi Reservor Project is an on-going constructionprogram of nine reservoirs which are inter-linked to serveexisting and new irrigated areas of about 330,000 ha at aproposed cropping intensity of 140%. It also provideswater for the industrial complex at Bhilai. Works tobe completed are the Paivi High Dam, a link feeder canalto connect the Paivi Dam to Mahandai Reservoir, remodellingand extension of the existing irrigation systems includinga proposal to line all canals, construction of about30,000 ha of lift irrigation and completion of minorirrigation works. There is also a power component.
(ii) Hasdeo-Bango Project is an existing multi-purpose schemeproviding water for thermal power stations and the industrialcomplex at Korba and presently serving about 42,000 hawith supplementary kharif irrigation. The Phase III con-struction is ongoing and consists of the Hasdeo-Bango HighDam and hydro-power station, remodelling and extension ofthe major canal system to serve about 220,000 ha at 160%cropping intensity and completion of minor irrigation works.
(iii) Arpa Project is at the planning stage. It would consist ofa low earth dam and construction of a complete irrigationsystem to serve about 72,000 with a cropping intensity ofabout 115%.
(iv) Hap Project is the planning stage. It would consist of anearth dam, a masonry diversion weir and headworks and acomplete irrigation system to serve about 26,000 ha at acropping intensity of about 115%. The Plan has hydrelpossibilities and some water supplies would be used forindustrial purposes. All projects have major CAD works,including rural roads and markets, field channel con-stuction and agricultural research and extension.
2.70 The major sub-project, Mahanadi Reservoir and Hasdeo-Bango areongoing programs in which construction of most major works are so advanced
that the basic design assumptions or concepts can be taken as fixed. Arpaand Hap are still at pre-construction stages, and could be modified.
2.71 Since the project has not yet been appraised, and some modificationsmay still be made, the first step in analyzing State implementation capacity,
namely fixing project cost, has not been made. All references to costs are
therefore taken from the WAPCOs- estimates shown in table 8.
2.72 Assessing the likelihood of smooth and timely implementation of theComposite Irrigation Project rests on the answers to two questions:
(a) Does the State have the ability to provide the necessaryresources?
- 49 -
(b) Is the heavy expenditure required for the Madhya PradeshComposite Irrigation Project consistent with State prioritiesas far as irrigation development is concerned, and withinthe irrigation sector itself, is this heavy expenditureconsistent with the Irrigation Department's priorities?
2.73 The first question is a function of the resources available forthe State Plan, the rate at which they will grow over the period of projectimplementation and the availability of Plan resources to the irrigation,as opposed to other sectors. The second question can be approached bylooking at the proportion of State Plan outlays earmarked for the Irrigation
Department in the period over which the Madyha Pradesh Composite IrrigationProject will be implemented. Is this proportion in line with the past trend
of expenditures in the sector? If not, which sectors will this larger com-mitment come at the cost of? Within the irrigation sector itself, expenditure
trends must be examined for any break in the past pattern of investment asbetween major, medium and minor schemes. If there are such changes which comeat the expense of expenditures on which the State also places great priority,conflicts may arise and allocations to Madhya Pradesh Composite IrrigationProject could undergo some slippage.
2.74 Table 8 provides the basic framework for analyzing the first issue.

- 50 -
Table 8: Madhya Pradesh Composite Irrigation Project in Relation to
State Plan Expenditure(Rs crores)
V /a VI VII VIII Total /e
1. Total Project Cost 62.2 137 671* 871
of which: 62.2 98.1 397* 557.3
(i) power - 24 30 - 54
(ii) CAD - 14.9 /g 244.4 259.7
2. Total Plan Size 1054 3156 7000 /b -
3. Irrigation DepartmentOutlay /f 204 /f 661 1463 /c -
4. Irrigation DepartmentOutlays as % of Plan 19% 22% 22% /d
5. Madhya PradeshCompositeIrrigation as% of I.D. outlay 30.4% 14.8% 27.1%
6. World Bank time slice - 61 470.74 531.74
7. World Bank Assistanceto Irrigation Dept. 23 194
8. Additionality forIrrigation Dept. 16 135*
9. Net Funds Requiredby State 62.2 87 262*
10. Net funds as % Irri-gation Dept. Outlay 12.4% 17.9%
Source: WAPCOS documents.
/a As estimated by WAPCOS; the State Government has not yet agreed to lining or
CAD works./b This is 2.2 times larger than the Sixth Plan.
7E Assuming Irrigation Department outlays remain a constant (20.9) percentage
of total Plan outlays./d It is thought likely that this will increase to 25% or more in Seventh Plan,
in which case resource position will be easier than shown here.
/e On assumption that the Bank finances 50% of the 5-year time slice 1981-85.
7f Excludes minor irrigation outlay by Irrigation Department.
/g As per WAPCOS' July 1979 letter.
/h Additionality assumed at 70%.* figures not final until 8th Plan spillover is determined.
- 51 -
2.75 Several comments need to be made about this table. The first has todo with the total project cost, which, as estimated by WAPCOs' will be Rs 871crores, or almost $1.03 billion dollars, by completion. This is a large figure,and one which has not been agreed by the State Government. Specifically, thereare disagreements as to the extent of canal lining which is necessary and alsoas to the amount of CAD works which will be carried out. Together, these makeup 16.1%, and 27%, respectively of the estimated project cost. CAD works are,of course, the responsibility of the Agriculture Department, and would have noimplications for the Irrigation Department's financial implementation capacity.
2.76 The second caveat is that the bulk of the expenditures as estimatedby WAPCOS take place in the Seventh Plan period. The Sixth Plan is still indraft form, and likely outlays in the Seventh Plan - whether total or for theIrrigation Department, are even more tentative. In this table, on the basisof discussion with the state Planning Department and the Planning Commission,the Seventh Plan has been assumed to be Rs 7,000 crores, 2.2 times larger thanSixth Plan. This number is in line with past trends of Plan growth, but sinceit is only an estimate, all the proportions which contain this figure in thedenominator must take this into account.
2.77 Similarly, the likely allocation of Plan resource to the IrrigationDepartment--assumed to remain constant at 21-22% of total Plan outlays--isbut a best guess of what is likely to happen 4-10 years hence. Should thisproportion increase, the resource position for the Irrigation Departmentwould be correspondingly eased.
2.78 Finally, there must be a caveat about the price escalation (7%) andother contingencies (15%), built into WAPCO's estimates. These account for31% of the total eleven year cost estimate. Any changes here, therefore, canmake a big difference.
2.79 The total project cost is Rs 871 crores (shown in line 1 of Table8) of which Rs 62.2 crores have already been spent in the 5th Plan period.Rs 137 crores fall into the 6th Plan and Rs 671 crores will spill over intothe 7th Plan period. In the Hasdeo-Bango work, both the CAD and IrrigationDepartment's components of the project will spill over into the 8th Plan(1988/89-1993/94) but WAPCOS has not yet indicated the time phasing; thus,the figures in column (3) will differ slightly ultimately.
2.80 The project works have three basic components. Irrigation makes upabout 64% of the total, power about 6%, and CAD about 30%. Only the first isthe responsibility of the Irrigation Department. The CAD works to be carriedout under the project fall under the purview of the Agriculture Department,which will also contribute the financial resources.
2.81 Lines (4), (5) and (6) of the table show the total size of the StatePlans from the Fifth and Seventh Plan periods and the corresponding share ofthe irrigation sector in the Plan.
- 52 -
2.82 Line (7) indicates the proportion of Irrigation Department Planoutlay which will be required for the implementation of the Madhya PradeshComposite Irrigation Project. In the Fifth Plan period, the project sub-components accounted for 30.4% of this department's Plan outlay. Under WAPCOScost and contingency estimate, this proportion will fall to 14.8% in the SixthPlan, but will rise again to 27.1% in the Seventh Plan period. 1/
2.83 Since the project will be financed by the World Bank, Madhya Pradeshwill receive additional funds, 70% of project disbursements, and these mustbe netted out to arrive at the net requirement of funds from State's ownsources. Line (8) shows the expenditures on the project during the five yearWorld Bank time slice from 1981/2-85/6, and line (9), on the assumption that
the project will be financed 50% by the World Bank, shows the amount of WorldBank assistance which would be forthcoming. Seventy percent of this assist-ance comes as an additional resource to the State. It is assumed that theadditionality is indeed passed on to the Irrigation Department, and the amountto the Irrigation Department is shown in line 10. 2/ To arrive at a net
1/ Twenty-seven percent is slightly overstated because some expenditurewill take place in the 8th Plan.
2/ This assumption is made on the basis of discussions with the PlanningDepartment, which categorically states that additionality funds are in-deed earmarked for the Department concerned, and effectively, do notsubstitute for funds which the State would have allocated to the depart-ment in any case. The implication is that additionality indeed doesenable more ambitious projects to be carried out than would otherwisebe the case. It is further assumed that within the Irrigation Departmentitself, additionality contributes to financing of the project on behalfof which funds are received. This is tantamount to saying that addi-tionality does not substitute for funds which the Irrigation Departmentitself would have earmarked for the Madhya Pradesh Composite IrrigationProject, were there no additionality. Again, the assertion was thatadditionality enabled the Department to carry out a larger project.The question of whether additionality is additional in the first placeto the assistance the State Government receives from the Center is ofcourse the most basic one. Given the political circumstances, it appearsthat indeed, the States are getting a larger share of the pie, and thatthe Central Government is not reducing its assistance on one front whileproviding additionality. From an economic point of view, a fairly clearcase be made for suggesting that additionality does not come at the costof Central Government expenditure either, but is manifest in a largerbudget deficit. The latter argument is quite compelling; the machina-tions within the Planning Department and the Irrigation Department areless easy to know. If the assumptions are indeed mistaken, to take theopposite case, there is full substitution, both at State and Departmentlevel the figures and proportions in lines (9) and (10) will be substan-tially higher--but the resource position of both State and Departmentwill still be eased. There is no change in direction.

- 53 -
figure for the State funds required, one must subtract these "additionalresources" from project cost. This is done in line 11. The final line (12) ofthe table shows the adjusted or net expenditure as a proportion of IrrigationDepartment Plan outlays. The fractions are far lower than those in line (7).There is no change in the Fifth Plan, when 30% of departmental outlays wereabsorbed by the composite schemes. In the Sixth Plan, the proportion fallsfrom 14.8% to 12.4% and in the Seventh Plan, additionality causes the projectto absorb 17.9% of Plan outlays instead of 27.1%.
2.84 It is clear that in the Sixth Plan period, the Madhya PradeshComposite Irrigation Project will imply no strains on the Irrigation Depart-ment. A net outlay of Rs 82 crores, or 12.4% of Plan outlays is far lessthan the 30% allocated to the project in the Fifth Plan period. In nominalterms, it is only 30% more and in real terms 1/ it is approximately the same.
2.85 The situation is slightly different in the Seventh Plan. The Irri-gation Department outlays for Madhya Pradesh Composite Irrigation Project areRs 397 crores, which after additionality, commits 17.9% of the IrrigationDepartment Plan to the Madhya Pradesh Composite Irrigation Project. It assumes,of course, that all the CAD components will be picked up by the AgricultureDepartment. Thus, there should be no financial problem in the IrrigationDepartment unless the State Plan is substantially smaller than Rs 7,000 crores,or Irrigation Department outlays are somehow reduced. The project size istherefore quite manageable for the irrigation sector.
State Priorities
2.86 Table 9 confirms the priority Madhya Pradesh places on irrigation.Since the Fourth Plan, allocations to the irrigation sector have been growingrapidly, from 15.8% of total outlays to 22% for the Sixth Plan period. Anychange in this trend is unlikely, because Madhya Pradesh is very determined toseek economic development though intensive efforts in the power and irrigationsectors. The assumption of 22% of Plan outlays allocated to irrigation in theSeventh Plan, therefore, seems easily justifiable.
1/ Assuming 7% annual inflation 1978/9 - 1982/3.
- 54 -
Table 9: Madhya Pradesh Plan Expenditures(% in parentheses)
II III Annual IV V VI /a
Agriculture and 4156 7078 5193 12414 19948 58317
Cooperatives (28) (25) (30.9) (21.0) (17) (18.4)
Irrigation excluding 2917 3702 2058 7800 20500 60172
minor irrigation /b (19.5) (12.9) (12.3) (15.8) (19.4) (21.6)
Power 2775 8907 10060 13376 42415 119437
(18.6) (31.0) (63.7) (27.0) (40.2) (37.8)
Industry & Mining 389 805 516 1171 1877 5641
(3) (3) (3) (2) (2) (1.8)
Transportation & 888 1544 1330 4079 4965 14667
Communications (6) (5) (7.9) (8) (5) (4.6)
Education 1474 2723 788 2534 2758 10889(9.8) (9.4) (4.6) (5.1) (2.6) (3.4)
Health 958 2153 1201 4601 7095 20710(6.4) (7.5) (7.1) (9.3) (6.7) (6.6)
Housing 284 305 95 1728 3356 10328(1.9) (1.1) (0.5) (3.4) (3.1) (3.3)
Other Social Services 328 769 452 1602 2084 6703(2.2) (2.7) (2.7) (3.2) (1.9) (3.3)
Miscellaneous 719 681 277 141 439 736(4.8) (2.4) (1.7) (0.31) (0.42) (0.23)
TOTAL 14892 28668 16779 49446 105437 315600
(100) (100) (100) (100) (100) (100)
Source: Madhya Pradesh Planning Department.
/a Plan outlays.
/b Source: Table 2.

- 55 -
2.87 Table 10 approaches the second part of the second question: Doesthe project--largely major irrigation works--imply any distortions in the Planallocation as between major, medium and minor schemes?
Table 10: IRRIGATION SECTOR EXPENDITURES(Rs lakhs)
Plan period:Type of Scheme: I II III Annual IV V VI /a
Major 423 2,122 2,573 1,215 5,368 12,765% (36) (58.9) (48.2) (36.8) (49) (41.8) 66,100
(80.9)Medium 372 795 1,129 843 2,392 8,790
% (31.6) (21.1) (21.1) (25.5) (21.8) (28.7)
Minor /b 365 702 1,242 1,034 3,125 8,970 15,656% (31) (18.6) (23.3) (31.3) (28.5) (29.3) (19.1)
Other 15 139 391 208 54 - -
% (1.2) (3.6) (7.3) (6.3) (0.4) - -
TOTAL 1,175 3,758 5,335 3,300 10,939 30,525 81,756(100) (100) (100) (100) (100) (100) (100)
Source: Irrigation Department - Statistical Cell.
/a Source: GOMP Planning Department./b Irrigation Department outlays only: Agriculture Department outlays on
minor irrigation are excluded.
2.88 The Sixth Plan does anticipate a far larger share of Irrigation Depart-ment outlays on major and medium schemes than in the past. Together they willmake up about 81% of the Irrigation Department Plan; closer to 70% was allo-cated in both the Fourth and Fifth Plan periods. As a result, the share of minorirrigation has fallen by one third, and there may, therefore, be some conflict.
It also appears that the share of medium irrigation is scheduled to be reducedslightly, (the Irrigation Department Plan has not yet been made public andno final figures are available) so that the bulk of the Rs 817 crores to be
spent in the three sub-sectors combined will in fact go to major works.Whether this will remain acceptable over the course of the Plan period remainsto be seen. The question which immediately follows is whether since the bulk
of the project takes place in the Seventh Plan, this sub-sectoral breakdowncan be maintained for such a long period. An answer is not realy possible.It can be noted, however, that since on a gross basis, 27% of Irrigation
Department outlays in the Seventh Plan will be taken up by the Madhya PradeshComposite Irrigation Project -- more than in the Sixth, further emphasis onmajor projects is likely to continue and conflict between the major works and
- 56 -
the political pressures for minor works, therefore remains a possibility. How
such conflicts might be resolved is difficult to know. One can refer back to
the Irrigation Department principles for Plan implementation, namely, that
implementation will go forward fastest where incremental returns are highest,
and weigh this against the obvious political influences to which the Irriga-
tion Department is subject in the field of minor irrigation. On the other
hand, on the timely implementation of the Hasdeo Bango component of the
Madhya Pradesh Project, depends further expansion of Korba superthermal plant,
a very high priority the State.
2.89 To summarize: There should be no financial difficulty in the
Sixth Plan, nor in the Seventh, because of additionality, for the Irrigation
Department to implement the Madhya Pradesh Composite Irrigation Project as
scheduled. The foreseeable source of conflict arrises out of the growing
proportion of total Plan outlays in the Sixth Plan (and, it is presumed here,
in the Seventh), devoted to major irrigation, at the cost of minor schemes
for which MLA's lobby loudly, and frequently with success. Moreover, since
immediate benefits of major schemes are not distributed across many districts
of the State, the "regional balance" criterion for Plan investment may even
support their cause. The trend of minor and medium irrigation in the Sixth
and Seventh Plans should therefore be closely monitored.

- 57 -
CHAPTER III
INDIA
A REVIEW OF MAHARASHTRA STATE FINANCES
John WallSouth Asia Programs
- 58 -
INDIA
A REVIEW OF MAHARASHTRA STATE FINANCES
TABLE OF CONTENTS
Page No.
Preface .......... ....................................... 59
SUMMARY AND CONCLUSIONS ................................. 60
I. Salient Features .................................... 61II. Financial Profile of Maharashtra .................... 64
III. Government Expenditures ............................. 73IV. Plan Expenditures ................................... 73V. Financial Resources in the Future .... ............... 81
Tables
1. Overall Budgetary Postion of Maharashtra State 29
2. Sources of Aggregate Budget Receipts 343. Maharashtra Revenue Elasticities - 1960-1976 354. Total Expenditure: Development and
Plan Expenditures 775. Maharashtra: Plan Expenditure by Sector 786. Plan Expenditures on Power 797. Maharashtra: Projected State Domestic Product
and Aggregate Receipts 828. Actual and Projected Expenditures on Power
and Irrigation 839. Comparison of Need-based Requirements and
Estimates of Finance Available (Power) 8310. Comparison of Need-based Requirements and
Estimates of Finance Available (Irrigation) 84
- 59 -
INDIA
A REVIEW OF MAHARASHTRA STATE FINANCES
Preface
1. Were Maharashtra an independent member of the Bank, its size--60
million people and an NDP of US$10 billion--and the Bank Group's lending with-
in the State--about US$420 million committed and US$250 million under consi-
deration--would make Maharashtra one of the Bank's larger borrowers and the
subject of considerable economic work as to the State's creditworthiness, its
development policies, implementation capacities and financial requirements. 1/
The loan guarantee of the Government of India mitigates any concern we may
have over Maharashtra's repayment capacity. We do not have the manpower to
undertake thorough going economic reviews of the development performance and
prospects of each State in India. However, the complex system of financing
development projects in India, the nature of the Bank's financial relations
with the Government of India and with individual State Governments and the
nature of Center/State financial relations in India cause us to be interested
in the financial situation of State Governments which implement projects
supported by the Bank. This is particularly so when either the Bank's overall
exposure in the State or a single project under consideration is large rela-
tive to the State's budget. Both of these conditions currently exist in
Maharashtra.
2. The data for the analysis was obtained in the course of a mission
to Maharastra in 1978 the paper is organized as follows: In the first sec-
tion basic features of the State economy are highlighted. The second section
provides an overview of Maharastra's financial position. Expenditure patterns
are discussed in sections III and IV, and future resource availability in
section V.
1/ The amount of US$420 million is the sum of Bank Group commitments on
projects that are financed through the budget of GOM: Bombay Water
Supply I & II, Maharashtra Irrigation, Purna Irrigation and Bombay Port.
This sum does not include the commitments on the Maharashtra components
of national projects or the commitments on projects which are physically
located in Maharashtra but financed by some means other than by the GOM,
e.g. Trombay (Tata) Power I & II, Korba Power, Trombay Fertilizer and
Bombay High Oil and Gas. Commitments on these sums US$536 million.

- 60 -
Summary and Conclusions
i. The State of Maharashtra, were it an independent country, would beone of the Bank Group's larger borrowers, both in terms of its size and interms of its borrowing from the Bank. The purpose of this paper is to reviewthe financial position and prospects of the Government of Maharashtra toinvestigate whether the program of irrigation development currently proposedfor Bank Group financing can be carried out as planned. This requires lookingat the capacity and willingness of the Government to provide the necessaryfinancial resources, which in turn requires a view of the State's past andfuture economic situation. Although analyzing a State's capacity and willing-ness to finance a particular sector's development program is a difficult task,it is no more so than, say, analyzing a country's creditworthiness, and itscapacity and willingness to pay foreign debts.
ii. Maharasthra is the most industrialized State in India, and itslargest electric power consumer. Agricultural production has been partic-ularly slow in growing and is highly variable, even by Indian standards.Living standards are somewhat higher in Maharashtra than elsewhere in India;but the overall growth of the economy has been no higher in Maharashtra thanin India as a whole.
iii. The Government of Maharashtra's financial resources are fairlyelastic with respect to economic growth in the State and this relation isexpected to persist into the future. An increasing proportion of State pro-duct and Government resources have been devoted to development expenditures,and recently, to plan expenditures.
iv. The Government of Maharashtra has allocated over the past about15% of plan expenditure to surface irrigation development, although this hasbeen as high as 17% in the recent past. The Government appears committed toraising expenditure on irrigation to develop the remaining potential as fastas possible; but there is also the need to accommodate within the Plan a pro-gram of power development that has grown quite large in both absolute andproportional terms as well as many other high priority development programs.
v. Under conservative assumptions concerning financial mobilizationby the Government of Maharashtra, carrying out the irrigation program asplanned, over the next five years, including the improved standards envisaged,would require the Government of Maharashtra to devote 21% to 23% of Plan out-lays to irrigation. This is a significant but not infeasible increase inpriority of irrigation in financial allocations. Although the additionalfunds derived from Bank Group financial participation in Maharashtra'sirrigation program do not relieve the State from deciding upon its overalldevelopment priorities, the additionality should make it somewhat easier forthe State to devote a larger proportion of Plan expenditure to irrigation.

- 61 -
INDIA
A REVIEW OF MAHARASHTRA STATE FINANCES
I. Salient Economic Features
3.01 Maharashtra is India's most industrialized State, which, with 9% of
India's population, has nearly one-sixth of her industrial capital, one-fifth
of factory employment and one-fourth of gross value of industrial output and
value added by manufacturing in the organized sector. Manufacturing contri-
butes one-fourth of Maharashtra's net domestic product compared to its 16%
share at the national level. The composition of manufacturing in Maharashtra
has changed considerably since the early 1960's, with a relative fall in the
manufacture of consumer goods--textiles and food products--which predominated
earlier, and a considerable rise in the proportion of producer goods--chem-
icals, metals and machinery. Industry is concentrated in the Bombay area; the
districts of Bombay, Thane and Pune have one-fourth of Maharashtra-s popula-
tion but five-sixths of its value added in organized industry. Maharashtra's
heavier industrialization means the State's economy is more vulnerable than
the rest of India to power shortages, labor disputes and industrial supply
constraints, three problems that have plagued India in the past. Manufactur-
ing output has grown more slowly in Maharashtra than nationwide, at about 5%
per annum in real terms since 1960/61 and 4% since 1970/71, compared to 7%
and 5% respectively, for India as a whole.
3.02 Agriculture both contributes a smaller portion of State product (SDP)
and is less advanced than in other States. In current prices, agriculturecontributes 30% of SDP, 1/ compared to 43% all-India. Foodgrain yields in
Maharashtra are, along with those in Rajasthan and Gujarat, the lowest in
India. Yields of cash crops like cotton and groundnut are somewhat better and
for sugarcane are among the highest in India. Maharashtra's basic agricultural
problem is low and variable rainfall, small areas of assured rainfall, lack of
perennial rivers and a low proportion of cropped area irrigated. A consequence
of this is a cropping pattern dominated by coarse grains--sorghum, millet and
barley--which are drought resistant but low yielding.
3.03 The progress of agricultural output can be appreciated by viewing
the accompanying graph (Chart 1). Maharashtra fully shared in the all-Indiadrought of 1965 and 1966. Production had barely recovered its pre-droughtlevel when the State had another, more severe and prolonged drought of its
own with bad monsoons in 1970, 1971 and 1972, by which time food-grain produc-
tion was an astounding 40% of its level just three years before. This drought
1/ This is a rise in the proportion of SDP contributed by agriculture;it was 26% in the early 1970's, when bad weather severely depressed
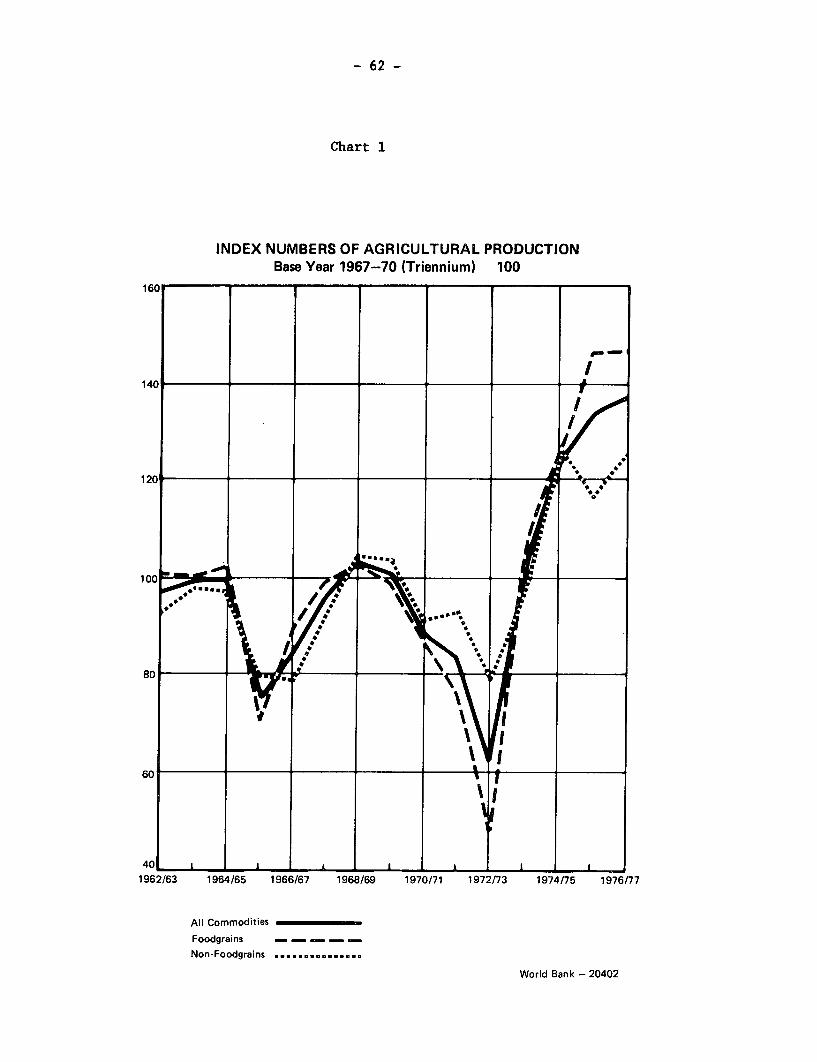
- 62 -
Chart 1
INDEX NUMBERS OF AGRICULTURAL PRODUCTIONBase Year 1967-70 (Triennium) 100
160
140
41 2C
Al Cmmodities
FoodgrainNon-Foograins .............
* C~~~~~~~Wol ak 00
- 63 -
had severe repercussions on the revenues of rural familes (see Wolf Ladejinsky,
-"Maharashtra, 1972/73") and in many other ways. Since 1972/73, output has
been growing smartly, although yields are still quite low.
3.06 Maharashtra's is India's largest electric power consumer, with 12%
of generating capacity and 16% of consumption. Only Punjab, with a higher
average income, all villages electrified and a considerable amount of tube-
well irrigation had a higher per capita power consumption than Maharashtra.
Economic growth in Maharashtra has been power intensive; power consumption
-has grown at an average of 9% per annum since 1960/61; the elasticity of power
demand with respect to industrial production is 1.7 and 2.5 with respect to
SDP; power demand for irrigation has grown at 30% per annum since the early
19 60's, but from a low base. Since 1960/61, 60% of the increase in supply
has been consumed by industry, 11% by domestic householders and 12% by tube-
wells. Currently about 60% of villages with 80% of the rural population are
served with electricity. Maharashtra is persistently short of power, the
deficit being 10% to 25% in a good year, such as now, and was as much as 50%
in the worst, as in the early 1970s.
3.07 Living standards are somewhat higher in Maharashtra than in most
other States in India. The per capita income of Maharashtra's population was
Rs 1,489 (or about US$175) in 1976/77, second only to Punjab's and 42% higher
than the India-wide average. A higher proportion--30%--of the population is
urban than in other States and a higher proportion is employed in factories.
Over 90% of children of primary school age are enrolled in school and about
40% of the population is literate, compared to 30% across India. Maharashtra
has had one of India's most active family planning programs and more than one-
third of couples in the reproductive age group are adopters of various birth
control methods. Nevertheless, due to steady in-migration, the population
growth rate is considerably higher than India's. Over the decade, 1961 to
1971, Maharashtra's growth rate was 2.4% per annum while India's was 2.2%.
Maharashtra is unique among the States of India in providing guaranteed
employment for those seeking unskilled jobs in rural areas; in 1976/77, the
Employment Guarantee Scheme provided 133 million man days of employment or
22% more than the year before.
3.08 The overall growth of the economy of Maharashtra since 1960/61 has
been almost exactly the same as for India as a whole, at about 3.6% per annum.
Agricultural growth was considerably less, under 1% per annum between 1960/61
and 1976/77. The secondary and tertiary sectors both grew at about 5% per
annum over the same period. Although the growth rates of each of these sectors
in Maharashtra is below the all-India average, the State's overall growth is
as high as India's due to the higher proportion of the faster growing second-
ary and tertiary sectors in Maharashtra's SDP. Given the faster population
growth rate, per capita income grew by 1.25% per annum, or less than it did
on the national level.
- 64 -
II. Financial Profile Of Maharashtra
3.09 Maharashtra-s finances, like those of other Indian States, areheavily influenced by the constitutional arrangements between the Centraland State Governments. Taxes on personal and corporate non-agriculturalincome, on imports and on certain commodities are reserved for the Center.Other taxes, including those on agriculture and on most commodities, are leftto the States. The States are responsible for funding through their budgetmost public development programs, including those in education, social ser-vices, agriculture, irrigation, power, transportation and communication.The Center has the responsibility for national defense and certain types ofdevelopment efforts, particularly for some large industries of national im-portance in the public sector, such as steel, coal, petroleum and heavyelectrical and engineering goods. In addition, the Center has the responsi-bility for overseeing the overall development of India and uses its resourcesto balance and accelerate development by transferring funds to States by avariety of means. The Center regulates the State's access to credit, not onlyfrom the Central budget and the Reserve Bank of India, but also from theopen market.
3.10 The accompanying chart II and Table 1 give a cross-sectoral overviewof Maharashtra's receipts and expenditures. In 1975/76, the GOM raised 43%of its receipts through State taxes and 17% from its own sources of non-taxrevenue. It received 4% as grants from the Center and 12% as its share inCentral taxes. It raised another 6% by borrowing from the Center and therest--18%-either by recovering its loans to others or by other borrowing.The State spent three-quarters of its total expenditures either directly ondevelopment programs or on capital transactions, including loans to others,such as Maharashtra's State Electricity Board, for development purposes.Plan expenditure was 23% of total disbursements.
3.11 As might be expected from its larger share of manufacturing andhigher average income, Maharashtra raises and spends more resources percapita than the average State--Rs 234 per capita for Maharashtra raisesmore of these funds from its own resource base and relies less on the Centerthan other States. See Table 2. Maharashtra's own tax revenue per capitais particularly high, almost twice the level of the other States. AlthoughMaharashtra's share of Central taxes is roughly in proportion to its popula-tion it receives a much lower proportion of central grant and loan assistance.
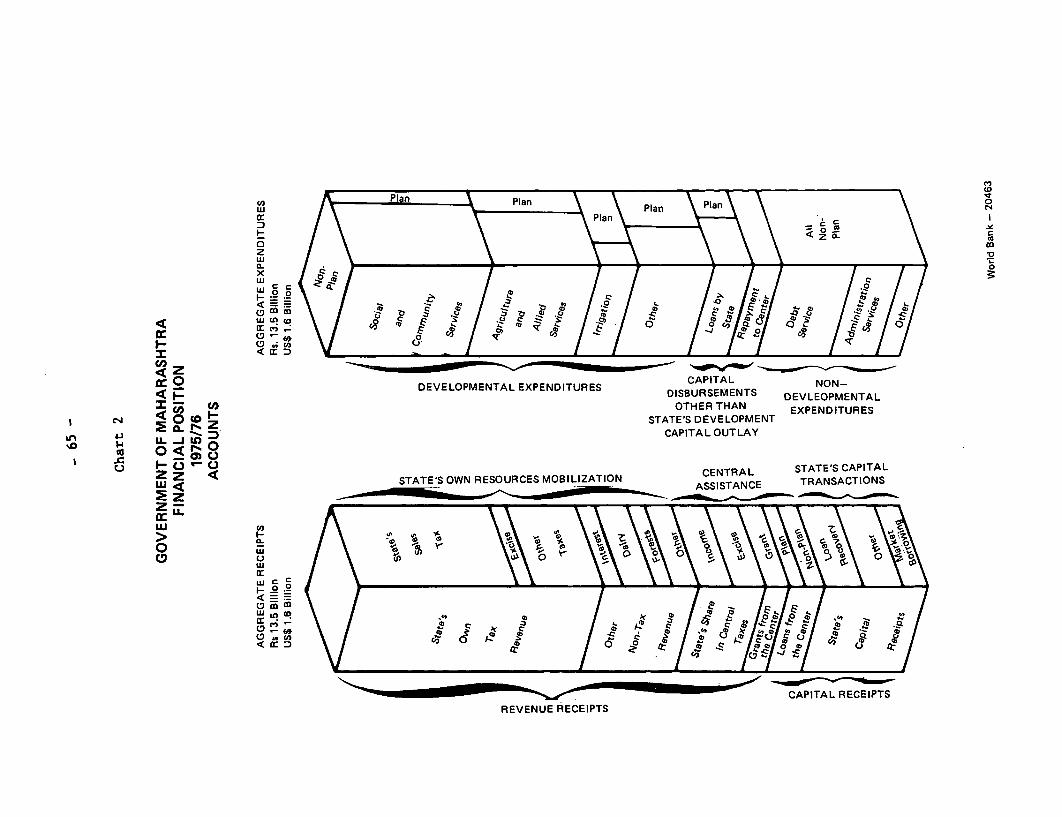
w~~~~~~~Pa { E lan
> J UZ: CAITAL OUTlA
E ~~~~~~~~~~~~~~~~~~~~~~Z_
L- - AIA RCIT
x~~~~~~~~~RVNERCIT
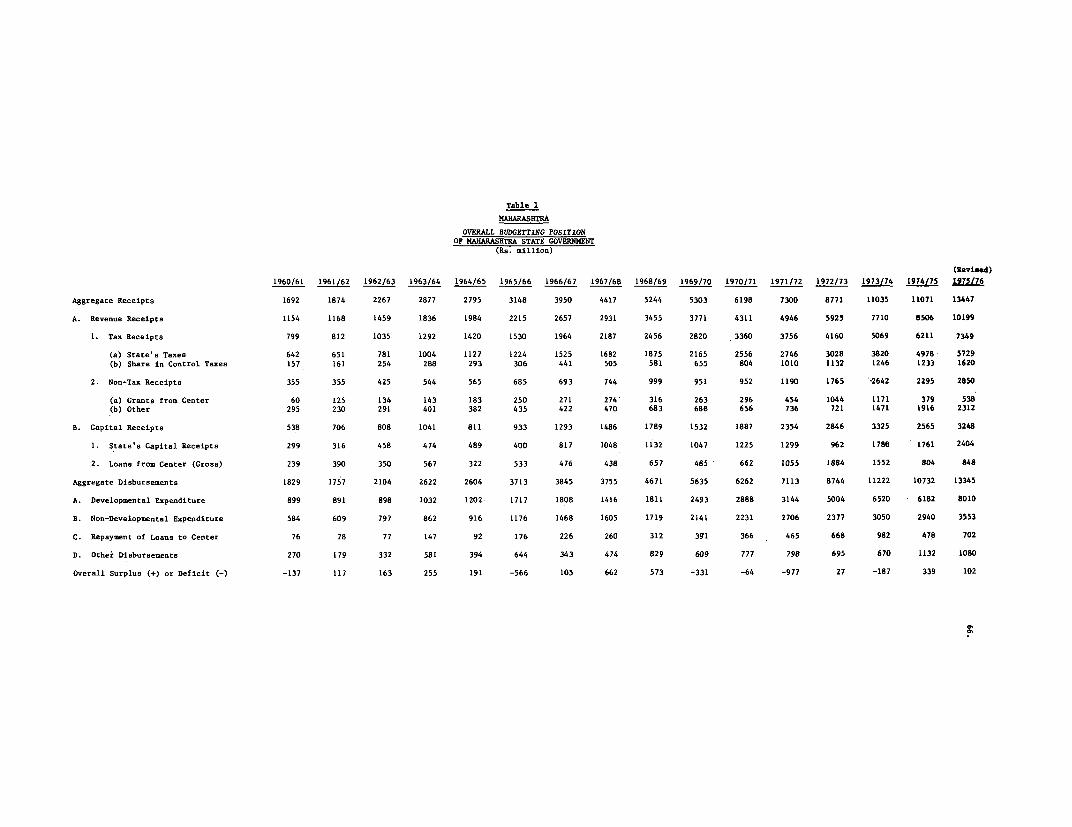
Table 1
NAHARASHTRA
OVERALL BUDGETTING POSITIONOF M1AHARASHTRA STATE GOVERNlENT
(Rs. million)
(Revised)1960/61 1961/62 1962/63 1963/64 1964/65 1965/66 1966/67 1967/68 1968/69 1969/70 1970/71 1971/72 1972/73 1973/74 1974/75 1975/76
Aggregate Receipts 1692 1874 2267 2877 2795 3148 3950 4417 5244 5303 6198 7300 8771 11035 11071 13447
A. Revenue Receipts 1154 1168 1459 1836 1984 2215 2657 2931 3455 3771 4311 4946 5925 7710 8506 10199
1. Tax Receipts 799 812 1035 1292 1420 1530 1964 2187 2456 2820 3360 3756 4160 5069 6211 7349
(a) State's Taxes 642 651 781 1004 1127 1224 1525 1682 1875 2165 2556 2746 3028 3820 4978 5729(b) Share in Control Taxes 157 161 254 288 293 306 441 505 581 655 804 1010 1132 1246 1233 1620
2. Non-Tax Receipts 355 355 425 544 565 685 693 744 999 951 952 1190 1765 '2642 2295 2850
(a) Grants from Center 60 125 134 143 183 250 271 274 316 263 296 454 1044 1171 379 538(b) Other 295 230 291 401 382 435 422 470 683 688 656 736 721 1471 1916 2312
B. Capital Receipts 538 706 808 1041 811 933 1293 1486 1789 1532 1887 2354 2846 3325 2565 3248
1. State's Capital Receipts 299 316 458 474 489 400 817 1048 1132 1047 1225 1299 962 1780 1761 2404
2. Loans from Center (Cross) 239 390 350 567 322 533 476 438 657 485 662 1055 1884 1552 804 848
Aggregate Disbursements 1829 1757 2104 2622 2604 3713 3845 3755 4671 5635 6262 7113 8744 11222 10732 13345
A. Developmental Expenditure 899 891 898 1032 1202 1717 1808 1416 1811 2493 2888 3144 5004 6520 6182 8010
B. Non-Developmental Expenditure 584 609 797 862 916 1176 1468 1605 1719 2141 2231 2706 2377 3050 2940 3553
C. Repayment of Loans to Center 76 78 77 147 92 176 226 260 312 3Pl 366 465 668 982 478 702
D. Other Disbursements 270 179 332 581 394 644 343 474 829 609 777 798 695 670 1132 1080
Overall Surplus (+) or Deficit (-) -137 117 163 255 191 -566 105 662 573 -331 -64 -977 27 -187 339 102
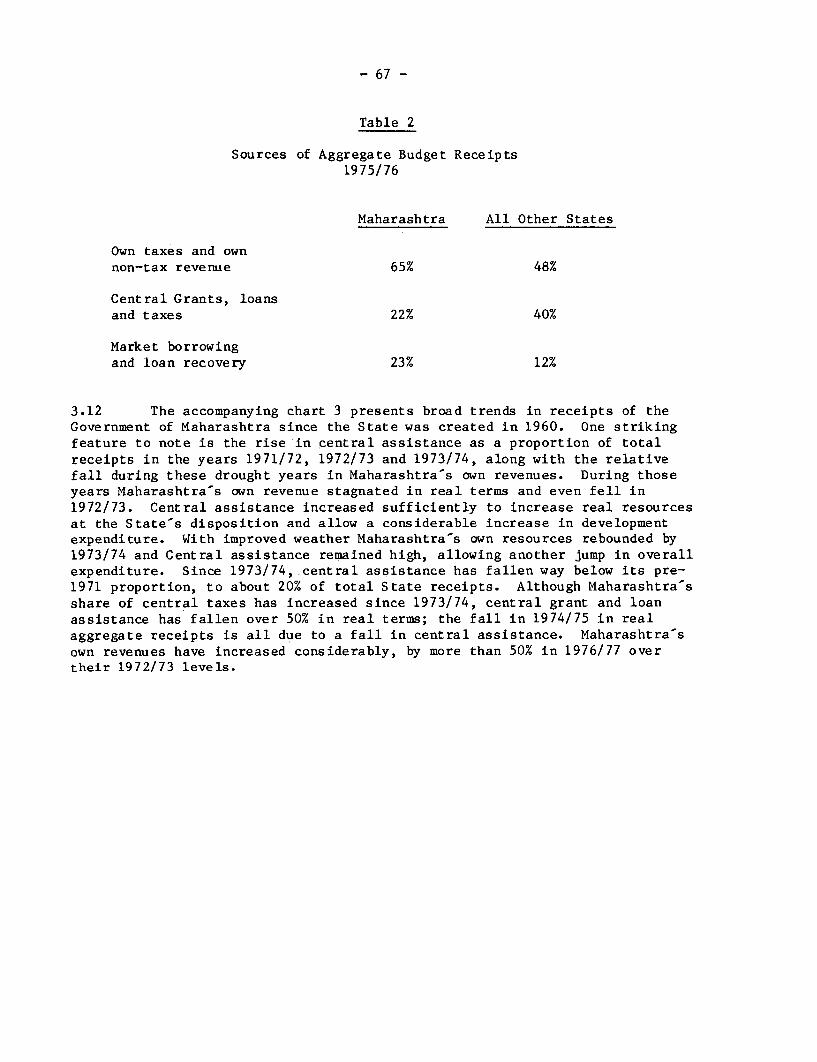
- 67 -
Table 2
Sources of Aggregate Budget Receipts1975/76
Maharashtra All Other States
Own taxes and ownnon-tax revenue 65% 48%
Central Grants, loansand taxes 22% 40%
Market borrowingand loan recovery 23% 12%
3.12 The accompanying chart 3 presents broad trends in receipts of theGovernment of Maharashtra since the State was created in 1960. One strikingfeature to note is the rise in central assistance as a proportion of totalreceipts in the years 1971/72, 1972/73 and 1973/74, along with the relativefall during these drought years in Maharashtra's own revenues. During thoseyears Maharashtra's own revenue stagnated in real terms and even fell in1972/73. Central assistance increased sufficiently to increase real resourcesat the State-s disposition and allow a considerable increase in developmentexpenditure. With improved weather Maharashtra's own resources rebounded by1973/74 and Central assistance remained high, allowing another jump in overallexpenditure. Since 1973/74, central assistance has fallen way below its pre-1971 proportion, to about 20% of total State receipts. Although Maharashtra'sshare of central taxes has increased since 1973/74, central grant and loanassistance has fallen over 50% in real terms; the fall in 1974/75 in realaggregate receipts is all due to a fall in central assistance. Maharashtra'sown revenues have increased considerably, by more than 50% in 1976/77 overtheir 1972/73 levels.
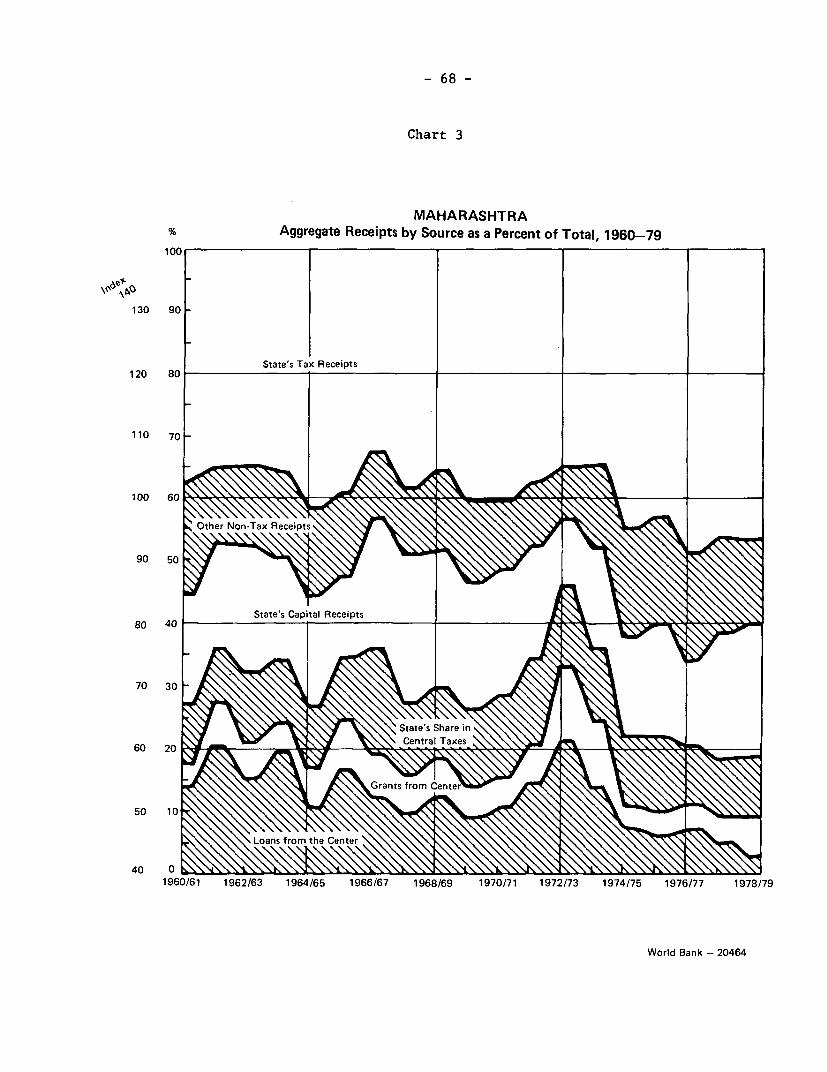
- 68 -
Chart 3
MAHARASHTRA% Aggregate Receipts by Source as a Percent of Total, 1960-79
100
130 90
State's Tax Receipts120 80
110 70
100 60
ivOther Non-Tax Receipts \\\ \\
90 50
State's Capi al ReceipitsSo 40 _ ............... _.,.
70 30 @
60 2g
1960/61 1962/63 1964/65 1966/67 1968/69 1970/71 1972/73 1974/75 1976/77 1978/79
World Bank - 20464
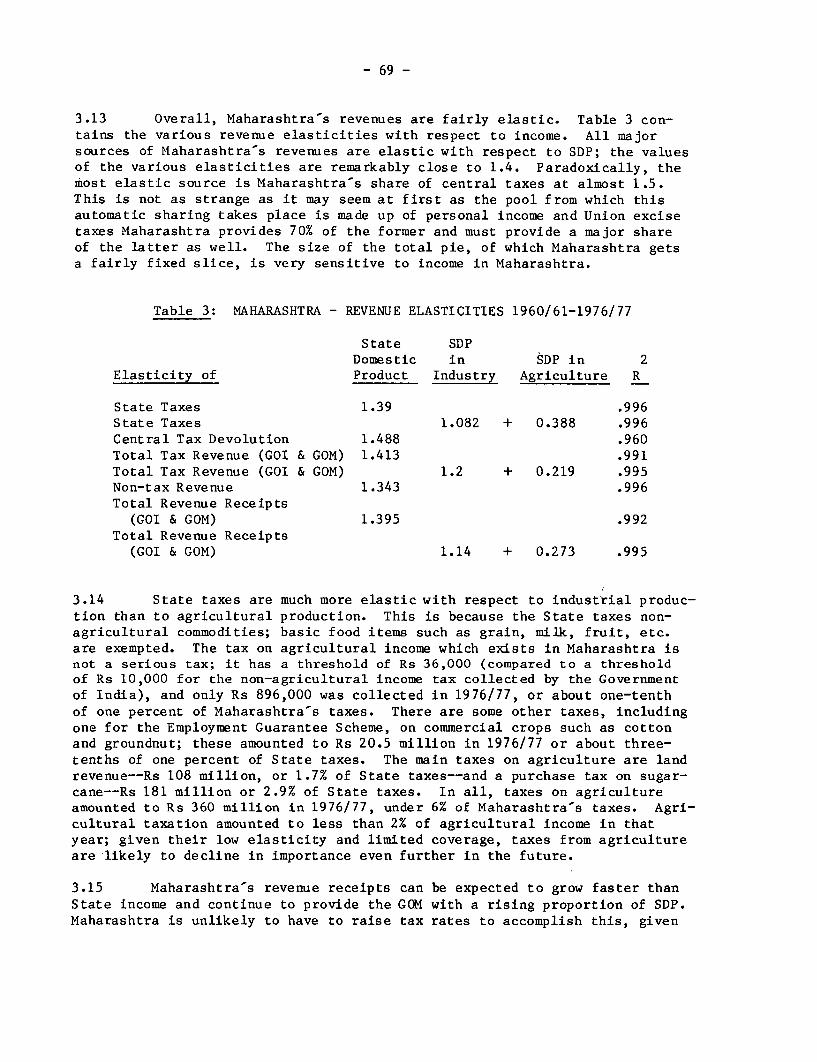
- 69 -
3.13 Overall, Maharashtra's revenues are fairly elastic. Table 3 con-tains the various revenue elasticities with respect to income. All majorsources of Maharashtra's revenues are elastic with respect to SDP; the valuesof the various elasticities are remarkably close to 1.4. Paradoxically, thetost elastic source is Maharashtra's share of central taxes at almost 1.5.This is not as strange as it may seem at first as the pool from which thisautomatic sharing takes place is made up of personal income and Union excisetaxes Maharashtra provides 70% of the former and must provide a major shareof the latter as well. The size of the total pie, of which Maharashtra getsa fairly fixed slice, is very sensitive to income in Maharashtra.
Table 3: MAHARASHTRA - REVENUE ELASTICITIES 1960/61-1976/77
State SDPDomestic in SDP in 2
Elasticity of Product Industry Agriculture R
State Taxes 1.39 .996State Taxes 1.082 + 0.388 .996Central Tax Devolution 1.488 .960Total Tax Revenue (GOI & GOM) 1.413 .991Total Tax Revenue (GOI & GOM) 1.2 + 0.219 .995Non-tax Revenue 1.343 .996Total Revenue Receipts
(GOI & GOM) 1.395 .992Total Revenue Receipts
(GOI & GOM) 1.14 + 0.273 .995
3.14 State taxes are much more elastic with respect to industrial produc-tion than to agricultural production. This is because the State taxes non-agricultural commodities; basic food items such as grain, milk, fruit, etc.are exempted. The tax on agricultural income which exists in Maharashtra isnot a serious tax; it has a threshold of Rs 36,000 (compared to a thresholdof Rs 10,000 for the non-agricultural income tax collected by the Governmentof India), and only Rs 896,000 was collected in 1976/77, or about one-tenthof one percent of Maharashtra's taxes. There are some other taxes, includingone for the Employment Guarantee Scheme, on commercial crops such as cottonand groundnut; these amounted to Rs 20.5 million in 1976/77 or about three-tenths of one percent of State taxes. The main taxes on agriculture are landrevenue--Rs 108 million, or 1.7% of State taxes--and a purchase tax on sugar-cane--Rs 181 million or 2.9% of State taxes. In all, taxes on agricultureamounted to Rs 360 million in 1976/77, under 6% of Maharashtra's taxes. Agri-cultural taxation amounted to less than 2% of agricultural income in thatyear; given their low elasticity and limited coverage, taxes from agricultureare likely to decline in importance even further in the future.
3.15 Maharashtra's revenue receipts can be expected to grow faster thanState income and continue to provide the GOM with a rising proportion of SDP.Maharashtra is unlikely to have to raise tax rates to accomplish this, given

- 70 -
the high revenue response from industrial production and the likelihood that
industrial production will continue to grow faster than agricultural output
and SDP. The Finance Minister of the GOM in his speech presenting the revised
budget for 1978/79 said he felt taxes were already at very high levels and he
could not recommend raising them further.
3.16 Overall, the elasticities calculated over the last 17 years can
be taken as a fair estimate of those likely to apply over the next five years.
They are unlikely to rise as a result of a rise in sales tax or agricultural
tax rate, although there is some possibility they may rise somewhat as a
result of Maharashtra getting a larger share of centrally collected taxes.
3.17 The broad outlines of Maharashtra's debt position is presented in
Charts 4 and 5. The first shows debt acquisition by the GOM and its propor-
tion of State taxes. Debt outstanding has grown by 85% from 1960/61 to
1971/78, just over 3.5% a year, in real terms, on average, or at about the
same rate as GDP. Debt outstanding grew rapidly in the drought years 1965 to
1968 and 1971 to 1973. It has fallen by half as a proportion of State taxes,
revenue receipts and aggregate receipts over the period. As of the end of
March 1978, Maharashtra's debt was just under Rs 15 billion (US$1.8 billion)
of which 56% was owed to the Government of India, 16% to State pension fund,
statutory bodies, etc., and 28% to the public. Acquiring debt is not com-
pletely under the control of the GOM; loans from the Government of India are
negotiated in the context of the State's needs for Plan and non-Plan assis-
tance and the overall volume and purpose are subject to criteria laid down by
the Government of India. The Government of India has also restricted GOM's
use of open market borrowing to avoid Maharashtra's crowding out borrowing by
financially weaker State Governments. In the last year (1977/78), GOM was
able to increase its market borrowing by only 10%, and all of this was for the
Maharashtra State Electricity Board. The GOM would appear to have the repay-
ment capacity to take on more liabilities and its Finance Secretary has said
the Government would like to do so to enhance development expenditure; but
at the moment the Government of India has restricted the GOM's long term
borrowing.
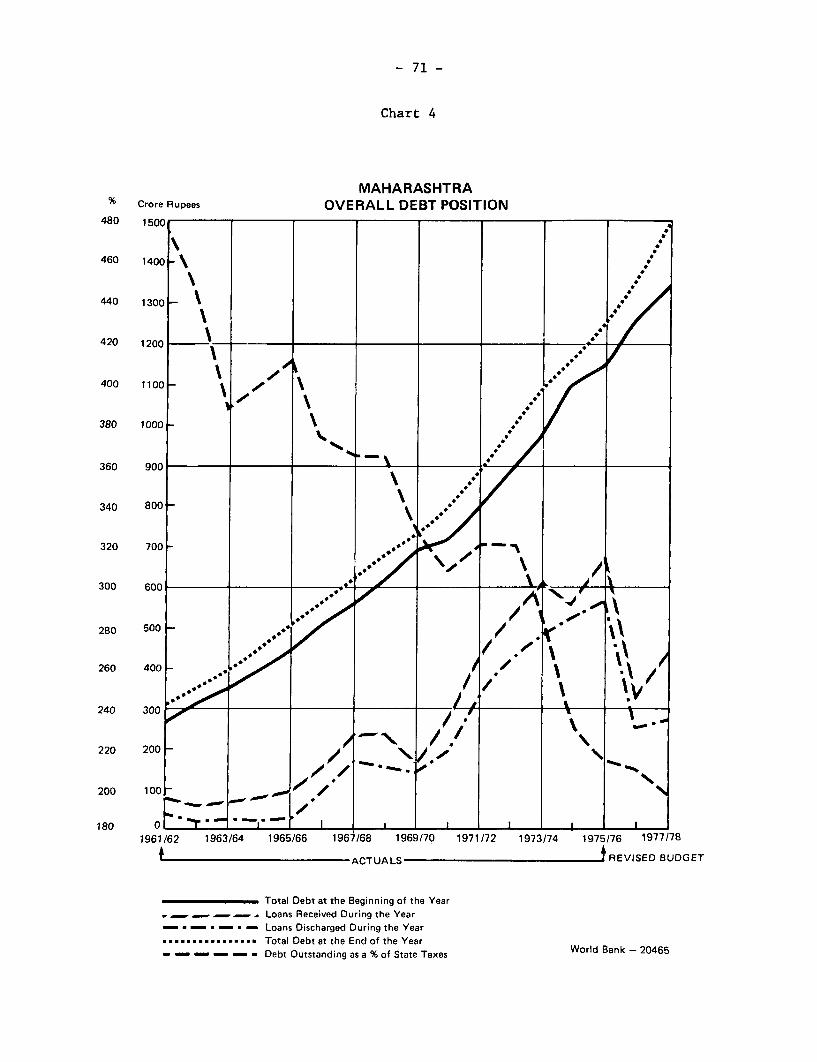
- 71 -
Chart 4
MAHARASHTRA% Crore Rupees OVERALL DEBT POSITION
480 isoc,
460 1400
440 1300
420 1200 1.400 1100 _
380 1000 _
360 900
340 800-
300 600 __>_
280 500 /r
260 400_ a // \*\/
240 300 700 '220 200 _-/ '\;/ /\_
18B0 0p zr _ _ _r ,,l 1961/62 1963/64 1965/66 1967/68 1969/70 1971/72 1973/74 1975/76 1977/78
ACTUALS I REVISED BUDGET
Total Debt at the Beginning of the YearLoans Received During the Year
- -. . Loans Discharged During the Year................ Total Debt at the End of the Year- ---- - Debt Outstanding as a % of State Taxes World Bank - 20465
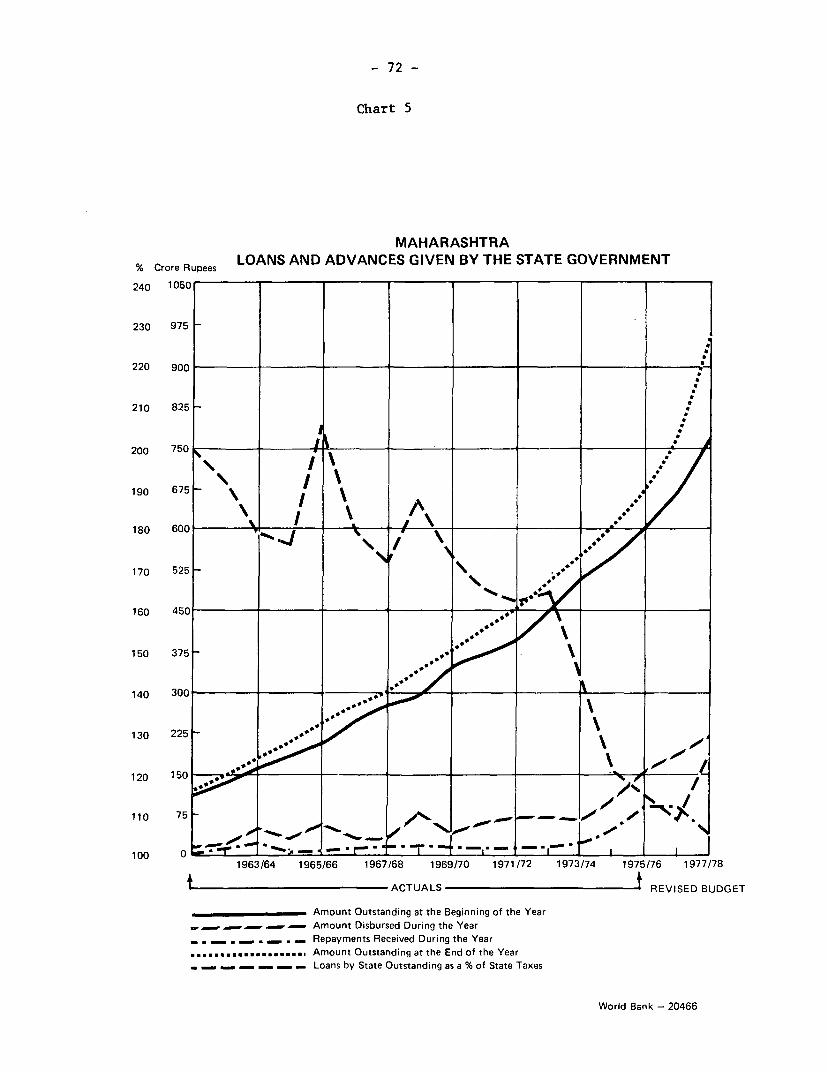
- 72 -
Chart 5
MAHARASHTRA% Crore Rupees LOANS AND ADVANCES GIVEN BY THE STATE GOVERNMENT
240 1050
230 975
220 900
210 825
200 750
190 675 - _-
180 600 *
170 525-
130 225 00
110 75
100 01963/64 1965/66 1967/68 1969/70 1971/72 1973/74 1975/76 1977/78
t ACTUALS I REVISED BUDGET
____________ Amount Outstanding at the Beginning of the Year_ _ _ _ _ _ Amount Disbursed During the Year_ . _ . _ . _ . _ Repayments Received During the Year
*.... ..... Amount Outstanding at the End of the Year, - - _- - - Loans by State Outstanding as a % of State Taxes
World Bank - 20466
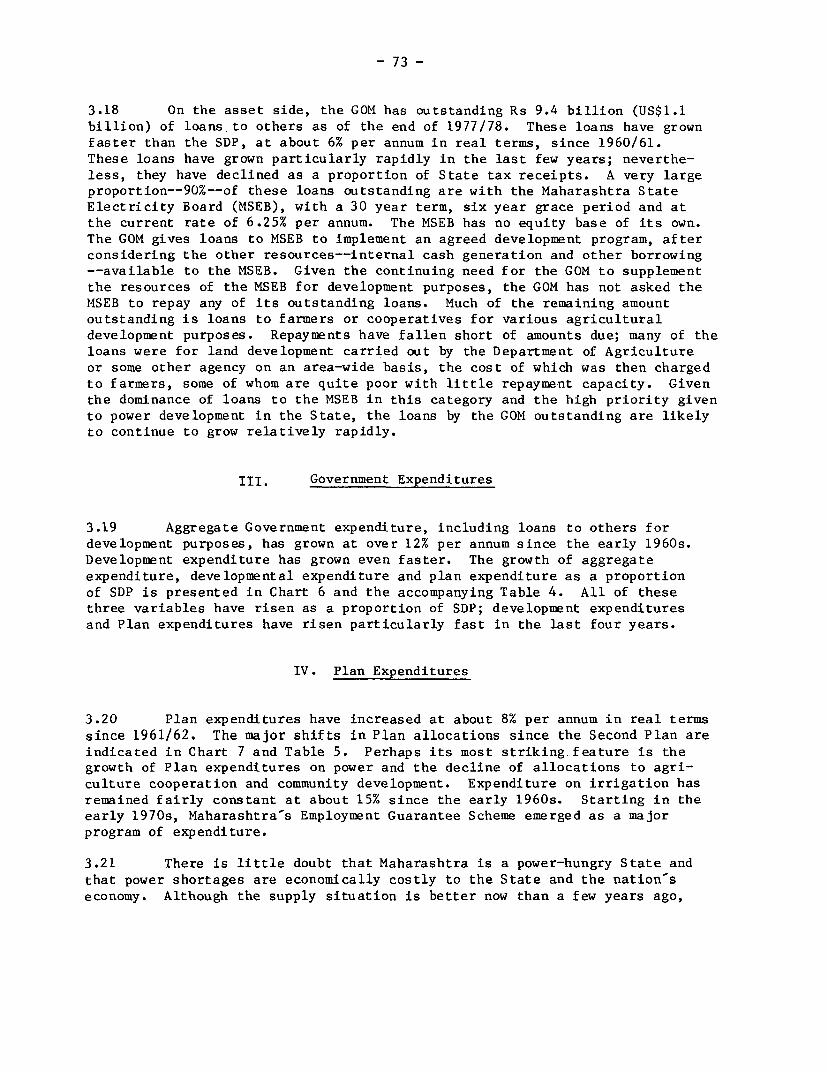
- 73 -
3.18 On the asset side, the GOM has outstanding Rs 9.4 billion (US$1.1billion) of loans to others as of the end of 1977/78. These loans have grownfaster than the SDP, at about 6% per annum in real terms, since 1960/61.These loans have grown particularly rapidly in the last few years; neverthe-less, they have declined as a proportion of State tax receipts. A very largeproportion--90%--of these loans outstanding are with the Maharashtra StateElectricity Board (MSEB), with a 30 year term, six year grace period and atthe current rate of 6.25% per annum. The MSEB has no equity base of its own.The GOM gives loans to MSEB to implement an agreed development program, afterconsidering the other resources--internal cash generation and other borrowing-- available to the MSEB. Given the continuing need for the GOM to supplementthe resources of the MSEB for development purposes, the GOM has not asked theMSEB to repay any of its outstanding loans. Much of the remaining amountoutstanding is loans to farmers or cooperatives for various agriculturaldevelopment purposes. Repayments have fallen short of amounts due; many of theloans were for land development carried out by the Department of Agricultureor some other agency on an area-wide basis, the cost of which was then chargedto farmers, some of whom are quite poor with little repayment capacity. Giventhe dominance of loans to the MSEB in this category and the high priority givento power development in the State, the loans by the GOM outstanding are likelyto continue to grow relatively rapidly.
III. Government Expenditures
3.19 Aggregate Government expenditure, including loans to others fordevelopment purposes, has grown at over 12% per annum since the early 1960s.Development expenditure has grown even faster. The growth of aggregateexpenditure, developmental expenditure and plan expenditure as a proportionof SDP is presented in Chart 6 and the accompanying Table 4. All of thesethree variables have risen as a proportion of SDP; development expendituresand Plan expenditures have risen particularly fast in the last four years.
IV. Plan Expenditures
3.20 Plan expenditures have increased at about 8% per annum in real termssince 1961/62. The major shifts in Plan allocations since the Second Plan areindicated in Chart 7 and Table 5. Perhaps its most striking.feature is thegrowth of Plan expenditures on power and the decline of allocations to agri-culture cooperation and community development. Expenditure on irrigation hasremained fairly constant at about 15% since the early 1960s. Starting in theearly 1970s, Maharashtra's Employment Guarantee Scheme emerged as a majorprogram of expenditure.
3.21 There is little doubt that Maharashtra is a power-hungry State andthat power shortages are economically costly to the State and the nation'seconomy. Although the supply situation is better now than a few years ago,
-74--
when power cuts of 50% or more of demand were experienced, current power cutsremain in the range of 10% to 25% of demand. The portion of unconstraineddemand not met is not readily discernable as many potential power users aredenied power connections or enhancements due to shortages. The basic prob-lem, Maharashtra's State Electricity Board (MSEB) feels, is lack of installedcapacity, which in turn has resulted from lack of finances. MSEB claims anefficient operating performance (while admitting there is room for improvement);these claims are supported by MSEB's meeting or bettering Central ElectricityAuthority's norms for capacity utilization, power production from rate capa-city, system losses, return on assets, etc. The MSEB thinks that planningand implementation capacity is not the problem; it is the constrained finan-cial provision for the Board's development program.
3.22 Plan expenditure on power generation has grown at a rate of over12% per annum, in real terms, since 1961/62.
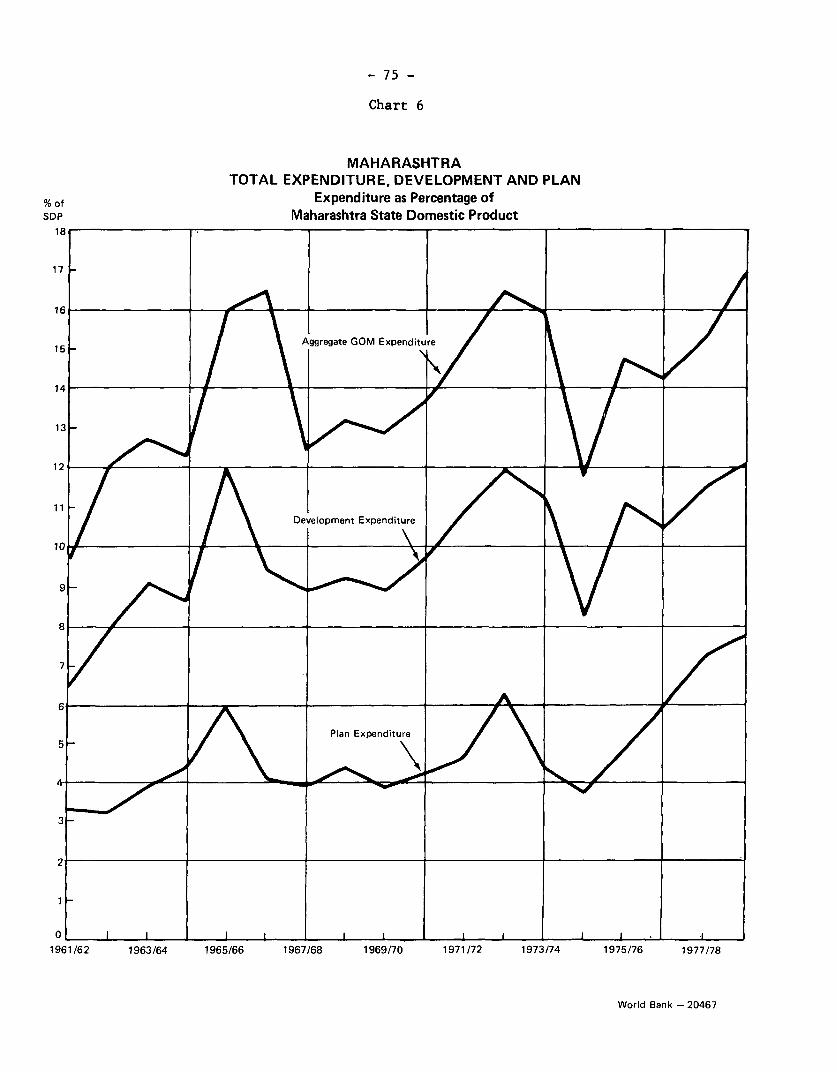
- 75 -
Chart 6
MAHARASHTRATOTAL EXPENDITURE, DEVELOPMENT AND PLAN
% of Expenditure as Percentage of
SDP Maharashtra State Domestic Product18
17-
16 / \/
/ Aggregaelopmen Expenditure /\
6 _ _ _ _ _ _ _ _ _ _ _ _ _ _ ___ A__ _ _ _ _ _ _ .I
5 _ A P~~~~~~~~tlopmnt Expenditure \/
3 .- s \
1961/62 1963/64 1965/66 1967/68 1969/70 1971/72 1973/74 1975/76 1977/78
World Bank - 20467

- 76 -
Chart 7
MAHARASHTRA: PLAN EXPENDITURE BY MAJOR SECTORin % and in 1970/71 Rupees
% 1955/56 - 1978/79100 Rs.
Billion
ower -4.500a
- 4.250\Trnportation\\
80- &5 and v\\\\\ Total Plan Expenditures in - 4.000
gommunciatjn u ~~~~~~~~~~ ~ ~~Annual Rate*- 3.750
t\\Industry and\\70~ -\\\ Mining \\\\ - 3.500
2 .250
60- -3.000
_ Social and Community Services -G 2.750
So_ ....\\\\\\ - "-"""""".t . -12.500
- 2.250\ Co~~operation \ \\\\ x o
40- - -2.000
_ 4\\\\\\\\\\\ > E m ploy m ena _1.750
30- .......... *= x -1.500
Agriculture and Allied Services. \_ B9---------w........... -1.250
20- -1.00- -~~~~~~~~~~~~~~~~~~~~~~~~~~~~~0.7500
Iriainand Flood Control- - ~~~~~~~~~~~~~~~~~~~~~~~~~~~~0.2500
0
Second Plan Third Plan Annual Plans Fourth Plan 4 Yrs. Fifth Plan Annula Plan
1956 - 1961 1961 - 1966 1966 - 1969 1969 - 1974 1974 - 1978 1978 - 1979
World Bank - 20468
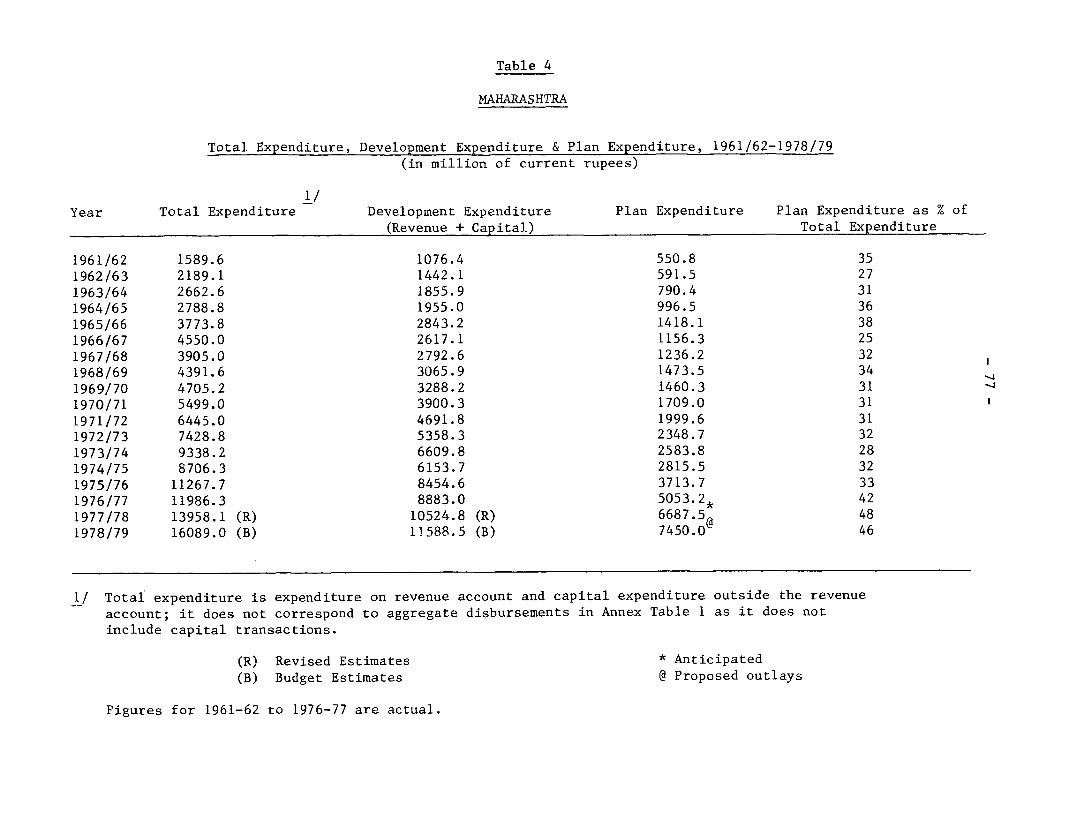
Table 4
MAHARASHTRA
Total Expenditure, Development Expenditure & Plan Expenditure, 1961/62-1978/79(in million of current rupees)
1/Year Total Expenditure Development Expenditure Plan Expenditure Plan Expenditure as % of
(Revenue + Capital) Total Expenditure
1961/62 1589.6 1076.4 550.8 351962/63 2189.1 1442.1 591.5 271963/64 2662.6 1855.9 790.4 311964/65 2788.8 1955.0 996.5 361965/66 3773.8 2843.2 1418.1 381966/67 4550.0 2617.1 1156.3 251967/68 3905.0 2792.6 1236.2 321968/69 4391.6 3065.9 1473.5 341969/70 4705.2 3288.2 1460.3 31 -1970/71 5499.0 3900.3 1709.0 311971/72 6445.0 4691.8 1999.6 311972/73 7428.8 5358.3 2348.7 321973/74 9338.2 6609.8 2583.8 281974/75 8706.3 6153.7 2815.5 321975/76 11267.7 8454.6 3713.7 331976/77 11986.3 8883.0 5053.2* 421977/78 13958.1 (R) 10524.8 (R) 6687.5 481978/79 16089.0 (B) 11588.5 (B) 7450.0 46
1/ Total expenditure is expenditure on revenue account and capital expenditure outside the revenueaccount; it does not correspond to aggregate disbursements in Annex Table 1 as it does notinclude capital transactions.
(R) Revised Estimates * Anticipated(B) Budget Estimates @ Proposed outlays
Figures for 1961-62 to 1976-77 are actual.
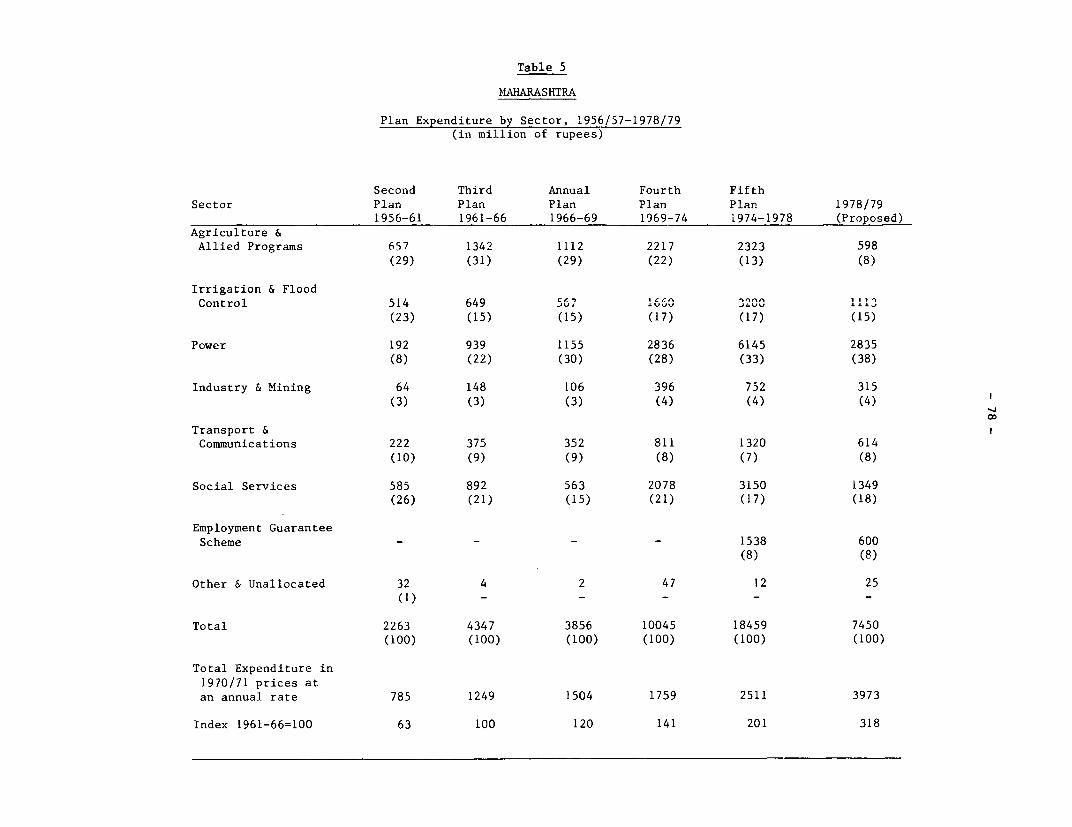
Table 5
MAHARASHTRA
Plan Expenditure by Sector, '1956/57-1978/79(in million of rupees)
Second Third Annual Fourth FifthSector Plan Plan Plan Plan Plan 1978/79
1956-61 1961-66 1966-69 1969-74 1974-1978 (Proposed)Agriculture &Allied Programs 657 1342 1112 2217 2323 598
(29) (31) (29) (22) (13) (8)
Irrigation & FloodControl 514 649 5', 1S0.
(23) (15) (15) (17) (17) (15)
Power 192 939 1155 2836 6145 2835(8) (22) (30) (28) (33) (38)
Industry & Mining 64 148 106 396 752 315(3) (3) (3) (4) (4) (4) 2
-J
Transport &Communications 222 375 352 811 1320 614
(10) (9) (9) (8) (7) (8)
Social Services 585 892 563 2078 3150 1349(26) (21) (15) (21) (17) (18)
Employment GuaranteeScheme - - - - 1538 600
(8) (8)
Other & Unallocated 32 4 2 47 12 25(1) - - _
Total 2263 4347 3856 10045 18459 7450(100) (100) (100) (100) (100) (100)
Total Expenditure in1970/71 prices atan annual rate 785 1249 1504 1759 2511 3973
Index 1961-66=100 63 100 120 141 201 318

- 79 -
Table 6
Plan Expenditure onPower at an annual rate
in 1970/71 Prices As a % of Plan As aRs Million Expenditure of SDP
3rd Plan 270 22 0.9
Annual Plans 450 30 1.3
4th Plan 497 28 1.3
5th Plan 841 34 1.9
1978/79 (outlay) 1,512 38 3.0
Only a portion of these Plan expenditures on power are financed through the
GOM's budget; the MSEB is a statutory body of the GOM and the first source of
Plan financing is its own internally generated funds. Since 1974/75 (at
least) the MSEB has been earning a rate of return of 9.5% 1/ on its capital
base and for the past two years the rate of return has exceeded 13%. The next
recourse is to market and other institutional borrowing. As mentioned earlier,
the Government of India has restricted the GOM's open market borrowing to that
for the MSEB and has limited this to a 10% increase over the year before. The
main institutional sources are the Life Insurance Corporation and Rural Elec-
trification Corporation. The remaining gap is filled by the GOM through loans
under the Plan. As an example, the following is the proposed distribution of
financing for the 1977/78 MSEB Plan expenditures.
_ Source
11 Internal Cash Generation6 Open Market2 Life Insurance Corporation2 Rural Electrification Corporation
79 Government of Maharashtra Loans100
Some Plan expenditure on power lies outside the MSB's budget; hydro generating
capacity is developed directly by the GOMI, which then leases the developed
hydro unit to the MSEB to operate. There are some minimal development expend-
itures of the MSEB that fall outside of Plan allocations; one example of this
is the special pump connection arranged under certain agricultural projects
financed by loans from ARDC.
1/ In 1975/76, reaching this rate required the transfer of subsidy funds
from the GOM, as agreed with the World Bank. In the previous year,
1974/75, such a transfer was unnecessary to achieve the target rate of
return.
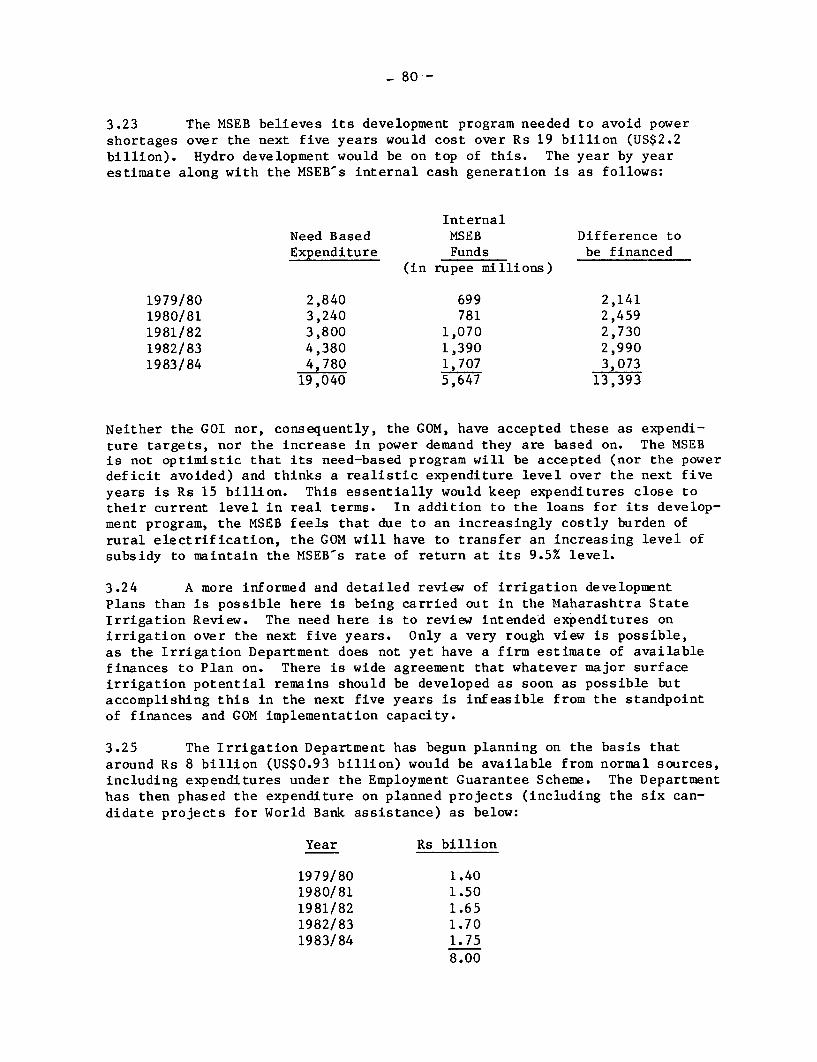
- 80 -
3.23 The MSEB believes its development program needed to avoid powershortages over the next five years would cost over Rs 19 billion (US$2.2billion). Hydro development would be on top of this. The year by yearestimate along with the MSEB's internal cash generation is as follows:
InternalNeed Based MSEB Difference toExpenditure Funds be financed
(in rupee millions)
1979/80 2,840 699 2,1411980/81 3,240 781 2,4591981/82 3,800 1,070 2,7301982/83 4,380 1,390 2,9901983/84 4,780 1,707 3,073
19,040 5,647 13,393
Neither the GOI nor, consequently, the GOM, have accepted these as expendi-ture targets, nor the increase in power demand they are based on. The MSEBis not optimistic that its need-based program will be accepted (nor the powerdeficit avoided) and thinks a realistic expenditure level over the next fiveyears is Rs 15 billion. This essentially would keep expenditures close totheir current level in real terms. In addition to the loans for its develop-ment program, the MSEB feels that due to an increasingly costly burden ofrural electrification, the GOM will have to transfer an increasing level ofsubsidy to maintain the MSEB-s rate of return at its 9.5% level.
3.24 A more informed and detailed review of irrigation developmentPlans than is possible here is being carried out in the Maharashtra StateIrrigation Review. The need here is to review intended expenditures onirrigation over the next five years. Only a very rough view is possible,as the Irrigation Department does not yet have a firm estimate of availablefinances to Plan on. There is wide agreement that whatever major surfaceirrigation potential remains should be developed as soon as possible butaccomplishing this in the next five years is infeasible from the standpointof finances and GOM implementation capacity.
3.25 The Irrigation Department has begun planning on the basis thataround Rs 8 billion (US$0.93 billion) would be available from normal sources,including expenditures under the Employment Guarantee Scheme. The Departmenthas then phased the expenditure on planned projects (including the six can-didate projects for World Bank assistance) as below:
Year Rs billion
1979/80 1.401980/81 1.501981/82 1.651982/83 1.701983/84 1.75
8.00

- 81 -
These levels do not include the costs of the improved standards and theaccelerated pace likely to be agreed to in the case of the six projectsmaking up the IDA composite project. The rough estimate for the additional
cost is Rs 2.1 billion (US$244 million including Command Area Development)and 15% price escalation not normally counted in the irrigation Plan) whichin the end will appear as Plan expenditures but which the GOM is considering
sources additional to its normal resources -- i.e., it should come from otherthan GOM as additionality. The total Plan expenditure on irrigation would be
then on the order of Rs 10 billion, Rs 2 billion of which should be additionalto normal Plan resources.
V. Financial Resources in the Future
3.26 The main variables that will determine Maharashtra's financial
ability to carry out its development Plans, including project undertakingswe are interested in, are the growth rate of SDP, the elasticity of State
receipts with respect to SDP, the level of aggregate State expenditure, theproportion of State expenditure devoted to Plan outlays and the prioritieswithin the Plan. We can ignore Maharashtra's debt position as an influence
on its resource mobilization efforts; Maharashtra may be constrained in thelevels it can borrow in the future but by the policy of the Government ofIndia rather than by creditworthiness considerations. As indicated below, weassume transfers from the Center will be as responsive (as adjusted below) asin the past to rises in Maharashtra's SDP.
3.27 There is one other crucial variable not mentioned above: the deter-mination of the Government of Maharashtra to carry out its development programas planned even if it requires departures from the patterns of past financialarrangements, which are used here as guides for the future. The GOM's deter-mination is, of course, a wild card in the play of forces governing expendi-ture. Some feel that if this variable cannot be included in the calculation(as it cannot in any very useful way), then the exercise is useless. Never-theless, this lack is of limited concern. The same objections can be raisedto exercises analyzing a borrower's creditworthiness, in which the borrower's
determination to service debt is equally a wild card in the deck. Determina-tion to repay cannot be rigorously analyzed; most Banks undertake creditwor-thiness investigations before lending and, in fact, the banking industrythrives on them.
3.28 There are many possible ways to specify the variables mentioned
above -- SDP, revenue elasticity, and Plan priorities. The approach followedbelow is to choose a set of parameters that constitute reasonable or bestguess estimates of their future levels, calculate the implications of theseparameters for GOM's finances, draw the conclusions that are warranted andthen test the sensitivity of these conclusions to changes in the parameters.The estimates chosen rely most heavily on their past levels or trends, althoughthese have been adjusted in some cases to reflect future conditions likelyto prevail.
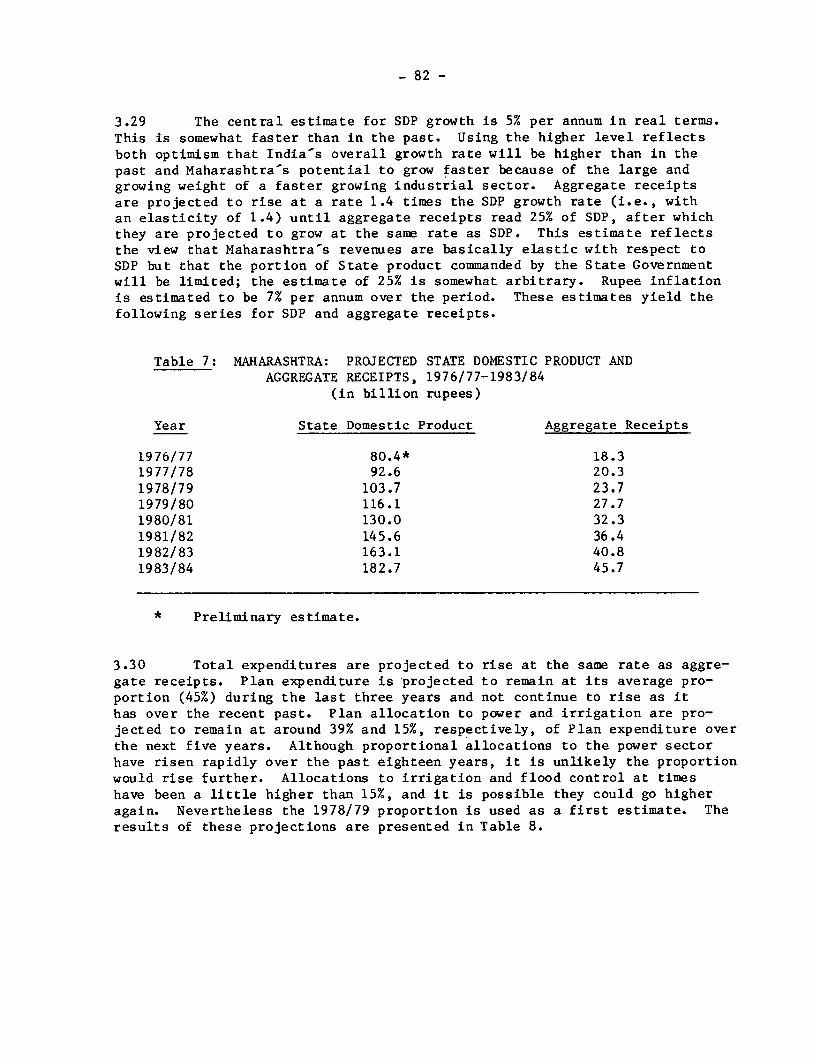
- 82 -
3.29 The central estimate for SDP growth is 5% per annum in real terms.This is somewhat faster than in the past. Using the higher level reflectsboth optimism that India-s overall growth rate will be higher than in thepast and Maharashtra's potential to grow faster because of the large andgrowing weight of a faster growing industrial sector. Aggregate receiptsare projected to rise at a rate 1.4 times the SDP growth rate (i.e., withan elasticity of 1.4) until aggregate receipts read 25% of SDP, after whichthey are projected to grow at the same rate as SDP. This estimate reflectsthe view that Maharashtra's revenues are basically elastic with respect toSDP but that the portion of State product commanded by the State Governmentwill be limited; the estimate of 25% is somewhat arbitrary. Rupee inflationis estimated to be 7% per annum over the period. These estimates yield thefollowing series for SDP and aggregate receipts.
Table 7: MAHARASHTRA: PROJECTED STATE DOMESTIC PRODUCT ANDAGGREGATE RECEIPTS, 1976/77-1983/84
(in billion rupees)
Year State Domestic Product Aggregate Receipts
1976/77 80.4* 18.31977/78 92.6 20.31978/79 103.7 23.71979/80 116.1 27.71980/81 130.0 32.31981/82 145.6 36.41982/83 163.1 40.81983/84 182.7 45.7
* Preliminary estimate.
3.30 Total expenditures are projected to rise at the same rate as aggre-gate receipts. Plan expenditure is projected to remain at its average pro-portion (45%) during the last three years and not continue to rise as ithas over the recent past. Plan allocation to power and irrigation are pro-jected to remain at around 39% and 15%, respectively, of Plan expenditure overthe next five years. Although proportional allocations to the power sectorhave risen rapidly over the past eighteen years, it is unlikely the proportionwould rise further. Allocations to irrigation and flood control at timeshave been a little higher than 15%, and it is possible they could go higheragain. Nevertheless the 1978/79 proportion is used as a first estimate. Theresults of these projections are presented in Table 8.
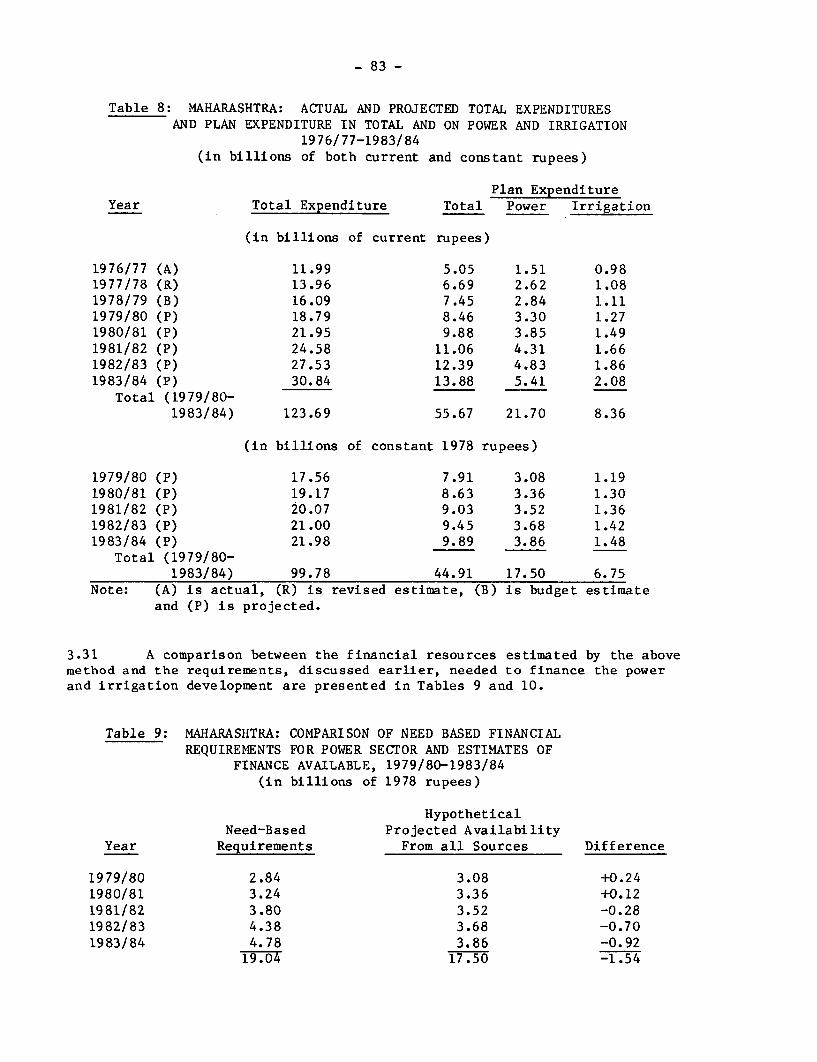
- 83 -
Table 8: MAHARASHTRA: ACTUAL AND PROJECTED TOTAL EXPENDITURESAND PLAN EXPENDITURE IN TOTAL AND ON POWER AND IRRIGATION
1976/77-1983/84(in billions of both current and constant rupees)
Plan ExpenditureYear Total Expenditure Total Power Irrigation
(in billions of current rupees)
1976/77 (A) 11.99 5.05 1.51 0.981977/78 (R) 13.96 6.69 2.62 1.081978/79 (B) 16.09 7.45 2.84 1.111979/80 (P) 18.79 8.46 3.30 1.271980/81 (P) 21.95 9.88 3.85 1.491981/82 (P) 24.58 11.06 4.31 1.661982/83 (P) 27.53 12.39 4.83 1.861983/84 (P) 30.84 13.88 5.41 2.08
Total (1979/80-1983/84) 123.69 55.67 21.70 8.36
(in billions of constant 1978 rupees)
1979/80 (P) 17.56 7.91 3.08 1.191980/81 (P) 19.17 8.63 3.36 1.301981/82 (P) 20.07 9.03 3.52 1.361982/83 (P) 21.00 9.45 3.68 1.421983/84 (P) 21.98 9.89 3.86 1.48
Total (1979/80-1983/84) 99.78 44.91 17.50 6.75
Note: (A) is actual, (R) is revised estimate, (B) is budget estimateand (P) is projected.
3.31 A comparison between the financial resources estimated by the abovemethod and the requirements, discussed earlier, needed to finance the powerand irrigation development are presented in Tables 9 and 10.
Table 9: MAHARASIITRA: COMPARISON OF NEED BASED FINANCIALREQUIREMENTS FOR POWER SECTOR AND ESTIMATES OF
FINANCE AVAILABLE, 1979/80-1983/84(in billions of 1978 rupees)
HypotheticalNeed-Based Projected Availability
Year Requirements From all Sources Difference
1979/80 2.84 3.08 +0.241980/81 3.24 3.36 +0.121981/82 3.80 3.52 -0.281982/83 4.38 3.68 -0.701983/84 4.78 3.86 -0.92
19.O4 17.50 -1.54
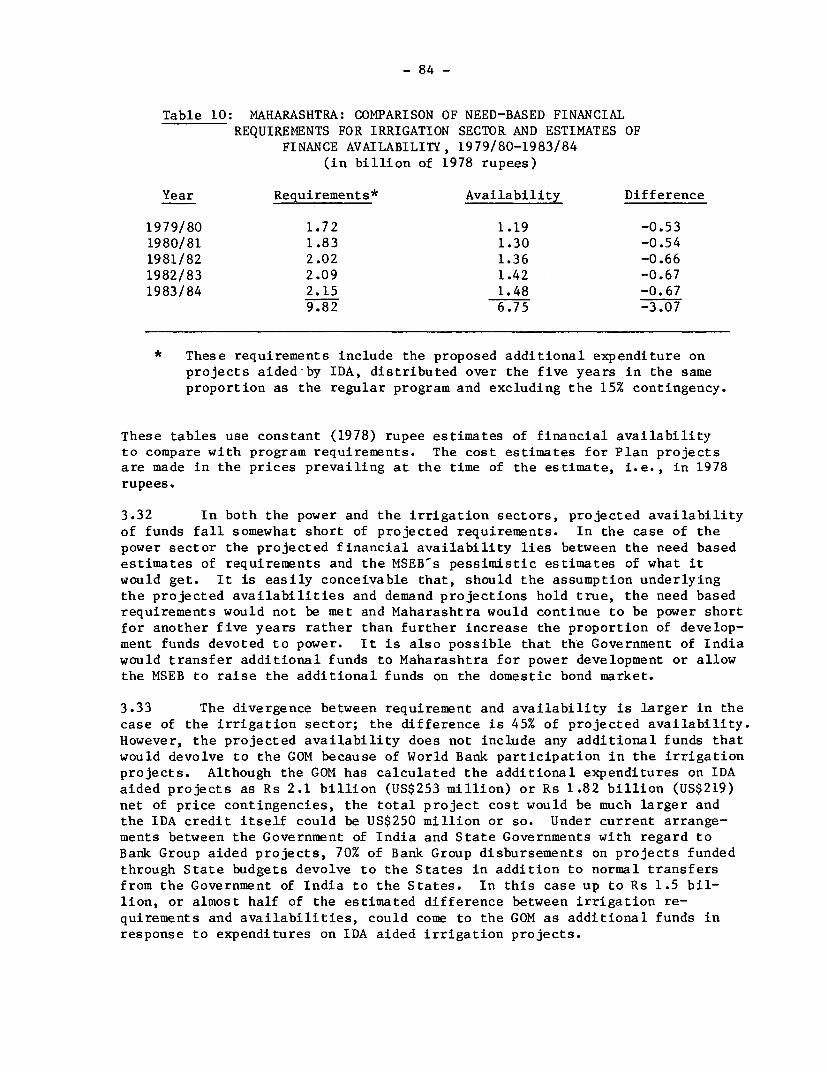
- 84 -
Table 10: MAHARASHTRA: COMPARISON OF NEED-BASED FINANCIALREQUIREMENTS FOR IRRIGATION SECTOR AND ESTIMATES OF
FINANCE AVAILABILITY, 1979/80-1983/84(in billion of 1978 rupees)
Year Requirements* Availability Difference
1979/80 1.72 1.19 -0.53
1980/81 1.83 1.30 -0.54
1981/82 2.02 1.36 -0.66
1982/83 2.09 1.42 -0.67
1983/84 2.15 1.48 -0.679.82 6.75 -3.07
* These requirements include the proposed additional expenditure onprojects aided-by IDA, distributed over the five years in the same
proportion as the regular program and excluding the 15% contingency.
These tables use constant (1978) rupee estimates of financial availabilityto compare with program requirements. The cost estimates for Plan projects
are made in the prices prevailing at the time of the estimate, i.e., in 1978
rupees.
3.32 In both the power and the irrigation sectors, projected availability
of funds fall somewhat short of projected requirements. In the case of thepower sector the projected financial availability lies between the need based
estimates of requirements and the MSEB's pessimistic estimates of what it
would get. It is easily conceivable that, should the assumption underlying
the projected availabilities and demand projections hold true, the need based
requirements would not be met and Maharashtra would continue to be power short
for another five years rather than further increase the proportion of develop-
ment funds devoted to power. It is also possible that the Government of India
would transfer additional funds to Maharashtra for power development or allow
the MSEB to raise the additional funds on the domestic bond market.
3.33 The divergence between requirement and availability is larger in the
case of the irrigation sector; the difference is 45% of projected availability.
However, the projected availability does not include any additional funds thatwould devolve to the GOM because of World Bank participation in the irrigationprojects. Although the GOM has calculated the additional expenditures on IDAaided projects as Rs 2.1 billion (US$253 million) or Rs 1.82 billion (US$219)net of price contingencies, the total project cost would be much larger and
the IDA credit itself could be US$250 million or so. Under current arrange-
ments between the Government of India and State Governments with regard to
Bank Group aided projects, 70% of Bank Group disbursements on projects funded
through State budgets devolve to the States in addition to normal transfers
from the Government of India to the States. In this case up to Rs 1.5 bil-
lion, or almost half of the estimated difference between irrigation re-
quirements and availabilities, could come to the GOM as additional funds in
response to expenditures on IDA aided irrigation projects.
- 85 -
full irrigation program would be 22% of Plan expenditures (42% for power).If economic growth in Maharashtra were 4% rather than 5%, the proportionof Plan expenditure devoted to the irrigation sector would be 22% with alladditionality and 23% if none was additional (42% and 43% respectively forthe power sector).
3.34 The above discussion should be sufficient to indicate the rangein which the Plan allocation must fall if the irrigation program is to beimplemented as planned. Plan allocations to the irrigation sector must bearound 21-23% of Plan outlays. This is somewhat higher than the currentproportion of 15% and is high enough to cause some concern; but the somewhathigher proportion cannot be regarded as being out of the feasible range.The GOM clearly can expand on irrigation at this rate if it chooses to giveirrigation developoment sufficient priority. The proportion has been as highas 17% in the past; the GOM says it is placing a higher priority on irriga-tion development than in the past; some of the requirements may be met bywork carried out by the Employment Guarantee Scheme; and the Bank Groupadditionality accompanying higher levels of expenditure on irrigation shouldallow some increase in the proportion of Plan outlays devoted to irrigation.Nevertheless, it should be recognized that carrying out the irrigation programas planned, including implementing the higher standards agreed between the GOMand the Bank will involve an increase in the proportion of Plan expendituresdevoted to irrigation.
- 86 -
CHAPTER IV
INDIA
ORISSA: STATE PLANNING AND FINANCE
Christine WallichIndia Division
- 87 -
INDIA
ORISSA: STATE PLANNING AND FINANCE
Table of Contents
Page No.
Preface .......................... ........................ 89
I. Orissa Background and History ..... ............. 90
(i) Salient Economic Features ........................... 90
II. Financial Resources ...................................... 92
(i) State Revenue Receipts .............................. 92
III. Review of State Expenditures ............. .. .............. 97
(i) Revenue Expenditures ................................ 97(ii) Composition of Plan Expenditures .................... 99
IV. The Plan: Financial Resources ........................... 102
V. The Planning Process ..................................... 105
(i) Planning Machinery ................................. 105
VI. Financing the Orissa Projects ............................ 106
Tables
1. Orissa Revenue Receipts 93
2. Orissa Revenue Expenditures 98
3. Plan Expenditure - Orissa 100
4. Resources for the State Plan 103
5. Orissa Irrigation Projects in relation to StatePlan Expenditures 109
6. Plan Expenditure - Orissa 113
7. Orissa: Irrigation Sector Expenditures 114
- 88 -
Appendix Tables
1. Orissa Capital Expenditure 116
- 89 -
INDIA
ORISSA STATE PLANNING AND FINANCE
Preface
This study was undertaken in early 1980, in support of preparation
of three major irrigation projects in Orissa. Its purpose was to shed some
light on the factors which affect the capacity and willingness of Orissa
to provide the budgetary resources received for financing the three largeirrigation projects. Data for the study was collected during a mission to
India in March 1980.
The paper is organized as follows: An introductory section pro-
vides a brief overview of the State of Orissa, its history and economic
characteristics. In section II, trends in Orissa's financial resources are
reviewed. The third section discusses trends in expenditure. Sections IV
and V address issues of planning and Plan finance. The final section assesses
the three irrigation projects in the content of the resources likely to be
available for the irrigation sector over the next two Plan periods. This
analysis is intended to assist in the allocations to the sector commensurate
with its other commitments.
- 90 -
INDIA
ORISSA STATE PLANNING AND FINANCE
I. Orissa Background and History
4.01 Orissa is among India's oldest kingdoms. It has been a unified
linguistic and cultural entity for many centuries before Christ, the sameterritory having been identified with Oriya speaking people for over two and ahalf millenia. Known as Kalinga until the 16th century, Orissa was a principalpower of medieval India, extending at the height of its power, in terms ofpolitical extension, from the Ganges to the Godvari in Andra Pradesh. Itspolitical supremacy also made a strong force of Oriya culture, and during the14 - 16th centuries, Orissa remained a citadel of Hindu culture: not untilthe reign of Akbar was Orissa finally incorporated into the Moghul empire.Orissa is typically still thought of as the bastion of Hindu civilizationin India. Indeed, 97% of the population is Hindu. This steadfastness orcultural integrity is among the factors cited, in its more negative aspectssuch as an immured caste system and excessive traditionalism, as inimicalto rapid economic development of the area.
4.02 Orissa was integrated into the British empire in the early 1800s,but 26 princely States remained outside the provincial administration, withthe result that large parts of the present day State remained feudal. Theconsequences are very clearly seen in the distribution of the transportnetwork, and in the failure to develop, until after 1947, Orissa's vastmineral reserves most of which are located in erstwhile princely States.Orissa was constituted as a State in the Indian Union in 1950.
Salient Economic Features
4.03 Orissa is among the poorest &nd most backward States of India,with a pet capita income of Rs 785, approximately three-f2urths of theall-India average. Both in terms of area, 156 million km , and population,at 1971 census, of 22 million, Orissa is fairly small, making up only 4% ofIndia's total population and 5% of its land area. Just under a quarter ofOrissa's population belongs to scheduled tribes, living in the Koraput andSurdargh districts primarily, and 15% come from the scheduled castes. Thisgives Orissa the largest proportion of disadvantaged people, relative to theState's total population of the Indian Union: 39% of the population belongsto these backward groups. The extent of poverty and backwardness of thisState is confirmed by the Planning Commission's estimate that 90% of Orissa'srural population and 76% of the urban population live below the poverty line,as compared with 40% for India as a whole.
- 91 -
4.04 The economy of the State centers on agriculture, which provides
employment to 79% of Orissa's working population, as compared to 68% for India
as a whole, and accounts for 69% of State income. It follows that Orissa
remains very rural. There are only six towns with populations greater than
50,000. Most urban areas are very new, having sprung up as a result of
Central Government development projects. These include Hirakud (dam), Rourkela
(steel), Paradeep (port), and Talcher (electricity). The bulk of the popu-
lation--92%, as compared with 80% for the country as a whole, lives in sparsely
populated rural areas. Population density is very low, and the population per
village--408--is the smallest in the country.
4.05 These features make the task of those trying to provide the fruits
of development very difficult, since transport and communication to most parts
of the State are very inadequate. The State is very poorly served by the
existing railway system and has only 30 km of road per 100 km , less than
one-fifth of which is surfaced. Large parts of the State thus become in-
accessible during much of the year. The consequences are myriad: incomes are
kept low as produce must be marketed locally at reduced prices; the exploi-
tation of the State's large mineral and forest resources cannot begin and,
with all-weather communication to only 6 of the 13 district headquarters, even
routine State administration is difficult.
4.06 In spite of heavy reliance on agriculture, this sector is extremely
undeveloped by all India standards. Less than 15% of net sown area is irri-
gated, and since double cropping is restricted to irrigated areas, it is
also limited. Use of HYV in irrigated areas has spread rapidly, however.
Fertilizer use, at nine kg per hectare, is amongst the lowest in the country.
Although there are substantial ground water resources in much of the State,
agricultural power consumption is negligible, since only 28% of villages have
been electrified. Orissa is thus extremely vulnerable to vagaries of weather
and even in years of normal rainfall, erratic distribution can cause severe
flooding and drought. As a result, agricultural output in the State, and
hence per capita incomes, are highly variable; in 1976/77, for example, per
capita income fell 20% below the previous year's level. A declining land/man
ratio is also the cause of concern to the Government.
4.07 The contribution of industry to State domestic product has been very
low; 12%, although the potential in view of the State's mineral and forest
wealth is tremendous. Orissa ranks third in India in terms of forest resources,
with 40% of its land area under forests, much of it in high value woods. In
terms of minerals, Orissa is rich in iron, chromite, manganese, coal and
limestone among others. Unfortunately, mineral development, which could have
for the State, was slow to take place since the bulk of the deposits were
located in princely States and were not exploited until the second Plan
period.
4.08 In terms of gross output of industry Orissa ranks 14 out of 15 major
states, and in terms of employment, the sector's contribution is also small,
with industry providing work for only 7% of the labor force. The bulk of
the industrial development which has taken place has been in public sector
- 92 -
undertakings. Not surprisingly, entrepreneurial talent and finance havebeen scarce in view of the very low level of technical education, poorbanking and commercial facilities, general low level of urbanization andfragmented markets.
4.09 With regard to basic needs and social infrastructure, Orissaalso fares very poorly. At independence, health standards were particu-larly deficient, the entire coastal region being malarial, with smallpoxand cholera epidemics frequent. During the first three Plan periods, muchwas accomplished to counteract this, but standards are still low. Thereare only 26 hospital beds per lakh of population, compared with 81 for Indiaas a whole. Per capita outlays on health, Rs 9, are also low, about 75%of the all India average. The relative standards are not much differentin education. Per capita outlays in education were Rs 25, 15% less thanthe all India average and less than half that of Punjab or Kerala. Literacyrates are concomittantly low although at 26% not much lower than the allIndia figure of 30%. They are above the corresponding figures for Biharand Rajasthan (19%), Madhya Pradesh (22%), Andhra Pradesh (24%) and UttarPradesh (22%). Similarly, rural water supply is deficient and many basicneeds are far from being met.
4.10 Notwithstanding the desperate lack in the basic needs sector,and the fact that basic needs are very far from being met, the developmentstrategy of the State emphasizes, in keeping with national priorities, thedevelopment of agriculture, irrigation anddpower, stress on these sectors hasleft very little room for development of soci#l services infrastructure.
II. Financial Resources
State Revenue Receipts
4.11 State revenue receipts are, as stated earlier, those receipts forwhich the State has no repayment liability and which are used to finance itemsof revenue expenditure. They consist of State tax revenues--the most impor-tant--non-tax revenues, the next largest, and grants from the Central Govern-ment. These categories will be treated in turn. Table 1 details the trendsin each category since 1960/61.
4.12 Orissa is, as we have seen, a poor State, and this poverty charac-terizes private as well as public incomes. Because of its low level ofurbanization, underdeveloped agriculture, small industrial sector, and thegenerally low purchasing power of most of the State's inhabitants, the taxablecapacity of the State is very low. Per capita tax receipts were 42 rupees,less than half of the all States average 1/; total receipts were similarlyconstrained.
1/ RBI Bulletin, September, 1978.
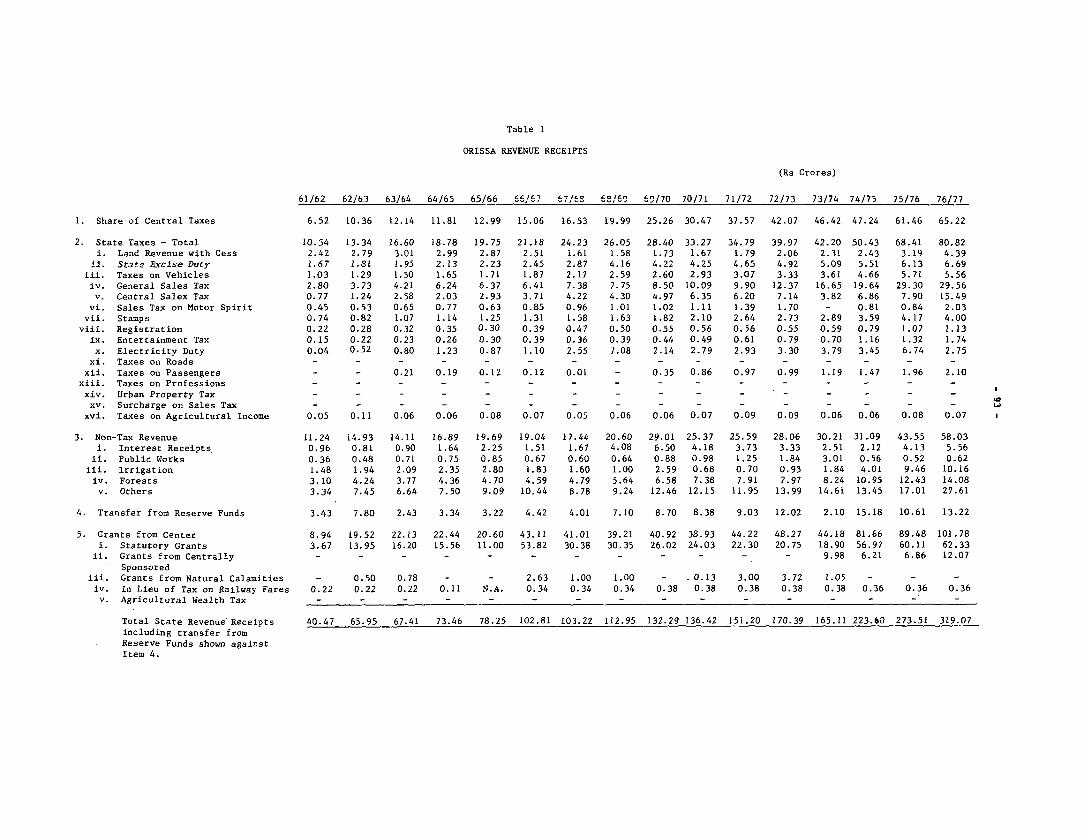
Table 1
ORISSA REVENUE RECEIPTS
(Rs Crores)
61/62 62/63 63/64 64/65 65/66 ee7 7/ 6', /69 69e/70 70/71 71/72 72/73 73/74 74/75 75/76 76/771. Share of Central Taxes 6.52 10.36 12.14 11.81 12.99 15.06 16.53 19.99 25.26 30.47 37.57 42.07 46.42 47.24 61.46 65.222. State Taxes - Total 10.34 13.34 16.60 18.78 19.75 21.18 24.23 26.05 28.40 33.27 34.79 39.97 42.20 50.43 68.41 80.82i. Land Revenue with Cess 2.42 2.79 3.01 2.99 2.87 2.51 1.61 1.58 1.73 1.67 1.79 2.06 2.31 2.43 3.19 4.39
4i. State Excise Duty 1.67 1.81 1.95 2.13 2.23 2.45 2.87 4.16 4.22 4.25 4.65 4.92 5.09 5.51 6.13 6.69iii. Taxes on Vehicles 1.03 1.29 1.50 1.65 1.71 1.87 2.17 2.59 2.60 2.93 3.07 3.33 3.61 4.66 5.71 5.56iv. General Sales Tax 2.80 3.73 4.21 6.24 6.37 6.41 7.38 7.75 8.50 10.09 9.90 12.37 16.65 19.64 29.30 29.56v. Central Salex Tax 0.77 1.24 2.58 2.03 2.93 3.71 4.22 4.30 4.97 6.35 6.20 7.14 3.82 6.86 7.90 15.49vi. Sales Tax on Motor Spirit 0.45 0.53 0.65 0.77 0.63 0.85 0.96 1.01 1.02 1.11 1.39 1.70 - 0.81 0.84 2.03
vii. Stamps 0.74 0.82 1.07 1.14 1.25 1.31 1.58 1.63 1.82 2.10 2.64 2.73 2.89 3.59 4.17 4.00viii. Registration 0.22 0.28 0.32 0.35 0.30 0.39 0.47 0.50 0.55 0.56 0.56 0.55 0.59 0.79 1.07 1.13ix. Entertainment Tax 0.15 0.22 0.23 0.26 0.30 0.39 0.36 0.39 0.44 0.49 0.61 0.79 0.70 1.16 1.32 1.74
x. Electricity Duty 0.04 0.52 0.80 1.23 0.87 1.10 2.55 7.08 2.14 2.79 2.93 3.30 3.79 3.45 6.74 2.75xi. Taxes on Roads - - - - - - - - - - - - - - - -xii. Taxes on Passengers - - 0.21 0.19 0.12 0.12 0.01 - 0.35 0.86 0.97 0.99 1.19 1.47 1.96 2.10
xiii. Taxes on Professions - - - - - - - - - - - - - - -xiv. Urban Property Tax - - - - - - - - - - - - - - - -xv. Surcharge on Sales Tax - - - - - - - - - - - - - - - - w
xvi. Taxes on Agricultural Income 0.05 0.11 0.06 0.06 0.08 0.07 0.05 0.06 0.06 0.07 0.09 0.09 0.06 0.06 0.08 0.073. Non-Tax Revenue 11.24 14.93 14.11 16.89 19.69 19.04 17.44 20.60 29.01 25.37 25.59 28.06 30.21 31.09 43.55 58.03
i. Interest Receipts. 0.96 0.81 0.90 1.64 2.25 1.51 1.67 4.08 6.50 4.18 3.73 3.33 2.51 2.12 4.13 5.56ii. Public Works 0.36 0.48 0.71 0.75 0.85 0.67 0.60 0.64 0.88 0.98 1.25 1.84 3.01 0.56 0.52 0.62iii. Irrigation 1.48 1.94 2.09 2.35 2.80 1.83 1.60 1.00 2.59 0.68 0.70 0.93 1.84 4.01 9.46 10.16iv. Forests 3.10 4.24 3.77 4.36 4.70 4.59 4.79 5.64 6.58 7.38 7.91 7.97 8.24 10.95 12.43 14.08v. Others 3.34 7.45 6.64 7.50 9.09 10.44 8.78 9.24 12.46 12.15 11.95 13.99 14.61 13.45 17.01 27.61
4. Transfer from Reserve Funds 3.43 7.80 2.43 3.34 3.22 4.42 4.01 7.10 8.70 8.38 9.03 12.02 2.10 15.18 10.61 13.225. Grants from Center 8.94 19.52 22.13 22.44 20.60 43.11 41.01 39.21 40.92 38.93 44.22 48.27 44.18 81.66 89.48 101.78i. Statutory Grants 3.67 13.95 16.20 15.56 11.00 53.82 30.38 30.35 26.02 24.03 22.30 20.75 18.90 56.97 60.11 62.33
ii. Grants from Centrally - - - - - - - - - - - - 9.98 6.21 6.86 12.07Sponsorediii. Grants from Natural Calamities - 0.50 0.78 - - 2.63 1.00 1.00 - .0.13 3.00 3.72 1.05 - - -iv. In Lieu of Tax on Railway Fares 0.22 0.22 0.22 0.11 N.A. 0.34 0.34 0.34 0.38 0.38 0.38 0.38 0.38 0.36 0.36 0.36v. Agricultural Wealth Tax - - - - - - - - - - - - - -
Total State Revenue Receipts 40.47 65.95 67.41 73.46 78.25 102.81 103.22 112.95 132.29 136.42 151.20 170.39 165.11 223.60 273.51 319.07including transfer fromReserve Funds shown againstItem 4.
- 94 -
4.13 The State derives 42% of its current revenues from taxes, 37%through grants from the central government and 20% from various non-taxsources. About 55% of the tax revenues are from taxes which the State imposesand collects itself, the remainder are taxes which the State receives throughrevenue sharing arrangements with the Central Government.
4.14 The States, Orissa included, receive a share in four central taxes:the income tax, central excise duties, the Center's "additional" excise dutiesand the estate duty. These shared taxes, known as devolutions, have over theof total tax receipts. Since the share of central taxes is a function of theaward made quinquennially by the Finance Commissions, their buoyancy, orelasticity is not a relevant concept here. Orissa has, in general, done wellby the Finance Commissions. Since the Fourth Plan, shared taxes have provideda relatively buoyant source of funds and the category has grown at approx-imately the same rate as the State's revenue from its own taxes, 13.8%.
4.15 The State's own taxes make up about 22% of its total revenue re-sources. The most important State tax is the sales tax which contributesabout one-third of the State's overall own tax revenues. Its growth is afuntion of the growth in the volume of trade and increases in the price level.This tax has proven to be acceptably buoyant, (its elasticity with respect toGDP has been 1.8 over the past two Plan periods) although it has not grown asfast as state own tax revenues as a whole.
4.16 Second in importance is the central sales tax, a tax levied by theCenter at a uniform rate of 4% in all States, but assigned to the States sothat they receive the entire revenues. The central sales tax makes up about20% of Orissa's own tax revenues Receipts from this tax are a function ofthe volume of interstate trade. At 13%, this tax has been among the fastergrowing sources of revenue for the States.
4.17 The excise duty contributes only about 8% to State own revenues, farless than in most States, and its growth has been slow (6%). The excise dutyis levied on narcotics and liquors and its buoyancy is related to revision ofrates, increases in the price of country liquor and the policies regardingprohibition and country liquor shops.
4.18 Most other taxes contribute less than 5% each to the State's owntaxes. Taxes on vehicles have grown slightly more slowly than the overalltotal, but with development of transport infrastructure, should grow faster,providing the State makes efforts to exploit them. The growth of land revenue,which contributes 5% or so to own tax revenues, has picked up after a periodof decline due to strict implementation of land reform measures and consolida-tion of holdings, but this rate of growth is not expected to continue. Theentertainment tax, taxes on passengers and taxes on motor spirit are all, inprinciple, elastic taxes. However, their contribution to State's incomeremains low, because of the State's overall low level of development. Thesame is true for electricity duties, which are duties on power sold by theOrissa State Electricity Board and on private generation. Since 1974/75,efforts have been made to collect arrears and duties have been raised, con-tributing to the faster growth in the recent period. As in other States,taxes such as the agricultural income tax have never been a prolific sourceof income to the State.

- 95 -
4.19 Overall, State tax revenues have grown at 13.5% per annum since1968/9. In real terms, this performance is diminished somewhat, since theprice level has risen also, by about 5% per annum. Nonetheless, an annualgrowth of 7-8% in real terms bespeaks some effort. Part of the explanationalso lies in the fact that Orissa began in the mid 1960s with very low levelsof taxation - own tax revenues as a fraction of SDP were only 1.5%. Theproportion has risen to 4% in 1976/7, which represents almost a tripling.
4.20 The fact that performance of own tax revenues in terms of growthrates or elasticities has not been poor should not obscure the fact thattaxes are very low, as the 4% figure above attests. Orissa collects only Rs20 per head in own tax revenues; this compares with an average of Rs 48 forthe 15 major States, and Rs 99 for Punjab, Rs 80 for Maharashtra, Rs 36 forMadhya Pradesh, Rs 23 for Bihar and Rs 31 for Assam. 1/ Thus in terms ofabsolute level of taxation, Orissa still has a very long way to go. How much
of this is due to poor tax effort, and how much to a taxable capacity whichremains to be developed is an interesting issue. Unfortunately it cannot bedealt with in this short paper.
4.21 In the past decade, non-tax receipts, such as revenues from irri-gation rates, forestry undertakings, interest receipts, etc. have grown much
less rapidly than tax receipts (11% per annum). Irrigation receipts havegrown rapidly in the past three years, just making up for poor cost recovery
and declining revenues throughout the sixties and early 1970s. Since 1974/75,efforts at better collections are quite striking, with a 3-fold increase inreceipts in 4 years. Whether this is evidence of a longer term change inthe pattern of cost recovery remains to be seen.
4.22 Forest receipts make up one-third of total non-tax receipts, as
might be expected, with Orissa's rich forest resources. The forest resourcein general remains underdeveloped, and more investment, if properly managed,
is likely to yield better returns from forestry operations. Income frominterest receipts, public works, (mostly building rents and tolls on govern-ment owned roads and bridges) have remained constant or declined.
4.23 The category "others" is a catch-all for administrative services,
social and development services and miscellaneous receipts. The first consistsof administration of justice (sale of unclaimed properties, court fees, etc.);jails (income from sale of jail manufactures); police and supplies (collection
of license fees). Under social services income come education (fees fromschools); medical and public health (medical fees and sale of medicines, feesfor preparing town drainage plans); agriculture (receipts from fisheries andfarms operated by the State) and cottage industries and cooperation. Receiptsfrom mines and minerals also come under this head.
1/ These figures are three year averages, see Volume III Chelliah "TheMeasurement of Tax Effort of State Governments".
- 96 -
4.24 In general, the trend in non-tax receipts, unlike tax receipts, isa function of the level of services provided, the development of the sectorand in the case of the State Government's commercial undertakings, the state'smanagement of these enterprises. It is on the non-tax side where Orissa'spoor performance, and poor effort are most visible. The picture on thenon-tax side is one of stagnation and decline, with a turn-around, beginningin 1974/5 in irrigation and forestry receipts. There is clearly a great dealof scope in increasing revenues from the non-tax source; additional resourcemobilization measures, better collection of arrears, management and collec-tion practices are necessary if the State is to avoid unintentional effectivesubsidization of the services it provides. Nevertheless, because taxablecapacity is indeed low, the same standards cannot be applied to Orissa as toother States.
4.25 The final State revenue receipts to be discussed are the grants fromthe Central Government. The first of these are the statutory grants, providedto the States through the Finance Commission's award. Orissa has continuallyreceived this special budgetary assistance; generally it has been onlyvery slightly less than the amount of the State's own tax revenues, 20% oftotal revenue receipts.
4.26 Natural calamities occur with unfortunate frequency in Orissa, andthe State has frequently required assistance for drought works for rebuildingafter floods. In the last year the State was eligible, 1.05 acres was trans-ferred on this account.
4.27 Centrally sponsored schemes are relatively rare in Orissa - grantsequivalent to just over 3% of revenue receipts were given in 1977/8. (Theloan portion of these schemes is found in the capital account.) Part of thereason for this is the high proportion of public sector investment in the State.
4.28 The grant in lieu of railway fares does not amount to very much.
4.29 To summarize, revenue receipts in Orissa have been acceptably buoyantover the period, growing 13% per annum in a period in which prices increasedat slightly over one-third that rate. On the other hand, the overall level ofreceipts has been extremely low; revenue receipts per capita are the lowest ofthe 15 major States. As a result, in spite of extreme economy in revenueexpenditures, the State has had a budget deficit for most of the recentperiod, (covered by ad hoc assistance from the center) whose consequence isthat no funds are available from budgetary sources, for financing the StatePlan. The State depends, therefore, entirely on borrowing central assistanceand additional resource mobilization undertaken during the Plan period. Thefollowing section discusses these trends in Plan and non-Plan expenditures.
- 97 -
III. Review of State Expenditures
Revenue Expenditures
4.30 Revenue expenditures make up some 16-18% of total expenditures
in Orissa, and have been growing at 11.4% per annum over the past decade,
more slowly than revenue receipts. Table 2 shows the allocation acrossvarious types of expenditure. Approximately two-thirds is spent on devel-opment items, primarly on education, irrigation, public health, and agri-
culture. The most important item in the non-development category is debt
service - this is common to most States, followed by the wages and over-
heads of state employees. Land revenue turns out to be a costly tax to
administer.
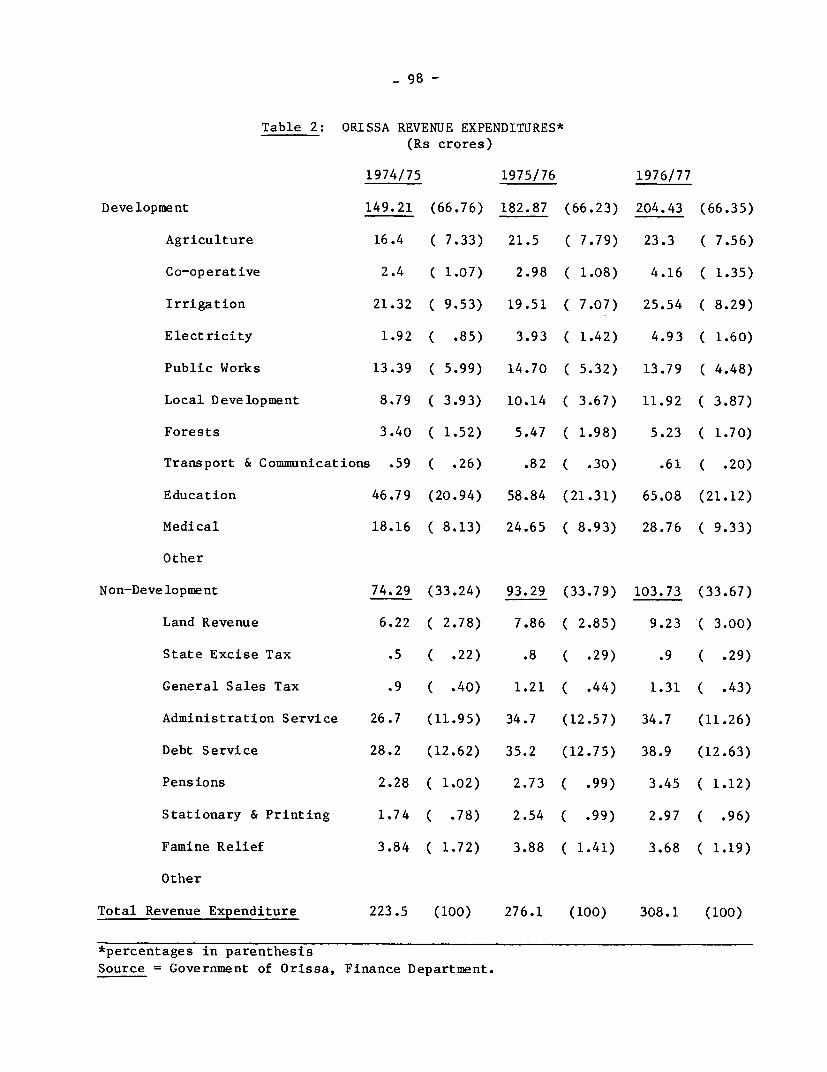
- 98 -
Table 2: ORISSA REVENUE EXPENDITURES*(Rs crores)
1974/75 1975/76 1976/77
Development 149.21 (66.76) 182.87 (66.23) 204.43 (66.35)
Agriculture 16.4 ( 7.33) 21.5 ( 7.79) 23.3 ( 7.56)
Co-operative 2.4 ( 1.07) 2.98 ( 1.08) 4.16 ( 1.35)
Irrigation 21.32 ( 9.53) 19.51 ( 7.07) 25.54 ( 8.29)
Electricity 1.92 ( .85) 3.93 ( 1.42) 4.93 ( 1.60)
Public Works 13.39 ( 5.99) 14.70 ( 5.32) 13.79 ( 4.48)
Local Development 8.79 ( 3.93) 10.14 ( 3.67) 11.92 ( 3.87)
Forests 3.40 ( 1.52) 5.47 ( 1.98) 5.23 ( 1.70)
Transport & Communications .59 ( .26) .82 ( .30) .61 ( .20)
Education 46.79 (20.94) 58.84 (21.31) 65.08 (21.12)
Medical 18.16 ( 8.13) 24.65 ( 8.93) 28.76 ( 9.33)
Other
Non-Development 74.29 (33.24) 93.29 (33.79) 103.73 (33.67)
Land Revenue 6.22 ( 2.78) 7.86 ( 2.85) 9.23 ( 3.00)
State Excise Tax .5 ( .22) .8 ( .29) .9 ( .29)
General Sales Tax .9 ( .40) 1.21 ( .44) 1.31 ( .43)
Administration Service 26.7 (11.95) 34.7 (12.57) 34.7 (11.26)
Debt Service 28.2 (12.62) 35.2 (12.75) 38.9 (12.63)
Pensions 2.28 ( 1.02) 2.73 ( .99) 3.45 ( 1.12)
Stationary & Printing 1.74 ( .78) 2.54 ( .99) 2.97 ( .96)
Famine Relief 3.84 ( 1.72) 3.88 ( 1.41) 3.68 ( 1.19)
Other
Total Revenue Expenditure 223.5 (100) 276.1 (100) 308.1 (100)
*percentages in parenthesis
Source = Government of Orissa, Finance Department.
- 99 -
4.31 Of the 16 - 18% of total expenditure on capital account, thebulk of it, approximately 95% represents Plan expenditures. Capital expen-ditures have grown at 13.7% per annum indicating that Orissa has succeeded indirecting an increasing proportion of State resources to development sectors,even though in absolute terms, the overall capital budget, and the Plan, isvery, very small. 1/
Composition of Plan Expenditures
4.32 Throughout the period, but especially since the Fourth Plan,Orissa has focused its efforts, as Table 3 shows, on three sectors: irriga-tion, power and agriculture. In the Sixth Plan period, the State expects tospend nearly 73% of all Plan outlays in these three sectors combined. Poweris being undertaken with the greatest intensity, taking up 31% of Plan expendi-ture. All other sectors--mineral and industrial development (which is allo-cated 3.4% of Draft Sixth Plan expenditures), transport and communication (8%)and human resource development have received far lower priority. Expendituresin the social service sector specifically have fallen from 16% of the Fourthand Fifth Plans to 13% in the Sixth through a decline in education and housingexpenditures.
4.33 It is very difficult to evaluate a States levels of Plan expendi-ture and the Plan strategy. They can be viewed in relation to deficienciesin infrastructure in each sector, or in relation to per capita expenditures inother States, or the Plan strategy can simply be taken as given.
4.34 As regards irrigation, there is no question that present levels ofinfrastructure development in the sector is very low. Orissa has vast irri-gation potential both from major rivers as well as groundwater. But inadequatedevelopment of irrigation facilities--less than 15% of net sown area ispresently irrigated--has led to low levels of productivity in areas where theagricultural potential is there. Moreover, existing irrigation facilities arefrequently underutilized, and the water supply system not always insure thatsmall farmers get their share. Both are to be remedied, according to theDraft Plan, although there is nothing in the document which suggests how thiswill be done.
1/ See appendix tables.

_ 100 -
Table 3: PLAN EXPENDITURE - ORISSA(in Rs. Crores)
(% in parenthesis)
II III Annual IV V VI* (Draft Plan
I. Agriculture & 17.88 39.97 21.55 46.00 67.54 208.40
Allied Sectors (20.64) (17.80) (17.25) (18.65) (14.89) (18.52)
II. Cooperation .97 2.37 1.72 6.75 9.89 22.00
( 1.13) (1.06) (1.38) ( 2.71) ( 2.18) ( 1.96)
III. Irrigation & 27.69 29.14 21.45 25.80 76.49 260.00
Flood Control (31.98) (12.97) (17.17) (10.34) (16.86) (23.11)
IV. Power 12.02 51.71 33.17 88.16 183.36 350.00(13.88) (23.03) (26.54) (35.36) (40.42) (31.11)
V. Industry & 3.94 20.26 11.94 21.14 13.24 38.00
Mining ( 4.56) ( 9.02) ( 9.55) ( 8.48) ( 2.92) ( 3.38)
VI. Transport & 6.04 38.46 17.37 16.63 28.62 93.65
Communication ( 6.97) (17.12) (13.90) ( 6.67) ( 6.31) ( 8.32)
VII. Social Services
i. education 6.47 17.63 6.34 14.75 26.57 47.00( 7.47) ( 7.85) ( 5.07) ( 5.92) ( 5.86) ( 4.18)
ii. health 3.50 14.66 7.96 14.96 21.90 61.00( 4.04) ( 6.53) ( 6.37) ( 6.00) ( 4.83) ( 5.42)
iii. housing 1.07 1.49 .43 7.43 11.59 19.00( 1.24) ( .66) ( .35) ( 2.98) ( 2.55) ( 1.69)
iv. other 3.83 4.56 2.19 3.16 11.02 20.00( 4.42) ( 2.03) ( 1.75) ( 1.26) ( 2.43) ( 1.78)
VIII. Economic Services .27 1.75
3.18 4.34 .83 4.06 ( .06) ( .16)
IX. General Services ( 3.67) ( 1.93) ( .67) ( 1.63) 3.13 4.20
( .69) ( .37)
Total PlanExpenditure 86.59 224.59 124.95 249.34 453.62 1125.00
* 5th Plan relates to 1974-75 to 1977-78.
- 101 -
4.35 Intensive power development is appropriate according to all of theabove criteria--installed capacity is the lowest of the 15 major States, as isgeneration. Domestic consumption is lower than all States but Bihar. Butmore importantly, it is felt that development of all other sectors, and theconcomitant development of the State, creation of employment, and attractionof industries is crucially dependent on this essential input. In the SixthPlan, Rs 350 crores are to be spent on power development. The bulk of thiswill be spent on additions to installed capacity, although the Plan includestransmission and rural electrification also. Institutional finance (mainlyARDC) will also contribute to the size of the rural electrification program.
4.36 In industry, the private sector is extremely weak, so to pushindustrial growth in Orissa, the State emphasizes the need for large scaleinvestments by the Central Government, although the Orissa State FinancialCorporation offers finance to local entrepreneurial activity. The State's owninput Plan-wise to industrial development and mining is correspondingly low,at 3.4% of Plan outlays.
4.37 Like it neighbors in the Eastern region, Orissa is rich in minerals,although exploitation to date has not gone far. In the Sixth Plan, furtherschemes for exploration and iron-ore extraction are planned.
4.38 Given its sparsely populated area, and vulnerability to weather,road transport facilities are a priority for a State like Orissa. The Plangoal is to provide all villages with populations greater than 1,500 with linkroads by the end of the Plan period. This sector has been allocated 8% ofSixth Plan outlays.
4.39 Among social services, universal primary education is the long-rungoal in the education sector, but it is still a very distant one, tentativelyto be achieved by the end of the Seventh Plan. At the end of the Fifth Plan,primary enrollments were about 80% and in upper primary, about 25%; althoughthe numbers are much lower in backward districts where distance is a problem.The Plan also focusses on adult literacy programs. Approximately 4% of Planoutlays are allocated to the education sector.
4.40 Public health facilities in Orissa are very poor, the doctor:
population ratio is 0.11 per thousand, and the bed:population is 0.47 perthousand, as compared to the al-India figures of 0.31 and 0.81 per thousand.These low overall standards are due to financial constraints and low level ofexpenditures on health which was only Rs 9 per capita, compared with an allIndia average of Rs 12.5. The objectives in the Sixth Plan are to achieve onehealth Center per 8000 population by 1982/3 and to strengthen the primaryhealth Center network. Family planning, financed in all States 100% by theCentral Government, also receives high priority. About 5.5% of Sixth Planexpenditures have been allocated to the health sector, including medicaleducation and rural water supply, both of which are still very deficient.
4.41 Outlays under "other", to which 2% of Plan expenditure has beenallocated, include, information and publicity, labor and labor welfare,craftsman training, development of backward classes, nutrition, welfare ofprisoners, and legal aid to the poor.
- 102 -
IV. The Plan: Financial Resources
4.42 Finance for the State Plan comes from five basic sources: (a) theState's surplus (if any) on current account, after all non-Plan expenditureshave been netted out from revenue receipts; (b) the contribution of publicsector enterprises; (c) central assistance, (d) negotiated and market loans,unfunded debt and other miscellaneous capital receipts, and (e) additionalresources mobilized during the Plan period. Ex post ad-hoc assistance fromthe Central Government or Reserve Bank, an increase in floating debt or saleof state assets can also contribute to financing the Plan, but these are, ofcourse, not planned sources of revenue when the Plan is being drawn up.
4.44 As table 4 shows, the contribution from the State s own revenues,the difference between non-Plan revenue receipts and non-Plan revenue expend-iture 1/ has been of a fairly large negative order, 10% of the estimated Plansize.
4.45 Additional resource mobilization is likewise a budgetary resourceconventionally accounted for apart from the ordinary revenue receipts becauseit is entirely earmarked for Plan finance. Examples of additional resourcemobilization measures include such things as changes in the issue price ofliquor, increases in the electricity tariff and bus fares, increases in therate of royalty on minerals, amendments to check evasion of sales tax and toprevent undervaluation of documents for stamp tax, higher retained receiptsfrom district lotteries, increases in court fee rates, higher sales tax rates,reductions in concessionary rates and withdrawals of tax exemptions, to namejust a few. Targets for additional resource mobilization are set by the Stategovernment in consultation with the Planning Commission at the time of theannual or 5-year Plan discussions to fix the State's contribution to its ownPlan.
1/ Note that while this is always loosely referred to as the revenue accountsurplus, it is, stricly speaking, the surplus (deficit) only of non-Planrevenues over expenditures on current account. Non-Plan revenue receipts,moreover, include only those receipts which would have been earned at ratesof tax prevailing at the beginning of the Plan period. Additional tax ornon-tax receipts, from rate increases introduced after the outset of thePlan, come under the heading "additional resource mobilization". At theoutset of the subsequent Plan period, the slate is once again clean, withall the previous Plan's additional measures included in revenue receiptsand a different set of new measures under this head.
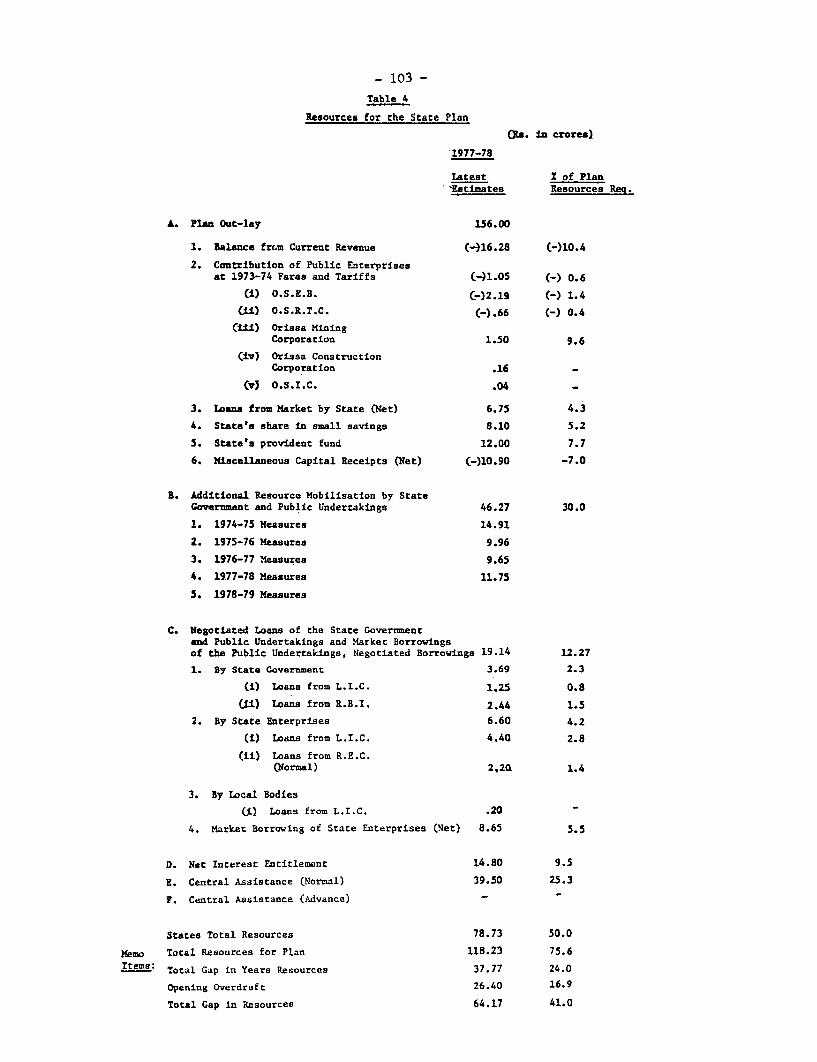
- 103 -
Table 4
Resources for the State Plan
CiA. in croreal
1977-78
Latest Z of Plan'Estimates Resources Req.
A. Plan Out-lay 156.00
1. Balance from Current Revenue (-)16.28 (-)10.4
2. Contribution of Public Enterprisesat 1973-74 Fares and Tariffs (-)1.05 (-) 0.6
(1) O.S.E.B. C-)2.19 (-) 1.4
Cii) O.S.R.T.C. (-).66 (-) 0.4
Ciii) Orissa MiningCorporation 1.50 9.6
(iv) Orissa ConstructionCorporation .16 _
Cv) O.S.I.C. .04 _
3. Loans from Market by State (Net) 6.75 4.3
4. State's share in small savings 8.10 5.2
5. State's provident fund 12.00 7.7
6. Miscellaneous Capital Receipts (Net) C-)lO.90 -7.0
B. Additional Resource Mobilisation by StateGovernment and Public Undertakings 46.27 30.0
1. 1974-75 Measures 14.91
2. 1975-76 Measures 9.96
3. 1976-77 Measures 9.65
4. 1977-78 Measures 11.75
5. 1978-79 Measures
C. Negotiated Loans of the State Governmentand Public Undertakings and Market Borrowingsof the Public Undertakings, Negotiated Borrowings 19.14 12.27
1. By State Government 3.69 2.3
(i) Loans from L.I.C. 1.25 0.8
(Ji) Loans from R.B.I. 2.44 1.5
2. By State Enterprises 6.60 4.2
(i) Loans from L.I.C. 4.40 2.8
Cii) Loans from R.E.C.CNormal) 2.20. 1.4
3. By Local Bodies
(i) Loans from L.I.C. .20 -
4. Market Borrowing of State Enterprises (Net) 8.65 5.5
D. Net Interest Entitlement 14.80 9.5
E. Central Assistance (Normal) 39.50 25.3
F. Central Assistance (Advance)
States Total Resources 78.73 50.0
Memo Total Resources for Plan 118.23 75.6
Ttems: Total Gap in Years Resources 37.77 24.0
Opening Overdraft 26.40 16.9
Total Gap In Resources 64.17 41.0
- 104 -
4.46 If additional resource mobilization over the Plan period is added tothe balance from current revenues, the State's budgetary contribution rises to20% of the Plan. This is very low compared to other States, in which up to40-60% can come from the State's own resources, and is simply a reflection ofOrissa's very low resource capacity.
4.47 The second item of Plan finance is the contribution of publicsector enterprises. This has been moderate throughout most Plan periods.
As pointed out in the introduction the figure simply represents the operatingsurplus and internal resources of the state corporations, not the enterprises'commercial profit.
4.48 Loans from the market and market borrowings of the State enter-prises, principally the Electricity Board amount to about 9.8% of Plan re-sources.
4.49 Negotiated loans of the State and State enterprises negotiatedprincipally from the Life Insurance Corporation of India and the Reserve Bankcontributed about 12% in 1977/78.
4.50 Small savings loans make a modest, though steady source of revenue,comprising about 5% of Plan resources.
4.51 "Miscellaneous capital receipts" are all the other net transactions
not accounted for under the other headings, such as short-term loans from theCentral Government, recoveries of loans and advances to other institutions by
the State Government, net accretions under various sinking funds and other netaccounts including non-Plan loans. In general, this is a negative figure,since a substantial amount is repaid to the Central Government and financialinstitutions.
4.52 Central assistance made up about 25% of plan expenditures in theyear under review. Central assistance on Plan account, (as opposed to theassistance on revenue account, discussed earlier) is composed of grants andloans, and is fixed by the Planning Commission. For Orissa, the assistance isgiven on a 70% loan, 30% grant basis, except for the funds earmarked for Plan
expenditures in tribal areas, which are given on a 10% loan, 90% grant basis.
Although it is not shown here, Orissa also receives special assistance from
the Central Government for its Plan, under the heading of "assistance forIspecial problems'.
4.53 Two other features should be noted: Orissa begins its financialyear 1977/8 with an opening overdraft. Moreover, after all sources of Planfinance have been taken into account, the expected size of the Plan remains32% larger than the resources available for it. There is a resource gap of
37.8 crores, in addition to the opening overdraft. This resource gap will befilled through various means, among them, the withdrawal from reserves,increase in floating debt and sale of securities. In addition, there are
various forms of ad hoc assistance from the Central Government which the Statemay take recourse to, including 'special problems' assistance.
- 105 -
4.54 The financial picture of Orissa is a troubling one. It shows a
State which is heavily dependent on the Central Government for financialassistance, and which has been unable to generate a revenue surplus to supple-
ment other sources of Plan funding. Quite the contrary, in most years in therecent past, the budget has shown a revenue deficit. The State's performancein the additional resource mobilization sphere remains an indication that
Orissa is indeed making efforts. Although these are sufficient to turn aroundthe revenue deficit so that a net positive balance of approximately Rs 30
crores was achieved in 1977/8, this reflects less than 20% of expected Plan
outlays, which is low by comparison with the average of 15 major States.
4.55 It is clear therefore that whatever progress the State is able tomake will be a function of resources from external sources or borrowing, and
that the State will continue to be affected closely, and far more than other
States, by the formula used by the Central Government in determining the
patterns of assistance, both on revenue and Plan account, to the States.
V. The Planning Process
Planning Machinery
4.56 Planning in Orissa is carried out by the Finance Department. There
is no separate department or Board for planning. The Finance Department atpresent functions as coordinator between the operational departments and is
the ultimate financial arbiter of overall Plan outlays as well as their
sectoral disposition. In the department's joint portfolio, Finance takes upthe bulk of the work, and the planning side is notably weak. Such planning as
is carried out consists, essentially, of an accounting and balancing of
revenues remaining after funds have been allocated to ongoing schemes; thereis no in-house facility for scrutinizing sectoral strategies, much less for an
examination of the State Plan on a project by project basis or for assisting
the individual departments in project evaluation or advising on the inclusionof specific projects in the departmental Plan.
4.57 In Orissa, a five-year plan of Rs 2525 crores expenditure ($2.9
billion) was put forward at the discussions with the Planning Commission. Thecenter's counter-proposal was a Rs 955 crore Plan. Subsequently the Plan has
been finanlized at Rs 1125 crores of which approximately Rs 237 crores is fromthe states own resources 1/ and the balance, Rs 888 crores, the Center-s
assistance plus borrowing.
1/ As per Sixth Draft Plan, November, 1978.
- 106 -
VI. Financing the Orissa Projects
4.58 The purpose of this review of state revenues and expenditures has
been to provide the background for an assessment of the State's implementationcapacity of the three irrigation projects, a brief description of which follows:
(i) Mahanadi Barrages. Preliminary, preparatory works on thisproject began in 1979/80. The barrages are expected tofinish in 1984/85, the second year of the Seventh Plan.Tentatively, the total cost of the works is estimated at$98 million (Rs 82 crores). Model studies for the projectremain to be completed by CWC, but eventually, they areexpected to show that the barrage needs shifting towardsthe left bank and that Kendrapara and Pattamundai canalswill function better if they are taken off from the leftbank of the Mahanadi Barrage rather than from the rightbank.
(ii) Subernarekha Irrigation Project. The project is to bea joint undertaking of the States of Bihar, Orissa (theprincipal partners) and West Bengal (minor share). Itwill provide irrigation to about 250,000 ha, industrialand municipal water supply to the Jamshedpur steel complex,and flood protection on the lower Subernarekha river. Theparticipating States have agreed on the sharing of thewater and the cost. The main investments will includetwo dams (Chandil and Kharkai), two barrages (Galudih andKharkai), main canals (including the Link Canal to Orissa),water distribution networks to 5-8 ha outlets, drainageand roads. The total cost is roughly estimated at US$500M.
(iii) Rengali Irrigation Project. The project is part of theRengali Multipurpose project which is being developed intwo stages. Stage I includes the construction of theRengali Dam on the Brahmani river for flood control,irrigation and hydropower generation (through two hydro-electric units of 50 m.w. each). Stage II envisagesdevelopment of irrigation over an area of about 400,000 haof CCA. It includes the construction of a barrage on riverBrahmani (Samal barrage), two main canals on the left andright river banks, the distribution system to 5-8 haoutlets, drainage and roads. The total cost of Phase 1 isroughly estimated at US$160 M.
4.59 Of these three, works have begun on the first two, for Subernarekha,implementation is presently scheduled to begin in 1981/82.
- 107 -
4.60 Since the projects have not yet been appraised and some modifica-
tions may still be made, the first step in analyzing State implementation
capacity, namely fixing project costs, has not been made. All references to
costs are therefore taken from the estimates provided by the Orissa Irrigation
Department. 1/ Assessing the likelihood of smooth and timely implementation
of the three irrigation projects rests on the answers to two questions:
(a) Does the State have the ability to provide the
necessary resources?
(b) Is the heavy expenditure required for the three irrigation
projects consistent with State priorities as far as irri-
gation development relative to other sectors is concerned,
and within the irrigation sector itself, is this heavy
expenditure consistent with the Irrigation Department's
priorities?
4.61 The first question is a function of the resources available for the
State Plan, the rate at which they will grow over the period of project imple-
mentation and the availability of Plan resources to the irrigation, as opposed
to other sectors. The second question can be approached by looking at the
proportion of State Plan outlays earmarked for the Irrigation Department in
the period over which the projects will be implemented. Is this proportion in
line with the past trend of expenditures in the sector? If not, which sectors
will this larger commitment come at the cost of? Within the irrigation sector
itself, expenditure trends must be examined for any break in the past pattern
of investment as between major, medium and minor schemes. If there are such
changes which come at the expense of expenditures on which the State also
places great priority, conflicts may arise and allocations to one or more of
the projects could undergo some slippage. Table 5 provides the basic framework
for analyzing the first issue.
4.62 Total Orissa commitments to Bank-financed projects in medium
and major irrigation are expected to total Rs 620 crores, or $738 million,
by 1990. This is a sizeable commitment, and averages out to Rs 23 per
capita, per year. Line (5) shows the proportion of irrigation department
outlays which, by mission estimates, will be committed to Bank-financed
projects. In the Sixth Plan, on average 67% of outlays are on Bank-financed
projects; in the Seventh Plan, the proportion averages 61%, although with
phasing of expenditures as proposed by the irrigation department, Bank com-
mitments absorb close to all of irrigation budget in the years 1983/84 and
1984/85. Not shown in the table, but worth pointing out, is that, if to
these committments, are added: (1) pre-Fifth Plan projects which remain
1/ The estimated project costs provide a probable lower bound to actual
costs; both design criteria as well as physical and price contingencies
may differ, most likely raising, not lowering costs. From the point of
view of implementation capacity, the project costs should be thought of
as a lower bound.
- io8 -
unfinished, and (2) Fifth Plan projects still incomplete this amounts tomore than 100% of projected outlays 1/ in the initial years of the SeventhPlan excluding spillover from Sixth Plan expenditures, as presently phased.
4.63 In sum, the table shows that the bulk of the Sixth and Seventhirrigation Plans do consist of World Bank projects, although at the outsetof the period a few ongoing schemes do come to completion and towards theend there is some slack so that new schemes can be begun.
4.64 Several comments need to be made about this table. The firsthas to do with the total cost of the new projects, which, as furnished by theIrrigation Dpartment will be Rs 81 crores, Rs 244 crores, and Rs 167 croresrespectively or almost $590 million, by completion of all three in 1990. Thisis a large figure, and one which has not been agreed by the State Government.All three projects are still far from appraisal; hence, price and physicalcontingencies, as well as project design, may ultimately change these costs.
4.65 The second caveat is that the bulk of the expenditures as estimatedby the Irrigation Department take place in the seventh Plan period. The sixthPlan is still in draft form, and likely outlays in the Seventh Plan - whethertotals or for the Irrigation Department, are even more tentative. In thistable, on the basis of discussion with the State Finance Department and thePlanning Commission, the Seventh Plan has been assumed to be Rs 2800 crores,2.5 times larger than Sixth Plan. The author feels this figure is generous,and is more in the nature of an upper bound on Plan growth given the growthin revenue trends of the State, discussed earlier. Thus, all the proportionswhich contain this figure in the denominator must take this into account.
4.66 Similarly, the likely allocation of Plan resource to the IrrigationDepartment--assumed to remain constant at 22% of total Plan outlays--is but abest guess of what is likely to happen 4 - 10 years .hence. It amounts to alarger figure than that presented by the Irrigation Department for its bestestimate of the Seventh Plan. Should this proportion increase, the resourceposition for the Irrigation Department would be correspondingly eased.However, such a rise is not likely, because of the pressure to maintain Planoutlays in the power sector. Several large projects were completed at the endof the Fifth Plan, leading to a temporary lull in the momentum of investmentin power. This provided the margin to increase irrigation department expend-itures, which are expected to rise to 25% of Plan outlays in the last year ofthe Sixth Plan. In the Seventh Plan however, it is likely that efforts toincrease investments on the power front will be renewed, it is for this reasonthat irrigation department outlays are projected at 22% through the seventhPlan.
1/ This result does not occur if the phasing for Seventh Plan annual expend-itures provided by the Irrigation Department is used, a phasing whichstruck the mission as most improbable, since annual Plan expenditureswere phased to decline from Rs 137 crores in the first year of theSeventh Plan to Rs 68 crores in the final year. The mission has pro-jected a rising trend, in line with past trends.
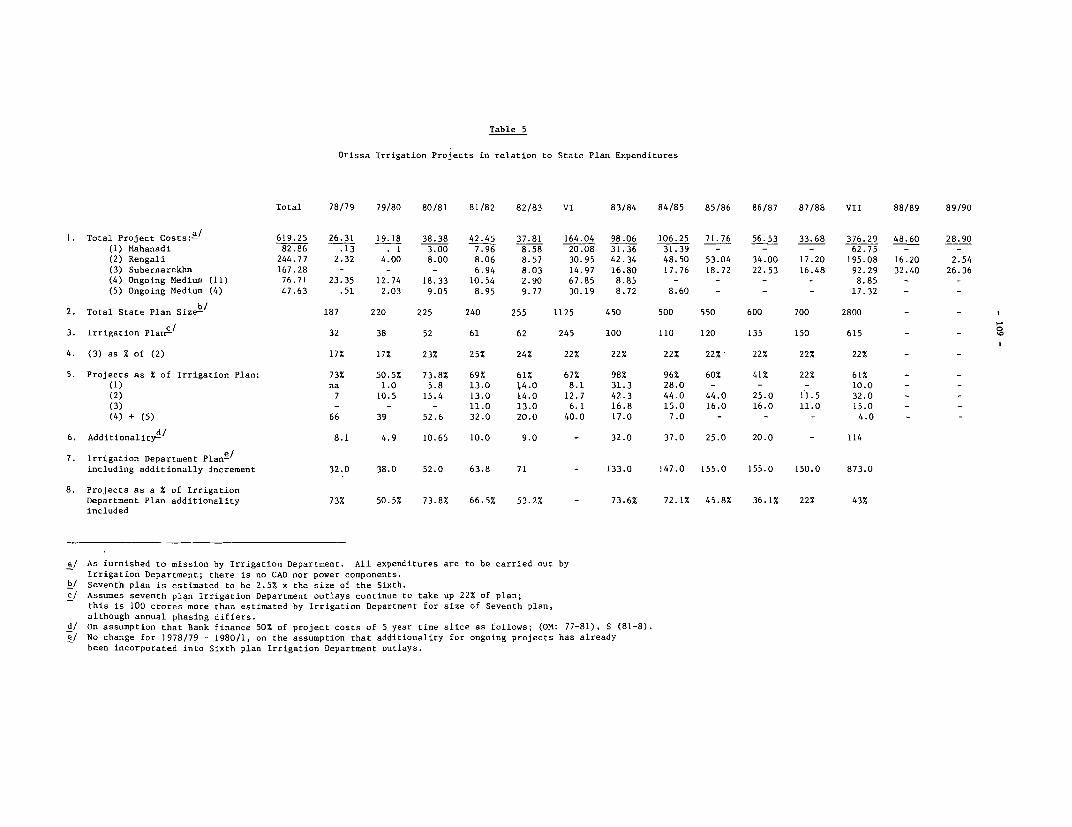
Table 5
Orissa Irrigation Projects in relation to State Plan Expenditures
Total 78/79 79/80 80/81 81/82 82/83 VI 83/84 84/85 85/86 86/87 87/88 VII 88/89 89/90
1. Total Project Costs:a/ 619.25 26.31 19.18 38.38 42.45 37.81 164.04 98.06 106.25 71.76 56.53 33.68 376.29 48.60 28.90
(1) Mahanadi 82.86 .13 . 1 3.00 7.96 8.58 20.08 31.36 31.39 - - _ 62.75 - _
(2) Rengali 244.77 2.32 4.00 8.00 8.06 8.57 30.95 42.34 48.50 53.04 34.00 17.20 195.08 16.20 2.54
(3) Subernarekhn 167.28 - - - 6.94 8.03 14.97 16.80 17.76 18.72 22.53 16.48 92.29 32.40 26.36
(4) Ongoing Medium (11) 76.71 23.35 12.74 18.33 10.54 2.90 67.85 8.85 - - - - 8.85 - -
(5) Ongoing Medium (4) 47.63 .51 2.03 9.05 8.95 9.77 30.19 8.72 8.60 - - 17.32 - _
2. Total State Plan Size-b 187 220 225 240 255 1125 450 500 550 600 700 2800 - -
3. Irrigation Plan'- 32 38 52 61 62 245 100 110 120 135 150 615 - -
4. (3) as % of (2) 17% 17% 23% 25% 24% 22% 22% 22% 22% 22% 22% 22% - -
5. Projects as % of Irrigation Plan: 73% 50.5% 73.8% 69% 61% 67% 98% 96% 60% 41% 22% 61% - -
(1) na 1.0 5.8 13.0 14.0 8.1 31.3 28.0 - - - 10.0 - -
(2) 7 10.5 15.4 13.0 14.0 12.7 42.3 44.0 44.0 25.0 11.5 32.0 - -
(3) - - - 11.0 13.0 6.1 16.8 15.0 16.0 16.0 11.0 15.0 - -
(4) + (5) 66 39 52.6 32.0 20.0 40.0 17.0 7.0 - - - 4.0 - -
6. Additionalityd/ 8.1 4.9 10.65 10.0 9.0 - 32.0 37.0 25.0 20.0 - 114
7. Irrigation Department Plan-/
including additionally increment 32.0 38.0 52.0 63.8 71 - 133.0 147.0 155.0 155.0 150.0 873.0
8. Projects as a % of Irrigation
Department Plan additionality 73% 50.5% 73.8% 66.5% 53.2% - 73.6% 72.1% 45.8% 36.1% 22% 43%
included
a/ As furnished to mission by Irrigation Department. All expenditures are to be carried out by
Irrigation Department; there is no CAD nor power components.
b/ Seventh plan is estimated to be 2.5% x the size of the Sixth.
c/ Assumes seventh plan Irrigation Department outlays continue to take up 22% of plan;
this is 100 crores more than estimated by Irrigation Department for size of Seventh plan,
although annual phasing differs.
d/ On assumption that Bank finance 50% of project costs of 5 year time slice as follows; (OM: 77-81), S (81-8).
e/ No change for 1978/79 - 1980/1, on the assumption that additionality for ongoing projects has already
been incorporated into Sixth plan Irrigation Department outlays.
- 110 -
4.67 Finally, there must be a caveat about the price escalation (8%)built into the Irrigation Department's estimates. These account for 34% ofthe total twelve year cost estimate. Any changes here, therefore, can make abig difference. Also, since all three projects are still far from appraisal,the annual phasing of the three projects, especially Subernarekha is still indoubt. Modifications here will also affect the ultimate burden on the Irri-gation Department Plan relative to the Department's other committments tonon-bank ongoing or new schemes.
4.68 Since the projects will be financed by foreign assistance, Orissawill receive additionality funds - 70% of project disbursements - which mustbe added to the State's present expected levels of Plan outlays to arrive atthe total irrigation Plan outlays, taking the effects of additionality intoaccount. Line 6 shows the additionality Orissa can expect to receive fromthe four projects (for ongoing medium, for the time-slice 1977/78 - 1982/83,for Subernarekha and Rengali 1982/83 - 1986/87 and for Mahanadi, 1980/81 -1985/86) on the assumption that all projects will be financed 50% by the WorldBank. Line (7.) shows the level of Irrigation Department outlays, inclusiveof additionality. A Seventh Plan of Rs 615 crores is the mission estimate:if the three major projects are in fact financed by the World Bank, then anadditional Rs 114 crores will become available for the State/irrigationdepartment Plan. The size of the Sixth Plan remains unchanged, since it isassumed that additionality has already been incorporated, the bulk of itderiving from projects which were ongoing pre-sixth Plan projects. Theproportion of Bank-assisted projects relative to this additionality inclusivePlan size are shown in line (8).
4.69 There is little way of knowing whether the Irrigation Department Plan,estimated at Rs 615 crores, will be based on the assumption that the projectswill go forward with Bank financing (and that the Rs 615 crores is thereforeinclusive of the additionality expected) or whether it has been drawn up onthe assumption that a program of this size is to be implemented regardless offinancing Plans. (In this case, if the projects do obtain Bank financing, the
- ll -
department will receive an additional, unexpected Rs 115 crore windfall). _/
If the former is the case, line (5) is relevant, if the latter, then line
(8) is the appropriate figure.
4.70 Additionality implies that Bank projects will require 63% of Irri-
gation Department outlays on the Sixth Plan, instead of 67% and to absorb 43%
in the Seventh instead of 61%.
4.71 The scenario depicted in Table 5 suggests that with the four pro-
jects in Orissa, the Bank is effectively implementing the major part of the
State's irrigation Plan. This represents a high degree of exposure for the
Bank, since any changes are likely to affect four projects simultaneously
there being so little slack in the secotr. The slack is reduced to near-zero
at the outset of the Seventh Plan, even though the figures include only spill-
overs from the Sixth Plan and no new projects to be taken up in the Seventh
Plan. Some rephasing of Sixth Plan projects, whether Bank or internallyfinanced, must clearly be contemplated. Both the estimates for the overall
size of the seventh Plan, and the Irrigation Department's share in it, are on
the generous side. Thus, it is unlikely that the financial burden represented
by the present arrangements would be significantly eased by an increase in
financial outlays to the state or to the sector.
I/ This assumption implies that additionality funds are indeed earmarked for
the department concerned, and effectively, do not substitute for funds
which the State would have allocated to the department in any case. The
implication is that additionality indeed does enable more ambitious pro-
jects to be carried out than would otherwise be the case. It is further
assumed that within the Irrigation Department itself, additionality
contributes to financing of the project on behalf of which funds are
received. This is tantamount to saying that additionality does not
substitute for funds which the Irrigation Department itself would have
earmarked for the Orissa projects, were there no additionality. Again,
the assertion was that additionality enable the Department to carry out
a larger project. The question of whether additionality is additional
in the first place to the assistance the State Government receives from
the Center is of course the most basic one. Given the political circum-
stances, it appears that indeed, the states are getting a larger share of
the pie, and that the Central Government is not reducing its assistance
on one front while providing additionality. From an economic point of
view, a fairly clear case can be made for suggesting that additionality
does not come at the cost of Central Government expenditure either, but
is manifest in a larger budget deficit. The latter argument is quite
compelling; the machinations within the Planning Department and the
Irrigation Department are less easy to know. If the assumptions are
indeed mistaken, to take the opposite case, there is full substitution,
both at State and Department level the figures and proportions in Line
(7) will be substantially higher - but the resource position of both
State and Department will still be eased. There is no change in direc-
tion.
- 112 -
State Priorities
4.72 Table 6 confirms the priority Orissa places on irrigation. Sincethe Fourth Plan, allocations to the irrigation sector have been growingrapidly, from 9.4% of total outlays to 22% for the sixth Plan period. Anyreduction in this level is unlikely, because Orissa is very determined toseek economic development though intensive efforts in the power and irriga-tion sectors. The assumption of 22% of Plan outlays allocated to irrigationin the seventh Plan, therefore, seems easily justifiable, although, as notedearlier, it is unlikely to be increased because of competing demand from thepower sector.
- 113 -
Table 6: PLAN EXPENDITURE - ORISSA(in Rs. Crores)
(% in parenthesis)
II III Annual IV V VI* (Draft Plan)
I. Agriculture & 17.88 39.97 21.55 46. 67.54 208.40
Allied Sectors (20.64) (17.80) (17.25) (18.65) (14.89) (18.52)
II. Cooperation .97 2.37 1.72 6.75 9.89 22.00
( 1.13) (1.06) (1.38) ( 2.71) ( 2.18) ( 1.96)
III. Irrigation & 27.69 29.14 21.45 25.80 76.49 260.00
Flood Control (31.98) (12.97) (17.17) (10.34) (16.86) (23.11)
IV. Power 12.02 51.71 33.17 88.16 183.36 350.00
(13.88) (23.03) (26.54) (35.36) (40.42) (31.11)
V. Industry & 3.94 20.26 11.94 21.14 13.24 38.00
Mining ( 4.56) ( 9.02) ( 9.55) ( 8.48) ( 2.92) ( 3.38)
VI. Transport & 6.04 38.46 17.37 16.63 28.62 93.65
Communication ( 6.97) (17.12) (13.90) ( 6.67) ( 6.31) ( 8.32)
VII. Social Services
i. education 6.47 17.63 6.34 14.75 26.57 47.00
( 7.47) ( 7.85) ( 5.07) ( 5.92) ( 5.86) ( 4.18)
ii. health 3.50 14.66 7.96 14.96 21.90 61.00
( 4.04) ( 6.53) ( 6.37) ( 6.00) ( 4.83) ( 5.42)
iii. housing 1.07 1.49 .43 7.43 11.59 19.00
( 1.24) ( .66) ( .35) (2.98) ( 2.55) ( 1.69)
iv. other 3.83 4.56 2.19 3.16 11.02 20.00
( 4.42) ( 2.03) ( 1.75) (1.26) ( 2.43) ( 1.78)
VIII. Economic Services .27 1.75
3.18 4.34 .83 4.06 ( .06) ( .16)
IX. General Services ( 3.67) ( 1.93) ( .67) (1.63) 3.13 4.20( .69) ( .37)
Total Plan Expenditure 86.59 224.59 124.95 249.34 453.62 1125.00
* 5th Plan relates to 1974-75 to 1977-78.
- 114 -
4.73 Table 7 approaches the second part of the second question: Dothe projects - major irrigation works - imply any distortions in the Planallocation as between major, medium and minor schemes?
Table 7: ORISSA: IRRIGATION SECTOR EXPENDITURES(Rs crores)
(% in parenthesis)
Plan Period: III Annual IV V VI VII
Type of Scheme:
Major: 14.09 28.58 136.34 475(54.6) (36.5) (50.0) (92)
26.22 20.44(95.8) (92.9)
Medium: 9.78 42.05 108.66 141(37.8) (53.6) (39.0) (8)
Minor: 1.14 1.56 1.92 7.72 30.0(4.2) (7.1) (7.4) (9.8) (11.0) -
TOTAL: 27.36 22.00 25.79 78.39 275.0 616
Source: Irrigation Department, GOO.
4.74 The proportion of minor irrigation undertaken by Irrigation Depart-ment has increased slightly over the past four Plan periods from 7% in theAnnual Plans to 11% in the Sixth Plan, in which major and medium projectsmake up 89% of the Irrigation Department Plan. Within the sector, though,there has been a major shift between major and medium schemes, which ac-counted for 36% and 54%, respectively in the Fifth Plan, but 50% and 39% inthe Sixth. A further shift is envisaged in the Seventh Plan. As presentedby the Irrigation Department, 92% is anticipated for major schemes, and 8%for medium.
4.75 Notwithstanding the State's stated shift in priorities towardsmajor irrigation, many exploitable medium schemes having been taken upthrough the Bank-assisted ongoing project, it is unlikely that investmentsin medium schemes can be reduced to the extent implied by the estimates pre-sented in the Irrigation Department Plan for no new medium or minor schemesto be taken up during the Seventh Plan. Thus, either the overall irrigationPlan must be larger to accommodate the planned major, some additional medium
and minor schemes, or likely inclusion of medium and minor schemes will cutinto the present phasing of the major works.
- 115 -
4.76 To summarize: the Plans for concurrent implementation of the threemajor irrigation projects, Mahanadi barrages, Rengali and Subernarekha, in
addition to the State's ongoing medium irrigation projects is likely to putsome financial strain on the State, especially at the beginning of the seventhPlan. The large proportion of Irrigation Department outlays devoted to major
irrigation, at the cost of medium and minor schemes which are politicallypopular is also a potential source of conflict. Both issues should be followedup during appraisal and postponement of Subernarekha on which works have not
yet begun or rephasing of outlays considered.
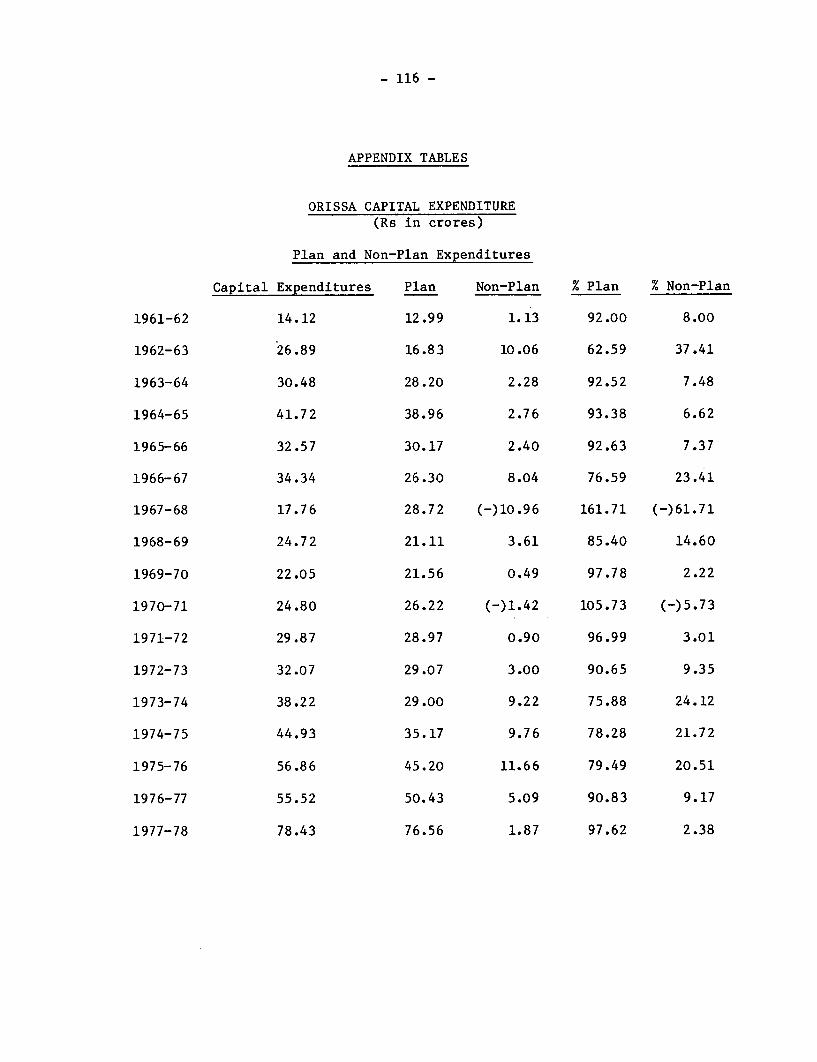
- 116 -
APPENDIX TABLES
ORISSA CAPITAL EXPENDITURE(Rs in crores)
Plan and Non-Plan Expenditures
Capital Expenditures Plan Non-Plan % Plan % Non-Plan
1961-62 14.12 12.99 1.13 92.00 8.00
1962-63 26.89 16.83 10.06 62.59 37.41
1963-64 30.48 28.20 2.28 92.52 7.48
1964-65 41.72 38.96 2.76 93.38 6.62
1965-66 32.57 30.17 2.40 92.63 7.37
1966-67 34.34 26.30 8.04 76.59 23.41
1967-68 17.76 28.72 (-)10.96 161.71 (-)61.71
1968-69 24.72 21.11 3.61 85.40 14.60
1969-70 22.05 21.56 0.49 97.78 2.22
1970-71 24.80 26.22 (-)1.42 105.73 (-)5.73
1971-72 29.87 28.97 0.90 96.99 3.01
1972-73 32.07 29.07 3.00 90.65 9.35
1973-74 38.22 29.00 9.22 75.88 24.12
1974-75 44.93 35.17 9.76 78.28 21.72
1975-76 56.86 45.20 11.66 79.49 20.51
1976-77 55.52 50.43 5.09 90.83 9.17
1977-78 78.43 76.56 1.87 97.62 2.38
- 117 -
CHAPTER V
GUJARAT STATE FINANCES AND
PLANNING FOR IRRIGATION AND AGRICULTURE
Roger GraweIndia Division
- 118 -
GUJARAT STATE FINANCES AND PLANNING FOR IRRIGATION AND AGRICULTURE
TABLE OF CONTENTS
Page No.
PREFACE 119
I. GUJARAT: HISTORY AND BACKGROUND ......................... 120Background ............................................... 120Salient Economic Features ................................ 120
II. TRENDS IN GUJARAT GOVERNMENT FINANCE ..................... 121
Structure of State Accounts ............................ 121State Income ........................................... 122State Expenditure ...................................... 127
III. PLANNING FOR IRRIGATION AND AGRICULTURAL INVESTMENT
IN GUJARAT ............................................. 127
General Planning Framework ............. .. ................ 127Irrigation Planning ...... ................... ............. 128Plan Investments ...... .............. ..................... 131Projected Expenditure ................ .. .................. 137
Tables
1. Sources of Gujarat State Finances 1232. Fifth Plan Period-Budget Expenditures Plan and Non-Plan
Expenditures on Agriculture and Irrigation 1253. Plan Expenditure as % of Total Expenditures in Each
Category 126
4. Statement of Outlays and Expenditure - Gujarat State
Fourth Five-Year Plan, 1969/70-1973/74 1295. Role of Agriculture and Irrigation in Gujarat Plan
Outlay and Expenditures 1326. Gujarat: "Implementation Ratios", Plan Outlays
and Expenditures 1347. Gujarat Progesss of Irrigation 136
- 119 -
GUJARAT STATE FINANCES AND PLANNING FOR IRRIGATION AND AGRICULTURE
Preface
This study was undertaken in support of a review of medium irri-gation in Gujarat. A proper assessment of the prospects for the State'sproposed investment program for medium irrigation could not be made outsidethe context of State planning and State finances.
Data for the study was collected during a mission to India in June1977. The author wishes to acknowledge the useful comments of Armand VanNimmen, Per Ljung, the mission leader, and John Wall. Consequently, it wasdecided to review briefly but systematically both the financial magnitudesand the institutional setting in the State. The resulting case study wasintended to indicate whether such reviews were feasible and useful so thatthey might become regular features of preparatory work on large State sectorprojects.
The paper is organized as follows: An introductory section pro-vides a brief overview of the State of Gujarat, its history, salient economicfeatures. In Section II, trends in State finance are reviewed. In SectionIII more detailed treatment is given to the process of planning in Gujarat,particularly as it affects the irrigation and agriculture sectors. The allo-cation pattern between major and medium irrigation will be reviewed and thefinancial feasibility of the projected medium irrigation program will beevaluated. The components of Plan expenditures in agriculture will besimilarly analyzed. Trend projections of likely expenditures in relevantcategories will be presented. This information is intended to assist inthe appraisal of the project size in the light of the State's capacity tomaintain allocations to the sector commensurate with its other commitments.
- 120 -
I. GUJARAT: HISTORY AND BACKGROUND
Background
5.01 Gujarat is one of India's newest States, created in 1960 under the
Bombay State Reorganization Act which split the State of Bombay into Gujarat
and Maharastra. The bifurcation of the State was made along linguistic lines,
and language is basically the only unifying feature of the State. Geographic-ally it is extremely varied, ranging from desert in the area near the Kutch
district to the rich, moist rice-growing areas of the southwest. Gujarat
history goes far back: lack of present day. Gujarat had contract with the
Indian Valley civilizations and the area is rich in paleolithic finds. Like
most of Northern India from the 4th-8th centuries, Gujarat was part of the
Mauryan and Gupta empires; it was in the 8th century that the first Parseemigrations began. The area was under Muslim domination from 1298, and fric-
tion with neighboring Rajput States was a source of constant trouble for
ruling sultans, who did, however, successfully rebuff the Portuguese trying
to establish trading centers along the coast. At the time of Independence,
all component princely States of what was then the Bombay Presidency, joined
the Indian union, forming Bombay State.
Salient Economic Features
5.02 Gujarat has a (1971) population of 26.7 million and an area of
196,000 square kilometers, giving it India's 4.9% of Indian population (the
9th largest) and 6% of its total land area. Gujarat is relatively ubranized,
with 28.1% of the population living in towns and cities, compared to the all
Indian average of 19.9. This places it third after Maharastra and Tamil Nadu.
Its villages, too, though scattered, are large; having an average population
of 1051, compared with the all-India figure of 762. The population of Gujarat
is highly literate - almost 36% of the population ws recorded as literate in
the 1971 Census, compared to 29% for India on a whole, and 40% for Tamil Nadu
and 18% for J&K, the States in the tails of the distribution.
5.03 Agriculture dominates the State economy, employing 67.6% of the
labor force and contributing 40% of GDP. Principal crops are wheat, jowar
and bajra, and amongst non-foodgrain, cotton and groundnut. Even in normal
years, Gujarat is a heavy foodgrain deficit State, with per capita foodgrainproduction of 132 kg, compared to the all Indian figure of 186 kg per person.
Irrigation development remains extremely low; with only 16% of net sown area
irrigated (compared to 23% for India as a whole). Multiple cropping is also
infrequent. Only 6% of net sown area is cropped more than once, compared
with 23% in the country overall, and 46% in States such as Haryana and
Punjab. Fertilizer consumption, however, is more or less the same as for
all States taken together. As a result, yields on foodgrains, rice, cereals
and pulses are below the all India average.
5.04 Industry in Gujarat by contrast is well developed. Per capita gross
output is Rs 1,000 per capita, second only to Maharastra, with Rs 1,284 and
per capita value added is Rs 190 compared to Rs 281 for Maharastra. In terms
of almost any measure--gross output, persons employed, productive capital,
- 121 -
etc., textiles industry dominates the State. In terms of net value added,the industry contributes 45%, chemicals 18%, machinery 9% and all others28%.
5.05 Per capita incomes in Gujarat, Rs 1,038 in 1975, are above the allIndia average of 989, but not by much.
5.06 From the point of view of social infrastructure development Gujaratgenerally ranks fairly high. A well developed transport network serves theState. Per capita consumption of electricity is 40% above the all Indiaaverage, 39% of villages have been electrified compared with 35% in Indiags a whole. Primary school enrollments are above the all Indian average.In terms of medical facilities, however, Gujarat fares poorly. There are70 hospital beds per lakh of population compared to 81 for India asa whole.
5.07 To summarize in terms of economic and social development, Gujaratpresents a mixed picture. On some indicators the State ranks well abovethe all-India level. On the other hand, agriculture remains very low pro-ductivity. Gujarat is clearly among the better off of India's States, butcannot by any means be classified as a "success case even in relativeterms.
5.08 In the following section, the State's financial resources areexamined.
SECTION II - TRENDS IN GUJARAT GOVERNMENT FINANCE
5.09 Structure of State Accounts. State financial accounts are cate-gorized in several different ways. Expenditures and receipts are both splitinto revenue and capital accounts. The revenue account balance representsroughly the excess or deficit of tax and non-tax revenue (i.e., receiptsexcluding borrowings) over recurrent expenditures while the capital accountcorresponds roughly to a statement of changes in the assets and liabilitiesof the State. On the expenditure side each of these categories is furtherbroken down into development and non-development. Development expendituresconsist of all expenditures except those which relate directly to the admin-istration and fiscal services of the State Government. Development expendi-tures, in turn, are subdivided into social and community services and economicservices each of which consists of several functional categories (education,housing, agriculture, water development, etc.). Non-development expendituresaside from administration, debt service and repayment also include loans andadvances by the State Government; but these are rarely of consequential size.All expenditures on projects in the State's Annual Plan are classified asdevelopment expenditures; the non-Plan classification includes all non-development expenditures and the recurrent portion of development expenditures.In principle, all investments undertaken by the State are included in theState's Annual Plan, though some minor irrigation works may escape inclusionas they are the responsibility of District Panchayats and could be fundedfrom general resources available to the Panchayat.
- 122 -
5.10 State Income. Tax revenues are the major source of funds to the
State and are growing in importance from 51% of the total in 1973/74 to 63%
in the budget estimates for 1977/78. Tax revenues have almost doubled while
total receipts of Gujarat have increased by 53% from 1973/74 to the budget
estimates of 1977/78. Gujarat's share in central taxes has remained rela-
tively constant as a proportion of total receipts at 14-15%. At the State
level, taxes on property and capital constitute 4-5% of the total while sales
and other consumption taxes constitute the cornerstone of the State's revenue
system providing approximately 30% of total receipts. Based on final accounts
data for 1973/74 through 1975/76, the contribution of taxes on agriculturalproduce to total sales tax revenue has averaged 13%. This percentage fell
over these three years, however, this is mostly due to worsening agricultural
terms of trade through 1975/76--a phenomenon which has subsequently reversed
itself. Commodities which are subject to agricultural sales tax in Gujarat
are groundnuts and other oilseeds, groundnut oil, cotton, and sugar. Ground-
nut oil is taxed at the rate of 5%, all others at 4%. Oilseeds and cotton
fall in the category of "declared goods" which can only be taxed at one
stage of production. As these are the two most important cash crops produced
in Gujarat and their processing constitutes a significant portion of industrial
activity in Gujarat, this restriction reduces the tax base and the effective
rate on value-added for these commodities. As the following figures indicate,
Gujarat has maintained a significant surplus on the revenue account in recentyears, indicating tax effort reasonably responsive to development needs. Based
on final account figures for 1974/75, the latest year for which all-India
comparisons are readily availabile (RBI Bulletin; December 1976), Gujarat's
revenue budget position was sixth among 21 States. This same position was
maintained for budget estimates in 1976/77.
1973/74 1974/75 1975/76 1976/77 1977/78(R.E.) (B.E.)
(Rupees, millions)
Surplus (+) or Deficit (-)on Revenue Account -2.9 +243.5 +721.0 520.5 825.3

Table 1: Sources of Gujarat State Finances
1973/74 1974/75 1974/75 1975/76 1975/76 1975/76 1976/77 1976/77 1977/78Actuals Revised Estimate Actuals Budget Estimate Revised Estimate Actuals Budget Estimate Revised Estimate Budget Estimate
Share in Central Taxes 5867 6341 6349 6886 8120 8316 7839 8478 8755Income 2720 2844 2844 3053 4069 4074 3258 3601 3704Estate 87 41 49 44 42 42 42 40 40Exise 3060 3456 3456 3789 4009 4200 4539 4837 5011
Property & Capital Taxes 1631 1571 1586 1700 1900 2221 2097 2859 3016Land Revenue 791 650 638 650 700 867 700 829 829Stamps, etc., other 840 921 948 1050 1200 1354 1397 2030 2187
State Taxes 13488 17239 18529 19142 21085 21377 24140 26134 27843Exise 90 93 97 97 100 126 107 190 200Sales 9397 12264 13452 13313 15482 15585 17704 19040 20000Vehicles 887 1055 1079 1319 1180 1162 1265 1293 1409Goods & Passengers 1286 1722 1713 2134 1936 1961 2231 2259 2478Electricity 971 1067 1080 1174 1130 1177 1425 1875 2162Entertainment 683 761 873 827 981 1002 1132 1175 1294Other 174 277 235 278 276 364 276 302 300
Tax Revenue 20986 25151 26464 27728 31105 31914 34076 37471 39614Interest Receipts 2408 2505 2486 3307 2724 3134 3519 3285 4121Dividends & Profits 283 319 213 328 250 382 300 557 420Other non-Tax Revenue 4304 4748 4925 4284 4627 5161 5389 7087 7465
General services 1033 544 658 620 1089 866 943 1133 1029Social services 676 665 857 619 680 1036 986 1079 898Economic services 2595 3539 3410 3045 2858 3259 3460 4875 5538
Cooperation 62 92 94 83 92 104 106 108 120Agriculture 166 74 107 119 98 85 111 88 96Dairy 36 123 64 23 23 30 23 22 24Forest 365 468 471 405 495 551 425 585 642
Industry & Mines 547 871 938 900 849 861 1080 1544 2126Water & Power - 5 5 13 13 47 28 21 54Irrigation 537 300 295 279 310 336 400 400 478Other (roads) 882 1606 1436 1223 978 1245 1287 2107 1998
Grants for State Plan Schemes 1184 1262 1165 965 1759 1700 965 1906 1460Grants for Central Plan Schemes 327 149 909 51 337 765 412 314 712Grants for Centrally Sponsored
Schemes 1497 1976 995 2365 1179 1923 2010 2544 2859Statutary Grants 165 - 141 - - - - - -Grants for National Calamities 2275Other Grants 210 161 286 171 172 348 477 599 557Net Public Debt-State 564 503 4040 1902 2170 -433 418 1953 1772Net Loans & Center Advances 5311 3425 3171 882 1770 1159 1430 2742 1931Recovery of Loans & Advances 1550 2356 1931 2918 2217 3961 1262 4361 1846
Grand Total 41064 42555 46766 44901 48310 50014 50258 62819 62757
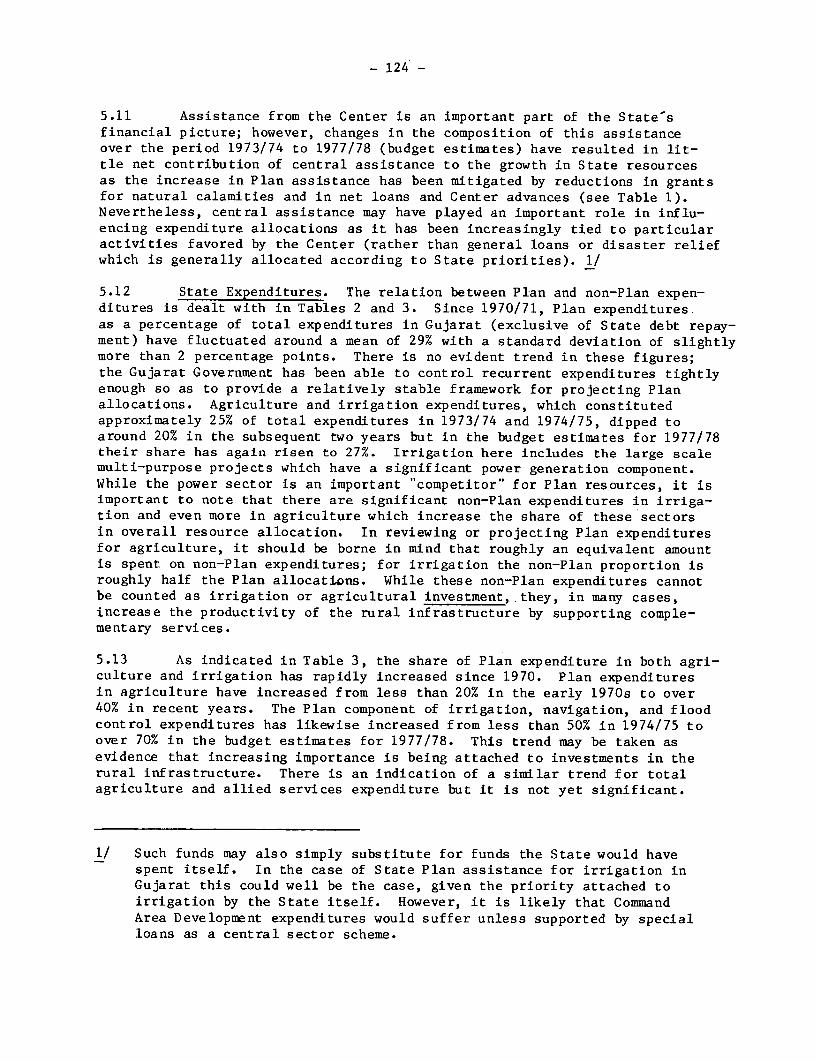
- 124 -
5.11 Assistance from the Center is an important part of the State-sfinancial picture; however, changes in the composition of this assistanceover the period 1973/74 to 1977/78 (budget estimates) have resulted in lit-tle net contribution of central assistance to the growth in State resourcesas the increase in Plan assistance has been mitigated by reductions in grantsfor natural calamities and in net loans and Center advances (see Table 1).Nevertheless, central assistance may have played an important role in influ-encing expenditure allocations as it has been increasingly tied to particularactivities favored by the Center (rather than general loans or disaster reliefwhich is generally allocated according to State priorities). 1/
5.12 State Expenditures. The relation between Plan and non-Plan expen-ditures is dealt with in Tables 2 and 3. Since 1970/71, Plan expenditures.as a percentage of total expenditures in Gujarat (exclusive of State debt repay-ment) have fluctuated around a mean of 29% with a standard deviation of slightlymore than 2 percentage points. There is no evident trend in these figures;the Gujarat Government has been able to control recurrent expenditures tightlyenough so as to provide a relatively stable framework for projecting Planallocations. Agriculture and irrigation expenditures, which constitutedapproximately 25% of total expenditures in 1973/74 and 1974/75, dipped toaround 20% in the subsequent two years but in the budget estimates for 1977/78their share has again risen to 27%. Irrigation here includes the large scalemulti-purpose projects which have a significant power generation component.While the power sector is an important "competitor" for Plan resources, it isimportant to note that there are significant non-Plan expenditures in irriga-tion and even more in agriculture which increase the share of these sectorsin overall resource allocation. In reviewing or projecting Plan expendituresfor agriculture, it should be borne in mind that roughly an equivalent amountis spent on non-Plan expenditures; for irrigation the non-Plan proportion isroughly half the Plan allocations. While these non-Plan expenditures cannotbe counted as irrigation or agricultural investment,.they, in many cases,increase the productivity of the rural infrastructure by supporting comple-mentary services.
5.13 As indicated in Table 3, the share of Plan expenditure in both agri-culture and irrigation has rapidly increased since 1970. Plan expendituresin agriculture have increased from less than 20% in the early 1970s to over40% in recent years. The Plan component of irrigation, navigation, and floodcontrol expenditures has likewise increased from less than 50% in 1974/75 toover 70% in the budget estimates for 1977/78. This trend may be taken asevidence that increasing importance is being attached to investments in therural infrastructure. There is an indication of a similar trend for totalagriculture and allied services expenditure but it is not yet significant.
1/ Such funds may also simply substitute for funds the State would havespent itself. In the case of State Plan assistance for irrigation inGujarat this could well be the case, given the priority attached toirrigation by the State itself. However, it is likely that CommandArea Development expenditures would suffer unless supported by specialloans as a central sector scheme.
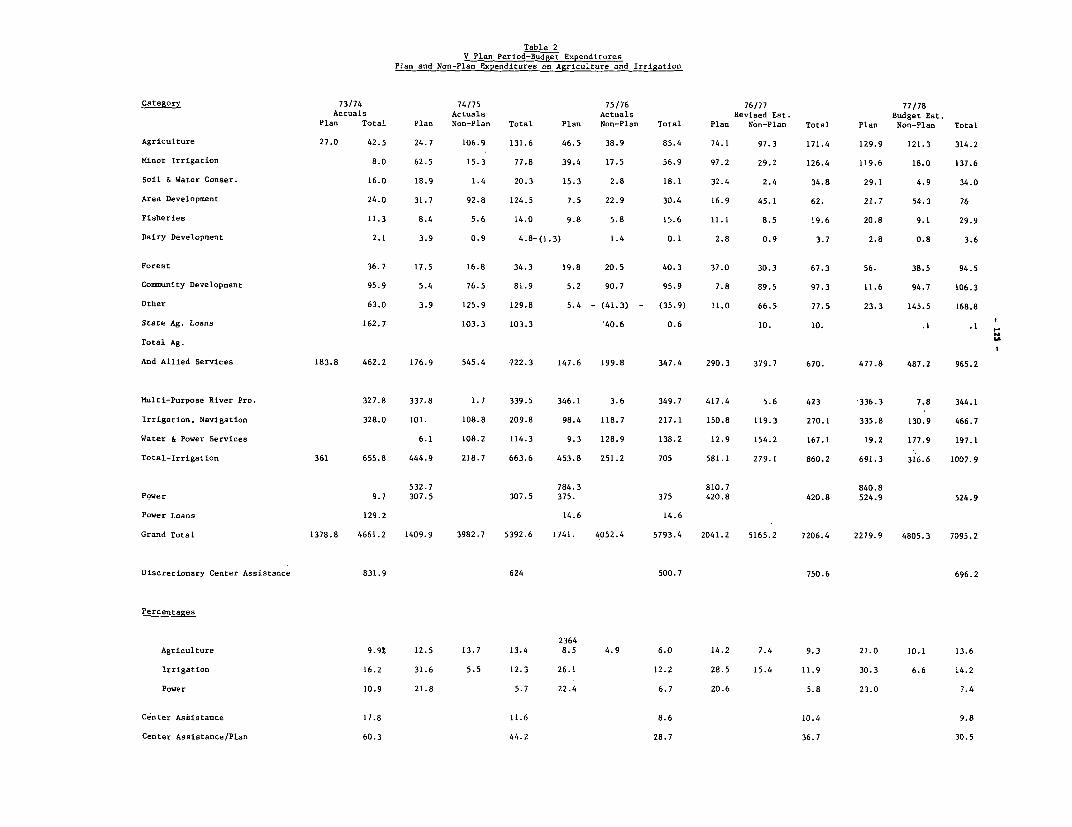
Table 2V Plan Period-Budget Expenditures
Plan and Non-Plan Expenditures on Agriculture and Irrigation
Categorv 73/74 74/75 75/76 76/77 77/78Actuals Actuals Actuals Revised Est. Budget Est.
Plan Total Plan Non-Plan Total Plan Non-Plan Total Plan Non-Plan Total Plan Non-Plan Total
Agriculture 27.0 42.5 24.7 106.9 131.6 46.5 38.9 85.4 74.1 97.3 171.4 129.9 121.3 314.2
Minor Irrigation 8.0 62.5 15.3 77.8 39.4 17.5 56.9 97.2 29.2 126.4 119.6 18.0 137.6
Soil & Water Conser. 16.0 18.9 1.4 20.3 15.3 2.8 18.1 32.4 2.4 34.8 29.1 4.9 34.0
Area Development 24.0 31.7 92.8 124.5 7.5 22.9 30.4 16.9 45.1 62. 21.7 54.3 76
Fisheries 11.3 8.4 5.6 14.0 9.8 5.8 15.6 11.1 8.5 19.6 20.8 9.1 29.9
Dairy Development 2.1 3.9 0.9 4.8-(1.3) 1.4 0.1 2.8 0.9 3.7 2.8 0.8 3.6
Forest 36.7 17.5 16.8 34.3 19.8 20.5 40.3 37.0 30.3 67.3 56. 38.5 94.5
Community Development 95.9 5.4 76.5 81.9 5.2 90.7 95.9 7.8 89.5 97.3 11.6 94.7 106.3
Other 63.0 3.9 125.9 129.8 5.4 - (41.3) - (35.9) 11.0 66.5 77.5 23.3 145.5 168.8
State Ag. Loans 162.7 103.3 103.3 40.6 0.6 10. 10. .1 .1
Total Ag.
And Allied Services 183.8 462.2 176.9 545.4 '722.3 147.6 199.8 347.4 290.3 379.7 670. 477.8 487.2 965.2
Multi-Purpose River Pro. 327.8 337.8 1.7 339.5 346.1 3.6 349.7 417.4 5.6 423 336.3 7.8 344.1
Irrigation. Navigation 328.0 101. 108.8 209.8 98.4 118.7 217.1 150.8 119.3 270.1 335.8 130.9 466.7
Water & Power Services 6.1 108.2 114.3 9.3 128.9 138.2 12.9 154.2 167.1 19.2 177.9 197.1
Total-Irrigation 361 655.8 444.9 218.7 663.6 453.8 251.2 705 581.1 279.1 860.2 691.3 316.6 1007.9
532.7 784.3 810.7 840.8
Power 9.7 307.5 307.5 375. 375 420.8 420.8 524.9 524.9
Power Loans 129.2 14.6 14.6
Grand Total 1378.8 4661.2 1409.9 3982.7 5392.6 1741. 4052.4 5793.4 2041.2 5165.2 7206.4 2279.9 4805.3 7095.2
Discretionary Center Assistance 831.9 624 500.7 750.6 696.2
Percentages
2364Agriculture 9.9% 12.5 13.7 13.4 8.5 4.9 6.0 14.2 7.4 9.3 21.0 10.1 13.6
Irrigation 16.2 31.6 5.5 12.3 26.1 12.2 28.5 15.4 11.9 30.3 6.6 14.2
Power 10.9 21.8 5.7 22.4 6.7 20.6 5.8 23.0 7.4
Center Assistance 17.8 11.6 8.6 10.4 9.8
Center Assistance/Plan 60.3 44.2 28.7 36.7 30.5
Table 3: PLANT EXPENDITURE AS % OF TOTAL FXPENDITURES
Category 1970/71 1971/72 1973/741/ 1974/75 1975/76 1976/77-1/ 1977/782/
Agriculture 16.7 22.5 65.2 18.8 54.4 43.2 41.3
Mines Irrigation 100.0 100.0 100.0 80.3 69.2 76.9 86.9
Total Agriculture Service 38.0 40.2 39.8 24.5 42.5 43.3 49.5
Multi-purpose schemes 99.5 99.0 98.7 97.7
Irrigation flood control 48.1 45.3 55.8 72.0
Water and power services 5.3 6.7 7.7 9.7
Total Irrigation 76.6 82.8 55.0 67.0 64.4 67.6 68.6
Power 100.0 100.0 100.0 100.0 100.0 100.0 100.0
Grand Total 26.2 30.9 29.6 26.1 30.1 28.3 32.1
1/ Break-down of expenditure on plan and non-plan basis not available on consistent basis as categorizationchanged this year. Fstimates may not be consistent with other years. 1972/73 is not presented due tonon-availability of data.
2/ Based on "revised estimates' as opposed to "actuals".
3/ Based on "budget estimates" as opposed to "actuals".
- 127 -
5.14 Considered in total, the receipts and expenditure position ofGujarat provides an adequate environment for investment planning. While theagricultural sector could probably contribute more development resources(land revenues, sales taxes on agricultural commodities, and other directlyagricultural sources raise only a moderate portion of revenue), there hasbeen considerable growth in total resources mobilized by the State and conse-quently in the capacity of the State to finance both its Plan and non-Plandevelopment expenditure. In particular, State sales tax revenues have morethan doubled between 1973/74 and 1977/78 belying any serious inelasticity inthe State tax resources. A sectoral analysis of expenditure indicates a con-tinuing commitment to agricultural and irrigation investment.
SECTION III - PLANNING FOR IRRIGATION AND AGRICULTURAL INVESTMENTIN GUJARAT
5.15 General Planning Framework. Planning by the Government of Gujaratis carried out by the Planning Division of the General Administration Depart-ment. The portfolio for this department is held by the Chief Minister ofthe State. The Planning Division is advised by the State Planning Boardwhich consists of the Chief Minister as Chairman, a Vice Chairman, and sevenother members. This body replaces previous advisory boards. Composed ofindividuals who donate their services (excepting, of course, the Chairman)and have no administrative authority, it is intended to play a major role indetermining intersectoral allocations and deciding on the inclusion of par-ticular projects in the Plan. The Vice Chairman of the State Planning Boardis a distinguished agricultural economist, V. L. Vyas, also newly appointedbut widely experienced. Other experts in various fields fill the remainingpositions on the Board. The new Planning Board intends not only to advisethe Government of Gujarat but also to undertake special studies to evaluatePlan performance and identify important constraints impeding Plan implemen-tation in key sectors. The evaluation of specific projects may also beundertaken by the State's Directorate of Evaluation which is responsibleto the Chief Secretary. The Planning Division and the Planning Board decidewhich projects should be evaluated by the Directorate which has its own staffof investigators. However, much of the work they currently perform is basic-ally of an audit nature responsive to the concerns of the secretaries ofthe various State departments. There is a need for more social and economicevaluation perhaps by units within the concerned departments so as to ensuremaximum feedback. At present, neither the Public Works nor AgricultureDepartments undertake any performance evaluations.
5.16 Each major planning document produced by the Planning Division ispreceded by a perspective paper which reflects the guidelines established bythe Central Planning Commission as well as the priorities of the State's ownPlanning Board. These documents are circulated throughout the executiveagencies of the State which would include State departments, municipal andState corporations, and district panchayats. (In Gujarat district panchayatshave responsibility for many agriculture and extension activities, socialwelfare, rural roads and minor irrigation.) Taking into account the priori-ties of the perspective papers, the various executive agencies prepare their
- 128 -
own Plans which are then refined and coordinated in working groups organizedby the Planning Division. As in other States, a draft Plan is produced anddiscussed with the national Planning Commission and on the basis of its com-ments as well as those from State agencies, the Plan is finalized. AnnualPlans have been produced within the five year Plan framework through a similarbut less intensive process.
5.17 Irrigation Planning. Within the Public Works Department, theWater Resources Investigation Unit is responsible for the technical prepara-tion of projects. Their program is geared to the availability of finance,the expression of local demand, and the availability of staff. Based onpreliminary assessments of valleys throughout the State which incorporatedata from existing rainfall and soil surveys, lists of prospective projectsare drawn up which form the basis for aggregate State planning estimates.Planning for individual irrigation projects then proceeds with the prepara-tion of a feasibility report which should be based on a thorough site in-vestigation. Preliminary cost estimates are then prepared and incorporatedinto a "Reconnaissance Report" which must be approved by the State PWD head-quarters. If the project goes ahead, a complete Project Report is preparedcovering soil conditions, cropping patterns and other agronomic data, aswell as detailed geological information. This is forwarded to the StateGovernment for administrative approval and to the Central Water Commissionin New Delhi for proforma approval in the case of medium schemes and tech-nical scrutiny in the case of major schemes. The project is then reviewedby the Planning Commission. In the case of major irrigation projects, admin-istrative approval by the State Government is delayed until the PlanningCommission has sanctioned the project. The final stage in the planning pro-cess is the preparation of a second project report on which final technicalsanction hinges taking into account detailed financial estimates and designs.This process is estimated to consume from two to three years; with presentstaffing the Water Resources Investigation unit processes approximately sevenprojects a year. However, the assurance of finance outside the scope ofregular State funds (through advance Plan assistance from the center, forexample) may considerably speed the process, indicating considerably flexi-bility in the system. The planning framework of the state thus relies greatlyon the capacity of functional departments. In the case of irrigation thiscapacity is adequate and should not be a constraint on an expansion of invest-ment in medium-scale irrigation. 1/
1/ This assessment does not apply should the resolution of the Narmadawater dispute require the preparation of detailed designs and estimatesfor that major scheme. In this case, a separate Narmada planning anddesign unit should be established outside the normal establishment.
TABLE 4
STATEMENT OF OUTLAYS AND EXPENDITURE -GUJARAT STATE
FOURTH FIVE-YEAR PLAN, 1969/70- 1973/74
(in millions of Rupees)
1969/70 1970/71 1971/72 1972/73 1973/74 TotalOutlay Expend- Outlay Expend- Outlay Expend- Outlay Expend- Outlay Expend- Outlay Expend-Major/Sub-Major Head of Development Budgeted iture Budeted iture Budgeted iture Budgeted iture Budgeted iture Budgeted itureAgriculture 21.0 16.6 22.7 19.9 24.9 18.6 26.3 18.4 34.1 27.0 129.0 100.5Land Reforms 2.0 2.2 2.0 2.5 2.0 2.5 2.2 2.4 3.3 2.6 11.5 12.2Minor Irrigation 45.0 70.1 53.1 61.6 59.1 49.8 76.7 64.4 66.8 77.8 302.7 323.9Soil and Water Conservation 14.7 17.3 15.7 14.2 18.3 17.1 20.6 32.4 22.3 20.8 91.6 101,BArea Development - - - - - - - - - - - -Animal Husbandry 9.9 5.8 11.4 7 .7 11.2 8.9 13.7 10.5 12.9 10.2 60.1 43.1Dairy Development 4.6 1.3 2.8 1.3 2.4 2.0 2.2 2.2 7.5 2.7 19.5 9.5Fisheries 6.5 5.3 7.3 9.1 7.4 6.8 8.2 6.9 11.0 7 .7 40.4 35.8Forests 5.3 5.2 5.4 5.0 5.5 5.3 15.7 10.2 14.1 10.0 46.0 35.7Investment in Agricultural Financial Institutions - - - - - - - - - - -Community Developmenta. Generel (Panchayats) 0.4 0.3 0.4 0.4 0.4 0.5 0.7 0.6 1.0 0.6 2.9 2.4b. Community Development 11.4 11.3 9.6 9.0 9.0 7.5 8.4 6.3 9.0 5.5 47.4 38.6c. Rural Wotks Program - - 1.5 0.6 3.0 1.8 3.0 3.0 3.0 1.0 10.5 6.4
TOTAL - Agriculture & Allied Services 120.8 135.4 133.9 130.5 143.2 120.8 177.7 157.3 186.0 165.9 761.6 709.9
Coo etation B.B 13.8 9.0 10.1 14.6 12.2 14.6 7.5 14.6 18.8 61.6 62.4Water Development (Irrigation) 190.0 161.4 214.0 193.4 233.0 234.7 218.8 361.8 254.5 361.0 1,170.3 1,312.3Power Development 190.0 254.0 220.0 288.1 272.0 301.6 294.6 399.3 315.7 269.5 1,292.3 1,602.5Industries 20.4 19.4 23.4 19.4 33.9 33.1 18.0 36.6 23.3 114.0 g.Village and Small Industries 5.1 4.9 5.0 4.3 38.1 5.5 11.2 7.0 8.4 7.1 213.5 28.8 Mining and Metallurgical Industries 8.5 7 .7 9.1 7 .7 __ 9.6 6.1 17.0 8.5 14.3 __ 56.3
TOTAL - Industries and Minerals 34.0 32.0 37.5 31.4 38.1 49.0 50.4 42.0 53.5 44.7 213.5 199.1
Ports. Light Ho.ses and Shipping 7.6 7.5 11.5 16.4 10.5 5.1 11.7 10.1 12.0 5.5 53.3 44.6Civil Aviation Roads and Bridges 37.5 39.9 37.7 43.6 40.5 52.6 60.0 77.1 64.0 86.8 239.7 300.0Road Transport 17.3 8.5 15.0 11.4 20.0 22.0 25.0 43.8 30.0 22.3 107.3 109.0Tourism 0.7 0.8 1.3 1.2 1.3 0.9 2.0 0.7 2.2 0.5 7.5 4.1
TOTAL - Transport and Commun ications 63.1 56.7 65.5 72.6 72.3 80.6 98.7 131.7 108.2 115.1 407.8 456.7
General Education 22.6 18.8 35.7 41.0 61.1 66.7 97.3 89.3 114.4 99.2 346.2 315.0Technical Education 1.9 1.9 3.0 2.8 4.1 4.9 4.9 5.3 4.3 18.0Medical )12.3 11.9 13.6 11.6 16.0 14.5 17.9 21.8 26.9 29.7 86,7 89.5Public Health and SanitationSewage and Water Supply 22.3 30.2 28.5 26.7 36.5 26.3 51.7 57.8 60.0 64.0 199.0 205.0Housing 5.4 5.1 10.0 12.9 18.0 17.4 -23.0 21.8 25.0 18.5 84.4 75.7Urban Development 0.8 0.7 0.8 0.8 1.0 1.1 1.4 1.6 1.7 1.6 5.7 5.8State Capital Project 52.5 6 7 .7 60.0 50.7 30.3 28.6 21.6 16.9 25.0 16.6 189.4 180.5Information and Publicity 0.5 0.5 0.8 0.6 0.9 0.4 0.8 0.5 0.7 0.4 3.7 2.4Labor and Labor Welfare 2.6 1.6 4.6 2.1 5.9 3.2 7.0 16.3 21.5 14.5 41.6 37 .7Welfare of Backward Classes 6.3 4.0 8.9 6.5 16.5 14.5 22.0 17.4 23.4 23.2 78.1 65.6Social Welfare 0.6 0.4 0.8 0.5 1.0 0.8 1.2 1.0 1.3 1.7 4.9 4.4Nutrition-
-- - - - - 1.6- 1.6 -
TOTAL - Social and Community Services 127.8 142.8 166.7 156.2 188.2 1 77 .6 248.8 249.3 306.8 2 73. 7 1,038.3 999.6
Secretariat Economic Service (Planning Machinery) - - - - - - - - 0.1 - 0.1 -Special and Backward Areas 25.1 18.1 26.2 21.0 25.1 28.5 32.5 36.7 32.4 29:8 141.3 134.1Other General Economic Services (Statistics) Neg Neg 0.2 0.2 0.2 0.2 0.3 0.2 0.3 0.2 1.0 -0.8TOTAL - Economic Services 25.1 18.1 26.4 21.2 25.3 28.7 32.8 36.9 32.8 30.0 142.4 1 34.-9
GRANDI TOTAL 759.6 814.2 873.5 903.5 986.7 1,005.2 1,196.4 1,375.8 1,272.1 1,378.7 5,088.3 5,477.4

STATEMENT OF OUTLAYS AND EXPENDITURE - GUJARAT STATE (Cont'd)
(1974/75 - 1977/78)
(in millions of Rupees)
1974/75 1975/76 1976/77 1977/78Budgeted Expend- Budgeted Expend- Budgeted Anticipated BudgetedOutlay iture Outlay iture Outlay Expenditure Outlay
Agriculture 55.7 36.3 65.8 40.3 64.0 75.8 90.3Land Reforms 4.4 5.1 5.0 5.5 6.3 16.2 32.0Minor Irrigation 58.6 79.6 61.0 158.9 74.0 104.1 119.5Soil and Water Conservation 19.5 59.7 21.5 73.0 17.0 34.1 29.0Area Development 10.0 5.4 12.0 3.3 10.0 8.3 6.1Animal Husbandry 11.6 3.7 10.0 5.3 10.0 ) 23.2Dairy Development 5.5 4.5 6.5 4.1 6.5 ) 18.8 5.8Fisheries 9.8 7.3 10.0 9.2 12.5 15.9 21.5Forests 14.6 22.3 22.0 28.4 25.0 38.1 55.5Investment in Agricultural Financial Industries 11.3 8.8 10.0 7.8 10.0 9.1 16.0Community Developmenta. General (Panchayats) - 1.0 1.2 3.3 6.3b. Community Developmeot 11.7 4.9 6.0 4.0 3.2 9.5 4.1c. Rural Works Program _ 46.8 2.5 68.4 3.0 1.6
TOTAL -Aricultur andAllied Services 212.7 284.4 233.3 409.4 244.8 329.9 410.9
Cooperation 14.1 6.2 14.0 47.4 41.5 61.0 55.5
Water Development (Irrigation) 314.9 448.0 385.0 468.7 481.3 606.7 730.3
Power Development 440.0 532.7 630.0 784.3 700.0 810.7 840.8
Industries 35.7 59.0 46.7 66.1 45.0 124.5 116.1Village and Small Industries 35.6 8.3 9.1 10.4 9.7 16.7 13.8Mining and Metallurgical Industries 9.4 8.6 12.6 6.4 7.9 8.6 11.1
TOTAL - Industries and Minerals 80.7 75.9 68.4 82.9 62.6 151.8 141.0
Ports, Lighthouses and Shipping 8.4 10.4 8.4 16.5 8.4 18.1 14.0Civil Aviation .Roads and Bridges 40.0 153.6 55.0 152.7 60.0 174.3 97.5Road Transport 43.9 78.6 65.0 64.2 61.0 83.0 67.5Tourism 0.9 0.6 0.9 0.3 0.9 2.0 1.5
TOTAL - Transport and Communication 93.2 243.2 129.3 233.7 130.3 277.4 180.5
General Education 65.4 33.2 53.9 43.6 61.5 77.2 83.9Technical Education 4.6 2.7 4,.9 3.0 4.7 5.2 7.0Medi::al. 25.8 7.5 5.4 6.2 5.9) 20 9 14.9Public Health and Sanitation ) 3.3 9.6 2.7 8.2 ) 12.0Sewerage and Water Supply 75.7 105.7 75.0 137.2 85.5 131.1 130.0Housing 51.8 53.5 54.6 86.6 41.9 134.8 86.5Urban Development 8.5 24.4 18.7 16.9 18.9 17.7 30.6State Capital Project 9.8 23.7 7.6 10.0 8.0 19.8 25.0Information and Publicity 1.2 0.7 1.0 0.3 0.5 0.4 0.9Labor and Labor Welfare 6.2 4.0 4.5 2.8 4.5 4.6 7.1Welfare of Backward Classes 15.7 20.4 15.7 17.0 17.0 22.9 29.5Social Welfare 1.1 1.1 1.1 1.2 1.2 1.2 1.7Nutrition 10.0 8.5 10.5 8.5 10.2 10.2 11.0
TOTAL - Social and Community Services 275.8 288.7 262.5 336.0 268.0 446.0 440.1
Secretariat Economic Services (Planning Machinery) 0.8 0.1 0.1 0.1 0.1 0.2 0.4Special and Backward Areas 0.2 0.7 3.1 1.5 3.1 3.1 5.0Other General Economic Services (Statistics) 1.5 3.7 0.8 0.8 0.8 1.2 1.3Growth Centers - - - - - 0.4 2.0Administrative Machinery for T.A.S.P. - - - - - 1.3 -
10.8 (TDD)
TOTAL - Economic Services 2.3 4.5 4.0 2.4 4.0 17.0 8.7
GRAND TOTAL 1,433.7 1,883.6 1,726.5 2,364.8 1,932.5 2,700.5 2,807.8+15,.0 76.51,876.5
- 131 -
5.18 Plan Investments. Details of Plan expenditures from 1969/70 are
presented in Table 4. Expenditures are estimated and revised for each year
in the same manner as receipts; estimates presented with the budget are
classified as "anticipated outlay" while the final accounts are character-
ized as "expenditures." 1/ It is apparent that sectoral allocations have
not changed substantially over the fourth and fifth Plan periods (see columns3 and 4 of Table 5). Of major expenditure heads, the share of power at 31%
and social and community services at 17.5% each declined by a percentagepoint or so in the seven year period 1969/70 to 1976/77. The major growth
items were water development (irrigation) which increased its share from19.8% to 22.5%, transport and communications, from 7% to 10.3% and industry
and minerals, from 3.9% to 5.6%. These increased shares were largely achieved
at the expense of agriculture and allied services which fell from 16.6% of
Plan expenditure in 1969/70 to 12.2% in 1976/77. This relative decline ofagricultural expenditures occurred in all sub-categories except forestry(and land reform, which, however, is a quite minor category); particularly
striking is the decline in the share of minor irrigation, 2/ though theshare of agriculture itself and soil and water conservation also declinedsignificantly.
5.19 Sectoral allocations are reflected in the anticipated outlays for
1977/78 show some reversal of the earlier trends in that the share of agri-
cultural services has increased again to 14.6% of the total. All subcate-gories, in particular agriculture, have experienced relative increases.Irrigation Plan outlay also grew in the 1977/78 budget to 26% of total, a
rather dramatic increase from 22.5% in 1976/77, largely compensated by a
decline in transport and communications outlays.
1/ "Revised estimates" are also prepared mid-way through the financial
year.
2/ These figures may primarily reflect the shift in responsibility for
minor irrigation from the State Government to the district panchayats
which occurred in 1971/72; but it is doubtful that resources raised by
the panchayats themselves could have made up the relative dramatic drop.Another factor is the increase in natural calamity assistance from the
center in 1972/73. Much of this went into minor irrigation and it is
likely to have displaced some regular State Plan associations.
TABLE 5
ROLE OF AGRICULTURE AND IRRIGATION IN GUJARAT PLAN OUTLAY AND EXPENDITURES
Contribution ContributionCompound Annual to Growth to Crowth Contribution
Growth of Increment for Increment for to GrowthExpenditure Sector Share Sector Share Expenditures Outlay Increment
69/70 - 76/77 69/70 76/77 69/70 - 76/77 76/77 - 77/78 "One"h!/ 69/70 - 76/77.Percentages Based"on Currcnt'Price Series Constant Price
Agriculture 21.8 2.0 0.8 3.1 3.0 9.9 3.9Nlinor Irrigation 1.1.4 8.6 3.9 1.8 5.2 0.6 ,-2.9Soil and Wjter Conservation 13.7 2.1 1.3 0.9 1.4 0.4 0.1Arua Development 0.3 0.4 -0.4 0.7Animal !lIlubandry 7.5 0.7 ) 0.7 0.6 1.4Dairy Developnttnt 3 0.2)Fislieries 10.1 0.7 0.6 0.6 1.0 6.6 0.5 1Forests 37.8 0.6 1.4 1.7 3.5 21.1 2.5 HAv ri ct lti zi& ari Allied
__ -_._.,ic._; - Total 18.9 16.6 12.3 10.3 19.0 7.4 6.0
:!iter DuvIlop)mIaent 20.5 19.8 22.5 23.6 28.4 8.7 26.21'cwur Developam.-n)t 19.2 31.2 30.0 29.5 16.1Jii..i:;.:ry .,,nd I l[J noals 24.9 3.9 5.6 6.4 9.0Tt ::ll: rr)nl C EI9(Coi,inunication 25.5 7.0 10.3 11.7 5.7SOC__ & . Service 17.7 17.5 16.5 16.1 19.7LcoIlluruic SCpv1ices -0.9 2.2 0.6 -0.1 0.5Coop.eratiog 23.7 1.7 2.3 2.5 1.6
(;RANN lTo'AL 19.7 100 100 100 100 8.8 100
1/ CNP Nec lnvestment Deflator used for period 1969/70 to 1975/76 and wholesale price index for fuel manufactures for1976/77.
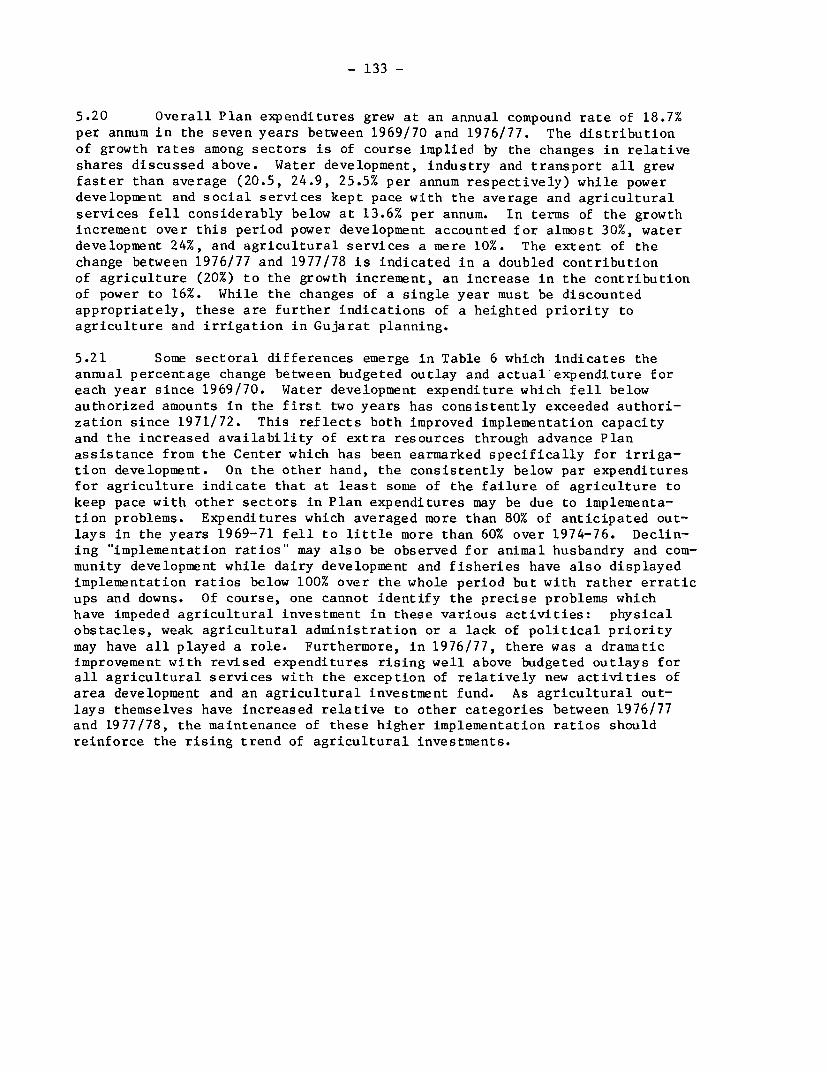
- 133 -
5.20 Overall Plan expenditures grew at an annual compound rate of 18.7%
per annum in the seven years between 1969/70 and 1976/77. The distributionof growth rates among sectors is of course implied by the changes in relative
shares discussed above. Water development, industry and transport all grewfaster than average (20.5, 24.9, 25.5% per annum respectively) while powerdevelopment and social services kept pace with the average and agricultural
services fell considerably below at 13.6% per annum. In terms of the growthincrement over this period power development accounted for almost 30%, waterdevelopment 24%, and agricultural services a mere 10%. The extent of the
change between 1976/77 and 1977/78 is indicated in a doubled contributionof agriculture (20%) to the growth increment, an increase in the contributionof power to 16%. While the changes of a single year must be discountedappropriately, these are further indications of a heighted priority toagriculture and irrigation in Gujarat planning.
5.21 Some sectoral differences emerge in Table 6 which indicates theannual percentage change between budgeted outlay and actual'expenditure foreach year since 1969/70. Water development expenditure which fell belowauthorized amounts in the first two years has consistently exceeded authori-zation since 1971/72. This reflects both improved implementation capacity
and the increased availability of extra resources through advance Plan
assistance from the Center which has been earmarked specifically for irriga-
tion development. On the other hand, the consistently below par expendituresfor agriculture indicate that at least some of the failure of agriculture to
keep pace with other sectors in Plan expenditures may be due to implementa-tion problems. Expenditures which averaged more than 80% of anticipated out-
lays in the years 1969-71 fell to little more than 60% over 1974-76. Declin-ing "implementation ratios" may also be observed for animal husbandry and com-
munity development while dairy development and fisheries have also displayedimplementation ratios below 100% over the whole period but with rather erratic
ups and downs. Of course, one cannot identify the precise problems whichhave impeded agricultural investment in these various activities: physicalobstacles, weak agricultural administration or a lack of political priority
may have all played a role. Furthermore, in 1976/77, there was a dramaticimprovement with revised expenditures rising well above budgeted outlays forall agricultural services with the exception of relatively new activities of
area development and an agricultural investment fund. As agricultural out-
lays themselves have increased relative to other categories between 1976/77and 1977/78, the maintenance of these higher implementation ratios shouldreinforce the rising trend of agricultural investments.
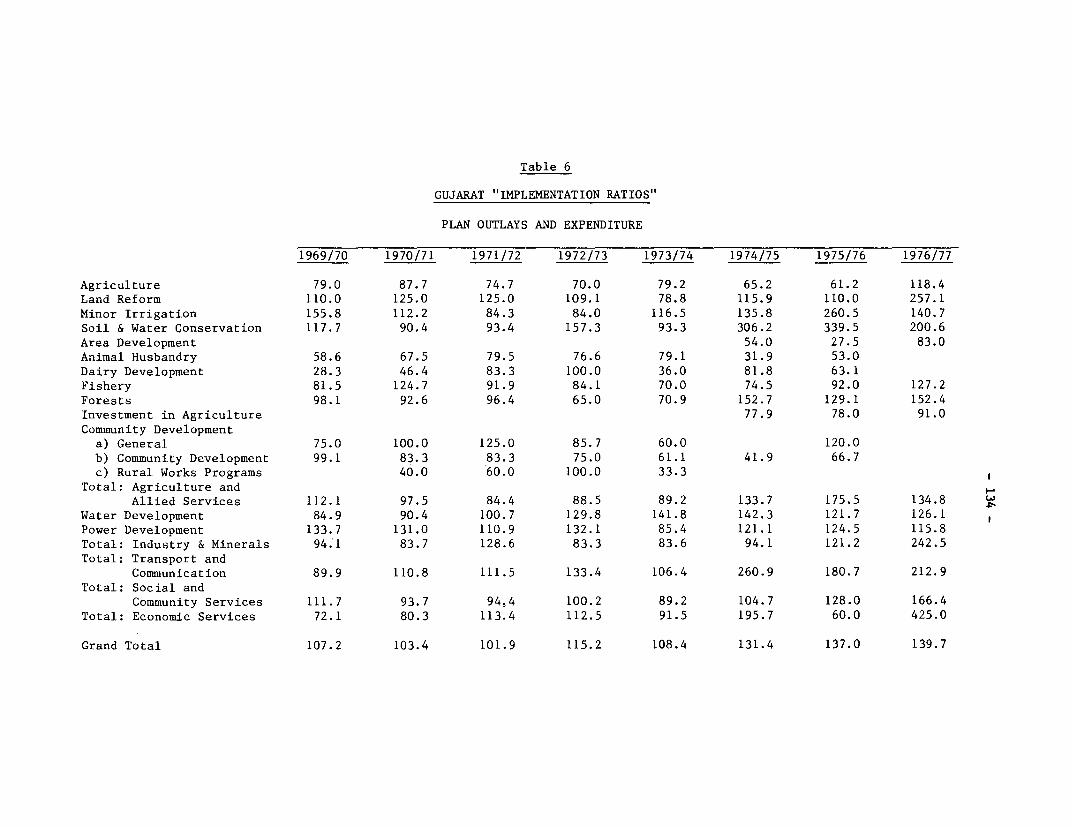
Table 6
GUJARAT "IMPLEMENTATION RATIOS"
PLAN OUTLAYS AND EXPENDITURE
1969/70 1970/71 1971/72 1972/73 1973/74 1974/75 1975/76 1976/77
Agriculture 79.0 87.7 74.7 70.0 79.2 65.2 61.2 118.4Land Reform 110.0 125.0 125.0 109.1 78.8 115.9 110.0 257.1Minor Irrigation 155.8 112.2 84.3 84.0 116.5 135.8 260.5 140.7Soil & Water Conservation 117.7 90.4 93.4 157.3 93.3 306.2 339.5 200.6Area Development 54.0 27.5 83.0Animal Husbandry 58.6 67.5 79.5 76.6 79.1 31.9 53.0Dairy Development 28.3 46.4 83.3 100.0 36.0 81.8 63.1Fishery 81.5 124.7 91.9 84.1 70.0 74.5 92.0 127.2Forests 98.1 92.6 96.4 65.0 70.9 152.7 129.1 152.4Investment in Agriculture 77.9 78.0 91.0Community Development
a) General 75.0 100.0 125.0 85.7 60.0 120.0b) Community Development 99.1 83.3 83.3 75.0 61.1 41.9 66.7c) Rural Works Programs 40.0 60.0 100.0 33.3
Total: Agriculture andAllied Services 112.1 97.5 84.4 88.5 89.2 133.7 175.5 134.8
Water Development 84.9 90.4 100.7 129.8 141.8 142.3 121.7 126.1Power Development 133.7 131.0 110.9 132.1 85.4 121.1 124.5 115.8Total: Industry & Minerals 94.1 83.7 128.6 83.3 83.6 94.1 121.2 242.5Total: Transport and
Communication 89.9 110.8 111.5 133.4 106.4 260.9 180.7 212.9Total: Social and
Community Services 111.7 93.7 94,4 100.2 89.2 104.7 128.0 166.4Total: Economic Services 72.1 80.3 113.4 112.5 91.5 195.7 60.0 425.0
Grand Total 107.2 103.4 101.9 115.2 108.4 131.4 137.0 139.7

- 135 -
5.22 Thus far, the analysis has been made in terms of current prices;however, in the period under review India experienced considerable inflation.The all-India index of wholesale prices increased from 168.8 to 300.8 between1969 and 1976, a rise of 178%. That Gujarat was not insulated from thegeneral trends is apparent as the Consumer Price Index for industrialworkers at Ahmedabad rose 165% over the same period. Deflators for GujaratPlan expenditure are not readily available but "real" outlays and expendi-tures have been calculated using the all-India implicit deflator for grossfixed capital formation. 1/ These figures indicate that the "real" growth inState expenditures from 1969/70 to 1976/77 was on the order of 8.2% per annum,less than half the nominal rate of 19.7% per annum. Expenditures on waterdevelopment, power development, and agricultural services have not grown atrates significantly different from the mean for overall Plan expenditure eitherin nominal or in real terms. However, minor irrigation expenditures (which isclassified here under agricultural services) which grew at 11.4% per annum innominal terms fell to only 0.6% per annum in real terms. Primarily this is dueto the rapid inflation during 1974/75 and 1975/76, years in which the nominalvalue of minor irrigation expenditure grew most rapidly as part of the Stateprogram to provide employment and alleviate severe drought conditions.
1/ The Gujarat based consumer price index and the all-India wholesaleprice index were eschewed as deflators because of the excessive weightgiven to agricultural and other consumption commodities in theirconstruction. The implicit deflator for gross fixed capital forma-tion effectively covers all investment goods excluding stocks andseemed the most appropriate adjustment factor for government invest-ment. The implicit deflator and wholesale price index may be comparedas follows:
Implicit Gross Investment Deflator Wholesale Price Goods
1969/70 100 1001970/71 107.1 100.51971/72 112.4 109.81972/73 119.3 120.71973/74 132.6 148.71974/75 167.3 182.41975/76 181.4 176.41976/77 194.1 (Est.) 191.5
- 136 -
Table 7: 3UJARAT PROGRESS OF IRRIGATION
ro. of Schfemes Outlay ExpenditureNew Spillover Ps. Million Ps. Million
I. Plan 351/ 33 192 192
II. Plan 23 52 354 354
III. Plan - 17 461 446
Annual Plans ) 461 479) 50 59
IV. Plan ) 1100 1213
V. Plan 17 33 2921 (est.)
1974/75 (448)
1975/76 (435)2/ (449)
1976/77 (481 + 60)'/ (607)
1977/78 (730)4/ (850) (est.)
1978/79
VI. Plan- 16 + 306/ 2892 + 1244 (est.)
1/ Including two "pre-plan" projects.
2/ Including advance plan assistance of Ps. 73 million (of which Ps. 53m
for Kadana).
3/ Additional approved outlay of which Rs 40 for Kadana.
4/ See Annual Plan 1977/78 p. 119 for breakdown. Recent indications are that Rs 120
million in additional funds will be spent during 1977/78.
5/ The introduction of rolling plans will mean that this period from 1979/80
to 1984/85 will not be officially designated as the "Sixth Plan', but will
function as one five year planning period.
6/ The sixteen projects have been included in the perspective planning for the
sixth plan period. Thirty additional projects have been identified by the
Water Resources Investigation Unit but the cost estimates are quite tentative.
It is likely that many of these projects would spillover into the late 1980's.
- 137 -
5.23 The productivity of agriculture and irrigation plan expenditures
has yet to show up in aggregate relationships, since weather induced fluctu-ations in agricultural production dominate any trend relationships. Dominanceof foodgrains other than wheat and rice establish this fluctuating pattern.Wheat and rice are largely produced on irrigated land and exhibit virtuallyno trend until the sharp upward spurt in 1975/76. This is at least consistent
with the steady increase in irrigated area from 1973/74 which coincided withan equally sharp upturn in nominal irrigation expenditures. 1/
5.24 Projected Expenditure. Projections for Gujarat Plan investment in
irrigation have been calculated on several alternative bases. Table 7 illus-
trates the scheme wise progress of irrigation. The tendency to initiate moreschemes than can be completed in a give planning horizon is evident in the
large number of schemes which have spilled over into subsequent Plan periods.
Spillover into the Third Plan was so great that no new projects were initi-
ated during this period. A new backlog developed during the IV Plan period(1969/70-1973/74) which has been ameliorated somewhat during the currentperiod. Nevertheless, a sufficient pipeline of projects clearly existsthrough the sixth Plan period. 2/ Sixteen new projects are well into theplanning stages and 30 additional projects have been identified and prelimi-nary cost estimates have been prepared, which would result in estimatedsixth Plan expenditures of approximately Rs 4,350 million or US$483 million(in constant 1976/77 prices and an exchange of Rs 9 = US$1).
5.25 This projection is based on the sum of individual project estimatesand is consistent with the aggregate projections contained in the (draft
1/ Efforts to correlate measures of agricultural production over the fourthand fifth Plans with total Plan investments or with particular componentsdid not lead to significant relationships. As indicated in AppendixTable 2 the log-linear estimated trend for agricultural productionbetween 1969/70 and 1975/76 is negative (-2.5 percent per annum) so thatsignificant aggregate relationships with irrigated area or Plan invest-ments are unlikely. The value of agricultural production in currentprices does exhibit a positive but low elasticity with real Plan expendi-ture. There are likely to be lags in this relationship which, if properly
accounted for, could increase its significance, but the few observationsavailable here preclude experimenting with lag structures.
2/ The inauguration of five year rolling Plans should not affect theseprojections since given any five year period, the allocative perspectivewill remain.
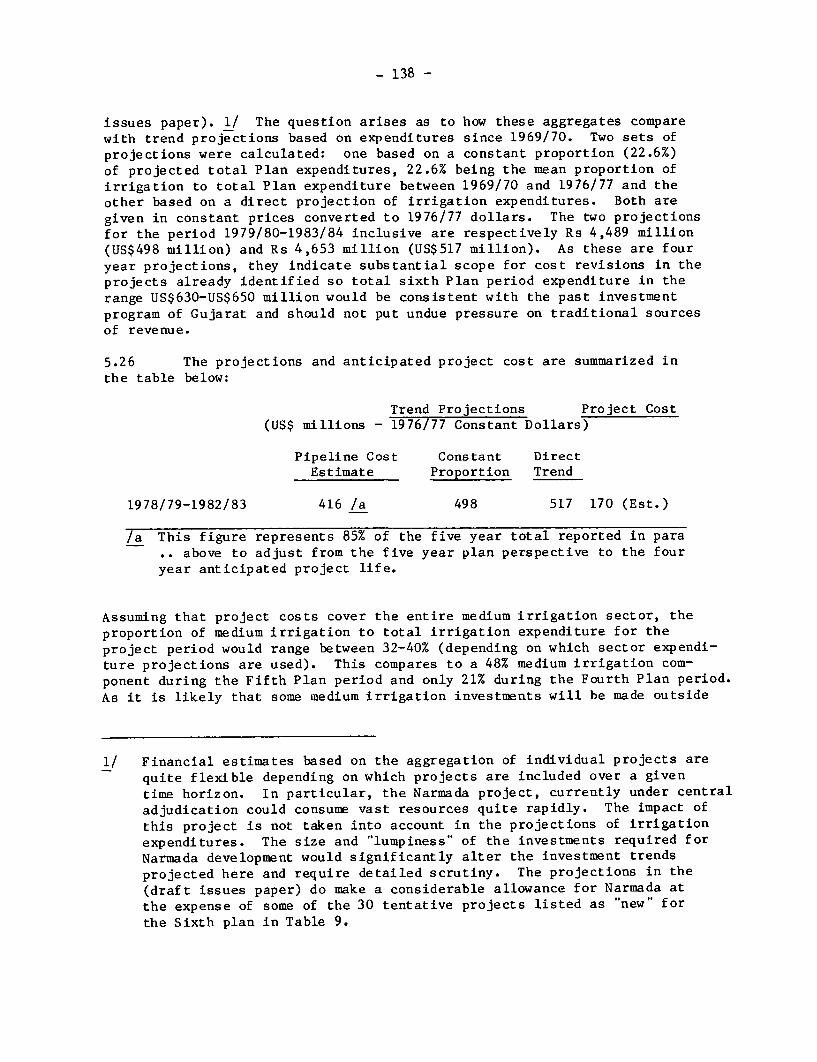
- 138 -
issues paper). 1/ The question arises as to how these aggregates comparewith trend projections based on expenditures since 1969/70. Two sets ofprojections were calculated: one based on a constant proportion (22.6%)of projected total Plan expenditures, 22.6% being the mean proportion ofirrigation to total Plan expenditure between 1969/70 and 1976/77 and theother based on a direct projection of irrigation expenditures. Both aregiven in constant prices converted to 1976/77 dollars. The two projectionsfor the period 1979/80-1983/84 inclusive are respectively Rs 4,489 million(US$498 million) and Rs 4,653 million (US$517 million). As these are fouryear projections, they indicate substantial scope for cost revisions in theprojects already identified so total sixth Plan period expenditure in therange US$630-US$650 million would be consistent with the past investmentprogram of Gujarat and should not put undue pressure on traditional sourcesof revenue.
5.26 The projections and anticipated project cost are summarized inthe table below:
Trend Projections Project Cost(US$ millions - 1976/77 Constant Dollars)
Pipeline Cost Constant DirectEstimate Proportion Trend
1978/79-1982/83 416 /a 498 517 170 (Est.)
/a This figure represents 85% of the five year total reported in para.. above to adjust from the five year plan perspective to the fouryear anticipated project life.
Assuming that project costs cover the entire medium irrigation sector, theproportion of medium irrigation to total irrigation expenditure for theproject period would range between 32-40% (depending on which sector expendi-ture projections are used). This compares to a 48% medium irrigation com-ponent during the Fifth Plan period and only 21% during the Fourth Plan period.As it is likely that some medium irrigation investments will be made outside
1/ Financial estimates based on the aggregation of individual projects arequite flexible depending on which projects are included over a giventime horizon. In particular, the Narmada project, currently under centraladjudication could consume vast resources quite rapidly. The impact ofthis project is not taken into account in the projections of irrigationexpenditures. The size and "lumpiness" of the investments required forNarmada development would significantly alter the investment trendsprojected here and require detailed scrutiny. The projections in the(draft issues paper) do make a considerable allowance for Narmada atthe expense of some of the 30 tentative projects listed as "new" forthe Sixth plan in Table 9.
- 139 -
the project coverage, a continuation of the high Fifth Plan proportion ofmedium to major schemes is necessary. As medium irrigation has receivedconsiderably greater emphasis in recent years, the timing of this project is
Gujarat appears quite appropriate and the project size is certainly manage-able within the range of projected government expenditures in the irrigation
sector as a whole. Nevertheless, successful implementation of the project
should include periodic monitoring of ongoing and new commitments to major
irrigation schemes in Gujarat, to ensure that the proportion of expenditures
on medium schemes is not unduly constrained.
- 140 -
Chapter VI
TAMIL NADU FINANCE AND PLANNING
Christine WallichIndia Division
- 141 -
TAMIL NADU: FINANCE AND PLANNING
Page No.
Preface ....... 142
I. The State . ..............---.-----. ............. 143(i) Salient Economic Features . ......................... 143
II. Financial Resources ...................... 144(i) State Revenue Receipts .144
III. Review of State Expenditures . . .147(i) Revenue Expenditures .148
(ii) Plan Expenditures .151
(iii) Composition of Plan Expenditures ..... .............. 151
IV. The Plan: Financial Resources ....... ................... 153
V. The Planning Process .................................... 158(i) Planning Machinery ................ ................. 158
(ii) Plan Coordination .................................. 158
VI. Madras: Municipal Finance in India .................. 160(i) Resources . . ........................................- 160
(ii) Revenue Buoyancy ..................... 164(iii) Expenditures ...................... 165(iv) Sectoral Composition of Expenditures ............... 165(v) Budgetary Balance .............. .................... 167
VII. Financing the Projects in Tamil Nadu .................... 169(i) Tamil Nadu .........................................- 170
(ii) Madras Corporation ........................... 173
Tables
1. Tamil Nadu Revenue Receipts ................................. 1452. Tamil Nadu Revenue Account Expenditures .1493. Tamil Nadu Revenue Account Plan and Non-Plan Expenditure ... 1504. Tamil Nadu Plan Expenditure, Category Totals .1525. Sources of State Plan Finance .1556. Total Current and Capital Revenues of Madras Metropolitan
Corporation .1627. Revenue and Capital Expenditures of Madras Corporation . 1668. Current Revenues and Expenditures of Madras Metropolitan
Corporation . 1689. Tamil Nadu Projects in Relation to State Plan 5120 .... ..... 172

- 142 -
TAMIL NADU FINANCE AND PLANNING
Preface
The objective of this study is to review the finances and planningframework of Tamil Nadu and of Madras, the State capital, since a properassessment of the State-s proposed investment program could not be made out-side of the context of the institutional setting, and the specific financialmagnitudes. The study was undertaken in early 1980, in connection with pastappraisal of Tamil Nadu Nutrition, Madran Urban Development II, and MadrasWater Supply projects. Data for the study was collected in the course of amission to Tamil Nadu in March 1980.
The paper is organized as follows: the introductory section providesa brief overview of the State, its history and economic features. In SectionsII and IV, the State-s financial resources and expenditure patterns are des-cribed. Sections IV and V are devoted to issues of planning and Plan finance,the financial status of Madras and the fiscal relations between Madras andthe State of Tamil Nadu, and a general discussion of municipal finances inIndia are contained in Chapter VI. The final chapter evaluates the threeprojects in the context of projected city and State resources.
- 143 -
I. Salient Economic Features
6.01 Tamil Nadu is typically thought of as a prosperous State, in themain, because of its high ranking in terms of indicators of social welfare,
high level of urbanization and achievements in literacy, indicators whichtend to be associated with high incomes. However, Tamil Nadu ranks ninthout of fifteen States in terms of its per capita income, which, at Rs 887(1975), places it 12% below the all India figure of Rs 1,008.
6.02 Tamil Nadu's population was estimated at 46.8 million in 1979,which is about 7.5% of the total population of India. Almost one -hird of
the State's population is urban, which makes Tamil Nadu India's most urban-ized State. It is also very densely populated with 317 people per square
kilometer, as compared with 178 for India as a whole.
6.03 As in all of India, agriculture provides the economic base for the
State, although in relative terms, the agricultural sector is small, making up
only 38.8% of State domestic product as contrasted with the 42.7% for Indiaas a whole. The sectoral distribution of income has shifted primarily infavor of the tertiary sector. This is also reflected in the fact that onlyabout 64.5% of the labor force is employed in agriculture, compared with 72.1%for India as a whole. This is on the low side; only in West Bengal and Punjabdoes the sector employ a smaller proportion of the labor force.
6.04 A large proportion of the agricultural labor force is landless,
and land holdings are small. The net sown area per cultivator is 1.3 hec-tares compared to 1.8 hectares for the 18 major States, and 2.8 in Haryana,Maharashtra, 2.9 in Rajasthan and 2.5 in Punjab. These factors, amongothers, contribute to Tamil Nadu's low ranking in terms of per capita incomes.Apparently, the intensive use of irrigation--over 44% of the net sown area,compared with 23% in India as a whole--and high rate of fertilizer consump-tion, 36 kg, which puts Tamil Nadu ahead of Haryana, are not enough to offsetthem.
6.05 Industry, mostly small scale, contributes about 22% of SDP and hasgrown fairly rapidly over the past two decades. The State's leading indus-
tries are textiles, the largest single industry in the State, electricalmachinery and transport equipment. Cement, sugar, fertilizers and mineralprocessing are also important. 15.2% of the work force is employed in theindustrial sector, as compared with 11% for India as a whole.
6.06 In terms of other indicators, especially social indicators, TamilNadu ranks very high. Communications infrastructure, such as roads and rail-ways, serve the State well, there being 71 km of roads per 1,000 square km,and 29 km of railway lines per 1,000 square km, 2 and 1.6 times the all Indiaaverage, respectively. Tamil Nadu has the second highest number of hospitalbeds relative to population of all Indian States. Tamil Nadu also rankshigh--third--in the provision of rural water supply and electricity. 98%of villages have been electrified. In literacy, Tamil Nadu ranks second, with40% of the population recorded as literate; this is roughly 34% higher thanthe all India average.
- 144 -
6.07 Tamil Nadu continues to emphasize basic needs and social infrastruc-ture in its development strategy, for although achievements are high, thereis still a great deal to be done. In the following sections, Tamil Nadu'sbudgeting and development strategies and the resources available for thestate's programs are discussed in greater detail.
II. Revenue Sources
State Revenue Receipts
6.08 State revenue receipts are those receipts for which the State has no
repayment liability and which are used to finance items of revenue expenditure.They consist of State tax revenues--the most important--non-tax revenues, thenext largest, and grants from the Central Government. These categories willbe treated in turn. Table 1 details the trends in each category since thebeginning of the Fourth Plan.
6.09 Revenues from taxes make up 80% of the State's total revenue receipts.About 60% of the tax revenues are from taxes which the State imposes and col-lects itself, the remainder are taxes which the State receives through revenuesharing arrangements with the Central Government.
6.10 The States, Tamil Nadu included, receive a share in four centraltaxes: the income tax, central excise duties, the Center's "additional"excise duties and the estate duty. These shared taxes, known as devolutions,have until recently made up from about 20% of Tamil Nadu's total revenuereceipts and 30% of total tax receipts. Under the award of the SeventhFinance Commission, the share of the States in the excise tax has been doubled,from 20% to 40% of the Center's receipts. The results of this change areclearly shown by the large jump in shared taxes in 1979/80; in the first yearof the award, shared taxes make up 32% of Tamil Nadu's revenue receipts.Since the share of central taxes is a function of the award made quinquen-nially by the Finance Commissions, their buoyancy, or elasticity is not arelevant concept here. Tamil Nadu has, in general, done well by the FinanceCommissions. Over the last 11 years, shared taxes have provided a growingsource of funds; at 14.5% the category has grown faster than the State'srevenues from its own taxes, 11.2%.
6.11 The state's own taxes make up about 50% of its total revenueresources, a proportion which, by comparison with other States, indicatesa high degress of self-reliance. As in most States, the single most impor-
tant State tax is the sales tax, which contributes about 68% of the State'sown tax revenues and dwarfs all other revenues. The sales tax has two parts:(they are not shown separately in the table), the central sales tax, leviedby the center but wholly assigned to and collected by, the States and theState's own sales tax. The taxes are a function of growth in the volumeof trade, including interstate trade, and increases in the price level.The sales tax is among the most buoyant revenue sources for the State, witha growth rate of 14.8%.
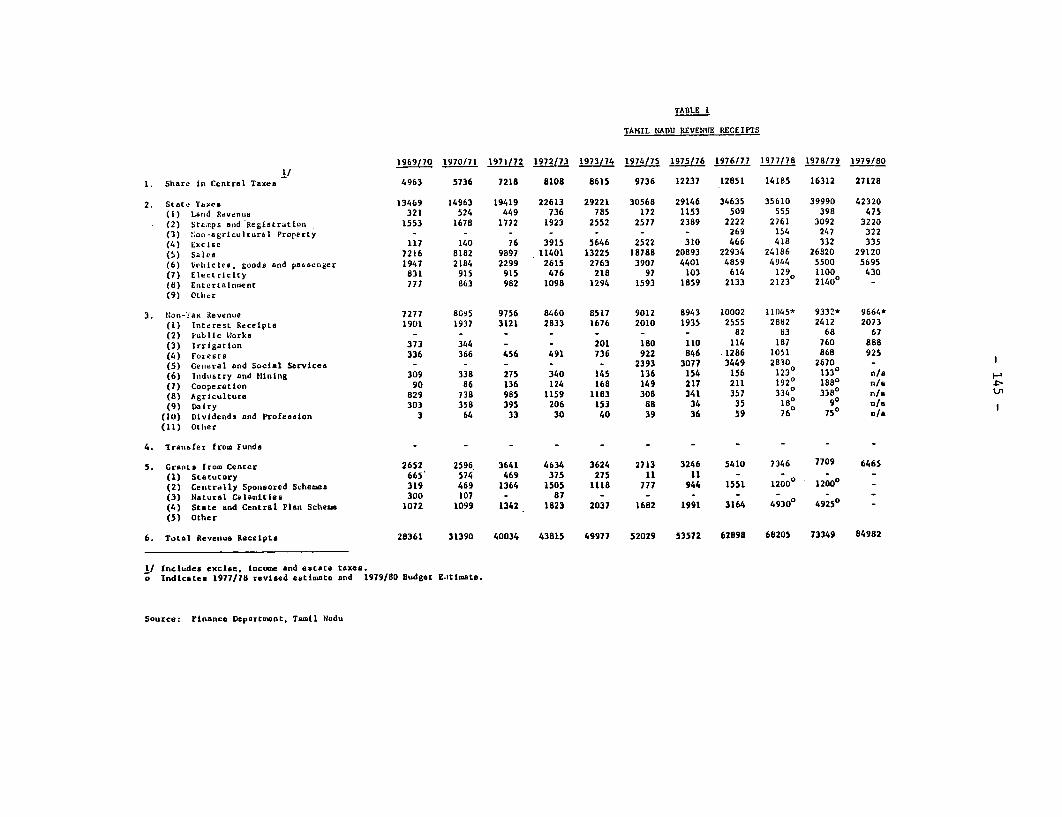
TABLE I
TAMIL NADU REVENIE RECEIPTS
1969/70 1970/71 1971/72 1972/73 1973/74 1974/75 1975/76 1976/77 1977/78 1978/79 1979/80
1/
1. Share in Central Taxes 4963 5736 7218 8108 8615 9736 12237 12851 14185 16312 27128
2. State T.xes 13469 14963 19419 22613 29221 30568 29146 34635 35610 39990 42320
(1) La5nd Revenue 321 524 449 736 785 172 1153 509 555 398 475
(2) Stm.Tps anid Registration 1553 1678 1772 1923 2552 2577 2389 2222 2761 3092 3220
(3) Non-agricultural Property - - - - - - 269 154 247 322
(4) Excise 117 140 76 3915 5646 2522 310 466 418 332 335
(5) Sales 7216 8182 9897 11401 13225 18788 20893 22934 24186 26820 29120
(6) Vehicles, goods and passenger 1947 2184 2299 2615 2763 3907 4401 4859 4944 5500 5695
(7) ElectricIty 831 915 915 476 218 97 103 614 1290 1100 430
(8) Entertainment 777 863 982 1098 1294 1593 1859 2133 2123 21400 -
(9) Other
3. ton-:ax Revenue 7277 8095 9756 8460 8517 9012 8943 10002 11045* 9332* 9664*
(1) Interest Receipts 1901 1937 3121 2833 1676 2010 1935 2555 2852 2412 2073
(2) Public Works - - - - - - - 82 83 68 67
(3) Irrigation 373 344 - - 201 180 110 114 187 760 888
(4) Forests 336 366 456 491 736 922 846 1286 1051 868 925
(5) General and Social Servicea - - - - - 2393 3077 3449 2830 2670 -
(6) Inidustry and Mining 309 338 275 340 145 136 154 156 1230 1330 n/a
(7) Cooperation 90 86 136 124 168 149 217 211 1920 1880 n/a s
(8) Agriculture 829 738 985 1159 1183 308 341 357 3340 3380 n/a U1
(9) Dairy 303 358 395 206 153 88 34 35 180 90 n/a
(10) Dividends and Profession 3 64 33 30 40 39 36 59 76 750 n/a
(11) Other
4. Transfer from Funds - - - - - -
5. Grants from Center 2652 2596 3641 4634 3624 2713 3246 5410 7346 7709 6465
(1) Statutory 665 574 469 375 275 11 11 - - - -
(2) Centrally Sponsored Schemes 319 469 1364 1505 1118 777 944 1551 1200 12000
(3) Natural Calamities 300 107 - 87 - - - -
(4) State and Central Plan Schemae 1072 1099 1342 1823 2037 1682 1991 3164 4930 49250
(5) Other
6. Total Revenue Receipts 28361 31390 40034 43815 49977 52029 53572 62898 68205 73349 84982
1/ Includes excise. Income and estate txeas.o Indicates 1977/78 revised eatiamate and 1979/80 Budget E.itimate.
Source: Finance Department, Tamil Nadu
- 146 -
6.12 Second in importance contributing 13% to State taxes are thetaxes on vehicles, goods and passengers. Tamil Nadu is the most urbanizedState in India, and also among the most densely populated, with a transportinfrastructure which is excellent by Indian standards. That transport taxesshould provide such a large slice of revenue is thus no surprise. This groupof taxes has been growing at 17.8%.
6.13 Tamil Nadu's high level of urbanization and per capita income, makeentertainment taxes a rapidly growing source of revenues, at 13%, second onlyto the sales tax, although it contributes a far smaller (5.3%) share of theState's revenues.
6.14 The effects of prohibition on State revenues are clearly shown inthe trend of the excise tax. It is levied on the sale of liquor and narcoticsand its growth is related to revision of tax rates, and price of country liquor.The excise tax is the mainstay of revenue collection in many States (in MadhyaPradesh, it contributes 15% of its own revenues, for example); in Tamil Naduit makes up less than 1%.
6.15 Other taxes, such as land revenue, urban property taxes, electri-city duties and the like are all very minor sources of revenue in Tamil Nadu,and it appears that they are suffering some neglect. Revenues from electri-city duties show an absolute decline in the past decade, as do the stamp andregistration taxes. This is a trend common to many States although in TamilNadu these have never been as important a source of revenue as in many otherstates.
6.16 Overall, State revenues have grown at 11.2% per annum since 1969.In real terms, this performance is diminished somewhat, since the price levelhas risen also, by about 5% per annum. Nonetheless, an annual growth of5-6% in real terms bespeaks some tax effort. As a proportion of State income(SDP) own tax revenues have risen from 6.2% in 1970/71 to 7.5% in 1975/76.In comparison with other States, Tamil Nadu is by far the most self-reliant:it has already been pointed out that own tax revenues as a fraction of totalState revenue receipts are higher in Tamil Nadu than any other State.
Non-Tax Revenues
6.17 Non-tax revenues have declined considerably in importance over thepast decade, due to their near stagnation since 1974/75. At the beginning ofthe decade, non-tax revenues contributed 26% of Tamil Nadu's revenue receipts;in 1979/80, they are expected to contribute less than 11%, the result of annualgrowth rates as low as 2.4%. Among the reasons for this is the formation ofmany corporations in the public sector, particularly in transport operations.In the past, the revenues from such operations, accrued directly to theState Government had been considerable, and this avenue is partly closedwith the formation of these corporations. Only Forestry and Irrigation haveprovided any growth at all, the former increasing at 11.9% and the latter at8.7% per annum.
6.18 The drain on State resources represented by these corporations,especially the Electricity Board is thus quite large.
- 147 -
6.19 Another 25% of non-tax revenues derives from social and develop-
mental services which head come education (fees from schools); medical and
public health (medical fees and sale of medicines, fees for preparing town
drainage Plans) and the like. This category have also shows stagnation.
The Agriculture represents receipts from fisheries and farms operated by
the State; under industries and minerals are found receipts from cottage
industries and mines and minerals. Receipts in all of those latter categories
of non-tax receipts, including dairy and cooperation have shown a downward
trend.
6.20 In general, the trend in non-tax receipts, unlike tax receipts,
is a function of the level of services provided, the development of the
sector, in the case of the State Government's commercial undertakings, the
State's management of these enterprises, and the overall level of collection
effort put forward by the State. In the case of Tamil Nadu, it appears that
concessions and failure to revise the prices of many services managed by the
State Government, have also played a role in the stagnating level of non-tax
receipts.
6.21 To summarize, the picture presented above is one of a structural
change in the composition of revenue receipts, towards far greater reliance on
tax, rather than non-tax receipts.
6.22 Tamil Nadu has not been eligible for the statutory grants in and
from the Finance Commission since 1975, the last year in which it had anex-ante budget deficit. Since then, Tamil Nadu has had, after revenue
sharing, a budgetary surplus in each year, projected to continue through
1983/84 by the Finance Commission.
6.23 Tamil Nadu's receipts from centrally sponsored schemes have
remained more or less constant over the past 10 years, indicating that the
importance of these schemes in the State expenditure picture has not changeddramatically.
6.24 Tamil Nadu has not received grants for natural calamities since1972.
6.25 To summarize, revenue receipts in Tamil Nadu have not been very
buoyant over the period, growing at only 10% per annum in a period in which
prices increased at slightly over one-half that rate. The failure of non-taxrevenues to keep pace--in real terms, they showed a decline of about 2-3% perannum--is largely accountable for this.
III. Review of State Expenditures
6.26 Expenditures in Tamil Nadu, as in other States, are classified
under two headings: revenue expenditures and capital expenditures. Broad-ly, there is a correspondence between revenue expenditures and current
expenditures, as they are generally understood, and between capital expend-
iture, and investment. The correspondence, however, is not exact. There
- 148 -
is some investment expenditure on revenue account (basically capital expend-itures which are required for carrying out general administration of theState, such as housing for civil servants, and likewise, current' or non-investment expenditures show up on the capital account. An example wouldbe the compensation payments to landlords on the abolition of the Zamindarisystem, or loans to State entities. Formally, the difference between revenueexpenditures and capital expenditures is determined on the basis of whetherthe expenditures are financed from revenue receipts or from capital receipts.It is clear that this distinction is somewhat artificial, since there isfungibility between State income from the various sources.
6.27 There is another dichotomy in the expenditure budget as between'developmental' and 'non-developmental' heads. The distinction is meant toindicate exactly what it implies, but the differences are sometimes a bitfuzzy. Thus, the budgetary heads for "administrative services" and "collec-tion of taxes" refer to non-developmental expenditures, while "education,""public health" or "industry," for example, would be developmental expendi-tures. On the other hand, compensation payments to landlords upon the aboli-tion of the Zamindari system are also developmental expenditures. Planexpenditures may be either revenue or capital expenditures, since the Planfinances expenditures of a non-capital nature during the Plan period, butthey are always "developmental."
Revenue Expenditures
6.28 Revenue expenditures in Tamil Nadu make up a far larger proportionof total expenditures - 72% - than in most States in the Indian union. Thisis a result of the explicit strategy, emphasizing social development, whichTamil Nadu has pursued. The high priority attached to investment in socialinfrastructure is a unique characteristic of Tamil Nadu's development program.In the Sixth Draft Plan, the combination of social services (including educa-tion, public health, water supply and sewerage and community development)accounted for 25.5% of total State Plan outlays, compared with the 10-12%which such expenditures typically represent in the Plans of most states inwhich greater emphasis is put on power and irrigation and agriculture. Theresult of this orientation is reflected in the revenue expenditure picturebecause investments in social sectors typically imply more ongoing expendi-tures (wages, salaries and other overheads) than investments in the morecapital-intensive sectors, such as power or irrigation. These ongoing expen-ditures are financed through the Plans, as part of total Plan project costsduring the Plan period. At the end of the Plan, however, the current ongoingexpenditure, after "bricks and mortar" part of the project has been completed,becomes "committed expenditure" for which the State is responsible on revenueaccount. 1/ This is in contradistinction to many States in which the Planfocus is on the more capital intensive sectors in which the State commitment
1/ Indirectly, since the Finance Commission takes committed expenditureinto account when projecting the State's revenue account balance, theburden of these committed expenditures is shared.
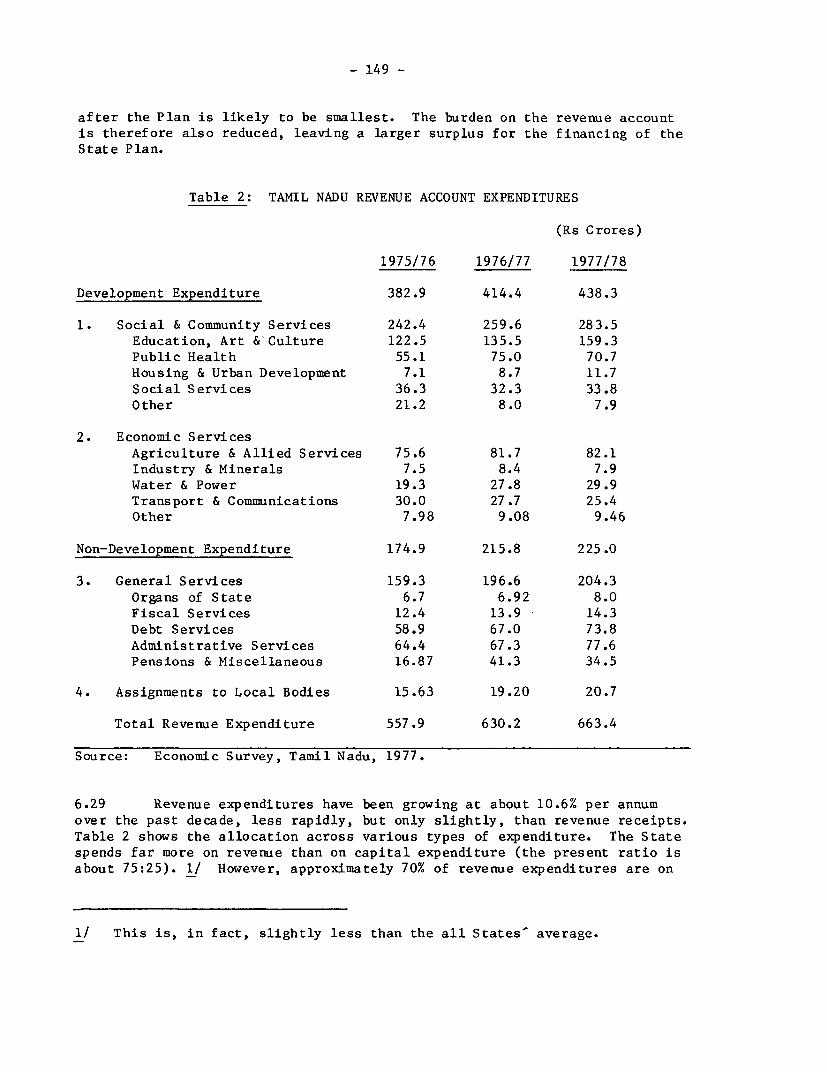
- 149 -
after the Plan is likely to be smallest. The burden on the revenue account
is therefore also reduced, leaving a larger surplus for the financing of the
State Plan.
Table 2: TAMIL NADU REVENUE ACCOUNT EXPENDITURES
(Rs Crores)
1975/76 1976/77 1977/78
Development Expenditure 382.9 414.4 438.3
1. Social & Community Services 242.4 259.6 283.5
Education, Art &-Culture 122.5 135.5 159.3Public Health 55.1 75.0 70.7Housing & Urban Development 7.1 8.7 11.7
Social Services 36.3 32.3 33.8Other 21.2 8.0 7.9
2. Economic ServicesAgriculture & Allied Services 75.6 81.7 82.1Industry & Minerals 7.5 8.4 7.9Water & Power 19.3 27.8 29.9Transport & Communications 30.0 27.7 25.4Other 7.98 9.08 9.46
Non-Development Expenditure 174.9 215.8 225.0
3. General Services 159.3 196.6 204.3
Organs of State 6.7 6.92 8.0
Fiscal Services 12.4 13.9 14.3Debt Services 58.9 67.0 73.8
Administrative Services 64.4 67.3 77.6Pensions & Miscellaneous 16.87 41.3 34.5
4. Assignments to Local Bodies 15.63 19.20 20.7
Total Revenue Expenditure 557.9 630.2 663.4
Source: Economic Survey, Tamil Nadu, 1977.
6.29 Revenue expenditures have been growing at about 10.6% per annum
over the past decade, less rapidly, but only slightly, than revenue receipts.
Table 2 shows the allocation across various types of expenditure. The Statespends far more on revenue than on capital expenditure (the present ratio is
about 75:25). 1/ However, approximately 70% of revenue expenditures are on
1/ This is, in fact, slightly less than the all States average.

- 150 -
development items, primarily education, agriculture and public health, indi-cating that Tamil Nadu has, like all State Governments, kept current expend-iture on routine items of State administration in check, in the interests ofa larger Plan size and emphasis on development in the revenue budget. Themost important item among non-development expenditures is general administra-tion services, followed closely by debt servicing. The assignments to localbodies item refers to assistance given to cities in Tamil Nadu, and is akinto the revenue sharing between the Center and the States. Of the expendi-tures on revenue account, some 8-12% are Plan expenditures, as Table 3 shows.Table 3 also shows the phenomenon of a spurt in "committed" expenditures atthe end of every Plan period as completed Plan schemes are continued underState aegis, generating additional expenditure to be met from the State'srevenue account. At the end of each Plan period, non-Plan expenditures jump:in 1965/66, the end of the Third Plan, from 81.1% of the total to 89% imme-diately the following year. Again, the same thing in 1968/69: non-Planexpenditure rise discontinuously from 90% in that year to 94% in 1969/70,the first year of the fifth Plan.
Table 3: TAMIL NADU REVENUE ACCOUNTPLAN AND NON-PLAN EXPENDITURE
Figures in Lakh Rupees
Total Plan Non-Plan Non-Plan asYear Expenditure Expenditure Expenditure % of Total
Actuals1965/66 18066 3421 14645 811966/67 20143 2117 18025 891967/68 23333 2261 21071 901968/69 36094 2443 23651 901969/70 30624 1811 28812 941970/71 32148 2285 29863 921971/72 39384 3053 36331 921972/73 41704 3497 38207 911973/74 47263 3583 43680 921974/75 52836 3790 49046 931975/76 55792 5677 50115 891976/77 62837 7169 55668 891977/78 70612 9411 61201 861978/79 75351 10442 64909 86
Source: GOTN Finance Department

- 151 -
Plan Expenditures
6.30 Plan expenditures have grown considerably faster than total revenues,
at 14.6% per annum, over the Fourth and Fifth Plan periods, indicating an
increasing emphasis on development expenditures. The sectors which havegrown most rapidly have been irrigation (18%), transport and communication
(23%) and social services (25%). Cooperation and industries also grew very
slightly faster than the overall average during the two Plan periods.
Composition of Plan Expenditures
6.31 Throughout the period, but especially since the fourth Plan, Tamil
Nadu has focused its efforts, as Table 4 shows, on the social sectors: educa-
tion, health, water supply, housing and the like. In the fifth Plan, expen-
ditures on social sectors made up 55% of total plan spending. In the sixth
Plan period, the State expects to spend nearly 26% of all Plan outlays in
this sector. Power is also being undertaken with great intensity, taking up
37% of Plan expenditure--this large increase comes at the expense of social
services. All other sectors, mineral and industrial development (5.7%),
transport and communication (8.9%) and irrigation (6.7%) receive far lowerpriority.
6.31 It is very difficult to evaluate these levels of Plan expenditure
and the Plan strategy. They can be viewed in relation to deficiencies in
infrastructure in each sector, or in relation to per capita plan expendituresin other States, or the plan strategy can simply be taken as given.
6.32 Irrigation and Agriculture: The gross irrigated area in Tamui Nadu
as a proportion of the gross cropped area was nearly 48% in 1973/74, almost
twice as high as the all-India average, about the same as Haryana, and twothirds that of Punjab. 75% of the state's irrigation potential has been
exploited. As a result, irrigation expenditures do not make up a very large
proportion of Plan expenditures. In the sixth Plan, Rs 156.7 crores is to be
the outlay, or roughly 7% of the overall draft Plan.
6.33 Power. Intensive power development is the cornerstone of theTamil Nadu Plan, as it is in most States. Since Tamil Nadu is relatively
dependent (70%) on hydro power, power supply is dependent on the monsoon and
there are typically chronic power shortages in poor monsoon years. Since thestate s industrial structure is biased in favor of industries such as chem-
icals, fertilizers, textiles, cement, aluminum and other metal-based indus-
tries whose requirements of power are of a very high order, reliable power
supply is essential. Rs 812 crores, 38% of sixth Plan outlays have, as a
result, been earmarked for power development, which includes more thermalstations; a nuclear plant is also under consideration.
6.34 Transport. Transport needs are relatively well served in Tamil
Nadu, compared with other States; road length per lakh of population is well
above the all India average, and second only to Kerala and Karnataka. Planinvestments in transport and communications make up about 8% of total outlays.
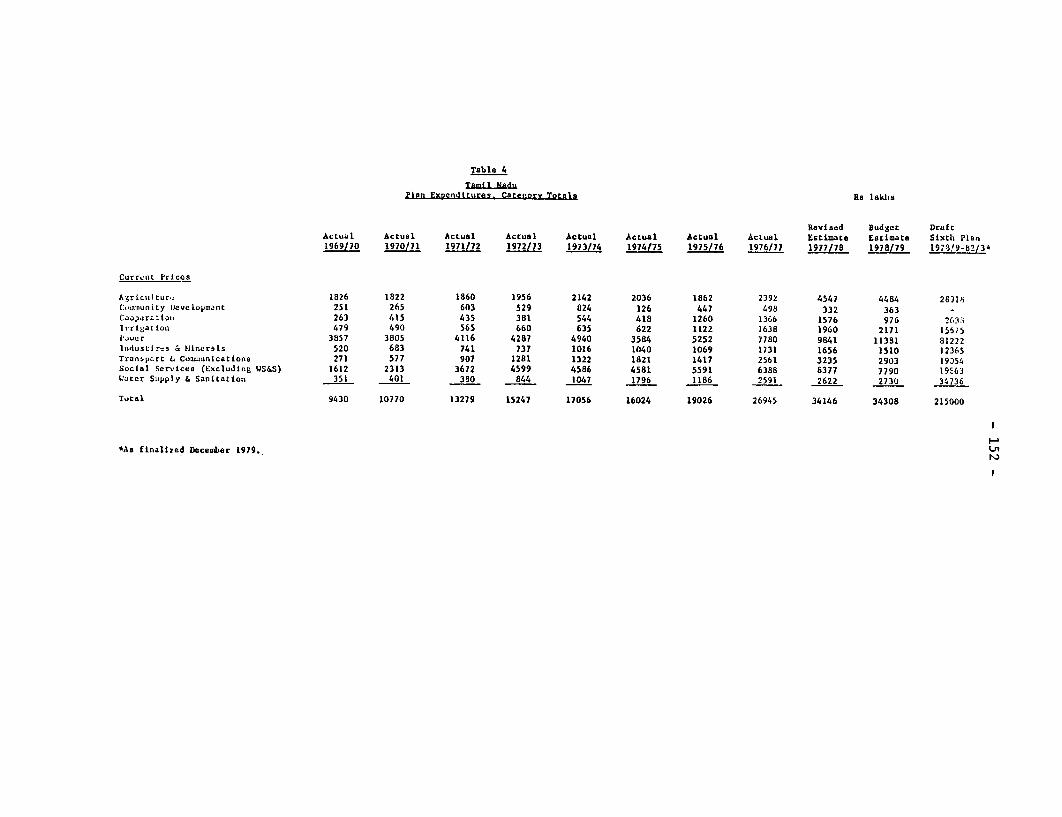
Table 4
TamLL Nadu~Plan Expendittires Caterory Totals Re lakhs
Reavised BudSet DraftActual Actual Actual Actual Actual Actual Actual Actual Estimate Eatimate Sixth Plan1969/70 1970/71 1971/72 1972/73 1973174 1974/75 1975/76 1976/77 1977/78 1978/79 1973!9-B2/3*
Curr.2nL Prices
AJ\ricultur. 1826 1822 1860 1956 2142 2036 1862 2392 4547 4484 26)13iC,mnnunity Dcvelopmant 251 265 603 529 824 126 447 498 332 363 -Coapdrctiot, 263 415 435 381 544 418 1260 1366 1576 976 2fi3.iIrrigaLion 479 490 565 660 635 622 1122 1638 1960 2171 15575Ioewur 3857 3805 4116 4287 4940 3584 5252 7780 9841 113S1 81222Industiris & Mincrfis 520 683 741 737 1016 1040 1069 1731 1656 1510 12365TranspGrt Li Con=unicstions 271 577 907 1281 1322 1821 1417 2561 3235 2903 19354Social Services (Excluding US&S) 1612 2313 3672 4599 4586 4581 5591 6388 8377 7790 19'63Ul4ter Supply & Sanitation 351 401 380 844 1047 1796 1186 2591 2622 2730 34736
Tutal 9430 10770 13279 15247 17056 16024 19026 26945 34146 34308 215000
*As finalized December 1979. L
- 153 -
6.35 Investments in social services have always been a high priorityrelative to other Plan sectors. On many indices, there are indications thatthis investment has resulted in increased service levels in some sectors.In health, Tamil Nadu has the second largest number of hospital beds relativeto population of all Indian states (97.2 per lakh in 1976), very slightly lessthan Kerala (106) and more than West Bengal with 91 per lakh. In literacy,Tamil Nadu ranks second in India, with 40% of the population recorded asliterate. In terms of rural water supply, Tamil Nadu ranks third amongIndian States.
6.36 On the other hand, the priority placed on investments in this sectorby no means exhaust the improvements in the quality of and access to serviceswhich can take place: rural mortality remains high, infant mortality ratesin Tamil Nadu rank the State in the lowest third of the major States.
6.37 Social sectors, as a whole, make up one-fourth of all Sixth Planoutlays. This is a slight decline from the 29% of the Fifth Plan. Thisreduction is spread across almost all social service categories, includingeducation, health, housing and water supply, barring only nutrition, whichhas increased its relative share of Plan outlays from 0.2% in the fifth Planto 1.6% in the Sixth Plan.
IV. THE PLAN: FINANCIAL RESOURCES
6.38 Finance for the State Plan comes from five basic sources: (a) theState's surplus (if any) on current account after all non-Plan expenditureshave been netted out from revenue receipts; (b) the contribution of publicsector enterprises; (c) central assistance; (d) negotiated and market loans,unfunded debt and other miscellaneous capital receipts; and (e) additionalresources mobilized during the Plan period. Ex post ad hoc assistance fromthe Central Government or Reserve Bank, an increase floating debt, or saleof state assets can also contribute to financing the Plan, -but these are,of course, not planned sources of revenue when the Plan is being drawn up. 1/
6.39 Table 5 shows the details of the financing of the Fifth and SixthPlans. As the table indicates, the contribution from the State's own revenues,the difference between non-Plan revenue receipts and non-Plan revenue expen-ditures, made up 4% of Plan resources during the Fifth Plan and is expected
1/ This is the standard format for all States for States Plan resources.Since all monies are fungible, this dichotomy between Plan finance andother financial resources is to some extent artificial.

- 154 -
to contribute 12.4% over the Sixth Plan. 1/ As was discussed earlier, al-though per capita revenue receipts in Tamil Nadu are high (Rs 178 per personin 1976), the State's emphasis on plan investments which require heavy sub-sequent committed expenditures serves to limit the extent to which the State-sown budgetary resources are available to finance the Plan. The grants-in-aidfrom the Finance Commission would fill in any gap rising from an excess ofrevenue expenditures over receipts, but in the absence of a gap, cannotprovide any assistance to increase the small revenue surplus.
6.40 Additional resources mobilization is also a budgetary resource,conventionally accounted for separately from the ordinary revenue receiptsbecause it is entirely earmarked from Plan finance. It refers to revenuesfrom tax and non-tax sources including public enterprises, over and abovewhat would accrue to the State at the rates of tax and tariffs prevailingin the final year of the previous Plan. These are always shown separatelyin the State accounts and not merged with base levels of receipts. Theyderive from changes made in tax and tariff rates or base, improved collec-tion techniques or better administration. Typical examples of additionalresource mobilization measures would include such things as changes in theissue price of liquor, increases in the electricity tariff and bus fares,increases in the rate of royalty on minor minerals, amendments to check salestax evasion or to prevent undervaluation of documents subject to stamp tax,higher retained receipts from district lotteries, increases in court feerates, higher sales tax rates, and reductions in concessionary rates andwithdrawals of tax exemptions, to name just a few.
6.41 Targets for additional resource mobilization are set by the StateGovernment in consultation with the Planning Commission at the time of theannual or five-year Plan discussions, to fix the State's contribution to itsown Plan. Tamil Nadu has always done very well on this score, and has usu-ally more than achieved its targets in the past decade. Between the currentbalance and additional resource mobilization, the State will finance, in theSixth Plan, 27.5% of its Plan outlays, compared with 20.1% in the Fifth Plan.This indicates a reasonable level of self-sufficiency, keeping in mind TamilNadu's explicit strategy to devote a large proportion of its Plan outlaysto social sectors representing subsequent drain on resources.
1/ This is often loosely referred to as the State's "revenue account surplus,"but it is, strictly speaking, the surplus (deficit) only of non-Planrevenue account receipts over non-Plan revenue account expenditures.The non-Plan revenue receipts moreover, include only those receiptswhich would have been earned at rates of tax prevailing at the beginningof the Plan period. Additional receipts, whether tax or non-tax earnedthanks to measures introduced after the beginning of the Plan, aredenominated "additional resource mobilization."

T&BLE 5
SOURCES OF STATE PLAN FINANCERe. in Crores
FTFTH PLAN SIXTH PLAN
1974/75 1975/76 1976/77 1977/78 Fifth Plan 1978/79 .1979/80. 1980/81 Sixth Plan
1. Balance from Current Revenue 10.04 11.01 10.67 39.28 71.0 (3.9) 103.52 72.62 71.10 268.50 (12.4)
2. Contributions of Public Sector Enterprises(L) State Electricity Board 6.87 17.21 37.55 17.08 78.71 (4.3) 20.90 1.82 20.47 32.58 (1.5)
(Li) Road Transport Corporation 7.53 14.78 21.36 9.74 53.41 (3.0) 12.91 13.26 13.64 62.46 (2.9)
(iii) Otbers - - - - - - - - 12.00 (0.5)
3. Loans from Market 16.34 26.30 13.68 13.19 69.5 (3.8) 13.22 13.05 14.36 65.38 (3.0)
4. Small Savings 10.12 18.27 23.54 22.20 74.13 (4.0) 36.98 32.00 34.60 173.00 (8.0)
5. State Production Fund 3.60 5.79 11.22 9.68 30.29 (1.6) 9.12 9.89 10.38 56.15 (2.6)
6. Miscellaneous Capital Receipta 1.68 16.98 20.41 31.57 70.64 (3.8) .103.11 15.12 1.12 34.06 (1.6)
7. Additional Reserve .......... 47.75 105.18 145.87 - 298.8 (16.2) 27.44 50.97 50.39 325.00 (15.1) F
Il
8. Negotiated Loans(i) State Governnent
-- From LIC 1.26 1.45 1.25 1.40 5.36 (0.2) 1.37 1.51 1.51 8.39 (0.4)
-- From RBI 0.76 2.90 3.85 1.82 9.33 (0.5) 1.14 1.82 2.00 10.09 (0.4)
(iL) State Enterprises 6.80 8.09 8.17 13.72 36.78 (2.0) 15.54 10.36 11.40 57.18 (2.6)
(ili) Others 6.55 3.50 5.35 6.08 21.48 (1.1) 5.81 6.60 7.26 36.63 (1.7)
Markat Borrowings(i) State Enterprises 9.90 9.82 12.65 15.34 47.71 (2.6) 18.72 22.15 24.28 131.65 (6.1)
(iL) Others 3.30 3.30 3.30 2.31 12.21 (0.7) 3.30 3.30 3.63 16.50 (0.7)
9. Withdrawal from Reserve andIncrease n .(i) Ways and Mteans Adv. 2.20 18.37 3.78 12.43 31.78 (1.7) 3.26 1.10 - -
10. Central Assistance(i) Grants 14.61 17.15 27.30 42.67 101.73 (5.6) 37.24 23.73 62.86 119.63 (5.5)
(fi) Loans 34.04 40.00 63.72 95.49 233.25 (12.7) 84.77 55.37 279.15 (13.0)
(iLL) IDA Additionality - - - - - 1.50 3.00 6.00 23.38 (1.1).
(iv) Supplementary Assistance - - - - - 35.35 30.00 33.00 377.34 (17.5)
TOTAL RESOURCES 140.85 195.14 226.13 270.86 1,832.98 310.74 331.59 324.82 2,149.84
- 156 -
6.42 The second item of Plan finance is the contribution of publicsector enterprises. This has been moderate throughout most Plan periods.In spite of the positive figures, this is in fact no "contribution" as such:most public enterprises represent a net outflow from the State's revenuecoffers. The figure represented here is simply an accounting notion: itrepresents the net operating surplus of the State enterprises which is thesurplus gross of depreciation and certain interest payment liabilities and isnot equivalent to the net commercial profit or loss of the enterprises. This,in most cases, is negative. 1/ The rationale for this accounting is that asinking fund is akin to the enterprises' own internal resource generation.Since these are public corporations and, therefore, their operations financedthrough the Plan, their depreciation fund is, in fact, Plan finance. Were itnetted out, the State would have to provide the same funds to the enterprisefor expansion by other means. While this notional accounting is completelyacceptable, it should be kept in mind that most public sector enterprises donot make a net contribution to the State's financial resources and do notgenerate funds for the public sector in a true sense. The figure simplyrepresents the operating surplus and internal resources of the State.corporations.
6.43 Loans from the market represent essentially State bond issues andare not market loans in a true sense, since their placement has been assigned,since the nationalization of the banks in 1969, between commercial banks andother financial institutions. As a contribution to the State's financialresources, they are not really significant; some 3.0% is expected from thissource ~-.iring the Sixth Plan period. There are also market borrowings of theState etterprises, principally the Electricity Board. These are again,placed by assignment to various lending institutions in the "market," andalso make a moderate contribution to Plan resources--about 6% is expectedfrom this source in the Sixth Plan. All of the public debt is allocated tothe States by the Central Government, and the State Government has practicallyno say in the matter.
6.44 Negotiated loans are what their name implies and are negotiatedprincipally from the Life Insurance Corporation of India, the Reserve Bankand HUDCO. State enterprises, principally the Electricity Board, also nego-tiate loans largely from the same sources. As a fraction of total resourcesfor the Plan, this source contributed less in the Sixth Plan (5.1%) than inthe Fifth Plan (3.7%).
6.45 Small savings loans are loans from the Central Government to theStates which each State receives automatically as a result of State partici-pation in the various schemes operated by the Center, primarily throughthe Post Office, to mobilize household savings. States receive two-thirdsof whatever savings are made through these channels as an incentive to
1/ In Tamil Nadu's case, were the SEB breaking even in a commercial sense,another Rs 20 crores would have been available to the State over theSixth Plan period.
- 157 -
encourage further savings. This has proven to be a modest source of revenue,
comprising 4% of Plan resources in the Fifth Plan, and to make up 8% in the
Sixth Plan.
6.46 "Miscellaneous capital receipts" are all the other net transactions
not accounted for under the other headings, such as short-term loans from the
Central Government, recoveries of loans and advances to other institutions
by the State Government, net accretions under various sinking funds and other
net accounts including non-Plan loans. In general, this is a negative figure,
since a substantial amount is repaid to the Central Government and financial
institutions. The final item, the withdrawal from reserves and net increase
in floating debt is an adjustment item. In it are entered the final closing
balance of the previous year's accounts, the proceeds from sales of securi-
ties and treasury bills and the net change in ways and means advances from
the Reserve Bank. This is, of course, not a planned resource for the State
Plan but results, ex-post, from the State Plan accounts.
6.47 Central assistance on Plan account (as opposed to the assistance
on revenue account, discussed earlier), 1/ is composed of grants and loans,
and is fixed by the Planning Commission. All states receive Plan assistance,
which is distributed among them according to a formula known as the "Gadgil
formula," in which State population and per capita income, among other factors,
are used as weights. For Tamil Nadu, the assistance is given on a 70% loan,
30% grant basis, except for the funds earmarked for Plan expenditures in
tribal areas (the "tribal sub-plan") which are given on a 10% loan, 90%
grant basis. Normal central assistance contributed approximately 18% to
financing the Fifth Plan; during the Sixth Plan, 19.6% is expected from this
form of revenue sharing. Compared with other States, this figure represents
a fair degree of independence.
6.48 Additionality is a type of central assistance which derives from
the foreign aid disbursements received by the Center, and which is passed on
to the State for the project which is being funded. Just about 1% of Tamil
Nadu's total Plan finance comes from this source, but at the margin it repre-
sents a considerable incentive to Tamil Nadu and to all States to put forward
projects for foreign assistance, since additionality represents funds which
they would not ordinarily receive. All three projects will imply additional
assistance for Tamil Nadu.
6.49 The picture presented by this brief overview of the State Plan and
its financing is one of overall soundness. Tamil Nadu differs from other
better off States primarily in the contribution made by the balance from
current revenues, which is small in relative terms. This is an explicit
choice of the State. As a result, however, the overall size of the Tamil
Nadu plan, Rs 305 crores in 1978/79, for example, is far smaller than what
1/ This distinction is to some extent arbitrary since the Finance Commission
award contributes to the positive balance on revenue account, which in
turn finances the Plan.
- 158 -
might at first expect from a State in which tax efforts and resource mobili-zation have been good, generally speaking. In terms of overall Plan size,Rs 305 crores places Tamil Nadu ninth in a ranking of 15 major States; inper capita terms with an expenditure of Rs 65, Tamil Nadu ranks far lower,fourteenth. 1/
V. THE PLANNING PROCESS
Planning Machinery
6.50 Planning in Tamil Nadu is carried out by the State's Finance De-partment, although there is also a State Planning Commission, whose purposeis to advise on Plan priorities and project selection. The Planning Commis-sion has recently produced its first five-year Plan (1978/79-1982/83), adocument in which, among other things, future Plan outlays are measuredagainst an estimate of resources over the Plan period, thus identifying thegap in future resource requirements. Although the Commission has not func-tioned effectively to date, the five-year Plan is a worthwhile document,because it represents the first step taken in Tamil Nadu toward the processof Plan formulation and monitoring. In the absence of such a Plan and acapital program which looks a few years ahead, spending agencies and theState Government can only budget on a year to year basis for both capitaland current expenditures. As a result, bids for spending are based on ahistorical pattern--as they have been in Tamil Nadu--and not on an analysisof goals and objectives and performance in the sector, or from the point ofview of the State's more global objectives.
6.51 The Commission is not a statutory body and its role is purelyadvisory. With continued development of its expertise, it is hoped thatthe broader perspective it provides will change the extent to which theannual budget process determines the State's development strategy. Untilthen, the Finance Department will continue to function, among other things,as coordinator between the operational departments and to be the ultimatefinancial arbiter over all Plan outlays as well as over their sectoraldisposition.
Plan Coordination
6.52 Tamil Nadu's State Plan is drawn up in consultation with the CentralPlanning Commission. The procedure is the same for all States, and is moreor less similar for five-year and annual Plans alike. The overall size ofthe State Plan is fixed by the Planning Commission in Delhi in consultationwith the State Finance Department through a series of discussions. These
1/ "Basic Statistics Relating to the Indian Economy," November 1978, Vol.II.
- 159 -
focus on State resource availability for the period (which is a function of
its budget surplus, capital receipts and additional resource mobilization
efforts) and implementation capacity in the various sectors.
6.53 In these discussions, the onus is generally on the State to "prove"
that it has sufficient resources for the size Plan it has prepared. Initially,
resource availability may be somewhat uncertain, since there are a number of
unknowns, most important, the amount of central assistance. The Plan which
the State proposes at this juncture is, therefore, a function of its best
assessment of its own capacity and the sketchy information available about
central resources. In Tamil Nadu, a five-year Plan of Rs 2,523 crores expen-
diture ($3.0 billion) was put forward at these discussions. Subsequently,
the Plan has been finalized at Rs 2,150 crores of which Rs 798 crores is from
central assistance and the balance, Rs 1,352 crores, the State's own resources
including borrowing. Additional resource mobilization is expected to be 24%
of own resources, a target which if not met, will have to be made up through
deficit finance such as overdrafts, accommodating loans from the central
Government, or by not meeting outlay targets. 1/
6.54 The sectoral allocation of the Plan is also discussed at this time.
National priorities find their way into State Plans via the guidelines of the
Planning Commission. Proposals from each State Department are drawn up and
forwarded to the Finance Department. The Finance Department's coordination
and scrutiny of sectoral outlay levels are carried out with these guidelines
in mind. In the case of Tamil Nadu, the view points of the Planning Commis-
sion and the State Finance and operating departments are generally convergent,
but this is not always the case for all States.
6.55 In its earliest stages, the State Plan consists of a set of proposals
for outlays drawn up by each department, detailing the program and strategy of
Plan expenditure in that sector. This level of outlays which results generally
represents the absolute maximum which the department could execute, and the
program is not very discriminating in terms of project content. State Depart-
ments usually consult their counterpart ministry in Delhi on the formulation
of their program. Even if not, the central ministries will in any case try to
influence the formulation of departmental proposals because of their "empire
building" tendencies. These departmental proposals are submitted to the
Finance Department in August/September of each year. They are discussed by
the Cabinet and at the Secretariat level, and an attempt is made to match the
aggregate of proposals against the available resources. This first round
aggregation of departmental proposals implied, in Tamil Nadu, a Plan far
greater than the Rs 2,523 crores which was presented to the Planning Com-
mission. How the sectoral allocation is ultimately determined in this
whittling down process remains somewhat of a mystery. To some extent, it is
an ad hoc procedure, in the absence of a perspective planning cell in the
Finance Department. The figure fixed for the Planning Commission for Tamil
Nadu after the Plan discussions for the Sixth Plan was Rs. 2,150 crores.
1/ In the past, Tamil Nadu has usually achieved its additional resource
mobilization targets. These figures are as finalized, December 1979.

- 160 -
6.56 The Tamil Nadu State Plan of Rs 2,150 crores is "final" in the sensethat all the motions have all been completed. It remains formally, however,in the "draft" stage, since the national Plan and hence central assistance,have not yet been finalized. Changes in the size or the sectoral breakdown ofthe Plan are, however, not expected to differ markedly the final version ofthe State's Sixth Plan.
VI. Madras: Municipal Finances in India
6.57 Up to this point, this paper has only been concerned with the re-source position of the State of Tamil Nadu, which is to finance and implementthe Tamil Nadu Nutrition Project, Madras Water Supply Project, and MadrasUrban Development II Project. Selected components of this last project,including street lighting, drains, land acquisition and solid waste manage-ment are to be implemented by the Madras Corporation. The financial healthof Madras city is, therefore, also pertinent to a full analysis of the finan-cial aspects of implementing these three projects. A brief survey of thecity's revenues, expenditure commitments and budgeting practices and a generaldiscussion of the situation of Indian municipalities in general, follows.
6.58 Madras is the oldest local government unit in India, chartered byJames-II of England in 1688. The city has grown from its rather modest begin-nings as a trading center to become India's fourth largest city, with a presentpopulation of 4.4 million, over 20% of Tamil Nadu's population.
6.59 There are two tiers of municipal administration in Madras, the MadrasMunicipal Corporation 1/ and the Madras Metropolitan Development Authority.The MMC takes care of purely local municipal functions, providing civicamenities and infrastructure facilities such as roads, water supply, drainage,street lights, elementary education parks, and public health. The City Cor-poration also licenses buildings, markets and industries, and is responsiblefor local tax administration and administration of public agencies. TheMI4DA is an agency set up in 1972 by the State Government and charged withresponsibility for development planning for the entire Madras MetropolitanArea. This area consists of the Madras Municipal Corporation, four muni-cipalities, four townships and twenty panchayats. 1/ At present, the MMDAhas only an advisory role, but is intended in future to be the primary bodyresponsible for capital budgeting and planning of investment priorities in
1/ In India, there are five types of urban local governments: municipalcorporations, municipalities, notified areas, town areas and cantonments.There are wide variations in the pattern of local authority betweenStates: all five types are not found in all States; some States mayhave only one type. On the rural side, Panchayati Raj institutionscover the entire rural areas and consist usually of a three-level hier-archy of administration linking the village to the district leveladministration.
- 161 -
the MMA. This dual arrangement is similar to that of the other large cities(Bombay, Calcutta) in which independent development and municipal authoritiesdivide responsibility for maintenance of services and town/regional planning.The Tamil Nadu government maintains considerable control over the adminis-tration and finances of the Corporation. A Commissioner, appointed by the
State Government is the executive head of the Corporation. Moreover, much of
the investment in MMA is carried out by various departments or agencies of the
Tamil Nadu government. This includes major city roads and highways which are
constructed and maintained by the Highways and Rural Works Department, andurban housing which falls under the aegis of the Tamil Nadu Housing Corporation
and the Slum Clearance Board. State approval is required for the Corporation'sbudget, for revisions in tax levies and for its borrowings, for which the
State is the major source. In 1974, the Municipal Council was dissolved and
replaced by a Special Officer, also appointed by the Tamil Nadu government.
Resources
6.60 The Madras Metropolitan Corporation, like almost all Indian munici-
pal corporations, is severely constrained in its ability to generate revenue
and to provide the urban services which are so urgently required. The muni-
cipal area faces pressures from both the need to provide services to a rapidly
growing population (5% per annum) and to remedy the existing deficiencies in
service levels to prevent service provision from deteriorating still further.
Revenues are derived from five broad sources: (i) local taxes and surchargeson State taxes (such as land revenue and entertainment taxes) which more or
less reflect the autonomous financial capacity of the city; (ii) assigned
revenues; (iii) taxes levied and collected by the State Government whose
proceeds are turned over to the local government (such as stamp duties);
(iv) grants from the State; and (v) loans primarily from the State and the
LIC. The first three items are considered current revenue, the latter capital
income, untied to the local revenue base and determined by factors largely
outside the local bodies control. The Corporation's current revenue has
always exceeded capital revenue, making up about 80% of the municipality'sincome.

Table 6
Total Current and Capital Revenues of Madras Met-opolitan Corporation. 1970/71 - 1979/80
(R. Lakhu)
1 970/7 1 197 1/72 1972 /73 1 97 3/74 1 974/75 1975/ 76 1976 /77 1977 /78 19 78 /79 1979/80R.E.
A. CURRENlT REVENUES
1. Tax R-vnues 614.84 700.99 706.53 914.87 1035.36 1126.06 1315.29 1,147.93 1,145.05 980.16(1) Property Ta.: 580.93 670.23 679.01 878.81 999.23 1086.26 1220.22
a) General1 Purpose 248.09 299.15 287.15 376.12 427.95 451.74 527.36 482.41 468.68 574.03b) Lighting 56.96 95.28 85.05 108.60 124.80 137.49 153.82 145.82 167.30 167.23c) Water 30.76 34.33 35.41 46.51 53.49 58.92 65.92 62.49 71.70 -d) Drainage 127.60 110.71 133.65 170.68 196.12 216.05 241.71 229.14 262.90 -e) Education 103.70 115.16 115.34 147.42 165.06 185.98 219.74 228.07 320.19 238.90f) Library Ceus 13.02 15.65 22.41 29.48 31.81 36.08 11.67 - 29.28-
(2) other Ta. Reven.e. 33.91 30.71 27.52 36.06 36.13 39.80 95.07 150.16 146.73 146.09a) Profession 21.43 16.86 13.69 20.46 18.74 22.41 72.91 127.55 123.12 125.00h) Company 7.95 8.26 8.15 8.59 9.58 9.95 10.62 10.27 10.66 10.00c) Timher 1.68 2.82 2.83 3.02 2 .7 7 2.23 72.91 1.98 1.76 2.00d) Advertisenet 2.78 2.75 2.80 3.95 5.15 7.14 9.57 10.22 11.09 9.00e) Carriages and Animals 0.07 0.02 0.05 0.04 0.09 0.07 0.36 0.14 0.10 0.09
1I. Non-Tan Revenues (User 228.48 249.57 299.05 341.92 265.05 284.30 228.43 304.76 360.93 374.58Charges, fees):
(1) Management 33.46 51.89 .82. 31 104.61 77.81 110.19 53.18 103.60 151.12 189.14(2) Education 0.24 9.42 6.27 6.84 6.87 0.57 1.13 11.57 26.10 23.81(3) Coennun-ica .o 42.50 49.35 45.86 50.53 33.15 35.80 28.37 22.20 98.39 104.00(4) Public Health 35.39 44.69 49.28 29.56 25.66 27.20 22.45 20.13 17.85 16.41(5) Remunerative 63.52 37.94 52.34 52.11 55.75 42.36 28.34 51.63 28.10 29.74(6) Lighting 1.09 1.86 2.75 2.07 3.18 1.20 5.09 1.70 2.58 11.36(7) Water Supply 49.30 50.20 56.35 63.80 51.43 46.72 67.84 65.07 23.80 -(8) Drainage 2.80 3.06 3.12 28.96 10.03 18.04 19.84 26.49 11.49 -(9) Toan Planning 0.18 1.16 0.71 0.44 1.12 2.12 2.19 2.37 1.50 0.12
III. Revenu e Transfers: 251.68 267.94 292.59 290.34 318.45 309.34 363.17 363.01 474.12 498.65(1) gntertainment Tan 197.42 211.97 234.91 284.76 235.17 231.33 323.75 346.62 364.34 350.09(2) Surrharge on S.D. 50.63 52.30 54.03 51.93 79.63 73.61 35.77 12.74 106.21 145.00(3) MPT Compens.ation 3.63 3.67 3.65 3.65 3.65 2.40 3.65 3.65 3.57 3.56
IV. Grats '38.33 18.15 22.39 24.58 22.00 0.11 1.84 141.05 138.65 215.95
V. Non-Recurring Grants 57.59 115.36 20.72 8 9 9 9 ---
TOTAL CURRENT REVENUERS 1.190,94 1,352.01 1,341.38 1,571.74 1,640.86 1,721.81 1,913.73 2,106.91 2,265.48 2,215.43
8. CAPITAL REVENUES
I . Grants 62.17 50.71 95.91 39.04 102.86 122.74 12.34 273.51 205.33 489.30(1) Management NE NE NE NE NE 3.40 Nf - - -(2) Education NE NE NE NE NE 15.00 NE - - -(3) Communiuatiun 15.50 44.57 68.75 28.32 7.84 19.08 10.72 84.57 185.15 461.80(4) Public Wealth NE NE NE NE 10.00 NIE NE - - -(5) Remunerative NE NE NE NE NE 1.22 NE - -(6) Lighting NE NE NE NE NE NE NE - - 27.50(7) Water Supply 20.93 2.95 16.12 3.61 57.70 69.40 1.01 51.73 - -(8) Drainage 25.74 3.19 11.04 7.11 27.32 14.64 0.91 130.00 --(9) Town Plannng NE Nft NE NE NE NE NE 7.21 20.18 -
L.-Lan 205.86 948.25 1,000.25 209.84 147.24 352.48 127.36 600.16 310.15 599.30(1) Managemen.t 54.00 103.41 696.60 100.00 NE 110.00 110.00 239.00 110.00 110.00(2) Educatipn. NE NE NE NE NE NE NE - - -(3) CmuIain89.36 189.34 38.50 22.36 '18.20 15.03 NE 172.50 185.15 461.80(4) Public Health 0.50 NE 1.00 NE 5.00 15.00 NE - 10.00 -~(5) Remunerative 20.00 NE 84.00 0.48 3.18 0.01 0.24 - - -(6) Lighting 14.00 37.75 83.00 NE 12.00 NE 5.00 5.00 5.00 27.50(7) Woter SuppLy 14.00 545.25 49.15 12.00 4 7 .7 94.62 4.62 53.66 - -(8) Drainage 14.00 72.50 48.00 61.76 40.32 105.50 NE 130.00 --(9) Tnwn Planning NE NE NE 13.24 20.79 12.32 7.50 - - -
TOTAL CAPITAL REVENUES 268.03 998.96 1,096.16 248.88 250.10 475.22 139.70 873.67 715.48 888.68
TOTAL REVENUES 1,458.92 2,350.97 2,437.54 1,870.62 1,890.96 2,197.03 2,053.73 2,980.58 2,980.96 3,104.03
9 Category abolished in 1973/74
- 163 -
6.61 Unlike the arrangements with respect to State-level government,there are no constitutional provisions regarding revenue competence forlocal bodies, which consequently, derive such taxing powers as they havefrom the State Government. The primary source of revenue for the MadrasMetropolitan Corporation is local taxes. The most important of these isthe property tax, which presently contributes about 50% of the city's totalincome and which constitutes about 95% of the city's total tax revenues asTable 6 shows. Within the property tax itself are cesses nominally earmarkedfor water supply, public lighting, drainage, education and libraries. Amongother city taxes are the tax on companies and professions, the scope of whichis limited by the Indian constitution to avoid double taxation of income andtaxes on animals. The contribution of these taxes to revenues is negligible:less than 5% of current income derives from this assortment of levies. Nota-ble by its absence is the octroi tax, a common source of revenue for mostlarge Indian cities (in Bombay and Ahmedabad, for example, it makes up 35%and 52% of municipal revenues, respectively). Octroi is an unpopular taxwith economists because of its impact on the movement of goods made and pro-posals for abolishing it are frequently made. Its absence in Tamil Nadu is,from this point of view, a good thing, in spite of the revenue implications.
6.62 Non-tax revenues are the user charges and fees charged by the muni-cipality for the services it provides, such as land development, leasing ofmarkets, cinemas, slaughter facilities, building permits, license fees, watercharges, fines and the like. The primary purpose of most of these fees is"regulation of trade" not resource mobilization, and as such, perhaps, it isnot surprising that non-tax revenues have made up only about 15% of MMC cur-rent revenues. Nonetheless, a good cause can be made for improving theiryield.
6.63 Local bodies own revenues are augmented through tax sharingarrangements with the State. Revenues from the State entertainment tax andstamp duty, for example, are generally shared with municipalities as well aswith panchayats. In the case of Madras, these revenue transfers made up about20% of current municipal revenues over the period 1970/71-1976/77. The mainobjective of this arrangement parallels that of the revenue sharing betweenthe Center and the States: (a) to ensure uniformity and efficiency in theadministration of certain revenues; and (b) to maintain some degree of controlover the finances of local bodies.
6.64 Local bodies receive other current income from the State as well,mostly in the form of grants. Recurring grants are given to meet the city'scurrent expenditure gap and are provided on an annual basis if the city'sown revenues are insufficient to cover required revenue expenditures. Thesegrants were required in 1975 and 1976, when the Madras Corporation was indeficit on revenue account. However, judging the city's fiscal health onthe basis of its revenue surplus is at best a dubious exercise since most ofMMC's expenditures go towards maintenance and, by varying standards, a widerange of outcomes is possible by year's end.
6.65 In addition to financing some revenue expenditures, all capitalexpenditures in MMC are covered from State funds. Grants and loans from theState Government are provided to help the city meet the capital costs of

- 164 -
specific projects. 1/ Over the period in question, capital revenues havefluctuated widely, ranging from 7-41% of the city's total income. The years1971/72 and 1972/73 represent a peak when large loans were provided formanagement, water supply, and street lighting. These fiscal transfers fromthe State are determined largely on an ad hoc basis, and are linked to aspecific project or program suggested by the local government. They alsoreflect to a large degree the financial straits of the State itself, finan-cial largesse being more likely when the State is under little financialpressure of its own. Madras, like other municipal bodies is allowed toborrow, although prior permission is required from the government of TamilNadu, from whom much of the borrowing is done in any case. Open marketborrowing and. negotiated loans from the Life Insurance Corporation of Indiamust also be cleared with the Reserve Bank, which also approves the loansend-use.
Revenue Buoyancy
6.66 While the municipal tax base is narrow, and the property tax--fromwhich the bulk of revenues derive--among the more difficult taxes to admin-ister, tax revenues in the Madras Metropolitan Corporation have increased atan average rate of 13% per annum in nominal terms. Non-tax revenues have notperformed so well. In the early 1970s, they showed a buoyancy equal to thatof the property tax, but this was shortlived, for by 1977, revenues hadfallen in nominal terms very close to their 1970 level of Rs 228 lakhs.By 1978/79, the levels had recovered.
6.67 Revenue transfers from the State and the State levies in whichthe MMC receives an agreed share, show a slight upward trend. Over theperiod, they have risen by an average 6.6% per annum, which is suprisinggiven the buoyancy one would expect, a priori, from an entertainment taxin an urban setting.
6.68 In sum, non-tax revenues have been far less buoyant than tax rev-enues, growing at just over 8% since 1979. Total current revenues grew at8.2% from 1970-77. This rate of increase, however, was not sufficient toachieve any growth in real terms, much less in per capita terms. In constantprices, total current revenues declined by 2% per annum, and in real percapita terms, by 6-7%. Even the property tax revenues, when seen in thislight, declined by 2-3% in real per capita terms since 1970/71. 2/
6.69 The Corporation is statutorily requird to raise sufficient revenuesto meet the current costs of operation and maintenance including debt servic-ing costs and, in addition, show a minimum balance of Rs 1.5 lakh on the
1/ The grant/loan proportion varies, but in general, loans are the moreimportant.
2/ Population growth rate is approximately 5% per annum in MMC, of whichroughly 50% is attributable to in-migration.
- 165 -
General Revenue Account. The Corporation has found it impossible untilrecently to comply with the requirement, as the following discussion of theexpenditure side of the municipal budget shows.
Madras Metropolitan Corporation - Expenditures
6.70 Current expenditures in MMC have increased far more slowly thancurrent revenues. Between 1970 and 1978, expenditures grew at 7.1% perannum. 1/ This trend growth rate masks some very large fluctuations duringthe period in many of the categories, and in the level of total expendituresas well. Current expenditures increased rapidly over the first three yearsof the period under review, at an average rate of 14% per annum, but declinedthereafter in absolute terms; by 1977, they had fallen back to their 1971/72level. These growth rates, however, are not very meaningful for two reasons:firstly, MMC operates under such a degree of fiscal constraint that expendi-ture levels can be directly and abruptly affected by shortfalls in revenues.The point was made earlier that the bulk of MMC expenditure is on maintenance-related items which allow for a great deal of flexibility in the items actu-ally undertaken each year. The more important reason, however, is the cash-accounting system used by MMC and most other municipalities, which means thatthe trends shown in the tables do not provide an adequate basis for extrapo-lating trends or predicting future expenditure patterns. This is especiallytrue of capital expenditures, where additionally, their lumpiness makes for avery uneven pattern, with large expenditures in any sector influencing signi-ficantly the total expenditure in a particular year.
6.71 These expenditure levels have been insufficient to generate anygrowth in service provision to the city in real per capita terms. On average,per capita real expenditures shrunk by 10% per annum over the period 1970/71-1978/79, implying an overall decline in the city's service level.
Sectoral Composition of Expenditures
6.72 Current expenditures constitute the bulk of expenditures in MMC,ranging from 88% to 63% between 1976/77 and 1979/80. The latter drop wasdue to the fact that loans for roads and bridges led to increased capitalexpenditures in this period.
1/ Because of the very uneven nature of the expenditure trends, the growthrates referred to are growth rates derived from the OLS regression ofthe relevant variable against time, enabling all observations to betaken into account in estimating the trend.

TABLE 7
REVENUE AND CAPITAL EXPENDITURES OF HADRAS CORPORATION (Re Lakha)
1970/71 1971/72 1972/73 1973/74 1974/75 1975/76 1976/77 1977/78 1978/79 1979/80(B.E.)
Revenue Expendittire
Management 96.67 97.88 113.56 138.31 134.61 150.80 182.06 327.39 423.12 514.45
Education 66.66 72.72 81.71 78.76 94.87 84.85 81.16 408.08 531.15 609.57
Communication 214.17 288.56 342.03 168.43 125.76 136.10 182.67 79.97 137.64 173.38
Public llealth 328.10 402.33 426.09 444.60 476.34 501.34 501.24 445.93 550.36 621.36
Remuineration 22.85 22.50 40.11 29.32 25.71- 20.94 23.31 13.21 15.56 15.89
Lighting 96.36 129.66 186.00 99.71 99.10 101.38 109.70 99.91 139.82 144.25
Water SS 68.09 74.06 91.37 98.95 105.59 120.63 136.26 l
Drainage 84.00 94.16 104.63 123.68 129.62 143.15 150.29 288.50 141.40 5.22ON
Town Planning 2.20 1.56 1.57 2.02 2.14 3.28 2.46 - 0 - - 0 - - 0 - 0%
Debt Service 121.24 130.24 169.99 442.46 388.30 167.89 110.24 243.24 351.34 212.45 l
Other - 0 - - 0 - - 0 - - 0 - - 0 - - 0 - - 0 - 48.10 114.01 181.83
Total 1097.64 1413.66 1557.06. 1636.53 1583.21 1434.40 1481.17 1954.38 2404.45 2478.44
Capital Expendituire
Management 54.00 99.08 31.03 1.44 0.69 2.90 3.16 - 0 - - 0 - - 0 -
Education - 0 - - 0 - -0.- 2-.17 3.57 13.56 8.11 - 0 - - 0 - - 0 -
Communication 59.59 94.00 134.70 133.40 68.77 88.76 74.21 198.98 371.65 1264.79
Public Health 10.06 6.38 9.01 20.11 37.28 12.37 20.91 26.81 53.05 76.87
Remuneration 0.36 0.99 3.79 7.06 6.05 15.85 29.25 1.96 1.76 5.51
Lighting 5.61 35.50 41.454 36.69 17.23 20.12 10.41 4.68 4.82 77.94
Water SS 51.45 54.27 46.73 61.67 52.25 84.63 38.06
Drainage 42.59 25.42 46.41 60.02 55.34 18.90 20.50 437.10 78.0 - 0 -
Town Planning 3.22 2.82 1.84 1.62 1.72 0.82 0.01 - 0 - 1.04 - 0 -
Total 226.88 318.61 314.96 324.18 243.90 270.96 204.42 670.70 546.99 1463.52
Source: MMC
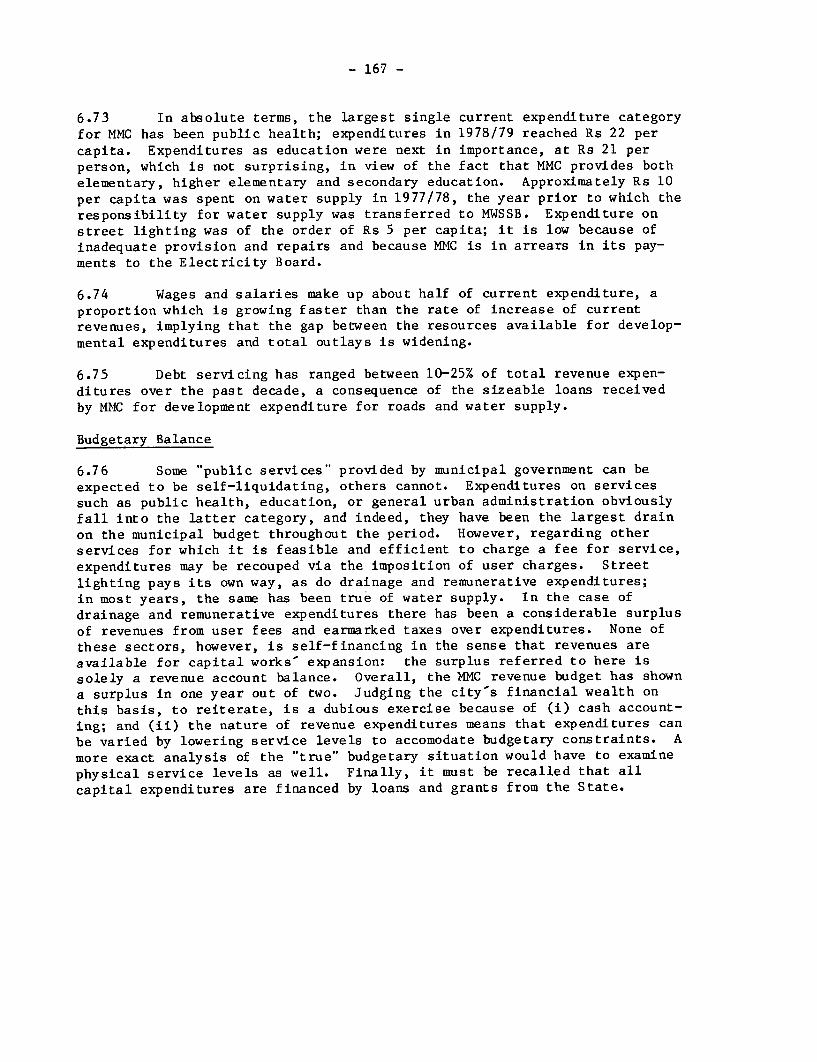
- 167 -
6.73 In absolute terms, the largest single current expenditure category
for MMC has been public health; expenditures in 1978/79 reached Rs 22 per
capita. Expenditures as education were next in importance, at Rs 21 per
person, which is not surprising, in view of the fact that MMC provides both
elementary, higher elementary and secondary education. Approximately Rs 10
per capita was spent on water supply in 1977/78, the year prior to which the
responsibility for water supply was transferred to MWSSB. Expenditure on
street lighting was of the order of Rs 5 per capita; it is low because of
inadequate provision and repairs and because MMC is in arrears in its pay-
ments to the Electricity Board.
6.74 Wages and salaries make up about half of current expenditure, aproportion which is growing faster than the rate of increase of currentrevenues, implying that the gap between the resources available for develop-
mental expenditures and total outlays is widening.
6.75 Debt servicing has ranged between 10-25% of total revenue expen-
ditures over the past decade, a consequence of the sizeable loans receivedby MMC for development expenditure for roads and water supply.
Budgetary Balance
6.76 Some "public services" provided by municipal government can be
expected to be self-liquidating, others cannot. Expenditures on services
such as public health, education, or general urban administration obviously
fall into the latter category, and indeed, they have been the largest drain
on the municipal budget throughout the period. However, regarding other
services for which it is feasible and efficient to charge a fee for service,
expenditures may be recouped via the imposition of user charges. Street
lighting pays its own way, as do drainage and remunerative expenditures;
in most years, the same has been true of water supply. In the case of
drainage and remunerative expenditures there has been a considerable surplus
of revenues from user fees and earmarked taxes over expenditures. None of
these sectors, however, is self-financing in the sense that revenues areavailable for capital works' expansion: the surplus referred to here is
solely a revenue account balance. Overall, the MMC revenue budget has shown
a surplus in one year out of two. Judging the city's financial wealth on
this basis, to reiterate, is a dubious exercise because of (i) cash account-
ing; and (ii) the nature of revenue expenditures means that expenditures can
be varied by lowering service levels to accomodate budgetary constraints. A
more exact analysis of the "true" budgetary situation would have to examine
physical service levels as well. Finally, it must be recalled that all
capital expenditures are financed by loans and grants from the State.
Table 8
Current Revenues and Expenditures of Madras Metropolitan Corporation
Rs. lakhs.
1970/71 1971/72 1972/73 1973/74 1974/75 1975/76 1976/77 1977/78 1978/79 1979/80
I. Management(i) Current Revenues 33.5 51.8 82.3 104.6 77.8 110.1 53.1 103.0 151.0 189.0
(ii) Current Expenditures 96.7 97.9 113.6 138.3 134.6 150.8 182.0 327.0 423.0 514.0(Deficit/Surplus) (-63.2) (-46.1) (-31.3) (-33.7) (-56.8) (-40.0) (-128.9) (-224.0) (-272.0) (-325.0)
II. Education(i) Current Revenues 103.9 124.6 121.6 154.2 171.9 186.5 220.8 239.0 346.0 261.0
(ii) Current Expenditures 66.6 72.2 81.7 78.6 94.8 84.8 81.1 408.0 531.0 609.0
(Deficit/Surplus) (+37.3) (+52.4) (+34.9) (+75.6) (+76.1) (+101.7) (+139.7) (-169.0) (-185.0) (-348.0)
Ill. Communication(i) Current Revenues 42.5 49.3 45.3 50.5 33.1 35.8 28.3 22.0 98.0 104.0
(ii) Current Expenditures 214.1 288.6 342.0 168.4 125.7 136.0 162.6 79.0 137.0 173.0(Deficit/Surplus) (-171.6) (-239.3) (-296.2) (-117.9) (-92.6) (-100.2) (-134.3) (-57.0) (-39.0) (-69.0)
IV. Public Health(i) Current Revenues 35.4 44.7 49.3 29.5 25.6 27.3 22.5 20.0 17.0 16.0
(ii) Current Expenditures 328.0 402.0 426.1 444.6 476.3 501.3 501.2 445.0 550.0 621.0
(Deficit/Surplus) (-292.6) (-357.3) (-376.8) (-415.1) (-449.7) (-474.0) (-479.8) (-425.0) (-537.0) (-605.0)
V. Remunerative(i) Current Revenues 65.5 37.9 52.8 55.1 55.7 42.3 28.3 51.0 28.0 29.0
(ii) Current Expenditures 22.8 22.5 40.1 29.3 25.7 20.9 23.3 73.0 15.0 16.0(Deficit/Surplus) (+42.7) (+15.4) (+12.7) (+25.8) (+30.0) (+21.4) (+05.0) (-38.0) (+13.0) (+13.0)
VI. Lighting(i) Current Revenues 50.0 107.4 87.8 110.6 127.9 147.7 158.9 147.0 169.0 178.0
(ii) Current Expenditures 96.3 129.6 186.0 99.7 99.0 101.4 109.1 99.0 139.0 144.0
(Deficit/Surplus) (-46.3) (-22.2) (-98.2) (+10.9) (+28.9) (+46.3) (+49.2) (+48.0) (+30.0) (+34.0)
VlI. Water Supply.(i) Current Revenues 80.0 84.5 91.7 110.3 104.9 105.6 133.7 383.0 368.3 -
(ii) Current Expenditures 68.0 74.0 91.2 98.9 105.6 120.6 136.3 288.0 141.0 5.0
(Deficit/Surplus) (+12.0) (+10.5) (+0.5) (+11.4) (-0.7) (-15.0) (-2.6) (+95.0) (+127.0) (-5.0)
VIII. Drainage(i) Current Revenues 130.4 113.7 139.8 199.6 206.1 234.0 261.5
(ii) Current Expenditures 84.0 94.1 104.6 123.7 129.6 143.0 150.3 5.0
(Deficit/Surplus) (+46.4) (+19.6) (+35.2) (+75.9) (+76.5) (+91.0) (+111.2) (-5.0)
IX. Town Planning(i) Current Revenues 0.1 1.1 0.7 0.4 1.1 2.1 2.1
(ii) Current Expendituires 2.2 1.5 1.8 2.0 2.1 3.2 2.4(Deficit/Surplus) (-2.1) (-0.4) (-0.9) (-1.6) (-1.0) (-0.9) (-0.3) - - -
X. Other Revenue 1/ 642.6 746.9 672.7 756.5 837.1 838.9 1003.9 1141.0 1088.0 1472.0
Other Expenditures 2/ 121.2 130.2 169.9 442.5 388.3 167.8 110.2 295.0 468.0 396.0
Total Revenues 1190.9 1352.0 1341.3 1571.7 1640.8 1721.8 1913.7 2106.0 2265.0 2478.0
Total Expenditures 1097.6 1413.6 1557.6 1636.5 1583.2 1434.0 1481.1 1954.0 2404.0 2478.0
Current Account Balance +93.3 -60.6 -215.7 -64.8 +57.6 +287.8 +432.6 +152.0 -139.0 -263.0
1/ Includes property taxes, library cess, other miscellaneous taxes, revenue transfers and current grants.
2/ Debt Service.
Source: Tables 6 and 7.
- 169 -
VII. FINANCING THE PROJECTS IN TAMIL NADU
6.77 The purpose of this review of State revenues and expenditures andmunicipal finances has been to provide the background for an assessment ofthe State's implementation capacity for the three appraised projects, scheduledto be executed between now and 1985/86. These projects are:
(i) Tamil Nadu Nutrition ($66.4 m) whose goal is to increasethe efficiency, coverage and impact of GOTN nutritionefforts by concentrating systematically on the nutrition-ally most vulnerable groups and includes supplemental feed-ing, improvement of home nutrition, education and expandedmaternal/child health care in six rural districts.
(ii) Madras Urban Development II ($74 m) will expand low costsolutions to Madras shelter, infrastructure and transportproblems, including sites and services, slum improvement,solid waste management, small scale business, and bus trans-port. This project is to be implemented between 1980-84.
(iii) Madras Water Supply ($238 m) which will augment the supplyof water to Madras and adjacent urban areas and improve thecity's existing water-borne sewerage system. Some additionalsewerage treatment capacity and expansion of existing sewer-age collection is also included.
6.78 Assessing the likelihood of smooth and timely implementation of thethree projects rests on the answers to the following questions:
(a) Does the State/city have the ability to provide the neces-sary resources?
(b) Is the heavy expenditure required for the projects, espe-cially in water supply, consistent with State prioritiesas far as sector development is concerned and within thesocial services sector itself, is the distribution ofexpenditures implied by the projects consistent with therequired outlays in other items on the same plan head?
(c) Finally, do the three projects taken together representover-investment in the MMA relative to rural areas of theState and is this likely to give pause at later budgetarysessions when difficult political decisions may have to bemade?
6.79 The first question is a function of the resources available for theState Plan, the rate at which they will grow over the period of project imple-mentation and the availability of Plan resources for the social services as

- 170 -
opposed to other sectors. The second question can be approached by lookingat the proportion of State Plan outlays earmarked for the social servicessector and its various sub-components in the period over which the projectswill be implemented. Is this proportion in line with the past trend of expen-ditures in the sector? If not, which sectors or sub-sector will the largerproject commitments come at the cost of? Within the social sector itself,expenditure trends must be examined for any break in the past pattern ofinvestment as between subsectors: education, health, water supply, nutrition,and housing all having their claims. These questions are important because ifthere are such changes which come at the expense of other expenditures on whichthe State also places great priority, conflicts may arise and allocations toany one of the three projects could undergo some slippage.
6.80 Tamil Nadu. Numerous agencies besides Tamil Nadu government andMadras Corporation 1/ will be responsible for implementing the three projects.However, because they are State agencies to whom allocations are made from theState budget (as opposed to parastatal autonomous corporations), it is primarilythe finances of Tamil Nadu and the budgeting practices of' the State whichare relevant. Since the budget of each organization is largely determinedby the State's contribution to it, it is this contribution which is impor-tant in relation to project implementation. From a financial or planningpoint of view, allocations to MWSSB, the implementing agency for MadrasWater Supply Project are a commitment of the Rural Development and LocalAdministration Department (RDLA). RDLA's proposals for outlays for MWSSB mustbe forwarded to the Finance Department, along with all other outlay proposalsof the RDLA Department in order to be incorporated into the State budget.In the case of MWSSB, 8% of its investment program must be contributed byself-generated resources, and its financial health is, therefore, not entirelya function of RDLA budget allocations. To the extent that among the project'sgoals is the strengthening of the body responsible for water supply in Madras,the overall financial viability of MWSSB is indeed important. But, becausethe amounts are small and because compensating allocations would be likelyto be made through RDLA Department in the case of any shortfalls, projectimplementation, narrowly defined, is not likely to suffer.
6.81 As Table 9 shows, total commitments to Bank-assisted projectsserving the Madras area are expected to come to Rs 115.9 crores ($137 m) inthe Sixth Plan and Rs 273.6 crores in the Seventh ($325 m). All of theseprojects come under the "social and community services" head of Plan outlayswhich traditionally has comprised upwards of 25% of the Tamil Nadu's Planoutlays, second only to outlays in power. Of these Plan expenditures onsocial services, approximately 21% in the Sixth Plan and 25% in the Seventh
1/ MWSSB is the implementing agency for Madras Water Supply; components ofMUDPII will be implemented by Tamil Nadu Housing Board, Tamil Nadu SlumClearance Board, Palavan Transport Co. and SIDCO. Allocations to theseagencies for carrying out components of Bank projects, can be found inthe Tamil Nadu Budget, under loans and grants to State corporations.Expenditures of these agencies do not appear in the budget.

- 171 -
Plan, must be earmarked for the four Bank assisted projects (see line 14),
a proportion which does not appear unduly high, leaving 75-80% of the sector s
outlays for ongoing or new, non-Bank schemes.
6.82 Within the sector itself, the four projects do not appear to upset
the balance between outlays on the various subsectors--education, art and
culture, public health, publicity, welfare of backward classes--to any extent.
Outlays implied by both urban development projects and even the Madras water
supply are not out of line with past trends in these subsectors. Expenditures
on water supply remain more or less constant between the Fifth and Sixth Plans
(9.8% compared with 9.4%). If this level of allocation is projected to con-
tinue through the Seventh Plan, project expenditures will absorb close to 50%
of outlays on this subhead (line 15). Urban development and housing alloca-
tions as a proportion of Plan outlays also shaw little change between Fifth and
Sixth Plans. Projecting this allocation to continue through 1987/88, approxi-
mately 60% of outlays in the Sixth Plan and 21% in the Seventh must be earmarked
for Bank-assisted urban development projects (see line 17). Since there is
substantial agreement between the Bank, the Government of Tamil Nadu and Madras
on the program of Plan investments in MMA, the proportions earmarked are in
line with government spending priorities.
6.83 Tamil Nadu Nutrition Project is the only exception, where project
outlays imply a six-fold increase in the level of expenditures under this
head between the opening and closing years of the Sixth Plan. However, the
absolute amounts are very small: the project implies an increase in the
proportion of Plan outlays allocated to this subsector from 0.2% in the
Fifth Plan to 1.6% in the Sixth Plan. Since the amounts are so small, they
do not come at the expense of outlays in other subsectors. The State commit-
ment to the innovative nutrition program is in any case very strong. The
relevant proportions of sectoral outlays, when additionality is added to the
outlays under the respective Plan heads is shown in line. Additionality,
assuming it is channelled by the State Government to the project-implementing
department, lowers the proportion of departmental outlays which must be ear-
marked for project outlays. 1/ It would not directly affect either the MWSSB
or the Madras Corporation, although indirectly, the funds would reach them,
via the department-s newly possible largesse. 2/
1/ Questions of fungibility, and whether additionality funds are (i) indeed
earmarked for the department concerned, or whether they amount to a free
resource since the State would have allocated to the department in any
case and (ii) whether within the Department the additionality contributes
to financing the project on behalf of which funds are received, clearly
spring to the fore. This discussion assumes that additionality does
supplement departmental resources.
2/ If it is assumed that Departments in turn earmark additional funds for
the project in question, enabling a larger program to be carried out.
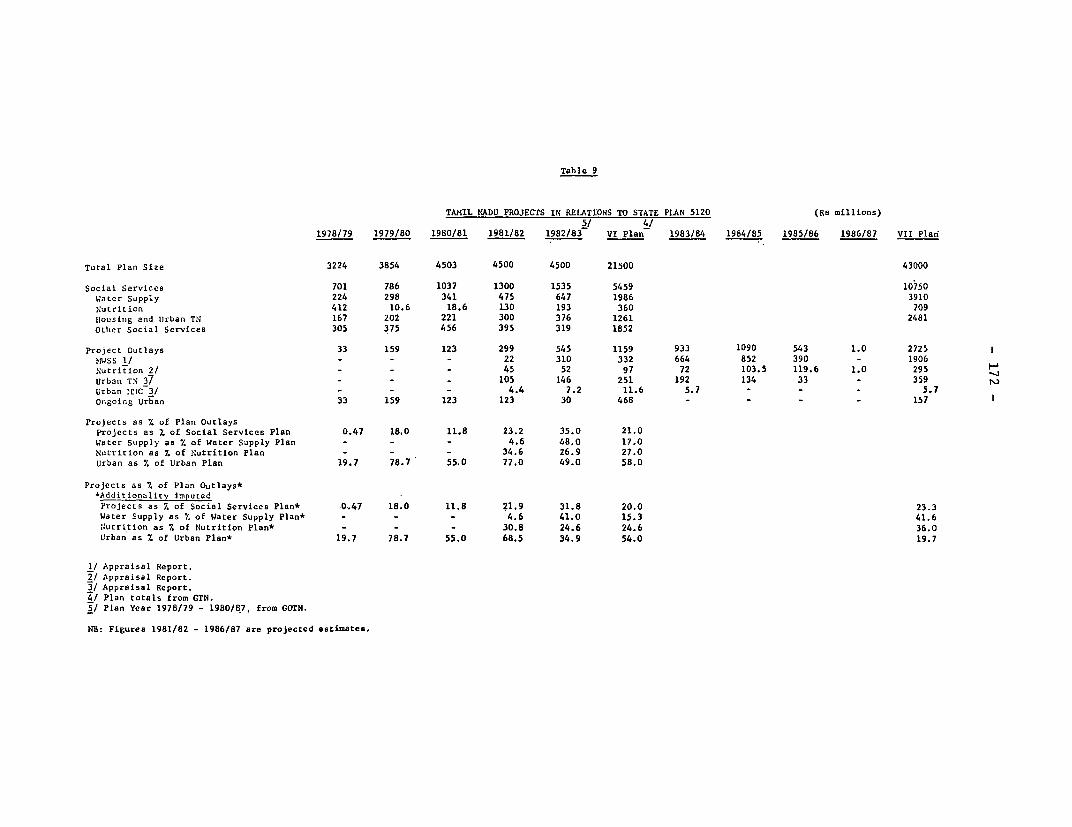
Table 9
TAMIL NADU PROJECTS IN RELATIONS TO STATE PLAN 5120 (Re millions)5/4/
1978/79 1979/80 1980/81 1981/82 1982/83 VI Plan 1983/84 1984/85 1985/86 1986/87 VII Plan
Total Plan Size 3224 3854 4503 4500 4500 21500 43000
Social Services 701 786 1037 1300 1535 5459 10750Water Supply 224 298 341 475 647 1986 3910Nutrition 412 10.6 18.6 130 193 360 709Housinig and UIrban TN 167 202 221 300 376 1261 2481OLber Social Services 305 375 456 395 319 1852
Project Outlays 33 159 123 299 545 1159 933 1090 543 1.0 2725wguss 1/ - - - 22 310 332 664 852 390 - 1906Nutrition 2/ - - - 45 52 97 72 103.5 119.6 1.0 295Urbani TN 37 - - - 105 146 251 192 134 33 - 359Urban icriC 3/ - - - 4.4 7.2 11.6 5.7 - - - 5.7Ongoing Urban 33 159 123 123 30 468 - _ _ _ 157
Projects as % of Plan OutlaysProjects as 7 of Social Services Plan 0.47 18.0 11.8 23.2 35.0 21.0Water Supply as 7. of Water Supply Plan - - - 4.6 48.0 17.0Nutrition as 7 of Nutrition Plan - - - 34.6 26.9 27.0Urban as 2 of Urban Plan 19.7 78.7 55.0 77.0 49.0 58.0
Projects as % of Plan Outlays**Additionality imputedProjects as % of Social Services Plan* .0.47 18.0 11.8 21.9 31.8 20.0 23.3Water Supply as *. of Water Supply Plan* - - - 4.6 41.0 15.3 41.6Nutrition as % of Nutrition Plan* - - - 30.8 24.6 24.6 36.0Urban as 7 of Urban Plan* 19.7 78.7 55.0 68.5 34.9 54.0 19.7
1/ Appraisal Report.2/ Appraisal Report.3/ Appraisal Report.4/ Plan totals from CTN.5/ Plan Year 1978/79 - 1980/87. from GOTN.
NB: Figures 1981/82 - 1986/87 are projected estimates.
- 173 -
Madras Corporation
6.84 The Madras Corporation is responsible for implementing componentsof MUDP II, including street lighting, drains, land acquisition and solid
waste management. The financial strengthening of MMC, a pre-condition of
MUDP II is quite crucial to the overall project objectives of expanding the
capacity of institutions in Madras to provide urban services and subsequentmaintenance of infrastructure facilities. As has already been mooted, the
Madras Corporation, like many other cities in India, is severely constrainedin regard to revenues, with current revenues usually insufficient to cover
even the low level of revenue expenditure which the city does undertake.Because of the inadequacy of its own revenues, all capital and some revenueexpenditures are financed by the Tamil Nadu Government through the budget
of the Rural Development and Local Administration Department (the departmentresponsible for all local bodies under the urban development and housingheads of Plan outlay). The procedure has been described in Section V: After
funds for existing commitments have been allocated to State Departments, thebalance is allocated across departments in line with their budget proposalsand State priorities. Since the Finance Department reviews the RDLA proposalson a project by project basis, and proposals for MMC capital expenditures arealso closely scrutinized. MMC thus competes with all other entities in theState for budgetary assistance--it is, after all, only one of the many demandsin the finite RDLA budget. A financial strengthening of MMC is, therefore, asine qua non for Madras ability to provide a higher standard of urban serv-
ices; its financial weakness, however, does not appear to threaten implemen-
tation of project components in the narrow sense for the reason that-thenecessary budget allocations will be made by the State Government.
6.85 The final issue is the implications of these three projects for
State investments in MMA in relation to investments in the rest of the State.
The two projects, MUDP II and Madras Water Supply, when added to the ongoing
MUDP I, do substantially shift the balance of investments between MMA and the
rest of the State, doubling the investment in MMA from about-8% of Stateinvestment in the Fifth Plan to 22% by the end of the sixth. It is important,because a shift on account of these projects, without the full support ofthe State Government and the Planning Commission, could give rise to pres-sures which might cause the State to back off from its original commitment.
6.86 The balance of outlays was an issue in the discussions betweenthe Planning Commission and Tamil Nadu in the annual Plan discussions which
ended in February 1980. The case made by the State Government in supportof this shift gave the reasoning that the past investment program has given
priority to rural areas of the State, to the detriment of MMA. According to
a study by ORG, a consulting firm involved in preparation of MUDP I and II,
the share of State public investments benefitting MMA has declined from 17%
in 1970/71 to about 8% in 1979/80, and its share is now less than MMA's 10%
share in the State population. Moreover, relative to other States, the qualityof rural life in Tamil Nadu is high: all villages have been electrified,health infrastructure standards are high, investment in roads and transport,
and education, all serve rural areas well in relative terms. Issues of ruralsubsidization of urban areas do not complicate this, since the bulk of Tamil
Nadu revenues are collected in MMC.
- 174 -
6.87 To right this balance and stem the decline in the level of urbanservices, the State Government is fully convinced that the projects are justi-fied. Moreover, continued development of Madras as the principal urban centerof the south--and the fact that it is the fastest growing of the large metro-politan centers in India--also provide justification for these investments.
6.88 In sum, the three future projects do not appear to pose any diffi-culties for the State or municipal government from a financing point of view.Moreover, they are consistent with past trends in outlays of Tamil Nadu'sdevelopment Plan as well as with the need to stem the growing deficiency inurban services in the Madras Metropolitan area.
World Bank Aggregate Demand and Development Prospectsublications .Macroeconomic Imbalances of Capital Surplus Oil-
flublications in Thailand: Simulations Exporting Countries: Iraq,
of Related with the SIAM 1 Model Kuwait, Libya, Qatar,Wafik Grais Saudi Arabia, UAE
Interest Focuses on the demand-side adjust- Rudolf Hablutzel
ments of the Thai economy to lower This background study for World
agricultural growth and to higher Development Report 1981,energy prices. Discusses policy discusses the production strategies
measures and structural changes that and the development policies of the
might enable the economy to over- capital-surplus oil-exportingcome these problems and continue countries.to maintain high GDP rates ofgrowth. World Bank Staff Working Paper No.
483. November 1981. About 38 pages.World Bank Staff Working Paper IYo. SokIo P08.$.0448. April 1981. 70 pages (including Stock No. WP-048.3. $5.00.2 appendixes).
Adjustment Experience and Stock No. WP-0448. $5.00.
Growth Prospects of the Developments in and
Semi-industrial Countries Prospects for the ExternalFrederick Jaspersen An Analysis of Debt of the Developing
This background study for World Developing Country Countries: 1970-80Development Report 1981, Adjustment Experiences in and Beyondexamines the successful process the 1970s: Low-Income Asia Nihoas C. Hon eof adjustment to external "shocks" of Christine Wallich T bclac r. s fpW
the 1970s (rising prices of oil This background study for World
imports, reduced demand for This background study for World Development Report .1981, analyzes
exports, slower economic growth in Development Report 1981, the debt situation and its implica-
the OECD countries) in the semi- examines low-income South Asia's tions for future borrowing.
industrial developing countries. Fre- adjustment to the external shocks of
sents an analytical framework for the 1970s, especially those factors World Bank Staff Working Paper No.
quantifying the effects of demand that helped make the effects of these 488. November 1981. About 40 pages.
management and structural adjust- external developments less severe in Stock No. WP-0488. $5.00.
ment in forty-two countries, with the region than in other parts of the
particular reference to Uruguay, developing world.Brazil, Republic of Korea, and Turkey. World Bank Staff Working Paper No.
World Bank Staff Working Paper No. 487. November 1981. About 45 pages. Energy Prices, Substitution,477. November 1981. About 52 paes. Stock No. WP-0487. $5.00. and Optimal Borrowing in
Stock No. WP-04 77. $5.00. teSotRn nAayithe Short Run: An Analysisof Adjustment in Oil-
Aspects of Development Importing DevelopingBank Management CountriesWilliam Diamond and Ricardo Martin and
Adjustment in V. S. Raghavan Marcelo Selowsky
Low-income Africa Deals exclusively with the manage- Develops a short-term model for
Robert Liebenthal ment of development banks. The evaluating the adjustment (par-
This background study for World book is divided into eight sections, ticularly, external borrowing) of oil-
Development Report 1981, analyzes each dealing with one aspect of importing developing countries to
the adjustment to external shocks management of its problems, and the increase in oil prices during the
during the 1970s made by a group of the various ways of dealing 1970s. Discusses the borrowing
of middle-income and low-income with them. strategies that can be expected in the
African countries, with particular EDI Series in Economic Development. future and the demands that will be
reference to Kenya, Tanzania, The Johns Hopkins University Press, made on multilateral institutions.
Senegal, and Sudan. April 1982. About 320 pages. World Bank Staff Working Paper No.
World Bank Staff Working Paper No. LC 81-481 74. ISBN 0-8018-2571-7, 466. July 1981. 77 pages (including
486. November 1981. About 45 pages. $29.95 hardcover; ISBN 0-8018-2572-5, footnotes, references).
Stock No. WP-0486. $5.00. $12.95 paperback. Stock No. WP-0466. $5.00.
Food Policy Issues in World Bank Staff Working Paper No. LC 81-481 75. ISBN 0-8018-2803-1,Low-Income Countries 476. August 1981. 67 pages. $35.00 hardcover; ISBN 0-8018-2804-X,Edward Clay and others Stock No. WP-04 76. $5.00. $12.95 paperback.A background study for WorldDevelopment Report 1981. Discusses The Policy Experience offood distribution-especially its Twelve Less Developed Private Bank Lending toinsecurity in the face of external Countries, 1973-1978 Developing Countrieseconomic pressures and potential Bela Balassa Richard O'Brienconflicts with internal productionconcerns-in general and with Uses the methodology applied in the A background study for Worldreference to Bangladesh, author's "The Newly-industrializing Development Report 1981.Zambia, and India. Developing Countries After the Oil Describes the evolution of relation-
Crisis" (World Bank Staff Working ships between private banks andWorld Bank Staff Working Paper No. Paper No. 437, October 1980) to developing countries.473. November 1981. About 45 pages. examine the policy experience ofStock No. WP-0473. $5.00. twelve less developed countries in World Bank Staff Working Paper No.
the period following the quadrupling 482. November 1981. About 40 pages.of oil prices in 1973-74 and the Stock No. WP-0482. $5.00.
A General Equilibrium world recession of 1974-75.Analysis of Foreign World Bank Staff Working Paper No.Exchange Shortages in a 449. April 1981. 36 pages (including Private Capital Flows toDeveloping Economy appendix). Developing Countries andKemal Dervis, Jaime de Melo, Stock No. WP-0449. $3.00. Their Determination:and Sherman Robinson Historical Perspective,Examines the consequences of alter- The Political Structure of Recent Experience, andnative adjustment mechanisms to the New Protectionism Future Prospectsforeign exchange shortages in semi- Douglas R. INelson Alex Flemingindustrial economies. Comparesdevaluation to two forms of import This background study for World A background study for Worldrationing and finds that adjusting by Development Report 1981, Development Report 1981.rationing is much more costly in presents a political-economic Discusses the nature and determina-terms of lost gross domestic product. analysis of what has been called the tion of recent private capital flows to
"Inew protectionism." developing countries. Focuses onWorld Bank Staff Working Paper No. those flows passing through the443. January 1981. 32 pages (includ- World Bank Staff Working Paper No. international banks and examines theing references). 471. July 1981. 57 pages (including prospects for and constraints onStock No. WP-0443. $5.00. references). developing countries' continuing
Stock No. WP-0471. $5.00. access to the international capitalmarkets.
intemational Ad1ustment Pricing Policy for Develop- World Bank Staff Working Paper No.in the 1980s ment Management 484. November 1981. 41 pages.Vjay Joshi Gerald M. Meier Stock No. WP-0484. $5.00.A background study for WorldDevelopment Report 1981. Analyzes Presupposing no formal training inthe macroeconomics of international economics, it explains the essentialadjustment. Highlights potential elements of a price system, the Structural Adjustmentmarket failures and areas for functions of prices, the variousintervention policies that a government might Policies in Developing
pursue in cases of market failure, EconomiesWorld Bank Staff Working Paper No. and the principles of public pricing of Bela Balassa485. Nouember 1981. About 45 pages. goods and services provided by
government enterprises. It also pro- Examines structural adjustmentStock No. WP-0485. $5.00. vides the would-be practitioner with policies (policy responses to external
an appreciation of the underlying shocks, such as the quadrupling ofNotes on he Analyss oflogial stpruciture of cot-beunderlitnpgj oil prices and the world recession of14otes on the Analysis of logec al s ubstane to the 1970s) of developing countries.CptlFlows to Developing eth applaiedand pogicy dimtanensions Considers reforms in production
Nations and the manypplie adicy arensiom incentives, incentives to save and to"Recycling" Problem the experience of development prac- invest, public investments, sectoralRalph C. Bryant titioners and relate to such important policies, and monetary policies, and
sectors as agriculture, industry, comments on the interdependence ofA background study for World power, urban services, foreign trade, the various policy measures and onDevelopment Report 1981. and employment. The principles the international environment inSummarizes and criticizes the con- outlined are therefore relevant to a which they operate.ventional analysis of the interrela- host of development problems. World Bank Staff Working Paper No.tions between rinancial markets in46.Jl 9136pgsthe industrialized countries and capi- The Johns Hopkins University Press. 464. July 1981. 36 pages.tal flows to the developing nations. June 1982. About 480 pages. Stock No. WP-0464. $3.00.
World Debt Tables Capital Market Imperfec- A Conceptual Approach toA compilation of data on the external tions and Economic the Analysis of External Debtpublic and publicly-guaranteed debt Development of the Developing Countriesof 101 developing countries plus Vinayak V. Bhatt and Robert Z. Aliberseventeen additional tables of private Alan R. Roeand nonguaranteed debt from the World Bank Staff Working Paper No.
World Bank Debtor Reporting World Bank Staff Working Paper 421. October 1980. 25 pages (includingSystem. Describes the nature, con- No. 338. July 1979. 87 pages appendix, references).tent, and coverage of the data; (including footnotes). Stock No. WP-0421. $3.00.reviews the external debt of 101countries through 1980; contains Stock No. WP-0338. $5.00.tables on external public debt out-standing, commitments, disburse- Development Banksments, service payments, and net The Changing Nature of William Diamondborrowings of 101 developing coun- Export Finance and Its Operating experiences that serve as atries, by country, 1971-1980. Implications for Developing practical guide for developing coun-
(EC-167/81). December 1981. Annual. Countries tries, with a selected list and
About 300 pages. Albert C. Cizauskas summary description of some
Stock No. DT-8101. $75.00. World Bank Staff Working Paper No. The Johns Hopkins University Press,
Computer tape-s containing the data 409. July 1980. 43 pages (including 1957: 5th printing, 1969. xiii + 128bases for the World Debt Tables will 3 annexes). pages (including 2 appendixes, index).be available early in 1982 from thePublications Distribution Unit World Stock No. WP-0409. $3.00. LC 57-13429. ISBN 0-8018-0708-5,Bank The tapes are available to $5.00 (.X.50) paperback.international agencies and officialnonprofit agencies of member Commercial Bank Lendinggovemments at a nominal fee. Forinfornation conceming fees for to Developing Countries: Development Finance Com-other organizations, please write to Supply Constraints panies: Aspects of Policythe addressee listed above. Chandra S. Hardy and Operation
Supplements to World Debt Tables World Bank Reprint Series: Plumber William Diamond, editor;are issued periodically as information 135. Reprinted from World Development essays by E. T. Kuiper,becomes available; the current 7 (1979):189-197. Douglas Gustafson, and
updates are included with orders for Stock No. RP-0135. Free of charge. P M. MathewWorld Debt Tables.
The Johns Hopkins University Press,1968. 130 pages (including appendix,
Compounding and Dis- index).counting Tables for LC 68-27738. ISBN 0-8018-0166-4,Project Evaluation $5.00 (.0.25) paperback.
Borrowing in International J. Price Gittinger, editor French: Les societes financiees de
Capital Markets Easily comprehensible, convenient developpement: quelques aspects de
Provides a review of activities during tables for project preparation and leur politique et de leurs activites.
the quarter in publicized borrowing in analysis. (Available free from the World Bank,international capital markets in the The Johns Hopkins University Press, Washington, D.C.)form of foreign and International 1973; 5th printing, 1978. 143 pages. Spanish: Las companfas financieras debonds and Eurocurrency credits. LC 75-186503. ISBN 0-8018-1604-1, desarrollo: algunos aspectos de su
EC-181. Quarterly (current issues). $6.00 paperback. poliftica y de sus actividades. Editorial
About 280 pages. Arabic: World Bank, 1973. (Available Tecnos, 1969.
Stock No. BC-8101. $30.00 paperback. from ILS, 1715 Connecticut Avenue, 300 pesetas.
N.W., Washington, D.C. 20009, U.S.A.)
$4.00 paperback. Economic Growth, Foreign
French: Tables d'interets composes et Loans and Debt Senricingd'actualisation. Economica, 4th print- Capacity of Developing
Capital Flows and Develop- ing, 1979. Countriesing Country Debt ISBN 2-7178-0205-3, 36 francs. Gershon FederJeffrey A. Katz Spanish: Tablas de interes compuesto y World Bank Reprint Series: Number
World Bank Staff Working Paper No. de descuento para evaluaci6n de proyec- 146. Reprintedfrom The Journal of
352. August 1979. 51 pages (including tos. EditorialJecnos, 1973; 4th Development Studies 16, No. 34 annex tables). printing, 1980. (1980):352-368.
Stock No. WP-0352. $3.00. ISBN 84-309-0716-5, 380 pesetas. Stock No. RP-0146. Free of charge.
Exchainge Rate Adjustment The Newly-Industrializingnd er Generalized Currency Developing Countries afterIFoating: Comparative the Oil CrisisAnaRlysis among Developing Bela BalassaCoQmntnie5 World Bank Staff Working Paper No.Romeo M. Bautista 437. October 1980. 57 pages (includingExamines the experiences of twenty- appendix).two developing countries in adapting Stock No. WP-0437. $3.00.to the generalized floating of theworld's major currencies since 1973 Notes on the Mechanics ofand discusses the implications thatcurrency floating has on policymaking Growth and Debtin these countries arild indicates direc- Benjamin B. Kingtions for further research. A practical model to explore the wayWorld Bank Staff Working Paper No. in which capital inflow from abroad436. October 1980. 99 pages (including affects economic growth.appendix). The Johns Hopkins University Press,Stock No. WP-0436. $5.00 1968. 69 pages (including 4 annexes).
LC 68-8701. ISBN 0-8018-0338-1, $5.00Gnrowth Policies and the (f3.00) paperback.Exchange Rate in Turkey Private Direct ForeignBela Balassa PiaeDrc oeg
Investment in DevelopingWorld Bank Reprint Series: Number Countries181. Reprinted from The Role of K. Billerbeck and Y. YasugiExchange Rate Policy in Achieving theOutward Orientation of the Turkish World Bank Staff Working Paper No.Economy, papers from a conference in 348. July 1979. iv + 97 pages (includ-Istanbul, July 20-21, 1979 (Istanbul: ing 2 annexes).Meban Securities Brokerage and Stock No. WP-0348. $5.00.Finance Corporation, 1981):15-59.Stock No. RP-0181. Free of charge. Recent Theoretical Develop-
ment in Public Financennteninationai Debt Nizar Jetha
Renegotiation: Lessonsfrom the Past Taxation and EconomicAlbert C. Cizauskas BehaviorWorld Bank Reprint Series: Number Nizar Jetha101. Reprinted from World Development World Bank Reprint Series: Number7 (1979):199-210. 168. Reprintedfrom Bulletin for Inter-Stock No. RP-0101. Free of charge. national Fiscal Documentation, vol. 33,
no. 7 (July 1979): 321-24 and vol. 34,no. 4 (April 1980): 156-60.
A P<Ddel for AnalyzingLendeirs' Perceived Risk Stock No. RP-0168. Free of charge.
Gershon Feder andRichard Just
Optimal InternationalBorrowing, CapitalAlDocationn, and CreditWorthiiness ControlGershon Feder andRichard Just
VWorld Bank Reprint Series: Number159. Reprintedfrom Applied Economics,vol. 12 (1980):125-44 and Kredit andKapital, vol. 12, no. 2 (1979):207-20.
Stock No. RP-0159. Free of charge.


HG3881.5 .W57 W67 no.523 v.2c.2Wallich, Christine, 1952- 1State finances in India.
DATE NAME AND EXTENSION ROOM________ ~~~NUMBER

The World BankHeadquarters:1818 H Street, N.W.Washington, D.C. 20433, U.S.A.
Telephone: (202) 477-1234Telex: WUI 64145 WORLDBANK
RCA 248423 WORLDBKCable address: INTBAFRAD
WASHINGTONDC
European Office:66, avenue d'lena75116 Paris, France
Telephone: 723.54.21Telex: 842-620628
Tokyo Office:Kokusai Building1-1, Marunouchi 3-chomeChiyoda-ku, Tokyo 100, Japan
Telephone: 214-5001Telex: 781-26838
ISBN 0-8213-0013-X (3 vols.)ISSN 0253-2115/ ISBN C-8213-0C15-6(vol. 2)