spatiotemporal reasoning about epidemiological data
TRANSCRIPT
Artificial Intelligence in Medicine (2006) 38, 157—170
http://www.intl.elsevierhealth.com/journals/aiim
Spatiotemporal reasoning aboutepidemiological data
Peter Revesz a,*,1, Shasha Wu b,2
aDepartment of Computer Science and Engineering, University of Nebraska-Lincoln,Lincoln, NE 68588, USAbComputer Science Department, Spring Arbor University, Spring Arbor, MI 49283, USA
Received 23 December 2004; received in revised form 5 May 2006; accepted 8 May 2006
KEYWORDSEpidemiology;Knowledge-base;Recursive definition;Spatiotemporal data;Visualization;West Nile Virus
Summary
Objective: In this article, we propose new methods to visualize and reason aboutspatiotemporal epidemiological data.Background: Efficient computerized reasoning about epidemics is important to publichealth and national security, but it is a difficult task because epidemiological data areusually spatiotemporal, recursive, and fast changing hence hard to handle in tradi-tional relational databases and geographic information systems.Methodology: We describe the general methods of how to (1) store epidemiologicaldata in constraint databases, (2) handle recursive epidemiological definitions, and (3)efficiently reason about epidemiological data based on recursive and non-recursiveStructured Query Language (SQL) queries.Results: We implement a particular epidemiological system called West Nile VirusInformation System (WeNiVIS) that enables the visual tracking of and reasoning aboutthe spread of the West Nile Virus (WNV) epidemic in Pennsylvania. In the system, userscan do many interesting reasonings based on the spatiotemporal dataset and therecursively defined risk evaluation function through the SQL query interfaces.Conclusions: In this article, the WeNiVIS system is used to visualize and reason aboutthe spread of West Nile Virus in Pennsylvania as a sample application. Beside thisparticular case, the general methodology used in the implementation of the system isalso appropriate for many other applications. Our general solution for reasoning aboutepidemics and related spatiotemporal phenomena enables one to solve many pro-blems similar to WNV without much modification.# 2006 Elsevier B.V. All rights reserved.
* Corresponding author. Tel.: +1 402 472 3488; Fax: +1 402 472 7767.E-mail addresses: [email protected] (P. Revesz), [email protected] (S. Wu).
1 Part of this work was done while the author was visiting the Max Planck Institut fur Informatik, Saarbrucken, Germany.2 Part of the work presented here was done while the author was at UNL.
0933-3657/$ — see front matter # 2006 Elsevier B.V. All rights reserved.doi:10.1016/j.artmed.2006.05.001
158 P. Revesz, S. Wu
1. Introduction
Infectious disease outbreaks are critical threats topublic health and national security [1]. With greatlyexpanded travel and trade, infectious diseases canquickly spread across large areas causing majorepidemics.
Efficient computerized reasoning about epi-demics is essential to detect their outbreak andnature, to provide fast medical aid to affectedpeople and animals, to prevent their further spread,and to manage them in other ways.
Several characteristics of epidemics make themspecial in terms of computer reasoning needs. First,epidemiological data are usually some kind of spa-tiotemporal data, that is, they have a spatial dis-tribution that changes over time. Second,epidemiological data are recursive in nature. Thismeans that the best predictions of the spread ofinfections are based on earlier situations. Third, weneed a fast response from any knowledge-base thatcontains epidemiological data. A flexible informa-tion system that can be easily modified to modelnew epidemics is critical in assisting people tohandle the outbreaks of new diseases.
The above three characteristics in combinationpose a difficult problem. Geographic informationsystems generally can represent only static objectsthat do not change over time, or if they change,then they change only slowly, for example, thepopulation density of counties. Such a slow changemay be represented in a geographic informationsystem by a limited number of separate maps.However, continuous change over time is not easyto represent and is hard to reason about in geo-graphic information systems.
We propose new methods to visualize and reasonabout epidemiological data. Themajor contributionsand novel features of our article are the following:
� G
eneral method for recursively defined spatio-temporal models:We propose a new general method to model aclass of recursively defined spatiotemporal con-cepts, which appear in many research areasincluding epidemiology. In this article, we extendthe definition in [2] to allow linear combinationsof the measurements of the indicators and adifferent time delay for each indicator.
� R
ecursive epidemiological definitions:We apply this new method to express therecursive epidemiological definitions and predic-tions about the spread of infectious diseases.
� Im
plementation using recursive SQL:The Prolog language is the choice for recursivedefinitions in many knowledge-base systems.
However, Prolog is not good for querying spatio-temporal data. It is also less well-known than thewidely-used Structured Query Language (SQL),which is the standard query language for bothrelational and constraint databases. The latestSQL standard added to the SQL language a form ofrecursion, enabling the expression of the neededrecursive definitions. It is expected that the latestSQL standard will be implemented in all majorrelational database products. As part of our con-tributions, we also implemented for the first timein the MLPQ [3] constraint database system, whichis one of the most sophisticated constraint data-base systems, the recursive SQL queries.
� E
pidemiological data stored in constraint data-bases:Relational databases and geographic informa-tion systems cannot easilymanageepidemiologicaldata because of their inherently spatiotemporalnature. Constraintdatabases [4—6],whichareverysuitable for spatiotemporal data,wereproposedasextensions of both relational databases and geo-graphic information systems. There are softwaretools that can export any relational database orgeographic information system data into a con-straint database [7,8].
� W
eNiVIS–—The West Nile Virus Information Sys-tem:We developed an example epidemic informa-tion system for reasoning about West Nile Virusinfections. This system can show visually thespread of the epidemic and any other spatiotem-poral data that may be generated by the system.We chose this example, because it has a typicalinfection pattern, it is currently still spreadingthrough the North America, and data for it wasreadily available from Pennsylvania’s West NileVirus Control Program [9].
The rest of the article is organized as follows:Section 2 describes some basic concepts and relatedwork. Section3describes thenewgeneralmethod formodeling recursively defined spatiotemporal con-cepts. Section 3.1 proposes a general recursive defi-nition for spatiotemporal concepts. Section 3.2describes the solution and optimization for the recur-sive definition using recursive SQL query language.Section 4 describes the source data we use for theWest Nile Virus analysis (in Section 4.1), their inter-polation and storage in a constraint database (inSection 4.2), and the West Nile Virus InformationSystemwedeveloped for theWNVanalysis (in Section4.3). Section 5 presents major results and benefits ofthis project. Section 6 discusses some specific issuesabout ourmethod and system. Finally, Section 7 givessome conclusions and directions for future work.
Spatiotemporal reasoning about epidemiological data 159
Figure 1 Relationship of a family.
Figure 2 User interface for recursive SQL in the MLPQsystem.
2. Basic concepts and related work
2.1. Recursive queries
We give only a brief introduction to recursivequeries in relational databases [10—13]. Fig. 1 showsa relational database table that describes child—parent relationships. A recursive query on this tablewould be to find all the ancestors of David.
The latest American National Standards Institute(ANSI) SQL language allows a form of recursion,enabling the expression of the above recursive query.We implement the recursive SQL for the first time inthe MLPQ constraint database system. The syntax ofthe recursive SQL in the MLPQ system follows thelatest SQL standard with only a minor modification.
A non-recursive SQL view definition is a state-ment of the form:
create viewVi as Bi;
where Vi is a view name with attributes and Bi is anSQL statement that uses only input relations(tables). Such Bi s are called basic SQL expressions.A recursive SQL view definition has the form:
create viewVi with recursive as Bi union Ri;
where Vi is a view name with attributes. Here Vi isdefined using the union of a basic SQL expression Bi
and a recursive SQL expression Ri, which may con-tain a reference to Vi or other non-recursive andrecursive views.
A sample recursive SQL query that finds all ances-tors of David based on the table of Fig. 1 can beexpressed as follows:
Query 2.1. Find all ancestors of David:
create view DavidAncestorsðAncestorÞwith recursive as
ðselect Parentfrom Familywhere Child ¼ David’’Þunionðselect F :Parentfrom Family as F ; DavidAncestors asDwhere F :Child ¼ D:AncestorÞ
Fig. 2 displays the implementation of Query 2.1 inthe MLPQ constraint database system.
2.2. Constraint database concepts
A constraint database is a finite set of constraintrelations. A constraint relation is a finite set ofconstraint tuples, where each constraint tuple is
a conjunction of atomic constraints using the sameset of attribute variables [6]. Hence, constraints arehidden inside the constraint tables, and the usersonly need to understand the logical meaning of theconstraint tables as an infinite set of constant tuplesrepresented by the finite set of constraint tuples.Typical atomic constraints include linear or polyno-mial arithmetic constraints.
The MLPQ system is a constraint database systemthat implements rational linear constraint databasesand queries. MLPQ is the abbreviation for Manage-ment of Linear Programming Queries. Among otherfunctionalities, it supports both SQL and Datalogqueries, andminimum/maximumaggregation opera-tors over linear objective functions [3]. It is a suitabletool for representing, querying, and managing spa-tiotemporal constraint databases. Other constraint
160 P. Revesz, S. Wu
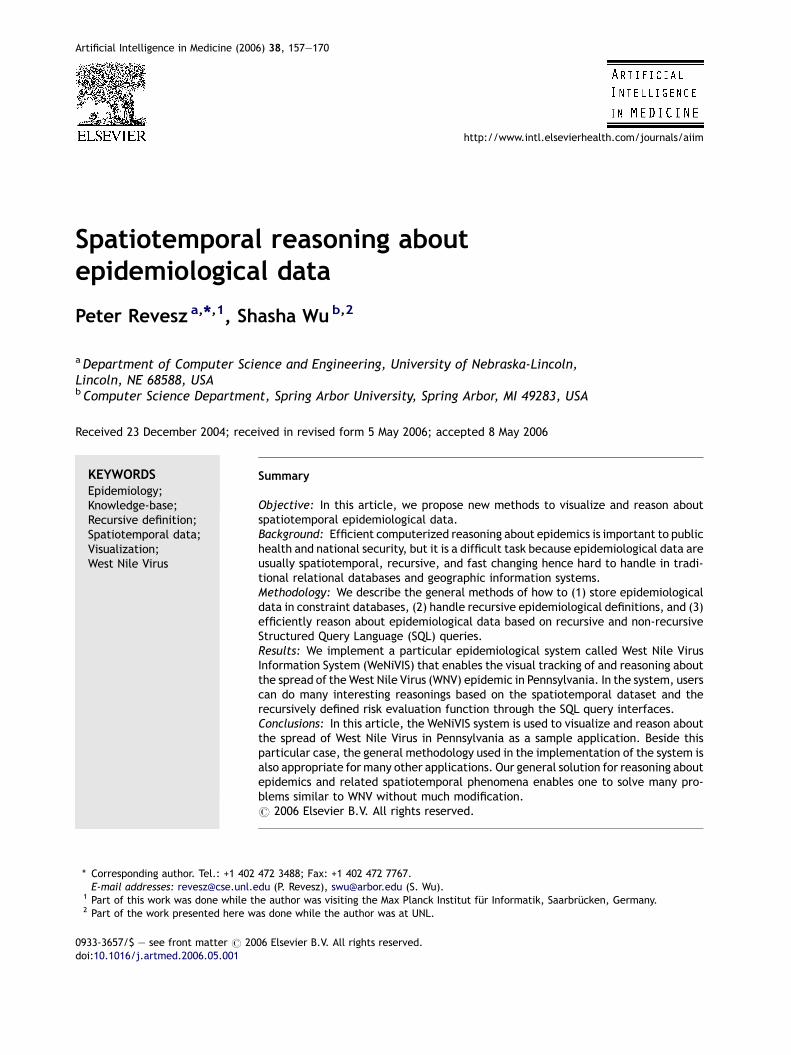
Figure 3 The triangulated network of sample points inthe state of Pennsylvania.
database systems includeCCUBE [14], CQA/CDB [15],and DEDALE [16], which could also be used.
Li and Revesz [17] considered constraint-basedvisualization for spatiotemporal data but did notconsider recursively defined concepts. Revesz andWu [2] considered constraint-based visualization forrecursively defined spatiotemporal data, but theyonly consider one indicator with a fixed time delay.That is too simple for real epidemiological problemsand need to be extended. In epidemiology, oneinfectious disease commonly has several indicators(i.e., measurable disease carriers) and differentindicators may have different effectiveness withdifferent delay times.
2.3. Interpolation methods
In a 2-D spatial problem, a point-based spatiotem-poral relation has the schema of (x, y, t,w1; w2; . . . ; wm), where the attributes ðx; yÞ specifypoint locations, t specifies a time instance, andwi ð1 � i � mÞ records the features of each location.
A point-based spatiotemporal data set only storesinformation of some sample points. To represent thefeatures beyond those finite sample points, it isnecessary to do spatiotemporal interpolation onthem. A shape function-based spatiotemporalmethod [18,17] was used to interpolate and translatethe original point-based spatiotemporal informationinto a constraint relation. Li and Revesz [19,17] didan extensive comparison and proved shape functionsto be the best over the Inverse Distance Weighting(IDW) [20] and Kriging [21,22] interpolations in a testexample concerning house price estimation.
Fig. 3 shows a point-based spatiotemporal dataset consisting of the vertices shown there, and its‘‘Delaunay Triangulation’’ network [23].
2.4. GIS enhancement for spatiotemporalinformation
Geographic information systems (GIS) are designedfor static data and need to be enhanced to be able toreason about spatiotemporal information [24,25].
One such GIS enhancement is given by Theophi-lides et al. [26], who developed DYCAST, which is anepidemic spread prediction system based on spatio-temporal interpolation. The DYCAST system wasused to predict human West Nile Virus infectionsbased on dead bird surveillance data. However, theDYCASTsystem does not provide a flexible reasoningmethod.
Another GIS enhancement is given by Raffaetaet al. [27], who use MuTACLP, which is a temporalannotated constraint logic programming language.While in theory MuTACLP can describe spatial data
by using constraints similarly to constraint data-bases [4—6], Raffaeta et al. [27] are only interestedin using MuTACLP on top of a GIS. The temporalannotations are simple, that is, they allow only todeclare some atomic formula is true at a certaintime, true throughout a time interval, or true some-time during a time interval. MuTACLP is implemen-ted based on Sicstus Prolog 3.8.3.
In contrast to MuTACLP, we use more complextemporal conditions, i.e., we allow any linear con-straint on the spatial variables x and y and temporalvariable t, and our implementation is based directlyon the MLPQ [3] constraint database system.
3. Methodology
3.1. General definition for recursivelydefined spatiotemporal concepts
Revesz and Wu proposed a general definition forrecursively defined spatiotemporal concepts in[2,28]. Unfortunately, that definition is too limitedfor our current need, because it only deals with oneindicator with fixed one unit time delay. In epide-miology, one infectious disease commonly has sev-eral indicators (i.e., measurable disease carriers)and different indicators may have different effec-tiveness. The animal indicators also may predictahead of the human infection with different delaytimes. To consider these extra complications, weextend their definition as follows:
Definition 3.1. Let Miðx; y; tÞ represent the amountof indicator imeasured at location ðx; yÞ at time unitt. For each indicator i, let wi be the effectivenessweight and di be the time delay to indicate propertyP. Then location ðx; yÞ has property P during timeunit t if
(1)P
wiMiðx; y; t� diÞ� k orP
(2) k 1 � wiMiðx; y; t� diÞ< k and the locationhas property P during time unit t� 1.
Spatiotemporal reasoning about epidemiological data 161
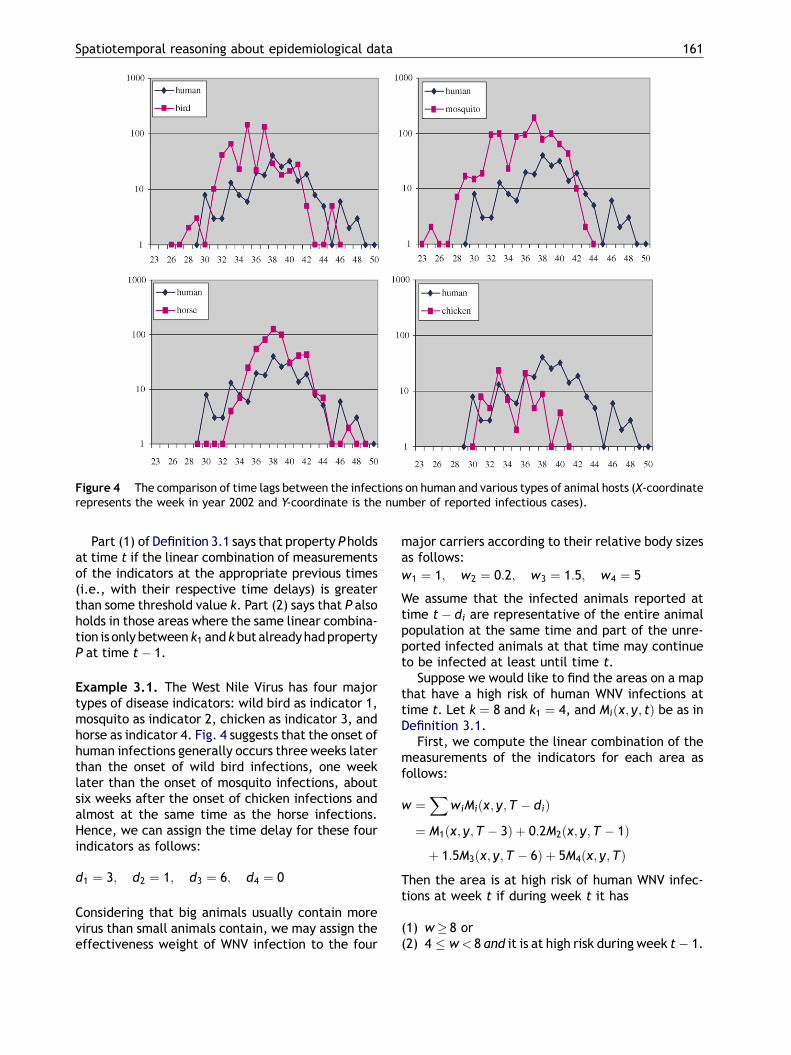
Figure 4 The comparison of time lags between the infections on human and various types of animal hosts (X-coordinaterepresents the week in year 2002 and Y-coordinate is the number of reported infectious cases).
Part (1) of Definition 3.1 says that property Pholdsat time t if the linear combination of measurementsof the indicators at the appropriate previous times(i.e., with their respective time delays) is greaterthan some threshold value k. Part (2) says that P alsoholds in those areas where the same linear combina-tion is only between k1 andkbut alreadyhadpropertyP at time t� 1.
Example 3.1. The West Nile Virus has four majortypes of disease indicators: wild bird as indicator 1,mosquito as indicator 2, chicken as indicator 3, andhorse as indicator 4. Fig. 4 suggests that the onset ofhuman infections generally occurs three weeks laterthan the onset of wild bird infections, one weeklater than the onset of mosquito infections, aboutsix weeks after the onset of chicken infections andalmost at the same time as the horse infections.Hence, we can assign the time delay for these fourindicators as follows:
d1 ¼ 3; d2 ¼ 1; d3 ¼ 6; d4 ¼ 0
Considering that big animals usually contain morevirus than small animals contain, we may assign theeffectiveness weight of WNV infection to the four
major carriers according to their relative body sizesas follows:
w1 ¼ 1; w2 ¼ 0:2; w3 ¼ 1:5; w4 ¼ 5
We assume that the infected animals reported attime t� di are representative of the entire animalpopulation at the same time and part of the unre-ported infected animals at that time may continueto be infected at least until time t.
Suppose we would like to find the areas on a mapthat have a high risk of human WNV infections attime t. Let k ¼ 8 and k1 ¼ 4, and Miðx; y; tÞ be as inDefinition 3.1.
First, we compute the linear combination of themeasurements of the indicators for each area asfollows:
w ¼X
wiMiðx; y;T � diÞ
¼ M1ðx; y;T � 3Þ þ 0:2M2ðx; y;T � 1Þ
þ 1:5M3ðx; y;T � 6Þ þ 5M4ðx; y;TÞ
Then the area is at high risk of human WNV infec-tions at week t if during week t it has
(1) w
� 8 or (2) 4 � w< 8 and it is at high risk during week t� 1.
P. Revesz, S. Wu
3.2. Solution and optimization
The general solution for the problem defined inDefinition 3.1 can be formally expressed as follows.
Given relations Miðx; y; t;mÞ where the value mrepresents the measurement of indicator i at loca-tion ðx; yÞ at time t for each 1 � i � n, let us definethe following:
A ¼ fðx; y; tÞjM1ðx; y; t� d1;m1Þ ^ � � � ^Mnðx; y; t
� dn;mnÞ ^w1m1 þ � � � þ wnmn� kg
B¼fðx;y; tÞjM1ðx;y; t� d1;m1Þ^ � � � ^
162
Mnðx;y; t�dn;mnÞ^k1 �w1m1þ � � � þwnmn<kg
where A is the part of M1; . . . ;Mn where the linearcombination of measurements of all indicators isgreater or equal to k, and B is the part that the linearcombination of measurements of all indicators isbetween k and k1. The above definition can beimplemented in the SQL query language as follows:
Query 3.1. SQL query for linear combination andtime delay:
create view Aðx; y; tÞ asselect M1:x; M1:y; tfrom M1; . . . ;Mn
where w1M1:mþ � � � þwnMn:m� k;M1:t ¼ t� d1; . . . ;Mn:t ¼ t� dn;M1:x ¼ � � � ¼ Mn:x;M1:y ¼ � � � ¼ Mn:y
Relation A returns the spatiotemporal locationsðx; y; tÞ that satisfy part (1) of Definition 3.1.
create view Bðx; y; tÞ asselect M1:x; M1:y; tfrom M1; . . . ;Mn
where k1 � w1M1:mþ � � � þ wnMn:m< k;M1:t ¼ t� d1; . . . ;Mn:t ¼ t� dn;M1:x ¼ � � � ¼ Mn:x;M1:y ¼ � � � ¼ Mn:y
Relation B returns the spatiotemporal locationsðx; y; tÞ that satisfy the first condition of part (2)of Definition 3.1.
Based on relations A and B and Definition 3.1, wecan define the areas having property P at time t asfollows:
P ¼ fðx; y; tÞjAðx; y; tÞ _ ðBðx; y; tÞ ^ Pðx; y; t� 1ÞÞg
We found that a direct implementation of theabove is very inefficient. To reduce the computa-
tional complexity, we express P by a logicallyequivalent formula that is easier to evaluate [2]:
Theorem 3.1.
P ¼�ðx; y; tÞjAðx; y; tÞ _
� _þ1m¼1ðCðx; y; t;m� 1Þ ^Aðx; y; t�mÞÞ
��
where
C ¼ fðx; y; t;mÞjðm ¼ 0^ Bðx; y; tÞÞ_ ðm� 1^ Bðx; y; t�mÞ ^Cðx; y; t;m� 1ÞÞg
Proof. First, we can prove for any m� 1 that
Cðx; y; t;mÞ ¼m
i¼0Bðx; y; t� iÞ (1)
as follows:
Cðx; y; t;mÞ ¼ Bðx; y; t�mÞ ^Cðx; y; t;m� 1Þ¼ Bðx; y; t�mÞ ^ Bðx; y; t�mþ 1Þ ^Cðx; y; t;m� 2Þ¼ Bðx; y; t�mÞ ^ � � � ^ Bðx; y; t� 1Þ ^Cðx; y; t; 0Þ¼ Bðx; y; t�mÞ ^ � � � ^ Bðx; y; t� 1Þ ^Bðx; y; tÞ
¼m
i¼0Bðx; y; t� iÞ
Second, by expanding Pðx; y; t� 1Þ in the definitionof P we get:
P ¼ fðx; y; tÞjAðx; y; tÞ _ ½Bðx; y; tÞ ^ ðAðx; y; t� 1Þ_ ðBðx; y; t� 1Þ ^ Pðx; y; t� 2ÞÞÞ�g¼ fðx; y; tÞjAðx; y; tÞ _ ½Bðx; y; tÞ ^Aðx; y; t� 1Þ�_ ½Bðx; y; tÞ ^ Bðx; y; t� 1Þ ^ Pðx; y; t� 2Þ�g
We can continue to expand Pðx; y; t� 2Þ and simplifyit as follows:
P ¼(ðx; y; tÞjAðx; y; tÞ _
0
i¼0Bðx; y; t� iÞ
!
^Aðx; y; t� 1Þ!_ � � � _
m�1
i¼0Bðx; y; t� iÞ
!
^ Pðx; y; t�mÞ!)
Spatiotemporal reasoning about epidemiological data
Using Eq. (1), the above can be further simplifiedas:
P ¼�ðx; y; tÞjAðx; y; tÞ _ ðCðx; y; t; 0Þ ^Aðx; y; t� 1ÞÞ_ � � � _ ðCðx; y; t;m� 1Þ ^ Pðx; y; t�mÞÞ
�Finally, the right-hand side of the formula can beexpanded to:
Aðx; y; tÞ __þ1m¼0ðCðx; y; t;mÞ ^Aðx; y; t�m� 1ÞÞ
!
&
Based on Theorem 3.1, we can express the opti-mized recursive SQL queries as follows:
Query 3.2. The recursive SQL query expressingrelation C in Theorem 3.1 is:
create view Cðx; y; t;mÞwith recursive as
ðselect x; y; t;m
from B
where m ¼ 0Þunion
ðselect x; y; t;m
from B;C
where m� 1; m � M;
B:x ¼ x; B:y ¼ y; B:t ¼ t�m;
C:x ¼ x; C:y ¼ y; C:t ¼ t;
C:m ¼ m� 1Þwhere relations Aðx; y; tÞ and Bðx; y; tÞ are defined inQuery 3.1. Assume Ck ¼ fðx; y; tÞjCðx; y; t; kÞg, thenwe have Cj�Ci for all 1 � i< j. That means foreach fixed time t the area of Cðx; y; t;mÞ monoto-nously decreases as m increases.
To set the boundary ofm, we introduceM� 1 thatis used to ensure the termination of the recursiveevaluation process. The bigger M is, the more accu-rate the result is, but the more calculation isrequired. Next, the recursive SQL query correspond-ing to relation P is:
create view Pðx; y; tÞ asðselect x; y; t
from AÞunion
ðselect C:x;C:y;C:t
from A; C
where C:x ¼ A:x; C:y ¼ A:y;
A:t ¼ C:t� C:m� 1Þ
4. The WeNiVIS system
4.1. The West Nile Virus Data
West Nile Virus (WNV) was originally discovered inthe West Nile district of Uganda in 1937. It causesinfection and fevers in humans in Africa, West Asia,and the Middle East. The first report of WNV in theUnited States was found in 1999 in New York City[29]. Since then, the disease has spread across theUnited States. In 2003, WNV activity occurred in 46states and caused illness in over 9800 people [30].
WNV is transmitted to humans through mosquitobites. Mosquitoes become infected when they feedon infected birds that have high levels of WNV intheir blood. Infected mosquitoes can then transmitWNV when they feed on humans or other animals[30].
We obtained data on the spread of WNV in Penn-sylvania in 2003 from Pennsylvania’s West Nile VirusControl Program [9]. The data include dead wildbirds, mosquitoes, sentinel chickens, equine (horse)veterinary and confirmed human cases of WNV asexplained below.
163
� D
ead wild bird: In Pennsylvania’s WNV ControlProgram, the dead birds were collected by passivesurveillance, relying on public reporting throughtelephone and Internet. Dead birds and infectedbirds that display erratic behavior are highly visi-ble for casual observers to identify and report inthe areas where WNVmay be active. When a deadbird is sighted, the information about that birdand its location is recorded. Then samples fromeach bird are tested for WNV and the results arerecorded in the database.� M
osquito: Mosquitoes were routinely collected insurveillance locations. All mosquitoes collected inone effort create a sample of mosquitoes. Onlyadult mosquitoes in the sample are tested forWNV.� S
entinel chicken: Pennsylvania’s surveillance sys-tem includes sentinel chickens. Several flocks arehoused near the areas that have dense humanpopulations and stagnant water sources. Thoseflocks are used by the medical experts to monitorthe presence of the virus. Samples from thesesentinels are collected weekly and tested forWNV.� E
quine: Equine diagnostic blood samples sub-mitted by veterinarians across the state are alsotested for WNV.Since the datasets are not recorded during theweekends, the data are summarized to weekly datato generate a continuous surveillance dataset.
164 P. Revesz, S. Wu
We first compare the onset of several kinds ofanimal infection hosts with the onset of humaninfections. To show the time relationship betweenthe number of various animal disease carriers foundand the number of human infection cases reported,we show in four separate charts in Fig. 4 the numberof the four animal diseases in red (gray) curves andthe number of human cases in blue (black) curves.Fig. 4 shows that there is a time lag of about sixweeks between the onset of sentinel chicken infec-tions and human cases. Similarly, there is a time lagof about three, one, and zero weeks between theinfected wild bird, mosquito, and equine veterinarycases with respect to the human cases. Hence, whileFig. 4 shows that each of the three types of animalWNV infections are strongly related to the humanWNV infections, the various animal cases providedifferent advance warnings of human WNVepidemicoutbreaks.
4.2. Epidemiological data in constraintdatabases
A point-based spatiotemporal data set only storesinformation of some sample points at some sampletimes. That is usually what one can obtain as the rawdata for infectious diseases. To represent the fea-tures beyond those finite spatiotemporal points, it isnecessary to do some spatiotemporal interpolationon them. Interpolation requires some basic assump-tions about the nature of the point data set. Theo-philides et al. [26] makes the following interpolationassumptions:
(1) W
Fig
est Nile Virus is a continuous phenomenonacross space.
(2) H
umans are infected at their resident places.ure 5 Weekly number of WNV-infected birds in Pennsy
(3) N
lvan
on-random space—time interaction of birddeaths is attributed to West Nile Virus infection.
(4) E
ach dead bird has an equal opportunity of beingreported.Wemake similar assumptions. We differ from [26]by applying instead of Knox spatiotemporal inter-polation a 2-D shape function-based interpolationmethod, which Li and Revesz [17] found to be themost reliable among several well-known spatial andspatiotemporal interpolation methods. It is easilyimplementable in constraint database systems, aswe will see later.
Before the interpolation, we need to get somedata point from each county in Pennsylvania. Wehave the positions of 102 cities and towns of Penn-sylvania. We pick as a sample point the biggest cityof each county based on the 1990 city populationcensus in Pennsylvania. If a county is too small tohave any cities on the list, we arbitrarily pick thecenter of the county as the sample point.
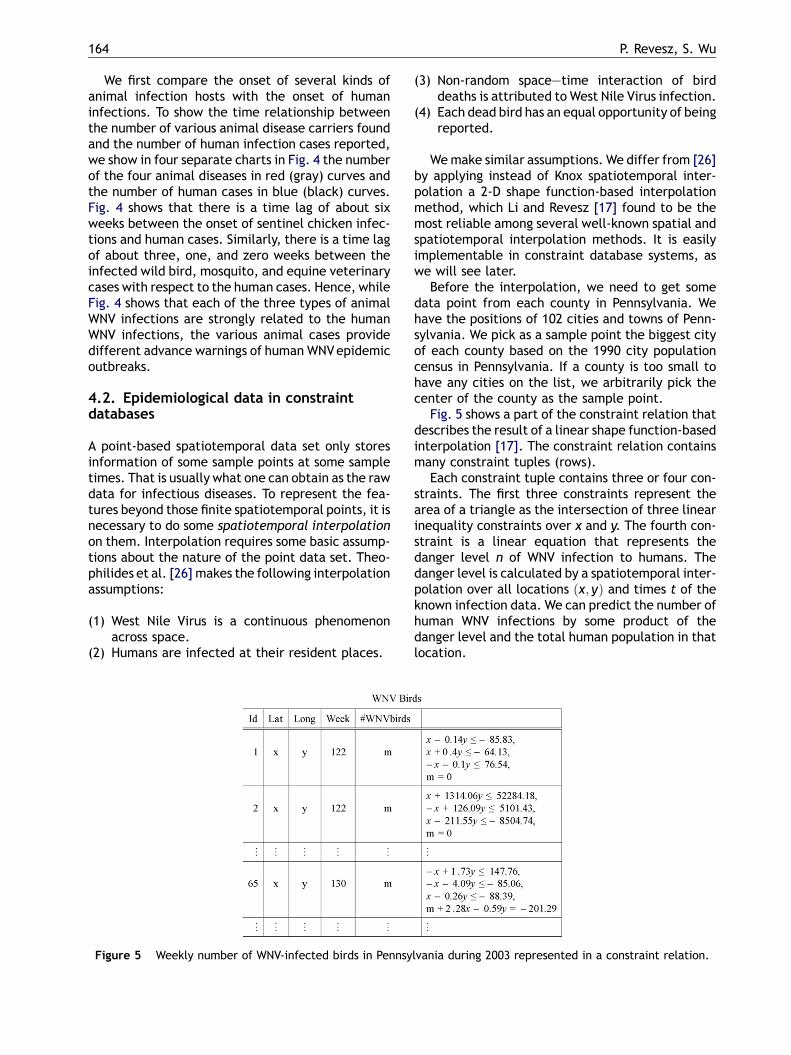
Fig. 5 shows a part of the constraint relation thatdescribes the result of a linear shape function-basedinterpolation [17]. The constraint relation containsmany constraint tuples (rows).
Each constraint tuple contains three or four con-straints. The first three constraints represent thearea of a triangle as the intersection of three linearinequality constraints over x and y. The fourth con-straint is a linear equation that represents thedanger level n of WNV infection to humans. Thedanger level is calculated by a spatiotemporal inter-polation over all locations ðx; yÞ and times t of theknown infection data. We can predict the number ofhuman WNV infections by some product of thedanger level and the total human population in thatlocation.
ia during 2003 represented in a constraint relation.
Spatiotemporal reasoning about epidemiological data 165
In each tuple the week attribute always repre-sents the time measured in weeks past January 1,2001, hence the week starting January 1, 2001,would be week 1, the week starting January 8,2001, would be week 2, etc. Finally, we also givea unique id value to each triangular area for easyidentification.
4.3. Implementation of the WeNiVISsystem
The West Nile Virus Information System is an epi-demiological information system designed to man-age the spatiotemporal WNV information. It is a two-layer client/server system built on top of the MLPQconstraint database system and has many uniquefunctionalities.
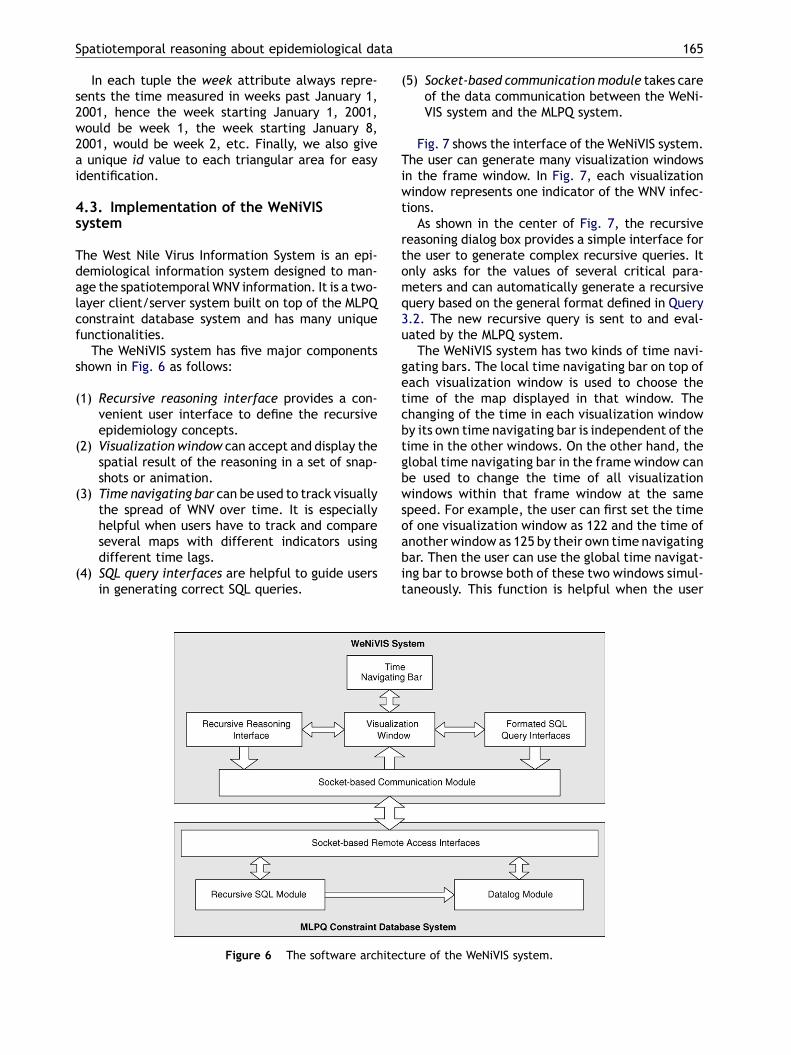
The WeNiVIS system has five major componentsshown in Fig. 6 as follows:
(1) R
ecursive reasoning interface provides a con-venient user interface to define the recursiveepidemiology concepts.(2) V
isualization window can accept and display thespatial result of the reasoning in a set of snap-shots or animation.(3) T
ime navigating bar can be used to track visuallythe spread of WNV over time. It is especiallyhelpful when users have to track and compareseveral maps with different indicators usingdifferent time lags.(4) S
QL query interfaces are helpful to guide usersin generating correct SQL queries.Figure 6 The software archite
(5) S
cture
ocket-based communicationmodule takes careof the data communication between the WeNi-VIS system and the MLPQ system.
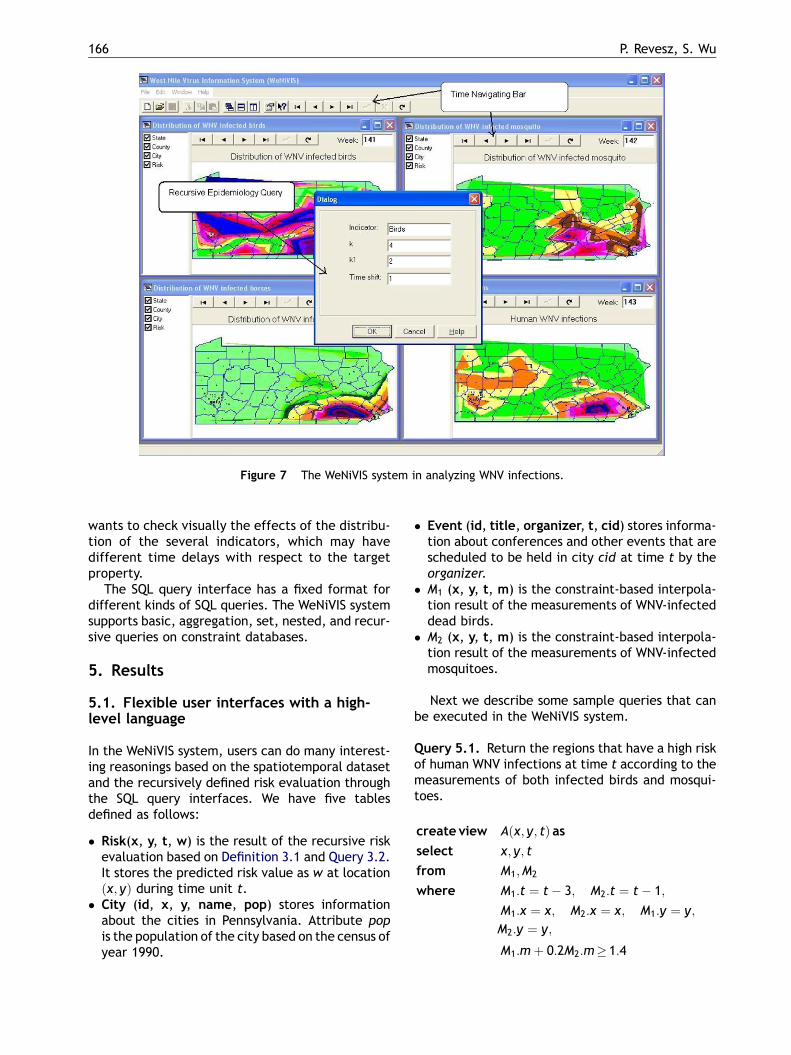
Fig. 7 shows the interface of the WeNiVIS system.The user can generate many visualization windowsin the frame window. In Fig. 7, each visualizationwindow represents one indicator of the WNV infec-tions.
As shown in the center of Fig. 7, the recursivereasoning dialog box provides a simple interface forthe user to generate complex recursive queries. Itonly asks for the values of several critical para-meters and can automatically generate a recursivequery based on the general format defined in Query3.2. The new recursive query is sent to and eval-uated by the MLPQ system.
The WeNiVIS system has two kinds of time navi-gating bars. The local time navigating bar on top ofeach visualization window is used to choose thetime of the map displayed in that window. Thechanging of the time in each visualization windowby its own time navigating bar is independent of thetime in the other windows. On the other hand, theglobal time navigating bar in the frame window canbe used to change the time of all visualizationwindows within that frame window at the samespeed. For example, the user can first set the timeof one visualization window as 122 and the time ofanother window as 125 by their own time navigatingbar. Then the user can use the global time navigat-ing bar to browse both of these two windows simul-taneously. This function is helpful when the user
of the WeNiVIS system.
166 P. Revesz, S. Wu
Figure 7 The WeNiVIS system in analyzing WNV infections.
wants to check visually the effects of the distribu-tion of the several indicators, which may havedifferent time delays with respect to the targetproperty.
The SQL query interface has a fixed format fordifferent kinds of SQL queries. The WeNiVIS systemsupports basic, aggregation, set, nested, and recur-sive queries on constraint databases.
5. Results
5.1. Flexible user interfaces with a high-level language
In the WeNiVIS system, users can do many interest-ing reasonings based on the spatiotemporal datasetand the recursively defined risk evaluation throughthe SQL query interfaces. We have five tablesdefined as follows:
� R
isk(x, y, t, w) is the result of the recursive riskevaluation based on Definition 3.1 and Query 3.2.It stores the predicted risk value as w at locationðx; yÞ during time unit t.� C
ity (id, x, y, name, pop) stores informationabout the cities in Pennsylvania. Attribute popis the population of the city based on the census ofyear 1990.� E
vent (id, title, organizer, t, cid) stores informa-tion about conferences and other events that arescheduled to be held in city cid at time t by theorganizer.� M
1 (x, y, t, m) is the constraint-based interpola-tion result of the measurements of WNV-infecteddead birds.� M
2 (x, y, t, m) is the constraint-based interpola-tion result of the measurements of WNV-infectedmosquitoes.Next we describe some sample queries that canbe executed in the WeNiVIS system.
Query 5.1. Return the regions that have a high riskof human WNV infections at time t according to themeasurements of both infected birds and mosqui-toes.
create view Aðx; y; tÞ asselect x; y; t
from M1;M2
where M1:t ¼ t� 3; M2:t ¼ t� 1;
M1:x ¼ x; M2:x ¼ x; M1:y ¼ y;
M2:y ¼ y;
M1:mþ 0:2M2:m� 1:4
Spatiotemporal reasoning about epidemiological data 167
create view Bðx; y; tÞ as
select x; y; tfrom M1; M2where M1:t ¼ t� 3; M2:t ¼ t� 1;M1:x ¼ x; M2:x ¼ x; M1:y ¼ y;
M2:y ¼ y;
0:4 � M1:mþ 0:2M2:m< 1:4
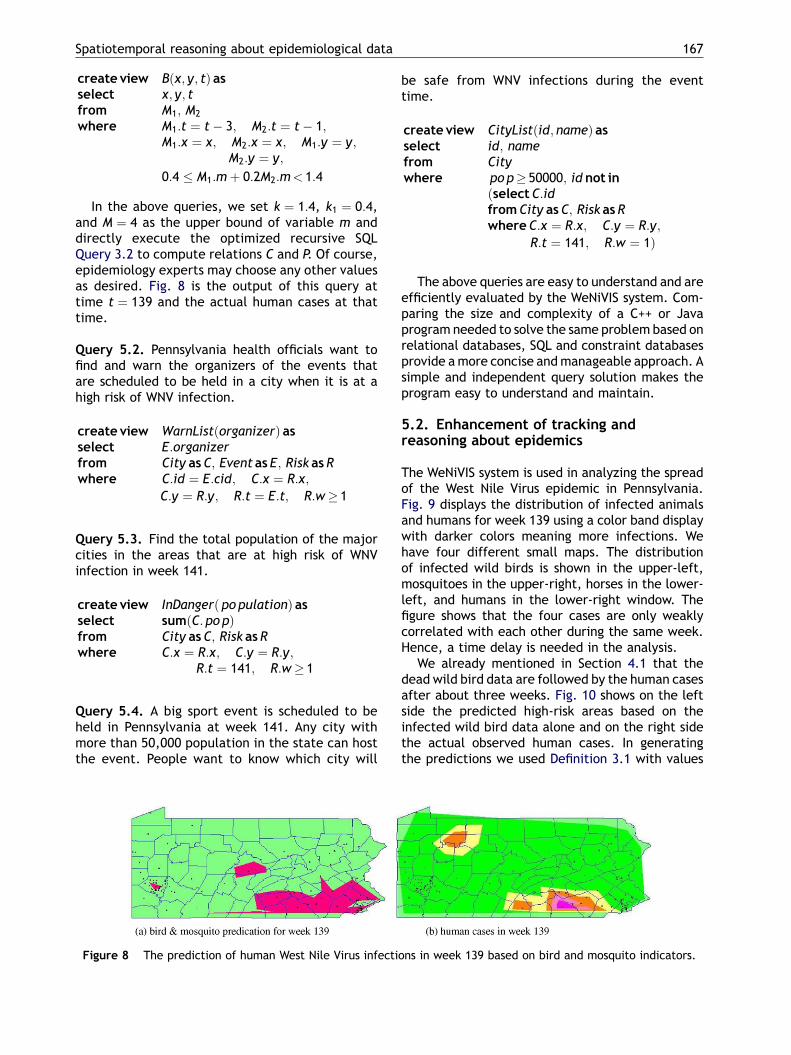
In the above queries, we set k ¼ 1:4, k1 ¼ 0:4,and M ¼ 4 as the upper bound of variable m anddirectly execute the optimized recursive SQLQuery 3.2 to compute relations C and P. Of course,epidemiology experts may choose any other valuesas desired. Fig. 8 is the output of this query attime t ¼ 139 and the actual human cases at thattime.
Query 5.2. Pennsylvania health officials want tofind and warn the organizers of the events thatare scheduled to be held in a city when it is at ahigh risk of WNV infection.
create view WarnListðorganizerÞ asselect E:organizerfrom City asC; Event as E; Risk asRwhere C:id ¼ E:cid; C:x ¼ R:x;
C:y ¼ R:y; R:t ¼ E:t; R:w� 1
Query 5.3. Find the total population of the majorcities in the areas that are at high risk of WNVinfection in week 141.
create view InDangerð po pulationÞ asselect sumðC: po pÞfrom City asC; Risk asRwhere C:x ¼ R:x; C:y ¼ R:y;
R:t ¼ 141; R:w� 1
Query 5.4. A big sport event is scheduled to beheld in Pennsylvania at week 141. Any city withmore than 50,000 population in the state can hostthe event. People want to know which city will
Figure 8 The prediction of human West Nile Virus infecti
be safe from WNV infections during the eventtime.
create view CityListðid; nameÞ asselect id; namefrom Citywhere po p� 50000; id not in
ðselectC:idfromCity asC; Risk asRwhereC:x ¼ R:x; C:y ¼ R:y;
R:t ¼ 141; R:w ¼ 1Þ
The above queries are easy to understand and areefficiently evaluated by the WeNiVIS system. Com-paring the size and complexity of a C++ or Javaprogram needed to solve the same problem based onrelational databases, SQL and constraint databasesprovide amore concise andmanageable approach. Asimple and independent query solution makes theprogram easy to understand and maintain.
5.2. Enhancement of tracking andreasoning about epidemics
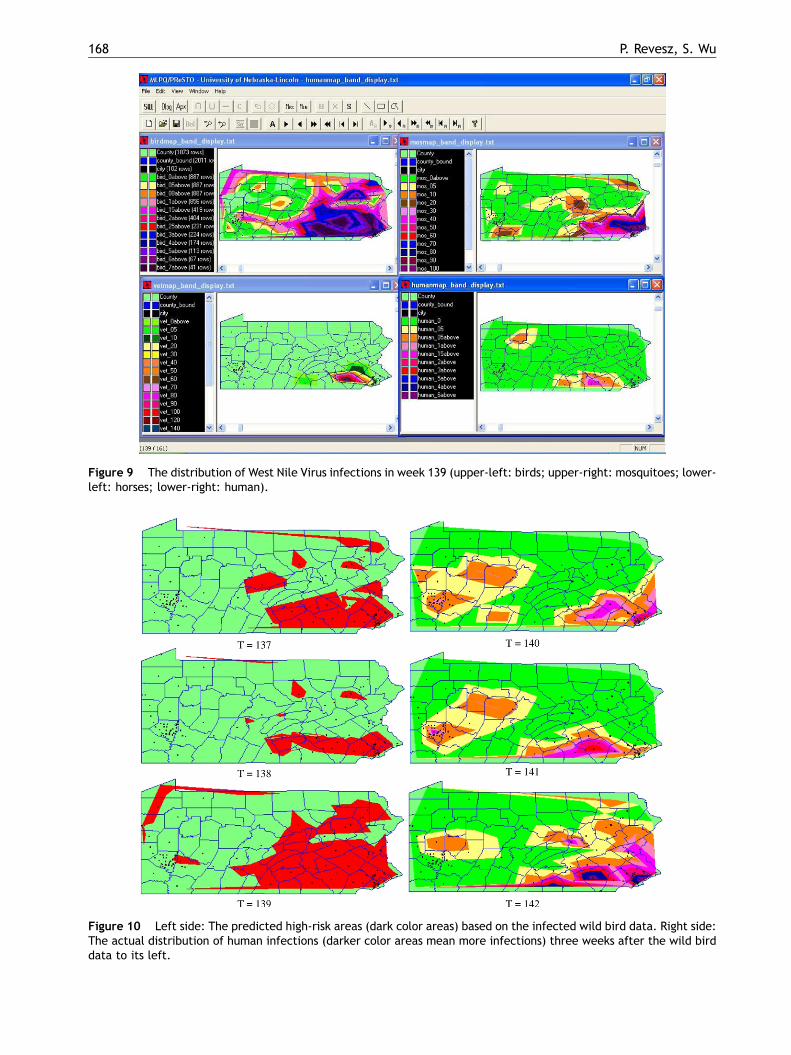
The WeNiVIS system is used in analyzing the spreadof the West Nile Virus epidemic in Pennsylvania.Fig. 9 displays the distribution of infected animalsand humans for week 139 using a color band displaywith darker colors meaning more infections. Wehave four different small maps. The distributionof infected wild birds is shown in the upper-left,mosquitoes in the upper-right, horses in the lower-left, and humans in the lower-right window. Thefigure shows that the four cases are only weaklycorrelated with each other during the same week.Hence, a time delay is needed in the analysis.
We already mentioned in Section 4.1 that thedead wild bird data are followed by the human casesafter about three weeks. Fig. 10 shows on the leftside the predicted high-risk areas based on theinfected wild bird data alone and on the right sidethe actual observed human cases. In generatingthe predictions we used Definition 3.1 with values
ons in week 139 based on bird and mosquito indicators.
168 P. Revesz, S. Wu
Figure 9 The distribution of West Nile Virus infections in week 139 (upper-left: birds; upper-right: mosquitoes; lower-left: horses; lower-right: human).
Figure 10 Left side: The predicted high-risk areas (dark color areas) based on the infected wild bird data. Right side:The actual distribution of human infections (darker color areas mean more infections) three weeks after the wild birddata to its left.
Spatiotemporal reasoning about epidemiological data 169
k1 ¼ 0:4 and k ¼ 1:4. We found these values byexperiments. The smaller values of k1 and k willgenerally yield more areas, but they may overpre-dict the risks and be less accurate.
In this article, the WeNiVIS system is used tovisualize and reason about the spread of West NileVirus in Pennsylvania as a sample application. Besidethis particular case, the general methodology usedin the implementation of the system is also appro-priate for many other applications.
First, with the additional data available, thesystem can be directly applied to any other statesin which West Nile Virus may occur. We only need totranslate the new state’s data into a constraintdatabase format, similarly as we have done forthe Pennsylvania data set.
Second, based on our methodology, similar track-ing and reasoning systems can be implemented forother epidemics besides the West Nile Virus epi-demic.
Third, there are many other diseases that haverecursive spread characteristics that are similar tothose of epidemics. For example, some inheriteddiseases can be naturally defined by recursive defi-nitions. The system can also be used to track andreason about many of those diseases too.
Finally, the recursive definition seems also nat-ural for many other problems in medicine. Forexample, the current status of a chronic patientis closely related to his/her previous status.Our methods can be adapted to those situationstoo.
6. Discussion
Although the WeNiVIS system is implemented andtested on the WNV data of Pennsylvania, there areseveral general issues that need to be mentioned.
First, in the spatiotemporal interpolation pro-cess, we made four interpolation assumptions inSection 4.2 similar to Theophilides et al. [26]. How-ever, we have to point out the sensitivity of theseassumptions to the actual data being interpreted.Theophilides et al. [26] applied their method withinNew York City, where each district has a high density.Since New York City is heavily interconnected with ahuge commuter population, assumption (2) may nothold.
We apply our interpolation over the whole stateof Pennsylvania with a high variation of populationdensity with the Philadelphia and the Pittsburghareas having higher and the middle areas lowerpopulation densities. In this case, assumption (2)may be more reasonable, but assumption (4) may beless reasonable. Indeed, it is more reasonable to
assume that in areas with a higher population den-sity, a dead bird has a higher ‘‘opportunity’’ orchance of being reported than a dead bird in alow density area.
However, in this article our intent is not to make amedically valid interpolation but to illustrate somemethodologies and leave it to themedical experts totest the methodology with empirical data anddecide whether it is applicable to the particularepidemics that they study.
Second, we only consider the relative size ofeach kind of infected animal in assigning the effec-tiveness weight for it in Example 3.1. Alternatively,the effectiveness weight for a type of animal maybe based on how close it generally lives tohuman beings. Intuitively, the closer an animallives to human beings, the more likely it is to infectthem.
Third, for spatiotemporal applications, recursivequeries are not expressible using the basic querylanguages of GIS systems. Some relational databasesand knowledge-base systems provide recursivequeries, but they do not provide spatiotemporaldata representation. Hence, the visualization ofrecursively defined concepts cannot be easilyhandled by these systems. They would usuallyrequire some special functions to be written in aprogramming language like C or C++ and added to alibrary. In contrast, our system only uses standardSQL queries to solve the problem. Therefore, theprogram is a simple, declarative, and high-levelquery that is easy to maintain. This feature isimportant, because the requirement of visualizingrecursively defined concepts on spatiotemporaldata is frequent enough to need a general andsimple solution method.
To manage a new epidemic in the WeNiVIS sys-tem, only the following modifications need to bemade:
� G
enerate a new basemap in constraint databases:a software named cdbdump can be used to trans-late ArcGIS map file to a constraint databaseformat.� In
terpolate measurements of indicators usingshape function-based interpolation methodsimplemented in cdbdump.� D
efine and examine the parameters k and k1 in theSQL query to model the new epidemic.� A
pply the model to predict the new epidemic andcheck its correctness.Based on our general definition for recursivelydefined spatiotemporal concepts and recursive SQLquery solution, the WeNiVIS system can be easilyextended to handle different epidemics.
170 P. Revesz, S. Wu
7. Conclusion
Our general solution for reasoning about epidemicsand related spatiotemporal phenomena enables oneto solve many problems similar to WNV withoutmuchmodification. The user does not need to searchfor different ad hoc solutions for each specific epi-demiological case.
There are still many interesting directions forfuture work. For example, we are currently extend-ing theWeNiVIS systembyallowing theuser to specifyin a convenient way the color of each overlay object.We are also expanding the recursive SQL generator sothat the user can select an object and calculate thegrowth in its area between two different timeinstances. Besides improving WeNiVIS, we are alsobranching out to other epidemic applications.
These and other issues remain interestingresearch topics for the future. We provide freecopies of the WeNiVIS system to researchers andpotential users whowould like to try it out onWNVorother similar infectious disease data.
Acknowledgments
This research was supported in part by USA NSF grantEIA-0091530. The first author was also supported byan Alexander von Humboldt Research Fellowship.
References
[1] Damianos L, Ponte J, Wohlever S, Reeder F, Day D, Wilson G,et al. MiTAP for bio-security: a case study. AI Magazine 2002;23(4):13—29.
[2] Revesz P, Wu S. Visualization of recursively defined con-cepts. In: Proceedings of 8th international conference oninformation visualization. London: IEEE Computer Society;2004. p. 613—21.
[3] Revesz P, Chen R, Kanjamala P, Li Y, Liu Y, Wang Y. The MLPQ/GIS constraint database system. In: Chen W, Naughton JF,Bernstein PA, editors. ACM SIGMOD international conferenceon management of data. New York: ACM Press; 2000. p. 601.
[4] Kanellakis PC, Kuper GM, Revesz PZ. Constraint query lan-guages. J Comput Syst Sci 1995;51(1):26—52.
[5] Kuper GM, Libkin L, Paredaens J, editors. Constraint data-bases. Heidelberg: Springer-Verlag; 2000.
[6] Revesz P. Introduction to constraint databases New York:Springer-Verlag; 2002.
[7] Chomicki J, Haesevoets S, Kuijpers B, Revesz P. Classes ofspatio-temporal objects and their closure properties. AnnMath Artif Intell 2003;39(4):431—61.
[8] Chomicki J, Revesz P. Constraint-based interoperability ofspatiotemporal databases. Geoinformatica 1999;3(3):211—43.
[9] Pennsylvania’s West Nile Virus Control Program. West NileVirus surveillance maps at http://www.westnile.state.pa.us/surv.htm [accessed 10 December 2004].
[10] Codd EF. A relational model for large shared data banks.Commun ACM 1970;13(6):377—87.
[11] Elmasri R, Navathe SB. Fundamentals of database systems,4th ed., New York: Addison-Wesley; 2003.
[12] Ramakrishnan R. Database management systems New York:McGraw-Hill; 1998.
[13] Silberschatz A, Korth H, Sudarshan S. Database systemconcepts, 5th ed., New York: McGraw-Hill; 2005.
[14] Brodsky A, Segal VE, Chen J, Exarkhopoulo PA. The CCUBEconstraint object-oriented database system. In: Delis A,Faloutsos C, Ghandeharizadeh S, editors. ACM SIGMOD inter-national conference onmanagement of data. New York: ACMPress; 1999. p. 577—9.
[15] Goldin DQ, Kutlu A, Song M, Yang F. The constraint databaseframework: lessons learned from CQA/CDB. In: Dayal U,Ramamritham K, Vijayaraman TM, editors. Internationalconference on data engineering. Bangalore, India: IEEEComputer Society; 2003. p. 735—7.
[16] Grumbach S, Rigaux P, Segoufin L. The DEDALE system forcomplex spatial queries. In: Haas LM, Tiwary A, editors. ACMSIGMOD international conference on management of data.New York: ACM Press; 1998. p. 213—24.
[17] Li L, Revesz P. Interpolation methods for spatio-temporalgeographic data. Comput Environ Urban Syst 2004;28(3):201—27.
[18] Li L, Li Y, Piltner R. A new shape function based spatiotem-poral interpolation method. In: Kuijpers B, Revesz P, editors.1st international symposium on the applications of con-straint databases, number 3074 in lecture notes in computerscience. Heidelberg: Springer-Verlag; 2004. p. 25—40.
[19] Li L, Revesz P. A comparison of spatio-temporal interpolationmethods. In: Egenhofer MJ, Mark DM, editors. Proceedings ofthe second international conference on geographic informa-tion science, volume 2478 of lecture notes in computerscience. Heidelberg: Springer-Verlag; 2002. p. 145—60.
[20] Shepard D. A two-dimensional interpolation function forirregularly spaced data. In: Proceedings of the 23rd ACMnational conference. New York: ACM Press; 1968. p. 517—24[Chairman Richard B. Blue Sr. and Chairman Arthur M.Rosenberg].
[21] Krige DG. A statistical approach to somemine valuations andallied problems at the witwatersrand. Master’s thesis. SouthAfrica: University of Witwatersrand; 1951.
[22] Matheron G. The theory of regionalized variables and itsapplications. In: Les Cahiers du Centre de MorphologieMathematique de Fontainebleau, vol. 5. 1971. p. 221.
[23] Goodman JE, O’Rourke J. Handbook of discrete and compu-tational geometry Boca Raton: CRC Press; 1997.
[24] Langran G. Time in geographical information systems Lon-don: Taylor & Francis; 1992.
[25] Worboys MF. GIS: a computing perspective London: Taylor &Francis; 1995.
[26] Theophilides CN, Ahearn SC, Grady S, MerlinoM. IdentifyingWest Nile Virus risk areas: the dynamic continuous-area space—time system. Am J Epidemiol 2003;157(9):843—54.
[27] Raffaeta A, Turini F, Renso C. Enhancing GISs for spatio-temporal reasoning. In: Voisard A, Chen S-CC., editors. ACM-GIS’02: proceedings of the 10th ACM international sympo-sium on advances in geographic information systems. NewYork: ACM Press; 2002. p. 42—8.
[28] Wu S. Information visualization methods for GIS, constraintand spatiotemporal databases. Ph.D. thesis. Lincoln: TheUniversity of Nebraska; 2005.
[29] Nash D, Mostashari F, Fine A, et al. The outbreak of West NileVirus infection in the New York City area in 1999. N Engl JMed 2001;344(24):1807—14.
[30] U.S. Geological Survey. West Nile Virus maps at http://westnilemaps.usgs.gov/ [accessed 12 December 2004].