spatiotemporal brain mapping of spatial attention effects on pattern-reversal erps
TRANSCRIPT
r Human Brain Mapping 33:1334–1351 (2012) r
Spatiotemporal Brain Mapping of Spatial AttentionEffects on Pattern-Reversal ERPs
Francesco Di Russo,1,2* Alessandra Stella,1,3 Grazia Spitoni,2,3
Francesca Strappini,3 Stefano Sdoia,1 Gaspare Galati,2,3
Steven A. Hillyard,4 Donatella Spinelli,1,2 and Sabrina Pitzalis1,2
1Department of Education Sciences for Motor Activity and Sport, University of Rome ‘‘Foro Italico,’’Rome, Italy
2Neuropsychology Center, Santa Lucia Foundation, IRCCS, Rome, Italy3Department of Psychology, University of Rome ‘‘La Sapienza,’’ Rome, Italy
4Department of Neurosciences, University of California San Diego, La Jolla, CA
r r
Abstract: Recordings of event-related potentials (ERPs) were combined with structural and functionalmagnetic resonance imaging (fMRI) to investigate the timing and localization of stimulus selectionprocesses during visual-spatial attention to pattern-reversing gratings. Pattern reversals were presentedin random order to the left and right visual fields at a rapid rate, while subjects attended to the rever-sals in one field at a time. On separate runs, stimuli were presented in the upper and lower visualquadrants. The earliest ERP component (C1, peaking at around 80 ms), which inverted in polarity forupper versus lower field stimuli and was localized in or near visual area V1, was not modulated byattention. In the latency range 80–250 ms, multiple components were elicited that were increased inamplitude by attention and were colocalized with fMRI activations in specific visual cortical areas. Theprincipal anatomical sources of these attention-sensitive components were localized by fMRI-seededdipole modeling as follows: P1 (ca. 100 ms—source in motion-sensitive area MTþ), C2 (ca. 130 ms—same source as C1), N1a (ca. 145 ms—source in horizontal intraparietal sulcus), N1b (ca. 165 ms—source in fusiform gyrus, area V4/V8), N1c (ca. 180 ms—source in posterior intraparietal sulcus, areaV3A), and P2 (ca. 220 ms—multiple sources, including parieto-occipital sulcus, area V6). These resultssupport the hypothesis that spatial attention acts to amplify both feed-forward and feedback signals inmultiple visual areas of both the dorsal and ventral streams of processing. Hum Brain Mapp 33:1334–1351, 2012. VC 2011 Wiley Periodicals, Inc.
Keywords: human brain mapping; ERP/fMRI coregistration; ERP source analysis; spatial attention;visual system
r r
Contract grant sponsor: Italian Ministry of Education; Contractgrant number: MIUR prot. 2007JLKBL9_004; Contract grantsponsor: U.S. Office of Naval Research; Contract grant number:N00014-07-1-0937; Contract grant sponsor: National Institute ofMental Health; Contract grant number: MH-86385; Contract grantsponsor: Santa Lucia Foundation.
*Correspondence to: Francesco Di Russo, University of Rome‘‘Foro Italico,’’ Piazza Lauro De Bosis, 15, 00135 Rome, Italy.E-mail: [email protected]
Received for publication 30 October 2010; Revised 22 October2010; Accepted 20 January 2011
DOI: 10.1002/hbm.21285Published online 15 April 2011 in Wiley Online Library(wileyonlinelibrary.com).
VC 2011 Wiley Periodicals, Inc.
INTRODUCTION
A basic goal of attention research is to identify the proc-essing stages at which sensory inputs are modulated(enhanced or suppressed) under top-down control. Inhumans, scalp recordings of event-related potentials (ERPs)to attended and unattended visual stimuli have providedinformation on the timing of stimulus selection processes inthe visual pathways. Studies over the past 3 decades haveshown that early ERP components in the 80–250 ms rangeare enhanced in amplitude by spatially focused attentionin the manner of a sensory gain control [Hillyard andAnllo-Vento, 1998; Hillyard et al., 1998; Hopf et al., 2009;Hopfinger et al., 2004]. Although ERP and magnetoence-phalographic (MEG) recordings have defined the timecourse of attentional selection processes with a high degreeof precision (of the order of ms), the anatomical localiza-tion of the underlying neural activity can only be approxi-mated on the basis of surface recordings. To improve theaccuracy of localizing the neural sources of ERP/MEGcomponents, many recent studies have combined surfacerecordings with the spatially more precise hemodynamicmeasures provided by functional magnetic resonanceimaging (fMRI) [e.g., Dale and Halgren, 2001; Di Russoet al., 2002b, 2005; Martinez et al., 2001; Murray et al., 2002;Schoenfeld et al., 2007; Valdes-Sosa et al., 2009; Vanniet al., 2004]. In studies of visual-spatial attention that com-bined ERP or MEG recordings with fMRI, it was foundthat the earliest evoked component (the C1 at 50–80 ms),which has been attributed to a primary visual cortex (V1)generator, was not affected by attention, but later compo-nents were enhanced in multiple areas of extrastriate vis-ual cortex [e.g., Di Russo et al., 2003; Martinez et al., 2001;Noesselt et al., 2002].
Most ERP studies of attention have used briefly flashedpattern-onset stimuli. An equally effective stimulus that hasbeen used extensively for clinical evaluations [Halliday,1993] is the pattern reversal produced by abruptly inter-changing the light and dark elements of a grating or check-erboard. The pattern-reversal stimulus differs importantlyfrom the pattern-onset in being continuously presentthroughout recording and in producing a clear perceptionof motion during the reversal. It is typically reported thatthe pattern-reversal visual-evoked potential (VEP) consistsof three main components, termed N75, P100, and N145[e.g., Hashimoto et al., 1999; Nakamura et al., 1997; Shigetoet al., 1998]. In a recent study, Di Russo et al. [2005] com-bined VEPs with fMRI and brain mapping methods (retino-topy and cortical surface reconstruction) to obtain acomprehensive spatiotemporal picture of the pattern-rever-sal VEPs and its neural generators. The results providedstrong evidence that the N75 component (also called C1)arises from activity in the primary visual cortex (area V1),whereas several subsequent components could beaccounted for by sources that were in close proximity tofMRI activations found in specific cortical areas: P100 inarea MTþ, N135 (also called C2) in area V1, N150 in parietal
areas, N160 in ventral occipital areas, and N180 in dorsaloccipital areas. These latter negativities (from 135 to 180 ms)appear to encompass the well-known N145 and are similarto a sequence of negative components (the ‘‘N1 complex’’)that was observed in the pattern-onset VEP [Di Russo et al.,2002b]. These results demonstrate that combining VEPs,fMRI, and brain mapping methods while using focal stimulimay reveal the spatiotemporal complexity of evoked neuralactivity patterns in the visual cortex.
Previous studies of spatial attention to pattern-reversalstimuli used rapid, repetitive (steady-state) stimulus presen-tations [Di Russo and Spinelli, 1999a,b, 2002a] response thathas been shown to provide a sensitive index of the allocationof attention to repetitive stimuli at different locations in thevisual field [Muller et al., 1998, 2003]. Steady-state ERPamplitudes to pattern-reversal stimuli have been investigatedas a function of several stimulus parameters that includedpattern contrast and chromaticity. Recordings from a mid-occipital sensor showed that spatial attention enhancedsteady-state amplitudes for both chromatic and achromaticstimuli but reduced the apparent latencies for achromaticstimuli only [reviewed in Di Russo et al., 2002c]. These resultsare consistent with the hypothesis that attention acts on corti-cal gain control mechanisms, which are known to be differentfor the magnocellular and parvocellular systems.
Although these steady-state experiments show that pat-tern-reversal ERPs are affected by spatial attention, theprevious use of only a single-scalp sensor does not allowinferences to be made about the neural sources of theseattentional modulations. Furthermore, the use of full- orhalf-field visual stimuli as in previous studies does notallow for clear separation of the neural sources. In particu-lar, stimuli that span more than one visual quadrant(crossing the horizontal or vertical meridians) may activateneural populations with opposing geometry (as in the pri-mary visual area), resulting in cancellation of concurrentelectric fields and misinterpretation of the underlyingsources [Di Russo et al., 2005; Regan, 1989].
This study investigated the effect of spatial attention on thetransient pattern-reversal ERP using a dense electrode arrayand focal stimulation in each of the visual quadrants. Theaim was to determine the spatiotemporal profile of attention-related ERP modulations and to localize their neural genera-tors. For this purpose, we used the same combined ERP/fMRI technique and stimulation paradigm developed by DiRusso et al. [2005]. Cortical sources were identified usingdipole modeling based on a realistic head model, taking intoaccount the loci of cortical activation revealed by fMRI whileperforming the same task. These sources were also localizedon flat maps with respect to visual cortical areas identified inindividual subjects by wide-field retinotopic mapping [e.g.,Pitzalis et al., 2006; Sereno et al., 1995]. In addition, twomotion-sensitive cortical areas were individually mapped: theclassic lateral area MTþ [Tootell and Taylor, 1995], which waspreviously found to be strongly activated by pattern-reversalstimuli [Di Russo et al., 2005, 2007], and a newly definedmedial area labeled V6 [e.g., Fattori et al., 2009; Pitzalis et al.,
r Mapping the Spatial Attention on Pattern-Reversal ERPs r
r 1335 r
2006, 2010]. It was found that spatial attention produced ro-bust modulations of pattern-reversal evoked activity thatcould be localized to multiple visual areas in the occipital, pa-rietal, and temporal lobes.
METHODS
Subjects
Thirty paid volunteer subjects (16 females, mean age of25.8, range 18–36 years) participated in the main ERPexperiment; a subset of 13 of these subjects (eight females,mean age 26.4 range 21–36 years) also received structuralMRI and fMRI scanning. All subjects were right handedand had normal or corrected-to-normal vision. All partici-pants gave written informed consent before both electro-physiological and neuroimaging procedures, which wereapproved by local ethics and human subjects committees.Before scanning, subjects were allowed, if they desired, toconsume a cup of coffee to better maintain alertness dur-ing the scan sessions.
ERP EXPERIMENT
Stimuli
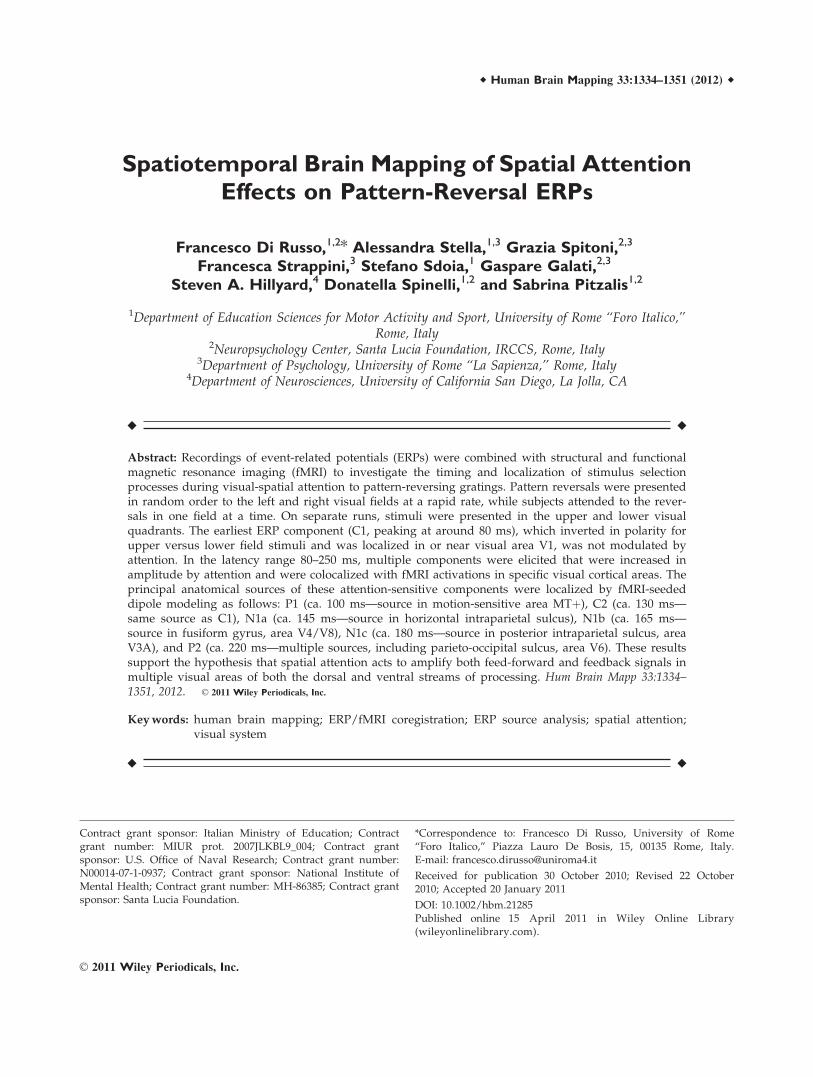
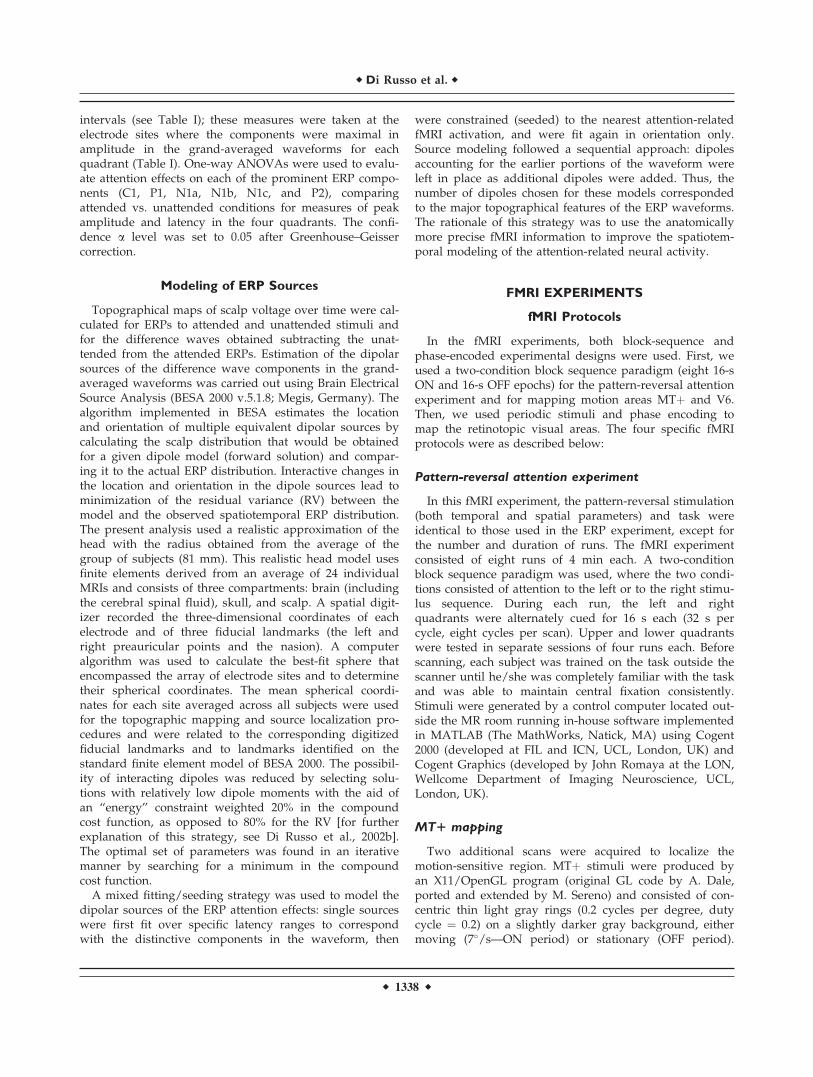
The standard stimuli (90% of total) consisted of circularGabor patterns modulated horizontally in black and white,having a diameter of 3� of visual angle, a spatial frequencyof four cycles per degree, and a mean contrast of 32% (Fig.1). Stimulus events were phase reversals (180� shift) for 66ms followed by return to the original phase (pattern-rever-sal stimulation). The background luminance (22 cd/m2)
was equiluminant with the mean luminance of the pattern.Stimuli were presented in the superior (upper quadrants)or inferior (lower quadrants) hemifields on separate runs.During each run, stimuli were presented to the left orright quadrants in a pseudo-randomized sequence; stimuliwere centered along an arc that was equidistant (4�) fromthe fixation point and located at a polar angle of 25� above(upper quadrants) or 45� below (lower quadrants) the hor-izontal meridian. The stimuli were presented asymmetri-cally in this way so that the upper and lower field stimuliwould activate approximately opposing sites on the lowerand upper banks of the calcarine fissure, respectively, inlight of evidence that the horizontal meridian is actuallyrepresented on the lower bank rather than in the lateralrecess of the calcarine fissure [e.g., Aine et al., 1996; Clarket al., 1995; Di Russo et al., 2002b, 2003].
Phase shifts occurred in random order in the left orright quadrants at a rapid presentation rate, with SOAsvarying between 350 and 650 ms. Target stimuli (10% oftotal) were phase reversals of the Gabor gratings that wereobliquely oriented but otherwise identical to the standardreversals. Targets rotated from horizontal to oblique dur-ing the phase reversal and were pseudo-randomly inter-mixed with the standards. A cue made up of four smallarrows surrounding the fixation cross indicated the visualquadrant to which attention had to be covertly focused.
Procedure
During the ERP recordings, subjects were comfortablyseated in a dimly lit, sound-attenuated and electricallyshielded chamber while viewing stimuli presented on a24-inch video monitor with a refresh rate of 60 Hz at a dis-tance of 114 cm. Subjects were trained to maintain stablebinocular fixation on a central cross (0.2� � 0.2�) through-out stimulus presentation. Each ERP run lasted for 120 s,followed by a 30-s rest period, with occasional longerbreaks interspersed. A total of 20 runs (10 with stimuli inthe upper hemifield and 10 in the lower hemifield) werecarried out to deliver at least 700 standard stimuli to eachquadrant. Subjects were instructed to direct their attentioncovertly (without moving their eyes) to the quadrant indi-cated by the direction of the spatial cue. On a given run,stimuli were presented only to either the upper or lowerhemifields, with the right/left order randomized. The sub-ject’s task was to detect and respond to the infrequent tar-gets at the cued location with a button press whileignoring the stimuli in the opposite field. The order ofattending to different quadrants was counterbalancedacross runs. The responding hand was similarly counter-balanced across runs. Responses were classified as hits ifthey occurred within a 200–1,200 ms window after the tar-get onset and as anticipatory or delayed responses other-wise. Subjects received a preliminary warm-up session inwhich they were trained to discriminate the target andachieve an average hit rate of 75–80%. The difficulty of thetarget discrimination, determined by the orientation
Figure 1.
Standard stimuli used in this experiment. Circular Gabor patches
were continuously present in either the upper or lower visual
quadrants. At intervals of 350–650 ms, either the left or the
right patch (in a randomized sequence) underwent phase rever-
sal for 66 ms and then returned to the original phase.
r Di Russo et al. r
r 1336 r
difference between standards and targets, was adjustedbetween runs if necessary to maintain this level of per-formance. The subjects received feedback on their behav-ioral performance and their ability to maintain fixation asmonitored by the electrooculogram.
Electrophysiological Recording and Data Analysis
The EEG was acquired using a BrainVisionTM system(BrainProducts, Germany), with 64 electrodes placedaccording to the 10-10 system montage [Di Russo et al.,2002b]. All scalp channels were referenced to the left mas-toid (M1). Horizontal eye movements were monitored witha bipolar recording from electrodes at the left and rightouter canthi. Blinks and vertical eye movements wererecorded with an electrode below the left eye, which wasreferenced to site Fp1. The EEG was digitized at 250 Hzwith an amplifier bandpass of 0.1–100 Hz including a 50-Hz
notch filter and was stored for off-line averaging. Compu-terized artifact rejection was performed before signal aver-aging to discard epochs in which deviations in eye position,blinks, or amplifier blocking occurred. On an average, 8% ofthe trials were rejected for violating artifact criteria.
Time-locked ERPs to standard stimuli were averagedseparately according to stimulus position (upper left,upper right, lower left, and lower right) and whether theposition was attended or unattended. The EEG was seg-mented into 1,100 ms epochs that began 100 ms prior thephase shift to establish a voltage baseline. To reduce high-frequency noise, the averaged ERPs were low-pass filteredat 35 Hz. ERPs to standards that were preceded by a tar-get stimulus within 1,000 ms or followed by a targetwithin 500 ms were not averaged to avoid any possiblecontamination by ERPs related to target detection or motorresponses. Component latencies and amplitudes weremeasured as peak voltage deflections within specified time
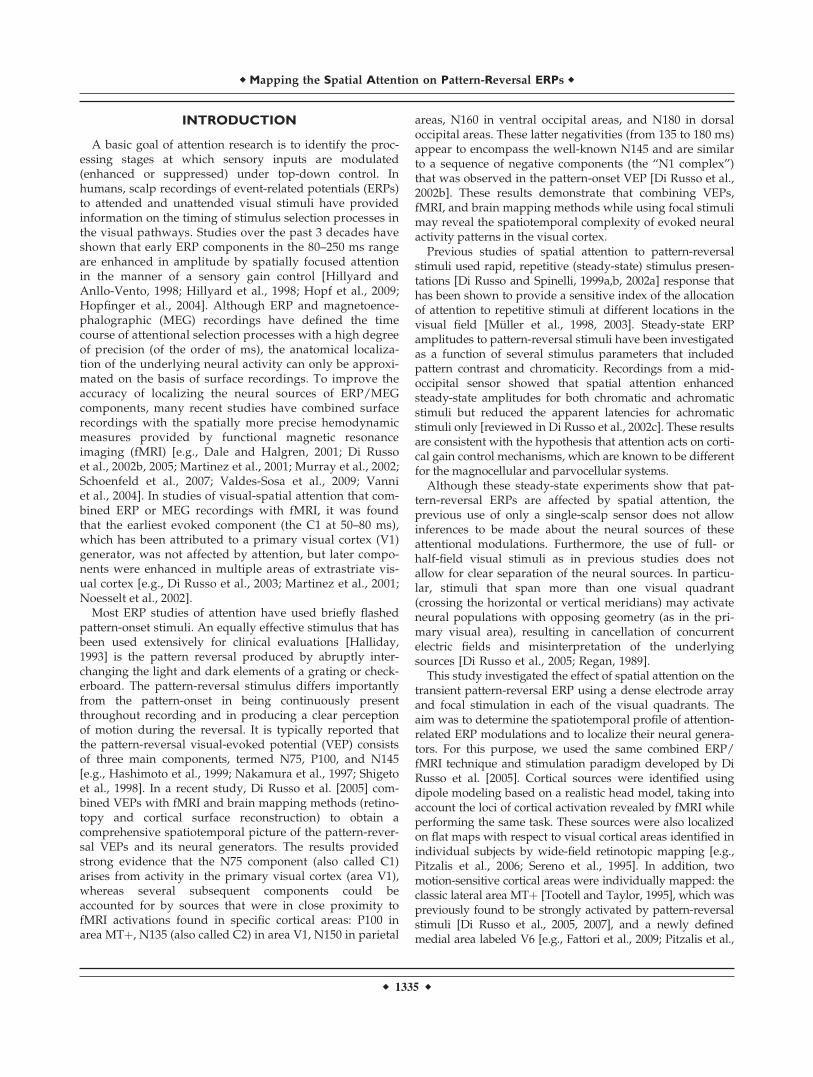
TABLE I. Mean peak latencies (ms), amplitudes (lV), and significance levels of attention
effects on ERP components
Upper left quadrant Latency
P
Amplitude
PComponent Sensor Attended Unattended Attended Unattended
C1 (60–100) PO1 78 82 ns �0.68 �0.64 n.s.P1 (80–110) P8 94 96 ns 0.39 0.21 <0.05C2 (100–150) PO1 128 132 ns 0.45 0.22 <0.05N1a (130–160) FC4 144 146 ns �0.43 �0.18 <0.05N1b (150–180) P4 164 166 ns �0.66 �0.23 <0.02N1c (170–200) PO8 180 184 ns �0.74 �0.21 <0.01P2 (200–250) C2 218 222 ns 1.39 0.71 <0.005
Lower left quadrant
C1 (60–100) P2 84 86 ns 0.38 0.36 n.s.P1 (80–110) PO4 96 96 ns 0.65 0.41 <0.05C2 (100–150) P2 128 130 ns �0.52 0.27 <0.05N1a (130–160) FC4 148 148 ns �0.72 �0.31 <0.02N1b (150–180) O2 164 166 ns �1.18 �0.64 <0.01N1c (170–200) P6 180 182 ns �1.08 0.49 <0.01P2 (200–250) C2 229 231 ns 1.26 0.71 <0.02
Upper right quadrant
C1 (60–100) PO2 76 78 ns �0.59 �0.52 n.s.P1 (80–110) P7 95 96 ns 0.38 0.26 <0.05C2 (100–150) PO2 124 126 ns 0.51 0.25 <0.05N1a (130–160) FC3 144 146 ns �0.39 �0.15 <0.05N1b (150–180) PO7 158 162 ns �0.75 �0.26 <0.02N1c (170–200) P3 180 184 ns �0.66 �0.28 <0.05P2 (200–250) C1 215 221 ns 1.25 0.81 <0.01
Lower right quadrant
C1 (60–100) P1 86 86 ns 0.5 0.48 n.s.P1 (80–110) PO3 96 97 ns 0.63 0.36 <0.05C2 (100–150) P1 128 130 ns �0.94 �0.61 <0.05N1a (130–160) FC3 148 150 ns �0.52 �0.22 <0.05N1b (150–180) O1 161 163 ns �0.98 �0.66 <0.02N1c (170–200) P5 180 183 ns �0.77 0.49 <0.05P2 (200–250) C1 229 232 ns 1.24 0.87 <0.01
Peak measurements were made within the latency intervals and at the electrode sites as indicated.
r Mapping the Spatial Attention on Pattern-Reversal ERPs r
r 1337 r
intervals (see Table I); these measures were taken at theelectrode sites where the components were maximal inamplitude in the grand-averaged waveforms for eachquadrant (Table I). One-way ANOVAs were used to evalu-ate attention effects on each of the prominent ERP compo-nents (C1, P1, N1a, N1b, N1c, and P2), comparingattended vs. unattended conditions for measures of peakamplitude and latency in the four quadrants. The confi-dence a level was set to 0.05 after Greenhouse–Geissercorrection.
Modeling of ERP Sources
Topographical maps of scalp voltage over time were cal-culated for ERPs to attended and unattended stimuli andfor the difference waves obtained subtracting the unat-tended from the attended ERPs. Estimation of the dipolarsources of the difference wave components in the grand-averaged waveforms was carried out using Brain ElectricalSource Analysis (BESA 2000 v.5.1.8; Megis, Germany). Thealgorithm implemented in BESA estimates the locationand orientation of multiple equivalent dipolar sources bycalculating the scalp distribution that would be obtainedfor a given dipole model (forward solution) and compar-ing it to the actual ERP distribution. Interactive changes inthe location and orientation in the dipole sources lead tominimization of the residual variance (RV) between themodel and the observed spatiotemporal ERP distribution.The present analysis used a realistic approximation of thehead with the radius obtained from the average of thegroup of subjects (81 mm). This realistic head model usesfinite elements derived from an average of 24 individualMRIs and consists of three compartments: brain (includingthe cerebral spinal fluid), skull, and scalp. A spatial digit-izer recorded the three-dimensional coordinates of eachelectrode and of three fiducial landmarks (the left andright preauricular points and the nasion). A computeralgorithm was used to calculate the best-fit sphere thatencompassed the array of electrode sites and to determinetheir spherical coordinates. The mean spherical coordi-nates for each site averaged across all subjects were usedfor the topographic mapping and source localization pro-cedures and were related to the corresponding digitizedfiducial landmarks and to landmarks identified on thestandard finite element model of BESA 2000. The possibil-ity of interacting dipoles was reduced by selecting solu-tions with relatively low dipole moments with the aid ofan ‘‘energy’’ constraint weighted 20% in the compoundcost function, as opposed to 80% for the RV [for furtherexplanation of this strategy, see Di Russo et al., 2002b].The optimal set of parameters was found in an iterativemanner by searching for a minimum in the compoundcost function.
A mixed fitting/seeding strategy was used to model thedipolar sources of the ERP attention effects: single sourceswere first fit over specific latency ranges to correspondwith the distinctive components in the waveform, then
were constrained (seeded) to the nearest attention-relatedfMRI activation, and were fit again in orientation only.Source modeling followed a sequential approach: dipolesaccounting for the earlier portions of the waveform wereleft in place as additional dipoles were added. Thus, thenumber of dipoles chosen for these models correspondedto the major topographical features of the ERP waveforms.The rationale of this strategy was to use the anatomicallymore precise fMRI information to improve the spatiotem-poral modeling of the attention-related neural activity.
FMRI EXPERIMENTS
fMRI Protocols
In the fMRI experiments, both block-sequence andphase-encoded experimental designs were used. First, weused a two-condition block sequence paradigm (eight 16-sON and 16-s OFF epochs) for the pattern-reversal attentionexperiment and for mapping motion areas MTþ and V6.Then, we used periodic stimuli and phase encoding tomap the retinotopic visual areas. The four specific fMRIprotocols were as described below:
Pattern-reversal attention experiment
In this fMRI experiment, the pattern-reversal stimulation(both temporal and spatial parameters) and task wereidentical to those used in the ERP experiment, except forthe number and duration of runs. The fMRI experimentconsisted of eight runs of 4 min each. A two-conditionblock sequence paradigm was used, where the two condi-tions consisted of attention to the left or to the right stimu-lus sequence. During each run, the left and rightquadrants were alternately cued for 16 s each (32 s percycle, eight cycles per scan). Upper and lower quadrantswere tested in separate sessions of four runs each. Beforescanning, each subject was trained on the task outside thescanner until he/she was completely familiar with the taskand was able to maintain central fixation consistently.Stimuli were generated by a control computer located out-side the MR room running in-house software implementedin MATLAB (The MathWorks, Natick, MA) using Cogent2000 (developed at FIL and ICN, UCL, London, UK) andCogent Graphics (developed by John Romaya at the LON,Wellcome Department of Imaging Neuroscience, UCL,London, UK).
MT1 mapping
Two additional scans were acquired to localize themotion-sensitive region. MTþ stimuli were produced byan X11/OpenGL program (original GL code by A. Dale,ported and extended by M. Sereno) and consisted of con-centric thin light gray rings (0.2 cycles per degree, dutycycle ¼ 0.2) on a slightly darker gray background, eithermoving (7�/s—ON period) or stationary (OFF period).
r Di Russo et al. r
r 1338 r
During the ON block, the concentric rings periodicallycontracted and expanded over a 2-s cycle to avoid generat-ing motion aftereffects during the OFF block. The averagebackground luminance was 61 cd/m2, and the luminancecontrast of the rings was low (�1.5%) to better isolateMTþ [Tootell and Taylor, 1995]. It is now generallyacknowledged that the relatively large motion-sensitiveregion found using this localizer and originally labeled V5(or MT) in humans [e.g., Tootell and Taylor, 1995] is prob-ably a complex of several areas [see also Pitzalis et al.,2010]. For this reason, here we refer to this region as the‘‘MT complex’’ or ‘‘MTþ.’’
V6 mapping
An additional two scans were acquired in separate ses-sions to define the medial motion-sensitive area V6, asdescribed by Pitzalis et al. [2010]. The same X11/OpenGLsoftware (Dale and Sereno) produced 16-s blocks of coher-ent dot field motion contrasted with 16-s blocks ofscrambled motion. A new field of white dots was gener-ated every 500 ms (dot size 0.4� � 0.4�). These dots imme-diately began to move along trajectories that defined eithercoherent motion or random movements. The coherentmotion patterns were chosen randomly for each 500-msperiod from a continuum ranging from dilation to out-ward spiral, to rotation, to inward spiral, to contraction.The center of the movement was jittered from flow toflow, and the speed varied within a small range. Duringthe scrambled OFF period, dots and their movement vec-tors were generated as during the coherent ON periodsexcept that each dot trajectory was rotated by a randomangle. This scrambled the coherency of movement (at agiven point, dots moved in different directions) but pre-served the speed gradient (central dots still moved slowerthan peripheral dots). The average luminance of the stimu-lus was 31 cd/m2.
Retinotopic mapping
We mapped polar angle (measured from the contralat-eral horizontal meridian around the center of gaze) and ec-centricity (distance from the center-of-gaze) using thesame phase-encoded retinotopic stimuli previously used tomap the visuotopic organization of human area V6 [Pitza-lis et al., 2006]. High-contrast light- and dark-coloredchecks were counterphase flickered in either a ray- or aring-shaped configuration (polar angle and eccentricity,respectively). The average luminance of the stimuli was105 cd/m2. Each subject was presented with periodic stim-uli (64 s per cycle, eight cycles per scan), varying in eccen-tricity or polar angle, in at least two pairs of scans. Stimulimoved slowly and continuously, and checks reversedbetween bright and dark at a rate of 8 Hz. Subjects viewedpolar angle stimuli moving in both clockwise and counter-clockwise directions in separate sessions.
Experimental Setup
Visual stimuli were projected using an LCD video pro-jector with a customized lens to a back projection screenmounted behind the MR tube and visible through a mirrorplaced inside the head coil. For the attention experiment,the average viewing distance was 66.5 cm, and the screensize was 23� � 12�. For both retinotopic and motion map-ping, a wide-field screen was used at a viewing distanceof 20 cm, and the standard mirror was enlarged so thatthe most peripheral part of the screen was in view. Thissetup allowed a field of view that subtended up to 69�
horizontally, 55� vertically, and 82� in an oblique direction.Besides better revealing cortical areas that represent theperiphery, such wide-field retinotopic stimulation alsohelped to avoid confounds in fMRI mapping due to sur-round inhibition. As explained previously [e.g., Pitzaliset al., 2006], retinotopic cortical regions having representa-tions of visual space just beyond the peripheral edge of arotating wedge can generate a periodic signal with a mis-leading 180� phase offset. By stimulating most of the vis-ual field, such phase inversion is greatly reduced. In allexperiments, fixation distance and head alignment wereheld constant by a chin rest mounted inside the head coil.Subjects’ heads were stabilized with foam padding to min-imize movement during the scans. In the attention experi-ment, the subject’s manual responses were recorded usinga magnet-compatible response pad connected to the con-trol computer via optic fibers. Retinotopic and motionmapping experiments used passive viewing and continu-ous central fixation throughout the period of scanacquisition.
Imaging parameters
The MR experiments were conducted at the Santa LuciaFoundation (Rome, Italy) on a 3-T MR scanner (SiemensAllegra, Siemens Medical Systems, Erlangen). Single-shotecho-planar imaging (EPI) images were collected using astandard transmit-receive birdcage head coil. The 30imaged coronal slices were each 2.5-mm thick (with a 0-mm gap, interleaved excitation order), with an in-plane re-solution of 3 � 3 mm, oriented approximately perpendicu-lar to the calcarine fissure. This voxel size strikes acompromise between sufficient signal-to-noise and theability to assign activations to the correct sides of the sulciand gyri. Each scan took either 256 s (two-conditionexperiments) or 512 s (retinotopy), with 128 or 256 single-shot EPI images per slice, respectively (TR ¼ 2000 ms, TE¼ 30 ms, TA ¼ 66.6 ms, flip angle ¼ 70�, 64 � 64 matrix,and bandwidth ¼ 2,298 Hz/pixel). The first 8 s of each ac-quisition was discarded from data analysis to achieve asteady state. A total of 166 scans were carried out on the13 subjects (52 scans to map retinotopy, 26 scans to mapMTþ, 26 scans to map V6, and 88 scans for the attentionexperiment). The cortical surface of each subject wasreconstructed from a pair of structural scans (T1-weighted
r Mapping the Spatial Attention on Pattern-Reversal ERPs r
r 1339 r
MPRAGE, 176 contiguous sagittal slices, 1 � 1 � 1 mm3;TR ¼ 2,000 ms, TE ¼ 4.38 ms, flip angle ¼ 8�, matrix 256� 256, and bandwidth ¼ 130 Hz/pixel) taken in a separatesession. The last scan of each functional session was analignment scan (also MPRAGE, 1 � 1 � 1 mm3) acquiredin the plane of the functional scans. The alignment scanwas used to establish an initial registration of the func-tional data with the surface. Additional affine transforma-tions that included a small amount of shear were thenapplied to the functional scans for each subject using blinkcomparison with the structural images to achieve an exactoverlay of the functional data onto each cortical surface.
Data Analysis
Anatomical image processing
FreeSurfer was used for surface reconstruction [Daleet al., 1999; Fischl et al., 1999]. The two high-resolutionstructural images obtained from each subject were man-ually registered and averaged. After reconstructing eachhemisphere, the inflated occipital lobe was flattened afterfirst cutting it off posterior to the Sylvian fissure and mak-ing an additional cut along the calcarine fissure. Stereo-taxic coordinates were calculated through an automaticnonlinear stereotaxic normalization procedure [Fristonet al., 1995] performed using the SPM99 software platform(Wellcome Department of Cognitive Neurology, London,UK) and implemented in MATLAB (The MathWorks,Natick, MA). The template image was based on averagedata provided by the Montreal Neurological Institute(MNI).
Functional image processing
Processing of functional images was performed usingFreeSurfer and SPM.
FreeSurfer analysis
Data from two-condition experiments (i.e., attentionexperiment, V6 and MTþ mapping) and phase-encodedretinotopy were analyzed by means of a Fourier transformof the MR time course from each voxel after removingconstant and linear terms. This generated a vector withreal and imaginary components for each frequency thatdefined an amplitude and phase of the periodic signal atthat frequency. To estimate the significance of the correla-tion between the blood oxygenation level-dependent(BOLD) signal and the stimulus frequency (eight cyclesper scan), the squared amplitude of the signal at the stim-ulus frequency was divided by the mean of squaredamplitudes at all other ‘‘noise’’ frequencies (excluding low-frequency signals due to residual head motion and har-monics of the stimulus frequency). This ratio of two chi-squared statistics follows the F-distribution with degreesof freedom equal to the number of time points and can be
used to calculate a significance P value. Above a minimumthreshold, the statistical significance levels of the displayedpseudocolor ranges were normalized according to theoverall sensitivity of each subject. These analysis methodswere similar to those used in previous studies [Pitzaliset al., 2006, 2010; Sereno et al., 1995; Tootell et al., 1998].The boundaries of retinotopic cortical areas (V1, V2, V3,VP, V3A, V7, V4v, and V4/V8) were defined on the corti-cal surface for each individual subject on the basis ofphase-encoded retinotopy [e.g., Sereno et al., 1995] andsubsequent calculation of visual field sign. This methodprovides an objective means of drawing borders betweenareas based on the angle between the gradients (directionsof fastest rate of change) in the polar angle and eccentric-ity with respect to cortical position [Sereno et al., 1995].
SPM analysis
In data analyses performed with SPM99, functionalimages from each participant were coaligned with thehigh-resolution anatomical scan (MPRAGE) taken in thesame session. Images were motion corrected, transformedinto MNI space using a nonlinear stereotaxic normaliza-tion procedure [Friston et al., 1995], and smoothed with athree-dimensional Gaussian filter (6-mm full-width-half-maximum). For the block sequence experiments, a generallinear model was fit to each individual subject’s data,modeling ‘‘ON’’ blocks as box-car functions convolvedwith a canonical hemodynamic response function. Astandard random-effects group analysis was then per-formed on parameter estimates derived from such generallinear models. Significance was judged at the voxel leveland by cluster size. Correction for multiple comparisonswas performed using distribution approximations fromthe theory of Gaussian fields at the cluster level (P � 0.01corrected), after forming clusters of adjacent voxels surviv-ing a threshold of P � 0.01 uncorrected. Localization andvisualization of individual activations by SPM wereachieved by using BrainShow, an in-house software pack-age (code by G. Galati) for visualization of fMRI data. ThisMatlab-based Analyze-SPM image viewer allows superim-position of individual SPM maps on individual brain slicesor on folded, inflated, and flattened representations ofcortical surfaces reconstructed by FreeSurfer. This viewerwas also used to superimpose SPM group maps (in MNIspace, see above) on the cortical surface of the single-sub-ject MNI canonical brain (Colin27) after reconstruction ofits cortical surface using FreeSurfer.
RESULTS
Behavioral Performance
During the EEG recording, the mean hit rate for targetdetections (79.7%) and reaction time (455 ms) did not dif-fer among stimulus positions (F(3,116) < 1; n.s.). Nor wasthere any effect of responding hand. Similarly, during the
r Di Russo et al. r
r 1340 r
fMRI scans, the mean hit rate for target detections (78.1%)and reaction time (463 ms) did not differ among stimuluspositions (F(3,48) < 1; n.s.). Nor was there any effect ofresponding hand. No significant differences were foundbetween the EEG and fMRI experiments (t(29) < 1; n.s.).
ERP Waveforms and Topography
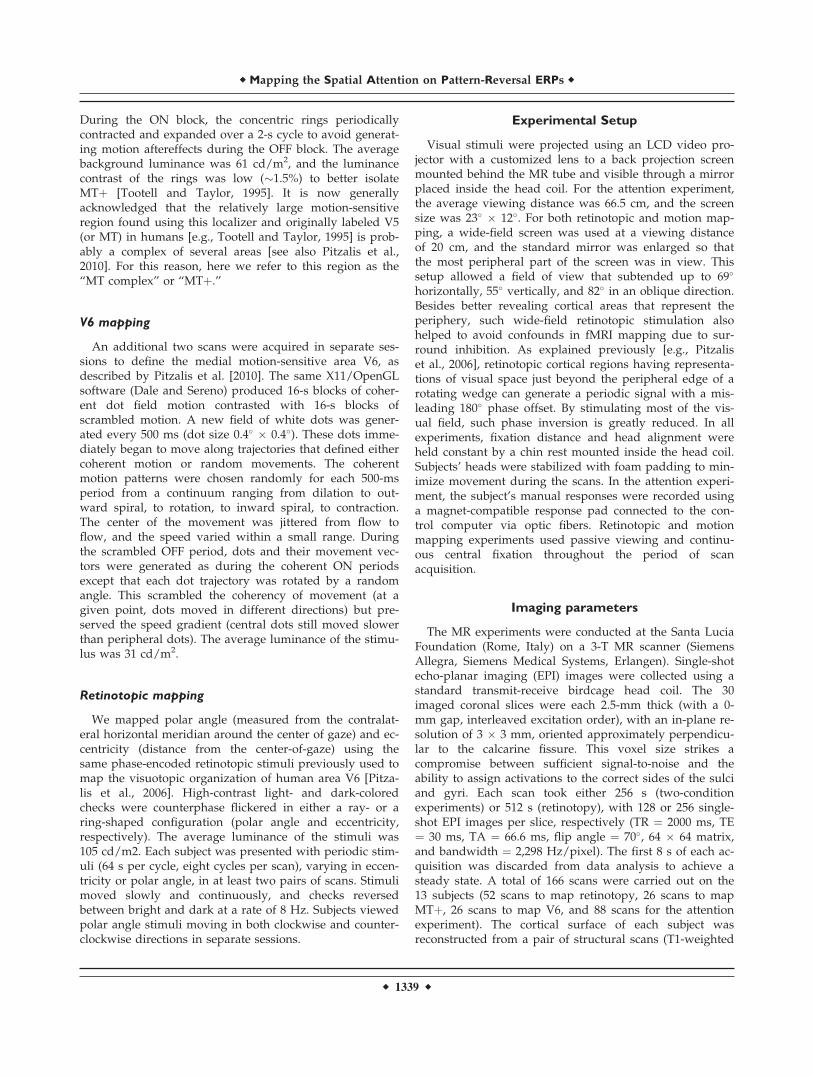
Grand-averaged ERPs in response to standard stimuli ineach visual quadrant are shown in Figure 2, and the scalpdistributions of the major components are mapped in Fig-ures 3 and 4.
At midline occipitoparietal sites, the C1 componentbegan at 50–60 ms and peaked at 75–85 ms, showing aninversion in polarity for upper vs. lower visual field. Forupper field stimuli, this component was negative and larg-est at occipitoparietal sites slightly ipsilateral to the visualfield of the eliciting stimulus. For lower field stimuli, theC1 was positive in polarity and was most prominent at oc-cipitoparietal sites slightly contralateral to the visual field
of the stimulus. As shown in Table I, the C1 was notaffected by attention. The earliest attention effect was seenas an increased positivity in the second component, a posi-tive deflection peaking around 90–95 ms, hereafter calledP1. The P1 attention effect was significant at 90 ms forupper field stimuli and at 95 for lower field stimuli at con-tralateral sites (P7/P8). The topography of the P1 attentioneffect for upper quadrants was strongly contralateral atoccipitotemporal sites, whereas for lower quadrants theattention effect was maximal at occipital sites slightly con-tralateral to the midline (PO3/PO4). The subsequent C2component at 125–135 ms, like the earlier C1, showed aninversion of polarity for upper vs. lower visual field stim-uli. This component was affected by attention and had amaximal voltage over occipitoparietal sites, with a distri-bution similar to that of the earlier C1 but with oppositepolarity.
In the interval between 140 and 180 ms, several spatiallyand temporally overlapping negative waves showed atten-tional modulation. At frontal-central sites, the most promi-nent component was the anterior N1a with a mean latency
Figure 2.
Grand-averaged waveforms of the ERPs to stimuli in each of the quadrants when those stimuli
were attended (red line) and unattended (blue line). [Color figure can be viewed in the online
issue, which is available at wileyonlinelibrary.com.]
r Mapping the Spatial Attention on Pattern-Reversal ERPs r
r 1341 r
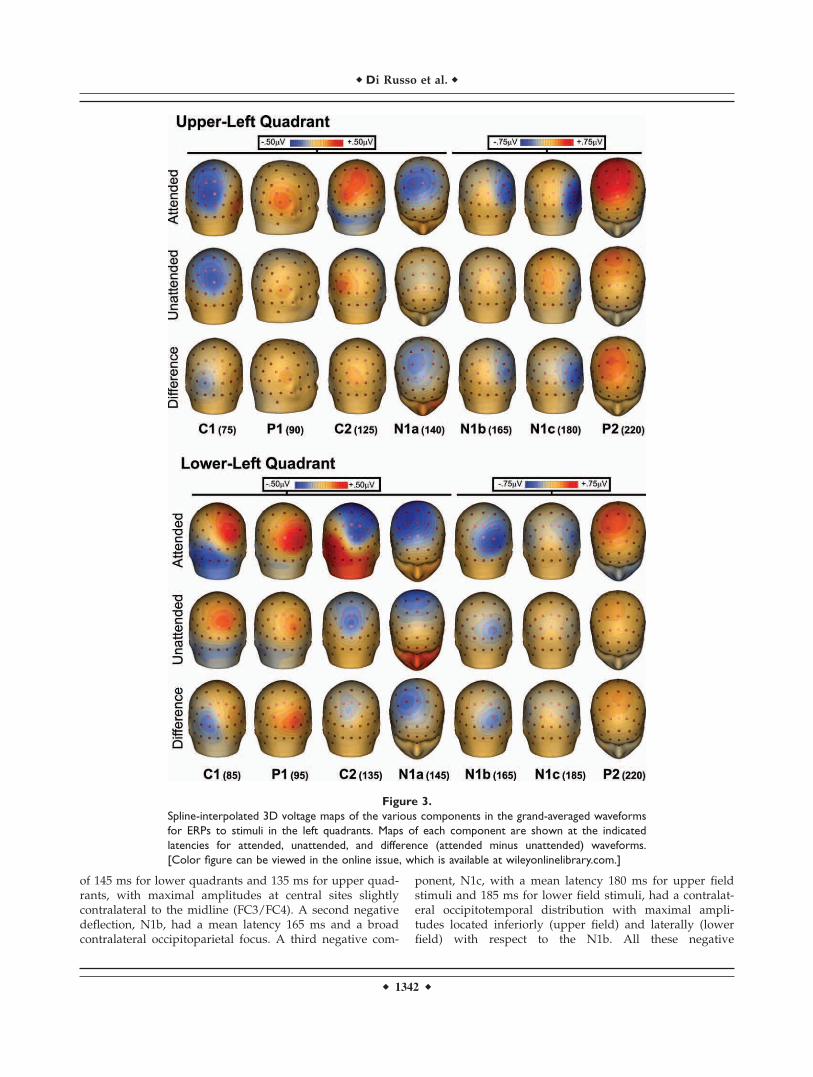
of 145 ms for lower quadrants and 135 ms for upper quad-rants, with maximal amplitudes at central sites slightlycontralateral to the midline (FC3/FC4). A second negativedeflection, N1b, had a mean latency 165 ms and a broadcontralateral occipitoparietal focus. A third negative com-
ponent, N1c, with a mean latency 180 ms for upper fieldstimuli and 185 ms for lower field stimuli, had a contralat-eral occipitotemporal distribution with maximal ampli-tudes located inferiorly (upper field) and laterally (lowerfield) with respect to the N1b. All these negative
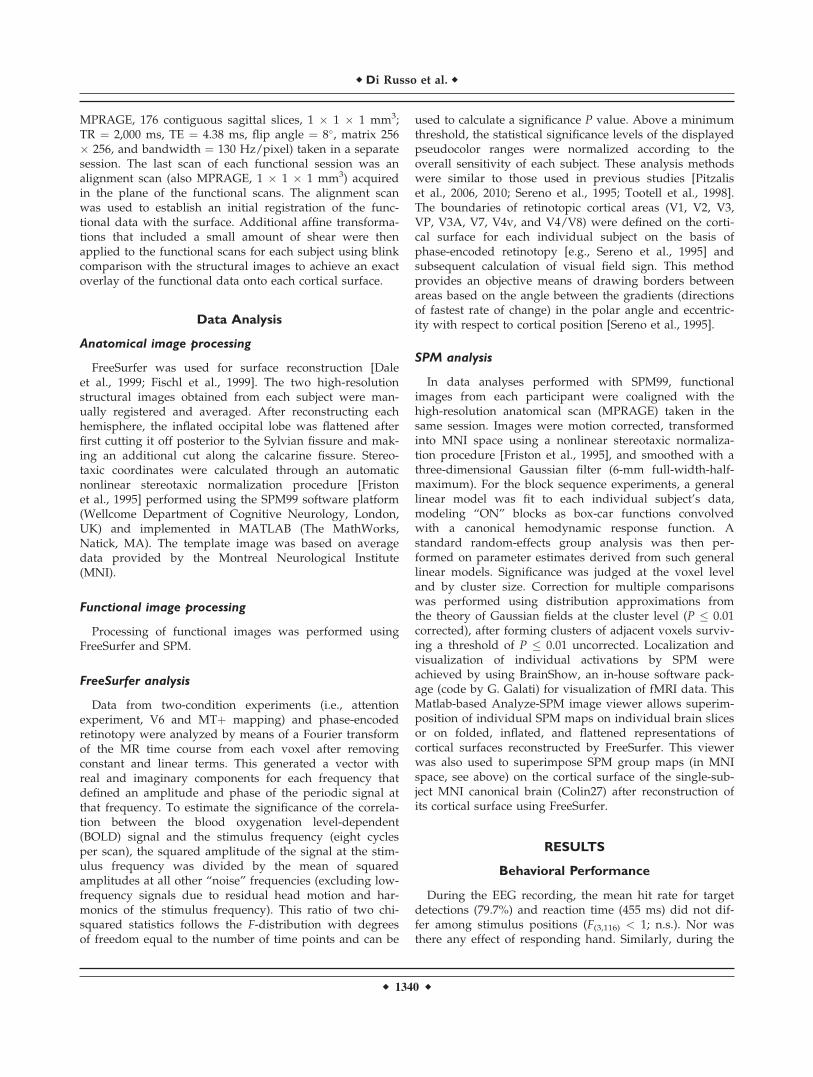
Figure 3.
Spline-interpolated 3D voltage maps of the various components in the grand-averaged waveforms
for ERPs to stimuli in the left quadrants. Maps of each component are shown at the indicated
latencies for attended, unattended, and difference (attended minus unattended) waveforms.
[Color figure can be viewed in the online issue, which is available at wileyonlinelibrary.com.]
r Di Russo et al. r
r 1342 r
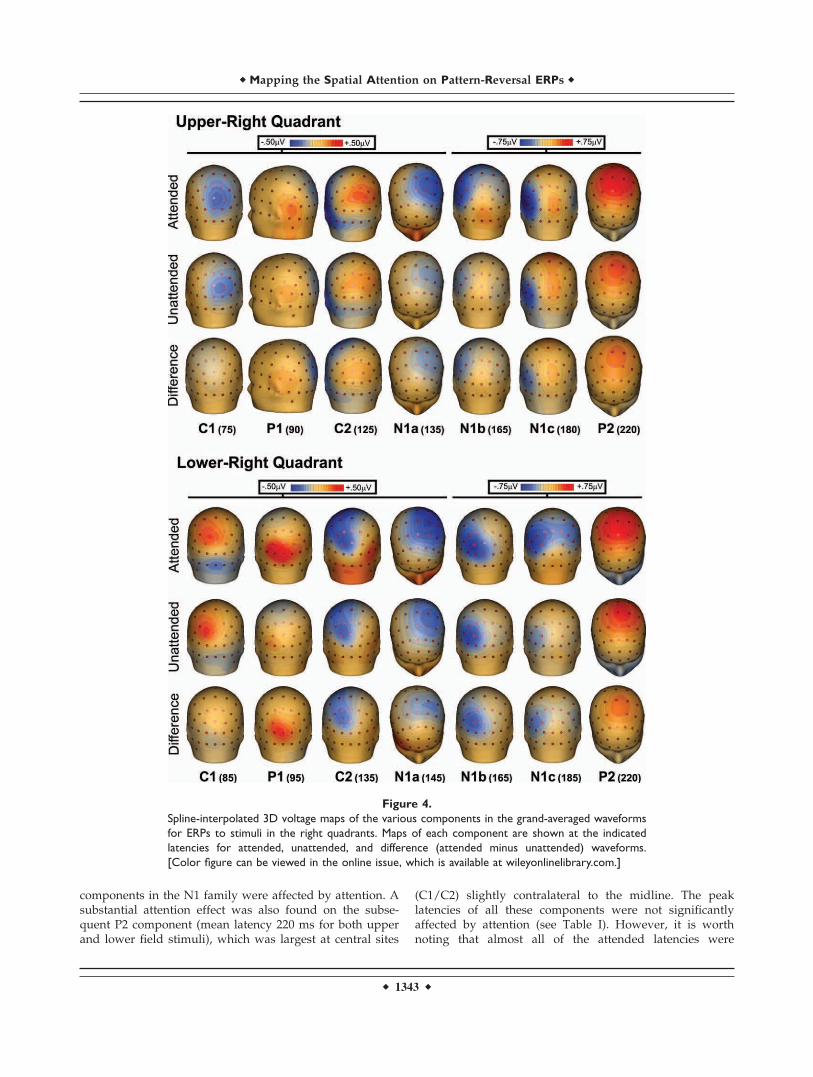
components in the N1 family were affected by attention. Asubstantial attention effect was also found on the subse-quent P2 component (mean latency 220 ms for both upperand lower field stimuli), which was largest at central sites
(C1/C2) slightly contralateral to the midline. The peaklatencies of all these components were not significantlyaffected by attention (see Table I). However, it is worthnoting that almost all of the attended latencies were
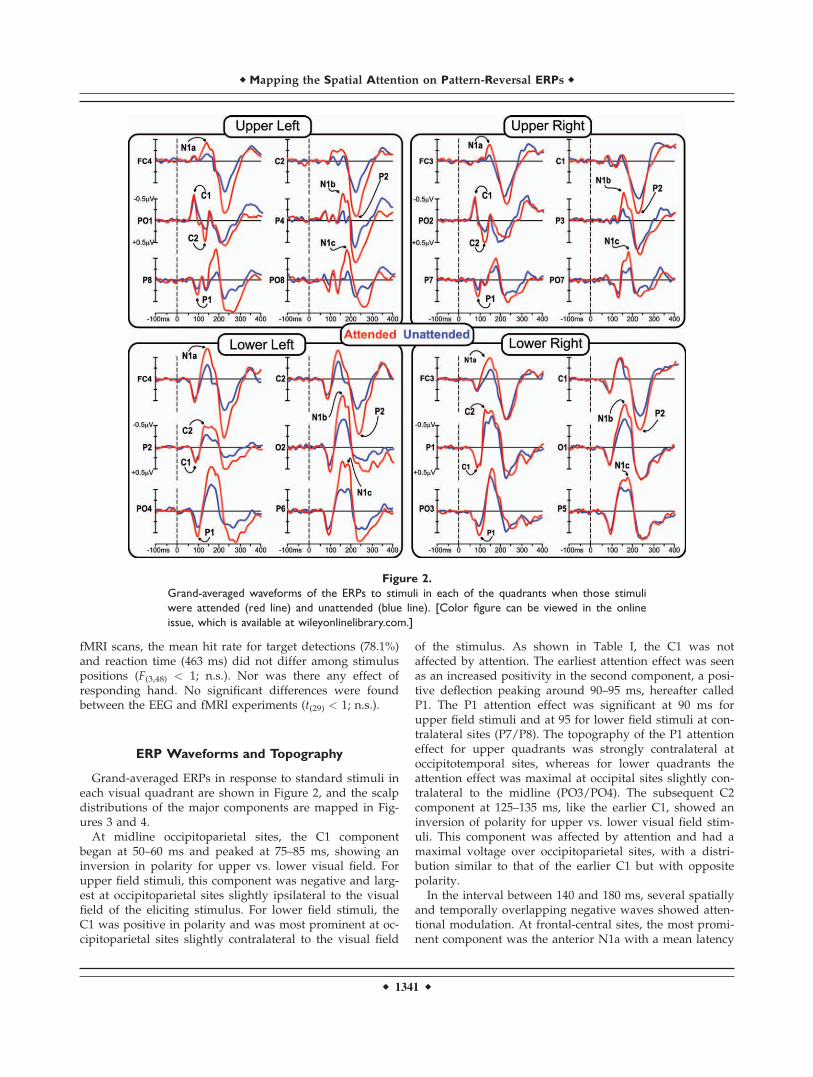
Figure 4.
Spline-interpolated 3D voltage maps of the various components in the grand-averaged waveforms
for ERPs to stimuli in the right quadrants. Maps of each component are shown at the indicated
latencies for attended, unattended, and difference (attended minus unattended) waveforms.
[Color figure can be viewed in the online issue, which is available at wileyonlinelibrary.com.]
r Mapping the Spatial Attention on Pattern-Reversal ERPs r
r 1343 r
shorter than the unattended by 1–6 ms, as was found inprevious steady-state VEP studies [Di Russo and Spinelli,1999a,b; Di Russo et al., 2001].
Group fMRI Activations
In the group-averaged data, attention-related fMRI acti-vations were observed in multiple visual cortical areas ofthe contralateral hemisphere. These included regions ofthe calcarine fissure, inferior and middle temporal sulci(ITS and MTS, respectively), the inferior occipital cortex(fusiform gyrus and collateral sulcus), and the middleoccipital gyrus in and around the posterior intraparietalsulcus (pIPS). Figures 5 and 6 (right panels) show the con-tralateral activations produced by attention to the pattern-reversal stimuli in each quadrant superimposed on theright and left flattened cortical surfaces of the MNI tem-plate (group average across subjects). These two figuresalso show the group-averaged location of the motion-sen-sitive cortex (MTþ; dashed outline boxes) that was func-tionally mapped by additional scans as described in theMethods. The fundus of the parieto-occipital sulcus (POS)is also indicated by dashed lines in the flat maps to aidthe anatomical location of area V6. When the upper visualfields were stimulated, the attention-related activationswere more prominent in ventral visual cortical areas (thelower bank of the calcarine fissure and the collateral sul-cus/fusiform region), whereas for lower visual field stimu-lation, activations were produced mainly in dorsal corticalareas (including the upper bank of the calcarine fissure) aswell as in a small region within the fusiform gyrus.
Attention to both upper and lower field stimuli enhancedthe BOLD signal in multiple extrastriate regions. The atten-tion-related activation found in the MTS correspondedclosely with the group-averaged position of the motion-sensi-tive region MTþ (outline boxes in the figures). A prominentactivation was also seen in the posterior limb of the IPS(pIPS), which enters the occipital lobe and reportedly extendsup to visual areas V3A and V7 [Tootell et al., 1998]. Moredorsal parietal activations were found on the horizontal seg-ment of the IPS (hIPS, just beyond the extreme medial tip ofthe IPS) and on the medial POS. The hIPS and the POS havebeen considered the anatomical landmarks of the LIP area[see Sereno et al., 2001] and V6 area [Pitzalis et al., 2006],respectively. Table II gives the MNI coordinates of the cent-roids of these attention-related activations.
Activations produced by the spatial attention task weregreatest in the hemisphere contralateral to the attendedvisual field. There were no regions with a stronger ipsilat-eral activation in the present task. It is likely that small ip-silateral fMRI activations were also present, but in thepresent analysis, which contrasted attend-left and attend-right conditions, any weak ipsilateral mirror foci wouldnot be seen because the spatially coincident contralateralactivations produced during attention to the opposite fieldwere larger [for more details, see Di Russo et al., 2003].
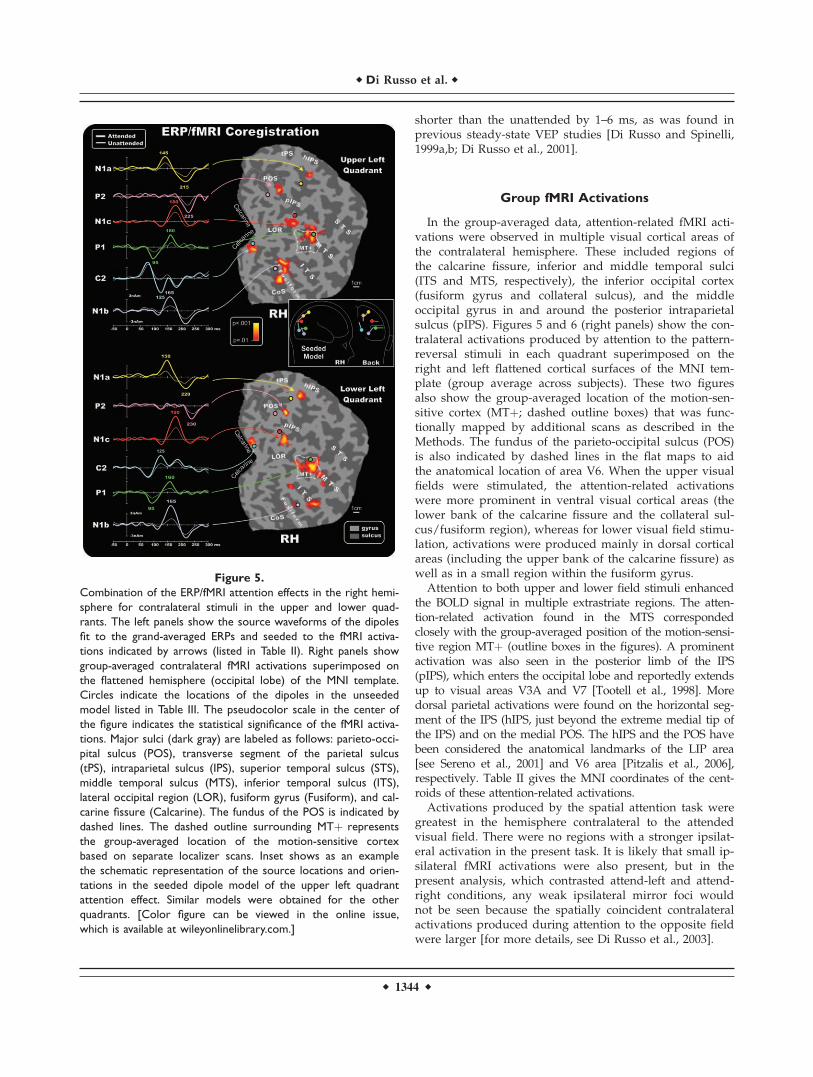
Figure 5.
Combination of the ERP/fMRI attention effects in the right hemi-
sphere for contralateral stimuli in the upper and lower quad-
rants. The left panels show the source waveforms of the dipoles
fit to the grand-averaged ERPs and seeded to the fMRI activa-
tions indicated by arrows (listed in Table II). Right panels show
group-averaged contralateral fMRI activations superimposed on
the flattened hemisphere (occipital lobe) of the MNI template.
Circles indicate the locations of the dipoles in the unseeded
model listed in Table III. The pseudocolor scale in the center of
the figure indicates the statistical significance of the fMRI activa-
tions. Major sulci (dark gray) are labeled as follows: parieto-occi-
pital sulcus (POS), transverse segment of the parietal sulcus
(tPS), intraparietal sulcus (IPS), superior temporal sulcus (STS),
middle temporal sulcus (MTS), inferior temporal sulcus (ITS),
lateral occipital region (LOR), fusiform gyrus (Fusiform), and cal-
carine fissure (Calcarine). The fundus of the POS is indicated by
dashed lines. The dashed outline surrounding MTþ represents
the group-averaged location of the motion-sensitive cortex
based on separate localizer scans. Inset shows as an example
the schematic representation of the source locations and orien-
tations in the seeded dipole model of the upper left quadrant
attention effect. Similar models were obtained for the other
quadrants. [Color figure can be viewed in the online issue,
which is available at wileyonlinelibrary.com.]
r Di Russo et al. r
r 1344 r
ERP/fMRI Combination
The first step was to construct a multisource model ofthe ERP modulations produced by attention using theBESA algorithm (unseeded model). Dipoles were opti-mally fit to the attended minus unattended differencewaveforms in the time range 70–250 ms (see Methods).Separate source models were calculated for each of thefour quadrants. Following the analysis by Di Russo et al.[2005], the coordinates of the unseeded dipolar sources(Table III) were then compared to the locations of the cent-roids of the attention-related fMRI activations (Table II). Aseeded model was then constructed by moving eachdipole’s location to that of the nearest fMRI activation andrefitting the dipole’s orientation.
The dipolar sources were fit to the ERP topographiessequentially in the following order: First, a source was fitover 70–120 ms and obtained its best fit closest to areaMTþ (RV ¼ 3.6% for unseeded model, 3.4% for seededmodel, averaged over all quadrants; mean separationbetween seeded and unseeded dipoles ¼ 5.0 mm). Thetime course of this source accounted for the P1 componentattention effect peaking at 95 ms. Second, a source was fitover 100–140 ms and obtained its best fit close to the cal-carine fissure (RV ¼ 2.2% unseeded, 1.9% seeded; separa-tion ¼ 4.3 mm). The time course of this source accountedfor the attention effect on the C2 component that peakedat 125–135 ms. Third, a dipole was fit over 135–155 msand obtained the best fit close to the parietal fMRI activa-tion near the hIPS (RV ¼ 3.7% unseeded, 3.5% seeded;separation ¼ 13.8 mm). The time course of this sourceaccounted for the attentional modulation of the N1a com-ponent peaking at around 145–150 ms. Fourth, a sourcewas optimized in the 150–170 ms window and obtained itsbest fit close to the fusiform gyrus activation (RV ¼ 3.1%
unseeded, 2.9% seeded; separation ¼ 5.1 mm). The timecourse of this source accounted for the N1b attention effectthat peaked at around 165 ms. Fifth, a dipole was fit over160–190 ms and obtained its best fit near the pIPS activa-tion (RV ¼ 3.2% unseeded, 3.1% seeded; separation ¼ 9.3mm). The time course of this source accounted for the N1cattention effect that peaked at around 180 ms. Finally, toaccount for the attention effect on the P2 component, asource was fit in the 200–250 ms window and obtained itsbest fit near the POS activation with a peak at around 220–230 ms (RV ¼ 3.9% unseeded, 3.8% seeded; separation ¼7.3 mm). The flattened cortical surfaces showed in Figures5 and 6 show the locations of the best-fit dipolar sources(colored circles) of the preliminary unseeded model for
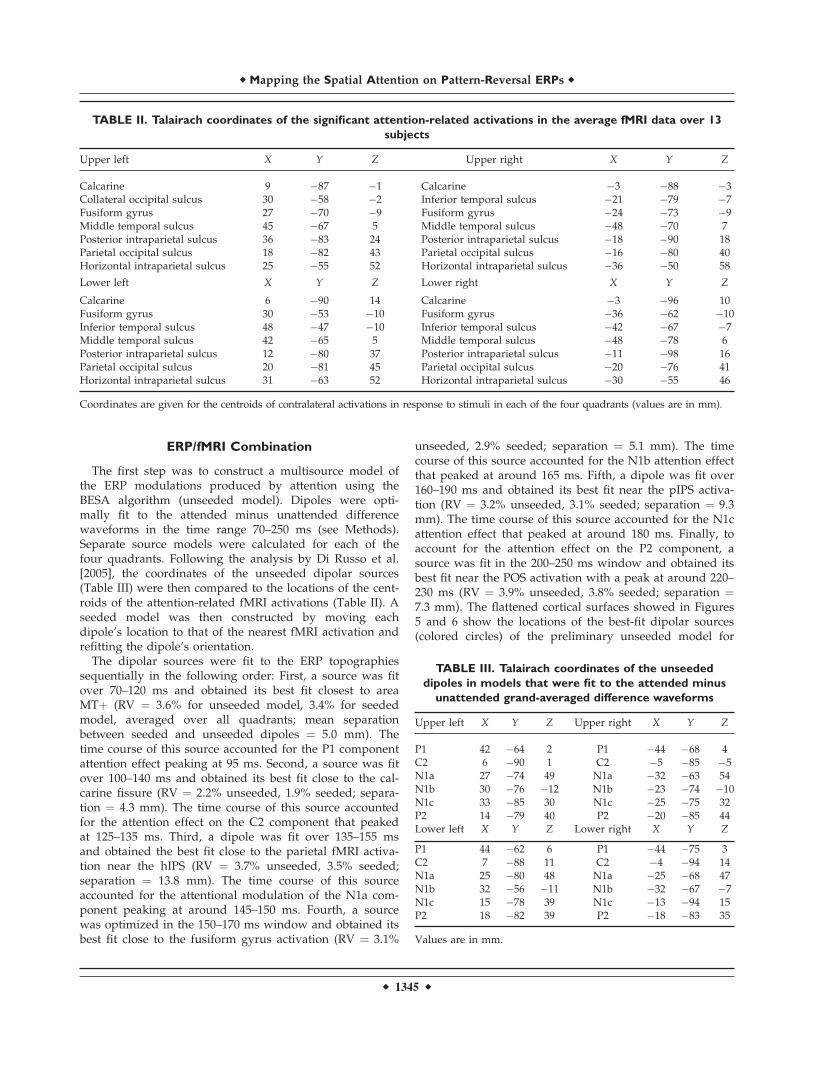
TABLE II. Talairach coordinates of the significant attention-related activations in the average fMRI data over 13
subjects
Upper left X Y Z Upper right X Y Z
Calcarine 9 �87 �1 Calcarine �3 �88 �3Collateral occipital sulcus 30 �58 �2 Inferior temporal sulcus �21 �79 �7Fusiform gyrus 27 �70 �9 Fusiform gyrus �24 �73 �9Middle temporal sulcus 45 �67 5 Middle temporal sulcus �48 �70 7Posterior intraparietal sulcus 36 �83 24 Posterior intraparietal sulcus �18 �90 18Parietal occipital sulcus 18 �82 43 Parietal occipital sulcus �16 �80 40Horizontal intraparietal sulcus 25 �55 52 Horizontal intraparietal sulcus �36 �50 58
Lower left X Y Z Lower right X Y Z
Calcarine 6 �90 14 Calcarine �3 �96 10Fusiform gyrus 30 �53 �10 Fusiform gyrus �36 �62 �10Inferior temporal sulcus 48 �47 �10 Inferior temporal sulcus �42 �67 �7Middle temporal sulcus 42 �65 5 Middle temporal sulcus �48 �78 6Posterior intraparietal sulcus 12 �80 37 Posterior intraparietal sulcus �11 �98 16Parietal occipital sulcus 20 �81 45 Parietal occipital sulcus �20 �76 41Horizontal intraparietal sulcus 31 �63 52 Horizontal intraparietal sulcus �30 �55 46
Coordinates are given for the centroids of contralateral activations in response to stimuli in each of the four quadrants (values are in mm).
TABLE III. Talairach coordinates of the unseeded
dipoles in models that were fit to the attended minus
unattended grand-averaged difference waveforms
Upper left X Y Z Upper right X Y Z
P1 42 �64 2 P1 �44 �68 4C2 6 �90 1 C2 �5 �85 �5N1a 27 �74 49 N1a �32 �63 54N1b 30 �76 �12 N1b �23 �74 �10N1c 33 �85 30 N1c �25 �75 32P2 14 �79 40 P2 �20 �85 44Lower left X Y Z Lower right X Y Z
P1 44 �62 6 P1 �44 �75 3C2 7 �88 11 C2 �4 �94 14N1a 25 �80 48 N1a �25 �68 47N1b 32 �56 �11 N1b �32 �67 �7N1c 15 �78 39 N1c �13 �94 15P2 18 �82 39 P2 �18 �83 35
Values are in mm.
r Mapping the Spatial Attention on Pattern-Reversal ERPs r
r 1345 r
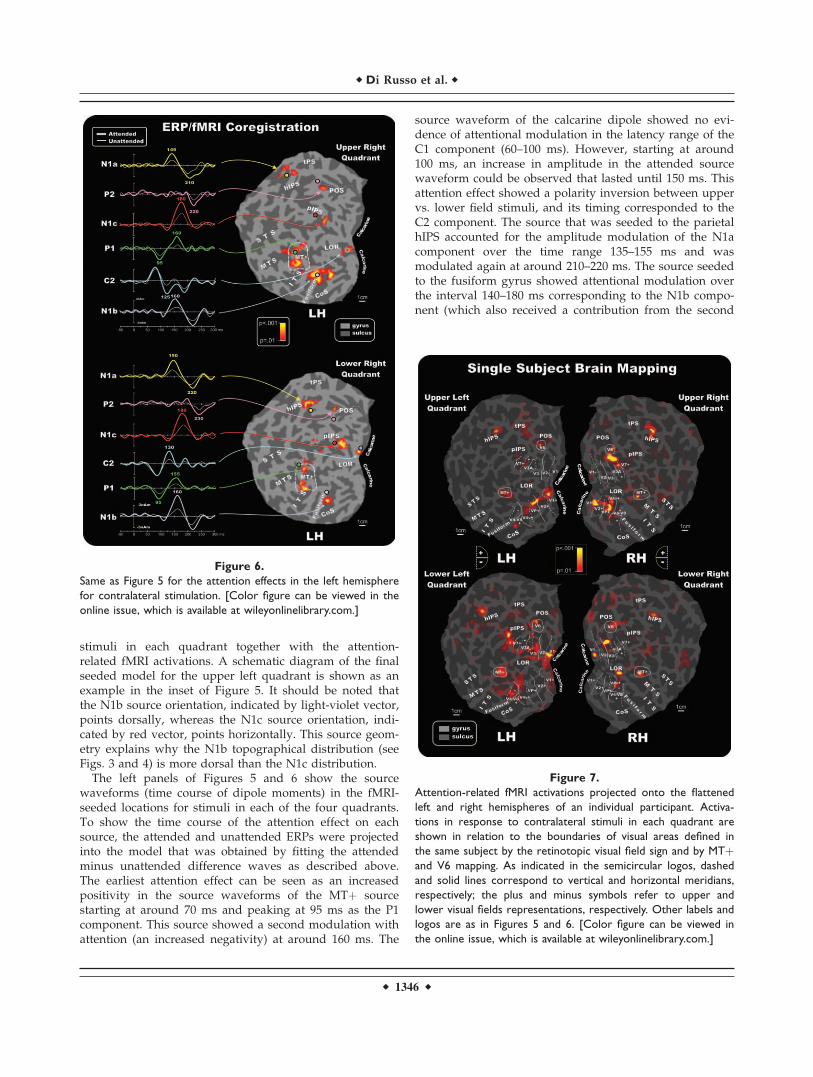
stimuli in each quadrant together with the attention-related fMRI activations. A schematic diagram of the finalseeded model for the upper left quadrant is shown as anexample in the inset of Figure 5. It should be noted thatthe N1b source orientation, indicated by light-violet vector,points dorsally, whereas the N1c source orientation, indi-cated by red vector, points horizontally. This source geom-etry explains why the N1b topographical distribution (seeFigs. 3 and 4) is more dorsal than the N1c distribution.
The left panels of Figures 5 and 6 show the sourcewaveforms (time course of dipole moments) in the fMRI-seeded locations for stimuli in each of the four quadrants.To show the time course of the attention effect on eachsource, the attended and unattended ERPs were projectedinto the model that was obtained by fitting the attendedminus unattended difference waves as described above.The earliest attention effect can be seen as an increasedpositivity in the source waveforms of the MTþ sourcestarting at around 70 ms and peaking at 95 ms as the P1component. This source showed a second modulation withattention (an increased negativity) at around 160 ms. The
source waveform of the calcarine dipole showed no evi-dence of attentional modulation in the latency range of theC1 component (60–100 ms). However, starting at around100 ms, an increase in amplitude in the attended sourcewaveform could be observed that lasted until 150 ms. Thisattention effect showed a polarity inversion between uppervs. lower field stimuli, and its timing corresponded to theC2 component. The source that was seeded to the parietalhIPS accounted for the amplitude modulation of the N1acomponent over the time range 135–155 ms and wasmodulated again at around 210–220 ms. The source seededto the fusiform gyrus showed attentional modulation overthe interval 140–180 ms corresponding to the N1b compo-nent (which also received a contribution from the second
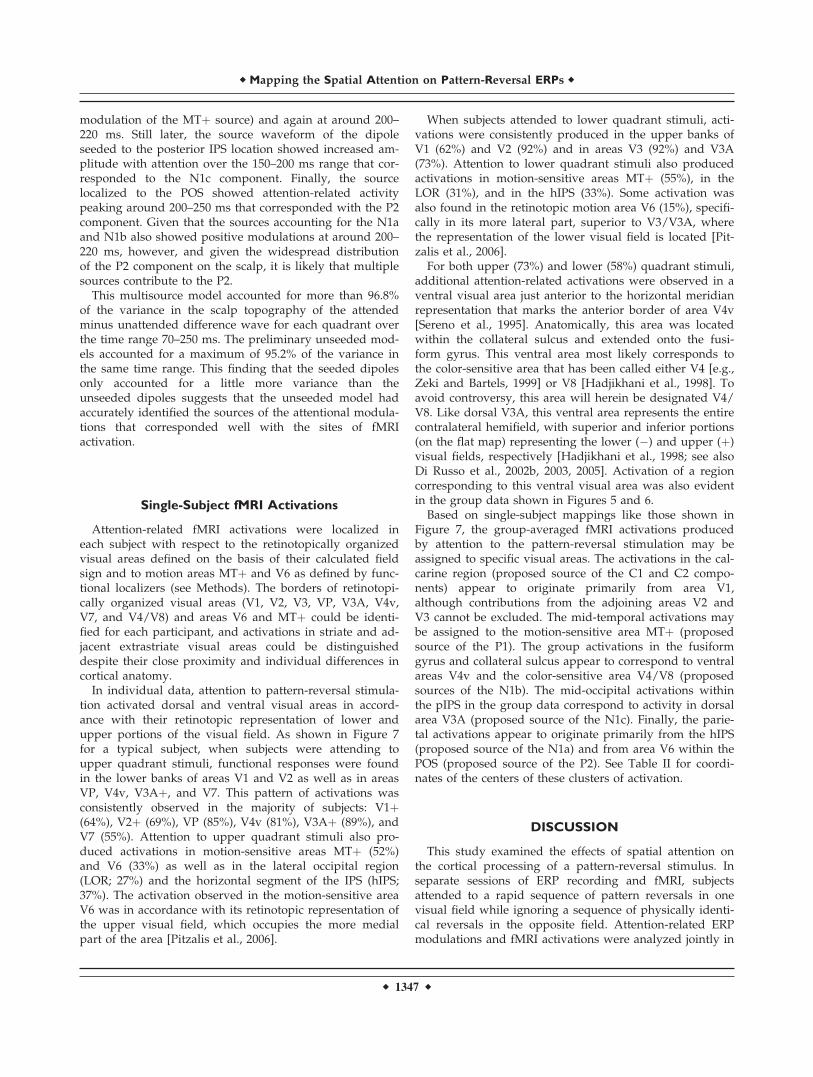
Figure 7.
Attention-related fMRI activations projected onto the flattened
left and right hemispheres of an individual participant. Activa-
tions in response to contralateral stimuli in each quadrant are
shown in relation to the boundaries of visual areas defined in
the same subject by the retinotopic visual field sign and by MTþand V6 mapping. As indicated in the semicircular logos, dashed
and solid lines correspond to vertical and horizontal meridians,
respectively; the plus and minus symbols refer to upper and
lower visual fields representations, respectively. Other labels and
logos are as in Figures 5 and 6. [Color figure can be viewed in
the online issue, which is available at wileyonlinelibrary.com.]
Figure 6.
Same as Figure 5 for the attention effects in the left hemisphere
for contralateral stimulation. [Color figure can be viewed in the
online issue, which is available at wileyonlinelibrary.com.]
r Di Russo et al. r
r 1346 r
modulation of the MTþ source) and again at around 200–220 ms. Still later, the source waveform of the dipoleseeded to the posterior IPS location showed increased am-plitude with attention over the 150–200 ms range that cor-responded to the N1c component. Finally, the sourcelocalized to the POS showed attention-related activitypeaking around 200–250 ms that corresponded with the P2component. Given that the sources accounting for the N1aand N1b also showed positive modulations at around 200–220 ms, however, and given the widespread distributionof the P2 component on the scalp, it is likely that multiplesources contribute to the P2.
This multisource model accounted for more than 96.8%of the variance in the scalp topography of the attendedminus unattended difference wave for each quadrant overthe time range 70–250 ms. The preliminary unseeded mod-els accounted for a maximum of 95.2% of the variance inthe same time range. This finding that the seeded dipolesonly accounted for a little more variance than theunseeded dipoles suggests that the unseeded model hadaccurately identified the sources of the attentional modula-tions that corresponded well with the sites of fMRIactivation.
Single-Subject fMRI Activations
Attention-related fMRI activations were localized ineach subject with respect to the retinotopically organizedvisual areas defined on the basis of their calculated fieldsign and to motion areas MTþ and V6 as defined by func-tional localizers (see Methods). The borders of retinotopi-cally organized visual areas (V1, V2, V3, VP, V3A, V4v,V7, and V4/V8) and areas V6 and MTþ could be identi-fied for each participant, and activations in striate and ad-jacent extrastriate visual areas could be distinguisheddespite their close proximity and individual differences incortical anatomy.
In individual data, attention to pattern-reversal stimula-tion activated dorsal and ventral visual areas in accord-ance with their retinotopic representation of lower andupper portions of the visual field. As shown in Figure 7for a typical subject, when subjects were attending toupper quadrant stimuli, functional responses were foundin the lower banks of areas V1 and V2 as well as in areasVP, V4v, V3Aþ, and V7. This pattern of activations wasconsistently observed in the majority of subjects: V1þ(64%), V2þ (69%), VP (85%), V4v (81%), V3Aþ (89%), andV7 (55%). Attention to upper quadrant stimuli also pro-duced activations in motion-sensitive areas MTþ (52%)and V6 (33%) as well as in the lateral occipital region(LOR; 27%) and the horizontal segment of the IPS (hIPS;37%). The activation observed in the motion-sensitive areaV6 was in accordance with its retinotopic representation ofthe upper visual field, which occupies the more medialpart of the area [Pitzalis et al., 2006].
When subjects attended to lower quadrant stimuli, acti-vations were consistently produced in the upper banks ofV1 (62%) and V2 (92%) and in areas V3 (92%) and V3A(73%). Attention to lower quadrant stimuli also producedactivations in motion-sensitive areas MTþ (55%), in theLOR (31%), and in the hIPS (33%). Some activation wasalso found in the retinotopic motion area V6 (15%), specifi-cally in its more lateral part, superior to V3/V3A, wherethe representation of the lower visual field is located [Pit-zalis et al., 2006].
For both upper (73%) and lower (58%) quadrant stimuli,additional attention-related activations were observed in aventral visual area just anterior to the horizontal meridianrepresentation that marks the anterior border of area V4v[Sereno et al., 1995]. Anatomically, this area was locatedwithin the collateral sulcus and extended onto the fusi-form gyrus. This ventral area most likely corresponds tothe color-sensitive area that has been called either V4 [e.g.,Zeki and Bartels, 1999] or V8 [Hadjikhani et al., 1998]. Toavoid controversy, this area will herein be designated V4/V8. Like dorsal V3A, this ventral area represents the entirecontralateral hemifield, with superior and inferior portions(on the flat map) representing the lower (�) and upper (þ)visual fields, respectively [Hadjikhani et al., 1998; see alsoDi Russo et al., 2002b, 2003, 2005]. Activation of a regioncorresponding to this ventral visual area was also evidentin the group data shown in Figures 5 and 6.
Based on single-subject mappings like those shown inFigure 7, the group-averaged fMRI activations producedby attention to the pattern-reversal stimulation may beassigned to specific visual areas. The activations in the cal-carine region (proposed source of the C1 and C2 compo-nents) appear to originate primarily from area V1,although contributions from the adjoining areas V2 andV3 cannot be excluded. The mid-temporal activations maybe assigned to the motion-sensitive area MTþ (proposedsource of the P1). The group activations in the fusiformgyrus and collateral sulcus appear to correspond to ventralareas V4v and the color-sensitive area V4/V8 (proposedsources of the N1b). The mid-occipital activations withinthe pIPS in the group data correspond to activity in dorsalarea V3A (proposed source of the N1c). Finally, the parie-tal activations appear to originate primarily from the hIPS(proposed source of the N1a) and from area V6 within thePOS (proposed source of the P2). See Table II for coordi-nates of the centers of these clusters of activation.
DISCUSSION
This study examined the effects of spatial attention onthe cortical processing of a pattern-reversal stimulus. Inseparate sessions of ERP recording and fMRI, subjectsattended to a rapid sequence of pattern reversals in onevisual field while ignoring a sequence of physically identi-cal reversals in the opposite field. Attention-related ERPmodulations and fMRI activations were analyzed jointly in
r Mapping the Spatial Attention on Pattern-Reversal ERPs r
r 1347 r
seeded-dipole models to reveal the spatiotemporal pattern-ing of stimulus selection processes in different regions ofthe visual cortex. It was found that attention did not mod-ulate the amplitude of the earliest component of the ERP(the C1, with an onset latency of 50–60 ms), which waslocalized to a medial occipital source in or near primaryvisual cortex (area V1). Over the time range of 80–250 ms,six different ERP components were identified that showedincreased amplitudes for stimuli at attended locations.Five of these components were localized to neural genera-tors in extrastriate visual cortex in temporal (P1), ventraloccipital (N1b), dorsal occipital (N1c), superior parietal(N1a), and parieto-occipital (P2) regions. Attention alsomodulated a longer latency component (C2) that waslocalized to the same medial occipital area as the C1. Weconclude that spatial attention produces a general amplifi-cation of sensory signal strength throughout both dorsaland ventral visual pathways and that both feed-forwardand feedback signals are enhanced.
The earliest attention effect was found on the P1 compo-nent, which had an onset latency of 70–75 ms and peakedat around 95 ms over the lateral occipital scalp. In agree-ment with the analysis of Di Russo et al. [2005], the P1was localized to a neural generator within a region of themiddle temporal sulcus that corresponded to the motion-sensitive MTþ area. The short onset latency of this compo-nent is compatible with the view that MTþ receives adirect projection from V1 [McKeefry and Zeki, 1997; Tze-lepi et al., 2001; Van Rullen and Thorpe, 2001; Vanni et al.,2004]. Attention is known to strongly modulate responsesin the motion-sensitive region MTþ, not only in macaque[e.g., Treue and Maunsell, 1999] but also in human brain[e.g., Tata et al., 2007]. It is not surprising that the motion-sensitive area MTþ is activated by pattern-reversal stimuli,because such reversal produces a clear perception of appa-rent motion that can be described in terms of motion onsetand offset responses [Kubova et al., 1995]. Consistent withthis idea, we did not find activation of MTþ in our previ-ous studies [Di Russo et al., 2002b, 2003] that used pat-tern-onset stimuli, which did not elicit a perception ofmotion. In those previous studies, the P1 component couldbe accounted for by neural generators in dorsal occipital(early phase, 70–100 ms) and ventral occipital (late phase,100–130 ms) regions.
Following the P1, attention produced an amplitudeincrease in the C2 component peaking at 125–135 ms witha medial occipital distribution very similar to that of theattention-invariant C1. A dipole in medial occipital cortexclose to the fMRI activation in area V1 accounted for theattention effect on this component, which, like the C1, alsoinverted in polarity for upper vs. lower visual field. Thepresence of such polarity inversion has often been takenas critical evidence for establishing a neural generator inarea V1 because of the cruciform organization of the upperand lower banks of the calcarine fissure [e.g., Clark et al.,1995; Di Russo et al., 2005]. A recent modeling study [Aleset al., 2010], however, found that neural generators in adja-
cent areas V2 and V3 may also show polarity inversionson the scalp for upper vs. lower field stimuli for someindividuals. In light of this new evidence, we would notrule out contributions of visual areas V2 and V3 to the C1and C2 components, although our fMRI evidence indicatesmuch larger and more consistent activations in V1 than inV2 or V3. The attentional modulation of C2 observed herestrongly resembles the late attention effects beginningaround 120–150 ms after stimulus onset that wereobserved in studies of spatial attention using pattern-onsetstimuli [Di Russo et al., 2003; Martinez et al., 2001; Noes-selt et al., 2002]. Those late attention effects also werelocalized in or near area V1 and appear to represent atten-tional enhancement of feedback projections to early visualareas. Such feedback from higher visual areas has beenproposed as an essential mechanism of visual perceptionthat may enhance the salience of stimuli at attended loca-tions [e.g., Fahrenfort et al., 2008; Lamme and Spekreijse,2000].
Spatial attention strongly modulated several negativecomponents in the ‘‘N1 complex’’ elicited in the interval140–200 ms, in agreement with previous findings [e.g., DiRusso et al., 2003; Luck et al., 1994; Mangun et al., 2001].The N1 complex consists of at least three negative compo-nents that arise from different cortical generators. The N1a(peaking at 145–155 ms) was modeled by a dipolar sourcein the superior parietal cortex in the vicinity of the hori-zontal segment of the intraparietal sulcus (hIPS, the mostdorsal part of the IPS). The parietal region around thehIPS is generally considered to belong to control networksfor spatial attention [e.g., Hopfinger et al., 2000], and itsfunctioning is impaired in neglect patients [Di Russo et al.,2008]. This region also corresponds to the parietal areaproposed by Sereno et al. [2001] as a putative human hom-olog of area LIP, which contains a retinotopic mapping ofattended locations in contralateral space. The presentresults suggest that visual input into this parietal regionfrom attended sources is enhanced by spatial attention, inaccordance with previous findings [Di Russo et al., 2003].
Attentional modulation of the N1b component (peakingat 160–165 ms) could be accounted for by dipolar sourcesin ventral occipital cortex including the fusiform gyrusand collateral sulcus. Attention-related fMRI activations inthese areas (VP, V4v, and V4/V8) were found to be retino-topically organized, in agreement with previous reports[Hadjikhani et al., 1998; Sereno et al., 1995]. Althoughareas VP and V4v were activated by attending to uppervisual field stimuli, area V4/V8 was activated by bothupper and lower field stimuli. These retinotopic mappingsmay account for differences in scalp topography of theattention-related amplitude increase of the N1b, whichwas distributed more ventrally and posteriorly for lowerfield than upper field stimuli.
The attention-related amplitude increase of the N1ccomponent (180–190 ms) could be accounted for by a dipo-lar source in the region of the posterior intraparietal sulcus(pIPS). Single-subject mapping placed this source in or
r Di Russo et al. r
r 1348 r
near area V3A for both upper and lower field stimuli, inaccordance with its retinotopic organization [Tootell et al.,1998]. The human V3A is a motion-sensitive area that isactivated by coherent motion, as demonstrated in manyprevious fMRI studies [e.g., Pitzalis et al., 2010]. V3A hasalso been reported to show activation during spatial atten-tion [e.g., Sereno et al., 2001; Tootell et al., 1998], perhapsas a consequence of its connections with the dorsal(‘‘where’’) magnocellular stream [reviewed in Fellemanand Van Essen, 1991].
Lastly, the attentional modulation of the P2 componentat 200–250 ms could be accounted for, at least in part, by asource near the POS that corresponded to the recentlydescribed visual area V6 [Pitzalis et al., 2006]. In humans,there have been to our knowledge no previous attempts todetect ERP correlates of V6 activity. Recent work by Pitza-lis et al. [2010] has shown that, as in primates, human V6is a motion-sensitive area, responding much more stronglyto coherent than incoherent motion. The present resultsshow in addition that area V6 responds to pattern-reversalstimulation. Neural activity in area V6 appears to bemodulated by attention although to a lesser extent thanthe lateral motion area MTþ. One possible explanation isthat area V6 in both humans and macaques contains anoverrepresentation of the periphery of the visual field atthe expense of the central visual field [e.g., Pitzalis et al.,2006]. Activation of POS in the fMRI experiment was lessconsistent here than in previous studies, probably becausethe present stimuli were too small (3� in diameter) andeccentric (4� from fixation) to produce robust hemody-namic effects. As noted previously, given that multiplesources are concurrently active in the time range of the P2component, it is likely that generators other than the POScontribute to this surface positivity.
The absence of attentional modulation of the C1 compo-nent is consistent with a number of previous findings[Clark and Hillyard, 1996; Di Russo et al., 2003; Fu et al.,2005; Hopfinger and West, 2006; Martinez et al., 2001;Noesselt et al., 2002; Woldorff et al., 2002]. Some recentstudies have reported that spatial attention can increasethe amplitude of the C1 [Fu et al., 2009, 2010; Kelly et al.,2008], but it may be questioned whether these findingsactually represent modulation of the initial feed-forwardresponse in area V1. In the experiment of Kelly et al.[2008], the left and right field stimuli were always alignedalong a diagonal, so that the well-known upper versuslower field polarity inversion seen for the C1 was con-founded with a left versus right field inversion, whichcould have been produced by a laterally oriented dipoleoutside of area V1. Moreover, the neural sources that werecalculated for the attention-related increase in C1 ampli-tude (using the LAURA algorithm) were situated 23–24mm lateral to the midline, at the extreme lateral edge ofcalcarine cortex. Fu et al. [2009, 2010] also reported atten-tion-related modulation within the C1 latency range (60–90ms), but this effect appeared to be localized to lateralextrastriate cortex and might have been the result of a sen-
sory interaction between the cue and target stimuli ratherthan a true attention effect. A recent MEG study [Pog-hosyan and Ioanides, 2008] reported that spatial attentionenhanced an early visual response at 55–90 ms that waslocalized to area V1, but this localization was based onaverages of only 18 presentations of each visual stimulustype in each visual field per subject. At present, the evi-dence that attention can influence the initial evokedresponse in area V1 appears slim indeed.
The ERP components and sources obtained in the pres-ent attention study were very similar to those observed ina prior study [Di Russo et al., 2005], where similar pattern-reversal stimuli were presented to subjects who passivelyviewed them. Moreover, in this study, the waveforms andscalp distributions of the increments of component ampli-tudes produced by attention were generally very similarto those of the same components when elicited by unat-tended stimuli. These findings support the view that spa-tial attention operates primarily by increasing the gain ofsensory-evoked neural responses [Hillyard et al., 1998;Posner and Dehaene, 1994] rather than by recruiting a dif-ferent population of neurons, and that this gain control oramplification mechanism is operative in many visual corti-cal areas. The fMRI activations produced during attentionshowed a strong retinotopic organization in many corticalareas, which suggests that the cortical mapping of visualfield location might provide the neural substrate for spa-tially directed attention [Yantis, 2008].
Overall, the results described here help to reveal thetiming and the neuroanatomical bases of stimulus selec-tion processes and to characterize the roles of extrastriateand striate cortex in visuo-spatial attention. In agreementwith previous studies, no evidence was obtained to sug-gest that attended stimuli are preferentially processed dur-ing the initial feed-forward response in striate cortex (areaV1) at 50–80 ms after stimulus onset. However, longer la-tency activity peaking at 125–135 ms that was localized toearly cortical generators in or near area V1 was enhancedby attention. Beginning at about 80 ms after stimulus pre-sentation, attended-location stimuli elicited enlarged neu-ral responses in multiple extrastriate visual areas in theoccipital, parietal, and temporal lobes. The timing of thisneural activity modulated by attention was established byelectrophysiological recordings of ERPs, and the localiza-tion of the underlying generators was reinforced by themapping of hemodynamic responses in a parallel fMRIexperiment. These findings support the hypothesis that asensory gain-control mechanism selectively amplifies bothfeed-forward and feedback responses elicited by attended-location stimuli in multiple visual cortical areas of boththe dorsal and ventral streams of processing.
REFERENCES
Aine CJ, Supek S, George JS, Ranken D, Lewine J, Sanders J, BestE, Tiee W, Flynn ER, Wood CC (1996): Retinotopic
r Mapping the Spatial Attention on Pattern-Reversal ERPs r
r 1349 r
organization of human visual cortex: Departures from the clas-sical model. Cereb Cortex 6:354–361.
Ales JM, Yates JL, Norcia AM (2010): V1 is not uniquely identifiedby polarity reversals of responses to upper and lower visualfield stimuli. Neuroimage 52:1401–1409.
Clark V, Hillyard SA (1996): Spatial selective attention affectsearly extrastriate but not striate components of the visualevoked potential. J Cogn Neurosci 8:387–402.
Clark VP, Fan S, Hillyard SA (1995): Identification of early visu-ally evoked potential generators by retinotopic and topo-graphic analysis. Hum Brain Mapp 2:170–187.
Dale AM, Halgren E (2001): Spatiotemporal mapping of brain ac-tivity by integration of multiple imaging modalities. Curr OpinNeurobiol 11:202–208.
Dale AM, Fischl B, Sereno MI (1999): Cortical surface-based analysis I:Segmentation and surface reconstruction. Neuroimage 9:179–194.
Di Russo F, Spinelli D (1999a) Electrophysiological evidence foran early attentional mechanism in visual processing inhumans. Vis Res 39:2975–2985.
Di Russo F, Spinelli D (1999b) Spatial attention has differenteffects on the magno- and parvo-cellular pathways. Neurore-port 10:2755–2762.
Di Russo F, Spinelli D (2002a) Effects of sustained, voluntaryattention on amplitude and latency of steady-state visualevoked potential: A costs and benefits analysis. Clin Neuro-physiol 113:1771–1777.
Di Russo F, Spinelli D, Morrone MC (2001): Automatic gain con-trol contrast mechanisms are modulated by attention inhumans: Evidence from visual evoked potentials. Vis Res41:2335–2347.
Di Russo F, Martınez A, Sereno MI, Pitzalis S, Hillyard SA (2002b)The cortical sources of the early components of the visualevoked potential. Hum Brain Mapp 15:95–111.
Di Russo F, Teder-Salejarvi WA, Hillyard SA (2002c): Steady-stateVEP and attentional visual processing. In: Zani A, ProverbioAM, editors. The Cognitive Electrophysiology of Mind andBrain. San Diego, CA: Academic Press. pp 259–274.
Di Russo F, Martınez A, Hillyard SA (2003): Source analysis ofevent-related cortical activity during visuo-spatial attention.Cereb Cortex 13:486–499.
Di Russo F, Pitzalis S, Spitoni G, Aprile T, Patria F, Spinelli D,Hillyard SA (2005): Identification of the neural sources of thepattern-reversal VEP. Neuroimage 24:874–886.
Di Russo F, Pitzalis S, Aprile T, Spitoni G, Patria F, Stella A,Spinelli D, Hillyard SA (2007): Spatio-temporal analysis of thecortical sources of the steady-state visual evoked potential.Hum Brain Mapp 28:323–334.
Di Russo F, Aprile T, Spitoni G, Spinelli D (2008): Impaired visualprocessing of contralesional stimuli in neglect patients: A vis-ual-evoked potential study. Brain 131:842–854.
Fahrenfort JJ, Scholte HS, Lamme VA (2008): The spatiotemporalprofile of cortical processing leading up to visual perception. JVis 8:1–12.
Fattori P, Pitzalis S, Galletti C (2009): The cortical visual area V6in macaque and human brains. J Physiol 103:88–97.
Felleman DJ, Van Essen DC (1991): Distributed hierarchical proc-essing in the primate cerebral cortex. Cereb Cortex 1:1–47.
Fischl B, Sereno MI, Dale AM (1999): Cortical surface-based analy-sis II: Inflation, flattening, and a surface-based coordinate sys-tem. Neuroimage 9:195–207.
Friston KJ, Frith CD, Turner R, Frackowiak RS (1995): Characteriz-ing evoked hemodynamics with fMRI. Neuroimage 2:157–165.
Fu S, Greenwood PM, Parasuraman R (2005): Brain mechanismsof involuntary visuospatial attention: An event-related poten-tial study. Hum Brain Mapp 25:378–390.
Fu S, Huang Y, Luo Y, Wang Y, Fedota J, Greenwood PM, Para-suraman R (2009): Perceptual load interacts with involuntaryattention at early processing stages: Event-related potentialstudies. Neuroimage 48:191–199.
Fu S, Fedota JR, Greenwood PM, Parasuraman R (2010): Dissocia-tion of visual C1 and P1 components as a function of atten-tional load: An event-related potential study. Biol Psychol85:171–178.
Hadjikhani N, Liu AK, Dale AM, Cavanagh P, Tootell RB (1998):Retinotopy and color sensitivity in human visual cortical areaV8. Nat Neurosci 1:235–241.
Halliday AM (1993): Evoked Potentials in Clinical Testing, 2nded. Edinburgh: Churchill Livingstone.
Hashimoto T, Kashii S, Kikuchi M, Honda Y, Nagamine T, Shiba-saki H (1999): Temporal profile of visual evoked responses topattern reversal stimulation analyzed with a whole-head mag-netometer. Exp Brain Res 125:375–382.
Hillyard SA, Anllo-Vento L (1998): Event-related brain potentialsin the study of visual selective attention. Proc Natl Acad SciUSA 95:781–787.
Hillyard SA, Vogel EK, Luck SJ (1998): Sensory gain control(amplification) as a mechanism of selective attention: Electro-physiological and neuroimaging evidence. Philos Trans R SocLond B Biol Sci 353:1257–1267.
Hopf JM, Heinze HJ, Schoenfeld MA, Hillyard SA (2009): Spatio-temporal analysis of visual attention. In: Gazzaniga MS, editor.The Cognitive Neurosciences IV. Cambridge, MA: MIT Press.pp 235–250.
Hopfinger JB, West VM (2006): Interactions between endogenousand exogenous attention on cortical visual processing. Neuro-image 31:774–789.
Hopfinger JB, Buonocore MH, Mangun GR (2000): The neuralmechanisms of top-down attentional control. Nat Neurosci3:284–291.
Hopfinger JB, Luck SJ, Hillyard SA (2004): Selective attention:Electrophysiological and neuromagnetic studies. In: GazzanigaMS, editor. The Cognitive Neurosciences III. Cambridge, MA:MIT Press. pp 561–574.
Kelly SP, Gomez-Ramirez M, Foxe JJ (2008): Spatial attention mod-ulates initial afferent activity in human primary visual cortex.Cereb Cortex 18:2629–2636.
Kubova Z, Kuba M, Spekreijse H, Blakemore C (1995): Contrastdependence of motion-onset and pattern-reversal evokedpotentials. Vis Res 35:197–205.
Lamme VAF, Spekreijse H (2000): Contextual modulation in pri-mary visual cortex and scene perception. In: Gazzaniga MS,editor. The New Cognitive Neurosciences. Cambridge, MA:MIT Press. pp 279–290.
Luck SJ, Hillyard SA, Mouloua M, Woldorff MG, Clark VP, Haw-kins HL (1994): Effect of spatial cuing on luminance detectabil-ity: Psychophysical and electrophysiological evidence for earlyselection. J Exp Psychol: Hum Percept Perform 20:1000–1014.
Mangun GR, Hinrichs H, Scholz M, Mueller-Gaertner HW, Her-zog H, Krause BJ, Tellman L, Kemna L, Heinze HJ (2001): Inte-grating electrophysiology and neuroimaging of spatialselective attention to simple isolated visual stimuli. Vis Res41:1423–1435.
Martinez A, Di Russo F, Anllo-Vento L, Sereno MI, Buxton RB,Hillyard SA (2001): Putting spatial attention on the map:
r Di Russo et al. r
r 1350 r

Timing and localization of stimulus selection processes instriate and extrastriate visual areas. Vis Res 41:1437–1457.
McKeefry DJ, Zeki S (1997): The position and topography of thehuman colour centre as revealed by functional magnetic reso-nance imaging. Brain 120:2229–2242.
Muller MM, Teder-Salejarvi W, Hillyard SA (1998): The timecourse of cortical facilitation during cued shifts of spatial atten-tion. Nat Neurosci 1:631–634.
Muller MM, Malinowski P, Gruber T, Hillyard SA (2003): Sus-tained division of the attentional spotlight. Nature 424:309–312.
Murray MM, Wylie GR, Higgins BA, Javitt DC, Schroeder CE,Foxe JJ (2002): The spatiotemporal dynamics of illusory con-tour processing: Combined high-density electrical mapping,source analysis, and functional magnetic resonance imaging. JNeurosci 22:5055–5073.
Nakamura A, Kakigi R, Hoshiyama M, Koyama S, Kitamura Y,Shimojo M (1997): Visual evoked cortical magnetic fields topattern reversal stimulation. Brain Res Cogn Brain Res 6:9–22.
Noesselt T, Hillyard SA, Woldorff MG, Schoenfeld A, Hagner T,Jancke L, Tempelmann C, Hinrichs H, Heinze HJ (2002):Delayed striate cortical activation during spatial attention.Neuron 35:575–587.
Pitzalis S, Galletti C, Huang RS, Patria F, Committeri G, Galati G,Fattori P, Sereno MI (2006): Wide-field retinotopy defineshuman cortical visual area V6. J Neurosci 26:7962–7973.
Pitzalis S, Sereno MI, Committeri G, Fattori P, Galati G, Patria F,Galletti C (2010): Human V6: The medial motion area. CerebCortex 20:411–424.
Poghosyan V, Ioannides AA (2008): Attention modulates earliestresponses in the primary auditory and visual cortices. Neuron58:802–813.
Posner MI, Dehaene S (1994): Attentional networks. Trend Neuro-sci 17:75–79.
Regan D (1989): Human Brain Electrophysiology: Evoked Poten-tials and Evoked Magnetic Fields in Science and Medicine.New York: Elsevier.
Schoenfeld MA, Hopf JM, Martinez A, Mai HM, Sattler C, GasdeA, Heinze HJ, Hillyard SA (2007): Spatio-temporal analysis offeature-based attention. Cereb Cortex 10:2468–2477.
Sereno MI, Dale AM, Reppas JB, Kwong KK, Belliveau JW, BradyTJ, Rosen BR, Tootell RBH (1995): Borders of multiple visualareas in humans revealed by functional magnetic resonanceimaging. Science 268:889–893.
Sereno MI, Pitzalis S, Martınez A (2001): Mapping of contralateralspace in retinotopic coordinates by a parietal cortical area inhumans. Science 294:1350–1354.
Shigeto H, Tobimatsu S, Yamamoto T, Kobayashi T, Kato M(1998): Visual evoked cortical magnetic responses to checker-board pattern reversal stimulation: A study on the neural gen-erators of N75, P100 and N145. J Neurol Sci 156:186–194.
Tata MS, Mason AL, Sutherland RJ (2007): Attention modulatesresponses to motion reversals in human visual cortex. Neuro-report 18:1361–1365.
Tootell RBH, Taylor JB (1995): Anatomical evidence for MT and addi-tional cortical visual areas in humans. Cereb Cortex 5:39–55.
Tootell RBH, Hadjikhani N, Hall EK, Marrett S, Vanduffel W,Vaughan JT, Dale AM (1998): The retinotopy of visual spatialattention. Neuron 21:1409–1422.
Treue S, Maunsell JH (1999): Effects of attention on the processingof motion in macaque middle temporal and medial superiortemporal visual cortical areas. J Neurosci 19:7591–7602.
Tzelepi A, Ioannides AA, Poghosyan V (2001): Early (N70m) neu-romagnetic signal topography and striate and extrastriate gen-erators following pattern onset quadrant stimulation.Neuroimage 13:702–718.
Valdes-Sosa PA, Sanchez-Bornot JM, Sotero RC, Iturria-Medina Y,Aleman-Gomez Y, Bosch-Bayard J, Carbonell F, Ozaki T(2009): Model driven EEG/fMRI fusion of brain oscillations.Hum Brain Mapp 30:2701–2721.
Van Rullen R, Thorpe SJ (2001): The time course of visual process-ing: From early perception to decision-making. J Cogn Neuro-sci 131:454–461.
Vanni S, Warnking J, Dojat M, Delon-Martin C, Bullier J, Sege-barth C (2004): Sequence of pattern onset responses in thehuman visual areas: An fMRI constrained VEP source analysis.Neuroimage 21:801–817.
Woldorff MG, Liotti M, Seabolt M, Busse L, Lancaster JL, Fox PT(2002): The temporal dynamics of the effects in occipital cortex ofvisual-spatial selective attention. Brain Res Cogn Brain Res 15:1–15.
Yantis S (2008): The neural basis of selective attention: Corticalsources and targets of attentional modulation. Curr Dir Psy-chol Sci 17:86–90.
Zeki S, Bartels A (1999): The clinical and functional measurement ofcortical (in) activity in the visual brain, with special reference tothe two subdivisions (V4 and V4 alpha) of the human colourcentre. Philos Trans R Soc Lond B Biol Sci 354:1371–1382.
r Mapping the Spatial Attention on Pattern-Reversal ERPs r
r 1351 r