spatial distribution of intracranially recorded spikes in medial and lateral temporal epilepsies
TRANSCRIPT
Spatial distribution of intracranially recorded spikes in
medial and lateral temporal epilepsies*Irina I. Goncharova, *Hitten P. Zaveri, *yRobert B. Duckrow,
*yzEdward J. Novotny, and *ySusan S. Spencer
*Departments of Neurology, yNeurosurgery, and zPediatrics, Yale University School of Medicine, New Haven,
Connecticut, U.S.A.
SUMMARY
Purpose: Although seizures and interictal spikes
are not always colocalized, there may be valuable
localizing information in the spatial distribution of
spikes. To test this hypothesis, we studied the spa-
tial distribution of intracranially recorded interictal
spikes in patients with medial temporal (MT) and
lateral temporal (LT) neocortical seizure onset.
Methods: A total of 21 patients (MT n = 12, LT
n = 9) who completed intracranial monitoring
were selected for this study. Two 4-h intracranial
electroencephalography (icEEG) epochs were
analyzed, one during wake and one during sleep,
both at least 6 h removed from seizures. Spikes
detected automatically in medial temporal struc-
tures [hippocampal formation (H) and entorhinal
cortex (EC)], and in five cortical areas (occipital,
frontal, parietal, lateral temporal, and inferior
temporal) were tabulated.
Results: Interictal spikes occurred broadly over
medial temporal structures and cortical areas in
MT and LT patients. The patients differed with a
greater number of spikes in medial temporal
structures in the MT group (p < 0.05 for H and
p < 0.001 for EC) and a greater number of spikes
in parietal (p < 0.01) and frontal (p < 0.001) areas
in the LT group. There were sleep-related
increases in spike rates in inferomedial temporal
structures in both groups. The two groups could
be separated with a classifier based on medial
temporal and parietal and frontal spikes (p <
0.0001).
Discussion: MT and LT patients have different spa-
tial distributions of interictal spikes and can be dis-
tinguished by the relative spike rates in medial
temporal and extratemporal areas during sleep
and wake.
KEY WORDS: Intracranial EEG, Interictal spikes,
Temporal lobe epilepsy, Sleep, Wake.
Interictal spikes recorded on electroencephalography(EEG) are known to be highly correlated with the presenceof epilepsy (Carreno & L�ders, 2001). However, manyepilepsy centers do not consider their localization in eval-uation for surgical resection. Interictal spikes recorded inthe individual patient have considerable variability in theirspatial and temporal characteristics. Furthermore, the spa-tial relationship between the location of interictal spikesand the seizure onset zone, and the temporal relationshipbetween the occurrence of spikes and the occurrence ofseizures, are poorly understood. Previous studies of spikesconducted with scalp EEG focused on idiosyncratically
selected individual spike occurrences and attempted todiscover their localization or origin with methods such assource localization (see Tao et al., 2007 for a review).More recently, spike-triggered functional magnetic reso-nance imaging (fMRI) has been used to determine theareas involved in spike generation by measurement offMRI activation synchronized to occurrence of spikes(Krakow et al., 2001; Al-Asmi et al., 2003).
Intracranial EEG offers an opportunity to understandspikes recorded closer to the source of their generation.Studies of spikes recorded on intracranial EEG, however,have been scarce. Challenges to the study of spikes withintracranial EEG are both the limited spatial samplingprovided by intracranial electrodes, and the considerablenumber of spikes that can be observed with intracranialelectrodes. If salient and robust characteristics of spikesthat relate to the seizure onset location are uncovered withthe study of intracranial EEG, these findings could present
Accepted June 5, 2009; Early View publication August 8, 2009.Address correspondence to Dr. Irina I. Goncharova, Yale University
School of Medicine, PO Box 208018, New Haven, CT 06520-8018,U.S.A. E-mail: [email protected]
Wiley Periodicals, Inc.ª 2009 International League Against Epilepsy
Epilepsia, 50(12):2575–2585, 2009doi: 10.1111/j.1528-1167.2009.02258.x
FULL-LENGTH ORIGINAL RESEARCH
2575
a target for future scalp EEG studies. That is, some of theintracranially detected characteristics might be sought anddetected with scalp EEG, and gainfully utilized for locali-zation of epileptogenic areas prior to, or even in place of,intracranial monitoring.
In this study, we tested a specific hypothesis about twodefined groups of epilepsy patients that the spatial distri-bution of spikes detected intracranially could distinguishbetween patients with medial temporal (MT) and lateraltemporal (LT) onset of seizures. We studied icEEGsrecorded during continuous video-EEG monitoring usingmultiple intracranial electrodes in 21 patients. Interictalspikes were automatically detected in 4-h epochs oficEEG during wake (typically from 8 a.m. to noon) andsleep (typically from midnight to 4 a.m.). Because broadintracranial electrode coverage of the brain is often used atour center, we could study the occurrence of spikes inmedial temporal structures, hippocampus (H), and entorh-inal cortex (EC), and in multiple cortical areas (inferiortemporal, IT; temporal T; occipital, O; parietal, P; andfrontal, F) in both these groups of patients.
Methods
PatientsPatients 15 years and older were selected from 59 con-
secutive patients who underwent icEEG monitoring atYale New Haven Hospital between September 2002 andDecember 2006. We included all patients with well-defined and consistent temporal lobe localization of sei-zure onset. The selected patients included 12 patients withmedial temporal onset and nine patients with lateral tem-poral onset of seizures. Six patients who had temporal sei-zure onset but had incomplete data, technical difficultiesthat reduced data quality, absence of spontaneous sei-zures, or frequent seizures that precluded selecting periodsof analysis in the same way, were excluded. Two patientswith both medial temporal and temporal neocortical onsetof seizures were also excluded. Patients in the MT grouphad onset of all observed seizures in medial temporalstructures. Eleven of these patients had unilateral medialtemporal onset of seizures and one had independent bilat-eral medial temporal seizure onset; in the bilateral case weanalyzed the hemisphere where the majority of seizuresoriginated. In the LT group, five patients had seizure onsetlocalized in the lateral temporal cortex only, three patientshad seizure onset originating from the area bordering lat-eral posterior temporal and parietal cortex, and one patienthad seizures originating from the border of anterior lateraltemporal and lateral frontal cortex. None of the patients inthe LT group had multifocal seizure onset, that is, seizuresoriginating independently in a brain area outside the lat-eral temporal cortex. Patients provided informed consentfor analyses of their icEEG records. Demographic data,the day of intracranial monitoring studied, intracranial
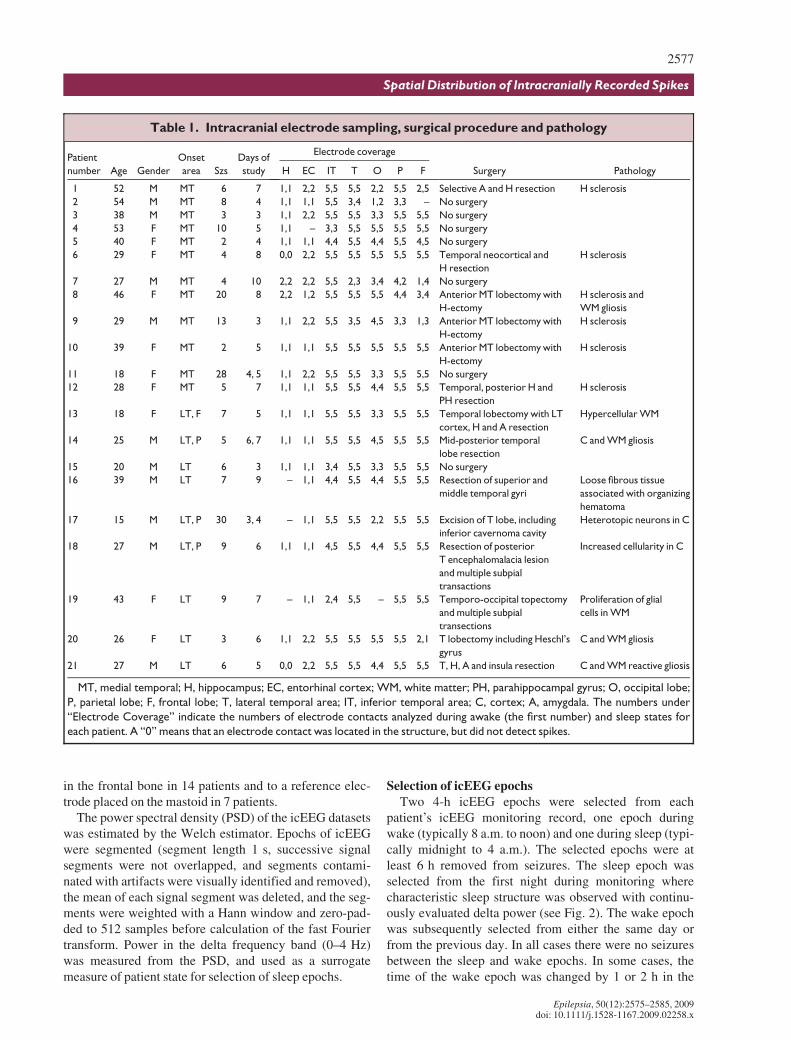
electrode placement, seizure onset area, the number of sei-zures recorded during the monitoring, surgery performed,and pathology are presented in Table 1.
H was sampled to a greater extent in the MT group (all12 cases) than in the LT group (6 of 9 cases). The hippo-campal contacts did not detect any spikes in one patientfrom each group and we considered this to be a result ofpoor electrode placement. Therefore, when studying spikerates from H, we analyzed 11 MT and 5 LT patients. ECwas sampled in 11 of 12 patients in the MT group and inall 9 patients in the LT group. Therefore, when studyingspike rates from EC, we analyzed 11 MT and 9 LTpatients. Neocortical areas were represented similarly inboth groups except for P, which had more electrode con-tacts in the LT group than in the MT group (p < 0.05) (seeTable 1). Information on electrode coverage of the brainand the spatial distribution of electrode contacts wherespikes were detected in each patient is provided in the sup-plemental data section (Table S1).
Electrode placementElectrode implantation consistently included a grid,
usually with 64 (8 · 8) contacts. The grid typically cov-ered the lateral temporal area, superior and lateral poster-ior frontal area, and superior and lateral anterior parietalarea. In addition, there were several subdural strips with8–12 contacts, which covered anterior F, O, posterior P,and IT areas. EC was covered by anterior medial temporalsubdural strip electrodes and, in some patients, by subtem-poral subdural strip electrodes. H was sampled by one ortwo transverse depth electrodes.
Subdural electrodes and depth electrodes were locatedand visualized in a three-step process using a computerprogram developed at Yale University (Papademetriset al., 2004). Briefly, intracranial electrode contacts wereaccurately located from a postimplantation computedtomography (CT) image. The postimplantation CT wasthen coregistered, first, with a postimplantation magneticresonance (MR) image using a linear coregistration proce-dure, and then with a preimplantation MR image usingboth a linear and nonlinear coregistration procedure. Thisprocedure allowed us to visualize intracranial electrodecontacts on preimplantation MR images, which were notdistorted by electrode artifacts. An example of the elec-trode placement for a patient from the MT group is shownin Fig. 1. Additional examples are provided in the supple-mental data section (Figs. S1–S3).
Intracranial EEG acquisition and spectral analysisIntracranial EEG with simultaneous video was recorded
with commercially available 128-channel long-term mon-itoring equipment (Bio-logic Systems Corp. Mundelein,IL, U.S.A.). The icEEGs were sampled at 256 Hz, andarchived for subsequent review and analysis. The icEEGrecordings were referenced to a peg electrode implanted
2576
I. I. Goncharova et al.
Epilepsia, 50(12):2575–2585, 2009doi: 10.1111/j.1528-1167.2009.02258.x
in the frontal bone in 14 patients and to a reference elec-trode placed on the mastoid in 7 patients.
The power spectral density (PSD) of the icEEG datasetswas estimated by the Welch estimator. Epochs of icEEGwere segmented (segment length 1 s, successive signalsegments were not overlapped, and segments contami-nated with artifacts were visually identified and removed),the mean of each signal segment was deleted, and the seg-ments were weighted with a Hann window and zero-pad-ded to 512 samples before calculation of the fast Fouriertransform. Power in the delta frequency band (0–4 Hz)was measured from the PSD, and used as a surrogatemeasure of patient state for selection of sleep epochs.
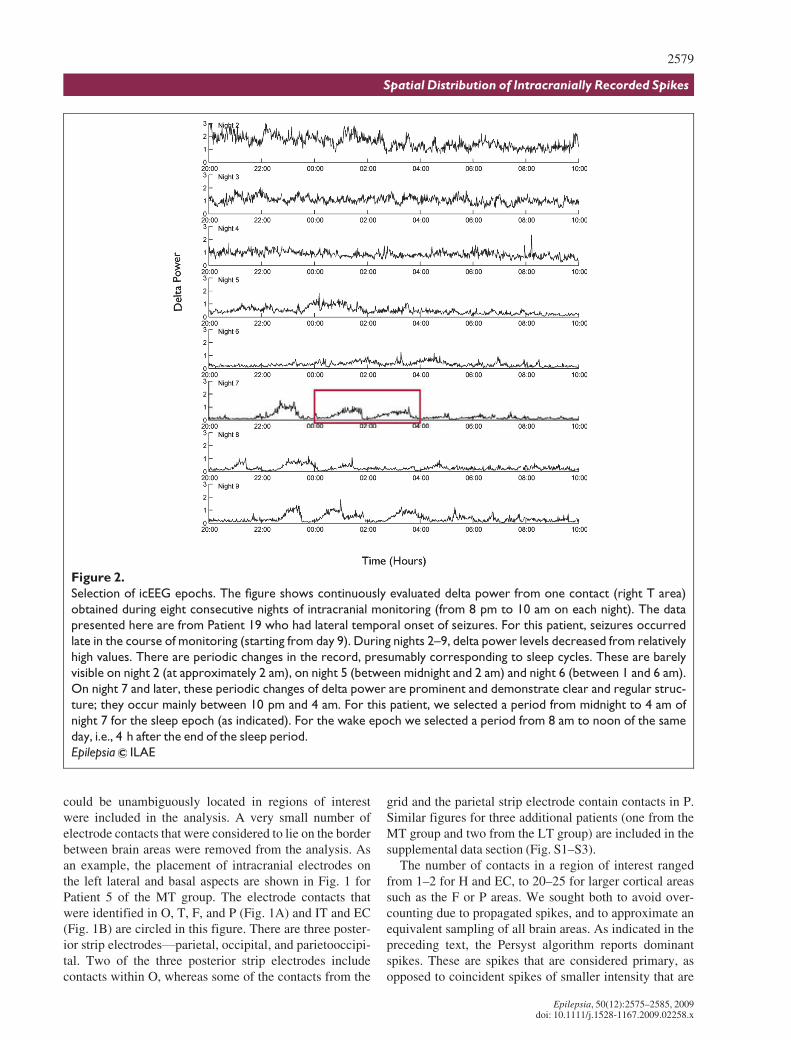
Selection of icEEG epochsTwo 4-h icEEG epochs were selected from each
patient’s icEEG monitoring record, one epoch duringwake (typically 8 a.m. to noon) and one during sleep (typi-cally midnight to 4 a.m.). The selected epochs were atleast 6 h removed from seizures. The sleep epoch wasselected from the first night during monitoring wherecharacteristic sleep structure was observed with continu-ously evaluated delta power (see Fig. 2). The wake epochwas subsequently selected from either the same day orfrom the previous day. In all cases there were no seizuresbetween the sleep and wake epochs. In some cases, thetime of the wake epoch was changed by 1 or 2 h in the
Table 1. Intracranial electrode sampling, surgical procedure and pathology
Patient
number Age Gender
Onset
area Szs
Days of
study
Electrode coverage
Surgery PathologyH EC IT T O P F
1 52 M MT 6 7 1,1 2,2 5,5 5,5 2,2 5,5 2,5 Selective A and H resection H sclerosis
2 54 M MT 8 4 1,1 1,1 5,5 3,4 1,2 3,3 – No surgery
3 38 M MT 3 3 1,1 2,2 5,5 5,5 3,3 5,5 5,5 No surgery
4 53 F MT 10 5 1,1 – 3,3 5,5 5,5 5,5 5,5 No surgery
5 40 F MT 2 4 1,1 1,1 4,4 5,5 4,4 5,5 4,5 No surgery
6 29 F MT 4 8 0,0 2,2 5,5 5,5 5,5 5,5 5,5 Temporal neocortical and
H resection
H sclerosis
7 27 M MT 4 10 2,2 2,2 5,5 2,3 3,4 4,2 1,4 No surgery
8 46 F MT 20 8 2,2 1,2 5,5 5,5 5,5 4,4 3,4 Anterior MT lobectomy with
H-ectomy
H sclerosis and
WM gliosis
9 29 M MT 13 3 1,1 2,2 5,5 3,5 4,5 3,3 1,3 Anterior MT lobectomy with
H-ectomy
H sclerosis
10 39 F MT 2 5 1,1 1,1 5,5 5,5 5,5 5,5 5,5 Anterior MT lobectomy with
H-ectomy
H sclerosis
11 18 F MT 28 4, 5 1,1 2,2 5,5 5,5 3,3 5,5 5,5 No surgery
12 28 F MT 5 7 1,1 1,1 5,5 5,5 4,4 5,5 5,5 Temporal, posterior H and
PH resection
H sclerosis
13 18 F LT, F 7 5 1,1 1,1 5,5 5,5 3,3 5,5 5,5 Temporal lobectomy with LT
cortex, H and A resection
Hypercellular WM
14 25 M LT, P 5 6, 7 1,1 1,1 5,5 5,5 4,5 5,5 5,5 Mid-posterior temporal
lobe resection
C and WM gliosis
15 20 M LT 6 3 1,1 1,1 3,4 5,5 3,3 5,5 5,5 No surgery
16 39 M LT 7 9 – 1,1 4,4 5,5 4,4 5,5 5,5 Resection of superior and
middle temporal gyri
Loose fibrous tissue
associated with organizing
hematoma
17 15 M LT, P 30 3, 4 – 1,1 5,5 5,5 2,2 5,5 5,5 Excision of T lobe, including
inferior cavernoma cavity
Heterotopic neurons in C
18 27 M LT, P 9 6 1,1 1,1 4,5 5,5 4,4 5,5 5,5 Resection of posterior
T encephalomalacia lesion
and multiple subpial
transactions
Increased cellularity in C
19 43 F LT 9 7 – 1,1 2,4 5,5 – 5,5 5,5 Temporo-occipital topectomy
and multiple subpial
transections
Proliferation of glial
cells in WM
20 26 F LT 3 6 1,1 2,2 5,5 5,5 5,5 5,5 2,1 T lobectomy including Heschl’s
gyrus
C and WM gliosis
21 27 M LT 6 5 0,0 2,2 5,5 5,5 4,4 5,5 5,5 T, H, A and insula resection C and WM reactive gliosis
MT, medial temporal; H, hippocampus; EC, entorhinal cortex; WM, white matter; PH, parahippocampal gyrus; O, occipital lobe;
P, parietal lobe; F, frontal lobe; T, lateral temporal area; IT, inferior temporal area; C, cortex; A, amygdala. The numbers under
‘‘Electrode Coverage’’ indicate the numbers of electrode contacts analyzed during awake (the first number) and sleep states for
each patient. A ‘‘0’’ means that an electrode contact was located in the structure, but did not detect spikes.
2577
Spatial Distribution of Intracranially Recorded Spikes
Epilepsia, 50(12):2575–2585, 2009doi: 10.1111/j.1528-1167.2009.02258.x
morning, or was changed from morning to afternoon (typi-cally from noon to 4 p.m.). These changes were made toavoid variability in patient state or to allow at least 6 h ofseparation between data epochs and seizures. The sleepand wake segments were separated by 4–16 h, and mostoften by 4 h. The day of the study varied from day 3 to day10 of the intracranial monitoring session (i.e., between 4and 11 days after electrodes were placed), with the day ofstudy for the majority of patients falling between days 3and 6 (Table 1). At the time of the study most of thepatients (n = 15) were on tapered or partially stoppedantiepileptic drugs (AEDs), five were off AEDs, and onewas on AEDs.
Spike identificationSpike identification was performed with commercially
available software. In a separate study, we determined themethod and parameters to be employed for spike detec-tion. Two commercially available spike detection algo-rithms (Stellate Systems Inc., Montreal, QC, Canada, andReveal, Persyst Development Corp., Prescott, AZ,U.S.A.) were evaluated for a number of algorithm para-meters to best match expert evaluation. This comparisonis described in the Appendix. The Reveal algorithm wasfound to be superior. The algorithm’s performance agreedwith the consensus of experts, with a sensitivity of 71%and specificity of 82%. This program with settingsdescribed in the Appendix was used to identify spikesautomatically.
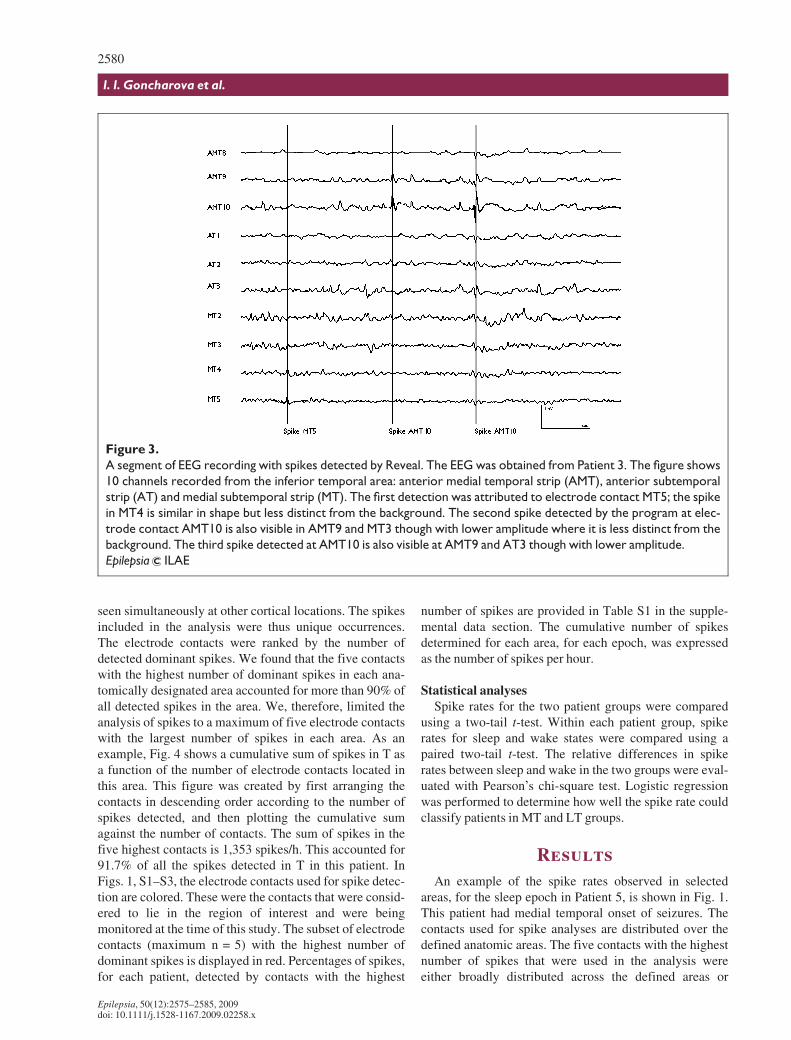
Reveal quantifies spikes that occur in several adjacentlocations simultaneously and attributes spike detection tothe electrode contact where the spike is most prominent.Therefore, it reports one spike with the highest perceptionfrom all simultaneously detected spikes. Fig. 3 illustratesthe detection of dominant spikes by Reveal from an 8-ssegment of EEG recorded from 10 contacts on three infe-rior temporal strips. The first spike occurred simulta-neously at electrode contacts MT4 and MT5 of a medialsubtemporal subdural strip. The first detection was attrib-uted to electrode contact MT5; the spike in MT4 is similarin shape but less distinct from the background. The secondand third spikes were detected at electrode contactAMT10 of the anterior medial temporal strip. At AMT9and other contacts the spikes are less prominent.
Selection of intracranial electrode contactsWe studied medial temporal structures (H and EC), and
five cortical areas (IT, T, O, P, and F), ipsilateral to the sei-zure onset area. The assignment of electrode contacts tothe defined cortical regions and H was based on anatomicatlases and morphologic studies (e.g., Duvernoy, 1988,1991; Jack et al., 1992; Damasio, 1995). The determina-tion of the placement of electrode contacts within EC wasguided by a protocol, which has defined EC borders fromMRI (Goncharova et al., 2001). All electrode contacts that
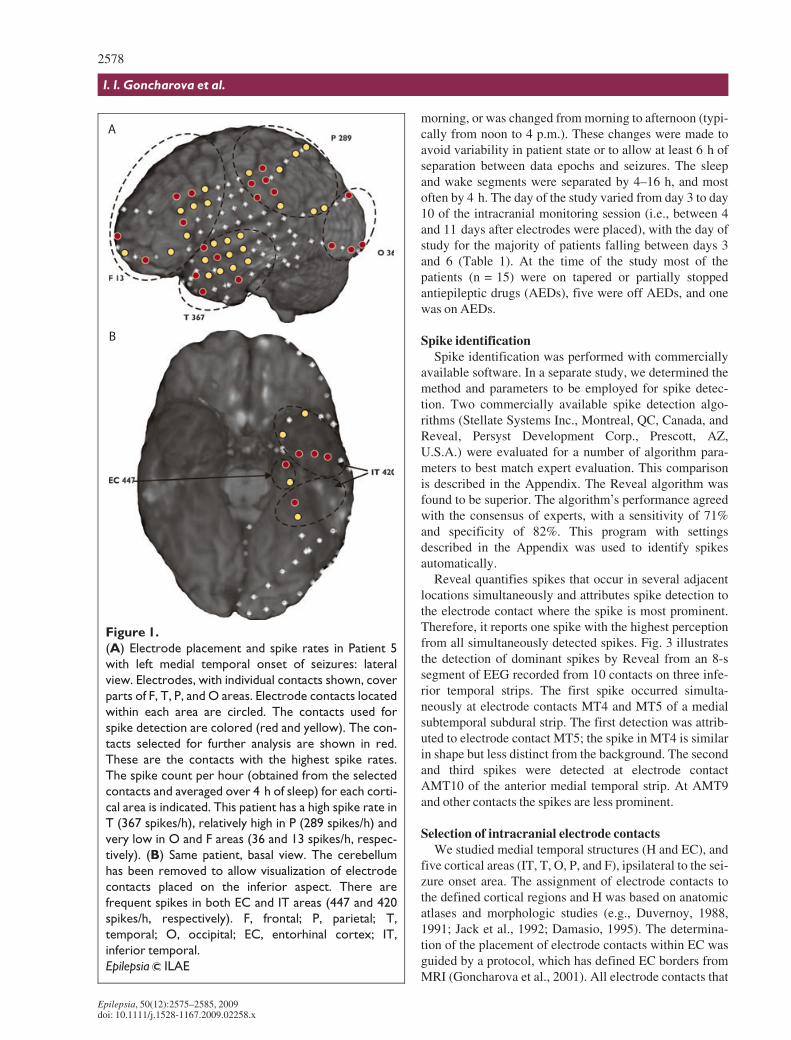
Figure 1.
(A) Electrode placement and spike rates in Patient 5
with left medial temporal onset of seizures: lateral
view. Electrodes, with individual contacts shown, cover
parts of F, T, P, and O areas. Electrode contacts located
within each area are circled. The contacts used for
spike detection are colored (red and yellow). The con-
tacts selected for further analysis are shown in red.
These are the contacts with the highest spike rates.
The spike count per hour (obtained from the selected
contacts and averaged over 4 h of sleep) for each corti-
cal area is indicated. This patient has a high spike rate in
T (367 spikes/h), relatively high in P (289 spikes/h) and
very low in O and F areas (36 and 13 spikes/h, respec-
tively). (B) Same patient, basal view. The cerebellum
has been removed to allow visualization of electrode
contacts placed on the inferior aspect. There are
frequent spikes in both EC and IT areas (447 and 420
spikes/h, respectively). F, frontal; P, parietal; T,
temporal; O, occipital; EC, entorhinal cortex; IT,
inferior temporal.
Epilepsia ILAE
2578
I. I. Goncharova et al.
Epilepsia, 50(12):2575–2585, 2009doi: 10.1111/j.1528-1167.2009.02258.x
could be unambiguously located in regions of interestwere included in the analysis. A very small number ofelectrode contacts that were considered to lie on the borderbetween brain areas were removed from the analysis. Asan example, the placement of intracranial electrodes onthe left lateral and basal aspects are shown in Fig. 1 forPatient 5 of the MT group. The electrode contacts thatwere identified in O, T, F, and P (Fig. 1A) and IT and EC(Fig. 1B) are circled in this figure. There are three poster-ior strip electrodes—parietal, occipital, and parietooccipi-tal. Two of the three posterior strip electrodes includecontacts within O, whereas some of the contacts from the
grid and the parietal strip electrode contain contacts in P.Similar figures for three additional patients (one from theMT group and two from the LT group) are included in thesupplemental data section (Fig. S1–S3).
The number of contacts in a region of interest rangedfrom 1–2 for H and EC, to 20–25 for larger cortical areassuch as the F or P areas. We sought both to avoid over-counting due to propagated spikes, and to approximate anequivalent sampling of all brain areas. As indicated in thepreceding text, the Persyst algorithm reports dominantspikes. These are spikes that are considered primary, asopposed to coincident spikes of smaller intensity that are
Figure 2.
Selection of icEEG epochs. The figure shows continuously evaluated delta power from one contact (right T area)
obtained during eight consecutive nights of intracranial monitoring (from 8 pm to 10 am on each night). The data
presented here are from Patient 19 who had lateral temporal onset of seizures. For this patient, seizures occurred
late in the course of monitoring (starting from day 9). During nights 2–9, delta power levels decreased from relatively
high values. There are periodic changes in the record, presumably corresponding to sleep cycles. These are barely
visible on night 2 (at approximately 2 am), on night 5 (between midnight and 2 am) and night 6 (between 1 and 6 am).
On night 7 and later, these periodic changes of delta power are prominent and demonstrate clear and regular struc-
ture; they occur mainly between 10 pm and 4 am. For this patient, we selected a period from midnight to 4 am of
night 7 for the sleep epoch (as indicated). For the wake epoch we selected a period from 8 am to noon of the same
day, i.e., 4 h after the end of the sleep period.
Epilepsia ILAE
2579
Spatial Distribution of Intracranially Recorded Spikes
Epilepsia, 50(12):2575–2585, 2009doi: 10.1111/j.1528-1167.2009.02258.x
seen simultaneously at other cortical locations. The spikesincluded in the analysis were thus unique occurrences.The electrode contacts were ranked by the number ofdetected dominant spikes. We found that the five contactswith the highest number of dominant spikes in each ana-tomically designated area accounted for more than 90% ofall detected spikes in the area. We, therefore, limited theanalysis of spikes to a maximum of five electrode contactswith the largest number of spikes in each area. As anexample, Fig. 4 shows a cumulative sum of spikes in T asa function of the number of electrode contacts located inthis area. This figure was created by first arranging thecontacts in descending order according to the number ofspikes detected, and then plotting the cumulative sumagainst the number of contacts. The sum of spikes in thefive highest contacts is 1,353 spikes/h. This accounted for91.7% of all the spikes detected in T in this patient. InFigs. 1, S1–S3, the electrode contacts used for spike detec-tion are colored. These were the contacts that were consid-ered to lie in the region of interest and were beingmonitored at the time of this study. The subset of electrodecontacts (maximum n = 5) with the highest number ofdominant spikes is displayed in red. Percentages of spikes,for each patient, detected by contacts with the highest
number of spikes are provided in Table S1 in the supple-mental data section. The cumulative number of spikesdetermined for each area, for each epoch, was expressedas the number of spikes per hour.
Statistical analysesSpike rates for the two patient groups were compared
using a two-tail t-test. Within each patient group, spikerates for sleep and wake states were compared using apaired two-tail t-test. The relative differences in spikerates between sleep and wake in the two groups were eval-uated with Pearson’s chi-square test. Logistic regressionwas performed to determine how well the spike rate couldclassify patients in MT and LT groups.
Results
An example of the spike rates observed in selectedareas, for the sleep epoch in Patient 5, is shown in Fig. 1.This patient had medial temporal onset of seizures. Thecontacts used for spike analyses are distributed over thedefined anatomic areas. The five contacts with the highestnumber of spikes that were used in the analysis wereeither broadly distributed across the defined areas or
Figure 3.
A segment of EEG recording with spikes detected by Reveal. The EEG was obtained from Patient 3. The figure shows
10 channels recorded from the inferior temporal area: anterior medial temporal strip (AMT), anterior subtemporal
strip (AT) and medial subtemporal strip (MT). The first detection was attributed to electrode contact MT5; the spike
in MT4 is similar in shape but less distinct from the background. The second spike detected by the program at elec-
trode contact AMT10 is also visible in AMT9 and MT3 though with lower amplitude where it is less distinct from the
background. The third spike detected at AMT10 is also visible at AMT9 and AT3 though with lower amplitude.
Epilepsia ILAE
2580
I. I. Goncharova et al.
Epilepsia, 50(12):2575–2585, 2009doi: 10.1111/j.1528-1167.2009.02258.x
concentrated in one locus. In this figure, the contacts in T,F, and O areas, which were used in the analysis, arebroadly distributed, whereas contacts in P are localized tothe anterior–inferior part of that area. Spike rates in ECand IT areas were greater than 400/h (Fig. 1B); the spikerate in T was high (367 spikes/h, Fig. 1A) and relativelyhigh in P (289 spikes/h), whereas spike rates in O and Fareas were low (36 and 13 spikes/h). Therefore, in thispatient, the spike rate is high not only in EC and neighbor-ing IT and T, but also in P, which is remote from the sei-zure onset area. Three additional examples are shown inthe supplemental data section (Figs. S1–S3).
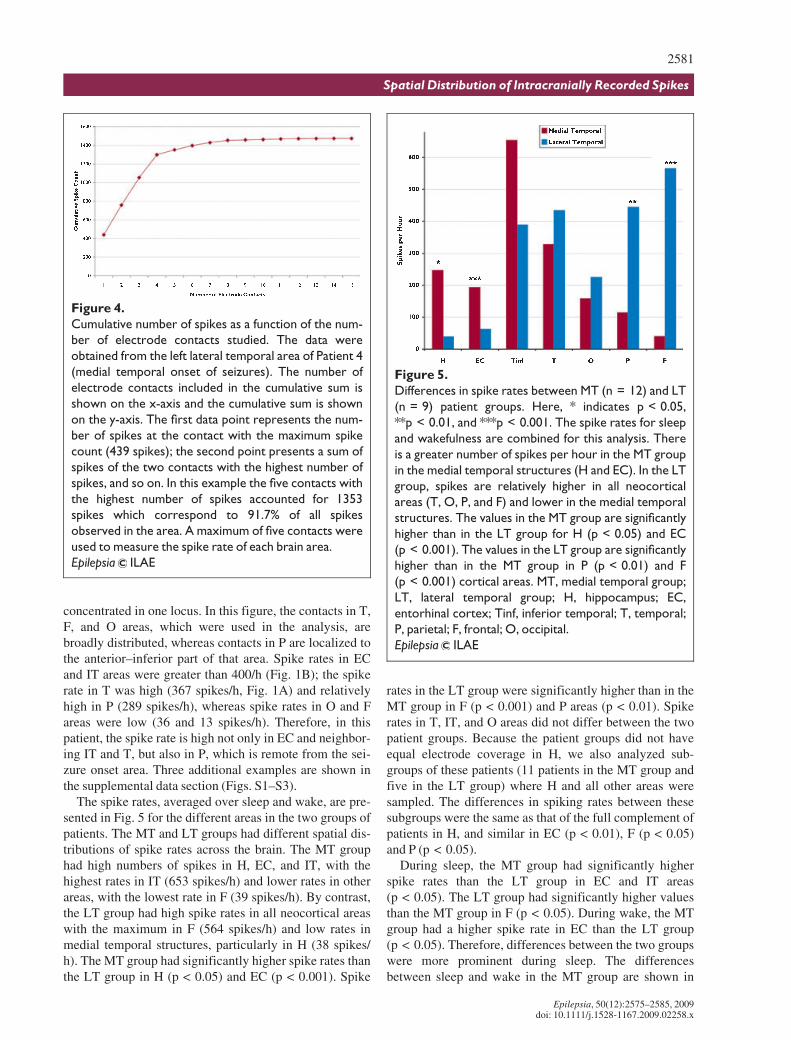
The spike rates, averaged over sleep and wake, are pre-sented in Fig. 5 for the different areas in the two groups ofpatients. The MT and LT groups had different spatial dis-tributions of spike rates across the brain. The MT grouphad high numbers of spikes in H, EC, and IT, with thehighest rates in IT (653 spikes/h) and lower rates in otherareas, with the lowest rate in F (39 spikes/h). By contrast,the LT group had high spike rates in all neocortical areaswith the maximum in F (564 spikes/h) and low rates inmedial temporal structures, particularly in H (38 spikes/h). The MT group had significantly higher spike rates thanthe LT group in H (p < 0.05) and EC (p < 0.001). Spike
rates in the LT group were significantly higher than in theMT group in F (p < 0.001) and P areas (p < 0.01). Spikerates in T, IT, and O areas did not differ between the twopatient groups. Because the patient groups did not haveequal electrode coverage in H, we also analyzed sub-groups of these patients (11 patients in the MT group andfive in the LT group) where H and all other areas weresampled. The differences in spiking rates between thesesubgroups were the same as that of the full complement ofpatients in H, and similar in EC (p < 0.01), F (p < 0.05)and P (p < 0.05).
During sleep, the MT group had significantly higherspike rates than the LT group in EC and IT areas(p < 0.05). The LT group had significantly higher valuesthan the MT group in F (p < 0.05). During wake, the MTgroup had a higher spike rate in EC than the LT group(p < 0.05). Therefore, differences between the two groupswere more prominent during sleep. The differencesbetween sleep and wake in the MT group are shown in
Figure 4.
Cumulative number of spikes as a function of the num-
ber of electrode contacts studied. The data were
obtained from the left lateral temporal area of Patient 4
(medial temporal onset of seizures). The number of
electrode contacts included in the cumulative sum is
shown on the x-axis and the cumulative sum is shown
on the y-axis. The first data point represents the num-
ber of spikes at the contact with the maximum spike
count (439 spikes); the second point presents a sum of
spikes of the two contacts with the highest number of
spikes, and so on. In this example the five contacts with
the highest number of spikes accounted for 1353
spikes which correspond to 91.7% of all spikes
observed in the area. A maximum of five contacts were
used to measure the spike rate of each brain area.
Epilepsia ILAE
Figure 5.
Differences in spike rates between MT (n = 12) and LT
(n = 9) patient groups. Here, * indicates p < 0.05,
**p < 0.01, and ***p < 0.001. The spike rates for sleep
and wakefulness are combined for this analysis. There
is a greater number of spikes per hour in the MT group
in the medial temporal structures (H and EC). In the LT
group, spikes are relatively higher in all neocortical
areas (T, O, P, and F) and lower in the medial temporal
structures. The values in the MT group are significantly
higher than in the LT group for H (p < 0.05) and EC
(p < 0.001). The values in the LT group are significantly
higher than in the MT group in P (p < 0.01) and F
(p < 0.001) cortical areas. MT, medial temporal group;
LT, lateral temporal group; H, hippocampus; EC,
entorhinal cortex; Tinf, inferior temporal; T, temporal;
P, parietal; F, frontal; O, occipital.
Epilepsia ILAE
2581
Spatial Distribution of Intracranially Recorded Spikes
Epilepsia, 50(12):2575–2585, 2009doi: 10.1111/j.1528-1167.2009.02258.x
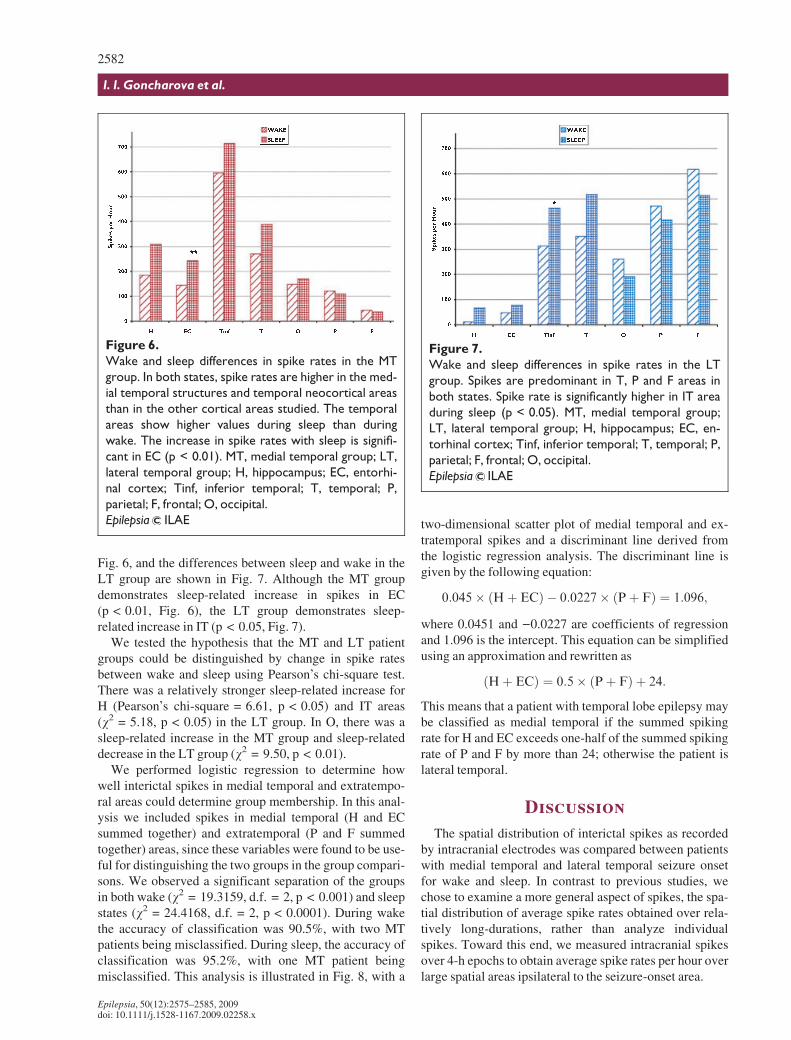
Fig. 6, and the differences between sleep and wake in theLT group are shown in Fig. 7. Although the MT groupdemonstrates sleep-related increase in spikes in EC(p < 0.01, Fig. 6), the LT group demonstrates sleep-related increase in IT (p < 0.05, Fig. 7).
We tested the hypothesis that the MT and LT patientgroups could be distinguished by change in spike ratesbetween wake and sleep using Pearson’s chi-square test.There was a relatively stronger sleep-related increase forH (Pearson’s chi-square = 6.61, p < 0.05) and IT areas(v2 = 5.18, p < 0.05) in the LT group. In O, there was asleep-related increase in the MT group and sleep-relateddecrease in the LT group (v2 = 9.50, p < 0.01).
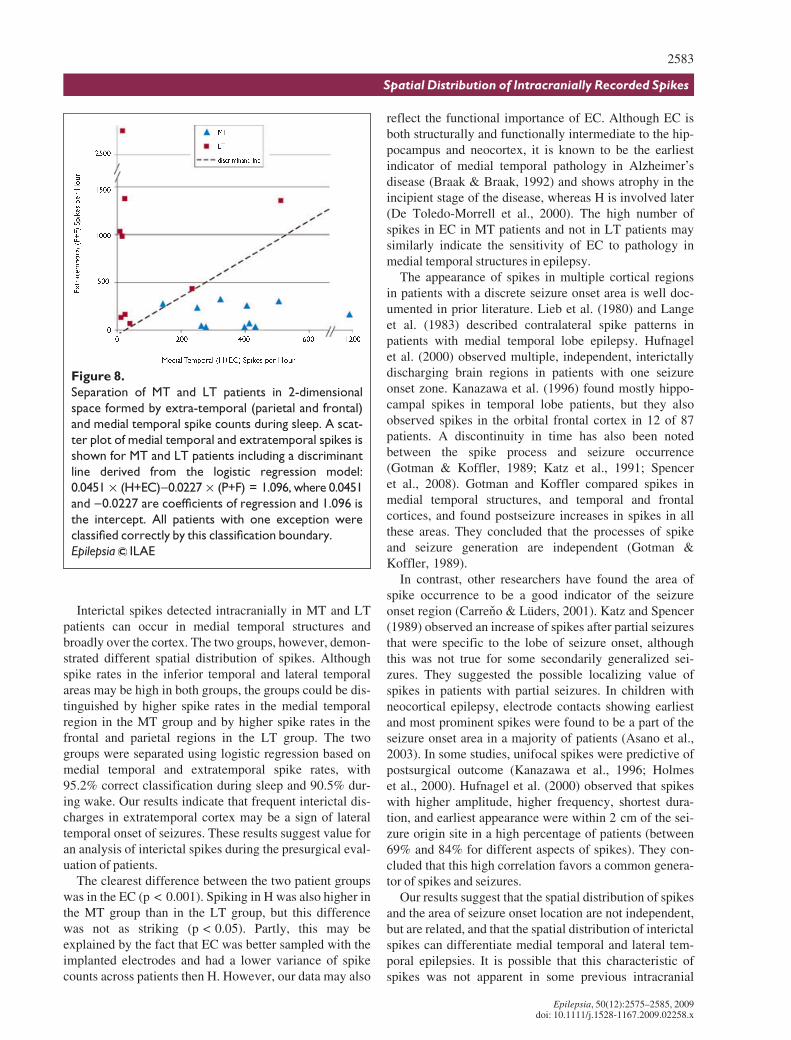
We performed logistic regression to determine howwell interictal spikes in medial temporal and extratempo-ral areas could determine group membership. In this anal-ysis we included spikes in medial temporal (H and ECsummed together) and extratemporal (P and F summedtogether) areas, since these variables were found to be use-ful for distinguishing the two groups in the group compari-sons. We observed a significant separation of the groupsin both wake (v2 = 19.3159, d.f. = 2, p < 0.001) and sleepstates (v2 = 24.4168, d.f. = 2, p < 0.0001). During wakethe accuracy of classification was 90.5%, with two MTpatients being misclassified. During sleep, the accuracy ofclassification was 95.2%, with one MT patient beingmisclassified. This analysis is illustrated in Fig. 8, with a
two-dimensional scatter plot of medial temporal and ex-tratemporal spikes and a discriminant line derived fromthe logistic regression analysis. The discriminant line isgiven by the following equation:
0:045� ðHþ ECÞ � 0:0227� ðPþ FÞ ¼ 1:096;
where 0.0451 and )0.0227 are coefficients of regressionand 1.096 is the intercept. This equation can be simplifiedusing an approximation and rewritten as
ðHþ ECÞ ¼ 0:5� ðPþ FÞ þ 24:
This means that a patient with temporal lobe epilepsy maybe classified as medial temporal if the summed spikingrate for H and EC exceeds one-half of the summed spikingrate of P and F by more than 24; otherwise the patient islateral temporal.
Discussion
The spatial distribution of interictal spikes as recordedby intracranial electrodes was compared between patientswith medial temporal and lateral temporal seizure onsetfor wake and sleep. In contrast to previous studies, wechose to examine a more general aspect of spikes, the spa-tial distribution of average spike rates obtained over rela-tively long-durations, rather than analyze individualspikes. Toward this end, we measured intracranial spikesover 4-h epochs to obtain average spike rates per hour overlarge spatial areas ipsilateral to the seizure-onset area.
Figure 6.
Wake and sleep differences in spike rates in the MT
group. In both states, spike rates are higher in the med-
ial temporal structures and temporal neocortical areas
than in the other cortical areas studied. The temporal
areas show higher values during sleep than during
wake. The increase in spike rates with sleep is signifi-
cant in EC (p < 0.01). MT, medial temporal group; LT,
lateral temporal group; H, hippocampus; EC, entorhi-
nal cortex; Tinf, inferior temporal; T, temporal; P,
parietal; F, frontal; O, occipital.
Epilepsia ILAE
Figure 7.
Wake and sleep differences in spike rates in the LT
group. Spikes are predominant in T, P and F areas in
both states. Spike rate is significantly higher in IT area
during sleep (p < 0.05). MT, medial temporal group;
LT, lateral temporal group; H, hippocampus; EC, en-
torhinal cortex; Tinf, inferior temporal; T, temporal; P,
parietal; F, frontal; O, occipital.
Epilepsia ILAE
2582
I. I. Goncharova et al.
Epilepsia, 50(12):2575–2585, 2009doi: 10.1111/j.1528-1167.2009.02258.x
Interictal spikes detected intracranially in MT and LTpatients can occur in medial temporal structures andbroadly over the cortex. The two groups, however, demon-strated different spatial distribution of spikes. Althoughspike rates in the inferior temporal and lateral temporalareas may be high in both groups, the groups could be dis-tinguished by higher spike rates in the medial temporalregion in the MT group and by higher spike rates in thefrontal and parietal regions in the LT group. The twogroups were separated using logistic regression based onmedial temporal and extratemporal spike rates, with95.2% correct classification during sleep and 90.5% dur-ing wake. Our results indicate that frequent interictal dis-charges in extratemporal cortex may be a sign of lateraltemporal onset of seizures. These results suggest value foran analysis of interictal spikes during the presurgical eval-uation of patients.
The clearest difference between the two patient groupswas in the EC (p < 0.001). Spiking in H was also higher inthe MT group than in the LT group, but this differencewas not as striking (p < 0.05). Partly, this may beexplained by the fact that EC was better sampled with theimplanted electrodes and had a lower variance of spikecounts across patients then H. However, our data may also
reflect the functional importance of EC. Although EC isboth structurally and functionally intermediate to the hip-pocampus and neocortex, it is known to be the earliestindicator of medial temporal pathology in Alzheimer’sdisease (Braak & Braak, 1992) and shows atrophy in theincipient stage of the disease, whereas H is involved later(De Toledo-Morrell et al., 2000). The high number ofspikes in EC in MT patients and not in LT patients maysimilarly indicate the sensitivity of EC to pathology inmedial temporal structures in epilepsy.
The appearance of spikes in multiple cortical regionsin patients with a discrete seizure onset area is well doc-umented in prior literature. Lieb et al. (1980) and Langeet al. (1983) described contralateral spike patterns inpatients with medial temporal lobe epilepsy. Hufnagelet al. (2000) observed multiple, independent, interictallydischarging brain regions in patients with one seizureonset zone. Kanazawa et al. (1996) found mostly hippo-campal spikes in temporal lobe patients, but they alsoobserved spikes in the orbital frontal cortex in 12 of 87patients. A discontinuity in time has also been notedbetween the spike process and seizure occurrence(Gotman & Koffler, 1989; Katz et al., 1991; Spenceret al., 2008). Gotman and Koffler compared spikes inmedial temporal structures, and temporal and frontalcortices, and found postseizure increases in spikes in allthese areas. They concluded that the processes of spikeand seizure generation are independent (Gotman &Koffler, 1989).
In contrast, other researchers have found the area ofspike occurrence to be a good indicator of the seizureonset region (Carreno & L�ders, 2001). Katz and Spencer(1989) observed an increase of spikes after partial seizuresthat were specific to the lobe of seizure onset, althoughthis was not true for some secondarily generalized sei-zures. They suggested the possible localizing value ofspikes in patients with partial seizures. In children withneocortical epilepsy, electrode contacts showing earliestand most prominent spikes were found to be a part of theseizure onset area in a majority of patients (Asano et al.,2003). In some studies, unifocal spikes were predictive ofpostsurgical outcome (Kanazawa et al., 1996; Holmeset al., 2000). Hufnagel et al. (2000) observed that spikeswith higher amplitude, higher frequency, shortest dura-tion, and earliest appearance were within 2 cm of the sei-zure origin site in a high percentage of patients (between69% and 84% for different aspects of spikes). They con-cluded that this high correlation favors a common genera-tor of spikes and seizures.
Our results suggest that the spatial distribution of spikesand the area of seizure onset location are not independent,but are related, and that the spatial distribution of interictalspikes can differentiate medial temporal and lateral tem-poral epilepsies. It is possible that this characteristic ofspikes was not apparent in some previous intracranial
Figure 8.
Separation of MT and LT patients in 2-dimensional
space formed by extra-temporal (parietal and frontal)
and medial temporal spike counts during sleep. A scat-
ter plot of medial temporal and extratemporal spikes is
shown for MT and LT patients including a discriminant
line derived from the logistic regression model:
0.0451 · (H+EC))0.0227 · (P+F) = 1.096, where 0.0451
and )0.0227 are coefficients of regression and 1.096 is
the intercept. All patients with one exception were
classified correctly by this classification boundary.
Epilepsia ILAE
2583
Spatial Distribution of Intracranially Recorded Spikes
Epilepsia, 50(12):2575–2585, 2009doi: 10.1111/j.1528-1167.2009.02258.x
studies because of limited spatial sampling, the analysis ofselected electrode contacts, or selected spikes or limitedduration data, or because heterogeneous groups of patientswith substantial overlap were included in the study. Oneunexpected finding is that distribution of spikes in the LTgroup is maximal in the frontal area. The broader corticaldistribution of spikes in the LT group than in the MTgroup may be influenced by the broad seizure onset areain some patients in this group. A broad spike distributionmay also suggest the presence of large scale networks thatsupport the generation of spikes. Our results would sug-gest that such networks, however, have specificity to theseizure onset location, at least for the two groups ofpatients studied here. In particular, a large neocortical net-work with interrelation between the lateral temporal andfrontal areas may underlie spike distribution in the LTgroup of patients. It remains to be seen if the differencebetween the two patient groups described here can also bedetected by scalp EEG.
We observed an increase of spikes during sleep com-pared to wake in EC for the MT group and in the inferiortemporal cortex for the LT group. Many studies reportedan increase in epileptiform discharges during sleep withscalp EEG (Malow et al., 1998; see also Mendez &Radtke, 2001; Malow, 2005 for reviews). Increased spikesand the appearance of new spike foci in non-REM (rapideye movement) sleep, compared to wake and REM sleep,were observed by Sammaritano et al. (1991); they sug-gested that non-REM sleep might be less important forlocalization of seizures than wake and REM sleep.Although we did not compare REM to non-REM sleep,we did not observe a sleep-related change in our intracra-nially recorded data. Indeed, we found stronger differ-ences between the two groups during sleep (significant inEC, IT, and F areas) than during wake (significant in EConly) and better classification of patients during sleep.Therefore, our findings from intracranial EEG, to theextent they can be compared to previous studies (Samma-ritano et al., 1991), do not support a conclusion that thediagnostic value of interictal spikes is lower during sleepthan during wakefulness.
Acknowledgments
We confirm that we have read the Journal’s position on issuesinvolved in ethical publication and affirm that this report is consistentwith those guidelines.
Disclosure: None of the authors has any conflict of interest to disclose.
In Memoriam
Susan S. Spencer died on May 21, 2009. She was the head of the YaleEpilepsy Program and founder and director of the Epilepsy MonitoringUnit at the Yale-New Haven Hospital. During her career she was anardent supporter of clinical research in epilepsy, a devoted advocate andmodel for physicians in training, and an uncompromising clinician. She
recognized and nurtured collaboration between investigators fromdiverse scientific disciplines to advance our understanding of epilepsy.
References
Al-Asmi A, B�nar CG, Gross DW, Khani YA, Anderma F, Pike B,Dubeau F, Gotman J. (2003) fMRI activation in continuous andspike-triggered EEG-fMRI studies of epileptic spikes. Epilepsia44:1328–1339.
Asano E, Muzik O, Shah A, Juh�sz C, Chugani DC, Sood S, Janisse J,Ergun EL, Ahn-Ewing J, Shen C, Gotman J, Chugani HT. (2003)Quantitative interictal subdural EEG analyses in children with neo-cortical epilepsy. Epilepsia 44:425–434.
Braak H, Braak E. (1992) The human entorhinal cortex: normal morphol-ogy and lamina-specific pathology in various diseases. Neurosci Res15:6–31.
Carreno M, L�ders HO. (2001) General principles of presurgical evalua-tion. In L�ders HO, Comair UG (Eds) Epilepsy surgery. 2nd edition.Lippincott Williams and Wilkins, Philadelphia, pp. 185–199.
Damasio H. (1995) Human brain anatomy in computerized images.Oxford University Press, New York, Oxford.
De Toledo-Morrell L, Goncharova II, Dickerson B, Wilson RS, BennettDA. (2000) From healthy aging to early Alzheimer’s disease: in vivodetection of entorhinal cortex atrophy. Ann NY Acad Sci 911:240–253.
Duvernoy HM. (1988) The human hippocampus. Springer-Verlag,New York.
Duvernoy HM. (1991) The human brain. Springer-Verlag, New York.Goncharova II, Dickerson BC, Stoub TR, de Toledo-Morrell L. (2001)
MRI of human entorhinal cortex: a reliable protocol for volumetricmeasurement. Neurobiol Aging 22:737–745.
Gotman J, Ives JR, Gloor P. (1979) Automatic recognition of interictalepileptic activity in prolonged EEG recordings. ElectroencephalogrClin Neurophysiol 46:510–5210.
Gotman J, Koffler DJ. (1989) Interictal spiking increases after seizuresbut does not after decrease in medication. Electroencephalogr ClinNeurophysiol 72:7–15.
Gotman J. (1999) Automatic detection of seizures and spikes. ClinNeurophysiol 16:130–140.
Holmes MD, Kutsy RL, Ojemann AJ, Wilensky AJ, Ojemann LM.(2000) Interictal, unifocal spikes in refractory extratemporal epilepsypredict ictal origin and postsurgical outcome. Clin Neurophysiol111:1802–1808.
Hufnagel A, D�mpelmann M, Zentner J, Schijns O, Elger CE. (2000)Clinical relevance of quantitative intracranial interictal spike activityin presurgical evaluation of epilepsy. Epilepsia 41:467–478.
Jack CR, Petersen RC, O’Brien PC, Tangalos EG. (1992) MR-based hip-pocampal volumetry in the diagnosis of Alzheimer’s disease.Neurology 42:183–188.
Kanazawa O, Blume WT, Girvin JP. (1996) Significance of spikes attemporal lobe electrocorticography. Epilepsia 37:50–55.
Katz A, Spencer S. (1989) Spatial and temporal relations of interictalspikes and seizures. Epilepsia 30:664.
Katz A, Marks DA, McCarthy G, Spencer SS. (1991) Does interictalspiking change prior to seizures? Electroencephalogr Clin Neuro-physiol 79:153–156.
Krakow K, Messina D, Lemieux L, Duncan JS, Fish DR. (2001)Functional MRI activation of individual interictal epileptiformspikes. Neuroimage 13:502–505.
Lange HH, Lieb JP, Engel J Jr, Crandall PH. (1983) Temporo-spatial pat-terns of pre-ictal spike activity in human temporal lobe epilepsy.Electroencephalogr Clin Neurophysiol 56:543–555.
Lieb JP, Joseph JP, Engel J Jr, Walker J, Crandall PH. (1980) Sleep state andseizure foci related to depth spike activity in patients with temporallobe epilepsy. Electroencephalogr Clin Neurophysiol 49:538–557.
Malow BA. (2005) Sleep and epilepsy. Neurol Clin 23:1127–1147.Malow BA, Lin X, Kushwaha R, Aldrich MS. (1998) Interictal spiking
increases with sleep depth in temporal lobe epilepsy. Epilepsia39:1309–1316.
Mendez M, Radtke RA. (2001) Interactions between sleep and epilepsy.J Clin Neurophysiol 18:106–127.
2584
I. I. Goncharova et al.
Epilepsia, 50(12):2575–2585, 2009doi: 10.1111/j.1528-1167.2009.02258.x
Papademetris X, Jackowski AP, Schultz RT, Staib LH, Duncan JS.(2004) Integrated intensity and point-feature non-rigid registration.In Barillot C, Haynor D, Hellier P (Eds) Medical image computingand computer-assisted intervention. Springer-Verlag, Saint-Malo,France, pp. 763–770.
Sammaritano M, Gigli GL, Gotman J. (1991) Interictal spiking duringwakefulness and sleep and the localization of foci in temporal lobeepilepsy. Neurology 41:290–297.
Spencer SS, Goncharova II, Duckrow RB, Novotny EJ, Zaveri HP.(2008) Interictal spikes on intracranial recording: behavior, physiol-ogy, and implications. Epilepsia 49:1881–1892.
Tao JX, Baldwin M, Hawes-Ebersole S, Ebersole JS. (2007) Cortical sub-strates of scalp EEG epileptiform discharges. J Clin Neurophysiol24:96–100.
Wilson SB, Turner CA, Emerson RG, Scheuer ML. (1999) Spikedetection II: automatic, perception-based detection and clustering.Clin Neurophysiol 110:404–411.
Appendix
Evaluation of automated spike detection programs forthe detection of intracranial spikes
We undertook an evaluation of two commercially avail-able programs to detect spikes automatically in intracra-nial EEG recordings. The two programs were Stellate, arule-based method (Gotman et al., 1979, Gotman, 1999),which is included in the Bio-Logic CEEGraph EEG acqui-sition system (Stellate Systems Inc., Montreal, QC, Can-ada), and Reveal, a neural network-based method (Wilsonet al., 1999), which is part of the Insight EEG acquisitionand visualization system (Persyst Development Corpora-tion, Prescott, AZ, U.S.A.).
We compared the performance of the two automatedmethods to three experienced raters who are board certi-fied electrophysiologists (RBD, EJN, SSS). The raterswere each asked to mark all spikes on 20-channel 10-minintracranial recordings from eight patients. The recordingswere from patients other than those studied for this manu-script. We considered as detections those spikes for whichthere was an agreement between at least two of the threeexperts.
There are differences in the manner in which Stellateand Reveal, the two programs tested, detect and reportspikes. Stellate detects and reports all spikes in all chan-nels. Reveal (Wilson et al., 1999), on the other hand, quan-tifies to what extent each spike stands out from backgroundactivity and reports the most prominent amongst simulta-neously detected spikes. To compare Stellate to expertevaluation we considered a detection to be a match if at
least one spike out of those simultaneously detected by theprogram coincided with one of the detections indicated bythe consensus of the experts. For Reveal, we consideredthe dominant spike detected by the program as a match if itagreed with the consensus of experts. We tested Stellatewith three amplitude levels, 3, 4, and 5. We tested Revealwith two amplitude settings (perception), 100 and 150 lVand with 10 s of recording displayed per page (using theoption ‘‘From EEG page’’). Stellate performed best withamplitude levels 3 or 4. Reveal performed best with a per-ception setting of 100 lV. Reveal provided more consis-tent results across the different patients, i.e., on all recordsperception 100 lV was better than 150 lV, while for Stel-late the best performance on different patients’ records waswith different amplitude levels (mainly 3 or 4). For Stel-late, the average sensitivity was 58.1% and specificity was87.5% with level 4, a level which gave the best results formost patients. No single setting for Stellate was better insensitivity than the performance of Reveal with a percep-tion setting of 100 lV. The average sensitivity of Revealfor perception 100 lV was 71.1% and the average speci-ficity 82.0%. This performance was considered satisfac-tory for the purpose of this study.
Supporting Information
Additional Supporting Information may be found in theonline version of this article:
Table S1. Electrode contacts employed for analysis inthe MT and LT groups of patients.
Figure S1. Electrode placement and spike rates inPatient 11 with left medial temporal onset of seizures: a,lateral view; b, basal view.
Figure S2. Electrode placement and spike rates inPatient 21 with right lateral temporal onset of seizures: a,lateral view; b, basal view.
Figure S3. Electrode placement and spike rates inPatient 16 with left lateral temporal onset of seizures: a,lateral view; b, basal view.
Please note: Wiley-Blackwell is not responsible for thecontent or functionality of any supporting informationsupplied by the authors. Any queries (other than missingmaterial) should be directed to the corresponding authorfor the article.
2585
Spatial Distribution of Intracranially Recorded Spikes
Epilepsia, 50(12):2575–2585, 2009doi: 10.1111/j.1528-1167.2009.02258.x