soep-wave-report_2015.pdf - econstor
TRANSCRIPT
econstorMake Your Publications Visible.
A Service of
zbwLeibniz-InformationszentrumWirtschaftLeibniz Information Centrefor Economics
Gerstorf, Sandra (Ed.); Schupp, Jürgen (Ed.)
Article
SOEP Wave Report 2015
SOEP Wave Report, No. 2015
Provided in Cooperation with:German Institute for Economic Research (DIW Berlin)
Suggested Citation: Gerstorf, Sandra (Ed.); Schupp, Jürgen (Ed.) (2016) : SOEP Wave Report2015, SOEP Wave Report, No. 2015, Deutsches Institut für Wirtschaftsforschung (DIW), Berlin
This Version is available at:http://hdl.handle.net/10419/148021
Standard-Nutzungsbedingungen:
Die Dokumente auf EconStor dürfen zu eigenen wissenschaftlichenZwecken und zum Privatgebrauch gespeichert und kopiert werden.
Sie dürfen die Dokumente nicht für öffentliche oder kommerzielleZwecke vervielfältigen, öffentlich ausstellen, öffentlich zugänglichmachen, vertreiben oder anderweitig nutzen.
Sofern die Verfasser die Dokumente unter Open-Content-Lizenzen(insbesondere CC-Lizenzen) zur Verfügung gestellt haben sollten,gelten abweichend von diesen Nutzungsbedingungen die in der dortgenannten Lizenz gewährten Nutzungsrechte.
Terms of use:
Documents in EconStor may be saved and copied for yourpersonal and scholarly purposes.
You are not to copy documents for public or commercialpurposes, to exhibit the documents publicly, to make thempublicly available on the internet, or to distribute or otherwiseuse the documents in public.
If the documents have been made available under an OpenContent Licence (especially Creative Commons Licences), youmay exercise further usage rights as specified in the indicatedlicence.
www.econstor.eu
SOEP — The German Socio-Economic Panel study at DIW Berlin
Sandra Gerstorf, Jürgen Schupp (Editors)
SOEP Wave Report
2015

Sandra Gerstorf, Jürgen Schupp (Editors)
SOEP Wave Report2015
SOEP — The German Socio-Economic Panel study at DIW Berlin
SOEP Wave Report 2015
2
SOEP Wave Report 2015
Contents | 3
Editorial .......................................................... 5
Part 1overview of the infrastructure SoEP at diW Berlin ........................................................ 7
SOEP Mission & Vision .................................................. 8SOEP Structure ........................................................... 11SOEP Directorship and Management .............................. 12Division 1: Survey Methodology ..................................... 14Division 2: Data Operation and Research
Data Center (RDC) ................................................ 16Division 3: Applied Panel Analysis and
Knowledge Transfer ............................................... 18SOEP Staff at DIW Berlin .............................................. 20
Part 2SoEP data and Fieldwork ................................... 23
The Landscape of SOEP Studies ..................................... 24Organization of SOEP Fieldwork by TNS Infratest .............. 26An Overview of the SOEP Samples
Fieldwork Report from TNS Infratest ............................ 28The SOEP Screening Samples
Fieldwork Report from TNS Infratest ............................ 37The SOEP Migration Survey
Report from the SOEP .............................................. 41Fieldwork Report from TNS Infratest ............................ 44
The SOEP-Innovation Sample Report from the SOEP .............................................. 53Fieldwork Report from TNS Infratest ............................ 56
The Bonn Intervention Panel: A SOEP-Related Study ........... 65 Fieldwork Report from TNS Infratest ............................ 69
The New SOEP Metadata Documentation System:Paneldata.org ....................................................... 71
Report from the SOEP Research Data Center .................... 73
Part 3a Selection of SoEP-Based DIW Economic Bulletin andDIW Wochenbericht ............................................... 77
Political Culture Still Divided 25 Years After Reunification? ...................................................... 78
Is Working on Weekends a Source of Dissatisfaction? ......... 90Changes in the Demand for Culture in Germany ................ 96Income Inequality Remains High in Germany:
Young Singles and Career Entrants Increasingly At Risk of Poverty ................................................. 108
Significant Statistical Uncertainty over Share of High Net Worth Households ................................... 124
Aircraft Noise in Berlin Affects Quality of Life Even Outside the Airport ............................................... 136
Part 4SoEP Service activities & Knowledge transfer in 2015 ............................... 145
SOEP in the Media .................................................... 146Citizens’ Dialogue with Chancellor Angela Merkel ........... 147Celebrating DIW Berlin’s Ninetieth Anniversary .............. 148SOEP at the European Survey Research Association ......... 149SOEP Service
SOEPcampus 2015 ................................................ 150SOEP-in-Residence 2015 ......................................... 150SOEP User Survey 2015 .......................................... 151
SOEP Staff & Community News ................................... 154SOEPPeople Video Series ............................................. 158
Elke Holst ........................................................... 159Thorsten Schneider ............................................... 160Matthias Pollmann-Schult ....................................... 161
SOEP Glossary .......................................................... 162
Part 5SoEP-Based Publications in 2015 ..................... 169
SOEP-Based SSCI Publications over the Last Decade ......... 170(S)SCI Publications by the SOEP Staff ........................... 171(S)SCI Publications by the SOEP User Community ........... 173SOEPpapers ............................................................. 181SOEP Survey Papers .................................................. 185
imPrint ........................................................... 188
Contents

SOEP Wave Report 2015
4
SOEP Wave Report 2015
Editorial | 5
We are pleased to present the sixth Wave Report of the SOEP longitudinal study, offering a glimpse of our work over the last year. In 2015, we interviewed our respondents in West Germany for the 32nd wave of the study and distributed a total of 31 waves of SOEP data to over 500 users worldwide, providing faster and more efficient data access and eliminat-ing shipping and handling costs by allowing users to download the encrypted data from our secure server.
In the last year, the central focus of our work has remained on SOEP-Core. We use this term to refer to the original SOEP study, including all of the sub-samples and refresher samples that have been added over the years. When the study was launched in 1984, its aim was to provide a representative picture of all private households in Germany from both a cross-sectional and longitudinal perspective, and this is still the aim of SOEP-Core today. At the same time, some of the more recent studies to join the SOEP
“family” (see part 2) are of growing importance to our data users, and are therefore another crucial area of our work.
One of the important developments in 2015 has been the growing importance of the SOEP in migration re-search (see pp. 44). In December 2015, shortly before Christmas, the IAB-BAMF-SOEP Migration Sample was launched. In it, we ask: What kind of qualifica-tions are refugees bringing with them to Germany? How quickly can they be integrated into the German labor market? Do they want to return to their home country? With the data from this study and a new set of questions in SOEP-Core about Germans’ attitudes towards refugees, we will be able to offer answers to these and related questions that have been domi-nating the political debate in Germany since 2015.
The SOEP has been in the public spotlight on sev-eral occasions over the last year, but perhaps most prominently when around 60 randomly selected SOEP respondents met with Chancellor Angela Merkel for a town hall style Citizens’ Dialogue to
discuss what “living well” in Germany means to them. On the subject of health, several participants expressed the desire to see the distinction between public and private health insurance eliminated. One university student pursuing a degree in education called for a change in adoption legislation. And a young woman from the region of Franken wanted more funding for her hometown so that town resi-dents would not have to pay for a new fire depart-ment vehicle themselves. The dialogue gave SOEP respondents a unique opportunity to express their desires, but also their concerns and criticisms, to the highest ranking political decision maker in the country. And what it signifies for SOEP research is also significant: It ref lects the expansion of stan-dardized, quantitatively oriented survey research in the direction of qualitative, mixed methods research. And in June 2015, DIW Berlin celebrated its 90th an-niversary. The theme of the festivities was the 25th anniversary of the introduction of the Germany’s economic, monetary, and social union in 1990. For the SOEP, June 1990 marked the start of Sample C in East Germany.
This Wave Report contains reports on migration research, on the Citizens’ Dialogue with Angela Merkel, and on other innovative research work cur-rently being done with the SOEP data, as well as an overview of the fieldwork conducted by TNS Infratest. You’ll also find the complete texts of sever-al recent DIW Wochenberichte, published in English in the DIW Economic Bulletin, ref lecting the wide range of SOEP-based research on subjects ranging the development of political culture in Germany over the 25 years since reunification to the effects of air-craft noise on Berlin residents. The publication list is a compilation of the most important SOEP-based papers published in the last year.
Editorial
Jürgen Schupp Director of the Research Infrastructure SOEP Professor of Sociology at Freie Universität Berlin

SOEP Wave Report 2015
2015
6
2015SOEP Wave Report 2015
Part 1: Overview of the Infrastructure SOEP at DIW Berlin | 7
PART 1
overview of the SoEP research infrastructure atdiW Berlin
SOEP Wave Report 2015
8 | PaRT 1: Overview of the Infrastructure SOEP at DIW Berlin
Cornerstones of our work
The SOEP data are provided in user-friendly form to researchers in a wide range of disciplines: the so-cial and behavioral sciences, including economics, sociology, demography, psychology, public health, political science, and contemporary history, but also the life sciences (in particular genetics) and medi-cine. The data from the SOEP and Related Studies are made available through an innovative metadata portal designed to international standards using open-source software.
The SOEP study is unique in that it covers thousands of households in Germany and has been collecting important information every year since 1984 on the economic and social circumstances, behavior, and subjective well-being of individuals from an inter-generational life-course perspective. The SOEP is constantly introducing new areas and methods of measurement (e.g., biomarkers, physical measures,
“qualitative measures” such as written answers to open-ended survey questions, and georeferenced context data) to improve and develop survey meth-odologies for assessing the determinants of human behavior. In this area, an important tool introduced recently is the SOEP-Innovation Sample (SOEP-IS). It offers the international research community a unique platform for cutting-edge research, provid-ing additional information to complement the data from the core SOEP sample.
Members of the SOEP group are engaged in concep-tually advanced and methodologically sophisticated scientific research in economics, sociology, psychol-ogy, and other areas of the social sciences, as well as in applied (policy-oriented) research and policy ad-vice (social monitoring) beyond descriptive research. Their research generates findings that are of crucial interest not only to the scientific community but also to policy-makers and the broader public.
The SOEP adopted a new mission and vision state-ment in 2015 after receiving feedback and improve-ments from the SOEP Survey Committee.
Our Mission
The German Socio-Economic Panel (SOEP) is an independent, non-partisan research-driven infra-structure unit that serves the international scien-tific community by providing nationally representa-tive longitudinal data (the SOEP study) and related datasets on private households in Germany. SOEP members (the SOEP group) are recognized for their high-level scientific research ranging from survey methodology to applied and policy-oriented topics.
The SOEP study is designed from a multidisciplinary perspective to provide data for basic, applied, and policy-relevant research that will improve our un-derstanding of human behavior in general, of eco-nomic decisions in detail, and of the mechanisms of social change embedded in the household context, the neighborhood, and different institutional set-tings and policy regimes. Research questions and survey contents are solely determined by scientific criteria. The SOEP group’s panel data expertise and high-level scientific research output, as exemplified by its outstanding publication record, are the founda-tion for its work in providing the SOEP household panel data to the scientific community.
SOEP Mission & Vision
SOEP Wave Report 2015
PaRT 1: Overview of the Infrastructure SOEP at DIW Berlin | 9
Vision
The SOEP is setting new national and international standards in the conception, design, implementa-tion, and user-friendly preparation and distribu-tion of household panel data and related data, and it strives to lead the field internationally in the qual-ity, originality, significance, and rigor of its work.
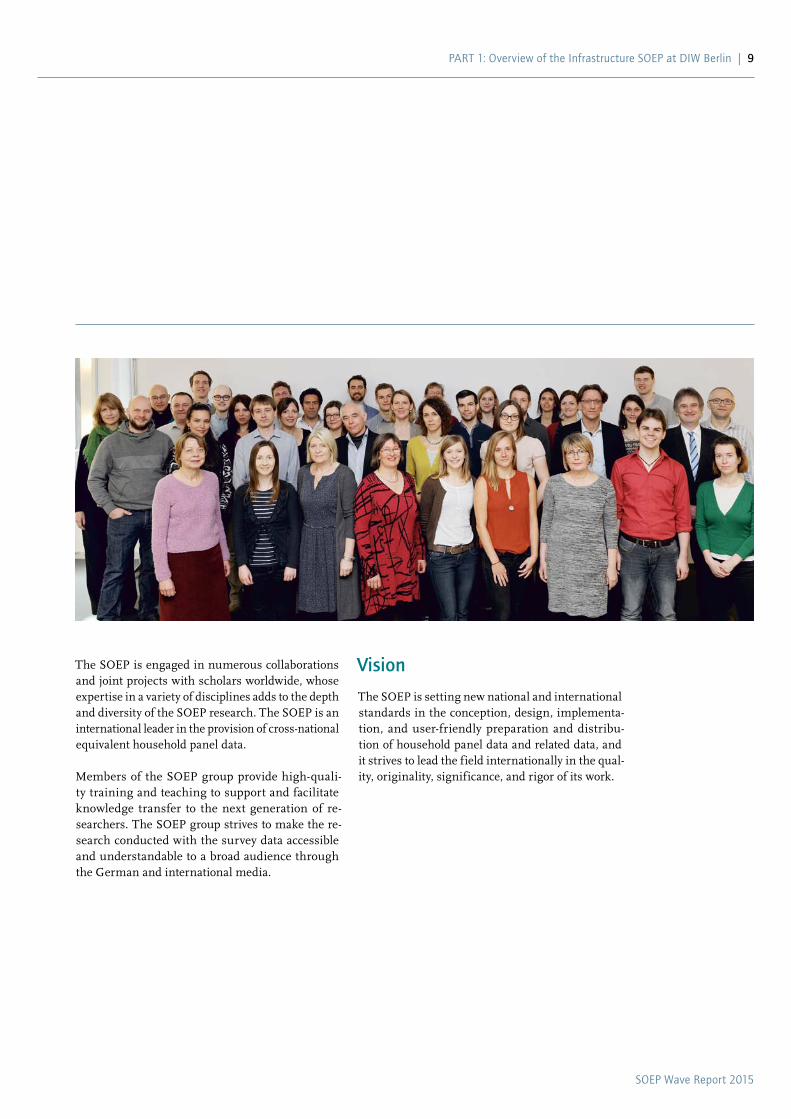
The SOEP is engaged in numerous collaborations and joint projects with scholars worldwide, whose expertise in a variety of disciplines adds to the depth and diversity of the SOEP research. The SOEP is an international leader in the provision of cross-national equivalent household panel data.
Members of the SOEP group provide high-quali-ty training and teaching to support and facilitate knowledge transfer to the next generation of re-searchers. The SOEP group strives to make the re-search conducted with the survey data accessible and understandable to a broad audience through the German and international media.

SOEP Wave Report 2015
10
SOEP Wave Report 2015
PaRT 1: Overview of the Infrastructure SOEP at DIW Berlin | 11
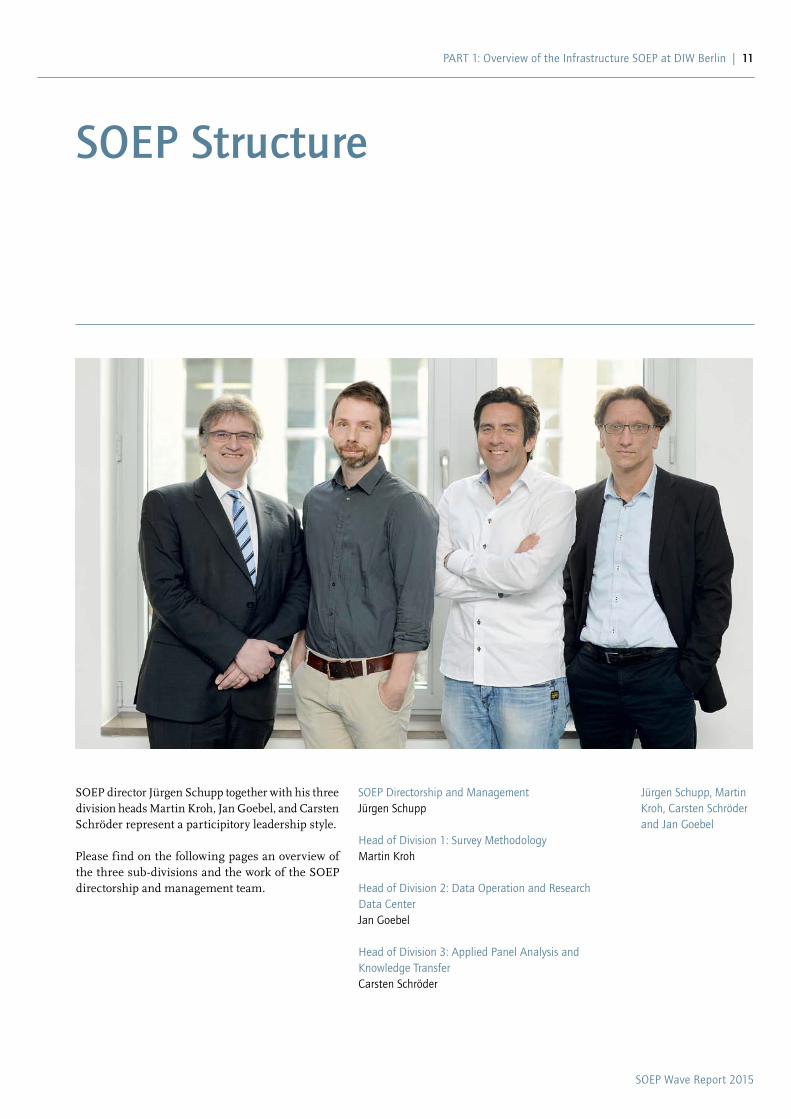
SOEP director Jürgen Schupp together with his three division heads Martin Kroh, Jan Goebel, and Carsten Schröder represent a participitory leadership style.
Please find on the following pages an overview of the three sub-divisions and the work of the SOEP directorship and management team.
SOEP Structure
Jürgen Schupp, Martin Kroh, Carsten Schröder and Jan Goebel
SOEP Directorship and ManagementJürgen Schupp
Head of Division 1: Survey MethodologyMartin Kroh
Head of Division 2: Data Operation and Research Data CenterJan Goebel
Head of Division 3: Applied Panel Analysis and Knowledge TransferCarsten Schröder
SOEP Wave Report 2015
12 | PaRT 1: Overview of the Infrastructure SOEP at DIW Berlin
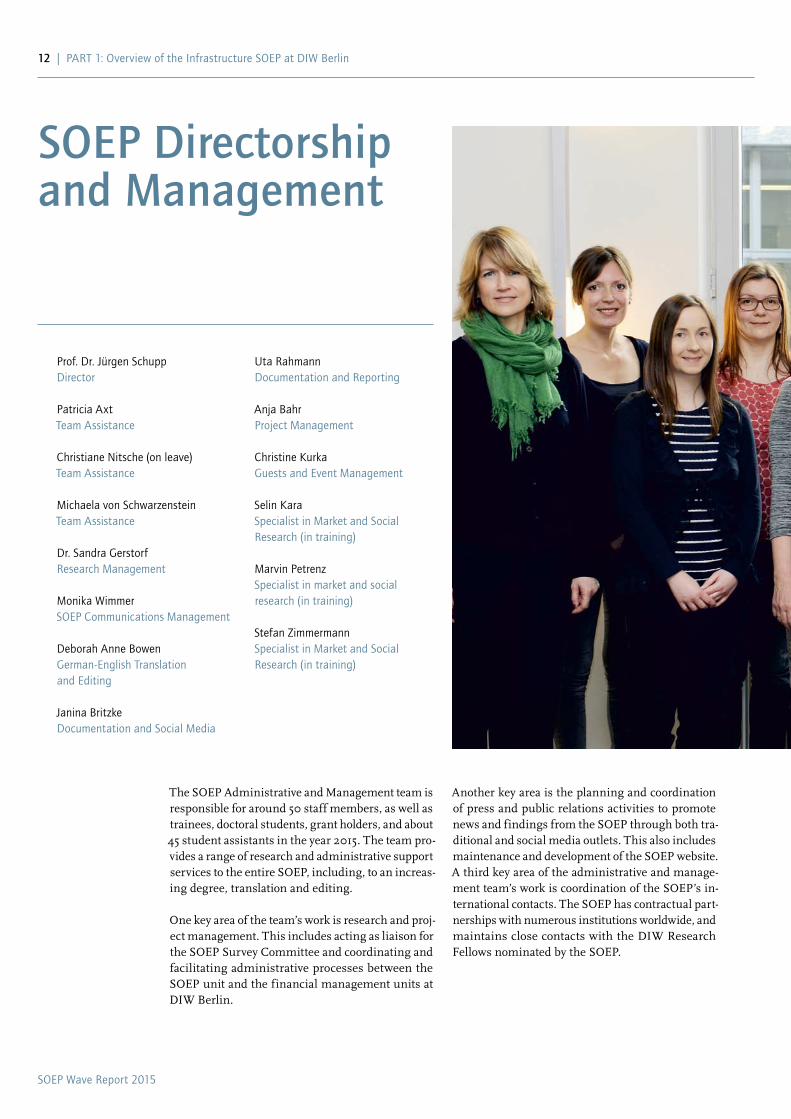
The SOEP Administrative and Management team is responsible for around 50 staff members, as well as trainees, doctoral students, grant holders, and about 45 student assistants in the year 2015. The team pro-vides a range of research and administrative support services to the entire SOEP, including, to an increas-ing degree, translation and editing.
One key area of the team’s work is research and proj-ect management. This includes acting as liaison for the SOEP Survey Committee and coordinating and facilitating administrative processes between the SOEP unit and the financial management units at DIW Berlin.
SOEP Directorship and Management
Prof. Dr. Jürgen Schupp Director
Patricia Axt Team Assistance
Christiane Nitsche (on leave)Team Assistance
Michaela von Schwarzenstein Team Assistance
Dr. Sandra Gerstorf Research Management
Monika Wimmer SOEP Communications Management
Deborah Anne BowenGerman-English Translation and Editing
Janina Britzke Documentation and Social Media
Uta Rahmann Documentation and Reporting
Anja Bahr Project Management
Christine Kurka Guests and Event Management
Selin KaraSpecialist in Market and SocialResearch (in training)
Marvin PetrenzSpecialist in market and social research (in training)
Stefan ZimmermannSpecialist in Market and SocialResearch (in training)
Another key area is the planning and coordination of press and public relations activities to promote news and findings from the SOEP through both tra-ditional and social media outlets. This also includes maintenance and development of the SOEP website.A third key area of the administrative and manage-ment team’s work is coordination of the SOEP’s in-ternational contacts. The SOEP has contractual part-nerships with numerous institutions worldwide, and maintains close contacts with the DIW Research Fellows nominated by the SOEP.
SOEP Wave Report 2015
PaRT 1: Overview of the Infrastructure SOEP at DIW Berlin | 13
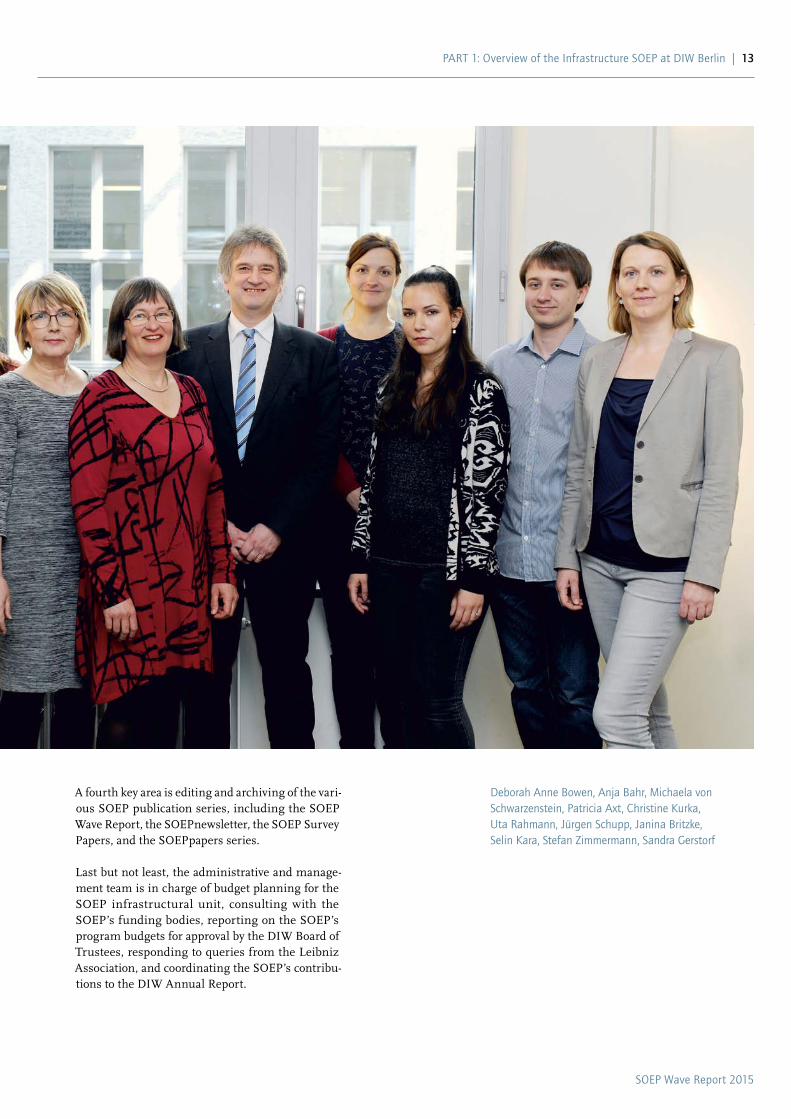
Deborah anne Bowen, anja Bahr, Michaela von Schwarzenstein, Patricia axt, Christine Kurka, Uta Rahmann, Jürgen Schupp, Janina Britzke, Selin Kara, Stefan Zimmermann, Sandra Gerstorf
A fourth key area is editing and archiving of the vari-ous SOEP publication series, including the SOEP Wave Report, the SOEPnewsletter, the SOEP Survey Papers, and the SOEPpapers series.
Last but not least, the administrative and manage-ment team is in charge of budget planning for the SOEP infrastructural unit, consulting with the SOEP’s funding bodies, reporting on the SOEP’s program budgets for approval by the DIW Board of Trustees, responding to queries from the Leibniz Association, and coordinating the SOEP’s contribu-tions to the DIW Annual Report.
SOEP Wave Report 2015
14 | PaRT 1: Overview of the Infrastructure SOEP at DIW Berlin
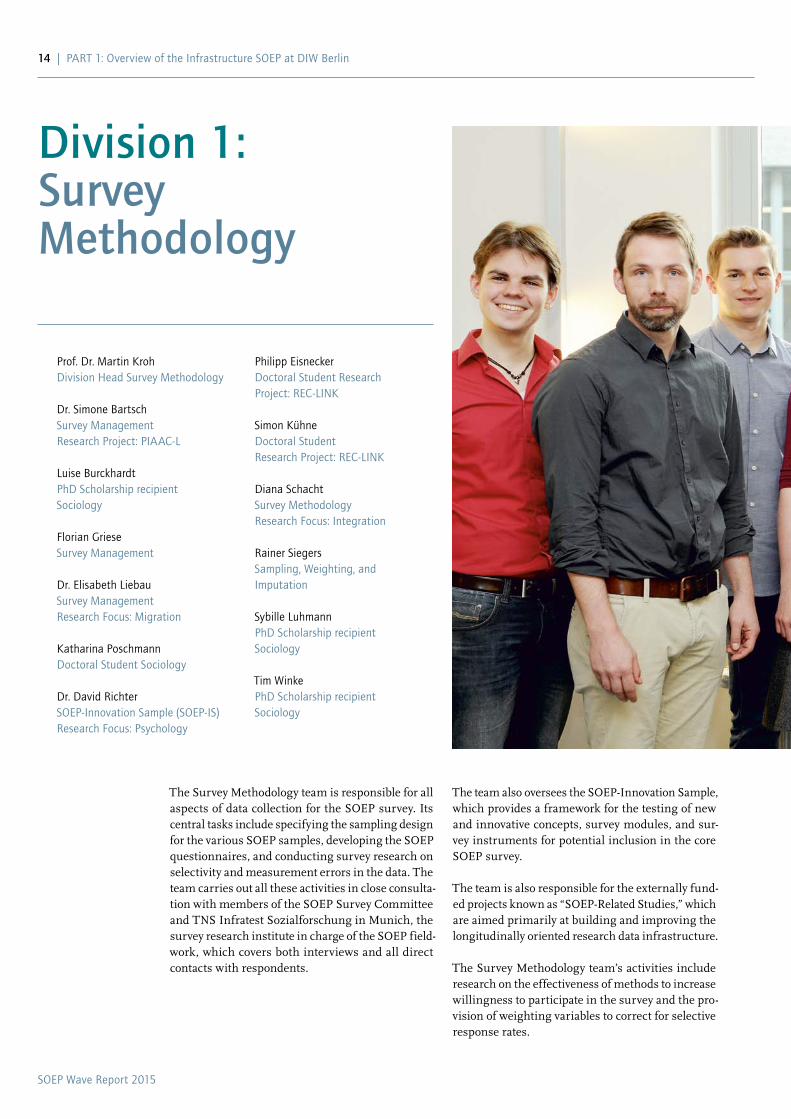
The Survey Methodology team is responsible for all aspects of data collection for the SOEP survey. Its central tasks include specifying the sampling design for the various SOEP samples, developing the SOEP questionnaires, and conducting survey research on selectivity and measurement errors in the data. The team carries out all these activities in close consulta-tion with members of the SOEP Survey Committee and TNS Infratest Sozialforschung in Munich, the survey research institute in charge of the SOEP field-work, which covers both interviews and all direct contacts with respondents.
Division 1: Survey Methodology
Prof. Dr. Martin Kroh Division Head Survey Methodology
Dr. Simone Bartsch Survey ManagementResearch Project: PIAAC-L
Luise Burckhardt PhD Scholarship recipientSociology
Florian Griese Survey Management
Dr. Elisabeth Liebau Survey Management Research Focus: Migration
Katharina PoschmannDoctoral Student Sociology
Dr. David Richter SOEP-Innovation Sample (SOEP-IS) Research Focus: Psychology
Philipp Eisnecker Doctoral Student ResearchProject: REC-LINK
Simon KühneDoctoral StudentResearch Project: REC-LINK
Diana SchachtSurvey Methodology Research Focus: Integration
Rainer SiegersSampling, Weighting, and Imputation
Sybille LuhmannPhD Scholarship recipient Sociology
Tim WinkePhD Scholarship recipient Sociology
The team also oversees the SOEP-Innovation Sample, which provides a framework for the testing of new and innovative concepts, survey modules, and sur-vey instruments for potential inclusion in the core SOEP survey.
The team is also responsible for the externally fund-ed projects known as “SOEP-Related Studies,” which are aimed primarily at building and improving the longitudinally oriented research data infrastructure.
The Survey Methodology team’s activities include research on the effectiveness of methods to increase willingness to participate in the survey and the pro-vision of weighting variables to correct for selective response rates.
SOEP Wave Report 2015
PaRT 1: Overview of the Infrastructure SOEP at DIW Berlin | 15
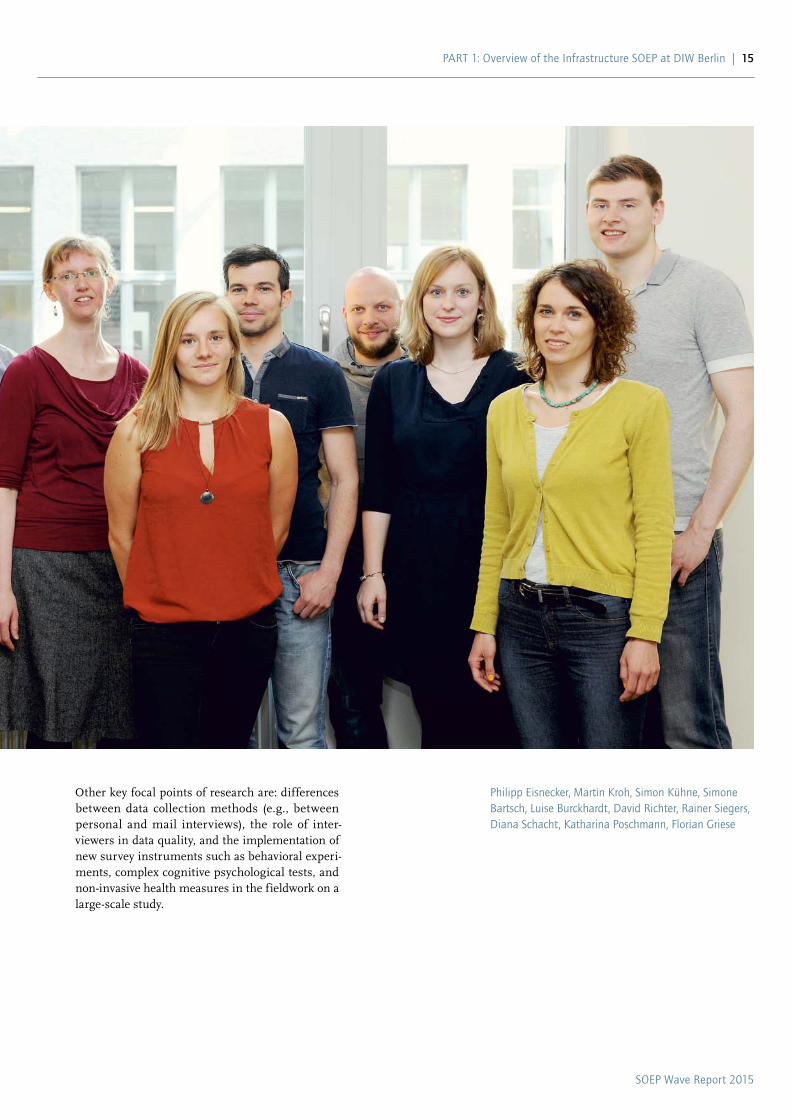
Philipp Eisnecker, Martin Kroh, Simon Kühne, Simone Bartsch, Luise Burckhardt, David Richter, Rainer Siegers, Diana Schacht, Katharina Poschmann, Florian Griese
Other key focal points of research are: differences between data collection methods (e.g., between personal and mail interviews), the role of inter-viewers in data quality, and the implementation of new survey instruments such as behavioral experi-ments, complex cognitive psychological tests, and non-invasive health measures in the fieldwork on a large-scale study.
SOEP Wave Report 2015
16 | PaRT 1: Overview of the Infrastructure SOEP at DIW Berlin
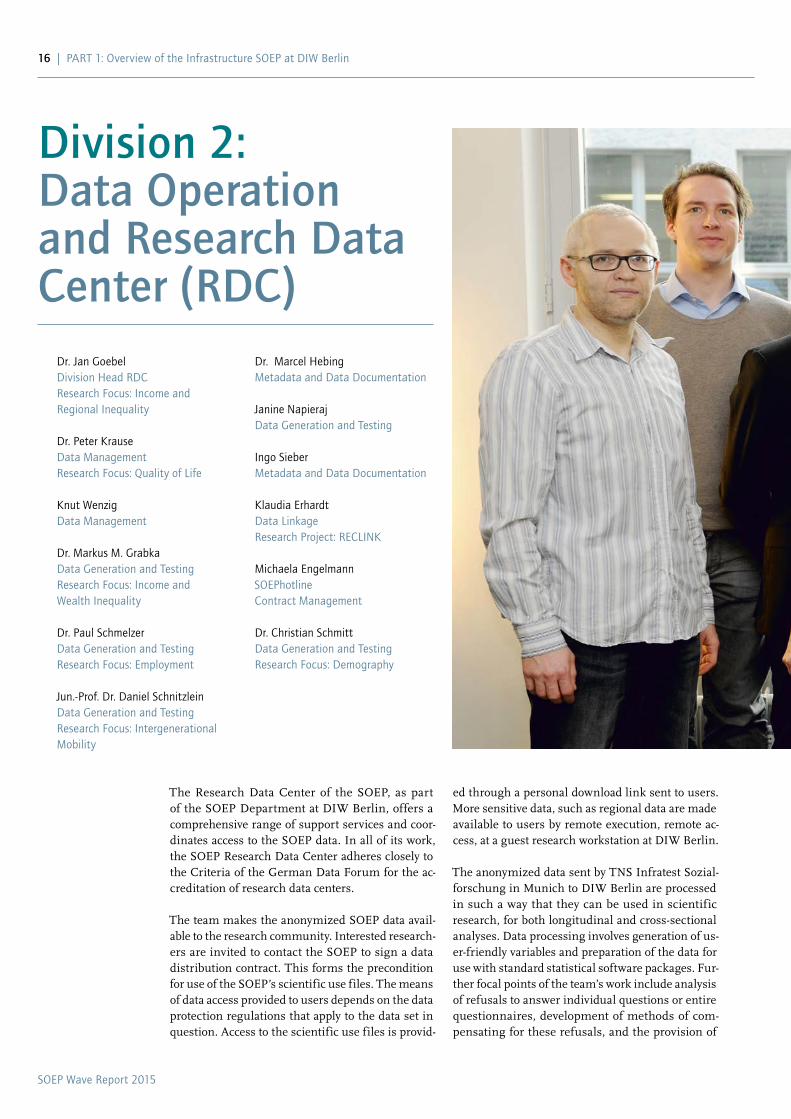
The Research Data Center of the SOEP, as part of the SOEP Department at DIW Berlin, offers a comprehen sive range of support services and coor-dinates access to the SOEP data. In all of its work, the SOEP Research Data Center adheres closely to the Criteria of the German Data Forum for the ac-creditation of research data centers.
The team makes the anonymized SOEP data avail-able to the research community. Interested research-ers are invited to contact the SOEP to sign a data distribution contract. This forms the precondition for use of the SOEP’s scientific use files. The means of data access provided to users depends on the data protection regulations that apply to the data set in question. Access to the scientific use files is provid-
Division 2: Data Operation and Research Data Center (RDC)
Dr. Jan Goebel Division Head RDC Research Focus: Income and Regional Inequality
Dr. Peter Krause Data ManagementResearch Focus: Quality of Life
Knut Wenzig Data Management
Dr. Markus M. Grabka Data Generation and TestingResearch Focus: Income and Wealth Inequality
Dr. Paul Schmelzer Data Generation and Testing Research Focus: Employment
Jun.-Prof. Dr. Daniel Schnitzlein Data Generation and Testing Research Focus: Intergenerational Mobility
Dr. Marcel Hebing Metadata and Data Documentation
Janine Napieraj Data Generation and Testing
Ingo Sieber Metadata and Data Documentation
Klaudia Erhardt Data LinkageResearch Project: RECLINK
Michaela Engelmann SOEPhotlineContract Management
Dr. Christian SchmittData Generation and TestingResearch Focus: Demography
ed through a personal download link sent to users. More sensitive data, such as regional data are made available to users by remote execution, remote ac-cess, at a guest research workstation at DIW Berlin. The anonymized data sent by TNS Infratest Sozial-forschung in Munich to DIW Berlin are processed in such a way that they can be used in scientific research, for both longitudinal and cross-sectional analyses. Data processing involves generation of us-er-friendly variables and preparation of the data for use with standard statistical software packages. Fur-ther focal points of the team’s work include analysis of refusals to answer individual questions or entire questionnaires, development of methods of com-pensating for these refusals, and the provision of
SOEP Wave Report 2015
PaRT 1: Overview of the Infrastructure SOEP at DIW Berlin | 17
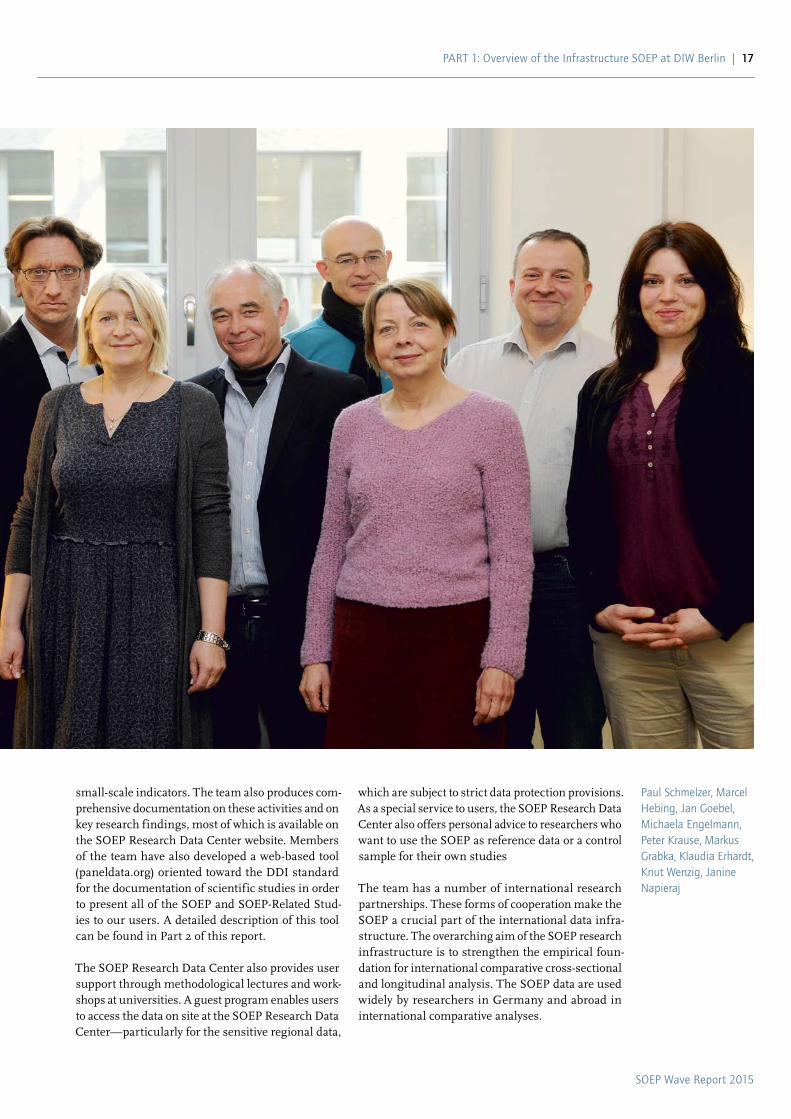
Paul Schmelzer, Marcel Hebing, Jan Goebel, Michaela Engelmann, Peter Krause, Markus Grabka, Klaudia Erhardt, Knut Wenzig, Janine Napieraj
small-scale indicators. The team also produces com-prehensive documentation on these activities and on key research findings, most of which is available on the SOEP Research Data Center website. Members of the team have also developed a web-based tool (paneldata.org) oriented toward the DDI standard for the documentation of scientific studies in order to present all of the SOEP and SOEP-Related Stud-ies to our users. A detailed description of this tool can be found in Part 2 of this report.
The SOEP Research Data Center also provides user support through methodological lectures and work-shops at universities. A guest program enables users to access the data on site at the SOEP Research Data Center—particularly for the sensitive regional data,
which are subject to strict data protection provisions. As a special service to users, the SOEP Research Data Center also offers personal advice to researchers who want to use the SOEP as reference data or a control sample for their own studies
The team has a number of international research partnerships. These forms of cooperation make the SOEP a crucial part of the international data infra-structure. The overarching aim of the SOEP research infrastructure is to strengthen the empirical foun-dation for international comparative cross-sectional and longitudinal analysis. The SOEP data are used widely by researchers in Germany and abroad in international comparative analyses.
SOEP Wave Report 2015
18 | PaRT 1: Overview of the Infrastructure SOEP at DIW Berlin
Division 3: Applied Panel Analysis and Knowledge Transfer
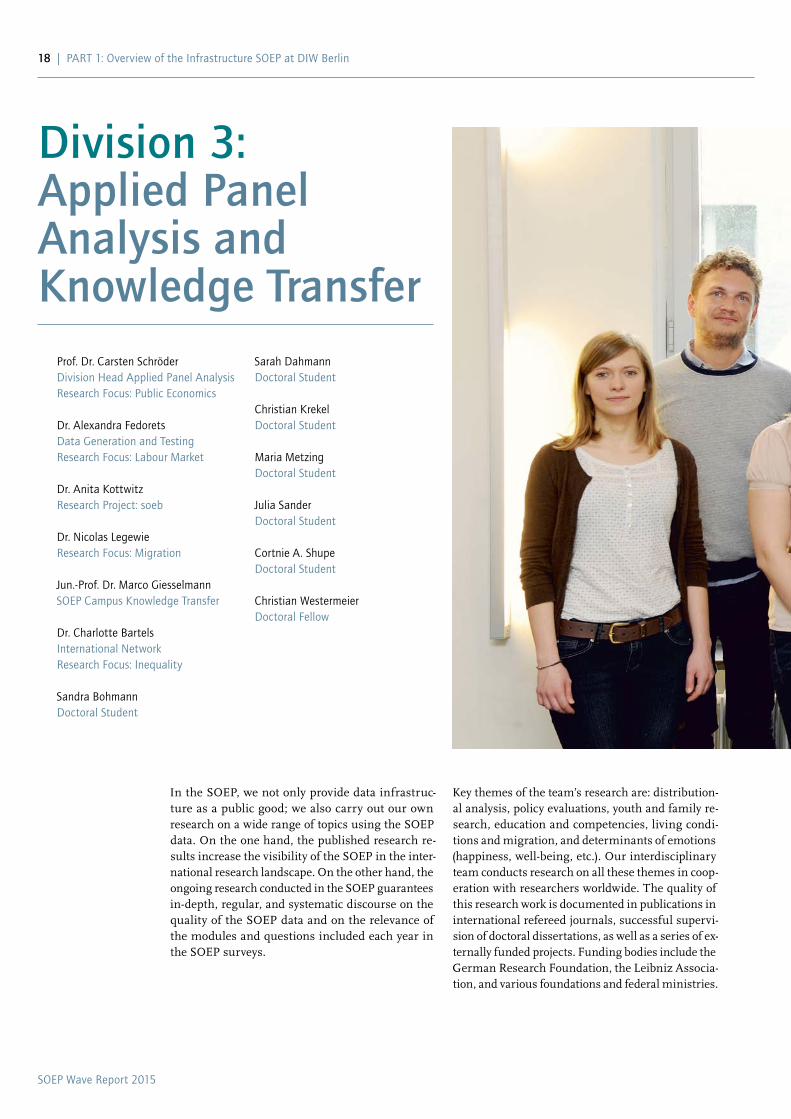
In the SOEP, we not only provide data infrastruc-ture as a public good; we also carry out our own research on a wide range of topics using the SOEP data. On the one hand, the published research re-sults increase the visibility of the SOEP in the inter-national research landscape. On the other hand, the ongoing research conducted in the SOEP guarantees in-depth, regular, and systematic discourse on the quality of the SOEP data and on the relevance of the modules and questions included each year in the SOEP surveys.
Prof. Dr. Carsten Schröder Division Head Applied Panel AnalysisResearch Focus: Public Economics
Dr. Alexandra Fedorets Data Generation and TestingResearch Focus: Labour Market
Dr. Anita Kottwitz Research Project: soeb
Dr. Nicolas Legewie Research Focus: Migration
Jun.-Prof. Dr. Marco Giesselmann SOEP Campus Knowledge Transfer
Dr. Charlotte BartelsInternational NetworkResearch Focus: Inequality
Sandra BohmannDoctoral Student
Sarah DahmannDoctoral Student
Christian Krekel Doctoral Student
Maria Metzing Doctoral Student
Julia SanderDoctoral Student
Cortnie A. ShupeDoctoral Student
Christian Westermeier Doctoral Fellow
Key themes of the team’s research are: distribution-al analysis, policy evaluations, youth and family re-search, education and competencies, living condi-tions and migration, and determinants of emotions (happiness, well-being, etc.). Our interdisciplinary team conducts research on all these themes in coop-eration with researchers worldwide. The quality of this research work is documented in publications in international refereed journals, successful supervi-sion of doctoral dissertations, as well as a series of ex-ternally funded projects. Funding bodies include the German Research Foundation, the Leibniz Associa-tion, and various foundations and federal ministries.
SOEP Wave Report 2015
PaRT 1: Overview of the Infrastructure SOEP at DIW Berlin | 19
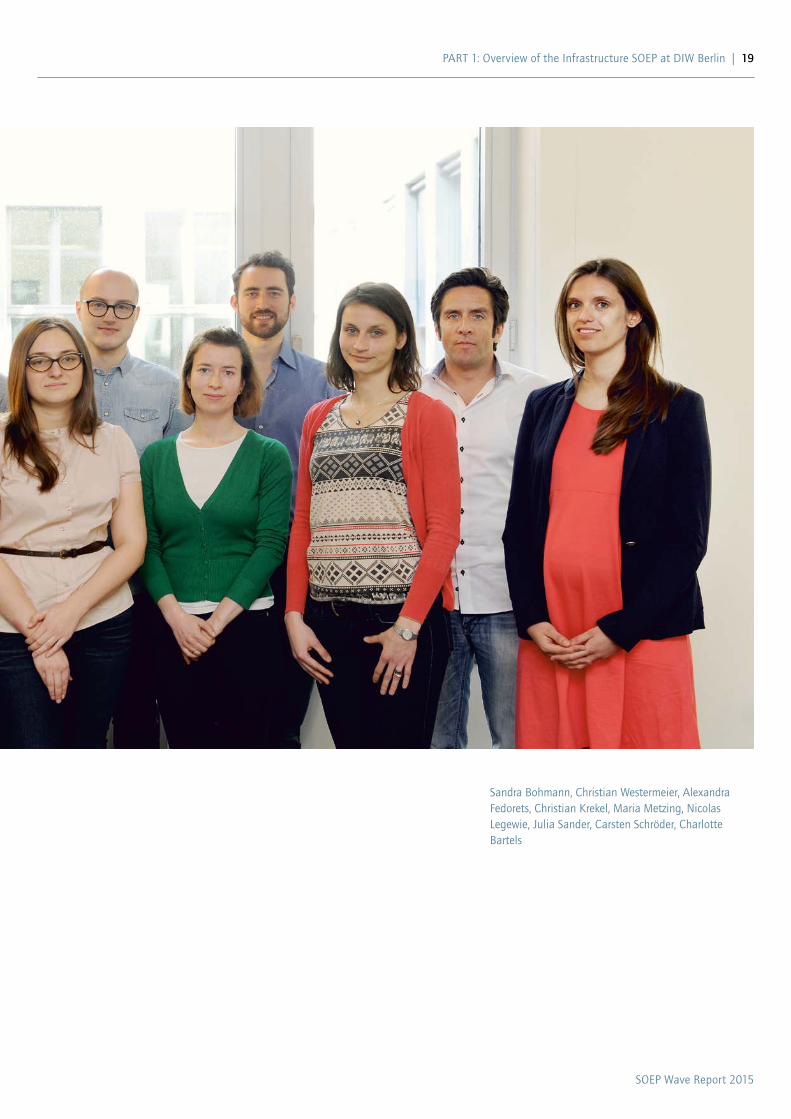
Sandra Bohmann, Christian Westermeier, alexandra Fedorets, Christian Krekel, Maria Metzing, Nicolas Legewie, Julia Sander, Carsten Schröder, Charlotte Bartels
SOEP Wave Report 2015
20 | PaRT 1: Overview of the Infrastructure SOEP at DIW Berlin
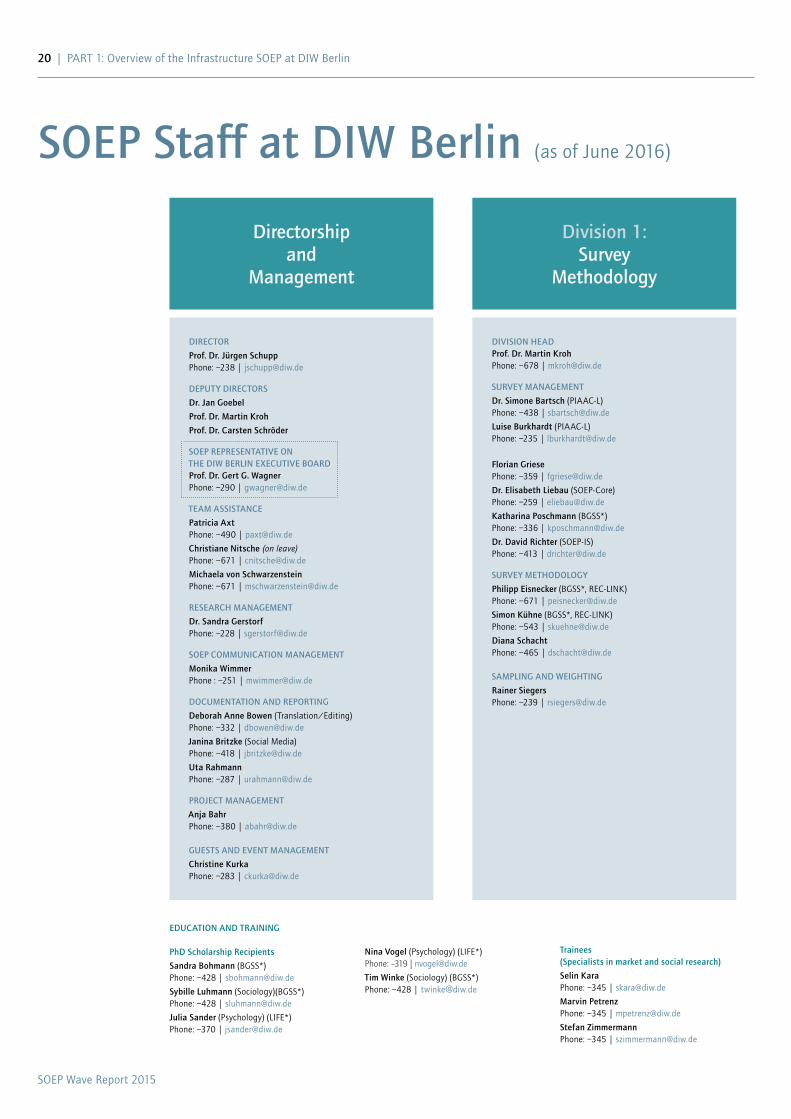
SOEP Staff at DIW Berlin (as of June 2016)
DiREctOR
Prof. Dr. Jürgen SchuppPhone: –238 | [email protected]
DEPuty DiREctORS
Dr. Jan Goebel
Prof. Dr. Martin Kroh
Prof. Dr. carsten Schröder
SOEP REPRESEntativE On thE DiW BERlin ExEcutivE BOaRDProf. Dr. Gert G. Wagner Phone: –290 | [email protected]
tEaM aSSiStancE
Patricia axt Phone: –490 | [email protected]
christiane nitsche (on leave)Phone: –671 | [email protected]
Michaela von Schwarzenstein Phone: –671 | [email protected]
RESEaRch ManaGEMEnt
Dr. Sandra GerstorfPhone: –228 | [email protected]
SOEP cOMMunicatiOn ManaGEMEnt
Monika WimmerPhone : –251 | [email protected]
DOcuMEntatiOn anD REPORtinG
Deborah anne Bowen (Translation/Editing)Phone: –332 | [email protected]
Janina Britzke (Social Media)Phone: –418 | [email protected]
uta RahmannPhone: –287 | [email protected]
PROJEct ManaGEMEnt
anja Bahr Phone: –380 | [email protected]
GuEStS anD EvEnt ManaGEMEnt
christine KurkaPhone: –283 | [email protected]
DiviSiOn hEaDProf. Dr. Martin KrohPhone: –678 | [email protected]
SuRvEy ManaGEMEnt
Dr. Simone Bartsch (PIAAC-L)Phone: –438 | [email protected]
luise Burkhardt (PIAAC-L)Phone: –235 | [email protected]
Florian GriesePhone: –359 | [email protected]
Dr. Elisabeth liebau (SOEP-Core) Phone: –259 | [email protected]
Katharina Poschmann (BGSS*)Phone: –336 | [email protected]
Dr. David Richter (SOEP-IS)Phone: –413 | [email protected]
SuRvEy MEthODOlOGy
Philipp Eisnecker (BGSS*, REC-LINK)Phone: –671 | [email protected]
Simon Kühne (BGSS*, REC-LINK)Phone: –543 | [email protected]
Diana SchachtPhone: –465 | [email protected]
SaMPlinG anD WEiGhtinG
Rainer SiegersPhone: –239 | [email protected]
Directorship and
Management
Division 1: Survey
Methodology
EDucatiOn anD tRaininG
PhD Scholarship Recipients
Sandra Bohmann (BGSS*)Phone: –428 | [email protected]
Sybille luhmann (Sociology)(BGSS*)Phone: –428 | [email protected]
Julia Sander (Psychology) (LIFE*)Phone: –370 | [email protected]
nina vogel (Psychology) (LIFE*)Phone: –319 | [email protected]
tim Winke (Sociology) (BGSS*)Phone: –428 | [email protected]
trainees(Specialists in market and social research)
Selin Kara Phone: –345 | [email protected]
Marvin PetrenzPhone: –345 | [email protected]
Stefan Zimmermann Phone: –345 | [email protected]
SOEP Wave Report 2015
PaRT 1: Overview of the Infrastructure SOEP at DIW Berlin | 21
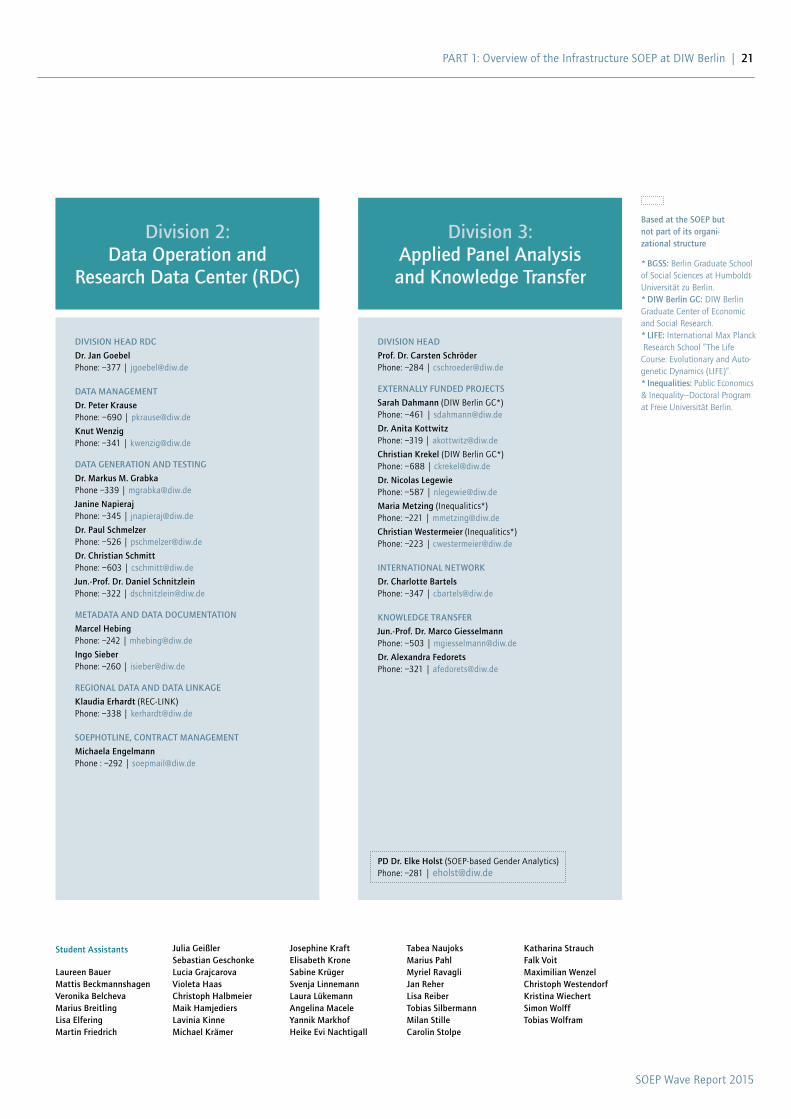
DiviSiOn hEaD RDc
Dr. Jan Goebel Phone: –377 | [email protected]
Data ManaGEMEnt
Dr. Peter Krause Phone: –690 | [email protected]
Knut WenzigPhone: –341 | [email protected]
Data GEnERatiOn anD tEStinG
Dr. Markus M. GrabkaPhone –339 | [email protected]
Janine napierajPhone: –345 | [email protected]
Dr. Paul Schmelzer Phone: –526 | [email protected]
Dr. christian SchmittPhone: –603 | [email protected]
Jun.-Prof. Dr. Daniel SchnitzleinPhone: –322 | [email protected]
MEtaData anD Data DOcuMEntatiOn
Marcel hebingPhone: –242 | [email protected]
ingo SieberPhone: –260 | [email protected]
REGiOnal Data anD Data linKaGE
Klaudia Erhardt (REC-LINK)Phone: –338 | [email protected]
SOEPhOtlinE, cOntRact ManaGEMEnt
Michaela EngelmannPhone : –292 | [email protected]
DiviSiOn hEaD
Prof. Dr. carsten Schröder Phone: –284 | [email protected]
ExtERnally FunDED PROJEctS
Sarah Dahmann (DIW Berlin GC*)Phone: –461 | [email protected]
Dr. anita KottwitzPhone: –319 | [email protected]
christian Krekel (DIW Berlin GC*)Phone: –688 | [email protected]
Dr. nicolas legewiePhone: –587 | [email protected]
Maria Metzing (Inequalitics*)Phone: –221 | [email protected]
christian Westermeier (Inequalitics*)Phone: –223 | [email protected]
intERnatiOnal nEtWORK
Dr. charlotte BartelsPhone: –347 | [email protected]
KnOWlEDGE tRanSFER
Jun.-Prof. Dr. Marco GiesselmannPhone: –503 | [email protected]
Dr. alexandra FedoretsPhone: –321 | [email protected]
PD Dr. Elke holst (SOEP-based Gender Analytics)Phone: –281 | [email protected]
Division 2: Data Operation and
Research Data Center (RDC)
Division 3: Applied Panel Analysis and Knowledge Transfer
Based at the SOEP but not part of its organi-zational structure
* BGSS: Berlin Graduate School of Social Sciences at Humboldt-Universität zu Berlin. * DIW Berlin GC: DIW Berlin Graduate Center of Economic and Social Research. * LIFE: International Max Planck Research School “The Life Course: Evolutionary and auto - genetic Dynamics (LIFE)”.* Inequalities: Public Economics & Inequality—Doctoral Program at Freie Universität Berlin.
Student assistants
laureen BauerMattis Beckmannshagenveronika BelchevaMarius Breitlinglisa ElferingMartin Friedrich
Julia GeißlerSebastian Geschonkelucia Grajcarovavioleta haaschristoph halbmeierMaik hamjedierslavinia KinneMichael Krämer
Josephine KraftElisabeth KroneSabine KrügerSvenja linnemannlaura lükemannangelina Maceleyannik Markhofheike Evi nachtigall
tabea naujoksMarius PahlMyriel RavagliJan Reherlisa Reibertobias SilbermannMilan Stillecarolin Stolpe
Katharina StrauchFalk voitMaximilian Wenzelchristoph WestendorfKristina WiechertSimon Wolfftobias Wolfram

SOEP Wave Report 2015
2015
22
2015SOEP Wave Report 2015
PART 2
SoEP data and Fieldwork
PaRT 2: SOEP Data and Fieldwork | 23

SOEP Wave Report 2015
24 | PaRT 2: SOEP Data and Fieldwork
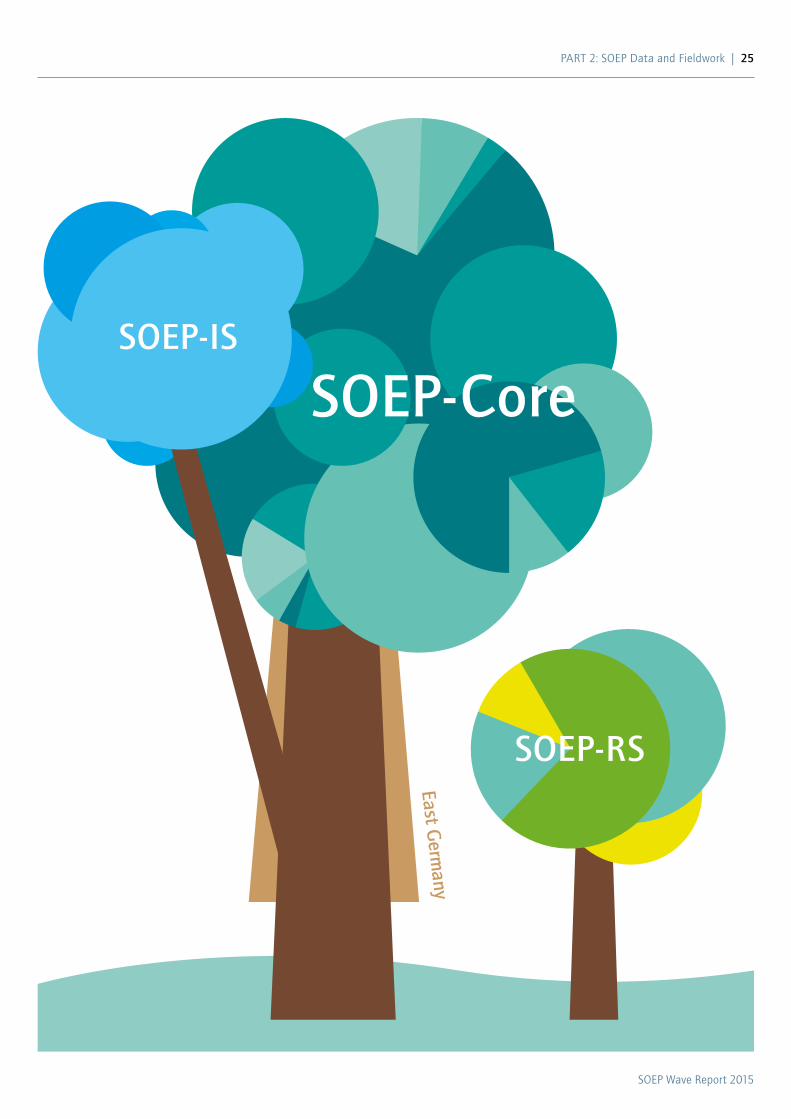
The Landscape of SOEP StudiesSOEP-Core
The SOEP-Core is THE centerpiece of the wide-ranging representative longi-tudinal study of private households located at the German Institute for Eco-nomic Research, DIW Berlin. SOEP-Core was started in 1984 as a research project in an interdisciplinary Collaborative Research Center of the German Research Foundation. In 1990—just after German reunification—we enlarged the area covered by the SOEP study by adding a representative sample from East Germany. This feature makes the SOEP unique among other household panel surveys worldwide. Each year since 1984, around 14,000 households and about 30,000 individuals have been surveyed by the SOEP’s fieldwork organization, TNS Infratest Sozialforschung. The data provide infor mation on all members of each household. Respondents include Germans living in the states of both the former East and West Germany, foreign citizens resid-ing in Germany, recent immigrants, and a new sample of refugees added in 2016. Some of the many topics include household composition, education, occu-pational biographies, employment, earnings, health, and satisfaction indicators.
SOEP-Innovation Sample (SOEP-IS)
The longitudinal SOEP-Innovation Sample (SOEP-IS) was created in 2012 as a special sample for testing highly innovative research projects. It was designed primarily for methodical and thematic research questions that involve too great a risk of non-response to be included in the long-term SOEP study, whether because the instruments are not yet scientifically verified or because they deal with very specific research issues. Proposals approved for the SOEP-IS up to now include economic behavioral experiments, implicit association tests (IAT), and complex procedures for measuring time use (day reconstruction method DRM). Researchers at universities and research institutes worldwide are encouraged to submit innovative proposals to the SOEP-IS. An open call for proposals is made annually, with a submission deadline at the end of the year.
SOEP-Related Studies (SOEP-RS)
There are now a number of studies in Germany that have incorporated ques-tions from the SOEP questionnaire to validate their results on a representative sample of the German population (“SOEP as Reference Data”). The SOEP-Related Studies (SOEP-RS) are designed and implemented in close coopera-tion with the SOEP team and structured in a similar way to the SOEP. This makes it possible to link the SOEP-RS datasets either with the original SOEP questionnaire (SOEP-Core) or with the SOEP-IS questionnaires and to ana-lyze the data together. Some examples of SOEP-Related Studies are: BASE-II (Berlin Aging Study II), FiD (Families in Germany), PIAAC-L, SOEP-ECEC Quality, SOEP-LEE (Employer-Employee Survey), and starting in 2016, BRISE.
1984
1990
2011
today
SOEP Wave Report 2015
PaRT 2: SOEP Data and Fieldwork | 25
East Germ
any
SOEP-coreSOEP-iS
SOEP-RS
SOEP Wave Report 2015
26 | PaRT 2: SOEP Data and Fieldwork
SOEP Team at TNS Infratest SozialforschungFor the SOEP, TNS Infratest has created a “tailor-made” business area that ref lects the specific requirements of the project in terms of its composition and struc-ture. The tasks of the SOEP team can be divided into three areas: first, methodological and concep-tual, science-based and science-oriented advice and guidance; second, panel management; and third, comprehensive data processing, in particular data acquisition, verification, and editing.
The first aspect includes general project manage-ment and project control, analysis, and documenta-tion for methodological field reports as well as con-sulting services for the SOEP group at DIW Berlin on issues of sample design, the design and implementa-tion of data collection methods, and consulting for innovative survey methods as used in SOEP tests, pilots, and the SOEP-Innovation Sample. With re-gard to panel management, several individual tasks are especially noteworthy: assignment and telecare of interviewers and coordination of the interface to the field organization. Further key tasks include organization and mailing of survey documents to interviewers and respondents, including ordering and handling of incentives, the “central adminis-tration” of households that participate exclusively in the survey in the mail mode, the coding of the response results in the panel database and the ho-tline for respondents on issues related to data col-lection and privacy information, etc. In the context of data processing, data from paper questionnaires are registered and comprehensive, partly automatic data checks are carried out along with individual checkups as well as longitudinal consistency checks. Moreover, occupation and industry classifications of respondents’ statements are coded.
TNS Infratest
TNS Infratest, headquartered in Munich, is one of the most prestigious institutes for market, politi-cal, and social research in Germany. It is the Ger-man member of the TNS Group, which in turn is part of the Kantar Group, in which WPP (London) has bundled its research activities. As a member of a leading global network, the institute provides its clients research data of the highest quality, strate-gic knowledge, and scientific advice for decisions in business and society; for large nationally or globally active companies and medium-sized businesses; as well as for numerous ministries, agencies, and sci-entific institutions. TNS Infratest uses systems for quality assurance and total quality management pro-cesses in all areas and at all levels of its organization.TNS Infratest has been conducting political and social research since the 1950s. In the early 1980s, “Infra - test Sozialforschung” (Infratest Social Research) was founded as a separate company that today is the leading commercial research institute in the field of social science surveys in Germany. In recent years, TNS Infratest Sozialforschung has worked closely with the contracting institutes to design and conduct a number of empirical studies and project types that have made national and international scientific his-tory. Foremost among these is the German Socio-Economic Panel (SOEP) study, which is also known to respondents under the title “Living in Germany” (LiD). TNS Infratest has been responsible for collect-ing data since the beginning of the SOEP in 1984. Range of tasks covers the entire process of data col-lection, from the conceptual design, through the sampling, the implementation of the survey instru-ments, up to the cross-sectional weighting, data pro-cessing, and methodical field reporting. These ac-tivities are coordinated in a separate business area of TNS Infratest Sozialforschung.
The Organization of SOEP Fieldwork
SOEP Wave Report 2015
PaRT 2: SOEP Data and Fieldwork | 27
To provide additional support in data collection for the SOEP, there are around 140 interviewers on the
“special staff” of “Living in Germany” (LiD). Most of these special LiD-interviewers have extensive SOEP experience and work exclusively with the conven-tional paper-and-pencil method (PAPI).
The large number of interviewers from the various interviewer staffs of TNS Infratest guarantees a na-tionwide infrastructure for face-to-face interviews in Germany. Through a rigorous selection process with requirements for a minimum level of experience and volume of work on the interviewer staff, the selec-tion of the SOEP interviewers is handled through professional recruitment management.
The so-called “Face-to-Face Line” located in Munich is in charge of the central control of the interview-er fieldwork for TNS Infratest. It is responsible for the complete organization of the interviewer staff. This includes complex recruitment processes, es-tablishing and maintaining database-driven infor-mation systems for the management and monitor-ing of the interviewer staff, monitoring and control of the samples in the fieldwork, and preparation of response statistics. In cooperation with the project management, the Face-to-Face Line also coordinates payment for interviewers through fees, charges, and premium models. In addition, the Face-to Face Line drafts and creates the field and training materials for the interviewers together with project management.
With the support of 33 regionally based “contact in-terviewers,” the Face-to-Face Line guarantees opti-mal coordination of the complete interviewer staff. The contact interviewers have extensive experience and outstanding contact and leadership abilities. Thus, each interviewer, in addition to having an in-house contact at TNS Infratest, also has a per-manent local contact available to him or her. The contact interviewers play an important role in local recruitment and training processes. They regularly take part in the central events training activities of the field organization (in-house or online events) or project-specific training, and thus serve as multipli-ers for the distribution of important information and knowledge to the interviewers.
Overall, the SOEP team includes 19 permanent employees (some part-time) as well as some addi-tional assistants. More employees are continuously involved in the processing of the project from sev-eral data production units of TNS Infratest. These include the project managers responsible for orga-nizing face-to-face fieldwork, the professionals in questionnaire programming, as well as experts from the department of statistics, who are responsible for sampling and cross-sectional weighting.
Face-to-Face Capabilities
TNS Infratest conducts all of the face-to-face in-terviews for ambitious surveys with interviewers trained and managed in-house by TNS, and thus does not follow the common practice of other insti-tutes of outsourcing parts of the fieldwork to third-party institutions. The reasons for the exclusive use of in-house expertise for demanding surveys like the SOEP are obvious. In-house interviewers are fun-damental for (a) effective communication between project leader and interviewer during the fieldwork phase, (b) efficient fieldwork management with a view to response-oriented processing of the sample, and (c) effective quality control of the fieldwork. For panel studies, it is especially important to maintain the use of the same interviewer each year to ensure continuity in processing the sample from a longitu-dinal perspective. At the household level, interviewer continuity has a favorable effect on the longitudinal response rate.
TNS Infratest has a total of approximately 1,600 in-terviewers, including several select groups of inter-viewers for special studies that are not equipped with modern touch-pen laptops. About 900 interviewers work with touch-pen laptops and about 600 of those are available for assignment to demanding surveys like the SOEP. These interviewers are experienced in the implementation of sophisticated social research projects in general and are also experienced in work-ing with the SOEP.
SOEP Wave Report 2015
28 | PaRT 2: SOEP Data and Fieldwork
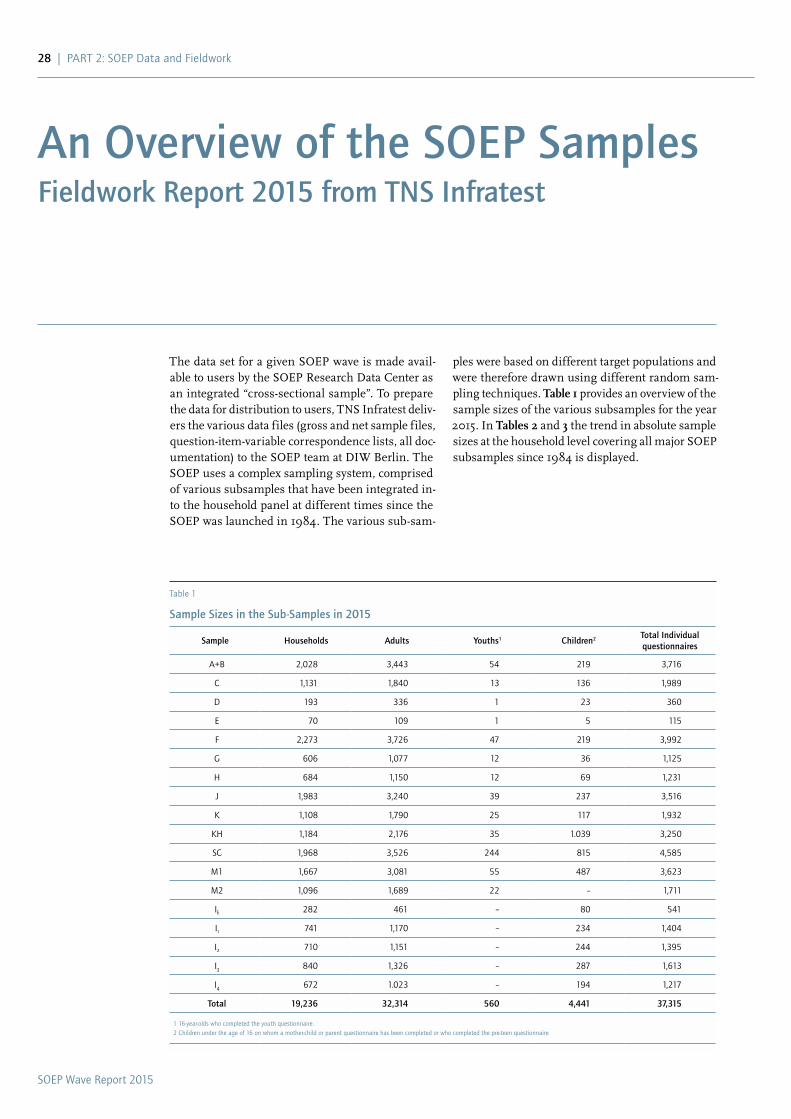
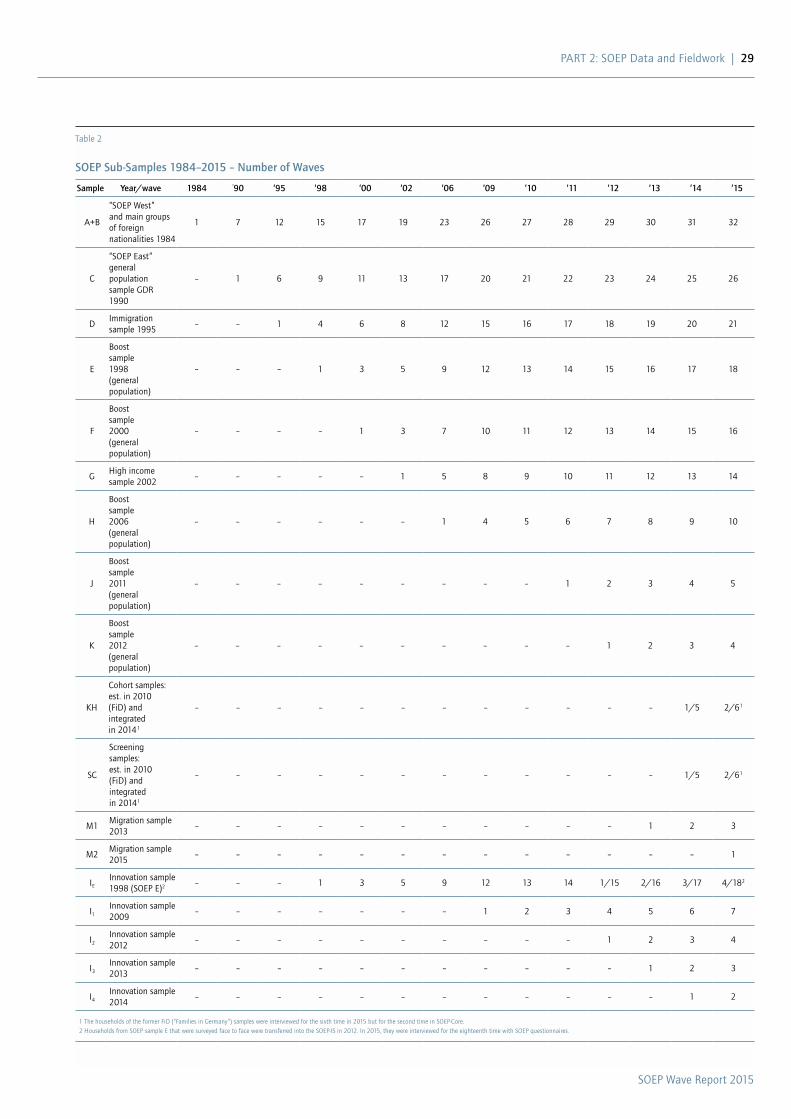
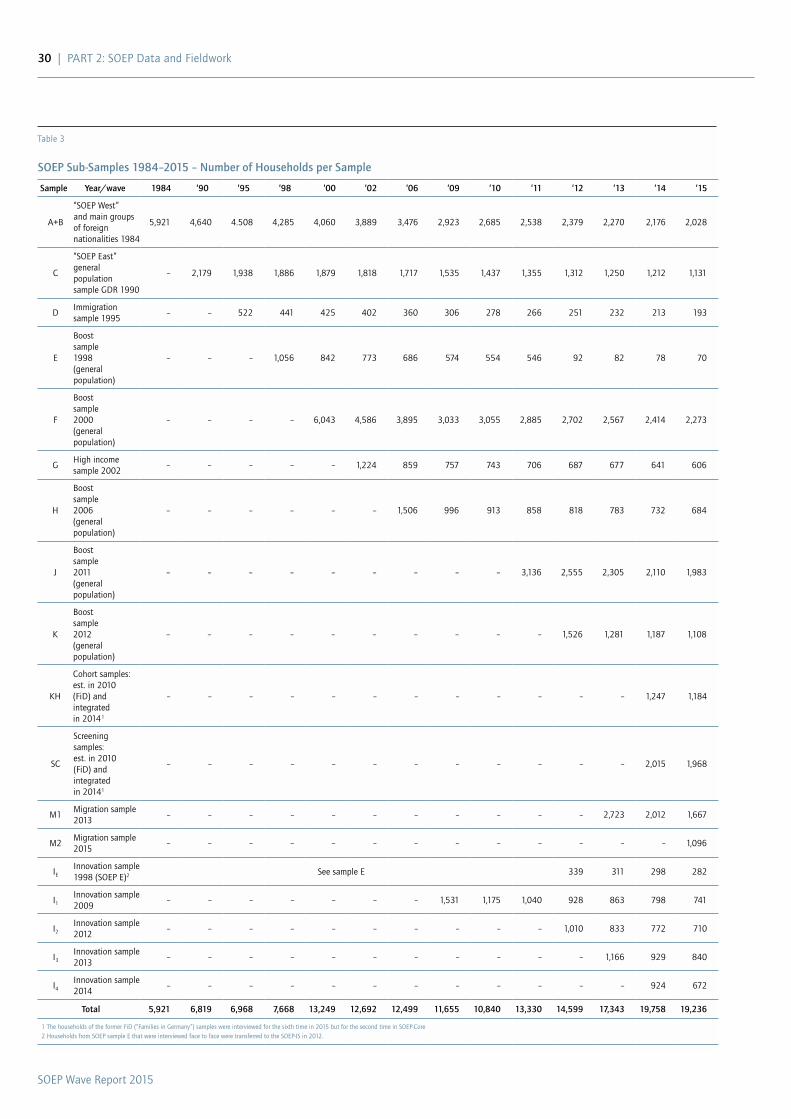
ples were based on different target populations and were therefore drawn using different random sam-pling techniques. table 1 provides an overview of the sample sizes of the various subsamples for the year 2015. In tables 2 and 3 the trend in absolute sample sizes at the household level covering all major SOEP subsamples since 1984 is displayed.
The data set for a given SOEP wave is made avail-able to users by the SOEP Research Data Center as an integrated “cross-sectional sample”. To prepare the data for distribution to users, TNS Infratest deliv-ers the various data files (gross and net sample files, question-item-variable correspondence lists, all doc-umentation) to the SOEP team at DIW Berlin. The SOEP uses a complex sampling system, comprised of various subsamples that have been integrated in-to the household panel at different times since the SOEP was launched in 1984. The various sub-sam-
An Overview of the SOEP SamplesFieldwork Report 2015 from TNS Infratest
Table 1
Sample Sizes in the Sub-Samples in 2015
Sample Households Adults Youths1 Children2 Total Individual questionnaires
a+B 2,028 3,443 54 219 3,716
C 1,131 1,840 13 136 1,989
D 193 336 1 23 360
E 70 109 1 5 115
F 2,273 3,726 47 219 3,992
G 606 1,077 12 36 1,125
H 684 1,150 12 69 1,231
J 1,983 3,240 39 237 3,516
K 1,108 1,790 25 117 1,932
KH 1,184 2,176 35 1.039 3,250
SC 1,968 3,526 244 815 4,585
M1 1,667 3,081 55 487 3,623
M2 1,096 1,689 22 – 1,711
IE 282 461 – 80 541
I1 741 1,170 – 234 1,404
I2 710 1,151 – 244 1,395
I3 840 1,326 – 287 1,613
I4 672 1.023 – 194 1,217
Total 19,236 32,314 560 4,441 37,315
1 16-year-olds who completed the youth questionnaire.2 Children under the age of 16 on whom a mother-child or parent questionnaire has been completed or who completed the pre-teen questionnaire
SOEP Wave Report 2015
PaRT 2: SOEP Data and Fieldwork | 29
Table 2
SOEP Sub-Samples 1984–2015 – Number of Waves
Sample Year/wave 1984 ‘90 ‘95 ‘98 ‘00 ‘02 ‘06 ‘09 ‘10 ‘11 ‘12 ‘13 ‘14 ‘15
a+B
“SOEP West” and main groups of foreign nationalities 1984
1 7 12 15 17 19 23 26 27 28 29 30 31 32
C
“SOEP East” general population sample GDR 1990
– 1 6 9 11 13 17 20 21 22 23 24 25 26
DImmigration sample 1995
– – 1 4 6 8 12 15 16 17 18 19 20 21
E
Boost sample 1998 (general population)
– – – 1 3 5 9 12 13 14 15 16 17 18
F
Boost sample 2000 (general population)
– – – – 1 3 7 10 11 12 13 14 15 16
GHigh income sample 2002
– – – – – 1 5 8 9 10 11 12 13 14
H
Boost sample 2006 (general population)
– – – – – – 1 4 5 6 7 8 9 10
J
Boost sample 2011 (general population)
– – – – – – – – – 1 2 3 4 5
K
Boost sample 2012 (general population)
– – – – – – – – – – 1 2 3 4
KH
Cohort samples: est. in 2010 (FiD) and integrated in 20141
– – – – – – – – – – – – 1/5 2/61
SC
Screening samples: est. in 2010 (FiD) and integrated in 20141
– – – – – – – – – – – – 1/5 2/61
M1Migration sample 2013
– – – – – – – – – – – 1 2 3
M2Migration sample 2015
– – – – – – – – – – – – – 1
IEInnovation sample 1998 (SOEP E)2 – – – 1 3 5 9 12 13 14 1/15 2/16 3/17 4/182
I1Innovation sample 2009
– – – – – – – 1 2 3 4 5 6 7
I2Innovation sample 2012
– – – – – – – – – – 1 2 3 4
I3Innovation sample 2013
– – – – – – – – – – – 1 2 3
I4Innovation sample 2014
– – – – – – – – – – – – 1 2
1 The households of the former FiD (“Families in Germany”) samples were interviewed for the sixth time in 2015 but for the second time in SOEP-Core.2 Households from SOEP sample E that were surveyed face to face were transferred into the SOEP-IS in 2012. In 2015, they were interviewed for the eighteenth time with SOEP questionnaires.
SOEP Wave Report 2015
30 | PaRT 2: SOEP Data and Fieldwork
Table 3
SOEP Sub-Samples 1984–2015 – Number of Households per Sample
Sample Year/wave 1984 ‘90 ‘95 ‘98 ‘00 ‘02 ‘06 ‘09 ‘10 ‘11 ‘12 ‘13 ‘14 ‘15
a+B
“SOEP West” and main groups of foreign nationalities 1984
5,921 4,640 4.508 4,285 4,060 3,889 3,476 2,923 2,685 2,538 2,379 2,270 2,176 2,028
C
“SOEP East” general population sample GDR 1990
– 2,179 1,938 1,886 1,879 1,818 1,717 1,535 1,437 1,355 1,312 1,250 1,212 1,131
DImmigration sample 1995
– – 522 441 425 402 360 306 278 266 251 232 213 193
E
Boost sample 1998 (general population)
– – – 1,056 842 773 686 574 554 546 92 82 78 70
F
Boost sample 2000 (general population)
– – – – 6,043 4,586 3,895 3,033 3,055 2,885 2,702 2,567 2,414 2,273
GHigh income sample 2002
– – – – – 1,224 859 757 743 706 687 677 641 606
H
Boost sample 2006 (general population)
– – – – – – 1,506 996 913 858 818 783 732 684
J
Boost sample 2011 (general population)
– – – – – – – – – 3,136 2,555 2,305 2,110 1,983
K
Boost sample 2012 (general population)
– – – – – – – – – – 1,526 1,281 1,187 1,108
KH
Cohort samples: est. in 2010 (FiD) and integrated in 20141
– – – – – – – – – – – – 1,247 1,184
SC
Screening samples: est. in 2010 (FiD) and integrated in 20141
– – – – – – – – – – – – 2,015 1,968
M1Migration sample 2013
– – – – – – – – – – – 2,723 2,012 1,667
M2Migration sample 2015
– – – – – – – – – – – – – 1,096
IEInnovation sample 1998 (SOEP E)2 See sample E 339 311 298 282
I1Innovation sample 2009
– – – – – – – 1,531 1,175 1,040 928 863 798 741
I2Innovation sample 2012
– – – – – – – – – – 1,010 833 772 710
I3Innovation sample 2013
– – – – – – – – – – – 1,166 929 840
I4Innovation sample 2014
– – – – – – – – – – – – 924 672
Total 5,921 6,819 6,968 7,668 13,249 12,692 12,499 11,655 10,840 13,330 14,599 17,343 19,758 19,236
1 The households of the former FiD (“Families in Germany”) samples were interviewed for the sixth time in 2015 but for the second time in SOEP-Core2 Households from SOEP sample E that were interviewed face to face were transferred to the SOEP-IS in 2012.
SOEP Wave Report 2015
PaRT 2: SOEP Data and Fieldwork | 31
SOEP-Core Samples A-KH
Questionnaires and Survey Instruments
The primary interviewing method in the SOEP-Core samples is face-to-face with computer-assisted per-sonal interviewing (CAPI) and/or paper and pencil interviewing (PAPI) as modes, depending on the sub-sample and the assigned interviewer. A small percentage of households in samples A to H are in-terviewed with the help of self-administered mail questionnaires that were introduced as a means of converting non-respondents.
In the year 2015, 13 different questionnaires were used in the households of the SOEP-Core samples. Most of them were processed with PAPI as well as CAPI:
1. Household questionnaire, answered by the person living in the household who is most familiar with household matters overall.
2. individual questionnaires for all persons born in 1997 or earlier.
3. Supplementary “life history” questionnaire for all new respondents joining a panel household born in 1997 or earlier.
4. Youth questionnaire for all household members born in 1998.
5. Additional cognitive competency tests for all persons with a completed youth questionnaire (interviewer-assisted modes only).
6. Supplementary questionnaire “mother and Child a” for mothers of children who were born in 2015 (or born in 2014 if the child was born after the previous year’s fieldwork was completed).
7. Supplementary questionnaire “mother and Child B” for mothers of children born in 2012. In households where the father is the main caregiver, fathers are asked to provide the interview.
8. Supplementary questionnaire “mother and Child C” for mothers (or fathers) of children born in 2009.
9. Supplementary questionnaire “Parents d”, for mothers and fathers of children born in 2007. In contrast to the mother and child questionnaires, both parents are asked to provide an interview if they live in the same SOEP household as the child.
10. Supplementary questionnaire “mother and Child E” for mothers (or fathers) of children born in 2005. In households where the father is the main caregiver, fathers are asked to provide the interview.
Households and individuals with the longest history of (continuous) panel participation took part for the 32nd time in 2015 (samples A and B). The following samples have been added to the core sample since the year 2009:
• Sample i1 started with more than 1,500 households in 2009 and served as the core sample of the SOEP-Innovation Sample when it was established in 2011. Since then, the SOEP-IS has been expanded with refresher samples in 2012 (sample I2), 2013 (sample I3), and 2014 (sample I4). Additionally a subset of households from sample E was transferred to the SOEP-IS in 2012 (sample IE).
• Sample J is a general population refresher of more than 3,000 households that was integrated in 2011.
• Sample K is a general population refresher totaling 1,500 households that was integrated in 2012.
• Samples SC (screening samples) and KH (cohort samples) were established in 2010 and originate from the former study “Families in Germany” (FiD), a longitudinal SOEP-equivalent sample system for the evaluation of German family polices on behalf of two German governmental departments (BMF/BMFSFJ). The evaluation ended in 2013. The FiD samples were transferred into the methodological and financial framework of SOEP-Core in 2014.
• Sample m1 was designed to improve the representation of migrants living in Germany. Established in 2013, over 2,700 households with at least one person with a migration background were interviewed to enhance the analytic potential for integration research and migration dynamics. A second migration sample (Sample m2) of almost 1,100 house- holds was integrated in 2015.
SOEP Wave Report 2015
32 | PaRT 2: SOEP Data and Fieldwork
11. Pre-teen questionnaire for all individuals born in 2003.
12. Supplementary questionnaire for temporary drop-outs from the previous wave to minimize
“gaps” in longitudinal data on panel members. This questionnaire is a short version of the previous year’s questionnaire.
13. Supplementary questionnaire for panel members who experienced a death in their household or family in 2014 or 2015: “the deceased person.”
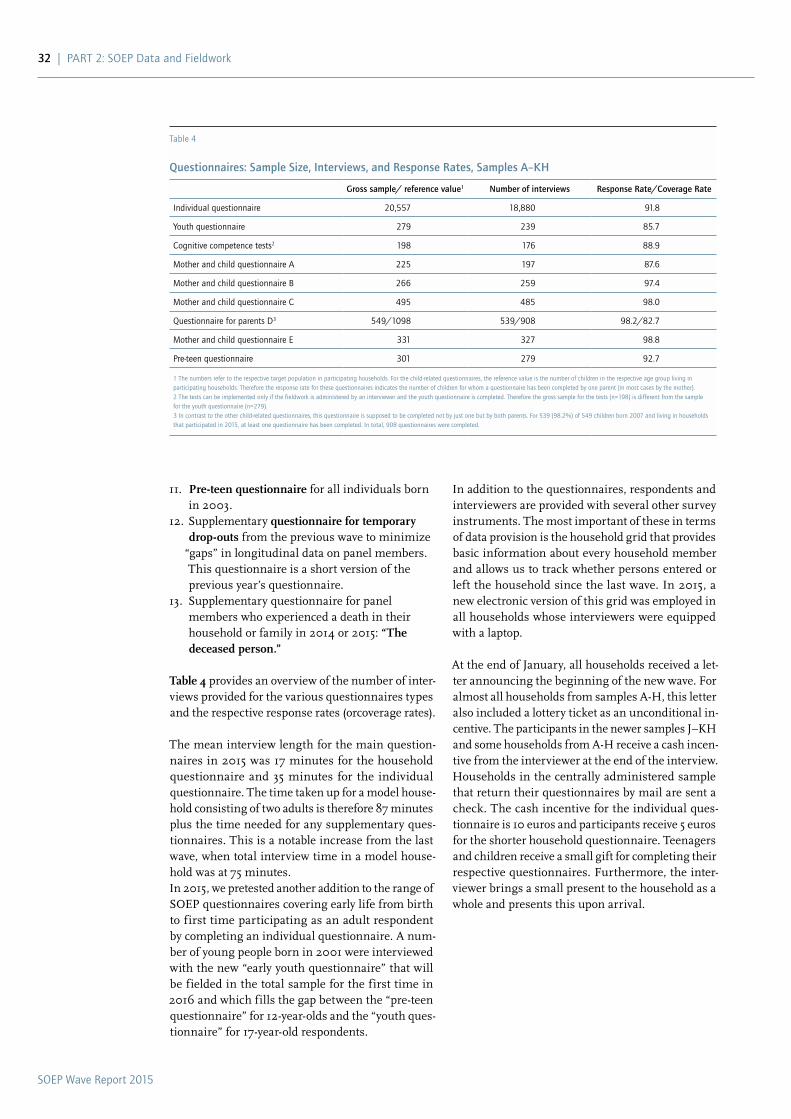
table 4 provides an overview of the number of inter-views provided for the various questionnaires types and the respective response rates (orcoverage rates).
The mean interview length for the main question-naires in 2015 was 17 minutes for the household questionnaire and 35 minutes for the individual questionnaire. The time taken up for a model house-hold consisting of two adults is therefore 87 minutes plus the time needed for any supplementary ques-tionnaires. This is a notable increase from the last wave, when total interview time in a model house-hold was at 75 minutes.In 2015, we pretested another addition to the range of SOEP questionnaires covering early life from birth to first time participating as an adult respondent by completing an individual questionnaire. A num-ber of young people born in 2001 were interviewed with the new “early youth questionnaire” that will be fielded in the total sample for the first time in 2016 and which fills the gap between the “pre-teen questionnaire” for 12-year-olds and the “youth ques-tionnaire” for 17-year-old respondents.
Table 4
Questionnaires: Sample Size, Interviews, and Response Rates, Samples A–KH
Gross sample/ reference value1 Number of interviews Response Rate/Coverage Rate
Individual questionnaire 20,557 18,880 91.8
Youth questionnaire 279 239 85.7
Cognitive competence tests2 198 176 88.9
Mother and child questionnaire a 225 197 87.6
Mother and child questionnaire B 266 259 97.4
Mother and child questionnaire C 495 485 98.0
Questionnaire for parents D3 549/1098 539/908 98.2/82.7
Mother and child questionnaire E 331 327 98.8
Pre-teen questionnaire 301 279 92.7
1 The numbers refer to the respective target population in participating households. For the child-related questionnaires, the reference value is the number of children in the respective age group living in participating households. Therefore the response rate for these questionnaires indicates the number of children for whom a questionnaire has been completed by one parent (in most cases by the mother). 2 The tests can be implemented only if the fieldwork is administered by an interviewer and the youth questionnaire is completed. Therefore the gross sample for the tests (n=198) is different from the sample for the youth questionnaire (n=279).3 In contrast to the other child-related questionnaires, this questionnaire is supposed to be completed not by just one but by both parents. For 539 (98.2%) of 549 children born 2007 and living in households that participated in 2015, at least one questionnaire has been completed. In total, 908 questionnaires were completed.
In addition to the questionnaires, respondents and interviewers are provided with several other survey instruments. The most important of these in terms of data provision is the household grid that provides basic information about every household member and allows us to track whether persons entered or left the household since the last wave. In 2015, a new electronic version of this grid was employed in all households whose interviewers were equipped with a laptop.
At the end of January, all households received a let-ter announcing the beginning of the new wave. For almost all households from samples A-H, this letter also included a lottery ticket as an unconditional in-centive. The participants in the newer samples J–KH and some households from A-H receive a cash incen-tive from the interviewer at the end of the interview. Households in the centrally administered sample that return their questionnaires by mail are sent a check. The cash incentive for the individual ques-tionnaire is 10 euros and participants receive 5 euros for the shorter household questionnaire. Teenagers and children receive a small gift for completing their respective questionnaires. Furthermore, the inter-viewer brings a small present to the household as a whole and presents this upon arrival.
SOEP Wave Report 2015
PaRT 2: SOEP Data and Fieldwork | 33
ers to participate for other reasons. As part of this process, households are contacted by telephone and urged to keep taking part in the study. If this “con-version” is successful, basic household information is collected and the questionnaires are sent by mail. Thus, in these households, questionnaires are fully self-administered. This mode shift often leads to a conversion of “soft” refusals and therefore supports the stability of the long-term samples A–H.
Another method of interviewing is used in multi-person households from samples A–H. For individu-als who were unable to provide an interview while the interviewer was present, the option of self-com-pletion of a paper questionnaire can be offered to reduce partial unit non-response (PUNR). Further-more, the possibility of interviewing more than one person simultaneously with the help of paper ques-tionnaires can be a useful method to reduce the over-all length of interviewer visits in households with many members and to thereby increase acceptance. This method is a mixture of face-to-face interviewing and self-administered interviewing. Although this option is supposed to be an exception, the longer a sample exists, the more this tends to become the only option to ensure low PUNR in larger households.
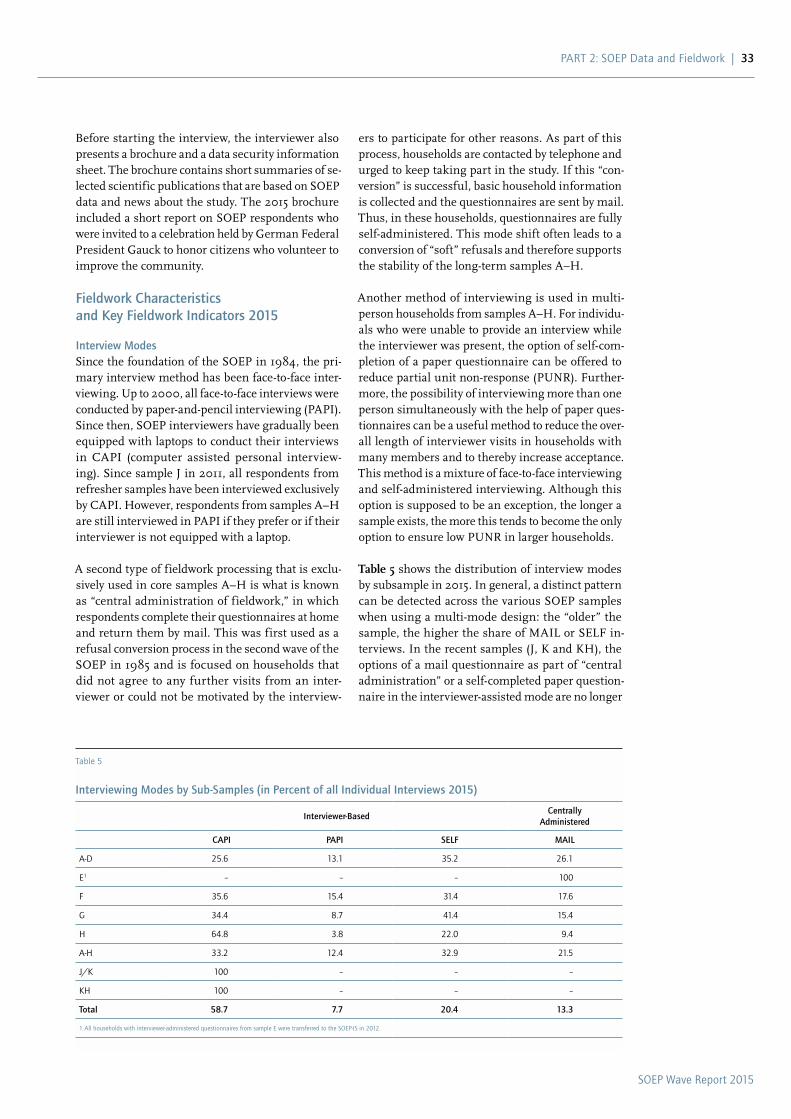
table 5 shows the distribution of interview modes by subsample in 2015. In general, a distinct pattern can be detected across the various SOEP samples when using a multi-mode design: the “older” the sample, the higher the share of MAIL or SELF in-terviews. In the recent samples (J, K and KH), the options of a mail questionnaire as part of “central administration” or a self-completed paper question-naire in the interviewer-assisted mode are no longer
Before starting the interview, the interviewer also presents a brochure and a data security information sheet. The brochure contains short summaries of se-lected scientific publications that are based on SOEP data and news about the study. The 2015 brochure included a short report on SOEP respondents who were invited to a celebration held by German Federal President Gauck to honor citizens who volunteer to improve the community.
Fieldwork Characteristics and Key Fieldwork Indicators 2015
Interview ModesSince the foundation of the SOEP in 1984, the pri-mary interview method has been face-to-face inter-viewing. Up to 2000, all face-to-face interviews were conducted by paper-and-pencil interviewing (PAPI). Since then, SOEP interviewers have gradually been equipped with laptops to conduct their interviews in CAPI (computer assisted personal interview-ing). Since sample J in 2011, all respondents from refresher samples have been interviewed exclusively by CAPI. However, respondents from samples A–H are still interviewed in PAPI if they prefer or if their interviewer is not equipped with a laptop.
A second type of fieldwork processing that is exclu-sively used in core samples A–H is what is known as “central administration of fieldwork,” in which respondents complete their questionnaires at home and return them by mail. This was first used as a refusal conversion process in the second wave of the SOEP in 1985 and is focused on households that did not agree to any further visits from an inter-viewer or could not be motivated by the interview-
Table 5
Interviewing Modes by Sub-Samples (in Percent of all Individual Interviews 2015)
Interviewer-BasedCentrally
Administered
CAPI PAPI SELF MAIL
a-D 25.6 13.1 35.2 26.1
E1 – – – 100
F 35.6 15.4 31.4 17.6
G 34.4 8.7 41.4 15.4
H 64.8 3.8 22.0 9.4
a-H 33.2 12.4 32.9 21.5
J/K 100 – – –
KH 100 – – –
Total 58.7 7.7 20.4 13.3
1 all households with interviewer-administered questionnaires from sample E were transferred to the SOEP-IS in 2012.
SOEP Wave Report 2015
34 | PaRT 2: SOEP Data and Fieldwork
Interviewers make every effort to contact the house-holds. But for the reasons stated above, if this is not possible, there are alternative ways of processing the households in samples A–H. In 2015, 72.2 per-cent of households in the gross sample in A–H were processed by interviewers, and 26.9 percent were administered centrally. The remaining 0.8 percent were households that are considered drop-outs based on information from the period between waves (e.g., final drop-outs; whole household moved abroad or is deceased). Response Rates and Panel StabilityThe field results of a longitudinal survey can be mea-sured in different ways. Two sets of indicators appear to be most relevant: response rates and panel stabil-ity rates. Response rates ref lect the simple relation between input (gross sample) and output (net sam-ple) and therefore are an indicator for cross-sectional fieldwork success. The response rate in the group of respondents from the previous wave processed by interviewers, which is the most important response rate, was 92.8 percent. The response rate for the centrally administered households is naturally lower than the rate of household processed by interviewers. However, at 86.5 percent in the group of respondents from the previous wave, it is still remarkable given the fact that all these households have a history of refusing further participation in the study.
Response rates for drop-outs from the previous wave and new households are significantly lower than for households that took part in the study the year be-fore. However, a response rate of 29.1 percent among drop-outs in the previous wave that were processed by interviewers shows that contacting these house-holds again does turn out successfully in about one-third of cases. Furthermore, about half of the new households that joined the sample when members of panel households formed a new household can be convinced by the interviewers to be part in the study (54.5 percent).
From a long-term perspective, panel stability can be regarded as a decisive indicator for monitoring and predicting a longitudinal sample’s development in terms of overall size. Panel stability is calculated as the number of households participating in the cur-rent year compared to the corresponding number from the previous year. Thus it ref lects the net total effects of panel mortality on the one hand and panel growth (due to split-off households and participation of temporary drop-outs in the previous wave) on the other. This approach is particularly helpful in house-hold surveys where split-off households are tracked. That means that if an individual from a participating household moves into a new household, the survey
provided. This serves one of our main objectives in improving the quality of the SOEP: we aim to increase the CAPI rate to improve data quality and provide a larger pool of respondents for question-naire modules such as cognitive tests or behavioral experiments that are not viable with paper based questionnaire administration.
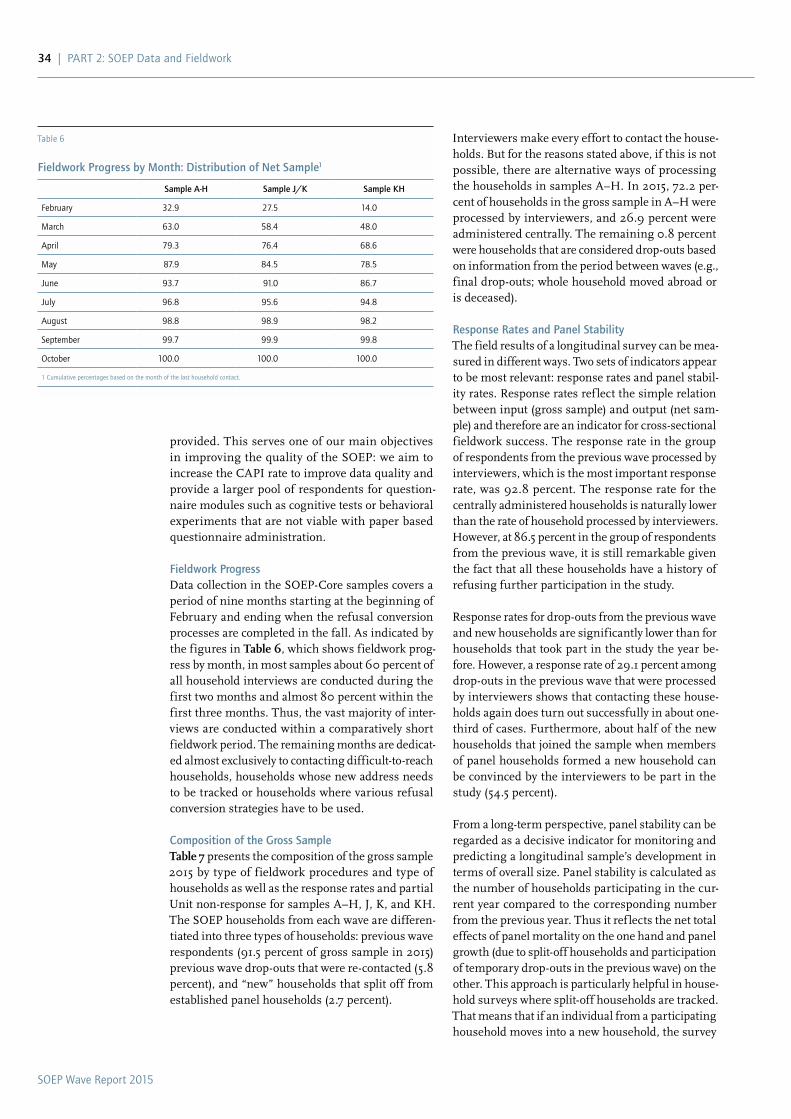
Fieldwork ProgressData collection in the SOEP-Core samples covers a period of nine months starting at the beginning of February and ending when the refusal conversion processes are completed in the fall. As indicated by the figures in table 6, which shows fieldwork prog-ress by month, in most samples about 60 percent of all household interviews are conducted during the first two months and almost 80 percent within the first three months. Thus, the vast majority of inter-views are conducted within a comparatively short fieldwork period. The remaining months are dedicat-ed almost exclusively to contacting difficult-to-reach households, households whose new address needs to be tracked or households where various refusal conversion strategies have to be used.
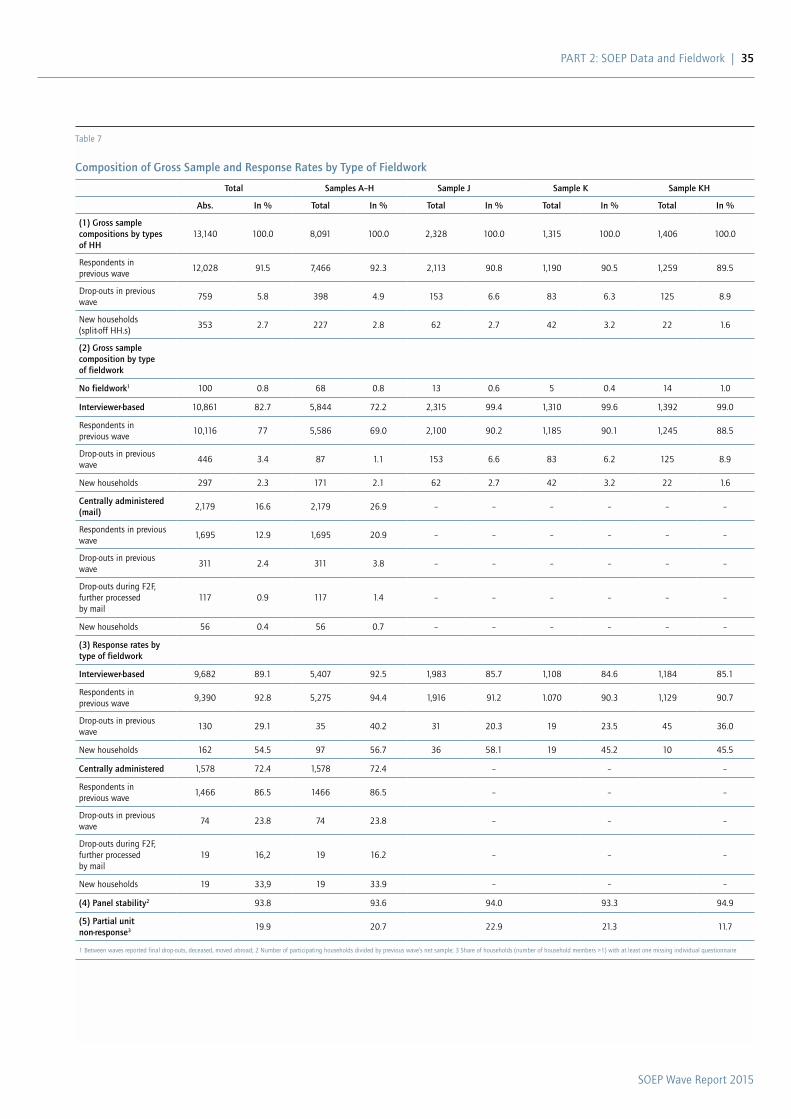
Composition of the Gross Sampletable 7 presents the composition of the gross sample 2015 by type of fieldwork procedures and type of households as well as the response rates and partial Unit non-response for samples A–H, J, K, and KH. The SOEP households from each wave are differen-tiated into three types of households: previous wave respondents (91.5 percent of gross sample in 2015) previous wave drop-outs that were re-contacted (5.8 percent), and “new” households that split off from established panel households (2.7 percent).
Table 6
Fieldwork Progress by Month: Distribution of Net Sample1
Sample A-H Sample J/K Sample KH
February 32.9 27.5 14.0
March 63.0 58.4 48.0
april 79.3 76.4 68.6
May 87.9 84.5 78.5
June 93.7 91.0 86.7
July 96.8 95.6 94.8
august 98.8 98.9 98.2
September 99.7 99.9 99.8
October 100.0 100.0 100.0
1 Cumulative percentages based on the month of the last household contact.
SOEP Wave Report 2015
PaRT 2: SOEP Data and Fieldwork | 35
Table 7
Composition of Gross Sample and Response Rates by Type of Fieldwork
Total Samples A–H Sample J Sample K Sample KH
Abs. In % Total In % Total In % Total In % Total In %
(1) Gross sample compositions by types of HH
13,140 100.0 8,091 100.0 2,328 100.0 1,315 100.0 1,406 100.0
Respondents in previous wave
12,028 91.5 7,466 92.3 2,113 90.8 1,190 90.5 1,259 89.5
Drop-outs in previous wave
759 5.8 398 4.9 153 6.6 83 6.3 125 8.9
New households (split-off HH.s)
353 2.7 227 2.8 62 2.7 42 3.2 22 1.6
(2) Gross sample composition by type of fieldwork
No fieldwork1 100 0.8 68 0.8 13 0.6 5 0.4 14 1.0
Interviewer-based 10,861 82.7 5,844 72.2 2,315 99.4 1,310 99.6 1,392 99.0
Respondents in previous wave
10,116 77 5,586 69.0 2,100 90.2 1,185 90.1 1,245 88.5
Drop-outs in previous wave
446 3.4 87 1.1 153 6.6 83 6.2 125 8.9
New households 297 2.3 171 2.1 62 2.7 42 3.2 22 1.6
Centrally administered (mail)
2,179 16.6 2,179 26.9 – – – – – –
Respondents in previous wave
1,695 12.9 1,695 20.9 – – – – – –
Drop-outs in previous wave
311 2.4 311 3.8 – – – – – –
Drop-outs during F2F, further processed by mail
117 0.9 117 1.4 – – – – – –
New households 56 0.4 56 0.7 – – – – – –
(3) Response rates by type of fieldwork
Interviewer-based 9,682 89.1 5,407 92.5 1,983 85.7 1,108 84.6 1,184 85.1
Respondents in previous wave
9,390 92.8 5,275 94.4 1,916 91.2 1.070 90.3 1,129 90.7
Drop-outs in previous wave
130 29.1 35 40.2 31 20.3 19 23.5 45 36.0
New households 162 54.5 97 56.7 36 58.1 19 45.2 10 45.5
Centrally administered 1,578 72.4 1,578 72.4 – – –
Respondents in previous wave
1,466 86.5 1466 86.5 – – –
Drop-outs in previous wave
74 23.8 74 23.8 – – –
Drop-outs during F2F, further processed by mail
19 16,2 19 16.2 – – –
New households 19 33,9 19 33.9 – – –
(4) Panel stability2 93.8 93.6 94.0 93.3 94.9
(5) Partial unit non-response3 19.9 20.7 22.9 21.3 11.7
1 Between waves reported final drop-outs, deceased, moved abroad; 2 Number of participating households divided by previous wave’s net sample; 3 Share of households (number of household members >1) with at least one missing individual questionnaire

SOEP Wave Report 2015
36 | PaRT 2: SOEP Data and Fieldwork
One indicator to measure the success of the field-work process on an individual level is the number of households in which at least one questionnaire is missing (PUNR). As the SOEP targets every adult member of the household, the share of multi-per-son households in which at least one person did not complete the individual interview is an interesting measure to look at in addition to response rates and panel stability. In 2015, this share was at 19.9% in the samples A–KH (table 7).
institute will try to track the address change and conduct interviews with the new household. In the context of a panel survey, a second group of house-holds can contribute to the stabilization of the sam-ple: “temporary drop-outs,” that is, households that could not be interviewed in the previous wave(s) (for various reasons) but that “re-joined” the panel in a given panel wave.
In order to meaningfully assess panel stability rates over the years, the various subsamples should be pro-cessed for at least five consecutive waves. After this period of time, the panel stability rates of samples are usually consolidated and therefore comparable. The mean value for panel stability across the estab-lished SOEP samples A-H achieved 93.6 percent in 2015, which is slightly lower than during the last waves (see Figure 1). However, the panel stability in the last two refresher samples J (fifth wave in 2015) and K (fourth wave in 2015) improved since 2014, reaching the level of A–H.
Figure 1
Panel Stability in SOEP Samples from 2008 to 2015
a–H J K KH
98,0
96,0
94,0
92,0
90,0
88,0
80,0
82,0
84,0
86,0
2008 2009 2010 2011 2012 2013 2014 2015
93,9
93,0
81,5
95,4
90,2
83,9
91,5
93,6 94
,093
,394
,9
95,0
94,6
94,7
94,6
92,7
SOEP Wave Report 2015
37
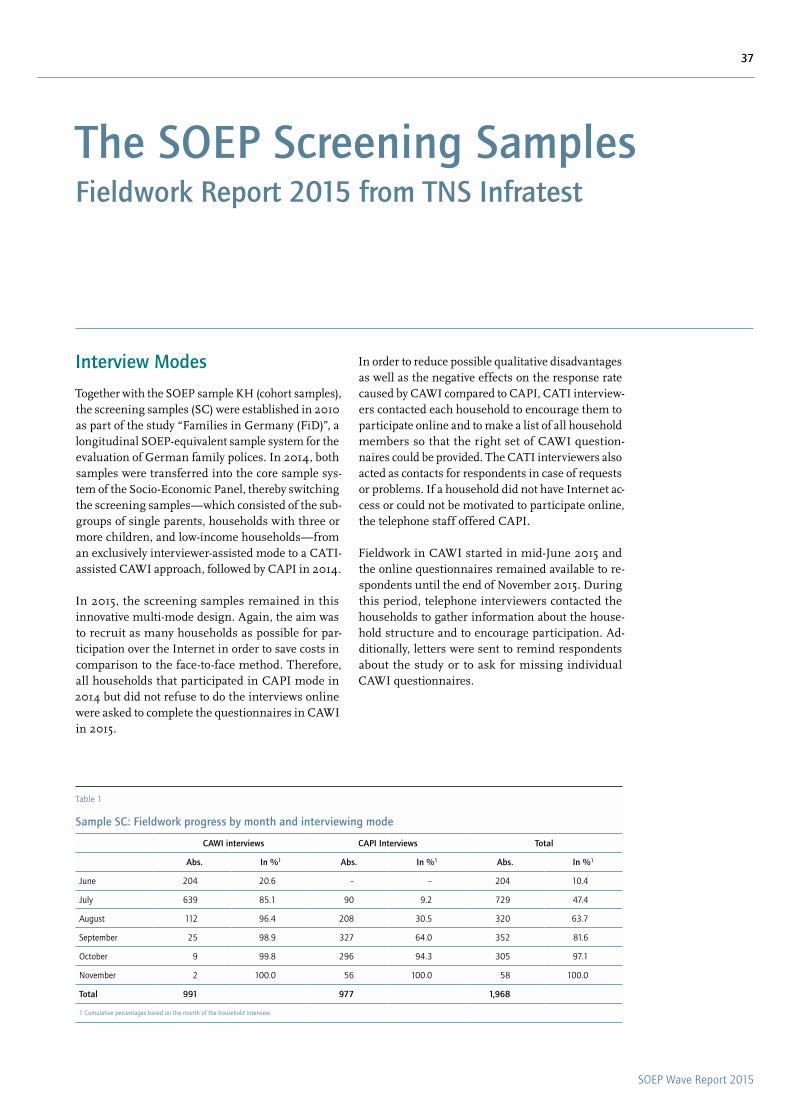
In order to reduce possible qualitative disadvantages as well as the negative effects on the response rate caused by CAWI compared to CAPI, CATI interview-ers contacted each household to encourage them to participate online and to make a list of all household members so that the right set of CAWI question-naires could be provided. The CATI interviewers also acted as contacts for respondents in case of requests or problems. If a household did not have Internet ac-cess or could not be motivated to participate online, the telephone staff offered CAPI.
Fieldwork in CAWI started in mid-June 2015 and the online questionnaires remained available to re-spondents until the end of November 2015. During this period, telephone interviewers contacted the households to gather information about the house-hold structure and to encourage participation. Ad-ditionally, letters were sent to remind respondents about the study or to ask for missing individual CAWI questionnaires.
Interview Modes
Together with the SOEP sample KH (cohort samples), the screening samples (SC) were established in 2010 as part of the study “Families in Germany (FiD)”, a longitudinal SOEP-equivalent sample system for the evaluation of German family polices. In 2014, both samples were transferred into the core sample sys-tem of the Socio-Economic Panel, thereby switching the screening samples—which consisted of the sub-groups of single parents, households with three or more children, and low-income households—from an exclusively interviewer-assisted mode to a CATI-assisted CAWI approach, followed by CAPI in 2014.
In 2015, the screening samples remained in this innovative multi-mode design. Again, the aim was to recruit as many households as possible for par-ticipation over the Internet in order to save costs in comparison to the face-to-face method. Therefore, all households that participated in CAPI mode in 2014 but did not refuse to do the interviews online were asked to complete the questionnaires in CAWI in 2015.
The SOEP Screening SamplesFieldwork Report 2015 from TNS Infratest
Table 1
Sample SC: Fieldwork progress by month and interviewing mode
CAWI interviews CAPI Interviews Total
Abs. In %1 Abs. In %1 Abs. In %1
June 204 20.6 – – 204 10.4
July 639 85.1 90 9.2 729 47.4
august 112 96.4 208 30.5 320 63.7
September 25 98.9 327 64.0 352 81.6
October 9 99.8 296 94.3 305 97.1
November 2 100.0 56 100.0 58 100.0
Total 991 977 1,968
1 Cumulative percentages based on the month of the household interview.
SOEP Wave Report 2015
38 | PaRT 2: SOEP Data and Fieldwork
All households received a letter and a brochure an-nouncing the new wave of the study. The letter was transmitted to respondents in CAWI along with an online access code to a personal page containing links to every questionnaire the respondent was expected to fill out. For every questionnaire, the household received 5 euros. It received an addition-al 10 euro bonus if all questionnaires required of the household were completed. In CAWI, the in-centives were sent as vouchers in letters or e-mails, depending on the respondent’s preference. In CAPI, the incentive was paid in cash by the interviewer.
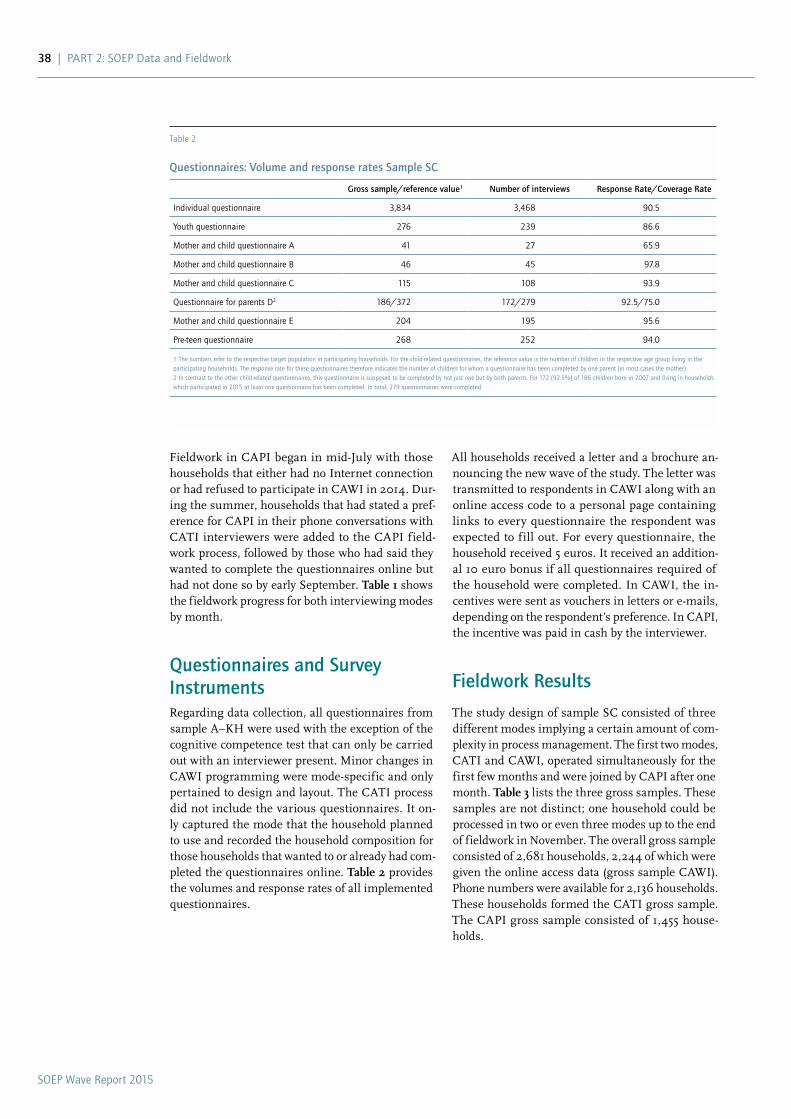
Fieldwork Results
The study design of sample SC consisted of three different modes implying a certain amount of com-plexity in process management. The first two modes, CATI and CAWI, operated simultaneously for the first few months and were joined by CAPI after one month. table 3 lists the three gross samples. These samples are not distinct; one household could be processed in two or even three modes up to the end of fieldwork in November. The overall gross sample consisted of 2,681 households, 2,244 of which were given the online access data (gross sample CAWI). Phone numbers were available for 2,136 households. These households formed the CATI gross sample. The CAPI gross sample consisted of 1,455 house-holds.
Fieldwork in CAPI began in mid-July with those households that either had no Internet connection or had refused to participate in CAWI in 2014. Dur-ing the summer, households that had stated a pref-erence for CAPI in their phone conversations with CATI interviewers were added to the CAPI field-work process, followed by those who had said they wanted to complete the questionnaires online but had not done so by early September. table 1 shows the fieldwork progress for both interviewing modes by month.
Questionnaires and Survey InstrumentsRegarding data collection, all questionnaires from sample A–KH were used with the exception of the cognitive competence test that can only be carried out with an interviewer present. Minor changes in CAWI programming were mode-specific and only pertained to design and layout. The CATI process did not include the various questionnaires. It on-ly captured the mode that the household planned to use and recorded the household composition for those households that wanted to or already had com-pleted the questionnaires online. table 2 provides the volumes and response rates of all implemented questionnaires.
Table 2
Questionnaires: Volume and response rates Sample SC
Gross sample/reference value1 Number of interviews Response Rate/Coverage Rate
Individual questionnaire 3,834 3,468 90.5
Youth questionnaire 276 239 86.6
Mother and child questionnaire a 41 27 65.9
Mother and child questionnaire B 46 45 97.8
Mother and child questionnaire C 115 108 93.9
Questionnaire for parents D2 186/372 172/279 92.5/75.0
Mother and child questionnaire E 204 195 95.6
Pre-teen questionnaire 268 252 94.0
1 The numbers refer to the respective target population in participating households. For the child-related questionnaires, the reference value is the number of children in the respective age group living in the participating households. The response rate for these questionnaires therefore indicates the number of children for whom a questionnaire has been completed by one parent (in most cases the mother).2 In contrast to the other child-related questionnaires, this questionnaire is supposed to be completed by not just one but by both parents. For 172 (92.5%) of 186 children born in 2007 and living in households which participated in 2015 at least one questionnaire has been completed. In total, 279 questionnaires were completed.

SOEP Wave Report 2015
PaRT 2: SOEP Data and Fieldwork | 39
Table 3
Sample SC: Overview of the various gross samples
Total in % gross sample
Total gross sample 2,681 100.0
Gross sample CaWI 2,244 83.7
Gross sample CaTI 2,136 79.7
Gross sample CaPI1 1,455 54.3
1 This sample consisted of households that had no Internet access or that had declined to use CaWI in the previous wave, that could not be reached during CaTI fieldwork and did not participate online, that could be reached during CaTI fieldwork and insisted on CaPI, that stated willingness to participate online but did not do so until early September, and households that were formed during the CaPI fieldwork process (split-off households).
Table 4
Sample SC: Overview of the various gross samples
Total In %
(1) Gross sample compositions by types of HH 2,681 100.0
Respondents in previous wave 2,018 75.3
Drop-outs in previous wave 541 20.2
New households (split-off HH.s) 122 4.6
(2) Net sample composition by type of HH 1,968 100.0
Respondents previous wave 1,695 86.1
Temporary drop-outs prev. wave(s) 241 12.2
New households (split-off HH) 32 1.6
(3) Response rates by type of HH
Respondents previous wave 84.0
Drop-outs previous wave 44.5
New households 26.2
(4) Panel stability1 97.7
(5) Partial unit non-response2 23.0
1 Number of participating households divided by previous wave net sample2 Share of households (number of household members >1) with at least one missing individual questionnaire
Table 5
Sample SC: Fieldwork results of the CATI process
Total in % gross sample In % contacted households
CaTI gross sample 2,136 100.0
Households that could not be contacted 546 25.6
Contacted households 1,590 74.5 100.0
Permanent refusal (Both CaWI and CaPI) 54 2.5 3.4
Target person/household undecided whether to participate
128 6.0 8.1
Target person/household insists on CaPI participation (no internet or other reasons)
141 6.6 8.9
Target person/household states intention to participate online
1,267 59.3 79.7

SOEP Wave Report 2015
40 | PaRT 2: SOEP Data and Fieldwork
Even though the households were reminded by mail to fill out the questionnaires, only 62.3 percent of those who had intended to participate online actually did so (table 6). Households that had not filled out the online questionnaires by early September were transferred into CAPI, in which 20.0 percent (254 households) of the households that had stated the intention to participate online took part in the study.
In total, 1,968 households were interviewed, 991 with CAWI and 977 with CAPI. The overall response rate for the screening samples was 84.0 percent in households that participated in the previous wave, 44.5 percent in households that did not participate in 2014, and 26.2 percent in split-off households that took part for the first time in 2015 (table 4). The relatively high response rates in the latter two groups and the relatively large share of dropouts from the previous wave in the gross sample (20.2 percent, SOEP-Core: 5.8 percent) helped stabilize the panel, resulting in a very high panel stability rate of 97.7 percent. Another fieldwork indicator is the share of partially realized households with more than one adult target respondent (partial unit non-response or PUNR). As was expected due to the implemen-tation in CAWI, the PUNR was comparatively high at 23.0 percent.
tables 5 and 6 show the results of the CATI fieldwork process. 74.5 percent (1,590 households) of the CATI gross sample could be contacted by phone. 3.4 per-cent of these households declined to participate fur-ther in the study, whether online or face-to-face. 8.9 percent insisted on being interviewed face-to-face. As in 2014, a relatively high share of all contacted households (79.7 percent) stated the willingness to participate online.
Table 6
Sample SC: Selected disposition groups of the CATI process and the resulting net interviews
Abs. In % of sub-group
Households that could not be contacted 546 100.0
Of that number:
– participated in CaWI 158 28.9
… – participated in CaPI 187 34.2
… – did not participate at all 201 36.8
All contacted households 1,590 100.0
Of that number:
– participated in CaWI 815 51.3
… – participated in CaPI 427 26.9
… – did not participate at all 348 21.9
Target person/household that stated intention to participate online 1,267 100.0
Of that number:
– participated in CaWI 789 62.3
… – participated in CaPI 254 20.0
… – did not participate at all 224 17.7
SOEP Wave Report 2015
PaRT 2: SOEP Data and Fieldwork | 41
table 1 provides an overview of the number of active adult respondents as well as children in the SOEP in 2014 distinguishing between persons with and without migration background1 in the different sub-samples. We distinguish between the existing “old” samples A through J (A/J)2, the recently integrated samples from the “Families in Germany Project” (L1, L2, L3)3 as well the 2013 migration boost (M1). The table shows that the 2013 migration boost almost doubled the number of adult respondents with a mi-gration background. Moreover, integrating the sam-ples L1, L2, and L3 as well as sample M1 increased the total number of children with a migration back-ground from fewer than 1,000 in the old samples A through J to more than 4,000 in total. The second IAB-SOEP migration boost (M2) in 2015 adds an ad-ditional 1,689 adult respondents and almost 1,000 children. The 2015 data including sample M2 will be released to the scientific community for second-ary data analysis in late 2016 (SOEP.v32). Finally, in 2016 in the IAB-BAMF-SOEP-Migration Study, we plan to augment the SOEP data on migrants with (at least) another 2,000 adult respondents who arrived in Germany as refugees.
The three SOEP migration boosts not only increase the total number of observations on persons with a migration background but also function as necessary enlargements to the SOEP’s prospective design, com-pensating for migration-based changes in the under-lying German population. Migration to Germany
1 according to the official German statistics, a person is considered to have migration background if he or she either migrated to Germany, has non-German citizenship, or if his or her parents migrated to Germany.
2 also the old samples contained migration boosts, namely Sample B from 1984 targeting what were then known as “guest worker” households and Sample D from 1994, which focused on ethnic German migration to Germany between 1984 and 1994.
3 Samples L1, L2, and L3 were first interviewed in 2010 and 2011 and integrated into the SOEP retrospectively in 2014 (SOEP.v31). Sample L1 targeted families with newborn children from the 2007–2010 birth cohort. L2 sampled families with low-income single parents as well as large fami-lies, and sample L3 targeted single parents and large families.
Report from the SOEP
Migration Boosts of the SOEP in 2013, 2015, and 2016The increased inf lux of refugees to Germany in the second half of 2015 poses a major challenge for the German government, policy makers, administra-tive agencies, and the population of the country as a whole. It also makes it all the more urgent for em-pirical social researchers, official statistical agencies, and research institutions to produce empirical data for studying the social processes surrounding this wave of immigration. Improvements are needed in research infrastructures that provide data for second-ary research on refugees and their motives for migra-tion; on concerns and fears about refugees within the German population and the willingness to pro-vide help; and on processes of political polarization.
In the SOEP longitudinal study, we are meeting this challenge by building, adapting, and expanding our survey and the range of services we provide. As part of this endeavor, the Institute for Employment Re-search (IAB) in Nuremberg and the Socio-Economic Panel (SOEP) research infrastructure at DIW Ber-lin have partnered to survey migrants to Germany. Three samples were created and interviewed in 2013, 2015, and 2016. The Federal Office of Migration and Refugees (BAMF) joined for the 2016 boost sample focusing on refugees.
The SOEP Migration SurveyBy Martin Kroh and Jürgen Schupp
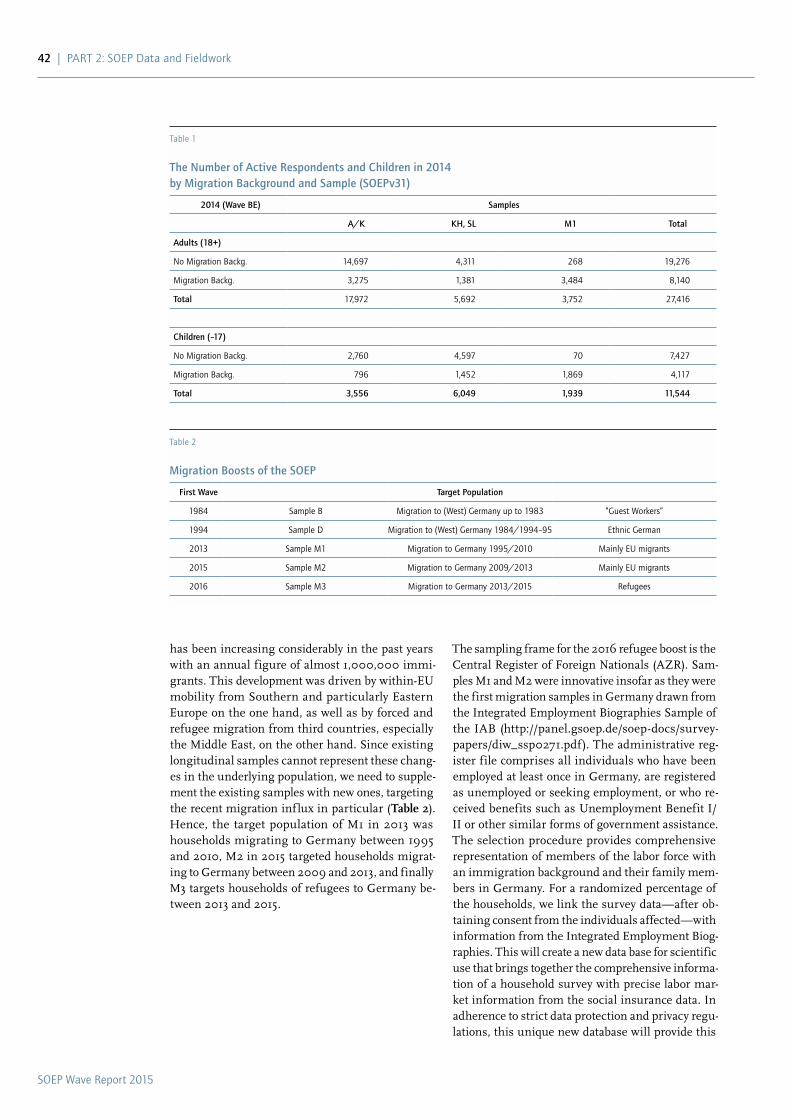
SOEP Wave Report 2015
42 | PaRT 2: SOEP Data and Fieldwork
The sampling frame for the 2016 refugee boost is the Central Register of Foreign Nationals (AZR). Sam-ples M1 and M2 were innovative insofar as they were the first migration samples in Germany drawn from the Integrated Employment Biographies Sample of the IAB (http://panel.gsoep.de/soep-docs/survey-papers/diw_ssp0271.pdf). The administrative reg-ister file comprises all individuals who have been employed at least once in Germany, are registered as unemployed or seeking employment, or who re-ceived benefits such as Unemployment Benefit I/II or other similar forms of government assistance. The selection procedure provides comprehensive representation of members of the labor force with an immigration background and their family mem-bers in Germany. For a randomized percentage of the households, we link the survey data—after ob-taining consent from the individuals affected—with information from the Integrated Employment Biog-raphies. This will create a new data base for scientific use that brings together the comprehensive informa-tion of a household survey with precise labor mar-ket information from the social insurance data. In adherence to strict data protection and privacy regu-lations, this unique new database will provide this
has been increasing considerably in the past years with an annual figure of almost 1,000,000 immi-grants. This development was driven by within-EU mobility from Southern and particularly Eastern Europe on the one hand, as well as by forced and refugee migration from third countries, especially the Middle East, on the other hand. Since existing longitudinal samples cannot represent these chang-es in the underlying population, we need to supple-ment the existing samples with new ones, targeting the recent migration inf lux in particular (table 2). Hence, the target population of M1 in 2013 was households migrating to Germany between 1995 and 2010, M2 in 2015 targeted households migrat-ing to Germany between 2009 and 2013, and finally M3 targets households of refugees to Germany be-tween 2013 and 2015.
Table 1
The Number of Active Respondents and Children in 2014 by Migration Background and Sample (SOEPv31)
2014 (Wave BE) Samples
A/K KH, SL M1 Total
Adults (18+)
No Migration Backg. 14,697 4,311 268 19,276
Migration Backg. 3,275 1,381 3,484 8,140
Total 17,972 5,692 3,752 27,416
Children (–17)
No Migration Backg. 2,760 4,597 70 7,427
Migration Backg. 796 1,452 1,869 4,117
Total 3,556 6,049 1,939 11,544
Table 2
Migration Boosts of the SOEP
First Wave Target Population
1984 Sample B Migration to (West) Germany up to 1983 “Guest Workers”
1994 Sample D Migration to (West) Germany 1984/1994–95 Ethnic German
2013 Sample M1 Migration to Germany 1995/2010 Mainly EU migrants
2015 Sample M2 Migration to Germany 2009/2013 Mainly EU migrants
2016 Sample M3 Migration to Germany 2013/2015 Refugees
SOEP Wave Report 2015
PaRT 2: SOEP Data and Fieldwork | 43
Furthermore, our efforts are not limited to the in-clusion of immigrants and refugees in the SOEP longitudinal samples. Over the last few weeks, we have also been adding new questions on the in-f lux of refugees to Germany to the 33rd wave of the SOEP-Core survey, which is set to go into the field in February 2016. We are particularly interested in whether people see the inf lux of refugees as more of an opportunity or a risk. And we will also be ask-ing questions about respondents’ social and politi-cal involvement in activities relating to refugees and about their plans and intentions to get involved in such activities in the future.
We are convinced that with this data—together with our standard indicators on concerns with immigra-tion to Germany and on xenophobia and hostility toward foreigners—the SOEP will soon offer a rich, diverse, and robust database for research on the im-pacts of the refugee influx to Germany, and one that will undoubtedly be of great interest to social scien-tists and economists worldwide.
labor market information from the social insurance system in fully anonymized form. This additional project using innovations in survey methodology and entitled “SOEP-REC-LINK“ has been granted three years of funding under the Leibniz Associa-tion’s Pact for Research and Innovation.
Questionnaires in the migration boost samples in-clude questions that have been part of the SOEP-Core for the last three decades. In addition, the survey also covers each respondent’s complete migration history, education and training, and employment history in Germany and abroad, and numerous aspects of the cultural and living environments that are relevant to the social integration of migrants (http://panel.gsoep.de/soep-docs/surveypapers/diw_ssp0216.pdf). Also in the case of the 2016 refugee boost, we ask questions specific to this population about the situation in their country of origin as well as their asylum application procedure and public housing.
The methodological challenges this refugee boost presents are significant in terms of both sample se-lection and survey implementation. It will require the involvement of translators and interpreters and the use of innovative technical solutions for some questions that respondents would like to have read out loud in their native language.
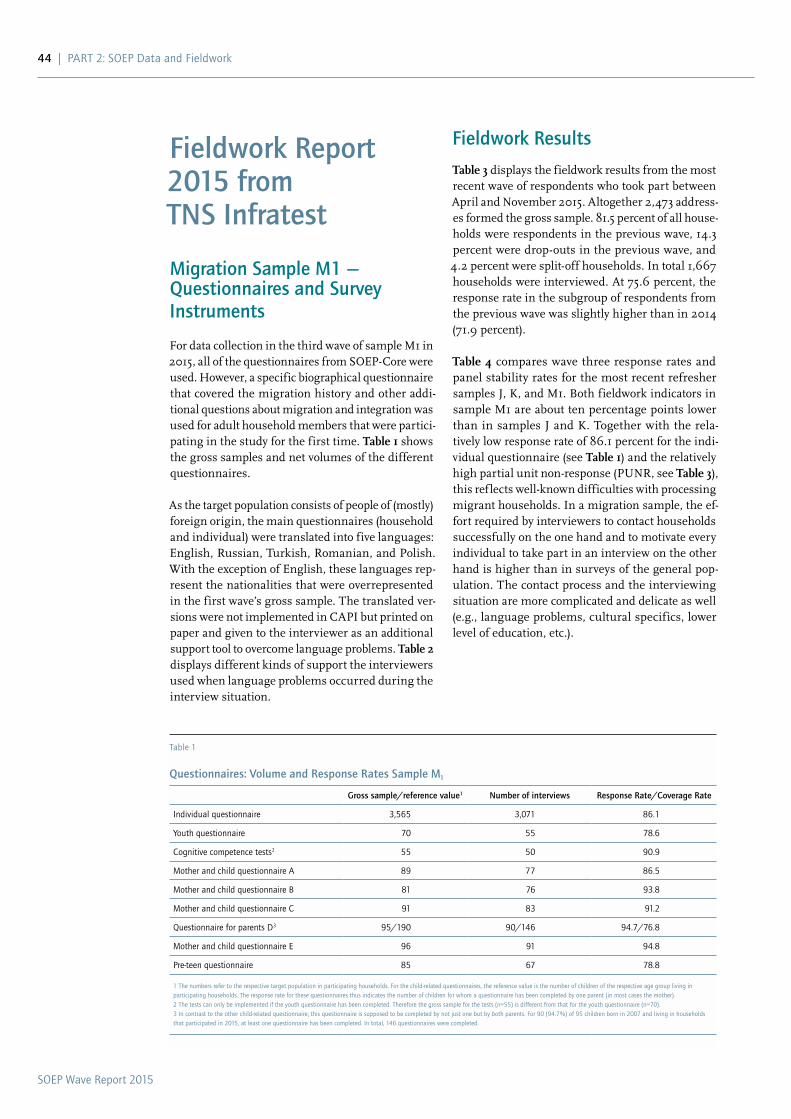
SOEP Wave Report 2015
44 | PaRT 2: SOEP Data and Fieldwork
Fieldwork Results
table 3 displays the fieldwork results from the most recent wave of respondents who took part between April and November 2015. Altogether 2,473 address-es formed the gross sample. 81.5 percent of all house-holds were respondents in the previous wave, 14.3 percent were drop-outs in the previous wave, and 4.2 percent were split-off households. In total 1,667 households were interviewed. At 75.6 percent, the response rate in the subgroup of respondents from the previous wave was slightly higher than in 2014 (71.9 percent).
table 4 compares wave three response rates and panel stability rates for the most recent refresher samples J, K, and M1. Both fieldwork indicators in sample M1 are about ten percentage points lower than in samples J and K. Together with the rela-tively low response rate of 86.1 percent for the indi-vidual questionnaire (see table 1) and the relatively high partial unit non-response (PUNR, see table 3), this ref lects well-known difficulties with processing migrant households. In a migration sample, the ef-fort required by interviewers to contact households successfully on the one hand and to motivate every individual to take part in an interview on the other hand is higher than in surveys of the general pop-ulation. The contact process and the interviewing situation are more complicated and delicate as well (e.g., language problems, cultural specifics, lower level of education, etc.).
Fieldwork Report 2015 from TNS Infratest
Migration Sample M1 — Questionnaires and Survey Instruments
For data collection in the third wave of sample M1 in 2015, all of the questionnaires from SOEP-Core were used. However, a specific biographical questionnaire that covered the migration history and other addi-tional questions about migration and integration was used for adult household members that were partici-pating in the study for the first time. table 1 shows the gross samples and net volumes of the different questionnaires.
As the target population consists of people of (mostly) foreign origin, the main questionnaires (household and individual) were translated into five languages: English, Russian, Turkish, Romanian, and Polish. With the exception of English, these languages rep-resent the nationalities that were overrepresented in the first wave’s gross sample. The translated ver-sions were not implemented in CAPI but printed on paper and given to the interviewer as an additional support tool to overcome language problems. table 2 displays different kinds of support the interviewers used when language problems occurred during the interview situation.
Table 1
Questionnaires: Volume and Response Rates Sample M1
Gross sample/reference value1 Number of interviews Response Rate/Coverage Rate
Individual questionnaire 3,565 3,071 86.1
Youth questionnaire 70 55 78.6
Cognitive competence tests2 55 50 90.9
Mother and child questionnaire a 89 77 86.5
Mother and child questionnaire B 81 76 93.8
Mother and child questionnaire C 91 83 91.2
Questionnaire for parents D3 95/190 90/146 94.7/76.8
Mother and child questionnaire E 96 91 94.8
Pre-teen questionnaire 85 67 78.8
1 The numbers refer to the respective target population in participating households. For the child-related questionnaires, the reference value is the number of children of the respective age group living in participating households. The response rate for these questionnaires thus indicates the number of children for whom a questionnaire has been completed by one parent (in most cases the mother). 2 The tests can only be implemented if the youth questionnaire has been completed. Therefore the gross sample for the tests (n=55) is different from that for the youth questionnaire (n=70).3 In contrast to the other child-related questionnaire, this questionnaire is supposed to be completed by not just one but by both parents. For 90 (94.7%) of 95 children born in 2007 and living in households that participated in 2015, at least one questionnaire has been completed. In total, 146 questionnaires were completed.
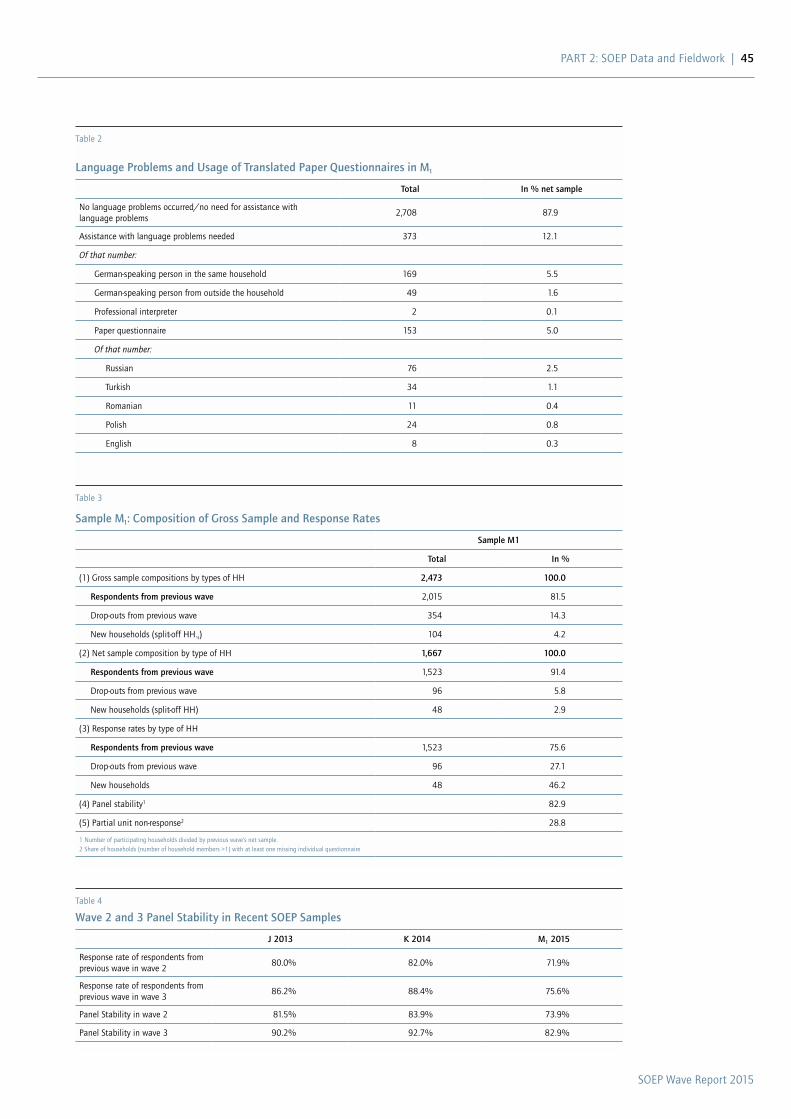
SOEP Wave Report 2015
PaRT 2: SOEP Data and Fieldwork | 45
Table 2
Language Problems and Usage of Translated Paper Questionnaires in M1
Total In % net sample
No language problems occurred/no need for assistance with language problems
2,708 87.9
assistance with language problems needed 373 12.1
Of that number:
German-speaking person in the same household 169 5.5
German-speaking person from outside the household 49 1.6
Professional interpreter 2 0.1
Paper questionnaire 153 5.0
Of that number:
Russian 76 2.5
Turkish 34 1.1
Romanian 11 0.4
Polish 24 0.8
English 8 0.3
Table 3
Sample M1: Composition of Gross Sample and Response Rates
Sample M1
Total In %
(1) Gross sample compositions by types of HH 2,473 100.0
Respondents from previous wave 2,015 81.5
Drop-outs from previous wave 354 14.3
New households (split-off HH.s) 104 4.2
(2) Net sample composition by type of HH 1,667 100.0
Respondents from previous wave 1,523 91.4
Drop-outs from previous wave 96 5.8
New households (split-off HH) 48 2.9
(3) Response rates by type of HH
Respondents from previous wave 1,523 75.6
Drop-outs from previous wave 96 27.1
New households 48 46.2
(4) Panel stability1 82.9
(5) Partial unit non-response2 28.8
1 Number of participating households divided by previous wave’s net sample.2 Share of households (number of household members >1) with at least one missing individual questionnaire
Table 4
Wave 2 and 3 Panel Stability in Recent SOEP Samples
J 2013 K 2014 M1 2015
Response rate of respondents from previous wave in wave 2
80.0% 82.0% 71.9%
Response rate of respondents from previous wave in wave 3
86.2% 88.4% 75.6%
Panel Stability in wave 2 81.5% 83.9% 73.9%
Panel Stability in wave 3 90.2% 92.7% 82.9%
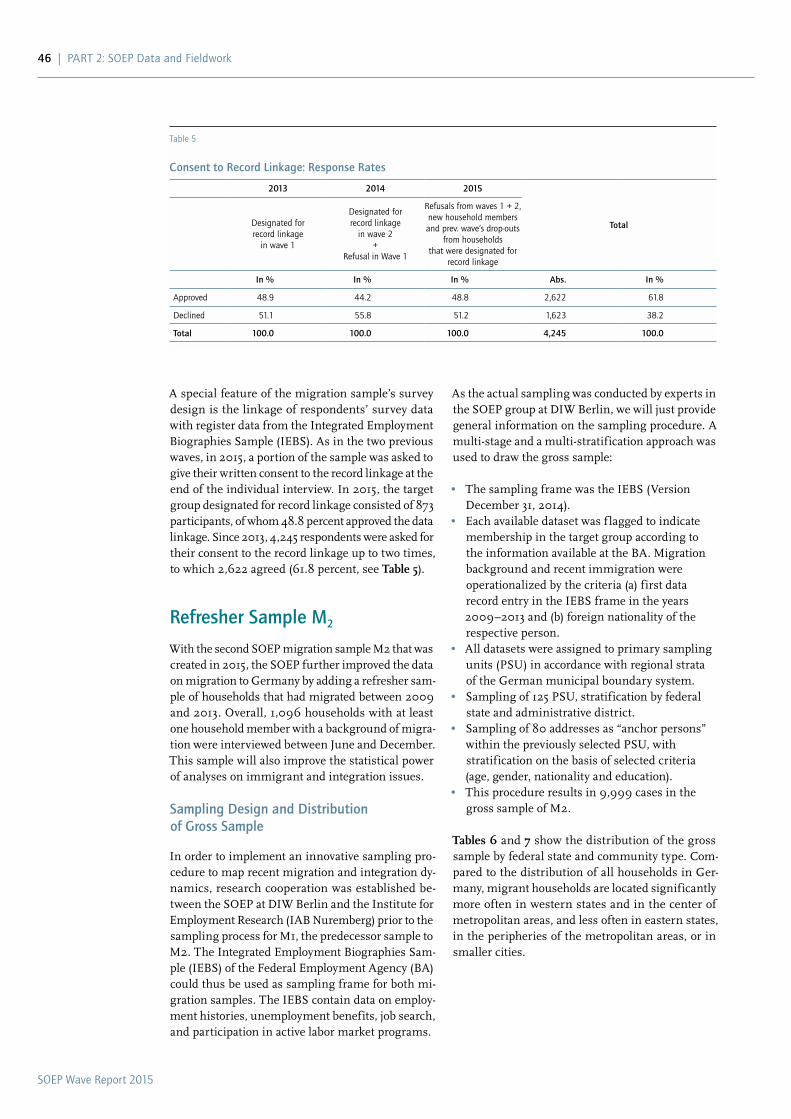
SOEP Wave Report 2015
46 | PaRT 2: SOEP Data and Fieldwork
As the actual sampling was conducted by experts in the SOEP group at DIW Berlin, we will just provide general information on the sampling procedure. A multi-stage and a multi-stratification approach was used to draw the gross sample:
• The sampling frame was the IEBS (Version December 31, 2014).
• Each available dataset was f lagged to indicate membership in the target group according to the information available at the BA. Migration background and recent immigration were operationalized by the criteria (a) first data record entry in the IEBS frame in the years 2009–2013 and (b) foreign nationality of the respective person.
• All datasets were assigned to primary sampling units (PSU) in accordance with regional strata of the German municipal boundary system.
• Sampling of 125 PSU, stratification by federal state and administrative district.
• Sampling of 80 addresses as “anchor persons” within the previously selected PSU, with stratification on the basis of selected criteria (age, gender, nationality and education).
• This procedure results in 9,999 cases in the gross sample of M2.
tables 6 and 7 show the distribution of the gross sample by federal state and community type. Com-pared to the distribution of all households in Ger-many, migrant households are located significantly more often in western states and in the center of metropolitan areas, and less often in eastern states, in the peripheries of the metropolitan areas, or in smaller cities.
A special feature of the migration sample’s survey design is the linkage of respondents’ survey data with register data from the Integrated Employment Biographies Sample (IEBS). As in the two previous waves, in 2015, a portion of the sample was asked to give their written consent to the record linkage at the end of the individual interview. In 2015, the target group designated for record linkage consisted of 873 participants, of whom 48.8 percent approved the data linkage. Since 2013, 4,245 respondents were asked for their consent to the record linkage up to two times, to which 2,622 agreed (61.8 percent, see table 5).
Refresher Sample M2
With the second SOEP migration sample M2 that was created in 2015, the SOEP further improved the data on migration to Germany by adding a refresher sam-ple of households that had migrated between 2009 and 2013. Overall, 1,096 households with at least one household member with a background of migra-tion were interviewed between June and December. This sample will also improve the statistical power of analyses on immigrant and integration issues.
Sampling Design and Distribution of Gross Sample
In order to implement an innovative sampling pro-cedure to map recent migration and integration dy-namics, research cooperation was established be-tween the SOEP at DIW Berlin and the Institute for Employment Research (IAB Nuremberg) prior to the sampling process for M1, the predecessor sample to M2. The Integrated Employment Biographies Sam-ple (IEBS) of the Federal Employment Agency (BA) could thus be used as sampling frame for both mi-gration samples. The IEBS contain data on employ-ment histories, unemployment benefits, job search, and participation in active labor market programs.
Table 5
Consent to Record Linkage: Response Rates
2013 2014 2015
TotalDesignated for record linkage
in wave 1
Designated for record linkage
in wave 2 +
Refusal in Wave 1
Refusals from waves 1 + 2, new household members and prev. wave’s drop-outs
from households that were designated for
record linkage
In % In % In % Abs. In %
approved 48.9 44.2 48.8 2,622 61.8
Declined 51.1 55.8 51.2 1,623 38.2
Total 100.0 100.0 100.0 4,245 100.0
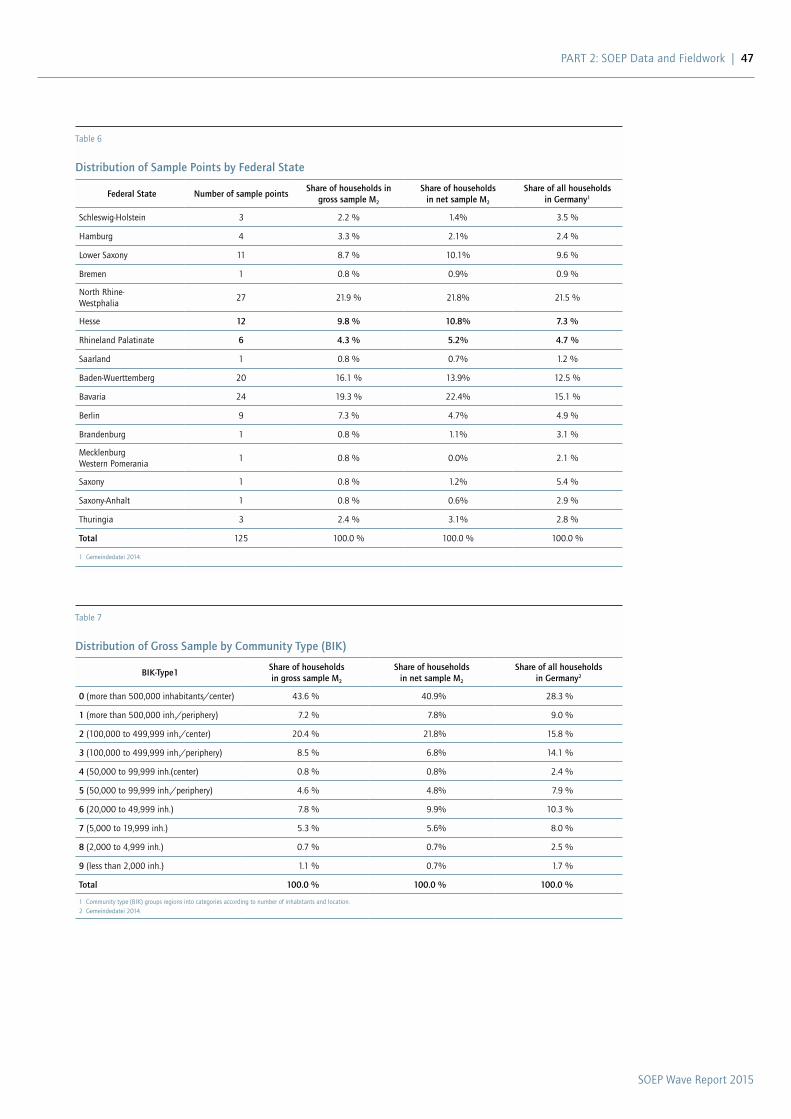
SOEP Wave Report 2015
PaRT 2: SOEP Data and Fieldwork | 47
Table 6
Distribution of Sample Points by Federal State
Federal State Number of sample pointsShare of households in
gross sample M2
Share of households in net sample M2
Share of all households in Germany1
Schleswig-Holstein 3 2.2 % 1.4% 3.5 %
Hamburg 4 3.3 % 2.1% 2.4 %
Lower Saxony 11 8.7 % 10.1% 9.6 %
Bremen 1 0.8 % 0.9% 0.9 %
North Rhine- Westphalia
27 21.9 % 21.8% 21.5 %
Hesse 12 9.8 % 10.8% 7.3 %
Rhineland Palatinate 6 4.3 % 5.2% 4.7 %
Saarland 1 0.8 % 0.7% 1.2 %
Baden-Wuerttemberg 20 16.1 % 13.9% 12.5 %
Bavaria 24 19.3 % 22.4% 15.1 %
Berlin 9 7.3 % 4.7% 4.9 %
Brandenburg 1 0.8 % 1.1% 3.1 %
Mecklenburg Western Pomerania
1 0.8 % 0.0% 2.1 %
Saxony 1 0.8 % 1.2% 5.4 %
Saxony-anhalt 1 0.8 % 0.6% 2.9 %
Thuringia 3 2.4 % 3.1% 2.8 %
Total 125 100.0 % 100.0 % 100.0 %
1 Gemeindedatei 2014.
Table 7
Distribution of Gross Sample by Community Type (BIK)
BIK-Type1Share of households in gross sample M2
Share of households in net sample M2
Share of all households in Germany2
0 (more than 500,000 inhabitants/center) 43.6 % 40.9% 28.3 %
1 (more than 500,000 inh./periphery) 7.2 % 7.8% 9.0 %
2 (100,000 to 499,999 inh./center) 20.4 % 21.8% 15.8 %
3 (100,000 to 499,999 inh./periphery) 8.5 % 6.8% 14.1 %
4 (50,000 to 99,999 inh.(center) 0.8 % 0.8% 2.4 %
5 (50,000 to 99,999 inh./periphery) 4.6 % 4.8% 7.9 %
6 (20,000 to 49,999 inh.) 7.8 % 9.9% 10.3 %
7 (5,000 to 19,999 inh.) 5.3 % 5.6% 8.0 %
8 (2,000 to 4,999 inh.) 0.7 % 0.7% 2.5 %
9 (less than 2,000 inh.) 1.1 % 0.7% 1.7 %
Total 100.0 % 100.0 % 100.0 %
1 Community type (BIK) groups regions into categories according to number of inhabitants and location. 2 Gemeindedatei 2014.
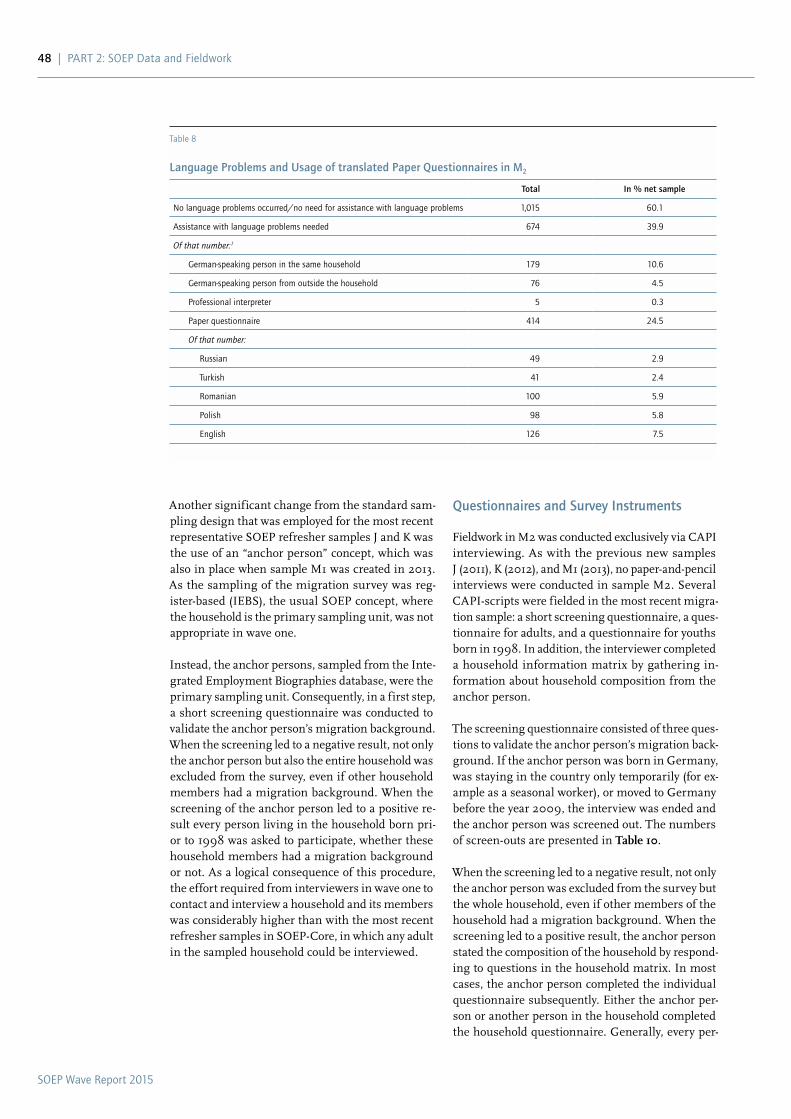
SOEP Wave Report 2015
48 | PaRT 2: SOEP Data and Fieldwork
Questionnaires and Survey Instruments
Fieldwork in M2 was conducted exclusively via CAPI interviewing. As with the previous new samples J (2011), K (2012), and M1 (2013), no paper-and-pencil interviews were conducted in sample M2. Several CAPI-scripts were fielded in the most recent migra-tion sample: a short screening questionnaire, a ques-tionnaire for adults, and a questionnaire for youths born in 1998. In addition, the interviewer completed a household information matrix by gathering in-formation about household composition from the anchor person.
The screening questionnaire consisted of three ques-tions to validate the anchor person’s migration back-ground. If the anchor person was born in Germany, was staying in the country only temporarily (for ex-ample as a seasonal worker), or moved to Germany before the year 2009, the interview was ended and the anchor person was screened out. The numbers of screen-outs are presented in table 10.
When the screening led to a negative result, not only the anchor person was excluded from the survey but the whole household, even if other members of the household had a migration background. When the screening led to a positive result, the anchor person stated the composition of the household by respond-ing to questions in the household matrix. In most cases, the anchor person completed the individual questionnaire subsequently. Either the anchor per-son or another person in the household completed the household questionnaire. Generally, every per-
Another significant change from the standard sam-pling design that was employed for the most recent representative SOEP refresher samples J and K was the use of an “anchor person” concept, which was also in place when sample M1 was created in 2013. As the sampling of the migration survey was reg-ister-based (IEBS), the usual SOEP concept, where the household is the primary sampling unit, was not appropriate in wave one.
Instead, the anchor persons, sampled from the Inte-grated Employment Biographies database, were the primary sampling unit. Consequently, in a first step, a short screening questionnaire was conducted to validate the anchor person’s migration background. When the screening led to a negative result, not only the anchor person but also the entire household was excluded from the survey, even if other household members had a migration background. When the screening of the anchor person led to a positive re-sult every person living in the household born pri-or to 1998 was asked to participate, whether these household members had a migration background or not. As a logical consequence of this procedure, the effort required from interviewers in wave one to contact and interview a household and its members was considerably higher than with the most recent refresher samples in SOEP-Core, in which any adult in the sampled household could be interviewed.
Table 8
Language Problems and Usage of translated Paper Questionnaires in M2
Total In % net sample
No language problems occurred/no need for assistance with language problems 1,015 60.1
assistance with language problems needed 674 39.9
Of that number:1
German-speaking person in the same household 179 10.6
German-speaking person from outside the household 76 4.5
Professional interpreter 5 0.3
Paper questionnaire 414 24.5
Of that number:
Russian 49 2.9
Turkish 41 2.4
Romanian 100 5.9
Polish 98 5.8
English 126 7.5
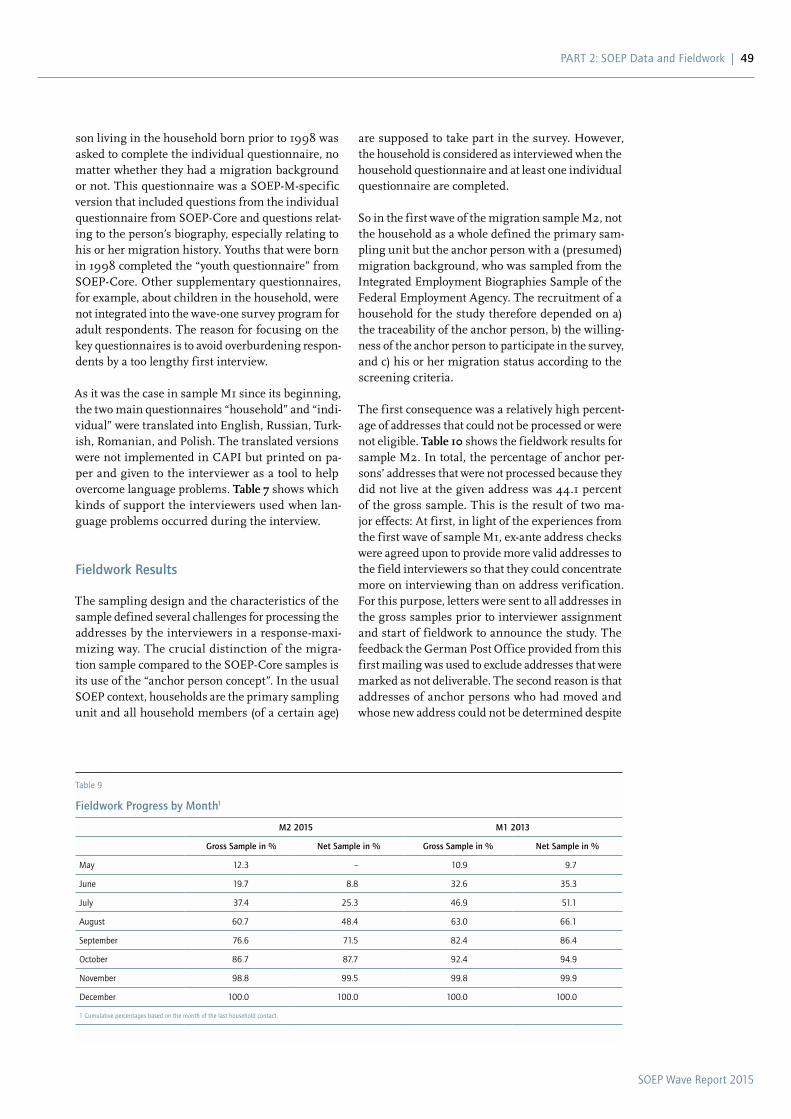
SOEP Wave Report 2015
PaRT 2: SOEP Data and Fieldwork | 49
are supposed to take part in the survey. However, the household is considered as interviewed when the household questionnaire and at least one individual questionnaire are completed.
So in the first wave of the migration sample M2, not the household as a whole defined the primary sam-pling unit but the anchor person with a (presumed) migration background, who was sampled from the Integrated Employment Biographies Sample of the Federal Employment Agency. The recruitment of a household for the study therefore depended on a) the traceability of the anchor person, b) the willing-ness of the anchor person to participate in the survey, and c) his or her migration status according to the screening criteria.
The first consequence was a relatively high percent-age of addresses that could not be processed or were not eligible. table 10 shows the fieldwork results for sample M2. In total, the percentage of anchor per-sons’ addresses that were not processed because they did not live at the given address was 44.1 percent of the gross sample. This is the result of two ma-jor effects: At first, in light of the experiences from the first wave of sample M1, ex-ante address checks were agreed upon to provide more valid addresses to the field interviewers so that they could concentrate more on interviewing than on address verification. For this purpose, letters were sent to all addresses in the gross samples prior to interviewer assignment and start of fieldwork to announce the study. The feedback the German Post Office provided from this first mailing was used to exclude addresses that were marked as not deliverable. The second reason is that addresses of anchor persons who had moved and whose new address could not be determined despite
son living in the household born prior to 1998 was asked to complete the individual questionnaire, no matter whether they had a migration background or not. This questionnaire was a SOEP-M-specific version that included questions from the individual questionnaire from SOEP-Core and questions relat-ing to the person’s biography, especially relating to his or her migration history. Youths that were born in 1998 completed the “youth questionnaire” from SOEP-Core. Other supplementary questionnaires, for example, about children in the household, were not integrated into the wave-one survey program for adult respondents. The reason for focusing on the key questionnaires is to avoid overburdening respon-dents by a too lengthy first interview.
As it was the case in sample M1 since its beginning, the two main questionnaires “household” and “indi-vidual” were translated into English, Russian, Turk-ish, Romanian, and Polish. The translated versions were not implemented in CAPI but printed on pa-per and given to the interviewer as a tool to help overcome language problems. table 7 shows which kinds of support the interviewers used when lan-guage problems occurred during the interview.
Fieldwork Results
The sampling design and the characteristics of the sample defined several challenges for processing the addresses by the interviewers in a response-maxi-mizing way. The crucial distinction of the migra-tion sample compared to the SOEP-Core samples is its use of the “anchor person concept”. In the usual SOEP context, households are the primary sampling unit and all household members (of a certain age)
Table 9
Fieldwork Progress by Month1
M2 2015 M1 2013
Gross Sample in % Net Sample in % Gross Sample in % Net Sample in %
May 12.3 – 10.9 9.7
June 19.7 8.8 32.6 35.3
July 37.4 25.3 46.9 51.1
august 60.7 48.4 63.0 66.1
September 76.6 71.5 82.4 86.4
October 86.7 87.7 92.4 94.9
November 98.8 99.5 99.8 99.9
December 100.0 100.0 100.0 100.0
1 Cumulative percentages based on the month of the last household contact.
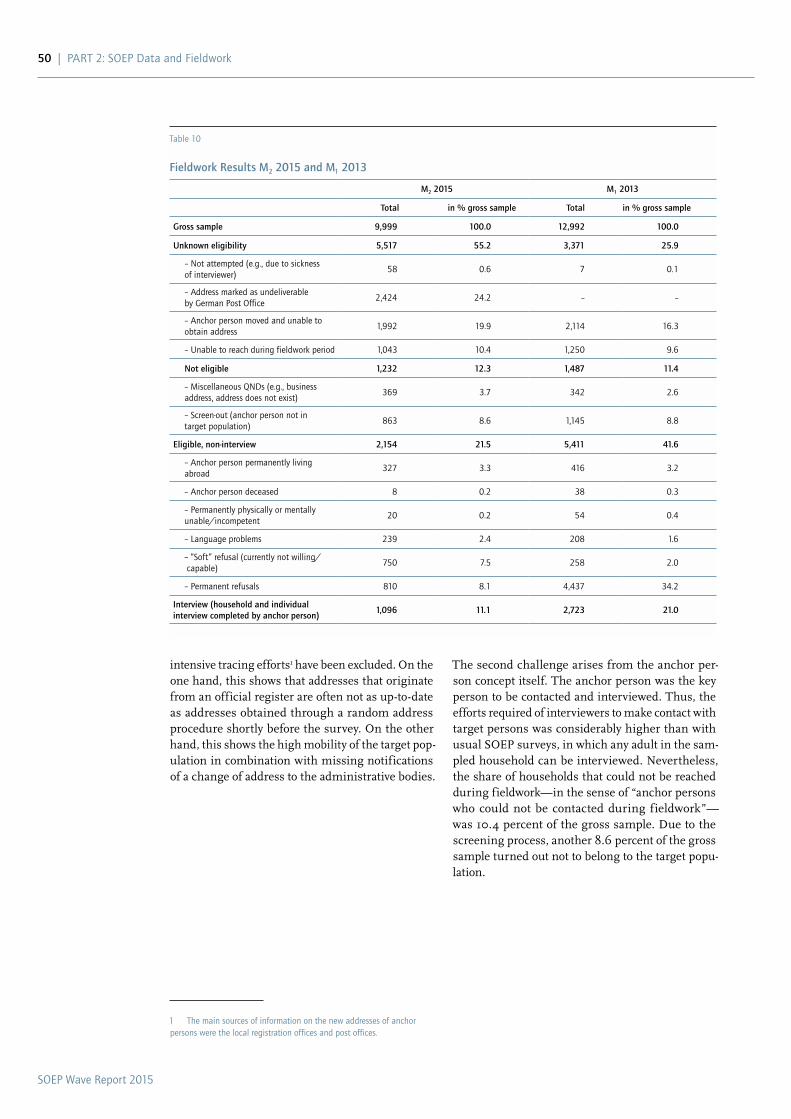
SOEP Wave Report 2015
50 | PaRT 2: SOEP Data and Fieldwork
The second challenge arises from the anchor per-son concept itself. The anchor person was the key person to be contacted and interviewed. Thus, the efforts required of interviewers to make contact with target persons was considerably higher than with usual SOEP surveys, in which any adult in the sam-pled household can be interviewed. Nevertheless, the share of households that could not be reached during fieldwork—in the sense of “anchor persons who could not be contacted during fieldwork”— was 10.4 percent of the gross sample. Due to the screening process, another 8.6 percent of the gross sample turned out not to belong to the target popu-lation.
intensive tracing efforts1 have been excluded. On the one hand, this shows that addresses that originate from an official register are often not as up-to-date as addresses obtained through a random address procedure shortly before the survey. On the other hand, this shows the high mobility of the target pop-ulation in combination with missing notifications of a change of address to the administrative bodies.
1 The main sources of information on the new addresses of anchor persons were the local registration offices and post offices.
Table 10
Fieldwork Results M2 2015 and M1 2013
M2 2015 M1 2013
Total in % gross sample Total in % gross sample
Gross sample 9,999 100.0 12,992 100.0
Unknown eligibility 5,517 55.2 3,371 25.9
– Not attempted (e.g., due to sickness of interviewer)
58 0.6 7 0.1
– address marked as undeliverable by German Post Office
2,424 24.2 – –
– anchor person moved and unable to obtain address
1,992 19.9 2,114 16.3
– Unable to reach during fieldwork period 1,043 10.4 1,250 9.6
Not eligible 1,232 12.3 1,487 11.4
– Miscellaneous QNDs (e.g., business address, address does not exist)
369 3.7 342 2.6
– Screen-out (anchor person not in target population)
863 8.6 1,145 8.8
Eligible, non-interview 2,154 21.5 5,411 41.6
– anchor person permanently living abroad
327 3.3 416 3.2
– anchor person deceased 8 0.2 38 0.3
– Permanently physically or mentally unable/incompetent
20 0.2 54 0.4
– Language problems 239 2.4 208 1.6
– “Soft” refusal (currently not willing/ capable)
750 7.5 258 2.0
– Permanent refusals 810 8.1 4,437 34.2
Interview (household and individual interview completed by anchor person)
1,096 11.1 2,723 21.0
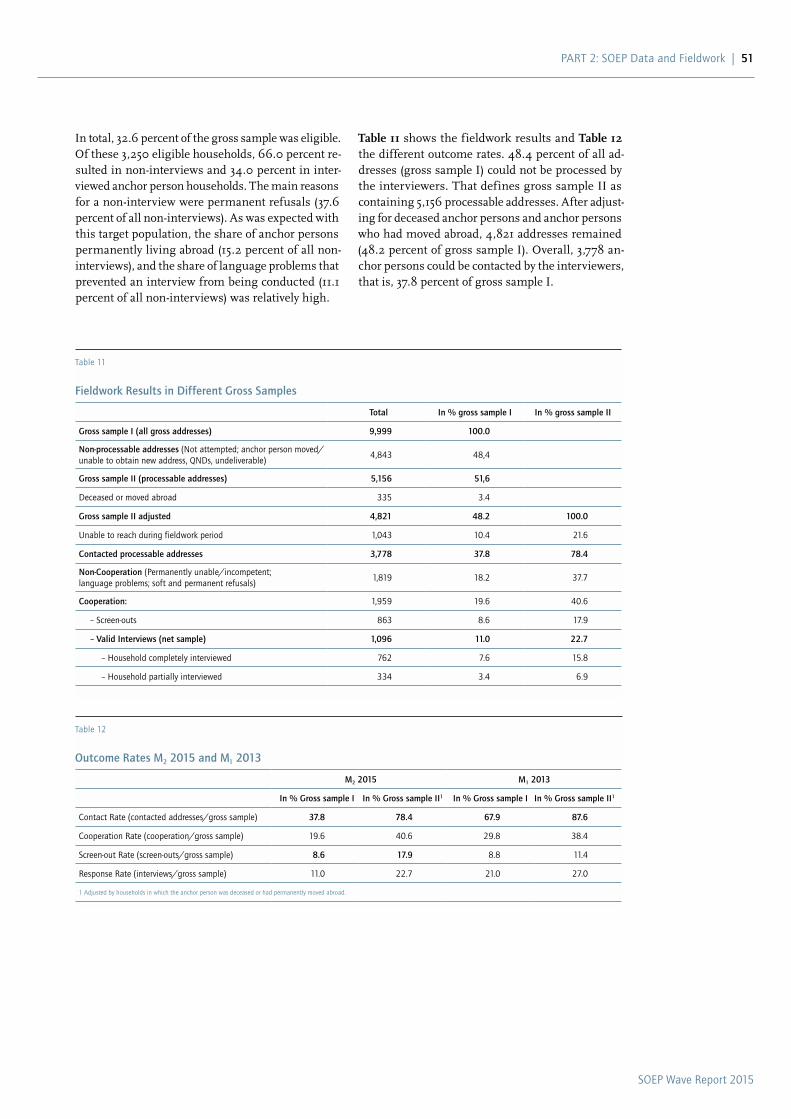
SOEP Wave Report 2015
PaRT 2: SOEP Data and Fieldwork | 51
table 11 shows the fieldwork results and table 12 the different outcome rates. 48.4 percent of all ad-dresses (gross sample I) could not be processed by the interviewers. That defines gross sample II as containing 5,156 processable addresses. After adjust-ing for deceased anchor persons and anchor persons who had moved abroad, 4,821 addresses remained (48.2 percent of gross sample I). Overall, 3,778 an-chor persons could be contacted by the interviewers, that is, 37.8 percent of gross sample I.
In total, 32.6 percent of the gross sample was eligible. Of these 3,250 eligible households, 66.0 percent re-sulted in non-interviews and 34.0 percent in inter-viewed anchor person households. The main reasons for a non-interview were permanent refusals (37.6 percent of all non-interviews). As was expected with this target population, the share of anchor persons permanently living abroad (15.2 percent of all non-interviews), and the share of language problems that prevented an interview from being conducted (11.1 percent of all non-interviews) was relatively high.
Table 11
Fieldwork Results in Different Gross Samples
Total In % gross sample I In % gross sample II
Gross sample I (all gross addresses) 9,999 100.0
Non-processable addresses (Not attempted; anchor person moved/unable to obtain new address, QNDs, undeliverable)
4,843 48,4
Gross sample II (processable addresses) 5,156 51,6
Deceased or moved abroad 335 3.4
Gross sample II adjusted 4,821 48.2 100.0
Unable to reach during fieldwork period 1,043 10.4 21.6
Contacted processable addresses 3,778 37.8 78.4
Non-Cooperation (Permanently unable/incompetent; language problems; soft and permanent refusals)
1,819 18.2 37.7
Cooperation: 1,959 19.6 40.6
– Screen-outs 863 8.6 17.9
– Valid Interviews (net sample) 1,096 11.0 22.7
– Household completely interviewed 762 7.6 15.8
– Household partially interviewed 334 3.4 6.9
Table 12
Outcome Rates M2 2015 and M1 2013
M2 2015 M1 2013
In % Gross sample I In % Gross sample II1 In % Gross sample I In % Gross sample II1
Contact Rate (contacted addresses/gross sample) 37.8 78.4 67.9 87.6
Cooperation Rate (cooperation/gross sample) 19.6 40.6 29.8 38.4
Screen-out Rate (screen-outs/gross sample) 8.6 17.9 8.8 11.4
Response Rate (interviews/gross sample) 11.0 22.7 21.0 27.0
1 adjusted by households in which the anchor person was deceased or had permanently moved abroad.
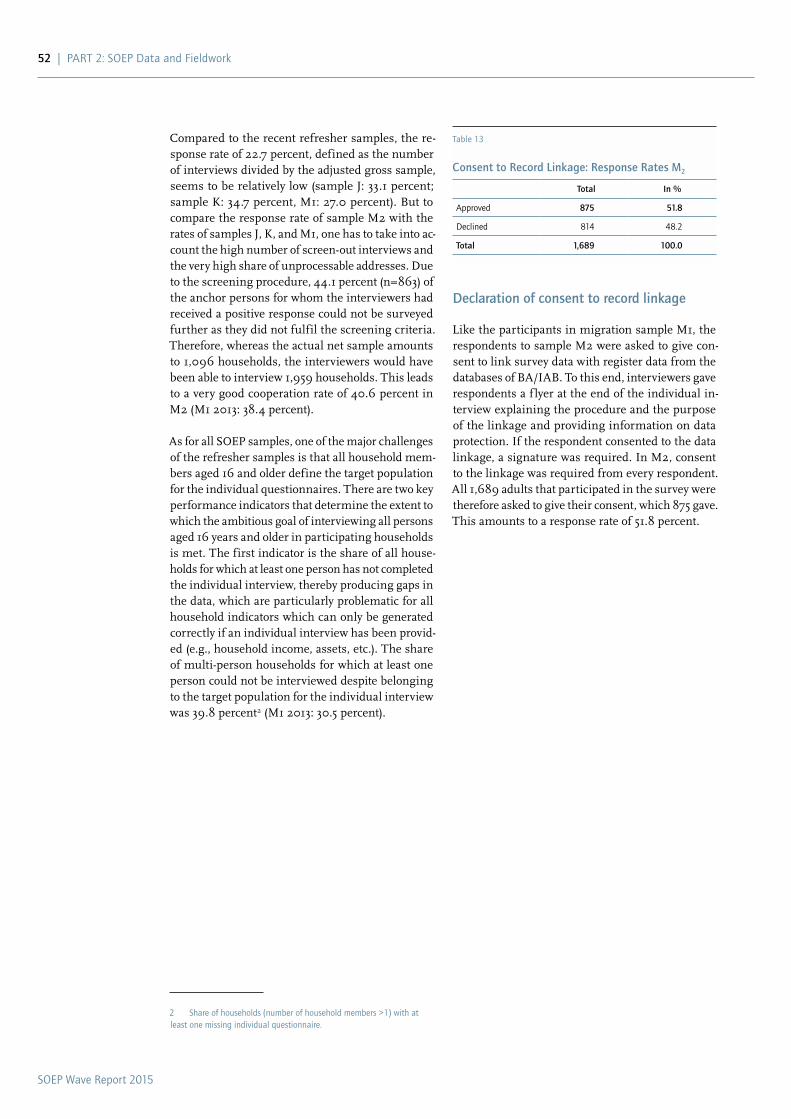
SOEP Wave Report 2015
52 | PaRT 2: SOEP Data and Fieldwork
Declaration of consent to record linkage
Like the participants in migration sample M1, the respondents to sample M2 were asked to give con-sent to link survey data with register data from the databases of BA/IAB. To this end, interviewers gave respondents a f lyer at the end of the individual in-terview explaining the procedure and the purpose of the linkage and providing information on data protection. If the respondent consented to the data linkage, a signature was required. In M2, consent to the linkage was required from every respondent. All 1,689 adults that participated in the survey were therefore asked to give their consent, which 875 gave. This amounts to a response rate of 51.8 percent.
Compared to the recent refresher samples, the re-sponse rate of 22.7 percent, defined as the number of interviews divided by the adjusted gross sample, seems to be relatively low (sample J: 33.1 percent; sample K: 34.7 percent, M1: 27.0 percent). But to compare the response rate of sample M2 with the rates of samples J, K, and M1, one has to take into ac-count the high number of screen-out interviews and the very high share of unprocessable addresses. Due to the screening procedure, 44.1 percent (n=863) of the anchor persons for whom the interviewers had received a positive response could not be surveyed further as they did not fulfil the screening criteria. Therefore, whereas the actual net sample amounts to 1,096 households, the interviewers would have been able to interview 1,959 households. This leads to a very good cooperation rate of 40.6 percent in M2 (M1 2013: 38.4 percent).
As for all SOEP samples, one of the major challenges of the refresher samples is that all household mem-bers aged 16 and older define the target population for the individual questionnaires. There are two key performance indicators that determine the extent to which the ambitious goal of interviewing all persons aged 16 years and older in participating households is met. The first indicator is the share of all house-holds for which at least one person has not completed the individual interview, thereby producing gaps in the data, which are particularly problematic for all household indicators which can only be generated correctly if an individual interview has been provid-ed (e.g., household income, assets, etc.). The share of multi-person households for which at least one person could not be interviewed despite belonging to the target population for the individual interview was 39.8 percent2 (M1 2013: 30.5 percent).
2 Share of households (number of household members >1) with at least one missing individual questionnaire.
Table 13
Consent to Record Linkage: Response Rates M2
Total In %
approved 875 51.8
Declined 814 48.2
Total 1,689 100.0
SOEP Wave Report 2015
PaRT 2: SOEP Data and Fieldwork | 53
stored at -80°C for subsequent whole-genome meth-ylation analysis. 972 respondents were asked to pro-vide a sample and 568 completed the data collection process (response rate of 58.4%).
Data Access
To protect the confidentiality of respondents’ data, the SOEP adheres to strict security standards in dis-tributing the SOEP-IS data. The data are reserved ex-clusively for research and provided only to members of the scientific community. The SOEP Research Data Center distributes the SOEP-IS data to users as an independent dataset. Individuals and institutions that have signed a SOEP data distribution contract can submit an informal application (in the form of a letter or e-mail) requesting a supplemental contract allowing use of the SOEP-IS data. After signing the required contracts with the SOEP, users receive the SOEP-IS dataset by personalized encrypted down-load. Users can also access small-scale regional data, which can be linked to the SOEP-IS data, on site at the SOEP Research Data Center.
Access to SOEP-IS Data from 2011, 2012, 2013, and 2014The latest SOEP-IS data were released in late March 2016. The data release contained the core SOEP ques-tions and additional SOEP modules included in the SOEP-IS in 2014, user-friendly generated SOEP vari-ables for 2014, as well as all of the previous SOEP-IS data going back to the first subsample in 1998. Also included were the innovative modules from 2011, 2012, and 2013, which are released after a 12-month embargo during which the data are available exclu-sively to the researcher who submitted the questions. The data from the 2014 SOEP-IS modules will be under embargo until April 2017 and not available to users until then.
Report from the SOEP
The SOEP-Innovation Sample (SOEP-IS) is a service provided by the SOEP to researchers worldwide for their research projects. The SOEP-IS is well suited to short-term experiments, but is especially useful for testing long-term instruments that are not suit-able to SOEP-Core, whether because the instruments have not yet been scientifically verified or because the questions deal with very specific research issues. Since 2013, the SOEP has accepted users’ proposals for SOEP-IS and assessed these submissions in an annual competitive refereed process to identify the
“best” research questions and operationalizations.
In 2015, almost 6,000 individual respondents in more than 200 households participated in the SOEP-IS survey. Many of these women and men have been part of a boost sample to SOEP-Core since 1998, while others joined in 2009. These individuals pro-vide a wealth of longitudinal data to SOEP-IS. Addi-tional samples were added to SOEP-IS in 2012, 2013, and 2014 (table 1).
In 2015, the SOEP-IS premiered the collection of saliva samples using self-collection saliva tubes in a sample of 500 participants. The project of Roland Weierstall (Medical School Hamburg) and Isabelle Mansuy (University of Zurich and ETH Zürich, Brain Research Institute) aims to investigate the re-ciprocal relations between socio-economic status (SES), psychological stress and epigenetic markers in a representative longitudinal multi-cohort study, the SOEP-IS, focusing on the most prominent SES factors, subclinical stress symptoms, and stress-re-lated candidate genes. In this study, two saliva sam-ples were collected from each subject. Saliva samples were sent to the laboratory of Professor Mansuy for DNA extraction and DNA methylation analyses. One sample will be used for DNA methylation analysis of selected candidate genes. The other sample will be
The SOEP-Innovation Sample (SOEP-IS)By David Richter
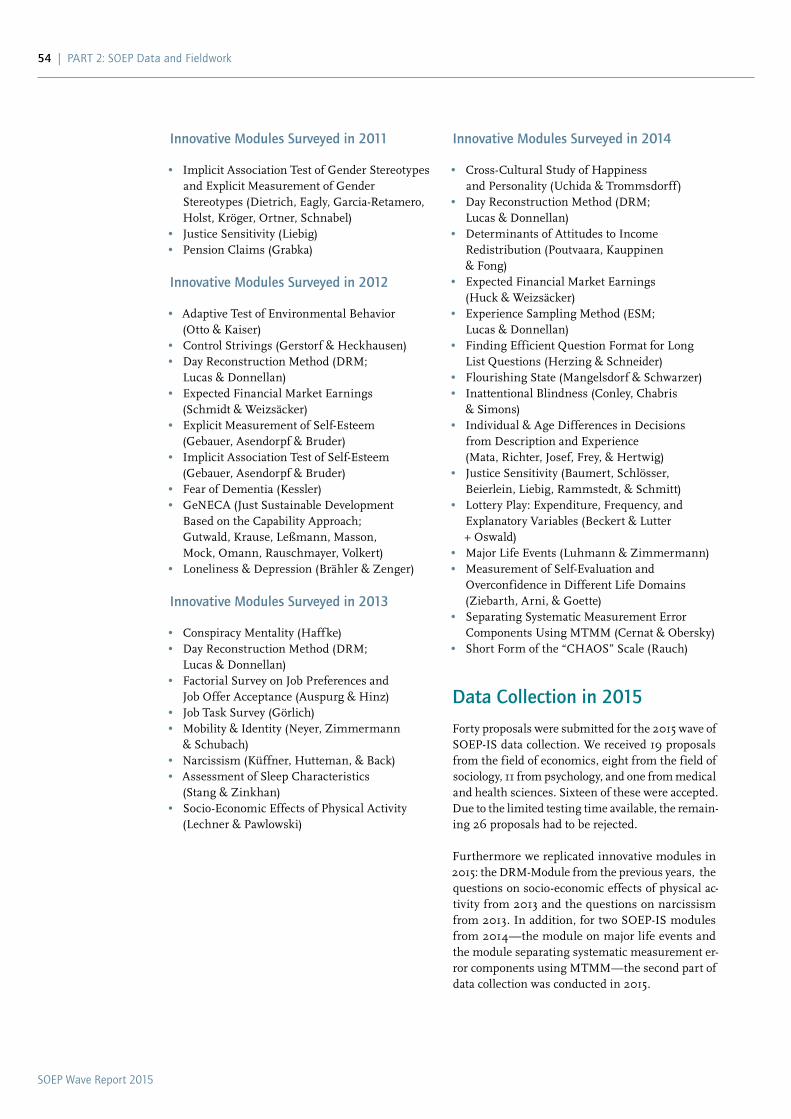
SOEP Wave Report 2015
54 | PaRT 2: SOEP Data and Fieldwork
Innovative Modules Surveyed in 2014
• Cross-Cultural Study of Happiness and Personality (Uchida & Trommsdorff)
• Day Reconstruction Method (DRM; Lucas & Donnellan)
• Determinants of Attitudes to Income Redistribution (Poutvaara, Kauppinen & Fong)
• Expected Financial Market Earnings (Huck & Weizsäcker)
• Experience Sampling Method (ESM; Lucas & Donnellan)
• Finding Efficient Question Format for Long List Questions (Herzing & Schneider)
• Flourishing State (Mangelsdorf & Schwarzer) • Inattentional Blindness (Conley, Chabris
& Simons) • Individual & Age Differences in Decisions
from Description and Experience (Mata, Richter, Josef, Frey, & Hertwig)
• Justice Sensitivity (Baumert, Schlösser, Beierlein, Liebig, Rammstedt, & Schmitt)
• Lottery Play: Expenditure, Frequency, and Explanatory Variables (Beckert & Lutter + Oswald)
• Major Life Events (Luhmann & Zimmermann) • Measurement of Self-Evaluation and
Overconfidence in Different Life Domains (Ziebarth, Arni, & Goette)
• Separating Systematic Measurement Error Components Using MTMM (Cernat & Obersky)
• Short Form of the “CHAOS” Scale (Rauch)
Data Collection in 2015
Forty proposals were submitted for the 2015 wave of SOEP-IS data collection. We received 19 proposals from the field of economics, eight from the field of sociology, 11 from psychology, and one from medical and health sciences. Sixteen of these were accepted. Due to the limited testing time available, the remain-ing 26 proposals had to be rejected.
Furthermore we replicated innovative modules in 2015: the DRM-Module from the previous years, the questions on socio-economic effects of physical ac-tivity from 2013 and the questions on narcissism from 2013. In addition, for two SOEP-IS modules from 2014—the module on major life events and the module separating systematic measurement er-ror components using MTMM—the second part of data collection was conducted in 2015.
Innovative Modules Surveyed in 2011
• Implicit Association Test of Gender Stereotypes and Explicit Measurement of Gender Stereotypes (Dietrich, Eagly, Garcia-Retamero, Holst, Kröger, Ortner, Schnabel)
• Justice Sensitivity (Liebig) • Pension Claims (Grabka)
Innovative Modules Surveyed in 2012
• Adaptive Test of Environmental Behavior (Otto & Kaiser)
• Control Strivings (Gerstorf & Heckhausen) • Day Reconstruction Method (DRM;
Lucas & Donnellan) • Expected Financial Market Earnings
(Schmidt & Weizsäcker) • Explicit Measurement of Self-Esteem
(Gebauer, Asendorpf & Bruder) • Implicit Association Test of Self-Esteem
(Gebauer, Asendorpf & Bruder) • Fear of Dementia (Kessler) • GeNECA (Just Sustainable Development
Based on the Capability Approach; Gutwald, Krause, Leßmann, Masson, Mock, Omann, Rauschmayer, Volkert)
• Loneliness & Depression (Brähler & Zenger)
Innovative Modules Surveyed in 2013
• Conspiracy Mentality (Haffke) • Day Reconstruction Method (DRM;
Lucas & Donnellan) • Factorial Survey on Job Preferences and
Job Offer Acceptance (Auspurg & Hinz) • Job Task Survey (Görlich) • Mobility & Identity (Neyer, Zimmermann
& Schubach) • Narcissism (Küffner, Hutteman, & Back) • Assessment of Sleep Characteristics
(Stang & Zinkhan) • Socio-Economic Effects of Physical Activity
(Lechner & Pawlowski)

SOEP Wave Report 2015
PaRT 2: SOEP Data and Fieldwork | 55
• Narcissism (Küffner, Hutteman, & Back) • Major Life Events (Luhmann & Zimmermann) • Ostracism Short Scale (Rudert & Greifeneder) • Outsourcing of Household Services (Schnell &
Shire) • Preference for Leisure (Borghans & Collewet) • Private or Public Health Care: Evaluation,
Attitudes, and Social Solidarity (Immergut, Burlacu, Ainsaar, & Oskarson)
• Self-Regulated Personality Development (Specht & Hennecke)
• Separating Systematic Measurement Error Components Using MTMM (Cernat & Obersky)
• Sickness Presenteeism (Steidelmüller & Breitsohl)
• Smartphone Usage (Wrzus) • Socio-Economic Effects of Physical Activity
(Lechner & Pawlowski)
Innovative Modules in 2015
• Attitude Inferences and Interviewer Effects (Kühne)
• Couples’ Prediction Accuracy for Food Preferences (Scheibehenne)
• Day Reconstruction Method (DRM; Lucas & Donnellan)
• Diversity of Living-Apart-Together-Couples (Schmiade)
• Emotion Regulation (Romppel & Schulz) • Epigenetic Markers of Stress (Helms &
Weierstall) • Fiscal Crisis in the EU and European
Solidarity (Lengfeld) • Grit and Entrepreneurship (Dupuy & Kritikos) • Happiness Analyzer Smartphone Application
(Ludwigs, Lucas, & Veenhoven) • Impostor Phenomenon and Career
Development (Neureiter)
Table 1
SOEP-IS Samples since 1998
Sample/ Survey Year
1998–2008 2009 2010 2011 2012 2013 2014 2015
Sample E
(started in 1998 with 373 households and 963 individuals)
373 (963)
in the SOEP
447 (934)
in the SOEP
453 (936)
in the SOEP
464 (944)
in the SOEP
339 (649) in the
SOEP-IS
310 (603) in the
SOEP-IS
298 (570) in the
SOEP-IS
282 (540) in the
SOEP-IS
Sample I
(started in 2009 with 1,495 households and 3,052 individuals)
1495
(3,052) in the SOEP
1175 (2,450)
in the SOEP
1040 (2,113) in the
SOEP-IS
928 (1,845) in the
SOEP-IS
846 (1,740) in the
SOEP-IS
798 (1,562) in the
SOEP-IS
741 (4,141) in the
SOEP-IS
Supplementary Sample 2012
(started in 2012 with 1,010 households and 2,005 individuals)
1,010 (2,035)
833 (1,698)
772 (1,550)
710 (1,399)
Supplementary Sample 2013
(started in 2013 with 1,166 households and 2,256 individuals)
1,166 (2,256)
929 (1,788)
840 (1,617)
Supplementary Sample 2014
(started in 2014 with 924 households and 1,667 individuals)
924 (1,667)
672 (1,226)
Households total (individuals total)
373 (963)
1,942 (3,986)
1,628 (3,386)
1,504 (3,057)
2,277 (4,529)
3,173 (6,297)
3,721 (7,137)
3,245 (6,196)
SOEP Wave Report 2015
56 | PaRT 2: SOEP Data and Fieldwork
Fieldwork Report 2015 from TNS Infratest
Overview
The SOEP-IS (SOEP-Innovation Sample) is a relative-ly new longitudinal household survey that comple-ments SOEP-Core by offering a survey framework for fielding innovative questionnaire modules and testing fieldwork procedures. Important features of sampling design and core fieldwork procedures are similar to those in the main sample, but the SOEP-IS also offers special design features that ease the piloting and testing of innovative survey modules. Sample I1, which was established as main SOEP sample I in 2009, served as the first SOEP-IS sam-ple when the study was institutionalized officially in 2011. Since then, the Innovation Sample has been expanded in sample size with refresher samples in 2012 (sample I2), 2013 (sample I3), and 2014 (sam-ple I4). Additionally, a subset of households from the main SOEP’s sample E was transferred to the SOEP-IS in 2012 (sample IE). Figure 1 provides a more detailed look at the development of sample size since 2009.
Questionnaire
An integrated core questionnaire based on question-naires from SOEP-Core sets the recurring frame-work for the collection of variables for the SOEP-IS. It consolidates the basic elements of the SOEP household and individual questionnaires, while in-cluding core questions from the life history ques-tionnaire for first-time panel members and three mother-child modules. In contrast to the other SOEP samples, where each questionnaire is separate, the SOEP-IS has one questionnaire for each respondent that has an integrated CAPI script. In order to pro-vide a smooth and efficient interview situation, the script automatically routes to all of the question mod-ules the target person is scheduled to answer in the given wave.
The SOEP-IS core questionnaire that was used in 2015 included the following modules:
• Core elements of the SOEP household questionnaire to be completed by only one member of the household (preferably the one who is best informed about household matters overall and about household members)
• Core elements of the SOEP individual questionnaire to be completed by each person aged 17 and above living in the household
• Core elements of the life history questionnaire for first-time panel members (new respondents as well as young people born in 1998 who participated in the panel for the first time)
• Three mother-child modules to be completed by: • Mothers of children up to 23 months old
(mother-child module A) • Mothers of children between 24 and 47
months old (mother-child module B) • Mothers of children older than 48 months
old (mother-child module C)
table 1 shows the gross samples and net volumes of the different questionnaire modules.
The rationale behind the integration of household and individual questionnaires into one shorter core interview is to allow for more time for innovative question modules and tests. Thus, as already men-tioned in the previous section, on top of the core el-ements, 21 different innovative modules were inte-grated into the SOEP-IS questionnaire in 2015. To be able to consider as many different ideas as possible, given the limited interview time, the members of the different sub-samples received different sets of in-novative modules. table 2 illustrates the distribution of the innovation modules over the subsamples. In the following section, we describe these modules in varying detail, depending on whether special aspects needed to be considered in their implementation in a large-scale face-to-face representative sample of Germany’s population.
Attitude Inferences and Interviewer Effects
The aim of this module was to examine the inf lu-ence of the interviewers on respondents’ answers. Therefore, respondents as well as interviewers were asked to give their own opinions and to guess the respective interviewer’s or respondent’s answers to a range of questions about political preferences, gen-eral sorrows and attitudes towards polarizing top-ics such as legalization of marihuana, gay adoption rights or medically assisted suicide.
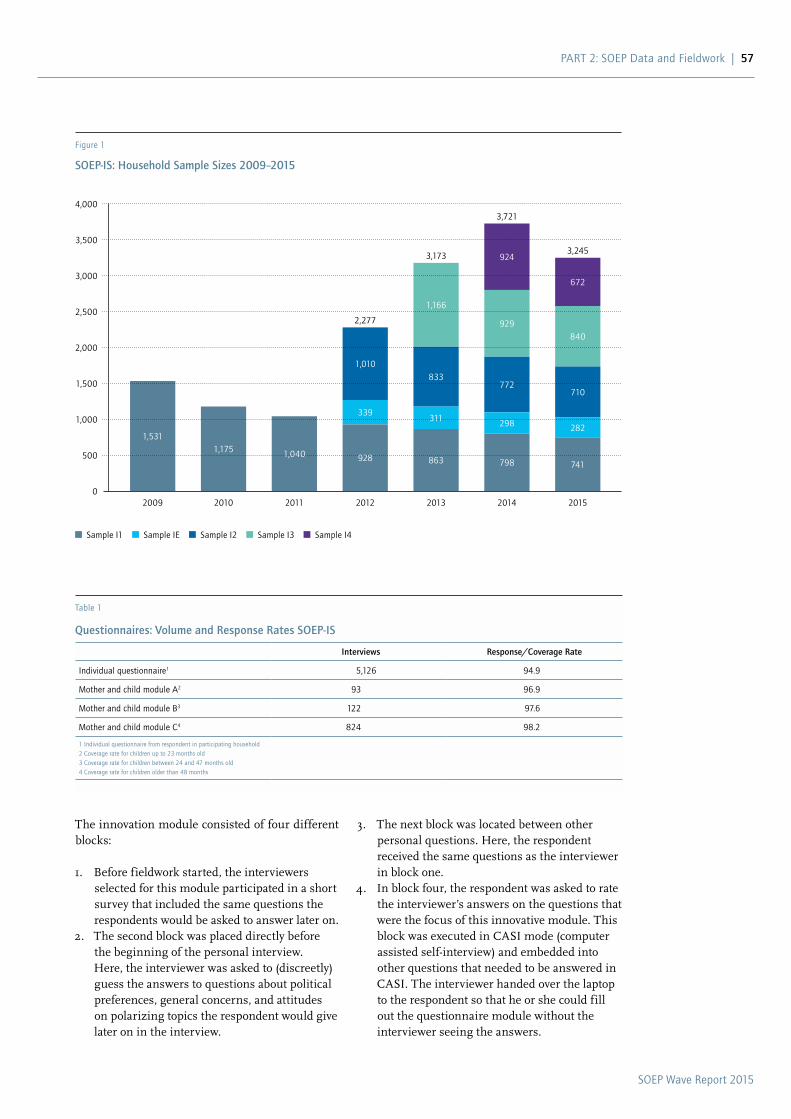
SOEP Wave Report 2015
PaRT 2: SOEP Data and Fieldwork | 57
3. The next block was located between other personal questions. Here, the respondent received the same questions as the interviewer in block one.
4. In block four, the respondent was asked to rate the interviewer’s answers on the questions that were the focus of this innovative module. This block was executed in CASI mode (computer assisted self-interview) and embedded into other questions that needed to be answered in CASI. The interviewer handed over the laptop to the respondent so that he or she could fill out the questionnaire module without the interviewer seeing the answers.
The innovation module consisted of four different blocks:
1. Before fieldwork started, the interviewers selected for this module participated in a short survey that included the same questions the respondents would be asked to answer later on.
2. The second block was placed directly before the beginning of the personal interview. Here, the interviewer was asked to (discreetly) guess the answers to questions about political preferences, general concerns, and attitudes on polarizing topics the respondent would give later on in the interview.
Table 1
Questionnaires: Volume and Response Rates SOEP-IS
Interviews Response/Coverage Rate
Individual questionnaire1 5,126 94.9
Mother and child module a2 93 96.9
Mother and child module B3 122 97.6
Mother and child module C4 824 98.2
1 Individual questionnaire from respondent in participating household2 Coverage rate for children up to 23 months old3 Coverage rate for children between 24 and 47 months old4 Coverage rate for children older than 48 months
Figure 1
SOEP-IS: Household Sample Sizes 2009–2015
Sample I1 Sample IE Sample I2 Sample I3 Sample I4
4,000
3,500
3,000
2,500
2,000
1,500
1,000
500
02009 2010 20122011 20142013 2015
1,5311,175
798863 741
339
1,010
2,277
298
772
929
924
3,721
833
1,166
3,173
282
710
840
672
3,245
1,040 928
311
SOEP Wave Report 2015
58 | PaRT 2: SOEP Data and Fieldwork
The whole recruitment and collection process con-tained several steps:
1. To enable respondents to make an informed decision, a brochure about the upcoming saliva sampling, its scientific background, and an additional incentive of 10 euros was enclosed with the letter announcing the study. 2. Before the interview started, target persons who showed interest in participating in the module were given a more detailed brochure. Interviewers were instructed not to put any pressure on hesitant participants in order to not jeopardize their willingness to participate in the SOEP-IS as a whole.3. At the end of the interview, the interviewers handed over two consent forms that respondents needed to read and sign before the process could proceed. The document stated the basic information from the brochures again, including the fact that the data extracted from the samples would be matched with the respondents’ data from the SOEP-IS. 4. Then the interviewers opened the first samp- ling kit and handed it over to the respondents who spit into the funnel that was attached to the top of every kit. This procedure took up to two to three minutes to complete. 5. Afterwards, interviewers inserted a liquid to conserve the sample by closing the funnel and shaking the kit, and then replacing the funnel with a lid. Then they attached a barcode with the respondents’ study ID number to the tube and repeated the sampling process a second time to retrieve the second sample.6. The interviewers collected the saliva tubes for two to three weeks before sending them back to TNS Infratest together with one of the signed consent forms.
Day Reconstruction Method (DRM)
After having been included in four consecutive waves since 2012, the DRM module was part of the SOEP-IS questionnaire for the last time in 2015. It is an adapta-tion of the DRM as introduced by Kahneman and col-leagues in 20041. By asking respondents about their feelings at different times throughout the day, the DRM module data provide researchers an opportu-nity to create new measures of subjective well-being and examine the impacts of different activities on the quality of life. In 2014, the DRM was supple-mented by a mobile study using the experience sam-pling method (ESM) that was described in further detail in the SOEP Wave Report 2014.
The set of questions is designed to deliver an accu-rate reconstruction of the respondent’s previous day. The module collected information about all activi-ties as episodes, including start and end time, with the help of a list that contained 26 activities, such as
“shopping,” “watching children,” and “doing sports.” Afterwards, additional questions were asked about a random subset of these episodes including affective feelings during the activity, where the activity took place, and the presence of other persons.
Epigenetic Markers of Stress
Within the module Epigenetic Markers of Stress, sa-liva samples were collected from respondents for the first time in SOEP-IS history. The interviewers used special self-collection saliva tubes2 to gather the sam-ples at the end of the interview. With the help of the saliva samples, relations between socio-economic status, psychological stress, and epigenetic markers can be analyzed in a longitudinal study.
To guarantee an accurate sampling procedure in the household while minimizing possible negative ef-fects on long-term panel stability, the interviewers received detailed instructions and were trained per-sonally by their contact interviewer. All contact in-terviewers attended a training session approximately three weeks before start of fieldwork in which the two scientists responsible for the innovation mod-ule and the project lead at TNS Infratest provided information about the scientific background of the module and demonstrated the collection process with the tubes.
1 Kahneman, D., Krueger, a. B., Schkade, D., Schwarz, N. & Stone, a. (2004). The Day Reconstruction Method (DRM): Instrument Documenta-tion. Science Magazine website accessed on September 2, 2013: http://www.sciencemag.org/cgi/content /full/306/5702/1776/DC1.
2 Oragene 500.
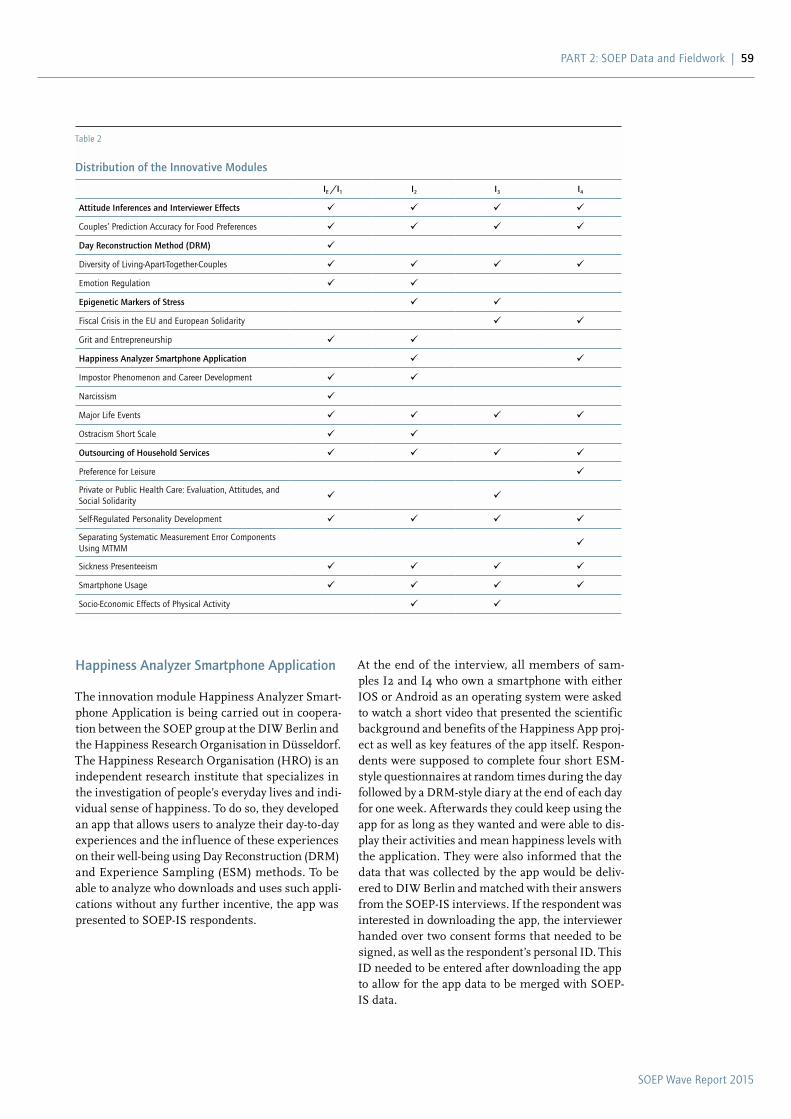
SOEP Wave Report 2015
PaRT 2: SOEP Data and Fieldwork | 59
At the end of the interview, all members of sam-ples I2 and I4 who own a smartphone with either IOS or Android as an operating system were asked to watch a short video that presented the scientific background and benefits of the Happiness App proj-ect as well as key features of the app itself. Respon-dents were supposed to complete four short ESM-style questionnaires at random times during the day followed by a DRM-style diary at the end of each day for one week. Afterwards they could keep using the app for as long as they wanted and were able to dis-play their activities and mean happiness levels with the application. They were also informed that the data that was collected by the app would be deliv-ered to DIW Berlin and matched with their answers from the SOEP-IS interviews. If the respondent was interested in downloading the app, the interviewer handed over two consent forms that needed to be signed, as well as the respondent’s personal ID. This ID needed to be entered after downloading the app to allow for the app data to be merged with SOEP-IS data.
Happiness Analyzer Smartphone Application
The innovation module Happiness Analyzer Smart-phone Application is being carried out in coopera-tion between the SOEP group at the DIW Berlin and the Happiness Research Organisation in Düsseldorf. The Happiness Research Organisation (HRO) is an independent research institute that specializes in the investigation of people’s everyday lives and indi-vidual sense of happiness. To do so, they developed an app that allows users to analyze their day-to-day experiences and the inf luence of these experiences on their well-being using Day Reconstruction (DRM) and Experience Sampling (ESM) methods. To be able to analyze who downloads and uses such appli-cations without any further incentive, the app was presented to SOEP-IS respondents.
Table 2
Distribution of the Innovative Modules
IE /I1 I2 I3 I4
Attitude Inferences and Interviewer Effects
Couples’ Prediction accuracy for Food Preferences
Day Reconstruction Method (DRM)
Diversity of Living-apart-Together-Couples
Emotion Regulation
Epigenetic Markers of Stress
Fiscal Crisis in the EU and European Solidarity
Grit and Entrepreneurship
Happiness Analyzer Smartphone Application
Impostor Phenomenon and Career Development
Narcissism
Major Life Events
Ostracism Short Scale
Outsourcing of Household Services
Preference for Leisure
Private or Public Health Care: Evaluation, attitudes, and Social Solidarity
Self-Regulated Personality Development
Separating Systematic Measurement Error Components Using MTMM
Sickness Presenteeism
Smartphone Usage
Socio-Economic Effects of Physical activity
SOEP Wave Report 2015
60 | PaRT 2: SOEP Data and Fieldwork
• Four statements about the respondent’s emotional behavior constitute the module about Emotion regulation. It covers two aspects of special interest: emotional experiencing and emotional expression.
• Fiscal Crisis in the EU and European Solidarity: Over the course of the European financial crisis, politicians appealed to German population to show solidarity by supporting the provision of financial aid to indebted countries. The main goal of the module is to find out how willing respondents would be to give to indebted countries and what types of cost cuts such pension reductions or federal employee layoffs they expect from recipient countries.
• The Grit and Entrepreneurship module provides data that can help to confirm or refute the research hypothesis that people who show more grit than others are much more successful as company founders. The scientists who proposed this module hypothesize that human personality characteristics have an important impact on the economic and administrative decisions taken in business life.
• impostor Phenomenon and Career development: Individuals affected by the impostor syndrome have the feeling that their work is not as good as other people’s work even though others perceive them as competent. They live in fear that others could discover that they are an impostor although their performance is completely normal. With this module, it will be possible to find out how widespread the impostor syndrome is in the German population.
• Implementing the narcissism module in the SOEP-IS 2015 questionnaire is an important step towards a more precise prediction of the positive (i.e., higher self-respect, leadership position) and negative effects (i.e., dissatisfaction with the social and occupational environment, instability of the social relations) of the personality characteristic narcissism. The “Narcissistic Admiration and Rivalry Questionnaire“(NARQ-S) has therefore been included in the SOEP-IS questionnaire for a second time since 2014.
Outsourcing of Household Services
The intention behind this module was to paint a clearer picture of the phenomenon of outsourcing in private households while testing the random-re-sponse technique in a relatively large representative sample of the population. In this study, outsourcing is defined as delegating housework to (commercial) service providers. The tasks that were covered by the innovation module were housework, childcare, care of the elderly, and maintenance work.
Of particular interest to the scientists that proposed the module was the amount of non-registered work that takes place in German households. Due to the fact that this type of question can be prone to social desirability bias, a randomly chosen set of respon-dents were asked about the registration status of the people they employ in their household using the ran-dom-response technique, which allows us to answer the precarious question indirectly without revealing personal information. Respondents were therefore asked to imagine the address of a person who does not live in the household. Then he or she was asked to state whether the house number they imagined started with the numbers one, two, three, or four and whether the answer to this first question matched the answer to the question “Is the household help employed officially?”. This way it remains possible to determine the percentage of households whose household help does not work under official contracts.
Shorter modules
A range of shorter modules made use of standard survey questions to gain insight into a variety of different topics:
• In relationships, knowledge about one’s partner is meaningful for many areas of daily life. The module Couples’ Prediction accuracy for Food Preferences examines the determinants of such knowledge to identify the consequences for the success of relationships by asking partners in participating households to guess each other’s preferences regarding a variety of foods.
• diversity of living-apart-together-Couples: In modern societies, the share of couples who are not living in the same household is growing. Through this module, these special relationships, their backgrounds, and intent - ions can be analyzed in more detail.

SOEP Wave Report 2015
PaRT 2: SOEP Data and Fieldwork | 61
• Separating Systematic measurement Error Components Using mtmm: A common problem in quantitative research lies in questions that produce systematic measurement errors. Using the Multitrait-Multimethod-Design (MTMM), this module tries to examine different systematic measurement errors.
• Sickness Presenteeism describes the phenomenon that despite being sick, employees come to work, for example because of a fear of losing their job.
• With the module about Smartphone Usage, the SOEP-IS gathers information about the use of different smartphone features in the German population. The researchers are planning to connect this data with socio-economic panel data to examine the impact of smartphone usage in daily life.
• The results of the Socio-Economic Effects of Physical activity module support research about the impact of sports on a variety of different aspects of social life such as health, education, personal job market chances, and personal well-being. In 2013, it was integrated for the first time into the SOEP-IS questionnaire.
Fieldwork Results
Data collection for the main fieldwork wave of the SOEP-IS usually lasts from September until the end of December or the beginning of January and is then followed by an additional fieldwork period at the be-ginning of the next year. Households are assigned to the second fieldwork stage if they could not be contacted successfully in the main fieldwork wave, if they were unable or unwilling to participate (for example, due to time constraints), or if interviews were missing for individual household members. As it is indicated by the figures in table 3, fieldwork for 91% of the households that participated in the study was completed by the end of December 2015. In the remaining households, some or all interviews were conducted in the year 2016.
table 4 presents the composition of the gross and net sample and response rates at the household level. The total gross sample consisted of 4,018 households. This includes previous wave respondents as well as temporary drop-outs from the previous wave and new households. Overall, 3,245 households took part in the SOEP-IS in 2015, that means at least one per-son in the household answered the individual and the household-related questions.
• major life Events: Since the beginning of the SOEP-IS, the questionnaire has ended with a question about certain major life events that have taken place since the last interview. In 2014, there was an additional question asking respondents to predict the incidence of these and some other major life events, such as spending time abroad or being promoted, in the following year. In 2015, this longer list of life events was included at the end of the interview to check whether the event took place. The scientists who proposed this module are interested in analyzing whether persons who expect something to happen might have an advantage in handling this event in the future.
• ostracism refers to the phenomenon of feeling excluded and ignored by others. The scientists who proposed this module state that research needs to examine the concept more precisely and over a long-term period because of the lack of clarity regarding the far-reaching effects on the psychological health of the affected persons.
• The module Preference for leisure presents several sets of possible weekly working times to employed respondents and asks them which monthly net income they would need to receive to be as content with this higher or lower amount of work as they are presently. Analyzing the outcome is expected to contribute to research on social- or tax policy decisions.
• Private or Public Health Care: Evaluation, attitudes, and Social Solidarity: Attitudes towards health policies might play an important role in the dynamics surrounding health reforms. This module asks respondents about their satisfaction with certain aspects of the German health care system such as availability of medical specialists and the state’s responsibility for offering sufficient health care.
• Using the generated data from the Self-regulated Personality development module, researchers will be able to find out more about processes that inf luence personality development in adults. Using the Big Five scale that has been employed in the SOEP for many years, respondents are asked who they would like to be in the 16 Big Five items. In another question, they are asked to state whether they believe personality characteristics can be changed.
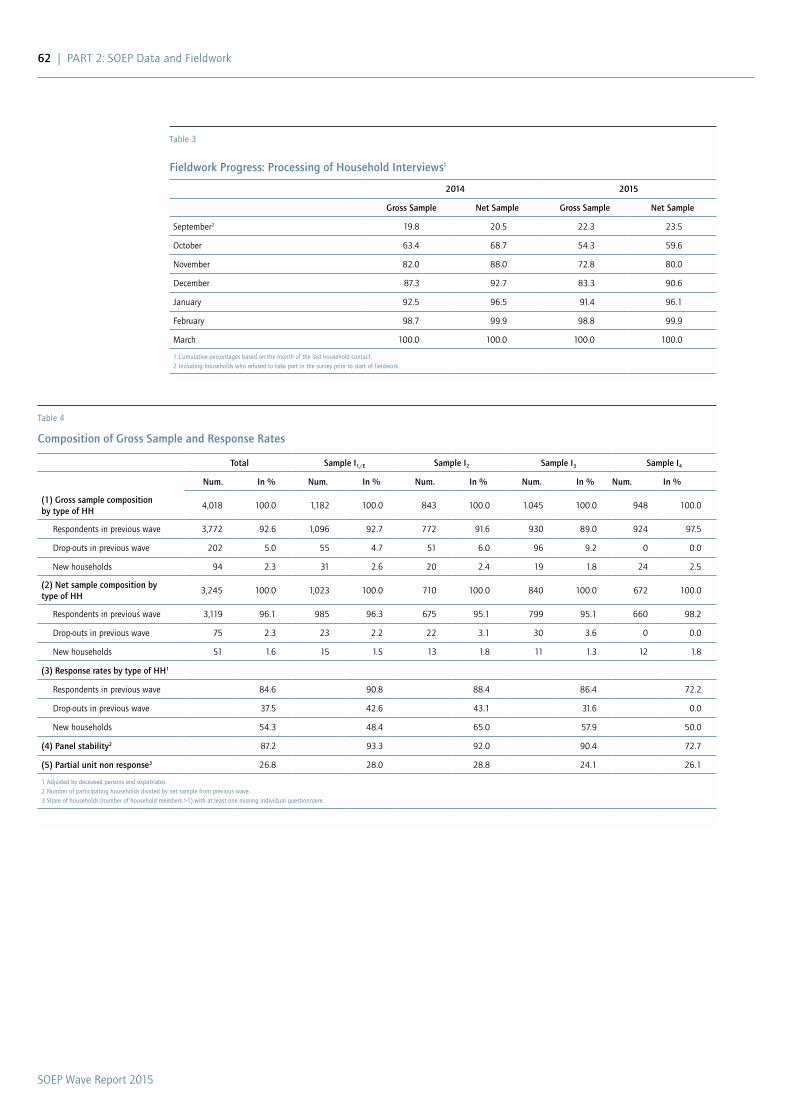
SOEP Wave Report 2015
62 | PaRT 2: SOEP Data and Fieldwork
Table 3
Fieldwork Progress: Processing of Household Interviews1
2014 2015
Gross Sample Net Sample Gross Sample Net Sample
September2 19.8 20.5 22.3 23.5
October 63.4 68.7 54.3 59.6
November 82.0 88.0 72.8 80.0
December 87.3 92.7 83.3 90.6
January 92.5 96.5 91.4 96.1
February 98.7 99.9 98.8 99.9
March 100.0 100.0 100.0 100.0
1 Cumulative percentages based on the month of the last household contact.2 Including households who refused to take part in the survey prior to start of fieldwork.
Table 4
Composition of Gross Sample and Response Rates
Total Sample I1/E Sample I2 Sample I3 Sample I4
Num. In % Num. In % Num. In % Num. In % Num. In %
(1) Gross sample composition by type of HH
4,018 100.0 1,182 100.0 843 100.0 1.045 100.0 948 100.0
Respondents in previous wave 3,772 92.6 1,096 92.7 772 91.6 930 89.0 924 97.5
Drop-outs in previous wave 202 5.0 55 4.7 51 6.0 96 9.2 0 0.0
New households 94 2.3 31 2.6 20 2.4 19 1.8 24 2.5
(2) Net sample composition by type of HH
3,245 100.0 1,023 100.0 710 100.0 840 100.0 672 100.0
Respondents in previous wave 3,119 96.1 985 96.3 675 95.1 799 95.1 660 98.2
Drop-outs in previous wave 75 2.3 23 2.2 22 3.1 30 3.6 0 0.0
New households 51 1.6 15 1.5 13 1.8 11 1.3 12 1.8
(3) Response rates by type of HH1
Respondents in previous wave 84.6 90.8 88.4 86.4 72.2
Drop-outs in previous wave 37.5 42.6 43.1 31.6 0.0
New households 54.3 48.4 65.0 57.9 50.0
(4) Panel stability2 87.2 93.3 92.0 90.4 72.7
(5) Partial unit non response3 26.8 28.0 28.8 24.1 26.1
1 adjusted by deceased persons and expatriates.2 Number of participating households divided by net sample from previous wave.3 Share of households (number of household members >1) with at least one missing individual questionnaire.
SOEP Wave Report 2015
PaRT 2: SOEP Data and Fieldwork | 63
Cooperation Rates in the Modules Epigenetic Markers of Stress and Happiness Analyzer Smartphone Application The module Epigenetic Markers of Stress was one of the innovation modules in which a certain amount of non-cooperation was to be expected. Interviewers therefore needed to proceed very carefully in order to maximize response rates while never jeopardiz-ing long-term participation of the household. table 5 examines cooperation rates and reasons for non-co-operation. Overall, the participants’ reactions to the request were quite positive, and 568 persons provid-ed one or two saliva samples and signed the consent form, which amounts to a cooperation rate of 58.4%. Among respondents who did not want to provide a sample, the most frequently mentioned reasons were lack of interest and objections regarding data security or privacy.
One aspect of the process that limited the number of samples that could be collected was the fact that collection kits were available for only 600 persons due to the high cost of the kits. Because some inter-viewers were more successful than others in collect-ing samples and the ad hoc re-distribution of unused kits is time consuming and does not always perfectly match interviewers’ appointments with households chosen for the saliva sampling, many interviewers ran out of sampling kits during fieldwork. Almost a quarter of respondents in the gross sample could not be asked to provide a sample because no sam-pling kit was available.
With the module Happiness Analyzer Smartphone Application, the aim was to find out what share of respondents in a representative sample are interested in downloading the Happiness Analyzer app. On this basis, the group of people who have downloaded and used the app can also be compared to the total sample to be able to find out more about the spe-cific group of people who use the application. The most important prerequisite for using the app is the availability of a smartphone with Android or IOS as operating system. 48.5% of the gross sample of 2,153 respondents who were selected for the module did not have such a phone available (table 6). Of the remaining 1,108 respondents who were presented with the app, 196 were interested in downloading it and signed the consent form. The cooperation rate in the group of people with suitable smartphones was 17.7%. This equals a cooperation rate of 9.1% in the total gross sample. Common reasons for not wanting to download the app were no interest and time constraints.
Combining all subsamples, 3,772 (92.6%) house-holds in the gross sample were respondents in the previous wave. There were 202 households (5.0%) that were temporary drop-outs from the previous wave and contacted again because there was some in-dication that participation in the next wave was still possible. The last group, “new households,” emerged during the fieldwork period: split-off households are created, for example, when children move out of their parents’ home and establish new households. In 2015, 94 new households were integrated into the gross sample (2.3%).The fieldwork results of longitudinal samples can be measured using two basic parameters. The first is panel stability, which is the decisive indicator of a household panel survey’s successful development from a long-term perspective. Since panel stability is calculated as the number of participating house-holds in the current wave divided by the correspond-ing number from the previous wave, panel mortality and panel growth (split-off households) or “regrowth” (dropouts from the previous wave who “rejoined” the sample) are taken into account. The second param-eter for measuring fieldwork results is the longitu-dinal response rate. Response rates indicate the ra-tio between the number of interviews—in this case household interviews—and the number of units in the gross sample. In table 4, the overall panel sta-bility and response rates for all relevant subgroups are listed.
The panel stability of sample I1/E has remained sta-ble since the last wave (2015: 93.3% 2014: 93.4%). Meanwhile, Sample I2 has achieved a value of 92.0% (2014: 92.7 %). Sample I3, which had its third pan-el wave in 2015, crossed the 90% mark to achieve 90.4% panel stability (2014: 79.7%). In the case of sample I4, which went through the challenging tran-sition from a cross-sectional to a longitudinal survey in this wave, panel stability was 72.7%.
In household surveys, a commonly used indicator to measure the success of the fieldwork process on an individual level is the number of households in which at least one questionnaire is missing (partial unit non-response). As in the standard SOEP sur-vey, the Innovation Sample tries to target every adult member of the household. The share of multi-person households in which at least one person did not com-plete the individual interview was 26.8% in 2015.
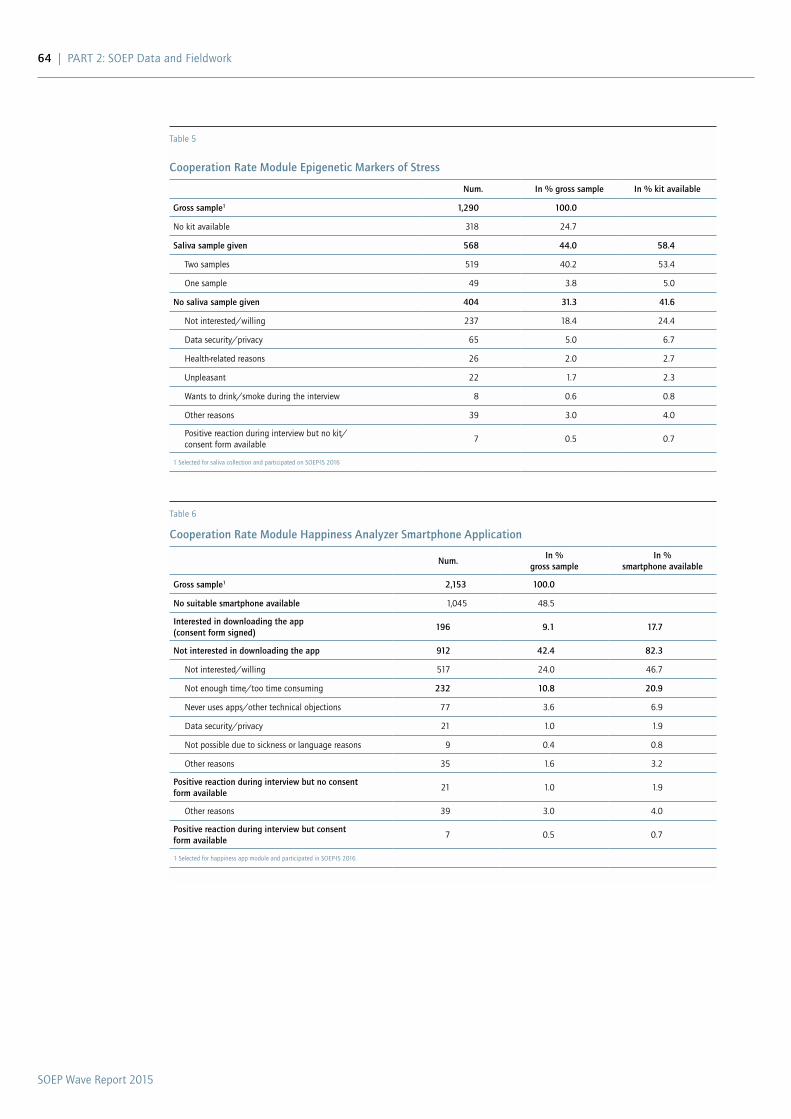
SOEP Wave Report 2015
64 | PaRT 2: SOEP Data and Fieldwork
Table 5
Cooperation Rate Module Epigenetic Markers of Stress
Num. In % gross sample In % kit available
Gross sample1 1,290 100.0
No kit available 318 24.7
Saliva sample given 568 44.0 58.4
Two samples 519 40.2 53.4
One sample 49 3.8 5.0
No saliva sample given 404 31.3 41.6
Not interested/willing 237 18.4 24.4
Data security/privacy 65 5.0 6.7
Health-related reasons 26 2.0 2.7
Unpleasant 22 1.7 2.3
Wants to drink/smoke during the interview 8 0.6 0.8
Other reasons 39 3.0 4.0
Positive reaction during interview but no kit/ consent form available
7 0.5 0.7
1 Selected for saliva collection and participated on SOEP-IS 2016
Table 6
Cooperation Rate Module Happiness Analyzer Smartphone Application
Num.In %
gross sampleIn %
smartphone available
Gross sample1 2,153 100.0
No suitable smartphone available 1,045 48.5
Interested in downloading the app (consent form signed)
196 9.1 17.7
Not interested in downloading the app 912 42.4 82.3
Not interested/willing 517 24.0 46.7
Not enough time/too time consuming 232 10.8 20.9
Never uses apps/other technical objections 77 3.6 6.9
Data security/privacy 21 1.0 1.9
Not possible due to sickness or language reasons 9 0.4 0.8
Other reasons 35 1.6 3.2
Positive reaction during interview but no consent form available
21 1.0 1.9
Other reasons 39 3.0 4.0
Positive reaction during interview but consent form available
7 0.5 0.7
1 Selected for happiness app module and participated in SOEP-IS 2016.
SOEP Wave Report 2015
PaRT 2: SOEP Data and Fieldwork | 65
Bonn Intervention Panel: Overview, Wave 1 and intervention
The BIP was launched based on these considerations as a novel and unprecedented project in Germany. In it, we examine the causal effect of early childhood environment on the development of personality and preferences. Our base sample (wave 1) consists of 732 children from the cities of Bonn and Cologne who were in either second or third grade in autumn 2011 as well as their mothers. The majority of these child-ren (590) have a low socio-economic status (SES) family background (low income and/or low educa-tional attainment and/or single parents). Among the children with low SES, we randomly chose 212 child-ren to form our treatment group. These children were selected to participate in an already existing mentoring program for a period of one year. In the mentoring program, child and mentor (usually a university student) spent time together once a week. Activities involved visiting the zoo, sports, going out for ice cream, or reading out aloud. The idea of the program is to positively change the environment of the child, substituting positive inf luences that are missing in the child’s normal life. Skills acquisiti-on in this program occurs on an informal basis. For example, when taking the bus, the child learns to read a map, deal with money, and be on time. Addi-tionally, the inf luence of another caregiver and new experiences broaden the child’s perspectives. The children who were not part of the treatment group form two kinds of comparison groups: The remai-ning low-SES children constitute the control group. By comparing control and treatment groups, we are able to infer causal effects of the intervention. 122 children from families with higher SES allow us to understand possible initial differences in personali-ty and preferences between children from high and low-SES families and how these initial differences develop over time (convergence or divergence).
Background
The Bonn Intervention Panel (BIP) investigates the development of personality and preferences of child-ren starting at primary school age up to age 25 and beyond. At age 25, the personality is largely developed and critical transitions in life have been accomplished. The main focus of our study is the impact of early childhood environments. In particular, we experimen-tally vary the childhood environment in our sample by giving a randomly chosen subgroup of the sample the opportunity to take part in a mentoring program. The comparison of these children with the control group (i.e., those children who did not participate in the mento- ring program) will provide information about the cau-sal and long-term effects of social environment on the development of children and their later paths in life.
It is widely accepted that the formation of key per-sonality traits and preferences starts in early child-hood (Cunha et al., 2006, Cunha et al., 2010). Two important aspects are characteristic of personality formation (Cunha and Heckman, 2007): First, per-sonality traits and abilities are self-reinforcing once they have been acquired. Second, personality traits and skills reinforce each other (cross-fertilization). A self-confident child, for example, tends to read out loud in class more often than other children. Hence, such a child will improve his or her reading skills, which in turn will have a positive effect on his or her self-confidence. These two aspects of the formation of personality, preferences, and abilities highlight the importance of studying environmental inf luen-ces at a very early stage in life. Given the reinforcing nature of this process, early improvements will have the highest “return” on acquired skills and preferen-ces. Moreover, the two described features suggest that it is vital to consider a long time horizon, i.e., to follow children into adulthood: Even if the effects of a change in social environment might appear to be small in the beginning, the complementary nature of the skill and preference formation process might lead to large differences in later stages of life.
The Bonn Intervention Panel: A SOEP-Related Study (SOEP-RS)By Armin Falk
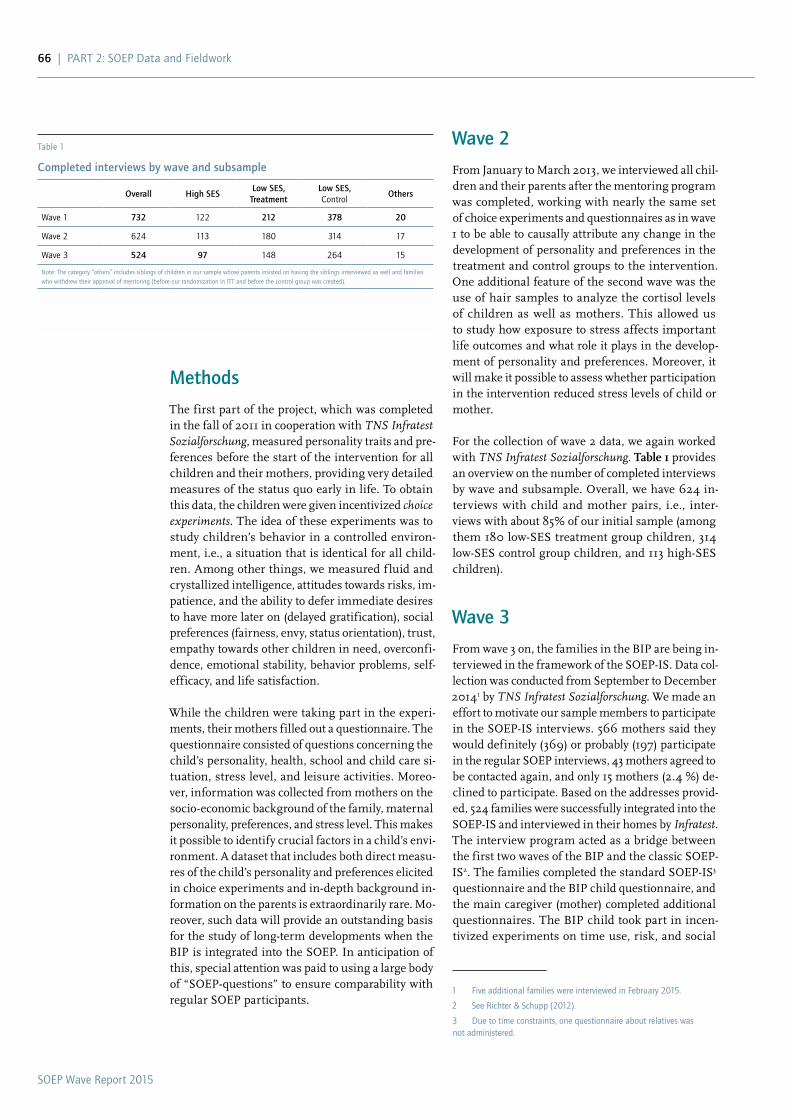
SOEP Wave Report 2015
66 | PaRT 2: SOEP Data and Fieldwork
Wave 2
From January to March 2013, we interviewed all chil-dren and their parents after the mentoring program was completed, working with nearly the same set of choice experiments and questionnaires as in wave 1 to be able to causally attribute any change in the development of personality and preferences in the treatment and control groups to the intervention. One additional feature of the second wave was the use of hair samples to analyze the cortisol levels of children as well as mothers. This allowed us to study how exposure to stress affects important life outcomes and what role it plays in the develop-ment of personality and preferences. Moreover, it will make it possible to assess whether participation in the intervention reduced stress levels of child or mother.
For the collection of wave 2 data, we again worked with TNS Infratest Sozialforschung. table 1 provides an overview on the number of completed interviews by wave and subsample. Overall, we have 624 in-terviews with child and mother pairs, i.e., inter-views with about 85% of our initial sample (among them 180 low-SES treatment group children, 314 low-SES control group children, and 113 high-SES children).
Wave 3
From wave 3 on, the families in the BIP are being in-terviewed in the framework of the SOEP-IS. Data col-lection was conducted from September to December 20141 by TNS Infratest Sozialforschung. We made an effort to motivate our sample members to participate in the SOEP-IS interviews. 566 mothers said they would definitely (369) or probably (197) participate in the regular SOEP interviews, 43 mothers agreed to be contacted again, and only 15 mothers (2.4 %) de-clined to participate. Based on the addresses provid-ed, 524 families were successfully integrated into the SOEP-IS and interviewed in their homes by Infratest. The interview program acted as a bridge between the first two waves of the BIP and the classic SOEP-IS2. The families completed the standard SOEP-IS3 questionnaire and the BIP child questionnaire, and the main caregiver (mother) completed additional questionnaires. The BIP child took part in incen-tivized experiments on time use, risk, and social
1 Five additional families were interviewed in February 2015.
2 See Richter & Schupp (2012).
3 Due to time constraints, one questionnaire about relatives was not administered.
Methods
The first part of the project, which was completed in the fall of 2011 in cooperation with TNS Infratest Sozialforschung, measured personality traits and pre-ferences before the start of the intervention for all children and their mothers, providing very detailed measures of the status quo early in life. To obtain this data, the children were given incentivized choice experiments. The idea of these experiments was to study children’s behavior in a controlled environ-ment, i.e., a situation that is identical for all child-ren. Among other things, we measured f luid and crystallized intelligence, attitudes towards risks, im-patience, and the ability to defer immediate desires to have more later on (delayed gratification), social preferences (fairness, envy, status orientation), trust, empathy towards other children in need, overconfi-dence, emotional stability, behavior problems, self-efficacy, and life satisfaction.
While the children were taking part in the experi-ments, their mothers filled out a questionnaire. The questionnaire consisted of questions concerning the child’s personality, health, school and child care si-tuation, stress level, and leisure activities. Moreo-ver, information was collected from mothers on the socio-economic background of the family, maternal personality, preferences, and stress level. This makes it possible to identify crucial factors in a child’s envi-ronment. A dataset that includes both direct measu-res of the child’s personality and preferences elicited in choice experiments and in-depth background in-formation on the parents is extraordinarily rare. Mo-reover, such data will provide an outstanding basis for the study of long-term developments when the BIP is integrated into the SOEP. In anticipation of this, special attention was paid to using a large body of “SOEP-questions” to ensure comparability with regular SOEP participants.
Table 1
Completed interviews by wave and subsample
Overall High SES Low SES,
TreatmentLow SES, Control
Others
Wave 1 732 122 212 378 20
Wave 2 624 113 180 314 17
Wave 3 524 97 148 264 15
Note: The category “others” includes siblings of children in our sample whose parents insisted on having the siblings interviewed as well and families who withdrew their approval of mentoring (before our randomization in ITT and before the control group was created).

SOEP Wave Report 2015
PaRT 2: SOEP Data and Fieldwork | 67
ticularly prosocial, this suggests that the mentor-ing program serves as a substitute for intra-family prosocial stimuli.
Additionally, the intervention reduces the prevalence of overconfidence (i.e., overestimation of own abili-ties) in the treatment group. Empirical evidence on the consequences of overconfidence highlights di-verse negative implications such as inefficient learn-ing behavior and an unhealthy lifestyle. Also with respect to overconfidence, our data document that a mentoring intervention bears the potential to close the developmental gap between children from fami-lies with low SES and children with high SES who are less likely to display overconfident behavior.
Finally, there are some initial weaker indications that the intervention increases children’s f luid IQ and reduces maternal exposure to stress.
Wave 3 data
The focus of the analysis of the wave 3 data was on exploring the persistence of the previously identi-fied effects. The analysis produced three important findings. First, over the time span of two years, we observe a general increase in prosociality among el-ementary school children. To the best of our knowl-edge, this was the first evidence of an increase in prosociality in children. Second, the high-low SES developmental gap in prosociality seen in wave 2 persists in wave 3. Third, and most importantly, the treatment effect found in wave 2 turns out to be remarkably robust over time. Two years after the end of the intervention, treated children display sig-nificantly higher levels of prosocial behavior than children from the control group. As a consequence, prosociality in wave 3 does not significantly differ between treated low-SES and high-SES children. In other words, the developmental gap that was closed in response to treatment remains closed more than two years after the intervention. The complete analy-sis is currently being finalized and will be published in the near future (Kosse et al., 2016).
Moreover, we are working on an analysis of second-ary schooling decisions among the children in the study and their parents. The preliminary analysis shows a positive effect of the mentoring program on the probability of choosing the highest educa-tion track.
preferences and completed the pre-teen question-naire from the core SOEP. The mothers answered addition question regarding her personality and par-enting style.
First results
Wave 1 data
Randomization of children into low-SES treatment and low-SES control groups worked well. There are no initial statistically significant differences in per-sonality and preference measures between those two groups.
Results based on wave 1 data show that SES is a pow-erful predictor of many facets of a child’s personality such as time preferences, risk preferences, altruism as well as crystallized and f luid IQ. Children from families with higher SES are more patient, less likely to be risk-seeking, and score higher on IQ tests. We further observe that children from low-SES families live in fundamentally different environments than children from high-SES families. The environment differs in many respects: parenting style, quantity and quality of time parents spend with their chil-dren, the mother’s IQ and economic preferences, the child’s initial condition at birth, and family structure. Personality profiles that vary systematically with SES offer an explanation for social immobility. For de-tails, see Deckers et al. (2015).
Furthermore, wave 1 data show large differences in educational success, emotional, mental, and beha-vioral problems, and general life satisfaction depen-ding on SES.
Wave 2 data
Comparing measures of personality, preferences, and other outcomes of the low-SES treatment and low-SES control groups in wave 2 makes it possible to draw causal inference about the effect of a ran-domly assigned variation in a child’s social environ-ment (mentoring) on personality or other outcomes. Our data reveal a significant increase in altruism, trust, and other-regarding behavior in the treatment relative to the control group. These findings provide evidence of a causal effect of social environment on the formation of prosociality. Our data addition-ally reveal that the intervention under examination substantially reduces the observed developmental gap in prosociality between low- and high-SES chil-dren. The intervention is most effective for children whose mothers score relatively low on prosociality. In combination with the fact that mentors are par-
SOEP Wave Report 2015
68 | PaRT 2: SOEP Data and Fieldwork
• Cunha, Flavio, James J. Heckman & Susanne m. Schennach (2010) “Estimating the Technology of Cognitive and Noncognitive Skill Formation”, Econometrica, 78(3): 883–931.
• deckers, thomas, armin Falk, Fabian Kosse & Hannah Schildberg-Hörisch (2015) “How Does Socio-Economic Status Shape a Child’s Personality?” IZA Discussion Paper No. 8977.
• Kosse, Fabian, thomas deckers, Hannah Schildberg-Hörisch & armin Falk (2016)
“Formation of Human Prosociality: Causal Evidence on the Role of Social Environment.” IZA Discussion Paper no. 9861.
• richter, david & Jürgen Schupp (2012) “SOEP Innovation Panel (SOEP-IS) – Description, Structure and Documentation.” SOEPpapers on Multidisciplinary Panel Data Research, No. 463, Berlin.
Subsequent steps
All families that took part in the third wave were invited to take part in the fourth wave at the end of 2015. The interview program is closely related to that from wave 3.
References
• Cunha, Flavio, James J. Heckman, lance J. lochner & dimitriy V. masterov (2006)
“Interpreting the Evidence on Life Cycle Skill Formation”, In Handbook of the Economics of Education, ed. Eric A. Hanushek and Frank Welch, 697–812. Amsterdam: North-Holland: Elsevier.
• Cunha, Flavio & James J. Heckman (2007) “The Technology of Skill Formation”, American Economic Review, 97(2): 31–47.
SOEP Wave Report 2015
PaRT 2: SOEP Data and Fieldwork | 69
Fieldwork Report 2015 from TNS Infratest
Overview
After the families in the Bonn Intervention Panel were interviewed in their homes using the SOEP-IS questionnaire for the first time in 2014, a very simi-lar approach was taken in the fourth wave of the BIP in 2015. Again, fieldwork started in the beginning of September, and the last interviews took place at the end of February. This very long fieldwork pe-riod given the size of the sample allowed us to use a special small group of interviewers and to process all households very thoroughly, especially those that did not participate in the third wave of the BIP and those that had initially indicated that they would not have time to take part in the study in 2015. In the end, over 500 families were convinced to contribute to the fourth wave of the Bonn Intervention Panel.
The interviewers, many of whom had already been assigned to the project in 2014, were hand-picked based on their experience and their capabilities in interviewing young respondents as well as in han-dling extremely valuable panel households. In a one-day training session at the University of Bonn, Prof. Armin Falk and Dr. Fabian Kosse briefed them about the scientific background and high expectations re-garding the study, and members of the project team at TNS Infratest Sozialforschung introduced them to the fieldwork processes and questionnaires.
Questionnaire
The interview program was very similar to the pre-vious wave with standard SOEP-IS or SOEP ques-tionnaires plus additional instruments for the BIP children:
• All adults answered the SoEP-iS core questionnaire 2015 with household questions and life history questions for the household head or new household members. In place of the innovation modules, several personality-related questions were included.
• The main caregiver (usually the mother) of the children was also asked to answer one of the three mother-child modules for all children in the household below the age of 17. In the mother-child section of the questionnaire, additional questions about the BIP child dealt with issues such as the transition from primary to secondary school.
• The BIP child took part in a set of incentivized experiments regarding time, risk, and social preferences that was very similar to 2014. However, in 2015, the amount of money the child could win in the “games” was slightly higher and the amount of time they needed to wait in the time preference experiment was extended from one to six weeks.
• The pre-teen questionnaire was also used again for BIP children with slight changes from the version used in the SOEP in 2015.
• Moreover, the BIP children completed two ultra-short tests of cognitive ability that were used in the main SoEP in the year 2012 and in the BIP in 2014 (a symbol correspondence test and a test that asked children to name animals).
• A new component of the interview program for the BIP children in 2015 was another test of cognitive ability based on raven’s Standard Progressive matrices.
Fieldwork Results
Most households were interviewed in the main field-work phase between early September and the end of October (ca. 85%). Another 10% followed up to mid-December and the last 5% of household interviews were conducted during the last refusal conversion processes in January and February 2016.
table 1 presents the sample sizes and response rates at the household and BIP child level for waves three and four. Due to the special setup of the BIP, the working definition of a realized case differs from the usual SOEP definition, in which an interviewed household consists of the household and (at least) one individual questionnaire. In contrast, five com-ponents need to be available to complete an entire case in the BIP:
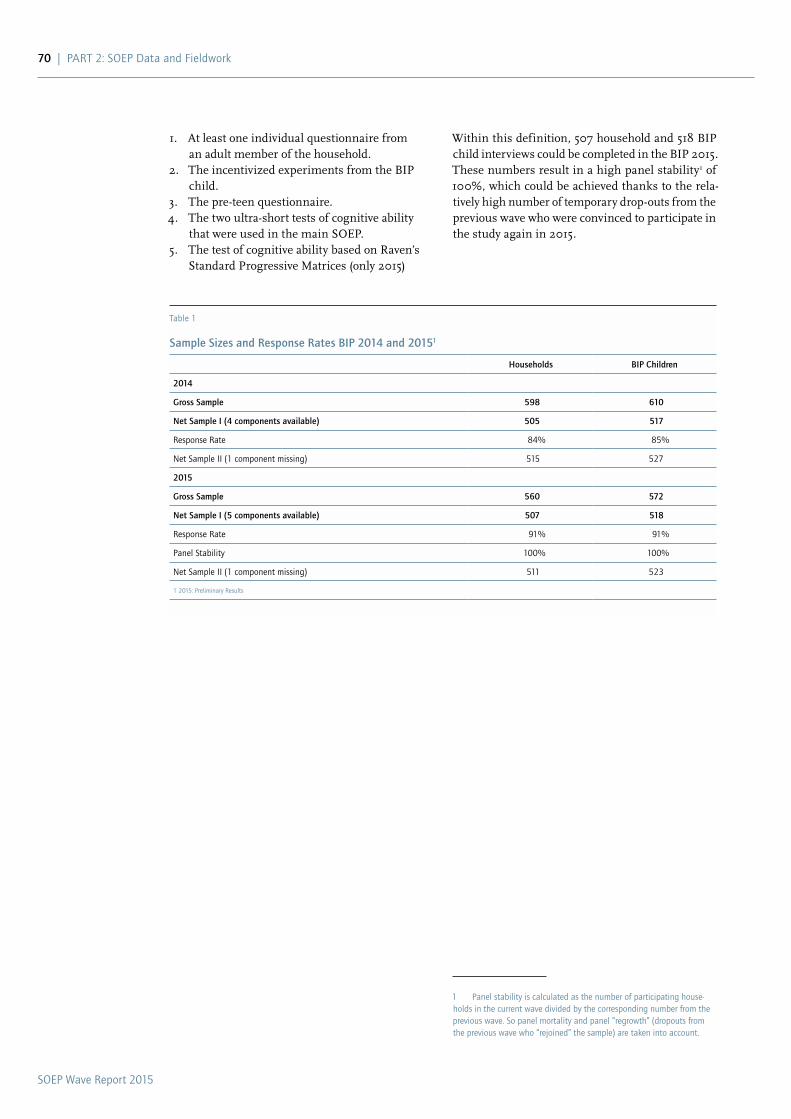
SOEP Wave Report 2015
70 | PaRT 2: SOEP Data and Fieldwork
Within this definition, 507 household and 518 BIP child interviews could be completed in the BIP 2015. These numbers result in a high panel stability1 of 100%, which could be achieved thanks to the rela-tively high number of temporary drop-outs from the previous wave who were convinced to participate in the study again in 2015.
1 Panel stability is calculated as the number of participating house-holds in the current wave divided by the corresponding number from the previous wave. So panel mortality and panel “regrowth” (dropouts from the previous wave who “rejoined” the sample) are taken into account.
1. At least one individual questionnaire from an adult member of the household.
2. The incentivized experiments from the BIP child.
3. The pre-teen questionnaire. 4. The two ultra-short tests of cognitive ability
that were used in the main SOEP. 5. The test of cognitive ability based on Raven’s
Standard Progressive Matrices (only 2015)
Table 1
Sample Sizes and Response Rates BIP 2014 and 20151
Households BIP Children
2014
Gross Sample 598 610
Net Sample I (4 components available) 505 517
Response Rate 84% 85%
Net Sample II (1 component missing) 515 527
2015
Gross Sample 560 572
Net Sample I (5 components available) 507 518
Response Rate 91% 91%
Panel Stability 100% 100%
Net Sample II (1 component missing) 511 523
1 2015: Preliminary Results
SOEP Wave Report 2015
PaRT 2: SOEP Data and Fieldwork | 71
The History of SOEPinfo, DDI on Rails, and our latest Service paneldata.org
In order to provide comprehensive and user-friendly documentation on the increased diversity within the SOEP family of studies over the last several years, we have been working to develop a new documen-tation and metadata portal. Here we use the term
“user-friendly” to describe documentation and data that can be easily understood by users and analyzed for a variety of research topics. This requires a clear description of the data and easy access to compre-hensive documentation. When the SOEP released its first longitudinal dataset in the mid-1980s, the documentation on questions that had been asked previously and the underlying variables could still be distributed in simple tables created using a word processing program. By the late 1980s, these tables had grown so large that they had to be transferred into the then widely used database management sys-tem dBASE.
As the complexity continued to increase with each ad-ditional wave of data, it became necessary to switch from simple tables to a documentation system called SOEPinfo. By the end of the 1990s, this documen-tation system was ported to a web-based program by the SOEP’s IT specialist Ingo Sieber. It has been developed continuously since then and is still in use today. It allows our user community a simple and practical point of entry to a SOEP data structure that is becoming more complex with each successive wave. By means of a web-based basket and a script generator that can be used in most common statis-tical software packages with the SOEP data, even first-time users are able to conduct their own inde-pendent longitudinal SOEP analyses after a short introductory workshop.
While the first version of SOEPinfo was tailored to the SOEP data format, the data reality at the SOEP Research Data Center has changed since then. We now offer SOEPlong, which uses the new computing capacities and translates the SOEP data from their usual cross-sectional format into the clearer longitu-dinal format. There are also additional studies like the SOEP-Innovation Sample and Related Studies like BASE II. The successor to SOEPinfo therefore had to combine similarly in-depth documentation to the old SOEPinfo with the abstraction of a model that can be applied to a variety of panel studies.
In 2013, we began work developing a new software system, which is intended as a study-independent documentation tool for panel data: DDI on Rails (http://www.ddionrails.org). The first version of the software was developed by Marcel Hebing as part of his doctoral thesis on metadata-driven infrastruc-tures for panel studies. The three main goals for the design of the new metadata system were (1) to cre-ate an “open source” software that would allow our solution to be applied by other longitudinal studies, (2) to adhere to a metadata standard like DDI, to en-sure the possibility of integration into other retrieval systems, and (3) to maintain the full functionality of SOEPinfo.
Our vision is that DDI on Rails will accompany re-searchers throughout the entire course of their re-search projects from conception to publication. The system offers researchers the possibility to explore the SOEP data and to compile personalized data-sets by using the script generator, and it ref lects the specific features of longitudinal studies. Even the SOEPlit database of SOEP-based publications is in-tegrated into DDI on Rails.
The New SOEP Metadata Documentation System: Paneldata.orgBy Marcel Hebing and Jan Goebel
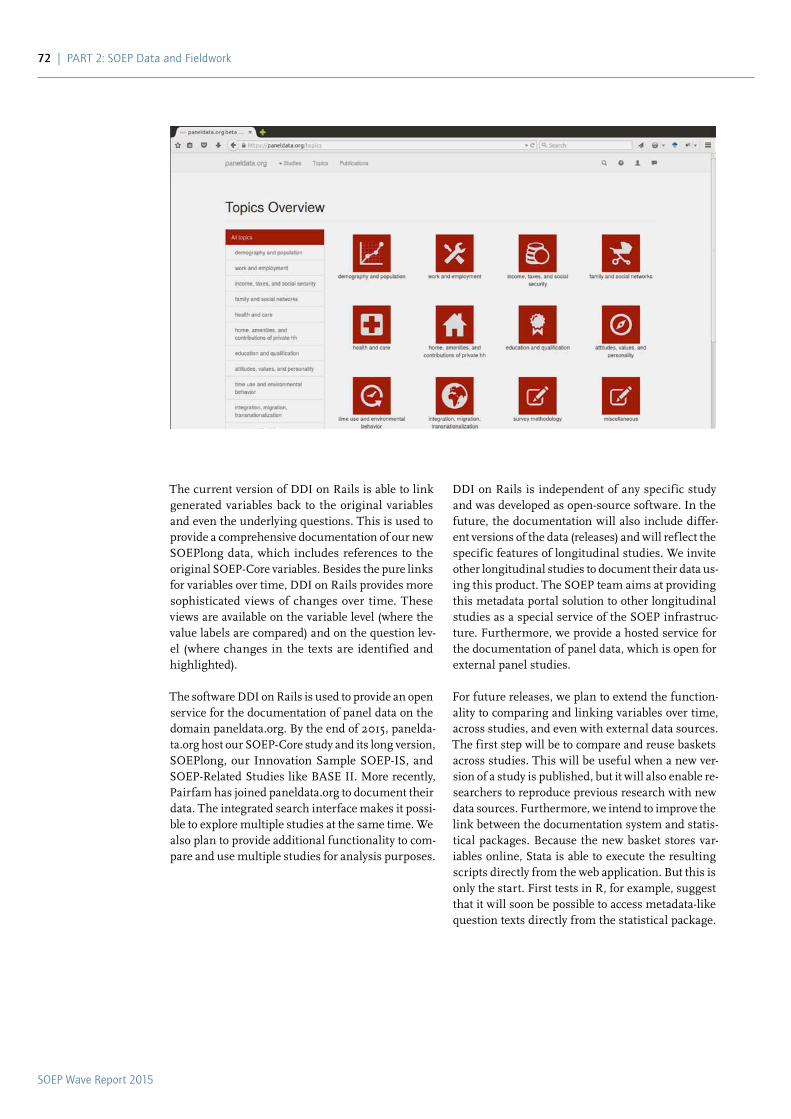
SOEP Wave Report 2015
72 | PaRT 2: SOEP Data and Fieldwork
DDI on Rails is independent of any specific study and was developed as open-source software. In the future, the documentation will also include differ-ent versions of the data (releases) and will ref lect the specific features of longitudinal studies. We invite other longitudinal studies to document their data us-ing this product. The SOEP team aims at providing this metadata portal solution to other longitudinal studies as a special service of the SOEP infrastruc-ture. Furthermore, we provide a hosted service for the documentation of panel data, which is open for external panel studies.
For future releases, we plan to extend the function-ality to comparing and linking variables over time, across studies, and even with external data sources. The first step will be to compare and reuse baskets across studies. This will be useful when a new ver-sion of a study is published, but it will also enable re-searchers to reproduce previous research with new data sources. Furthermore, we intend to improve the link between the documentation system and statis-tical packages. Because the new basket stores var-iables online, Stata is able to execute the resulting scripts directly from the web application. But this is only the start. First tests in R, for example, suggest that it will soon be possible to access metadata-like question texts directly from the statistical package.
The current version of DDI on Rails is able to link generated variables back to the original variables and even the underlying questions. This is used to provide a comprehensive documentation of our new SOEPlong data, which includes references to the original SOEP-Core variables. Besides the pure links for variables over time, DDI on Rails provides more sophisticated views of changes over time. These views are available on the variable level (where the value labels are compared) and on the question lev-el (where changes in the texts are identified and highlighted).
The software DDI on Rails is used to provide an open service for the documentation of panel data on the domain paneldata.org. By the end of 2015, panelda-ta.org host our SOEP-Core study and its long version, SOEPlong, our Innovation Sample SOEP-IS, and SOEP-Related Studies like BASE II. More recently, Pairfam has joined paneldata.org to document their data. The integrated search interface makes it possi-ble to explore multiple studies at the same time. We also plan to provide additional functionality to com-pare and use multiple studies for analysis purposes.
SOEP Wave Report 2015
PaRT 2: SOEP Data and Fieldwork | 73
Second, for the “sensitive” regional data, which are subject to strict data protection regulations, users can obtain access to the data through our remote execution system SOEPremote (through the LISSY system of the Luxembourg Income Study), which has been available for several years now, or on a guest research visit to the SOEP.
Over recent years we have added two additional modes of data access. First, we piloted our first real remote access from the Research Data Center at the Collaborative Research Center SFB 882 in Bielefeld to an internal server at DIW Berlin. This allows re-searchers at a specially protected terminal in Biele-feld to access regional data connected with the SOEP and FiD and data from SOEP-LEE. The second ad-ditional mode of data access was designed especially for the sensitive geocoded coordinates of the survey households, which are provided on specific comput-ers on site at DIW Berlin, where researchers can use the data through a secure connection with a special server. The SOEP Research Data Center is the only one in Germany that allows its scientific users to use a longitudinal survey in connection with the coor-dinates of the survey households. This is only pos-sible, however, under adherence to extremely strict technical and organizational standards. Researchers are not allowed to use the coordinates and the sur-vey data simultaneously. This prevents researchers from determining where an individual household is actually located. Data transfers to or from this server have to be made and overseen by employees of the Data Research Center.1
1 See Jan Goebel and Bernd Pauer (2014): “Datenschutzkonzept zur Nutzung von SOEPgeo im Forschungsdatenzentrum SOEP am DIW Berlin,” Zeitschrift für amtliche Statistik Berlin-Brandenburg 8 (3), 42–47 (https://www.statistik-berlin-brandenburg.de/produkte/zeitschrift/2014/HZ_201403.pdf).
Overview of 2015
In 2015, the range of datasets the SOEP provides to our user community has continued to grow. The SOEP is no longer merely a single longitudinal study, but a constellation of different studies with SOEP-Core at its center.
Of course, our most important user service in 2015 was the release of Version 31 of the SOEP-Core da-ta (1984–2014, 10.5684/soep.v31) and the integra-tion of the longitudinal data from study Familien in Deutschland (Families in Germany, FiD, see below). This “classic” data release also included data from the SOEP-Innovation Sample (10.5684/soep.is.2013, see p. 56 for more on the SOEP-IS). An important addition to SOEP-Core was the IAB-SOEP Migration Sample, a special immigrant boost sample released in cooperation with the IAB. The second wave of data from this new sample will be released with Version 32 of the SOEP data.
The increasing diversity and growing range of data products provided by the SOEP Research Data Cen-ter underscore the importance of the new system we have been developing as the successor to SOEPinfo. A beta version of this new system has been publicly available since January 2013, and now not only con-tains virtually all the functions of the old SOEPinfo but can also show relationships between the individ-ual studies. We plan to continue expanding the pos-sibilities of this new documentation service, panelda-ta.org, for documenting various surveys and linking them together in one overarching system. Details can be found on p. 74.
Due to the differing demands of the various datasets depending on the size and depth of the data, we offer different forms of data access. First, we distribute the data as standard scientific use files, which we did for the first time in 2013 entirely via Internet (using the encryption program cryptshare and providing users with individual passwords for downloading).
Report from the SOEP Research Data CenterBy Jan Goebel
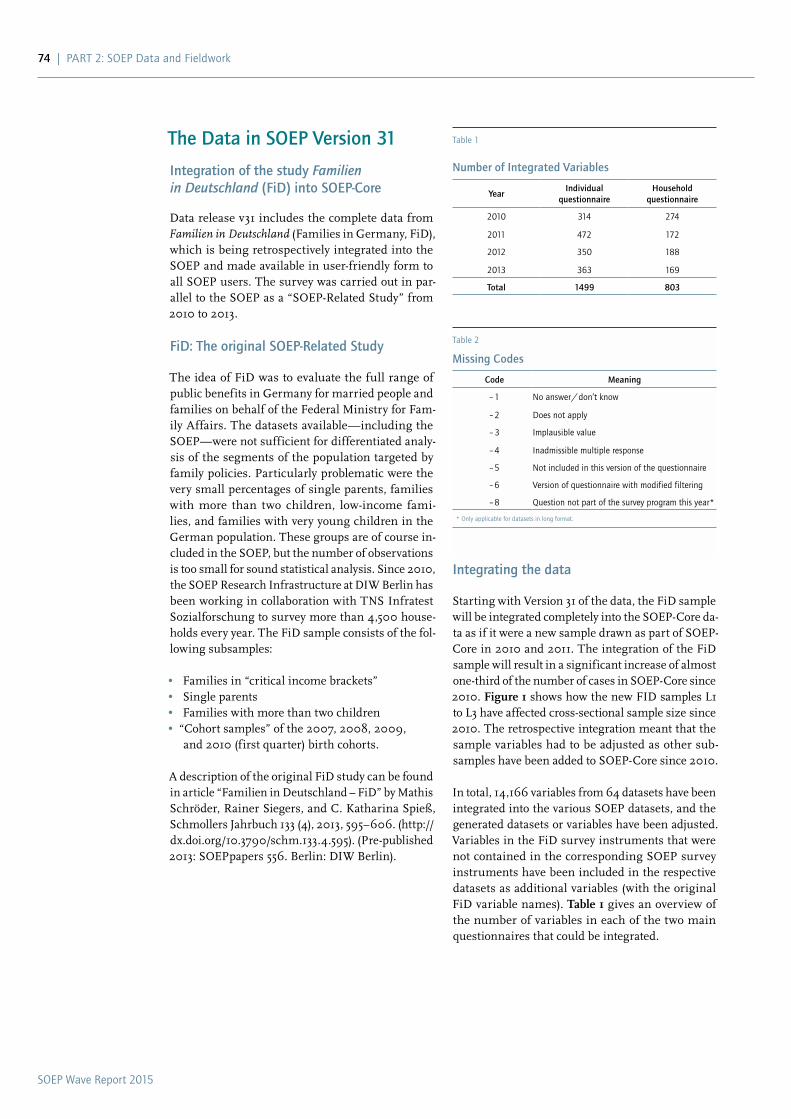
SOEP Wave Report 2015
74 | PaRT 2: SOEP Data and Fieldwork
Integrating the data
Starting with Version 31 of the data, the FiD sample will be integrated completely into the SOEP-Core da-ta as if it were a new sample drawn as part of SOEP-Core in 2010 and 2011. The integration of the FiD sample will result in a significant increase of almost one-third of the number of cases in SOEP-Core since 2010. Figure 1 shows how the new FID samples L1 to L3 have affected cross-sectional sample size since 2010. The retrospective integration meant that the sample variables had to be adjusted as other sub-samples have been added to SOEP-Core since 2010.
In total, 14,166 variables from 64 datasets have been integrated into the various SOEP datasets, and the generated datasets or variables have been adjusted. Variables in the FiD survey instruments that were not contained in the corresponding SOEP survey instruments have been included in the respective datasets as additional variables (with the original FiD variable names). table 1 gives an overview of the number of variables in each of the two main questionnaires that could be integrated.
The Data in SOEP Version 31
Integration of the study Familien in Deutschland (FiD) into SOEP-Core
Data release v31 includes the complete data from Familien in Deutschland (Families in Germany, FiD), which is being retrospectively integrated into the SOEP and made available in user-friendly form to all SOEP users. The survey was carried out in par-allel to the SOEP as a “SOEP-Related Study” from 2010 to 2013.
FiD: The original SOEP-Related Study
The idea of FiD was to evaluate the full range of public benefits in Germany for married people and families on behalf of the Federal Ministry for Fam-ily Affairs. The datasets available—including the SOEP—were not sufficient for differentiated analy-sis of the segments of the population targeted by family policies. Particularly problematic were the very small percentages of single parents, families with more than two children, low-income fami-lies, and families with very young children in the German population. These groups are of course in-cluded in the SOEP, but the number of observations is too small for sound statistical analysis. Since 2010, the SOEP Research Infrastructure at DIW Berlin has been working in collaboration with TNS Infratest Sozialforschung to survey more than 4,500 house-holds every year. The FiD sample consists of the fol-lowing subsamples:
• Families in “critical income brackets” • Single parents • Families with more than two children • “Cohort samples” of the 2007, 2008, 2009,
and 2010 (first quarter) birth cohorts.
A description of the original FiD study can be found in article “Familien in Deutschland – FiD” by Mathis Schröder, Rainer Siegers, and C. Katharina Spieß, Schmollers Jahrbuch 133 (4), 2013, 595–606. (http://dx.doi.org/10.3790/schm.133.4.595). (Pre-published 2013: SOEPpapers 556. Berlin: DIW Berlin).
Table 1
Number of Integrated Variables
YearIndividual
questionnaireHousehold
questionnaire
2010 314 274
2011 472 172
2012 350 188
2013 363 169
Total 1499 803
Table 2
Missing Codes
Code Meaning
– 1 No answer / don’t know
– 2 Does not apply
– 3 Implausible value
– 4 Inadmissible multiple response
– 5 Not included in this version of the questionnaire
– 6 Version of questionnaire with modified filtering
– 8 Question not part of the survey program this year*
* Only applicable for datasets in long format.
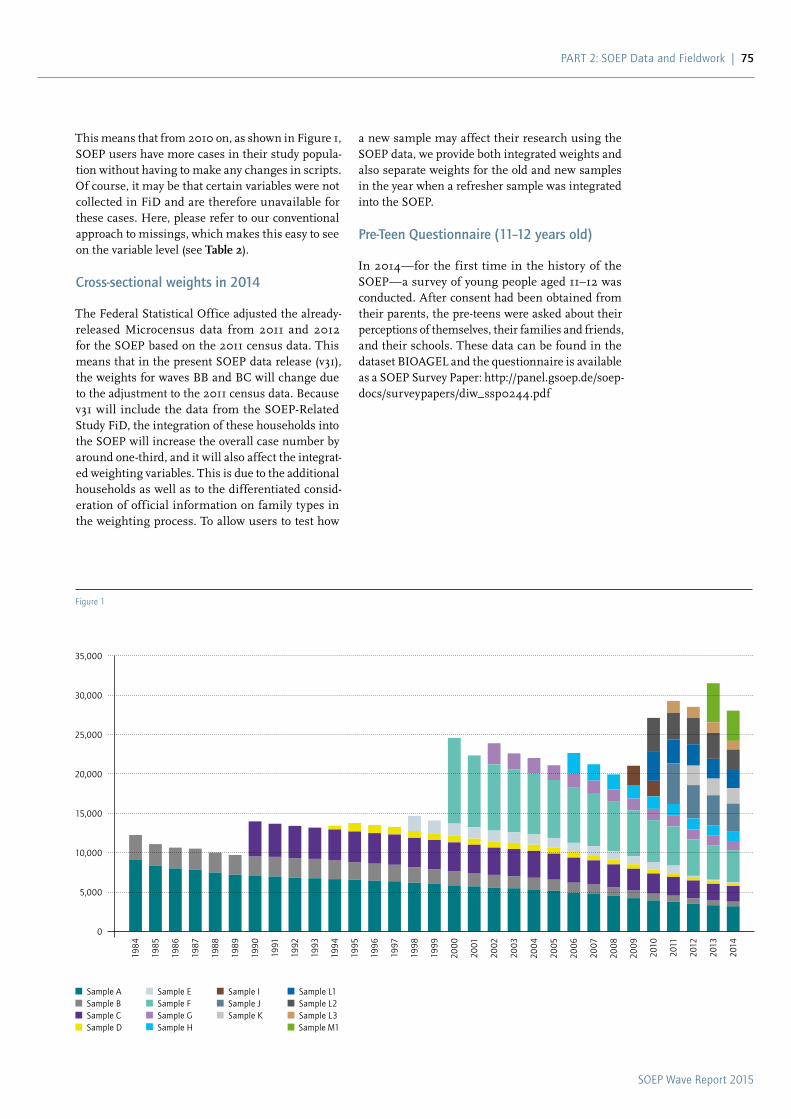
SOEP Wave Report 2015
PaRT 2: SOEP Data and Fieldwork | 75
This means that from 2010 on, as shown in Figure 1, SOEP users have more cases in their study popula-tion without having to make any changes in scripts. Of course, it may be that certain variables were not collected in FiD and are therefore unavailable for these cases. Here, please refer to our conventional approach to missings, which makes this easy to see on the variable level (see table 2).
Cross-sectional weights in 2014
The Federal Statistical Office adjusted the already-released Microcensus data from 2011 and 2012 for the SOEP based on the 2011 census data. This means that in the present SOEP data release (v31), the weights for waves BB and BC will change due to the adjustment to the 2011 census data. Because v31 will include the data from the SOEP-Related Study FiD, the integration of these households into the SOEP will increase the overall case number by around one-third, and it will also affect the integrat-ed weighting variables. This is due to the additional households as well as to the differentiated consid-eration of official information on family types in the weighting process. To allow users to test how
a new sample may affect their research using the SOEP data, we provide both integrated weights and also separate weights for the old and new samples in the year when a refresher sample was integrated into the SOEP.
Pre-Teen Questionnaire (11–12 years old)
In 2014—for the first time in the history of the SOEP—a survey of young people aged 11–12 was conducted. After consent had been obtained from their parents, the pre-teens were asked about their perceptions of themselves, their families and friends, and their schools. These data can be found in the dataset BIOAGEL and the questionnaire is available as a SOEP Survey Paper: http://panel.gsoep.de/soep-docs/surveypapers/diw_ssp0244.pdf
Figure 1
Sample a Sample B Sample C Sample D
Sample E Sample F Sample G Sample H
Sample I Sample J Sample K
Sample L1 Sample L2 Sample L3 Sample M1
5,000
30,000
35,000
25,000
20,000
10,000
15,000
0
1984
1985
1986
1987
1988
1989
1990
1991
1992
1993
1994
1995
1996
1997
1998
1999
2000
2001
2002
2003
2004
2005
2006
2007
2008
2009
2010
2011
2012
2013
2014
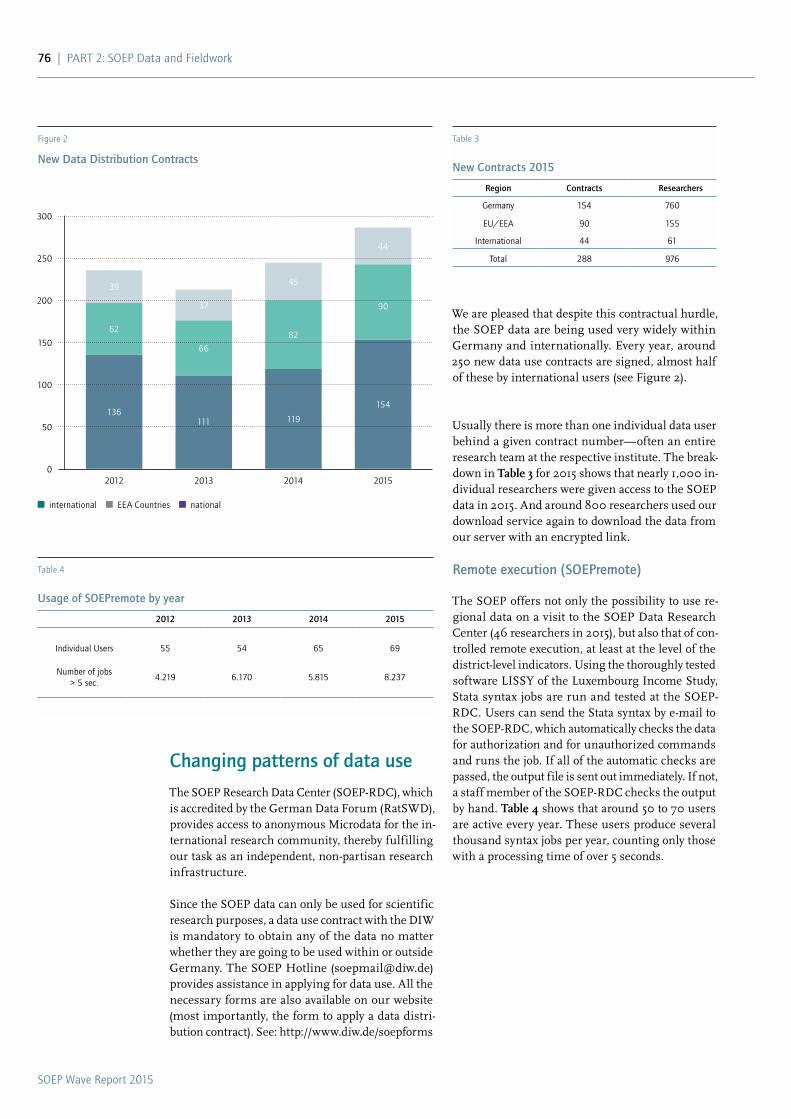
2015SOEP Wave Report 2015
76 | PaRT 2: SOEP Data and Fieldwork
Changing patterns of data use
The SOEP Research Data Center (SOEP-RDC), which is accredited by the German Data Forum (RatSWD), provides access to anonymous Microdata for the in-ternational research community, thereby fulfilling our task as an independent, non-partisan research infrastructure.
Since the SOEP data can only be used for scientific research purposes, a data use contract with the DIW is mandatory to obtain any of the data no matter whether they are going to be used within or outside Germany. The SOEP Hotline ([email protected]) provides assistance in applying for data use. All the necessary forms are also available on our website (most importantly, the form to apply a data distri-bution contract). See: http://www.diw.de/soepforms
We are pleased that despite this contractual hurdle, the SOEP data are being used very widely within Germany and internationally. Every year, around 250 new data use contracts are signed, almost half of these by international users (see Figure 2).
Usually there is more than one individual data user behind a given contract number—often an entire research team at the respective institute. The break-down in table 3 for 2015 shows that nearly 1,000 in-dividual researchers were given access to the SOEP data in 2015. And around 800 researchers used our download service again to download the data from our server with an encrypted link.
Remote execution (SOEPremote)
The SOEP offers not only the possibility to use re-gional data on a visit to the SOEP Data Research Center (46 researchers in 2015), but also that of con-trolled remote execution, at least at the level of the district-level indicators. Using the thoroughly tested software LISSY of the Luxembourg Income Study, Stata syntax jobs are run and tested at the SOEP-RDC. Users can send the Stata syntax by e-mail to the SOEP-RDC, which automatically checks the data for authorization and for unauthorized commands and runs the job. If all of the automatic checks are passed, the output file is sent out immediately. If not, a staff member of the SOEP-RDC checks the output by hand. table 4 shows that around 50 to 70 users are active every year. These users produce several thousand syntax jobs per year, counting only those with a processing time of over 5 seconds.
Table 3
New Contracts 2015
Region Contracts Researchers
Germany 154 760
EU/EEa 90 155
International 44 61
Total 288 976
Table 4
Usage of SOEPremote by year
2012 2013 2014 2015
Individual Users 55 54 65 69
Number of jobs > 5 sec.
4.219 6.170 5.815 8.237
international EEa Countries national
300
250
200
150
100
50
02012
136
62
39
2013
111
66
37
2014
119
82
45
2015
154
90
44
Figure 2
New Data Distribution Contracts

2015SOEP Wave Report 2015
PART 3
a Selection of SoEP-Based DIW Economic Bulletin and DIW Wochenbericht
PaRT 3: a Selection of SOEP-based DIW Wochenberichte | 77

SOEP Wave Report 2015
78 | PaRT 3: a Selection of SOEP-based DIW Wochenberichte
Source:
DIW Economic Bulletin 37/2015
Vol 5, pp. 481–491September 9, 2015ISSN 2192-7219
www.diw.de/econbull
Economy. Politics. sciEncE.
DiW Economic Bulletin
2015
Political Culture in East and West Germany
37
REPoRt by Felix Arnold, Ronny Freier and Martin Kroh
Political culture still divided 25 years after reunification? 481intERViEW with Martin Kroh
» Similar levels of political interest between East and West, notable differences in turnout « 492
SOEP Wave Report 2015
PaRT 3: a Selection of SOEP-based DIW Wochenberichte | 79
In 1990, during reunification, West German democratic institutions and the existing political party system were expanded to the East German states. Even after 25 years, the people of eastern and western Germany still differ in their political engagement and attitudes.
However, these differences do not apply across the board by any means. a detailed analysis of survey data from the Socio-Economic Panel (SOEP) study shows that differences both in terms of general interest and active participation in politics cannot be identified statistically in many years. By contrast, there are considerable differences between eastern and western Germany in terms of party attachments and actual turnout in national and state elections. The gap in turnout at national elections is not only evident over the years but is also clearly recognizable across all age groups.
There are also still distinct differences in the political party systems of eastern and western Germany. In particular, the Left (Die Linke) plays a major role in eastern Germany but despite some electoral successes in some state parliaments, this party has not been able to establish itself to the same extent in the former West German states. What is more, according to our data, individuals’ attitudes to the welfare state in the two parts of the country, which differed significantly at the beginning of the 1990s, have converged since.
Political culture still divided 25 years after reunification?By Felix Arnold, Ronny Freier and Martin Kroh
Political unification through the accession of the Ger-man Democratic Republic to the Federal Republic of Germany 25 years ago on October 3, 1990 created uni-fied government institutions in both parts of the coun-try. The convergence of political attitudes and political participation of citizens in the two parts of the country is, by its nature, a long-term process due to their dif-ferent past and present experiences and life situations.
The convergence process of life situations is not yet com-plete in many areas and this is frequently documented in the economy (unemployment, wealth, and productiv-ity), in general attitudes (confidence, self-esteem, and anxiety about the future), and in social aspects ( women in work and child daycare).1
While some of the differences are still considerable, in many areas of life a convergence between levels in east-ern and western Germany can be observed — albeit in gradual steps. Unemployment in eastern Germany has fallen from its highest levels at the turn of the millen-nium to 9 percent in 2015 (compared to 5.7 percent in western Germany). Productivity in eastern Germany is increasing slowly (it currently stands at 71 percent of the western German level). Also in terms of women in work and child daycare, the two parts of the country are more closely aligned because western Germany is catching up with eastern Germany. On a positive note, general life satisfaction in the two parts of Germany has continu-ously converged over the past 25 years.2
1 See for example, K. Brenke, M. Fratzscher, M. M. Grabka, E. Holst, S. Hülle, S. Liebig, M. Priem, a. Rasner, P. S. Schober, J. Schupp, J. F. Stahl, and a. Wieber, “Reunification: an Economic Success Story,” DIW Economic Bulletin, no. 11 (2014); P. Krause, J. Goebel, M. Kroh, and G. G. Wagner, “20 Jahre Wieder-vereinigung: Wie weit Ost- und Westdeutschland zusammengerückt sind, ” DIW Wochenbericht, no. 44 (2010); P. Krause and I. Ostner, eds., Leben in Ost- und Westdeutschland: Eine sozialwissenschaftliche Bilanz der deutschen Einheit 1990–2010 (Campus, 2010); alesina and Fuchs-Schuendeln (2007); Rainer and Siedler (2009); Ockenfels and Weimann (1999); Brosig-Koch et al. (2011).
2 J. Schupp, J. Goebel, M. Kroh, and G. G. Wagner, “Life Satisfaction in Germany at Highest Levels since Reunification,” SOEP Wave Report (2013).
SOEP Wave Report 2015
80 | PaRT 3: a Selection of SOEP-based DIW Wochenberichte
however, the survey data comprise all adults living in Germany — including migrants not entitled to vote.6
Importance of politics and political parties
Active participation in the political process presuppos-es that citizens consider politics to be relevant to them. Respondents to the SOEP survey, conducted on an an-nual basis, indicate how interested they are in politics,7 whether political or social engagement is important to them personally,8 and whether they feel they have a long-term attachment to a particular party.9 The repeat-ed survey, in which more than 25,000 adults currently participate, was established in 1984 in West Germany and first conducted in the former GDR in 1990, sever-al months before political unity.10
The following section examines differences in politi-cal engagement between citizens in eastern and west-ern Germany. We have used odds ratios to demonstrate these differences (see Box 1). These odds ratios summa-rize the differences in the shares in a single measure. An odds ratio value of one means the share of individ-uals in western Germany who are interested in politics is equal to the share of individuals in eastern Germany who are interested in politics. An odds ratio value high-er than one means that the share of people interested in politics in western Germany is higher than in east-ern Germany; a value of less than one means that the share of those interested in politics is higher in the east.
6 The SOEP is able to distinguish between people who lived in West or East Germany in 1989 (abbreviated to: East and West Germans) as well as between those who lived in the territory of former West Germany and West Berlin or in East Germany and East Berlin (abbreviated to: persons in eastern and western Germany). Both definitions are not identical due to persistent migration between East and West Germany. Since in the German General Social Survey (aLLBUS) only the place of residence at the time of the survey is known, we consistently differentiated between people in eastern and western Germany when analyzing the survey data. In official election data, the distinction between eastern and western Germany is only possible up until the national election in 1994 after which the data only differentiate by state, with West Berlin being designated as one of the five former West German states (abbreviated to: people from the former West and former East German states).
7 The question was, “Generally speaking, how interested are you in politics?” Possible answers were: very interested, moderately interested, not interested, and disinterested. In our analyses, we only differentiate between interested (very or moderately interested) and not interested (not interested or disinterested).
8 The question was, “Is social or political engagement important to you personally?” Possible answers are: very important, important, less important and quite unimportant. We also summarized these answers into a binary indicator from important (less important or quite unimportant) or not important (very important or important).
9 The question was, “Many people in Germany lean towards one party in the long term, even if they occasionally vote for another party. Do you lean towards a particular party?” Possible answers were yes and no.
10 J. Schupp and G. Wagner, “Die DDR-Stichprobe des Sozio-oekonomischen Panels – Konzept und Durchführung der “Basiserhebung 1990” in der DDR,” Vierteljahreshefte zur Wirtschaftsforschung, no. 2 (1990): 152–159.
On the occasion of the 25th anniversary of political uni-fication, it is of general interest to examine differenc-es in the political attitudes and political participation of individuals in eastern and western Germany and to document the development of a unified political culture.3
The country was divided for over 40 years and this has had a varying impact on the regions, also in terms of dealing with democracy. While individuals in western Germany had already had experience of a parliamentary democracy since 1949, people in eastern Germany were denied this opportunity up until 1989. Consistent differ-ences in political participation, electoral behavior, and attitudes toward government and politics and their own role in the political system are therefore to be expected and — as our results show — these are clearly evident.
The following analyses examine the period from 1990 to 2014 and are based on official election data from the national and state election administrators, INFRATEST DIMAP, the latest data collected from the longitudinal Socio-Economic Panel (SOEP)4 study by DIW Berlin in cooperation with the survey institute TNS Infratest Sozialforschung and the German General Social Survey (Die allgemeine Bevölkerungsumfrage der Sozialwissenschaften, ALLBUS) which is made available by the Leibniz Institute for the Social Sciences (Leibniz-Institut für Sozialwissenschaften, GESIS).5 In the follow-ing trend analysis from 1990, we have distinguished between adults living in East or West Germany at the time of the survey or election. It should be noted that official election data refer to votes by eligible citizens,
3 See, for example, O. W. Gabriel, ed., Politische Orientierungen und Verhaltensweisen im vereinigten Deutschland (Opladen: Leske + Budrich, 1997); J. van Deth, H. Rattinger, and E. Roller, eds., Die Republik auf dem Weg zur Normalität? Wahlverhalten und politische Einstellungen nach acht Jahren Einheit (Opladen: Leske + Budrich, 2000); D. Fuchs, E. Roller, and B. Wessels, eds., Bürger und Demokratie in Ost und West. Studien zur politischen Kultur und zum politischen Prozess (Wiesbaden: Westdeutscher Verlag, 2002); O. W. Gabriel, J. W. Falter, and H. Rattinger, eds., Wächst zusammen, was zusam-mengehört? Stabilität und Wandel politischer Einstellungen im wieder vereinigten Deutschland (Baden-Baden: 2005); J. W. Falter, O. W. Gabriel, H. Rattinger, and H. Schoen, eds., Sind wir ein Volk? Ost- und Westdeutschland im Vergleich (Munich: 2006); M. Kroh, “Wertewandel: Immer mehr Ost- und Westdeutsche sind Postmaterialisten,” DIW Wochenbericht, no. 34 (2008).
4 The SOEP is a representative longitudinal study of households conducted every year since 1984 in West Germany and since 1990 in eastern Germany, see G. G. Wagner, J. Göbel, P. Krause, R. Pischner, and I. Sieber, “Das Sozio-oekonomische Panel (SOEP): Multidisziplinäres Haushaltspanel und Kohortenstudie für Deutschland – Eine Einführung (für neue Datennutzer) mit einem ausblick (für erfahrene anwender),” AStA Wirtschafts- und Sozial-statistisches Archiv, 2 (4) (2008): 301–328.
5 www.bundeswahlleiter.de; www.infratest-dimap.de; Socio-Economic Panel (SOEP) study, Daten für die Jahre 1984–2014, Version 31beta, (SOEP, 2015); Leibniz Institute for the Social Sciences (GESIS), German General Social Survey (aLLBUS) 2014, Za5240 Datenfile Version 2.0. (Cologne: GESIS Datenarchiv, 2015).
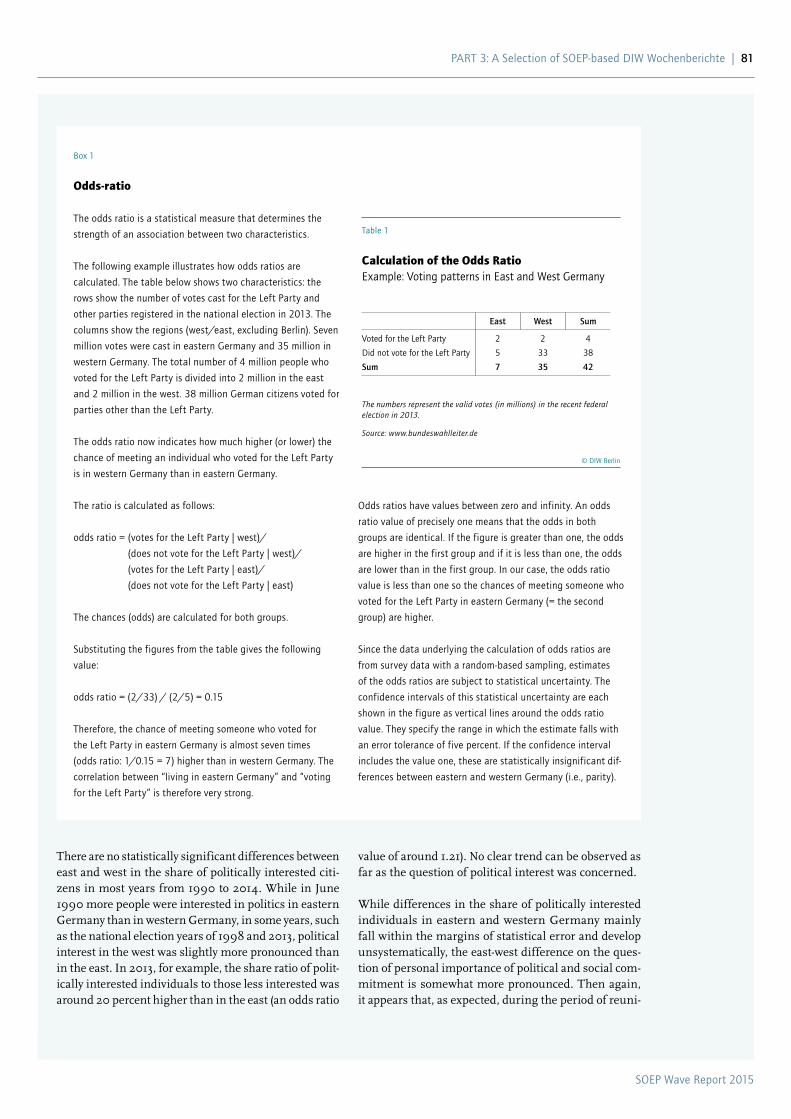
SOEP Wave Report 2015
PaRT 3: a Selection of SOEP-based DIW Wochenberichte | 81
value of around 1.21). No clear trend can be observed as far as the question of political interest was concerned.
While differences in the share of politically interested individuals in eastern and western Germany mainly fall within the margins of statistical error and develop unsystematically, the east-west difference on the ques-tion of personal importance of political and social com-mitment is somewhat more pronounced. Then again, it appears that, as expected, during the period of reuni-
There are no statistically significant differences between east and west in the share of politically interested citi-zens in most years from 1990 to 2014. While in June 1990 more people were interested in politics in eastern Germany than in western Germany, in some years, such as the national election years of 1998 and 2013, political interest in the west was slightly more pronounced than in the east. In 2013, for example, the share ratio of polit-ically interested individuals to those less interested was around 20 percent higher than in the east (an odds ratio
Box 1
Odds-ratio
The odds ratio is a statistical measure that determines the
strength of an association between two characteristics.
The following example illustrates how odds ratios are
calculated. The table below shows two characteristics: the
rows show the number of votes cast for the Left Party and
other parties registered in the national election in 2013. The
columns show the regions (west/east, excluding Berlin). Seven
million votes were cast in eastern Germany and 35 million in
western Germany. The total number of 4 million people who
voted for the Left Party is divided into 2 million in the east
and 2 million in the west. 38 million German citizens voted for
parties other than the Left Party.
The odds ratio now indicates how much higher (or lower) the
chance of meeting an individual who voted for the Left Party
is in western Germany than in eastern Germany.
The ratio is calculated as follows:
odds ratio = (votes for the Left Party | west)/
(does not vote for the Left Party | west)/
(votes for the Left Party | east)/
(does not vote for the Left Party | east)
The chances (odds) are calculated for both groups.
Substituting the figures from the table gives the following
value:
odds ratio = (2/33) / (2/5) = 0.15
Therefore, the chance of meeting someone who voted for
the Left Party in eastern Germany is almost seven times
(odds ratio: 1/0.15 = 7) higher than in western Germany. The
correlation between “living in eastern Germany” and “voting
for the Left Party” is therefore very strong.
Odds ratios have values between zero and infinity. an odds
ratio value of precisely one means that the odds in both
groups are identical. If the figure is greater than one, the odds
are higher in the first group and if it is less than one, the odds
are lower than in the first group. In our case, the odds ratio
value is less than one so the chances of meeting someone who
voted for the Left Party in eastern Germany (= the second
group) are higher.
Since the data underlying the calculation of odds ratios are
from survey data with a random-based sampling, estimates
of the odds ratios are subject to statistical uncertainty. The
confidence intervals of this statistical uncertainty are each
shown in the figure as vertical lines around the odds ratio
value. They specify the range in which the estimate falls with
an error tolerance of five percent. If the confidence interval
includes the value one, these are statistically insignificant dif-
ferences between eastern and western Germany (i.e., parity).
Table 1
Calculation of the Odds RatioExample: Voting patterns in East and West Germany
East West Sum
Voted for the Left Party 2 2 4
Did not vote for the Left Party 5 33 38
Sum 7 35 42
The numbers represent the valid votes (in millions) in the recent federal election in 2013.
Source: www.bundeswahlleiter.de
© DIW Berlin
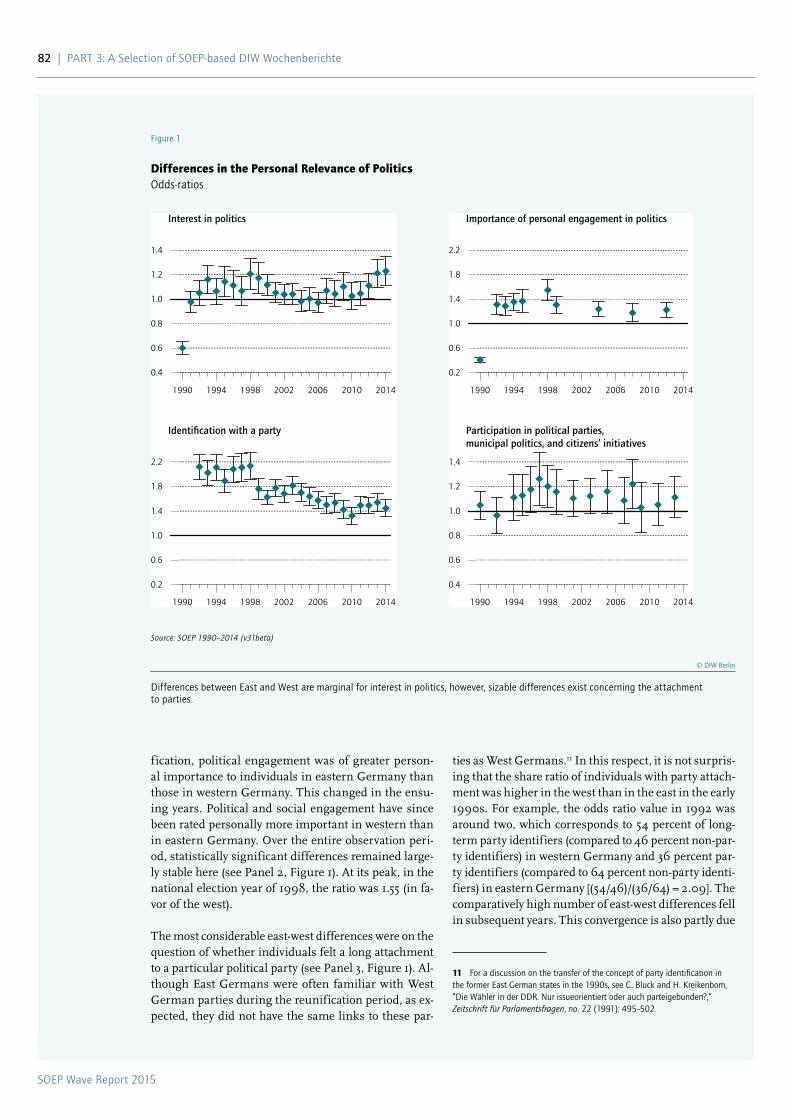
SOEP Wave Report 2015
82 | PaRT 3: a Selection of SOEP-based DIW Wochenberichte
fication, political engagement was of greater person-al importance to individuals in eastern Germany than those in western Germany. This changed in the ensu-ing years. Political and social engagement have since been rated personally more important in western than in eastern Germany. Over the entire observation peri-od, statistically significant differences remained large-ly stable here (see Panel 2, Figure 1). At its peak, in the national election year of 1998, the ratio was 1.55 (in fa-vor of the west).
The most considerable east-west differences were on the question of whether individuals felt a long attachment to a particular political party (see Panel 3, Figure 1). Al-though East Germans were often familiar with West German parties during the reunification period, as ex-pected, they did not have the same links to these par-
ties as West Germans.11 In this respect, it is not surpris-ing that the share ratio of individuals with party attach-ment was higher in the west than in the east in the early 1990s. For example, the odds ratio value in 1992 was around two, which corresponds to 54 percent of long-term party identifiers (compared to 46 percent non-par-ty identifiers) in western Germany and 36 percent par-ty identifiers (compared to 64 percent non-party identi-fiers) in eastern Germany [(54/46)/(36/64) = 2.09]. The comparatively high number of east-west differences fell in subsequent years. This convergence is also partly due
11 For a discussion on the transfer of the concept of party identification in the former East German states in the 1990s, see C. Bluck and H. Kreikenbom, “Die Wähler in der DDR. Nur issueorientiert oder auch parteigebunden?,” Zeitschrift für Parlamentsfragen, no. 22 (1991): 495–502.
Figure 1
Differences in the Personal Relevance of PoliticsOdds-ratios
0.4
0.6
0.8
1.0
1.2
1.4
1990 1994 1998 2002 2006 2010 2014
0.2
0.6
1.0
1.4
1.8
2.2
1990 1994 1998 2002 2006 2010 2014
0.2
0.6
1.0
1.4
1.8
2.2
1990 1994 1998 2002 2006 2010 2014
0.4
0.6
0.8
1.0
1.2
1.4
1990 1994 1998 2002 2006 2010 2014
Importance of personal engagement in politicsInterest in politics
Participation in political parties, municipal politics, and citizens’ initiatives
Identi�cation with a party
0.4
0.6
0.8
1.0
1.2
1.4
1990 1994 1998 2002 2006 2010 2014
0.2
0.6
1.0
1.4
1.8
2.2
1990 1994 1998 2002 2006 2010 2014
0.2
0.6
1.0
1.4
1.8
2.2
1990 1994 1998 2002 2006 2010 2014
0.4
0.6
0.8
1.0
1.2
1.4
1990 1994 1998 2002 2006 2010 2014
Importance of personal engagement in politicsInterest in politics
Participation in political parties, municipal politics, and citizens’ initiatives
Identi�cation with a party
Source: SOEP 1990–2014 (v31beta)
© DIW Berlin
Differences between East and West are marginal for interest in politics, however, sizable differences exist concerning the attachment to parties.
SOEP Wave Report 2015
PaRT 3: a Selection of SOEP-based DIW Wochenberichte | 83
of the years observed. No clear trend is evident in the time series either.
Signs of slight disparities in political participation be-tween the two parts of Germany can be found in the sur-vey data. How do these differences manifest themselves, however, in a measure such as voter turnout which is commonly perceived by citizens as a key instrument for articulating intention in representative democracies?
Figure 2 compares voter turnout in eastern and west-ern Germany at four different election levels (national elections, European elections, state elections and local government elections).13 First, it is clear that voter turn-out has decreased over time in both parts of the coun-try across all election levels (in line with trends in many other developed democracies). In national elections, voter turnout was still 82.2 percent in 1998, falling to 71.5 percent in the last election in 2013.
Voter turnout in eastern and western Germany indicates significant differences at almost all election levels. Par-ticipation in all national elections in eastern Germany (excluding Berlin) is between three and eight percent-age points lower than in the western part of the country. There is also a discrepancy between eastern and west-ern Germany in other elections but the differences are not always so clear. This is only surprising inasmuch as the public perceive national elections as the most important elections in Germany. In the European elec-tions, voter turnout in the east was only lower than that of the west in the 1990s. Since 2004, it has fallen to be-low 50 percent in both parts of the country. In state elec-tions, the picture in the first four electoral periods after 1990 is mixed: only in recent years has the gap in vot-er turnout opened considerably (at its height, this gap was 12 percentage points). The historically low partici-pation rates in state elections in Saxony (49.1 percent in 2014), Brandenburg (47.9 percent in 2014), or Saxony-Anhalt (44.4 percent in 2006) give cause for concern.
While the sign of the gap in voter turnout is clear, we identify no clear trend for the differences in voter turn-out between eastern and western Germany in the pre-ceding analysis. The discrepancy in the national elec-tion remains stable over time. Results are mixed in the European and local government elections and only in the state elections does a trend emerge over time — here,
13 In national and European elections, describing voter turnout over time is not a problem since elections in eastern and western Germany took place simultaneously. The timing is not as easy to depict in Länder and local government elections as state-specific election periods and election dates make it more complex. We decided to allocate the elections here according to election periods (regardless of the specific election year).
to a decline in party attachment in western Germany. Currently, the share ratio (odds ratio value) is around 1.5. In 2014, this represented share differences of 50 percent party identifiers in the west and 41 percent in the east.
Overall, the people of eastern and western Germany are very similar in terms of their fundamental interest in politics. Citizens in western Germany, however, consid-er political and social engagement to be slightly more important. Both findings have remained quite stable over the past 25 years since political unity. There used to be and still are considerable differences with respect to individuals’ identification with political parties, with the shares of long-term party identifiers in both parts of the country slowly converging. This difference is of-ten linked to the volatility of election results: the low-er the long-term attachment of individuals to the es-tablished parties, the more willing they are to vote for different parties in elections or support new political parties (swing voters).
Active political participation
Interest in politics, the perceived importance of politi-cal and social engagement, as well as long-term attach-ment to a party are indeed important factors that favor active participation in the political process but, as ex-pected, these conditions alone are not sufficient. It is therefore important to shed light on the actual politi-cal participation of people in eastern and western Ger-many. To achieve this, the following section considers both participation in elections, the most common form of political participation in Germany, for which official figures are available from national and Länder election administrators, and participation in parties, in local pol-itics, and in citizens’ initiatives which we can identify through survey data from the SOEP.12
For each year, approximately ten percent of all adults stat-ed that they actively participate in political parties, in local politics, and in citizens’ initiatives. The odds ratio value, which expresses the difference in this share be-tween western and eastern Germany, tends to be more than one, thus indicating that the share of politically ac-tive people is slightly higher in the west than in the east (see Panel 4, Figure 1). However, this difference f luctu-ates within the band of statistical uncertainty in most
12 In roughly every second year, SOEP participants are asked for detailed information about how they spend their time (question wording: “Please indicate how often you take part in each activity:” to which respondents could answer: daily, at least once a week, at least once a month, seldom or never” to the activity, “Participation in in political parties, municipal politics, and citizens’ initiatives.” We differentiate between those individuals who actively participated daily, weekly, monthly, or seldom and those that never did.
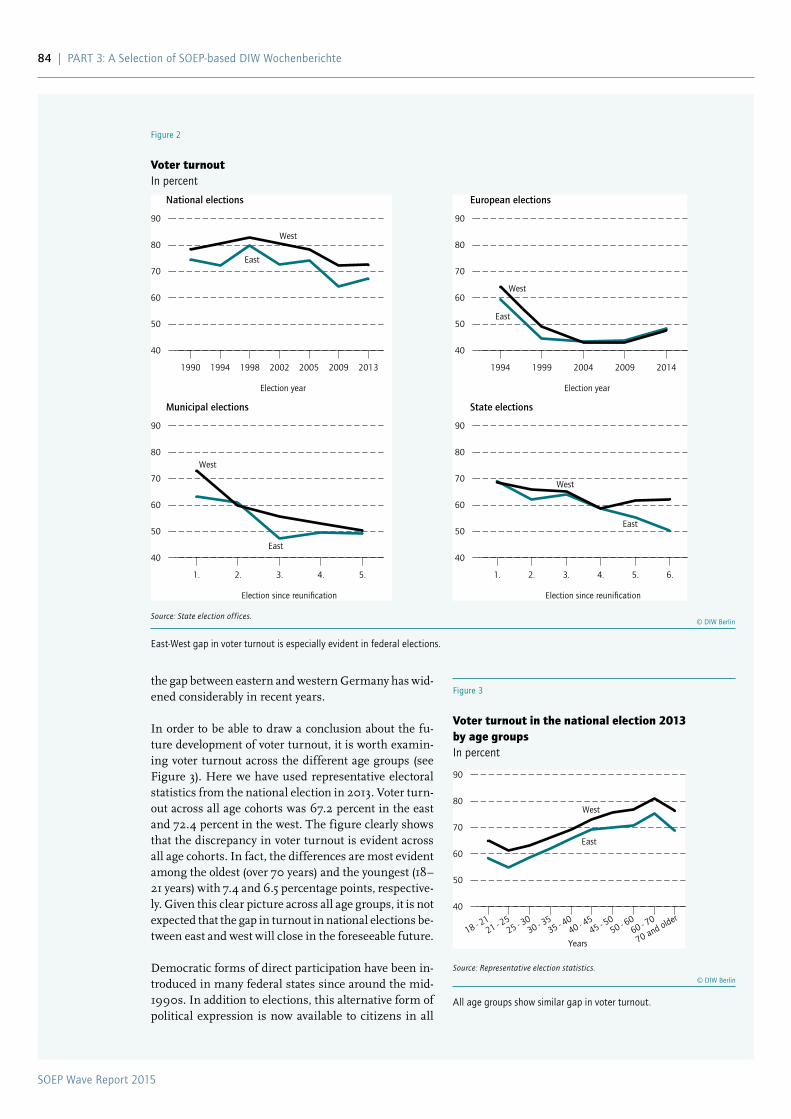
SOEP Wave Report 2015
84 | PaRT 3: a Selection of SOEP-based DIW Wochenberichte
the gap between eastern and western Germany has wid-ened considerably in recent years.
In order to be able to draw a conclusion about the fu-ture development of voter turnout, it is worth examin-ing voter turnout across the different age groups (see Figure 3). Here we have used representative electoral statistics from the national election in 2013. Voter turn-out across all age cohorts was 67.2 percent in the east and 72.4 percent in the west. The figure clearly shows that the discrepancy in voter turnout is evident across all age cohorts. In fact, the differences are most evident among the oldest (over 70 years) and the youngest (18–21 years) with 7.4 and 6.5 percentage points, respective-ly. Given this clear picture across all age groups, it is not expected that the gap in turnout in national elections be-tween east and west will close in the foreseeable future.
Democratic forms of direct participation have been in-troduced in many federal states since around the mid-1990s. In addition to elections, this alternative form of political expression is now available to citizens in all
Figure 3
Voter turnout in the national election 2013 by age groupsIn percent
40
50
60
70
80
90
18 - 2121 - 2
525 - 3
030 - 3
535 - 4
040 - 4
545 - 5
050 - 6
060 - 7
0
70 and older
Years
West
East
Source: Representative election statistics.© DIW Berlin
all age groups show similar gap in voter turnout.
Figure 2
Voter turnoutIn percent
40
50
60
70
80
90
1990 1994 1998 2002 2005 2009 2013
40
50
60
70
80
90
1994 1999 2004 2009 2014
40
50
60
70
80
90
1. 2. 3. 4. 5.
40
50
60
70
80
90
1. 2. 3. 4. 5. 6.
National elections European elections
Municipal elections State elections
Election year Election year
Election since reuni�cation Election since reuni�cation
West
East
West
West
East
West
East
East
40
50
60
70
80
90
1990 1994 1998 2002 2005 2009 2013
40
50
60
70
80
90
1994 1999 2004 2009 2014
40
50
60
70
80
90
1. 2. 3. 4. 5.
40
50
60
70
80
90
1. 2. 3. 4. 5. 6.
National elections European elections
Municipal elections State elections
Election year Election year
Election since reuni�cation Election since reuni�cation
West
East
West
West
East
West
East
East
Source: State election offices.© DIW Berlin
East-West gap in voter turnout is especially evident in federal elections.
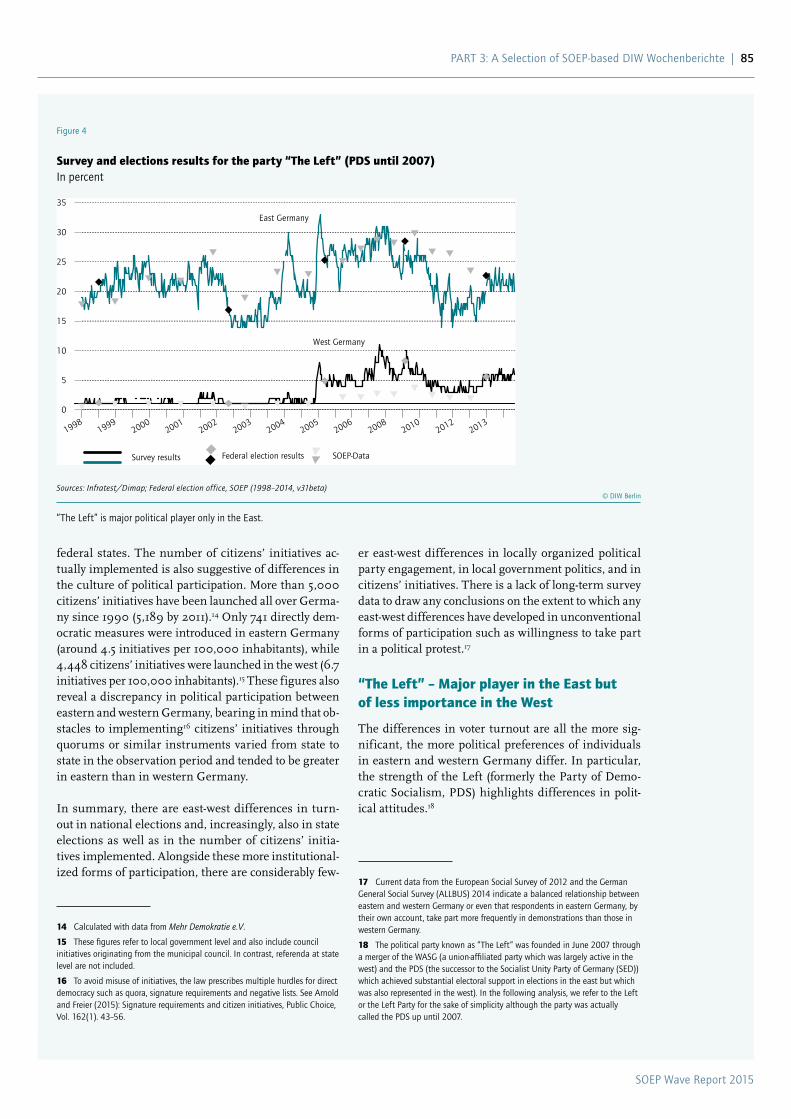
SOEP Wave Report 2015
PaRT 3: a Selection of SOEP-based DIW Wochenberichte | 85
er east-west differences in locally organized political party engagement, in local government politics, and in citizens’ initiatives. There is a lack of long-term survey data to draw any conclusions on the extent to which any east-west differences have developed in unconventional forms of participation such as willingness to take part in a political protest.17
“The Left” – Major player in the East but of less importance in the West
The differences in voter turnout are all the more sig-nificant, the more political preferences of individuals in eastern and western Germany differ. In particular, the strength of the Left (formerly the Party of Demo-cratic Socialism, PDS) highlights differences in polit-ical attitudes.18
17 Current data from the European Social Survey of 2012 and the German General Social Survey (aLLBUS) 2014 indicate a balanced relationship between eastern and western Germany or even that respondents in eastern Germany, by their own account, take part more frequently in demonstrations than those in western Germany.
18 The political party known as “The Left” was founded in June 2007 through a merger of the WaSG (a union-affiliated party which was largely active in the west) and the PDS (the successor to the Socialist Unity Party of Germany (SED)) which achieved substantial electoral support in elections in the east but which was also represented in the west). In the following analysis, we refer to the Left or the Left Party for the sake of simplicity although the party was actually called the PDS up until 2007.
federal states. The number of citizens’ initiatives ac-tually implemented is also suggestive of differences in the culture of political participation. More than 5,000 citizens’ initiatives have been launched all over Germa-ny since 1990 (5,189 by 2011).14 Only 741 directly dem-ocratic measures were introduced in eastern Germany (around 4.5 initiatives per 100,000 inhabitants), while 4,448 citizens’ initiatives were launched in the west (6.7 initiatives per 100,000 inhabitants).15 These figures also reveal a discrepancy in political participation between eastern and western Germany, bearing in mind that ob-stacles to implementing16 citizens’ initiatives through quorums or similar instruments varied from state to state in the observation period and tended to be greater in eastern than in western Germany.
In summary, there are east-west differences in turn-out in national elections and, increasingly, also in state elections as well as in the number of citizens’ initia-tives implemented. Alongside these more institutional-ized forms of participation, there are considerably few-
14 Calculated with data from Mehr Demokratie e.V.
15 These figures refer to local government level and also include council initiatives originating from the municipal council. In contrast, referenda at state level are not included.
16 To avoid misuse of initiatives, the law prescribes multiple hurdles for direct democracy such as quora, signature requirements and negative lists. See arnold and Freier (2015): Signature requirements and citizen initiatives, Public Choice, Vol. 162(1). 43–56.
Figure 4
Survey and elections results for the party “The Left” (PDS until 2007)In percent
0
5
10
15
20
25
30
35
West Germany
East Germany
Survey results Federal election results SOEP-Data
19981999
20002001
20022003
20042005
20062008
20102012
2013
Sources: Infratest/Dimap; Federal election office, SOEP (1998–2014, v31beta)© DIW Berlin
“The Left” is major political player only in the East.
SOEP Wave Report 2015
86 | PaRT 3: a Selection of SOEP-based DIW Wochenberichte
Figure 4 shows the results of an opinion poll conduct-ed by infratest dimap, the national election results for the relevant period, and information on party identifi-cation from the SOEP.19 All three sources paint a uni-fied picture of the strength of the Left in eastern and western Germany.20
In the opinion poll, support for the Left Party varied in eastern Germany between 14 percent in 2003 and 32 percent in 2005. The collapse around 2002 coincid-ed with the resignation of Gregor Gysi as the Senator for Economics in the Berlin state government. Then, be-tween June 2004 and mid-2005, there was a rapid re-surgence in two waves, which was closely linked to the Social Democratic Party (SPD)’s Agenda 2010, the pro-tests of large sections of the labor unions, and the Left Party against these reforms and the political merger of the PDS and the west German Labour and Social Jus-tice – The Electoral Alternative (Wahlalternative Arbeit und soziale Gerechtigkeit, WASG) (and with Oskar Lafon-taine). Essentially, the time series here hovers around 20 to 25 percent. As a result, the Left can be seen as a major party in eastern Germany.
In western Germany, however, support for the Left Par-ty remained considerably under five percent until mid-2005. When the announcement of a collaboration be-tween the PDS and the WASG was announced in spring 2005, there was a significant rise in the opinion polls. At its height (around the time of the financial crisis in 2008), the figure reached 11 percent. In general, approv-al in western Germany never exceeds five percent; the Left Party remains on the fringes here.
Figure 5 outlines, by region, differences in election re-sults of the former PDS and later the Left Party in the 16 German federal states. It shows results in the most recent elections for each state and a comparison with previous elections in parentheses. The figure clearly shows that the Left reported strong results across the board at all election levels. The variation here is mini-mal (with a few exceptions in state and local government elections). The success of the Left in the eastern federal states is also ref lected in the number of representatives they have in government. Bodo Ramelow was the first member of the Left Party to be elected Minister-Pres-ident of Thuringia, a position he has held since 2014.
19 In the SOEP, the question is divided into two parts. The first part asks whether respondents are generally inclined toward a particular party in Germany (see Figure 1). The second part asks respondents which party they feel affiliated to. We calculate the share of those with a party preference for the Left Party to respondents who generally indicated a long-term party attachment.
20 M. Kroh and T. Siedler, “Die anhänger der Linken: Rückhalt quer durch alle Einkommensschichten,” DIW Wochenbericht, no. 41 (2008).
As indicated above, the Left Party has much less support in western Germany. In addition, there are considera-ble regional disparities. The Left Party’s strongest sup-port in the west comes from Saarland and Bremen but the party also achieves high approval ratings in Ham-burg, North Rhine-Westphalia, and Hesse.
Convergence in attitudes toward the welfare state
The successes of the Left in eastern Germany are of-ten attributed to the perception of the party as the rep-resentative of eastern German regional interests, and to the greater political orientation of the people of east-ern Germany to the left. In fact, a number of previous studies show that issues of equality and redistribution of incomes are more pronounced in eastern Germany than in western Germany.21
As part of the German General Social Survey (ALLBUS), respondents have been asked the following four ques-tions repeatedly since 1991:
• “On the whole, do you consider the social differences in our country just.”
• “On the whole, are economic gains in Germany distributed justly today?”
• “Do you think the state must ensure that people receive a decent income even in illness, hardship, unemployment and old age?”
• “Should social benefits be cut in the future, should things stay as they are, or should social benefits be extended”
Approximately 66 percent of respondents consider so-cial differences to be unjust on the whole (complete-ly agree/tend to agree/tend to disagree/completely dis-agree), 79 percent think the distribution of economic gains is unjust (completely agree/tend to agree/tend to disagree/completely disagree), 88 percent believe the state has a responsibility in cases of illness, hardship, unemployment, and old age (completely agree/tend to agree/tend to disagree/completely disagree), and, finally,
21 E. Roller, “Kürzungen von Sozialleistungen aus der Sicht der Bundesbürg-er,” Zeitschrift für Sozialreform, no. 42 (1996): 777–788; B. Wegener and S. Liebig, “Is the “Inner Wall” Here to Stay? Justice Ideologies in Unified Germany,” Social Justice Research, no. 13, (2000): 177–197; S. Svallfors, “Policy Feedback, Generational Replacement, and attitudes to State Intervention: Eastern and Western Germany, 1990–2006,” European Political Science Review, no. 2 (2010): 119–135; E. Roller, “Sozialstaatsvorstellungen im Wandel? Stabilität, anpassungsprozesse und anspruchszunahme zwischen 1976 und 2010,” in Bürger und Wähler im Wandel der Zeit. 25 Jahre Wahl- und Einstellungsforschung in Deutschland, eds. S. Roßteutscher, T. Faas, and U. Rosar (Wiesbaden: VS Verlag für Sozialwissenschaften).
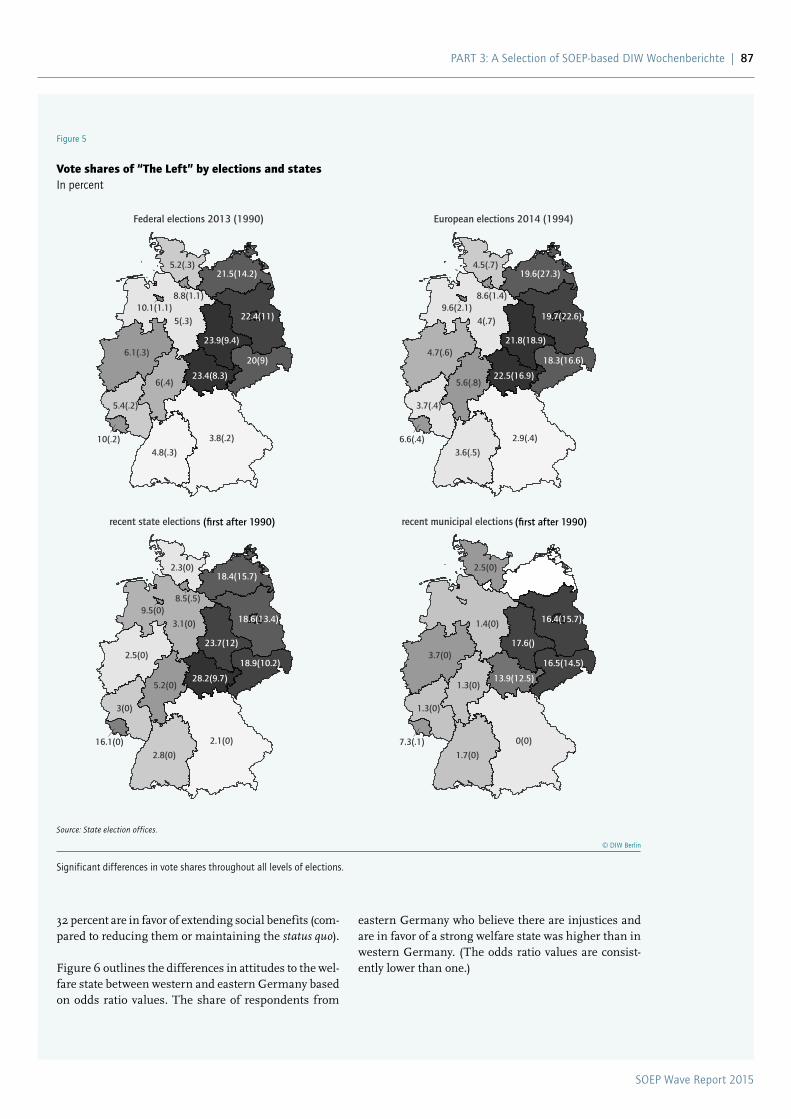
SOEP Wave Report 2015
PaRT 3: a Selection of SOEP-based DIW Wochenberichte | 87
eastern Germany who believe there are injustices and are in favor of a strong welfare state was higher than in western Germany. (The odds ratio values are consist-ently lower than one.)
32 percent are in favor of extending social benefits (com-pared to reducing them or maintaining the status quo).
Figure 6 outlines the differences in attitudes to the wel-fare state between western and eastern Germany based on odds ratio values. The share of respondents from
Figure 5
Vote shares of “The Left” by elections and statesIn percent
5.2(.3)
8.8(1.1)
5(.3)10.1(1.1)
6.1(.3)
6(.4)
5.4(.2)
4.8(.3)
3.8(.2)10(.2)
22.4(11)
21.5(14.2)
20(9)
23.9(9.4)
23.4(8.3)
Federal elections 2013 (1990)
4.5(.7)
8.6(1.4)
4(.7)9.6(2.1)
4.7(.6)
5.6(.8)
3.7(.4)
3.6(.5)
2.9(.4)6.6(.4)
19.7(22.6)
19.6(27.3)
18.3(16.6)
21.8(18.9)
22.5(16.9)
European elections 2014 (1994)
2.3(0)
8.5(.5)
3.1(0)9.5(0)
2.5(0)
5.2(0)
3(0)
2.8(0)
2.1(0)16.1(0)
18.6(13.4)
18.4(15.7)
18.9(10.2)
23.7(12)
28.2(9.7)
recent state elections (erste nach 1990)
2.5(0)
1.4(0)
3.7(0)
1.3(0)
1.3(0)
1.7(0)
0(0)7.3(.1)
16.4(15.7)
16.5(14.5)
17.6()
13.9(12.5)
recent municipal elections (erste nach 1990)
Source: State election offices.
© DIW Berlin
Significant differences in vote shares throughout all levels of elections.
(first after 1990) (first after 1990)
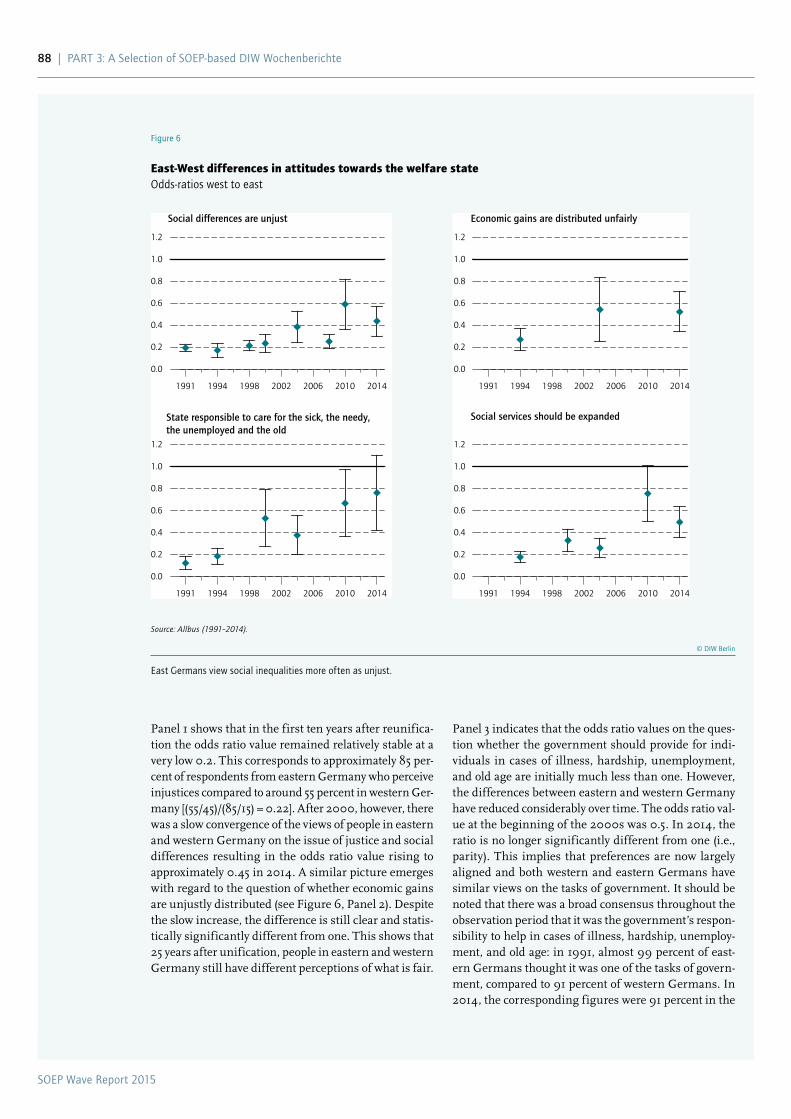
SOEP Wave Report 2015
88 | PaRT 3: a Selection of SOEP-based DIW Wochenberichte
Panel 1 shows that in the first ten years after reunifica-tion the odds ratio value remained relatively stable at a very low 0.2. This corresponds to approximately 85 per-cent of respondents from eastern Germany who perceive injustices compared to around 55 percent in western Ger-many [(55/45)/(85/15) = 0.22]. After 2000, however, there was a slow convergence of the views of people in eastern and western Germany on the issue of justice and social differences resulting in the odds ratio value rising to approximately 0.45 in 2014. A similar picture emerges with regard to the question of whether economic gains are unjustly distributed (see Figure 6, Panel 2). Despite the slow increase, the difference is still clear and statis-tically significantly different from one. This shows that 25 years after unification, people in eastern and western Germany still have different perceptions of what is fair.
Panel 3 indicates that the odds ratio values on the ques-tion whether the government should provide for indi-viduals in cases of illness, hardship, unemployment, and old age are initially much less than one. However, the differences between eastern and western Germany have reduced considerably over time. The odds ratio val-ue at the beginning of the 2000s was 0.5. In 2014, the ratio is no longer significantly different from one (i.e., parity). This implies that preferences are now largely aligned and both western and eastern Germans have similar views on the tasks of government. It should be noted that there was a broad consensus throughout the observation period that it was the government’s respon-sibility to help in cases of illness, hardship, unemploy-ment, and old age: in 1991, almost 99 percent of east-ern Germans thought it was one of the tasks of govern-ment, compared to 91 percent of western Germans. In 2014, the corresponding figures were 91 percent in the
Figure 6
East-West differences in attitudes towards the welfare stateOdds-ratios west to east
0.0
0.2
0.4
0.6
0.8
1.0
1.2
1991 1994 1998 2002 2006 2010 2014
0.0
0.2
0.4
0.6
0.8
1.0
1.2
1991 1994 1998 2002 2006 2010 2014
0.0
0.2
0.4
0.6
0.8
1.0
1.2
1991 1994 1998 2002 2006 2010 2014
0.0
0.2
0.4
0.6
0.8
1.0
1.2
1991 1994 1998 2002 2006 2010 2014
Social differences are unjust Economic gains are distributed unfairly
State responsible to care for the sick, the needy, the unemployed and the old
Social services should be expanded
0.0
0.2
0.4
0.6
0.8
1.0
1.2
1991 1994 1998 2002 2006 2010 2014
0.0
0.2
0.4
0.6
0.8
1.0
1.2
1991 1994 1998 2002 2006 2010 2014
0.0
0.2
0.4
0.6
0.8
1.0
1.2
1991 1994 1998 2002 2006 2010 2014
0.0
0.2
0.4
0.6
0.8
1.0
1.2
1991 1994 1998 2002 2006 2010 2014
Social differences are unjust Economic gains are distributed unfairly
State responsible to care for the sick, the needy, the unemployed and the old
Social services should be expanded
Source: Allbus (1991–2014).
© DIW Berlin
East Germans view social inequalities more often as unjust.
SOEP Wave Report 2015
PaRT 3: a Selection of SOEP-based DIW Wochenberichte | 89
virtually no differences in willingness to have a long-term attachment to a political party among the genera-tion of citizens who were children and adolescents dur-ing the period of reunification.22 There is, however, an alarming discrepancy in voter turnout, especially in na-tional elections, which has remained constant for many years and across all age groups. Even more dramatic is the trend in participation in state elections, where the 50 percent threshold in voter turnout was often missed in recent years.
Clear differences can be identified between eastern and western Germany in terms of political preferences (in addition to people in eastern Germany supporting the Left Party) and attitudes to the welfare state: individuals in eastern Germany would like a stronger welfare state to provide support in social emergencies and would like to expand social benefits accordingly. In addition, social inequality and the distribution of economic gains are perceived as far more unjust than in western Germany. However, it is worth noting that after 2002 attitudes to-ward the welfare state — despite continuing differenc-es — slowly began to converge between east and west.
22 as part of the analyses conducted for the present article, all east-west differences were also calculated for those born after 1975, i.e., who were children or adolescents during the period of reunification. The pattern of east-west differences for this generation who grew up in a unified Germany mostly coincides with those of the entire population. One exception is the difference between east and west in long-term attachment to political parties. See also M. Kroh and H. Schoen, “Politisches Engagement,” in Leben in Ost- und Westdeutschland: Eine sozialwissenschaftliche Bilanz der deutschen Einheit 1990–2010, eds. P. Krause and I. Ostner (Campus, 2010).
east and 88 percent in the west. Eventually, the shares of those in favor of expanding social services also con-verged, although the share in eastern Germany is still higher than in western Germany.
In contrast to political engagement and voter turnout in elections — the most profound differences overall be-tween eastern and western Germany were found in atti-tudes to the welfare state; however, in these attitudes we also found the strongest alignment in political culture.
Conclusion
Although German Chancellor Angela Merkel and Fed-eral President Joachim Gauck are both from East Ger-many and hold the top political offices in Germany, po-litical unity has not occurred in the attitudes of citizens toward politics and participation in the political process.
In terms of general interest in politics and active partic-ipation in local politics (working for political parties, in local government politics, and citizens’ initiatives), the differences are often slight and statistically insignificant. Individuals from eastern and western Germany are po-litically engaged to a very similar degree.
There are, however, disparities in party attachment and voter turnout. Although the population in eastern Ger-many was quite familiar with the political system of the West at the time of reunification, attachment to specific parties is still considerably less pronounced in eastern Germany. There is, however, a slow convergence between people of eastern and western Germany. Today, there are
JEL: D63, D72, D74
Keywords: reunification, political participation and attitudes, turnout
Felix Arnold is Research associate in the Public Economics Department at DIW Berlin | [email protected]
Ronny Freier is Research associate in the Public Economics Department at DIW Berlin and assistant Professor in the department of economic policy at FU Berlin | [email protected]
Martin Kroh is Deputy Head of the Research Infrastructure Socio-Economic Panel (SOEP) at DIW Berlin | [email protected]
SOEP Wave Report 2015
90 | PaRT 3: a Selection of SOEP-based DIW Wochenberichte
Source:
DIW Wochenbericht50/2015
Volume 82, pp. 1183–1188 December 10, 2015ISSN 0012-1304
www.diw.de/wochenbericht
WIRTSCHAFT. POLITIK. WISSENSCHAFT. Seit 1928
DIW Wochenbericht
2015
Wochenendarbeit
50
Bericht von Maria Metzing und David Richter
Macht Wochenendarbeit unzufrieden? 1183Interview mit David Richter
»Wechsel zu Wochenendarbeit macht nicht unzufriedener« 1189Bericht von Pia S. Schober und Gundula Zoch
Kürzere Elternzeit von Müttern – gleichmäßigere Aufteilung der Familienarbeit? 1190Am aktuellen Rand Kommentar von Christian von Hirschhausen
Braunkohlehalden sind wie Atommüll … nur dringender: Verkauf der Lausitzer Vattenfall nicht vertretbar 1200
SOEP Wave Report 2015
PaRT 3: a Selection of SOEP-based DIW Wochenberichte | 91
Over 40 percent of the working population in Germany work not only from Monday to Friday but also on Saturdays, with one-quarter even regularly going to work on Sundays. There was a slight increase in the share of people working weekends between 1996 and 2014. However, little is known about how working weekends impacts on the sleep and life satisfaction of the individuals con-cerned. The present analysis shows that, on average, individuals working weekends are less satisfied with their health, family life, and sleep, as well as with their life in general than those who do not work on Saturdays and/or Sundays. The crucial factor here, however, is not the weekend work per se. If we look at people who initially do not work on weekends and then start working Saturdays and Sundays at a later point, it becomes clear that their satisfaction in most areas remains unchanged; there is only a slight decrease in job satisfaction when individuals begin working on Sundays.
Carrying out paid work on Sundays and state holidays is generally prohibited in Germany and exceptions are highly regulated. For instance, the Basic Law states: “Sunday and other state holidays are designated as days of rest from work and [of] spiritual collection and are, as such, protected by law.”1 There is a long list of excep-tions, however: in accordance with the German Act on Working Hours (Arbeitszeitgesetz, ArbZG), those work-ing in hospitals, for energy providers, or for the police are also permitted to work on Sundays and state holi-days, for example. 2
Prior to 2014, exceptions were also made for call cent-ers, state libraries, video rental stores, and lottery and sports betting companies. This legislation was revised in 2014, however, since the Federal Constitutional Court of Germany did not see any particular need for Sunday opening here. The court argues that if Sundays and state holidays are recognized as days of rest reserved for rec-reation, then the majority of the population should be able to use these days for enjoying leisure activities and relaxing with friends and family.
Very little research has been conducted to date on how working on weekends affects the satisfaction of those in paid employment; the focus has tended to be on work-ing shifts or nights. Hence, using data from the Socio-Economic Panel (SOEP) study,3 the present article ex-amines satisfaction patterns among individuals who do not initially work weekends and then begin to do so.
1 article 140 of the Basic Law in conjunction with article 139 of the Weimar Constitution (WRV).
2 Section 10 of the German act on Working Hours (arbZG).
3 The SOEP is an annual representative follow-up survey of households which has been conducted in West Germany since 1984 and in eastern Germany since 1990; see G. G. Wagner, J. Göbel, P. Krause, R. Pischner, and I. Sieber, “Das Sozio-oekonomische Panel (SOEP): Multidisziplinäres Haushaltspanel und Kohortenstudie für Deutschland – Eine Einführung (für neue Datennutzer) mit einem ausblick (für erfahrene anwender),” asta Economic and Social Statistical archive 2 (4) (2008): 301–328.
Is Working on Weekends a Source of Dissatisfaction?By Maria Metzing and David Richter
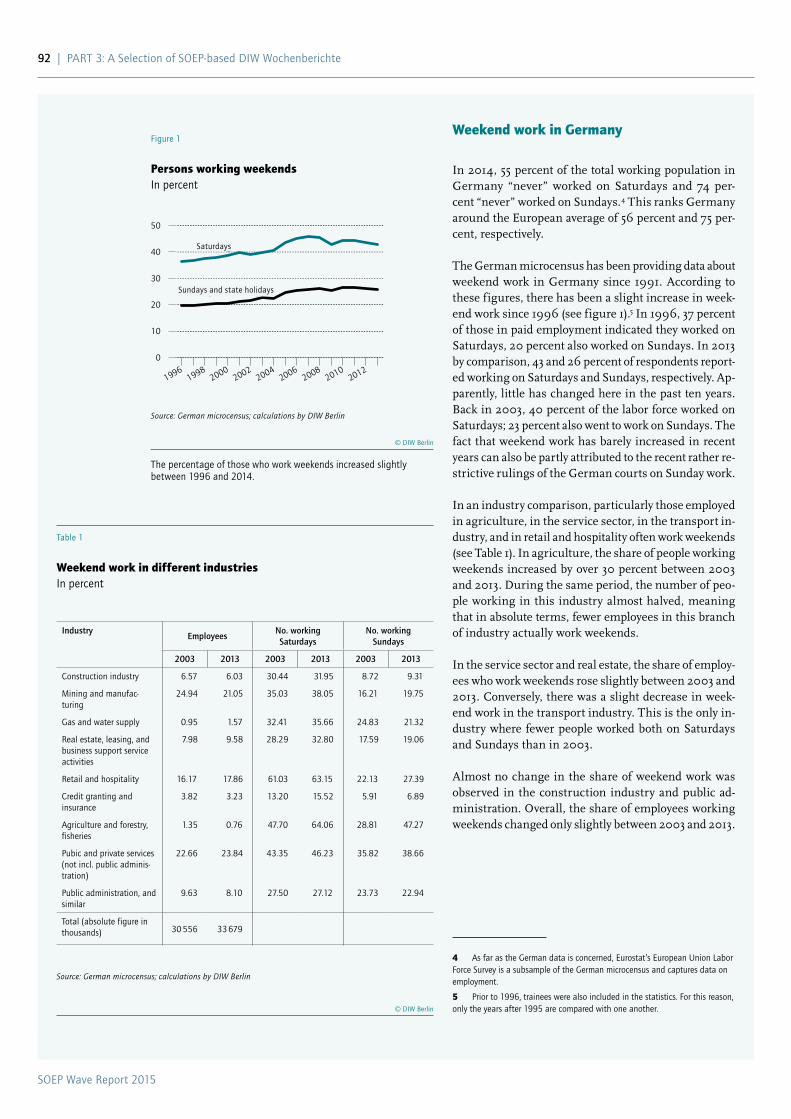
SOEP Wave Report 2015
92 | PaRT 3: a Selection of SOEP-based DIW Wochenberichte
Weekend work in Germany
In 2014, 55 percent of the total working population in Germany “never” worked on Saturdays and 74 per-cent “never” worked on Sundays.4 This ranks Germany around the European average of 56 percent and 75 per-cent, respectively.
The German microcensus has been providing data about weekend work in Germany since 1991. According to these figures, there has been a slight increase in week-end work since 1996 (see figure 1).5 In 1996, 37 percent of those in paid employment indicated they worked on Saturdays, 20 percent also worked on Sundays. In 2013 by comparison, 43 and 26 percent of respondents report-ed working on Saturdays and Sundays, respectively. Ap-parently, little has changed here in the past ten years. Back in 2003, 40 percent of the labor force worked on Saturdays; 23 percent also went to work on Sundays. The fact that weekend work has barely increased in recent years can also be partly attributed to the recent rather re-strictive rulings of the German courts on Sunday work.
In an industry comparison, particularly those employed in agriculture, in the service sector, in the transport in-dustry, and in retail and hospitality often work weekends (see Table 1). In agriculture, the share of people working weekends increased by over 30 percent between 2003 and 2013. During the same period, the number of peo-ple working in this industry almost halved, meaning that in absolute terms, fewer employees in this branch of industry actually work weekends.
In the service sector and real estate, the share of employ-ees who work weekends rose slightly between 2003 and 2013. Conversely, there was a slight decrease in week-end work in the transport industry. This is the only in-dustry where fewer people worked both on Saturdays and Sundays than in 2003.
Almost no change in the share of weekend work was observed in the construction industry and public ad-ministration. Overall, the share of employees working weekends changed only slightly between 2003 and 2013.
4 as far as the German data is concerned, Eurostat’s European Union Labor Force Survey is a subsample of the German microcensus and captures data on employment.
5 Prior to 1996, trainees were also included in the statistics. For this reason, only the years after 1995 are compared with one another.
Figure 1
Persons working weekendsIn percent
0
10
20
30
40
50
19961998
20002002
20042006
20082010
2012
Sonntag und Feiertag
Samstag
Source: German microcensus; calculations by DIW Berlin
© DIW Berlin
The percentage of those who work weekends increased slightly between 1996 and 2014.
Saturdays
Sundays and state holidays
Table 1
Weekend work in different industriesIn percent
IndustryEmployees
No. working Saturdays
No. working Sundays
2003 2013 2003 2013 2003 2013
Construction industry 6.57 6.03 30.44 31.95 8.72 9.31
Mining and manufac-turing
24.94 21.05 35.03 38.05 16.21 19.75
Gas and water supply 0.95 1.57 32.41 35.66 24.83 21.32
Real estate, leasing, and business support service activities
7.98 9.58 28.29 32.80 17.59 19.06
Retail and hospitality 16.17 17.86 61.03 63.15 22.13 27.39
Credit granting and insurance
3.82 3.23 13.20 15.52 5.91 6.89
agriculture and forestry, fisheries
1.35 0.76 47.70 64.06 28.81 47.27
Pubic and private services (not incl. public adminis-tration)
22.66 23.84 43.35 46.23 35.82 38.66
Public administration, and similar
9.63 8.10 27.50 27.12 23.73 22.94
Total (absolute figure in thousands) 30 556 33 679
Source: German microcensus; calculations by DIW Berlin
© DIW Berlin

SOEP Wave Report 2015
PaRT 3: a Selection of SOEP-based DIW Wochenberichte | 93
workers both with and without children or for part-time workers with no children. However, this study only fo-cuses on job satisfaction and fails to factor in other sat-isfaction scales which might be affected such as general life satisfaction or satisfaction with family life.
Those who work weekends are less satisfied …
As long ago as 2001, DIW Berlin published a study on the subject of Sunday work.9 The findings showed that as far as general life satisfaction is concerned, employ-ees who regularly work on Sundays are more frequent-ly dissatisfied, while employees who occasionally work on Sundays are in fact more satisfied than employees who never work on Sundays. The present study, based on SOEP data from 2013 covering almost 9,000 individ-uals in gainful employment, largely confirms the find-ings of the previous study (see Table 2). Here, the rela-tionship between weekend work and people’s satisfac-tion with their health, sleep, job, and family life is also examined as well as general life satisfaction.
Individuals who work on Saturdays report a slightly low-er general life satisfaction of 7.22 (compared with 7.31) on a scale of 0 (not at all satisfied) to 10 (very satisfied) and lower satisfaction with their family life (7.65 versus 7.90) and their sleep (6.70 as opposed to 6.96) than in-dividuals who do not work on Saturdays (see Table 2, col-
9 Jürgen Schupp, “Wandel zur Dienstleistungs- und Informationsgesells-chaft fördert ausweitung der Sonntagsarbeit,” DIW Wochenbericht, no. 27 (2001): 410–419.
Satisfaction and weekend work in Germany
A study conducted by the Confederation of German Trade Unions (DGB) in 2012 shows that people who work weekends more frequently feel pressured at work.6
Similar results are presented in a fact sheet compiled by the Federal Institute for Occupational Safety and Health (BAuA) in 2014, based on data from an employment sur-vey of the working population from 2012.7 According to this fact sheet, people who work weekends are less likely to have a very good to excellent general state of health. Furthermore, they more often suffer from physical and emotional exhaustion and report sleep disorders. The data also indicate that job satisfaction is lower among persons who work weekends. Consequently, weekend work is associated with higher stress levels and lower life satisfaction. It is not clear, however, whether these results can in fact be attributed to weekend work per se or whether other factors related to the living and work environment of those concerned are responsible.
Another study only finds a drop in job satisfaction for part-time workers with children after starting to work Sundays.8 No significant effect is evident for full-time
6 DGB-Index Gute arbeit GmbH, Stressfaktor Wochenend-arbeit (2012), accessed on august 21, 2015, http://www.dgb.de/++co++dee159fa-abff-11e1-5298-00188b4dc422/Sonderauswertung-Index-Gute-arbeit-Stressfaktor-Wochenendarbeit.pdf
7 Federal Institute for Occupational Safety and Health, “arbeiten, wenn andere frei haben – Wochenendarbeit bei abhängig Beschäftigten,” Factsheet 07 (July 2014).
8 Dominik Hanglberger, “arbeitszeiten außerhalb der Normalarbeitszeit nehmen weiter zu: eine analyse zu arbeitszeitarrangements und arbeitszu-friedenheit,” Informationsdienst Soziale Indikatoren 46 (2011): 12–16.
Table 2
Average levels of satisfaction and Saturday, Sunday, and weekend workOn a scale of 0 (not at all satisfied) to 10 (very satisfied)
Saturdays Sundays Weekends (Saturdays and Sundays)
No Yes Difference No Yes Difference No Yes Difference
General life satisfaction 7.31 7.22 −0.09** 7.32 7.17 −0.15*** 7.32 7.15 −0.17***
Employment 7.06 7.04 −0.02 7.06 7.08 0.02 7.06 7.07 0.01
Health 6.92 6.88 −0.05 6.95 6.78 −0.17** 6.95 6.77 −0.18***
Family 7.90 7.65 −0.25*** 7.90 7.59 −0.31*** 7.89 7.57 −0.32***
Sleep 6.96 6.70 −0.26*** 6.93 6.64 −0.30*** 6.93 6.61 −0.33***
Note: all persons between the ages of 18 and 65 in 2013 who were working full- or part-time and were not on parental leave, weighted.*** p < 0,1 %; ** p < 1 %.
Source: SOEP V30 (2013).
© DIW Berlin
SOEP Wave Report 2015
94 | PaRT 3: a Selection of SOEP-based DIW Wochenberichte
cerned. Consequently, solely comparing groups of indi-viduals who do and do not work weekends does not ena-ble us to deduce whether weekend work is the true cause of lower satisfaction among these people. One possible way of establishing this would be by means of a longi-tudinal analysis with the aid of a fixed-effects estima-tor. This method can be used to control for both time-constant characteristics of the professions and also spe-cific individual characteristics such as general amount of sleep needed as inf luencing factors.
umns 2 and 3). Those who work Sundays are also less satisfied with their lives in general as well as with their family lives, sleep, and their own health. These descrip-tive analyses confirm the 2001 findings10: people who work weekends tend to be somewhat less satisfied with their lives and also report lower satisfaction with their sleep, health, and family lives.
However, many of the professions involving weekend work are accompanied by other pressures, such as work-ing different day and night shifts. For instance, nurs-es work both weekends and nights and they also work constantly changing shifts. This could have an addition-al adverse effect on the satisfaction levels of those con-
10 Schupp, “Wandel zur Dienstleistungs- und Informationsgesellschaft.”
Box 1
Empirical methods
The present analysis uses SOEP data from 2005, 2007, 2009,
2011, and 2013 because questions about weekend work were
included in these years.1 Respondents were aged at least 18
in 2005 and no older than 65 in 2013 and continually em-
ployed full- or part-time in the same job throughout the entire
period from 2005 to 2013. Individuals who took maternity
or parental leave during the observation period were not
included in the analysis.
The questions in the survey about working on Saturdays and
Sundays are multiple choice with five possible answers.2 The
responses “no” and “rarely” were combined in categories
called “generally no Saturday work” or “generally no Sunday
work” for the present analysis. The responses “every week,”
“every two weeks,” and “every three to four weeks” were
coded as “regular Saturday work” or “regular Sunday work.”
In order to verify whether combining the possible responses
makes sense, the results of this analysis were also calculated
using all five possible answers. The findings were comparable.
1 Since respondents were not asked about family and sleep satisfaction every year, the analyses are limited to the period from 2007 to 2013 in the case of family satisfaction and from 2009 to 2013 in the case of sleep satisfaction.
2 The exact wording of the question is: “Do you have to work weekends? If so, how often?”
a fixed-effects regression model3 is used to examine the cor-
relation between weekend work and satisfaction. Using this
approach, we were able to take advantage of the longitudinal
nature of the available data, i.e., the fact that the survey
captured the same information over several years. The fixed-
effects model allows us to analyze the correlation between
changes in weekend work and changes in satisfaction. The
variables for Saturday and Sunday work were combined into
one variable for this purpose. The switch to working on Satur-
days or Sundays was also tested separately.
Therefore, the fixed-effects model only takes into account the
satisfaction of those who have switched from not working on
weekends to working on weekends (or vice versa). In addition,
individual fixed effects are controlled for here, that is, stable
and time-invariant characteristics of the respondents such as
genetic predisposition, personality, or aspects of their profes-
sion. Thus, the statistics ignore the effect of the time-invariant
characteristics of the respondents that might also be linked to
satisfaction.
3 Paul D. allison, Fixed Effects Regression Models (Thousand Oaks: Sage, 2009).
SOEP Wave Report 2015
PaRT 3: a Selection of SOEP-based DIW Wochenberichte | 95
Therefore, the conclusions of the longitudinal analy-sis are different to the descriptive findings of the cross-sectional analysis in the first part of the present study. One possible explanation for this is that general life satisfaction and satisfaction with sleep and family life among respondents in professions involving weekend work is lower in general than among respondents in a profession with no weekend work. The decisive factor here is not whether someone works weekends. Instead, other aspects of these professions presumably have an adverse effect on the general life satisfaction of the re-spondents as well as their satisfaction with their health, family lives, and sleep.
Conclusion
People in gainful employment who work weekends are, on average, less satisfied with life in general, their health, family lives, and sleep than those who do not carry out paid work at weekends. There is a direct negative corre-lation but only between job satisfaction and working on Sundays. Hence, it is not the switch to weekend work per se which has an adverse effect on people’s general life satisfaction and satisfaction with their health, fam-ily lives, and sleep. It is more a case that professions re-quiring weekend working are associated with a lower level of satisfaction due to other characteristics. These might include, for instance, shift or night work, a regu-lar occurrence for nurses, inter alia.
… but this is not due to weekend work per se
Does a switch from non-weekend work to weekend work in fact make a negative contribution to life satisfaction and satisfaction in other areas? In order to answer this question, 1,400 participants in the SOEP were consid-ered who were continually employed in the same job in the period from 2005 to 2013. A total of 345 individuals from this group switched to Saturday work and 211 to Sunday work. Additionally, 211 persons in gainful em-ployment who had never worked weekends previously switched to weekend work on both days. A fixed-effects estimator can be used to show how the satisfaction of these individuals has changed over time (see box 1)—i.e., whether beginning to work weekends did in fact have an adverse effect on the level of satisfaction. Here, the switch from no weekend work at all to weekend work on both days and the switch to Saturday or Sunday work are considered separately.
The results show no statistically significant relationship between shifting the working days to the weekend on the one hand and changes in general life satisfaction and satisfaction with health, family life, and sleep on the other.11 The findings show that those who initially do not work on weekends and then change their work-ing days are no less satisfied in these areas than before they began working weekends.
This is not the case, however, as far as job satisfaction is concerned12: a statistically significant (albeit relative-ly small) drop in job satisfaction is associated with the switch to weekend work. However, this only applies to people who have switched to Sunday work (see Table 3). This finding is consistent with the analyses from a 2011 study which also establishes a decrease in job sat-isfaction following the switch to Sunday work at least for part-time employees with children.13
11 This applies to all three models: the switch to Saturday work, the switch to Sunday work, and the switch to weekend work on both days.
12 See also the general overview of the development of job satisfaction in Germany in the study by Karl Brenke: Karl Brenke, “The Vast Majority of Employees in Germany are Satisfied with Their Jobs,” DIW Economic Bulletin, no. 32/33 (2015): 429–436.
13 Hanglberger, “arbeitszeiten außerhalb der Normalarbeitszeit.”
Maria Metzing is a doctoral student in the SOEP at DIW Berlin | [email protected]
David Richter is a Research associate in the SOEP at DIW Berlin | [email protected]
Table 3
Satisfaction and Sunday work plus other control variables
General life satisfaction
Employment Health Family Sleep
Saturday 0.00 −0.13 0.08 −0.04 −0.04
Sunday −0.03 −0.25** 0.08 −0.03 0.08
Observations 7 040 7 040 7 040 5 516 4 221
Individuals 1 408 1 408 1 408 1 379 1 407
** 1 %, *** 0,1 %.The coefficients shown are „working on Saturdays“ and „working on Sundays.“ The following variables are also controlled for in the calculated models: logarithmic income (centered), age (centered), number of visits to the doctor (centered), length of employment (centered), agreed working time (centered), marital status (single), senior position in civil service, managerial position, and company size (0–199, 200–1999, over 2000).
Source: SOEP V30.
© DIW Berlin

SOEP Wave Report 2015
96 | PaRT 3: a Selection of SOEP-based DIW Wochenberichte
Economy. Politics. sciEncE.
DiW Economic Bulletin
2015
Aircraft Noise and Quality of Life
REPoRt by Peter Eibich, Konstantin Kholodilin, Christian Krekel and Gert G. Wagner
Aircraft Noise in Berlin Affects Quality of Life Even Outside the Airport Grounds 127intERViEW with Peter Eibich
»Aircraft Noise Has Negative Impact on Well-Being and Health — Even When Not Perceived as a Disturbance« 134
9WIRTSCHAFT. POLITIK. WISSENSCHAFT. Seit 1928
DIW Wochenbericht
2015
Risikogewichtung von EU-Staatsanleihen
Bericht von Dorothea Schäfer und Dominik Meyland
Verschärfte Eigenkapitalanforderungen für EU-Staatsanleihen – Ein Schritt in Richtung eines stabileren Finanzsystems 475Interview mit Dorothea Schäfer
»Griechenland würde mit neuen Eigenkapitalregelungen für EU-Staats anleihen Probleme bekommen« 486Bericht von Maximilian Priem und Jürgen Schupp
Die Nutzung des Kulturangebots in Deutschland 487Am aktuellen Rand Kommentar von Alexander Kritikos
100 Tage Tsipras und kein Anfang 500
20
Source:
DIW Wochenbericht20/2015
Volume 82, pp. 487–497 May 13, 2015ISSN 0012-1304
www.diw.de/wochenbericht
SOEP Wave Report 2015
PaRT 3: a Selection of SOEP-based DIW Wochenberichte | 97
In the wake of structural changes underway throughout the industrialized world, creative activities and experi-ences are taking on an increasingly important role in so-ciety. Cities have become hotbeds of creativity and mag-nets for a new “creative class” that is often instrumen-tal in boosting regional economic growth.1 In addition, what a town or city has to offer in the way of theaters, opera, concerts, and museums, as well as diverse mu-sic and arts scenes are important “soft location factors” that can give a town or city an all-important edge when it comes to attracting a qualified workforce. What a region offers in terms of cultural experiences also plays a ma-jor role in how locals choose to spend their leisure time, and can transform a region into a magnet for tourism.
Government subsidies for the promotion of cultural events and activities therefore do not just fulfill cultural and education policy goals but can also have major im-plications for the economy. In the present study, we an-alyze government cultural spending at the federal state level based on official statistical data. We then compare the demand for culture in Germany by region over the period 1995 to 2013, thus updating and expanding on a previous study by DIW Berlin.2 Our data source is the long-term Socio-Economic Panel (SOEP) study3 carried out by DIW Berlin in cooperation with the survey insti-tute TNS Infratest Sozialforschung.
1 R. Florida, The Rise of the Creative Class (New York: Basic Books, 2002).
2 T. Schneider and J. Schupp, “Berliner sind Kulturliebhaber – Die Nutzung des Kulturangebots in Berlin im bundesdeutschen Vergleich,” DIW Berlin Wochenbericht, no. 4 (2002): 63–7.
3 The SOEP is an annual representative household survey conducted in West Germany since 1984 and in eastern Germany since 1990; see G. G. Wagner, J. Göbel, P. Krause, R. Pischner, and I. Sieber, “Das Sozio-oekonomische Panel (SOEP): Multidisziplinäres Haushaltspanel und Kohortenstudie für Deutschland – Eine Einführung (für neue Datennutzer) mit einem ausblick (für erfahrene anwender),” asta Economic and Social Statistical archive 2 (4) (2008): 301–328.
Changes in the Demand for Culture in GermanyBy Maximilian Priem and Jürgen Schupp
In 2009, public cultural spending amounted to a little over 9 bil-lion euros, which breaks down to 111 euros per person. In 2011, pri-vate households spent an average of around 144 euros on cultural events and activities, totaling 5.7 billion euros. according to data from the Socio-Economic Panel (SOEP) study for the year 2013, 58% of adults in Germany were found to engage in high-culture activities occasionally or frequently, compared to 64% for popular-culture activities. This constitutes a significant increase over 1995.
In Germany’s major cities—Berlin in particular—the demand for cul-tural events and activities is greater than in other regions. In recent years, however, demand in Berlin has declined. When examining the regional differences in demand for cultural activities, it is impor-tant to bear in mind the individual factors that affect this demand, such as education, income, and employment status, as well as the specifics of the place of residence, such as regional tax revenues and cultural spending. If all of these factors are factored into the estimates, differences in demand for culture between Germany’s major cities and other regions cease to be statistically significant.

SOEP Wave Report 2015
98 | PaRT 3: a Selection of SOEP-based DIW Wochenberichte
91 euros to 111 euros annually. What must be borne in mind here, however, is that overall price levels rose by 23% in the same period. In real terms, therefore, gov-ernment spending on culture has in fact stagnated.5
The majority of funding for culture comes from the in-dividual German states and municipal authorities. In-deed, in 2009, German government spending on cul-ture amounted to 1.2 billion euros, which equates to 13.4% of total cultural spending.
Public funding for cultural activities has varied widely between western and eastern Germany over time. Due to differences in population development as well as in the existing infrastructure for cultural events and rec-reational activities, spending on culture went up by one third from 1995 to 2009 in the western states, compared with just 5% in the eastern states. Developments in the city-states of Berlin, Hamburg, and Bremen were mixed as well. While Hamburg and Bremen increased spend-ing on culture between 1995 and 2009 by 44 and 31%, respectively, the state of Berlin cut its cultural spending by 12%.6 Despite this reduction, Berlin’s cultural spend-ing in 2009 of 176 euros per capita was still higher than that of any other state in Germany.
More than one third (3.2 billion euros) of total cultur-al spending in 2009 was spent on theater and music, with the three city-states allocating higher proportions (around 50%) of their total cultural spending to these areas compared to the remaining German states.
In 2009, a good 1% of total public spending on culture in Berlin went to culture and arts administration (as op-posed to 2% in 2001), compared with over 10% in Hesse, Mecklenburg Pomerania, and Thuringia. When making such comparisons, however, it should be kept in mind that cost reductions will often lead to higher costs for ad-ministrative work outsourced to external organizations.
5 German Federal Statistical Office, Verbraucherpreisindizes für Deutschland – Lange Reihe ab 1948 (Wiesbaden: March 2015).
6 The spending cuts in Berlin were made very soon after the city was reunified and had three opera houses to finance. One consequence of this, for example, was the closure of the Schiller Theater in 1993 based on a decision by the Berlin Senate following a long battle to keep the theater running. The financial situation in Berlin is also marked by the fact that the city receives around 3 billion euros per year as part of the fiscal equalization schemes across the Länder; see M. Bickmann and K. van Deuverden, “Länderfinanzausgleich vor der Reform: eine Bestandsaufnahme,” DIW Wochenbericht, no. 28 (2014): 671–682.
The Structure of Public Cultural Spending in Germany
To date there is a lack of standardized, comprehensive cultural statistics for Germany. The Statistical Offices of the German Federation and the 2012 report by the federal states on government cultural spending does provide an overview of public cultural expenditures..4 This database and the thoroughly revised statistical var-iables allow us to trace the development of public cultur-al spending over the period 1995 to 2009.
Our findings show that in 2009, German federal, state, and local governments spent a total of 9.1 billion euros on culture. This was 1.6 billion euros or 22% more than in 1995 (see Table 1). Per capita government cultural spending has increased by 22% as well, taking it from
4 Statistical Offices of the German Federation and the Länder (Statistische Ämter des Bundes und der Länder): Kulturfinanzbericht 2012.
Table 1
Public Spending on Culture 1995 to 20091
1995 2000 2005 2009
million euros
Total 7 468 8 206 8 003 9 127
Federal government 966 1 011 1 018 1 225
Western territorial states 3 977 4 557 4 639 5 271
Eastern territorial states 1 553 1 695 1 500 1 629
City states 973 944 846 1 002
Berlin 690 656 498 604
Bremen 75 83 98 97
Hamburg 209 205 250 301
For information purposes:
Public spending on culture per capita (in euros) 91 100 97 111
Change over 1995 (in percent)
Total 100 110 107 122
Federal government 100 105 105 127
Western territorial states 100 115 117 133
Eastern territorial states 100 109 97 105
City states 100 97 87 103
Berlin 100 95 72 88
Bremen 100 111 131 131
Hamburg 100 98 120 144
For information purposes:
Public spending on culture per capita (in euros) 100 109 106 122
1 Basic funding including expenditure of local authorities and special-purpose organizations.
Sources: Federal Statistical Office and the Statistical Offices of the Länder—2012 Report on Government Expenditure on Culture; calculations by DIW Berlin.
© DIW Berlin
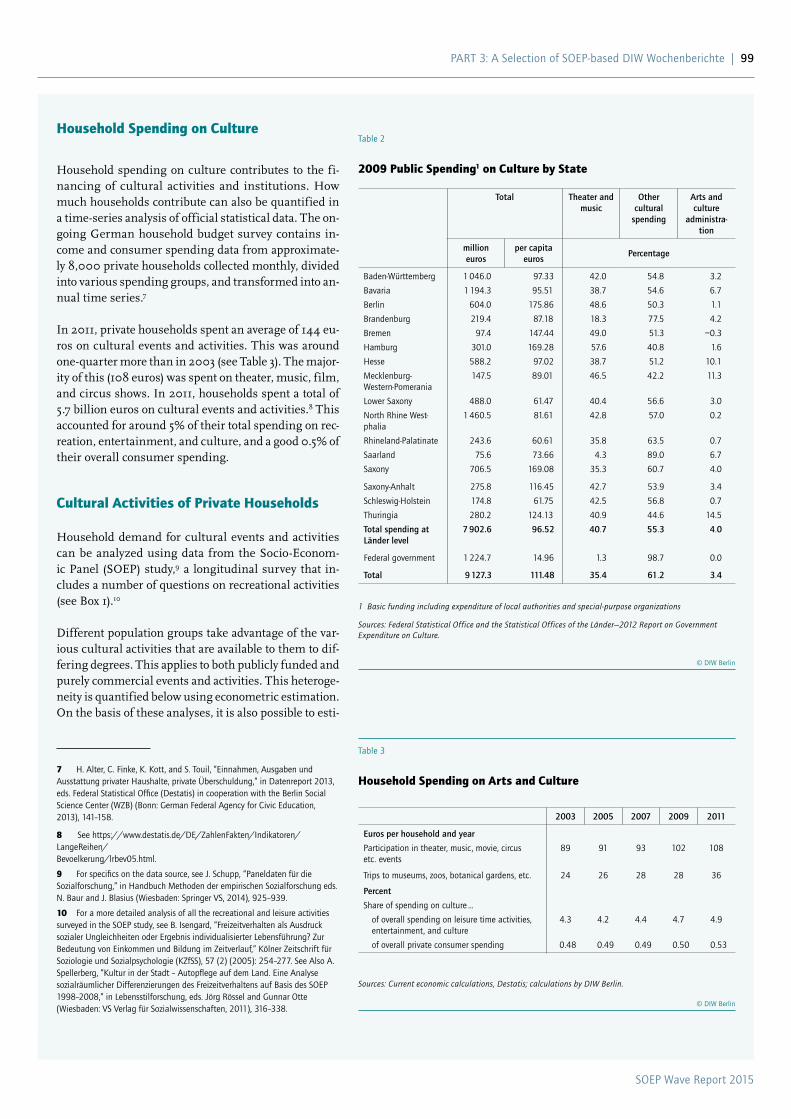
SOEP Wave Report 2015
PaRT 3: a Selection of SOEP-based DIW Wochenberichte | 99
Household Spending on Culture
Household spending on culture contributes to the fi-nancing of cultural activities and institutions. How much households contribute can also be quantified in a time-series analysis of official statistical data. The on-going German household budget survey contains in-come and consumer spending data from approximate-ly 8,000 private households collected monthly, divided into various spending groups, and transformed into an-nual time series.7
In 2011, private households spent an average of 144 eu-ros on cultural events and activities. This was around one-quarter more than in 2003 (see Table 3). The major-ity of this (108 euros) was spent on theater, music, film, and circus shows. In 2011, households spent a total of 5.7 billion euros on cultural events and activities.8 This accounted for around 5% of their total spending on rec-reation, entertainment, and culture, and a good 0.5% of their overall consumer spending.
Cultural Activities of Private Households
Household demand for cultural events and activities can be analyzed using data from the Socio-Econom-ic Panel (SOEP) study,9 a longitudinal survey that in-cludes a number of questions on recreational activities (see Box 1).10
Different population groups take advantage of the var-ious cultural activities that are available to them to dif-fering degrees. This applies to both publicly funded and purely commercial events and activities. This heteroge-neity is quantified below using econometric estimation. On the basis of these analyses, it is also possible to esti-
7 H. alter, C. Finke, K. Kott, and S. Touil, “Einnahmen, ausgaben und ausstattung privater Haushalte, private Überschuldung,” in Datenreport 2013, eds. Federal Statistical Office (Destatis) in cooperation with the Berlin Social Science Center (WZB) (Bonn: German Federal agency for Civic Education, 2013), 141–158.
8 See https://www.destatis.de/DE/ZahlenFakten/Indikatoren/LangeReihen/ Bevoelkerung/lrbev05.html.
9 For specifics on the data source, see J. Schupp, “Paneldaten für die Sozialforschung,” in Handbuch Methoden der empirischen Sozialforschung eds. N. Baur and J. Blasius (Wiesbaden: Springer VS, 2014), 925–939.
10 For a more detailed analysis of all the recreational and leisure activities surveyed in the SOEP study, see B. Isengard, “Freizeitverhalten als ausdruck sozialer Ungleichheiten oder Ergebnis individualisierter Lebensführung? Zur Bedeutung von Einkommen und Bildung im Zeitverlauf,” Kölner Zeitschrift für Soziologie und Sozialpsychologie (KZfSS), 57 (2) (2005): 254–277. See also a. Spellerberg, “Kultur in der Stadt – autopflege auf dem Land. Eine analyse sozialräumlicher Differenzierungen des Freizeitverhaltens auf Basis des SOEP 1998–2008,” in Lebensstilforschung, eds. Jörg Rössel and Gunnar Otte (Wiesbaden: VS Verlag für Sozialwissenschaften, 2011), 316–338.
Table 2
2009 Public Spending1 on Culture by State
Total Theater and music
Other cultural
spending
Arts and culture
administra-tion
million euros
per capita euros
Percentage
Baden-Württemberg 1 046.0 97.33 42.0 54.8 3.2
Bavaria 1 194.3 95.51 38.7 54.6 6.7
Berlin 604.0 175.86 48.6 50.3 1.1
Brandenburg 219.4 87.18 18.3 77.5 4.2
Bremen 97.4 147.44 49.0 51.3 −0.3
Hamburg 301.0 169.28 57.6 40.8 1.6
Hesse 588.2 97.02 38.7 51.2 10.1
Mecklenburg- Western-Pomerania
147.5 89.01 46.5 42.2 11.3
Lower Saxony 488.0 61.47 40.4 56.6 3.0
North Rhine West-phalia
1 460.5 81.61 42.8 57.0 0.2
Rhineland-Palatinate 243.6 60.61 35.8 63.5 0.7
Saarland 75.6 73.66 4.3 89.0 6.7
Saxony 706.5 169.08 35.3 60.7 4.0
Saxony-anhalt 275.8 116.45 42.7 53.9 3.4
Schleswig-Holstein 174.8 61.75 42.5 56.8 0.7
Thuringia 280.2 124.13 40.9 44.6 14.5
Total spending at Länder level
7 902.6 96.52 40.7 55.3 4.0
Federal government 1 224.7 14.96 1.3 98.7 0.0
Total 9 127.3 111.48 35.4 61.2 3.4
1 Basic funding including expenditure of local authorities and special-purpose organizations
Sources: Federal Statistical Office and the Statistical Offices of the Länder—2012 Report on Government Expenditure on Culture.
© DIW Berlin
Table 3
Household Spending on Arts and Culture
2003 2005 2007 2009 2011
Euros per household and year
Participation in theater, music, movie, circus etc. events
89 91 93 102 108
Trips to museums, zoos, botanical gardens, etc. 24 26 28 28 36
Percent
Share of spending on culture …
of overall spending on leisure time activities, entertainment, and culture
4.3 4.2 4.4 4.7 4.9
of overall private consumer spending 0.48 0.49 0.49 0.50 0.53
Sources: Current economic calculations, Destatis; calculations by DIW Berlin.
© DIW Berlin
SOEP Wave Report 2015
100 | PaRT 3: a Selection of SOEP-based DIW Wochenberichte
The econometric analyses are conducted in three stag-es: (1) cross-sectional regressions for the years 1998 and 2013, (2) a longitudinal regression for the period 1998 to 2013, and (3) a multi-level model for the years 1998 and 2013. In all cases, attendance of cultural events—divided into high culture and popular culture—was tak-en as the independent variable (see Box 1).
Cross-Sectional Regressions for 1998 and 2013
The estimated “marginal effects” of the logistic cross-sectional regressions indicate the probability of a per-son participating in a cultural event relative to a refer-ence group (see Table 4). These estimations are carried out for the various population groups, which are catego-rized according to specific socio-economic properties. According to the results, in both 1998 and 2013, wom-en—adjusted for differences in age and education struc-ture—were 6% more likely to attend high culture events than men. Female attendance of popular-culture activ-ities, on the other hand, was 3% lower in 1998, while no gender-specific differences were observed in 2013.
In households with children under 16, the adults at-tended high and popular culture events less frequent-ly. Marital status has a similar effect on cultural partic-ipation, although here, too, changes can be seen over time. In 1998, for example, married persons were two percent less likely to participate in high-culture events. They also attended popular culture events 4% less fre-quently than unmarried persons. For 2013, no differ-ences in attendance of high-culture activities were ob-served between these two groups, and the gap in culture consumption between married and unmarried individ-uals had narrowed to 3%.
The 45 to 59-year-old age group participates in high-cul-ture activities significantly more often than the under-30s group. The 60 to 75-year-old population group also attends cultural events and activities relatively frequent-ly. A clear age effect can also be seen in the area of pop-ular-culture activities, albeit with the reverse outcome: older people attend popular-culture events far less often.
Despite the heavy subsidizing of cultural events and ac-tivities, they still cost the consumer money. It is there-fore not surprising that the household financial situa-tion will clearly affect the extent to which people attend cultural events. In 1998, those in the bottom quarter of the income distribution attended popular culture events 5% less often than those in the two middle income quar-tiles. In 2013, this income effect amounted to as much as 8%. A similar picture emerges for high culture. Those
mate whether the populations of certain regions or cit-ies tend to be more culture-oriented than others after adjusting for the specific socio-economic structure.11
11 See Schneider and Schupp, “Berliner sind Kulturliebhaber.”
Box 1
Data Source and Analysis Methods
In the Socio-Economic Panel (SOEP) study, people aged
17 years and over are asked what type of leisure activi-
ties they take part in and how often. They are asked
at regular intervals (in 1995, 1998, 2003, 2008, and,
most recently, 2013) about their leisure activities, and
are given a list of 18 or 19 different leisure activities to
choose from in their answer options.
The independent variables in the regression analysis are
respondents’ answers to questions about high-culture
activities (“Going to cultural events such as opera, clas-
sical concerts, theater, exhibitions”) and popular culture
activities (“Going to the movies, pop or jazz concerts,
and dance clubs”). The respective question is worded as
follows: “Please indicate how often you take part in each
activity: daily, at least once per week, at least once per
month, seldom, or never?” If a respondent states that he/
she takes part in an activity at all, the independent vari-
able takes on the value of 1.1
In addition to cross-sectional analyses for the years 1998
and 2013 and longitudinal analysis for the period 1998
to 2013, a multi-level model with additional local-level in-
formation (for 403 districts) was estimated for the years
1998 and 2013. Here, too, estimations were performed
as logistic regressions of random intercept models with
individual and context variables. an important parameter
in these models is the statistical correlation coefficient
rho—the residual intraclass correlation at district level.
Rho can be interpreted as the share of variation that is
attributable to district-specific features. Based on this,
the effect of the individual and district levels can be
determined.
1 This study thus does not differentiate by frequency of participation in cultural events and activities.
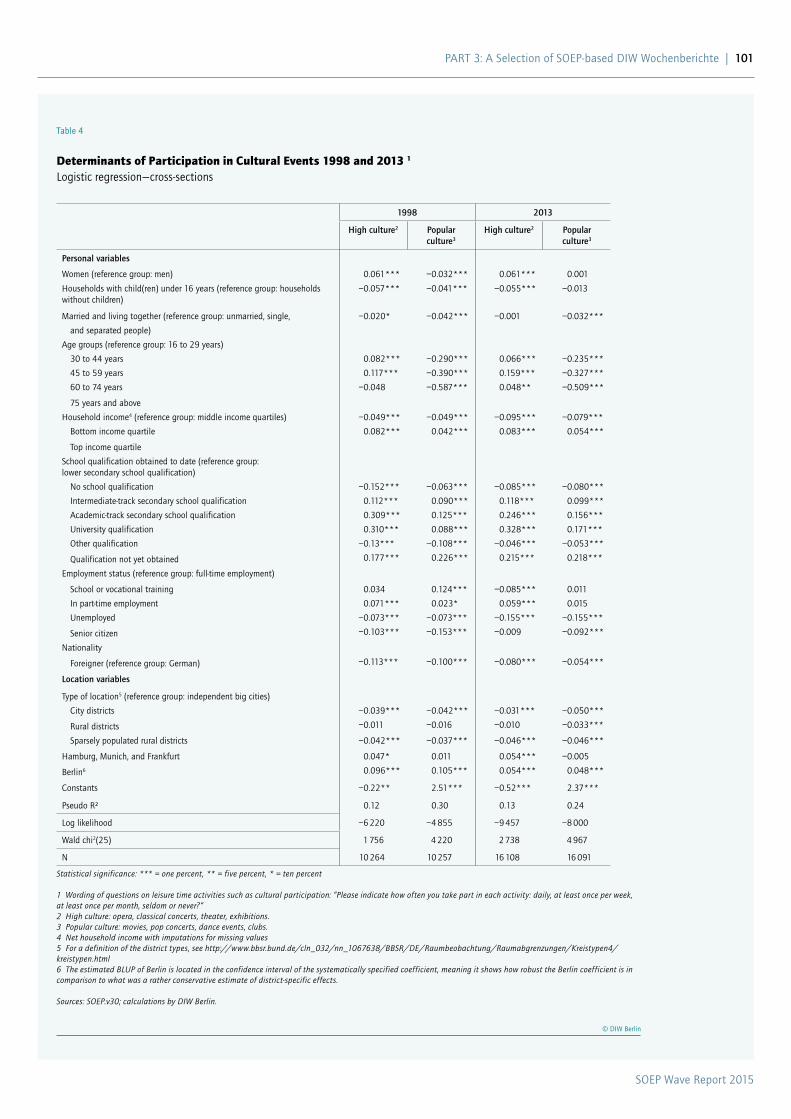
SOEP Wave Report 2015
PaRT 3: a Selection of SOEP-based DIW Wochenberichte | 101
Table 4
Determinants of Participation in Cultural Events 1998 and 2013 1
Logistic regression—cross-sections
1998 2013
High culture2 Popular culture3
High culture2 Popular culture3
Personal variables
Women (reference group: men) 0.061*** −0.032*** 0.061*** 0.001
Households with child(ren) under 16 years (reference group: households without children)
−0.057*** −0.041*** −0.055*** −0.013
Married and living together (reference group: unmarried, single, −0.020* −0.042*** −0.001 −0.032***
and separated people)
age groups (reference group: 16 to 29 years)
30 to 44 years 0.082*** −0.290*** 0.066*** −0.235***
45 to 59 years 0.117*** −0.390*** 0.159*** −0.327***
60 to 74 years −0.048 −0.587*** 0.048** −0.509***
75 years and above
Household income4 (reference group: middle income quartiles) −0.049*** −0.049*** −0.095*** −0.079***
Bottom income quartile 0.082*** 0.042*** 0.083*** 0.054***
Top income quartile
School qualification obtained to date (reference group: lower secondary school qualification)
No school qualification −0.152*** −0.063*** −0.085*** −0.080***
Intermediate-track secondary school qualification 0.112*** 0.090*** 0.118*** 0.099***
academic-track secondary school qualification 0.309*** 0.125*** 0.246*** 0.156***
University qualification 0.310*** 0.088*** 0.328*** 0.171***
Other qualification −0.13*** −0.108*** −0.046*** −0.053***
Qualification not yet obtained 0.177*** 0.226*** 0.215*** 0.218***
Employment status (reference group: full-time employment)
School or vocational training 0.034 0.124*** −0.085*** 0.011
In part-time employment 0.071*** 0.023* 0.059*** 0.015
Unemployed −0.073*** −0.073*** −0.155*** −0.155***
Senior citizen −0.103*** −0.153*** −0.009 −0.092***
Nationality
Foreigner (reference group: German) −0.113*** −0.100*** −0.080*** −0.054***
Location variables
Type of location5 (reference group: independent big cities)
City districts −0.039*** −0.042*** −0.031*** −0.050***
Rural districts −0.011 −0.016 −0.010 −0.033***
Sparsely populated rural districts −0.042*** −0.037*** −0.046*** −0.046***
Hamburg, Munich, and Frankfurt 0.047* 0.011 0.054*** −0.005
Berlin6 0.096*** 0.105*** 0.054*** 0.048***
Constants −0.22** 2.51*** −0.52*** 2.37***
Pseudo R² 0.12 0.30 0.13 0.24
Log likelihood −6 220 −4 855 −9 457 −8 000
Wald chi2(25) 1 756 4 220 2 738 4 967
N 10 264 10 257 16 108 16 091
Statistical significance: *** = one percent, ** = five percent, * = ten percent 1 Wording of questions on leisure time activities such as cultural participation: “Please indicate how often you take part in each activity: daily, at least once per week, at least once per month, seldom or never?“ 2 High culture: opera, classical concerts, theater, exhibitions. 3 Popular culture: movies, pop concerts, dance events, clubs. 4 Net household income with imputations for missing values 5 For a definition of the district types, see http://www.bbsr.bund.de/cln_032/nn_1067638/BBSR/DE/Raumbeobachtung/Raumabgrenzungen/Kreistypen4/kreistypen.html 6 The estimated BLUP of Berlin is located in the confidence interval of the systematically specified coefficient, meaning it shows how robust the Berlin coefficient is in comparison to what was a rather conservative estimate of district-specific effects. Sources: SOEP.v30; calculations by DIW Berlin.
© DIW Berlin
SOEP Wave Report 2015
102 | PaRT 3: a Selection of SOEP-based DIW Wochenberichte
with a university degree are a good 30% more likely to attend high-culture events and, in 2013, 17% more like-ly to attend popular-culture events than those with only a lower secondary school leaving qualification.
Irrespective of all the other factors, employment status also affects whether or not people participate in cultur-al activities. In 1998, for example, registered job-seek-ers went to cultural events 7% less often than those in full-time employment; by 2013 this difference had grown to around 16%.
In 1998, people with non-German nationality attend-ed high culture events and popular culture events less frequently than Germans (11 and 10%, respectively). In 2013, the differences had diminished to 8% for high cul-ture and 5% for popular culture events.
Attendance of cultural events and activities also differs significantly by geographical location. After correcting for the inf luence of observable individual characteris-tics, we found that the population of rural districts at-tended cultural events far less often than the population of urban districts with at least 100,000 inhabitants. The populations of cities with more than 700,000 inhab-itants such as Berlin, Hamburg, Munich, and Frank-furt are more culture-oriented than those of other cit-ies. This is especially true of high culture events. Ber-lin ranks particularly high among Germany’s big cities in culture consumption, although the gap between Ber-lin and other cities narrowed significantly from 1998 to 2013 (see Box 2).
Longitudinal Analysis of the Period 1998 to 2013
The relationships identified in the cross-sectional re-gressions do not necessarily represent causal effects on attendance of cultural events and activities. This is due to the possible existence of unobserved respondent char-acteristics that are not contained in the data and that also affect attendance of cultural events.12 For this rea-son, we conducted a longitudinal analysis of the data for the survey years 1998, 2003, 2008, and 2013 for all re-spondents who participated in the SOEP at least twice. A fixed-effects model of this kind takes into account the unobserved heterogeneity between individuals and al-lows us to see how this correlates with the other explan-
12 See J. Brüderl, “Kausalanalyse mit Paneldaten,” in Handbuch der sozialwissenschaftlichen Datenanalyse Christof Wolf and Henning Best, eds. (Wiesbaden: VS Verlag für Sozialwissenschaften, 2010): 963–994.
atory variables included in the model.13 Since time-con-stant individual characteristics such as gender do not vary over time, they cannot be included in this analy-sis (see Table 5).
If children under the age of 16 living in the respond-ents’ household were also included, this would result in a clear decrease in attendance of cultural events and ac-tivities. The case is similar for those whose marital sta-tus changed because they married and moved in with their spouse during the course of the study.
In pure cross-sectional observations, it is virtually im-possible to distinguish between age and birth cohort ef-fects. The longitudinal panel model, on the other hand, provides greater possibilities for analysis and makes it possible to separate the effects. We find, for instance, that the only group of people who display a significant decrease in demand for high-culture events and activ-ities after moving into the next age group was the 75 and over age cohort. It is therefore likely that the effects identified in the cross-sectional models are cohort rath-er than age effects as cohorts do not vary over time. In contrast to this, as expected, aging has a clear negative effect on attendance of pop culture events. This nega-tive effect becomes more pronounced with increasing age, suggesting that here, too, the youngest birth cohort is driving the overall increase in attendance of popular-culture events observed in the study.
Changes in income situation also affect demand for cul-tural and recreational activities. Moving from one of the two middle income quartiles into the top income brack-et, for example, results in an increase in attendance of both high- and popular-culture events. Moving into the lowest income quartile has a significant negative effect on attendance of popular-culture events, but no signif-icant effect on attendance of high-culture events.
An increase in the level of education during the peri-od under observation does not lead to any change in demand for culture. The same is true of a change in employment status, for instance, going from full-time employment into vocational training or secondary ed-ucation. Only for high culture do we find a significant but weak positive effect among those who moved from full- to part-time employment. In contrast, when apply-ing the longitudinal model alone, entering unemploy-ment causes a decline in attendance of popular culture events. Thus, a change in employment status does not have as strong an effect as the results of the cross-sec-tional regressions for 1998 and 2013 would suggest.
13 See. M. Giesselmann and M. Windzio, Regressionsmodelle zur analyse von Paneldaten (Wiesbaden: Springer VS, 2012), 142ff.
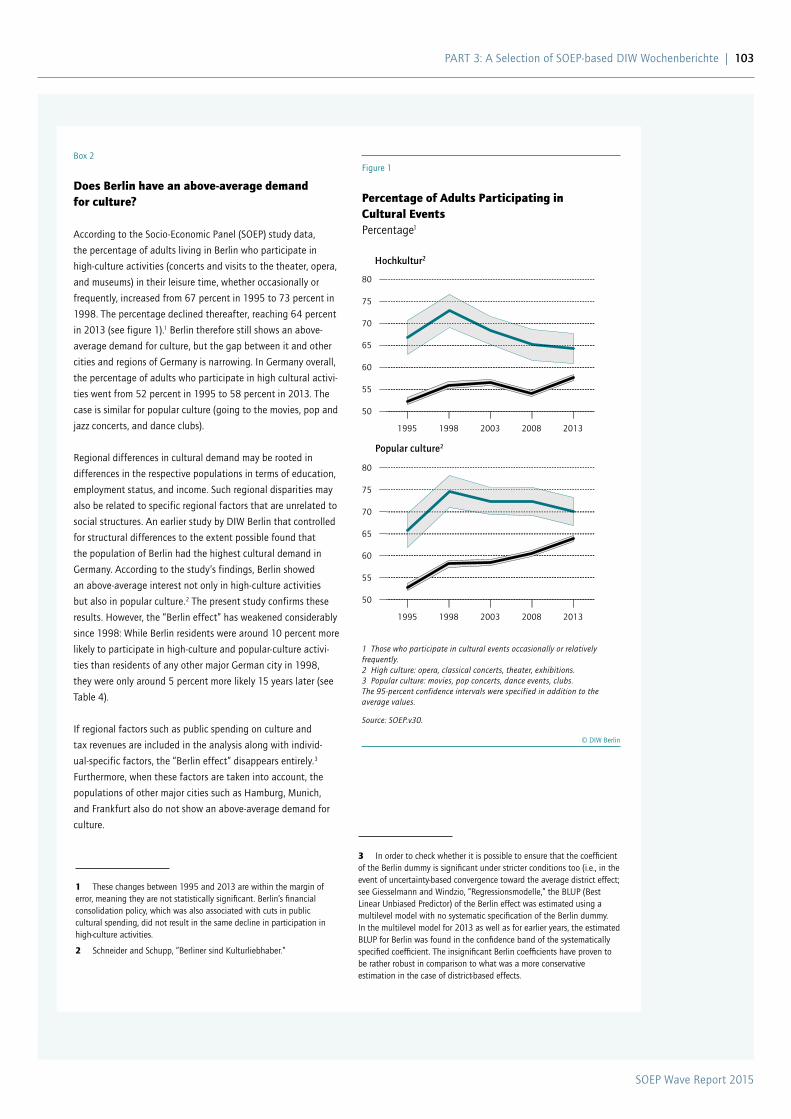
SOEP Wave Report 2015
PaRT 3: a Selection of SOEP-based DIW Wochenberichte | 103
Box 2
Does Berlin have an above-average demand for culture?
according to the Socio-Economic Panel (SOEP) study data,
the percentage of adults living in Berlin who participate in
high-culture activities (concerts and visits to the theater, opera,
and museums) in their leisure time, whether occasionally or
frequently, increased from 67 percent in 1995 to 73 percent in
1998. The percentage declined thereafter, reaching 64 percent
in 2013 (see figure 1).1 Berlin therefore still shows an above-
average demand for culture, but the gap between it and other
cities and regions of Germany is narrowing. In Germany overall,
the percentage of adults who participate in high cultural activi-
ties went from 52 percent in 1995 to 58 percent in 2013. The
case is similar for popular culture (going to the movies, pop and
jazz concerts, and dance clubs).
Regional differences in cultural demand may be rooted in
differences in the respective populations in terms of education,
employment status, and income. Such regional disparities may
also be related to specific regional factors that are unrelated to
social structures. an earlier study by DIW Berlin that controlled
for structural differences to the extent possible found that
the population of Berlin had the highest cultural demand in
Germany. according to the study’s findings, Berlin showed
an above-average interest not only in high-culture activities
but also in popular culture.2 The present study confirms these
results. However, the “Berlin effect” has weakened considerably
since 1998: While Berlin residents were around 10 percent more
likely to participate in high-culture and popular-culture activi-
ties than residents of any other major German city in 1998,
they were only around 5 percent more likely 15 years later (see
Table 4).
If regional factors such as public spending on culture and
tax revenues are included in the analysis along with individ-
ual-specific factors, the “Berlin effect” disappears entirely.3
Furthermore, when these factors are taken into account, the
populations of other major cities such as Hamburg, Munich,
and Frankfurt also do not show an above-average demand for
culture.
High culture1
Figure 1
Percentage of Adults Participating in Cultural EventsPercentage1
50
55
60
65
70
75
80
50
55
60
65
70
75
80
1995 1998 2003 2008 2013
1995 1998 2003 2008 2013
Hochkultur2
Populärkultur3
1 Those who participate in cultural events occasionally or relatively frequently.2 High culture: opera, classical concerts, theater, exhibitions.3 Popular culture: movies, pop concerts, dance events, clubs.The 95-percent confidence intervals were specified in addition to the average values.
Source: SOEP.v30.
© DIW Berlin
Popular culture2
1 These changes between 1995 and 2013 are within the margin of error, meaning they are not statistically significant. Berlin’s financial consolidation policy, which was also associated with cuts in public cultural spending, did not result in the same decline in participation in high-culture activities.
2 Schneider and Schupp, “Berliner sind Kulturliebhaber.”
3 In order to check whether it is possible to ensure that the coefficient of the Berlin dummy is significant under stricter conditions too (i.e., in the event of uncertainty-based convergence toward the average district effect; see Giesselmann and Windzio, “Regressionsmodelle,” the BLUP (Best Linear Unbiased Predictor) of the Berlin effect was estimated using a multilevel model with no systematic specification of the Berlin dummy. In the multilevel model for 2013 as well as for earlier years, the estimated BLUP for Berlin was found in the confidence band of the systematically specified coefficient. The insignificant Berlin coefficients have proven to be rather robust in comparison to what was a more conservative estimation in the case of district-based effects.
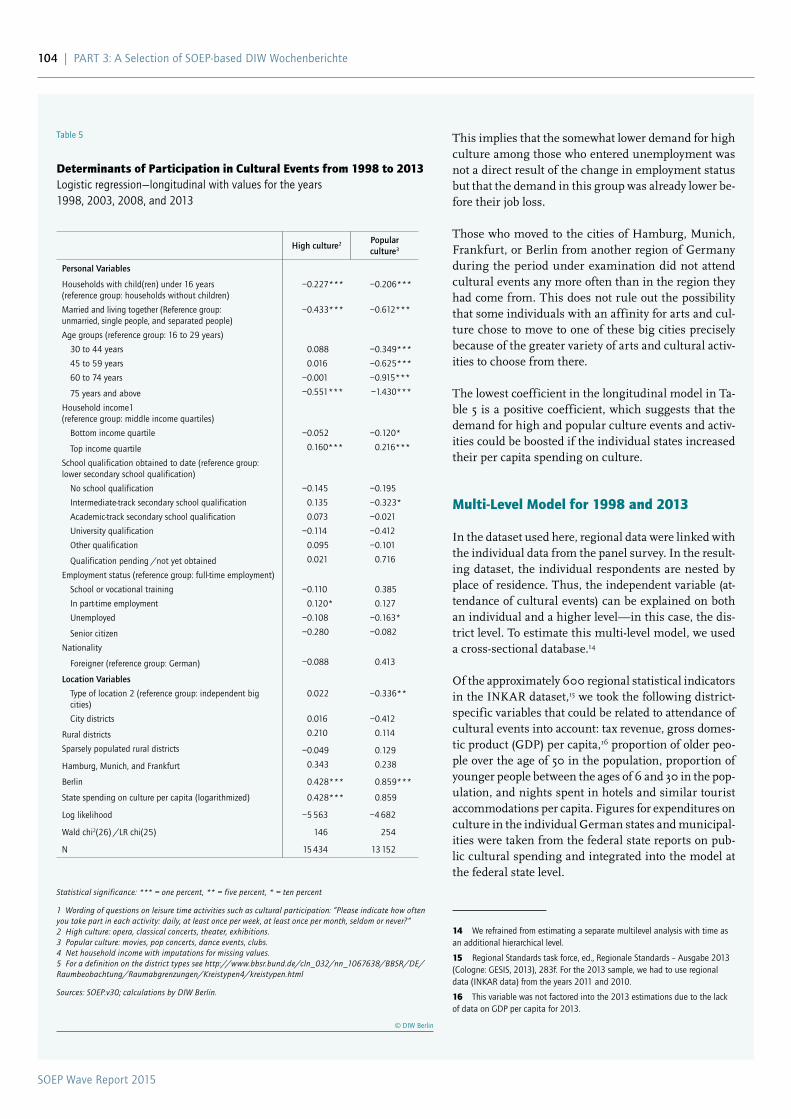
SOEP Wave Report 2015
104 | PaRT 3: a Selection of SOEP-based DIW Wochenberichte
This implies that the somewhat lower demand for high culture among those who entered unemployment was not a direct result of the change in employment status but that the demand in this group was already lower be-fore their job loss.
Those who moved to the cities of Hamburg, Munich, Frankfurt, or Berlin from another region of Germany during the period under examination did not attend cultural events any more often than in the region they had come from. This does not rule out the possibility that some individuals with an affinity for arts and cul-ture chose to move to one of these big cities precisely because of the greater variety of arts and cultural activ-ities to choose from there.
The lowest coefficient in the longitudinal model in Ta-ble 5 is a positive coefficient, which suggests that the demand for high and popular culture events and activ-ities could be boosted if the individual states increased their per capita spending on culture.
Multi-Level Model for 1998 and 2013
In the dataset used here, regional data were linked with the individual data from the panel survey. In the result-ing dataset, the individual respondents are nested by place of residence. Thus, the independent variable (at-tendance of cultural events) can be explained on both an individual and a higher level—in this case, the dis-trict level. To estimate this multi-level model, we used a cross-sectional database.14
Of the approximately 600 regional statistical indicators in the INKAR dataset,15 we took the following district-specific variables that could be related to attendance of cultural events into account: tax revenue, gross domes-tic product (GDP) per capita,16 proportion of older peo-ple over the age of 50 in the population, proportion of younger people between the ages of 6 and 30 in the pop-ulation, and nights spent in hotels and similar tourist accommodations per capita. Figures for expenditures on culture in the individual German states and municipal-ities were taken from the federal state reports on pub-lic cultural spending and integrated into the model at the federal state level.
14 We refrained from estimating a separate multilevel analysis with time as an additional hierarchical level.
15 Regional Standards task force, ed., Regionale Standards – ausgabe 2013 (Cologne: GESIS, 2013), 283f. For the 2013 sample, we had to use regional data (INKaR data) from the years 2011 and 2010.
16 This variable was not factored into the 2013 estimations due to the lack of data on GDP per capita for 2013.
Table 5
Determinants of Participation in Cultural Events from 1998 to 2013Logistic regression—longitudinal with values for the years 1998, 2003, 2008, and 2013
High culture2 Popular culture3
Personal Variables
Households with child(ren) under 16 years (reference group: households without children)
−0.227*** −0.206***
Married and living together (Reference group: unmarried, single people, and separated people)
−0.433*** −0.612***
age groups (reference group: 16 to 29 years)
30 to 44 years 0.088 −0.349***
45 to 59 years 0.016 −0.625***
60 to 74 years −0.001 −0.915***
75 years and above −0.551*** −1.430***
Household income1 (reference group: middle income quartiles)
Bottom income quartile −0.052 −0.120*
Top income quartile 0.160*** 0.216***
School qualification obtained to date (reference group: lower secondary school qualification)
No school qualification −0.145 −0.195
Intermediate-track secondary school qualification 0.135 −0.323*
academic-track secondary school qualification 0.073 −0.021
University qualification −0.114 −0.412
Other qualification 0.095 −0.101
Qualification pending /not yet obtained 0.021 0.716
Employment status (reference group: full-time employment)
School or vocational training −0.110 0.385
In part-time employment 0.120* 0.127
Unemployed −0.108 −0.163*
Senior citizen −0.280 −0.082
Nationality
Foreigner (reference group: German) −0.088 0.413
Location Variables
Type of location 2 (reference group: independent big cities)
0.022 −0.336**
City districts 0.016 −0.412
Rural districts 0.210 0.114
Sparsely populated rural districts −0.049 0.129
Hamburg, Munich, and Frankfurt 0.343 0.238
Berlin 0.428*** 0.859***
State spending on culture per capita (logarithmized) 0.428*** 0.859
Log likelihood −5 563 −4 682
Wald chi2(26) /LR chi(25) 146 254
N 15 434 13 152
Statistical significance: *** = one percent, ** = five percent, * = ten percent
1 Wording of questions on leisure time activities such as cultural participation: “Please indicate how often you take part in each activity: daily, at least once per week, at least once per month, seldom or never?“2 High culture: opera, classical concerts, theater, exhibitions.3 Popular culture: movies, pop concerts, dance events, clubs.4 Net household income with imputations for missing values.5 For a definition on the district types see http://www.bbsr.bund.de/cln_032/nn_1067638/BBSR/DE/Raumbeobachtung/Raumabgrenzungen/Kreistypen4/kreistypen.html
Sources: SOEP.v30; calculations by DIW Berlin.
© DIW Berlin
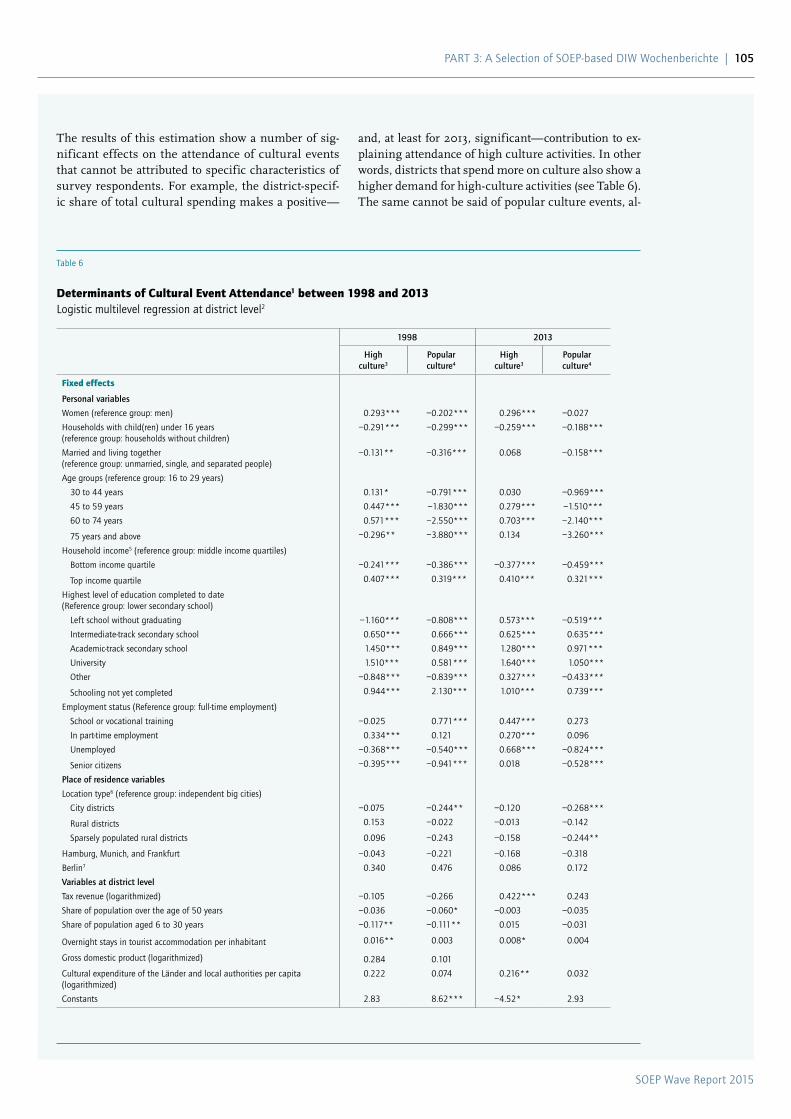
SOEP Wave Report 2015
PaRT 3: a Selection of SOEP-based DIW Wochenberichte | 105
and, at least for 2013, significant—contribution to ex-plaining attendance of high culture activities. In other words, districts that spend more on culture also show a higher demand for high-culture activities (see Table 6). The same cannot be said of popular culture events, al-
The results of this estimation show a number of sig-nificant effects on the attendance of cultural events that cannot be attributed to specific characteristics of survey respondents. For example, the district-specif-ic share of total cultural spending makes a positive—
Table 6
Determinants of Cultural Event Attendance1 between 1998 and 2013Logistic multilevel regression at district level2
1998 2013
High culture3
Popular culture4
High culture3
Popular culture4
Fixed effects
Personal variables
Women (reference group: men) 0.293*** −0.202*** 0.296*** −0.027
Households with child(ren) under 16 years (reference group: households without children)
−0.291*** −0.299*** −0.259*** −0.188***
Married and living together (reference group: unmarried, single, and separated people)
−0.131** −0.316*** 0.068 −0.158***
age groups (reference group: 16 to 29 years)
30 to 44 years 0.131* −0.791*** 0.030 −0.969***
45 to 59 years 0.447*** −1.830*** 0.279*** −1.510***
60 to 74 years 0.571*** −2.550*** 0.703*** −2.140***
75 years and above −0.296** −3.880*** 0.134 −3.260***
Household income5 (reference group: middle income quartiles)
Bottom income quartile −0.241*** −0.386*** −0.377*** −0.459***
Top income quartile 0.407*** 0.319*** 0.410*** 0.321***
Highest level of education completed to date (Reference group: lower secondary school)
Left school without graduating −1.160*** −0.808*** 0.573*** −0.519***
Intermediate-track secondary school 0.650*** 0.666*** 0.625*** 0.635***
academic-track secondary school 1.450*** 0.849*** 1.280*** 0.971***
University 1.510*** 0.581*** 1.640*** 1.050***
Other −0.848*** −0.839*** 0.327*** −0.433***
Schooling not yet completed 0.944*** 2.130*** 1.010*** 0.739***
Employment status (Reference group: full-time employment)
School or vocational training −0.025 0.771*** 0.447*** 0.273
In part-time employment 0.334*** 0.121 0.270*** 0.096
Unemployed −0.368*** −0.540*** 0.668*** −0.824***
Senior citizens −0.395*** −0.941*** 0.018 −0.528***
Place of residence variables
Location type6 (reference group: independent big cities)
City districts −0.075 −0.244** −0.120 −0.268***
Rural districts 0.153 −0.022 −0.013 −0.142
Sparsely populated rural districts 0.096 −0.243 −0.158 −0.244**
Hamburg, Munich, and Frankfurt −0.043 −0.221 −0.168 −0.318
Berlin7 0.340 0.476 0.086 0.172
Variables at district level
Tax revenue (logarithmized) −0.105 −0.266 0.422*** 0.243
Share of population over the age of 50 years −0.036 −0.060* −0.003 −0.035
Share of population aged 6 to 30 years −0.117** −0.111** 0.015 −0.031
Overnight stays in tourist accommodation per inhabitant 0.016** 0.003 0.008* 0.004
Gross domestic product (logarithmized) 0.284 0.101
Cultural expenditure of the Länder and local authorities per capita (logarithmized)
0.222 0.074 0.216** 0.032
Constants 2.83 8.62*** −4.52* 2.93
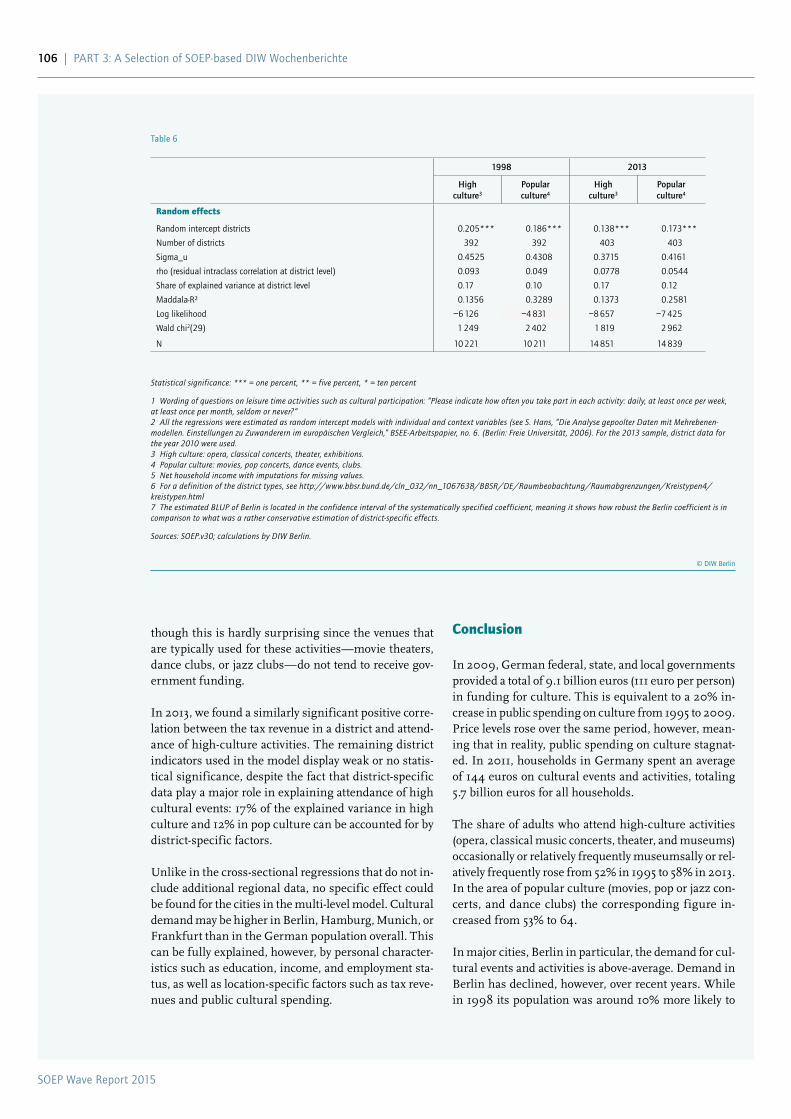
SOEP Wave Report 2015
106 | PaRT 3: a Selection of SOEP-based DIW Wochenberichte
Conclusion
In 2009, German federal, state, and local governments provided a total of 9.1 billion euros (111 euro per person) in funding for culture. This is equivalent to a 20% in-crease in public spending on culture from 1995 to 2009. Price levels rose over the same period, however, mean-ing that in reality, public spending on culture stagnat-ed. In 2011, households in Germany spent an average of 144 euros on cultural events and activities, totaling 5.7 billion euros for all households.
The share of adults who attend high-culture activities (opera, classical music concerts, theater, and museums) occasionally or relatively frequently museumsally or rel-atively frequently rose from 52% in 1995 to 58% in 2013. In the area of popular culture (movies, pop or jazz con-certs, and dance clubs) the corresponding figure in-creased from 53% to 64.
In major cities, Berlin in particular, the demand for cul-tural events and activities is above-average. Demand in Berlin has declined, however, over recent years. While in 1998 its population was around 10% more likely to
though this is hardly surprising since the venues that are typically used for these activities—movie theaters, dance clubs, or jazz clubs—do not tend to receive gov-ernment funding.
In 2013, we found a similarly significant positive corre-lation between the tax revenue in a district and attend-ance of high-culture activities. The remaining district indicators used in the model display weak or no statis-tical significance, despite the fact that district-specific data play a major role in explaining attendance of high cultural events: 17% of the explained variance in high culture and 12% in pop culture can be accounted for by district-specific factors.
Unlike in the cross-sectional regressions that do not in-clude additional regional data, no specific effect could be found for the cities in the multi-level model. Cultural demand may be higher in Berlin, Hamburg, Munich, or Frankfurt than in the German population overall. This can be fully explained, however, by personal character-istics such as education, income, and employment sta-tus, as well as location-specific factors such as tax reve-nues and public cultural spending.
1998 2013
High culture3
Popular culture4
High culture3
Popular culture4
Random effects
Random intercept districts 0.205*** 0.186*** 0.138*** 0.173***
Number of districts 392 392 403 403
Sigma_u 0.4525 0.4308 0.3715 0.4161
rho (residual intraclass correlation at district level) 0.093 0.049 0.0778 0.0544
Share of explained variance at district level 0.17 0.10 0.17 0.12
Maddala-R² 0.1356 0.3289 0.1373 0.2581
Log likelihood −6 126 −4 831 −8 657 −7 425
Wald chi2(29) 1 249 2 402 1 819 2 962
N 10 221 10 211 14 851 14 839
Statistical significance: *** = one percent, ** = five percent, * = ten percent
1 Wording of questions on leisure time activities such as cultural participation: “Please indicate how often you take part in each activity: daily, at least once per week, at least once per month, seldom or never?“2 All the regressions were estimated as random intercept models with individual and context variables (see S. Hans, “Die Analyse gepoolter Daten mit Mehrebenen-modellen. Einstellungen zu Zuwanderern im europäischen Vergleich,” BSEE-Arbeitspapier, no. 6. (Berlin: Freie Universität, 2006). For the 2013 sample, district data for the year 2010 were used.3 High culture: opera, classical concerts, theater, exhibitions.4 Popular culture: movies, pop concerts, dance events, clubs.5 Net household income with imputations for missing values.6 For a definition of the district types, see http://www.bbsr.bund.de/cln_032/nn_1067638/BBSR/DE/Raumbeobachtung/Raumabgrenzungen/Kreistypen4/kreistypen.html7 The estimated BLUP of Berlin is located in the confidence interval of the systematically specified coefficient, meaning it shows how robust the Berlin coefficient is in comparison to what was a rather conservative estimation of district-specific effects.
Sources: SOEP.v30; calculations by DIW Berlin.
© DIW Berlin
Table 6
SOEP Wave Report 2015
PaRT 3: a Selection of SOEP-based DIW Wochenberichte | 107
Maximilian Priem is a Research associate in the Department of Sociology at FU Berlin | [email protected]
Jürgen Schupp is Director of the SOEP at DIW Berlin | [email protected]
participate in high- and popular-culture activities than the populations of other major cities in Germany, by 2013 this difference had declined by half to just under 5%. Furthermore, our results show that at the individual level, attendance of cultural activities is affected by both personal characteristics such as education, income, and
employment status and location-related specifics such as regional tax revenue and spending on culture. If all of these aspects are factored into the analysis, no signif-icant differences in cultural demand can be found be-tween Germany’s major cities and other regions.
SOEP Wave Report 2015
108 | PaRT 3: a Selection of SOEP-based DIW Wochenberichte
Source:
DIW Economic Bulletin 25/2015
Volume 5, pp. 325–339 June 17, 2015 ISSN 2192-7219
www.diw.de/econbull
ECONOMY. POLITICS. SCIENCE.
DIW Economic Bulletin
2015
Income Inequality and Risk of Poverty
REPORT by Jan Goebel, Markus M. Grabka and Carsten Schröder
Income Inequality Remains High in Germany— Young Singles and Career Entrants Increasingly At Risk of Poverty 325INTERVIEW with Markus M. Grabka
»Income Inequality Remains High« 340
25
SOEP Wave Report 2015
PaRT 3: a Selection of SOEP-based DIW Wochenberichte | 109
according to calculations based on the Socio-Economic Panel (SOEP) study, average disposable household income rose by five percent in real terms between 2000 and 2012. Only the highest earners have benefited from this development. While real income in the top ten percent rose by more than 15 percent, the earnings of the middle income groups stagnated, and even fell in the lower income groups. as a result, the inequality of disposable house-hold income in Germany climbed sharply up until 2005 and has remained at the same high level ever since.
at the same time, the risk of poverty in Germany increased signifi-cantly between 2000 and 2009, and is currently at approximately 14 percent. The risk of poverty has risen significantly for young singles (up to the age of 35) in particular. Their at-risk-of-poverty rate increased by 12 percentage points since 2000 to just under 40 percent in 2012. Even being in gainful employment does not necessarily protect them from poverty: in particular, young adults (aged 25 to 35) who are just starting out in their careers are increasingly at risk of poverty.
Income Inequality Remains High in Germany — Young Singles and Career Entrants Increasingly At Risk of PovertyBy Markus M. Grabka, Jan Goebel and Carsten Schröder
Not only are income inequality and poverty socio-polit-ically relevant but they are also economically relevant. A recent report by the OECD shows that increasing in-come inequality may affect a country’s economic devel-opment. According to the OECD simulations, GDP in OECD countries could have been almost five percentage points higher from 1970 to 2010 if there had not been such a considerable rise in income equality observed over the same period.1
The present study updates previous studies by DIW Berlin on personal income inequality in Germany up to 2012 and extends them to include analyses of rela-tive income poverty and material deprivation (see Box 1). These analyses of personal income distribution is com-plemented by a functional distributional analysis of in-come on the production factors (labor and capital).2 The empirical basis for the personal distribution analysis is data from the longitudinal Socio-Economic Panel (SOEP) study collected by DIW Berlin in cooperation with the fieldwork organization TNS Infratest Sozialforschung.3 The annual repetition of the study allows the estimation of consistent time series on the development of person-al income distribution.4 The functional income analy-
1 OECD, In It Together: Why Less Inequality Benefits All, (Paris: OECD Publishing, 2015), http://dx.doi.org/10.1787/9789264235120-en
2 See M. M. Grabka and J. Goebel, “Reduction in Income Inequality Faltering,” DIW Economic Bulletin, no. 1 (2014).
3 SOEP is an annual representative longitudinal survey of individual households conducted in West Germany since 1984 and also in eastern Germany since 1990, see G. G. Wagner, J. Goebel, P. Krause, R. Pischner, and I. Sieber, “Das Sozio-oekonomische Panel (SOEP): Multidisziplinäres Haushaltspanel und Kohortenstudie für Deutschland – Eine Einführung (für neue Datennutzer) mit einem ausblick (für erfahrene anwender),” AStA Wirtschafts- und Sozialstatistisches Archiv 2 (4) (2008): 301–328.
4 In accordance with the first governmental Report on Poverty and Wealth (Federal Ministry of Labour and Social affairs Lebenslagen in Deutschland (Life Situations in Germany) (2013) and a report by the advisory Council assessing overall economic development (last annual report for 2014/2015: Mehr Vertrauen in Marktprozesse (More Confidence in Market Processes)) the present report indicates the respective income year. In the SOEP, annual incomes are retrospectively collected for the preceding calendar year but weighted according to the population structure on the survey date. Hence, the data for 2012 presented here were recorded in the 2013 survey wave.
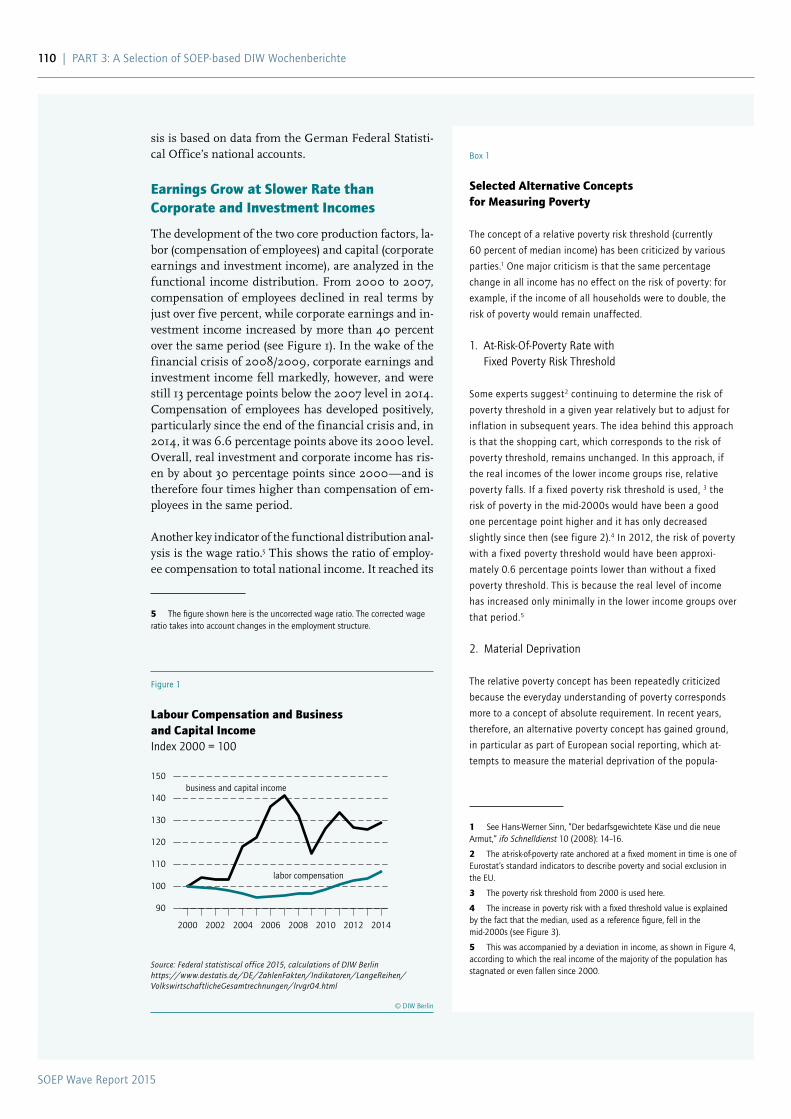
SOEP Wave Report 2015
110 | PaRT 3: a Selection of SOEP-based DIW Wochenberichte
sis is based on data from the German Federal Statisti-cal Office’s national accounts.
Earnings Grow at Slower Rate than Corporate and Investment Incomes
The development of the two core production factors, la-bor (compensation of employees) and capital (corporate earnings and investment income), are analyzed in the functional income distribution. From 2000 to 2007, compensation of employees declined in real terms by just over five percent, while corporate earnings and in-vestment income increased by more than 40 percent over the same period (see Figure 1). In the wake of the financial crisis of 2008/2009, corporate earnings and investment income fell markedly, however, and were still 13 percentage points below the 2007 level in 2014. Compensation of employees has developed positively, particularly since the end of the financial crisis and, in 2014, it was 6.6 percentage points above its 2000 level. Overall, real investment and corporate income has ris-en by about 30 percentage points since 2000—and is therefore four times higher than compensation of em-ployees in the same period.
Another key indicator of the functional distribution anal-ysis is the wage ratio.5 This shows the ratio of employ-ee compensation to total national income. It reached its
5 The figure shown here is the uncorrected wage ratio. The corrected wage ratio takes into account changes in the employment structure.
Figure 1
Labour Compensation and Business and Capital IncomeIndex 2000 = 100
90
100
110
120
130
140
150
2000 2002 2004 2006 2008 2010 2012 2014
labor compensation
business and capital income
Source: Federal statistiscal office 2015, calculations of DIW Berlinhttps://www.destatis.de/DE/ZahlenFakten/Indikatoren/LangeReihen/VolkswirtschaftlicheGesamtrechnungen/lrvgr04.html
© DIW Berlin
Box 1
Selected Alternative Concepts for Measuring Poverty
The concept of a relative poverty risk threshold (currently
60 percent of median income) has been criticized by various
parties.1 One major criticism is that the same percentage
change in all income has no effect on the risk of poverty: for
example, if the income of all households were to double, the
risk of poverty would remain unaffected.
1. at-Risk-Of-Poverty Rate with Fixed Poverty Risk Threshold
Some experts suggest2 continuing to determine the risk of
poverty threshold in a given year relatively but to adjust for
inflation in subsequent years. The idea behind this approach
is that the shopping cart, which corresponds to the risk of
poverty threshold, remains unchanged. In this approach, if
the real incomes of the lower income groups rise, relative
poverty falls. If a fixed poverty risk threshold is used, 3 the
risk of poverty in the mid-2000s would have been a good
one percentage point higher and it has only decreased
slightly since then (see figure 2).4 In 2012, the risk of poverty
with a fixed poverty threshold would have been approxi-
mately 0.6 percentage points lower than without a fixed
poverty threshold. This is because the real level of income
has increased only minimally in the lower income groups over
that period.5
2. Material Deprivation
The relative poverty concept has been repeatedly criticized
because the everyday understanding of poverty corresponds
more to a concept of absolute requirement. In recent years,
therefore, an alternative poverty concept has gained ground,
in particular as part of European social reporting, which at-
tempts to measure the material deprivation of the popula-
1 See Hans-Werner Sinn, “Der bedarfsgewichtete Käse und die neue armut,” ifo Schnelldienst 10 (2008): 14–16.
2 The at-risk-of-poverty rate anchored at a fixed moment in time is one of Eurostat’s standard indicators to describe poverty and social exclusion in the EU.
3 The poverty risk threshold from 2000 is used here.
4 The increase in poverty risk with a fixed threshold value is explained by the fact that the median, used as a reference figure, fell in the mid-2000s (see Figure 3).
5 This was accompanied by a deviation in income, as shown in Figure 4, according to which the real income of the majority of the population has stagnated or even fallen since 2000.
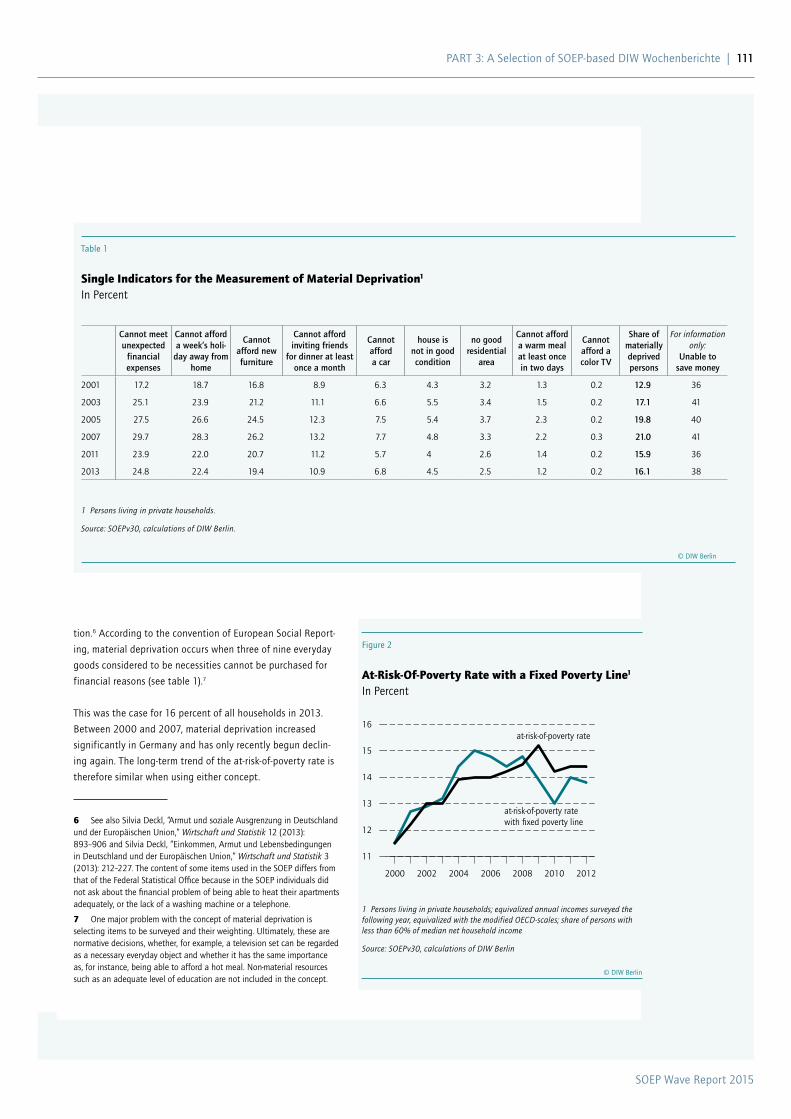
SOEP Wave Report 2015
PaRT 3: a Selection of SOEP-based DIW Wochenberichte | 111
tion.6 according to the convention of European Social Report-
ing, material deprivation occurs when three of nine everyday
goods considered to be necessities cannot be purchased for
financial reasons (see table 1).7
This was the case for 16 percent of all households in 2013.
Between 2000 and 2007, material deprivation increased
significantly in Germany and has only recently begun declin-
ing again. The long-term trend of the at-risk-of-poverty rate is
therefore similar when using either concept.
6 See also Silvia Deckl, “armut und soziale ausgrenzung in Deutschland und der Europäischen Union,” Wirtschaft und Statistik 12 (2013): 893–906 and Silvia Deckl, “Einkommen, armut und Lebensbedingungen in Deutschland und der Europäischen Union,” Wirtschaft und Statistik 3 (2013): 212–227. The content of some items used in the SOEP differs from that of the Federal Statistical Office because in the SOEP individuals did not ask about the financial problem of being able to heat their apartments adequately, or the lack of a washing machine or a telephone.
7 One major problem with the concept of material deprivation is selecting items to be surveyed and their weighting. Ultimately, these are normative decisions, whether, for example, a television set can be regarded as a necessary everyday object and whether it has the same importance as, for instance, being able to afford a hot meal. Non-material resources such as an adequate level of education are not included in the concept.
Table 1
Single Indicators for the Measurement of Material Deprivation1
In Percent
Cannot meet unexpected
financial expenses
Cannot afford a week’s holi-
day away from home
Cannot afford new furniture
Cannot afford inviting friends
for dinner at least once a month
Cannot afford a car
house is not in good condition
no good residential
area
Cannot afford a warm meal at least once in two days
Cannot afford a color TV
Share of materially deprived persons
For information only:
Unable to save money
2001 17.2 18.7 16.8 8.9 6.3 4.3 3.2 1.3 0.2 12.9 36
2003 25.1 23.9 21.2 11.1 6.6 5.5 3.4 1.5 0.2 17.1 41
2005 27.5 26.6 24.5 12.3 7.5 5.4 3.7 2.3 0.2 19.8 40
2007 29.7 28.3 26.2 13.2 7.7 4.8 3.3 2.2 0.3 21.0 41
2011 23.9 22.0 20.7 11.2 5.7 4 2.6 1.4 0.2 15.9 36
2013 24.8 22.4 19.4 10.9 6.8 4.5 2.5 1.2 0.2 16.1 38
1 Persons living in private households.
Source: SOEPv30, calculations of DIW Berlin.
© DIW Berlin
Figure 2
At-Risk-Of-Poverty Rate with a Fixed Poverty Line1
In Percent
11
12
13
14
15
16
2000 2002 2004 2006 2008 2010 2012
at-risk-of-poverty rate
at-risk-of-poverty rate with �xed poverty line
1 Persons living in private households; equivalized annual incomes surveyed the following year, equivalized with the modified OECD-scales; share of persons with less than 60% of median net household income
Source: SOEPv30, calculations of DIW Berlin
© DIW Berlin
SOEP Wave Report 2015
112 | PaRT 3: a Selection of SOEP-based DIW Wochenberichte
highest level for the period under observation here (2000 to 2012) in 2000 at 72.1 percent. As a result of wage re-straints in the 2000s, it had fallen to below 64 percent by 2007.6 Since then, the number of employed individu-als has increased considerably and consequently—apart from during the financial crisis—the wage ratio stabi-lized again somewhat in 2014 at 68.1 percent.
The information content for the personal distribution analysis of developments in the aforementioned com-ponents (compensation of employees, corporate earn-ings and investment income, and wage ratio) is, how-ever, limited. This is partly because households gen-erate income from paid employment, entrepreneurial activities, capital investments, and government trans-fers. Households are also taxed differently on the var-ious types of income (including income tax), so they only receive part of that income which, in turn, de-pends on the individual average tax rate. Furthermore, the shares of the various income types will depend on the level of household income. For instance, the share of transfer income in the lower band of the income dis-tribution is considerably higher than in the upper band. The reverse applies, for example, to investment income or even to the tax and social security contributions of the individual household groups. Therefore, the find-ings of the personal income distribution are based on the SOEP micro data.
High Incomes Outperform Low Incomes
The average needs-weighted7 and inflation-adjusted mar-ket income8 of individuals in households from 2000 to 2005 declined slightly (see Figure 3), which can be ex-plained by the particularly high unemployment in Ger-many throughout this period (see Box 2 for a definition and measurement of income). Since then, both employ-ment and real wages9 have increased considerably con-tributed to a turnaround in personal income growth. From 2005 to 2012, the market incomes of households rose markedly by 7.5 percent. Overall, average market income has risen in real terms by around 1,000 euros since 2000 to 25,000 euros in 2012.
6 Karl Brenke and Markus M. Grabka, “Schwache Lohnentwicklung im letzten Jahrzehnt,” DIW Wochenbericht, no. 45 (2011): 3–15.
7 See also the term “equivalent income” in the DIW glossary (in German only), http://www.diw.de/de/diw_01.c.411605.de/presse_glossar/ diw_glossar/aequivalenzeinkommen.html
8 Market incomes are the sum of capital and earned income, including private transfers and private pensions.
9 The real wage index shows an increase between 2007 and 2013 of 3.4 percentage points. This was preceded from the mid-1990s onwards by a long period of stagnating or even declining real wages (Federal Statistical Office, Verdienste und Arbeitskosten, 4. Vierteljahr 2014 (Fourth Quarter of 2014) (2015).
Box 2
Definitions, Methods, and Assumptions for Measuring Income
The analyses presented in this report are based on data
from the longitudinal household survey the Socio-Economic
Panel (SOEP) study and primarily based on annual incomes.
In the survey year (t), all the income components affecting
a surveyed household as a whole, and all the individual
gross incomes of the current members of the surveyed
household are added together (market income from the
sum of capital income and earned income, including pri-
vate transfer payments and private pensions), all of these
referring to the previous calendar year (t − 1). In addition,
income from statutory pensions as well as social transfer
payments (income support, housing assistance, child
benefits, unemployment benefits, and others) are taken
into account, and finally, annual net incomes are calculated
employing a simulation of taxes and social security contri-
butions—including one-off special payments such as a 13th
or 14th month’s salary for a given year, a Christmas bonus,
and a vacation bonus.
The calculation of the annual burden of income taxes and
social security contributions is based on a micro-simulation
model1 which generates a tax assessment incorporating
all types of income in accordance with the Income Tax act
(Einkommensteuergesetz, EStG) as well as tax exemptions,
income-related expenses, and extraordinary expenses.
Since this model cannot simulate all the complexity of
German tax law because of its numerous special provisions,
income inequality measured in the SOEP is assumed to be
underestimated.
Following the international literature,2 fictitious (net) in-
come components from owner-occupied housing (imputed
rent) are added to income. In addition, non-monetary
income components from subsidized rental housing (gov-
ernment-subsidized housing, housing with rents reduced by
private owners or employers, households that do not pay
rent) are taken into account in the following—as required
by the EU Commission for EU-wide income distribution
calculations based on EU-SILC as well.
1 See J. Schwarze, “Simulating German income and social security tax payments using the GSOEP. Cross-national studies in aging,” Program project paper no. 19 (Syracuse University, US, 1995).
2 See J. R. Frick, J. Goebel, and M. M. Grabka, “assessing the distributional impact of “imputed rent” and “non-cash employee income” in micro-data, in European Communities, ed., Comparative EU statistics on Income and Living Conditions: Issues and Challenges. Proceedings of the EU-SILC Conference, Helsinki, November 6–8, 2006, EUROSTaT 2006: 116–142.
SOEP Wave Report 2015
PaRT 3: a Selection of SOEP-based DIW Wochenberichte | 113
The income situations of households of different sizes and
compositions are made comparable by converting a house-
hold’s entire income into equivalent incomes (per capita
incomes modified according to needs) in accordance with
international standards. Household incomes are thereby
converted employing a scale proposed by the Organisation for
Economic Co-operation and Development (OECD) and gener-
ally accepted in Europe. The calculated equivalent income is
allocated to each household member on the assumption that
all household members benefit from the joint income equally.
The head of household is given a needs weighting of 1; ad-
ditional adults each have a weighting of 0.5, and children
up to 14 years of age weightings of 0.3.3 In other words, cost
degression is assumed in larger households. That means, for
example, that household income for a four-person household
(parents, a 16-year-old, and a 13-year-old) is not divided by
four as is the case in a per-capita calculation (= 1 + 1 + 1 + 1),
but by 2.3 (= 1 + 0.5 + 0.5 + 0.3).
In all population surveys, a particular challenge is how to take
proper account of missing values for individual people sur-
veyed, especially concerning questions considered sensitive,
such as those about income. The incidence of missing values
is often selective, with households with incomes far above or
below the average refusing to respond.
In the SOEP data analyzed here, missing values are replaced
using an elaborate imputation procedure that is both cross-
sectional and longitudinal.4 This also applies to missing values
for individual household members refusing to answer any
questions in households otherwise willing to participate in
the survey. In these cases, a multi-stage statistical procedure
is applied to six individual gross income components (earned
income, pensions and transfer payments in case of unemploy-
ment, vocational training/tertiary-level study, maternity
benefits/child-raising allowance/parental leave benefits, and
private transfer payments).5 For each new data collection,
all missing values are always imputed again retrospectively
3 See B. Buhmann, L. Rainwater, G. Schmaus, and T. Smeeding, “Equivalence Scales, Well-Being, Inequality and Poverty,” Review of Income and Wealth 34 (1998): 115–142.
4 J. R. Frick and M. M. Grabka, “Item Non-response on Income Questions in Panel Surveys: Incidence, Imputation and the Impact on Inequality and Mobility,” Allgemeines Statistisches Archiv 89 (1) (2005): 49–61.
5 J. R. Frick, M. M. Grabka, and O. Groh-Samberg, “Dealing with incomplete household panel data in inequality research,” Sociological Methods & Research 41 (1) (2012): 89–123.
because new information from the surveys can be used to
impute missing data from the previous year. This can result
in changes to earlier evaluations. as a rule, however, these
changes are minor.
In order to avoid methods-based effects in the time series of
calculated indicators, the first survey wave of the individual
SOEP samples was excluded from the calculations. Studies
show that there are more changes in response behavior which
cannot be attributed to differences in willingness to partici-
pate in the survey.6
after taking weighting factors into account, the SOEP micro-
data on which these analyses are based (version v30 based on
the 30th survey wave in 2013) show a representative picture
of the population in households and thus permit inferences
about the entire population. The weighting factors allow
for differences in the sampling designs of the various SOEP
samples as well as in the respondents’ participation behavior.
Populations living in institutions (for example, in retirement
homes) are generally not taken into account.
Besides updates in the context of adjusted imputation of miss-
ing values for income in the previous year, a targeted revision
of weighting factors was carried out. In order to increase com-
patibility with official statistics, these factors are adjusted to
currently available framework data from the official microcen-
sus. This is the first time new information about population
structure from the 2011 census will be included in the 2013
survey year. These data were first adjusted for the SOEP in the
2013 survey year as there is still no revised information from
the German Federal Statistical Office for previous years.
Further revisions are expected in the upcoming data version
SOEPv31, first because revised framework data from the 2010
to 2012 microcensuses will then be available and, second, a
large additional SOEP sample of Families in Germany (FiD) will
then be retrospectively integrated into user-friendly processed
data structures. This also requires a fundamental revision of
the weighting variables from 2010—also differentiating ac-
cording to the migrants’ year of immigration.
6 J. R. Frick, J. Goebel, E. Schechtman, G. G. Wagner, and S. Yitzhaki, “Using analysis of Gini (aNOGI) for Detecting Whether Two Subsamples Represent the Same Universe. The German Socio-Economic Panel study (SOEP) Experience,” Sociological Methods & Research 34 (4) (2006): 427–468, doi: 10.1177/0049124105283109.
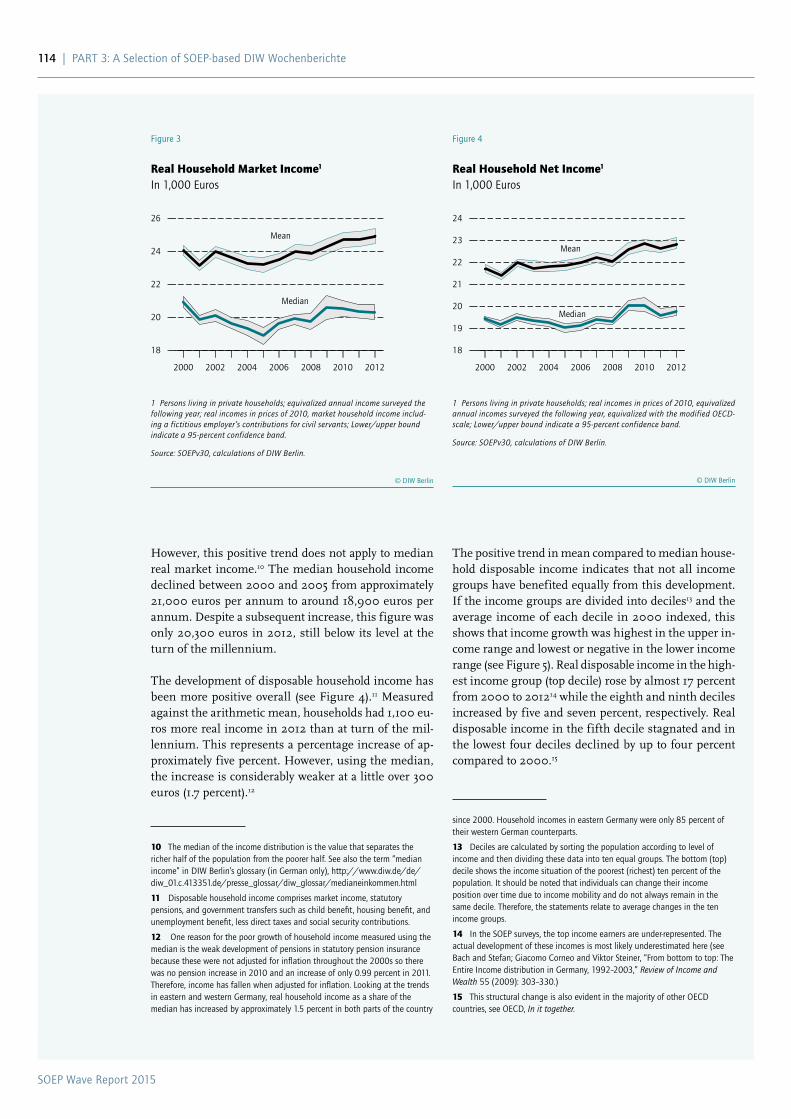
SOEP Wave Report 2015
114 | PaRT 3: a Selection of SOEP-based DIW Wochenberichte
The positive trend in mean compared to median house-hold disposable income indicates that not all income groups have benefited equally from this development. If the income groups are divided into deciles13 and the average income of each decile in 2000 indexed, this shows that income growth was highest in the upper in-come range and lowest or negative in the lower income range (see Figure 5). Real disposable income in the high-est income group (top decile) rose by almost 17 percent from 2000 to 201214 while the eighth and ninth deciles increased by five and seven percent, respectively. Real disposable income in the fifth decile stagnated and in the lowest four deciles declined by up to four percent compared to 2000.15
since 2000. Household incomes in eastern Germany were only 85 percent of their western German counterparts.
13 Deciles are calculated by sorting the population according to level of income and then dividing these data into ten equal groups. The bottom (top) decile shows the income situation of the poorest (richest) ten percent of the population. It should be noted that individuals can change their income position over time due to income mobility and do not always remain in the same decile. Therefore, the statements relate to average changes in the ten income groups.
14 In the SOEP surveys, the top income earners are under-represented. The actual development of these incomes is most likely underestimated here (see Bach and Stefan; Giacomo Corneo and Viktor Steiner, “From bottom to top: The Entire Income distribution in Germany, 1992–2003,” Review of Income and Wealth 55 (2009): 303–330.)
15 This structural change is also evident in the majority of other OECD countries, see OECD, In it together.
However, this positive trend does not apply to median real market income.10 The median household income declined between 2000 and 2005 from approximately 21,000 euros per annum to around 18,900 euros per annum. Despite a subsequent increase, this figure was only 20,300 euros in 2012, still below its level at the turn of the millennium.
The development of disposable household income has been more positive overall (see Figure 4).11 Measured against the arithmetic mean, households had 1,100 eu-ros more real income in 2012 than at turn of the mil-lennium. This represents a percentage increase of ap-proximately five percent. However, using the median, the increase is considerably weaker at a little over 300 euros (1.7 percent).12
10 The median of the income distribution is the value that separates the richer half of the population from the poorer half. See also the term “median income” in DIW Berlin’s glossary (in German only), http://www.diw.de/de/diw_01.c.413351.de/presse_glossar/diw_glossar/medianeinkommen.html
11 Disposable household income comprises market income, statutory pensions, and government transfers such as child benefit, housing benefit, and unemployment benefit, less direct taxes and social security contributions.
12 One reason for the poor growth of household income measured using the median is the weak development of pensions in statutory pension insurance because these were not adjusted for inflation throughout the 2000s so there was no pension increase in 2010 and an increase of only 0.99 percent in 2011. Therefore, income has fallen when adjusted for inflation. Looking at the trends in eastern and western Germany, real household income as a share of the median has increased by approximately 1.5 percent in both parts of the country
Figure 3
Real Household Market Income1
In 1,000 Euros
18
20
22
24
26
2000 2002 2004 2006 2008 2010 2012
Mean
Median
1 Persons living in private households; equivalized annual income surveyed the following year; real incomes in prices of 2010, market household income includ-ing a fictitious employer’s contributions for civil servants; Lower/upper bound indicate a 95-percent confidence band.
Source: SOEPv30, calculations of DIW Berlin.
© DIW Berlin
Figure 4
Real Household Net Income1
In 1,000 Euros
18
19
20
21
22
23
24
2000 2002 2004 2006 2008 2010 2012
Mean
Median
1 Persons living in private households; real incomes in prices of 2010, equivalized annual incomes surveyed the following year, equivalized with the modified OECD-scale; Lower/upper bound indicate a 95-percent confidence band.
Source: SOEPv30, calculations of DIW Berlin.
© DIW Berlin
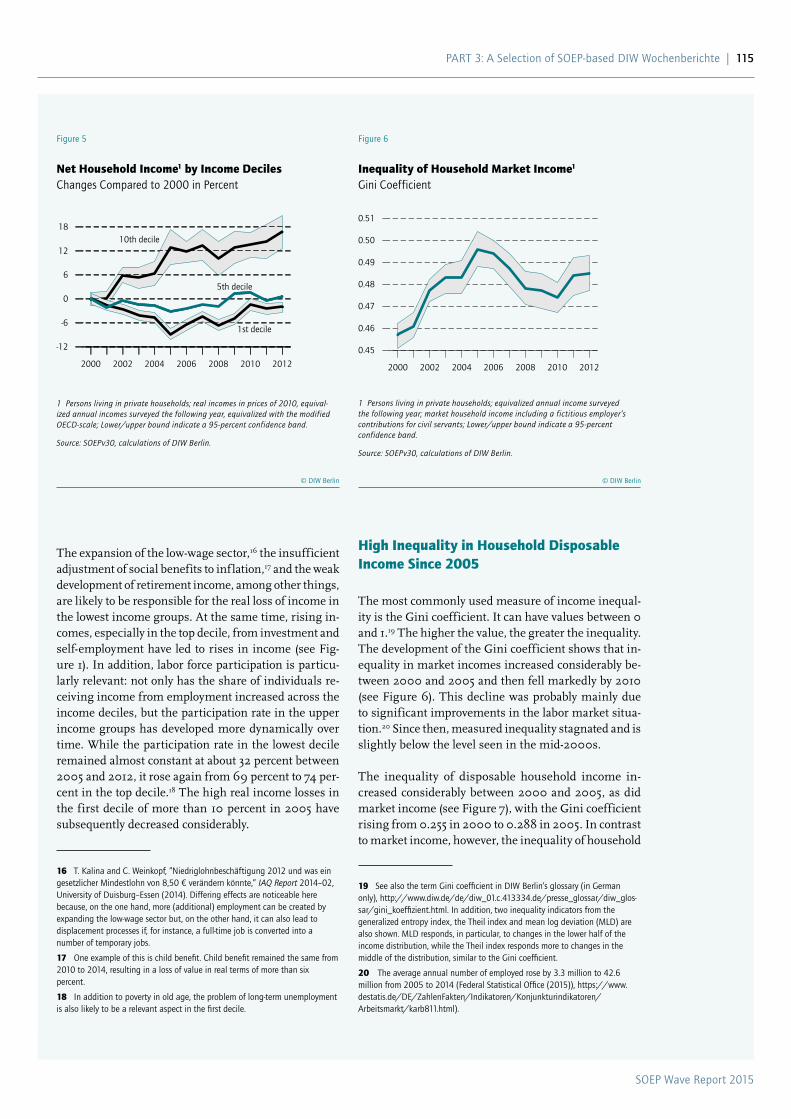
SOEP Wave Report 2015
PaRT 3: a Selection of SOEP-based DIW Wochenberichte | 115
High Inequality in Household Disposable Income Since 2005
The most commonly used measure of income inequal-ity is the Gini coefficient. It can have values between 0 and 1.19 The higher the value, the greater the inequality. The development of the Gini coefficient shows that in-equality in market incomes increased considerably be-tween 2000 and 2005 and then fell markedly by 2010 (see Figure 6). This decline was probably mainly due to significant improvements in the labor market situa-tion.20 Since then, measured inequality stagnated and is slightly below the level seen in the mid-2000s.
The inequality of disposable household income in-creased considerably between 2000 and 2005, as did market income (see Figure 7), with the Gini coefficient rising from 0.255 in 2000 to 0.288 in 2005. In contrast to market income, however, the inequality of household
19 See also the term Gini coefficient in DIW Berlin’s glossary (in German only), http://www.diw.de/de/diw_01.c.413334.de/presse_glossar/diw_glos-sar/gini_koeffizient.html. In addition, two inequality indicators from the generalized entropy index, the Theil index and mean log deviation (MLD) are also shown. MLD responds, in particular, to changes in the lower half of the income distribution, while the Theil index responds more to changes in the middle of the distribution, similar to the Gini coefficient.
20 The average annual number of employed rose by 3.3 million to 42.6 million from 2005 to 2014 (Federal Statistical Office (2015)), https://www.destatis.de/DE/ZahlenFakten/Indikatoren/Konjunkturindikatoren/arbeitsmarkt/karb811.html).
The expansion of the low-wage sector,16 the insufficient adjustment of social benefits to inf lation,17 and the weak development of retirement income, among other things, are likely to be responsible for the real loss of income in the lowest income groups. At the same time, rising in-comes, especially in the top decile, from investment and self-employment have led to rises in income (see Fig-ure 1). In addition, labor force participation is particu-larly relevant: not only has the share of individuals re-ceiving income from employment increased across the income deciles, but the participation rate in the upper income groups has developed more dynamically over time. While the participation rate in the lowest decile remained almost constant at about 32 percent between 2005 and 2012, it rose again from 69 percent to 74 per-cent in the top decile.18 The high real income losses in the first decile of more than 10 percent in 2005 have subsequently decreased considerably.
16 T. Kalina and C. Weinkopf, “Niedriglohnbeschäftigung 2012 und was ein gesetzlicher Mindestlohn von 8,50 € verändern könnte,” IAQ Report 2014–02, University of Duisburg–Essen (2014). Differing effects are noticeable here because, on the one hand, more (additional) employment can be created by expanding the low-wage sector but, on the other hand, it can also lead to displacement processes if, for instance, a full-time job is converted into a number of temporary jobs.
17 One example of this is child benefit. Child benefit remained the same from 2010 to 2014, resulting in a loss of value in real terms of more than six percent.
18 In addition to poverty in old age, the problem of long-term unemployment is also likely to be a relevant aspect in the first decile.
Figure 5
Net Household Income1 by Income DecilesChanges Compared to 2000 in Percent
-12
-6
0
6
12
18
2000 2002 2004 2006 2008 2010 2012
10th decile
1st decile
5th decile
1 Persons living in private households; real incomes in prices of 2010, equival-ized annual incomes surveyed the following year, equivalized with the modified OECD-scale; Lower/upper bound indicate a 95-percent confidence band.
Source: SOEPv30, calculations of DIW Berlin.
© DIW Berlin
Figure 6
Inequality of Household Market Income1
Gini Coefficient
0.45
0.46
0.47
0.48
0.49
0.50
0.51
2000 2002 2004 2006 2008 2010 2012
1 Persons living in private households; equivalized annual income surveyed the following year; market household income including a fictitious employer’s contributions for civil servants; Lower/upper bound indicate a 95-percent confidence band.
Source: SOEPv30, calculations of DIW Berlin.
© DIW Berlin
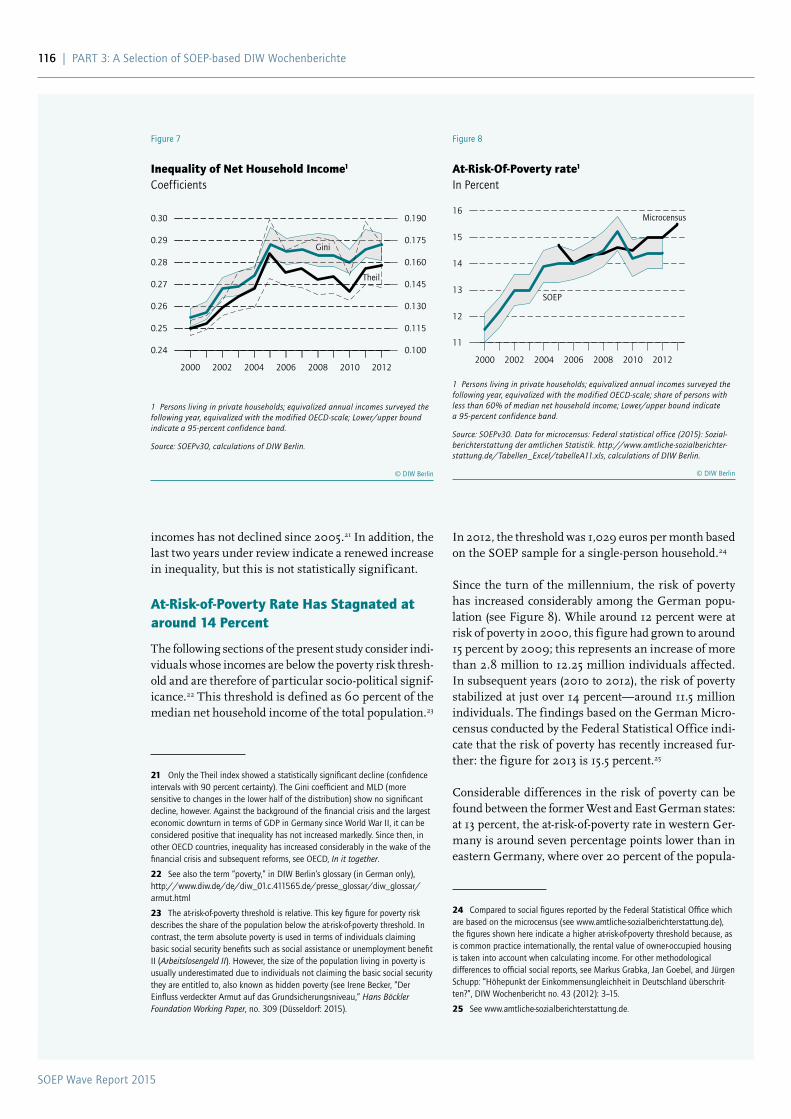
SOEP Wave Report 2015
116 | PaRT 3: a Selection of SOEP-based DIW Wochenberichte
In 2012, the threshold was 1,029 euros per month based on the SOEP sample for a single-person household.24
Since the turn of the millennium, the risk of poverty has increased considerably among the German popu-lation (see Figure 8). While around 12 percent were at risk of poverty in 2000, this figure had grown to around 15 percent by 2009; this represents an increase of more than 2.8 million to 12.25 million individuals affected. In subsequent years (2010 to 2012), the risk of poverty stabilized at just over 14 percent—around 11.5 million individuals. The findings based on the German Micro-census conducted by the Federal Statistical Office indi-cate that the risk of poverty has recently increased fur-ther: the figure for 2013 is 15.5 percent.25
Considerable differences in the risk of poverty can be found between the former West and East German states: at 13 percent, the at-risk-of-poverty rate in western Ger-many is around seven percentage points lower than in eastern Germany, where over 20 percent of the popula-
24 Compared to social figures reported by the Federal Statistical Office which are based on the microcensus (see www.amtliche-sozialberichterstattung.de), the figures shown here indicate a higher at-risk-of-poverty threshold because, as is common practice internationally, the rental value of owner-occupied housing is taken into account when calculating income. For other methodological differences to official social reports, see Markus Grabka, Jan Goebel, and Jürgen Schupp: “Höhepunkt der Einkommensungleichheit in Deutschland überschrit-ten?”, DIW Wochenbericht no. 43 (2012): 3–15.
25 See www.amtliche-sozialberichterstattung.de.
incomes has not declined since 2005.21 In addition, the last two years under review indicate a renewed increase in inequality, but this is not statistically significant.
At-Risk-of-Poverty Rate Has Stagnated at around 14 Percent
The following sections of the present study consider indi-viduals whose incomes are below the poverty risk thresh-old and are therefore of particular socio-political signif-icance.22 This threshold is defined as 60 percent of the median net household income of the total population.23
21 Only the Theil index showed a statistically significant decline (confidence intervals with 90 percent certainty). The Gini coefficient and MLD (more sensitive to changes in the lower half of the distribution) show no significant decline, however. against the background of the financial crisis and the largest economic downturn in terms of GDP in Germany since World War II, it can be considered positive that inequality has not increased markedly. Since then, in other OECD countries, inequality has increased considerably in the wake of the financial crisis and subsequent reforms, see OECD, In it together.
22 See also the term “poverty,” in DIW Berlin’s glossary (in German only), http://www.diw.de/de/diw_01.c.411565.de/presse_glossar/diw_glossar/armut.html
23 The at-risk-of-poverty threshold is relative. This key figure for poverty risk describes the share of the population below the at-risk-of-poverty threshold. In contrast, the term absolute poverty is used in terms of individuals claiming basic social security benefits such as social assistance or unemployment benefit II (Arbeitslosengeld II). However, the size of the population living in poverty is usually underestimated due to individuals not claiming the basic social security they are entitled to, also known as hidden poverty (see Irene Becker, “Der Einfluss verdeckter armut auf das Grundsicherungsniveau,” Hans Böckler Foundation Working Paper, no. 309 (Düsseldorf: 2015).
Figure 7
Inequality of Net Household Income1
Coefficients
0.24
0.25
0.26
0.27
0.28
0.29
0.30
0.100
0.115
0.130
0.145
0.160
0.175
0.190
2000 2002 2004 2006 2008 2010 2012
Theil
Gini
1 Persons living in private households; equivalized annual incomes surveyed the following year, equivalized with the modified OECD-scale; Lower/upper bound indicate a 95-percent confidence band.
Source: SOEPv30, calculations of DIW Berlin.
© DIW Berlin
Figure 8
At-Risk-Of-Poverty rate1
In Percent
11
12
13
14
15
16
2000 2002 2004 2006 2008 2010 2012
SOEP
Microcensus
1 Persons living in private households; equivalized annual incomes surveyed the following year, equivalized with the modified OECD-scale; share of persons with less than 60% of median net household income; Lower/upper bound indicate a 95-percent confidence band.
Source: SOEPv30. Data for microcensus: Federal statistical office (2015): Sozial-berichterstattung der amtlichen Statistik. http://www.amtliche-sozialberichter-stattung.de/Tabellen_Excel/tabelleA11.xls, calculations of DIW Berlin.
© DIW Berlin
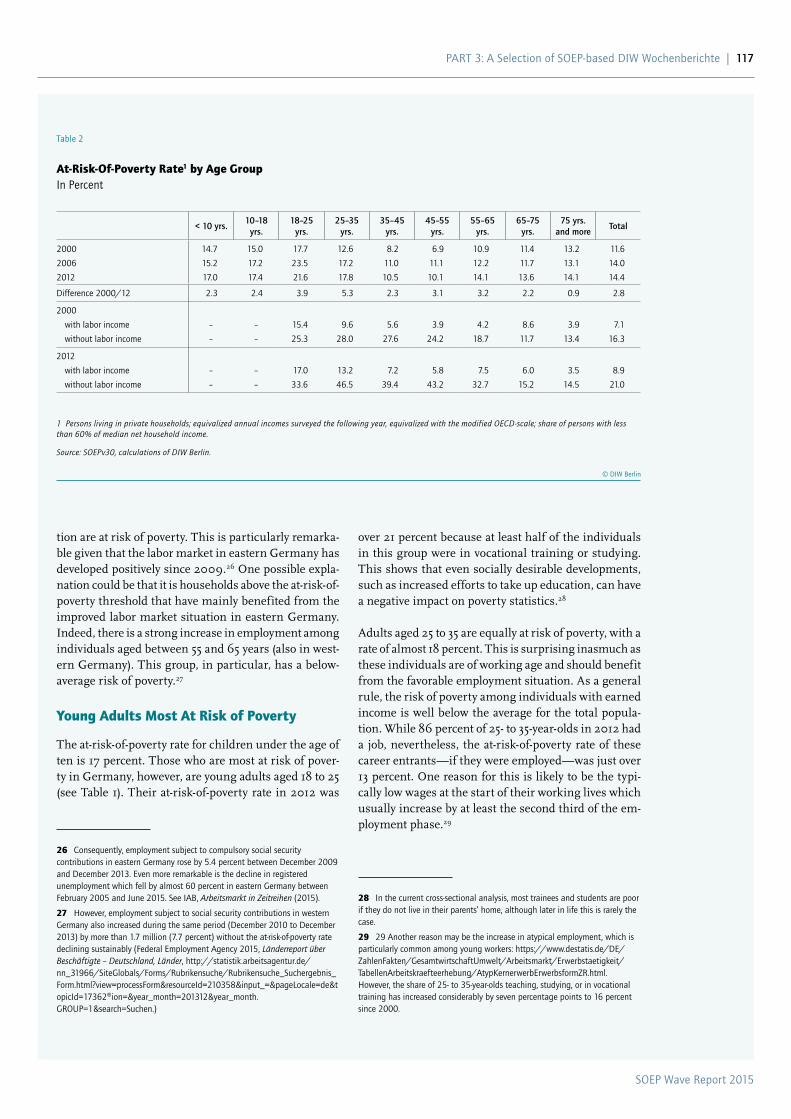
SOEP Wave Report 2015
PaRT 3: a Selection of SOEP-based DIW Wochenberichte | 117
over 21 percent because at least half of the individuals in this group were in vocational training or studying. This shows that even socially desirable developments, such as increased efforts to take up education, can have a negative impact on poverty statistics.28
Adults aged 25 to 35 are equally at risk of poverty, with a rate of almost 18 percent. This is surprising inasmuch as these individuals are of working age and should benefit from the favorable employment situation. As a general rule, the risk of poverty among individuals with earned income is well below the average for the total popula-tion. While 86 percent of 25- to 35-year-olds in 2012 had a job, nevertheless, the at-risk-of-poverty rate of these career entrants—if they were employed—was just over 13 percent. One reason for this is likely to be the typi-cally low wages at the start of their working lives which usually increase by at least the second third of the em-ployment phase.29
28 In the current cross-sectional analysis, most trainees and students are poor if they do not live in their parents’ home, although later in life this is rarely the case.
29 29 another reason may be the increase in atypical employment, which is particularly common among young workers: https://www.destatis.de/DE/ZahlenFakten/GesamtwirtschaftUmwelt/arbeitsmarkt/Erwerbstaetigkeit/Tabellenarbeitskraefteerhebung/atypKernerwerbErwerbsformZR.html. However, the share of 25- to 35-year-olds teaching, studying, or in vocational training has increased considerably by seven percentage points to 16 percent since 2000.
tion are at risk of poverty. This is particularly remarka-ble given that the labor market in eastern Germany has developed positively since 2009.26 One possible expla-nation could be that it is households above the at-risk-of-poverty threshold that have mainly benefited from the improved labor market situation in eastern Germany. Indeed, there is a strong increase in employment among individuals aged between 55 and 65 years (also in west-ern Germany). This group, in particular, has a below-average risk of poverty.27
Young Adults Most At Risk of Poverty
The at-risk-of-poverty rate for children under the age of ten is 17 percent. Those who are most at risk of pover-ty in Germany, however, are young adults aged 18 to 25 (see Table 1). Their at-risk-of-poverty rate in 2012 was
26 Consequently, employment subject to compulsory social security contributions in eastern Germany rose by 5.4 percent between December 2009 and December 2013. Even more remarkable is the decline in registered unemployment which fell by almost 60 percent in eastern Germany between February 2005 and June 2015. See IaB, Arbeitsmarkt in Zeitreihen (2015).
27 However, employment subject to social security contributions in western Germany also increased during the same period (December 2010 to December 2013) by more than 1.7 million (7.7 percent) without the at-risk-of-poverty rate declining sustainably (Federal Employment agency 2015, Länderreport über Beschäftigte – Deutschland, Länder, http://statistik.arbeitsagentur.de/nn_31966/SiteGlobals/Forms/Rubrikensuche/Rubrikensuche_Suchergebnis_Form.html?view=processForm&resourceId=210358&input_=&pageLocale=de&topicId=17362®ion=&year_month=201312&year_month.GROUP=1&search=Suchen.)
Table 2
At-Risk-Of-Poverty Rate1 by Age GroupIn Percent
< 10 yrs.10–18
yrs.18–25
yrs.25–35
yrs.35–45
yrs.45–55
yrs.55–65
yrs.65–75
yrs.75 yrs.
and moreTotal
2000 14.7 15.0 17.7 12.6 8.2 6.9 10.9 11.4 13.2 11.6
2006 15.2 17.2 23.5 17.2 11.0 11.1 12.2 11.7 13.1 14.0
2012 17.0 17.4 21.6 17.8 10.5 10.1 14.1 13.6 14.1 14.4
Difference 2000/12 2.3 2.4 3.9 5.3 2.3 3.1 3.2 2.2 0.9 2.8
2000
with labor income – – 15.4 9.6 5.6 3.9 4.2 8.6 3.9 7.1
without labor income – – 25.3 28.0 27.6 24.2 18.7 11.7 13.4 16.3
2012
with labor income – – 17.0 13.2 7.2 5.8 7.5 6.0 3.5 8.9
without labor income – – 33.6 46.5 39.4 43.2 32.7 15.2 14.5 21.0
1 Persons living in private households; equivalized annual incomes surveyed the following year, equivalized with the modified OECD-scale; share of persons with less than 60% of median net household income.
Source: SOEPv30, calculations of DIW Berlin.
© DIW Berlin

SOEP Wave Report 2015
118 | PaRT 3: a Selection of SOEP-based DIW Wochenberichte
Table 3
At-Risk-Of-Poverty Rate1 by Household TypeIn Percent
1 person household < 35 yrs.
1 person household 35–59 yrs.
1 person household
60 yrs. and older
couple without children
Lone par-ent 1 child
Lone parent 2 and more
children
Couple with
1 child
Couple with
2 children
Couple with 3
and more children
Other house-holds
2000 27.1 13.8 20.2 7.0 25.6 44.1 6.4 6.5 15.3 9.2
2006 36.2 19.4 18.4 8.5 32.1 43.2 10.2 6.9 16.5 15.3
2012 39.1 20.9 21.9 8.4 27.3 41.0 6.2 8.5 21.9 12.4
Difference 2000/12
12.0 7.1 1.7 1.4 1.7 −3.1 −0.2 2.1 6.6 3.2
1 Persons living in private households; equivalized annual incomes surveyed the following year, equivalized with the modified OECD-scale; share of persons with less than 60% of median net household income.
Source: SOEPv30, calculations of DIW Berlin.© DIW Berlin
Table 4
Correlates of Poverty-Risk1 in Germany, Selected Years
2000, 2006, 2012 2006, 2012
Marginal Effect Standard Error Marginal Effect Standard Error
Main Variables
Sex: Women 0.2699 0.1035*** 0.1595 0.2368
Household type (Reference group: couple without children < 65 yrs.)
Single ≤ 25 yrs. 2.4722 0.3257*** 3.4287 0.8313***
Single 26–64 yrs. 1.6702 0.1657*** 1.9196 0.4082***
Single 65 yrs. and more −1.1849 0.2975*** −1.8089 0.7294**
Couple 65 yrs. and more without children −1.5408 0.2806*** −2.2365 0.7032***
Couple with children > 16 yrs. 0.2217 0.1948 0.8428 0.4585
Couple with 1 child ≤ 16 yrs. 0.5447 0.2185** 0.4468 0.5682
Couple with 2 children ≤ 16 yrs. 0.7368 0.2059*** −0.0097 0.5526
Couple with 3 children ≤ 16 yrs. 1.5242 0.2298*** 0.1600 0.6346
Lone parent 3.0371 0.2236*** 2.5166 0.5478***
Other households 0.2148 0.3311 1.0471 0.8818
age of household head (Reference group < 25 yrs.)
26–65 yrs. −0.9904 0.2129*** −0.7866 0.5470
65 yrs. and more −0.3238 0.2604 −0.5926 0.6281
Work intensity index (Reference group: not employed)
1–49% −0.1401 0.1481 −0.7192 0.3599**
50% −1.9832 0.1578*** −2.0587 0.4147***
51–99% −3.1751 0.1792*** −4.0161 0.4720***
100% employed −4.6401 0.2003*** −5.5574 0.4907***
Highest educational level in household −1.1618 0.0835*** −1.3221 0.1910***
Household with migrants 0.9396 0.1276*** 1.2139 0.3137***
Living in East Germany 0.7812 0.1086*** 1.2338 0.2499***
Municipal size 100,000 inhabitants and more −0.1320 0.0981 −0.1868 0.2337
Household head with bad health 0.3248 0.1068*** 0.1665 0.2596
Home owner −1.8091 0.1176*** −1.2304 0.2633***
Household with a person in need of care −0.7084 0.2291*** −0.8262 0.5491
Income year (Reference group: 2000)
2006 0.0805 0.1782
2012 0.1775 0.3401 0.0402 0.3714
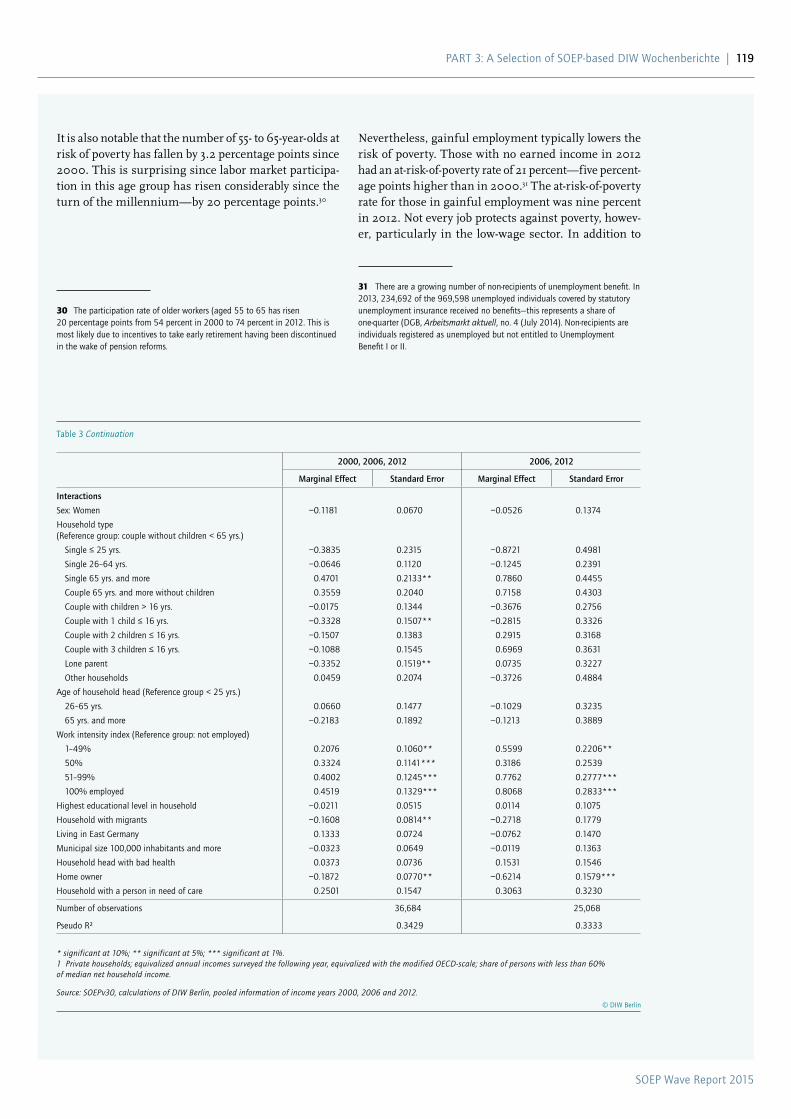
SOEP Wave Report 2015
PaRT 3: a Selection of SOEP-based DIW Wochenberichte | 119
Nevertheless, gainful employment typically lowers the risk of poverty. Those with no earned income in 2012 had an at-risk-of-poverty rate of 21 percent—five percent-age points higher than in 2000.31 The at-risk-of-poverty rate for those in gainful employment was nine percent in 2012. Not every job protects against poverty, howev-er, particularly in the low-wage sector. In addition to
31 There are a growing number of non-recipients of unemployment benefit. In 2013, 234,692 of the 969,598 unemployed individuals covered by statutory unemployment insurance received no benefits—this represents a share of one-quarter (DGB, Arbeitsmarkt aktuell, no. 4 (July 2014). Non-recipients are individuals registered as unemployed but not entitled to Unemployment Benefit I or II.
It is also notable that the number of 55- to 65-year-olds at risk of poverty has fallen by 3.2 percentage points since 2000. This is surprising since labor market participa-tion in this age group has risen considerably since the turn of the millennium—by 20 percentage points.30
30 The participation rate of older workers (aged 55 to 65 has risen 20 percentage points from 54 percent in 2000 to 74 percent in 2012. This is most likely due to incentives to take early retirement having been discontinued in the wake of pension reforms.
2000, 2006, 2012 2006, 2012
Marginal Effect Standard Error Marginal Effect Standard Error
Interactions
Sex: Women −0.1181 0.0670 −0.0526 0.1374
Household type (Reference group: couple without children < 65 yrs.)
Single ≤ 25 yrs. −0.3835 0.2315 −0.8721 0.4981
Single 26–64 yrs. −0.0646 0.1120 −0.1245 0.2391
Single 65 yrs. and more 0.4701 0.2133** 0.7860 0.4455
Couple 65 yrs. and more without children 0.3559 0.2040 0.7158 0.4303
Couple with children > 16 yrs. −0.0175 0.1344 −0.3676 0.2756
Couple with 1 child ≤ 16 yrs. −0.3328 0.1507** −0.2815 0.3326
Couple with 2 children ≤ 16 yrs. −0.1507 0.1383 0.2915 0.3168
Couple with 3 children ≤ 16 yrs. −0.1088 0.1545 0.6969 0.3631
Lone parent −0.3352 0.1519** 0.0735 0.3227
Other households 0.0459 0.2074 −0.3726 0.4884
age of household head (Reference group < 25 yrs.)
26–65 yrs. 0.0660 0.1477 −0.1029 0.3235
65 yrs. and more −0.2183 0.1892 −0.1213 0.3889
Work intensity index (Reference group: not employed)
1–49% 0.2076 0.1060** 0.5599 0.2206**
50% 0.3324 0.1141*** 0.3186 0.2539
51–99% 0.4002 0.1245*** 0.7762 0.2777***
100% employed 0.4519 0.1329*** 0.8068 0.2833***
Highest educational level in household −0.0211 0.0515 0.0114 0.1075
Household with migrants −0.1608 0.0814** −0.2718 0.1779
Living in East Germany 0.1333 0.0724 −0.0762 0.1470
Municipal size 100,000 inhabitants and more −0.0323 0.0649 −0.0119 0.1363
Household head with bad health 0.0373 0.0736 0.1531 0.1546
Home owner −0.1872 0.0770** −0.6214 0.1579***
Household with a person in need of care 0.2501 0.1547 0.3063 0.3230
Number of observations 36,684 25,068
Pseudo R² 0.3429 0.3333
* significant at 10%; ** significant at 5%; *** significant at 1%.1 Private households; equivalized annual incomes surveyed the following year, equivalized with the modified OECD-scale; share of persons with less than 60% of median net household income.
Source: SOEPv30, calculations of DIW Berlin, pooled information of income years 2000, 2006 and 2012.© DIW Berlin
Table 3 Continuation
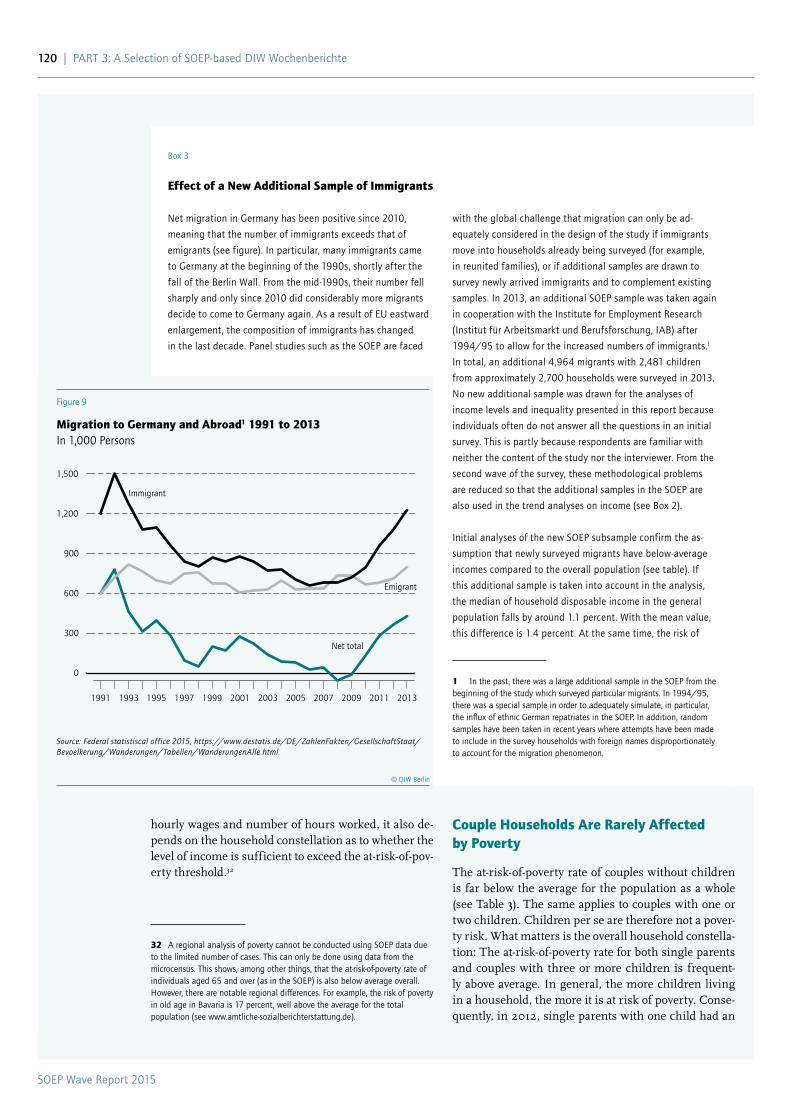
SOEP Wave Report 2015
120 | PaRT 3: a Selection of SOEP-based DIW Wochenberichte
Couple Households Are Rarely Affected by Poverty
The at-risk-of-poverty rate of couples without children is far below the average for the population as a whole (see Table 3). The same applies to couples with one or two children. Children per se are therefore not a pover-ty risk. What matters is the overall household constella-tion: The at-risk-of-poverty rate for both single parents and couples with three or more children is frequent-ly above average. In general, the more children living in a household, the more it is at risk of poverty. Conse-quently, in 2012, single parents with one child had an
hourly wages and number of hours worked, it also de-pends on the household constellation as to whether the level of income is sufficient to exceed the at-risk-of-pov-erty threshold.32
32 a regional analysis of poverty cannot be conducted using SOEP data due to the limited number of cases. This can only be done using data from the microcensus. This shows, among other things, that the at-risk-of-poverty rate of individuals aged 65 and over (as in the SOEP) is also below average overall. However, there are notable regional differences. For example, the risk of poverty in old age in Bavaria is 17 percent, well above the average for the total population (see www.amtliche-sozialberichterstattung.de).
Box 3
Effect of a New Additional Sample of Immigrants
Net migration in Germany has been positive since 2010,
meaning that the number of immigrants exceeds that of
emigrants (see figure). In particular, many immigrants came
to Germany at the beginning of the 1990s, shortly after the
fall of the Berlin Wall. From the mid-1990s, their number fell
sharply and only since 2010 did considerably more migrants
decide to come to Germany again. as a result of EU eastward
enlargement, the composition of immigrants has changed
in the last decade. Panel studies such as the SOEP are faced
with the global challenge that migration can only be ad-
equately considered in the design of the study if immigrants
move into households already being surveyed (for example,
in reunited families), or if additional samples are drawn to
survey newly arrived immigrants and to complement existing
samples. In 2013, an additional SOEP sample was taken again
in cooperation with the Institute for Employment Research
(Institut für arbeitsmarkt und Berufsforschung, IaB) after
1994/95 to allow for the increased numbers of immigrants.1
In total, an additional 4,964 migrants with 2,481 children
from approximately 2,700 households were surveyed in 2013.
No new additional sample was drawn for the analyses of
income levels and inequality presented in this report because
individuals often do not answer all the questions in an initial
survey. This is partly because respondents are familiar with
neither the content of the study nor the interviewer. From the
second wave of the survey, these methodological problems
are reduced so that the additional samples in the SOEP are
also used in the trend analyses on income (see Box 2).
Initial analyses of the new SOEP subsample confirm the as-
sumption that newly surveyed migrants have below-average
incomes compared to the overall population (see table). If
this additional sample is taken into account in the analysis,
the median of household disposable income in the general
population falls by around 1.1 percent. With the mean value,
this difference is 1.4 percent. at the same time, the risk of
1 In the past, there was a large additional sample in the SOEP from the beginning of the study which surveyed particular migrants. In 1994/95, there was a special sample in order to adequately simulate, in particular, the influx of ethnic German repatriates in the SOEP. In addition, random samples have been taken in recent years where attempts have been made to include in the survey households with foreign names disproportionately to account for the migration phenomenon.
Figure 9
Migration to Germany and Abroad1 1991 to 2013In 1,000 Persons
0
300
600
900
1,200
1,500
1991 1993 1995 1997 1999 2001 2003 2005 2007 2009 2011 2013
Net total
Immigrant
Emigrant
Source: Federal statistiscal office 2015, https://www.destatis.de/DE/ZahlenFakten/GesellschaftStaat/Bevoelkerung/Wanderungen/Tabellen/WanderungenAlle.html.
© DIW Berlin
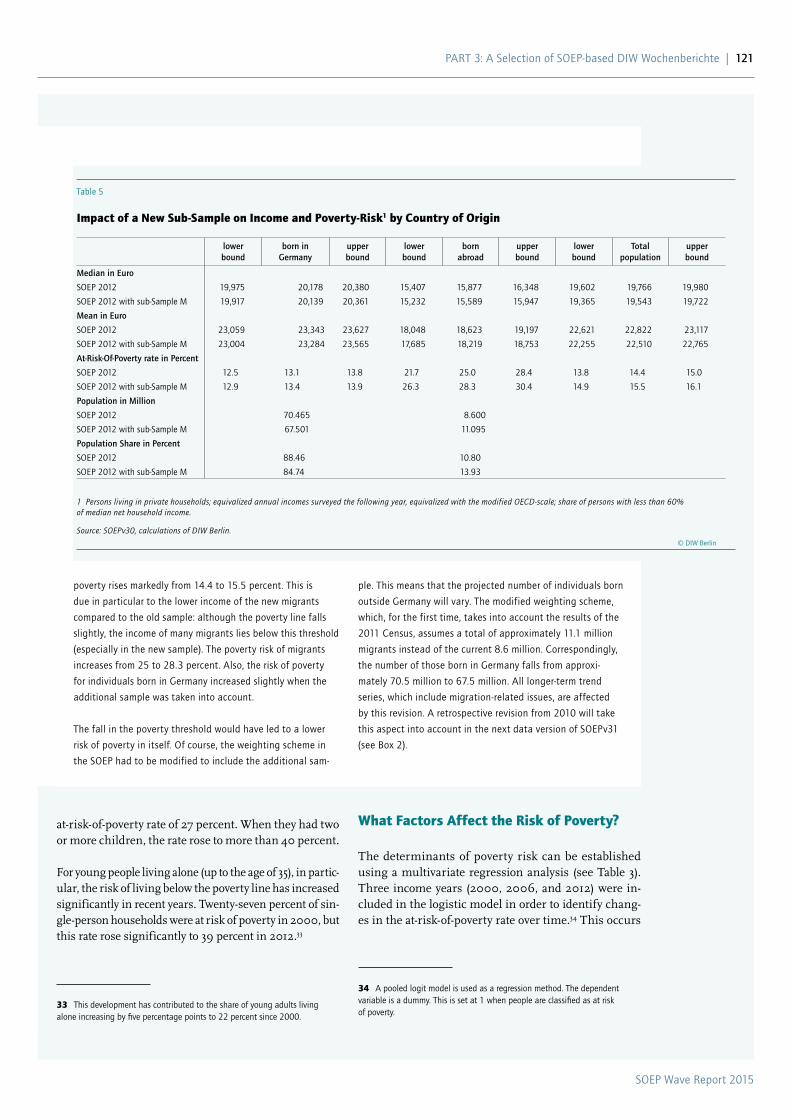
SOEP Wave Report 2015
PaRT 3: a Selection of SOEP-based DIW Wochenberichte | 121
What Factors Affect the Risk of Poverty?
The determinants of poverty risk can be established using a multivariate regression analysis (see Table 3). Three income years (2000, 2006, and 2012) were in-cluded in the logistic model in order to identify chang-es in the at-risk-of-poverty rate over time.34 This occurs
34 a pooled logit model is used as a regression method. The dependent variable is a dummy. This is set at 1 when people are classified as at risk of poverty.
at-risk-of-poverty rate of 27 percent. When they had two or more children, the rate rose to more than 40 percent.
For young people living alone (up to the age of 35), in partic-ular, the risk of living below the poverty line has increased significantly in recent years. Twenty-seven percent of sin-gle-person households were at risk of poverty in 2000, but this rate rose significantly to 39 percent in 2012.33
33 This development has contributed to the share of young adults living alone increasing by five percentage points to 22 percent since 2000.
poverty rises markedly from 14.4 to 15.5 percent. This is
due in particular to the lower income of the new migrants
compared to the old sample: although the poverty line falls
slightly, the income of many migrants lies below this threshold
(especially in the new sample). The poverty risk of migrants
increases from 25 to 28.3 percent. also, the risk of poverty
for individuals born in Germany increased slightly when the
additional sample was taken into account.
The fall in the poverty threshold would have led to a lower
risk of poverty in itself. Of course, the weighting scheme in
the SOEP had to be modified to include the additional sam-
ple. This means that the projected number of individuals born
outside Germany will vary. The modified weighting scheme,
which, for the first time, takes into account the results of the
2011 Census, assumes a total of approximately 11.1 million
migrants instead of the current 8.6 million. Correspondingly,
the number of those born in Germany falls from approxi-
mately 70.5 million to 67.5 million. all longer-term trend
series, which include migration-related issues, are affected
by this revision. a retrospective revision from 2010 will take
this aspect into account in the next data version of SOEPv31
(see Box 2).
Table 5
Impact of a New Sub-Sample on Income and Poverty-Risk1 by Country of Origin
lower bound
born in Germany
upper bound
lower bound
born abroad
upper bound
lower bound
Total population
upper bound
Median in Euro
SOEP 2012 19,975 20,178 20,380 15,407 15,877 16,348 19,602 19,766 19,980
SOEP 2012 with sub-Sample M 19,917 20,139 20,361 15,232 15,589 15,947 19,365 19,543 19,722
Mean in Euro
SOEP 2012 23,059 23,343 23,627 18,048 18,623 19,197 22,621 22,822 23,117
SOEP 2012 with sub-Sample M 23,004 23,284 23,565 17,685 18,219 18,753 22,255 22,510 22,765
At-Risk-Of-Poverty rate in Percent
SOEP 2012 12.5 13.1 13.8 21.7 25.0 28.4 13.8 14.4 15.0
SOEP 2012 with sub-Sample M 12.9 13.4 13.9 26.3 28.3 30.4 14.9 15.5 16.1
Population in Million
SOEP 2012 70.465 8.600
SOEP 2012 with sub-Sample M 67.501 11.095
Population Share in Percent
SOEP 2012 88.46 10.80
SOEP 2012 with sub-Sample M 84.74 13.93
1 Persons living in private households; equivalized annual incomes surveyed the following year, equivalized with the modified OECD-scale; share of persons with less than 60% of median net household income.
Source: SOEPv30, calculations of DIW Berlin.© DIW Berlin
SOEP Wave Report 2015
122 | PaRT 3: a Selection of SOEP-based DIW Wochenberichte
advantage of owner-occupied housing protects against poverty. Even in households with care recipients, the poverty risk is reduced since they frequently receive fi-nancial transfers from nursing care funds.
The interaction effects37 of the analysis also show that the risk of poverty has increased markedly for retired people living alone. This probably ref lects the weak per-formance of retirement income in Germany. Fortunate-ly, the risk of poverty has declined both in single-parent families and in those with a child aged under the age of 16. There is a need for further analyses to show wheth-er parental allowance was able to, at least partially, com-pensate for the loss of income from the birth of a child. It is striking that the risk of poverty increased during the observation period despite rising employment in all four work intensity groups.38
The risk of poverty for migrant households has decreased in the past few years, with recent migrants having dif-ferent characteristics than those from the traditional guest-worker countries who have lived in Germany for some time. These include different procedures for rec-ognizing educational qualifications acquired abroad.39 The risk of poverty for real estate owners has declined further. This is probably due to their financial status be-ing better than that of tenant households.40
In addition, the model was reduced to the income years 2006 and 2012 to verify whether, in particular, the im-proved labor market situation since the mid-2000s had affected the determinants of poverty risk (see column 2 in Table 3). The key findings of this analysis are sim-ilar. However, in contrast, the risk of falling below the poverty risk threshold despite (full-time) employment has increased over time. The reason for this is likely to be, among other things, the poorer wages of low-skilled occupations rather than the change in house-hold structures.41
37 The interaction effects were created by multiplying the annual dummies in 2012 by the covariate values.
38 Two alternative models were estimated to check the robustness of these findings: the first was a simple pooled logistic model (with cluster effects to control for individuals being surveyed multiple times) and the other was a fixed effects model. The first confirmed the findings from the random effects model. In the fixed effects model, the effects are no longer significant. One possible explanation for this is that there are only three instances where the intrapersonal variation is relatively small.
39 See Herbert Brücker, Ingrid Tucci, Simone Bartsch, Martin Kroh, Parvati Trübswetter, and Jürgen Schupp, “Neue Muster der Migration,” DIW Wochenbericht, no. 43 (2014): 1126–1135.
40 However, this important economic factor cannot be considered here since it was not surveyed every year in the SOEP.
41 See M. Biewen and a. Juhasz, “Understanding Rising Inequality in Germany, 1999/2000–2005/06,” Review of Income and Wealth, vol. 58 (2012): 62–647.
with the relevant interaction effects of the explanatory variables with a time variable.
The Table reports marginal effects. The marginal effects for binary variables (such as gender) indicate how the probability of being at risk of poverty varies if the bina-ry variable is 1 (female) instead of 0 (male)—assuming that the values of all other explanatory variables remain constant. Accordingly, the risk of poverty is 26 percent-age points higher if the head of the household is female rather than male (see column 1 in Table 3). Consequent-ly, the marginal effects for continuous variables (such as income) indicate the immediate impact on the risk of poverty.35
Broken down by household types, younger people living alone (aged up to 35), single parents, and couples with children under the age of 16 are significantly more at risk of poverty than couples with no children of work-ing age. Both older people living alone and couples of retirement age have a lower risk of poverty. The risk of poverty among single parents is, as expected, particu-larly high, more than three times higher than that of the reference group.
As previously mentioned, the risk of poverty depends, inter alia, on labor force participation (see Table 1).36 The higher the participation rate of the household, the low-er the risk of poverty. For households that have spent only six months of a potential working year in employ-ment, the risk of poverty declines sharply compared to jobless households, and the effect is more pronounced if they are in full-time employment. As expected, there is also a negative correlation between the level of edu-cation and the risk of poverty: the higher the education level, the lower the risk of poverty. In contrast, all house-holds with at least one person born outside Germany (see Box 3) and eastern German households have a consider-ably greater risk of poverty. If the head of the household suffers from a medical condition (and receives a disabil-ity pension, for example), the risk of poverty increases by 32 percent. Real estate owners generally have a lower risk of poverty compared to tenants because the income
35 They are only meaningful for small changes in the explanatory variables (for example, changes by one percentage point) because the relationships are often nonlinear. Therefore, it is also possible that the absolute value of the marginal effect is greater than 1, although the probability of being at risk of poverty cannot be above 1 (i.e., 100 percent).
36 The labor market participation of a household is measured here as the proportion of time spent working in the previous year to the potential number of working hours of all those of working age living in the household. People in households in which all employed persons were in full-time employment for the whole of the previous year received an index score of 100, with part-time employment being weighted at 50 percent. In extreme cases, when none of the potential labor force participants are in fact working, the index assumes a value of 0.
SOEP Wave Report 2015
PaRT 3: a Selection of SOEP-based DIW Wochenberichte | 123
points to just under 40 percent in 2012. This is especial-ly remarkable considering the majority of these people are in work—a factor that, in the past, would have pro-tected them from income poverty. In other age groups, too, the risk of poverty in households with labor force participation has increased since 2000. This might ex-plain why the risk of poverty has stagnated for several years, although employment reached record highs dur-ing the same period. Whether the minimum wage in-troduced in 2015 can help reduce the risk of poverty for the employed depends, in particular, on how targeted its effects are (whether individuals with low hourly wages tend to be more in the lower deciles of the income dis-tribution) and how the number of paid hours worked by these individuals develop.
Conclusion
Real disposable household incomes have risen in Ger-many by an average of five percent since 2000. At the same time, the gap between rich and poor has widened. Real incomes in the top decile of income distribution increased by more than 15 percent between 2000 and 2012, while income in the middle of the distribution stagnated and, in the lowest 40 percent, incomes fell in real terms. In sum, the inequality of disposable house-hold income remains unchanged since 2005.
The risk of poverty among the population grew consid-erably from 2000 to 2009 and has stagnated since then at around 14 percent. Young people aged 25 to 35 and liv-ing alone, in particular, are increasingly at risk of pov-erty. Their at-risk-of-poverty rate rose by 12 percentage
Jan Goebel is Deputy Head of the Socio-Economic Panel study at DIW Berlin | [email protected]
Markus M. Grabka is a Research associate at the Socio-Economic Panel study at DIW Berlin | [email protected]
Carsten Schröder is Deputy Head of the Socio-Economic Panel study at DIW Berlin | [email protected]
JEL: D31, I31, I32
Keywords: Income inequality, poverty, SOEP

SOEP Wave Report 2015
124 | PaRT 3: a Selection of SOEP-based DIW Wochenberichte
ECONOMY. POLITICS. SCIENCE.
DIW Economic Bulletin
2015
Care Households
REPORT by Johannes Geyer
Income and Assets of Care Households in Germany 203INTERVIEW with Johannes Geyer
»Long-term home care recipients are often women who live alone« 209REPORT by Christian Westermeier and Markus M. Grabka
Significant Statistical Uncertainty over Share of High Net Worth Households 210
14+15
Source:
DIW Economic Bulletin 14+15/2015
Volume 5, pp. 210–219 Month 1, 2015 ISSN 2192-7219
www.diw.de/econbull

SOEP Wave Report 2015
PaRT 3: a Selection of SOEP-based DIW Wochenberichte | 125
The analyses of wealth inequality based on survey data usually suf-fer from undercoverage of the upper percentiles of the very wealthy. Yet given this group’s substantial share of total net worth, it is of particular relevance. as no tax data are available in Germany, the largest fortunes can only be simulated using “rich lists.” For example, combining the Forbes list, with its approximately 50 Ger-man US dollar billionaires, with survey data results in an increased aggregate total net worth for all households in Germany in 2012 of between one-third and 50 percent, depending on the scenario. Moreover, the share of the richest one percent of the population (about 400,000 households) rises from approximately one-fifth to one-third. after reassessment, the richest ten percent of the popula-tion’s share of total net worth is estimated to be between 64 and 74 percent, depending on the scenario. These reassessments are characterized by a high degree of uncertainty which eventually can only be reduced by improving the base data.
Typically, individuals’ net worth, the sum of all their as-sets, is far more unequally distributed than current in-come. This is evident, for instance, from the fact that only a relatively small proportion of the population ac-counts for a considerable share of the entire net worth.1 Given that the exact figures on the percentage of the richer social strata and the precise distribution of wealth provide an important basis for tax and social policies, there is significant public interest in the status quo and developments in wealth distribution in Germany. How-ever, the existing data bases have a significant f law in terms of representing high net worth individuals suffi-ciently (see Box 1 on the general problem of measuring wealth). Using econometric estimation techniques, the aim of the present study is to simulate the upper mar-gin of wealth distribution to obtain an improved data base for the entire distribution of wealth as well as key distribution ratios.
The findings presented in this report are based on a re-search project funded by the Hans Böckler Foundation to analyze wealth distribution in Germany2 and extended analyses by DIW Berlin on describing the amount, com-position, and distribution of private net worth from 2002 to 2012.3 The empirical basis is the data from the Socio-Economic Panel (SOEP) longitudinal study of house-holds collected by DIW Berlin together with the field-work organization Infratest Sozialforschung.4 Every five years since 2002, a series of focused interviews have been conducted to gather data on net worth (2002, 2007,
1 See M. M. Grabka and C. Westermeier, “Persistently High Wealth Inequality in Germany,” DIW Economic Bulletin, no. 6 (2014).
2 “Vermögen in Deutschland– Status-quo-analysen und Perspektiven,” Project number: S-2012-610-4; project management: Markus M. Grabka.
3 See Grabka and Westermeier, “Persistently High Wealth Inequality.”
4 The SOEP is a representative longitudinal study of households conducted every year since 1984 in western Germany and since 1990 in eastern Germany, see G. G. Wagner, J. Göbel, P. Krause, R. Pischner, and I. Sieber, “Das Sozio- oekonomische Panel (SOEP): Multidisziplinäres Haushaltspanel und Kohorten-studie für Deutschland – Eine Einführung (für neue Datennutzer) mit einem ausblick (für erfahrene anwender),” aSta Wirtschafts- und Sozialstatistisches archiv, vol 2, no. 4 (2008): 301–328.
Significant Statistical Uncertainty over Share of High Net Worth HouseholdsBy Christian Westermeier and Markus M. Grabka

SOEP Wave Report 2015
126 | PaRT 3: a Selection of SOEP-based DIW Wochenberichte
disproportionately in interviews.7 This approach leads to enhanced estimates on the upper margin of wealth distribution and, in addition, after projections to the en-tire population, shows a higher aggregate of net worth.
The improved coverage of wealthy households has virtu-ally no effect on the median8 of the household net worth. In the PHF study, this value was equivalent to approx-imately 51,000 euros, while it was just under 47,000 in the SOEP study. However, the mean of the distribu-tion of wealth is sensitive to the improved representa-tion of wealthy households. While the SOEP reports a figure of almost 155,000 euros per household in 2012 (not adjusted for inf lation), the PHF records an equiv-alent amount of 195,000 euros, a good 40,000 euros more. Moreover, looking at the percentiles on the upper margin of distribution, it becomes evident that the es-timates from the PHF lead to significantly higher fig-ures. Here, for instance, the cut-off for the 95th percen-tile (661,000euros) is slightly over 100,000 euros above
7 In the PHF, this oversampling of high-income households is based on a regional oversampling in areas with high income and high net worth households. although the SOEP also utilizes oversampling from the 2002 survey year, this only comprises households with an above-average income. However, rather than there being a perfect correlation between income and net worth, high-income households may also only have a low net worth.
8 The median is the value separating the wealthier 50 percent of the population from the poorer half and is robust against distortions on the upper distribution margin.
and 2012). Although the SOEP study establishes available assets on a personal level, the data are then aggregated on the household level for the purpose of analysis. This dataset is thus comparable with the panel study “House-holds and their finances” (Private Haushalte und ihre Finanzen, PHF) conducted by the Deutsche Bundesbank in 2010/2011,5 which comprised a slightly more compre-hensive portfolio of questions on current net worth.6
Multimillionaires Underreported in Population Surveys
In 2012, according to the SOEP survey, total net worth in Germany amounted to just under 6.3 trillion euros (see Table 1), approximately 1.5 trillion euros less than the fig-ures reported in the PHF for 2010/2011. However, the comparability of the two surveys is limited, not only due to the different times of the surveys and the components of individual net worth taken as parameters (see also Box 1), but also since the PHF study made particular efforts to identify high net worth households and include them
5 U. von Kalkreuth and H. Hermann, “Vermögen und Finanzen privater Haushalte in Deutschland: Ergebnisse der Bundesbankstudie,” Deutsche Bundesbank Monthly Reports (6) (2013): 25–51.
6 HFCN, “The Eurosystem Household Finance and Consumption Survey: Methodological report for the first wave,” ECB Statistical Paper Series, no. 1 (2013).
Table 1
Raw Distribution of Household Net Worth1 in SOEP and PHFIn euros
PHF (2010/11) SOEP (2012)
Mean 195,170 154,380
Median 51,358 46,680
90th percentile 442,320 380,740
95th percentile 661,240 563,100
99th percentile 1,929,344 1,349,640
Share of top one percent of total net worth in percent 24.3 18.2
Share of top five percent of total net worth in percent 45.7 39.0
Maximum value in millions 76.3 45.5
Total net worth in trillions 7.742 6.278
Base data: Number of households with net worth of …
UnweightedProjection for
the entire populationUnweighted
Projection for the entire population
Over 500,000 euro 654 3,261,599 862 2,516,656
Over 1,000,000 euro 246 1,051,254 270 708,424
Over 3,000,000 euro 45 239,407 42 108,366
Total of all households 3,565 39,672,983 10,711 40,657,024
1 Households (excluding the institutional population).
Sources: SOEPv29; “Private Haushalte und ihre Finanzen” study.
© DIW Berlin
High net worth individuals tend to be underrepresented in survey random samples.
SOEP Wave Report 2015
PaRT 3: a Selection of SOEP-based DIW Wochenberichte | 127
ber of households with a net worth of more than three million euros is also almost twice as high.
The improved data on wealthy households is important at the upper margin of the wealth distribution. Despite both surveys making particular efforts to recruit wealthy households for interviews, both random samples here share the problem that they hardly include any multi-millionaires with a net worth of over five million euros and no billionaires at all.10
verbesserten Erfassung von Haushaltsnettoeinkommen und Vermögen in Haushaltssurveys,” in Reichtum und Vermögen – Zur gesellschaftlichen Bedeu-tung der Reichtums- und Vermögensforschung, eds. T. Druyen, W. Lauterbach, and M. Grundmann (Wiesbaden: 2009), 85–96.
10 The Federal Statistical Office’s cross-sectional Income and Consumption Survey (Einkommens- und Verbrauchsstichprobe, EVS) is conducted every five years to establish the net worth situation of private households. However, the
SOEP estimates; in the 99th percentile, this gap has al-ready increased to almost 580,000 euros (approximate-ly 1.9 million in comparison to 1.35 million).
Accordingly, the PHF records a higher number of house-holds with a net worth of one million euros. The ex-trapolated PHF figure amounts to just over one mil-lion households, while the SOEP equivalent is around 700,000 households.9 In the PHF, the estimated num-
9 In the SOEP, the last additional random sample to improve the statistical force of wealthy households was taken in 2002. Here, high-income households were overrepresented in the random sample. Due to “panel mortality,” the number of households and individuals in the panel decrease over time because of respondents’ refusal to participate or demographic processes, such as migration or death. as a result, solely in terms of the upper margin of wealth distribution, this sample’s cover is constantly eroded. On this, see J. Schupp, J. R. Frick, J. Goebel, M. M. Grabka, O. Groh-Samberg, and G. G. Wagner, “Zur
Data Sources on the Distribution of Wealth
Not only does the national accounts approach face a number
of methodological and statistical problems, but so too does
the analysis of the distribution of wealth based on microdata
representative of the population.
Neither approach takes into account—as is common the world
over—the entitlements to statutory pension insurance. ac-
cumulated pension-related claims are converted into personal
earning points which do not unequivocally indicate social
security assets and therefore are hardly directly ascertain-
able in a survey; this applies equally to occupational pension
entitlements. However, since the majority of the working
population is subject to compulsory pension insurance or has
pension-related claims, for example, in the form of training
or childrearing periods, social security assets in the statutory
pension scheme in particular can be assumed to represent the
most frequent component in household net worth. Pension
insurance data analyses have shown that 91 percent of men
and 87 percent of women aged 65 or over have statutory
pension entitlements. (In eastern Germany, the corresponding
figures are even higher at 99 percent.)
Other components of net worth are also commonly not
addressed in population surveys since they are particularly dif-
ficult to record, such as household effects, including the value
of vehicles. Neither of these two asset components flow into
the concept of net worth underlying this analysis. Thus, due
to these limitations, in comparison to the national accounts
approach, the net worth in these figures is, all other things
being equal, underestimated.
In population surveys, assets are usually recorded at the
household level. In this context, the SOEP methodology has a
special feature since it records the individual assets of each
respondent aged 17 or over. In contrast to only recording
household assets, this approach can show differences within
households and partnerships while it still allows the indi-
vidual worth to be added to obtain a result for a particular
household. Hence, the present analyses refer to the net worth
of households. The data collection methods do not gather
information on the assets held by children, so this, too, is
underestimated.
a comparison of aggregated assets based on the SOEP and
the sectoral and overall economic balance sheets of the
German Federal Statistical Office (FSO) is complicated by a
number of differences in distinctions and definitions. The fol-
lowing reasons for this are germane in this context. First, the
FSO categorizes households together with private non-profit
organizations. Second, in addition to durable consumer goods,
other types of assets are also included which are not recorded
in the SOEP, including cash, the value of livestock and crops,
equipment, intangible fixed assets, claims against private
health insurance companies, commercial loans, and commer-
cial holdings in residential buildings. Third, the SOEP generally
records the current market value of real estate while the
FSO calculates its replacement value. However, market value
differs significantly from the replacement value of portfolio
properties. as a result, the SOEP’s 2002 calculation for net
worth on this basis totaled almost 90 percent of the balance
sheet figure arrived at by the FSO, but it was only 64 percent
in 2012. In the case of residential buildings, the quantitatively
most important asset component, the coverage rate fell from
Box 1
SOEP Wave Report 2015
128 | PaRT 3: a Selection of SOEP-based DIW Wochenberichte
the assumptions explained below, the upper margin of the distribution of wealth follows a Pareto distribution which can then be used to simulate the upper margin of the survey data (see Box 2). To estimate the Pareto distri-bution parameters, the data at the SOEP survey’s top lev-el have been taken together with information from the US Forbes magazine on German billionaires and, using this information, the top section in the SOEP survey’s distribution of wealth has been simulated. On the ba-sis of the resulting distribution, more precise estimates can be calculated to show, for example, the shares of the top one or top 0.1 percent of the distribution of wealth.
Since applying the Pareto method to simulate the top net worth households results in estimates with a consider-able degree of uncertainty, two scenarios, each with an upper and lower limit, are presented for all three years
In the research presented here, external information on billionaires in Germany from the Forbes list was includ-ed to correct the continuing underrepresentation of high net worth individuals.11 Unfortunately, with few exact de-tails provided on how these lists are compiled, the esti-mates are likely to be highly imprecise. On the basis of
EVS uses a cut-off threshold so that households above a certain income threshold are excluded from the sample. In 2008, this point was set at a net household income of 18,000 euros. Since income and net worth are related, this resulted in the undercoverage especially of high-income households in the EVS.
11 alternatively, information on high net worth individuals in Germany is available in the manager magazin “rich list.” However, since the less detailed estimates in the triple-digit million area result in heaping effects, it was decided to use the Forbes list. On this basis, an estimate of the top high net worth individuals for 2007 using the SOEP data has already been published; S. Bach, M. Beznoska, and V. Steiner, “a Wealth Tax on the Rich to Bring Down Public Debt? Revenue and Distributional Effects of a Capital Levy in Germany,” Fiscal Studies, vol. 35 (1) (2014): 67–89.
129 percent in 2002 to slightly under 103 percent in 2012.
Here, liabilities are recorded at 73 percent. With aggregate
gross monetary assets at 33 percent, the SOEP, as in all other
wealth surveys worldwide, has significantly underestimated
their value.
a comparison with the wealth survey conducted by the Ger-
man Federal Bank in 2010/11 (Private Haushalte und ihre
Finanzen, PHF) shows that the SOEP slightly underestimated
per capita net worth at 86,000 euros, compared to the PHF ’s
95,000 euros. Here, it should also be taken into account that
the PHF conducts a far more detailed survey of the asset
situation, for example, also explicitly taking into account the
value of vehicles.
Since 2002, the SOEP has included a subsample of “high-
income households” in a concerted effort to counter the
widespread problem in population surveys of not having a sta-
tistically significant subgroup of higher incomes and assets. In
the context of high inequality in personal wealth distribution,
this subsample and the sufficiently large number of wealthy
households in the SOEP is especially important. In particular,
the relationship between income and wealth distribution for
all groups, and above all for the group of high-income earn-
ers, can also be shown in greater detail, since assets, asset
income, and savings depend to a large extent on disposable
income. Nevertheless, despite this dedicated subsample, the
problem remains that surveys such as the SOEP effectively do
not contain top high net worth individuals. This applies in par-
ticular to billionaires as well as multi-millionaires with a net
worth in the triple-digits million range. as a result, the true
extent of wealth inequality is underestimated. Germany pres-
ently has no available external statistics, for instance, wealth
tax statistics, to validate this potential underestimation.
The need to provide fair market value of assets also presents
such surveys with a fundamental problem. Estimating fair
market value in a survey is difficult, especially when the
object was inherited or purchased a long time ago and
respondents do not have sufficient knowledge of the current
market. as is well known, valuing business assets is also
particularly difficult. In contrast to regular income, asset
values can be very volatile and this further complicates their
evaluation. aside from the overall sensitivity of this issue, this
in turn increasingly results in refusals to answer asset-related
questions.
Not only does the SOEP conduct extensive consistency checks
on the individual data, but it also uses multiple imputations
to replace all missing asset values. Due to the use of longitu-
dinal data from the repeated wealth surveys in 2002, 2007,
and 2012, the quality of the imputation is better than in the
case of a single survey.
after extrapolation and weighting factors are applied, the
SOEP microdata underlying these analyses give a representa-
tive picture of the sample in households and thus allow con-
clusions to be drawn about the entire population. Members of
the population in institutions (for example, in nursing homes)
were not taken into account. The weighting factors correct
differences in the designs of the various SOEP samples as well
as the participation behavior of respondents after the first
interview. The framework data of the microcensus is adjusted
to increase its compatibility with official statistics.
Box 1 Continuation
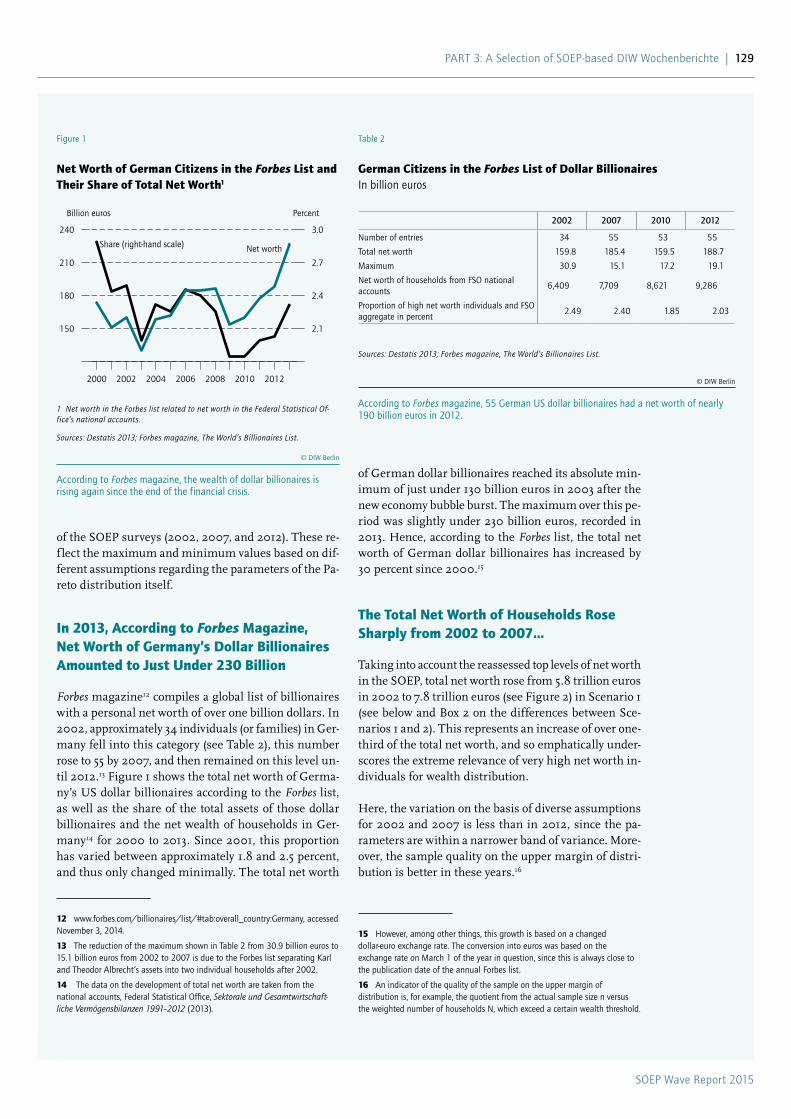
SOEP Wave Report 2015
PaRT 3: a Selection of SOEP-based DIW Wochenberichte | 129
of German dollar billionaires reached its absolute min-imum of just under 130 billion euros in 2003 after the new economy bubble burst. The maximum over this pe-riod was slightly under 230 billion euros, recorded in 2013. Hence, according to the Forbes list, the total net worth of German dollar billionaires has increased by 30 percent since 2000.15
The Total Net Worth of Households Rose Sharply from 2002 to 2007…
Taking into account the reassessed top levels of net worth in the SOEP, total net worth rose from 5.8 trillion euros in 2002 to 7.8 trillion euros (see Figure 2) in Scenario 1 (see below and Box 2 on the differences between Sce-narios 1 and 2). This represents an increase of over one-third of the total net worth, and so emphatically under-scores the extreme relevance of very high net worth in-dividuals for wealth distribution.
Here, the variation on the basis of diverse assumptions for 2002 and 2007 is less than in 2012, since the pa-rameters are within a narrower band of variance. More-over, the sample quality on the upper margin of distri-bution is better in these years.16
15 However, among other things, this growth is based on a changed dollar-euro exchange rate. The conversion into euros was based on the exchange rate on March 1 of the year in question, since this is always close to the publication date of the annual Forbes list.
16 an indicator of the quality of the sample on the upper margin of distribution is, for example, the quotient from the actual sample size n versus the weighted number of households N, which exceed a certain wealth threshold.
of the SOEP surveys (2002, 2007, and 2012). These re-f lect the maximum and minimum values based on dif-ferent assumptions regarding the parameters of the Pa-reto distribution itself.
In 2013, According to Forbes Magazine, Net Worth of Germany’s Dollar Billionaires Amounted to Just Under 230 Billion
Forbes magazine12 compiles a global list of billionaires with a personal net worth of over one billion dollars. In 2002, approximately 34 individuals (or families) in Ger-many fell into this category (see Table 2), this number rose to 55 by 2007, and then remained on this level un-til 2012.13 Figure 1 shows the total net worth of Germa-ny’s US dollar billionaires according to the Forbes list, as well as the share of the total assets of those dollar billionaires and the net wealth of households in Ger-many14 for 2000 to 2013. Since 2001, this proportion has varied between approximately 1.8 and 2.5 percent, and thus only changed minimally. The total net worth
12 www.forbes.com/billionaires/list/#tab:overall_country:Germany, accessed November 3, 2014.
13 The reduction of the maximum shown in Table 2 from 30.9 billion euros to 15.1 billion euros from 2002 to 2007 is due to the Forbes list separating Karl and Theodor albrecht’s assets into two individual households after 2002.
14 The data on the development of total net worth are taken from the national accounts, Federal Statistical Office, Sektorale und Gesamtwirtschaft-liche Vermögensbilanzen 1991–2012 (2013).
Table 2
German Citizens in the Forbes List of Dollar BillionairesIn billion euros
2002 2007 2010 2012
Number of entries 34 55 53 55
Total net worth 159.8 185.4 159.5 188.7
Maximum 30.9 15.1 17.2 19.1
Net worth of households from FSO national accounts
6,409 7,709 8,621 9,286
Proportion of high net worth individuals and FSO aggregate in percent
2.49 2.40 1.85 2.03
Sources: Destatis 2013; Forbes magazine, The World’s Billionaires List.
© DIW Berlin
according to Forbes magazine, 55 German US dollar billionaires had a net worth of nearly 190 billion euros in 2012.
Figure 1
Net Worth of German Citizens in the Forbes List and Their Share of Total Net Worth1
150
180
210
240
2.1
2.4
2.7
3.0
2000 2002 2004 2006 2008 2010 2012
Billion euros Percent
Net worthShare (right-hand scale)
1 Net worth in the Forbes list related to net worth in the Federal Statistical Of-fice’s national accounts.
Sources: Destatis 2013; Forbes magazine, The World’s Billionaires List.
© DIW Berlin
according to Forbes magazine, the wealth of dollar billionaires is rising again since the end of the financial crisis.
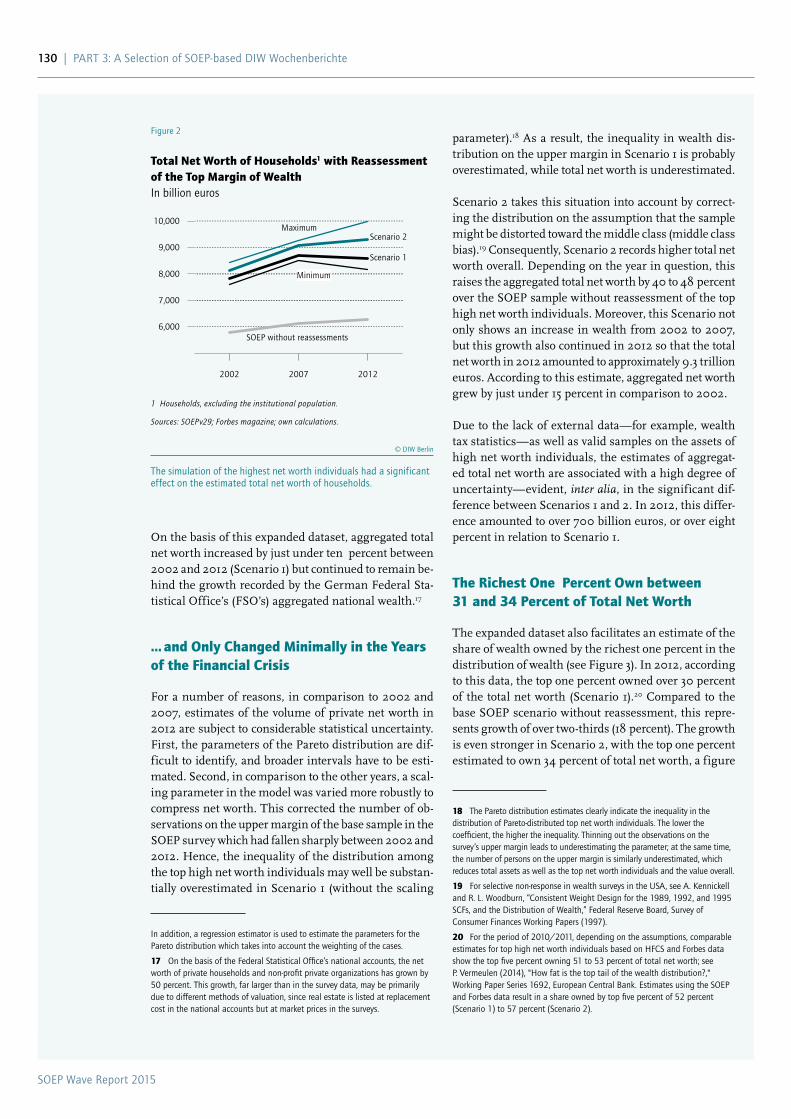
SOEP Wave Report 2015
130 | PaRT 3: a Selection of SOEP-based DIW Wochenberichte
parameter).18 As a result, the inequality in wealth dis-tribution on the upper margin in Scenario 1 is probably overestimated, while total net worth is underestimated.
Scenario 2 takes this situation into account by correct-ing the distribution on the assumption that the sample might be distorted toward the middle class (middle class bias).19 Consequently, Scenario 2 records higher total net worth overall. Depending on the year in question, this raises the aggregated total net worth by 40 to 48 percent over the SOEP sample without reassessment of the top high net worth individuals. Moreover, this Scenario not only shows an increase in wealth from 2002 to 2007, but this growth also continued in 2012 so that the total net worth in 2012 amounted to approximately 9.3 trillion euros. According to this estimate, aggregated net worth grew by just under 15 percent in comparison to 2002.
Due to the lack of external data—for example, wealth tax statistics—as well as valid samples on the assets of high net worth individuals, the estimates of aggregat-ed total net worth are associated with a high degree of uncertainty—evident, inter alia, in the significant dif-ference between Scenarios 1 and 2. In 2012, this differ-ence amounted to over 700 billion euros, or over eight percent in relation to Scenario 1.
The Richest One Percent Own between 31 and 34 Percent of Total Net Worth
The expanded dataset also facilitates an estimate of the share of wealth owned by the richest one percent in the distribution of wealth (see Figure 3). In 2012, according to this data, the top one percent owned over 30 percent of the total net worth (Scenario 1).20 Compared to the base SOEP scenario without reassessment, this repre-sents growth of over two-thirds (18 percent). The growth is even stronger in Scenario 2, with the top one percent estimated to own 34 percent of total net worth, a figure
18 The Pareto distribution estimates clearly indicate the inequality in the distribution of Pareto-distributed top net worth individuals. The lower the coefficient, the higher the inequality. Thinning out the observations on the survey’s upper margin leads to underestimating the parameter; at the same time, the number of persons on the upper margin is similarly underestimated, which reduces total assets as well as the top net worth individuals and the value overall.
19 For selective non-response in wealth surveys in the USa, see a. Kennickell and R. L. Woodburn, “Consistent Weight Design for the 1989, 1992, and 1995 SCFs, and the Distribution of Wealth,” Federal Reserve Board, Survey of Consumer Finances Working Papers (1997).
20 For the period of 2010/2011, depending on the assumptions, comparable estimates for top high net worth individuals based on HFCS and Forbes data show the top five percent owning 51 to 53 percent of total net worth; see P. Vermeulen (2014), "How fat is the top tail of the wealth distribution?," Working Paper Series 1692, European Central Bank. Estimates using the SOEP and Forbes data result in a share owned by top five percent of 52 percent (Scenario 1) to 57 percent (Scenario 2).
On the basis of this expanded dataset, aggregated total net worth increased by just under ten percent between 2002 and 2012 (Scenario 1) but continued to remain be-hind the growth recorded by the German Federal Sta-tistical Office’s (FSO’s) aggregated national wealth.17
… and Only Changed Minimally in the Years of the Financial Crisis
For a number of reasons, in comparison to 2002 and 2007, estimates of the volume of private net worth in 2012 are subject to considerable statistical uncertainty. First, the parameters of the Pareto distribution are dif-ficult to identify, and broader intervals have to be esti-mated. Second, in comparison to the other years, a scal-ing parameter in the model was varied more robustly to compress net worth. This corrected the number of ob-servations on the upper margin of the base sample in the SOEP survey which had fallen sharply between 2002 and 2012. Hence, the inequality of the distribution among the top high net worth individuals may well be substan-tially overestimated in Scenario 1 (without the scaling
In addition, a regression estimator is used to estimate the parameters for the Pareto distribution which takes into account the weighting of the cases.
17 On the basis of the Federal Statistical Office’s national accounts, the net worth of private households and non-profit private organizations has grown by 50 percent. This growth, far larger than in the survey data, may be primarily due to different methods of valuation, since real estate is listed at replacement cost in the national accounts but at market prices in the surveys.
Figure 2
Total Net Worth of Households1 with Reassessment of the Top Margin of WealthIn billion euros
6,000
7,000
8,000
9,000
10,000
2002 2007 2012
Maximum
Minimum
Scenario 2
Scenario 1
SOEP without reassessments
1 Households, excluding the institutional population.
Sources: SOEPv29; Forbes magazine; own calculations.
© DIW Berlin
The simulation of the highest net worth individuals had a significant effect on the estimated total net worth of households.
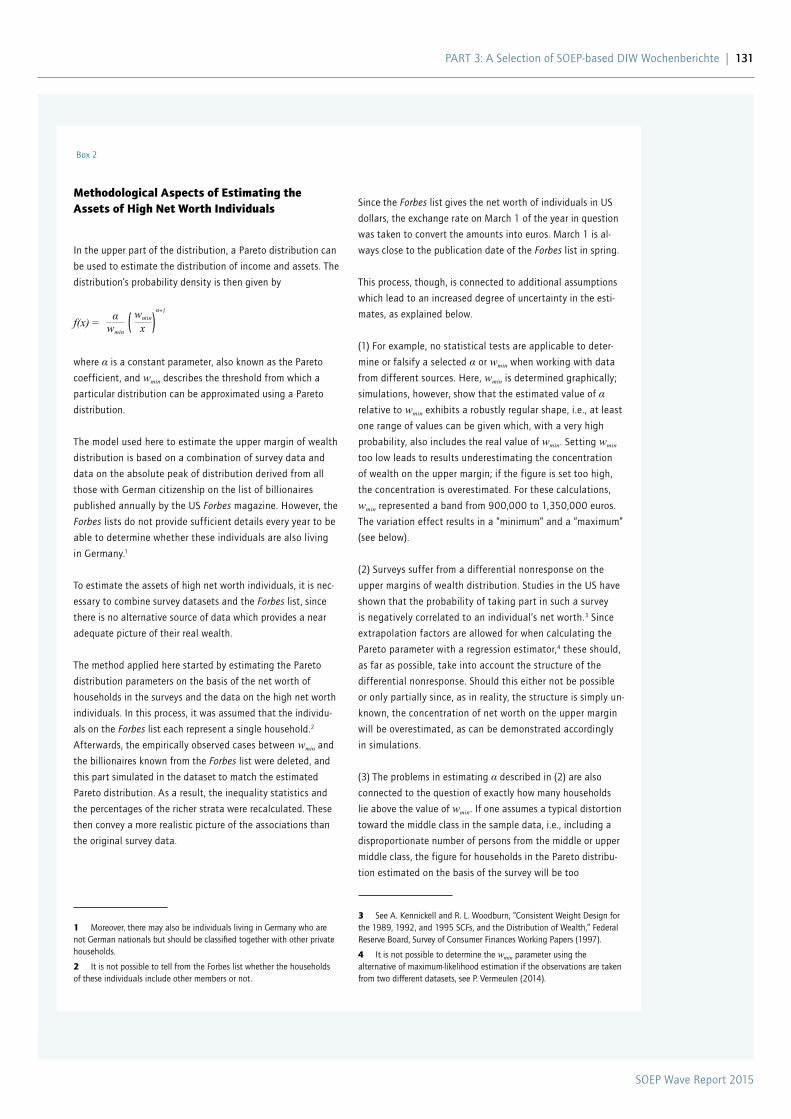
SOEP Wave Report 2015
PaRT 3: a Selection of SOEP-based DIW Wochenberichte | 131
Methodological Aspects of Estimating the Assets of High Net Worth Individuals
In the upper part of the distribution, a Pareto distribution can
be used to estimate the distribution of income and assets. The
distribution’s probability density is then given by
f(x) = αwmin
wmin
x
α+1
( )
where α is a constant parameter, also known as the Pareto
coefficient, and wmin describes the threshold from which a
particular distribution can be approximated using a Pareto
distribution.
The model used here to estimate the upper margin of wealth
distribution is based on a combination of survey data and
data on the absolute peak of distribution derived from all
those with German citizenship on the list of billionaires
published annually by the US Forbes magazine. However, the
Forbes lists do not provide sufficient details every year to be
able to determine whether these individuals are also living
in Germany.1
To estimate the assets of high net worth individuals, it is nec-
essary to combine survey datasets and the Forbes list, since
there is no alternative source of data which provides a near
adequate picture of their real wealth.
The method applied here started by estimating the Pareto
distribution parameters on the basis of the net worth of
households in the surveys and the data on the high net worth
individuals. In this process, it was assumed that the individu-
als on the Forbes list each represent a single household.2
afterwards, the empirically observed cases between wmin and
the billionaires known from the Forbes list were deleted, and
this part simulated in the dataset to match the estimated
Pareto distribution. as a result, the inequality statistics and
the percentages of the richer strata were recalculated. These
then convey a more realistic picture of the associations than
the original survey data.
1 Moreover, there may also be individuals living in Germany who are not German nationals but should be classified together with other private households.
2 It is not possible to tell from the Forbes list whether the households of these individuals include other members or not.
Since the Forbes list gives the net worth of individuals in US
dollars, the exchange rate on March 1 of the year in question
was taken to convert the amounts into euros. March 1 is al-
ways close to the publication date of the Forbes list in spring.
This process, though, is connected to additional assumptions
which lead to an increased degree of uncertainty in the esti-
mates, as explained below.
(1) For example, no statistical tests are applicable to deter-
mine or falsify a selected α or wmin when working with data
from different sources. Here, wmin is determined graphically;
simulations, however, show that the estimated value of α
relative to wmin exhibits a robustly regular shape, i.e., at least
one range of values can be given which, with a very high
probability, also includes the real value of wmin. Setting wmin
too low leads to results underestimating the concentration
of wealth on the upper margin; if the figure is set too high,
the concentration is overestimated. For these calculations,
wmin represented a band from 900,000 to 1,350,000 euros.
The variation effect results in a “minimum” and a “maximum”
(see below).
(2) Surveys suffer from a differential nonresponse on the
upper margins of wealth distribution. Studies in the US have
shown that the probability of taking part in such a survey
is negatively correlated to an individual’s net worth.3 Since
extrapolation factors are allowed for when calculating the
Pareto parameter with a regression estimator,4 these should,
as far as possible, take into account the structure of the
differential nonresponse. Should this either not be possible
or only partially since, as in reality, the structure is simply un-
known, the concentration of net worth on the upper margin
will be overestimated, as can be demonstrated accordingly
in simulations.
(3) The problems in estimating α described in (2) are also
connected to the question of exactly how many households
lie above the value of wmin. If one assumes a typical distortion
toward the middle class in the sample data, i.e., including a
disproportionate number of persons from the middle or upper
middle class, the figure for households in the Pareto distribu-
tion estimated on the basis of the survey will be too
3 See a. Kennickell and R. L. Woodburn, “Consistent Weight Design for the 1989, 1992, and 1995 SCFs, and the Distribution of Wealth,” Federal Reserve Board, Survey of Consumer Finances Working Papers (1997).
4 It is not possible to determine the wmin parameter using the alternative of maximum-likelihood estimation if the observations are taken from two different datasets, see P. Vermeulen (2014).
Box 2
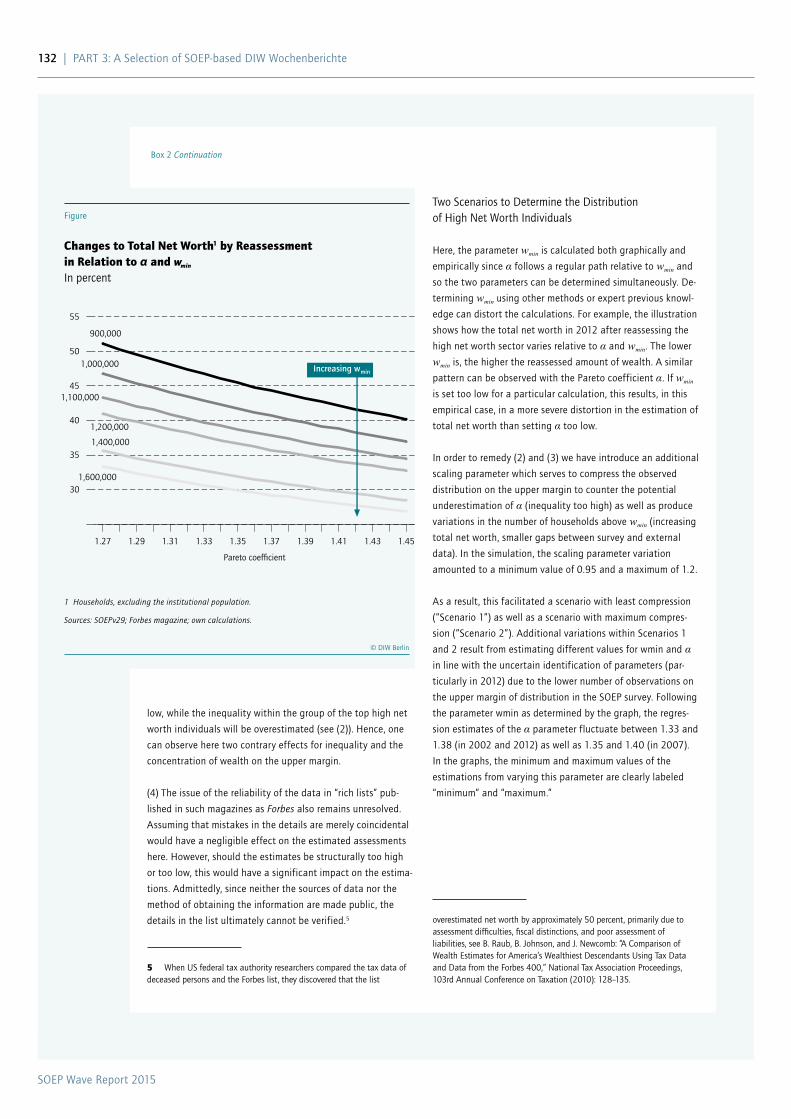
SOEP Wave Report 2015
132 | PaRT 3: a Selection of SOEP-based DIW Wochenberichte
low, while the inequality within the group of the top high net
worth individuals will be overestimated (see (2)). Hence, one
can observe here two contrary effects for inequality and the
concentration of wealth on the upper margin.
(4) The issue of the reliability of the data in “rich lists” pub-
lished in such magazines as Forbes also remains unresolved.
assuming that mistakes in the details are merely coincidental
would have a negligible effect on the estimated assessments
here. However, should the estimates be structurally too high
or too low, this would have a significant impact on the estima-
tions. admittedly, since neither the sources of data nor the
method of obtaining the information are made public, the
details in the list ultimately cannot be verified.5
5 When US federal tax authority researchers compared the tax data of deceased persons and the Forbes list, they discovered that the list
Two Scenarios to Determine the Distribution of High Net Worth Individuals
Here, the parameter wmin is calculated both graphically and
empirically since α follows a regular path relative to wmin and
so the two parameters can be determined simultaneously. De-
termining wmin using other methods or expert previous knowl-
edge can distort the calculations. For example, the illustration
shows how the total net worth in 2012 after reassessing the
high net worth sector varies relative to α and wmin. The lower
wmin is, the higher the reassessed amount of wealth. a similar
pattern can be observed with the Pareto coefficient α. If wmin
is set too low for a particular calculation, this results, in this
empirical case, in a more severe distortion in the estimation of
total net worth than setting α too low.
In order to remedy (2) and (3) we have introduce an additional
scaling parameter which serves to compress the observed
distribution on the upper margin to counter the potential
underestimation of α (inequality too high) as well as produce
variations in the number of households above wmin (increasing
total net worth, smaller gaps between survey and external
data). In the simulation, the scaling parameter variation
amounted to a minimum value of 0.95 and a maximum of 1.2.
as a result, this facilitated a scenario with least compression
(“Scenario 1”) as well as a scenario with maximum compres-
sion (“Scenario 2”). additional variations within Scenarios 1
and 2 result from estimating different values for wmin and α
in line with the uncertain identification of parameters (par-
ticularly in 2012) due to the lower number of observations on
the upper margin of distribution in the SOEP survey. Following
the parameter wmin as determined by the graph, the regres-
sion estimates of the α parameter fluctuate between 1.33 and
1.38 (in 2002 and 2012) as well as 1.35 and 1.40 (in 2007).
In the graphs, the minimum and maximum values of the
estimations from varying this parameter are clearly labeled
“minimum” and “maximum.”
overestimated net worth by approximately 50 percent, primarily due to assessment difficulties, fiscal distinctions, and poor assessment of liabilities, see B. Raub, B. Johnson, and J. Newcomb: “a Comparison of Wealth Estimates for america’s Wealthiest Descendants Using Tax Data and Data from the Forbes 400,” National Tax association Proceedings, 103rd annual Conference on Taxation (2010): 128–135.
Figure
Changes to Total Net Worth1 by Reassessment in Relation to α and wmin
In percent
1 Households, excluding the institutional population.
Sources: SOEPv29; Forbes magazine; own calculations.
© DIW Berlin
Box 2 Continuation
30
35
40
45
50
55
1.27 1.29 1.31 1.33 1.35 1.37 1.39 1.41 1.43 1.45
Pareto coef�cient
900,000
1,000,000
1,100,000
1,200,000
1,400,000
1,600,000
Increasing wmin
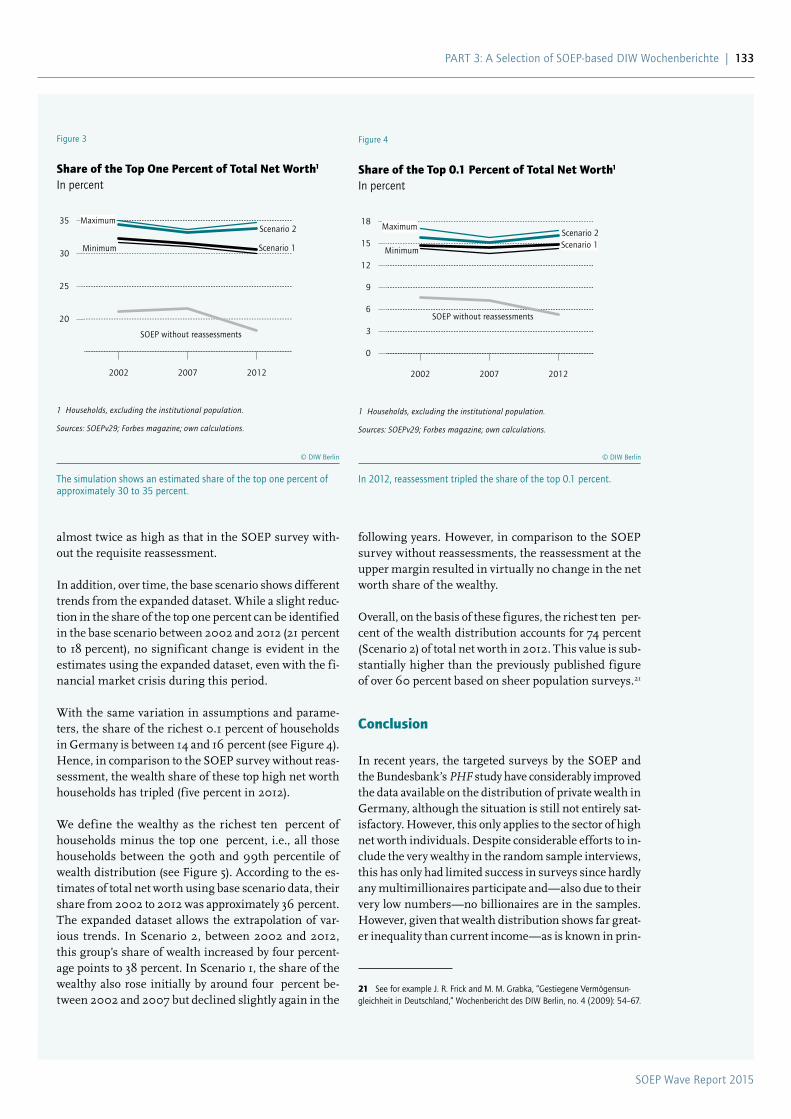
SOEP Wave Report 2015
PaRT 3: a Selection of SOEP-based DIW Wochenberichte | 133
following years. However, in comparison to the SOEP survey without reassessments, the reassessment at the upper margin resulted in virtually no change in the net worth share of the wealthy.
Overall, on the basis of these figures, the richest ten per-cent of the wealth distribution accounts for 74 percent (Scenario 2) of total net worth in 2012. This value is sub-stantially higher than the previously published figure of over 60 percent based on sheer population surveys.21
Conclusion
In recent years, the targeted surveys by the SOEP and the Bundesbank’s PHF study have considerably improved the data available on the distribution of private wealth in Germany, although the situation is still not entirely sat-isfactory. However, this only applies to the sector of high net worth individuals. Despite considerable efforts to in-clude the very wealthy in the random sample interviews, this has only had limited success in surveys since hardly any multimillionaires participate and—also due to their very low numbers—no billionaires are in the samples. However, given that wealth distribution shows far great-er inequality than current income—as is known in prin-
21 See for example J. R. Frick and M. M. Grabka, “Gestiegene Vermögensun-gleichheit in Deutschland,” Wochenbericht des DIW Berlin, no. 4 (2009): 54–67.
almost twice as high as that in the SOEP survey with-out the requisite reassessment.
In addition, over time, the base scenario shows different trends from the expanded dataset. While a slight reduc-tion in the share of the top one percent can be identified in the base scenario between 2002 and 2012 (21 percent to 18 percent), no significant change is evident in the estimates using the expanded dataset, even with the fi-nancial market crisis during this period.
With the same variation in assumptions and parame-ters, the share of the richest 0.1 percent of households in Germany is between 14 and 16 percent (see Figure 4). Hence, in comparison to the SOEP survey without reas-sessment, the wealth share of these top high net worth households has tripled (five percent in 2012).
We define the wealthy as the richest ten percent of households minus the top one percent, i.e., all those households between the 90th and 99th percentile of wealth distribution (see Figure 5). According to the es-timates of total net worth using base scenario data, their share from 2002 to 2012 was approximately 36 percent. The expanded dataset allows the extrapolation of var-ious trends. In Scenario 2, between 2002 and 2012, this group’s share of wealth increased by four percent-age points to 38 percent. In Scenario 1, the share of the wealthy also rose initially by around four percent be-tween 2002 and 2007 but declined slightly again in the
Figure 4
Share of the Top 0.1 Percent of Total Net Worth1
In percent
0
3
6
9
12
15
18
2002 2007 2012
Maximum
MinimumScenario 1Scenario 2
SOEP without reassessments
1 Households, excluding the institutional population.
Sources: SOEPv29; Forbes magazine; own calculations.
© DIW Berlin
In 2012, reassessment tripled the share of the top 0.1 percent.
Figure 3
Share of the Top One Percent of Total Net Worth1
In percent
20
25
30
35
2002 2007 2012
Maximum
Minimum Scenario 1
Scenario 2
SOEP without reassessments
1 Households, excluding the institutional population.
Sources: SOEPv29; Forbes magazine; own calculations.
© DIW Berlin
The simulation shows an estimated share of the top one percent of approximately 30 to 35 percent.

SOEP Wave Report 2015
134 | PaRT 3: a Selection of SOEP-based DIW Wochenberichte
sults. In particular, there is a lack of valid external statis-tics or official lists22 to calibrate estimates and increase their accuracy. In other countries, for example in Spain, wealth tax details provide data that are considerably more precise. In Germany, although this problem cannot be completely resolved by targeted and more comprehen-sive surveys, it can be substantially reduced.
Although the estimates presented here are calculated from an expanded SOEP dataset based on a variety of as-sumptions, they do tend to indicate there is, in all prob-ability, considerably higher wealth inequality in Germa-ny than the standard survey data could have feasibly de-scribed previously. For example, the top one percent may well account for over 30 percent of the total net worth, and the top 0.1 percent for as much as approximately 14 to 17 percent. As a result, in comparison to the estimates solely based on surveys, the top 0.1 percent’s share of to-tal net worth tripled in 2012.
The uncertainty of the estimates shows that improving the possible methods for acquiring statistical data on the net worth of households continues to be an important task. Here, policymakers also have to play their part and work together with the research community on projects to improve the insufficiency of the existing datasets.
22 Sweden, for example, has compiled a register for decades of all persons subject to a wealth tax. The data from these censuses allow valid statements on the distribution of wealth and national wealth overall. However, recently Sweden suspended its wealth tax so that now this country also has difficulties in making valid statements on wealth distribution.
ciple from other studies—the very wealthy are more im-portant for statistically determining inequality ratios in such random samples. Including the very wealthy in a reassessment of the figures can lead to improved esti-mates for the sum of aggregate wealth as well as wealth inequality overall. The validity of such a reassessment is, however, based on a number of assumptions which generate a greater level of insecurity in the estimated re-
Figure 5
Share of the Wealthy of Total Net Worth1
In percent
32
34
36
38
40
2002 2007 2012
Maximum
Minimum
Scenario 1
Scenario 2
SOEP without reassessments
1 Households 90th to 99th percentiles, households, excluding the institutional population.
Sources: SOEPv29; Forbes magazine; own calculations.
© DIW Berlin
Reassessment has relatively little impact on the wealthy’s share of net worth.
Christian Westermeier is a Ph.D. student at the Socio-Economic Panel study at DIW Berlin | [email protected]
Markus M. Grabka is a Research associate at the Socio-Economic Panel study at DIW Berlin | [email protected]
JEL: D31, I31
Keywords: Wealth Inequality, Pareto distribution, SOEP

SOEP Wave Report 2015
135

SOEP Wave Report 2015
136 | PaRT 3: a Selection of SOEP-based DIW Wochenberichte
ECONOMY. POLITICS. SCIENCE.
DIW Economic Bulletin
2015
Aircraft Noise and Quality of Life
REPORT by Peter Eibich, Konstantin Kholodilin, Christian Krekel and Gert G. Wagner
Aircraft Noise in Berlin Affects Quality of Life Even Outside the Airport Grounds 127INTERVIEW with Peter Eibich
»Aircraft Noise Has Negative Impact on Well-Being and Health — Even When Not Perceived as a Disturbance« 134
9
Source:
DIW Economic Bulletin 9/2015
Volume 5, pp. 127–133February 25, 2015ISSN 2192-7219
www.diw.de/econbull
SOEP Wave Report 2015
PaRT 3: a Selection of SOEP-based DIW Wochenberichte | 137
aircraft noise is a particularly problematic source of noise as many airports are located in or near major cities and, as a result, densely populated areas are affected. Data from the Berlin aging Study II (Berliner altersstudie II, BaSE-II), whose socio-economic module is based on the longitudinal Socio-Economic Panel (SOEP) study which has been conducted since 1984, allows us to examine the effect of different levels of aircraft noise on the subjective well-being and health of the older residents of a major city, in this case Berlin. The findings show that the presence of aircraft noise, also measured using objective aircraft noise data, is associated with significantly reduced well-being, lower satisfaction with one’s living environment, and poorer health. The association between well-being and a crossing altitude reduced by 100 meters is given certain assumptions — for crossing altitudes of between 1,000 and 2,500m — comparable to an income loss of between 30 and 117 euros per month.
Aircraft Noise in Berlin Affects Quality of Life Even Outside the Airport GroundsBy Peter Eibich, Konstantin Kholodilin, Christian Krekel and Gert G. Wagner
Publicly and in the media, aircraft noise is often asso-ciated with restrictions on well-being and lasting dam-age to health. Fears of the impacts on individuals’ health are ref lected inter alia in discussions on future f light paths for the Berlin Brandenburg International Airport (BER).1 Additionally, aircraft noise is associated with negative material consequences empirically evidenced through falling property and land prices.2 The health effects of aircraft noise have already been analyzed in several medical research studies. The findings suggest that aircraft noise inter alia is also associated with an in-creased risk of cardiovascular diseases, sleep disorders in adults, and impaired cognitive development in chil-dren.3 There are few studies in the economic literature that deal with the effects of aircraft noise.4 For example, Van Praag and Baarsma (2005) studied whether the low cost of housing in the vicinity of Amsterdam airport off-set the negative impact of the aircraft noise. They have found evidence leading them to conclude that loss of
1 See P. Neumann, “So macht der Fluglärm anwohner krank,” Berliner Zeitung, March 23, 2014, available online at http://www.berliner-zeitung.de/hauptstadtflughafen/klage-gegen-flughafen-tegel-so-macht-der-fluglaerm-an-wohner-krank,11546166,26635970.html, last accessed on December 16, 2014; and R. Kotsch, “Ungerecht, aber unausweichlich,” Frankfurter Rundschau, January 26, 2012, available online at http://www.fr-online.de/politik/aerger-um-flugrouten-ueber-berlin-ungerecht--aber-unausweich-lich,1472596,11513756.html, last accessed on December 16, 2014.
2 andreas Mense and Konstantin Kholodilin, “Noise expectations and house prices: the reaction of property prices to an airport expansion,” The annals of Regional Science, vol. 52(3) (2013): 763–797.
3 See a. Hansell et al., “aircraft noise and cardiovascular disease near Heath-row airport in London: small area study,” British Medical Journal, vol. 347 (2013): 5432; S. Perron et al., “Review of the effect of aircraft noise on sleep disturbance in adults,” Noise & Health, vol. 14, no. 57 (2012): 58–67; S. a. Stansfeld et al., “aircraft and road traffic noise and children’s cognition and health: a cross-national study,” The Lancet, vol. 365, no. 9475 (2005): 1942–1949.
4 See D. a. Black et al., “aircraft noise exposure and resident’s stress and hypertension: a public health perspective for airport environmental management,” Journal of air Transport Management, vol. 13, no. 5 (2007): 264–275; S. Boes et al., “aircraft Noise, Health, and Residential Sorting: Evidence From Two Quasi-Experiments,” Health Economics, vol. 22, no. 9 (2013): 1037–1051; and B. M. S. van Praag and B. E. Baarsma, “Using Happiness Surveys to Value Intangibles: The Case of airport Noise,” Economic Journal, vol. 115 (2005): 224–246.
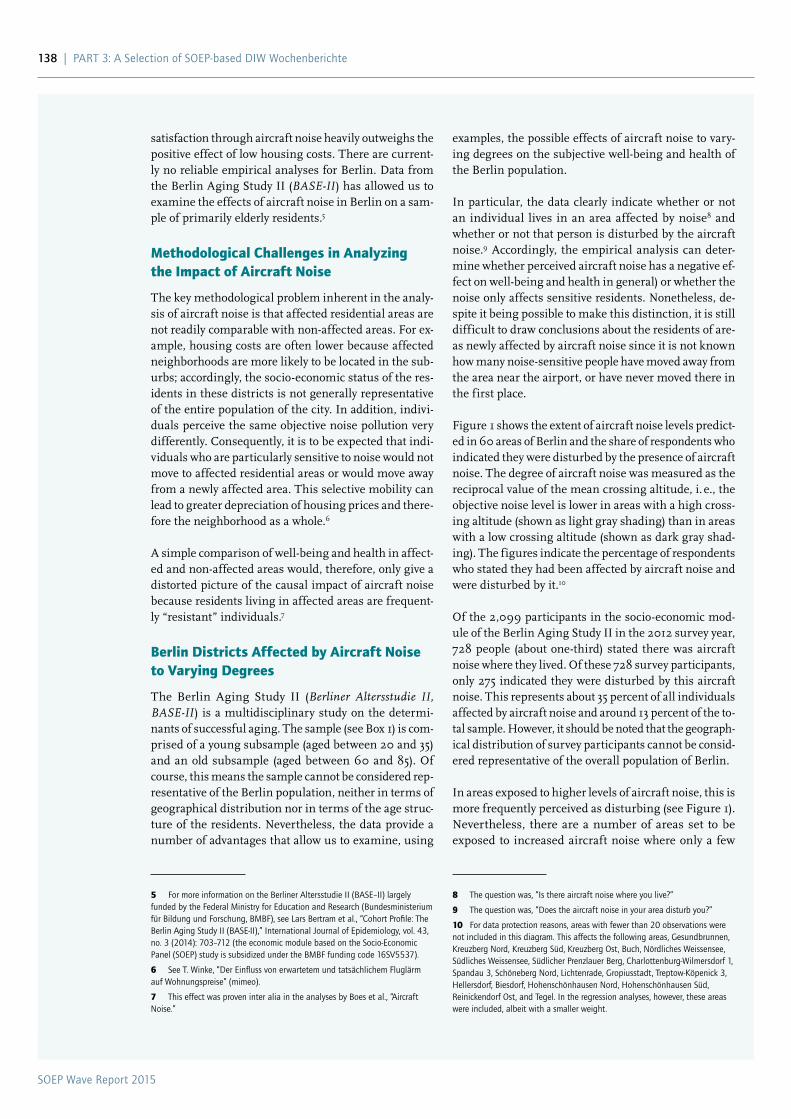
SOEP Wave Report 2015
138 | PaRT 3: a Selection of SOEP-based DIW Wochenberichte
examples, the possible effects of aircraft noise to vary-ing degrees on the subjective well-being and health of the Berlin population.
In particular, the data clearly indicate whether or not an individual lives in an area affected by noise8 and whether or not that person is disturbed by the aircraft noise.9 Accordingly, the empirical analysis can deter-mine whether perceived aircraft noise has a negative ef-fect on well-being and health in general) or whether the noise only affects sensitive residents. Nonetheless, de-spite it being possible to make this distinction, it is still difficult to draw conclusions about the residents of are-as newly affected by aircraft noise since it is not known how many noise-sensitive people have moved away from the area near the airport, or have never moved there in the first place.
Figure 1 shows the extent of aircraft noise levels predict-ed in 60 areas of Berlin and the share of respondents who indicated they were disturbed by the presence of aircraft noise. The degree of aircraft noise was measured as the reciprocal value of the mean crossing altitude, i. e., the objective noise level is lower in areas with a high cross-ing altitude (shown as light gray shading) than in areas with a low crossing altitude (shown as dark gray shad-ing). The figures indicate the percentage of respondents who stated they had been affected by aircraft noise and were disturbed by it.10
Of the 2,099 participants in the socio-economic mod-ule of the Berlin Aging Study II in the 2012 survey year, 728 people (about one-third) stated there was aircraft noise where they lived. Of these 728 survey participants, only 275 indicated they were disturbed by this aircraft noise. This represents about 35 percent of all individuals affected by aircraft noise and around 13 percent of the to-tal sample. However, it should be noted that the geograph-ical distribution of survey participants cannot be consid-ered representative of the overall population of Berlin.
In areas exposed to higher levels of aircraft noise, this is more frequently perceived as disturbing (see Figure 1). Nevertheless, there are a number of areas set to be exposed to increased aircraft noise where only a few
8 The question was, “Is there aircraft noise where you live?”
9 The question was, “Does the aircraft noise in your area disturb you?”
10 For data protection reasons, areas with fewer than 20 observations were not included in this diagram. This affects the following areas, Gesundbrunnen, Kreuzberg Nord, Kreuzberg Süd, Kreuzberg Ost, Buch, Nördliches Weissensee, Südliches Weissensee, Südlicher Prenzlauer Berg, Charlottenburg-Wilmersdorf 1, Spandau 3, Schöneberg Nord, Lichtenrade, Gropiusstadt, Treptow-Köpenick 3, Hellersdorf, Biesdorf, Hohenschönhausen Nord, Hohenschönhausen Süd, Reinickendorf Ost, and Tegel. In the regression analyses, however, these areas were included, albeit with a smaller weight.
satisfaction through aircraft noise heavily outweighs the positive effect of low housing costs. There are current-ly no reliable empirical analyses for Berlin. Data from the Berlin Aging Study II (BASE-II) has allowed us to examine the effects of aircraft noise in Berlin on a sam-ple of primarily elderly residents.5
Methodological Challenges in Analyzing the Impact of Aircraft Noise
The key methodological problem inherent in the analy-sis of aircraft noise is that affected residential areas are not readily comparable with non-affected areas. For ex-ample, housing costs are often lower because affected neighborhoods are more likely to be located in the sub-urbs; accordingly, the socio-economic status of the res-idents in these districts is not generally representative of the entire population of the city. In addition, indivi-duals perceive the same objective noise pollution very differently. Consequently, it is to be expected that indi-viduals who are particularly sensitive to noise would not move to affected residential areas or would move away from a newly affected area. This selective mobility can lead to greater depreciation of housing prices and there-fore the neighborhood as a whole.6
A simple comparison of well-being and health in affect-ed and non-affected areas would, therefore, only give a distorted picture of the causal impact of aircraft noise because residents living in affected areas are frequent-ly “resistant” individuals.7
Berlin Districts Affected by Aircraft Noise to Varying Degrees
The Berlin Aging Study II (Berliner Altersstudie II, BASE-II) is a multidisciplinary study on the determi-nants of successful aging. The sample (see Box 1) is com-prised of a young subsample (aged between 20 and 35) and an old subsample (aged between 60 and 85). Of course, this means the sample cannot be considered rep-resentative of the Berlin population, neither in terms of geographical distribution nor in terms of the age struc-ture of the residents. Nevertheless, the data provide a number of advantages that allow us to examine, using
5 For more information on the Berliner altersstudie II (BaSE–II) largely funded by the Federal Ministry for Education and Research (Bundesministerium für Bildung und Forschung, BMBF), see Lars Bertram et al., “Cohort Profile: The Berlin aging Study II (BaSE-II),” International Journal of Epidemiology, vol. 43, no. 3 (2014): 703–712 (the economic module based on the Socio-Economic Panel (SOEP) study is subsidized under the BMBF funding code 16SV5537).
6 See T. Winke, “Der Einfluss von erwartetem und tatsächlichem Fluglärm auf Wohnungspreise” (mimeo).
7 This effect was proven inter alia in the analyses by Boes et al., “aircraft Noise.”
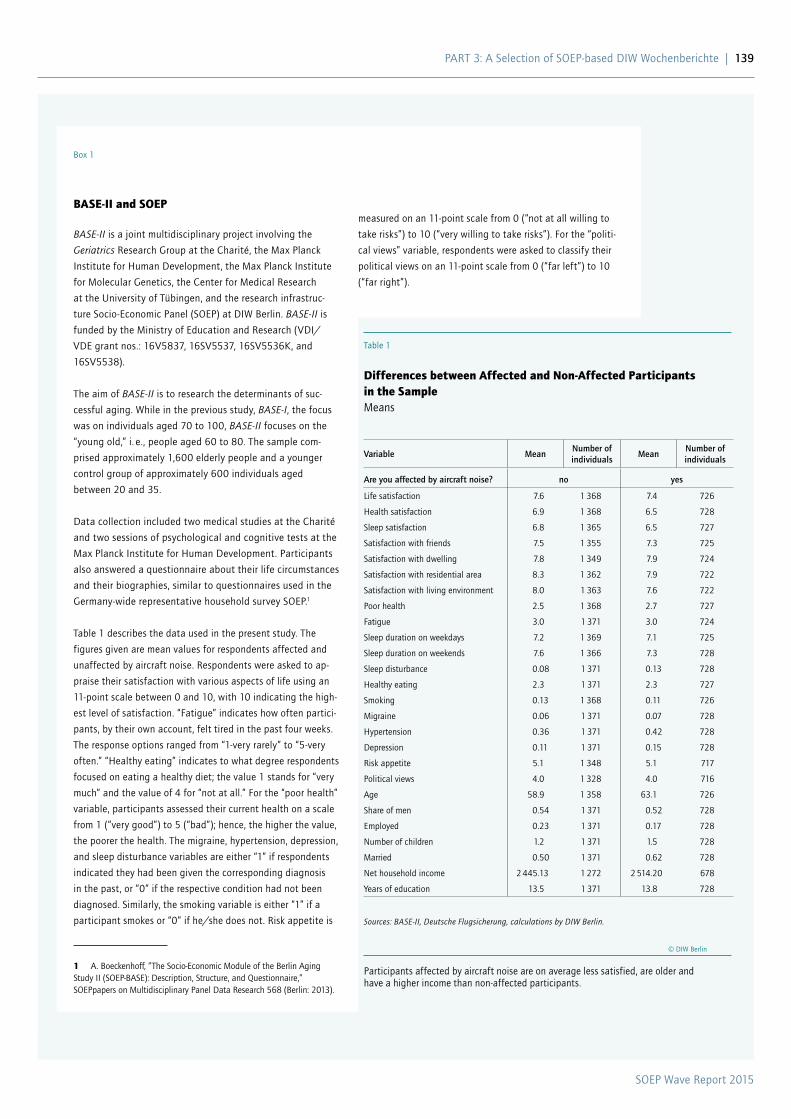
SOEP Wave Report 2015
PaRT 3: a Selection of SOEP-based DIW Wochenberichte | 139
BASE-II and SOEP
BASE-II is a joint multidisciplinary project involving the
Geriatrics Research Group at the Charité, the Max Planck
Institute for Human Development, the Max Planck Institute
for Molecular Genetics, the Center for Medical Research
at the University of Tübingen, and the research infrastruc-
ture Socio-Economic Panel (SOEP) at DIW Berlin. BASE-II is
funded by the Ministry of Education and Research (VDI/
VDE grant nos.: 16V5837, 16SV5537, 16SV5536K, and
16SV5538).
The aim of BASE-II is to research the determinants of suc-
cessful aging. While in the previous study, BASE-I, the focus
was on individuals aged 70 to 100, BASE-II focuses on the
“young old,” i. e., people aged 60 to 80. The sample com-
prised approximately 1,600 elderly people and a younger
control group of approximately 600 individuals aged
between 20 and 35.
Data collection included two medical studies at the Charité
and two sessions of psychological and cognitive tests at the
Max Planck Institute for Human Development. Participants
also answered a questionnaire about their life circumstances
and their biographies, similar to questionnaires used in the
Germany-wide representative household survey SOEP.1
Table 1 describes the data used in the present study. The
figures given are mean values for respondents affected and
unaffected by aircraft noise. Respondents were asked to ap-
praise their satisfaction with various aspects of life using an
11-point scale between 0 and 10, with 10 indicating the high-
est level of satisfaction. “Fatigue” indicates how often partici-
pants, by their own account, felt tired in the past four weeks.
The response options ranged from “1-very rarely” to “5-very
often.” “Healthy eating” indicates to what degree respondents
focused on eating a healthy diet; the value 1 stands for “very
much” and the value of 4 for “not at all.” For the “poor health”
variable, participants assessed their current health on a scale
from 1 (“very good”) to 5 (“bad”); hence, the higher the value,
the poorer the health. The migraine, hypertension, depression,
and sleep disturbance variables are either “1” if respondents
indicated they had been given the corresponding diagnosis
in the past, or “0” if the respective condition had not been
diagnosed. Similarly, the smoking variable is either “1” if a
participant smokes or “0” if he/she does not. Risk appetite is
1 a. Boeckenhoff, “The Socio-Economic Module of the Berlin aging Study II (SOEP-BaSE): Description, Structure, and Questionnaire,” SOEPpapers on Multidisciplinary Panel Data Research 568 (Berlin: 2013).
measured on an 11-point scale from 0 (“not at all willing to
take risks”) to 10 (“very willing to take risks”). For the “politi-
cal views” variable, respondents were asked to classify their
political views on an 11-point scale from 0 (“far left”) to 10
(“far right”).
Box 1
Table 1
Differences between Affected and Non-Affected Participants in the SampleMeans
Variable MeanNumber of individuals
MeanNumber of individuals
Are you affected by aircraft noise? no yes
Life satisfaction 7.6 1 368 7.4 726
Health satisfaction 6.9 1 368 6.5 728
Sleep satisfaction 6.8 1 365 6.5 727
Satisfaction with friends 7.5 1 355 7.3 725
Satisfaction with dwelling 7.8 1 349 7.9 724
Satisfaction with residential area 8.3 1 362 7.9 722
Satisfaction with living environment 8.0 1 363 7.6 722
Poor health 2.5 1 368 2.7 727
Fatigue 3.0 1 371 3.0 724
Sleep duration on weekdays 7.2 1 369 7.1 725
Sleep duration on weekends 7.6 1 366 7.3 728
Sleep disturbance 0.08 1 371 0.13 728
Healthy eating 2.3 1 371 2.3 727
Smoking 0.13 1 368 0.11 726
Migraine 0.06 1 371 0.07 728
Hypertension 0.36 1 371 0.42 728
Depression 0.11 1 371 0.15 728
Risk appetite 5.1 1 348 5.1 717
Political views 4.0 1 328 4.0 716
age 58.9 1 358 63.1 726
Share of men 0.54 1 371 0.52 728
Employed 0.23 1 371 0.17 728
Number of children 1.2 1 371 1.5 728
Married 0.50 1 371 0.62 728
Net household income 2 445.13 1 272 2 514.20 678
Years of education 13.5 1 371 13.8 728
Sources: BASE-II, Deutsche Flugsicherung, calculations by DIW Berlin.
© DIW Berlin
Participants affected by aircraft noise are on average less satisfied, are older and have a higher income than non-affected participants.
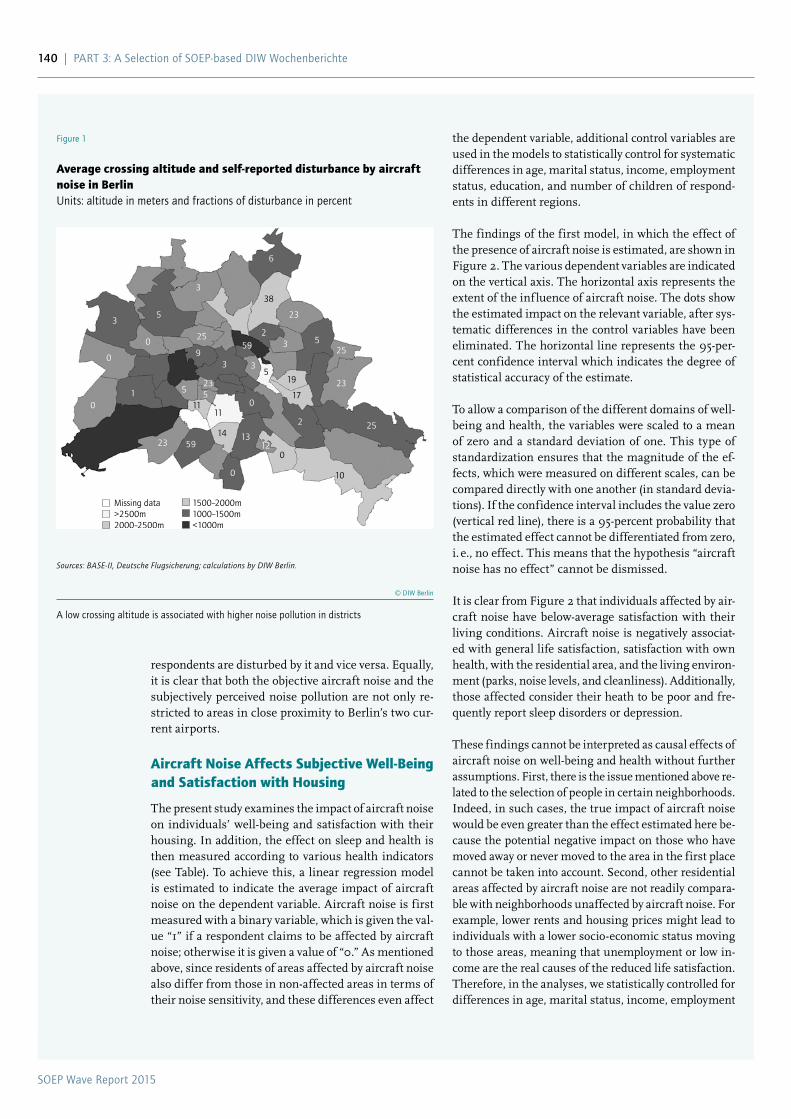
SOEP Wave Report 2015
140 | PaRT 3: a Selection of SOEP-based DIW Wochenberichte
respondents are disturbed by it and vice versa. Equally, it is clear that both the objective aircraft noise and the subjectively perceived noise pollution are not only re-stricted to areas in close proximity to Berlin’s two cur-rent airports.
Aircraft Noise Affects Subjective Well-Being and Satisfaction with Housing
The present study examines the impact of aircraft noise on individuals’ well-being and satisfaction with their housing. In addition, the effect on sleep and health is then measured according to various health indicators (see Table). To achieve this, a linear regression model is estimated to indicate the average impact of aircraft noise on the dependent variable. Aircraft noise is first measured with a binary variable, which is given the val-ue “1” if a respondent claims to be affected by aircraft noise; otherwise it is given a value of “0.” As mentioned above, since residents of areas affected by aircraft noise also differ from those in non-affected areas in terms of their noise sensitivity, and these differences even affect
the dependent variable, additional control variables are used in the models to statistically control for systematic differences in age, marital status, income, employment status, education, and number of children of respond-ents in different regions.
The findings of the first model, in which the effect of the presence of aircraft noise is estimated, are shown in Figure 2. The various dependent variables are indicated on the vertical axis. The horizontal axis represents the extent of the inf luence of aircraft noise. The dots show the estimated impact on the relevant variable, after sys-tematic differences in the control variables have been eliminated. The horizontal line represents the 95-per-cent confidence interval which indicates the degree of statistical accuracy of the estimate.
To allow a comparison of the different domains of well-being and health, the variables were scaled to a mean of zero and a standard deviation of one. This type of standardization ensures that the magnitude of the ef-fects, which were measured on different scales, can be compared directly with one another (in standard devia-tions). If the confidence interval includes the value zero (vertical red line), there is a 95-percent probability that the estimated effect cannot be differentiated from zero, i. e., no effect. This means that the hypothesis “aircraft noise has no effect” cannot be dismissed.
It is clear from Figure 2 that individuals affected by air-craft noise have below-average satisfaction with their living conditions. Aircraft noise is negatively associat-ed with general life satisfaction, satisfaction with own health, with the residential area, and the living environ-ment (parks, noise levels, and cleanliness). Additionally, those affected consider their heath to be poor and fre-quently report sleep disorders or depression.
These findings cannot be interpreted as causal effects of aircraft noise on well-being and health without further assumptions. First, there is the issue mentioned above re-lated to the selection of people in certain neighborhoods. Indeed, in such cases, the true impact of aircraft noise would be even greater than the effect estimated here be-cause the potential negative impact on those who have moved away or never moved to the area in the first place cannot be taken into account. Second, other residential areas affected by aircraft noise are not readily compara-ble with neighborhoods unaffected by aircraft noise. For example, lower rents and housing prices might lead to individuals with a lower socio-economic status moving to those areas, meaning that unemployment or low in-come are the real causes of the reduced life satisfaction. Therefore, in the analyses, we statistically controlled for differences in age, marital status, income, employment
Figure 1
Average crossing altitude and self-reported disturbance by aircraft noise in BerlinUnits: altitude in meters and fractions of disturbance in percent
Missing data>2500m2000–2500m
1500–2000m1000–1500m<1000m
3
0
0
0
1
23 59
0
14
110
1312
0
10
252
17
19 23
255
23
3
53
59
38
6
3
5
25
93
235 5
11
2
Sources: BASE-II, Deutsche Flugsicherung; calculations by DIW Berlin.
© DIW Berlin
a low crossing altitude is associated with higher noise pollution in districts
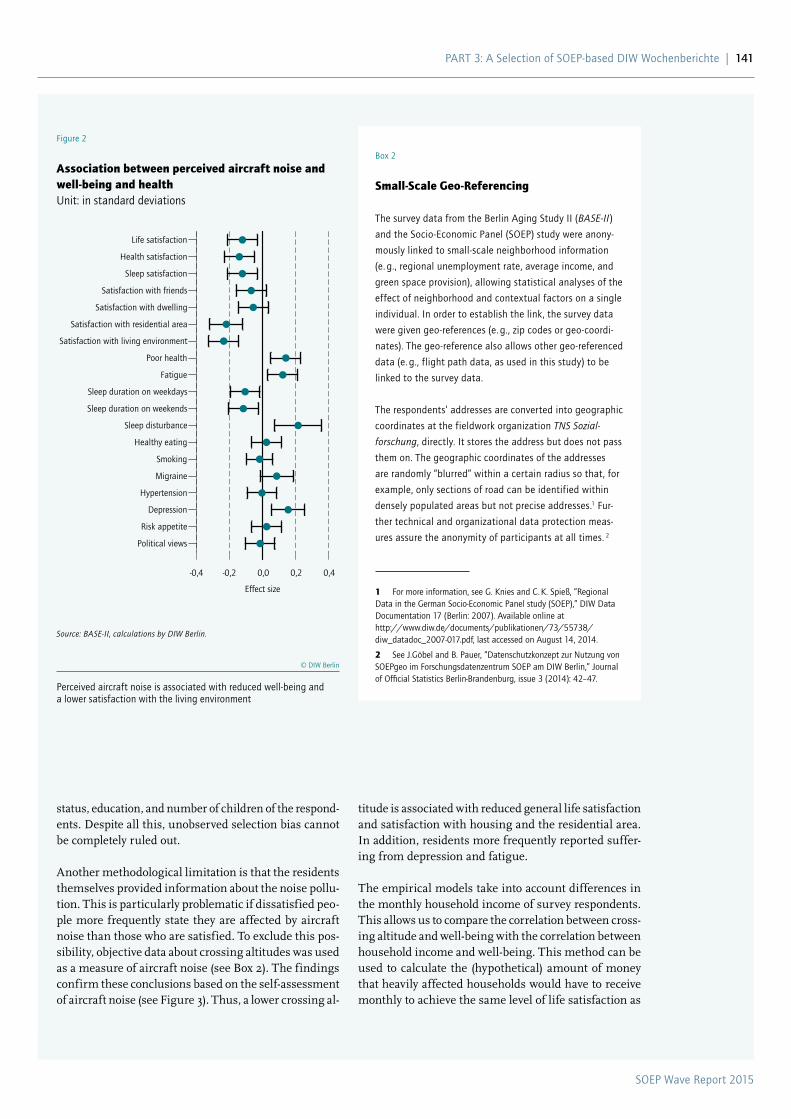
SOEP Wave Report 2015
PaRT 3: a Selection of SOEP-based DIW Wochenberichte | 141
titude is associated with reduced general life satisfaction and satisfaction with housing and the residential area. In addition, residents more frequently reported suffer-ing from depression and fatigue.
The empirical models take into account differences in the monthly household income of survey respondents. This allows us to compare the correlation between cross-ing altitude and well-being with the correlation between household income and well-being. This method can be used to calculate the (hypothetical) amount of money that heavily affected households would have to receive monthly to achieve the same level of life satisfaction as
status, education, and number of children of the respond-ents. Despite all this, unobserved selection bias cannot be completely ruled out.
Another methodological limitation is that the residents themselves provided information about the noise pollu-tion. This is particularly problematic if dissatisfied peo-ple more frequently state they are affected by aircraft noise than those who are satisfied. To exclude this pos-sibility, objective data about crossing altitudes was used as a measure of aircraft noise (see Box 2). The findings confirm these conclusions based on the self-assessment of aircraft noise (see Figure 3). Thus, a lower crossing al-
Figure 2
Association between perceived aircraft noise and well-being and healthUnit: in standard deviations
-0,4 -0,2 0,0 0,2 0,4
Effect size
Life satisfaction
Health satisfaction
Sleep satisfaction
Satisfaction with friends
Satisfaction with dwelling
Satisfaction with residential area
Satisfaction with living environment
Poor health
Fatigue
Sleep duration on weekdays
Sleep duration on weekends
Sleep disturbance
Healthy eating
Smoking
Migraine
Hypertension
Depression
Risk appetite
Political views
Source: BASE-II, calculations by DIW Berlin.
© DIW Berlin
Perceived aircraft noise is associated with reduced well-being and a lower satisfaction with the living environment
Box 2
Small-Scale Geo-Referencing
The survey data from the Berlin aging Study II (BASE-II)
and the Socio-Economic Panel (SOEP) study were anony-
mously linked to small-scale neighborhood information
(e. g., regional unemployment rate, average income, and
green space provision), allowing statistical analyses of the
effect of neighborhood and contextual factors on a single
individual. In order to establish the link, the survey data
were given geo-references (e. g., zip codes or geo-coordi-
nates). The geo-reference also allows other geo-referenced
data (e. g., flight path data, as used in this study) to be
linked to the survey data.
The respondents’ addresses are converted into geographic
coordinates at the fieldwork organization TNS Sozial-
forschung, directly. It stores the address but does not pass
them on. The geographic coordinates of the addresses
are randomly “blurred” within a certain radius so that, for
example, only sections of road can be identified within
densely populated areas but not precise addresses.1 Fur-
ther technical and organizational data protection meas-
ures assure the anonymity of participants at all times. 2
1 For more information, see G. Knies and C. K. Spieß, “Regional Data in the German Socio-Economic Panel study (SOEP),” DIW Data Documentation 17 (Berlin: 2007). available online at http://www.diw.de/documents/publikationen/73/55738/ diw_datadoc_2007-017.pdf, last accessed on august 14, 2014.
2 See J.Göbel and B. Pauer, “Datenschutzkonzept zur Nutzung von SOEPgeo im Forschungsdatenzentrum SOEP am DIW Berlin,” Journal of Official Statistics Berlin-Brandenburg, issue 3 (2014): 42–47.
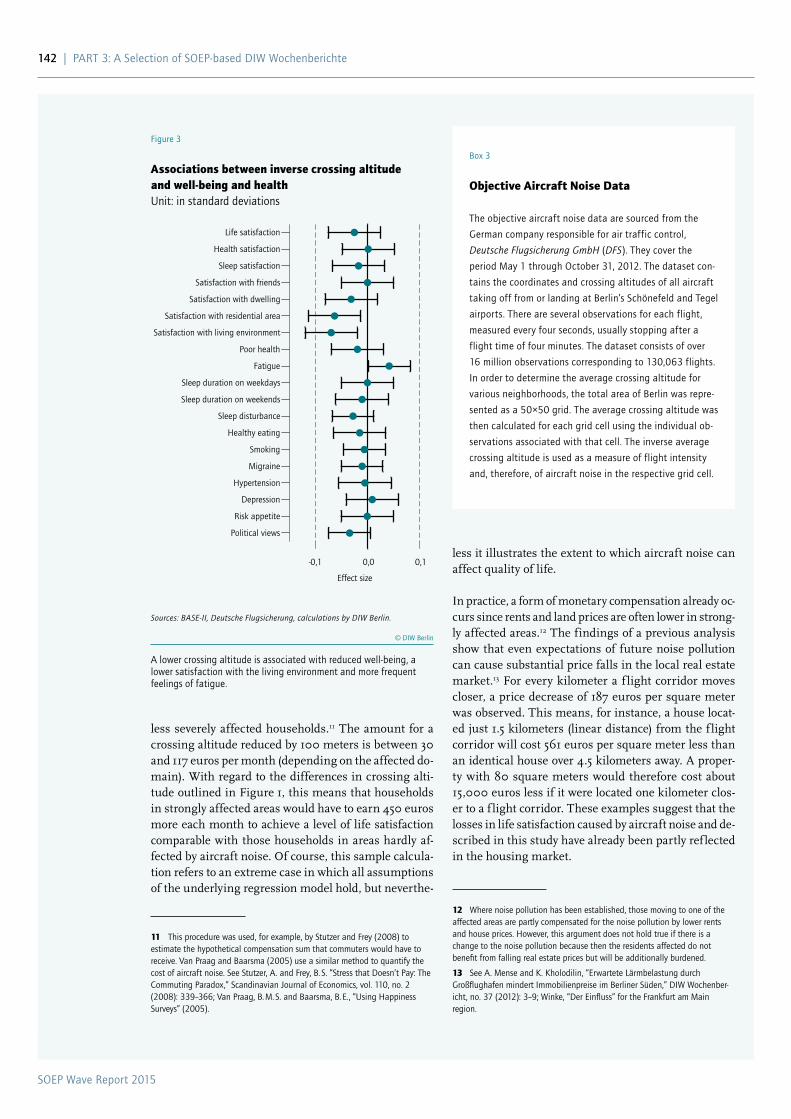
SOEP Wave Report 2015
142 | PaRT 3: a Selection of SOEP-based DIW Wochenberichte
less severely affected households.11 The amount for a crossing altitude reduced by 100 meters is between 30 and 117 euros per month (depending on the affected do-main). With regard to the differences in crossing alti-tude outlined in Figure 1, this means that households in strongly affected areas would have to earn 450 euros more each month to achieve a level of life satisfaction comparable with those households in areas hardly af-fected by aircraft noise. Of course, this sample calcula-tion refers to an extreme case in which all assumptions of the underlying regression model hold, but neverthe-
11 This procedure was used, for example, by Stutzer and Frey (2008) to estimate the hypothetical compensation sum that commuters would have to receive. Van Praag and Baarsma (2005) use a similar method to quantify the cost of aircraft noise. See Stutzer, a. and Frey, B. S. “Stress that Doesn’t Pay: The Commuting Paradox,” Scandinavian Journal of Economics, vol. 110, no. 2 (2008): 339–366; Van Praag, B. M. S. and Baarsma, B. E., “Using Happiness Surveys” (2005).
less it illustrates the extent to which aircraft noise can affect quality of life.
In practice, a form of monetary compensation already oc-curs since rents and land prices are often lower in strong-ly affected areas.12 The findings of a previous analysis show that even expectations of future noise pollution can cause substantial price falls in the local real estate market.13 For every kilometer a f light corridor moves closer, a price decrease of 187 euros per square meter was observed. This means, for instance, a house locat-ed just 1.5 kilometers (linear distance) from the f light corridor will cost 561 euros per square meter less than an identical house over 4.5 kilometers away. A proper-ty with 80 square meters would therefore cost about 15,000 euros less if it were located one kilometer clos-er to a f light corridor. These examples suggest that the losses in life satisfaction caused by aircraft noise and de-scribed in this study have already been partly ref lected in the housing market.
12 Where noise pollution has been established, those moving to one of the affected areas are partly compensated for the noise pollution by lower rents and house prices. However, this argument does not hold true if there is a change to the noise pollution because then the residents affected do not benefit from falling real estate prices but will be additionally burdened.
13 See a. Mense and K. Kholodilin, “Erwartete Lärmbelastung durch Großflughafen mindert Immobilienpreise im Berliner Süden,” DIW Wochenber-icht, no. 37 (2012): 3–9; Winke, “Der Einfluss” for the Frankfurt am Main region.
Figure 3
Associations between inverse crossing altitude and well-being and healthUnit: in standard deviations
-0,1 0,0 0,1
Effect size
Life satisfaction
Health satisfaction
Sleep satisfaction
Satisfaction with friends
Satisfaction with dwelling
Satisfaction with residential area
Satisfaction with living environment
Poor health
Fatigue
Sleep duration on weekdays
Sleep duration on weekends
Sleep disturbance
Healthy eating
Smoking
Migraine
Hypertension
Depression
Risk appetite
Political views
Sources: BASE-II, Deutsche Flugsicherung, calculations by DIW Berlin.
© DIW Berlin
a lower crossing altitude is associated with reduced well-being, a lower satisfaction with the living environment and more frequent feelings of fatigue.
Box 3
Objective Aircraft Noise Data
The objective aircraft noise data are sourced from the
German company responsible for air traffic control,
Deutsche Flugsicherung GmbH (DFS). They cover the
period May 1 through October 31, 2012. The dataset con-
tains the coordinates and crossing altitudes of all aircraft
taking off from or landing at Berlin’s Schönefeld and Tegel
airports. There are several observations for each flight,
measured every four seconds, usually stopping after a
flight time of four minutes. The dataset consists of over
16 million observations corresponding to 130,063 flights.
In order to determine the average crossing altitude for
various neighborhoods, the total area of Berlin was repre-
sented as a 50×50 grid. The average crossing altitude was
then calculated for each grid cell using the individual ob-
servations associated with that cell. The inverse average
crossing altitude is used as a measure of flight intensity
and, therefore, of aircraft noise in the respective grid cell.
SOEP Wave Report 2015
PaRT 3: a Selection of SOEP-based DIW Wochenberichte | 143
impact of aircraft noise is underestimated as a result of particularly noise-sensitive people moving to quieter neighborhoods. However, moving is not always possible or reasonable in all circumstances. Furthermore, (short-term) changes to f light paths might affect residents in previously unaffected neighborhoods. In both cases, there is a need for policy-makers to take steps to miti-gate the negative effects of aircraft noise at local levels.
Conclusion
Cross-sectional analyzes alone do not allow any causal statements to be made. Based on the empirical findings presented in this report for a non-representative sam-ple of primarily elderly residents of Berlin, it can be ten-tatively concluded that the presence of aircraft noise is associated with both reduced well-being and impaired health of those affected. The real extent of the negative
Peter Eibich is Research associate at the SOEP Research Infrastructure at DIW Berlin | [email protected]
Dr. habil. Konstantin Kholodilin is Research associate of the Department for Macroeconomics at DIW Berlin | [email protected]
Christian Krekel is Doctoral Student at the SOEP Research Infrastructure at DIW Berlin | [email protected]
Prof. Dr. Gert G. Wagner is Member of the Executive Board of DIW Berlin | [email protected]
JEL: JEL: I31, R41, I12
Keywords: aircraft noise, well-being, health, BaSE-II, SOEP

SOEP Wave Report 2015
2015
144
2015SOEP Wave Report 2015
PART 4
SoEP Service activities & Knowledge transfer in 2015
PaRT 4: SOEP Service activities & Knowledge Transfer in 2015 | 145
SOEP Wave Report 2015
146 | PaRT 4: SOEP Service activities & Knowledge Transfer in 2015
The topic of immigration has dominated not only the German media over the last year but also the re-search based on SOEP data. In 2015, the IAB-SOEP Migration Sample launched in 2013 added another 1,200 households to the sample to provide an even clearer picture of the situation of migration to Ger-many. Shortly before Christmas 2015, the SOEP signed an agreement with the Institute for Employ-ment Research (IAB), the Federal Office for Migra-tion and Refugees (BAMF) to survey around 2,000 refugees over the next three years in the framework of the IAB-BAMF-SOEP refugee sample. And initial findings from a recent study using SOEP data show that people who are bitter about their own living situation are more concerned about immigration than others.
Another topic of SOEP research that attracted a great deal of media interest in 2015 was the ques-tion of intergenerational mobility. How does it af-fect children’s personality development when their fathers are unemployed? And how does divorce af-fect children’s educational outcomes—especially for children from socially disadvantaged family back-grounds?
Numerous media reports were published in 2015 on SOEP-based analyses of the distribution of in-come and wealth in Germany. In one interview for Frankfurter Rundschau, SOEP income distribution expert Markus M. Grabka discussed the problem of poverty in Germany and its scientific predictability.
Reports on the SOEP in the media are posted on our SOEP Facebook page at: www.facebook.com/soepnet.de
SOEP in the Media 2015
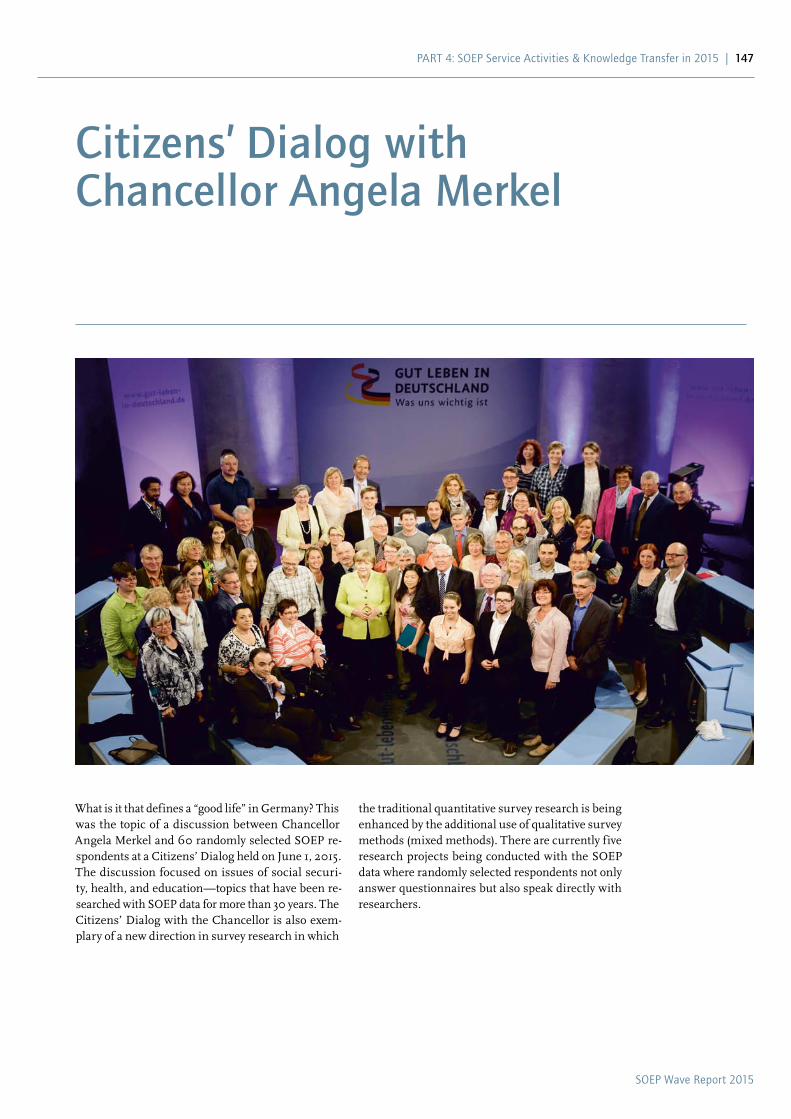
SOEP Wave Report 2015
PaRT 4: SOEP Service activities & Knowledge Transfer in 2015 | 147
What is it that defines a “good life” in Germany? This was the topic of a discussion between Chancellor Angela Merkel and 60 randomly selected SOEP re-spondents at a Citizens’ Dialog held on June 1, 2015. The discussion focused on issues of social securi-ty, health, and education—topics that have been re-searched with SOEP data for more than 30 years. The Citizens’ Dialog with the Chancellor is also exem-plary of a new direction in survey research in which
Citizens’ Dialog with Chancellor Angela Merkel
the traditional quantitative survey research is being enhanced by the additional use of qualitative survey methods (mixed methods). There are currently five research projects being conducted with the SOEP data where randomly selected respondents not only answer questionnaires but also speak directly with researchers.
SOEP Wave Report 2015
148 | PaRT 4: SOEP Service activities & Knowledge Transfer in 2015
DIW Berlin celebrated its ninetieth birthday in 2015. We talked with SOEP Director Jürgen Schupp about the special role the Socio-Economic Panel plays in one of the leading economic research institutes in Germany and Europe.
Over the past 90 years, the DIW has gone through some stormy times as well. What role do controversies play within the institute?
Controversies provide the raw material for new ways of explaining and solving problems. In economics, but in all other research areas as well, competition for the best explanations and unbiased, evidence-based analysis is far superior to “official positions” or ideologically driven positions on issues.
What social developments do you see as key challenges facing our society in the coming decade?
The refugee issue will be one of the most important challenges. We will have to grapple with questions of how to foster successful integration and how to maintain social harmony and a tolerant, civil, and free and democratic society. These, along with the classic, primarily economic questions, will be the key themes in the next ten years.
What do you personally wish the DIW Berlin on its ninetieth anniversary?
I wish the DIW unbroken support from its funding bodies. And I wish it success and a modicum of luck in its applications for competitively awarded funding. Both of these will benefit the institute’s freedom to set its own priorities and focal points in providing outstanding research, relevant policy advice, user-friendly infrastructure, and sustainable knowledge transfer, and will raise the institute’s visibility at both the national and international level.
Celebrating DIW Berlin’s Ninetieth AnniversaryA Conversation with SOEP Director Jürgen Schupp
DIW Berlin was founded ninety years ago as an eco-nomic research institute focused primarily on business cycle analysis. Where do you see the institute’s strengths in the year 2015?
When I started at the DIW as a young research as-sociate 30 years ago, our microanalytical project group, which was funded by the German Research Foundation (DFG), was fairly exotic within the more macroeconomically oriented DIW. Today, when you look at the research being done by the most recent graduates of the DIW Graduate Center, you see a balance between micro and macro analysis. In my view, this methodological diversity and the connec-tion between macro and micro analysis is the defin-ing strength of DIW Berlin today.
What role does the Socio-Economic Panel (SOEP) play within DIW Berlin?
It plays a very special role. As one of the world’s lead-ing long-term household panel studies, the SOEP provides the material for cutting-edge research, not only in economics but also in a wide range of other social scientific disciplines including psychology. The longitudinally structured data also offer a cur-rent, representative basis for evidence-based policy advice by the DIW itself, by the member institutes of the Leibniz Association, but also by many other re-search institutes worldwide. The SOEP has received outstanding ratings in numerous evaluations over the last 20 years both for its research output and for the quality of its infrastructure services.

SOEP Wave Report 2015
PaRT 4: SOEP Service activities & Knowledge Transfer in 2015 | 149
Twelve SOEP staff members were in Reykjavik to present recent findings and new survey methodol-ogies based on research using the different SOEP (sub)samples, and several also chaired sessions. One of the presentations at the conference was on experi-ments run in the SOEP-Innovation Sample (SOEP-IS) such as the SOEP-IS Risk Module, which consists of two incentive-compatible behavioral risk-taking tasks involving described and experienced risk. It extends the SOEP by providing an assessment of in-dividual differences that may predict real-world out-comes, such as employment, financial, and health decisions that are partly guided by individuals’ risk tendencies.
The SOEP had an exhibition stand at the sixth con-ference of the European Survey Research Associa-tion (ESRA) at the University of Iceland in Reykja-vik from July 13-17, 2015, where information was provided to conference visitors on the wide range of analyses that are possible with the SOEP data. Con-ference attendees had the opportunity to try the grip strength test, a recognized tool used in the SOEP to measure respondents’ general health status, and to compare their test results to those from the UK Household Longitudinal Study (Understanding So-ciety) at ISER (University of Essex), which uses the same instrument in its survey. SOEP and UKHLS had their stands side by side in the exhibition area. There was also a presentation of our new data plat-form, paneldata.org, which is the relaunched ver-sion of SOEPinfo.
SOEP at the European Survey Research Association (ESRA)
Philipp Eisnecker, Simon Kühne, Christian Westermeier, Luisa Hilgert at ESRa 2015.

SOEP Wave Report 2015
150 | PaRT 4: SOEP Service activities & Knowledge Transfer in 2015
SOEP-in-Residence 2015
Since 2009, the SOEP has been offering visiting scholars the opportunity to make research visits to the SOEP in the framework of the SOEP-in-Resi-dence program, coordinated by Christine Kurka. A visit to the SOEP allows visiting researchers all the benefits of the SOEP research environment, includ-ing input and support from staff experts and the logistical infrastructure of the SOEP Research Da-ta Center. Research visits can be arranged to work on ongoing research projects or to address special research questions and topics. For researchers in-terested in using small-scale coded geodata, a re-search stay at the SOEP is mandatory—the data are only available for use on site at the SOEP Research Data Center. Research visits to the SOEP’s fieldwork organization, TNS Infratest Sozialforschung, are also possible. In 2015, the SOEP hosted a total of 46 guests from eight countries: Germany, Egypt, Italy, Canada, the USA, Belgium, the UK, and Spain. The majority of visiting researchers came from other cit-ies within Germany.
SOEPcampus 2015
The SOEP provides methodological training in the use of SOEP data to students in the fields of sociol-ogy, economics, and psychology. As an additional service, we offer introductory workshops on the use of the SOEP data and particular issues of data use. In 2015, the SOEP held a total of eight SOEPcampus workshops in Berlin, Bochum, Mannheim, Bamberg, Köln, Sankelmark and Tübingen. And in August 2015, we also held a SOEP User Workshop at the American Sociological Association (ASA) Confer-ence in Chicago.
The SOEP is also part of the Doctoral Study Network for Ph.D. Courses, a group of several northern Ger-man universities and research institutes that have joined together to improve doctoral-level education and training.
SOEP Service
SOEP Wave Report 2015
PaRT 4: SOEP Service activities & Knowledge Transfer in 2015 | 151
of “advance data access”, “quality of data checking and testing” and “completeness of the data” into their own order of importance (see Figure 2). The results show that for our users, “advance data access” is less important than data quality checking or data com-pleteness. Based on this, we have concluded that we should put more weight on completeness and data checking procedures, even if this means delays in data provision.
Data documentation
We use our annual survey to evaluate the various services we provide. Respondents were asked to rate on a scale from 0 to 10 how satisfied they were with SOEP contract management, data, data downloads, and documentation. In all of these areas, the over-whelming majority of users were very satisfied with our services. And in some areas, respondents rated us even higher this year than in 2014. The impor-tance of data documentation is also evident from the critiques and suggestions provided by respondents, which confirm the need to continue improving our work in this area. An important step in this direc-tion has been taken with the introduction of our new metadata portal, paneldata.org. The difficulties en-tailed by learning a new way of working are evident in Figure 3. Many of our users continue to use our old metadata portal, SOEPinfo, which continues to run parallel to paneldata.org. Almost half of all re-spondents were not yet aware of paneldata.org, at least not under this new name that we introduced instead of SOEPinfo v.2. Thanks to our respondents’ extensive feedback, we have valuable ideas for facili-tating the transition to paneldata.org.
We are working hard to optimize paneldata.org and to make it as user-friendly as possible. We encour-age all users to take the leap and switch over, since paneldata.org contains documentation not only on SOEP-Core but also on the practical new SOEPlong, as well as the SOEP-Innovation Sample (SOEP-IS) and other studies.
Thank you again to everyone who participated in our 2015 SOEP User Survey!
Results of the SOEP User Survey 2015
In winter 2015, 771 SOEP users again took part in the SOEP user survey. This year’s survey covered classic questions about SOEP service and infrastruc-ture as well as the new topics of data sharing in aca-demia and re-analysis of data. To ensure the high-est possible participation in our survey, we sent the invitation to an integrated mailing list consisting of longtime SOEP users with a data distribution con-tract, new users who signed a sub-contract for data use within the last year, users who download the SOEP data, and members of the SOEP mailing list. We are proud to report that we achieved the highest response rate of any year since the start of our user survey. Participation increased 13% over 2014 (see Figure 1). We are very grateful to everyone who par-ticipated in the survey.
We do not know the characteristics of our entire user community. In the following we use the term “user community” to refer to those who participated in our user survey. The results show that in 2015, our user community was 41% women and 59% men: an 8 percentage point increase in female users and the highest number of female users since the beginning of the survey in 2004.
Research staff and post-doctoral students made up one third of all respondents to the user survey, while percentage of professors has declined since last year. This is accompanied by a decline in the use of SOEP data in teaching (from 69% in 2014 to 61% in 2015). The research fields represented by SOEP users have not changed in a significant manner since the last user survey. The proportion of users from the field of economics has declined to 45% since the last sur-vey. Around 41% of our users are from the social sciences or sociology.
Data distribution
In this year’s user survey, we wanted to find out our users’ preferences for data distribution. The in-creasing complexity of the SOEP sample means an increasing amount of effort to generate the data. To meet this challenge, the SOEP is constantly work-ing to improve the process of data preparation and generation. We want to give you—our users—the opportunity to tell us your preferences so that we can meet your needs as well as possible. In the survey, respondents were asked to drag and drop the aspects
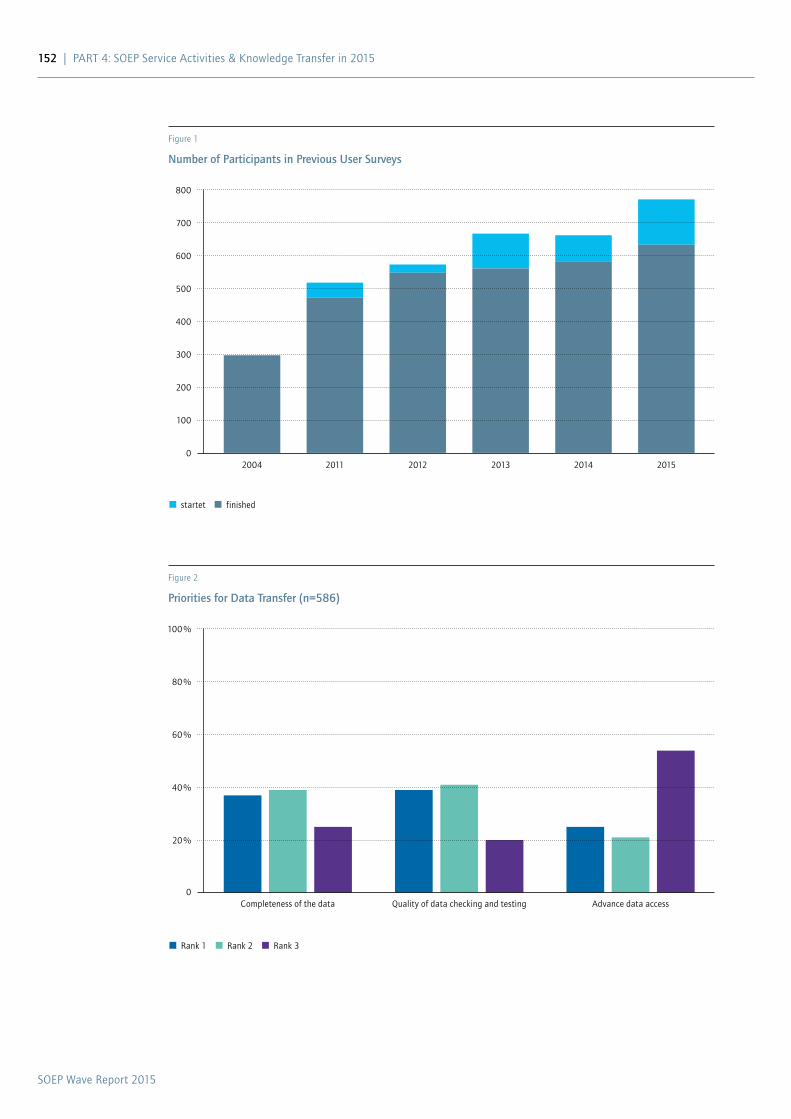
SOEP Wave Report 2015
152 | PaRT 4: SOEP Service activities & Knowledge Transfer in 2015
Figure 1
Number of Participants in Previous User Surveys
Figure 2
Priorities for Data Transfer (n=586)
0
800
700
600
500
400
300
200
100
2004 2011 2012 2013 2014 2015
0
100 %
80 %
60 %
40 %
20 %
Completeness of the data Quality of data checking and testing advance data access
startet finished
Rank 1 Rank 2 Rank 3
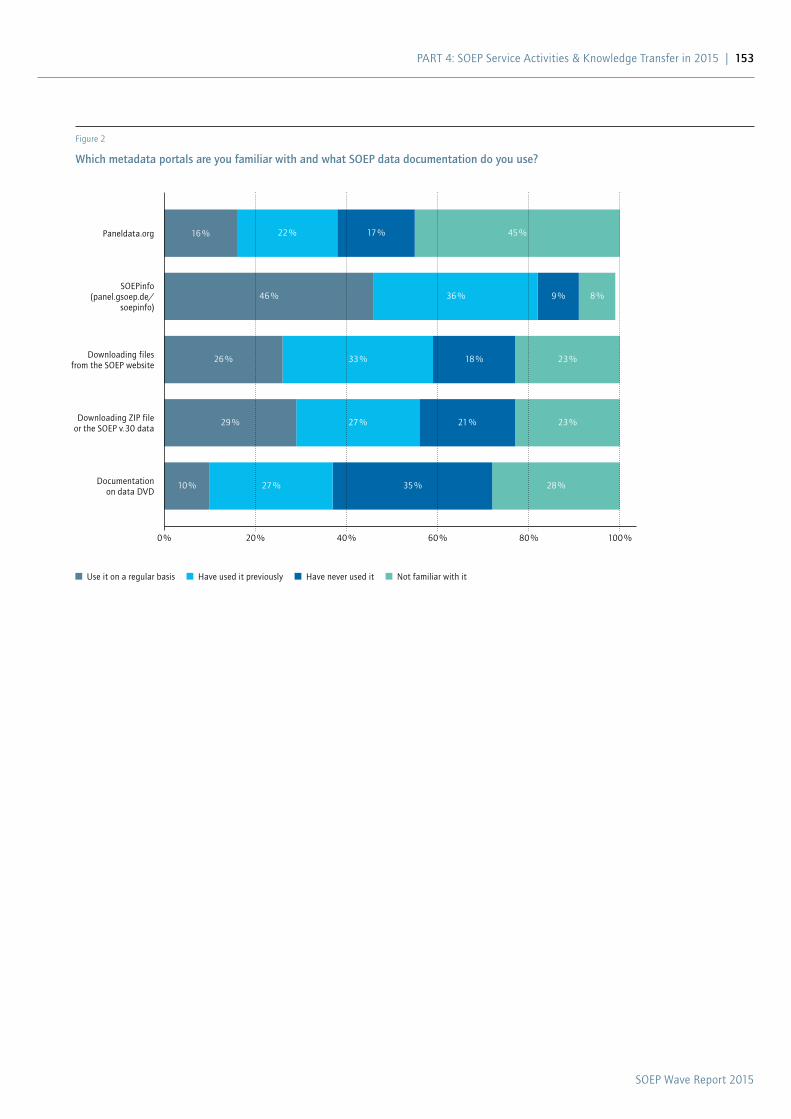
SOEP Wave Report 2015
PaRT 4: SOEP Service activities & Knowledge Transfer in 2015 | 153
Figure 2
Which metadata portals are you familiar with and what SOEP data documentation do you use?
16 %
46 %
26 %
29 %
10 %
22 %
36 %
33 %
27 %
27 %
17 %
9 %
18 %
21 %
35 %
45 %
8 %
23 %
23 %
28 %
Paneldata.org
SOEPinfo (panel.gsoep.de/
soepinfo)
Downloading filesfrom the SOEP website
Downloading ZIP file or the SOEP v.30 data
Documentation on data DVD
0 % 20 % 40 % 60 % 80 % 100 %
Use it on a regular basis Have used it previously Have never used it Not familiar with it
SOEP Wave Report 2015
154 | PaRT 4: SOEP Service activities & Knowledge Transfer in 2015
• SOEP Director Jürgen Schupp was appointed to the advisory board of the ZBW Leibniz Information Centre for Economics. As a service infrastructure of the Leibniz Association, the ZBW runs the German National Library of Economics, the world’s largest information center for economic literature, online as well as off line at its locations in Kiel and Hamburg. Jürgen Schupp will be ad-vising the ZBW on expanding and improving its services for the 2015–2017 appointment period.
• SOEP trainee Carolin Stolpe completed an intern-ship at the Institute for Social and Economic Research (ISER) in Essex as part of her studies. Her internship was supervised by Gundi Knies, a past scholarship holder at DIW Berlin and organizer of the ISER-SOEP Exchange Program.
• At an awards ceremony held on January 20, 2015, at Berlin City Hall, Jule Specht, Assistant Professor at the Freie Universität Berlin and Re search Fellow at the SOEP, was awarded the 2014 Berliner Wissenschaftspreis (Berlin Science Prize) for young scholars. According to Governing Mayor Klaus Wowereit, this year’s young scholars Wissenschaftspreis recipients “stand for the ex-cellence of Berlin as a locus for research and clearly demonstrate the breadth of their research fields.”
• Gert G. Wagner, SOEP Representative on the Executive Board of DIW Berlin, was appointed by the Federal Ministry of Justice and Consumer Protection to the newly established Expert Council for Consumer Policy. The nine-member body, which includes scholars from various disciplines as well as representatives from the business com-munity and consumer associations, will advise the German government on important consumer questions and make recommendations. He was also appointed by Chancellor Angela Merkel and
Federal Economics Minister Sigmar Gabriel to a scientific advisory board on the government strategy “Living well in Germany: What’s important to us” (“Gut leben in Deutschland – was uns wichtig ist”). Citizen dialogues are planned to take place in the framework of the government strategy, and the results of the dialogues will be used as the basis for developing a system of social indicators. Gert Wagner will contribute his methodological experiences to this project. By lucky coincidence, the title of this government strategy is very similar to the “field name” of SOEP: “Living in Germany.”
• michael Weinhardt (DIW Graduate Center, now University of Bielefeld) successfully completed his dissertation (summa cum laude) in October. His advisor was SOEP Director Jürgen Schupp. The topic of his dissertation is “The influence of values on choice of occupation and intergenerational transmission of social inequality—Microanalyses for Germany”. Michael completed his doctoral studies in the DIW Berlin Graduate Center of Economic and Social Research and is currently working on the European Social Survey at the University of Bielefeld.
• Sandra Bohmann joined the SOEP team in mid-February as a doctoral student. After completing a degree in European Business Studies at the University of Applied Sciences Regensburg and a BA in International Business Management at Oxford Brookes University, she shifted her focus slightly and completed an MA in Philosophy and Economics at the University of Bayreuth. Her thesis was entitled “The role of redistributive preferences and beliefs about the origin of social inequality in the Inequality – Growth Nexus.” She has been a member of the BGSS since 2014 and is conducting research on socioeconomic determination of non-cognitive skills and their role in reproducing social inequality.
SOEP Staff & Community News in 2015
SOEP Wave Report 2015
PaRT 4: SOEP Service activities & Knowledge Transfer in 2015 | 155
• maximilian Priem started work in the SOEP in March. His responsibilities will include integrating the FID data into the data released to SOEP users. He just completed his MSc in Public Economics at the FU Berlin with an analysis of income trends in East and West Germany.
• marius Pahl successfully completed his exam as a Specialist in Social and Market Research.
• anika rasner left the SOEP team to take a new position in the Federal Chancellery on March 1. She joined a project group responsible for organizing and evaluating the Citizens’ Dialog with Chancellor Merkel plans to hold.
• The SOEP welcomed Charlotte Bartels, who is studying inequality and poverty across different countries and analyzing the role institutions play in contributing to inequality and social welfare. Before coming to DIW Berlin, Charlotte coordinated the PhD program “Public Economics and Inequality” at the Free University of Berlin. She did her PhD in “Insurance and incentives in the German welfare state” at the FU from 2009 to 2013. She is working as a Post-Doc in the SOEP in the area of international comparative distribution analysis.
• Frederike Esche, graduate student at the Berlin Graduate School of Social Sciences (BGSS) and member of the SOEP team from 2010 to 2013, successfully defended her dissertation “Mine, yours or our problem? Does unemployment affect the life satisfaction within couples and does it increase the risk of partnership dissolutions?” on September 17 at the Humboldt University, Berlin.
• SOEP researchers nicolas legewie and Christian Schmitt were invited to speak to various mem-bers of German parliament about aspects of demographic change as part of the event “Leibniz im Bundestag 2015” this April. Nicolas Legewie met personally with Members of Parliament Oliver Kaczmarek and Dr. Philipp Lengsfeld, as well as Helmut Uwer from Martin Patzelt’s office. They discussed issues of education, migration, and upward social mobility. Christian Schmitt spoke personally with Members of Parliament Johannes Singhammer, Sven Schulz, and Kerstin Radomski and discussed topics related to population development, childlessness, and fertility behavior.
• Peter Eibich left the SOEP on March 1. He is now working as a Senior Researcher at the Health Economics Research Centre, Nuffield Department for Population Health, University of Oxford. His work there will focus initially on the ACHE study and the cost-effectiveness of knee and hip replacements.
• Jan Goebel and daniel d. Schnitzlein were appointed by Federal Labor Minister Andrea Nahles to the Scientific Advisory Board for the German federal government’s Fifth Poverty and Wealth Report (Armuts- und Reichtumsbericht der Bundesregierung). Every four years, the German government submits a poverty and wealth report to the Bundestag. The report is produced under the oversight of the Federal Ministry of Labor and Social Affairs with scientific advice from the advisory board as an instrument to monitor policy measures and obtain suggestions for new measures. The SOEP was also an important source of information for the German government’s Poverty and Wealth Reports in past legislative periods. The fifth Poverty and Wealth Report is scheduled to appear in 2016.
• lukas Hoppe joined the SOEP team in mid-February to work on the project “Socio-Spatial Segregation in Germany: Scope and Trends,” which is financed by the BMAS in the frame-work of the government’s Poverty and Wealth Report. The project will analyze additional microm data in combination with SOEP data. In his dissertation at the Bremen International Graduate School for the Social Sciences (BIGSSS), Lukas Hoppe is using SOEP and microm data to explore how the co-occurrence of social and ethnic segregation produce differential effects on the integration of immigrants and their children in Germany.
• Simon Kühne won a 7,050 USD award from the Charles Cannell Fund in Survey Methodology for his research project “Attitude Inferences and Interviewer Effects: The Role of Interpersonal Perceptions in Face-to-Face Interviews.” The project is part of Simon’s dissertation on
“Determinants of Interviewer Effects in Face-to-Face Surveys” and is being supervised at the BGSS by Martin Kroh. The Charles Cannell Fund in Survey Methodology is based at the Institute for Social Research at the University of Michigan.
SOEP Wave Report 2015
156 | PaRT 4: SOEP Service activities & Knowledge Transfer in 2015
• Gert G. Wagner was elected Speaker of Section B “Economics, Social Sciences, Spatial Research” of the Leibniz Association. He will be a member of its Executive Board for the next two years. The member institutes of the Leibniz Association form five sections that ref lect its scientific profile and expertise. The main tasks of the Sections are to drive the sharing of scientific experience and cooperation and to promote junior researchers. The Sections are involved in developing the evaluation criteria. Business is conducted at Section conferences which are held regularly. Every Section chooses a Speaker who represents them on the Executive Board and other committees.
• Uwe Sunde, longtime SOEP user and recently elected as deputy chairman of the SOEP Survey Committee, was awarded the renowned Gossen Prize of the “Verein für Socialpolitik” at its annual conference. The Gossen Prize is awarded every year to honor a German-speaking economist working in central Europe, whose work has gained international renown. The aim of the award is to promote the internationalization of economic research by residents of Germany, Austria, and Switzerland. The most important criterion for the prize is publications in internationally recognized journals, and it comes with prize money in the amount of 10,000 euros.
• Carolin Stolpe received three honors for her outstanding work as a FAMS trainee in the SOEP. She received the Leibniz Award for Apprentices at the Annual Meeting of the Leibniz Association on November 26, 2015, by Stephan Weil, Minister-President of Lower Saxony and the President of the Leibniz Association, Matthias Kleiner. As the second-place winner of this award, Carolin will receive a 600-euro prize. Carolin completed her dual-track training as a Specialist in Market and Social Research (Fachangestellte für Markt- und Sozialforschung) in Summer 2015. She passed her final exam at the Berlin Chamber of Industry and Commerce (IHK) with top marks and the highest grade in her graduating class. The IHK Berlin honored her outstanding performance at an awards ceremony on November 16, 2015. Even on the federal level she was the best in this exam and received a prize at an awards ceremony (Nationale Bestenehrung der DIHK) on December 14, 2015. Since completing her degree, Carolin Stolpe has been working in the SOEP infrastructure, where she has taken on responsibilities in the area of data management. In October, she began working on a
• On October 1, michaela von Schwarzenstein started working in the SOEP administrative office, replacing Christiane Nitsche for one year while Christiane is on maternity leave.
• Carsten Schröder, FU Berlin and Deputy Head of the Research Infrastructure SOEP, was elected to the International Board of Directors of the LIS Cross National Data Center in Luxembourg. He follows Gert G. Wagner, who took the position of the late Joachim R. Frick on the Board three years ago. The Chairman of the Board is renowned British economist Sir Tony Atkinson (Oxford University), who is mainly known to a larger audience for his research in the field of inequality. The LIS Cross National Data Center, formerly known as Luxembourg Income Study, provides the worldwide scientific community with international comparable research data on income, wealth, and employment of private households for more than 50 countries. Germany is represented in the LIS Database with SOEP data.
• Jürgen Schupp was appointed in September 2015 to the advisory board to the administration of the project “Zivilgesellschaft in Zahlen” (civil society in figures) of the Stifterverband für die Deutsche Wissenschaft, a non-profit organization promoting science and education in Germany. His term is for two years.
• doreen triebe, graduate student at the DIW GC and member of SOEP staff up to 2014, sucessfully defended her dissertation on “To marry or not to marry: essays on partnership formation and economic labor market behavior of married and cohabiting couples” on July 1, 2015, at TU Berlin.
• ingrid tucci left the SOEP on November 1. She applied to the 2015 researchers’ competition of the French National Center for Scientific Research in the area of sociology, and her achievements and research were evaluated as the best. Starting in November, she will be working at the CNRS Institute of Labour Economics and Industrial Sociology (LEST —Laboratoire d’Economie et de Sociologie du Travail). Her comparative research there will focus on processes of ethnic boundary-making and inequality on the labor market. She will remain connected with the SOEP and DIW Berlin as head of the DFG project on “Transition to adulthood among the children of Turkish immigrants: A mixed-methods study based on the SOEP data.
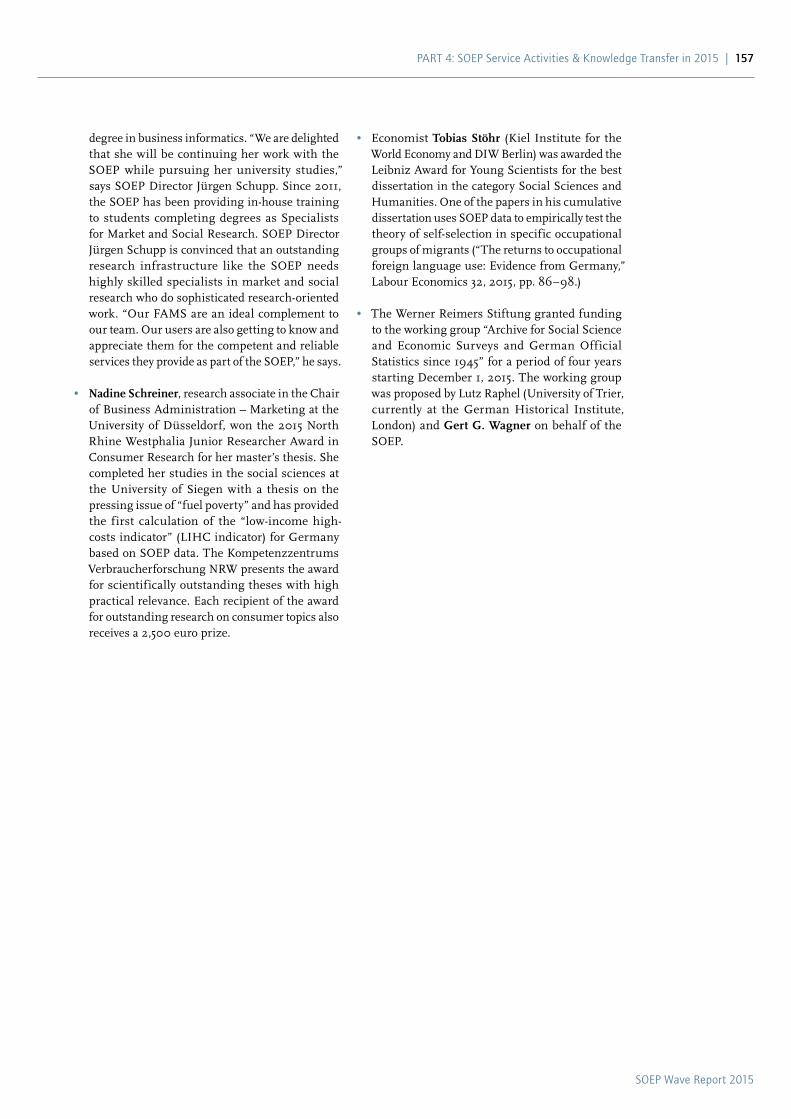
SOEP Wave Report 2015
PaRT 4: SOEP Service activities & Knowledge Transfer in 2015 | 157
• Economist tobias Stöhr (Kiel Institute for the World Economy and DIW Berlin) was awarded the Leibniz Award for Young Scientists for the best dissertation in the category Social Sciences and Humanities. One of the papers in his cumulative dissertation uses SOEP data to empirically test the theory of self-selection in specific occupational groups of migrants (“The returns to occupational foreign language use: Evidence from Germany,” Labour Economics 32, 2015, pp. 86–98.)
• The Werner Reimers Stiftung granted funding to the working group “Archive for Social Science and Economic Surveys and German Official Statistics since 1945” for a period of four years starting December 1, 2015. The working group was proposed by Lutz Raphel (University of Trier, currently at the German Historical Institute, London) and Gert G. Wagner on behalf of the SOEP.
degree in business informatics. “We are delighted that she will be continuing her work with the SOEP while pursuing her university studies,” says SOEP Director Jürgen Schupp. Since 2011, the SOEP has been providing in-house training to students completing degrees as Specialists for Market and Social Research. SOEP Director Jürgen Schupp is convinced that an outstanding research infrastructure like the SOEP needs highly skilled specialists in market and social research who do sophisticated research-oriented work. “Our FAMS are an ideal complement to our team. Our users are also getting to know and appreciate them for the competent and reliable services they provide as part of the SOEP,” he says.
• nadine Schreiner, research associate in the Chair of Business Administration – Marketing at the University of Düsseldorf, won the 2015 North Rhine Westphalia Junior Researcher Award in Consumer Research for her master’s thesis. She completed her studies in the social sciences at the University of Siegen with a thesis on the pressing issue of “fuel poverty” and has provided the first calculation of the “low-income high-costs indicator” (LIHC indicator) for Germany based on SOEP data. The Kompetenzzentrums Verbraucherforschung NRW presents the award for scientifically outstanding theses with high practical relevance. Each recipient of the award for outstanding research on consumer topics also receives a 2,500 euro prize.

SOEP Wave Report 2015
158 | PaRT 4: SOEP Service activities & Knowledge Transfer in 2015
about why research should never be “me-search”. matthias Pollmann-Schult of the Social Science Re-search Center in Berlin (WZB) is one of the few male sociologists using the SOEP data to do research on fathers. We talked to him about his findings on the new generation of “involved fathers,” on whether children make people happy, on how parenthood affects relationships between men and women, and about how he balances his work as a researcher with the everyday demands of fatherhood.
The videos can be found in the DIW Mediatek at www.diw.de/soeppeople, on YouTube at https://www.youtube.com/user/SOEPstudie, and are announced on the SOEP Facebook page at https://www.facebook.com/SOEPnet.de/. The interviews are also published in written form in our quarterly SOEP Newsletter under the heading “Five questions to...”.
Since 2014, our video series SOEP People has been spotlighting some of the many interesting people who make up the SOEP community. Right now, there are over 500 researchers around the world working with SOEP data. In our short video por-traits, members of the SOEP community give a personal perspective on their work, telling us what drives their research interests, what first led them to work on these subjects, and how their research affects their lives.
In 2015, we created video portraits of three very dif-ferent researchers: Elke Holst, Research Director of Gender Studies at DIW Berlin, is one of Germany’s most inf luential economists according to the FAZ ranking. For SOEP People, she talked about why the topic of equality of opportunity between men and women occupies her to this day. thorsten Schneider, Professor of Sociology at the University of Leipzig, talked to us about the role of sociology in society, the connection between education and religion, and
The SOEP People Video Series
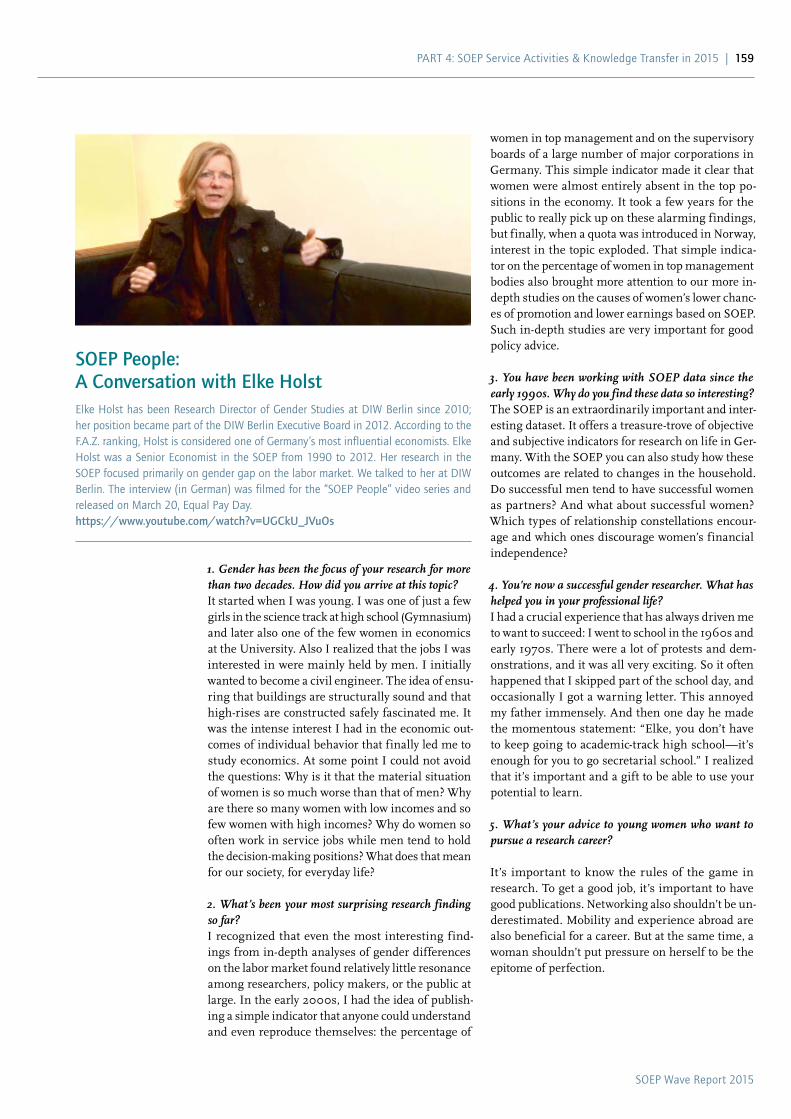
SOEP Wave Report 2015
PaRT 4: SOEP Service activities & Knowledge Transfer in 2015 | 159
women in top management and on the supervisory boards of a large number of major corporations in Germany. This simple indicator made it clear that women were almost entirely absent in the top po-sitions in the economy. It took a few years for the public to really pick up on these alarming findings, but finally, when a quota was introduced in Norway, interest in the topic exploded. That simple indica-tor on the percentage of women in top management bodies also brought more attention to our more in-depth studies on the causes of women’s lower chanc-es of promotion and lower earnings based on SOEP. Such in-depth studies are very important for good policy advice.
3. You have been working with SOEP data since the early 1990s. Why do you find these data so interesting?The SOEP is an extraordinarily important and inter-esting dataset. It offers a treasure-trove of objective and subjective indicators for research on life in Ger-many. With the SOEP you can also study how these outcomes are related to changes in the household. Do successful men tend to have successful women as partners? And what about successful women? Which types of relationship constellations encour-age and which ones discourage women’s financial independence?
4. You’re now a successful gender researcher. What has helped you in your professional life?I had a crucial experience that has always driven me to want to succeed: I went to school in the 1960s and early 1970s. There were a lot of protests and dem-onstrations, and it was all very exciting. So it often happened that I skipped part of the school day, and occasionally I got a warning letter. This annoyed my father immensely. And then one day he made the momentous statement: “Elke, you don’t have to keep going to academic-track high school—it’s enough for you to go secretarial school.” I realized that it’s important and a gift to be able to use your potential to learn.
5. What’s your advice to young women who want to pursue a research career?
It’s important to know the rules of the game in research. To get a good job, it’s important to have good publications. Networking also shouldn’t be un-derestimated. Mobility and experience abroad are also beneficial for a career. But at the same time, a woman shouldn’t put pressure on herself to be the epitome of perfection.
1. Gender has been the focus of your research for more than two decades. How did you arrive at this topic? It started when I was young. I was one of just a few girls in the science track at high school ( Gymnasium) and later also one of the few women in economics at the University. Also I realized that the jobs I was interested in were mainly held by men. I initially wanted to become a civil engineer. The idea of ensu-ring that buildings are structurally sound and that high-rises are constructed safely fascinated me. It was the intense interest I had in the economic out-comes of individual behavior that finally led me to study economics. At some point I could not avoid the questions: Why is it that the material situation of women is so much worse than that of men? Why are there so many women with low incomes and so few women with high incomes? Why do women so often work in service jobs while men tend to hold the decision-making positions? What does that mean for our society, for everyday life?
2. What’s been your most surprising research finding so far?I recognized that even the most interesting find-ings from in-depth analyses of gender differences on the labor market found relatively little resonance among researchers, policy makers, or the public at large. In the early 2000s, I had the idea of publish-ing a simple indicator that anyone could understand and even reproduce themselves: the percentage of
SOEP People: A Conversation with Elke Holst Elke Holst has been Research Director of Gender Studies at DIW Berlin since 2010; her position became part of the DIW Berlin Executive Board in 2012. according to the F.a.Z. ranking, Holst is considered one of Germany’s most influential economists. Elke Holst was a Senior Economist in the SOEP from 1990 to 2012. Her research in the SOEP focused primarily on gender gap on the labor market. We talked to her at DIW Berlin. The interview (in German) was filmed for the “SOEP People” video series and released on March 20, Equal Pay Day. https://www.youtube.com/watch?v=UGCkU_JVuOs
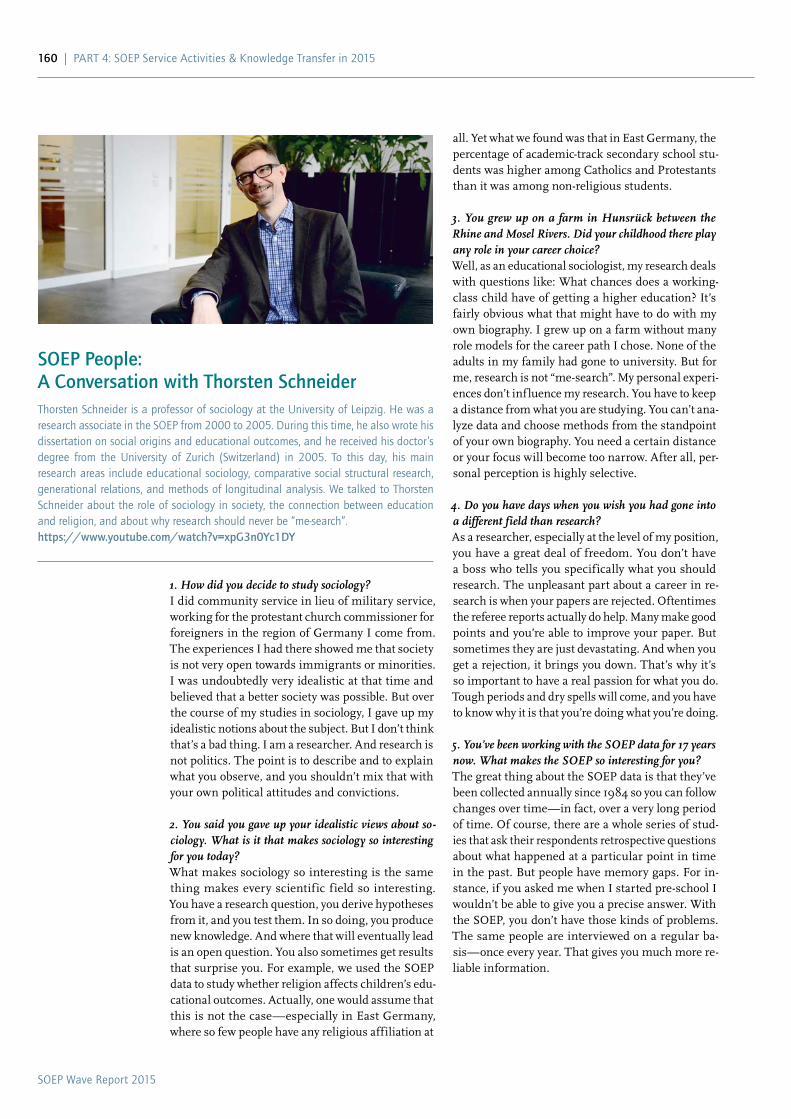
SOEP Wave Report 2015
160 | PaRT 4: SOEP Service activities & Knowledge Transfer in 2015
all. Yet what we found was that in East Germany, the percentage of academic-track secondary school stu-dents was higher among Catholics and Protestants than it was among non-religious students.
3. You grew up on a farm in Hunsrück between the Rhine and Mosel Rivers. Did your childhood there play any role in your career choice?Well, as an educational sociologist, my research deals with questions like: What chances does a working-class child have of getting a higher education? It’s fairly obvious what that might have to do with my own biography. I grew up on a farm without many role models for the career path I chose. None of the adults in my family had gone to university. But for me, research is not “me-search”. My personal experi-ences don’t inf luence my research. You have to keep a distance from what you are studying. You can’t ana-lyze data and choose methods from the standpoint of your own biography. You need a certain distance or your focus will become too narrow. After all, per-sonal perception is highly selective.
4. Do you have days when you wish you had gone into a different field than research?As a researcher, especially at the level of my position, you have a great deal of freedom. You don’t have a boss who tells you specifically what you should research. The unpleasant part about a career in re-search is when your papers are rejected. Oftentimes the referee reports actually do help. Many make good points and you’re able to improve your paper. But sometimes they are just devastating. And when you get a rejection, it brings you down. That’s why it’s so important to have a real passion for what you do. Tough periods and dry spells will come, and you have to know why it is that you’re doing what you’re doing.
5. You’ve been working with the SOEP data for 17 years now. What makes the SOEP so interesting for you?The great thing about the SOEP data is that they’ve been collected annually since 1984 so you can follow changes over time—in fact, over a very long period of time. Of course, there are a whole series of stud-ies that ask their respondents retrospective questions about what happened at a particular point in time in the past. But people have memory gaps. For in-stance, if you asked me when I started pre-school I wouldn’t be able to give you a precise answer. With the SOEP, you don’t have those kinds of problems. The same people are interviewed on a regular ba-sis—once every year. That gives you much more re-liable information.
1. How did you decide to study sociology?I did community service in lieu of military service, working for the protestant church commissioner for foreigners in the region of Germany I come from. The experiences I had there showed me that society is not very open towards immigrants or minorities. I was undoubtedly very idealistic at that time and believed that a better society was possible. But over the course of my studies in sociology, I gave up my idealistic notions about the subject. But I don’t think that’s a bad thing. I am a researcher. And research is not politics. The point is to describe and to explain what you observe, and you shouldn’t mix that with your own political attitudes and convictions.
2. You said you gave up your idealistic views about so-ciology. What is it that makes sociology so interesting for you today?What makes sociology so interesting is the same thing makes every scientific field so interesting. You have a research question, you derive hypotheses from it, and you test them. In so doing, you produce new knowledge. And where that will eventually lead is an open question. You also sometimes get results that surprise you. For example, we used the SOEP data to study whether religion affects children’s edu-cational outcomes. Actually, one would assume that this is not the case—especially in East Germany, where so few people have any religious affiliation at
SOEP People: A Conversation with Thorsten SchneiderThorsten Schneider is a professor of sociology at the University of Leipzig. He was a research associate in the SOEP from 2000 to 2005. During this time, he also wrote his dissertation on social origins and educational outcomes, and he received his doctor’s degree from the University of Zurich (Switzerland) in 2005. To this day, his main research areas include educational sociology, comparative social structural research, generational relations, and methods of longitudinal analysis. We talked to Thorsten Schneider about the role of sociology in society, the connection between education and religion, and about why research should never be “me-search”.https://www.youtube.com/watch?v=xpG3n0Yc1DY
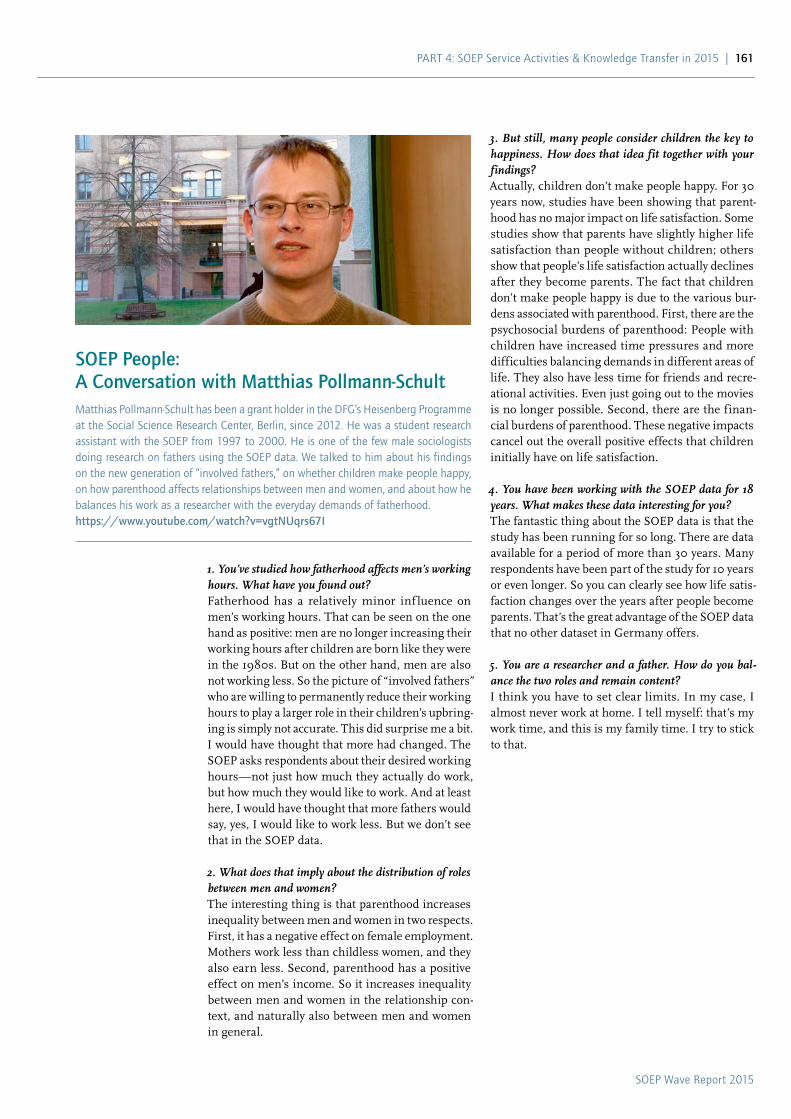
SOEP Wave Report 2015
PaRT 4: SOEP Service activities & Knowledge Transfer in 2015 | 161
3. But still, many people consider children the key to happiness. How does that idea fit together with your findings?Actually, children don’t make people happy. For 30 years now, studies have been showing that parent-hood has no major impact on life satisfaction. Some studies show that parents have slightly higher life satisfaction than people without children; others show that people’s life satisfaction actually declines after they become parents. The fact that children don’t make people happy is due to the various bur-dens associated with parenthood. First, there are the psychosocial burdens of parenthood: People with children have increased time pressures and more difficulties balancing demands in different areas of life. They also have less time for friends and recre-ational activities. Even just going out to the movies is no longer possible. Second, there are the finan-cial burdens of parenthood. These negative impacts cancel out the overall positive effects that children initially have on life satisfaction.
4. You have been working with the SOEP data for 18 years. What makes these data interesting for you?The fantastic thing about the SOEP data is that the study has been running for so long. There are data available for a period of more than 30 years. Many respondents have been part of the study for 10 years or even longer. So you can clearly see how life satis-faction changes over the years after people become parents. That’s the great advantage of the SOEP data that no other dataset in Germany offers.
5. You are a researcher and a father. How do you bal-ance the two roles and remain content?I think you have to set clear limits. In my case, I almost never work at home. I tell myself: that’s my work time, and this is my family time. I try to stick to that.
1. You’ve studied how fatherhood affects men’s working hours. What have you found out?Fatherhood has a relatively minor inf luence on men’s working hours. That can be seen on the one hand as positive: men are no longer increasing their working hours after children are born like they were in the 1980s. But on the other hand, men are also not working less. So the picture of “involved fathers” who are willing to permanently reduce their working hours to play a larger role in their children’s upbring-ing is simply not accurate. This did surprise me a bit. I would have thought that more had changed. The SOEP asks respondents about their desired working hours—not just how much they actually do work, but how much they would like to work. And at least here, I would have thought that more fathers would say, yes, I would like to work less. But we don’t see that in the SOEP data.
2. What does that imply about the distribution of roles between men and women?The interesting thing is that parenthood increases inequality between men and women in two respects. First, it has a negative effect on female employment. Mothers work less than childless women, and they also earn less. Second, parenthood has a positive effect on men’s income. So it increases inequality between men and women in the relationship con-text, and naturally also between men and women in general.
SOEP People: A Conversation with Matthias Pollmann-Schult Matthias Pollmann-Schult has been a grant holder in the DFG’s Heisenberg Programme at the Social Science Research Center, Berlin, since 2012. He was a student research assistant with the SOEP from 1997 to 2000. He is one of the few male sociologists doing research on fathers using the SOEP data. We talked to him about his findings on the new generation of “involved fathers,” on whether children make people happy, on how parenthood affects relationships between men and women, and about how he balances his work as a researcher with the everyday demands of fatherhood.https://www.youtube.com/watch?v=vgtNUqrs67I
SOEP Wave Report 2015
162 | PaRT 4: SOEP Service activities & Knowledge Transfer in 2015
SOEP-Core
The German Socio-Economic Panel (SOEP) is a wide-ranging representative longitudinal study of private households, located at the German Insti-tute for Economic Research, DIW Berlin. Every year, there were nearly 11,000 households, and more than 20,000 persons sampled by the fieldwork organiza-tion TNS Infratest Sozialforschung.The SOEP study is available in the two formats
“SOEP-Core” and “SOEPlong.”
Contents of SOEP-Core
The SOEP started in 1984 as a longitudinal survey of private households in the Federal Republic of Ger-many. The central aim then and now is to collect representative micro- data to measure stability and change in living conditions by following a micro-economic approach enriched with variables from sociology and political science. Therefore the central survey instruments are a houeshold questionnaire, which is responded by the head of a household and an individual questionnaire, which each household member is intended to answer. Furthermore, since 1997, retrospective biographical information has been collected for every new respondent. Based on the information from these questionnaires, user-friendly BIO$$ datafiles are constructed (e.g., BIO-BIRTH).A rather stable set of core questions is asked every year covering the most essential areas of interest of the SOEP:
• population and demography • education, training, and qualification • labor market and occupational dynamics • earnings, income and social security • housing
• health • household production • preferences and values • satisfaction with life in general and certain
aspects of life.
Additionally, yearly topical modules enhance the ba-sic information in (at least) one of these areas by ask-ing detailed questions as documented in the follow-ing table. These modules for the main part appear in the personal questionnaires; only some of them are additions to the household questionnaire. Starting in the year 2001, the data have become even richer by including several different health measures and well-known psychological concepts as well as age specific questionnaires.
SOEPlong
SOEPlong is a highly compressed, easily analyzable version of the SOEP data that is much simpler to handle than the usual SOEP-Core version. It con-tains a significantly reduced number of datasets and number of variables. The data are no longer provided as wave-specific in-dividual files but rather pooled across all available years (in “long” format). In some cases, variables are harmonized to ensure that they are defined consis-tently over time. For example, the income informa-tion up to 2001 is provided in euros, and categories are modified over time when versions of the ques-tionnaire are changed. All these modifications are clearly documented and described for ease of under-standing. In the case of recoding or integration of data (for example, datasets specific to East German or foreign populations), documentation is generated automatically and all modified variabels are provided in their original form as well. SOEPlong thus pro-vides a well-documented compilation of all variables and data that is consistent over time. https://paneldata.org/studies/1
SOEP Glossary
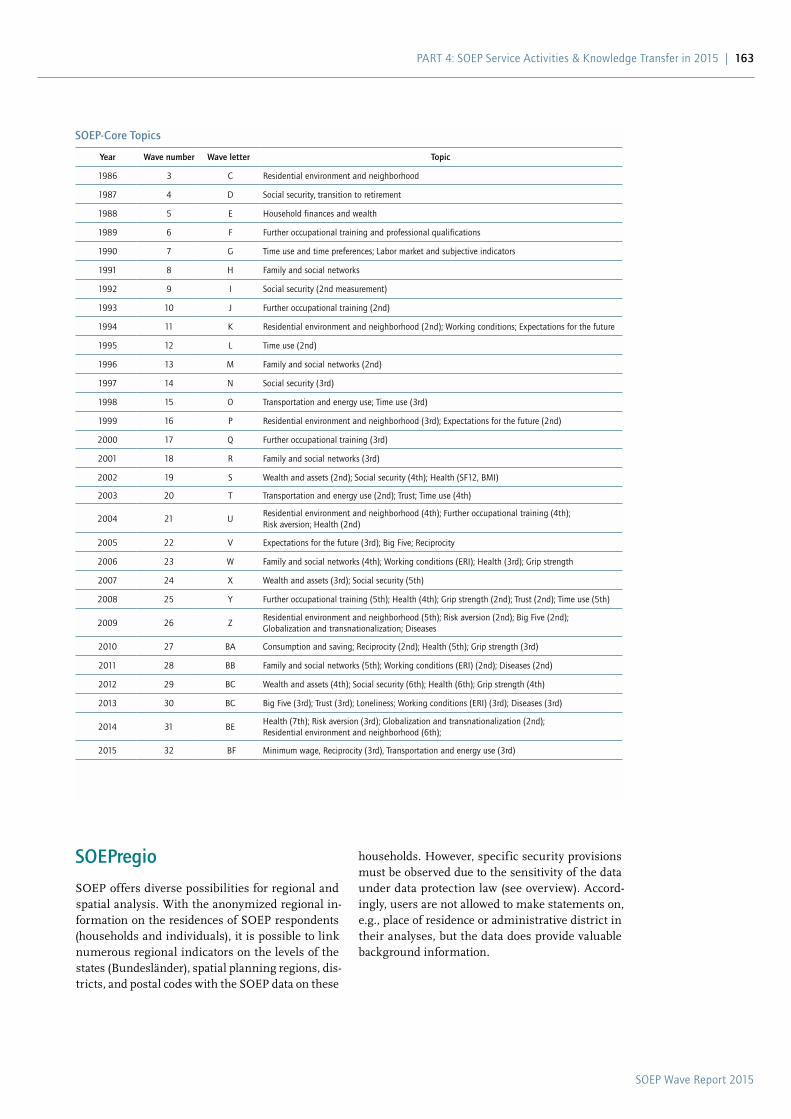
SOEP Wave Report 2015
PaRT 4: SOEP Service activities & Knowledge Transfer in 2015 | 163
households. However, specific security provisions must be observed due to the sensitivity of the data under data protection law (see overview). Accord-ingly, users are not allowed to make statements on, e.g., place of residence or administrative district in their analyses, but the data does provide valuable background information.
SOEPregio
SOEP offers diverse possibilities for regional and spatial analysis. With the anonymized regional in-formation on the residences of SOEP respondents (households and individuals), it is possible to link numerous regional indicators on the levels of the states (Bundesländer), spatial planning regions, dis-tricts, and postal codes with the SOEP data on these
SOEP-Core Topics
Year Wave number Wave letter Topic
1986 3 C Residential environment and neighborhood
1987 4 D Social security, transition to retirement
1988 5 E Household finances and wealth
1989 6 F Further occupational training and professional qualifications
1990 7 G Time use and time preferences; Labor market and subjective indicators
1991 8 H Family and social networks
1992 9 I Social security (2nd measurement)
1993 10 J Further occupational training (2nd)
1994 11 K Residential environment and neighborhood (2nd); Working conditions; Expectations for the future
1995 12 L Time use (2nd)
1996 13 M Family and social networks (2nd)
1997 14 N Social security (3rd)
1998 15 O Transportation and energy use; Time use (3rd)
1999 16 P Residential environment and neighborhood (3rd); Expectations for the future (2nd)
2000 17 Q Further occupational training (3rd)
2001 18 R Family and social networks (3rd)
2002 19 S Wealth and assets (2nd); Social security (4th); Health (SF12, BMI)
2003 20 T Transportation and energy use (2nd); Trust; Time use (4th)
2004 21 UResidential environment and neighborhood (4th); Further occupational training (4th); Risk aversion; Health (2nd)
2005 22 V Expectations for the future (3rd); Big Five; Reciprocity
2006 23 W Family and social networks (4th); Working conditions (ERI); Health (3rd); Grip strength
2007 24 X Wealth and assets (3rd); Social security (5th)
2008 25 Y Further occupational training (5th); Health (4th); Grip strength (2nd); Trust (2nd); Time use (5th)
2009 26 ZResidential environment and neighborhood (5th); Risk aversion (2nd); Big Five (2nd); Globalization and transnationalization; Diseases
2010 27 Ba Consumption and saving; Reciprocity (2nd); Health (5th); Grip strength (3rd)
2011 28 BB Family and social networks (5th); Working conditions (ERI) (2nd); Diseases (2nd)
2012 29 BC Wealth and assets (4th); Social security (6th); Health (6th); Grip strength (4th)
2013 30 BC Big Five (3rd); Trust (3rd); Loneliness; Working conditions (ERI) (3rd); Diseases (3rd)
2014 31 BEHealth (7th); Risk aversion (3rd); Globalization and transnationalization (2nd); Residential environment and neighborhood (6th);
2015 32 BF Minimum wage, Reciprocity (3rd), Transportation and energy use (3rd)
SOEP Wave Report 2015
164 | PaRT 4: SOEP Service activities & Knowledge Transfer in 2015
CNEF—Cross-National Equivalent File of the SOEP
The International Science Use Version of the SOEP (95% version) can be used worldwide. The Research Data Center SOEP is providing it upon request for free via secure download. CNEF data will no longer be distributed by Cornell University, but by Ohio State University. At the mo-ment, an order form is not available, but the condi-tions are unchanged: $125 one-time charge at first order. More information is given here: Cross-Nation-al Equivalent File Project http://cnef.ehe.osu.edu/
LIS
LIS, the cross-national data center in Luxembourg—formerly known as the Luxembourg Income Study—will soon turn 32 years old. While LIS’ mission and core work have not changed since its inception—that is, to acquire and harmonize high-quality micro-datasets and to make them available to researchers around the world—LIS is constantly evolving and growing, as is its user community which currently numbers in the thousands. LIS’ data holdings are organized into two databases. The longstanding luxembourg income Study (liS) database, which is focused on income data, will soon contain over 300 datasets from more than 50 high- and middle-income countries. The smaller and newer luxembourg Wealth Study (lWS) database contains microdata on assets and debt; LWS now in - cludes 20 datasets from 12 countries. (Germany was one of the earliest participating countries; the LIS and LWS Databases contain 11 and 2 datasets from Germany, respectively.) www.lisdatacenter.org
SOEP Pretests
Within the framework of SOEP, the questionnaires are pretested before being fielded each year. The aim of the pretests is to test new sets of questions or modifications to certain questions. Furthermore, behavioral experiments are prepared and tested and sometimes even included in the main SOEP survey. A pretest in the SOEP usually includes about 1,000 respondents. The samples are representative by ap-proximation for the population aged 16 years and older in Germany. Data are collected by Infratest and passed on to the SOEP, which makes the data available to external users. Since 2012 pretests are part of sub-samples in SOEP-IS.https://paneldata.org/studies/5
SOEP-LEE
There is increasing consensus in the economic and social sciences that the workplace plays a crucial role in individual life outcomes. This is true in the eco-nomic and sociological labor market research, net-work and social capital research, health research, the research on educational and competency acquisition processes, wage information, and the work-life inter-face, as well as in the inequality research as a whole. For this reason, there has been increasing interest in what are known as “linked employer-employee” (LEE) datasets, in which employees’ individual data are linked with information on their employers. The workplace data collected in the framework of the project SOEP-LEE will substantially expand the information on the work contexts and working condi-tions of respondents to the SOEP survey. The project has been implemented by asking all dependent em-ployees in all of the SOEP samples to provide local contact information to their employer in 2011. The employer contact data then formed the basis for a standardized employer survey conducted seperately from the rest of the SOEP survey. This employer information can be linked with the individual and household data from the SOEP study.The new linked employer-employee dataset opens up new opportunities for wide-ranging forms of sec-ondary analysis with innovative questions from wide range of disciplines in the social and economic sci-ences. An additional unique feature of SOEP-LEE is the analysis of employer survey data quality, carried out through the measurement of meta- and paradata over the course of data collection. As a result, this project also contributes to the ongoing development and refinement of survey methodology in the field of organizational studies. http://www.diw.de/en/diw_01.c.433198.en/soep_lee. html
SOEP Wave Report 2015
PaRT 4: SOEP Service activities & Knowledge Transfer in 2015 | 165
SOEP-IS
The research infrastructure SOEP at DIW Berlin es-tablished a longitudinal Innovation Sample (SOEP-IS) in 2011 for particularly innovative research projects. The SOEP-IS is primarily available for me-thodical and thematic research that involves too high a risk of non-response for the long-term SOEP study.
SOEP-IS
• is based on an evaluation conducted by the German Council of Science and Humanities.
• is a longitudinal sample for particularly innovative survey methods and behavioral experiments.
• will be further developed in the period from 2012 to 2017 and should be fully developed by 2017.
The annual fieldwork runs from September to De-cember of each year. The first wave of the first sub-sample of the SOEP-IS started in September 2011, with a newly developed core questionnaire “SOEP Innovations” and new methods to measure gender stereotypes.The overall volume and costs of the surveys conduct-ed in the SOEP-IS are lower than if “fresh” samples were used: central household and individual char-acteristics, invariant over time, are already available and do not have to be collected again.A two-step module of Governance is established to regulate topics and question modules: first, the SOEP survey management runs a basic method-ological test to establish whether the size, format, and survey mode outlined in a proposal seem ap-propriate for implementation in the SOEP-IS. The SOEP Survey Committee then checks the content of proposals received and prioritizes these for se-lection purposes.Information about SOEP-IS in general and about the application process is published in: SOEP-Inno-vation Sample (SOEP-IS) – Description, Structure and Documentation by David Richter and Jürgen Schupp (SOEPpaper 463).www.diw.de/soep-is paneldata.org/studies/4(See pages 53-64 of this report)
SOEP-RS
FiD data (Families in Germany)
The project Familien in Deutschland (Families in Ger-many) – is a longitudinal panel study financed by theGerman Federal Ministry for Family Affairs, Senior Citizens, Women and Youth (BMFSFJ) and the Ger-man Federal Ministry of Finance (BMF). Its main purpose is to provide researchers with new and bet-ter data on specific groups in the German popula-tion: low-income families, families with more than two children, single parent families, as well as fami-lies with young children. The data are the backbone of the first large-scale evaluation of family policy measures in Germany on behalf of the two involved ministries. In 2014 FiD has been fully integratedinto SOEP-Core.
BASE II (Berlin Aging Study II)
The Berlin Aging Study II (BASE-II) is an extension and expansion of the Berlin Aging Study (BASE). This study with more than 2,200 participants of different ages aims to complement the analysis of cognitive development across the lifespan by includ-ing socio-economic and biological factors such as living conditions, health, and genetic preconditions. The study has been funded by the Federal Ministry of Education and Research up to December 2015. Participants are involved in the annual survey of the German Socio-EconomicPanel (SOEP) and pro-vide information about their life situation and liv-ing conditions.paneldata.org/studies/3
PIAAC-L
The Programme for the International Assessment ofAdult Competencies (PIAAC), carried out on behalf of the OECD, examines the basic skills that are nec-essary for adults to participate successfully in society and working life. Findings from the 2011/2012 wave of the PIACC study were released in October 2013.Around 98% of the approximately 5,400 PIAAC survey respondents in Germany agreed to partici-pate in further surveys. PIAAC-L is a cooperative project of GESIS, the National Educational Panel Survey (NEPS) at the Leibniz Institute for Educa-tional Trajectories (LIfBi), and the Socio-Economic Panel (SOEP) at DIW Berlin, whose aim is to con-vert the PIAAC study into a longitudinal study with three waves. This will create one of the world’s first
SOEP Wave Report 2015
166 | PaRT 4: SOEP Service activities & Knowledge Transfer in 2015
Bonn Intervention Panel (BIP)
The Bonn Intervention Panel (BIP) investigates thedevelopment of personality and preferences of chil-dren starting at primary school age up to age 25 andbeyond. At age 25, the personality is largely devel-oped and critical transitions in life have been ac-complished.The main focus of the BIP is the impact of early childhood environments.
TwinLife (cooperation study)
TwinLife is a 12-year representative behavioral ge-netic study investigating the development of social inequality. The long-term project has begun in 2014and will survey more than 4,000 pairs of twins andtheir families regarding their different stages of life on a yearly basis. All of the subjects reside in Germa-ny. Not only social, but also genetic mechanisms as well as covariations and interactions between these two parameters can be examined with the help of identical and fraternal twins. In order to document the individual development of different parameters it is important to examine a family extensively over thecourse of several years. The focus is on five impor-tant contextual points: Education and academic per-formance, career and labor market attainment, in-tegration and participation in social, cultural and political life.http://www.twin-life.de/en
internationally comparable longitudinal studies on competencies and their significance across the life course.www.diw.de/piaac-l_en
SOEP-ECEC Quality (K2ID-SOEP)
Are some groups of parents in Germany more likelyto choose high-quality education and care institu-tions for their children than others, e.g. whether due to a lack of information or varying preferences? Are mothers whose children attend high-quality settings more satisfied and more likely to be employed?These are some of the questions studied as part of the project “Early childhood education and care quality in the Socio-Economic Panel (K2ID-SOEP)— direct and indirect effects on child development, socio-economic selection and information asymme-tries.” The threeyear project launched in September 2013 is funded by the Jacobs Foundation:http://kid2id.de
IAB-SOEP Migration Sample
The IAB-SOEP Migration Sample is a joint project ofthe Institute for Employment Research (IAB) and theSocio-Economic Panel (SOEP) at the German Insti-tute for Economic Research (DIW Berlin). The project attempts to overcome limitations of previous datas-ets through a sample that takes into account changes in the structure of migration to Germany since 1995.The dataset is an additional sample for the SOEP-Core study and therefore completely harmonized with the SOEP and integrated into SOEP v30 (iden-tical questionnaire with additional questions on the respondent’s migration situation). The study opens up new perspectives for migration research and gives insights on the living situations of new immigrants to Germany. Data collector: TNS Infratest Sozial-forschung GmbH.paneldata.org/studies/6
SOEP Wave Report 2015
PaRT 4: SOEP Service activities & Knowledge Transfer in 2015 | 167
Simultaneously the numerical series of the SOEP-monitor represent social indicators. With every is-sue of the SOEPmonitor, we provide data series for the years 1984 to the current wave disaggregated for East and West Germany since 1990 households and persons. Since the 2007 SOEPmonitor tables are in English as well.www.diw.de/SoEPmonitor
SOEP-in-Residence
In addition to offering SOEP users the standard Sci-entific Use File (via secured download), a special mode of online access (via SOEPremote), and advice over the SOEPhotline, we also provide the opportu-nity to conduct research during a stay in the SOEP Department at DIW Berlin. Direct discussion with SOEP team members and our user-friendly environ-ment provide fruitful input and support, enabling visiting scholars to work effectively on research proj-ects and bring them to successful completion.For the use of small-scale coded geodata, a research stay at the SOEP Data Research Center located at DIW Berlin is mandatory. SOEP also provides re-search stays to address special research questions and topics. Furthermore, research visit to SOEP’s field organization, TNS Infratest Sozialforschung, are also possible. https://www.diw. de/en/diw_02.c.222617.en/soep_in_residence/html
SOEP Re-Analysis
Data protection issues are of utmost importance to SOEP and CNEF users as well. First, data protection comprises part of the (implicit) contract between the survey and the respondent. Second, in order to access the data, users are required to address data protection issues thoroughly. Ultimately, all these precautions are crucial to ensure future participation by panel respondents. As such, making SOEP and CNEF data available for re-analyses while maintain-ing the highest levels of data protection can presenta major-challenge. Whenever such a microdata set isnot considered completely anonymous from a legal point of view, we—as data producers—are not per-mitted to allow archiving without setting and guar-anteeing adherence to clear-cut access regulations. http://www.diw.de/en/diw_01.c.340858.en/soep_re_analyses.html
SOEP Service
SOEPnewsletter
Above and beyond the comprehensive documenta-tion and the various user support programs, the SOEP Research Data Center publishes the quar-terly SOEPnewsletter, containing the latest updates on data, conferences, and related information, and distributes it by email to the constantly growing in-ternational SOEP user community.www.diw.de/SoEPnewsletter
SOEPlit
Many of the research findings and publications based on SOEP data are archived at DIW Berlin. You will find the bibliographic descriptions in our SOEPlit database. In addition, we collect publica-tions based on the European Community Household Panel (ECHP) and the Luxembourg Income Study (LIS), as the data on Germany contained within these international comparable data sets are partly gener-ated from SOEP data.To keep this service up to date, we ask all authors to send us copies of all of their publications based on SOEP data by e-mail to: [email protected]. diw.de/SoEPlit
SOEPcampus
The SOEP is working to strengthen methodologicaltraining in the use of SOEP data—especially for young scholars in the disciplines of sociology, eco-nomics, and psychology. In addition to holding work-shops at universites, we list workshops and lectures providing introductions to the use of the SOEP data or dealing with particular issues of data use on our website at: http://www.diw.de/soepcampus.
SOEPmonitor
The SOEPmonitor compiles time series since the mid 1990’s for chosen indicators, calculated on basis of the SOEP data.The most important function of the SOEPmonitor— aside from reporting detailed infor-mation on the situations of individuals and house-holds—is to give SOEP users a benchmark for their own studies. With the figures contained in the SO-EPmonitor, we offer an important reference point to evaluate the results of your own research.
SOEP Wave Report 2015
2015
168 | PaRT 4: SOEP Service activities & Knowledge Transfer in 2015
The SOEP RDC, as a publication agent, will be as-signed the prefix 5684 in each DOI registered via da|ra. It is important for SOEP users to know that this does not change anything about our proposed mode of citation for the SOEP data. Rather, this provides you with the additional possibility to add a unique DOI to your citations.Because precise references to data sources are be-coming increasingly important in the scientific re-search community, the SOEP group recommends citing the SOEP data as follows.
English: Socio-Economic Panel (SOEP), data for years 1984–2014, version 31, SOEP, 2015, doi:10.5684/soep.v31.
German: Sozio-oekonomisches Panel (SOEP), Daten für die Jahre 1984–2014, Version 31, SOEP, 2015, doi:10.5684/soep.v31.
Short Version: SOEP v31
Digital Object Identifiers (DOI)
The need for replicability of findings makes it nec-essary to be able to identify and cite the particular SOEP data used in research. One way of doing this is through the system of Digital Object Identifiers (DOI), which is already being used for numerous publications. It is also well-suited for research data, and is therefore now being used for the SOEP data as well.Digital identifiers provide a form of permanent iden-tification for digital objects and thus guarantee that they can be found again on the Internet. They are a basic requirement for citing and finding research data on the Internet, even when the location (URL) has changed. A series of metadata are linked with each DOI (defined in the “metadata schema”) in order to guarantee improved description and recog-nition of the data.
2015SOEP Wave Report 2015
PaRT 5: SOEP-Based Publications in 2015 | 169
PART 5
SoEP-Based Publications in 2015
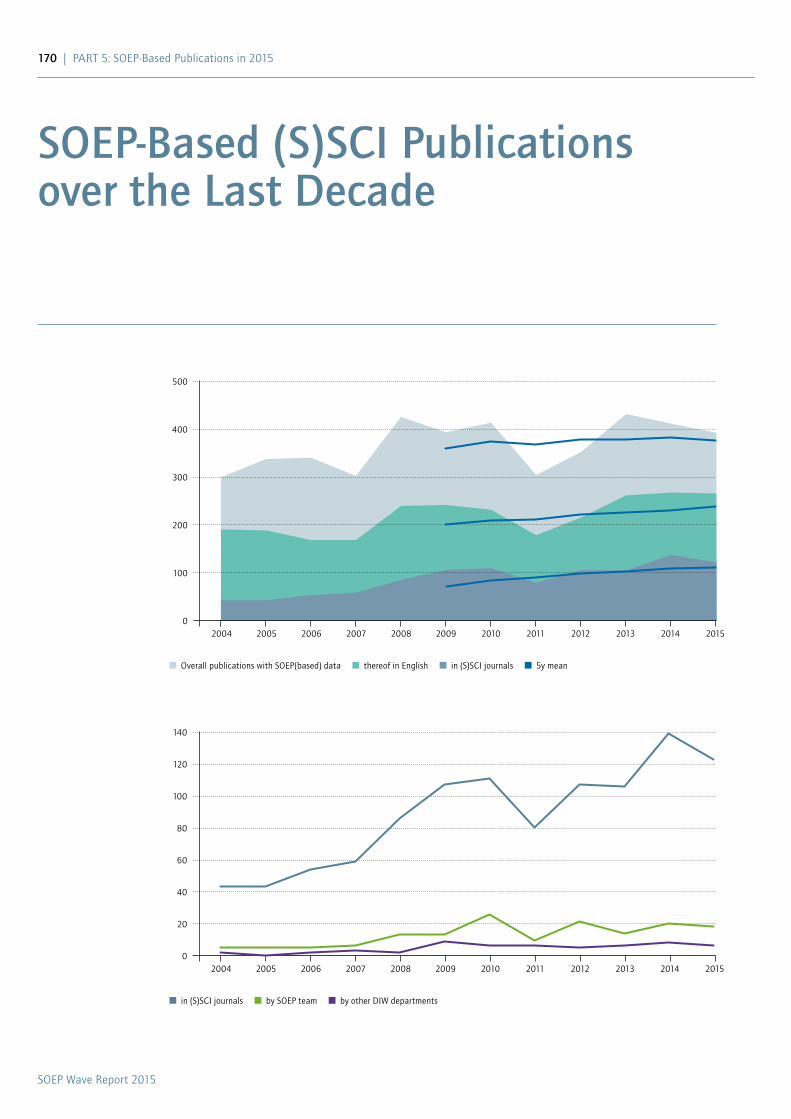
SOEP Wave Report 2015
170 | PaRT 5: SOEP-Based Publications in 2015
SOEP-Based (S)SCI Publications over the Last Decade
140
120
100
80
60
40
20
02004 2005 2006 2007 2008 2009 2010 2011 2012 2013 2014 2015
in (S)SCI journals by SOEP team by other DIW departments
Overall publications with SOEP(based) data thereof in English in (S)SCI journals 5y mean
500
400
300
200
100
02004 2005 2006 2007 2008 2009 2010 2011 2012 2013 2014 2015

SOEP Wave Report 2015
PaRT 5: SOEP-Based Publications in 2015 | 171
DDiehl, Claudia and Elisabeth Liebau. 2015. Turning back to Turkey – Or Turning the Back on Germany? Remigration Intentions and Behavior of Turkish Immigrants in Germany between 1984 and 2011. Zeitschrift für Soziologie 44, No. 1, 22–41.
EEibich, Peter. 2015. Understanding the effect of retirement on health using Regression Discontinuity Design. Journal of Health Economics 43, September 2015, 1–12. (http://dx.doi.org/10.1016/ j.jhealeco.2015.05.001).
FFauser, Margit, Elisabeth Liebau, Sven Voigtländer, Hidayet Tuncer, Thomas Faist and Oliver Razum. 2015. Measuring transnationality of immigrants in Germany: prevalence and relationship with social inequalities. Ethnic and Racial Studies 38, No. 9, 1479–1519. (http://dx.doi.org/10.1080/01419870.2015.1005639).
Fecher, Benedikt, Sascha Friesike and Marcel Hebing. 2015. What Drives academic Data Sharing? PLoS ONE 10, No. 2, e0118053. (http://dx.doi.org/10.1371/journal.pone.0118053).
GGerstorf, Denis, Gizem Hülür, Johanna Drewelies, Peter Eibich, Sandra Düzel, Ilja Demuth, Paolo Ghisletta, Elisabeth Steinhagen-Thiessen, Gert G. Wagner and Ulman Lindenberger. 2015. Secular Changes in Late-Life Cognition and Well-Being: Towards a Long Bright Future with a Short Brisk Ending? Psychology and Aging. 30, No. 2, 301–310. (http://dx.doi.org/10.1037/pag0000016).
Giesselmann, Marco. 2015. Differences in the Patterns of in-work Poverty in Germany and the UK. European Societies 17, No. 1, 27–46. (http://dx.doi.org/10.1080/14616696.2014.968796).
Goebel, Jan, Christian Krekel, Tim Tiefenbach and Nicolas R. Ziebarth. 2015. How natural disasters can affect environmental concerns, risk aversion, and even politics: evidence from Fukushima and three European countries. Journal of Population Economics 28, No. 4, 1137–1180. (http://dx.doi.org/10.1007/s00148-015-0558-8).
Grabka, Markus M. 2015. Income and wealth inequality after the financial crisis: the case of Germany. Empirica 42, No. 2, 371–390. (http://dx.doi.org/10.1007/s10663-015-9280-8).
Grabka, Markus M., Jan Marcus and Eva M. Sierminska. 2015. Wealth distribution within couples. Review of Economics of the Household 13, No. 3, 459–486. (http://dx.doi.org/10.1007/s11150-013-9229-2).
hHille, Adrian and Jürgen Schupp. 2015. How learning a musical instrument affects the development of skills. Economics of Education Review 44, February 2015, 56–82. (http://dx.doi.org/10.1016/ j.econedurev.2014.10.007).
iInfurna, Frank J., Denis Gerstorf, Nilam Ram, Jürgen Schupp, Gert G. Wagner and Jutta Heckhausen. 2015. Maintaining perceived control with unemployment facilitates future adjustment. Journal of Vocational Behavior (online first). (http://dx.doi.org/ 10.1016/j.jvb.2016.01.006).
KKottwitz, Anita, Anja Oppermann and C. Katharina Spieß. 2015. Parental leave benefits and breastfeeding in Germany: Effects of the 2007 reform. Review of Economics of the Household (online first), (http://dx.doi.org/ 10.1007/s11150-015-9299-4).
(S)SCI Publications in 2015by SOEP Staff
SOEP Wave Report 2015
172 | PaRT 5: SOEP-Based Publications in 2015
Kühne, Simon, Thorsten Schneider and David Richter. 2015. Big changes before big birthdays? Panel data provide no evidence of end-of-decade crises. Proceedings of the National Academy of Sciences of the United States of America (PNAS) 112, No. 11, E1170. (http://dx.doi.org/10.1073/pnas.1424903112).
PPforr, Klaus, Michael Blohm, Annelies G. Blom, Barbara Erdel, Barbara Felderer, Mathis Fräßdorf, Kristin Hajek, Susanne Helmschrott, Corinna Kleinert, Achim Koch, Ulrich Krieger, Martin Kroh, Silke Martin, Denise Saßenroth, Claudia Schmiedeberg, Eva-Maria Trüdinger and Beatrice Rammstedt. 2015. are incentive effects on response rates and nonresponse bias in large-scale, face-to-face surveys generalizable to Germany? Evidence from ten experiments. Public Opinion Quarterly 79, No. 3, 740–768. (http://dx.doi.org/10.1093/poq/nfv014).
SSaßenroth, Denise, Antje Meyer, Bastian Salewsky, Martin Kroh, Kristina Norman, Elisabeth Steinhagen-Thiessen and Ilja Demuth. 2015. Sports and Exercise at Different ages and Leukocyte Telomere Length in Later Life – Data from the Berlin aging Study II (BaSE-II). PLoS ONE 10, No. 12, e0142131. (http://dx.doi.org/10.1371/journal.pone.0142131).
Schmelzer, Paul, Stefanie Gundert and Christian Hohendanner. 2015. Qualifikationsspezifische Übergänge aus befristeter Beschäftigung am Erwerbsanfang – zwischen Screening und Flexibilisierung. Kölner Zeitschrift für Soziologie und Sozialpsychologie. 67, No. 2, 243–267. (http://dx.doi.org/10.1007/s11577-015-0305-x).
Schmelzer, Paul, Karin Kurz and Kerstin Schulze. 2015. Einkommensnachteile von Müttern im Vergleich zu kinderlosen Frauen in Deutschland. Kölner Zeitschrift für Soziologie und Sozialpsychologie (KZfSS) 67, No. 4, 737–762. (http://dx.doi.org/10.1007/s11577-015-0346-1).
Schnitzlein, Daniel D. 2015. a new look at intergenerational mobility in Germany compared to the US. Review of Income and Wealth (online first). (http://dx.doi.org/10.1111/roiw.12191).
Schnitzlein, Daniel D. and Christoph Wunder. 2015. are we architects of our own happiness? The importance of family background for well-being. The B.E. Journal of Economic Analysis & Policy 16, No. 1, 125–149. (http://dx.doi.org/10.1515/bejeap-2015-0037).
Schröder, Carsten, Katrin Rehdanz, Daiju Narita and Toshihiro Okubo. 2015. The Decline in average Family Size and Its Implications for the average Benefits of Within-Household Sharing. Oxford Economic Papers 67, No. 3, 760–780. (http://dx.doi.org/10.1093/oep/gpv033).
vVirtanen, Marianna, Markus Jokela, Solja T. Nyberg, Ida E. H. Madsen, Tea Lallukka, Kirsi Ahola, Lars Alfredsson, G. David Batty, Jakob B. Bjorner, Marianne Borritz, Hermann Burr, Annalisa Casini, Els Clays, Dirk De Bacquer, Nico Dragano, Raimund Erbel, Jane E. Ferrie, Eleonor I. Fransson, Mark Hamer, Katriina Heikkilä, Karl-Heinz Jöckel, France Kittel, Anders Knutsson, Markku Koskenvuo, Karl-Heinz Ladwig, Thorsten Lunau, Martin L. Nielsen, Maria Nordin, Tuula Oksanen, Jan H. Pejtersen, Jaana Pentti, Reiner Rugulies, Paula Salo, Jürgen Schupp, Johannes Siegrist, Archana Singh-Manoux, Andrew Steptoe, Sakari B. Suominen, Töres Theorell, Jussi Vahtera, Gert G. Wagner, Peter J. M. Westerholm, Hugo Westerlund and Mika Kivimäki. 2015. Long working hours and alcohol use: systematic review and meta-analysis of published studies and unpublished individual participant data. The BMJ 350, No. g7772. (http://dx.doi.org/10.1136/bmj.g7772).
Vogel, Nina, Denis Gerstorf, Nilam Ram, Jan Goebel and Gert G. Wagner. 2015. Terminal decline in well-being differs between residents in East Germany and West Germany. International Journal of Behavioral Development (IJBD) (online first). (http://dx.doi.org/10.1177/0165025415602561).
SOEP Wave Report 2015
PaRT 5: SOEP-Based Publications in 2015 | 173
(S)SCI Publications in 2015 by the SOEP User Community
aAuer, Wolfgang and Natalia Danzer. 2015. Fixed-Term Employment and Fertility: Evidence from German Micro Data. CESifo Economic Studies (online first). (http://dx.doi.org/10.1093/cesifo/ifv014).
Ayllón, Sara. 2015. Youth Poverty, Employment, and Leaving the Parental Home in Europe. Review of Income and Wealth 61, No. 4, 651–676. (http://dx.doi.org/10.1111/roiw.12122).
BBaetschmann, Gregori, Kevin E. Staub and Rainer Winkelmann. 2015. Consistent estimation of the fixed effects ordered logit model. Journal of the Royal Statistical Society, Series A (Statistics in Society) 178, No. 3, 685–703. (http://dx.doi.org/10.1111/rssa.12090). http://ftp.iza.org/dp5443.pdf
Bauernschuster, Stefan and Martin Schlotter. 2015. Public Child Care and Mothers’ Labor Supply – Evidence from Two Quasi-Experiments. Journal of Public Economics 123, March 2015, 1–16. (http://dx.doi.org/10.1016/j.jpubeco.2014.12.013).
Blazquez Cuesta, Maite and Santiago Budria. 2015. Income deprivation and mental well-being: The role of non-cognitive skills. Economics & Human Biology 17, April 2015, 16–28. (http://dx.doi.org/10.1016/j.ehb.2014.11.004). Boenigk, Silke and Marcel Lee Mayr. 2015. The Happiness of Giving: Evidence from the German Socioeconomic Panel That Happier People are More Generous. Journal of Happiness Studies (online first). (http://dx.doi.org/10.1007/s10902-015-9672-2).
Boenigk, Silke, Marius Mews and Wim de Kort. 2015. Missing Minorities: Explaining Low Migrant Blood Donation Participation and Developing Recruitment Tactics. VOLUNTAS: International Journal of Voluntary and Nonprofit Organizations 26, No. 4, 1240–1260. (http://dx.doi.org/10.1007/s11266-014-9477-7).
Böhnke, Petra, Janina Zeh and Sebastian Link. 2015. atypische Beschäftigung im Erwerbsverlauf: Verlaufstypen als ausdruck sozialer Spaltung? Zeitschrift für Soziologie 44, No. 4, 234–252.
Bordone, Valeria, Sergei Scherbov and Nadia Steiber. 2015. Smarter every day: The deceleration of population ageing in terms of cognition. Intelligence 52, September–October 2015, 90–96. (http://dx.doi.org/10.1016/j.intell.2015.07.005).
Boyce, Christopher J., Alex M. Wood, Michael Daly and Constantine Sedikides. 2015. Personality Change Following Unemployment. Journal of Applied Psychology 100, No. 4, 991–1011. (http://dx.doi.org/10.1037/a0038647).
Bröckel, Miriam, Anne Busch-Heizmann and Katrin Golsch. 2015. Headwind or Tailwind: Do Partners’ Resources Support or Restrict Promotion to a Leadership Position in Germany? European Sociological Review 31, No. 5, 533–545. (http://dx.doi.org/10.1093/esr/jcv054).
Brücker, Herbert. 2015. Migration und Finanzkrise – Eine quantitative und strukturelle analyse der Umlenkung von Wanderungsströmen. Kölner Zeitschrift für Soziologie und Sozialpsychologie (KZfSS) 67, No. 1, 165–191. (http://dx.doi.org/10.1007/s11577-015-0320-y).
SOEP Wave Report 2015
174 | PaRT 5: SOEP-Based Publications in 2015
Bünning, Mareike. 2015. What Happens after the ‘Daddy Months’? Fathers’ Involvement in Paid Work, Childcare, and Housework after Taking Parental Leave in Germany. European Sociological Review 31, No. 6, 738–748. (http://dx.doi.org/10.1093/esr/jcv072).
Bünnings, Christian, Jan Kleibrink and Jens Weßling. 2015. Fear of Unemployment and its Effect on the Mental Health of Spouses. Health Economics (online first). (http://dx.doi.org/10.1002/hec.3279).
Bünnings, Christian and Harald Tauchmann. 2015. Who Opts Out of the Statutory Health Insurance? a Discrete Time Hazard Model for Germany. Health Economics 24, No. 10, 1331–1347. (http://dx.doi.org/10.1002/hec.3091).
Busch-Heizmann, Anne. 2015. Supply-Side Explanations for Occupational Gender Segregation: adolescents’ Work Values and Gender-(a)Typical Occupational aspirations. European Sociological Review 31, No. 1, 48–64. (http://dx.doi.org/10.1093/esr/jcu081).
Busch-Heizmann, Anne and Miriam Bröckel. 2015. Die auswirkungen geschlechts(un)typischer Berufstätigkeiten auf die aufteilung der Hausarbeit in Partnerschaften. Kölner Zeitschrift für Soziologie und Sozialpsychologie (KZfSS) 67, No. 3, 475–507. (http://dx.doi.org/10.1007/s11577-015-0334-5).
cCheung, Felix and Richard E. Lucas. 2015. When does money matter most? Examining the association between income and life satisfaction over the life course. Psychology and Aging 30, No. 1, 120–135. (http://dx.doi.org/10.1037/a0038682).
Clark, Andrew E., Sarah Flèche and Claudia Senik. 2015. Economic Growth Evens Out Happiness: Evidence from Six Surveys. Review of Income and Wealth (online first). (http://dx.doi.org/10.1111/roiw.12190).
DDecoster, André and Peter Haan. 2015. Empirical welfare analysis with preference heterogeneity. International Tax and Public Finance 22, No. 2, 224–251. (http://dx.doi.org/10.1007/s10797-014-9304-5).
Diehl, Claudia and Elisabeth Liebau. 2015. Turning back to Turkey – Or Turning the Back on Germany? Remigration Intentions and Behavior of Turkish Immigrants in Germany between 1984 and 2011. Zeitschrift für Soziologie 44, No. 1, 22–41.
Dudel, Christian, Notburga Ott and Martin Werding. 2015. Maintaining One’s Living Standard at Old age: What Does that Mean? Evidence Using Panel Data from Germany. Empirical Economics (online first). (http://dx.doi.org/10.1007/s00181-015-1042-8).
EEckhard, Jan. 2015. abnehmende Bindungsquoten in Deutschland: ausmaß und Bedeutung eines historischen Trends. Kölner Zeitschrift für Soziologie und Sozialpsychologie (KZfSS) 67, No. 1, 27–55. (http://dx.doi.org/10.1007/s11577-014-0296-z).
Eckhard, Jan, Johannes Stauder and Daniel Wiese. 2015. Die Entwicklung des Partnermarkts im Längsschnitt – alters- und Kohortenunterschiede. Kölner Zeitschrift für Soziologie und Sozialpsychologie (KZfSS) 67, No. 1, 81–109. (http://dx.doi.org/10.1007/s11577-015-0316-7).
Eibich, Peter. 2015. Understanding the effect of retirement on health using Regression Discontinuity Design. Journal of Health Economics 43, September 2015, 1–12. (http://dx.doi.org/10.1016/ j.jhealeco.2015.05.001).
Erlinghagen, Marcel and Christiane Lübke. 2015. arbeitsplatzunsicherheit im Erwerbsverlauf. Eine Sequenzmusteranalyse westdeutscher Paneldaten. Zeitschrift für Soziologie 44, No. 6, 407–425.
FFacchini, Giovanni, Eleonora Patacchini and Max F. Steinhardt. 2015. Migration, Friendship Ties and Cultural assimiliation. The Scandinavian Journal of Economics 117, No. 2, 619–649. (http://dx.doi.org/10.1111/sjoe.12096).
SOEP Wave Report 2015
PaRT 5: SOEP-Based Publications in 2015 | 175
Fauser, Margit, Elisabeth Liebau, Sven Voigtländer, Hidayet Tuncer, Thomas Faist and Oliver Razum. 2015. Measuring transnationality of immigrants in Germany: prevalence and relationship with social inequalities. Ethnic and Racial Studies 38, No. 9, 1479–1519. (http://dx.doi.org/10.1080/01419870.2015.1005639).
Fecher, Benedikt, Sascha Friesike and Marcel Hebing. 2015. What Drives academic Data Sharing? PLoS ONE 10, No. 2, e0118053. (http://dx.doi.org/10.1371/journal.pone.0118053).
GGerstorf, Denis, Gizem Hülür, Johanna Drewelies, Peter Eibich, Sandra Duezel, Ilja Demuth, Paolo Ghisletta, Elisabeth Steinhagen-Thiessen, Gert G. Wagner and Ulman Lindenberger. 2015. Secular Changes in Late-Life Cognition and Well-Being: Towards a Long Bright Future with a Short Brisk Ending? Psychology and Aging 30, No. 2, 301–310. (http://dx.doi.org/10.1037/pag0000016).
Giesecke, Johannes, Jan Paul Heisig and Heike Solga. 2015. Getting more unequal: Rising labor market inequalities among low-skilled men in West Germany. Research in Social Stratification and Mobility 39, March 2015, 1–17. (http://dx.doi.org/10.1016/ j.rssm.2014.10.001).
Giesselmann, Marco. 2015. Differences in the Patterns of in-work Poverty in Germany and the UK. European Societies 17, No. 1, 27–46. (http://dx.doi.org/10.1080/14616696.2014.968796).
Goebel, Jan, Christian Krekel, Tim Tiefenbach and Nicolas R. Ziebarth. 2015. How natural disasters can affect environmental concerns, risk aversion, and even politics: evidence from Fukushima and three European countries. Journal of Population Economics 28, No. 4, 1137–1180. (http://dx.doi.org/10.1007/s00148-015-0558-8).
Goerke, Laszlo and Markus Pannenberg. 2015. Direct evidence for income comparisons and subjective well-being across reference groups. Economics Letters 137, October 2015, 95–101. (http://dx.doi.org/10.1016/ j.econlet.2015.10.012).
Goerke, Laszlo and Markus Pannenberg. 2015. Trade union membership and sickness absence: Evidence from a sick pay reform. Labour Economics 33, April 2015, 13–25. (http://dx.doi.org/10.1016/ j.labeco.2015.02.004).
Goetzke, Frank and Tilmann Rave. 2015. automobile access, peer effects and happiness. Transportation 42, No. 5, 791–805. (http://dx.doi.org/10.1007/s11116-015-9647-5).
Grabka, Markus M. 2015. Income and wealth inequality after the financial crisis: the case of Germany. Empirica 42, No. 2, 371–390. (http://dx.doi.org/10.1007/s10663-015-9280-8).
Grabka, Markus M., Jan Marcus and Eva M. Sierminska. 2015. Wealth distribution within couples. Review of Economics of the Household 13, No. 3, 459–486. (http://dx.doi.org/10.1007/s11150-013-9229-2).
Grätz, Michael. 2015. When Growing Up Without a Parent Does Not Hurt: Parental Separation and the Compensatory Effect of Social Origin. European Sociological Review 31, No. 5, 546–557. (http://dx.doi.org/10.1093/esr/jcv057). Grund, Christian. 2015. Gender pay gaps among highly educated professionals — Compensation components do matter. Labour Economics 34, June 2015, 118–126. (http://dx.doi.org/10.1016/ j.labeco.2015.03.010).
hHaan, Peter, Daniel Kemptner and Arne Uhlendorff. 2015. Bayesian procedures as a numerical tool for the estimation of an intertemporal discrete choice model. Empirical Economics 49, No. 3, 1123–1141. (http://dx.doi.org/10.1007/s00181-014-0906-7).
Hahn, Elisabeth, Jule Specht, Juliana Gottschling and Frank M. Spinath. 2015. Coping With Unemployment: The Impact of Unemployment Duration and Personality on Trajectories of Life Satisfaction. European Journal of Personality 29, No. 6, 635–646. (http://dx.doi.org/10.1002/per.2034).
Hakulinen, Christian, Mirka Hintsanen, Marcus R. Munafò, Marianna Virtanen, Mika Kivimäki, G. David Batty and Markus Jokela. 2015. Personality and smoking: individual-participant meta-analysis of 9 cohort studies. Addiction 110, No. 11, 1844–1852. (http://dx.doi.org/10.1111/add.13079).
SOEP Wave Report 2015
176 | PaRT 5: SOEP-Based Publications in 2015
Headey, Bruce and Ruud Muffels. 2015. Towards a Theory of Medium Term Life Satisfaction: Two-Way Causation Partly Explains Persistent Satisfaction or Dissatisfaction. Social Indicators Research (online first). (http://dx.doi.org/10.1007/s11205-015-1146-8).
Heizmann, Boris, Anne Busch-Heizmann and Elke Holst. 2015. Immigrant Occupational Composition and the Earnings of Immigrants and Natives in Germany: Sorting or Devaluation? International Migration Review (online first). (http://dx.doi.org/10.1111/imre.12209).
Hertweck, Matthias S. and Oliver Sigrist. 2015. The ins and outs of German unemployment: a transatlantic perspective. Oxford Economic Papers – New Series 67, No. 4, 1078-1095. (http://dx.doi.org/10.1093/oep/gpv031).
Hille, Adrian and Jürgen Schupp. 2015. How learning a musical instrument affects the development of skills. Economics of Education Review 44, February 2015, 56-82. (http://dx.doi.org/10.1016/ j.econedurev.2014.10.007).
Huebener, Mathias. 2015. The role of paternal risk attitudes in long-run education outcomes and intergenerational mobility. Economics of Education Review 47, August 2015, 64–79. (http://dx.doi.org/10.1016/ j.econedurev.2015.04.004).
Hülür, Gizem, Denis Gerstorf and Nilam Ram. 2015. Historical Improvements in Well-Being Do Not Hold in Late Life: Birth- and Death-Year Cohorts in the United States and Germany. Developmental Psychology 51, No. 7, 998–1012. (http://dx.doi.org/10.1037/a0039349).
iInfurna, Frank J., Denis Gerstorf, Nilam Ram, Jürgen Schupp, Gert G. Wagner and Jutta Heckhausen. 2015. Maintaining perceived control with unemployment facilitates future adjustment. Journal of Vocational Behavior (online first). (http://dx.doi.org/10.1016/j.jvb.2016.01.006).
JJäntti, Markus, Jukka Pirttilä and Håkan Selin. 2015. Estimating labour supply elasticities based on cross-country micro data: a bridge between micro and macro estimates? Journal of Public Economics 127, July 2015, 87–99. (http://dx.doi.org/10.1016/j.jpubeco.2014.12.006).
Jirjahn, Uwe and Vanessa Lange. 2015. Reciprocity and Workers’ Tastes for Representation. Journal of Labor Research 36, No. 2, 188–209. (http://dx.doi.org/10.1007/s12122-015-9198-8).
KKamhöfer, Daniel A. and Hendrik Schmitz. 2015. Reanalyzing Zero Returns to Education in Germany. Journal of Applied Econometrics (online first). (http://dx.doi.org/10.1002/jae.2461).
Kamin, Stefan T. and Frieder R. Lang. 2015. Cognitive Functions Buffer age Differences in Technology Ownership. Gerontology (online first). (http://dx.doi.org/10.1159/000437322).
Kleiner, Sibyl, Reinhard Schunck and Klaus Schömann. 2015. Different Contexts, Different Effects? Work Time and Mental Health in the United States and Germany. Journal of Health and Social Behavior 56, No. 1, 98–113. (http://dx.doi.org/10.1177/0022146514568348).
Korndörfer, Martin, Boris Egloff and Stefan C. Schmukle. 2015. a Large Scale Test of the Effect of Social Class on Prosocial Behavior. PLoS ONE 10, No. 7, e0133193. (http://dx.doi.org/10.1371/journal.pone.0133193).
Kottwitz, Anita, Anja Oppermann and C. Katharina Spieß. 2015. Parental leave benefits and breastfeeding in Germany: Effects of the 2007 reform. Review of Economics of the Household (online first). (http://dx.doi.org/10.1007/s11150-015-9299-4).
Kreyenfeld, Michaela. 2015. Economic Uncertainty and Fertility. Kölner Zeitschrift für Soziologie und Sozialpsychologie (KZfSS) 67, No. 1, 59–80. (http://dx.doi.org/10.1007/s11577-015-0325-6).
Kropfhäußer, Frieder and Marco Sunder. 2015. a weighty issue revisited: the dynamic effect of body weight on earnings and satisfaction in Germany. Applied Economics 47, No. 41, 4364–4376. (http://dx.doi.org/10.1080/00036846.2015.1030563).
Kühne, Simon, Thorsten Schneider and David Richter. 2015. Big changes before big birthdays? Panel data provide no evidence of end-of-decade crises. Proceedings of the National Academy of Sciences of the United States of America (PNAS) 112, No. 11, E1170. (http://dx.doi.org/10.1073/pnas.1424903112).
lLancee, Bram. 2015. Job search methods and immigrant earnings: a longitudinal analysis of the role of bridging social capital. Ethnicities (online first). (http://dx.doi.org/10.1177/1468796815581426).
SOEP Wave Report 2015
PaRT 5: SOEP-Based Publications in 2015 | 177
Langner, Laura Antonia. 2015. Within-couple specialisation in paid work: a long-term pattern? a dual trajectory approach to linking lives. Advances in Life Course Research 24, June 2015, 47–65. (http://dx.doi.org/10.1016/ j.alcr.2015.02.002).
Lechner, Clemens M. and Thomas Leopold. 2015. Religious attendance Buffers the Impact of Unemployment on Life Satisfaction: Longitudinal Evidence from Germany. Journal for the Scientific Study of Religion 54, No. 1, 166–174. (http://dx.doi.org/10.1111/jssr.12171).
Leopold, Thomas and Clemens M. Lechner. 2015. Parents’ Death and adult Well-being: Gender, age, and adaptation to Filial Bereavement. Journal of Marriage and Family 77, No. 3, 747–760. (http://dx.doi.org/10.1111/jomf.12186).
Leopold, Thomas and Jan Skopek. 2015. Convergence or Continuity? The Gender Gap in Household Labor after Retirement. Journal of Marriage and Family 77, No. 4, 819–832. (http://dx.doi.org/10.1111/jomf.12199).
Leßmann, Ortrud and Torsten Masson. 2015. Sustainable consumption in capability perspective: Operationalization and empirical illustration. Journal of Behavioral and Experimental Economics 57, August 2015, 64–72. (http://dx.doi.org/10.1016/ j.socec.2015.04.001).
Levels, Mark, Peer Scheepers, Tim Huijts and Gerbert Kraaykamp. 2015. Formal and Informal Social Capital in Germany: The Role of Institutions and Ethnic Diversity. European Sociological Review 31, No. 6, 766–779. (http://dx.doi.org/10.1093/esr/jcv075).
Loerbroks, Adrian, Raphael M. Herr, Jian Li, Jos A. Bosch, Max Seegel, Michael Schneider, Peter Angerer and Burkhard Schmidt. 2015. The association of effort–reward imbalance and asthma: findings from two cross-sectional studies. International Archives of Occupational and Environmental Health 88, No. 3, 351–358. (http://dx.doi.org/10.1007/s00420-014-0962-5).
MMäder, Miriam, Steffen Müller, Regina T. Riphahn and Caroline Schwientek. 2015. Intergenerational transmission of unemployment – evidence for German sons. Jahrbücher für Nationalökonomie und Statistik 235, No. 4+5, 355–375.
Marcus, Jan, Janina Nemitz and C. Katharina Spieß. 2015. Veränderungen in der gruppenspezifischen Nutzung von ganztägigen Schulangeboten – Längsschnittanalysen für den Primarbereich. Zeitschrift für Erziehungswissenschaft (online first). (http://dx.doi.org/10.1007/s11618-015-0647-1).
Margolis, Rachel and Mikko Myrskylä. 2015. Parental Well-being Surrounding First Birth as a Determinant of Further Parity Progression. Demography 52, No. 4, 1147–1166. (http://dx.doi.org/10.1007/s13524-015-0413-2).
Martinovic, Borja, Frank van Tubergen and Ineke Maas. 2015. a Longitudinal Study of Interethnic Contacts in Germany: Estimates from a Multilevel Growth Curve Model. Journal of Ethnic and Migration Studies 41, No. 1, 83–100. (http://dx.doi.org/10.1080/1369183x.2013.869475).
Matta, Vanita Irene. 2015. Führen selbstgesteuerte arbeitszeiten zu einer ausweitung der arbeitsstunden? Eine Längsschnittanalyse auf der Basis des Sozio-oekonomischen Panels. Zeitschrift für Soziologie 44, No. 4, 253–271.
Mertens, Antje and Miriam Beblo. 2015. Self-reported Satisfaction and the Economic Crisis of 2007-09: Or How People in the UK and Germany Perceive a Severe Cyclical Downturn. Social Indicators Research 125, No. 2, 537–565. (http://dx.doi.org/10.1007/s11205-014-0854-9).
OOesch, Daniel. 2015. Welfare regimes and change in the employment structure: Britain, Denmark and Germany since 1990. Journal of European Social Policy 25, No. 1, 94–110. (http://dx.doi.org/10.1177/0958928714556972). Olney, William W. 2015. Remittances and the Wage Impact of Immigration. Journal of Human Resources 50, No. 3, 694–727. (http://dx.doi.org/10.3368/jhr.50.3.694).
PPagán, Ricardo. 2015. The contribution of holiday trips to life satisfaction: the case of people with disabilities. Current Issues in Tourism 18, No. 6, 524–538. (http://dx.doi.org/10.1080/13683500.2013.860086).
Pagán, Ricardo. 2015. Determinants of participation in further training among workers with disabilities. Disability and Rehabilitation 37, No. 11, 1009–1016. (http://dx.doi.org/10.3109/09638288.2014.948140).
SOEP Wave Report 2015
178 | PaRT 5: SOEP-Based Publications in 2015
Pagán, Ricardo. 2015. How Do Leisure activities Impact on Life Satisfaction? Evidence for German People with Disabilities. Applied Research in Quality of Life 10, No. 4, 557–572. (http://dx.doi.org/10.1007/s11482-014-9333-3). Pagán-Rodríguez, Ricardo. 2015. Disability, Training and Job Satisfaction. Social Indicators Research 122, No. 3, 865–885. (http://dx.doi.org/10.1007/s11205-014-0719-2).
Pforr, Klaus, Michael Blohm, Annelies G. Blom, Barbara Erdel, Barbara Felderer, Mathis Fräßdorf, Kristin Hajek, Susanne Helmschrott, Corinna Kleinert, Achim Koch, Ulrich Krieger, Martin Kroh, Silke Martin, Denise Saßenroth, Claudia Schmiedeberg, Eva-Maria Trüdinger and Beatrice Rammstedt. 2015. are incentive effects on response rates and nonresponse bias in large-scale, face-to-face surveys generalizable to Germany? Evidence from ten experiments. Public Opinion Quarterly 79, No. 3, 740–768. (http://dx.doi.org/10.1093/poq/nfv014).
Pförtner, Timo-Kolja. 2015. Materielle Deprivation und Gesundheit von Männern und Frauen in Deutschland: Ergebnisse aus dem Sozioökonomischen Panel 2011. Bundesgesundheitsblatt – Gesundheitsforschung – Gesundheitsschutz 58, No. 1, 100–107. (http://dx.doi.org/10.1007/s00103-014-2080-7).
Pförtner, Timo-Kolja and Frank J. Elgar. 2015. Widening inequalities in self-rated health by material deprivation? a trend analysis between 2001 and 2011 in Germany. Journal of Epidemiology and Community Health (online first). (http://dx.doi.org/10.1136/jech-2015-205948).
Proto, Eugenio and Aldo Rustichini. 2015. Life Satisfaction, Income and Personality. Journal of Economic Psychology 48, June 2015, 17–32. (http://dx.doi.org/10.1016/j.joep.2015.02.001).
RRaschke, Christian. 2015. The Impact of the German Child Benefit on Child Well-Being. German Economic Review (online first). (http://dx.doi.org/10.1111/geer.12079).
Reichert, Arndt R., Boris Augurzky and Harald Tauchmann. 2015. Self-perceived job insecurity and the demand for medical rehabilitation: does fear of unemployment reduce health care utilization? Health Economics 24, No. 1, 8–25. (http://dx.doi.org/10.1002/hec.2995).
Rietveld, Cornelius A., Jolanda Hessels and Peter van der Zwan. 2015. The stature of the self-employed and its relation with earnings and satisfaction. Economics and Human Biology 17, April 2015, 59–74. (http://dx.doi.org/10.1016/j.ehb.2015.02.001).
Riphahn, Regina T. and Christoph Wunder. 2015. State Dependence in Welfare Receipt: Transitions Before and after a Reform. Empirical Economics (online first). (http://dx.doi.org/10.1007/s00181-015-0977-0).
Rohrer, Julia M., Boris Egloff and Stefan C. Schmukle. 2015. Examining the Effects of Birth Order on Personality. Proceedings of the National Academy of Sciences of the United States of America (PNAS) 112, No. 46, 14224–14229. (http://dx.doi.org/10.1073/pnas.1506451112).
SSaßenroth, Denise, Antje Meyer, Bastian Salewsky, Martin Kroh, Kristina Norman, Elisabeth Steinhagen-Thiessen and Ilja Demuth. 2015. Sports and Exercise at Different ages and Leukocyte Telomere Length in Later Life – Data from the Berlin aging Study II (BaSE-II). PLoS ONE 10, No. 12, e0142131. (http://dx.doi.org/10.1371/journal.pone.0142131).
Sauter, Nicolas. 2015. Social networks as a catalyst of economic change. Economics Letters 134, September 2015, 45–48. (http://dx.doi.org/10.1016/ j.econlet.2015.06.010).
Sauter, Nicolas, Jan Walliser and Joachim Winter. 2015. Tax incentives, bequest motives and the demand for life insurance: evidence from a natural experiment in Germany. Journal of Pension Economics and Finance 14, No. 4, 525–553. (http://dx.doi.org/10.1017/S1474747215000244).
Schmelzer, Paul, Karin Kurz and Kerstin Schulze. 2015. Einkommensnachteile von Müttern im Vergleich zu kinderlosen Frauen in Deutschland. Kölner Zeitschrift für Soziologie und Sozialpsychologie (KZfSS) 67, No. 4, 737–762. (http://dx.doi.org/10.1007/s11577-015-0346-1).
Schmitz, Hendrik and Matthias Westphal. 2015. Short- and medium-term effects of informal care provision on female caregivers’ health. Journal of Health Economics 42, July 2015, 174–185. (http://dx.doi.org/10.1016/ j.jhealeco.2015.03.002).
SOEP Wave Report 2015
PaRT 5: SOEP-Based Publications in 2015 | 179
Schneider, Thorsten and Julia Dohrmann. 2015. Religion und Bildungserfolg in Westdeutschland unter besonderer Berücksichtigung von Diasporaeffekten. Kölner Zeitschrift für Soziologie und Sozialpsychologie (KZfSS) 67, No. 2, 293–320. (http://dx.doi.org/10.1007/s11577-015-0310-0).
Schnitzlein, Daniel D. 2015. a new look at intergenerational mobility in Germany compared to the US. Review of Income and Wealth (online first). (http:// dx.doi.org/10.1111/roiw.12191).
Schnitzlein, Daniel D. and Christoph Wunder. 2015. are we architects of our own happiness? The importance of family background for well-being. The B.E. Journal of Economic Analysis & Policy 16, No. 1, 125–149. (http://dx.doi.org/10.1515/bejeap-2015-0037).
Schober, Pia S. and C. Katharina Spieß. 2015. Local day-care quality and maternal employment: Evidence from East and West Germany. Journal of Marriage and Family 77, No. 3, 712–729. (http://dx.doi.org/10.1111/jomf.12180).
Schüller, Simone. 2015. Parental Ethnic Identity and Educational attainment of Second-Generation Immigrants. Journal of Population Economics 28, No. 4, 965–1004. (http://dx.doi.org/10.1007/s00148-015-0559-7).
Schulze, Alexander and Volker Dreier. 2015. Der Beitrag des sozialen und demographischen Strukturwandels zur armutsentwicklung in Deutschland. Kölner Zeitschrift für Soziologie und Sozialpsychologie (KZfSS) 67, No. 2, 197–216. (http://dx.doi.org/10.1007/s11577-015-0307-8).
Schulze Waltrup, Linda and Göran Kauermann. 2015. Smooth expectiles for panel data using penalized splines. Statistics and Computing (online first). (http://dx.doi.org/10.1007/s11222-015-9621-2).
Schunck, Reinhard, Katharina Reiss and Oliver Razum. 2015. Pathways between perceived discrimination and health among immigrants: evidence from a large national panel survey in Germany. Ethnicity & Health 20, No. 5, 493–510. (http://dx.doi.org/10.1080/13557858.2014.932756).
Schunck, Reinhard, Carsten Sauer and Peter Valet. 2015. Unfair Pay and Health: The Effects of Perceived Injustice of Earnings on Physical Health. European Sociological Review 31, No. 6, 655–666. (http://dx.doi.org/10.1093/esr/jcv065).
Schurer, Stefanie. 2015. Lifecycle patterns in the socioeconomic gradient of risk preferences. Journal of Economic Behavior & Organization 119, November 2015, 482–495. (http://dx.doi.org/10.1016/j.jebo.2015.09.024).
Shehu, Edlira, Annette Hofmann, Michel Clement and Ann-Christin Langmaack. 2015. Healthy donor effect and satisfaction with health. The European Journal of Health Economics 16, No. 7, 733–745. (http://dx.doi.org/10.1007/s10198-014-0625-1).
Shehu, Edlira, Ann-Christin Langmaack, Elena Felchle and Michel Clement. 2015. Profiling Donors of Blood, Money, and Time: a Simultaneous Comparison of the German Population. Nonprofit Management & Leadership 25, No. 3, 269–295. (http://dx.doi.org/10.1002/nml.21126).
Simonson, Julia, Laura Romeu Gordo and Nadiya Kelle. 2015. Separate paths, same direction? De-standardization of male employment biographies in East and West Germany. Current Sociology 63, No. 3, 387–410. (http://dx.doi.org/10.1177/0011392115572380).
Sinnewe, Elisabeth, Michael A. Kortt and Brian Dollery. 2015. Religion and Life Satisfaction: Evidence from Germany. Social Indicators Research 123, No. 3, 837–855. (http://dx.doi.org/10.1007/s11205-014-0763-y).
Stavrova, Olga and Daniel Ehlebracht. 2015. Cynical Beliefs about Human Nature and Income: Longitudinal and Cross-Cultural analyses. Journal of Personality and Social Psychology 110, No. 1, 116–132. (http://dx.doi.org/10.1037/pspp0000050).
Steiber, Nadia. 2015. Population aging at Cross-Roads: Diverging Secular Trends in average Cognitive Functioning and Physical Health in the Older Population of Germany. PLoS ONE 10, No. 8, e0136583. (http://dx.doi.org/10.1371/journal.pone.0136583).
Stöhr, Tobias. 2015. The returns to occupational foreign language use: Evidence from Germany. Labour Economics 32, January 2015, 86–98. (http://dx.doi.org/10.1016/ j.labeco.2015.01.004).
Stolberg, Carolyn and Sten Becker. 2015. Gesundheitliche Ungleichheit zum Lebensbeginn. Kölner Zeitschrift für Soziologie und Sozialpsychologie (KZfSS) 67, No. 2, 321–354. (http://dx.doi.org/10.1007/s11577-015-0306-9).
SOEP Wave Report 2015
180 | PaRT 5: SOEP-Based Publications in 2015
tTrachte, Florian, Stefanie Sperlich and Siegfried Geyer. 2015. Kompression oder Expansion der Morbidität? Entwicklung der Gesundheit in der älteren Bevölkerung. Zeitschrift für Gerontologie und Geriatrie 48, No. 3, 255–262. (http://dx.doi.org/10.1007/s00391-014-0644-7).
uUnger, Rainer, Klaus Giersiepen and Michael Windzio. 2015. Pflegebedürftigkeit im Lebensverlauf – Der Einfluss von Familienmitgliedern und Freunden als Versorgungsstrukturen auf die funktionale Gesundheit und Pflegebedürftigkeit im häuslichen Umfeld. Kölner Zeitschrift für Soziologie und Sozialpsychologie (KZfSS) 67, No. 1, 193–215. (http://dx.doi.org/10.1007/s11577-015-0312-y).
vVan den Berg, Gerard J., Pia R. Pinger and Johannes Schoch. 2015. Instrumental Variable Estimation of the Causal Effect of Hunger Early in Life on Health Later in Life. The Economic Journal (online first). (http://dx.doi.org/10.1111/ecoj.12250).
Vogel, Nina, Denis Gerstorf, Nilam Ram, Jan Goebel and Gert G. Wagner. 2015. Terminal decline in well-being differs between residents in East Germany and West Germany. International Journal of Behavioral Development (IJBD) (online first). (http://dx.doi.org/10.1177/0165025415602561).
Voßemer, Jonas and Bettina Schuck. 2015. Better Overeducated than Unemployed? The Short- and Long-Term Effects of an Overeducated Labour Market Re-entry. European Sociological Review (online first). (http://dx.doi.org/10.1093/esr/jcv093).
WWelsch, Heinz and Jan Kühling. 2015. Income Comparison, Income Formation, and Subjective Well-Being: New Evidence on Envy versus Signaling. Journal of Behavioral and Experimental Economics 59, December 2015, 21–31. (http://dx.doi.org/10.1016/ j.socec.2015.09.004).
Westermaier, Franz, Brant Morefield and Andrea M. Mühlenweg. 2015. Parental health and child behavior: evidence from parental health shocks. Review of Economics of the Household (online first). (http://dx.doi.org/10.1007/s11150-015-9284-y).
SOEP Wave Report 2015
PaRT 5: SOEP-Based Publications in 2015 | 181
728christian Krekel, Jens Kolbe, henry WüstemannThe Greener, The Happier? The Effects of Urban Green and Abandoned Areas on Residential Well-Being
729christian Dustmann, Joseph- Simon GörlachThe Economics of Temporary Migrations
730 thomas haipeter, christine SlomkaIndustriebeschäftigung im Wandel – Arbeiter, Angestellte und ihre Arbeitsbedingungen
731Emily Murphy, Daniel OeschThe feminization of occupations and change in wages: a panel analysis of Britain, Germany and Switzerland
732henna Busk, Elke J. Jahn, christine SingerDo changes in regulation affect temporary agency workers’ job satisfaction?
733Frank M. Fossen, Johannes KönigPublic health insurance and entry into self-employment
734Ralf Dewenter, leonie GiessingDie Langzeiteffekte der Sport-förderung: Auswirkung des Leistungssports auf den beruflichen Erfolg
735christina Boll, Malte hoffmannIt’s not all about parents’ education, it also matters what they do. Parents’ employment and children’s school success in Germany
736nicolai SuppaTowards a Multidimensional Poverty Index for Germany
737Daniel avdic, christian BünningsDoes the Burglar Also Disturb the Neighbor? Crime Spillovers on Individual Well-being
738Denis Gerstorf, Gizem hülür, Johanna Drewelies, Peter EibichSecular Changes in Late-life Cognition and Well-being: Towards a Long Bright Future with a Short Brisk Ending?
739andrew E. clark, conchita D’ambrosio, Simone GhislandiPoverty Profiles and Well-Being: Panel Evidence from Germany
740Doreen triebeThe Added Worker Effect Differentiated by Gender and Partnership Status – Evidence from Involuntary Job Loss
741christian Bünnings, hendrik Schmitz, harald tauchmann, nicolas R. ZiebarthHow Health Plan Enrollees Value Prices Relative to Supplemental Benefits and Service Quality
742Stefanie SchurerLifecycle patterns in the socioeconomic gradient of risk preferences
743Regina t. Riphahn, Michael ZibrowiusApprenticeship, Vocational Training and Early Labor Market Outcomes – in East and West Germany
744Daniel Kuehnle, christoph WunderUsing the life satisfaction approach to value daylight savings time transitions. Evidence from Britain and Germany
745alan t. PiperSleep duration and life satisfaction
2015 SOEPpapers on Multidisciplinary Panel Data Research at DIW Berlinwww.diw.de/soeppapers
SOEP Wave Report 2015
182 | PaRT 5: SOEP-Based Publications in 2015
746Peter heindl, Rudolf SchüsslerDynamic Properties of Energy Affordability Measures
747adrian chadi, clemens hetschkoHow Job Changes Affect People’s Lives – Evidence from Subjective Well-being Data
748angela Faßhauer, Katrin RehdanzEstimating Benefits from Regional Amenities: Internal Migration and Life Satisfaction
749charlotte cabane, adrian hille, Michael lechnerMozart or Pelé? The effects of teenagers’ participation in music and sports
750Peter haan, victoria ProwseOptimal Social Assistance and Unemployment Insurance in a Life-cycle Model of Family Labor Supply and Savings
751Johannes Schult, Jörn R. SparfeldtCompulsory Military Service and Personality Development
752Peter Bönisch, Walter hyllTelevision Role Models and Fertility – Evidence from a Natural Experiment
753Patricia Gallego-Granados, Johannes GeyerDistributional and Behavioral Effects of the Gender Wage Gap
754adrian chadi, Matthias KrapfThe Protestant Fiscal Ethic: Religious Confession and Euro Skepticism in Germany
755Jan Goebel, Martin GornigDeindustrialization and the Polarization of Household Incomes: The Example of Urban Agglomerations in Germany
756Katja Görlitz, Marcus tammParenthood and risk preferences
757Renate lange, Jörg Schiller, Petra SteinorthDemand and Selection Effects in Supplemental Health Insurance in Germany
758Regina t. Riphahn, christoph WunderState dependence in welfare receipt: transitions before and after a reform
759Michael KostmannArbeitsmarktintegration: Spielt der Geburtsort eine Rolle? – Eine empirische Untersuchung mit Daten des SOEP zum Zusammenhang zwischen Geburts-ort und Arbeitsmarkterfolg von Migranten in Deutschland
760christian Krekel, alexander ZerrahnSowing the Wind and Reaping the Whirlwind? The Effect of Wind Turbines on Residential Well-Being
761Marco Bertoni, luca corazziniLife Satisfaction and Endogenous Aspirations
762Jan Goebel, christian Krekel, tim tiefenbach, nicolas R. ZiebarthHow Natural Disasters Can Affect Environmental Concerns, Risk Aversion, and Even Politics: Evidence from Fukushima and Three European Countries
763Michael Berlemann, Max Steinhardt, Jascha tuttDo Natural Disasters Stimulate Individual Saving? Evidence from a Natural Experiment in a Highly Developed Country
764inna Petrunyk, christian PfeiferLife satisfaction in Germany after reunification: Additional insights on the pattern of convergence
765Peter KrauseQuality of Life and Inequality
766christina Boll, hendrik hüning, Julian leppin, Johannes PuckelwaldPotential Effects of a Statutory Minimum Wage on the Gender Pay Gap – A Simulation-Based Study for Germany
767lars thielLeave the Drama on the Stage: The Effect of Cultural Participation on Health
768Michael Beckmann, thomas cornelissen, Matthias KräkelSelf-Managed Working Time and Employee Effort: Theory and Evidence
769Sarah DahmannHow Does Education Improve Cognitive Skills? Instructional Time versus Timing of Instruction
770holger Bonin, Karsten Reuss, holger StichnothLife-cycle Incidence of Family Policy Measures in Germany: Evidence from a Dynamic Microsimulation Model
SOEP Wave Report 2015
PaRT 5: SOEP-Based Publications in 2015 | 183
771ines ZapfIndividual and Workplace-specific Determinants of Paid and Unpaid Overtime Work in Germany
772carsten Schroeder, Shlomo yitzhakiRevisiting the evidence for a cardinal treatment of ordinal variables
773hannah ZagelUnderstanding differences in labour market attachment of single mothers in Great Britain and West Germany
774Berndt Keller, hartmut SeifertAtypical forms of employment in the public sector – are there any?
775Paula thieme, Dennis a.v. DittrichA life-span perspective on life satisfaction
776tim Friehe, Markus Pannenberg, Michael WedowLet Bygones be Bygones? Socialist Regimes and Personalities in Germany
777charlotte Bartels, nico PestelThe Impact of Short- and Long-term Participation Tax Rates on Labor Supply
778Dominique Meurs, Patrick a. Puhani, Friederike von haarenNumber of Siblings and Educational Choices of Immigrant Children: Evidence from First- and Second-Generation Immigrants
779charlotte von Möllendorff, heinz WelschMeasuring Renewable Energy Externalities: Evidence from Subjective Well-Being Data
780Judith KaschowitzDer Einfluss der Pflegeverantwortung von Frauen auf das Arbeitsangebot ihrer Partner – Eine Untersuchung mit dem SOEP
781Robin Jessen, Davud Rostam-afschar, viktor SteinerGetting the Poor to Work: Three Welfare Increasing Reforms for a Busy Germany
782David WrightHow have employment transitions for older workers in Germany and the UK changed?
783christian hakulinen, Mirka hintsanen, Marcus R. Munafò, Marianna virtanenPersonality and smoking: Individual-Participant Meta-Analysis of 9 cohort studies
784Sarah Flèche, Richard layardDo more of those in misery suffer from poverty, unemployment or mental illness?
785Johannes Geyer, thorben KorfhageLong-term care reform and the labor supply of household members
– evidence from a quasi-experiment
786nico PestelMarital Sorting, Inequality and the Role of Female Labor Supply: Evidence from East and West Germany
787Reto Odermatt, alois Stutzer(Mis-)Predicted Subjective Well-Being Following Life Events
788Jörg EulenbergerDie Persönlichkeitsmerkmale von Personen im Kontext des Lehrer_innenberufs
789christian PfeiferUnfair Wage Perceptions and Sleep: Evidence from German Survey Data
790christian Westermeier, Markus M. GrabkaLongitudinal Wealth Data and Multiple Imputation: An Evaluation Study
791Katrin huberMoving to an earnings-related parental leave system – do heterogeneous effects on parents make some children worse off?
792Rui DangExplaining the Body Mass Index Gaps between Turkish Immigrants and Germans in West Germany 2002–2012: A Decomposition Analysis of Socio-economic Causes
793thomas Dohmen, hartmut lehmann, norberto PignattiTime-Varying Individual Risk Attitudes over the Great Recession: A Comparison of Germany and Ukraine
794hendrik thiel, Stephan l. thomsenIndividual Poverty Paths and the Stability of Control-Perception
SOEP Wave Report 2015
184 | PaRT 5: SOEP-Based Publications in 2015
795viola angelini, Marco Bertoni, luca corazziniThe Causal Effect of Paternal Unemployment on Children’s Personality
796Marc Fleurbaey, vito Peragine, xavier RamosEx Post Inequality of Opportunity Comparisons
797andreas Peichl, Martin ungererAccounting for the Spouse when Measuring Inequality of Opportunity
798andreas Peichl, Martin ungererEquality of Opportunity: East vs. West Germany
799Malte SandnerEffects of Early Childhood Intervention on Fertility and Maternal Employment: Evidence from a Randomized Controlled Trial
800Panu Poutvaara, Max Friedrich SteinhardtBitterness in life and attitudes towards immigration
801Simon Decker, hendrik SchmitzHealth Shocks and Risk Aversion
802alexander SohnBeyond Conventional Wage Discrimination Analysis: Assessing Comprehensive Wage Distributions of Males and Females using Structured Additive Distributional Regression
803Pia S. Schober, Gundula ZochChange in the gender division of domestic work after mummy or daddy took leave: An examination of alternative explanations
804anna Wieber, Elke holstGender identity and womens’ supply of labor and non-market work – Panel data evidence for Germany
805Rui DangSpillover Effects of Local Human Capital Stock on Adult Obesity: Evidence from German Neighborhoods
806teresa Backhaus, Kathrin Gebers, carsten SchröderEvolution and Determinants of Rent Burdens in Germany
807Julia M. Rohrer, Boris Egloff, Stefan c. SchmukleExamining the Effects of Birth Order on Personality
808Martin Korndörfer, Boris Egloff, Stefan c. SchmukleA Large Scale Test of the Effect of Social Class on Prosocial Behavior
809Matthew Dimick, Daniel StegmuellerThe Political Economy of Risk and Ideology
810adrian hilleHow a universal music education program affects time use, behavior, and school attitude
811nadine SchreinerAuf der Suche nach Energiearmut: Eine Potentialanalyse des Low-Income-High-Costs Indikators für Deutschland
812Philipp Marek, Benjamin Damm, tong-yaa SuBeyond the Employment Agency: The Effect of Social Capital on the Duration of Unemployment
813clemens hetschko, Malte PreussIncome in Jeopardy: How Losing Employment Affects the Willingness to Take Risks
814Elena Shvartsman, Michael BeckmannStressed by your job: What is the role of personnel policy?
815Mariacristina Rossi, Eva SierminskaHousing Decisions, Family Types and Gender. A look across LIS countries
SOEP Wave Report 2015
PaRT 5: SOEP-Based Publications in 2015 | 185
Series a
Survey Instruments (Erhebungsinstrumente)
262Erhebungsinstrumente des IAB-SOEP-Migrationssamples 2014: Jugendfragebogen
267SOEP 2014 – Erhebungsinstrumente 2014 (Welle 31) des Sozio-oekonomi-schen Panels: Übersetzungshilfen, Altstichproben (englisch, türkisch, russisch)
268Erhebungsinstrumente des IAB-SOEP-Migrationssamples 2014: Übersetzungshilfen (englisch, polnisch, türkisch, rumänisch, russisch)
269SOEP-RS BASE II 2008–2014 – Erhebungsinstrumente Berliner Altersstudie II
273SOEP 2013 – Erhebungsinstrumente 2013 (Welle 30) des Sozio-oekonomi-schen Panels: Ihr Leben außerhalb Deutschlands
274SOEP 2015 – Erhebungsinstrumente 2015 (Welle 32) des Sozio-oekonomi-schen Panels: Personenfragebogen, Altstichproben
275SOEP 2015 – Erhebungsinstrumente 2015 (Welle 32) des Sozio-oekono mi - schen Panels: Haushaltsfragebogen, Altstichproben
276SOEP 2015 – Erhebungsinstrumente 2015 (Welle 32) des Sozio-oekonomi-schen Panels: Jugendfragebogen, Altstichproben
277SOEP 2015 – Erhebungsinstrumente 2015 (Welle 32) des Sozio-oekonomi-schen Panels: Mutter und Kind (Neugeboren), Altstichproben
278SOEP 2015 – Erhebungsinstrumente 2015 (Welle 32) des Sozio-oekonomi-schen Panels: Mutter und Kind (2–3 Jahre), Altstichproben
279SOEP 2015 – Erhebungsinstrumente 2015 (Welle 32) des Sozio-oekonomi-schen Panels: Mutter und Kind (5–6 Jahre), Altstichproben
280SOEP 2015 – Erhebungsinstrumente 2015 (Welle 32) des Sozio-oekonomi-schen Panels: Eltern und Kind (7–8 Jahre), Altstichproben
281SOEP 2015 – Erhebungsinstrumente 2015 (Welle 32) des Sozio-oekonomi-schen Panels: Mutter und Kind (9–10 Jahre), Altstichproben
286SOEP 2015 – Erhebungsinstrumente 2015 (Welle 32) des Sozio-oekonomi-schen Panels: Schülerinnen und Schüler (11–12 Jahre), Altstichproben
287SOEP 2015 – Erhebungsinstrumente 2015 (Welle 32) des Sozio-oekonomi - schen Panels: Lebenslauffrage- bogen, Altstichproben
288SOEP 2015 – Erhebungsinstrumente 2015 (Welle 32) des Sozio-oekonomi-schen Panels: Die verstorbene Person, Altstichproben
Complete Listing of 2015 SOEP Survey Paperswww.diw.de/soepsurveypapers
SOEP Wave Report 2015
186 | PaRT 5: SOEP-Based Publications in 2015
289SOEP 2015 – Erhebungsinstrumente 2015 (Welle 32) des Sozio-oekonomi-schen Panels: Personenfragebogen Kurzfassung (Lücke), Altstich- proben
290SOEP 2015 – Erhebungsinstrumente 2015 (Welle 32) des Sozio-oekonomi-schen Panels: Begleitinstrumente
Series B
Survey Reports (Methodenberichte)
282SOEP 2014 – TNS Report of SOEP Fieldwork in 2014
Series c
Data Documentations (Datendokumentationen)
261Flowcharts for the Integrated Individual-Biography Questionnaire of the IAB-SOEP Migration Sample 2013
270Migrations- und Integrations-forschung mit dem SOEP von 1984 bis 2012: Erhebung, Indikatoren und Potentiale
271The 2013 IAB-SOEP Migration Sample (M1): Sampling Design and Weighting Adjustment
272Editing and Multiple Imputation of Item Non-response in the Wealth Module of the German Socio-Economic Panel
291The Request for Record Linkage in the IAB-SOEP Migration Sample: Request Procedure, Consent Outcomes and Generation of Non-Consent Weights
297Documentation of Sample Sizes and Panel Attrition in the German Socio Economic Panel (SOEP) (1984 until 2014)
Series D
Variable Descriptions and Coding
265SOEP 2013 – Informationen zu den SOEP-Geocodes in SOEP v30
266SOEP 2013 – Documentation on Biography and Life History Data for SOEP v30
292SOEP 2014 – Documentation of Person-related Status and Generated Variables in PGEN for SOEP v31
293SOEP 2014 – Documentation of the Person-related Meta-dataset PPFAD for SOEP v31
294SOEP 2014 – Documentation of Household-related Status and Generated Variables in HGEN for SOEP v31
295SOEP 2014 – Documentation of the Household-related Meta-dataset HPFAD for SOEP v31
296SOEP 2014 – Documentation of the Person-related Meta-dataset HEALTH for SOEP v31
298SOEP 2014 – Documentation of the Dataset INTERVIEWER: Detailed Information on SOEP Interviewers for SOEP v31
Series E
SOEPmonitors
283SOEP 2013 – SOEPmonitor Household 1984–2013 (SOEP v30)
284SOEP 2013 – SOEPmonitor Individuals 1984–2013 (SOEP v30)
Series F
SOEP Newsletters
263SOEP Newsletters 2004 – SOEP-Newsletters 63–66
264SOEP Newsletters 2005 – SOEP-Newsletters 67–70
Series G
General Issues and Teaching Materials
285SOEP Glossary

SOEP Wave Report 2015
187
SOEP Wave Report 2015
188
Imprint
German Socio-Economic Panel study | SOEPDIW BerlinMohrenstr. 58 | 10117 Berlin | GermanyPhone +49-30-897 89-238Fax +49-30-897 89-109
DirectorJürgen Schupp
EditorsSandra Gerstorf, Jürgen Schupp
Translation & EditingDeborah anne Bowen
ProofreadingUta Rahmann
PhotosBarbara Dietl, Zoe/Fotolia
Design ann Katrin Siedenburg, www.katigraphie.de
PrintWerner Jahnke, DIW Berlin
ISSN 2199-4226 (print)ISSN 1868-1131 (online)
Berlin, June 2016

The Socio-Economic Panel (SOEP) is the largest and longest running multidisciplinary longitudinal study in Germany. The SOEP is an integral part of Germany’s scientific research infrastructure and is funded by the federal and state governments under the framework of the Leibniz Association (WGL). The SOEP is based at DIW Berlin.
SOEPthe German Socio-Economic Panel study at DiW Berlin
DiW Berlin – Deutsches institut für Wirtschaftsforschung e.v.Mohrenstraße 58 | 10117 Berlinwww.diw.de