77981312x.pdf - econstor
TRANSCRIPT
econstorMake Your Publications Visible.
A Service of
zbwLeibniz-InformationszentrumWirtschaftLeibniz Information Centrefor Economics
Sanwald, Alice; Theurl, Engelbert
Working Paper
What drives out-of pocket health expenditures ofprivate households? Empirical evidence from theAustrian household budget survey
Working Papers in Economics and Statistics, No. 2014-04
Provided in Cooperation with:Institute of Public Finance, University of Innsbruck
Suggested Citation: Sanwald, Alice; Theurl, Engelbert (2014) : What drives out-of pocket healthexpenditures of private households? Empirical evidence from the Austrian household budgetsurvey, Working Papers in Economics and Statistics, No. 2014-04, University of Innsbruck,Research Platform Empirical and Experimental Economics (eeecon), Innsbruck
This Version is available at:http://hdl.handle.net/10419/101082
Standard-Nutzungsbedingungen:
Die Dokumente auf EconStor dürfen zu eigenen wissenschaftlichenZwecken und zum Privatgebrauch gespeichert und kopiert werden.
Sie dürfen die Dokumente nicht für öffentliche oder kommerzielleZwecke vervielfältigen, öffentlich ausstellen, öffentlich zugänglichmachen, vertreiben oder anderweitig nutzen.
Sofern die Verfasser die Dokumente unter Open-Content-Lizenzen(insbesondere CC-Lizenzen) zur Verfügung gestellt haben sollten,gelten abweichend von diesen Nutzungsbedingungen die in der dortgenannten Lizenz gewährten Nutzungsrechte.
Terms of use:
Documents in EconStor may be saved and copied for yourpersonal and scholarly purposes.
You are not to copy documents for public or commercialpurposes, to exhibit the documents publicly, to make thempublicly available on the internet, or to distribute or otherwiseuse the documents in public.
If the documents have been made available under an OpenContent Licence (especially Creative Commons Licences), youmay exercise further usage rights as specified in the indicatedlicence.
www.econstor.eu
What drives out-of pocket healthexpenditures of private households?Empirical evidence from the Austrianhousehold budget survey
Alice Sanwald, Engelbert Theurl
Working Papers in Economics and Statistics
2014-04
University of Innsbruckhttp://eeecon.uibk.ac.at/
University of InnsbruckWorking Papers in Economics and Statistics
The series is jointly edited and published by
- Department of Economics
- Department of Public Finance
- Department of Statistics
Contact Address:University of InnsbruckDepartment of Public FinanceUniversitaetsstrasse 15A-6020 InnsbruckAustriaTel: + 43 512 507 7171Fax: + 43 512 507 2970E-mail: [email protected]
The most recent version of all working papers can be downloaded athttp://eeecon.uibk.ac.at/wopec/
For a list of recent papers see the backpages of this paper.
What drives out-of pocket health expenditures ofprivate households? - Empirical evidence from the
Austrian household budget survey
Alice Sanwald† Engelbert Theurl‡
Abstract
Out-of-pocket health expenditures (OOPHE) are a substantial source of healthcare financing even in health care systems with an established role of prepaid financ-ing. The empirical analysis of OOPHE is challenging, because they are fixed in aninteraction with other sources of health care financing. We analyze to what extent aset of socio-economic and socio-demographic covariates of private households influ-ences the OOPHE-patterns in Austria. Our empirical research strategy is guided bythe approach Propper (2000) used to study the demand for private health care in theNHS. We use cross-sectional information provided by the Austrian household bud-get survey 2009/10. We apply a Two-Part Model (Logit/OLS with log-transformeddependent variable or Logit/GLM). We present results for total OOPHE and forselected OOPHE-subcategories. Overall, we find mixed results for the different ex-penditure categories and for the two decision stages. Probability & level of OOPHEincrease with the household size and the level of education, while household incomeshows mixed results on both stages. Private health insurance and OOPHE seem tobe complements, at least for total OOPHE and for OOPHE for physician services,while this relationship is insignificant for pharmaceuticals. Different forms of publicinsurance have an effect on the total OOPHE-level, for physician services and phar-maceuticals on both stages. To some extent the participation decision is influencedin a different way compared to the intensity decision. This is especially true forage, sex, household structure and the status of retirement. It turns out, that theexplanatory power of the used variables is low for OOPHE for pharmaceuticals.A splitting up of pharmaceuticals into prescription fees and direct payments givesbetter insights into the determinants. We conclude: It is necessary to investigatesubcategories of OOPHE. It also turns out, that systematic covariates explain onlya very small part of the variation in the OOPHE-patterns. Finally, we also concludethat information on OOPHE from general household budget surveys are of limitedvalue when studying the determinants.
JEL Classification: I1.
Keywords: Health care expenditures, out-of-pocket health expenditures, consumersurvey, Two-Part Model.
Acknowledgements: Financial support by the Austrian Science Fund (FWF: S10306-G16 National Research Network Labor Economics and the Welfare State) is grate-fully acknowledged. We also thank several discussants at different conferences forhelpful comments.
†University of Innsbruck, Department of Economics and Statistics, Universitatsstrasse 15, A-6020Innsbruck, Austria: E-Mail: [email protected]
‡University of Innsbruck, Department of Economics and Statistics, Universitatsstrasse 15, A-6020Innsbruck, Austria, E-Mail: [email protected]
1 Introduction
There exists a quite voluminous empirical literature on the determinants of health ex-
penditures, primarily based on between country comparisons (Chernew and Newhouse,
2012). These studies mainly focus on total health expenditures and/or on their public
part in order to answer questions about total or public resources devoted to health care
and to evaluate the macroeconomic efficiency of health spending. Much less research has
been done on private health expenditures, especially on out-of-pocket health care expen-
ditures (OOPHE). This contradicts with the economic significance of this form of health
care financing in reality. OOPHE are substantial. This is especially true in a worldwide
perspective. Roughly 40 percent of the total health care bill is financed out of this source,
in several world regions the OOPHE-share is up to 60 - 70 percent of the total health
care bill (Kohlmeier, 2012). In a sample of OECD-countries the share of OOPHE on total
health care spending is close to 20 percent (OECD-Health-Data (2013), see also figure 1).
But OOPHE are not only important from a fiscal perspective, they also have im-
portant consequences for the economic welfare. Illness poses a multiple threat to the
economic wellbeing of individuals. It directly reduces utility and in many cases lowers the
benefits from consuming other goods. It negatively affects the earning capabilities result-
ing in lower possibilities of consumption. Finally, treatment of bad health causes health
expenditures which on their part further reduce the funds to consume other necessities &
amenities of life. If individuals are risk averse they will demand risk pooling mechanisms
to smooth their consumption path - either on the private insurance market and/or in the
political arena. Avoiding OOPHE by prepaid plans seems to have a high potential for
Pareto-improvements. It is also well known from empirical studies that a major reliance
on OOPHE is likely to have a regressive impact on the income distribution (Wagstaff and
Van Doorslaer, 2000). In addition, OOPHE act as a barrier for health care use and may
have negative effects on the long term health status, especially for low income individuals
(Newhouse and the Insurance Experiment Group, 1993). On the other hand, OOPHE
might reduce the welfare loss caused by moral hazard behavior. In addition, if health in-
surance premiums include substantial loading fees above the fair premiums full insurance
is no longer optimal at all even if no other market imperfections exist (e. g. moral hazard,
adverse selection).
Any discussion of OOPHE needs an agreement on a working definition. OOPHE in
reality cover a broad range of financing instruments. They are expenditures on health
care services by individuals (households) in the form of direct payments to health care
providers netted from reimbursements by prepaid plans. Using this broad definition we
are able to define three types of OOPHE:
Type 1: An individual is not covered by prepaid plans at all and has to pay the
total health care bill directly (breadth of the prepaid plans)
2
Type 2: Although prepaid plans exist, parts of the health care services offered are
excluded and have to be paid totally out-of-pocket (depth of the prepaid plans)
Type 3: The costs of the health care services covered are not financed completely
by the prepaid plan (height of the prepaid plans). This type of OOPHE covers
different forms of cost sharing (e. g. proportional cost sharing, coverage limits per
health care service, absolute cost sharing)
There exist several reasons why surprisingly little scientific research work addresses
the determinants of OOPHE, especially at the individual level. The definition of OOPHE
given above reveals a few of them. We expect that the three types of OOPHE influence the
individual decision to utilize the health care system differently.1 This is even true within
the different OOPHE-types. OOPHE of type 2 and especially type 3 are to some extent
residual categories which accumulate in health care utilization within a public and/or
private prepaid plan. Thus, the examination of the determinants of OOPHE requires a
comprehensive model of health care utilization including all forms of financing and health
care provision. Finally, the empirical basis offered by official statistical institutions to
study the determinants of OOPHE at the individual level is rather poor. In many countries
information on OOPHE (disaggregated by expenditure categories, e.g. inpatient care,
outpatient care, pharmaceuticals) combined with reliable and relevant information on the
socio-economic characteristics of individuals (households) is extremely scarce. Data on
OOPHE derived from general consumer surveys often lack valid information of the latter
type. Information from surveys on the health behavior and the health status of individuals
do comparable well on the socio-economic characteristics of individuals (households), but
as far as health care utilization is concerned they mainly focus on indicators of health
care utilization in real terms (physician visits, hospital days) and not on health care
expenditures. Even if they focus on health care expenditures, they do not differentiate
between different OOPHE-types.
The following paper contributes to the literature in addressing the determinants of
OOPHE on the household level. We study the determinants of OOPHE in Austria using
cross-sectional information from the latest household budget survey 2009/10. No empirical
work on this relationship is available at the moment. We are not only interested in the
coefficients of the covariates which determine the OOPHE-level, we also want to gain
insights whether the information from the household budget survey is an appropriate
basis to study the proposed research question at all, an issue widely neglected in previous
empirical research of OOPHE.
1Studies on the determinants of OOPHE in between country comparisons based on aggregated officialdata (OECD, WHO) are not able to differentiate between the different types of OOPHE mentioned inthe text. The decision to use OOPHE as homogenous aggregate masks important differences betweenthe countries.
3
The paper builds on the already existing empirical literature on the determinants of
OOPHE using micro data mainly coming from consumer surveys. Briefly this literature
is based on two traditions: (i) the health economics tradition and (ii) the consumer
economics tradition. As far as the second approach is concerned, several papers study
Engel Curves for private health expenditures (Leive and Xu, 2007). An important agenda
of this type of papers is to analyze whether OOPHE have catastrophic effects on the
economic welfare of the household (Xu et al., 2003). The papers of type (i) study OOPHE
in different contexts of health economics and health politics. So Norton et al. (2006)
study OOPHE in the US for elderly people. Chaze (2005) studies OOPHE in Switzerland
using a Box-Cox indirect censoring model. Bilger and Chaze (2008) extent this model
in order to analyze simultaneously health care consumption and insurance deductible
choice in Switzerland. Matsaganis et al. (2009) present evidence on the performance of
six alternative econometric estimators in studying OOPHE in Greece on the household
level. Besides Bilger/Chaze also other authors study the effect of voluntary/obligatory
public insurance on the level of OOPHE. Jowett et al. (2003) analyze the role of public
voluntary health insurance on private health expenditures in Vietnam. Cuong et al. (2010)
give evidence on the impact of compulsory health insurance on OOPHE in Vietnam. Jones
et al. (2008) specifically focus on the role of the concession card on the OOPHE of private
households in Australia.
The paper is organized as follows. Section 2 presents a brief overview of the institu-
tional structure and the main characteristics of the Austrian health care system as far
as this is necessary to follow our empirical strategy. Section 3 derives and describes the
empirical approach used in the paper. Section 4 informs about the data basis. Section 5
presents the empirical results starting with an extended descriptive part on OOPHE in
Austria. In section 6 we discuss several limitations and give conclusions.
2 The institutional setting of the Austrian health
care system
In the next two sections we provide a stylized framework of the individual decision to
make OOPHE in the Austrian health care sector. Such a framework has to include two
building blocks: (i) the description of those characteristics of the Austrian health care
system which predetermine the consumption decision and the utilization paths and (ii)
the elaboration of an economic perspective, which allows the identification of possible
OOPHE-determinants and their empirical estimation.
We start with building block (i). Basically the Austrian health care system is a two
tiered health care system. The public health insurance system represents the first tier.
Membership in this system is obligatory not only for wage earners in the public and
4
private sector, but also for self-employed persons (including farmers) and individuals re-
ceiving a pension from a public pension fund.2 Individuals with family ties to obligatory
insured persons and without own public insurance coverage obtain free insurance cover-
age. Overall, the public health insurance system covers around 99.3 percent3 of the whole
population, excluding only marginal groups from public health insurance. It is mainly
financed by income related contributions paid by employers and employees. These contri-
butions are the sole source of financing public outpatient care, while public inpatient care
is additionally co-financed by the states and the communities out of taxes (Theurl, 2007).
Private health insurance and OOPHE constitute the second tier of the Austrian health
care system. Roughly 35 percent4 of the population has signed contracts with private sick-
ness funds, which predominantly offer additional coverage to the first tier services and/or
improve the possibility to choose from a broader portfolio of providers within the system.
The range/level of services financed by the public health insurance system and the states
is fixed in benefit catalogues agreed between providers and financing institutions. These
benefit catalogues are quite comprehensive and include almost all services which are state
of the art.
Basically outpatient health care services are supplied by physicians having a con-
tract with the public health insurance system and by private physicians. The spatial
distribution of contracted physicians, which form the nucleus of public outpatient health
care provision, is based on a location plan agreed between the public health insurance
system and the Chamber of Physicians. Contracted physicians generate income from
fee-for-services and lump-sum-payments. In contrast to contracted physicians, their pri-
vate counterparts are free to choose their practice location. Their remuneration is agreed
between the doctor and the patient, mainly based on a fee-for-service system.
Public inpatient health care services (including outpatient services of hospitals) are
supplied by public hospitals financed on a DRG-basis (Theurl, 2007). Private inpatient
health care services are offered by private - non-profit or profit - hospitals and by private
departments of public hospitals.
Patients with public health insurance coverage are basically free to consult public or
private health care providers. While the utilization of public health care services is based
2Thereby the public health insurance consists of different sickness funds with limited autonomy. Theyare separated by territorial and occupational characteristics. Workers in the private sector (76 % ofthe population) are covered by nine sickness funds operating at the level of the nine provinces (namedGKK in the tables). Farmers (4 %; sickness fund named SVB), employers (8 %; sickness fund namedSVA), public workers (8 %; sickness fund named BVA) are covered by nationwide operating insuranceinstitutions. The picture is completed by insurance funds on the firm basis (’Betriebskrankenkassen’).
3The information is taken from OECD-Health-Data (2012). Previous more detailed studies on thistopic come up with slightly lower figures. Reliable information on the quality of health insurance coverageand the access to health care services for the missing 0.7 % is not available.
4Information from 2012, for details see Versicherungsverband-Osterreich (2013). This share is quitestable over time.
5
on a benefit-in-kind-scheme with only limited cost-sharing elements,5 treatment costs in
the private sector (i) have to be paid out-of-pocket, (ii) are born by the private sickness
funds and/or (iii) by the public health insurance. The latter only finances parts of the
services offered by private providers, essentially based on the benefit catalogue and the
remuneration scheme for public health care institutions. So financing mode (iii) includes
substantial cost sharing for the patients. Patients with private health insurance normally
pay their providers directly and get their money back on agreed principles of the insurance
treaty. Pharmaceuticals in inpatient care are part of the hospital remuneration within
the DRG-system. In the outpatient care sector a positive list of pharmaceuticals exists
which are paid by the public insurance system.
In the next section we will use the information on the institutional structure in Austria
to derive a stylized model of health care utilization and to describe its consequences on
the level of OOPHE. What seems already clear from this section: For ’normal’ individuals
(households) in Austria OOPHE are mainly a matter of depth and height of public and
private prepaid plans and not a matter of their breadth.6
3 The empirical approach: A model of health care
utilization decisions
Basically, the significance of OOPHE in health care systems can be studied in two differ-
ent, but interrelated settings: (i) on the macro level and (ii) on the micro level. In studies
of the first type important institutional characteristics of the health care system (e. g.
the level and structure of taxes to finance public health care provision, social health insur-
ance contribution rates, cost sharing schemes) are endogenous. In the health economics
literature models of this decision situation are quite prominent. They are mainly used to
explain expenditure shares (e. g. private vs. public, OOPHE vs. prepaid financing plans)
in between country comparisons. In these models the share of OOPHE is not primarily a
private decision. Consequently, one has to use a perspective which is able to explain the
joint allocation of resources between OOPHE and prepaid plans. The expenditure shares
are determined in a political economy model by the distribution of individual characteris-
tics (e. g. morbidity distribution in the population, income distribution) and institutional
features (e. g. progressivity of public health care financing). Several authors offer such
approaches (Gouveia, 1997); more recently Li et al. (2012) offer an extended version of
the Gouveia-model; For an overview of different aspects of these models see Barros and
5This is especially true for workers in the private sector and farmers. Public workers and employersface a proportional cost sharing of 20 percent. All individuals with public insurance are confronted withprescription fees for pharmaceuticals as well as substantial cost sharing for therapeutic aids (e.g. glasses,crowns, bridges).
6This statement is especially valid for the data basis we use in the empirical analysis. We expect, thatthe 0.7 % of Austrians which are without social health insurance are not part of our sample.
6
Siciliani (2011). Decision models on the micro level predominantly focus on the individual
process of health care utilization, thereby assuming that important institutional charac-
teristics of health care utilization are fixed exogenous (e. g. the service level and financing
scheme of the public system).
In our context we study the level of OOPHE from a micro perspective. Thereby
the essential institutional characteristics of the health care system are fixed by political
decisions in the past and are therefore treated as exogenous. We use an approach of
demand for medical care where different institutional options of care exist. This model
goes back to Goddard and Smith (1998) and was used by Propper (2000) to study the
demand for private health care in the UK. We adjust this approach to the institutional
setting of the Austrian health care system as outlined in section 2.
Each individual7 has four alternative pathways (j=0,1,2,3) through the Austrian
health care sector with different consequences for OOPHE. Additionally, there exists an
outside option not to use the health care sector in the case of illness at all. This clearly
leads to zero OOPHE. There exist two possibilities to use the health care sector without
OOPHE (j=0). First, the individual consumes services offered by the public health care
sector which are totally covered by public and/or private health insurance institutions.
The second possibility is to use services of the private sector without any deductibles or
direct OOPHE. The second pathway is cost sharing of type 3 (j=1), when using the public
and/or the private sector of the health care system. This means that the height of the
prepaid systems is not complete. The third option (j=2) is the consumption of services,
which are not included in the benefit catalog of the public and private prepaid plans. This
leads to direct OOPHE and means that the depth of the prepaid plans is not complete
(type 2). The last pathway (j=3) is a consumption which leads to a combination of type
2 and 3.
According to Propper the individual i assigns each alternative pathway a latent net
valuation depending on the characteristics of the individual e.g. the health status, will-
ingness to pay, willingness to wait (Propper, 2000). The latent net valuation is given by
mij = f(Xi, R,Q,Wij, pij); i = 1, ..., n; j= 0,1,2,3 while the associated weight of each
pathway is determined by the mentioned characteristics. X is defined as a set of de-
mographic and socio-economic variables including information on the associated public
and private insurance coverage. The range of services in the total health care system R
is determined by the existing medical knowledge and the basic entry rules (e.g. market
approval for pharmaceuticals). This range can be separated into i) services of the benefit
catalogue of public health insurance system R(P) determined by political decisions and
therefore exogenous in the case of health care consumption. Some individuals have signed
a private health insurance contract. This contract already exists and therefore will be
7Although our data set is based on information on the household level, the actors in our model ofhealth care utilization are individuals.
7
treated as exogenous in our decision making context. The benefit catalogue of private
health insurance offers ii) services R(PR) and we assume thatR(PR) includes the total
range of R(P) and additional services. In addition, we expect that the benefits Q indi-
viduals derive from the services follow approved medical standards and do not depend on
the mode of provision (e. g. private or public).8 The consumption of health care services
is combined with additional characteristics (e. g. waiting time, transport costs, anxiety,
psychological costs, search costs) which are captured by W and are seen as costs. In
addition, we say that individuals may have to pay a direct price p for consuming health
care goods. This price p takes the form of cost sharing and/or of direct out-of-pocket
payments.9 We expect that the latent net valuation increases with R and Q and de-
creases with W and p. The household chooses the alternative with the highest level of
net valuation, that is mij = max(mi0,mi1,mi2,mi3). Assuming that X, R and Q remain
constant and W, p > 0 we can define the following scenarios of health care utilization and
its consequences for type 2 and 3:
1. The individual will consume exclusively in the public sector, if (i) the services needed
are within the range of publicly provided health care services R(P), if (ii) (W+p) of
consuming in the publicly financed sector is lower than (W+p) in the sector financed
by private insurance and if (iii) (W+p) of consuming in the public financed sector
is lower than (W+p) in the direct out-of-pocket provision mode. If there does not
exist a private insurance contract, condition (ii) vanishes. If the conditions (i) - (iii)
hold, OOPHE will be zero if no cost sharing arrangement exists (j=0). Otherwise
we will have OOPHE of type 3 from cost sharing (j=1).
2. If (i) holds, but (ii) changes the signs and (iv) (W+p) in the out-of-pocket-mode is
higher than in the private insurance mode, than the individual will consume under
the private health insurance regime. OOPHE may result out of consumption in
the private health insurance regime, if cost sharing arrangements are valid (j=1),
otherwise OOPHE are zero (j=0).
3. If (i) holds, but (ii) and (iii) change the sign, the individual will consume in the
out-of-pocket-mode and this will lead to direct OOPHE (j=2).
4. If the services needed are not within the range of publicly financed health care
services R(P), but they are covered by R(PR) and if they fulfill preposition (iv),
the individual will consume under the private health insurance regime. OOPHE
will result if the utilization of the health care sector is combined with cost sharing
(j=1), otherwise (j=0).
8The assumption is made to keep the comparison clearly presented.9p is relative to income. So the resource restriction is included in the optimization problem.
8
5. If the services needed are not within the range of publicly financed health care
services R(P), but they are covered by R(PR), but preposition (iv) changes the
sign, the individual will consume in the out-of-pocket-mode and this will lead to
direct OOPHE (j=2).
6. If the health care services are neither covered by R(P) nor by R(PR), then the indi-
vidual will consume in the out-of-pocket-mode and this will lead to direct OOPHE
(j=2).
7. The pathway (j=3) results, if the individual simultaneously consumes multiple ser-
vices of the previous listing.
Our stylized model makes clear that the institutional design of the health care system
(range of services provided, prices, quality) fixes important cornerstones of the utilization
pathways. Additionally, the probability of choosing one of the four pathways (j=0,1,2,3)
depends on socio-economic characteristics of the individual (e. g. age, family status,
opportunity costs of time, income, health status, distance to health care facilities, insur-
ance status). In our empirical approach we use selected socio-economic characteristics
to explain differences in OOPHE between households in Austria. Our data set shows
the characteristics of data sets about health expenditures widely known in the empirical
literature: skewness, excess zeros and heavy right tails. In our econometric approach we
therefore use a Two-Part Model widely proposed in the health economics literature for
similar empirical problems (Jones, 2000; Madden, 2008). The first stage of the model pre-
dicts the likelihood of any OOPHE and was specified as Logit. The second part predicts
the level of spending, conditional on having non-zero OOPHE. For the latter part we use
either an OLS model with log-transformed dependent variable or a GLM depending on
the performance of the expenditure subgroups.
The probability of having positive OOPHE - either of type 2 or 3 or the combination
of both - reduces to three different binary Logit models and can be defined in the following
way:
Prij = Prob[mi = j|Xi] =exp(X
′iβj)
1+exp(X′iβj)
∀i = 1, ..., n; j=1,2,3
mi ist the observed pathway individual i has chosen; X is a matrix of the socio-
economic characteristics of the household, e. g. household structure, regional conditions,
public insurance arrangements and additional private health insurance contracts, age,
gender, household income and education level. Furthermore, the height of spending is
also affected by the matrix X with the included household variables. The conditional
expenditure level can be summarized to:
Eij[mi|Xi,mi = j] ∀i = 1, ..., n; j=1,2,3
9
4 Data
To analyze OOPHE at the household level in Austria we use data from the household
budget survey 2009/10 conducted by the National Statistical Service Office, Statistics
Austria.10 In Austria this periodically repeated survey (in the moment with a five year
interval) is primarily used to study the level and structure of private consumption of
households within the System of National Accounts and to calculate the inflation rate for
consumption goods. The observation unit is the private household without institution-
alized households (hospitals, long term care and jail). A household consists of a single
person or two or more persons living and consuming together in a flat or parts of a flat.
Temporary absent persons (for holidays, schooling) are part of the household, blood rela-
tionship has no significance to define a household. The total sample offered by Statistics
Austria consists of 6,534 households with 15,540 members, which means a return rate of
38.1 %. The exclusion of 747 households with undefined household or insurance structures
results in a final sample size of 5,787 households. For several reasons the sample is not
representative for the Austrian household structure. Therefore each household is assigned
a weight in order to establish representativeness of the sample to the Austrian population
(for details see Statistik-Austria (2011b)).
Information on the consumer behavior is gathered in two ways: (i) the diary approach
and (ii) the recall approach. Households participating in the survey are asked to fill in
a diary over 14 days in which they record every single expense. The system results in
52 overlapping weeks of bookkeeping (end of April 2009 - beginning of May 2010). This
method allows the representation of seasonal patterns and of specific consumption periods.
The recall approach is used for consumer durables and irregular/seasonal expenditures
within the last 12 months. 53 % of the overall consumption expenditures are based on the
information from the diary approach and 47 % on the recall method. As far as health ex-
penditures are concerned the following expenditure categories are collected following the
recall approach: therapeutic aids (in ophthalmology and dentistry, expenditures for spas,
rehabilitation centers and long term care institutions. In addition, households are asked
for expenses > EUR 300 in the last year by using the recall method (see Statistik-Austria
(2011a,c)). Important socio-economic characteristics of the household are gathered by
face-to-face interviews. All expenditures are controlled for plausibility und recalculated
into monthly expenditures. The health care expenditure catalog consists of pharmaceu-
ticals, medical products, physician services, dental services, hospital services, diagnostic
tests, long term care and health spas. Figure A1 in the appendix informs about the differ-
ent expenditure categories and the rules of aggregation. Several household expenditures
are not counted as consumption expenditures. So health expenditures, which are refunded
10We checked alternative data sources (e. g. EU-SILC, Mikrocensus, ATHIS, SHARE). The householdbudget survey is the only data source which provides information about OOPHE for health care servicesfor private households in Austria at a micro level at all.
10
by public or private health insurance institutions, are not included as consumption ex-
penditures, they are netted out. The monetary value of all expenditures is represented in
Euros.
5 Results
5.1 Selected empirical insights into the role of OOPHE in Aus-
tria
We provide more extensive descriptive statistics beyond the simple summary statistics
presented in empirical analyses normally to give better insights into the character and
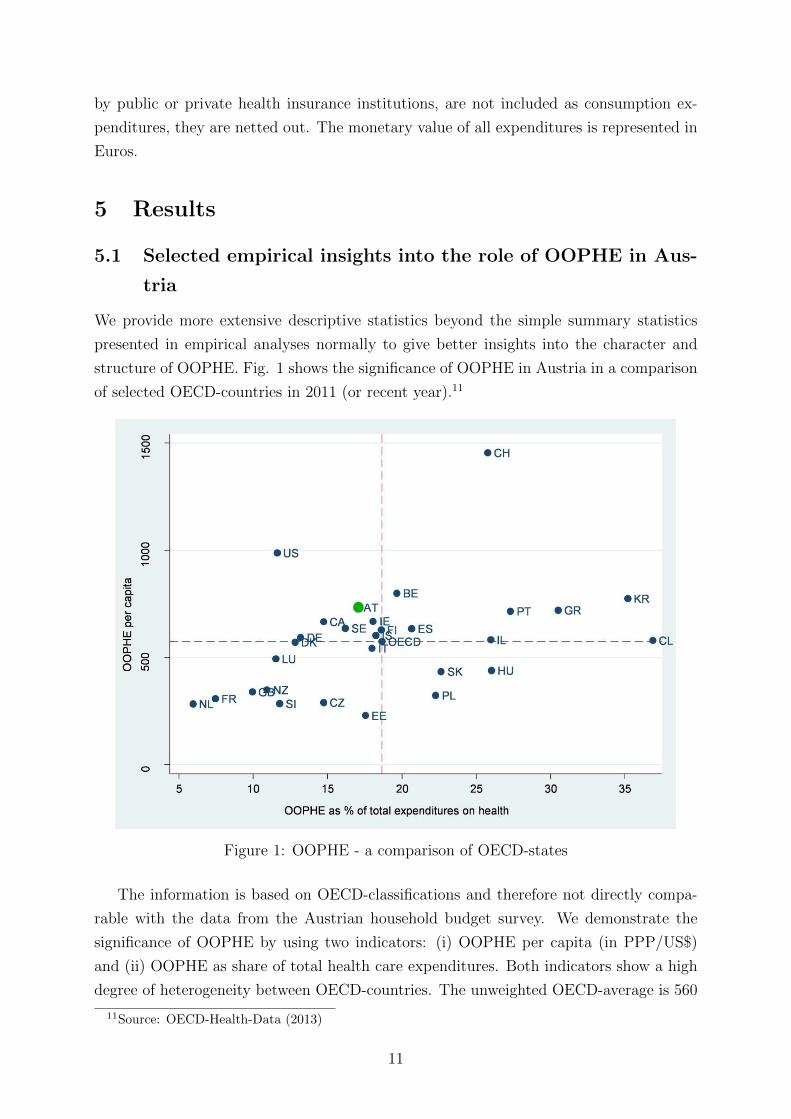
structure of OOPHE. Fig. 1 shows the significance of OOPHE in Austria in a comparison
of selected OECD-countries in 2011 (or recent year).11
Figure 1: OOPHE - a comparison of OECD-states
The information is based on OECD-classifications and therefore not directly compa-
rable with the data from the Austrian household budget survey. We demonstrate the
significance of OOPHE by using two indicators: (i) OOPHE per capita (in PPP/US$)
and (ii) OOPHE as share of total health care expenditures. Both indicators show a high
degree of heterogeneity between OECD-countries. The unweighted OECD-average is 560
11Source: OECD-Health-Data (2013)
11
US$ on indicator (i) and 18.5 percent on indicator (ii). The values for Austria are slightly
above the average for indicator (i) and slightly below the average on indicator (ii). In
a time series perspective covering the period since 1995 the share of OOPHE on total
health care expenditures in Austria is remarkable stable. OOPHE account for approx-
imately 75 % of all private health expenditures. We observe also a high stability in a
medium term perspective for the shares of total private consumption spend for health
purposes. Based on the ESVG-1995 classification Austrian households currently spend
3.5 % of total private consumption out-of-pocket on health care goods ( Statistik-Austria
(2013)).
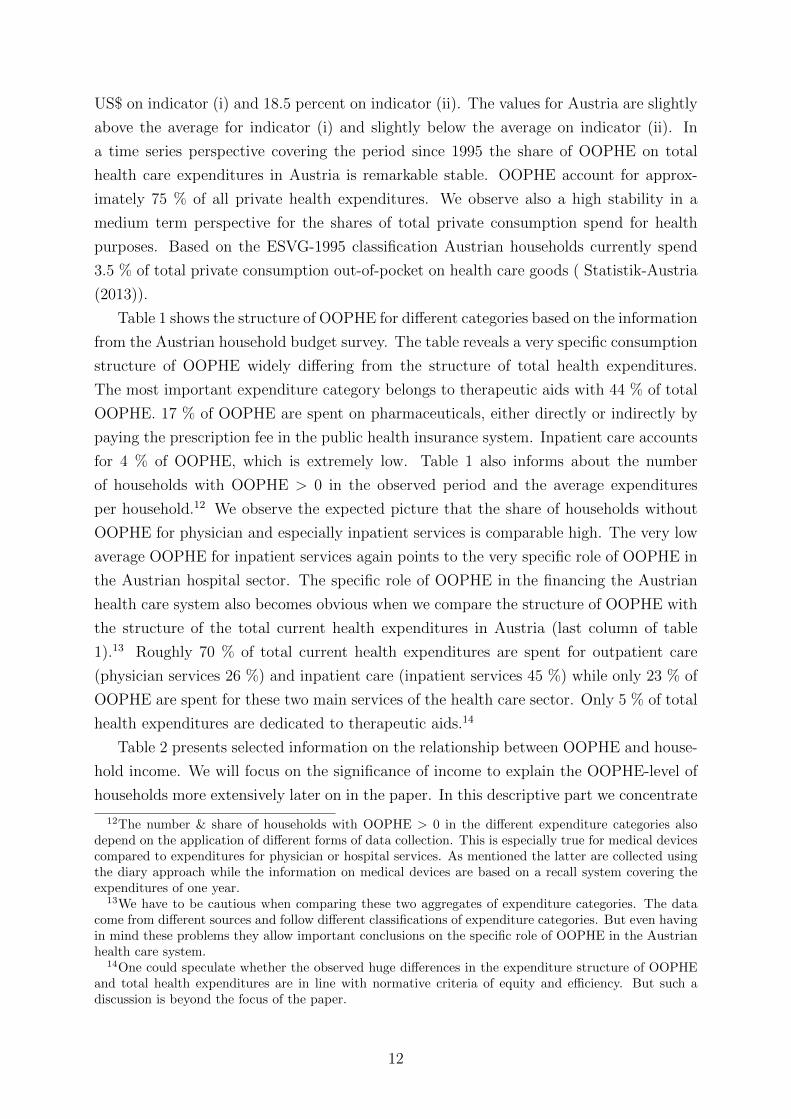
Table 1 shows the structure of OOPHE for different categories based on the information
from the Austrian household budget survey. The table reveals a very specific consumption
structure of OOPHE widely differing from the structure of total health expenditures.
The most important expenditure category belongs to therapeutic aids with 44 % of total
OOPHE. 17 % of OOPHE are spent on pharmaceuticals, either directly or indirectly by
paying the prescription fee in the public health insurance system. Inpatient care accounts
for 4 % of OOPHE, which is extremely low. Table 1 also informs about the number
of households with OOPHE > 0 in the observed period and the average expenditures
per household.12 We observe the expected picture that the share of households without
OOPHE for physician and especially inpatient services is comparable high. The very low
average OOPHE for inpatient services again points to the very specific role of OOPHE in
the Austrian hospital sector. The specific role of OOPHE in the financing the Austrian
health care system also becomes obvious when we compare the structure of OOPHE with
the structure of the total current health expenditures in Austria (last column of table
1).13 Roughly 70 % of total current health expenditures are spent for outpatient care
(physician services 26 %) and inpatient care (inpatient services 45 %) while only 23 % of
OOPHE are spent for these two main services of the health care sector. Only 5 % of total
health expenditures are dedicated to therapeutic aids.14
Table 2 presents selected information on the relationship between OOPHE and house-
hold income. We will focus on the significance of income to explain the OOPHE-level of
households more extensively later on in the paper. In this descriptive part we concentrate
12The number & share of households with OOPHE > 0 in the different expenditure categories alsodepend on the application of different forms of data collection. This is especially true for medical devicescompared to expenditures for physician or hospital services. As mentioned the latter are collected usingthe diary approach while the information on medical devices are based on a recall system covering theexpenditures of one year.
13We have to be cautious when comparing these two aggregates of expenditure categories. The datacome from different sources and follow different classifications of expenditure categories. But even havingin mind these problems they allow important conclusions on the specific role of OOPHE in the Austrianhealth care system.
14One could speculate whether the observed huge differences in the expenditure structure of OOPHEand total health expenditures are in line with normative criteria of equity and efficiency. But such adiscussion is beyond the focus of the paper.
12
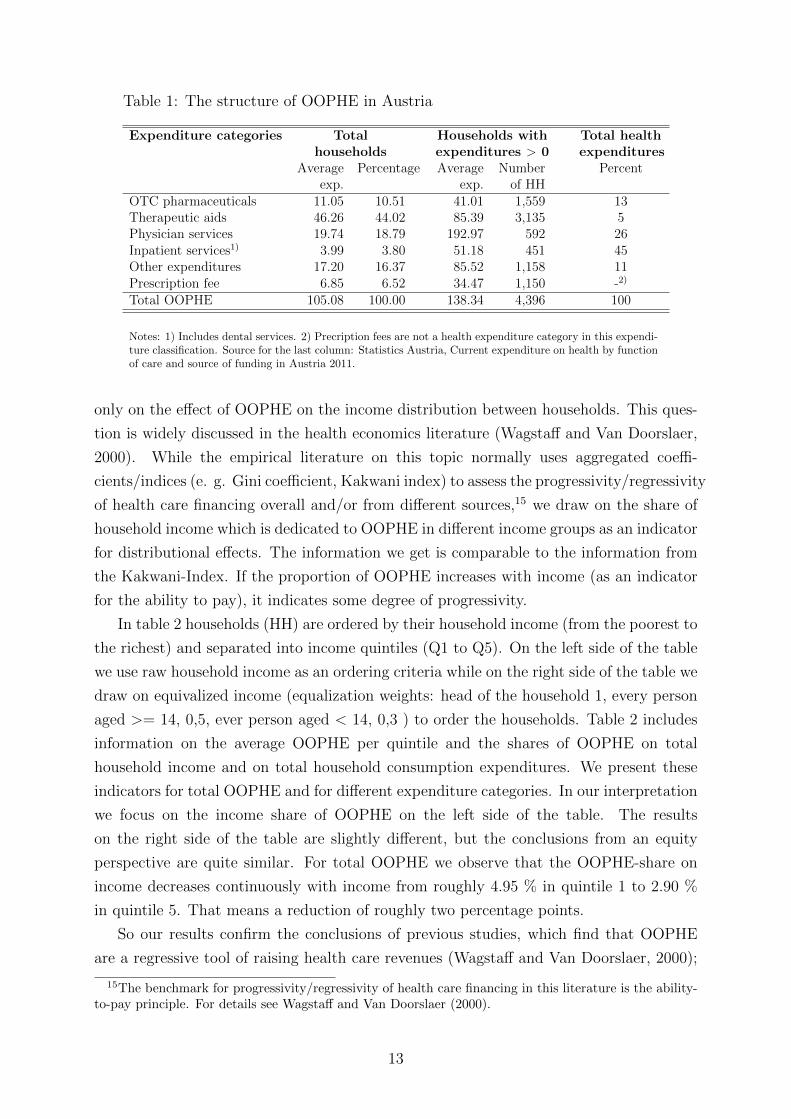
Table 1: The structure of OOPHE in Austria
Expenditure categories Total Households with Total healthhouseholds expenditures > 0 expenditures
Averageexp.
Percentage Averageexp.
Numberof HH
Percent
OTC pharmaceuticals 11.05 10.51 41.01 1,559 13Therapeutic aids 46.26 44.02 85.39 3,135 5Physician services 19.74 18.79 192.97 592 26Inpatient services1) 3.99 3.80 51.18 451 45Other expenditures 17.20 16.37 85.52 1,158 11Prescription fee 6.85 6.52 34.47 1,150 -2)
Total OOPHE 105.08 100.00 138.34 4,396 100
Notes: 1) Includes dental services. 2) Precription fees are not a health expenditure category in this expendi-ture classification. Source for the last column: Statistics Austria, Current expenditure on health by functionof care and source of funding in Austria 2011.
only on the effect of OOPHE on the income distribution between households. This ques-
tion is widely discussed in the health economics literature (Wagstaff and Van Doorslaer,
2000). While the empirical literature on this topic normally uses aggregated coeffi-
cients/indices (e. g. Gini coefficient, Kakwani index) to assess the progressivity/regressivity
of health care financing overall and/or from different sources,15 we draw on the share of
household income which is dedicated to OOPHE in different income groups as an indicator
for distributional effects. The information we get is comparable to the information from
the Kakwani-Index. If the proportion of OOPHE increases with income (as an indicator
for the ability to pay), it indicates some degree of progressivity.
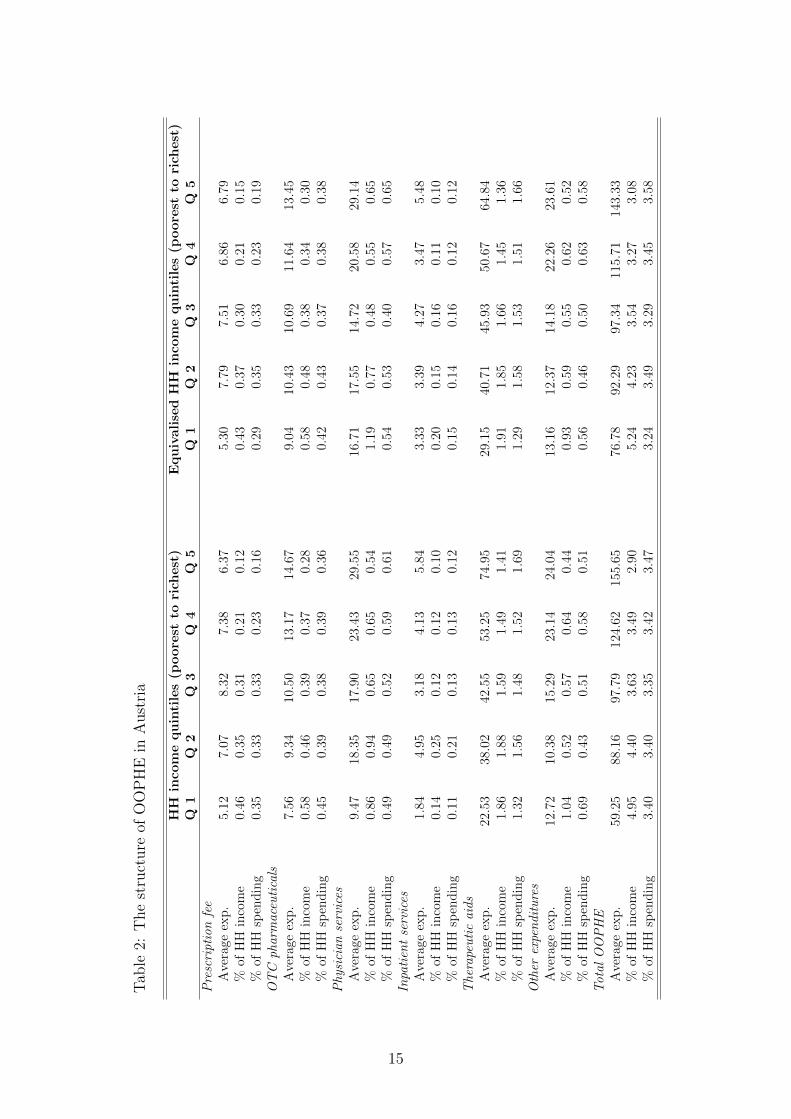
In table 2 households (HH) are ordered by their household income (from the poorest to
the richest) and separated into income quintiles (Q1 to Q5). On the left side of the table
we use raw household income as an ordering criteria while on the right side of the table we
draw on equivalized income (equalization weights: head of the household 1, every person
aged >= 14, 0,5, ever person aged < 14, 0,3 ) to order the households. Table 2 includes
information on the average OOPHE per quintile and the shares of OOPHE on total
household income and on total household consumption expenditures. We present these
indicators for total OOPHE and for different expenditure categories. In our interpretation
we focus on the income share of OOPHE on the left side of the table. The results
on the right side of the table are slightly different, but the conclusions from an equity
perspective are quite similar. For total OOPHE we observe that the OOPHE-share on
income decreases continuously with income from roughly 4.95 % in quintile 1 to 2.90 %
in quintile 5. That means a reduction of roughly two percentage points.
So our results confirm the conclusions of previous studies, which find that OOPHE
are a regressive tool of raising health care revenues (Wagstaff and Van Doorslaer, 2000);
15The benchmark for progressivity/regressivity of health care financing in this literature is the ability-to-pay principle. For details see Wagstaff and Van Doorslaer (2000).
13
recent information for Hungary is given by Baji et al. (2012). The regressive effect on
the distribution of household income does not only depend on the decline of the share
when income rises but also on the level of the share, which is - as already mentioned -
quite low. As far as the single components of OOPHE are concerned, their effect from
an equity perspective is not so clear. Prescription fees seem to have a strong regressive
effect since their share on income declines from 0.46 % in quintile 1 to 0.12 % in quintile
5. The picture for inpatient services is ambiguous, the other components show regressive
effects, but the share does not fall monotonic with rising household income.
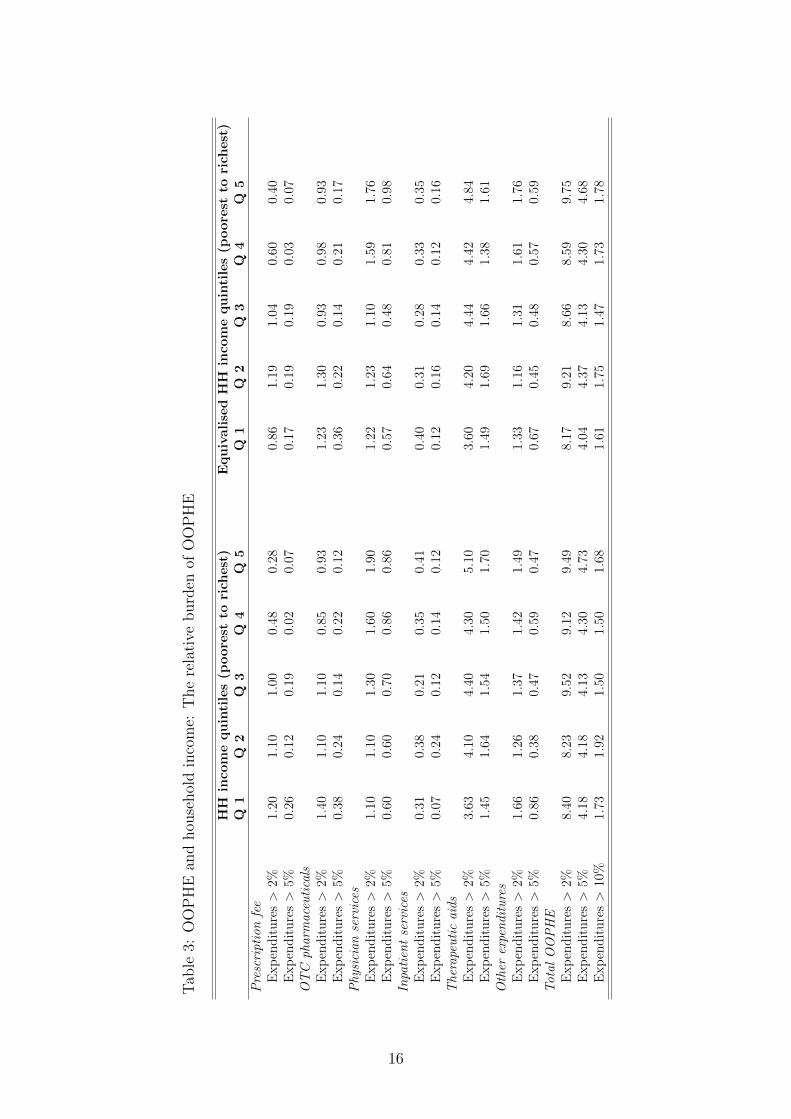
In table 3 we present additional information on the relative burden OOPHE cause for
private households. We ask which percentage of the households faces a share of OOPHE
to total consumption expenditures above a threshold of 2 %, 5 % and 10 %.16 As in table
2 we rank the households based on income quintiles. In our description we concentrate
on total OOPHE of private households and the ranking based on raw income (left part
of table 3). Overall the data reveal a low percentage of private households (less than 2
%) with a substantial relative burden (>10 %) caused by OOPHE. The pattern is very
stable for the different income quintiles.
Table A2 in the appendix gives previous insights into additional covariates which
might cause differences in OOPHE. We present disaggregated information on OOPHE for
different types of households, for different private and public insurance characteristics and
for the broader socio-economic environment of the household, measured by the degree of
urbanization. However, we are cautious in drawing any conclusions from the raw data.
6 Econometric Results
In the present data set we defined four different subgroups of OOPHE: total OOPHE,
physician services, OTC pharmaceuticals and prescription fees. Our data do not allow
differentiating between the pathways 1, 2 for total OOPHE and physician services which
results in (j=3). They include deductibles on services offered by contracted or private
physicians and direct OOPHE which are not born by public or private health insurance
institutions. Only in the case of pharmaceutical expenditures we are able to disaggregate:
Pathway (j=1) is covered by prescription fees and (j=2) by OTC pharmaceuticals.
We use different socio-economic characteristics to explain differences in OOPHE-levels
between households. Household types were defined depending on the number of children
and adults. This remained in standard household constellations of singles, couples, couples
with children and single parents. Households with ’exceptional’ household members, e.g.
further relatives or non-related cohabitants are excluded. In order to derive socio-economic
16This approach is widely used in the health economics literature to identify households with ’catas-trophic and impoverishing’ shares of OOPHE. Not surprisingly this research work primarily focuses onthe situation in countries with low economic development. See Xu et al. (2003).
14
Tab
le2:
The
stru
cture
ofO
OP
HE
inA
ust
ria
HH
inco
mequintiles(p
oorest
torich
est)
EquivalisedHH
inco
mequintiles(p
oorest
torich
est)
Q1
Q2
Q3
Q4
Q5
Q1
Q2
Q3
Q4
Q5
Prescriptionfee
Ave
rage
exp
.5.
127.
078.
327.
386.
375.
307.
797.
516.
866.
79%
ofH
Hin
com
e0.
460.
350.
310.
210.
120.
430.
370.
300.
210.
15%
ofH
Hsp
end
ing
0.35
0.33
0.33
0.23
0.16
0.29
0.35
0.33
0.23
0.19
OTC
pharmaceuticals
Ave
rage
exp
.7.
569.
3410
.50
13.1
714
.67
9.04
10.4
310
.69
11.6
413
.45
%of
HH
inco
me
0.58
0.46
0.39
0.37
0.28
0.58
0.48
0.38
0.34
0.30
%of
HH
spen
din
g0.
450.
390.
380.
390.
360.
420.
430.
370.
380.
38Physician
services
Ave
rage
exp
.9.
4718
.35
17.9
023
.43
29.5
516
.71
17.5
514
.72
20.5
829
.14
%of
HH
inco
me
0.86
0.94
0.65
0.65
0.54
1.19
0.77
0.48
0.55
0.65
%of
HH
spen
din
g0.
490.
490.
520.
590.
610.
540.
530.
400.
570.
65Inpatientservices
Ave
rage
exp
.1.
844.
953.
184.
135.
843.
333.
394.
273.
475.
48%
ofH
Hin
com
e0.
140.
250.
120.
120.
100.
200.
150.
160.
110.
10%
ofH
Hsp
end
ing
0.11
0.21
0.13
0.13
0.12
0.15
0.14
0.16
0.12
0.12
Therapeuticaids
Ave
rage
exp
.22
.53
38.0
242
.55
53.2
574
.95
29.1
540
.71
45.9
350
.67
64.8
4%
ofH
Hin
com
e1.
861.
881.
591.
491.
411.
911.
851.
661.
451.
36%
ofH
Hsp
end
ing
1.32
1.56
1.48
1.52
1.69
1.29
1.58
1.53
1.51
1.66
Other
expenditures
Ave
rage
exp
.12
.72
10.3
815
.29
23.1
424
.04
13.1
612
.37
14.1
822
.26
23.6
1%
ofH
Hin
com
e1.
040.
520.
570.
640.
440.
930.
590.
550.
620.
52%
ofH
Hsp
end
ing
0.69
0.43
0.51
0.58
0.51
0.56
0.46
0.50
0.63
0.58
Total
OOPHE
Ave
rage
exp
.59
.25
88.1
697
.79
124.
6215
5.65
76.7
892
.29
97.3
411
5.71
143.
33%
ofH
Hin
com
e4.
954.
403.
633.
492.
905.
244.
233.
543.
273.
08%
ofH
Hsp
end
ing
3.40
3.40
3.35
3.42
3.47
3.24
3.49
3.29
3.45
3.58
15
Tab
le3:
OO
PH
Ean
dhou
sehol
din
com
e:T
he
rela
tive
burd
enof
OO
PH
E
HH
inco
mequintiles(p
oorest
torich
est)
EquivalisedHH
inco
mequintiles(p
oorest
torich
est)
Q1
Q2
Q3
Q4
Q5
Q1
Q2
Q3
Q4
Q5
Prescriptionfee
Exp
end
itu
res>
2%1.
201.
101.
000.
480.
280.
861.
191.
040.
600.
40E
xp
end
itu
res>
5%0.
260.
120.
190.
020.
070.
170.
190.
190.
030.
07OTC
pharmaceuticals
Exp
end
itu
res>
2%1.
401.
101.
100.
850.
931.
231.
300.
930.
980.
93E
xp
end
itu
res>
5%0.
380.
240.
140.
220.
120.
360.
220.
140.
210.
17Physician
services
Exp
end
itu
res>
2%1.
101.
101.
301.
601.
901.
221.
231.
101.
591.
76E
xp
end
itu
res>
5%0.
600.
600.
700.
860.
860.
570.
640.
480.
810.
98Inpatientservices
Exp
end
itu
res>
2%0.
310.
380.
210.
350.
410.
400.
310.
280.
330.
35E
xp
end
itu
res>
5%0.
070.
240.
120.
140.
120.
120.
160.
140.
120.
16Therapeuticaids
Exp
end
itu
res>
2%3.
634.
104.
404.
305.
103.
604.
204.
444.
424.
84E
xp
end
itu
res>
5%1.
451.
641.
541.
501.
701.
491.
691.
661.
381.
61Other
expenditures
Exp
end
itu
res>
2%1.
661.
261.
371.
421.
491.
331.
161.
311.
611.
76E
xp
end
itu
res>
5%0.
860.
380.
470.
590.
470.
670.
450.
480.
570.
59Total
OOPHE
Exp
end
itu
res>
2%8.
408.
239.
529.
129.
498.
179.
218.
668.
599.
75E
xp
end
itu
res>
5%4.
184.
184.
134.
304.
734.
044.
374.
134.
304.
68E
xp
end
itu
res>
10%
1.73
1.92
1.50
1.50
1.68
1.61
1.75
1.47
1.73
1.78
16
information about the household we use both adults of the household if available and
calculate their average education level, age and early retirement status. Information
about gender refers to the householder. Furthermore, we derive if both or at least one
adult has a contract with a private health insurance. A subcategorization of different
public health insurance institutions is done to account for different deductibles. As a
reference point we use the public health insurance status of the householder and take the
public insurance for private workers (GKK) as reference group.
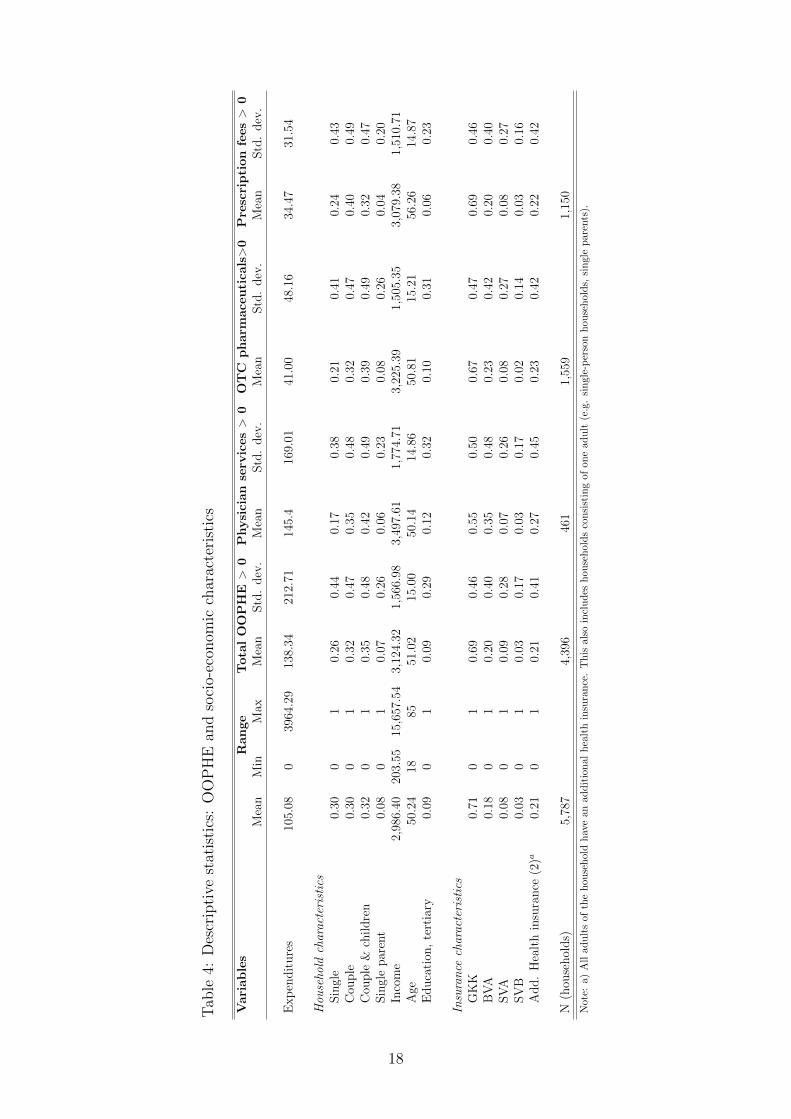
Table 6 shows the descriptive statistics of selected household characteristics related
to the four OOPHE-subgroups. The first column is the mean of the total sample size
whereby the conditional mean of households with non-zero expenditures is separated
by the OOPHE-subcategories. The range of the variables relates to the total sample
size. The average OOPHE of all households are EUR 105 per month and the maximum
monthly burden is EUR 3,964 which relates predominantly to dental services. Households
consisting of singles, couples and couples with children are relatively even distributed
throughout the total sample size. Single parents are the minority and account for 8% of
the included households. The percentage of single-person households decreases slightly
while the share of couples with children increases if we consider households with non-zero
expenditures. The average household income of the total sample size is EUR 2,986 while
the level of income increases in all OOPHE-subcategories. The adults age lies between
18 and 85 years and they are on average 50 years old. Tertiary education relates to
9% of households and is consistent for the total sample size and households with total
OOPHE. 21% of the included households have an additional health insurance contract
for both adults. This remains consistent if households face total OOPHE. Almost three-
quarters of the householders are insured at GKK both in the total sample size and in the
conditional parts. The subgroup of total OOPHE has the fewest non-zero expenditure
observations and 76% of the included households report monthly expenditures.
The highest monthly burden relates to OOPHE on physician services. Furthermore,
households in this OOPHE-subcategory have on average the highest level of income. This
expenditure category also includes the highest share of couples with children, householders
insured at BVA, adults with tertiary education and additional health insurance compared
to all other OOPHE-subcategories. It is important to note that twice as many households
are insured at BCA compared to the total sample size.
In contrast to prescription fees the subcategory of OTC pharmaceuticals has a higher
share of couples with children and single parents. The adults of this category are on aver-
age 6 years younger and have a higher household income than adults in the prescription
fee subgroup. The conditional means of the household income, private health insurance
and householders age are in each subgroup on average larger or at least equal to the means
of the total sample size. Tertiary education behaves differently and is smaller or larger
depending on the concerned expenditure subgroup.
17
Tab
le4:
Des
crip
tive
stat
isti
cs:
OO
PH
Ean
dso
cio-
econ
omic
char
acte
rist
ics
Variables
Range
TotalOOPHE
>0
Physician
serv
ices>
0OTC
pharm
ace
utica
ls>0
Prescription
fees>
0M
ean
Min
Max
Mea
nStd
.dev
.M
ean
Std
.dev
.M
ean
Std
.dev
.M
ean
Std
.dev
.
Exp
endit
ure
s10
5.08
039
64.2
913
8.34
212.
7114
5.4
169.
0141
.00
48.1
634
.47
31.5
4
Hou
seho
ldcharacteristics
Sin
gle
0.30
01
0.26
0.44
0.17
0.38
0.21
0.41
0.24
0.43
Cou
ple
0.30
01
0.32
0.47
0.35
0.48
0.32
0.47
0.40
0.49
Cou
ple
&ch
ildre
n0.
320
10.
350.
480.
420.
490.
390.
490.
320.
47Sin
gle
par
ent
0.08
01
0.07
0.26
0.06
0.23
0.08
0.26
0.04
0.20
Inco
me
2,98
6.40
203.
5515
,657
.54
3,12
4.32
1,56
6.98
3,49
7.61
1,77
4.71
3,22
5.39
1,50
5.35
3,07
9.38
1,51
0.71
Age
50.2
418
8551
.02
15.0
050
.14
14.8
650
.81
15.2
156
.26
14.8
7E
duca
tion
,te
rtia
ry0.
090
10.
090.
290.
120.
320.
100.
310.
060.
23
Insurance
characteristics
GK
K0.
710
10.
690.
460.
550.
500.
670.
470.
690.
46B
VA
0.18
01
0.20
0.40
0.35
0.48
0.23
0.42
0.20
0.40
SV
A0.
080
10.
090.
280.
070.
260.
080.
270.
080.
27SV
B0.
030
10.
030.
170.
030.
170.
020.
140.
030.
16A
dd.
Hea
lth
insu
rance
(2)a
0.21
01
0.21
0.41
0.27
0.45
0.23
0.42
0.22
0.42
N(h
ouse
hol
ds)
5,78
74,
396
461
1,55
91,
150
Not
e:a)
All
adu
lts
of
the
hou
seh
old
hav
ean
add
itio
nal
hea
lth
insu
ran
ce.
Th
isal
soin
clu
des
hou
seh
old
sco
nsi
stin
gof
one
adu
lt(e
.g.
sin
gle-
per
son
hou
seh
old
s,si
ngle
par
ents
).
18
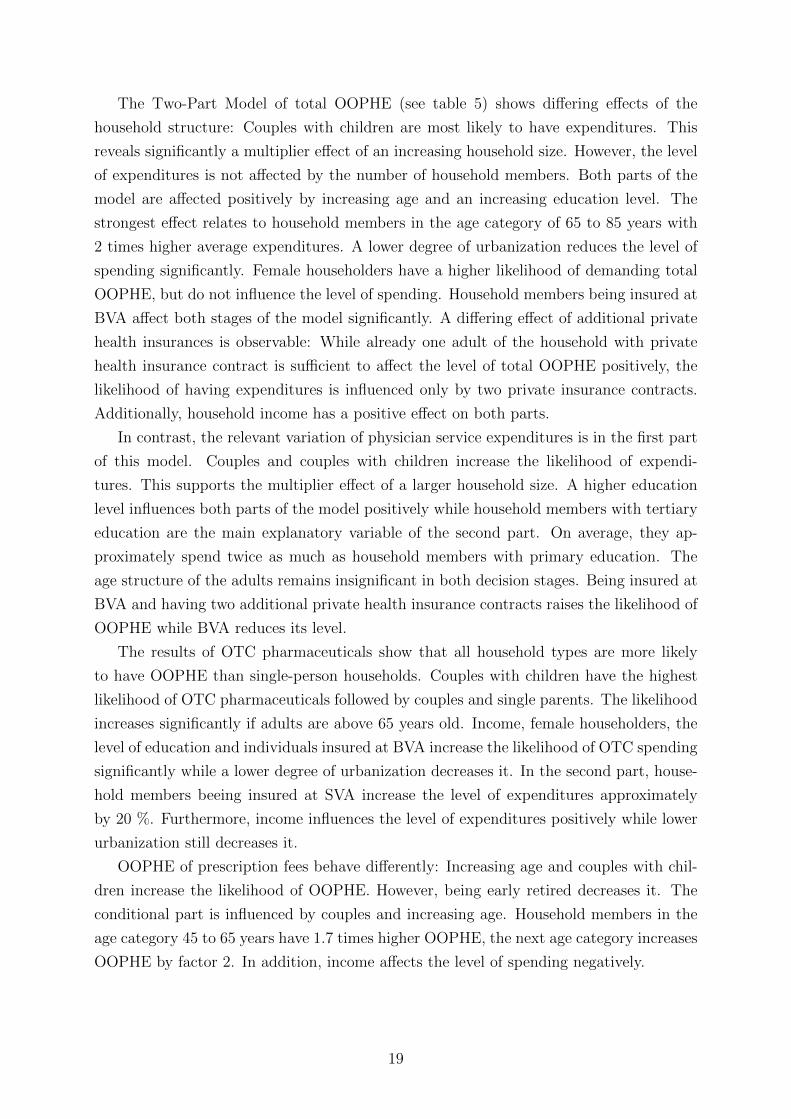
The Two-Part Model of total OOPHE (see table 5) shows differing effects of the
household structure: Couples with children are most likely to have expenditures. This
reveals significantly a multiplier effect of an increasing household size. However, the level
of expenditures is not affected by the number of household members. Both parts of the
model are affected positively by increasing age and an increasing education level. The
strongest effect relates to household members in the age category of 65 to 85 years with
2 times higher average expenditures. A lower degree of urbanization reduces the level of
spending significantly. Female householders have a higher likelihood of demanding total
OOPHE, but do not influence the level of spending. Household members being insured at
BVA affect both stages of the model significantly. A differing effect of additional private
health insurances is observable: While already one adult of the household with private
health insurance contract is sufficient to affect the level of total OOPHE positively, the
likelihood of having expenditures is influenced only by two private insurance contracts.
Additionally, household income has a positive effect on both parts.
In contrast, the relevant variation of physician service expenditures is in the first part
of this model. Couples and couples with children increase the likelihood of expendi-
tures. This supports the multiplier effect of a larger household size. A higher education
level influences both parts of the model positively while household members with tertiary
education are the main explanatory variable of the second part. On average, they ap-
proximately spend twice as much as household members with primary education. The
age structure of the adults remains insignificant in both decision stages. Being insured at
BVA and having two additional private health insurance contracts raises the likelihood of
OOPHE while BVA reduces its level.
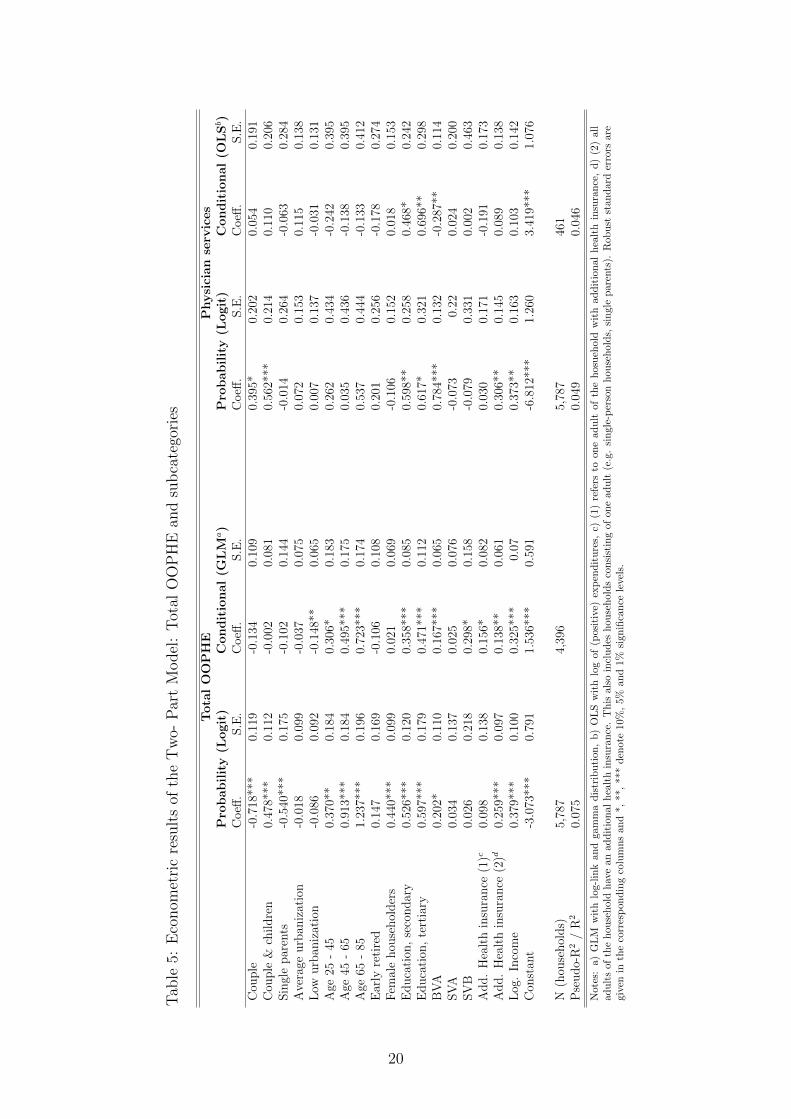
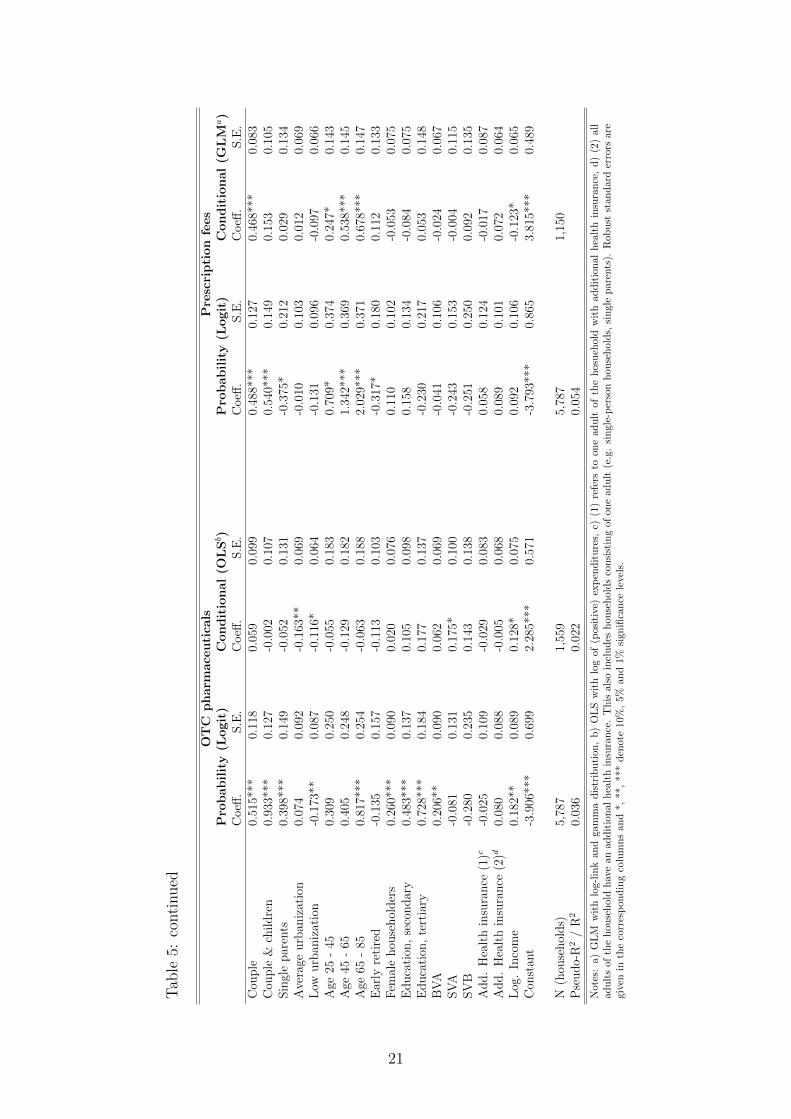
The results of OTC pharmaceuticals show that all household types are more likely
to have OOPHE than single-person households. Couples with children have the highest
likelihood of OTC pharmaceuticals followed by couples and single parents. The likelihood
increases significantly if adults are above 65 years old. Income, female householders, the
level of education and individuals insured at BVA increase the likelihood of OTC spending
significantly while a lower degree of urbanization decreases it. In the second part, house-
hold members beeing insured at SVA increase the level of expenditures approximately
by 20 %. Furthermore, income influences the level of expenditures positively while lower
urbanization still decreases it.
OOPHE of prescription fees behave differently: Increasing age and couples with chil-
dren increase the likelihood of OOPHE. However, being early retired decreases it. The
conditional part is influenced by couples and increasing age. Household members in the
age category 45 to 65 years have 1.7 times higher OOPHE, the next age category increases
OOPHE by factor 2. In addition, income affects the level of spending negatively.
19
Tab
le5:
Eco
nom
etri
cre
sult
sof
the
Tw
o-P
art
Model
:T
otal
OO
PH
Ean
dsu
bca
tego
ries
TotalOOPHE
Physician
serv
ices
Pro
bability(L
ogit)
Conditional(G
LM
a)
Pro
bability(L
ogit)
Conditional(O
LSb)
Coeff
.S.E
.C
oeff
.S.E
.C
oeff
.S.E
.C
oeff
.S
.E.
Cou
ple
-0.7
18**
*0.
119
-0.1
340.
109
0.39
5*0.
202
0.05
40.
191
Cou
ple
&ch
ildre
n0.
478*
**0.
112
-0.0
020.
081
0.56
2***
0.21
40.
110
0.20
6Sin
gle
par
ents
-0.5
40**
*0.
175
-0.1
020.
144
-0.0
140.
264
-0.0
630.
284
Ave
rage
urb
aniz
atio
n-0
.018
0.09
9-0
.037
0.07
50.
072
0.15
30.
115
0.13
8L
owurb
aniz
atio
n-0
.086
0.09
2-0
.148
**0.
065
0.00
70.
137
-0.0
310.
131
Age
25-
450.
370*
*0.
184
0.30
6*0.
183
0.26
20.
434
-0.2
420.
395
Age
45-
650.
913*
**0.
184
0.49
5***
0.17
50.
035
0.43
6-0
.138
0.39
5A
ge65
-85
1.23
7***
0.19
60.
723*
**0.
174
0.53
70.
444
-0.1
330.
412
Ear
lyre
tire
d0.
147
0.16
9-0
.106
0.10
80.
201
0.25
6-0
.178
0.27
4F
emal
ehou
sehol
der
s0.
440*
**0.
099
0.02
10.
069
-0.1
060.
152
0.01
80.
153
Educa
tion
,se
condar
y0.
526*
**0.
120
0.35
8***
0.08
50.
598*
*0.
258
0.46
8*0.
242
Educa
tion
,te
rtia
ry0.
597*
**0.
179
0.47
1***
0.11
20.
617*
0.32
10.
696*
*0.
298
BV
A0.
202*
0.11
00.
167*
**0.
065
0.78
4***
0.13
2-0
.287
**0.
114
SV
A0.
034
0.13
70.
025
0.07
6-0
.073
0.22
0.02
40.
200
SV
B0.
026
0.21
80.
298*
0.15
8-0
.079
0.33
10.
002
0.46
3A
dd.
Hea
lth
insu
rance
(1)c
0.09
80.
138
0.15
6*0.
082
0.03
00.
171
-0.1
910.
173
Add.
Hea
lth
insu
rance
(2)d
0.25
9***
0.09
70.
138*
*0.
061
0.30
6**
0.14
50.
089
0.13
8L
og.
Inco
me
0.37
9***
0.10
00.
325*
**0.
070.
373*
*0.
163
0.10
30.
142
Con
stan
t-3
.073
***
0.79
11.
536*
**0.
591
-6.8
12**
*1.
260
3.41
9***
1.07
6
N(h
ouse
hol
ds)
5,78
74,
396
5,78
746
1P
seudo-
R2
/R
20.
075
0.04
90.
046
Not
es:
a)
GL
Mw
ith
log-l
ink
an
dga
mm
ad
istr
ibu
tion
,b
)O
LS
wit
hlo
gof
(pos
itiv
e)ex
pen
dit
ure
s,c)
(1)
refe
rsto
on
ead
ult
ofth
ehos
ueh
old
wit
had
dit
ion
al
hea
lth
insu
ran
ce,
d)
(2)
all
adu
lts
ofth
eh
ou
seh
old
hav
ean
add
itio
nal
hea
lth
insu
ran
ce.
Th
isal
soin
clu
des
hou
seh
old
sco
nsi
stin
gof
one
adu
lt(e
.g.
sin
gle-
per
son
hou
seh
old
s,si
ngl
ep
aren
ts).
Rob
ust
stan
dard
erro
rsar
egi
ven
inth
eco
rres
pon
din
gco
lum
ns
and
*,**
,**
*d
enot
e10
%,
5%an
d1%
sign
ifica
nce
leve
ls.
20
Tab
le5:
conti
nued
OTC
pharm
ace
utica
lsPrescription
fees
Pro
bability(L
ogit)
Conditional(O
LSb)
Pro
bability(L
ogit)
Conditional(G
LM
a)
Coeff
.S.E
.C
oeff
.S.E
.C
oeff
.S.E
.C
oeff
.S
.E.
Cou
ple
0.51
5***
0.11
80.
059
0.09
90.
488*
**0.
127
0.46
8***
0.08
3C
ouple
&ch
ildre
n0.
933*
**0.
127
-0.0
020.
107
0.54
0***
0.14
90.
153
0.10
5Sin
gle
par
ents
0.39
8***
0.14
9-0
.052
0.13
1-0
.375
*0.
212
0.02
90.
134
Ave
rage
urb
aniz
atio
n0.
074
0.09
2-0
.163
**0.
069
-0.0
100.
103
0.01
20.
069
Low
urb
aniz
atio
n-0
.173
**0.
087
-0.1
16*
0.06
4-0
.131
0.09
6-0
.097
0.06
6A
ge25
-45
0.30
90.
250
-0.0
550.
183
0.70
9*0.
374
0.24
7*0.
143
Age
45-
650.
405
0.24
8-0
.129
0.18
21.
342*
**0.
369
0.53
8***
0.14
5A
ge65
-85
0.81
7***
0.25
4-0
.063
0.18
82.
029*
**0.
371
0.67
8***
0.14
7E
arly
reti
red
-0.1
350.
157
-0.1
130.
103
-0.3
17*
0.18
00.
112
0.13
3F
emal
ehou
sehol
der
s0.
260*
**0.
090
0.02
00.
076
0.11
00.
102
-0.0
530.
075
Educa
tion
,se
condar
y0.
483*
**0.
137
0.10
50.
098
0.15
80.
134
-0.0
840.
075
Educa
tion
,te
rtia
ry0.
728*
**0.
184
0.17
70.
137
-0.2
300.
217
0.05
30.
148
BV
A0.
206*
*0.
090
0.06
20.
069
-0.0
410.
106
-0.0
240.
067
SV
A-0
.081
0.13
10.
175*
0.10
0-0
.243
0.15
3-0
.004
0.11
5SV
B-0
.280
0.23
50.
143
0.13
8-0
.251
0.25
00.
092
0.13
5A
dd.
Hea
lth
insu
rance
(1)c
-0.0
250.
109
-0.0
290.
083
0.05
80.
124
-0.0
170.
087
Add.
Hea
lth
insu
rance
(2)d
0.08
00.
088
-0.0
050.
068
0.08
90.
101
0.07
20.
064
Log
.In
com
e0.
182*
*0.
089
0.12
8*0.
075
0.09
20.
106
-0.1
23*
0.06
5C
onst
ant
-3.9
06**
*0.
699
2.28
5***
0.57
1-3
.793
***
0.86
53.
815*
**0.
489
N(h
ouse
hol
ds)
5,78
71,
559
5,78
71,
150
Pse
udo-
R2
/R
20.
036
0.02
20.
054
Not
es:
a)G
LM
wit
hlo
g-l
ink
an
dga
mm
ad
istr
ibu
tion
,b
)O
LS
wit
hlo
gof
(pos
itiv
e)ex
pen
dit
ure
s,c)
(1)
refe
rsto
one
adu
ltof
the
hos
ueh
old
wit
had
dit
ion
alh
ealt
hin
sura
nce
,d
)(2
)all
adu
lts
of
the
hou
seh
old
hav
ean
add
itio
nal
hea
lth
insu
ran
ce.
Th
isal
soin
clu
des
hou
seh
old
sco
nsi
stin
gof
one
adu
lt(e
.g.
sin
gle-
per
son
hou
seh
old
s,si
ngl
ep
are
nts
).R
ob
ust
stan
dar
der
rors
are
give
nin
the
corr
esp
ond
ing
colu
mn
san
d*,
**,
***
den
ote
10%
,5%
and
1%si
gnifi
can
cele
vels
.
21
7 Discussion, Limitations and Conclusions
We start with the discussion of the results of our study. In all expenditure categories our
results show the strong impact of household structures on the probability part of the model
and partially on the conditional expenditures. Couples and the increase of the household
size by children increase the risk of OOPHE. The average household of couples has 1.8
children until the age of 18 which makes it to the largest observation unit in the sample.
Only one household member with non-zero OOPHE is sufficient to classify the total
observation unit as expenditure-household which may explain their higher probability of
OOPHE. This is in contrast to the findings of Bilger and Chaze where individuals living
alone demonstrate a higher probability and higher expected consumption. However, they
are examining total costs of health care instead of OOPHE (Bilger and Chaze, 2008).
Single parents predominantly decrease the probability of OOPHE and never determine
the level of expenditures. This result may reflect their lower income level, utilization of
health care in the public sector or actual lower utilization of health care services (Rubin
and Koelln, 1993).
Age effects are observable in both parts of the analysis with an increasing impact the
older the household members are. The effects of increasing age on OOPHE are consistent
with previous literature (Bilger and Chaze, 2008; Corrieri et al., 2010; You and Kobayashi,
2011). Furthermore, the age class of 25 to 45 covers most years of maternity and the re-
lated excess expenditures of preventive and follow-up medical examination. These female
specific expenditures and gender-specific morbidities support higher probability of female
householders regarding total OOPHE and OTC pharmaceuticals (Corrieri et al., 2010).
Bilger and Chaze (2008) show a higher expected probability and expected consumption
for women in all age classes with a local consumption maximum at the age of 32 (Bilger
and Chaze, 2008). A systematic review of the elderly aged (65+) in OECD countries
illustrated significant gender inequalities due to females lower participation rate in the
labor market which reduces their social protection. Further explanatories are females
higher consumption of medication including alternative medicine, female specific mor-
bidities with higher OOPHE-shares and their longer life-expectancy (Corrieri et al., 2010;
Costa-Font et al., 2007).
The existing literature shows mixed results on the effects of income on OOPHE. In-
come is considered to be a strong determinant in the demand of private health care
(Propper, 2000). Furthermore, an increase in income raises OOPHE in WHO countries
(Ahmed et al., 2006; Jowett et al., 2003; Musgrove et al., 2002). However our findings do
not support previous results consistently except for total OOPHE. Significance in the sub-
group of total OOPHE may be related to higher private expenditures for dental services
and health spas. The household income does not affect the OOPHE-level for physician
services and prescription fees but increases the probability of consuming OTC pharmaceu-
22
ticals and physician services. This may reflect the properties of the well-covered benefit
catalogue of the public health insurance system. Expenses for prescription fees and physi-
cian services presume an actual need due to illness which is uncoupled from income or
further socio-economic factors. An equal distribution of treatment needs of the included
households may reduce the income effect. OTC pharmaceuticals include prevention and
may also display an impatience tradeoff: Some medical products offer the opportunity
to trade off invested time until treatment with combined higher compensation properties
against immediate treatment with higher OOPHE-burdens. This tradeoff may be influ-
enced by income and supports the significance in both parts of OTC pharmaceuticals.
The non-significance of income in prescription fees might reflect a prescribing behavior of
physicians. A Dutch study argued that the awareness of patients financial problems seem
to increase the prescription of fully reimbursed drugs which is in line with our findings
(Kasje et al., 2002).
Tertiary education strongly increases the probability and the conditional level of total
OOPHE and physician services. This positive association between OOPHE and higher
education is in line with findings from Switzerland (Bilger and Chaze, 2008). A higher level
of education may improve the awareness of a healthier lifestyle and prevention measures
which influences consumption and expenditure decisions (Corrieri et al., 2010).
Lower urbanization decreases the probability and/or the conditional expenditures in
total OOPHE and OTC pharmaceuticals. This reflects the lower concentration of pri-
vate health care facilities in regions with a lower degree of urbanization. Farmers pre-
dominantly located in regions with low-urbanization are insured at SVB which is also
considered with limited proportion of cost sharing compared to the other public health
insurance institutions.
Households insured at BVA or SVA are faced with an identical percentage of de-
ductibles. However, BVA- households show in 3 out of 4 expenditure subgroups a sig-
nificantly higher probability of OOPHE while SVA remains insignificant. BVAs higher
demand of OOPHE may depend on the household structure (higher percentage of house-
holds with children), the increased age of the members, a higher income and/or a stronger
need of health care services. Further, the results show differing time restrictions and op-
portunity costs between both employment groups. While individuals insured at BVA
experience a stronger social protection by the employer, self-employed individuals usu-
ally have a reduced time to verify the most adequate treatment. In the Austrian health
care system, BVA-members receive a continuation of payments in the first three days of
sickness by the employer. In case of long-lasting illness the public health care institution
commits themselves to sick allowances up to 52 weeks with an extension to 78 weeks
depending on the severity of illness. In contrast, individuals insured at SVA receive sick-
ness benefits from the fourth day after illness until a maximum of 26 weeks if and only
if they have an additional insurance. This allows BVA-households to invest more time in
23
comparing private and public health care facilities which may result in extended doctoral
visits inducing more OOPHE-burdens. SVAs significant affection in the level of OTC
pharmaceuticals displays their higher opportunity costs in receiving immediate treatment
combined with a lower willingness of waiting. Overall, we have to admit that different cost
sharing arrangements are only one consequence of the public insurance status. Farmers,
public workers, employers differ in other conditions/characteristics of health care utiliza-
tion (e. g. opportunity cost of waiting time) and these might also change their utilization
behavior. Our data do not allow controlling for these characteristics.
The higher probability of physician service expenditures of BVA-households and their
negative effects on the conditional expenditures compared to SVA-households might show
a stronger risk aversion which is secured by additional private health insurances.
Possibly the most interesting result is the positive co-movement of OOPHE and addi-
tional health insurance contracts. In total OOPHE and physician services two additional
health insurances increased the probability of having OOPHE significantly however leav-
ing the conditional part unaffected except for total OOPHE subcategory. Additional
insurance contracts seem to stimulate the purchase of services and products which are
not born by private or public insurances but result in negligible cost sharing. General
OOPHE and additional health insurances behave complementary in the first part of the
model and additional health insurance contracts do not protect households from additional
costs as would be expected.
The discussion of the regression results is one important dimension of the assessment
of the value added by our paper. In addition to this task it is also necessary to dis-
cuss more explicitly the validity of the data coming from the household budget survey to
study different aspects of OOPHE. In the following we tackle several dimensions of this
data source without being comprehensive. Our empirical approach is guided by a utility
based model of health care utilization. We assume that individuals choose those path-
ways through the health care system which maximize their net utility. This is a strong
assumption, because the utilization of health care services in many cases results from
an imperfect physician-patient agency relationship. To replicate this model empirically it
would be necessary to have a rich data set, which has to include information on all possible
utilization paths. This information should also entail prices and quantities (e.g. physician
contacts, hospital days) of utilization in the different pathways. The household budget
survey only includes private OOPHE. The restricted information from the data set has
important implications. The differentiation between prices and quantities is not possible.
No distinction is possible whether the OOPHE comes from one treatment episode, from
parts of a treatment episode or from several treatment episodes. There exists no possibil-
ity to discriminate between the outside option (not to consume health care goods at all)
and the pathway (j = 0). In addition, the differentiation between OOPHE of type 2 and
3 is only possible for pharmaceuticals, but not for total OOPHE and other subcategories
24
of services. This has important implications for the use of the double hurdle approach in
the empirical estimation, a point we will mention later.
The expenditure estimates in the household budget survey are a combination of two
different methods of information gathering: the recall and the diary method. The general
advantages/disadvantages of these data sources of consumption expenditures are discussed
in the literature (Ahmed et al., 2006; Crossley and Winter, 2013; Neter, 1970). Much less
evidence is available on possible biases in the context of health care utilization. The
majority of the studies focusing on this question only identify the directions of the bias
in OOPHE estimates (Lu et al., 2009; Zuvekas and Olin, 2009). Lavado et al. (2012) are
the first which come up with quantified effects of this bias. They did a meta-analysis of
household expenditure studies all over the world. In the end they asked: To which extent
do different forms of household surveys change the expenditure share of OOPHE? The
answer is given by a multivariate regression including 214 studies. They find significant
and stable effects of important survey characteristics on the OOPHE-share. Other factors
held constant, a one-unit increase in the number of health questions was accompanied by a
1 % increase in the OOPHE share. Increasing the number of questions on the consumption
(with holding the number of health expenditure questions constant) resulted in a 0.2 %
decrease in OOPHE-share. A one-month increase in the recall period reduces the OOPHE-
share by 6 %. Surveys based on diaries generate a lower expenditure share compared to
interviews over a recall period. In addition to the possibility of estimation bias it seems
to be clear that the two methods of data gathering produce data with different statistical
characteristics; e. g. we would expect that the number and significance of zeros, the
skewness of the sample, the size of the standard deviation is different in the diary method
compared to the recall methods. On the other hand, these characteristics are crucial for
the choice of the econometric approach (Jones, 2000).
Another important aspect is the adequate reference unit of OOPHE. In the Austrian
household survey this is the total household. No information is available on OOPHE
disaggregated for the different household members. In addition, the information on the
socio-economic characteristics of the household members is limited. This is especially true
for important predictors of individual health expenditures. In our opinion, there is no
clear answer to the question, whether we should use the individual or the household as a
reference unit for OOPHE. It seems to be clear that the household is an adequate reference
unit for equity/equality considerations. As far as the determinants of OOPHE are con-
cerned many different aspects have to be kept in mind. If health expenditures are public
goods on the household level, this would be a strong argument to use the household as a
reference unit. But this assumption is not very realistic. The vast majority of the health
care goods financed out-of-pocket are private goods on an individual basis. Individuals
utilize the health care system and not households. Of course the individual decision to
use the health care sector is influenced by household characteristics (Jacobson, 2000), but
25
that is not an argument to study OOPHE on the household level, it is just an argument
to include household characteristics in the empirical estimation on the individual and the
household level. For many purposes it seems to be appropriate to use the individual as
a reference unit. This is especially true for demand and utilization studies in the health
care sector. On the other hand, the household level could deliver additional insights on
the determinants of OOPHE. But overall we have to be cautious in the interpretation of
the results on the household level. In particular, we are not allowed to draw conclusions
of statistical interference from the macro level of a household to the micro level of an
individual (ecological fallacy problems).
As already mentioned, general consumption surveys only include rudimental informa-
tion on socio-economic characteristics which are important for explaining the utilization
of health care services. This statement is also valid for the Austrian household bud-
get survey. Crucial socio-economic and socio-demographic characteristics to explain the
determinants of OOPHE are missing and lead to a low explanatory power of the used
covariates. Such characteristics are indicators for the health status, indicators for the
need of long term care and the individual disease profile over a longer or medium time
period (e. g. the OOPHE in the past).
All in all the specific characteristics of the data basis are a big challenge to the econo-
metric modelling of OOPHE. The health econometrics literature on this topic (see the
seminal contributions by (Jones, 2000; Madden, 2008; Mihaylova et al., 2011)) proposes
clear criteria which allow to choose between different types of econometric approaches
(Sample Selection vs. Two-Part Models). The impossibility to separate the different
pathways in our data completely (especially to differentiate zero expenditures from zero
consumption), the choice of the household as a reference unit and the aggregation of data
based on diaries and on the recall system is a backlash to apply these criteria. The general
problems of finding the appropriate econometric approach in clear structured decisions of
participation and intensity (see Madden (2008) for the smoking example) are multiplied
in our data set.
These arguments are strong votes for efforts to create a new set of data on health
spending in Austria which avoids the disadvantages/weaknesses of the existing data bases.
26
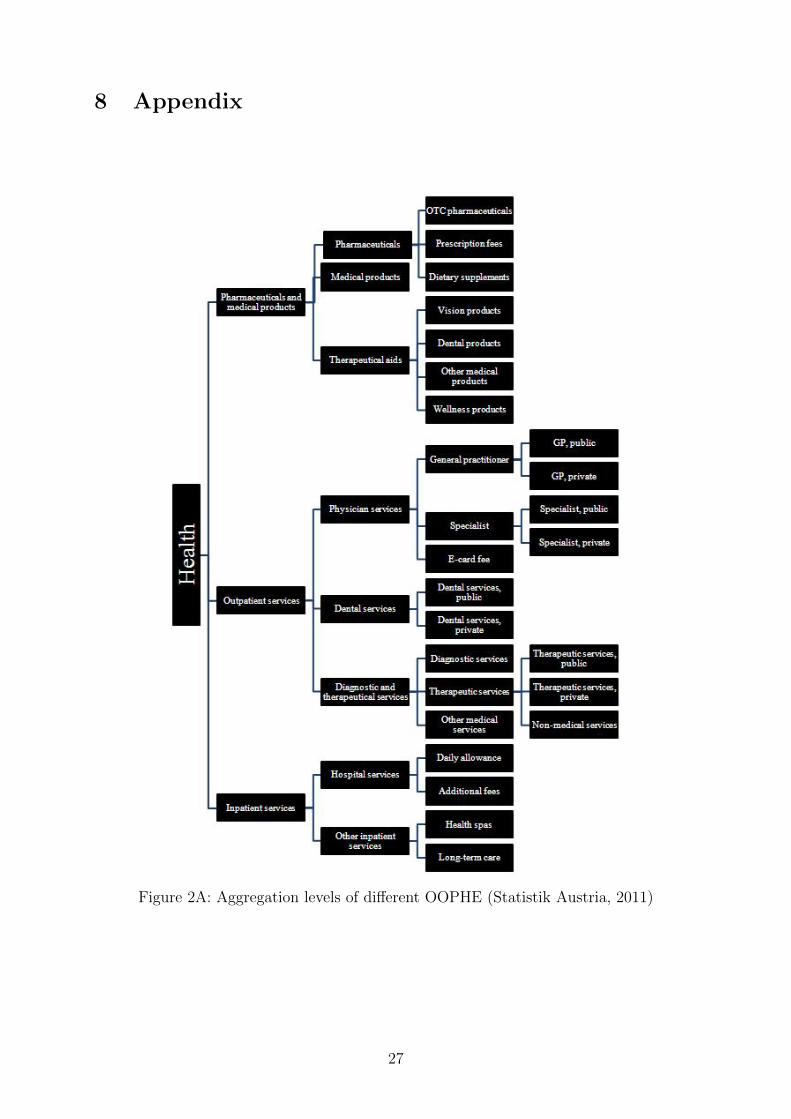
8 Appendix
Figure 2A: Aggregation levels of different OOPHE (Statistik Austria, 2011)
27
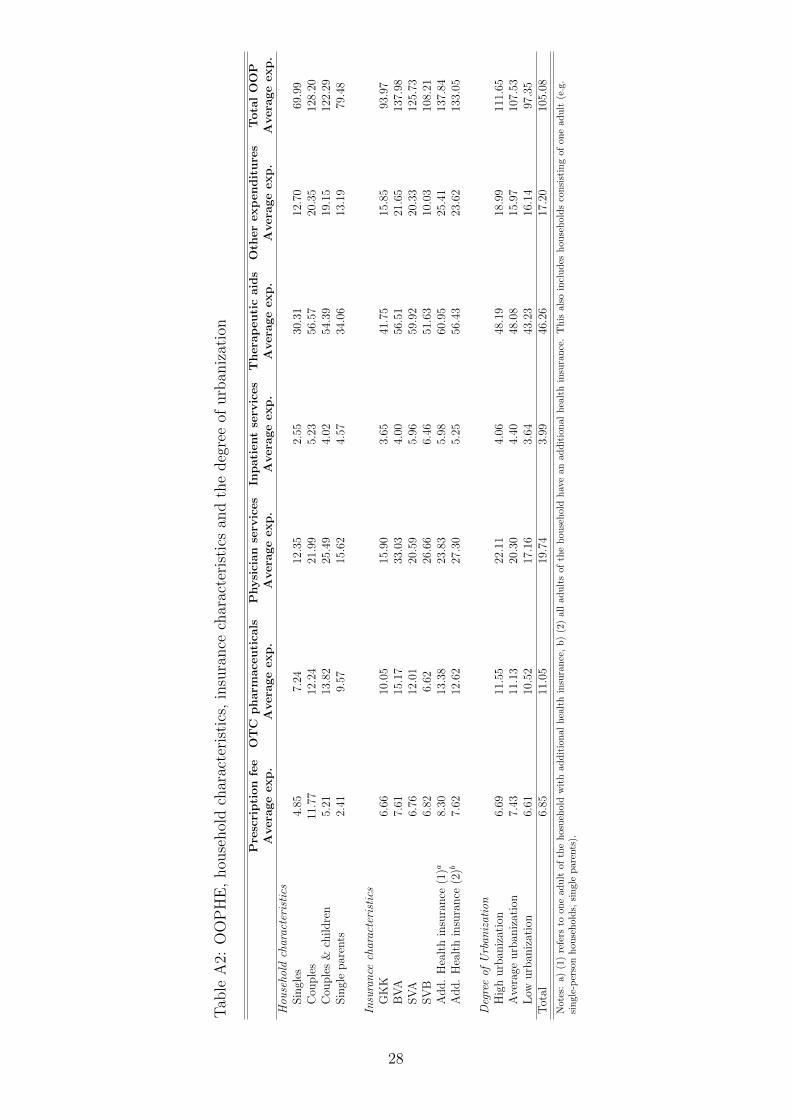
Tab
leA
2:O
OP
HE
,hou
sehol
dch
arac
teri
stic
s,in
sura
nce
char
acte
rist
ics
and
the
deg
ree
ofurb
aniz
atio
n
Prescription
fee
OTC
pharm
ace
utica
lsPhysician
serv
ices
Inpatientserv
ices
Thera
peuticaids
Oth
erexpenditures
TotalOOP
Avera
geexp.
Avera
geexp.
Avera
geexp.
Avera
geexp.
Avera
geexp.
Avera
geexp.
Avera
geexp.
Hou
seho
ldcharacteristics
Sin
gles
4.85
7.24
12.3
52.
5530
.31
12.7
069
.99
Cou
ple
s11
.77
12.2
421
.99
5.23
56.5
720
.35
128.
20C
ouple
s&
childre
n5.
2113
.82
25.4
94.
0254
.39
19.1
512
2.29
Sin
gle
par
ents
2.41
9.57
15.6
24.
5734
.06
13.1
979
.48
Insurance
characteristics
GK
K6.
6610
.05
15.9
03.
6541
.75
15.8
593
.97
BV
A7.
6115
.17
33.0
34.
0056
.51
21.6
513
7.98
SV
A6.
7612
.01
20.5
95.
9659
.92
20.3
312
5.73
SV
B6.
826.
6226
.66
6.46
51.6
310
.03
108.
21A
dd.
Hea
lth
insu
rance
(1)a
8.30
13.3
823
.83
5.98
60.9
525
.41
137.
84A
dd.
Hea
lth
insu
rance
(2)b
7.62
12.6
227
.30
5.25
56.4
323
.62
133.
05
Degreeof
Urban
ization
Hig
hurb
aniz
atio
n6.
6911
.55
22.1
14.
0648
.19
18.9
911
1.65
Ave
rage
urb
aniz
atio
n7.
4311
.13
20.3
04.
4048
.08
15.9
710
7.53
Low
urb
aniz
atio
n6.
6110
.52
17.1
63.
6443
.23
16.1
497
.35
Tot
al6.
8511
.05
19.7
43.
9946
.26
17.2
010
5.08
Note
s:a)
(1)
refe
rsto
on
ead
ult
ofth
eh
osu
ehold
wit
had
dit
ion
al
hea
lth
insu
ran
ce,
b)
(2)
all
adu
lts
of
the
hou
seh
old
hav
ean
add
itio
nal
hea
lth
insu
ran
ce.
Th
isals
oin
clu
des
hou
seh
old
sco
nsi
stin
gof
one
adu
lt(e
.g.
sin
gle-
per
son
hou
seh
old
s,si
ngle
pare
nts
).
28
References
Ahmed, N., Brzozowski, M., and Crossley, T. F. (2006). Measurement errors in recall
food consumption data. Technical report, Institute for Fiscal Studies, Working Paper.
Baji, P., Pavlova, M., Gulacsi, L., and Groot, W. (2012). Changes in equity in out-of-
pocket payments during the period of health care reforms: Evidence from Hungary.
International Journal for Equity in Health, 11(1):1–11.
Barros, P. P. and Siciliani, L. (2011). Public and Private Sector Interface. In: Mark V.
Pauly, Thomas G. Mcguire and Pedro, P. Barros, (eds.) Handbook of Health Economics,
2, Elsevier: Amsterdam et al., 927-1001.
Bilger, M. and Chaze, J.-P. (2008). What drives individual health expenditure in Switzer-
land? Swiss Journal of Economics and Statistics, 144(III):337–358.
Chaze, J.-P. (2005). Assessing household health expenditure with box-cox censoring mod-
els. Health Economics, 14(9):893–907.
Chernew, M. E. and Newhouse, J. P. (2012). Health care spending growth. In: Mark V.
Pauly, Thomas G. Mcguire and Pedro, P. Barros, (eds.) Handbook of Health Economics,
2, Elsevier: Amsterdam et al., 1-43.
Corrieri, S., Heider, D., Matschinger, H., Lehnert, T., Raum, E., and Konig, H. (2010).
Income-, education-and gender-related inequalities in out-of-pocket health-care pay-
ments for 65+ patients - a systematic review. International Journal for Equity in
Health, 9(1):20.
Costa-Font, J., Kanavos, P., and Rovira, J. (2007). Determinants of out-of-pocket pharma-
ceutical expenditure and access to drugs in Catalonia. Applied Economics, 39(5):541–
551.
Crossley, T. F. and Winter, J. K. (2013). Asking Households about Expenditures: What
Have We Learned? NBER Working Paper 19543.
Cuong, N. V., Hanh, N. T., Nguyet, P. M., and Nga, N. T. (2010). The impact of
compulsory health insurance on health care utilization and out-of-pocket payments:
New evidence for Vietnam. Research Proposal.
Goddard, M. and Smith, P. C. (1998). Equity of access to health care. Technical report,
Centre for Health Economics, University of York, Discussion Paper.
Gouveia, M. (1997). Majority rule and the public provision of a private good. Public
Choice, 93(3-4):221–244.
29
Jacobson, L. (2000). The family as producer of health - an extended grossman model.
Journal of Health Economics, 19(5):611–637.
Jones, A. M. (2000). Health econometrics. In: Culyer, Anthony J. and Newhouse, Joseph,
P. (eds.) Handbook of Health Economics, 1, Elsevier: Amsterdam et al., 1265-344.
Jones, G., Savage, E., and Van Gool, K. (2008). The distribution of household health
expenditures in Australia. Economic Record, 84(s1):S99–S114.
Jowett, M., Contoyannis, P., and Vinh, N. D. (2003). The impact of public voluntary
health insurance on private health expenditures in Vietnam. Social Science & Medicine,
56(2):333–342.
Kasje, W. N., Timmer, J., Boendermaker, P., and Haaijer-Ruskamp, F. (2002). Dutch
GPs’ perceptions: the influence of out-of-pocket costs on prescribing. Social Science &
Medicine, 55(9):1571–1578.
Kohlmeier, J. (2012). Economic determinants of out-of-pocket expenditure in health care
financing: A worldwide perspective. Unpublished Thesis, University of Innsbruck.
Lavado, R. F., Brooks, B. P., and Hanlon, M. (2012). Estimating health expenditure
shares from household surveys. Bulletin of the World Health Organization, 91:519–524.
Leive, A. and Xu, K. (2007). Coping with the out-of-pocket health payments: applications
of Engel curves and two-part models in six African countries. WHO-HSF, Discussion
Paper 7.
Li, S. M., Moslehi, S., and Yew, S. L. (2012). Public-private mix of health expenditure: A
political economy approach and a quantitative exercise, Monash University, Discussion
Paper 11/12.
Lu, C., Chin, B., Li, G., and Murray, C. J. (2009). Limitations of methods for measur-
ing out-of-pocket and catastrophic private health expenditures. Bulletin of the World
Health Organization, 87(3):238–244D.
Madden, D. (2008). Sample selection versus two-part models revisited: The case of female
smoking and drinking. Journal of Health Economics, 27(2):300–307.
Matsaganis, M., Mitrakos, T., and Tsakloglou, P. (2009). Modelling health expenditure at
the household level in Greece. The European Journal of Health Economics, 10(3):329–
336.
Mihaylova, B., Briggs, A., O’Hagan, A., and Thompson, S. G. (2011). Review of statistical
methods for analysing healthcare resources and costs. Health Economics, 20(8):897–916.
30
Musgrove, P., Zeramdini, R., and Carrin, G. (2002). Basic patterns in national health
expenditure. Bulletin of the World Health Organization, 80(2):134–146.
Neter, J. (1970). Measurement errors in reports of consumer expenditures. Journal of
Marketing Research, VII:11–25.
Newhouse, J. P. and the Insurance Experiment Group, R. C. I. E. (1993). Free for all?:
Lessons from the RAND health insurance experiment. Harvard University Press.
Norton, E. C., Wang, H., and Stearns, S. C. (2006). Out-of-pocket health care expendi-
tures. Swiss Journal of Economics and Statistics, 142(V):3–11.
OECD-Health-Data (2012). http://www.oecd.org/health/health-systems/oecdhealth
data.htm.
OECD-Health-Data (2013). http://www.oecd.org/health/health-systems/oecdhealth
data.htm.
Propper, C. (2000). The demand for private health care in the UK. Journal of Health
Economics, 19(6):855–876.
Rubin, R. M. and Koelln, K. (1993). Determinants of household out-of-pocket health
expenditures. Social Science Quarterly, 74(4):721–735.
Statistik-Austria (2011a). Konsumerhebung 2009/10: Codebuch fur detaillierte Mikro-
daten, http://www.ifarm.at/web de/statistiken/soziales/verbrauchsausgaben/konsum
erhebung 2009 2010/index.htm.
Statistik-Austria (2011b). Konsumerhebung 2009/10: Mikrodaten.
Statistik-Austria (2011c). Konsumerhebung 2009/10: Standard-Dokumentation,
Metainformationen (Definitionen, Erlauterungen, Methoden, Qualitat),
http://www.ifarm.at/web de/statistiken/soziales/verbrauchsausgaben/konsumerheb
ung 2009 2010/index.htm.
Statistik-Austria (2013). Gesundheitsausgaben in Osterreich, https://www.statistik.at/
web de/statistiken/gesundheit/gesundheitsausgaben.
Theurl, E. (2007). Die Ordnung des Gesundheitswesens. In: DirningerChristian, Nautz
Jurgen, Theurl Engelbert, Theurl Theresia (eds) Zwischen Markt und Staat - Geschichte
und Perspektiven der Ordnungspolitik in der Zweiten Republik, Bohlau Verlag, Wien,
451-552.
Versicherungsverband-Osterreich (2013). Daten von Taten - Jahresbericht 2012. Wien.
31
Wagstaff, A. and Van Doorslaer, E. (2000). Equity in health care finance and delivery. In:
Culyer, Anthony J. and Newhouse, Joseph, P. (eds.) Handbook of Health Economics, 1,
Elsevier: Amsterdam et al., 1803-1862.
Xu, K., Evans, D. B., Kawabata, K., Zeramdini, R., Klavus, J., and Murray, C. J.
(2003). Household catastrophic health expenditure: a multicountry analysis. The
Lancet, 362(9378):111–117.
You, X. and Kobayashi, Y. (2011). Determinants of out-of-pocket health expenditure in
China. Applied Health Economics and Health Policy, 9(1):39–49.
Zuvekas, S. H. and Olin, G. L. (2009). Validating household reports of health care use in
the medical expenditure panel survey. Health Services Research, 44(5p1):1679–1700.
32

University of Innsbruck - Working Papers in Economics and StatisticsRecent Papers can be accessed on the following webpage:
http://eeecon.uibk.ac.at/wopec/
2014-04 Alice Sanwald, Engelbert Theurl: What drives out-of pocket health ex-penditures of private households? - Empirical evidence from the Austrian hou-sehold budget survey
2014-03 Tanja Hortnagl, Rudolf Kerschbamer: How the value of information sha-pes the value of commitment or: Why the value of commitment does not vanish
2014-02 Adrian Beck, Rudolf Kerschbamer, Jianying Qiu, Matthias Sutter:Car mechanics in the lab - Investigating the behavior of real experts on expe-rimental markets for credence goods
2014-01 Loukas Balafoutas, Adrian Beck, Rudolf Kerschbamer, MatthiasSutter: The hidden costs of tax evasion - Collaborative tax evasion in marketsfor expert services
2013-37 Reto Stauffer, Georg J. Mayr, Markus Dabernig, Achim Zeileis: So-mewhere over the rainbow: How to make effective use of colors in meteorolo-gical visualizations
2013-36 Hannah Frick, Carolin Strobl, Achim Zeileis: Rasch mixture models forDIF detection: A comparison of old and new score specifications
2013-35 Nadja Klein, Thomas Kneib, Stephan Klasen, Stefan Lang: Bayesianstructured additive distributional regression for multivariate responses
2013-34 Sylvia Kaufmann, Johann Scharler: Bank-lending standards, loan growthand the business cycle in the Euro area
2013-33 Ting Wang, Edgar C. Merkle, Achim Zeileis: Score-based tests of mea-surement invariance: Use in practice
2013-32 Jakob W. Messner, Georg J. Mayr, Daniel S. Wilks, Achim Zeileis:Extending extended logistic regression for ensemble post-processing: Extendedvs. separate vs. ordered vs. censored
2013-31 Anita Gantner, Kristian Horn, Rudolf Kerschbamer: Fair division inunanimity bargaining with subjective claims
2013-30 Anita Gantner, Rudolf Kerschbamer: Fairness and efficiency in a subjec-tive claims problem

2013-29 Tanja Hortnagl, Rudolf Kerschbamer, Rudi Stracke, Uwe Sunde:Heterogeneity in rent-seeking contests with multiple stages: Theory and expe-rimental evidence
2013-28 Dominik Erharter: Promoting coordination in summary-statistic games
2013-27 Dominik Erharter: Screening experts’ distributional preferences
2013-26 Loukas Balafoutas, Rudolf Kerschbamer, Matthias Sutter: Second-degree moral hazard in a real-world credence goods market
2013-25 Rudolf Kerschbamer: The geometry of distributional preferences and a non-parametric identification approach
2013-24 Nadja Klein, Michel Denuit, Stefan Lang, Thomas Kneib: Nonliferatemaking and risk management with bayesian additive models for location,scale and shape
2013-23 Nadja Klein, Thomas Kneib, Stefan Lang: Bayesian structured additivedistributional regression
2013-22 David Plavcan, Georg J. Mayr, Achim Zeileis: Automatic and probabi-listic foehn diagnosis with a statistical mixture model
2013-21 Jakob W. Messner, Georg J. Mayr, Achim Zeileis, Daniel S. Wilks:Extending extended logistic regression to effectively utilize the ensemble spread
2013-20 Michael Greinecker, Konrad Podczeck: Liapounoff’s vector measure theo-rem in Banach spaces forthcoming in Economic Theory Bulletin
2013-19 Florian Lindner: Decision time and steps of reasoning in a competitive mar-ket entry game forthcoming in Economics Letters
2013-18 Michael Greinecker, Konrad Podczeck: Purification and independence
2013-17 Loukas Balafoutas, Rudolf Kerschbamer, Martin Kocher, MatthiasSutter: Revealed distributional preferences: Individuals vs. teams forthcomingin Journal of Economic Behavior and Organization
2013-16 Simone Gobien, Bjorn Vollan: Playing with the social network: Socialcohesion in resettled and non-resettled communities in Cambodia
2013-15 Bjorn Vollan, Sebastian Prediger, Markus Frolich: Co-managing com-mon pool resources: Do formal rules have to be adapted to traditional ecolo-gical norms? published in Ecological Economics
2013-14 Bjorn Vollan, Yexin Zhou, Andreas Landmann, Biliang Hu, CarstenHerrmann-Pillath: Cooperation under democracy and authoritarian norms

2013-13 Florian Lindner, Matthias Sutter: Level-k reasoning and time pressure inthe 11-20 money request game published in Economics Letters
2013-12 Nadja Klein, Thomas Kneib, Stefan Lang: Bayesian generalized additivemodels for location, scale and shape for zero-inflated and overdispersed countdata
2013-11 Thomas Stockl: Price efficiency and trading behavior in limit order marketswith competing insiders forthcoming in Experimental Economics
2013-10 Sebastian Prediger, Bjorn Vollan, Benedikt Herrmann: Resource scar-city, spite and cooperation
2013-09 Andreas Exenberger, Simon Hartmann: How does institutional changecoincide with changes in the quality of life? An exemplary case study
2013-08 E. Glenn Dutcher, Loukas Balafoutas, Florian Lindner, Dmitry Ryv-kin, Matthias Sutter: Strive to be first or avoid being last: An experimenton relative performance incentives.
2013-07 Daniela Glatzle-Rutzler, Matthias Sutter, Achim Zeileis: No myopicloss aversion in adolescents? An experimental note
2013-06 Conrad Kobel, Engelbert Theurl: Hospital specialisation within a DRG-Framework: The Austrian case
2013-05 Martin Halla, Mario Lackner, Johann Scharler: Does the welfare statedestroy the family? Evidence from OECD member countries
2013-04 Thomas Stockl, Jurgen Huber, Michael Kirchler, Florian Lindner:Hot hand belief and gambler’s fallacy in teams: Evidence from investmentexperiments
2013-03 Wolfgang Luhan, Johann Scharler: Monetary policy, inflation illusion andthe Taylor principle: An experimental study
2013-02 Esther Blanco, Maria Claudia Lopez, James M. Walker: Tensions bet-ween the resource damage and the private benefits of appropriation in thecommons
2013-01 Jakob W. Messner, Achim Zeileis, Jochen Broecker, Georg J. Mayr:Improved probabilistic wind power forecasts with an inverse power curve trans-formation and censored regression
University of Innsbruck
Working Papers in Economics and Statistics
2014-04
Alice Sanwald, Engelbert Theurl
What drives out-of pocket health expenditures of private households? - Empiricalevidence from the Austrian household budget survey
AbstractOut-of-pocket health expenditures (OOPHE) are a substantial source of health carefinancing even in health care systems with an established role of prepaid financing.The empirical analysis of OOPHE is challenging, because they are fixed in an inter-action with other sources of health care financing. We analyze to what extent a set ofsocio-economic and socio-demographic covariates of private households in influencesthe OOPHE-patterns in Austria. Our empirical research strategy is guided by theapproach Propper (2000) used to study the demand for private health care in theNHS. We use cross-sectional information provided by the Austrian household bud-get survey 2009/10. We apply a Two-Part Model (Logit/OLS with log-transformeddependent variable or Logit/GLM). We present results for total OOPHE and forselected OOPHE-subcategories. Overall, we find mixed results for the different ex-penditure categories and for the two decision stages. Probability and level of OOPHEincrease with the household size and the level of education, while household incomeshows mixed results on both stages. Private health insurance and OOPHE seemto be complements, at least for total OOPHE and for OOPHE for physician ser-vices, while this relationship is insignificant for pharmaceuticals. Different forms ofpublic insurance have an effect on the total OOPHE-level, for physician servicesand pharmaceuticals on both stages. To some extent the participation decision isinfluenced in a different way compared to the intensity decision. This is especiallytrue for age, sex, household structure and the status of retirement. It turns out, thatthe explanatory power of the used variables is low for OOPHE for pharmaceuticals.A splitting up of pharmaceuticals into prescription fees and direct payments givesbetter insights into the determinants. We conclude: It is necessary to investigatesubcategories of OOPHE. It also turns out, that systematic covariates explain onlya very small part of the variation in the OOPHE-patterns. Finally, we also concludethat information on OOPHE from general household budget surveys are of limitedvalue when studying the determinants.
ISSN 1993-4378 (Print)ISSN 1993-6885 (Online)