control without deception - econstor
TRANSCRIPT

econstorMake Your Publications Visible.
A Service of
zbwLeibniz-InformationszentrumWirtschaftLeibniz Information Centrefor Economics
Bardsley, Nicholas
Working Paper
Control without Deception
Tinbergen Institute Discussion Paper, No. 00-107/1
Provided in Cooperation with:Tinbergen Institute, Amsterdam and Rotterdam
Suggested Citation: Bardsley, Nicholas (2000) : Control without Deception, Tinbergen InstituteDiscussion Paper, No. 00-107/1, Tinbergen Institute, Amsterdam and Rotterdam
This Version is available at:http://hdl.handle.net/10419/85743
Standard-Nutzungsbedingungen:
Die Dokumente auf EconStor dürfen zu eigenen wissenschaftlichenZwecken und zum Privatgebrauch gespeichert und kopiert werden.
Sie dürfen die Dokumente nicht für öffentliche oder kommerzielleZwecke vervielfältigen, öffentlich ausstellen, öffentlich zugänglichmachen, vertreiben oder anderweitig nutzen.
Sofern die Verfasser die Dokumente unter Open-Content-Lizenzen(insbesondere CC-Lizenzen) zur Verfügung gestellt haben sollten,gelten abweichend von diesen Nutzungsbedingungen die in der dortgenannten Lizenz gewährten Nutzungsrechte.
Terms of use:
Documents in EconStor may be saved and copied for yourpersonal and scholarly purposes.
You are not to copy documents for public or commercialpurposes, to exhibit the documents publicly, to make thempublicly available on the internet, or to distribute or otherwiseuse the documents in public.
If the documents have been made available under an OpenContent Licence (especially Creative Commons Licences), youmay exercise further usage rights as specified in the indicatedlicence.
www.econstor.eu
TI 2000-107/1 Tinbergen Institute Discussion Paper
CControl without Deception:ontrol without Deception:
Individual Behaviour in FreeIndividual Behaviour in Free--Riding Riding
Experiments RevisitedExperiments Revisited
Nicholas Bardsley
Tinbergen Institute The Tinbergen Institute is the institute for economic research of the Erasmus Universiteit Rotterdam, Universiteit van Amsterdam and Vrije Universiteit Amsterdam. Tinbergen Institute Amsterdam Keizersgracht 482 1017 EG Amsterdam The Netherlands Tel.: +31.(0)20.5513500 Fax: +31.(0)20.5513555 Tinbergen Institute Rotterdam Burg. Oudlaan 50 3062 PA Rotterdam The Netherlands Tel.: +31.(0)10.4088900 Fax: +31.(0)10.4089031 Most TI discussion papers can be downloaded at http://www.tinbergen.nl

Control Without Deception: Individual Behaviour in Free-Riding
Experiments Revisited
by Nicholas Bardsley
CREED
Faculty of Economics and Econometrics
Universiteit van Amsterdam
Roeterstraat 11
1018 WB Amsterdam
The Netherlands
August 2000 Version
Acknowledgements: I would like to acknowledge useful criticism of earlier versions of this paper from
Robert Sugden, Chris Starmer, Rachel Croson, Jens Grosser and two anonymous referees, plus some
advice concerning statistics from Peter Moffatt. Any remaining errors are entirely my own responsibility.

1
This paper incorporates material from two chapters of my dissertation submitted to the University of East
Anglia.
2
Control Without Deception: Individual Behaviour in Free-
Riding Experiments Revisited
Abstract Lying to participants offers an experimenter the enticing prospect of making “others’ behaviour” a controlled variable, but is eschewed by experimental economists because it may pollute the pool of subjects. This paper proposes and implements a new experimental design, the Conditional Information Lottery, which offers all the benefits of deception without actually deceiving anyone. The design should be suitable for most economics experiments, and works by a modification of an already standard device, the Random Lottery incentive system. The deceptive scenarios of designs which use deceit are replaced with fictitious scenarios, each of which, from a subject’s viewpoint, has a chance of being true. The design is implemented in a public good experiment prompted by Weimann’s (1994) result, from a deceptive design, that subjects are more sensitive to free-riding than cooperation on the part of others. The experiment provides similar results to Weimann’s, in that subjects are at least as cooperative when uninformed about others’ behaviour as they are if reacting to high contributions. No deception is used and the data cohere well both internally and with other public goods experiments. In addition, simultaneous play is found to be more efficient than sequential play, and subjects contribute less at the end of a sequence than at the start. The results suggest pronounced elements of overconfidence, egoism and (biased) reciprocity in behaviour, which may explain decay in contributions in repeated play designs. The experiment shows there is a workable alternative to deception. Keywords: experimental economics, deception, reciprocity, public goods JEL Classification: C9, C92, H41 1. Introduction: the problem of deception
Deception enables precise manipulation of key aspects of the laboratory environment. For this reason,
deceptive designs are common in experimental psychology. They allow one, for example, to control
“behaviour of others” in interactive settings of great importance to economics. Deception only can work,
however, if participants trust the experimenter - despite the dissemination of deceptive experiments through
academic journals. Often subjects are students and so relatively likely to be aware of this material.
Economists typically worry that trust may deteriorate, and if so control will be lost since the intended
environment will be usurped by subjects’ second guesses. A general scepticism amongst participants, it is
argued, would render controlled experiments impossible. Honesty is therefore a methodological public
good for experimenters and deception is proscribed in experimental economics (Ledyard (1995 pp 134),
Davis and Holt (1992 pp 23-24) and Hey (1991, pp 21)).1

3
The debate over deception can be seen in terms of a dispute over the correct cost-benefit analysis, for a
good overview of which see the recent exchange between Bonetti (1998a and b), Starmer and McDaniel
(1998) and Hey (1998). In addition, there may well be valid ethical concerns about dishonesty in
experiments. This paper does not explore these arguments,2 but proposes instead a design which should
appeal to participants on both sides. For proponents of deception ought to agree there is at least a potential
cost and opponents should agree that a method of controlling, say, others’ behaviour, would be a very
useful device. The design proposed below shows how the benefits of deception can be reaped without
risking the costs.
2. A solution
Economists routinely use a device which with one modification would enable the control sought by those
who deceive, without any deception. In parametric (non-interactive) experiments with many tasks
motivated by monetary rewards, it is a standard technique for only one task, randomly selected, to be paid
out: the Random Lottery (RL) design. This cuts costs and allows designs with multiple tasks for each
subject. (These enable within-subject comparisons, which are otherwise problematic because of possible
wealth effects (that is, a subject’s changing wealth influencing his choices as the experiment progresses) and
portfolio effects (that is, a subject’s desire for a specific stock of assets)).
Subjects in an RL know in advance that the actual task is to be selected at random from the full set of
tasks; all but one turn out to be hypothetical, but they do not know which one ex ante. They might be
asked, for example, to choose between gambles of £10 with certainty and £110 with probability 1/10 in a
task which, in the event, is not paid out. The modification proposed is to make the random lottery a
subjectively random lottery, in which the one true task is camouflaged amongst controlled dummy
tasks. These are not paid out and may comprise “information” about others’ actions. Subjects are
told that all but one tasks are fictional, that any information in the fictional tasks is an artefact of the
experiment, and that behaviour in these has no effects whatsoever. The other task will be entirely real, and
this determines the outcome, but they will not know which it is ex-ante.
The only differences from an RL lie in the content of the task information, which may now encompass any
relevant non-monetary factors, such as others’ behaviour, and the fact that the experimenter knows in
4
advance which tasks are fictional. Otherwise the modification is just a special case of an RL; an RL could
even be set up with the experimenter’s, but not the subjects’, prior knowledge of the true task: from the
subjects’ point of view, each task could be the real one. Call the modified design the Conditional
Information Lottery (CIL); conditional on the task’s being the true one, all the task information is true.
3. The validity of CIL
i) a priori
The point of the design is to see how subjects behave in situations which are impractical to set up for real.
Call the supposition that subjects treat each task as if it is real and the only task, the isolation hypothesis
(following Cubitt et al. (1998a)). Standard rational choice theory implies that such behaviour is rationally
required. In addition, there is a body of evidence which supports the hypothesis as a description of
behaviour in experiments. The rationality argument carries strong normative appeal and might therefore be
presented to subjects to encourage them to treat each task as if it is real. It should also appeal to
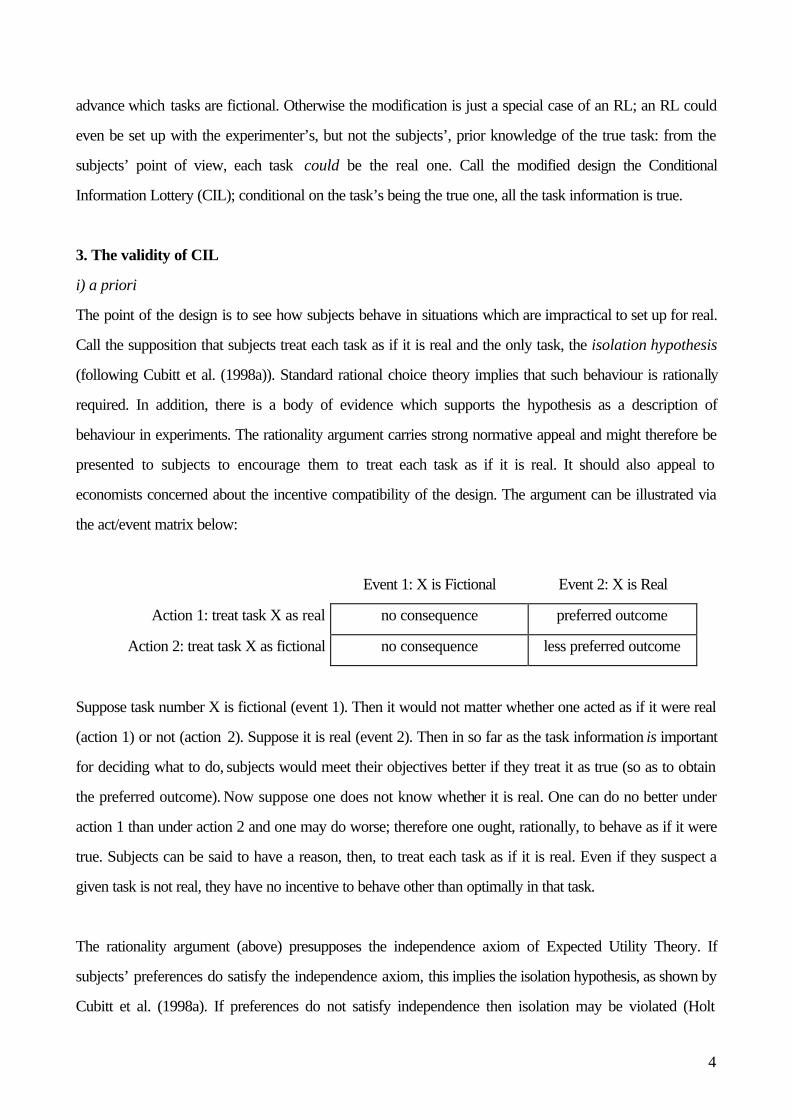
economists concerned about the incentive compatibility of the design. The argument can be illustrated via
the act/event matrix below:
Event 1: X is Fictional Event 2: X is Real
Action 1: treat task X as real no consequence preferred outcome
Action 2: treat task X as fictional no consequence less preferred outcome
Suppose task number X is fictional (event 1). Then it would not matter whether one acted as if it were real
(action 1) or not (action 2). Suppose it is real (event 2). Then in so far as the task information is important
for deciding what to do, subjects would meet their objectives better if they treat it as true (so as to obtain
the preferred outcome). Now suppose one does not know whether it is real. One can do no better under
action 1 than under action 2 and one may do worse; therefore one ought, rationally, to behave as if it were
true. Subjects can be said to have a reason, then, to treat each task as if it is real. Even if they suspect a
given task is not real, they have no incentive to behave other than optimally in that task.
The rationality argument (above) presupposes the independence axiom of Expected Utility Theory. If
subjects’ preferences do satisfy the independence axiom, this implies the isolation hypothesis, as shown by
Cubitt et al. (1998a). If preferences do not satisfy independence then isolation may be violated (Holt
5
(1986) - see below for an example of the problem). The mainline view amongst economists, however, is
that independence is, nonetheless, an axiom of rational choice (Savage (1954 chapters 3 and 5), and
Binmore (1992 p117), state views typical of orthodox economists); if preferences do not satisfy the axiom,
the agents, not utility theory, are judged to be at fault. In other words, the view that behaviour in
accordance with the isolation hypothesis is rationally required is not threatened by observed failures of
independence, because it is essentially normative.
ii) empirical
The claim that the isolation hypothesis holds in fact is more problematic, but it is necessary (and sufficient)
for the general validity of CIL. To see the problem, we shall consider a subjects’ preferences in two choice
problems. Let the notation {J: (...), K: (...)} denote a choice between prospects J and K, and f the
preference relation. The choice tasks are:
{J: (x, p; 0, 1-p), K: (y, q; 0, 1-q)} and
{M: (x, λp; 0, 1-λp), N: (y, λq; 0, 1- λq)},
where p and q lie in the range [0,1], 0 < λ < 1, p > q and y f x. Independence implies J f K if and only
if M f N, because {M, N} is equivalent to a λ chance of {J, K} and a 1-λ chance of nothing, whilst
subjects often prefer J and N (the “common ratio” effect).
In an RL with ten tasks, the choice presented as “{J, K}” is an instance of {M, N} (λ = 0.1) if the other
nine “offer” nothing, with certainty. Holt’s conjecture is that if preferences have the structure that produces
the common ratio effect, then the isolation hypothesis will be violated, undermining the validity of the RL
design: the RL “{J, K}” will elicit preferences over {M, N}.
Although independence violations are frequent in some contexts, there is evidence that they are unlikely to
undermine the validity of the RL. Cubitt et al. (1998a, 1998b), Starmer and Sugden (1991), Wilcox
(1993) and Beattie and Loomes (1997) all attempt to find differences in behaviour between RL gambles
and single choice gambles. The only such differences occurred with RL tasks involving composite gambles
- gambles which are chances of chances of prizes (Wilcox (1993) and Beattie and Loomes (1997)). For
RL tasks with choices over simple gambles (chances of prizes), no such differences were found even when
the tasks were formulated to elicit such differences via Allais’ (1953) independence violations (Cubitt et al.
(1998a)). The RL has not thus far, then, been undermined by failures of independence.

6
In short, the CIL is as valid a priori as the RL and the RL has been reasonably robust to testing. An
explanation of why the isolation hypothesis holds in these cases appears in Kahneman and Tversky (1979).
They posit a simplifying editing operation in decision making whereby subjects delete from multi-stage
lotteries any stage the lotteries have in common. All tasks in an RL or CIL have a common first stage - the
lottery determining the task to be chosen - so this editing operation implies the isolation hypothesis.
4. Comparison with the strategy method
It might be thought that CIL is equivalent to the “strategy method”. The strategy method involves subjects’
specifying a strategy, before a game is played, which can be implemented at any point in the game tree.
Behaviour in the game is then computed from the assembled strategies, determining payoffs. Clearly CIL
and the strategy method have important elements in common - they both involve subjects making decisions
about possible situations. Both methods are suited practically to the study of both sequential games and
repeated games, since the experimenter can use them to chart behaviour over any branches of the game
tree, whereas to investigate specific branches using normal methods would take time, resources and luck.
Also, both methods have the advantage of generating much more data than designs using only actual
choices.
There are also important differences, however. Where the strategy space is large, as in, say, repeated play
Voluntary Contribution Mechanism (VCM) public goods experiments, specification of an action for each
and every possible combination of previous actions is much too onerous a task to be workable. Also, the
strategy method involves subjects specifying a complete strategy before the game is played. Roth (1995
p322) notes that this implies an obvious disadvantage of the strategy method: it removes any possibility of
observing effects of the timing of decisions; subjects have to specify behaviour in advance, rather than
having reached a specific node of the game. This is not a feature of CIL, where subjects are presented with
specific situations which they have to react to, though any given situation may turn out to be fictional. CIL is
thus closer in structure to actual choice experiments than the strategy method. Because of these differences,
it would be more accurate to say that CIL is a hybrid of random lottery and strategy methods.
A potential problem of both strategy and CIL methods, discussed by Brandts and Charness (1998), is that
they might filter out the impact of emotions and irrational behaviours, because of the hypothetical aspect of
7
the tasks.3 If this occurs, it can be seen as a kind of timing effect. (Consider how people might respond to
being insulted at a cocktail party compared with what they might say if one asked them how they would
respond. Or think how an alcoholic might behave after taking one drink, and the actions they would like to
commit to if they could.) Despite the frequent use of the strategy method, the question of its validity in this
respect appears not to have received much attention.
Examples using the strategy method include Camerer and Knez (1995) and Mitzkewitz and Nagel (1993).
These (incomplete information) ultimatum game experiments return results which are qualitatively similar to
actual choice designs, showing, for example, rejections of obviously inequitable offers, and a greater desire
of proposers to seem rather than to be fair (see Güth et al.(1996) for an actual choice example with similar
results and Roth (1995) for an overview). It does not seem possible to say much more about the
consistency of behaviour in strategy method and actual choice designs at present, because the experiments
employ design-specific manipulations. Brandts and Charness (1998) compare the results of 2-person
prisoners’ dilemma and Chicken games with the strategy method and the normal method (where subjects
only respond to an observed real choice), but find no significant difference in response frequencies between
the conditions.
Even if there were such evidence attributable to emotions, however, CIL could plausibly constitute a half-
way house between the “cool” environment of the strategy method and the “hot” environment of actual
choice designs. In CIL, subjects do not concoct a strategy prior to play; they face specific situations in
series and just have to react to each as it arises.
An application to which CIL may be more suited than the strategy method is the study of learning, since to
study learning using the strategy method requires allowing subjects to repeatedly modify complete strategy
statements. This could produce learning artificially as a result of inducing subjects repeatedly to plan their
behaviour in each possible scenario. This might lead them to specify consistent behaviours, for example.
Whereas all they have to do in CIL is to act in specific situations. Allowing learning to occur is important
because theorists commonly argue that predictions of economic models apply only to environments in
which subjects can learn and adapt their behaviour (see Binmore (1992) for example). The usual method
for allowing learning to take place in games, a repeated play design, undermines statistical independence of
observations across subjects through interaction. This is a problem, for example, in most public goods
8
experiments; if subjects’ behaviour at a given point is affected by play in previous rounds (as it will be if,
say, expectations are adaptive and / or subjects reciprocate past behaviour), then there is really only one
independent observation of behaviour per interacting group.
One way around this is to implement a CIL consisting of several one-shot sequential game tasks, in which
subjects only see real decisions or outcomes once. This technique is tried out in the experiment reported
below. Using sequential games, one can create and give (conditional) information about the behaviour of
(some or all) others. One can then chart learning in an interactive environment without actual interaction
eroding statistical independence.4
The comparison with the strategy method revealed that emotional behaviour is potentially problematic for
the design proposed here. An additional problem potentially with CIL is a risk of “low motivation
reasoning”; if subjects perceive there is a high probability that any given task is false, they might not bother
to make the effort involved in deciding on a desirable action. So, for the isolation hypothesis to hold, we
need to assume both that emotions affect behaviour equally in CIL and in actual choice task designs, and
that motivation in decision making is not significantly diluted by multiple tasks. However, note that neither
the “unemotional” nor “unmotivated” hypothesis about potential CIL bias is really testable yet, since to run
a strong test we need to know what behaviour would look like if it were either relatively unemotional or
unmotivated. In comparison, it was possible to investigate the validity of the RL design rigorously only
relatively recently, after RL had already become standard practice, thanks to the specific hypothesis
devised by Holt (1986) about potential RL bias (discussed above).
5. Cautionary notes
From what is known about the strategy method, it does not seem that there is already evidence which
counts against CIL. The aim of this paper is to show that the design is workable by reporting on an attempt
to use it, for a VCM public good experiment. It will also be possible, to some extent, to assess the
plausibility of the results obtained by examining their coherence with existing data from other public goods
experiments.5 There are some potential practical pitfalls, though, which experimenters attracted to the
design should bear in mind.
9
First, it is important (to improve on deception) that subjects do not leave the experiment feeling deceived;
everything should be as open and above board as possible. Ideally experimenters should ensure that
subjects are able to verify that the task determining payoffs is entirely real, and that the true task was not in
fact determined ex-post on the basis of cost minimisation. If “others’ behaviour” is being controlled, it must
be emphasised that the experimenter has set up a series of fictitious scenarios for this purpose, in which
“others’ behaviour” will be shown which is in fact made up. Secondly, since such emphasis may create a
desire to spot the true task, care should be taken to camouflage this task. In particular, subjects ought not
to be able to observe each other making choices. Thirdly, there is a danger the procedure will be
misunderstood. Further reflections on these pitfalls are incorporated into the report below. Fourthly, tasks
involving compound gambles should be avoided, given the evidence cited above concerning the validity of
the RL.
6. Individual behaviour in free-riding experiments revisited
Weimann’s (1994) design, from which this paper takes its title, is cited by Bonetti (1998a) and Starmer
and McDaniel (1998) as an example of good and bad practice, respectively. In that experiment, public
good games were used to explore the behaviour of individual contributors. Participants had to divide an
endowment (given in each round of a repeated game) between a public and a private good, both simulated
by monetary payoffs. In some conditions deception was used: each subject in a group was given false
reports of the others’ contributions to the public good in the previous round, before being asked to make
their own contribution in the current one. In the low contributions condition, each subject was told, falsely,
that the others had contributed 15.75% of the endowment on average, and in the high condition 89.75%
(Weimann (1994) p189), thus, a very high amount by the standards of other public goods experiments
(Ledyard (1995)). It was observed that behaviour was significantly different from the honest baseline only
in the low contributions condition. Subjects apparently reacted to reported uncooperative behaviour by
others by non-contribution, but were unresponsive when highly cooperative behaviour was depicted,
returning similar contributions to those in normal play.
If robust, it this an interesting finding because it is surprising from the point of view of rationalistic theories of
cooperation, such as Sugden’s (1984) or Fehr and Schmidt’s (1999) theories, in which the more
cooperation is expected from others the more reason there is for an individual to contribute. It is not known
if the result is robust, though, because of the ban on deception.
10
One reason for being sceptical about the finding is that the mechanism deployed in Weimann’s design
involved an unnatural contribution procedure whereby subjects were placed in different rooms and
communicated with the experimenter by telephone. This could have undermined subjects’ confidence in the
information they received, particularly when subjects were told that the other members of their group had
contributed around 90% of their endowment, an unusually high amount by the standards of what normally
happens in VCM designs (see Ledyard (1995)). For one natural reason for separating subjects and
avoiding talking to them face-to-face is precisely to facilitate misinformation. There was no systematic
check of the effect of subjects’ isolation on the confidence they had in their information.6
Weimann’s experiment motivates the following hypothesis to be explored here using CIL: subjects playing
a one-shot public good game simultaneously, so with no information about others’ contributions, will not
give a different amount to the public good account than if playing sequentially, informed that the others in
their group have made very high contributions. Whilst they will give less under sequential play informed that
the others have made very low contributions, than under simultaneous play. Call this the reciprocity
hypothesis.7 It may be thought of in terms of reciprocity having a flattening functional form as others’
contributions increase. This is one interpretation of Weimann’s “asymmetry” notion.8 Intuitively, though,
subjects should give the most in the high contributions condition, whilst Shafir and Tversky (1992)9 suggests
that simultaneous play will be most productive of the public good. Below I report on an implementation of
CIL, designed to test the reciprocity hypothesis. It compares tasks with controlled information about
others’ behaviour (that is, sequential-play public good games) and tasks with no such information
(simultaneous-play games), but without using deception.
7. The experiment
The experiment was conducted in the experimental economics laboratory at the University of East Anglia
(UEA), Norwich, UK, in March 1999. Subjects were all UEA students, recruited via university-wide
email, from a variety of schools and courses. They played in groups of seven, with two groups running
concurrently per session. There were 7 sessions, two groups of seven per session and so 98 subjects in
total. Participants were linked to the other members of their group by personal computers.
11
Subjects faced a public good decision task thirty times. That is, they had to specify how they would use an
endowment of ten tokens, awarded once at the start of the experiment, in each of thirty tasks. The tokens
could either be kept or donated to an account which generated a payoff for everyone in the group. The
payoff function ensured a game theoretic prediction of zero contributions (see below). The design was an
instance of the multiple one-shot game CIL argued for in section 4. Effectively, subjects performed thirty
one-shot game decision tasks. This is not a contradiction because really only one game was played, and
subjects knew this from the beginning: in one task, but subjects did not know which one ex-ante, others’
actual behaviour would be shown and everyone’s actual behaviour would determine payoffs. Only that task
was paid out. In the other tasks, figures were given representing others’ decisions, which were in fact
creations of the experimenter (they were mostly randomised via the computer program - see below).
Subjects were fully informed that this was the procedure to be followed, so no deception was involved.
The aim of setting the experiment up in this way was to ensure that each task, from a subject’s point of
view, would have a chance of being the real one.
Each subject was initially endowed with 10 tokens, as in Weimann’s design, worth £0.40p each. In each
task, each subject had to decide how to use their endowment by entering the number of tokens to be
contributed to the public good at their keyboard. To ensure anonymity, they were separated by partitions
and seated such that the two groups in each session were mixed together, and in addition, in each task all
group members had to use the keyboard at each stage in the game before the next person could make a
decision. When it was not a subject’s turn to make a decision (in sequential tasks) they had to enter a letter
randomly generated by the program, further disguising who was doing what when. The instructions, which
include an explanation and demonstration of the CIL procedure,10 are included in the appendix, together
with the screen display used.
There were two types of public good task: “sequential” and “simultaneous”. In simultaneous tasks
everyone contributed at the same time, with the dummy contributions shown only after the task was
completed. In sequential tasks, subjects had to make contributions in turn, after viewing the (supposed)
preceding contributions of the others in their group on screen. The true task was sequential. Excepting the
true task, the contributions shown were controlled stimuli. A subject’s own contribution appeared on their
screen only, apart from in the true task when subjects’ real decisions were shown on all screens. Two tasks
with a sequential task structure were constructed so as to approximate the levels of contribution which
12
Weimann used. I shall call these the “focus” (f) tasks. In these, although subjects were shown an emerging
sequence of contributions, all 98 subjects in fact acted in last position. This did not involve deception
because subjects knew ex-ante that, with just one exception, the task information was an artefact of the
experimental design. The focus tasks involve each subject reacting to the supposed contributions of all the
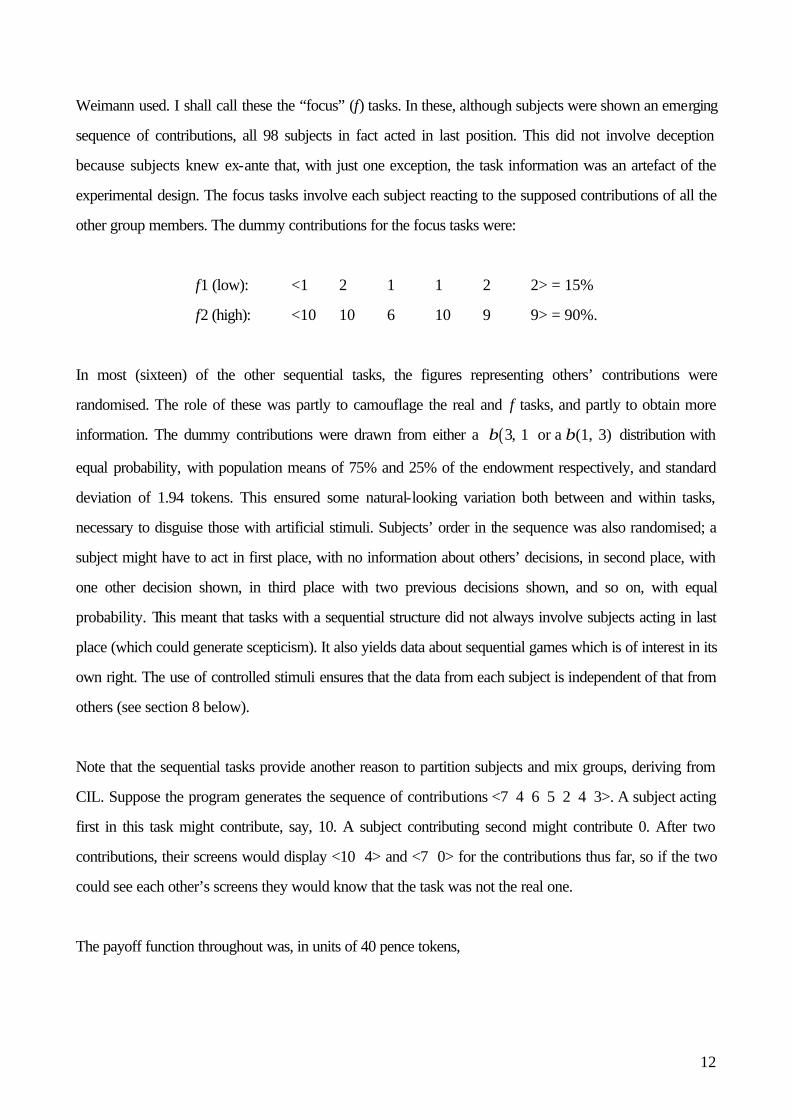
other group members. The dummy contributions for the focus tasks were:
f1 (low): <1 2 1 1 2 2> = 15%.
f2 (high): <10 10 6 10 9 9> = 90%.
In most (sixteen) of the other sequential tasks, the figures representing others’ contributions were
randomised. The role of these was partly to camouflage the real and f tasks, and partly to obtain more
information. The dummy contributions were drawn from either a ( )β β3 1, or a (1, 3) distribution with
equal probability, with population means of 75% and 25% of the endowment respectively, and standard
deviation of 1.94 tokens. This ensured some natural-looking variation both between and within tasks,
necessary to disguise those with artificial stimuli. Subjects’ order in the sequence was also randomised; a
subject might have to act in first place, with no information about others’ decisions, in second place, with
one other decision shown, in third place with two previous decisions shown, and so on, with equal
probability. This meant that tasks with a sequential structure did not always involve subjects acting in last
place (which could generate scepticism). It also yields data about sequential games which is of interest in its
own right. The use of controlled stimuli ensures that the data from each subject is independent of that from
others (see section 8 below).
Note that the sequential tasks provide another reason to partition subjects and mix groups, deriving from
CIL. Suppose the program generates the sequence of contributions <7 4 6 5 2 4 3>. A subject acting
first in this task might contribute, say, 10. A subject contributing second might contribute 0. After two
contributions, their screens would display <10 4> and <7 0> for the contributions thus far, so if the two
could see each other’s screens they would know that the task was not the real one.
The payoff function throughout was, in units of 40 pence tokens,

13
n
wwC
n
hh
ii
∑=+−= 1
210
where Ci is an individual i’s monetary payoff, wi is i’s contribution to the public good and n = 7 is the
number of players in a group. This ensures a unique Nash equilibrium both for the sequential and
simultaneous-play games, which is a vector of zero contributions in both cases.11 However, since each 40p
token contributed generates a group payoff of 80p, the pareto optimum occurs when each agent
contributes maximally. This ensures that subjects face a problem of public good provision. Subjects had a
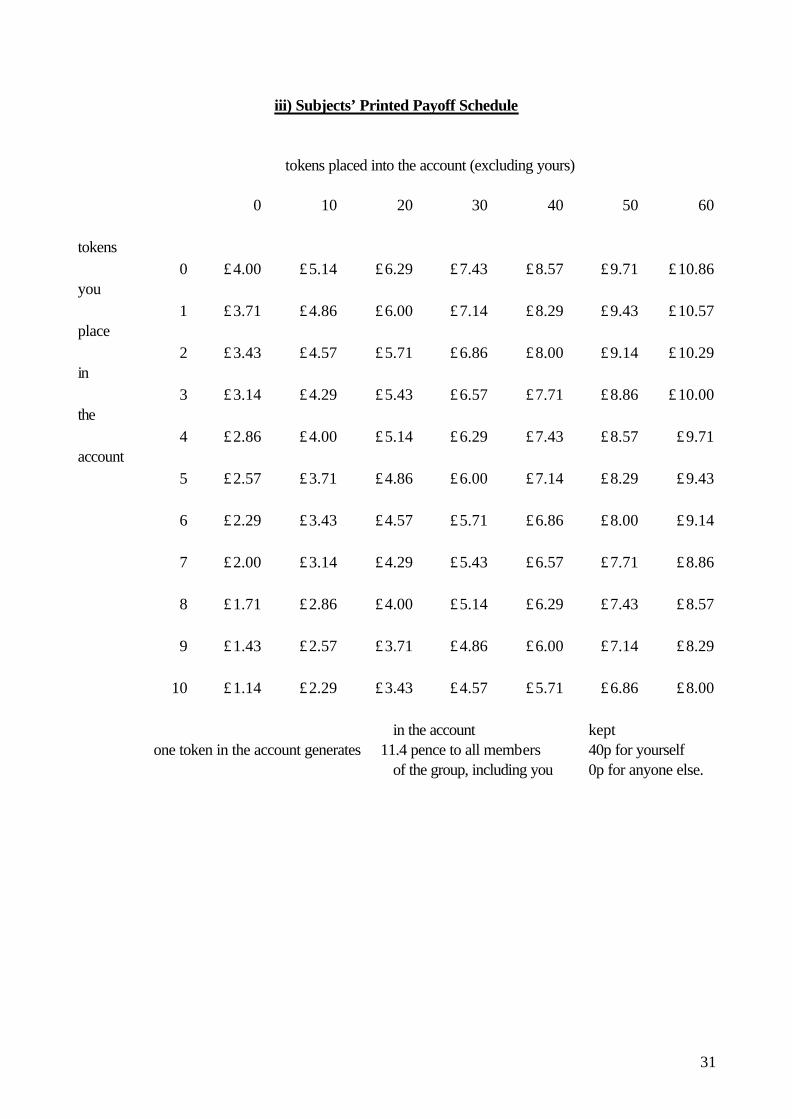
simplified payoff schedule printed out at their desk (see appendix, section iii). The experiments lasted on
average one hour. Subjects could earn up to £10.86 in the experiment and could guarantee themselves a
payoff of at least £4.00 (the endowment) by contributing zero, which was favourably comparable to one
hour’s earnings for casual part-time work (the UK introduced a national minimum wage in April 1999 of
£3.00 per hour for 18-21 year-olds and £3.60 per hour for those over 21).
The composition of tasks is shown below. The order in which any task occurred was randomised across
groups.12 Subjects worked through computerised instructions at their own pace and three practice tasks
before the experiment began. There were eight other tasks with a sequential structure with stimuli designed
to test other conjectures about public goods. I shall not report on these here, since these were designed to
test other hypotheses, but all were sequential tasks using the same payoff function.13 I shall refer to the
observations from the 22 tasks reported here as the data-set.
Type of task Number of tasks
Simultaneous
Real
Focus
Randomised
Other
3
1
2
16
8
Total 30
Table 1: Composition of Tasks
During the course of each task, subjects were informed of the (running) total of supposed contributions, in
addition to each individual contribution. Also, after each task was completed (by every group member)
14
they were told their monetary payoff conditional on its being the real one (see the sample screen in the
appendix, section ii).
It was necessary that subjects could verify that the task according to which they had been paid was, in fact,
the real task, so they could see that no deception was involved. There was a trade-off between the
openness with which this could be done and the usual risk of subsequent social interaction interfering with
the results. If subjects know at the start that decisions are to be revealed in public at the end of the
experiment, this could easily affect their cooperativeness during the tasks. One could simply not tell them
that this is to be the procedure, but one aim of the present experiment was to eliminate anything construable
as deception. This entailed avoiding deliberate under-information.
At the end of the experiment, therefore, each subject was shown (individually) the true task and their own
behaviour in this task, before being paid. (The programming and choice (ex ante) of a sequential game as
the true task ensured a subject’s contribution could be identified by means of the number of the terminal
they had used.) With hindsight, it would have been more transparent if the number of the true task had
either been placed in a sealed envelope before the experiment and taken out at the end, or told to a
randomly-selected, non-participant monitor. It would also have helped to write the program such that
subjects could privately refer back to their decision in that task. This procedure would have made less
demands on subjects’ memory. However, with the actual procedure, any subject who had adopted a
definite strategy, such as contributing at the start of a sequence but not at the end, would have found it easy
to verify their decision.
8. Results
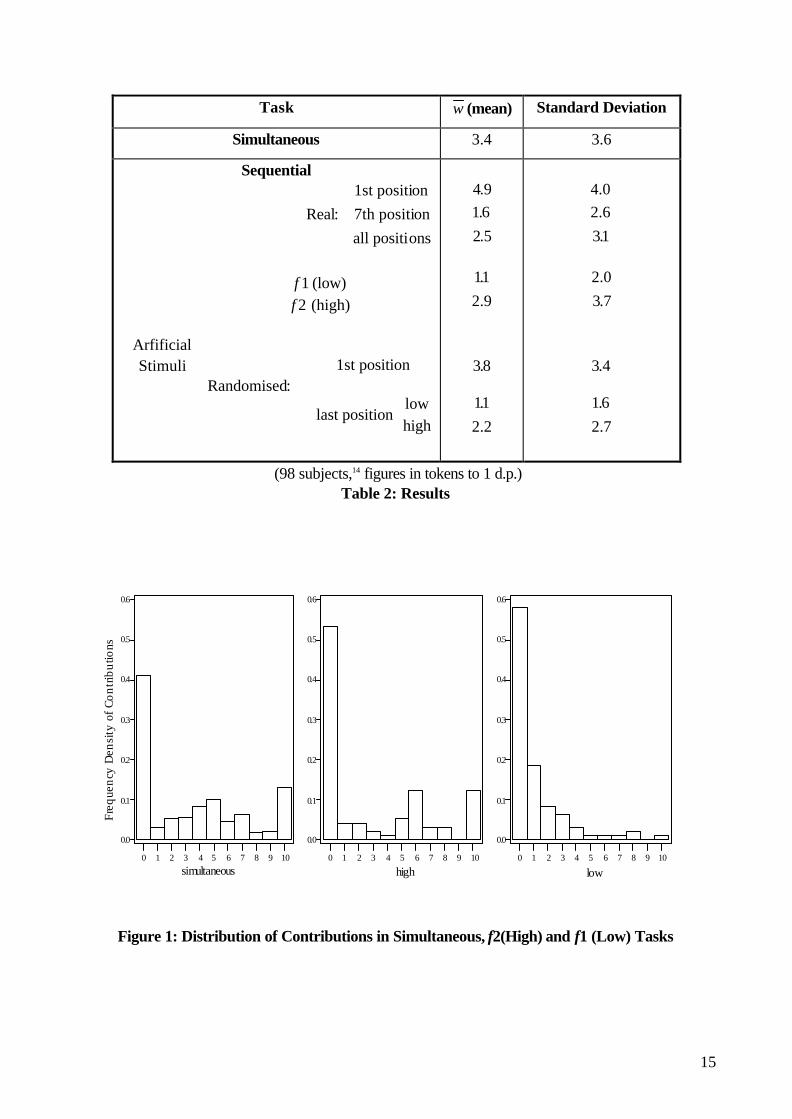
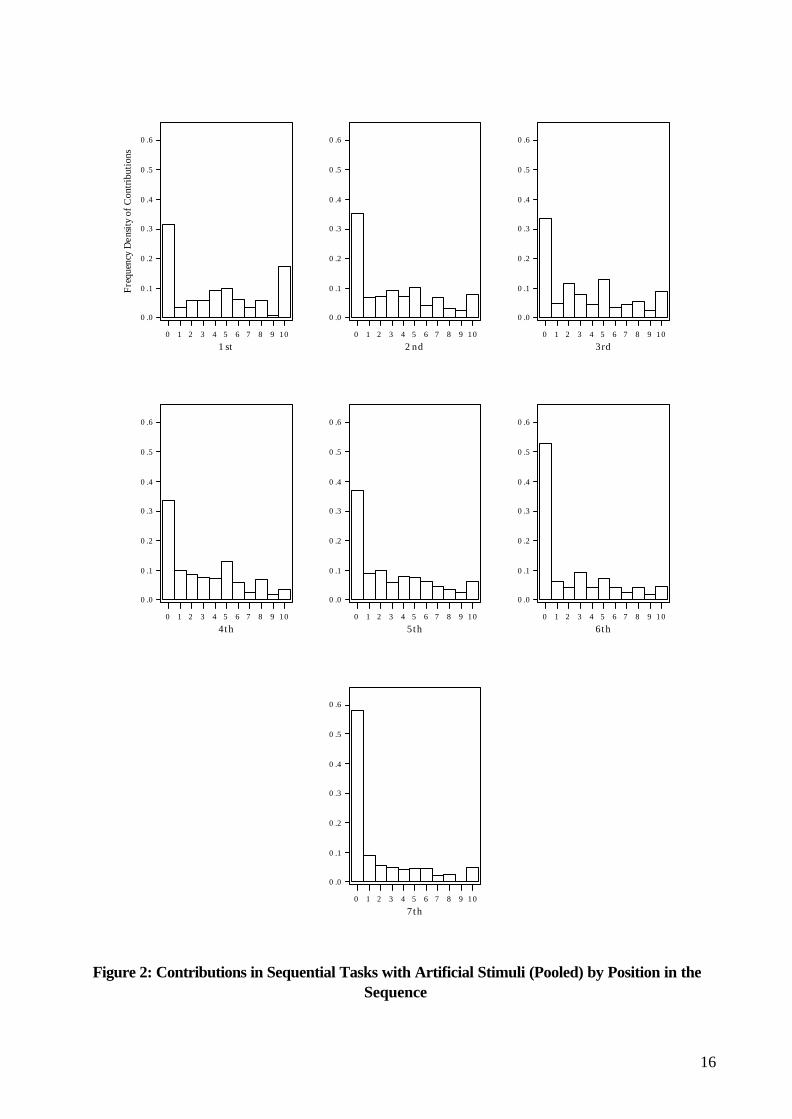
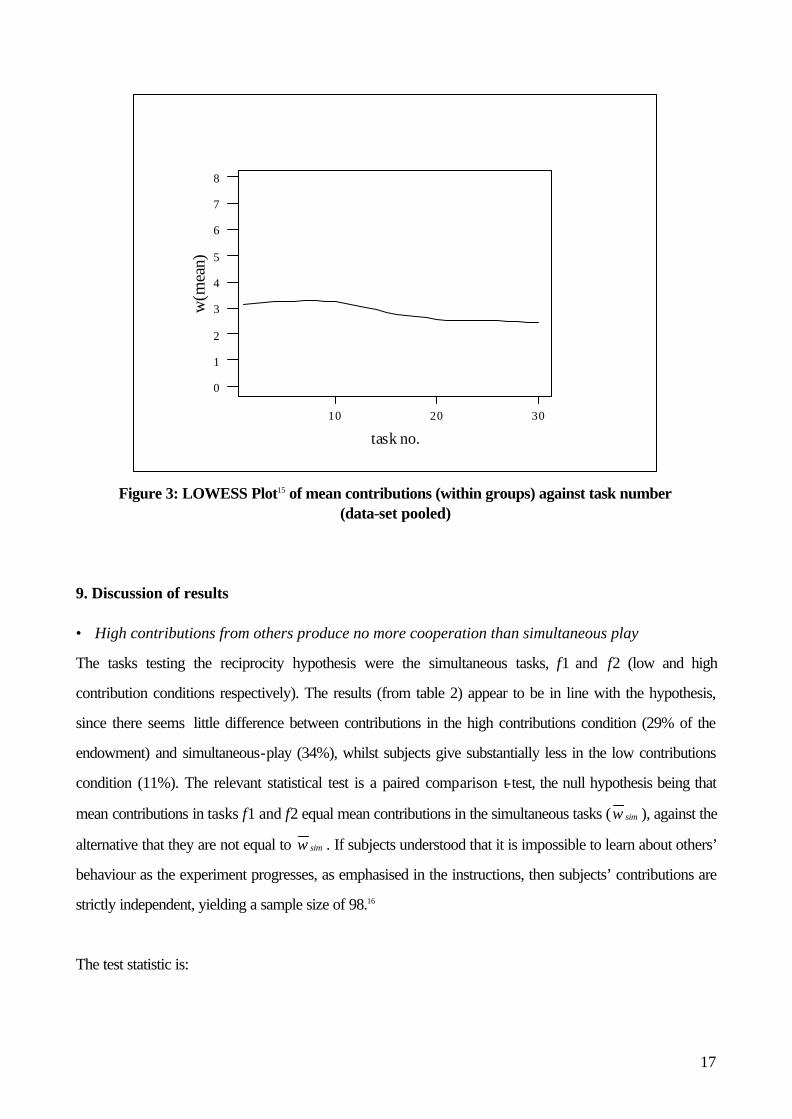
The results of the experiment are summarised in table 2, and graphed in figures 1-3 below. The histograms
of figure 1 show the distribution of subjects’ choices in the tasks testing the reciprocity hypothesis, whilst
those of figure 2 show the distributions of subjects’ decisions for the randomised-stimuli sequential tasks by
order in the sequence. Figure 3 illustrates the relationship between contributions and task number.
15
Table 2: Results
0 1 2 3 4 5 6 7 8 9 10
0.0
0.1
0.2
0.3
0.4
0.5
0.6
simultaneous
Freq
uenc
y D
ensi
ty o
f Con
tribu
tions
0 1 2 3 4 5 6 7 8 9 10
0.0
0.1
0.2
0.3
0.4
0.5
0.6
high0 1 2 3 4 5 6 7 8 9 10
0.0
0.1
0.2
0.3
0.4
0.5
0.6
low
Den
sity
Figure 1: Distribution of Contributions in Simultaneous, f2(High) and f1 (Low) Tasks
Task w (mean) Standard Deviation
Simultaneous 3.4 3.6
Sequential
Real
1st position
7th position
all positions
:
ArfificialStimuli
(low) (high)
Randomised:1st position
last positionlowhigh
ff
12
4 916
2 5
..
.
11
2 9
38
11
2 2
.
.
.
.
.
4 02 6
31
.
.
.
2 0
3 7
3
16
2 7
.
.
.4
.
.
(98 subjects,14 figures in tokens to 1 d.p.)
16
109876543210
0 .6
0 .5
0 .4
0 .3
0 .2
0 .1
0 .0
1 st
Fre
quen
cy D
ensi
ty o
f C
ontr
ibut
ions
109876543210
0 .6
0 .5
0 .4
0 .3
0 .2
0 .1
0 .0
2 nd0 1 2 3 4 5 6 7 8 9 10
0 .0
0 .1
0 .2
0 .3
0 .4
0 .5
0 .6
3rd
0 1 2 3 4 5 6 7 8 9 10
0 .0
0 .1
0 .2
0 .3
0 .4
0 .5
0 .6
4th0 1 2 3 4 5 6 7 8 9 10
0 .0
0 .1
0 .2
0 .3
0 .4
0 .5
0 .6
5th0 1 2 3 4 5 6 7 8 9 10
0 .0
0 .1
0 .2
0 .3
0 .4
0 .5
0 .6
6th
0 1 2 3 4 5 6 7 8 9 10
0 .0
0 .1
0 .2
0 .3
0 .4
0 .5
0 .6
7th
Figure 2: Contributions in Sequential Tasks with Artificial Stimuli (Pooled) by Position in the Sequence
17
9. Discussion of results • High contributions from others produce no more cooperation than simultaneous play
The tasks testing the reciprocity hypothesis were the simultaneous tasks, f1 and f2 (low and high
contribution conditions respectively). The results (from table 2) appear to be in line with the hypothesis,
since there seems little difference between contributions in the high contributions condition (29% of the
endowment) and simultaneous-play (34%), whilst subjects give substantially less in the low contributions
condition (11%). The relevant statistical test is a paired comparison t-test, the null hypothesis being that
mean contributions in tasks f1 and f2 equal mean contributions in the simultaneous tasks (w sim ), against the
alternative that they are not equal to w sim . If subjects understood that it is impossible to learn about others’
behaviour as the experiment progresses, as emphasised in the instructions, then subjects’ contributions are
strictly independent, yielding a sample size of 98.16
The test statistic is:
10 20 30
0
1
2
3
4
5
6
7
8
task no.
w(m
ean)
Figure 3: LOWESS Plot15 of mean contributions (within groups) against task number (data-set pooled)
18
( )
+
−∑=
22
1
31
1
fsim
n
i
if
isim
SS
n
wwn =
+
−
22
31
fsim
fsim
SS
n
ww~ t(96) under H0: fsim ww =
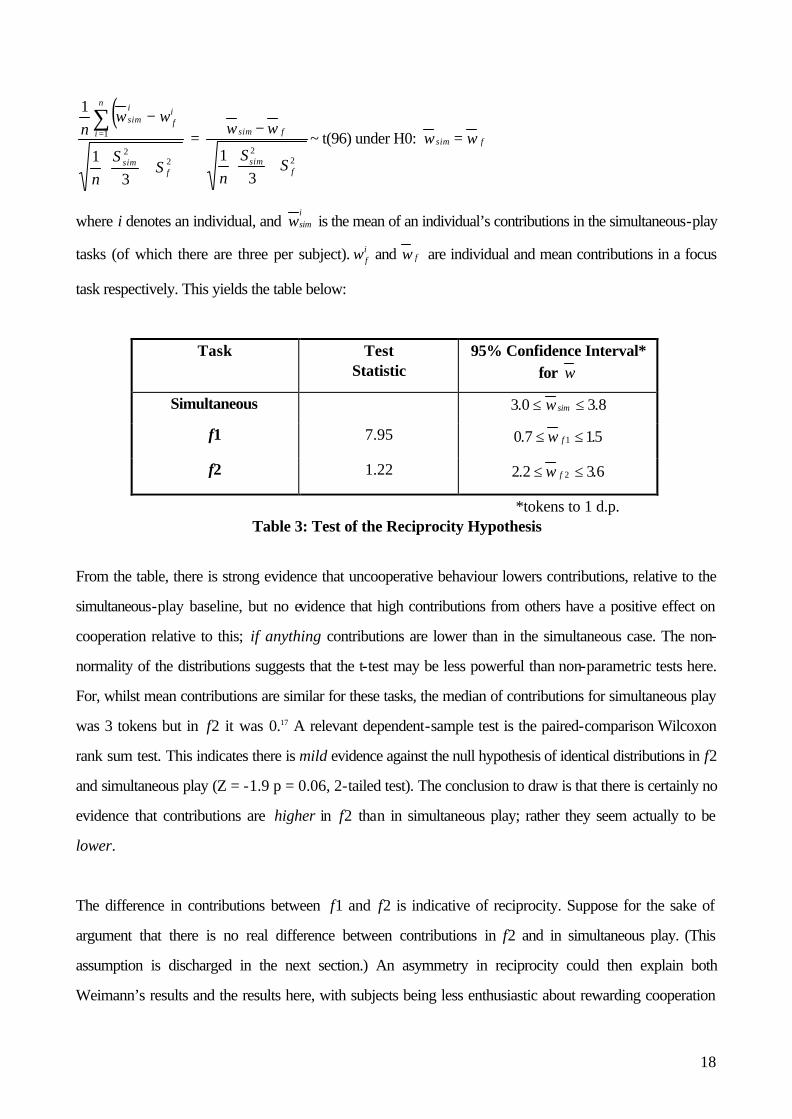
where i denotes an individual, and wsimi
is the mean of an individual’s contributions in the simultaneous-play
tasks (of which there are three per subject). fif ww and are individual and mean contributions in a focus
task respectively. This yields the table below:
From the table, there is strong evidence that uncooperative behaviour lowers contributions, relative to the
simultaneous-play baseline, but no evidence that high contributions from others have a positive effect on
cooperation relative to this; if anything contributions are lower than in the simultaneous case. The non-
normality of the distributions suggests that the t-test may be less powerful than non-parametric tests here.
For, whilst mean contributions are similar for these tasks, the median of contributions for simultaneous play
was 3 tokens but in f2 it was 0.17 A relevant dependent-sample test is the paired-comparison Wilcoxon
rank sum test. This indicates there is mild evidence against the null hypothesis of identical distributions in f2
and simultaneous play (Z = -1.9 p = 0.06, 2-tailed test). The conclusion to draw is that there is certainly no
evidence that contributions are higher in f2 than in simultaneous play; rather they seem actually to be
lower.
The difference in contributions between f1 and f2 is indicative of reciprocity. Suppose for the sake of
argument that there is no real difference between contributions in f2 and in simultaneous play. (This
assumption is discharged in the next section.) An asymmetry in reciprocity could then explain both
Weimann’s results and the results here, with subjects being less enthusiastic about rewarding cooperation
Task Test Statistic
95% Confidence Interval* for w
Simultaneous 3 0 3 8. .≤ ≤w sim
f1 7.95 0 7 151. .≤ ≤w f
f2 1.22 2 2 362. .≤ ≤w f
*tokens to 1 d.p. Table 3: Test of the Reciprocity Hypothesis

19
(positive reciprocity) than punishing free-riding (negative reciprocity), perhaps combined with
overconfidence in simultaneous play.
There is some independent evidence favouring this interpretation, and the hypothesis could also explain
other aspects of the data discussed below. Regarding the evidence, over-confidence in others’
contributions has been noted in other public good games by Offerman (1996). The power of negative
reciprocity is evidenced in a public good context in Fehr and Gächter (1996), in which subjects displayed
considerable enthusiasm for punishing free-riders despite thereby incurring a cost to themselves. For
evidence of an asymmetry between positive and negative reciprocity see Offerman (1999), where it is
regarded as an effect of a self-serving bias,18 or Cox (2000). One could think of the asymmetry in the
present context as a kind of “ceiling” on aggregate positive reciprocity. Such a picture is suggested by the
frequency distribution of contributions in f2 (see figure 1), where of subjects making a non-zero
contribution, the majority gave less than the mean of the stimuli (9 tokens).
• Simultaneous-play induces more cooperation than sequential-play
Now compare the data from the simultaneous tasks with that from the real, sequential game (see table 2). It
seems that the same public good payoff function induced more cooperation in the simultaneous-play game
than in sequential-play. A paired-comparison t-test confirms this, rejecting the null hypothesis that mean
contributions are equal (T = 2.39, p < 0.05 for a 2-tailed test).
Such a result would follow from a mixture of overconfidence, egoism and reciprocity. Enough over-
confidence in simultaneous play would make contributions there relatively high. Overconfidence may be a
factor in sequential play too (see below), but in the sequential game it must be less of a factor, since
subjects acting late in the sequence have seen most of the preceding contributions. The last actor cannot
possibly be overconfident, as he acts with full information about others’ behaviour. One would expect low
contributions in sequential play if, as was the case, there was a substantial amount of selfish behaviour
exhibited, plus a degree of negative reciprocity. As an indicator of the extent of selfishness, consider than in
f2, where subjects responded to 90% contribution levels from others, 52 subjects (53%) contributed
nothing. Evidence of negative reciprocity consists in the fact that contributions are significantly higher in f2
than in f1, as established above.
20
The two results thus far indicate that contributions in simultaneous play are relatively high. Alternative
explanations of a similar effect discussed in Shafir and Tversky (1992) are “magical thinking” and collective
rationality. The former posits that subjects think, in effect, “If I do not cooperate, who will?”, which is an
attitude they cannot adopt if they are already informed about others’ decisions. The latter hypothesis is that
not knowing what other subjects have done induces agents to frame the problem as a joint decision, so that
in effect they ask themselves “What should we do?” rather than “What should I do?” - a “team-thinking”
effect in the terminology of Sugden (1993). However, the explanatory factors already cited (biased
reciprocity and overconfidence) would also serve to explain aspects of behaviour in other public goods
experiments (see below). The attraction of an additional hypothesis is that it could explain why subjects
appear to be more cooperative in the simultaneous play condition than when shown the high contributions
in f2. To explain this by overconfidence would be awkward because one would apparently have to posit
extremely over-optimistic beliefs - either that mean contributions will be greater than 90% of the
endowment (the mean in f2), or, say, that the minimum contribution is greater than 6 (the minimum in f2).19
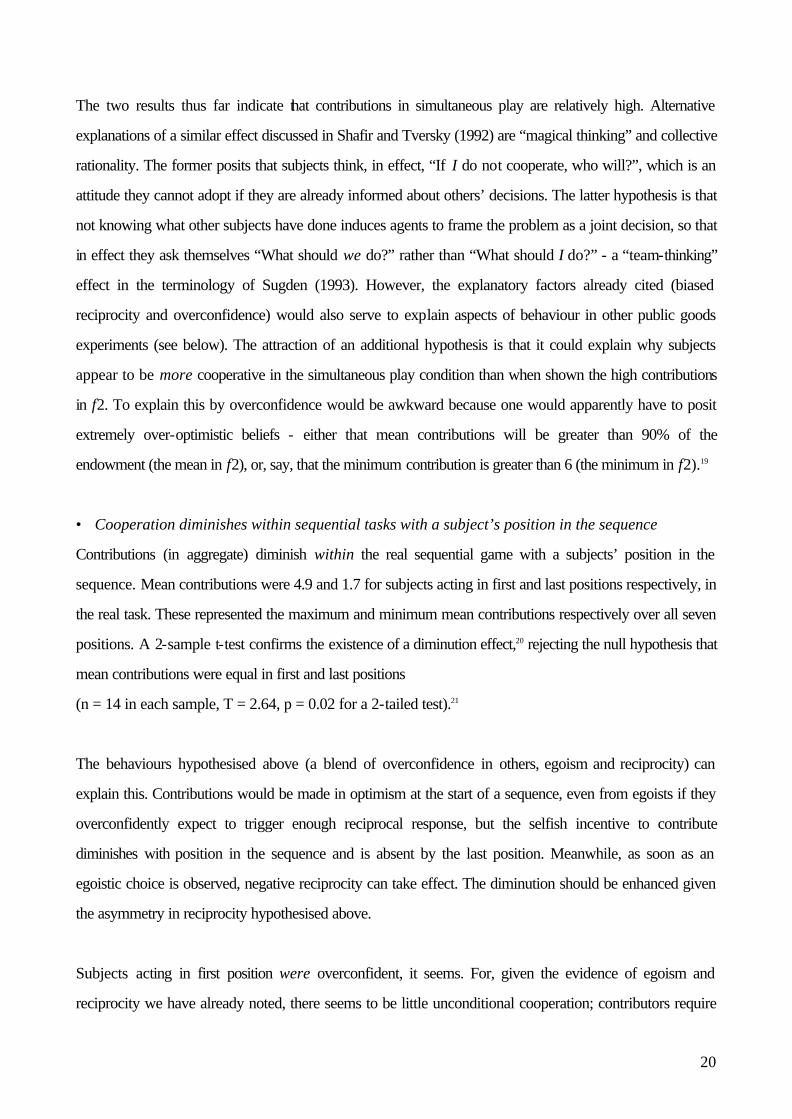
• Cooperation diminishes within sequential tasks with a subject’s position in the sequence
Contributions (in aggregate) diminish within the real sequential game with a subjects’ position in the
sequence. Mean contributions were 4.9 and 1.7 for subjects acting in first and last positions respectively, in
the real task. These represented the maximum and minimum mean contributions respectively over all seven
positions. A 2-sample t-test confirms the existence of a diminution effect,20 rejecting the null hypothesis that
mean contributions were equal in first and last positions
(n = 14 in each sample, T = 2.64, p = 0.02 for a 2-tailed test).21
The behaviours hypothesised above (a blend of overconfidence in others, egoism and reciprocity) can
explain this. Contributions would be made in optimism at the start of a sequence, even from egoists if they
overconfidently expect to trigger enough reciprocal response, but the selfish incentive to contribute
diminishes with position in the sequence and is absent by the last position. Meanwhile, as soon as an
egoistic choice is observed, negative reciprocity can take effect. The diminution should be enhanced given
the asymmetry in reciprocity hypothesised above.
Subjects acting in first position were overconfident, it seems. For, given the evidence of egoism and
reciprocity we have already noted, there seems to be little unconditional cooperation; contributors require

21
others to contribute. In first position a mean of 4.9 tokens was given, whilst contributions in the other six
positions had a mean of 2.1 tokens overall, whereas it only pays to contribute 5 tokens as a first mover if
one expects others to contribute a mean of at least 3 tokens in response. So there was really no egoistic
incentive for first movers to contribute so heavily. Their behaviour is also difficult to rationalise according to
formal theories of cooperation, assuming expectations were not over-optimistic. For example, it apparently
contravenes Fehr and Schmidt’s (1999) inequality aversion theory, since on average those who made
typical donations in position one received a payoff which was low relative to their successors and lower
than could have been secured through free-riding. There was no obligation to contribute anything according
to the motivation specified in Sugden’s (1984) reciprocity theory, based on cooperative gains, since
without overconfidence a first mover contributing 5 tokens would expect a payoff lower than their
endowment.
A similar diminution effect holds within the other sequential tasks in the data-set, that is, those with artificial
stimuli. This is indicated by rows 2-4 of table 2 and confirmed by a paired comparison Wilcoxon rank sum
test, using each subject’s mean contribution acting in first and last position in the sequence. This rejects the
null hypothesis that the distribution of contributions is identical for the first and last positions (Z = -5.3 p =
0.00 for a 2-tailed test).22 As in the case of the real task, the effect would follow from a mixture of egoism
and reciprocity, with subjects acting in first position displaying overconfidence. In both cases the effect
would be enhanced by asymmetry in reciprocity. Suppose that the low stimuli were low relative to what
subjects expected to be reciprocated when acting in first position, and the high stimuli were no higher than
this level. Since approximately half the tasks involved low stimuli, there would then be very low
contributions in half of these tasks at the end of the sequence (negative reciprocity), so in aggregate
contributions would be lower in last position than in first, independently of the effects of egoism and
asymmetry in reciprocity. The Weimann-type asymmetry would enhance this effect since when stimuli are
high and expectations surpassed, contributions in last position would be no higher than for simultaneous
play.
In fact, last contributions in the high-stimuli tasks were no higher than for simultaneous play (see table 2).
Consistently with the difference in behaviour observed in f1 and f2, last contributions are lower in the
“low” randomised-stimuli tasks than in the “high” ones. The paired-comparison Wilcoxon rank sum test
rejects the null hypothesis of identical distributions: Z = -3.7, p = 0.00 for a 2-tailed test. In both the high
22
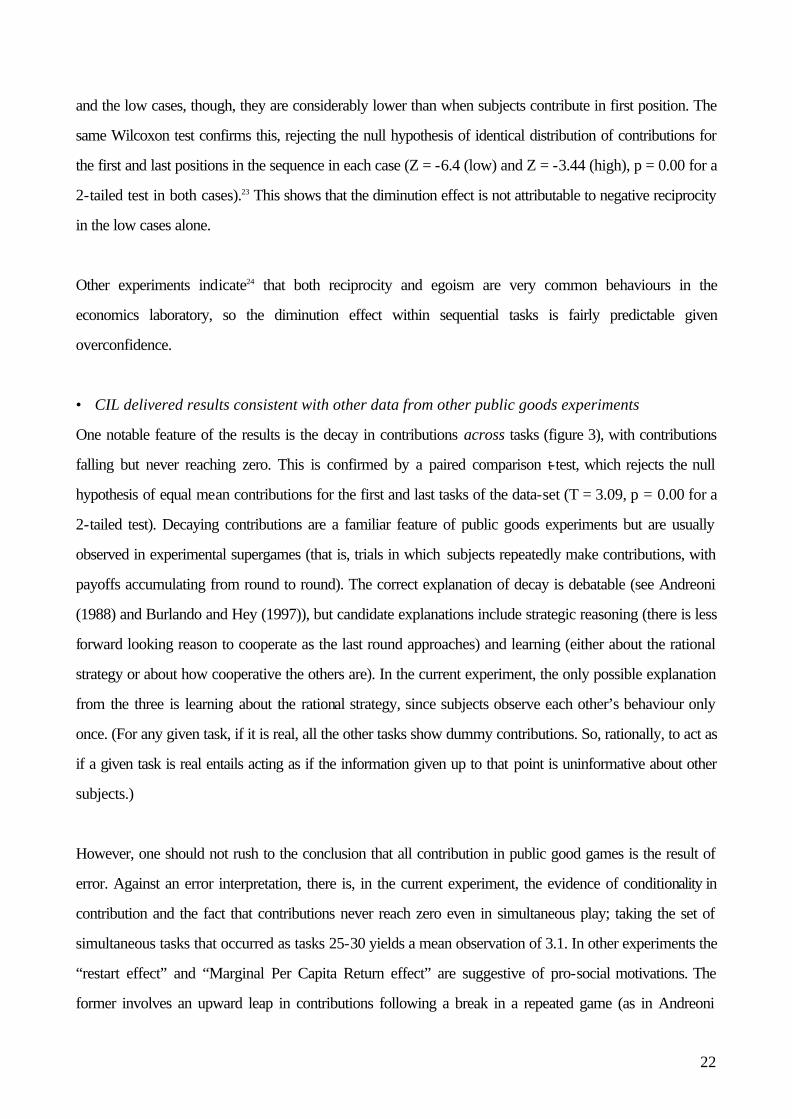
and the low cases, though, they are considerably lower than when subjects contribute in first position. The
same Wilcoxon test confirms this, rejecting the null hypothesis of identical distribution of contributions for
the first and last positions in the sequence in each case (Z = -6.4 (low) and Z = -3.44 (high), p = 0.00 for a
2-tailed test in both cases).23 This shows that the diminution effect is not attributable to negative reciprocity
in the low cases alone.
Other experiments indicate24 that both reciprocity and egoism are very common behaviours in the
economics laboratory, so the diminution effect within sequential tasks is fairly predictable given
overconfidence.
• CIL delivered results consistent with other data from other public goods experiments
One notable feature of the results is the decay in contributions across tasks (figure 3), with contributions
falling but never reaching zero. This is confirmed by a paired comparison t-test, which rejects the null
hypothesis of equal mean contributions for the first and last tasks of the data-set (T = 3.09, p = 0.00 for a
2-tailed test). Decaying contributions are a familiar feature of public goods experiments but are usually
observed in experimental supergames (that is, trials in which subjects repeatedly make contributions, with
payoffs accumulating from round to round). The correct explanation of decay is debatable (see Andreoni
(1988) and Burlando and Hey (1997)), but candidate explanations include strategic reasoning (there is less
forward looking reason to cooperate as the last round approaches) and learning (either about the rational
strategy or about how cooperative the others are). In the current experiment, the only possible explanation
from the three is learning about the rational strategy, since subjects observe each other’s behaviour only
once. (For any given task, if it is real, all the other tasks show dummy contributions. So, rationally, to act as
if a given task is real entails acting as if the information given up to that point is uninformative about other
subjects.)
However, one should not rush to the conclusion that all contribution in public good games is the result of
error. Against an error interpretation, there is, in the current experiment, the evidence of conditionality in
contribution and the fact that contributions never reach zero even in simultaneous play; taking the set of
simultaneous tasks that occurred as tasks 25-30 yields a mean observation of 3.1. In other experiments the
“restart effect” and “Marginal Per Capita Return effect” are suggestive of pro-social motivations. The
former involves an upward leap in contributions following a break in a repeated game (as in Andreoni
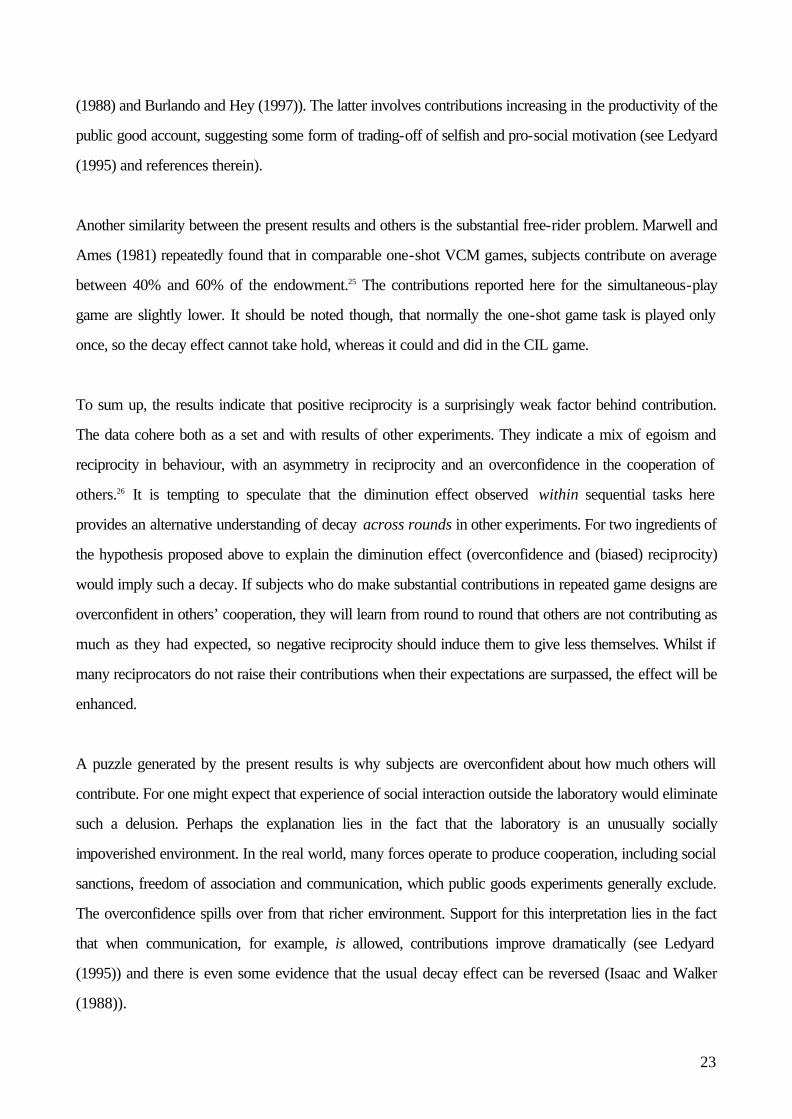
23
(1988) and Burlando and Hey (1997)). The latter involves contributions increasing in the productivity of the
public good account, suggesting some form of trading-off of selfish and pro-social motivation (see Ledyard
(1995) and references therein).
Another similarity between the present results and others is the substantial free-rider problem. Marwell and
Ames (1981) repeatedly found that in comparable one-shot VCM games, subjects contribute on average
between 40% and 60% of the endowment.25 The contributions reported here for the simultaneous-play
game are slightly lower. It should be noted though, that normally the one-shot game task is played only
once, so the decay effect cannot take hold, whereas it could and did in the CIL game.
To sum up, the results indicate that positive reciprocity is a surprisingly weak factor behind contribution.
The data cohere both as a set and with results of other experiments. They indicate a mix of egoism and
reciprocity in behaviour, with an asymmetry in reciprocity and an overconfidence in the cooperation of
others.26 It is tempting to speculate that the diminution effect observed within sequential tasks here
provides an alternative understanding of decay across rounds in other experiments. For two ingredients of
the hypothesis proposed above to explain the diminution effect (overconfidence and (biased) reciprocity)
would imply such a decay. If subjects who do make substantial contributions in repeated game designs are
overconfident in others’ cooperation, they will learn from round to round that others are not contributing as
much as they had expected, so negative reciprocity should induce them to give less themselves. Whilst if
many reciprocators do not raise their contributions when their expectations are surpassed, the effect will be
enhanced.
A puzzle generated by the present results is why subjects are overconfident about how much others will
contribute. For one might expect that experience of social interaction outside the laboratory would eliminate
such a delusion. Perhaps the explanation lies in the fact that the laboratory is an unusually socially
impoverished environment. In the real world, many forces operate to produce cooperation, including social
sanctions, freedom of association and communication, which public goods experiments generally exclude.
The overconfidence spills over from that richer environment. Support for this interpretation lies in the fact
that when communication, for example, is allowed, contributions improve dramatically (see Ledyard
(1995)) and there is even some evidence that the usual decay effect can be reversed (Isaac and Walker
(1988)).

24
10. Conclusions
The CIL design was successfully implemented to test a hypothesis about how subjects react to specific
patterns of contribution by others, which is precisely the type of investigation which generates the
temptation to deceive. Clear results were obtained with no deception. There was no evidence that subjects
contribute more when reacting to very high contributions from others than when they are acting
simultaneously. There was evidence statistically significant at the 10% level that subjects were actually less
cooperative in the high contributions condition. In addition, there is evidence that subjects are more
cooperative in simultaneous-play than in sequential-play games. In the sequential games, a predictable
result was obtained (attributable to a combination of overconfidence, egoism and (biased) reciprocity)
whereby contributions diminish with lateness in the sequence. These factors provide an alternative
explanation of decay in standard, repeated play designs.27
The results are consistent with outcomes of other public goods experiments, showing both a decay in
contributions and a substantial free-rider problem. The decay in contributions in this one-shot game
experiment is a product neither of strategic reasoning nor of learning about others’ behaviour, but may
show subjects either learning to be selfishly rational or adhering stubbornly to a strategic rule of thumb. A
puzzle was generated about why subjects might come to experiments with over-optimistic expectations
about others’ cooperation. This may be attributable to the laboratory’s systematic stripping away of the
social-situational factors which underpin cooperation in the context of free interaction.
It is possible, then, using CIL to achieve with total honesty the control afforded by deception, and so
without risking any costs to other experimenters. This involves using a manipulation of a random lottery
design, which should be suitable for most economics type experiments. It is an advance on the strategy
method, being closer in structure to single task designs whilst at the same time allowing experiments in
which subjects can learn and change their strategies. Hence there is a workable alternative to dishonesty, in
which subjects are fully informed, free of any risk of pollution of the subject pool; experimentalists should
use it rather than deceive.

25
Appendix
i) Instructions
Subjects worked through the following instructions on computer, then played three practice tasks before
the experiment began, of which one was simultaneous and two were sequential. Each box indicates a
separate screen. Subjects could move backwards and forwards between screens, by entering a 0
(backwards) or 1 (forwards). Subjects were given an oral précis of a few screens, and then worked
through these in their own time to get to a specific screen, before comprehension was checked and they
move on to the next set of screens.
Welcome. In this experiment, which investigates interactive choices, you will be placed in a number of situations. Only one of these will be real, the others will be fictional. An example of this procedure follows on the next screen.
[follow the instructions below. You’ll hear a <beep> if you make a mistake. You can use <backspace> to delete at any point.]
Example:
The experimenter, through this program, is about to make you an offer. The offer is one of three possibilities. One but only one of these is REAL. You have to decide whether to accept or reject each of the three possible offers, before you learn what the offer was. What happens then depends on how you responded to the real offer.
1. You will be paid two pounds if you do a maths test and score above 60% AND take part in this experiment. <enter 0 to reject, 1 to accept the offer>

26
2. You will be paid 2 pounds if you fill out a questionnaire about your diet AND take part in this experiment. <enter 0 to reject, 1 to accept the offer> 3. You have been offered 4 pounds. You do NOT have to do anything in return [other than participate in this experiment]. <enter 0 to reject, 1 to accept the offer>28 The offer was in fact number 3. The 4 pounds you have just accepted are your resources to be used in the experiment. They have been given as 10 tokens worth 40p each. You can walk away with more or less than this depending on how you and the rest of your group behave in the real situation, but you cannot leave with less than £1.14.
Please WAIT ...29 The 30 situations you will confront are all set in the following context. There are two groups of seven people and each person has 10 tokens [worth 40p each]. In each situation, each person must decide how to use their ten tokens. Each person will leave the experiment with a monetary reward. The size of this depends on what everyone in their group, themselves included, does with their tokens in the real situation.
27
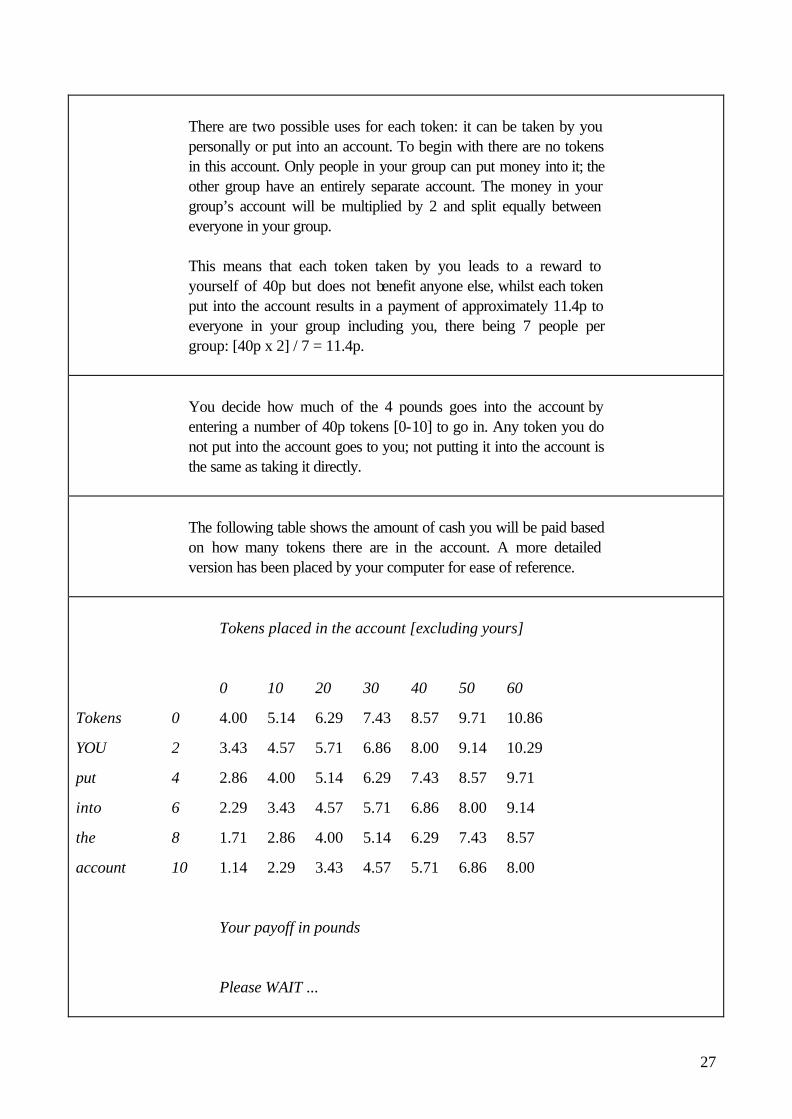
There are two possible uses for each token: it can be taken by you personally or put into an account. To begin with there are no tokens in this account. Only people in your group can put money into it; the other group have an entirely separate account. The money in your group’s account will be multiplied by 2 and split equally between everyone in your group. This means that each token taken by you leads to a reward to yourself of 40p but does not benefit anyone else, whilst each token put into the account results in a payment of approximately 11.4p to everyone in your group including you, there being 7 people per group: [40p x 2] / 7 = 11.4p.
You decide how much of the 4 pounds goes into the account by entering a number of 40p tokens [0-10] to go in. Any token you do not put into the account goes to you; not putting it into the account is the same as taking it directly.
The following table shows the amount of cash you will be paid based on how many tokens there are in the account. A more detailed version has been placed by your computer for ease of reference.
Tokens placed in the account [excluding yours]
0 10 20 30 40 50 60
Tokens 0 4.00 5.14 6.29 7.43 8.57 9.71 10.86
YOU 2 3.43 4.57 5.71 6.86 8.00 9.14 10.29
put 4 2.86 4.00 5.14 6.29 7.43 8.57 9.71
into 6 2.29 3.43 4.57 5.71 6.86 8.00 9.14
the 8 1.71 2.86 4.00 5.14 6.29 7.43 8.57
account 10 1.14 2.29 3.43 4.57 5.71 6.86 8.00
Your payoff in pounds
Please WAIT ...

28
In each situation, your screen will show you data representing other people’s choices. This data will either be randomly generated or, in some cases, set by the experimenter, unless the situation is the real situation. If so, the numbers will show the actual decisions made by the rest of the group. Because the data are real only once, it is not possible to learn about other people’s behaviour as the experiment progresses.
In most situations people take it in turns to make decisions. These are named “sequential” situations. In these, you will be shown numbers representing people’s decisions before you decide what to do. [The decisions will be made in sequence, the order changing between situations.] In some cases you must choose either 10 or 0 tokens to go into the account. [“sequential/binary” situations.]
In addition there will be some situations during which everyone makes their decision at the same time [“simultaneous” ones]. In these, the only information you have when making your decision will be that in the payments table.
After each situation has been played out, you will be shown how much money you will be given if that is the real one.
We would like you to treat each situation as if it is real and the only situation. Note that, for all you know, each one could be the real one, in which case ALL information you are given about it is true, and only the real one has any effect on the outcome. [Remember that for one of the offers in the example, all the information turned out to be true but the other offers were purely fictional. The experiment works in the same way.]
The next screen shows you the display you will see during the experiment. Explanations are in green text.30 The white text31 is what you will actually see.
Please WAIT ...
29
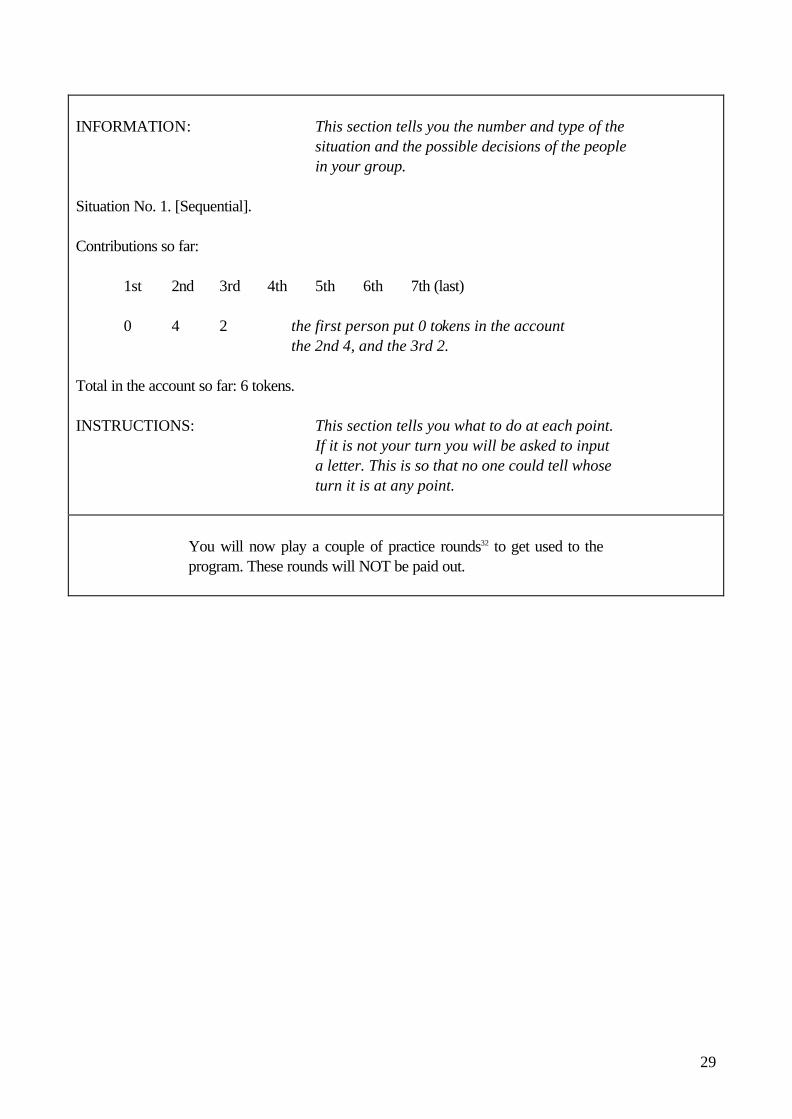
INFORMATION: This section tells you the number and type of the
situation and the possible decisions of the people in your group.
Situation No. 1. [Sequential]. Contributions so far: 1st 2nd 3rd 4th 5th 6th 7th (last) 0 4 2 the first person put 0 tokens in the account the 2nd 4, and the 3rd 2. Total in the account so far: 6 tokens. INSTRUCTIONS: This section tells you what to do at each point. If it is not your turn you will be asked to input a letter. This is so that no one could tell whose turn it is at any point.
You will now play a couple of practice rounds32 to get used to the program. These rounds will NOT be paid out.
30
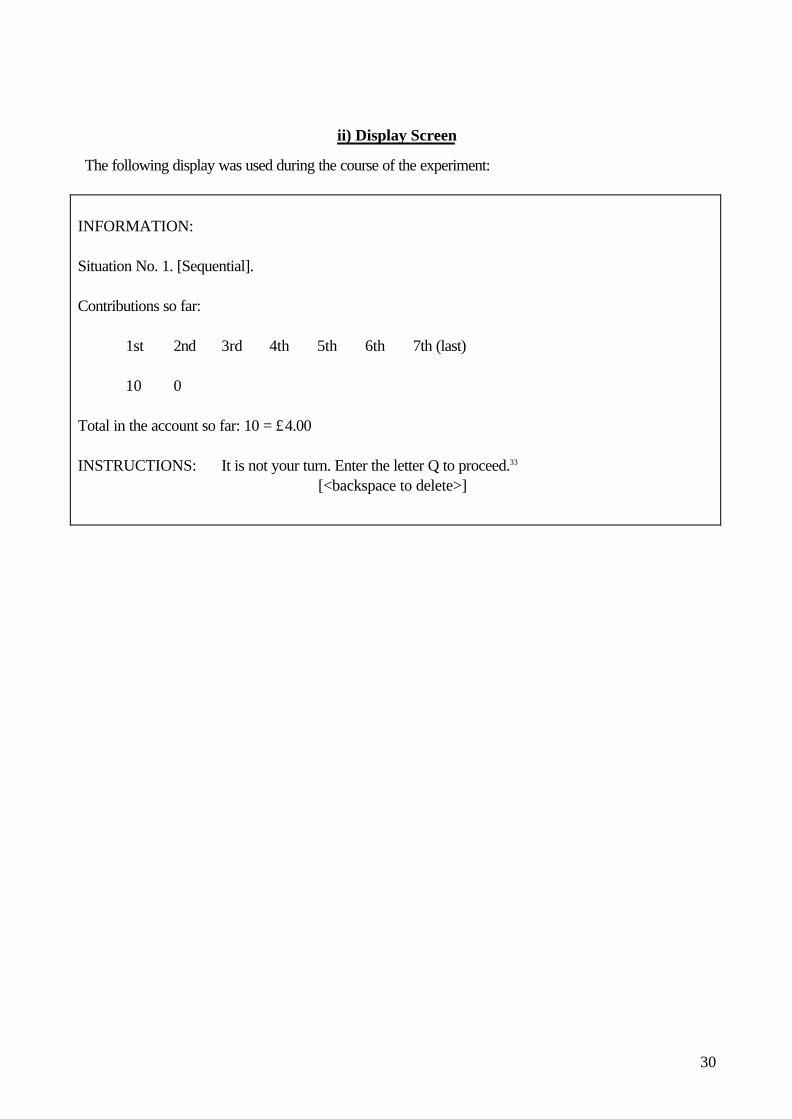
ii) Display Screen
The following display was used during the course of the experiment:
INFORMATION: Situation No. 1. [Sequential]. Contributions so far: 1st 2nd 3rd 4th 5th 6th 7th (last) 10 0 Total in the account so far: 10 = £4.00 INSTRUCTIONS: It is not your turn. Enter the letter Q to proceed.33
[<backspace to delete>]
31
iii) Subjects’ Printed Payoff Schedule
.
tokens placed into the account (excluding yours)
0
10
20
30
40
50
60 tokens
you
0 £4.00 £5.14 £6.29 £7.43 £8.57 £9.71 £10.86
place
1 £3.71 £4.86 £6.00 £7.14 £8.29 £9.43 £10.57
in
2 £3.43 £4.57 £5.71 £6.86 £8.00 £9.14 £10.29
the
3 £3.14 £4.29 £5.43 £6.57 £7.71 £8.86 £10.00
account
4 £2.86 £4.00 £5.14 £6.29 £7.43 £8.57 £9.71
5 £2.57 £3.71 £4.86 £6.00 £7.14 £8.29 £9.43
6 £2.29 £3.43 £4.57 £5.71 £6.86 £8.00 £9.14
7 £2.00 £3.14 £4.29 £5.43 £6.57 £7.71 £8.86
8 £1.71 £2.86 £4.00 £5.14 £6.29 £7.43 £8.57
9 £1.43 £2.57 £3.71 £4.86 £6.00 £7.14 £8.29
10 £1.14 £2.29 £3.43 £4.57 £5.71 £6.86 £8.00
in the account one token in the account generates 11.4 pence to all members of the group, including you
kept 40p for yourself 0p for anyone else.

32
Acknowledgements
I would like to acknowledge useful criticism of earlier versions of this paper from Robert Sugden, Chris
Starmer, Rachel Croson, Jens Grosser and two anonymous referees, plus some advice concerning statistics
from Peter Moffatt. Any remaining errors are entirely my own responsibility. This paper incorporates
material from two chapters of my dissertation submitted to the University of East Anglia.
Affiliation of Author
Centre for Research into Experimental Economics and Political Decision (CREED), Faculty of
Economics and Econometrics, University of Amsterdam
email: [email protected]
Notes
1 The worry is not that deception causes spurious results within an experiment, though the procedure used to deceive
may give reasons for doubt in specific cases (see section 5 below) and this may even be a common problem. This would
only mean that the experimenters have not been skilful enough at deceiving. The fundamental concern is rather that if
deception were a common enough practice, eventually subjects would expect to be mislead; deception may, that is,
cause spurious results across experiments, contaminating even honest designs. 2 It is not the author’s intention to belittle the importance of the debate over deception, but a thorough exploration of
these issues would overburden this paper. 3 Subjects know that one (but only one) task they encounter will be real. Hence, if there are more than 2 tasks, as in the
experiment reported below, each one is probably hypothetical, but possibly real. 4 Given, that is, subjects realise the imp ossibility of learning anything useful about others’ behaviour as the experiment
progresses. This should be emphasised as in the instructions to the experiment below (see appendix, section i below). 5 A Brandts and Charness (1998) type test (which would compare behaviour in CIL tasks with that in identical actual
choice experiments) would be useful with a specific hypothesis about bias. With such hypotheses one can construct
conditions in which bias is especially likely (as in the Cubitt et al.(1998a) test of the RL design). 6 There seems to be little evidence on the efficacy of common techniques of deception. Weimann did incorporate a
control of whether the telephone communication set up had any effect on contributions (1994 p188-190), concluding that
it did not. This consisted of comparing the results of an (honest) experiment in which subjects communicated with the
experimenter in person with those of an (honest) experiment, involving different subjects, which was identical but for the
fact that subjects talked to the experimenter by telephone. This did not determine, though, whether people’s behaviour in
a very high contributions setting differs in the two conditions because these non-deceptive experiments, unsurprisingly,
yielded lower average contribution rates.

33
7 From here on “reciprocity” covers various motivations, including inequality-aversion (à la Fehr and Schmidt (1999)) and
returning benefits on principle (à la Sugden (1984)), which give rise to conditionality of contributions. 8 A natural interpretation given that most formalisations of reciprocity (including Sugden (1984), Rabin (1993) and Fehr
and Schmidt (1999)) have worked with games in normal form. 9 This paper reported on 2-player (deceptive) prisoners’ dilemma experiments, finding a higher degree of cooperation for
simultaneous play than when one party had already cooperated. However, the statistical analysis appears to suffer from
an artificial inflation of the sample size, reporting different choices by the same subjects as independent observations
(Shafir and Tversky (1992) table 1). 10 CIL is easier to understand having played it than having merely listened to an explanation. Demonstration is also time-
effective, which matters because a potential cost of CIL compared to deception is the time necessary to explain the
procedure. In total, the instructions plus practice tasks took about half an hour to complete. Once underway, play was
reasonably swift, each task lasting just under one minute on average. 11 That is, this is the equilibrium contributions vector if all subjects maximise a utility function of the form Ui = Ui(Ci),
increasing in Ci. 12 Effectively, the program consulted a different row of a random number table for each group. This also provided the
basis for the other two randomised elements (the dummy contributions and subjects’ orders in the sequence for the
randomised-sequential tasks). The program is available on request from the author. 13 Full details are available on request from the author. Six tasks were “binary” games (subjects could either contribute
zero or ten tokens), the other two were non-binary and sequential with fixed stimuli (as in the f tasks). The statistical
significance of the results in the text is in no case dependent on the inclusion/omission of these “other” tasks. 14 Because of the randomisation of subjects’ positions in the sequence, the number of times a subject was observed in a
particular position varied in the randomised-sequential tasks. 9 subjects were not observed in first position, 31 in 7th
(low), 31 in 7th (high). The figures in table 2 for the randomised-stimuli tasks report on each subject’s mean decision in
each position. 15 LOWESS stands for LOcally-WEighted Scatterplot Smoother. A LOWESS plot connects smoothed values of the
dependent variable (here contributions) plotted against each value of the independent variable (task number). 16 And if not, since subjects only really interact once, the effect of this should be very dilute. 17 That is, for each subject, a mean decision was calculated for the simultaneous play tasks. The median of these average
observations was 3 tokens. 18 In a gift exchange game it was observed that harmful actions provoked more response than kind ones, with games
against nature providing the benchmark for comparison. Roughly, Offerman’s idea is that subjects have a relatively high
opinion of themselves, and so find it unremarkable that others are generous to them, but unpleasantly surprising when
others’ actions are harmful. Harmful actions, therefore, are supposedly mo re likely to trigger emotional responses. 19 See also Charness and Rabin (2000) for comparison, who find evidence that kind actions by first movers in (reduced
strategy) gift exchange games can lead to enhanced selfishness in the latter player, compared to play in a control dictator
game. 20 I use the term “diminution effect” to avoid confusion with the decay effect across tasks (see below).

34
21 The true task in each group involved one subject acting in each position, so there are 14 subjects observed acting in
each. Since each observation comes from a different subject, a 2-sample rather than paired comparison test is appropriate
here. 22 See note 11. The different numbers of observations for different subjects make the simple paired comparison t-test
above inappropriate; each subject’s mean choice is a random variable with a standard deviation dependent on the
number of observations. 9 subjects were not observed acting in first position in artificial-stimuli tasks so n = 89. 23 The diminution effects hold with equal statistical significance for the artificial-stimuli tasks whether you take the latter
pooled (as in the text), or take f1 (Low) and f2 (High), and randomised tasks (high and low) separately. 24 For the evidence on reciprocity and egoism, consult Fehr and Gächter (1998). For evidence of reciprocity in normal
public good experiments see Croson (1999). 25 This reference is quite dated, but appears to be the most recent for a one-shot, non-threshold public good experiment. 26 It may seem that rather many explanatory factors are invoked here. It might be possible to reduce this number if
overconfidence takes the form of a lack of anticipation of the weakness of positive reciprocity from others. 27 Essentially the same explanation is proposed in Brandts and Schram (1996), and Fischbacher, Gächter and Fehr (1999). 28 The software enabled the experimenter to tell whether offer 3 had been accepted (rejecting offer 3 is tantamount to
refusing to take part in the experiment, since one needs an endowment of four pounds in order to play). Nobody rejected
offer 3. 29 Anything printed here in italics actually appeared in green text on screen. 30 Italics here. 31 Plain text here. 32 There was an error here, since actually three practice tasks were played. This was explained verbally. 33 “Enter” appeared in flashing text. When it was a subject’s turn to make a contribution, the message read “It is your
turn. Enter the number of tokens [0-10] to put into the account.”
References
Allais, M. (1953). “Le Comportement de l’Homme Rationnel Davant le Risque: Critiques des Postulats et
Axioms de l’Ecole Americaine.” Econometrica. 21, 503-546.
Andreoni, J. (1988). “Why Free-Ride? Strategies and Learning in Public Goods Experiments.” Journal of
Public Economics. 37, 291-304.
Beattie, J. and Loomes, G. (1997). “The Impact of Incentives Upon Risky Choice Experiments.” Journal
of Risk and Uncertainty. 14, 149-162.
35
Binmore, K. (1992). Fun and Games. Massachusetts: D. C. Heath and Co.
Bonetti, S. (1998a). “Experimental Economics and Deception.” Journal of Economic Psychology. 19,
377-395.
Bonetti, S. (1998b). “Reply to Hey and Starmer and McDaniel.” Journal of Economic Psychology. 19,
411-414.
Brandts, J. and Charness, G. (1998). “Hot vs. Cold: Sequential Responses and Preference Stability in
Experimental Games.” Discussion Paper upfgen#321, Universitat Pompeu Fabra.
Brandts, J. and Schram, A. (1996). “Cooperative Gains or Noise in Public Goods Experiments.”
Tinbergen Institute Discussion Paper #TI 96-81/1, University of Amsterdam.
Burlando, R. and Hey, J. D. (1997). “Do Anglo-Saxons Free-Ride More?” Journal of Public
Economics. 64, 41-60.
Camerer, M. J. and Knez, C. F. (1995). “Outside Options and Social-Comparison in 3-Player Ultimatum
Game Experiments.” Games and Economic Behaviour. 10, 65-94.
Charness, G. and Rabin, M. (2000). “Social Preferences: Some Simple Tests and a New Model.”
Discussion Paper, University of California, Berkeley.
Cox, J. C. (2000). “Trust and Reciprocity: Implications of Game Triads and Social Contexts.” Discussion
Paper, University of Arizona.
Croson, R. T. A. (1999). “Contributions to Public Goods: Altruism or Reciprocity?” Discussion Paper
#96-08-01, University of Pennsylvania.
36
Cubitt, R., Starmer, C. and Sugden, R. (1998a). “On the Validity of the Random Lottery Incentive
System.” Experimental Economics. 1, 115-131.
Cubitt, R., Starmer, C. and Sugden, R. (1998b). “Dynamic Choice and the Common Ratio Effect: An
Experimental Investigation.” The Economic Journal. 108, 1-20.
Davis, D. D. and Holt, C. A. (1992). Experimental Economics. Princeton, N. J.: Princeton University
Press.
Fehr, E. and Gächter, S. (1996). “Cooperation and Punishment - an Experimental Analysis of Norm
Formation and Norm Enforcement.” Discussion paper, University of Zürich.
Fehr, E. and Gächter, S. (1998). “Reciprocity and Economics: The Economic Implications of Homo
Reciprocans.” European Economic Review. 42, 845-859.
Fehr, E. and Schmidt, K. M. (1999). “A Theory of Fairness, Competition and Cooperation.” Quarterly
Journal of Economics. 114, 817-868.
Fischbacher, U., Gächeter, S. and Fehr, E. (1999). “Anomalous Behaviour in Public Goods Experiments:
How Much and Why? Comment.” Discussion Paper, University of Zürich.
Güth, W., Huck, S. and Ockenfels, P. (1996). “Two-Level Ultimatum Bargaining With Incomplete
Information: An Experimental Study.” Economic Journal. 106, 593-604.
Hey, J. D. (1991). Experiments in Economics. Blackwell: Oxford.
Hey, J. D. (1998). “Experimental Economics and Deception: a Comment.” Journal of Economic
Psychology. 19, 377-395.
37
Holt, C. A. (1986). “Preference Reversals and the Independence Axiom.” American Economic Review.
76, 508-515.
Isaac, R. M. and Walker, J. M. (1988). “Communication and Free-Riding Behaviour: The Voluntary
Contributions Mechanism.” Economic Inquiry. 26, 585-608.
Kahneman, D. and Tversky, A. (1979). “Prospect Theory: An Analysis of Decision Under Risk.”
Econometrica. 47, 263-291.
Ledyard, J. O. (1995). “Public Goods: a Survey of Experimental Research.” in Kagel, J. and Roth, A. E.
(eds.) The Handbook of Experimental Economics, 111-81. Princeton, N. J.: Princeton University Press.
Marwell, G. and Ames, R. (1981). “Economists Free-Ride, Does Anyone Else? Experiments on the
Provision of Public Goods, IV.” Journal of Public Economics. 15, 295-310.
Mitzkewitz, M. and Nagel, R. (1993). “Experimental Results on Ultimatum Games With Incomplete
Information.” International Journal of Game Theory. 22, 171-98.
Offerman, T. (1996). Beliefs and Decision Rules in Public Good Games. Kluwer Academic Publishers:
Dordrecht.
Offerman, T. (1999). “Hurting Hurts More than Helping Helps: the Role of the Self-Serving Bias.”
Tinbergen Institute Discussion Paper TI 99-018/1, University of Amsterdam.
Roth, A. E. (1995). “Bargaining Experiments.” In Kagel, J. and Roth, A. E. (eds.) Handbook of
Experimental Economics. 258-348. Princeton, N. J.: Princeton University Press.
Savage, L. (1954). Foundations of Statistics. New York: John Wiley.
38
Shafir, E. and Tversky, A. (1992). “Thinking Through Uncertainty”: Nonconsequential Reasoning and
Choice.” Cognitive Psychology. 24, 449-474.
Starmer, C. and McDaniel, T. (1998). “Experimental Economics and Deception: A Comment.” Journal
of Economic Psychology. 19, 403-409.
Starmer, C. and Sugden, R. (1991). “Does the Random-Lottery Incentive System Elicit True Preferences?
An Experimental Investigation.” American Economic Review. 81, 971-978.
Sugden, R. (1984). “Reciprocity: the supply of public goods through voluntary contributions.” Economic
Journal. 94, 772-87.
Sugden, R. (1993). “Thinking as a Team.” in Altruism. ed. Paul, E. F., Miller, F. D. Jr., and Paul, J.,
Cambridge, Cambridge University Press.
Weimann, J. (1994). “Individual Behaviour in a Free-Riding Experiment.” Journal of Public Economics.
54, 185-200.
Wilcox, N. T. (1993). “Lottery Choice: Incentives, Complexity and Decision Time.” Economic Journal.
103, 1397-1417.