social traits moderate associations between changes ... - osf
TRANSCRIPT
SOCIAL CONTACT, WELL-BEING, AND SOCIAL TRAITS 1
Resuming Social Contact After Months of Contact Restrictions: Social Traits1
Moderate Associations Between Changes in Social Contact and Well-Being2
Michael D. Krämer1,2,3, Yannick Roos4, David Richter1,2,3, and Cornelia Wrzus43
1German Institute for Economic Research, Germany4
2International Max Planck Research School on the Life Course (LIFE), Max Planck5
Institute for Human Development, Germany6
3Freie Universität Berlin, Germany7
4Universität Heidelberg, Germany8
SOCIAL CONTACT, WELL-BEING, AND SOCIAL TRAITS 2
Author Note9
10
Michael D. Krämer https://orcid.org/0000-0002-9883-5676, Socio-Economic11
Panel (SOEP), German Institute for Economic Research (DIW Berlin); International Max12
Planck Research School on the Life Course (LIFE), Max Planck Institute for Human13
Development; Department of Education and Psychology, Freie Universität Berlin.14
Yannick Roos https://orcid.org/0000-0001-7223-8577, Department of15
Psychological Aging Research, Institute of Psychology, Universität Heidelberg.16
David Richter https://orcid.org/0000-0003-2811-8652, Socio-Economic Panel17
(SOEP), German Institute for Economic Research (DIW Berlin); Survey Research18
Division, Department of Education and Psychology, Freie Universität Berlin.19
Cornelia Wrzus https://orcid.org/0000-0002-6290-959X, Department of20
Psychological Aging Research, Institute of Psychology, Universität Heidelberg.21
Acknowledgements: We thank Theresa Entringer for valuable feedback.22
The authors made the following contributions. Michael D. Krämer:23
Conceptualization, Data Curation, Formal Analysis, Methodology, Visualization, Writing -24
Original Draft Preparation, Writing - Review & Editing; Yannick Roos: Conceptualization,25
Data Curation, Methodology, Writing - Review & Editing; David Richter:26
Conceptualization, Funding Acquisition, Supervision, Writing - Review & Editing; Cornelia27
Wrzus: Conceptualization, Funding Acquisition, Supervision, Methodology, Writing -28
Review & Editing.29
Correspondence concerning this article should be addressed to Michael D. Krämer,30
German Institute for Economic Research, Mohrenstr. 58, 10117 Berlin, Germany. E-mail:31
SOCIAL CONTACT, WELL-BEING, AND SOCIAL TRAITS 3
Abstract33
Humans possess a need for social contact. Satisfaction of this need benefits well-being,34
whereas deprivation is detrimental. However, how much contact people desire is not35
universal, and evidence is mixed on individual differences in the association between36
contact and well-being. This preregistered longitudinal study (N = 190) examined changes37
in social contact and well-being (life satisfaction, depressivity/anxiety) in Germany during38
pervasive contact restrictions, which exceed lab-based social deprivation. We analyzed how39
changes in personal and indirect contact and well-being during the first COVID-1940
lockdown varied with social traits (e.g., affiliation, extraversion). Results showed that41
affiliation motive, need to be alone, and social anxiety moderated the resumption of42
personal contact under loosened restrictions as well as associated changes in life43
satisfaction and depressivity/anxiety.44
Keywords: social contact, well-being, social traits, need regulation, affiliation45
motive, mental health, COVID-1946
SOCIAL CONTACT, WELL-BEING, AND SOCIAL TRAITS 4
Resuming Social Contact After Months of Contact Restrictions: Social Traits47
Moderate Associations Between Changes in Social Contact and Well-Being48
Humans have an innate need to seek social contact and form relationships49
(Baumeister & Leary, 1995; Hofer & Hagemeyer, 2018). At the same time, people differ in50
how they satisfy this need in daily life: Some enjoy being around others a lot and feel51
unwell in ongoing solitude, whereas others seek less social contact and are less affected in52
well-being by little contact.53
Our study examines social contact and well-being as part of a dynamic need54
regulation in the context of the COVID-19 pandemic, which required a population-wide55
reduction in personal contact to curtail virus transmission (Flaxman et al., 2020).56
Harnessing the unique situation of a gradual reboot of social contact over three months,57
our study provides insights into social need regulation and individual differences in social58
behavior during the pandemic. The contact restrictions introduced to reduce the spread of59
COVID-19 provide an unprecedented opportunity to study social need regulation outside60
the laboratory. We investigate longitudinally (a) how social contact changes in relation to61
social traits, and (b) how well-being changes with increased social contact depending on62
social traits. Under a broad conceptualization of well-being, we examine both life63
satisfaction and depressivity/anxiety as potential markers of social need satisfaction.64
Social Need Regulation65
Social need regulation is conceptualized as continuous internal comparisons between66
a person’s ideal level of social contact and the level currently experienced (i.e., both67
amount and quality; Hall & Davis, 2017; Nezlek, 2001; Sheldon, 2011). Deviations from the68
ideal level in both directions are theorized to reduce well-being and motivate individuals to69
align social behavior towards need satisfaction (Hall & Davis, 2017; Sheldon, 2011). For70
example, experience sampling studies have shown that higher momentary need motivation71
leads to higher need satisfaction through need-relevant behavior (Neubauer et al., 2018;72
SOCIAL CONTACT, WELL-BEING, AND SOCIAL TRAITS 5
Zygar et al., 2018). Social need regulation therefore represents a dynamic process in which73
past social contact influences future contact through need satisfaction or dissatisfaction74
(Carver & Scheier, 1998).75
Satisfying one’s social needs is linked to higher well-being (Demir & Özdemir, 2010;76
J. Sun et al., 2020; Tay & Diener, 2011). Early motive theories (e.g., McClelland, 1987) and77
recent empirical work suggest that, depending on social need strength, people’s well-being78
is differently affected by need satisfaction (Dufner et al., 2015; Zygar et al., 2018).79
Evidence on the extent to which indirect contact (e.g., texting, videocalls) satisfies80
social needs remains inconclusive (Kushlev et al., 2019; Orben & Przybylski, 2019, 2020).81
Indirect contact might substitute personal contact during the pandemic lockdown82
(Gabbiadini et al., 2020). Daily diary data indicate, however, that only personal contact is83
robustly related to well-being (Lades et al., 2020; R. Sun et al., 2020). In terms of mental84
health, the prevalence of depression and anxiety symptoms increased during the COVID-1985
pandemic (Ettman et al., 2020; Twenge & Joiner, 2020), and there is associative evidence86
that being alone due to contact restrictions—thereby unable to satisfy social87
needs—negatively affects mental health (Benke et al., 2020; Fried et al., 2021).88
Social Traits89
People differ in the ideal level of social contact to which they compare their current90
experiences (Sheldon, 2011). Thus, the same situation such as being alone for several days91
can elicit either an appetitive (i.e., enjoying and maintaining solitude) or an aversive92
response (i.e., disliking solitude and seeking social contact; Hagemeyer et al., 2013)93
depending on the individual’s ideal level, which is captured in social traits.94
Of the Big Five traits (Soto & John, 2017), extraversion is closely related to95
interpersonal behavior (DeYoung et al., 2013). Extraversion predicts, among other things,96
how much someone likes the company of others (Breil et al., 2019), and whether someone97
leaves situations when they are alone (Wrzus et al., 2016).98
SOCIAL CONTACT, WELL-BEING, AND SOCIAL TRAITS 6
The affiliation motive describes the need to initiate and maintain close relationships99
(Hofer & Hagemeyer, 2018). With a higher affiliation motive, people partake in more social100
interactions such as visiting friends or phone calls and are more likely to crave social101
contact when alone (Hill, 2009).102
Although humans have social needs, they also seek solitude, for example, to pursue103
a hobby or wind down after a long day of meetings (Lay et al., 2019). Individuals vary in104
the strength of this need to be alone (Coplan et al., 2019; Hagemeyer et al., 2013). A105
higher need to be alone reduces the likelihood of social contact (Hall, 2017).106
Another reason why people avoid others is that they experience anxiety when107
anticipating social contact. Subclinically low to moderate anxiety about social contact is108
prevalent in the general population (Peters et al., 2012). Higher social anxiety is associated109
with smaller social networks (Van Zalk et al., 2011), being disliked by interaction partners110
more frequently (Tissera et al., 2020), and lower momentary well-being (Brown et al.,111
2007).112
Current Study113
In this longitudinal study, we assessed social contact and well-being four times over114
three months—beginning during most rigorous contact restrictions and continuing during115
gradual resumption of social contact. Governmental restrictions limiting personal contact116
for several weeks in early 2020 constitute a strong situation with limited room to express117
social traits (Cooper & Withey, 2009). In contrast, person effects of social traits are118
presumably more pronounced in weak situations that do not constrain social activity and119
allow behavioral expression of traits (Blum et al., 2018; Schmitt et al., 2013). Successively120
eased restrictions therefore represent a transition from a strong situation curbing the121
person-situation interaction into a more normal interplay of the two (Schmitt et al., 2013).122
However, as Cooper and Withey (2009) state, the “personality-dampening effect of strong123
situations” (p. 62) has not been shown convincingly because truly strong situations are124
SOCIAL CONTACT, WELL-BEING, AND SOCIAL TRAITS 7
difficult to induce in laboratory settings or to observe under regular situational125
circumstances. The first COVID-19 lockdown, thus, represents a unique opportunity to126
study social need regulation because it caused long-lasting and pervasive restrictions of127
social contact with widespread deprivation of social needs, which considerably exceed128
laboratory-based deprivation.129
The “lockdown” to manage the COVID-19 pandemic in Germany in early 2020130
initially created strong situational constraints severely restricting everyday mobility in all131
age groups and regions (Becher et al., 2021; Bönisch et al., 2020). Compared to132
pre-pandemic levels, social contact frequency was estimated to have decreased by 61-90%,133
reaching a nadir in April 2020 (Del Fava et al., 2021; Tomori et al., 2021). This time134
period, during which our longitudinal study started, also represents the maximum extent of135
governmental contact restrictions in all German federal states during the first COVID-19136
wave (Aravindakshan et al., 2020). Following federal decrees on 6 May 2020137
(Bundesregierung, 2020), restrictions were gradually eased (until the second wave of138
infections in the fall of 2020), and people in Germany resumed social contact accordingly,139
although not yet to pre-pandemic levels by late June 2020 (Tomori et al., 2021). In140
addition to these mean-level increases of social contact frequency, its variance had141
substantially increased over this period of eased restrictions (Tomori et al., 2021). This is142
consistent with evidence that personality traits were associated with differences in143
precautionary behavior and adherence to contact restrictions (Aschwanden et al., 2021;144
Götz et al., 2020; Zajenkowski et al., 2020; Zettler et al., 2021).145
Although contact restrictions undoubtedly presented a strong situation146
unprecedented in the second half of the 20th century, evidence is ambiguous regarding147
resiliency and well-being during this period (Luchetti et al., 2020; Zacher & Rudolph,148
2020). German population-representative panel data indicate stability in well-being but an149
increase in loneliness during contact restrictions, which affects extraverted people more150
severely (Entringer et al., 2020; Entringer & Gosling, 2021). In contrast, providing151
SOCIAL CONTACT, WELL-BEING, AND SOCIAL TRAITS 8
preliminary support for the strong situation hypothesis, the association between152
extraversion and well-being was lower during lockdown than before the pandemic in a153
cross-sectional study (Anglim & Horwood, 2021). We go beyond previous work by154
considering multiple social traits, distinguishing personal and indirect social contact, and155
making use of the strong situation of the COVID-19 pandemic.156
Specifically, we address how social traits influence two steps of social need157
regulation: First, we investigate whether individual differences in social traits were158
associated with diverging trends in pursuing social contact when restrictions were gradually159
being eased. Second, we probe the well-being consequences of increased social contact and160
differences therein related to social traits.161
We preregistered the following hypotheses1 (https://osf.io/n8jrv):162
• H1a: Social contact will increase over time more strongly for people higher in163
extraversion and affiliation motive.164
• H1b: Social contact will increase less over time for people higher in the need to be165
alone and social anxiety.166
• H2a: Social contact and personality (extraversion, affiliation motive) will moderate167
effects of time on well-being, that is, well-being will be lowest for people with low168
social contact and high extraversion or affiliation motive.169
• H2b: With higher need to be alone and social anxiety2, well-being will be less170
strongly related to social contact.171
1 In the preregistration, H1=H2 and H2=H3.2 We intended H2a/H2b to mirror H1a/H1b in constructs but forgot to include social anxiety in H2b in ourpreregistration. Deviations from our preregistration are listed at https://osf.io/8xubm/.
SOCIAL CONTACT, WELL-BEING, AND SOCIAL TRAITS 9
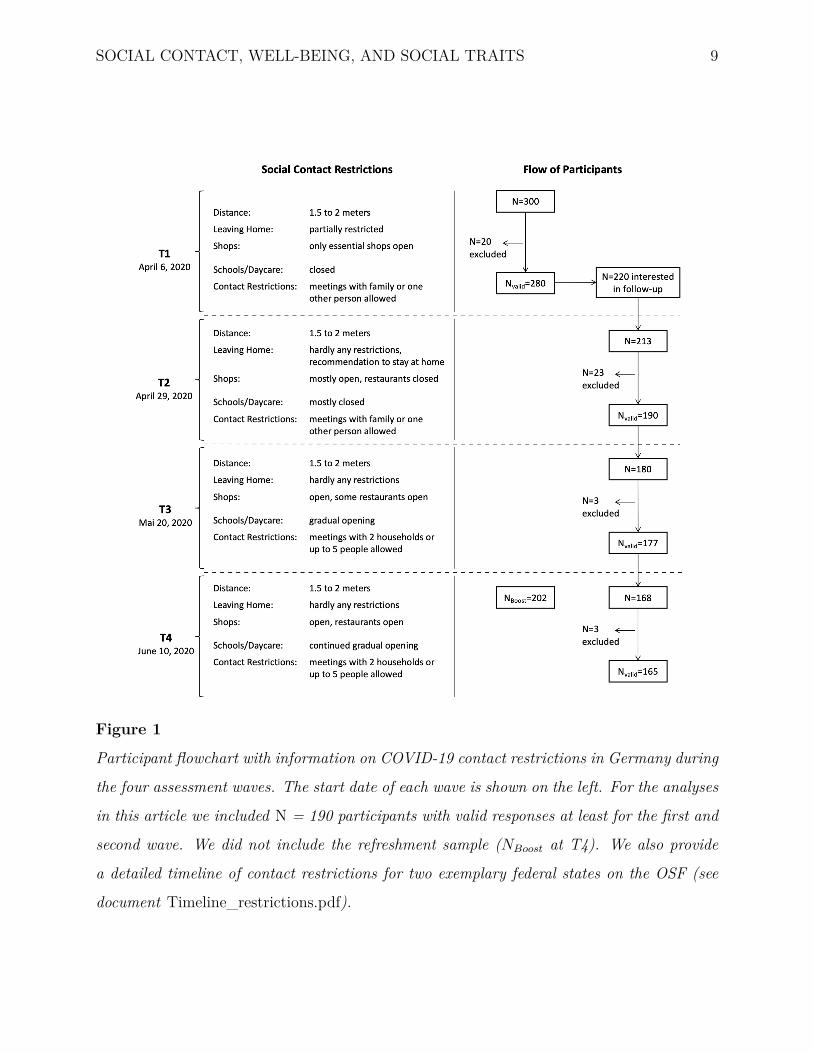
Figure 1
Participant flowchart with information on COVID-19 contact restrictions in Germany during
the four assessment waves. The start date of each wave is shown on the left. For the analyses
in this article we included N = 190 participants with valid responses at least for the first and
second wave. We did not include the refreshment sample (NBoost at T4). We also provide
a detailed timeline of contact restrictions for two exemplary federal states on the OSF (see
document Timeline_restrictions.pdf).
SOCIAL CONTACT, WELL-BEING, AND SOCIAL TRAITS 10
Methods172
We report how we determined our sample size, all data exclusions (if any), all173
manipulations, and all measures in the study. The preregistration (and deviations from it),174
data, documentation of assessed variables, and R-scripts to reproduce this manuscript are175
available at https://osf.io/8xubm/. The current data stem from a project aimed at176
developing a questionnaire on social dynamics.177
Participants178
Our preregistered sample size rationale of N = 195 relied on an a-priori power179
estimation based on a repeated measures ANOVA with α = .05, (1 − β) = .90 and a small180
effect size of f = .10 which we performed when we were uncertain about the ultimate181
temporal progression of the study (see document Deviations_preregistration.pdf on the182
OSF). Anticipating attrition, we recruited 300 German-speaking participants balanced by183
gender and five age groups (18-29, 30-39, 40-49, 50-59, 60-75) via the crowdsourcing service184
www.clickworker.com. Of these, 220 initially agreed to participate in up to three185
longitudinal follow-ups (see Fig. 1).186
We screened participants for non-compliant response behavior (Meade & Craig,187
2012) and—out of the 220 interested in follow-ups—excluded those with unrealistically188
short response times for the longest page of the online survey (< 70 seconds for a 39-item189
scale on social dynamics; n = 9 at T2, n = 3 each at T3/T4). We did not need to exclude190
further participants solely based on other signs of non-compliant responding (unusual191
response patterns, failed attention check). Additionally, a few participants gave invalid192
identifiers for follow-up preventing matching to the previous wave (n = 8) or opted out of193
the longitudinal part of the study (n = 5).194
For longitudinal analyses, we included N = 190 participants who provided valid195
responses at least for the first and second wave. Participants ranged in age from 16 to 70196
(M = 44.24, SD = 14.18) and 47% were women. Most participants were married (34%) or197
SOCIAL CONTACT, WELL-BEING, AND SOCIAL TRAITS 11
in a romantic relationship (31%); 42% were parents and 23% had children living in their198
household. Regarding occupational status, 39% of participants were employed full-time, 9%199
part-time, 21% were self-employed, 9% were students, 11% were pensioners, and the200
remaining were marginally employed or not employed. About 46% of participants held a201
university degree, and 43% came from urban areas.202
At the first measurement, 85% of participants reported that they currently stayed203
at home most of the time, either as a voluntary precaution for themselves and others204
(52%), because they were working from home (32%), because of closed (pre-)schools (11%),205
illness (6%), short-time work (6%), unemployment (5%), or compulsory quarantine (1%;206
multiple answers allowed). 32% indicated that they or someone in their household belonged207
to an at-risk group for COVID-19. Over three further assessment waves, the proportion of208
participants staying at home most of the time decreased: 83% at the second (50% as a209
voluntary precaution; 10% due to closed schools), 76% at the third (38% as a voluntary210
precaution; 5% due to closed schools), and 67% at the fourth wave (27% as a voluntary211
precaution; 4% due to closed schools). The proportion of participants staying at home212
most of the time due to work-related reasons remained roughly the same. Overall, this213
progression is in line with contact survey data demonstrating that contact frequency had214
substantially increased by June 2020, though not yet to pre-pandemic levels (Tomori et al.,215
2021). Note that the phrasing of the item asking whether participants stayed home most of216
the time includes the possibility that changes in social contact occurred even if answered in217
the affirmative, as we see in the measurement of personal contact frequency (see Table S1).218
Attrition Analysis219
We performed two kinds of attrition analyses: First, we compared participants who220
provided valid responses in all four waves (165) with participants who initially expressed221
interest in participating in follow-ups but later dropped out (55). Those who provided valid222
responses in all waves had a lower affiliation motive, d = -0.39, p = .013, were on average223
SOCIAL CONTACT, WELL-BEING, AND SOCIAL TRAITS 12
5.82 years younger, p = .010, and had a lower indirect contact frequency, d = -0.42, p =224
.008. All other variables included in analyses did not differ significantly between the two225
groups (all p > .05). Second, in the final longitudinal analysis sample (N = 190), we226
compared participants who provided valid responses in all four waves (165) with those who227
dropped out (25), and found no significant group differences (all p > .05) as well as smaller228
mean differences than in the first comparison (in 8 out of 10 variables).229
Procedure230
Participants answered four online surveys approximately every three231
weeks—starting on April 6, 2020, and ending on June 14, 2020 (722 longitudinal232
observations). At the first assessment, to reduce COVID-19 transmissions in Germany, all233
(pre-)schools, leisure activities, and shops besides supermarkets and drug stores were234
closed, and people were only allowed to meet with one other person (but were discouraged235
from doing so). Over the course of the two and a half months of the study, contact236
restrictions were gradually eased (see Aravindakshan et al., 2020; Tomori et al., 2021). At237
the time of the last assessment, shops, restaurants, and schools had reopened, recreational238
activities were again allowed, and warmer weather attracted people to meet outdoors239
(Yakubenko, 2021). Figure 1 summarizes the progression of the main contact restrictions in240
Germany. On the OSF, we provide a detailed timeline of restrictions for two exemplary241
federal states along with federal decrees (document timeline_restrictions.pdf ).242
Participants gave informed consent and received 4.50 to 5.00 euros per wave as243
compensation. The study adhered to the principles of the Declaration of Helsinki for244
research involving human subjects and was declared exempt from IRB evaluation.245
Measures246
Extraversion247
Extraversion was assessed at the first wave as part of the Big Five Inventory-2248
(BFI-2; Soto & John, 2017; German version: Danner et al., 2016) consisting of 60 items, 12249
SOCIAL CONTACT, WELL-BEING, AND SOCIAL TRAITS 13
of which measure extraversion (ω = 0.88). A sample item reads “I am someone who is250
outgoing, sociable”. Items were answered on a 5-point Likert-scale (1 = disagree strongly, 2251
= disagree a little, 3 = neutral, 4 = agree a little, 5 = agree strongly).252
Affiliation Motive253
We used the six-item version of the affiliation subscale of the Unified Motive Scales254
(Schönbrodt & Gerstenberg, 2012) at the first measurement occasion (ω = 0.87). A sample255
item is “I try to be in company of friends as much as possible”. The Unified Motive Scales256
include items formulated as statements, which require an agreement rating (1 = strongly257
disagree, 2 = disagree, 3 = rather disagree, 4 = rather agree, 5 = agree, 6 = strongly agree),258
and items formulated as goals, which require an importance rating (1 = not important to259
me, 2 = of little importance to me, 3 = of some importance to me, 4 = important to me, 5260
= very important to me, 6 = extremely important to me).261
Need to be Alone262
The need to be alone was assessed at the first wave using the four-item appetence263
subscale of the desire for being alone (ω = 0.74) included in the ABC model of social264
desires (Hagemeyer et al., 2013). A sample item is “I like to be completely alone”. Items265
were answered on a 7-point frequency scale ranging from 1 to 7 (1 = never, 4 = sometimes,266
7 = always).267
Social Anxiety268
We measured social anxiety at the first wave using the Social Interaction Anxiety269
Scale (SIAS-6; Peters et al., 2012; German version: Stangier et al., 1999). One of the items270
reads “I have difficulty talking with other people”. The six items were answered on a271
5-point scale (1 = not at all, 2 = slightly, 3 = moderately, 4 = very, 5 = extremely) and272
showed high internal consistency, ω = 0.85.273
SOCIAL CONTACT, WELL-BEING, AND SOCIAL TRAITS 14
Social Contact274
At each wave, participants were asked “How often did you engage in social275
interactions during the last week?” for three different relationship categories (family,276
friends, coworkers) and four channels of social contact (personal contact, calls, video calls,277
texts). Personal contact referred to in-person interactions. These 12 items were answered278
on a 5-point scale (1 = not at all, 2 = once, 3 = multiple days, 4 = daily, 5 = multiple279
times a day). Personal contact frequency was computed as the average of personal contact280
from all relationship categories. To calculate indirect contact frequency, we averaged the281
frequency ratings of calls, video calls, and texts from all relationship categories.282
Well-Being283
To capture several aspects of the broad construct well-being, we measured both life284
satisfaction, representing a general, cognitive appraisal of well-being, and285
depressivity/anxiety, representing negative affect, which we deemed likely to have been286
affected by the pandemic lockdown.287
We measured life satisfaction at each wave with an 11-point Likert scale item288
adapted from the Socio-Economic Panel (SOEP; see Richter et al., 2017): “How satisfied289
are you with your life, all things considered?” (0 = completely dissatisfied, 10 = completely290
satisfied). This single-item measure has been shown to perform very similarly to longer291
scales in terms of criterion validity (Cheung & Lucas, 2014; Lucas & Donnellan, 2012).292
We used the four-item screening tool Patient Health Questionnaire for Depression293
and Anxiety (PHQ–4; Kroenke et al., 2009; Löwe et al., 2010) to assess depressivity and294
generalized anxiety symptoms at each wave. We asked “Over the last week, how often have295
you been bothered by any of the following problems?” The four items “Little interest or296
pleasure in doing things”, “Feeling down, depressed, or hopeless”, “Feeling nervous,297
anxious, or on edge”, and “Not being able to stop or control worrying” were each answered298
on a 4-point scale (1 = not at all, 2 = several days, 3 = more than half the days, 4 = nearly299
SOCIAL CONTACT, WELL-BEING, AND SOCIAL TRAITS 15
every day). Internal consistency was high, ω = 0.81.300
A raw correlation plot of the constructs analyzed is shown in Figure S1.301
Analytical Strategy302
As preregistered, we winsorized outliers with scores outside M ± 3 × SD to the303
respective upper or lower bound. This procedure was used for eleven observations of304
depressivity/anxiety, eight observations of social anxiety, two and five observations of305
personal and indirect contact frequency, respectively.306
We employed multilevel modeling (Hoffman, 2015) with observations (Level 1)307
nested in participants (Level 2). Intra-class correlations for all time-varying variables along308
with means and standard deviations over time can be found in Table S1. All models were309
estimated using maximum likelihood with random intercepts. We included random slopes310
of the Level-1 predictors of interest in those instances where likelihood ratio tests indicated311
that the addition of the random slope significantly improved model fit (Hoffman &312
Walters, 2022). If this was the case, we report the results of the random slope model herein313
and of the fixed slope model in the Supplemental Material (Tables S2-S6), and vice versa.314
As Level-2 variables, all social traits were grand-mean centered and, thus, represent the315
between-person effect of deviation from the average trait level in the sample. To test our316
hypotheses, we estimated two different types of models. First, to predict personal and317
indirect contact frequency (H1a, H1b), we estimated models with a cross-level interaction318
of time (linear effect, zero at the first wave) and each trait:319
contactti = γ00 + γ01traiti + γ10timeti + γ11timetitraiti + υ0i + eti , (1)
where at time t for person i eti ∼ N(0, σ2e) and υ0i ∼ N(0, τ00) (for a fixed slope model).320
We estimated separate models for the two dependent variables personal and indirect321
contact and each of the four traits, extraversion, affiliation motive, need to be alone, and322
social anxiety.323
SOCIAL CONTACT, WELL-BEING, AND SOCIAL TRAITS 16
Second, we predicted variation in well-being over time (life satisfaction and324
depressivity/anxiety) with contact frequency as a time-varying predictor (either personal or325
indirect contact) and each social trait as a Level-2 predictor (person level):326
wellbeingti =γ00 + γ01traiti + γ02contactBPi + γ03traiticontactBPi
+ γ10timeti + γ20contactWPti + γ21contactWPtitraiti
+ υ0i + eti ,
(2)
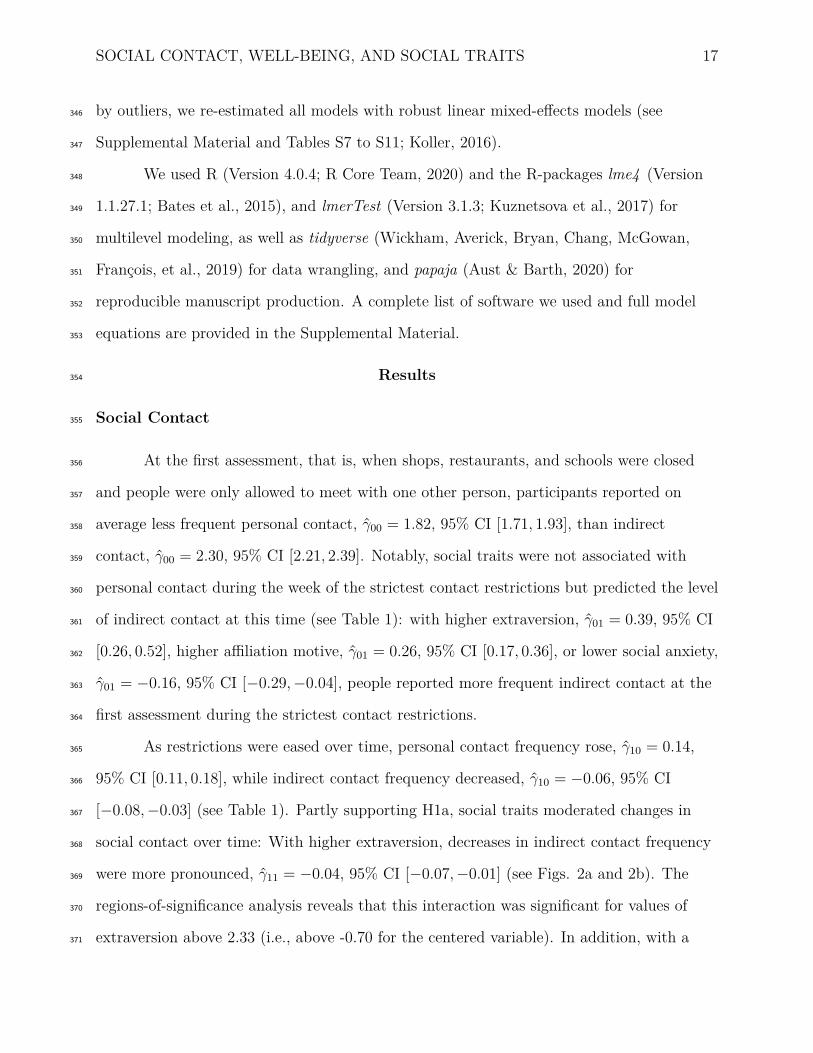
where eti ∼ N(0, σ2e) and υ0i ∼ N(0, τ00) (for a fixed slope model). We included time as a327
linear predictor centered at the first assessment wave to detrend the effects (Wang &328
Maxwell, 2015). Contact was centered on the person-specific baseline (T1) to distinguish329
between-person from within-person variation in contact (Hoffman, 2015, 2020): With330
baseline-centering, the between-person component (contactBPi) was each person’s contact331
frequency at the first assessment, from which the grand mean was subtracted. The332
within-person component (contactWPti) was the baseline-centered contact frequency, that333
is, a person’s contact frequency at each wave, from which their contact frequency at the334
first wave was subtracted. Thus, contactWPti represented the within-person effect of a335
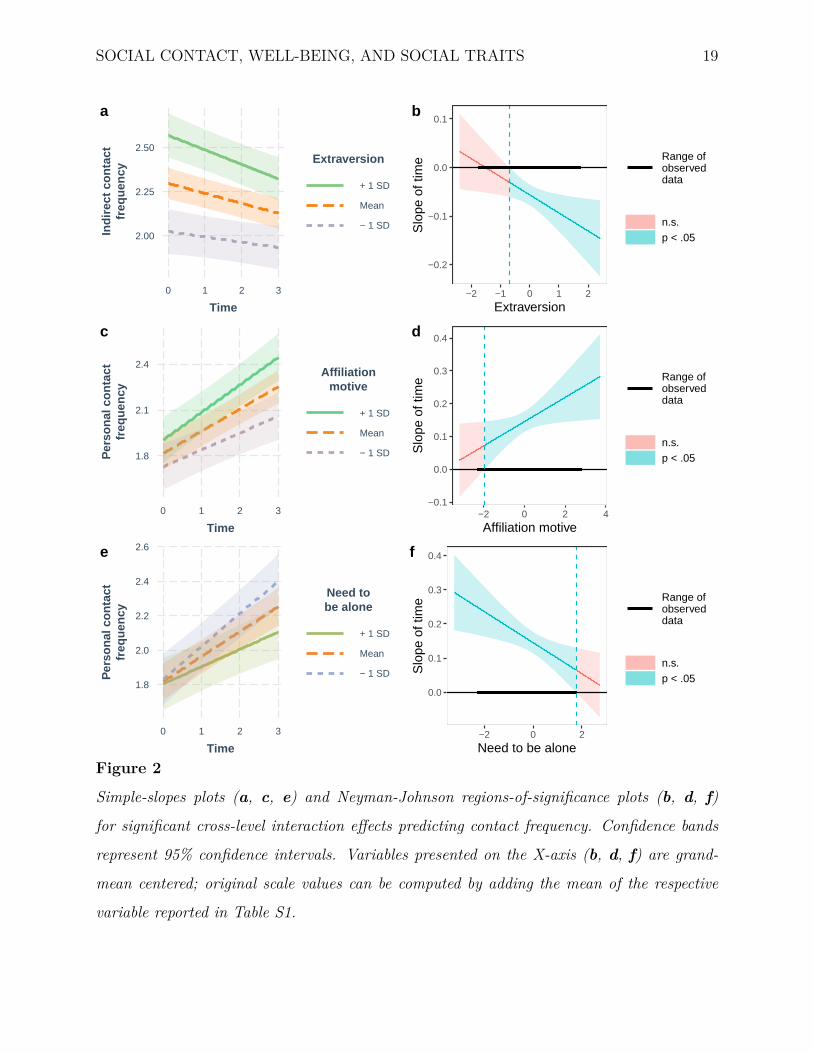
higher contact frequency at that wave than at the first wave. To test H2a and H2b, we336
estimated a cross-level interaction between contact frequency (personal or indirect) and337
each social trait (contactWPtitraiti).338
To probe significant cross-level interactions, we utilized simple-slopes plots at339
conditional values and regions-of-significance plots via the Johnson-Neyman technique340
(McCabe et al., 2018; Preacher et al., 2006). To compare the models’ predictive power, we341
computed R2 for the proportion of total variance explained by the model fixed effects342
(Hoffman, 2015), which is the squared Pearson correlation between the actual outcome and343
the outcome predicted by the model fixed effects. To gauge how robust the multilevel344
models were to violated assumptions regarding multivariate normality and contamination345
SOCIAL CONTACT, WELL-BEING, AND SOCIAL TRAITS 17
by outliers, we re-estimated all models with robust linear mixed-effects models (see346
Supplemental Material and Tables S7 to S11; Koller, 2016).347
We used R (Version 4.0.4; R Core Team, 2020) and the R-packages lme4 (Version348
1.1.27.1; Bates et al., 2015), and lmerTest (Version 3.1.3; Kuznetsova et al., 2017) for349
multilevel modeling, as well as tidyverse (Wickham, Averick, Bryan, Chang, McGowan,350
François, et al., 2019) for data wrangling, and papaja (Aust & Barth, 2020) for351
reproducible manuscript production. A complete list of software we used and full model352
equations are provided in the Supplemental Material.353
Results354
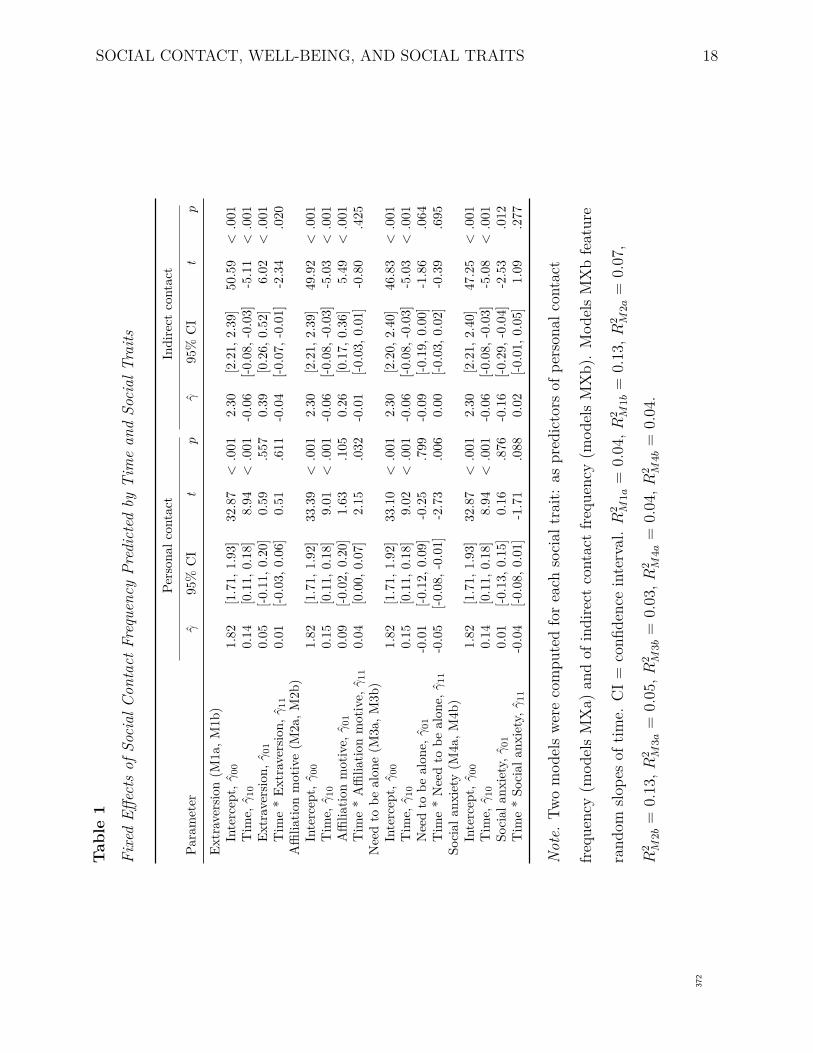
Social Contact355
At the first assessment, that is, when shops, restaurants, and schools were closed356
and people were only allowed to meet with one other person, participants reported on357
average less frequent personal contact, γ̂00 = 1.82, 95% CI [1.71, 1.93], than indirect358
contact, γ̂00 = 2.30, 95% CI [2.21, 2.39]. Notably, social traits were not associated with359
personal contact during the week of the strictest contact restrictions but predicted the level360
of indirect contact at this time (see Table 1): with higher extraversion, γ̂01 = 0.39, 95% CI361
[0.26, 0.52], higher affiliation motive, γ̂01 = 0.26, 95% CI [0.17, 0.36], or lower social anxiety,362
γ̂01 = −0.16, 95% CI [−0.29, −0.04], people reported more frequent indirect contact at the363
first assessment during the strictest contact restrictions.364
As restrictions were eased over time, personal contact frequency rose, γ̂10 = 0.14,365
95% CI [0.11, 0.18], while indirect contact frequency decreased, γ̂10 = −0.06, 95% CI366
[−0.08, −0.03] (see Table 1). Partly supporting H1a, social traits moderated changes in367
social contact over time: With higher extraversion, decreases in indirect contact frequency368
were more pronounced, γ̂11 = −0.04, 95% CI [−0.07, −0.01] (see Figs. 2a and 2b). The369
regions-of-significance analysis reveals that this interaction was significant for values of370
extraversion above 2.33 (i.e., above -0.70 for the centered variable). In addition, with a371
SOCIAL CONTACT, WELL-BEING, AND SOCIAL TRAITS 18
Tab
le1
Fixe
dEff
ects
ofSo
cial
Con
tact
Freq
uenc
yPr
edic
ted
byT
ime
and
Soci
alTr
aits
Pers
onal
cont
act
Indi
rect
cont
act
Para
met
erγ̂
95%
CI
tp
γ̂95
%C
It
p
Extr
aver
sion
(M1a
,M1b
)In
terc
ept,
γ̂00
T1
1.82
[1.7
1,1.
93]
32.8
7<
.001
2.30
[2.2
1,2.
39]
50.5
9<
.001
Tim
e,γ̂
10T
10.
14[0
.11,
0.18
]8.
94<
.001
-0.0
6[-0
.08,
-0.0
3]-5
.11
<.0
01Ex
trav
ersio
n,γ̂
010.
05[-0
.11,
0.20
]0.
59.5
570.
39[0
.26,
0.52
]6.
02<
.001
Tim
e*
Extr
aver
sion,
γ̂11
0.01
[-0.0
3,0.
06]
0.51
.611
-0.0
4[-0
.07,
-0.0
1]-2
.34
.020
Affi
liatio
nm
otiv
e(M
2a,M
2b)
Inte
rcep
t,γ̂
00T
21.
82[1
.71,
1.92
]33
.39
<.0
012.
30[2
.21,
2.39
]49
.92
<.0
01T
ime,
γ̂10
T2
0.15
[0.1
1,0.
18]
9.01
<.0
01-0
.06
[-0.0
8,-0
.03]
-5.0
3<
.001
Affi
liatio
nm
otiv
e,γ̂
010.
09[-0
.02,
0.20
]1.
63.1
050.
26[0
.17,
0.36
]5.
49<
.001
Tim
e*
Affi
liatio
nm
otiv
e,γ̂
110.
04[0
.00,
0.07
]2.
15.0
32-0
.01
[-0.0
3,0.
01]
-0.8
0.4
25N
eed
tobe
alon
e(M
3a,M
3b)
Inte
rcep
t,γ̂
00T
31.
82[1
.71,
1.92
]33
.10
<.0
012.
30[2
.20,
2.40
]46
.83
<.0
01T
ime,
γ̂10
T3
0.15
[0.1
1,0.
18]
9.02
<.0
01-0
.06
[-0.0
8,-0
.03]
-5.0
3<
.001
Nee
dto
beal
one,
γ̂01
-0.0
1[-0
.12,
0.09
]-0
.25
.799
-0.0
9[-0
.19,
0.00
]-1
.86
.064
Tim
e*
Nee
dto
beal
one,
γ̂11
-0.0
5[-0
.08,
-0.0
1]-2
.73
.006
0.00
[-0.0
3,0.
02]
-0.3
9.6
95So
cial
anxi
ety
(M4a
,M4b
)In
terc
ept,
γ̂00
T4
1.82
[1.7
1,1.
93]
32.8
7<
.001
2.30
[2.2
1,2.
40]
47.2
5<
.001
Tim
e,γ̂
10T
40.
14[0
.11,
0.18
]8.
94<
.001
-0.0
6[-0
.08,
-0.0
3]-5
.08
<.0
01So
cial
anxi
ety,
γ̂01
0.01
[-0.1
3,0.
15]
0.16
.876
-0.1
6[-0
.29,
-0.0
4]-2
.53
.012
Tim
e*
Soci
alan
xiet
y,γ̂
11-0
.04
[-0.0
8,0.
01]
-1.7
1.0
880.
02[-0
.01,
0.05
]1.
09.2
77
Not
e.Tw
om
odel
swe
reco
mpu
ted
for
each
soci
altr
ait:
aspr
edic
tors
ofpe
rson
alco
ntac
t
frequ
ency
(mod
els
MX
a)an
dof
indi
rect
cont
act
frequ
ency
(mod
els
MX
b).
Mod
els
MX
bfe
atur
e
rand
omslo
pes
oftim
e.C
I=co
nfide
nce
inte
rval
.R
2 M1a
=0.
04,R
2 M1b
=0.
13,R
2 M2a
=0.
07,
R2 M
2b=
0.13
,R2 M
3a=
0.05
,R2 M
3b=
0.03
,R2 M
4a=
0.04
,R2 M
4b=
0.04
.
372
SOCIAL CONTACT, WELL-BEING, AND SOCIAL TRAITS 19
2.00
2.25
2.50
0 1 2 3
Time
Indi
rect
con
tact
freq
uenc
y
Extraversion
+ 1 SD
Mean
− 1 SD
a
−0.2
−0.1
0.0
0.1
−2 −1 0 1 2
Extraversion
Slo
pe o
f tim
e Range ofobserveddata
n.s.p < .05
b
1.8
2.1
2.4
0 1 2 3
Time
Per
sona
l con
tact
freq
uenc
y
Affiliationmotive
+ 1 SD
Mean
− 1 SD
c
−0.1
0.0
0.1
0.2
0.3
0.4
−2 0 2 4
Affiliation motive
Slo
pe o
f tim
e Range ofobserveddata
n.s.p < .05
d
1.8
2.0
2.2
2.4
2.6
0 1 2 3
Time
Per
sona
l con
tact
freq
uenc
y
Need tobe alone
+ 1 SD
Mean
− 1 SD
e
0.0
0.1
0.2
0.3
0.4
−2 0 2
Need to be alone
Slo
pe o
f tim
e Range ofobserveddata
n.s.p < .05
f
Figure 2
Simple-slopes plots (a, c, e) and Neyman-Johnson regions-of-significance plots (b, d, f)
for significant cross-level interaction effects predicting contact frequency. Confidence bands
represent 95% confidence intervals. Variables presented on the X-axis (b, d, f) are grand-
mean centered; original scale values can be computed by adding the mean of the respective
variable reported in Table S1.
SOCIAL CONTACT, WELL-BEING, AND SOCIAL TRAITS 20
higher affiliation motive, the increase in personal contact frequency was more pronounced,373
γ̂11 = 0.04, 95% CI [0.00, 0.07]. This interaction was significant for values of affiliation374
motive above 1.28 (i.e., above -1.95 for the centered variable), nearly the complete range of375
observed values (see Figs. 2c and 2d). In partial support of H1b, with a higher need to be376
alone, increases in personal contact frequency were less pronounced, γ̂11 = −0.05, 95% CI377
[−0.08, −0.01] (see Table 1 and Figs. 2e and 2f). This interaction was significant for the378
whole range of observed values in the need to be alone. We did not observe social anxiety379
to be related to rates of change in personal or indirect social contact.380
The practical significance and size of the effects can be inferred from the scaling of381
personal contact on the y-axis in Figure 2. For example, in Figure 2c, participants low (-1382
SD) and high (+1 SD) in affiliation motive reported roughly the same amount of personal383
contact at the first assessment, which was a little less than “once” during the last week384
(corresponding to 2 on the 5-point scale). At the last assessment, participants low in385
affiliation motive reported on average 0.33 scale points more personal contact just passing386
2 on the 5-point scale (i.e, “once” during the last week). In contrast, participants high in387
affiliation motive reported 0.54 higher personal contact, which corresponded to 2.44 on the388
5-point scale (i.e., in between “once” and “multiple days” during the last week).389
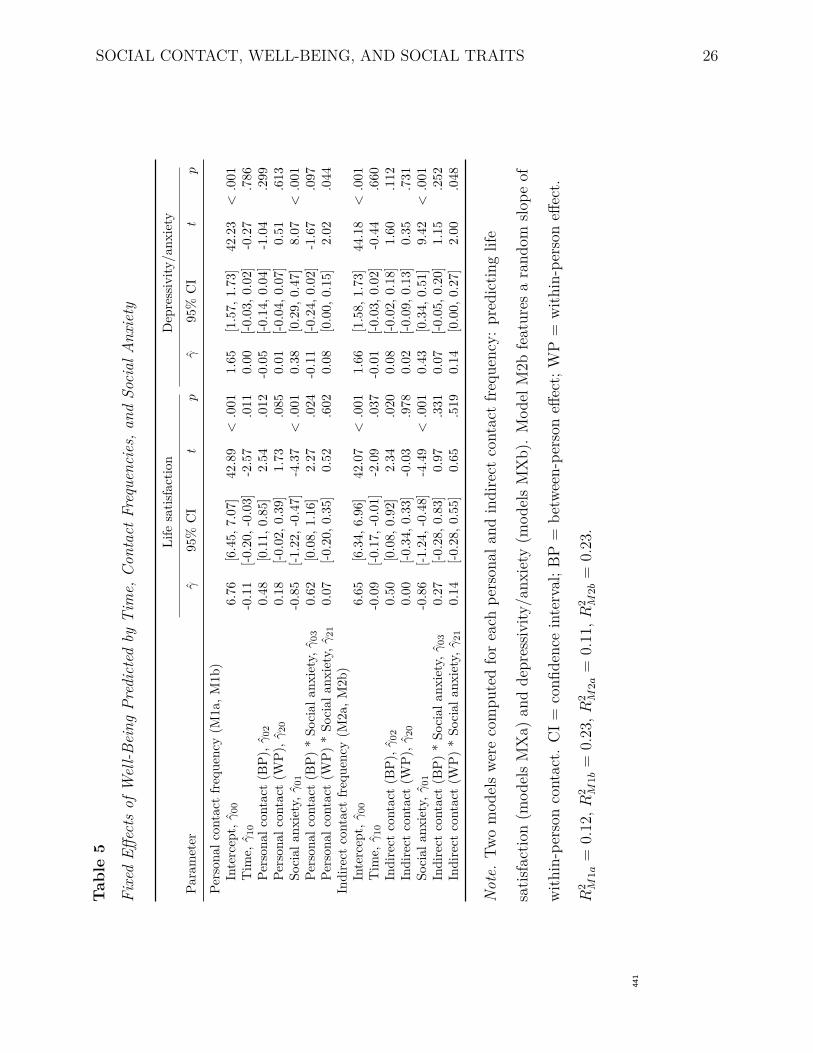
Well-Being390
Over time, life satisfaction declined linearly, γ̂10 = −0.11, 95% CI [−0.20, −0.03],391
whereas depressivity/anxiety remained stable on average (see Tables 2 to 5). During strict392
contact restrictions at the first assessment, life satisfaction was higher with higher393
extraversion, γ̂01 = 1.18, 95% CI [0.76, 1.60], higher affiliation motive, γ̂01 = 0.40, 95% CI394
[0.08, 0.73], and lower social anxiety, γ̂01 = −0.85, 95% CI [−1.22, −0.47]. At the same395
time, the lower the participants’ extraversion, γ̂01 = −0.26, 95% CI [−0.38, −0.15], and the396
higher their social anxiety, γ̂01 = 0.38, 95% CI [0.29, 0.47], the higher their397
depressivity/anxiety. More frequent initial personal and indirect contact (i.e.,398
SOCIAL CONTACT, WELL-BEING, AND SOCIAL TRAITS 21
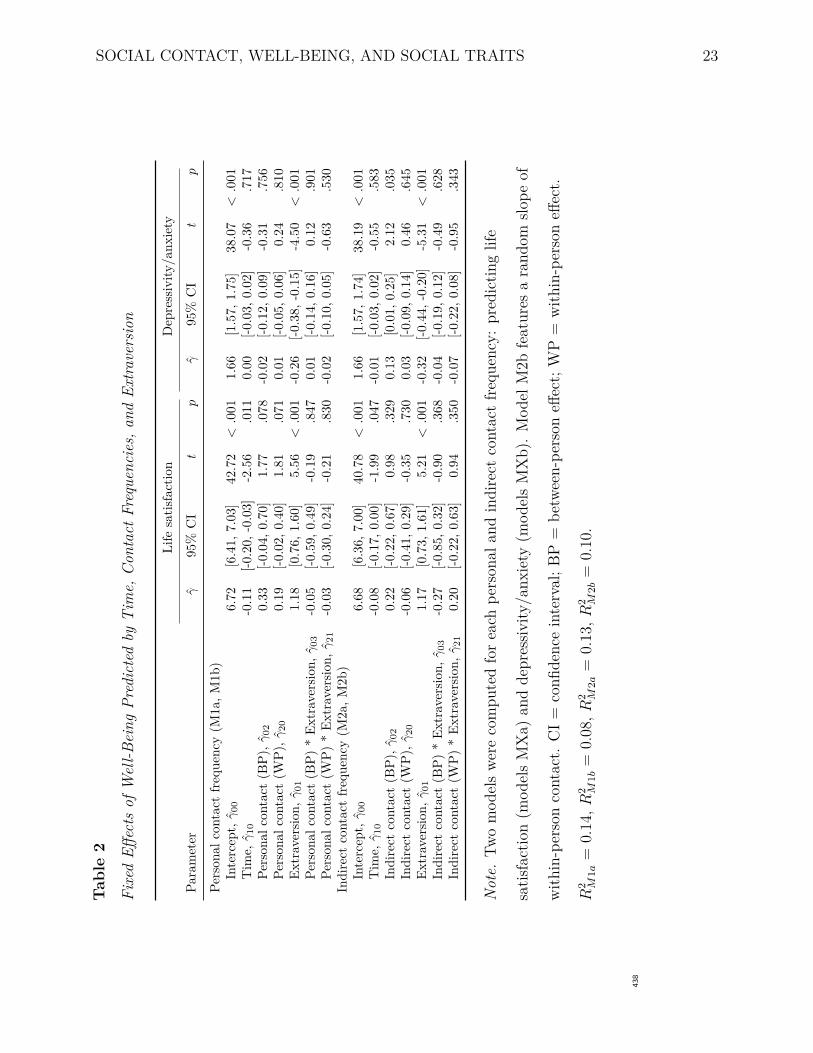
between-person differences at T1) was associated with higher life satisfaction, although399
these effects were significant in only five out of eight models (see Tables 2 to 5).400
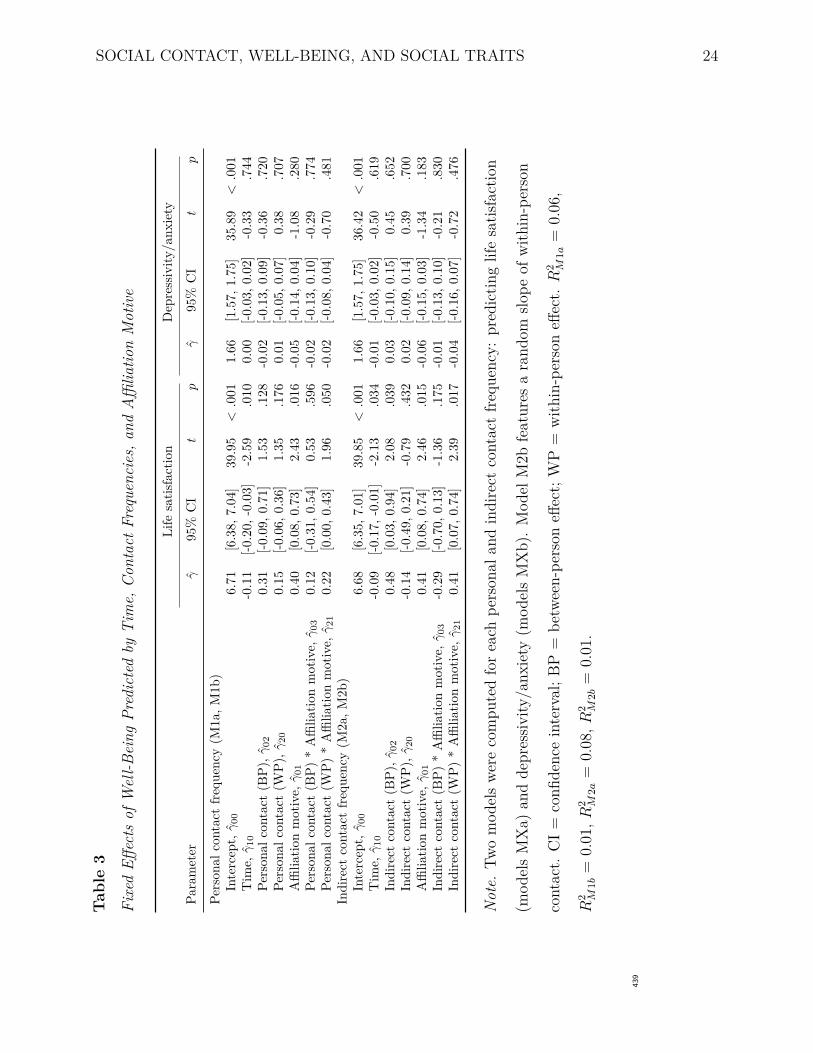
Having more indirect contact as compared to the baseline (i.e., during the strictest401
contact restrictions) was associated with higher life satisfaction for people with a higher402
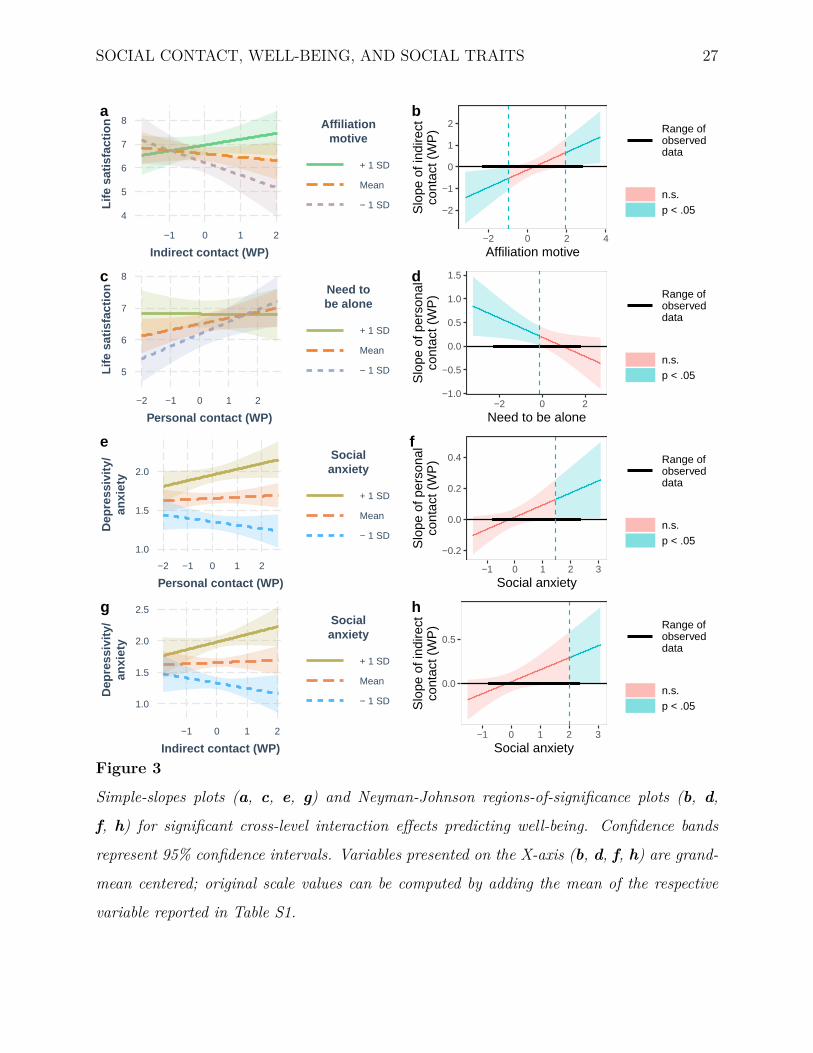
affiliation motive, γ̂21 = 0.41, 95% CI [0.07, 0.74] (see Table 3). As Figures 3a and 3b show,403
life satisfaction increased with more frequent indirect contact for those with a higher404
affiliation motive, whereas it decreased for those with a lower affiliation motive. The405
regions-of-significance plot shows that the within-person association between indirect406
contact and life satisfaction was significant for values of affiliation motive below 2.26 (i.e.,407
below -0.97 for the centered variable) and above 5.18 (i.e., above 1.95 for the centered408
variable), albeit in opposite directions. Although non-significant at p = .050, we found a409
similar pattern for the cross-level interaction of affiliation motive and more frequent410
personal contact as compared to the baseline, which we present in Figure S2 for the sake of411
completeness.412
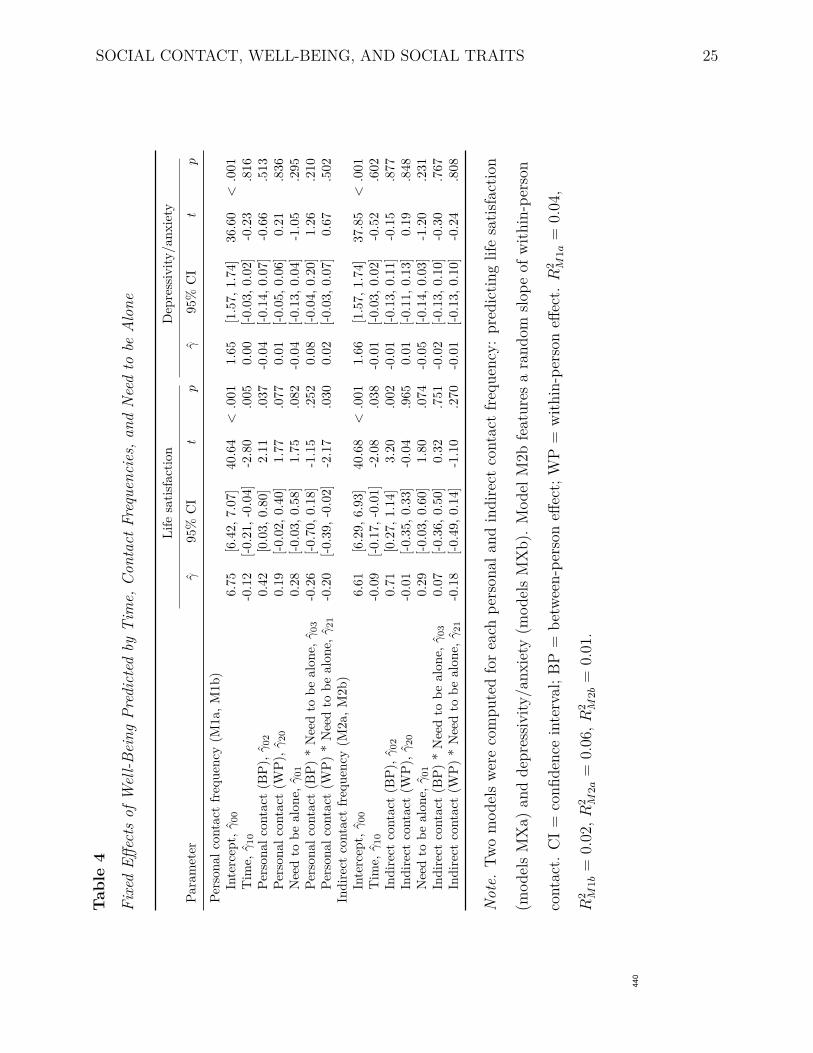
Conversely, more frequent personal contact as compared to the first assessment was413
associated with higher life satisfaction for people with a lower need to be alone,414
γ̂21 = −0.20, 95% CI [−0.39, −0.02] (see Table 4 and Figs. 3c and 3d), the slope being415
significant for people scoring below 5.15 (i.e., below -0.10 for the centered variable) in the416
need to be alone. Participants’ depressivity/anxiety increased with more frequent personal417
or indirect contact as compared to the baseline among people higher in social anxiety,418
γ̂21 = 0.08, 95% CI [0.00, 0.15], γ̂21 = 0.14, 95% CI [0.00, 0.27] (see Table 5). Figures 3e to419
3h emphasizes the nature of these associations via simple-slopes and regions-of-significance420
plots: More frequent social contact than at the first wave was associated with higher421
depressivity/anxiety among people higher in social anxiety (above 3.23 in social anxiety for422
personal contact, i.e., above 1.47 for the centered variable; and above 3.78 for indirect423
contact, i.e., above 2.02 for the centered variable).424
Overall, we found partial empirical support for H2a and H2b such that affiliation425
SOCIAL CONTACT, WELL-BEING, AND SOCIAL TRAITS 22
motive, need to be alone, and social anxiety moderated the effects of increased social426
contact on well-being over the course of our study as contact restrictions were being eased.427
Exploratory Analyses428
Following an anonymous reviewer’s suggestion to investigate overlap between the429
social trait constructs, we specified multilevel structural equation models in Mplus430
(Muthén & Muthén, 2019, Version 8.4), in which a latent social trait factor moderated the431
effects of time and of social contact. This latent factor represented the shared variance of432
the four social traits. The exploratory analyses suggested significant moderation of the433
resumption of personal contact by the latent social trait factor (see Table S12). For434
predicting well-being changes, we did not find significant moderation of the effects of435
increased contact by the latent social trait factor (see Table S13). This could indicate that436
the effects for well-being reported in the main manuscript are specific to each social trait.437
SOCIAL CONTACT, WELL-BEING, AND SOCIAL TRAITS 23
Tab
le2
Fixe
dEff
ects
ofW
ell-B
eing
Pred
icte
dby
Tim
e,C
onta
ctFr
eque
ncie
s,an
dEx
trave
rsio
n
Life
satis
fact
ion
Dep
ress
ivity
/anx
iety
Para
met
erγ̂
95%
CI
tp
γ̂95
%C
It
p
Pers
onal
cont
act
freq
uenc
y(M
1a,M
1b)
Inte
rcep
t,γ̂
00T
16.
72[6
.41,
7.03
]42
.72
<.0
011.
66[1
.57,
1.75
]38
.07
<.0
01T
ime,
γ̂10
T1
-0.1
1[-0
.20,
-0.0
3]-2
.56
.011
0.00
[-0.0
3,0.
02]
-0.3
6.7
17Pe
rson
alco
ntac
t(B
P),γ̂
020.
33[-0
.04,
0.70
]1.
77.0
78-0
.02
[-0.1
2,0.
09]
-0.3
1.7
56Pe
rson
alco
ntac
t(W
P),γ̂
200.
19[-0
.02,
0.40
]1.
81.0
710.
01[-0
.05,
0.06
]0.
24.8
10Ex
trav
ersio
n,γ̂
01T
11.
18[0
.76,
1.60
]5.
56<
.001
-0.2
6[-0
.38,
-0.1
5]-4
.50
<.0
01Pe
rson
alco
ntac
t(B
P)*
Extr
aver
sion,
γ̂03
-0.0
5[-0
.59,
0.49
]-0
.19
.847
0.01
[-0.1
4,0.
16]
0.12
.901
Pers
onal
cont
act
(WP)
*Ex
trav
ersio
n,γ̂
21-0
.03
[-0.3
0,0.
24]
-0.2
1.8
30-0
.02
[-0.1
0,0.
05]
-0.6
3.5
30In
dire
ctco
ntac
tfr
eque
ncy
(M2a
,M2b
)In
terc
ept,
γ̂00
T2
6.68
[6.3
6,7.
00]
40.7
8<
.001
1.66
[1.5
7,1.
74]
38.1
9<
.001
Tim
e,γ̂
10T
2-0
.08
[-0.1
7,0.
00]
-1.9
9.0
47-0
.01
[-0.0
3,0.
02]
-0.5
5.5
83In
dire
ctco
ntac
t(B
P),γ̂
020.
22[-0
.22,
0.67
]0.
98.3
290.
13[0
.01,
0.25
]2.
12.0
35In
dire
ctco
ntac
t(W
P),γ̂
20-0
.06
[-0.4
1,0.
29]
-0.3
5.7
300.
03[-0
.09,
0.14
]0.
46.6
45Ex
trav
ersio
n,γ̂
01T
21.
17[0
.73,
1.61
]5.
21<
.001
-0.3
2[-0
.44,
-0.2
0]-5
.31
<.0
01In
dire
ctco
ntac
t(B
P)*
Extr
aver
sion,
γ̂03
-0.2
7[-0
.85,
0.32
]-0
.90
.368
-0.0
4[-0
.19,
0.12
]-0
.49
.628
Indi
rect
cont
act
(WP)
*Ex
trav
ersio
n,γ̂
210.
20[-0
.22,
0.63
]0.
94.3
50-0
.07
[-0.2
2,0.
08]
-0.9
5.3
43
Not
e.Tw
om
odel
swe
reco
mpu
ted
for
each
pers
onal
and
indi
rect
cont
act
frequ
ency
:pr
edic
ting
life
satis
fact
ion
(mod
els
MX
a)an
dde
pres
sivity
/anx
iety
(mod
els
MX
b).
Mod
elM
2bfe
atur
esa
rand
omslo
peof
with
in-p
erso
nco
ntac
t.C
I=co
nfide
nce
inte
rval
;BP
=be
twee
n-pe
rson
effec
t;W
P=
with
in-p
erso
neff
ect.
R2 M
1a=
0.14
,R2 M
1b=
0.08
,R2 M
2a=
0.13
,R2 M
2b=
0.10
.
438
SOCIAL CONTACT, WELL-BEING, AND SOCIAL TRAITS 24
Tab
le3
Fixe
dEff
ects
ofW
ell-B
eing
Pred
icte
dby
Tim
e,C
onta
ctFr
eque
ncie
s,an
dA
ffilia
tion
Mot
ive
Life
satis
fact
ion
Dep
ress
ivity
/anx
iety
Para
met
erγ̂
95%
CI
tp
γ̂95
%C
It
p
Pers
onal
cont
act
freq
uenc
y(M
1a,M
1b)
Inte
rcep
t,γ̂
00T
16.
71[6
.38,
7.04
]39
.95
<.0
011.
66[1
.57,
1.75
]35
.89
<.0
01T
ime,
γ̂10
T1
-0.1
1[-0
.20,
-0.0
3]-2
.59
.010
0.00
[-0.0
3,0.
02]
-0.3
3.7
44Pe
rson
alco
ntac
t(B
P),γ̂
020.
31[-0
.09,
0.71
]1.
53.1
28-0
.02
[-0.1
3,0.
09]
-0.3
6.7
20Pe
rson
alco
ntac
t(W
P),γ̂
200.
15[-0
.06,
0.36
]1.
35.1
760.
01[-0
.05,
0.07
]0.
38.7
07A
ffilia
tion
mot
ive,
γ̂01
T1
0.40
[0.0
8,0.
73]
2.43
.016
-0.0
5[-0
.14,
0.04
]-1
.08
.280
Pers
onal
cont
act
(BP)
*A
ffilia
tion
mot
ive,
γ̂03
0.12
[-0.3
1,0.
54]
0.53
.596
-0.0
2[-0
.13,
0.10
]-0
.29
.774
Pers
onal
cont
act
(WP)
*A
ffilia
tion
mot
ive,
γ̂21
0.22
[0.0
0,0.
43]
1.96
.050
-0.0
2[-0
.08,
0.04
]-0
.70
.481
Indi
rect
cont
act
freq
uenc
y(M
2a,M
2b)
Inte
rcep
t,γ̂
00T
26.
68[6
.35,
7.01
]39
.85
<.0
011.
66[1
.57,
1.75
]36
.42
<.0
01T
ime,
γ̂10
T2
-0.0
9[-0
.17,
-0.0
1]-2
.13
.034
-0.0
1[-0
.03,
0.02
]-0
.50
.619
Indi
rect
cont
act
(BP)
,γ̂02
0.48
[0.0
3,0.
94]
2.08
.039
0.03
[-0.1
0,0.
15]
0.45
.652
Indi
rect
cont
act
(WP)
,γ̂20
-0.1
4[-0
.49,
0.21
]-0
.79
.432
0.02
[-0.0
9,0.
14]
0.39
.700
Affi
liatio
nm
otiv
e,γ̂
01T
20.
41[0
.08,
0.74
]2.
46.0
15-0
.06
[-0.1
5,0.
03]
-1.3
4.1
83In
dire
ctco
ntac
t(B
P)*
Affi
liatio
nm
otiv
e,γ̂
03-0
.29
[-0.7
0,0.
13]
-1.3
6.1
75-0
.01
[-0.1
3,0.
10]
-0.2
1.8
30In
dire
ctco
ntac
t(W
P)*
Affi
liatio
nm
otiv
e,γ̂
210.
41[0
.07,
0.74
]2.
39.0
17-0
.04
[-0.1
6,0.
07]
-0.7
2.4
76
Not
e.Tw
om
odel
swe
reco
mpu
ted
for
each
pers
onal
and
indi
rect
cont
act
frequ
ency
:pr
edic
ting
life
satis
fact
ion
(mod
els
MX
a)an
dde
pres
sivity
/anx
iety
(mod
els
MX
b).
Mod
elM
2bfe
atur
esa
rand
omslo
peof
with
in-p
erso
n
cont
act.
CI=
confi
denc
ein
terv
al;B
P=
betw
een-
pers
oneff
ect;
WP
=w
ithin
-per
son
effec
t.R
2 M1a
=0.
06,
R2 M
1b=
0.01
,R2 M
2a=
0.08
,R2 M
2b=
0.01
.
439
SOCIAL CONTACT, WELL-BEING, AND SOCIAL TRAITS 25
Tab
le4
Fixe
dEff
ects
ofW
ell-B
eing
Pred
icte
dby
Tim
e,C
onta
ctFr
eque
ncie
s,an
dN
eed
tobe
Alo
ne
Life
satis
fact
ion
Dep
ress
ivity
/anx
iety
Para
met
erγ̂
95%
CI
tp
γ̂95
%C
It
p
Pers
onal
cont
act
freq
uenc
y(M
1a,M
1b)
Inte
rcep
t,γ̂
00T
16.
75[6
.42,
7.07
]40
.64
<.0
011.
65[1
.57,
1.74
]36
.60
<.0
01T
ime,
γ̂10
T1
-0.1
2[-0
.21,
-0.0
4]-2
.80
.005
0.00
[-0.0
3,0.
02]
-0.2
3.8
16Pe
rson
alco
ntac
t(B
P),γ̂
020.
42[0
.03,
0.80
]2.
11.0
37-0
.04
[-0.1
4,0.
07]
-0.6
6.5
13Pe
rson
alco
ntac
t(W
P),γ̂
200.
19[-0
.02,
0.40
]1.
77.0
770.
01[-0
.05,
0.06
]0.
21.8
36N
eed
tobe
alon
e,γ̂
01T
10.
28[-0
.03,
0.58
]1.
75.0
82-0
.04
[-0.1
3,0.
04]
-1.0
5.2
95Pe
rson
alco
ntac
t(B
P)*
Nee
dto
beal
one,
γ̂03
-0.2
6[-0
.70,
0.18
]-1
.15
.252
0.08
[-0.0
4,0.
20]
1.26
.210
Pers
onal
cont
act
(WP)
*N
eed
tobe
alon
e,γ̂
21-0
.20
[-0.3
9,-0
.02]
-2.1
7.0
300.
02[-0
.03,
0.07
]0.
67.5
02In
dire
ctco
ntac
tfr
eque
ncy
(M2a
,M2b
)In
terc
ept,
γ̂00
T2
6.61
[6.2
9,6.
93]
40.6
8<
.001
1.66
[1.5
7,1.
74]
37.8
5<
.001
Tim
e,γ̂
10T
2-0
.09
[-0.1
7,-0
.01]
-2.0
8.0
38-0
.01
[-0.0
3,0.
02]
-0.5
2.6
02In
dire
ctco
ntac
t(B
P),γ̂
020.
71[0
.27,
1.14
]3.
20.0
02-0
.01
[-0.1
3,0.
11]
-0.1
5.8
77In
dire
ctco
ntac
t(W
P),γ̂
20-0
.01
[-0.3
5,0.
33]
-0.0
4.9
650.
01[-0
.11,
0.13
]0.
19.8
48N
eed
tobe
alon
e,γ̂
01T
20.
29[-0
.03,
0.60
]1.
80.0
74-0
.05
[-0.1
4,0.
03]
-1.2
0.2
31In
dire
ctco
ntac
t(B
P)*
Nee
dto
beal
one,
γ̂03
0.07
[-0.3
6,0.
50]
0.32
.751
-0.0
2[-0
.13,
0.10
]-0
.30
.767
Indi
rect
cont
act
(WP)
*N
eed
tobe
alon
e,γ̂
21-0
.18
[-0.4
9,0.
14]
-1.1
0.2
70-0
.01
[-0.1
3,0.
10]
-0.2
4.8
08
Not
e.Tw
om
odel
swe
reco
mpu
ted
for
each
pers
onal
and
indi
rect
cont
act
frequ
ency
:pr
edic
ting
life
satis
fact
ion
(mod
els
MX
a)an
dde
pres
sivity
/anx
iety
(mod
els
MX
b).
Mod
elM
2bfe
atur
esa
rand
omslo
peof
with
in-p
erso
n
cont
act.
CI=
confi
denc
ein
terv
al;B
P=
betw
een-
pers
oneff
ect;
WP
=w
ithin
-per
son
effec
t.R
2 M1a
=0.
04,
R2 M
1b=
0.02
,R2 M
2a=
0.06
,R2 M
2b=
0.01
.
440
SOCIAL CONTACT, WELL-BEING, AND SOCIAL TRAITS 26
Tab
le5
Fixe
dEff
ects
ofW
ell-B
eing
Pred
icte
dby
Tim
e,C
onta
ctFr
eque
ncie
s,an
dSo
cial
Anxi
ety
Life
satis
fact
ion
Dep
ress
ivity
/anx
iety
Para
met
erγ̂
95%
CI
tp
γ̂95
%C
It
p
Pers
onal
cont
act
freq
uenc
y(M
1a,M
1b)
Inte
rcep
t,γ̂
00T
16.
76[6
.45,
7.07
]42
.89
<.0
011.
65[1
.57,
1.73
]42
.23
<.0
01T
ime,
γ̂10
T1
-0.1
1[-0
.20,
-0.0
3]-2
.57
.011
0.00
[-0.0
3,0.
02]
-0.2
7.7
86Pe
rson
alco
ntac
t(B
P),γ̂
020.
48[0
.11,
0.85
]2.
54.0
12-0
.05
[-0.1
4,0.
04]
-1.0
4.2
99Pe
rson
alco
ntac
t(W
P),γ̂
200.
18[-0
.02,
0.39
]1.
73.0
850.
01[-0
.04,
0.07
]0.
51.6
13So
cial
anxi
ety,
γ̂01
T1
-0.8
5[-1
.22,
-0.4
7]-4
.37
<.0
010.
38[0
.29,
0.47
]8.
07<
.001
Pers
onal
cont
act
(BP)
*So
cial
anxi
ety,
γ̂03
0.62
[0.0
8,1.
16]
2.27
.024
-0.1
1[-0
.24,
0.02
]-1
.67
.097
Pers
onal
cont
act
(WP)
*So
cial
anxi
ety,
γ̂21
0.07
[-0.2
0,0.
35]
0.52
.602
0.08
[0.0
0,0.
15]
2.02
.044
Indi
rect
cont
act
freq
uenc
y(M
2a,M
2b)
Inte
rcep
t,γ̂
00T
26.
65[6
.34,
6.96
]42
.07
<.0
011.
66[1
.58,
1.73
]44
.18
<.0
01T
ime,
γ̂10
T2
-0.0
9[-0
.17,
-0.0
1]-2
.09
.037
-0.0
1[-0
.03,
0.02
]-0
.44
.660
Indi
rect
cont
act
(BP)
,γ̂02
0.50
[0.0
8,0.
92]
2.34
.020
0.08
[-0.0
2,0.
18]
1.60
.112
Indi
rect
cont
act
(WP)
,γ̂20
0.00
[-0.3
4,0.
33]
-0.0
3.9
780.
02[-0
.09,
0.13
]0.
35.7
31So
cial
anxi
ety,
γ̂01
T2
-0.8
6[-1
.24,
-0.4
8]-4
.49
<.0
010.
43[0
.34,
0.51
]9.
42<
.001
Indi
rect
cont
act
(BP)
*So
cial
anxi
ety,
γ̂03
0.27
[-0.2
8,0.
83]
0.97
.331
0.07
[-0.0
5,0.
20]
1.15
.252
Indi
rect
cont
act
(WP)
*So
cial
anxi
ety,
γ̂21
0.14
[-0.2
8,0.
55]
0.65
.519
0.14
[0.0
0,0.
27]
2.00
.048
Not
e.Tw
om
odel
swe
reco
mpu
ted
for
each
pers
onal
and
indi
rect
cont
act
frequ
ency
:pr
edic
ting
life
satis
fact
ion
(mod
els
MX
a)an
dde
pres
sivity
/anx
iety
(mod
els
MX
b).
Mod
elM
2bfe
atur
esa
rand
omslo
peof
with
in-p
erso
nco
ntac
t.C
I=co
nfide
nce
inte
rval
;BP
=be
twee
n-pe
rson
effec
t;W
P=
with
in-p
erso
neff
ect.
R2 M
1a=
0.12
,R2 M
1b=
0.23
,R2 M
2a=
0.11
,R2 M
2b=
0.23
.
441
SOCIAL CONTACT, WELL-BEING, AND SOCIAL TRAITS 27
4
5
6
7
8
−1 0 1 2
Indirect contact (WP)
Life
sat
isfa
ctio
n Affiliationmotive
+ 1 SD
Mean
− 1 SD
a
−2
−1
0
1
2
−2 0 2 4
Affiliation motive
Slo
pe o
f ind
irect
cont
act (
WP
) Range ofobserveddata
n.s.p < .05
b
5
6
7
8
−2 −1 0 1 2
Personal contact (WP)
Life
sat
isfa
ctio
n Need tobe alone
+ 1 SD
Mean
− 1 SD
c
−1.0
−0.5
0.0
0.5
1.0
1.5
−2 0 2
Need to be aloneS
lope
of p
erso
nal
cont
act (
WP
) Range ofobserveddata
n.s.p < .05
d
1.0
1.5
2.0
−2 −1 0 1 2
Personal contact (WP)
Dep
ress
ivity
/an
xiet
y
Socialanxiety
+ 1 SD
Mean
− 1 SD
e
−0.2
0.0
0.2
0.4
−1 0 1 2 3
Social anxiety
Slo
pe o
f per
sona
lco
ntac
t (W
P) Range of
observeddata
n.s.p < .05
f
1.0
1.5
2.0
2.5
−1 0 1 2
Indirect contact (WP)
Dep
ress
ivity
/an
xiet
y
Socialanxiety
+ 1 SD
Mean
− 1 SD
g
0.0
0.5
−1 0 1 2 3
Social anxiety
Slo
pe o
f ind
irect
cont
act (
WP
) Range ofobserveddata
n.s.p < .05
h
Figure 3
Simple-slopes plots (a, c, e, g) and Neyman-Johnson regions-of-significance plots (b, d,
f, h) for significant cross-level interaction effects predicting well-being. Confidence bands
represent 95% confidence intervals. Variables presented on the X-axis (b, d, f, h) are grand-
mean centered; original scale values can be computed by adding the mean of the respective
variable reported in Table S1.
SOCIAL CONTACT, WELL-BEING, AND SOCIAL TRAITS 28
Discussion442
Based on the assumption that people differ in the need to maintain social443
relationships (Hall & Davis, 2017; Nezlek, 2001; Sheldon, 2011), we investigated how four444
social traits predicted changes in both contact frequency and well-being during successively445
eased contact restrictions.446
At the first assessment when personal contact was severely restricted447
(Aravindakshan et al., 2020; Becher et al., 2021; Bönisch et al., 2020; Del Fava et al., 2021;448
Tomori et al., 2021), only indirect but not personal contact varied with individual449
differences in social traits: Extraversion and affiliation motive were associated with more450
frequent indirect contact (Harari et al., 2019), and higher social anxiety with less frequent451
indirect contact. These results are especially noteworthy given robust associations between452
higher extraversion or affiliation motive and more frequent social contact under453
unrestricted circumstances (Breil et al., 2019; Hall, 2017; Wrzus et al., 2016). The454
difference between personal and indirect contact further suggests that governmental455
contact restrictions created a strong situation overriding individual differences (Cooper &456
Withey, 2009). As restrictions were eased, social traits predicted the resumption of457
personal contact. People with a higher affiliation motive increased their personal contact458
more, whereas people with a higher need to be alone increased their personal contact less.459
This supports our preregistered hypotheses and theoretical considerations of social need460
regulation (Hall & Davis, 2017; Sheldon, 2011): People experienced contact461
restrictions—on average—as deviations from their ideal level of social contact (Entringer &462
Gosling, 2021). With increasing situational opportunities to pursue their social needs,463
people resumed personal contact. The intensity of this increase varied depending on464
people’s affiliation motive and need to be alone. Likewise, recent studies have found465
personality traits to be associated with differences in self-reported pandemic precautions466
and adherence to governmental contact restrictions (Aschwanden et al., 2021; Götz et al.,467
2020; Zajenkowski et al., 2020; Zettler et al., 2021).468
SOCIAL CONTACT, WELL-BEING, AND SOCIAL TRAITS 29
The results for well-being offer further insights into how social traits shape the469
response to this strong situation: Well-being was still higher with higher extraversion when470
social contact was severely restricted during lockdown, yet extraverts’ well-being did not471
benefit more from resumed social activity. This is in line with research that extraverts’472
higher well-being is due primarily to the energy level facet and not to being more active473
socially (Anglim et al., 2020; Lucas et al., 2008; Margolis et al., 2020). Instead, differences474
in affiliation motive, need to be alone, and social anxiety moderated how well-being475
changed with increased contact: As predicted, more frequent indirect or personal contact476
compared to the first assessment during strict contact restrictions was associated with477
higher life satisfaction among people with a higher affiliation motive or a lower need to be478
alone, respectively—in line with previous research on romantic relationships (Zygar et al.,479
2018). In addition, people high in social anxiety increased in depressivity/anxiety as their480
social contact increased. Possibly, unwanted social contact amid an ongoing pandemic481
increased worries and fears among socially anxious people (Brown et al., 2007; Olivera-La482
Rosa et al., 2020). Results for indirect contact further emphasize the importance of483
individual differences in social need regulation: Affiliation motive and social anxiety484
moderated effects of changes in indirect contact frequency on well-being. This could485
explain divergent results on the role of digital technologies regarding well-being and coping486
with COVID-19-related distress (Boursier et al., 2020; Gabbiadini et al., 2020). The487
moderating effects of social traits on well-being, however, only occurred with certain trait488
manifestations (see Fig. 3) and, thus, warrant further investigation. It is possible that the489
regulation of life satisfaction, a cognitive component of well-being, is more closely linked to490
affiliation motive and need to be alone, whereas the regulation of depressivity/anxiety, an491
affective component of well-being, is linked to social anxiety.492
Together, these results provide novel, real-life evidence of differential regulation of493
social needs (Hall & Davis, 2017; McClelland, 1987) under unique nationwide external494
constraints on social contact that would not be possible in laboratory experiments or in495
SOCIAL CONTACT, WELL-BEING, AND SOCIAL TRAITS 30
observational studies under regular circumstances. After initial social deprivation during496
strict contact restrictions, people resumed personal contact to differing degrees, and497
increases in social contact were differentially associated with changes in well-being—with498
both effects depending on people’s social traits.499
Limitations500
Despite following an age- and gender-stratified sample longitudinally during501
governmental contact restrictions, some limitations need to be addressed. First, we did not502
measure participants’ pre-pandemic traits, contact frequency, and well-being. We assume503
that personal contact was at a nadir in Germany in early April 2020 (see mobility and504
social contact survey data, Bönisch et al., 2020; Becher et al., 2021; Del Fava et al., 2021;505
Tomori et al., 2021) and social need satisfaction thwarted at the first measurement.506
Relatedly, we assessed experiences during the previous week instead of moment to moment.507
Combined with an average time lag of 22 days between assessments, our design may have508
missed more short-term fluctuations in social contact and well-being as well as reciprocal509
links. For example, unmet social needs presumably reduce well-being within the next510
hours, and low well-being likely initiates seeking social contact (Zygar et al., 2018).511
Instead, the present study’s timing and reference frame of contact measurements allowed512
for an examination of a particular person-situation interaction, with changes to the strong513
situation unfolding over the course of weeks. Second, more culturally diverse samples would514
have allowed us to test effects of contact restrictions in different countries. Given previous515
cross-cultural work on social relationships and need satisfaction (Chen et al., 2015; Tay &516
Diener, 2011), however, we assume that the current results generalize relatively broadly to517
cultures other than Germany, when they underwent similar contact restrictions. Third, we518
focused on life satisfaction and depressivity/anxiety, yet did not measure positive affect,519
which was also affected in the COVID-19 pandemic (e.g., Anglim & Horwood, 2021; Lades520
et al., 2020), and is important to social need satisfaction (Tay & Diener, 2011). Fourth, we521
SOCIAL CONTACT, WELL-BEING, AND SOCIAL TRAITS 31
cannot completely rule out nonrandom attrition over time. Attrition analyses indicate522
differences in affiliation motive and indirect contact frequency between participants523
completing the study and those initially indicating interest in participating in follow-ups524
but not taking part in all waves. There are no meaningful differences if only attrition in the525
longitudinal analysis sample is considered. Still, attrition might have led us to526
underestimate effects involving affiliation motive and indirect contact frequency. Finally,527
relying on self-reports, our results are subject to common method bias (Podsakoff et al.,528
2003). Future studies could incorporate experience sampling and smartphone sensing data529
(Harari et al., 2019; Zygar et al., 2018), for which we expect similar results.530
Conclusions531
Our study demonstrates that social traits such as affiliation motive and need to be532
alone play an important role in the regulation of social contact. Experiencing a situation533
that imposed strict constraints on the expression of social traits, people nonetheless534
demonstrated trait differences in their levels of indirect contact and well-being.535
Afterwards—as the situation opened up—social traits moderated both the resumption of536
personal contact and changes in well-being associated with more frequent contact. This537
illuminates the regulation of social needs and also provides support to the theoretical538
assumption that social need satisfaction feels different depending on someone’s traits. The539
COVID-19 pandemic has restricted many people in their satisfaction of social needs with540
little leeway to evade. Our study adds further evidence that the ways in which people react541
or adapt to this restricted situation differ depending on their personality traits, in this case542
their affiliation motive, need to be alone, and social anxiety.543
SOCIAL CONTACT, WELL-BEING, AND SOCIAL TRAITS 32
References544
Anglim, J., & Horwood, S. (2021). Effect of the COVID-19 Pandemic and Big Five545
Personality on Subjective and Psychological Well-Being. Social Psychological and546
Personality Science, Advance Online Publication.547
https://doi.org/10.1177/1948550620983047548
Anglim, J., Horwood, S., Smillie, L. D., Marrero, R. J., & Wood, J. K. (2020). Predicting549
psychological and subjective well-being from personality: A meta-analysis.550
Psychological Bulletin, 146 (4), 279–323. https://doi.org/10.1037/bul0000226551
Aravindakshan, A., Boehnke, J., Gholami, E., & Nayak, A. (2020). Preparing for a552
future COVID-19 wave: Insights and limitations from a data-driven evaluation of553
non-pharmaceutical interventions in Germany. Scientific Reports, 10 (1), 20084.554
https://doi.org/10.1038/s41598-020-76244-6555
Aschwanden, D., Strickhouser, J. E., Sesker, A. A., Lee, J. H., Luchetti, M., Stephan, Y.,556
Sutin, A. R., & Terracciano, A. (2021). Psychological and behavioural responses to557
Coronavirus disease 2019: The role of personality. European Journal of Personality,558
35 (1), 51–66. https://doi.org/10.1002/per.2281559
Aust, F. (2019). Citr: ’RStudio’ add-in to insert markdown citations.560
https://github.com/crsh/citr561
Aust, F., & Barth, M. (2020). papaja: Prepare reproducible APA journal articles with R562
Markdown [R Package Version 0.1.0.9997].563
Barth, M. (2020). Tinylabels: Lightweight variable labels.564
https://CRAN.R-project.org/package=tinylabels565
Bates, D., & Maechler, M. (2019). Matrix: Sparse and dense matrix classes and methods.566
https://CRAN.R-project.org/package=Matrix567
Bates, D., Mächler, M., Bolker, B., & Walker, S. (2015). Fitting linear mixed-effects568
SOCIAL CONTACT, WELL-BEING, AND SOCIAL TRAITS 33
models using lme4. Journal of Statistical Software, 67 (1), 1–48.569
https://doi.org/10.18637/jss.v067.i01570
Baumeister, R. F., & Leary, M. R. (1995). The need to belong: Desire for interpersonal571
attachments as a fundamental human motivation. Psychological Bulletin, 117 (3),572
497–529. https://doi.org/10.1037/0033-2909.117.3.497573
Becher, H., Bönisch, S., & Wegscheider, K. (2021). Reduction of Mobility During the574
COVID-19 Pandemic in Germany According to Age, Sex, and Federal State.575
Deutsches Arzteblatt International, 118 (31-32), 536–537.576
https://doi.org/10.3238/arztebl.m2021.0293577
Benke, C., Autenrieth, L. K., Asselmann, E., & Pané-Farré, C. A. (2020). Lockdown,578
quarantine measures, and social distancing: Associations with depression, anxiety579
and distress at the beginning of the COVID-19 pandemic among adults from580
Germany. Psychiatry Research, 293, 113462.581
https://doi.org/10.1016/j.psychres.2020.113462582
Bernaards, C. A., & I.Jennrich, R. (2005). Gradient projection algorithms and software for583
arbitrary rotation criteria in factor analysis. Educational and Psychological584
Measurement, 65, 676–696.585
Blum, G. S., Rauthmann, J. F., Göllner, R., Lischetzke, T., & Schmitt, M. (2018). The586
Nonlinear Interaction of Person and Situation (NIPS) Model: Theory and Empirical587
Evidence. European Journal of Personality, 32 (3), 286–305.588
https://doi.org/10.1002/per.2138589
Boursier, V., Gioia, F., Musetti, A., & Schimmenti, A. (2020). Facing Loneliness and590
Anxiety During the COVID-19 Isolation: The Role of Excessive Social Media Use in591
a Sample of Italian Adults. Frontiers in Psychiatry, 11, 586222–586222.592
https://doi.org/10.3389/fpsyt.2020.586222593
Bönisch, S., Wegscheider, K., Krause, L., Sehner, S., Wiegel, S., Zapf, A., Moser, S., &594
SOCIAL CONTACT, WELL-BEING, AND SOCIAL TRAITS 34
Becher, H. (2020). Effects of Coronavirus Disease (COVID-19) Related Contact595
Restrictions in Germany, March to May 2020, on the Mobility and Relation to596
Infection Patterns. Frontiers in Public Health, 8, 619.597
https://doi.org/10.3389/fpubh.2020.568287598
Breil, S. M., Geukes, K., Wilson, R. E., Nestler, S., Vazire, S., & Back, M. D. (2019).599
Zooming into Real-Life Extraversion how Personality and Situation Shape600
Sociability in Social Interactions. Collabra: Psychology, 5 (7).601
https://doi.org/10.1525/collabra.170602
Brown, L. H., Silvia, P. J., Myin-Germeys, I., & Kwapil, T. R. (2007). When the Need to603
Belong Goes Wrong: The Expression of Social Anhedonia and Social Anxiety in604
Daily Life. Psychological Science, 18 (9), 778–782.605
https://doi.org/10.1111/j.1467-9280.2007.01978.x606
Bundesregierung. (2020). Pressekonferenz von Bundeskanzlerin Merkel, Ministerpräsident607
Söder und dem Ersten Bürgermeister Tschentscher im Anschluss an das Gespräch608
mit den Regierungschefinnen und Regierungschefs der Länder [Press conference by609
Chancellor Merkel, Minister President Söder and First Mayor Tschentscher610
following the conversation with the heads of the federal states].611
https://www.bundesregierung.de/breg-612
de/aktuelles/pressekonferenzen/pressekonferenz-von-bundeskanzlerin-merkel-613
ministerpraesident-soeder-und-dem-ersten-buergermeister-tschentscher-im-anschluss-614
an-das-gespraech-mit-den-regierungschefinnen-und-regierungschefs-der-laender-615
1751050.616
Carver, C. S., & Scheier, M. F. (1998). On the self-regulation of behavior. Cambridge617
University Press. https://doi.org/10.1017/CBO9781139174794618
Chang, W., Cheng, J., Allaire, J., Xie, Y., & McPherson, J. (2020). Shiny: Web application619
framework for r. https://CRAN.R-project.org/package=shiny620
SOCIAL CONTACT, WELL-BEING, AND SOCIAL TRAITS 35
Chen, B., Vansteenkiste, M., Beyers, W., Boone, L., Deci, E. L., Van der Kaap-Deeder, J.,621
Duriez, B., Lens, W., Matos, L., Mouratidis, A., Ryan, R. M., Sheldon, K. M.,622
Soenens, B., Van Petegem, S., & Verstuyf, J. (2015). Basic psychological need623
satisfaction, need frustration, and need strength across four cultures. Motivation624
and Emotion, 39 (2), 216–236. https://doi.org/10.1007/s11031-014-9450-1625
Cheung, F., & Lucas, R. (2014). Assessing the validity of single-item life satisfaction626
measures: Results from three large samples. Quality of Life Research, 23 (10),627
2809–2818. https://doi.org/10.1007/s11136-014-0726-4628
Cooper, W. H., & Withey, M. J. (2009). The Strong Situation Hypothesis. Personality and629
Social Psychology Review, 13 (1), 62–72. https://doi.org/10.1177/1088868308329378630
Coplan, R. J., Hipson, W. E., Archbell, K. A., Ooi, L. L., Baldwin, D., & Bowker, J. C.631
(2019). Seeking more solitude: Conceptualization, assessment, and implications of632
aloneliness. Personality and Individual Differences, 148, 17–26.633
https://doi.org/10.1016/j.paid.2019.05.020634
Danner, D., Rammstedt, B., Bluemke, M., Treiber, L., Berres, S., Soto, C., & John, O.635
(2016). Die deutsche Version des Big Five Inventory 2 (BFI-2).636
https://doi.org/10.6102/zis247637
Del Fava, E., Cimentada, J., Perrotta, D., Grow, A., Rampazzo, F., Gil-Clavel, S., &638
Zagheni, E. (2021). Differential impact of physical distancing strategies on social639
contacts relevant for the spread of SARS-CoV-2: Evidence from a cross-national640
online survey, MarchApril 2020. BMJ Open, 11 (10), e050651.641
https://doi.org/10.1136/bmjopen-2021-050651642
Demir, M., & Özdemir, M. (2010). Friendship, Need Satisfaction and Happiness. Journal643
of Happiness Studies, 11 (2), 243–259. https://doi.org/10.1007/s10902-009-9138-5644
DeYoung, C. G., Weisberg, Y., Quilty, L., & Peterson, J. (2013). Unifying the Aspects of645
the Big Five, the Interpersonal Circumplex, and Trait Affiliation. Journal of646
SOCIAL CONTACT, WELL-BEING, AND SOCIAL TRAITS 36
Personality, 81, 465–475. https://doi.org/10.1111/jopy.12020647
Dufner, M., Arslan, R. C., Hagemeyer, B., Schönbrodt, F. D., & Denissen, J. J. A. (2015).648
Affective contingencies in the affiliative domain: Physiological assessment,649
associations with the affiliation motive, and prediction of behavior. Journal of650
Personality and Social Psychology, 109 (4), 662–676.651
https://doi.org/10.1037/pspp0000025652
Entringer, T. M., & Gosling, S. D. (2021). Loneliness During a Nationwide Lockdown and653
the Moderating Effect of Extroversion. Social Psychological and Personality654
Science, 19485506211037871. https://doi.org/10.1177/19485506211037871655
Entringer, T. M., Kröger, H., Schupp, J., Kühne, S., Liebig, S., Goebel, J., Grabka, M. M.,656
Graeber, D., Kroh, M., Schröder, C., Seebauer, J., & Zinn, S. (2020). Psychische657
Krise durch Covid-19? Sorgen sinken, Einsamkeit steigt, Lebenszufriedenheit bleibt658
stabil (SOEPpapers on Multidisciplinary Panel Data Research Nos. 1087).659
Deutsches Institut für Wirtschaftsforschung (DIW).660
https://doi.org/http://hdl.handle.net/10419/222647661
Ettman, C. K., Abdalla, S. M., Cohen, G. H., Sampson, L., Vivier, P. M., & Galea, S.662
(2020). Prevalence of Depression Symptoms in US Adults Before and During the663
COVID-19 Pandemic. JAMA Network Open, 3 (9), e2019686–e2019686.664
https://doi.org/10.1001/jamanetworkopen.2020.19686665
Flaxman, S., Mishra, S., Gandy, A., Unwin, H. J. T., Mellan, T. A., Coupland, H.,666
Whittaker, C., Zhu, H., Berah, T., Eaton, J. W., Monod, M., Perez-Guzman, P. N.,667
Schmit, N., Cilloni, L., Ainslie, K. E. C., Baguelin, M., Boonyasiri, A., Boyd, O.,668
Cattarino, L., . . . Imperial College COVID-19 Response Team. (2020). Estimating669
the effects of non-pharmaceutical interventions on COVID-19 in Europe. Nature,670
584 (7820), 257–261. https://doi.org/10.1038/s41586-020-2405-7671
Fox, J. (2003). Effect displays in R for generalised linear models. Journal of Statistical672
SOCIAL CONTACT, WELL-BEING, AND SOCIAL TRAITS 37
Software, 8 (15), 1–27. https://www.jstatsoft.org/article/view/v008i15673
Fox, J., & Hong, J. (2009). Effect displays in R for multinomial and proportional-odds674
logit models: Extensions to the effects package. Journal of Statistical Software,675
32 (1), 1–24. https://www.jstatsoft.org/article/view/v032i01676
Fox, J., & Weisberg, S. (2018). Visualizing fit and lack of fit in complex regression models677
with predictor effect plots and partial residuals. Journal of Statistical Software,678
87 (9), 1–27. https://doi.org/10.18637/jss.v087.i09679
Fox, J., & Weisberg, S. (2019). An R companion to applied regression (Third). Sage.680
https://socialsciences.mcmaster.ca/jfox/Books/Companion/681
Fox, J., Weisberg, S., & Price, B. (2020). CarData: Companion to applied regression data682
sets. https://CRAN.R-project.org/package=carData683
Fried, E. I., Papanikolaou, F., & Epskamp, S. (2021). Mental Health and Social Contact684
During the COVID-19 Pandemic: An Ecological Momentary Assessment Study.685
Clinical Psychological Science, 21677026211017839.686
https://doi.org/10.1177/21677026211017839687
Gabbiadini, A., Baldissarri, C., Durante, F., Valtorta, R. R., De Rosa, M., & Gallucci, M.688
(2020). Together Apart: The Mitigating Role of Digital Communication689
Technologies on Negative Affect During the COVID-19 Outbreak in Italy. Frontiers690
in Psychology, 11, 2763. https://doi.org/10.3389/fpsyg.2020.554678691
Genz, A., & Bretz, F. (2009). Computation of multivariate normal and t probabilities.692
Springer-Verlag.693
Götz, F. M., Gvirtz, A., Galinsky, A. D., & Jachimowicz, J. M. (2020). How personality694
and policy predict pandemic behavior: Understanding sheltering-in-place in 55695
countries at the onset of COVID-19. American Psychologist, No Pagination696
Specified–No Pagination Specified. https://doi.org/10.1037/amp0000740697
SOCIAL CONTACT, WELL-BEING, AND SOCIAL TRAITS 38
Green, P., & MacLeod, C. J. (2016). Simr: An r package for power analysis of generalised698
linear mixed models by simulation. Methods in Ecology and Evolution, 7 (4),699
493–498. https://doi.org/10.1111/2041-210X.12504700
Hagemeyer, B., Neyer, F. J., Neberich, W., & Asendorpf, J. B. (2013). The ABC of Social701
Desires: Affiliation, Being Alone, and Closeness to Partner. European Journal of702
Personality, 27 (5), 442–457. https://doi.org/10.1002/per.1857703
Hall, J. A. (2017). The regulation of social interaction in everyday life: A replication and704
extension of O’Connor and Rosenblood (1996). Journal of Social and Personal705
Relationships, 34 (5), 699–716. https://doi.org/10.1177/0265407516654580706
Hall, J. A., & Davis, D. C. (2017). Proposing the Communicate Bond Belong Theory:707
Evolutionary Intersections With Episodic Interpersonal Communication.708
Communication Theory, 27 (1), 21–47. https://doi.org/10.1111/comt.12106709
Hallquist, M. N., & Wiley, J. F. (2018). MplusAutomation: An R package for facilitating710
large-scale latent variable analyses in Mplus. Structural Equation Modeling, 1–18.711
https://doi.org/10.1080/10705511.2017.1402334712
Harari, G. M., Müller, S. R., Stachl, C., Wang, R., Wang, W., Bühner, M., Rentfrow, P. J.,713
Campbell, A. T., & Gosling, S. D. (2019). Sensing sociability: Individual differences714
in young adults’ conversation, calling, texting, and app use behaviors in daily life.715
Journal of Personality and Social Psychology, Advance Online Publication.716
https://doi.org/10.1037/pspp0000245717
Harrell Jr, F. E. (2021). Hmisc: Harrell miscellaneous.718
https://CRAN.R-project.org/package=Hmisc719
Henry, L., & Wickham, H. (2020). Purrr: Functional programming tools.720
https://CRAN.R-project.org/package=purrr721
Hill, C. A. (2009). Affiliation motivation. In M. R. Leary & R. H. Hoyle (Eds.), Handbook722
SOCIAL CONTACT, WELL-BEING, AND SOCIAL TRAITS 39
of individual differences in social behavior (pp. 410–425). The Guilford Press.723
Hofer, J., & Hagemeyer, B. (2018). Social Bonding: Affiliation Motivation and Intimacy724
Motivation. In J. Heckhausen & H. Heckhausen (Eds.), Motivation and Action (pp.725
305–334). Springer International Publishing.726
https://doi.org/10.1007/978-3-319-65094-4_7727
Hoffman, L. (2015). Longitudinal analysis: Modeling within-person fluctuation and change.728
Routledge/Taylor & Francis Group.729
Hoffman, L. (2020). Disaggregating Between-Person Time Slope Effects from730
Within-Person Effects. PsyArXiv. https://doi.org/10.31234/osf.io/6q2sm731
Hoffman, L., & Walters, R. W. (2022). Catching Up on Multilevel Modeling. Annual732
Review of Psychology, 73. https://doi.org/10.31234/osf.io/j8x9k733
Hothorn, T. (2019). TH.data: TH’s data archive.734
https://CRAN.R-project.org/package=TH.data735
Hothorn, T., Bretz, F., & Westfall, P. (2008). Simultaneous inference in general parametric736
models. Biometrical Journal, 50 (3), 346–363.737
Koller, M. (2016). robustlmm: An R package for robust estimation of linear mixed-effects738
models. Journal of Statistical Software, 75 (6), 1–24.739
https://doi.org/10.18637/jss.v075.i06740
Koller, M. (2019). Robustlmm: Robust linear mixed effects models [R Package Version 2.3].741
Kroenke, K., Spitzer, R. L., Williams, J. B. W., & Löwe, B. (2009). An Ultra-Brief742
Screening Scale for Anxiety and Depression: The PHQ4. Psychosomatics, 50 (6),743
613–621. https://doi.org/10.1016/S0033-3182(09)70864-3744
Kushlev, K., Dwyer, R., & Dunn, E. W. (2019). The Social Price of Constant Connectivity:745
Smartphones Impose Subtle Costs on Well-Being. Current Directions in746
Psychological Science, 28 (4), 347–352. https://doi.org/10.1177/0963721419847200747
SOCIAL CONTACT, WELL-BEING, AND SOCIAL TRAITS 40
Kuznetsova, A., Brockhoff, P. B., & Christensen, R. H. B. (2017). lmerTest package: Tests748
in linear mixed effects models. Journal of Statistical Software, 82 (13), 1–26.749
https://doi.org/10.18637/jss.v082.i13750
Lades, L. K., Laffan, K., Daly, M., & Delaney, L. (2020). Daily emotional well-being751
during the COVID-19 pandemic. British Journal of Health Psychology, 25 (4),752
902–911. https://doi.org/10.1111/bjhp.12450753
Lay, J. C., Pauly, T., Graf, P., Biesanz, J. C., & Hoppmann, C. A. (2019). By myself and754
liking it? Predictors of distinct types of solitude experiences in daily life. Journal of755
Personality, 87 (3), 633–647. https://doi.org/10.1111/jopy.12421756
Long, J. A. (2019). Interactions: Comprehensive, user-friendly toolkit for probing757
interactions [R Package Version 1.1.0].758
Long, J. A. (2020). Jtools: Analysis and presentation of social scientific data.759
https://cran.r-project.org/package=jtools760
Löwe, B., Wahl, I., Rose, M., Spitzer, C., Glaesmer, H., Wingenfeld, K., Schneider, A., &761
Brähler, E. (2010). A 4-item measure of depression and anxiety: Validation and762
standardization of the Patient Health Questionnaire-4 (PHQ-4) in the general763
population. Journal of Affective Disorders, 122 (1), 86–95.764
https://doi.org/10.1016/j.jad.2009.06.019765
Lucas, R. E., & Donnellan, M. B. (2012). Estimating the reliability of single-item life766
satisfaction measures: Results from four national panel studies. Social Indicators767
Research, 105 (3), 323–331. https://doi.org/10.1007/s11205-011-9783-z768
Lucas, R. E., Le, K., & Dyrenforth, P. S. (2008). Explaining the Extraversion/Positive769
Affect Relation: Sociability Cannot Account for Extraverts’ Greater Happiness.770
Journal of Personality, 76 (3), 385–414.771
https://doi.org/10.1111/j.1467-6494.2008.00490.x772
SOCIAL CONTACT, WELL-BEING, AND SOCIAL TRAITS 41
Luchetti, M., Lee, J. H., Aschwanden, D., Sesker, A., Strickhouser, J. E., Terracciano, A.,773
& Sutin, A. R. (2020). The trajectory of loneliness in response to COVID-19.774
American Psychologist, 75 (7), 897–908. https://doi.org/10.1037/amp0000690775
Margolis, S., Stapley, A. L., & Lyubomirsky, S. (2020). The association between776
Extraversion and well-being is limited to one facet. Journal of Personality, 88 (3),777
478–484. https://doi.org/10.1111/jopy.12504778
McCabe, C. J., Kim, D. S., & King, K. M. (2018). Improving Present Practices in the779
Visual Display of Interactions. Advances in Methods and Practices in Psychological780
Science, 1 (2), 147–165. https://doi.org/10.1177/2515245917746792781
McClelland, D. C. (1987). Human motivation. Cambridge University Press.782
Meade, A. W., & Craig, S. B. (2012). Identifying careless responses in survey data.783
Psychological Methods, 17 (3), 437–455. https://doi.org/10.1037/a0028085784
Muthén, L. K., & Muthén, B. O. (2019). Mplus (Version 8.4). Muthén & Muthén.785
Müller, K., & Wickham, H. (2020). Tibble: Simple data frames.786
https://CRAN.R-project.org/package=tibble787
Neubauer, A. B., Voss, A., & Ditzen, B. (2018). Exploring need dynamics within and788
across days in everyday life: A three-level analysis. Journal of Research in789
Personality, 77, 101–112. https://doi.org/10.1016/j.jrp.2018.10.001790
Nezlek, J. B. (2001). The motivational and cognitive dynamics of day-to-day social life. In791
J. P. Forgas, K. D. Williams, & L. Wheeler (Eds.), The social mind: Cognitive and792
motivational aspects of interpersonal behavior (pp. 92–111). Cambridge University793
Press.794
Olivera-La Rosa, A., Chuquichambi, E. G., & Ingram, G. P. D. (2020). Keep your (social)795
distance: Pathogen concerns and social perception in the time of COVID-19.796
Personality and Individual Differences, 166, 110200.797
SOCIAL CONTACT, WELL-BEING, AND SOCIAL TRAITS 42
https://doi.org/10.1016/j.paid.2020.110200798
Ooms, J. (2021). Magick: Advanced graphics and image-processing in r.799
https://CRAN.R-project.org/package=magick800
Orben, A., & Przybylski, A. K. (2019). Screens, Teens, and Psychological Well-Being:801
Evidence From Three Time-Use-Diary Studies. Psychological Science, 30 (5),802
682–696. https://doi.org/10.1177/0956797619830329803
Orben, A., & Przybylski, A. K. (2020). Reply to: Underestimating digital media harm.804
Nature Human Behaviour, 4 (4), 349–351.805
https://doi.org/10.1038/s41562-020-0840-y806
Pedersen, T. L. (2020). Patchwork: The composer of plots.807
Peters, L., Sunderland, M., Andrews, G., Rapee, R. M., & Mattick, R. P. (2012).808
Development of a short form Social Interaction Anxiety (SIAS) and Social Phobia809
Scale (SPS) using nonparametric item response theory: The SIAS-6 and the SPS-6.810
Psychological Assessment, 24 (1), 66–76. https://doi.org/10.1037/a0024544811
Pinheiro, J., Bates, D., DebRoy, S., Sarkar, D., & R Core Team. (2021). nlme: Linear and812
nonlinear mixed effects models. https://CRAN.R-project.org/package=nlme813
Podsakoff, P. M., MacKenzie, S. B., Jeong-Yeon, L., & Podsakoff, N. P. (2003). Common814
method biases in behavioral research: A critical review of the literature and815
recommended remedies. Journal of Applied Psychology, 88 (5), 879–903.816
https://doi.org/10.1037/0021-9010.88.5.879817
Preacher, K. J., Curran, P. J., & Bauer, D. J. (2006). Computational Tools for Probing818
Interactions in Multiple Linear Regression, Multilevel Modeling, and Latent Curve819
Analysis. Journal of Educational and Behavioral Statistics, 31 (4), 437–448.820
https://doi.org/10.3102/10769986031004437821
R Core Team. (2020). R: A language and environment for statistical computing. R822
SOCIAL CONTACT, WELL-BEING, AND SOCIAL TRAITS 43
Foundation for Statistical Computing. https://www.R-project.org/823
Revelle, W. (2020). Psych: Procedures for psychological, psychometric, and personality824
research. Northwestern University. https://CRAN.R-project.org/package=psych825
Richter, D., Rohrer, J., Metzing, M., Nestler, W., Weinhardt, M., & Schupp, J. (2017).826
SOEP scales manual (updated for SOEP-Core v32.1) (SOEP Survey Papers Nos.827
423). Deutsches Institut für Wirtschaftsforschung (DIW).828
Sarkar, D. (2008). Lattice: Multivariate data visualization with r. Springer.829
http://lmdvr.r-forge.r-project.org830
Schmitt, M., Gollwitzer, M., Baumert, A., Blum, G., Gschwendner, T., Hofmann, W., &831
Rothmund, T. (2013). Proposal of a Nonlinear Interaction of Person and Situation832
(NIPS) model. Frontiers in Psychology, 4, 499–499.833
https://doi.org/10.3389/fpsyg.2013.00499834
Schönbrodt, F. D., & Gerstenberg, F. X. R. (2012). An IRT analysis of motive835
questionnaires: The Unified Motive Scales. Journal of Research in Personality,836
46 (6), 725–742. https://doi.org/10.1016/j.jrp.2012.08.010837
Sheldon, K. M. (2011). Integrating behavioral-motive and experiential-requirement838
perspectives on psychological needs: A two process model. Psychological Review,839
118 (4), 552–569. https://doi.org/10.1037/a0024758840
Soto, C. J., & John, O. P. (2017). The next Big Five Inventory (BFI-2): Developing and841
assessing a hierarchical model with 15 facets to enhance bandwidth, fidelity, and842
predictive power. Journal of Personality and Social Psychology, 113 (1), 117–143.843
https://doi.org/10.1037/pspp0000096844
Stangier, U., Heidenreich, T., Berardi, A., Golbs, U., & Hoyer, J. (1999). Die Erfassung845
sozialer Phobie durch die Social Interaction Anxiety Scale (SIAS) und die Social846
Phobia Scale (SPS). Zeitschrift Für Klinische Psychologie Und Psychotherapie,847
SOCIAL CONTACT, WELL-BEING, AND SOCIAL TRAITS 44
28 (1), 28–36. https://doi.org/10.1026//0084-5345.28.1.28848
Sun, J., Harris, K., & Vazire, S. (2020). Is well-being associated with the quantity and849
quality of social interactions? Journal of Personality and Social Psychology, 119 (6),850
1478–1496. https://doi.org/10.1037/pspp0000272851
Sun, R., Rieble, C., Liu, Y., & Sauter, D. (2020). Connected Despite Lockdown: The Role852
of Social Interactions and Social Media Use in Wellbeing. PsyArXiv.853
https://doi.org/10.31234/osf.io/x5k8u854
Tay, L., & Diener, E. (2011). Needs and subjective well-being around the world. Journal of855
Personality and Social Psychology, 101 (2), 354–365.856
https://doi.org/10.1037/a0023779857
Terry M. Therneau, & Patricia M. Grambsch. (2000). Modeling survival data: Extending858
the Cox model. Springer.859
Tissera, H., Gazzard Kerr, L., Carlson, E. N., & Human, L. J. (2020). Social anxiety and860
liking: Towards understanding the role of metaperceptions in first impressions.861
Journal of Personality and Social Psychology, Advance Online Publication.862
https://doi.org/10.1037/pspp0000363863
Tomori, D. V., Rübsamen, N., Berger, T., Scholz, S., Walde, J., Wittenberg, I., Lange, B.,864
Kuhlmann, A., Horn, J., Mikolajczyk, R., Jaeger, V. K., & Karch, A. (2021).865
Individual social contact data and population mobility data as early markers of866
SARS-CoV-2 transmission dynamics during the first wave in Germanyan analysis867
based on the COVIMOD study. BMC Medicine, 19 (1), 271.868
https://doi.org/10.1186/s12916-021-02139-6869
Twenge, J. M., & Joiner, T. E. (2020). U.S. Census Bureau-assessed prevalence of anxiety870
and depressive symptoms in 2019 and during the 2020 COVID-19 pandemic.871
Depression and Anxiety, 37 (10), 954–956. https://doi.org/10.1002/da.23077872
SOCIAL CONTACT, WELL-BEING, AND SOCIAL TRAITS 45
Urbanek, S. (2013). Png: Read and write png images.873
https://CRAN.R-project.org/package=png874
Van Zalk, N., Van Zalk, M. H. W., Kerr, M., & Stattin, H. (2011). Social Anxiety as a875
Basis for Friendship Selection and Socialization in Adolescents’ Social Networks.876
Journal of Personality, 79 (3), 499–526.877
https://doi.org/10.1111/j.1467-6494.2011.00682.x878
Venables, W. N., & Ripley, B. D. (2002). Modern applied statistics with s (Fourth).879
Springer. http://www.stats.ox.ac.uk/pub/MASS4/880
Wang, L., & Maxwell, S. E. (2015). On disaggregating between-person and within-person881
effects with longitudinal data using multilevel models. Psychological Methods,882
20 (1), 63–83. https://doi.org/10.1037/met0000030883
Wei, T., & Simko, V. (2017a). R package "corrplot": Visualization of a correlation matrix884
[R Package Version 0.84].885
Wei, T., & Simko, V. (2017b). R package "corrplot": Visualization of a correlation matrix.886
https://github.com/taiyun/corrplot887
Wickham, H. (2016). Ggplot2: Elegant graphics for data analysis. Springer-Verlag New888
York. https://ggplot2.tidyverse.org889
Wickham, H. (2019). Stringr: Simple, consistent wrappers for common string operations.890
https://CRAN.R-project.org/package=stringr891
Wickham, H. (2020a). Forcats: Tools for working with categorical variables (factors).892
https://CRAN.R-project.org/package=forcats893
Wickham, H. (2020b). Tidyr: Tidy messy data.894
https://CRAN.R-project.org/package=tidyr895
Wickham, H., Averick, M., Bryan, J., Chang, W., McGowan, L. D., François, R.,896
Grolemund, G., Hayes, A., Henry, L., Hester, J., Kuhn, M., Pedersen, T. L., Miller,897
SOCIAL CONTACT, WELL-BEING, AND SOCIAL TRAITS 46
E., Bache, S. M., Müller, K., Ooms, J., Robinson, D., Seidel, D. P., Spinu, V., . . .898
Yutani, H. (2019). Welcome to the tidyverse. Journal of Open Source Software,899
4 (43), 1686. https://doi.org/10.21105/joss.01686900
Wickham, H., Averick, M., Bryan, J., Chang, W., McGowan, L. D., François, R.,901
Grolemund, G., Hayes, A., Henry, L., Hester, J., Kuhn, M., Pedersen, T. L., Miller,902
E., Bache, S. M., Müller, K., Ooms, J., Robinson, D., Seidel, D. P., Spinu, V., . . .903
Yutani, H. (2019). Welcome to the tidyverse. Journal of Open Source Software,904
4 (43), 1686. https://doi.org/10.21105/joss.01686905
Wickham, H., François, R., Henry, L., & Müller, K. (2020). Dplyr: A grammar of data906
manipulation. https://CRAN.R-project.org/package=dplyr907
Wickham, H., & Hester, J. (2020). Readr: Read rectangular text data.908
https://CRAN.R-project.org/package=readr909
Wickham, H., & Seidel, D. (2020). Scales: Scale functions for visualization.910
https://CRAN.R-project.org/package=scales911
Wilke, C. O. (2020). Cowplot: Streamlined plot theme and plot annotations for ’ggplot2’.912
https://CRAN.R-project.org/package=cowplot913
Wrzus, C., Wagner, G. G., & Riediger, M. (2016). Personality-situation transactions from914
adolescence to old age. Journal of Personality and Social Psychology, 110 (5),915
782–799. https://doi.org/10.1037/pspp0000054916
Yakubenko, S. (2021). Home alone? Effect of weather-induced behaviour on spread of917
SARS-CoV-2 in Germany. Economics & Human Biology, 42, 100998.918
https://doi.org/10.1016/j.ehb.2021.100998919
Yentes, R. D., & Wilhelm, F. (2018). Careless: Procedures for computing indices of careless920
responding [R Package Version 1.1.3].921
Zacher, H., & Rudolph, C. W. (2020). Individual differences and changes in subjective922
SOCIAL CONTACT, WELL-BEING, AND SOCIAL TRAITS 47
wellbeing during the early stages of the COVID-19 pandemic. American923
Psychologist, Advance Online Publication. https://doi.org/10.1037/amp0000702924
Zajenkowski, M., Jonason, P. K., Leniarska, M., & Kozakiewicz, Z. (2020). Who complies925
with the restrictions to reduce the spread of COVID-19?: Personality and926
perceptions of the COVID-19 situation. Personality and Individual Differences, 166,927
110199. https://doi.org/10.1016/j.paid.2020.110199928
Zeileis, A., & Croissant, Y. (2010). Extended model formulas in R: Multiple parts and929
multiple responses. Journal of Statistical Software, 34 (1), 1–13.930
https://doi.org/10.18637/jss.v034.i01931
Zettler, I., Schild, C., Lilleholt, L., Kroencke, L., Utesch, T., Moshagen, M., Böhm, R.,932
Back, M. D., & Geukes, K. (2021). The Role of Personality in COVID-19-Related933
Perceptions, Evaluations, and Behaviors: Findings Across Five Samples, Nine934
Traits, and 17 Criteria. Social Psychological and Personality Science,935
19485506211001680. https://doi.org/10.1177/19485506211001680936
Zygar, C., Hagemeyer, B., Pusch, S., & Schönbrodt, F. D. (2018). From Motive937
Dispositions to States to Outcomes: An Intensive Experience Sampling Study on938
Communal Motivational Dynamics in Couples. European Journal of Personality,939
32 (3), 306–324. https://doi.org/10.1002/per.2145940
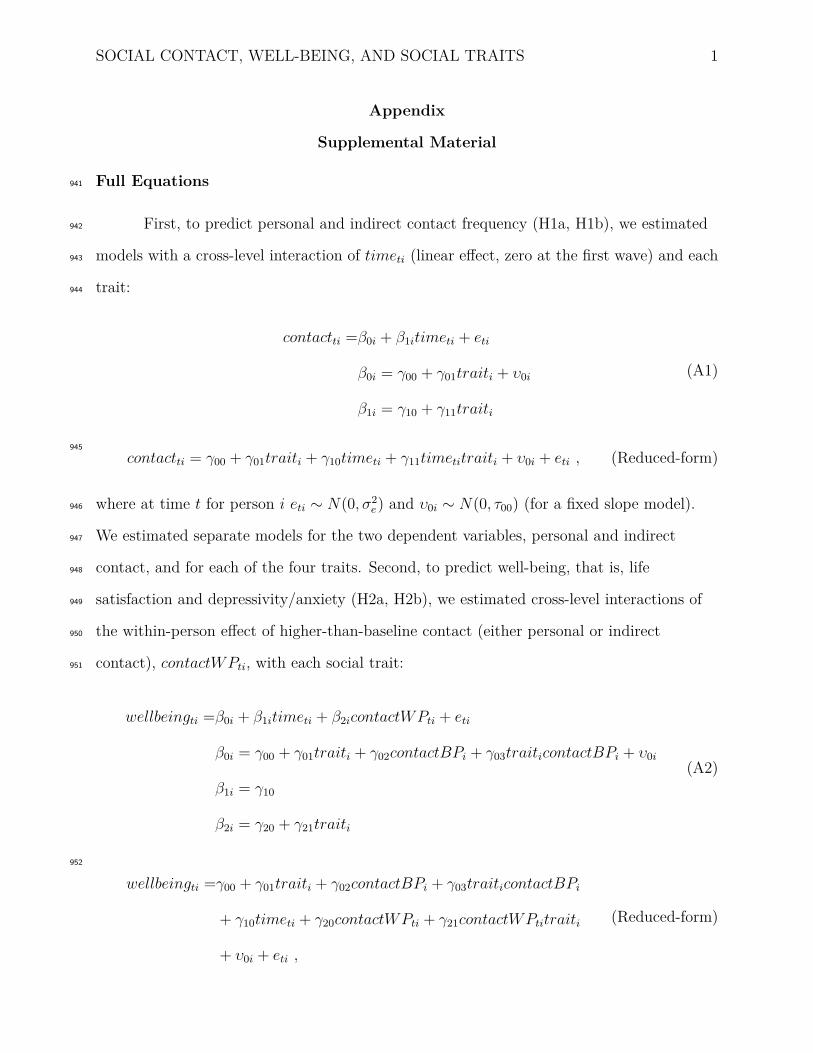
SOCIAL CONTACT, WELL-BEING, AND SOCIAL TRAITS 1
Appendix
Supplemental Material
Full Equations941
First, to predict personal and indirect contact frequency (H1a, H1b), we estimated942
models with a cross-level interaction of timeti (linear effect, zero at the first wave) and each943
trait:944
contactti =β0i + β1itimeti + eti
β0i = γ00 + γ01traiti + υ0i
β1i = γ10 + γ11traiti
(A1)
945contactti = γ00 + γ01traiti + γ10timeti + γ11timetitraiti + υ0i + eti , (Reduced-form)
where at time t for person i eti ∼ N(0, σ2e) and υ0i ∼ N(0, τ00) (for a fixed slope model).946
We estimated separate models for the two dependent variables, personal and indirect947
contact, and for each of the four traits. Second, to predict well-being, that is, life948
satisfaction and depressivity/anxiety (H2a, H2b), we estimated cross-level interactions of949
the within-person effect of higher-than-baseline contact (either personal or indirect950
contact), contactWPti, with each social trait:951
wellbeingti =β0i + β1itimeti + β2icontactWPti + eti
β0i = γ00 + γ01traiti + γ02contactBPi + γ03traiticontactBPi + υ0i
β1i = γ10
β2i = γ20 + γ21traiti
(A2)
952
wellbeingti =γ00 + γ01traiti + γ02contactBPi + γ03traiticontactBPi
+ γ10timeti + γ20contactWPti + γ21contactWPtitraiti
+ υ0i + eti ,
(Reduced-form)
SOCIAL CONTACT, WELL-BEING, AND SOCIAL TRAITS 2
where eti ∼ N(0, σ2e) and υ0i ∼ N(0, τ00) (for a fixed slope model). Again, we estimated953
separate models for the two dependent variables life satisfaction and depressivity/anxiety,954
for personal and indirect contact, and for each social trait.955
Robustness Check956
In order to judge how robust the multilevel models were to violated assumptions957
regarding multivariate normality and contamination by outliers, we re-estimated all models958
presented in the main part of the article with robust linear mixed-effects models using the959
robustlmm package (Koller, 2016, 2019). Based on the random effects contamination model960
and the central contamination model, this method supports hierarchically grouped data961
structures such as observations nested in participants. There is no universally accepted way962
to obtain confidence intervals or p-values based on the method implemented in the963
robustlmm package (Koller, 2019) which is why we decided not to report these robust964
models in the main part of the article. Generally, the results reported in the main part of965
the article were very similar to these robust estimates (see Tables S7, S8, S9, S10, & S11),966
especially for models related to hypotheses H1a and H1b. Differences between robust and967
non-robust models were slightly larger for models testing hypotheses H2a and H2b, where968
trait ∗ contactWP effects were slightly reduced in magnitude for affiliation motive and969
social anxiety in the robust models.970
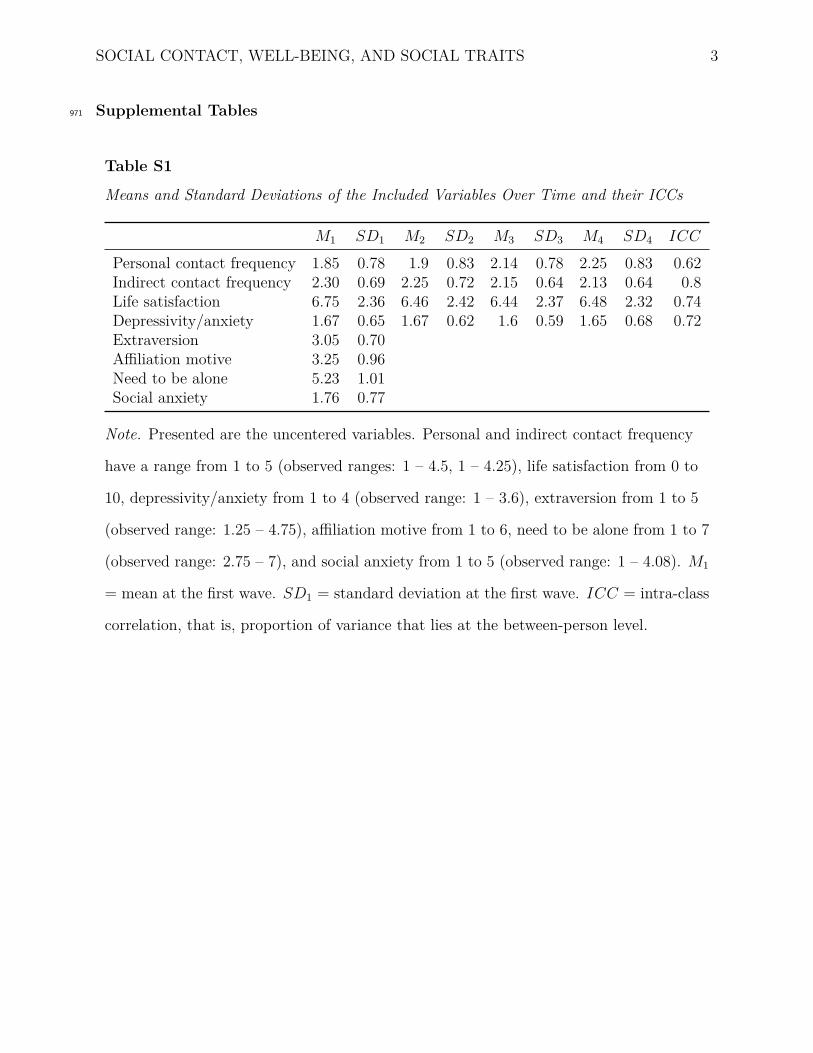
SOCIAL CONTACT, WELL-BEING, AND SOCIAL TRAITS 3
Supplemental Tables971
Table S1
Means and Standard Deviations of the Included Variables Over Time and their ICCs
M1 SD1 M2 SD2 M3 SD3 M4 SD4 ICC
Personal contact frequency 1.85 0.78 1.9 0.83 2.14 0.78 2.25 0.83 0.62Indirect contact frequency 2.30 0.69 2.25 0.72 2.15 0.64 2.13 0.64 0.8Life satisfaction 6.75 2.36 6.46 2.42 6.44 2.37 6.48 2.32 0.74Depressivity/anxiety 1.67 0.65 1.67 0.62 1.6 0.59 1.65 0.68 0.72Extraversion 3.05 0.70Affiliation motive 3.25 0.96Need to be alone 5.23 1.01Social anxiety 1.76 0.77
Note. Presented are the uncentered variables. Personal and indirect contact frequency
have a range from 1 to 5 (observed ranges: 1 – 4.5, 1 – 4.25), life satisfaction from 0 to
10, depressivity/anxiety from 1 to 4 (observed range: 1 – 3.6), extraversion from 1 to 5
(observed range: 1.25 – 4.75), affiliation motive from 1 to 6, need to be alone from 1 to 7
(observed range: 2.75 – 7), and social anxiety from 1 to 5 (observed range: 1 – 4.08). M1
= mean at the first wave. SD1 = standard deviation at the first wave. ICC = intra-class
correlation, that is, proportion of variance that lies at the between-person level.
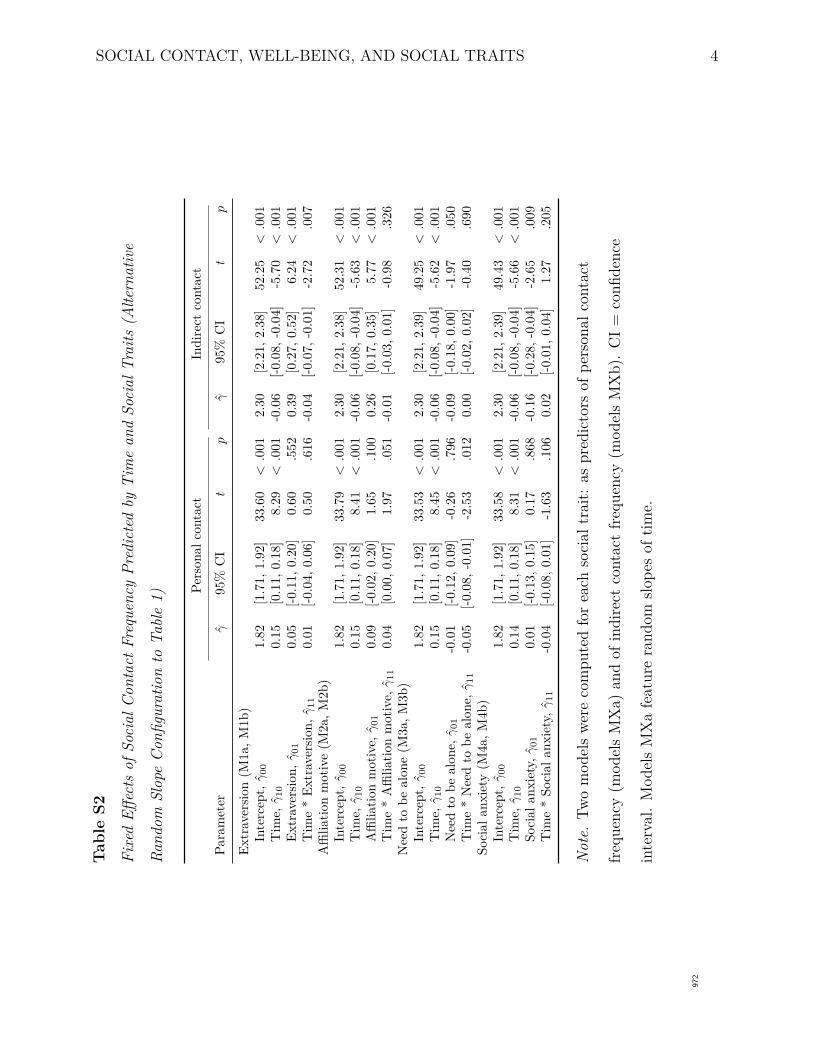
SOCIAL CONTACT, WELL-BEING, AND SOCIAL TRAITS 4
Tab
leS2
Fixe
dEff
ects
ofSo
cial
Con
tact
Freq
uenc
yPr
edic
ted
byT
ime
and
Soci
alTr
aits
(Alte
rnat
ive
Rand
omSl
ope
Con
figur
atio
nto
Tabl
e1) Pe
rson
alco
ntac
tIn
dire
ctco
ntac
t
Para
met
erγ̂
95%
CI
tp
γ̂95
%C
It
p
Extr
aver
sion
(M1a
,M1b
)In
terc
ept,
γ̂00
T1
1.82
[1.7
1,1.
92]
33.6
0<
.001
2.30
[2.2
1,2.
38]
52.2
5<
.001
Tim
e,γ̂
10T
10.
15[0
.11,
0.18
]8.
29<
.001
-0.0
6[-0
.08,
-0.0
4]-5
.70
<.0
01Ex
trav
ersio
n,γ̂
010.
05[-0
.11,
0.20
]0.
60.5
520.
39[0
.27,
0.52
]6.
24<
.001
Tim
e*
Extr
aver
sion,
γ̂11
0.01
[-0.0
4,0.
06]
0.50
.616
-0.0
4[-0
.07,
-0.0
1]-2
.72
.007
Affi
liatio
nm
otiv
e(M
2a,M
2b)
Inte
rcep
t,γ̂
00T
21.
82[1
.71,
1.92
]33
.79
<.0
012.
30[2
.21,
2.38
]52
.31
<.0
01T
ime,
γ̂10
T2
0.15
[0.1
1,0.
18]
8.41
<.0
01-0
.06
[-0.0
8,-0
.04]
-5.6
3<
.001
Affi
liatio
nm
otiv
e,γ̂
010.
09[-0
.02,
0.20
]1.
65.1
000.
26[0
.17,
0.35
]5.
77<
.001
Tim
e*
Affi
liatio
nm
otiv
e,γ̂
110.
04[0
.00,
0.07
]1.
97.0
51-0
.01
[-0.0
3,0.
01]
-0.9
8.3
26N
eed
tobe
alon
e(M
3a,M
3b)
Inte
rcep
t,γ̂
00T
31.
82[1
.71,
1.92
]33
.53
<.0
012.
30[2
.21,
2.39
]49
.25
<.0
01T
ime,
γ̂10
T3
0.15
[0.1
1,0.
18]
8.45
<.0
01-0
.06
[-0.0
8,-0
.04]
-5.6
2<
.001
Nee
dto
beal
one,
γ̂01
-0.0
1[-0
.12,
0.09
]-0
.26
.796
-0.0
9[-0
.18,
0.00
]-1
.97
.050
Tim
e*
Nee
dto
beal
one,
γ̂11
-0.0
5[-0
.08,
-0.0
1]-2
.53
.012
0.00
[-0.0
2,0.
02]
-0.4
0.6
90So
cial
anxi
ety
(M4a
,M4b
)In
terc
ept,
γ̂00
T4
1.82
[1.7
1,1.
92]
33.5
8<
.001
2.30
[2.2
1,2.
39]
49.4
3<
.001
Tim
e,γ̂
10T
40.
14[0
.11,
0.18
]8.
31<
.001
-0.0
6[-0
.08,
-0.0
4]-5
.66
<.0
01So
cial
anxi
ety,
γ̂01
0.01
[-0.1
3,0.
15]
0.17
.868
-0.1
6[-0
.28,
-0.0
4]-2
.65
.009
Tim
e*
Soci
alan
xiet
y,γ̂
11-0
.04
[-0.0
8,0.
01]
-1.6
3.1
060.
02[-0
.01,
0.04
]1.
27.2
05
Not
e.Tw
om
odel
swe
reco
mpu
ted
for
each
soci
altr
ait:
aspr
edic
tors
ofpe
rson
alco
ntac
t
frequ
ency
(mod
els
MX
a)an
dof
indi
rect
cont
act
frequ
ency
(mod
els
MX
b).
CI=
confi
denc
e
inte
rval
.M
odel
sM
Xa
feat
ure
rand
omslo
pes
oftim
e.
972
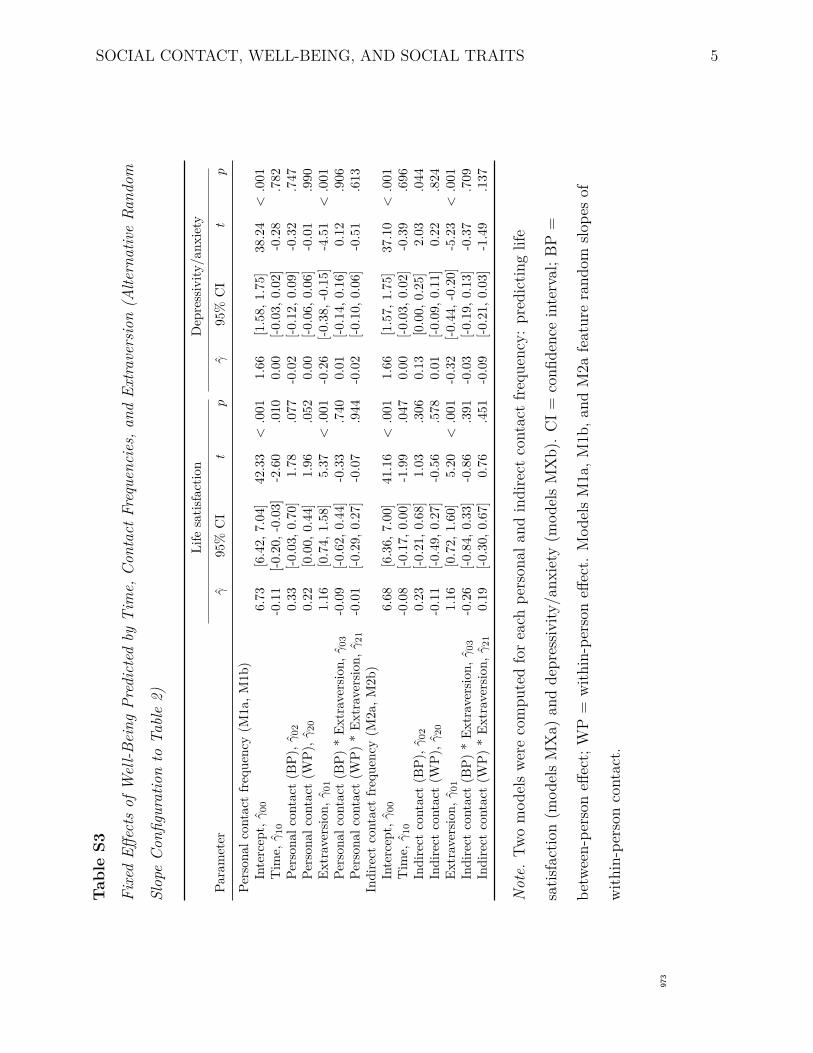
SOCIAL CONTACT, WELL-BEING, AND SOCIAL TRAITS 5
Tab
leS3
Fixe
dEff
ects
ofW
ell-B
eing
Pred
icte
dby
Tim
e,C
onta
ctFr
eque
ncie
s,an
dEx
trave
rsio
n(A
ltern
ativ
eRa
ndom
Slop
eC
onfig
urat
ion
toTa
ble
2)
Life
satis
fact
ion
Dep
ress
ivity
/anx
iety
Para
met
erγ̂
95%
CI
tp
γ̂95
%C
It
p
Pers
onal
cont
act
freq
uenc
y(M
1a,M
1b)
Inte
rcep
t,γ̂
00T
16.
73[6
.42,
7.04
]42
.33
<.0
011.
66[1
.58,
1.75
]38
.24
<.0
01T
ime,
γ̂10
T1
-0.1
1[-0
.20,
-0.0
3]-2
.60
.010
0.00
[-0.0
3,0.
02]
-0.2
8.7
82Pe
rson
alco
ntac
t(B
P),γ̂
020.
33[-0
.03,
0.70
]1.
78.0
77-0
.02
[-0.1
2,0.
09]
-0.3
2.7
47Pe
rson
alco
ntac
t(W
P),γ̂
200.
22[0
.00,
0.44
]1.
96.0
520.
00[-0
.06,
0.06
]-0
.01
.990
Extr
aver
sion,
γ̂01
T1
1.16
[0.7
4,1.
58]
5.37
<.0
01-0
.26
[-0.3
8,-0
.15]
-4.5
1<
.001
Pers
onal
cont
act
(BP)
*Ex
trav
ersio
n,γ̂
03-0
.09
[-0.6
2,0.
44]
-0.3
3.7
400.
01[-0
.14,
0.16
]0.
12.9
06Pe
rson
alco
ntac
t(W
P)*
Extr
aver
sion,
γ̂21
-0.0
1[-0
.29,
0.27
]-0
.07
.944
-0.0
2[-0
.10,
0.06
]-0
.51
.613
Indi
rect
cont
act
freq
uenc
y(M
2a,M
2b)
Inte
rcep
t,γ̂
00T
26.
68[6
.36,
7.00
]41
.16
<.0
011.
66[1
.57,
1.75
]37
.10
<.0
01T
ime,
γ̂10
T2
-0.0
8[-0
.17,
0.00
]-1
.99
.047
0.00
[-0.0
3,0.
02]
-0.3
9.6
96In
dire
ctco
ntac
t(B
P),γ̂
020.
23[-0
.21,
0.68
]1.
03.3
060.
13[0
.00,
0.25
]2.
03.0
44In
dire
ctco
ntac
t(W
P),γ̂
20-0
.11
[-0.4
9,0.
27]
-0.5
6.5
780.
01[-0
.09,
0.11
]0.
22.8
24Ex
trav
ersio
n,γ̂
01T
21.
16[0
.72,
1.60
]5.
20<
.001
-0.3
2[-0
.44,
-0.2
0]-5
.23
<.0
01In
dire
ctco
ntac
t(B
P)*
Extr
aver
sion,
γ̂03
-0.2
6[-0
.84,
0.33
]-0
.86
.391
-0.0
3[-0
.19,
0.13
]-0
.37
.709
Indi
rect
cont
act
(WP)
*Ex
trav
ersio
n,γ̂
210.
19[-0
.30,
0.67
]0.
76.4
51-0
.09
[-0.2
1,0.
03]
-1.4
9.1
37
Not
e.Tw
om
odel
swe
reco
mpu
ted
for
each
pers
onal
and
indi
rect
cont
act
frequ
ency
:pr
edic
ting
life
satis
fact
ion
(mod
els
MX
a)an
dde
pres
sivity
/anx
iety
(mod
els
MX
b).
CI=
confi
denc
ein
terv
al;B
P=
betw
een-
pers
oneff
ect;
WP
=w
ithin
-per
son
effec
t.M
odel
sM
1a,M
1b,a
ndM
2afe
atur
era
ndom
slope
sof
with
in-p
erso
nco
ntac
t.
973
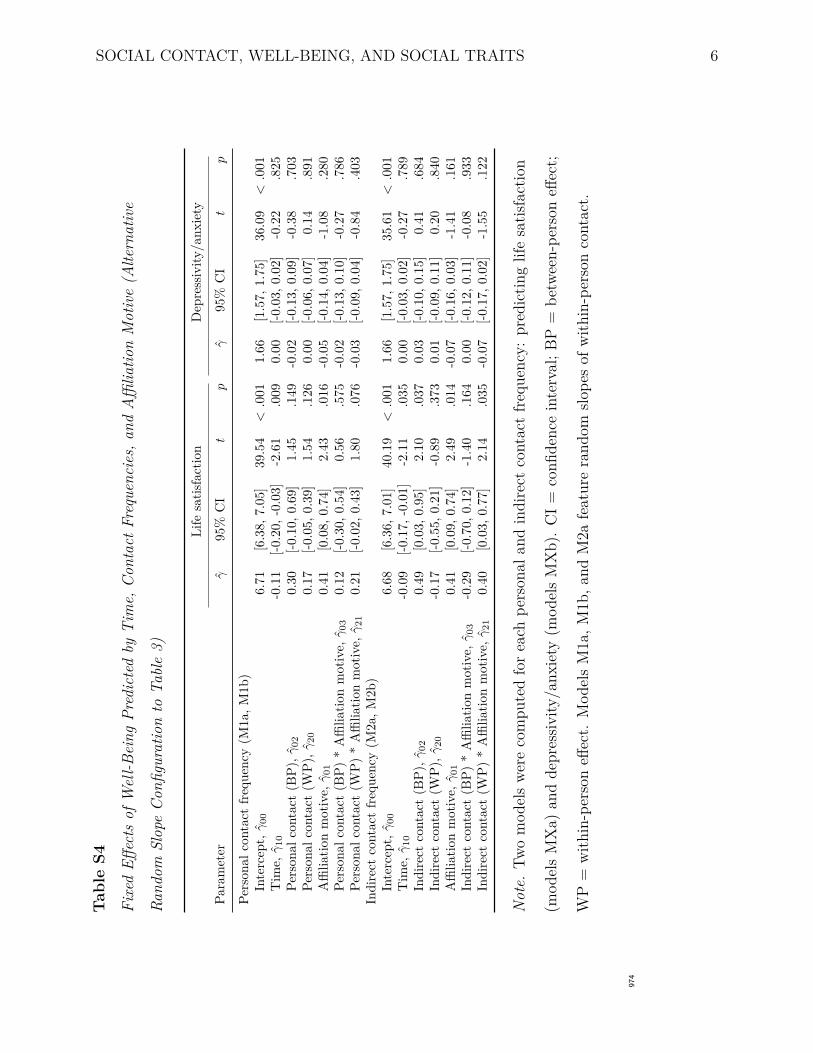
SOCIAL CONTACT, WELL-BEING, AND SOCIAL TRAITS 6
Tab
leS4
Fixe
dEff
ects
ofW
ell-B
eing
Pred
icte
dby
Tim
e,C
onta
ctFr
eque
ncie
s,an
dA
ffilia
tion
Mot
ive
(Alte
rnat
ive
Rand
omSl
ope
Con
figur
atio
nto
Tabl
e3)
Life
satis
fact
ion
Dep
ress
ivity
/anx
iety
Para
met
erγ̂
95%
CI
tp
γ̂95
%C
It
p
Pers
onal
cont
act
freq
uenc
y(M
1a,M
1b)
Inte
rcep
t,γ̂
00T
16.
71[6
.38,
7.05
]39
.54
<.0
011.
66[1
.57,
1.75
]36
.09
<.0
01T
ime,
γ̂10
T1
-0.1
1[-0
.20,
-0.0
3]-2
.61
.009
0.00
[-0.0
3,0.
02]
-0.2
2.8
25Pe
rson
alco
ntac
t(B
P),γ̂
020.
30[-0
.10,
0.69
]1.
45.1
49-0
.02
[-0.1
3,0.
09]
-0.3
8.7
03Pe
rson
alco
ntac
t(W
P),γ̂
200.
17[-0
.05,
0.39
]1.
54.1
260.
00[-0
.06,
0.07
]0.
14.8
91A
ffilia
tion
mot
ive,
γ̂01
T1
0.41
[0.0
8,0.
74]
2.43
.016
-0.0
5[-0
.14,
0.04
]-1
.08
.280
Pers
onal
cont
act
(BP)
*A
ffilia
tion
mot
ive,
γ̂03
0.12
[-0.3
0,0.
54]
0.56
.575
-0.0
2[-0
.13,
0.10
]-0
.27
.786
Pers
onal
cont
act
(WP)
*A
ffilia
tion
mot
ive,
γ̂21
0.21
[-0.0
2,0.
43]
1.80
.076
-0.0
3[-0
.09,
0.04
]-0
.84
.403
Indi
rect
cont
act
freq
uenc
y(M
2a,M
2b)
Inte
rcep
t,γ̂
00T
26.
68[6
.36,
7.01
]40
.19
<.0
011.
66[1
.57,
1.75
]35
.61
<.0
01T
ime,
γ̂10
T2
-0.0
9[-0
.17,
-0.0
1]-2
.11
.035
0.00
[-0.0
3,0.
02]
-0.2
7.7
89In
dire
ctco
ntac
t(B
P),γ̂
020.
49[0
.03,
0.95
]2.
10.0
370.
03[-0
.10,
0.15
]0.
41.6
84In
dire
ctco
ntac
t(W
P),γ̂
20-0
.17
[-0.5
5,0.
21]
-0.8
9.3
730.
01[-0
.09,
0.11
]0.
20.8
40A
ffilia
tion
mot
ive,
γ̂01
T2
0.41
[0.0
9,0.
74]
2.49
.014
-0.0
7[-0
.16,
0.03
]-1
.41
.161
Indi
rect
cont
act
(BP)
*A
ffilia
tion
mot
ive,
γ̂03
-0.2
9[-0
.70,
0.12
]-1
.40
.164
0.00
[-0.1
2,0.
11]
-0.0
8.9
33In
dire
ctco
ntac
t(W
P)*
Affi
liatio
nm
otiv
e,γ̂
210.
40[0
.03,
0.77
]2.
14.0
35-0
.07
[-0.1
7,0.
02]
-1.5
5.1
22
Not
e.Tw
om
odel
swe
reco
mpu
ted
for
each
pers
onal
and
indi
rect
cont
act
frequ
ency
:pr
edic
ting
life
satis
fact
ion
(mod
els
MX
a)an
dde
pres
sivity
/anx
iety
(mod
els
MX
b).
CI=
confi
denc
ein
terv
al;B
P=
betw
een-
pers
oneff
ect;
WP
=w
ithin
-per
son
effec
t.M
odel
sM
1a,M
1b,a
ndM
2afe
atur
era
ndom
slope
sof
with
in-p
erso
nco
ntac
t.
974
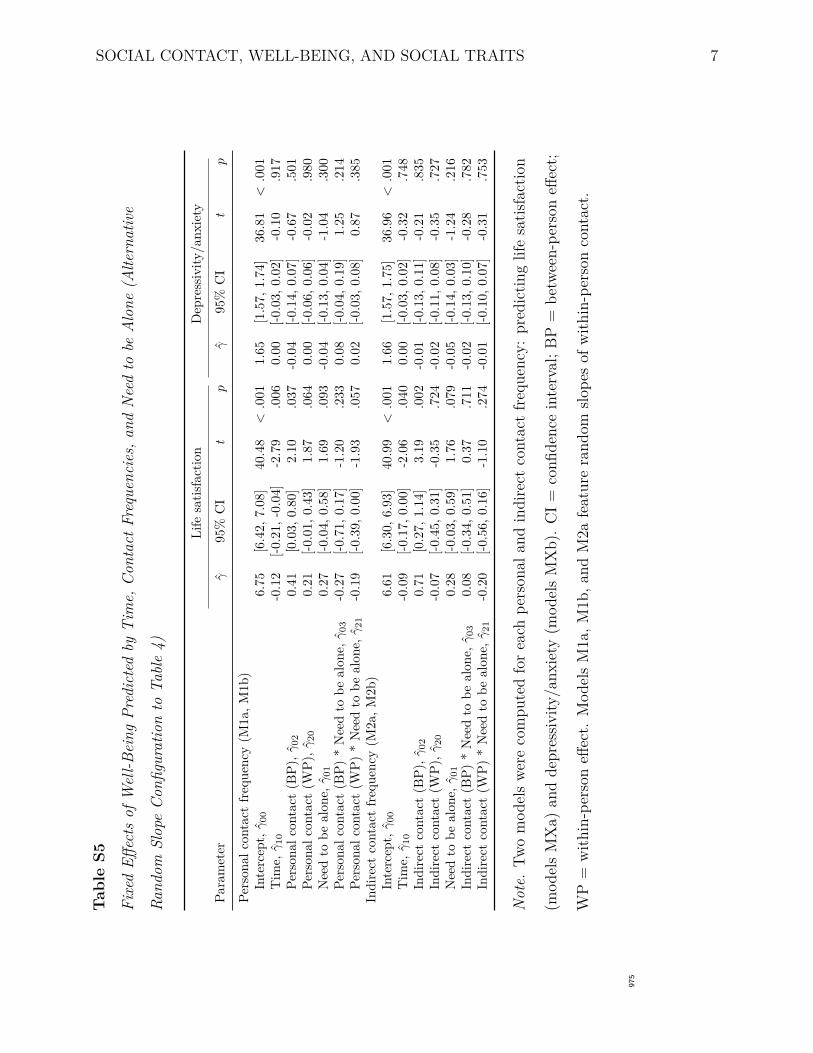
SOCIAL CONTACT, WELL-BEING, AND SOCIAL TRAITS 7
Tab
leS5
Fixe
dEff
ects
ofW
ell-B
eing
Pred
icte
dby
Tim
e,C
onta
ctFr
eque
ncie
s,an
dN
eed
tobe
Alo
ne(A
ltern
ativ
e
Rand
omSl
ope
Con
figur
atio
nto
Tabl
e4)
Life
satis
fact
ion
Dep
ress
ivity
/anx
iety
Para
met
erγ̂
95%
CI
tp
γ̂95
%C
It
p
Pers
onal
cont
act
freq
uenc
y(M
1a,M
1b)
Inte
rcep
t,γ̂
00T
16.
75[6
.42,
7.08
]40
.48
<.0
011.
65[1
.57,
1.74
]36
.81
<.0
01T
ime,
γ̂10
T1
-0.1
2[-0
.21,
-0.0
4]-2
.79
.006
0.00
[-0.0
3,0.
02]
-0.1
0.9
17Pe
rson
alco
ntac
t(B
P),γ̂
020.
41[0
.03,
0.80
]2.
10.0
37-0
.04
[-0.1
4,0.
07]
-0.6
7.5
01Pe
rson
alco
ntac
t(W
P),γ̂
200.
21[-0
.01,
0.43
]1.
87.0
640.
00[-0
.06,
0.06
]-0
.02
.980
Nee
dto
beal
one,
γ̂01
T1
0.27
[-0.0
4,0.
58]
1.69
.093
-0.0
4[-0
.13,
0.04
]-1
.04
.300
Pers
onal
cont
act
(BP)
*N
eed
tobe
alon
e,γ̂
03-0
.27
[-0.7
1,0.
17]
-1.2
0.2
330.
08[-0
.04,
0.19
]1.
25.2
14Pe
rson
alco
ntac
t(W
P)*
Nee
dto
beal
one,
γ̂21
-0.1
9[-0
.39,
0.00
]-1
.93
.057
0.02
[-0.0
3,0.
08]
0.87
.385
Indi
rect
cont
act
freq
uenc
y(M
2a,M
2b)
Inte
rcep
t,γ̂
00T
26.
61[6
.30,
6.93
]40
.99
<.0
011.
66[1
.57,
1.75
]36
.96
<.0
01T
ime,
γ̂10
T2
-0.0
9[-0
.17,
0.00
]-2
.06
.040
0.00
[-0.0
3,0.
02]
-0.3
2.7
48In
dire
ctco
ntac
t(B
P),γ̂
020.
71[0
.27,
1.14
]3.
19.0
02-0
.01
[-0.1
3,0.
11]
-0.2
1.8
35In
dire
ctco
ntac
t(W
P),γ̂
20-0
.07
[-0.4
5,0.
31]
-0.3
5.7
24-0
.02
[-0.1
1,0.
08]
-0.3
5.7
27N
eed
tobe
alon
e,γ̂
01T
20.
28[-0
.03,
0.59
]1.
76.0
79-0
.05
[-0.1
4,0.
03]
-1.2
4.2
16In
dire
ctco
ntac
t(B
P)*
Nee
dto
beal
one,
γ̂03
0.08
[-0.3
4,0.
51]
0.37
.711
-0.0
2[-0
.13,
0.10
]-0
.28
.782
Indi
rect
cont
act
(WP)
*N
eed
tobe
alon
e,γ̂
21-0
.20
[-0.5
6,0.
16]
-1.1
0.2
74-0
.01
[-0.1
0,0.
07]
-0.3
1.7
53
Not
e.Tw
om
odel
swe
reco
mpu
ted
for
each
pers
onal
and
indi
rect
cont
act
frequ
ency
:pr
edic
ting
life
satis
fact
ion
(mod
els
MX
a)an
dde
pres
sivity
/anx
iety
(mod
els
MX
b).
CI=
confi
denc
ein
terv
al;B
P=
betw
een-
pers
oneff
ect;
WP
=w
ithin
-per
son
effec
t.M
odel
sM
1a,M
1b,a
ndM
2afe
atur
era
ndom
slope
sof
with
in-p
erso
nco
ntac
t.
975
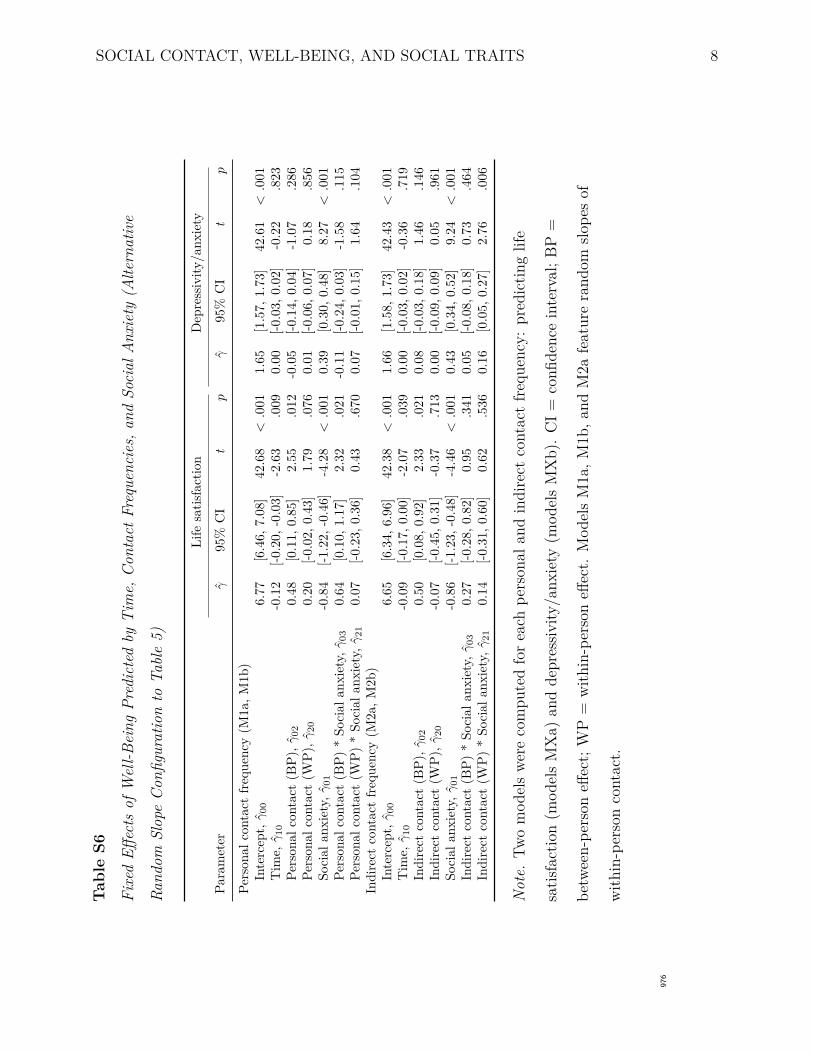
SOCIAL CONTACT, WELL-BEING, AND SOCIAL TRAITS 8
Tab
leS6
Fixe
dEff
ects
ofW
ell-B
eing
Pred
icte
dby
Tim
e,C
onta
ctFr
eque
ncie
s,an
dSo
cial
Anxi
ety
(Alte
rnat
ive
Rand
omSl
ope
Con
figur
atio
nto
Tabl
e5)
Life
satis
fact
ion
Dep
ress
ivity
/anx
iety
Para
met
erγ̂
95%
CI
tp
γ̂95
%C
It
p
Pers
onal
cont
act
freq
uenc
y(M
1a,M
1b)
Inte
rcep
t,γ̂
00T
16.
77[6
.46,
7.08
]42
.68
<.0
011.
65[1
.57,
1.73
]42
.61
<.0
01T
ime,
γ̂10
T1
-0.1
2[-0
.20,
-0.0
3]-2
.63
.009
0.00
[-0.0
3,0.
02]
-0.2
2.8
23Pe
rson
alco
ntac
t(B
P),γ̂
020.
48[0
.11,
0.85
]2.
55.0
12-0
.05
[-0.1
4,0.
04]
-1.0
7.2
86Pe
rson
alco
ntac
t(W
P),γ̂
200.
20[-0
.02,
0.43
]1.
79.0
760.
01[-0
.06,
0.07
]0.
18.8
56So
cial
anxi
ety,
γ̂01
T1
-0.8
4[-1
.22,
-0.4
6]-4
.28
<.0
010.
39[0
.30,
0.48
]8.
27<
.001
Pers
onal
cont
act
(BP)
*So
cial
anxi
ety,
γ̂03
0.64
[0.1
0,1.
17]
2.32
.021
-0.1
1[-0
.24,
0.03
]-1
.58
.115
Pers
onal
cont
act
(WP)
*So
cial
anxi
ety,
γ̂21
0.07
[-0.2
3,0.
36]
0.43
.670
0.07
[-0.0
1,0.
15]
1.64
.104
Indi
rect
cont
act
freq
uenc
y(M
2a,M
2b)
Inte
rcep
t,γ̂
00T
26.
65[6
.34,
6.96
]42
.38
<.0
011.
66[1
.58,
1.73
]42
.43
<.0
01T
ime,
γ̂10
T2
-0.0
9[-0
.17,
0.00
]-2
.07
.039
0.00
[-0.0
3,0.
02]
-0.3
6.7
19In
dire
ctco
ntac
t(B
P),γ̂
020.
50[0
.08,
0.92
]2.
33.0
210.
08[-0
.03,
0.18
]1.
46.1
46In
dire
ctco
ntac
t(W
P),γ̂
20-0
.07
[-0.4
5,0.
31]
-0.3
7.7
130.
00[-0
.09,
0.09
]0.
05.9
61So
cial
anxi
ety,
γ̂01
T2
-0.8
6[-1
.23,
-0.4
8]-4
.46
<.0
010.
43[0
.34,
0.52
]9.
24<
.001
Indi
rect
cont
act
(BP)
*So
cial
anxi
ety,
γ̂03
0.27
[-0.2
8,0.
82]
0.95
.341
0.05
[-0.0
8,0.
18]
0.73
.464
Indi
rect
cont
act
(WP)
*So
cial
anxi
ety,
γ̂21
0.14
[-0.3
1,0.
60]
0.62
.536
0.16
[0.0
5,0.
27]
2.76
.006
Not
e.Tw
om
odel
swe
reco
mpu
ted
for
each
pers
onal
and
indi
rect
cont
act
frequ
ency
:pr
edic
ting
life
satis
fact
ion
(mod
els
MX
a)an
dde
pres
sivity
/anx
iety
(mod
els
MX
b).
CI=
confi
denc
ein
terv
al;B
P=
betw
een-
pers
oneff
ect;
WP
=w
ithin
-per
son
effec
t.M
odel
sM
1a,M
1b,a
ndM
2afe
atur
era
ndom
slope
sof
with
in-p
erso
nco
ntac
t.
976
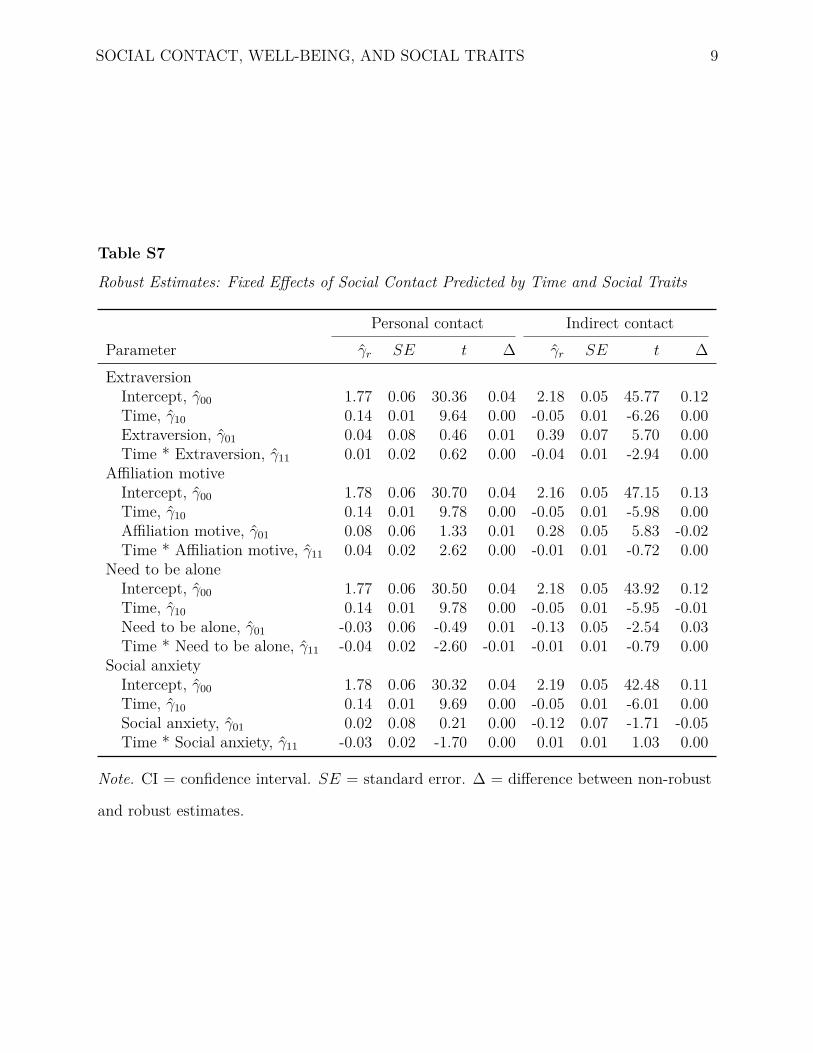
SOCIAL CONTACT, WELL-BEING, AND SOCIAL TRAITS 9
Table S7
Robust Estimates: Fixed Effects of Social Contact Predicted by Time and Social Traits
Personal contact Indirect contactParameter γ̂r SE t ∆ γ̂r SE t ∆Extraversion
Intercept, γ̂00 T1 1.77 0.06 30.36 0.04 2.18 0.05 45.77 0.12Time, γ̂10 T1 0.14 0.01 9.64 0.00 -0.05 0.01 -6.26 0.00Extraversion, γ̂01 0.04 0.08 0.46 0.01 0.39 0.07 5.70 0.00Time * Extraversion, γ̂11 0.01 0.02 0.62 0.00 -0.04 0.01 -2.94 0.00
Affiliation motiveIntercept, γ̂00 T2 1.78 0.06 30.70 0.04 2.16 0.05 47.15 0.13Time, γ̂10 T2 0.14 0.01 9.78 0.00 -0.05 0.01 -5.98 0.00Affiliation motive, γ̂01 0.08 0.06 1.33 0.01 0.28 0.05 5.83 -0.02Time * Affiliation motive, γ̂11 0.04 0.02 2.62 0.00 -0.01 0.01 -0.72 0.00
Need to be aloneIntercept, γ̂00 T3 1.77 0.06 30.50 0.04 2.18 0.05 43.92 0.12Time, γ̂10 T3 0.14 0.01 9.78 0.00 -0.05 0.01 -5.95 -0.01Need to be alone, γ̂01 -0.03 0.06 -0.49 0.01 -0.13 0.05 -2.54 0.03Time * Need to be alone, γ̂11 -0.04 0.02 -2.60 -0.01 -0.01 0.01 -0.79 0.00
Social anxietyIntercept, γ̂00 T4 1.78 0.06 30.32 0.04 2.19 0.05 42.48 0.11Time, γ̂10 T4 0.14 0.01 9.69 0.00 -0.05 0.01 -6.01 0.00Social anxiety, γ̂01 0.02 0.08 0.21 0.00 -0.12 0.07 -1.71 -0.05Time * Social anxiety, γ̂11 -0.03 0.02 -1.70 0.00 0.01 0.01 1.03 0.00
Note. CI = confidence interval. SE = standard error. ∆ = difference between non-robust
and robust estimates.

SOCIAL CONTACT, WELL-BEING, AND SOCIAL TRAITS 10
Tab
leS8
Robu
stEs
timat
es:
Fixe
dEff
ects
ofW
ell-B
eing
Pred
icte
dby
Tim
e,C
onta
ctFr
eque
ncie
s,an
d
Extra
vers
ion.
Life
satis
fact
ion
Dep
ress
ivity
/anx
iety
Para
met
erγ̂
rS
Et
∆γ̂
rS
Et
∆
Pers
onal
cont
act
freq
uenc
yIn
terc
ept,
γ̂00
T1
6.93
0.15
46.2
0-0
.22
1.60
0.04
40.6
80.
06T
ime,
γ̂10
T1
-0.1
00.
03-3
.44
-0.0
2-0
.01
0.01
-0.9
10.
00Pe
rson
alco
ntac
t(B
P),γ̂
020.
330.
191.
760.
01-0
.01
0.05
-0.1
3-0
.01
Pers
onal
cont
act
(WP)
,γ̂20
0.12
0.07
1.73
0.07
0.01
0.02
0.28
0.00
Extr
aver
sion,
γ̂01
T1
1.22
0.21
5.78
-0.0
4-0
.26
0.05
-4.8
60.
00Pe
rson
alco
ntac
t(B
P)*
Extr
aver
sion,
γ̂03
-0.0
60.
27-0
.23
0.01
0.00
0.07
-0.0
40.
01Pe
rson
alco
ntac
t(W
P)*
Extr
aver
sion,
γ̂21
-0.0
40.
09-0
.50
0.01
-0.0
20.
03-0
.68
0.00
Indi
rect
cont
act
freq
uenc
yIn
terc
ept,
γ̂00
T2
6.92
0.16
44.0
1-0
.24
1.56
0.04
38.6
00.
10T
ime,
γ̂10
T2
-0.0
80.
03-2
.91
-0.0
1-0
.01
0.01
-0.7
90.
00In
dire
ctco
ntac
t(B
P),γ̂
020.
270.
231.
18-0
.04
0.13
0.06
2.35
0.00
Indi
rect
cont
act
(WP)
,γ̂20
0.02
0.11
0.16
-0.0
80.
040.
041.
07-0
.02
Extr
aver
sion,
γ̂01
T2
1.21
0.22
5.40
-0.0
4-0
.27
0.06
-4.8
0-0
.05
Indi
rect
cont
act
(BP)
*Ex
trav
ersio
n,γ̂
03-0
.40
0.30
-1.3
50.
13-0
.08
0.07
-1.1
50.
05In
dire
ctco
ntac
t(W
P)*
Extr
aver
sion,
γ̂21
0.05
0.14
0.37
0.15
-0.0
70.
05-1
.39
-0.0
1
Not
e.γ̂
r=
robu
stes
timat
e;∆
=di
ffere
nce
betw
een
non-
robu
stan
dro
bust
estim
ate;
BP=
betw
een-
pers
oneff
ect;
WP
=w
ithin
-per
son
effec
t.
977
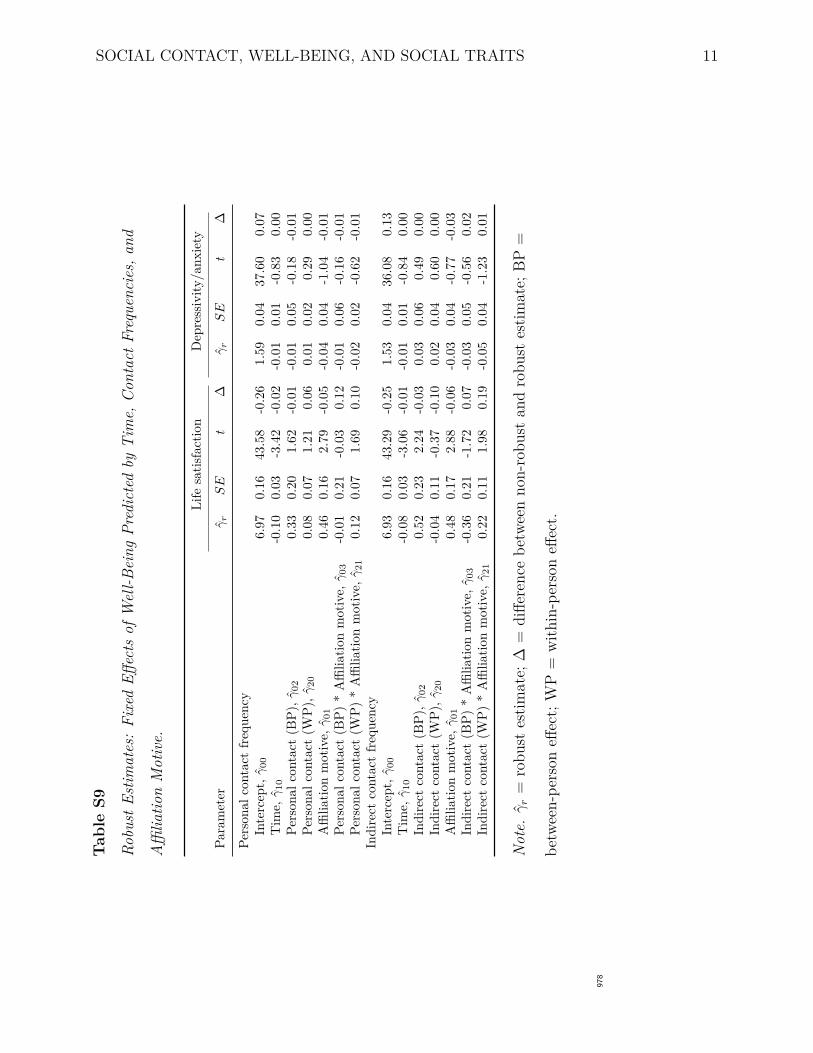
SOCIAL CONTACT, WELL-BEING, AND SOCIAL TRAITS 11
Tab
leS9
Robu
stEs
timat
es:
Fixe
dEff
ects
ofW
ell-B
eing
Pred
icte
dby
Tim
e,C
onta
ctFr
eque
ncie
s,an
d
Affi
liatio
nM
otiv
e.
Life
satis
fact
ion
Dep
ress
ivity
/anx
iety
Para
met
erγ̂
rS
Et
∆γ̂
rS
Et
∆
Pers
onal
cont
act
freq
uenc
yIn
terc
ept,
γ̂00
T1
6.97
0.16
43.5
8-0
.26
1.59
0.04
37.6
00.
07T
ime,
γ̂10
T1
-0.1
00.
03-3
.42
-0.0
2-0
.01
0.01
-0.8
30.
00Pe
rson
alco
ntac
t(B
P),γ̂
020.
330.
201.
62-0
.01
-0.0
10.
05-0
.18
-0.0
1Pe
rson
alco
ntac
t(W
P),γ̂
200.
080.
071.
210.
060.
010.
020.
290.
00A
ffilia
tion
mot
ive,
γ̂01
T1
0.46
0.16
2.79
-0.0
5-0
.04
0.04
-1.0
4-0
.01
Pers
onal
cont
act
(BP)
*A
ffilia
tion
mot
ive,
γ̂03
-0.0
10.
21-0
.03
0.12
-0.0
10.
06-0
.16
-0.0
1Pe
rson
alco
ntac
t(W
P)*
Affi
liatio
nm
otiv
e,γ̂
210.
120.
071.
690.
10-0
.02
0.02
-0.6
2-0
.01
Indi
rect
cont
act
freq
uenc
yIn
terc
ept,
γ̂00
T2
6.93
0.16
43.2
9-0
.25
1.53
0.04
36.0
80.
13T
ime,
γ̂10
T2
-0.0
80.
03-3
.06
-0.0
1-0
.01
0.01
-0.8
40.
00In
dire
ctco
ntac
t(B
P),γ̂
020.
520.
232.
24-0
.03
0.03
0.06
0.49
0.00
Indi
rect
cont
act
(WP)
,γ̂20
-0.0
40.
11-0
.37
-0.1
00.
020.
040.
600.
00A
ffilia
tion
mot
ive,
γ̂01
T2
0.48
0.17
2.88
-0.0
6-0
.03
0.04
-0.7
7-0
.03
Indi
rect
cont
act
(BP)
*A
ffilia
tion
mot
ive,
γ̂03
-0.3
60.
21-1
.72
0.07
-0.0
30.
05-0
.56
0.02
Indi
rect
cont
act
(WP)
*A
ffilia
tion
mot
ive,
γ̂21
0.22
0.11
1.98
0.19
-0.0
50.
04-1
.23
0.01
Not
e.γ̂
r=
robu
stes
timat
e;∆
=di
ffere
nce
betw
een
non-
robu
stan
dro
bust
estim
ate;
BP=
betw
een-
pers
oneff
ect;
WP
=w
ithin
-per
son
effec
t.
978
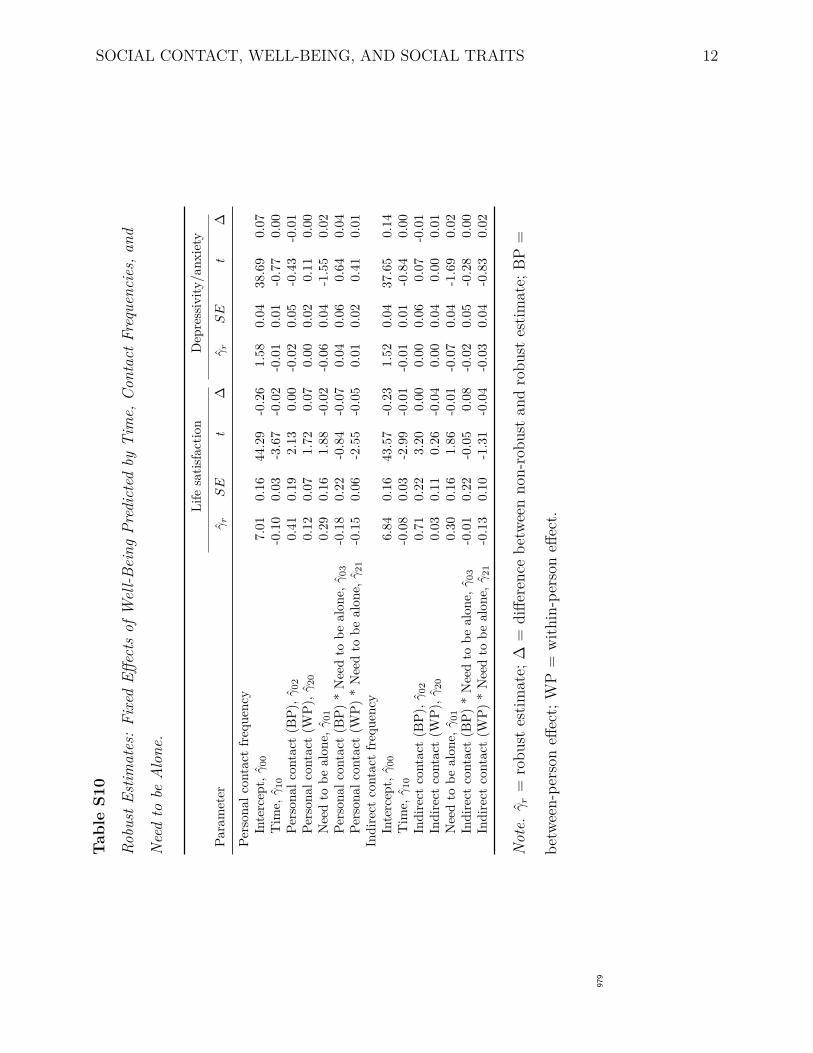
SOCIAL CONTACT, WELL-BEING, AND SOCIAL TRAITS 12
Tab
leS1
0
Robu
stEs
timat
es:
Fixe
dEff
ects
ofW
ell-B
eing
Pred
icte
dby
Tim
e,C
onta
ctFr
eque
ncie
s,an
d
Nee
dto
beA
lone
.
Life
satis
fact
ion
Dep
ress
ivity
/anx
iety
Para
met
erγ̂
rS
Et
∆γ̂
rS
Et
∆
Pers
onal
cont
act
freq
uenc
yIn
terc
ept,
γ̂00
T1
7.01
0.16
44.2
9-0
.26
1.58
0.04
38.6
90.
07T
ime,
γ̂10
T1
-0.1
00.
03-3
.67
-0.0
2-0
.01
0.01
-0.7
70.
00Pe
rson
alco
ntac
t(B
P),γ̂
020.
410.
192.
130.
00-0
.02
0.05
-0.4
3-0
.01
Pers
onal
cont
act
(WP)
,γ̂20
0.12
0.07
1.72
0.07
0.00
0.02
0.11
0.00
Nee
dto
beal
one,
γ̂01
T1
0.29
0.16
1.88
-0.0
2-0
.06
0.04
-1.5
50.
02Pe
rson
alco
ntac
t(B
P)*
Nee
dto
beal
one,
γ̂03
-0.1
80.
22-0
.84
-0.0
70.
040.
060.
640.
04Pe
rson
alco
ntac
t(W
P)*
Nee
dto
beal
one,
γ̂21
-0.1
50.
06-2
.55
-0.0
50.
010.
020.
410.
01In
dire
ctco
ntac
tfr
eque
ncy
Inte
rcep
t,γ̂
00T
26.
840.
1643
.57
-0.2
31.
520.
0437
.65
0.14
Tim
e,γ̂
10T
2-0
.08
0.03
-2.9
9-0
.01
-0.0
10.
01-0
.84
0.00
Indi
rect
cont
act
(BP)
,γ̂02
0.71
0.22
3.20
0.00
0.00
0.06
0.07
-0.0
1In
dire
ctco
ntac
t(W
P),γ̂
200.
030.
110.
26-0
.04
0.00
0.04
0.00
0.01
Nee
dto
beal
one,
γ̂01
T2
0.30
0.16
1.86
-0.0
1-0
.07
0.04
-1.6
90.
02In
dire
ctco
ntac
t(B
P)*
Nee
dto
beal
one,
γ̂03
-0.0
10.
22-0
.05
0.08
-0.0
20.
05-0
.28
0.00
Indi
rect
cont
act
(WP)
*N
eed
tobe
alon
e,γ̂
21-0
.13
0.10
-1.3
1-0
.04
-0.0
30.
04-0
.83
0.02
Not
e.γ̂
r=
robu
stes
timat
e;∆
=di
ffere
nce
betw
een
non-
robu
stan
dro
bust
estim
ate;
BP=
betw
een-
pers
oneff
ect;
WP
=w
ithin
-per
son
effec
t.
979

SOCIAL CONTACT, WELL-BEING, AND SOCIAL TRAITS 13
Tab
leS1
1
Robu
stEs
timat
es:
Fixe
dEff
ects
ofW
ell-B
eing
Pred
icte
dby
Tim
e,C
onta
ctFr
eque
ncie
s,an
d
Soci
alAn
xiet
y.
Life
satis
fact
ion
Dep
ress
ivity
/anx
iety
Para
met
erγ̂
rS
Et
∆γ̂
rS
Et
∆
Pers
onal
cont
act
freq
uenc
yIn
terc
ept,
γ̂00
T1
6.95
0.15
46.1
6-0
.19
1.61
0.04
45.1
90.
04T
ime,
γ̂10
T1
-0.0
90.
03-3
.37
-0.0
2-0
.01
0.01
-0.8
20.
00Pe
rson
alco
ntac
t(B
P),γ̂
020.
600.
193.
24-0
.13
-0.0
70.
04-1
.62
0.02
Pers
onal
cont
act
(WP)
,γ̂20
0.12
0.07
1.79
0.06
0.02
0.02
0.66
0.00
Soci
alan
xiet
y,γ̂
01T
1-0
.96
0.19
-4.9
90.
120.
370.
048.
410.
01Pe
rson
alco
ntac
t(B
P)*
Soci
alan
xiet
y,γ̂
030.
740.
272.
71-0
.11
-0.1
60.
06-2
.54
0.05
Pers
onal
cont
act
(WP)
*So
cial
anxi
ety,
γ̂21
0.14
0.09
1.57
-0.0
70.
050.
031.
520.
03In
dire
ctco
ntac
tfr
eque
ncy
Inte
rcep
t,γ̂
00T
26.
860.
1545
.01
-0.2
11.
580.
0444
.52
0.07
Tim
e,γ̂
10T
2-0
.08
0.03
-2.9
4-0
.01
-0.0
10.
01-0
.60
0.00
Indi
rect
cont
act
(BP)
,γ̂02
0.60
0.22
2.80
-0.1
00.
050.
051.
080.
03In
dire
ctco
ntac
t(W
P),γ̂
200.
040.
110.
40-0
.05
0.07
0.04
1.80
-0.0
5So
cial
anxi
ety,
γ̂01
T2
-0.8
70.
19-4
.52
0.01
0.39
0.04
9.06
0.03
Indi
rect
cont
act
(BP)
*So
cial
anxi
ety,
γ̂03
0.47
0.28
1.66
-0.1
90.
050.
060.
770.
03In
dire
ctco
ntac
t(W
P)*
Soci
alan
xiet
y,γ̂
210.
100.
140.
750.
030.
150.
053.
11-0
.02
Not
e.γ̂
r=
robu
stes
timat
e;∆
=di
ffere
nce
betw
een
non-
robu
stan
dro
bust
estim
ate;
BP=
betw
een-
pers
oneff
ect;
WP
=w
ithin
-per
son
effec
t.
980
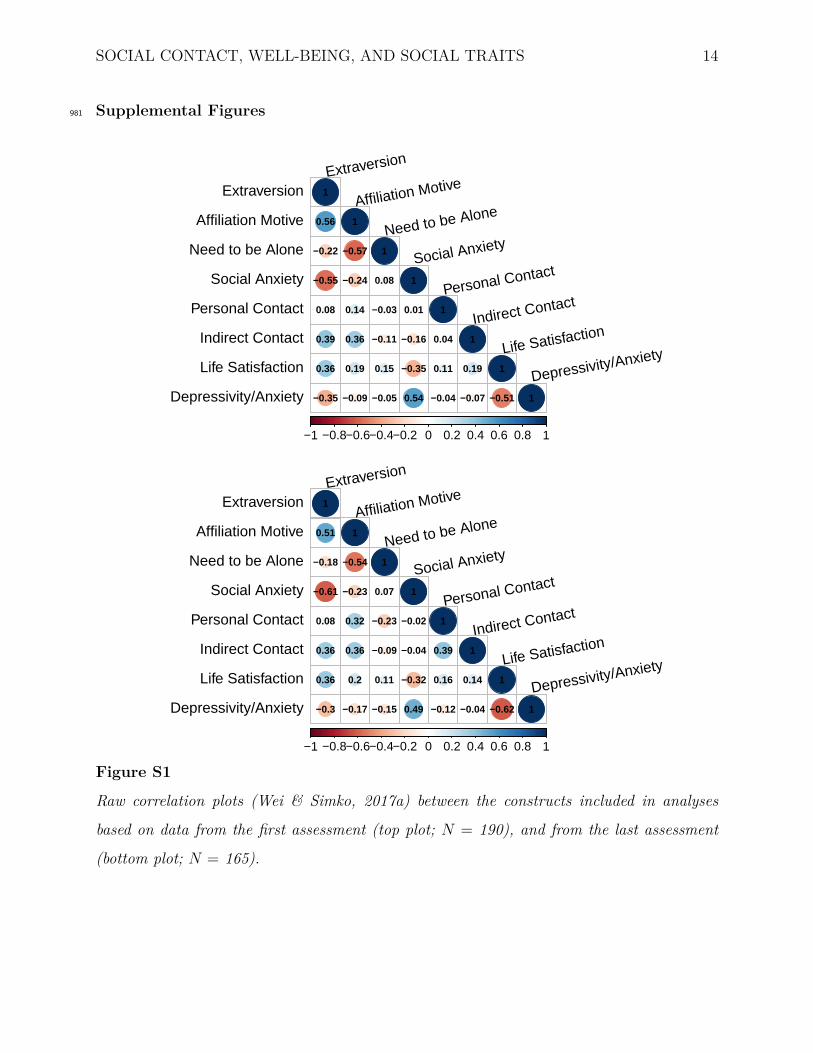
SOCIAL CONTACT, WELL-BEING, AND SOCIAL TRAITS 14
Supplemental Figures981
−1 −0.8−0.6−0.4−0.2 0 0.2 0.4 0.6 0.8 1
Extraversion
Affiliation Motive
Need to be Alone
Social Anxiety
Personal Contact
Indirect Contact
Life Satisfaction
Depressivity/Anxiety
Extraversion
Affiliation Motive
Need to be Alone
Social Anxiety
Personal Contact
Indirect Contact
Life Satisfaction
Depressivity/Anxiety
1
0.56
−0.22
−0.55
0.08
0.39
0.36
−0.35
1
−0.57
−0.24
0.14
0.36
0.19
−0.09
1
0.08
−0.03
−0.11
0.15
−0.05
1
0.01
−0.16
−0.35
0.54
1
0.04
0.11
−0.04
1
0.19
−0.07
1
−0.51 1
−1 −0.8−0.6−0.4−0.2 0 0.2 0.4 0.6 0.8 1
Extraversion
Affiliation Motive
Need to be Alone
Social Anxiety
Personal Contact
Indirect Contact
Life Satisfaction
Depressivity/Anxiety
Extraversion
Affiliation Motive
Need to be Alone
Social Anxiety
Personal Contact
Indirect Contact
Life Satisfaction
Depressivity/Anxiety
1
0.51
−0.18
−0.61
0.08
0.36
0.36
−0.3
1
−0.54
−0.23
0.32
0.36
0.2
−0.17
1
0.07
−0.23
−0.09
0.11
−0.15
1
−0.02
−0.04
−0.32
0.49
1
0.39
0.16
−0.12
1
0.14
−0.04
1
−0.62 1
Figure S1
Raw correlation plots (Wei & Simko, 2017a) between the constructs included in analyses
based on data from the first assessment (top plot; N = 190), and from the last assessment
(bottom plot; N = 165).
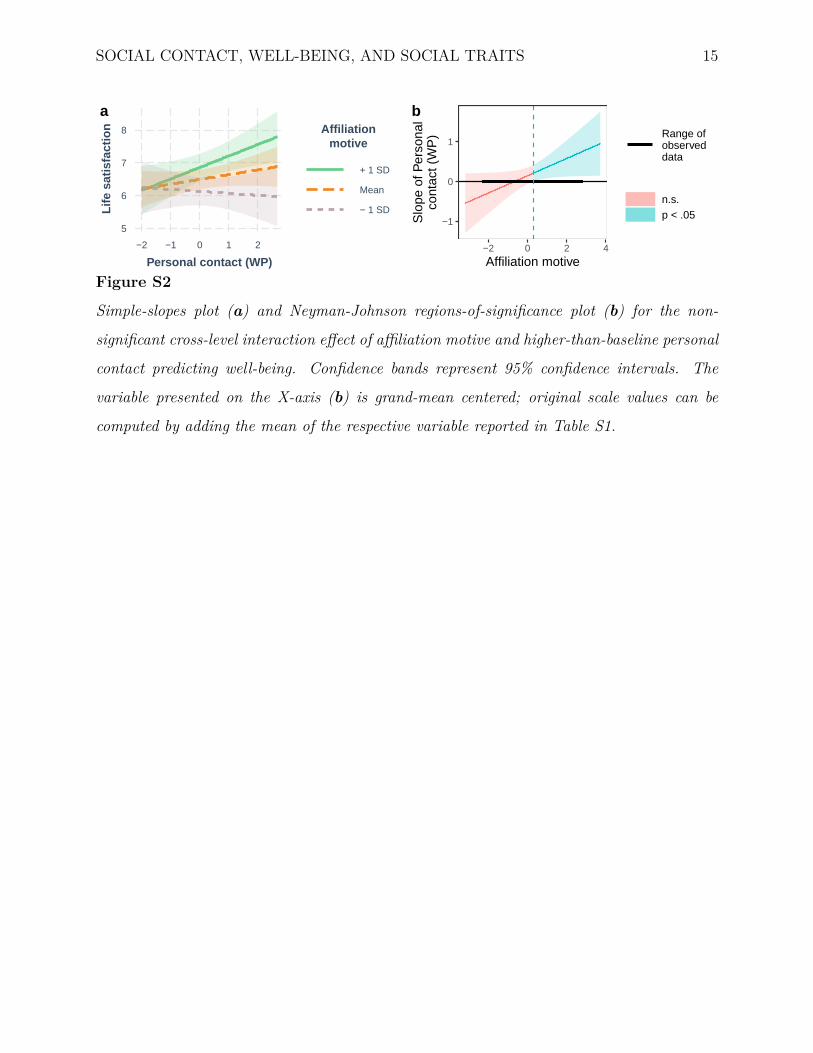
SOCIAL CONTACT, WELL-BEING, AND SOCIAL TRAITS 15
5
6
7
8
−2 −1 0 1 2
Personal contact (WP)
Life
sat
isfa
ctio
n Affiliationmotive
+ 1 SD
Mean
− 1 SD
a
−1
0
1
−2 0 2 4
Affiliation motive
Slo
pe o
f Per
sona
lco
ntac
t (W
P) Range of
observeddata
n.s.p < .05
b
Figure S2
Simple-slopes plot (a) and Neyman-Johnson regions-of-significance plot (b) for the non-
significant cross-level interaction effect of affiliation motive and higher-than-baseline personal
contact predicting well-being. Confidence bands represent 95% confidence intervals. The
variable presented on the X-axis (b) is grand-mean centered; original scale values can be
computed by adding the mean of the respective variable reported in Table S1.
SOCIAL CONTACT, WELL-BEING, AND SOCIAL TRAITS 16
Complete Software and Session Information982
We used R (Version 4.0.4; R Core Team, 2020) and the R-packages car (Version983
3.0.12; Fox & Weisberg, 2019; Fox et al., 2020; Yentes & Wilhelm, 2018), carData (Version984
3.0.4; Fox et al., 2020), careless (Version 1.1.3; Yentes & Wilhelm, 2018), citr (Version985
0.3.2; Aust, 2019), corrplot2017 (Wei & Simko, 2017b), cowplot (Version 1.1.1; Wilke,986
2020), dplyr (Version 1.0.7; Wickham, François, et al., 2020), effects (Version 4.2.0; Fox &987
Weisberg, 2018; Fox, 2003; Fox & Hong, 2009), forcats (Version 0.5.1; Wickham, 2020a),988
Formula (Version 1.2.4; Zeileis & Croissant, 2010), ggplot2 (Version 3.3.5; Wickham, 2016),989
GPArotation (Version 2014.11.1; Bernaards & I.Jennrich, 2005), Hmisc (Version 4.6.0;990
Harrell Jr, 2021), interactions (Version 1.1.5; Long, 2019), jtools (Version 2.1.4; Long,991
2020), lattice (Version 0.20.41; Sarkar, 2008), lme4 (Version 1.1.27.1; Bates et al., 2015),992
lmerTest (Version 3.1.3; Kuznetsova et al., 2017), magick (Version 2.7.3; Ooms, 2021),993
MASS (Version 7.3.53; Venables & Ripley, 2002), Matrix (Version 1.3.2; Bates & Maechler,994
2019), MplusAutomation (Hallquist & Wiley, 2018), multcomp (Version 1.4.18; Hothorn et995
al., 2008), mvtnorm (Version 1.1.1; Genz & Bretz, 2009), nlme (Version 3.1.152; Pinheiro et996
al., 2021), papaja (Version 0.1.0.9997; Aust & Barth, 2020), patchwork (Version 1.1.1;997
Pedersen, 2020), png (Version 0.1.7; Urbanek, 2013), psych (Version 2.1.9; Revelle, 2020),998
purrr (Version 0.3.4; Henry & Wickham, 2020), readr (Version 2.1.1; Wickham & Hester,999
2020), robustlmm (Version 2.5.0; Koller, 2019), scales (Version 1.1.1; Wickham & Seidel,1000
2020), shiny (Version 1.7.1; Chang et al., 2020), simr (Green & MacLeod, 2016), stringr1001
(Version 1.4.0; Wickham, 2019), survival (Version 3.2.7; Terry M. Therneau & Patricia M.1002
Grambsch, 2000), TH.data (Version 1.0.10; Hothorn, 2019), tibble (Version 3.1.6; Müller &1003
Wickham, 2020), tidyr (Version 1.1.4; Wickham, 2020b), tidyverse (Version 1.3.1;1004
Wickham, Averick, Bryan, Chang, McGowan, François, et al., 2019), and tinylabels1005
(Version 0.2.2; Barth, 2020) for data wrangling, analyses, and plots.1006
The following is the output of R’s sessionInfo() command, which shows information1007
to aid analytic reproducibility of the analyses.1008
SOCIAL CONTACT, WELL-BEING, AND SOCIAL TRAITS 17
R version 4.0.4 (2021-02-15) Platform: x86_64-apple-darwin17.0 (64-bit) Running1009
under: macOS Big Sur 10.161010
Matrix products: default BLAS:1011
/Library/Frameworks/R.framework/Versions/4.0/Resources/lib/libRblas.dylib LAPACK:1012
/Library/Frameworks/R.framework/Versions/4.0/Resources/lib/libRlapack.dylib1013
locale: [1]1014
en_US.UTF-8/en_US.UTF-8/en_US.UTF-8/C/en_US.UTF-8/en_US.UTF-81015
attached base packages: [1] grid stats graphics grDevices utils datasets methods1016
[8] base1017
other attached packages: [1] png_0.1-7 magick_2.7.3 corrplot_0.841018
[4] careless_1.1.3 car_3.0-12 scales_1.1.11019
[7] patchwork_1.1.1 effects_4.2-0 carData_3.0-41020
[10] cowplot_1.1.1 jtools_2.1.4 interactions_1.1.51021
[13] lmerTest_3.1-3 robustlmm_2.5-0 lme4_1.1-27.11022
[16] Matrix_1.3-2 GPArotation_2014.11-1 psych_2.1.91023
[19] forcats_0.5.1 stringr_1.4.0 dplyr_1.0.71024
[22] purrr_0.3.4 readr_2.1.1 tidyr_1.1.41025
[25] tibble_3.1.6 ggplot2_3.3.5 tidyverse_1.3.11026
[28] citr_0.3.2 papaja_0.1.0.9997 tinylabels_0.2.21027
loaded via a namespace (and not attached): [1] TH.data_1.0-10 minqa_1.2.41028
colorspace_2.0-21029
[4] ellipsis_0.3.2 estimability_1.3 fs_1.5.21030
[7] rstudioapi_0.13 farver_2.1.0 fansi_1.0.21031
[10] mvtnorm_1.1-1 lubridate_1.8.0 xml2_1.3.31032
[13] codetools_0.2-18 splines_4.0.4 mnormt_2.0.21033
[16] robustbase_0.93-6 knitr_1.37 jsonlite_1.7.31034
SOCIAL CONTACT, WELL-BEING, AND SOCIAL TRAITS 18
[19] nloptr_1.2.2.2 broom_0.7.11.9000 dbplyr_2.1.11035
[22] shiny_1.7.1 compiler_4.0.4 httr_1.4.21036
[25] emmeans_1.7.1-1 backports_1.4.1 assertthat_0.2.11037
[28] fastmap_1.1.0 survey_4.0 cli_3.1.11038
[31] later_1.3.0 htmltools_0.5.2 tools_4.0.41039
[34] coda_0.19-4 gtable_0.3.0 glue_1.6.11040
[37] Rcpp_1.0.7 cellranger_1.1.0 vctrs_0.3.81041
[40] nlme_3.1-152 insight_0.14.5 xfun_0.291042
[43] rvest_1.0.2 mime_0.12 miniUI_0.1.1.11043
[46] lifecycle_1.0.1 DEoptimR_1.0-8 MASS_7.3-531044
[49] zoo_1.8-8 hms_1.1.1 promises_1.2.0.11045
[52] parallel_4.0.4 sandwich_3.0-0 yaml_2.2.21046
[55] pander_0.6.3 fastGHQuad_1.0 stringi_1.7.61047
[58] highr_0.9 boot_1.3-26 rlang_0.4.121048
[61] pkgconfig_2.0.3 evaluate_0.14 lattice_0.20-411049
[64] labeling_0.4.2 tidyselect_1.1.1 magrittr_2.0.21050
[67] bookdown_0.24 R6_2.5.1 generics_0.1.11051
[70] multcomp_1.4-18 DBI_1.1.0 pillar_1.6.51052
[73] haven_2.4.3 withr_2.4.3 abind_1.4-51053
[76] survival_3.2-7 nnet_7.3-15 modelr_0.1.81054
[79] crayon_1.4.2 utf8_1.2.2 tmvnsim_1.0-21055
[82] tzdb_0.2.0 rmarkdown_2.11 readxl_1.3.11056
[85] reprex_2.0.1 digest_0.6.29 xtable_1.8-41057
[88] httpuv_1.6.5 numDeriv_2016.8-1.1 munsell_0.5.01058
[91] mitools_2.41059