social networks and their impact on the employment and earnings of mexican immigrants
TRANSCRIPT
Social Networks and Their Impact on the Employment and Earnings of Mexican Immigrants
Catalina Amuedo-Dorantes San Diego State University Department of Economics San Diego CA 92182-4485
Ph: 619-594-1663 Fax: 619-594-5062
Kusum Mundra San Diego State University Department of Economics San Diego CA 92182-4485
Ph: 619-594-5662 Fax: 619-594-5062
September 23, 2004 We would like to thank Susan Pozo, as well as participants at the 2004 ASSA meetings and at the 2004 Midwest Economic Association meetings for their comments to previous drafts of this paper.
Social Networks and Their Impact on the Employment and Earnings of Mexican Immigrants
Abstract
We examine the impact of different types of social networks on the employment and wages of unauthorized and legal Mexican immigrants using data from the Mexican Migration Project. We find that social networks, particularly strong ties, contribute to the economic assimilation of immigrants by raising their hourly wages. However, networks do not enhance immigrants’ employability. Instead, strong ties allow for a lower employment likelihood possibly through the shelter against temporary unemployment provided by close family members. Finally, social networks do not alter the relative employment and earnings performance of unauthorized and legal immigrants in the absence of networks.
1
I. Introduction
Social networks facilitate immigrants’ assimilation to their host countries. Public interest
in immigrants’ integration into their adopting nations has produced a prolific literature that
examines the role of social networks on a wide variety of aspects of immigrants’ lives, primarily
their employment and earnings.1 Despite using very different definitions of social networks,
previous work on this area has generally found that social networks enhance immigrants’
employment opportunities, while not necessarily their earnings.2
However, to this date, the literature has not examined the effect of social networks on the
employment and earnings of legal versus unauthorized immigrants. This is of special interest in
the case of unauthorized immigrants, who reached 8.7 million in the U.S. as of the year 2000
(Census 2000). Furthermore, there is evidence of immigrants’ unauthorized status adversely
affecting their employment and earnings in the U.S. (e.g. Bean et al. 1988, Winegarden and Khor
1991). Unauthorized immigrants lack appropriate work documentation, increasing their
difficulty in finding employment and lowering their wages relative to those of legal immigrants
with proper immigration and work documentation. In this vein, and focusing on the U.S.,
Rivera-Batiz (1999) finds that male Mexican legal migrants earn, on average, forty-one percent
more than unauthorized workers. There is also evidence of immigrants’ legal status explaining
their earnings and their wage differential with respect to other groups for Italy (Baldacci et. al.
1999). Some studies have argued that unauthorized immigrants’ difficulty in finding
employment and the lower wages they often earn relative to legal immigrants are due to their
also lower human capital (e.g. Chiswick 1988, Borjas 1990). However, differences in human
1 Some examples include: Datcher 1983, Granovetter 1995, Chiswick and Miller 1996, Lin 1999, Fafchamps and Minten 2002, Rauch 2002, Rauch and Trindale 2002, and Mouw 2003. 2 E.g. Granovetter 1973 and 1974, Corcoran et al. 1980, Datcher 1983, Montgomery 1992, Chiswick and Miller 1996, Korenman and Turner 1996, Fernandez et al. 2000, and Calvo-Armengol and Jackson 2002.

2
capital –such as immigrants’ English proficiency– only explain 48 percent of the log-wage gap
between unauthorized and legal immigrants (Rivera-Batiz 1999). Therefore, immigrants’ legal
status may be affecting their employment and earnings independently of their personal and
human capital characteristics. In particular, given their lack of proper work documentation,
social networks may have a greater impact on unauthorized immigrants (relative to legal
immigrants) by helping them find employment and/or earn higher wages through a better job
match.
In this paper, we examine immigrants’ social networks and the impact of such networks
on their employment and wages on the basis of their legal status during their last U.S. migration.
Following Granovetter (1973, 1974, 1982, 1995) and others in the literature (e.g. see Lin 1999),
we distinguish between strong ties with family members originating from the same household
back in Mexico, and weak ties with other relatives and friends. This distinction is of interest
given the importance of loyalty, solidarity, and reciprocity among immediate household
members as compared to more distant relatives and friends. Additionally, the social capital
available to the migrant through strong and weak ties may also differ. At last, distinguishing
between the impact of strong and weak ties on the employment likelihood and hourly wages
earned by unauthorized and legal immigrants is also of interest due to: (a) the nature of U.S.
immigration laws, which have traditionally favored family reunification, and (b) the dissimilar
risk exposure of unauthorized and legal immigrants.
We use data on Mexican immigrants in the U.S. from the Mexican Migration Project
(MMP). Mexican immigrants constitute a particularly interesting immigrant group given that 44
percent of the unauthorized immigrants in the U.S. are Mexican (Census 2000). We first find
that legal immigrants are generally more likely to have larger networks providing both strong
3
and weak ties than unauthorized immigrants. The presence of a larger close family network
could, in part, be due to the nature of U.S. immigration laws. A larger network of strong ties
may, in turn, facilitate the acquisition of an extended network of weak ties constituted by family
friends.
Additionally, we find that social networks do facilitate the economic assimilation of
Mexican immigrants by raising their wages. In particular, the presence of an additional
household member in the U.S. increases the wages earned by unauthorized immigrants by 3
percent and those of their legal counterparts by 2.5 percent. Likewise, each additional distant
relative or friend providing weak ties raises unauthorized and legal immigrants’ average hourly
wages by approximately 0.5 percent. Given unauthorized and legal immigrants’ average
network size, weak ties improve unauthorized and legal immigrants’ average hourly wages by
approximately 7.5 percent and 9.5 percent, respectively. Nevertheless, we do not find evidence
of social networks improving immigrants’ employment likelihood once in the U.S. On the
contrary, the presence of a household member in the U.S. reduces, albeit to a small amount, the
employment likelihood of immigrants. We interpret this result as evidence of the temporary
shelter provided by strong ties, which may enable migrants a longer unemployment period
during which they can search for a better job match relative to similar migrants lacking such ties.
Finally, despite their differential impact on unauthorized and legal immigrants’
employability, social networks do not alter the already greater employment likelihood exhibited
by unauthorized relative to legal immigrants, nor the similar average hourly wage earned by
unauthorized and legal immigrants in the absence of networks. In this regard, strong and weak
ties are unable to change the already prevailing employment differences or the similar wages
earned by the two immigrant groups when they do not network.
4
II. Background: Social Networks and their Impact on Immigrant Labor Outcomes
The effect of social networks on immigrants’ employment and wages may significantly
differ according to how we define social networks. In this regard, it is first important to point out
some of the ways in which the existing literature has measured social networks. For instance,
Chiswick and Miller (1996) measure social networks by the extent of linguistic concentration in
the area where the immigrant resides. Datcher (1983), however, captures the existence of social
networks with three variables. The first one is a dummy variable indicative of whether the
immigrant knew anybody in her current workplace before accepting the job. The second
variable is a dichotomous variable equal to one if the immigrant heard about the job from this
person (or contact). Finally, a third variable indicates how much influence this person (or
contact) had in the immigrant’s decision to accept the job. In a recent paper, Munshi (2003) uses
data from the MMP to measure social networks as the proportion of individuals in the MMP
living in the vicinity of the individual in the U.S. and originating from the same community in
Mexico. Nonetheless, one of the most influential definitions of social networks is the one
provided by Granovetter (1973, 1974, 1982, 1995), who distinguishes between strong and weak
ties. In particular, he asserts that close friends and family provide us with strong ties, whereas
acquaintances constitute weak ties.
The distinction between strong and weak ties is of interest when examining the impact of
social networks due to the importance of loyalty, solidarity, and reciprocity among family
members relative to acquaintances. Consequently, strong and weak ties may exert different
effort levels when helping migrants find a good job match. Furthermore, the network social
capital –that is, the resources, information and influence (as defined by Lin (1999), Mouw
(2003))– available to the migrant through strong ties may differ from those made available
5
through weak ties. As such, it may be reasonable to expect a differential effect from strong ties
versus weak ties on immigrants’ employment and earnings.
What have been the major findings in the literature of social networks regarding the
effect of these networks on the employment and earnings of immigrants? Despite the different
measures used in the literature, there are some common findings. For instance, Granovetter
(1973, 1974), Fernandez et al. (2000) and Munshi (2003) find that workers have better chances
of finding employment when using networks. In particular, they argue that weak ties constituted
by acquaintances are more effective than strong ties with close friends in part due to the fact that
acquaintances move in social circles distinct from those of your close friends. As a result, weak
ties may offer inside information on alternative job openings. Similarly, Datcher (1983) finds
evidence of a positive impact of social networks on employment, although from a different
perspective. In particular, Datcher focuses on the impact of informal networks on the probability
of quitting a job and finds that workers with contacts before being hired are less likely to quit
their jobs. Yet another study investigating the effect of social network on employment is the
analysis by Calvo-Armengol and Jackson (2004). By means of their theoretical model, they also
show that the employment likelihood increases with the extent of social contacts.
The literature includes a greater diversity of findings when assessing the effect of social
networks on immigrants’ hourly wages. For example, Montgomery (1992) finds that weak ties
can be associated with lower earnings, even though weak ties increase the likelihood of
employment. Also while examining immigrants’ earnings, Chiswick and Miller (1996) show
that there is a tendency among immigrant groups to live in the areas where many others speak
their language (i.e. areas with a high linguistic concentration). This tendency, however, appears
to reduce immigrants’ incentive to learn the new language. As a result, immigrants living in
6
areas with higher linguistic concentrations tend to earn less than their counterparts living in areas
where English is spoken more frequently. In contrast, Calvo-Armengol and Jackson (2002)
theoretical analysis shows a positive impact of social contacts on wages. Likewise, Mouw
(2003) finds that, once we control for unobserved worker characteristics, there is some evidence
on the use of contacts positively impacting wages. Finally, using the MMP data, Munshi (2003)
finds evidence of a higher likelihood of holding a higher paying non-agriculture job among
migrants with larger networks once the potential endogeneity of social networks with respect to
employment and earnings is accounted for.
However, as noted earlier, the literature has not yet addressed networking differences
between unauthorized and legal immigrants, nor the distinct impact that these networks may
have on their respective employment and earned wages. Given the predominance of
unauthorized Mexican immigrants in the U.S., the aforementioned evidence of immigrants’
unauthorized status adversely affecting their employment and earnings, and the nature of U.S.
immigration laws –which have traditionally allowed for family reunification, we address this gap
in the literature as follows.
Inspired on Granovetter (1973, 1974, 1982, 1995) and in order to account for differences
in the effect of networks according to their composition, we distinguish between immigrants’
strong and weak ties. On the one hand, we measure strong ties by the number of the immigrant’s
household members back in Mexico residing in the U.S. On the other hand, weak ties are
defined as the number of more distant relatives and friends living in the U.S. In both cases, we
focus on the size of the strong and weak ties available to the migrant as of the year prior to
her/his last U.S. trip as a means to guarantee their predetermined character relative to the
migrant’s employment and earnings outcomes.
7
We first examine the extent of social networks available to immigrants depending on
their legal status. On the one hand, legal immigrants may display larger social networks than
unauthorized immigrants due to the facilitated family reunification by U.S. immigration laws.
On the other hand, unauthorized immigrants could maintain more extensive social networks than
legal immigrants, in particular weak ties with friends, as a means to insure themselves against
their higher deportation and income risk. After assessing the extent of immigrants’ weak and
strong ties according to their legal status, we thoroughly examine the potential impact of such
ties on the employment and hourly wages of unauthorized and legal immigrants. Finally, we
compare the impact of social networks on the employment and hourly wages earned by each
immigrant group and investigate whether social networks modify or, rather, help perpetuate the
employment differences or the pay similarity between unauthorized and legal immigrants in the
absence of social networks.
III. Theoretical Framework: The Effect of Social Networks on Employment and Wages
In examining the impact of social networks on unauthorized and legal immigrants’
employment and wages, it is useful to make use of a simple model that describes some of the
ways in which social networks may affect immigrants’ employment and earnings. The model
helps us outline the hypotheses we later test within a theoretical framework. With the
aforementioned purposes, we use a job-search labor model where immigrants attempt to
maximize their expected discounted lifetime utility:
(1) ),(0∑∞
=ttt
t lyuE β , 10 << β
which depends on their income y and leisure l , as well as on the discount rate: β . If employed,
immigrants choose how many hours to work each period, that is: )1( tl− where 10 ≤≤ tl , and
8
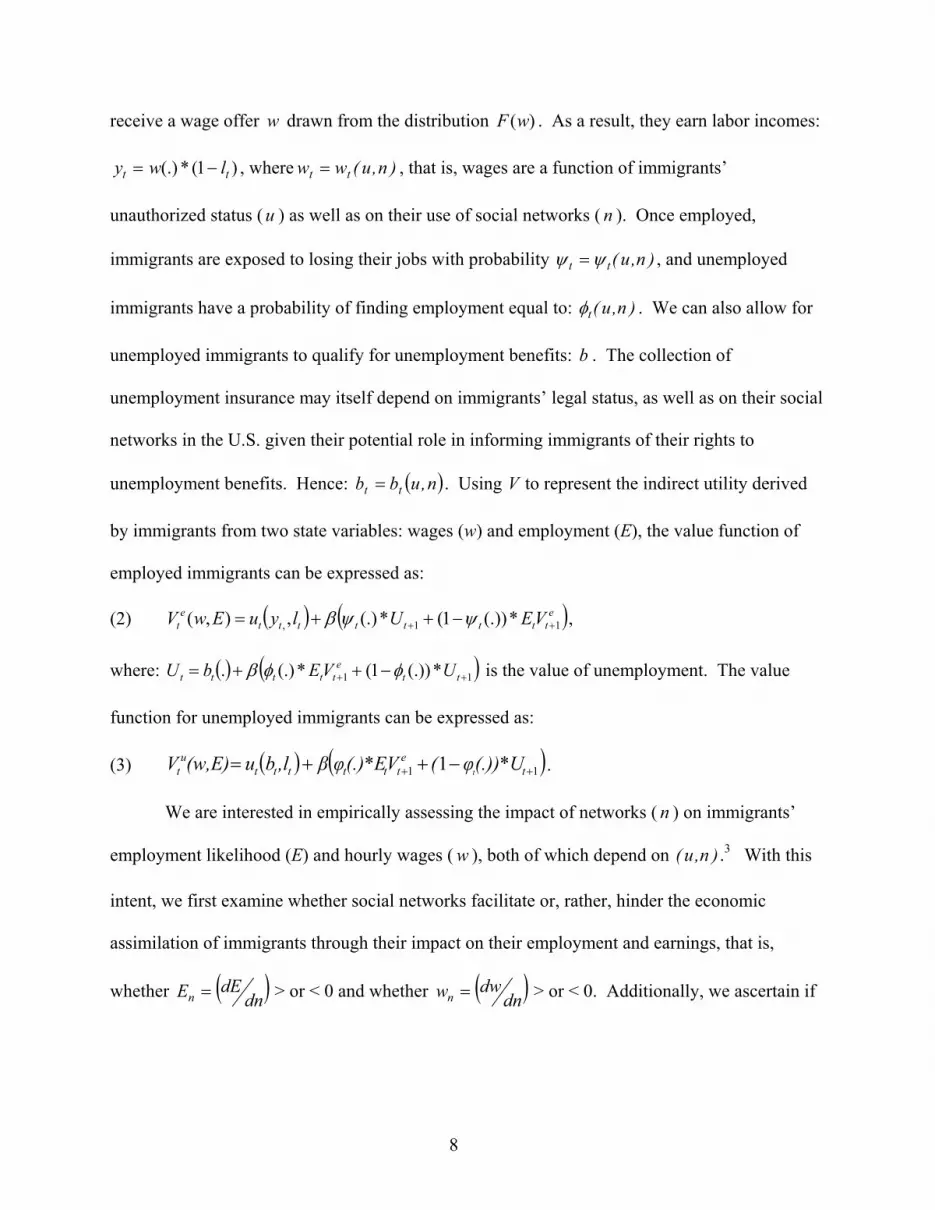
receive a wage offer w drawn from the distribution )(wF . As a result, they earn labor incomes:
)1(*(.) tt lwy −= , where )n,u(ww tt = , that is, wages are a function of immigrants’
unauthorized status (u ) as well as on their use of social networks ( n ). Once employed,
immigrants are exposed to losing their jobs with probability )n,u(tt ψψ = , and unemployed
immigrants have a probability of finding employment equal to: )n,u(tφ . We can also allow for
unemployed immigrants to qualify for unemployment benefits: b . The collection of
unemployment insurance may itself depend on immigrants’ legal status, as well as on their social
networks in the U.S. given their potential role in informing immigrants of their rights to
unemployment benefits. Hence: ( )n,ubb tt = . Using V to represent the indirect utility derived
by immigrants from two state variables: wages (w) and employment (E), the value function of
employed immigrants can be expressed as:
(2) ( ) ( )etttttttt
et VEUlyuEwV 11, *(.))1(*(.),),( ++ −++= ψψβ ,
where: ( ) ( )11 *(.))1(*(.). ++ −++= tte
ttttt UVEbU φφβ is the value of unemployment. The value
function for unemployed immigrants can be expressed as:
(3) ( ) ( )11 1 ++ −++= te
ttttttu
t (.))*Uφ(V(.)*Eφβ,lbu(w,E)V t .
We are interested in empirically assessing the impact of networks ( n ) on immigrants’
employment likelihood (E) and hourly wages ( w ), both of which depend on )n,u( .3 With this
intent, we first examine whether social networks facilitate or, rather, hinder the economic
assimilation of immigrants through their impact on their employment and earnings, that is,
whether ( )dndEEn = > or < 0 and whether ( )dn
dwwn = > or < 0. Additionally, we ascertain if
9
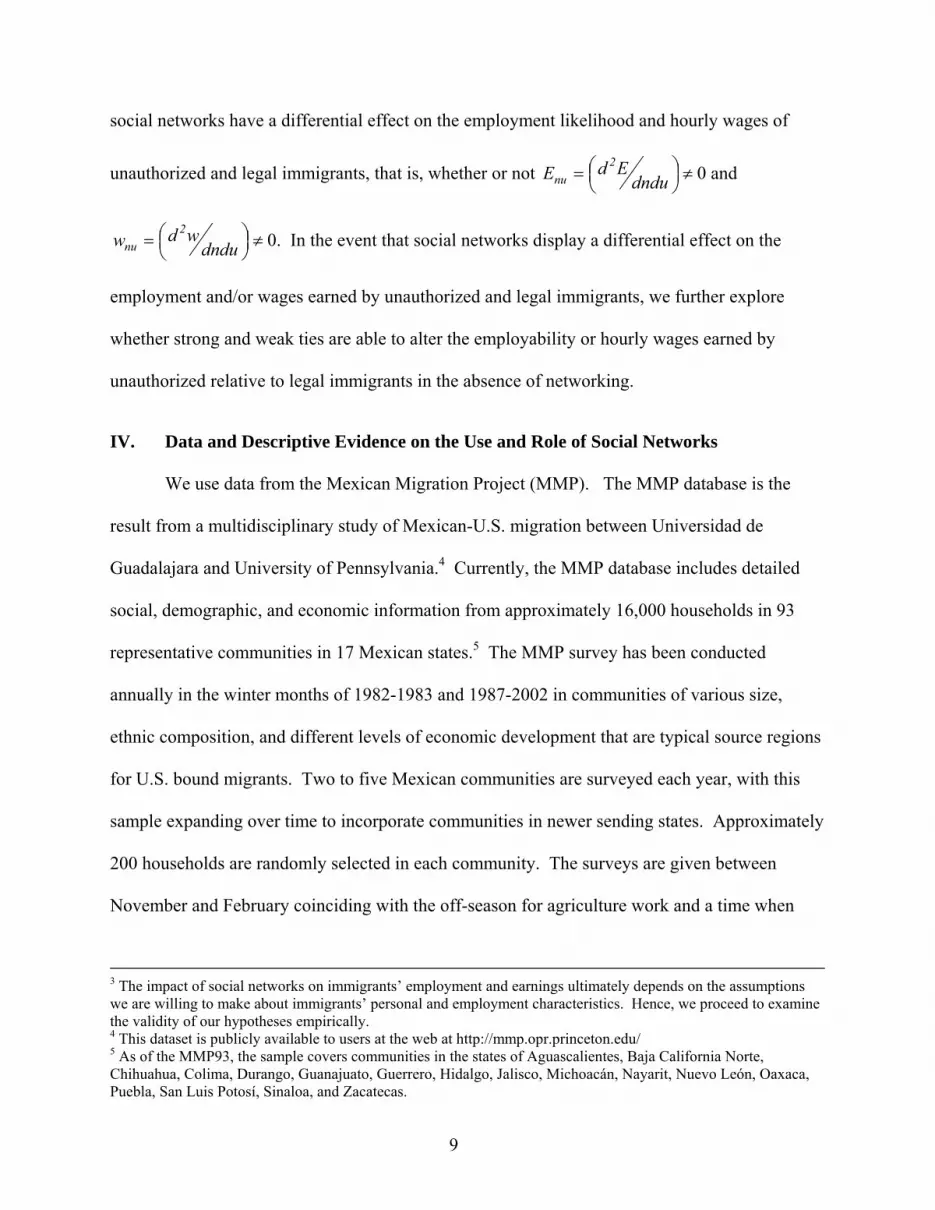
social networks have a differential effect on the employment likelihood and hourly wages of
unauthorized and legal immigrants, that is, whether or not ⎟⎠⎞⎜
⎝⎛= dndu
EdE2
nu ≠ 0 and
⎟⎠⎞⎜
⎝⎛= dndu
wdw2
nu ≠ 0. In the event that social networks display a differential effect on the
employment and/or wages earned by unauthorized and legal immigrants, we further explore
whether strong and weak ties are able to alter the employability or hourly wages earned by
unauthorized relative to legal immigrants in the absence of networking.
IV. Data and Descriptive Evidence on the Use and Role of Social Networks
We use data from the Mexican Migration Project (MMP). The MMP database is the
result from a multidisciplinary study of Mexican-U.S. migration between Universidad de
Guadalajara and University of Pennsylvania.4 Currently, the MMP database includes detailed
social, demographic, and economic information from approximately 16,000 households in 93
representative communities in 17 Mexican states.5 The MMP survey has been conducted
annually in the winter months of 1982-1983 and 1987-2002 in communities of various size,
ethnic composition, and different levels of economic development that are typical source regions
for U.S. bound migrants. Two to five Mexican communities are surveyed each year, with this
sample expanding over time to incorporate communities in newer sending states. Approximately
200 households are randomly selected in each community. The surveys are given between
November and February coinciding with the off-season for agriculture work and a time when
3 The impact of social networks on immigrants’ employment and earnings ultimately depends on the assumptions we are willing to make about immigrants’ personal and employment characteristics. Hence, we proceed to examine the validity of our hypotheses empirically. 4 This dataset is publicly available to users at the web at http://mmp.opr.princeton.edu/ 5 As of the MMP93, the sample covers communities in the states of Aguascalientes, Baja California Norte, Chihuahua, Colima, Durango, Guanajuato, Guerrero, Hidalgo, Jalisco, Michoacán, Nayarit, Nuevo León, Oaxaca, Puebla, San Luis Potosí, Sinaloa, and Zacatecas.

10
many migrants return to Mexico. After gathering detailed information on these households,
interviewers travel to the destination areas in the U.S. to administer identical questionnaires to
households from the same communities in Mexico who have settled in the U.S. and no longer
return home. Altogether, the MMP provides reasonably representative data on authorized and
unauthorized Mexican immigrants in the U.S. (Massey and Zenteno 2000) and has been used by
researchers when examining immigrant networks (e.g. Munshi 2003, Philip and Massey 2003).
In this project, we use data collected from all household heads (whether or not they ever
migrated to the U.S.) in the U.S. and Mexico between 1982 through 2003. In this manner, we
are able to partially address the selection issues that arise when exclusively focusing on
immigrants. Of the approximately 16,000 household heads in the survey, around 6,000 have
migrated to the U.S. at some point in their lives. About 85 percent of these U.S. immigrants
were interviewed in Mexico, with the remaining 15 percent being interviewed in the U.S.6
Given our focus on the role of social networks on the employment and wages earned by
Mexican immigrants according to the closeness of the network ties to the migrant, we follow
much of the literature on social networks and distinguish between strong and weak ties
(Granovetter 1973, 1982). We define strong ties as the number of household members already
living in the U.S. one year prior to the migrant’s last U.S. trip. In contrast, weak ties indicate the
number of more distant relatives and friends residing in the U.S. one year prior to the migrant’s
last U.S. spell. Measuring immigrants’ networks as of the year before their last U.S. trip
guarantees their predetermined nature with respect to immigrants’ employment and wage
outcomes.
6 While there are no official figures on the proportion of Mexican migrants who never return to Mexico, this percentage is suspected to be relatively low due in part to the geographic proximity of the two countries (Lowell 1992).
11
In addition, we account for a variety of personal and household characteristics possibly
affecting individuals’ decision to migrate to the U.S., their likelihood of working during their last
U.S. trip and, in this last event, their earned wages. Some of these characteristics include
household heads’ demographic characteristics, human capital, economic standing, and legal
status once in the U.S.7 Additionally, we control for the duration of their U.S. migration and for
when their last migration took place to account for macroeconomic factors that may have
affected their employment and wages while in the U.S.
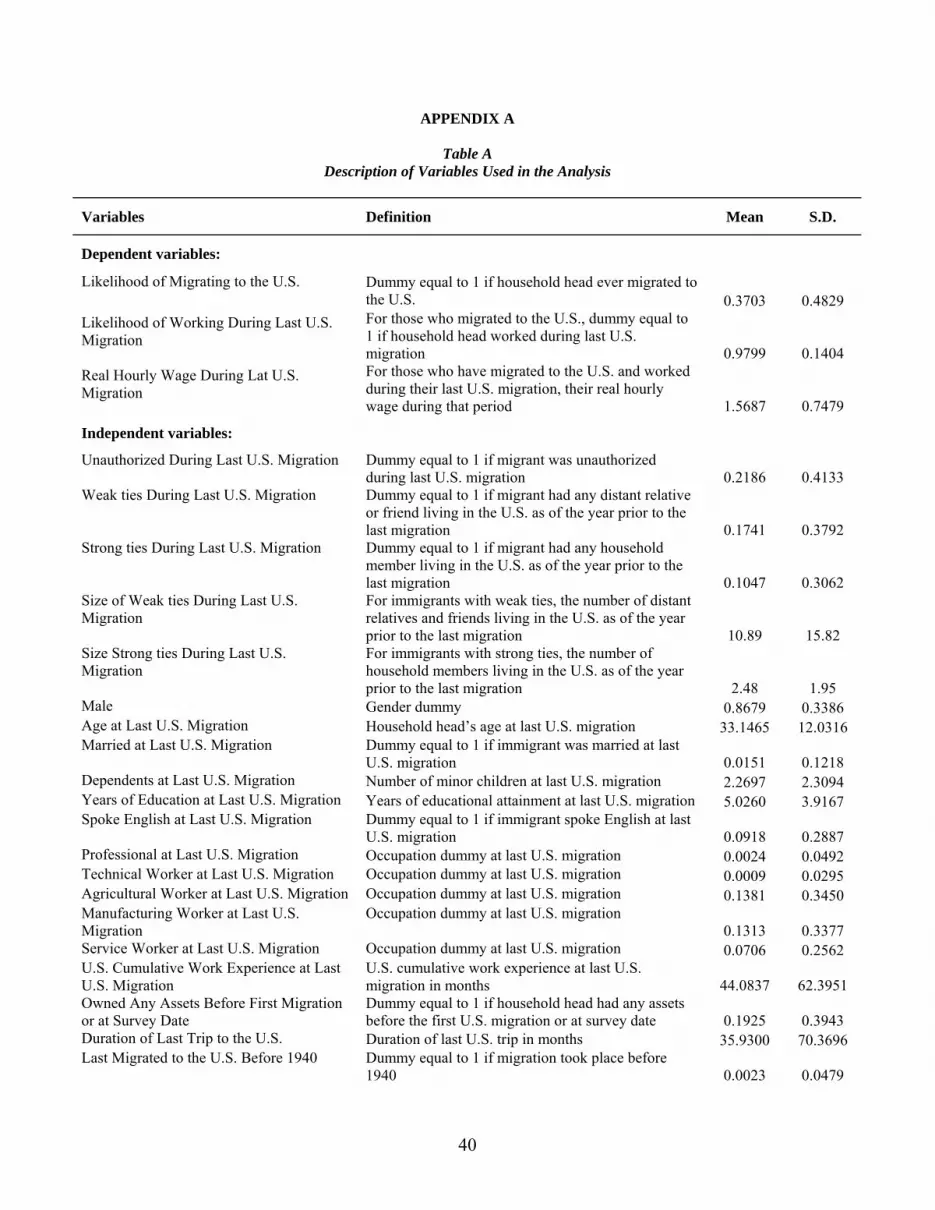
A detailed description of the variables used in our analysis, as well as their means and
standard deviations, is included in the Appendix (Table A). Overall, eighty-seven percent of our
sample is male. Approximately 37 percent migrated to the U.S. at some point in their lives, and
about 98 percent of those who migrated worked, earning an average real hourly wage of $5.31.8
Seventeen percent of immigrants had social networks providing weak ties one year prior to their
last U.S. trip, whereas 10 percent declared having strong ties during the same time period. On
average, immigrants with weak ties had 11 relatives and/or friends, whereas immigrants with
strong ties had about 2 household members residing in the U.S. Approximately 22 percent of
immigrants were unauthorized. Industry-wise, fourteen percent worked in agriculture and 13
percent in manufacturing. Finally, the vast majority of our sample migrated during recent
decades. In particular, twelve percent of immigrants last came to the U.S. during the 1980s,
whereas 74 percent last entered the U.S. during the 1990s.
7 Immigrants’ demographic characteristics include their gender, marital status, and presence of children in their households. Immigrants’ human capital is captured by their educational attainment, as well as by their ability to speak English, occupation, and cumulative work experience once in the U.S. At last, immigrants’ economic standing is captured by whether they had any land, property, or business assets, as well as whether they were employed before migration took place. 8 Hourly wages are measured in 1982-84 constant dollars.

12
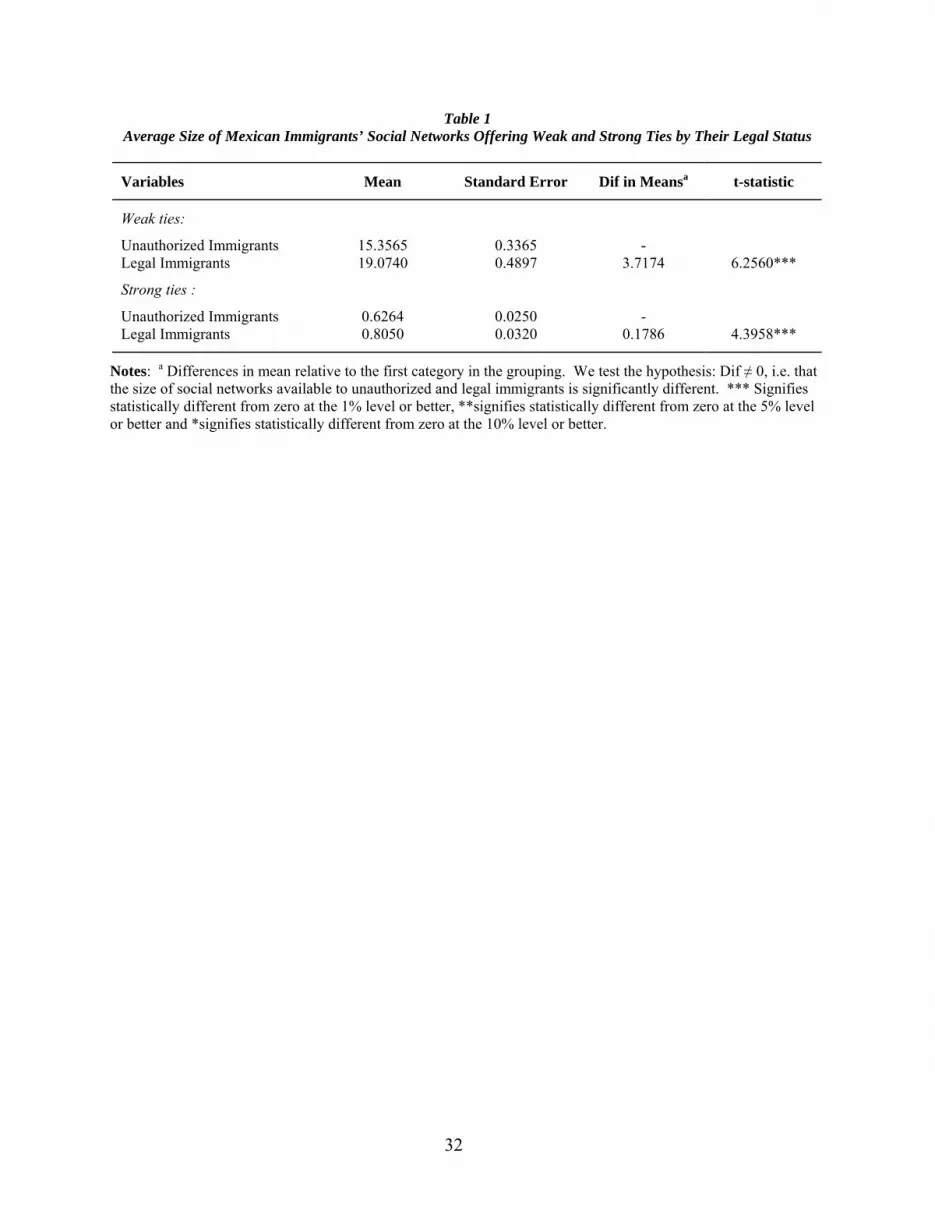
Preliminary descriptive evidence of immigrants’ social networks according to their legal
status can be found in Table 1. Legal immigrants had larger networks providing both strong and
weak ties than their unauthorized counterparts. This result may, in part, be explained by the
nature of U.S. immigration laws, which have traditionally favored family reunification and, as a
result, the build up of stronger social networks.
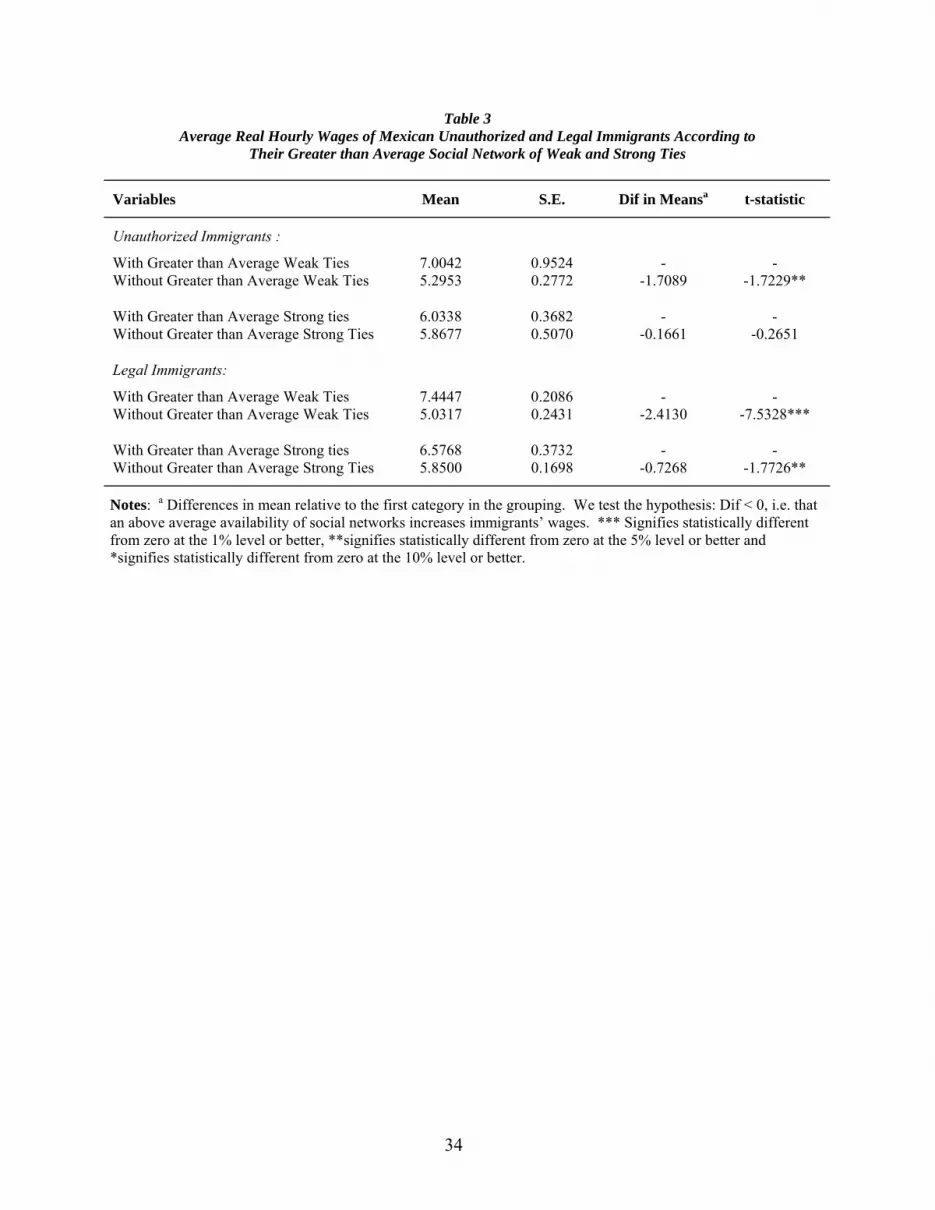
Immigrants’ social networks may significantly improve their employment and wage
outcomes once in the U.S. We examine this possibility for unauthorized and legal immigrants in
Table 2 and Table 3. According to Table 2, the availability of larger than average networks of
strong or weak ties does not improve unauthorized nor legal immigrants’ employment odds.
However, as shown by Table 3, accessibility to a larger than usual network of weak ties is
associated to higher average real hourly wages for both unauthorized and legal immigrants,
whereas strong ties only raise legal immigrants’ average real hourly wages.
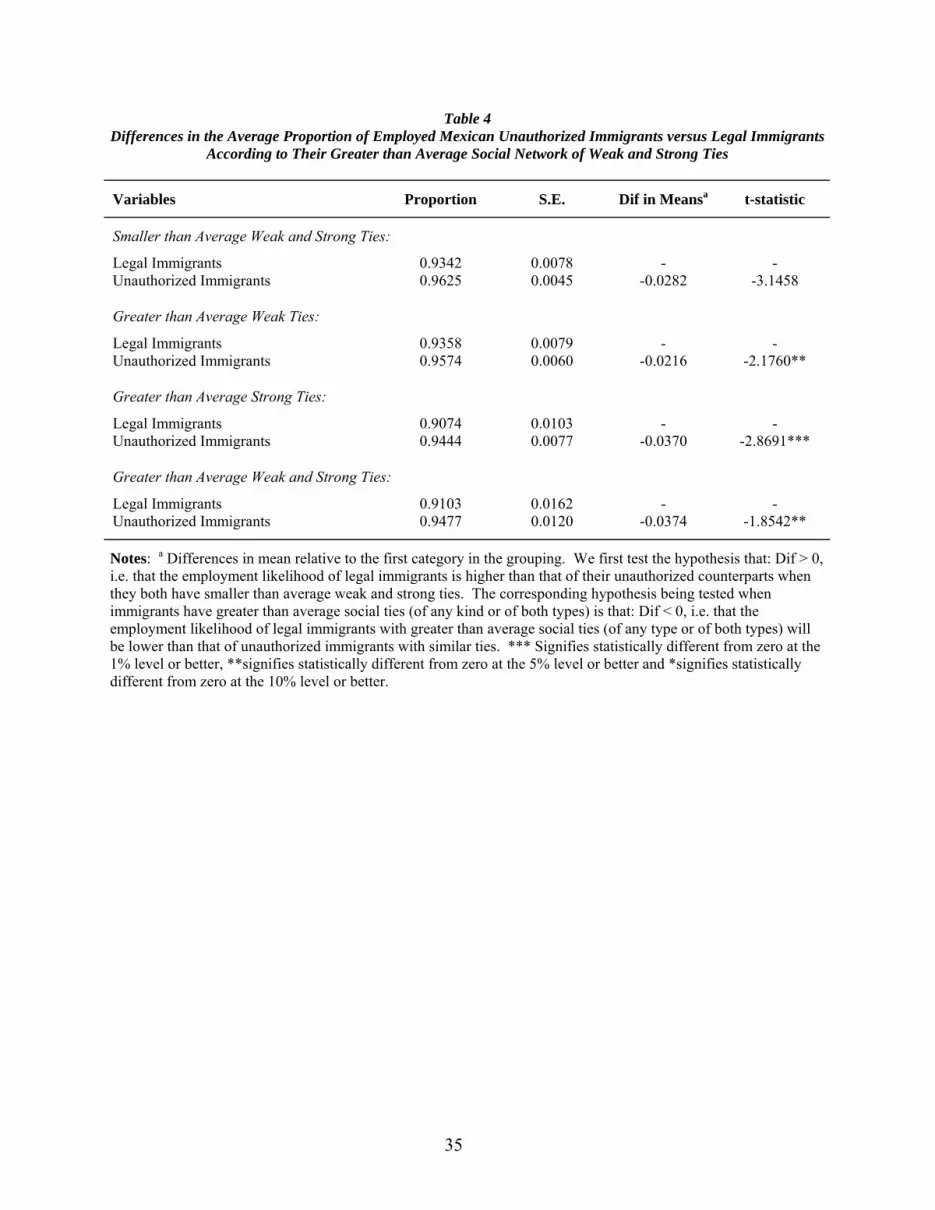
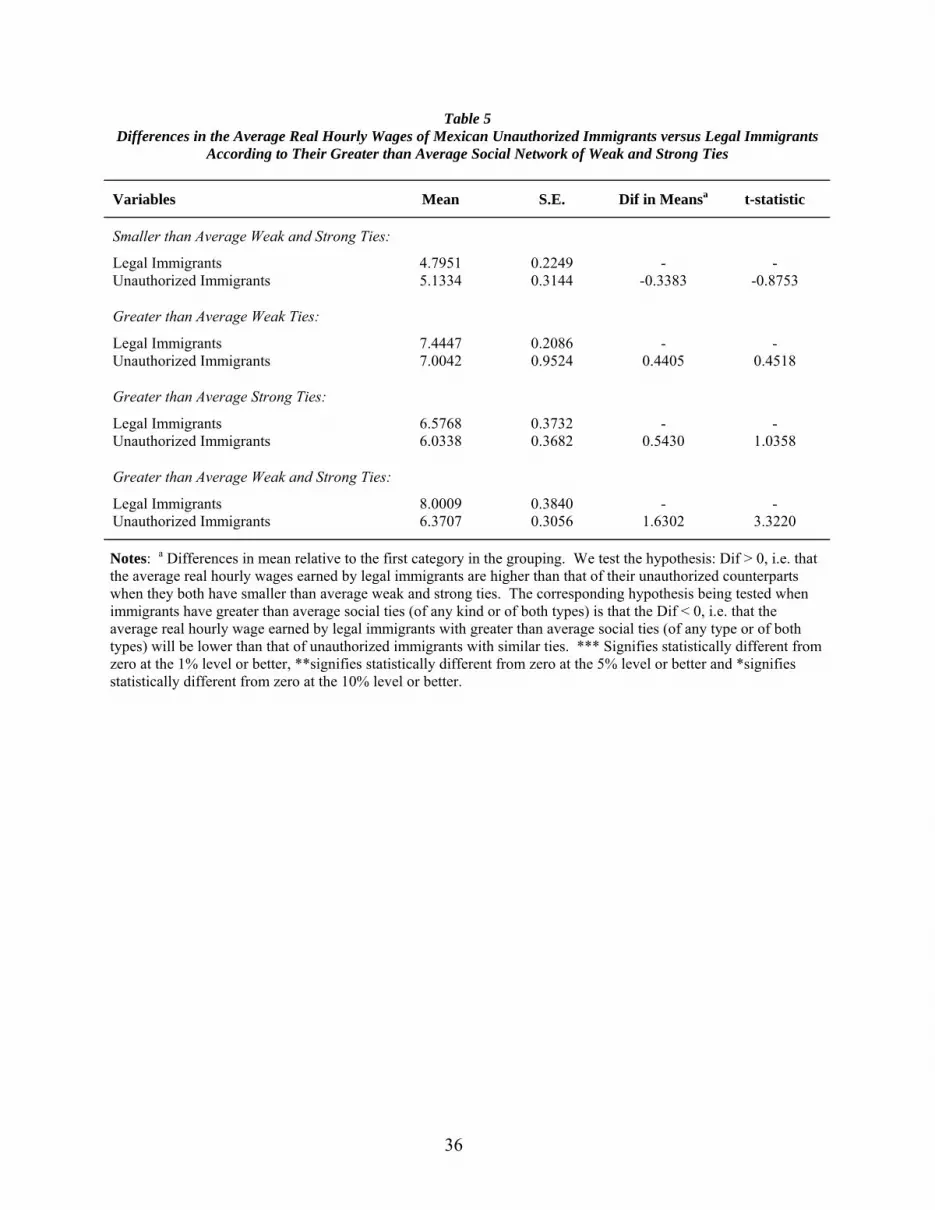
Finally, we may ask whether the impact of strong and weak ties on immigrants’
employability and wages significantly differs across unauthorized and legal immigrants. The
figures in Table 4 and Table 5 address this question. Both tables distinguish legal from
unauthorized Mexican immigrants. Larger than usual social networks appear to favor the
employment of unauthorized, relative to legal, immigrants. However, immigrants’ social
networks do not have a differential effect on their labor earnings depending on whether they
have proper documentation or not.
At any rate, much of the effect of social networks on immigrants’ performance during
their last U.S. trip in Tables 2 through 5 may be due to omitted variable and selection biases. In
particular, personal and macroeconomic characteristics we are not accounting for,9 along with
the ongoing migration and employment selection (i.e. who chooses to migrate and work in the
13
U.S.), may be partially responsible for the observed effect of social networks on the employment
and wages of immigrants. The analysis in the next sections accounts for these factors.
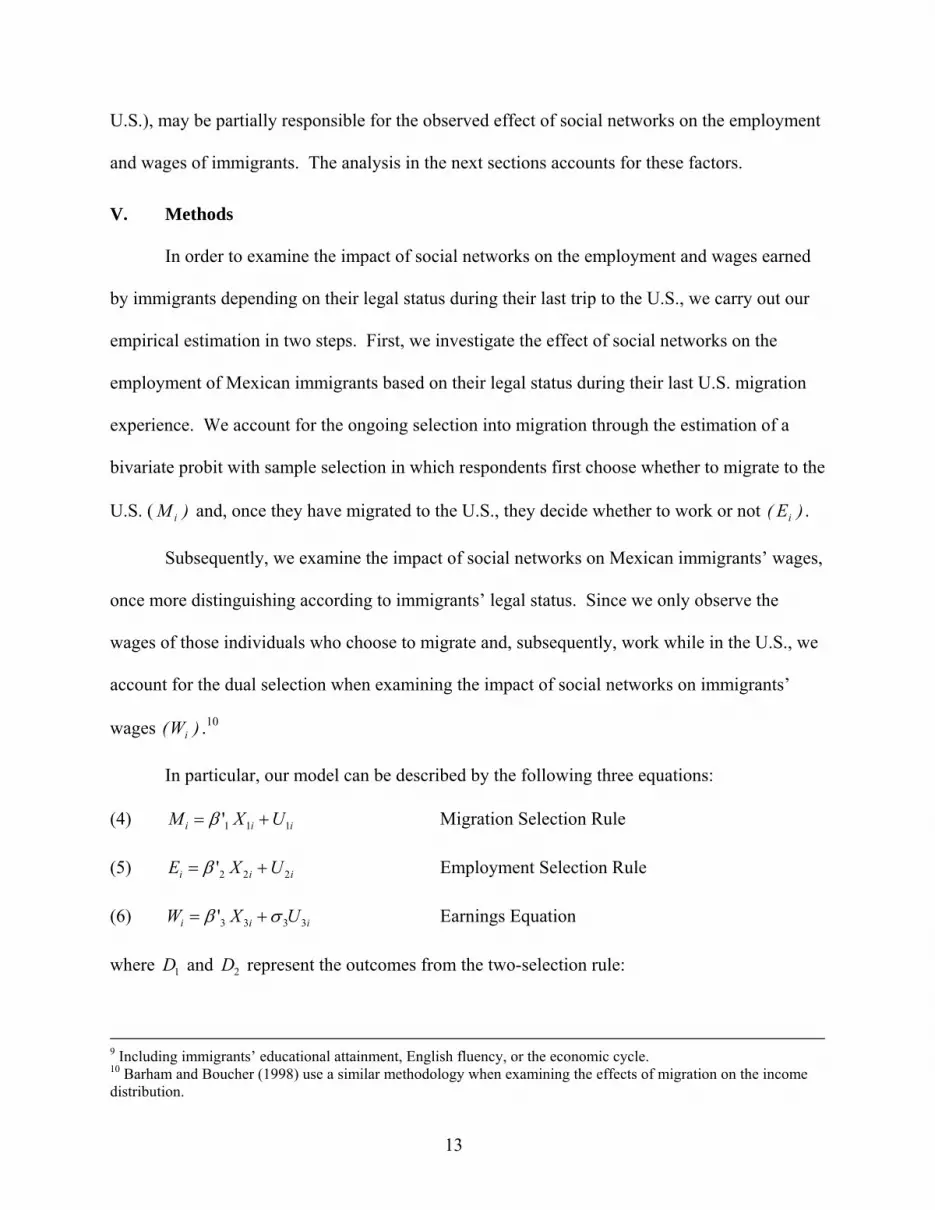
V. Methods
In order to examine the impact of social networks on the employment and wages earned
by immigrants depending on their legal status during their last trip to the U.S., we carry out our
empirical estimation in two steps. First, we investigate the effect of social networks on the
employment of Mexican immigrants based on their legal status during their last U.S. migration
experience. We account for the ongoing selection into migration through the estimation of a
bivariate probit with sample selection in which respondents first choose whether to migrate to the
U.S. ( )M i and, once they have migrated to the U.S., they decide whether to work or not )E( i .
Subsequently, we examine the impact of social networks on Mexican immigrants’ wages,
once more distinguishing according to immigrants’ legal status. Since we only observe the
wages of those individuals who choose to migrate and, subsequently, work while in the U.S., we
account for the dual selection when examining the impact of social networks on immigrants’
wages )W( i .10
In particular, our model can be described by the following three equations:
(4) iii UXM 111' += β Migration Selection Rule
(5) iii UXE 222' += β Employment Selection Rule
(6) iii UXW 3333' σβ += Earnings Equation
where 1D and 2D represent the outcomes from the two-selection rule:
9 Including immigrants’ educational attainment, English fluency, or the economic cycle. 10 Barham and Boucher (1998) use a similar methodology when examining the effects of migration on the income distribution.

14
00
01
1 ≤>
⎩⎨⎧
=i
i
MM
ifif
D 00
01
2 ≤>
⎩⎨⎧
=i
i
EE
ifif
D .
and the correlation matrix of the error term is given by ⎥⎥⎥
⎦
⎤
⎢⎢⎢
⎣
⎡
ρρρρρρ
=Σ1
11
2313
2312
1312
.
A) Migrants’ Employment Likelihood
In modeling migration and immigrants’ decision to work once in the U.S., we are
interested in the first two equations of the model specified above, which we can rewrite as:
(7) Migration Selection Rule: iiiii ZXM 11'
0,111'
1 εχβεβ ++=+=
(8) Employment Equation: =+= iii XE 22'2 εβ
iiZorksStrongNetwedUndocumentorksStrongNetw
ksWeakNetworedUndocumentksWeakNetworedUndocument
22'
5,24,2
3,22,21,20,2
*
*
εδββ
ββββ
++++
+++=
where ),1,1,0,0(N~, 12i2i1 ρεε and 12i2i1 ),(corr ρ=εε .
Equation (7) models the decision to migrate to the U.S. for the first time. The vector iZ1
includes a variety of demographic and family characteristics typically considered in the literature
as determinants of the migration decision, such as: gender, age, marital status, family
composition, number of family members with U.S. migration experience, education,
employment and assets before first migrating to the U.S. or as of the survey year if they never
migrated.11 In addition, the vector iZ1 includes dummy variables indicating the migrant’s state
of origin to account for local economic and social conditions possibly affecting the decision to
migrate.
11 These personal, employment, wealth, and family characteristics have been shown to play a significant role in Mexican immigration by previous studies in the literature, such as Greenwood (1975), Durand et. al (1996), Lindstrom (1996), and Borjas (1999).
15
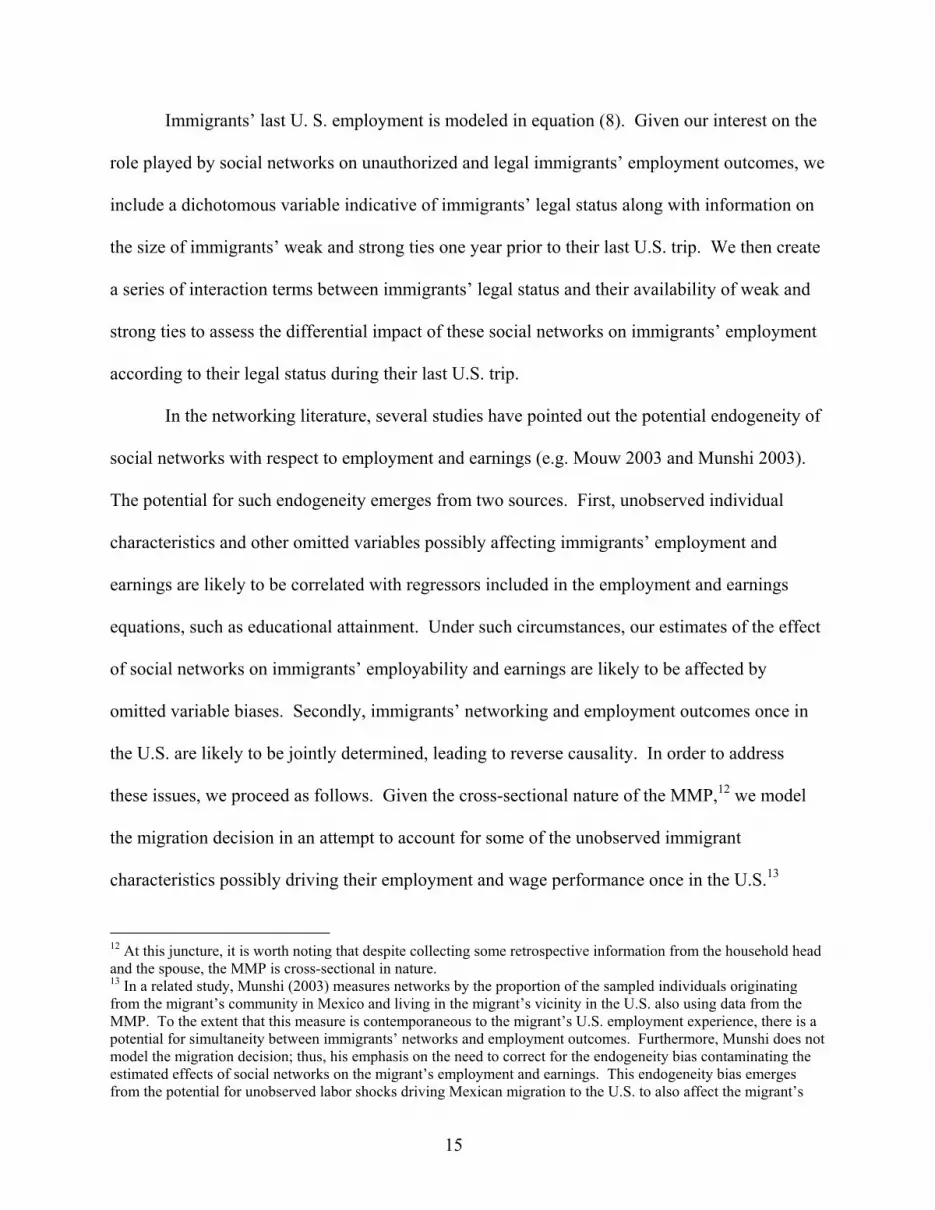
Immigrants’ last U. S. employment is modeled in equation (8). Given our interest on the
role played by social networks on unauthorized and legal immigrants’ employment outcomes, we
include a dichotomous variable indicative of immigrants’ legal status along with information on
the size of immigrants’ weak and strong ties one year prior to their last U.S. trip. We then create
a series of interaction terms between immigrants’ legal status and their availability of weak and
strong ties to assess the differential impact of these social networks on immigrants’ employment
according to their legal status during their last U.S. trip.
In the networking literature, several studies have pointed out the potential endogeneity of
social networks with respect to employment and earnings (e.g. Mouw 2003 and Munshi 2003).
The potential for such endogeneity emerges from two sources. First, unobserved individual
characteristics and other omitted variables possibly affecting immigrants’ employment and
earnings are likely to be correlated with regressors included in the employment and earnings
equations, such as educational attainment. Under such circumstances, our estimates of the effect
of social networks on immigrants’ employability and earnings are likely to be affected by
omitted variable biases. Secondly, immigrants’ networking and employment outcomes once in
the U.S. are likely to be jointly determined, leading to reverse causality. In order to address
these issues, we proceed as follows. Given the cross-sectional nature of the MMP,12 we model
the migration decision in an attempt to account for some of the unobserved immigrant
characteristics possibly driving their employment and wage performance once in the U.S.13
12 At this juncture, it is worth noting that despite collecting some retrospective information from the household head and the spouse, the MMP is cross-sectional in nature. 13 In a related study, Munshi (2003) measures networks by the proportion of the sampled individuals originating from the migrant’s community in Mexico and living in the migrant’s vicinity in the U.S. also using data from the MMP. To the extent that this measure is contemporaneous to the migrant’s U.S. employment experience, there is a potential for simultaneity between immigrants’ networks and employment outcomes. Furthermore, Munshi does not model the migration decision; thus, his emphasis on the need to correct for the endogeneity bias contaminating the estimated effects of social networks on the migrant’s employment and earnings. This endogeneity bias emerges from the potential for unobserved labor shocks driving Mexican migration to the U.S. to also affect the migrant’s
16
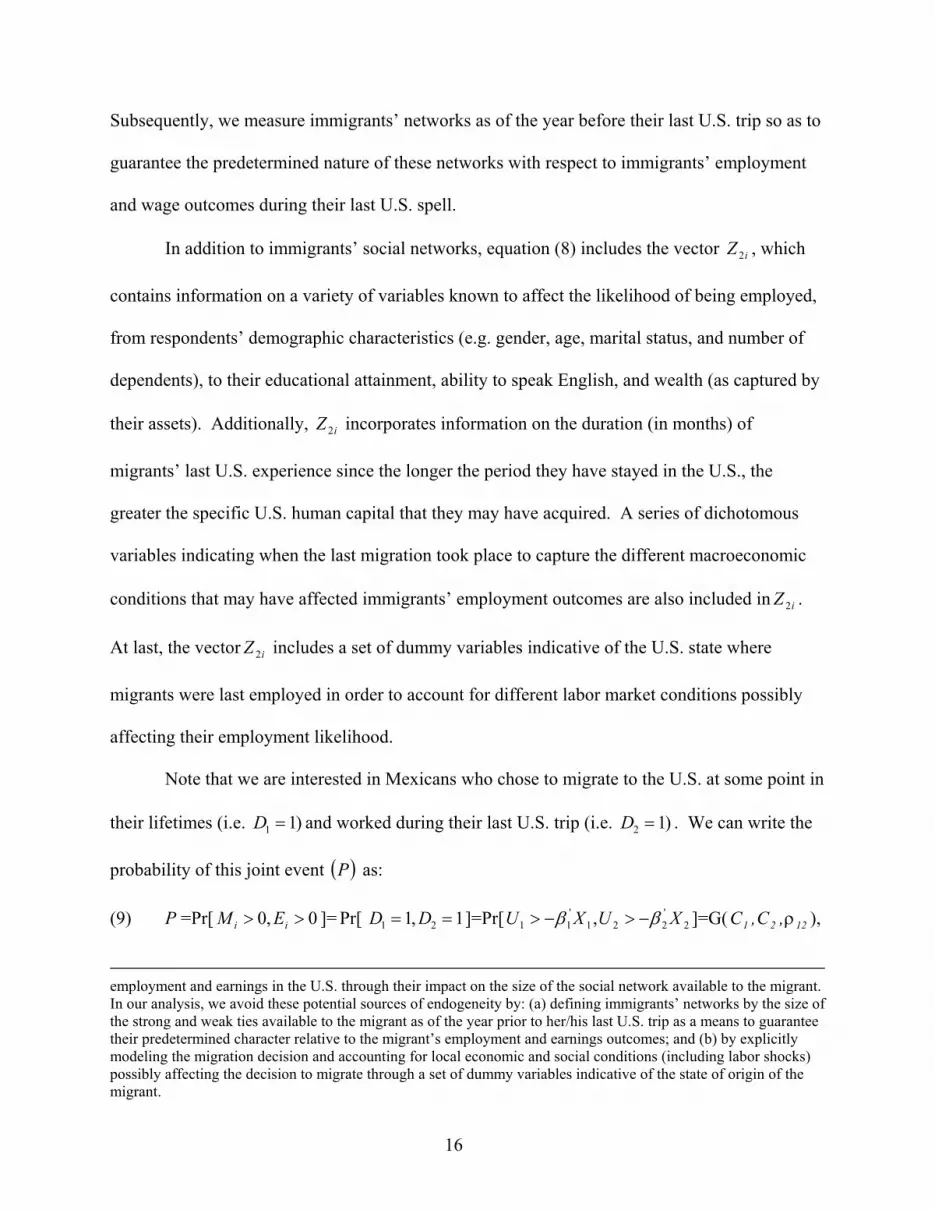
Subsequently, we measure immigrants’ networks as of the year before their last U.S. trip so as to
guarantee the predetermined nature of these networks with respect to immigrants’ employment
and wage outcomes during their last U.S. spell.
In addition to immigrants’ social networks, equation (8) includes the vector iZ 2 , which
contains information on a variety of variables known to affect the likelihood of being employed,
from respondents’ demographic characteristics (e.g. gender, age, marital status, and number of
dependents), to their educational attainment, ability to speak English, and wealth (as captured by
their assets). Additionally, iZ 2 incorporates information on the duration (in months) of
migrants’ last U.S. experience since the longer the period they have stayed in the U.S., the
greater the specific U.S. human capital that they may have acquired. A series of dichotomous
variables indicating when the last migration took place to capture the different macroeconomic
conditions that may have affected immigrants’ employment outcomes are also included in iZ 2 .
At last, the vector iZ 2 includes a set of dummy variables indicative of the U.S. state where
migrants were last employed in order to account for different labor market conditions possibly
affecting their employment likelihood.
Note that we are interested in Mexicans who chose to migrate to the U.S. at some point in
their lifetimes (i.e. )11 =D and worked during their last U.S. trip (i.e. )12 =D . We can write the
probability of this joint event ( )P as:
(9) P =Pr[ 0,0 >> ii EM ]= Pr[ 1,1 21 == DD ]=Pr[ 2'221
'11 , XUXU ββ −>−> ]=G( 1221 ,C,C ρ ),
employment and earnings in the U.S. through their impact on the size of the social network available to the migrant. In our analysis, we avoid these potential sources of endogeneity by: (a) defining immigrants’ networks by the size of the strong and weak ties available to the migrant as of the year prior to her/his last U.S. trip as a means to guarantee their predetermined character relative to the migrant’s employment and earnings outcomes; and (b) by explicitly modeling the migration decision and accounting for local economic and social conditions (including labor shocks) possibly affecting the decision to migrate through a set of dummy variables indicative of the state of origin of the migrant.
17
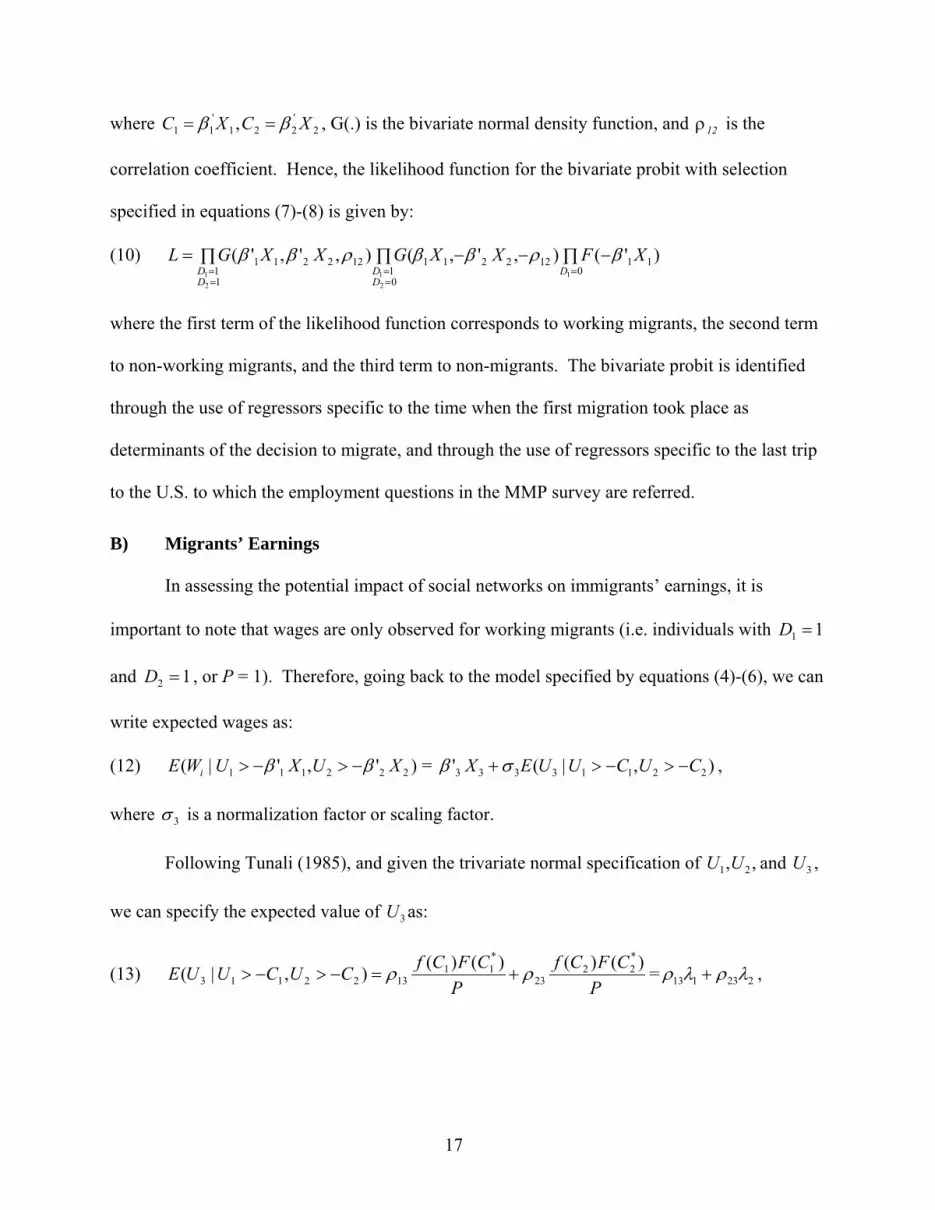
where 2'221
'11 , XCXC ββ == , G(.) is the bivariate normal density function, and 12ρ is the
correlation coefficient. Hence, the likelihood function for the bivariate probit with selection
specified in equations (7)-(8) is given by:
(10) )'(),',(),','( 10
1122211
01
12221
11
11
21
21
XFXXGXXGLD
DD
DD
∏ −−−∏∏==
==
==
βρββρββ
where the first term of the likelihood function corresponds to working migrants, the second term
to non-working migrants, and the third term to non-migrants. The bivariate probit is identified
through the use of regressors specific to the time when the first migration took place as
determinants of the decision to migrate, and through the use of regressors specific to the last trip
to the U.S. to which the employment questions in the MMP survey are referred.
B) Migrants’ Earnings
In assessing the potential impact of social networks on immigrants’ earnings, it is
important to note that wages are only observed for working migrants (i.e. individuals with 11 =D
and 12 =D , or P = 1). Therefore, going back to the model specified by equations (4)-(6), we can
write expected wages as:
(12) |( iWE 222111 ',' XUXU ββ −>−> ) = ),|(' 22113333 CUCUUEX −>−>+σβ ,
where 3σ is a normalization factor or scaling factor.
Following Tunali (1985), and given the trivariate normal specification of ,, 21 UU and 3U ,
we can specify the expected value of 3U as:
(13) P
CFCfP
CFCfCUCUUE )()()()(),|(*22
23
*11
1322113 ρρ +=−>−> = 223113 λρλρ + ,

18
where f(.) and F(.) are the standard univariate normal density and distribution function,
respectively, P is given by equation (9), ( ) 2/12
21*1
1 ρ
ρ
−
−=
CCC , ( ) 2/1212*
21 ρ
ρ−
−=
CCC , 1λ =P
CFCf )()( *11
and 2λ =P
CFCf )()( *22 .
Substituting equation (13) in (12), we obtain the expression for the expected wages of
working migrants:
(14) |( iWE 222111 ',' XUXU ββ −>−> ) = 133' γβ +X 221 λγλ + ,
where 1331 ρσγ = , and 2332 ρσγ = . Using the consistent estimates of ,, 21 ββ and 12ρ obtained
from the maximum likelihood estimation of equation (10), we construct 1λ and 2λ for each
migrant and rewrite the selection corrected wage equation as:
(15) 33221133' VXWi σλγλγβ +++= =
3322113
'5,34,3
3,32,31,30,3
*
*
VZorksStrongNetwedUndocumentorksStrongNetw
ksWeakNetworedUndocumentksWeakNetworedUndocument
i σλγλγθββ
ββββ
++++++
+++=
where: 0)1,1|( 213 === DDVE . In addition to the sample selection correction terms, equation
(15) includes the vector iZ3 with variables known to affect immigrants’ earnings, such as
immigrants’ gender, age, educational attainment, English speaking ability, cumulative work
experience in the U.S., duration of their U.S. trip, and the specific time period when such trip
took place.14 Likewise, the vector iZ3 includes a set of dummy variables indicative of the U.S.
states where immigrants located to account for special labor market conditions possibly affecting
their wages. Equation (15) is estimated by OLS. The variance-covariance matrix is computed
following Tunali (1985).
14 See, for example, Philips and Massey (1999).
19
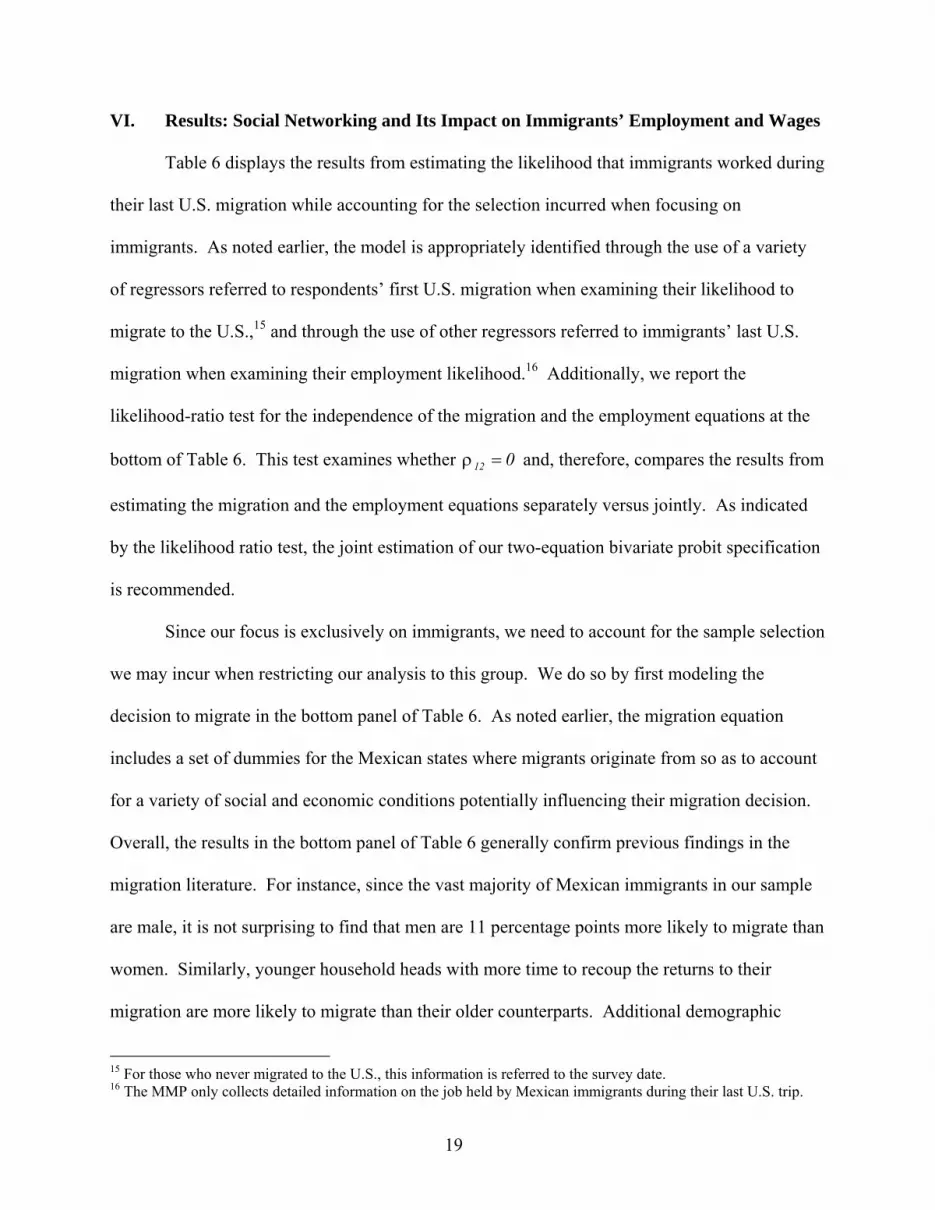
VI. Results: Social Networking and Its Impact on Immigrants’ Employment and Wages
Table 6 displays the results from estimating the likelihood that immigrants worked during
their last U.S. migration while accounting for the selection incurred when focusing on
immigrants. As noted earlier, the model is appropriately identified through the use of a variety
of regressors referred to respondents’ first U.S. migration when examining their likelihood to
migrate to the U.S.,15 and through the use of other regressors referred to immigrants’ last U.S.
migration when examining their employment likelihood.16 Additionally, we report the
likelihood-ratio test for the independence of the migration and the employment equations at the
bottom of Table 6. This test examines whether 012 =ρ and, therefore, compares the results from
estimating the migration and the employment equations separately versus jointly. As indicated
by the likelihood ratio test, the joint estimation of our two-equation bivariate probit specification
is recommended.
Since our focus is exclusively on immigrants, we need to account for the sample selection
we may incur when restricting our analysis to this group. We do so by first modeling the
decision to migrate in the bottom panel of Table 6. As noted earlier, the migration equation
includes a set of dummies for the Mexican states where migrants originate from so as to account
for a variety of social and economic conditions potentially influencing their migration decision.
Overall, the results in the bottom panel of Table 6 generally confirm previous findings in the
migration literature. For instance, since the vast majority of Mexican immigrants in our sample
are male, it is not surprising to find that men are 11 percentage points more likely to migrate than
women. Similarly, younger household heads with more time to recoup the returns to their
migration are more likely to migrate than their older counterparts. Additional demographic
15 For those who never migrated to the U.S., this information is referred to the survey date. 16 The MMP only collects detailed information on the job held by Mexican immigrants during their last U.S. trip.
20
characteristics influencing the migration decision include marital status and the number of non-
working age dependents. In particular, single household heads and those with fewer dependents
are more mobile than their married counterparts and other household heads with more
dependents.
While respondents are not asked about networks in the U.S. unless they declare having
emigrated to the U.S. at some point in their lifetimes, we do have information regarding the
number of household members with a U.S. migration history. Not surprisingly, the presence of
an additional household member with such a migration experience increases the respondent’s
migration likelihood by 3 percentage points. In contrast, having an additional dependent lowers
the respondent’s migration likelihood by 1 percentage point. Additionally, the results indicate
that less educated Mexican household heads are more likely to migrate than their more educated
counterparts. Specifically, each additional year of education lowers the likelihood of migration
by approximately 3 percentage points. Lastly, migration seems to be linked to immigrants’
employment status and asset ownership prior to departure. In particular, employed household
heads are approximately 25 percentage points less likely to migrate than their unemployed or
inactive counterparts. Likewise, household heads owning houses, land, businesses or similar
properties prior to migration are about 26 percentage points less likely to migrate than non-
proprietors.
A) Immigrants’ Employment by Legal Status and Network Use
The top panel of Table 6 shows the determinants of the decision to work among Mexican
immigrant household heads during their last U.S. trip. As when modeling migration, the analysis
includes as set of dummy variables representing the state where the respondent last migrated to
so as to account for regional economic conditions potentially affecting their employment
21
likelihood. Of special interest to our analysis is the role played by social networks on
immigrants’ employment according to their legal status. Hence, we first examine unauthorized
immigrants’ performance relative to legal immigrants’ performance in the absence of social
networking. Under such circumstances, unauthorized immigrants display a 2-percentage point
greater likelihood of having worked during their last U.S. trip than their legal counterparts. The
difference may simply reflect the fact that unauthorized immigrants are more likely to have
crossed to the U.S. with the exclusive purpose of working than their legal counterparts.
How does this percentage change with the use of strong and weak ties? Unlike the
previous literature, we find that social networks do not improve the employment likelihood of
immigrants. In fact, strong ties constituted by household members residing in the U.S. seem to
allow for a slightly lower (each member reduces the employment likelihood by less than 1
percentage point) employment likelihood on the part of migrants. The possibility exists that the
presence of close family members in the U.S. allows migrants for a longer job search period, a
non-existent opportunity when those strong ties are not available. At any rate, with the intent of
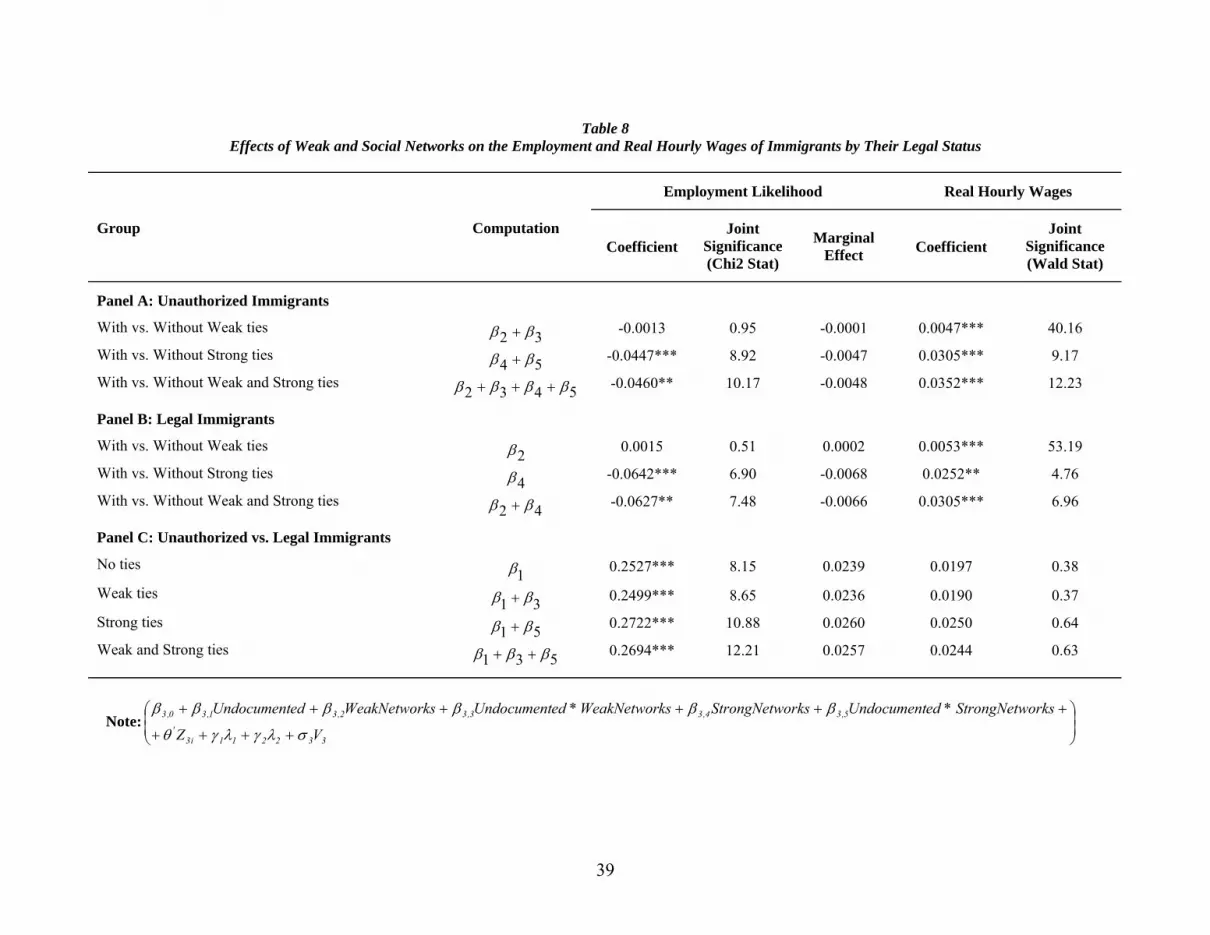
facilitating the evaluation of any social networks’ employment or wage effects, we compare their
impact within groups of unauthorized and legal immigrants as well as across both groups in
Table 8. First, the figures in the first row of Panel A and Panel B reveal that social networks
constituted by distant relatives and friends do not significantly change the employment
likelihood of neither unauthorized nor legal immigrants once we account for the ongoing
migration selectivity.
Second, the figures in the second row of Panel A and Panel B suggest that strong ties
allow immigrants to extend their unemployment status, may be through a longer job search
period, relative to other immigrants lacking the shelter provided by close family members.
22
Nonetheless, this effect is relatively small, always below 1 percentage point for both
unauthorized and legal immigrants.
Third, Panel C explores potential differences in the impact of social networks on the
employment likelihood of unauthorized versus legal immigrants. As suggested by the summary
statistics in Table 4, social networks seem to favor the employment of unauthorized immigrants
over the employment of their legal counterparts. However, social networks’ differential impact
on immigrants’ employability is not large enough to substantially change the 2 percentage point
higher likelihood of being employed displayed by unauthorized immigrants relative to their legal
counterparts in the absence of networks.
Finally, we return to the figures in Table 6 to discuss other determinants of immigrants’
employment during their last U.S. trip. As in the case of migration, the results from estimating
the likelihood of having worked during their last U.S. trip for immigrant household heads are in
line with findings from the labor supply literature. Focusing first on immigrants’ personal
characteristics, men and younger household heads, who typically display higher labor force
participation rates, also appear more likely to have worked during their last U.S. trip than women
and older immigrants. Additionally, Mexican immigrants with dependents appear more likely to
be employed than their counterparts without dependents as of their last time in the U.S. In
particular, each additional dependent increases the probability of employment among immigrants
by approximately 1percentage point. Lastly, the employment likelihood of immigrants may be
potentially influenced by other migrant cohort characteristics as reflected by the fact that
immigrants who last came to the U.S. in the 1950s were significantly more likely to have worked
during their last U.S. migration than their more recent counterparts in the 1990s.
23
B) Immigrants’ Hourly Wages by Legal Status and Network Use
Do strong and weak ties have any discernable impact on unauthorized and legal
immigrants’ hourly wages? The figures in Table 7 address this question with the estimated
effects of social networks on the log real hourly wages earned by Mexican immigrants employed
during their last U.S. visit. The estimation accounts for any potential biases resulting from the
ongoing migration and work selection. Specifically, the sample selection correction term
accounting for the migration selection is negative and statistically different from zero. The sign
on the bias correction term for the ongoing migration selection reveals that Mexicans unable to
migrate to the U.S. would have earned lower wages in the U.S. market than their migrating
counterparts. In contrast, the sample selection correction term accounting for the selection of
migrants into work is positive and indicative of the higher reservation wage of those migrants
who choose not to work relative to their working counterparts. Nonetheless, since the majority
of migrants do work once in the U.S. (approximately 94 percent of migrants in our sample), the
correction term for the ongoing selection of migrants into employment is not statistically
different from zero. Finally, as with the modeling of migrants’ employment outcomes during
their last U.S. migration, the analysis includes as set of dummy variables representing the U.S.
state where the respondent last migrated to so as to account for regional economic conditions
possibly affecting their earned wages.
Focusing on the variables of interest to the present study, we find that social networks
improve the average hourly wages of immigrants regardless of their legal status. To facilitate a
further comparison of the impact of different types of social networks on unauthorized and legal
immigrants’ wages, we refer to the figures in Table 8. First of all, and unlike for employment,
social networks positively affect the wages earned by unauthorized and legal immigrants (see
24
Panel A and Panel B). Indeed, the presence of an additional household member in the U.S. –a
source of strong ties— raises unauthorized and legal immigrants’ average real hourly wages by 3
percent and by 2.5 percent, respectively. Weak ties also help improve immigrants’ labor
earnings, raising average real hourly wages by approximately 0.5 percent with each additional
relative or friend added to the network. While this may seem a relatively small effect, it is worth
remembering that the average social network providing weak ties to unauthorized immigrants
consists of 15 members (see Table 1). Likewise, legal immigrants have an average of 19
individuals providing weak ties. Therefore, weak ties improve unauthorized and legal
immigrants’ hourly wages by an average of 7.5 percent and 9.5 percent, respectively.
However, as revealed by the figures in Table 5, social networks do not seem to have a
differential impact on the hourly wages earned by unauthorized relative to legal immigrants. As
can be seen from Panel C, similar unauthorized and legal immigrants earn comparable wages
regardless of their social networks.
Finally, the remaining figures in Table 7 confirm those of the literature on immigrants’
earnings. Men and younger migrants, possibly due to gender differences and, in the case of
younger migrants, to their easier assimilation to their host country, earn significantly more than
women and older migrants. Furthermore, as hypothesized in the labor economics literature,
immigrants’ human capital –as captured by their educational attainment, ability to speak English,
accumulated U.S. work experience, and time in the U.S., increases their wages. In particular,
each additional year of education raises immigrants’ wages by 2 percent. Likewise, Mexican
immigrants who speak English earn approximately 18 percent more than their employed
counterparts unable to speak the language. We also find that immigrants’ occupation during
their last U.S. trip (a proxy for skill) affects their wages. In particular, immigrants in either more
25
skilled positions –such as professional and technical occupations, or in typically unionized jobs –
as is often the case in manufacturing, earn between 19 percent and 27 percent higher wages than
their counterparts in the service sector. Finally, immigrants who last migrated during the 1960s,
1970s, and 1980s earned relatively higher wages than similar immigrants who came before the
1990s. This was particularly the case for immigrants last arriving during the 1960s and 1970s,
who earned up to 24 percent and 29 percent more, respectively. This wage gap closed following
the overall deterioration of real wages during the 1980s, when the wage differential declined to
approximately 5 percent.
VII. Summary and Conclusions
The new economics of labor migration emphasizes the importance of risk diversification
in understanding international migration (Stark and Bloom 1985, Gubert 2002). One of the ways
in which migrants accomplish this objective is by diversifying family income with earnings from
a job held abroad. It is in this respect that social networks –defined as immigrants’ ties with
family and friendship– become instrumental. Social networks have been known to facilitate the
economic and social assimilation of immigrants to their host country through the provision of a
safety net and contacts useful in finding employment, as well as social support (Granovetter
1995 and Lin 1999). This support is likely to be crucial among unauthorized immigrants, who
are exposed to a greater deportation and income risk. Despite the magnitude of Mexican
unauthorized migration in the U.S. and the various reasons as for why unauthorized and legal
immigrants’ social networks may differ in nature, size, and effectiveness in improving
immigrants’ employability and earnings, the literature has not looked into differences in the size
and role of social networks in facilitating unauthorized versus legal immigrants’ economic
assimilation.
26
In this paper, we address this gap in the literature with: (1) a descriptive analysis of social
networks available to unauthorized and legal Mexican immigrants in the U.S., and (2) an
econometric study of the potentially distinct effect of these networks on their employment and
earned wages during their last U.S. migration.
Using data from the Mexican Migration Project, we follow the tradition established by
Granovetter (1973, 1974, 1982, 1995), among others, and distinguish between strong ties
constituted by close family members and weak ties composed of distant relatives and friends.
Several results are worth discussing. First, we find that legal immigrants maintain significantly
larger social networks offering strong and weak ties than unauthorized immigrants. The larger
size of social networks available to legal immigrants may be partially due to the nature of U.S.
immigration, which favors family reunification. This finding further emphasizes the importance
of distinguishing according to immigrants’ legal status when examining the role of social
networks on immigrants’ employment likelihood and labor earnings.
Second, we examine the role played by strong and weak ties on the employment and
wages of both legal and unauthorized immigrants. We confirm some of the findings in the
literature of social networks, such as the fact that social networks raise immigrants’ wages (e.g.
Calvo-Armengol and Jackson 2002, Mouw 2003, and Munshi 2003). Specifically, the presence
of an additional household member in the U.S. raises immigrants’ wages by as much as 3 percent
in the case of unauthorized immigrants and by 2.5 percent in the case of legal immigrants. The
impact of each additional distant relative or friend providing weak ties is, however, lower;
improving unauthorized and legal immigrants’ average hourly wages by 0.5 percent.
Nonetheless, given the average size of unauthorized and legal immigrants’ social networks, the
results suggest that weak ties end up raising unauthorized and legal immigrants’ hourly wages by

27
an average of 7.5 percent and 9.5 percent, respectively. At any rate, we do not find evidence of
social networks improving immigrants’ employment likelihood once in the U.S. In fact, the
presence of a household member in the U.S. reduces, albeit to a small amount (0.5 percentage
points among unauthorized immigrants and 0.7 percentage points among legal immigrants), the
employment likelihood of immigrants. We interpret this result as evidence of the temporary
shelter provided by household members, which may enable unemployed migrants a longer job
search period.
Finally, social networks only seem to have a differential impact on the employment
likelihood of unauthorized immigrants relative to legal immigrants. However, their differential
impact is not large enough to significantly alter the sign or magnitude of the employment gap
between the two immigrant groups in the absence of social networks. In particular, unauthorized
immigrants continue to display a 2 to 3 percentage point higher likelihood of being employed
relative to similar legal counterparts regardless of whether they both lack or have weak and/or
strong ties. Similarly, the availability of a larger network of close family members, distant
relatives, and/or friends does not modify the similar average real hourly wage earned by alike
unauthorized and legal immigrants in the absence of networks.
Overall, the results emphasize the important role of social networks in providing a
temporary shelter against unemployment. Additionally, possibly through a better job match
product of an extended job search, social networks play an important role in facilitating the
economic assimilation of Mexican immigrants by means of a higher hourly wage. In this
manner, social networks provide immigrants with needed insurance against the risk involved in
their migration experience. As such, social networks become instrumental in the risk
diversification strategy possibly motivating their international migration. This form of ‘private’

28
insurance provided by social networks, which could be strengthened (lessened) through
immigration laws favoring (restricting) family reunification, substitutes other types of ‘public’
insurance (e.g. government assistance programs) that could otherwise be provided by the State.
29
References
Baldacci Emanuele, Inglese, Luca, and Strozza, Salvatore. “Determinants of Foreign Workers’ Wages in Two Italian Regions with High Illegal Immigration” Labour, 1999, 13(3), pp. 675-709. Barham, Bradford and Stephen Boucher. “Migration, Remittances, and Inequality: Estimating, the Net Effects of Migration on Income Distribution.” Journal of Development Economics, 1998, 55(2), pp. 307-331. Bean, Frank D., Lowell, Lindsay B., Taylor, Lowell J. “Unauthorized Mexican Immigrants and the Earnings of Other Workers in the United States.” Demography, 1988, 25(1), pp. 35-52. Borjas, George J. Friends or Strangers: The Impact of Immigrants on the U.S. Economy. Basic Books, New York, 1990. Borjas, George J. “The Economic Analysis of Immigration,” in the Handbook of Labor Economics, edited by Orley Ashenfelter and David Card, North Holland, 1999, pp.1697 – 1760. Calvo-Armengol, Antoni and Jackson, Mathew O. “Networks in Labor Market: Wage and Employment Dynamics and Inequality.” 2004 , manuscript, California Institute of Technology. Chiswick, Barry R. Illegal Aliens: Their Employment and Employers. Upjohn Institute for Employment Research, Kalamazoo, Michigan, 1988. Chiswick, Barry R. and Miller, Paul W. “Ethnic Networks and Language Proficiency Among Immigrants.” Journal of Population Economics, 1996, 9(1), pp. 19-35. Chiswick, Barry R. and Miller, Paul W. “Immigrant Earnings: Language Skills, Linguistic Concentrations and Business Cycle.” Journal of Population Economics, 2002, 15(1), pp. 31-57. Corcoran, Mary, Linda Datcher, and Greg Duncan. “Information and Influence Networks in Labor Markets.” 1980, in Five Thousand American Families: Patterns of Economic Progress, edited by G. J. Duncan and J. N. Morgan, pp 1-37, Ann Arbor, MI: Institute for Social Research. Datcher, Linda. “The Impact of Informal Networks on Quit Behavior” The Review of Economics and Statistics, 1983, 65(3), pp. 491-495. Durand, Jorge, William Kandel, Emilio A. Parrado and Douglas S. Massey. “International Migration and Development in Mexican Communities.” Demography, 1996, 33(2), pp. 249 – 264. Fafchamps, Marcel and Minten, Bart. “Returns to Social Capital among Traders.” Oxford Economic Papers, 2002, 54(2), pp. 173-206.
30
Fernandez, Roberto M., Emilio Castilla, and Paul Moore. “Social Capital at Work: Networks and Employment at a Phone Center.” American Journal of Sociology, 2000, 105, pp.1288-1356. Granovetter, Mark S. “The Strength of Weak Ties.” American Journal of Sociology, 1973, 78:1360-80. __________________. “Getting a Job: A Study of Contacts and Careers”. Cambridge, MA: Harvard University Press, 1974. __________________. “The Strength of Weak Ties: A Network Theory Revisited.” In Social Structure and Network Analysis, edited by P. V. Marsden and N. Lin. Beverly Hills, CA: Sage Publications, 1982, pp105-30. __________________. “Afterword 1994: Reconsiderations and a New Agenda” in Getting a Job, 2d ed., Chicago, IL: University of Chicago Press, 1995, pp139-82. Greene, W. H. LIMDEP 8.0: User’s Manual. Econometric Software, Bellport, NY, 1991. Greenwood, Michael J. “Research on Internal Migration in the United States: A Survey.” Journal of Economic Literature, 1975, 13(2), pp. 397-433. Griswold, D.T. “Mexican Workers Come Here to Work: Let Them!” The Wall Street Journal, Dow Jones & Company, Inc., 2002. Gubert, Flore. “Do Migrants Insure Those who Stay Behind? Evidence from the Kayes Area (Western Mali).” Oxford Development Studies, 2002, 30(3), pp. 267-287. Heckman, J. “Sample Selection Bias as a Specification Error.” Econometrica, 1979, 47(1), pp.153-161. Lin, Nan. “Social Networks and Status Attainment.” Annual Review of Sociology, 1999, 25, pp. 467-87. Lindstrom, David P. “Economic Opportunity in Mexico and return Migration form the United States.” Demography, 1996, 33(3), pp. 357-374. Lowell, Lindsay B. “Circular Mobility, Migrant Communities, and Policy Restrictions: Unauthorized Flows from Mexico” in Migration, Population Structure, and Redistribution Policies, edited by C. Goldscheider, Boulder: Westview, 1992, pp. 137-57. Massey, Douglas S. and René Zenteno. “A Validation of the Ethnosurveys: The Case of Mexico-U.S. Migration.” International Migration Review, 2000, 34(3), pp. 766-793. Montgomery, James D. “Job Search and network Composition: Implications of the Strength-Of-Weak-Ties Hypothesis.” American Sociological Review, 1992, 57, pp. 586-596. Mouw, Ted. “Social Capital and Finding a Job: Do Contact Matter?,” American Sociological Review, 2003, 68(6), pp. 868-870.

31
Munshi, Kaivan. “Networks in the Modern Economy: Mexican Migrants in the U. S. Labor Market,” The Quarterly Journal of Economics, 2003, May, 549-599. Philips, Julie A. and Douglas S. Massey. “The New Labor Market: Immigrants and Wages after IRCA.” Demography, 1999, 36(2), pp. 233 – 246. Rauch, James. “Business and Social Networks in International Trade.” Journal of Economic Literature, 2002, 39(4), pp.1177-1203. Rauch, James and Trindale, Victor. “Ethnic Chinese Networks in International Trade.” The Review of Economics and Statistics, 2002, 84(1), pp. 116-130. Rivera-Batiz, Francisco. “Undocumented Workers in the Labor Market: An Analysis of the Earnings of Legal and Illegal Mexican Immigrants in the United States.” Journal of Population Economics, 1999, 12(1), pp. 91-116. Stark, Oded, and David E. Bloom. “The New Economics of Labor Migration.” American Economic Review, 1985, 75(2), pp. 173-8. Tunali, Insan. “A General Structure for Models of Double-Selection and an Application to a Joint Migration/Earning Process with Remigration,” Research in Labor Economics, 8(B), JAI Press Inc. pp. 235 – 282. Winegarden, C. R. and Khor, Lay B. “Unauthorized Immigrants and Unemployment of US Youth and Minority Workers: Econometric Evidence.” Review of Economics and Statistics, 1991, 73(1), pp.105-12.
32
Table 1 Average Size of Mexican Immigrants’ Social Networks Offering Weak and Strong Ties by Their Legal Status
Variables Mean Standard Error Dif in Meansa t-statistic
Weak ties:
Unauthorized Immigrants 15.3565 0.3365 - Legal Immigrants 19.0740 0.4897 3.7174 6.2560***
Strong ties :
Unauthorized Immigrants 0.6264 0.0250 - Legal Immigrants 0.8050 0.0320 0.1786 4.3958***
Notes: a Differences in mean relative to the first category in the grouping. We test the hypothesis: Dif ≠ 0, i.e. that the size of social networks available to unauthorized and legal immigrants is significantly different. *** Signifies statistically different from zero at the 1% level or better, **signifies statistically different from zero at the 5% level or better and *signifies statistically different from zero at the 10% level or better.

33
Table 2 Average Proportion Of Employed Mexican Unauthorized and Legal Immigrants According to
Their Larger than Average Social Network of Weak and Strong Ties
Variables Proportion S.E. Dif in Meansa t-statistic
Unauthorized Immigrants :
With Greater than Average Weak Ties 0.9574 0.0060 - - Without Greater than Average Weak Ties 0.9578 0.0041 0.0004 0.0552
With Greater than Average Strong ties 0.9444 0.0077 - - Without Greater than Average Strong Ties 0.9622 0.0038 0.0178 2.0749
Legal Immigrants:
With Greater than Average Weak Ties 0.9358 0.0079 - - Without Greater than Average Weak Ties 0.9251 0.0068 -0.0107 -1.0299
With Greater than Average Strong ties 0.9074 0.0103 - - Without Greater than Average Strong Ties 0.9396 0.0058 0.0323 2.7201
Notes: a Differences in mean relative to the first category in the grouping. We test the hypothesis: Dif < 0, i.e. that an above average availability of social networks increases the employment likelihood of immigrants. *** Signifies statistically different from zero at the 1% level or better, **signifies statistically different from zero at the 5% level or better and *signifies statistically different from zero at the 10% level or better.
34
Table 3 Average Real Hourly Wages of Mexican Unauthorized and Legal Immigrants According to
Their Greater than Average Social Network of Weak and Strong Ties
Variables Mean S.E. Dif in Meansa t-statistic
Unauthorized Immigrants :
With Greater than Average Weak Ties 7.0042 0.9524 - - Without Greater than Average Weak Ties 5.2953 0.2772 -1.7089 -1.7229**
With Greater than Average Strong ties 6.0338 0.3682 - - Without Greater than Average Strong Ties 5.8677 0.5070 -0.1661 -0.2651
Legal Immigrants:
With Greater than Average Weak Ties 7.4447 0.2086 - - Without Greater than Average Weak Ties 5.0317 0.2431 -2.4130 -7.5328***
With Greater than Average Strong ties 6.5768 0.3732 - - Without Greater than Average Strong Ties 5.8500 0.1698 -0.7268 -1.7726**
Notes: a Differences in mean relative to the first category in the grouping. We test the hypothesis: Dif < 0, i.e. that an above average availability of social networks increases immigrants’ wages. *** Signifies statistically different from zero at the 1% level or better, **signifies statistically different from zero at the 5% level or better and *signifies statistically different from zero at the 10% level or better.
35
Table 4 Differences in the Average Proportion of Employed Mexican Unauthorized Immigrants versus Legal Immigrants
According to Their Greater than Average Social Network of Weak and Strong Ties
Variables Proportion S.E. Dif in Meansa t-statistic
Smaller than Average Weak and Strong Ties:
Legal Immigrants 0.9342 0.0078 - - Unauthorized Immigrants 0.9625 0.0045 -0.0282 -3.1458
Greater than Average Weak Ties:
Legal Immigrants 0.9358 0.0079 - - Unauthorized Immigrants 0.9574 0.0060 -0.0216 -2.1760**
Greater than Average Strong Ties:
Legal Immigrants 0.9074 0.0103 - - Unauthorized Immigrants 0.9444 0.0077 -0.0370 -2.8691***
Greater than Average Weak and Strong Ties:
Legal Immigrants 0.9103 0.0162 - - Unauthorized Immigrants 0.9477 0.0120 -0.0374 -1.8542**
Notes: a Differences in mean relative to the first category in the grouping. We first test the hypothesis that: Dif > 0, i.e. that the employment likelihood of legal immigrants is higher than that of their unauthorized counterparts when they both have smaller than average weak and strong ties. The corresponding hypothesis being tested when immigrants have greater than average social ties (of any kind or of both types) is that: Dif < 0, i.e. that the employment likelihood of legal immigrants with greater than average social ties (of any type or of both types) will be lower than that of unauthorized immigrants with similar ties. *** Signifies statistically different from zero at the 1% level or better, **signifies statistically different from zero at the 5% level or better and *signifies statistically different from zero at the 10% level or better.
36
Table 5 Differences in the Average Real Hourly Wages of Mexican Unauthorized Immigrants versus Legal Immigrants
According to Their Greater than Average Social Network of Weak and Strong Ties
Variables Mean S.E. Dif in Meansa t-statistic
Smaller than Average Weak and Strong Ties:
Legal Immigrants 4.7951 0.2249 - - Unauthorized Immigrants 5.1334 0.3144 -0.3383 -0.8753
Greater than Average Weak Ties:
Legal Immigrants 7.4447 0.2086 - - Unauthorized Immigrants 7.0042 0.9524 0.4405 0.4518
Greater than Average Strong Ties:
Legal Immigrants 6.5768 0.3732 - - Unauthorized Immigrants 6.0338 0.3682 0.5430 1.0358
Greater than Average Weak and Strong Ties:
Legal Immigrants 8.0009 0.3840 - - Unauthorized Immigrants 6.3707 0.3056 1.6302 3.3220
Notes: a Differences in mean relative to the first category in the grouping. We test the hypothesis: Dif > 0, i.e. that the average real hourly wages earned by legal immigrants are higher than that of their unauthorized counterparts when they both have smaller than average weak and strong ties. The corresponding hypothesis being tested when immigrants have greater than average social ties (of any kind or of both types) is that the Dif < 0, i.e. that the average real hourly wage earned by legal immigrants with greater than average social ties (of any type or of both types) will be lower than that of unauthorized immigrants with similar ties. *** Signifies statistically different from zero at the 1% level or better, **signifies statistically different from zero at the 5% level or better and *signifies statistically different from zero at the 10% level or better.

37
Table 6 Bivariate Probit of the Likelihood for Migrating to the U.S. and Working During Their Last U.S. Trip
Variables Coefficient Robust S.E. Marginal Effect
Worked During Last U.S. Migration
Unauthorized During Last U.S. Migration 0.2527*** 0.0885 0.0239 Weak ties During Last U.S. Migration 0.0015 0.0021 0.0002
Unauthorized*Weak ties -0.0028 0.0029 -0.0003 Strong ties During Last U.S. Migration -0.0642*** 0.0244 -0.0068
Unauthorized*Strong ties 0.0195 0.0345 0.0021 Male 1.1288*** 0.0945 0.2200
Age at Last U.S. Migration -0.0133*** 0.0032 -0.0014 Married at Last U.S. Migration 0.1455 0.1617 0.0137
Dependents at Last U.S. Migration 0.1070*** 0.0163 0.0113 Years of Education at Last U.S. Migration -0.0058 0.0092 -0.0006
Spoke English at Last U.S. Migration 0.0740 0.0802 0.0074 Owned Any Assets Before Last U.S. Migration 0.0841 0.0732 0.0085
Duration of Last Trip to the U.S. 0.0007 0.0005 0.0001 Last Migrated to the U.S. Before 1940 -0.2845 0.3806 -0.0377
Last Migrated to the U.S. During the 1940s -0.0475 0.1943 -0.0052 Last Migrated to the U.S. During the 1950s 0.4755*** 0.1722 0.0348 Last Migrated to the U.S. During the 1960s 0.1815 0.1290 0.0167 Last Migrated to the U.S. During the 1970s -0.0614 0.0941 -0.0068 Last Migrated to the U.S. During the 1980s 0.0990 0.0770 0.0098
Migrated to the U.S.
Male 0.3607*** 0.0523 0.1086 Age at First Migration or at Survey Date -0.0775*** 0.0015 -0.0256
Married at First Migration or at Survey Date -0.7813*** 0.0596 -0.1968 Dependents at First Migration or at Survey Date -0.0236*** 0.0071 -0.0078
Number of Family Members with U.S. Migration Experience 0.0910*** 0.0108 0.0301 Years of Education at First Migration or at Survey Date -0.1004*** 0.0037 -0.0332
Employed Before First Migration or at Survey Date -0.6942*** 0.0560 -0.2540 Owned Any Assets Before First Migration or at Survey Date -0.7568*** 0.0316 -0.2586
Regression Fit Statistics
Number of Observations 15,654 Rho (S.E.) -0.1783 (0.0643) Censored Observations 9,837 Log Likelihood -5961.65
Wald Chi2 Test Wald Chi2 (19) = 288.07; Prob > Chi2 =0.0000 LR Test of Independence of the Two Equations Chi2 (1) = 7.85 ; Prob > Chi2 =0.0051
Notes: *** Signifies statistically different from zero at the 1% level or better, ** at the 5% level or better and *at the 10% level or better. In addition to a constant, the employment regression includes regional dummies of the U.S. state where they last migrated and the migration regression includes regional dummies of the place of interview in Mexico. Omitted categories in the employment regression: Legal migrants, migrants lacking weak ties, migrants lacking strong ties, female migrants, migrants who were not married, migrants who did not speak English, migrants who did not own any assets before migrating, migrants who last migrated to the U.S. from 1990 onwards. Omitted variables are defined similarly in the migration regression, although referred to the year before the first migration ever took place or to the survey date if the individual never migrated to the U.S.

38
Table 7 OLS Estimates of the Real Hourly Wages During Their Last U.S. Trip
Variables Coefficients Robust S.E.
Unauthorized During Last U.S. Migration 0.0197 0.0320 Weak ties During Last U.S. Migration 0.0053*** 0.0007
Unauthorized*Weak ties -0.0007 0.0010 Strong ties During Last U.S. Migration 0.0252*** 0.0115
Unauthorized*Strong ties 0.0053 0.0148 Male 0.2601*** 0.0801
Age at Last U.S. Migration -0.0032** 0.0013 Years of Education at Last U.S. Migration 0.0191*** 0.0035
Spoke English at Last U.S. Migration 0.1797*** 0.0290 Professional at Last U.S. Migration 0.2691** 0.1317
Technical Worker at Last U.S. Migration 0.3331 0.2172 Agricultural Worker at Last U.S. Migration -0.0121 0.0325
Manufacturing Worker at Last U.S. Migration 0.1858*** 0.0291 U.S. Cumulative Work Experience at Last U.S. Migration 0.0008*** 0.0002
Duration of Last Trip to the U.S. 0.0036*** 0.0002 Last Migrated to the U.S. Before 1940 -0.1857 0.1632
Last Migrated to the U.S. During the 1940s 0.0452 0.0732 Last Migrated to the U.S. During the 1950s 0.0362 0.0513 Last Migrated to the U.S. During the 1960s 0.2428*** 0.0458 Last Migrated to the U.S. During the 1970s 0.2904*** 0.0354 Last Migrated to the U.S. During the 1980s 0.0476* 0.0287
λ From Migration Equation -0.2036*** 0.0320 λ From Work Equation 0.3894 0.1867
Regression Fit Statistics Number of Observations 5,626
F-statistic 45.68 Prob > F 0.0000
Adjusted R2 0.2365
Notes: *** Signifies statistically different from zero at the 1% level or better, **signifies statistically different from zero at the 5% level or better and *signifies statistically different from zero at the 10% level or better. The regression includes a constant. Omitted categories: Legal migrants, migrants lacking weak ties, migrants lacking strong ties, migrants who did not speak English, migrants in service related occupations, and migrants who last migrated to the U.S. from 1990 onwards.
39
Table 8 Effects of Weak and Social Networks on the Employment and Real Hourly Wages of Immigrants by Their Legal Status
Employment Likelihood Real Hourly Wages
Group Computation Coefficient
Joint Significance (Chi2 Stat)
Marginal Effect Coefficient
Joint Significance (Wald Stat)
Panel A: Unauthorized Immigrants With vs. Without Weak ties 32 ββ + -0.0013 0.95 -0.0001 0.0047*** 40.16
With vs. Without Strong ties 54 ββ + -0.0447*** 8.92 -0.0047 0.0305*** 9.17
With vs. Without Weak and Strong ties 5432 ββββ +++ -0.0460** 10.17 -0.0048 0.0352*** 12.23
Panel B: Legal Immigrants
With vs. Without Weak ties 2β 0.0015 0.51 0.0002 0.0053*** 53.19
With vs. Without Strong ties 4β -0.0642*** 6.90 -0.0068 0.0252** 4.76
With vs. Without Weak and Strong ties 42 ββ + -0.0627** 7.48 -0.0066 0.0305*** 6.96
Panel C: Unauthorized vs. Legal Immigrants
No ties 1β 0.2527*** 8.15 0.0239 0.0197 0.38
Weak ties 31 ββ + 0.2499*** 8.65 0.0236 0.0190 0.37
Strong ties 51 ββ + 0.2722*** 10.88 0.0260 0.0250 0.64
Weak and Strong ties 531 βββ ++ 0.2694*** 12.21 0.0257 0.0244 0.63
Note: ⎟⎟⎠
⎞⎜⎜⎝
⎛
++++
++++++
332211i3'
5,34,33,32,31,30,3
VZ
orksStrongNetw*edUndocumentorksStrongNetwksWeakNetwor*edUndocumentksWeakNetworedUndocument
σλγλγθ
ββββββ
40
APPENDIX A
Table A Description of Variables Used in the Analysis
Variables Definition Mean S.D.
Dependent variables:
Likelihood of Migrating to the U.S. Dummy equal to 1 if household head ever migrated to the U.S. 0.3703 0.4829
Likelihood of Working During Last U.S. Migration
For those who migrated to the U.S., dummy equal to 1 if household head worked during last U.S. migration 0.9799 0.1404
Real Hourly Wage During Lat U.S. Migration
For those who have migrated to the U.S. and worked during their last U.S. migration, their real hourly wage during that period 1.5687 0.7479
Independent variables:
Unauthorized During Last U.S. Migration Dummy equal to 1 if migrant was unauthorized during last U.S. migration 0.2186 0.4133
Weak ties During Last U.S. Migration Dummy equal to 1 if migrant had any distant relative or friend living in the U.S. as of the year prior to the last migration 0.1741 0.3792
Strong ties During Last U.S. Migration Dummy equal to 1 if migrant had any household member living in the U.S. as of the year prior to the last migration 0.1047 0.3062
Size of Weak ties During Last U.S. Migration
For immigrants with weak ties, the number of distant relatives and friends living in the U.S. as of the year prior to the last migration 10.89 15.82
Size Strong ties During Last U.S. Migration
For immigrants with strong ties, the number of household members living in the U.S. as of the year prior to the last migration 2.48 1.95
Male Gender dummy 0.8679 0.3386 Age at Last U.S. Migration Household head’s age at last U.S. migration 33.1465 12.0316 Married at Last U.S. Migration Dummy equal to 1 if immigrant was married at last
U.S. migration 0.0151 0.1218 Dependents at Last U.S. Migration Number of minor children at last U.S. migration 2.2697 2.3094 Years of Education at Last U.S. Migration Years of educational attainment at last U.S. migration 5.0260 3.9167 Spoke English at Last U.S. Migration Dummy equal to 1 if immigrant spoke English at last
U.S. migration 0.0918 0.2887 Professional at Last U.S. Migration Occupation dummy at last U.S. migration 0.0024 0.0492 Technical Worker at Last U.S. Migration Occupation dummy at last U.S. migration 0.0009 0.0295 Agricultural Worker at Last U.S. Migration Occupation dummy at last U.S. migration 0.1381 0.3450 Manufacturing Worker at Last U.S. Migration
Occupation dummy at last U.S. migration 0.1313 0.3377
Service Worker at Last U.S. Migration Occupation dummy at last U.S. migration 0.0706 0.2562 U.S. Cumulative Work Experience at Last U.S. Migration
U.S. cumulative work experience at last U.S. migration in months 44.0837 62.3951
Owned Any Assets Before First Migration or at Survey Date
Dummy equal to 1 if household head had any assets before the first U.S. migration or at survey date 0.1925 0.3943
Duration of Last Trip to the U.S. Duration of last U.S. trip in months 35.9300 70.3696 Last Migrated to the U.S. Before 1940
Dummy equal to 1 if migration took place before 1940 0.0023 0.0479
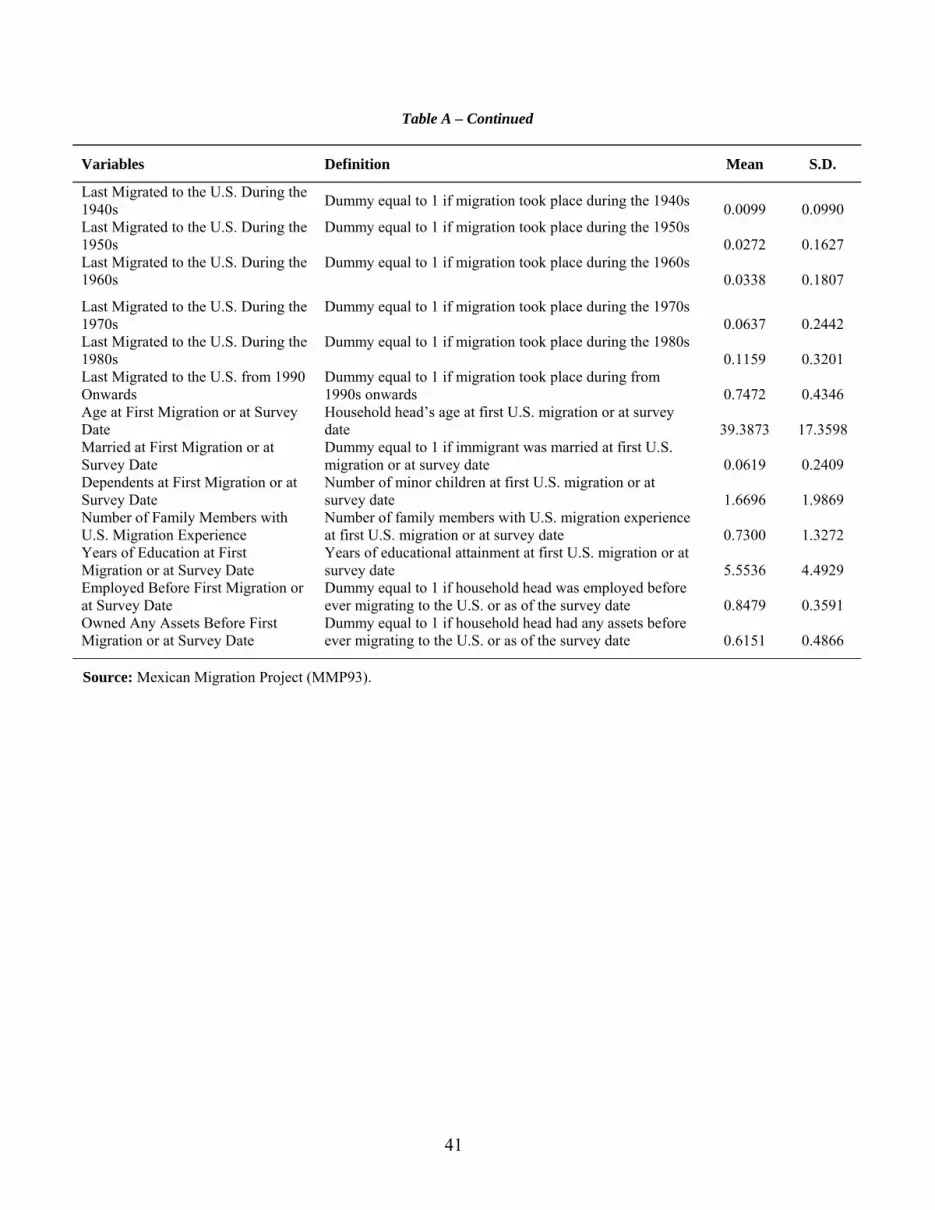
41
Table A – Continued
Variables Definition Mean S.D.
Last Migrated to the U.S. During the 1940s Dummy equal to 1 if migration took place during the 1940s 0.0099 0.0990 Last Migrated to the U.S. During the 1950s
Dummy equal to 1 if migration took place during the 1950s 0.0272 0.1627
Last Migrated to the U.S. During the 1960s
Dummy equal to 1 if migration took place during the 1960s 0.0338 0.1807
Last Migrated to the U.S. During the 1970s
Dummy equal to 1 if migration took place during the 1970s 0.0637 0.2442
Last Migrated to the U.S. During the 1980s
Dummy equal to 1 if migration took place during the 1980s 0.1159 0.3201
Last Migrated to the U.S. from 1990 Onwards
Dummy equal to 1 if migration took place during from 1990s onwards 0.7472 0.4346
Age at First Migration or at Survey Date
Household head’s age at first U.S. migration or at survey date 39.3873 17.3598
Married at First Migration or at Survey Date
Dummy equal to 1 if immigrant was married at first U.S. migration or at survey date 0.0619 0.2409
Dependents at First Migration or at Survey Date
Number of minor children at first U.S. migration or at survey date 1.6696 1.9869
Number of Family Members with U.S. Migration Experience
Number of family members with U.S. migration experience at first U.S. migration or at survey date 0.7300 1.3272
Years of Education at First Migration or at Survey Date
Years of educational attainment at first U.S. migration or at survey date 5.5536 4.4929
Employed Before First Migration or at Survey Date
Dummy equal to 1 if household head was employed before ever migrating to the U.S. or as of the survey date 0.8479 0.3591
Owned Any Assets Before First Migration or at Survey Date
Dummy equal to 1 if household head had any assets before ever migrating to the U.S. or as of the survey date 0.6151 0.4866
Source: Mexican Migration Project (MMP93).