small-world file-sharing communities
TRANSCRIPT

arX
iv:c
s.D
C/0
3070
36 v
1 1
3 Ju
l 200
3
Small-World File-Sharing CommunitiesAdriana Iamnitchi, Matei Ripeanu, Ian Foster
Department of Computer ScienceThe University of Chicago
Chicago, IL 60637{anda, matei, foster}@cs.uchicago.edu
Abstract— Web caches, content distribution networks,peer-to-peer file sharing networks, distributed file systems,and data grids all have in common that they involve acommunity of users who generate requests for shareddata. In each case, overall system performance can beimproved significantly if we can first identify and thenexploit interesting structure within a community’s accesspatterns. To this end, we propose a novel perspective on filesharing based on the study of the relationships that formamong users based on the files in which they are interested.We propose a new structure that captures common userinterests in data—thedata-sharing graph— and justify itsutility with studies on three data-distribution systems: ahigh-energy physics collaboration, the Web, and the Kazaapeer-to-peer network. We find small-world patterns in thedata-sharing graphs of all three communities. We analyzethese graphs and propose some probable causes for theseemergent small-world patterns. The significance of small-world patterns is twofold: it provides a rigorous support tointuition and, perhaps most importantly, it suggests waysto design mechanisms that exploit these naturally emergingpatterns.
I. INTRODUCTION
Large-scale, Internet-connected distributed systemsare notoriously difficult to manage. In a resource-sharingenvironment such as a peer-to-peer system that con-nects hundreds of thousands of computers in an ad-hocnetwork, intermittent resource participation, large andvariable scale, and high failure rates are challenges thatoften impose performance tradeoffs. Thus, existing P2Pfile-location mechanisms favor specific requirements: inGnutella, the emphasis is on accommodating highlyvolatile peers and on fast file retrieval, with no guaranteesthat files will always be located. In Freenet [1], the em-phasis is on ensuring anonymity. In contrast, distributedhash tables such as CAN [2], Chord [3], Pastry [4], andTapestry [5] guarantee that files will always be located,but do not support wildcard searches.
One way to optimize these tradeoffs is to understanduser behavior. In this paper we analyze user behavior inthree file-sharing communities in an attempt to get inspi-
ration for designing efficient mechanisms for large-scale,dynamic, self-organizing resource-sharing communities.
We look at these communities in a novel way: westudy the relationships that form among users based onthe data in which they are interested. We capture andquantify these relationships by modeling the communityas a data-sharing graph. To this end, we propose anew structure that captures common user interests indata (Section III) and justify its utility with studieson three data-distribution systems (Section IV): a high-energy physics collaboration, the Web, and the Kazaapeer-to-peer network. We find small-world patterns in thedata-sharing graphs of all three communities (SectionV).We discuss the causes of these emergent small-worldpatterns in Section VI. The significance of these newlyuncovered patterns is twofold (Section VII): First, itexplains previous results [6] and confirms (with formalsupport) the intuition behind them. Second, it suggestsways to design mechanisms that exploit these naturallyemerging patterns.
II. I NTUITION
It is not news that understanding the system propertiescan help guide efficient solution design. A well knownexample is the relationship between file popularity in theWeb and cache size. The popularity of web pages hasbeen shown to follow a Zipf distribution [7], [8]: fewpages are highly popular and many pages are requestedfew times. As a result, the efficiency of increasing cachesize is not linear: caching is useful for the popular items,but there is little gain from increasing the cache toprovision for unpopular items.
As a second example, many real networks are powerlaw. That is, their node degrees are distributed accordingto a power law, such that a small number of nodeshave large degrees, while most nodes have small degrees.Adamic et al. [9] propose a mechanism for probabilisticsearch in power-law networks that exploits exactly thischaracteristic: the search is guided first to nodes withhigh degree and their many neighbors. This way, a largepercentage of the network is covered fast.

2
This type of observations inspired us to look forpatterns in user resources requests. But what patterns?
A. Patterns, Patterns Everywhere
It is believed that the study of networks started withEuler’s solution of the Konigsberg bridge problem in1735. The field has since extended from theoreticalresults to the analysis of patterns in real networks. Socialsciences have apparently the longest history in the studyof real networks [10], with significant quantitative resultsdating from the 1920s [11].
The development of the Internet added significantmomentum to the study of networks: by both facilitatingaccess to collections of data and by introducing newnetworks to study, such as the Web graph, whose nodesare web pages and edges are hyperlinks [12], the Internetat the router and the AS level [13] and the email graph[14].
The study of large real networks led to fascinatingresults: recurring patterns emerge in real networks (see[15], [16], [17], [10] for good surveys). For example,a frequent pattern is the power-law distribution of nodedegree, that is, a small number of nodes act as hubs(having a large degree), while most nodes have a smalldegree. Examples of power-law networks are numerousand from many domains: the phone-call network (longdistance phone calls made during a single day) [18], [19],the citation network [20], and the linguistics network[21] (pairs of words in English texts that appear at mostone word apart). In computer science, perhaps the firstand most surprising result at its time was the proof thatthe random graph-based models of the Internet (withtheir Poisson degree distribution) were inaccurate: theInternet topology had a power-law degree distribution[13]. Other results followed: the web graph [22], [12]and the Gnutella overlay (as of year 2000) [23] are alsopower-law networks.
Another class of networks are the “small worlds”.Two characteristics distinguish small-world networks:first, a small average path length, typical of randomgraphs (here ‘path’ means shortest node-to-node path);second, a large clustering coefficient that is independentof network size. The clustering coefficient captures howmany of a node’s neighbors are connected to each other.This set of characteristics is identified in systems asdiverse as social networks, in which nodes are peopleand edges are relationships; the power grid system ofwestern USA, in which nodes are generators, transform-ers, substations, etc. and edges are transmission lines;and neural networks, in which nodes are neurons andedges are synapses or gap junctions [24].
B. Research Questions
Newman shows that scientific collaboration networksin different domains (physics, biomedical research, neu-roscience, and computer science) have the characteristicsof small worlds [25], [26], [27]. Collaboration networksconnect scientists who have written articles together.
Moreover, Girvan and Newman [28] show that well-defined groups (such as a research group in a spe-cific field) can be identified in (small-world) scientificcollaboration networks. In parallel, a theoretical modelfor small-world networks by Watts and Strogatz [29]pictures a small world as a loosely connected set ofhighly connected subgraphs.
From here, the step is natural: since scientists tendto collaborate on publications, they most likely use thesame resources (sharethem) during their collaboration:for example, they might use the same instruments toobserve physics phenomena, or they might analyze thesame data, using perhaps the same software tools oreven a common set of computers. This means that ifwe connect scientists who use the same files, we mightget a small world. Even more, we might be able toidentify groups that share the same resources. Notice thatthe notion of “collaboration” transformed into “resourcesharing”: the social relationships do not matter anymore,scientists who use the same resources within some timeinterval may never hear of each other.
Resource sharing in a (predominantly) scientific com-munity is the driving force of computational Grids. If weindeed see these naturally occurring sharing patterns andwe find ways to exploit them (e.g., by identifying usersgrouped around common sets of resources), then we canbuild mechanisms that can tame the challenges typicalof large-scale, dynamic, heterogeneous, latency-affecteddistributed systems.
The research question now become clear:Q1 Are there any patterns in the way scientists share
resources that could be exploited for designingmechanisms?
But resource sharing also exists outside scientific com-munities: peer-to-peer systems or even the Web facilitatethe sharing of data. Another question arises:Q2 Are these characteristics typical of scientific com-
munities or are they more general?This article answers these two questions: it shows
that small-world patterns exist in diverse file-sharingcommunities.
III. T HE DATA -SHARING GRAPH
To answer questionQ1, we define a new graph thatcaptures the virtual relationship between users who re-quest the same data at about the same time.

3
Definition: The data-sharing graph is a graph in whichnodes are users and an edge connects two users withsimilar interests in data.
We consider one similarity criterion in this article:the number of shared requests within a specified timeinterval.
To answer questionQ2, we analyze the data-sharinggraphs of three different file-sharing communities. Sec-tion IV presents briefly these systems and the traceswe used. We discover that in all cases, for differentsimilarity criteria, these data-sharing graphs are smallworlds. The next sections show that using the data-sharing graph for system characterization has potentialboth for basic science, because we can identify newstructures emerging in real, dynamic networks (SectionV); and for system design, because we can exploit thesestructures when designing data location and deliverymechanisms (Section VII).
IV. T HREE DATA -SHARING COMMUNITIES
We study the characteristics of the data-sharing graphcorresponding to three file-sharing communities: a high-energy physics collaboration (Section IV-A), the Webas seen from the Boeing traces (Section IV-B), and theKazaa peer-to-peer file-sharing system seen from a largeISP in Israel (Section IV-C).
This section gives a brief description of each com-munity and its traces (duration of each trace, numberof users and files requested, etc.) In addition, we presentthe file popularity and user activity distributions for eachof these traces as these have a high impact on thecharacteristics of the data-sharing graph: intuitively, auser with high activity is likely to map onto a highlyconnected node in the data sharing graph. Similarly,highly popular files are likely to produce dense clusters.
TABLE I
CHARACTERISTICS OF TRACES ANALYZED.
System Users Requests DurationAll Distinct Traces
D0 317 2,757,015 193,686 180 daysWeb 60,826 16,527,194 4,794,439 10 hoursKazaa 14,404 976,184 116,509 5 days
A. The D0 Experiment: a High-Energy Physics Collab-oration
The D0 experiment [30] is a virtual organizationcomprising hundreds of physicists from more than 70institutions in 18 countries. Its purpose is to provide aworldwide system of shareable computing and storageresources that can together solve the common problem of
extracting physics results from about a Petabyte (c.2003)of measured and simulated data. In this system, data filesare read-only and typical jobs analyze and produce new,processed data files. The tracing of system utilization ispossible via a software layer (SAM [31]) that providescentralized file-based data management.
We analyzed logs over the first six months of 2002,amounting to about 23,000 jobs submitted by more than300 users and involving more than 2.5 million requestsfor about 200,000 distinct files. A data analysis jobtypically runs on multiple files (117 on average). Figure1 left shows the distribution of the number of files perjob.
1
10
100
1000
10000
100000
1 10 100 1000 10000
# F
iles
# Projects
Fig. 1. Left: Number of file requests per project in D0.Right: Filepopularity distribution in D0
Figure 2 shows the daily activity (in number of re-quests per day) and user activity (in number of requestssubmitted by each user during the 6-month interval).The daily activity is relatively constant, with a fewsignificant peaks—corresponding perhaps to approach-ing paper submission deadlines in high-energy physics?.User activity is highly variable, with scientists who scanfrom tens of thousands of distinct data files to just acouple.
0
20000
40000
60000
80000
100000
120000
140000
0 20 40 60 80 100 120 140 160 180
Num
ber
of r
eque
sts
Day
1
10
100
1000
10000
100000
1e+06
0 50 100 150 200 250 300 350
# R
eque
sts
User Rank
Distinct requestsAll requests
Fig. 2. Left: Number of file requests per day in D0.Right: Numberof files (total and distinct) asked by each user during the 6-monthinterval.
In D0 file popularity does not follow the Zipf’s lawtypical of Web requests. (Figure 1, right). The reason webelieve is that data in this scientific application is moreuniformly interesting: a typical job swipes a significantpart of the data space (and hence file set) in search ofparticular physics events.

4
B. The Web
We use the Boeing proxy traces [32] as a representa-tive sample for Web data access patterns. These tracesrepresent a five-day record from May 1999 of all HTTPrequests (more than 20M requests per day) from a largeorganization (Boeing) to the Web. Because traces areanonymized and IDs are not preserved from day to day,our study was limited to one-day intervals. However,given the intense activity recorded (Figure 4 left showsthe number of requests per second), this limitation doesnot affect the accuracy of our results. Here we study arepresentative 10-hour interval.
For the study of Web traces, we consider a user as anIP address. During the 10-hour interval, 60,826 users sent16.5 million web requests, of which 4.7 million requestswere distinct. It is possible that the same IP addresscorresponded in fact to multiple users (for example,for DHCP addresses or shared workstations). We donot have any additional information to help us identifythese cases or evaluate their impact. However, given therelatively short intervals we consider in our studies—from 2 minutes to a couple of hours—the chances ofmultiple users using the same IP are small.
Fig. 3. The file popularity distributions in Kazaa follows Zipf’s law.
0
100
200
300
400
500
600
700
800
30 40 50 60 70 80 90 100 110 120 130
# R
eque
sts
per
Sec
ond
Time (’000s)
Fig. 4. Left: Activity level (averaged over 15-minute intervals).Right: Number of requests per Web user.
C. The KaZaA Peer-to-Peer Network
Kazaa is a popular peer-to-peer file-sharing systemwith an estimated number of more than 4 million con-current users as of June 2003 [33].
Few details are publicly available about the Kazaaprotocol. Apparently, Kazaa nodes dynamically elect“supernodes” that form an unstructured overlay networkand use query flooding to locate content. Regular nodesconnect to one or more super-nodes and act as queryingclients to super-nodes. Control information, such asqueries, membership, and software version. is encrypted.Once content has been located, data is transfered (unen-crypted) directly from provider to requester using theHTTP protocol. In order to improve transfer speed,multiple file fragments are downloaded in parallel frommultiple providers.
Since control information is encrypted, the only ac-cessible traffic information can be obtained from thedownload channel. As a result we can only gatherinformation about the files requested for download andnot about files searched for (therefore, typos are naturallyfiltered). Details on how Kazaa traces were recordedas well as a thorough analysis of the Kazaa traffic arepresented in [34].
0
1
2
3
4
5
6
7
8
0 50 100 150 200 250 300 350 400 450 500
# R
eque
sts
per
peco
nd
Time (’000 seconds)
1
10
100
1000
10000
0 3000 6000 9000 12000
# R
eque
sts
User rank
Fig. 5. Left: Activity level (averaged over 100 s) in Kazaa;Right:Number of requests per user in KaZaa
We had access to five days of Kazaa traffic, duringwhich 14,404 users downloaded 976,184 files, of which116,509 were distinct. Users are identified based ontheir (anonymized) user ID that appears in the HTTPdownload request. The user population is formed ofKazaa users who are clients of the ISP: similar to theBoeing traces, these traces give information about onlya limited set of Kazaa users.
V. SMALL -WORLD DATA -SHARING GRAPHS
Data-sharing graphs are built using the definition inSection III: users are nodes in the graph and two usersare connected if they have similar interests in data duringsome interval. For the rest of this paper we considerone class of similarity criteria: we say that two usershave similar data interests if the size of the intersectionof their request sets is larger than some threshold. Thissection presents the properties of data-sharing graphs forthe three communities introduced previously.
The similarity criterion has two degrees of freedom:the length of the time interval and the threshold on the

5
number of common requests. Section V-A studies thedependence between these parameters for each of thethree data-sharing communities.
Sections V-B and V-C present the properties of thedata-sharing graphs. We shall see that not all data-sharinggraphs are power law. However, they all exhibit small-world characteristics, a result that we support with morerigorous analysis in Section VI-A.
A. Distribution of Weights
We can think of data-sharing graphs as weightedgraphs: two users are connected by an edge labeledwith the number of shared requests during a specifiedtime period. Remove 0-weight edges, as well as isolatednodes (those that have no edges). We obtain a weighteddata-sharing graph (Figures 6 and 7). The distributionof weights highlights differences among the sharingcommunities: the sharing in D0 is significantly morepronounced than in Kazaa, with weights in the order ofhundreds or thousands in D0 compared to 5 in Kazaa.
1
10
100
1000
10000
1 10
Wei
ght
# Edges
7 days
1
10
100
1000
10000
100000
1 10 100
# Edges
28 days
Fig. 6. The distribution of weights in D0 data-sharing graphs fordifferent intervals during the same period.
1
10
100
1000
10000
1 10 100 1000100001000001e+061e+071e+08
Wei
ght
# Edges
1 hour30 min15 min
1
10
1 10 100 1000 10000 100000
Wei
ght
# Edges
8h4h1h
Fig. 7. The distribution of weights in Kazaa (left) and Web (right)data-sharing graphs for different time intervals.
B. Degree Distribution
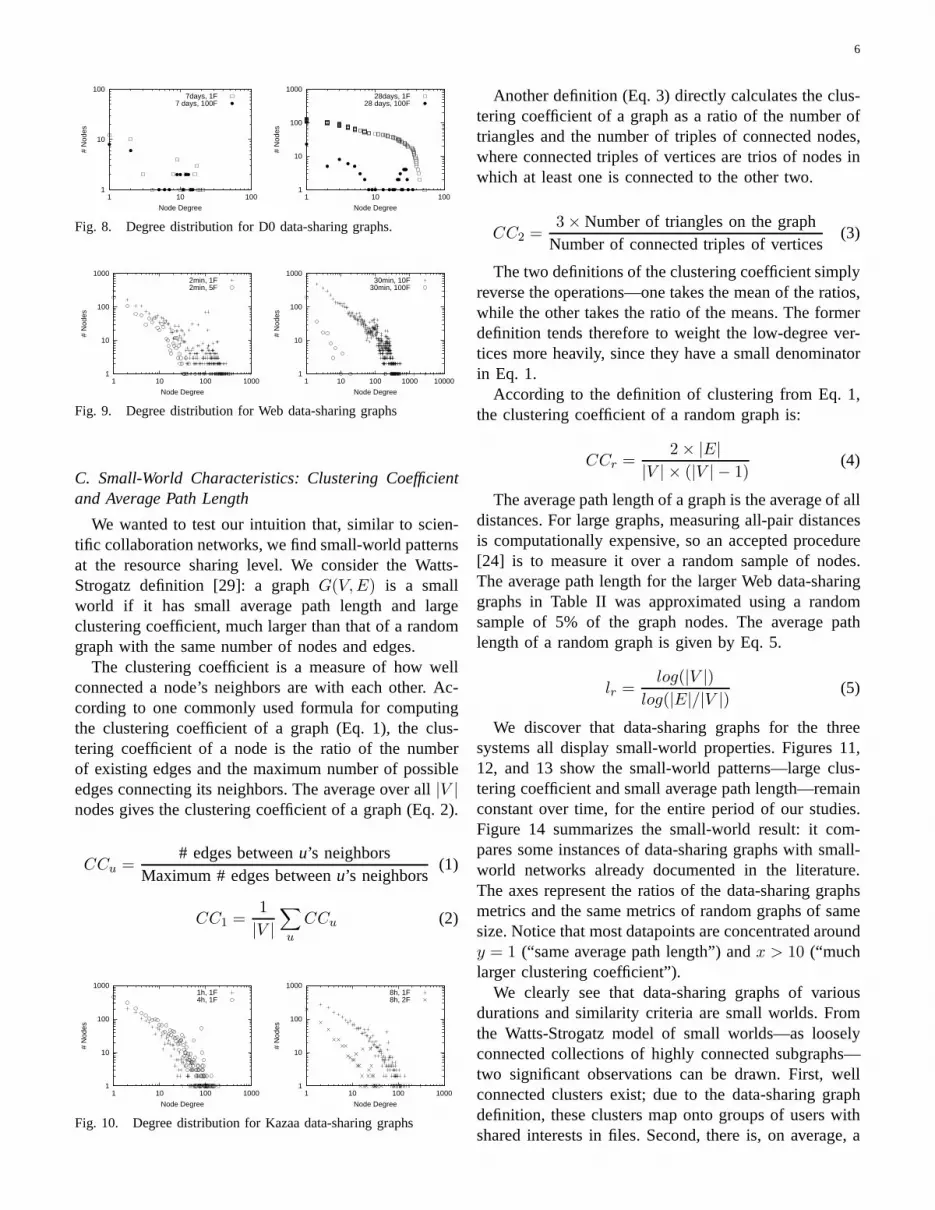
The node degree distribution of the data-sharing graphis particularly interesting for designing distributed ap-plications. Figures 8, 9, and 10 present the degreedistributions for the three systems: note that the Kazaadata-sharing graph is the closest to a power-law, whileD0 graphs clearly are not power-law.
TAB
LE
II
PR
OP
ER
TIE
SO
FD
AT
A-S
HA
RIN
GG
RA
PH
SF
OR
TH
ET
HR
EE
CO
MM
UN
ITIE
SS
TU
DIE
D.CC
1IS
TH
EM
EA
SU
RE
DW
AT
TS-S
TR
OG
AT
ZC
LU
ST
ER
ING
CO
EF
FIC
IEN
T(E
Q.
1),
CC
2IS
TH
E
ME
AS
UR
ED
CL
US
TE
RIN
GC
OE
FF
ICIE
NT
DE
FIN
ED
INE
Q.
3;C
Cr
IST
HE
WA
TT
S-S
TR
OG
AT
ZC
LU
ST
ER
ING
CO
EF
FIC
IEN
TO
FR
AN
DO
MG
RA
PH
S(EQ
.4
);l
IST
HE
ME
AS
UR
ED
AV
ER
AG
E
PA
TH
LE
NG
TH
AN
Dl r
IST
HE
AV
ER
AG
EP
AT
HL
EN
GT
HO
FR
AN
DO
MG
RA
PH
S(E
Q.
5)
Tim
eF
iles
in#
Co
nn
ect
ed
La
rge
stco
nn
ect
ed
com
po
ne
nt
Ra
nd
om
Gra
ph
Sys
tem
Inte
rva
lC
om
mo
n#
No
de
s#
Ed
ge
sC
om
po
ne
nts
#N
od
es
#E
dg
es
CC
1C
C2
lC
Cr
l rD
07
da
ys1
46
15
35
35
14
20
.74
10
.64
82
.11
40
.23
82
.53
8D
07
da
ys1
00
26
95
32
08
80
.77
30
.74
31
.65
0.4
63
2.0
21
D0
7d
ays
10
00
14
43
11
44
30
.83
40
.65
21
.50
.47
22
.35
1D
02
8d
ays
11
29
77
79
10
77
57
0.7
16
0.6
41
2.4
76
0.1
33
2.3
88
D0
28
da
ys1
00
84
44
14
78
43
80
.70
60
.76
32
.76
90
.14
52
.52
4D
02
8d
ays
10
00
49
23
56
35
22
60
.83
80
.80
81
.62
80
.37
91
.90
6W
eb
12
0s
12
07
64
76
10
10
01
80
54
72
56
0.7
86
0.6
34
2.6
66
0.0
29
2.2
96
We
b1
80
0s
16
13
71
86
63
38
39
60
49
18
66
27
10
.80
82
.05
60
.10
21
.51
9W
eb
18
00
s1
00
14
31
96
20
10
21
72
0.7
20
0.1
30
3.6
0.0
33
8.8
51
Ka
zaa
1h
ou
r1
80
91
93
79
75
48
16
90
0.7
40
0.5
93
5.6
29
0.0
11
5.5
99
Ka
zaa
8h
ou
rs1
36
08
31
25
27
93
40
33
05
55
0.6
52
0.4
73
3.6
11
0.0
05
3.7
05
Ka
zaa
8h
ou
rs3
11
11
11
24
56
78
0.4
42
0.1
78
3.1
60
0.0
50
12
.14
8
6
1
10
100
1 10 100
# N
odes
Node Degree
7days, 1F7 days, 100F
1
10
100
1000
1 10 100
# N
odes
Node Degree
28days, 1F28 days, 100F
Fig. 8. Degree distribution for D0 data-sharing graphs.
1
10
100
1000
1 10 100 1000
# N
odes
Node Degree
2min, 1F2min, 5F
1
10
100
1000
1 10 100 1000 10000
# N
odes
Node Degree
30min, 10F30min, 100F
Fig. 9. Degree distribution for Web data-sharing graphs
C. Small-World Characteristics: Clustering Coefficientand Average Path Length
We wanted to test our intuition that, similar to scien-tific collaboration networks, we find small-world patternsat the resource sharing level. We consider the Watts-Strogatz definition [29]: a graphG(V,E) is a smallworld if it has small average path length and largeclustering coefficient, much larger than that of a randomgraph with the same number of nodes and edges.
The clustering coefficient is a measure of how wellconnected a node’s neighbors are with each other. Ac-cording to one commonly used formula for computingthe clustering coefficient of a graph (Eq. 1), the clus-tering coefficient of a node is the ratio of the numberof existing edges and the maximum number of possibleedges connecting its neighbors. The average over all|V |nodes gives the clustering coefficient of a graph (Eq. 2).
CCu =# edges betweenu’s neighbors
Maximum # edges betweenu’s neighbors(1)
CC1 =1
|V |
∑
u
CCu (2)
1
10
100
1000
1 10 100 1000
# N
odes
Node Degree
1h, 1F4h, 1F
1
10
100
1000
1 10 100 1000
# N
odes
Node Degree
8h, 1F8h, 2F
Fig. 10. Degree distribution for Kazaa data-sharing graphs
Another definition (Eq. 3) directly calculates the clus-tering coefficient of a graph as a ratio of the number oftriangles and the number of triples of connected nodes,where connected triples of vertices are trios of nodes inwhich at least one is connected to the other two.
CC2 =3 × Number of triangles on the graph
Number of connected triples of vertices(3)
The two definitions of the clustering coefficient simplyreverse the operations—one takes the mean of the ratios,while the other takes the ratio of the means. The formerdefinition tends therefore to weight the low-degree ver-tices more heavily, since they have a small denominatorin Eq. 1.
According to the definition of clustering from Eq. 1,the clustering coefficient of a random graph is:
CCr =2 × |E|
|V | × (|V | − 1)(4)
The average path length of a graph is the average of alldistances. For large graphs, measuring all-pair distancesis computationally expensive, so an accepted procedure[24] is to measure it over a random sample of nodes.The average path length for the larger Web data-sharinggraphs in Table II was approximated using a randomsample of 5% of the graph nodes. The average pathlength of a random graph is given by Eq. 5.
lr =log(|V |)
log(|E|/|V |)(5)
We discover that data-sharing graphs for the threesystems all display small-world properties. Figures 11,12, and 13 show the small-world patterns—large clus-tering coefficient and small average path length—remainconstant over time, for the entire period of our studies.Figure 14 summarizes the small-world result: it com-pares some instances of data-sharing graphs with small-world networks already documented in the literature.The axes represent the ratios of the data-sharing graphsmetrics and the same metrics of random graphs of samesize. Notice that most datapoints are concentrated aroundy = 1 (“same average path length”) andx > 10 (“muchlarger clustering coefficient”).
We clearly see that data-sharing graphs of variousdurations and similarity criteria are small worlds. Fromthe Watts-Strogatz model of small worlds—as looselyconnected collections of highly connected subgraphs—two significant observations can be drawn. First, wellconnected clusters exist; due to the data-sharing graphdefinition, these clusters map onto groups of users withshared interests in files. Second, there is, on average, a

7
0
0.2
0.4
0.6
0.8
1
0 5 10 15 20 25 30
Clu
ster
ing
Coe
ffici
ent
Week
D0Random
0
0.5
1
1.5
2
2.5
3
3.5
0 5 10 15 20 25 30
Ave
rage
pat
h Le
ngth
Week
D0Random
Fig. 11. Clustering coefficients (left) and average path lengths (right)of D0 data-sharing graphs and random graphs of same size. Similaritycriterion: 1 shared file during a 7-day interval.
0
0.2
0.4
0.6
0.8
1
0 2 4 6 8 10 12 14 16 18 20
Clu
ster
ing
Coe
ffici
ent
Interval (30 min)
WWW, 10 filesRandom
0
0.5
1
1.5
2
2.5
3
3.5
0 2 4 6 8 10 12 14 16 18 20
Ave
rage
Pat
h Le
ngth
Interval (30 min)
WWW,10 filesRandom
0
0.2
0.4
0.6
0.8
1
0 2 4 6 8 10 12 14 16 18 20
Clu
ster
ing
Coe
ffici
ent
Interval (30 min)
WWW, 100 filesRandom
0
10
20
30
40
50
60
0 2 4 6 8 10 12 14 16 18 20
Ave
rage
Pat
h Le
ngth
Interval (30min)
WWW,100 filesRandom
Fig. 12. Clustering coefficients (left) and average path lengths(right) of WWW data-sharing graphs and random graphs of samesize. Similarity criterion: 10, respectively 100 shared requests duringa half-hour interval.
small path between any two nodes in the data-sharinggraph: therefore, for example, flooding with relativelysmall time-to-live would cover most of the graph.
VI. H UMAN NATURE OR ZIPF’ S LAW?
We observed small-world patterns in three differentfile-sharing communities: a scientific collaboration, theWeb, and the Kazaa peer-to-peer system. Given the vari-ety of our study sample, we could perhaps generalize thisobservation to any file-sharing user community. Thus, we
0
0.2
0.4
0.6
0.8
1
0 2 4 6 8 10 12 14 16
Clu
ster
ing
Coe
ffici
ent
8-hour interval
KazaaRandom
3.5
4
4.5
5
5.5
6
6.5
7
0 2 4 6 8 10 12 14 16
Ave
rage
Pat
h Le
ngth
8-hour interval
KazaaRandom
Fig. 13. Clustering coefficients (left) and average path lengths(right) of Kazaa data-sharing graphs and random graphs of samesize. Similarity criterion: 2 shared requests during an 8-hour interval.
Fig. 14. Small-world networks: data-sharing graphs and networkspreviously documented in the literature as small worlds
seek to understand what causes these characteristics indata-sharing graphs and to answer the question:Q3 Are the small-world characteristics consequences of
previously documented patterns or do they reflect anew observation concerning user’s preferences indata?
We explore two directions that help us answer thecausality question. In Section VI-A we focus on thedefinition of the data-sharing graph and question thelarge clustering coefficient as a natural consequence ofthe graph definition. In Section VI-B we analyze theinfluence of well-known patterns in file access, such astime locality and file popularity distribution.
A. Affiliation Networks
An affiliation network(also called “a preference net-work”) is a social network in which the participants(actorsin sociology terminology) are linked by commonmembership in groups or clubs of some kind. Examplesinclude scientific collaboration networks (in which actorsbelong to the group of authors of a scientific paper),movie actors (in which actors belong to the cast ofa certain movie), and board directors (in which actorsbelong to the same board).
Affiliation networks are therefore bipartite graphs:there are two types of vertices, for actors and respectivelygroups, and edges link nodes of different types only (Fig-ure 15, left). Affiliation networks are often representedas unipartite graphs of actors joined by undirected edgesthat connect actors in the same group. One observes nowthat the data-sharing graph with one-shared file thresholdfor the similarity criterion is such a one-mode projectionof a bipartite affiliation network (Figure 15, right).

8
A
A
E F
G
B
DC
B
C
D
E
F
G
m
n
p
Fig. 15. A bipartite network (left) and its unipartite projection (right).Users A-G access files m-p. In the unipartite projection, twousersare connected if they requested the same file.
These one-mode projections of bipartite graphs haveparticular characteristics. Most relevant to this discussionis the clustering coefficient: inherently, the clusteringcoefficient is larger in these graphs than in randomgraphs of the same size, since the members of a groupwill form a complete subgraph in the one-mode projec-tion. Consequently, our comparison with random graphs,although faithful to the Watts-Strogatz definition of smallworlds, is misleading.
We therefore identified two possible sources of biasin our analysis: one is the implicitly large clusteringcoefficient of the unimodal affiliation networks, as justshown. Another is the degree distribution of the data-sharing graphs which, as in many other real networks,is far from the Poisson distribution of a random graph(Figures 8, 9, and 10).
Newman et al. [35], [36] propose a model for randomgraphs with given degree distributions. These graphs,therefore, will not be random in the Erdos-Renyi sense,but will be random members of a class of graphswith a fixed degree distribution. The authors also adapttheir model to affiliation networks and deduce a set ofparameters of their unimodal projection. We use theirtheoretical model to estimate the clustering coefficientof unimodal projections of random affiliation networksof the size and degree distributions as given by tracesand compare it with the actual values.
In a bipartite affiliation network, there are two degreedistributions: of actors (to how many groups does anactor belong) and of groups (how many actors does agroup contain). Let us consider a bipartite affiliationgraph ofN actors andM groups. Let us namepj theprobability that an actor is part of exactlyj groups andqk the probability that a group consists of exactlykmembers. In order to easily compute the average nodedegree and the clustering coefficient of the unipartiteaffiliation network, Newman et al. use three functionsf0, g0, andG0 defined as follows:
f0(x) =N∑
j=1
pjxj (6)
g0(x) =M∑
k=1
qkxk (7)
G0(x) = f0(g′
0(x)/g′0(1)) (8)
The average degree for the actors’ one-mode projec-tion of the affiliation network is:
AvgDegree = G′
0(1) (9)
And the clustering coefficient is:
C =M
N
g′′′0
(1)
G′′
0(1)
(10)
The definition of the clustering coefficient is that ofEq. 3.
It is therefore relevant to compare the clustering coef-ficient of data-sharing graphs with that given by Equation10.
1
10
100
1000
10000
1 10 100 1000 10000 100000
Nod
e D
egre
e
# Nodes
Users
1
10
100
1000
10000
100000
1e+06
1 10 100 1000 10000
Nod
e D
egre
e
# Nodes
Files
Fig. 16. Degree distribution of user (left) and file (right) nodes of abipartite affiliation network corresponding to a half-hourinterval inthe Boeing Web traces.
Figure 16 shows the corresponding values for thedegree distributionp and q (but not normalized: i.e., itshows the number rather than the percentage of users thatrequested exactlyk files) in a Web data-sharing graphwith a similarity criterion of one shared request withina half-hour interval.
Table III shows that our intuition was correct: there isa significant difference between the values of measuredand modeled parameters. Thus, the large clustering co-efficient is not due to the definition of the data-sharinggraph as a one-mode projection of an affiliation networkwith non-Poisson degree distributions.
Table III leads to two observations. First, the actualclustering coefficient in the data-sharing graphs is alwayslarger than predicted and the average degree is alwayssmaller than predicted. An interesting new questionemerges: what is the explanation for these (sometimessignificant) differences? One possible explanation is thatuser requests for files are not random: their preferences

9
TABLE III
PROPERTIES OF DATA-SHARING GRAPHS, MEASURED AND MODELED AS UNIMODAL PROJECTION OF AFFILIATIONNETWORKS.
CLUSTERING COEFFICIENT ARE MEASURED USINGEQ. 3 AND MODELED USING EQ. 10
Clustering Average degreeInterval Users Files Theory Measured Theory Measured
D0 7 days 74 28638 0.0006 0.65 1242.5 3.328 days 151 67742 0.0004 0.64 7589.6 6.0
Web 2 min 3385 39423 0.046 0.63 50.0 22.930 min 6757 240927 0.016 1453.1 304.1
Kazaa 1 h 1629 3393 0.55 0.60 2.9 2.48 h 2497 9224 0.30 0.48 9.5 8.7
are limited to a set of files, which explains the actualaverage degree being smaller than predicted. A rigorousunderstanding of this problem is left for future work.
A second observation is that we can perhaps comparethe file sharing in the three communities by comparingtheir distance from the theoretical model. We see that theKazaa data-sharing graphs are the closest to the theoret-ical model and the D0 graphs are very different fromtheir corresponding model. This is different from thecomparison with the Erdos-Renyi random graphs (TableII). The cause of this difference and the significance ofthis observation remain to be studied in the future.
B. Influences of Zipf’s Law and Time and Space Locality
Event frequency has been shown to follow a Zipfdistribution in many systems, from word occurrences inEnglish and in monkey-typing texts to city population.It is also present in two of the three cases we analyze:the Web and Kazaa. Other patterns characteristic to dataaccess systems include time locality, in which an item ismore popular (and possibly requested by multiple users)during a limited interval and temporal user activity,meaning that users are not uniformly active during aperiod, but follow some patterns (for example, down-loading more music files during weekends or holidays[23]). Thus, we ask:Q4 Are the patterns we identified in the data-sharing
graph, especially the large clustering coefficient, aninherent consequence of these well-known behav-iors?
To answer this question, we generate random tracesthat preserve the documented characteristics but breakthe user-request association. From these synthetic traces,we build the resulting data-sharing graphs, and analyzeand compare their properties with those resulting fromthe real traces.
1) Synthetic Traces:The core of our traces is a tripletof user ID, item requested and request time. Figure 17identifies the following correlations in traces, some ofwhich we want to preserve in the synthetic traces:
(1)
(3)
(5)
(6)
TimeUser(4)
(2)
Request
Fig. 17. The relations between users, their requests, and their requesttimes determine observed patterns like Zipf frequency of requests ortime locality.
(1) User–Time: User’s activity varies over time: forexample, in the D0 traces, some users accesseddata only in May.
(2) Request–Time: Items may be more popular duringsome intervals: for example, news sites are morepopular in the morning.
(3) User–Request: This is the key to user’s prefer-ences. By breaking this relationship and randomlyrecreating it, we can analyze the effect of userpreferences on the properties of the data-sharinggraph.
(4) User: The number of items requested per user overthe entire interval studied may be relevant, as someusers are more active than others (see Figures 4 leftfor the Web traces).
(5) Time: The time of the day (or in our case, of theperiods studied) is relevant, as the Web traces show(the peak in Figure 4 right).
(6) Request: This is item popularity: number of re-quests for the same item.
Our aim is to break the relationship (3), which implic-itly requires the break of (1), (2), or both. We also wantto preserve relationships (4), (5), and (6).
One can picture the traces as aR×3 matrix, in whichR is the number of requests in that trace and the threecolumns correspond to users, files requested, and request

10
times, respectively. Now imagine the we shuffle the userscolumn while the other two are kept unchanged: thisbreaks relations (3) and (1). If the requests column isshuffled, relations (3) and (2) are broken. If both userand request columns are shuffled, then relations (1), (2),and (3) are broken. In all cases, (4), (5), and (6) aremaintained faithful to the real behavior: that is, usersask the same number of requests (4); the times whenrequests are sent are the same (5); and the same requestsare asked and repeated the same number of times (6).
We generated synthetic traces in three ways, as pre-sented above:ST1: No correlation related to time is maintained: break
relations (1), (2), and (3).ST2: Maintain the request times as in the real traces:
break relations (1) and (3).ST3: Maintain the user’s activity over time as in the real
traces: break (2) and (3).2) Properties of Synthetic Data-Sharing Graphs:
Three characteristics of the synthetic data-sharing graphsare relevant to our study. First, the number of nodes insynthetic graphs is significantly different than in theircorresponding real graphs (“corresponding” in terms ofsimilarity criterion and time). On the one hand, thesynthetic data-sharing graphs for which user activity intime (relation (1)) is not preserved have a significantlylarger number of nodes. Even when the user activityin time is preserved (as in the ST3 case), the numberof nodes is larger: this is because in the real data-sharing graphs, we ignored the isolated nodes and inthe synthetic graphs there are no isolated nodes. On theother hand, when the similarity criterion varies to a largenumber of common requests (say, 100 in the D0 case,Figure 19), the synthetic graphs are much smaller or evendisappear. This behavior is explained by the distributionof weights in the synthetic graphs (Figure 18): comparedto the real graphs (Figure 6), there are many more edgeswith small weights. The median weight in the real D0data-sharing graphs is 356 and the average is 657.9,while for synthetic graphs the median is 137 (185 forST3) and the average is 13.8 (75.6 for ST3).
1
10
100
1000
1 10 100 1000 10000
Wei
ght
# Edges
7 days, ST1
1
10
100
1000
10000
1 10 100 1000
# Edges
7 days, ST3
Fig. 18. Distribution of weights in the synthetic data-sharing graphsbuilt from shuffling the D0 traces.
0
50
100
150
200
250
300
0 5 10 15 20 25
Nod
es in
gra
ph
7-day interval (1 common request)
ST1ST2ST3Real
0
10
20
30
40
50
60
0 5 10 15 20 25
Nod
es in
gra
ph
7-day interval (1000 common requests)
ST1ST2ST3Real
Fig. 19. Number of nodes in data-sharing graphs in real and syntheticD0 traces
Second, the synthetic data-sharing graphs are alwaysconnected (unlike real graphs, that always have multipleconnected components, as shown in Table II). Even forsimilarity criteria with large number of common requeststhe synthetic graphs remain connected. This behavior isdue to the uniform distribution of requests per user inthe case of synthetic traces, which is obviously not truein the real case.
Third, the synthetic data-sharing graphs are “less”small worlds than their corresponding real graphs: theratio between the clustering coefficients is smaller andthe ratio between average path lengths is larger thanin real data-sharing graph (Figure 20). However, thesedifferences are not major: the synthetic data-sharinggraphs would perhaps pass as small worlds.
0.2
0.4
0.6
0.8
1
1.2
1.4
1.6
1.8
1 2 3 4 5 6 7
Avg
. pat
h le
ngth
rat
io
Clustering coefficient ratio
RealST1ST2ST3
Fig. 20. Comparison of the small-world data-sharing graphsasresulted from the real and synthetic D0 traces.
These results show that user preferences for files havesignificant influence on the data-sharing graphs: theirproperties are not induced (solely) by user-independenttrace characteristics, but human nature has some impact.So perhaps the answer to this section title (“Humannature or Zipf’s law?”) is “Both”. However, it seems thatidentifying small-world properties is not a sufficient met-ric to characterize the natural interest-based clusteringof users: we might need a metric of how small world asmall-world data-sharing graph is. This problem remainsto be studied further in the future.

11
VII. SMALL -WORLD DATA -SHARING GRAPH:SIGNIFICANCE FORMECHANISM DESIGN
It is interesting to notice that the structure we call thedata-sharing graph can be applied at various levels andgranularities in a computing system. We looked at rela-tionships that form at the file access level, but intuitivelysimilar patterns could be found at finer granularity, suchas access to same memory locations or access to sameitems in a database. For example, a recent article [37]investigates the correlation of program addresses thatreference the same data and shows that these correlationscan be used to eliminate load misses and partial hits.
At a higher level, the data-sharing graph can identifythe structure of an organization—based on the appli-cations its members use, for example—by identifyinginterest-based clusters of users and then use this infor-mation to optimize an organization’s infrastructure, suchas servers or network topology.
In this section we focus on implications for mecha-nism design of the data-sharing graph from two perspec-tive: its structure (definition) and its small-world prop-erties. We stress that these are untested but promisingideas for future work.
A. Relevance of the Data-Sharing Graph Structure
Some recommender systems have a similar flavor tothe data-sharing graph. ReferralWeb [38] attempts touncover existing social networks to create a referral chainof named individuals. It does this by inferring socialrelationships from web pages, such as co-authorship,research groups and interests, co-participation in dis-cussion panels, etc. This social network is then used toidentify experts and to guide searches around them.
Sripanidkulchai et. al came close to the intuition ofthe data-sharing graph in their Infocom 2003 article [6]:they improve Gnutella’s flooding-based mechanism byinserting and exploiting interest-based shortcuts betweenpeers. Interest-based shortcuts connect a peer to peerswho provided data in the past. This is slightly differentfrom our case, where an edge in the data-sharing graphconnects peers that requested the same data. However,the two graphs are likely to overlap significantly if peersstore data of their own interest. Our study distinguishesby its independence from any underlying infrastructure(in this case, the distribution of data on peers and thelocation mechanism) and gives a theoretical explanationof the performance improvements in [6].
The data-sharing graph can be exploited for a va-riety of decentralized file management mechanisms inresource-sharing systems (such as peer-to-peer or Grids).
• In a writable file-sharing system, keeping track ofwhich peers recently requested a file facilitates theefficient propagation of updates in a fully decen-tralized, self-organizing fashion (a similar idea isexplored in [39]).
• In large-scale, unreliable, dynamic peer-to-peer sys-tems file replication may be used to insure dataavailability [40] and transfer performance. The data-sharing graph may suggest where to place replicascloser to the nodes that access them. Similarly,it may be useful for dynamic distributed storage:if files cannot be stored entirely on a node, thenthey can be partitioned among the nodes that areinterested in that file.
• In a peer-to-peer computing scenario, the relation-ships between users who requested the same filescan be exploited for job management. If nodes storeand share recently downloaded files, they becomegood candidates for running jobs that take thosefiles as input. This can be used for scheduling,migrating or replicating data-intensive jobs.
B. Relevance of Small-World Characteristics
The idea underlying the data-sharing graph was firstpresented in [41] as a challenge to design a file-locationmechanism that exploits the small-world characteristicsof a file-sharing community. Meanwhile we completedthe design and evaluation of a mechanism that dy-namically identifies interest-based clusters, disseminateslocation information in groups of interested users, andpropagates requests among clusters [42]. Its strengthscome from mirroring and adapting to changes in user’sbehavior. File insertion and deletion are low cost, whichmakes it a good candidate for scientific collaborations,where use of files leads to creation of new files.
VIII. S UMMARY
This article reveals a predominant pattern in diversefile-sharing communities, from scientific communities tothe Web and file-swapping peer-to-peer systems. Thispattern is brought to light by a structure we proposeand that we call “data-sharing graph”. This structurecaptures the relationships that form between users whoare interested in the same files. We present propertiesof data-sharing graphs from three communities. Theseproperties are relevant to and might inspire the designof a new style of mechanisms in peer-to-peer systems,mechanisms that take into account, adapt to, and exploituser’s behavior. We also sketch some mechanisms thatcould benefit from the data-sharing graph and its small-world properties.

12
REFERENCES
[1] Ian Clarke, Oskar Sandberg, Brandon Wiley, and TheodoreW.Hong, “Freenet: A distributed anonymous information storageand retrieval system,” inInternational Workshop on DesigningPrivacy Enhancing Technologies, Berkeley, CA, 2000, vol. 44-66, Springer-Verlag.
[2] Sylvia Ratnasamy, Paul Francis, Mark Handley, Richard Karp,and Scott Shenker, “A scalable content-addressable network,”in SIGCOMM. 2001, ACM.
[3] Ion Stoica, Robert Morris, David Karger, M. Frans Kaashoek,and Hari Balakrishnan, “Chord: A scalable peer-to-peer lookupservice for internet applications,” inSIGCOMM, San Diego,USA, 2001.
[4] A.I.T. Rowstron and P. Druschel, “Pastry: Scalable, decentral-ized object location, and routing for large-scale peer-to-peersystems,” inMiddleware, 2001, pp. 329–350.
[5] Ben Y. Zhao, John D. Kubiatowicz, and Anthony D. Joseph,“Tapestry: An infrastructure for fault-tolerant wide-area locationand routing,” Tech. Rep. CSD-01-1141, Berkeley, 2001.
[6] Kunwadwee Sripanidkulchai, Bruce Maggs, and Hui Zhang,“Efficient content location using interest-based localityin peer-to-peer systems,” inINFOCOM, San Francisco, 2003.
[7] Paul Barford, Azer Bestavros, Adam Bradley, and Mark Crov-ella, “Changes in web client access patterns characteristics andcaching implications,” Tech. Rep. BUCS-TR-1998-023, BostonUniversity, 1998.
[8] Lee Breslau, Pei Cao, Li Fan, Graham Phillips, and ScottShenker, “Web caching and zipf-like distributions: Evidenceand implications,” inInfoCom, New York, NY, 1999, IEEEPress.
[9] Lada Adamic, Bernardo Huberman, Rajan Lukose, and AmitPuniyani, “Search in power law networks,”Physical Review.E, vol. 64, pp. 46135–46143, 2001.
[10] Mark Newman, “The structure and function o complex net-works,” Tech. Rep. cond-mat/0303516, Los Alamos Archive,2003.
[11] Linton Freeman, “Some antecedents of social network analy-sis,” Connections, vol. 19, pp. 39–42, 1996.
[12] Andrei Broder, Ravi Kumar, Farzin Maghoul, Prabhakar Ragha-van, Sridhar Rajagopalan, Raymie Stata, Andrew Tomkins,and Janet Wiener, “Graph structure in the web,”ComputerNetworks: The International Journal of Computer and Telecom-munications Networking, vol. 33, no. 1-6, 2000.
[13] Michalis Faloutsos, Petros Faloutsos, and Christos Faloutsos,“On power-law relationships of the internet topology,” inSIGCOMM, 1999, pp. 251–262.
[14] Mark Newman, Stephanie Forrest, and Justin Balthrop, “Emailnetworks and the spread of computer viruses,”Phys. Rev. E,vol. 66, no. 035101, 2002.
[15] Reka Albert and Albert-Laszlo Barabasi, “Statistical mechanicsof complex networks,”Reviews of Modern Physics, vol. 74, pp.47–97, 2002.
[16] Albert-Laszlo Barabasi,Linked: The New Science of Networks,Perseus Publishing, 2002.
[17] Sergei Dorogovtsev and JFF. Mendes, “Evolution of networks,”Advances in Physics, vol. 51, no. 4, pp. 1079–1187, 2002.
[18] J. Abello, P.M. Pardalos, and M.G.C. Resende, “On maximumclique problems in very large graphs,”DIMACS Series onDiscrete Mathematics and Theoretical Computer Science, vol.50, pp. 119–130, 1999.
[19] William Aiello, Fan Chung, and Linyuan Lu, “A random graphmodel for massive graphs,” 2000, pp. 171–180.
[20] Sidney Redner, “How popular is your paper? An empiricalstudy of the citation distribution,” 1998, vol. 4, pp. 131–134.
[21] Ramon Ferrer Cancho and Ricard V. Sole, “The small worldof human language,” 2001, vol. 268, pp. 2261–2266.
[22] Albert-Laszlo Barabasi, Reka Albert, and HawoongJeong,“Scale-free characteristics of random netwroks: The topologyof the World Wide Web,” Physica A, vol. 286, pp. 69–77,2000.
[23] Matei Ripeanu, Ian Foster, and Adriana Iamnitchi, “Mappingthe Gnutella network: Properties of large-scale peer-to-peer sys-tems and implications for system design,”Internet Computing,vol. 6, no. 1, pp. 50–57, 2002.
[24] Duncan J. Watts,Small Worlds: The Dynamics of Networksbetween Order and Randomness, Princeton University Press,1999.
[25] Mark Newman, “Scientific collaboration networks: I. Networkconstruction and fundamental results,”Phys. Rev. E, vol. 64,2001.
[26] Mark Newman, “Scientific collaboration networks: II. Shortestpaths, weighted networks, and centrality,”Phys. Rev. E, vol.64, 2001.
[27] Mark Newman, “The structure of scientific collaborationnetworks,” Proc. Natl. Acad. Sci. USA, vol. 98, pp. 404–409,2001.
[28] Michelle Girvan and Mark Newman, “Community structureinsocial and biological networks,”Proc. Natl. Acad. Sci. USA,vol. 99, pp. 8271–8276, 2002.
[29] Duncan Watts and Steven Strogatz, “Collective dynamics of’small-world’ networks,” Nature, vol. 393, 1998.
[30] “The DZero Experiment.,” http://www-d0.fnal.gov.[31] Lauri Loebel-Carpenter, Lee Lueking, Carmenita Moore, Ruth
Pordes, Julie Trumbo, Sinisa Veseli, Igor Terekhov, MatthewVranicar, Stephen White, and Victoria White, “SAM and theparticle physics data grid,” inProceedings of Computing inHigh-Energy and Nuclear Physics. Beijing, China, 2001.
[32] “Boeing proxy logs,” ftp://researchsmp2.cc.vt.edu/pub/boeing/boeing.990301-05.no[33] “http://www.slyck.com,” .[34] Nathaniel Leibowitz, Matei Ripeanu, and Adam Wierzbicki,
“Deconstructing the kazaa network,” inWorkshop on InternetApplications, San Francisco, CA, 2003.
[35] Mark Newman, Duncan Watts, and Steven Strogatz, “Randomgraph models of social networks,”Proc. Natl. Acad. Sci. USA,vol. 99, pp. 2566–2572, 2002.
[36] Mark Newman, Steven Strogatz, and Duncan Watts, “Randomgraphs with arbitrary degree distribution and their applications,”Phys. Rev. E, vol. 64, no. 026118, 2001.
[37] R. Sendag, P.-f. Chuang, and D. J. Lilja, “Address correlation:Exceeding the limits of locality,”Computer Architecture Letters,vol. 2, May 2003.
[38] Henry Kautz, Bart Selman, and Mehul Shah, “ReferralWeb:Combining the social networks and collaborative filtering,”Communications of the ACM, vol. 40, no. 3, pp. 63–65, 1997.
[39] Yasushi Saito, Christos Karamanolis, Magnus Karlsson, andMallik Mahalingam, “Taming aggressive replication in thePangaea wide-area file system,” inOSDI, 2002.
[40] Kavitha Ranganathan, Adriana Iamnitchi, and Ian Foster, “Im-proving data availability through dynamic model-driven replica-tion in large peer-to-peer communities,” inGlobal and Peer-to-Peer Computing on Large Scale Distributed Systems Workshop.2002.
[41] Adriana Iamnitchi, Matei Ripeanu, and Ian Foster, “Locat-ing data in (small-world?) peer-to-peer scientific collabora-tions,” in 1st International Workshop on Peer-to-Peer Systems(IPTPS’02). 2002, LNCS Hot Topics series, Springer-Verlag.
[42] Adriana Iamnitchi and Ian Foster, “FLASK: A file-locationalgorithm for small-world communities,”Unpublished.