size selective spectroscopy of se microclusters
TRANSCRIPT

THE JOURNAL OF CHEMICAL PHYSICS 137, 044304 (2012)
Size selective spectroscopy of Se microclustersK. Kooser,1,a) D. T. Ha,1,2 E. Itälä,1,2 J. Laksman,3 S. Urpelainen,4,5 and E. Kukk1,6
1Department of Physics, University of Turku, FIN-20014 Turku, Finland2Graduate School of Materials Research, Turku, Finland3Department of Synchrotron Radiation Research, Lund University, Sölvegatan 14, SE-22362 Lund, Sweden4MAX-lab, Lund University, P.O. Box 118, SE-22100 Lund, Sweden5Department of Physics, University of Oulu, Box 3000, FIN-90014 Oulu, Finland6Turku University Centre for Materials and Surfaces (MatSurf), Turku, Finland
(Received 10 April 2012; accepted 3 July 2012; published online 25 July 2012)
The electronic structure and photofragmentation in outer and inner valence regions of Sen (n ≤ 8)clusters produced by direct vacuum evaporation have been studied with size-selective photoelectron-photoion coincidence technique by using vacuum-ultraviolet synchrotron radiation. The experimen-tal ionization potentials of these clusters were extracted from the partial ion yield measurements. Thecalculations for the possible geometrical structures of the Sen microclusters have been executed. Theionization energies of the clusters have been calculated and compared with the experimental results.In addition, theoretical fragment ion appearance energies were estimated. The dissociation energiesof Sen clusters were derived from the recurrent relation between the gas phase enthalpies of the for-mation of corresponding cationic clusters and experimental ionization energies. © 2012 AmericanInstitute of Physics. [http://dx.doi.org/10.1063/1.4737633]
I. INTRODUCTION
The evolution of the electronic states and properties inmicroclusters (containing less than a few hundred atoms)has drawn great attention due to their fundamental interestin basic research as well as the possibility of constructingnanostructured materials and devices using clusters as build-ing blocks. The basic aim is to gather information about theunique chemical and physical properties of the clusters, whichcompared to the single atoms and solids have intermediate na-ture. One of the central questions in cluster physics is, howthe number of atoms in a specific cluster determines its elec-tronic properties. In spite of the possibility to use differentcluster formation methods (for example, pulsed supersonicexpansion, inert gas condensation, or laser vaporization), thestudy of microclusters is usually limited because of the factthat cluster beams cannot be generated in a single adjustablecluster size.
The chemistry of the chalcogen (such as S, Se, Te) clus-ters is an area of growing relevance because of their useful-ness in the miscellaneous applications. For example, it hasbeen shown that nanostructured selenium is a promising mer-cury sorbent that may be applied in cleanup, disposal, recy-cling and packaging applications,1 and that Se nanoclustershave the potential as a chemopreventive Ti orthopedic mate-rial coating.2 Also, there has been reported that the microbi-ologically formed nanorods composed of elemental telluriumforms unusual nanocomposites when combined with an or-ganic chemical host.3 These bio-nanocomposites are likely toform a new class of nanomaterials for the future nanoelec-tronic and nanophotonic applications. The properties of thesenanomaterials are mainly caused by the ability of chalcogenesto form polyatomic complex chains and rings of a variety of
a)Electronic mail: [email protected].
sizes and shapes. While moving in the periodic table fromsulfur toward tellurium the gradual changes in the structuralpreferences of the different elements appear, which influencethe physical properties of their microclusters.4, 5
Until now the equilibrium geometries, energetics, and vi-brational frequencies of the neutral and cationic Sen (2 ≤ n≤ 8) clusters have been investigated by exploiting differenttheoretical approaches.6–9 The experimental investigation ofthe valence electronic structure of the Se microclusters pro-duced by the adiabatic expansion method and using the N2-flashlamp at energy 10.0 eV (Ref. 10) as well as electron im-pact ionization on Se clusters in the size range from 2 to 36has been performed.11 The photothermodissociation of smallSe cluster ions produced by a gas aggregation source, ionized,and heated up by a pulsed excimer laser have been studied.12
Also photofragmentation study of selenium cluster cationsproduced by combination of laser vaporization and supersonicexpansion13 can be found.
In order to explore the electronic properties of the Sen
(n ≤ 8) microclusters as a function of their size, in thisstudy a mass-selective photoelectron-photoion coincidence(PEPICO) setup has been used.14 The aim of this work is toexplore, accurately, the evolution of the electronic structure ofSe clusters produced by the direct vacuum evaporation tech-nique as a function of the cluster size. We present the resultsof the experimental study of the ionization and fragmentationof Sen clusters after valence photoionization, using the partialion yield (PIY) and PEPICO techniques. For the interpreta-tion of these results, ab initio electronic structure calculationsof the binding and appearance energies of selenium clustersand their fragments are carried out and compared with the ex-perimental outcomes.
The application of PIY technique for the exploration ofneutral clusters over the vacuum ultraviolet (VUV) photon
0021-9606/2012/137(4)/044304/9/$30.00 © 2012 American Institute of Physics137, 044304-1
044304-2 Kooser et al. J. Chem. Phys. 137, 044304 (2012)
energy range yields valuable information for the accurate de-termination of adiabatic ionization energies and ion appear-ance energies.15 The data recorded by using PEPICO tech-nique and extracted to the form of coincidence ion yields(CIYs) represent the intensities of ionized clusters as a func-tion of the coincident electron’s binding energy.16 The curvesof CIYs enable to unravel in detail the valence electronicstructure of the ionized clusters. The CIYs may also con-tain the complex signal of the fragmented cluster ions orig-inated from bigger clusters. The integration of the theoreticalCIY spectrum, assuming constant photoionization cross sec-tion and absence of dissociation channels, generates a corre-sponding PIY curve. Here the advantages of PIY techniquesuch as a shorter recording time and an excellent energy reso-lution for determination of ion appearance energies have beenused. PEPICO method was employed for the examination ofthe electronic structure of ionized clusters and for studying ofpossible fragmentation channels.
II. EXPERIMENT
The measurements were performed at the FinEst branch-line at the normal incidence monochromator beamline I3 ofMAX-III synchrotron storage ring (Lund, Sweden).17, 18 Inthis work the experimental PEPICO setup19 consisting of amodified Scienta SES-100 electron analyser20 and a home-made Wiley-McLaren type ion time-of-flight (TOF) detectorwas used.
Briefly, the original CCD-camera-based detection systemof the electron spectrometer was replaced by a resistive an-ode detector (Quantar) in order to achieve fast single electronposition-sensitive response signal in a nanosecond scale. Theion TOF spectrometer is equipped with a 77 mm active areaHamamatsu microchannel plate detector followed by 10 con-centric anode rings to enable the registration of the longitu-dinal and radial time-of-flight components of the ions rela-tive to the symmetry axis of the ion spectrometer tube. Theion detection electronics is based on a 1 GHz waveform digi-tizer card (Signatec PDA 1000). The PEPICO measurementswere performed in a pulsed field mode, where the detection ofthe electron by the electron analyzer triggers the clock for theTOF of the ions (true coincidences), within a certain time win-dow. However, the ion TOF spectrometer detects also the frag-ments (false coincidences or noncoincidences) which are notcreated from the molecule that initially ejected the detectedphotoelectron. For the extraction of the coincidence and non-coincidence events, the experimental setup contains also anadditional pulse generator which provides artificial extractionpulses at a constant frequency. During the PEPICO experi-ment both – the electron and artificially triggered events, andthe coincidence and noncoincidence data maps, respectively,were recorded. Finally, a custom made IGOR PRO softwarebased data analysis macros were used to subtract the false co-incidence background from the initial coincidence map andretrieve the real coincidence data pattern.
The PEPICO system was operated in the pulsed extrac-tion field mode and in the present experiment the extractionpulse voltage was ±300 V across the sample region, with thedrift tube held at −1680 V. The entrance slit of the electron
spectrometer was 1.6 mm and the pass energy was 50 eV,which gives a resolution of 0.4 eV. The base pressure in theend-station chamber was less than 5 × 10⁻⁷ mbar. Duringthe experiment the chamber pressure was maintained below2 × 10−6 mbar.
In order to retrieve the PIYs the time-of-flight massspectra were collected at the photon energies in the rangeof 7.0–10.0 eV with an energy step of 0.05 eV. In eachtime-of-flight mass spectrum 100 000 triggers (or events) wasrecorded. The PIYs were obtained by selecting the time-of-flight window of an ion peak from the dataset of time-of-flightmass spectra and by integrating the ion counts at each photonenergy. The photon flux used for spectra normalization wasmeasured by a photodiode. A LiF crystal was used to blockthe higher harmonics of the undulator radiation. The absorp-tion spectrum of Ar gas was used for the photon energy cali-bration of the PIY spectra.
The Se sample was purchased from Sigma-Aldrich withthe purity greater than 99.99% and evaporated into the in-teraction area of the spectrometers from a boron nitride cru-cible of effusion cell with integrated cooling shroud (MBEKomponenten NTEZ-40) at the temperature around 240 ◦C.
III. RESULTS
A. Partial ion yields of Se microclusters
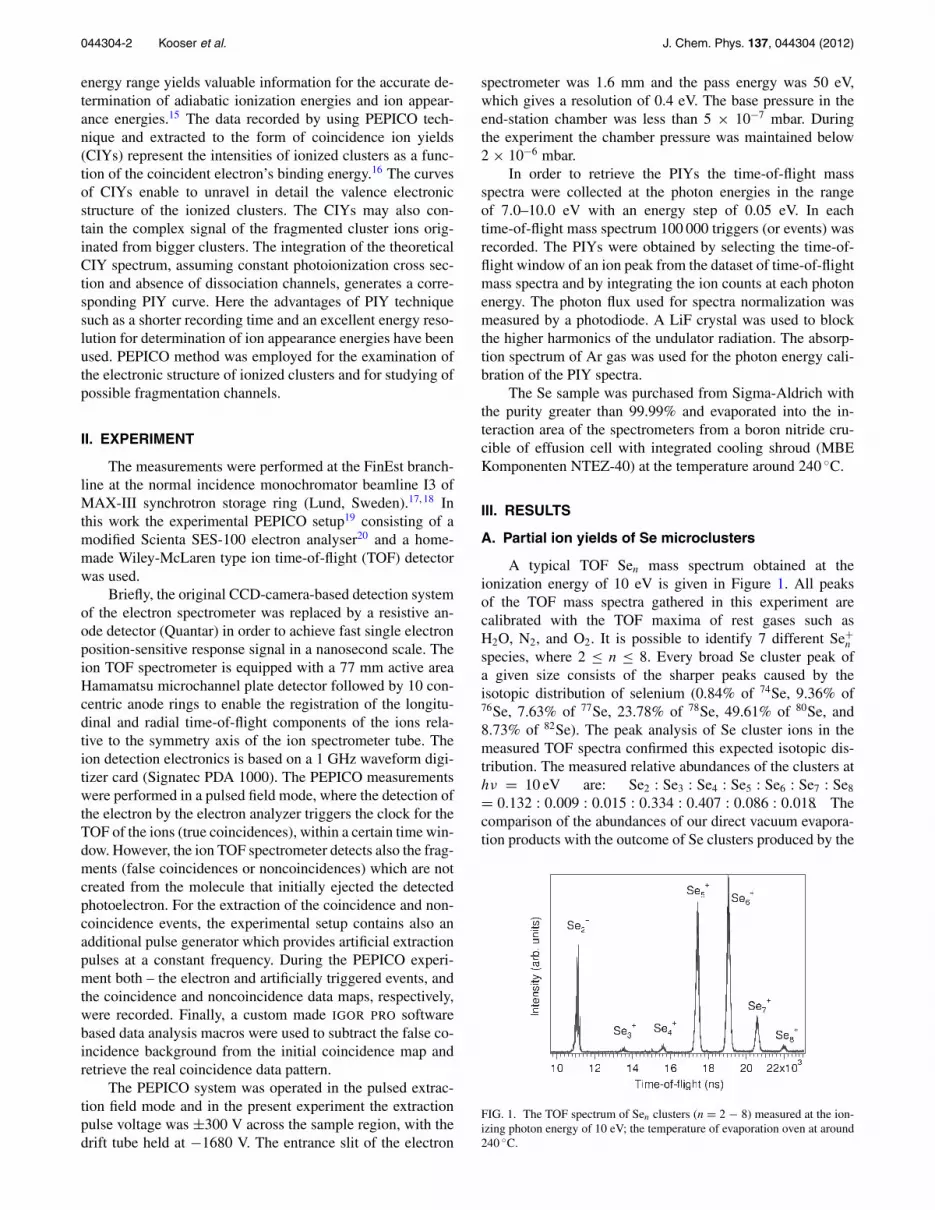
A typical TOF Sen mass spectrum obtained at theionization energy of 10 eV is given in Figure 1. All peaksof the TOF mass spectra gathered in this experiment arecalibrated with the TOF maxima of rest gases such asH2O, N2, and O2. It is possible to identify 7 different Se+
n
species, where 2 ≤ n ≤ 8. Every broad Se cluster peak ofa given size consists of the sharper peaks caused by theisotopic distribution of selenium (0.84% of 74Se, 9.36% of76Se, 7.63% of 77Se, 23.78% of 78Se, 49.61% of 80Se, and8.73% of 82Se). The peak analysis of Se cluster ions in themeasured TOF spectra confirmed this expected isotopic dis-tribution. The measured relative abundances of the clusters athν = 10 eV are: Se2 : Se3 : Se4 : Se5 : Se6 : Se7 : Se8
= 0.132 : 0.009 : 0.015 : 0.334 : 0.407 : 0.086 : 0.018. Thecomparison of the abundances of our direct vacuum evapora-tion products with the outcome of Se clusters produced by the
FIG. 1. The TOF spectrum of Sen clusters (n = 2 − 8) measured at the ion-izing photon energy of 10 eV; the temperature of evaporation oven at around240 ◦C.

044304-3 Kooser et al. J. Chem. Phys. 137, 044304 (2012)
FIG. 2. The PIY spectra of Sen clusters (n = 2 − 8) measured at the valenceregion threshold. The vertical red lines represent the positions of ionizationenergies together with numerical values.
supersonic molecular beam technique10 at the same excitationenergy shows some clear differences in the composition ofthe selenium vapor. The intensity of the ion TOF peakscorresponding to the Se2 clusters is much higher in thecase of direct vacuum evaporation and has almost the samemagnitude as for the clusters Se5, Se6. The abundancies ofthe Se3, Se4 clusters have not been detected in the supersonicmolecular beam evaporation process (at hν = 10 eV). In thedirect vacuum evaporation process the intensities of Se5,Se6 cluster peaks are the strongest and the intensity of the
TOF peak corresponding to the Se7 clusters is much weaker.The Se5 clusters are most abundant also if the supersonicmolecular beam technique is used, but the intensity of Se6
cluster peak was suppressed to the same level as for Se7. Theestimation of the signal ratio Se+
2 /Se+8 for direct evaporation
experiment and for supersonic molecular beam techniquegives approximate values 7 and 2, respectively.
The partial ion yields of Sen clusters measured in the pho-ton energy range from 7.5 eV to 10 are shown in Figure 2. Dueto the high efficiency of the TOF mass spectrometer, it waspossible to extract PIY curves for the main cluster specieswith a very good signal-to-noise ratio and to detect the lessabundant clusters. In order to provide a complete set of infor-mation from the photoionization efficiency curves of Se clus-ters produced by direct vacuum evaporation, the backgroundsignal of lighter mass-fragments is subtracted from each PIYof the Sen cluster (n = 1 − 8).
In the photon energy range up to 10 eV a signal from allSe clusters Se1−8 was detected. A strong signal from the clus-ter ions Se2, Se5, Se6, Se7 has been detected, whereas thePIYs of Se3, Se4 and Se8 clusters have much weaker signalon an absolute scale and the weakest Se1 signal (not given inFigure 2) is detectable only above 9.75 eV. The onsets andshapes of PIYs show strong dependence on the size and par-ity of cluster. Using a linear extrapolation method, the ion ap-pearance energies (AE) for all Se1−8 clusters have been de-termined. The comparison of the obtained AE values with theearlier studies of Se clusters is given in Table I. Note that theAEs of the ions are equivalent to adiabatic cluster ionizationenergies only if the ions are not produced by fragmentation. InRefs. 10 and 11, the term ionization potential, what is a syn-onym to the adiabatic ionization energy, has been used.
The given values of AEs from different experiments varyslightly depending on the growth method of the clusters. Inother words, it cannot be excluded that the size distributionof the small Se clusters in the vapor is strongly affectedby the initial evaporation and nucleation conditions. Further-more, the values of the ionization energies as indicators of thestructural (or geometrical) properties of the clusters given inTable I may indicate the presence of different isomeric dis-tribution due to the experimental thermodynamic conditions.The geometry and conditions for creation and appearance ofSe trimers and tetramers are probably the most affected bythese circumstances in various experiments.
TABLE I. Appearance energies of Sen (n = 1–8) clusters or fragments in electronvolts from differentexperiments.
This work From Ref. 10 From Ref. 11(VUV photon impact) (VUV photon impact) (electron impact)
n Direct evaporation method Supersonic expansion method Supersonic expansion method
1 9.75 ± 0.05 . . . . . .2 8.84 ± 0.05 8.7 ± 0.2 8.3 ± 0.33 9.58 ± 0.05 . . . 9.2 ± 0.34 9.14 ± 0.05 . . . 9.1 ± 0.35 7.93 ± 0.05 7.6 ± 0.2 8.3 ± 0.36 8.24 ± 0.05 7.9 ± 0.2 8.4 ± 0.37 7.94 ± 0.05 7.6 ± 0.2 8.2 ± 0.38 8.11 ± 0.05 7.8 ± 0.2 8.4 ± 0.3

044304-4 Kooser et al. J. Chem. Phys. 137, 044304 (2012)
FIG. 3. PEPICO maps of selenium clusters recorded in coincidence with Sevalence photoionization
B. Photoelectron-photoion coincidence patternof valence region of the Se microclusters
In Figure 3 the PEPICO maps of Sen cluster ionsin coincidence with Se valence photoelectrons are repre-sented. The values of the vertical axis of the plot corre-spond to the coincident ionized cluster time-of-flight andthe horizontal scale represents the characteristic energy ofcoincidence electrons. Ion counts are represented in thegrayscale. Here a binding energy scale is used, correspond-ing one-to-one to the experimentally measured kinetic en-ergy of electrons. The patterns have been recorded sep-arately in two adjacent kinetic energy windows (Ecenter
= 10.2 eV and 13.5 eV (or �Ecenter = 3.3 eV)) of the elec-tron spectrometer at the pass energy of 50 eV.
The ionizing photon energy equal to 22 eV, below thedouble ionization threshold of Se (Ref. 21) was chosen.
The coincidence signals from all eight selenium clusters(from Se1 up to Se8) were detected. Here the pattern of Se+
8 isleft out from Figure 3 due to a very low intensity and blurredtrace, though an evidence for the presence of Se8 clusters isgiven in Sec. III A by results of photoionization efficiencycurves (see the lowest left panel in Figure 2). The examinationof both PEPICO maps indicates a strong variance of coinci-dence pattern depending on the size of the cluster. The map ofthe upper valence region (the right one in Figure 3) containsintense signals from the clusters Se+
2 , Se+5 , Se+
6 , and Se+7 , the
intensities from Se+3 and Se+
4 are much weaker in this bindingenergy range. As the binding energy of coincident electronsincreases (the left map in Figure 3), the signal from the ionsof trimers and tetramers increases remarkably and at around12.5 eV also the first detectable signal of Se+
1 ion appears. Theintensities of Se+
7 , Se+6 ions drop to zero above 10.5 eV in the
binding energy scale and only a weak tail of signal from Se+5
ions remains. Only the coincidence signal from Se+2 ions is
present in the whole detected binding energy range. The ap-pearance of the coincidence patterns of Se+
1 , Se+2 , Se+
3 , andSe+
4 cations in a higher binding energy range suggests thefragmentation of larger clusters such as Se8, Se7, Se6, and Se5,as discussed in Sec. IV.
FIG. 4. The CIY spectra of Sen clusters (n = 2–7) measured at photon en-ergy 22 eV. The experimental data (black dots) are represented together withsmoothed guide (solid) lines. The long horizontal bars present the total en-ergy levels of isomers and every tiny vertical bar on a long bar stands fora molecular orbital (MO) energy level of corresponding cluster isomer. Thecalculation results of restricted open-shell Hartree-Fock theory (grey bars)are depicted below the corresponding CIY curve and the results of the unre-stricted Hartree-Fock with second-order Møeller-Plesset method (black bars)are given above the CIY spectrum. The maximum of counts (or coincidenceevents) 890 for Se2, 430 for Se3, 480 for Se4, 520 for Se5, 430 for Se6 and110 for Se7 have been detected.
The data of the PEPICO maps in Figure 3 were also ex-tracted to the form of CIYs, representing the cluster intensi-ties as a function of the coincident electron’s binding energy.In Figure 4 the CIYs of the Se+
n (n = 2–7) clusters are shown,corresponding to the photoionization at 22 eV.
The spectrum of ionized Se2 dimer (bottom left panel ofFigure 4) has three strong peaks at binding energies 9.0 eV,10.7 eV, and 12.5 eV. The last two maxima have shoulders atenergies 11.3 eV and 13.1 eV. The valence molecular orbitalconfiguration of Se2 can be represented, in the ground state,by
. . . (σg4s)2 (σu4s)2 (σg4p)2 (πu4p)4 (πg4p)2. (1)
The first band at 9.0 eV may be identified as ionizationfrom the outermost (πg4p)2 orbital, leaving the ion in theX2�g state, which has spin-orbit split components 2�g, 1/2

044304-5 Kooser et al. J. Chem. Phys. 137, 044304 (2012)
and 2�g, 3/2 identified by Streets et al.22 at the binding en-ergies 8.89 eV and 9.13 eV (they are not resolvable in thisstudy due to the lower resolution of the electron spectrom-eter). Similarly, according to the same Ref. 22, the next struc-ture between 10 eV and 12 eV corresponds to the ionizationof an electron from the second highest orbital (πu4p) and theresolvable peaks at 10.7 eV and 11.3 eV may be interpretedas the a4�u and A2�u states, respectively. Additionally, theresults of photoelectron spectroscopy of Se2 dimer by Streetset al.22 show sharp peaks at 12.27 eV, 13.31 eV, and 14.00 eV,assigned to the 4�−
g , 2�−g , and 2�(3)
u states. The CIY of Se2
cations of the present study contains only one clear peak at12.5 eV with a shoulder at 13.1 eV. However, this huge peakis remarkably stronger than the structures at lower binding en-ergies. Additionally, there are detected strong TOF peaks ofSe+
5 , Se+6 , and Se+
7 clusters (see Figure 1). These differencesin the CIY spectrum are indicators for a strong contributionfrom Se+
2 fragments, created by the dissociation of the largerSe clusters, in a binding energy range from 12 to 14 eV.
The CIY of ionized Se3 trimer has a very low intensitybelow 10.2 eV and a broad band extending up to 14 eV inbinding energy scale. The band contains two maxima at about11.4 eV and 12.8 eV. The intensity of Se4 tetramer ions is alsolow below 10.2 eV and has a weak visible maximum at around9.1 eV. The CIY of Se+
4 shows a strong peak at 11.1 eV andmore than two times weaker maximum at 12.3 eV.
Let us consider the CIYs of Se+5 , Se+
6 , and Se+7 jointly.
The CIY curve of Se+5 has the first peak at 8.1 eV and the
second at 9.5 eV with a shoulder located at 8.8 eV. The in-tensity of the yield is remarkably lower above 10 eV, but hasstill two peaks at 10.4 eV and 11.1 eV. The comparison of theCIY of the Se+
5 with the result of Becker et al.10 shows en-ergetically small but visible differences. The first peak of thecoincidence photoelectron spectrum of the Se5 cluster in Ref.10 is located 0.2–0.3 eV towards lower binding energy com-pared to the present study. Also the middle peak at 8.9 eV ismore clearly separated and the highest third maximum is at9.6 eV. The present coincidence study of the electronic struc-ture of the Se6 cluster shows that it can be characterized bydouble peak shape with maxima at 8.6 eV and 9.1 eV, but inRef. 10 one single asymmetric broadband structure was re-ported, in binding energy range between 8 and 10 eV. Theyield of Se+
7 resembles to the abundance distribution of theSe6 clusters, but the higher peak is shifted to 8.7 eV and thelower is detectable at 8.1 eV.
The variances in the spectra of the Se+5−7 clusters com-
pared with the earlier coincidence study10 may be caused bythe substantial influence of changes in thermodynamic condi-tions to the formation of isomeric distribution of microclus-ters. A possible explanation for the discrepancies with Ref.10 can be found in the isomeric distribution of the clustersin the vapor. As the thermodynamic conditions of the clus-ter formation vary, they can produce clusters of the same sizebut with very different abundancies of isomers. As demon-strated by the horizontal bars in Figure 4, different isomers of,e.g., Se5 and Se6 have drastically different energy level struc-tures and even relatively small changes in isotopic abundancesshould be immediately reflected in the valence photoelectronspectra.
IV. DISCUSSION
A. Correlation between the ionization, dissociationenergies, and gas phase enthalpies of the formationof the Se clusters.
The fragmentation of different sizes of clusters can bestudied by PIY measurements, following ion production asa function of the ionizing photon energy or by PEPICOtechnique extracting information from CIY curves. The PIYcurves in VUV energy range enable an accurate determina-tion of adiabatic ionization energies depending on the clustersize. The adiabatic ionization energy IE(M) of a cluster M isconnected to the enthalpy of the formation (or heat of forma-tion) of an ion in the gas phase �fH(M+). Its value can beobtained through a simple treatment of the thermochemistryof the ionization process.23 The corresponding relation maybe formulated as
�f H (M+) = �f Ho(M) + IE(M), (2)
where �fHo(M) is the enthalpy of the formation of a neutralcluster (or molecule). Similarly, the enthalpy of formation ofa positive fragment cluster ion, A+, from precursor cluster AB,is given by
�f H (A+) = �f Ho(AB) − �f Ho(B) + AE(A+),(3)
where the appearance energy AE(A+) of fragment is equal tothe sum of dissociation energy, D+(AB), and the ionizationenergy of the precursor cluster,
AE(A+) = IE(AB) + D+(AB). (4)
Here, it is assumed that there is no potential barrier in thereaction coordinate for the processes.
Now let us consider the following ionization and disso-ciation reactions of selenium clusters Sen and Sen−p, where n> p:
Sen + hν → Se+n + e−, (5)
Sen−p + hν → Se+n−p + e−, (6)
Se+n → Se+
n−p + Sep, (7)
Sen → Sen−p + Sep. (8)
Corresponding equations connecting the spectroscopicand thermodynamic characteristics are, respectively,
�f H (Se+n ) = �f Ho(Sen) + IE(Sen), (9)
�f H (Se+n−p) = �f Ho(Sen−p) + IE(Sen−p), (10)
�f H (Se+n−p) = �f Ho(Se+
n ) − �f Ho(Sep) + D+n,p,
(11)
�f H (Sen−p) = �f Ho(Sen) − �f Ho(Sep) + Dn,p.
(12)

044304-6 Kooser et al. J. Chem. Phys. 137, 044304 (2012)
TABLE II. Calculated neutral Dn,p and ion D+n,p dissociation energies of Sen clusters at T = 513K (ion dissociation energies given in brackets). Here the letter
p denotes a number of atoms in a neutral fragment. The calculated enthalpies of formation of different clusters (based on the standard enthalpies from Ref. 25)and measured experimental ionization energies are given in the second and third column, respectively. Here the values of IEs are equalized with AEs that aregiven in Table I.
Dn, p (D+n,p)
n f Ho(Sen) IE(Sen) p = 1 p = 2 p = 3 p = 4 p = 5 p = 6 p = 7
1 2.47 9.752 1.43 8.84 3.52
(4.43)3 1.97 9.58 1.94 1.94
(1.20) (2.11)4 1.87 9.14 2.58 1.00 2.58
(3.02) (0.70) (3.19)5 1.73 7.93 2.61 1.67 1.67 2.61
(3.82) (3.32) (2.58) (4.43)6 1.70 8.24 2.51 1.60 2.24 1.60 2.51
(2.19) (2.50) (3.58) (2.20) (4.02)7 1.90 7.94 2.27 1.26 1.94 1.94 1.26 2.27
(2.57) (1.25) (3.13) (3.57) (2.16) (4.08)8 2.02 8.11 2.35 1.11 1.68 1.71 1.68 1.11 2.35
(2.19) (1.24) (1.50) (2.75) (3.15) (1.84) (4.00)
Now, combining Eqs. (9)–(12), one leads to the relation
D+n,p = Dn,p + IE(Sen−p) − IE(Sen), (13)
what gives the dissociation energy of a Se+n cluster connected
to the fragmentation energy of the corresponding neutral Sen
cluster plus the difference of ionization energies of the frag-ment and precursor cluster. The neutral dissociation energyDn,p, corresponding to the reaction (8), may be estimated bycombining enthalpies of the formation of neutral precursorand fragment clusters.24 In order to evaluate an increase inthe enthalpy with temperature, the corresponding dependenceof the heat capacities of the clusters need to be taken intoaccount.25
However, before going further it should be noted thatthe preferential fragmentation pathways are, instead of theenthalpy change of the system, governed by the free energychange which takes into account the possible existence of dif-ferent isomers of the fragments at finite temperature. An in-creasing role of the entropy contribution to the free energy ofclusters, as the most rapidly rising function of the cluster sizehas been shown in Ref. 26. For comparison, the investigationof thermal effects on the equilibrium geometric structure andsize distribution of Si4, Si5, Si6 clusters neither find any ther-mally induced stabilization of metastable cluster geometries,nor any large changes in the entropy with changing clusterwhich would change the abundances.27 According to ab initomolecular dynamics studies of the selected microclusters ofNa, Si, and Mg at finite temperatures the residence time inone specific isomer as well its temperature range of “rigid-ity” depend strongly on the size of the cluster. Additionally,the changes in the vibrational spectra are far more influencedby the structural than electronic properties (especially for Naclusters).28 From the study of the photothermodissociation ofSe clusters has been obtained that the entropy contribution af-fects the dissociation energy values less than ±0.1 eV, but it
is essential to consider the entropy to ensure the consistencywithin the dissociation rates.12 Taking into account the above-mentioned circumstances, the interpretation of CIYs of Seclusters are constrained only in view of the enthalpy changein the present study. The calculated dissociation energies forSe1−8 clusters are presented in Table II. In these calculationsit is assumed that the onsets of PIY curves do not contain ionsignals from fragmentation products and the values of ioniza-tion energies are equalized with appearance energies that aregiven in Table I.
These calculated dissociation energies can now be used topredict the preferential dissociation pathways of VUV-ionizedSen clusters. The analysis of Table II indicates that for ionsSe+
3 , Se+4 , and Se+
5 the lowest dissociation energy value be-longs to the fragmentation channel that produces Se+
2 dimers.For Se+
6 cation, there are two energetically almost equal disso-ciation paths: Se+
2 + Se4 and Se+5 + Se1. However, for larger
cluster ions Se+7 and Se+
8 , the lowest energy dissociation path-way is again the one that produces Se2 neutral dimers. ForSe+
7 , the channel Se+7 → Se+
5 + Se2 requires about 0.9 eVless energy than the next pathway, Se+
7 → Se+2 + Se5. These
trends in fragmentation channels may be directly related tothe fact that the charge is preferably located at the fragment,which has lower ionization energy. However, the most stableclusters are Se2 and Se+
2 . The last result is confirmed also bythe earlier experimental study of Se cluster cations producedby the combination of laser vaporization and supersonic ex-pansion techniques.13 The very low dissociation energy val-ues for the creation of Se+
2 fragments from ionized clustersSe+
3 and Se+4 are an indication of high structural instability
of Se trimers and tetramers, compared with other Se clusterscreated in direct evaporation process. The very low intensityof the CIY curves of Se trimers and tetramers below 10 eV, inbinding energy scale, is thus in very good agreement with ourpredictions based on the thermochemical treatment.

044304-7 Kooser et al. J. Chem. Phys. 137, 044304 (2012)
B. Ab initio calculations of molecular orbitalsand fragmentation pathways of Sen microclusters
The different conformations of Sen clusters formed inthe direct evaporation process cannot be resolved by the usedtechnique, but quantum chemistry modeling offers a glimpseinto the geometries of Sen clusters. More essentially, the elec-tronic properties of modeled clusters provide useful infor-mation for interpreting the experimental data. The ab initiocalculations in this work were performed under the frame-work of restricted open-shell Hartree-Fock29 (ROHF) and un-restricted Hartree-Fock with second-order Møeller-Plesset30
(UMP2) theory with the help of GAMESS (Ref. 31) (TheGeneral Atomic and Molecular Electronic Structure System)software. The spin contamination in UMP2 calculations isless than 3% and zero-point energies were taken into accountin calculating theoretical appearance energies. Theoretical ap-pearance energies were estimated by subtracting the lowesttotal energy of the neutral parent cluster from the sum of totalenergies of its isolated fragment clusters.
In order to find an extensive conformation number of theSen=2–7 clusters, great numbers of grid points on 3n − 6 (n> 2) dimensional potential surfaces (as functions of inter-nuclear positions) of the Sen clusters were set as initial ge-ometries for optimization. A compact code written in C++programming language was used for generating grid points,where angle parameters in z-matrices of the initial geometrieswere set to vary with 30◦ steps. The located conformations ata light basis set were re-optimized with higher basis sets 6-31 and 6-31(df) using the ROHF and UMP2 theories, respec-tively. Molecular orbital energies of the geometry optimizedSe clusters were used to qualitatively determine their bindingenergies (BEs). The MO energies of different conformationsof Sen=2–6 clusters are presented together with the seleniumCIY spectra in Figure 4. The horizontal bars in Figure 4 coverthe calculated MO energy ranges of various conformations,starting upwards with the lowest total energy isomers. Everyvertical tick marks a MO energy of the isomer.
Se2: Consider first the Se+2 CIY spectrum in Figure 4. The
bottom left of Figure 4 displays the Se+2 CIY spectrum com-
bined with theoretical BEs calculated using the 6-31/ROHFtheory (grey bars) and the 6-31(df)/UMP2 theory (black bars).The calculated BEs agree well with the Se+
2 CIY spectrum,and a comparison between the BEs of the different methodsshows no essential differences in the qualitative features. Thevalence/outer shell MO energy distributions provided by thedifferent methods are slightly varied, but they both match wellwith the peaks of Se+
2 CIY spectrum. In fact, (see the otherspectra in Figure 4) further contrasting the MO energies ofheavier Se clusters calculated by using the two different meth-ods demonstrates the concord of the results of both methodswith the CIY spectra. Thus, the results provided by the ROHFtheory at the 6-31 basis level are adequate for interpretingthe photoelectron spectra with the given energy resolution ofthe measurements. Besides, due to the technical limitation ofused computational resources all conformations of the sele-nium clusters, which are found by using the ROHF theory at6-31 basis set, cannot be searched by using the more accuratemethod. The following discussion will focus on the calcula-tion results provided by the ROHF method.
FIG. 5. The different conformations of Se4 and Se5 clusters modelled byusing the restricted open-shell Hartree-Fock theory with the split-valence 6-31 basis set with the help of GAMESS and MACMOLPLT softwares. The totalenergy of cluster isomers increases from left to right. The labels mark a sym-metry of isomers.
Se3: In the right bottom panel of Figure 4 calculation re-sults for two conformers of Se3 are given. The lower one ofthe ROHF results is for an equilateral triangle (D3h) and theupper one (with 0.7 eV higher total energy) corresponds tothe open triangle geometry (C2v). The total energy order ofthe two conformations is opposite under the framework of 6-31(df)/UMP2, but the total energy difference is only 0.01 eV.As mentioned in Sec. IV A, Se3 and Se4 clusters are hardly atall formed, at least in the production by direct vacuum evap-oration conditions. Taking into account the energy positionsof the highest occupied molecular orbitals (HOMO) for bothSe3 isomers that are clearly and quite far below the onset ofstrong TOF signal above 10.2 eV, it may be concluded thatneutral Se3 still exists in initial cluster’s beam. However, in aspectrum of Se+
3 one can see great intensities above 10.2 eV.This high CIY signal may be interpreted (see also Table II)as a result of ejected photoelectrons from dissociating biggerclusters, such as Se5, Se6, and Se7 clusters. In other words,the spectrum shows photoelectrons in coincidence with Se+
3cationic fragments, not with parent Se+
3 clusters.Se4: A similar feature, the late gain of CIY intensity, can
also be seen in the spectrum of Se4 ions. In the case of Setetramer four different isomer’s geometries have been calcu-lated (see Figure 5). These four isomers from left to right inthe upper panel of Figure 5 and in increasing sequence of to-tal energy have D2d, Cs, C2v , C2h symmetries separated by0.95 eV, 0.24 eV, and 0.27 eV, respectively.
Se5−7: In the right middle panel of Figure 4 the MOs forsix distinct conformation of Se5 clusters are depicted. Accord-ing to the calculations, the first peak at the binding energy of8.0 eV in the spectrum corresponds solely to the HOMO en-ergy of Se5 cluster with geometry symmetry Cs (see also thelower panel of Figure 5). Intensities in the region with greaterbinding energy are mostly the sum of intensities of the pho-toelectrons departed from various MOs of different Se5 con-formations (see Figure 5). These six isomers from bottom totop in increasing sequence of total energy have separated by1.71 eV, 0.03 eV, 0.92 eV, 0.08 eV, and 0.54 eV, respectively.
A peak and its shoulder in CIY spectrum in left toppanel of Figure 4 sit well on the calculated BEs of valenceMOs of Se6 clusters. It is noteworthy that photoelectron in-tensities drop to the background signal level at the bindingenergy of 10.0 eV. However, the calculations of MO levelsfor nine different conformation of Se6 show high numberof orbitals above 10 eV. In other words, very low signal of

044304-8 Kooser et al. J. Chem. Phys. 137, 044304 (2012)
TABLE III. Photodissociation pathways for Sen clusters of different size(n = 3–7) given together with corresponding ab initio calculated appearanceenergies using the ROHF and UMP2 theories, AE1 and AE2. The last col-umn contains values of appearance energy, AE3, that are derived using Eqs.(4) and (13).
Fragments Parent cluster AE1 (eV) AE2 (eV) AE3 (eV)
Se, Se+2 Se3 10.77 11.91 10.8
Se+, Se2 Se3 11.73 13.99 11.7Se+, Se, Se Se3 14.73 19.84 . . .
Se+2 , Se2 Se4 9.87 9.42 9.8
Se, Se+3 Se4 10.64 11.73 12.2
Se+, Se3 Se4 11.38 13.17 12.3Se, Se, Se+
2 Se4 12.88 15.27 . . .Se+, Se, Se2 Se4 13.83 17.35 . . .
Se+2 , Se3 Se5 10.32 9.86 10.5
Se2, Se+3 Se5 10.54 10.50 11.2
Se, Se+4 Se5 11.15 11.94 11.8
Se+, Se4 Se5 12.18 14.43 12.4Se, Se, Se+
3 Se5 13.55 16.35 . . .Se+, Se, Se3 Se5 14.28 17.79 . . .Se, Se, Se, Se+
2 Se5 15.78 19.9 . . .Se+, Se, Se, Se2 Se5 16.74 21.97 . . .
Se+3 , Se3 Se6 10.66 . . . 11.8
Se2, Se+4 Se6 10.72 . . . 10.7
Se, Se+5 Se6 10.77 . . . 10.4
Se+2 , Se4 Se6 10.79 . . . 10.4
Se+, Se5 Se6 11.85 . . . 12.3Se+
2 , Se2, Se2 Se6 12.35 . . . . . .Se, Se+
2 , Se3 Se6 12.90 . . . . . .Se, Se2, Se+
3 Se6 13.12 . . . . . .Se, Se, Se+
4 Se6 13.73 . . . . . .Se+, Se2, Se3 Se6 13.85 . . . . . .Se+, Se, Se4 Se6 14.75 . . . . . .Se, Se, Se, Se+
3 Se6 16.12 . . . . . .Se+, Se, Se2, Se2 Se6 16.31 . . . . . .Se+, Se, Se, Se3 Se6 16.86 . . . . . .
Se+5 , Se2 Se7 9.93 . . . 9.2
Se+2 , Se5 Se7 10.05 . . . 10.1
Se+4 , Se3 Se7 10.43 . . . 11.1
Se+3 , Se4 Se7 10.72 . . . 11.5
Se+6 , Se Se7 10.72 . . . 10.5
Se+, Se6 Se7 11.43 . . . 12.0
photoelectrons, detected in coincidence with Se6 clustercations above binding energy equal to 10 eV, suggests that theSe6 clusters would dissociate before the detection of the coin-cidence signal of Se+
6 ions in this binding energy range. If welook at the spectrum of Se7 clusters in the right top panel ofFigure 4, a similar feature as in the context of Se6 clusters canbe observed – rather weak photoelectron intensities are seenafter binding energy higher than 9.5 eV. The same conclusioncan be drawn as in the case of Se6 clusters.
In Table III photofragmentation pathways for clustersSe3–7 together with ab initio calculated appearance en-ergy values (AE1 and AE2) are given. The last column ofTable III contains also, for comparison, the values of appear-ance energies (AE3), what are derived from Eqs. (4) and (13).The calculated AE1 values correspond to the conformationswith the lowest total energy, respectively. In the case of clus-
ters Se3, Se4, and Se5 the values of AE1 and AE3 match verywell. For Se6 and Se7, a comparison of the values of AE1 andAE3 shows already some discrepancies in energy sequence.These differences can be explained by the increased num-ber of possible isomers participating in different dissociationchannels. Hence, the appearance energy of one definite dis-sociation pathway is not determined by the isomer with thelowest total ground state energy, but is affected by distribu-tion of different conformations at fixed temperature.
Now, using the values of AE3 for the clusters Se6 andSe7 in Table III and the dissociation energies of Se8 inTable II, it is possible to give more detailed interpretation ofCIYs in Figure 4. The peaks of clusters Se+
6 and Se+7 below
the 10 eV of binding energy are caused by ionization of thecorresponding neutral clusters. The high energy shoulder ofcluster Se6 may also contain weak fragment signal from dis-sociation of a cluster Se8, but above the binding energy equalto 9.3 eV. In the case of the CIY of cluster Se+
5 , the maximumat 9.5 eV is clearly above the appearance energy of a fragmentpair Se2, Se+
5 created in dissociation of cluster Se7. The strongmaximum of CIY of Se+
4 cluster at 11.1 eV has substan-tial contribution from fragmentation process Se6 + hν →Se+
4 + Se2 and its energetic location coincides with the AEof Se+
4 and Se3 from dissociating cluster Se7. The intensityof the weaker peak at 12.3 eV can be related to the open-ing of the dissociation pathway Se5 + hν → Se+
4 + Se atbinding energy equal to 11.8 eV. The first maximum of theCIY of Se trimer at 11.4 eV may be related to the dissocia-tion of the clusters Se5, Se8, and Se7. The weak maximum atbinding energy 12.1 eV is 0.3 eV above the AE of fragmen-tation pair (Se3, Se+
3 ) from the cluster Se6. The closest AE tothe second higher maximum at 12.8 eV has the decay chan-nel Se4 + hν → Se+
3 + Se at binding energy 12.2 eV. Thefirst peak at 9.0 eV of the spectrum of the Se dimer can beinterpreted as an ionization of HOMO of initially neutral Sedimer. The next maximum at 10.7 eV is already above the AElevel of all bigger Se clusters in this experiment. The thirdmost intense structure in binding energy range from 12 eV to14 eV contains electron signal, what is caused by the ioniza-tion of higher orbitals of Se2 fragments from different largerSe clusters and multiple dissociation processes.
V. CONCLUSIONS
In this study the valence electronic structure of the Sen
clusters (n ≤ 8), produced by direct vacuum evaporation, hasbeen investigated by using the PEPICO technique togetherwith the PIY detection. The ionization and appearance en-ergies of the clusters have been calculated and comparedwith the experimental results. The dissociation energies ofSen clusters were derived from the recurrent relation betweenthe gas phase enthalpies of the formation of correspondingcationic clusters and experimental ionization energies.
It was shown that PEPICO technique combined withab initio calculations of dissociation (and appearance) ener-gies is a very useful experimental tool for the size-selectiveexploration of the electronic structure of microclusters andtheir fragmentation dynamics. The consistent interpretationfor CIYs of all detected Se clusters based on calculated

044304-9 Kooser et al. J. Chem. Phys. 137, 044304 (2012)
appearance and dissociation energies was given. The coinci-dence signals from eight selenium clusters (from Se1 up toSe8) were detected. The existence of (unstable) neutral Setrimers and tetramers in a direct vacuum evaporation has beendetected. The high intensity structures in the CIYs of clustersSe+
3 and Se+4 are caused by the different fragmentation chan-
nels of larger Se clusters. According to the analysis of thederived dissociation energies of Se+
n clusters, the lowest frag-mentation energy have decay channels that lead to the creationof singly charged Se dimers from clusters Se+
3–6 and neutralSe dimers from bigger clusters Se+
7 , Se+8 . The comparison
of the experimental and theoretical ionization energies andCIY curve for one definite cluster indicates that the experi-mental adiabatic ionization energy is not always determinedby the isomer, which has the lowest total energy. The adia-batic ionization energy is determined, on the contrary, by thenumber of possible isomers and by their abundance at fixedtemperature.
ACKNOWLEDGMENTS
The experimental and theoretical work of this projectwas supported by the Academy of Finland, the Turku Uni-versity Foundation, Nordforsk Infrastructure Network “Ad-vanced spectroscopy using MAX-laboratory in Lund” and theEU “Transnational Access to Research Infrastructures” pro-gramme. The members of the electron spectroscopy group ofthe University of Oulu are acknowledged for their role in de-veloping the PEPICO setup and sharing the equipment. Alsothe help of the staff of MAX-lab is greatly appreciated.
1N. Ralston, Nat. Nanotechnol. 3, 527 (2008).2P. Tran et al., Int. J. Nanomedicine 3, 391 (2008).3K.-S. Liao, Chem. Phys. Lett. 484, 242 (2010).4J. Berkowitz et al., J. Chem. Phys. 48, 4346 (1968).5J. Becker et al., Z. Phys. D 19, 233 (1991).6D. Hohl, R. O. Jones, R. Car, and M. Parrinello, Chem. Phys. Lett. B 139,540 (1987).
7Z. Q. Li, J. Z. Yu, K. Ohno, B. L. Gu, R. Czajka, A. Kasuya, Y. Nishina,and Y. Kawazoe, Phys. Rev. B 52, 1524 (1995).
8S. Kohara, A. Goldbach, N. Koura, M.-L. Saboungi, and L. A. Curtiss,Chem. Phys. Lett. B 287, 282 (1998).
9B. C. Pan, J. G. Han, J. Yang, and S. Yang, Phys. Rev. B 62, 17026 (2000).10J. Becker, K. Rademann, and F. Hensel, Z. Phys. D 19, 229 (1991).11B. Tribollet, A. Benamar, D. Rayane, P. Melinon, and M. Broyer, Z. Phys.
D 26, 352 (1993).12C. Bréchignac, P. Cahuzac, N. Kébaïli, and J. Leygnier, J. Chem. Phys. 112,
10197 (2000).13X. Yang, Y. Hu, S. Yang, and M. M. T. Loy, J. Chem. Phys. 111, 7837
(1999).14Frontiers of Coincidence Experiments, in J. Electron. Spectrosc. Relat. Phe-
nom., edited by K. Ueda (Elsevier, 2004), Vol. 141.15O. Kostko, S. R. Leone, M. A. Duncan, and M. Ahmed, J. Phys. Chem. A
114, 3176 (2010).16K. Rademann, Ber. Bunsenges. Phys. Chem. 93, 653 (1989).17M. Patanen, S. Urpelainen, M. Huttula, R. Sankari, V. Kisand, E. Nõm-
miste, E. Kukk, H. Aksela, and S. Aksela, Phys.Rev. A 80, 013414 (2009).18S. Urpelainen, M. Huttula, T. Balasubramanian, R. Sankari, P. Kovala, E.
Kukk, E. Nõmmiste, S. Aksela, R. Nyholm, and H. Aksela, AIP Conf. Proc.1234, 411 (2009).
19E. Kukk, R. Sankari, M. Huttula, A. Sankari, H. Aksela, and S. Aksela, J.Electron. Spectrosc. Relat. Phenom. 155, 141 (2007).
20M. Huttula, S. Heinäsmäki, H. Aksela, E. Kukk, and S. Aksela, J. Electron.Spectrosc. Relat. Phenom. 156–158, 270 (2007).
21R. S. Freund, R. C. Wetzel, R. J. Shul, and T. R. Hayes, Phys. Rev. A 41,3575 (1990).
22D. G. Streets and J. Berkowitz, J. Electron. Spectrosc. Relat. Phenom. 9,269 (1976).
23S. G. Lias and J. E. Bartmess, “Gas-phase ion thermochemistry,” seehttp://webbook.nist.gov/chemistry/ion/.
24P. W. Atkins and J. C. de Paula, Atkins’ Physical Chemistry (Oxford Uni-versity Press, New York, 2006).
25Å. Olin, B. Noläng, L.-O. Öhman, E. G. Osadchii, and E. Rosén, ChemicalThermodynamics Series Volume 7: Chemical Thermodynamics of Selenium(Elsevier Science, Amsterdam, 2005).
26C. Bréchignac, Ph. Cahuzac, M. de Frutos, N. Kébaïli, and A. Sarfati, Phys.Rev. Lett. 77, 251 (1996).
27D. Tománek, C. Sun, N. Sharma, and L. Wang, Phys. Rev. B 39, 5361(1989).
28U. Röthlisberger and W. Andreoni, Z. Phys. D 20, 243 (1991).29F. W. Bobrowicz and W. A. Goddard, in Modern Theoretical Chemistry,
3rd ed., edited by H. F. Schaefer (Plenum, New York, 1977), Vol. 3,Chap. 4.
30C. M. Aikens, S. P. Webb, R. L. Bell, G. D. Fletcher, M. W. Schmidt, andM. S. Gordon, Theor. Chem. Acc. 110, 233–253 (2003).
31M. W. Schmidt, K. K. Baldridge, J. A. Boatz, S. T. Elbert, M. S. Gordon, J.J. Jensen, S. Koseki, N. Matsunaga, K. A. Nguyen, S. Su, T. L. Windus, M.Dupuis, and J. A. Montgomery, J. Comput. Chem. 14, 1347 (1993). gamess(see http://www.msg.chem.iastate.edu/gamess/).