newly generated t cell receptor microclusters initiate and sustain t cell activation by recruitment...
TRANSCRIPT
Newly generated T cell receptor microclusters initiateand sustain T cell activation by recruitment of Zap70and SLP-76
Tadashi Yokosuka1, Kumiko Sakata-Sogawa2, Wakana Kobayashi1, Michio Hiroshima2, Akiko Hashimoto-Tane1,Makio Tokunaga2–4, Michael L Dustin5 & Takashi Saito1
T cell receptor (TCR) activation and signaling precede immunological synapse formation and are sustained for hours after
initiation. However, the precise physical sites of the initial and sustained TCR signaling are not definitively known. We report
here that T cell activation was initiated and sustained in TCR-containing microclusters generated at the initial contact sites and
the periphery of the mature immunological synapse. Microclusters containing TCRs, the tyrosine kinase Zap70 and the adaptor
molecule SLP-76 were continuously generated at the periphery. TCR microclusters migrated toward the central supramolecular
cluster, whereas Zap70 and SLP-76 dissociated from these microclusters before the microclusters coalesced with the TCR-rich
central supramolecular cluster. Tyrosine phosphorylation and calcium influx were induced as microclusters formed at the initial
contact sites. Inhibition of signaling prevented recruitment of Zap70 into the microclusters. These results indicated that TCR-
rich microclusters initiate and sustain TCR signaling.
Immune responses are triggered by the activation of T cells afterrecognition of a specific antigen, which is mediated by the interactionbetween antigen-presenting cells (APCs), such as dendritic cells, andantigen-specific T cells. Such interactions takes place through theformation of a specific structure at the interface: the ‘immunologicalsynapse’1–3. Within 10–15 min of cell-cell contact, dynamic rearrange-ment occurs, accompanied by protein organization of both cell surfaceand membrane-associated intracellular molecules. Immunologicalsynapse formation is dependent on T cell receptor (TCR)–mediatedsignaling that induces the cellular organization of cytoskeleton andreceptors and has effector functions4,5. For example, TCR stimulationinduces specific segregation of surface molecules: the TCR-CD3 com-plex accumulates at the center of the interface as the central supra-molecular activation cluster (c-SMAC) together with other molecules,such as CD4-CD8, CD2 and CD28, whereas adhesion molecules suchas LFA-1 accumulate in a surrounding area called the peripheralsupramolecular activation cluster (p-SMAC). In addition, large mole-cules such as CD43 and CD45 are excluded from the immunologicalsynapse and instead are located in the distal supramolecular activationcluster (d-SMAC)6–9. From these structural features of the immuno-logical synapse, particularly the accumulation of TCRs in the c-SMAC,it was thought that the c-SMAC mediates the antigen recognition andactivation of T cells, whereas the p-SMAC serves to support celladhesion and maintain the immunological synapse.
However, the initial activation of T cells, including tyrosine phos-phorylation, calcium mobilization and phosphoinositide metabolism,occurs much earlier than immunological synapse formation10–13.Indeed, phosphorylation of the Src tyrosine kinases Lck and Zap70occurs earlier than mature immunological synapse formation10.Analysis of CD2AP-deficient mice has similarly indicated thatT cell activation is induced in the absence of mature immuno-logical synapses14. Furthermore, partial agonist peptides can triggerT cells in the absence of mature immunological synapses11,15. Thus,immunological synapse formation may not be required for initialT cell activation.
In contrast, the signaling pathways induced after TCR stimulationhave been analyzed extensively by biochemical and geneticapproaches. Antigen recognition by TCRs induces the phosphoryla-tion of the immunoreceptor tyrosine-based activation motif ofCD3 molecules, particularly the CD3z chains, by Lck, which leadsto recruitment of Zap70 to the phosphorylated immunoreceptortyrosine-based activation motifs. Zap70 is activated and then phos-phorylates several adaptor molecules, including two critical adaptors,LAT and SLP-76. The membrane adaptor molecule LAT, localized inlipid rafts, recruits SLP-76 through association with the adaptorprotein Gads. Phosphorylated LAT and SLP-76 then recruit many‘downstream’ signaling molecules, leading to the activation ofvarious effector functions.
Received 11 July; accepted 6 October; published online 6 November 2005; doi:10.1038/ni1272
1Laboratory for Cell Signaling and 2Single-Molecule Immunoimaging, RIKEN Center for Allergy and Immunology, Tsurumi-ku, Yokohama, Kanagawa 230-0045, Japan.3Structural Biology Center, National Institute of Genetics, and 4Department of Genetics, The Graduate University for Advanced Studies, Mishima, Shizuoka 411-8540,Japan. 5Program in Molecular Pathogenesis, Skirball Institute of Biomolecular Medicine and Department of Pathology, New York University School of Medicine, New York,New York 10021, USA. Correspondence should be addressed to T.S. ([email protected]).
NATURE IMMUNOLOGY VOLUME 6 NUMBER 12 DECEMBER 2005 1253
A R T I C L E S©
2005
Nat
ure
Pub
lishi
ng G
roup
ht
tp://
ww
w.n
atur
e.co
m/n
atur
eim
mun
olog
y
The dynamic recruitment of signaling molecules during the initialactivation of T cells has been analyzed using Jurkat cells expressingvarious enhanced green fluorescent protein (EGFP) fusion proteinsand stimulation with immobilized antibody to CD3 (anti-CD3)16.Those studies have demonstrated that small clusters containing TCR,kinase and adaptor molecules are induced immediately after stimula-tion of the TCR. However, stimulation with immobilized anti-CD3limits analysis to the initial phase of activation, and thus the entireprocess up to the formation of the immunological synapse in morephysiological conditions remains unknown. The immunologicalsynapse structure is necessary for the maintenance of sustainedsignals required for full T cell activation17. It is well known thatsustained signal transduction, including mitogen-activated proteinkinase activation, calcium mobilization and activation of Akt (proteinkinase B), is required for T cell activation and induction of cytokinesecretion and effector function. Immunological synapse structure ismaintained for hours17–20, and disruption of the immunologicalsynapse immediately stops sustained signaling, which suggests thatthe immunological synapse is required for the maintenance ofsustained signaling13,21–27. However, the actual physical location forthe induction of such sustained signaling remains unclear.
To analyze precisely and in real time the dynamic process ofimmunological synapse formation, particularly its relationship withthe formation of the TCR signaling complex to induce activationsignals, we used a combined system of a planar bilayer for normalantigen-specific T cells and total internal reflection fluorescencemicroscopy (TIRFM). This approach allowed us to analyze the‘nanoscale’ movement of signal molecules during T cell activation.Using this system, we have identified microclusters containing TCRs,kinases and adaptor molecules and have monitored the entire processfrom immediately after cell-bilayer contact to the completion ofimmunological synapse formation. We found that the microclusterswere sites for generating the initial and sustained activation signalsand, moreover, that formation of TCR signaling complexes in
microclusters was necessary for inducing activation. After immuno-logical synapse formation, signal-inducing microclusters were gener-ated only at the periphery of the immunological synapse, whichsuggested that sustained activation signals were produced from themicroclusters at the periphery of the immunological synapse and notfrom the c-SMAC.
RESULTS
Generation of TCR microclusters at the initial contact sites
Because we intended to analyze the microstructural basis of immu-nological synapse formation, we used a combined system of a planarbilayer that incorporated glycophosphatidylinositol (GPI)–anchoredintercellular adhesion molecule 1 (ICAM-1) and major histocompat-ibility complex (MHC) class II (I-Ek) loaded with a pigeon cyto-chrome c (PCC) peptide of amino acids 88–104 (PCC(88–104))18 andobjective-type TIRFM to detect the dynamic recruitment of clusteringmolecules after antigen stimulation of T cells. We obtained PCC(88–104)-specific T cells from AND TCR-transgenic (AND-Tg) mice thathad been activated in vitro and had been previously transduced byEGFP-tagged CD3z, Zap70 and SLP-76 retroviruses and placed thecells on a planar bilayer. Immunological synapse formation, visualizedas TCR-enriched c-SMACs and LFA-1-enriched p-SMACs, asdescribed before1,2, occurred 5–10 min after cell-bilayer contact.
When we analyzed c-SMACs in T cells expressing a fusion proteinof an EGFP tag and CD3z (EGFP–CD3z) in this system, we foundthat the c-SMACs were composed not simply of accumulated CD3zbut also many CD3z-containing microclusters, as suggested by otherreports6,16,28. We then sought to determine the origin of thesemicroclusters by tracing back to the initial cell-bilayer contact (time0). The CD3z microclusters were generated as early as 5 s after cellcontact with the planar bilayer (Fig. 1a and Supplementary Video 1online). During the initial 1–2 min, T cells expanded the contact areaand many microclusters were generated all over (expansion phase).Microcluster formation was induced by the interaction with the
70–1
05 s
150–
225
s
150–
225
s
75–1
50 s
75–1
50 s
0–75
s
0–75
s
35–7
0 s
0–35
s
SLP-76Zap70
CD3ζ
CD3ζ
CD
3ζ
Afte
r-co
ntra
ctio
nC
ontr
actio
nE
xpan
sion
SLP-76Zap70
5
4
3
2
1
0
5
4
3
2
1
0
5
4
3
2
1
0
Tim
e (m
in)
SLP
-76
Zap
70
10 s 20 s 30 s 40 s 50 s 60 s 150 s 300 sa
c
b
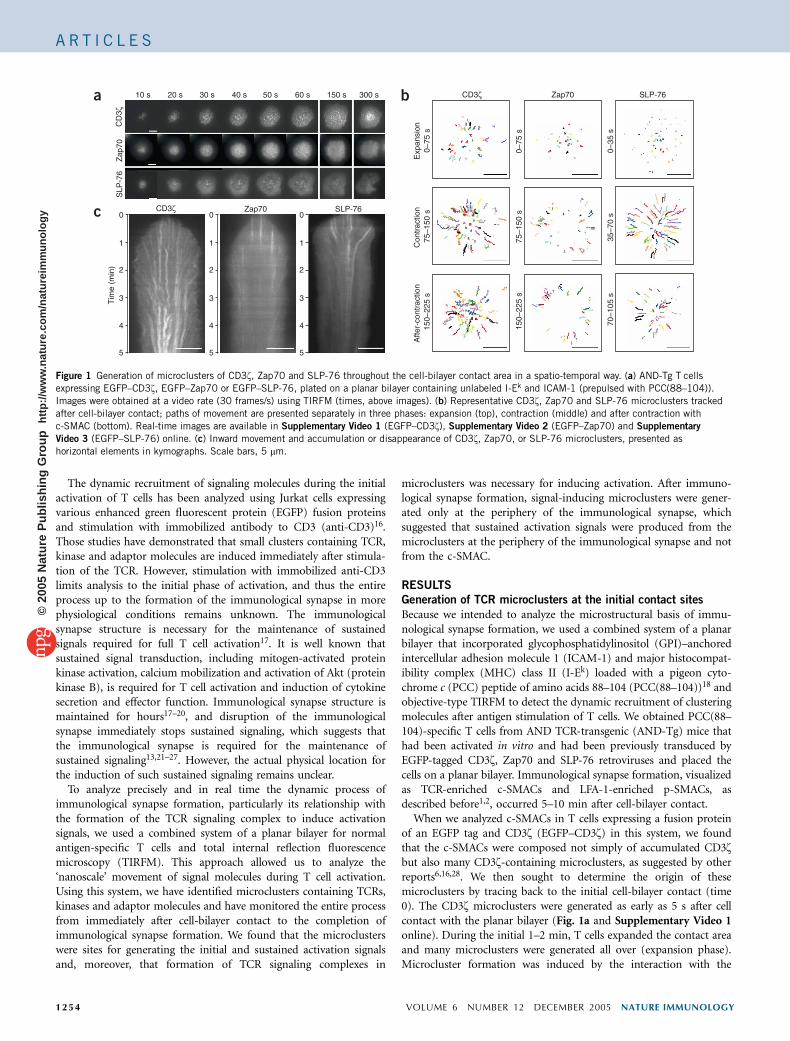
Figure 1 Generation of microclusters of CD3z, Zap70 and SLP-76 throughout the cell-bilayer contact area in a spatio-temporal way. (a) AND-Tg T cells
expressing EGFP–CD3z, EGFP–Zap70 or EGFP–SLP-76, plated on a planar bilayer containing unlabeled I-Ek and ICAM-1 (prepulsed with PCC(88–104)).
Images were obtained at a video rate (30 frames/s) using TIRFM (times, above images). (b) Representative CD3z, Zap70 and SLP-76 microclusters tracked
after cell-bilayer contact; paths of movement are presented separately in three phases: expansion (top), contraction (middle) and after contraction with
c-SMAC (bottom). Real-time images are available in Supplementary Video 1 (EGFP–CD3z), Supplementary Video 2 (EGFP–Zap70) and Supplementary
Video 3 (EGFP–SLP-76) online. (c) Inward movement and accumulation or disappearance of CD3z, Zap70, or SLP-76 microclusters, presented as
horizontal elements in kymographs. Scale bars, 5 mm.
1254 VOLUME 6 NUMBER 12 DECEMBER 2005 NATURE IMMUNOLOGY
A R T I C L E S©
2005
Nat
ure
Pub
lishi
ng G
roup
ht
tp://
ww
w.n
atur
e.co
m/n
atur
eim
mun
olog
y
peptide-MHC (pMHC), as microclusters were neither generated onthe planar bilayer in the absence of antigen nor present in the cells,indicating that the microclusters were not pre-formed. During theexpansion phase, the CD3z microclusters did not move, remaining atthe same location (Fig. 1b, top left). After reaching maximum cellspreading, the CD3z microclusters began to move toward the centerand created a c-SMAC at 5 min (contraction phase; Fig. 1b, leftcolumn, middle and bottom images). We determined the time courseusing a kymograph (Fig. 1c, left). From that image, it was clear thatthe size and intensity of the CD3z microclusters increased as themicroclusters moved to the center, suggesting that the microclusterswere fused on their way to the center. Traces of the movement ofindividual microclusters containing CD3z showed that most of theCD3z proteins were translocated into the c-SMAC.
By means of such individual tracing, we quantified the averagevelocity and the moving distance (Supplementary Fig. 1 online).During the expansion phase, CD3z microclusters appeared first at thecenter and then at the periphery, remaining at the same location. Theaverage velocity was 6.8 ± 1.9 nm/s at the center and 19.0 ± 7.9 nm/sat the periphery. During the contraction phase, peripheral microclus-ters in more distal areas moved much faster toward the center (92.5 ±31.0 nm/s) than did those at the central area (4.4 ± 1.9 nm/s). Afterthe contraction phase, the velocity was reduced to a constant value(24.9 ± 12.6 nm/s). Most CD3z microclusters reached the center, and
the average moving distance was 0.84 ± 0.45 mm for the centralmicroclusters and 3.1 ± 1.2 mm for peripheral microclusters.
The number of EGFP–CD3z proteins in a single microcluster wasapproximately 30–100 in this system, as estimated from the fluores-cence intensity. The expression of EGFP–CD3z was two- to threefoldhigher than that of endogenous CD3z, as assessed by intracellularstaining (data not shown). Accordingly, we estimated that the numberof CD3z proteins in one microcluster was approximately 40–150.
We also quantified the area and relative fluorescence intensity of in-dividual CD3z microcluster (Supplementary Fig. 2 online) to deter-mine how extensively EGFP–CD3z accumulated in microclusters. Theaverage sum of the area and the relative intensity of microclusters was9.0% ± 3.0% and 32.4% ± 7.5% of whole contact area, compared withbackground. The fluorescence intensity inside the microclusters was10.4 ± 4.7 times higher than outside the microclusters. These data mayunderestimate the number and fluorescence intensity of microclustersbecause of the possible existence of undetectable small clusters.
Initial microclusters contain TCRs, kinases and adaptors
To understand the spatio-temporal dynamism of the TCR signalingcomplex during the generation and translocation of microclusters,we analyzed T cells expressing EGFP–Zap70 as a CD3-associatingcritical kinase and EGFP–SLP-76 as a critical adaptor molecule fortransducing activation signals downstream, respectively. EGFP–Zap70
1 min
Zap
70Z
ap70
Mer
geD
ICC
D3ε
CD
3ε
SLP
-76
SLP
-76
Mer
geD
ICC
D3ε
CD
3ε
SLP
-76
SLP
-76
Mer
geD
ICZ
ap70
Zap
70
3 min 30 min
1 min 3 min 30 min 1 min 3 min 30 min 1 min 3 min 30 min
1 min 3 min 30 min 1 min 3 min 30 mina
d
b
e
c
f
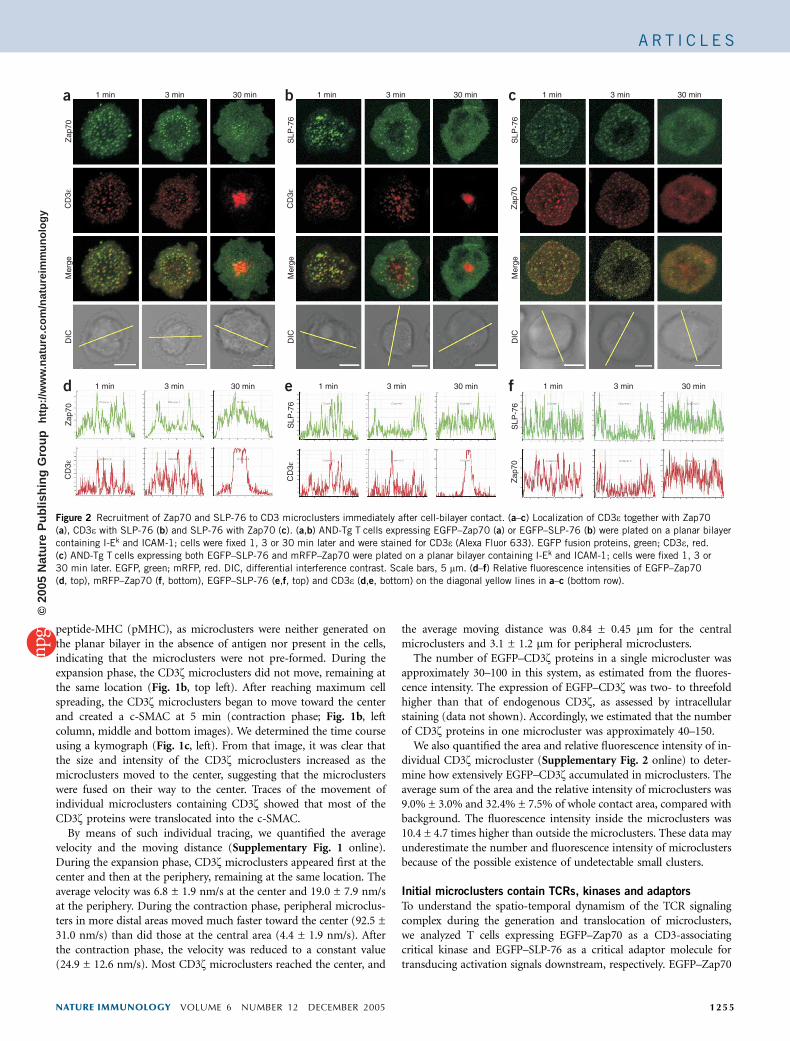
Figure 2 Recruitment of Zap70 and SLP-76 to CD3 microclusters immediately after cell-bilayer contact. (a–c) Localization of CD3e together with Zap70
(a), CD3e with SLP-76 (b) and SLP-76 with Zap70 (c). (a,b) AND-Tg T cells expressing EGFP–Zap70 (a) or EGFP–SLP-76 (b) were plated on a planar bilayer
containing I-Ek and ICAM-1; cells were fixed 1, 3 or 30 min later and were stained for CD3e (Alexa Fluor 633). EGFP fusion proteins, green; CD3e, red.
(c) AND-Tg T cells expressing both EGFP–SLP-76 and mRFP–Zap70 were plated on a planar bilayer containing I-Ek and ICAM-1; cells were fixed 1, 3 or
30 min later. EGFP, green; mRFP, red. DIC, differential interference contrast. Scale bars, 5 mm. (d–f) Relative fluorescence intensities of EGFP–Zap70
(d, top), mRFP–Zap70 (f, bottom), EGFP–SLP-76 (e,f, top) and CD3e (d,e, bottom) on the diagonal yellow lines in a–c (bottom row).
NATURE IMMUNOLOGY VOLUME 6 NUMBER 12 DECEMBER 2005 1255
A R T I C L E S©
2005
Nat
ure
Pub
lishi
ng G
roup
ht
tp://
ww
w.n
atur
e.co
m/n
atur
eim
mun
olog
y
and EGFP–SLP-76 restored the TCR signaling for interleukin 2production in Zap70-deficient and SLP-76-deficient Jurkat cells,respectively (data not shown). Zap70 and SLP-76 emerged as micro-clusters immediately after cell-bilayer contact, and the number ofmicroclusters increased until maximum cell spread was reached,similar to EGFP–CD3z (Fig. 1a and Supplementary Videos 2 and 3online). These microclusters did not move during the expansion phase(Fig. 1b,c, top row, middle and right images). However, their activitydiffered from that of CD3z after the contraction phase. Most Zap70microclusters did not reach the center, stayed around the peripheryand disappeared (Fig. 1a,c), whereas some Zap70 accumulated in thec-SMAC. Consistent with that finding, the total moving distances ofZap70 microclusters were rather small (Fig. 1b, middle column,middle and bottom images). In contrast, whereas the initial micro-clusters containing EGFP–SLP-76 were formed like those containingCD3z and Zap70 during the expansion phase, some of SLP-76microclusters moved to the center during the early contractionphase (Fig. 1b, right), and almost all disappeared after the contractionphase (Fig. 1c, right). These results demonstrate that Zap70 and SLP-76 may have nonredundant functions in immunological synapseformation. The disappearance of microclusters containing Zap70and SLP-76 suggests that most Zap70 and SLP-76 microclusterswere generated only at the periphery after the contraction phaseand did not translocate to the c-SMAC, unlike CD3z.
To determine whether a single microcluster contained all themolecules required for T cell activation, we analyzed the colocalizationof TCR, Zap70 and SLP-76 (Fig. 2). We fixed AND-Tg T cellstransduced by EGFP–Zap70 (Fig. 2a,d), and EGFP–SLP-76(Fig. 2b,e) at various times after cell-bilayer contact, followed bystaining with anti-CD3e. At initiation of contact and during theexpansion phase (1 min), Zap70 and CD3e and SLP-76 and CD3ewere colocalized in the same microclusters (Fig. 2a,b, left column).Zap70 and SLP-76 were mainly in the periphery at 3 min, when CD3ebegan translocate to the center (contraction phase, Fig. 2a,b, centercolumn). Next, to analyze the localization of Zap70 and SLP-76together, we transfected monomeric red fluorescent protein(mRFP)–Zap70 and EGFP–SLP-76 fusion proteins together intoAND-Tg T cells and plated cells on a planar bilayer. Zap70 andSLP-76 localized together at the initiation of cell-bilayer contact(Fig. 2c,f). We further analyzed the colocalization of these threemolecules by counting all the microclusters on the eight representativecells in the three different combinations of proteins (Fig. 2a–e, leftcolumn) and examining the localization of the two molecules together.The percentage localization of Zap70 together with CD3e, SLP-76 withCD3e, or Zap70 with SLP-76 was 90.2% ± 7.7%, 85.3% ± 6.5% or88.5% ± 7.2%, respectively (Supplementary Table 1 online). Theseresults indicated that CD3z, Zap70 and SLP-76 were localized togetherin most of the initial microclusters.
1 min
CD
3ζC
D3ζ
pZap
70pZ
ap70
CD
3ζpY
Mer
geD
IC
CD
3ζpZ
ap70
Mer
geD
IC
CD
3ζpY
Mer
geD
IC
CD
3ζpY
Mer
geD
IC
3 min 30 min 30 min
30 min3 min1 min30 min3 min1 min
3 min3 min1 min 3 mina
e f
b c d
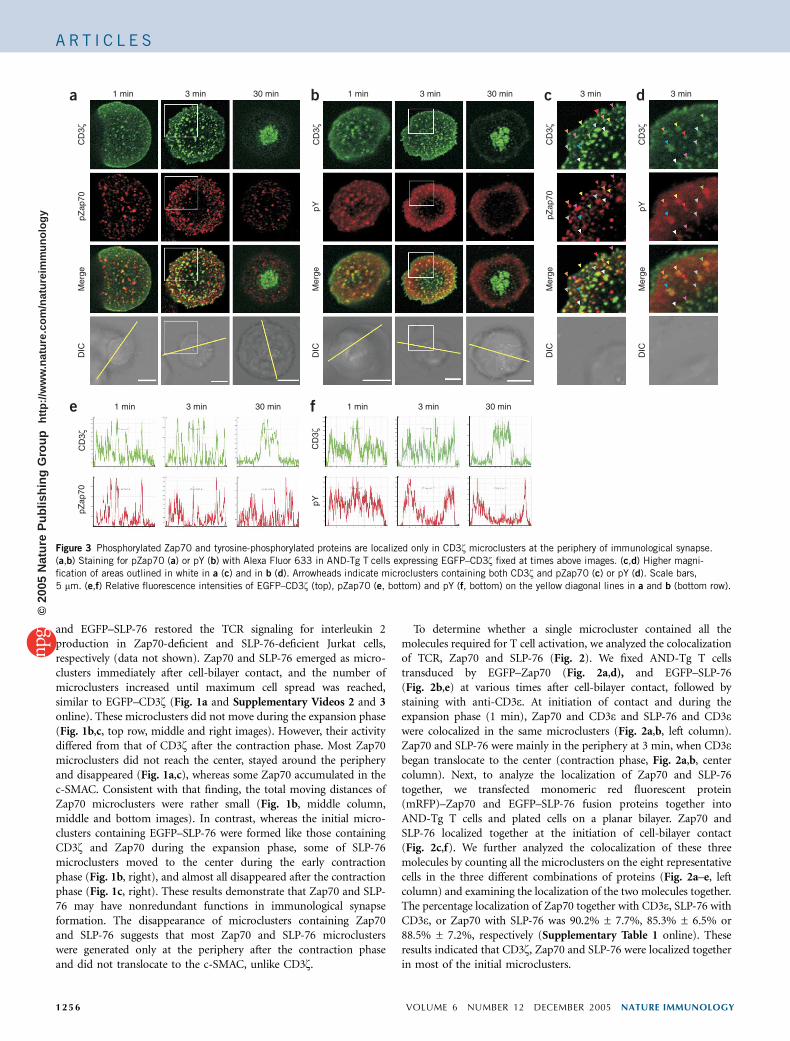
Figure 3 Phosphorylated Zap70 and tyrosine-phosphorylated proteins are localized only in CD3z microclusters at the periphery of immunological synapse.
(a,b) Staining for pZap70 (a) or pY (b) with Alexa Fluor 633 in AND-Tg T cells expressing EGFP–CD3z fixed at times above images. (c,d) Higher magni-
fication of areas outlined in white in a (c) and in b (d). Arrowheads indicate microclusters containing both CD3z and pZap70 (c) or pY (d). Scale bars,
5 mm. (e,f) Relative fluorescence intensities of EGFP–CD3z (top), pZap70 (e, bottom) and pY (f, bottom) on the yellow diagonal lines in a and b (bottom row).
1256 VOLUME 6 NUMBER 12 DECEMBER 2005 NATURE IMMUNOLOGY
A R T I C L E S©
2005
Nat
ure
Pub
lishi
ng G
roup
ht
tp://
ww
w.n
atur
e.co
m/n
atur
eim
mun
olog
y
We then examined whether these microclusters were generated inmore physiological conditions. We analyzed two aspects: stimulationwith low concentrations of an agonistic peptide, and microclustersduring cell-cell contact. When the concentration of PCC(88–104) was‘titrated down’ to suboptimal doses for in vitro stimulation, both thesize and the density of c-SMACs were decreased gradually. However,all CD3z, Zap70 and SLP-76 microclusters were clearly detected at thesuboptimal PCC(88–104) concentration of 0.8 mM (SupplementaryFig. 3 online). Quantitative analysis of CD3z microclusters showedthat the decrease in fluorescence intensity of each microclustersseemed to be greater than that of the number of microclusters atlow concentrations of antigen peptide (Supplementary Fig. 3 online),suggesting that the increase in antigen concentration may haveaccumulated more microcluster components into microclustersinstead of increasing the number of microclusters. We noted similarcharacteristics for Zap70 and SLP-76 microclusters at all concentra-tions of PCC(88–104). Next, to analyze microcluster formation duringT cell–APC interaction, we generated Jurkat T cell lines expressingEGFP–CD3z, EGFP–Zap70 or EGFP–SLP-76 and conjugated thesecells with Raji cells loaded with staphylococcus enterotoxin E. Therewas microcluster formation of each of these molecules at the cell-cellcontact sites (Supplementary Fig. 4 online). After the mature immu-nological synapse was formed, CD3z and a part of Zap70 wereaccumulated at c-SMAC and localized together with the TCR. SLP-76 was present mainly in the cytosol and not at the contact sites in theabsence of stimulation. These results coincide with our data on T cell–bilayer interactions. We also assessed microcluster formation at theinitiation of cell-cell contact using AND-Tg T cells expressing EGFP–SLP-76 and PCC(88–104)-pulsed activated B cells (SupplementaryFig. 5 online). Indeed, there were microclusters on the interface at thevery beginning of cell contact. After the mature immunologicalsynapse was formed, SLP-76 did not seem to be localized in themicroclusters. Notably, only bright clusters and not small microclus-ters could be detected in this system.
TCR microclusters as the sites for initiating T cell activation
To identify the site for generating activation signals, we assessedtyrosine phosphorylation in T cells expressing EGFP–CD3z usingmonoclonal antibody to phosphorylated Zap70 (pZap70) and mono-clonal antibody to phosphotyrosine (pY). During the expansionphase, most of the CD3z-containing microclusters were stainedtogether with anti-pZap70 (Fig. 3a, left column) and anti-pY
(Fig. 3b, left column), whereas only the microclusters at the peripherywere stained after contraction began (Fig. 3a,b, center columns, andc,d). The colocalization was restricted to the periphery and was notinside the cells, suggesting that phosphorylation of Zap70 and othermolecules was induced in most of the microclusters during theexpansion phase and then was induced mainly in the microclustersat the periphery after the contraction phase. In a report suggesting the‘resetting’ of T cell activation, the central clustering of pZap70 wasshown transiently at 7 min but not at 3 min after the T cell–APCcontact6. Therefore, we carefully analyzed the kinetics of pZap70-containing microclusters at T cell–bilayer contacts throughout theformation of mature immunological synapse. However, the accumula-tion of pZap70 at around 7 min was not obvious (SupplementaryFig. 6 online). Within 1 min, pZap70 was localized together with TCRmicroclusters. The initial pZap70 microclusters soon disappeared andonly the peripheral pZap70 microclusters remained, probably becauseZap70 microclusters were continuously generated at the periphery andpZap70 microclusters were renewed there.
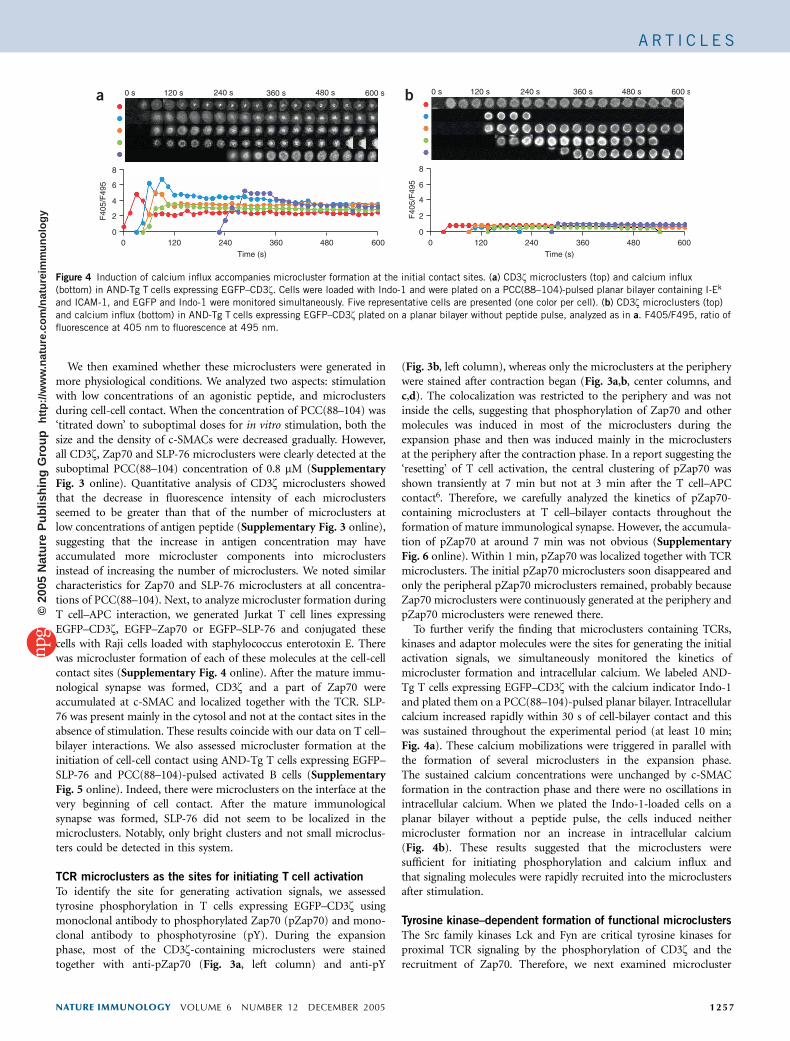
To further verify the finding that microclusters containing TCRs,kinases and adaptor molecules were the sites for generating the initialactivation signals, we simultaneously monitored the kinetics ofmicrocluster formation and intracellular calcium. We labeled AND-Tg T cells expressing EGFP–CD3z with the calcium indicator Indo-1and plated them on a PCC(88–104)-pulsed planar bilayer. Intracellularcalcium increased rapidly within 30 s of cell-bilayer contact and thiswas sustained throughout the experimental period (at least 10 min;Fig. 4a). These calcium mobilizations were triggered in parallel withthe formation of several microclusters in the expansion phase.The sustained calcium concentrations were unchanged by c-SMACformation in the contraction phase and there were no oscillations inintracellular calcium. When we plated the Indo-1-loaded cells on aplanar bilayer without a peptide pulse, the cells induced neithermicrocluster formation nor an increase in intracellular calcium(Fig. 4b). These results suggested that the microclusters weresufficient for initiating phosphorylation and calcium influx andthat signaling molecules were rapidly recruited into the microclustersafter stimulation.
Tyrosine kinase–dependent formation of functional microclusters
The Src family kinases Lck and Fyn are critical tyrosine kinases forproximal TCR signaling by the phosphorylation of CD3z and therecruitment of Zap70. Therefore, we next examined microcluster
600480360Time (s)
24012000
2
4
6
8
F40
5/F
495
0 s 120 s 240 s 360 s 480 s 600 s
600480360Time (s)
24012000
2
4
6
8
F40
5/F
495
0 s 120 s 240 s 360 s 480 s 600 sa b
Figure 4 Induction of calcium influx accompanies microcluster formation at the initial contact sites. (a) CD3z microclusters (top) and calcium influx
(bottom) in AND-Tg T cells expressing EGFP–CD3z. Cells were loaded with Indo-1 and were plated on a PCC(88–104)-pulsed planar bilayer containing I-Ek
and ICAM-1, and EGFP and Indo-1 were monitored simultaneously. Five representative cells are presented (one color per cell). (b) CD3z microclusters (top)
and calcium influx (bottom) in AND-Tg T cells expressing EGFP–CD3z plated on a planar bilayer without peptide pulse, analyzed as in a. F405/F495, ratio of
fluorescence at 405 nm to fluorescence at 495 nm.
NATURE IMMUNOLOGY VOLUME 6 NUMBER 12 DECEMBER 2005 1257
A R T I C L E S©
2005
Nat
ure
Pub
lishi
ng G
roup
ht
tp://
ww
w.n
atur
e.co
m/n
atur
eim
mun
olog
y
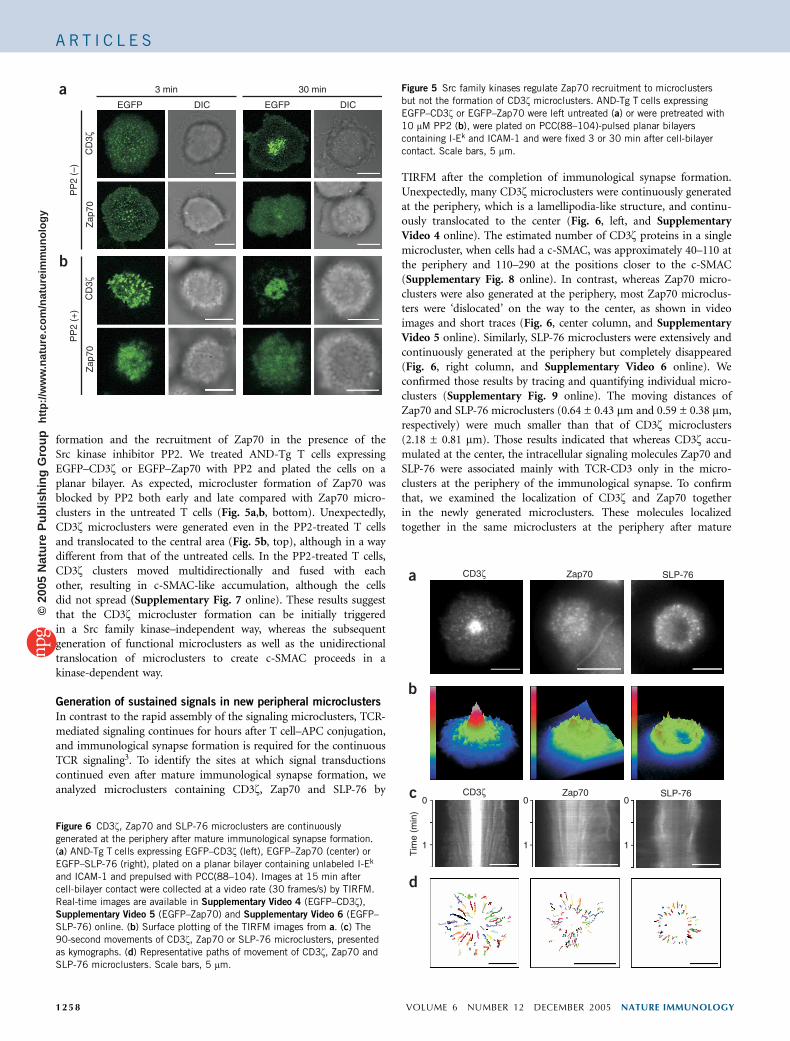
formation and the recruitment of Zap70 in the presence of theSrc kinase inhibitor PP2. We treated AND-Tg T cells expressingEGFP–CD3z or EGFP–Zap70 with PP2 and plated the cells on aplanar bilayer. As expected, microcluster formation of Zap70 wasblocked by PP2 both early and late compared with Zap70 micro-clusters in the untreated T cells (Fig. 5a,b, bottom). Unexpectedly,CD3z microclusters were generated even in the PP2-treated T cellsand translocated to the central area (Fig. 5b, top), although in a waydifferent from that of the untreated cells. In the PP2-treated T cells,CD3z clusters moved multidirectionally and fused with eachother, resulting in c-SMAC-like accumulation, although the cellsdid not spread (Supplementary Fig. 7 online). These results suggestthat the CD3z microcluster formation can be initially triggeredin a Src family kinase–independent way, whereas the subsequentgeneration of functional microclusters as well as the unidirectionaltranslocation of microclusters to create c-SMAC proceeds in akinase-dependent way.
Generation of sustained signals in new peripheral microclusters
In contrast to the rapid assembly of the signaling microclusters, TCR-mediated signaling continues for hours after T cell–APC conjugation,and immunological synapse formation is required for the continuousTCR signaling3. To identify the sites at which signal transductionscontinued even after mature immunological synapse formation, weanalyzed microclusters containing CD3z, Zap70 and SLP-76 by
TIRFM after the completion of immunological synapse formation.Unexpectedly, many CD3z microclusters were continuously generatedat the periphery, which is a lamellipodia-like structure, and continu-ously translocated to the center (Fig. 6, left, and SupplementaryVideo 4 online). The estimated number of CD3z proteins in a singlemicrocluster, when cells had a c-SMAC, was approximately 40–110 atthe periphery and 110–290 at the positions closer to the c-SMAC(Supplementary Fig. 8 online). In contrast, whereas Zap70 micro-clusters were also generated at the periphery, most Zap70 microclus-ters were ‘dislocated’ on the way to the center, as shown in videoimages and short traces (Fig. 6, center column, and SupplementaryVideo 5 online). Similarly, SLP-76 microclusters were extensively andcontinuously generated at the periphery but completely disappeared(Fig. 6, right column, and Supplementary Video 6 online). Weconfirmed those results by tracing and quantifying individual micro-clusters (Supplementary Fig. 9 online). The moving distances ofZap70 and SLP-76 microclusters (0.64 ± 0.43 mm and 0.59 ± 0.38 mm,respectively) were much smaller than that of CD3z microclusters(2.18 ± 0.81 mm). Those results indicated that whereas CD3z accu-mulated at the center, the intracellular signaling molecules Zap70 andSLP-76 were associated mainly with TCR-CD3 only in the micro-clusters at the periphery of the immunological synapse. To confirmthat, we examined the localization of CD3z and Zap70 togetherin the newly generated microclusters. These molecules localizedtogether in the same microclusters at the periphery after mature
EGFP
Zap
70C
D3ζ
Zap
70C
D3ζ
3 min
PP
2 (–
)P
P2
(+)
DIC EGFP DIC
30 mina
b
CD3ζ Zap70 SLP-76
CD3ζ Zap70 SLP-760
Tim
e (m
in)
1
0
1
0
1
a
b
d
c
Figure 6 CD3z, Zap70 and SLP-76 microclusters are continuously
generated at the periphery after mature immunological synapse formation.
(a) AND-Tg T cells expressing EGFP–CD3z (left), EGFP–Zap70 (center) or
EGFP–SLP-76 (right), plated on a planar bilayer containing unlabeled I-Ek
and ICAM-1 and prepulsed with PCC(88–104). Images at 15 min after
cell-bilayer contact were collected at a video rate (30 frames/s) by TIRFM.
Real-time images are available in Supplementary Video 4 (EGFP–CD3z),Supplementary Video 5 (EGFP–Zap70) and Supplementary Video 6 (EGFP–
SLP-76) online. (b) Surface plotting of the TIRFM images from a. (c) The
90-second movements of CD3z, Zap70 or SLP-76 microclusters, presented
as kymographs. (d) Representative paths of movement of CD3z, Zap70 and
SLP-76 microclusters. Scale bars, 5 mm.
Figure 5 Src family kinases regulate Zap70 recruitment to microclusters
but not the formation of CD3z microclusters. AND-Tg T cells expressing
EGFP–CD3z or EGFP–Zap70 were left untreated (a) or were pretreated with
10 mM PP2 (b), were plated on PCC(88–104)-pulsed planar bilayers
containing I-Ek and ICAM-1 and were fixed 3 or 30 min after cell-bilayer
contact. Scale bars, 5 mm.
1258 VOLUME 6 NUMBER 12 DECEMBER 2005 NATURE IMMUNOLOGY
A R T I C L E S©
2005
Nat
ure
Pub
lishi
ng G
roup
ht
tp://
ww
w.n
atur
e.co
m/n
atur
eim
mun
olog
y
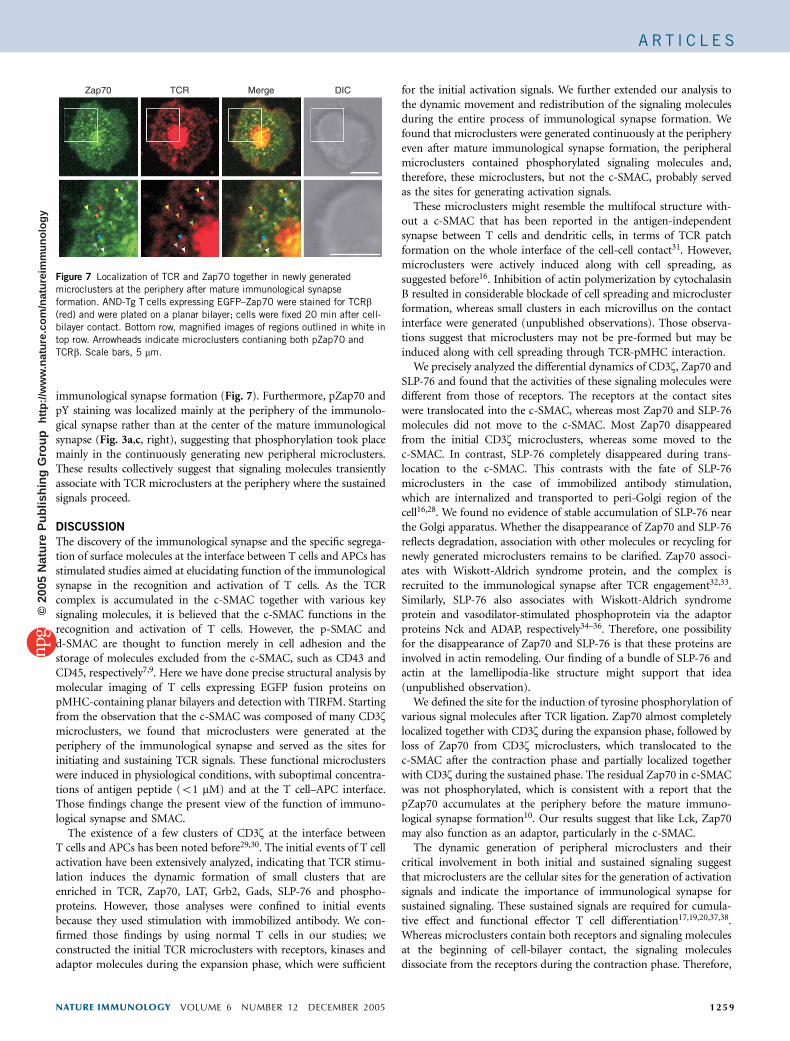
immunological synapse formation (Fig. 7). Furthermore, pZap70 andpY staining was localized mainly at the periphery of the immunolo-gical synapse rather than at the center of the mature immunologicalsynapse (Fig. 3a,c, right), suggesting that phosphorylation took placemainly in the continuously generating new peripheral microclusters.These results collectively suggest that signaling molecules transientlyassociate with TCR microclusters at the periphery where the sustainedsignals proceed.
DISCUSSION
The discovery of the immunological synapse and the specific segrega-tion of surface molecules at the interface between T cells and APCs hasstimulated studies aimed at elucidating function of the immunologicalsynapse in the recognition and activation of T cells. As the TCRcomplex is accumulated in the c-SMAC together with various keysignaling molecules, it is believed that the c-SMAC functions in therecognition and activation of T cells. However, the p-SMAC andd-SMAC are thought to function merely in cell adhesion and thestorage of molecules excluded from the c-SMAC, such as CD43 andCD45, respectively7,9. Here we have done precise structural analysis bymolecular imaging of T cells expressing EGFP fusion proteins onpMHC-containing planar bilayers and detection with TIRFM. Startingfrom the observation that the c-SMAC was composed of many CD3zmicroclusters, we found that microclusters were generated at theperiphery of the immunological synapse and served as the sites forinitiating and sustaining TCR signals. These functional microclusterswere induced in physiological conditions, with suboptimal concentra-tions of antigen peptide (o1 mM) and at the T cell–APC interface.Those findings change the present view of the function of immuno-logical synapse and SMAC.
The existence of a few clusters of CD3z at the interface betweenT cells and APCs has been noted before29,30. The initial events of T cellactivation have been extensively analyzed, indicating that TCR stimu-lation induces the dynamic formation of small clusters that areenriched in TCR, Zap70, LAT, Grb2, Gads, SLP-76 and phospho-proteins. However, those analyses were confined to initial eventsbecause they used stimulation with immobilized antibody. We con-firmed those findings by using normal T cells in our studies; weconstructed the initial TCR microclusters with receptors, kinases andadaptor molecules during the expansion phase, which were sufficient
for the initial activation signals. We further extended our analysis tothe dynamic movement and redistribution of the signaling moleculesduring the entire process of immunological synapse formation. Wefound that microclusters were generated continuously at the peripheryeven after mature immunological synapse formation, the peripheralmicroclusters contained phosphorylated signaling molecules and,therefore, these microclusters, but not the c-SMAC, probably servedas the sites for generating activation signals.
These microclusters might resemble the multifocal structure with-out a c-SMAC that has been reported in the antigen-independentsynapse between T cells and dendritic cells, in terms of TCR patchformation on the whole interface of the cell-cell contact31. However,microclusters were actively induced along with cell spreading, assuggested before16. Inhibition of actin polymerization by cytochalasinB resulted in considerable blockade of cell spreading and microclusterformation, whereas small clusters in each microvillus on the contactinterface were generated (unpublished observations). Those observa-tions suggest that microclusters may not be pre-formed but may beinduced along with cell spreading through TCR-pMHC interaction.
We precisely analyzed the differential dynamics of CD3z, Zap70 andSLP-76 and found that the activities of these signaling molecules weredifferent from those of receptors. The receptors at the contact siteswere translocated into the c-SMAC, whereas most Zap70 and SLP-76molecules did not move to the c-SMAC. Most Zap70 disappearedfrom the initial CD3z microclusters, whereas some moved to thec-SMAC. In contrast, SLP-76 completely disappeared during trans-location to the c-SMAC. This contrasts with the fate of SLP-76microclusters in the case of immobilized antibody stimulation,which are internalized and transported to peri-Golgi region of thecell16,28. We found no evidence of stable accumulation of SLP-76 nearthe Golgi apparatus. Whether the disappearance of Zap70 and SLP-76reflects degradation, association with other molecules or recycling fornewly generated microclusters remains to be clarified. Zap70 associ-ates with Wiskott-Aldrich syndrome protein, and the complex isrecruited to the immunological synapse after TCR engagement32,33.Similarly, SLP-76 also associates with Wiskott-Aldrich syndromeprotein and vasodilator-stimulated phosphoprotein via the adaptorproteins Nck and ADAP, respectively34–36. Therefore, one possibilityfor the disappearance of Zap70 and SLP-76 is that these proteins areinvolved in actin remodeling. Our finding of a bundle of SLP-76 andactin at the lamellipodia-like structure might support that idea(unpublished observation).
We defined the site for the induction of tyrosine phosphorylation ofvarious signal molecules after TCR ligation. Zap70 almost completelylocalized together with CD3z during the expansion phase, followed byloss of Zap70 from CD3z microclusters, which translocated to thec-SMAC after the contraction phase and partially localized togetherwith CD3z during the sustained phase. The residual Zap70 in c-SMACwas not phosphorylated, which is consistent with a report that thepZap70 accumulates at the periphery before the mature immuno-logical synapse formation10. Our results suggest that like Lck, Zap70may also function as an adaptor, particularly in the c-SMAC.
The dynamic generation of peripheral microclusters and theircritical involvement in both initial and sustained signaling suggestthat microclusters are the cellular sites for the generation of activationsignals and indicate the importance of immunological synapse forsustained signaling. These sustained signals are required for cumula-tive effect and functional effector T cell differentiation17,19,20,37,38.Whereas microclusters contain both receptors and signaling moleculesat the beginning of cell-bilayer contact, the signaling moleculesdissociate from the receptors during the contraction phase. Therefore,
Zap70 Merge DICTCR
Figure 7 Localization of TCR and Zap70 together in newly generated
microclusters at the periphery after mature immunological synapse
formation. AND-Tg T cells expressing EGFP–Zap70 were stained for TCRb(red) and were plated on a planar bilayer; cells were fixed 20 min after cell-
bilayer contact. Bottom row, magnified images of regions outlined in white intop row. Arrowheads indicate microclusters contianing both pZap70 and
TCRb. Scale bars, 5 mm.
NATURE IMMUNOLOGY VOLUME 6 NUMBER 12 DECEMBER 2005 1259
A R T I C L E S©
2005
Nat
ure
Pub
lishi
ng G
roup
ht
tp://
ww
w.n
atur
e.co
m/n
atur
eim
mun
olog
y
functional ‘signaling microclusters’ are continuously generated only atthe periphery, which induces sustained TCR signals. As biochemicalanalysis has shown that tyrosine phosphorylation is induced within afew minutes of TCR stimulation, this may be consistent with thekinetics of the localization of TCRs and signaling molecules togetherin the peripheral microclusters. It is likely that phosphorylation andactivation signals are induced when TCRs and signaling moleculesexist together in the microclusters, although it is possible that muchsmaller and undetectable TCR clusters that may transit to detectablemicroclusters could transduce activation signals. The estimated num-ber of CD3z proteins in the peripheral microclusters in the sustainedphase was approximately 40–110. CD3z proteins in microclustersclose to the c-SMAC numbered 110–290, probably because of fusionwhile moving toward c-SMAC. Those numbers are similar to thosegenerated immediately after the initial cell-bilayer contact (Supple-mentary Fig. 8 online). Given a report that the engagement of5–10 TCRs may be sufficient to trigger calcium signaling11, we assumethat activation signals can be induced in even smaller microclusters,which remain to be analyzed at the single-molecule level. As TCRdownregulation can continue over a period of hours, it is possible thatthe TCR microclusters may become progressively smaller with increas-ing time of sustained signaling.
Treatment with PP2 inhibited the recruitment of Zap70 but notthe formation of CD3z microclusters, indicating that the TCR signal-ing complex has the ability to form microclusters in a Src familykinase–independent way, consistent with a report describingZap70-independent clustering of CD3z in the immunologicalsynapse8. However, the activity of the clusters in that condition wasdifferent from the activity of clusters without PP2. They fused anddissociated randomly, suggesting that assembly with other signalingmolecules and the actin cytoskeleton regulates the proper formationand translocation of the microclusters. Those results suggest thatsequential and sustained signals in the microclusters are necessaryfor maintaining the structure of the immunological synapse. More-over, the continuous generation of signals delivered from eachmicrocluster might explain the ‘counting phenomenon’ associatedwith TCR downregulation, as outlined in the published ‘serialtriggering’ model39.
As the signaling sites for T cell activation are peripheral micro-clusters, the issue of the function of the immunological synapseremains. Our observation that signaling molecules associated withthe TCR complex only in the peripheral microclusters indicates thatc-SMAC is not involved in signal transduction, as suggestedbefore10,40. Whereas the c-SMAC may contribute in some conditionsto the stabilization of a small amount of specific TCR-pMHCinteraction41, microclusters could also contribute to this process at avery low agonist pMHC density through the involvement of CD4 andself peptide–MHC. The ‘pseudo-dimer’ model, in which low-affinityself peptide–MHC contributes to T cell signaling11,42, may incorporateself peptide–MHC into TCR triggering and microcluster formation.In contrast, it has also been proposed that the immunological synapseis involved in TCR downregulation and endocytosis, which maybe involved in the downregulation of excess activation10. Our analysessuggest that the immunological synapse may function in continuousT cell activation by creating new signaling microclusters at theperiphery and the c-SMAC may support late activation signals.Furthermore, given that whereas c-SMAC is relatively stable,p-SMACs and d-SMACs show dynamic flow of microclusters, wepropose a possible function for the c-SMAC as an ‘anchor’ for thedynamic movement of cells. The c-SMAC may function in mediatingthe microcluster-induced ‘stop signal’ by stabilizing the mobility of
cells and maintaining cell-cell contact through strong interaction withpMHC. The balance between c-SMAC-mediated stabilization andchemokine-induced polarization may determine the cell fate of stop-ping versus moving.
METHODSReagents. Staining antibodies and reagents were purchased from the following
suppliers: biotinylated anti-CD3e (2C11), eBioscience; anti-pZap70, Cell
Signaling; anti-pY, Upstate; Alexa Fluor 633–streptavidin and Alexa Fluor
647–anti-rabbit IgG, Molecular Probes; and indocarbocyanine–anti-mouse
IgG, Amersham Biosciences. Indo-1 acetoxylmethylester (Indo-1 AM) was
purchased from Molecular Probes. PP2 was purchased from Calbiochem.
Plasmid construction. Mouse EGFP–CD3z, EGFP–Zap70, EGFP–SLP-76 and
mRFP–Zap70 fusion proteins were generated by recombinant PCR with mouse
cDNA and pEGFP-N1 (BD Clontech) or pRSETB–mRFP1 (ref. 43; provided by
R.Y. Tsien, University of California, San Diego, California) and were subcloned
into retroviral vector pMXs (provided by T. Kitamura, Tokyo University, Tokyo,
Japan). The fusion proteins contained no linker sequences.
Primary cell cultures and transductions. Constructs were transiently
transduced into Phoenix packaging cells (provided by G. Norlan, Stanford
University) using Lipofectamine (Invitrogen). Retroviral supernatants were
centrifuged at 8,000g for 12 h and were concentrated tenfold. CD4+ T cells
were purified from AND-Tg mice on a recombination-activating gene
2–deficient background and were stimulated with 3 mM PCC(88–104)
(KAERADLIAYLKQATAK) and irradiated whole spleen cells from C3H/HeN
mice. At 1 and 2 d after stimulation, the cells were suspended in the retroviral
supernatant and were centrifuged at 1,000g for 90 min in the presence of
8 mg/ml of polybrene (Sigma) and 200 U/ml of human recombinant interleukin
2 (Ajinomoto). At day 4, 60–80% of T cells were transduced with EGFP
and were sorted with a FACSAria (BD) to obtain populations homogenous
in fluorescence intensity. Cells were maintained for 5–14 d in RPMI
medium plus 10% FCS supplemented with recombinant interleukin 2. In
the Src kinase–blocking assay, AND-Tg cells expressing EGFP–CD3z or
EGFP–Zap70 were preincubated for 20 min at 37 1C with 10 mM PP2 in
the culture medium. This drug was present in the assay medium throughout
the experiment.
Planar bilayers. The mouse MHC class II molecule I-Ek with a GPI ‘anchor’
(Ek–GPI) and mouse ICAM-1 with a GPI ‘anchor’ (ICAM-1–GPI) were
purified from transfected Chinese hamster ovary and baby hamster kidney
cells, respectively, and were incorporated into dioleoyl phosphatidylcholine
liposomes (Avanti Polar Lipids). Planar bilayers containing Ek–GPI and ICAM-
1–GPI were formed in a flow cell chamber system (Bioptechs). For quantifica-
tion of I-Ek, activated B cells from C3H mice and silica beads (Bangs
Laboratories) loaded with dioleoyl phosphatidylcholine liposomes containing
Ek–GPI were stained with fluorescein isothiocyanate–labeled monoclonal
antibody to I-Ek (14-4-4) and were analyzed by flow cytometry. The density
of I-Ek on the bilayers was 2.3-fold higher than that on activated B cells. Planar
bilayers were loaded overnight at 37 1C with 100 mM PCC(88–104) in citrate
buffer, pH 4.5; were blocked for 1 h at 37 1C with 5% nonfat dried milk in PB;
and were left open in the assay medium. The mobility of each GPI ‘anchor
protein’ was checked before the experiments by analysis using the same proteins
labeled with fluorescence. All experiments in the planar bilayer were done in
HEPES-buffered saline containing 1% human serum albumin, 2 mM MgCl2and 1 mM CaCl2.
TIRFM imaging. Cells were imaged by TIRFM as described44,45. A beam from a
solid-state laser (488 nm and 20 mW; Sapphire 488-20-OPS; Coherent) and an
inverted microscope (IX-81, Olympus, Japan) were used. Images were captured
with an electron-bombarded charge-coupled device camera (C-7190-23;
Hamamatsu Photonics). Images were recorded and analyzed with AquaCosmos
software (Hamamatsu Photonics). The high sensitivity and resolution of our
TIRFM system allowed us to monitor the formation of fluorescent micro-
clusters and the signaling process with minimal fluorescence decrease due to
photo bleaching.
1260 VOLUME 6 NUMBER 12 DECEMBER 2005 NATURE IMMUNOLOGY
A R T I C L E S©
2005
Nat
ure
Pub
lishi
ng G
roup
ht
tp://
ww
w.n
atur
e.co
m/n
atur
eim
mun
olog
y
Fluorescence imaging with lipid bilayers. Cells on the planar bilayers were
fixed at various time points and were incubated overnight with 4% parafor-
maldehyde. Then, the cells were stained for 30 min at 25 1C with primary and
secondary antibodies. Before being stained for intracellular molecules,
cells were treated for 1 min at 25 1C with 0.05% Triton X-100 in PBS and
for 30 min at 25 1C with 3% BSA in PBS for permeabilization and blocking,
respectively. Antibodies were used at the following concentrations: anti-CD3e,
5 mg/ml; anti-pZap70, 1 mg/ml; anti-pY, 2 mg/ml; anti-mouse IgG, 10 mg/ml;
and anti-rabbit IgG, 10 mg/ml. All images were collected on a Leica DMIRES2
system and data were analyzed and prepared for presentation with Leica
confocal software.
Calcium induction assay. AND-Tg CD4+ T cells expressing EGFP–CD3z were
incubated for 20 min at 37 1C with 20 mM Indo-1 in Hank’s balanced salt
solution buffer containing 1% BSA. Cells were washed twice, were resuspended
in the assay medium and were loaded on the planar bilayers. Ratiometric
calcium measurements correlated with EGFP–CD3z images were collected by
alternate visualization of Indo-1 through 405-nm and 495-nm filters in the cell
body every 15 s. All images were collected with an Olympus IX81 fluorescence
microscope, and fluorescence intensity was measured and calculated with
MetaMorph (Universal Imaging).
T cell–B cell interactions. B cells were purified from C3H/HeN spleen cell
samples and were incubated in culture medium containing 10 mg/ml of
lipopolysaccharide and 3 mM PCC. After 24–36 h, dead cells were excluded
from lipopolysaccharide-stimulated B cell samples with Lympholyte-M (Cedar-
lane) and were used as APCs for AND-Tg CD4+ T cells. B cells were applied on
poly-L-lysine-coated coverslips and T cells were subsequently loaded onto the
coverslips. After conjugation, cells were fixed with 4% paraformaldehyde
at various times and were stained with biotinylated anti-CD3e and Alexa
Fluor–labeled streptavidin. All images were collected with a Leica DMIRE2
microscope. EGFP–CD3z, EGFP–Zap70 and EGFP–SLP-76 were transduced
into wild-type, Zap70-deficient (p116) and SLP-76-deficient (J14) Jurkat
T cells, respectively. Jurkat T cells were conjugated with Raji cells prepulsed
with staphylococcus enterotoxin E as described above.
Image processing and data analysis. The number of molecules in an
microcluster was calculated as the fluorescence intensity of a single microcluster
divided by the average of the fluorescence intensity of a single EGFP molecule.
Kymographs and surface plots were prepared for presentation with the
Montage and Surface Plot ‘plug-ins’, respectively. Individual microclusters
were tracked by ‘Manual tracking’, and the area and intensity of each
microcluster were calculated by ‘Analyze particles’ in ImageJ (National
Institutes of Health).
Note: Supplementary information is available on the Nature Immunology website.
ACKNOWLEDGMENTSWe thank R. Varma, G. Campi and T. Starr for instructions on the preparationof planar bilayers and for sharing data before publication, and H. Yamaguchifor secretarial assistance. Supported by the Ministry of Education, Culture,Sports, Science and Technology of Japan (T.Y., M.T. and T.S.), New EnergyDevelopment Organization (M.T.), and the National Institutes of Health(AI043542 and AI044931 to M.L.D.).
COMPETING INTERESTS STATEMENTThe authors declare that they have no competing financial interests.
Published online at http://www.nature.com/natureimmunology/
Reprints and permissions information is available online at http://npg.nature.com/
reprintsandpermissions/
1. Monks, C.R., Freiberg, B.A., Kupfer, H., Sciaky, N. & Kupfer, A. Three-dimensionalsegregation of supramolecular activation clusters in Tcells. Nature 395, 82–86 (1998).
2. Grakoui, A. et al. The immunological synapse: a molecular machine controlling T cellactivation. Science 285, 221–227 (1999).
3. Huppa, J.B. & Davis, M.M. T-cell-antigen recognition and the immunological synapse.Nat. Rev. Immunol. 3, 973–983 (2003).
4. Dustin, M.L. & Cooper, J.A. The immunological synapse and the actin cytoskeleton:molecular hardware for T cell signaling. Nat. Immunol. 1, 23–29 (2000).
5. Vicente-Manzanares, M. & Sanchez-Madrid, F. Role of the cytoskeleton during leuko-cyte responses. Nat. Rev. Immunol. 4, 110–122 (2004).
6. Freiberg, B.A. et al. Staging and resetting T cell activation in SMACs. Nat. Immunol. 3,911–917 (2002).
7. Allenspach, E.J. et al. ERM-dependent movement of CD43 defines a novelprotein complex distal to the immunological synapse. Immunity 15, 739–750(2001).
8. Blanchard, N., Di Bartolo, V. & Hivroz, C. In the immune synapse, ZAP-70 controls Tcell polarization and recruitment of signaling proteins but not formation of the synapticpattern. Immunity 17, 389–399 (2002).
9. Delon, J., Kaibuchi, K. & Germain, R.N. Exclusion of CD43 from the immunologicalsynapse is mediated by phosphorylation-regulated relocation of the cytoskeletal adaptormoesin. Immunity 15, 691–701 (2001).
10. Lee, K.H. et al. T cell receptor signaling precedes immunological synapse formation.Science 295, 1539–1542 (2002).
11. Irvine, D.J., Purbhoo, M.A., Krogsgaard, M. & Davis, M.M. Direct observation of ligandrecognition by T cells. Nature 419, 845–849 (2002).
12. Harriague, J. & Bismuth, G. Imaging antigen-induced PI3K activation in T cells. Nat.Immunol. 3, 1090–1096 (2002).
13. Costello, P.S., Gallagher, M. & Cantrell, D.A. Sustained and dynamic inositollipid metabolism inside and outside the immunological synapse. Nat. Immunol. 3,1082–1089 (2002).
14. Lee, K.H. et al. The immunological synapse balances T cell receptor signaling anddegradation. Science 302, 1218–1222 (2003).
15. Purtic, B., Pitcher, L.A., van Oers, N.S. & Wulfing, C. T cell receptor (TCR) clusteringin the immunological synapse integrates TCR and costimulatory signaling in selectedT cells. Proc. Natl. Acad. Sci. USA 102, 2904–2909 (2005).
16. Bunnell, S.C. et al. T cell receptor ligation induces the formation of dynamicallyregulated signaling assemblies. J. Cell Biol. 158, 1263–1275 (2002).
17. Huppa, J.B., Gleimer, M., Sumen, C. & Davis, M.M. Continuous T cell receptorsignaling required for synapse maintenance and full effector potential. Nat. Immunol.4, 749–755 (2003).
18. Dustin, M.L. & Shaw, A.S. Costimulation: building an immunological synapse. Science283, 649–650 (1999).
19. Stoll, S., Delon, J., Brotz, T.M. & Germain, R.N. Dynamic imaging of T cell-dendriticcell interactions in lymph nodes. Science 296, 1873–1876 (2002).
20. Miller, M.J., Wei, S.H., Parker, I. & Cahalan, M.D. Two-photon imaging of lymphocytemotility and antigen response in intact lymph node. Science 296, 1869–1873(2002).
21. Hailman, E., Burack, W.R., Shaw, A.S., Dustin, M.L. & Allen, P.M. ImmatureCD4+CD8+ thymocytes form a multifocal immunological synapse with sustainedtyrosine phosphorylation. Immunity 16, 839–848 (2002).
22. Heissmeyer, V. et al. Calcineurin imposes T cell unresponsiveness through targetedproteolysis of signaling proteins. Nat. Immunol. 5, 255–265 (2004).
23. Iezzi, G., Karjalainen, K. & Lanzavecchia, A. The duration of antigenic stimulationdetermines the fate of naive and effector T cells. Immunity 8, 89–95 (1998).
24. van Stipdonk, M.J. et al. Dynamic programming of CD8+ T lymphocyte responses. Nat.Immunol. 4, 361–365 (2003).
25. Faroudi, M., Zaru, R., Paulet, P., Muller, S. & Valitutti, S. Cutting edge: T lymphocyteactivation by repeated immunological synapse formation and intermittent signaling.J. Immunol. 171, 1128–1132 (2003).
26. Depoil, D. et al. Immunological synapses are versatile structures enabling selectiveT cell polarization. Immunity 22, 185–194 (2005).
27. Bunnell, S.C., Kapoor, V., Trible, R.P., Zhang, W. & Samelson, L.E. Dynamic actinpolymerization drives T cell receptor-induced spreading: a role for the signal transduc-tion adaptor LAT. Immunity 14, 315–329 (2001).
28. Barda-Saad, M. et al. Dynamic molecular interactions linking the T cell antigenreceptor to the actin cytoskeleton. Nat. Immunol. 6, 80–89 (2004).
29. Krummel, M.F. & Davis, M.M. Dynamics of the immunological synapse: finding,establishing and solidifying a connection. Curr. Opin. Immunol. 14, 66–74(2002).
30. Krummel, M.F., Sjaastad, M.D., Wulfing, C. & Davis, M.M. Differential clustering ofCD4 and CD3z during T cell recognition. Science 289, 1349–1352 (2000).
31. Brossard, C. et al. Multifocal structure of the T cell - dendritic cell synapse. Eur. J.Immunol. 35, 1741–1753 (2005).
32. Gelkop, S. & Isakov, N. T cell activation stimulates the association of enzymaticallyactive tyrosine-phosphorylated ZAP-70 with the Crk adapter proteins. J. Biol. Chem.274, 21519–21527 (1999).
33. Sasahara, Y. et al. Mechanism of recruitment of WASP to the immunologicalsynapse and of its activation following TCR ligation. Mol. Cell 10, 1269–1281(2002).
34. Zeng, R. et al. SLP-76 coordinates Nck-dependent Wiskott-Aldrich syndrome proteinrecruitment with Vav-1/Cdc42-dependent Wiskott-Aldrich syndrome protein activationat the T cell-APC contact site. J. Immunol. 171, 1360–1368 (2003).
35. Griffiths, E.K. & Penninger, J.M. Communication between the TCR and integrins:role of the molecular adapter ADAP/Fyb/Slap. Curr. Opin. Immunol. 14, 317–322(2002).
36. Krause, M. et al. Fyn-binding protein (Fyb)/SLP-76-associated protein (SLAP), Ena/vasodilator-stimulated phosphoprotein (VASP) proteins and the Arp2/3 complex linkT cell receptor (TCR) signaling to the actin cytoskeleton. J. Cell Biol. 149, 181–194(2000).
37. Dustin, M.L. Stop and go traffic to tune T cell responses. Immunity 21, 305–314(2004).
NATURE IMMUNOLOGY VOLUME 6 NUMBER 12 DECEMBER 2005 1261
A R T I C L E S©
2005
Nat
ure
Pub
lishi
ng G
roup
ht
tp://
ww
w.n
atur
e.co
m/n
atur
eim
mun
olog
y
38. Maldonado, R.A., Irvine, D.J., Schreiber, R. & Glimcher, L.H. A role for the immuno-logical synapse in lineage commitment of CD4 lymphocytes. Nature 431, 527–532(2004).
39. Valitutti, S., Muller, S., Cella, M., Padovan, E. & Lanzavecchia, A. Serial triggering ofmany T-cell receptors by a few peptide-MHC complexes. Nature 375, 148–151(1995).
40. Davis, S.J. & van der Merwe, P.A. The immunological synapse: required for T cell recep-tor signalling or directing T cell effector function? Curr. Biol. 11, R289–R291 (2001).
41. Delon, J. & Germain, R.N. Information transfer at the immunological synapse. Curr.Biol. 10, R923–R933 (2000).
42. Wulfing, C. et al. Costimulation and endogenous MHC ligands contribute to T cellrecognition. Nat. Immunol. 3, 42–47 (2002).
43. Campbell, R.E. et al. A monomeric red fluorescent protein. Proc. Natl. Acad. Sci. USA99, 7877–7882 (2002).
44. Axelrod, D. Cell-substrate contacts illuminated by total internal reflection fluorescence.J. Cell Biol. 89, 141–145 (1981).
45. Tokunaga, M., Kitamura, K., Saito, K., Iwane, A.H. & Yanagida, T. Single moleculeimaging of fluorophores and enzymatic reactions achieved by objective-type totalinternal reflection fluorescence microscopy. Biochem. Biophys. Res. Commun. 235,47–53 (1997).
1262 VOLUME 6 NUMBER 12 DECEMBER 2005 NATURE IMMUNOLOGY
A R T I C L E S©
2005
Nat
ure
Pub
lishi
ng G
roup
ht
tp://
ww
w.n
atur
e.co
m/n
atur
eim
mun
olog
y