site-specific atherogenic gene expression correlates with subsequent variable lesion development in...
TRANSCRIPT
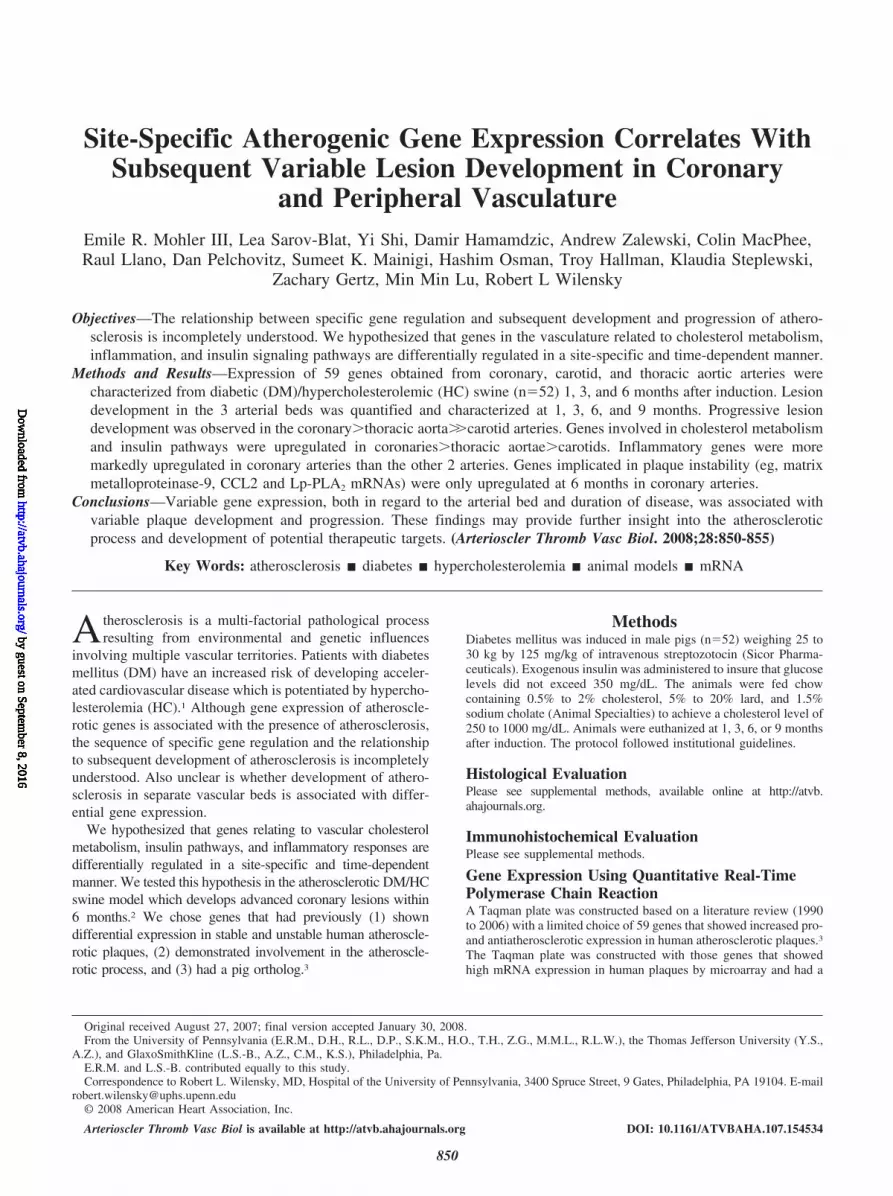
Site-Specific Atherogenic Gene Expression Correlates WithSubsequent Variable Lesion Development in Coronary
and Peripheral VasculatureEmile R. Mohler III, Lea Sarov-Blat, Yi Shi, Damir Hamamdzic, Andrew Zalewski, Colin MacPhee,Raul Llano, Dan Pelchovitz, Sumeet K. Mainigi, Hashim Osman, Troy Hallman, Klaudia Steplewski,
Zachary Gertz, Min Min Lu, Robert L Wilensky
Objectives—The relationship between specific gene regulation and subsequent development and progression of athero-sclerosis is incompletely understood. We hypothesized that genes in the vasculature related to cholesterol metabolism,inflammation, and insulin signaling pathways are differentially regulated in a site-specific and time-dependent manner.
Methods and Results—Expression of 59 genes obtained from coronary, carotid, and thoracic aortic arteries werecharacterized from diabetic (DM)/hypercholesterolemic (HC) swine (n�52) 1, 3, and 6 months after induction. Lesiondevelopment in the 3 arterial beds was quantified and characterized at 1, 3, 6, and 9 months. Progressive lesiondevelopment was observed in the coronary�thoracic aorta��carotid arteries. Genes involved in cholesterol metabolismand insulin pathways were upregulated in coronaries�thoracic aortae�carotids. Inflammatory genes were moremarkedly upregulated in coronary arteries than the other 2 arteries. Genes implicated in plaque instability (eg, matrixmetalloproteinase-9, CCL2 and Lp-PLA2 mRNAs) were only upregulated at 6 months in coronary arteries.
Conclusions—Variable gene expression, both in regard to the arterial bed and duration of disease, was associated withvariable plaque development and progression. These findings may provide further insight into the atheroscleroticprocess and development of potential therapeutic targets. (Arterioscler Thromb Vasc Biol. 2008;28:850-855)
Key Words: atherosclerosis � diabetes � hypercholesterolemia � animal models � mRNA
Atherosclerosis is a multi-factorial pathological processresulting from environmental and genetic influences
involving multiple vascular territories. Patients with diabetesmellitus (DM) have an increased risk of developing acceler-ated cardiovascular disease which is potentiated by hypercho-lesterolemia (HC).1 Although gene expression of atheroscle-rotic genes is associated with the presence of atherosclerosis,the sequence of specific gene regulation and the relationshipto subsequent development of atherosclerosis is incompletelyunderstood. Also unclear is whether development of athero-sclerosis in separate vascular beds is associated with differ-ential gene expression.
We hypothesized that genes relating to vascular cholesterolmetabolism, insulin pathways, and inflammatory responses aredifferentially regulated in a site-specific and time-dependentmanner. We tested this hypothesis in the atherosclerotic DM/HCswine model which develops advanced coronary lesions within6 months.2 We chose genes that had previously (1) showndifferential expression in stable and unstable human atheroscle-rotic plaques, (2) demonstrated involvement in the atheroscle-rotic process, and (3) had a pig ortholog.3
MethodsDiabetes mellitus was induced in male pigs (n�52) weighing 25 to30 kg by 125 mg/kg of intravenous streptozotocin (Sicor Pharma-ceuticals). Exogenous insulin was administered to insure that glucoselevels did not exceed 350 mg/dL. The animals were fed chowcontaining 0.5% to 2% cholesterol, 5% to 20% lard, and 1.5%sodium cholate (Animal Specialties) to achieve a cholesterol level of250 to 1000 mg/dL. Animals were euthanized at 1, 3, 6, or 9 monthsafter induction. The protocol followed institutional guidelines.
Histological EvaluationPlease see supplemental methods, available online at http://atvb.ahajournals.org.
Immunohistochemical EvaluationPlease see supplemental methods.
Gene Expression Using Quantitative Real-TimePolymerase Chain ReactionA Taqman plate was constructed based on a literature review (1990to 2006) with a limited choice of 59 genes that showed increased pro-and antiatherosclerotic expression in human atherosclerotic plaques.3
The Taqman plate was constructed with those genes that showedhigh mRNA expression in human plaques by microarray and had a
Original received August 27, 2007; final version accepted January 30, 2008.From the University of Pennsylvania (E.R.M., D.H., R.L., D.P., S.K.M., H.O., T.H., Z.G., M.M.L., R.L.W.), the Thomas Jefferson University (Y.S.,
A.Z.), and GlaxoSmithKline (L.S.-B., A.Z., C.M., K.S.), Philadelphia, Pa.E.R.M. and L.S.-B. contributed equally to this study.Correspondence to Robert L. Wilensky, MD, Hospital of the University of Pennsylvania, 3400 Spruce Street, 9 Gates, Philadelphia, PA 19104. E-mail
[email protected]© 2008 American Heart Association, Inc.
Arterioscler Thromb Vasc Biol is available at http://atvb.ahajournals.org DOI: 10.1161/ATVBAHA.107.154534
850
by guest on September 8, 2016
http://atvb.ahajournals.org/D
ownloaded from
by guest on Septem
ber 8, 2016http://atvb.ahajournals.org/
Dow
nloaded from
by guest on September 8, 2016
http://atvb.ahajournals.org/D
ownloaded from
by guest on Septem
ber 8, 2016http://atvb.ahajournals.org/
Dow
nloaded from
by guest on September 8, 2016
http://atvb.ahajournals.org/D
ownloaded from
by guest on Septem
ber 8, 2016http://atvb.ahajournals.org/
Dow
nloaded from
by guest on September 8, 2016
http://atvb.ahajournals.org/D
ownloaded from
by guest on Septem
ber 8, 2016http://atvb.ahajournals.org/
Dow
nloaded from
by guest on September 8, 2016
http://atvb.ahajournals.org/D
ownloaded from
by guest on Septem
ber 8, 2016http://atvb.ahajournals.org/
Dow
nloaded from
by guest on September 8, 2016
http://atvb.ahajournals.org/D
ownloaded from
by guest on Septem
ber 8, 2016http://atvb.ahajournals.org/
Dow
nloaded from
by guest on September 8, 2016
http://atvb.ahajournals.org/D
ownloaded from
by guest on Septem
ber 8, 2016http://atvb.ahajournals.org/
Dow
nloaded from

porcine analog. The selected genes were then annotated for variouspathways using GO terms. (For a complete list of genes evaluatedand their GO annotation, please see supplemental Table I). Follow-ing removal of overlying adipose and connective tissue the entirevessel was used for analysis. Total RNA was extracted using RNeasyMini Kit (Qiagen), followed by removal of genomic DNA contam-ination using DNase I (Ambion). The efficiency of the DNaseprocedure was validated in a standard TaqMan assay using RNAsamples not subjected to a reverse transcription step and GAPDHprimer set. The DNA-free total RNA samples were quantified usingRiboGreen RNA quantitation reagent (Molecular Probes) mRNAwas converted to cDNA by reverse transcription utilizing HighCapacity cDNA Archive Kit (Applied Biosystems) and the equiva-lent of 10 ng per well was arrayed into high-density 384-well platesusing a Biomek FX robot (Beckman Coulter) allowing expressionprofile generation for 1 gene at a time. Quantitative RT-PCR wascarried out using a 7900HT Sequence Detector System (AppliedBiosystems) in 10 �L reaction volume. TaqMan Universal PCRMaster Mix 2X (Applied Biosystems) and universal PCR conditionsrecommended by the manufacturer were followed. Copy numbers ofa given mRNA detected in each sample were calculated afternormalization to the average log of the expression of 3 housekeepinggenes (cyclophilin, GAPDH, and B-actin). Four non-DM/non-HCage- and sex-matched animals acted as controls for comparison in thegene expression studies. In these animals for the 59 evaluated genesthe group coefficient of variation was 63%, 35%, and 30% forcoronary, carotid, and aortic samples, respectively.
Statistical AnalysisNumeric data are expressed as mean�SD, unless otherwise noted.Comparisons of multiple groups were made using analysis ofvariance (ANOVA). If the results of the ANOVA were significant,posthoc analysis using the Sheffe method was performed to evaluateintergroup differences. Significance of up- and downregulation ofgene expression used ANACOVA. SPSS version 12 was used forstatistical analysis. A probability value �0.05 was consideredsignificant.
ResultsDM/HC animals (n�52) were euthanized at 1 month, (n�7),3 (n�10), 6 (n�26), or 9 months (n�9) after induction.Originally 7 animals were enrolled in the 1-month group and10 animals in the other groups. One animal died suddenly inthe 9-month group. Additional vascular tissue was availablefor histology, immunohistochemistry, and gene expressionstudies at the 6-month time point and we elected to enrich thissample. There was no difference in the care or results in theadditional 16 animals compared to the original 10. Afterinitiation of DM/HC the serum glucose levels increased toapproximately 300 mg/dL and cholesterol levels increased to
�700 mg/dL at 3 months. Both remained elevated for theduration of the study (P�0.0001, supplemental Table II).
HistopathologyArterial samples were obtained 1, 3, 6, and 9 months toevaluate the time course of complex lesion development. The9-month samples were obtained to document variable pro-gression of atherosclerosis in the 3 arterial territories, specif-ically the continued differential lesion progression over time.There were no lesions 1 month after initiation of DM/HC inany arterial bed. By 3 months lesions were observed in allarterial beds but were more frequently observed in coronaryarteries and thoracic aortae (Table 1). Over the study periodthe intimal-medial ratio increased in the coronary artery andthoracic aorta (coronary��aorta) and was relatively stable inthe carotid arteries. Coronary lesions at 3 months generallyconsisted of lipid laden foam cells or smooth muscle �-actinnegative cells, whereas at 6 months increased complexity wasobserved with the lesions consisting of smooth muscle cells(�-actin positive), extracellular matrix, and macrophages.Lipid pools and necrotic cores were also observed. By 9months high-grade complex lesions consisting of smoothmuscle cells, extracellular matrix, and macrophages withlipid pools, necrotic debris, and calcifications were com-monly observed. Examples of coronary, carotid, and thoracicaortic lesions obtained from 1 animal at each time point areshown in Figure 1. Adjacent sections demonstrating macro-phage accumulation in the 3 arterial beds at the 3 time points isseen in supplemental Figure II. Histological evaluation of allcoronary arteries demonstrating an atherosclerotic plaque(n�78) showed that the most severe lesion was generallylocated in the proximal segment of the coronary artery (60/78,77%). In 62 arteries 1 or more sections per artery contained abranching vessel. Of the 62, 55 arteries had a lesion located nearthe ostium of the side branch (89%). In 13 (of the 55) the lesionswere only noted near the branching vessel while in 3 (of theremaining 7) a lesion was noted only in the nonbranchingsegment.
A progressive increase in the percentage of advancedatherosclerotic lesions was noted in left coronary arteries(Tables 2 and 3). In contradistinction, the thoracic aortademonstrated less advanced lesions at each time point, as 8 of9 thoracic aortae had intimal xanthomas at 3 months. At 6months 19 of 21 had intimal xanthomas, 1 had a fibrous
Table 1. Intimal Area, Intimal/Medial Ratio, and Extent of Atherosclerosis (% arteries and % sections with a lesion) in the 3Assessed Arterial Beds
Months
Intimal Area (mm2) Intimal/Medial Ratio
1 3 6 9 1 3 6 9
Coronary arteries* 0 0.18�0.23 0.74�1.45 2.00�2.24 0 0.20�0.42 0.67�1.54 1.16�1.05
Carotid arteries 0 0.08�0.19 0.24�0.78 0.12�0.21 0 0.03�0.07 0.05�0.15 0.01�0.03
Thoracic aorta** 0 0.43�0.28 2.74�4.79 5.70�8.11 0 0.03�0.01 0.05�0.07 0.06�0.09
(Continued)
In total 7 animals were studied at the 1-month time point, 10 at 3 months, 26 at 6 months, and 9 at 9 months. The number of arteries studied is listed. A significantincrease in intimal area was noted in coronary arteries (*P�0.0001 by ANOVA with P�0.08 3 vs 6 months, P�0.002 3 vs 9 months, P�0.006 6 vs 9 months). Nosignificant differences, over time, were noted in intimal area in the carotid artery group ( P�NS for all comparisons within group). The increase in intimal area inthe thoracic aortae approached significance at the 9-month time point (**P�0.07).
Mohler et al Gene Expression in DM/HC-Induced Atherosclerosis 851
by guest on September 8, 2016
http://atvb.ahajournals.org/D
ownloaded from

atheroma, and 1 a thin fibrous cap atheroma. At 9 months, ofthe 9 arteries, 7 exhibited an intimal xanthoma and 2 a fibrouscap atheroma. Of the 10 carotid arteries, at 3 months only 2had intimal xanthomas whereas at 6 months, 6 of 26 arterieshad intimal xanthomas and 2 had fibrous atheromas. By 9months of 6 arteries there was 1 with an intimal xanthoma and1 with a fibrous atheroma. The remaining arteries at thesetime points demonstrated no lesions.
Gene Expression in Cholesterol Metabolism andInsulin Related Gene PathwaysA complete listing of gene expression changes over time arepresented in supplemental Table III. There was persistent up-regulation in the ATP-binding cassette transporter gene, ABCA1, and consistent downregulation of fatty acid synthase in allarterial beds at all time points except at 6 months in carotids forABCA 1 and 1 month for aortic fatty acid synthase. In coronaryarteries only there was late upregulation of apoE and themitochondrial gene UCP2 and downregulation of PPAR� geneexpression at 6 months. Elevation in insulin related pathwaygene expression (adiponectin, leptin, PPAR�, and preproadip-sin) was only noted early (generally at 1 month) and only incoronary arteries, whereas IRS1 (insulin receptor substrate 1)was downregulated only in the thoracic aorta at 3 and 6 months.
Gene Expression in Inflammatory SignalingRelated Gene PathwaysWith the exception of intercellular adhesion molecule-1(ICAM-1), early increased inflammatory gene expression wasnoted in the coronary arteries only. ICAM-1 upregulation wasalso observed at all time points in carotid arteries but not thethoracic aortae. At 1 month, genes involved with cell-celladhesion (ICAM-1, vascular cell adhesion molecule[VCAM]-1), regulation of an inflammatory-immune response(PTGS2 or COX-2, NOS-2A), and macrophage internaliza-tion of hemoglobin/haptoglobin (CD163),7 were only upregu-lated in coronary arteries. At 3 months only ICAM-1 andNOS2A continued to be significantly upregulated in thecoronary arteries and ICAM-1 in the carotid arteries. At 6months, increased expression of multiple genes was ob-served. Several were preferentially upregulated in coronaryarteries, including those involved with monocyte chemotaxis(CCL2 or Monocyte chemotactic protein-1), progression ofmacrophages to foam cells (CD68),8 cell growth and main-tenance (EV12B), and genes associated with increased lesioncomplexity such as MMP-9 and the urokinase plasminogenactivator (uPA) receptor (PLAUR) which degrade extracel-lular matrix proteins and increase cellular migration. Multiplegenes were upregulated both in the coronary arteries and
Table 1. Continued
Arteries With Lesions Arterial Sections With Lesions
1 3 6 9 1 3 6 9
0/14 (0%) 10/18 (61%) 50/52 (96%) 18/18 (100%) 0/42 (0%) 21/59 (36%) 106/215 (49%) 43/49 (92%)
0/7 (0%) 2/10 (20%) 8/26 (31%) 2/6 (33%) 0/30 (0%) 3/41 (7%) 14/116 (14%) 2/30 (7%)
0/7 (0%) 8/9 (89%) 21/21 (100%) 9/9 (100%) 0/32 (0%) 27/33 (82%) 97/110 (88%) 42/45 (93%)
Coronary artery Carotid artery Thoracic aorta
9 m
onth
s6
mon
ths
3 m
onth
s
*
*+
+
+*
Figure 1. Examples of lesions obtained afterDM/HC induction. The coronary, carotid, andaortic arteries were obtained from 1 animal ateach time point. Note increasing complexity ofcoronary lesions, the relative lack of atheroscle-rosis in carotids, and the minimal but complexappearance of thoracic aortic lesions at 6 and9 months. *denotes necrotic cores and � are offocal calcification. Bar indicates 100micrometers.
852 Arterioscler Thromb Vasc Biol May 2008
by guest on September 8, 2016
http://atvb.ahajournals.org/D
ownloaded from

thoracic aorta (but not carotid arteries). These included genesinvolved in cell-cell signaling and immune response (CCR1,interleukin [IL]-8), neutrophil chemotaxis (ITGB2, IL-8), andactivation (IL-8), Lp-PLA2, and NOS2A. Finally, CD163 wasupregulated at 6 months in the thoracic aorta whereas it wasupregulated at 1 month in the coronary artery. EV12Aexpression (cell proliferation and growth) was increased incoronary arteries and thoracic aortae at 1 month and increasedin carotid arteries at 3 months. The cytoprotective geneHMOX-1 was upregulated at 1 month only in coronaryarteries.
Genes With Unknown FunctionWe added genes that were previously shown to be highlyexpressed within inflamed areas of human plaque tissue butdo not have as yet have a published known function.3 Themajority of genes upregulated were noted in the coronaryartery. FLJ22457 was increased in coronary arteries at alltime points but only at 6 months in carotid arteries.
Gene AssociationsTo further investigate the correlation between expression ofactivated monocyte markers and the high-fat diet associationsbetween several prominently upregulated inflammatory geneswere determined. There were significant associations be-tween gene expression of CD68, Lp-PLA2, and MMP9(supplemental Figure III); genes involved in macrophageactivation and function. A significant correlation was notedbetween these genes and the total cholesterol exposure.
DiscussionThe induction of Type I diabetes mellitus and hypercholes-terolemia led to progressive yet variable development ofatherosclerosis with a majority of coronary vessels develop-ing advanced lesions whereas a minority of thoracic aortaeand carotid arteries demonstrated complex atheroma devel-opment. The observation that gene expression of inflamma-tory mediators was most pronounced in the coronary arteriessuggests a particularly important role for vascular inflamma-tion in the development of advanced atherosclerosis in this
arterial bed compared to the thoracic aortae and carotidarteries.
Gene expression profiling has previously been used toidentify genes and pathways relevant to atherosclerosis andhas identified differentially expressed genes involved in lipidmetabolism, inflammation, cell turnover, matrix degradation,and coding for matrix proteins.9 In the present study adynamic interplay of pro- and antiatherosclerotic gene profileexpression was noted with upregulation of some genespreceeding atherosclerotic plaque development whereas somelipid metabolism genes, which may play a role in preventinglesion development, were also expressed (Figure 2). Persis-tent upregulation of ABCA1 may indicate a defensive mech-anism to offload cholesterol from macrophages onto HDL inthe setting of the increased serum LDL levels. The persistentdownregulation of fatty acid synthase (FAS), the majorenzyme involved with fatty acid synthesis, likely reflects theperturbation in the insulin and glucagon ratio.
Early increases in vascular inflammation gene expressionin coronary arteries, specifically genes for ICAM-1 (alsoobserved in carotid arteries), VCAM-1, IL-1, the nitric oxideisoform NOS2A, as well as the cytoprotective gene HMox1were noted. Early and persistent upregulation of ICAM-1supports previous data showing increases within circulatingperipheral blood mononuclear cells and coronary tissue.10
However, given the distinct difference in lesion developmentin coronary and carotid arteries ICAM-1 may not play a majorrole in subsequent plaque progression. Later, upregulationwas observed for CCR-1, produced by macrophages, T cells,neutrophils and dendritic cells, CCL2; genes associated witha vascular inflammatory-immune response. Upregulation ofthe Lp-PLA2 gene indicates the potential role that thismolecule plays in the development and progression of ath-erosclerosis and supports previous data showing upregulationof Lp-PLA2 mRNA in peripheral blood mononuclear cells at3 months and in coronary artery tissue at 6 months.10
Lp-PLA2 acts on the truncated phospholipid of oxidized LDLresulting in generation of 2 important mediators of inflam-matory cell homing: nonesterified fatty acids (NEFA) andlysoPC. Other genes also upregulated at 6 months, such asMMP-9 and PLAUR, have been postulated to major roles inlesion instability deemed vulnerable plaques. Importantlythere was a lack of significant change in gene expression inthe thoracic aorta of MMP-9 and PLAUR paralleling therelative lack of development of high-grade complex lesions atthis location.
Increased inflammatory and insulin signaling pathwaygene expression suggests a mechanism of the observedincreased susceptibility to lesion development and increasedcomplexity observed in coronary arteries compared to carotid
Table 2. Classification of Porcine Coronary Arteries Accordingto the AHA/Stary Classification Scheme
No Lesion I II III IV V VI
3 months (n�18) 39% 0% 44% 11% 6% 0 0
6 months (n�52) 4% 0% 40% 35% 15% 6% 0%
9 months (n�18) 0 0% 17% 22% 28% 28% 6%
Stage IV and higher are considered advanced atherosclerotic lesions.4,5
n indicates number of arteries.
Table 3. Classification of Porcine Coronary Arteries According to the Modified AHA/Virmani et al Criteria6
No Lesion
AdaptiveIntimal
ThickeningIntimal
Xanthoma
PathologicIntimal
ThickeningFibrous CapAtheroma
Thin CapFibroatheroma
CalcificNodule
FibrocalcificPlaque
3 months (n�18) 39% 0% 44% 11% 6% 0 0 0
6 months (n�52) 4% 0% 40% 35% 15% 2% 2% 2%
9 months (n�18) 0 0% 17% 22% 28% 11% 0% 22%
Mohler et al Gene Expression in DM/HC-Induced Atherosclerosis 853
by guest on September 8, 2016
http://atvb.ahajournals.org/D
ownloaded from

arteries and thoracic aortae. Indeed, the differential develop-ment of lesions in the 3 vascular beds supports previousobservations that atherosclerosis is unevenly distributed.Passarini et al11 has shown the presence of heterogeneouspopulations of endothelial phenotypes from hemodynam-ically distinct regions of adult nonatherosclerotic porcineaortae, indicating the potential for atherogenic vulnerabilityin the setting of additional risk factors. Chatzizisis et al12 haveshown using a DM/HC model that areas of low endothelialshear stress in coronary arteries predicted future developmentof atherosclerotic plaque development and progression tohigh-risk lesions with increased lipid accumulation, inflam-mation, and expansive remodeling, hallmarks of vulnerablelesions with increased risk of causing clinical instability.There are several theories on the origin of the differentialvascular gene expression which include (1) that additional ordifferent risk factors are required, eg, hypertension or smok-ing for complex lesion development in carotids or thoracicaortae, (2) variable deposition of LDL particles,13 (3) shearstress dependent accumulation of inflammatory cells in spe-cific vascular regions,14 (4) differential shear stress dependentendothelial gene expression resulting from direct biome-chanical effects,15 or (5) blood vessel geometry. Curved andbranching arteries, such as the coronaries, possess areas ofdisturbed blood flow, whereas a higher shear stress and anotable lack of atherosclerosis is noted in arteries withunidirectional laminar blood flow, such as the carotidartery.11
This is the first study to evaluate gene expression over a6-month time period in a large atherosclerotic animal model.Mouse models, developed through genetic manipulation,have proven useful in elucidating underlying mechanisms ofdisease development; however, they are limited by theirvarying lipid profiles, lack of spontaneous coronary arterydisease, and nonhuman like atherosclerotic disease.16–18 For
example, the apoE knock-out and LDL receptor negativemodel generally develop atherosclerosis in the proximalaorta, aortic arch, and the brachiocephalic arteries19–21 bedsdissimilar from human atherosclerosis. In mice DM has littleeffect on atherosclerosis development,19 and their small sizemakes tissue acquisition and physiological evaluation diffi-cult. A distinct advantage of the porcine model is the complexhuman-like appearance of the lesions and abundant tissueavailable for genetic, molecular, and cellular studies. Pro-longed DM/HC results in increased arterial stiffness, reducedvascular compliance, and compromised cardiac functionalreserve; characteristics of diabetic heart disease.22 Earlycoronary lesions, however, are intimal xanthomas rather thanintimal thickening, as often noted in humans.6 Nonetheless,the location and composition of later atherosclerotic lesions,metabolism, diets, and cardiovascular physiology are similarto that of humans, and their size makes them amenable toboth cellular and preclinical testing. One difference is thatafter cholesterol feeding pigs exhibit high HDL and lowtriglyceride levels in the setting of very high LDL levels(supplemental Table II), whereas humans often exhibit lowHDL and high triglyceride levels. Specifically, clinicallyrelevant studies designed to evaluate treatment aimed atpreventing or regressing complex atherosclerotic complexlesions and the subsequent genetic response can be studied inthis model.
There are potential limitations in this study. Gene expres-sion was determined in the right coronary and carotid arteries,and lesion complexity was determined in the left coronaryand carotid arteries. Although we have previously observedno differences in the incidence or composition of atheroscle-rotic lesions in the right (supplemental Figure I) and leftcoronary arteries, given the potential variability in lesiondevelopment it is possible that a variation in gene expressionor inflammation was present in the 2 arterial beds. Insofar asthe entire vessel was sampled, gene expression would differin the presence of an atherosclerotic plaque. Hence, cellularheterogeneity at the different time points and different arterialbeds may limit interpretation of the results. We have at-tempted to reduce this potential variation by sampling manyanimals and using sufficient quantities of tissue to reducesampling error. The limited list of genes selected for Taqmananalysis was constructed from published human plaque mi-croarray data and not from a porcine microarray. Otherpotentially important porcine pathways may have beenmissed. However, the purpose of this study was to focus on ahuman plaque profile to understand the similarities in geneexpression between humans and pigs. The diet used contained0.5 to 1.5% sodium cholate to increase cholesterol levels anddevelopment of atherosclerotic lesions. In murine models ofatherosclerosis the addition of sodium cholate has beenassociated with pleitropic effects which may confound inter-pretation of chronic inflammation.23 No such effects havebeen reported in swine models; nevertheless, it is possiblethat some of the effects observed in inflammatory pathwaygene expression may have reflected the use of sodium cholaterather than atherosclerosis per se. However, all 3 arterial bedswere subjected to the same cholate dose and the notedheterogeneity in inflammation would not be present if cholate
1m 3m 6m 9m
1
2
3
4
5
1.0
2.0
3.0
0
Fold
cha
nge
in g
ene
expr
essi
on
0
Intim
al a
rea
(mm
2 )
% A
dvan
ced
lesi
ons
100%
75%
50%
25%
>6
ILIRNleptin
ICAM-1NOS2A,
PTGS2
ABCA1VCAM1Adiponectin,
CD163,HMOX1, HLA
PPARg
preproadipsin
leptin
ICAM-1
NOS2AABCA1
CD68,
CCL2,
CCR1
HMOX1
ICAM-1
IL8
ILIRN
ITGB2
LpPLA2
MMP9
PLAUR
TM7SF1
ABCA1
APOE
UCP2
Figure 2. Graph showing the association of coronary arterygene expression, development of coronary atherosclerosis(intimal area, black line), and percentage of coronary arteriesdemonstrating advanced lesions by the Virmani et al criteria(orange line). Only genes showing statistically significantincreases in expression are listed at the 1-, 3-, and 6-monthtime points. The location of the genes on the graph indicatesthe time and fold-increase.
854 Arterioscler Thromb Vasc Biol May 2008
by guest on September 8, 2016
http://atvb.ahajournals.org/D
ownloaded from

was the sole instigator of vascular inflammation. The pigsused in this study were “farm raised” and not genetic clonesand thus there are some individual genetic differences. Thismay, however, be an advantage as humans also exhibitgenetic heterogeneity, and this model mimics some of thechallenges in studying a complex environmental and geneticdisease such as atherosclerosis. It should be noted that anassociation of increased or decreased gene expression withincreased development and complexity of coronary artery andthoracic aortic atherosclerosis does not indicate causality.Finally, this is a model of type I diabetes mellitus andalthough the addition of hypercholesterolemia results inaspects of metabolic syndrome, there is no evidence of insulinresistance. As such it should be viewed purely as a model ofcoronary and peripheral atherosclerosis.
In summary, atherosclerosis in the DM/HC porcine modelis phenotypically similar to human atherosclerosis. Variabil-ity in the extent and complexity of the subsequent lesionsobserved in the 3 arterial beds was associated with differen-tial gene expression and provides insight into the use of geneexpression to predict arterial response to DM and HC. Severalgenes with as of yet unknown function, when understood,may provide further insights into the atherosclerotic processand possibly novel targets for therapy.
AcknowledgmentsWe gratefully acknowledge the assistance of Harrilla Profka in thecare of the animals and the performance of the procedures.
Sources of FundingThis work was supported by the Juvenile Diabetes Foundation andGlaxoSmithKline.
DisclosuresDrs Mohler, Shi, and Wilensky are recipients of research grants fromGlaxoSmithKline. Drs Sarov-Blat, Zalewski, MacPhee, andSteplewski are employees of GlaxoSmithKline.
References1. Mohler ER, III. Peripheral Arterial Disease and Diabetes: Pathogenesis to
Guidelines. Nat Clin Pract Cardiovasc Med. 2007;4:151–162.2. Gerrity RG, Natarajan R, Nadler JL, Kimsey T. Diabetes-induced accel-
erated atherosclerosis in swine. Diabetes. 2001;50:1654–1665.3. Papaspyridonos M, Smith A, Burnand KG, Taylor P, Padayachee S,
Suckling KE, James CH, Greaves DR, Patel L. Novel candidate genes inunstable areas of human atherosclerotic plaques. Arterioscler ThrombVasc Biol. 2006;26:1837–1844.
4. Stary HC, Chandler AB, Glagov S, Guyton JR, Insull W Jr, RosenfeldME, Schaffer SA, Schwartz CJ, Wagner WD, Wissler RW. A definitionof initial, fatty streak, and intermediate lesions of atherosclerosis. A reportfrom the Committee on Vascular Lesions of the Council on Arterioscle-rosis, American Heart Association. Circulation. 1994;89:2462–2478.
5. Stary HC, Chandler AB, Dinsmore RE, Fuster V, Glagov S, Insull WJ,Rosenfeld ME, Schwartz CJ, Wagner WD, Wissler RW. A definition ofadvanced types of atherosclerotic lesions and a histological classification ofatherosclerosis. A report from the Committee on Vascular Lesions of the
Council on Arteriosclerosis, American Heart Association. Circulation. 1995;92:1355–1374.
6. Virmani R, Kolodgie FD, Burke AP, Farb A, Schwartz SM. Lessons fromsudden coronary death: a comprehensive morphological classificationscheme for atherosclerotic lesions. Arterioscler Thromb Vasc Biol. 2000;20:1262–1275.
7. Schaer DJ, Buehler PW, Schoedon G, Alayash AI, Schaffner A. CD163is the macrophage scavenger receptor for native and chemically modifiedhemoglobins in the absence of haptoglobin. Blood. 2006;107:373–380.
8. Tsukamoto K, Kinoshita M, Kojima K, Mikuni Y, Kudo M, Mori M,Fujita M, Horie E, Shimazu N, Teramoto T. Synergically IncreasedExpression of CD36, CLA-1 and CD68, but Not of SR-A and LOX-1,with the Progression to Foam Cells from Macrophages. J AtherosclerThomb 2002;9:57–64.
9. Bijnens AP, Lutgens E, Ayoubi T, Kuiper J, Horrevoets AJ, DaemenMJ. Genome-wide expression studies of atherosclerosis: critical issues inmethodology, analysis, interpretation of transcriptomics data. Arte-rioscler Thromb Vasc Biol. 2006;26:1226–1235.
10. Shi Y, Zhang P, Zhang L, Osman H, Mohler ER III, Macphee C,Zalewski A, Postle A, Wilensky RL. Role of lipoprotein-associated phos-pholipase A(2) in leukocyte activation and inflammatory responses.Atheroscler. 2006;191:54–62.
11. Passerini AG, Polacek DC, Shi C, Francesco NM, Manduchi E, GrantGR, Pritchard WF, Powell S, Chang GY, Stoeckert CJ Jr, Davies PF.Coexisting proinflammatory and antioxidative endothelial transcriptionprofiles in a disturbed flow region of the adult porcine aorta. Proc NatlAcad Sci U S A. 2004;101:2482–2487.
12. Chatzizisis YS, Coskun AU, Jonas M, Edelman ER, Feldman CL, StonePH. Role of endothelial shear stress in the natural history of coronaryatherosclerosis and vascular remodeling. J Am Coll Cardiol. 2007;49:2379–2393.
13. Kleinstreuer C, Hyun S, Buchanan JR Jr, Longest PW, Archie JP Jr,Truskey GA. Hemodynamic parameters and early intimal thickening inbranching blood vessels. Crit Rev Biomed Eng. 2001;29:1–64.
14. Honda HM, Hsiai T, Wortham CM, Chen M, Lin H, Navab M, Demer LL.A complex flow pattern of low shear stress and flow reversal promotesmonocyte binding to endothelial cells. Atheroscler. 2001;158:385–390.
15. Resnick N, Yahav H, Khachigian LM, Collins T, Anderson KR, DeweyFC, Gimbrone MA Jr. Endothelial gene regulation by laminar shearstress. Adv Exp Med Biol. 1997;430:155–164.
16. Kolb-Bachofen V, Epstein S, Kiesel U, Kolb H. Low-dose streptozocin-induced diabetes in mice. Electron microscopy reveals single-cell insulitisbefore diabetes onset. Diabetes. 1988;37:21–27.
17. Howard CF Jr. Diabetes mellitus: relationships of nonhuman primates andother animal models to human forms of diabetes. Adv Vet Sci Comp Med.1984;28:115–149.
18. Breslow JL. Mouse models of atherosclerosis. Science. 1996;272:685–688.
19. Kako Y, Huang LS, Yang J, Katopodis T, Ramakrishnan R, Goldberg IJ.Streptozotocin-induced diabetes in human apolipoprotein B transgenicmice. Effects on lipoproteins and atherosclerosis. J Lipid Res. 1999;40:2185–2194.
20. Rosenfeld ME, Polinsky P, Virmani R, Kauser K, Rubanyi G, SchwartzSM. Advanced atherosclerotic lesions in the innominate artery of theApoE knockout mouse. Arterioscler Thromb Vasc Biol. 2000;20:2587–2592.
21. Ishibashi S, Goldstein JL, Brown MS, Herz J, Burns DK. Massivexanthomatosis and atherosclerosis in cholesterol-fed low densitylipoprotein receptor-negative mice. J Clin Invest. 1994;93:1885–1893.
22. Wang Y-X, Fitch R, Weiwei L, Werner M, Halks-Miller M, Lillis B,Vergona R, Post J, Sullivan ME, Verhallen PF. Reduction of cardiacfunctional reerve and elevation of aortic stiffness in hyperlipidemicYucatan minipigs with systemic and coronary atherosclerosis. VascPharmacol. 2002;39:69–76.
23. Getz GS, Reardon CA. Diet and murine atherosclerosis. ArteriosclerThromb Vasc Biol. 2006;26:242–249.
Mohler et al Gene Expression in DM/HC-Induced Atherosclerosis 855
by guest on September 8, 2016
http://atvb.ahajournals.org/D
ownloaded from

Klaudia Steplewski, Zachary Gertz, Min Min Lu and Robert L WilenskyMacPhee, Raul Llano, Dan Pelchovitz, Sumeet K. Mainigi, Hashim Osman, Troy Hallman, Emile R. Mohler III, Lea Sarov-Blat, Yi Shi, Damir Hamamdzic, Andrew Zalewski, Colin
Development in Coronary and Peripheral VasculatureSite-Specific Atherogenic Gene Expression Correlates With Subsequent Variable Lesion
Print ISSN: 1079-5642. Online ISSN: 1524-4636 Copyright © 2008 American Heart Association, Inc. All rights reserved.
Greenville Avenue, Dallas, TX 75231is published by the American Heart Association, 7272Arteriosclerosis, Thrombosis, and Vascular Biology
doi: 10.1161/ATVBAHA.107.1545342008;
2008;28:850-855; originally published online February 14,Arterioscler Thromb Vasc Biol.
http://atvb.ahajournals.org/content/28/5/850World Wide Web at:
The online version of this article, along with updated information and services, is located on the
http://atvb.ahajournals.org/content/suppl/2008/04/18/ATVBAHA.107.154534.DC1.htmlData Supplement (unedited) at:
http://atvb.ahajournals.org//subscriptions/
at: is onlineArteriosclerosis, Thrombosis, and Vascular Biology Information about subscribing to Subscriptions:
http://www.lww.com/reprints
Information about reprints can be found online at: Reprints:
document. Question and AnswerPermissions and Rightspage under Services. Further information about this process is available in the
which permission is being requested is located, click Request Permissions in the middle column of the WebCopyright Clearance Center, not the Editorial Office. Once the online version of the published article for
can be obtained via RightsLink, a service of theArteriosclerosis, Thrombosis, and Vascular Biologyin Requests for permissions to reproduce figures, tables, or portions of articles originally publishedPermissions:
by guest on September 8, 2016
http://atvb.ahajournals.org/D
ownloaded from

Histological Evaluation Animals were sacrificed with Eutasol (Virbac AH, Fort Worth, TX) and the coronary and carotid arteries and thoracic aortae immediately harvested. Thirty mm of the proximal and mid left anterior descending and left circumflex coronary arteries, the entire left common carotid artery and alternating sections of the descending thoracic aorta from the apex of the aortic arch to 5 cm distal, were used for histology/immunohistochemisty. The coronary arteries were perfusion fixed at physiologic pressure with formaldehyde while samples from carotid and aortic arteries were placed in formaldehyde. Thirty mm of proximal and mid right coronary artery, the entire right carotid and the alternating, other sections of the thoracic aorta were immediately snap-frozen at -80°C for gene analysis. Both the right coronary and right carotid arteries show similar degrees of lesion development and progression in relation to their contralateral artery (supplemental Figure I). Formaldehyde fixed sections were cut into 5-mm segments, stained with hematoxylin/eosin and Movat’s pentachrome. Results are presented only for arteries in which there were >2 non-branching sections cut perpendicular to the plane of the lumen with gene expression (performed in triplicate) available from the same animal. As a result there is some variability in arterial results at each time point between arterial beds. Morphometric analysis was performed using a NIH imaging software system. Results are also presented as the number of sections of the examined artery that demonstrated neointima and the lesions were classified using both the AHA/ Stary et al4,5 and the modified AHA/Virmani et al6. Lipid pools were defined as the presence of extracellular lipid accumulation without necrosis while necrotic cores were defined as well formed cores with necrotic debris present6.
Immunohistochemical Analysis After deparaffinizing and two 5-minute washes in PBS, antigen retrieval was performed by incubating sections with protein kinase K (Dako Inc., Carpinteria, CA) for 15 minutes at room temperature. Endogenous peroxydase activity was quenched by a 5 minute incubation with 10% H2O2, followed by blocking with a solution of 10% newborn bovine serum in 1xPBS for 20 minutes. Sections were incubated over night in the presence of polyclonal goat anti-human cathepsin S antibody (Santa Cruz Biotechnology, Santa Cruz, CA) for the presence of macrophages, mouse monoclonal anti-a-smooth muscle actin clone 1A4 (Sigma, St. Louis, MO), or rabbit anti-human Von Willebrand factor antibody (Abcam, Inc., Cambridge, MA) followed by two 5-minute washes with PBS. HRP conjugated secondary bovine anti-goat IgG (Jackson ImmunoResearch Laboratories, Inc., West Grove, PA), rabbit anti-mouse IgG (AbD Serotec, Raleigh, NC), or goat anti-rabbit (Abcam Inc., Cambridge, MA) was added to the slides and incubated for 30 minutes. Slides were washed two times for 5 minutes in PBS and color was developed using DAB method (Vector Laboratories, Burlingame, CA). After two 1-minute rinses in distilled water, the tissue sections were lightly counterstained with methyl green, cleared and dehydrated by successive gradations through 70%, 95%, and 100% ethanol followed by a final passage in xylene. The slides were mounted and analyzed by bright field microscopy.
1

Table II. Glucose, cholesterol and triglyceride levels over time. All units in mg/dL, Cholesterol and triglyceride levels are reported as mean ± S.E.M. *p<0.0001 by ANOVA, †p=0.018 (baseline to 1 month p=0.03, baseline to 3 and 3 to 6 months p=NS).
Baseline 1 month 3 months 6 months 9 months
Glucose* 49.0 ± 13.9 319.6 ± 107.8 298.4 ± 131.6 311.6 ± 128.3 331.0 ± 77.7
Total cholesterol *
89.5 ± 2.4 453.2 ± 59.8 757.5 ± 83.7 745.3 ± 79.0 882.3 ± 249.9
LDL* 40.1 ± 1.7 233.3 ± 29.9 540.9 ± 51.7 538.6 ± 77.4 660.0 ± 186.6
HDL* 48.8 ± 1.2 94.0 ± 11.4 172.0 ± 16.0 169.1 ± 9.6 200.0 ± 51.8
Triglycerides† 19.4 ± 1.6 82.4 ± 23.3 66.0 ± 10.0 53.5 ± 7.4 68.0 ± 22.3
2

Table III. Genes demonstrating a significant change in expression at one or more of the time points in one or more of the three evaluated blood vessel. Genes demonstrating a significant increase are highlighted in red while those demonstrating a significant decrease in expression are highlighted in green. All values are the average median fold-change compared to non-DM/non-HC control arteries. *p<0.05, **p<0.001, NC= no change.
Table IIIA Gene expression related to cholesterol metabolism.
Gene name Month Coronary Carotid Aorta 1 2.64** 2.43* 1.93* 3 2.59** 2.97* 4.86* ABCA1
6 3.02** 2.64 2.65** 1 2.00 0.76 1.53 3 2.04 0.72 1.40 APOE
6 3.93* 0.41 0.79 1 1.05 0.96 0.85 3 1.22 0.85 0.83* FATP_4
6 1.19 0.74 0.65 1 0.19** 0.22* 1.00 3 0.26** 0.23** 0.72*
FASN 6 0.13** 0.19** 0.37* 1 0.75 1.02 0.89 3 0.72 1.03 1.42
PPARα 6 0.67* 0.72 1.21 1 1.34 1.44 NC 3 1.36 1.65 NC UCP2
6 1.94* 1.66 NC
Table IIIB. Gene expression related to insulin signaling pathways. Gene name Month Coronary Carotid Aorta
1 2.42* 0.96 1.13 3 1.66 0.86 0.07
ADIPOQ 6 1.12 0.97 1.08 1 0.72 0.95 0.78 3 0.91 1.16 0.71* IRS1
6 0.84 0.72 0.65* 1 4.71** 1.18 NC 3 4.18* 0.76 NC Leptin
6 1.82 0.73 NC 1 1.93* 0.88 0.81 3 1.17 1.27 0.94 PPARG
6 1.04 0.99 0.74 1 1.85* 1.06 1.38 3 1.76 1.30 1.23 Preproadipsin
6 1.14 1.07 0.85
3
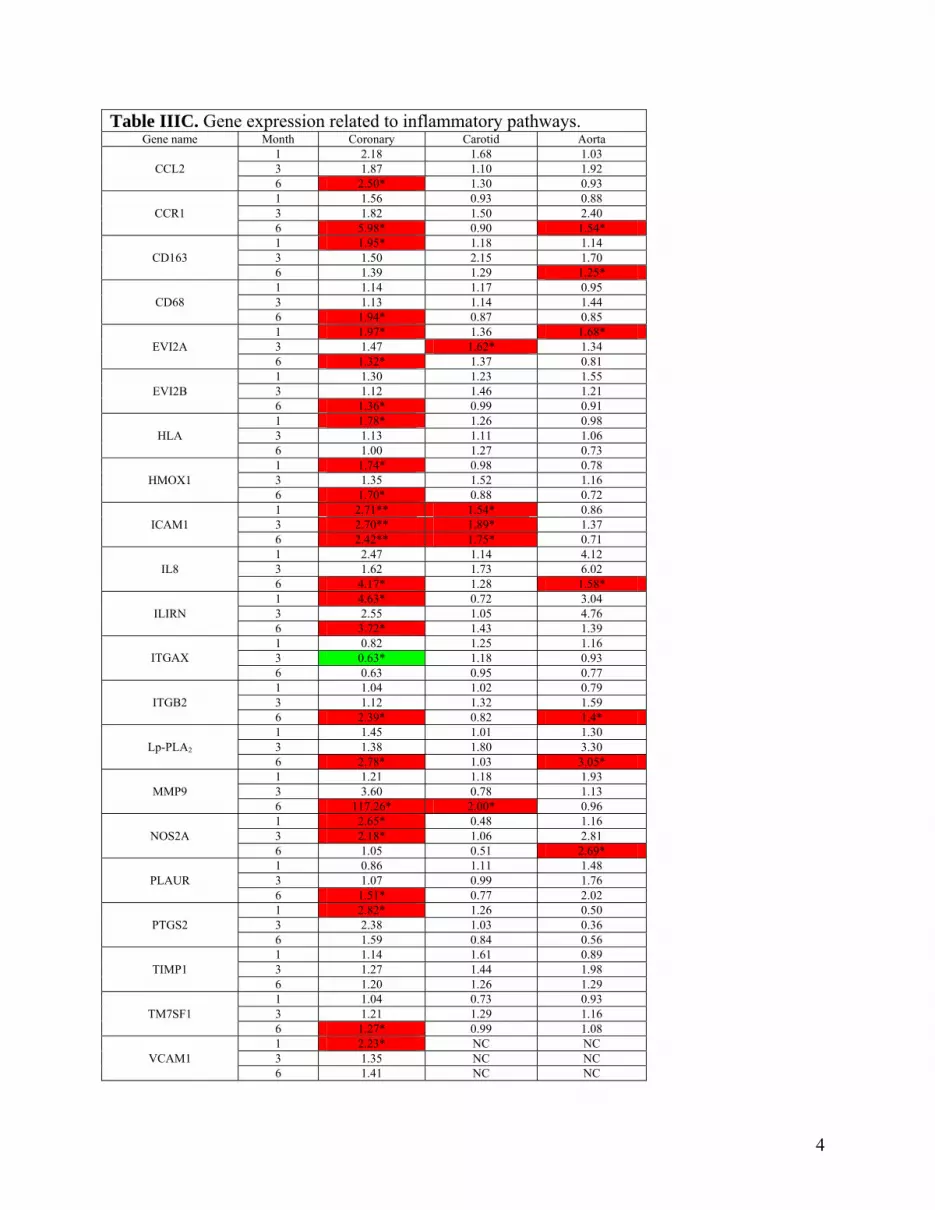
Table IIIC. Gene expression related to inflammatory pathways. Gene name Month Coronary Carotid Aorta
1 2.18 1.68 1.03 3 1.87 1.10 1.92 CCL2
6 2.50* 1.30 0.93 1 1.56 0.93 0.88 3 1.82 1.50 2.40 CCR1
6 5.98* 0.90 1.54* 1 1.95* 1.18 1.14 3 1.50 2.15 1.70 CD163
6 1.39 1.29 1.25* 1 1.14 1.17 0.95 3 1.13 1.14 1.44 CD68
6 1.94* 0.87 0.85 1 1.97* 1.36 1.68* 3 1.47 1.62* 1.34 EVI2A
6 1.32* 1.37 0.81 1 1.30 1.23 1.55 3 1.12 1.46 1.21 EVI2B
6 1.36* 0.99 0.91 1 1.78* 1.26 0.98 3 1.13 1.11 1.06 HLA
6 1.00 1.27 0.73 1 1.74* 0.98 0.78 3 1.35 1.52 1.16 HMOX1
6 1.70* 0.88 0.72 1 2.71** 1.54* 0.86 3 2.70** 1.89* 1.37 ICAM1
6 2.42** 1.75* 0.71 1 2.47 1.14 4.12 3 1.62 1.73 6.02 IL8
6 4.17* 1.28 1.58* 1 4.63* 0.72 3.04 3 2.55 1.05 4.76 ILIRN
6 3.72* 1.43 1.39 1 0.82 1.25 1.16 3 0.63* 1.18 0.93 ITGAX 6 0.63 0.95 0.77 1 1.04 1.02 0.79 3 1.12 1.32 1.59 ITGB2
6 2.39* 0.82 1.4* 1 1.45 1.01 1.30 3 1.38 1.80 3.30 Lp-PLA2
6 2.78* 1.03 3.05* 1 1.21 1.18 1.93 3 3.60 0.78 1.13 MMP9
6 117.26* 2.00* 0.96 1 2.65* 0.48 1.16 3 2.18* 1.06 2.81 NOS2A
6 1.05 0.51 2.69* 1 0.86 1.11 1.48 3 1.07 0.99 1.76 PLAUR
6 1.51* 0.77 2.02 1 2.82* 1.26 0.50 3 2.38 1.03 0.36 PTGS2
6 1.59 0.84 0.56 1 1.14 1.61 0.89 3 1.27 1.44 1.98 TIMP1
6 1.20 1.26 1.29 1 1.04 0.73 0.93 3 1.21 1.29 1.16 TM7SF1
6 1.27* 0.99 1.08 1 2.23* NC NC 3 1.35 NC NC VCAM1
6 1.41 NC NC
4

Table IIID. Expression of genes of unknown function
Gene name Month Coronary Carotid Aorta 1 3.19* NC NC 3 1.39 NC NC
ADAMDEC1 6 1.83* NC NC 1 2.61** 1.47 0.99 3 2.58* 1.51 1.78
FLJ22457 6 3.01** 1.59* 1.25 1 12.77* 9.03* 11.15* 3 5.22* 3.96 2.94
HS3ST2 6 8.95* 1.85 3.40 1 1.24 1.00 0.98 3 0.97 1.85 1.51
ITIH3 6 0.84 0.92 0.50* 1 0.03* 1.33 0.67 3 0.03* 1.66 1.21
PFKFB3 6 0.02 1.28 0.71
5

Figure I. Lesion development in the right coronary and right carotid arteries is similar to lesion development in the left coronary and carotid arteries (Figure 1). Arrows show minimal intimal accumulation and arrowheads denote the internal elastic lamina. Bar indicates 100 micrometers.
6

Figure II. Extent of macrophage infiltration as determined by the presence of cathepsin S positive staining (brown) in coronary, carotid and aortic arteries. Sections are adjacent to those shown in figure 1 although of greater magnification in order to demonstrate specific features of the plaque. *denotes plaque, arrowheads show the internal elastic lamina. No cathepsin S positive cells were observed prior to DM/HC induction (control).
7

Figure III. Graphs showing significant associations between gene expression of CD68, Lp-PLA2 and MMP9 and these genes and total cholesterol load.
8

Table I. Gene Ontology classification
Gene name Gene description Gene Ontology (Biological Process) Gene Ontology (Cellular Component) Gene Ontology (Molecular Function)ABCA1 ATP-binding cassette, sub-family A (ABC1),
member 1
phagocytosis, engulfment;cholesterol metabolism;small molecule transport;transport integral to plasma membrane;membrane fraction;integral to membrane;cellular_component unknown;membrane
anion transporter activity;ATPase activity, coupled to transmembrane movement of substances;ATP binding;nucleotide binding;ATPase activity;adenosinetriphosphatase activity;sterol transporter activity;ATP-binding cassette (ABC) transporter activity
ADAMDEC1 ADAM-like, decysin 1 negative regulation of cell adhesion;proteolysis and peptidolysis;integrin-mediated signaling pathway
integral to membrane integrin binding;metalloendopeptidase activity;peptidase activity;zinc ion binding
adiponectin adiponectin, C1Q and collagen domain containing
energy pathways;phosphate transport;generation of precursor metabolites and energy extracellular;cytoplasm;extracellular region hormone activity
ALOX5 arachidonate 5-lipoxygenase electron transport;inflammatory response;leukotriene biosynthesis arachidonate 5-lipoxygenase activity;lipoxygenase activity;oxidoreductase activity;iron ion binding
APOE apolipoprotein E lipid transport;cytoskeleton organization and biogenesis;synaptic transmission, cholinergic;regulation of neuronal synaptic plasticity;cholesterol homeostasis;intracellular transport;lipoprotein metabolism;regulation of axon extension;response to reactive oxygen species;induction of apoptosis;cholesterol metabolism;circulation;development;learning and/or memory;immune response;lipid metabolism
extracellular;cytoplasm;extracellular region heparin binding;lipid transporter activity;receptor binding;low-density lipoprotein
receptor binding;apolipoprotein E receptor binding;tau protein
binding;antioxidant activity;beta-amyloid binding;lipid bindingARRB2 arrestin, beta 2 sensory perception;signal transduction cytoplasm;plasma membrane;nucleusBIN2 bridging integrator 2 endocytosis;synaptic transmission cytoplasm;membrane protein bindingCCL2 chemokine (C-C motif) ligand 2 response to pathogenic bacteria;anti-apoptosis;inflammatory response;cell-cell
signaling;cell adhesion;histogenesis and organogenesis;humoral immune response;calcium ion homeostasis;protein amino acid phosphorylation;JAK-STAT cascade;viral genome replication;organogenesis;G-protein signaling, coupled to cyclic nucleotide second messenger;viral replication;chemotaxis
membrane;extracellular space chemokine activity;protein kinase activity
CCR1 chemokine (C-C motif) receptor 1 cytosolic calcium ion concentration elevation;cell adhesion;immune response;inflammatory response;positive regulation of cytosolic calcium ion concentration;cell-cell signaling;invasive growth;chemotaxis;G-protein signaling, coupled to cyclic nucleotide second messenger
integral to plasma membrane C-C chemokine receptor activity;rhodopsin-like receptor activity
CD163 CD163 molecule biological_process unknown;antimicrobial humoral response (sensu Vertebrata) membrane;extracellular;integral to plasma membrane;extracellular region
scavenger receptor activity;protein-lysine 6-oxidase activity;copper ion binding
CD4 CD4 molecule transmembrane receptor protein tyrosine kinase signaling pathway;cell adhesion;pathogenesis;immune response;T-cell differentiation;positive regulation of interleukin-2 biosynthesis;T-cell selection
integral to membrane;T-cell receptor
complex;plasma membrane
internalization receptor activity;MHC class II protein binding;transmembrane
receptor activity;coreceptor activityCD48 CD48 molecule defense response integral to plasma membrane protein bindingCD68 CD68 molecule lysosome;membrane fraction;integral to
membraneCEBP-a CCAAT/enhancer binding protein (C/EBP),
alphatranscription;regulation of transcription, DNA-dependent nucleus DNA binding;RNA polymerase II transcription factor activity, enhancer binding
CHI3L1 chitinase 3-like 1 (cartilage glycoprotein-39) metabolism extracellular matrix;extracellular space;extracellular matrix (sensu Metazoa)
extracellular matrix structural constituent;sugar binding;hydrolase activity
CSTA cystatin A (stefin A) intracellular cysteine protease inhibitor activityCTSS cathepsin S proteolysis and peptidolysis;immune response lysosome;extracellular region;extracellular cathepsin S activity;hydrolase activityCXCR3 chemokine (C-X-C motif) receptor 3 cytosolic calcium ion concentration elevation;antimicrobial humoral response (sensu
Vertebrata);positive regulation of cytosolic calcium ion concentration;antimicrobial
humoral response (sensu Invertebrata);cell motility;cell adhesion;chemotaxis;G-protein
coupled receptor protein signaling pathway
integral to plasma membrane;cytoplasm C-C chemokine receptor activity;rhodopsin-like receptor activity;C-X-C
chemokine receptor activitycyclophilin peptidylprolyl isomerase A (cyclophilin A) viral replication;protein folding;antimicrobial humoral response (sensu
Vertebrata);regulation of viral genome replication;antimicrobial humoral response
(sensu Invertebrata)
cytoplasm cyclophilin;cyclophilin-type peptidyl-prolyl cis-trans isomerase activity;virion
binding;unfolded protein binding;cyclosporin A binding;peptidyl-prolyl cis-trans
isomerase activity;FK506-sensitive peptidyl-prolyl cis-trans isomerase;protein
transporter activity;isomerase activity;chaperone activityEDNRA endothelin receptor type A phosphatidylinositol-4,5-bisphosphate hydrolysis;adenylate cyclase activation;cytosolic
calcium ion concentration elevation;phospholipase C activation;smooth muscle contraction;signal transduction;respiratory gaseous exchange;glucose transport;biological_process unknown;G-protein coupled receptor protein signaling pathway;positive regulation of cytosolic calcium ion concentration;cell proliferation
integral to plasma
membrane;cellular_component
unknown;integral to membrane
receptor activity;endothelin receptor activity;protein binding;endothelin-A
receptor activity;rhodopsin-like receptor activity;phosphoinositide phospholipase
C activityEGR1 early growth response 1 regulation of transcription, DNA-dependent nucleus transcription factor activity;zinc ion bindingEVI2A ecotropic viral integration site 2A cell proliferation;cell growth and/or maintenance integral to membrane transmembrane receptor activityEVI2B ecotropic viral integration site 2B cell growth and/or maintenance integral to plasma membraneFATP-4 solute carrier family 27 (fatty acid transporter),
member 4fatty acid transport;transport;fatty acid metabolism;metabolism;lipid metabolism;small molecule transport
fatty acid transporter activity;catalytic activity
Fatty acid synthase fatty acid synthase fatty acid metabolism;biosynthesis;fatty acid biosynthesis alcohol dehydrogenase activity, zinc-dependent;S-adenosylmethionine-dependent methyltransferase activity;cofactor binding;palmitoyl-[acyl-carrier protein] hydrolase activity;myristoyl-[acyl-carrier protein] hydrolase activity;oleoyl-[acyl-carrier protein] hydrolase activity;lyase activity;hydrolase activity, acting on ester bonds;transferase activity;oxidoreductase activity;enoyl-[acyl-carrier protein] reductase (NADPH, B-specific) activity;[acyl-carrier protein] S-acetyltransferase activity;3-oxoacyl-[acyl-carrier protein] synthase activity;3-oxoacyl-[acyl-carrier protein] reductase activity;[acyl-carrier protein] S-malonyltransferase activity;zinc ion binding
FLJ22457 DENN/MADD domain containing 2D

GM2A GM2 ganglioside activator glycosphingolipid metabolism;glycolipid catabolism;sphingolipid catabolism lysosome sphingolipid activator protein activityHLA major histocompatibility complex, class II, DM
alpha
perception of pest/pathogen/parasite;immune response;detection of pest, pathogen or parasite;detection of pest/pathogen/parasite;antigen processing, exogenous antigen via MHC class II;antigen presentation, exogenous antigen
integral to membrane;membrane protein binding;receptor activity;MHC class II receptor activity;chaperone activity
HMOX1 heme oxygenase (decycling) 1 heme oxidation;positive regulation of I-kappaB kinase/NF-kappaB cascade microsome;membrane fraction;endoplasmic reticulum
heme oxygenase (decyclizing) activity;oxidoreductase activity;signal transducer activity
HS3ST2 (2ND SET) heparan sulfate (glucosamine) 3-O-sulfotransferase 2
integral to membrane heparin-glucosamine 3-O-sulfotransferase activity;transferase activity
ICAM1 intercellular adhesion molecule 1 (CD54),
human rhinovirus receptor
cell-cell adhesion proteoglycan integral to plasma
membrane;integral to plasma membrane;plasma
membrane;integral to membrane
transmembrane receptor activity;protein binding;cell adhesion molecule activity
IGF receptor insulin-like growth factor 1 receptor insulin receptor signaling pathway;protein amino acid phosphorylation;regulation of cell
cycle;signal transduction;positive regulation of cell proliferation;anti-apoptosis
integral to membrane insulin-like growth factor receptor activity;ATP binding;transferase
activity;receptor activity;protein binding;epidermal growth factor receptor activityIL1B interleukin 1, beta negative regulation of cell proliferation;cell proliferation;signal transduction;immune
response;apoptosis;regulation of cell cycle;antimicrobial humoral response (sensu Invertebrata);antimicrobial humoral response (sensu Vertebrata);inflammatory response;cell-cell signaling
extracellular space;extracellular region interleukin-1 receptor antagonist activity;signal transducer activity;interleukin-1
receptor bindingIL8 interleukin 8 cell cycle arrest;negative regulation of cell proliferation;G-protein coupled receptor
protein signaling pathway;chemotaxis;immune response;regulation of retroviral genome replication;neutrophil activation;regulation of cell adhesion;neutrophil chemotaxis;calcium-mediated signaling;angiogenesis;cell-cell signaling;cell motility;induction of positive chemotaxis;intracellular signaling cascade
soluble fraction;extracellular space interleukin-8 receptor binding;chemokine activity;protein binding
ILI interleukin 1, alpha negative regulation of cell proliferation;apoptosis;anti-apoptosis;regulation of cell cycle;inflammatory response;cell-cell signaling;cell proliferation;immune response;chemotaxis
extracellular space;cytoplasm interleukin-1 receptor binding;signal transducer activity;protein binding
IL1rn interleukin 1 receptor antagonist Blocks the binding of interleukin-1 to the interleukin-1 receptor complex. extracellular space interleukin-1 receptor antagonist activityIRS1 insulin receptor substrate 1 signal transduction cytoplasm transmembrane receptor protein tyrosine kinase docking protein activity;protein
binding;insulin receptor binding;signal transducer activityITGAX integrin, alpha X (complement component 3
receptor 4 subunit)integrin-mediated signaling pathway;organogenesis;cell-matrix adhesion;histogenesis and organogenesis
integrin complex;integral to membrane cell adhesion receptor activity;receptor activity;protein binding;magnesium ion binding
ITGB2 integrin, beta 2 (complement component 3
receptor 3 and 4 subunit)
integrin-mediated signaling pathway;antimicrobial humoral response (sensu Vertebrata);development;cell-matrix adhesion;regulation of peptidyl-tyrosine phosphorylation;regulation of cell shape;neutrophil chemotaxis;leukocyte cell adhesion;inflammatory response;cell-cell signaling;antimicrobial humoral response (sensu Invertebrata);apoptosis;cell adhesion
integrin complex;integral to membrane cell adhesion receptor activity;receptor activity;protein binding;protein kinase
bindingITIH3 inter-alpha (globulin) inhibitor H3 extracellular;extracellular region serine protease inhibitor activity;serine-type endopeptidase inhibitor activity
LAIR1 leukocyte-associated immunoglobulin-like receptor 1
immune response;signal transduction integral to plasma membrane transmembrane receptor activity;receptor activity
leptin leptin (obesity homolog, mouse) energy reserve metabolism;signal transduction;cell-cell signaling extracellular space hormone activityLpPLa2 phospholipase A2, group VII (platelet-activating
factor acetylhydrolase, plasma)
inflammatory response;lipid catabolism extracellular;2-acetyl-1-alkylglycerophosphocholine esterase complex;extracellular region
phospholipid binding;1-alkyl-2-acetylglycerophosphocholine esterase
activity;hydrolase activityMMP1 matrix metallopeptidase 1 (interstitial
collagenase)collagen catabolism extracellular matrix;extracellular matrix (sensu
Metazoa);extracellular spacezinc ion binding;calcium ion binding;hydrolase activity;interstitial collagenase activity
MMP9 matrix metallopeptidase 9 (gelatinase B, 92kDa
gelatinase, 92kDa type IV collagenase)
collagen catabolism extracellular matrix;extracellular matrix (sensu
Metazoa);extracellular space
collagenase activity;zinc ion binding;gelatinase B activity;hydrolase activity
NOS2A nitric oxide synthase 2A (inducible,
hepatocytes)
nitric oxide biosynthesis;positive regulation of cytotoxic T-cell differentiation;inflammatory response;defense response to bacteria;superoxide metabolism;electron transport
cytoplasm;cytosol nitric oxide synthase activity;oxidoreductase activity;FMN binding;nitric-oxide synthase activity;heme binding;calcium ion binding;calmodulin binding;electron transporter activity
PFKB3 6-phosphofructo-2-kinase/fructose-2,6-
biphosphatase 3
fructose 2,6-bisphosphate metabolism;metabolism cellular_component unknown fructose-2,6-bisphosphate 2-phosphatase activity;6-phosphofructo-2-kinase activity;ATP binding;catalytic activity;hydrolase activity;transferase activity;kinase activity
PLAUR plasminogen activator, urokinase receptor chemotaxis;blood coagulation;cell surface receptor linked signal transduction extrinsic to membrane;plasma membrane GPI-anchored membrane-bound receptor;U-plasminogen activator receptor activity;protein binding
PPARA peroxisome proliferator-activated receptor
alpha
fatty acid metabolism;transcription from Pol II promoter;regulation of transcription, DNA-dependent;transcription;generation of precursor metabolites and energy;energy pathways;lipid metabolism
nucleus peroxisome receptor;DNA binding;transcription factor activity;ligand-dependent
nuclear receptor activity;steroid hormone receptor activity;receptor activityPPARD peroxisome proliferator-activated receptor delta transcription;lipid metabolism;regulation of transcription from Pol II promoter;energy
pathways;regulation of transcription, DNA-dependent;generation of precursor metabolites and energy
nucleus steroid hormone receptor activity;transcription factor activity
PPARG peroxisome proliferator-activated receptor
gamma
response to nutrients;signal transduction;white adipocyte differentiation;white adipocyte
cell differentiation;generation of precursor metabolites and energy;regulation of
transcription from Pol II promoter;energy pathways;lipid metabolism
nucleus steroid hormone receptor activity;transcription factor activity
Preproadipsin ml complement factor D (adipsin) proteolysis and peptidolysis;complement activation, alternative pathway complement factor D activity;chymotrypsin activity;peptidase activity;hydrolase activity;trypsin activity
PTAFR platelet-activating factor receptor pathogenesis;G-protein coupled receptor protein signaling pathway;antimicrobial humoral response (sensu Invertebrata);antimicrobial humoral response (sensu Vertebrata);inflammatory response;immune response;chemotaxis
integral to plasma membrane platelet activating factor receptor activity
PTGS2 prostaglandin-endoperoxide synthase 2
(prostaglandin G/H synthase and
cyclooxygenase)
physiological processes;cell motility;prostaglandin biosynthesis;regulation of blood pressure;keratinocyte differentiation;cyclooxygenase pathway;regulation of inflammatory response;physiological process;keratinocyte cell differentiation;inflammatory response;response to oxidative stress
membrane;cytoplasm;nucleus;perinuclear space prostaglandin-endoperoxide synthase activity;peroxidase
activity;oxidoreductase activity;oxidoreductase activity, acting on single donors
with incorporation of molecular oxygen, incorporation of two atoms of oxygen

RAGE renal tumor antigen protein amino acid phosphorylation;signal transduction cytoplasm protein serine/threonine kinase activity;ATP binding;transferase activitySCARB1 scavenger receptor class B, member 1 cell adhesion integral to membrane receptor activity;cell adhesion molecule activityTIMP1 TIMP metallopeptidase inhibitor 1 positive regulation of cell proliferation;development;negative regulation of membrane
protein ectodomain proteolysis;proteolysis and peptidolysisextracellular matrix;extracellular matrix (sensu Metazoa)
metalloendopeptidase inhibitor activity;metallopeptidase activity
TM7SF1 G protein-coupled receptor 137B integral to plasma membrane;membrane fraction
UCP2 uncoupling protein 2 (mitochondrial, proton
carrier)
mitochondrial transport;transport;proton transport mitochondrion;integral to membrane;mitochondrial inner membrane;membrane fraction
uncoupling protein activity;transporter activity;binding
VCAM1 vascular cell adhesion molecule 1 cell-cell adhesion integral to membrane;plasma membrane;membrane
cell adhesion molecule activity;protein binding