single–molecule conductance measurements:
TRANSCRIPT

Delft University of Technology
Single–molecule conductance measurementsCorrelations between chemical design and electronic propertiesOlavarria Contreras, Ignacio
DOI10.4233/uuid:da689def-97eb-4199-88a9-0637d820e47bPublication date2018Document VersionFinal published versionCitation (APA)Olavarria Contreras, I. (2018). Single–molecule conductance measurements: Correlations betweenchemical design and electronic properties. https://doi.org/10.4233/uuid:da689def-97eb-4199-88a9-0637d820e47b
Important noteTo cite this publication, please use the final published version (if applicable).Please check the document version above.
CopyrightOther than for strictly personal use, it is not permitted to download, forward or distribute the text or part of it, without the consentof the author(s) and/or copyright holder(s), unless the work is under an open content license such as Creative Commons.
Takedown policyPlease contact us and provide details if you believe this document breaches copyrights.We will remove access to the work immediately and investigate your claim.
This work is downloaded from Delft University of Technology.For technical reasons the number of authors shown on this cover page is limited to a maximum of 10.

SINGLE–MOLECULE CONDUCTANCEMEASUREMENTS:
CORRELATIONS BETWEEN CHEMICAL DESIGN ANDELECTRONIC PROPERTIES


SINGLE–MOLECULE CONDUCTANCEMEASUREMENTS:
CORRELATIONS BETWEEN CHEMICAL DESIGN ANDELECTRONIC PROPERTIES
Proefschrift
ter verkrijging van de graad van doctoraan de Technische Universiteit Delft,
op gezag van de Rector Magnificus Prof. dr. ir. T. H. J. J. van der Hagen,voorzitter van het College voor Promoties,
in het openbaar te verdedigen op maandag 2 juli 2018 om 10:00 uur
door
Ignacio José OLAVARRIA CONTRERAS
Master in Sciences with mention in Physics,Universidad de Chile, Santiago, Chile,
geboren te Santiago, Chile.

Dit proefschrift is goedgekeurd door de
promotor: Prof. dr. H.S.J. van der Zantpromotor: Prof. dr. D. Dulic
Samenstelling promotiecommissie:
Rector Magnificus voorzitterProf. dr. ir. H.S.J. van der Zant Technische Universiteit DelftProf. dr. D. Dulic Universidad de Chile
Onafhankelijke leden:Dr. J. Thijssen Technische Universiteit DelftProf. Dr. P. G. Steeneken Technische Universiteit DelftDr. N. Aliaga Alcalde Institut de Ciència de Materials de BarcelonaProf. dr. J.M. van Ruitenbeek Universiteit LeidenDr. I. Diez Perez University of Barcelona
Keywords: single-molecule electronics, conductance measurements, mechani-cally controlled break junction, quantum transport, curcuminoids,salen, carbon-gold bond.
Printed by: IPSKAMP PRINTING
Front & Back: In the same way exploration brought spices to our knowledge, ex-ploration on spices-inspired compounds bring new insights on howmolecules work.
Copyright © 2018 by I.J. Olavarria
Casimir PhD-Series 2018-23ISBN 978-90-8593-352-6
An electronic version of this dissertation is available athttp://repository.tudelft.nl/.

CONTENTS
1 Introduction 11.1 Introduction to single-molecule electronics. . . . . . . . . . . . . . . . . 21.2 Theoretical context . . . . . . . . . . . . . . . . . . . . . . . . . . . . . 31.3 State of the art: advantages and drawbacks of measuring methods . . . . . 7
1.3.1 Electromigrated break junctions . . . . . . . . . . . . . . . . . . . 71.3.2 Scanning tunneling microscope . . . . . . . . . . . . . . . . . . . 81.3.3 Mechanically controlled break junctions (MCBJ). . . . . . . . . . . 8
1.4 Implementation of the MCBJ technique . . . . . . . . . . . . . . . . . . 91.4.1 samples . . . . . . . . . . . . . . . . . . . . . . . . . . . . . . . 91.4.2 Measurement set-up . . . . . . . . . . . . . . . . . . . . . . . . . 101.4.3 Electronics and operation . . . . . . . . . . . . . . . . . . . . . . 10
1.5 From Conductance traces to histograms . . . . . . . . . . . . . . . . . . 111.5.1 Conductance measurement . . . . . . . . . . . . . . . . . . . . . 12
1.6 This thesis . . . . . . . . . . . . . . . . . . . . . . . . . . . . . . . . . 13References . . . . . . . . . . . . . . . . . . . . . . . . . . . . . . . . . . . . 13
2 Measurement protocols and data analysis 172.1 Filtering, selection and criteria for molecular fingerprints . . . . . . . . . 182.2 Junction-formation yield . . . . . . . . . . . . . . . . . . . . . . . . . . 242.3 The importance of cleaning procedures. . . . . . . . . . . . . . . . . . . 272.4 Distance modulation . . . . . . . . . . . . . . . . . . . . . . . . . . . . 31References . . . . . . . . . . . . . . . . . . . . . . . . . . . . . . . . . . . . 33
3 Direct carbon Gold contacted molecules 353.1 Conductance measurements . . . . . . . . . . . . . . . . . . . . . . . . 373.2 Funtionalized molecules: Radicals . . . . . . . . . . . . . . . . . . . . . 42
3.2.1 Conductance measurements. . . . . . . . . . . . . . . . . . . . . 453.2.2 Theoretical calculation. . . . . . . . . . . . . . . . . . . . . . . . 483.2.3 Conclusions . . . . . . . . . . . . . . . . . . . . . . . . . . . . . 50
References . . . . . . . . . . . . . . . . . . . . . . . . . . . . . . . . . . . . 50
4 Curcuminoids: Single-molecule conductance of thiophene anchored com-pounds 574.1 Introduction to Curcuminoids . . . . . . . . . . . . . . . . . . . . . . . 584.2 Discussion on chemical characterization . . . . . . . . . . . . . . . . . . 594.3 Conductance measurements . . . . . . . . . . . . . . . . . . . . . . . . 624.4 Transport calculations . . . . . . . . . . . . . . . . . . . . . . . . . . . 644.5 Discussion and conclusions. . . . . . . . . . . . . . . . . . . . . . . . . 67References . . . . . . . . . . . . . . . . . . . . . . . . . . . . . . . . . . . . 67
v

vi CONTENTS
5 Single-molecule measurement on curcuminoid compounds: B and Cu sub-stitution 715.1 Description of the molecules . . . . . . . . . . . . . . . . . . . . . . . . 725.2 Conductance measurements . . . . . . . . . . . . . . . . . . . . . . . . 745.3 Boron substituted curcuminoid . . . . . . . . . . . . . . . . . . . . . . . 785.4 Discussion . . . . . . . . . . . . . . . . . . . . . . . . . . . . . . . . . 805.5 Conclusions. . . . . . . . . . . . . . . . . . . . . . . . . . . . . . . . . 80References . . . . . . . . . . . . . . . . . . . . . . . . . . . . . . . . . . . . 815.A Appendices . . . . . . . . . . . . . . . . . . . . . . . . . . . . . . . . . 84
5.A.1 Additional histograms and filtering procedures . . . . . . . . . . . 845.A.2 Fitting method . . . . . . . . . . . . . . . . . . . . . . . . . . . . 855.A.3 Fit parameters MeS-BF2-CCM and time traces . . . . . . . . . . . . 865.A.4 Additional measurements on the molecules with thiocarbamate an-
choring (S-CCM and S-CCM-BF2) . . . . . . . . . . . . . . . . . . 885.A.5 Additional measurements on the copper derivative . . . . . . . . . 895.A.6 Measurement on Cu-curcuminoids with a double backbone. . . . . 905.A.7 Curcuminoid-like molecules: dibenzoylmethane derivatives . . . . 92
6 The role of side groups as anchoring sites in curcuminoids 1036.1 Molecules with different pathways for charge transport. . . . . . . . . . . 1046.2 Conductance measurements . . . . . . . . . . . . . . . . . . . . . . . . 106
6.2.1 Distance modulation. . . . . . . . . . . . . . . . . . . . . . . . . 1086.3 Discussion . . . . . . . . . . . . . . . . . . . . . . . . . . . . . . . . . 111References . . . . . . . . . . . . . . . . . . . . . . . . . . . . . . . . . . . . 1116.A Appendices . . . . . . . . . . . . . . . . . . . . . . . . . . . . . . . . . 114
6.A.1 measurements on additional samples . . . . . . . . . . . . . . . . 1146.A.2 Frequency detection . . . . . . . . . . . . . . . . . . . . . . . . . 114
7 Salen and salophen compounds 1197.1 Salen and salophenes . . . . . . . . . . . . . . . . . . . . . . . . . . . . 1207.2 Electronic measurements . . . . . . . . . . . . . . . . . . . . . . . . . . 122References . . . . . . . . . . . . . . . . . . . . . . . . . . . . . . . . . . . . 129
8 The conductance of miscellaneous molecular systems 1338.1 Other interesting systems . . . . . . . . . . . . . . . . . . . . . . . . . . 1348.2 Redox centers: TTF-Indenofluorenes . . . . . . . . . . . . . . . . . . . . 1348.3 polyoxometalates (POM) . . . . . . . . . . . . . . . . . . . . . . . . . . 1388.4 Outlook . . . . . . . . . . . . . . . . . . . . . . . . . . . . . . . . . . . 142References . . . . . . . . . . . . . . . . . . . . . . . . . . . . . . . . . . . . 143
Summary 147
Samenvatting 151
Acknowledgements 155
Curriculum Vitæ 159
List of Publications 161

1INTRODUCTION
There are two words that will open you many doorspull and push.
les luthiers
Y he aquí que una buena mañana, después de una noche de preciosos sueños y delicadaspesadillas, el poeta se levanta y grita a la madre Natura: Non serviam.
Vicente Huidobro
This chapter introduces the field of single–molecule electronics, discussing the motiva-tions, the evolution and the theoretical background of the field. The main experimentalmethods to address single molecules are generally described, namely, eletromigrated breakjunctions (EM), STM-break junctions (STM-BJ) and the mechanically controlled breakjunction technique (MCBJ). Since the latter one the technique of choice for the experimentsin this dissertation, it is explained in more detail.
1

1
2 1. INTRODUCTION
1.1. INTRODUCTION TO SINGLE-MOLECULE ELECTRONICSMany of the processes that shape our lives rely on electrons flowing one way or the otherthrough organic molecules. Examples are ubiquitous in biological systems including,photosynthesis, enzymatic catalysis, energy conversion, etc. Nature seems to have mas-tered the design of molecular machinery that manage charge across different conductingchannels and barriers. Since the origin of electronics and circuitry the tools that we haveused to move electrons around have evolved from rudimentary metals to complicatedsemiconductor architectures. Nevertheless we have not reached the level of complexityseen in nature. Scientists have put forward the idea that a single-molecule could performtasks as an electronic component[1] dreaming with the use of molecules as the buildingblock of a circuits. The realization of such a dream would not come easy but the lessonlearned opened a whole new subject in science called molecular electronics[2, 3].
Molecules have the advantage that chemists can make a huge number of atomicallyidentical molecules design to perform the same function. This was one of the main moti-vations to envision them as active components in electronic circuitry [4, 5]; in principle,they could overcome the inherit variability of top-down fabrication when the device di-mensions reach the atomic size, as predicted by Moore’s law [6]. In the beginning, manytechniques were developed to measure current through organic molecules relying on selfassembled mono-layers (SAM) to measure ensembles of molecules [7]. As technologyadvanced, single-molecule measurements became possible [2, 8, 9]. Despite the successof this quest scientists quickly realize that reproducibility of the results was a challenge,as even the same molecule could show very different current-voltage (IV) characteristicsdepending on the exact atomic configuration of the molecule in the gap [10]. Becausethe current-voltage characteristic nor the conductance traces were the same from sam-ple to sample, statistical analysis and large amounts of data gathering were needed toget reproducible results[11, 12]. Nevertheless different functionalities were founded insingle-molecules: resistors [12], diodes [13–17] and switches[18, 19] are good examples.
As experiments succeeded in measuring the electronic properties of single moleculesthe experimental results revealed that theoretical models did not capture the complex-ity of the electrode-molecule-electrode system. The theoretical models advanced fromsimple tight binding ones [1] to complex quantum chemistry calculations [11, 20]. Theproblem of electrical current flowing through single molecules turned from a technolog-ical challenge to a problem of fundamentals physics. As the technical challenges weresolved (or partially solved), theoreticians had to work hard to match their prediction withthe experimental results.
One of the achievements of the field of single-molecule electronics was the abil-ity to design molecules with specific functionalities and demonstrate, that indeed, themolecule showed it when measured[13, 17–19, 21], good examples of that are the diodereported in reference [17] based in two conjugated parts weakly coupled that differed intheir electron withdrawing character or the molecular switch on reference [18], where,upon UV-light exposure the molecule changed its conjugation pattern and therefore itsconductance. Nevertheless measurements rely on repetition to find the overall trend andthe variability. This meant that despite the good capability on the molecular synthesis,experiments lacked the control over the molecular configuration when attached to elec-trodes. This has not changed much in the last decades; there is still not a reliable way to

1.2. THEORETICAL CONTEXT
1
3
determine and, even less, to control the exact configuration of molecules contacted totwo electrodes.
The aim of this dissertation is not to give a definitive answer to such issues, but con-tribute to the building up of knowledge of how simple molecules conduct electrical cur-rent when contacted between two metallic electrodes. We focus on the comparison ofdifferent chemical designs and correlate the differences and similarities with the molec-ular structure.
1.2. THEORETICAL CONTEXTMolecules are collections of electrons wobbling around a quasi-fixed frame of nuclei.The standard way to model them is in terms of the Schrödinger equation HΦ= EΦwhereE the energy of the system and H is the electrons hamiltonian and Φ the many-bodywave functions describing the electrons in the molecule. To approximate the solutionof this problem the most used approach is to express it in terms of single electron wavefunctions or molecular orbitals (MO). The ground states of the system is the one in whichthe states are filled with two electron each (one for each spin state) from the lowestenergy upwards due to the Pauli exclusion principle. In this way the higher occupiedmolecular orbital (HOMO) represent the single-electron state with the highest possibleenergy when all the states below are filled. The next available state is known as the low-est unoccupied molecular orbital (LUMO). Importantly, the energy difference betweenthe HOMO and the LUMO (HOMO-LUMO gap) coincides with the energy difference be-tween the ground states and the first exited state so, from here on, we will make no dis-tinction between them. In most of organic molecules the HOMO-LUMO gap is in therange of a few eV. Since the energy related to thermal fluctuations are in the range oftenths of meV at room temperature we can safely assume that there are no thermallyexited process occurring in an isolated molecule.
Solving the Schrödinger equation typically relies on quantum chemistry calculationusing the density functional formalism (DFT) derived by Kohn and Sham [22, 23]. Thisformalism allows for powerful predictions about the molecular levels and HOMO-LUMOgaps, but shows strong discrepancy with experiments when, for example, metallic elec-trodes are included. This is usually because the calculations do not take properly into ac-count electron-electron interactions. Another theoretical tool to approximate the elec-tronic behaviour of molecules is called the Hartree-Fock approximation which is a meanfield theory. It works with the many-body wave function (Φ) explicitly and, therefore, iscomputationally expensive [24]. The most successful attempts to predict molecular con-ductance values use a combination of the two methods[25], but an in depth descriptionof them goes beyond the scope of this thesis.
The picture of discrete energy states is modified when one introduces electrodes tothe simple MO model. In general terms, the energy distribution is broadened by the in-teraction between the molecule and the continuous states of electrodes. The strength ofthis interaction is determined by a parameter ΓL(R) for the left (L) and right (R) electroderespectively that encodes the overlapping of the MOs with the states in the electrodes.Depending on the relation between the total coupling (Γ = ΓL +ΓR ) and the other rel-evant energy scales, one can identify three different regimes: weak, intermediate andstrong coupling. In the weak coupling case, Γ term is smaller than the charging energy

1
4 1. INTRODUCTION
μL μR
μ+eV/2
μ-eV/2ε0 ε0
a) b) c)
Cur
rent
(µA)
Bias voltage (V)-2 -1 0 1 2
-4
-2
0
2
4
eV
Figure 1.1: Schematic of the chemical potential of a molecule with a single level (HOMO) in between twoelectrodes. a) System in equilibrium with V = 0 V and b) with an applied bias voltage (V ). The red dashedregion corresponds to electrons that contribute to transport. c) Current-voltage (IV ) characteristic of a singlelevel model with ε0 =0.8 eV and ΓL = ΓR = 10 meV.
EC of the molecules Γ¿ EC = e2
2C where C is the capacitance of the molecular junction.This situation translates into electrons that sequentially tunnel from the source elec-trode to the molecule, stay in the molecule long enough to lose information about theiroriginal quantum state and then tunnel to the drain electrode. In this regime, the chargeon the molecule is well defined and it is an integer multiple of the electron charge e. Incontrast, when the system is in the strong coupling regime, Γ is larger than the chargingenergy (EC ¿ Γ); in this case the states of the molecule strongly hybridize with the statesof the electrodes. This produces a partial charge transfer between the electrodes andthe molecule. Thus, the charge on the molecule is not necessarily an integer multipleof e and the electrons flow through the molecule without losing information about theiroriginal quantum states. The intermediate regime is the one in which all the energy con-tributions have approximately the same weight. The system is then difficult to describeand the usual way to approach this problem is to combine the theoretical approxima-tions in the other two regimes.
If we take the toy model of a single level coupled to electrodes with a coupling en-ergy Γ, there is a simple analytical expression for the energy distributions that has aLorentzian peak shape:
D(E) = 1
π
Γ
(E −ε0)2 + (Γ/2)2 , (1.1)
where the term (E − ε0) corresponds to the level alignment between the Fermi energyof the electrodes and the ‘molecular’ level at ε0. The electrodes, on the other hand, canbe described as two thermal reservoirs at temperature T and with a chemical potentialµL(R). In equilibrium, both chemical potentials have the same value (see Fig. 1.1 a),but when a bias voltage (V ) is applied between the two electrodes the chemical poten-tial shift such that µL −µR = eV (see Fig. 1.1 b). In this situation, the molecule is thechannel that connects both reservoirs; it is thus held in a non-equilibrium situation.TheLandauer-Buttiker formula gives the expression for the current through the moleculewhen electrons flow phase-coherently from one electrode to the other:

1.2. THEORETICAL CONTEXT
1
5
Bridge AnchorAnchor ElectrodeElectrode
FunctionalityΓLμL μRΓR
ε0
Figure 1.2: Diagram of a molecular junction, the electrodes are modelled as semi-infinite reservoirs with chem-ical potential µL(R) and temperature T . The anchors are the part of the molecule with affinity to metals thatprovides the mechanical stability of the metal-molecule-metal system. The bridge corresponds to the body ofthe molecule and attached to it functionalities can be added. The energy ε0 is the level alignment correspond-ing to the distance between the Fermi energy of the electrodes and the nearest molecular orbital.
I (V ) = G0
e
∫ ∞
−∞T (E)( f (E ,µL)− f (E ,µR ))dE , (1.2)
where T (E) is the transmission function through the ‘molecule’ and f (E ,µ) the FermiEnergy distribution:
f (E ,µ) = 1
1+exp(
E−µkB T
) . (1.3)
In the case of the single level description, T (E) = 2πD(E)ΓL+ΓRΓ . Replacing this in equa-
tion 1.2 and solving the integral at zero temperature one gets the expression for the cur-rent flowing through a single level system as a function of the bias voltage applied acrossit:
I (V ) =G0
e
4ΓLΓR
Γ
arctan
(ε0 + eV
2
Γ
)−arctan
(ε0 − eV
2
Γ
). (1.4)
Here we have assumed that the voltage drop is symmetrical across the contacts. The
parameter G0= 2e2
h (= 77.48 µS) is the conductance quantum (h is the Plank constant).Figure 1.1 c) displays a theoretical current-voltage (IV) characteristic of a single-levelmodel with ε0 =0.8 eV and ΓL = ΓR = 10 meV. This result can be used to gain some intu-ition about the role of the level alignment and the coupling term on the expected currentthrough a molecule. The parameter ε0 determines at which voltage a non-linear IV de-pendence can be expected. Typical values for the level alignment of molecules with goldelectrodes are around 1 eV while the coupling parameter Γ varies in the range of one toten meV. The higher the Γs’ the more hybridized is (are) the molecular level(s), so that,states far away from the Fermi energy of the electrodes can still have a significant contri-bution to the current.
A schematic picture of a molecular junction is displayed in Fig. 1.2. The electrodesset the level of the left and right chemical potentials (µL andµL). In an analogous way the

1
6 1. INTRODUCTION
coupling terms, are related to a part of the molecule called anchoring group. In the real,world these anchoring groups are chemical moieties designed to strongly interact withthe metallic electrodes. They provide mechanical stability by the formation of chemicalbonds and also tune the interaction of the molecular levels with the states the electrodes.Thus, Γ depends strongly on them. Usual anchoring groups are thiol, methyl-thiol, thio-phenes, pyridines, amines, among others.
1
2 3
4
565
6
1
2
3
4
SS
R RR R
SS
a) b)
c)
e)
d)
-2 -1 0 1 210 -8
10 -6
10 -4
10 -2
100
Tran
smis
sion
Energy (eV)
meta-benzene
para-benzene
Figure 1.3: Drawing of a) a polyvinyl chains, b) a polyethylene chain, c) a para-configured benzene ring andd) a meta-configured benzene ring. Hydrogen atoms have been omitted for simplicity. Panel e) displays thetransmission function from sulfur to sulfur atom for the para- and meta-configured benzene ring computedusing the tight binding model of reference [26]. The site self-energy is zero, inter-site coupling is 1.2 eV and theelectrodes to molecule coupling (ΓL(R)) is 10 meV .
In the context of transport, when short molecules (<5 nm) strongly interact with theelectrodes the time that they expend in the molecule is proportional to the inverse of thecoupling (τel ∝ ħ
Γ ). When this time is smaller than the time between electron-electron
interaction (τe−e ∝ ħU ), the electrons are in the ballistic tunneling regime. Under these
conditions, the scattering region is smaller than the free path of the electrons. Sincethe size of the molecules studied in this dissertation is below the coherence length ofelectrons in gold at room-temperature (approximately 10 nm[27]), the electrons flowingthrough them do not change their phase. This regime is known as ballistic and phase-coherent transport. It is characterized by L < Lmfp,LΦ,1 where L is the size of the scatter-ing region, Lmfp the mean free path and LΦ the phase coherence length. In this regime,one can expect to observe quantum phenomena even at room temperature, for example,interference.
Coming back again to the picture of molecular orbitals, an important characteristicof the electron states, that allow for charge transport, is the de-localization of electrons

1.3. STATE OF THE ART: ADVANTAGES AND DRAWBACKS OF MEASURING METHODS
1
7
over most the molecule. In organic chemistry, the π-system is the family of orbitals thatextend for most of the molecule; they are the states that align perpendicular to the axesof the molecular chain. When these states connect the points in which the molecule isattached they are the main conduction channel through molecular systems. For exam-ple, the structure of the molecule in Fig. 1.3 a) has a larger conductance than the one inpanel b) because of the de-localization that the π-system provides.
Since at the molecular scale one needs to consider quantum effects the merely dis-tinction of conjugated versus non-conjugated is not enough to explain the most basic re-lations between conductance and structure. A clear example of this is the phenomenonof quantum interference in a benzene rings. Remarkably, even the most simple tight-binding model predicts a significant difference in conductance if a benzene ring is con-nected in a diametrical manner like the one depicted in Fig. 1.3 c), compared to the samering connected like the one in Fig. 1.3 d). This difference is explained by the interferencebetween the pathways of the charge carriers. The two interfering paths are the frontierorbitals, the HOMO and LUMO. Since a electron can go through each channel at thesame time and depending on the phase acquired in each one of them, the transmittedwave functions can add up or cancel the contribution of the channels. In Fig. 1.3 e), thetransmission function of both configurations is displayed as a function of the energy; no-toriously, the values of the meta-configured ring are lower, showing a pronounce dip or‘anti-resonance’. This feature is considered to be the fingerprint of destructive quantuminterference [28, 29]. The para-configured benzene ring in contrast shows no dip be-tween the resonances because quantum interference works constructively in this case.
1.3. STATE OF THE ART: ADVANTAGES AND DRAWBACKS OF MEA-SURING METHODS
From the time in which the first single-molecule circuit was proposed [1], thirty yearspassed before the first single-molecule was actually trapped between electrodes [2]. Themain achievement that allowed for such experiments was the formation of a nano-gapbetween two metallic leads. Here we will discuss the main strategies that allow for theformation of such gap. Table 1.1 summarizes the advantages and drawbacks of the dif-ferent methods to electronically address single-molecules.
1.3.1. ELECTROMIGRATED BREAK JUNCTIONS
Electromigration is a technique to make nano-gaps starting from a continuous metallicwire (usually gold) with a lithographically patterned constriction. This part of the wireis then opened by applying a high current that drives atoms from the constriction awaythereby creating a gap [30, 31]. The achievable control in this technique depends on thefeedback control over the junction resistance. Specifically, it is important to quickly turnon and off the applied bias voltages as the resistance of the junction changes. In thatway, one can prevents the abrupt opening of the junction due to overheating. The cur-rent state of the art allows for the reliable formation of gaps ranging from one to a fewnanometers. The advantages of this technique are a good stability of the electrodes anda fixed inter electrode distance that allows for the use of an on-chip electrical gate. Hav-ing fixed electrodes after the gap formation allows for using this technique at cryogenic

1
8 1. INTRODUCTION
Technique Gate Statistic Moving electrodes Stability ImagingElectromigration 3 limited 7 high 7STM-BJ limited 3 3 poor 3MCBJ limited 3 3 high 7
Table 1.1: Comparison table among the main techniques to electronically address single-molecules: electro-migration, scanning tunnelling microscope break-junctions (STM-BJ) and the mechanically controlled breakjunction (MCBJ) technique.
temperatures giving access to high resolution measurements necessary for spectroscopyof the ground state of the electrode-molecule-electrode system and its low energy exci-tations. Moreover, electromigration has been extended to other materials than gold, in-cluding graphene (electroburning) [32]. Since a single device is able to measure only onemolecular configuration, it is typically not used to acquire statistics over a large numberof them. The second limitation comes from the limited control over the gap size; withthe current state of the art it is possible to open small gaps but there is no means to tuneit on the nanometer scale afterwards.
1.3.2. SCANNING TUNNELING MICROSCOPE
The scanning tunneling microscope, has been used from the very beginning of the single-molecule electronics field. There are at least two different ways to use it: the scanningmode and the break junction (BJ) mode. The first consists on depositing the moleculeson a surface, usually forming a SAM and, in this the case, the tip of the microscopedoes not chemically interact with the molecule(s). The corresponding system can bedescribed as metal-molecule-vacuum-metal [2]; we will not discuss this method in fur-ther detail. For the break junction (STM-BJ) approach a modified microscope is neededin such a way that it can measure currents flowing when the tip ’touches’ the metallicsurface (G > 1G0) and, at the same time, currents flowing through molecular junctions(G ¿ 1Go) [33, 34]. This enables pushing the STM tip onto the substrate and then pullingit out while measuring the current; this better defines the metal-molecule-tip geometrybut makes harder to obtain good quality of images. STM-BJ has the advantages of: al-lowing non-symetrical environment, for example, temperature gradients [35] or differ-ent tip and surface materials [36]; the introduction of solvents or other environmentsis relatively easy and it possible to gather statistically significant amount of data. Thedrawbacks of this technique are related to the drifting of the tip positioning that makesdifficult to measure single-molecules over the time scale of seconds. It is also hard toinclude a third electrode near the junction, but the use of liquid-gating allows for gatingin the presence of solvents; this only works near room temperature.
1.3.3. MECHANICALLY CONTROLLED BREAK JUNCTIONS (MCBJ)All the experiments carried out in this dissertation were performed using the MCBJ tech-nique. This technique allows for electronically contact single-molecules and gatheringstatistically meaningful data sets with an outstanding mechanical stability even at roomtemperature [37]. The elegance of this technique lies in the simple and effective way tomake nano-gaps and, at the same time, to fine-tune their size. The mechanism works as

1.4. IMPLEMENTATION OF THE MCBJ TECHNIQUE
1
9
follows: on a flexible substrate a thin gold wire is deposited. The sample is clamped tothe end points of a three point bending mechanism as schematically shown in Fig. 1.5 a).The third contact point (pushing rod) lies in the middle of the sample and its movementdrives the bending as it causes a compressive stress in the lower part of the substrateand , simultaneously, an extensive stress in the upper part similarly to the bending of adouble-metal strip bar under a thermal expansion. This movement stretches the goldwire and eventually breaks it at its narrower point forming two electrodes. Importantly,the horizontal stretching of the gold wire has a tiny proportionality relation with the ver-tical displacement of the pushing rod (approximately 1×10⁻⁵ for our devices). This pro-vides the exceptional control over the distance between the two electrodes (10 pm) thatcan be fused back again and re-opened thousands times.
Thanks to this mechanism the MCBJ technique has a remarkable mechanical stabil-ity and a very low sensibility to external vibrations in contrast to the STM-BJ case [38].On the other hand, the sample fabrication of lithographically patterned MCBJ’s samplesis more laborious and time consuming and the technique does not allow for imaging ofthe molecules. Although electrical gating is possible, the coupling to the energy levels ofthe molecules is low [17].
1.4. IMPLEMENTATION OF THE MCBJ TECHNIQUE
Detailed explanations of the experimental design of our MCBJ implementation (TU Delft)can be found in references [39, 40]. Importantly, in this implementation the rod is drivenby a stepper motor or a piezoelectric actuator at choice. This action cause the gold wiresto stretch and, subsequently, break leaving two atomically sharp electrodes. In the re-minder of this section we will describe the samples, the experimental set-up and elec-tronics in more detail.
1.4.1. SAMPLES
Fig. 1.4 b) shows a scanning tunneling microscopy (SEM) micrography of a MCBJ deviceartificially colored; each of the four yellow wires is a MCBJ device. The breaking point liesin the narrower part of the wire which is suspended one µm above the polyimide sub-strate (see Fig. 1.4 c). The process to make the devices starts with a polished phosphorusbronze wafer; a 6 µm layer of polyimide is then spin-coated on the wafer; subsequently,using electron-beam lithography the pattern of the device is written and a 80 nm thicklayer of gold is evaporated on top forming the wires. Finally a layer of polymer resist isspin-coated as a protective layer. Each 5 cm × 5 cm wafer is used to make ten individ-ual samples. They are cut off from the wafer using laser cutting and then stored untilthey are used for single-molecule experiments. The last fabrication step is carried outno longer than a week before the measuring procedure. This step consists of a reactiveion etching process that etches away part of the polyimide suspending, in this way, thenarrower part of the gold wire. This step forms the bridge that will be broken to performthe experiments. The dimension of the samples are chosen such that the ratio betweenthe pushing rod displacement and the electrode displacement is around 5×10⁻⁵.

1
10 1. INTRODUCTION
AV
a) b)
c)
pusshing rod
gold nanowire
clamp
Figure 1.4: a) Schematic of the MCBJ sample, the black lines represent the electrical connections throughwhich the bias voltage is applied and the current measured. b) Artificially colored SEM micrography of anactual device which shows the four junctions of a single chip. c) Zoom in on a single junction.
1.4.2. MEASUREMENT SET-UP
The used experimental set-up of the MCBJ technique has been described previously inthe work of Christian Martin et al.[41]. In a nutshell, the set-up is based on a dip-stickdesign carrying the three-points bending mechanism at the bottom. There are two ac-tuators that drive the bending of the samples: a servo motor and a piezoelectric ele-ment. For coarse movement and mechanical control at low temperatures a brushlessservo motor (Faulhaber) is used as it provides a wide range of displacement. The motoris connected to a gear box with attenuation 246:1 and after that, the movement is trans-ferred to the vertical direction by a differential screw with a pitch of 150µm per turn. Theshortest step possible is approximately 0.1 µm corresponding to about 5 pm of horizon-tal displacement. The maximal speed is 5 µm/s in the vertical direction (correspondingto 0.25 nm/s of electrode separation speed). The fine and fast movement is driven bya piezoelectric-stack connected to the pushing rod through a lever mechanism. It candrive the electrodes at a maximum speed of around 40 nm/s with a step of 0.15 pm. Thebending mechanism is placed at the bottom of a dip-stick that can be pumped down toa base pressure of approximately 1×10⁻⁶ mbar. It can be cooled down to 4 K, but at suchtemperature the piezo-actuator can not be used.
1.4.3. ELECTRONICS AND OPERATION
The electronic equipment used in the measurements was develop by Raymond Schouten(TU Delft). It is hosted in a shielded rack (IVVI rack) powered by two batteries and it is

1.5. FROM CONDUCTANCE TRACES TO HISTOGRAMS
1
11
controlled via an optically coupled interface. Different modules like voltage sources,current sources, current amplifiers, current-voltage converters can be placed in the IVVIrack allowing for customizing the measurements. The electronic isolation makes thissystem ideal for low-noise measurement of low current signals. For the MCBJ measure-ment a logarithmic amplifier is used that has a dynamic range of ten orders of magni-tude. This is a requirement for measuring conductances from the metallic regime ofa gold nano-wire (100’s Ω) down to conductances of poorly conducting molecules (≈1GΩ).
In measurements of single-molecule conductance timing is a crucial aspect. For thisreason, the direct control of the electronic measurements is performed using a Adwingold system. It holds two analog-digital converters (ADC) and two analog-digital con-verter (DAC), each of them with a resolution of 16 bits for a range of ±10 V. The pro-cessing frequency of the Adwin is 40 MHz allowing an acquisition rate up to 100 KHz.The DAC’s are used to control the bias voltage and the voltage of the piezo-actuator, re-spectively. It is its operational frequency what determines the limits of data acquisitionrate. The ADC’s are use to read out the current from the logarithmic amplifier and theinformation is stored in an internal memory (32 MB) until the data is retrieved from thecomputer controller.
The control of the experiments is performed through two layers of software: the userinterface consists of a home made python script with which the parameters of each mea-surement are set and the results retrieved from the Adwin gold; the second layer corre-sponds to a home made Ad-basic script that runs on the Adwin gold system taking careof the real-time control of the applied voltages across the junction and piezo-stack aswell as the reading and storing of the data before it is moved to the computer.
1.5. FROM CONDUCTANCE TRACES TO HISTOGRAMS
0 1 2 3
10 -6
10 -4
10 -2
100
Low
High
Con
duct
ance
(G0)
Electrode displacement (nm)
Cou
nts
/trac
e
Conductance (G0)10 -6 10 -4 10 -2 100
0
0.2
0.4
0.6
0.8a) b)
Figure 1.5: a) Blue lines correspond to a set of representative traces from a bare gold sample (offset in thex-direction for clarity) the colored data on the left represents a two-dimensional conductance vs. electrodedisplacement histogram of a MCBJ constructed from 10000 consecutive traces measured in a sample withoutany molecule. b) One-dimensional (1D) conductance histogram of the same measurement obtained by inte-gration along the x-axes of the histogram in a). The peak at 1 G0 at the right hand side correspond toa singlegold atom contact.

1
12 1. INTRODUCTION
1.5.1. CONDUCTANCE MEASUREMENT
In a typical measurement of molecular conductance, a clean sample is loaded in thethree-point breaking mechanism and the sample is electrically connected to the set-upelectronics. A bias voltage is applied between the two ends of the gold wire. Subse-quently, the pushing rod is pressed against the sample and bends it. The conductance ofthe wire (G=I/V) is monitored as it is stretched until the wire breaks (motor controlled)at the constriction creating two sharp electrodes. When this happens the electrodes arepushed back together in such a way that the breaking and making of the metallic contactcan be achieved using only the range of the piezoelectric element.
A conductance trace consists of recording the conductance value (G) as a functionof the electrode displacement. When the wire is stretched the conductance decreasesas the cross section of the wire thins down. When the wire is only a few atoms thick(1-5 atoms), the conductance decreases in a stepwise manner showing values close tointeger multiples of the conductance value (G0= 77.48 µS). When the constriction is heldonly by 1 gold atom the conductance is equal to 1 G0, corresponding to a single perfectlytransmitting quantum channel.
As the electrodes are pulled further apart there is a sharp drop of the conductancevalue due to the loss of metallic contact; it is known that the electrodes snap back likecutting a rubber band under tension. On average, the electrode retraction is about 0.5nm. After that point the current is caused by electrons tunneling from the source to thedrain electrodes through the nano-gap. This tunneling is characterized by an exponen-tial decay of the conductance as a function of the electrode displacement as seen in theblue drawn lines of Fig. 1.5 a). No two conductance traces are the same and to obtain thegeneral trend the traces are aligned at the sharp drop and these point is defined as zerodisplacement. Subsequently, all are compiled in a two-dimensional (2D) conductancevs. electrode displacement histogram. An example of such an histogram constructedfrom 10000 traces is displayed in Fig. 1.5. The color scale represents the frequency withwhich each value of conductance was observed at every point of displacement.
To gain a more specific insight of the conductance distribution a one-dimensional(1D) conductance histograms is constructed by integrating the counts on the displace-ment axes. Figure 1.5 b) shows the conductance histogram corresponding to the sameexperiment as the one shown in panel a) of the same figure. An important feature isthe sharp peak at 1 G0 which is an indication of the formation of atomically sharp elec-trodes. For lower conductance values the distribution is near zero between 1 to a fewtimes 10−4 G0. Then from 10−4 G0 downwards there is an onset of the tunneling currentthat smoothly increases as the conductance decreases. The data in Fig. 1.5 correspondsto measurements in which no molecule was deposited in the device and constitutes thebase line of all the measurement discussed in this dissertation.
Summarizing, a standard conductance measurement consists of a few thousandstraces that are displayed in the form of 2D- and 1D- histograms; the presence of a sharp1 G0 peak indicates the formation of atomically sharp electrodes. Deviations from thehistograms in Fig.1.5 may indicate the presence of molecules or other objects bridgingthe gap.

1.6. THIS THESIS
1
13
1.6. THIS THESISFollowing this introduction, Chapter 2 describes the experimental and analysis meth-ods used in the following chapters. Subsequently, several molecular families are studied:Chapter 3 introduces a new strategy for anchoring molecules to metallic electrodes, inparticular a method to make direct C-Au bonds in the context of single-molecule elec-tronics. Chapters 4, 5 and 6 discuss the single-molecule electrical properties of curcum-ine inspired molecules devided in series of compounds that shares specific characteris-tics. The first group of molecules is used to explore the influence of the sulfur atom posi-tion in the thiophene anchoring group. The second group deals with the modificationsto the molecular backbone and, in particular, it is shown that boron difluorine groupsgive rise to a bi-stable system. The last group of curcuminoids compoumds exhibit mod-ifications to the backbone with moieties with affinity to metals; a system with three an-choring sites is thus formed. Chapter 7 deals with metal-organic complexes called salenand salophenes, there the relation between the charge carrier pathway and the metallicfunctionalization of the free ligands is studied. Finally, various examples are discussedin the context of the outlook of this dissertation and the future of single-molecule elec-tronics field is described following the view of the author.
REFERENCES[1] A. Aviram and M. A. Ratner, Molecular rectifiers, Chemical Physics Letters 29 (1974).
[2] C. Joachim, J. K. Gimzewski, R. R. Schlittler, and C. Chavy, Electronic transparenceof a single c60 molecule, Phys. Rev. Lett. 74, 2102 (1995).
[3] C. Dekker, S. Tans, M. Devoret, H. Dai, R. E. Smalley, A. Thess, and L. Georliga,Individual single-wall carbon nanotubes as quantum wires, Nature 386 (6624), 474(1997).
[4] E. Lörtscher, Wiring molecules into circuits, Nature Nanotechnology 8, 381 (2013).
[5] M. Ratner, A brief history of molecular electronics, Nature Nanotechnology 8, 378(2013).
[6] I. Present, Cramming more components onto integrated circuits, Readings in com-puter architecture 56 (2000).
[7] C. P. Collier, E. W. Wong, M. Belohradský, F. M. Raymo, J. F. Stoddart, P. J. Kuekes,R. S. Williams, and J. R. Heath, Electronically configurable molecular-based logicgates, Science 285, 391 (1999).
[8] M. A. Reed, C. Zhou, C. J. Muller, T. P. Burgin, and J. M. Tour, Conductance of amolecular junction, Science 278, 252 (1997).
[9] C. Muller, J. van Ruitenbeek, and L. de Jongh, Experimental observation of the tran-sition from weak link to tunnel junction, Physica C: Superconductivity 191, 485(1992).

1
14 REFERENCES
[10] T. A. Su, M. Neupane, M. L. Steigerwald, L. Venkataraman, and C. Nuckolls, Chem-ical principles of single-molecule electronics, Nature Reviews Materials 1, 16002(2016).
[11] A. Nitzan and M. A. Ratner, Electron Transport in Molecular Wire Junctions, Science300, 1384 (2003), 0208239 .
[12] X. D. Cui, A. Primak, X. Zarate, J. Tomfohr, O. F. Sankey, A. L. Moore, T. A. Moore,D. Gust, G. Harris, and S. M. Lindsay, Reproducible measurement of single-moleculeconductivity, Science 294, 571 (2001).
[13] M. Elbing, R. Ochs, M. Koentopp, M. Fischer, C. von Hänisch, F. Weigend, F. Evers,H. B. Weber, and M. Mayor, A single-molecule diode, Proceedings of the NationalAcademy of Sciences 102, 8815 (2005).
[14] I. Díez-Pérez, J. Hihath, Y. Lee, L. Yu, L. Adamska, M. A. Kozhushner, I. I. Oleynik,and N. Tao, Rectification and stability of a single molecular diode with controlledorientation, Nature Chemistry 1, 635 (2009).
[15] E. Lörtscher, B. Gotsmann, Y. Lee, L. Yu, C. Rettner, and H. Riel, Transport propertiesof a single-molecule diode, ACS Nano 6, 4931 (2012).
[16] A. Batra, P. Darancet, Q. Chen, J. S. Meisner, J. R. Widawsky, J. B. Neaton, C. Nuckolls,and L. Venkataraman, Tuning rectification in single-molecular diodes, Nano Letters13, 6233 (2013).
[17] M. L. Perrin, E. Galan, R. Eelkema, J. M. Thijssen, F. Grozema, and H. S. J. van derZant, A gate-tunable single-molecule diode, Nanoscale 8, 8919 (2016).
[18] D. Dulic, S. J. van der Molen, T. Kudernac, H. T. Jonkman, J. J. D. de Jong, T. N. Bow-den, J. van Esch, B. L. Feringa, and B. J. van Wees, One-way optoelectronic switchingof photochromic molecules on gold, Phys. Rev. Lett. 91, 207402 (2003).
[19] N. Darwish, I. Díez-Pérez, P. DaSilva, N. Tao, J. J. Gooding, and M. N. Paddon-Row, Observation of electrochemically controlled quantum interference in a singleanthraquinone-based norbornylogous bridge molecule, Angewandte Chemie Inter-national Edition 51, 3203 (2012).
[20] J. C. Cuevas, J. Heurich, F. Pauly, W. Wenzel, and G. Schön, Theoretical descriptionof the electrical conduction in atomic and molecular junctions, Nanotechnology 14,R29 (2003).
[21] L. Sun, Y. A. Diaz-Fernandez, T. A. Gschneidtner, F. Westerlund, S. Lara-Avila, andK. Moth-Poulsen, Single-molecule electronics: from chemical design to functionaldevices, Chem. Soc. Rev. 43, 7378 (2014).
[22] P. Hohenberg and W. Kohn, Inhomogeneous electron gas, Phys. Rev. 136, B864(1964).

REFERENCES
1
15
[23] W. Kohn and L. J. Sham, Self-consistent equations including exchange and correla-tion effects, Phys. Rev. 140, A1133 (1965).
[24] T. Tsuneda, Density functional theory in quantum chemistry (Springer, 2016).
[25] S. Y. Quek, L. Venkataraman, H. J. Choi, S. G. Louie, M. S. Hybertsen, and J. B.Neaton, Aminegold linked single-molecule circuits: experiment and theory, NanoLetters 7, 3477 (2007).
[26] C. J. Lambert, Basic concepts of quantum interference and electron transport insingle-molecule electronics, Chem. Soc. Rev. 44, 875 (2015).
[27] S. Elke and C. J. Carlos, Molecular electronics: an introduction to theory and experi-ment, Vol. 15 (World Scientific, 2017).
[28] D. Z. Manrique, C. Huang, M. Baghernejad, X. Zhao, O. a. Al-owaedi, H. Sadeghi,V. Kaliginedi, W. Hong, M. Gulcur, T. Wandlowski, M. R. Bryce, and C. J. Lambert,A quantum circuit rule for interference effects in single-molecule electrical junctions,Nature Communications 6, 1 (2015).
[29] T. Markussen, R. Stadler, and K. S. Thygesen, The relation between structure andquantum interference in single molecule junctions, Nano Letters 10, 4260 (2010).
[30] H. Park, A. K. Lim, A. P. Alivisatos, J. Park, and P. L. McEuen, Fabrication of metallicelectrodes with nanometer separation by electromigration, Applied Physics Letters75, 301 (1999).
[31] P. S. Ho and T. Kwok, Electromigration in metals, Reports on Progress in Physics 52,301 (1989).
[32] F. Prins, A. Barreiro, J. W. Ruitenberg, J. S. Seldenthuis, N. Aliaga-Alcalde, L. M. K.Vandersypen, and H. S. J. van der Zant, Room-temperature gating of molecu-lar junctions using few-layer graphene nanogap electrodes, Nano Letters 11, 4607(2011).
[33] B. Xu and N. J. Tao, Measurement of single-molecule resistance by repeated formationof molecular junctions, Science 301, 1221 (2003).
[34] S. Y. Quek, L. Venkataraman, H. J. Choi, S. G. Louie, M. S. Hybertsen, and J. B.Neaton, Amine - Gold linked single-molecule circuits: Experiment and theory, NanoLetters 7, 3477 (2007).
[35] J. R. Widawsky, P. Darancet, J. B. Neaton, and L. Venkataraman, Simultaneous de-termination of conductance and thermopower of single molecule junctions, NanoLetters 12, 354 (2012).
[36] A. V. Rudnev, V. Kaliginedi, A. Droghetti, H. Ozawa, A. Kuzume, M.-a. Haga,P. Broekmann, and I. Rungger, Stable anchoring chemistry for room temperaturecharge transport through graphite-molecule contacts, Science Advances 3 (2017),10.1126/sciadv.1602297.

1
16 REFERENCES
[37] C. Untiedt, M. J. Caturla, M. R. Calvo, J. J. Palacios, R. C. Segers, and J. M. van Ruiten-beek, Formation of a metallic contact: Jump to contact revisited, Phys. Rev. Lett. 98,206801 (2007).
[38] M. S. Hybertsen, L. Venkataraman, J. E. Klare, A. C. Whalley, M. L. Steigerwald, andC. Nuckolls, Amine-linked single-molecule circuits: systematic trends across molec-ular families, Journal of Physics: Condensed Matter 20, 374115 (2008).
[39] C. A. Martin, D. Ding, H. S. J. van der Zant, and J. M. van Ruitenbeek, Lithographicmechanical break junctions for single-molecule measurements in vacuum: possibil-ities and limitations, New Journal of Physics 10, 065008 (2008).
[40] C. A. Martin, Charge transport through single molecules in two-and three-terminalmechanical break junctions (2011) phD. Thesis.
[41] C. a. Martin, R. H. M. Smit, R. V. Egmond, H. S. J. Van Der Zant, and J. M. VanRuitenbeek, A versatile low-temperature setup for the electrical characterization ofsingle-molecule junctions, Review of Scientific Instruments 82, 053907 (2011).

2MEASUREMENT PROTOCOLS AND
DATA ANALYSIS
POESÍA POESÍA todo poesíahacemos poesía
hasta cuando vamos a la sala de baño
Nicanor Parra
The elegance of the mechanically controlled break junction (MCBJ) technique is oftenovershadowed by the limited control over variables such as the exact atomic configurationor the alignment between the frontier orbitals and the Fermi energy of the electrodes. Theusual strategy to overcome these difficulties is to gather large amounts of data to obtainstatistically significant information from the random arrangement of molecular junc-tions. In this chapter we will describe different methods to extract valuable informationfrom single-molecule conductance measurements. We will discuss methods to identifymolecular features and describe a method to determine the yield of junction formation infast breaking experiments using a filtering procedure. Subsequently, we will examine theimpact of the yield of junction formation on the obtained values of conductance. Finally,we will comment on how contamination plays a role on experiments and how it can beminimized.
17

2
18 2. MEASUREMENT PROTOCOLS AND DATA ANALYSIS
2.1. FILTERING, SELECTION AND CRITERIA FOR MOLECULAR FIN-GERPRINTS
In an ideal single-molecule conductance measurement one can distinguish the cases inwhich molecules are trapped between the electrodes from the ones in which no moleculebridges both electrodes. Due to the large amount of information collected in such ex-periments, it is necessary to establish criteria to split the data in meaningful subsets. Inother words, a filter is needed to allow the identification of traces in which a molecule istrapped between the electrodes. The yield of junction formation is then defined by theratio of molecular traces and the total amount of traces.
Cond
ucta
nce
(G0)
Displacement (nm) Displacement (nm)0 2 4 6
10 -6
10 -4
10 -2
10 -0
0 1 2 3 4
10 -6
10 -4
10 -2
100 a) b)
Figure 2.1: a) Examples of single breaking traces, from left to right: a trace of a pristine gold sample, one inwhich a pyridine terminated curcuminoid was deposited, one where MeS-OPE3 is measured and one in whicha Alkynyl terminated phenyl ring is measured (OPA1). The traces are offset for clarity. All these traces representa problem for selection methods because they are longer than the average empty trace, but do not show a clearplateau structure. b) Three clear molecular traces are displayed from left to right for a MeS-OPE3, a methylsulfide terminated curcuminoid with a BF2 central group and a trace from the measurement of an alkynylterminated oligo-phenylene (OPA3).
In literature, several criteria have been used to select the set of data that is taken intoaccount for further analysis [1, 2]. In the early days of the field, this task was performedmanually. On top of the inconvenience of doing so with large amount of data, the usageof supervised methods increases the chances of creating artificial artifacts or features onthe data. This can originated by either confirmation bias or undetermined thresholds.Other methods rely on the length of the traces, which allow a clear definition of the yieldof junction formation when the molecular traces show long plateaus but fail to captureshort features in the traces.
By inspecting individual traces of a ‘bare gold experiment’ one could give a qualita-tive description of an empty trace as follows: the trace begins in the metallic regime, andthe conductance decreases smoothly upon stretching until it reaches a value of a fewG0 (3 to 5 G0). From there it evolves in a stepwise manner until a value close to 1 G0 hasbeen established. Upon further stretching, the conductances a sharply drops to around

2.1. FILTERING, SELECTION AND CRITERIA FOR MOLECULAR FINGERPRINTS
2
19
1×10⁻⁴ G0 (usually called ’onset of the current’) followed by a smooth exponential decayof the conductance at a rate of around 4 dec/nm.
One inconvenience of this description is that it does not hold for all the traces in a‘bare gold experiment’, either because non-ideal elastic breaking of the gold wire or dueto the presence of contamination. The latter point will be addressed in a subsequentsection. In Fig. 2.1a) several examples of single traces are displayed: in red a trace takenfrom a ‘bare gold measurement’, the blue is from a measurement of a pyridine termi-nated curcuminoid, green is comming from a measurement on a (MeS-OPE3), and inblack from a measurement of an alkynyl terminated phenyl ring. Although these tracescome from different measurements they share a particular feature, which is that theydiffer from the standard ‘empty trace’ but they do not show a clear plateau-like behav-ior. This illustrates the challenge in establishing criteria to differentiate molecular tracesfrom the ones which are empty. In contrast, in Fig. 2.1b) clear plateaus are displayed.The traces correspond to MeS-terminated OPE3, a BF2 substituted curcuminoid and analkynyl terminated 4-phenylene (OPA4). These kind of traces can be unambiguously at-tributed to molecular junctions, and any filtering method should, therefore, label themas molecular traces.
Figure 2.2: Examples of a single trace from a measurement of a OPA 1 molecule. In blue the full trace and inred the same trace compressed to a resolution of 80 bins per decade in conductance and 24 (center) and 54(right) bins per nm in displacement. The traces has been offset for clarity. The black lines represent the linearfit of log10(G) which has the higher slope (lower decay rate) in each case in a window of 0.5 nm. The slopes areindicated on top of each line.
In this section we elaborate a different kind of method to split the information fromsingle-molecule conductance experiments. We start with the observation that conduc-tance traces of empty junctions decay sharply with the inter-electrode displacement.When a molecule or other object bridges the electrodes this dependence is weakened;the conductance drops off more slowly as a function of inter-electrode displacement. Agood way to establish the likelihood of a trace originated from a molecular junction is,thus, to look at the way it decays as a function of inter-electrode distance.

2
20 2. MEASUREMENT PROTOCOLS AND DATA ANALYSIS
With this in mind, we choose to look in each conductance trace for a window of dis-placement (∆x) in which the decay of the conductance is small. Here, ‘small’ needs amore rigorous definition. For that we define the decay inside the window∆x as the slope(m) of the linear fit of log10(G/G0). In this way m represents the rate at which the trace ischanging as a function of electrode displacement inside the chosen window, in decadesper nanometer (dec/nm). In this context, m = 0 means a plateau-like behavior in whichthe conductance stays relatively constant; if for a particular window m =−1 means thatthe trace is decaying on average one order of magnitude per nanometer and, contrarily,m = 1 would mean that the conductance has an upturn with an average increase of oneorder of magnitude per nanometer. It is worth mentioning that this methodology doesnot take into account the shape, fluctuations or oscillations of the trace but the averageslope of the trace in a certain window.
0 1 2
10-6
10-4
10-2
100
0 1 2
10-6
10-4
10-2
100
10-6 10-4 10-2 10-0
Conductance (G0)
Con
duct
ance
(G0)
0
0.5
1
1.5
2
2.5
coun
ts/tr
ace
0 1 2
10-6
10-4
10-2
100
0 1 2
Electrode displacement (nm)
Length (nm)
a)
d) e) f)
b) c)
Slope (dec/nm)
0
100
200
300
400
# of
trac
es
-15 -10 -5 0 5
10
30
50
70
Figure 2.3: a) 2D-Histogram of a sample with a thiophene terminated curcuminoid built up from 5000 consec-utive breaking traces. As a reference the short black solid line is 0.5 nm long and has a slope of -0.5 dec/nm.b) 2D-histogram of the selected traces using (∆x =0.5 and mthrs =-0.5 dec/nm). c) 2-D-histograms of the uns-elected traces. d) The length histogram of the traces of the same measurement. e) Histogram of the maximumslope of the measurement using a displacement window (∆x=0.5 nm). The vertical dashed line indicates aslope of -0.5 used as the threshold for selection (mthrs ). f ) 1D-histograms of the selected traces (red), unse-lected traces (orange) and total traces (blue).
Before describing the selection method in more detail it is worth enumerating someimportant features observed in a typical experiment. When a trace transits from themetallic regime to the tunneling one following the breaking point (1 G0), it is often seena dramatic drop in conductance, below the onset of the current (≈ 1 × 10⁻⁴ G0) and,sometimes, below the detection limit. This can be seen in the red and green traces in

2.1. FILTERING, SELECTION AND CRITERIA FOR MOLECULAR FINGERPRINTS
2
21
-15 -10 -5 0 5Slope (decades/nm)
# of
trac
es
0
20
40
60
80
100
120
-15 -10 -5 0 5Slope (decades/nm)
0
20
40
60
80
-15 -10 -5 0 5Slope (decades/nm)
0
10
20
30
40
50∆x=0.3 nm ∆x=0.50 nm ∆x=0.7 nm
Figure 2.4: Distribution of the maximum slope found in the traces of the measurement displayed in Fig. 2.3 fora window width (∆x) of a) 0.3 , b) 0.5 , c) 0.7 nm.
Fig. 2.1a) and the green trace in the panel b) of the same figure. This is an artifact due toan overshoot of the current amplifier caused by the fast snapping of the electrodes outof contact. Subsequently, the measurement recovers to what we could call a normal be-havior without artifacts caused by rapid changes in current. Another important charac-teristic is that when a molecule bridges the gap between the electrodes the conductanceis not always stable; it often fluctuates and jumps between different values. Ultimately,a single trace is composed of thousands of points (between 5000 to 12000) and a typi-cal measurement consist of around 2000 to 20000 of such traces. These characteristicsconstitute the framework in which the filtering method has to be applied.
To account for the high sensitivity of linear fits to extreme points, the fitting proce-dure is performed on a compressed version of each trace, in which large fluctuations aresmeared. This also allows for the speeding up the procedure and to make the analysisin-situ while an experiment is running. In Fig. 2.2 a trace is displayed using differentcompression settings: in the blue curve all points are represented; in red, the trace wascompressed to the resolution of a 2D-histogram with 80 bins per decade in the conduc-tance axis, 24 (left) and 54 (right) bins per nanometer in the displacement axis. It is clearthat the roughest compression (24 bins/nm) removes the artificial drop in conductanceat zero displacement while the fine compression preserves this characteristic. In thesame figure the black lines correspond to the linear fit of log10(G) in a window of 0.5nm which has the highest slope (lowest decay rate) in the trace. Notably, regardless ofthe compression the algorithm has selected the same part of the trace. The maximumslope obtained in the case of the roughest compression (middle line) is somewhat lowerthan the one obtained with the other compression settings. Since we want to preserve asmuch as possible the characteristics of the original trace we decided to impose an extrarequirement to the window of each trace that holds the lower decay rate: in the regiondefined by the window ∆x no point can drop below the conductance detection limit,which nominally is 1× 10⁻⁶G0. From here we can now define the ’trace slope’ as themaximum of such slopes from all the possible windows ∆x nm long along the positiveside of the displacement axis.
If we now apply the same method to every trace of a measurement of 5000 tracesof, for example, a thiophene terminated curcuminoid we can obtain the information

2
22 2. MEASUREMENT PROTOCOLS AND DATA ANALYSIS
displayed in Fig. 2.3. Panel a) displays the usual 2D-conductance vs. displacement his-togram including all the data. The solid black line is a guide to the eye that is 0.5 nmwide and has a decay rate of -0.5 dec/nm. Panel b) shows the 2D-conductance vs. dis-placement histogram of the traces which have a ’trace slope’ larger than -0.5 dec/nm in,at least, a window of 0.5 nm in displacement. It is interesting that by constructing anhistogram from only traces selected this way it is possible to highlight features that char-acterize molecular junctions. In Fig. 2.3f), the red line corresponds to the 1D-histogramof these traces. It shows a pronounced peak in the region in which the complete dataset (blue line) shows a smaller peak. In Fig. 2.3c) the 2D-histogram of the traces thatwere not selected is displayed as well; it evidences that the unselected traces still holdfeatures of molecular junctions, which is also visible as the small peak on the green con-ductance histogram in panel f). These molecular-like features could be associated withplateau-like regions that are shorter than 0.5 nm.
One can visualize what this method does if for each trace the maximum slope in ev-ery window ∆x= 0.5 nm wide is computed and plotted in the form of a distribution; seefor example in Fig. 2.3e). This plot shows two accumulation centers, one around m=-3and the other around m=0.3. The vertical dashed line located at mthr=-0.5 dec/nm rep-resents the threshold above which the algorithm labels a trace as molecular. In contrast,the length distribution of all traces shown in Fig. 2.3 d) only presents one peak at 0.5nm with an asymmetric tale towards larger lengths. In this particular case the use of afilter based on the slope of the traces allows for the distinction of sorts of traces while thedistinction by length does not provide it.
-2-1010
4
8
12
-2-101Slope (dec/nm) Slope (dec/nm) Slope (dec/nm)
0
5
10
15
20
25
% o
f sel
ecte
d tra
ces
-2-1010
2
4
6
8∆x=0.3 nm ∆x=0.50 nm ∆x=0.7 nm
Figure 2.5: Charts displaying the percentage of selected traces from the measurement displayed in Fig. 2.3 fordifferent threshold (mthr from -1.5 to 0.5 dec/nm). The window of displacement considered in each chart aredisplayed in the upper left corner of each panel.
This example nicely illustrates the capability of our method to extract a meaning-ful subset of the traces and highlights the conductance distribution and the electrodedisplacement dependence of the molecular conductance. Nevertheless, the green 1D-histogram in Fig. 2.3d) shows a smaller but still noticeable peak in the same region asthe one containing the selected traces. This means that there is a sizable amount oftraces that are mistakenly taken out, the false negatives. It is important, to define astandard window size (∆x) such that we can reliably capture molecular features in theconductance measurements and, at the same time, minimize the false negative counts.

2.1. FILTERING, SELECTION AND CRITERIA FOR MOLECULAR FINGERPRINTS
2
23
0 1 2
100
200
300
400
0 1 2
10-6
10-4
10-2
100
0 1 2
-10 -5 0 10-6 10-4 10-2 10-0
0 1 2
0
Conductance (G0)
Electrode displacement (nm)
Slope (dec/nm)Length(nm)Co
unts
(a.u
.)
# of
trac
esCo
nduc
tanc
e (G
0)
Figure 2.6: a) 2D-Histogram of a clean bare gold sample including 10000 traces. b) 2D-histogram of the se-lected traces using (∆x =0.5 and mthr=-0.5 dec/nm). c) displays the 2-D-histograms of the unselected traces.d) length histogram of the traces in the same measurement. e) Histogram of the maximum slope of the mea-surement using the indicated window and slope the vertical dashed line indicates a slope of -0.5 (dec/nm)used as the threshold for selection. d) 1D-histograms of the selected traces (red), unselected traces (orange,indistinguishable from the blue) and total traces (blue).
To illustrate how this works we construct the slope histograms of the data in Fig. 2.3 fordifferent values of ∆x and check what are the parameters that allow separation betweenmolecular and empty traces in the best way. Fig. 2.4 displays three histograms of the‘trace slope’ considering ∆x values of 0.3, 0.5 and 0.7 nm respectively. The middle panelrepeats the information on Fig. 2.3 e). By Comparing these plots one can see that thesmaller the window size the higher the amount of traces is considered. This means thatmore and more traces have the minimum amount of points above the detection limit aswe decrease the window size. Regarding the selectivity, on the other hand, the plots with∆x = 0.3 nm and 0.5 nm show a structure that can be interpreted as two peaks, while for0.7 nm there is only one recognizable group.
The aim of this analysis is to set a threshold slope (mthrs) above which a trace wouldbe considered molecular. We tried several values for this threshold. The result can beseen in the bar plots shown in Fig. 2.5 in which the x-axis represents mthrs and the y-axisthe percentage of traces selected. The x-axis is inverted in such a way that steeper tracesare plotted on the right hand side. As expected, the lower the required slope the moretraces are identified as molecular, but the figure does not provide further information

2
24 2. MEASUREMENT PROTOCOLS AND DATA ANALYSIS
-15 -10 -5 500
100
200
300
400
500
# of
trac
es
∆x=0.3 nm
0
50
100
150
200
-15 -10 -5 50
∆x=0.50 nm
05
1015202530
-15 -10 -5 50
∆x=0.7 nm
Slope (dec/nm) Slope (dec/nm) Slope (dec/nm)
Figure 2.7: Distribution of the maximum fitted slope computed by a linear fit of log(G) of the measurementdisplayed in Fig. 2.6 in a window (∆x) indicated in each panel.
about which is the better choice for ∆x and mthrs.The problem in the other extreme case is the issue of false positive cases, meaning the
amount of traces in which the target molecule was not trapped but the filter still labelsit as a molecular trace. To gain more insight on this point we performed the same anal-ysis on a clean sample in which no molecule has been deposited. Fig. 2.6 displays 10000traces of a ‘bare gold measurement’ in the same fashion as in Fig. 2.3. Both, length andslope histograms only show a single peak. In this case the tail of the slope distributionto the right of -0.5 dec/nm (black dashed line) contains only 0.6% of the total amountof traces. The slope histogram for different ∆x windows is displayed in Fig. 2.7. In thecase of ∆x =0.7 nm, an almost negligible amount of traces are labeled as molecular; thiswould mean a very low rate of false positives. In the case of∆x=0.3 nm most of the tracesshow a slope around -4 dec/nm with a broad distribution. We find that a good compro-mise between the false positive and false negative can be achieved with ∆x=0.5 nm andmthrs=0.5 dec/nm; a threshold that produces below 1% of false positive counts in thecase of a clean junction. This choice is rather arbitrary but gives an unsupervised man-ner to split data in meaningful subsets. We point out that the accuracy of this methodmay vary depending on the molecular system to which it is applied and modification tothe parameters we discuss may need to be tuned to obtain optimal results. From here on,unless otherwise mentioned, we will define the yield of junction formation as the ratiobetween the traces selected with this method (with ∆x= 0.5 nm and mthrs= -0.5 dec/nm)and the total amount of traces.
2.2. JUNCTION-FORMATION YIELDOne may think that by increasing or decreasing the concentration of the solution de-posited on a device, the chances of trapping a molecule when breaking the electrodeswould increase or decrease. However, this relation has proven not to be so simple. Ex-periments have shown that using different concentrations and methods to determinethe single-molecule conductance are nearly independent of the concentration. This hasbeen rationalized by the fact that the experiments are sensible only to a very restrictedvolume around the breaking point rather than to the average concentration of the usedsolution. In addition, the atomic sharpness of the electrodes makes the scenario of a

2.2. JUNCTION-FORMATION YIELD
2
25
-2-1.5-1-0.500.51Slope (dec/nm)
0
0.5
1
1.5
2
2.5
3%
of s
elec
ted
trac
es
-2-1.5-1-0.500.510
0.20.40.60.8
11.2
-2-1.5-1-0.500.510
0.1
0.2
0.3
0.4
0.5
0.6∆x=0.3 nm ∆x=0.50 nm ∆x=0.7 nm
Slope (dec/nm) Slope (dec/nm)
Figure 2.8: Selected traces as a function of the threshold slope as explained in the main text for three differentwindow width (∆x) as indicated in the insets. The measurements contain 10000 consecutive conductancetraces of a ’bare gold measurement’. The total number of included traces varies because the ones that extendfor less than the window width are excluded from the counting.
single-molecule bridging the gap the more likely, instead of an ensemble of moleculesbetween them.
10-6 10-4 10-2 10-0
Conductance (G0)
Cou
nts
(a.u
)
0
1
2
3
0.1V 52.6 % 0.1V 95.2 % 0.1V 85.9 % 0.15V 76.0 % 0.15V 51.5 % 0.2V 47.9 % 0.25V 39.4 % 0.3V 44.3 % 0.1V 36.0 %
Figure 2.9: Series of 1D-histograms of the full data sets acquired on a single junction in which a di-methyl-sulfide OPE-3 was deposited. The histograms collect information from thousands of traces each. The legendnext to the figure displays the bias voltage used in each case and the yield of junction formation, defined as thepercentage of selected traces using the filter described in the previous section with mths = −0.5 dec/nm and∆x= 0.5 nm. The curves are normalized to the molecular peak and offset for clarity. Notably there is a clearshift of the peak which does not follow a clear trend.
There has been no systematic study on the influence of the yield of the conduc-tance values obtained from the measurements. Thanks to the mechanical stability of theMCBJ devices we have been able to run experiments on a single junction for nearly hun-dred thousand times. Interestingly, we have seen variations that are not exclusively at-

2
26 2. MEASUREMENT PROTOCOLS AND DATA ANALYSIS
tributable to degradation of the target molecules. Figure 2.9 shows a series of normalized1D-histograms which are offset for clarity; the data was recorded from a single junctionin which a solution of methylsulfide terminated OPE 3 molecules in dichloromethanewas drop-casted. Each histogram is constructed from at least 1000 consecutive tracesup to 2000. The legend displays the bias voltage and the yield of junction formation asdetermined using the algorithm described in the previous section. The measurementare sorted from the bottom to the top in a temporal order and the bottom (first) curveand the last one share more characteristic features than the bottom one and the secondone. The distribution of the conductance of the selected traces has been fitted to log-normal distributions. The peak conductance values and the full width half maximum(FWHM) are plotted in Figure 2.10 as a function of bias voltage and yield. An uprise ofthe conductance is seen as a function of yield while there is no clear dependence on thebias. It seems that the more likely trapping a molecule, the higher the obtained conduc-tance. It is worth mentioning that the width of the peaks stays almost the same for allbias voltages and yields.
Cond
ucta
nce
Cond
ucta
nce
(10-5
G0)
Yield (%)0 0.1 0.2 0.3 20
10
2
4
40 80 100Bias Voltage(V)
0
0.2
0.4
0.6
0.8
1
Wid
th (d
ec)
a) b)
c) d)
Figure 2.10: Conductance values obtained by fitting a log-normal curve to the selected traces from the mea-surements displayed in Figure 2.9 as a function of a) bias voltage and b) yield of junction formation. The fullwidth half maximum of such fits is displayed as a function of: c) bias voltage and d) yield.
A reasonable explanation for this behavior is that the more probable it is to trap amolecule, the higher the chance to trap more than one. So if the yield of junction for-mation approaches 100%, it is less likely that the junction holds just a single-molecule.Therefore, one should be careful in claiming single-molecule conductance values es-

2.3. THE IMPORTANCE OF CLEANING PROCEDURES
2
27
pecially when the yield of junction formation is high. For the sake of determining theconductance of single-molecules it is important to aim for a yield of junction formationlow enough to ensure that the most likely configuration is a single-molecule bridgingthe electrodes. As a rule of thumb, we estimate a safe upper limit around 60 to 70%. Thelower limit has to do with the capability of distinguishing the measurement on a baregold sample from the one in which molecules have been deposited. This has to do withhow clean are the samples and the set-up. We will discuss this aspect in the next section.
2.3. THE IMPORTANCE OF CLEANING PROCEDURESOne of the main requirements for single-molecule conductance measurements is thatthe obtained data that is used to extract information about the measured molecule, doesnot contain features from other sources [3–5]. For this reason before performing single-molecule conductance measurements, normally a ‘control experiment’ or ‘bare gold ex-periment’ is executed to check that there is no contamination [4, 6]. However, often thereare indications of small amounts of contamination. When the expected signal of thetarget molecule is sufficiently distinctive from that of the spurious additional features,either with respect to yield, length or conductance value, the molecule is drop-castedand the experiment is carried out. On the contrary, it is interrupted and a new sample ismounted or additional cleaning procedures have to be considered.
An aspect that is often overlooked is the fact that the number of breaking traces onthe bare gold sample are fewer than those taken on the target molecules. Under certaincircumstances this can lead to an underestimation of the contamination present in thesystem. In this section we show that clean samples can show features similar to molec-ular plateaus when one does not take care of the appropriate cleaning procedures. Wealso propose a protocol which reduces the level of contamination in our samples to val-ues of less than one percent in the number of breaking traces. This value is sufficientlylow to ensure a proper analysis of the molecular features in the data.
We have measured a clean MCBJ sample for 20000 consecutive conductance traceswithout depositing molecules on it; the duration of the experiment was 21 hours. InFig. 2.11 a set of 2D-conductance vs. displacement histograms is displayed, each onerepresents the information of 2500 consecutive traces of the described experiment andare numbered in chronological order. The presence of contamination is seen as tracesthat extend to around one nanometer. It is important to mention that the histogram inpanel number 1 of Fig. 2.11 shows a small amount of contamination as it is reflected inthe 3% of selected traces using our filter method (see Fig. 2.14). If a particular moleculewould be measured in this device, OPE 3 for example, then just by looking at this first his-togram one could decide to deposit the target molecule and continue the experiment. If,however, the control measurement would look more like the one depicted in the secondpanel in Fig. 2.11 then one would start doubting about the quality of the sample. Thus,as more and more breaking traces are taken on the bare gold junction, the number oftraces that are considered to lead to spurious counts, increases, at least in this case.
If the filtering method described in the previous section is used in the aforemen-tioned experiment, 1508 traces are labelled as ’molecular’, corresponding to 7.5% of thetotal. Figure 2.15 a) shows the 2D-histogram of those traces. Interestingly, the shape re-sembles a plateau-like structure usually seen when measuring molecular wires; the con-
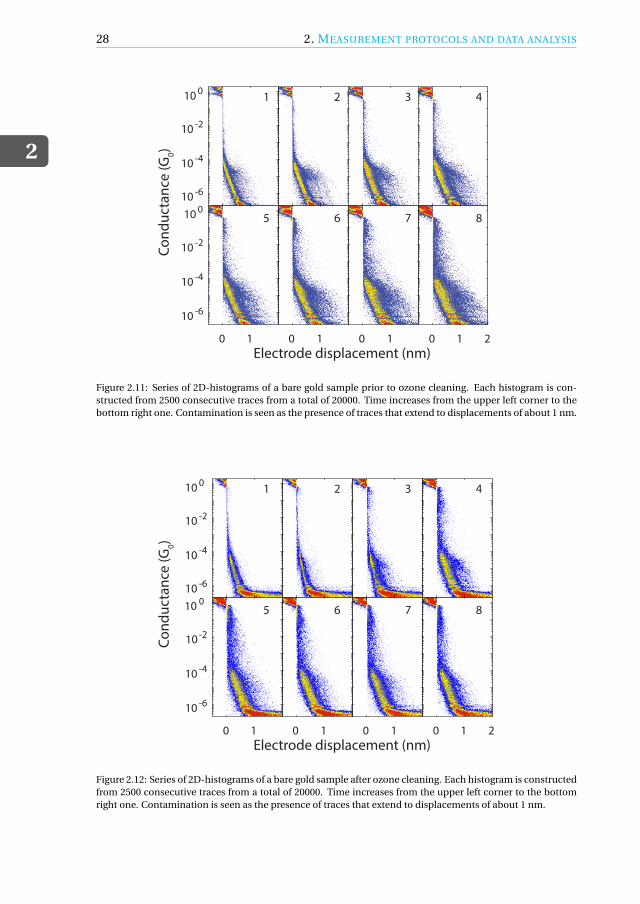
2
28 2. MEASUREMENT PROTOCOLS AND DATA ANALYSIS
10 -6
10 -4
10 -2
100
0 1
10 -6
10 -4
10 -2
100
0 1 0 1 0 1 2
Cond
ucta
nce
(G0)
Electrode displacement (nm)
1 2 3 4
5 6 7 8
Figure 2.11: Series of 2D-histograms of a bare gold sample prior to ozone cleaning. Each histogram is con-structed from 2500 consecutive traces from a total of 20000. Time increases from the upper left corner to thebottom right one. Contamination is seen as the presence of traces that extend to displacements of about 1 nm.
10 -6
10 -4
10 -2
100
0 1
10 -6
10 -4
10-2
10 0
0 1 0 1 0 1 2
Cond
ucta
nce
(G0)
Electrode displacement (nm)
1 2 3 4
5 6 7 8
Figure 2.12: Series of 2D-histograms of a bare gold sample after ozone cleaning. Each histogram is constructedfrom 2500 consecutive traces from a total of 20000. Time increases from the upper left corner to the bottomright one. Contamination is seen as the presence of traces that extend to displacements of about 1 nm.

2.3. THE IMPORTANCE OF CLEANING PROCEDURES
2
29
10 -6
10 -4
10 -2
100
0 1
10 -6
10 -4
10 -2
100
0 1 0 1 0 1 2
Cond
ucta
nce
(G0)
Electrode displacement (nm)
1 2 3 4
5 6 7 8
Figure 2.13: Series of 2D-histograms of a clean sample after two steps of ozone cleaning and cap cleaningprocedure as described in the main text. Each histogram is constructed from 2500 traces except for the lastone which contains the remaining traces from a total of 19148. Time increases from the upper left cornerto the bottom right one. The presence of long traces is less prominent than in the measurements before thecleaning protocols.
0 2 4 6 8Interval number
0
5
10
15
20
Yie
ld (%
)
0 2 4 6 8Interval number
0 2 4 6 8Interval number
a) b) c)
Figure 2.14: Yield computed as the fraction of the number of traces that is selected by the filter described insection 2.1. The values on the x-axis correspond to the numbers indicated in Figures 2.11, 2.12 and 2.13 in a),b) and c), respectively.
ductance distribution of the selected traces (red line in Fig. 2.15 d) shows a peak around2×10−5 G0.
We cleaned the same sample using an UV-ozone cleaning system for one minute.Subsequently, we performed the same experiment recording again 20000 consecutive

2
30 2. MEASUREMENT PROTOCOLS AND DATA ANALYSIS
breaking traces. Fig. 2.12 displays a set of 2D-histograms in the same fashion as Fig. 2.11.The presence of contamination is almost negligible in the first two panels (below 1% offiltered traces) but in the third and fourth panels a small amount of contamination inthe form of plateaus becomes visible. This is seen in Fig. 2.14b) in which the x-axis rep-resents the numbers used as label in Fig. 2.12 and the y-axis the percentage of filteredtraces in the respective 2500 traces subset. When comparing Fig. 2.14 a) and b) a cleardecrease in the number of selected traces is observed which we attribute to a lower con-tamination level. The cleaning procedure using ozone is, therefore, useful to diminishthe contamination; this observation suggests that the contamination has an organic na-ture. It is also worth mentioning that the 2D-conductance vs. displacement histogramof the selected traces (Fig. 2.15 b) shows a similar plateau structure and the conductancedistribution (blue line in Figure 2.15d) peaks at the same value as in the experiment be-fore the ozone cleaning.
Until this point, the observable trend has been that a clean sample can start showingsignals of contamination after a few thousands traces. This suggests that contaminationcan be coming from the sample environment inside the set-up as well. We hypothesizethat some of the molecules measured previously in the same set-up have been rede-posited on the inner side of the chamber and the cap protecting the sample. From therethey could desorb again and in turn be redeposited on a new sample while another ex-periment is running.
0 1 210 -6
10 -4
10 -2
10 0
0 1 20 1 2 0.4 0.8
1508 traces
528 traces
176 traces
Cond
ucta
nce
(G0)
Electrode displacement (nm) Counts/trace
a) b) c) d)
Figure 2.15: 2D-histograms of the traces selected by the filter in the case of: a) 20000 traces of bare gold beforeadopting a cleaning procedure, b) 20000 traces after first ozone cleaning procedure and c) 19148 traces after asecond step of ozone cleaning and a cleaning procedure of the cap. d) Corresponding 1D-histograms from a)in red, b) in blue and c) in red. Although the presence of contamination decreases with the cleaning steps inall cases a peak around 2×10⁻⁵G0 is visible.
The part of the set-up that provides the larger area in the vicinity of the sample isthe bronze cap that seals the dip-stick. We decided to establish a cleaning protocol forboth, i.e., for contaminated samples and the set-up: the sample is ozone cleaned for 5min. and separately, the cap undergoes an extensive cleaning process. Firstly, the capis wiped clean with acetone to remove residues of vacuum grease or dirt on the inside

2.4. DISTANCE MODULATION
2
31
of the cup. Subsequently, it is flushed with dichlorometane, which is the most commonsolvent used for our single-molecule conductance measurement. Then, the cap is putin an ultrasonic bath at 40 0C with soap and de-ionized water, flushed with de-ionizedwater, put back in ultra-sonic bath in hot acetone for 30 minutes (40 0C) and, finally, putin an ultrasonic bath of hot isopropanol (IPA) for 30 min. The removable parts of the set-up were wiped and sonicated in acetone and IPA in the same way as the cap, while thenon removable parts of the dip-stick were wiped with ethanol and dried with a nitrogenflow.
Afterwards, using the same sample used for the experiment of Fig. 2.11, we per-formed again the same experiment recording 19148 consecutive conductance traces. Inthe same way as in the prior cases, data is displayed in Fig. 2.13 in subsets of 2500 tracesexcept for the last one that is constructed with the remaining traces to complete the set.It can be seen that the presence of contamination is lower in this case. The diagram inFig. 2.14 c) shows a yield of selected traces using our filtering method below 1%. Whenall 176 selected traces are collected in a single histogram (Fig. 2.15 c) and the black linein panel d) the structure resembles the same single peak structure around 2×10⁻⁵G0.
The important lesson that can be learned from this experiment is that contamina-tions can be originated from the close environment of the sample. If one does not takecare of this sources and still perform an experiment, then one could mistakenly probecontamination (molecules measured in previous runs) with the target molecules. Never-theless, even when the equipment and samples are recently cleaned, the filter still selecta few traces on a ‘bare gold experiment’. This can be interpreted as having a molecularorigin. These traces can have two sources: a small amount of contamination aroundthe junction that remains present even after cleaning or a ‘false positive’ selection bythe used method to filter the data. Either way we conclude that measurements in whichthe yield of junction formation is small (a low percentage) it would be difficult to un-mistakable relate observed features to those of target molecules. To be on the safe sidewe suggest a minimum of 10 % yield to ensure a high enough contrast from the controlexperiments.
2.4. DISTANCE MODULATIONGiven the mechanical stability and control of the inter-electrode distances of the MCBJtechnique it is a promising platform for mechanical actuation of single-molecules. Atlow temperatures MCBJ has been used to tune the strength of the image charge effectin single-molecule junctions [7]. Modulation of the tip-surface distance has been usedin STM-break junctions to study conductance of molecular switches [8–12]. In one ofthem, for example, the changes in dihedral angles among the bonds at the molecule-electrode interface drive the switching mechanism. MCBJ devices are very insensitive todrift in the electrode positions even at room temperature, Thanks to their mechanicalattenuation. Using this advantage we implemented a similar measurement techniqueto the one used in STM break junctions. The conductance is measured as a function ofthe electrode displacement, but with the difference that the inter-electrode distance ismodulated in a non-uniform manner as described below.
A distance modulation measurement consists on recording the conductance (G =I /V ) as a function of time while the electrodes are moving, similarly to the fast breaking

2
32 2. MEASUREMENT PROTOCOLS AND DATA ANALYSIS
0 1 2 3 4 5 610-6
10-4
10-2
1000
0.5
1
Time (s)
Cond
ucta
nce
(G0)
d (n
m) x1
x2
Δt
Figure 2.16: The lower panel diplays a single modulated trace of a measurement on a MeS-CCM-pyr moleculeat a bias voltage of 0.1V and an electrode speed of 4 nm/s. The modulation parameters are x1 =0.8 nm,x2 =0.4 nm and ∆t= 1 s. The upper panel shows the electrode displacement as a function of time in the samemeasurement.
experiment. The difference lays in the electrodes movement, which is non-monotonousas a function of time. In Fig. 2.16 the blue line depicts the conductance as a function oftime while the red one in the upper panel describes the inter-electrode distance duringthe same period. The control parameters introduced in this measurement are the timespan that the electrodes are kept steady (∆t) and the two distances at which the elec-trodes are stationary (x1 and x2). These distances are measured from the point where themetallic regime is lost (i.e., when the conductance drops below 1 G0). Keeping the elec-trodes fixed for a certain amount of time allows for studying the stability of the molecularjunctions. The parameter ∆t can be tuned from a few milliseconds to tenths of minutes.The modulation of the inter-electrode distance is used mainly for two purposes: iden-tifying the event of junction formation and gathering information about the mechani-cal stability of the different molecular configurations including its dependence on theinter-electrode distance. The first one relates to the capacity distinguish between shortmolecular traces from empty traces, in those cases the fast breaking experiment does notprovide a sensible way to split theses cases. But a small modulation in the electrodes dis-tance for a sufficiently long time allows for observation of the conductance dependenceon the electrode displacement; a strong exponential dependence on the modulated dis-tance indicates a single barrier process that is most likely related to an empty junction;a weak dependence, on the other hand, indicates that the junctions holds at least onemolecule between the electrodes. The second use of the modulation is to attempt con-trolling the configuration a molecule inside the junctions, for example when it shows

REFERENCES
2
33
more than 2 possible anchoring moieties (in chapter 6 we will explore this possibility).
REFERENCES[1] V. Kaliginedi, a. V. Rudnev, P. Moreno-Garcia, M. Baghernejad, C. C. Huang, W. J.
Hong, and T. Wandlowski, Promising anchoring groups for single-molecule conduc-tance measurements, Physical Chemistry Chemical Physics 16, 23529 (2014).
[2] W. Hong, H. Li, S. X. Liu, Y. Fu, J. Li, V. Kaliginedi, S. Decurtins, and T. Wand-lowski, Trimethylsilyl-terminated oligo(phenylene ethynylene)s: An approach tosingle-molecule junctions with covalent Au-C σ-bonds, Journal of the AmericanChemical Society 134, 19425 (2012).
[3] Z. Huang, F. Chen, P. A. Bennett, and N. Tao, Single molecule junctions formedvia Au-thiol contact: Stability and breakdown mechanism, Journal of the AmericanChemical Society 129, 13225 (2007).
[4] R. Frisenda, M. L. Perrin, H. Valkenier, J. C. Hummelen, and H. S. J. Van der Zant,Statistical analysis of single-molecule breaking traces, Physica Status Solidi (B) BasicResearch 250, 2431 (2013).
[5] K. Hansen, S. K. Nielsen, M. Brandbyge, E. Lægsgaard, I. Stensgaard, and F. Be-senbacher, Current-voltage curves of gold quantum point contacts revisited, AppliedPhysics Letters 77, 708 (2000).
[6] C. R. Arroyo, R. Frisenda, K. Moth-Poulsen, J. S. Seldenthuis, T. Bjørnholm, andH. S. van der Zant, Quantum interference effects at room temperature in opv-basedsingle-molecule junctions, Nanoscale Research Letters 8, 234 (2013).
[7] M. L. Perrin, C. J. Verzijl, C. A. Martin, A. J. Shaikh, R. Eelkema, J. H. Van Esch, J. M.Van Ruitenbeek, J. M. Thijssen, H. S. Van Der Zant, and D. Dulic, Large tunableimage-charge effects in single-molecule junctions, Nature Nanotechnology 8, 282(2013).
[8] S. Y. Quek, M. Kamenetska, M. L. Steigerwald, H. J. Choi, S. G. Louie, M. S. Hybert-sen, J. Neaton, and L. Venkataraman, Mechanically controlled binary conductanceswitching of a single-molecule junction, Nature Nanotechnology 4, 230 (2009).
[9] C. Bruot, J. Hihath, and N. Tao, Mechanically controlled molecular orbital align-ment in single molecule junctions, Nature Nanotechnology 7, 35 (2011).
[10] M. Nakamura, S. Yoshida, T. Katayama, A. Taninaka, Y. Mera, S. Okada, O. Takeuchi,and H. Shigekawa, Mechanically activated switching of Si-based single-moleculejunction as imaged with three-dimensional dynamic probe, Nature Communica-tions 6, 8465 (2015).
[11] T. A. Su, H. Li, V. Zhang, M. Neupane, A. Batra, R. S. Klausen, B. Kumar, M. L. Steiger-wald, L. Venkataraman, and C. Nuckolls, Single-molecule conductance in atomi-cally precise germanium wires, Journal of the American Chemical Society 137, 12400(2015).

2
34 REFERENCES
[12] T. A. Su, H. Li, M. L. Steigerwald, L. Venkataraman, and C. Nuckolls, Stereoelectronicswitching in single-molecule junctions, Nature Chemistry 7, 215 (2015).

3DIRECT CARBON GOLD CONTACTED
MOLECULES
El adjetivo, cuando no da vida, mataThe adjective, when it doesn’t give life, kills it.
Vicente Huidobro
We report on an approach to realize carbon–gold (C–Au) bonded molecular junctionswithout the need for an additive to deprotect the alkynyl carbon as endstanding anchorgroup. Using the mechanically controlled break junction (MCBJ) technique, we determinethe most probable conductance value of a family of alkynyl terminated oligophenylenes(OPA(n)) connected to gold electrodes through such an akynyl moiety in ambient condi-tions. The molecules bind to the gold leads through an sp-hybridized carbon atom at eachside. Comparing our results with other families of molecules that present organometallicC–Au bonds, we conclude that the conductance of molecules contacted via an sp-hybridizedcarbon atom is lower than the ones using sp3 hybridization due to strong differences inthe coupling of the conducting orbitals with the gold leads. Following the same strategywe demonstrate the realization of a single-molecule junction containing a purely organicradical. Experiments at low temperature suggest the presence of Kondo correlation imply-ing that the magnetic properties of the molecule are still present after attachment to theelectrodes.
Parts of this chapter have been published in Journal of American Chemical Society 138, 8465 (2016) [1] and inthe same journal 140, 1691 (2018)[2].
35

3
36 3. DIRECT CARBON GOLD CONTACTED MOLECULES
One of the common challenges that are encountered while designing molecules suitablefor molecular electronic experiments, is the choice of the strategy to bind the moleculesto the metallic electrodes. There is a vast library of possibilities of the so called anchor-ing groups, such moieties are chemical groups with certain affinity to metals, specially togold. They are responsible for the mechanical stability of the metal-molecule-metal sys-tem and the efficiency of the electron injection and collection at the molecule- metal in-terface. Several different groups have been studied, for example, thiols[3], metylsulfide,amine[4–6] and pyridine[7] among others and careful comparison have been performed.
Recent developments of the break-junction measuring techniques [8–11] have al-lowed researchers to investigate charge transport through individual molecules. Strate-gies for contacting molecules to metallic electrodes usually rely on the use of anchoringgroups such as thiols,[3], cyano[12], pyridines[7] or amines[4–6] and systematic com-parisons have been carried out [13–16]. Recently, new methods have been developedto contact molecules based on a direct carbon-gold bond [17–23]. These methods em-ploy protection groups at the extremities of the molecule that by applying different ex-ternal stimuli, are removed in the solvent leaving the endstanding carbon atoms free tocoordinate directly to the gold atoms of the electrodes. It has been shown that directcarbon-gold bond can give rise to a high molecular conductance.[19].
Molecules composed by a series of phenyl rings, such as oligphenylenes (OP), oligo-phenylethylenes (OPE) or oligophenylvinylenes (OPV) are interesting systems becausethey posses de-localized orbitals allowing for efficient charge transport. Several researchgroups have reported on transport through single-molecule junctions with a direct C-Au bond using these conjugated molecular backbones [18–21]. W. Chen et al.[19] havestudied a family of highly conductive OP(n=1-4) molecules which form a covalent C-Au bond by cleaving SnMe3 protecting groups, exposing a methylene (sp3-hybridizedcarbon). The same research group also reported on the conductance of a para-phenyl(OP1) molecule connected by a sp2-hybridized carbon to the gold using the same SnMe3
leaving groups[18]. Hong et al. [20] performed measurements on a trimethylsilyl oligo-phenylethylene (TMS-OPEn, n=1,2,3) family of molecules. Using tetrabutylammoniumfluoride (TBAF) as a de-protecting agent the TMS end group was cleaved from the oligo-phenylethylene backbone leaving a sp-hybridized carbon free to form a Au-C σ-bond.Despite the advantages of the C-Au bonding there are also drawbacks to the the reportedapproaches including the rapid formation of dimers, the need of a de-protecting agentand/or rather toxic precursors as leaving groups.
CHHC HC CH CHHC
OPA2 OPA3 OPA4
Figure 3.1: Drawings of the measured OPA series.
Here, we report on the measurement of the low-bias conductance on a family ofoligophenylene ethylene OPA(n) molecules, displayed in Figure 3.1a, in which the alkynylend-group (R−C ≡C−H) acts as anchoring group. These molecules directly form a C-Au bond to the leads by the in-situ de-protonation of the acidic C-H proton (pKa ∼ 26)of the alkynyl groups[24–26]. This approach avoids the need of de-protecting agents

3.1. CONDUCTANCE MEASUREMENTS
3
37
or toxic leaving groups. Moreover, the molecules do not have bulky protective groups.Measurements are performed using the mechanically controlled break junction (MCBJ)technique in ambient conditions and show the formation of molecular junctions evenafter several hours after deposition; the conductance values are of the same order ofmagnitude as similar molecules with sp- or sp2-hybridized Au-C bonds while being anorder of magnitude lower than those using sp3 Au-C hybridization[18].
3.1. CONDUCTANCE MEASUREMENTSThe conductance measurements are carried out in ambient conditions. A drop of a28 µM solution of target molecules in dichloromethane is drop casted on an MCBJ de-vice and after the solvent dries up, 2000 conductance vs. electrode displacement tracesare measured. In Figure3.2 the 2D-histograms of OPA(n, n=2-4) are displayed: a) OPA2,b)OPA3, c) OPA4. In each plot we can distinguish two main features. Namely, a regionof exponential decay of the conductance between 0 and 0.5 nm, covering the range from1×10−4G0 to the noise level (depicted with black lines in the figure); we attribute thesebreaking traces to empty junctions. The second characteristic is a region where the con-ductances decay slowly upon stretching. Examples of individual traces in this regimeare displayed in the insets of Figure 3.2. OPA3 (Figure 3.2b) presents this region betweendisplacements ranging from 0 to 1 nm with a conductance around 10−3G0. For OPA4(Figure 3.2c) the same behavior is observed between 0 and 1.5 nm with a conductancearound 10−4G0. OPA2 requires a closer look, because it shows two such regions; the firstone, around 10−3G0, is characterized by displacements shorter than 0.6 nm and a secondhigh-count region is present near 10−5G0 for traces between 0.5 and 2.5 nm. An interest-ing feature is that most of the traces show slanted plateaus rather than flat ones, whichare usually seen in molecular wires.
0 1 2
10−6
10−4
10−2
100
0 1 2
10−6
10−4
10−2
100
0 1 2
10−6
10−4
10−2
100
high
low
Con
duct
ance
(G0)
coun
tsa) c)b)
Displacement (nm) Displacement (nm)Displacement (nm)
0 2 410
−6
10−3
100
0 2 410
−6
10−3
100
0 2 410
−6
10−3
100
Figure 3.2: Two-dimensional conductance vs electrode displacement histograms constructed from 2000 con-secutive breaking traces measured at room-temperatue in air with a 0.1 V bias voltage applied and a ramp rateof 10 nm/s. Junctions exposed to a 28 µM molecule solution in dichloromethane for (a) OPA2, (b) OPA3, and(c) OPA4. Insets show examples of individual conductance traces with plateau-like features assigned to thepresence of a molecule; traces are offset in the displacement direction.
We have also performed the same experiment on a phenyl ethylene (OPA1) molecule

3
38 3. DIRECT CARBON GOLD CONTACTED MOLECULES
but we did not observe clear molecular signatures; the molecular structure and his-tograms are shown in Figure 3.3. In reference [20] a similar single phenyl ring with anunprotected alkynyl anchoring group was measured: junction formation was not ob-served there either. On the other hand the same backbone with a TMS protecting groupshowed molecular features.
0 1 20 1 2
10−6
10−4
10−2
100
Electrodes displacement (nm)
a) b)
Con
duct
ance
(G0)
Counts (a.u.)
c)
Bare Au OP1
OP1
Bare AuHH
Figure 3.3: Conductance vs. electrode displacement two-dimensional histograms of a) a bare gold sample(1000 traces) and b) OPA1 molecule (2000 traces) in which no clear plateaus or regions of highly probableconductance can be identified. c) Normalized one-dimensional conductance histogram of gold (in black) andOPA1 (blue); the curves are offset for clarity. For OPA1 no features are visible in the one-dimensional histogram,indicating a very low probability of junction formation.
To determine the conductance value of the OPA(n) molecules we used the conduc-tance histograms without any data selection (Figure 3.4a). By fitting a log-normal dis-tribution to the conductance regions in which molecular features are observed (dottedlines in Figure 3.4a), we extract the most probable molecular conductance value for thethree molecules. To ensure reproducibility at least two samples of were measured. Thevalues of the obtained conductance are summarized in Table 5.1 and the average val-ues are plotted with blue diamonds as a function of molecular length in Figure 3.4b.For OPA2, two values of conductance are listed; one at high conductance and one atlow conductance, corresponding to the two features appearing in the two-dimensionalhistogram. We attribute the highest one to the molecular conductance of the moleculeitself, whereas the lower value with plateau lengths exceeding the length of the moleculecan be associated to the presence of dimers of the molecule[20, 21] or to π−π stacking oftwo molecules each attached to one electrode[27]. For this molecule, we have analyzedthe time evolution of the conductance vs. displacement curves in time to investigatewhether the dimer formation occurs more frequently as times progresses. We have notfound a clear indication for such a trend (see Figure 3.5): after four hours of measure-ments high and low-conductance traces are still present.
A striking characteristic of Figure 3.4b is the non-exponential decay of the conduc-tance with molecular length (open blue diamonds) for the OPA(n=2,3,4) series. The

3.1. CONDUCTANCE MEASUREMENTS
3
39
Molecule Conductance (G0)OPA2 6.6 ·10−4 1.0 ·10−5 4.1 ·10−4 7.8 ·10−6
OPA3 4.6 ·10−4 4.4 ·10−4
OPA4 5.7 ·10−5 3.9 ·10−5
Table 3.1: Most probable molecular conductance for the series of OPA(n) molecules extracted from the one-dimensional conductance histograms. The first column contains the values obtained with a concentrationof 28 µM and the values in the second column were obtained with a saturated concentration of molecules,meaning 4.95 mM for OPA2, 0.36 mM for OPA3 and 28 µM for OPA4. The values plotted in Figure 3.4 are theaverage of the two measurements of each molecule. For OPA2, two values are listed, one at high conductanceand one at low conductance (see text for a discussion on these values).
Figure 3.4: a) One-dimensional conductance histograms using a logarithmically binning (solid line) for OPA2(blue), OPA3 (red) and OPA4 (green). Dotted lines represent log-normal fittings around the regions of highcounts in the histograms and are used to extract the most probable conductance value. b) Conductance as afunction of molecular length for OPA(n) (blue) compared to other molecules in the literature that form directC-Au bonds. Different families present different hybridization of the last carbon. Red open circles representmolecules with direct sp3 C-Au bonding from reference [19]; the green square is a single benzene ring con-nected to gold through a sp2-hybridized carbon;[18] the open blue circle corresponds to OPE1 connected togold via a sp-hybridized carbon from the series in reference [citenumTMSOPE]; the green x is a diazonium ter-minated OP2 which is electrochemically deprotected and connected through an sp2-hybridized carbon thatwas studied in [citenumHines2013]. The black dashed line connects the OPA(n= 3,4) and OPE1 in reference[19]. Note, that the structure of OPE1 corresponds to the same structure as OPA1 in this study when contactedto the gold electrodes.
fact that the conductance of OPA2 has approximately the same value as OPA3 is anunexpected result, especially because measurements on the same molecular backbone(oligophenylene) have shown an exponential decay for different anchoring groups andmeasurement techniques[19, 28–30], with β ≈ 0.45 Å−1. An interesting observation isthat the de-protonated OPA1 has the same structure as the de-protected TMS-OPE1 inreference [20] when contacted to the electrodes. If we take into account this conduc-tance value an exponential decay among TMS-OPE1, OPA3 and OPA4 (black dashed linein Figure 3.4b) is found.
To put our results in a broader context we compare our data with other molecules

3
40 3. DIRECT CARBON GOLD CONTACTED MOLECULES
Cond
ucta
nce
(G0)
Displacement (nm) Displacement (nm)Displacement (nm)0 1 2
10−6
10−4
10−2
100
0 1 2
10−6
10−4
10−2
100
0 1 2
10−6
10−4
10−2
100
200 500 2500a) b)c)
Figure 3.5: Conductance versus electrode displacement two-dimensional histograms of OPA2 considering thefirst a) 200, b) 500 and c) 2500 traces. The measurement were carried out during 4 hours; the same regions ofhigh counts can be observed in all of them.
that also form a direct Au-C bonds to the leads. The conductance vs. length dependenceof these molecular families is displayed in Figure 3.4b as well. We observe that the con-ductance of molecular chains which are connected via sp3-hybridized carbon atoms ishigher than the corresponding chain connected by sp-hybridized carbon atoms. For thesingle benzene ring case this observation was already discussed in reference [19] whencomparing sp3- and sp2 hybridization.
b) c)
Energy eV
Tran
smis
sion
−6 −4 −210
−6
10−5
10−4
10−3
10−2
10−1
100
spsp3
a)
Figure 3.6: Diagram of the HOMO of a OP3 attached to gold atoms through a) sp- and b) sp3-hybridized carbon.Zoom ins (lower panels) show the same orbitals near the Au-C interface. c) Transmissions calculated usingDFT+NEGF for the OP3 molecule with sp- (blue line) and sp3-hybridized (green line) linking to the gold.
Theoretical calculations were performed using density functional theory (DFT) meth-ods to compute the geometries and electronic structure of OP n (n= 2,3,4) chains con-tacted to gold electrodes through sp- and sp3 hybridized carbon atoms, which corre-spond to OPA n and SnMe-OPn inside the junction, respectively. The calculation werecombined with the non-equilibrium Green’s function (NEGF) formalism to obtain thetransmission functions; self-energies were corrected using the DFT +Σ method [4]. Adetailed explanation of the methods used can be found in reference [1].
Figure [3.6] a) and b) displays the HOMO orbital of an OP3 molecule contacted via

3.1. CONDUCTANCE MEASUREMENTS
3
41
a sp and sp3 hybridized carbon atom respectively, the lower panels are a closeup ofthe molecule electrode contacting region. It is clear that in both cases the orbitals arede-localized through the whole molecule but regardless of the similarities there are dis-tinguishable characteristic that characterize each of them. The Amplitude of the wavefunction around the linking gold is much smaller in the case of sp-hybridization. A lessevident difference lies in the symmetry of the of the atomic orbital of the gold atom thatis involved in the wave function. In the case of sp hybridization, the main contributionof the gold to the wave function comes from the 5d orbital, while in the case of the sp3-hybridized carbon, the main contribution comes from the 6s orbital of the gold.
When we look into the transmission functions of, for example, OP3 contacted to theelectrode in the two scenarios previously described we distinguish several differences.First the value of the transmission function is higher in the case of the sp3 in most ofthe off resonant range. Secondly the shape of the resonance peaks is sharper in thecase of sp-hybridization, this indicates a lower coupling between the electrodes an themolecule in accordance with the observation about the wave function’s amplitude. Thecalculations further support our findings that the conductance of molecules with thesame number of benzene rings differs greatly depending on the hybridization of the endstanding carbon atoms: sp3-hybridization gives a higher conductance, mainly becausethe favorable coupling between the gold electrodes and the molecule.
−6 −4 −210
−6
10−5
10−4
10−3
10−2
10−1
100
Energy (eV)
Tran
smis
sion
1 ring2 rings3 rings4 rings
Figure 3.7: Transmission computed using NEGF-DFT for the four OP(n) series reported in this study. Thedistances between consecutive transmission are the same (in log scale) for level alignments between -5 and -2eV.
Ultimately we analyze the dependence of the transmission on the length of the molec-ular backbone. In figure [3.7] the transmission function of the series OPA n (n=1-4) con-tacted to gold pyramidal electrodes is shown. We observe a exponential dependenceof the transmission on the molecular length. The odd behavior of the OPA2 conduc-tance values, therefore, may be associated with degrees of freedom not captured in thecalculations. For example, a non-exponential decay of conductance has also been ob-served for oligo-thiophene molecules[31, 32], and in that case it was attributed to theability of a 4-thiophene to rotate toward a more conjugated configuration compare to

3
42 3. DIRECT CARBON GOLD CONTACTED MOLECULES
the 3-tiophene that cannot rotate. Another explanation may originate from the bindingconfiguration itself. In the literature it has been proposed that alkynyl groups in contactwith gold may form a rather “undetermined” binding configuration displaying a moresp2 like character;[24, 33–35] the smaller the molecule, the more likely this is expectedto occur.[36] This suggestion is in line with the results displayed in Figure 3.4 which showthat a line parallel to the black and red drawn lines through the sp2-hybridized OP1 anddiazonium terminated OP2 data points (open square and the green x respectively). In-terestingly, it is close to the OPA2 conductance value from our study.
In conclusion, we have demonstrated that it is possible to contact single moleculesthrough a covalent σ-C-Au bond formation directly from deprotonating alkynyl anchor-ing groups. This method removes the need for cleavage of bulky protecting groups andthe use of deprotection by an external agent. In our approach, the molecules connectto the gold leads through an sp-hybridized carbon atom in such a way that it mainlycouples to the 5d orbital of the gold. The involvement of the 5d orbital leads to a lowerelectronic coupling than for sp3- hybridized carbon, which involves the 6s orbital of gold.
3.2. FUNTIONALIZED MOLECULES: RADICALSAs discussed before the formation of covalent highly directional σ-bonded C-Au junc-tions can provide high conductance at the single-molecule level. Different anchoringgroups such as trimethyl tin (SnMe3)-terminated polymethylene chains [18] and silyl-protected acetylenes [7] have been employed for this aim. In the case of the silyl groupsthere is a need of in-situ applying desilylation chemistry to form the Au-C bond. Onthe contrary, the terminal acetylene (R-C≡C-H) group spontaneously forms stable C-Aubonds. As shown in the previous sections this strategy has already been used to pre-pare self-assembled monolayers (SAMs) on Au (flat [6] and on Au nanoparticles [37])and on Ag [38, 39]. Charge transport measurements through some of these SAMs havebeen performed in large-area molecular junctions (such as Ga2O3/EGaIn as top elec-trode), in an STM break-junction, [40] and with electrochemical scanning tunnelingspectroscopy[41]. However, up to now, single-molecule measurements through bridgesincorporating a functional moiety linked through a -C≡C-Au bond at room-temperatue(RT) are scarce.
In this section, we employ the highly persistent perchlorotriphenylmethyl (PTM) rad-icals as a functional moiety. The charge transport mechanism in the tunneling regimewas previously studied in PTM SAMs covalently grafted to Au through a thiol groupshowing that the single-unoccupied molecular orbital (SUMO) played a crucial role inthe transport enhancing the junction conductivity [42–44]. Electrochemical gating wasalso used to achieve a highly effective redox-mediated current enhancement [45]. Be-ing all-organic, PTM radicals present an intrinsic magnetic moment, low spin-orbit cou-pling and small hyperfine interactions. These attractive redox and magnetic properties,absent in transition metal-based magnetic compounds, have recently attracted atten-tion in molecular (spin)electronics [46–48] where long spin coherence times are requiredto preserve the information encoded in the electronic spin. The individual spin of dif-ferent radical species has been detected in low-temperature electron transport mea-surements by means of Kondo correlations in molecular junctions [49]. The PTM rad-ical has proved to be robust in the junction thanks to the encapsulation of the radical

3.2. FUNTIONALIZED MOLECULES: RADICALS
3
43
Figure 3.8: a) Chemical structure of the PTM radicals employed in this study. b) Scheme of the SAM based on1-Rad (top) and of the MCBJ with 2-Rad bridging the two electrodes (bottom).
spin in a chlorinated-phenyl shell. Moreover, it has been shown that the magnetic stateof PTM-based polyradicals can be mechanically modified [50] and electrically gated toform the basis of a quantum SWAP gate [50]. Similar OPE-based radicals have shownlarge magneto-resistance effects that could be used to tune charge transport in metal-molecule junctions [51]. Moreover, although it remains still to be proved, organic radi-cals could act as spin filters [52]. Aside from the magnetic properties, the redox proper-ties of similar organic radicals have been used to enhance charge transport in molecularjunctions [53]. All these intriguing properties depend up to some extent on the repro-ducibility and strength of the bond radical to the electrodes, a key-step still to improve.
Raman shift (cm-1) Binding energy (eV)
Figure 3.9: Characterization of SAM-1-Rad. a) Raman spectrum of 1-Rad in powder (black) and SAM-1-Rad(blue). b) High resolution Cl2p XPS spectrum.
In this section, we report on characterization of two novel PTM radical derivativesbearing one (1-Rad) and two (2-Rad) acetylene terminated groups (Fig. 3.8). Thanks tothe stability of the alkynyl group, compared to the –SH one, there is no need of protectingand deprotecting it during the deprotonation and oxidation reactions required to gener-ate the radical species. Additionally, these linkers once formed are stable without show-ing signs of oxidation in time, as it is the case of most of the thiolated compounds [54–56].

3
44 3. DIRECT CARBON GOLD CONTACTED MOLECULES
SAMs based on 1-Rad (Fig. 3.8 b) were successfully prepared. Surface characterizationtechniques ( XPS, Raman) show the formation of a very stable metal-molecule covalentbond where the unpaired spin is preserved after bonding. Molecular junctions basedon 2-Rad (Fig. 3.8 b) were prepared and compared with the equivalent bisthiophene-terminated derivative (PTM-bt3-Rad, Fig. 3.8 a) that shares the same functional corebut is functionalized with thiophene anchoring groups[49]. Room-temperatue electrontransport measurements and the statistical analysis show that 2-Rad form a very stablebond with a better defined anchoring geometry when compared to the S-Au bond in thePTM-bt3-Rad, while still having similar current levels. Low temperature current-voltage(IV) measurement help to on 2-Rad show zero-bias peaks consistent with Kondo corre-lations. These findings are supported by density functional theory (DFT) and quantumtransport calculations that predict a C-Au bond three times stronger than the S-Au andwith a lower anchoring geometry variability.
0 1 2Electrode displacement (nm)
10 -6
10 -4
10 -2
10 -0
Cond
ucta
nce
(G0)
0 4 8Counts/trace
0 5 1010 -6
10 -3
10 -0
Figure 3.10: a) Two-dimensional conductance vs electrode displacement histogram of the 2-Rad moleculeconstructed from 2500 consecutive traces at room temperature, 0.2 V of bias voltage and an electrode speed of6 nm/s. The inset shows five selected individual traces. b) One-dimensional conductance histogram for 2-Radconstructed by integrating over the displacement in a). The black dashed line corresponds to a log-normalfitting of the conductance distribution without data selection.
First, self-assembled monolayers (SAMs) of 1-Rad were prepared on Au(111) to inves-tigate the formation of the C-Au bond. The SAM formation conditions were optimized tomaximize the surface coverage. SAMs were prepared under inert conditions to avoid thepossible oxidation of the alkyne group in presence of O2 and Au, as previously reported[57]. At this point, it is worth mentioning the reactivity of the terminal acetylenes withthe gold substrate. Maity et al. [24] studied the functionalization of gold clusters with

3.2. FUNTIONALIZED MOLECULES: RADICALS
3
45
a series of terminal alkynes derivatives by means of a various spectroscopic methods.They demonstrated the binding motif and the loss of the terminal H through the het-erolytic deprotonation of the alkyne as the key mechanism for the binding of the alkynylgroup to gold [58]. Furthermore, Raman spectroscopy has been used by several authorsto identify the covalent C-Au formation [20, 59, 60]. Taking all this into account, SAM-1-Rad was characterized by Raman spectroscopy (Fig. 3.9 a). The spectrum of the 1-Radin powder was also acquired for comparison. The weak band corresponding to the C-Ctriple bond stretching is observed both in powder (2108 cm−1) and red-shifted on surface(2035 cm−1) confirming the integrity of the alkyne group after the monolayer formation.The displacement of the above-mentioned band is in agreement with previous studiesdescribing the reactivity of terminal alkynes on gold [24]. Remarkable is the appearanceof a new sharp band at 432 cm−1 in the SAM spectrum. According to literature,[20, 59, 60]this band can be assigned to the characteristic C-Au stretching mode, and constitutes astrong proof of the covalent character of the binding between the PTM 1-Rad and thegold surface. These observations point to an up-right configuration of 1-Rad maintain-ing the directional triple bond and losing a hydrogen atom. In addition, X-ray photoelec-tron spectra (XPS) confirmed the presence of chlorine (Fig. 3.9 b). The Cl2p spectrumshowed the typical doublet corresponding to Cl2p1/2 and Cl2p3/2 at 202.4 eV and 200.8eV, respectively.
3.2.1. CONDUCTANCE MEASUREMENTS
We have performed room-temperatue charge transport measurements through individ-ual 2-Rad molecules using the MCBJ technique described in Refs [1, 23]. Briefly, a 2 µldrop of a 50 µM solution of the molecule in dichloromethane was drop casted on a cleanMCBJ sample. Subsequently, the setup was pumped down until the pressure reached5×10−6 mbar to avoid degradation of the target molecule due to the presence of oxygen.Only then the fast breaking experiment was performed by measuring the conductance(G=I/V) while the electrodes are moved apart and reconnected thousand of times.
Figure 3.10 a) shows a two-dimensional conductance vs electrode displacement his-togram for 2-Rad molecules. The histogram is made using 2500 consecutive traces recor-ded at an electrode speed of 6 nm/s and an applied bias voltage of 0.2 V. Two character-istic features are present: first, the conductance drops exponentially from 10−4 G0 to thenoise level for electrode displacements between 0 and 0.7 nm with a characteristic lengthof 0.5 nm corresponding to the left peak in the length histogram in Fig. 3.11. These tracesare attributed to empty junctions with no molecules bridging the electrodes. The secondfeature is a single flat plateau with a characteristic length of 2.3 nm after (right peak infig. 3.11) which the conductance drops abruptly. Individual examples of these tracescan be observed in the inset of Fig. 3.10 a). The plateau is indicative of the formationof a molecular junction that breaks when the gap between the electrodes is too wide forthe 2-Rad molecule to bind to both electrodes. Interestingly, the plateau length plus thesnap-back correction ( 0.5 nm) approximately matches the length of the relaxed 2-Radmolecule bonded to Au (2.7 nm).
The conductance value of the plateau in Fig. 3.10 a) is determined from the one-dimensional conductance histogram shown in Fig. 3.10 b). The dotted line is a log-normal distribution fit around the conductance regions displaying molecular features.

3
46 3. DIRECT CARBON GOLD CONTACTED MOLECULES
0 1 2 3Length (nm)
0
50
100
Cou
nts
Figure 3.11: Length histogram of the traces compiled in Fig. 3.10. The green solid line correspond to a Gaussianpeaks characterized by a position and full width half maximum of 0.47 and 0.28 nm in the case of the left peakand 2.3 and 0.36 nm for the right peak.
The most probable conductance value for the 2-Rad molecule is 8.8×10⁻⁶ G0. To gain adeeper insight, we have compared these results with the conductance characteristics ofa similar PTM moiety functionalized with thiophene anchoring groups measured withSTM-BJ technique (measurement performed by Alexander Rudnev’s group at Universityof Bern). In the latter case, the conductance values appear more spread between twoconductance features at Ghigh = 1×10⁻⁴ G0 and Glow=4×10⁻⁶ G0. Moreover, the size ofthe plateau (plus snap-back) extends only up to 0.95 nm, whereas the length of the fullystretched molecules is 1.7 nm. These results point to a stronger mechanical bond inthe case of 2-Rad. In addition, 2-Rad provides a better-defined molecule-electrode an-choring geometry when compared with the thiophene anchoring group. Note, that thestrength in the mechanical bond is not straightforwardly translated into a higher con-ductance.
To evaluate the presence of the magnetic moiety we performed IV measurementsusing a low-temperature set up. It is expected that a magnetic molecule generates alocalized Kondo cloud at the Fermi energy, creating a state through which charge canpass [49]. That would give rise to a zero-bias peak in the d I /dV curve.
Using a dipstick set-up we cool down a sample on which a fresh solution of 2-Radwas dropcasted as described before, down to liquid helium temperatures. To improvethe thermal contact helium exchange gas was used so that the actual temperature of thesample was around 6 K. The experiment consisted of measuring the IV characteristic
1These measurements have been performed in Berns University by the group of Prof. Alexander Rudnev.

3.2. FUNTIONALIZED MOLECULES: RADICALS
3
47
Figure 3.12: a) Individual conductance traces without and with molecular plateaus for PTM-bt3-Rad, obtainedby STM-BJ with V = 0.1 V and a stretching rate of 87 nm s-1. b) 1D and c) 2D conductance histograms for PTM-bt3-Rad. The asterisk indicates the noise level of the set-up. The small spike at log(G/G0) -2.2 in panel b) isan artefact related to the switching of the amplifier stage. d) Characteristic length distribution between 10−4.6
G0 and 10−0.3 G0. The measurements were performed at room-temperatue in argon atmosphere after dropcasting 20 µL of 0.08 mM PTM-bis-thiophene in dichloromethane and drying in a gentle argon stream.1

3
48 3. DIRECT CARBON GOLD CONTACTED MOLECULES
of the junction while breaking. Figure 3.13a) show an example of a breaking trace thatshows molecular features. The spacing between each point is approximately 0.01 nm. Inthe same figure three IV b), c) and d) are displayed. The three of them share a character-istic feature: a zero-bias peak in the d I /dV , depicted in panels e), f) and g). The sharpdip at zero-bias is an electronic artifact caused by the logaritmic amplifier that was used.
An interesting characteristic that repeats in the cases of the presence of a zero-biaspeak is that the conductance values measured at the points that shows such featureis several order of magnitude higher than the conductance value measured at room-temperature. The amount of traces that shows zero-bias peak is around 10 % of thetraces that showed molecular features. This provides an indication that the magneticnature of 2-Rad is intact there after been contacted by gold electrodes. We point out thatthe the Kondo interpretation of the peak is not the only one but it draws a consistentpicture between the molecular structure and the electronic measurement on the singlemolecules and therefore provides an indication that the spin degree of freedom remainsactive after connecting the molecule to the electrodes.
Curr
ent (
nA)
740 750 760 770Steps V (V) V (V) V (V)
10-7
10-6
10-5
10-4
10-3
10-2
10-1
100
Cond
ucta
nce
(G0)
-0.02 -0.01 0 0.01 0.02)
-2
-1
0
1
2
-0.02 -0.01 0 0.01 0.020
0.05
0.1
0.15
0.2
-0.02 -0.01 0 0.01 0.02-4
-2
0
2
4
6
-0.02 -0.01 0 0.01 0.020
0.1
0.2
0.3
0.4
0.5
-0.02 -0.01 0 0.01 0.02-4
-2
0
2
4
6
Curr
ent (
nA)
Curr
ent (
nA)
-0.02 -0.01 0 0.01 0.020
0.1
0.2
0.3
0.4
0.5
dI/d
V (μ
S)
dI/d
V (μ
S)
dI/d
V (μ
S)
a) b) c) d)
e) f) g)
Figure 3.13: a) Individual conductance trace of 2-Rad, obtained using a low temperature (6 K) MCBJ technique.For each point a IV curve was measured. b), c) and d) IV curves measured during the breaking on the pointshighlighted with the same colors in a). e), f) and g) are the corresponding d I /dV curves. The sharp dip atzero-bias is an electronic artifact caused by the logaritmic amplifier that was used.
3.2.2. THEORETICAL CALCULATIONThe strength of the mechanical bond between the molecule and Au is quantified bymeans of the maximum rupture force F and of the bond dissociation energy D [61] Thesecannot be directly obtained from our experiments, but they can be estimated by calcu-lating the potential energy surface (PES) for the stretched bond with DFT, and then fittingthe PES with a Morse potential. We find F= 3.05 nN and D= 3.5 eV for the Au-C bond inthe bridge configuration. Furthermore, such an Au-C bond has to be elongated by about0.5 Å under an applied force as large as 3.85 nN for the Au-C bond-breaking activationenergy to equal room temperature. This means that in RT-MCBJs experiments the Au-Cbond will not break until it is stretched up to 0.3 Å. Overall the results support the obser-

3.2. FUNTIONALIZED MOLECULES: RADICALS
3
49
vations about the mechanical junction stability in Figure 3.14. In contrast, a thiophenelinker establishes no covalent bond with a flat Au surface, so it is physisorbed. A cova-lent bond can only be established between the thiophene S atom and an Au adatom ona corrugated surface. In this case, for the adatom-S bond, F and D are just 0.45 nN and0.3 eV, respectively, and the bond-breaking activation energy equals KbT (where Kb is theBoltzmann constant) when the bond is stretched by less than 0.1 Å. For comparison, wealso point out that for the S-Au bond of standard thiol linkers used in previous experi-ments [62], F and D are about three times smaller than for the Au-C bond, i.e. F=1.45 nNand D=1.26 eV.
Figure 3.14: a) Transmission as a function of energy for different atomic configurations (CFGs): b) CFG T1 andc) CFG T2 are two typical structures expected to be found in high temperature break–junction measurementswith PTM–bisthiophene and Au; d) with 2-Rad directly bonded via C–Au link.
We also performed charge transport calculation based on DFT and non-equilibriumGreen function (NEGEF) for 2-Rad and PTM-bt3-Rad. The results are displayed in Fig.3.14. PTM-bt3-Rad can contact either a rather flat part of the electrode or a protrudingadatom, and we model these two situations by considering different atomic configura-tions (CFGs), for instance configuration CFG T1 and CFG T2 in Fig. 3.14 b) and c). In thefirst case, as outlined above, the bond to the Au is non-covalent, and the molecule cantherefore slide on the Au tip as the junction is elongated. The conductance is quite lowdue to the weak electronic coupling between Au and the molecule. For more corrugatedAu tips, the covalent bond between the thiophene S atom and the protruding Au adatom

3
50 REFERENCES
results in an increased electronic coupling and therefore in a higher conductance. This isin agreement with the experimental results, where for PTM-bt3-Rad a quite wide rangeof conductances between a higher and a lower value is found.
For 2-Rad, whenever the relative displacement of the electrodes is in the plateauregion of Figure 3.10, the linkers establish a strong covalent bond with the electrodes,where the C atom is on the bridge site between two Au atoms (Fig. 3.14 d). The fact thatthe molecule binds to the electrodes with such a locally well-defined C–Au bond, inde-pendently of the overall junction geometry, drastically reduces the variability in conduc-tance values. The calculated transmission curve lies in an intermediate range betweenthe ones for CFG T2 and CFG T1. The low bias conductance corresponds to the trans-mission at the Fermi energy, for which we obtain a value around T ≈ 10−4. This is on theupper end of the experimentally measured conductance peak (Fig. 3.10).
3.2.3. CONCLUSIONSIn conclusion, the functionalization of a PTM organic radical with alkynyl end groupshas led to the formation of a robust covalent binding between these electroactive andparamagnetic molecules and Au. Throughout a detailed comparison with a similar thio-phene functionalized derivative we show that the Au-C bond provides a more robustand better-defined anchoring geometry but a lower conductance value as supported byDFT calculations. Our results contribute to the efforts to incorporate active elementsin molecular devices, for examples the spin degree of freedom and enhance the perfor-mance of single-molecule devices in particular.
REFERENCES[1] I. J. Olavarria-Contreras, M. L. Perrin, Z. Chen, S. Klyatskaya, M. Ruben, and
H. S. J. van der Zant, [C–Au covalently bonded molecular junctions using nonpro-tected alkynyl anchoring groups, Journal of the American Chemical Society 138,8465 (2016).
[2] F. Bejarano, I. J. Olavarria-Contreras, A. Droghetti, I. Rungger, A. Rudnev, D. Gutiér-rez, M. Mas-Torrent, J. Veciana, H. S. J. van der Zant, C. Rovira, E. Burzurı, andN. Crivillers, Robust organic radical molecular junctions using acetylene terminatedgroups for c–au bond formation, Journal of the American Chemical Society 140,1691 (2018).
[3] Z. Huang, F. Chen, P. A. Bennett, and N. Tao, Single molecule junctions formedvia Au-thiol contact: Stability and breakdown mechanism, Journal of the AmericanChemical Society 129, 13225 (2007).
[4] S. Y. Quek, L. Venkataraman, H. J. Choi, S. G. Louie, M. S. Hybertsen, and J. B.Neaton, Amine - Gold linked single-molecule circuits: Experiment and theory, NanoLetters 7, 3477 (2007).
[5] Z. Li and D. S. Kosov, Nature of well-defined conductance of amine-anchored molec-ular junctions: Density functional calculations, Physical Review B 76, 035415 (2007),0702507 .

REFERENCES
3
51
[6] M. S. Hybertsen, L. Venkataraman, J. E. Klare, A. C. Whalley, M. L. Steigerwald, andC. Nuckolls, Amine-linked single-molecule circuits: systematic trends across molec-ular families, Journal of Physics: Condensed Matter 20, 374115 (2008).
[7] M. Kamenetska, S. Y. Quek, A. C. Whalley, M. L. Steigerwald, H. J. Choi, S. G. Louie,C. Nuckolls, M. S. Hybertsen, J. B. Neaton, and L. Venkataraman, Conductanceand geometry of pyridine-linked single-molecule junctions, Journal of the AmericanChemical Society 132, 6817 (2010).
[8] K. Moth-Poulsen and T. Bjørnholm, Molecular electronics with single molecules insolid-state devices. Nature Nanotechnology 4, 551 (2009).
[9] A. Nitzan and M. A. Ratner, Electron Transport in Molecular Wire Junctions, Science300, 1384 (2003), 0208239 .
[10] S. V. Aradhya and L. Venkataraman, Single-molecule junctions beyond electronictransport. Nature Nanotechnology 8, 399 (2013).
[11] F. Schwarz and E. Lörtscher, Break-junctions for investigating transport at themolecular scale, Journal of Physics: Condensed Matter 26, 474201 (2014).
[12] M. Kiguchi, S. Miura, K. Hara, M. Sawamura, and K. Murakoshi, Conductance ofa single molecule anchored by an isocyanide substituent to gold electrodes, AppliedPhysics Letters 89, 213104 (2006), 0610388 .
[13] F. Chen, X. Li, J. Hihath, Z. Huang, and N. Tao, Effect of anchoring groups on single-molecule conductance: Comparative study of thiol-, amine-, and carboxylic-acid-terminated molecules, Journal of the American Chemical Society 128, 15874 (2006).
[14] I. S. Kristensen, D. J. Mowbray, K. S. Thygesen, and K. W. Jacobsen, Compara-tive study of anchoring groups for molecular electronics: structure and conductanceof Au-S-Au and Au-NH(2)-Au junctions. Journal of physics. Condensed matter 20,374101 (2008).
[15] L. A. Zotti, T. Kirchner, J. C. Cuevas, F. Pauly, T. Huhn, E. Scheer, and A. Erbe, Reveal-ing the role of anchoring groups in the electrical conduction through single-moleculejunctions, Small 6, 1529 (2010).
[16] R. Frisenda, S. Tarkuç, E. Galán, M. L. Perrin, R. Eelkema, F. C. Grozema, and H. S. J.van der Zant, Electrical properties and mechanical stability of anchoring groups forsingle-molecule electronics, Beilstein Journal of Nanotechnology 6, 1558 (2015).
[17] D. Millar, L. Venkataraman, and L. H. Doerrer, Efficacy of Au -Au contacts for scan-ning tunneling microscopy molecular conductance measurements, The Journal ofPhysical Chemistry C 111, 17635 (2007).
[18] Z.-L. Cheng, R. Skouta, H. Vazquez, J. R. Widawsky, S. Schneebeli, W. Chen, M. S.Hybertsen, R. Breslow, and L. Venkataraman, In situ formation of highly conductingcovalent Au-C contacts for single-molecule junctions. Nature Nanotechnology 6, 353(2011).

3
52 REFERENCES
[19] W. Chen, J. R. Widawsky, H. Vazquez, S. T. Schneebeli, M. S. Hybertsen, R. Breslow,and L. Venkataraman, Highly Conducting pi-Conjugated Molecular Junctions Co-valently Bonded to Gold Electrodes, Journal of the American Chemical Society 133,17160 (2011).
[20] W. Hong, H. Li, S. X. Liu, Y. Fu, J. Li, V. Kaliginedi, S. Decurtins, and T. Wand-lowski, Trimethylsilyl-terminated oligo(phenylene ethynylene)s: An approach tosingle-molecule junctions with covalent Au-C σ-bonds, Journal of the AmericanChemical Society 134, 19425 (2012).
[21] J. R. Widawsky, W. Chen, H. Vazquez, T. Kim, R. Breslow, M. S. Hybertsen,and L. Venkataraman, Length-dependent thermopower of highly conducting Au-Cbonded single molecule junctions, Nano Letters 13, 2889 (2013).
[22] T. Hines, I. Díez-Pérez, H. Nakamura, T. Shimazaki, Y. Asai, and N. Tao, Controllingformation of single-molecule junctions by electrochemical reduction of diazoniumterminal groups, Journal of the American Chemical Society 135, 3319 (2013).
[23] A. M. Ricci, E. J. Calvo, S. Martin, and R. J. Nichols, Electrochemical scanning tun-neling spectroscopy of redox-active molecules bound by Au-C bonds. Journal of theAmerican Chemical Society 132, 2494 (2010).
[24] P. Maity, S. Takano, S. Yamazoe, T. Wakabayashi, and T. Tsukuda, Binding motif ofterminal alkynes on gold clusters, Journal of the American Chemical Society 135,9450 (2013).
[25] Y.-Q. Zhang, J. Björk, P. Weber, R. Hellwig, K. Diller, A. C. Papageorgiou, S. C. Oh,S. Fischer, F. Allegretti, S. Klyatskaya, M. Ruben, J. V. Barth, and F. Klappenberger,Unusual deprotonated alkynyl hydrogen bonding in metal-supported hydrocarbonassembly, The Journal of Physical Chemistry C 119, 9669 (2015).
[26] N. Kepcija, Y. Q. Zhang, M. Kleinschrodt, J. Björk, S. Klyatskaya, F. Klappenberger,M. Ruben, and J. V. Barth, Steering on-surface self-assembly of high-quality hydro-carbon networks with terminal alkynes, Journal of Physical Chemistry C 117, 3987(2013).
[27] S. Martín, I. Grace, M. R. Bryce, C. Wang, R. Jitchati, A. S. Batsanov, S. J. Higgins,C. J. Lambert, and R. J. Nichols, Identifying diversity in nanoscale electrical breakjunctions, Journal of the American Chemical Society 132, 9157 (2010).
[28] D. J. Wold, R. Haag, M. A. Rampi, and C. D. Frisbie, Distance dependence of elec-tron tunneling through self-assembled monolayers measured by conducting probeatomic force microscopy: Unsaturated versus saturated molecular junctions, Journalof Physical Chemistry B 106, 2813 (2002).
[29] C. J. Querebillo, A. Terfort, D. L. Allara, and M. Zharnikov, Static conductance ofnitrile-substituted oligophenylene and oligo(phenylene ethynylene) self-assembledmonolayers studied by the mercury-drop method, Journal of Physical Chemistry C117, 25556 (2013).

REFERENCES
3
53
[30] D. M. Adams, L. Brus, C. E. D. Chidsey, S. Creager, C. Creutz, C. R. Kagan, P. V. Kamat,M. Lieberman, S. Lindsay, R. a. Marcus, R. M. Metzger, M. E. Michel-Beyerle, J. R.Miller, M. D. Newton, D. R. Rolison, O. Sankey, K. S. Schanze, J. Yardley, and X. Zhu,Charge Transfer on the Nanoscale: Current Status, The Journal of Physical ChemistryB 107, 6668 (2003).
[31] B. Capozzi, E. J. Dell, T. C. Berkelbach, D. R. Reichman, L. Venkataraman, and L. M.Campos, Length-dependent conductance of oligothiophenes, Journal of the Ameri-can Chemical Society 136, 10486 (2014).
[32] B. Q. Xu, X. L. Li, X. Y. Xiao, H. Sakaguchi, and N. J. Tao, Electromechanical andconductance switching properties of single oligothiophene molecules, Nano Letters5, 1491 (2005).
[33] M. J. Ford, R. C. Hoft, and A. McDonagh, Theoretical study of ethynylbenzene ad-sorption on au(111) and implications for a new class of self-assembled monolayer,The Journal of Physical Chemistry B 109, 20387 (2005).
[34] H. Y. Gao, J. H. Franke, H. Wagner, D. Zhong, P.-A. Held, A. Studer, and H. Fuchs,Effect of metal surfaces in on-surface glaser coupling, The Journal of Physical Chem-istry C 117, 18595 (2013).
[35] A. M. McDonagh, H. M. Zareie, M. J. Ford, C. S. Barton, M. Ginic-Markovic, andJ. G. Matisons, Ethynylbenzene monolayers on gold: a metal-molecule binding motifderived from a hydrocarbon, Journal of the American Chemical Society 129, 3533(2007).
[36] C. M. Bowers, D. Rappoport, M. Baghbanzadeh, F. C. Simeone, K.-C. Liao, S. N.Semenov, T. Zaba, P. Cyganik, A. Aspuru-Guzik, and G. M. Whitesides, Tunnelingacross SAMs containing oligophenyl groups, The Journal of Physical Chemistry C120, 11331 (2016).
[37] Q. Lu, K. Liu, H. Zhang, Z. Du, X. Wang, and F. Wang, From tunneling to hopping: Acomprehensive investigation of charge transport mechanism in molecular junctionsbased on oligo(p-phenylene ethynylene)s, ACS Nano 3, 3861 (2009).
[38] R. C. Hoft, M. J. Ford, A. M. McDonagh, and M. B. Cortie, Adsorption of amine com-pounds on the Au(111) surface: a density functional study, The Journal of PhysicalChemistry C 111, 13886 (2007).
[39] C. M. Crudden, J. H. Horton, I. I. Ebralidze, O. V. Zenkina, A. B. McLean, B. Drevniok,Z. She, H.-B. Kraatz, N. J. Mosey, T. Seki, et al., Ultra stable self-assembled monolay-ers of n-heterocyclic carbenes on gold, Nature Chemistry 6, 409 (2014).
[40] C.-H. Ko, M.-J. Huang, M.-D. Fu, and C.-h. Chen, Superior contact for single-molecule conductance: Electronic coupling of thiolate and isothiocyanate on pt, pd,and au, Journal of the American Chemical Society 132, 756 (2010).

3
54 REFERENCES
[41] Y. Xing, T.-H. Park, R. Venkatramani, S. Keinan, D. N. Beratan, M. J. Therien,and E. Borguet, Optimizing single-molecule conductivity of conjugated organicoligomers with carbodithioate linkers, Journal of the American Chemical Society132, 7946 (2010).
[42] M. Souto, L. Yuan, D. C. Morales, L. Jiang, I. Ratera, C. A. Nijhuis, and J. Ve-ciana, Tuning the rectification ratio by changing the electronic nature (open-shelland closed-shell) in donor–acceptor self-assembled monolayers, Journal of the Amer-ican Chemical Society 139, 4262 (2017).
[43] N. Crivillers, C. Munuera, M. Mas-Torrent, C. Simão, S. T. Bromley, C. Ocal,C. Rovira, and J. Veciana, Dramatic influence of the electronic structure on the con-ductivity through open- and closed-shell molecules, Advanced Materials 21, 1177(2009).
[44] L. Yuan, C. Franco, N. Crivillers, M. Mas-Torrent, L. Cao, C. S. Sangeeth, C. Rovira,J. Veciana, and C. A. Nijhuis, Chemical control over the energy-level alignment in atwo-terminal junction, Nature Communications 7 (2016).
[45] N. Crivillers, C. Munuera, M. Mas-Torrent, C. Simão, S. T. Bromley, C. Ocal,C. Rovira, and J. Veciana, Dramatic influence of the electronic structure on the con-ductivity through open- and closed-shell molecules, Advanced Materials 21, 1177(2009).
[46] I. Ratera and J. Veciana, Playing with organic radicals as building blocks for func-tional molecular materials, Chem. Soc. Rev. 41, 303 (2012).
[47] M. MAS-TORRENT, N. CRIVILLERS, V. MUGNAINI, I. RATERA, C. ROVIRA, andJ. VECIANA, Organic radicals on surfaces: towards molecular spintronics, Journalof material chemistry 19, 1691 (2009).
[48] M. Mas-Torrent, N. Crivillers, C. Rovira, and J. Veciana, Attaching persistent organicfree radicals to surfaces: How and why, Chemical Reviews 112, 2506 (2012).
[49] R. Frisenda, R. Gaudenzi, C. Franco, M. Mas-Torrent, C. Rovira, J. Veciana, I. Alcon,S. T. Bromley, E. Burzurí, and H. S. J. van der Zant, Kondo effect in a neutral and sta-ble all organic radical single molecule break junction, Nano Letters 15, 3109 (2015).
[50] R. Gaudenzi, E. Burzurí, D. Reta, I. d. P. R. Moreira, S. T. Bromley, C. Rovira, J. Ve-ciana, and H. S. J. van der Zant, Exchange coupling inversion in a high-spin organictriradical molecule, Nano Letters 16, 2066 (2016).
[51] R. Hayakawa, M. A. Karimi, J. Wolf, T. Huhn, M. S. Zöllner, C. Herrmann, andE. Scheer, Large magnetoresistance in single-radical molecular junctions, Nano Let-ters 16, 4960 (2016).
[52] C. Herrmann, G. C. Solomon, and M. A. Ratner, Organic radicals as spin filters,Journal of the American Chemical Society 132, 3682 (2010).

REFERENCES
3
55
[53] J. Liu, X. Zhao, Q. Al-Galiby, X. Huang, J. Zheng, R. Li, C. Huang, Y. Yang, J. Shi, D. Z.Manrique, C. J. Lambert, M. R. Bryce, and W. Hong, Radical-enhanced charge trans-port in single-molecule phenothiazine electrical junctions, Angewandte Chemie In-ternational Edition 56, 13061 (2017).
[54] L. Srisombat, A. C. Jamison, and T. R. Lee, Stability: A key issue for self-assembledmonolayers on gold as thin-film coatings and nanoparticle protectants, Colloids andSurfaces A: Physicochemical and Engineering Aspects 390, 1 (2011).
[55] M. J. Tarlov and J. G. Newman, Static secondary ion mass spectrometry of self-assembled alkanethiol monolayers on gold, Langmuir 8, 1398 (1992).
[56] J. R. Scott, L. S. Baker, W. R. Everett, C. L. Wilkins, and I. Fritsch, Laser desorptionfourier transform mass spectrometry exchange studies of air-oxidized alkanethiolself-assembled monolayers on gold, Analytical Chemistry 69, 2636 (1997).
[57] T. Zaba, A. Noworolska, C. M. Bowers, B. Breiten, G. M. Whitesides, and P. Cyganik,Formation of highly ordered self-assembled monolayers of alkynes on au(111) sub-strate, Journal of the American Chemical Society 136, 11918 (2014).
[58] X. Kang, N. B. Zuckerman, J. P. Konopelski, and S. Chen, Alkyne-functionalizedruthenium nanoparticles: Ruthenium–vinylidene bonds at the metal–ligand inter-face, Journal of the American Chemical Society 134, 1412 (2012).
[59] H. M. Osorio, P. Cea, L. M. Ballesteros, I. Gascon, S. Marques-Gonzalez, R. J. Nichols,F. Perez-Murano, P. J. Low, and S. Martin, Preparation of nascent molecular elec-tronic devices from gold nanoparticles and terminal alkyne functionalised mono-layer films, J. Mater. Chem. C 2, 7348 (2014).
[60] L. Laurentius, S. R. Stoyanov, S. Gusarov, A. Kovalenko, R. Du, G. P. Lopinski, andM. T. McDermott, Diazonium-derived aryl films on gold nanoparticles: Evidence fora carbon–gold covalent bond, ACS Nano 5, 4219 (2011).
[61] M. Grandbois, M. Beyer, M. Rief, H. Clausen-Schaumann, and H. E. Gaub, Howstrong is a covalent bond? Science 283, 1727 (1999).
[62] C. Huang, S. Chen, K. Baruël Ørnsø, D. Reber, M. Baghernejad, Y. Fu, T. Wandlowski,S. Decurtins, W. Hong, K. S. Thygesen, and S.-X. Liu, Controlling electrical conduc-tance through aπ-conjugated cruciform molecule by selective anchoring to gold elec-trodes, Angewandte Chemie International Edition 54, 14304 (2015).


4CURCUMINOIDS:
SINGLE-MOLECULE CONDUCTANCE
OF THIOPHENE ANCHORED
COMPOUNDS
The most elegant solutions are found in nature.You just have to know where to look.
‘Vines of the Recluse’ card, Magic the gathering game
We studied the electrical properties of two thiophene–curcuminoid molecules, 2-thphCCM(1) and 3-thphCCM (2), in which the only structural difference is the position of the sul-fur atoms in the thiophene terminal groups. We used electrochemical techniques as wellas UV/Vis absorption studies to obtain the values of the HOMO–LUMO band gap ener-gies, showing that 2-thphCCM has lower values than 3-thphCCM. Theoretical calcula-tions show the same trend. Self-assembled monolayers (SAMs) of these molecules werestudied by using electrochemistry, showing that the interaction with gold reduces drasti-cally the HOMO–LUMO gap in both molecules to almost the same value. Single-moleculeconductance measurements show that 3-thphCCM has two different conductance values,whereas 2-thphCCM exhibits only one. Based on theoretical calculations, we concludethat the lowest conductance value, similar in both molecules, corresponds to the van derWaals interaction between the thiophene ring and the electrodes. The one order of mag-nitude higher conductance value for 3-thphCCM corresponds to a coordinate interactionbetween (dative covalent) the sulfur atoms and the gold electrodes. 1
Parts of this chapter have been published in Chem. Eur. J. 2016, 22, 12808. [1].1This information was published in Chemistry European Journal, 2016, 22, 12808 – 12818. We thank Mickael
Perrin for his help with the calculations and Monica Soler, Nuria Aliaga and their teams for the synthesis andchemical characterization of the molecules.
57

4
584. CURCUMINOIDS: SINGLE-MOLECULE CONDUCTANCE OF THIOPHENE ANCHORED
COMPOUNDS
4.1. INTRODUCTION TO CURCUMINOIDSCurcuminoids are a family of molecules which are derived from the curcuma moleculefound in the Indian spice turmeric. They have been intensively used as inks, anti- in-flammatory and cancer treating agents [2–5]. During the long history of the use of thesecompounds, synthetic chemists have gained great control over their molecular struc-ture. This characteristic, together with the conjugated nature of the curcumin backbone,makes it a interesting candidate for molecular electronic devices.
In this work we investigate the electrochemical and single-molecule charge-transportproperties of two thiophene-terminated curcuminoid (CCMoid) molecules, 2-thphCCM(1) and 3-thphCCM (2) (Fig. 4.1). In particular, we have investigated the influence of thesulfur atom positions on the electronic and charge-transport properties of both molecules.These two molecules have the same atomic composition and anchoring groups with sul-fur atoms (S) as linkers, but differ in the relative position of the sulfur atom of the anchor-ing group. 3-thphCCM has the S atoms more available (outer position) for anchoring togold electrodes than 2-thphCCM (Fig. 4.1).
OH
O
SS
OH
O
SS
2-thphCCM(1) 3-thphCCM (2)
Figure 4.1: Sketch of the molecules considered in this chapter. (1) 2-thiophene curcuminoid (2Thph-CCM)compound in which the sulfur atoms in the thiophenes groups are located in position 2 with respect to themain molecular backbone. (2) 3-thiophene curcuminoid (3Thph-CCM) compound but this time the sulfuratoms are in position 3 with respect to the backbone.
To design ligands that are suitable for molecular electronics, we consider three prin-cipal aspects. First, our ligands must have proper anchoring groups to enable attach-ment to the electrodes; secondly, to achieve good molecular conductance, a short buthighly conjugated skeleton is needed. Finally, metal complexation may introduce in-teresting features to molecular wires, thus a versatile structure that allows for metaliza-tion is desired. In this sense, curcuminoids were chosen because they possess a highlyconjugated skeleton, have a β−diketone group that enables coordination, and their syn-thetic versatility allows the facile replacement of the aromatic groups with a wide libraryof commercial aldehydes with anchoring groups. These molecules represent promis-ing building blocks for the construction of functional molecular nanocircuits as theypossess structural flexibility and a well-developed synthetic chemistry methodology al-lowing their physical and chemical properties to be tailored. Both molecules share aβ−diketone group placed in the center of a seven carbon conjugated chain, which al-lows coordination to metal ions[4–8], such as CuII, ZnII, MnII, VIV, and RuII[5, 6], as wellas lanthanides DyIII , TbIII, EuIII, GdIII, and LuIII [7, 8]. This β−diketone moiety showsa tautomeric equilibrium between a diketo and a keto-enol form, and several studieshave focused their attention to elucidate which of these forms is more stable. Spec-

4.2. DISCUSSION ON CHEMICAL CHARACTERIZATION
4
59
troscopic studies [2, 3, 9] have shown that the cis keto-enol tautomer (Fig. 4.1) is themore stable structure in solution and X-ray diffraction shows the same result in the solidstate[10, 11]. Specifically, the cis keto-enol tautomer has an intramolecular hydrogen-bond (KEIHB, ketoenol intramolecular hydrogen-bond), which could affect the molecu-lar conductance by means of an intramolecular proton transfer. On the other hand, thetwo terminal carbon atoms of the conjugated carbon are bound to two terminal rings,which can be chosen from a wide library of terminal substituents. The side groups canalso be easily modified to improve the electrical contact with the electrodes. In this re-spect, the anchoring groups chosen for our molecules are thiophene units, which haveaffinity to gold. When a thiophene group binds a metal surface, the sulfur anchoringatom, which is in an aromatic ring, has two possible types of bonding interactions as ithas two unpaired electrons. One of the unpaired electrons is de-localized in the aromaticring, able to bind the gold surface though a p-interaction. On the other hand, the otherunpaired electron can bind through a coordinated bond (dative covalent bond), in whichthe two electrons of the bond are donated from the sulfur atom to the surface [12]. Sev-eral examples of molecules with thiophene anchoring groups deposited between elec-trodes have been reported [13, 14]. Recently, an anthracene-based curcuminoid, called9Accm, and a CuII-9Accm compound have been studied in molecular break junction de-vices made of a few layers of graphene (FLG) [15]. To the best of our knowledge, chargetransport studies of curcuminoids using gold electrodes have not been reported before.
First, we study, in the bulk, different ways to obtain experimentally and theoreticallythe frontier orbitals and HOMO–LUMO band gap energies of these two curcuminoidmolecules in the gas phase, in solution, and in the solid state. Generally speaking, thedifference in conductance between two molecules can be estimated based on the differ-ence in the band gap energy, although this band being near the Fermi level (5.1 eV) isalso important[16]. As a first approximation, a small HOMO–LUMO gap energy is bene-ficial for the molecular conductance properties. However, it is known that the frontier or-bital energies will change based on the hybridization of these orbital wave functions withthose of the metallic leads in the electronic device [17–19]. We have performed electro-chemical studies on self-assembled monolayers of these molecules to understand howthe frontier orbitals and HOMO–LUMO band gap energies can change as a result of themolecule–surface interaction. Finally, we have performed single-molecule conductancemeasurements using the mechanically controlled break junction (MCBJ) technique totest the performance of our compounds as single-molecule wires. We support our find-ings by DFT calculations.
4.2. DISCUSSION ON CHEMICAL CHARACTERIZATION2
The bulk characterization of the compounds was performed using electrochemicalexperiments and UV-visible spectroscopy in solution and solid state. The results arecompared to DFT calculations for the compounds in solution and in gas phase.
The electronic absorption spectra of both molecules in the solid state were used to
2The chemical characterization was performed by the groups of Nuria Aliaga and Monica Soler in Barcelona(Spain) and Santiago (Chile). A more detail explanation can be found in reference [1].

4
604. CURCUMINOIDS: SINGLE-MOLECULE CONDUCTANCE OF THIOPHENE ANCHORED
COMPOUNDS
obtain the HOMO–LUMO gap of the molecules, which are summarized in Table 4.1.Based on the absorption spectra obtained for 2-thphCCM and 3-thphCCM, the opticalband gap of the frontier orbitals (Eop
g ) were estimated by using the cut-off (onset) of the
lowest absorbed energy in their respective UV/Vis spectra. The Eopg for the solid state
provided values of 2.20 eV for 2-thphCCM and 2.45 eV for 3-thphCCM.
a)
LUMO
HOMO
b)
Figure 4.2: Molecular orbitals of a) 2-thphCCM (1) and b) 3-thphCCM (2).
To calculate the HOMO–LUMO gap, we have run two sets of calculations. The firstis a set of density functional theory calculations (DFT) in the gas phase based on theKohn–Sham analog of the Koopmans’ theorem (KT, valid within the Hartree–Fock frame-work) [20], which were demonstrated by Gritsenko and Baerends [21, 22] and expandedto other problems [23]. The second group of DFT calculations include the effect of sol-vent (CH2Cl2) and Tomasi’s continuum polarizable method in order to compare the re-sults with experimental measurements from the UV/Vis spectra.
In both cases, the calculations are a reasonably good estimation of the HOMO–LUMOgap and the absorption spectral characteristics. We cannot expect a perfect agreementwith the experimental data, as the calculations are affected by the limits of the theoreti-cal approach [21], the choice of the exchange-correlation functional, and the basis set.
2thph CCM 3thph CCMEtheor
g gas phase 5.72 5.96
Etheorg solution phase 3.08 3.26
Eopg solid 2.20 2.45
Eecg solution 2.27 2.47
Table 4.1: Comparison of the HOMO-LUMO energies of the studied molecules in gas, solution and solid phase.The methods used to obtaing these values were theoretical (theor), using DFT calculations; optical (op), usingUV-Vis spectroscopy and electrochemical (ec), as the labels indicate.
Table 4.1 shows the calculated band gap energies for the molecules in the gas phaseand in solution. The HOMO and LUMO calculated data, including the solvent effect,show quite good agreement with the experimental data from the UV/Vis experiments insolution. Based on the comparison of the calculated band gap energies of both molecules,

4.2. DISCUSSION ON CHEMICAL CHARACTERIZATION
4
61
3-thphCCM has smaller energies than 2-thphCCM. The band gap energies for both mole-cules obtained from solid-state optical absorption or solution electrochemistry are inagreement. All the energies obtained for 2-thphCCM and 3-thphCCM show the sametrend, suggesting to a first approximation that 3-thphCCM could conduct better.
Cyclic voltammetry (CV) and differential pulse voltammetry(DPV) were used to in-vestigate the redox properties of 2-thphCCM and 3-thphCCM and to estimate values ofthe HOMO and LUMO energy levels of both systems. Overall, the two compounds dis-play a similar electrochemical behavior, exhibiting a number of irreversible reductions inthe -2.5 to -1.5 V region and three close irreversible oxidations in the +0.5 to +2.0 V range,with features that are similar to other thiophene species reported in the literature[24, 25].However, a closer look at the DPV data shows that the potentials for the first oxidationand reduction processes are shifted between the two target molecules. 2-thpthCCMpresents the first oxidation and reduction processes at +0.87 and -1.66 V, respectively,whereas 3-thphCCM displays these processes at +0.95 and -1.80 V (both referenced vs.Fc/Fc+).
1st Oxid 1st Red EHOMO ELUMO Eelecg
1 Sol. +0.87 -1.66 -5.53 -3.26 2.272 Sol. +0.95 -1.80 -5.58 -3.11 2.471 SAM +0.78 -1.33 -5.40 -4.65 0.752 SAM1 +0.93 -0.30 -5.42 -4.68 0.74
Table 4.2: Electrochemical data in CH2Cl2, for 2-thphCCM and 3-thphCCM in solution and in a SAM config-uration. Potentials (V) are refered to Fc/Fc+. EHOMO and ELUMO refer to the HOMO and the LUMO energylevels and Eelec
g [eV] stands for the electrochemical energy gap.
The HOMO is estimated [26, 27] from the first oxidation potential, corresponding tothe ionization potential (IP; removal of one electron from the highest occupied molecu-lar orbital) and the LUMO is deduced from the first reduction potential, correlated withthe electron affinity (EA; addition of one electron to the lowest unoccupied orbital). Asa result, the corresponding HOMO and LUMO energy levels are -5.53 and -3.26 eV for2-thphCCM, and -5.58 and -3.11 eV for 3-thphCCM. Hence, the electrochemical bandgaps, Eec
g , are 2.27 and 2.47 eV, respectively. These energies as well as the gap values arecomparable to other conjugated systems, which are of the order of donor polymers andsmall molecules [21, 25–28]. For both molecules, the metal Fermi level is found to liecloser to the HOMO than to the LUMO energy level.
Electrochemical studies of self-assembled monolayers (SAMs) of 2-thphCCM and 3-thphCCM on Au(111) were also carried out to evaluate the changes in the HOMO andLUMO energy levels. The results are summarized in Table 4.2.
SAM(2-thphCCM-Au(111)) presents the first oxidation and reduction processes at+0.78 and -0.33 V, respectively, and SAM(3-thphCCM-Au(111)) displays parallel redoxprocesses at +0.93 and -0.30 V. The comparison of these potentials with the ones ob-tained for the molecules in solution suggests that the oxidation potentials for the SAMconfigurations have experienced small shifts toward positive values, whereas the reduc-tion potentials show pronounced shifts to less negative values.

4
624. CURCUMINOIDS: SINGLE-MOLECULE CONDUCTANCE OF THIOPHENE ANCHORED
COMPOUNDS
We found that the electrochemical band gaps, for 2-thphCCM and 3-thphCCM whenin contact with the gold electrode, are 0.75 and 0.74 eV, respectively. This change in theband gap energies upon binding is mainly a result of the mixing of the LUMO orbitalswith the orbitals of the gold electrode, as the HOMO orbitals are almost the same forboth molecules. When compounds 2-thphCCM and 3-thphCCM are anchored to thegold surface, the reduction potentials (or the LUMO energies) cause the reduction of theband gap energy, resulting in smaller values than the ones obtained for the molecules insolution. Based on the electrochemical measurements of SAMs, we can conclude thatthe interaction with the gold electrodes reduces the LUMO energies of both molecules,ending up with a smaller and more similar band gap for both molecules, therefore as afirst approximation, if everything else is the same, both molecules should show similarconductance values in a single-molecule experiment using gold electrodes.
Representations of the molecular orbitals for the HOMO and LUMO electronic statesfor 2-thphCCM and 3-thphCCM are presented in Fig. 4.2, which show the typical delo-calization of the charge of a conjugated molecule, using p-type orbitals along the com-plete structure. Two observations can be made when comparing the molecular orbitalsof 2-thphCCM and 3-thphCCM: (i) 2-thphCCM has a reduced capacity for charge trans-fer as the S atoms are less involved in the HOMO orbital; (ii) looking at the LUMO or-bital, 3-thphCCM is less conjugated, as two carbon atoms of each thiophene ring arenot participating in the conjugation of the complete structure, which gives a more directpath for eventual charge transport from one sulfur atom to the other in the molecule,favoring better conductance. Therefore, depending on if the charge transport is throughthe HOMO or the LUMO orbital, the conductance of both molecules could be different.Based on the proximity of the HOMO energies of both molecules, as obtained from elec-trochemistry, with the Fermi level of gold, as a first approximation, the injection couldbe through the HOMO.
4.3. CONDUCTANCE MEASUREMENTSSingle-molecule conductance measurements were performed with the controllable me-chanical break junction technique (MCBJ) [29]. A 2µl drop of the molecular solution wasdrop-casted on the device before breaking the electrodes. Thousands of molecular con-ductance traces were collected while breaking and re-connecting the electrodes, allow-ing a statistical analysis. The data is visualized by the constructions of two-dimensionalconductance vs. electrode displacement histograms and one-dimensional conductancehistograms. Fig. 4.3 displays two-dimensional conductance versus electrode displace-ment histograms of MCBJ experiments (conductance in logarithmic scale). Fig. 4.3a)and c) display information about 2-thphCCM and panels b) and d) about 3-thphCCM.In these histograms, individual breaking traces have been shifted along the horizontalaxis to fix the rupture of the one-atom gold contact at zero. Areas of high counts repre-sent the most typical breaking behavior of the molecular junctions. In Fig. 4.3, panelsa) and b) there are histograms constructed with the full data sets including 5000 consec-utive conductance traces; the panels c) and d) display histograms built from traces thatextend of over 0.7 nm above 1×10⁻⁵G0. In the latter case, the shortest and steepest traceshave been omitted so that most it includes mainly traces in which a molecule bridges thegap.

4.3. CONDUCTANCE MEASUREMENTS
4
63
0 1 2Electrode displacement (nm)
0 1 2Electrode displacement (nm)
Cond
ucta
nce
(G0)
10-6
10-4
10-2
100
Cond
ucta
nce
(G0)
10-6
10-4
10-2
1002-thphCCM 3-thphCCM
3-thphCCM2-thphCCM
a) b)
c) d)
Figure 4.3: a) and b): 2D-Conductance vs. electrode displacement histograms constructed from 5000 con-secutive traces of a) 3-thphCCM and b) 2-thphCCM. Panels c) and d) show 2D-Conductance vs. electrodedisplacement histograms constructed from 253 and 1650 traces respectively in which the distance betweenthe last point above 1 G0 and the last point above 10−5 G0 is larger than 0.7 nm.

4
644. CURCUMINOIDS: SINGLE-MOLECULE CONDUCTANCE OF THIOPHENE ANCHORED
COMPOUNDS
The two-dimensional histograms (Fig. 4.3) show that for compound 2-thphCCM,there is a region of high counts between 10−4 and 10−5 G0 and for compound 3-thphCCM,there are two regions of high counts, one just above 10−4 G0 extending no further than1.5 nm and a broad feature spreading from below 10−5 G0 to the detection limit andreaching displacements up to 2.5 nm.
To extract the conductance values of the most probable molecular configuration,one-dimensional (1D) conductance histograms have been constructed. These 1D-his-tograms are presented in Fig. 4.4. The two panels show, the presence of peak at 1G0(G0=2e2/h=77 mS), the quantum of conductance, indicating the formation of atomi-cally sharp electrodes. The histograms for the two molecules yield a distribution of con-ductance values peaked around 3.1×10⁻⁵ G0 for 2-thphCCM (Fig. 4.4 a) and two con-ductance peaks at G0 and 7×10⁻⁶ G0 for 3-thphCCM (Fig. 4.4 a).
Comparison of both histograms yields a consistent picture in which 2-thphCCM ex-hibits one stable conformation with a conductance plateau that peaks at 3.1×10⁻⁵ G0,with counts concentrated for electrode displacements between 0 and 0.7 nm, with al-most no counts at larger displacements. For 3-thphCCM, the histograms reveal a max-imum around 3.2×10⁻⁴ G0 and a broad maximum around 6.9×10⁻⁶ G0, with countsspread over larger displacements, and conductance counts up to 2.5 nm of electrode dis-placement. Fig 4.1 shows that the observed differences have to be related to the differentpositions of the sulfur atoms in the terminal thiophene rings. If we compare the distancebetween the sulfur atoms in both molecules, 2-thphCCM has the shortest distance be-tween them and the observed conductance counts for 3-thphCCM at higher electrodedisplacement is thus consistent with the molecular structure. Moreover, the lower con-ductance value (Fig. 4.4), which corresponds to a more stretched conformation of themolecule between the electrodes, is of the same order in both molecules, suggesting thatthe change in the sulfur atom position for that conformation does not affect the conduc-tance considerably. The high conductance value seen only for 3-thphCCM, may then berelated to the fact that it has the S atoms at a more favorable position for anchoring tothe gold electrodes, which is better for charge injection.
4.4. TRANSPORT CALCULATIONSTo compare the single-molecule conductance measurements with theoretical calcula-tions, we have calculated the transmission through 2-thphCCM and 3-thphCCM by us-ing the non-equilibrium Green’s function method with a density functional theory (DFT)calculation of the ground-state electron density for different electrode stretching dis-tances. We found that the exact geometry of the molecule with respect to the electrodesplays an important role in the HOMO and LUMO energy values, as well as on the trans-mission through the molecular junction. To investigate the evolution of the molecularconformation while stretching the junction, we performed DFT calculations for variouselectrode separations.
In Fig. 4.5, we present the different molecular junction configurations for 2-thphCCMand 3-thphCCM during stretching. These three configurations are marked in Fig. 4.6 a)and b) with arrows in the force versus Au–Au distance plots. The initial molecular junc-tion configuration is presented on top, whereas the middle and lower configurations cor-respond to maxima in the forces/displacement curves. The colors in Fig. 4.6 a),b) are

4.4. TRANSPORT CALCULATIONS
4
65
0
10
20
30
10-6 10-4 10-2 10002
10
20
coun
ts/t
race
Conductance (G0)
3.2x10⁻⁴G0
6.9x10⁻⁶ G0
3.1x10⁻⁵ G0
Figure 4.4: 1D-conductance histograms of a) 2-thphCCM and b) 3-thphCCM constructed from the traces col-lected in Fig. 4.3 c) and d) respectively. The red line in b) corresponds to the fit of two log-normal distributions.Arrows pinpoint the most probable conductance value of the different conductance states.
Figure 4.5: DFT calculations of the different molecular junction configurations. Top: initial molecular junctionconfiguration; middle: the configuration at an intermediate stretch; bottom: the configuration at the point ofmaximum stretching for molecules 2-thphCCM and 3-thphCCM.

4
664. CURCUMINOIDS: SINGLE-MOLECULE CONDUCTANCE OF THIOPHENE ANCHORED
COMPOUNDS
linked to the transmission curves shown in Fig. 4.6 c). These were calculated by usingDFT+Σ in combination with the non-equilibrium Green’s function (NEGF) formalism.Conductance values were then calculated by using the Landauer formula[30].
a) b) c)
Figure 4.6: Force versus Au–Au distance curves as obtained from the DFT stretching calculations for 2-thphCCM (a) and 3-thphCCM (b). c) Transmission curves calculated by using DFT+NEGF for 2-thphCCM and3-thphCCM. The colors of the curves are related to the junction geometry along the stretching curves shownin a) and b). The vertical dotted line indicates the estimated location of the Fermi energy.
Comparing the force–stretching curves for both molecules with the force maximamarked by the black arrows in Fig. 4.6 and the representation of the calculated molec-ular junction configurations shown in Fig. 4.5; the following observations can be made:first, the rupture of the molecular junction, that is, the last local maximum in the force,marked by the black arrows, occurs at 2.99 nm for molecule 1, whereas molecule 3-thphCCM can be stretched up to 3.29 nm, so essentially 3-thphCCM can be stretchedmore than 2-thphCCM. This may explain the shorter conductance plateaus for 2-thphCCMin the experimental conductance histograms. Second, the junction evolution for the twomolecules is different. 2-thphCCM shows a second peak at 2.74 nm, with an amplitude of0.8 nN. 3-thphCCM, on the other hand, shows multiple peaks, located at 2.62, 2.73, and3.04 nm, with amplitudes of 0.9, 0.9, and 1.6 nN, respectively. The fact that the force istwice as high for the peak at 3.04 nm suggests a different nature for this bond comparedwith the others. Inspection of the different junction geometries in Fig. 4.5 suggests thefollowing scenarios: (i) at the point of rupture of 2-thphCCM, the interaction is a weakvan der Waals interaction between a distant thiophene ring and the electrode, leavingonly a H atom of the ring as the last contact with the gold electrode. No coordinate S–Aubond is formed, and the molecule/electrode interaction occurs through van der Waalsforces. The peak at 2.73 nm is also caused by van der Waals forces, with the entire thio-phene rings interacting with the electrodes. (ii) In the case of 3-thphCCM, the situationis different. At the point of rupture (3.29 nm), the hydrogen atom is the closest to theelectrode suggesting a molecule/electrode interaction occurring through van der Waalsforces. This is similar to 2-thphCCM. At positions 2.64 and 2.73 nm, the thiophene ringsoverlap with the gold electrodes and van der Waals forces predominate again. At a dis-tance of 3.04 nm, however, the S atoms are located close to the gold, indicating the for-mation of coordinate bonds. This bond formation can be related to the higher breakingforce. Upon further stretching, as also seen in 2-thphCCM, the last molecule/electrodeinteraction is again through van der Waals forces.

4.5. DISCUSSION AND CONCLUSIONS
4
67
This structural difference is also reflected in the transmission through the moleculewhile stretching, as shown in Fig. 4.6 c). For thph2, when the molecular junction isformed through van der Waals interactions with the electrodes (red), the curves clusteraround a conductance value of about 3×10⁻³ G0. For 3-thphCCM, the conductance inthe van der Waals regime (blue) is slightly lower than for molecule 1, and with a largerspread. When 3-thphCCM is connected through the S atoms (green), on the other hand,the conductance is about an order of magnitude larger. The conductance values ob-tained from DFT are higher than the ones found in the MCBJ experiments, and can there-fore only be compared qualitatively. Nevertheless, the two different binding geometriesof 3-thphCCM yield different conductance values, with an order of magnitude differencebetween the two. In addition, the HOMO and LUMO energies of both molecules are sim-ilar to those obtained experimentally from the electrochemical measurements on SAMs.
4.5. DISCUSSION AND CONCLUSIONSThe experimental data in solution and in the solid state show that the HOMO–LUMOband gap for 2-thphCCM has a lower energy value than for 3-thphCCM. Theoretical cal-culations show the same trend. Inspection of the HOMO and LUMO molecular orbitalsshow that both molecules have the typical delocalization of p-type orbitals along thecomplete structure of the molecule, but owing to the difference in the position of thesulfur atoms in the terminal thiophene rings, the electronic densities in the HOMO andLUMO orbitals are different. Analysis of the frontier molecular orbital electron densitiessuggest that if charge transport were to occur through the HOMO orbitals, 2-thphCCMcould show a reduced capacity for eventual charge-transfer processes as the sulfur atomare less involved in the HOMO orbital. In the opposite case scenario, in which chargetransport occurs through the LUMO energy levels of the molecules, 3-thphCCM showsa more direct path for eventual charge transport between both sulfur atoms, resulting inbetter conductance. Therefore, the energy band gap for 2-thphCCM is smaller than for3-thphCCM, but the electron energies of the HOMO and the LUMO orbitals may affectdifferently the injected process to or from the molecule. Once the molecules are an-chored on the gold electrode surfaces, the band gap energies are significantly reduced,exhibiting a lowering of the LUMO orbital energies in both cases, and the band gap ofboth molecules end up almost the same. Single-molecule measurements show that theconductance of 3-thphCCM is an order of magnitude higher than the conductance of2-thphCCM. Therefore, considering that the HOMO and LUMO energies are almost thesame, we attribute this difference in conductance to the ability of 3-thphCCM to formcoordinate interactions with the nanogold electrodes, owing to the more available posi-tion of the sulfur atoms. We supported our findings by DFT calculations.
REFERENCES[1] A. Etcheverry-Berríos, I. Olavarría, M. L. Perrin, R. Díaz-Torres, D. Jullian, I. Ponce,
J. H. Zagal, J. Pavez, S. O. Vásquez, H. S. J. van der Zant, D. Dulic, N. Aliaga-Alcalde, and M. Soler, Multiscale Approach to the Study of the Electronic Proper-ties of Two Thiophene Curcuminoid Molecules, Chemistry - A European Journal 22,12808 (2016).

4
68 REFERENCES
[2] C. F. Chignell, P. Bilskj, K. J. Reszka, A. G. Motten, R. H. Sik, and T. A. Dahl, Spectraland photochemical properties of curcumin, Photochemistry and Photobiology 59,295 (1994).
[3] L. Nardo, A. Andreoni, M. Bondani, M. Másson, T. Haukvik, and H. H. Tønnesen,Studies on curcumin and curcuminoids. xlvi. photophysical properties of dimethoxy-curcumin and bis-dehydroxycurcumin, Journal of Fluorescence 22, 597 (2012).
[4] N. Aliaga-Alcalde, L. Rodríguez, M. Ferbinteanu, P. Höfer, and T. Weyhermüller,Crystal structure, fluorescence, and nanostructuration studies of the first ZnII
anthracene-based curcuminoid, Inorganic Chemistry 51, 864 (2012).
[5] K. Krishnankutty and V. John, Synthesis, characterization, and antitumour studies ofmetal chelates of some synthetic curcuminoids, Synthesis and Reactivity in Inorganicand Metal-Organic Chemistry 33, 343 (2003).
[6] N. Aliaga-Alcalde, P. Marqués-Gallego, M. Kraaijkamp, C. Herranz-Lancho, H. denDulk, H. Görner, O. Roubeau, S. J. Teat, T. Weyhermüller, and J. Reedijk, Coppercurcuminoids containing anthracene groups: Fluorescent molecules with cytotoxicactivity, Inorganic Chemistry 49, 9655 (2010).
[7] M. Menelaou, F. Ouharrou, L. Rodríguez, O. Roubeau, S. J. Teat, and N. Aliaga-Alcalde, DyIII- and YbIII-curcuminoid compounds: Original fluorescent single-ionmagnet and magnetic near-ir luminescent species, Chemistry – A European Journal18, 11545 (2012).
[8] Y. Mawani and C. Orvig, Improved separation of the curcuminoids, syntheses of theirrare earth complexes, and studies of potential antiosteoporotic activity, Journal of In-organic Biochemistry 132, 52 (2014), special Issue Containing Contributions fromthe Third Latin American Meeting on Biological Inorganic Chemistry - LABIC 2012.
[9] F. Payton, P. Sandusky, and W. L. Alworth, Nmr study of the solution structure ofcurcumin, Journal of Natural Products 70, 143 (2007).
[10] J. T. Mague, W. L. Alworth, and F. L. Payton, Curcumin and derivatives, Acta Crys-tallographica Section C 60, o608 (2004).
[11] H. H. Tonnensen, J. Karlsen, and A. Mostad, Structural Studies of Curcuminoids. I.The Crystal structure of Curcumin , Acta Chemica Scandinavica B 36, 475 (1882).
[12] J. Zhou, Y. X. Yang, P. Liu, N. Camillone, and M. G. White, Electronic structure ofthe thiophene/au(111) interface probed by two-photon photoemission, The Journalof Physical Chemistry C 114, 13670 (2010).
[13] I. Rattalino, V. Cauda, P. Motto, T. Limongi, G. Das, L. Razzari, F. Parenti, E. Di Fab-rizio, A. Mucci, L. Schenetti, G. Piccinini, and D. Demarchi, A nanogap-arrayplatform for testing the optically modulated conduction of gold-octithiophene-goldjunctions for molecular optoelectronics, RSC Adv. 2, 10985 (2012).

REFERENCES
4
69
[14] Y. Ie, K. Tanaka, A. Tashiro, S. K. Lee, H. R. Testai, R. Yamada, H. Tada, and Y. Aso,Thiophene-based tripodal anchor units for hole transport in single-molecule junc-tions with gold electrodes, The Journal of Physical Chemistry Letters 6, 3754 (2015).
[15] F. Prins, A. Barreiro, J. W. Ruitenberg, J. S. Seldenthuis, N. Aliaga-Alcalde, L. M. K.Vandersypen, and H. S. J. van der Zant, Room-temperature gating of molecu-lar junctions using few-layer graphene nanogap electrodes, Nano Letters 11, 4607(2011).
[16] C. B. George, M. A. Ratner, and J. B. Lambert, Strong conductance variation inconformationally constrained oligosilane tunnel junctions, The Journal of PhysicalChemistry A 113, 3876 (2009).
[17] J. Ponce, C. R. Arroyo, S. Tatay, R. Frisenda, P. Gaviña, D. Aravena, E. Ruiz, H. S. J.van der Zant, and E. Coronado, Effect of metal complexation on the conductanceof single-molecular wires measured at room temperature, Journal of the AmericanChemical Society 136, 8314 (2014).
[18] V. Kaliginedi, a. V. Rudnev, P. Moreno-Garcia, M. Baghernejad, C. C. Huang, W. J.Hong, and T. Wandlowski, Promising anchoring groups for single-molecule conduc-tance measurements, Physical Chemistry Chemical Physics 16, 23529 (2014).
[19] Z. Li, M. Smeu, M. A. Ratner, and E. Borguet, Effect of anchoring groups on singlemolecule charge transport through porphyrins, The Journal of Physical Chemistry C117, 14890 (2013).
[20] T. Koopmans, Über die zuordnung von wellenfunktionen und eigenwerten zu deneinzelnen elektronen eines atoms, Physica 1, 104 (1934).
[21] P. I. Djurovich, E. I. Mayo, S. R. Forrest, and M. E. Thompson, Measurement of thelowest unoccupied molecular orbital energies of molecular organic semiconductors,Organic Electronics 10, 515 (2009).
[22] D. P. Chong, O. V. Gritsenko, and E. J. Baerends, Interpretation of the kohn–sham or-bital energies as approximate vertical ionization potentials, The Journal of ChemicalPhysics 116, 1760 (2002).
[23] O. V. Gritsenko and E. J. Baerends, The analog of koopmans’ theorem in spin-densityfunctional theory, The Journal of Chemical Physics 117, 9154 (2002).
[24] D. Liu, C. Gu, M. Xiao, M. Qiu, M. Sun, and R. Yang, A new highly conjugated crossedbenzodithiophene and its donor-acceptor copolymers for high open circuit voltagespolymer solar cells, Polym. Chem. 6, 3398 (2015).
[25] Q. Fan, Y. Liu, M. Xiao, H. Tan, Y. Wang, W. Su, D. Yu, R. Yang, and W. Zhu,Donor–acceptor copolymers based on benzo[1,2-b:4,5-b’]dithiophene and pyrene-fused phenazine for high-performance polymer solar cells, Organic Electronics 15,3375 (2014).

4
70 REFERENCES
[26] J. Pommerehne, H. Vestweber, W. Guss, R. F. Mahrt, H. Bässler, M. Porsch, andJ. Daub, Efficient two layer leds on a polymer blend basis, Advanced Materials 7, 551(1995).
[27] A. P. Kulkarni, C. J. Tonzola, A. Babel, and S. A. Jenekhe, Electron transport materialsfor organic light-emitting diodes, Chemistry of Materials 16, 4556 (2004).
[28] C.-Y. Yu, C.-P. Chen, S.-H. Chan, G.-W. Hwang, and C. Ting,Thiophene/phenylene/thiophene-based low-bandgap conjugated polymers forefficient near-infrared photovoltaic applications, Chemistry of Materials 21, 3262(2009).
[29] C. A. Martin, J. M. van Ruitenbeek, and H. S. J. van der Zant, Sandwich-type gatedmechanical break junctions, Nanotechnology 21, 265201 (2010).
[30] M. Büttiker, Y. Imry, R. Landauer, and S. Pinhas, Generalized many-channel con-ductance formula with application to small rings, Phys. Rev. B 31, 6207 (1985).

5SINGLE-MOLECULE MEASUREMENT
ON CURCUMINOID COMPOUNDS: BAND CU SUBSTITUTION
"You wanna know how I did it? This is how I did it, Anton:- I never saved anything for the swim back"
GATTACA, Andrew Niccol, 1997
We have studied the conductance of a family of curcuminoids, which possess different an-choring groups and have been modified with boron and copper substituents1. We find thatthe combination of methyl sulfide anchoring moieties and a boron difluoride group incor-porated to the middle of the backbone gives rise to a switching behavior characterized bytwo distinctive conductance values. We corroborate the same trend with measurementson shorter curcuminoid analog compounds. We experimentally discard various possiblemechanisms that give rise to conductance bistability in other molecular systems. The con-clusion is that the most likely explanation lies in conformational changes related to themethyl sulfide group and the presence of the boron difluorine moiety in the center.
1The molecules studied in this chapter were synthesized in the groups of Monica Soler at University of Chile(Santiago, Chile) and Nuria Aliaga at Catalan Institution for Research and Advanced Studies (Barcelona,Spain).
71

5
725. SINGLE-MOLECULE MEASUREMENT ON CURCUMINOID COMPOUNDS: B AND CU
SUBSTITUTION
The realization of single-molecule circuits has opened the way to explore the elec-tronic properties of a large variety of (in-)organic molecules. [1] Techniques such asmechanically controlled break junctions (MCBJ) [2] and the scanning tunnelling mi-croscopy break junctions (STM-BJ [3]) are widely used to measure charge transport acrossmolecules as short as 1 nm at ambient conditions. These single-molecule studies allowresearchers to disentangle intrinsic charge transport properties from intermolecular in-teractions so that the relations between molecular structure and charge transport canbe studied in a direct way. Conjugated organic molecules are a fruitful playground forthis purpose; for example, molecular resistors [4] and diodes [5–8] have been designedand measured. On the other hand, biological molecules hold an enormous potential,but due to their complexity it is hard to establish a clear relation between the chargetransport characteristics and their biological role. A way to build up knowledge in thisdirection is to characterize and understand the electronic properties of simple moleculesthat biological organisms can produce.
An important topic of interest is the inclusion of non-organic modifications to or-ganic backbones, such as, metal ions or metalloids and their effect on the molecularconductance. Inclusion of metal ions, for example, has been studied in structures suchas porphyrins, [9] in which a down-shift in the conductance value was reported up toa factor of 2.5 compared to the metal-free ligand when a metal ion was included in thestructure. In a rotaxane-based molecule the inclusion of a Cu ion produced, on the otherhand, no change in conductance value [10]. Metal ions can also be used to create in-teresting magnetic properties that can be exploited in molecular electronics like spincross-over compounds [11] or single molecule magnets [12]. Furthermore, it is knownthat metal ions play an important role in the bio-functionality of certain proteins andfacilitate charge transport in them. [13]
Here, we study a series of curcuminoid molecules (see Fig. 5.1) which have differentanchoring groups and have a boron atom as a substituent group; a curcuminoid with acopper in is used as a reference compound. The thiocarbamate terminated moleculeshave a new anchoring group that to our knowledge has not been studied before in thecontext of single-molecule electronics. Measurements are performed with the MCBJmethod in ambient conditions. In all cases, we find that stable molecular junctions canbe formed and the acquisition of thousands of consecutive breaking traces allow for astatistical analysis of the data. We find that S-CCM-BF2 possesses the highest conduc-tance and that the inclusion of a boron atom in combination with MeS anchoring groupsleads to a bi-stability in the conductance values.
5.1. DESCRIPTION OF THE MOLECULESOne of the features that has shown to be relevant in obtaining a relatively high con-ductance in molecular wires is the existence of a de-localized π-system between thetwo ends of the molecule. Here, we study a family of curcuminoid compounds whosestructures are displayed in Figure 5.1. These molecules have been synthesized mim-icking the structure of the natural compound curcumin, found in the roots of the cur-cuma longa plant. These bio-compatible molecules are short conjugated molecules withde-localized frontier orbitals. Because of the pharmaceutical use of these compounds,chemists have gained noticeable control over their structure [15–17]. In our previous

5.1. DESCRIPTION OF THE MOLECULES
5
73
S-CCM-BF2 (4)
MeS-CCM (5)
S-CCM (3)
Thph-CCM-BF2 (6)
MeS-CCM-BF2 (2)MeS-CCM (1)
Figure 5.1: Schematic of the molecules considered in this chapter: (1) methylsulfide terminated free ligand cur-cuminoid, (2) methylsulfide terminated BF2 substituted curcuminoid, (3) thiocarbamate terminated free lig-and curcuminoid, (4) thiocarbamate terminated BF2 substituted curcuminoid, (5) methylsulfide terminatedCu substituted curcuminoid and (6) thiophene terminated BF2 substituted curcuminoid. The sulfur to sul-fur distance of MeS-CCM and MeS-CCM-BF2is 1.86 nm obtained by X-ray diffraction, the same distance as-sumed for thiocarbamate terminated molecules due to the structure similarities, in the case of MeS-CCM-Cuis1.78 nm and finally S-S distance in the Thph-CCM-BF2 is asumed to be the same as the free ligand reported in[14].
work [14] we have shown that this kind of molecules can bridge two gold electrodes whenconnected through thiophene (Thph) endgroups.
In this chapter we explore the differences that arise in the electronic properties ofcurcuminoids when a metalloid (boron in this case) is introduced in the central part ofthe molecule (compounds 2,4,6 in Figure 5.1). The different anchoring strategies to bindthese compounds to gold electrodes include methyl sulfide groups (MeS-:compounds1,2,5 in Fig. 5.1); 3-thiophene groups (molecule 6) and a new anchoring moiety calledthiocarbamate (S-:molecules 3 and 4 ). For comparison, a curcuminoid with a copper ionattached to the backbone (compound 5) is studied as well. The un-modified backbone(compounds 1 and 3) are used as a reference for the respective anchoring strategy.

5
745. SINGLE-MOLECULE MEASUREMENT ON CURCUMINOID COMPOUNDS: B AND CU
SUBSTITUTION
5.2. CONDUCTANCE MEASUREMENTSSingle-molecule conductance measurements were performed in a mechanically con-trollable break junction set up. [18] The devices consist of a phosphorus bronze flexiblesubstrate coated with a polyimide insulation layer, on top of which a lithographicallydefined gold wire with a constriction is patterned by e-beam lithography. The narrowerpart of the wire is suspended by reactive ion etching of the polyimide. The substrate isthen clamped at both ends and bent by the action of a pushing rod beneath the centerof the substrate until the gold wire breaks leaving two atomically sharp electrodes sepa-rated by a nanoscale gap.
The electrodes are fused and broken thousands of times at rates between 3 and 8 nm/s.During this process, the conductance (G = I /V ) is recorded using a logarithmic am-plifier. Data is displayed in two-dimensional (2D) conductance vs. displacement his-tograms, in which the color code represents the relative frequency a particular conduc-tance value is measured at the corresponding displacement value. Traces are alignedin such a way that zero displacement is defined as the point where the metallic contact
is lost and the conductance drops sharply below the conductance quantum (G0 = 2e2
h ,where e is the electron charge and h Planck constant). The actual distance between theelectrodes is larger than the one displayed in the 2D-histogram because the electrodessnap like a rubber band when the last atom loses contact. On average, the retractionof the electrodes after breaking is about 0.5 nm [19] and this distance should be addedto the distances displayed in the 2D-histograms. One-dimensional (1D-) conductancehistograms of the same data sets are obtained by integrating out the displacement axis;these 1D histograms are typically used to determine the most probable conductancevalue of the molecule.
Before depositing the molecule of interest, a control experiment is performed; oneof the four junctions on a chip is broken and, at least, a thousand breaking traces aremeasured. Only if clear single gold atomic contacts are formed followed by a cleansingle-barrier tunnelling-like behaviour as the electrodes are separated further, a solu-tion (> 50µM) with target molecules in dichloromethane is drop-casted onto the device(2 µl) and let to dry, after which measurements are started.
Figure 5.2 displays six 2D-histograms of which each is a representative measurementof one of the molecules introduced in Fig. 5.1. Molecular-junction formation is observedas plateau-like structures for which the conductance stays almost constant as the junc-tion breaks further and the electrode distance increases. The signal coming from emptyjunctions, on the other hand, is seen as a cloud of counts in the conductance that expo-nentially decays with the distance between the electrodes, characteristic of a single bar-rier tunnelling process. The relative occurrence of the two types of features is a measurefor the molecular junction formation yield; for example, the absence of exponentiallydecaying conductance traces indicates a high chance of trapping molecules between theelectrodes.
A characteristic feature that arises from comparing the six two-dimensional conduc-tance vs. displacement histograms in Fig. 5.2 is the difference in the plateau length de-pending on the anchoring strategy used to contact the molecule to the gold electrodes.The order of plateau length is thiophene < methyl sulfide < thiocarbamate, indicatingthat the latter anchor is mechanically the more stable one among the three. An excep-

5.2. CONDUCTANCE MEASUREMENTS
5
75
10 -6
10 -4
10 -2
100
0 1 2
10 -6
10 -4
10 -2
100
0 1 2
10 -6
10 -4
10 -2
100
Con
duct
ance
(G0)
Electrode displacement (nm)
a) MeS-CCM b) MeS-CCM-BF2
c) S-CCM d) S-CCM-BF2
e) MeS-CCM-Cu f) Thph-CCM-BF2
Figure 5.2: 2D-conductance vs. displacement histograms of the full data sets of a representative sample of a)MeS-CCM, b) MeS-CCM-BF2, c) S-CCM, d) S-CCM-BF, e) MeS-CCM-Cu and f) Thph-CCM-BF2. The conduc-tance axis is logarithmically binned with 80 bins per decade. The measurements were performed using a biasvoltage of 0.1 V in ambient conditions; the electrode speed is between 3 to 8 nm/s. Each histogram containstwo thousand consecutive breaking traces.
tion to this rule is seen in the case of MeS-Cu-CCM (Fig. 5.2e)): the plateau-like structurehas a small slope and is longer than for the other compounds that share the same an-choring group. Another particularity of the same compound is a low frequency of emptytraces. Apparently, the Cu-substituted molecule exhibits a high chance to be capturedin between the electrodes. It is likely that in for this molecule, the junctions containmore than one molecule. We have consistently found this high junction-formation yieldfor different samples and for different bias voltages, see Appendix 5.A.5. We have notanalysed this behaviour in further detail but we do note that the listed single-moleculeconductance value for this compound could be slightly overestimated.
To quantify the most probable conductance value of each molecule we select the

5
765. SINGLE-MOLECULE MEASUREMENT ON CURCUMINOID COMPOUNDS: B AND CU
SUBSTITUTION
Figure 5.3: 1D-conductance histograms of selected traces corresponding to the same measurements displayedin Figure 5.2: a) MeS-CCM, b) MeS-CCM-BF2, c) S-CCM, d) S-CCM-BF2, e) MeS-CCM-Cu and f) Thph-CCM-BF2. Light blue shaded areas correspond to log-normal fits of the conductance peaks, used to determine thepeak position and the full width half maximum (FWHM). For b), two log-normal distributions are used to fitthe data. The individual peak shapes in this case are depicted by the black dashed lines.
traces that show molecular features using a method detailed in Appendix 5.A.1) and con-struct 1D-conductance histograms. A log-normal distribution is fitted to the data in awindow around the peak of conductance; the fit parameters are the peak conductancevalues and the full width half maximum (FWHM) of the peaks. The values for these pa-rameters are averaged among the different samples and are listed in Table 5.1. Remark-ably, the data of the MeS-CCM-BF2molecule needs to be fitted with two log-normal dis-tribution functions. A closer look at the two-dimensional histogram of this compoundin Fig. 5.2 b) shows that MeS-CCM-BF2 has a broad molecular feature that extends fromzero displacement to the breaking point. We will analyse this double-peak structure in

5.2. CONDUCTANCE MEASUREMENTS
5
77
Molecule G (G0) std (G0) FWHM
MeS-CCM 3.9×10⁻⁵ 4.0×10⁻⁶ 1.0
MeS-CCM-BF21.4×10−4 2.2×10⁻⁵ 1.15.4×10−5 1.6×10⁻⁵ 0.5
S-CCM 1.2×10⁻⁴ 3.6×10⁻⁷ 1.2S-CCM-BF2 4.3×10⁻⁴ 1.1×10⁻⁴ 0.9MeS-CCM-Cu 6.2×10⁻⁵ 1.0×10⁻⁵ 1.1Thph-CCM-BF2 4.3×10⁻⁴ - 0.6Thph-CCM 2.7×10⁻⁴ - 0.5
Table 5.1: Most probable conductance value (first column), standard deviation (second column) and FWHM(third column) obtained from fitting the data of 1D-conductance histograms of several samples to log-normaldistributions, as described in the text. The considered data sets were measured at a bias voltage of 0.1 V andthe electrode speed was varied between 3 and 8 nm/s. The standard deviations are calculated using the data oftwo devices for MeS-CCM, six for MeS-CCM-BF2, one for S-CCM, one S-CCM-BF2, two for MeS-CCM-Cu andone for Thph-CCM-BF2 and Thph-CCM respectively. The values of the free ligand with thiophene anchoringgroups (bottom row) were published by us elsewhere. [14]
more detail below.The results displayed in Table 5.1 show interesting trends. Comparing the anchor-
ing strategies for both the free ligand and the boron substituted molecules, thiocarba-mate (S-) yields conductance values similar to that of the thiophene which are around3.9 times larger than the peak conductance value for the MeS- compounds. The FWHM,a quantity that is a measure for the variability of the molecular junctions under consider-ation, is the smallest for the measurements involving the thiophene anchoring group (0.5decades) while the compounds with the other anchoring groups show a spread of around1 decade. When a boron difluorine ion (BF2) is introduced into the curcuminoid back-bone, there is a consistent increase in the conductance value by a factor of 3.6 in the caseof MeS-(high conductance state) and S-, and 1.6 for Thph- . When copper is incorporatedinto the backbone with the MeS anchoring, the conductance value increases as well, butto lesser extent (factor of 1.8). While for MeS-CCM-BF2 two peaks are needed to describethe data, the histogram of MeS-CCM-Cu contains only a single conductance peak. Un-til now we have compared the high-conductance peak of MeS-CCM-BF2 with the restof the molecules, but noticeable the low-conductance peak matches very well with theconductance value of the bare ligand with the same anchoring group(MeS-CCM).
We note that the 1D histograms of the two molecules with the thiocarbamate an-choring units exhibit long tails towards the low-conductance region. The histogramscan also be fitted to two log-normal distributions. In the 2D histogram of S-CCM-BF2inparticular, a narrow distribution is seen in the vicinity of zero displacement and as thedisplacement increases the cloud of molecular counts moves to lower conductance val-ues. This behavior is distinctly different from the one observed for MeS-CCM-BF2, sug-gesting a different underlying mechanism. For S-CCM-BF2the high-conductance statemost likely corresponds from the one in which the molecule bridges the gap betweenthe electrodes; the lower conductance state occurs when the molecule loose contact ei-ther by going through another binding configuration with a lower coupling to the elec-

5
785. SINGLE-MOLECULE MEASUREMENT ON CURCUMINOID COMPOUNDS: B AND CU
SUBSTITUTION
trodes or by forming a dimer (π−π stacking or covalently bonded molecule pair) with alower conductance value, as reported before for other molecules. We have studied thedouble peak structure as a function of time and found that initially (first two thousandtraces), the peak at low conductance values is not that prominent. In subsequent mea-surements, it starts appearing but there is no substantial increase in its appearance forthe next 10000 traces; the bias voltage also does not have a clear influence on its forma-tion. Additional data are presented in Appendix 5.A.3.
5.3. BORON SUBSTITUTED CURCUMINOID
Figure 5.4: a) 1D-conductance histograms of selected traces of five different samples containing MeS-CCM-BF2 measured at a bias voltage of 0.2 V. b) Series of measurements on one device with MeS-BF2-CCM fordifferent bias voltages; the voltages are indicated in the figure. Light blue shaded areas represent fits of twolog-normal distributions to the data in the region which the molecular features are seen. Black dashed linesdepict the individual log-normal distributions. The values of the fit are displayed in Table 5.2.
We have investigated in further detail the double-peak structure in the conductancedistribution of MeS-CCM-BF2. Several samples were measured and the applied bias volt-age across the junction was varied. In Fig. 5.4 a) the conductance histograms of five dif-ferent samples are displayed; these measurements were carried out using a bias voltageof 0.2 V as at this voltage the double-peak structure is clearer in most of the cases. Impor-

5.3. BORON SUBSTITUTED CURCUMINOID
5
79
tantly, all samples show the double-peak structure although the relative weight of bothpeaks varies from sample to sample. In fitting the data we used an automatized routinein which a window along the conductance axis was defined to optimize the fitting, i.e.,by making the fits less sensitive to the tails at the low conductance side. The best fitswere found as a result of minimizing the error between the fit function and the data. Wenote, however, that by changing the window slightly, the area below the peaks and thusthe FWHM can change considerably. On the other hand, the peak conductance valuesremain approximately the same.
Figure 5.4 b) displays an example of the evolution of the peak structure as the biasvoltage varies from 50 to 300 mV. Interestingly, the appearance of the high-conductancepeak becomes more prominent as the bias voltage increases. This characteristic mayhint at a relation between the dipolar nature of the molecule and its conductance dis-tribution. Although a similar behavior was observed in two other samples, the overalltrend among all 6 samples was less clear.
Figure 5.5: Examples of individual breaking traces of MeS-CCM-BF2 in which switching events are observed.Traces are measured at a bias voltage of 0.1 V and an electrode speed of 4 nm/s. Traces switch up and downregardless of the distance. The average high- and low-conductance values of MeS-CCM-BF2from Table 5.1arehighlighted by the red and green dashed lines respectively. The traces have been offset in the x-direction forclarity.
Examination of individual breaking traces (see Fig. 5.5 for representative ones) re-veals that within a single trace the conductance can switch back and forth between val-ues that are consistent with the two conductance values obtained from the fitting proce-dure. We have studied this switching behaviour in more detail by varying the electrodespeed or by taking time traces at a particular electrode separation distance. In manycases, we find a switching between two conductance states. The time traces show thatthe time constant for the switching can vary over various order of magnitude from a fewms to 10 s or even more. In Appendix 5.A.4 representative individual traces are shown. In

5
805. SINGLE-MOLECULE MEASUREMENT ON CURCUMINOID COMPOUNDS: B AND CU
SUBSTITUTION
contrast, the breaking traces of molecules with the thiocarbamate show only step downswitching events; the conductance then never returns to the original value (see Fig. 5.9in Appendix 5.A.4).
5.4. DISCUSSIONIn summary, we have shown than curcuminoid compounds attached to gold electrodesform stable electrode-molecule-electrode connections when using methyl sulfide andthiocarbamate groups. The later anchoring moiety has proven to effectively couple themolecular backbone to the electrodes, producing long molecular traces in the conduc-tance experiments and giving rise to conductance values comparable to those of thiolconnected OPE3. Nevertheless, thiocarbamate anchors also produce broad conduc-tance peaks and the breaking behavior often goes through lower conductance state be-fore loose contact. This may indicate the formation of another molecular conformationrelated to the change to a different anchoring configuration as the molecule is stretched.
On the other hand, measurements on MeS-CCM-BF2 showed two conductance statesthat switch from one to the other in a random fashion on different time scales as seen inthe individual time and breaking traces. Although the trend was not clear in all the fivemeasured samples, the bias dependent relative peak weight favors the high conductancestate, the higher the bias voltage.
It is important to stress that the ratio between the two conductance values of MeS-CCM-BF2 varies from sample to sample and that it is not exactly two as expected wheneither one or two molecules bridge the gap [20–22]. In addition, previous reported two-states conductance features have been linked to different anchoring positions in themolecule [23, 24] or to rectification behavior [6, 7]. These scenarios can be disregardedin our measurements as the former one would yield plateaus of different lengths for eachconductance state (which is not observed) and the later one needs an asymmetry in themolecular structure (which is not the case). The testing of different anchoring groupsand modifications to the curcuminoid backbone point allows to conclude that the an-choring group itself does not give rise to the double peak structure seen in MeS-CCM-BF2 and that it can not be purely related to anchoring configurations as in other cases[25–28].
5.5. CONCLUSIONScurcuminoid compounds form stable single-molecule junctions with the three differentanchoring moieties studied in this junction; the highest conductance is found for a BF2
substituted and thiocarbamate ended curcuminoid. When a boron di-fluoride groupis incorporated to the central part of the molecule the conductance across it increasescompared to the molecule with the corresponding free ligand.
The combination of MeS- end group and boron difluoride inclusion in the curcumi-noid backbone gives rise to conductance traces with a bi-stable conductance state inde-pendently of the inter electrode displacement; switching time constants vary from abouta few ms to 10 s or more. The nature of the switching mechanism remains unknown, butvarious possibles mechanisms have been discarded, namely: diode behavior, the pres-ence of more than one molecule in the junction and conformational changes connected

REFERENCES
5
81
to additional anchoring sites.After completion of this chapter quantum chemistry calculations became available
that provide insights to the switching mechanism and the conducatnce bistability.2 Theseshow that MeS-CCM-BF2can display two distinct conformers when contacted by elec-trodes inside a junction. These configurations only differ in the relative orientation ofone of the MeS- groups with respect to the plane of the backbone (phenyl rings). This dif-ference is enough to radically change the magnitude and direction of molecular dipolemoment. Importantly, the two conformers have different conductance values and thechange in dipole moment may explain the relative electric-field dependent occurrenceof the two states. This mechanism has not been described previously in the contextof single-molecule electronics and may provide a novel pathway to design molecularswitches.
REFERENCES[1] Z. Huang, F. Chen, P. A. Bennett, and N. Tao, Single molecule junctions formed
via Au-thiol contact: Stability and breakdown mechanism, Journal of the AmericanChemical Society 129, 13225 (2007).
[2] R. Frisenda, S. Tarkuç, E. Galán, M. L. Perrin, R. Eelkema, F. C. Grozema, and H. S. J.van der Zant, Electrical properties and mechanical stability of anchoring groups forsingle-molecule electronics, Beilstein Journal of Nanotechnology 6, 1558 (2015).
[3] F. Chen, X. Li, J. Hihath, Z. Huang, and N. Tao, Effect of anchoring groups on single-molecule conductance: Comparative study of thiol-, amine-, and carboxylic-acid-terminated molecules, Journal of the American Chemical Society 128, 15874 (2006).
[4] X. D. Cui, A. Primak, X. Zarate, J. Tomfohr, O. F. Sankey, A. L. Moore, T. A. Moore,D. Gust, G. Harris, and S. M. Lindsay, Reproducible measurement of single-moleculeconductivity, Science 294, 571 (2001).
[5] M. Elbing, R. Ochs, M. Koentopp, M. Fischer, C. von Hänisch, F. Weigend, F. Evers,H. B. Weber, and M. Mayor, A single-molecule diode, Proceedings of the NationalAcademy of Sciences 102, 8815 (2005).
[6] I. Díez-Pérez, J. Hihath, Y. Lee, L. Yu, L. Adamska, M. A. Kozhushner, I. I. Oleynik,and N. Tao, Rectification and stability of a single molecular diode with controlledorientation, Nature Chemistry 1, 635 (2009).
[7] E. Lörtscher, B. Gotsmann, Y. Lee, L. Yu, C. Rettner, and H. Riel, Transport propertiesof a single-molecule diode, ACS Nano 6, 4931 (2012).
[8] M. L. Perrin, E. Galan, R. Eelkema, J. M. Thijssen, F. Grozema, and H. S. J. van derZant, A gate-tunable single-molecule diode, Nanoscale 8, 8919 (2016).
2Calculations performed by Eliseo Ruiz at the Departament de Química Inorgànica i Orgànica, Universitat deBarcelona, Barcelona, Spain

5
82 REFERENCES
[9] Z. F. Liu, S. Wei, H. Yoon, O. Adak, I. Ponce, Y. Jiang, W. D. Jang, L. M. Campos,L. Venkataraman, and J. B. Neaton, Control of single-molecule junction conductanceof porphyrins via a transition-metal center, Nano Letters 14, 5365 (2014).
[10] J. Ponce, C. R. Arroyo, S. Tatay, R. Frisenda, P. Gaviña, D. Aravena, E. Ruiz, H. S. J.van der Zant, and E. Coronado, Effect of metal complexation on the conductanceof single-molecular wires measured at room temperature, Journal of the AmericanChemical Society 136, 8314 (2014).
[11] C. Lefter, V. Davesne, L. Salmon, G. Molnár, P. Demont, A. Rotaru, and A. Boussek-sou, Charge transport and electrical properties of spin crossover materials: Towardsnanoelectronic and spintronic devices, Magnetochemistry 2, 18 (2016).
[12] E. C. Constable, G. Baum, E. Bill, R. Dyson, R. van Eldik, D. Fenske, S. Kaderli,D. Morris, A. Neubrand, M. Neuburger, D. R. Smith, K. Wieghardt, M. Zehnder, andA. D. Zuberbühler, Control of iron(ii) spin states in 2,2':6',2''-terpyridine complexesthrough ligand substitution, Chemistry – A European Journal 5, 498 (1999).
[13] N. Amdursky, D. Marchak, L. Sepunaru, I. Pecht, M. Sheves, and D. Cahen, Elec-tronic transport via proteins, Advanced Materials 26, 7142 (2014).
[14] A. Etcheverry-Berríos, I. Olavarría, M. L. Perrin, R. Díaz-Torres, D. Jullian, I. Ponce,J. H. Zagal, J. Pavez, S. O. Vásquez, H. S. J. van der Zant, D. Dulic, N. Aliaga-Alcalde, and M. Soler, Multiscale Approach to the Study of the Electronic Proper-ties of Two Thiophene Curcuminoid Molecules, Chemistry - A European Journal 22,12808 (2016).
[15] M. Menelaou, F. Ouharrou, L. Rodríguez, O. Roubeau, S. J. Teat, and N. Aliaga-Alcalde, DyIII- and YbIII-curcuminoid compounds: Original fluorescent single-ionmagnet and magnetic near-ir luminescent species, Chemistry – A European Journal18, 11545 (2012).
[16] Y. Mawani and C. Orvig, Improved separation of the curcuminoids, syntheses of theirrare earth complexes, and studies of potential antiosteoporotic activity, Journal of In-organic Biochemistry 132, 52 (2014), special Issue Containing Contributions fromthe Third Latin American Meeting on Biological Inorganic Chemistry - LABIC 2012.
[17] L. Nardo, A. Andreoni, M. Bondani, M. Másson, T. Haukvik, and H. H. Tønnesen,Studies on curcumin and curcuminoids. xlvi. photophysical properties of dimethoxy-curcumin and bis-dehydroxycurcumin, Journal of Fluorescence 22, 597 (2012).
[18] C. A. Martin, J. M. van Ruitenbeek, and H. S. J. van der Zant, Sandwich-type gatedmechanical break junctions, Nanotechnology 21, 265201 (2010).
[19] N. Agraıt, A. L. Yeyati, and J. M. van Ruitenbeek, Quantum properties of atomic-sized conductors, Physics Reports 377, 81 (2003).
[20] B. Xu and N. J. Tao, Measurement of single-molecule resistance by repeated formationof molecular junctions, Science 301, 1221 (2003).

REFERENCES
5
83
[21] Y. Zang, A. Pinkard, Z.-F. Liu, J. B. Neaton, M. L. Steigerwald, X. Roy, andL. Venkataraman, Electronically transparent au–n bonds for molecular junctions,Journal of the American Chemical Society 139, 14845 (2017).
[22] B. Capozzi, J. Z. Low, J. Xia, Z.-F. Liu, J. B. Neaton, L. M. Campos, and L. Venkatara-man, Mapping the transmission functions of single-molecule junctions, Nano Let-ters 16, 3949 (2016).
[23] T. A. Su, J. R. Widawsky, H. Li, R. S. Klausen, J. L. Leighton, M. L. Steigerwald,L. Venkataraman, and C. Nuckolls, Silicon ring strain creates high-conductancepathways in single—molecule circuits, Journal of the American Chemical Society135, 18331 (2013).
[24] D. Miguel, L. Álvarez de Cienfuegos, A. Martín-Lasanta, S. P. Morcillo, L. A. Zotti,E. Leary, M. Bürkle, Y. Asai, R. Jurado, D. J. Cárdenas, G. Rubio-Bollinger, N. Agraït,J. M. Cuerva, and M. T. González, Toward multiple conductance pathways withheterocycle-based oligo(phenyleneethynylene) derivatives, Journal of the AmericanChemical Society 137, 13818 (2015).
[25] S. Y. Quek, M. Kamenetska, M. L. Steigerwald, H. J. Choi, S. G. Louie, M. S. Hybert-sen, J. Neaton, and L. Venkataraman, Mechanically controlled binary conductanceswitching of a single-molecule junction, Nature Nanotechnology 4, 230 (2009).
[26] T. A. Su, H. Li, V. Zhang, M. Neupane, A. Batra, R. S. Klausen, B. Kumar, M. L. Steiger-wald, L. Venkataraman, and C. Nuckolls, Single-molecule conductance in atomi-cally precise germanium wires, Journal of the American Chemical Society 137, 12400(2015).
[27] T. A. Su, H. Li, M. L. Steigerwald, L. Venkataraman, and C. Nuckolls, Stereoelectronicswitching in single-molecule junctions, Nature Chemistry 7, 215 (2015).
[28] M. Kamenetska, S. Y. Quek, A. C. Whalley, M. L. Steigerwald, H. J. Choi, S. G. Louie,C. Nuckolls, M. S. Hybertsen, J. B. Neaton, and L. Venkataraman, Conductanceand geometry of pyridine-linked single-molecule junctions, Journal of the AmericanChemical Society 132, 6817 (2010).

5
84 REFERENCES
5.A. APPENDICES
5.A.1. ADDITIONAL HISTOGRAMS AND FILTERING PROCEDURES
In this appendix we explain in more detail the filtering method employed to determinethe junction-formation yield and to select the traces that make up the one-dimensionalconductance histograms that were used to obtain the conductance values listed in thetables.
10 -6
10 -4
10 -2
100
0 1 2
10 -6
10 -4
10 -2
100
0 1 2
10 -6
10 -4
10 -2
100
Con
duct
ance
(G0)
Electrode displacement (nm)
a) MeS-CCM b) MeS-CCM-BF2
d) S-CCM-BF2
f ) Thph-CCM-BF2
c) S-CCM
e) MeS-CCM-Cu
Figure 5.6: Filtered 2D-conductance vs. displacement histograms corresponding to the measurements dis-played in Fig. 5.2. The window of displacement used for the selection was ∆x=0.5 nm and the threshold slopemthrs=0.5 decades per nm.
The filtering method is based on determining the decay rate of the conductance asa function of electrode displacement to distinguish between empty traces and those inwhich molecules bridge the electrodes. Note that the procedure is performed on thepart of the traces after breaking of the metallic contact. There are two parameters that

5.A. APPENDICES
5
85
define the filtering procedure: the displacement window (∆x) and the threshold decayrate (mthrs). The procedure is as follows:
• A trace is compressed to the resolution of the 2D-conductance vs. displacementhistogram (80 points per decade in conductance and 75 points per nm); this isdone to avoid too much sensitivity to large conductance variations and it allowsspeeding up the analysis. When performing the analysis with the non-compresseddata sets as a check, the results were found to be very similar.
• For every window of displacement ∆x nanometer long, a linear fit to the data inlog10(G) format is performed. The obtained slope m is defined as the decay rateof that trace in that window. The decay rate has units of decades/nm; a decayrate of m =−1, thus, means that, on average, the conductance decays by an orderof magnitude per nanometer. A horizontal line corresponds to m = 0 and m = 1means an average upturn of the conductance by one order of magnitude per nmfor increasing displacement.
• For each trace the maximum value of mmax along the whole breaking trace is deter-mined by evaluating m at each point (positive displacements only) and comparedwith the threshold mthrs. If mmax > mthrs the trace is labelled as a molecular trace.
In Fig. 5.6 we display the 2D-conductance vs. displacement histograms of the se-lected data from the same data sets as shown in Fig. 5.2. In these histograms, the con-tribution of the empty traces has been deleted so that the molecular features show upmore clearly. As these data sets contain molecular features only, they are used in the 1Dhistograms to determine the value of the conductance peaks and their FWHM. We, how-ever, generally find that values obtained from fitting the unfiltered data sets are close tothe ones obtained from the filtered ones. As explained above, the filtering method alsodefines the yield of junction formation; for the measurements in Fig. 5.6 the yields are:51% for MeS-CCM, 64% for MeS-CCM-BF2, 39.7 % for S-CCM, 26.7 % for S-CCM-BF2,91% for MeS-CCM-Cu and 26% for Thph-CCM-BF2.
5.A.2. FITTING METHODFor filtered and unfiltered 1D-conductance histograms we use a log-normal distributionN (x) to fit the data given by the following equation:
N (x) = A∗exp(− ( (x −Gm)
(0.6005615×FWHM)
)2), (5.1)
where x is expressed in log10 of G , A is the height of the peak, FWHM the full width halfmaximum and Gm the logarithm of the most probable conductance value. In the case offitting two peaks, two of such curves are used with different Gm . We note that in fittingthe data with two log-normal distributions, more than one combination of parameterscan yield visually good fits to the data. As mentioned already in the main text, the mostprobable conductance varies little when changing the initial guess of the parameters orthe fitting window, but the height and width of the two peaks can vary considerably; thestatistical weight of the peaks can thus change significantly.

5
86 REFERENCES
5.A.3. FIT PARAMETERS MES-BF2-CCM AND TIME TRACES
In this subsection, we list the parameters of the fits shown in Fig. 5.4 of the main text. InTable 5.2, the values at 0.2 V are presented belonging to five different samples and in Ta-ble 5.3 the values for sample A at five different bias voltages are listed. When comparingthe different samples, the high-conductance values vary between 1.1 and 1.7×10⁻⁴ G0,while the low-conductance values vary between 2.5 and 4.3×10⁻⁴ G0; the ratio is aboutfour in all cases. When changing the bias voltage, the high-conductance peak shifts tohigher values whereas the low-conductance peak remains more or less constant. Corre-spondingly, the ratio between the two increases when a higher bias voltage is applied.
sample GH (G0) FWHM GL (G0) FWHM GH/GL
A 1.2×10⁻⁴ 0.5 3.4×10⁻⁵ 0.8 3.5B 1.7×10⁻⁴ 0.4 4.3×10⁻⁵ 1.5 3.9C 1.1×10⁻⁴ 1.0 2.5×10⁻⁵ 0.6 4.4D 1.5×10⁻⁴ 0.3 3.9×10⁻⁵ 1.3 3.8E 1.7×10⁻⁴ 0.4 4.3×10⁻⁵ 1.5 4.0
Table 5.2: Fit parameters of the high ( GH) and low ( GL) conductance peaks and their respective FWHM asdisplayed in Fig. 5.4 a). The last column lists the ratio between the mean conductance values of the two log-normal distributions.
V (V) GH (G0) FWHM GL (G0) FWHM GH/GL
0.05 9.3×10⁻⁵ 0.4 3.5×10⁻⁵ 0.8 2.70.1 1.3×10⁻⁴ 0.3 5.1×10⁻⁵ 0.7 2.50.2 1.2×10⁻⁴ 0.5 3.4×10⁻⁵ 0.8 3.50.25 1.3×10⁻⁴ 0.5 3.5×10⁻⁵ 0.8 3.70.3 1.5×10⁻⁴ 0.7 4.1×10⁻⁵ 0.9 3.6
Table 5.3: Applied bias voltage (first column), high (GH) and the low (GL) conductance values and the respec-tive FWHM of the measurements displayed in Fig. 5.4 b) corresponding to sample A in Fig. 5.4 a). The lastcolumn lists the ratio between the mean conductance values of the two log-normal distributions.
To illustrate the intrinsic switching behavior of MeS-CCM-BF2 in Fig.5.7 we displaytime traces in which the conductance was monitored as a function of times: the first3 s the electrodes were put at a prefixed distance (typically 0.15 nm) to which the snap-back distance has to be added; for the next 3 s the electrode spacing was reduced by0.15 nm, after which the electrodes were placed at the original position. After 9 s, theelectrodes were moved apart to break the molecular junctions (the red line in the up-per panel of Fig. 5.7 illustrates this procedure). This procedure was used to ensure thatthe conductance monitored during the time trace has a molecular origin and is not dueto tunnelling across a barrier. In the latter case, the conductance would drop upon anincrease in electrode displacements, while, if a molecule is trapped, the conductanceplateau will be hardly affected by the displacement.

5.A. APPENDICES
5
87
The three bottom panels of Fig. 5.7 show typical time traces in which switching eventsare observed at different time scales. Note that there is no relation with the change of theelectrode displacement as anticipated. Both, the high G and low G states, are observedto be stable on the time scale of seconds, but the switching event between the two canalso occur on the millisecond time scale, e.g., the fast switching in the middle curve andin the last 2 s of the upper curve. We, thus, conclude that MeS-CCM-BF2 can sponta-neously jump from one state to another independently of the exact separation betweenthe electrodes on time scales varying between a few ms to seconds. This observationshows that next to the electric field, geometrical considerations also play a role in de-termining which conductance state prevails. This is in line with the finding that at thelowest bias both conductance states can be found; apparently, geometrical constraintscan favour one over the other. The data do show that for high electrical fields the high-conductance state is the dominant one .
Figure 5.7: Examples of time traces of MeS-CCM-BF2. Top: electrode displacement as a function of time whilethe conductance is measured. Bottom three panels: examples of time traces in which switching events areobserved at different time scales. The thin red and green lines represent the average conductance of the highand low conductance state of this molecule. The bias voltage across the junction is 0.2 V.

5
88 REFERENCES
5.A.4. ADDITIONAL MEASUREMENTS ON THE MOLECULES WITH THIOCAR-BAMATE ANCHORING (S-CCM AND S-CCM-BF2)
b) S-CCM-BF2
10-6 10-4 10-2 100
Conductance (G0)
0
1
2
3
4
26.7 %
19.3 %
18.6 %
22.8 %
24.4 %
21.9 %
34.1 %
37.5 %
a) S-CCM
10-6 10-4 10-2 1000
1
2
3
4
Conductance (G0)
Coun
ts (a
.u.)
Coun
ts (a
.u.)
time
49.5 %
41.1 %
44.2 %
51.7 %
33.4 %
46.4 %
time
Figure 5.8: Series of normalized 1D-conductance histograms of data selected from series of 2000 consecutivetraces measured at a bias voltage of 0.1 V and one after another. The percentage above each line displays thecorresponding yield of junction formation. In a), the target molecule is S-CCM and in b), S-CCM-BF2. Thehistograms have been offset in the y-direction for clarity.
As the thiocarbamate group is not commonly used as an anchoring moiety in single-molecule electronics, we have performed additional measurements with the moleculescontaining this group. The advantage of this group is that it may cleave spontaneouslyin the presence of atomically sharp gold electrodes giving rise to a S-Au covalent bondanalogous to the case of acetyl-protected thiol moiety (AcS) when a de-protecting agentis added to the solution. We have not used a de-protecting agent in the measurementreported here.
In Fig. 5.3 we show one-dimensional histograms of S-CCM (left panel) and S-CCM-BF2 (right panel); in these plots the histograms are normalized meaning that the peakheight of the molecular conductance feature is set to one. Each measurement is builtup from selected traces obtained from data sets containing 2000 consecutive traces andthis two-hour measurement is repeated 6 times for the molecule with the free ligand(S-CCM) and 8 times for the molecule with the BF2 substituent. In all cases, the his-tograms show a very distinct peak at 1 G0, indicating the formation of clean and atomi-cally sharp electrodes before the final breaking. The percentages listed above each curveindicate the yield of junction formation. As one can see, the yields do not systemati-cally change as a function of time and vary between 20 and 50%. More importantly, thehistograms show that after some time a low-conductance peak develops in both cases.For S-CCM, the trend continues for six data sets and, at the end, the low-conductancepeak is more prominent than the high-conductance one. For S-CCM-BF2, only the first

5.A. APPENDICES
5
89
Figure 5.9: Examples of individual breaking traces of S-CCM-BF2 in which the conductance switches to a lowconductance value at the end of the high-conductance plateau. There are only step-down events in conduc-tance as the inter electrode distance increase. The traces have been offset in the x-direction for clarity. Dashedlines are guides to the eye, representing the average conductance values of a double peaked structure in theconductance histograms.
measurement (i.e. the one at the bottom) show this change; for the remaining six curvesthere is no clear trend in this respect. Inspection of the 2D-histograms show that the low-conductance peak appears for large separation; individual traces displayed in Fig. 5.9confirm this picture. In this figure, the dashed lines indicate the mean values of the twoconductance states and, clearly, the low-conductance state is only accessed at large sep-aration, unlike the situation for MeS-CCM-BF2 as discussed in the main text.
We, thus, conclude that the cleavage of the carbamate unit between the moleculesand the gold electrodes can proceed without the addition of de-protecting agents. Thelow-conductance counts for extended electrode spacing may indicate the presence ofπ−π stacking or dimerization, although as a function of time, their formation stabilizesin the case of the boron substituted compound.
5.A.5. ADDITIONAL MEASUREMENTS ON THE COPPER DERIVATIVEWe studied in more detail the bias dependence and the reproducibility of the measure-ment of MeS-CCM-Cu. Ten different samples were measured; the results of five of themare shown here. The results in the main text are of those of sample E in the list. Fig. 5.10shows the 1D histograms of five different samples (left panel) and for sample E, four dif-ferent bias voltages. Except for sample A, the measurements show little variation of theconductance with bias voltage and a high reproducibility. A common feature of the mea-surements is that this molecule shows a high yield of junction formation (above 60% andgenerally above 70%). The fact that MeS-CCM-Cu is a charged molecule may play a rolein the high yield of junction formation for this derivative.

5
90 REFERENCES
10-6
10-4
10-2
100
0.05 V
0.1 V
0.2 V
0.3 V
Conductance (G0)
Coun
ts (a
.u.)
10-6
10-4
10-2
100
Conductance (G0)
Coun
ts (a
.u.)
sample A
sample B
sample C
sample D
sample E
b)a)
Figure 5.10: a) Series of conductance histograms of MeS-Cu-CCM corresponding to five different samples mea-sured using a bias voltage of 0.1 V. b)Series of conductance histograms of measurements on the MeS-Cu-CCMcompound (sample E) for different bias voltage; the light blue shaded areas correspond to log-normal distri-bution fits. The obtained parameters are shown in Table 5.4.
Sample V (V) G (G0) FWHM
A 0.1 9.2×10⁻⁵ 1.1B 0.1 5.2×10⁻⁵ 1.2C 0.1 4.1×10⁻⁵ 1.0D 0.1 5.5×10⁻⁵ 1.0E 0.05 5.4×10⁻⁵ 1.1E 0.1 5.7×10⁻⁵ 1.1E 0.2 5.0×10⁻⁵ 1.1E 0.3 4.8×10⁻⁵ 1.1
Table 5.4: Mean conductance value and FWHM obtained by fitting a log-normal distribution to the measure-ments on MeS-Cu-CCM displayed in Fig. 5.10.
5.A.6. MEASUREMENT ON CU-CURCUMINOIDS WITH A DOUBLE BACKBONETo test that the double-peak structure is not due to the in-situ formation of a new moleculecontaining two ligands, additional measurements on three samples have been performedusing a compound holding two backbones attached to the same central part, mimickingthis situation. We found that such a molecule with the B atom is not stable enough butwith Cu incorporation such a molecule could be synthesized. The molecule is shown inFig. 5.11 c) and here we present the conductance measurements on this molecule for onesample; the same conditions were used as for the other molecules shown in this chapter.
Fig. 5.11 a) shows a series of 1D-histogram constructed from selected traces out of

5.A. APPENDICES
5
91
10-6
10-4
10-2
100
0.05 V
0.1 V
0.15 V
0.2 V
0.25 V
0.3 V
Conductance (G0)
Coun
ts (a
.u.)
Electrode displacement (nm)
10
0 1 2 3 4
-6
10-4
10-2
100
Cond
ucta
nce
(G0)
a) b)
c) Cu-(MeS-CCM)2 (7)
Figure 5.11: a)Series of conductance histograms of measurements on the 2(MeS-Cu)-CCM compound for dif-ferent bias voltage; the light blue shaded areas correspond to log-normal distribution fits. The obtained pa-rameters are shown in Table 5.5. b) 2D-conductance vs. displacement histogram of a representative sampleof 2(MeS-Cu)-CCM constructed from 2000 consecutives traces measured at a bias voltage of 0.1 V/s and anelectrode speed of 2.5 nm/s. c) Drawing of Cu(MeS-CCM)2’s structure. The estimated S to S distance in thesame backbone is 1.7 nm, while this distance is 2.2 nm for two sulphur atoms in different back bones.
2000 consecutive traces at different bias voltages. A remarkable feature is the nearly in-dependent position of the molecular conductance peak. The conductance values andFWHM of those measurements are listed in Table 5.5. These values and the ones listedfor MeS-CCM-Cu(Table 5.4) appear to be very similar. This indicates that the conduc-tance peak of Cu-(CCM-MeS)2 comes from a configuration in which one branch is con-nected to both electrodes so that the current is mainly flowing through only one of thebackbones.
A closer inspection of the the 2D-conductance vs. displacement histogram displayedin Fig. 5.11 indicates the presence of molecular features at low conductance values (around10−6 G0) that extend up to 3 nm. This distance is larger than that of a single curcuminoidbackbone; possibly conduction through the Cu atom with a current pathway going fromone backbone to the other, contributing to this feature in the data. Nevertheless, for thelargest distances, the molecular lengths are too short to support a picture and it is likelythat molecule-molecule interactions play a role. We further note that we have observedsimilar behaviour in two other junctions; the main conductance peak in these junctionsappeared at 3.6×10⁻⁵ and 6.5×10⁻⁵ G0, respectively.

5
92 REFERENCES
V (V) G (G0) FWHM
0.05 5.5×10⁻⁵ 1.00.1 5.6×10⁻⁵ 1.00.15 5.2×10⁻⁵ 1.10.2 5.3×10⁻⁵ 1.00.25 5.6×10⁻⁵ 1.00.3 5.5×10⁻⁵ 1.1
Table 5.5: Mean conductance value and FWHM obtained by fitting a log-normal distribution to the 1D-histograms of Cu(MeS-CCM)2 displayed in Fig. 5.11.
5.A.7. CURCUMINOID-LIKE MOLECULES: DIBENZOYLMETHANE DERIVATIVESTo confirm that the combination of a SMe anchoring group and a BF2 substitution inthese derivatives give rise to a double peak structure in the conductance histograms, ad-ditional measurements were performed on a shorter system that resembles the structureof the curcuminoids. Fig. 5.12 displays the two dibenzoylmethane derivatives studiedMeS-dbm and MeS-dbm-BF2 which are the shorter analogues of MeS-CCM and MeS-CCM-BF2, respectively. The difference between the two sets of molecules is the armlength of the molecule that connects the central part with the outer phenyl rings. Thedistance between the sulfur atoms in the shorter molecules is about 1.3 nm, while forthe the longer curcuminoids it is around 1.9 nm. We have measured in detail two sam-ples for each compound at different bias voltages and two different electrode speeds.
O
S SCH3 CH3
OH
F F
OB
S SCH3 CH3
O
MeS-dbm (8) MeS-dbm-BF2 (9)
Figure 5.12: Drawings of the short versions of the curcuminoid-like derivatives with a) the free ligand mimick-ing the structure of MeS-CCM and b) the boron difluorine substituted compound analogous to MeS-CCM-BF2.The sulphur to sulphur distance of MeS-dbm-BF2is 1.32 nm as obtained from X-ray diffraction measurementsand the one for MeS-dbmis assumed to be similar.
Four 2D-conductance vs. electrode displacement histograms of the shorter com-pounds are displayed in Fig. 5.13: On the left hand side MeS-dbm and on the right handside MeS-dbm-BF2, both at two different bias and electrodes speed. Before describingand discussing the results in more detail, it is worth making some general remarks: thelength of the molecular features in the top panels (fast measurements) is about 0.5 nmshorter than those of the curcuminoids analogues shown in Fig. 5.2. This difference isin good agreement with the molecular length difference between the two compounds.Furthermore, the molecular conductance features are observed at higher values in com-parison with the longer curcuminoids which is expected for shorter molecules. Overall

5.A. APPENDICES
5
93
the data shows remarkable similarities with those of the longer curcuminoids; impor-tantly, the double-peak structure of the curcuminoid molecule with the BF2 substituentis reproduced. We will now discuss the two short molecules in more detail, starting withthe bare-ligand one.
10-6
10-4
10-2
100
Electrode displacement (nm)
10-6
10-4
10-2
100
Cond
ucta
nce
(G0)
0 01 12 2 3
a) MeS-dbm
c) d)
b) MeS-dbm-BF2
Figure 5.13: 2D conductance vs. displacement histograms of a) and c) MeS-dbm ; b) and d) MeS-dbm-BF2 con-structed from 2000 consecutives traces measured at 50 mV in a), 25 mV in b) and 0.25 V in c) and d). Theexperiments were performed in ambient conditions and with an electrode speed of 3 nm/s in a) and b); and0.3 nm/s in c), d).
MEASUREMENTS ON MES-DBM
In fig. 5.13 a) the two-dimensional of MeS-dbm shows a less steep slope for the tracesin which the conductance exponentially drops to the noise level. This is also observedfor the longer analogue (MeS-CCM) in Fig. 5.2 a). The shallower slope of the exponentialdecay in these cases may be caused by a smaller work function (inspection of the lengthof the 1 G0 peak shows that it cannot be attributed to an error in the calibration). Itshould be noted that the bare-ligand molecules with the other anchoring groups do notshow this extended tunnelling-like behaviour. The reason is not known but a possibilitycould be that the bare-ligand molecules with this anchoring group form a rather denselayer while being flat on the Au surface, thereby, altering the work function.

5
94 REFERENCES
Importantly, these longer features in the measurements for this compound makethe filtering method less effective in distinguishing molecular traces from empty ones.Therefore, all further analysis on this molecule was performed on the full data sets. Ingeneral, we found that at the electrode speeds used for the longer curcuminoids (3 nm/s),the conductance peaks in the 1 and 2D histograms were not clearly visible. We foundthat by reducing this speed by about a factor of 10, makes the molecular features moreprominent. In addition, we found that by increasing the bias voltage, the conductancepeaks become more prominent. Fig. 5.13 a) and c) show this for the 2D histograms whilefig. 5.14 illustrates this for the 1D conductance histograms for the two samples studied.
The molecular features are more prominent in the slow breaking experiments andpeaks are observed around 2×10⁻⁴ G0. The background counts at low conductance val-ues make the estimation of the most probable molecular conductance less accurate withrespect to the estimates on the filtered data for the other compounds. The exception maybe the high-bias measurements in Fig. 5.14 in which the conductance peaks appear tobe sharper. Nevertheless, we have extracted the values of the mean conductance andthe FWHM of the corresponding peaks from fitting the data to a log-normal distribution(blue shaded areas in Fig. 5.14). The values are listed in table 5.6; the values for the dif-ferent bias voltages are remarkably consistent. We find that the most probable conduc-tance for this compound is about three times larger than that of the longer curcuminoidanalogue (MeS-CCM).
Conductance (G0)
Coun
ts (a
.u.)
10-6 10-4 10-2 100
0.1 V
0.15 V
0.2 V
0.25 V
0.05 V
Conductance (G0)10-6 10-4 10-2 100
0.1 V
0.15 V
0.2 V
0.25 V
0.05 Vsample A sample B
Figure 5.14: a) Series of un-filtered 1D-histograms measured at different bias voltages of MeS-dbm and at0.3 nm/s for two different samples.
There is one more characteristic of the 1D histograms on this molecule that deservesa closer look, namely the broad peak at low conductance values that is visible mainly

5.A. APPENDICES
5
95
sample V (V) G (G0) FWHM
A 0.05 1.2×10⁻⁴ 1.2A 0.1 1.3×10⁻⁴ 1.4A 0.15 1.2×10⁻⁴ 1.3A 0.2 1.4×10⁻⁴ 1.1A 0.25 1.3×10⁻⁴ 1.0
B 0.05 1.3×10⁻⁴ 1.3B 0.1 1.8×10⁻⁴ 1.7B 0.15 1.8×10⁻⁴ 1.3B 0.2 1.8×10⁻⁴ 1.2B 0.25 1.8×10⁻⁴ 1.0
Table 5.6: Mean conductance values and FWHM of MeS-dbm obtained by fitting a log-normal distribution tothe data in the 1D-histograms displayed in Fig. 5.14.
at high bias voltages (especially at at 0.25 V for both samples). As mention before, thelong features in this measurement made the filter used in the curcuminoids ineffective.We, therefore, performed a different kind of filtering method, in which traces with a highnumber of counts in a particular region of interest compared to those that exhibit theaverage frequency of counts in that region, are selected. For example, in Fig. 5.15 wesplit the traces of the measurement on sample B at 0.25 V in two groups: the ones thathave at least 1.3 times as much counts as the average distribution in the region between9.4×10−5 and 5.3 ×10⁻⁴ G0; and the ones that do not obey this criterion. Then, 1D and2D conductance histograms are constructed with the traces of each group. The result-ing histograms are displayed in panels b) and c) of fig. 5.15 along with the 2D histogramof the full data set in a). The 2D-histograms show that the selected traces in the high-conductance region display a plateau-like behavior while in the region of low conduc-tance the features are slanted, smoothly reaching the noise level.
In fig. 5.15 d) the three corresponding 1D-conductance histograms are displayed.The choice of the conductance region of interest matches the region where the molecularfeatures are observed, and consequently, the strength of the conductance peak for theselected traces (red curve) is enhanced. In contrast, the 1D-conductance histogram ofthe unselected traces shows no features in the selected high-conductance region whilethe broad peak, at low conductance, is a bit more prominent.
When the same filtering is used to enhance the traces with conductance values in theregion of the broad peak (Fig. 5.16 ), a similar picture emerges: the traces at low conduc-tance values are slanted, but in this case the selected traces (red line in Fig. 5.16 d)) stillshow a small bump at the conductance value of the high conductance state. This meansthat the occurrence of the low-conductance state does not prevent the occurrence of theother state. The curves of the selected traces do indicate, that in addition, there is a sub-stantial amount of traces that either follow the high-conductance peak structure or themore gradual evolution with displacement at low conductance values.

5
96 REFERENCES
Figure 5.15: a) 2D-histogram of sample A (MeS-dbm) measured at a bias voltage of 0.25 V and an electrodespeed of 0.3 nm/s. The black dashed lines mark the region of interest. b)2D-histogram constructed from thetraces in a) that have at least 1.3 times the counts of the total 1D-histogram (blue line in d) in the region de-picted by the yellow shaded area (between 9.4×10⁻⁵ and 5.3 ×10⁻⁴ G0). c) 2D-histogram constructed from thetraces that do not fullfill the condition considered in b). d) 1D-conductance histograms of all (blue), selected(red), and not selected (orange) traces. The yellow shaded area highlights the conductance region of interest.

5.A. APPENDICES
5
97
Figure 5.16: a) 2D-histogram of sample A (MeS-dbm) measured at a bias voltage of 0.25 V and an electrodespeed of 0.3 nm/s. The black dashed lines mark the region of interest. b) 2D-histogram constructed from thetraces that have at least 1.3 times the counts of the total 1D-histogram (blue line in d) in the region depictedby the yellow shaded area (between 6.3×10⁻⁷ and 1.0 ×10⁻⁵ G0). c) 2D-histogram constructed from the tracesthat do not fullfill the condition to be considered in b). d) 1D-conductance histograms of all (blue), selected(red), and not selected (ornage) traces.

5
98 REFERENCES
MEASUREMENTS ON MES-DBM-BF2
We have measured two samples with the MeS-dbm-BF2 compound. In contrast to thefree ligand, we find that the MeS-dbm-BF2 compound shows clear plateaus when itbridges the gap between the electrodes. Although our filtering procedure can effectivelysplit the data in meaningful subsets, we performed all the analysis on the un-filtered datato consistently compare it to the free ligand .
Fig. 5.17 shows the 1D-histograms of two samples at different bias voltages. A sim-ilar fitting procedure as used for the longer curcuminoid analogue was performed; thedashed lines indicate the corresponding two log-normal fits to the data. The double-peak structure is apparent in these samples especially at low bias voltages and shows aclear evolution as the bias voltage increases from 10 mV to 0.25 V. The low-conductancepeaks are consistently broader and, as a consequence, the estimates of the correspond-ing peak conductance may be less accurate. In addition, the fitting is not unique in thesense that depending on the window chosen to fit the data, several combinations of log-normal distributions allow good fits to the data, albeit that the conductance values forthose do not change much (see also discussion in Appendix 5.A.3). Nevertheless, thedata show a clear change in the weight of the two conductance states: at low bias volt-ages both states are present and the peak heights are about the same. By increasingthe bias voltage, the high-conductance peak starts to become more prominent. In bothsamples, this occurs at a bias of 50-100 mV and upon increasing the bias further, thehigh-conductance peak becomes even more prominent, especially in sample B.
Using the fitting procedure mentioned above, we have also extracted the most proba-ble conductance values and the FWHM of the peaks from the data. The values are listedin Table 5.7 and Table 5.8 for the un-filtered and filtered data respectively. For the se-lected data the same criterion is used as for the longer curcuminoids discussed in themain text. Un-filtered and filtered data are presented to facilitate the comparison withthe short free ligand (MeS-dbm) and the longer curcuminoid (MeS-CCM-BF2), respec-tively.
Interestingly, the ratio between the high conductance value of MeS-dbm-BF2 and thecorrelative curcuminoid MeS-CCM-BF2 is about 3.4 (at 0.1 V), which is close to the valuefound when comparing the bare ligands of the corresponding compounds. It is also in-teresting to investigate the ratio between the conductance values of the free ligands andthe BF2 substituted compound for the two classes of molecules: at a bias voltage of 0.1 V,this ratio is 3.1 for the short derivatives and 3.6 for the longer curcuminoids. The ratiobetween the two peak conductance in Table 5.7 fluctuates around a factor of 3.5, a valuethat is slightly higher than the one found for the longer curcuminoid molecule with BF2
substitution (see Tables 5.2, 5.3). Finally, the time traces displayed in Fig. 5.18 again showthat the switching happens while stretching the molecule and that the switches can beboth down and up in conductance, very similar to what has been observed for the longercurcuminoid BF2 substituted molecule. Noteworthy, the conductance values obtainedfrom the unfiltered data are in good agreement with the ones obtained with the filtereddata, but in general the filtered data produces lower FWHM values than the full data sets,thus, giving a more accurate estimation of the most probable conductance value.
In conclusion, the data on MeS-dbm-BF2 show a striking resemblance with those ofMeS-CCM-BF2. This consistency further strengthens the conclusion that the combina-

5.A. APPENDICES
5
99
tion of the SMe anchoring unit and the BF2 substituent are the required ingredients forachieving the observed double-peak structure for these compounds.
Figure 5.17: Series of un-filtered 1D-histograms measured at different bias voltages of MeS-dbm-BF2 recordedat an electrode displacement speed of 3 nm/s. Vertical lines are guides to the eye, marking the average valuesof the conductance peaks obtained from fits at 0.25 V.
10 12Electrode displacement (nm)
10-5
10-4
10-3
10-2
Cond
ucta
nce
(G0)
0 2 4 6 8
Figure 5.18: Series of single breaking traces of MeS-dbm-BF2 measured at a bias voltage of 0.2 V and an elec-trode speed of 0.3 nm/s. Traces have been offset in the x-direction for clarity.

5
100 REFERENCES
Sample V (V) GH (G0) FWHM GL (G0) FWHM GH/GL
A 0.01 3.4×10⁻⁴ 0.4 1.0×10⁻⁴ 1.3 3.2A 0.02 3.6×10⁻⁴ 0.5 1.2×10⁻⁴ 1.4 3.0A 0.05 4.5×10⁻⁴ 0.4 1.1×10⁻⁴ 1.4 4.0A 0.1 4.2×10⁻⁴ 0.7 6.6×10⁻⁵ 0.9 6.4A 0.15 4.1×10⁻⁴ 0.6 8.1×10⁻⁵ 1.5 5.1A 0.2 4.6×10⁻⁴ 0.5 9.8×10⁻⁵ 1.7 4.7A 0.25 4.8×10⁻⁴ 0.8 9.0×10⁻⁵ 2.0 5.3
B 0.01 2.7×10⁻⁴ 0.7 5.8×10⁻⁵ 0.8 4.7B 0.02 3.0×10⁻⁴ 0.2 1.2×10⁻⁴ 1.3 2.6B 0.05 5.7×10⁻⁴ 0.6 1.3×10⁻⁴ 1.6 4.3B 0.1 5.1×10⁻⁴ 0.5 1.1×10⁻⁴ 1.9 4.8B 0.15 5.1×10⁻⁴ 0.7 1.0×10⁻⁴ 1.9 4.9B 0.2 5.2×10⁻⁴ 0.7 1.2×10⁻⁴ 1.9 4.2B 0.25 6.7×10⁻⁴ 0.8 1.2×10⁻⁴ 1.7 5.8
Table 5.7: Fit parameters of high (GH) and low (GL) conductance peaks and their respective FWHM for MeS-dbm-BF2, as displayed in Fig. 5.17 a). The last column shows the ratio between the mean conductance valuesof the two log-normal distributions.
Sample V (V) GH (G0) FWHM GL (G0) FWHM GH/GL
A 0.01 3.4×10⁻⁴ 0.4 1.2×10⁻⁴ 1.2 2.8A 0.02 3.8×10⁻⁴ 0.5 1.4×10⁻⁴ 1.2 2.7A 0.05 4.6×10⁻⁴ 0.4 1.4×10⁻⁴ 1.2 3.3A 0.1 4.6×10⁻⁴ 0.5 1.2×10⁻⁴ 1.4 3.7A 0.15 4.2×10⁻⁴ 0.6 1.0×10⁻⁴ 1.4 4.1A 0.2 4.8×10⁻⁴ 0.5 1.4×10⁻⁴ 1.5 3.5A 0.25 5.3×10⁻⁴ 0.6 1.7×10⁻⁴ 1.5 3.2
B 0.01 3.0×10⁻⁴ 0.4 1.2×10⁻⁴ 1.1 2.4B 0.02 3.4×10⁻⁴ 0.2 1.4×10⁻⁴ 1.1 2.4B 0.05 5.5×10⁻⁴ 0.6 1.5×10⁻⁴ 1.4 3.7B 0.1 5.0×10⁻⁴ 0.5 1.4×10⁻⁴ 1.5 3.5B 0.15 5.0×10⁻⁴ 0.6 1.2×10⁻⁴ 1.7 4.1B 0.2 5.1×10⁻⁴ 0.7 1.5×10⁻⁴ 1.7 3.4B 0.25 7.0×10⁻⁴ 0.8 1.3×10⁻⁴ 1.5 5.4
Table 5.8: Fit parameters of high ( GH) and low ( GL) conductance peaks and their respective FWHM as dis-played in Fig. 5.19 a) considering only the selected molecular traces. The last column shows the ratio betweenthe mean conductance values of the two log-normal distributions.

5.A. APPENDICES
5
101
Figure 5.19: Series of filtered 1D-histograms of MeS-dbm-BF2 measured at different bias voltages and at3 nm/s. Vertical lines are guides to the eye at the average value of the conductance obtained from fits at 0.25 V.


6THE ROLE OF SIDE GROUPS AS
ANCHORING SITES IN
CURCUMINOIDS
Wie weet van het spel van het kind en de vrouwhet kind en de vrouw zijn op zoek naar vuurrood
maar het kind noch de vrouw vindt het rood dat het wouen het kind en de vrouw vinden samen de dood.
Muziek voor kijkdieren, Hans Andreus
Using curcumin inspired molecular systems we show that the inclusion of pyrazole andisoxalozane groups in the conducting molecule leads to an alternative pathway for chargetransport. Using the mechanically controlled break junction (MCBJ) technique we obtainthe most probable conductance values of the two different binding configurations. Theseare mechanically stable on the time scale of seconds and the probability of trapping themolecule in each state can be tuned by controlling the inter-electrode distance. The highconductance states are related to the molecule attached through the nitrogenated moietyin the middle of the molecules. This high conductance arrangement can be broken andre-made unless a bulky group is attached to such group, i.e., a phenyl ring. In such case,the high conductance states can not be recovered after the breaking of the N-Au contact.
103

6
104 6. THE ROLE OF SIDE GROUPS AS ANCHORING SITES IN CURCUMINOIDS
6.1. MOLECULES WITH DIFFERENT PATHWAYS FOR CHARGE TRANS-PORT
One of the first challenges confronted in the field of single-molecule electronics was themethod for attaching molecules to the metallic electrodes. As experience accumulated,several strategies have proven to reliably bind molecules to metallic electrodes; most ofthem rely on the inclusion of anchoring groups, which are moieties with an affinity tometals. Some examples include thiol [1], pyridine [2] or amine [3–5] groups. However,different strategies are better suited for some systems but give suboptimal results in oth-ers. Further exploration of this respect is, thus, needed.
A common practice in molecular electronics is to functionalize the molecules of in-terest with anchoring moieties at the ends of the longest axis of the molecules. Some-times, either by design or by chance, some molecular systems present alternative an-choring moieties placed somewhere along the backbone between the main anchoringsites [6–9]. This may introduce an alternative molecular conformation of the molecule inbetween electrodes, providing a shorter pathway for charge carriers to cross the molecule.
S S
NO
Me-CCM-isox (2.4)Me-CCM-pyr (2.3)
S S
OHO
MeS-CCM (2.1) MeS-CCM-pyrPh (2.2)
H
S
N N
S
S
N N
S
Figure 6.1: Structure of the molecules of interest in this chapter which are methyl-sulphide terminated cur-cuminoids: (2.1) the free ligand, (2.2) contains a pyrazole-phenyl attached to the backbone, (2.3) has a pyrazolegroup (un-blocked) added in the backbone and (2.4) an isoxazole group.
Curcuminoids have been introduced in chapter 4. In short, curcuminod are organiccompounds with a conjugated nature that share the structure of the naturally occurringcurcumin molecule found in the turmeric spice. In this chapter, we study the implica-tions of incorporating nitrogen containing groups on the central part of the molecularstructure. In Fig.6.1, a drawing of the four molecules considered in this study is dis-played. The conjugated nature of the molecular backbone is evident. When the moleculeis connected to two gold electrodes, the intended pathway for electrons goes from onesulfur atom at one end, to the other sulfur atom, at the other end. The molecule MeS-CCM (2.1) does not contain an aromatic ring in the middle of the molecule; we refer to

6.1. MOLECULES WITH DIFFERENT PATHWAYS FOR CHARGE TRANSPORT
6
105
it as the free ligand because it resembles the structure of the naturally occurring cur-cumin and it is used as a reference for comparison. Molecule 2.3 (MeS-CCM-pyr) holdsa pyrazole group in the central part. This generate a five member aromatic ring and alsointroduces a group with a high affinity for metals. Molecule 2.2 (MeS-CCM-pyrPh) hasthe same core configuration as molecule 2.3 but, in this case the proton, in the pyrolyzegroup is replaced by a phenyl ring. Lastly, molecule 2.4 (MeS-CCM-isox) incorporates anisoxazole group in the middle. It also exhibits an aromatic ring but has a compositionthat is more similar to that of the free ligand.
From the perspective of molecular electronics, the structure of these molecules al-lows them to form a covalently bond with gold electrodes through the MeS end groups.The proccess of charge exchange between the molecules and the electrodes, in this caseoccurs, by ’through-bond’ interactions or extraction. When a molecule is physisorb, forexample, on a metallic surface charge transfer between the surface and the moleculemay occur by ‘through-space’ injection. In general this kind of processes happen at lowtemperature and not in ambient conditions because thermal fluctuation can easily breakthe connection. In some cases, the injection (or collection) of electrons can be more ef-fective through a ‘through-space’ process, because, for example, the pathway betweenthe injection and collection points is shorter than the distance between the bondingsites at the ends of the molecule. The mechanical stability could then be provided bythe chemical bond that is farther away. In the case of the molecules presented here thereis the posibility that the pyrazole and the isoxazole group interact with gold atoms toform dative donor-acceptor bonds [10, 11] through the lone pair of the nitrogen atoms.This could, in principle, provide an alternative anchoring and therefore a ‘through-bond’site for charge injection. In the case of MeS-CCM-pyrPh there is still the posibility of achemical bond formation through the lone pair of the nitrogen atom that is not con-nected to the phenyl ring. The phenyl ring, on the other hand, could mechanically blockthe access to the pyrazole as a bonding site but, at the same time, an effective link for‘through-space’ charge injection could appear, thanks to its pronounced π-cloud.
Here, we test these ideas by single-molecule conductance measurements using themechanically controlled break junction (MCBJ) technique. By linking the results to thestructure of the target molecule, we try to enhance our understanding concerning whichvariables in the chemical design of the molecules have impact on their electronic prop-erties. More specifically, we can quantify the different efficiency of conduction path inmolecules by measuring conductance traces in MCBJ devices.
It has been shown that if a molecule has another group that can bind to the elec-trodes, it is possible to observe multiple states of conductance [7, 8] related to differentpathways through the molecule. Here, we demonstrate that the same phenomena canbe achieved in curcuminoid complexes using pyrazole and isoxazole groups that act asalternative anchoring positions that can be successively connected and disconnected.Using the mechanical stability of the MCBJ devices, we show that single-molecules canbe cycled between different anchoring configurations that differ in conductance valuedue to the electronics pathway that the charge carriers go through.
The chemistry between nitrogen and noble metals is very well documented. In thecontext of molecular electronics, nitrogen has been used to link molecules to metallicelectrodes, for example, amine or pyridine groups have successfully been used to con-

6
106 6. THE ROLE OF SIDE GROUPS AS ANCHORING SITES IN CURCUMINOIDS
nect single-molecule to gold electrodes [2, 12]. Although pyrazole groups have not beenexploited as anchoring moieties, their interaction with noble metals is well establishedin organometallic chemistry [13].
6.2. CONDUCTANCE MEASUREMENTS
We performed conductance vs. electrode displacement measurements using the MCBJtechnique. After a control measurement on the clean device was performed to check theabsence of contamination, the molecules were drop-casted from solution (< 50 µM indichloromethane for MeS-CCM and tetrahydrofuran otherwise) on an MCBJ device. Twothousand traces were recorded at electrode speed between 3 to 8 nm/s and a bias voltageof 0.1 V for each molecule. The collected data is displayed in Fig. 6.2 in the form of 2D-conductance vs. electrode displacement histograms of the 4 molecules. All 4 histogramsshow the formation of molecular traces in the form of plateaus in which the traces ex-tend for more than one nanometer while the conductance remains, approximately, thesame over this range. Remarkably, MeS-CCM-pyr, MeS-CCM-pyrPh and Me-CCM-isoxshow a second region of high counts at a higher conductance value, related to a smallerdisplacement of up to 1 nm.
10-6
10-4
10-2
10-0
0 1 2
10-6
10-4
10-2
10-0
0 1 2Electrode displacement (nm)
Cond
ucta
nce
(G0)
Low
Higha)
c) d)
b)
Figure 6.2: Two-dimensional conductance vs. electrode displacement histograms of the molecules displayedin Fig.6.1 constructed from 2000 consecutive breaking traces each using 80 bins per decade and 70 bins per nm.The panels correspond to the results obtained with a) MeS-CCM, b) MeS-CCM-pyrPh, c) MeS-CCM-pyr and d)MeS-CCM-isox.

6.2. CONDUCTANCE MEASUREMENTS
6
107
Figure 6.3 displays the corresponding 1D-conductance histograms of molecules de-picted in Fig. 6.1, the considered data was filtered from the total data using a plateauselection criterion base on the slope of the traces as described in chapter 2, utilizingparameters ∆x=0.5 nm and mthrs=0.5 dec/nm. The green shaded areas correspond tolog-normal fits of the main molecular peak and in the cases of MeS-CCM-pyr and MeS-CCM-isox a second peak was needed to fit the data (light blue shaded areas). The con-ductance values as well as the full with half maximum (FWHM) of these fits are listedin table 6.1 and, in the last column, the ratio between the high- and low-conductancestates is displayed.
The values obtained this way reveal that the conductance of MeS-CCM and the lowerpeak of MeS-CCM-isox are very similar, indicating that the isoxazole group has little in-fluence on the conductance of the sulfur to sulfur path through the entire backbone.There is a noticeable reduction of the conductance value in the cases of MeS-CCM-pyrand MeS-CCM-pyrPh with respect to MeS-CCM, being MeS-CCM-pyrPh slightly lowerthan MeS-CCM-pyr. Despite these differences, all the compounds but the free ligandhave a similar conductance value for the high conductance peak. It is worth mentioningthat the conductance histogram of MeS-CCM-isox 6.3d) also has a bump at low con-ductances. This could be another state or configuration related to the presence of theisoxale group. A candidate for such behavior could be two molecules stack together by,for example, hydrogen bonding, each one attached to a different lead through one of thesulfur atoms[14], but we have not pursued this topic in detail.
Molecule G (G0) FWHM GH /GL
MeS-CCM 3.7×10⁻⁵ 1.1 -
MeS-CCM-pyrPh3.0×10−4 1.7
41.17.4×10−6 1.24.8×10−4 1.1
MeS-CCM-pyr1.4×10−5 1.2
36.3
4.7×10⁻⁴ 1.2MeS-CCM-isox
3.4×10⁻⁵ 0.813.7
Table 6.1: Most probable conductance value (first column), full width half maximum (FWHM) (second col-umn) and the conductance ratio obtained from fitting the data of 1D-histograms of each compound to log-normal distributions. The considered data sets were measured at a bias voltage of 0.1 V and the electrodespeed was in the range of 3 to 8 nm/s.
The existence of high conductance states related to short displacements is an inter-esting feature that may be related to particular junction conformations. We made a moredetailed analysis on the data of MeS-CCM-pyr (see 6.A.2) and concluded that there areat least three different classes of molecular breaking traces occurring with almost thesame probability; traces that only show long plateaus at low conductance values, shortplateaus with a high conductance value, and traces that start at the high conductanceregion and then, abruptly, transit to the low-conductance plateau behaviour. The samekind of analysis gave similar results with the compound MeS-CCM-isox with a slightlysmaller proportion of traces with a transition from high- to low-conductance state.In

6
108 6. THE ROLE OF SIDE GROUPS AS ANCHORING SITES IN CURCUMINOIDS
10-6 10-4 10-2 100
Conductance (G0)
Coun
ts (a
.u.)
a)
b)
c)
d)
MeS-CCM-pyrPh
MeS-CCM-pyr
MeS-CCM-isox
MeS-CCM
Figure 6.3: Conductance histograms of the molecules constructed from selected traces of measurements of2000 consecutive traces measured at a bias voltage of 0.1 V and an electrode speed between 3 and 8 nm/s us-ing MeS-CCM (a), MeS-CCM-pyrPh (b), MeS-CCM-pyr (c) and MeS-CCM-isox (d) as the target molecule. Theconducance bining is 80 bins per decade. The shaded areas correspond to log normal distribution fitting ofthe conductance peaks, the light blue shaded areas correspond to the same kind of fitting to the high conduc-tance states. In the cases in which two curves were fit, the procedure was run a single time with twice the fitparameters in the region of interest.
the case of MeS-CCM-pyrPh, the amount of traces showing plateaus at high conduc-tance state were considerably less (between the 30 and the 51 % of the molecular traces).
6.2.1. DISTANCE MODULATION
With the aim of testing the mechanical tunability of the conductance states, we per-formed a conductance measurement while the inter-electrode distance was modulatedin the following way: during each trace, the electrode displacement was increased fromthe last gold atom breaking point to a predefined displacement x1 to which the 0.5 nmsnapping of the electrodes has to be added in order to obtain an estimate of the actualinter-electrode distance. Then, the electrodes were kept at that distance for a period oftime (∆t) after which the electrodes were pushed back together to a predetermined dis-tance (x2). There the electrodes were again kept for ∆t at this position and this process

6.2. CONDUCTANCE MEASUREMENTS
6
109
was repeated a number of times.
0 2 4 60 2 4 6
10-6
10-4
10-2
10-00
1
2
Time (s) Counts (a.u.)Time (s)
Con
duct
ance
(G0)
d (n
m) a) b)
d) e)c)
g)f)
H
S
N N
S
H
S
N N
S
counts/trace
low high
Figure 6.4: a) and b) Inter-electrode distance as a function of time for the distance modulation experiment.Zero displacement is defined as the breaking point at which the conductance drops below 1 G0 which cor-responds, approximately, to a distance of 0.5 nm in real space. c) and d) Conductance vs. time histogramsconstructed from 1200 consecutive traces in which the inter-electrodes distance was modulated as shown ina) and b), respectively. The conductance axis has been logarithmically binned with 94 bins/decade and thetime axis with 100 bins/sec. The target molecule used in the measurement was MeS-CCM-pyr. In e) the one-dimensional conductance histogram obtained in the the fast breaking experiment on the same junction (cor-responding to 6.2c) is shown. The drawings in f) and g) schematically represent the proposed configurationsof the low- and high-conductance states respectively.
Figure 6.4 c) and d) display 2D-conductance vs. time histograms of 1200 modulatedtraces with x1 = 0.75 nm (1.25 nm of inter-electrode distance), ∆t = 1 s and x2=0.45 andx2 =0.18 nm in c) and d), respectively. The panels a) and b) of the same figure representthe corresponding electrode distance modulation of the histogram below as a functionof time. The most outstanding characteristic of these measurements is the difference inthe appearance of the high conductance state in each experiment. As a general trend,when the electrode displacement (d) reaches x1, the conductance matches either valuesnear the noise level or the low-conductance state indicating empty traces in the former

6
110 6. THE ROLE OF SIDE GROUPS AS ANCHORING SITES IN CURCUMINOIDS
0 1 2 3 4
10-6
10-4
10-2
100
0
1
2
time (s)
Con
duct
ance
(G0)
d (n
m) a)
b) c)counts/trace
low high
S
N N
S
V
Figure 6.5: a) Inter-electrode distance as a function of time for the distance modulation experiment. Zero dis-placement is defined as the breaking point at which the conductance drops below 1 G0 which corresponds,approximately, to a distance of 0.5 nm in real space. b) Conductance vs. time histograms constructed from1000 consecutive traces in which the inter-electrodes distance was modulated as shown in a). The conduc-tance axis has been logarithmically binned with 94 bins/decade and the time axis with 100 bins/sec. The targetmolecule used in the measurement was MeS-CCM-pyrPh. c) Shows the drawing of the expected configurationof the MeS-CCM-pyrPh inside the junction.
or the formation of single-molecule junctions in the latter case. When the electrodes arepushed back to x2 = 0.45 nm (Fig. 6.4 a) and c), the conductance values spread out (in theintervals [1.3, 2.3] s and [3.6, 4.6] s ), especially towards higher values, but importantlythe conductance does not reach the value of the high-conductance state. In contrast,when the electrodes are pushed together to x2 = 0.18 nm (time intervals [1.4, 2.4] s and[3.7, 4.7] s of Fig. 6.4d), there is a significant amount of counts in the high-conductanceregion that is reached in a sharp switching manner. It is interesting to note that consis-tently in both experiments, the behavior is reproducible over more than thousand tracesand that the molecular junctions are stable in the range of seconds in ambient condi-tions.
When the same experiment is performed with MeS-CCM-pyrPh, the results are re-markably different. Regardless of how close the electrodes are pushed back together thehigh-conductance state is never reached. Figure 6.5 shows the conductance vs. time his-togram for a measurement of 1000 consecutive modulation traces at a speed of 4 nm/sand a bias voltage of 0.1 V, with parameters x1 = 0.8 nm and x2 =0.0 nm. Interestingly,despite the close proximity to which the electrodes are pushed back together, the con-ductance value did not reach the level of the high-conductance state. We point out thatthe only difference between MeS-CCM-pyr and MeS-CCM-pyrPh is that in the secondmolecule the pyrazole group is attached to a phenyl ring; it provides a physical blockinggroup that may prevent the re-binding of the molecule through such moiety.

6.3. DISCUSSION
6
111
6.3. DISCUSSIONPutting the results in a broader context, it is worth looking at similar systems that havebeen related with alternatives pathways for charge transport: Silanes [7] are one exam-ple. These molecules containing silacycle groups along the main backbone, enablingalternative pathways for charge transport. In their paper, Su et al., evaluate differentcompounds and conclude that the conditions for having a sulfur to silacycle pathwayis associated with a high strain in the silacycle ring. Thus, this pathway can be turnedoff by relaxing the strain in the Si containing group (usually by chemical design). Alongthe same line, Delia et al. [6] studied oligo-phenyleneethynylene (OPE3) based com-pounds with a modified central ring that holds a certain affinity with metals. In this casethe authors claim that nitrogen atoms can grant the compounds an alternative bondingsite in the middle of the molecule, although the weak bounding made it necessary toinclude a second MeS anchoring group to stabilize the molecular junction in the high-conductance (short pathway) states.
For the compounds studied here there are a few remarkable features. First, all the ni-trogen containing molecules showed counts at high-conductance states consistent withthe idea that they provide an alternative anchoring group that provides a shorter path-way for charge transport. We find that the traces can be clasified in four groups: the onesthat after the breaking of the 1 G0 breaking point transit through the high-conductancestate and then through low-conductance state; traces that go only through one of theconductance states; and those that do not show a clear indication of molecular junc-tions (see 6.A.2). The probability of having the high-conductance state in a moleculartrace is aproximately 2/3 (table 6.3); 1/3 for the high-conductance state alone and an-other 1/3 for traces with a section in the high-conductance state and a transition to thelow-conductance one. This indicates that the bonding of the well-established MeS an-choring group does not seem to be more stable than the alternative pyrazole group. Wesee, as well, that there is no indication of traces that go back an forth between the 2states. The case of the isoxazole group is similar to the one with pyrazole. The prob-ability of making a connection through the nitrogen also approaches 2/3, but there theposibility of having only high-conductance states is higher than having both states in thesame trace.
There is a notable difference in the percentages of traces with an indication of high-conductance state for MeS-CCM-pyrPh. A consistent high proportion of traces onlyshow low-conductance states and between 30 and 52% of the traces show the high-conductance state, depending on how the selection is performed.
In conclusion, our results provide strong evidence that pyrozale and isoxzale groupscan become an alternative anchoring site and that the inclusion of a bulky group such asa phenyl ring can prevent the availability of the pyrazole group, as an anchoring moiety.
REFERENCES[1] Z. Huang, F. Chen, P. A. Bennett, and N. Tao, Single molecule junctions formed
via Au-thiol contact: Stability and breakdown mechanism, Journal of the AmericanChemical Society 129, 13225 (2007).
[2] M. Kamenetska, S. Y. Quek, A. C. Whalley, M. L. Steigerwald, H. J. Choi, S. G. Louie,

6
112 REFERENCES
C. Nuckolls, M. S. Hybertsen, J. B. Neaton, and L. Venkataraman, Conductanceand geometry of pyridine-linked single-molecule junctions, Journal of the AmericanChemical Society 132, 6817 (2010).
[3] S. Y. Quek, L. Venkataraman, H. J. Choi, S. G. Louie, M. S. Hybertsen, and J. B.Neaton, Amine - Gold linked single-molecule circuits: Experiment and theory, NanoLetters 7, 3477 (2007).
[4] Z. Li and D. S. Kosov, Nature of well-defined conductance of amine-anchored molec-ular junctions: Density functional calculations, Physical Review B 76, 035415 (2007),0702507 .
[5] M. S. Hybertsen, L. Venkataraman, J. E. Klare, A. C. Whalley, M. L. Steigerwald, andC. Nuckolls, Amine-linked single-molecule circuits: systematic trends across molec-ular families, Journal of Physics: Condensed Matter 20, 374115 (2008).
[6] M. Iwane, S. Fujii, T. Nishino, and M. Kiguchi, Single tripyridyl–triazine molecularjunction with multiple binding sites, The Journal of Physical Chemistry C 120, 8936(2016).
[7] T. A. Su, J. R. Widawsky, H. Li, R. S. Klausen, J. L. Leighton, M. L. Steigerwald,L. Venkataraman, and C. Nuckolls, Silicon ring strain creates high-conductancepathways in single—molecule circuits, Journal of the American Chemical Society135, 18331 (2013).
[8] D. Miguel, L. Álvarez de Cienfuegos, A. Martín-Lasanta, S. P. Morcillo, L. A. Zotti,E. Leary, M. Bürkle, Y. Asai, R. Jurado, D. J. Cárdenas, G. Rubio-Bollinger, N. Agraït,J. M. Cuerva, and M. T. González, Toward multiple conductance pathways withheterocycle-based oligo(phenyleneethynylene) derivatives, Journal of the AmericanChemical Society 137, 13818 (2015).
[9] N. T. Kim, H. Li, L. Venkataraman, and J. L. Leighton, High-conductance pathwaysin ring-strained disilanes by way of direct σ-Si–Si to Au coordination, Journal of theAmerican Chemical Society 138, 11505 (2016).
[10] G. Cardini and M. Muniz-Miranda, Density functional study on the adsorption ofpyrazole onto silver colloidal particles, The Journal of Physical Chemistry B 106,6875 (2002).
[11] V. Garcia-Pacios, M. Arroyo, N. Anton, D. Miguel, and F. Villafane, Non-covalentinteractions at bis(pyrazole)silver(i) or -gold(i) cations, Dalton Trans. , 2135 (2009).
[12] A. M. Ricci, E. J. Calvo, S. Martin, and R. J. Nichols, Electrochemical scanning tun-neling spectroscopy of redox-active molecules bound by Au-C bonds. Journal of theAmerican Chemical Society 132, 2494 (2010).
[13] V. Heras, A. Campo, M. L. Gallego, P. Ovejero, M. Cano, and M. R. Torres, ( Pyrazole) silver ( I ) and -gold ( I ) Complexes with Strong and Weak Hydrogen- Bonding In-teractions as the Basis of One- or Two-Dimensional Structures, European Journal ofInorganic Chemistry , 3089 (2004).

REFERENCES
6
113
[14] T. Nishino, N. Hayashi, and P. T. Bui, Direct measurement of electron transferthrough a hydrogen bond between single molecules, Journal of the American Chem-ical Society 135, 4592 (2013).

6
114 REFERENCES
6.A. APPENDICES
6.A.1. MEASUREMENTS ON ADDITIONAL SAMPLES
We have measured a second junction for each molecule obtaining similar results. Theconductance values obtained from two thousand consecutive traces (with the exceptionof MeS-CCM-isox in which case 1300 traces were collected) is displayed in table 6.2. Thelack of a conductance value for the high-conductance state in the case of MeS-CCM-pyrPh is because the peak at high conductance was not clearly visible even after dataselection. The second measurement on MeS-CCM-pyr gave conductance values almosta factor of 2 higher than the ones shown in the main text. A reason for this may be ahigher probability of trapping more than one molecule.
Molecule G (G0) FWHM GH /GL
MeS-CCM 4.0×10⁻⁵ 1.1 -
MeS-CCM-pyrPh- -
-4.0×10⁻⁶ 0.97.7×10−4 1.0
MeS-CCM-pyr2.2×10−5 1.5
35.0
4.8×10⁻⁴ 0.8MeS-CCM-isox
2.6×10⁻⁵ 0.918.5
Table 6.2: Most probable conductance value (first column), FWHM (second column) and the conductanceratio obtained from fitting the data of 1D histograms of representative samples of each compound to log-normal distributions, as described in the text. The considered data sets were measured at a bias voltage of0.1 V and the electrode speed was in the range of 3 to 8 nm/s.
6.A.2. FREQUENCY DETECTION
With the aim of quantifying the correlation between the appearance of the high- andlow-conductance states, we perform a sequence of filtering steps based on the likeli-hood of each conductance state to be present on a trace. We quantify this likelihood asthe ratio between the counts a conductance trace has in the region of the conductancepeaks and the average of the counts in the same region over all traces. We call this ratiothe prevalence ratio as the quotient between counts of a trace and the counts in the con-ductance histogram in a determined region of conductance values. This region is usuallychosen around the conductance value of a molecular state.
In the case of MeS-CCM-pyrPh in Fig. 6.6a) we select the traces with a prevalence ra-tio above 1.0 in the region around the high conductance peak (between 2.7×10⁻⁴ and1.7×10−3 G0). The data is then split in two subsets: selected and not-selected ones.The selected traces show an 1D-histogram (red line in Fig. 6.6 a) in which the high-conductance state is enhanced compared to the original 1D- histogram, while the un-selected traces (orange line in Fig. 6.6 a) show a depletion in the same region comparedto the original 1D-histogram (blue line in Fig. 6.6 a). For each subset a subsequent fil-tering step is applied (b) and c) in Fig 6.6). This time the prevalence is considered in theregion of the low-conductance state (between 3.8×10⁻⁶ and 5.4×10⁻⁵ G0) and in these

6.A. APPENDICES
6
115
0 1 210-6
10-4
10-2
1001066
10-6 10-4 10-2 100
0 1 2
529selected
0 1 2
537 non selected
excluded stp 1selectedunselected
Conductance (G0)
Cond
ucta
nce
(G0)
Coun
ts (a
.u.)
Electrode displacement (nm)0 1 2
10-6
10-4
10-2
100934
10-6 10-4 10-2 100
0 1 2
456selected
0 1 2
478 non selected
Conductance (G0)
Cond
ucta
nce
(G0)
Coun
ts (a
.u.)
Electrode displacement (nm)included stp 1selectedunselected
b) c)
0 1 210-6
10-4
10-2
1002000
10-6 10-4 10-2 100
totalselectedunselected
0 1 2
934selected
0 1 2
1066 non selected
Conductance (G0)
Cond
ucta
nce
(G0)
Coun
ts (a
.u.)
Electrode displacement (nm)
a)
Figure 6.6: Series of filtering steps a), b) and c) in which the data set of Fig. 6.2 is divided in subsets dependingon the prevalence of counts in the high- and low-conductance state. In a) the set of 2D-conductance versusdisplacement histograms correspond from left to right to: the original data set, the traces with a prevalenceratio greater than 1.0 and the traces with prevalence ratio lower than 1. Considering the prevalence between2.7×10−4 and 1.7×10⁻³ G0 in the 1D-conductance histogram below (yellow shaded region in the lower panel).The reference is the total 1D-conductance histogram (blue line). Panels b) and c) display information in thesame way as in a), but the selection is applied over the selected data b) and not-selected data c) from a). Theprevalence is computed in reference to the region between 3.8×10⁻⁶ and 5.4×10⁻⁵ G0 (yellow shaded regionin the conductance histograms).

6
116 REFERENCES
cases the reference for computing the prevalence ratio is considered to be the conduc-tance histogram of the respective subset.
In this way, the data can be split in four non-overlapping subsets related to differentbehaviors: traces that show both states (selected in Fig. 6.6 b); traces that show onlythe high-conductance state (non-selected in Fig. 6.6 b); traces that show only the low-conductance state (selected in Fig. 6.6 c) and traces that show neither (non-selected inFig. 6.6 c). Table 6.3 shows the summary of this selection procedure, where 0 meansthe absence of a peak and 1 the presence of it. The third column corresponds to thefiltering sequence displayed in Fig. 6.6; the fourth column is the corresponding result forthe inverse order of filtering (first low conductance and then high conductance). Theprobability of getting either or both of the conductance states is approximately the samein both cases which show the robustness of the method. To a certain extend, the choiceof the prevalence threshold is arbitrary, nevertheless, one can argue that a factor 1.0 isa good starting point because the condition for selecting a trace to have a plateau-likebehavior is based on having, at least, the average number of counts in that region. Wehave tried factors up to 1.5 and the trend of four distinguishable subsets is preserved.However, the 2D-conductance vs. displacement histograms of the different selectionsteps did not add any different recognizable group and, moreover, tend to mix the onesthat we have described before, so for that reason, the factor 1.0 has been chosen.
GH GL#tracesGH →GL
#tracesGL →GH
0 0 27% 26%0 1 26% 27%1 0 24% 23%1 1 23% 23%
Table 6.3: Sumary table of Fig. 6.6 in which the number of traces that belong to each behavior are displayed,(0 0) non molecular, (0 1) only low G, (1 0) only high G and (1 1) low and high G. The label GH → GL (thirdcolumn) means that the first filter was performed for selection in the high conductance region and then in thelow conductance one. GL →GH (fourth column) stands for the inverse order of selection.
Interestingly, the bonding with the well established MeS anchoring group does notseem more probable than the alternative pyrazole site. We see as well that there is noindication of traces that go back an forth between the 2 states. This fact is a furtherindication of the interpretation of the multiple anchoring sites within the molecule.
The Idea of adding a phenyl ring on the pyrazole group (MeS-CCM-pyrPh) is to im-pose a physical barrier that prevent the interaction of the nitrogen atoms with the goldelectrodes. Although this modification did not prevent the appearance of the high-con-ductance peak it certainly had a blocking role. Table 6.4 summarizes the analysis on theprevalence of the high and low conductance peak. Since the fraction of counts in theregion of high conductance was lower, the prevalence factor to filter in the high conduc-tance region was chosen to be 1.5 instead of 1.0.
In the case of MeS-CCM-isox compound the trend is very similar to MeS-CCM-pyr,The features at both conductance states are clear enough, so no modification to the fac-

6.A. APPENDICES
6
117
MeS-CCM-pyrPh MeS-CCM-isox
GH GL# tracesGH →GL
# tracesGL →GH
# tracesGH →GL
# tracesGL →GH
0 0 47% 46% 42% 41%0 1 37% 26% 20% 19%1 0 9% 10% 25% 26%1 1 7% 18% 13% 14%
Table 6.4: Sumary table of prevalence of the two conductance states for MeS-CCM-pyrPh and MeS-CCM-isoxin which the number of traces that belong to each behavior are displayed: (0 0) non molecular, (0 1) only lowG, (1 0) only high G and (1 1) low and high G. The label GH → GL means that the first filter was performedfor selection in the high conductance region and then in the low conductance one.GL → GH stands for theinverse order of selection. For MeS-CCM-pyrPh, the regions considered were: GL between 2.37×10⁻⁶ and2.66×10−5 G0, and GH between 2.43×10⁻⁴ and 1.72×10⁻³ G0. For MeS-CCM-isox: GL between 1.29×10⁻⁵
and 1.02×10⁻⁴ G0, and GH between 2.82×10⁻⁴ and 1.78×10⁻³ G0. As explained in the text, the prevalencefactor for MeS-CCM-pyrPh the region of high conductance was considered 1.5 instead of 1.0.
tors was needed to split the data in meaningful sets. The results are summarized in thesame way in the previous cases in table 6.4. The amount of empty traces is larger than inthe case of MeS-CCM-pyr, but the yield of only high-conductance state traces is almostequivalent to the one observed in the molecule with pyrazole mid-group. This indicatesthat the isoxazole group may also be working as an anchoring site and provides a shorterpathway for charge transport.


7SALEN AND SALOPHEN
COMPOUNDS
"You believe that reality is something objective,external, existing in its own right. You also believe
that the nature of reality is self-evident."
O’Brien to Winston, 1984, George Orwell
We performed the single molecule conductance experiments on a series of salophen andsalen compounds exploring different connection strategies and metal ion inclusion, in-cluding Cu, and Mg. Our results show a dramatic difference on the qualitative behaviorof each molecule between metallic electrodes depending on the position on which the an-choring group is attached to the central structure. From these results we draw two relatedconclusions: (i) quantum interference plays a momentous role in the charge transportcharacteristic of the molecules, suppressing the conductance when a meta-conjugatedphenyl ring is placed in the pathway and (ii) the conduction pathway goes mainly throughthe organic ligand. If a Cu or Zn ion is used the metal ion plays a gating role for charge car-riers and provides rigidity to the molecular structure but does not constitute a separatedpath for electrons. 1
1We thanks Diana Dulic, Cristian Gutierrez and collaborators, from the University of Chile, for the chemicaldesign and synthesis of the compounds and Nuria Aliaga, at Institut de Ciència de Materials de Barcelona, forher help in the chemical characterization and analysis.
119

7
120 7. SALEN AND SALOPHEN COMPOUNDS
7.1. SALEN AND SALOPHENESSalen molecules are a family of chelates similar to porphyrins albeit they do not possesa closed ring structure but just half of it. They have attracted attention because of theircatalytic properties and, in particular, manganese salens have shown high enantoselec-tivity [1, 2], meaning that they favor a particular kind of chilarity over the oposite onein certain oxidation processes. Importantly, salen derivatives can be synthesized moreeasily than porphyrins and their structures can be manipulated to create an asymmetricenvironment around the active metal site in the center [2]. This makes them an interest-ing system to investigate the role of metalization on organic molecules. From anotherpoint of view, salen complexes hold various similarities with the catalytic activity of en-zymes [3]. Studying the charge transport mechanisms through such systems could shinelight on the understanding biological processes.
As stated, these compounds have shown high enantoselectivity, from the physicalpoint of view, this may suggest a spin dependent electron transfer process [4]. Thus,they could have the potential to show spin dependent currents, but until now there havebeen no reports on charge transport measurement through such molecules. Many stud-ies have focused the attention on the electrochemical properties of the salen compoundsand/or on its charge transfer characteristics [5–7]. In particular, it has been shown thatthe locus of oxidation, i.e., the place in which the molecular charge is localized uponoxidation, can be tune by the use of different metal complexation or by the use of ‘non-inocent’ ligands [8]. Charge transfer phenomena have also been reported and depend-ing on which metal is placed in the center of the molecule, in particular copper andmanganese,[6].
The structure of the salen compounds considered in this work is depicted in Fig.7.1. The MeS groups at the ends of the molecules are the anchoring groups to the goldelectrodes[9, 10]. These groups have been separated from the core of the molecule bya phenyl ring spacer. In this work, three aspects of the chemical design are explored:(i)the aromaticity and conjugation of the organic bridge that joins the two half of the com-pound; (ii) the site with respect to the imine group (N atom) to which the phenyl spaceris connected; and (iii) the inclusion of different metal ions.
Regarding the organic bridge, we tested two different architectures: salen and sa-lophen as specified in Fig. 7.1. In salen compounds, the bridge consists of an aliphaticchain of two carbon atoms while the salophens have a phenyl ring in orto-substitutionconnecting the two halves. On one hand, the aliphatic chain is expected to split themolecule in two almost independent conjugated parts, while the phenyl ring allows fordelocalization of the molecular orbitals throughout the whole molecule. On the otherhand, the orto-connection of the phenyl ring may give rise to destructive quantum inter-ference effects for charge carriers going from one S atom. at the first end of the molecule,to the S atom, at the other end, thereby, reducing the conductance.
The connection of the spacer to the center of the molecule has to do with the siteto which the phenyl spacer is attached with respect to the imine group. Two config-urations were explored: meta- (m-) and para- (p-) substitution as illustrated in Fig. 7.1.This different connection may have a strong influence on the electronic properties of themolecules due to quantum interference effects [11, 12]. Meta-substitution has been re-lated to low-conductance values because of destructive interference while para-substitu-

7.1. SALEN AND SALOPHENES
7
121
O
SMeMeS
N
OM
N
MeS HO
N
OH
N
SMe MeS O
N
O
N
SMeM
HO
SMeMeS
N
OH
N
O
SMeMeS
N
OM
N
MeS HO
N
OH
N
SMe MeS O
N
O
N
SMeM
p-Salen p-Salen-M
Free ligand Metallic complexes
m-Salen m-Salen-M
HO
SMeMeS
N
OH
N
p-Salophen p-Salophen-M
m-Salophen
Salo
phen
Sale
n
met
a-su
bstit
uted
para
-sub
stitu
ted
met
a-su
bstit
uted
para
-sub
stitu
ted
m-Salophen-M
Figure 7.1: Schematic of the molecular systems addressed in this section: the first column depicts the freeligands and the the second column the metallic complexes in which M represents a metal ion (Cu and Zn wereused for this study). Para-connected salen (p-Salen) and the meta-connected salen (m-Salen) are displayed inthe upper half of the table while the salophenes are shown in the lower part in the corresponding configuration.

7
122 7. SALEN AND SALOPHEN COMPOUNDS
tion yields to higher conductance values [11, 13–15]. Note that in the cases in which ametal is included in the molecule, a meta-substitution with respect to the imine groupleads to a para-substitution with respect to the metallic atom and vice versa. Thus, ina simplistic picture one could expect that p-salen and p-salophens promote conduc-tion through the organic bridge while m-salen and m-salophen enhance the conductionthrough the metallic atom.
The role of the metallic ion in charge transport across molecules containing themis an aspect that is part of a long standing debate in the molecular electronics com-munity [16–22]. In some cases, the metals are reported to have a gating effect on themolecular levels and, indirectly, tune the molecular conductance through the molecu-lar backbone[16]; in other cases, the metals are part of the conducting pathway [21–23]and it has been reported that they can work as hopping centers upon charging [20]. Thethrough-metal path in the salen and salophen compounds is connected in the oppositeconfiguration of imine group (m-salophen-M ⇒ para-connected metal and vice versa).Therefore, they can be used to understand the role of metalization in charge transport ina better way, but it is a concept yet to be proven.
7.2. ELECTRONIC MEASUREMENTSTo begin the electrical characterization of the different metal-containing derivatives, wefirst establish the conductance of the free ligand chelates displayed in the left columnof Fig. 7.1. Intuitively, the compounds that hold the most chances to conduct electricityare those that have a conjugated path between the two intended anchoring groups (MeSin these cases). Therefore, it is important to compare the electrical properties of theisomers p-salophen and m-salophen with each other.
0 1 2-0.5 0 1 2
10-6
10-4
10-2
100
Electrode displacement (nm)
Cond
ucta
nce
(G0)
a) b)
Figure 7.2: 2D-conductance vs. electrode displacement of a) p-salophen and b) m-salophen constructed from5000 and 3000 consecutive traces respectively at a bias voltage of 0.1 V and an electrode speed of 6nm/s andusing 80 bins per decade and 70 bins per nm.

7.2. ELECTRONIC MEASUREMENTS
7
123
The high-conductance state is related to shorter displacements, with values smallerthan 1 nm. This indicates that the high-conductance state does not correspond to themolecule fully extended in between the electrodes, but to some other configuration. Pos-sibly, one of the electrodes is connected to one of the N atoms in the central part of themolecule or interacts with the middle phenyl ring. In this case, transport through onlypart of the molecule would be measured. We will latter see that the feature is also sharedwith the compounds including metal ions.
Additionally, the conductance value of the traces that extend for a larger displace-ment decrease as a function of electrode displacement. This may indicate that the con-ductance of the molecule decays as its extreme points are pulled apart.
To gain a deeper insight on the role of metal complexation we measured the samesalophen framework complexated with a copper or a zinc ion. In Fig. 7.3, the 2D-conductance vs. electrode displacement of a) p-salophen-Cu, b) m-salophen-Cu, c) p-salophen-Zn and d) m-salophen-Zn are displayed. Remarkably, when the para-substitutionis used, clear plateau-like structures appear in the histograms with two common fea-tures: a region of relative high counts above 1×10⁻⁴ G0 related to short displacements(smaller than 1 nm) and a region of high counts with a clear plateau structure between1×10−5 and 1×10⁻⁴ G0 that extends for up to 2 nm in the case of p-salophen-Cu and to2.4 nm in the case of p-salophen-Zn. The data for of the meta-substituted isomers isless clear, since non clear signature of molecular plateaus is visible in either of the metalcomplexated. Nonetheless, m-salophen-Zn show short conductance features around1×10−3 G0, similar to the ones observed in p-salophen-Zn.
Fig. 7.4 displays the 1D-conductance histograms of the para-substituted(a) and themeta-substituted (b) salophens. To obtain the most probable conductance values, wefiltered out the traces without molecular features using the filtering method describedin chap. 2. Subsequently, a log-normal distribution was fitted to the conductance his-tograms of the selected traces for each peak. The corresponding conductance values andtheir full width at half maximum (FWHM) are listed in Table 7.1; the 1D-histograms andfitted distribution are exhibited in Fig. 7.5. Before discussing the long features that canbe related to the fully extended molecule, we focus on the high-conductance state. Thecompounds including metal ions that show short features at high conductance valuessimilar to p-salophen were both para-substituted salophen and m-salophen-Zn. Theconductance values listed in table 7.1 evidence little variation on its values between thefree ligand and the zinc compound, while the copper salophen has a conductance valuealmost one order of magnitude lower. We do not discard the existence of a configurationwith a higher conductance value that is not statistically visible in this measurement, wewill later comment on that. The fact that these states are related to a shorter displace-ment suggests that the current does not flow through a molecule in its full extension.Instead, it is likely that the conduction path from electrode to electrode goes througha portion of the molecule, for example, from one sulfur atom to the imine group andthen directly to the drain electrode. It is not clear whether the shorter path involves an-other anchoring site or if the charge injection (or collection) happens in a different sitethan the anchoring. Neither the role of the metallic ion is clear in the presence of thismechanism.
In the case of longer features at lower conductance values, the compounds show rec-

7
124 7. SALEN AND SALOPHEN COMPOUNDS
10 -6
10 -4
10 -2
10 0
0 1 2Electrode displacement (nm)
0 1 2
10 -6
10 -4
10 -2
10 0
Cond
ucta
nce
(G0)
para- meta-
Zn
Cu
a) b)
c) d)
Figure 7.3: 2D-conductance vs. electrode displacement of a) p-salophen-Cu, b) m-salophen-Cu, c) p-salophen-Zn and d) m-salophen-Zn constructed from 3000 consecutive traces at a bias voltage of 0.1 V andan electrode speed between 2 to 6 nm/s. The histograms were constructed using 80 bins per decade and 70bins per nm.

7.2. ELECTRONIC MEASUREMENTS
7
125
ognizable plateaus for the para- configuration. The molecular features are more clearlypresent when a metallic ion is incorporated in the structure; this can be seen, for in-stance, in the width of the low-conductance peaks in Fig.7.5 a) as well as in full widthhalf maximum of the fitted distributions displayed in the fifth column of Table 7.1. Thespread of the p-salophen ligand has a width of 1.5 decades, while p-salophen-Zn and p-salophen-Cu only reach 1 decade of spread. Comparing the low-conductance states inthe para-substituted molecules the progression of the conductance values follows the se-quence Gp-salophen ≈ Gp-salophen-Cu < Gp-salophen-Zn . Although the peak width follows therelation FWHMm-salophen-Zn >FWHMp-salophen >FWHMp-salophen-Zn >FWHMp-salophen-Cu.This fact indicates that when a metal ion is positioned in the central part of the moleculesthe conductance value of the system metal-molecule-metal has a narrower set of possi-ble values.
10-6 10-4 10-2 100 10-6 10-4 10-2 100
p-Salophen-Zn
p-Salophen-Cu
p-Salophen
m-Salophen-Znm-Salophen-Cu
m-Salophen
Conductance (G0)
Coun
ts (a
.u.)
a) b)
Figure 7.4: 1D-conductance histograms of a) p-salophen, p-salophen-Cu and b) p-salophen-Zn; and b) m-salophen, m-salophen-Cu and m-salophen-Zn constructed from 3000 consecutive traces at a bias voltage of0.1 V and an electrode speed of 2 to 6 nm/s. The histograms were constructed using 80 bins per decade and 70bins per nm.
Table 7.1 shows relevant values obtained from the measurements previously described,the last column lists the yield of junction formation defined as the fraction of traces thatwere selected using the filtering method described in chapter 2 (with mthr =−0.5 dec/nmand ∆x= 0.5 nm). The conductance histograms constructed from only molecular tracesof the compounds that showed a peak structure are displayed in Fig. 7.5. The fitted log-normal distributions from which the conductance values were obtained are displayed aswell. There are a few observations that are important to discuss here: the conductancevalue of the high-conductance peak of the p-salophen-Cu. Its value is 1.4×10⁻⁴ G0 buta quick inspection of the corresponding peak in Fig. 7.5 b) reveals that the fitted distri-bution follows a shoulder to the right of the low-conductance peak and does not align

7
126 7. SALEN AND SALOPHEN COMPOUNDS
Molecule High G FWHM Low G FWHM Yield(G0) (dec) (G0) (dec) (%)
p-salophen 1.3×10⁻³ 1.0 2.1×10⁻⁵ 1.5 26m-salophen – – – – 1p-salophen-Cu 1.4×10⁻⁴ 1.1 2.0×10⁻⁵ 0.7 44m-salophen-Cu – – – – 9p-salophen-Zn 7.1×10⁻⁴ 1.4 3.0×10⁻⁵ 1.0 83m-salophen-Zn 1.4 ×10⁻³ 0.8 7.6×10⁻⁶ 2.3 14
Table 7.1: Conductance value and full width half maximum (FWHM) of measurements of the salophen seriesobtained by fitting a log-normal distribution to the conductance histogram of the selected traces of measure-ment displayed in Fig.7.5. The last column represents the percentage of traces that were considered after thefilter procedure as a quantification of the yield of junction formation.
with the features at high conductance observed in the 2D-conductance vs. displace-ment histograms (Fig. 7.3). This may be caused by the low yield of the high-conductancestate compared to the low-conductance one. In a lesser extend, something similar hap-pens with p-salophen-Zn; there the peak position does not match the local maximumof the histogram, this is because the high amount of counts in the inter-peak region.In both cases the conductance value of the high-conductance state is underestimated,and consequently, if this observation correctly describes what happens with the high-conductance state, it would mean that the conductance value has a weak dependenceon the metalization of the molecule.
Comparing the low-conductance peaks now, it is clear from Fig. 7.5 that the conduc-tance distribution is narrower in the case of the copper inclusion in the para-connection.Under the same para-connection, the free ligand showed a much broader peak. This dif-ference may be a natural consequence of the low rigidity of the free-ligand comparedto the metalized compounds. Furthermore, the only meta-connected molecule thatshowed a substantial amount of molecular traces was the zinc complexation, giving riseto a 2 decades broad peak around 7.6×10⁻⁶ G0 (Fig. 7.5 d).This broadening may have todo with the previously mentioned quantum interference effect. Since meta-substitutionis related to destructive quantum interference, the transmission function should have adip or ‘anti-resonance’ in between the highest occupied molecular orbital (HOMO) andthe lowest unoccupied molecular orbital (LUMO) [11, 24]. Thus, if the alignment of goldFermi energy and the HOMO-LUMO gap varies slightly from one molecular configura-tion to another, it would have a larger effect on the measured conductance than the caseof molecules with para-connection.
The experiments involving the salen structure with the non-aromatic joint betweenthe two halves of the compounds have also been performed but turned to be less consis-tent. No clear and reproducible conductance measurements have been performed yet.The conductance values may be lower, close or even below the detection limit and/orvery sensible to the molecular conformation inside the gap. An example of two mea-surements on m-salen-Cu are displayed in Fig. 7.6. There, two independent measure-ments show different behaviors, albeit the same molecule was deposited. Both of them

7.2. ELECTRONIC MEASUREMENTS
7
127
10 -6 10 -4 10 -2 10 0
Coun
ts (a
.u.)
Conductance (G0)
a)
b)
c)
d) m-salophen-Zn
m-salophen-Zn
p-salophen-Cu
p-salophen
Figure 7.5: One-dimensional conductance histograms of a) p-salophen, b) p-salophen-Cu and c) p-salophen-Zn and d) m-salophen-Zn, constructed from selected traces using the filter described in chapter 2 from themeasurements diplayed in Fig.7.4 a) at a bias voltage of 0.1 V and an electrode speed of 2 to 6 nm/s. Theshaded areas correspond to log-normal distribution fitted to the data which conductance value and width arelisted in 7.1. At least two samples were measured for each compound, in the second junction the values ofthe low conductance peak were: 2.0 ×10⁻⁵ G0 for p-salophen-Cu, 2.8 ×10⁻⁵ G0for p-salophen-Zn and 2.8×10⁻⁵ G0 for m-salophen-Zn .

7
128 7. SALEN AND SALOPHEN COMPOUNDS
10
0
a) b)
1 2 0 1 2
-6
10 -4
10 -2
10 0
Electrode displacement (nm)
Cond
ucta
nce
(G0)
High
Low
Figure 7.6: 2D-conductance vs. electrode displacement of m-Salen-Cu using 3000 consecutive traces at a biasvoltage of a) 0.3 and b) 0.2 V and an electrode speed of 4nm/s using 80 bins per decade and 70 bins per nm.The measurements were performed in two different samples.
present a low yield of plateau formation, as visible from the color contrast between theplateau traces and the empty traces background. On the left, the plateaus run parallel tothe x-axis at values around 1×10⁻⁶ G0. In contrast, in the right panel there are shorterplateaus around 1×10⁻⁵ G0 up to 1.3 nm but some traces extend for longer at values withconductance droping to 1×10⁻⁶ G0. So far the data is non-conclusive but certainly thesalen structure shows lower conductance values than the para-substituted salophens, atleast in the case of copper complexation.
In summary we have measured molecular conductance of salen and salophen com-plexes. The results show that the configuration, in which the salophen units are con-nected to the electrodes, has a dramatic influence on the electrical properties of themolecule. We can associate this influence to quantum interference effects of the para- ormeta- substituted rings leading respectively to constructive or destructive interferenceof carriers moving along the backbone. If this interpretation is right, it implies that themain pathway for charge carriers in these molecules goes through the organic backboneand not through the metallic ion. This observation is confirmed by the fact that metal-ion inclusion only slightly changes the conductance values; it may be that the metal ionshave a small gating effect on the conductance value of the molecules. In the case of zinc,the molecular conductance is enhanced while for copper it is diminished. Another im-portant role of the metallic atoms is to grant rigidity to the molecular structures, whichcan be related to the narrowing of the conductance peaks and the corresponding muchbetter visibility of the molecular features (e.g. plateaus) in the conduction histograms.
In the case of the salen architecture, more exploration is needed to draw conclu-sions. Preliminarily, the salophen structure gives rise to a lower conductance but a bet-ter defined plateau behavior, in the case of meta-substitution. This may indicate that thealiphatic chain together with the meta-substitution ‘deactivate’ the pathway through theorganic framework, promoting in this way conduction through the metal ion.

REFERENCES
7
129
REFERENCES[1] T. P. Yoon and E. N. Jacobsen, Privileged chiral catalysts, Science 299, 1691 (2003).
[2] N. S. Venkataramanan, G. Kuppuraj, and S. Rajagopal, Metal–salen complexesas efficient catalysts for the oxygenation of heteroatom containing organic com-pounds—synthetic and mechanistic aspects, Coordination Chemistry Reviews 249,1249 (2005).
[3] M. Orio, O. Jarjayes, H. Kanso, C. Philouze, F. Neese, and F. Thomas, X-Ray struc-tures of copper(II) and nickel(II) radical salen complexes: The preference of galactoseoxidase for copper(II), Angewandte Chemie - International Edition 49, 4989 (2010).
[4] O. B. Dor, S. Yochelis, A. Radko, K. Vankayala, E. Capua, A. Capua, S.-H. Yang, L. T.Baczewski, S. S. P. Parkin, R. Naaman, et al., Magnetization switching in ferromag-nets by adsorbed chiral molecules without current or external magnetic field, NatureCommunications 8 (2017).
[5] L. Chiang, K. Herasymchuk, F. Thomas, and T. Storr, Influence of Electron-Withdrawing Substituents on the Electronic Structure of Oxidized Ni and Cu SalenComplexes, Inorganic Chemistry , 150527115639006 (2015).
[6] T. Kurahashi and H. Fujii, One-electron oxidation of electronically diverse man-ganese(III) and nickel(II) salen complexes: Transition from localized to delocalizedmixed-valence ligand radicals, Journal of the American Chemical Society 133, 8307(2011).
[7] Y. Yuanyuan, H. Jingya, L. Bingxin, and X. Lan, Enantioselective ito electrode modi-fied with chiral salen co(ii) complex, Chemistry Letters 39, 690 (2010).
[8] L. Chiang, K. Herasymchuk, F. Thomas, and T. Storr, Influence of Electron-Withdrawing Substituents on the Electronic Structure of Oxidized Ni and Cu SalenComplexes, Inorganic Chemistry , 150527115639006 (2015).
[9] Y. S. Park, A. C. Whalley, M. Kamenetska, M. L. Steigerwald, M. S. Hybertsen,C. Nuckolls, and L. Venkataraman, Contact chemistry and single-molecule con-ductance: a comparison of phosphines, methyl sulfides, and amines, Journal of theAmerican Chemical Society 129, 15768 (2007).
[10] R. Frisenda, S. Tarkuç, E. Galán, M. L. Perrin, R. Eelkema, F. C. Grozema, and H. S. J.van der Zant, Electrical properties and mechanical stability of anchoring groups forsingle-molecule electronics, Beilstein Journal of Nanotechnology 6, 1558 (2015).
[11] T. Markussen, R. Stadler, and K. S. Thygesen, The relation between structure andquantum interference in single molecule junctions, Nano Letters 10, 4260 (2010).
[12] C. M. Guédon, H. Valkenier, T. Markussen, K. S. Thygesen, J. C. Hummelen, and S. J.Van Der Molen, Observation of quantum interference in molecular charge transport,Nature Nanotechnology 7, 305 (2012).

7
130 REFERENCES
[13] C. R. Arroyo, S. Tarkuc, R. Frisenda, J. S. Seldenthuis, C. H. M. Woerde, R. Eelkema,F. C. Grozema, and H. S. van der Zant, Signatures of quantum interference effects oncharge transport through a single benzene ring, Angewandte Chemie InternationalEdition 52, 3152 (2013).
[14] G. C. Solomon, D. Q. Andrews, T. Hansen, R. H. Goldsmith, M. R. Wasielewski, R. P. V.Duyne, and M. A. Ratner, Understanding quantum interference in coherent molec-ular conduction, The Journal of Chemical Physics 129, 054701 (2008).
[15] C. R. Arroyo, R. Frisenda, K. Moth-Poulsen, J. S. Seldenthuis, T. Bjørnholm, andH. S. van der Zant, Quantum interference effects at room temperature in opv-basedsingle-molecule junctions, Nanoscale Research Letters 8, 234 (2013).
[16] J. Ponce, C. R. Arroyo, S. Tatay, R. Frisenda, P. Gaviña, D. Aravena, E. Ruiz, H. S. J.van der Zant, and E. Coronado, Effect of metal complexation on the conductanceof single-molecular wires measured at room temperature, Journal of the AmericanChemical Society 136, 8314 (2014).
[17] Z. F. Liu, S. Wei, H. Yoon, O. Adak, I. Ponce, Y. Jiang, W. D. Jang, L. M. Campos,L. Venkataraman, and J. B. Neaton, Control of single-molecule junction conductanceof porphyrins via a transition-metal center, Nano Letters 14, 5365 (2014).
[18] M. L. Perrin, C. J. Verzijl, C. A. Martin, A. J. Shaikh, R. Eelkema, J. H. Van Esch, J. M.Van Ruitenbeek, J. M. Thijssen, H. S. Van Der Zant, and D. Dulic, Large tunableimage-charge effects in single-molecule junctions, Nature Nanotechnology 8, 282(2013).
[19] S. Fujii, S. Marqués-González, J.-Y. Shin, H. Shinokubo, T. Masuda, T. Nishino, N. P.Arasu, H. Vázquez, and M. Kiguchi, Highly-conducting molecular circuits based onantiaromaticity, Nature Communications 8, 15984 (2017).
[20] F. Schwarz, G. Kastlunger, F. Lissel, C. Egler-Lucas, S. N. Semenov, K. Venkatesan,H. Berke, R. Stadler, and E. Lörtscher, Field-induced conductance switching bycharge-state alternation in organometallic single-molecule junctions, Nature Nan-otechnology 11, 170 (2016).
[21] M. Ruben, A. Landa, E. Lörtscher, H. Riel, M. Mayor, H. Görls, H. B. Weber, A. Arnold,and F. Evers, Charge transport through a cardan-joint molecule, Small 4, 2229 (2008).
[22] S. Marques-Gonzalez, D. S. Yufit, J. A. K. Howard, S. Martin, H. M. Osorio, V. M.Garcia-Suarez, R. J. Nichols, S. J. Higgins, P. Cea, and P. J. Low, Simplifying the con-ductance profiles of molecular junctions: the use of the trimethylsilylethynyl moietyas a molecule-gold contact, Dalton Trans. 42, 338 (2013).
[23] S. J. Higgins and R. J. Nichols, Metal/molecule/metal junction studies oforganometallic and coordination complexes; what can transition metals do formolecular electronics? Polyhedron 140, 25 (2018), molecules for devices: the in-organic chemistry behind modern technologies.

REFERENCES
7
131
[24] D. Z. Manrique, C. Huang, M. Baghernejad, X. Zhao, O. a. Al-owaedi, H. Sadeghi,V. Kaliginedi, W. Hong, M. Gulcur, T. Wandlowski, M. R. Bryce, and C. J. Lambert,A quantum circuit rule for interference effects in single-molecule electrical junctions,Nature Communications 6, 1 (2015).


8THE CONDUCTANCE OF
MISCELLANEOUS MOLECULAR
SYSTEMS
Valía más renunciar, porque la renuncia a la acción era la protesta misma y no sumáscara.
It was worthier quiting, because quiting is the very action of protest and not its mask.
Rayuela, Julio Cortazar
In this chapter we discuss other interesting molecular systems that have been studied inlesser detail but that shine some light on the kind of problems and new possibilities thatthe field of molecular electronics offers. Finally, we reflect on the directions that single-molecule electronics is going and which ones in our opinion are the most promising ones.
133

8
134 8. THE CONDUCTANCE OF MISCELLANEOUS MOLECULAR SYSTEMS
8.1. OTHER INTERESTING SYSTEMSIn this chapter we discuss other interesting molecular systems that have been studied inlesser detail but that shine some light on the kind of problems and new possibilities thatthe field of molecular electronics offers. Finally, we reflect on the directions that single-molecule electronics is going and which ones in our opinion are the most promisingones.
8.2. REDOX CENTERS: TTF-INDENOFLUORENESAn interesting molecular system comprises the indenofluorene (IF) backbone, function-alized with tetrathiofulvane moieties (TTF)1. Our conductance measurements are framedin the context of the study of the TTF groups embedded in different backbones [1–3].Since the early days of molecular electronics TTF compounds attracted a lot of attentionbecause polymers containing them showed a measurable conductance, an unexpectedproperty in those days. With the development of single-molecule electronics TTF be-came an attractive candidate to be used as active parts of single-molecule wires. Be-cause unpaired spins (radicals) can be generated upon oxidation, these systems have abig potential for applications in spintronics as well as in electronics when used an elec-trochemical molecular switch [4, 5].
AcSSAc
SS
SHexHexS
SHexHexS
SS
SAcAcS
SHexHexS
SHexHexS
SS
SS
SAc
AcS
SHexHexS
SHexHexS
SS
SS
(1) s-IF
SAcAcS
SHexHexS
SHexHexS
SS
SS
(2) pp-IF (3) mm-IF (4) pm-IF
Figure 8.1: Schematic of the molecular systems addressed in this section: 1) the un-extended IF (s-IF) 2) para-para phenyl-extended IF (pp-IF), 3) meta-meta phenyl-extended IF (mm-IF) and para-meta phenyl-extendedIF (pm-IF).
The molecules considered here are displayed in Fig. 8.1. The chemical design, in con-trast to previous attempts [2, 3], uses a planar indenoflurene (IF) backbone to couple two
1We thank Prof. Mogens Brøndsted Nielsen from the University of Copenhagen for synthesis and basic char-acterization of the TTF-Indenofluorenes. Part of this section has been published in [1]

8.2. REDOX CENTERS: TTF-INDENOFLUORENES
8
135
TTF units perpendicular to the charge carrier pathway [5]. The coupling with the elec-trode is achieved by thiol groups at the ends of the molecules and it is completed after thecleavage of the acetyl protecting group by the usage of tetrabutylammonium hydroxide.In compound (1) (s-IF) the thiol group is attached directly to the indenofluerene struc-ture. In the three remaining compounds phenyl spacers are located between the thiolgroups and the central part; the difference among them is the way the first and secondphenyl rings are connected: (2)(pp-IF) para-para, (3) meta-meta (mm-IF)and (4) para-meta (pm-IF) respectively.
0 1 2
10−6
10−4
10−2
100
0 1 2
10−6
10−4
10−2
100
0 1 2
10−6
10−4
10−2
100
0 1 2
10−6
10−4
10−2
100
Cond
ucta
nce
(G0)
Cond
ucta
nce
(G0)
Electrode displacement (nm)
a) b)
c) d)
Figure 8.2: Two-dimensional conductance vs. electrode displacement histograms constructed from 5000 in-dividual traces of compounds a) s-IF (1), b) pp-IF (2), c)mm-IF (3) and d) pm-IF (4). The molecules weredrop casted from a 0.5 µM solution in CH2Cl2; a concentrated solution of tetrabutylammonium hydroxide(Bu4NOH) in CH2Cl2 was used to cleave the acetyl group to form the thiolate end group. The bias voltage was0.1 V and the electrode speed was 6 nm/s.
As mentioned in the introduction of this dissertation the incorporation of a meta-connected phenyl ring in the electron pathway can drastically reduce the conductanceof a molecule due to destructive quantum interference. Therefore one would expect

8
136 8. THE CONDUCTANCE OF MISCELLANEOUS MOLECULAR SYSTEMS
that the conductance of these molecules should follow the sequence: s-IF (1) >pp-IF(2)>pm-IF (3) >mm-IF (4).
10-6 10-4 10-2 100
Conductance (G0)
a)
b)
c)
d)
Coun
ts (a
.u.)
Figure 8.3: One-dimensional conductance histogram of the full data corresponding to the same measurementsof Fig. 8.2. Histogrmas correspond to (1)s-IF a), (2)pp-IF b) (3)pm-IF c) and (4)mm-IF a). Green areas corre-spond to log-normal distributions fitted to the data. For compounds (1) and (3) such fits did not describe thefeatures observed in the 2D-conductance vs. displacement histograms.
Figure 8.2 displays the two-dimensional conductance vs. electrode displacementhistograms of the compounds. The histograms predominantly show an accumulationof counts in the region from 0 to 0.5 nm of displacement dropping from around 1 ×

8.2. REDOX CENTERS: TTF-INDENOFLUORENES
8
137
10−4 G0 to the noise level of about 2× 10⁻⁷. This behavior corresponds to the one ex-pected for single-barrier tunneling, in which no molecule bridges the electrodes afterthe gold contacts snap apart. On top of this signal, regions can be identified in whichthe conductance vs. displacement traces show step-like features at characteristic con-ductance values; these traces are attributed to molecular junctions. The yield for thesetraces is approximately 5–20% depending on the specific molecule; this is a typical valuefor these types of MCBJ experiments.
0 1 2
10−6
10−4
10−2
100
Cond
ucta
nce
(G0)
Electrode displacement (nm)
0 1 2
10−6
10−4
10−2
100
Cond
ucta
nce
(G0)
Electrode displacement (nm)
Conductance (G0)
Conductance (G0)
Coun
ts (a
.u.)
Coun
ts (a
.u.)
a) b)
c) d)
10 -6 10 -4 10 -2 10 0
10 -6 10 -4 10 -2 10 0
Figure 8.4: a) Two-dimensional conductance vs. electrode displacement of s-IF (1). Shaded area correspondsto the displacement section considered to build its partial one-dimensional conductance histogram displayedin b). c) Two-dimensional conductance vs. electrode displacement of pm-IF (3), shaded area correspond to thedisplacement section consider to build its partial conductance histogram displayed in d). The green shadedareas in b) and d) depict log-normal distributions fitted to the data.
To obtain the most probable conductance values of the compounds, one-dimensionalhistograms have been constructed. A log-normal distribution was fitted in the regionsof conductance where plateau-like features are observed. For s-IF there is a low yieldof junction formation and the peak seen in the conductance histogram does not corre-spond to the feature seen in the two-dimensional conductance vs. electrode displace-ment histogram. Similarly, in the case of pm-IF the features of molecular conductanceappear near the noise level, thus there is no clear peak in the conductance histogram. Toobtain the single-molecule conductance value in both of these cases a partial conduc-tance histogram has been constructed by integration of the two-dimensional histogramfor a limited displacement range as indicated by the shaded areas in Fig. 8.4a) and c).The resulting one-dimensional conductance histograms are displayed in Fig. 8.4 b) and

8
138 8. THE CONDUCTANCE OF MISCELLANEOUS MOLECULAR SYSTEMS
d). The most probable conductance value for the molecular is obtained by fitting a log-normal distribution to these data sets.
The most probable conductance values obtained from the fits are listed in table 8.1,for at least 2 different samples for each molecule. Surprisingly, contrary to the intuition,the progression of conductance values follows the rule s-IF>pp-IF>mm-IF> pm-IF. Ex-amples of the quantum interference rule in phenyl rings being turned up side downare not common. For example in reference [6] two meta connected phenyl rings giverise to a higher charge transfer rate than its para connected counterpart when used as abridge between a donor and an acceptor unit. Nevertheless those result are not directlytransferable to charge transport measurements. Indeed the same two phenyl ring sys-tem gives rise to a high conductance in the para configuration and a low conductance inthe meta configuration.
We must, however, look at these result with a bit of skepticism. Although the resultsunambiguously show a higher conductance value for mm-IF than for pm-IF, we mustbe cautious on concluding that in this case the replacement of a para-connected phenylring by a meta-connected ring increases the sulfur to sulfur molecular conductance. Inthis respect, a few observations can be made: first the length of the mm-IF’s traces isshorter than the ones of pm-IF and almost as long as the ones of s-IF. Furthermore, theconductance value obtained from mm-IF lies near the conductance peak observed in s-IF in Figure 8.3. This may indicate the presence of other type of configuration in which,for example, the electron injection (or collection), does not happen through the thiolgroups but through the π-cloud of one of the phenyl rings. If that is the case then theobserved conductance peak of mm-IF could be the result of a different configurationand the conductance of the sulfur to sulfur configuration may be below the detectionlimit as intuition would predict.
Condutance (G0)molecule sample 1 sample 2 sample 31) s-IF 2.1 ×10⁻⁴ 1.4 ×10⁻⁴
2) pp-IF 3.4 ×10⁻⁵ 2.8 ×10⁻⁵ 2.8 ×10⁻⁵
3) mm-IF 1.4 ×10⁻⁵ 1.5 ×10⁻⁵ 2.1 ×10⁻⁵
4) pm-IF 2.1 ×10⁻⁶ 1.4 ×10⁻⁶
Table 8.1: Most probable conductance values for the compounds extracted from a log-normal fitting of theconductance histograms. For compounds (1) and (3) the values are obtained from partial conductance his-tograms as described in Figure 8.4.
To exploit the potential magnetic properties of these molecules cryogenic temper-atures are needed. In reference [1] this topic has been addressed with electromigratedbreak junction measurements.
8.3. POLYOXOMETALATES (POM)Another interesting branch of molecular electronics is the coupling of inorganic clustersto electrodes through organic ligands, in other words, molecular systems that can sus-tain localized clusters of inorganic material. A remarkable example of this is a family

8.3. POLYOXOMETALATES (POM)
8
139
of transition metal oxygen anion clusters (polyoxometalates or POMs for convenience)which are compounds that consist of three or more transition metal oxyanions linkedtogether by shared oxygen atoms to form closed 3-dimensional frameworks [7, 8]. ThePOM architecture offers a way to accommodate a specific number of atoms caged in arobust oxometallic frame.
The capability to encase a well-defined 3-dimensional arrangement of inorganic atomsgrants these compounds the potential to study and perhaps control of the properties of,for example, the spin degree of freedom of single atoms within the structure. It is partic-ularity interesting to electronically address these degrees of freedom and test if single-molecule electronics techniques allow for control of these systems. Compared to othermagnetic systems like spin crossover molecules [9], or molecules with a multitude ofmagnetic atoms. These molecules poses the particularity that the central atom(s) canbe framed in a rigid three-dimensional inorganic cage and that the flexibility of organicchemistry can be used for connections to metallic electrodes. In the context of molecularelectronics there has been interest in measuring inorganic clusters connected to metal-lic electrodes through organic frameworks [10, 11], because it provides a tool to exploitthe magnetic degree of freedom of heavy elements and in the future use them for spin-tronic applications. In this work we have characterized the conductance features of thetwo compounds displayed in Figure 8.5.
H2N NH 2
a) POM1
b) POM2
HN
ON
HN
ON
Figure 8.5: a) Structure of the molecules considered in this study based on the basic structure[MnIIIMo6O24L2]3−. In a) the POM unit is directly connected to a amine group that is intended to be theanchoring position between the molecule and the metallic electrodes (POM1). In b) a spacer has been intro-ducer between the molecule and the anchoring sites, and in this case the intended anchoring group are thepyridine end-groups (POM2).
The system considered here is depicted in Figure 8.5. It consists of an inorganic shellthat surrounds a single manganese atom that provides the magnetic characteristic ofthe compounds. We have tested the possibility of measuring single-manganese POMsusing the mechanical break junction technique. The experiments were performed by

8
140 8. THE CONDUCTANCE OF MISCELLANEOUS MOLECULAR SYSTEMS
Bias voltage (V) Conductance (G0) FWHM (dec)0.05 2.2×10⁻⁵ 1.60.1 1.9×10⁻⁵ 1.20.15 1.4×10⁻⁵ 1.20.2 1.2×10⁻⁵ 1.40.25 8.3×10⁻⁶ 1.6
Table 8.2: Conductance value and full width half maximum of POM1.
drop-casting a solution with a low concentration of the target molecule (≈ 10µM) in ace-tonitrile. Then a set of 2000 conductance traces (G=I/V) were measured at a electrodespeed of 4 nm/s using bias voltages ranging from 0.05 to 0.3 V at intervals of 0.05 V.
The results of this experiment for the top molecule in Fig. 8.5 are summarized inFig. 8.6. The two-dimensional conductance vs. electrode distance histogram (left panel)shows the absence of clear plateau-like features. Over all the trace length, however, islarger than the one of measurements on the device prior to drop-casting of the molecule.Next to the two-dimensional histograms the 1D-conductance traces of the measurementof the same junction at different bias voltage are displayed. The measurement at 0.1 Vshows a clear peak at a few times 1×10⁻⁵ G0. Remarkably, this feature moves to lowervalues as a function of bias voltage but at the same time its amplitude decreases. Whena log-normal distribution is fitted to the histograms the obtained values of conductance,listed in Table 8.2, follow the same tendency.
-0.5 0 0.5 1 1.5 2 2.5
10-6
10-4
10-2
100
Electrode displacement (nm)
Cond
ucta
nce
(G0)
10-6 10-4 10-2 100
0.1 V
0.15 V
0.2 V
0.25 V
0.05 V
Conductance (G0)
Coun
ts (a
.u.)
a) b)
Figure 8.6: a) Example of a two-dimensional conductance vs. electrode displacement histogram constructedfrom 2000 consecutive traces of POM1. b) Series of one-dimensional conductance histograms at different biasvoltages. They are offset in the vertical direction for clarity.
The lack of clear plateaus makes a further characterization difficult. In terms ofchemical design it is desirable to have a longer molecule. In that way it would be eas-ier to unambiguously recognize molecular traces from empty ones. With this in mind

8.3. POLYOXOMETALATES (POM)
8
141
-0.5 0 0.5 1 1.5
10-6
10-4
10-2
100
Electrode displacement (nm)
Cond
ucta
nce
(G0)
10-6 10-4 10-2 100
Conductance (G0)
Coun
ts (a
.u.)
0.15 V
0.1 V
0.2 V
0.25 V
0.3 V a) b)
Figure 8.7: Example of a two-dimensional conductance vs. electrode displacement histogram constructedfrom 2000 consecutive traces of POM2. b) Series of one-dimensional conductance histograms at different biasvoltages. They are offset for clarity.
we decided to measure the compound POM2 displayed on Fig. 8.5 b). This compoundshares the same polyoxometalate center with the POM1 molecule and its main differ-ence lies in its length; the amine end groups in POM1 are extended using a pyridine ringthat is intended to be the new anchoring site.
In the case of the long POM2 the same experiment showed similar results. They aredisplayed in the same way as for POM1 in Fig. 8.7. In the whole range from 0.1 to 0.3 Vof bias voltage the 1D-conductance histograms show a single peak in the same regionas POM1. Intriguingly, the length of the traces in the latter case does not correspond tothe difference in molecular length between POM1 and POM2; the traces even show theopposite trend. The conductance values obtained by fitting log-normal distributions tothe data are displayed in Table 8.3. It is clear that the measured conductance values areapproximately the same as for POM1 and they follow the same downwards trend as afunction of voltage.
Bias voltage (V) Conductance (G0) FWHM (dec)0.1 1.7×10⁻⁵ 1.40.15 1.5×10⁻⁵ 1.40.2 1.0×10⁻⁵ 1.50.25 9.6×10⁻⁶ 1.70.3 5.0×10⁻⁶ 1.7
Table 8.3: Conductance value and full width half maximum of POM2.
From the above mention experiments we conclude that the measured conductanceof the POM2 molecule does not correspond to the fully extended molecule. The similar-ities between the measurements on the two compounds suggest that the measured fea-

8
142 8. THE CONDUCTANCE OF MISCELLANEOUS MOLECULAR SYSTEMS
tures on the POM2 molecule are a consequence of charge injection and collection at anintermediate site of the molecule, presumable, the nitrogen atom present in the spacerbetween the POM center and the pyridine groups which correspond to the position ofthe amine group of the POM1.
Few improvements in the chemical design can be suggested to make the POM molecu-les suitable for MCBJ studies. In the first place, the choice of anchoring moieties such asthiol or methylsulfide or even the one used for POM1, amine have shown a better cou-pling capability than pyridine [12]. The second design issue is the presence of the crossconjugation path between the POM center and the pyridine anchoring group given bythe presence of the oxygen atom. Another ligand aternative that preserves a conjugatedpath from the anchoring moiety to the POM unit may increase the molecular conduc-tance.
From another perspective the molecules analyzed in this section are interesting can-didates for low-temperature, three-terminals measurements in a magnetic field. Thesingle-spin nature of POM1 and POM2 makes them interesting for studying their single-molecule magnet properties that these molecules exhibit in bulk, on the level of a singlemolecule.
8.4. OUTLOOKThroughout this dissertation we have discussed important aspect concerning single-molecule devices including molecular design, experiment design and statistical analy-sis. We have studied new strategies to bind molecules to metallic electrodes (chapter 3),in which we showed that the hybridization of carbon atoms involved in C-Au bonds pro-vide a lower barrier when it is sp hybridized than when it is sp3. One of the puzzlingfeatures of the Alkynyl terminated oligo-phenylene (OPA) family is the non exponentialdependence of the molecular conductance. We point out that there is no a clear expla-nation for such a behaviour. This is a good example of how single-molecule experimentsresist simple explanations.
We have intensively worked on bio-inspired molecules; the curcuminoids and sa-lophens are good examples of compounds similar to molecules found in nature. Theexiting part of this approach is that the chemical design can take advantage of the al-ready set ’biological design’ and apply it in a completely different context. Our workon curcuminoids has shown that simple architectures can give rise to various electronicfeatures upon chemical modifications.
Finally, we have presented a couple of examples that extend this study to some otherdirections. The indenofluoreces are an example of combining the knowledge of the earlydays of molecular- and polymer-electronics, using the TTF units, with the molecular de-sign for single-molecule measurements to achieve new functionalities. In contrast, thePOMs’ are a new architecture that combines the inorganic chemistry tool-set with theflexibility of organic ligands and exploit this combination to create systems with isolatedhigh spins ground states.
The field of single-molecule electronics is growing in many ways. Up to now single-molecule experiments have contributed to the fundamental understanding of transportthrough organic molecules and their interaction with metals but, despite the efforts,there is not a foreseeable application in which single molecules could replace existing

REFERENCES
8
143
electronic components. The main problem is still that there is no reliable way to arrangedifferent molecules in a way that they would work as a designed circuit. Moreover, the re-producibility achievable in single conductance experiments relays on statistics, makingthe performance of a single device unpredictable.
From the technological perspective, single molecules are not yet a suitable replace-ment for silicon-based electronic components including transistors or diodes. The ad-vantages of molecular design are masked by the lack of control over the binding con-figurations to the electrodes. At this point, it is hard to imagine that the existing archi-tecture of electronics can be adapted to one that incorporates single-molecular compo-nents. Nevertheless, molecules do offer a new potential in a different scheme of devices.One could imagine devices (a sensor for example) with a high degree of redundancy thatcould rely on the switching or activation of a single-molecule. In other words, such adevice would have various single molecule active sites, but its response only needs theactivation of only one of them. Biological systems work somehow in this way; for exam-ple, the eye has receptors that can ‘switch on’ by the action of a single photon [13] andin some cases, this single switch is able to trigger brain activity. This kind of devices mayneed the combination of conventional electronics with ionic or electrochemical currents[14].
There is also another side of the coin that is at least as exiting. It is the one thattouches upon the unknown fundamental questions that remain to be answered. To givea taste of the simplicity of a question that is still unanswered: it is still not clear how themolecular energy levels align with the electrode Fermi-energy. In summary, despite ofthe limited amount of atoms in a single molecule the abundance of degrees of freedomsmakes it an intricate system to study. One the next experimental challenges is to couplesingle molecules to other kind of stimuli, light [15, 16] for example or to control molec-ular junctions in liquid environments, in which a chemical reaction takes place while acurrent is driven through a single molecule.
REFERENCES[1] M. Mansø, M. Koole, M. Mulder, I. J. Olavarria-Contreras, C. L. Andersen, M. Jevric,
S. L. Broman, A. Kadziola, O. Hammerich, H. S. J. van der Zant, and M. B. Nielsen,Synthesis and single-molecule conductances of neutral and cationic indenofluorene-extended tetrathiafulvalenes: Kondo effect molecules, The Journal of Organic Chem-istry 81, 8406 (2016).
[2] Z. Wei, T. Li, K. Jennum, M. Santella, N. Bovet, W. Hu, M. B. Nielsen, T. Bjørnholm,G. C. Solomon, B. W. Laursen, and K. Nørgaard, Molecular junctions based on samsof cruciform oligo(phenylene ethynylene)s, Langmuir 28, 4016 (2012).
[3] C. R. Parker, Z. Wei, C. R. Arroyo, K. Jennum, T. Li, M. Santella, N. Bovet, G. Zhao,W. Hu, H. S. J. van der Zant, M. Vanin, G. C. Solomon, B. W. Laursen, K. Nørgaard,and M. B. Nielsen, A new class of extended tetrathiafulvalene cruciform molecules formolecular electronics with dithiafulvene-4,5-dithiolate anchoring groups, AdvancedMaterials 25, 405 (2013).

8
144 REFERENCES
[4] S. J. van der Molen and P. Liljeroth, Charge transport through molecular switches,Journal of Physics: Condensed Matter 22, 133001 (2010).
[5] J. Fock, M. Leijnse, K. Jennum, A. S. Zyazin, J. Paaske, P. Hedegård, M. Brønd-sted Nielsen, and H. S. J. van der Zant, Manipulation of organic polyradicals in asingle-molecule transistor, Phys. Rev. B 86, 235403 (2012).
[6] N. Gorczak, N. Renaud, S. Tarkuc, A. J. Houtepen, R. Eelkema, L. D. A. Siebbeles,and F. C. Grozema, Charge transfer versus molecular conductance: molecular orbitalsymmetry turns quantum interference rules upside down, Chem. Sci. 6, 4196 (2015).
[7] M. Clemente-León, E. Coronado, C. J. Gómez-García, and E. Martínez-Ferrero,Polyoxometalates as inorganic building blocks of multifunctional molecular mate-rials, Journal of Cluster Science 13, 381 (2002).
[8] G. Cao, J. Xiong, Q. Xue, S. Min, H. Hu, and G. Xue, Organic–inorganic heteropolyblue based on dawson-type molybdosulfate and organic dye and its characterizationand application in electrocatalysis, Electrochimica Acta 106, 465 (2013).
[9] F. Prins, M. Monrabal-Capilla, E. A. Osorio, E. Coronado, and H. S. J. van der Zant,Room-temperature electrical addressing of a bistable spin-crossover molecular sys-tem, Advanced Materials 23, 1545 (2011).
[10] G. Lovat, B. Choi, D. W. Paley, M. L. Steigerwald, L. Venkataraman, and X. Roy,Room-temperature current blockade in atomically defined single-cluster junctions,Nature Nanotechnology 12, 1050 (2017).
[11] A. Lombana, C. Rinfray, F. Volatron, G. Izzet, N. Battaglini, S. Alves, P. Decorse,P. Lang, and A. Proust, Surface organization of polyoxometalate hybrids steered bya 2d supramolecular ptcdi/melamine network, The Journal of Physical Chemistry C120, 2837 (2016).
[12] R. Frisenda, S. Tarkuç, E. Galán, M. L. Perrin, R. Eelkema, F. C. Grozema, and H. S. J.van der Zant, Electrical properties and mechanical stability of anchoring groups forsingle-molecule electronics, Beilstein Journal of Nanotechnology 6, 1558 (2015).
[13] J. N. Tinsley, M. I. Molodtsov, R. Prevedel, D. Wartmann, J. Espigulé-Pons, M. Lauw-ers, and A. Vaziri, Direct detection of a single photon by humans, Nature communi-cations 7, 12172 (2016).
[14] J. Zhang, A. M. Kuznetsov, I. G. Medvedev, Q. Chi, T. Albrecht, P. S. Jensen, and J. Ul-strup, Single-molecule electron transfer in electrochemical environments, ChemicalReviews 108, 2737 (2008), pMID: 18620372.
[15] R. Chikkaraddy, B. de Nijs, F. Benz, S. J. Barrow, O. A. Scherman, E. Rosta, A. Deme-triadou, P. Fox, O. Hess, and J. J. Baumberg, Single-molecule strong coupling at roomtemperature in plasmonic nanocavities, Nature 535, 127 (2016).

REFERENCES
8
145
[16] F. Benz, M. K. Schmidt, A. Dreismann, R. Chikkaraddy, Y. Zhang, A. Demetri-adou, C. Carnegie, H. Ohadi, B. de Nijs, R. Esteban, J. Aizpurua, and J. J. Baum-berg, Single-molecule optomechanics in “picocavities”, Science 354, 726 (2016),http://science.sciencemag.org/content/354/6313/726.full.pdf .


SUMMARY
This thesis describes an experimental investigation of the electronic properties of sin-gle molecules focusing on in simple organic systems with the aim of shine light on theircharge transport properties. Chapter 1 introduces the field of molecular electronics andfocuses on the development of single-molecule electronics. The terminology and themain historical aspects of the field are presented and discussed. The relevant theoret-ical concepts are briefly described as well. The standard techniques to contact singlemolecules are presented, including electro-migrated junctions, scanning-probe based-break junctions and mechanically controlled break junctions (MCBJ). The latter is ex-plained in more detail because it is the main tool in this dissertation.
chapter 2 describes the experimental methods used to obtain statistically relevantdatasets. In the first part the distinction between empty and molecular traces is dis-cussed and a method to filter the large datasets and split them in meaningful subsetsis proposed. Then, the concept of junction formation yield is examined, and its impacton the information obtained from single-molecule conductance measurement is eval-uated. The main conclusion is that when the yield of junction formation is high, theconductance values obtained from the one-dimensional conductance histogram maynot represent the value of a single molecule in the junction. At the end of the chapterthe problem of spurious contamination is systematically addressed and a protocol ofcleaning is evaluated and standardized.
Chapter 3 presents the single-molecule conductance of a series of alkynyl terminatedolygophenylenes (OPA) with 1 to 4 phenyl units. The result of the conductance measure-ment show that OPA 2, 3 and 4 produce stable metal-molecule-metal junction through adirect carbon gold bound thanks to the de-protonation of the alkynyl groups. Unexpect-edly, the molecular conductance does not decay exponentially as the molecular lengthincreases. The second part of the chapter shows that the same anchoring strategy allowsfor the formation of single-molecule junctions comprising functionalized compounds,in this case, a radical molecule. The experiments reveal that, at low temperature, Kondo-like behavior is present and, thus, we conclude that the spin degree of freedom is pre-served after the formation of the single-molecule junction with direct Au-C anchoring.
Chapters 4, 5 and 6 describe the investigation of curcuminoid compounds. Thesemolecules mimic the structure of curcumin, a molecule found in the Indian spice turmeric.The first of these chapters discusses the measurements of the single-molecule conduc-tance of two isomers which only differ in the position of the sulfur atom in the thiophenerings that acts as anchoring moeties. There are two main conclusions out of this chapter.First, the position of the sulfur atom in the thiophene end group drastically changes theconductance value and the number of configurations in which the molecule can attachto the electrodes. Sulfur atoms positioned in the outer part of the molecule show a high-conductance state related to a covalent binging to the electrodes and a low-conductancestate related to a non-covalent binding. When the sulfur atom is positioned in the inner
147

8
148 SUMMARY
part of the thiophene ring only a low-conductance state was observed. This latter ob-servation is consistent with a non-covalent binding configuration. The second impor-tant conclusion refers to the potential of curcuminoids as test bed for single-moleculeexperiments since the molecules showed comparable conductance values to well knowsystems such as oligophenyl-ethylenes.
In chapter 5 the electronic properties of a family of curcuminoids are studied. Dif-ferent anchoring groups and functionalizations to the central backbone of the curcuminstructure are tested. The most remarkable conclusion refers to the existence of two dis-tinguishable conductance states of a curcuminoid compound when the beta-diketonegroup is replaced by a boron-difluorine (BF2) group and, at the same time, the anchor-ing groups are methyl-sulfide moieties. In contrast, the free ligand and the copper con-taining functionalization do not show the same behavior; neither do molecules with thesame BF2 group but with different anchoring groups. Further measurements show thata similar, but shorter molecular architecture gives rise to the same qualitative behaviorunder the same combination of functionalization and anchoring strategy.
Chapter 6 explores another kind of modification to the curcumin backbone, in thiscase, the inclusion of nitrogen-containing groups, namely, pyrazole and isoxazole groups.The data show that these compounds have two distinctive conductance states related todifferent electrode displacements. This suggests that the nitrogen inclusions act as al-ternative anchoring groups providing another pathway for charge carriers to cross themolecule. Experiments showing that the high conductance state (related to shorter dis-placements) can be connected and disconnected by modulating the inter-electrode dis-tance, further supporting this interpretation. Although the experiments were performedat room temperature both molecular configurations were stable on the time scale of sec-onds. As a control, another compound with a nitrogenated modification is tested,themolecule contains a phenyl ring with the intention to block the accessibility of the ni-trogen atoms as anchoring groups. Despite that the high-conductance molecular stateswere still visible, the yield of that configuration was lower. Moreover, when the inter-electrode distance was modulated the high conductance state was not recovered. Thus,pyrazole and isoxazole groups do provide another anchoring site that also acts as a chargeinjection (or collection) point. The inclusion of bulky groups near the nitrogen atomspartially, but no totally, reduces the availability of these sites for binding to the elec-trodes.
In chapter 7 the research on two families of molecules, salens and salophenes is pre-sented. These compounds have an asymmetric organic ligand frame that allows for avariety of metalizations. The conductance measurements show the pathway for chargecarriers is important. Specifically, the configuration (meta or para) on which the anchor-ing moieties are connected to the organic backbone of the molecule plays a crucial rolein the conductance value of the molecule. The metalization of the compounds, on theother hand, has a small effect on the conductance. These observations involve quantuminterference effects and the data suggest that the most important pathway for chargecarriers is through the organic backbone and not the metallic atom.
Finally, in chapter 8 various measurements on different sets of molecules are dis-cussed. They are presented in the context of the directions toward the field of single-molecule electronics could follow. Measurements on tetrathiofulvane-functionalized

SUMMARY
8
149
indenofluorenes are presented; these molecules show a counterintuitive trend. Threeisomers are measured each one connected to the central part of the molecule either viatwo para-connected, two meta-connected or one meta- and one para-connected phenylrings. The conductance values of the molecules follows the sequence para-para > meta-meta > meta-para. This contradicts the intuition of quantum interference in single-molecules. The other example presented involves polyoxometalates (POM) which arewell controlled inorganic frameworks that can be combined with organic ligands. Thiskind of compounds may be a good test bed of well-isolated spin systems that can beelectronically addressed with single-molecule electronics techniques. Finally, we dis-cuss aspects of the future of single-molecule electronics based on the systems discussedduring the body of this dissertation.


SAMENVATTING
Dit proefschrift beschrijft een experimenteel onderzoek naar de elektronische eigen-schappen van afzonderlijke moleculen, het onderxoek behelst eenvoudige organischesystemen met als doel licht op hun ladingstransporteigenschappen te laten schijnen.Hoofdstuk 1 introduceert het vakgebied van de moleculaire elektronica en richt zichop de ontwikkeling van ‘single-molecule’ elektronica. De terminologie en de belangrijk-ste historische aspecten van het veld worden gepresenteerd en besproken. De relevantetheoretische concepten worden ook kort beschreven. De standaardtechnieken om con-tact te maken met afzonderlijke moleculen worden gepresenteerd, inclusief elektrischgemigreerde verbindingen, op aftasting gebaseerde breekverbindingen en mechanischgestuurde breekverbindingen (MCBJ). De laatste techniek wordt in meer detail uitgelegdomdat het de belangrijkste is in dit proefschrift.
Hoofdstuk 2 beschrijft de experimentele methoden die worden gebruikt om statis-tisch relevante datasets te verkrijgen. In het eerste deel wordt het onderscheid tussenlege en moleculaire verbindungen besproken en wordt een methode voorgesteld om degrote datasets te filteren en te splitsen in subsets. Vervolgens wordt het concept vanhet rendement van de bindingsformatie onderzocht en wordt de impact op de informa-tie verkregen uit de meting van de geleiding van een enkel molecuul geëvalueerd. Dehoofdconclusie is dat wanneer het rendement van de bindingsformatie hoog is, de ge-leidingswaarden verkregen uit het eendimensionale geleidingshistogram mogelijk nietde waarde van een enkel molecuul vertegenwoordigt. Aan het einde van het hoofd-stuk wordt het probleem van mogelijke vervuiling besmetting systematisch aangepakten wordt een reinigingsprotocol geëvalueerd en gestandaardiseerd.
Hoofdstuk 3 presenteert de geleiding van een enkel molecuul va neen reeks vanalkynyl-getermineerde olygofenylenen (OPA) met 1 tot 4 fenyleenheden. Het resultaatvan de geleidingsmeting is dat OPA 2, 3 en 4 een stabiele metaal-molecuul-metaal ver-binding produceren via een directe koolstof-goud binding door de de-protonering vande alkynylgroepen. Onverwacht daalt de moleculaire geleiding niet exponentieel als demoleculaire lengte toeneemt. Het tweede deel van het hoofdstuk laat zien dat dezelfdeverankeringsstrategie de vorming mogelijk maakt van verbindingen met een enkel mo-lecuul die een functie verbindingen bevatten, in dit geval een radicaalmolecuul. De ex-perimenten onthullen dat bij lage temperatuur Kondo-achtig gedrag aanwezig is. Ditbetekent daarom concluderen we dat de spinvrijheidsgraad behouden blijft na de vor-ming van de single-molecule verbinding met directe Au-C verankering.
Hoofdstukken 4, 5 en 6 beschrijven het onderzoek naar curcuminoïde verbindingen.Deze moleculen bootsen de structuur van curcumine na, een molecuul dat te vinden isin de Indiase specerij turmeric. De eerste van deze hoofdstukken bespreekt de metin-gen van de geleiding van een enkel molecuul van twee isomeren die alleen verschillenin de positie van het zwavel atoom in de thiofeenringen die als de ankers met het goudvormen. Er zijn twee hoofdconclusies uit dit hoofdstuk. Ten eerste verandert de posi-
151

8
152 SAMENVATTING
tie van het zwavel atoom in de thiofeen eindgroep drastisch de geleidingswaarde en hetaantal configuraties waarin het molecuul zich kan hechten aan de elektroden. Zwave-latomen gepositioneerd in het buitenste deel van het molecuul vertonen een hoge ge-leidingstoestand die gerelateerd is aan een covalente binding aan de elektroden en eenlage geleidingstoestand die gerelateerd is aan een niet-covalente binding. Wanneer hetzwavel atoom aan de binnenkant van de thiofeenring is geplaatst, wordt alleen een toe-stand met een lage geleiding waargenomen. Deze laatste waarneming is consistent meteen niet-covalente bindingsconfiguratie. De tweede belangrijke conclusie verwijst naarhet potentieel van curcuminoïden als model systeem voor experimenten met een enkelmolecuul, omdat de moleculen vergelijkbare geleidingswaarden vertonen met algemeenbekende systemen zoals oligofenyl-ethylenen.
In hoofdstuk 5 worden de elektronische eigenschappen van een familie van curcu-minen bestudeerd. Verschillende verankeringsgroepen en functies van de centrale rug-gengraat van de curcumine structuur worden getest. De meest opmerkelijke conclu-sie verwijst naar het bestaan van twee onderscheidbare toestanden in de geleiding vaneen curcuminoid-verbinding wanneer de beta-diketon-groep wordt vervangen door eenboor-difluorine (BF2) groep; deze bistabiliteit wordt alleen gezien met methylsulfide alsverankerings-groepen. De verankeringsgroepen methyl- sulfidedelen. Daarentegen ver-tonen de vrije ligand en de koperbevattende functionalisatie niet hetzelfde gedrag; even-min moleculen met dezelfde BF2 groep maar met een andere verankeringsgroepen. Ver-volg metingen tonen aan dat een vergelijkbare, maar kortere moleculaire architectuurhetzelfde kwalitatieve gedrag oplevert onder dezelfde combinatie van functionalisatieen verankeringsstrategie.
Hoofdstuk 6 onderzoekt een andere vorm van modificatie van het curcumineskelet,in dit geval de toevoeging van stikstofhoudende groepen, namelijk pyrazol- en isoxazol-groepen. De gegevens tonen aan dat deze verbindingen twee onderscheidbare geleid-baarheidstoestanden hebben die verband houden met verschillende elektrode-verplaat-singen. Dit suggereert dat de stikstofhoudende groepen fungeren als alternatieve ver-ankeringsgroepen die een andere route verschaffen voor ladingsdragers om het mo-lecuul te passeren. Experimenten die aantonen dat de hoge geleidingsstatus (gerela-teerd aan kortere verplaatsingen) kan worden gemaakt en ontkoppeld door de inter-elektrodeafstand te moduleren, ondersteunen deze interpretatie. Hoewel de experimen-ten bij kamertemperatuur werden uitgevoerd, waren beide molecuul configuraties sta-biel op de tijdschaal van seconden. Als controle werd een andere verbinding met eenstikstofbevattende modificatie getest, het molecuul bevat een fenylring met de bedoe-ling de toegankelijkheid van de stikstofatomen als ankergroepen te blokkeren. Ondanksdat de moleculaire toestanden met hoog geleidingsvermogen nog steeds zichtbaar wa-ren, was het rendement van die configuratie lager. Bovendien werd, wanneer de afstandtussen de elektroden werd gemoduleerd, de toestand van hoge geleidbaarheid niet te-ruggewonnen. Aldus verschaffen pyrazool- en isoxazoolgroepen een derde veranke-ringsplaats die ook als een ladingsinjectie- of verzamelpunt fungeert. Het opnemen vanvolumineuze groepen nabij de stikstofatomen vermindert de beschikbaarheid van dezeplaatsen voor binding aan de elektroden gedeeltelijk, maar niet volledig.
In hoofdstuk 7 wordt het onderzoek naar twee families van moleculen, salens en sa-lophenen gepresenteerd. Deze verbindingen hebben een asymmetrisch, organisch li-

SAMENVATTING
8
153
gandframe dat verschillende metalliseringen mogelijk maakt. De geleidingsmetingenlaten zien dat de route voor ladingdragers belangrijk is. In het bijzonder speelt de con-figuratie (meta of para) waarop de verankeringsdelen zijn verbonden met de organischeruggengraat van het molecuul een cruciale rol in de geleidingswaarde van het molecuul.De metallisatie van de verbindingen, aan de andere kant, heeft een klein effect op de ge-leiding. Deze waarnemingen brengen kwantuminterferentie-effecten met zich mee ende gegevens suggereren dat de belangrijkste route voor ladingsdragers via de organischehoofdketen is en niet via het metaalatoom.
Tenslotte worden in hoofdstuk 8 diverse metingen aan verschillende sets van mo-leculen besproken. Ze worden gepresenteerd in de context van de richtingen die hetvakgebeid van elektronica met één molecuul kan volgen. Metingen op tetrathiofulvaan-gefunctionaliseerde indenofluorenen worden gepresenteerd; deze moleculen vertoneneen contra-intuïtieve trend. Drie isomeren werden gemeten, elk verbonden met het cen-trale deel van het molecuul, hetzij via twee para-gehoppelde, twee meta-gehoppelde oféén meta- en één para-gehoppelde fenylringen. De geleidingswaarden van de molecu-len volgen de sequentie para-para > meta-meta > meta-para. Dit is in tegenspraak metde intuïtie van kwantuminterferentie in enkele moleculen. Het andere gepresenteerdevoorbeeld betreft polyoxometalaten (POM), die goed gecontroleerde anorganische ka-ders zijn die kunnen worden gecombineerd met organische liganden. Dit soort verbin-dingen kan een nieuw model systeem zijn van goed geïsoleerde spin-systemen die elek-tronisch kunnen worden uitgelezen met de elektronica-technieken met één molecuul.Ten slotte bespreken we aspecten van de toekomst van moleculaire elektronica op basisvan de moleculaire verbindingen die besproken zijn in dit proefschrift.


ACKNOWLEDGEMENTS
Yo no sufro de locura,la distruto a cada minuto
I do not suffer from madness,I enjoy every minute of it.
Les Luthiers
Dear reader, finally I have the freedom to address you. If you are reading this, itmeans that, for one reason or another, you care about who I am as a person beside thescience that precedes this section. I honestly thank you for taking the time to read theselines. Let me tell you that this dissertation is just a small part of all the experiences thatthis PhD has signified. Please forgive me if I miss you in the following text that expressesmy gratitude towards the important persons that played a role in my (PhD) life.
Herre, I cannot start this acknowledgment without thanking you for the amazing op-portunity and for the mentor you have been. This feels the right occasion to tell you thatwhat struck me the most about you was that you value your father’s poems among thebetter of Dutch literature. There is a little tribute of this fact somewhere in the thesis. Ireally admire the way you combine an extremely efficient way of working with a nice andfulfilling personal life. It is something that I would like to take with me.
Diana, I think that the way Mickael described you is illustrative enough, you are themost colorful person in the lab. Thank you for the long conversations, your advice andsupport, and the optimism in the long days in the lab. Good luck in all the future projects.
Nuria, we have worked hard to put the curcuminoids in the world of single-moleculeelectronics. I really thank you, and by extension all chemists involved, for providing uswith one of the most exciting systems to work with. I was also happy to realize that bothof us share the appreciation for GATTACA (Not everything is written in your DNA). I wishyou the best. Jos, thanks for being part of my committee, I have always admired the waythat you explain complicated subjects in simple terms. Peter, thank you in the first placefor reading my thesis but more especially for being always calm and curious with anhonest interest for others’ research. Ismael, thanks for your kind answers to my e-mailsand for your feedback. Jan, you are one of my references as a scientist. I always enjoyedyour interventions in the meetings and the discussions you enabled.
There are several groups or teams of people to whom I owe a lot. The first of themis the one composed by Dorine, Maria, Heleen, Etty, Marije and Erika. Thank you all forkeeping everything working in order. I have a great deal of admiration for you because Iam sure that I would not be able to do the same. Dorine, thank you especially for comingto see me performing in the circus. Masha, Tino, Ronald, you have been the peoplethat keep the labs running. Thank you for making our PhDs’ possible and the socialenvironment more alive. The Kavli nanolab staff, thanks for keeping the clean-roomrunning smoothly for the most part of the year. Our work would be so much difficult
155

8
156 SAMENVATTING
without you. Thank you all Marc, Marco, Anja, Charles, Eugene, Ewan, Hozanna, andeverybody else.
My fellow Chileans in Delft and The Netherlands, you have been such an importantconnection to my roots. Paola and Bas, thank you for the support, and the invaluablehelp you have given Rocio and me. I truly owe you a big one. Carlos, Paula, Daniel,Susan, Lisset and Cristobal, we have missed you all, thank for all those fun moments andgames nights. Pablo, vecino, you have been a discovery on our lives, the conversations,drinks and food that we shared meant a lot. I believe that this will be a long-lastingfriendship and our conversation will be again long and intricate. Pelo, I had the privilegeof training you for a short period of time. You are one of the kindest people I know andI’m sure that our paths will cross again at some point. Until then, good luck and success.Accel, Dory, Ale and Luzma we are the old ones now, you know how little the communitywas back then. I wish you happiness and strength for the future. To the other Chileansin the lab: Jacqui, you were the most cheerful being in the lab and Cristian, we will bea bit more careful with the beers next time. I hope that none of the rest slip my mind,thank you all, Javier and Nicol, Camila, Oscar and Maca, Seba, Pato and Ari. I guess youwill have to find someone else to take care of barbecue. To the people in Amsterdam:Diego, I would not have entered this country if it were not for you; Naty, it was a pleasureto become your friend; Camilo you are the last representative of Blanco Encalada 2008you have to welcome the ones to come.
Dear colleagues, all of you that stand at the frontier of knowledge, I truly thank you formaking research something more than just a job. Those of you that knew the MED andthe ones that came afterwards, thank for the parties, the outings and more importantlyall the little moments that made us deliciously unperfect (yes unperfect). Girodano, theman for whom I was kicked out of a party. I hope to listen to you playing the piano again.Dejan, the man on the cellphone, our conversations during lunches and breaks were en-lightening specially when Joao, Dirk and Mafalda participated. Santiago, the wreckingball, your presence was unmistakable, and now, missed. Thank you for sharing someof your secrets with me. Floriano, the man of the ring, I really appreciate your commit-ment to improve the working environment in the department I wish you the best in thenext steps. Nikos, the only true DJ inside the group, you were the nicest company forthose long evening in the lab. You are an amazing guy. Richard, you were a great of-ficemate. Your enthusiasm is contagious. I would like to listen to you playing the violinonce. Emre, if you ever read this, you will always be the sultan of the office. Ranko, thealways tidy singer, we shared funny moments, including that crazy week of moving fromone apartment to the next. It was not fun then, but it makes me smile now. Thank youfor being such a nice officemate. Joao you are one of the nicer persons I know to have adiscussion with, there was always something to reconsider after talking with you. Thereare a lot more people that deserve to be mentioned the postdocs and colleagues, thesmiley Marck, Holgar, Nicola, Daniel, the other Marck, the Españoles Mari, David andMiguel, Martijn, Ines, Thierry, Luigi, Lorenzo and the old ones Albert (the trumpet firstand then the congas), Ronald, Michele, Anna, Shun and Sal, Christian. The colleaguesoutside Delft were also a nice part of the PhD. Either in conferences or meetings it wasallways nice to see you and have a conversation. Sasha and Sander, I don’t think we willever see you closer together, thanks for all the little moments. Cansel and Darma on the

SAMENVATTING
8
157
side of the chemists keep pushing.
The People in the lab deserve their own paragraph, those who have suffered the in-difference of their molecules and the broke down of a piece that takes a week to replace,thank you all for making the environment so nice. Riccardo, thanks for being my mentor.In a more personal aspect, I admire your dedication to photography and your cookingskills, but your musical choices were, how to say it? Discomforting. Mickael, you were al-ways the man to go when things got complicated. Thank you for all the answers and willto help and for the fascinating stories of how you risk your life climbing, in crazy racesor skiing. Max, the sailor, you were the representation of the Dutch culture for me, youhave the best of my wishes for your parenting life. Anastasia keep fencing and research-ing. Vera, I enjoy talking with you about politics and culture, you have a very matureopinion in most subjects and the will to do what you think is right. Alexandra, I admireyour determination and pride. Enrique, you are the kindest postdoc I ever met; it was apleasure to work with you. Rocco, the most epistemic of the scientist I met in the Nether-lands, I wish you the most gratifying trip through knowledge and I am curious of whenI will be reading your books. Sabina, you have an amazing artistic sense and an impres-sive capability for science, thanks for all your feedback on my work and your supportiveattitude. Pascal, the enthusiastic brewer, your presence in the lab has been refreshing.Thank you for revitalizing the social environment of the lab. Joeri, you are such a tal-ented scientist, I admire the versatility for theory and experiments. I wish you successwith that fridge. Julien, you sick man, a great wisdom and a bit of madness, or was theother way around? Mucha felicidad para ti, Mary y Lila. Matthijs thanks for passing byeach time you are in town. Chun Wei, you will be in charge of the lab at some point,please take care of it. Maria, yes you are in the lab paragraph, you are incredibly friendlygirl and a meticulous scientist. From these lines I give you the welcome to the lab and mycongratulations for your graduation. The man that never touched a single set-up, José,only theoretician working with molecules (PhD) and only other latin-american, you area charismatic person. I loved your talks during the meetings and conferences. Senja,my one and only bachelor student, thanks for your work and commitment. And the restof them Damien, Jorik, Luuk (thank for the help with Dutch), Jochem and Esmee goodluck to all of you. Benjamin, I almost forget you... the warrior of the lab... I think it wasbecause you went away before my defense, success in NASA.
There have been people that have helped me on bearing this northern Europe cul-ture of telegraphic proxemics. Dancers are these people that ‘speak’ another languagewhich involves abandoning the fear of interpersonal proximity and use the music andthe body to express themselves. Daniel, Jeroen, Regina, Chunwei, Lidia, Chara, Jessica,Sofia, Victor, Diego, Leon, Camila, Victoria, Mousa and all the SoSalsa members, the per-formers of the shows that I have the privilege to lead, I own you (and the dances we hadtogether), my sanity (the little that I have). See you on the dance floor. From these groupa remarkable guy stands out, my canijo. Victor, I once taught you a few dance moves,since then you became one of my best friends, always there in the parties and alwayssupportive. I am honored to have you as my paranyph. Keep working hard, but do notoverdo it, the PhD is not everything.
There is also an aspect of my life that drift apart from sanity; circus artist are theicons of madness and I pride myself for training with them. Johanes you have opened

8
158 SAMENVATTING
the doors of your gym and home to me and there is so much that I want to thank you for,but overall for your friendship and teachings; you are a really selfless person. Stephany,Marieke, Ramona you have been my training partners in the air thanks for all the timewe have shared. Roosje you are a kind of hybrid in my life, an aerialist and a dancer,probably you are the person with whom I have the most in common, even with yourdislike for beer. I treasure our friendship as one of the most important relations I havebuild in the Netherlands. To all the acrobats and friends Anja, Stef, Sequoia, Dana, Evert,Melissa, Anne, Paco, Farid, Djeena, Thami, Kaj, all the Mariekes and the ones that nowslip my mind thank you for the trainings, the shows and the nice moments.
There are a few people that I have deliberately skipped until now. Davide, you areprobably the most significant friend inside the University, thanks for your kindness andthis twisted kind of humor that we share. There is a long list of activities we shared, somebouldering, conferences, games, dinners and endless office days. You became a greatfriend of mine. I had no doubt that I wanted you as my paranyph. If at any time I couldhelp you please do not hesitate in contacting me. For the time being, keep pushing anddon’t overstress.
Nandini, you were like a little sister to me. I am very happy that you are achievingthe things you wanted and I am terribly sorry for not being there for your wedding. Wehave shared the good and the bad moments. Your support was crucial in the hard times.Thanks for believing in me. I wish you happiness and an intense life, just as you are. Ofcourse, have a terrific honeymoon. Send my regards to Ash.
Por último a mi familia, papá, mamá y hermanos no puedo más que agradecerlestodo, sus visitas, el ánimo que enviaban, su preocupación. Ya saben que para mi estode las graduaciones no es importante, pero quiero aprovechar estas líneas para decirlesque los quiero y nunca dejé de sentir su apoyo. Que estoy feliz que la Naty esté viviendoindependientemente, que la Ale esté estudiando algo que la apasiona y que Franciscoesté tan lleno de proyectos. Estoy orgulloso de pertenecer a esta familia, los admiro atodos por sus inmensas capacidades y logros. Un abrazo apretado a todos y cada uno.A la tía Ani, gracias por su visita, y sus cariñosos mails de saludos. Gracias también atodos los primos y tíos que han preguntado por mi. Tío Nancho, gracias por las conver-saciones, las comidas y las historias que compartiste conmigo. Saludos a la Tía Elisa y ala Dominga.
Chio, has sido el pilar fundamental que me ha mantenido de pie, me has ayudadomás de lo que yo hubiese creído posible. Pero ’gracias’ no refleja lo que siento por ti. Teamo, haces de mi vida algo exitante. Me encanta compartir la vida e imaginar el futurocontigo.
CURRICULUM VITÆ
Ignacio José OLAVARRIA CONTRERAS
09-12-1986 Born in Santiago, Chile.
EDUCATION2005–2009 Bachelor in Science with Mention in Physics
Universidad de Chile, Santiago, Chile
2010–2014 Master in Science with Mention in PhysicsUniversidad de ChileSantiago, ChileThesis: Copper nucleation on TiO2 (001) by electrodeposi-
tionPromotor: Dr. Victor Fuenzalida
2014-2018 PhD. in Applied PhysicsDelft University of TechnologyDelft, The NetherlandsThesis: Single-molecule conductance measurements:
Correlations between chemical design and elec-tronic properties
Promotor: Prof. dr. H.S.J. van der Zant
159


LIST OF PUBLICATIONS
5. Sabina Caneva, Pascal Gehring, Víctor M. García-Suárez, Amador García-Fuente, DavideStefani, Ignacio J. Olavarria-Contreras, et al., Mechanically Controlled Quantum Interfer-ence in Graphene Break Junctions. arXiv:1803.05642 [cond-mat.mes-hall]
4. Francesc Bejarano, Ignacio Jose Olavarria-Contreras, Andrea Droghetti, et al. Robust Or-ganic Radical Molecular Junctions Using Acetylene Terminated Groups for C–Au Bond For-mation, Journal of the American Chemical Society 140, 5 (2018).
3. Ignacio J. Olavarría-Contreras, M. L. Perrin, Z. Chen, et al. C–Au covalently bonded molecu-lar junctions using nonprotected alkynyl anchoring groups, Journal of the American Chem-ical Society 138, 27 (2016).
2. Etcheverry-Berríos, I. Olavarría, M. L. Perrin et al., Multiscale Approach to the Study of theElectronic Properties of Two Thiophene Curcuminoid Molecules, Chemistry - A EuropeanJournal 22, 36 (2016).
1. V.M. Fuenzalida, D.G. Galvez-Arancibia, I.J. Olavarría-Contreras, et al., Tungsten oxide nanopar-ticles grown by condensation in gas using domestic appliances, Materials Letters 65 (2011)3061–3063.
161