oligoyne single molecule wires
TRANSCRIPT
Oligoyne Single Molecule Wires
Changsheng Wang,† Andrei S. Batsanov,† Martin R. Bryce,*,† Santiago Martın,‡
Richard J. Nichols,*,‡ Simon J. Higgins,‡ Vıctor M. Garcıa-Suarez,§ andColin J. Lambert*,§
Department of Chemistry and Centre for Molecular and Nanoscale Electronics, DurhamUniVersity, Durham DH1 3LE, United Kingdom, Centre for Nanoscale Science and Departmentof Chemistry, UniVersity of LiVerpool, LiVerpool, L69 7ZD, United Kingdom, and Department of
Physics, Lancaster UniVersity, Lancaster, LA1 4YB, United Kingdom
Received November 6, 2008; E-mail: [email protected]; [email protected];[email protected]
Abstract: We report the electrical conductance at the single molecule level of the oligoyne molecular wiresPy-(CtC)n-Py (n ) 1, 2 and 4; Py ) 4-pyridyl) using STM-molecular break junction techniques inAu|molecule|Au configurations. The conductance histograms reveal multiple series of peaks attributed todiffering contact geometries between the pyridyl head groups and the gold electrodes. Both experimentaland theoretical evidence point to the higher conduction groups being related to adsorption of the pyridylgroup at more highly coordinated sites such as step edges or alongside gold adatoms. All three conductiongroups in the oligoyne series show a remarkably low � value of (0.06 ( 0.03) Å-1, that is, the conductanceis almost independent of molecular length. 4,4′-Bipyridyl studied under the same conditions does not followthis exponential decay series. Theoretical calculations using a combination of density functional theoryand nonequilibrium Green’s function formalism support the experimental results. We conclude that oligoynesand polyynes are a very promising class of molecular wires for integration into electronic circuitry.
Introduction
There is great interest in measuring and controlling electricalcurrent through single molecules that are wired to two elec-trodes. Experimental studies, combined with theoretical calcula-tions, provide insights into the mechanisms of charge transportin tailored nanoscale junctions and probe the interplay ofmolecular structure, electronic structure and single moleculeconductance. These studies are crucial in the development ofmolecular electronic devices and related technologies includingsensors based on the electrical detection of individual molecularbinding events.1 A growing number of experimental techniquesare now being used for the measurements of charge transportthrough either single molecules or small ensembles of molecules.These include mechanically formed break junctions,2-7 or breakjunctions formed by scanning probe microscopy techniques
based on either STM8-12 or conducting AFM.13,14 It is clearthat the measured conductance values depend not only on themolecule(s) in the junction but also on other importantparameters, namely, the electrodes, the detailed contact geometry(i.e., hybridization at the molecule-electrode interfaces),15-18
the temperature19,20 and the local environment of the system
† Department of Chemistry, Durham University.‡ Department of Chemistry, University of Liverpool.§ Department of Physics, Lancaster University.
(1) Reviews: (a) Tour, J. M. Acc. Chem. Res. 2000, 33, 791–804. (b)Carroll, R. L.; Gorman, C. B. Angew. Chem., Int. Ed. 2002, 41, 4378–4400. (c) Maruccio, G. R.; Cingolani, R.; Rinaldi, R. J. Mater. Chem2004, 14, 4378542–554. (d) Troisi, A.; Ratner, M. A. Small 2006, 2,172–181. (e) James, D. K.; Tour, J. M. Aldrichim. Acta 2006, 39 (2),47–56. (f) Weibel, N.; Grunder, S.; Mayor, M. Org. Biomol. Chem.2007, 5, 2343–2353. (g) Chen, F.; Hihath, J.; Huang, Z.; Li, X.; Tao,N. J. Annu. ReV. Phys. Chem. 2007, 58, 535–564. (h) Akkerman, H. B.;de Boer, B. J. Phys.: Condens. Matter 2008, 20, 013001.
(2) Reed, M. A.; Zhou, C.; Muller, C. J.; Burgin, T. P.; Tour, J. M. Science1997, 278, 252–254.
(3) Kergueris, C.; Bourgoin, J. P.; Palacin, S.; Esteve, D.; Urbina, C.;Magoga, M.; Joachim, C. Phys. ReV. B 1999, 59, 12505–12513.
(4) Weber, H. B.; Reichert, J.; Ochs, R.; Beckmann, D.; Mayor, M.; vonLohneysen, H. Phys. E 2003, 18, 231–232.
(5) Reichert, J.; Ochs, R.; Beckmann, D.; Weber, H. B.; Mayor, M.; vonLohneysen, H. Phys. ReV. Lett. 2002, 88, 176804.
(6) Park, H.; Lim, A. K. L.; Alivisatos, A. P.; Park, J.; McEuen, P. L.Appl. Phys. Lett. 1999, 75, 301–303.
(7) Gruter, L.; Gonzalez, M. T.; Huber, R.; Calame, M.; Schonenberger,C. Small 2005, 1, 1067–1070.
(8) Yazdani, A.; Eigler, D. M.; Lang, N. D. Science 1996, 272, 1921–1924.
(9) Xu, B. Q.; Tao, N. J. Science 2003, 301, 1221–1223.(10) Dorogi, M.; Gomez, J.; Osifchin, R.; Andres, R. P.; Reifenberger, R.
Phys. ReV. B 1995, 52, 9071–9077.(11) Haiss, W.; van Zalinge, H.; Higgins, S. J.; Bethell, D.; Hobenreich,
H.; Schiffrin, D. J.; Nichols, R. J. J. Am. Chem. Soc. 2003, 125, 15294–15295.
(12) Haiss, W.; Nichols, R. J.; van Zalinge, H.; Higgins, S. J.; Bethell, D.;Schiffrin, D. J. Phys. Chem. Chem. Phys. 2004, 6, 4330–4337.
(13) Cui, X. D.; Primak, A.; Zarate, X.; Tomfohr, J.; Sankey, O. F.; Moore,A. L.; Moore, T. A.; Gust, D.; Harris, G.; Lindsay, S. M. Science2001, 294, 571–574.
(14) Leatherman, G.; Durantini, E. N.; Gust, D.; Moore, T. A.; Moore,A. L.; Stone, S.; Zhou, Z.; Rez, P.; Liu, Y. Z.; Lindsay, S. M. J. Phys.Chem. B 1999, 103, 4006–4010.
(15) McCreery, R. L.; Viswanathan, U.; Kalakodium, R. P.; Nowak, A. M.Faraday Discuss. 2006, 131, 33–43.
(16) Lindsay, S. M.; Ratner, M. A. AdV. Mater. 2007, 19, 23–31.(17) Hu, Y.; Zhu, Y.; Gao, H.; Gao, H. Phys. ReV. Lett. 2005, 95, 156803.(18) Li, C.; Pobelov, I.; Wandlowski, T.; Bagrets, A.; Arnold, A.; Evers,
F. J. Am. Chem. Soc. 2008, 130, 318–326.(19) Haiss, W.; van Zalinge, H.; Bethell, D.; Ulstrup, J.; Schiffrin, D. J.;
Nichols, R. J. Faraday Discuss. 2006, 131, 253–264.
Published on Web 10/13/2009
10.1021/ja9061129 CCC: $40.75 2009 American Chemical Society J. AM. CHEM. SOC. 2009, 131, 15647–15654 9 15647
(vacuum or air, solvent, etc.).21,22 Key molecular features thatinfluence the conductance are: the extent of conjugation,23,24
the nature of the terminal anchor groups (e.g., thiol, amine,carboxylic acid),25 the detailed conformation26,27 and the tiltangle28,29 of the molecule in the junction.
To enhance electronic communication over nanometerdistances, conjugated molecules which possess delocalizedπ-systems and low HOMO-LUMO gaps are attractivetargets. In this context, oligo(phenyleneethynylene), (OPE) [i.e.,(C6H4-C≡C-)n] and oligo(phenylenevinylene), (OPV) [i.e.,(C6H4-CHdCH-)n] derivatives end-capped with thiol unitshave been integrated into device structures and their singlemolecule conductance values obtained.30,31 The higher conduc-tance for OPV derivatives, compared to OPE, has been explainedby the longer vinyl bond (CdC length ca. 1.35 Å) in OPVdisrupting the conjugation of the backbone less than the shorterethynyl linkage (CtC length ca. 1.22 Å) in OPE, that is, thereis less bond alternation and a smaller HOMO-LUMO gap inOPV compared to OPE.24
We identified polyynes32 [(CtC-)n] as a class of conjugatedcompounds that have not been explored experimentally in singlemolecule junctions. Polyynes comprise an array of sp-hybridizedcarbon atoms with approximately cylindrical electron delocal-ization along a one-dimensional, rigid-rod, length-persistentbackbone.33 They are, therefore, very appealing linear molecularwires where electron transport along the chain is independentof rotation around the polyyne single bondssa feature whichmakes them clearly distinct from other conjugated oligomers,for example, OPVs and OPEs, where the barrier to rotation aboutsingle bonds in the backbone is low34,35 and conjugation isinterrupted when the phenyl rings are rotated with respect to
each other. A previous experimental study of the opticalproperties of silyl end-capped oligoynes [(CtC-)n] (n ) 2-10)established that they possess extensive conjugation which wassupported by theoretical models of the third-order nonlinearoptical response as a function of the number of alkyne units.36
Analogous data for ligated platinum end-capped systems (n )3-6, 8, 10, 12) are also known.37 An ab initio calculation ofthiolate-capped oligoynes (n ) 2-8) in contact with goldelectrodes suggested almost perfect molecular wire behavior.The conductance was calculated to be an order of magnitudehigher compared to other conjugated oligomers, weakly de-pendent on the applied bias and almost independent of the lengthof the oligoyne chain.38 In a recent calculation of pyridyl end-capped molecules,32 where the conductance is found to be lower,the weak length dependence persists and moreover a pronouncedsigmoidal I-V characteristic is predicted. We now reportexperimental studies on the pyridyl end-capped systems 1-3and compare these with theory. As a benchmark, data are alsopresented for 4,4′-bipyridyl 4 (Figure 1).
Experimental and Theoretical Methods
Synthesis. Compounds 139 and 240 (Figure 1) were synthesizedby the literature routes.
1,8-Di(4-pyridyl)-1,3,5,7-octatetrayne 3. (4-Pyridyl)-1,3-buta-diyne41 (0.191 g, 1.5 mmol), PdCl2(PPh3)2 (21 mg, 2 mol %) andCuI (7 mg) were mixed in THF (20 mL). Triethylamine (3 mL)was added and oxygen was bubbled through the mixture at 20 °Cfor 2 h with stirring to obtain a pale brown solution. The additionof oxygen was stopped and the mixture was stirred for an additional10 h until no unreacted butadiyne was present. The solution wasevaporated to dryness. The brown solid residue was chromato-graphed on a silica column (eluent 1:1 v/v DCM-acetone) to afforda yellow solid, which was crystallized from ethyl acetate to yieldgreenish-yellow needles (59 mg, 31%), mp: the solid became darkbrown at >160 °C; no clear mp was observed on heating up to 350°C; 1H NMR (CDCl3, 400 MHz) δ ) 7.37 (d, J ) 6.2 Hz, 4H),8.63 (d, J ) 6.2 Hz, 4H); 13C NMR (CDCl3, 100.6 MHz) δ )63.6, 68.4, 74.8, 78.0, 126.4, 128.6, 150.0. Anal. Calcd for C18H8N2:C, 85.70; H, 3.20; N, 11.10. Found: C, 85.64; H, 3.26; N, 11.22. Asingle crystal (yellow needle) was obtained by slow evaporationof a chloroform solution of the compound. The molecular structureof compound 3, obtained from an X-ray crystal structure analysis,is described in the Supporting Information.
Conductance Measurements. Both the I(s) and the in situ breakjunction (BJ) techniques use an STM for single molecule conduc-tance determination, but they differ in how the junction is formed.In the I(s) technique (I ) current and s ) distance) a gold STM tipis brought to a fixed distance above the gold surface covered with
(20) Jones, D. R.; Troisi, A. J. Phys. Chem. C 2007, 111, 14567–14573.(21) Long, D. P.; Lazorcik, J. L.; Mantooth, B. A.; Moore, M. H.; Ratner,
M. A.; Troisi, A.; Tour, J. M.; Shashidhar, R. Nat. Mater. 2006, 5,901–908.
(22) (a) Cao, H.; Jiang, J.; Ma, J.; Luo, Y. J. Am. Chem. Soc. 2008, 130,6674–6675. (b) Leary, E.; Hobenreich, H.; Higgins, S. J.; van Zalinge,H.; Haiss, W.; Nichols, R. J.; Finch, C. M.; Grace, I.; Lambert, C. J.;McGrath, R.; Smerdon, J. Phys. ReV. Lett. 2009, 102, 086801.
(23) Salomon, A.; Cahen, D.; Lindsay, S.; Tomfohr, J.; Engelkes, V. B.;Frisbie, C. D. AdV. Mater. 2003, 15, 1881–1890.
(24) Kushmerick, J. G.; Holt, D. B.; Pollack, S. K.; Ratner, M. A.; Yang,J. C.; Schull, T. L.; Naciri, J.; Moore, M. H.; Shashidhar, R. J. Am.Chem. Soc. 2002, 124, 1065410655. It should be noted that in thiscommunication the OPE and OPV derivatives studied experimentallyhave different end groups. The OPE has terminal -C6H4-S units,whereas the OPV has terminal -C6H4-CH2-S units.
(25) Chen, F.; Li, X.; Hihath, J.; Huang, Z.; Tao, N. J. Am. Chem. Soc.2006, 128, 2135–2141.
(26) Venkataraman, L.; Klare, J. E.; Nuckolls, C.; Hybertsen, M. S.;Steigerwald, M. L. Nature 2006, 442, 904–907.
(27) Pauly, F.; Viljas, J. K.; Cuevas, J. C.; Schon, G. Phys. ReV. B 2008,77, 155312.
(28) Haiss, W.; Wang, C.; Grace, I.; Batsanov, A. S.; Schiffrin, D. J.;Higgins, S. J.; Bryce, M. R.; Lambert, C. J.; Nichols, R. J. Nat. Mater.2006, 5, 995–1002.
(29) Haiss, W.; Wang, C.; Jitchati, R.; Grace, I.; Martın, S.; Batsanov, A. S.;Higgins, S. J.; Bryce, M. R.; Lambert, C. J.; Jensen, P. S.; Nichols,R. J. J. Phys.: Condens. Matter 2008, 20, 374119.
(30) Seferos, D. W.; Trammell, S. A.; Bazan, G. C.; Kushmerick, J. G.Proc. Natl. Acad. Sci. U.S.A. 2005, 102, 8821–8825.
(31) Huber, R.; Gonzalez, M. T.; Wu, S.; Langer, M.; Grunder, S.; Horhoiu,V.; Mayor, M.; Bryce, M. R.; Wang, C.; Jitchati, R.; Schonenberger,C.; Calame, M. J. Am. Chem. Soc. 2008, 130, 1080–1084.
(32) Garcia-Suarez, V. M.; Lambert, C. J. Nanotechnology 2008, 19,455203.
(33) (a) Szafert, S.; Gladysz, J. A. Chem. ReV. 2003, 103, 4175–4205. (b)Szafert, S.; Gladysz, J. A. Chem. ReV. 2006, 106, PR1–PR33.
(34) Taylor, J.; Brandbyge, M.; Stokbro, K. Phys. ReV. B 2003, 68, 121101.(35) James, P. V.; Sudeep, P. K.; Suresh, C. H.; Thomas, K. G. J. Phys.
Chem. A 2006, 110, 4329–4337.
(36) Slepkov, A. D.; Hegmann, F. A.; Eisler, S.; Elliott, E.; Tykwinski,R. R. J. Chem. Phys. 2004, 120, 6807–6810.
(37) Samoc, M.; Dalton, G. T.; Gladysz, J. A.; Zheng, Q.; Velkov, Y.;Ågren, H.; Norman, P.; Humphrey, M. G. Inorg. Chem. 2008, 47,9946–9957.
(38) Crljen, Z.; Baranoviæ, G. Phys. ReV. Lett. 2007, 98, 116801.(39) Champness, N. R.; Khlobystov, A. N.; Majuga, A. G.; Schroder, M.;
Zyk, N. V. Tetrahedron Lett. 1999, 40, 5413–5416.(40) Lee, C. K. Y.; Groneman, J. L.; Turner, P.; Rendina, L. M.; Harding,
M. M. Tetrahedron 2006, 62, 4870–4878.(41) West, K.; Wang, C.; Batsanov, A. S.; Bryce, M. R. J. Org. Chem.
2006, 71, 8541–8544.
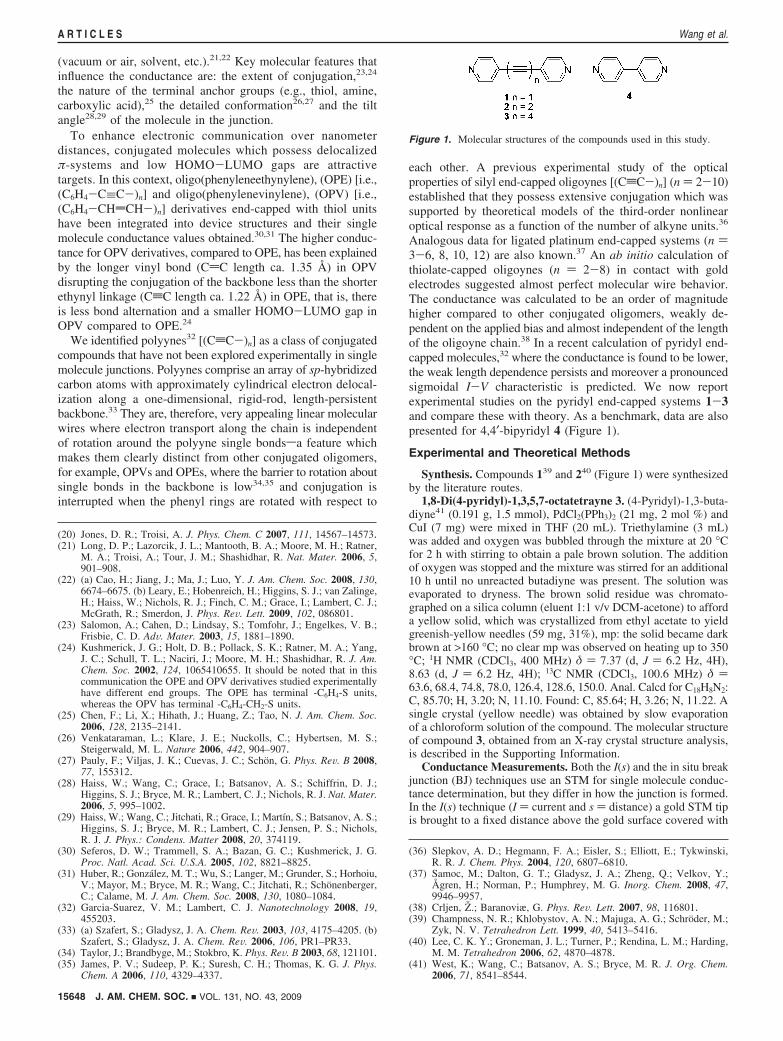
Figure 1. Molecular structures of the compounds used in this study.
15648 J. AM. CHEM. SOC. 9 VOL. 131, NO. 43, 2009
A R T I C L E S Wang et al.
the analyte molecule.11,12 The current is then recorded as the STMtip is retracted from a surface until the molecule bridge(s) break,resulting in a current plateau followed by a step. In this way contactbetween the gold STM tip and the surface is avoided, with singlemolecular bridges then being formed between the gold substratesurface and gold STM tip. Current-distance [I(s)] curves are thenanalyzed statistically in the form of histogram plots to determinethe single molecule conductance. These histograms are built byadding all the current (or conductance) points from ∼100 currentversus distance curves showing discernible plateaus which are takenas a characteristic of molecular bridge formation. In any givenexperimental run typically more than 1000 I(s) scans were recorded,with exponential decay curves characteristic of tunnelling in theabsence of molecular bridge formation and other indistinct curvesbeing rejected from histogram analysis. For calculating errors allvalues encompassing a given histogram peak were statisticallyanalyzed (using Origin) and the error is quoted as one standarddeviation from the statistical spread of the points forming thehistogram peak.
In contrast to the I(s) method, the in situ break junction techniquerelies on the cleavage of metal break junctions formed betweenthe STM tip and the metal surface. The break junction is formedby driving the tip a certain distance into the metal substrate.9 Thetip is then retracted until the metal contact cleaves and molecularbridges form within the break junction. These bridges then breakupon further retraction of the tip and molecular conductance canbe determined through statistical analysis of the current versusdistance retraction curves.
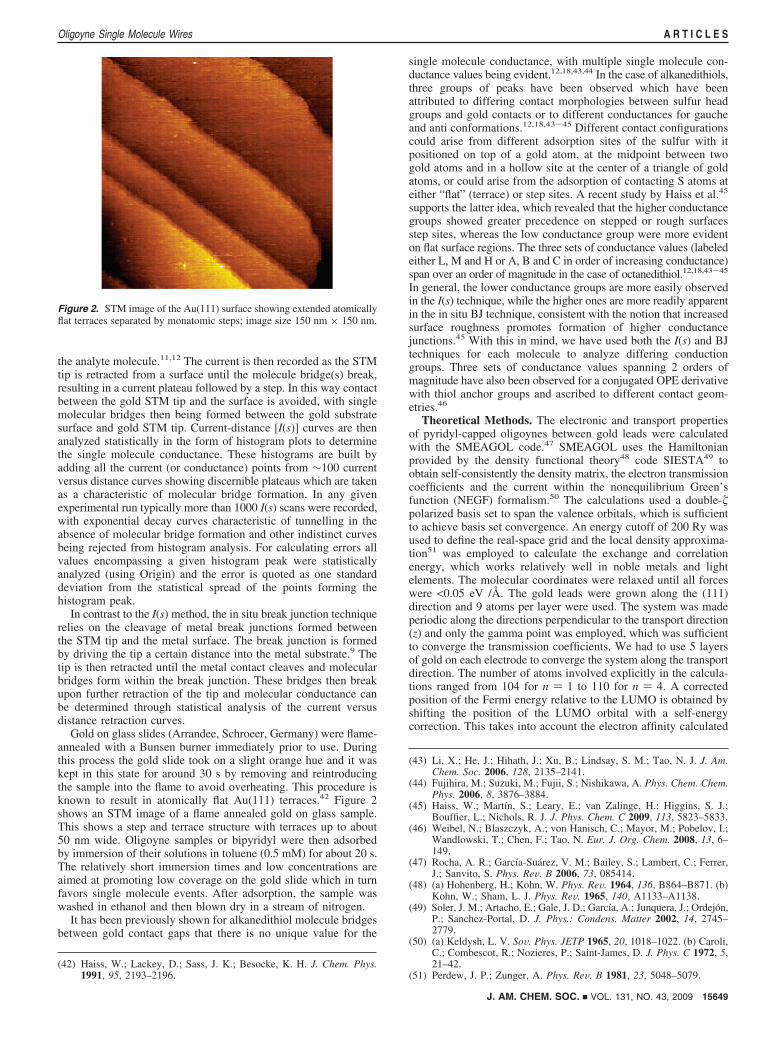
Gold on glass slides (Arrandee, Schroeer, Germany) were flame-annealed with a Bunsen burner immediately prior to use. Duringthis process the gold slide took on a slight orange hue and it waskept in this state for around 30 s by removing and reintroducingthe sample into the flame to avoid overheating. This procedure isknown to result in atomically flat Au(111) terraces.42 Figure 2shows an STM image of a flame annealed gold on glass sample.This shows a step and terrace structure with terraces up to about50 nm wide. Oligoyne samples or bipyridyl were then adsorbedby immersion of their solutions in toluene (0.5 mM) for about 20 s.The relatively short immersion times and low concentrations areaimed at promoting low coverage on the gold slide which in turnfavors single molecule events. After adsorption, the sample waswashed in ethanol and then blown dry in a stream of nitrogen.
It has been previously shown for alkanedithiol molecule bridgesbetween gold contact gaps that there is no unique value for the
single molecule conductance, with multiple single molecule con-ductance values being evident.12,18,43,44 In the case of alkanedithiols,three groups of peaks have been observed which have beenattributed to differing contact morphologies between sulfur headgroups and gold contacts or to different conductances for gaucheand anti conformations.12,18,43-45 Different contact configurationscould arise from different adsorption sites of the sulfur with itpositioned on top of a gold atom, at the midpoint between twogold atoms and in a hollow site at the center of a triangle of goldatoms, or could arise from the adsorption of contacting S atoms ateither “flat” (terrace) or step sites. A recent study by Haiss et al.45
supports the latter idea, which revealed that the higher conductancegroups showed greater precedence on stepped or rough surfacesstep sites, whereas the low conductance group were more evidenton flat surface regions. The three sets of conductance values (labeledeither L, M and H or A, B and C in order of increasing conductance)span over an order of magnitude in the case of octanedithiol.12,18,43-45
In general, the lower conductance groups are more easily observedin the I(s) technique, while the higher ones are more readily apparentin the in situ BJ technique, consistent with the notion that increasedsurface roughness promotes formation of higher conductancejunctions.45 With this in mind, we have used both the I(s) and BJtechniques for each molecule to analyze differing conductiongroups. Three sets of conductance values spanning 2 orders ofmagnitude have also been observed for a conjugated OPE derivativewith thiol anchor groups and ascribed to different contact geom-etries.46
Theoretical Methods. The electronic and transport propertiesof pyridyl-capped oligoynes between gold leads were calculatedwith the SMEAGOL code.47 SMEAGOL uses the Hamiltonianprovided by the density functional theory48 code SIESTA49 toobtain self-consistently the density matrix, the electron transmissioncoefficients and the current within the nonequilibrium Green’sfunction (NEGF) formalism.50 The calculations used a double-�polarized basis set to span the valence orbitals, which is sufficientto achieve basis set convergence. An energy cutoff of 200 Ry wasused to define the real-space grid and the local density approxima-tion51 was employed to calculate the exchange and correlationenergy, which works relatively well in noble metals and lightelements. The molecular coordinates were relaxed until all forceswere <0.05 eV /Å. The gold leads were grown along the (111)direction and 9 atoms per layer were used. The system was madeperiodic along the directions perpendicular to the transport direction(z) and only the gamma point was employed, which was sufficientto converge the transmission coefficients. We had to use 5 layersof gold on each electrode to converge the system along the transportdirection. The number of atoms involved explicitly in the calcula-tions ranged from 104 for n ) 1 to 110 for n ) 4. A correctedposition of the Fermi energy relative to the LUMO is obtained byshifting the position of the LUMO orbital with a self-energycorrection. This takes into account the electron affinity calculated
(42) Haiss, W.; Lackey, D.; Sass, J. K.; Besocke, K. H. J. Chem. Phys.1991, 95, 2193–2196.
(43) Li, X.; He, J.; Hihath, J.; Xu, B.; Lindsay, S. M.; Tao, N. J. J. Am.Chem. Soc. 2006, 128, 2135–2141.
(44) Fujihira, M.; Suzuki, M.; Fujii, S.; Nishikawa, A. Phys. Chem. Chem.Phys. 2006, 8, 3876–3884.
(45) Haiss, W.; Martın, S.; Leary, E.; van Zalinge, H.; Higgins, S. J.;Bouffier, L.; Nichols, R. J. J. Phys. Chem. C 2009, 113, 5823–5833.
(46) Weibel, N.; Blaszczyk, A.; von Hanisch, C.; Mayor, M.; Pobelov, I.;Wandlowski, T.; Chen, F.; Tao, N. Eur. J. Org. Chem. 2008, 13, 6–149.
(47) Rocha, A. R.; Garcıa-Suarez, V. M.; Bailey, S.; Lambert, C.; Ferrer,J.; Sanvito, S. Phys. ReV. B 2006, 73, 085414.
(48) (a) Hohenberg, H.; Kohn, W. Phys. ReV. 1964, 136, B864–B871. (b)Kohn, W.; Sham, L. J. Phys. ReV. 1965, 140, A1133–A1138.
(49) Soler, J. M.; Artacho, E.; Gale, J. D.; Garcıa, A.; Junquera, J.; Ordejon,P.; Sanchez-Portal, D. J. Phys.: Condens. Matter 2002, 14, 2745–2779.
(50) (a) Keldysh, L. V. SoV. Phys. JETP 1965, 20, 1018–1022. (b) Caroli,C.; Combescot, R.; Nozieres, P.; Saint-James, D. J. Phys. C 1972, 5,21–42.
(51) Perdew, J. P.; Zunger, A. Phys. ReV. B 1981, 23, 5048–5079.
Figure 2. STM image of the Au(111) surface showing extended atomicallyflat terraces separated by monatomic steps; image size 150 nm × 150 nm.
J. AM. CHEM. SOC. 9 VOL. 131, NO. 43, 2009 15649
Oligoyne Single Molecule Wires A R T I C L E S
from differences between total energies of the neutral molecule andits singly charged anion radical. An additional shift is also appliedin the opposite direction, which accounts for screening effects.52-54
To calculate the latter we followed the procedure described by Queket al.55 (For more details, see the Supporting Information.)
Results and Discussion
Diaryloligo(poly)ynes are accessible via a range of syntheticmethods and their stability decreases significantly with increas-ing chain length.56-58 We chose pyridyl end-groups for ourseries of oligoynes 1-3 as previous work9 had shown that thenitrogen atoms of 4,4′-bipyridyl 4 were suitable anchor pointsfor single molecule measurements at electrode surfaces.59
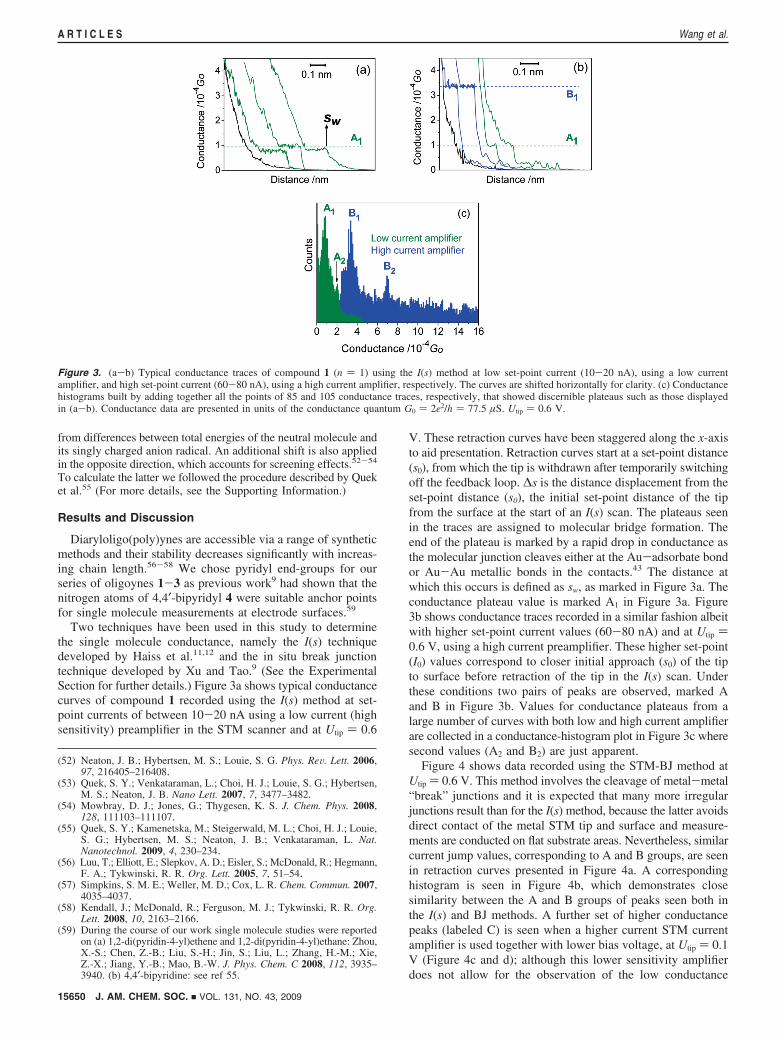
Two techniques have been used in this study to determinethe single molecule conductance, namely the I(s) techniquedeveloped by Haiss et al.11,12 and the in situ break junctiontechnique developed by Xu and Tao.9 (See the ExperimentalSection for further details.) Figure 3a shows typical conductancecurves of compound 1 recorded using the I(s) method at set-point currents of between 10-20 nA using a low current (highsensitivity) preamplifier in the STM scanner and at Utip ) 0.6
V. These retraction curves have been staggered along the x-axisto aid presentation. Retraction curves start at a set-point distance(s0), from which the tip is withdrawn after temporarily switchingoff the feedback loop. ∆s is the distance displacement from theset-point distance (s0), the initial set-point distance of the tipfrom the surface at the start of an I(s) scan. The plateaus seenin the traces are assigned to molecular bridge formation. Theend of the plateau is marked by a rapid drop in conductance asthe molecular junction cleaves either at the Au-adsorbate bondor Au-Au metallic bonds in the contacts.43 The distance atwhich this occurs is defined as sw, as marked in Figure 3a. Theconductance plateau value is marked A1 in Figure 3a. Figure3b shows conductance traces recorded in a similar fashion albeitwith higher set-point current values (60-80 nA) and at Utip )0.6 V, using a high current preamplifier. These higher set-point(I0) values correspond to closer initial approach (s0) of the tipto surface before retraction of the tip in the I(s) scan. Underthese conditions two pairs of peaks are observed, marked Aand B in Figure 3b. Values for conductance plateaus from alarge number of curves with both low and high current amplifierare collected in a conductance-histogram plot in Figure 3c wheresecond values (A2 and B2) are just apparent.
Figure 4 shows data recorded using the STM-BJ method atUtip ) 0.6 V. This method involves the cleavage of metal-metal“break” junctions and it is expected that many more irregularjunctions result than for the I(s) method, because the latter avoidsdirect contact of the metal STM tip and surface and measure-ments are conducted on flat substrate areas. Nevertheless, similarcurrent jump values, corresponding to A and B groups, are seenin retraction curves presented in Figure 4a. A correspondinghistogram is seen in Figure 4b, which demonstrates closesimilarity between the A and B groups of peaks seen both inthe I(s) and BJ methods. A further set of higher conductancepeaks (labeled C) is seen when a higher current STM currentamplifier is used together with lower bias voltage, at Utip ) 0.1V (Figure 4c and d); although this lower sensitivity amplifierdoes not allow for the observation of the low conductance
(52) Neaton, J. B.; Hybertsen, M. S.; Louie, S. G. Phys. ReV. Lett. 2006,97, 216405–216408.
(53) Quek, S. Y.; Venkataraman, L.; Choi, H. J.; Louie, S. G.; Hybertsen,M. S.; Neaton, J. B. Nano Lett. 2007, 7, 3477–3482.
(54) Mowbray, D. J.; Jones, G.; Thygesen, K. S. J. Chem. Phys. 2008,128, 111103–111107.
(55) Quek, S. Y.; Kamenetska, M.; Steigerwald, M. L.; Choi, H. J.; Louie,S. G.; Hybertsen, M. S.; Neaton, J. B.; Venkataraman, L. Nat.Nanotechnol. 2009, 4, 230–234.
(56) Luu, T.; Elliott, E.; Slepkov, A. D.; Eisler, S.; McDonald, R.; Hegmann,F. A.; Tykwinski, R. R. Org. Lett. 2005, 7, 51–54.
(57) Simpkins, S. M. E.; Weller, M. D.; Cox, L. R. Chem. Commun. 2007,4035–4037.
(58) Kendall, J.; McDonald, R.; Ferguson, M. J.; Tykwinski, R. R. Org.Lett. 2008, 10, 2163–2166.
(59) During the course of our work single molecule studies were reportedon (a) 1,2-di(pyridin-4-yl)ethene and 1,2-di(pyridin-4-yl)ethane: Zhou,X.-S.; Chen, Z.-B.; Liu, S.-H.; Jin, S.; Liu, L.; Zhang, H.-M.; Xie,Z.-X.; Jiang, Y.-B.; Mao, B.-W. J. Phys. Chem. C 2008, 112, 3935–3940. (b) 4,4′-bipyridine: see ref 55.
Figure 3. (a-b) Typical conductance traces of compound 1 (n ) 1) using the I(s) method at low set-point current (10-20 nA), using a low currentamplifier, and high set-point current (60-80 nA), using a high current amplifier, respectively. The curves are shifted horizontally for clarity. (c) Conductancehistograms built by adding together all the points of 85 and 105 conductance traces, respectively, that showed discernible plateaus such as those displayedin (a-b). Conductance data are presented in units of the conductance quantum G0 ) 2e2/h ) 77.5 µS. Utip ) 0.6 V.
15650 J. AM. CHEM. SOC. 9 VOL. 131, NO. 43, 2009
A R T I C L E S Wang et al.

groups. The occurrence of these different conductance groupscould be ascribed to different contact geometries as discussedabove, i.e. with the nitrogen-gold contacts occupying differentsurface coordination sites. These could be top, bridge or hollowsites on terraces or more highly coordinated step-edge sites, asdiscussed later in the text. The respective data of the singlemolecule conductances for compounds 1-4 are summarized inTable 1.
4,4-Bipyridine 4 is the control compound which has beenstudied previously. Our values (Table 1 and Figure 6) are 1.34( 0.17, 5.38 ( 0.64 and 75.5 ( 15.3 × 10⁻⁴ G0 for A, B andC groups, respectively. These data compare favorably with thosefor 4 reported by Quek et al.55 (1.6 × 10⁻⁴ G0 and 6.0 × 10⁻⁴
G0 extending to ca. 3 × 10⁻³ G0) and differ from the datareported by Xu and Tao9 (1 × 10⁻² G0) and Zhou et al.59 (0.59× 10⁻³ and 4.79 × 10⁻³).
As explained in the literature,28,45,60 careful calibration of thetip-to-substrate distance allows an estimation of the gap separa-tion at which the molecular junction is cleaved. This calibrationis achieved by obtaining d ln(I(s))/ds in the distance range ofinterest and extrapolating to the point contact conductance toobtain the zero tip-to-substrate reference separation. The retrac-tion distance measured in an I(s) scan from the initial set-pointdistance (s0) can then be recalibrated to the estimated separationbetween tip and sample. In a given I(s) scan current steps occur
at sw (Figure 3); since the I(s) scan starts at the separation of s0
the experimentally measured break-off distances (sbreak-off) is thengiven by (s0 + sw). This experimentally measured break-offdistance can then be compared to the length of the molecule(for compound 3 obtained from the crystal structure and forthe other compounds from standard bond lengths taking intoaccount the rigidity of these systems). Such a comparison isshown in Figure 5 for both groups A and B. From this figure itcan be seen that the sbreak-off values are close to distances obtainedfor each of the molecules extended between gold contacts, withthe distance being that between the respective gold contact atomsat each end of the molecular wire.
The collected conductance values for groups A, B and C forcompounds 1-3 (i.e., n ) 1, 2 and 4) are plotted as logarithmicconductance versus n in Figure 6. All three conduction groups(A, B and C) show a similar length decay. The decay from n )1-4 is very shallow with an apparent � value of (0.06 ( 0.03)Å-1. For comparison the conductance for bipyridyl 4 (n ) 0)is also shown. This does not lie on the exponential decay line,since the latter is associated with the oligoyne backbone. Thevery low attenuation factor of 0.06 Å-1 is comparable withobservations for some other highly conjugated, low bandgap
(60) Sedghi, G.; Sawada, K.; Esdaile, J. L.; Hoffmann, M.; Anderson, H. L.;Bethell, D.; Haiss, W.; Higgins, S. J.; Nichols, R. J. J. Am. Chem.Soc. 2008, 130, 8582–8583.
Figure 4. Typical conductance traces of compound 1 (n ) 1) using (a) the STM-BJ method and (c) a higher current STM current amplifier together withlower bias voltage (0.1 V) to observe the highest conductance peak (labeled C). The curves in (a) and (c) are shifted horizontally for clarity. (b-d) Conductancehistograms built by adding together all the points of 95 and 75 conductance traces, respectively, that showed discernible plateaus.
Table 1. Single Molecule Conductance Data for TheseCompounds, with Data for the A (“Low”), B (“Medium”) and C(“High”) Conductance Groups Tabulated
conductance /10-4 G0
compound A B C
1 (n ) 1) 0.90 ( 0.30 3.45 ( 0.43 28.9 ( 5.202 (n ) 2) 0.62 ( 0.13 2.93 ( 0.37 24.9 ( 3.063 (n ) 4) 0.51 ( 0.11 2.41 ( 0.33 21.6 ( 3.054 (n ) 0) 1.34 ( 0.17 5.38 ( 0.64 75.5 ( 15.3
Figure 5. Experimentally determined average break-off distance (sbreak-off
) sw + s0) for group A (green, upper line) and group B (blue, lower line)events for compounds with n ) 0, 1, 2, and 4 as measured with the I(s)technique. The results of the molecular modeling calculation schematicallydepicted in Figure 9 are shown as black squares together with a linear fit.
J. AM. CHEM. SOC. 9 VOL. 131, NO. 43, 2009 15651
Oligoyne Single Molecule Wires A R T I C L E S
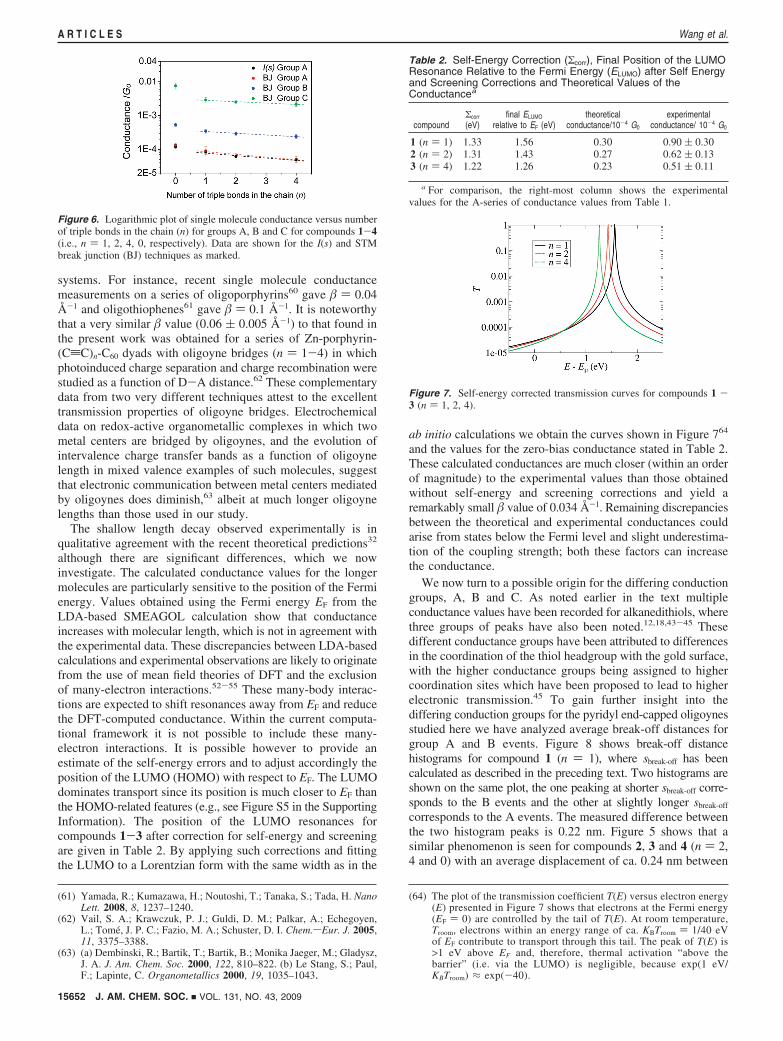
systems. For instance, recent single molecule conductancemeasurements on a series of oligoporphyrins60 gave � ) 0.04Å-1 and oligothiophenes61 gave � ) 0.1 Å-1. It is noteworthythat a very similar � value (0.06 ( 0.005 Å-1) to that found inthe present work was obtained for a series of Zn-porphyrin-(CtC)n-C60 dyads with oligoyne bridges (n ) 1-4) in whichphotoinduced charge separation and charge recombination werestudied as a function of D-A distance.62 These complementarydata from two very different techniques attest to the excellenttransmission properties of oligoyne bridges. Electrochemicaldata on redox-active organometallic complexes in which twometal centers are bridged by oligoynes, and the evolution ofintervalence charge transfer bands as a function of oligoynelength in mixed valence examples of such molecules, suggestthat electronic communication between metal centers mediatedby oligoynes does diminish,63 albeit at much longer oligoynelengths than those used in our study.
The shallow length decay observed experimentally is inqualitative agreement with the recent theoretical predictions32
although there are significant differences, which we nowinvestigate. The calculated conductance values for the longermolecules are particularly sensitive to the position of the Fermienergy. Values obtained using the Fermi energy EF from theLDA-based SMEAGOL calculation show that conductanceincreases with molecular length, which is not in agreement withthe experimental data. These discrepancies between LDA-basedcalculations and experimental observations are likely to originatefrom the use of mean field theories of DFT and the exclusionof many-electron interactions.52-55 These many-body interac-tions are expected to shift resonances away from EF and reducethe DFT-computed conductance. Within the current computa-tional framework it is not possible to include these many-electron interactions. It is possible however to provide anestimate of the self-energy errors and to adjust accordingly theposition of the LUMO (HOMO) with respect to EF. The LUMOdominates transport since its position is much closer to EF thanthe HOMO-related features (e.g., see Figure S5 in the SupportingInformation). The position of the LUMO resonances forcompounds 1-3 after correction for self-energy and screeningare given in Table 2. By applying such corrections and fittingthe LUMO to a Lorentzian form with the same width as in the
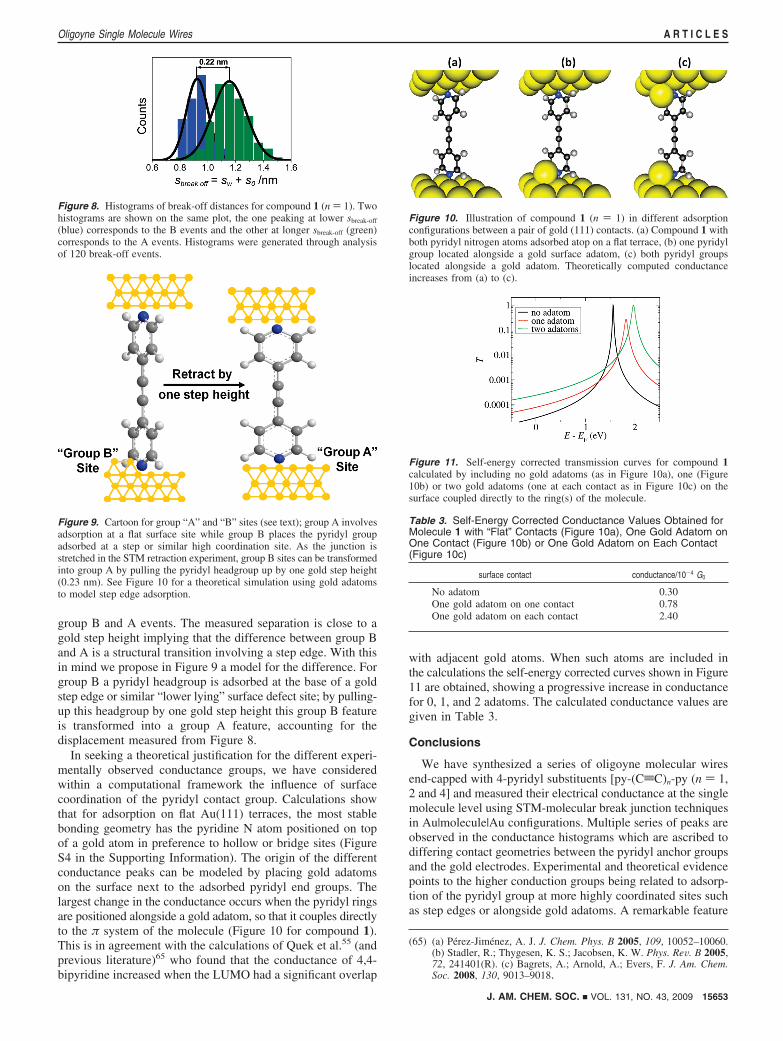
ab initio calculations we obtain the curves shown in Figure 764
and the values for the zero-bias conductance stated in Table 2.These calculated conductances are much closer (within an orderof magnitude) to the experimental values than those obtainedwithout self-energy and screening corrections and yield aremarkably small � value of 0.034 Å-1. Remaining discrepanciesbetween the theoretical and experimental conductances couldarise from states below the Fermi level and slight underestima-tion of the coupling strength; both these factors can increasethe conductance.
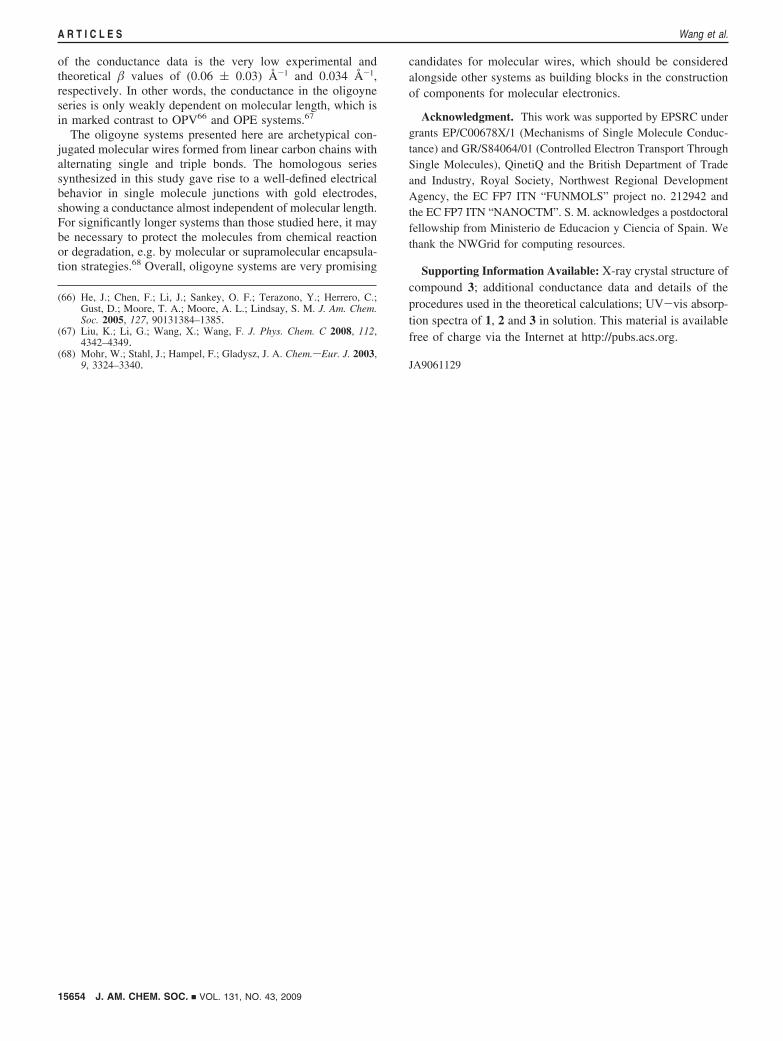
We now turn to a possible origin for the differing conductiongroups, A, B and C. As noted earlier in the text multipleconductance values have been recorded for alkanedithiols, wherethree groups of peaks have also been noted.12,18,43-45 Thesedifferent conductance groups have been attributed to differencesin the coordination of the thiol headgroup with the gold surface,with the higher conductance groups being assigned to highercoordination sites which have been proposed to lead to higherelectronic transmission.45 To gain further insight into thediffering conduction groups for the pyridyl end-capped oligoynesstudied here we have analyzed average break-off distances forgroup A and B events. Figure 8 shows break-off distancehistograms for compound 1 (n ) 1), where sbreak-off has beencalculated as described in the preceding text. Two histograms areshown on the same plot, the one peaking at shorter sbreak-off corre-sponds to the B events and the other at slightly longer sbreak-off
corresponds to the A events. The measured difference betweenthe two histogram peaks is 0.22 nm. Figure 5 shows that asimilar phenomenon is seen for compounds 2, 3 and 4 (n ) 2,4 and 0) with an average displacement of ca. 0.24 nm between
(61) Yamada, R.; Kumazawa, H.; Noutoshi, T.; Tanaka, S.; Tada, H. NanoLett. 2008, 8, 1237–1240.
(62) Vail, S. A.; Krawczuk, P. J.; Guldi, D. M.; Palkar, A.; Echegoyen,L.; Tome, J. P. C.; Fazio, M. A.; Schuster, D. I. Chem.sEur. J. 2005,11, 3375–3388.
(63) (a) Dembinski, R.; Bartik, T.; Bartik, B.; Monika Jaeger, M.; Gladysz,J. A. J. Am. Chem. Soc. 2000, 122, 810–822. (b) Le Stang, S.; Paul,F.; Lapinte, C. Organometallics 2000, 19, 1035–1043.
(64) The plot of the transmission coefficient T(E) versus electron energy(E) presented in Figure 7 shows that electrons at the Fermi energy(EF ) 0) are controlled by the tail of T(E). At room temperature,Troom, electrons within an energy range of ca. KBTroom ) 1/40 eVof EF contribute to transport through this tail. The peak of T(E) is>1 eV above EF and, therefore, thermal activation “above thebarrier” (i.e. via the LUMO) is negligible, because exp(1 eV/KBTroom) ≈ exp(-40).
Figure 6. Logarithmic plot of single molecule conductance versus numberof triple bonds in the chain (n) for groups A, B and C for compounds 1-4(i.e., n ) 1, 2, 4, 0, respectively). Data are shown for the I(s) and STMbreak junction (BJ) techniques as marked.
Table 2. Self-Energy Correction (Σcorr), Final Position of the LUMOResonance Relative to the Fermi Energy (ELUMO) after Self Energyand Screening Corrections and Theoretical Values of theConductancea
compoundΣcorr
(eV)final ELUMO
relative to EF (eV)theoretical
conductance/10-4 G0
experimentalconductance/ 10-4 G0
1 (n ) 1) 1.33 1.56 0.30 0.90 ( 0.302 (n ) 2) 1.31 1.43 0.27 0.62 ( 0.133 (n ) 4) 1.22 1.26 0.23 0.51 ( 0.11
a For comparison, the right-most column shows the experimentalvalues for the A-series of conductance values from Table 1.
Figure 7. Self-energy corrected transmission curves for compounds 1 -3 (n ) 1, 2, 4).
15652 J. AM. CHEM. SOC. 9 VOL. 131, NO. 43, 2009
A R T I C L E S Wang et al.
group B and A events. The measured separation is close to agold step height implying that the difference between group Band A is a structural transition involving a step edge. With thisin mind we propose in Figure 9 a model for the difference. Forgroup B a pyridyl headgroup is adsorbed at the base of a goldstep edge or similar “lower lying” surface defect site; by pulling-up this headgroup by one gold step height this group B featureis transformed into a group A feature, accounting for thedisplacement measured from Figure 8.
In seeking a theoretical justification for the different experi-mentally observed conductance groups, we have consideredwithin a computational framework the influence of surfacecoordination of the pyridyl contact group. Calculations showthat for adsorption on flat Au(111) terraces, the most stablebonding geometry has the pyridine N atom positioned on topof a gold atom in preference to hollow or bridge sites (FigureS4 in the Supporting Information). The origin of the differentconductance peaks can be modeled by placing gold adatomson the surface next to the adsorbed pyridyl end groups. Thelargest change in the conductance occurs when the pyridyl ringsare positioned alongside a gold adatom, so that it couples directlyto the π system of the molecule (Figure 10 for compound 1).This is in agreement with the calculations of Quek et al.55 (andprevious literature)65 who found that the conductance of 4,4-bipyridine increased when the LUMO had a significant overlap
with adjacent gold atoms. When such atoms are included inthe calculations the self-energy corrected curves shown in Figure11 are obtained, showing a progressive increase in conductancefor 0, 1, and 2 adatoms. The calculated conductance values aregiven in Table 3.
Conclusions
We have synthesized a series of oligoyne molecular wiresend-capped with 4-pyridyl substituents [py-(CtC)n-py (n ) 1,2 and 4] and measured their electrical conductance at the singlemolecule level using STM-molecular break junction techniquesin Au|molecule|Au configurations. Multiple series of peaks areobserved in the conductance histograms which are ascribed todiffering contact geometries between the pyridyl anchor groupsand the gold electrodes. Experimental and theoretical evidencepoints to the higher conduction groups being related to adsorp-tion of the pyridyl group at more highly coordinated sites suchas step edges or alongside gold adatoms. A remarkable feature
(65) (a) Perez-Jimenez, A. J. J. Chem. Phys. B 2005, 109, 10052–10060.(b) Stadler, R.; Thygesen, K. S.; Jacobsen, K. W. Phys. ReV. B 2005,72, 241401(R). (c) Bagrets, A.; Arnold, A.; Evers, F. J. Am. Chem.Soc. 2008, 130, 9013–9018.
Figure 8. Histograms of break-off distances for compound 1 (n ) 1). Twohistograms are shown on the same plot, the one peaking at lower sbreak-off
(blue) corresponds to the B events and the other at longer sbreak-off (green)corresponds to the A events. Histograms were generated through analysisof 120 break-off events.
Figure 9. Cartoon for group “A” and “B” sites (see text); group A involvesadsorption at a flat surface site while group B places the pyridyl groupadsorbed at a step or similar high coordination site. As the junction isstretched in the STM retraction experiment, group B sites can be transformedinto group A by pulling the pyridyl headgroup up by one gold step height(0.23 nm). See Figure 10 for a theoretical simulation using gold adatomsto model step edge adsorption.
Figure 10. Illustration of compound 1 (n ) 1) in different adsorptionconfigurations between a pair of gold (111) contacts. (a) Compound 1 withboth pyridyl nitrogen atoms adsorbed atop on a flat terrace, (b) one pyridylgroup located alongside a gold surface adatom, (c) both pyridyl groupslocated alongside a gold adatom. Theoretically computed conductanceincreases from (a) to (c).
Figure 11. Self-energy corrected transmission curves for compound 1calculated by including no gold adatoms (as in Figure 10a), one (Figure10b) or two gold adatoms (one at each contact as in Figure 10c) on thesurface coupled directly to the ring(s) of the molecule.
Table 3. Self-Energy Corrected Conductance Values Obtained forMolecule 1 with “Flat” Contacts (Figure 10a), One Gold Adatom onOne Contact (Figure 10b) or One Gold Adatom on Each Contact(Figure 10c)
surface contact conductance/10-4 G0
No adatom 0.30One gold adatom on one contact 0.78One gold adatom on each contact 2.40
J. AM. CHEM. SOC. 9 VOL. 131, NO. 43, 2009 15653
Oligoyne Single Molecule Wires A R T I C L E S
of the conductance data is the very low experimental andtheoretical � values of (0.06 ( 0.03) Å-1 and 0.034 Å-1,respectively. In other words, the conductance in the oligoyneseries is only weakly dependent on molecular length, which isin marked contrast to OPV66 and OPE systems.67
The oligoyne systems presented here are archetypical con-jugated molecular wires formed from linear carbon chains withalternating single and triple bonds. The homologous seriessynthesized in this study gave rise to a well-defined electricalbehavior in single molecule junctions with gold electrodes,showing a conductance almost independent of molecular length.For significantly longer systems than those studied here, it maybe necessary to protect the molecules from chemical reactionor degradation, e.g. by molecular or supramolecular encapsula-tion strategies.68 Overall, oligoyne systems are very promising
candidates for molecular wires, which should be consideredalongside other systems as building blocks in the constructionof components for molecular electronics.
Acknowledgment. This work was supported by EPSRC undergrants EP/C00678X/1 (Mechanisms of Single Molecule Conduc-tance) and GR/S84064/01 (Controlled Electron Transport ThroughSingle Molecules), QinetiQ and the British Department of Tradeand Industry, Royal Society, Northwest Regional DevelopmentAgency, the EC FP7 ITN “FUNMOLS” project no. 212942 andthe EC FP7 ITN “NANOCTM”. S. M. acknowledges a postdoctoralfellowship from Ministerio de Educacion y Ciencia of Spain. Wethank the NWGrid for computing resources.
Supporting Information Available: X-ray crystal structure ofcompound 3; additional conductance data and details of theprocedures used in the theoretical calculations; UV-vis absorp-tion spectra of 1, 2 and 3 in solution. This material is availablefree of charge via the Internet at http://pubs.acs.org.
JA9061129
(66) He, J.; Chen, F.; Li, J.; Sankey, O. F.; Terazono, Y.; Herrero, C.;Gust, D.; Moore, T. A.; Moore, A. L.; Lindsay, S. M. J. Am. Chem.Soc. 2005, 127, 90131384–1385.
(67) Liu, K.; Li, G.; Wang, X.; Wang, F. J. Phys. Chem. C 2008, 112,4342–4349.
(68) Mohr, W.; Stahl, J.; Hampel, F.; Gladysz, J. A. Chem.sEur. J. 2003,9, 3324–3340.
15654 J. AM. CHEM. SOC. 9 VOL. 131, NO. 43, 2009
A R T I C L E S Wang et al.