simulated climate and biomes of africa during the late quaternary - evidence from lake magadi...
TRANSCRIPT

Quaternary Science Reviews, Vol. 17, pp. 629—657, 1998( 1998 Elsevier Science Ltd.
Printed in Great Britain. All rights reserved.0277—3791/98, $19.00
PII: S0277-3791(98)00015-8
SIMULATED CLIMATE AND BIOMES OF AFRICA DURING THELATE QUATERNARY: COMPARISON WITH POLLEN AND LAKE
STATUS DATA
D. JOLLY*, S.P. HARRISON-, B. DAMNATI-, and R. BONNEFILLE‡* Global Systems Group, Department of Ecology, University of Lund, Ekology Building, Solvegatan 37,
S-223 62 Lund, Sweden-Dynamic Palaeoclimatology, Lund University, Box 117, S-221 00, Sweden
‡ Laboratoire de Ge&ologie du Quaternaire, CNRS, CEREGE, BP 80, 13545 Aix en Provence Cedex 04, France
Abstract— New compilations of African pollen and lake data are compared with climate(CCM1, NCAR, Boulder) and vegetation (BIOME 1.2, GSG, Lund) simulations for the lastglacial maximum (LGM) and early to mid-Holocene (EMH). The simulated LGM climate wasca 4°C colder and drier than present, with maximum reduction in precipitation in semi-aridregions. Biome simulations show lowering of montane vegetation belts and expansion ofsouthern xerophytic associations, but no change in the distribution of deserts and tropical rainforests. The lakes show LGM conditions similar or drier than present throughout northern andtropical Africa. Pollen data indicate lowering of montane vegetation belts, the stability of theSahara, and a reduction of rain forest. The paleoenvironmental data are consistent with thesimulated changes in temperature and moisture budgets, although they suggest the climatemodel underestimates equatorial aridity. EMH simulations show temperatures slightly lessthan present and increased monsoonal precipitation in the eastern Sahara and East Africa.Biome simulations show an upward shift of montane vegetation belts, fragmentation ofxerophytic vegetation in southern Africa, and a major northward shift of the southern margin ofthe eastern Sahara. The lakes indicate conditions wetter than present across northern Africa.Pollen data show an upward shift of the montane forests, the northward shift of the southernmargin of the Sahara, and a major extension of tropical rain forest. The lake and pollen dataconfirm monsoon expansion in eastern Africa, but the climate model fails to simulate the wetconditions in western Africa. ( 1998 Elsevier Science Ltd. All rights reserved
INTRODUCTION
Significant changes in the regional climates of Africasince the last glacial maximum (ca. 21 ka calendar)have been documented from syntheses of pollen (Zin-deren Bakker and Coetzee, 1972; Zinderen Bakker,1976; Hamilton, 1982; Zinderen Bakker, 1982; Lezineand Casanova, 1989; Street-Perrott and Perrott, 1993)and lake level data (Grove and Goudie, 1971; Streetand Grove, 1976; Street-Perrott and Roberts, 1983;Street-Perrott et al., 1985; Gasse et al., 1987; Street-Perrott and Perrott, 1993). Comparisons of thesepalaeoenvironmental observations and climate modelsimulations have shown that changes in regional cli-mates can largely be explained in terms of global cha-nges in glaciation and insolation regimes (COHMAPMembers, 1988; Street-Perrott and Perrott, 1993). At21 ka (cal.), the combination of large northern-hemi-sphere ice sheets, more extensive sea-ice and coldersea-surface temperatures resulted in low temperaturesand drier conditions over most of Africa (COHMAPMembers, 1988). During the early to mid-Holocene,the enhancement of northern-hemisphere monsoons,resulting from orbitally induced changes in the latitudi-nal and seasonal distribution of insolation created sub-
stantially wetter conditions over much of northern andeastern Africa (Kutzbach and Street-Perrott, 1985;COHMAP Members, 1988; Street-Perrott and Perrott,1993).
In this paper, we use a new sequence of atmosphericgeneral circulation model (AGCM) simulations of keyintervals during the Late Quaternary made with a ver-sion of the National Center for Atmospheric Research(NCAR) Community Climate Model (CCM1) (Kut-zbach et al., this volume) to re-examine the evolutionof African regional climates. Our aim is to assess thedegree to which not only the sense but the magnitudeof the observed changes in regional climate are cor-rectly simulated by the climate model. Our detailedevaluation of the simulated climate changes is madepossible by the existence of new syntheses of palaeoen-vironmental (pollen and lake status) data, and by anew data-model comparison technique using the bi-ome model of Prentice et al. (1992) to translatesimulated climates into predictions of vegetation distri-bution for direct comparison with the pollen data.We first describe the climate model and the biomemodel simulations. We then describe the pollen andlake level data before using these data to test the modelsimulations.
629

TABLE 1. Modern vegetation in Africa and biomes
Tropical rain forest Lowland evergreen forestTransitional rain forest
Tropical seasonal forest lowland semi-evergreen forest
Tropical dry forest/savanna Dry deciduous forestDry semi-evergreen forestTransitional woodlandMiomboMopane woodland
Tropical xerophytic bush/savanna Evergreen and deciduous
bushlandScrub forest
Broad-leaved evergreen/ Broad-leaved sclerophyllouswarm mixed forest forest
Coniferous forestDeciduous oak forest
Temperate xerophytic Maquis and garriguewoods/scrub Fynbos
Semi-desertic bushy and succu-lent Karoo shrublandShrubby plant communities(high mountains of the Sahara)
Warm grass/shrub Sclerophyllous grasses, che-nopodiaceous shrubs andtherophytesWooded and semi-deserticgrassland
Temperate microphyllousshrub Afroalpine and austroafroal-
pine shrubland
DATA AND METHODS
The Climate Simulations
The AGCM simulations have been made with a ver-sion of the NCAR CCM1 coupled to a 50 m mixed-layerocean with prescribed ocean heat flux (Kutzbach et al.,this volume). In these simulations, insolation is cal-culated in accordance with known changes in the earth isorbital configuration at 21, 11 and 6 ka calendar (cal.)years. The height and lateral extent of ice sheets at thesetimes are imposed (see Kutzbach et al., this volume)following Peltier’s (1994) reconstructions. Atmosphericcarbon dioxide levels are lowered to 191 ppmv at 21 ka(cal.), and to the pre-industrial level of 267 ppmv for 11and 6 ka (cal.) and the control simulation.
Earlier simulations, made with CCM0 (Kutzbachand Guetter, 1986), were run with prescribed sea sur-face temperatures (SSTs) and run in ‘perpetual’ Jan-uary and July mode, so that soil moisture was alsoprescribed. Changes in SSTs (Street-Perrott and Per-rott, 1990) and feedbacks associated with changes insoil moisture (Kutzbach et al., 1996) may have a signifi-cant influence on the African monsoon. These influen-ces should (to some extent) be captured by CCM1because of the incorporation of a mixed-layer ocean,allowing variable SSTs, and because the simulationswere run through a full seasonal cycle, so that the soilmoisture could be calculated interactively. These newsimulations might therefore be expected to providea more realistic picture of regional climate changes inAfrica, and our comparisons with palaeoenvironmen-tal data are designed to test whether this is the case.
The BIOME model
BIOME is a model developed from physiologicalconsiderations to predict global patterns in potentialvegetation physiognomy as a function of climate (Pren-tice et al., 1992, 1993). In the model, constraints on thegrowth and regeneration of different plant functionaltypes are formulated in terms of limiting values of themean temperature of the coldest and warmest months,‘growing’ degree-days (GDD), and a coefficient (thePriestley-Taylor coefficient a) for the extent to whichsoil moisture supply satisfies atmospheric moisture de-mand. Biomes emerge from the combination of differ-ent plant functional types. In the original application,when driven by modern climate data, the model cor-rectly assigned 53% of all of the 2.5° cells coveringAfrica (Prentice et al., 1992) to the observed biomedistributions according to Olson et al. (1983).
To improve its applicability to the palaeorecords ofAfrica, the model is extended here (BIOME 1.2) byintroducing three new plant functional types (Prenticeand Jolly, in press): temperate sclerophyll/succulent,tropical sclerophyll/succulent and temperate micro-phyllous shrub (Table 1). Temperate sclerophyll/succu-lents are distinguished from tropical sclerophyll/succu-lents on the basis of winter cold tolerance, with a meantemperature of the coldest month limit of 15.5°C. This
temperature limit is based on the observation thatbroad-leaved summergreen trees will not survive longin frost-free climates (Box, 1981; Prentice et al., 1992).The presence of temperate sclerophyll/succulent andtropical sclerophyll/succulent plants define respective-ly the biomes temperate xerophytic woods/scrub andtropical xerophytic bush/savanna (Table 2). Temperatexerophytic woods/scrub occurs today under Mediter-ranean-type climates in northern and southernAfrica, corresponding to White’s (1983) mapping unitsVII and XIV respectively. The tropical xerophyticbush/savanna biome is a mosaic of steppe, savannaand bushland, with a modern distribution in the Saheltransition zone. White (1983) maps this biome as units19b, 40, 41, 43, 46 and 47. We have defined a newbiome called temperate microphyllous shrubland. Thisbiome corresponds to the Highveld grassland in SouthAfrica (White’s mapping units 34, 57b and 58) and theAfromontane grass/shrubland (units 19a, 65 and 66) intropical Africa. Temperate microphyllous shrubs occurin environments where the winters are mild enough topermit the growth of temperate xerophytes and warmtemperate evergreens, but where the seasonal contrastis low so that the growing degree day requirements oftrees are only barely met and grasses and shrubs there-fore have a competitive advantage. Temperate micro-phyllous shrubs occur where the minimum mean tem-perature of the coldest month is 5°C, the maximummean temperature of the coldest month is 10.5°C, with
630 Quaternary Science Reviews: Volume 17

TABLE 2. Environmental constraints (mean temperature of the coldest month, MTCO; growing degree days on 15°C (GDD15°), 5°C (GDD5°)and 0°C (GDD0°) bases, mean temperature of the warmest month, MTWA; Priestley—Taylor coefficient of annual moisture availability, a;
dominance class, D) for each plant functional type in BIOME 1.2.
Plant functional type MTCO GDD15 GDD5 GDD0 MTWA a D
Min Max Min Min Min Min Min Max
Tropical evergreen 15.5 0.80 1Tropical raingreen 15.5 0.45 0.95 1Warm-temperate evergreen 5 550 0.65 2Temperate summergreen !15 15.5 1200 0.65 3Cool-temperate conifer !19 5 900 0.65 3Boreal evergreen conifer !35 !2 350 0.75 3Boreal summergreen 5 350 0.65 3Temperate sclerophyll/succulent 5 15.5 550 0.28 4Tropical sclerophyll/succulent 15.5 0.28 4Temperate microphyllous shrub 5 10.5 0.28 0.80 5Warm grass/shrub 22 0.18 6Cool grass/shrub 500 0.33 7Cold grass/shrub 100 0.33 7Hot desert shrub 22 8Cold desert shrub 100 9Dummy type 10
values of a between 28 and 80%, and less than 550GDD
15(Table 1). These critical limits were derived by
visual comparison of the mapped distribution of theseplants as shown by the ICIV/FAO (Lavenu et al., 1987)and UNESCO/AETFAT/UNSO (White, 1983) vegeta-tion maps of Africa, with maps of these climatic vari-ables based on the modern data. The presence of tem-perate microphyllous shrubs defines the biome of thesame name (Table 2).
The biome model is run on a 0.5° grid. AGCManomalies (absolute differences between the experi-ment and the control simulation values) of meanmonthly temperature, precipitation and cloudiness areinterpolated to this grid and superimposed on a mod-ern climate data set based on an extended version(2423 African terrestrial stations) of Leemans andCramer (1991). The use of AGCM anomalies is de-signed to minimise the effects of systematic modelbiases (Harrison and Laarif, unpublished data); addingthe anomalies to a modern data set which incorporatesthe effects of topography on climate makes it possibleto capture some of the local-scale spatial pattern due toterrestrial geography. The biome maps presented inthis study are different from the maps published inKutzbach et al. (this volume) because we used a modi-fied version 1.2 of BIOME (Prentice and Jolly, inpress). We obtained broadly the same patterns but withmore details in the simulated distribution of the tropi-cal biomes.
Palaeoenvironmental Data and their use for Data-modelComparisons
Our palaeoenvironmental reconstructions are basedon pollen and lake status data. The geological record ofchanges in lake depth or area provides a record oflong-term changes in annual moisture budgets (pre-cipitation — evaporation: P—E). Lake data provide onlya limited test of the simulation of regional climate.Pollen data discriminate changes in both temperature
and precipitation, but cannot provide a complete pic-ture of the environmental changes in Africa because,while relatively abundant in the semi-arid zone andmountainous regions, suitable sites for pollen preserva-tion are rarely found in the deserts. Lake data aretherefore needed to supplement the information aboutclimate changes in the desert regions.
Changes in lake status (a qualitative measure of thechange in lake level or relative water depth) are directlycompared to the change in simulated P—E (*P—E:P—E
%91%3*.%/5!P—E
#0/530-). Various methods exist to
translate pollen data into quantitative estimates ofclimatic variables (see Guiot, 1990, 1994 for a summaryof these methods). Quantitative reconstructions havebeen made for only a few sites in central East Africa(Bonnefille et al., 1990, 1992; Chalie, 1992; Vincenset al., 1993) and thus cannot be used to provide map-ped reconstructions of temperature and precipitationat a continental scale for comparison with the climatesimulations. We have therefore adopted an alternativeapproach, in which the simulated climate variables aretranslated into a map of vegetation distribution acrossthe continent using the BIOME model of Prentice et al.(1992). These maps are then directly compared with theobserved vegetation at a site, as indicated by the pollenassemblages.
The sense of biome changes in the pollen datathrough time can indicate which climatic variableschanged and how they changed. This information canhelp in the analysis of mismatches between observedand simulated biomes, by the use of BIOME 1.2 indiagnostic mode to assign climate response surfaces tobiomes (Tables 1 and 2). For example, a change fromtropical rainforest, characterised by the plant func-tional type tropical evergreen, to tropical seasonal for-est, with both tropical evergreen and tropical raingreenplants, indicates a decrease in the moisture index below0.95 (Table 1). However, a change from tropicalrainforest to evergreen warm-mixed forest, character-ised by warm-temperate evergreen plants, implies a
D. Jolly et al.: Simulated climate and biomes of Africa during the Late Quaternary 631
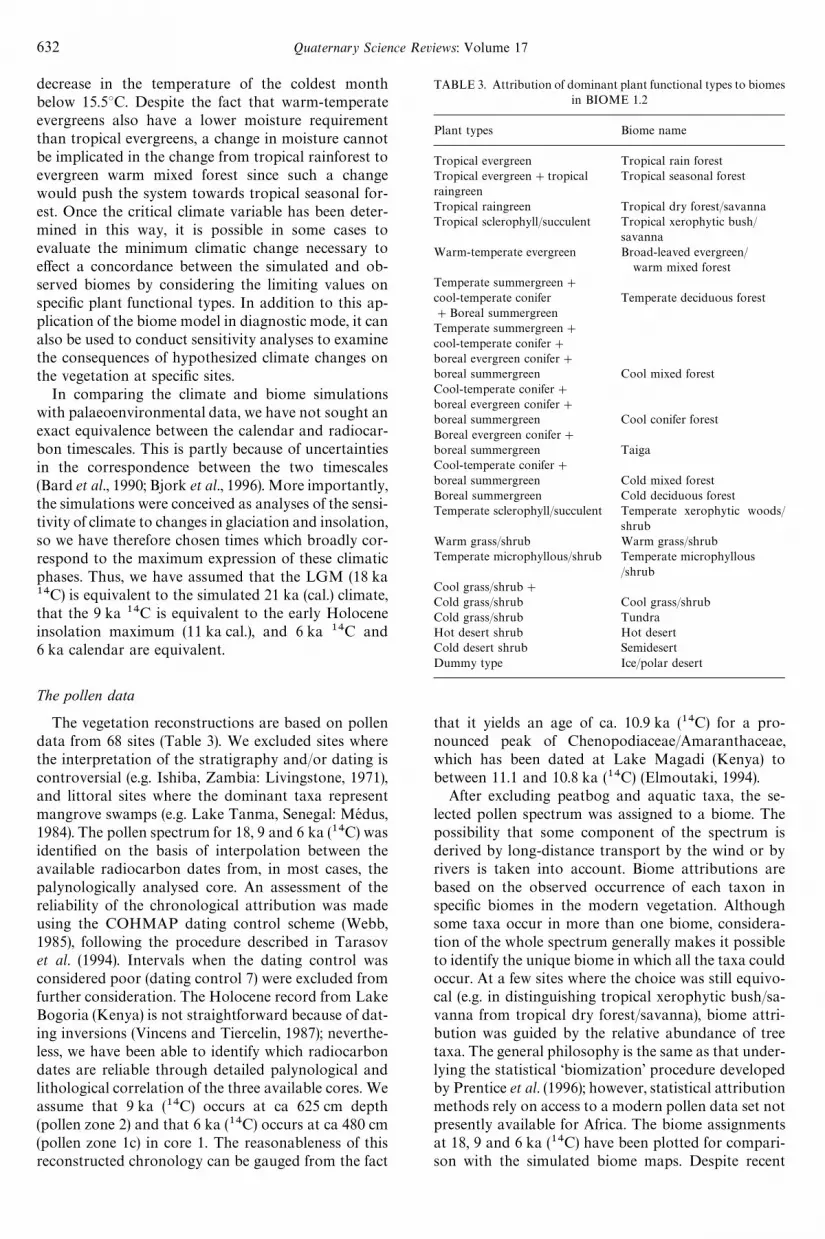
TABLE 3. Attribution of dominant plant functional types to biomesin BIOME 1.2
Plant types Biome name
Tropical evergreen Tropical rain forestTropical evergreen#tropicalraingreen
Tropical seasonal forest
Tropical raingreen Tropical dry forest/savannaTropical sclerophyll/succulent Tropical xerophytic bush/
savannaWarm-temperate evergreen Broad-leaved evergreen/
warm mixed forestTemperate summergreen#cool-temperate conifer#Boreal summergreen
Temperate deciduous forest
Temperate summergreen#cool-temperate conifer#boreal evergreen conifer#boreal summergreen Cool mixed forestCool-temperate conifer#boreal evergreen conifer#boreal summergreen Cool conifer forestBoreal evergreen conifer#boreal summergreen TaigaCool-temperate conifer#boreal summergreen Cold mixed forestBoreal summergreen Cold deciduous forestTemperate sclerophyll/succulent Temperate xerophytic woods/
shrubWarm grass/shrub Warm grass/shrubTemperate microphyllous/shrub Temperate microphyllous
/shrubCool grass/shrub#Cold grass/shrub Cool grass/shrubCold grass/shrub TundraHot desert shrub Hot desertCold desert shrub SemidesertDummy type Ice/polar desert
decrease in the temperature of the coldest monthbelow 15.5°C. Despite the fact that warm-temperateevergreens also have a lower moisture requirementthan tropical evergreens, a change in moisture cannotbe implicated in the change from tropical rainforest toevergreen warm mixed forest since such a changewould push the system towards tropical seasonal for-est. Once the critical climate variable has been deter-mined in this way, it is possible in some cases toevaluate the minimum climatic change necessary toeffect a concordance between the simulated and ob-served biomes by considering the limiting values onspecific plant functional types. In addition to this ap-plication of the biome model in diagnostic mode, it canalso be used to conduct sensitivity analyses to examinethe consequences of hypothesized climate changes onthe vegetation at specific sites.
In comparing the climate and biome simulationswith palaeoenvironmental data, we have not sought anexact equivalence between the calendar and radiocar-bon timescales. This is partly because of uncertaintiesin the correspondence between the two timescales(Bard et al., 1990; Bjork et al., 1996). More importantly,the simulations were conceived as analyses of the sensi-tivity of climate to changes in glaciation and insolation,so we have therefore chosen times which broadly cor-respond to the maximum expression of these climaticphases. Thus, we have assumed that the LGM (18 ka14C) is equivalent to the simulated 21 ka (cal.) climate,that the 9 ka 14C is equivalent to the early Holoceneinsolation maximum (11 ka cal.), and 6 ka 14C and6 ka calendar are equivalent.
The pollen data
The vegetation reconstructions are based on pollendata from 68 sites (Table 3). We excluded sites wherethe interpretation of the stratigraphy and/or dating iscontroversial (e.g. Ishiba, Zambia: Livingstone, 1971),and littoral sites where the dominant taxa representmangrove swamps (e.g. Lake Tanma, Senegal: Medus,1984). The pollen spectrum for 18, 9 and 6 ka (14C) wasidentified on the basis of interpolation between theavailable radiocarbon dates from, in most cases, thepalynologically analysed core. An assessment of thereliability of the chronological attribution was madeusing the COHMAP dating control scheme (Webb,1985), following the procedure described in Tarasovet al. (1994). Intervals when the dating control wasconsidered poor (dating control 7) were excluded fromfurther consideration. The Holocene record from LakeBogoria (Kenya) is not straightforward because of dat-ing inversions (Vincens and Tiercelin, 1987); neverthe-less, we have been able to identify which radiocarbondates are reliable through detailed palynological andlithological correlation of the three available cores. Weassume that 9 ka (14C) occurs at ca 625 cm depth(pollen zone 2) and that 6 ka (14C) occurs at ca 480 cm(pollen zone 1c) in core 1. The reasonableness of thisreconstructed chronology can be gauged from the fact
that it yields an age of ca. 10.9 ka (14C) for a pro-nounced peak of Chenopodiaceae/Amaranthaceae,which has been dated at Lake Magadi (Kenya) tobetween 11.1 and 10.8 ka (14C) (Elmoutaki, 1994).
After excluding peatbog and aquatic taxa, the se-lected pollen spectrum was assigned to a biome. Thepossibility that some component of the spectrum isderived by long-distance transport by the wind or byrivers is taken into account. Biome attributions arebased on the observed occurrence of each taxon inspecific biomes in the modern vegetation. Althoughsome taxa occur in more than one biome, considera-tion of the whole spectrum generally makes it possibleto identify the unique biome in which all the taxa couldoccur. At a few sites where the choice was still equivo-cal (e.g. in distinguishing tropical xerophytic bush/sa-vanna from tropical dry forest/savanna), biome attri-bution was guided by the relative abundance of treetaxa. The general philosophy is the same as that under-lying the statistical ‘biomization’ procedure developedby Prentice et al. (1996); however, statistical attributionmethods rely on access to a modern pollen data set notpresently available for Africa. The biome assignmentsat 18, 9 and 6 ka (14C) have been plotted for compari-son with the simulated biome maps. Despite recent
632 Quaternary Science Reviews: Volume 17

improvements in data coverage for Africa, the numberof pollen sites is still very low in some areas, limitingextrapolation of the observed biomes beyond the ac-tual site.
The lake data
Records of changes in lake status (a measure ofrelative water depth or lake level) for 66 sites have beenderived from the Oxford Lake-Level Data Base(OLLDB: Street-Perrott et al., 1989), supplemented bynew data from 33 sites that have become availablesince the OLLDB compilation (Table 4). The OLLDBcontains records of climatically-induced changes inlake status at individual sites based on geomorphic,stratigraphic, geochemical and palaeocological evid-ence and where the chronology is based on radiocar-bon dating. Reconstructions of changes in lake statusat the 33 new sites are based on similar lines of evid-ence, but a somewhat wider range of dating methodsincluding radiometric (14C, U/Th) dating, the presenceof dated tephras, annual lamination-counting andpalaeomagnetism. The OLLDB contains an assess-ment of the dating control at specific time periodsbased on the COHMAP dating control scheme (Webb,1985); an assessment of the chronological reliability ofthe lake status attribution at particular times has beenmade for the new sites using this scheme and followingthe procedure described in Tarasov et al. (1994). Wehave used these assessments to exclude intervals whenthe dating control was poor (dating control 7) at a par-ticular site, for consistency with the pollen data. Theremay be differences between the assessed dating controlfrom pollen and lake status at a specific site, becausethe lake status record is based on all available datawhile the pollen dating is derived solely from thepalynologically-analysed core.
For comparison and mapping purposes, lake statusis expressed in terms of three categories (high, inter-mediate, low). The definition of the boundaries be-tween these status categories is arbitrary but waschosen to ensure that each occurs with approximatelyequal frequency in the global data set (Street-Perrottet al., 1989). The use of three status categories makesit possible to discriminate between large changesin regional moisture balance (e.g. corresponding to achange by two status categories, such as from lowto high) and smaller changes (e.g. correspondingto a change in status by a single category, such as fromlow to intermediate, or intermediate to high). The dif-ferences in lake status [18 ka (14C)-modern, 9 ka (14C)-modern and 6 ka (14C)—modern] have been plottedfor comparison with maps of the changes in simulatedprecipitation minus evaporation (*P—E).
MODERN CLIMATE AND VEGETATION
The African continent is topographically simple, andthe climatic zones, which are the surface expression of
upper air circulation, tend to occur as symmetricalbelts on either side of the equator (Thompson, 1965).The main floristic regions of Africa (Table 1) as de-scribed by White (1983) show a similarly broadly zonalpattern, although the Ethiopian mountains disturb thissimple pattern.
The northern and southern extremeties of the conti-nent lie in the zone affected by the equatorward dis-placement of the mid-latitude Westerlies in winter.These regions therefore experience a Mediterranean-type climate with summer drought and winter rainsbrought by cyclonic depressions. The vegetation ofMediterranean North Africa encompasses broad-leaved sclerophyllous forests with evergreen Quercus(Q. ilex, Q. suber and Q. coccifera), coniferous forests(with Abies, Pinus, Cedrus, Juniperus, Cupressus and¹etraclinis), and deciduous oak forests (Quercusfaginea, Q. pyrenaica and Q. afares). In the drier re-gions, forests are replaced by bushland, thicket andshrubland (maquis and garrigue) characterized by Oleaeuropaea, Juniperus phoenicia, Pinus halepensis, ever-green Quercus, ¹etraclinis articulata, Erica arborea, andArbutus unedo. The southern extremity of Africa istypified by sclerophyllous shrubland (fynbos) withEricaceae, Proteaceae, Restionaceae, and by semi-de-sertic bushy and succulent Karoo shrubland.
Equatorward of the Mediterranean zone lie the sub-tropical deserts (Sahara, Namib), dominated by sub-tropical anticyclones throughout the year. The Sa-haran vegetation is characterized by sclerophyllousgrasses, Chenopodiaceous shrubs and therophytes,with swampy genera in oases (¹ypha, Phragmites) and¹amarix, Acacia or Hyphaene communities in wadis.Only two perennial species (Stipagrostis zitelli and Cor-nulaca monacantha) occur in regions with less than200 mm yr~1 precipitation in the desert core. In thehigh mountains of the Sahara, shrubby plant commu-nities of Mediterranean affinity (Olea laperrinei, Ar-temisia, Ephedra, Pentzia monodiana and Erica arborea)occur.
The climate of the tropical zone is governed by theseasonal movement of the meteorological equator (in-ter-tropical convergence zone: ITCZ) in response tochanges in the location of maximum solar heating. TheITCZ migrates northward to ca. 15—24°N in June toAugust, and southward to ca. 8°N in West Africa andto ca. 16° S in East Africa in December—February(Hastenrath, 1985). The equatorial zone is thereforecharacterised by a double rainfall maximum, and flan-ked by a transitional zone (e.g. Sahel, Kalahari-High-veld region) characterised by monsoonal summer rain-fall and dry winters. In West Africa, the equatorial zoneis characterized by lowland evergreen and semi-ever-green rain forest (with Leguminosae, Irvingiaceae,Sapotaceae, Ebenaceae, Euphorbiaceae etc), by swampand riparian forests (with ºapaca, Symphonia, Carapa,Phoenix reclinata etc), and by wooded grassland (withGramineae and trees such as Annona senegalensis,Bridelia ferruginea, Hymenocardia acida or Strychnos).Equatorial East Africa is characterized by deciduous
D. Jolly et al.: Simulated climate and biomes of Africa during the Late Quaternary 633
TA
BL
E4.
The
pol
len
dat
ase
t
Dat
ing
Contr
ol(k
a)Bio
me
(ka)
Site
Nam
eC
ountr
yLat
itude
Longi
tude
Ele
vation
Ref
eren
ces
(dec
.)(d
ec.)
(m)
69
180
69
18
La
chat
aign
erai
eA
lger
ia36
.80
4.58
1225
2D1D
—W
AM
FW
AM
FW
AM
F—
Sala
man
i(1
991,
1993
)Sid
iBou
Rhab
aM
oroc
co34
.25
!6.
670
2D—
—TE
XE
WA
GR
——
Rei
lle(1
979)
Tig
alm
amin
eM
oroc
co32
.90
!5.
3516
261C
1C—
WA
MF
WA
MF
CO
GS
—Lam
bet
al.(
1989
),‘E
lH
amouti
etal
.(1
991)
Lam
bet
al.1
995
Tig
haslan
tM
oroc
co31
.43
!7.
4721
971C
*—
—C
OG
SW
AM
F—
—Ber
nar
dan
dR
eille
(198
7)A
gorg
ott
Mal
i22
.65
!4.
0013
33D
——
HO
DE
TX
BS
——
Schu
lz(1
991)
Tao
ude
nni
Mal
i22
.50
!4.
0012
02D
——
HO
DE
TX
BS
——
Cou
ran
dD
uze
r(1
976)
Mou
skorb
eC
had
22.3
718
.53
2600
—2D
—H
OD
E—
TE
XE
—TEX
E-M
aley
(198
1,19
83)
Selim
aSu
dan
21.3
729
.32
200
1D1C
—H
OD
EW
AG
RW
AG
R—
Ritch
iean
dH
ayne
s(1
987)
Enner
iC
had
21.3
317
.05
1100
—1C
—H
OD
E—
WA
GR
—Sc
hulz
(198
0)C
hem
chan
eM
aurita
nia
20.9
3!
12.2
225
2—
2C—
HO
DE
—TX
BS
—Lez
ine
(198
9a,b,
1993
),L
ezin
ean
dH
oog
hiem
stra
(199
0)O
yoSud
an19
.27
26.1
851
01C
2D—
HO
DE
TX
BS
TX
BS
—R
itch
ieet
al.(1
985)
ElA
trun
Sud
an18
.17
26.6
551
02D
1C—
HO
DE
TX
BS
TX
BS
—R
itch
iean
dH
ayne
s(1
987)
LG
S3Se
nega
l16
.28
!15
.83
11D
——
TX
BS
TD
FO
——
Lez
ine
(198
8a)
LG
S2Se
nega
l16
.12
!15
.92
01D
——
TX
BS
TD
FO
——
Lez
ine
(198
8a,1
989a
,b)
Poto
uSen
egal
15.7
5!
16.5
012
3C—
—TX
BS
TD
FO
——
Lez
ine
(198
8b)
Lom
pou
lSen
egal
15.4
2!
16.7
23
3C2D
—TX
BS
TD
FO
TX
BS
—Lez
ine
(198
8b)
Dio
goSen
egal
15.2
7!
16.8
08
2C2C
—TX
BS
TD
FO
TX
BS
—Lez
ine
(198
8b),
(198
9a#
b)Toub
aN
’Dia
yeSe
nega
l15
.17
!16
.87
61C
1C—
TX
BS
TD
FO
TX
BS
—Lez
ine
(198
8b)
Tje
riC
had
13.7
316
.50
300
1C3C
—W
AG
RTX
BS
WA
GR
—M
aley
(198
1,19
83,1
989)
Bad
da
Eth
iopi
a7.
8739
.37
4040
2C2C
—TE
MS
TE
MS
TE
MS
—H
amilto
n(1
982)
,Bon
nefi
lle
and
Ham
ilto
n(1
986)
Abi
yata
Eth
iopi
a7.
7038
.60
1578
—1C
—TD
FO
—W
AM
F—
Lez
ine
(198
1),L
ezin
ean
dBonne
fille
(198
2)D
anka
Eth
iopi
a6.
9738
.65
3830
4C—
—TE
MS
TE
MS
——
Ham
ilto
n(1
982)
,Bon
nefi
lle
and
Ham
ilto
n(1
986)
Bosu
mtw
iG
han
a6.
53—1
.33
100
2C1D
2CTSFO
TSFO
TEM
STEM
SM
aley
and
Liv
ings
tone
(198
3),
Tal
bot
etal
.(1
984)
Bar
om
biM
boC
amer
oon
4.67
9.40
300
2C1D
2CTSFO
TSFO
TSFO
TR
FO
Bre
nac
(198
8),
Mal
eyet
al.,
(199
0)M
aley
(199
1)G
ires
seet
al.(
1991
)M
obutu
Ses
eSe
ko
Uga
nda
1.52
30.5
761
94C
*1C
*—
TD
FO
TSFO
TSFO
—Ss
eman
daan
dV
ince
ns(1
993)
Koitobos
sK
enya
1.13
34.5
739
402D
—TE
MS
TE
MS
——
Ham
ilto
n(1
982)
Lab
oot
Ken
ya1.
1234
.58
2880
1C4C
5CW
AM
FW
AM
FTEM
STEM
SH
amilto
n(1
982)
Kim
ilili
Ken
ya1.
1034
.57
4150
1C1C
—TE
MS
TE
MS
TE
MS
Ham
ilto
n(1
982)
Kai
sungo
rK
enya
1.00
35.4
729
00—
—4D
WA
MF
——
TEM
SC
oetz
ee(1
967)
Kar
imu
Ken
ya0.
5036
.68
3040
—2D
—TE
MS
—TE
MS
—Per
rott
and
Str
eet-
Per
rott
,(1
982)
Mah
oma
Uga
nda
0.35
29.9
729
605D
4C—
WA
MF
WA
MF
WA
MF
Liv
ings
tone
(196
7)Bogo
ria
Ken
ya0.
3036
.10
990
1C4C
—W
AG
RTX
BS
TX
BS
—Tie
rcel
inet
al.(1
987)
Vic
toria
Uga
nda
0.30
33.3
311
341C
1C—
TSFO
TSFO
TSFO
—K
enda
ll(1
969)
Sacr
edK
enya
0.03
37.4
724
004C
4C7C
WA
MF
WA
MF
WA
MF
TEM
SC
oetz
ee(1
967)
,Z
inder
enBak
-ke
ran
dC
oetz
ee(1
972)
Rut
und
uK
enya
!0.
1737
.32
3140
1D—
—TE
MS
TE
MS
——
Coe
tzee
,(1
967)
,Zin
der
enBak
-ke
ran
dC
oetz
ee,(
1972
)N
aiva
sha
Ken
ya!
0.75
36.3
318
902C
3D4C
TD
FO
WA
MF
WA
MF
TEM
SM
aitim
a(1
991)
634 Quaternary Science Reviews: Volume 17

Aha
kagy
ezi2
Uga
nda
!1.
0829
.90
1830
1D2C
—W
AM
FW
AM
FW
AM
F—
Tay
lor
(199
0),(1
993)
Muc
hoya
Uga
nda
!1.
2829
.80
2260
1C1C
1DW
AM
FW
AM
FW
AM
FTEM
SM
orriso
n(1
968)
,Tay
lor
(199
0,19
92)
Kam
iran
zovu
Rw
anda
!2.
3329
.00
1950
——
4CW
AM
F—
—TEM
SH
amilto
n(1
982)
Gat
ovu
1Buru
ndi
!2.
5330
.05
1350
—1C
—TD
FO
—TSFO
—Elm
out
aki(1
994)
Ndur
umu
2Buru
ndi
!2.
7229
.93
1363
2C—
—TD
FO
TSFO
——
Jolly
and
Bon
nefi
lle(1
992)
Nya
musw
aga
1Buru
ndi
!2.
9029
.98
1546
5C5D
—TD
FO
TSFO
TSFO
—Jo
lly
(199
3)M
ukib
ongo
Buru
ndi
!3.
1530
.58
1540
4C—
—TD
FO
TSFO
——
Jolly
(199
3)K
ashi
ru1
Buru
ndi
!3.
4729
.57
2240
1C—
2CW
AM
FW
AM
F—
TE
MS
Bonne
fille
(198
7),
Bonn
efille
and
Rio
llet
(198
8)K
uru
yang
e1
Buru
ndi
!3.
5829
.68
2000
1C1C
7CW
AM
FW
AM
FW
AM
FTE
MS
Bonne
fille
etal
.(1
991)
Kuru
yang
e2
Buru
ndi
!3.
5829
.68
2000
1C1C
—W
AM
FW
AM
FW
AM
F—
Jolly
and
Bonne
fille
(199
1),
Jolly
etal
.(19
94)
Nga
mak
ala
Con
go!
4.07
15.3
840
0—
—4C
TSFO
——
TSFO
Ele
nga
(199
2),
Ele
nga
etal
.(1
994)
N.Tan
gany
ika
Buru
ndi
!4.
5029
.33
773
1D2C
5DTD
FO
TD
FO
TD
FO
TD
FO
Vin
cens
(198
9a,(1
993)
S.T
anga
nyi
kaZam
bia/
Tan
zani
a!
8.50
30.8
377
3—
—1D
TD
FO
——
TD
FO
Vin
cens
(198
9b,19
91a,
b)It
asy
Mad
agas
car
!19
46.5
012
303C
2D—
TD
FO
WA
MF
WA
MF
—St
raka
(199
3)Tritr
ivak
ely
Mad
agas
car
!19
.78
46.9
218
002C
1C—
TX
BS
TX
BS
TE
MS
—Burn
ey(1
987)
Vin
anin
ony
Mad
agas
car
!19
.83
47.3
318
75—
2D*
7CTEM
S—
WA
MF
TE
MS
Str
aka
(199
3)W
indhoe
kN
amib
ia!
22.3
817
.50
1700
1C—
—W
AG
RW
AG
R—
—Sc
ottet
al.(1
991)
Tat
eV
ondo
Sou
thA
fric
a!
22.8
830
.33
1100
2D2D
-TEX
EW
AM
FTD
FO
—Sc
ott(1
987a
)W
onder
crat
erSou
thA
fric
a!
24.4
328
.75
1100
2D1C
2CTEX
ETEX
ETEX
ETEM
SSc
ott(1
982)
Mor
elet
taSou
thA
fric
a!
25.4
428
.18
1310
3D—
—TE
XE
TE
XE
——
Scot
t,(1
983)
Sal
tpan
Sou
thA
fric
a!
25.5
728
.08
1100
1C—
—TE
XE
TE
XE
——
Par
trid
geet
al.(1
993)
Rie
tvle
iSou
thA
fric
a!
25.8
328
.33
1480
3D1C
—TEM
STE
XE
TEM
S-
Sco
ttan
dV
oge
l(1
983)
Equus
Cav
eSou
thA
fric
a!
27.2
724
.37
1250
2C1C
4CTEX
ETEX
ETEX
ETEM
SSc
ott(1
987b
)W
onder
wer
kSou
thA
fric
a!
27.8
523
.55
1665
3D4D
—TE
XE
TE
XE
TE
XE
—Zin
der
enBak
ker
(198
2)Elim
Sou
thA
fric
a!
28.4
928
.42
1890
——
5DTEM
S—
—TEM
SSco
tt(1
989)
Cor
nel
iaSou
thA
fric
a!
28.5
028
.42
1800
——
4CTEM
S—
—TEX
ESc
ott(1
986,
1989
)C
raig
ross
ieSou
thA
fric
a!
28.5
328
.47
1735
4C2D
—TE
MS
TE
MS
TE
MS
—Sc
ott(1
986,
1989
)Bly
def
ont
ein
Sou
thA
fric
a!
31.0
925
.04
1700
1C—
—W
AG
RW
AG
R—
—Bousm
anet
al.(1
991)
Pak
hui
sSou
thA
fric
a!
32.0
619
.04
600
2C—
1CTE
XE
TE
XE
—TE
XE
Sco
tt(1
994)
Ced
erber
gSou
thA
fric
a!
32.6
419
.33
2026
3C3D
—TE
XE
TE
XE
TE
XE
—M
eado
ws
and
Sugd
en(1
993)
Gro
envl
eiSou
thA
fric
a!
33.8
022
.87
04C
——
TE
XE
TE
XE
——
Mar
tin
(196
8)H
angk
lipSou
thA
fric
a!
34.3
318
.90
453C
——
TE
XE
TE
XE
——
Scha
lke
(197
3)
*po
llen
and/o
rst
ratigr
aphi
cco
rrel
atio
ns
with
anea
rby
radio
car-
bon
-dat
edsite
—Co-
ord
inat
esar
egi
ven
for
pre
cise
loca
tion
ofth
epo
llen
reco
rd-
Dat
aba
sere
fere
nces
are
give
nin
Appe
ndix
A.
Cod
esfo
rbi
ome:
TX
BS:T
ropic
alxe
rophyt
icbush
/sav
anna
WA
GR
:W
arm
gras
s/sh
rub
TD
FO
:Tro
pic
alD
ryfo
rest
/sav
anna
TSFO
:Tro
pica
lse
ason
alfo
rest
TR
FO
:T
ropi
calra
info
rest
CO
GS:
Cool
gras
s/sh
rub
WA
MF:W
arm
Mix
edfo
rest
TE
MS:Tem
pera
tem
icro
phy
llous
shru
bla
nd
TE
XE
:Tem
per
ate
xero
phyt
icw
oods/
shru
bsC
odes
for
dating
cont
rol:
For
cont
inuous
reco
rds
(C)
1C:b
rack
etin
gdat
esw
ithi
na
2000
yrin
terv
alab
outt
hetim
ebe
ing
asse
ssed
.2C
:bra
cket
ing
date
s,1
within
2000
yr,t
hese
cond
within
4000
yrof
the
tim
ebei
ng
asse
ssed
.3C
:bra
cket
ing
dat
esw
ithi
na
4000
yrin
terv
alab
outt
hetim
ebe
ing
asse
ssed
.4C
:bra
cket
ing
dat
es,1
within
4000
yr,t
hese
cond
withi
n60
00yr
ofth
etim
ebei
ng
asse
ssed
.5C
:bra
cket
ing
dat
esw
ithi
na
6000
yrin
terv
alab
outt
hetim
ebe
ing
asse
ssed
.6C
:bra
cket
ing
dat
es,1
within
6000
yr,t
hese
cond
withi
n80
00yr
ofth
etim
ebei
ng
asse
ssed
.7C
:poor
lydat
ed
For
disc
ontinuou
sre
cord
s(D
)1D
:da
tew
ithin
250
yrofth
etim
ebei
ngas
sess
ed.
2D:da
tew
ithin
500
yrofth
etim
ebei
ngas
sess
ed.
3D:da
tew
ithin
750
yrofth
etim
ebei
ngas
sess
ed.
4D:da
tew
ithin
1000
yrof
the
tim
ebei
ng
asse
ssed
.5D
:da
tew
ithin
1500
yrof
the
tim
ebei
ng
asse
ssed
.6D
:da
tew
ithin
2000
yrof
the
tim
ebei
ng
asse
ssed
.7D
:po
orly
dat
ed.
D. Jolly et al.: Simulated climate and biomes of Africa during the Late Quaternary 635

(Acacia-Commiphora) and evergreen (Dodonaea vis-cosa, Olea africana, 2) bushland, wooded (Com-miphora, Boscia) and semi-desert grassland (Eragrostishararensis, Aerva) and scrub forest with Commiphora,Sterculia, Adansonia digitata (baobab) and candelabraEuphorbias. A transitional zone, characterised bya mosaic of vegetation types including transitional rainforest (Parinari, Prunus africana), dry semi-evergreenforest (Holoptelea, Albizzia, Chlorophora), scrub forest(Euphorbia dawei, Cynometra alexandri) andtransitional woodlands (¸annea) and wooded grass-land (Dialium, Combretum), occurs at the periphery ofthe lowland forest. The monsoon regions are typifiedby Sudano-Zambezian woodlands and dry forests. Inthe northern hemisphere, these vegetation types arecharacterized by Acacia, Isoberlinia, and Anogeissus.South of the equator, the monsoon zone is character-ised by Julbernardia, Brachystegia and Isoberlinia(miombo), Colophospermum mopane (mopane wood-land), and Baikiaea plurijuga (dry deciduous forest).The Sahel and Kalahari-Highveld are characterised bywooded and semi-desert grassland and bushland richin Acacia, associated with Commiphora africana andBalanites aegyptica in the Sahel, and with ¹archonan-thus and Capparidaceae in the Kalahari.
On most of the East and South African mountains,the uppermost vegetation is afroalpine and austroaf-roalpine shrubland (Ericaceae, Cliffortia, ¸obelia, De-ndrosenecio2). Montane forest, characterized byPodocarpus, Olea capensis, Juniperus, Prunus africana,Macaranga, Hagenia abyssinica and Syzygiumguineense, occurs at lower altitudes between ca 1200and 2500 m where the mean annual rainfall lies in therange 1250—2500 mm.
RESULTS
Simulated Climate and Vegetation at 21 ka (cal.)
The 21 ka (cal.) CCM1 simulation (Fig. 1) showsa reduction in January temperature compared to pres-ent of ca. 4—5°C in the equatorial zone and southernAfrica, with a cooling of between 7—10°C in northernAfrica. A similar pattern, with maximum cooling innorthern Africa, occurs in July; equatorial cooling is ofthe order of 2—3°C and maximum cooling in the northis ca. 6—7°C. Simulated rainfall is reduced over most ofthe continent, except in southern Africa where there isa band of increased precipitation between 24 and 30°S.However, the reduction in precipitation in the equato-rial zone is slight (0—200 mm yr~1). The simulatedmoisture balance shows the interplay between theseeffects. P—E is more positive than today in a narrowzone along the Mediterranean coast, reflecting a reduc-tion in evaporation as a consequence of the muchreduced temperatures throughout the year over north-ern Africa, while drier conditions are registered acrossthe Sahara/Sahel zone, where the substantial relativereduction in precipitation was sufficient to offset theeffects of reduced temperatures. In the equatorial zone,
the cooling was sufficient to compensate for the modestrelative reduction in precipitation; the simulatedincrease in P—E is only 50—100 mm yr~1. The band ofincreased precipitation in southern Africa gave rise toa zone where the moisture balance is significantly morepositive. Equatorward of this zone, between 12 and18°S, there is a region where conditions were signifi-cantly drier than present.
These climatic differences resulted in significant dif-ferences in the simulated vegetation between 21 ka(cal.) and today (Fig. 2a and d). The simulated lowertemperatures during the winter season resulted in theextension of cool grass/shrub in northern Africa intothe zone occupied today by temperate xerophyticwoods. In southern Africa (Orange Free State andNatal), these lower temperatures resulted in a reduc-tion of the current area of temperate microphyllousshrubland which was replaced by either temperate de-ciduous forest or cool grass/shrub, depending onmoisture availability. Lower winter temperatures alsoresulted in a significant extension of warm mixed for-ests and afroalpine shrublands to lower elevations.Warm mixed forests are simulated in the Adamaoua(Cameroon) and Fouta Djalon (Guinea) mountains ofwestern Africa, whereas afromontane shrublands andforests are simulated in the eastern African mountainsin the zone occupied today by tropical dry and seasonalforests. Warm mixed forests and temperate micro-phyllous shrubland are simulated in the discontinuousmountain areas of Angola (Planalto), Madagascar,Namibia (Damoraland), Zimbabwe and South Africa(Drakensberg) in regions characterised today by tro-pical dry, seasonal and rain forests, and xerophyticecosystems. The lower temperatures simulated duringthe summer season resulted in an increase in theextent of semi-desert shrubs in the Maghreb, Libyaand Egypt, and in the southwestern part of SouthAfrica, where warm grass/shrub and hot deserts occurtoday.
The changes in moisture budgets had comparativelylittle effect on simulated biome distributions (Fig 2a).The southern boundary of the Sahara is unchangedcompared to present except in the region to the west ofLake Chad, where the Sahara/Sahel limit was shiftedsouthward to ca 10° N because of a reduction of P—E ofthe order of 100—200 mm yr~1. The extent of tropicaldry, seasonal and rain forests was little changed, excepton their southern margin in consequence of the com-paratively small changes in simulated P—E in the equa-torial zone. The simulated expansion (compared totoday) of temperate xerophytic woods in southern Afri-ca, at the expense of hot desert and warm grass/shrubin Botswana-Namibia, and of tropical dry forests inAngola-Zambia, and as far as the northern margin ofLake Malawi, corresponds to the simulated band ofincreased P—E between 24 and 30° S and the zone ofdecreased P—E that occurs on its northern flank. A fur-ther feature of the zone of increased P—E is thesimulated extension of temperate deciduous forest insouthern Africa.
636 Quaternary Science Reviews: Volume 17

FIG. 1. Differences in January temperature (*°C), July temperature (*°C), annual precipitation (*mm yr~1) and annual precipitation minusevaporation (*mm yr~1) at 21 ka (cal) according to the CCM1 21 ka (cal) and control simulations.
Simulated Climate and Vegetation at 11 ka (cal.)
The 11 ka (cal.) GCM simulations (Fig. 3), showAfrica was still generally cooler in northern hemispherewinter than present. The temperature lowering in Jan-uary was at least 2°C north of the equator, reachinga maximum of 5°C in the northwestern Sahara. Thecooling was only of the order of 1°C over most of thesouthern hemisphere, reaching a maximum of 2—3°C in
Angola. In July, temperatures 1—2°C warmer thanpresent were registered over the whole of northernAfrica, north of 24°N. In contrast, the northern tropicswere between 1 and 4°C cooler, except on the WestAfrican coast. Temperatures in the southern hemi-sphere were similar to or slightly warmer (up to 1°C)than today. The simulation shows an increase in pre-cipitation over all of northern Africa and most of theSahara/Sahel zone, as a consequence of the expanded
D. Jolly et al.: Simulated climate and biomes of Africa during the Late Quaternary 637

FIG. 2. Simulated biomes distributions at (a) 21 ka (cal), (b) 11 ka (cal), (c) 6 ka (cal) and (d) using modern baseline climate data. The key is given inFig. 5.
monsoon. In consequence of the associated morenortherly position of the ITCZ in summer, both meanannual and summer precipitation were reduced in theequatorial zone. The southeastern tropical zone ischaracterised by a significant decrease in the Januaryand mean annual precipitation. The zone to the southis characterised by an increase in precipitation, specifi-cally in the southern-hemisphere summer. The changesin P—E primarily reflect of changes in precipitation,with the Sahara/Sahel zone characterised by a morepositive water balance, a corresponding reduction inthe equatorial zone, and wetter-than-present condi-tions to the south.
The biome simulation at 11 ka (cal.) (Fig. 2b) showsa reduction in montane vegetation (warm mixed forestsand temperate microphyllous shrublands) compared tothe situation at 21 ka (cal.), resulting from an increasein the altitude of the montane elements in the moun-tains of West and East Africa, and their replacement bytropical seasonal and dry forests. The tropical dryforest biome encroached upon xerophytic associationsin southern Africa. These changes are due to thesimulated change in winter temperature. The simulatedsummer warming in northern Africa resulted in thereplacement of semidesert, typical of the glacial max-imum in Egypt and Libya, by hot desert, warm
638 Quaternary Science Reviews: Volume 17

FIG. 3. Differences in January temperature (*°C), July temperature (*°C), annual precipitation (*mm yr~1) and annual precipitation minusevaporation (*mm yr~1) at 11 ka (cal) according to the CCM1 11 ka (cal) and control simulations.
grass/shrub and temperate xerophytic woods. Insouthern Africa, where summer temperatures werecomparable to present by 11 ka (cal.), the coolgrass/shrub and temperate deciduous forest vegetationtypical of the glacial situation were replaced by temper-ate microphyllous shrubland and by temperatexerophytic woods.
Changes in the simulated moisture balance hadmore significant effects at 11 ka (cal.) than during the
glacial. In northern Africa, the simulation indicatesa more northerly position of the southern margin of theSaharan desert to between 15°N in the west and tobetween ca 20 and 22°N in the central and easternSahara (Fig. 2b). Thus, by 11 ka (cal.) the desert marginwas simulated ca. 400—500 km further north than to-day. Temperate xerophytic associations occurred inTibesti (Chad), on the Tangale (Niger) and Darfur(W. Sudan) mountains. In tropical West Africa, drier
D. Jolly et al.: Simulated climate and biomes of Africa during the Late Quaternary 639
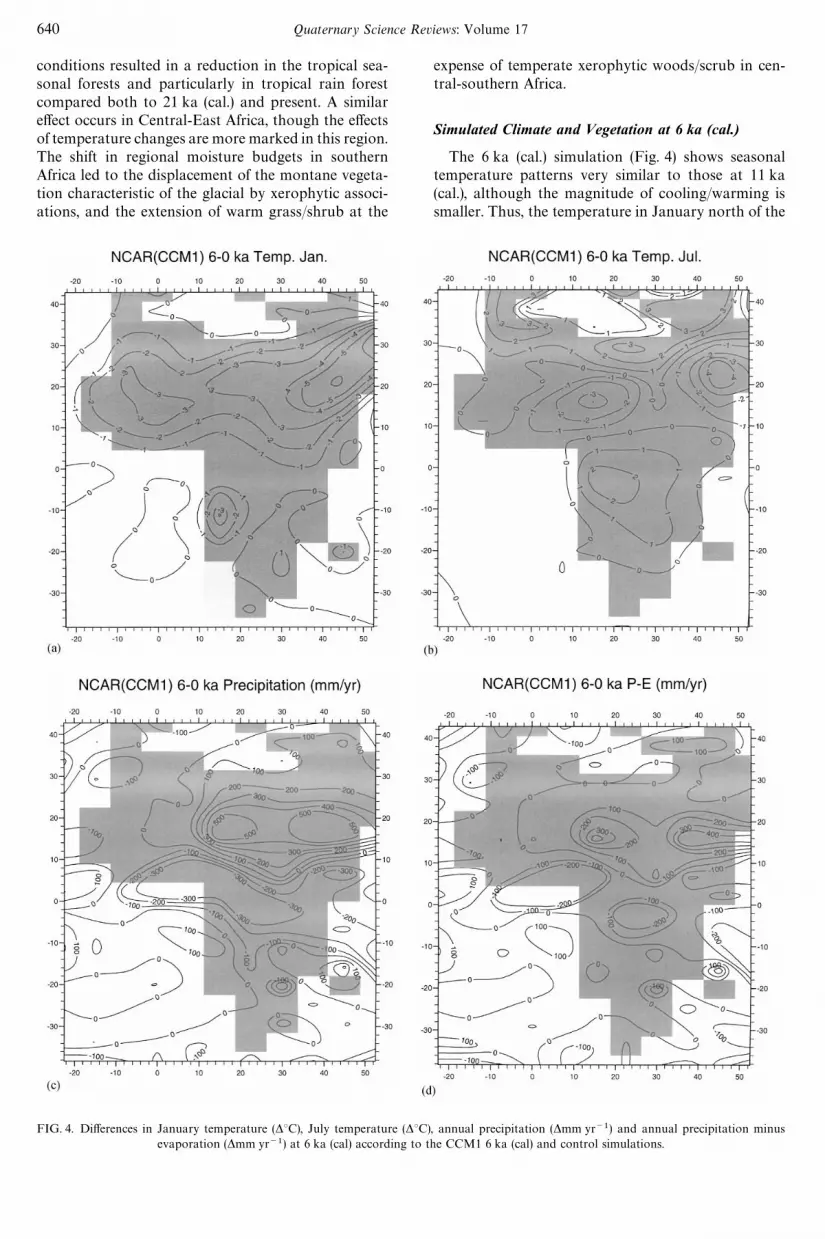
FIG. 4. Differences in January temperature (*°C), July temperature (*°C), annual precipitation (*mm yr~1) and annual precipitation minusevaporation (*mm yr~1) at 6 ka (cal) according to the CCM1 6 ka (cal) and control simulations.
conditions resulted in a reduction in the tropical sea-sonal forests and particularly in tropical rain forestcompared both to 21 ka (cal.) and present. A similareffect occurs in Central-East Africa, though the effectsof temperature changes are more marked in this region.The shift in regional moisture budgets in southernAfrica led to the displacement of the montane vegeta-tion characteristic of the glacial by xerophytic associ-ations, and the extension of warm grass/shrub at the
expense of temperate xerophytic woods/scrub in cen-tral-southern Africa.
Simulated Climate and Vegetation at 6 ka (cal.)
The 6 ka (cal.) simulation (Fig. 4) shows seasonaltemperature patterns very similar to those at 11 ka(cal.), although the magnitude of cooling/warming issmaller. Thus, the temperature in January north of the
640 Quaternary Science Reviews: Volume 17

equator was at least 1°C cooler than present, thoughstill reaching maximum values of 4—5°C. In July, thecooling in the northern tropics was also less pro-nounced than at 11 ka (cal.), being between 1 and 3°C.In the southern hemisphere, the simulated warmingwas slightly greater than at 11 ka (cal.). The simulatedprecipitation patterns are also similar to those at 11 ka(cal.), but there are important differences in some re-gions. Thus, there is still a broad band of higher-than-present rainfall over northern Africa. However, in theeast-central Sahara, the zone of increased precipitationis broader, impinging further northward than at 11 ka(cal.). At the same time, the simulation of monsoonpenetration westward is less marked than at 11 ka(cal.), such that there is no simulated increase in pre-cipitation in West Africa. The equatorial zone is char-acterised by a reduction in precipitation compared topresent, consequent on the more northerly position ofthe ITCZ. The magnitude of the reduction is similar to11 ka (cal.), but the area affected is smaller and dis-placed toward the east. As at 11 ka (cal.), the simulatedpatterns of P—E at 6 ka (cal.) are closely related to thepatterns in precipitation.
The simulated temperature changes had comparat-ively little effect on simulated vegetation distributionsat 6 ka (cal.) (Fig. 2c). The warmer winter temperaturesled to a further reduction in the extent of montanevegetation compared to 11 ka (cal.), with warm mixedforest being replaced by tropical dry forest in Central-East Africa and Angola, and by temperate microphyl-lous shrubland and temperate xerophytic scrubs inSouth Africa.
Most of the simulated changes in vegetation distri-bution at 6 ka are related to changes in the simulatedmoisture budgets (Fig. 2c). The simulated increase inP—E in North—East Africa resulted in a northward shiftin warm grass/shrub and tropical and temperatexerophytic woods. Xerophytic vegetation extended fur-ther north than at 11 ka (cal.) (by ca. 600 km) inNorth—East Africa but was less extensive in Cen-tral—West Africa, reflecting the simulated changes inthe area affected by monsoon precipitation betweenthese two times. The extension of tropical dry forest inthe region around lake Chad, occupied today by warmgrass/shrub, is a further reflection of the change in thearea affected by monsoonal precipitation. Tropical sea-sonal forest and rain forest was further reduced com-pared to 11 ka (cal.), particularly on its eastern andnorthern margins, by the encroachment of tropical dryforest. This reflects the easterly shift in the area ofreduced P—E in the equatorial zone between the simu-lations of 11 and 6 ka (cal.). In the Zambezian basinand Madagascar, tropical dry forest also expands onits south and eastern margin at the expense ofxerophytic associations, reflecting the simulated in-creases in P—E in these regions. The simulated decreasein P—E in East Africa is reflected in a reduction in theextent of the warm mixed forest in the mountains ofKenya, Tanzania and Burundi, and a reduction in theextent of warm grass/shrub in the lowland zone leading
to the establishment of a continuous desertic corridorbetween Somalia and Kenya.
DATA-MODEL COMPARISONS
Vegetation at 18 ka (14C) (Fig. 5a)
The pollen record from Tigalmamine suggests coolgrass/shrub was already established by 16 ka (14C) inthe Atlas mountains (Lamb et al., 1989), consistentwith the simulated extension of this biome at 18 ka(14C) as a result of a winter cooling. A marine core(M80-17-B) at 33.5°N off the West African coast showsan increase in semi-desert pollen-types and an absenceof forest taxa during the glacial maximum (Agwu andBeug, 1984). This is consistent with the simulated ex-tension of the semi-desert in the southern Maghreb asa consequence of summer cooling. The stability of thesouthern limit of the Sahara in West Africa is in goodagreement with pollen data from marine cores whichplaces the limit at ca 15°N (Rossignol-Strick andDuzer, 1979; Hooghiemstra et al., 1987; Hooghiemstra,1988).
The simulated montane forest was more extensive at18 ka (14C) in equatorial West Africa, in response towinters colder than present. The available pollen datado not show warm mixed forest. However, the increaseof high altitude taxa such as Olea capensis at lakeBarombi Mbo (Maley et al., 1990; Giresse et al., 1994),and the occurrence of taxa typical of temperate micro-phyllous shrubland at Bosumtwi (Talbot et al., 1984)are consistent with the estimated lower winter temper-atures. Evidence from several marine cores from theGulf of Guinea provide additional confirmation of thesimulated extension of warm mixed forest (Caratiniand Giresse, 1979; Fredoux and Tastet, 1988; Fredouxet al., 1989). Few data are available to reconstruct thedistribution of tropical rain, seasonal and dry forests at18 ka (14C). The pollen-derived biome reconstructionfrom the single available site (Ngamakala, Congo) inthe equatorial forest zone is consistent with the simula-tion which shows a regression of the southern marginof the lowland forest. Lezine and Vergnaud-Grazzini(1993) have demonstrated on the basis of marine pollenrecord the persistance of tropical rain forest at leastlocally. However, a pollen record from another marinecore north of the equator has been interpreted asshowing a larger reduction in the area of lowland forest(Fredoux, 1994) than was simulated, which implies thatthe model underestimates equatorial aridity in WestAfrica. Sensitivity analyses with the biome model showthat, given the simulated temperature lowering in thisregion, a 6% reduction in moisture availability wouldbe sufficient to wipe out the tropical rain forests, anoccurrence not supported by the data. Thus, anyunderestimate in simulated equatorial aridity by theclimate model is rather small.
Pollen records from high altitude sites in East Africashow the occurrence of cool grass/shrub vegetation,
D. Jolly et al.: Simulated climate and biomes of Africa during the Late Quaternary 641
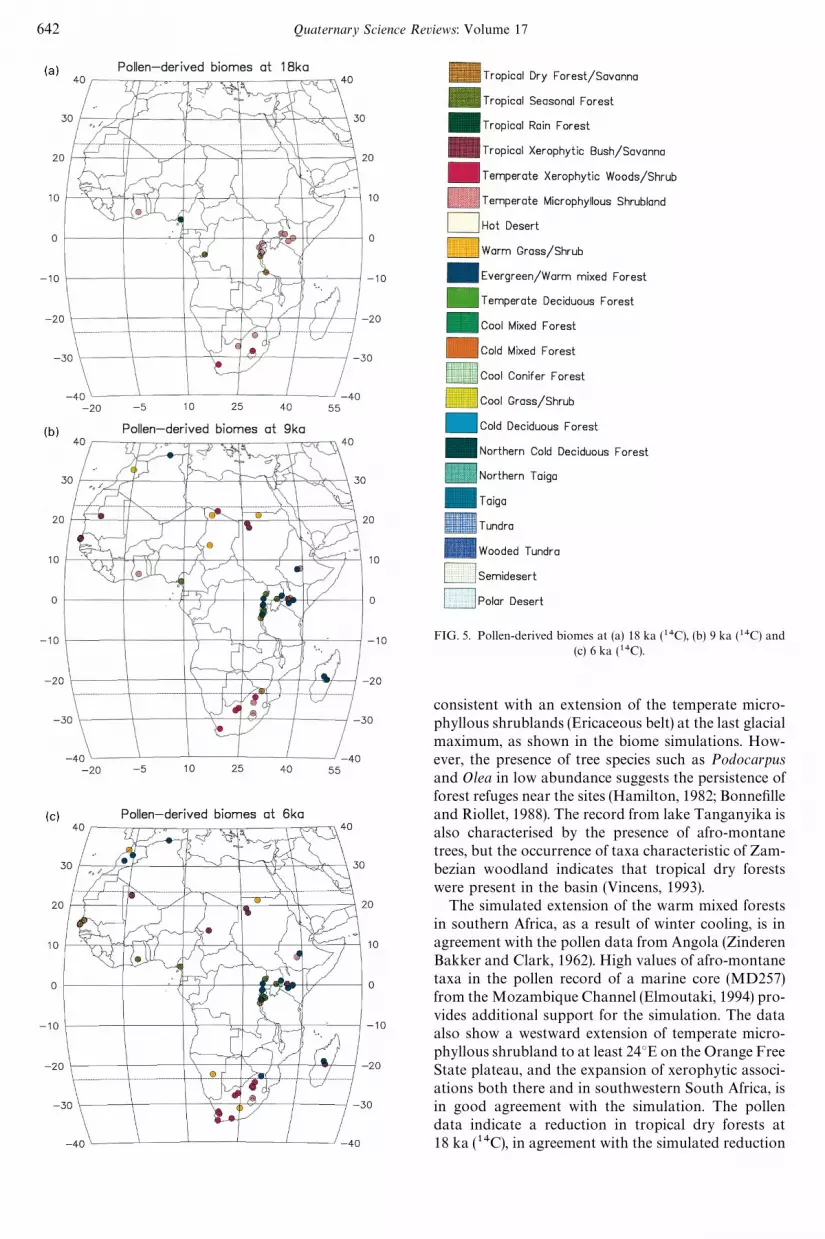
FIG. 5. Pollen-derived biomes at (a) 18 ka (14C), (b) 9 ka (14C) and(c) 6 ka (14C).
consistent with an extension of the temperate micro-phyllous shrublands (Ericaceous belt) at the last glacialmaximum, as shown in the biome simulations. How-ever, the presence of tree species such as Podocarpusand Olea in low abundance suggests the persistence offorest refuges near the sites (Hamilton, 1982; Bonnefilleand Riollet, 1988). The record from lake Tanganyika isalso characterised by the presence of afro-montanetrees, but the occurrence of taxa characteristic of Zam-bezian woodland indicates that tropical dry forestswere present in the basin (Vincens, 1993).
The simulated extension of the warm mixed forestsin southern Africa, as a result of winter cooling, is inagreement with the pollen data from Angola (ZinderenBakker and Clark, 1962). High values of afro-montanetaxa in the pollen record of a marine core (MD257)from the Mozambique Channel (Elmoutaki, 1994) pro-vides additional support for the simulation. The dataalso show a westward extension of temperate micro-phyllous shrubland to at least 24°E on the Orange FreeState plateau, and the expansion of xerophytic associ-ations both there and in southwestern South Africa, isin good agreement with the simulation. The pollendata indicate a reduction in tropical dry forests at18 ka (14C), in agreement with the simulated reduction
642 Quaternary Science Reviews: Volume 17

FIG. 6. Differences from present lake status at (a) 18 ka (14C), (b)9 ka (14C) and (c) 6 ka (14C).
(consequent on winter cooling) in the Zambezian basin.The simulated reduction in tropical dry forest between5 and 15°S and the creation of an arid corridor betweenlakes Tanganyika and Malawi are also consistent withthe data (e.g. Zinderen Bakker, 1976). The biomemodel predicts the establishment of temperate decidu-ous forests, linked with the simulation of winter tem-peratures colder than present, in the Natal and OrangeFree State; this feature is not shown by thepalaeobotanical evidence (Zinderen Bakker, 1976). Thesimulation of cool grass/shrub in the same region indi-cates that this mismatch is related to an overestimationof P—E rather than poor simulation of the difference inwinter temperature. This conclusion is supported bythe fact that a biome simulation of the LGM driven byoutput from the Hamburg ECMWF T21 model cor-rectly simulates the distribution of cool grass/shruband does not show an expansion of temperate decidu-ous forest in southern Africa (Prentice et al., 1993).
Lake Status at 18 ka (14C) (Fig. 6a)
At 18 ka (14C), two lakes show a more positive waterbalance in the northwestern Sahara, just to the south ofthe Atlas Mountains, but conditions similar to presentare registered over the rest of the Sahara. Since theSaharan basins are dry today, the absence of changesin lake status in the band between 18 and 22°N isconsistent with the simulated decrease in P—E acrossthis zone. The lake data are in agreement with thepollen data in showing that the southern margin of theSahara at 18 ka (14C) was broadly similar to today.The lake evidence of wetter conditions in the north-western Sahara may reflect problems in the interpreta-tion or dating of the two sites involved, Kadda andSaoura (Conrad, 1969; Causse et al., 1988). However, tothe extent that these lakes are fed by runoff from theAtlas mountains, these data are in good agreementwith the higher than present P—E simulated in thecircum-Mediterranean region (Street-Perrott et al.,1989). The lakes in equatorial West Africa show condi-tions slightly drier than present, in contrast to the simu-lation which is characterized by a P—E slightly higherthan present. In equatorial East Africa the lakes showconditions similar to or drier than present to the west ofca. 34°E and similar to or wetter than present to the east.This east-west distinction is shown in the climate simu-lation but the boundary between the regions withmore/less positive moisture balance is displaced and liesat Ca. 40°E. In southern Africa, the lakes show condi-tions wetter than present, as would be expected giventhe simulation of higher than present P—E between ca24 and 30°S. The qualitative nature of the lake datamakes it difficult to assess whether the simulated in-crease is overestimated as suggested by pollen data.
Vegetation at 9 ka (14C) (Fig. 5b)
Data from the Atlas Mountains show that the coolgrass/shrub association which was present during the
D. Jolly et al.: Simulated climate and biomes of Africa during the Late Quaternary 643

late glacial persisted until 9 ka (14C) (Fig. 2b). This is indisagreement with the occurrence of warm grass/shruband xerophytic associations in the 11 ka (cal.) simula-tions. However, warm mixed forest occurred at lowelevation sites (e.g. Grande Kabylie: Salamani, 1993).Pollen data from a marine core in the Gulf of Gabesindicate the establishment of an association character-ised by Olea europaea and Pistacia (Brun, 1983), typicalof temperate xerophytic woods/shrubs, consistent withthe biome simulation. The data support the simulatedhigher than 21 ka (cal.) summer and winter temper-atures in the Maghreb, but the information from sitesin the mountains suggest that the simulated summertemperatures at 11 ka (cal.) are overestimated.
The pollen data are consistent with a northwarddisplacement of the southern margin of the Sahara toat least 21°N. The magnitude of this displacement isconfirmed by evidence from marine cores off CapBlanc (M-16017-2), which has been interpreted asshowing the occurence of seasonal forest to ca. 15°Nand of sahelian steppe to ca. 23—24°N (Hooghiemstra,1988), and off Cap Vert, which shows the northwardexpansion of sudano-guinean elements (Rossignol-Strick and Duzer, 1979). The observed change in theposition of the southern margin of the Sahara is ingood agreement with the simulated shift in the easternSahara (Fig. 2b), but the climate model does not pre-dict wetter than present conditions extending to thewest coast of West Africa (Fig. 3). The model estimateof P—E is less than the increase shown by the data fromthis region.
The simulation of conditions wetter than today inthe Sahara (Fig. 3) is also confirmed by the availablepollen data from two sites in the Tibesti: Mouskorbeand Enneri. At the Mouskorbe site, the pollen spectraare characterized by Gramineae, Cyperaceae, ferns andsclerophyllous hepathics, but also include Artemisia,Pentzia monodiana and Ephedra (Maley, 1981, 1983,1989). Since White (1983), on the basis of botanicalinvestigations (Quezel, 1965) (pp. 259—264) has at-tributed these latter taxa to the ‘saharo-montane dwarfshrubland’ with great mediterranean affinity, and onthe assumption that the spectra are not dominated byaeolian transport (as suggested by e.g. Zinderen Bak-ker and Maley, 1979), we attribute the site to temperatexerophytic woods/shrub. The local presence of temper-ate xerophytic woods/shrub at Mouskourbe and ofwarm grass/shrub at Enneri indicates conditions wet-ter than today.
In equatorial West Africa, the limited pollen datasuggest a major discrepancy with the simulations. Atlake Bosumtwi, the record shows temperate micro-phyllous shrubs at 9 ka replaced by tropical seasonalforest at least by 8.5 ka (14C) (Talbot et al., 1984). AtBarombi Mbo, seasonal forest was established by9.5 ka (14C) (Brenac, 1988; Maley et al., 1990). Theseresults indicate an extension of the tropical seasonalforest around 9 ka (14C), consistent with marine pollendata from the Gulf of Guinea which show an increasein taxa characteristic of the rain forest (Lezine and
Vergnaud-Grazzini, 1993) and a decrease in the abund-ance of montane taxa (Fredoux, 1994). However thesimulation shows lowland forests were less extensivethan present (Fig. 2b), due to an underestimation ofP—E by CCM1.
The data from equatorial East Africa show a gradi-ent from temperate microphyllous shrubland at highelevation, through warm mixed forests to tropical sea-sonal or dry forests in the lowlands, in good agreementwith the simulated biome distributions (Fig. 2b). Pol-len-based transfer-function reconstructions from peat-bogs in Uganda and Burundi (Chalie, 1992) and fromlake Tanganyika (Vincens et al., 1993) have yieldedestimates of mean annual temperature of between0 and 2°C warmer than today, whereas the climatesimulation shows temperatures similar to present inJuly but ca. 2°C cooler in January in equatorial EastAfrica (Fig. 3). Sensitivity experiments with the biomemodel suggest that adding 2°C to the temperaturessimulated by CCM1 at 11 ka (cal.) would not producea change in vegetation distribution resolvable at thescale of the biome comparisons.
The limited pollen data from southern Africa arebroadly concordant with the biome simulations. Thus,the data show the establishment of temperate micro-phyllous shrub on the Orange Free State and Natalplateau with more extensive temperate xerophyticwoods to the north and with tropical dry forest in thenorthern extremity of the Drakensberg Mountains.This distribution is reproduced in the biome simula-tions (Fig. 2b). The major discrepancy with the simula-tion is in terms of simulated moisture budgets in thesoutheastern tropical zone. The climate modelsimulated a reduction in January and mean annualprecipitation (and also of ca 150—200 mm yr~1 in P—E)across a broad zone over the Zambezi Basin and ex-tending eastwards to Madagascar (Fig. 3). The datafrom Madagascar show temperate microphyllousshrubland at high elevation and tropical xerophyticwoods/shrub at lower elevations (MacPhee et al.,1985). This vegetation distribution is not shown by thebiome model. The cause of this mismatch seems to bethe simulation of temperatures at least 1—2°C toowarm, but there must also be a slight overestimation ofP—E by CCM1. Pollen data from a marine core(MD257: 20°S) from the southern Mozambique Chan-nel shows a reduction in afro-montane taxa and anincrease in taxa characteristic of tropical dry forest(Elmoutaki, 1994), in agreement with the simulation,but also shows a significant development of mangroveat 9 ka (14C), with highest percentages of Rhizophora at8 ka (14C). The presence of mangrove indicates, interalia, an increase in continental runoff and thus wetterconditions in the Zambezi Basin. Geochemical evid-ence indicating freshwater dilution (Caralp et al., 1993),and pollen data from a marine core in the northernMozambique Channel indicating the establishment oftropical rain forest on Mayotte Island (Elmoutakiet al., 1992), confirm this indication of wetter condi-tions. In order to explain these observations, the zone
644 Quaternary Science Reviews: Volume 17

of P—E higher than today simulated south of 24°S bythe climate model has to be expanded further northand the extent of the simulated zone of P—E lower thantoday has to be reduced (Fig. 3).
Lake Status at 9 ka (14C) (Fig. 6b)
At 9 ka (14C), the lakes show a more positive waterbalance over northern Africa than at either 21 ka (cal.)or today. There is a suggestion that conditions wetterthan today were less marked in the region to the northand east of Lake Chad, where a number of lakesregistered only intermediate status. This is consistentwith the pollen data from Tjeri, east of Lake Chad,which shows warm grass/shrub rather than the morewooded vegetation found in Senegal and southernSudan. The lake data are in good agreement with thepronounced increase in P—E relative to presentsimulated by CCM1 (Fig. 3) as a result of the expandedmonsoon in northern Africa. However, lake data fromMauritania shows that conditions wetter than presentdo not extend far enough westward in the simulation.In conjunction with the pollen data from further south,this difference suggests that the climate model under-estimates P—E along the whole coast of West Africa.The two lake sites from equatorial West Africa indicateconditions similar to or slightly wetter than today,consistent with pollen data from this region, whereasthe simulation shows slightly drier conditions becauseof the more northerly position of the ITCZ in summer.In equatorial East Africa, the lakes show conditionswetter than present. There appears to be a north-southgradient, with lakes north of the equator suggestinga very much more positive water balance than the lakessouth of the equator. While this gradient also appearsto be a feature of the simulation, the climate modelresults suggest that conditions were drier than todaysouth of the equator. The lake data do not indicateconditions substantially drier than today except ata single site (Lake Tritrivakely) in Madagascar. Theseobservations are concordant with the pollen data fromsoutheastern southern Africa, and confirm that theclimate model simulates conditions drier than todayover too broad a zone. The simulated increase in P—Ecompared to 21 ka (cal.) and today in southern Africabetween ca 26 and 34° S (Fig. 3) is confirmed by thelimited lake data, which shows conditions similar orslightly wetter than present. There are no lake datawhich would enable us to confirm whether this zoneextended further north as suggested by the pollen data.
Vegetation at 6 ka (14C) (Fig. 5c)
In the Maghreb, warm mixed forest was present atelevations between 1200 and 2200 m. Pollen data froma marine core off Tunisia indicate the presence oftemperate xerophytic vegetation (Brun, 1983), presum-ably at lower altitudes. This picture is inconsistent withthe biome simulation (Fig. 2c), which indicates temper-ate xerophytic vegetation even at higher elevations, in
response to the climate model simulation of conditionsdrier than today (Fig. 4).
Continental pollen data show that the Sahara/Sahelboundary was as far north as at least 23°N in centraland eastern northern Africa. Pollen data from marinecores suggest a more southward position of thisboundary in coastal West Africa, probably between 15and 19°N (Rossignol-Strick and Duzer, 1979;Hooghiemstra, 1988). The pollen data support thesimulated northward extension of the Sahara/Sahelboundary in northeastern Africa (Fig. 2c), but showwetter conditions over most of West Africa suggestingthat the climate model significantly underestimates thedegree of monsoon expansion in West Africa at 6 ka(14C).
The biome model simulates temperate xerophyticwoods/shrub over a more extensive area than today inthe Central Saharan mountains and eastward towardsthe Red Sea (Fig. 2c). There are no adequately datedsites that would allow us to evaluate this predictiondirectly, however, it is consistent with the interpreta-tion of Pons and Quezel (1957, 1958), Quezel andMartinez (1958) and Schultz (1980) that xerophyticvegetation of mediterranean affinity was present atleast on the central Saharan mountains during thewettest phase of the Holocene. Temperate xerophyticpollen taxa in the Saharan mountains may reflect longdistance transport (Zinderen Bakker and Maley, 1979;Reille, pers. comm.). Pollen data from northern Sudanshow tropical xerophytic bush/savanna rather thantemperate xerophytic elements, which indicates a sub-stantial mismatch with the biome simulation at least inthis region. It is clear that more data are required toevaluate the simulated extent of the temperatexerophytic woods/shrubs in central and eastern north-ern Africa. The results of sensitivity analyses with thebiome model show that the 6 ka (cal.) climate has to beat least 3°C warmer in winter and 15% drier thansimulated by CCM1 in order to obtain an agreementwith the pollen records from Sudan. If these changesare imposed over the whole of central and easternnorthern Africa, they result in the prediction ofwarm/grass shrub in the Central Sahara consistentwith archaeological and palaeontological data (Gab-riel, 1976, 1984) and temperate xerophytic woods/scrubin the mountains of Hoggar, the Tibesti and DjebelAsoteriba (northeastern Sudan). The temperaturewould have to be more than 6—7°C higher thansimulated by CCM1 in order for tropical xerophytictaxa to replace temperate xerophytic taxa in thesemountains.
Except at two sites (Bosumtwi, Ghana and Laboot,Kenya), the pollen data from equatorial Africa showa similar pattern to 9 ka (14C). The persistence oftropical seasonal forest in West Africa indicates thatthe climate model underestimates P—E. In equatorialEast Africa, the data are concordant with the biomesimulations (Fig. 2c). As at 9 ka (14C), pollen-basedreconstructions suggest that there may be discrepanciesbetween the climate simulation and the observations
D. Jolly et al.: Simulated climate and biomes of Africa during the Late Quaternary 645
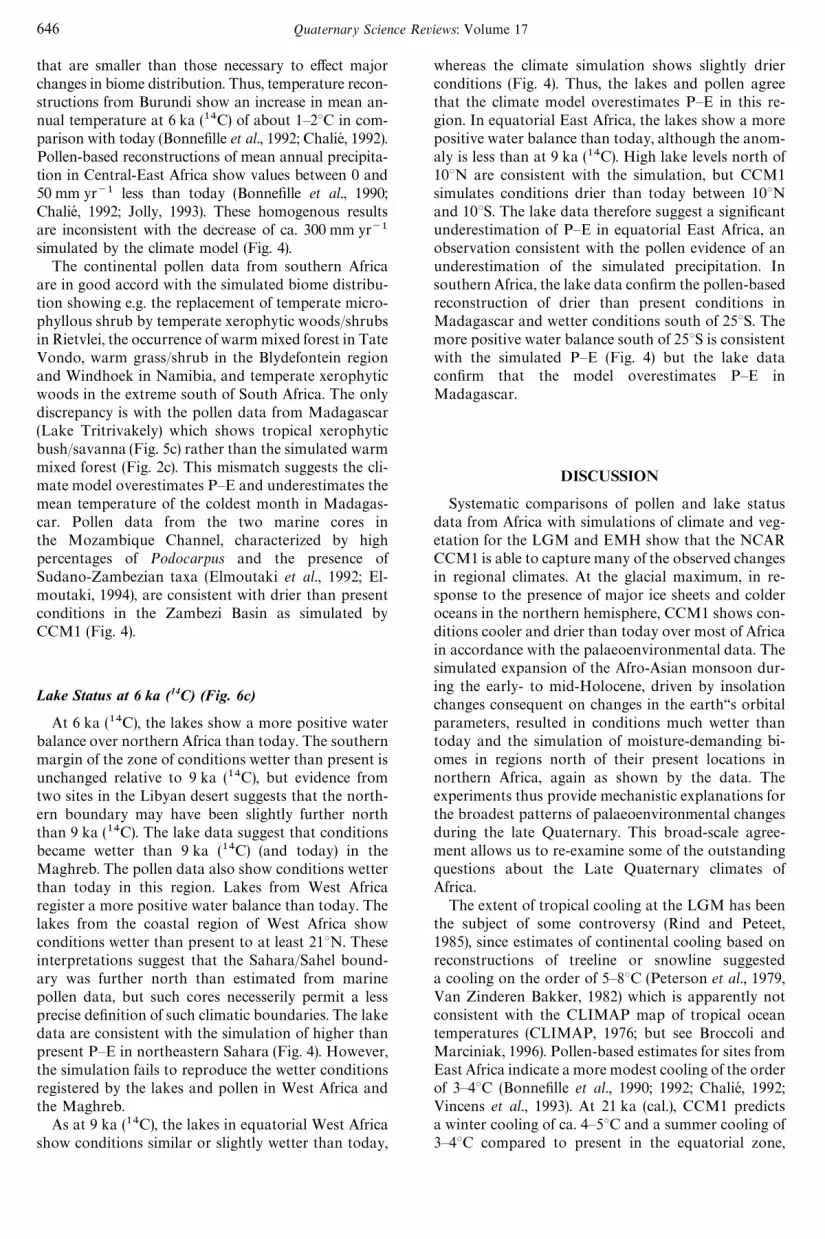
that are smaller than those necessary to effect majorchanges in biome distribution. Thus, temperature recon-structions from Burundi show an increase in mean an-nual temperature at 6 ka (14C) of about 1—2°C in com-parison with today (Bonnefille et al., 1992; Chalie, 1992).Pollen-based reconstructions of mean annual precipita-tion in Central-East Africa show values between 0 and50 mm yr~1 less than today (Bonnefille et al., 1990;Chalie, 1992; Jolly, 1993). These homogenous resultsare inconsistent with the decrease of ca. 300 mm yr~1
simulated by the climate model (Fig. 4).The continental pollen data from southern Africa
are in good accord with the simulated biome distribu-tion showing e.g. the replacement of temperate micro-phyllous shrub by temperate xerophytic woods/shrubsin Rietvlei, the occurrence of warm mixed forest in TateVondo, warm grass/shrub in the Blydefontein regionand Windhoek in Namibia, and temperate xerophyticwoods in the extreme south of South Africa. The onlydiscrepancy is with the pollen data from Madagascar(Lake Tritrivakely) which shows tropical xerophyticbush/savanna (Fig. 5c) rather than the simulated warmmixed forest (Fig. 2c). This mismatch suggests the cli-mate model overestimates P—E and underestimates themean temperature of the coldest month in Madagas-car. Pollen data from the two marine cores inthe Mozambique Channel, characterized by highpercentages of Podocarpus and the presence ofSudano-Zambezian taxa (Elmoutaki et al., 1992; El-moutaki, 1994), are consistent with drier than presentconditions in the Zambezi Basin as simulated byCCM1 (Fig. 4).
Lake Status at 6 ka (14C) (Fig. 6c)
At 6 ka (14C), the lakes show a more positive waterbalance over northern Africa than today. The southernmargin of the zone of conditions wetter than present isunchanged relative to 9 ka (14C), but evidence fromtwo sites in the Libyan desert suggests that the north-ern boundary may have been slightly further norththan 9 ka (14C). The lake data suggest that conditionsbecame wetter than 9 ka (14C) (and today) in theMaghreb. The pollen data also show conditions wetterthan today in this region. Lakes from West Africaregister a more positive water balance than today. Thelakes from the coastal region of West Africa showconditions wetter than present to at least 21°N. Theseinterpretations suggest that the Sahara/Sahel bound-ary was further north than estimated from marinepollen data, but such cores necesserily permit a lessprecise definition of such climatic boundaries. The lakedata are consistent with the simulation of higher thanpresent P—E in northeastern Sahara (Fig. 4). However,the simulation fails to reproduce the wetter conditionsregistered by the lakes and pollen in West Africa andthe Maghreb.
As at 9 ka (14C), the lakes in equatorial West Africashow conditions similar or slightly wetter than today,
whereas the climate simulation shows slightly drierconditions (Fig. 4). Thus, the lakes and pollen agreethat the climate model overestimates P—E in this re-gion. In equatorial East Africa, the lakes show a morepositive water balance than today, although the anom-aly is less than at 9 ka (14C). High lake levels north of10°N are consistent with the simulation, but CCM1simulates conditions drier than today between 10°Nand 10°S. The lake data therefore suggest a significantunderestimation of P—E in equatorial East Africa, anobservation consistent with the pollen evidence of anunderestimation of the simulated precipitation. Insouthern Africa, the lake data confirm the pollen-basedreconstruction of drier than present conditions inMadagascar and wetter conditions south of 25°S. Themore positive water balance south of 25°S is consistentwith the simulated P—E (Fig. 4) but the lake dataconfirm that the model overestimates P—E inMadagascar.
DISCUSSION
Systematic comparisons of pollen and lake statusdata from Africa with simulations of climate and veg-etation for the LGM and EMH show that the NCARCCM1 is able to capture many of the observed changesin regional climates. At the glacial maximum, in re-sponse to the presence of major ice sheets and colderoceans in the northern hemisphere, CCM1 shows con-ditions cooler and drier than today over most of Africain accordance with the palaeoenvironmental data. Thesimulated expansion of the Afro-Asian monsoon dur-ing the early- to mid-Holocene, driven by insolationchanges consequent on changes in the earth‘‘s orbitalparameters, resulted in conditions much wetter thantoday and the simulation of moisture-demanding bi-omes in regions north of their present locations innorthern Africa, again as shown by the data. Theexperiments thus provide mechanistic explanations forthe broadest patterns of palaeoenvironmental changesduring the late Quaternary. This broad-scale agree-ment allows us to re-examine some of the outstandingquestions about the Late Quaternary climates ofAfrica.
The extent of tropical cooling at the LGM has beenthe subject of some controversy (Rind and Peteet,1985), since estimates of continental cooling based onreconstructions of treeline or snowline suggesteda cooling on the order of 5—8°C (Peterson et al., 1979,Van Zinderen Bakker, 1982) which is apparently notconsistent with the CLIMAP map of tropical oceantemperatures (CLIMAP, 1976; but see Broccoli andMarciniak, 1996). Pollen-based estimates for sites fromEast Africa indicate a more modest cooling of the orderof 3—4°C (Bonnefille et al., 1990; 1992; Chalie, 1992;Vincens et al., 1993). At 21 ka (cal.), CCM1 predictsa winter cooling of ca. 4—5°C and a summer cooling of3—4°C compared to present in the equatorial zone,
646 Quaternary Science Reviews: Volume 17

resulting in an extension of warm mixed forest in WestAfrica and of temperate microphyllous shrublands inEast Africa. The available pollen data from equatorialAfrica are consistent with the simulated biome changes(Figs 2a and 5a). This consistency, and the consistencybetween the simulated temperature changes and pol-len-based estimates of temperature changes from EastAfrica, suggests that the estimates of tropical coolingbased on treeline or snowline changes are unrealisticbecause they fail to distinguish between the effects oftemperature and precipitation (Bonnefille et al., 1990).Furthermore, the results of sensitivity analyses with theBIOME 1.2 model show that cooling of the magnitudeestimated from the treeline and the snowline datawould produce extensions of montane forests and tem-perate xerophytic associations very much greater thansupported by the available pollen data. However, nei-ther the BIOME 1.2 simulations nor the pollen-basedestimates allow for possible physiological effects, dueto the lowering of atmospheric CO
2concentrations at
the LGM (Barnola et al., 1987) on vegetation dis-tribution. Recent experiments with a biome model(BIOME3: Haxeltine and Prentice, 1996) that incor-porates the physiological response of vegetation tochanges in atmospheric CO
2concentrations, have
suggested that the observed changes in East Africanmontane vegetation could occur without a substan-tial decrease in temperature if CO
2was lowered to
190 ppmv (Jolly and Haxeltine, 1997). These simula-tions would imply that treeline estimates and the pol-len-based transfer-function estimates of tropical coolingare biased. Clearly, the issue of tropical cooling at theLGM is not resolved and a re-evaluation of the avail-able data, in conjunction with new interpretative tools,which do not rely on modern analogue approaches,would be helpful.
Although the level of qualitative agreement is rathergood, comparisons of pollen-derived biomes withsimulated biome distributions show that the climatesimulations do not always capture the magnitude ofchange indicated by the data (Table 5). At the LGM,the only discrepancy between the data and the modeloccurs in equatorial West Africa and the region ofOrange Free State and Natal, where the data indicatethat the climate model simulates conditions less aridthan shown by the data. Given the simulated cooling inthe equatorial zone, a decrease in the moisture index toca 2—4% less than today would be sufficient to resolvethis discrepancy in equatorial West Africa. These re-sults throw considerable doubt on the widely heldhypothesis of extreme aridity in equatorial Africa at theglacial maximum (Hamilton, 1976; Maley, 1987).
Discrepancies between the data and the simulationsfor the EMH involve both temperature and moisturebalance parameters. However, the most systematic er-rors are related to the estimation of P—E in zonesperipheral to the region affected by the simulated en-hancement of the Afro-Asian monsoon in northernAfrica (Table 6). At 11 ka (cal.), CCM1 simulatesa broad band of increased P—E extending as far west as
6°W but shows arid conditions (similar to today) in thecoastal zone of West Africa (Fig. 3). The pollen andlake data for 9 ka (14C) indicate that conditions wetterthan today were registered over the whole of northernAfrica, including the coastal zone of West Africa(Figs 5b and 6b). At 6 ka (cal.), the region affected bythe enhanced monsoon in the simulation is less exten-sive than at 11 ka (cal.), and most of West Africa is arid(Fig 4). This simulated result is inconsistent with thepollen and lake data, which suggest that West Africawas as wet at 6 ka as at 9 ka (14C) (Figs 5c and 6c). Thediscrepancies between data and the EMH simulationssuggests that CCM1 underestimates the strength ofmonsoon penetration (and hence the strength of thetropical easterly jet aloft).
The underestimation of monsoon penetration intoWest Africa appears to be a robust feature of manyAGCM simulations of the response to EMH insolationanomalies (e.g. UKMO: Mitchell et al., 1988; CCMO:Kutzbach et al., 1993; LMD4-LMCE: de Noblet et al.,1996). This systematic underestimation of monsoonpenetration suggests the existence of a mechanismwhich amplifies the strength of the monsoon. Modelsimulations show that precipitation in northern Africais sensitive to surface boundary conditions, parti-cularly albedo (Mintz, 1984). The observed shift fromdesert to savanna vegetation in the early Holocene inresponse to the more positive moisture balance conse-quent upon monsoon enhancement, by substantiallyaltering surface albedo, could provide an importantpositive feedback. An experiment to assess the effect ofa plausible reduction of albedo over Africa and Arabiabetween 15 and 30° N in response to vegetation cha-nges at 9 ka (14C) (Street-Perrott et al., 1990) shows anenhancement of monsoon precipitation over most ofnorthern Africa, including West Africa. This resultsuggests that the failure of CCM1 to reproduce thewetter conditions observed in West Africa at 9 and 6 ka(14C) may be due to the absence of vegetationfeedbacks. However, a further consequence of thechange in albedo in Street-Perrott et al.’s (1990) ex-periment is a pronounced warming of up to 2°C in theMaghreb and extending eastwards into the MiddleEast. According to our sensitivity analyses, CCM1already overestimates the summer warming in the At-las Mountains by at least 2°C at 9 ka (14C). A similarproblem arises in northeastern Africa, where the al-bedo experiment produces a slight reduction in tem-perature. However, comparisons with the pollen-basedbiome reconstructions from northern Sudan show thatCCM1 already underestimates temperature in this re-gion by as much as 3°C. Thus, while vegetation-in-duced albedo feedbacks are clearly implicated in thecorrect simulation of the monsoon over northern Afri-ca, the situation is complex. Additional feedbacksdue, for example, to the presence of lakes and wetlandsmay well be implicated. Further experiments usingcoupled biosphere—hydrosphere—atmospheric modelscould provide a better understanding of past monsoonregimes.
D. Jolly et al.: Simulated climate and biomes of Africa during the Late Quaternary 647

TABLE 5. The lake status data set
Dating Control Status(kyr/B.P) (kyr/B.P)
Site name Country Lati- Longi- Eleva- Referencestude tude tion 6 9 18 0 6 9 18(dec.) (dec.) (m)
El Akarit Tunisia 34.50 10.00 1 1 1 L H H L Fontes et al. (1983), Fontes and Gasse (1987),Fontes and Gasse (199)
Dayet Aaoua Morocco 33.35 !5.03 1180 1 — — L H — — Street-Perrott et al. (1989)Tigalmamine Morocco 32.90 !5.35 1626 1 1 — L H I — Lamb et al. (1989); El Hamouti et al. (1991), Gasse
and Fontes, (1992), Lamb et al. (1995)Mellala Algeria 32.11 5.12 128 1 1 — L H H — Gasse et al. (1990); Gibert et al. (1990), Fontes and
Gasse (1991), Gasse and Fontes (1992)HassiMessaoud
Algeria 32.00 5.85 470 1 — — L H — — Street-Perrott et al. (1989)
Hassi el Mejna Algeria 31.50 2.30 500 1 2 — L H H — Gasse et al. (1987), Fontes et al. (1985)El Borma Tunisia 31.35 9.15 250 2 — — L H — — Petit-Maire et al. (1991)
Graret-Abdel-lah
Tunisia 31.35 10.00 250 2 — — L H — — Petit-Maire et al. (1991)
Jenain Tunisia 31.35 10.15 250 2 — — L H — — Petit-Maire et al. (1991)Daiet el Melah Algeria 31.13 1.24 695 3 — — L I — — Fontes et al. (1985), Gasse et al. (1987)Ghadames Libya 30.17 10.10 300 — 2 — L — H — Street—Perrott et al. (1989)Saoura Algeria 30.00 !2.00 400 1 1 6 L H H H Street—Perrott et al. (1989)Shati Libya 27.50 14.00 270 2 — — L I — — Street—Perrott et al. (1989)Behar Belama Egypt 27.47 21.30 160 1 — — L H — — Street—Perrott et al. (1989)Bou Bernous Algeria 27.33 3.07 200 2 — — L H — — Street—Perrott et al. (1989)Bou Ali Algeria 27.17 !0.25 350 2 — — L H — — Street—Perrott et al. 1989Kadda Algeria 26.20 !0.88 250 2 — 1 L H — H Street—Perrott et al. (1989)Abu Tartur Egypt 25.50 29.30 145 2 7 — L H H — Street—Perrott et al. (1989)Abu Ballas Egypt 24.23 27.40 506 2 2 — L I I — Street—Perrott et al. (1989)Serir Libya 23.52 17.50 250 — 1 — L — H — Street-Perrott et al. (1989)El Bakht Egypt 23.22 26.30 850 1 2 — L H I — Street-Perrott et al. (1989)Ard el Akhdar Egypt 23.18 26.00 950 1 2 — L I I — Street-Perrott et al. (1989)Nabta Egypt 23.00 31.00 250 1 1 7 L H H L Street-Perrott et al. (1989)Sbeita Mali 22.93 !4.20 220 — 2 — L — H — Street-Perrott et al. (1989)Fderick Mauritania 22.67 !12.70 350 — 1 — L — H — Street-Perrott et al. (1989)Haijad Mali 22.57 !3.56 175 1 — — L H — — Street-Perrott et al. (1989)Taoudenni Mali 22.50 !4.00 120 1 — — — H — — Street-Perrott et al. (1989)Enneri Bar-dague
Chad 21.50 17.00 1025 2 1 — L L H — Street-Perrott et al. (1989)
Tirersioum Mauritania 21.37 !16.70 100 6 — — L H — — Street-Perrott et al. (1989)Mouskorbe Chad 21.37 18.50 2600 — 2 — L — H — Street-Perrott et al. (1989)Selima Sudan 21.32 29.30 200 1 1 — L I I — Haynes et al. (1989)Tagnout—Chaggaret
Mali 21.03 !0.75 310 2 — — L H — — Street-Perrott et al. (1989)
Chemchane-Aderg
Mauritania 21.00 !12.10 260 6 1 — L H H — Street-Perrott et al. (1989)
Erg Ine Sakane57-19
Mali 20.95 —0.53 320 1 — — L I — — Street-Perrott et al. (1989)
Oum Arouaba Mauritania 20.87 !12.90 150 1 — — L H — — Street-Perrott et al. (1989)Erg IneSakane 20
Mali 20.83 !0.63 320 2 — — L H — — Street—Perrott et al. (1989)
Erg IneSakane 48—50
Mali 20.80 !0.70 320 2 — — L H — — Street-Perrott et al. (1989)
Oukechert Mali 20.67 !0.75 320 2 1 — L I H — Street-Perrott et al. (1989)Ine Kousa-mene
Mali 20.67 !0.58 330 1 1 — L H H — Street-Perrott et al. (1989)
Ichourad Mali 20.50 !1.13 300 2 1 — L H H — Street-Perrott et al. (1989)Adrar Bous Niger 20.20 9.00 700 1 1 — L H H — Dubar, 1988; El Hamouti, (1989), Fontes and
Gasse, (1991), Gasse and Fontes, (1992)Tin Ouffadene Niger 20.10 9.00 5 1 7 L L H H Dubar (1988), El Hamouti (1989), Fontes and
Gasse (1991)Hussein Sudan 19.33 26.50 1150 — 1 — L — H — Street-Perrott et al. (1989)Tin Guettai Mali 19.27 !3.54 350 1 1 — L H H — Street-Perrott et al. (1989)Oyo Sudan 19.27 26.20 510 2 — — L I — — Street-Perrott et al. (1989)Khat Mauritania 19.17 !12.50 100 6 2 — L L H — Street-Perrott et al. (1989)Hassi el Abiod Mali 19.17 !3.83 400 1 — — L H — — Street-Perrott et al. (1989)Ounianga Kebir Chad 19.05 20.50 310 1 — — L H — — Street-Perrott et al. (1989)
648 Quaternary Science Reviews: Volume 17

TABLE 5. (Continued)
Dating Control Status(kyr/B.P) (kyr/B.P)
Site name Country Lati- Longi- Eleva- Referencestude tude tion 6 9 18 0 6 9 18(dec.) (dec.) (m)
Bilma Niger 18.75 13.00 310 4 2 7 L H I L Street-Perrott et al. (1989)Feshfesh Sudan 18.75 26.00 1250 2 — — L I — — Pachur and Kropelin, (1987), Pachur and
Hoelzmann, (1991)Hassei Gaboun Mauritania 18.30 !15.80 150 1 — — L H — — Street-Perrott et al. (1989)El’ Atrun Sudan 18.17 26.60 510 6 1 — L H H — Street-Perrott et al. (1989)Fachi Niger 18.12 11.70 275 3 1 7 L H I L Street-Perrott et al. (1989)Tamaya Mellet Niger 17.80 5.44 390 1 — — L H — — Street-Perrott et al. (1989)Howar Sudan 17.55 28.50 400 2 2 — L H H — Street—Perrott et al. (1989)Tageru Sudan 17.00 26.90 700 — 1 — L — H — Street-Perrott et al. (1989)Agadem Niger 16.83 13.30 350 1 1 — L I I — Street—Perrott et al. (1989)Gureinat Lake Sudan 16.58 27.18 100 2 2 — L L I Pachur and Hoelzmann, (1991)Termit Ouest Niger 16.08 11.30 300 2 2 — L H H — Street—Perrott et al. (1989)Tarada Niger 15.98 4.85 400 — 1 — L — H — Street—Perrott et al. (1989)Bouloum Gana Niger 15.02 10.60 340 — 1 — L — H — Street-Perrott et al. (1989)Afrera Ethiopia 13.34 40.66 !82 1 1 — L I H — Gasse et al. (1974), Gasse et al. (1980)Bougdouma Niger 13.30 11.70 320 1 2 — L I H — Gasse et al. (1990), Fontes and Gasse, (1991),
Gasse and Fontes, (1992)Maine—Soroa Niger 13.12 12.00 315 2 1 — L I — I Street—Perrott et al. (1989)Jebel Marra Sudan 13.00 24.20 2000 — — 1 L — — I Street-Perrott et al. (1989)Chad Niger/
Nigeria13.00 14.00 282 2 1 — I I H — Street-Perrott et al. (1989)
Asal Djibouti 11.60 42.50 —155 1 1 — L I H — Gasse and Fontes, (1989)Dobi—Hanle Ethiopia 11.50 42.00 120 3 1 — L H H — Street-Perrott et al. (1989)Gamari Ethiopia 11.30 42.40 339 2 6 — L I H — Gasse et al. (1974)Abhe Djibouti/
Ethiopia11.25 42.00 240 1 1 4 L I H I Grove et al. (1975), Street (1977), Gasse et al. (1980),
Grove (1983)Besaka Ethiopia 8.88 39.90 1000 4 2 — I L H — Grove et al. (1975), Street, (1977), Gasse, et al.
(1980), Grove (1983)Ziway Ethiopia 8.00 39.45 1636 1 2 7 L I H I Street—Perrott et al. (1989)Abiyata Ethiopia 7.20 38.30 1578 7 1 7 L I H I Grove et al. (1975), Street, (1977) Gasse et al. (1980),
Grove (1983), Lezine and Bonnefille (1982)Shala Ethiopia 7.15 38.40 1558 1 2 7 L I H I Street—Perrott et al. (1989)Bosumtwi Ghana 6.50 !1.42 100 1 1 2 I H H L Hall et al. (1978), Talbot and Delibrias (1980), Tal-
bot et al. (1984), Maley (1987) Maley (1991), Talbotand Johannessen (1992).
Turkana Kenya 5.00 36.00 375 1 1 — — I H — Owen et al. (1982).Chew Bahir Ethiopia/
Kenya4.75 37.00 500 2 — — I H — — Grove et al. (1975); Grove (1983)
Barombi—Mbo Cameroon 4.39 9.24 301 2 1 2 H H H L Thouveny and Williamson (1988), Maley et al.(1990), Maley et al. (1991), Giresse et al. (1991).
Suguta Kenya 1.91 36.50 900 — 1 — L — H — Street-Perrott et al. 1989Mobutu SeseSeko
Uganda/Zaıre
1.50 31.00 619 4 1 5 I H H I Street-Perrott et al. (1989)
Baringo Kenya 0.37 36.40 967 7 1 — I H H — Tiercelin et al., (1987)Bogoria Kenya 0.30 36.10 990 1 4 7 I H H L Tiercelin et al. (1981), Tiercelin et al. (1982), Tier-
celin et al. (1987), Renaut and Owen (1991)Nakuru—Elmenteita
Kenya !0.42 36.20 1750 3 1 4 I H H L Street-Perrott et al. (1989)
Sonachi Kenya !0.47 36.20 1890 2 — — I I — — Macintyre and Melack (1982), Ase et al. (1986),Damnati (1993a), Damnati and Taieb, submitted.
Naivasha Kenya !0.68 36.30 1890 2 2 4 I H H H Street-Perrott et al. (1989)Victoria Uganda/
Tanzania/Kenya
!1.00 33.00 1134 1 1 4 H H H IStreet-Perrott et al. (1989)
Natron Tanzania !2.00 36.20 608 4 2 — L I I — Hillaire-Marcel et al. (1986), Hillaire-Marcel andCasanova (1987), Damnati (1989), Goetz (1990),Barker (1990), Williamson (1991), Taieb et al. (1992),Damnati et al. (1992), Damnati (1993a#b), Will-iamson et al. (1993), Roberts et al. (1993).
Kivu Rwanda/Burundi/Zaıre
!2.00 29.00 1462 1 2 — H H H — Street-Perrott et al. (1989)
D. Jolly et al.: Simulated climate and biomes of Africa during the Late Quaternary 649

TABLE 5. (Continued)
Dating Control Status(kyr/B.P) (kyr/B.P)
Site name Country Lati- Longi- Eleva- Referencestude tude tion 6 9 18 0 6 9 18(dec.) (dec.) (m)
Magadi Kenya !1.83 36.30 600 7 1 5 L I H I Butzer et al. (1972), Hillaire-Marcel et al. (1986),Hillaire-Marcel and Casanova (1987), Damnati,(1989), Goetz (1990), Barker (1990), Williamson(1991), Taieb et al. (1992), Damnati et al. (1992),Damnati (1993a#b), Williamson et al. (1993),Roberts et al. (1993).
Manyara Tanzania !3.62 35.80 945 1 6 1 L I H I Street-Perrott et al. (1989)Tanganyika Burundi/
Tanzania/Zambia/Zaıre
!6.03 28.50 773 1 2 1 I I H L Haberyan and Hecky (1987), Tiercelin et al. (1988),Gasse et al. (1989), Vincens (1989), Vincens (1991),Williamson et al. (1991), Baltzer (1991), Vincens etal. (1993), Vincens (1993).
Rukwa Tanzania !8.00 32.50 793 2 3 — L H H — Street-Perrott et al. (1989)Cheshi—MweruWantipaa
Zambia !8.87 29.70 928 3 4 7 I H H I Street-Perrott et al. (1989)
Malawi Malawi !12.00 34.50 2 1 6 I H I H Scholz and Rosendahl (1988), Finney and Johnson,(1991), Owen and Crossley (1992), Johnson andMuchane, submitted; Finney et al. in press
Chilwa Malawi !15.50 35.50 622 2 1 — L I I — Street—Perrott et al. (1989)Tritrivakely Madagas-
car !19.78 46.90 1800 2 1 — I L L — Street-Perrott et al. (1989)Alexander-sfontein
SouthAfrica
!28.83 24.80 1119 6 2 6 L I I H Street-Perrott et al. (1989)
Lieben-bergspan
SouthAfrica
!29.13 25.30 1224 2 — — L H — — Street-Perrott et al. (1989)
Breek BeenKolk
SouthAfrica
!30.80 20.10 800 7 7 6 L L L H Street-Perrott et al. (1989)
Lake status codes L: Low; I: Intermediate; H: High.Coordinates are given for the centre of the lakeCodes for dating control are defined in Table 3. The distinction between continuous (C) and discontinuous (D) records is not specified in the
OLLDB.Data base references are given in Appendix A.
TABLE 6. Summary of the comparison between the palaeoenvironmental data and simulated by CCM1, with diagnostics of the magnitude of thediscrepancy based on sensitivity analyses with BIOME 1.2, where ok"agreement, #"an overestimate by CCM1, !"an underestimate by
CCM1, and n/r means that the parameter does not influence the observed biome changes in this region.
Key period Region Temperature Moisture availability
Maghreb ok n/rWestern Sahara n/r okEastern Sahara n/r ok
21 ka (cal.) East African mountains ok n/rEquatorial West Africa n/r #
Zambezian Domain ok n/rOFS-Natal n/r #
Maghreb #2°C Tjuly n/rWestern Sahara n/r -Eastern Sahara n/r ok
11 ka (cal.) East African mountains ok n/rEquatorial West Africa n/r -Zambezian Domain n/r -Madagascar #1—2°C Tannual n/r
Maghreb n/r -15—25%Western Sahara n/r -Central Saharan mountains n/r okSudan -3—7°C Tjanuary #10—15%
6 ka (cal.) Eastern Sahara n/r (ok)East Africa -1-1.5°C Tannual -Equatorial West Africa n/r -Zambezian Domain n/r okSouthern Africa ok okMadagascar -Tjanuary #
650 Quaternary Science Reviews: Volume 17

SUMMARY AND CONCLUSION
The relative paucity of palaeoenvironmental datafrom Africa prohibits, for the moment, the use of theinverse methods which have been successfully appliedin, e.g. Europe (Cheddadi et al., in press; Prentice et al.,this volume) to make quantitative reconstructions ofclimate variables at a continental scale. This paper haspresented a new strategy for comparing palaeoenviron-mental data from Africa to climate simulations, involv-ing the explicit use of a forward model (BIOME 1.2) totranslate climate variables into predictions of potentialvegetation. This approach represents a substantial im-provement compared to standard qualitative compari-sons (e.g. Street-Perrott and Perrott, 1993) because itallows both the sense and the magnitude of thesimulated climatic changes to be evaluated. The recentdevelopment of mechanistically-based lake models (Coe,in press; Coe and Bonan, subm.) will permit a similarapproach to be adopted for lakes in the near future.
Our comparisons have shownf the simulation by CCM1 of conditions colder and
drier than present at the LGM is consistent with theavailable palaeoenvironmental data, except that thesimulation slightly underestimates equatorial aridity.
f the simulation by CCM1 of increased summer pre-cipitation in the eastern Sahara and East Africa, inconsequence of the orbitally induced expansion ofthe African monsoon, is consistent with the availablepalaeoenvironmental data, except that the simula-tion underestimates the northward penetration ofthe monsoon into northern Africa.
f the regional climate simulated by CCM1 appears tobe in better agreement with palaeoenvironmentaldata than previous simulations with CCM0. How-ever, there are some persistant mismatches withpalaeoenvironmental data which are probably re-lated to the absence of land-surface feedbacks.
ACKNOWLEDGEMENTS
This research is a contribution to the CooperativeHolocene Mapping Project (COHMAP), throughfunding from the U.S. National Science Foundationvia a subcontract with the University of Madison-Wis-consin, and to the IGBP Global Analysis, Interpreta-tion and Modeling (GAIM) Task Force, supported bythe U.S. Environmental Protection Agency via a sub-contract from the University of New Hampshire. Thecompilation of African lake status data is a contribu-tion to the IGBP International Decade of East AfricanLakes (IDEAL) project, through funding from the U.S.National Science Foundation via a subcontract withthe University of Minnesota. Additional financial sup-port was provided by the Swedish Natural ScienceResearch Council and the French Centre National dela Recherche Scientifique. We thank John Kutzbachfor access to the climate model output, Francois Lav-enu and Jacques Fontes (L’Institut de la Carte Interna-
tionale de la Vegetation) for providing a digital vegeta-tion map of Africa, Wolfgang Cramer for access to theupdated version of the modern climate data set, FouziaLaarif for computer cartography, and our many Quat-ernary colleagues who provided lake and pollen data.We also thank Colin Prentice, Thompson Webb III,John Kutzbach and two anonymous referees for re-viewing the manuscript.
REFERENCES
Agwu, C.O.C. and Beug, H.-J. (1984) Palinologische untersuchungenan marinen sedimenten vor der Westafrikanischen kuste.Palaeoecology of Africa, 16, 37—52.
Bard, E., Hamelin, B. and Fairbanks, R.G. (1990) U/Th ages ob-tained by mass spectrometry in corals from Barbados: Sea levelduring the past 130,000 years. Nature, 346, 456—458.
Barnola, J.M., Raynaud, D., Korotkevich, Y.S. and Lorius, C. (1987)Vostok ice core provides 160,000-year record of atmosphericCO
2. Nature, 32° 408—414.
Bjork et al. (1996) Science.Bonnefille, R., Chalie, F., Guiot, J. and Vincens, A. (1992) Quantitat-
ive estimates of Full Glacial Temperatures in Equatorial Africafrom palynological data. Climate Dynamics, 6, 251—257.
Bonnefille, R. and Riollet G. (1988) The Kashiru pollen sequence(Burundi) Palaeoclimatic implications for the last 40,000 yr B.P.in Tropical Africa. Quaternary Research, 30, 19—35.
Bonnefille, R., Roeland, J.C. and Guiot, J. (1990) Temperature andrainfall estimates for the past 40 000 years in equatorial Africa.Nature, 346, 347—349.
Box, E.O (1981) Macroclimate and Plant Forms: an Introduction toPredictive Modelling in Phytogeography. Junk, The Hague.
Brenac, P. (1988) Evolution de la vegetation et du climat dansl’Ouest-Cameroun entre 25 000 et 11 000 ans B.P. Institut Fran-cais de Pondiche& ry, ¹ravaux de la Section Sciences et ¹echniques,25, 91—103.
Broccoli, A.J. and Marciniak, E.P. (1996) Comparing simulatedglacial climate and paleodata: a reexamination Paleoceanogra-phy, 11/1, 3—14.
Brun, A. (1983) Etude palynologique des sediments marins Holo-cenes de 5000 B.P. a l’actuel dans le Golfe de Gabes (MerPelagienne). Pollen et Spores, 25, n°3-4, 437—460.
Caralp, M.H., Duprat, J., Labeyrie, L.D. and Peypouquet, J.P. (1993)Evolution paleohydrologique des eaux intermediaires deduited’une carotte d’age Quaternaire recent dans le canal de Mozam-bique. Apports des analyses isotopiques et microfauniques. Bull-etin de la Socie& te& Ge&ologique de France, 164(2), 301—312.
Caratini, C. and Giresse, P. (1979) Contribution palynologique a laconnaissance des environnements continentaux et marins duCongo a la fin du Quaternaire. Comptes Rendus de l’Acade&mie desSciences, Paris, D, 228, 379—382.
Causse, C., Conrad, G., Fontes, J.C., Gasse, F., Gibert, E. and Kassir,A. (1988) Le dernier ‘‘humide’’ pleistocene du Sahara nord-occi-dental daterait de 80-100000 ans. Comptes Rendus de l’Acade&miedes Sciences, Paris, 306, 1459—1464.
Chalie, F. (1992) Paleoclimatologie quantitative en Afrique orientaledepuis 40 000 ans. Pollen et Statistiques. Thesis, University ofAix-Marseille III, 160 pp, unpublished.
Cheddadi, R., Yu, G., Guiot, J., Harrison, S.P. and Prentice, I.C. (inpress). The climate 6000 years ago in Europe. Climate Dynamics.
CLIMAP Project Members (1976) The surface of the ice-age earth.Science, 191, 1131—1136.
Coe, M.T. (in press). Simulating continental surface waters: an ap-plication to Holocene Northern Africa.
Coe, M.T. and Bonan, G. (in press). Feedbacks between climate andsurface water in North Africa during the Middle Holocene.
COHMAP Members (1988) Major climatic changes of the last18,000 years: Observations and model simulations. Science, 241,1043—1052.
D. Jolly et al.: Simulated climate and biomes of Africa during the Late Quaternary 651

Conrad, G. (1969) L’evolution continentale post-hercynienne duSahara algerien (Saoura, Erg, Chech, Tanezrouft, Ahnet-Mouydir). Publication du Centre de Recherche sur les Zonesarides, C.N.R.S., serie Geologie, Vol 10, 527 pp.
de Noblet, N., Braconnot, P., Joussaume, S. and Masson, V. (1996)Sensitivity of simulated Asian and African summer monsoons toorbitally induced variations in insolation 126, 115 and 6 kBP.Climate Dynamics, 12, 589—603.
Elmoutaki, S. (1994) Transition glaciaire-interglaciaire et YoungerDryas dans l’Hemisphere Sud (1°—20° Sud): analysepalynologique a haute resolution de sondages marin et continen-taux (lac et marecage). Thesis, University of Aix-Marseille III, 130pp, unpublished.
Elmoutaki, S., Lezine, A.M. and Thomassin, B.A. (1992) Mayotte(canal de Mozambique). Evolution de la vegetation et du climatau cours de la derniere transition glaciaire-interglaciaire et del’Holocene. Comptes Rendus de l’Acade&mie des Sciences, Paris (3),314, 237—244.
Fredoux, A. (1994) Pollen analysis of a deep-sea core in the Gulf ofGuinea: vegetation and climatic changes during the last 225,000years B.P. Palaeogeography, Palaeoclimatology, Palaeoecology,109, 317—330.
Fredoux, A. and Tastet, J.P. (1988) Stratigraphie pollinique etpaleoclimatologie de la marge septentrionale du Golfe de Guineedepuis 200,000 ans. Institut Francais de Pondiche& ry, ¹ravaux dela Section Sciences et ¹echniques, 25, 175—183.
Fredoux, A., Tastet, J.P., Maley, J. and Guilmette, C. (1989) Carac-terisation palynologique du stade isotopique 5 et presence dePodocarpus latifolius en Cote d’Ivoire au Pleistocene superieur.1er Symposium de Palynologie Africaine, Rabat, resume 1p.
Gabriel, B. (1976) Neolitische Steinplatze und Palaeookologie in denEbenen der ostlichen Zentralsahara. Palaeoecology of Africa, 9,25—40.
Gabriel, B. (1984) Great plains and mountains areas as habitats forthe Neolithic man in the Sahara. In: Krzyzaniak, L. andLobusiewicz, M. (eds), Origin and Early Development of Food-producing Cultures in North-eastern Africa, pp. 391—398. Archa-eological Museum-Polish Academy of Sciences, Poznan(Poland).
Gasse, F., Fontes, J.-C., Plaziat, J.-C., Carbonel, P., Kaczmarska, I.,De Deckker, P., Soulie-Marsche, I., Callot, Y. and Dupeuple,P.A. (1987) Biological remains, geochemistry and stable isotopesfor the reconstruction of environmental and hydrological cha-nges in the Holocene lakes from north Sahara. Palaeogeography,Palaeoclimatology, Palaeoecology, 60, 1—46.
Giresse, P., Maley, J. and Brenac, P. (1994) Late Quaternarypalaeoenvironments in the Lake Barombi Mbo (WestCameroon) deduced from pollen and carbon isotopes of organicmatter. Palaeogeography, Palaeoclimatology, Palaeoecology, 107,65—78.
Grove, A.T. and Goudie, A.S. (1971) Late Quaternary lake levels inthe Rift Valley of Ethiopia and elsewhere in tropical Africa.Nature, 234, 403—405.
Guiot, J. (1990) Methodology of the last climatic cycle reconstruc-tion from pollen data. Palaeogeography, Palaeoclimatology,Palaeoecology, 80, 49—69.
Guiot, J. (1994) Statistical analyses of biospherical variability. In:Duplessy, J.C. and Spyridakis, M.T. (eds), ¸ong-term Climatic»ariations. Data and Modelling, NATO ASI Series I, Vol. 22, pp.299—334. Springer, Berlin.
Hamilton, A.C. (1976) The significance of patterns of distributionshown by forest plants and animals in tropical Africa for thereconstruction of Upper Pleistocene palaeoenvironments: a re-view. Palaeoecology of Africa, 9, 63—97.
Hamilton, A.C. (1982) Environmental History of East Africa: a Studyof the Quaternary, 328pp. Academic press. New York.
Hastenrath, S. (1985) Climate and Circulation of the ¹ropics. D.Reidel, Dordrecht.
Haxeltine, A. and Prentice, I.C. (1996) BIOME3: An equilibriumterrestrial biosphere model based on ecophysiological con-straints, resource availability, and competition among plant func-tional types. Global Biogeochemical Cycles, 10/4, 693—709.
Hooghiemstra, H. (1988) Changes of major wind belts and vegeta-tion zones in NW Africa 20,000—5000 yr B.P., as deduced froma marine pollen record near Cap Blanc. Review of Palaeobotanyand Palynology, 55, 101—140.
Hooghiemstra, H., Bechler, A. and Beug, H.J. (1987) Isopollen mapsfor 18,000 yr B.P. of the Atlantic offshore of northwest Africa:evidence for paleo-wind circulation. Paleoceanography, 2, 561—582.
Jolly, D. (1993) Evolution et dynamique des ecosystemes du Burundi.Pollen et statistique. Thesis, University of Aix-Marseille II, 143pp, unpublished.
Jolly, D. and Haxeltine, A. (1997) Effect of low glacial atmosphericCO
2on tropical African montane vegetation. Science, 276, 786—788.
Kutzbach, J.E., Bonan, G., Foley, J. and Harrison, S.P. (1996) Veg-etation/soil feedbacks and African monsoon response to orbitalforcing in the Holocene. Nature, 384, 623—626.
Kutzbach, J.E. and Guetter, P.J. (1986) The influence of changingorbital parameters and surface boundary conditions on climatesimulations for the past 18,000 years. Journal of the AtmosphericSciences, 43, 1726—1759.
Kutzbach, J.E., Guetter, P.J., Behling, P.J. and Selin, R. (1993)Simulated climatic changes: results of the COHMAP Climate-model experiments. In: Wright, H.E. Jr, Kutzbach, J.E., Webb, T.III, Ruddiman, W.F., Street-Perrott, F.A. and Bartlein, P.J. (eds),Global Climates since the ¸ast Glacial Maximum, pp. 24—93.University of Minnesota Press, Minnesota.
Kutzbach, J.E. and Street-Perrott, F.A. (1985) Milankovitch forcingof fluctuations in the level of tropical lakes from 18 to 0 kyr B.P.Nature, 317, 130—134.
Kutzbach, J.E., Gallimore, R., Harrison, S., Behling, P., Selin, R. andLarrif, F. (1998) Climate and Biome simulations for the past21,000 years. Quaternary Science Reviews, 17, 473—506.
Lamb, H.F., Eicher, U. and Switsur, V.R. (1989) An 18,000-yearrecord of vegetation, lake-level and climatic change from Tigal-mamine, Middle Atlas, Morocco. Journal of Biogeography, 16,65—74.
Lavenu, F., Fontes, J. and Bellan, M.F. (1987) »egetation Map ofAfrica. Institut de la Carte Internationale de la Vegetation(Universite Paul Sabatier)/FAO, Toulouse, France.
Leemans, R. and Cramer, W. (1991) The IIASA climate database formean monthly values of temperature, precipitation and cloudi-ness on a terrestrial grid. RR-91-18, IIASA, Laxenburg.
Lezine, A.M. and Casanova, J. (1989) Pollen and hydrological evid-ence for the interpretation of past climates in tropical West Africaduring the Holocene. Quaternary Science Reviews, 8, 45—55.
Lezine, A.M. and Vergnaud-Grazzini, C. (1993) Evidence of forestextension in West Africa since 22,000 BP: a pollen record fromthe eastern tropical Atlantic. Quaternary Science Reviews, 12,203—210.
Livingstone, D.A. (1971) A 22,000-year pollen record from the Pla-teau of Zambia. ¸imnology and Oceanography, 16, 349—356.
MacPhee, R.D.E., Burney, D.A. and Wells, N.A. (1985) Early Holo-cene Chronology and Environment of Ampasambazimba,a Malagasy subfossil Lemur site. International Journal ofPrimatology, 6(5), 463—489.
Maley, J. (1981) Etudes palynologiques dans le bassin du Tchad etpaleoclimatologie de l’Afrique nord-tropicale de 30,000 ansa l’epoque actuelle. Thesis, Universite des Sciences et Techniquesdu Languedoc, Travaux et documents 127, Editions de l’OR-STOM. Paris.
Maley, J. (1983) Histoire de la vegetation et du climat de l’Afriquenord-tropicale au Quaternaire recent. Bothalia, 14, 377—389.
Maley, J. (1987) Fragmentation de la foret dense humide africaine etextension des biotopes montagnards au Quaternaire recent:nouvelles donnees polliniques et chronologiques. Implicationspaleoclimatiques et biogeographiques. Palaeoecology of Africa,18, 307—334.
Maley, J. (1989) Les climats. 20.000 ans d’evolution des climats duSahara Central aux Savanes tropicales humides. In: Centre Cul-turel Francais d’Abidjan (ed), Sud Sahara-Sahel Nord, pp. 34—52.
Maley, J., Livingstone, D.A., Giresse, P., Thouveny, N., Brenac, P.,Kelts, K., Kling, G., Stager, C., Haag, M., Fournier, M., Bandet,Y. and Zogning, A. (1990) Lithostratigraphy, volcanism,
652 Quaternary Science Reviews: Volume 17
paleomagnetism and palynology of Quaternary lacustrine de-posits from Barombi Mbo (West Cameroon): preliminary results.Journal of »olcanic and Geothermal Research, 42, 319—335.
Medus, J. (1984) Essai de reconstitution de la vegetation et du climatHolocenes de la cote septentrionale du Senegal. Review ofPalaeobotany and Palynology, 41, 31—38.
Mintz, Y. (1984) The sensitivity of numerically simulated climates toland-surface boundary conditions. In: Houghton, J.T. (ed.), ¹heGlobal Climate, pp. 79—105. Cambridge University Press, Cam-bridge.
Mitchell, J.F.R., Grahame, N.S. and Needham, K.J. (1988) Climatesimulations for 9000 years before present: seasonal variations andeffect of the Laurentide ice sheet. Journal of Geophysical Re-search, 93, 8283—8303.
Olson, J.S., Watts, J.A. and Allison, L.J. (1983) Carbon in livevegetation of Major world ecosystems. ORNL-5862. Oak RidgeNational Laboratory, Oak Ridge.
Peltier, W.R. (1994) Ice age paleotopography. Science, 265, 195—201.Peterson, G.M., Webb III, T., Kutzbach, J.E., van der Hammen, T.,
Wijmstra, T.A. and Street, F.A. (1979) The continental record ofenvironmental conditions at 18,000 yr B.P.: an initial evaluation.Quaternary Research, 12, 47—82.
Pons, A. and Quezel, P. (1957) Premiere etude palynologique dequelques paleosols sahariens. ¹ravaux de l’Institut de Recherchedu Sahara. ºniversity of Alger, 16, 15—40.
Pons, A. and Quezel, P. (1958) Premieres remarques sur l’etudepalynologique d’un guano fossile du Hoggar. Comptes rendus desse&ances de l’Acade&mie des Sciences, 244, 2290—2292.
Prentice, I.C., Cramer, W., Harrison, S.P., Leemans, R., Monserud,R.A. and Solomon, A.M. (1992) A global biome model based onplant physiology and dominance, soil properties and climate.Journal of Biogeography, 19, 117—134.
Prentice, I.C., Guiot, J., Huntley, B., Jolly, D. and Cheddadi, R.(1996) Reconstructing biomes from palaeoecological data: a gen-eral method and its application to European pollen data at 0 and6 ka. Climate Dynamics, 12, 185—194.
Prentice, I.C., Harrison, S.P., Jolly, D. and Guiot, J. (1998) TheClimate and Biomes of Europe at 6000 yr BP: Comparison ofmodel simulations and polles-based reconstructions. QuaternaryScience Reviews. 17, 607—627.
Prentice, I.C. and Jolly, D. (in press). Biome Modelling. In: BartleinP.J., Guiot J., Harrison S.P. and Prentice I.C. (eds), Forward andInverse Modelling in Palaeoclimatology, NATO ASI Series, SeriesI: Global Environmental Change.
Prentice, I.C., Sykes, M.T. and Cramer, W. (1993) A simulationmodel for the transient effects of climate change on forest land-scapes. Ecological Modelling, 65, 51—70.
Quezel, P. (1965) ¸a ve&ge& tation du Sahara, du ¹chad a% la Mauritanie,333pp. Masson Paris.
Quezel, P. and Martinez, C. (1958) Etude palynologique de deuxdiatomites du Borkou (Territoire du Tchad A.E.F.). Bulletin de laSocie& te& d’Histoire Naturelle de l’Afrique du Nord, 49, 230—244.
Rind, D. and Peteet, D. (1985) Terrestrial conditions at the LastGlacial Maximum and CLIMAP sea surface temperature esti-mates: are they consistent? Quaternary Research, 24, 1—22.
Rossignol-Strick, M. and Duzer, D. (1979) West African vegetationand climate since 22,000 BP from deep-sea cores palynology.Pollen et Spores, 11(2—2), 105—134.
Salamani, M. (1993) Premieres donnees paleophytogeographiquesdu Cedre de l’Atlas (Cedrus atlantica) dans la region de grandeKabylie (NE Algerie). Palynosciences, 2, 147—155.
Schulz, E. (1980) Zur Vegetation der ostlichen zentralen Sahara undzu ihrer Entwicklung im Holozan. ¼u( rzburger GeographischeArbeiten, 51, 1—194.
Street, F.A. and Grove, A.T. (1976) Environmental and climaticimplications of late Quaternary lake-level fluctuations in Africa.Nature, 261, 385—390.
Street-Perrott, F.A. and Roberts, N. (1983) Fluctuations in closed-basin lakes as an indicator of past atmospheric circulationpatterns. In: Street-Perrott, A., Beran, M. and Ratcliffe, R. (eds),»ariations in the Global ¼ater Budget, pp. 331—345. D. Reidel,Dordrecht.
Street-Perrott, F.A., Marchand, D.S., Roberts, N. and Harrison, S.P.(1989) Global lake-level variations from 18,000 to 0 years age.United States Department of Energy, Technical Report TRO46,213pp.
Street-Perrott, F.A., Mitchell, J.F.B., Marchand, D.S. and Brunner,J.S. (1990) Milankovitch and albedo forcing of the tropic mon-soons: a comparison of geologic evidence and numerical simula-tions for 9,000 yr B.P. ¹ransactions of the Royal Society ofEdimburgh, Earth Sciences, 81, 407—427.
Street-Perrott, F.A. and Perrott, R.A. (1990) Abrupt climate fluctu-ations in the tropics: the influence of Atlantic Ocean circulation.Nature, 343, 607—612.
Street-Perrott, F.A. and Perrott, R.A. (1993) Holocene vegetation,lake levels and climate of Africa. In: Wright, H.E. Jr, Kutzbach,J.E., Webb, T. III, Ruddiman, W.F., Street-Perrott, F.A. andBartlein, P.J. (eds), Global Climates since the ¸ast GlacialMaximum, pp. 318—356. University of Minnesota Press,Minnesota.
Street-Perrott, F.A., Roberts, N. and Metcalfe, S.E. (1985) Geomor-phic implications of late Quaternary hydrological and climaticchanges in the Northern Hemisphere tropics. In: Douglas, I. andSpencer, T. (eds), Environmental Change and ¹ropical Geomor-phology, pp. 165—183. George Allen and Unwin, London.
Talbot, M.R., Livingstone, D.A., Palmer, P.G., Maley, J., Melack,J.M., Delibrias, G. and Gulliksen, S. (1984) Preliminary resultsfrom sediment cores from lake Bosumtwi, Ghana. Palaeoecologyof Africa, 16, 173—192.
Tarasov, P.E., Harrison, S.P., Saarse, L., Ya Pushenko, M., Andreev,A.A., Aleshinskaya, Z.V., Davydova, N.N., Dorofeyuk, N.I., YuEfremov, V., Khomutova, V.I., Sevastyanov, D.V., Tamosaitis,J., Uspenskaya, O.N., Yakushko, O.F. and Tarasova, I.(1994) ¸ake status records from the Former Soviet ºnion andMongolia: Data Base Documentation, 274 pp. PaleoclimatologyPublications Series Report N°2. World Data Center-A forPaleoclimatology NOAA Paleoclimatology Program, Boulder,Colorado, USA.
Thompson, B.W. (1965) ¹he Climate of Africa, 132 pp. OxfordUniversity Press, Nairobi.
Vincens, A. (1993) Nouvelle sequence pollinique du Lac Tanganyika:30,000 ans d’histoire botanique et climatique du Bassin Nord.Review of Palaeobotany and Palynology, 78, 381—394.
Vincens, A., Chalie, F., Bonnefille, R., Guiot, J. and Tiercelin, J.J.(1993) Pollen-derived rainfall and temperatures estimates fromlake Tanganyika and their implication for Late PleistoceneWater Levels. Quaternary Research, 40, 343—350.
Vincens, A. and Tiercelin, J.J. (1987) Le demi-graben de Baringo-Bogoria: evolution hydrologique et sedimentaire depuis le Pleis-tocene Superieur. In: Tiercelin, J.J. and Vincens, A. (eds), ¸e demi-graben de Baringo-Bogoria, rift Gregory, Kenya. 30 000 ansd’histoire hydrologique et se&dimentaire, pp. 514—530. BCREDPElf-Aquitaine, 11, 2. Pau, France.
Webb III, T. (1985) A Global Paleoclimatic Data Base for 6000 yr B.P.DOE/EV/10097-6, US Department of Energy, Washington, 155pp.
Webb III, T., Ruddiman, W.F., Street-Perrott, F.A., Markgraf, V.,Kutzbach, J.E., Bartlein, P.J., Wright Jr, H.E. and Prell, W.L.(1993) Climatic changes during the past 18,000 years: regionalsyntheses, mechanisms and causes. In: Wright, H.E. Jr, Kutzbach,J.E., Webb, T. III, Ruddiman, W.F., Street-Perrott, F.A. andBartlein, P.J. (eds), Global Climates since the ¸ast Glacial Max-imum, pp. 514—535. University of Minnesota Press, Minnesota.
White, F. (1983) ¹he vegetation of Africa. A descriptive memoir toaccompany the ºNESCO/AE¹FA¹/ºNSO vegetation map ofAfrica, 356 pp, UNESCO, Paris.
Zinderen Bakker, E.M. van (1976) The evolution of Late-Quaternarypalaeoclimates of Southern Africa. Palaeoecology of Africa, 9,160—202.
Zinderen Bakker, E.M. van (1982) African palaeoenvironments18000 yrs BP. Palaeoecology of Africa, 14, 77—99.
Zinderen Bakker, E.M. van and Clark, J.D. (1962) Pleistoceneclimates and cultures in north-eastern Angola. Nature, 196,639—642.
D. Jolly et al.: Simulated climate and biomes of Africa during the Late Quaternary 653

Zinderen Bakker, E.M. van and Coetzee, J.A. (1972) A re-appraisal oflate-Quaternary climatic evidence from tropical Africa.Palaeoecology of Africa, 7, 151—181.
Zinderen Bakker, E.M. van and Maley, J. (1979) Late Quaternarypalaeoenvironments of the Sahara region. Palaeoecology ofAfrica, 11, 83—104.
Appendix A: References to Tables 3 and 4
Ase, L.E., Sembo, K. and Syren, P. (1986) Studies of ¸ake Naivasha,Kenya, and its Drainage Area, 74 pp. Stockholms Universitet,Naturgeograafiska Institutionen.
Baltzer, F. (1991) Late Pleistocene and recent detrital sedimentationin the deep parts of northern lake Tanganyika (East African rift).Special Publications In. Ass. Sediment. 13, 147—173.
Barker, P. (1990) Diatoms as palaeolimnology indicators: a recon-struction of late Quaternary environments in two East Africansalt lakes. Thesis, Loughborough University of Technology, 267pp, unpublished.
Bernard, J. and Reille, M. (1987) Nouvelles analyses polliniques dansl’Atlas de Marrakech, Maroc. Pollen et Spores, 29(2—3), 225—240.
Bonnefille, R. (1987) Evolution forestiere et climatique au Burundidurant les quarante derniers milliers d’annees. Comptes Rendusde l’Academie des Sciences, Paris, Serie II, 305, 1021—1026.
Bonnefille, R. and Hamilton, A. (1986) Quaternary and Late Tertiaryhistory of Ethiopian vegetation. Acta ºniversitatis ºpsaliensisSymb. Bot. ºps., 26, 48—63.
Bonnefille, R. and Riollet G. (1988) The Kashiru pollen sequence(Burundi). Palaeoclimatic implications for the last 40,000 yr B.P.in Tropical Africa. Quaternary Research, 30, 19—35.
Bonnefille, R., Riollet, G. and Buchet, G. (1991) Nouvelle sequencepollinique d’une tourbiere de la crete Zaıre-Nil (Burundi). Reviewof Palaeobotany and Palynology, 67, 315—330.
Bousman, C.B., Partridge, T.C., Scott, L., Metcalfe, S.E., Vogel, J.C.,Seaman, M. and Brink, J.S. (1988) Palaeoenvironmental implica-tions of Late Pleistocene and Holocene valley fills in BlydefonteinBasin, Noupoort, C.P., South Africa. Palaeoecology of Africa, 19,43—67.
Brenac, P. (1988) Evolution de la vegetation et du climat dansl’Ouest-Cameroun entre 25 000 et 11 000 ans B.P. Institut Fran-cais de Pondiche& ry, ¹ravque de la Section Science ¹echnique., 25,91—103.
Burney, D.A. (1987) Pre-settlement vegetation changes at lake Trit-rivakely, Madagascar. Palaeoecology of Africa, 18, 357—381.
Butzer, K.W., Isaac, G.L., Richardson, J.L. and Washbourn-Kamau,C. (1972) Radiocarbon dating of East African lake levels. Science,175, 1069—1076.
Coetzee, J.A. (1967) Pollen analytical studies in ehat and southernAfrica. Palaeoecology of Africa, 3, 1—146.
Cour, P. and Duzer, D. (1976) Persistance d’un climat hyperaride auSahara central et meridional au cours de l’Holocene. Revue deGe&ographie Physique et de Ge&ologie Dynamique (2), 18(2—3),175—198.
Damnati, B. (1989) Les depots lamines du lac Magadi (Kenya), leursignification sedimentologique et paleoecologique pendant la pe-riode 18000—12000 ans B.P. Diplome d’Etudes Approfondies,University of Aix-Marseille II, III, Nice and Perpignan, 89 pp,unpublished.
Damnati, B. (1993a) Sedimentologie et Geochimie de sequenceslacustres du Pleistocene superieur et de l’Holocene en regionintertropicale (lac Magadi et Green Crater Lake, Kenya): im-plications paleoclimatiques. Thesis, University of Aix-MarseilleII, 239 pp., unpublished.
Damnati, B. (1993b) Sedimentology and Geochemistry of lacustrinesequences of the Upper Pleistocene and Holocene in intertropicalarea (Lake Magadi and Green Crater Lake): paleoclimatic im-plications. Journal of African Earth Sciences, 16(4), 519—521.
Damnati, B. and Taieb, M. (submitted). Green Crater Lake (Sonachi,Kenya): evolution du paleoenvironnement hydrologique et geo-chimique Holocene (entre 7400 ans BP et l’actuel). ComptesRendus de l’Acade&mie des Sciences, Paris.
Damnati, B., Taieb, M. and Williamson, D. (1992) Laminated de-posits from Lake Magadi (Kenya). Climatic contrast effect duringthe maximum wet period between 12,000-10,000 yr B.P. Bulletinde la Socie& te& Ge&ologique de France, 4, 407—414.
Elenga, H. (1992) Vegetation et climat du Congo depuis 24 000 ansB.P. Analyse palynologique de sequences sedimentaires du PaysBateke et du littoral. Thesis, University of Aix-Marseille III, 238pp., unpublished.
Elenga, H., Schwartz, D. and Vincens, A. (1994) Pollen evidence oflate Quaternary vegetation and inferred climate changes in Con-go. Palaeogeography, Palaeoclimatology, Palaeoecology, 109,345—356.
El Hamouti, N. (1989) Contribution a la reconstitution de lapaleohydrologie et de la paleoclimatologie du Maghreb et duSahara au Quaternaire superieur a partir des diatomees. Thesis,University of Paris XI, 299 pp., unpublished.
El Hamouti, N., Lamb, H., Fontes, J.C. and Gasse, F. (1991) Change-ments hydroclimatiques abrupts dans le moyen Atlas marocaindepuis le dernier maximum glaciaire. Comptes rendus de l’Aca-de&mie des Sciences, Paris, Serie II, 313, 259—265.
Elmoutaki, S. (1994) Transition glaciaire-interglaciaire et YoungerDryas dans l’Hemisphere Sud (1°—20° Sus): analysepalynologique a haute resolution de sondages marin et continen-taux (lac et marecage). Thesis, University of Aix-Marseille III, 130pp, unpublished.
Fontes, J.C., Coque, R., Dever, L., Filly, A. and Mamou, A. (1983)Paleohydrologie isotopique de l‘‘Oued El Akarit (Sud Tunisie) auPleistocene superieur et a l’Holocene. Palaeogeography, Palaeoc-limatology, Palaeoecology, 43, 41—62.
Fontes, J.C. and Gasse, F. (1991) Palhydaf (Palaeohydrology inAfrica) program: objectives, methods, major results. Palaeogeog-raphy, Palaeoclimatology, Palaeoecology, 84, 191—215.
Fontes, J.C., Gasse, F., Callot, Y., Plaziat, J.C., Carbonel, P.,Dupeuple, P.A. and Kaczmarska, I. (1985) Freshwater to mar-ine-like environments from Holocene lakes in northern Sahara.Nature, 317, 608—610.
Finney, B.P. and Johnson, T.C. (1991) Sedimentation in lake Malawi(East Africa) during the past 10,000 years: a continuous paleocli-matic record from the southern tropics. Palaeogeography,Palaeoclimatology, Palaeoecology, 85, 351—366.
Finney, B.P., Scholz, C.A., Trumbore, S. and Southon, J. (1994) LateQuaternary lake-level changes of lake Malawi. In: Johnson, T.C.and Odada, E.O. (eds), ¹he ¸imnology, Climatology and Paleoc-limatology of the East African ¸akes, (in press).
Gasse, F., Fontes, J.C. and Rognon, P. (1974) Variations hy-drologiques et extension des lacs Holocenes du desert Danakil.Palaeogeography, Palaeoclimatology, Palaeoecology, 15,109—148.
Gasse, F., Rognon, P. and Street, F.A. (1980) Quaternary history ofthe Afar and Ethiopian Rift lakes. In: Williams, M.A.J. andFaure, H. (eds), ¹he Sahara and the Nile: Quaternary Environ-ments and Prehistoric Occupation in Northern Africa, pp 361—400.Balkema, Rotterdam.
Gasse, F., Fontes, J.C., Plaziat, J.C., Carbonel, P., Kaczmarska, I., DeDekker, P., Soulie-Marsche, I., Callot, Y. and Dupeuple, P.A.(1987) Biological remains, geochemistry and stable isotopes forthe reconstruction of environmental and hydrological changes inthe Holocene lakes from north Sahara. Palaeogeography,Palaeoclimatology, Palaeoecology, 60, 1—46.
Gasse, F. and Fontes, J.C. (1989) Palaeoenvironments andpalaeohydrology of a tropical closed lake (Lake Asal, Djibouti)since 10,000 yr B.P. Palaeogeography, Palaeoclimatology,Palaeoecology, 69, 67—102.
Gasse, F. and Fontes, J.C. (1992) Climatic changes in NorthwestAfrica during the last deglaciation (16—7 ka BP). In: Bard, E. andBroecker, W.S. (eds), ¹he last deglaciation: Absolute andRadiocarbon Chronologies, NATO ASI Series I 2, pp. XX,Berlin.
Gasse, F., Ledee, V., Massault, M. and Fontes, J.C. (1989) Water-level fluctuations of lake Tanganyika in phase with oceanicchanges during the last glaciation and deglaciation. Nature, 342,57—59.
654 Quaternary Science Reviews: Volume 17

Gasse, F., Tehet, R., Durand, A., Gibert, E. and Fontes, J.C. (1990)The arid-humid transition in the Sahara and the Sahel during thelast deglaciation. Nature, 346, 141—146.
Gibert, E., Arnold, M., Conrad, G., De Dekker, P., Fontes, J.C.,Gasse, F. and Kasir, A. (1990) Retour des conditions humides auTardiglaciaire au Sahara septentrional (sebkha Mellala, Algerie).Bulletin de la Socie& te& Ge&ologique de France, 8, VI, 3, 497—504.
Giresse, P., Maley, J. and Kelts, K. (1991) Sedimentation andpalaeoenvironment in crater lake Barombi Mbo, Cameroon,during the last 25,000 years. Sedimentology Geology, 71, 151—175.
Goetz, C. (1990) Tracage isotopique et chronologique des processusd’alimentation par l’etude des desequilibres U et Th. Thesis,University of Aix-Marseille II, 224 pp., unpublished.
Grove, A.T. (1983) Evolution of the Physical Geography of EastAfrican Rift Valley region. In: Sims, R.W., Price, J.H. and Whal-ley, P.E.S. (eds), Evolution, ¹ime and Space: ¹he emergence of theBiosphere, Systematics Association Special Volume 23, pp.115—155. Academic Press, London.
Grove, A.T., Street, F.A. and Gouldie, A.S. (1975) Former lake levelsand climatic change in the rift valley of Southern Ethiopia.Geographical Journal, 141, 177—202.
Haberyan, K.A. and Hecky, R.E. (1987) The late Pleistocene andHolocene stratigraphy and paleolimnology of lakes Kivu andTanganyika. Palaeogeography, Palaeoclimatology, Palaeoecol-ogy, 61, 169—197.
Hall, J.B., Swaine, M.D. and Talbot, M.R. (1978) An early Holoceneleaf flora from Lake Bosumtwi, Ghana. Palaeogeography,Palaeoclimatology, Palaeoecology, 43, 41—62.
Hamilton, A.C. (1982) Environmental history of East Africa: a Study ofthe Quaternary, 328 pp. Academic Press, New York.
Haynes, C.V., Eyles, C.H., Pavlish, L.A., Ritchie, J.C. and Rybak, M.(1989) Holocene palaeoecology of the Eastern Sahara; SelimaOasis. Quaternary Science Reviews, 8, 109—136.
Hillaire-Marcel, C., Carro, O. and Casanova, J. (1986) 14C and Th/Udating of Pleistocene and Holocene stromatolites from EastAfrican paleolakes. Quaternary Research, 25, 312—329.
Hillaire-Marcel, C. and Casanova, J. (1987) Isotopic hydrology andpaleohydrology of the Magadi (Kenya)-Natron (Tanzania) basinduring the late Quaternary. Palaeogeography, Palaeoclimatology,Palaeoecology, 58, 155—181.
Johnson, T.C. and Muchane, M.M. (submitted). Sedimentary pro-cesses and signals of past climatic change in the large lakes of theEast African valley. In: Johnson, T.C. and Odada, E.O. (eds), ¹he¸imnology, Climatology and Paleoclimatology of the East African¸akes.
Jolly, D. (1993) Evolution et dynamique des ecosystemes du Burundi.Pollen et statistique. Thesis, University of Aix-Marseille II, 143pp., unpublished.
Jolly, D. and Bonnefille, R. (1991) Diagramme pollinique d’un sond-age Holocene de la Kuruyange (Burundi, Afrique Centrale).Palaeoecology of Africa, 22, 265—274.
Jolly, D. and Bonnefille, R. (1992) Histoire et dynamique du marec-age tropical de Ndurumu (Burundi), donnees polliniques. Reviewof Palaeobotany and Palynology, 75, 133—151.
Jolly, D., Bonnefille, R. and Roux, M. (1994) Numerical interpreta-tion of a high resolution Holocene pollen record from Burundi.Palaeogeography, Palaeoclimatology, Palaeoecology, 109,357—370.
Kendall, R.L. (1969) An ecological history of the Lake Victoria basin.Ecological Monographs, 39, 121—176.
Lamb, H.F., Eicher, U. and Switsur, V.R. (1989) An 18,000-year recordof vegetation, lake-level and climatic change from Tigalmamine,Middle Atlas, Morocco. Journal of Biogeography, 16, 65—74.
Lamb, H.F., Gasse, F., Benkaddour, A., El Hamouti, N., van derKaars, S., Perkins, W.T., Pearce, N.J. and Roberts, C.N. (1995)Relation between century-scale Holocene arid intervals in tropi-cal and temperate zones. Nature, 373, 134—137.
Lezine, A.M. (1988a) New pollen data from the Sahel, Senegal.Review of Paleobotany and Palynology, 55, 141—154.
Lezine, A.M. (1988b) Les variations de la couverture forestiere me0sophile d’Afrique occidentale au cours de l’Holocene. Comptesrendus de l’Acade&mie des Sciences, Paris, 307, Serie II, 439—445.
Lezine, A.M. (1989a) Le Sahel: 20 000 ans d’histoire de la vegetation.Bulletin de la Socie& te& Ge&ologique de France, 5(1), 35—42.
Lezine, A.M. (1989b) Late Quaternary Vegetation and Climate of theSahel. Quaternary Research, 32, 317—334.
Lezine, A.M. (1993) Chemchane, histoire d’une sebkha. Se& cheressen°1, 4, 25—30.
Lezine, A.M. and Bonnefille, R. (1982) Diagramme pollinique Holo-cene d’un sondage du lac Abiyata (Ethiopie, 7°42’Nord). Pollen etSpores, 24(3—4), 463—480.
Lezine, A.M. and Hooghiemstra, H. (1990) Land-sea comparisonsduring the last glacial-interglacial transition: pollen records fromWest Tropical Africa. Palaeogeography, Palaeoclimatology,Palaeoecology, 79, 313—331.
Livingstone, D.A. (1967) Postglacial vegetation of the RuwenzoriMountains in Equatorial Africa. Ecological Monographs, 37,25—52.
Macintyre, S. and Melack, J.M. (1982) Meromixis in an equatorialAfrican Soda Lake. ¸imnology and Oceanography, 27(4), 595—609.
Maitima, J.M. (1991) Vegetation response to climatic change inCentral Rift valley, Kenya. Quaternary Research, 35, 234—245.
Maley, J. (1981) Etudes palynologiques dans le bassin du Tchad etpaleoclimatologie de l’Afrique nord-tropicale de 30,000 ansa l’epoque actuelle. Thesis, Universite des Sciences et Techniquesdu Languedoc. Travaux et documents 127. Editions de l’OR-STOM. Paris.
Maley, J. (1983) Histoire de la vegetation et du climat de l’Afriquenord-tropicale au Quaternaire recent. Bothalia, 14, 377—389.
Maley, J. (1987) Fragmentation de la foret dense humide africaine etextension des biotopes montagnards au Quaternaire recent:Nouvelles donnees polliniques et chronologiques. Implicationspaleoclimatiques et biogeographiques. Palaeoecology of Africa,18, 307—334.
Maley, J. (1989) Les climats. 20.000 ans d’evolution des climatsdu Sahara Central aux Savanes tropicales humides. In: CentreCulturel Francais d’Abidjan (ed), Sud Sahara-Sahel Nord,pp. 34—52.
Maley, J. (1991) The African rain forest vegetation and palaeoen-vironments during Late Quaternary. Climatic Change, 19, 79—98.
Maley, J. and Livingstone D.A. (1983) Extension d’un element mon-tagnard dans le sud du Ghana (Afrique de l’Ouest) au Pleistoceneet a l’Holocene inferieur: premieres donnees polliniques. Comptesrendus de l’’Acade&mie des Sciences, Paris, 296, 1287—1292.
Maley, J., Livingstone, D.A., Giresse, P., Brenac, P., Kling, G.,Stager, C., Thouveny, N., Kelts, K., Haag, M., Fournier, M.,Bandet, Y., Williamson, D. and Zogning, A. (1991) WestCameroon Quaternary lacustrine deposits: preliminary results.Journal of African Earth Sciences, 12, 147—157.
Maley, J., Livingstone, D.A., Giresse, P., Thouveny, N., Brenac, P.,Kelts, K., Kling, G., Stager, C., Haag, M., Fournier, M., Bandet,Y. and Zogning, A. (1990) Lithostratigraphy, volcanism,paleomagnetism and palynology of Quaternary lacustrine de-posits from Barombi Mbo (West Cameroon): preliminary results.Journal of »olcanic and Geothermal Research, 42, 319—335.
Martin, A.R.H. (1968) Pollen analysis of Groenvlei lake sediments,Knysna (South Africa). Review of Palaeobotany and Palynology,7, 107—144.
Meadows, M.E. and Sugden, J.M. (1993) The late Quaternarypalaeoecology of a floristic kingdom: the southwestern CapeSouth Africa. Palaeogeography, Palaeoclimatology, Palaeoecol-ogy, 101, 271—281.
Morrison, M.E.S. (1968) Vegetation and climate in the uplands ofsouth-western Uganda during the later Pleistocene period,Muchoya Swamp, Kigezi District. Journal of Ecology, 62, 1—31.
Owen, R.B., Barthelme, J.W., Renaut, R.W. and Vincens, A. (1982)Palaeolimnology and archaeology of the Holocene depositsnortheast of Lake Turkana, Kenya. Nature, 298, 523—529.
Owen, R.B. and Crosseley, R. (1992) Spatial and temporal distribu-tion of diatoms in sediments of lake Malawi, Central Africa, andecological implications. Journal of Paleolimnology, 7, 55—71.
Pachur, H. and Hoelzmann, P. (1991) Paleoclimatic implications oflate Quaternary lacustrine sediments in Western Nubia, Sudan.Quaternary Research, 36, 257—276.
D. Jolly et al.: Simulated climate and biomes of Africa during the Late Quaternary 655
Pachur, H. and Kropelin, S. (1987) Wadi Howar: Paleoclimaticevidence from an extinct river system in the southeastern Sahara.Science, 237, 298—300.
Partridge, T.C., Kerr, S.J., Meltcafe, S.E., Scott, L., Talma, A.S. andVogel, J.C. (1993) The Pretoria Saltpan: a 200,000 year SouthernAfrican lacustrine sequence. Palaeogeography, Palaeoclimatol-ogy, Palaeoecology, 101, 317—337.
Perrott, R.A. and Street-Perrott, F.A. (1982) New evidence for a latePleistocene wet phase in northern intertropical Africa.Palaeoecology of Africa, 14, 57—75.
Petit-Maire, N., Burollet, P.F., Ballais, J.L., Fontugne, M., Rosso,J.C. and Lazaar, A. (1991) Paleoclimats Holocenes du Saharaseptentrional. Depots lacustres et terrasses alluviales en borduredu Grand Erg Oriental a l’extreme-Sud de la Tunisie. Comptesrendus de l’Acade&mie des Sciences, Paris, Serie II, 312, 1661—1666.
Reille, M. (1979) Analyse pollinique du lac de Sidi Bou Rhaba,littoral atlantique (Maroc). Ecologia Mediterranea, 4, 61—65.
Renaut, R.W. and Owen, R.B. (1991) Shore-zone sedimentation andfacies in a closed rift lake: the Holocene beach deposits of LakeBogoria, Kenya. Publs Int. Ass. Sediment, 13, 175—195.
Ritchie, J.C., Eyles, C.H. and Haynes, C.V. (1985) Sediment andpollen evidence for an early to mid-Holocene humid period in theeastern Sahara. Nature, 314, 352—355.
Ritchie, J.C. and Haynes, C.V. (1987) Holocene vegetation zonationin the eastern Sahara. Nature, 330, 645—647.
Roberts, N., Taieb, M., Barker, P., Damnati, B., Icole, M. andWilliamson, D. (1993) High resolution record of terminal Pleis-tocene climatic oscillation in the tropics, from lake Magadi,Kenya. Nature, 366, 146—148.
Salamani, M. (1991) Premieres donnees palynologiques sur l’histoireHolocene du massif de l’Akfadou (Grande-Kabylie, Algerie).Ecologia Mediterranea, 17, 145—159.
Salamani, M. (1993) Premieres donnees paleophytogeographiquesdu Cedre de l’Atlas (Cedrus atlantica) dans la region de grandeKabylie (NE Algerie). Palynosciences, 2, 147—155.
Schalke, H.J.W.G. (1973) The upper Quaternary of the Cape Flatsarea (Cape Province, South Africa). Scripta Geologica, 15,1—57.
Scholz, C.A. and Rosendahl, B.R. (1989) Low Lake stands in LakesMalawi and Tanganyika, East Africa, delineated with multifoldseismic data. Science, 240, 1645—1648.
Schulz, E. (1980) Zur Vegetation der ostlichen zentralen Sahara undzu ihrer Entwicklung im Holozan. ¼u( rzburger GeographischeArbeiten, 51, 1—194.
Schulz, E. (1991) The Taoudenni-Agorgott pollen record and theHolocene vegetation history of the Central Sahara. In: Petit-Maire, N. (ed), Pale&oenvironnements du Sahara. ¸acs holoce%nesa% ¹aoudenni (Mali), pp. 143—162. Editions du CNRS. Paris.
Scott, L. (1982) A late Quaternary pollen record from the TransvaalBushveld, South Africa. Quaternary Research, 17, 339—370.
Scott, L. (1983) Late Quaternary palaeoenvironments in the Trans-vaal on the basis of palynological evidence. SASQºA Interna-tional Symposium, Swaziland, 29 August-2 September 1983, pp.317—327.
Scott, L. (1986) Pollen analysis and palaeoenvironmental interpreta-tion of late Quaternary sediment exposures in the eastern OrangeFree State, South Africa. Palaeoecology of Africa, 17, 113—122.
Scott, L. (1987a) Pollen analysis of Hyena coprolites and sedimentsfrom Equus Cave, Taung, Southern Kalahari (South Africa).Quaternary Research, 28, 144—156.
Scott, L. (1987b) Late Quaternary forest history in Venda, SouthernAfrica. Review of Palaeobotany and Palynology, 53, 1—10.
Scott, L. (1989) Late Quaternary vegetation history and climaticchange in the eastern Orange Free State, South Africa. SouthAfrican Journal of Botany, 55(1), 107—116.
Scott, L. (1994) Palynology of Late Pleistocene Hyrax middens,South-Western Cape Province, South Africa: a preliminary re-port. Historical Biology, in press.
Scott, L., Cooremans, B., de Wet, J.S. and Vogel, J.C. (1991)Holocene environmental changes in Namibia inferred frompollen analysis of swamp and lake deposits. ¹he Holocene, 1(1),8—13.
Scott, L. and Vogel, J.C. (1983) Late Quaternary pollen profile fromthe Transvaal Highveld, South Africa. South African Journal ofScience, 79, 266—272.
Ssemmanda, I. and Vincens, A. (1993) Vegetation et climat dans leBassin du lac Albert (Ouganda, Zaıre) depuis 13000 ans B.P.:Apport de la palynologie. Comptes Rendus de l’Acade&mie desSciences, Paris, Serie II, 316, 561—567.
Straka, H. (1993) Beitrage zur Kenntnis der Vegetationsgeschichtevon Madagaskar (Vorlaufige Mitteilung). Dissertationes Botan-icae, 196, 439—449.
Street, A.F. (1977) Chronology of Late Pleistocene and Holocenelake-level fluctuations, Ziway-Shala basin, Ethiopia. Proceedingof the 8th Panafrican Congress of Prehistory and QuaternaryStudies, Nairobi September 1977, pp. 143—146.
Street-Perrott, F.A., Marchand, D.S., Roberts, N. and Harrison, S.P.(1989) Global lake-level variations from 18,000 to 0 years age.Technical Report TRO46, United States Department of Energy,213 pp.
Taieb, M., Barker, P., Bonnefille, R., Damnati, B., Gasse, F., Goetz,C., Hillaire-Marcel, C., Icole, M., Massault, M., Roberts, N.,Vincens, A. and Williamson, D. (1991) Histoire paleohyd-rologique du lac Magadi (Kenya) au Pleistocene superieur.Comptes Rendus de l’Acade&mie des Sciences, Paris, Serie II, 313,339—346.
Talbot, M.R. and Delibrias, G. (1980) A new late Pleistocene-Holo-cene water-level curve for Lake Bosumtwi, Ghana. Earth andPlanetary Science ¸etters, 47, 336—344.
Talbot, M.R., Livingstone, D.A., Palmer, P.G., Maley, J., Melack,J.M., Delibrias, G. and Gulliksen, S. (1984) Preliminary resultsfrom sediment cores from lake Bosumtwi, Ghana. Palaeoecologyof Africa, 16, 173—192.
Talbot, M.R. and Johannessen, T. (1992) A high resolution palaeocli-matic record for the last 27,500 years in tropical west Africa fromthe carbon and nitrogen isotopic composition of lacus-trine organic matter. Earth and Planetary Science ¸etters, 110,23—37.
Taylor, D.M. (1990) Late Quaternary pollen records from two Ugan-dan mires: evidence for environmental change in the RukigaHighlands of Southwest Uganda. Palaeogeography, Palaeoc-limatology, Palaeoecology, 80, 283—300.
Taylor, D.M. (1992) Pollen evidence from Muchoya swamp, RukigaHighlands (Uganda), for abrupt changes in vegetation during thelast ca. 21,000 years. Bulletin de la Socie& te& Ge&ologique de France,163, 77—82.
Taylor, D.M. (1993) Environmental change in montane southwestUganda: a pollen record for the Holocene from AhakagyeziSwamp. ¹he Holocene, 3,4, 324—332.
Tiercelin, J.J., Renaut, R.W., Delibrias, G., Le Fournier, J. and Bieda,S. (1981) Late Pleistocene and Holocene lake level fluctuations inthe lake Lake Bogoria basin, northern Kenya rift valley.Palaeoecology of Africa, 13, 105—120.
Tiercelin, J.J., Perinet G., Le Fournier, J., Bieda, S. and Robert, P.(1982) Lacs du rift est-africain, exemples de transition eaux dou-ces-eaux salees: le lac Bogoria, rift Gregory, Kenya. Me&moire dela Socie& te& Ge&ologique de France, N.S., 144, 217—230.
Tiercelin, J.J., Vincens, A. (coord.), Barton, C., Carbonel, P.,Casanova, J., Delibrias, G., Gasse, F., Grosdidier, E.,Herbin, J.P., Huc, A.Y., Jardine, S., Le Fournier, J.,Melieres, F., Owen, R.B., Page, P., Palacios, C., Paquet, H.,Peniguel, G., Peypouquet, J.P., Raynaud, J.F., Renaut, R.W.,De Reneville, P., Richert, J.P., Riff, R., Robert, P.,Seyve, C., Vandenbroucke, M. and Vidal, G. (1987) Ledemi-Graben de Baringo-Bogoria, rift Gregory, Kenya. 30 000ans d’histoire hydrologique et sedimentaire. Bulletin des Centresde Recherche Exploration-Production Elf-Aquitaine, 11(2),249—540.
Tiercelin, J.J., Mondeguer, A., Gasse, F., Hillaire-Marcel, C., Hoffert,M., Larque, P., Ledee, V., Marestang, P., Ravenne, C., Raynaud,J.F., Thouveny, N., Vincens, A. and Williamson, D. (1988) 25000ans d’histoire hydrologique et sedimentaire du lac Tanganyika,Rift Est-Africain. Comptes Rendus de l’Acade&mie des Sciences,Paris, Serie II, 307, 1375—1382.
656 Quaternary Science Reviews: Volume 17

Thouveny, N. and Williamson, D. (1988) Palaeomagnetic study ofthe Holocene and Upper Pleistocene sediments from LakeBarombi-Mbo, Cameroon: first results. Physics of the Earth Plan-etary Interiors, 52, 193—206.
Vincens, A. (1989a) Paleoenvironnements du Bassin Nord-Tan-ganyika (Zaıre, Burundi, Tanzanie) au cours des 13 derniers milleans: apport de la palynologie. Review of Palaeobotany andPalynology, 61, 69—88.
Vincens, A. (1989b) Les forets claires Zambeziennes du bassin Sud-Tanganyika. Evolution entre 25000 et 6000 ans B.P. Comptesrendus de l‘Acade&mie des Sciences, Paris, Serie II, 308, 809—814.
Vincens, A. (1989c) Early Holocene pollen data from an arid EastAfrican region, Lake Turkana (Kenya): botanical and climaticimplications. XX, 87—97.
Vincens, A. (1991a) Late Quaternary vegetation history of theSouth-Tanganyika Basin. Climatic implications in South CentralAfrica. Palaeogeography, Palaeoclimatology, Palaeoecology, 86,207—226.
Vincens, A. (1991b) Vegetation et climat dans le bassin Sud-Tan-ganyika entre 25000 et 9000 ans B.P.: nouvelles donneespalynologiques. Palaeoecology of Africa, 22, 253—263.
Vincens, A. (1993) Nouvelle sequence pollinique du Lac Tanganyika:30,000 ans d’histoire botanique et climatique du Bassin Nord.Review of Palaeobotany and Palynology, 78, 381—394.
Vincens, A., Chalie, F., Bonnefille, R., Guiot, J. and Tiercelin, J.J.(1993) Pollen-derived rainfall and temperatures estimates fromlake Tanganyika and their implication for Late PleistoceneWater Levels. Quaternary Research, 40, 343—350.
Williamson, D. (1991) Proprietes magnetiques de sequences sedimen-taires de Mediterranee et d‘Afrique intertropicale. Implicationsenvironnementales et geomagnetiques pour la periode 30-0 kaB.P. Thesis, University of Aix-Marseille II, 230 pp, unpublished.
Williamson, D., Taieb, M., Damnati, B., Icole, M. and Thouveny, N.(1993) Equatorial extension of the Younger Dryas event: evidencefrom lake Magadi (Kenya). Palaeogeography, Palaeoclimatology,Palaeoecology, Global and Planetary Change, 7, 235—242.
Williamson, D., Thouveny, N., Hillaire-Marcel, C., Mondeguer, A.,Taieb, M., Tiercelin, J.J. and Vincens, A. (1991) Chronologicalpotential of palaeomagnetic oscillations recorded in late Quater-nary sediments from lake Tanganyika. Quaternary Science Re-views, 10, 351—361.
Zinderen Bakker, E.M. van (1982) Pollen analytical studies of theWonderwerk Cave, South Africa. Pollen et Spores, 24(2), 235—250.
Zinderen Bakker, E.M. van and Coetzee, J.A. (1972) A re-appraisal ofLate-Quaternary climatic evidence from Tropical Africa.Palaeoecology of Africa, 7, 151—181.
D. Jolly et al.: Simulated climate and biomes of Africa during the Late Quaternary 657