komolafe342013prri3697: investigations into the tectonic faults on magadi geothermal field using...
TRANSCRIPT

Seediscussions,stats,andauthorprofilesforthispublicationat:https://www.researchgate.net/publication/272020186
Komolafe342013PRRI3697:InvestigationsintotheTectonicFaultsonMagadiGeothermalFieldUsingGroundandAeromagneticData
DATASET·JUNE2013
READS
77
5AUTHORS,INCLUDING:
AkinolaAdesujiKomolafe
FederalUniversityofTechnology,Akure
14PUBLICATIONS9CITATIONS
SEEPROFILE
TsehaieWoldai
UniversityoftheWitwatersrand
110PUBLICATIONS463CITATIONS
SEEPROFILE
YekiniBiodunAnifowose
FederalUniversityofTechnology,Akure
20PUBLICATIONS37CITATIONS
SEEPROFILE
Availablefrom:TsehaieWoldai
Retrievedon:03February2016
____________________________________________________________________________________________
*Corresponding author: Email: [email protected];
Physical Review & Research International3(4): 385-406, 2013
SCIENCEDOMAIN internationalwww.sciencedomain.org
Investigations into the Tectonic Faults onMagadi Geothermal Field Using Ground and
Aeromagnetic Data
A. A. Komolafe1*, Z. N. Kuria2, T. Woldai3, M. Noomen3
and A. Y. B. Anifowose1
1Department of Remote Sensing and Geoscience Information System, Federal University ofTechnology, Akure, Nigeria.
2Department of Geology, University of Nairobi, Kenya.3International Institute for Geoinformation Science and Earth Observation (ITC), University
of Twente, Enschede, The Netherlands..
Authors’ contributions
This work was carried out in collaboration between all authors. Author AAK designed thestudy, carried out the field work along with author ZNK and wrote the first draft of the
manuscript. Authors TW and MN supervised the work. Author AYBA reviewed advised andmade corrections. All authors read and approved the final manuscript.
Received 13th March 2013Accepted 7th June 2013
Published 16th June 2013
ABSTRACT
Lake Magadi area of the Kenya Rift is characterized by faulting, tectonic activities andgeothermal resources. The geothermal potential of the graben in the southern part of thelake was investigated using magnetic methods (ground and airborne). This was done todetermine the geometry of tectonic faults and ascertain their influence on the flow of hotsprings, which are manifested on the surface. Five N-S faults were identified for groundinvestigation using ground magnetic survey. Magnetic data were processed using verticalderivatives, analytical signal and Euler deconvolution. The faults were further mapped withaeromagnetic data using 2D Euler deconvolution. Magnetic derivative grids and profilesrevealed subsurface faulting/tectonic activities up to a depth of 400m and the presence offluid-filled zones within the basin, which are marked by the absence of magnetic sources.A deeper investigation into the lineaments from the aeromagnetic data showed that thesurface faults extend to a depth of 7.5 km in the subsurface. The alignment of magneticsources at the rift axis showed that these faults are probably the parallel faults which
Research Article

Physical Review & Research International, 3(4): 385-406, 2013
386
bound the basin/graben to the west and to the east. The N-S fault structures in the southof the lake serve as conduits for fluids which support the upward flow of the hydrothermalfluid along its margin.
Keywords: Lake Magadi; magnetics; tectonics; geothermics; Kenya rift system.
1. INTRODUCTION
The roles of faults and fractures on crustal fluids have been of major interest in earthsciences, including geology, seismology, hydrogeology and petroleum geology [1]. The staticand dynamic effects of different stresses on rocks often produce change in rock mass suchas fractures, faults and in general permeability which in turn control the flow of fluids in theearth crust. Fractures and faults are defined as planes of tensile or shear failure atmicroscopic to regional scales in brittle rocks [2], and they are developed mostly incompetent rocks within the earth crust. In case of fractures, they are usually developed whenthe stress applied exceeds the elastic limit of the rock. These two deformations are of greatimportance in crustal fluid distributions and control. The movement of crustal fluids (in thiscase, hydrothermal) to the surface from the reservoir rock depends of the pressure,temperature and most importantly the presence of active faults and fractures in thesubsurface which are extended to the surface.
Geothermal resources are generally associated with tectonically active regions which aregenerated as a result of temperature differences between the different parts of theasthenosphere (below the lithosphere) where convective movements occur [3]. Suchconvective movements are maintained by radioactive elements and heat from the deepestpart of the earth. The less dense deep hotter rocks tend to rise with the movement towardsthe surface while the colder but heavier rocks close to the surface tend to sink, re-heat andrise again. Generally, a geothermal system is made up of heat source, reservoir, rechargearea and connecting paths through which fluids percolate to the reservoir (the host rock)and, in most cases, escape to the surface as fumaroles and hot springs. The heat source isoften assumed to be a magmatic intrusion that has reached shallow depths (5-10km) [3].The reservoir rocks are permeable rocks through which fluids circulate and extract heat fromthe heat source, and are overlain by impermeable rocks. Through fractures, meteoric waterreplaces or partly replaces the fluids which escape from the reservoirs as hot springs.
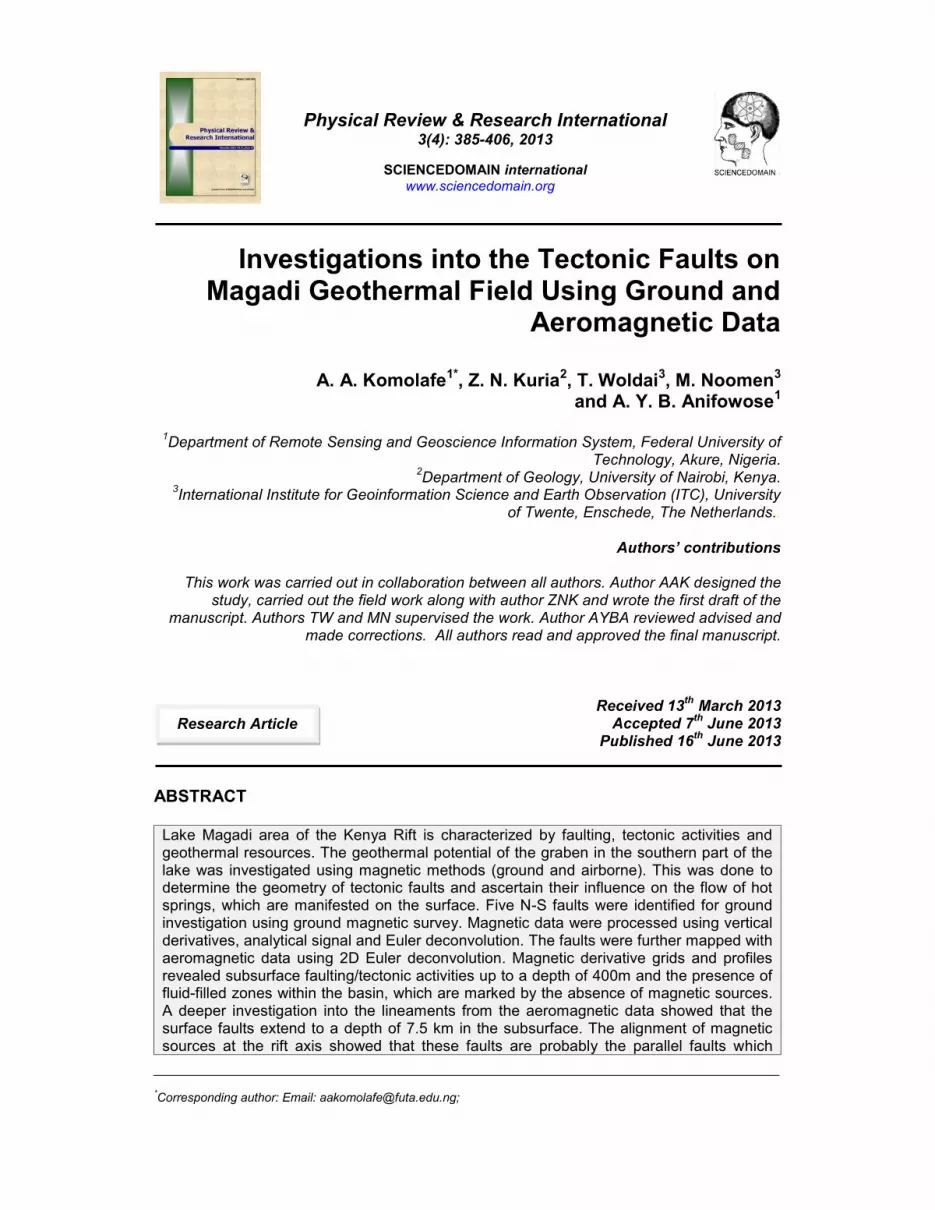
Geothermal activities are associated with most parts of the Kenyan Rift Valley. The warmand hot springs are mostly connected to the lakes through various conduits [4]. Geothermalmanifestations have been identified at different locations in the study area (Fig. 1), the mostactive and currently producing being the Olkaria geothermal field in the northern part [5]. Itexists within an old caldera complex, with surface manifestations in form of hot springs. It isassociated with N-S normal faulting as observed by [5] in the southern part of the rift(Magadi). Lake Magadi water is mostly derived from underground hot water inflow with acontinuous recharge from the surface waters [4,6]. Unlike some other geothermal regionswhere the reservoirs containing hot fluids have to be penetrated during exploitation,geothermal resources around Lake Magadi are clearly manifested on the surface in the formof hot springs and trona deposits along the lake margin and within the lake respectively.These surface manifestations of the hot springs have been attributed to continuous tectonicactivities and the presence of various faulting systems in the area [6-7]. The role of N-Sfaults in the south of Lake Magadi as major conduits for geothermal resources and the
Physical Review & Research International, 3(4): 385-406, 2013
387
deposition of trona in the lake have been proposed by [6] but not yet investigated. Hence,the focus of this study is to investigate the flow paths of hydrothermal fluids in the study areawith the aim of understanding the geothermal potentials.
Earlier workers investigated the proposed influence of tectonic faults at Lake Magadi usinggeoelectric method [8], revealing an upward flow of saline hot water to the surface via thefault splay as shown by the relatively low resistivity within the profile. To further probe theclaim, ground magnetic method with constraint from airborne magnetics was applied toinvestigate the geometry of the N-S faults in the south of Lake Magadi and determine theirinfluence on the expression of geothermal resources.
Magnetics method is very effective in studying structures and delineating depth to heatsource in geothermal environments [8-10]. This study employs the use of magnetic methods(ground and airborne) to investigate the geometry of the N-S faults in the south of LakeMagadi and determine their influence on the expression of geothermal resources such ashot springs and trona deposits.
Fig. 1. Location of significant geothermal areas in the Kenya Rift valley (source: [5])
1.1 The Study Area
Lake Magadi area is the southernmost part of Kenya Rift, 120km southwest of Nairobi and20km north of the Tanzanian border. It is located within Latitudes 1º40’S and 2º10’S, andLongitudes 36º00’E and 36º30’E, characterized by a flat rift floor [11] (Fig. 2). Theapproximately 100km2 size lake is recharged by saline hot springs (between 26ºC and 86ºC)along the lake margins [6]. Most of the hot springs lie along the north-western and southern
Physical Review & Research International, 3(4): 385-406, 2013
388
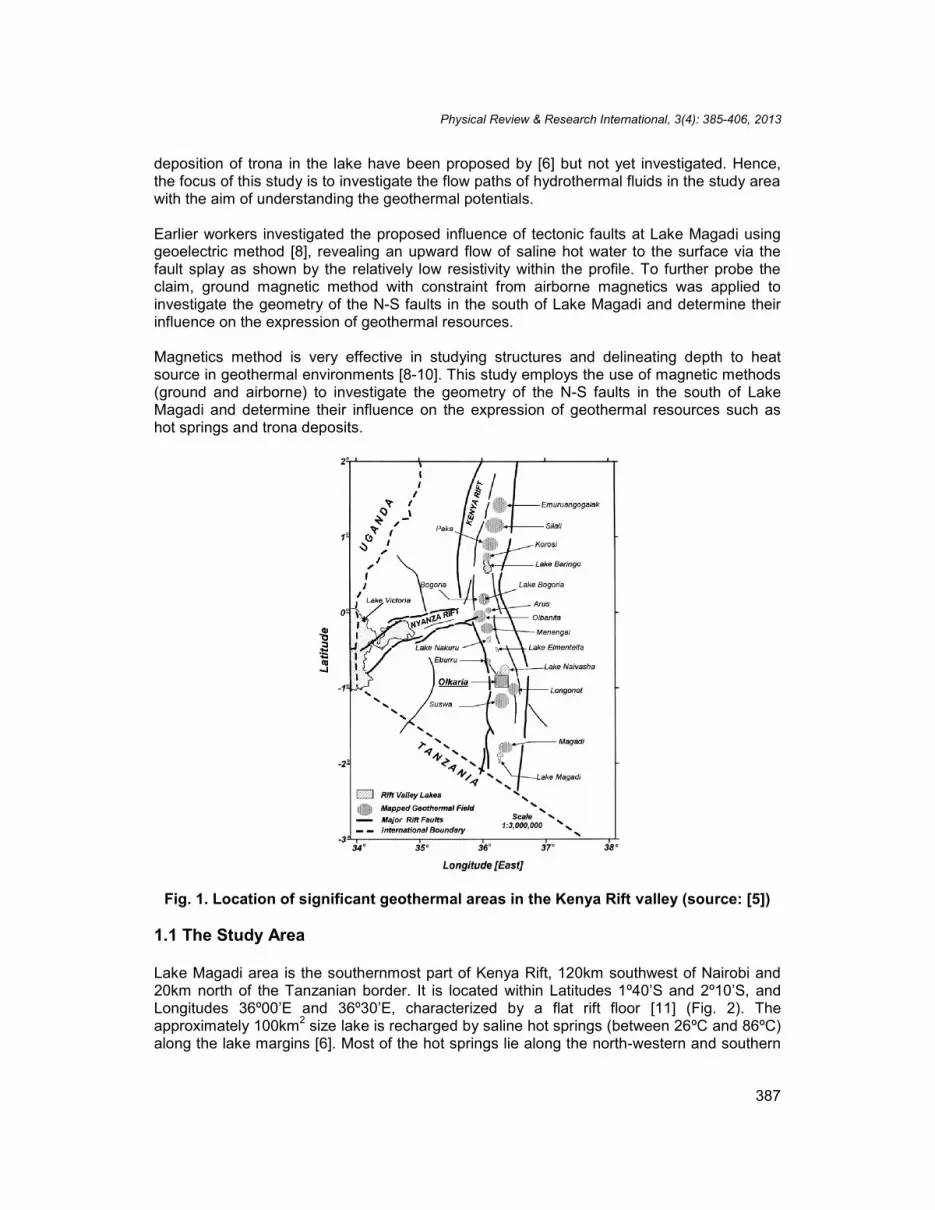
shorelines of the lake. The lake comprises of trona deposit (Na2CO3.NaHCO3.2H2O) about40m thick, covering about 75km2 resulting from the concentration of different water sources,especially hydrothermal fluid [6]. Chemical analysis of the lake waters show that the Magaditrona was formed from the evaporated concentration and mixing of waters from threesources namely dilute surface inflow, relatively deep hot and concentrated groundwaterreservoir, and cold concentrated surface brine [12]. Another study also revealed five distincthydrologic stages in the evolution of the water compositions viz: i) the dilute stream flow, ii)dilute ground water, iii) saline ground water (or hot springs reservoir), iv) saturated brines,and v) residual brines [6]. The active alkaline volcanoes in the area through hydrothermalsystems circulation supply the saline (alkaline brine) hot springs. For the purpose of thisstudy, sampling points located close to the hot springs in the southern part of the Lake wereselected (Fig. 2).
Fig. 2. (a) Geographic location of Magadi area (Adapted from [11], (b) lineament mapof Lake Magadi overlain on SRTM DEM (c) the study area and associated springs
Physical Review & Research International, 3(4): 385-406, 2013
389
1.2 Geology of Lake Magadi
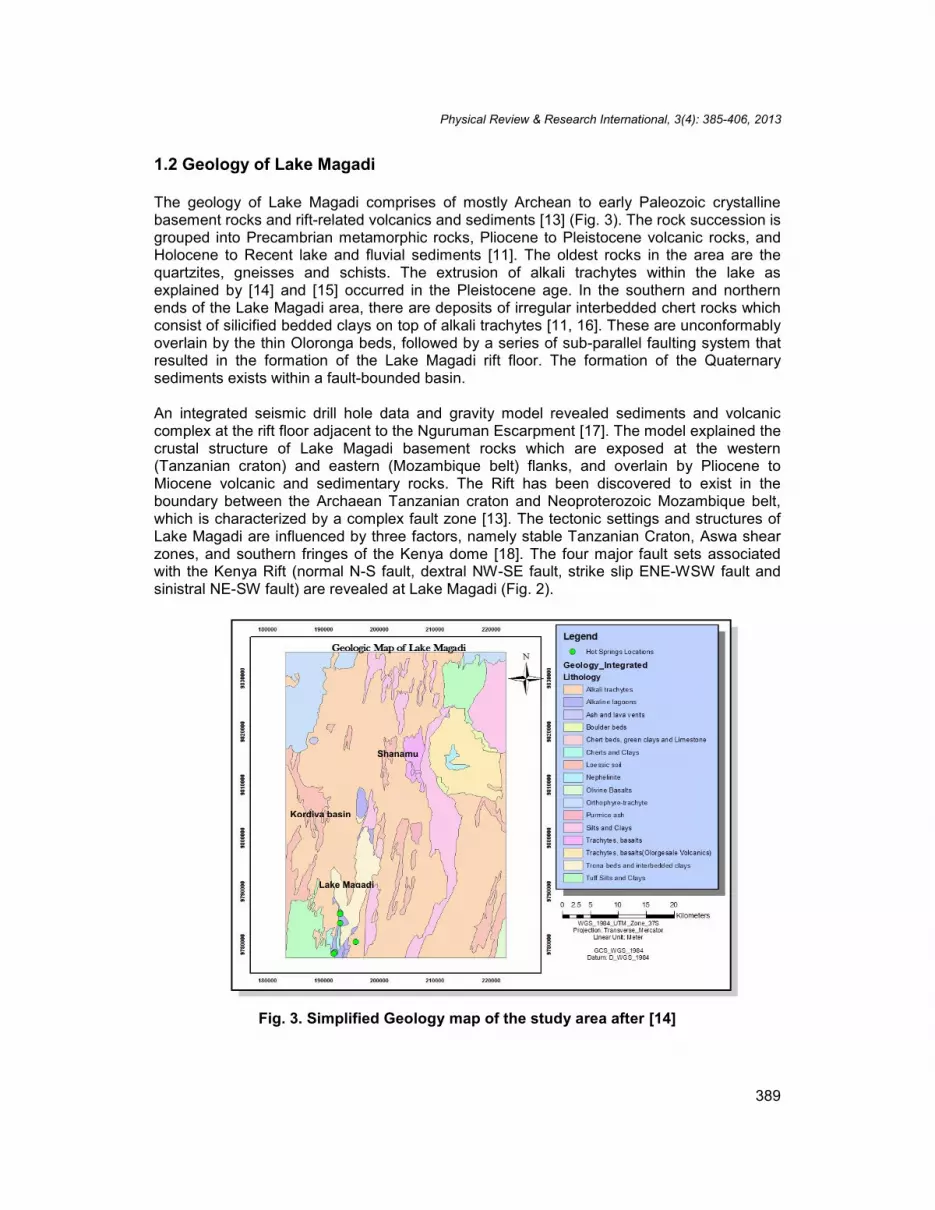
The geology of Lake Magadi comprises of mostly Archean to early Paleozoic crystallinebasement rocks and rift-related volcanics and sediments [13] (Fig. 3). The rock succession isgrouped into Precambrian metamorphic rocks, Pliocene to Pleistocene volcanic rocks, andHolocene to Recent lake and fluvial sediments [11]. The oldest rocks in the area are thequartzites, gneisses and schists. The extrusion of alkali trachytes within the lake asexplained by [14] and [15] occurred in the Pleistocene age. In the southern and northernends of the Lake Magadi area, there are deposits of irregular interbedded chert rocks whichconsist of silicified bedded clays on top of alkali trachytes [11, 16]. These are unconformablyoverlain by the thin Oloronga beds, followed by a series of sub-parallel faulting system thatresulted in the formation of the Lake Magadi rift floor. The formation of the Quaternarysediments exists within a fault-bounded basin.
An integrated seismic drill hole data and gravity model revealed sediments and volcaniccomplex at the rift floor adjacent to the Nguruman Escarpment [17]. The model explained thecrustal structure of Lake Magadi basement rocks which are exposed at the western(Tanzanian craton) and eastern (Mozambique belt) flanks, and overlain by Pliocene toMiocene volcanic and sedimentary rocks. The Rift has been discovered to exist in theboundary between the Archaean Tanzanian craton and Neoproterozoic Mozambique belt,which is characterized by a complex fault zone [13]. The tectonic settings and structures ofLake Magadi are influenced by three factors, namely stable Tanzanian Craton, Aswa shearzones, and southern fringes of the Kenya dome [18]. The four major fault sets associatedwith the Kenya Rift (normal N-S fault, dextral NW-SE fault, strike slip ENE-WSW fault andsinistral NE-SW fault) are revealed at Lake Magadi (Fig. 2).
Fig. 3. Simplified Geology map of the study area after [14]
Lake Magadi
Kordiya basin
Shanamu
Physical Review & Research International, 3(4): 385-406, 2013
390
2. METHODOLOGIES
2.1 Ground Magnetic Data
Ground and airborne magnetic methods were adopted to study the subsurface geometry ofthe tectonic faults and their influence on the geothermal resources in Lake Magadi. Since itmeasures the magnetic field intensity of the Earth, the magnetic technique is capable ofmapping subsurface structures such as faults, grabens, horsts and lithology. Lithologycontrols magnetic properties through mineralogy, and sharp variation in rock propertiesgenerally coincides with lithological contacts [19]. Generally, igneous and metamorphic rocksshow significant magnetic properties while sedimentary rocks are mostly non-magnetic [20].The existence of faults and fractures in the geologic units creates magnetic variations whichgenerate magnetic anomalies. Magnetic variation is quite important in mapping hydrothermalalteration zones [21], because most magnetic rocks must have been altered and convertedfrom magnetite to pyrite, which in turn results in lower magnetic anomaly than the unalteredzones. In general, the presence of fluid within the faults and fractures would reduce or haveno magnetic response. The geometry of subsurface structures can be constructed frommagnetic profiles data using various inversion processes. The anomaly due to the nearsurface and deep source can be enhanced using vertical derivative and upward continuationrespectively. Depth to magnetic sources and geometry of the structures can be estimatedfrom Euler’s deconvolution method as applied in this study.
Geometrics 856 Proton Precession Magnetometer was used for the magnetic survey. It ismade up of six-digit display of the magnetic field and three-digit displays of station, linenumber and signal strength, and it measures the absolute value of total magnetic field to aresolution of 0.1nT with accuracy of 0.5nT. The equipment is used in various fieldapplications such as geological mapping, mining and location of magnetic materials. Theequipment uses nine D-size cell industrial grade batteries and it is connected to magneticcoils mounted on the pole for measurement.
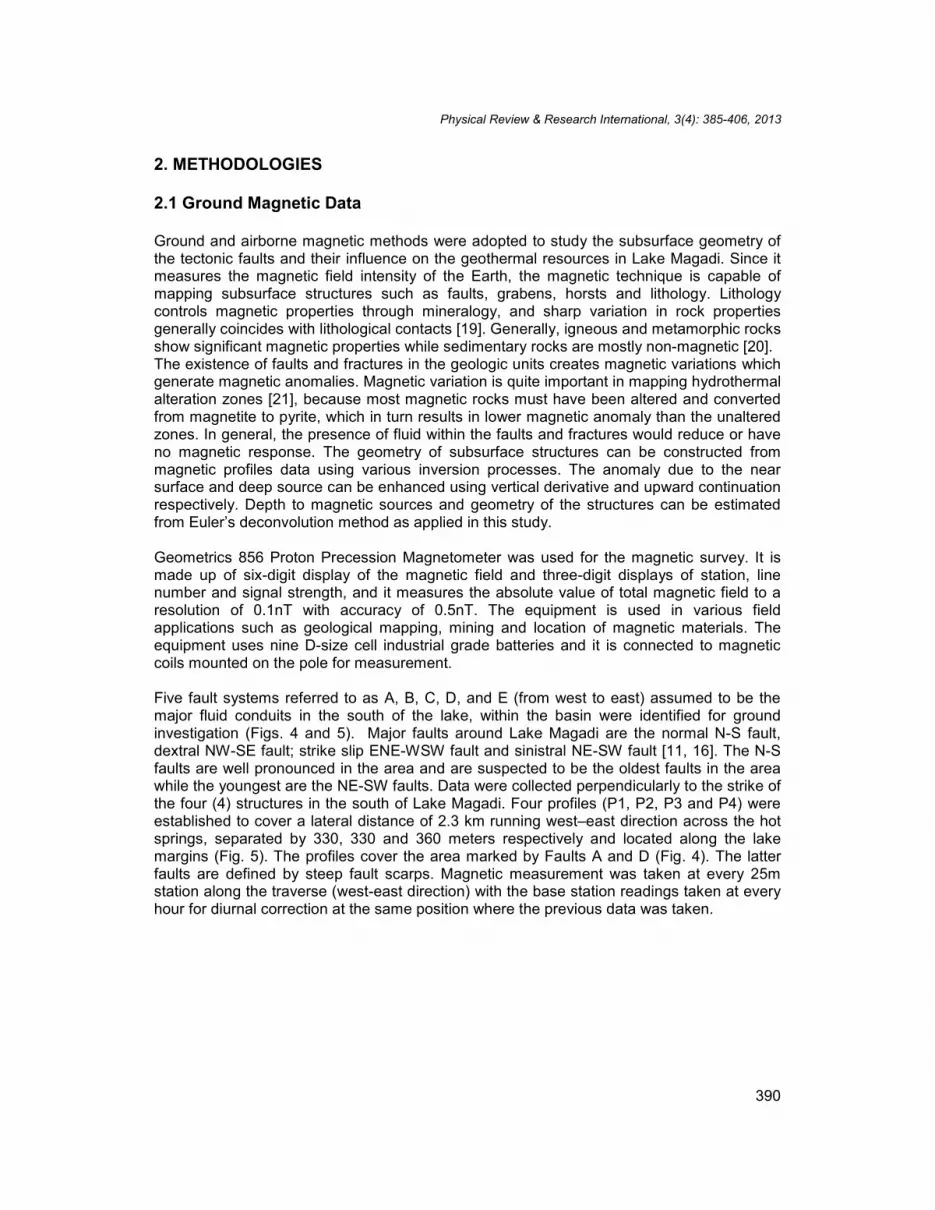
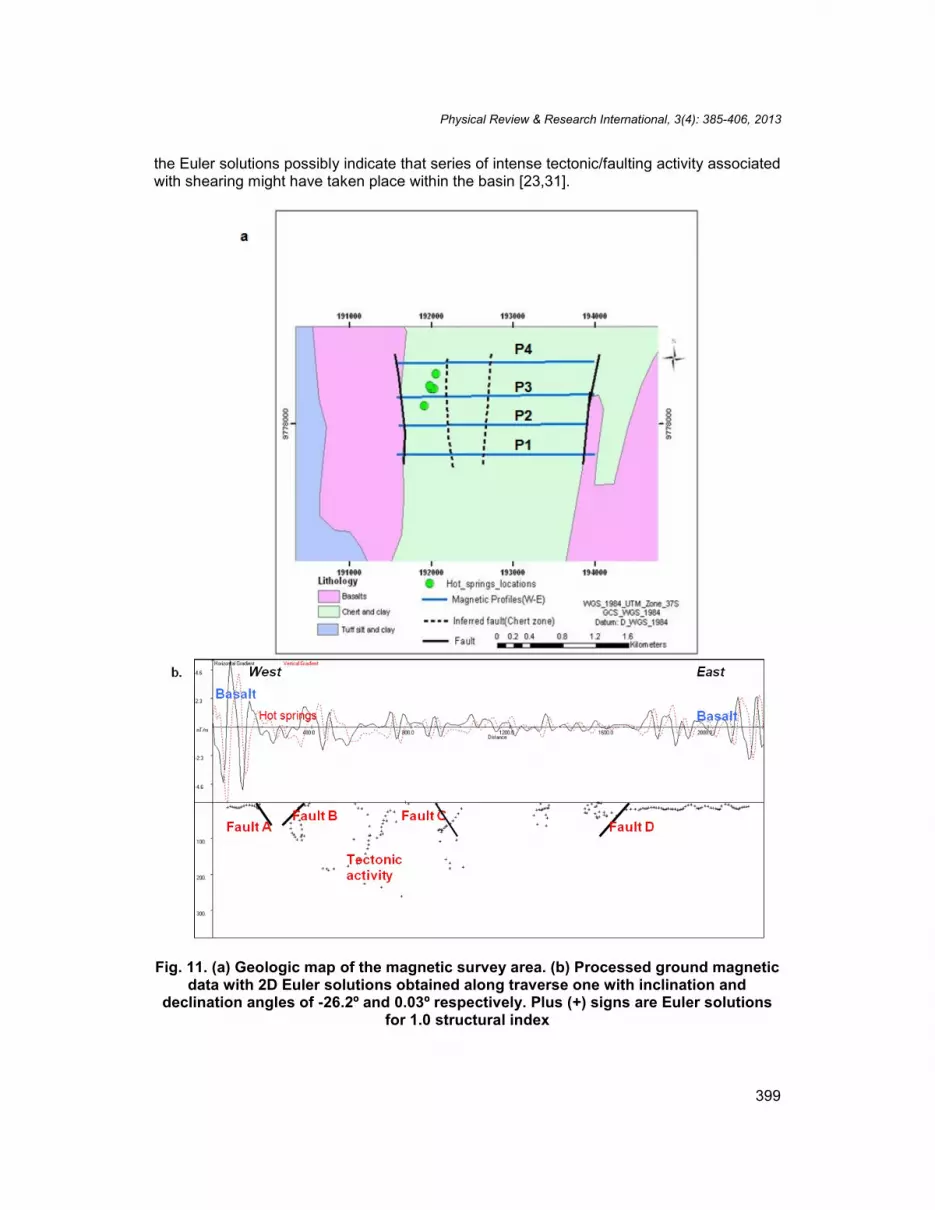
Five fault systems referred to as A, B, C, D, and E (from west to east) assumed to be themajor fluid conduits in the south of the lake, within the basin were identified for groundinvestigation (Figs. 4 and 5). Major faults around Lake Magadi are the normal N-S fault,dextral NW-SE fault; strike slip ENE-WSW fault and sinistral NE-SW fault [11, 16]. The N-Sfaults are well pronounced in the area and are suspected to be the oldest faults in the areawhile the youngest are the NE-SW faults. Data were collected perpendicularly to the strike ofthe four (4) structures in the south of Lake Magadi. Four profiles (P1, P2, P3 and P4) wereestablished to cover a lateral distance of 2.3 km running west–east direction across the hotsprings, separated by 330, 330 and 360 meters respectively and located along the lakemargins (Fig. 5). The profiles cover the area marked by Faults A and D (Fig. 4). The latterfaults are defined by steep fault scarps. Magnetic measurement was taken at every 25mstation along the traverse (west-east direction) with the base station readings taken at everyhour for diurnal correction at the same position where the previous data was taken.

Physical Review & Research International, 3(4): 385-406, 2013
391
Fig. 4. Field photo showing the magnetic profile extent from fault A to Fault D (on awest-east direction); the black arrow indicates the north
2.2 Data Processing
2.2.1 Diurnal variation correction
The variation of the Earth’s magnetic field with time, due to the rotation of the earth and withrespect to the solar wind is called diurnal variation [22]. Such solar wind may last severalhours to one day. In order to correct for drift or diurnal effect in the magnetic readings, abase station within the four magnetic profiles (assumed to be free from magnetic noise) wasselected. Repeated readings were taken every hour of the magnetic measurement for thedrift correction. Thereafter, the diurnal effect was calculated and the magnetic data werefiltered. Noise due to secular change or epoch was considered negligible because consistentmeasurements were taken at the base station every hour [23].
Fault A
Physical Review & Research International, 3(4): 385-406, 2013
392
Fig. 5. (a) Field photo showing the hot springs along the lake margin between faults Aand B. (b) Hill-shaded Aster DEM showing the magnetic profiles across the major
faults in the study area
2.3 Calculation and Removal of the Geomagnetic Field
Magnetic survey involves measurement of the sum of magnetic field produced by both localand regional magnetic fields. The regional magnetic field (often referred to as geomagneticfield) needed to be subtracted from the acquired total magnetic field to obtain the magneticfield anomaly caused by the local source. The geomagnetic field was subsequentlycalculated using the International Geomagnetic Reference Frame (IGRF) Model 2005 inGeosoft™ Oasis Montaj. This model is calculated based on the dates, elevation andgeographical locations (Latitudes and Longitudes) of the observed magnetic data with thegenerated average geomagnetic field of 33430nT, inclination of -26.2º and declination of0.03º. The IGRF values were subtracted from the observed magnetic values for each station
P1P2
P4
P3

Physical Review & Research International, 3(4): 385-406, 2013
393
to determine the residual magnetic field due to anomalous contributions from local magneticsources in the area.
2.4 Data Enhancements
The corrected magnetic data were presented in grid forms for visualization and furtherenhancements. The total magnetic intensity (TMI) data were gridded using minimumcurvature gridding method with 50m cell size, having the four faults and hot-springs locationsoverlaid (Fig. 6). A minimum curvature surface is the smoothest possible surface that will fitthe given data values [24]; It smoothes two straight-line segments by using the Ratio Factor.This gridding method is very effective in the interpolation of gridded points. For effectiveinterpretation of the obtained magnetic data, further enhancements were carried out
Fig. 6. Gridded residual ground total magnetic field intensity (TMI) for the four profilesshowing hot springs and faults locations
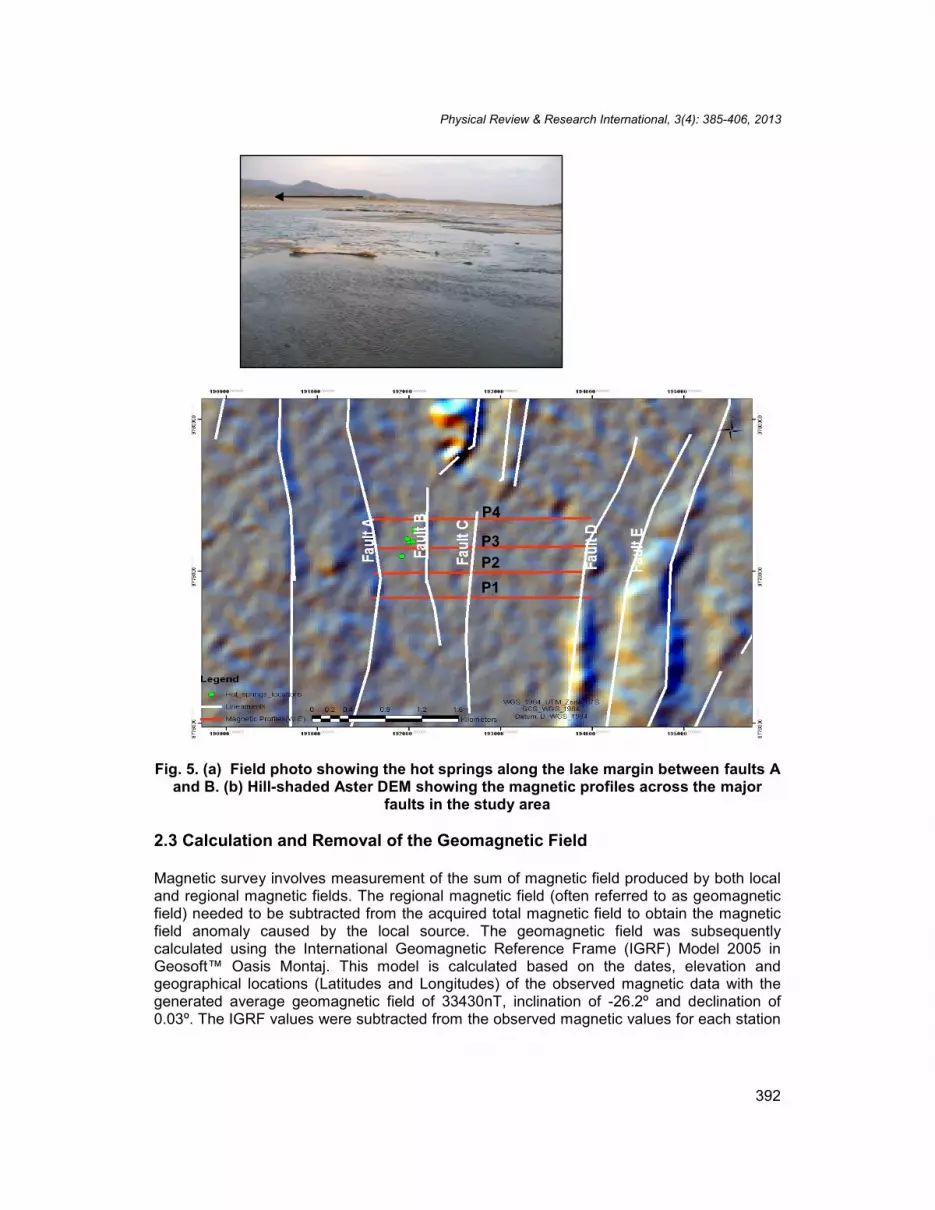
2.5 Vertical Derivatives
Vertical derivatives of magnetic data generally aid the interpretation process as it enhancesand sharpens geophysical anomalies. This filtering method is effective in enhancinganomalies due to shallow sources as it narrows the width of anomalies, and is very effectivein the accurate location of source bodies [25]. Vertical derivative was done by applying low-pass filters to remove high-wavelength, thereby enhancing low-wavelength component of the
Physical Review & Research International, 3(4): 385-406, 2013
394
magnetic spectrum. The vertical derivative of the total magnetic Intensity was derived inGeosoft™ Oasis software as shown in Fig. 7.
Fig. 7. Colour-shaded vertical derivative of the magnetic field intensity showing theshallow magnetic sources
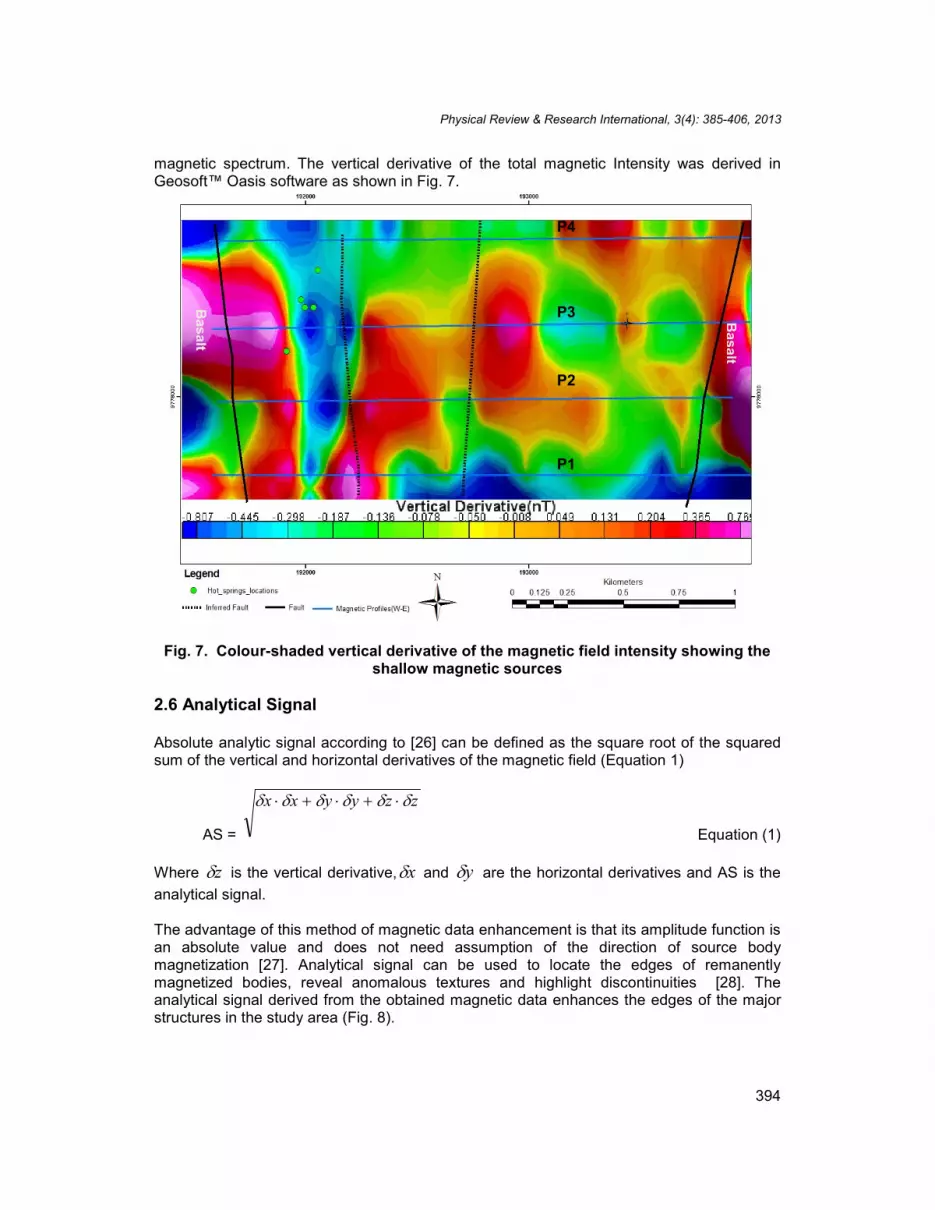
2.6 Analytical Signal
Absolute analytic signal according to [26] can be defined as the square root of the squaredsum of the vertical and horizontal derivatives of the magnetic field (Equation 1)
AS =
zzyyxx
Equation (1)
Where z is the vertical derivative, x and y are the horizontal derivatives and AS is theanalytical signal.
The advantage of this method of magnetic data enhancement is that its amplitude function isan absolute value and does not need assumption of the direction of source bodymagnetization [27]. Analytical signal can be used to locate the edges of remanentlymagnetized bodies, reveal anomalous textures and highlight discontinuities [28]. Theanalytical signal derived from the obtained magnetic data enhances the edges of the majorstructures in the study area (Fig. 8).
Basalt
Basalt
P1
P2
P3
P4
Physical Review & Research International, 3(4): 385-406, 2013
395
Fig. 8. Colour -shaded Analytical signal maps of the four profiles
2.7 Euler Deconvolution
Euler deconvolution is an inversion method for estimating location and depth to magneticanomaly source. It relates the magnetic field and its gradient components to the location ofthe anomaly source with the degree of homogeneity expressed as a structural index and it isthe best suited method for anomalies caused by isolated and multiple sources [29]. Thestructural index (SI) is a measure of the fall-off off the field with distance from the source.Euler deconvolution is expressed in Equation (2) as:
)(/)(/)(/)( 0 TBNzTzzyTyyxTxx oo Equation (2)
where ( xo , yo , z ) is the source position of a magnetic source whose total field T ismeasured at x , y , z , while B is the regional value of the total field, and N is expressed asthe structural index (SI), a measure of the rate of change with distance of the potential field,depending on the geometry of the source [29].
Estimating depth to magnetic anomaly using Euler deconvolution involves the following: i)Reduction to the pole; ii) Calculation of horizontal and vertical gradients of magnetic fielddata, calculated in frequency domain; iii) choosing window sizes; and iv) structural index,e.g. contact, dike and point [29]. In general, the desired structural indices are chosen withthe window size for depth determination. This is set based on the anomaly of interest. In this
Physical Review & Research International, 3(4): 385-406, 2013
396
study, both 3D and 2D Euler deconvolution were adopted for both the gridded and profiledata respectively.
2.8 2D Euler Deconvolution
Two-dimensional Euler deconvolution was generated from the software developed forconstraining the subsurface geometry along the profile lines [30]. The software requiresmagnetic parameters such as the geomagnetic field, survey locations, inclinations anddeclination angles. Two columns with a space delimited ASCII file are required for input; thefirst column is the magnetic station locations while the second column is the correctedmagnetic field values. The results of the IGRF was used as the inputs for this process, i.e.geomagnetic field intensity of 33430nT, inclination of -26.2o and declination of 0.03o. Similarto the 3D Euler deconvolution, the structural indices and the Euler window size must beselected. In this research, a window size of 13, 110m X-separation and 55m Y separationwere adopted. To better constrain the subsurface geology, 1.0 structural index (steepcontact) which is an indication of faults contacts were plotted for all the traverses; these areshown in Figs. 11- 14 respectively.
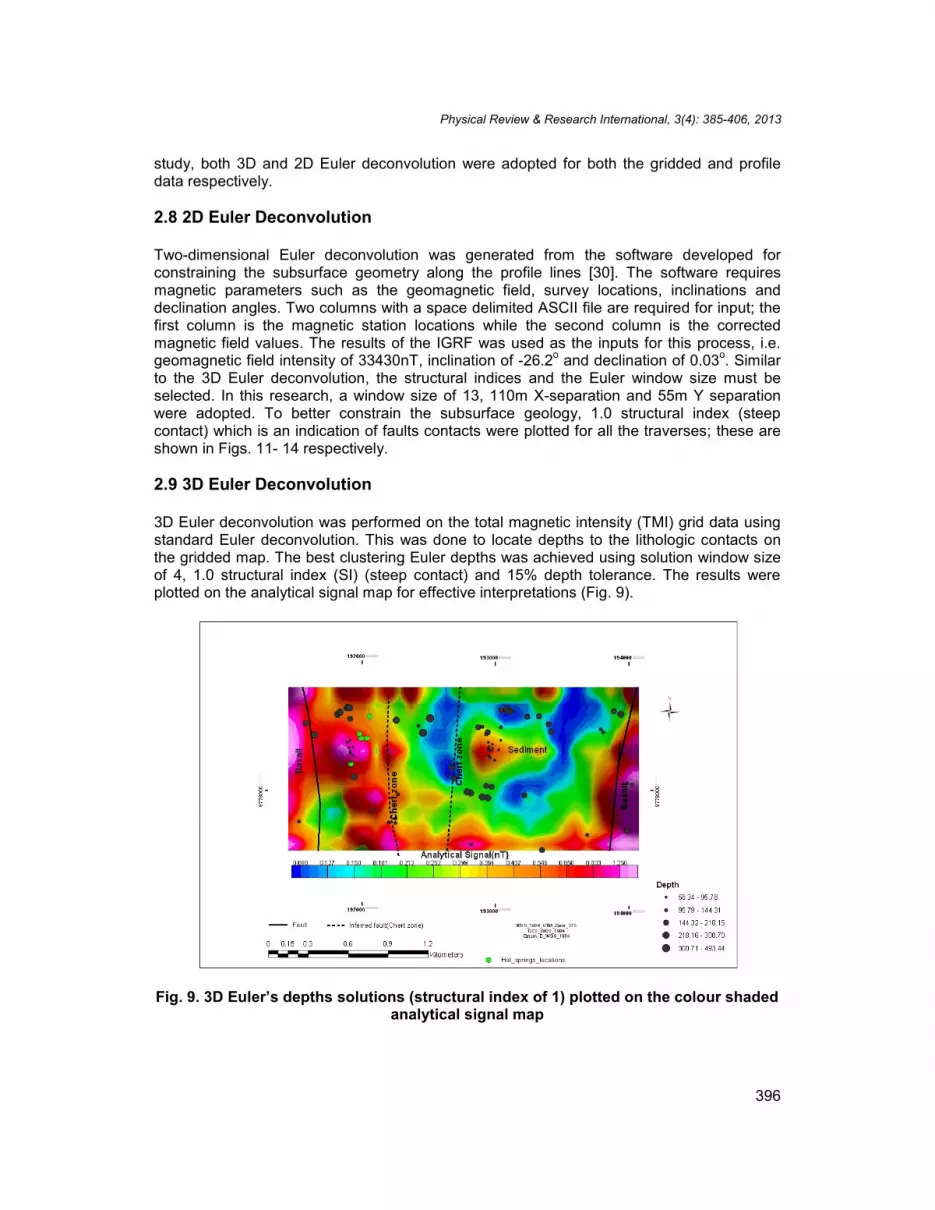
2.9 3D Euler Deconvolution
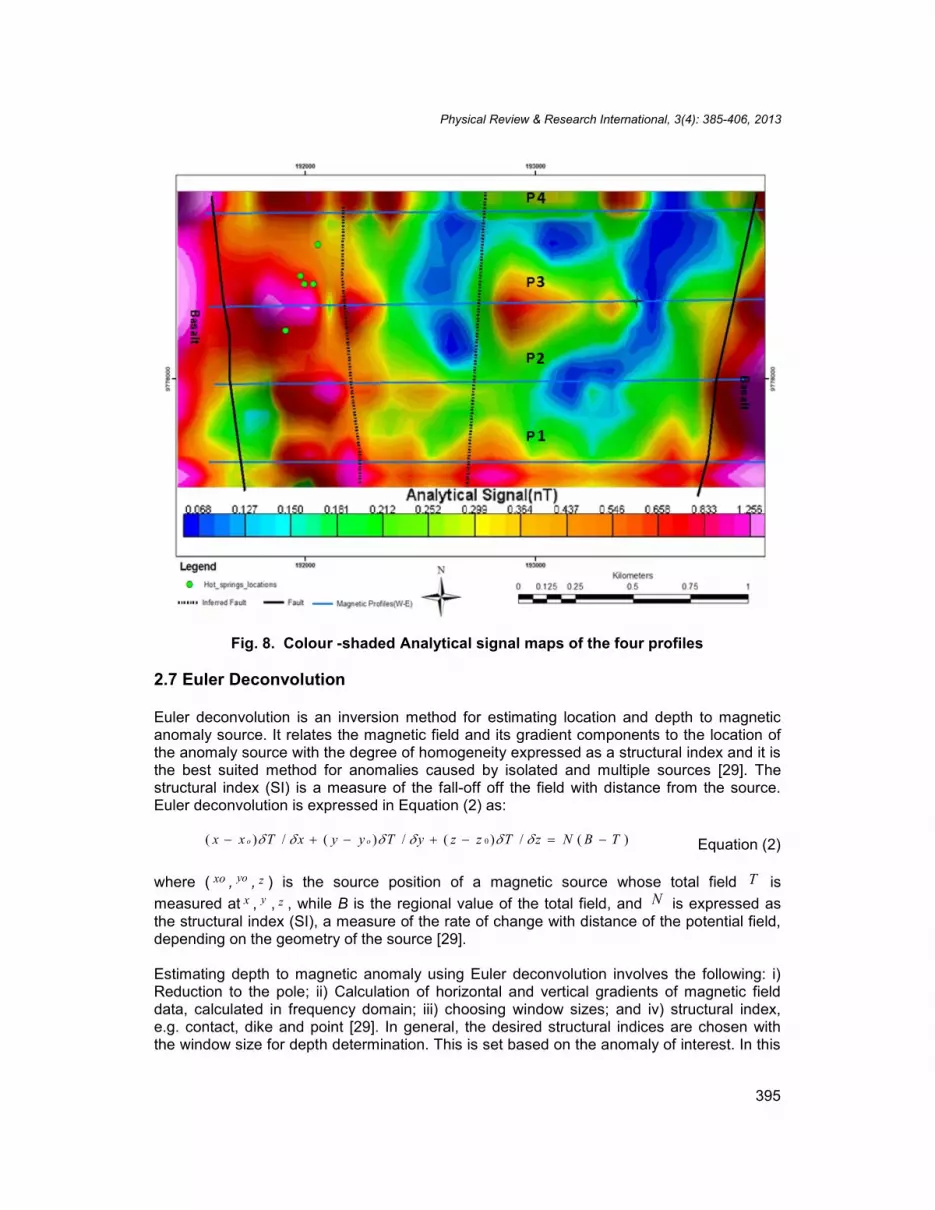
3D Euler deconvolution was performed on the total magnetic intensity (TMI) grid data usingstandard Euler deconvolution. This was done to locate depths to the lithologic contacts onthe gridded map. The best clustering Euler depths was achieved using solution window sizeof 4, 1.0 structural index (SI) (steep contact) and 15% depth tolerance. The results wereplotted on the analytical signal map for effective interpretations (Fig. 9).
Fig. 9. 3D Euler’s depths solutions (structural index of 1) plotted on the colour shadedanalytical signal map
Physical Review & Research International, 3(4): 385-406, 2013
397
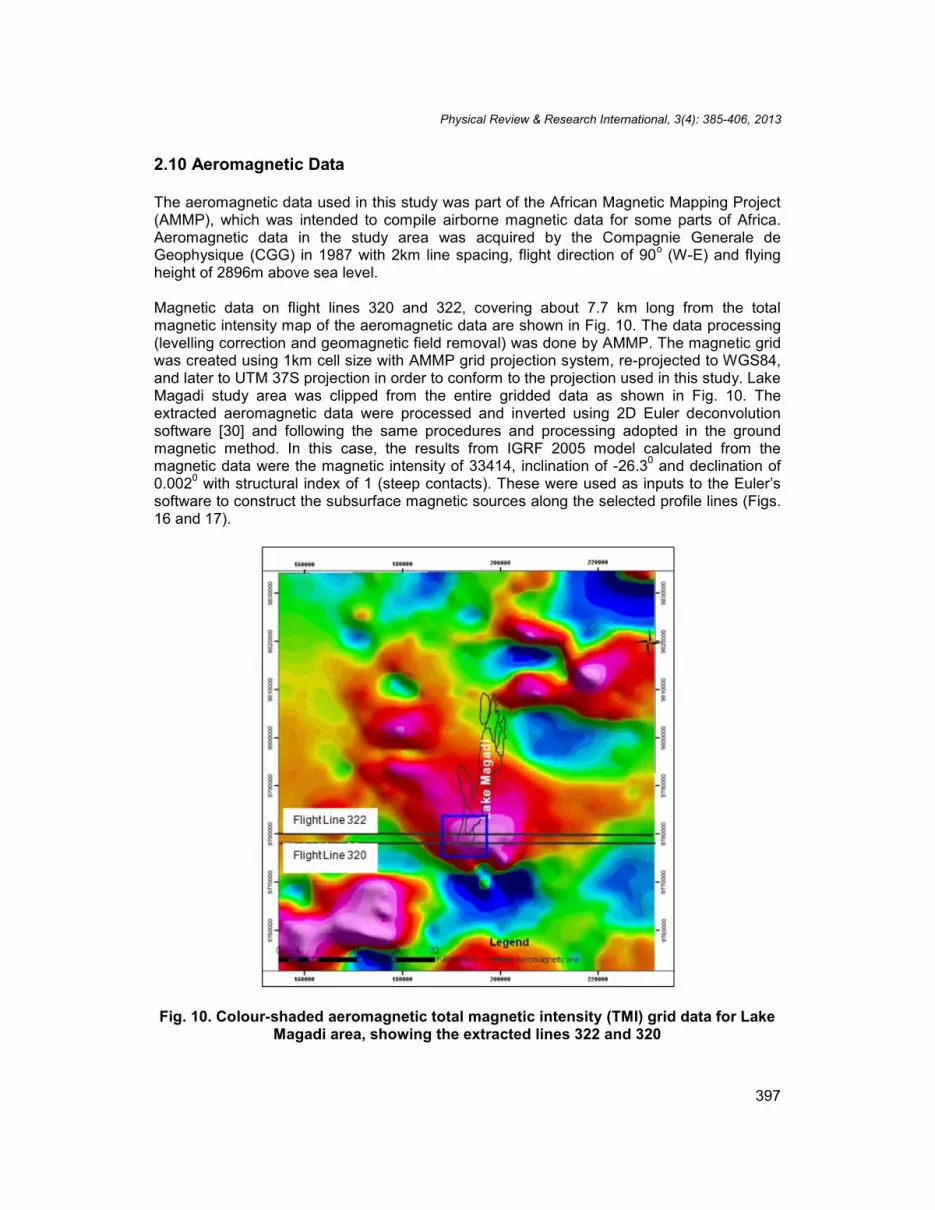
2.10 Aeromagnetic Data
The aeromagnetic data used in this study was part of the African Magnetic Mapping Project(AMMP), which was intended to compile airborne magnetic data for some parts of Africa.Aeromagnetic data in the study area was acquired by the Compagnie Generale deGeophysique (CGG) in 1987 with 2km line spacing, flight direction of 90o (W-E) and flyingheight of 2896m above sea level.
Magnetic data on flight lines 320 and 322, covering about 7.7 km long from the totalmagnetic intensity map of the aeromagnetic data are shown in Fig. 10. The data processing(levelling correction and geomagnetic field removal) was done by AMMP. The magnetic gridwas created using 1km cell size with AMMP grid projection system, re-projected to WGS84,and later to UTM 37S projection in order to conform to the projection used in this study. LakeMagadi study area was clipped from the entire gridded data as shown in Fig. 10. Theextracted aeromagnetic data were processed and inverted using 2D Euler deconvolutionsoftware [30] and following the same procedures and processing adopted in the groundmagnetic method. In this case, the results from IGRF 2005 model calculated from themagnetic data were the magnetic intensity of 33414, inclination of -26.30 and declination of0.0020 with structural index of 1 (steep contacts). These were used as inputs to the Euler’ssoftware to construct the subsurface magnetic sources along the selected profile lines (Figs.16 and 17).
Fig. 10. Colour-shaded aeromagnetic total magnetic intensity (TMI) grid data for LakeMagadi area, showing the extracted lines 322 and 320
Physical Review & Research International, 3(4): 385-406, 2013
398
3. DATA INTERPRETATION
From the Total Magnetic Intensity (TMI) grid data, the high intensity magnetic signals at thewestern margins mark the faults with basaltic rocks (Fig. 6) while the eastern margin showsa decay of the magnetic intensity corresponding to the end of the basalts and marking theonset of the chert zone. The basin is characterized by low magnetic signatures, which canbe attributed to the presence of fluids. The two-chert zones show reasonably high magneticanomaly in the TMI grid (Fig. 6). In the vertical derivative map (Fig. 7), the hot springs, whichare clearly manifested in the surface between the north-south trending Fault A, and Fault Bin the south west show low (negative) magnetic anomaly. The map also shows the lateralcontinuity N-S faults along the axial rift zone. High magnetic signal within the basin coincideswith the Fault zones (B and C) (Figs. 6 and 7). The analytic signal map (Fig. 8) shows thatthe survey area is inside a basin surrounded by the west, east Faults A and D. In this map,the edges of the magnetic anomaly are better enhanced and it clearly shows the zones ofdiscontinuities between each geologic unit, especially the major faults in the area. Majority ofthe hot springs occurs within a boundary between high and moderate magnetic intensityrocks. The location of hot spring is characterized by very low and negative anomaly asrevealed in the vertical derivative map (Fig. 7). The sediments further bury the basaltic rocksoutcropping at the hot springs south; these are probably responsible for the high magneticanomaly, which are evident in the analytical signal map (Fig. 8). Within the basin is alocalized high magnetic anomaly, which can be attributed to the presence of volcanic rocks.From the depth estimation, the basin depth between 300 and 493 metres, with the westernand eastern basalts from the Euler’s depth extending to about 300m.
3.1 2D Interpretation of the Magnetic Data along the Traverses
Qualitative interpretation of the magnetic traverses shows that the basin is bounded by N-Strending faults both to the west and to the east. The 2D magnetic profiles (Figs. 11 – 14)show the magnetic anomaly observed over the four faults in the south of Lake Magadi. Thedifferences in magnetic anomaly signatures possibly indicate structurally controlledsubsurface features [23,31].
Fig. 11(b) shows magnetic anomaly along traverse P1. Here, four distinct trends arerecognized, which coincide with the location of the identified faults within the basin. Thetraverse begins with a high and low magnetic anomaly (Station 0–200m), which is attributedto the highly faulted basaltic dyke that bounds the basin to the west (Figs. 11a and b). Thissignature is followed to the east by generally low signatures (Station 200–380m). This verylow magnetic anomaly coincides with the hot and cold spring locations within the basin. Thesame result was experienced in Ethiopian Rift Valley by Abiye and Tigistu [21]. The lack ofmagnetic sources exists mostly between the faults, an evident of the presence of fluids asexperienced in the field. The discontinuity between the basalt and sediments basin show theexistence of faults between the rock units. A gentle rise in the anomaly towards the east(Station 380-500m) shows the commencement of the chert zone within Fault B followed bylow signatures characterized by sediments (Station 500-700m). The high magnetic responsewithin this zone could be attributed to the presence of chert vein as observed in the field. Atthe end of the low anomaly, there is a little rise but undulating signatures (Station 700 m)which commence the chert zone (Fault C), followed by a relatively low anomaly (up toStation 1700 m). The eastern-most basaltic rock along the traverse shows a rise in magneticanomaly. General fluctuation of the magnetic response along the profile and the scattering of
Physical Review & Research International, 3(4): 385-406, 2013
399
the Euler solutions possibly indicate that series of intense tectonic/faulting activity associatedwith shearing might have taken place within the basin [23,31].
Fig. 11. (a) Geologic map of the magnetic survey area. (b) Processed ground magneticdata with 2D Euler solutions obtained along traverse one with inclination and
declination angles of -26.2º and 0.03º respectively. Plus (+) signs are Euler solutionsfor 1.0 structural index
Physical Review & Research International, 3(4): 385-406, 2013
400
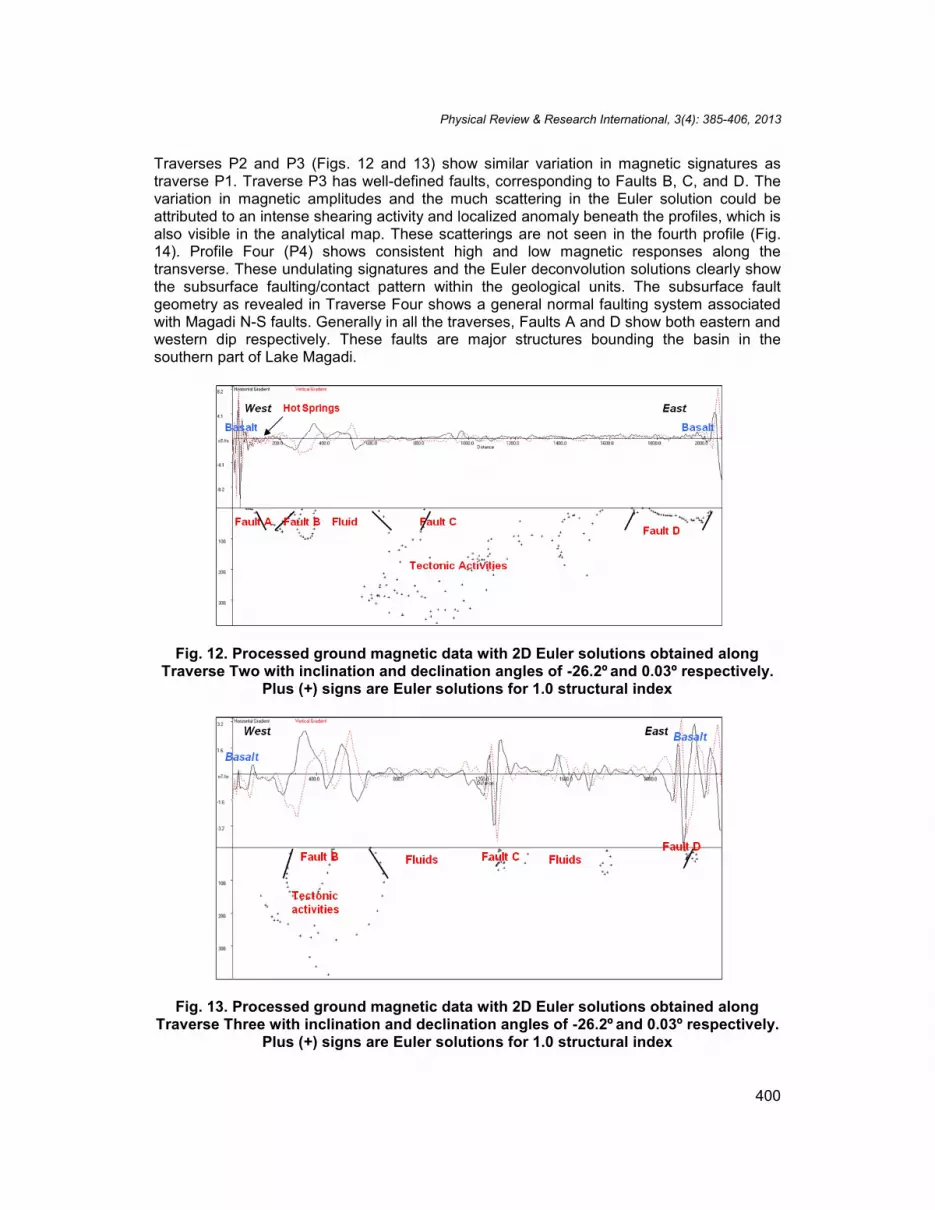
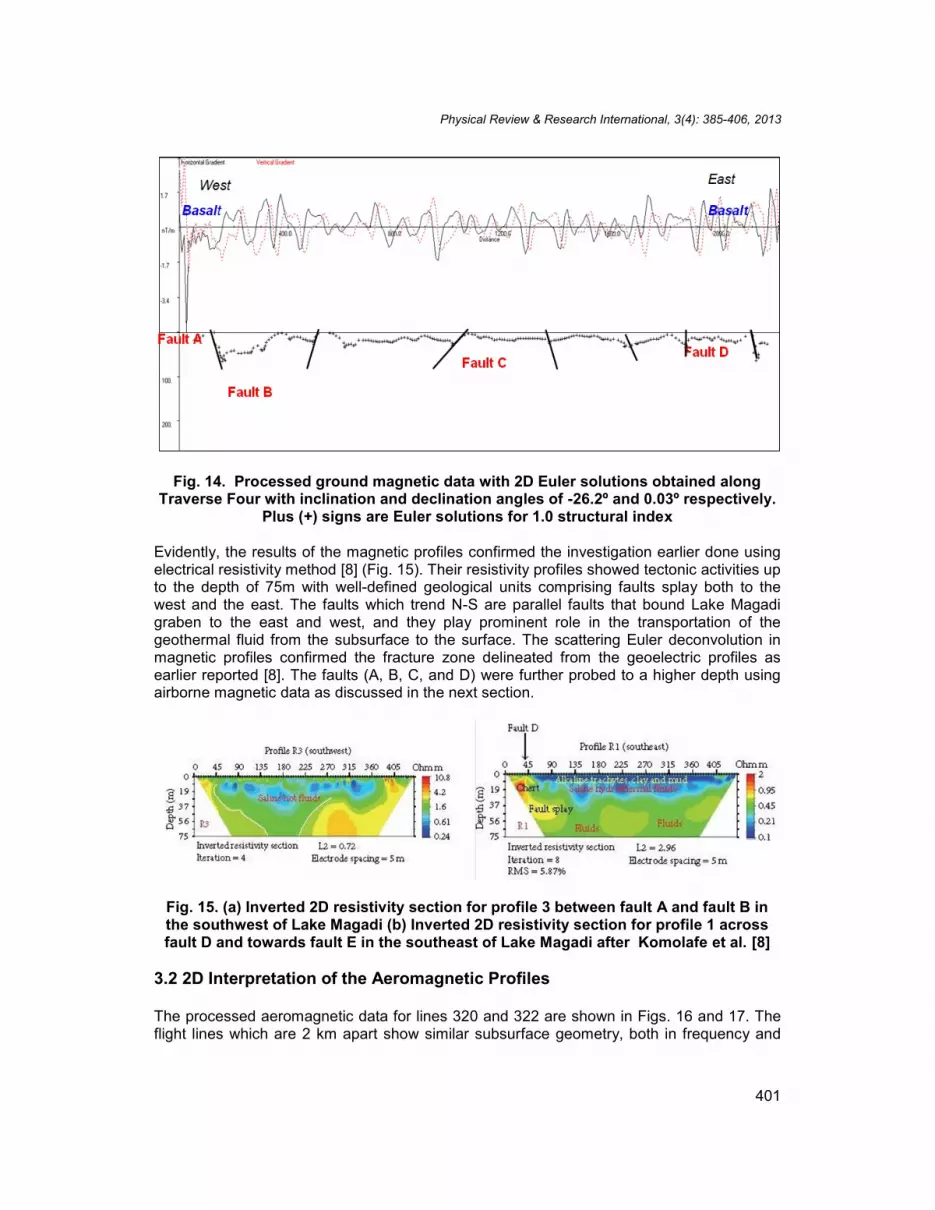
Traverses P2 and P3 (Figs. 12 and 13) show similar variation in magnetic signatures astraverse P1. Traverse P3 has well-defined faults, corresponding to Faults B, C, and D. Thevariation in magnetic amplitudes and the much scattering in the Euler solution could beattributed to an intense shearing activity and localized anomaly beneath the profiles, which isalso visible in the analytical map. These scatterings are not seen in the fourth profile (Fig.14). Profile Four (P4) shows consistent high and low magnetic responses along thetransverse. These undulating signatures and the Euler deconvolution solutions clearly showthe subsurface faulting/contact pattern within the geological units. The subsurface faultgeometry as revealed in Traverse Four shows a general normal faulting system associatedwith Magadi N-S faults. Generally in all the traverses, Faults A and D show both eastern andwestern dip respectively. These faults are major structures bounding the basin in thesouthern part of Lake Magadi.
Fig. 12. Processed ground magnetic data with 2D Euler solutions obtained alongTraverse Two with inclination and declination angles of -26.2º and 0.03º respectively.
Plus (+) signs are Euler solutions for 1.0 structural index
Fig. 13. Processed ground magnetic data with 2D Euler solutions obtained alongTraverse Three with inclination and declination angles of -26.2º and 0.03º respectively.
Plus (+) signs are Euler solutions for 1.0 structural index
Physical Review & Research International, 3(4): 385-406, 2013
401
Fig. 14. Processed ground magnetic data with 2D Euler solutions obtained alongTraverse Four with inclination and declination angles of -26.2º and 0.03º respectively.
Plus (+) signs are Euler solutions for 1.0 structural index
Evidently, the results of the magnetic profiles confirmed the investigation earlier done usingelectrical resistivity method [8] (Fig. 15). Their resistivity profiles showed tectonic activities upto the depth of 75m with well-defined geological units comprising faults splay both to thewest and the east. The faults which trend N-S are parallel faults that bound Lake Magadigraben to the east and west, and they play prominent role in the transportation of thegeothermal fluid from the subsurface to the surface. The scattering Euler deconvolution inmagnetic profiles confirmed the fracture zone delineated from the geoelectric profiles asearlier reported [8]. The faults (A, B, C, and D) were further probed to a higher depth usingairborne magnetic data as discussed in the next section.
Fig. 15. (a) Inverted 2D resistivity section for profile 3 between fault A and fault B inthe southwest of Lake Magadi (b) Inverted 2D resistivity section for profile 1 acrossfault D and towards fault E in the southeast of Lake Magadi after Komolafe et al. [8]
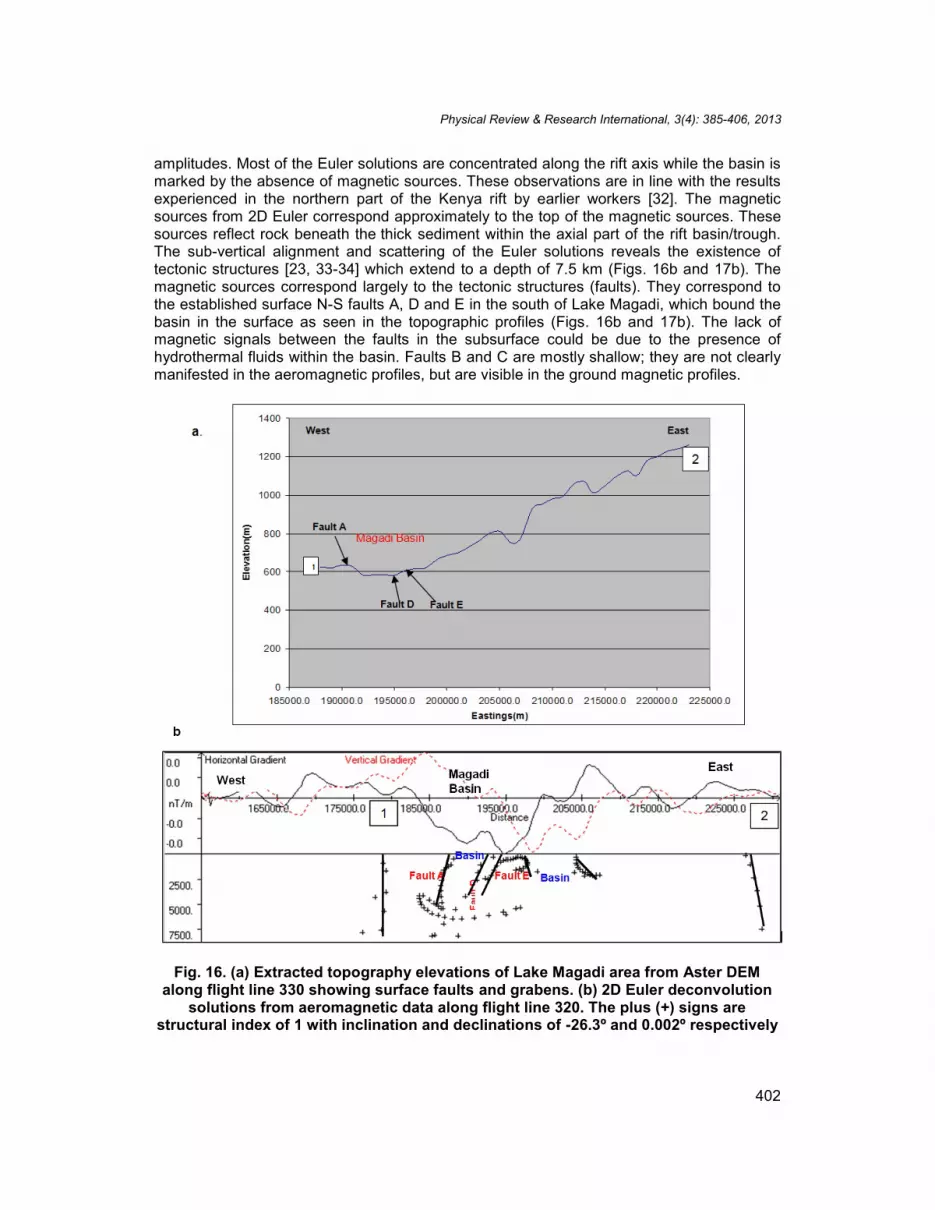
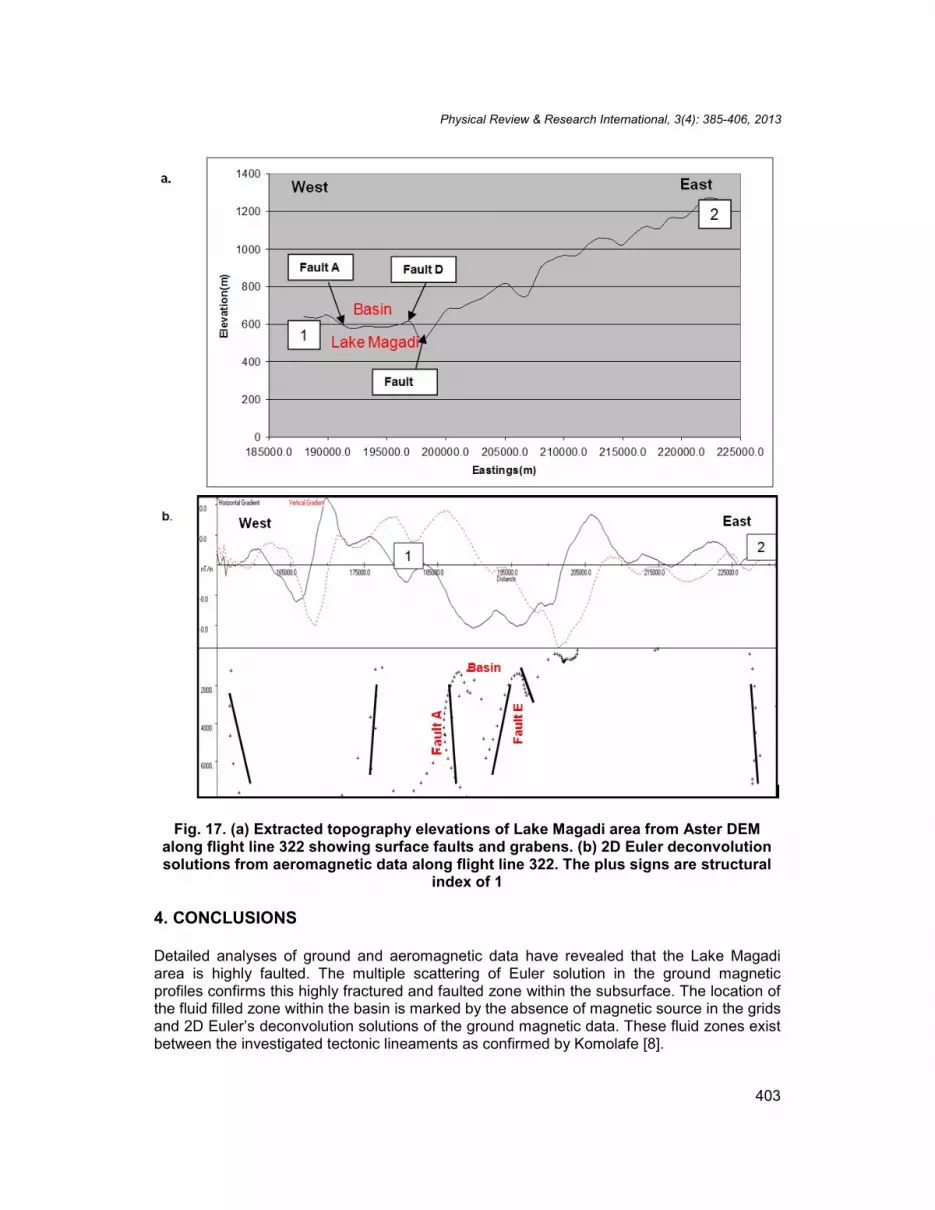
3.2 2D Interpretation of the Aeromagnetic Profiles
The processed aeromagnetic data for lines 320 and 322 are shown in Figs. 16 and 17. Theflight lines which are 2 km apart show similar subsurface geometry, both in frequency and
Physical Review & Research International, 3(4): 385-406, 2013
402
amplitudes. Most of the Euler solutions are concentrated along the rift axis while the basin ismarked by the absence of magnetic sources. These observations are in line with the resultsexperienced in the northern part of the Kenya rift by earlier workers [32]. The magneticsources from 2D Euler correspond approximately to the top of the magnetic sources. Thesesources reflect rock beneath the thick sediment within the axial part of the rift basin/trough.The sub-vertical alignment and scattering of the Euler solutions reveals the existence oftectonic structures [23, 33-34] which extend to a depth of 7.5 km (Figs. 16b and 17b). Themagnetic sources correspond largely to the tectonic structures (faults). They correspond tothe established surface N-S faults A, D and E in the south of Lake Magadi, which bound thebasin in the surface as seen in the topographic profiles (Figs. 16b and 17b). The lack ofmagnetic signals between the faults in the subsurface could be due to the presence ofhydrothermal fluids within the basin. Faults B and C are mostly shallow; they are not clearlymanifested in the aeromagnetic profiles, but are visible in the ground magnetic profiles.
Fig. 16. (a) Extracted topography elevations of Lake Magadi area from Aster DEMalong flight line 330 showing surface faults and grabens. (b) 2D Euler deconvolution
solutions from aeromagnetic data along flight line 320. The plus (+) signs arestructural index of 1 with inclination and declinations of -26.3º and 0.002º respectively
Physical Review & Research International, 3(4): 385-406, 2013
403
Fig. 17. (a) Extracted topography elevations of Lake Magadi area from Aster DEMalong flight line 322 showing surface faults and grabens. (b) 2D Euler deconvolutionsolutions from aeromagnetic data along flight line 322. The plus signs are structural
index of 1
4. CONCLUSIONS
Detailed analyses of ground and aeromagnetic data have revealed that the Lake Magadiarea is highly faulted. The multiple scattering of Euler solution in the ground magneticprofiles confirms this highly fractured and faulted zone within the subsurface. The location ofthe fluid filled zone within the basin is marked by the absence of magnetic source in the gridsand 2D Euler’s deconvolution solutions of the ground magnetic data. These fluid zones existbetween the investigated tectonic lineaments as confirmed by Komolafe [8].
Physical Review & Research International, 3(4): 385-406, 2013
404
The tectonic activities in the Lake Magadi upper crust contribute to the upward flow ofhydrothermal fluids from the hot geothermal reservoir to the surface. It was established thatthe surface lineaments and tectonic activities along and beneath Magadi Basin extenddeeply to the subsurface (approximately 7.5km), with surface expressions showing as faultswhich bound the graben to the west and the east. It was observed that the existence ofstructures south of Lake Magadi plays an important role in creating a conduit through whichhydrothermal fluids (hot or cold) are transported to the surface. Therefore, the manifestationsof hot springs and trona deposit in the south of Lake Magadi are largely supported by thepresence of N-S faults in the area.
ACKNOWLEDGEMENT
Our appreciation goes to the University of Twente, ITC, Enschede, The Netherlands, andNuffic for funding the study. We acknowledge the supports rendered by the Department ofGeology, Ministry of Mineral Resources, Nairobi, Kenya for providing its Magnetometerequipment for our use. We also thank Dr Sally Barrit of the University of Twente, ITC,Enschede for the provision of aeromagnetic data.
COMPETING INTERESTS
Authors have declared that no competing interests exist.
REFERENCES
1. Gudmundsson A, Berg SS, Lyslo KB, Skurtveit, E. Fracture networks and fluidtransport in active fault zones. Journal of Structural Geology. 2001;23(2-3):343-353.
2. Lerner EKL, Cengage BWLG. Faults and Fractures; 2003. Available:http://www.enotes.com/earth-science.
3. Mary HD, Mario F. What is Geothermal Energy? Istituto di Geoscienze e Georisorse:Pisa, Italy. 2004;1-61.
4. Mwaura F. A spatio-chemical survey of hydrogeothermal springs in LakeElementaita, Kenya. International Journal of Salt Lake Research. 1999;8(2):127-138.
5. Simiyu SM, Keller GR. Seismic monitoring of the Olkaria Geothermal area, KenyaRift valley. Journal of Volcanology and Geothermal Research, 2000;95(1-4):197-208.
6. Jones BF, Eugster HP, Rettig SL. Hydrochemistry of the Lake Magadi basin, Kenya.Geochimica et Cosmochimica Acta. 1977;41(1):53-72.
7. Maguire PKH, Long RE. The Structure on the Western Flank of the Gregory Rift(Kenya). Part I. The Crust. Geophysical Journal of the Royal Astronomical Society.1976;44(3):661-675.
8. Komolafe AA, Kuria ZN, Woldai T, Noomen M, Anifowose AYB. Integrated RemoteSensing and Geophysical Investigations of the Geodynamic Activities at LakeMagadi, Southern Kenyan Rift. International Journal of Geophysics. 2012;15.
9. Stampolidis A, Tsokas GN. Curie Point Depths of Macedonia and Thrace, N.Greece. Pure and Applied Geophysics. 2002;159(11):2659-2671.
10. Spector A, Grant FS. Statistical models for interpreting aeromagnetic data.Geophysics. 1970;35:293–302.
11. Atmaoui N, Hollnack D, Neotectonics and extension direction of the Southern KenyaRift, Lake Magadi area. Tectonophysics. 2003;364(1-2):71-83.
Physical Review & Research International, 3(4): 385-406, 2013
405
12. Eugster HP. Chemistry and origin of brines of Lake Magadi, Kenya. Mineral. Soc.Amer. Spec. Paper. 1970;3:215-235.
13. Smith M, Mosley P. Crustal Heterogeneity and Basement Influence on theDevelopment of the Kenya Rift, East Africa. Tectonics. 1993;12.
14. Baker BH. Geology of the Magadi area. 1958, Geological Survey of Kenya, Nairobi.15. Baker BH, Williams LAJ, Miller JA, Fitch FJ. Sequence and geochronology of the
Kenya rift volcanics. Tectonophysics, 1971;11(3):191-215.16. Sequar GW. Neotectonics of the East African rift system : new interpretations from
conjunctive analysis of field and remotely sensed datasets in the lake Magadi area,Kenya., ITC: Enschede. 2009;99.
17. Simiyu SM, Keller GR. Upper crustal structure in the vicinity of Lake Magadi in theKenya Rift Valley region. Journal of African Earth Sciences, 1998;27(3-4):359-371.
18. Le Turdu C, Tiercelin JJ, Richert Pl. Influence of pre-existing oblique discontinuitieson the geometry and evolution of extensional fault patterns; Evidence from theKenya Rift using Spot Imagery. In: C.K. Morley (Editor), Geoscience of Rift systems-Evolution of East Africa. AAPG studies in Geology. 1999;173-191.
19. Jessell M. Three-dimensional geological modelling of potential-field data. Computers& Geosciences. 2001;27(4):455-465.
20. Clark DA, Emerson DW. Notes on rock magnetization characteristics in appliedgeophysical studies. Exploration Geophysics, 1991;22(3):547-555.
21. Abiye TA and Tigistu, H. Geophysical exploration of the Boku geothermal area,Central Ethiopian Rift. Geothermics. 2008;37(6):586-596.
22. Riddihough RP. Diurnal Corrections To Magnetic Surveys—An AssessmentOf Errors. Geophysical Prospecting, 1971;19(4):551-567.
23. Adepelumi AA, Ako BD, Ajayi TR, Olorunfemi AO, Awoyemi MO, Falebita DE.Integrated geophysical mapping of the Ifewara transcurrent fault system, Nigeria.Journal of African Earth Sciences, 2008;52(4-5):161-166.
24. Briggs IC, Machine Contouring Using Minimum Curvature. GEOPHYSICS,1974;39(1):39-48.
25. Cooper GRJ, and Cowan DR. Filtering using variable order vertical derivatives.Computers & Geosciences. 2004;30(5):455-459.
26. Roest WR, Verhoef J, Pilkington M. Magnetic interpretation using the 3-D analyticsignal. Geophysics 1992. 57: p. 116–125.
27. Jeng Y, Lee Y, Chen C, Lin M. Integrated signal enhancements in magneticinvestigation in archaeology. Journal of Applied Geophysics. 2003;53(1):31-48.
28. MacLeod IN, Jones K, Dai TF. 3-D analytic signal in the interpretation of totalmagnetic field data at low magnetic latitudes. Exploration Geophysics,1993;24(4):679-688.
29. El Dawi MG, Tianyou L, Hui S, Dapeng L. Depth estimation of 2-D magneticanomalous sources by using Euler deconvolution method. American Journal ofApplied Sciences; 2004.
30. Cooper GRJ. Euler deconvolution applied to potential field gradients. ExplorationGeophysics. 2004;35(3):165-170.
31. Telford WM, Geldart LP, Sheriff RE. Applied Geophysics. second ed. Vol. 1. 1976:Cambridge University Press. 50-102.
32. Mariita NO, Keller GR. An integrated geophysical study of the northern Kenya rift.Journal of African Earth Sciences. 2007;48(2-3):80-94.
33. Mushayandebvu MF, Van Driel P, Reid AB, Fairhead JD. Magnetic sourceparameters of two-dimensional structures using extended Euler deconvolution.Geophysics. 2001;66(3):814-823.

Physical Review & Research International, 3(4): 385-406, 2013
406
34. Kuria ZN, Woldai T, Meer FDVD, Barongo JO. Active fault segments as potentialearthquake sources: Inferences from integrated geophysical mapping of the Magadifault system, southern Kenya Rift. Journal of African Earth Sciences.2010;57(4):345–359.
_________________________________________________________________________© 2013 Komolafe et al.; This is an Open Access article distributed under the terms of the Creative CommonsAttribution License (http://creativecommons.org/licenses/by/3.0), which permits unrestricted use, distribution, andreproduction in any medium, provided the original work is properly cited.
Peer-review history:The peer review history for this paper can be accessed here:
http://www.sciencedomain.org/review-history.php?iid=224&id=4&aid=1531