sheathless reverse-polarity capillary electrophoresis-electrospray-mass spectrometry for analysis of...
TRANSCRIPT
Laura BindilaJasna Peter-KatalinicAlina Zamfir
Institute for Medical Physicsand Biophysics,University of Münster,Münster, Germany
Sheathless reverse-polarity capillaryelectrophoresis-electrospray-mass spectrometryfor analysis of underivatized glycoconjugates
We report on the development of a novel methodology to extend the limits of capillaryelectrophoresis-electrospray ionization-mass spectrometry (CE-ESI-MS) general ap-plicability. A sheathless on-line CE-ESI-MS setup was optimized on standard mono-saccharide mixture to operate in reverse polarity and negative ion mode for MSdetection without pressure to assist the sample migration, coating of the capillaries,and/or sample derivatization. This approach was further applied for screening of acomplex glycopeptide mixture obtained from the urine of a patient diagnosed withN-acetylhexosaminidase deficiency, known as Schindler’s disease. The potential ofthis methodology in terms of high sensitivity, separation efficiency, resolution, and re-producibility is demonstrated. In combination with the high quality of MS data, a new,significantly improved insight into the sample heterogeneity is possible.
Keywords: Capillary electrophoresis / Electrospray ionization / Glycoconjugates / Mass spectrom-etry DOI 10.1002/elps.200410307
1 Introduction
By introduction of electrospray ionization (ESI) andmatrix-assisted laser desorption/ionization (MALDI)-mass spectrometry (MS) as potent analytical tools forglycomic studies, new insights into the carbohydrateheterogeneity in different biological matrices becamefeasible [1–8]. A high microheterogeneity of complex car-bohydrates determined by the their different chain length,different branching patterns, type of glycosidic linkages,and potential modifications of functional groups by sulfa-tion, phosphorylation, acetylation, etc. is responsible fortheir particular MS behavior: relatively low ionization effi-ciency under standard conditions, in-source decay oflabile attachments, and overlapping of fragment ionsobtained from isobaric structures by MS/MS [9–11].Therefore, particular considerations of ionization/detec-
tion parameters even within the same class of carbohy-drates must be considered [8, 12–14]. We recentlydemonstrated that for glycopeptide and ganglioside mix-tures a superior ionization efficiency, a targeted formationof multiply charged ions, a higher sensitivity of detection,and a minimized in-source decay could be achieved bythe novel chip-based ESI-quadrupole time-of-flight(QTOF) [15–18] and Fourier transform ion cyclotron reso-nance (FTICR)-MS methodology [8, 19, 20].
However, novel efficient ways for preseparation prior todirect identification and structural elucidation of carbo-hydrate mixtures by MS and MS/MS could supplementthese present efforts. This is of particular interest in thecase of ESI-FTICR-MS, where the space charge effectswere shown to limit the accuracy of mass determination[8, 19, 20]. On the other hand, in ESI-QTOF-MS experi-ments, the overlapping of the near-isobaric structure ionscan still occur, frequently causing problems associatedwith data interpretation and isolation of a precursor ion forMS/MS analysis. Therefore, hyphenation of MS with high-performance separation techniques like CE [20–28] andhigh-performance liquid chromatography (HPLC) [29–31]is a highly relevant option, however, a serious furtherdevelopment and refinement of conditions is necessary.
A general prerequisite for an on-line CE-MS approach forcarbohydrate analysis is the use of MS-friendly buffers athigh pH values to promote the ionization. The separationassisted by the high electroosmotic flow (EOF) is gen-erally carried out in the normal polarity to achieve an effi-cient separation within short analysis time. A general
Correspondence: Prof. Dr. Jasna Peter-Katalinic, Institute forMedical Physics and Biophysics, University of Münster, Robert-Koch-Straße 31, D-48149 Münster, GermanyE-mail: [email protected]: 149-251-8355140Dr. Alina Zamfir, Robert-Koch-Straße 31, D-48149 Münster, Ger-manyE-mail: [email protected]: 149-251-8355140
Abbreviations: RPCE/(-)nanoESI-QTOF, reverse polarity capil-lary electrophoresis coupled to negative ion mode electrospray-quadrupole time-of-flight; FTICR, Fourier transform ion cyclotronresonance; GalNAc, N-acetyl galactosamine; Neu5Ac, N-acetylneuraminic acid; Q-TOF, quadrupole time-of-flight; TIC, total ionchromatogram; XIC, extracted ion chromatogram
1488 Electrophoresis 2005, 26, 1488–1499
2005 WILEY-VCH Verlag GmbH & Co. KGaA, Weinheim

Electrophoresis 2005, 26, 1488–1499 RPCE/(-)nano ESI-QTOF-MS of underivatized glycoconjugates 1489
protocol for the on-line sheathless CE/(-)nanoESI-QTOF-MS in the normal polarity at high ammonium acetate/ammonia pH has been previously developed and intro-duced by our group for analysis of negatively chargedglycans, such as sialylated glycopeptides and glycosa-minoglycans [32, 33]. Recently, it was reported that theuse of an acidic buffer for the on-line CE-MS when oper-ating in the reverse polarity is advantageous, either ifassisted by pressure [26] or by coating of the CE capillarywalls to sustain the electrospray [27], offering validoptions for separation and identification of sulfated gly-cosaminoglycans [26] and derivatized and underivatizedN-glycans [27].
In the present study we describe the optimization of thesheathless CE/(-)nanoESI-QTOF-MS for reverse-polarityseparation/detection of an underivatized glycopeptidemixture. The method was optimized to achieve an effi-cient separation without pressure assistance and/or acoating of the CE capillary. The sheathless reverse-polarity CE/(-)nanoESI-QTOF-MS (RPCE/(-)nanoESI-QTOF-MS) was applied for the screening of glycopep-tides extracted from urine of a patient diagnosed withSchindler’s disease. This type of substrates was inten-sively explored by our group using an arsenal of MS-based methods [8, 15, 16, 18–20, 34, 35], each providingadditional valuable data information upon the mixturecomplexity. The RPCE/(-)nanoESI-QTOF-MS method isshown here to represent a reliable prerequisite for furtherdevelopment of CE-MS and MS/MS glycoscreening andits use as a routine tool in the high-throughput glyco-analysis.
2 Materials and methods
2.1 Reagents and materials
Methanol, 98% formic acid, 32% ammonia were pur-chased from Merck (Darmstadt, Germany). Distilled anddeionized water from a Milli-Q water system (Millipore,Bedford, MA, USA) was used for preparation of the CEbuffer and sample solution. The buffer was prepared at aconcentration of 0.1 M formic acid as a methanol/water(6:4% v/v) solution and adjusted with ammonia to pH2.8. Prior to use, all solvents were filtered through 0.2 mmdisposable filter units from Schleicher and Schuell (Das-sel, Germany). Aqueous sample solutions were dried in aSpeedVac SPD 111V evaporator (Savant, Düsseldorf,Germany). The pH of the CE buffer was adjusted by a766 pH-meter Calimatic (Knick, Germany). Externallypolyimide-coated fused-silica CE capillaries (75 mmID6375 mm OD) were obtained from BGB Analytic Ver-trieb (Essen, Germany). The sample/buffer solutionswere centrifuged for 1 h in an Eppendorf 5415 C cen-
trifuge (Hamburg, Germany). The externally distal coatednanospray needles (75 mm ID6360 mm OD) wereobtained from New Objective, (Cambridge, MA, USA).
2.2 Samples
2.2.1 Standard sample
Standard sialic acid (Neu5Ac) and N-acetylgalactosamine(GalNAc) were obtained from Sigma (Steinheim, Germany)and used further without any purification procedure. Stockaqueous Neu5Ac and GalNAc solutions, respectively, of1mg?mL21 were prepared by dissolving the dried material inwater and stored at 2707C. For optimization of the on-lineCE-ESI-MS an equimolar mixture of Neu5Ac and GalNAcwas prepared by drying the stock aqueous solutionsand dissolving into the CE buffer at concentrations of1 mg?mL21. The standard mixture was further diluted intothe CE buffer to the appropriate concentration.
2.2.2 Biological sample
The biological material investigated in this study was amixture of O-glycosylated sialylated amino acids andpeptides, denoted BQ5, extracted and purified from urineof a patient suffering from Schindler’s disease type I asdescribed previously [36–38]. Briefly, for isolation of theBQ5 fraction, the patient’s urine has been first filtered andsubmitted to gel filtration chromatography (GFC) on Bio-gel P2. The glycans were first fractionated by GFC onFractogel TSK HW 50 in 0.01 M pyridinium acetate, pH5.4, as eluting buffer followed by anion-exchange chro-matography (AEC) using a monoQ column [39]. Theresulting Q5 fraction has been investigated in this study. Astock sample/water solution of 1 mg?mL21 BQ5 has beenprepared and stored at 2707C. The working aliquots of0.75, 0.5, and 0.25 mg?mL21, respectively, for on-line CE-nanoESI-MS screening were prepared by drying the stocksolution and further dissolving in the CE buffer system.
2.3 Instrumentation
2.3.1 Capillary electrophoresis
CE experiments were carried out on a PACE 5000 seriesinstrument (Beckman, Fullerton, CA, USA). The instru-ment is interfaced with an 486 IBM PS/2, 56SX computerequipped with System Gold dedicated software to controlthe instrument and acquire the experimental data. Be-tween successive runs the capillary was flushed withmethanol for 30 min and dried by air flow for 15 min. Priorto sample injection, the CE capillary was conditioned withthe running buffer by rinsing for 15 min, followed by 20 min
2005 WILEY-VCH Verlag GmbH & Co. KGaA, Weinheim
CE
and
CE
C

1490 L. Bindila et al. Electrophoresis 2005, 26, 1488–1499
separation voltage application at an operating value of225 kV. The temperature of the capillary cartridge was setto 157C for all experiments. The sample/buffer solutionswere hydrodynamically injected by applying an operatingnitrogen pressure of 0.5 psi for 6–10 s, yielding approxi-mately 15 nL sample/buffer injected.
2.3.2 Mass spectrometry
MS was performed on an orthogonal hybrid QTOF massspectrometer (QTOF Micromass, Manchester, UK)equipped with a Z-spray ion source geometry. The massspectrometer is interfaced with a PC running the Mass-Lynx N.T. software package to control the instrument,record, and process the MS data. All the measurementswere carried out in the negative ion mode, shown pre-viously to be favorable for the carbohydrate ion speciesformation [9–11]. For an efficient ionization and minimalin-source decomposition of the glycan components, thesampling cone potential was varied within 20–40 V. Theion source temperature was set to 807C for and the de-solvation gas at a 50 L?h21 for all experiments. Theextracted ion chromatograms (XIC) were performedwithin a mass window of 0.3 Da for the most abundantglycopeptide ion in the total ion chromatogram (TIC) MS.The QTOF instrument was programmed to record thedata at a scan speed of 2.1 scans/s. The calibration of thespectra was performed using NaI as a calibrant.
2.3.3 Sheathless CE/(-)nanoESI-QTOF-MS
CE has been on-line coupled to the nanoESI-QTOF-MSvia an in-house made sheathless interface, described indetail by us previously [33]. Basically, the CE separationcapillary is butted to a commercial nanospray needle viaan in-house made joint. The resulting column is incorpo-rated into a stainless-steel clenching device, designedand constructed to allow the application of the ESI volt-age to the needle. The whole setup was mounted by a setof screws directly onto the ESI high-voltage QTOF plate.In order to prevent the misalignment of the CE capillaryand the nanoneedle into the joint, and to reduce the deadvolume formation to a minimum, the CE capillary and theneedle end surfaces were adjusted by filing. Prior torepeated couplings between runs, the joint was as welldried by air flow to hinder any air bubble formation. TheCE-MS blank run of the separation buffer only, carried outafter each washing procedure, indicated a completeremoval of the sample and/or impurities and that noadsorption of the sample to the CE capillary, joint, and theneedle occurred. In the actual study, the length of the CEcapillary was set to 130 cm, due to practical considera-tions, like the position of the two instruments, the ease of
mounting and handling the interface onto the QTOF-plate, higher stability of the system throughout the analy-sis, and less risk of disconnection of the CE capillary andESI needle during the coupling. The CE separation wascarried out in reverse polarity by application of 225 kVseparation voltage on the inlet electrode. The electro-spray was initiated at values of 800–1100 V. The resultingoverall potential difference along the column was223.9 kV, which generated a constant drawing current of3.4 mA. The pressure-assisted reverse-polarity CE/(-)nanoESI-QTOF-MS experiment was carried out in thelow-pressure-assisted mode available on the CE Beck-man instrument. For the nonpressure assisted reverse-polarity CE/(-)nanoESI-QTOF-MS mode, the use of abuffer pH value of 2.8 in combination with uncoatedinternally capillary walls, resulted in almost total suppres-sion of the EOF. Under these conditions, without over-imposing pressure to assist the separation, the migrationof the negatively charged analytes toward the anode isdriven by the electrical force. The buffer and separation/detection conditions allowed a constant and stable sprayover the entire analysis time and no interruption of theelectrical contact was noticed. Unless otherwise noted,the QTOF instrument was programmed to acquire the CE-MS signal, i.e., the TIC-MS starting at min 45 after sampleinjection into the CE capillary.
3 Results and discussion
3.1 Optimization of the on-lineRPCE/(-)nanoESI-QTOF-MS for the mixtureof standard monosaccharides
To develop a reliable protocol for analysis of underivatizedglycans based on sheathless CE/(-)nanoESI-QTOF-MSwith CE operating in reverse polarity and ESI-QTOF ioni-zation/detection in the negative ion mode in the absence ofthe EOF, in the first step different buffer concentrationsranging from 30 mM to 0.5 M were considered. So far, theon-line RPCE/(-)nanoESI-QTOF-MS was carried out underlow buffer pH and concentration and with coated capil-laries to suppress the EOF, and pressure assistance toreduce the diffusion processes and the analysis time [26].However, a major drawback of the pressure-assistedsheathless RPCE/(-)nanoESI-QTOF-MS is the consider-able decrease of separation efficiency and resolution.Therefore, this approach can not be considered here asbeneficial toward the separation/detection of componentsin complex biological mixtures. For this reason, the devel-opment of a reliable sheathless RPCE/(-)nanoESI-QTOF-MS method, based solely on the migration of componentsin the electrical field without assistance of pressure andcoating of the capillaries, has been considered.
2005 WILEY-VCH Verlag GmbH & Co. KGaA, Weinheim

Electrophoresis 2005, 26, 1488–1499 RPCE/(-)nano ESI-QTOF-MS of underivatized glycoconjugates 1491
When attempting to run sheathless RPCE/(-)nanoESI-QTOF-MS with ammonium formate at concentrations of30 to 75 mM under nonpressure conditions and in uncoat-ed capillaries, a slight EOF occurred and problems asso-ciated with the stability of the electrospray were noticed.Therefore, the use of higher concentrations of formic acidbuffer was explored to decrease the zeta potential at thecapillary walls and to provide a higher stability of electro-spray. At concentrations of ammonium formate within therange of 0.25–0.5 M, however, Corona discharge at the ESItip and air bubble formation appeared, most probably at-tributed to the redox reaction at the cathode. The 0.1 M
methanol/water (6:4 % v/v) formic acid at pH 2.8 wasfound as an optimal value for suppression of EOF and for asubsequent generation of a constant and stable sprayunder the sheathless RPCE/(-)nanoESI-QTOF-MS. Thehigh stability of the spray generated under the given CE-MS conditions is presently attributed to the constant eva-poration of the buffer at the ESI tip and the high ionizationefficiency of the formic acid in the negative ion mode.
The optimization of the sheathless RPCE(-)nanoESI-QTOF-MS parameters was carried out on a standardmixture of the monosaccharides Neu5Ac and GalNAc.The TIC-MS of an equimolar mixture of Neu5Ac and Gal-NAc prepared in the CE carrier at a concentration of0.5 mg?mL21 is presented in Fig. 1a. Under a CE separa-tion voltage of 225 kV, a careful adjustment of the ESIvoltage and the positioning of the interface toward thesampling cone, two TIC peaks corresponding to the elu-tion of the Neu5Ac and GalNAc were detected at min53.22 and min 60.88, respectively.
The spectra resulted by combining across the TIC peak atmin 53.22 and at min 60.88, respectively, are depicted inFigs. 2a and b. Neu5Ac was detected as its [M2H]2 mo-lecular ion at m/z 308.48 (Fig. 2a) in the first TIC peak (Fig.1a), while GalNAc at m/z 220.36 along with its low-abun-dant dehydrated counterpart at m/z 202.33 (Fig. 2b) isvisible in the second TIC peak (Fig. 1a). It can be deducedfrom Figs. 1 and 2, respectively, that under the formic acidbuffer conditions at pH 2.8 the ionic yield of the neutralsugars, as GalNAc in comparison with charged sugars,such as Neu5Ac, is reduced. The time window betweenthe two peaks of 7.66 min clearly indicates a high resolv-ing power and separation efficiency of the analytes underthese conditions. Moreover, in the spectra shown in Figs.2a and b relative low background ions even at this highconcentration of the buffer system can be observed,allowing detection of even low-molecular-weight carbo-hydrates at a fair signal-to-noise (S/N) ratio.
A particular aspect arising from the experiment in Fig. 1ais the relative broadening of the TIC peaks, as comparedwith our previous experiments carried out in normal
Figure 1. (a) RPCE/(-)nanoESI-QTOF TIC-MS of thestandard mixture of Neu5Ac and GalNAc. Sample con-centration 0.5 mg?mL21; CE voltage, 225 kV; CE buffer,0.1 M methanol/water (6:4 % v/v) formic acid, pH 2.8; CEcapillary length, 130 cm. (b) XIC for the ion at m/z 308.4corresponding to Neu5Ac. Dm = 0.3 Da. RPCE/(-)nanoESI-QTOF-MS carried out for mixture concentration of0.25 mg?mL21. Other conditions as in (a). (c) XIC for the ionat m/z 220.3 corresponding to GalNAc. Dm = 0.3 Da.RPCE/(-)nanoESI-QTOF-MS carried out for mixture con-centration of 0.25 mg?mL21. Other conditions as in (a).
polarity [32]. This peculiarity is attributed to the slowermigration of components under the present CE condi-tions and to the diffusion process, prone to occur underthe circumstances of missing EOF. By infusing samples oflower concentrations, the appropriate TIC peak wasobserved to be slightly narrower peak, accompanied by achange in the migration time and a minimal diffusion, dueto the absence of the EOF (Figs. 1b and c), respectively. Agood in-run reproducibility with respect to peak profileand migration times and consequently a consistent reso-lution of the component peaks is beneficial for standardi-zation of this procedure.
2005 WILEY-VCH Verlag GmbH & Co. KGaA, Weinheim

1492 L. Bindila et al. Electrophoresis 2005, 26, 1488–1499
Figure 2. (a) RPCE/(-)nanoESI-QTOF-MS of the TIC peakat min 53.22 from Fig. 1a. (b) RPCE/(-)nanoESI-QTOF-MSof the TIC peak at min 60.88 from Fig. 1a.
The sensitivity limit exhibited by the sheathless RPCE/(-)nanoESI-QTOF-MS was further tested by screening ofthe stepwise diluted sample mixture into the CE carrier toconcentrations of 0.25, 0.12, and 0.05 mg?mL21, respec-tively. Spectra of fair S/N ratios accessible to a straight-forward identification of these species could be obtainedat 0.25 mg?mL21 and already at concentrations of 0.12 and0.05 mg?mL21. In Figs. 1b and c the XICs obtained at aconcentration of 0.25 mg?mL21 Neu5Ac/GalNAc mixtureare presented.
3.2 Analysis of the glycopeptide mixture fromurine of a patient with Schindler’s disease byRPCE/(-)nanoESI-QTOF-MS
The newly developed RPCE/(-)nanoESI-QTOF-MS proto-col was evaluated for the screening of the BQ5 fraction.The ionizability of the BQ5/buffer at this pH values hasbeen previously tested by direct nanoESI-QTOF-MSscreening. Interestingly, at pH 2.8 in the negative ionmode a higher ionization efficiency of anionic species wasobserved in comparison to the positive ion mode, possi-
bly due to a different acid-base equilibrium in the electro-spray ion source. Moreover, under this particular buffersystem regime, enhanced ionization of these species ascompared to methanol and water was observed, alongwith suppression of sodiated species. The same buffersystem tested on a mixture of neutral carbohydrates (datanot shown) was found to be more effective for ionization inthe positive ion mode.
The sample dissolved in the CE carrier to a concentrationof 0.75 mg?mL21, corresponding to approximately 5.0 pmol(calculated for an average molecular mass of 2500 Da)total material, was injected into the CE capillary and firstsubmitted to the pressure-assisted RPCE/(-) nanoESI-QTOF-MS screening (Fig. 3), where five major TIC peaksin a time window of 15 min were not baseline-separated.The spectra combined across the major TIC peaks indi-cated a partial separation of the components accordingto the amino acid/peptide part, but no other factors. Asexample, in the spectrum obtained by combining acrossthe second TIC peak (Fig. 3), dominant MS signals corre-spond to Neu5Ac2HexHexNAc-Ser, while some Neu5A-c2HexHexNAc-Thr is also visible, along with lower-inten-sity peaks related to (disialo) Ser- and Thr-hexasacchar-ide and (trisialo) pentasaccharide.
Different results were obtained under the conditionswithout pressure assistance from the BQ5 fraction pre-pared under the same solution conditions as for theexperiment in Fig. 3. In this experiment, the separationvoltage, and the injection time were set at the samevalues as for pressure-assisted RPCE/(-)nanoESI-QTOF-MS. The TIC-MS corresponding to the RPCE/(-)nanoESI-QTOF-MS of the BQ5 (Fig. 4) revealed 17 major TICpeaks, 11 baseline-separated, all detected within amigration time window from min 18 to 65. Obviously, inthe nonpressured RPCE/(-)nanoESI-QTOF-MS (Fig. 4) asuperior separation efficiency and resolution as com-pared to the pressure-assisted RPCE/(-)nanoESI-QTOF-MS was achieved.
The intensity of ten peaks exceeded well the threshold ofionic current intensity of the buffer, being automaticallylabeled by the instrument software with the m/z value ofthe ion exhibiting the highest relative intensity. The spec-tra combined across the most prominent TIC peaksclearly indicate that the mixture is dominated by the Ser-,Thr-, and Thr-Pro-linked tetrasaccharide bearing two sia-lic acid moieties (Fig. 4, TIC-peaks: 8, 11, 13), hex-asaccharide bearing two sialic acids (Fig. 4, TIC-peaks: 9,10, 12), and monosialo trisaccharides (Fig. 4, TIC peaks:13, 16). These results are in agreement with our dataobtained by experiments carried out by a number of dif-ferent MS-based techniques [8, 15, 16, 18–20, 34, 35],with respect to the relative abundance of these species in
2005 WILEY-VCH Verlag GmbH & Co. KGaA, Weinheim

Electrophoresis 2005, 26, 1488–1499 RPCE/(-)nano ESI-QTOF-MS of underivatized glycoconjugates 1493
Figure 3. Pressure-assisted RPCE/(-)nanoESI-QTOF TIC-MS of the BQ5 fraction. Sample concentration, 0.75 mg?mL21
(5 pmol injected); CE voltage, 225 kV. CE buffer, 0.1 M methanol/water (6:4 % v/v) formic acid, pH 2.8; CE capillary length,130 cm. Inset: spectrum corresponding to the second TIC-MS peak.
the mixture. It is known that carbohydrates migrate gen-erally under electrophoretic conditions according to theirextension of chain length and this migration behavior wasgenerally observed also in this case. In our previousstudies it was found that by sheathless normal-polarityCE/(-)nanoESI-QTOF-MS the elution of similar glycopep-tide components follows the order from short chain lengthand lower sialylation degree to the higher but no dis-crimination according to the amino acid moiety could beachieved [32, 33]. This feature might be attributed to theexisting high EOF which results in a slight decrease of theseparation efficiency.
In RPCE/(-)nanoESI-QTOF-MS experiments, however,components with identical glycan composition anddegree of sialylation are efficiently separated according totheir amino acid composition. These homologous com-ponents migrated in the following order: Ser-, Thr-, and at
last Thr-Pro saccharide, as demonstrated directly by theXIC performed on the doubly charged ions at m/z 525.3,532.3 and 580.9 corresponding to Ser-, Thr-, and Thr-Prolinked (disialo) tetrasaccharides, respectively. Thus, thetetrasaccharides bearing two sialic acid moieties linked toSer-, Thr-, and Thr-Pro represented by their doublycharged molecular ions are eluting at min 34.58 (TIC peak8), 39.39 (TIC peak 11), and 47.90 (TIC peak 13), respec-tively. The XICs of the (disialo) tetrasaccharide Ser-, Thr-,and Thr-Pro linked are inserted in Figs. 5a, b and c,respectively. The corresponding spectra obtained bycombining across the XIC-peak (Figs. 5a, b, and c,respectively), indicate a good separation of these homol-ogous species and a high S/N ratio of detection. The Ser-linked tetrasaccharide was detected in the 8th TIC peak asa doubly charged ion at m/z 525.37 and a singly chargedion at 1051.45 (Fig. 5a), the Thr-linked tetrasaccharide inthe 11th TIC peak as a doubly charged ion at m/z 532.38
2005 WILEY-VCH Verlag GmbH & Co. KGaA, Weinheim

1494 L. Bindila et al. Electrophoresis 2005, 26, 1488–1499
Figure 4. RPCE/(-)nanoESI-QTOF TIC-MS of the BQ5 fraction. Sample concentration; 0.75 mg?mL21
(5 pmol injected); CE voltage, 225 kV; CE buffer, 0.1 M methanol/water (6:4 % v/v) formic acid, pH 2.8;CE capillary length, 130 cm.
and a singly charged one at 1065.46 (Fig. 5b). The Thr-Pro linked tetrasaccharide was detected in the 13th TICpeak as a doubly charged ion at m/z 580.92 along withits corresponding singly charged ion at m/z 1162.50. Thesame order of elution was followed by the Ser-, Thr-, andThr-Pro-linked hexasaccharides bearing two sialic acids(Fig. 4, TIC peaks 9, 10, 12), and Ser-, Thr- linked(monosialo) trisaccharides (Fig. 4, TIC peaks 14, 16). Bya detailed inspection of data, this rule for separationbasis has been confirmed for other homologous sac-charides as well.
A second basis for separation and elution order wasfound to be the degree of sialylation for species of iden-tical neutral glycan backbone and amino acid but carryingdifferent numbers of sialic acid moieties. These com-pounds eluted in reverse order of the sialylation degree,from highly sialylated to mono- and nonsialylated spe-cies. The trisialo Hex-HexNAc Ser-linked was detected asa doubly charged ion at m/z 670.91 at min 31.66, the dis-ialo HexHexNAc Ser-linked at min 34.58 (Fig. 5a), and themonosialo HexHexNAc Ser-linked at min 47.82 (Fig. 4,TIC peak 14). Few ions were found in more than one TICpeak at different intensities: this could be attributed to acertain degree of in-source fragmentation. On the otherhand, they could arise also from isobaric structures pres-ent in the mixture and migrate consequently differently
but deliver the same nominal m/z values. Further struc-tural investigation of this behavior by fragmentation anal-ysis is still ongoing.
Of particular importance, arising from the data analysis, isthe fact that under this solution/ionization/detection con-ditions the in-source decay by desialylation of the glyco-peptide species is rather low. In the case of trisialo spe-cies a neutral loss of one sialic acid moiety could occur. Aneutral loss of one disaccharide unit from the molecularions was also observed, considered to arise preferentiallyin the case of a nonsialylated or already desialylatednonreducing end of the branch.
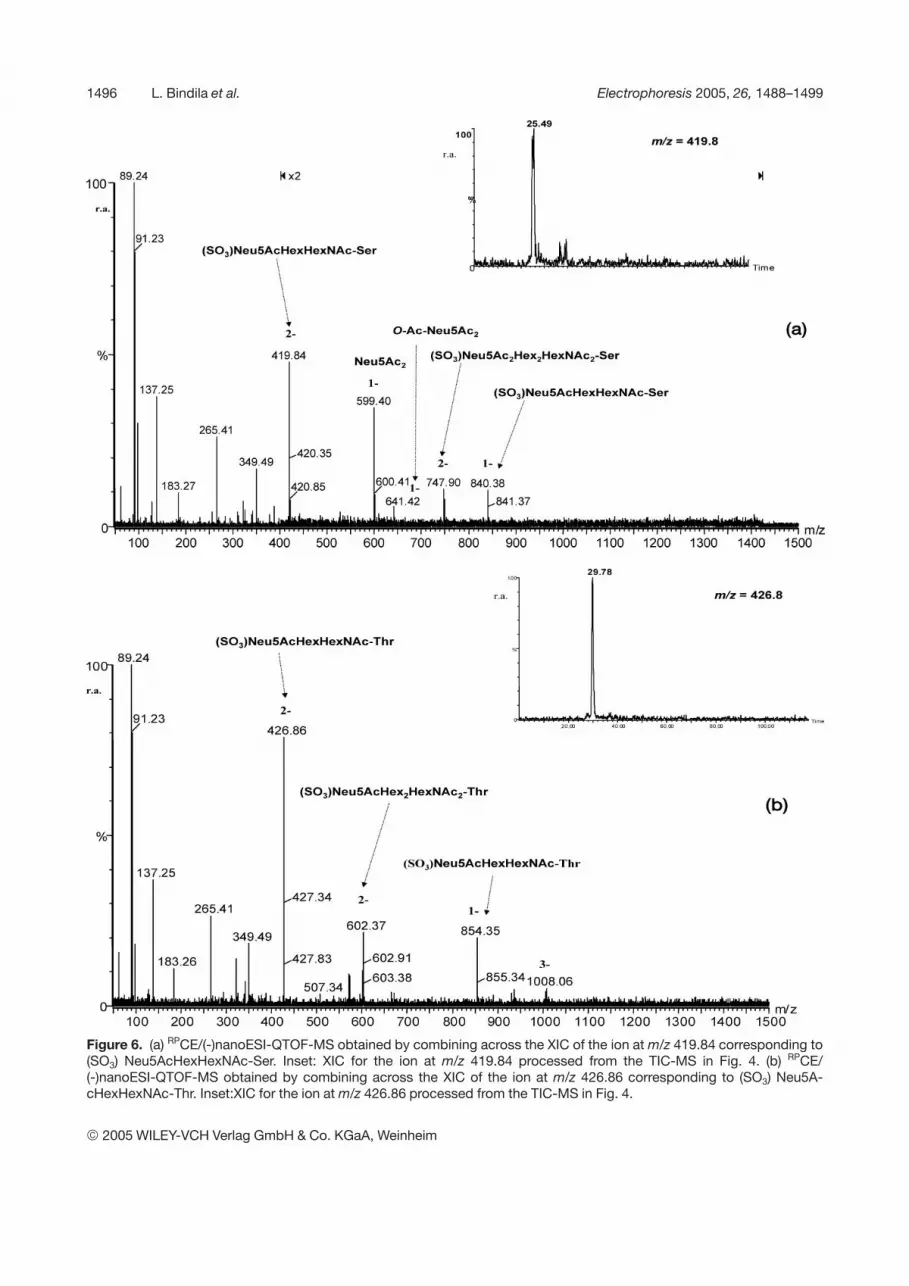
The monosaccharide composition and their anomericlinkages and branching of the major components werepreviously determined [18, 40]. A detailed inspection ofdata, revealed, however, that a larger number of minorcomponents than expected was detected with a fairlyhigh S/N ratio. In Table 1 the assignment of the major andminor molecular ions in the 17th TIC peaks is listed. Thehigh ionization efficiency under the acidic conditions andoptimized parameters for detection is indicated by thepredominant generation of multiply charged ions corre-sponding to short and long carbohydrate chain lengths.By combining across narrow areas along the TIC-MSprofile, spectra containing doubly and triply charged ions
2005 WILEY-VCH Verlag GmbH & Co. KGaA, Weinheim

Electrophoresis 2005, 26, 1488–1499 RPCE/(-)nano ESI-QTOF-MS of underivatized glycoconjugates 1495
Figure 5. (a) RPCE/(-)nanoESI-QTOF-MS obtained bycombining across the XIC of the ion at m/z 525.3 corre-sponding to Neu5Ac2HexHexNAc-Ser. Inset: XIC of theion at m/z 525.3 proccessed from the TIC-MS in Fig. 4.(b) RPCE/(-)nanoESI-QTOF-MS obtained by combiningacross the XIC of the ion at m/z 532.3 corresponding toNeu5Ac2HexHexNAc-Thr. Inset: XIC of the ion at m/z532.3 proccessed from the TIC MS in Fig. 4. (c) RPCE/(-)nanoESI-QTOF-MS obtained by combining across theXIC of the ion at m/z 580.9 corresponding to Neu5A-c2HexHexNAc-Thr-Pro. Inset: XIC of the ion at m/z 580.9proccessed from the TIC-MS in Fig. 4.
corresponding to molecular masses up to 4000 Da, pre-viously not detectable in this complex mixture, could beobtained. The low TICs exhibited by these componentsas compared to the ionic intensity of the CE buffer can berationalized by their low abundance in this mixture show-ing a feasibility of high dynamic range detection. Never-theless, the potential of this approach to separate anddetect with high sensitivity even less abundant compo-nents, previously inaccessible due to overlapping of iso-baric structures and/or low content in the original biolog-ical material, is of major importance for progress indetailed glycoconjugate identification.
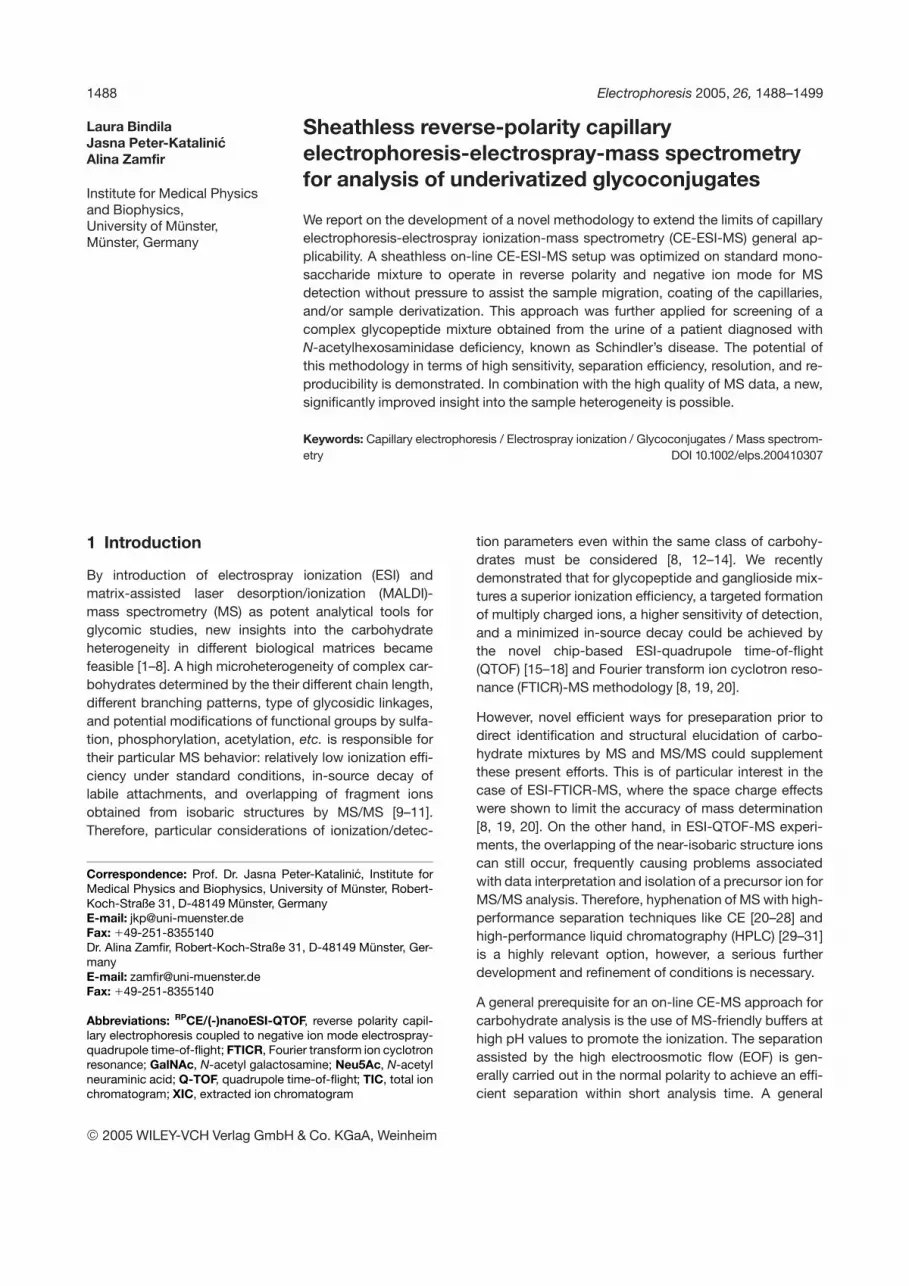
Exemplarily, by combining across 25 scans at min 25.4and across the peak at min 29.7 the spectra in Figs. 6aand b were obtained, respectively. In these spectra, gly-can ions of lower intensities as compared to the ionicspecies intensity of the CE buffer were visible. However, afairly good S/N ratio of detection for identification of thespecies could still be obtained. The XICs of the mostabundant ions in Figs. 6a and b, except for those of theCE carrier, are inserted in the Figs. 6a and b, respectively.The assignment of these peaks according to their molec-ular ions was conducted under the hypothesis that mod-ification of glycopeptides by sulfation and acetylationcould be present [40]. Thus, at this point of investigation,the doubly charged ion at m/z 419.84 (Fig. 6a) and thedoubly charged ion at m/z 426.86 (Fig. 6b) were by cal-culation attributed to the (SO3) Neu5AcHexHexNAc-Serand -Thr-linked, respectively. In analogy, the specieselongated by one HexHexNAc and Neu5AcHexHexNAcunit at m/z 602.37/609.4 and 747.7/754.89 can beassigned to the (SO3) Neu5AcHex2HexNAc2-Ser/Thr and(SO3) Neu5Ac2Hex2HexNAc2-Ser/Thr (Table 1), respec-tively. Moreover, these species are homologous to thenonsulfated structures detected at the m/z values shiftedby 40 (for doubly charged ions) (Table 1). Though of lowerintensity, the disialo ion was detected as a singly chargedion at m/z 599.40 (Fig. 6a). This ion is accompanied by thesingly charged ion at m/z 641.42, corresponding to mod-ification of this moiety by O-acetylation (Peter-Katalinic etal., in preparation).
The study was further extended on the limit of sensitivityof the RPCE/(-)nanoESI-QTOF-MS screening in the caseof complex biological mixture. The experiments carriedout for a mixture concentration of 0.5 and 0.25 mg?mL21,corresponding to approximately 3.4 and 1.2 pmol mixtureinfusion, respectively, revealed a still fairly good sensitivityof detection, high quality of spectra, and reproducibleseparation and detection pattern. This is illustrated in Fig.7 where extracted ion chromatograms for the major spe-cies in the 0.5 mg?mL21 BQ5 fraction are presented, inwhich the elution order remained consistent with the onein Fig. 4. However, at this concentration and at lower
2005 WILEY-VCH Verlag GmbH & Co. KGaA, Weinheim
1496 L. Bindila et al. Electrophoresis 2005, 26, 1488–1499
Figure 6. (a) RPCE/(-)nanoESI-QTOF-MS obtained by combining across the XIC of the ion at m/z 419.84 corresponding to(SO3) Neu5AcHexHexNAc-Ser. Inset: XIC for the ion at m/z 419.84 processed from the TIC-MS in Fig. 4. (b) RPCE/(-)nanoESI-QTOF-MS obtained by combining across the XIC of the ion at m/z 426.86 corresponding to (SO3) Neu5A-cHexHexNAc-Thr. Inset:XIC for the ion at m/z 426.86 processed from the TIC-MS in Fig. 4.
2005 WILEY-VCH Verlag GmbH & Co. KGaA, Weinheim
Electrophoresis 2005, 26, 1488–1499 RPCE/(-)nano ESI-QTOF-MS of underivatized glycoconjugates 1497
Table 1. Assignment of the major and minor species detected by RPCE/(-)nanoESI-QTOF-MS in theBQ5 fraction
TIC peak/retention time (min)
m/z Chargestate
Proposed structure
1/18 753.34a) 1- (SO3)Neu5AcHexHexNAc2/25 419.87a) 2- (SO3)Neu5AcHexHexNAc-Ser
840.38 1- (SO3)Neu5AcHexHexNAc-Ser599.43 1- NeuAc2641.42b) 1- O-Ac-Neu5Ac2747.9 2- (SO3)Neu5Ac2Hex2HexNAc2-Ser
3/27 481.87a) 2- Neu5Ac2HexHexNAc964.41 1- Neu5Ac2HexHexNAc754.89 2- (SO3)Neu5Ac2Hex2HexNAc2-Thr
4/28 571.9a) 2- Neu5Ac2HexHexNAc-Thr-Pro-H2O1144.49 1- Neu5Ac2HexHexNAc-Thr-Pro-H2O589.88b) 2- Neu5Ac3HexNAc-Ser754.55 2- Neu5Ac2Hex2HexNAc2-Thr-Pro-H2O564.41b) 2- O-Ac-Neu5Ac2HexHexNAc-Ser
5/29 426.86a) 2- (SO3)Neu5AcHexHexNAc-Thr854.41 1- (SO3)Neu5AcHexHexNAc-Thr602.37 2- (SO3)Neu5AcHex2HexNAc2-Ser
6/30 670.91a) 2- Neu5Ac3HexHexNAc-Ser7/33 609.4a) 2- (SO3)Neu5AcHex2HexNAc2-Thr
853.38 2- Neu5Ac3Hex2HexNAc2-Ser1219.9 1- (SO3)Neu5AcHex2HexNAc2-Thr
8/34 525.37a) 2- Neu5Ac2HexHexNAc-Ser677.9b) 2- Neu5Ac3HexHexNAc-Thr626.71b) 2- Neu5Ac2HexHexNAc2-Ser1218.91b) 2- Neu5Ac3Hex4HexNAc4-Ser
9/36 707.92a) 2- Neu5Ac2Hex2HexNAc2-Ser860.44b) 2- Neu5Ac3Hex2HexNAc2-Thr525.4c) 2- Neu5Ac2HexHexNAc-Ser
10/38 714.92a) 2- Neu5Ac2Hex2HexNAc2-Thr532.41c) 2- Neu5Ac2HexHexNAc-Thr
11/39 532.38a) 2- Neu5Ac2HexHexNAc-Thr1065.42 1- Neu5Ac2HexHexNAc-Thr714.92c) 2- Neu5Ac2Hex2HexNAc2-Thr774.43c) 2- Neu5AcHexHexNAc-Thr890.43 2- Neu5Ac2Hex3HexNAc3-Ser290.33c) 1- Neu5Ac
12/45 763.44a) 2- Neu5Ac2Hex2HexNAc2-Thr-Pro580.92b) 2- Neu5Ac2HexHexNAc-Thr-Pro532.41c) 2- Neu5Ac2HexHexNAc-Thr
13/47 580.92a) 2- Neu5Ac2HexHexNAc-Thr-Pro1162.5 1- Neu5Ac2HexHexNAc-Thr-Pro
14/49 760.43a) 1- Neu5Ac HexHexNAc-Ser580.89d) 2- Neu5Ac2HexHexNAc-Thr-Pro
15/51 308.35a) 1- Neu5Ac562.39b) 1- Neu5AcHex2HexNAc2-Ser
16/57 774.43a) 1- Neu5AcHexHexNAc-Thr569.44b) 2- Neu5AcHex2HexNAc2-Thr751.92 2- Neu5AcHex3HexNAc3-Thr
17/65 161.29 1- Hex179.32 1- Hex656.4 2- FucNeu5AcHexHexNAc2341.36a) 1- 2Hex
a) Most abundant ion detected in the TIC peakb) low-abundant ionc) In-source fragment iond) Ion derived from partial overlapping with a neighbor ion
2005 WILEY-VCH Verlag GmbH & Co. KGaA, Weinheim

1498 L. Bindila et al. Electrophoresis 2005, 26, 1488–1499
Figure 7. XIC for the five most abundant ions detected byRPCE/(-)nanoESI-QTOF-MS for a BQ5 sample concentra-tion of 0.5 mg?mL21. TIC-MS acquired after sample injec-tion.
amounts of sample injected into the CE capillary, minorglycopeptide species originally of low concentration inthe raw fraction were not detectable any more, but a closerepresentation of the mixture composition was still possi-ble.
4 Concluding remarks
In this study, a novel CE-MS method for separation anddetection of underivatized glycans based on sheathlessRPCE/(-)nanoESI-QTOF-MS is described. The methodwas developed for separation/detection of underivatizedglycans under reverse polarity without pressure assis-tance and/or coating of the capillaries. Such a straight-forward approach is basically simple, not associated withlaborious sample preparation steps and special instru-mental requirements like coating, use of make up liquid,
or additives, and special support for EOF. By careful con-sideration of solution/detection parameters, a constantand stable spray and good in-run reproducibility alongwith high sensitivity and ionization efficiency could beobtained.
The optimized method was applied for separation anddetection of a complex mixture of O-glycosylated aminoacids and peptides extracted from urine of a patient suf-fering from Schindler’s disease. A superior separationefficiency and resolution of the components according tothe sialylation degree and the amino acid type wasobtained. All these attributes in combination with the highsensitivity of detection are of particular importance forstructural investigation of single components present incomplex mixtures. A fair isolation of a doubly or triplycharged Ser-linked glycan from its homologous Thr-linked species shifted by 7 and/or 4.3 m/z units (for doublyand triply charged ions) as a precursor ion for fragmenta-tion analysis by CID is a difficult task. Due to the improvedseparation efficiency and resolution according to the newRPCE/(-)nanoESI-QTOF-MS protocol presented here thestructural identification of similar or homologous singlecomponents in complex mixtures by MS/MS is now fea-sible. Preliminary data obtained by the same approachupon mixtures of other types of glycoconjugates allow usto consider this method as one of broad applicability instructural glycobiology and glycomics.
We thank Prof. Dr. Detlev Schindler for providing the urinesamples and for fruitful collaboration. The financial sup-port of this work was provided by the Deutsche For-schungsgemeinschaft within the Sonderforschungsbe-reich 492, project Z2 to J.P.-K. The ESI-QTOF massspectrometer was obtained from the HbfG grant (LandNordrhein Westfalen) to J. P.-K. The additional financialsupport provided by the Romanian C.N.C.S.I.S. is grate-fully acknowledged.
Received November 8, 2004
5 References
[1] Kurogochi, M., Nishimura, S., Anal. Chem. 2004, 20, 6097–6101.
[2] Park, Y., Lebrilla, C. B., Mass Spectrom. Rev. 2004, May 3[Epub ahead of print].
[3] Naggar, E. F., Costello, C. E., Zaia, J., J. Am. Soc. MassSpectrom. 2004, 11, 1534–1544.
[4] Ivleva, V. B., Elkin, Y. N., Budnik, B. A., Moyer, S. C., O’Con-nor, P. B., Costello, C. E., Anal. Chem. 2004, 21, 6484–6491.
[5] Saad, O. M., Leary, J. A., J. Am. Soc. Mass Spectrom. 2004,9, 1274–1286.
[6] Petzold, C. J., Leavell, M. D., Leary, J. A., Anal. Chem. 2004,1, 203–210.
2005 WILEY-VCH Verlag GmbH & Co. KGaA, Weinheim

Electrophoresis 2005, 26, 1488–1499 RPCE/(-)nano ESI-QTOF-MS of underivatized glycoconjugates 1499
[7] Khalaila, I., Peter-Katalinic, J., Tsang, C., Radcliffe, C. M.,Aflalo, E. D., Harvey, D. J., Dwek, R. A., Rudd, P. M., Sagi, A.,Glycobiology 2004, 9, 767–774.
[8] Froesch, M., Bindila, L., Zamfir, A., Peter-Katalinic, J., RapidCommun. Mass Spectrom. 2003, 17, 2822–2832.
[9] Peter-Katalinic, J., Mass Spectrom. Rev. 1994, 13, 77.[10] Zaia, J., Mass Spectrom. Rev. 2004, 23, 161–277.[11] Mechref, Y., Novotny, M. V., Chem. Rev. 2002, 2, 321–369.[12] Metelmann, W., Vukelic, Z., Peter-Katalinic, J., J. Mass
Spectrom. 2001, 36, 21–29.[13] Šagi, D., Peter-Katalinic, J., Conradt, H. S., Nimtz, M., J.
Am. Soc. Mass. Spectrom. 2002, 13, 1138–1148.[14] Mechref, Y., Novotny, M. V., Krishnan, C., Anal. Chem. 2003,
18, 4895–4903.[15] Zamfir, A., Vakhrushev, S., Sterling, A., Niebel, H. J., Allen,
M., Peter-Katalinic, J., Anal. Chem. 2004, 76, 2046–2054.[16] Zamfir, A., Vukelic, Z., Bindila, L., Peter-Katalinic, J.,
Almeida, R., Sterling, A., Allen, M., J. Am. Soc. Mass.Spectrom. 2004, 15, 1649–1657.
[17] Zamfir, A., Lion, N., Vukelic, Z., Bindila, L., Rossier, J., Gir-ault, H. H., Peter-Katalinic, J., Lab. Chip 2004, 5, 298–307.
[18] Bindila, L., Almeida, R., Sterlin, A., Allen, M., Peter-Katalinic,J., Zamfir, A., J. Mass Spectrom. 2004, 39, 1190–1201.
[19] Froesch, M., Bindila, L., Baykut, G., Allen, M., Peter-Kata-linic, J., Zamfir, A., Rapid Commun. Mass Spectrom. 2004,18, 3084–3092.
[20] Bindila, L., Froesch, M., Lion, N., Vukelic, Z., Rossier, J.,Girault, H. H., Peter-Katalinic, J., Zamfir, A., Rapid Commun.Mass Spectrom. 2004, 18, 2913–2920.
[21] Kuhn, A. V., Ruttinger, H. H., Neubert, R. H., Raith, K., RapidCommun. Mass Spectrom. 2003, 17, 576–582.
[22] Que, A. H., Novotny, M. V., Anal. Bioanal. Chem. 2003, 375,599–608.
[23] Que, A. H., Novotny, M. V., Anal. Chem. 2002, 74, 5184–5191.
[24] Lanz, C., Thormann, W., Electrophoresis 2003, 24, 4272–4281.
[25] Larrson, M., Sundberg, R., Folestad, S., J. Chromatogr. A2001, 934, 75–85.
[26] Calero-Ruiz, V., Moyano, E., Puignou, L., Galceran, M. T., J.Chromatogr. A 2001, 914, 277–291.
[27] Gennaro, L. A., Harvey, D. J., Vouros, P., Rapid Commun.Mass. Spectrom. 2002, 16, 192–200.
[28] Schmitt-Kopplin, P., Frommberger, M., Electrophoresis2003, 24, 3837–3867.
[29] Gennaro, L. A., Harvey, D. J., Vouros, P., Rapid Commun.Mass Spectrom. 2003, 17, 1528–1534.
[30] Saba, J. A., Shen, X., Jamieson, J. C., Perreault, H., J. MassSpectrom. 2001, 36, 563–574.
[31] Shen, X., Perreault, H., J. Chromatogr. A 1998, 811, 47–59.[32] Zamfir, A., Peter-Katalinic, J., Electrophoresis 2001, 22,
2448–2457.[33] Zamfir, A., Seidler, D. G., Schönherr, E., Kresse, H., Peter-
Katalinic, J., Electrophoresis 2004, 25, 2010–2016.[34] Zamfir, A., Peter-Katalinic, J., Electrophoresis 2004, 25,
1949–1963.[35] Zamfir, A., König, S., Althoff, J., Peter-Katalinic, J., J. Chro-
matogr. A 2000, 895, 291–299.[36] de Jong, J., van den Berg, C., Wijburg, H., Willemsen, R.,
van Diggelen, O., Schindler, D., Hoevenaars, F., Wevers, R.,J. Pediat. 1994, 125, 385–391.
[37] Sakuraba, H., Matsuzawa, F., Aikawa, S., Doi, H., Kotani, M.,Nakada, H., Fukushige., T., Kanzaki, T., J. Hum. Genet.2004, 49, 1–8.
[38] Linden, H. U., Klein, R. A., Egge, H., Peter-Katalinic, J.,Dabrowski, J., Schindler, D., Biol. Chem. Hoppe Seyler1989, 370, 661–672.
[39] Williger, K., Doctoral Thesis, University of Bonn, 1993.[40] Peter-Katalinic, J., Williger, K., Egge, H., Green, B., Hanisch,
F. G., Schindler, D. J. Carbohydr. Chem. 1994, 13, 447–465.
2005 WILEY-VCH Verlag GmbH & Co. KGaA, Weinheim