sequence effects on stochastic fatigue of welded joints
TRANSCRIPT

SEQUENCE EFFECTS ON STOCHASTIC FATIGUE OF WELDED JOINTS
By Shahram Sarkani,1 Loren D. Lutes,2 Paul J. Hughes,3
and David P. Kihl"
ABSTRACT: The influence of small stress ranges on a recently proposed sequence-dependent fatigue damage model is examined. The damage model is capable of including sequence effects by taking into account the interaction of neighboring cycles in predicting the fatigue damage accumulation. The parameters necessary for use of the damage model are obtained using a combined experimental and empirical approach. The model is modified here to ignore stress cycles below a truncation level that is consistent with the endurance limit of the specimens under constant amplitude loads. It is shown that with this modification, the damage model gives fatigue life predictions that compare very well with experimental results for a wide variety of stochastic loads. Additional experimental investigation with dif-ferent specimen geometry and material is needed to further examine the validity of the proposed damage model and the extent to which the parameters needed to use this model are geometry- and material-dependent.
INTRODUCTION
Many structures and components in service today are at risk of failure as the result of cumulative fatigue damage arising from response to external excitations. The elements are often subject to stresses of variable amplitude. In contrast, most experimental results are obtained under constant amplitude loading conditions, and it is often on such results that design decisions are based. It is clear that constant amplitude loads do not adequately represent the typical environmental loading (wind, wave, etc.) experienced by a struc-ture. Thus, use is made of the theory of stochastic processes to analyze variable amplitude loading situations.
Although precise stochastic time histories cannot be predicted, it is pos-sible to predict certain statistical properties of the time history, enabling cal-culation of mean damage values, and thus, of probabilities of failure. Such calculations are dependent on the choice of appropriate mathematical models that characterize the behavior of the material in controlled tests. The results of these tests can then be utilized to provide a probabilistic estimate of the fatigue life for a particular structure. It should be noted that the emphasis here is on the prediction of the mean fatigue life as influenced by stochastic time histories. In order to predict probabilities of failure, it is also necessary, at a minimum, to estimate the standard deviation of fatigue life. This is omitted here since past studies indicate that the standard deviation of fatigue
'Assoc. Prof., Dept. of Civ., Mech. and Envir. Engrg., The George Washington Univ., Washington, D.C. 20052.
2Prof., Dept. of Civ. Engrg., Texas A&M Univ., College Station, TX 77843. 3Grad. Student, Dept. of Civ. Mech., and Envir. Engrg., The George Washington
Univ., Washington, DC. 4Sr. Struct. Engr., Ship Structures and Protection Dept., David Taylor Res. Ctr.,
Bethesda, MD 20084. Note. Discussion open until November 1, 1991. To extend the closing date one
month, a written request must be filed with the ASCE Manager of Journals. The manuscript for this paper was submitted for review and possible publication on Feb-ruary 19, 1990. This paper is part of the Journal of Structural Engineering, Vol. 117, No. 6, June, 1991. ©ASCE, ISSN 0733-9445/91/0006-1852/$1.00 + $.15 per page. Paper No. 25935.
1852
J. Struct. Eng. 1991.117:1852-1867.
Dow
nloa
ded
from
asc
elib
rary
.org
by
TEX
AS
A&
M U
NIV
ERSI
TY o
n 03
/30/
15. C
opyr
ight
ASC
E. F
or p
erso
nal u
se o
nly;
all
right
s res
erve
d.

life depends primarily on the uncertainty about the individual specimens, rather than on the uncertainty about the details of the stochastic stress time history (Crandall and Mark 1963).
Until recently, it had been assumed that the currently accepted and widely used Palmgren-Miner (PM) damage model (Palmgren 1924; Miner 1945) was reasonably accurate, and conservative, when applied to welded con-nections. However, recent experimental investigations have suggested that in some circumstances the model may be too conservative, resulting in an unnecessarily expensive structure, while in other cases its use may result in the opposite situation, which is a much more serious problem (Sarkani 1986).
In order to learn more about fatigue damage accumulation in welded joints under stochastic loads, an experimental-analytical study was undertaken. Al-though some of these results have been previously reported (Sarkani and Lutes 1988b; Sarkani 1989), this paper presents significant extensions, par-ticularly in the analytical model. Controlled experiments were conducted to identify the parameters of the stochastic loading process having the most significant influence on fatigue life, and it was concluded that the correlation of different extrema within the loading process is one such parameter. This implies that the damage due to a particular variable amplitude cycle is also a function of stress ranges in the previous cycles, which contradicts the basic assumption of the PM damage model. Finally, a possible form was suggested for a sequence-dependent (SD) damage model that might be more consistent with experimental results. For one particular type of stochastic load (sub-sequently referred to as pseudo-narrow-band), it was found that the coef-ficients in the SD damage model could be chosen such that the model gave fatigue life predictions that compared well with the experimental data (Sar-kani and Lutes 1988b).
This paper shows that the SD model that worked well for the pseudo-narrow-band loadings does not give predictions that are in good agreement with experimental results for an alternate set of stochastic loads (Sarkani 1989). It appears that the lack of agreement is due to the high-frequency/ small-amplitude components that were present in the second set of loadings, but were not present in the pseudo-narrow-band loads.
The two situations for the alternative set of loadings with high-frequency components considered here include bimodal block power spectral density (psd) curves and smooth unimodal psd curves with a high-frequency tail that was truncated at a specific frequency. The first of these situations arises in practical problems due to the fact that the energy of the structural response is often concentrated around more than one frequency value. For example, the response of an offshore structure usually consists of components at the frequency of the wave motion and components due to dynamic response at the resonant frequency of the structure. Therefore, the response of such an offshore structure to wave loading can often be represented by a bimodal psd. The other situation of high-frequency components arising from the pres-ence of a gradually decaying tail of the psd is even more common. Few physical processes really have a well-defined high-frequency cutoff. Simu-lation procedures, on the other hand, generally consider only a finite band of frequencies, so a decision must be made regarding an appropriate trun-cation frequency. It seems important to have a damage accumulation model that gives accurate results in both of these situations that include high-fre-quency components.
1853
J. Struct. Eng. 1991.117:1852-1867.
Dow
nloa
ded
from
asc
elib
rary
.org
by
TEX
AS
A&
M U
NIV
ERSI
TY o
n 03
/30/
15. C
opyr
ight
ASC
E. F
or p
erso
nal u
se o
nly;
all
right
s res
erve
d.
The purpose of the current investigation is to further examine the SD dam-age model and to determine whether reasonable refinements can be intro-duced so that it may yield accurate predictions for all the stochastic loads investigated, particularly those having small-amplitude/high-frequency com-ponents.
EXPERIMENTAL PROGRAM
The studies by Sarkani and Lutes (Sarkani and Lutes 1988b; Sarkani 1989) used statistical methods to categorize actual service loads in order to obtain experimental data on the relationship between fatigue life and the various statistical parameters. Of particular interest were the effect of the correlation of consecutive extrema and the influence of high-frequency components of the loading process, which are briefly discussed here.
Basically, two groups of variable amplitude loads were studied. The vari-able amplitude loadings in group I were completely characterized by the correlation of their successive extrema. Each loading time history had the same mean value (zero), the same root-mean-square (rms) value [= 3 kips (13.36 kN)], the same probability distribution for each extremum (the Ray-leigh distribution), and the same wave form between adjacent extrema (hav-ersine). Only the correlation of these Rayleigh-distributed extrema was var-ied from one set of tests to the next. These time histories were simulated using an autoregressive simulation technique (Sarkani 1990). When the cor-relation is near negative unity, the amplitude varies slowly; thus the time history may be classified as narrow-band. At the other extreme, i.e., for a correlation at or approaching zero, the amplitude varies rapidly, as with a broad-band process.
Processes of these types have an irregularity factor of unity. That is, they have the same number of zero up-crossings as they do peaks, and thus are referred to as pseudo-narrow-band loadings. The five loads applied to the test specimens had peak-valley correlation values p of 0, —0.45, —0.75, —0.95, and —0.995. This group of loadings allowed study of the effect of amplitude correlation on fatigue life, without including variation of ampli-tude distribution.
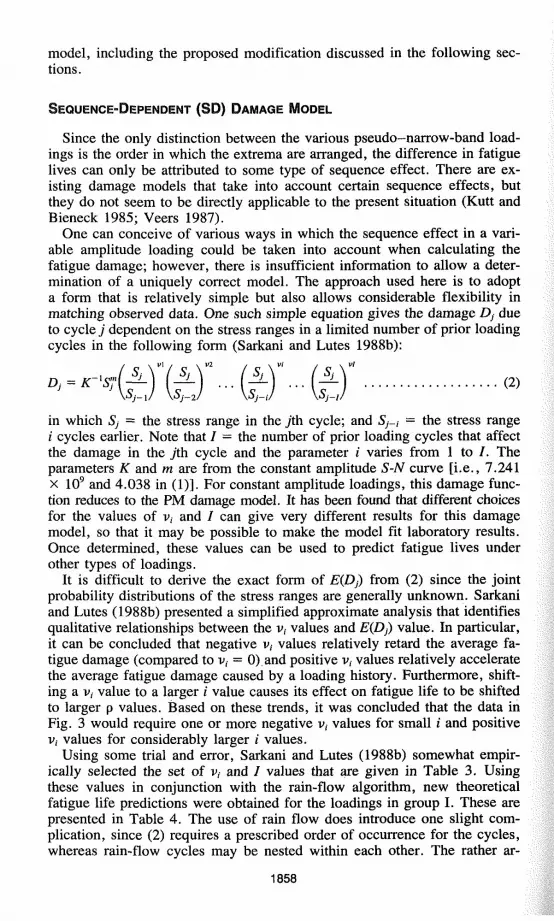
The variable amplitude loadings in group II were simulated using a stan-dard Gaussian process simulation technique. The loadings used in this group were completely characterized by their power spectral densities. One of the objectives was to determine how fatigue life was influenced by various char-acteristics of the psd. Of particular interest was the effect of high-frequency modes in the psd and/or high-frequency truncation of the psd. Fig. 1 shows a complete description of psd for all the stochastic loadings in group II.
The specimens used were welded-plate tees, since welds are one of the most common locations for initiation of fatigue cracks in actual structures. The configuration and dimensions of the test specimens are shown in Fig. 2. For each loading, at least three specimens were tested to failure. More details about the experimental setup can be found in Sarkani and Lutes (1988b). Tables 1 and 2 present the individual experimental results and the corre-sponding geometric mean values for the groups I and II loadings, respec-tively.
In order to compare the variable amplitude experimental results with any analytical technique, the constant amplitude S-N curve for the test specimens
1854
J. Struct. Eng. 1991.117:1852-1867.
Dow
nloa
ded
from
asc
elib
rary
.org
by
TEX
AS
A&
M U
NIV
ERSI
TY o
n 03
/30/
15. C
opyr
ight
ASC
E. F
or p
erso
nal u
se o
nly;
all
right
s res
erve
d.

<X = 0.99 W(u>)
Q1
0.68 0.82 •w (rad/sec)
<X = 0.89 W(«u)
G1
0.4 1.1 .u> (rad/sec)
<*=0.43 W(w)
G1
<32
G1/G2 = 10
n_w (red/sec) 0.4 1.1 3.4 3.7
<* =0.26 W(w)
G1
G2
0.4 1.1 10.2 10.8
G^Gg = 15
to (rad/sec)
d = 0.85 WOo)
fi\w(w) = K<u-4exp (-0.05uT3)
j \ w max = 0.75 u—• UJ (rad/sec) 0.33 wmax
of = 0.52 WOu)
llWUu) = Kw_4exp (-0.05cu-3)
I V wmax = 3.0 0.33
ui (rad/sec) max
FIG. 1. Summary of Stochastic Loads: Group II Loadings
1855
J. Struct. Eng. 1991.117:1852-1867.
Dow
nloa
ded
from
asc
elib
rary
.org
by
TEX
AS
A&
M U
NIV
ERSI
TY o
n 03
/30/
15. C
opyr
ight
ASC
E. F
or p
erso
nal u
se o
nly;
all
right
s res
erve
d.
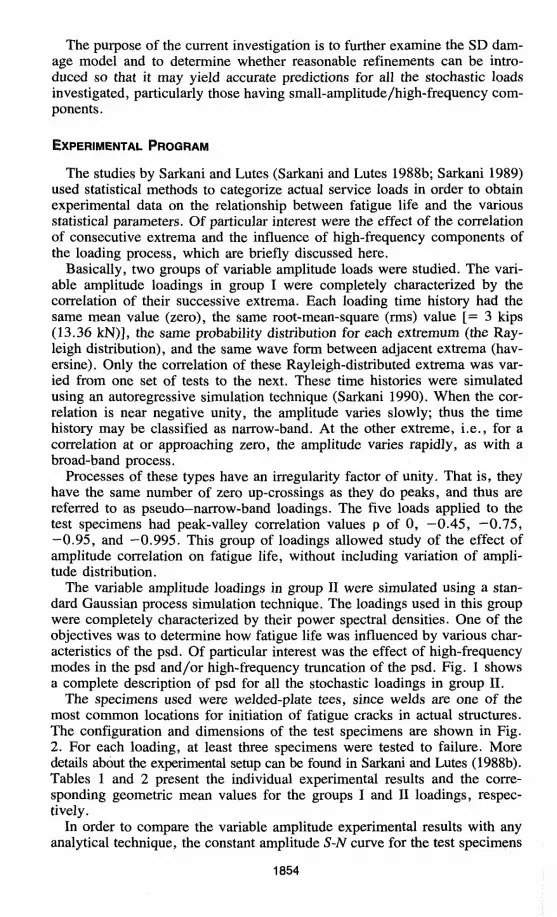
FIG. 2. Sketch of Test Specimen
TABLE 1. Comparison of Experimental and Analytical Results (Pseudo-Narrow-Band Loadings): Group I Loadings
Description (D
Experiment 1 Experiment 2 Experiment 3 Experiment 4
Experiments (geometric mean)
Rain-flow (PM damage model)
p = 0.0 (2) 361 966 673 — 617
741
Peaks to Failure (x103) p = -0.45
(3) 871 481 312 — 507
667
p = - 0 .75 (4)
334 307 790 — 432
638
p = 0.95 (5)
331 253 232 368
291
661
p = -0 .995 (6)
462 512 551 — 508
614
Note: p = correlation of extrema.
TABLE 2. Comparison of Experimental and Analytical Results (Gaussian Load-ings): Group II Loadings
Description
(D Experiment t Experiment 2 Experiment 3 Experiment 4
Experiments (geometric mean)
Rain-How (PM damage model)
IFa = 0.99 (2) 384 342 330 -351
748
IF = 0.89 (3) 480 650 770 — 622
757
Peaks to Failure (X103)
IF = 0.43 (4)
1,200 1,160 1,800
— 1,360
1,750
IF = 0.26 (5)
4,460 4,340 5,970
— 4,870
5,448
IF = 0.85 (6) 930 460 550 650
625
806
IF = 0.52 (7) 655 973 491 970
742
1,360 aIF - irregularity factor.
1856
J. Struct. Eng. 1991.117:1852-1867.
Dow
nloa
ded
from
asc
elib
rary
.org
by
TEX
AS
A&
M U
NIV
ERSI
TY o
n 03
/30/
15. C
opyr
ight
ASC
E. F
or p
erso
nal u
se o
nly;
all
right
s res
erve
d.

o >-o 105
o Rayleigh Extrema (Experimental) • Rainflow
_L 0.20 0.40 0.60
£%2 0.80 1.00
FIG. 3. Comparison of Experimental Results with Analytical Techniques
is required. Constant amplitude tests were performed, and corrections were considered to take into account the effect of residual stresses due to the weld (Sarkani and Lutes 1988a). The equation of the S-N curve corrected by the Gerber formula is
N = 7.241 x 10⁹ (S)' (1)
and it was concluded that this was the most appropriate S-N curve to use in this study. Note that S in (1) is the load range in kips, or in KN multiplied by 0.2248. Using the S-N curve of (1), the analytical fatigue life predictions by the commonly used rain-flow analysis technique (Matsuishi and Endo 1968) in conjunction with the PM damage model have been computed and are also presented in Tables 1 and 2.
As indicated by Tables 1 and 2, the predictions for fatigue life obtained using rain-flow analysis and the PM damage model exceed the actual fatigue lives measured experimentally. Furthermore, examination of the results for group I loadings indicates a dependence of fatigue life on the correlation of the extrema. A graphical representation of this is shown in Fig. 3. Since all other parameters of the group I loadings were held constant, the difference in fatigue lives can only be attributed to a sequence effect. This implies that the damage occurring in any loading cycle is also a function of the stress ranges in prior loading cycles, requiring an extension of the commonly used Palmgren-Miner hypothesis that the damage occurring in any cycle is de-pendent only on the stress range of that cycle.
It should be noted that the experimental results for groups I and II loadings have already been given by Sarkani and Lutes (1988b) and Sarkani (1989), respectively. However, they have been brought together here to provide a complete picture and to establish the validity of the sequence-dependent damage
1857
J. Struct. Eng. 1991.117:1852-1867.
Dow
nloa
ded
from
asc
elib
rary
.org
by
TEX
AS
A&
M U
NIV
ERSI
TY o
n 03
/30/
15. C
opyr
ight
ASC
E. F
or p
erso
nal u
se o
nly;
all
right
s res
erve
d.
model, including the proposed modification discussed in the following sec-tions.
SEQUENCE-DEPENDENT (SD) DAMAGE MODEL
Since the only distinction between the various pseudo-narrow-band load-ings is the order in which the extrema are arranged, the difference in fatigue lives can only be attributed to some type of sequence effect. There are ex-isting damage models that take into account certain sequence effects, but they do not seem to be directly applicable to the present situation (Kutt and Bieneck 1985; Veers 1987).
One can conceive of various ways in which the sequence effect in a vari-able amplitude loading could be taken into account when calculating the fatigue damage; however, there is insufficient information to allow a deter-mination of a uniquely correct model. The approach used here is to adopt a form that is relatively simple but also allows considerable flexibility in matching observed data. One such simple equation gives the damage Dj due to cycle j dependent on the stress ranges in a limited number of prior loading cycles in the following form (Sarkani and Lutes 1988b):
-r«£f®"~<B'~®' « in which Sj = the stress range in the jth cycle; and S,_, = the stress range i cycles earlier. Note that / = the number of prior loading cycles that affect the damage in the jth cycle and the parameter i varies from 1 to /. The parameters K and m are from the constant amplitude S-N curve [i.e., 7.241 X 10⁹ and 4.038 in (1)]. For constant amplitude loadings, this damage func-tion reduces to the PM damage model. It has been found that different choices for the values of v, and / can give very different results for this damage model, so that it may be possible to make the model fit laboratory results. Once determined, these values can be used to predict fatigue lives under other types of loadings.
It is difficult to derive the exact form of E(DJ) from (2) since the joint probability distributions of the stress ranges are generally unknown. Sarkani and Lutes (1988b) presented a simplified approximate analysis that identifies qualitative relationships between the v, values and E(Dj) value. In particular, it can be concluded that negative v, values relatively retard the average fa-tigue damage (compared to v, = 0) and positive v, values relatively accelerate the average fatigue damage caused by a loading history. Furthermore, shift-ing a v, value to a larger / value causes its effect on fatigue life to be shifted to larger p values. Based on these trends, it was concluded that the data in Fig. 3 would require one or more negative v, values for small i and positive v, values for considerably larger i values.
Using some trial and error, Sarkani and Lutes (1988b) somewhat empir-ically selected the set of v, and / values that are given in Table 3. Using these values in conjunction with the rain-flow algorithm, new theoretical fatigue life predictions were obtained for the loadings in group I. These are presented in Table 4. The use of rain flow does introduce one slight com-plication, since (2) requires a prescribed order of occurrence for the cycles, whereas rain-flow cycles may be nested within each other. The rather ar-
1858
J. Struct. Eng. 1991.117:1852-1867.
Dow
nloa
ded
from
asc
elib
rary
.org
by
TEX
AS
A&
M U
NIV
ERSI
TY o
n 03
/30/
15. C
opyr
ight
ASC
E. F
or p
erso
nal u
se o
nly;
all
right
s res
erve
d.

TABLE 3. Values of v and / i
(1) 1 2 3 4 5 6
7-10 11-60
V (2)
-0 .45 -0 .35 -0 .25 -0 .15 - 0 . 1 -0 .05
0 0.03
bitrary but logical choice was made to order the rain-flow cycles according to the time of occurrence of the peaks associated with the cycles. The results of the SD damage model for the pseudo-narrow-band loads are in reasonable agreement with the experimental results. In order to further test the model's validity, it has also been used to predict the theoretical fatigue lives for group II loadings. These results, which have not been previously published, are presented in Table 5.
Examination of the results in Table 5 indicates that the SD damage model can produce results that are in better agreement with experimental results than those produced by the PM model, but only when the loading psd does not contain a high-frequency component. For the two loadings that have bimodal psd, fatigue life predictions using the SD damage model are up to 49% lower than the experimental results. Since for such loads the time his-tories consist of the sum of a low-frequency/large-amplitude component and a high-frequency/small-amplitude component, it appears that the small rain-
TABLE 4. Comparison of Experimental and Analytical Results (Pseudo-Narrow-Band Loadings): Group I Loadings
Description (1)
Experimental (mean value) Rain-flow (PM damage model) Rain-flow (SD damage model)
Peaks to Failure (x103)
p = 0.0 (2)
617 741 650
p = -0 .4 5 (3)
507 667 508
p = -0 .7 5 (4)
432 638 319
p = -0 .95 (5)
291 661 273
p = -0 .995 (6) 508 614 415
Note: p = correlation of extrema.
TABLE 5. Comparison of Experimental and Analytical Results (Gaussian Load-ings): Group II Loadings
Description (D
Experimental (geometric mean) Rain-flow (PM damage model) Rain-flow (SD damage model)
Peaks to Failure (x103)
IF = 0.99 (2)
351 748 286
IF = 0.89 0) 622 757 514
IF = 0.43
1,360 1,750
861
IF = 0.26 (5)
4,870 5,448 2,471
IF = 0.85 (6)
625 860 500
IF = 0.52 (7)
742 1,360
686
"IF = irregularity factor.
1859
J. Struct. Eng. 1991.117:1852-1867.
Dow
nloa
ded
from
asc
elib
rary
.org
by
TEX
AS
A&
M U
NIV
ERSI
TY o
n 03
/30/
15. C
opyr
ight
ASC
E. F
or p
erso
nal u
se o
nly;
all
right
s res
erve
d.

flow cycles caused by the high-frequency/small-amplitude component may have an overly significant effect on the fatigue life predicted by the SD damage model. This is a serious shortcoming of the SD damage model since many practical loadings do contain high-frequency/small-amplitude cycles, and these cycles appear to interfere with the calculation of damage caused by the larger loading cycles. It is clear that this shortcoming must be re-solved before the SD damage model can be effectively used for a wide range of stochastic loadings.
INFLUENCE OF SMALL STRESS RANGES
For a stochastic time history, it is reasonable to assume that only those cycles with ranges above a given level contribute to the damage calculation. This is an extension to the stochastic loading of the constant amplitude S-N curve finding that there is a particular stress level, the endurance limit, below which cycles are considered not to contribute to fatigue damage. In the study of pseudo-narrow-band loads (Sarkani and Lutes 1988b), the effect of en-durance limit on variable amplitude fatigue life predictions was ignored, i.e., all rain-flow cycles were included in the fatigue damage calculation.
It is generally assumed that the endurance limit effect is negligible when the PM damage model is used to calculate fatigue life, provided that a sig-nificant fraction of the cycles have ranges above the endurance limit. Fur-thermore, neglecting the endurance limit with the PM model always gives a conservative result. Including the endurance limit would predict zero dam-age accumulation due to cycles below the endurance limit, while neglecting the limit gives a prediction of a small amount of damage due to those small cycles. On the other hand, it is possible that neglecting the endurance limit may result in significant error when the SD damage model is used. This is due to the fact that when using the SD damage model, small preceding cycles may significantly alter the amount of damage calculated as being caused by the larger cycles. For example, consider a rather extreme case in which the level of the stress ranges suddenly changes from one constant amplitude to another much larger constant amplitude. In particular, let St = Sz = . . . = 560 = 0.015* and S61 = S62 = . •. = S*. Using (2) with the v, values from Table 3 then predicts that S61 will cause almost twice as much damage as if it were a constant amplitude time history (at level S*), and this damage per cycle increases with each cycle until S^ through 570, where each causes 1,000 times as much damage as the constant amplitude damage level. The possi-bility of such greatly accelerated damage predictions is perhaps the most serious shortcoming of the SD damage model.
The most obvious way to overcome the inaccuracy that the small ampli-tude cycles introduce into the SD model is to simply remove those cycles from all damage calculations. This can be done by introducing a truncation limit into the rain-flow analysis so that all ranges smaller than the truncation limit are completely ignored in damage calculations. The following section discusses the appropriate choice of the truncation level and its effect on fa-tigue life predictions by the SD damage model for both the pseudo-narrow-band and Gaussian loadings discussed earlier.
MODIFICATION OF SD DAMAGE MODEL
Elimination of the small variable amplitude cycles can be expected to pro-duce a change in the fatigue life predicted by the SD damage model if the
1860
J. Struct. Eng. 1991.117:1852-1867.
Dow
nloa
ded
from
asc
elib
rary
.org
by
TEX
AS
A&
M U
NIV
ERSI
TY o
n 03
/30/
15. C
opyr
ight
ASC
E. F
or p
erso
nal u
se o
nly;
all
right
s res
erve
d.

i o 6 r
o Zero Truncation ® Truncation 2 kips A Truncation 3 kips A Truncation 4 kips
0 0.20 0.40 0.60 0.80 1.00 p2
FIG. 4. Fatigue Life for Raylelgh-Dlstributed Extrema at Various Truncation Lev-els
v, and / values are unchanged. While such a change may be desired for the Gaussian loadings, it is also likely to occur for the pseudo-narrow-band loading for which the SD damage model was already quite acceptable. Thus, it is necessary to determine whether an accurate SD model can be obtained when a truncation level is introduced. The fatigue lives predicted for the pseudo-narrow-band loads using the SD damage model are plotted in Fig. 4 for various levels of truncation between zero (i.e., the original condition) and four kips (or 17.81 kN), or 1.33 times the rms of the loading process. The v, and / values used are those of Table 3. It is noticeable that as the truncation level increases with the range shown, the shape of the N versus p2 curves remains essentially the same, but the fatigue life increases. It is then reasonable to expect that by changing the value of v, for a particular truncation level, it may be possible to obtain fatigue life levels approximately the same as those obtained for zero truncation, thereby agreeing with the experimental results for this class of loadings.
The largest truncation level shown in Fig. 4 (i.e., 4 kips or 17.81 kN) appears to be a good approximation of the endurance limit for these speci-mens, based on observations of the fatigue strength under constant amplitude loadings (Hughes 1989). Since the results for 4-kip (or 17.81-kN) truncation in Fig. 4 are consistent in form with those for no truncation, it appears reasonable to use this truncation level and completely neglect cycles below the constant amplitude endurance limit. This choice is used in the remainder of this paper.
Since the introduction of truncation decreases the predicted fatigue dam-age, this must be counteracted by modifying the v, values. Based on the general trends already noted for the SD model, this requires using more negative v, for small i values and more positive v, for the larger i values. A
UJ f£
< O H CO UJ _J O >-o
•4 f\
1861
J. Struct. Eng. 1991.117:1852-1867.
Dow
nloa
ded
from
asc
elib
rary
.org
by
TEX
AS
A&
M U
NIV
ERSI
TY o
n 03
/30/
15. C
opyr
ight
ASC
E. F
or p
erso
nal u
se o
nly;
all
right
s res
erve
d.

TABLE 6. Values of v and i
;' 0) 1 2 3 4 5
6-10 11-29 30-49 50-60
V*
(2) - 0 . 5 - 0 . 4 -0 .30 - 0 . 2 - 0 . 1
0 0.03 0.05 0.03
set of values of the v, found to achieve the required levels of fatigue life with a truncation level of 4 kips (or 17.81 kN) is given in Table 6. As with the earlier set of choices (Table 3), the particular values chosen are quite arbitrary, but the general form of v versus i is dictated by the experimental results.
The theoretical fatigue life predictions of the SD model using the new v, values and a 4-kip (or 17.81-kN) truncation level are shown in Tables 7 and 8. Examination of the results indicates that the theoretical predictions ob-tained for the pseudo—narrow-band loads again compare well with the ex-perimental results, showing that the v, modification does correct for the trun-cation effects shown in Fig. 4. The theoretical results obtained for the Gaussian loadings are also generally in good agreement with the experimental results, including those variable amplitude loads with bimodal psd, for which the SD model previously gave overly conservative predictions. The only excep-tion is the fatigue life prediction for the smooth psd loading with high-fre-
TABLE 7. Comparison of Experimental and Analytical Results (Pseudo-Narrow-Band Loadings): Group I Loadings
Description (D
Experimental (geometric mean) Rain-flow (modified SD damage model)
Peaks to Failure (x103)
p = 0.0 (2)
617 609
p = -0 .45 (3)
507 504
p = -0 .75 (4)
432 365
p = - 0 . 9 5 (5)
291 299
p = -0 .995 (6)
508 436
Note: p = correlation of extrema.
TABLE 8. Comparison of Experimental and Analytical Results (Gaussian Load-ings): Group li Loadings ^ ^ ^ ^
Description (D
Experimental (geometric mean) Rain-flow (modified SD damage model)
Peaks to Failure (X103)
IF" = 0.99 (2)
351
331
IF = 0.89 (3)
622
593
IF = 0.43 (4)
1,360
1,418
IF = 0.26 (5)
4,870
5,421
IF = 0.85 (6)
625
645
IF = 0.52 (7)
742
1,064 aIF = irregularity factor,
1862
J. Struct. Eng. 1991.117:1852-1867.
Dow
nloa
ded
from
asc
elib
rary
.org
by
TEX
AS
A&
M U
NIV
ERSI
TY o
n 03
/30/
15. C
opyr
ight
ASC
E. F
or p
erso
nal u
se o
nly;
all
right
s res
erve
d.

quency tail. For this loading, the experimental results are about 30% lower than that predicted by the SD model. It is not known why the model and experimental data do not agree better for this situation. Possibly the dis-crepancy reflects a shortcoming of the model, but it is also possible that it reflects a statistical inaccuracy in the experimental data. In fact, the writers had concerns regarding the accuracy of the experimental results for this par-ticular loading even before the theoretical model was invented. For this rea-son, a fourth experiment was run at this loading.
Recall that the two smooth unimodal psds are the same except for the truncation limit. Thus, it seems somewhat surprising that the modified SD damage model works very well when a>max = 0.75 rad/sec and has a 30% overprediction when utmm = 3.0 rad/sec, particularly inasmuch as the pres-ence of small-amplitude high-frequency components does not seem to cause trouble for the bimodal psd considered. Even though the reason for the dis-crepancy is not known, there are at least two relevant factors that should be noted. First, although the 30% discrepancy is larger than for any of the other situations for the modified SD model, it is not really unexpectedly large. More specifically, a 30% statistical error in the mean results from "identical" experiments would not be very surprising, since fatigue results are typically notable for their statistical scatter. In light of this scatter, it may not be reasonable to seek an analytical model that gives greater agreement with experimental data unless many more data points are available. Second, the modified SD model predicts almost exactly the same effect of the comax trun-cation limit as does the usual PM approach. In particular, both of these models predict that increasing o)max from 0.75 to 3.0 will increase the number of peaks to failure by about 65%, even though the experimental data show only a 20% increase. Thus, even if the modified SD model has significantly overpredicted this effect of a high-frequency tail, it has done so to no greater extent than the usual PM model (and it has actually improved the prediction of fatigue life for both situations compared to the PM results).
Overall, it does appear that the adverse effects of high-frequency/low-amplitude cycles on the fatigue life predictions of the SD damage model can be removed by truncation of the loading processes and modification of the v, values.
COMPARISON OF VARIOUS DAMAGE MODELS
In order to provide further comparison of the PM damage model, the SD damage model, and the modified SD damage model, a third group of time histories has been generated using the Gaussian simulation technique. Only the theoretical fatigue lives for these loadings are compared since no ex-periments have been run. The first two load cases are unimodal and finite-band, i.e., not narrow-band. The second pair of load cases are bimodal and broad-band. Fig. 5 shows the psd for each of the loadings used in this sec-tion. For each loading, a sample time history was simulated by using the Gaussian simulation technique (consisting of 4,000-8,000 extrema). For each time history, the moments of the simulated extrema were checked numeri-cally against the values obtained from the theoretical distribution of extrema of a Gaussian process (Rice 1944). No time history was used for the analysis unless the moments showed very good agreement.
The predicted fatigue lives using the three damage models (i.e., PM, SD
1863
J. Struct. Eng. 1991.117:1852-1867.
Dow
nloa
ded
from
asc
elib
rary
.org
by
TEX
AS
A&
M U
NIV
ERSI
TY o
n 03
/30/
15. C
opyr
ight
ASC
E. F
or p
erso
nal u
se o
nly;
all
right
s res
erve
d.

of =0.78 W(w)
Q i -
0.4 3.7 w (rad/sec)
o( =0.75 W(w)
G1
0.4 10.8
d =0.61 W(w)
G1
G2
0.5 0.65 9.5 11.0
- <*> (rad/sec)
Gi/G2 = 15
- u) (rad/sec)
«< = 0.98 W(u>)
Q2
G l II Gl/G2 = 0.2
_ u (rad/sec) 0.5 0.6 9.5 11.0
FIG. 5. Summary of Stochastic Loads: Group III Loading
damage model, modified SD damage model) are presented in Table 9. From the results of Table 9, it can be seen that for the unimodal load cases there is not a great deal of difference between the results for the SD damage model and the modified SD model, the former giving slightly more conservative results. This is as expected from the results for the other unimodal Gaussian
TABLE 9. Comparison of Various Damage Models: Gaussian Loading
Description (1)
PM damage model SD damage model Modified SD damage model
Rain-flow Cycles to Failure (x103)
IF = 0.78 (2)
1,053 785 854
IF = 0.75 (3)
1,144 868 908
IF = 0.61 (4)
2,161 1,059 1,808
IF = 0.98 (5) 815 272 435
"IF = irregularity factor.
1864
J. Struct. Eng. 1991.117:1852-1867.
Dow
nloa
ded
from
asc
elib
rary
.org
by
TEX
AS
A&
M U
NIV
ERSI
TY o
n 03
/30/
15. C
opyr
ight
ASC
E. F
or p
erso
nal u
se o
nly;
all
right
s res
erve
d.

loads. For the bimodal loads, the SD damage model gives results that are significantly more conservative than those given by the modified SD model, again, comparable with the differences already observed for bimodal Gaus-sian loads. In all cases, the PM damage model predicts a longer fatigue life than either SD model, suggesting that this common model may again be nonconservative.
Based on all the data presented here, it is clear that at least for the spec-imen geometry and material used in this investigation, the modified SD model gives consistent results. Nonetheless, calculations were performed using the PM damage model, for comparison, and it was shown that the PM damage model can give predictions for fatigue life that are greatly in excess of those obtained in controlled tests. At the present, experimental and theoretical fa-tigue studies are under way to examine the validity of the proposed damage model for different specimen geometries and materials.
CHOICE OF V, VALUES
It should be reemphasized that the choices for the v, values used in (2) are somewhat arbitrary, and that it is not possible, based on existing data, to conclude whether the values used are correct or incorrect. It may be help-ful to review the thinking that led to the general form chosen for the values in Tables 3 and 6, as well as to indicate directions for further study. The results of the original study by Sarkani and Lutes (1988b) led to the con-clusion that v, < 0 for very small i values, v, > 0 for larger i values, and v, = 0 for very large i values are appropriate choices. These conclusions were obtained from a very rudimentary analysis of the model with only one or two nonzero v, values, but they seem qualitatively to represent much more general behavior.
These results indicated that one might actually be able to match the ex-perimental data for group I loadings by using only two nonzero v, values:
® Table 3 # Table 6 o Equation 3
60
FIG. 6. v versus ; Values
1865
J. Struct. Eng. 1991.117:1852-1867.
Dow
nloa
ded
from
asc
elib
rary
.org
by
TEX
AS
A&
M U
NIV
ERSI
TY o
n 03
/30/
15. C
opyr
ight
ASC
E. F
or p
erso
nal u
se o
nly;
all
right
s res
erve
d.

V! < 0 and v20 > 0. While this simple model is mathematically attractive, it is clearly not physically reasonable. For example, one must presume that if Dj depends on Sj-20, then it surely must also depend on S,_19 and S/_21, etc. Similarly, if v, is negative and v20 is positive, then there surely must be some relatively smooth transition between the two. The sets of values presented in both Table 3 and Table 6 were simple unsophisticated choices based on this principle of smoothing the two parameter models.
Planned extensions of this work will include study of other choices for the set of v, values. This will include studies of the sensitivity of the damage to the choice of v, values and study of simple analytical relationships between v and i. One candidate relationship for study may be of the family v,- = (—a + bi) exp (—ci) (3) Fig. 6 shows this function for a = +0.5, b = +0.05, and c = +0.10, along with the values from Tables 3 and 6, to illustrate that the general form of v is similar in all three cases. Numerical study will be required to establish whether the damage accumulation is also similar.
SUMMARY AND CONCLUSION
The influence of small stress ranges on stochastic fatigue life predictions using a recently proposed damage model has been examined. The proposed damage model is capable of taking into account the sequence effect in vari-able amplitude loading situations. The parameters needed to implement the SD damage model were obtained by a combined experimental and analytical approach. It is shown that using the SD model but introducing an endurance limit consistent with observations under constant amplitude testing results in variable amplitude fatigue life predictions that are in excellent agreement with the experimental results.
At the present time, a comprehensive experimental study with different specimen geometry and material is underway to further test the validity of the proposed damage model and the extent to which the parameters needed to use this model are geometry- and material-dependent.
ACKNOWLEDGMENTS
The first author would like to express his appreciation for the financial support provided by the David Taylor Research Center under an IPA agree-ment with The George Washington University. The last author would like to thank Bruce Douglas of the David Taylor Research Center for the support provided through the Center's Independent Research and Independent Ex-ploratory Development Program.
APPENDIX. REFERENCES
Crandall, S. H., and Mark, W. D. (1963). Random vibration in mechanical systems. Academic Press, New York, N.Y.
Hughes, P. J. (1989). "The influence of small stress ranges on stochastic fatigue of welded steel joints," thesis presented to George Washington University at Wash-ington, D.C., in partial fulfillment of the requirements for the degree of Master of Science.
1866
J. Struct. Eng. 1991.117:1852-1867.
Dow
nloa
ded
from
asc
elib
rary
.org
by
TEX
AS
A&
M U
NIV
ERSI
TY o
n 03
/30/
15. C
opyr
ight
ASC
E. F
or p
erso
nal u
se o
nly;
all
right
s res
erve
d.

Kutt, T. V., and Bieniek, M. P. (1985). "Cumulative damage and fatigue life pre-diction." Proc. 26th Structures, Structural Dynamics and Materials Conference, AIAA, New York, N.Y., 53-61.
Matsuishi, M., and Endo, T. (1968). "Fatigue of metals subjected to varying stress." Presented to the Japan Society of Mechanical Engineers Symposium, Fukuoka, Japan.
Miner, M. A. (1945). "Cumulative damage in fatigue." J. Appl. Mech., 12, A159-A164.
Palmgren, A. (1924). "Die Lebensdauer Von Kugallagern." Ver. Deut. Ingr., 68, 339-341 (in German).
Rice, S. O. (1944). "Mathematical analysis of random noise." Bell System Tech. J., 23, 282-332 and Vol. 24, pp. 46-156. Reprinted in Selected papers on noise and stochastic processes. (1952). N. Wax, ed., Dover, New York.
Sarkani, S. (1986). "Experimental and analytical stochastic fatigue of welded steel joints," thesis presented to Rice University at Houston, Tex., in partial fulfillment of the requirements for the degree of Doctor of Philosophy.
Sarkani, S. (1989). "Effect of high frequency response on fatigue of offshore struc-tures." Structural material, John F. Orofino, ed., ASCE, New York, N.Y., 422-431.
Sarkani, S. (1990). "Feasibility of auto-regressive simulation model for fatigue stud-ies." J. Struct. Engrg., ASCE, 116(9), 2481-2495.
Sarkani, S., and Lutes, L. D. (1988a). "Residual stress effects in fatigue of welded joints." J. Struct. Engrg., ASCE, 114(2), 462-467.
Sarkani, S., and Lutes, L. D. (1988b). "An experimental investigation of fatigue of welded joints under pseudo-narrow-band loadings." J. Struct. Engrg., ASCE, 114(8), 1901-1916.
Veers, P. S. (1987). "Fatigue crack growth due to random loading." Sandia Report SAND 87-2039.
1867
J. Struct. Eng. 1991.117:1852-1867.
Dow
nloa
ded
from
asc
elib
rary
.org
by
TEX
AS
A&
M U
NIV
ERSI
TY o
n 03
/30/
15. C
opyr
ight
ASC
E. F
or p
erso
nal u
se o
nly;
all
right
s res
erve
d.