fatigue assessment of defect-free and defect-containing brazed steel joints
TRANSCRIPT

1 23
Journal of Materials Engineering andPerformance ISSN 1059-9495Volume 21Number 5 J. of Materi Eng and Perform (2012)21:739-747DOI 10.1007/s11665-012-0182-7
Fatigue Assessment of Defect-Free andDefect-Containing Brazed Steel Joints
Christian Leinenbach, Michael Koster &Hans-Jakob Schindler

1 23
Your article is protected by copyright and
all rights are held exclusively by ASM
International. This e-offprint is for personal
use only and shall not be self-archived in
electronic repositories. If you wish to self-
archive your work, please use the accepted
author’s version for posting to your own
website or your institution’s repository. You
may further deposit the accepted author’s
version on a funder’s repository at a funder’s
request, provided it is not made publicly
available until 12 months after publication.

Fatigue Assessment of Defect-Free andDefect-Containing Brazed Steel Joints
Christian Leinenbach, Michael Koster, and Hans-Jakob Schindler
(Submitted October 20, 2011; in revised form January 16, 2012)
This work aims at the development of lifetime estimation procedures for defect-free and defect-containingbrazed joints. Preliminary investigations were performed to measure the influence of specimen geometry onthe joint strength. To estimate the influence of defects on the fatigue lifetime, defect-free specimens werecompared with specimens containing defects. The experiments show that defect-containing specimensprovide considerably lower joint strengths than defect-free specimens. The decrease of the fatigue strengthwith increasing defect size can be shown, but the direct comparison of different defects is not possible withS-N-curves. Based on the experimental results and on theoretical investigations, a procedure was developedto estimate the lifetime of defect-free and defect-containing brazed joints based on the stress intensitycaused by a defect.
Keywords brazing, brazing defects, defect assessment, fatiguebehavior, lifetime estimation
1. Introduction
Brazing is a method of consistent joining for a wide range ofmaterials. Besides the reliability, fast processing time and thelow manufacturing costs, especially the comparably lowprocess temperatures qualify brazing for many industrialapplications, e.g., for the production of power electroniccomponents, but also in automotive engineering and for powergeneration. Simultaneously, brazing provides potentials forseminal applications, e.g., for the production of structures forparticle accelerators (Ref 1), in aerospace technology (Ref 2),as well as for heat exchanging systems for hydrogen energyproduction (Ref 3). Especially, brazing of steel structuresbecomes more economical and efficient with the use ofadvanced furnace brazing methods (Ref 4), as, e.g., hightemperature (HT) furnace brazing in vacuum or with ashielding gas. HT furnace brazing is performed at temperatures>900� C for the production of highly loaded components,such as turbo compressor impellers or turbine parts (Ref 5).Many of the above-mentioned components are exposed to
complex loading conditions in service, comprising mechanical,thermal, or thermo-mechanical loads.
Brazings form heterogeneous, anisotropic systems, consist-ing of the base material, the filler metal, and the diffusion zone.Under mechanical loading, the properties of the system varysignificantly from those of the individual joining partners. Thedifferent elastic-plastic properties of the filler metal and thebase material lead to a triaxial stress state in the brazing zone,caused by constraining effects of the base material on the filleralloy. As a result, large hydrostatic stresses occur in the brazelayer and the ultimate tensile strength of the joint can be severaltimes higher than the strength of the unconstrained layermaterial (Ref 6, 7). The mechanical performance of suchconstrained systems under static loading has been studiedextensively in the past (e.g. Ref 8-12).
Considering the integrity of a brazed component, especiallythe influence of (brazing) defects is of significant importance.Typical defects that can occur during brazing are incompletegap filling due to local contaminations and poor wetting, poresdue to entrapped gas or air or cracks as a result of residualstresses due to different thermal expansion coefficients of thejoining partners and/or the presence of hard and brittle phasesin the brazing zone (Ref 13). To estimate the influence ofdefects on bulk materials and on welded structures, defectassessment procedures, such as R6, BS7910, or SINTAP, basedon the so-called failure assessment diagrams (FAD) have beendeveloped for static loading conditions (Ref 14-17). In ourprevious investigations, it could be shown that the FAD conceptcan be also used to estimate the influence of defects that occurduring brazing (Ref 18, 19).
To provide structural reliability for brazed components inservice, their behavior under cyclic loading needs to beconsidered, too. The fatigue behavior of brazed componentsis much more complex in comparison with bulk materials andhas hardly been considered in the literature yet (Ref 20, 21). Anumber of studies on the fatigue crack propagation behavior ator near interfaces in constrained layers (e.g., in adhesivelybonded joints, metal-ceramic joints, or multi-layered materials)have been published in the past two decades (e.g., Ref 22-24).
This article is an invited submission to JMEP selected frompresentations at the Symposia ‘‘Wetting, soldering and brazing’’ and‘‘Diffusion bonding and characterization’’ belonging to the Topic‘‘Joining’’ at the European Congress and Exhibition on AdvancedMaterials and Processes (EUROMAT 2011), held September 12-15,2011, in Montpellier, France, and has been expanded from the originalpresentation.
Christian Leinenbach andMichael Koster, Laboratory of Joining andInterface Technology, EMPA-Swiss Federal Laboratories for MaterialsScience and Technology, Ueberlandstrasse 129, 8600 Dubendorf,Switzerland; and Hans-Jakob Schindler, Mat-Tec AG, Winterthur,Switzerland. Contact e-mail: [email protected].
JMEPEG (2012) 21:739–747 �ASM InternationalDOI: 10.1007/s11665-012-0182-7 1059-9495/$19.00
Journal of Materials Engineering and Performance Volume 21(5) May 2012—739
Author's personal copy

In their previous works, the present authors investigated thefatigue crack propagation in braze joints. It was shown that thejoints are characterized by the absence of a clear short crackregime, a relatively high threshold value DKth as well as by anunusually high Paris exponent (Ref 25-27). While for mostmetals, the Paris exponent nParis is known to be between 3 and 4in the stable crack-growth regime (Ref 28), it was estimatedbetween 11 and 13 for brazed martensitic stainless steelcomponents. In addition, a concept for the consideration ofresidual stresses in the braze layer on the fatigue crack behaviorof brazed components was developed (Ref 29). However, thesestudies do not cover the crack initiation stage and thereforecannot be used for making predictions of the whole fatiguelifetime of brazed components.
Considering the influence of pores or partly unfilled brazinggaps—which can be considered as sharp notches in the brazingzone rather than cracks—on the fatigue behavior of brazedjoints no information is available in the literature.
In the current work, the fatigue behavior of brazed steel jointsunder axial loading was studied. By the combination of experi-mental testing methods and theoretical models, a method forestimating the fatigue life of defect-free and defect-containingbrazed joints based on stress concentration factors was developed.
2. Experimental Investigations
2.1 Materials, Brazing Process, and Specimen Preparation
For the following investigations, the soft martensitic stain-less steel X3CrNiMo13-4 (AISI CA 6-NM) was used as basematerial for the brazings. It is characterized by a martensitic-ferritic microstructure, providing high strength after heattreatment (Fig. 1a). Due to its excellent mechanical propertiesand corrosion behavior as well as its thermal resistance, thesteel is widely used for pumps, compressors, or water turbines.Brazing was performed using foils of the binary alloy Au-18Ni
(Tm� 955 �C) with a thickness of 100 lm as filler metal. Steelplates with the dimensions 3009 1009 25 mm were brazedusing a special brazing jig. The brazing process was performed
Nomenclature
Roman Symbols
a, mm Crack/defect length
an, mm Depth of initial notch
Afatigue, mm2 Fatigue fracture surface
Ares, mm2 Residual fracture surface
d, mm Thickness of the braze layer
Kfc, MPa m1/2 Critical stress intensity factor in fatigue
KIN, MPa m1/2 Stress intensity in a sharp notch
KIc, MPa m1/2 Fracture toughness
KI,max, MPa m1/2 Maximum stress intensity
Kth,max, MPa m1/2 Stress intensity threshold
DKI, MPa m1/2 Stress intensity range
nParis, - Paris exponent
Nini, - Number of loading cycles for crack
formation
Nf, - Number of cycles to fracture
Ntot, - Total fatigue lifetime
Nmax, - Maximum number of cycles (29 104 for
the following investigations)
Nprop, - Number of loading cycles for crack
propagation
Nis, - Number of loadings at the LCF/HCF-SIF
intersection
R, - Load ratio
SIF, MPa m1/2 Stress intensity factor
T, mm Specimen length
W, mm Specimen width
Yse, - Dimensionless factor for the calculation of
KI,max
Greek Symbols
q, mm Notch root radius
rf, MPa Ultimate tensile strength
ry, MPa Yield strength
Drnom, MPa Applied nominal stress range
Drnom,20000, MPa Maximum tolerable nominal stress range
until Nmax
rnotch, MPa Maximum local stress in a notch
Fig. 1 Microstructure of (a) the base material and (b) the brazed joint
740—Volume 21(5) May 2012 Journal of Materials Engineering and Performance
Author's personal copy

in an industrial shielding gas furnace (SOLOProfitherm 600) at atemperature of 1020 �C for 20 min. After brazing, the specimenswere tempered at 520 �C for 5.5 h in nitrogen atmosphere.Figure 1(b) shows the microstructure of the braze joint.
Besides standard round tensile specimens, round fatiguespecimens with gauge length diameters of Ø1 = 4 mm andØ2 = 5 mm were used for the experiments (Fig. 2a). Further-more, special T-joint geometry specimens (Fig. 2b) weremanufactured to determine the geometry effect on the jointstrength. This geometry is often realized in technical compo-nents. The T-joint specimens are characterized by an abruptchange of the cross section and consequently by the highestloads, occurring in the braze layer. This geometry was also usedto study the influence of brazing defects on the mechanicalproperties. Therefore, defects of different geometries (straightand semi-elliptical) and sizes were introduced into the brazingzone by electrical discharge machining (EDM), using a wirewith a diameter of 0.3 mm (Fig. 3).
To investigate the influence of the defect size, specimenscontaining straight defects with a size of a = 0.5 mm,a = 1 mm, and a = 2 mm were prepared. For the semi-elliptical defects, a ratio of a/c = 2/3 with a = 0.75 mm,a = 1.5 mm, and a = 3 mm was selected. With this, typicalbrazing defects like a partly unfilled brazing gap or large poresshould be simulated. With respect to their three-dimensionalgeometry, the defects can be considered as sharp notches.
2.2 Testing Procedures
In order to determine the quasistatic mechanical propertiesof the braze joints, tensile tests were performed with an electro-mechanical testing machine (Schenck Trebel RSA 250 kN).
For the simulation of start/stop cycles of highly loaded brazedcomponents, the fatigue behavior in the LCF regime wascharacterized with a servohydraulic testing machine (SchenkHydroplus 5666) until a maximum number of loading cycles ofNmax = 29 104 cycles. The tests were performed with asinusoidal load, applied with a constant amplitude at afrequency of 1 Hz and at a load ratio of R = 0.1.
2.3 Behavior of Joints Under Quasistatic Loading
To characterize the influence of different specimen geom-etries and of different defects on the quasistatic joint strength,tensile tests were performed. Therefore, standard round spec-imens according to DIN 50125 were tested. Their values servedas a reference for the further experiments. The average ultimatetensile strength (rf) of standard round specimens is 1084 MPa.Experiments with T-joint specimens show that the change ofthe specimen geometry leads to a slight increase of rf to
Fig. 2 The geometry of (a) the standard round specimens and (b) the T-joint specimen
Fig. 3 Defect geometries of (a) straight and (b) semi-ellipticaldefects
Journal of Materials Engineering and Performance Volume 21(5) May 2012—741
Author's personal copy
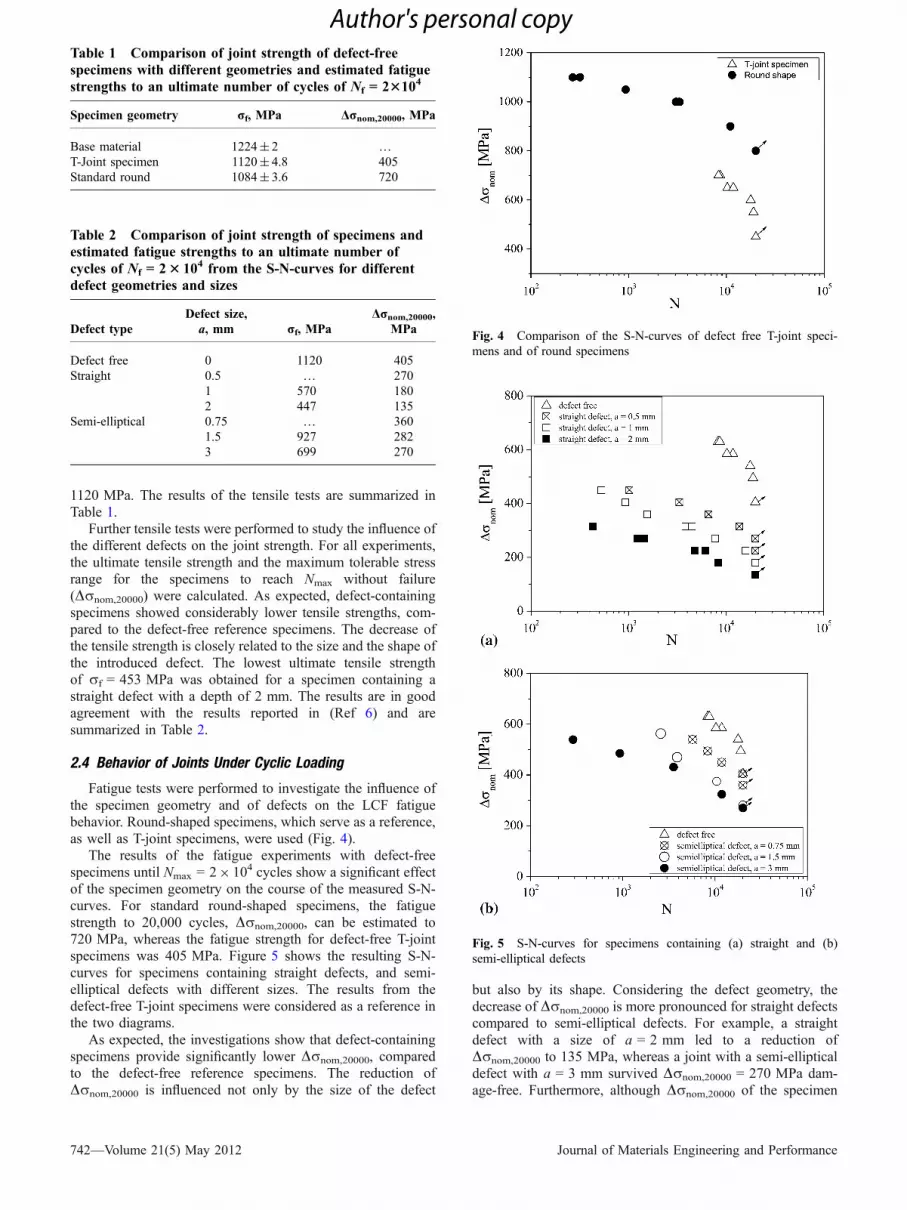
1120 MPa. The results of the tensile tests are summarized inTable 1.
Further tensile tests were performed to study the influence ofthe different defects on the joint strength. For all experiments,the ultimate tensile strength and the maximum tolerable stressrange for the specimens to reach Nmax without failure(Drnom,20000) were calculated. As expected, defect-containingspecimens showed considerably lower tensile strengths, com-pared to the defect-free reference specimens. The decrease ofthe tensile strength is closely related to the size and the shape ofthe introduced defect. The lowest ultimate tensile strengthof rf = 453 MPa was obtained for a specimen containing astraight defect with a depth of 2 mm. The results are in goodagreement with the results reported in (Ref 6) and aresummarized in Table 2.
2.4 Behavior of Joints Under Cyclic Loading
Fatigue tests were performed to investigate the influence ofthe specimen geometry and of defects on the LCF fatiguebehavior. Round-shaped specimens, which serve as a reference,as well as T-joint specimens, were used (Fig. 4).
The results of the fatigue experiments with defect-freespecimens until Nmax = 29 104 cycles show a significant effectof the specimen geometry on the course of the measured S-N-curves. For standard round-shaped specimens, the fatiguestrength to 20,000 cycles, Drnom,20000, can be estimated to720 MPa, whereas the fatigue strength for defect-free T-jointspecimens was 405 MPa. Figure 5 shows the resulting S-N-curves for specimens containing straight defects, and semi-elliptical defects with different sizes. The results from thedefect-free T-joint specimens were considered as a reference inthe two diagrams.
As expected, the investigations show that defect-containingspecimens provide significantly lower Drnom,20000, comparedto the defect-free reference specimens. The reduction ofDrnom,20000 is influenced not only by the size of the defect
but also by its shape. Considering the defect geometry, thedecrease of Drnom,20000 is more pronounced for straight defectscompared to semi-elliptical defects. For example, a straightdefect with a size of a = 2 mm led to a reduction ofDrnom,20000 to 135 MPa, whereas a joint with a semi-ellipticaldefect with a = 3 mm survived Drnom,20000 = 270 MPa dam-age-free. Furthermore, although Drnom,20000 of the specimen
Fig. 4 Comparison of the S-N-curves of defect free T-joint speci-mens and of round specimens
Fig. 5 S-N-curves for specimens containing (a) straight and (b)semi-elliptical defects
Table 1 Comparison of joint strength of defect-freespecimens with different geometries and estimated fatiguestrengths to an ultimate number of cycles of Nf = 23104
Specimen geometry rf, MPa Drnom,20000, MPa
Base material 1224± 2 …T-Joint specimen 1120± 4.8 405Standard round 1084± 3.6 720
Table 2 Comparison of joint strength of specimens andestimated fatigue strengths to an ultimate number ofcycles of Nf = 23 104 from the S-N-curves for differentdefect geometries and sizes
Defect typeDefect size,
a, mm rf, MPaDrnom,20000,
MPa
Defect free 0 1120 405Straight 0.5 … 270
1 570 1802 447 135
Semi-elliptical 0.75 … 3601.5 927 2823 699 270
742—Volume 21(5) May 2012 Journal of Materials Engineering and Performance
Author's personal copy

with the smallest straight defect (a = 0.5 mm in Fig. 5) isexpected to be the closest to the defect-free specimens, thesmallest semi-elliptical defect (a = 0.75 mm in Fig. 5) exhib-ited the highest tolerable stress range of Drnom,20000 = 360MPa, and almost reaches Drnom,20000 of the defect-freereference specimen (Table 2).
2.5 Fractographic Investigations
After the fatigue tests, the fracture surfaces of the T-jointswere characterized by stereo microscopy. All specimens clearlyfractured in the brazing zone as residual filler alloy wasdetected on both parts of the fractured specimens.
Figure 6(a) shows a specimen containing a straight defectwith a size of 0.5 mm, that failed after Nf = 3,318 loadingcycles Drnom = 405 MPa. A specimen containing a semi-elliptical defect with a = 0.75 mm, exhibited 19,819 loadingcycles at the same loading amplitude (Fig. 6b). The fracturesurfaces can be clearly divided into a fatigue fracture surface(Afatigue) and residual fracture surface (Ares). An increase in thenumber of cycles to fracture leads to an increase in Afatigue.While Afatigue amounts 24.18% for the specimen shown inFig. 6(a), it increases to 32.49% for higher Nf (Fig. 6b). For thespecimens containing semi-elliptical defects, the a/c ratiochanged slightly from 0.67 to approximately 0.55 to 0.6 untilfinal fracture as determined from the fatigue fracture areas.
SEM investigations have shown that Afatigue is characterizedby a smooth fracture surface and contains fatigue-induceddeformation features, as, e.g., striations (Fig. 6c). SEM inves-tigations at the transition from fatigue to residual fracture
surface show a pronounced increase of the striation spacingfrom <100 to �1000 nm, what is in good agreement with themeasured crack growth curves (Ref 26). The residual fracturesurface is characterized by ductile deformation features likedimples (Fig. 6d).
2.6 Correlation of Fatigue Life with DK
In cases of joints with large brazing defects the nominalstress is not a suitable parameter to correlate the fatigue life, ascan be seen from the test data (Fig. 5). Therefore, a lifetimeprediction or a safety analysis for a component containingbrazing defects cannot be done in a reasonable way based onS-N-curves.
As shown in Ref 24, the loading state of a crack-like defectin a thin layer can be characterized by the global stress intensityfactor (SIF) of a crack with the same geometry and size in acorresponding homogeneous body. In Fig. 7, the data shown inFig. 5 are plotted as a function of DK(an), the latter being therange of the SIF of a hypothetical crack of the same length asthe defect, a = an, under mode I loading. The SIFs for thedefects in the tests specimens are calculated as follows:
For a straight crack of length a emanating from the corner ofa T-Joint, the SIF is given by (Ref 29)
KI ¼ 2:293 � rnom �ffiffiffiffiffi
Wp�ffiffiffiffiffiffiffiffiffiffiffiffiffiffiffiffiffiffiffiffiffiffiffiffi
a
Wþ 0:0338
r
� Ystða=W Þ ðEq 1Þ
For a/W> 0.01, the non-dimensional function Yst(a/W) isgiven by
Fig. 6 Fractographic investigations of a T-joint specimen, containing (a) a straight and (b) a semi-elliptical defect, (c) of the fatigue fracturesurface, and (d) at the transition between fatigue and residual fracture surface
Journal of Materials Engineering and Performance Volume 21(5) May 2012—743
Author's personal copy

Ystða=W Þ ¼ 1� 0:5454 � a
W
� �
þ 5:8863 � a
W
� �2
� 8:9417 � a
W
� �3þ15:809 � a
W
� �4: ðEq 2Þ
Note that Eq 1 and 2 can also be used as a conservativeestimation of the SIF for short cracks in the range a/W< 0.01,as discussed in section 3.2.
For the semi-elliptical defects with a/c = 2/3 emanatingfrom the corner of a T-Joint, the SIF as derived in Ref 18 can beapproximated by the following formula:
KI ¼ 2:293 � rnom �ffiffiffiffiffi
Wp� Yse ða=W Þ ðEq 3Þ
with
Yseða=W Þ ¼a
W
� �0:196� 0:9644� 0:5641 � a
W
� �h i
: ðEq 4Þ
With a = an, the test data from Fig. 5 can be represented asa function of DK(an) using Eq 1-4. The results are shown asSIF-N-curves in Fig. 7. Obviously they collapse in a relativelynarrow scatter band, called in the following the SIF-N-curve.The correlation between log(Ntot) and DKI(an) is approximatelylinear and follows the regression line
DK ðanÞ ¼ 70:533� 11:781 � logNtot: ðEq 5Þ
The good correlation between Ntot is somewhat surprisingsince the total life of a notched specimen is expected to dependon many more parameters than just DK(an). However, there aretheoretical reasons for DK(an) to be the main influencing factorof Ntot, as shown in section 3.1.
3. Theoretical Considerations
3.1 Relation Between Fatigue Life and DK
As mentioned above, the total fatigue life of a notchedcomponent, Ntot, can be divided into the number of load cyclesrequired to form a crack at the notch tip, Nini, and thoserequired for crack propagation up to the critical crack length,Nprop, i.e.,
Ntot ¼ Nini þ Nprop: ðEq 6Þ
The transition from crack initiation to propagation cannot beclearly defined and is difficult to be detected experimentally.However, for the purpose of the present investigation, there isno need for a sharp distinction between these two phases offatigue damage. Nprop can be obtained analytically quiteuniquely. The fatigue crack propagation behavior of thesebrazings has been studied in Ref 24-26. It was found that theda/dN- versus DK-curves for brazed specimens do not exhibitthe usual sigmoidal shape, but a Paris-type behavior in theentire range of crack growth. Correspondingly, the da/dN-curvecan be approximated by
da
dN¼ C � DKnParis ðEq 7Þ
the entire range of DK, i.e., from the threshold value Kth, tothe critical SIF in fatigue, DKfc. For R = 0.1, the parametersin Eq 7 were determined to be
C ¼ 1:309� 1022 and nParis ¼ 11:17: ðEq 8Þ
DKfc is obtained by
DKfc ¼Kfc
1� RðEq 9Þ
where Kfc is fracture toughness in fatigue and ac is the criticalcrack length, which is determined by the equation
DKða ¼ acÞ ¼ DKcf : ðEq 10Þ
From Eq 7-10, the propagation life is obtained to be
Nprop ¼Z
ac
an
da
C � DKnParisðaÞ: ðEq 11Þ
Considering straight defects, Eq 7-10 inserted in Eq 11result in the crack propagation life shown in Fig. 8. One can seethat the propagation life as a function of DK(an) is nearly thesame for all the considered defect sizes. The reason for thissurprising behavior is the high value of the exponent nParis,which leads to an enormous acceleration of the crack growthrate as a approaches the critical length ac. Therefore, DK(an)
Fig. 8 Calculated crack-propagation life as a function of DK(an)Fig. 7 SIF-N-curves for the estimation of the fatigue life of defectcontaining T-joint specimens
744—Volume 21(5) May 2012 Journal of Materials Engineering and Performance
Author's personal copy
has more significant influence on Nprop than DK(ac). The sameholds for other crack geometries such as the semi-ellipticalcracks. So the above finding that Nprop depends on DK(an) onlyis likely to hold not only for the straight cracks considered inFig. 8 but also for any crack shape.
In LCF, Nini is known to be governed by the local plasticstrain range Dep. A dimensional analysis suggests a functionaldependence of the form
Dep ¼ fDK2ðanÞE � ry � d
� �
ðEq 12Þ
where E is Young�s modulus of the base material, ry theyield stress of the layer, and d the thickness of the layer.Thus,
Nini ¼ f ðDKðanÞ; dÞ: ðEq 13Þ
Since Nini as well as Nprop are functions of DK(an), it followsfrom Eq 6 that the total life of a notched brazing is mainly afunction of DK(an), too. This is the theoretical reasons for thecorrelation shown in Fig. 7.
3.2 LCF at Structural Hot-Spots in Brazed Components
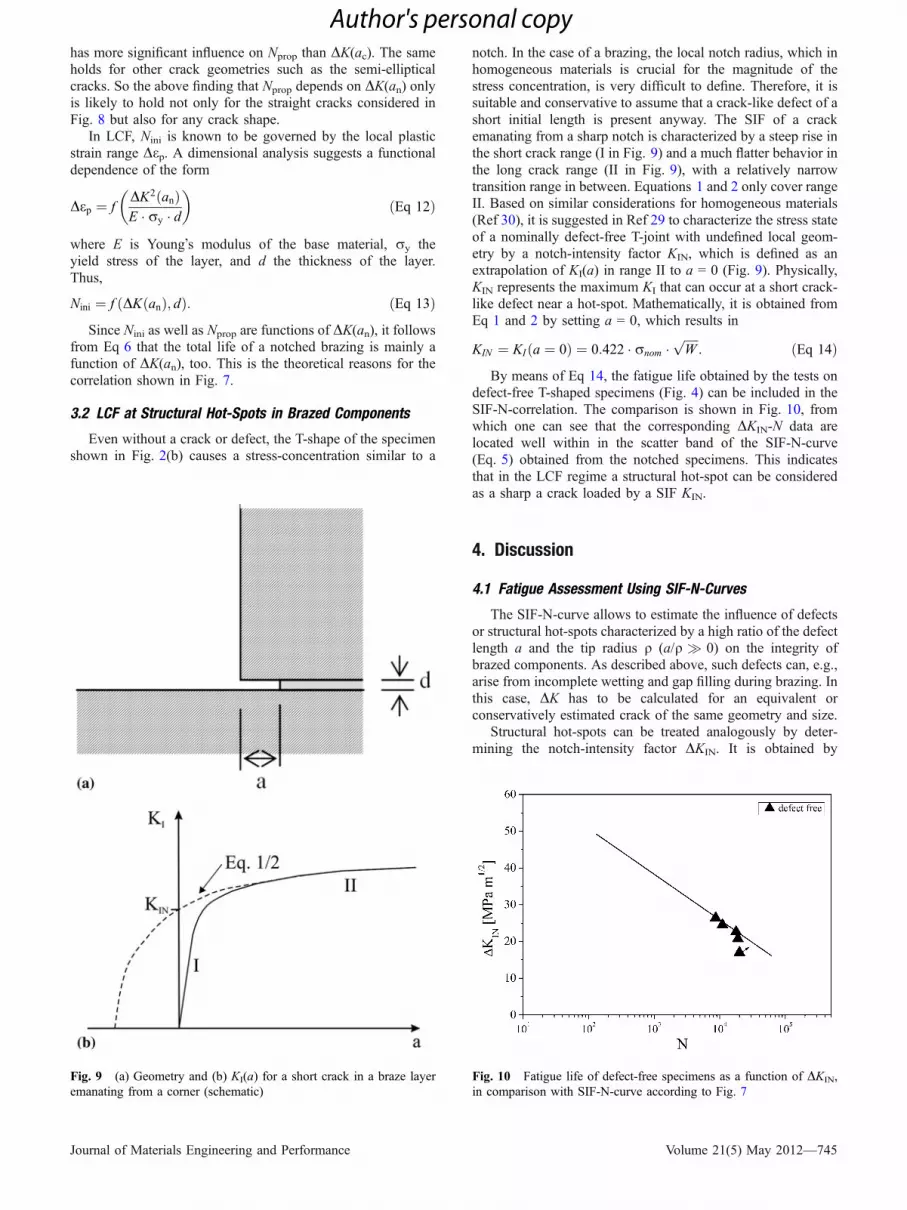
Even without a crack or defect, the T-shape of the specimenshown in Fig. 2(b) causes a stress-concentration similar to a
notch. In the case of a brazing, the local notch radius, which inhomogeneous materials is crucial for the magnitude of thestress concentration, is very difficult to define. Therefore, it issuitable and conservative to assume that a crack-like defect of ashort initial length is present anyway. The SIF of a crackemanating from a sharp notch is characterized by a steep rise inthe short crack range (I in Fig. 9) and a much flatter behavior inthe long crack range (II in Fig. 9), with a relatively narrowtransition range in between. Equations 1 and 2 only cover rangeII. Based on similar considerations for homogeneous materials(Ref 30), it is suggested in Ref 29 to characterize the stress stateof a nominally defect-free T-joint with undefined local geom-etry by a notch-intensity factor KIN, which is defined as anextrapolation of KI(a) in range II to a = 0 (Fig. 9). Physically,KIN represents the maximum KI that can occur at a short crack-like defect near a hot-spot. Mathematically, it is obtained fromEq 1 and 2 by setting a = 0, which results in
KIN ¼ KI ða ¼ 0Þ ¼ 0:422 � rnom �ffiffiffiffiffi
Wp
: ðEq 14Þ
By means of Eq 14, the fatigue life obtained by the tests ondefect-free T-shaped specimens (Fig. 4) can be included in theSIF-N-correlation. The comparison is shown in Fig. 10, fromwhich one can see that the corresponding DKIN-N data arelocated well within in the scatter band of the SIF-N-curve(Eq. 5) obtained from the notched specimens. This indicatesthat in the LCF regime a structural hot-spot can be consideredas a sharp a crack loaded by a SIF KIN.
4. Discussion
4.1 Fatigue Assessment Using SIF-N-Curves
The SIF-N-curve allows to estimate the influence of defectsor structural hot-spots characterized by a high ratio of the defectlength a and the tip radius q (a/q � 0) on the integrity ofbrazed components. As described above, such defects can, e.g.,arise from incomplete wetting and gap filling during brazing. Inthis case, DK has to be calculated for an equivalent orconservatively estimated crack of the same geometry and size.
Structural hot-spots can be treated analogously by deter-mining the notch-intensity factor DKIN. It is obtained by
Fig. 9 (a) Geometry and (b) KI(a) for a short crack in a braze layeremanating from a corner (schematic)
Fig. 10 Fatigue life of defect-free specimens as a function of DKIN,in comparison with SIF-N-curve according to Fig. 7
Journal of Materials Engineering and Performance Volume 21(5) May 2012—745
Author's personal copy

calculating K(an) for the initial defect sizes a and extrapolatingthe resulting curve to a = 0.
Strictly speaking, the SIF-N-curves shown in Fig. 7 is onlyapplicable for the defect- and braze-parameters used for thepresented experiments (d = 0.1 mm, q = 0.15 mm, andR = 0.1). If the deviations of the actual parameters aresubstantial, corresponding experimental data are required.However, to some degree it is possible to generalize thepresented results, at least as approximations.
In homogeneous materials, the notch root radius is crucialfor the crack-initiation life, since it affects the local stresses andstrains. In the case of a notched brazed specimens, the situationis more complex, since the width of the braze layer and themismatch of the material parameters represent additionalcharacteristics. The experimental finding that the SIF-N-dataof defect-free T-joint specimens fit very well to the data fromstraight or elliptical notches indicates that the root radius ofnotches in brazings are of minor importance. Parameters relatedto the brazing, like the thickness d of the layer, are of moreimportance.
The effect of the width of the braze layer, d, on the da/dN-curve has been considered theoretically in Ref 27. It was foundthat the DKth is proportional to d1/4 and that the da/dN-curve isroughly proportional to 1/d. This affects the SIF-N-curve in thehigh-cycle regime and the endurance limit.
It has also been shown that the fracture toughness isassociated with a certain critical strain in the layer (Ref 19). Ingeneral, the latter is proportional to KI
2/d, so KIc is proportionalto d1/2. It can be expected for physical reasons that Kfc and theSIF-N-curve in the LCF-regime are about proportional to d1/2
as well. Therefore, the SIF-N-curve shown in Fig. 7 is expectedto be conservative if the actual layer thickness d is larger thanthe one of the specimens used here, which is about 0.1 mm.
The motivation of the present investigation was the safetyassessment of brazed components for start/stop-loading cyclesthat can occur during service of, e.g., compressor or turbineparts, which are relatively few in number and correspond ingeneral to a load ratio R� 0. For practical reasons, theexperimental fatigue tests were performed at R = 0.1. Thefatigue data in the LCF-regime are expected to be affected by R.For R< 0.1, they are conservative, but for R> 0.1 they arelikely to be non-conservative.
4.2 Estimation of the Entire SIF-N-Curve
The SIF-N-curve given by Eq 5 holds in the range coveredby the experimental data, which is about 22< DK< 40 MPam0.5. In terms of DK(an), the total possible range of finitefatigue life is DKth < DK(an)<Kcf(1�R), which means, forthe properties of the present brazing as given in Ref 26, about9< DKI < 45 MPa m0.5. Obviously, a large part of the totalrange of finite fatigue life is covered by LCF. The relativelynarrow missing parts can be covered approximately by thefollowing semi-empirical extrapolations.
As mentioned before, the crack initiation life can be estimatedby Eq 6 from the total life (Eq 5) and Nprop. In mathematicalterms, the relation between Nprop and DK(an) shown in Fig. 8 isfound by linear regression to be approximately
logDKIðanÞ ¼ 1:6721� 1
nParis� logNprop: ðEq 15Þ
By Eq 1, 5, and 15, one obtains Nini as a function of DK(an)for straight defects. The corresponding fraction of fatigue
initiation life with respect to the total life, Nini/Ntot, is shown inFig. 11. For DK> 25 MPa m0.5 nearly the entire life is spentin the initiation phase. For decreasing DK (Fig. 11) the fractionof Nini decreases. As DK approaches the fatigue crack growththreshold DKth, Nini/Npropis obviously bound to approach zero.The relatively small gap between the lowest experimental datapoint, 22.5 MPa m0.5, and DKth can be bridged with sufficientaccuracy by a linear interpolation, as shown by the dashed linein Fig. 11. This interpolation enables the SIF-N-curve to beestimated from (Eq. 15) even in the HCF-regime up toendurance. The resulting curve is shown in Fig. 12. Forcomparison (Eq 15), which is a lower bound of the total life isalso shown. Therefrom one can see that the interpolation affectsonly the transition from the SIF-N-curve of the LCF-range(Eq 5 to 15), which represents a lower bound in the HCF range.An alternative, conservative way to estimate the total SIF-N-curve (from the low-cycle to the high-cycle regime) is toneglect the transition by just using Eq 5 for N<Nis and Eq 15for N>Nis, where Nis is N at the intersection of these twocurves (Fig. 12).
The gap on the lower end of the SIF-N-curve, i.e., betweenthe highest experimentally covered DKI and the critical fatigue
Fig. 11 Portion of Initiation life with respect to total life, Nini/Ntot,as a function of the SIF
Fig. 12 Total fatigue life estimated from the LCF-tests data andcalculated propagation life
746—Volume 21(5) May 2012 Journal of Materials Engineering and Performance
Author's personal copy

load range Kcf(1�R), which is the cut-off of the curve atKcf(1�R), can be bridged by another interpolation. For thispurpose, using a straight line is expected to be sufficient ingeneral, since this lower range of LCF is usually of minorpractical importance. The entire obtained SIF-N-curve is shownin Fig. 12.
The course of DK as a function of the total service life Nshows that the corresponding coordinate in the SIF-N-diagramhas to be located on the left-hand side of the graph in Fig. 12 toguarantee the safe life of the component. Vice versa, for a givennominal stress and a required service life, the SIF-N-curveallows to determine the maximum tolerable defect size.
5. Conclusions
In the scope of the performed experiments, a method wasdeveloped to estimate the fatigue lifetime of brazed componentsunder the influence of brazing defects. Based on cyclic loadingexperiments, the influence of the specimen geometry and ofdifferent defects was determined. The resulting S-N-curvesshow that brazing defects considerably affect the joint strength,but a direct comparison of different defect types based on S-N-curves is not possible. To estimate the influence of differentdefects, fracture mechanical investigations were performed.The results show that the total life of notched brazings iscorrelated by DK(an). This approach allows structural hot-spotsto be treated analogously using the notch SIF KIN. Theoreticalinvestigations show that in the LCF-regime, total life isdominated by initiation process, whereas in the HCF-range,total life is dominated by crack propagation life. This behaviorallows the entire SIF-N-curve to be determined and the amountof experimental investigations to be reduced significantly. Fordifferent brazing conditions, e.g., for different layer thick-nesses, the applicability could already be shown, but furtherexperiments must be performed to investigate the influence of,e.g., different heat treatments.
Acknowledgments
The present work was financially supported by MAN Turbo AG,Zurich, which is gratefully acknowledged. The authors would like tothank Dr. T. A. Baser for her support during the experiments.
References
1. L. Sancheza, D. Carrillo, E. Rodrıgueza, F. Aragona, J. Sotelob, andF. Torala, Development of High Precision Joints in Particle AcceleratorComponents Performed by Vacuum Brazing, J. Mater. Process.Technol., 2011, 211, p 1379–1385
2. R.K. Shiue, S.K.Wu, and S.Y. Chen, Infrared Brazing of TiAl IntermetallicUsing BAg-8 Braze Alloy, Acta Mater., 2001, 51, p 1991–2004
3. T. Ma, M. Zeng, Y. Ji, H. Zhu, and Q. Wang, Investigation of a NovelBayonet Tube High Temperature Heat Exchanger with Inner and OuterFins, Int. J. Hydrogen Energy, 2011, 36, p 3757–3768
4. S.L. Feldbauer, Modern Brazing of Stainless Steel, Am. Weld. Soc. J.,2004, 10, p 30–33
5. J. Novacki and P. Swider, Producibility of Brazed High-DimensionCentrifugal Compressor Impellers, J. Mater. Process. Technol., 2003,133, p 174–180
6. M.E. Kassner, T.C. Kennedy, and K.K. Schrems, The Mechanism ofDuctile Fracture in Constrained Thin Silver Films, Acta Mater., 1998,46, p 6445–6457
7. J. Cugnoni, J. Botsis, and J. Janczak-Rusch, Size and ConstrainingEffects in Lead-Free Solder Joints, Adv. Eng. Mater., 2006, 8,p 184–191
8. A.G. Varias, Z. Suo, and C.F. Shih, Ductile Failure of a ConstrainedMetal Foil, J. Mech. Phys. Solids, 1991, 39, p 963–986
9. M.Y. He, A.G. Evans, and J.W. Hutchinson, Interface CrackingPhenomena in Constrained Metal Layers, Acta Mater., 1996, 44,p 2963–2971
10. Y. Flom, L. Wang, M.M. Powell, M.A. Soffa, and M.L. Rommel,Evaluating Margins of Safety in Brazed Joints, Am. Weld. Soc. J., 2009,10, p 31–37
11. S.H. Choi, B.G. Song, K.J. Kang, and N.A. Fleck, Fracture of a DuctileLayer Constrained by Stiff Substrates, Fatigue Fract. Eng. Mater.Struct., 2001, 23, p 1–13
12. S. Roy Chowdhury and R. Narasimhan, Finite Element Simulations ofDuctile Rupture in a Constrained Metal Foil, Mater. Sci. Eng. A, 1995,191, p 27–37
13. D.M. Jacobsen and G. Humpston, Principles of Brazing, ASMInternational, Materials Park, OH, 2005
14. Y.J. Kim, M. Kocak, R.A. Ainsworth, and U. Zerbst, SINTAP DefectAssessment Procedure for Strength Mismatched Structures, Eng. Fract.Mech., 2000, 67, p 529–546
15. British Energy Generation Ltd., Assessment of the Integrity ofStructures Containing Defects. R6-Rev. 4, 2002
16. British Standard, Guide on methods for assessing the acceptability offlaws in metallic structures. BS 7910, 1999
17. S. Webster and A. Bannister, Structural Integrity Assessment Procedurefor Europe—of the SINTAP Programme Overview, Eng. Fract. Mech.,2000, 67, p 481–514
18. C. Leinenbach, H. Lehmann, and H.J. Schindler, MechanicalBehaviour and Defect Sensitivity of High Temperature Braze Joints,MP Mater. Test., 2007, 49, p 2–9 (in German)
19. C. Leinenbach, H.J. Schindler, T.A. Baser, N. Ruttimann, and K.Wegener, Quasistatic Fracture Behaviour and Defect Assessment ofBrazed Soft Martensitic Stainless Steel Joints, Eng. Fail. Anal., 2010,17, p 672–682
20. H.D. Solomon, A Statistical Analysis of Brazed Joints FatigueBehaviour, Weld. Res. Suppl., 2001, 6, p 148–156
21. C. Leinenbach, N. Gelder, V. Bissig, F. Gattiker, and U.E. Klotz,Shielding Gas Brazing of Martensitic Stainless Steels with Copper FreeSilver Based Filler Metals, Sci. Technol. Weld. Join., 2007, 12,p 708–717
22. B. Chen and D.A. Dillard, Numerical Analysis of DirectionallyUnstable Crack Propagation in Adhesively Bonded Joints, Int. J. Solid.Struct., 2001, 38, p 6907–6924
23. S. Azari, M. Papini, J.A. Schroeder, and J.K. Spelt, The Effect of ModeRatio and Bond Interface on the Fatigue Behavior of a Highly-Toughened Epoxy, Eng. Fract. Mech., 2010, 77, p 395–414
24. R.O. Ritchie, R.M. Cannon, B.J. Dalgleish, R.H. Dauskardt, andJ.M. McNaney, Mechanics and Mechanisms of Crack Growth at orNear Ceramic-Metallic Interfaces, Mater. Sci. Eng., 1993, 166,p 221–235
25. T.A. Baser, C. Leinenbach, and H.J. Schindler, Cyclic FractureBehaviour of Brazed Martensitic Stainless Steel Joints. Proceedingsof the ICF 12, 2009
26. T.A. Baser, C. Leinenbach, and H.J. Schindler, Fracture Behaviour ofBrazed Soft Martensitic Stainless Steel Joints Under Cyclic Loading,Mater. Sci. Forum, 2010, 636–637, p 1490–1495
27. H.J. Schindler, and C. Leinenbach, Mechanics of Fatigue CrackGrowth in a Bonding Interface. Eng. Fract. Mech. (in press)
28. S. Li, L. Sun, W. Jia, and Z. Wang, The Paris Law in Metals andCeramics, J. Mater. Sci. Lett., 1995, 14, p 1493–1495
29. H.J. Schindler, and C. Leinenbach: Fatigue Assessment of BrazedT-Joints Based on Damage Tolerance Including Residual Stress Effects.J. ASTM Int., 2010, 7, 102515
30. H.J. Schindler, Endurance Assessment for Notched Structural Partswith Imperfections. DVM Rep., 2002, 234, 67–76
Journal of Materials Engineering and Performance Volume 21(5) May 2012—747
Author's personal copy