selectivity in calcium mineral flotation - diva-portal
TRANSCRIPT
DOCTORA L T H E S I S
Department of Civil, Environmental and Natural Resources EngineeringDivision of Minerals and Metallurgical Engineering
Selectivity in Calcium Mineral Flotation- An analysis of novel and existing approaches
Tommy Karlkvist
ISSN 1402-1544ISBN 978-91-7583-914-1 (print)ISBN 978-91-7583-915-8 (pdf)
Luleå University of Technology 2017
Tomm
y Karlkvist Selectivity in C
alcium M
ineral Flotation
Mineral Processing
O–
O–
ON H
O O
Ca OOOCa Ca
O–
O
OO
O–
N H
CaOCaOCa

Selectivity in calcium mineral flotation- An analysis of novel and existing approaches
Tommy Karlkvist
Luleå University of Technology Department of Civil, Environmental and Natural Resources Engineering
Division of Minerals and Metallurgical Engineering Mineral Processing
June 2017

Printed by Luleå University of Technology, Graphic Production 2017
ISSN 1402-1544 ISBN 978-91-7583-914-1 (print)ISBN 978-91-7583-915-8 (pdf)
Luleå 2017
www.ltu.se
iii
Summary Flotation has long been one of the most important ways of separating different minerals in the small particle size. The success of mineral flotation processes depends on the hydrophobization of the surface for the desired mineral particles whilst keeping, or making, all other minerals hydrophilic. This is achieved by adding several reagents to the flotation pulp to adsorb selectively at the mineral-water interface. The reagents (surface active agents) which selectively adsorbs on minerals to be floated are called collectors. With the steady depletion of high grade, relatively easy to process ores, the mineral industry is confronted with a challenging task of finding more efficient techniques so as to exploit low grade, complex and disseminated type of ore deposits and old tailing dumps. The development of new selective and environmentally acceptable substances containing almost tailor-made reagents is thus of interest for the mineral industry. Over the years, several known chelating agents have been appropriately modified to behave as selective flotation collectors with some degree of success. The problem is that almost all of the chelating groups form complexes with almost all of the transition and many non-transition metals. As a consequence, absolute selectivity does not exist. Besides being unsatisfactory from a scientific viewpoint, it assumes that the metal ion specificity observed for a functional group in bulk aqueous system would remain valid during surface chelation at the interface, while in actual practice, the specificity based on metal ion is neither valid nor useful where the cations participating in the complexation reactions are the same, for example in separation among the calcium minerals.
To make a more selective reagent it should be based on the reagent interactions not merely with the metal ion on the surface, but with the whole surface. It is more appropriate to design reagents having functional groups so spaced that those are matching with the relative positions of the metal ion sites available on the surface, that is, to design not just metal-specific but structure-specific reagents.
The understandings of molecular interactions involved in the recognition of surfaces by organic molecules in biomineralization process suggest the possibility of reagents specific to the crystal structure. These understandings have been successfully applied to the rational design and synthesis of molecules either for the control of crystal morphology or to inhibit crystal growth processes through the recognition of specific crystal surfaces. The idea of molecules consisting of two groups with appropriate spacing between them to achieve structural compatibility during interaction with the mineral surface, to exhibit structure-specificity, is of direct relevance for the reagents selectivity in flotation processes.
The present investigation aims to systematically examine mineral specific reagents with two functional groups for use in flotation of calcium containing minerals. For this purpose, a series of dicarboxylate-based surfactants with varying spacing between the carboxylate groups were synthesized. The adsorption behavior of these new reagents on pure apatite, calcite and fluorite mineral surfaces was studied using Hallimond tube flotation, zeta-potential and FTIR/TOC measurements. A series of commercially available collector with varying number of functional groups were also examined using bench-scale flotation and zeta-potential to investigate the importance of addition order for flotation.
The results show that some bi-dentate surfactants show better result than others, indicating that the distance between the functional groups is an important factor. However, there is also clear indications that this distance is not the only important factor as surfactants with similar distance

iv
between the functional groups behave differently. There is also clear indications that the addition order of collectors is important.
Flotation with multiple surfactants can be seen as a two-step process where a more selective collector should be added first to adsorb on the surface. A second less selective but more reactive collector may then be added to create the hydrophobic layer. This to achieve a better flotation result.
v
Acknowledgements There are many people who have been part of this journey and should be thanked. I would like to start with my supervisors who made this possible. Professor Kota Hanumantha Rao who started this project and brought me here. Associate Professor Bertil I. Pålsson who took over main supervision when Professor Rao moved to Norway and has been a great help; and my previous co-supervisor Professor Mattias Grahn who was there for me in the early stages of the project. I would also especially thank my co-author Dr. Anuttam Patra who has been a great help, Associate Professor Allan Holmgren for the many discussions about IR and surface interactions, Ulf Nordström for his assistance in the lab and my co-authors for their time and ideas. The financial support of the Hjalmar Lundbohm Research Centre (HLRC) and Luossavaara-Kiirunavaara Aktiebolag (LKAB) is gratefully acknowledged. The work with conventional collectors was funded by research grant EU FP7-603564 – REEcover, which is a European FP7 project. I would also like to thank my friends and colleagues at Mineral Processing, Process Metallurgy, Chemical Technology as well as many other areas of the university who have made this experience a pleasure. A special thank you to Anders Sand and Mehdi Parian for their help over the years. I also extend my deepest gratitude to my wife-to-be, my parents and the rest of my family who have supported me throughout this. Tack för att ni alltid finns där som ett stöd.

vi
vii
List of papers The thesis is based on the following papers:
I. Patra, A., Karlkvist, T., Rao, K. H., Fredriksson, A., Bordes, R., & Holmberg, K. (2014). Design and development of novel mineral-specific collectors for flotation. In XXVII International Mineral Processing Congress (pp. 1–10). Santiago, Chile.
II. Karlkvist, T., Patra, A., Rao, K. H., Bordes, R., & Holmberg, K. (2015). Flotation selectivity of novel alkyl dicarboxylate reagents for apatite–calcite separation. Journal of Colloid and Interface Science, 445, 40–47.
III. Karlkvist, T., Patra, A., Bordes, R., Holmberg, K., & Rao, K. H. (2016). Flotation Selectivity of Novel Alkyl Dicarboxylate Reagents for Calcite-Fluorite Separation. Tenside Surfactants Detergents, 53(6), 516–523.
IV. Karlkvist, T., Pålsson, B. I., Fredriksson, A., & Kota, H. R. (2016). Pre-print 15-165 Novel alkyl aminodicarboxylate reagents for mineral specific flotation. In 2016 SME Annual Conference and Expo: The Future for Mining in a Data-Driven World (pp. 807–810).
V. Pålsson, B. I. Karlkvist, T., Synergism among collectors used for flotation of apatite and REE minerals – To be submitted to Minerals Engineering
My contributions to the papers included in this thesis:
Paper I Some planning and writing
Paper II All experimental work relating to Hallimond tube flotation and DRIFT as well as most of the writing
Paper III All experimental work relating to Hallimond tube flotation and DRIFT as well as most of the writing
Paper IV All experimental work and writing
Paper V All experimental work regarding zeta-potentials, their evaluation and writing up of collector description and general conclusions
Work not included in this thesis:
Rao, K. H., Javadi, A., Karlkvist, T., Patra, A., Vilinska, A., & Chernyshova, I. V. (2013). Revisiting Sulphide Mineral ( Bio ) Processing : a Few Priorities and Directions.Powder Metallurgy & Mining, 2(4), 51–56.
Karlkvist, T., Patra, A., Rao, K. H. (2013). Molecular recognition mechanisms in biomineralization applied to reagents selectivity in froth flotation (pp. 81–94). In Conference in Minerals Engineering 2013, Luleå
Karlkvist, T., Patra, A., Rao, K. H., Bengtsson A.K., Fredriksson A., Bordes, R., & Holmberg, K. Development of Novel Mineral-Specific Reagents in Selective Flotation (pp. 57–72). In Conference in Minerals Engineering 2014, Luleå

viii
ix
Table of Contents Summary ................................................................................................................................ iii
Acknowledgements ................................................................................................................ v
List of papers ........................................................................................................................ vii
1 Introduction ............................................................................................................................. 1
1.1 Objective ........................................................................................................................... 1
1.2 Significance ...................................................................................................................... 1
1.3 Bio-mineralization ............................................................................................................ 2
1.4 Background ....................................................................................................................... 5
1.4.1 Phosphate rock ........................................................................................................... 5
1.4.2 Calcium minerals ....................................................................................................... 6
1.4.3 Separation of apatite ores ........................................................................................... 7
2 Theory and Experimental Methods ....................................................................................... 11
2.1 Reagents .......................................................................................................................... 11
2.2 Novel Collectors ............................................................................................................. 11
2.3 Materials ......................................................................................................................... 14
2.4 Flotation .......................................................................................................................... 15
2.4.1 Modified Hallimond tube flotation .......................................................................... 16
2.4.2 Bench scale flotation ................................................................................................ 17
2.5 Zeta-potential .................................................................................................................. 18
2.6 Diffuse Reflectance Fourier Transform Spectroscopy (DRIFT) .................................... 19
2.7 NMR ............................................................................................................................... 19
2.8 Total Organic Carbon ..................................................................................................... 20
3 Results ................................................................................................................................... 21
3.1 Collectors 1 (Amide groups) .......................................................................................... 21
3.1.1 Apatite ...................................................................................................................... 21
3.1.2 Calcite ...................................................................................................................... 24
3.1.3 Fluorite ..................................................................................................................... 27
3.1.4 Minor Summary ....................................................................................................... 29
3.2 Collectors 2 (Amine group) ............................................................................................ 30
3.2.1 Apatite ...................................................................................................................... 30
3.2.2 Calcite ...................................................................................................................... 32
3.2.3 Fluorite ..................................................................................................................... 33
3.2.4 Minor summary ........................................................................................................ 35
3.3 Conventional collectors .................................................................................................. 35
x
3.3.1 Bench-scale flotation ............................................................................................... 35
3.3.2 Zeta-potential ........................................................................................................... 38
4 Discussion ............................................................................................................................. 41
4.1 Monofunctional surfactants ............................................................................................ 41
4.2 Apatite ............................................................................................................................ 41
4.3 Calcite ............................................................................................................................. 42
4.4 Fluorite ............................................................................................................................ 42
4.5 Combined discussion/Comparison ................................................................................. 43
4.6 Zeta-potential, adsorption and flotation .......................................................................... 44
4.7 Combination of collectors – addition orders .................................................................. 44
5 Conclusion ............................................................................................................................. 47
6 Future work ........................................................................................................................... 49
7 References ............................................................................................................................. 51
1
1 Introduction
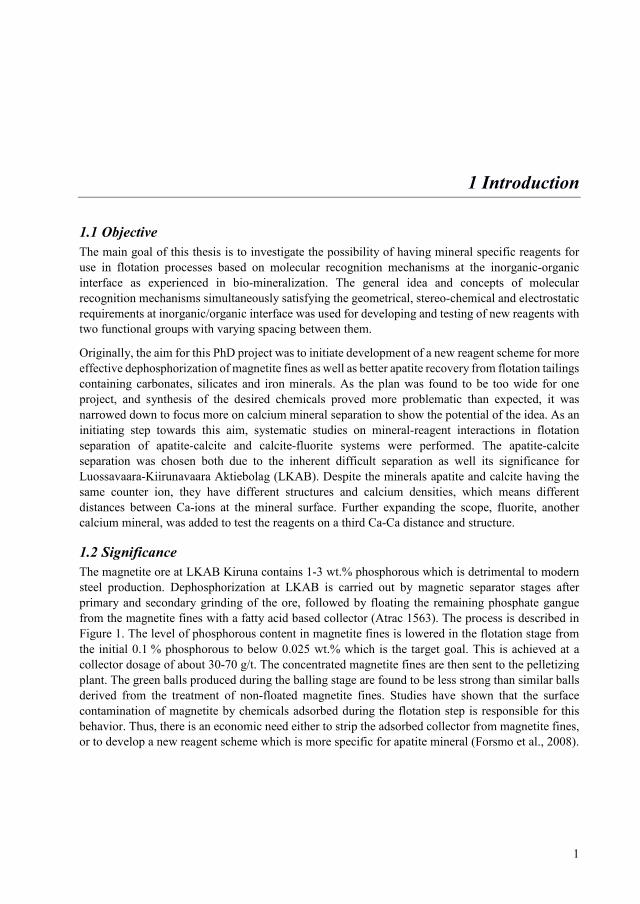
1.1 Objective The main goal of this thesis is to investigate the possibility of having mineral specific reagents for use in flotation processes based on molecular recognition mechanisms at the inorganic-organic interface as experienced in bio-mineralization. The general idea and concepts of molecular recognition mechanisms simultaneously satisfying the geometrical, stereo-chemical and electrostatic requirements at inorganic/organic interface was used for developing and testing of new reagents with two functional groups with varying spacing between them.
Originally, the aim for this PhD project was to initiate development of a new reagent scheme for more effective dephosphorization of magnetite fines as well as better apatite recovery from flotation tailings containing carbonates, silicates and iron minerals. As the plan was found to be too wide for one project, and synthesis of the desired chemicals proved more problematic than expected, it was narrowed down to focus more on calcium mineral separation to show the potential of the idea. As an initiating step towards this aim, systematic studies on mineral-reagent interactions in flotation separation of apatite-calcite and calcite-fluorite systems were performed. The apatite-calcite separation was chosen both due to the inherent difficult separation as well its significance for Luossavaara-Kiirunavaara Aktiebolag (LKAB). Despite the minerals apatite and calcite having the same counter ion, they have different structures and calcium densities, which means different distances between Ca-ions at the mineral surface. Further expanding the scope, fluorite, another calcium mineral, was added to test the reagents on a third Ca-Ca distance and structure.
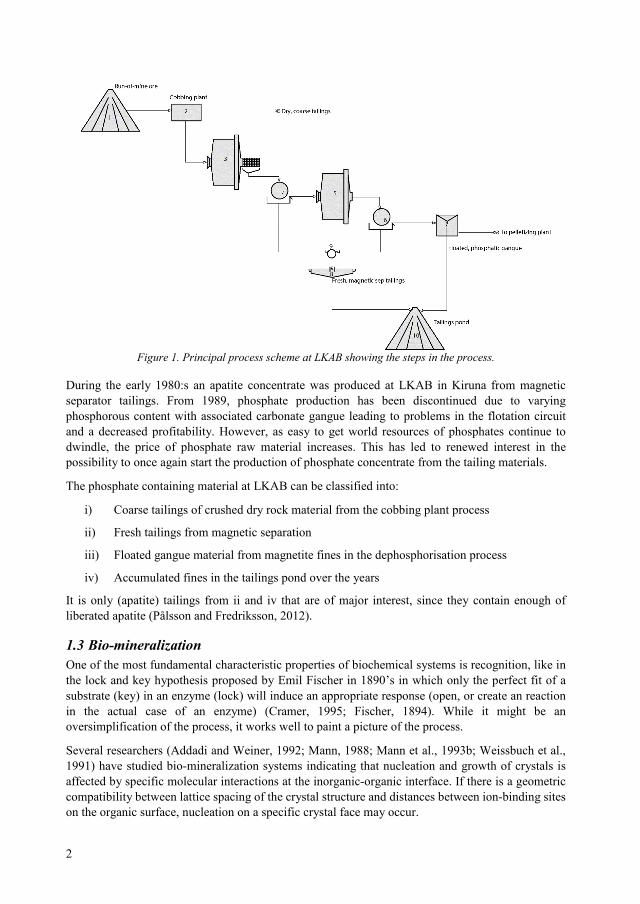
1.2 Significance The magnetite ore at LKAB Kiruna contains 1-3 wt.% phosphorous which is detrimental to modern steel production. Dephosphorization at LKAB is carried out by magnetic separator stages after primary and secondary grinding of the ore, followed by floating the remaining phosphate gangue from the magnetite fines with a fatty acid based collector (Atrac 1563). The process is described in Figure 1. The level of phosphorous content in magnetite fines is lowered in the flotation stage from the initial 0.1 % phosphorous to below 0.025 wt.% which is the target goal. This is achieved at a collector dosage of about 30-70 g/t. The concentrated magnetite fines are then sent to the pelletizing plant. The green balls produced during the balling stage are found to be less strong than similar balls derived from the treatment of non-floated magnetite fines. Studies have shown that the surface contamination of magnetite by chemicals adsorbed during the flotation step is responsible for this behavior. Thus, there is an economic need either to strip the adsorbed collector from magnetite fines, or to develop a new reagent scheme which is more specific for apatite mineral (Forsmo et al., 2008).
2
Figure 1. Principal process scheme at LKAB showing the steps in the process.
During the early 1980:s an apatite concentrate was produced at LKAB in Kiruna from magnetic separator tailings. From 1989, phosphate production has been discontinued due to varying phosphorous content with associated carbonate gangue leading to problems in the flotation circuit and a decreased profitability. However, as easy to get world resources of phosphates continue to dwindle, the price of phosphate raw material increases. This has led to renewed interest in the possibility to once again start the production of phosphate concentrate from the tailing materials.
The phosphate containing material at LKAB can be classified into:
i) Coarse tailings of crushed dry rock material from the cobbing plant process
ii) Fresh tailings from magnetic separation
iii) Floated gangue material from magnetite fines in the dephosphorisation process
iv) Accumulated fines in the tailings pond over the years
It is only (apatite) tailings from ii and iv that are of major interest, since they contain enough of liberated apatite (Pålsson and Fredriksson, 2012).
1.3 Bio-mineralization One of the most fundamental characteristic properties of biochemical systems is recognition, like in the lock and key hypothesis proposed by Emil Fischer in 1890’s in which only the perfect fit of a substrate (key) in an enzyme (lock) will induce an appropriate response (open, or create an reaction in the actual case of an enzyme) (Cramer, 1995; Fischer, 1894). While it might be an oversimplification of the process, it works well to paint a picture of the process.
Several researchers (Addadi and Weiner, 1992; Mann, 1988; Mann et al., 1993b; Weissbuch et al., 1991) have studied bio-mineralization systems indicating that nucleation and growth of crystals is affected by specific molecular interactions at the inorganic-organic interface. If there is a geometric compatibility between lattice spacing of the crystal structure and distances between ion-binding sites on the organic surface, nucleation on a specific crystal face may occur.
3
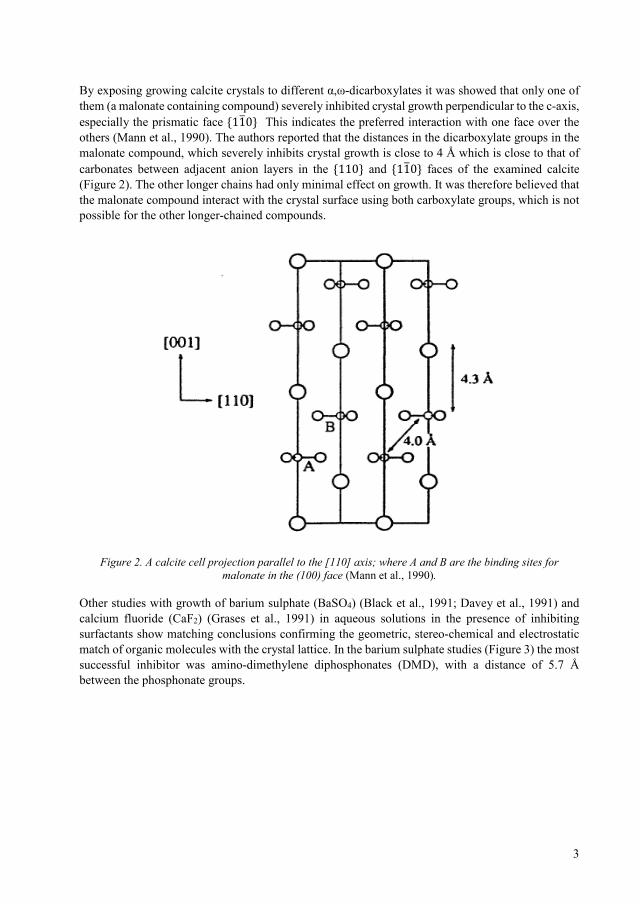
By exposing growing calcite crystals to different α,ω-dicarboxylates it was showed that only one of them (a malonate containing compound) severely inhibited crystal growth perpendicular to the c-axis, especially the prismatic face {11�0} This indicates the preferred interaction with one face over the others (Mann et al., 1990). The authors reported that the distances in the dicarboxylate groups in the malonate compound, which severely inhibits crystal growth is close to 4 Å which is close to that of carbonates between adjacent anion layers in the {110} and {11�0} faces of the examined calcite (Figure 2). The other longer chains had only minimal effect on growth. It was therefore believed that the malonate compound interact with the crystal surface using both carboxylate groups, which is not possible for the other longer-chained compounds.
Figure 2. A calcite cell projection parallel to the [110] axis; where A and B are the binding sites for
malonate in the (100) face (Mann et al., 1990).
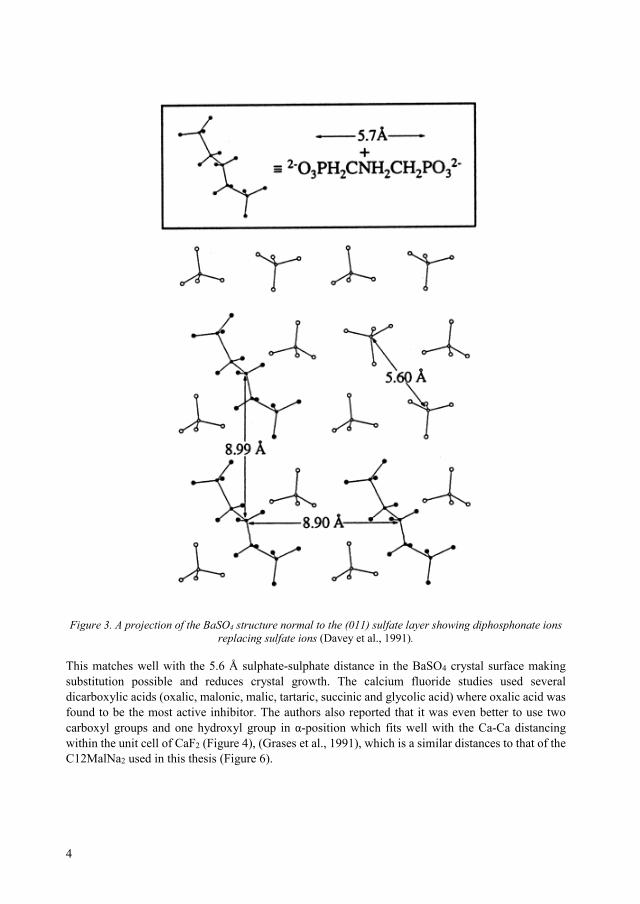
Other studies with growth of barium sulphate (BaSO4) (Black et al., 1991; Davey et al., 1991) and calcium fluoride (CaF2) (Grases et al., 1991) in aqueous solutions in the presence of inhibiting surfactants show matching conclusions confirming the geometric, stereo-chemical and electrostatic match of organic molecules with the crystal lattice. In the barium sulphate studies (Figure 3) the most successful inhibitor was amino-dimethylene diphosphonates (DMD), with a distance of 5.7 Å between the phosphonate groups.
4
Figure 3. A projection of the BaSO4 structure normal to the (011) sulfate layer showing diphosphonate ions
replacing sulfate ions (Davey et al., 1991).
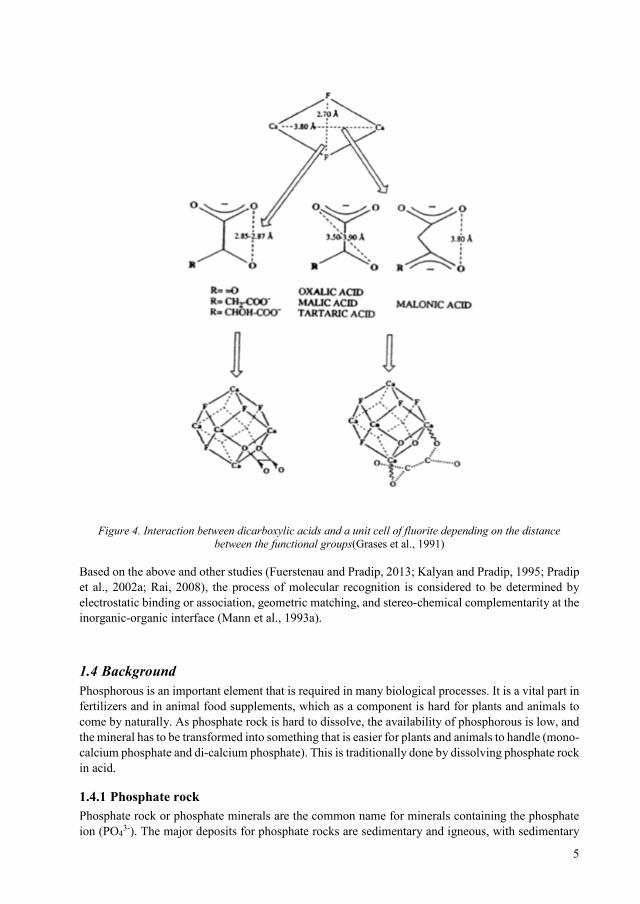
This matches well with the 5.6 Å sulphate-sulphate distance in the BaSO4 crystal surface making substitution possible and reduces crystal growth. The calcium fluoride studies used several dicarboxylic acids (oxalic, malonic, malic, tartaric, succinic and glycolic acid) where oxalic acid was found to be the most active inhibitor. The authors also reported that it was even better to use two carboxyl groups and one hydroxyl group in α-position which fits well with the Ca-Ca distancing within the unit cell of CaF2 (Figure 4), (Grases et al., 1991), which is a similar distances to that of the C12MalNa2 used in this thesis (Figure 6).
5
Figure 4. Interaction between dicarboxylic acids and a unit cell of fluorite depending on the distance
between the functional groups(Grases et al., 1991)
Based on the above and other studies (Fuerstenau and Pradip, 2013; Kalyan and Pradip, 1995; Pradip et al., 2002a; Rai, 2008), the process of molecular recognition is considered to be determined by electrostatic binding or association, geometric matching, and stereo-chemical complementarity at the inorganic-organic interface (Mann et al., 1993a).
1.4 Background Phosphorous is an important element that is required in many biological processes. It is a vital part in fertilizers and in animal food supplements, which as a component is hard for plants and animals to come by naturally. As phosphate rock is hard to dissolve, the availability of phosphorous is low, and the mineral has to be transformed into something that is easier for plants and animals to handle (mono-calcium phosphate and di-calcium phosphate). This is traditionally done by dissolving phosphate rock in acid.
1.4.1 Phosphate rock Phosphate rock or phosphate minerals are the common name for minerals containing the phosphate ion (PO4
3-). The major deposits for phosphate rocks are sedimentary and igneous, with sedimentary
6
being the larger source of phosphate by far (~80%). However, as igneous deposits are more prevalent in Scandinavia the focus in this thesis is on igneous deposits. The largest group of phosphate minerals is the apatite group Ca5(PO4)3(F,Cl,OH) with other major phosphate minerals being francolite ((Ca, Mg, Sr, Na)10(PO4, SO4, CO3)6F2–3), collophane (Ca5(PO4,CO3)3F) and dahllite (Ca5(PO4,CO3)3OH). It should be noted that francolite, collophane and dahllite are mostly found in sedimentary deposits (Kawatra and Carlson, 2014; U.S. Geological Survey, 2016).
The largest producers of phosphate rock are China (100 000 tons), Morocco (30 000 tons) and the United States (27 600 tons). Morocco is also the biggest exporter, between 2011 and 2014 it alone stood for 64% of the United States import of phosphate rock (U.S. Geological Survey, 2016). These countries have mostly sedimentary deposits.
1.4.2 Calcium minerals A common group of minerals found with apatite as gangue are clay, dolomite (CaMg(CO3)2), quartz (SiO2) and calcite (CaCO3). Since clays are mostly common in sedimentary ores, it is considered outside the scope of this thesis. The same goes for dolomite and quartz; dolomite due to only minor amount of the mineral found in the apatite-iron ore, and quartz as it already is relatively easy to remove; especially compared to calcite (Niiranen, 2015).
Apatite Apatite is besides a phosphor mineral also a calcium mineral. It has a hexagonal bipyramidal structure. As stated earlier the structural formula is Ca5(PO4)3(F,Cl,OH) and it has a Ca density between 5.1 and 6.6 μmol/m2 (Horta et al., 2016; Lu et al., 1998). The common names for the different species are hydroxyapatite (Ca5(PO4)3OH), fluorapatite (Ca5(PO4)3F) and chlorapatite (Ca5(PO4)3Cl). As already mentioned the most common use of apatite is within agriculture as fertilizer, which accounts for approximately 80% of the mined apatite usage (Scholz et al., 2014). Other notable industrial uses of apatite are as pigment and raw material for phosphoric acid, which is used in several down-stream processes, e.g. production of mono- and dicalcium phosphate. Interestingly, hydroxyapatite is besides a naturally occurring mineral also a component in human bone and teeth (Arnold and Gaengler, 2007; Vučinić et al., 2010).
Calcite Calcite is a calcium carbonate with a trigonal-rombohedral structure with a Ca density of 8,2 μmol/m2(Horta et al., 2016; Lu et al., 1998). The other major carbonate mineral is aragonite (CaCO3), which has the same formula but different structure (orthorhombic). Aragornite is not thermodynamically stable under ambient conditions and will eventually convert into calcite with enough time (>107 years). As calcite is a carbonate it will readily dissolve in most acids thereby increasing the pH making flotation separation at lower pH problematic. Calcite, together with aragonite are the major constituents in limestone and as such important as building material for construction. Calcite is also used as a filler in toothpaste and paint as well in production of burnt lime and cement.
Fluorite Another calcium mineral often found with calcite is fluorite (CaF2) or fluorspar as it is also known. It has a Ca density between 11.1 and 12.9 μmol/m2 (Horta et al., 2016; Lu et al., 1998). It has a cubic (isometric) structure and its main industrial use is for production of the strong acid hydrogen fluoride (HF), in welding electrodes and as slag viscosity modifier.
7
1.4.3 Separation of apatite ores
Flotation The efficiency of a mineral flotation process depends on the desired mineral particles being hydrophobic while at the same time keeping, or making, all unwanted particles hydrophilic. To make the mineral surface hydrophobic (if needed) a collector is added to the flotation pulp. Currently, there is hardly any satisfactory scientific theory describing the collector selectivity for mineral surfaces, and most of the reagents presently used were discovered by empirical and/or trial and error methods. Several known chelating agents have been modified to make them act as selective flotation collectors with some degree of success (Bustamante and Shergold, 1983; Marabini et al., 2007). The problem is that almost all of the chelating groups form complexes with almost all of the transition and many non-transition metals. Hence, absolute selectivity does not exist, especially where the cations participating in the complexation reactions are the same. One way to improve the selectivity is to use other reagents, depressants, to hinder the flotation of undesired minerals. This will improve the selectivity of the flotation scheme but does add an additional reagent cost and complexity.
As the easy to access and high grade ores are steadily depleting, it is becoming more and more urgent to find efficient techniques to exploit low-grade, complex and disseminated type of ore deposits and old tailings dumps (Steiner et al., 2015). In this, the development of new selective reagents (collectors) by correlating the chemical structure of a surface-active molecule directly to the physico-chemical activity of a mineral is of particular interest (Pradip et al., 2002b).
The minerals studied here have been chosen due to their similarities and importance for the industry. Especially apatite and calcite are often being found together and are difficult to separate. These minerals behave more or less the same in their interaction with flotation collectors (at least regarding oleate) which is due to these minerals containing calcium in surface sites; which is a major factor in their problematic separation. As they all have the same positive calcium group targeted by the negatively charged flotation reagent they are also useful to study, and to show any possible differences in their interaction with surfactants having more than one functional group.
Reagents Much research has been performed on the adsorption of fatty acid collectors to calcium mineral surfaces and comprehensive reviews have previously been published in the literature (Finkelstein, 1989; Hanna and Somasundaran, 1976; Horta et al., 2016; Lu et al., 1998; Rao and Forssberg, 1992). Despite this, there is still no common solution for their separation processes on an industrial level (Abouzeid, 2008) This is partially due to the complexity of the minerals themselves and in part due to the high reactivity of the collectors employed for this purpose. The traditional collectors have a low selectivity with depression of unwanted minerals being the way to selectively separate calcium minerals, but with limited success. The most common depressant for calcium mineral separation is starch, which has a higher affinity towards calcite over apatite, thereby adsorbing more on the calcite surface and blocking collector adsorption (Kawatra and Carlson, 2014; Leal Filho et al., 2000).
In theory, it would be more efficient to design a selective collector based on interactions with the whole surface and not only on a single constituent, i.e. designing a collector that recognizes the surface of a mineral and takes into account the differences in the crystal structure of the mineral surfaces.
The discoveries in bio-mineralization that molecules with the same functional groups, but different distances between them, will interact differently with the inorganic surface suggest the possibility of designing crystal structure specific reagents (Mann, 1993, 1988; Pradip et al., 2002a). The same
8
influence with reagents having only one functional group was not observed, indicating that the distance between functional groups is an important factor in selectivity for crystal growth inhibition. These concepts have been successfully applied to the rational design and synthesis of molecules, either for the control of crystal morphology, or to inhibit crystal growth processes through the recognition of specific crystal surfaces (Davey et al., 1991).
Conventional collectors There are many different types of collectors used for mineral flotation. While the collectors listed here might not all be conventional for calcium flotation, they are all commercially available and used in flotation separation.
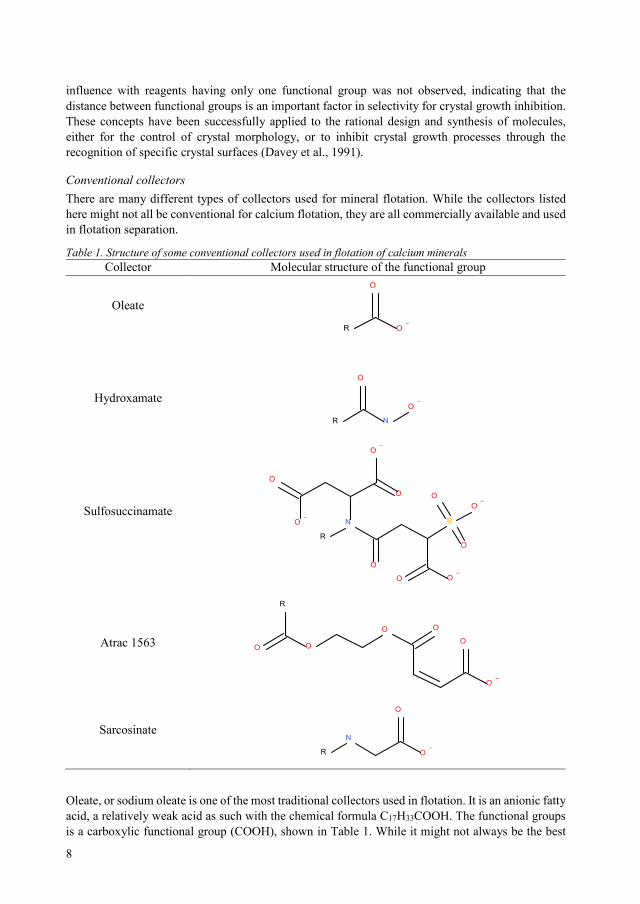
Table 1. Structure of some conventional collectors used in flotation of calcium minerals Collector Molecular structure of the functional group
Oleate
O–
O
R
Hydroxamate
R N
O–
O
Sulfosuccinamate O
O–
O–
O
N
R
O
O–
O
S
O–
O
O
Atrac 1563
R
O O
O O
O–
O
Sarcosinate N
R O–
O
Oleate, or sodium oleate is one of the most traditional collectors used in flotation. It is an anionic fatty acid, a relatively weak acid as such with the chemical formula C17H33COOH. The functional groups is a carboxylic functional group (COOH), shown in Table 1. While it might not always be the best
9
collector for a mineral system, as it is more reactive then selective, it is a very well-studied collector, which has been tested in a wide variety of systems over the years.
Hydroxamates are anionic collectors that have CONO as the functional group (Table 1). It has a similar behavior as the carboxylic collectors, possibly due to similarities with the, and both collectors having electronegative functional groups. Flotation separation with hydroxamates have been used in many different systems like iron ore, tin, tungsten and rare-earth minerals and have shown themselves to be very selective (Pradip et al., 2002b). Examples of commercially available collectors in this family are the AM2 flotation reagent developed by Ausmelt Ltd and AERO 6493 developed by CYTEC.
Sulfosuccinamate collectors are alkylated succinate acids with a sulphonate group attached between the groups and can be seen in Table 1. The reagent have several carboxylic groups with different distances between them and has as such similarities to the oleates. They were developed to be more selective than the oleates with its many carboxylic groups and the varying distances between them (Cytec Industries, 2002). A commercial example of this type of collector is AERO 845 from CYTEC
Atrac is a commercially available reagent from Akzo Nobel, Sweden. It is currently used for apatite flotation by LKAB in their Kiruna and Svappavaara plants in Sweden. The actual structure is not known as it is proprietary information but from the safety data sheet, it is known to contain ethoxylated tall oil ester of maleic acid and maleic anhydride (Table 1). While the aim is apatite removal it has been shown that the collector also adsorbs on the iron mineral surfaces, which may lower the quality of the green pellets produced. Investigations by Potapova et al has proposed a structure for the groups involved in the interactions with iron ore (Potapova et al., 2010), It is likely that the collector interaction with apatite will be from the carboxylic groups.
Another group of collectors is based on sarcosine, a carboxylic acid coupled to a methylated nitrogen via a spacer carbon, seen in Table 1. The methyl group on the nitrogen will make it adsorb stronger on a suitable surface than similar glycine based surfactants (same structure as sarcosinate if the methyl group is removed). A drawback with the methyl group could be that the nitrogen lacks the possibility of hydrogen bonding that the hydrogenated nitrogen has. The hydrogen bonding possibility is a little more advantageous for good packing when used as a surfactant (Bordes et al., 2010). A commercially available reagent of this type is Berol A3 from Akzo Nobel.
Mixtures of collectors At times using only one collector might not be sufficient or yield the best result. Combining several surface active reagents could help by improving selectivity towards one mineral over another or by further depressing gangue. One collectors in this study (AERO 845) has a recommendation to combine it with other collectors, while A6494 is a combination of the hydroxamate collector A6493 and vegetable oil. Historically, several of the early dithiophosphate collectors offered by Cytec were mixtures (Cyanamid, 1976):
• Aerofloat 208 – 50 % diethyldithiophosphate and 50 % disec-butyldithiophosphate, • Aerofloat 242 – 94 % dicresyldithiophosphate and 6 % thiocarbanilide
The strategy for doing such combinations is not entirely clear. Most combinations appear to have been found without much of scientific basis. One example of the benefit of using an addition of long-chained alcohol to hydroxamate is published (Miller et al., 2002a, 2002b). However, it is not clear how the authors came to the conclusion to try this mixture. In searching for background information for this thesis, no conclusive literature references regarding how to select combinations of surface-active reagents to get the best packing of a hydrophobic layer at the mineral surface have been found.
10
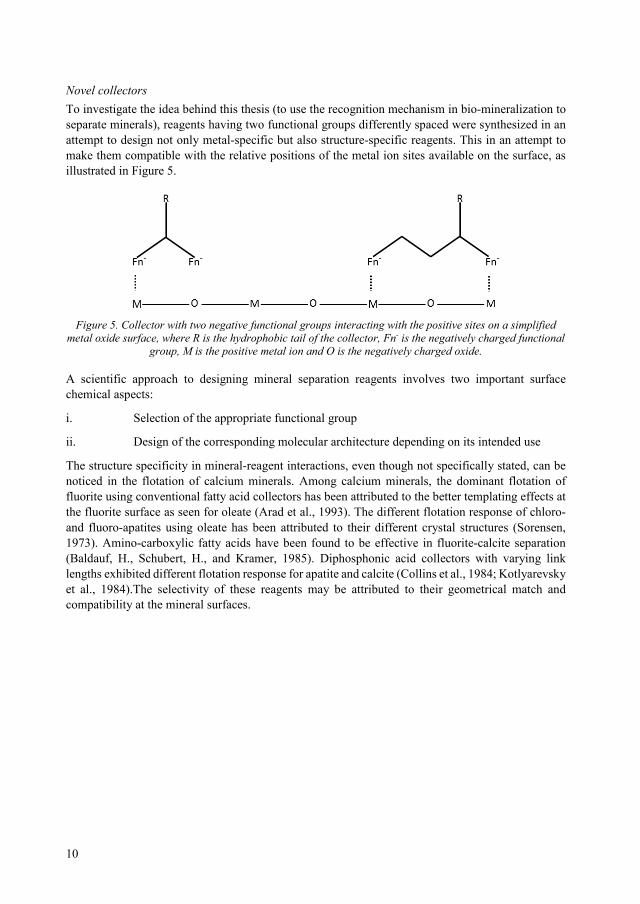
Novel collectors To investigate the idea behind this thesis (to use the recognition mechanism in bio-mineralization to separate minerals), reagents having two functional groups differently spaced were synthesized in an attempt to design not only metal-specific but also structure-specific reagents. This in an attempt to make them compatible with the relative positions of the metal ion sites available on the surface, as illustrated in Figure 5.
Figure 5. Collector with two negative functional groups interacting with the positive sites on a simplified
metal oxide surface, where R is the hydrophobic tail of the collector, Fn- is the negatively charged functional group, M is the positive metal ion and O is the negatively charged oxide.
A scientific approach to designing mineral separation reagents involves two important surface chemical aspects:
i. Selection of the appropriate functional group
ii. Design of the corresponding molecular architecture depending on its intended use
The structure specificity in mineral-reagent interactions, even though not specifically stated, can be noticed in the flotation of calcium minerals. Among calcium minerals, the dominant flotation of fluorite using conventional fatty acid collectors has been attributed to the better templating effects at the fluorite surface as seen for oleate (Arad et al., 1993). The different flotation response of chloro- and fluoro-apatites using oleate has been attributed to their different crystal structures (Sorensen, 1973). Amino-carboxylic fatty acids have been found to be effective in fluorite-calcite separation (Baldauf, H., Schubert, H., and Kramer, 1985). Diphosphonic acid collectors with varying link lengths exhibited different flotation response for apatite and calcite (Collins et al., 1984; Kotlyarevsky et al., 1984).The selectivity of these reagents may be attributed to their geometrical match and compatibility at the mineral surfaces.
11
2 Theory and Experimental Methods
2.1 Reagents Hydrochloric acid (HCl) and sodium hydroxide (NaOH) were used as pH regulators for all experiments. In the zeta-potential measurement sodium chloride (NaCl, 0,01 M) was used as the background electrolyte.
Lauroyl chloride, l-aspartic acid, l-glutamic acid, aminomalonic acid diethyl ester hydrochloride, l-glycine ethyl ester, lithium aluminum hydride, calcium chloride anhydrous were purchased from Sigma–Aldrich, USA. Dodecylamine, bromoacetic acid, bromopropanoic acid, bromoacetic acid methyl ester, bromopropanoic acid methyl ester, and carbon disulfide were purchased from Alfa-Aesar, UK. Sodium hydroxide, hydrochloric acid 37%, ethanol, tetrahydrofuran (THF) anhydrous were purchased from VWR, Sweden. All these reagents were used as received. Pyridine (Aldrich, 99%) was used freshly distilled in vacuum and stored over potassium hydroxide (KOH).
The hydroxamate and sulfosuccinamate collectors used in the bench scale flotation were received by courtesy of Cytec, USA and used according to their instructions. The Na-oleate reagent is of technical grade and was received from Avantor Performace Materials. The Atrac collector was received from LKAB as it is their standard collector (manufactured by Akzo Nobel, Sweden)
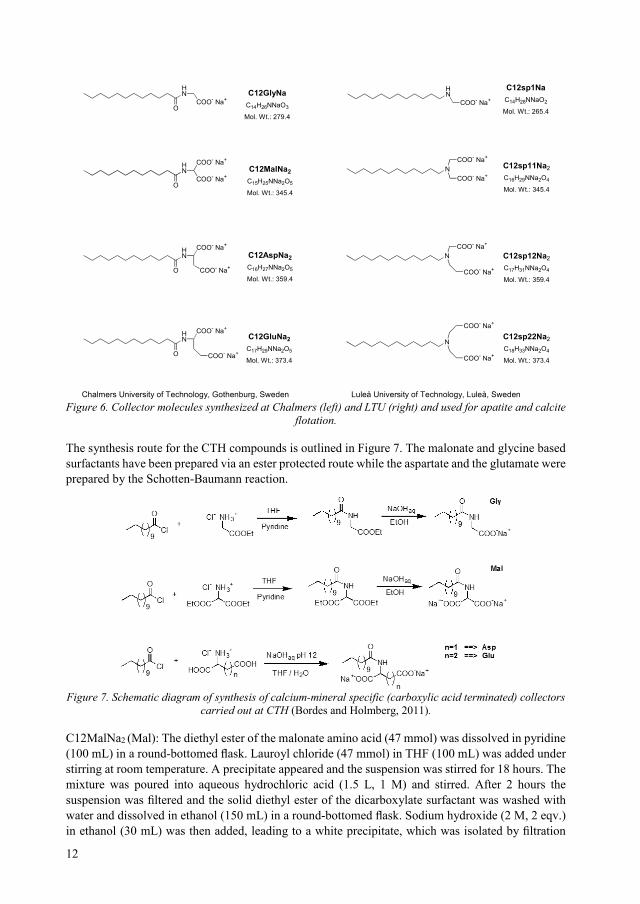
2.2 Novel Collectors The novel collectors used in this work were synthesized at both Chalmers University of Technology (CTH), left column, and at Luleå University of Technology (LTU), right column, Figure 6. The reagents synthesized at Chalmers University are amino acid derivatives, which are suspected to be less detrimental for the environment compared to traditional collectors. The functional group in all the synthesized surfactants involved in the mineral surface interaction is the carboxylic group (COOH). However, to separate the two different groups of surfactants from each other when discussing in general, they are referred to as amides (surfactants on the left side in Figure 6) or amines (surfactants on the right in Figure 6).
12
Figure 6. Collector molecules synthesized at Chalmers (left) and LTU (right) and used for apatite and calcite
flotation.
The synthesis route for the CTH compounds is outlined in Figure 7. The malonate and glycine based surfactants have been prepared via an ester protected route while the aspartate and the glutamate were prepared by the Schotten-Baumann reaction.
Figure 7. Schematic diagram of synthesis of calcium-mineral specific (carboxylic acid terminated) collectors
carried out at CTH (Bordes and Holmberg, 2011).
C12MalNa2 (Mal): The diethyl ester of the malonate amino acid (47 mmol) was dissolved in pyridine (100 mL) in a round-bottomed flask. Lauroyl chloride (47 mmol) in THF (100 mL) was added under stirring at room temperature. A precipitate appeared and the suspension was stirred for 18 hours. The mixture was poured into aqueous hydrochloric acid (1.5 L, 1 M) and stirred. After 2 hours the suspension was filtered and the solid diethyl ester of the dicarboxylate surfactant was washed with water and dissolved in ethanol (150 mL) in a round-bottomed flask. Sodium hydroxide (2 M, 2 eqv.) in ethanol (30 mL) was then added, leading to a white precipitate, which was isolated by filtration
HN
O
HN
O
HN
O
HN
O
C12GluNa2C17H29NNa2O5
Mol. Wt.: 373.4
C12AspNa2C16H27NNa2O5
Mol. Wt.: 359.4
C12MalNa2C15H25NNa2O5
Mol. Wt.: 345.4
C12GlyNaC14H26NNaO3
Mol. Wt.: 279.4
N
N
N
HN
C12sp1NaC14H28NNaO2
Mol. Wt.: 265.4
C12sp22Na2
C18H33NNa2O4
Mol. Wt.: 373.4
C12sp12Na2
C17H31NNa2O4
Mol. Wt.: 359.4
C12sp11Na2
C16H29NNa2O4
Mol. Wt.: 345.4
COO- Na+
COO- Na+
COO- Na+
COO- Na+
COO- Na+
COO- Na+
COO- Na+
COO- Na+
COO- Na+
COO- Na+
COO- Na+
COO- Na+
COO- Na+ COO- Na+
Chalmers University of Technology, Gothenburg, Sweden Luleå University of Technology, Luleå, Sweden
13
with a 95% yield. The substance was confirmed using NMR: 1H NMR (D2O, δ 0.85 (t, 3 protons), δ 1.26 (m, 16 protons), δ 1.58 (m, 2 protons), δ 2.30 (t, 2 protons), δ 3.33 (s, 1 proton)), 13C NMR (D2O, δ 13.96, 17.07, 22.68, 29.35, 29.86, 36.07, 49.11, 57.62, 62.19, 174.39, 175.62) (Bordes and Holmberg, 2011).
C12AspNa2 (Asp) and C12GluNa2 (Glu): A suspension of amino acid (310 mmol) was prepared in a mixture of water/acetone (210 mL/150 mL) in a round-bottomed flask. pH was set to 12 with an automatic titrator filled with a solution of sodium hydroxide (2.5 M). Lauroyl chloride was added drop-wise under stirring at 5°C and stirring was continued for 90 minutes. The mixture was then cooled to 0°C and stirred for 2 hours while the pH was kept at 12. The solution was warmed to room temperature after which then the pH was lowered to 2. A white precipitate appeared which was filtered and washed with water. The product was recrystallized three times in toluene. The product was dissolved in ethanol, and a solution of sodium hydroxide was added (2 M, 2 eq.). The subsequent precipitate was isolated by filtration with a 74% yield.
The substances were confirmed by NMR:
• C12AspNa2: 1H NMR (D2O, δ 0.85 (t, 3 protons), δ 1.26 (m, 16 protons), δ 1.56 (m, 2 protons), δ 2.24 (t, 2 protons), δ 2.56 (d, 2 protons), δ 4.38 (t, 1 proton)), 13C NMR (D2O, δ 14.02, 22.71, 25.67,29.28, 29.36, 29.42, 29.61, 29.71, 31.99, 36.25, 40.16, 52.97, 176.08, 178.98, 179.10).
• C12GluNa2: 1H NMR (D2O, δ 0.83 (t, 3 protons), δ 1.24 (m, 16 protons), δ 1.56 (m, 2 protons), δ 1.85 (m, 1 proton), δ 2.02 (m, 1 proton), δ 2.23 (m, 4 protons), δ 4.12 (m, 1 proton)), 13C NMR (D2O, δ 13.98, 22.65, 25.72, 29.15, 31.90, 34.40, 36.16, 55.42, 176.39, 179.16, 182.36).
C12GlyNa (Gly): l-glycine ethyl ester (10 g) was dissolved in pyridine (20 mL) in a round-bottomed flask under reflux. Dodecyl chloride (15.7 g) was added drop-wise under stirring, leading to a white precipitate. The solvent was evaporated and the product dispersed in water, stirred and then filtered and recrystallized from ethanol. The N-dodecyl ester formed was dissolved in ethanol (100 mL) and aqueous sodium hydroxide (2 M, 35 mL) was added drop-wise under stirring, leading to a white precipitate of the sodium salt of the surfactant. The yield was 46%.
The substance was confirmed by NMR: 1H NMR (D2O, δ 0.83 (t, 3 protons), δ 1.25 (m, 16 protons), δ 1.57 (m, 2 protons), δ 2.26 (t, 2 protons), δ 3.70 (s, 2 protons)), 13C NMR (D2O, δ 13.84, 22.58, 25.67, 29.07, 29.24, 29.46, 29.56, 31.84, 36.09, 43.44, 176.49, 176.91).
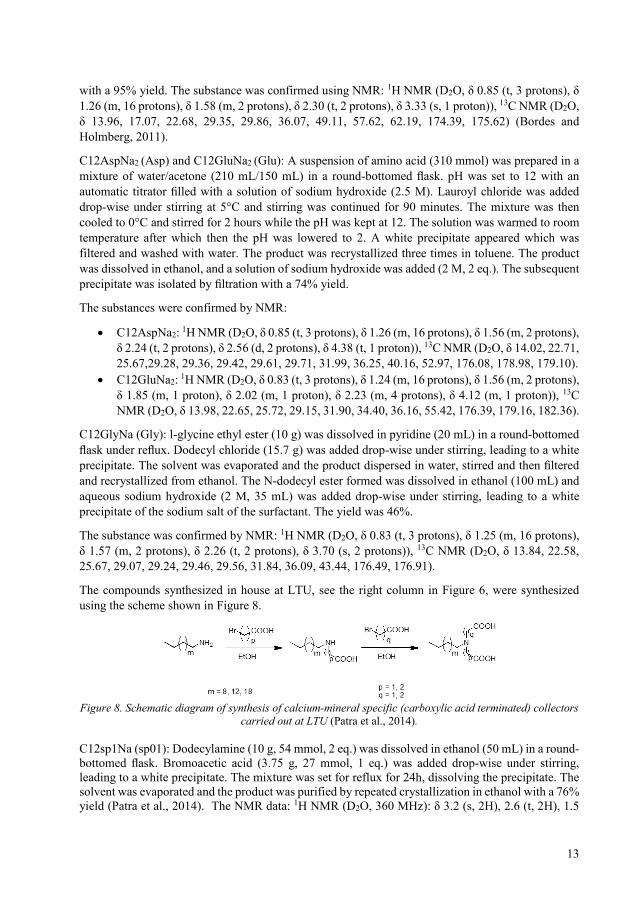
The compounds synthesized in house at LTU, see the right column in Figure 6, were synthesized using the scheme shown in Figure 8.
Figure 8. Schematic diagram of synthesis of calcium-mineral specific (carboxylic acid terminated) collectors
carried out at LTU (Patra et al., 2014).
C12sp1Na (sp01): Dodecylamine (10 g, 54 mmol, 2 eq.) was dissolved in ethanol (50 mL) in a round-bottomed flask. Bromoacetic acid (3.75 g, 27 mmol, 1 eq.) was added drop-wise under stirring, leading to a white precipitate. The mixture was set for reflux for 24h, dissolving the precipitate. The solvent was evaporated and the product was purified by repeated crystallization in ethanol with a 76% yield (Patra et al., 2014). The NMR data: 1H NMR (D2O, 360 MHz): δ 3.2 (s, 2H), 2.6 (t, 2H), 1.5
14
(br t, 2H), 1.3 (br m, 18H), 0.9 (t, 3H). 13C NMR (D2O, 90 MHz): δ 182.2, 56.2, 52.3, 36.7-28.5, 26.0, 17.3.
C12sp11Na2 (sp11): C12sp1Na (1.33 g, 5 mmol, 1 eq.) was dissolved in ethanol (20 mL) in a round-bottomed flask. Bromoacetic acid (0.70 g, 5 mmol, 1 eq.) was added drop-wise under stirring, leading to a white precipitate. The mixture was set for reflux for 24h, dissolving the precipitate. The solvent was evaporated and the product was purified by repeated crystallization in ethanol. The yield was 62%. The NMR data: 1H NMR (D2O, 360 MHz): δ 3.2 (s, 4H), 2.6 (t, 2H), 1.5 (br t, 2H), 1.3 (br m, 18H), 0.9 (t, 3H). 13C NMR (D2O, 90 MHz): δ 182.3, 62.6, 59.3, 36.7-28.5, 26.0, 17.3.
C12sp12Na2 (sp12): C12sp1Na (1.33 g, 5 mmol, 1 eq.) was dissolved in ethanol (20 mL) in a round-bottomed flask. Bromopropanoic acid (0.77 g, 5 mmol, 1 eq.) was added drop-wise under stirring, leading to a white precipitate. The mixture was set for reflux for 24h, dissolving the precipitate. The solvent was evaporated and the product was purified by repeated crystallization in ethanol. The yield was 41%. The NMR data: 1H NMR (D2O, 360 MHz): δ 3.2 (s, 2H), 2.9 (t, 2H), 2.6 (t, 2H), 2.4 (t, 2H), 1.5 (br t, 2H), 1.3 (br m, 18H), 0.9 (t, 3H). 13C NMR (CDCl3, 90 MHz): δ 184.2, 181.3, 60.7, 57.5, 54.0, 37.4, 36.3-27.6, 25.7, 17.0.
C12sp22Na2 (sp22): The synthesis was performed using a similar scheme as for the preparation of C12sp11Na2, but using bromopropanoic acid instead of bromoacetic acid for both the steps. The stoichiometry remained unchanged. The yield was only 28%. The NMR data: 1H NMR (D2O, 360 MHz): δ 2.9 (t, 4H), 2.6 (t, 2H), 2.4 (t, 4H), 1.5 (br t, 2H), 1.3 (br m, 18H), 0.9 (t, 3H). 13C NMR (CDCl3, 90 MHz): δ 184.0, 56.6, 53.0, 37.1, 36.7-28.5, 26.0, 17.3.
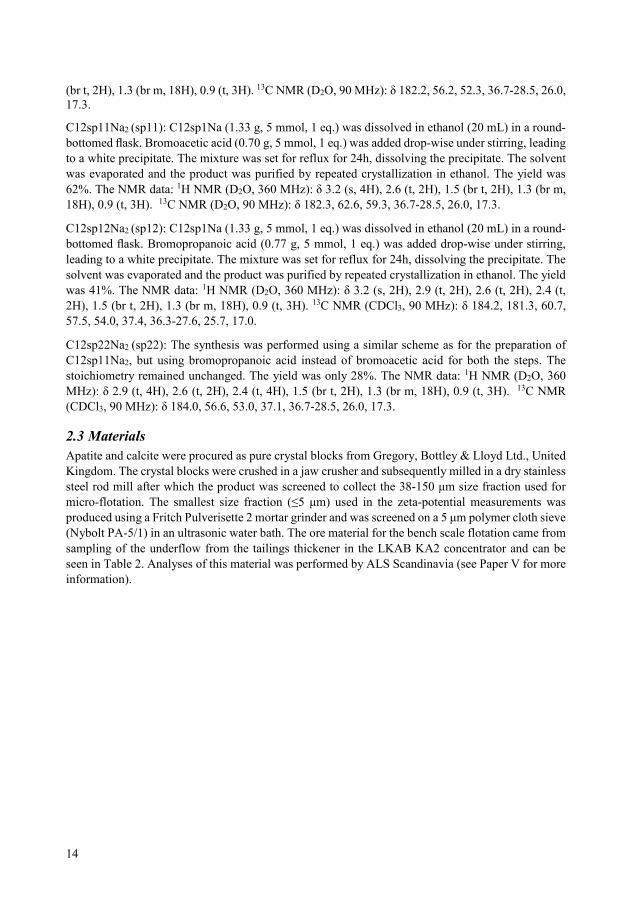
2.3 Materials Apatite and calcite were procured as pure crystal blocks from Gregory, Bottley & Lloyd Ltd., United Kingdom. The crystal blocks were crushed in a jaw crusher and subsequently milled in a dry stainless steel rod mill after which the product was screened to collect the 38-150 μm size fraction used for micro-flotation. The smallest size fraction (≤5 μm) used in the zeta-potential measurements was produced using a Fritch Pulverisette 2 mortar grinder and was screened on a 5 μm polymer cloth sieve (Nybolt PA-5/1) in an ultrasonic water bath. The ore material for the bench scale flotation came from sampling of the underflow from the tailings thickener in the LKAB KA2 concentrator and can be seen in Table 2. Analyses of this material was performed by ALS Scandinavia (see Paper V for more information).
15
Table 2. Main elements and REE in underflow thickener. Main element Assay (%) REE Assay (mg/kg)
SiO2 45.8 Sc 35.6 Al2O3 8.37 Y 178 CaO 14.61 La 339
Fe2O3 10.41 Ce 627 K2O 1.95 Pr 70.9 MgO 6.86 Nd 256 MnO 0.22 Sm 40.9 Na2O 2.82 Eu 5.84 P2O5 6.38 Gd 36.9 TiO2 1.25 Tb 5.03 L.O.I. ≈4 Dy 26.9
Ho 5.85 Er 16.1 Tm 2.14 Yb 13.4 Lu 2.1
TOTAL 1 661
2.4 Flotation Froth flotation is one of the most important and widely used methods in mineral processing to separate minerals from gangue. The method aggregates air bubbles and minerals in an aqueous solution with the aggregates then following the flow of air bubbles to the surface. Whether the mineral particle attaches to the air bubble is determined by thermodynamics. The attraction force between the water molecules and the mineral surface is called the work of adhesion (WAD) and is calculated as:
𝑊𝑊𝐴𝐴𝐴𝐴 = 𝛾𝛾𝑆𝑆𝑆𝑆 + 𝛾𝛾𝑆𝑆𝐿𝐿 − 𝛾𝛾𝑆𝑆𝐿𝐿 (1)
where , γSL is the surface tension between the solid and liquid phase, γLG is the surface tension between the liquid and gas phase and γSG is the surface tension between the solid phase and the gas phase.
This is related to what degree of wettability the surfaces of the mineral particles have. Wettability is essentially how much a drop of a certain liquid will spread on a surface in the presence of air. Assuming the surface is flat and rigid the equation for surface tension is simplified to the Young equation (2).
𝛾𝛾𝑆𝑆𝐿𝐿 = 𝛾𝛾𝑆𝑆𝑆𝑆 + 𝛾𝛾𝑆𝑆𝐿𝐿𝑐𝑐𝑐𝑐𝑐𝑐𝑐𝑐 (2)
where γSG is the surface tension between the solid phase and the gas phase, γSL is the surface tension between the solid and liquid phase, γLG is the surface tension between the liquid and gas phase and θ is the contact angle of the drop at the boundary point.
Combining the surface tension with the work of adhesion yields the equation:
𝑊𝑊𝐴𝐴𝐴𝐴 = 𝛾𝛾𝑆𝑆𝐿𝐿(1− 𝑐𝑐𝑐𝑐𝑐𝑐𝑐𝑐) (3)
From this equation, it is easy to see that a large contact angle is preferable given that we want the attraction force between the mineral surface and the air to be as large as possible (Parekh and Miller, 1999; Rao, 2004; Wills, 2006).
16
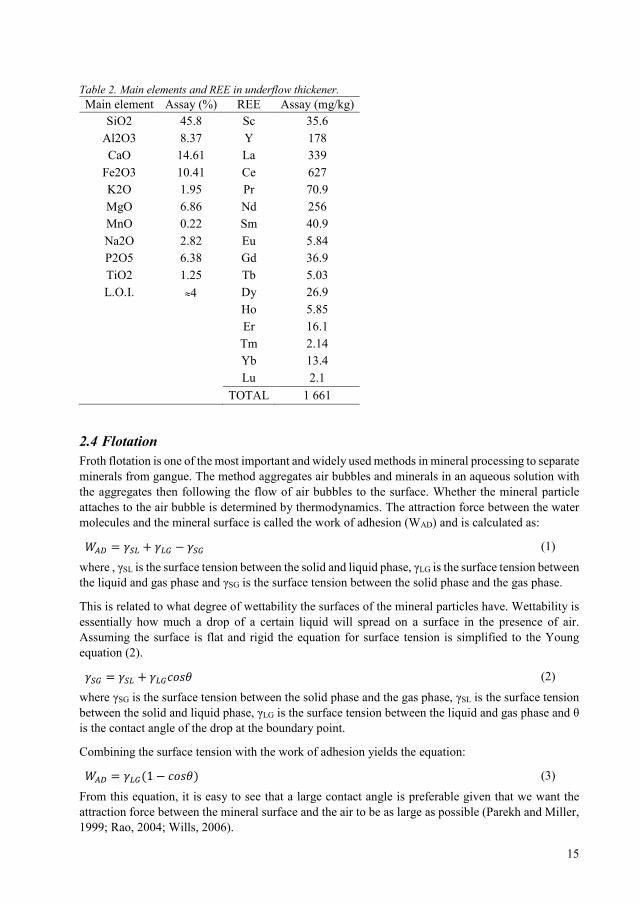
Thus, the contact angle describes the wettability of a surface where a large θ correspond to a hydrophobic surface, from greek hydro, meaning water and phobic, meaning fear. A low θ corresponds to a hydrophilic surface, from greek philia, meaning love. High wettability results in less interaction with the gas phase and more with the water phase, with water spreading itself over the surface. A low wettability results in more interaction with the gas phase and low water phase interaction, with air taking on more of a drop shape to reduce water-solid interaction. However, as Figure 9 represent the opposite scenario, with a mineral surface in water, the behavior is changed in the sense that the air bubble will spread when interacting with a hydrophobic surface, and form a more rounded bubble when interacting with a less hydrophobic surface.
Figure 9. Schematic image of wettability showing a bubble of air attached to a solid mineral surface in a
water solution. The left side of the picture represent more hydrophobic interaction while the right side represent less hydrophobic interaction
When a surface active reagent (collector) adsorbs to the mineral, it shields the surface from the water molecules and the water interacts with the collector instead of the mineral. If the collector is sufficiently hydrophobic, it will increase γSG enough to promote the collector-mineral complex to attach to air bubbles and follow them to the pulp surface where they can be skimmed off. Only adding collector is usually not enough. Other reagents may have to be added for improved recovery or control of the process; for example depressants, to prevent unwanted minerals or gangue to float, frothers to stabilize the froth so that the bubbles do not burst and release the minerals before they have been skimmed off, and modifying reagents to facilitate the collector-mineral adsorption. (Rao, 2004; Wills, 2006)
The adsorption interaction between mineral and collector can be divided in two major groups, chemical adsorption and physical adsorption. Chemical adsorption, or chemisorption, is when there is an actual electron transfer in the form of a covalent bond between the mineral and the surfactant molecule. This is common in surface precipitation of oleates on calcium minerals (Finkelstein, 1989; Hanna and Somasundaran, 1976; Hanumantha Rao and Forssberg, 1991; Horta et al., 2016; Lu et al., 1998; Rao et al., 1991; Young and Miller, 2000). It generally has a higher energy change relative to physical adsorption as well as an initial activation stage. The process is in most cases irreversible and results in monolayers as a first stage. Physical adsorption, or physisorption, is commonly reversible, involves weak interactions, has a high rate of adsorption and can result in formation of mono, double or multilayers. The most prominent forces involved are electrostatic interaction and van der Waals forces (Rao, 2004).
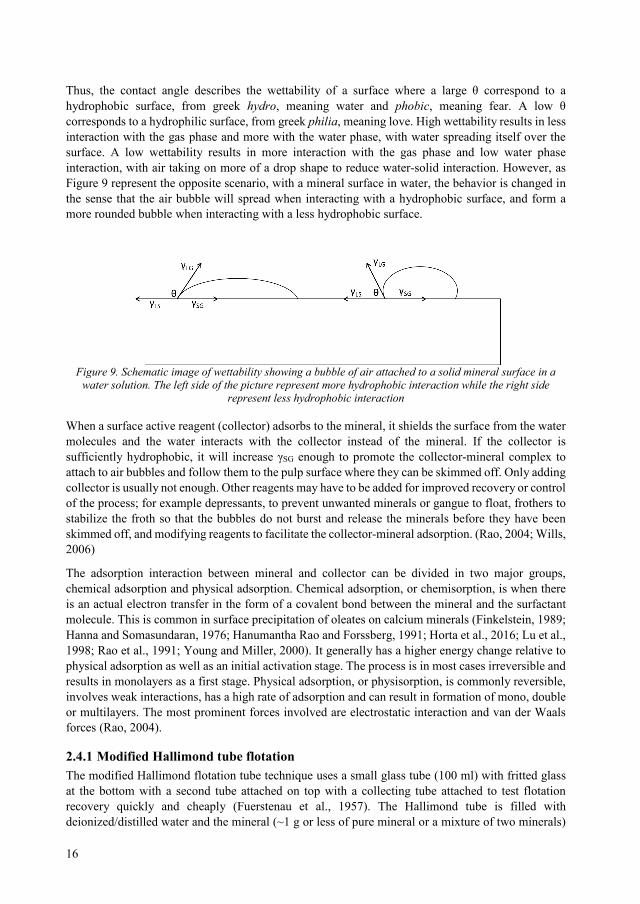
2.4.1 Modified Hallimond tube flotation The modified Hallimond flotation tube technique uses a small glass tube (100 ml) with fritted glass at the bottom with a second tube attached on top with a collecting tube attached to test flotation recovery quickly and cheaply (Fuerstenau et al., 1957). The Hallimond tube is filled with deionized/distilled water and the mineral (~1 g or less of pure mineral or a mixture of two minerals)
17
with magnetic stirring or another agitator is placed on the sinter and air is introduced from underneath the sinter. Any hydrophobic particles will follow bubbles to the top of the second tube and fall back into the float collecting tube where it can be removed and weighed after the experiment to evaluate the recovery. The method has been used for several years; however, there is still debate over how accurately it can predict flotation recovery (Pålsson, 2017). The major concerns include the lack of frother in the experiments making it more of a hydrophobicity test; and the use of distilled/deionized water and pure minerals, not entirely a true representation of the normal flotation process.
Figure 10. Modified Hallimond tube flotation cell used in this thesis
The micro flotation tests presented in this thesis were done in a 100 ml Hallimond tube flotation cell with an aqueous suspension of 1 g of pure mineral in the size fraction -150+38 μm. The mineral-deionized water suspension was conditioned for 10 minutes at the desired pH and concentration, transferred to the Hallimond tube and floated for 1 minute. The flotation recovery was calculated as the mass-ratio between the floated particles and the total number of particles. The mineral recovery was calculated according to equation (4)
𝑅𝑅𝑅𝑅𝑐𝑐𝑐𝑐𝑅𝑅𝑅𝑅𝑅𝑅𝑅𝑅 =𝑚𝑚𝑓𝑓
𝑚𝑚𝑡𝑡𝑡𝑡𝑡𝑡× 100 (4)
Where mf is the mass of floated mineral and mtot is the total mass of mineral used in the experiment. The pH was adjusted using NaOH or HCl to reach the correct value. The experiments at natural pH were performed without adjusting or measuring the pH, however, the pH values are assumed to be in the proximity of neutral pH. Due to the difficulty of synthesizing large amounts of the amine surfactants, it was not possible to perform flotation experiments using neither C12sp01 nor C12sp22.
2.4.2 Bench scale flotation Bench scale flotation uses small cells (2.7L in these experiments) and a small amount of ore (1 kg). The cell has a mechanical stirrer to both agitate and introduce air into the flotation pulp. The pulp density is much more similar to the actual plant situation compared to Hallimond flotation, and both frother and process water is commonly used. The process is usually done in several stages to mimic the actual stages in plant flotation.
18
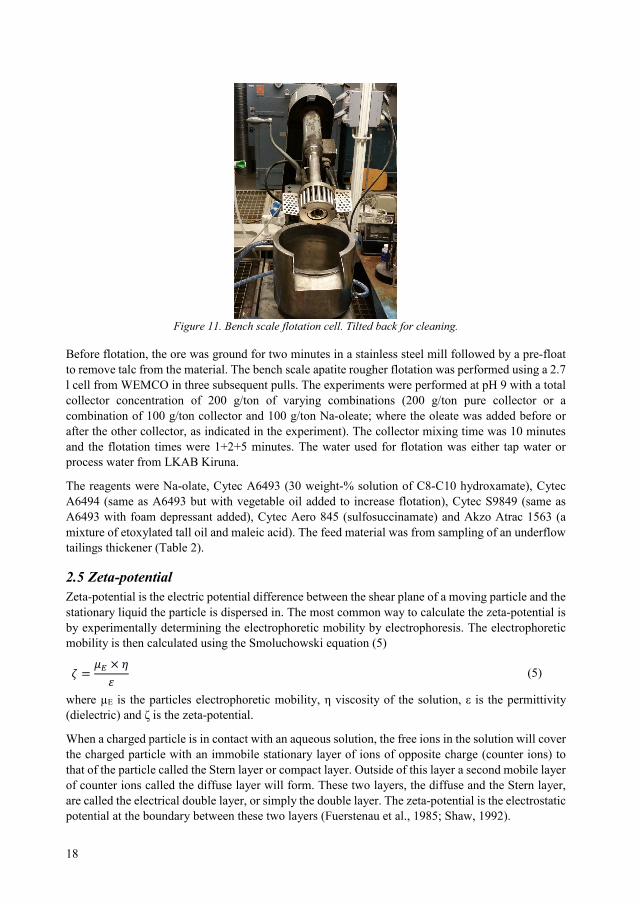
Figure 11. Bench scale flotation cell. Tilted back for cleaning.
Before flotation, the ore was ground for two minutes in a stainless steel mill followed by a pre-float to remove talc from the material. The bench scale apatite rougher flotation was performed using a 2.7 l cell from WEMCO in three subsequent pulls. The experiments were performed at pH 9 with a total collector concentration of 200 g/ton of varying combinations (200 g/ton pure collector or a combination of 100 g/ton collector and 100 g/ton Na-oleate; where the oleate was added before or after the other collector, as indicated in the experiment). The collector mixing time was 10 minutes and the flotation times were 1+2+5 minutes. The water used for flotation was either tap water or process water from LKAB Kiruna.
The reagents were Na-olate, Cytec A6493 (30 weight-% solution of C8-C10 hydroxamate), Cytec A6494 (same as A6493 but with vegetable oil added to increase flotation), Cytec S9849 (same as A6493 with foam depressant added), Cytec Aero 845 (sulfosuccinamate) and Akzo Atrac 1563 (a mixture of etoxylated tall oil and maleic acid). The feed material was from sampling of an underflow tailings thickener (Table 2).
2.5 Zeta-potential Zeta-potential is the electric potential difference between the shear plane of a moving particle and the stationary liquid the particle is dispersed in. The most common way to calculate the zeta-potential is by experimentally determining the electrophoretic mobility by electrophoresis. The electrophoretic mobility is then calculated using the Smoluchowski equation (5)
𝜁𝜁 =𝜇𝜇𝐸𝐸 × 𝜂𝜂𝜀𝜀
(5)
where µE is the particles electrophoretic mobility, η viscosity of the solution, ε is the permittivity (dielectric) and ζ is the zeta-potential.
When a charged particle is in contact with an aqueous solution, the free ions in the solution will cover the charged particle with an immobile stationary layer of ions of opposite charge (counter ions) to that of the particle called the Stern layer or compact layer. Outside of this layer a second mobile layer of counter ions called the diffuse layer will form. These two layers, the diffuse and the Stern layer, are called the electrical double layer, or simply the double layer. The zeta-potential is the electrostatic potential at the boundary between these two layers (Fuerstenau et al., 1985; Shaw, 1992).
19
By placing aqueous particles in an electric field and measuring their mobility, the zeta-potential can be calculated. This is an important parameter for the understanding of several chemical and biological processes, agglomeration stability of fine particles for instance. In this thesis however, zeta-potential is used to monitor the mineral surface. By examining the zeta-potential, we can see if the mineral particle surface is changed for different pH or collector concentrations. This can indicate collector adsorption or affinity for the mineral surface (Fuerstenau et al., 1985; Shaw, 1992).
Zeta-potential measurements were done using a ZetaCompact (CAD instruments) instrument. The background electrolyte was 0.01 M NaCl and the mineral solid concentration was 50 mg/dm3. Each sample was equilibrated on a laboratory shaking table for 10 minutes. Due to the high number of particles in the sample, it was necessary to dilute the mineral water suspension four times before measurement in the ZetaCompact for some of the experiment series. The results were calculated using the Schmoluchowski equation in the Zeta4 software®. Each data point is an average of three measurements with different aliquots.
2.6 Diffuse Reflectance Fourier Transform Spectroscopy (DRIFT) Infrared (IR) spectrometry uses light in the infrared region and is split in three groups, near infrared (NIR) 14000-4000 cm-1, mid infrared (MIR) 4000-400 cm-1 and far infrared (FIR) 400-10 cm-1. Light in the infrared region has the right frequency to excite atoms in molecules, making them move to release the energy absorbed. As the IR-beam passes through a sample with molecules, energy is absorbed. Different bonds will absorb energy from different frequencies. A detector on the opposite side of the sample measures the beam that has passed through and calculates an absorbance spectrum. IR spectroscopy has a very wide array of applications and several different methods have been developed over the years (Griffiths and Haseth, 2007). One such method is Diffuse Reflectance Infrared Fourier Transform Spectroscopy (DRIFTS). It is a method that has been developed specifically for powder samples. The infrared beam is directed towards the sample where the beam is then partially absorbed as it refracts, diffracts and reflects before exiting the sample. The fraction of the incident beam that escapes the sample is called the diffusely refracted beam and is recorded. The recorded spectra is then ratioed against a nonabsorbing reference spectra (normally KBr) to get the reflectance spectra (R(v)). The reference spectra must be converted to be linear towards concentration using the Kubelka-Munk theory (Griffiths and Haseth, 2007).
The DRIFTS measurements were performed using a Bruker IFS 66 v/S instrument with a deuterated triglycine sulfate (DTGS) detector to investigate the amount of surfactant present at the mineral surface. The -5 μm fractions were conditioned for 10 minutes, at different pH and concentration. The samples were washed three times with deionized water and filtered to remove any molecules not chemically adhered to the surface. The samples were air-dried overnight at room temperature. The dried samples were mixed with potassium bromide to give a 13 wt.% concentration. The spectra were recorded using 128 scans at a resolution of 4 cm-1. Due to calcite having two bands overlapping with the CH2-band absorption region, a spectrum of pure (freshly ground) calcite was subtracted from the spectrum of surfactant-coated calcite to find the spectrum for the adsorbed collector only. The spectra were then normalized via the highest peak in the CH2-band absorption region. As the experiments were not repeated multiple times there are no error bars presented in the DRIFTS-graphs in this thesis.
2.7 NMR Nuclear magnetic resonance (NMR) is a phenomenon which occurs when the nuclei of certain atoms are immersed in a static magnetic field and exposed to a second oscillating magnetic field. Some nuclei experience this phenomenon, and others do not, depending on the presence or absence of spin in the nuclei. Nuclear magnetic resonance spectroscopy uses the NMR phenomenon to study physical,
20
chemical, and biological properties of matter. There are two major interactions within NMR spectroscopy: chemical shift and spin-spin coupling.
First, chemical shift: When an atom is placed in a magnetic field, its electrons circulate along the direction of the applied magnetic field. This circulation causes a small magnetic field at the nucleus, which opposes the externally applied field. The magnetic field at the nucleus (the effective field) is therefore generally less than the applied field by a fraction σ:
𝐵𝐵 = 𝐵𝐵0(1 − 𝜎𝜎) (6)
where B is the magnetic field interacting with the sample, B0 is the external magnetic field and σ is the shielding constant (Hore, 1995).
The electron density around each nucleus in a molecule varies according to the types of nuclei and bonds in the molecule. The opposing field and therefore the effective field at each nucleus will vary. This is called the chemical shift phenomenon. The chemical shift is a precise measurement of the chemical environment around a nucleus.
Spin-Spin Coupling: Nuclei experiencing the same chemical environment or chemical shift are called equivalent. Those nuclei experiencing different environments or having different chemical shifts are nonequivalent. Nuclei that are close to one another exert an influence on each other's effective magnetic field. This effect shows up in the NMR spectrum when the nuclei are nonequivalent. If the distance between non-equivalent nuclei is less than or equal to three bond lengths, this effect is observable. This effect is called spin-spin or J coupling.
2.8 Total Organic Carbon Total Organic Carbon (TOC) is a method to measure the amount of organic carbon in a sample. By first measuring the total carbon content, i.e. organic and inorganic carbon, and then measuring and deducting how much inorganic carbon (mostly CO2/CO3) is present. By first acidifying one aliquot of the sample, it is possible to transform the inorganic carbon to CO2 which can be measured. Following this, the second aliquot can be combusted whereby all carbon is converted to CO2 and measured. The organic carbon is then calculated as TC minus IC. There are several different ways to measure the CO2 concentration Non-dispersive Infrared (NDIR) has been used in this work.
The instrument used for the Total Organic Carbon (TOC) was a TOC-V from Shimadzu Corporation, Kyoto, Japan. In this instrument, TOC was determined according to the European standard method EN 1484 (CEN, 1997) to investigate how much surfactant was left in the solution after suspension and from this the amount of surfactant adsorbed on the mineral surface was calculated. IC (inorganic carbon) was analyzed by preparation of the samples with phosphoric acid. TC (total carbon) in the samples was analyzed by oxidation of all carbon present in the sample to carbon dioxide by combustion at 680 °C. The produced carbon dioxide was analyzed using Non-Dispersive Infrared (NDIR) technology. TOC was calculated as the difference between TC and IC. The samples were diluted using deionized water 1:4 to get sufficient volume for the TOC measurement.
21
3 Results
The result section is divided into three sections (one for each type of collector series) containing multiple parts for each mineral and analysis method. The three types of collectors are amide, amine and conventional (in regards to them being commercially available). The amide and amine sections were investigated using Hallimond tube flotation and zeta-potential. The results were further substantiated using DRIFTS for the amide type collectors and TOC for the amine type collectors. The conventional collectors were investigated using batch cell flotation complemented by zeta-potential.
3.1 Collectors 1 (Amide groups) The amide collectors (C12GlyNa, C12MalNa2 C12AspNa2, and C12GluNa2) were produced at Chalmers University of Technology and were the first molecules examined in this research project. The only difference between the surfactants with more than one functional groups is the distance between said groups. The monofunctional C12GlyNa was included in the experiment as a reference to be able to attribute differences in adsorption/recovery to the distance between the groups.
3.1.1 Apatite
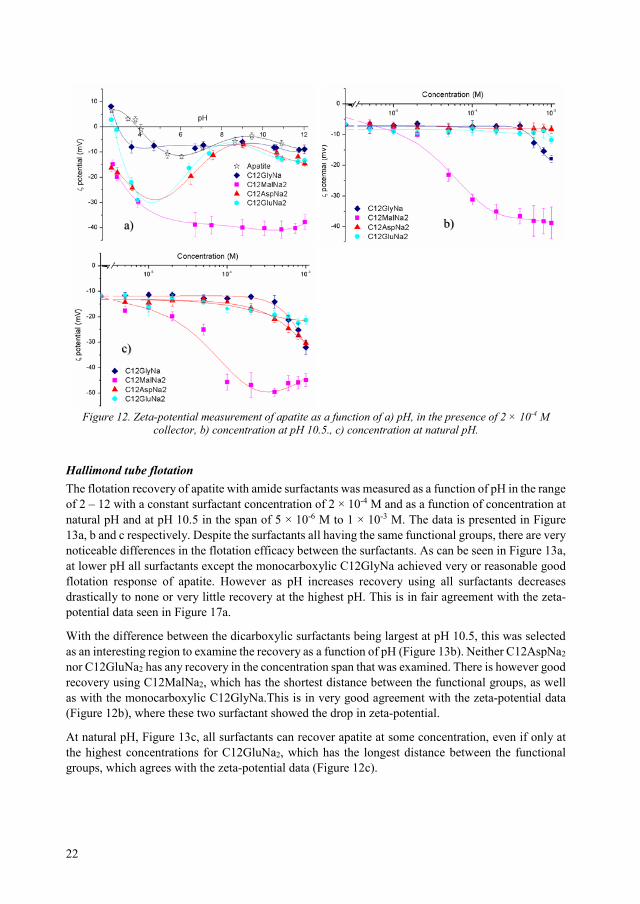
Zeta-potential measurements Zeta-potential of apatite with amide surfactants was measured as a function of pH in the range of 2 – 12 with a constant surfactant concentration of 2 × 10⁻⁴ M, as a function of concentration at natural pH, and at pH 10.5 in the span of 5 × 10⁻⁶ M to 1 × 10⁻³ M. The measurements were done using NaCl as background electrolyte at a concentration of 1 × 10⁻² M. The data is presented in Figure 12a, b and c respectively. In Figure 12a, which shows zeta-potential as a function of pH for apatite with and without surfactant present; the isoelectric point for pure apatite is slightly below pH 4. The isoelectric point is of interest due to the charge reversal it represents, which can be very important for flotation possibility. In the presence of either C12GluNa2 or C12GlyNa the isoelectric point of apatite was shifted slightly to below pH 3 while there was no isoelectric point found in the presence of either C12MalNa2 or C12AspNa2 in the pH range examined. The zeta-potential of apatite in the presence of collector is noticeably different compared to pure apatite at lower pH. With increasing pH the zeta gets closer to the pure apatite surface for all surfactants except for C12MalNa2, which shows a strong charge reversal over the entire region.
At pH 10.5 however only C12MalNa2 and C12GlyNa are showing lower zeta-potential than the pure mineral with the remaining two surfactants not changing the zeta dramatically in any way indication little or no adsorption.
At natural pH, Figure 12c, the zeta-potential is slightly lower for all surfactants over the entire region; with C12MalNa2 showing the lowest zeta.
22
Figure 12. Zeta-potential measurement of apatite as a function of a) pH, in the presence of 2 × 10⁻⁴ M collector, b) concentration at pH 10.5., c) concentration at natural pH.
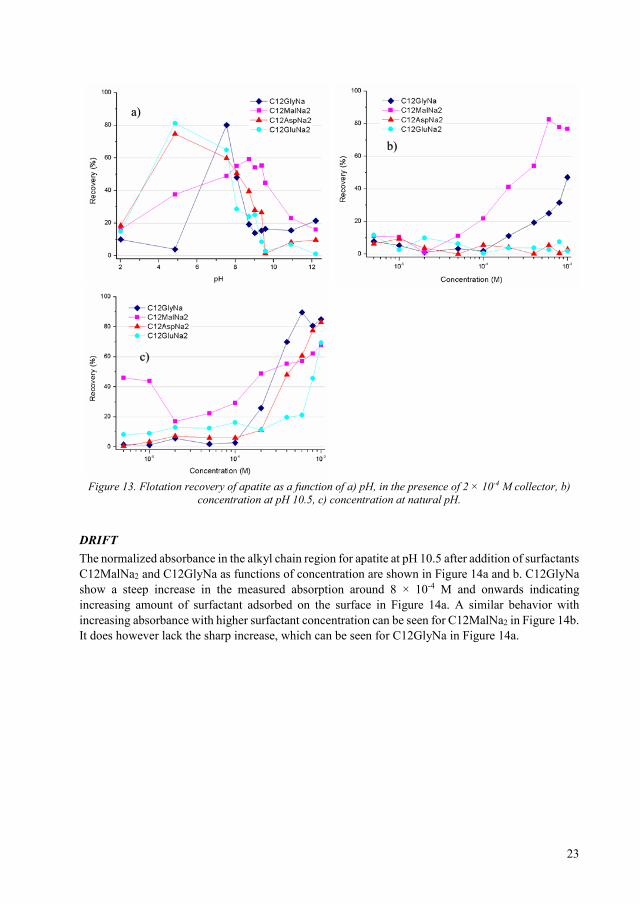
Hallimond tube flotation The flotation recovery of apatite with amide surfactants was measured as a function of pH in the range of 2 – 12 with a constant surfactant concentration of 2 × 10⁻⁴ M and as a function of concentration at natural pH and at pH 10.5 in the span of 5 × 10⁻⁶ M to 1 × 10⁻³ M. The data is presented in Figure 13a, b and c respectively. Despite the surfactants all having the same functional groups, there are very noticeable differences in the flotation efficacy between the surfactants. As can be seen in Figure 13a, at lower pH all surfactants except the monocarboxylic C12GlyNa achieved very or reasonable good flotation response of apatite. However as pH increases recovery using all surfactants decreases drastically to none or very little recovery at the highest pH. This is in fair agreement with the zeta-potential data seen in Figure 17a.
With the difference between the dicarboxylic surfactants being largest at pH 10.5, this was selected as an interesting region to examine the recovery as a function of pH (Figure 13b). Neither C12AspNa2 nor C12GluNa2 has any recovery in the concentration span that was examined. There is however good recovery using C12MalNa2, which has the shortest distance between the functional groups, as well as with the monocarboxylic C12GlyNa.This is in very good agreement with the zeta-potential data (Figure 12b), where these two surfactant showed the drop in zeta-potential.
At natural pH, Figure 13c, all surfactants can recover apatite at some concentration, even if only at the highest concentrations for C12GluNa2, which has the longest distance between the functional groups, which agrees with the zeta-potential data (Figure 12c).
a) b)
c)
23
Figure 13. Flotation recovery of apatite as a function of a) pH, in the presence of 2 × 10⁻⁴ M collector, b) concentration at pH 10.5, c) concentration at natural pH.
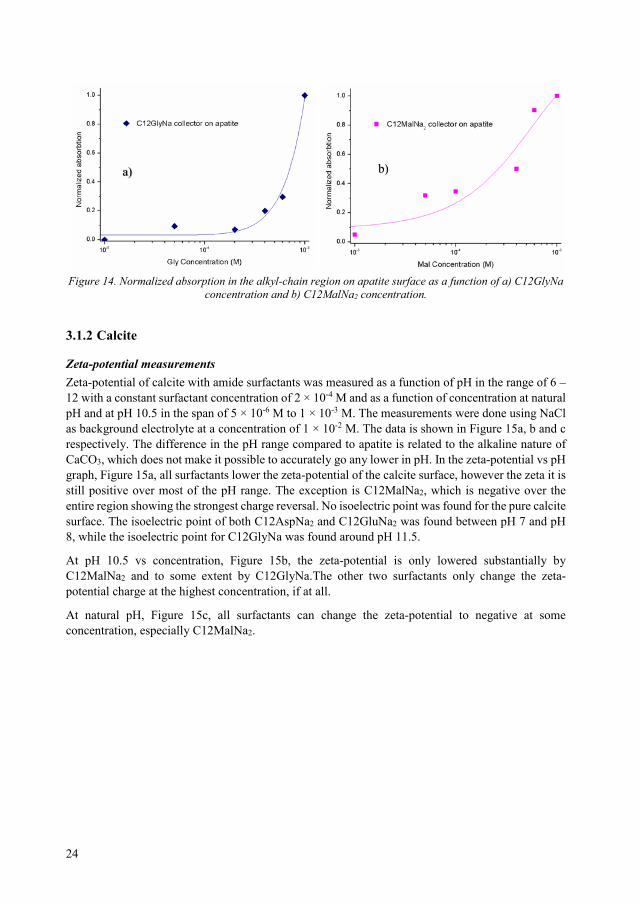
DRIFT The normalized absorbance in the alkyl chain region for apatite at pH 10.5 after addition of surfactants C12MalNa2 and C12GlyNa as functions of concentration are shown in Figure 14a and b. C12GlyNa show a steep increase in the measured absorption around 8 × 10⁻⁴ M and onwards indicating increasing amount of surfactant adsorbed on the surface in Figure 14a. A similar behavior with increasing absorbance with higher surfactant concentration can be seen for C12MalNa2 in Figure 14b. It does however lack the sharp increase, which can be seen for C12GlyNa in Figure 14a.
a)
b)
c)
24
Figure 14. Normalized absorption in the alkyl-chain region on apatite surface as a function of a) C12GlyNa
concentration and b) C12MalNa2 concentration.
3.1.2 Calcite
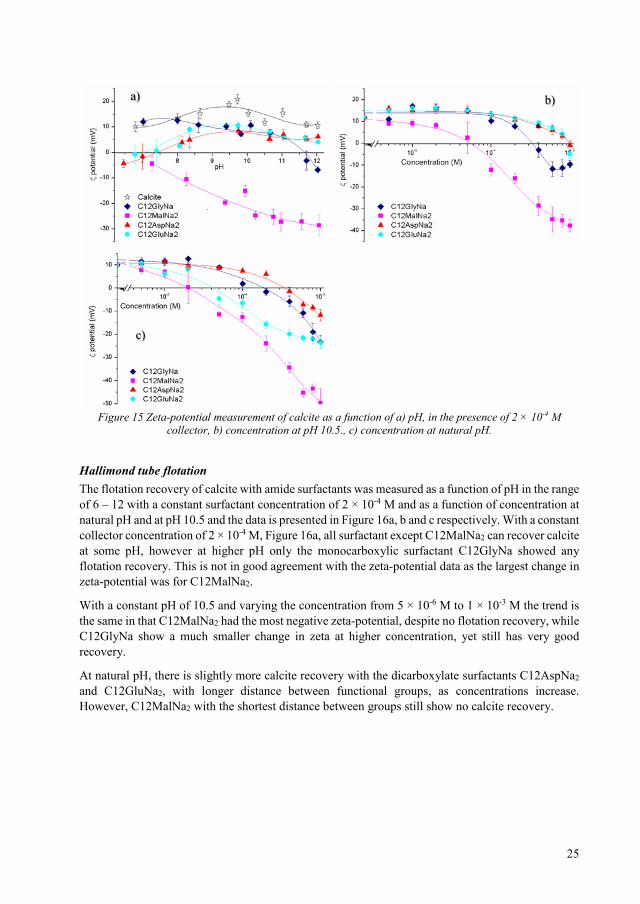
Zeta-potential measurements Zeta-potential of calcite with amide surfactants was measured as a function of pH in the range of 6 – 12 with a constant surfactant concentration of 2 × 10⁻⁴ M and as a function of concentration at natural pH and at pH 10.5 in the span of 5 × 10⁻⁶ M to 1 × 10⁻³ M. The measurements were done using NaCl as background electrolyte at a concentration of 1 × 10⁻² M. The data is shown in Figure 15a, b and c respectively. The difference in the pH range compared to apatite is related to the alkaline nature of CaCO3, which does not make it possible to accurately go any lower in pH. In the zeta-potential vs pH graph, Figure 15a, all surfactants lower the zeta-potential of the calcite surface, however the zeta it is still positive over most of the pH range. The exception is C12MalNa2, which is negative over the entire region showing the strongest charge reversal. No isoelectric point was found for the pure calcite surface. The isoelectric point of both C12AspNa2 and C12GluNa2 was found between pH 7 and pH 8, while the isoelectric point for C12GlyNa was found around pH 11.5.
At pH 10.5 vs concentration, Figure 15b, the zeta-potential is only lowered substantially by C12MalNa2 and to some extent by C12GlyNa.The other two surfactants only change the zeta-potential charge at the highest concentration, if at all.
At natural pH, Figure 15c, all surfactants can change the zeta-potential to negative at some concentration, especially C12MalNa2.
a) b)
25
Figure 15 Zeta-potential measurement of calcite as a function of a) pH, in the presence of 2 × 10⁻⁴ M collector, b) concentration at pH 10.5., c) concentration at natural pH.
Hallimond tube flotation The flotation recovery of calcite with amide surfactants was measured as a function of pH in the range of 6 – 12 with a constant surfactant concentration of 2 × 10⁻⁴ M and as a function of concentration at natural pH and at pH 10.5 and the data is presented in Figure 16a, b and c respectively. With a constant collector concentration of 2 × 10⁻⁴ M, Figure 16a, all surfactant except C12MalNa2 can recover calcite at some pH, however at higher pH only the monocarboxylic surfactant C12GlyNa showed any flotation recovery. This is not in good agreement with the zeta-potential data as the largest change in zeta-potential was for C12MalNa2.
With a constant pH of 10.5 and varying the concentration from 5 × 10⁻⁶ M to 1 × 10⁻³ M the trend is the same in that C12MalNa2 had the most negative zeta-potential, despite no flotation recovery, while C12GlyNa show a much smaller change in zeta at higher concentration, yet still has very good recovery.
At natural pH, there is slightly more calcite recovery with the dicarboxylate surfactants C12AspNa2 and C12GluNa2, with longer distance between functional groups, as concentrations increase. However, C12MalNa2 with the shortest distance between groups still show no calcite recovery.
a) b)
c)
26
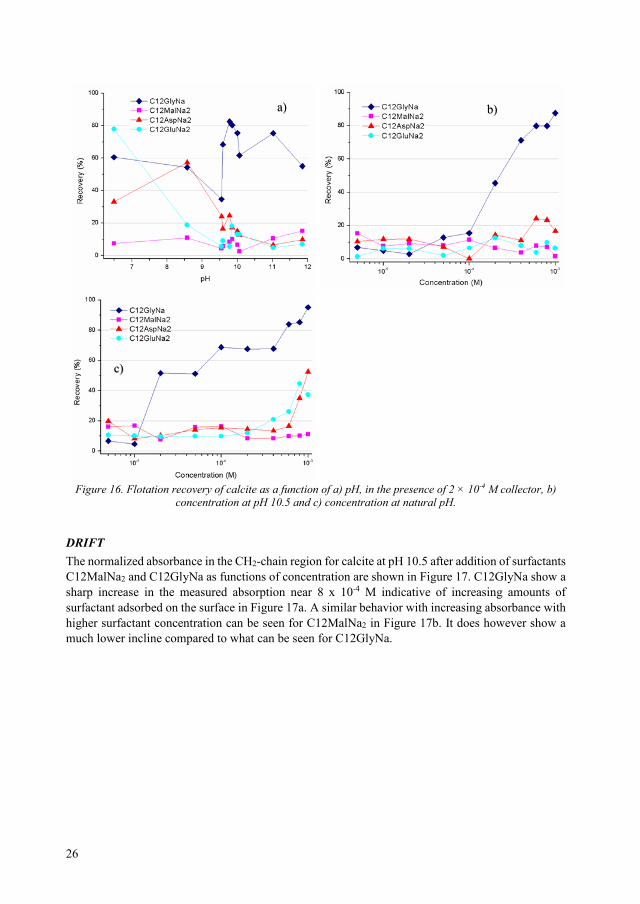
Figure 16. Flotation recovery of calcite as a function of a) pH, in the presence of 2 × 10⁻⁴ M collector, b) concentration at pH 10.5 and c) concentration at natural pH.
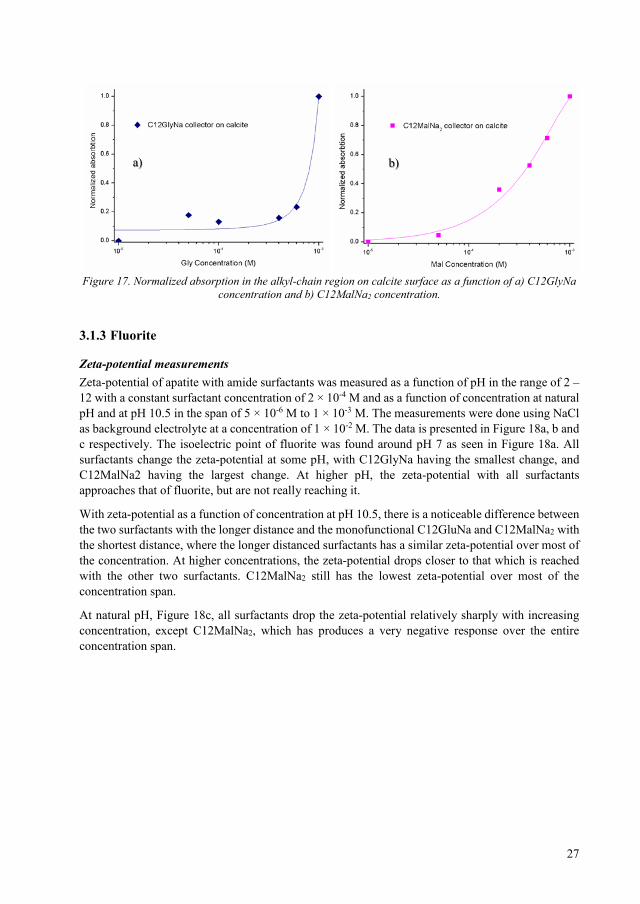
DRIFT The normalized absorbance in the CH2-chain region for calcite at pH 10.5 after addition of surfactants C12MalNa2 and C12GlyNa as functions of concentration are shown in Figure 17. C12GlyNa show a sharp increase in the measured absorption near 8 x 10⁻⁴ M indicative of increasing amounts of surfactant adsorbed on the surface in Figure 17a. A similar behavior with increasing absorbance with higher surfactant concentration can be seen for C12MalNa2 in Figure 17b. It does however show a much lower incline compared to what can be seen for C12GlyNa.
a) b)
c)
27
Figure 17. Normalized absorption in the alkyl-chain region on calcite surface as a function of a) C12GlyNa
concentration and b) C12MalNa2 concentration.
3.1.3 Fluorite
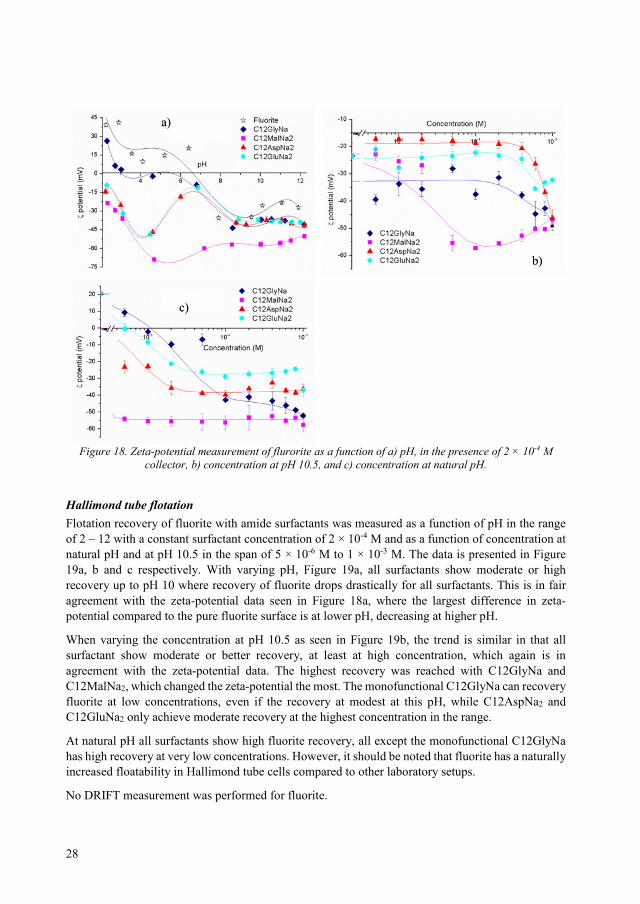
Zeta-potential measurements Zeta-potential of apatite with amide surfactants was measured as a function of pH in the range of 2 – 12 with a constant surfactant concentration of 2 × 10⁻⁴ M and as a function of concentration at natural pH and at pH 10.5 in the span of 5 × 10⁻⁶ M to 1 × 10⁻³ M. The measurements were done using NaCl as background electrolyte at a concentration of 1 × 10⁻² M. The data is presented in Figure 18a, b and c respectively. The isoelectric point of fluorite was found around pH 7 as seen in Figure 18a. All surfactants change the zeta-potential at some pH, with C12GlyNa having the smallest change, and C12MalNa2 having the largest change. At higher pH, the zeta-potential with all surfactants approaches that of fluorite, but are not really reaching it.
With zeta-potential as a function of concentration at pH 10.5, there is a noticeable difference between the two surfactants with the longer distance and the monofunctional C12GluNa and C12MalNa2 with the shortest distance, where the longer distanced surfactants has a similar zeta-potential over most of the concentration. At higher concentrations, the zeta-potential drops closer to that which is reached with the other two surfactants. C12MalNa2 still has the lowest zeta-potential over most of the concentration span.
At natural pH, Figure 18c, all surfactants drop the zeta-potential relatively sharply with increasing concentration, except C12MalNa2, which has produces a very negative response over the entire concentration span.
a) b)
28
Figure 18. Zeta-potential measurement of flurorite as a function of a) pH, in the presence of 2 × 10⁻⁴ M collector, b) concentration at pH 10.5, and c) concentration at natural pH.
Hallimond tube flotation Flotation recovery of fluorite with amide surfactants was measured as a function of pH in the range of 2 – 12 with a constant surfactant concentration of 2 × 10⁻⁴ M and as a function of concentration at natural pH and at pH 10.5 in the span of 5 × 10⁻⁶ M to 1 × 10⁻³ M. The data is presented in Figure 19a, b and c respectively. With varying pH, Figure 19a, all surfactants show moderate or high recovery up to pH 10 where recovery of fluorite drops drastically for all surfactants. This is in fair agreement with the zeta-potential data seen in Figure 18a, where the largest difference in zeta-potential compared to the pure fluorite surface is at lower pH, decreasing at higher pH.
When varying the concentration at pH 10.5 as seen in Figure 19b, the trend is similar in that all surfactant show moderate or better recovery, at least at high concentration, which again is in agreement with the zeta-potential data. The highest recovery was reached with C12GlyNa and C12MalNa2, which changed the zeta-potential the most. The monofunctional C12GlyNa can recovery fluorite at low concentrations, even if the recovery at modest at this pH, while C12AspNa2 and C12GluNa2 only achieve moderate recovery at the highest concentration in the range.
At natural pH all surfactants show high fluorite recovery, all except the monofunctional C12GlyNa has high recovery at very low concentrations. However, it should be noted that fluorite has a naturally increased floatability in Hallimond tube cells compared to other laboratory setups.
No DRIFT measurement was performed for fluorite.
a)
b)
c)
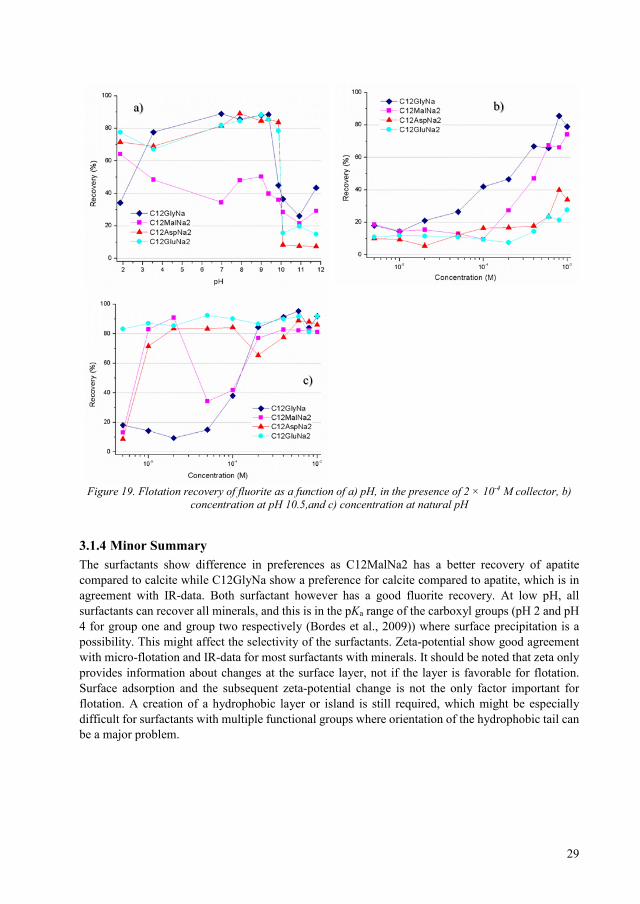
29
Figure 19. Flotation recovery of fluorite as a function of a) pH, in the presence of 2 × 10⁻⁴ M collector, b) concentration at pH 10.5,and c) concentration at natural pH
3.1.4 Minor Summary The surfactants show difference in preferences as C12MalNa2 has a better recovery of apatite compared to calcite while C12GlyNa show a preference for calcite compared to apatite, which is in agreement with IR-data. Both surfactant however has a good fluorite recovery. At low pH, all surfactants can recover all minerals, and this is in the pKa range of the carboxyl groups (pH 2 and pH 4 for group one and group two respectively (Bordes et al., 2009)) where surface precipitation is a possibility. This might affect the selectivity of the surfactants. Zeta-potential show good agreement with micro-flotation and IR-data for most surfactants with minerals. It should be noted that zeta only provides information about changes at the surface layer, not if the layer is favorable for flotation. Surface adsorption and the subsequent zeta-potential change is not the only factor important for flotation. A creation of a hydrophobic layer or island is still required, which might be especially difficult for surfactants with multiple functional groups where orientation of the hydrophobic tail can be a major problem.
a) b)
c)
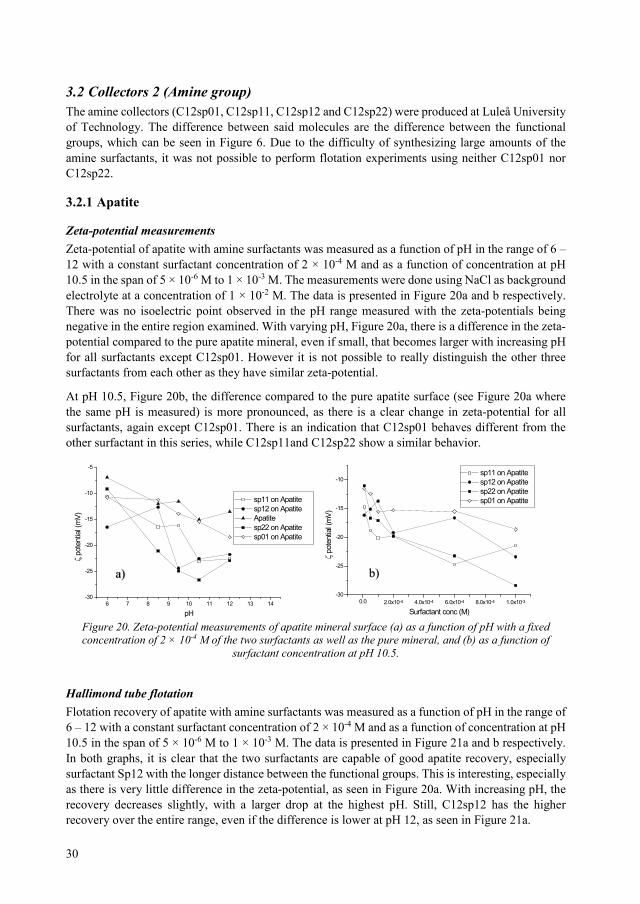
30
3.2 Collectors 2 (Amine group) The amine collectors (C12sp01, C12sp11, C12sp12 and C12sp22) were produced at Luleå University of Technology. The difference between said molecules are the difference between the functional groups, which can be seen in Figure 6. Due to the difficulty of synthesizing large amounts of the amine surfactants, it was not possible to perform flotation experiments using neither C12sp01 nor C12sp22.
3.2.1 Apatite
Zeta-potential measurements Zeta-potential of apatite with amine surfactants was measured as a function of pH in the range of 6 – 12 with a constant surfactant concentration of 2 × 10⁻⁴ M and as a function of concentration at pH 10.5 in the span of 5 × 10⁻⁶ M to 1 × 10⁻³ M. The measurements were done using NaCl as background electrolyte at a concentration of 1 × 10⁻² M. The data is presented in Figure 20a and b respectively. There was no isoelectric point observed in the pH range measured with the zeta-potentials being negative in the entire region examined. With varying pH, Figure 20a, there is a difference in the zeta-potential compared to the pure apatite mineral, even if small, that becomes larger with increasing pH for all surfactants except C12sp01. However it is not possible to really distinguish the other three surfactants from each other as they have similar zeta-potential.
At pH 10.5, Figure 20b, the difference compared to the pure apatite surface (see Figure 20a where the same pH is measured) is more pronounced, as there is a clear change in zeta-potential for all surfactants, again except C12sp01. There is an indication that C12sp01 behaves different from the other surfactant in this series, while C12sp11and C12sp22 show a similar behavior.
Figure 20. Zeta-potential measurements of apatite mineral surface (a) as a function of pH with a fixed concentration of 2 × 10⁻⁴ M of the two surfactants as well as the pure mineral, and (b) as a function of
surfactant concentration at pH 10.5.
Hallimond tube flotation Flotation recovery of apatite with amine surfactants was measured as a function of pH in the range of 6 – 12 with a constant surfactant concentration of 2 × 10⁻⁴ M and as a function of concentration at pH 10.5 in the span of 5 × 10⁻⁶ M to 1 × 10⁻³ M. The data is presented in Figure 21a and b respectively. In both graphs, it is clear that the two surfactants are capable of good apatite recovery, especially surfactant Sp12 with the longer distance between the functional groups. This is interesting, especially as there is very little difference in the zeta-potential, as seen in Figure 20a. With increasing pH, the recovery decreases slightly, with a larger drop at the highest pH. Still, C12sp12 has the higher recovery over the entire range, even if the difference is lower at pH 12, as seen in Figure 21a.
6 7 8 9 10 11 12 13 14-30
-25
-20
-15
-10
-5
sp11 on Apatite sp12 on Apatite Apatite sp22 on Apatite sp01 on Apatite
ζ po
tent
ial (
mV)
pH0.0 2.0x10⁻⁴ 4.0x10⁻⁴ 6.0x10⁻⁴ 8.0x10⁻⁴ 1.0x10⁻³
-30
-25
-20
-15
-10 sp11 on Apatite sp12 on Apatite sp22 on Apatite sp01 on Apatite
ζ po
tent
ial (
mV)
Surfactant conc (M)
a) b)
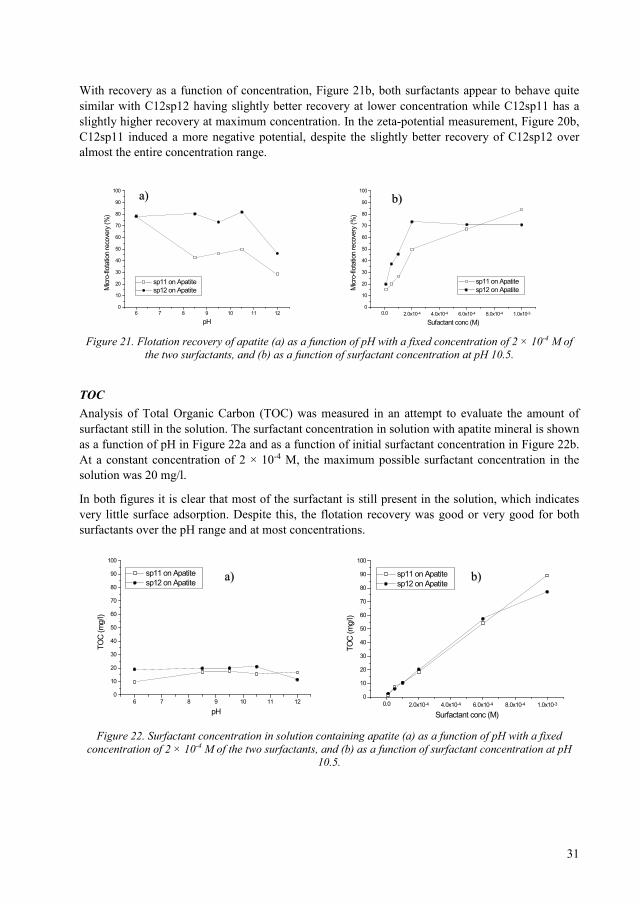
31
With recovery as a function of concentration, Figure 21b, both surfactants appear to behave quite similar with C12sp12 having slightly better recovery at lower concentration while C12sp11 has a slightly higher recovery at maximum concentration. In the zeta-potential measurement, Figure 20b, C12sp11 induced a more negative potential, despite the slightly better recovery of C12sp12 over almost the entire concentration range.
Figure 21. Flotation recovery of apatite (a) as a function of pH with a fixed concentration of 2 × 10⁻⁴ M of
the two surfactants, and (b) as a function of surfactant concentration at pH 10.5.
TOC Analysis of Total Organic Carbon (TOC) was measured in an attempt to evaluate the amount of surfactant still in the solution. The surfactant concentration in solution with apatite mineral is shown as a function of pH in Figure 22a and as a function of initial surfactant concentration in Figure 22b. At a constant concentration of 2 × 10⁻⁴ M, the maximum possible surfactant concentration in the solution was 20 mg/l.
In both figures it is clear that most of the surfactant is still present in the solution, which indicates very little surface adsorption. Despite this, the flotation recovery was good or very good for both surfactants over the pH range and at most concentrations.
Figure 22. Surfactant concentration in solution containing apatite (a) as a function of pH with a fixed concentration of 2 × 10⁻⁴ M of the two surfactants, and (b) as a function of surfactant concentration at pH
10.5.
6 7 8 9 10 11 120
10
20
30
40
50
60
70
80
90
100
sp11 on Apatite sp12 on ApatiteM
icro-
flota
tion
reco
very
(%)
pH0.0 2.0x10⁻⁴ 4.0x10⁻⁴ 6.0x10⁻⁴ 8.0x10⁻⁴ 1.0x10⁻³
0
10
20
30
40
50
60
70
80
90
100
sp11 on Apatite sp12 on ApatiteM
icro-
flota
tion
reco
very
(%)
Sufactant conc (M)
6 7 8 9 10 11 120
10
20
30
40
50
60
70
80
90
100
sp11 on Apatite sp12 on Apatite
TOC
(mg/
l)
pH0.0 2.0x10⁻⁴ 4.0x10⁻⁴ 6.0x10⁻⁴ 8.0x10⁻⁴ 1.0x10⁻³
0
10
20
30
40
50
60
70
80
90
100
sp11 on Apatite sp12 on Apatite
TOC
(mg/
l)
Surfactant conc (M)
a) b)
a) b)
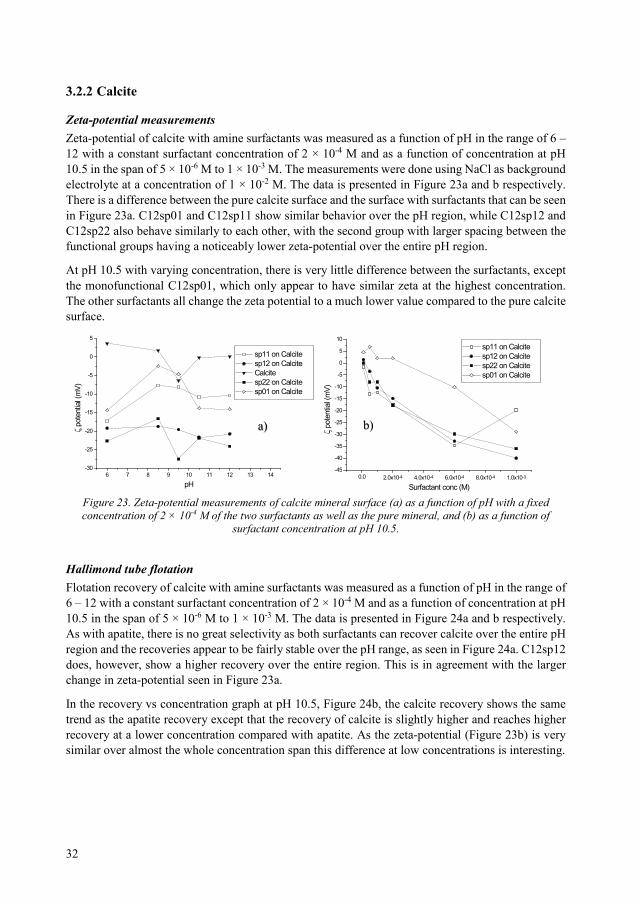
32
3.2.2 Calcite
Zeta-potential measurements Zeta-potential of calcite with amine surfactants was measured as a function of pH in the range of 6 – 12 with a constant surfactant concentration of 2 × 10⁻⁴ M and as a function of concentration at pH 10.5 in the span of 5 × 10⁻⁶ M to 1 × 10⁻³ M. The measurements were done using NaCl as background electrolyte at a concentration of 1 × 10⁻² M. The data is presented in Figure 23a and b respectively. There is a difference between the pure calcite surface and the surface with surfactants that can be seen in Figure 23a. C12sp01 and C12sp11 show similar behavior over the pH region, while C12sp12 and C12sp22 also behave similarly to each other, with the second group with larger spacing between the functional groups having a noticeably lower zeta-potential over the entire pH region.
At pH 10.5 with varying concentration, there is very little difference between the surfactants, except the monofunctional C12sp01, which only appear to have similar zeta at the highest concentration. The other surfactants all change the zeta potential to a much lower value compared to the pure calcite surface.
Figure 23. Zeta-potential measurements of calcite mineral surface (a) as a function of pH with a fixed concentration of 2 × 10⁻⁴ M of the two surfactants as well as the pure mineral, and (b) as a function of
surfactant concentration at pH 10.5.
Hallimond tube flotation Flotation recovery of calcite with amine surfactants was measured as a function of pH in the range of 6 – 12 with a constant surfactant concentration of 2 × 10⁻⁴ M and as a function of concentration at pH 10.5 in the span of 5 × 10⁻⁶ M to 1 × 10⁻³ M. The data is presented in Figure 24a and b respectively. As with apatite, there is no great selectivity as both surfactants can recover calcite over the entire pH region and the recoveries appear to be fairly stable over the pH range, as seen in Figure 24a. C12sp12 does, however, show a higher recovery over the entire region. This is in agreement with the larger change in zeta-potential seen in Figure 23a.
In the recovery vs concentration graph at pH 10.5, Figure 24b, the calcite recovery shows the same trend as the apatite recovery except that the recovery of calcite is slightly higher and reaches higher recovery at a lower concentration compared with apatite. As the zeta-potential (Figure 23b) is very similar over almost the whole concentration span this difference at low concentrations is interesting.
6 7 8 9 10 11 12 13 14-30
-25
-20
-15
-10
-5
0
5
sp11 on Calcite sp12 on Calcite Calcite sp22 on Calcite sp01 on Calcite
ζ po
tent
ial (
mV)
pH0.0 2.0x10⁻⁴ 4.0x10⁻⁴ 6.0x10⁻⁴ 8.0x10⁻⁴ 1.0x10⁻³
-45
-40
-35
-30
-25
-20
-15
-10
-5
0
5
10 sp11 on Calcite sp12 on Calcite sp22 on Calcite sp01 on Calcite
ζ po
tent
ial (
mV)
Surfactant conc (M)
a) b)
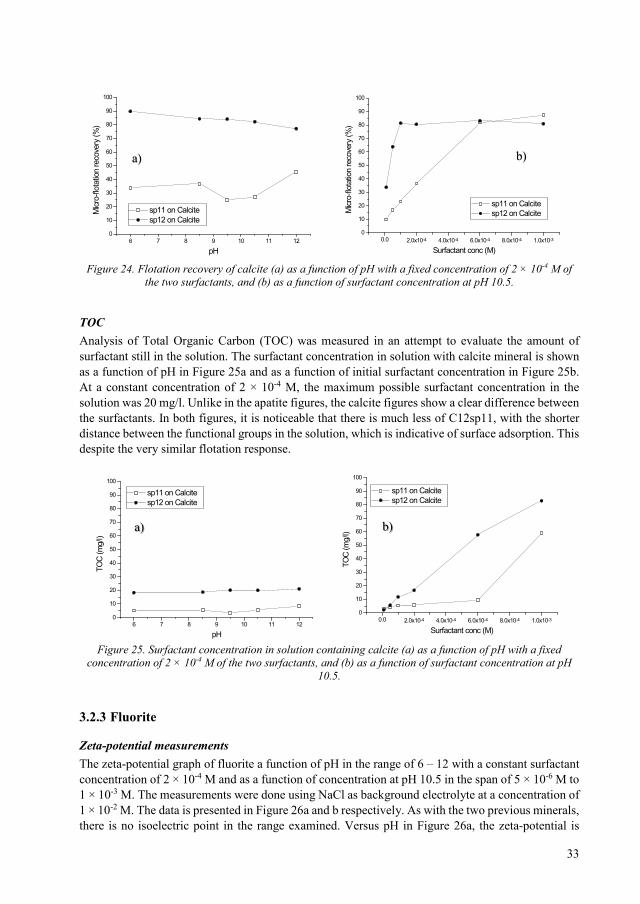
33
Figure 24. Flotation recovery of calcite (a) as a function of pH with a fixed concentration of 2 × 10⁻⁴ M of
the two surfactants, and (b) as a function of surfactant concentration at pH 10.5.
TOC Analysis of Total Organic Carbon (TOC) was measured in an attempt to evaluate the amount of surfactant still in the solution. The surfactant concentration in solution with calcite mineral is shown as a function of pH in Figure 25a and as a function of initial surfactant concentration in Figure 25b. At a constant concentration of 2 × 10⁻⁴ M, the maximum possible surfactant concentration in the solution was 20 mg/l. Unlike in the apatite figures, the calcite figures show a clear difference between the surfactants. In both figures, it is noticeable that there is much less of C12sp11, with the shorter distance between the functional groups in the solution, which is indicative of surface adsorption. This despite the very similar flotation response.
Figure 25. Surfactant concentration in solution containing calcite (a) as a function of pH with a fixed
concentration of 2 × 10⁻⁴ M of the two surfactants, and (b) as a function of surfactant concentration at pH 10.5.
3.2.3 Fluorite
Zeta-potential measurements The zeta-potential graph of fluorite a function of pH in the range of 6 – 12 with a constant surfactant concentration of 2 × 10⁻⁴ M and as a function of concentration at pH 10.5 in the span of 5 × 10⁻⁶ M to 1 × 10⁻³ M. The measurements were done using NaCl as background electrolyte at a concentration of 1 × 10⁻² M. The data is presented in Figure 26a and b respectively. As with the two previous minerals, there is no isoelectric point in the range examined. Versus pH in Figure 26a, the zeta-potential is
6 7 8 9 10 11 120
10
20
30
40
50
60
70
80
90
100
sp11 on Calcite sp12 on Calcite
Micr
o-flo
tatio
n re
cove
ry (%
)
pH0.0 2.0x10⁻⁴ 4.0x10⁻⁴ 6.0x10⁻⁴ 8.0x10⁻⁴ 1.0x10⁻³
0
10
20
30
40
50
60
70
80
90
100
sp11 on Calcite sp12 on CalciteM
icro-
flota
tion
reco
very
(%)
Surfactant conc (M)
6 7 8 9 10 11 120
10
20
30
40
50
60
70
80
90
100
sp11 on Calcite sp12 on Calcite
TOC
(mg/
l)
pH
0.0 2.0x10⁻⁴ 4.0x10⁻⁴ 6.0x10⁻⁴ 8.0x10⁻⁴ 1.0x10⁻³⁰
10
20
30
40
50
60
70
80
90
100
sp11 on Calcite sp12 on Calcite
TOC
(mg/
l)
Surfactant conc (M)
a) b)
a) b)
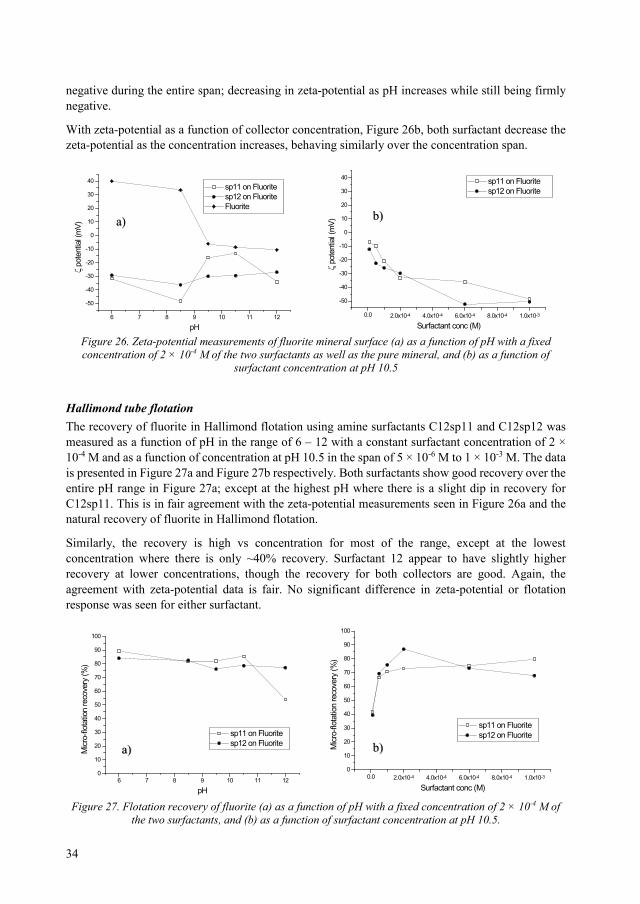
34
negative during the entire span; decreasing in zeta-potential as pH increases while still being firmly negative.
With zeta-potential as a function of collector concentration, Figure 26b, both surfactant decrease the zeta-potential as the concentration increases, behaving similarly over the concentration span.
Figure 26. Zeta-potential measurements of fluorite mineral surface (a) as a function of pH with a fixed concentration of 2 × 10⁻⁴ M of the two surfactants as well as the pure mineral, and (b) as a function of
surfactant concentration at pH 10.5
Hallimond tube flotation The recovery of fluorite in Hallimond flotation using amine surfactants C12sp11 and C12sp12 was measured as a function of pH in the range of 6 – 12 with a constant surfactant concentration of 2 × 10⁻⁴ M and as a function of concentration at pH 10.5 in the span of 5 × 10⁻⁶ M to 1 × 10⁻³ M. The data is presented in Figure 27a and Figure 27b respectively. Both surfactants show good recovery over the entire pH range in Figure 27a; except at the highest pH where there is a slight dip in recovery for C12sp11. This is in fair agreement with the zeta-potential measurements seen in Figure 26a and the natural recovery of fluorite in Hallimond flotation.
Similarly, the recovery is high vs concentration for most of the range, except at the lowest concentration where there is only ~40% recovery. Surfactant 12 appear to have slightly higher recovery at lower concentrations, though the recovery for both collectors are good. Again, the agreement with zeta-potential data is fair. No significant difference in zeta-potential or flotation response was seen for either surfactant.
Figure 27. Flotation recovery of fluorite (a) as a function of pH with a fixed concentration of 2 × 10⁻⁴ M of
the two surfactants, and (b) as a function of surfactant concentration at pH 10.5.
6 7 8 9 10 11 12
-50
-40
-30
-20
-10
0
10
20
30
40 sp11 on Fluorite sp12 on Fluorite Fluorite
ζ po
tent
ial (
mV)
pH0.0 2.0x10⁻⁴ 4.0x10⁻⁴ 6.0x10⁻⁴ 8.0x10⁻⁴ 1.0x10⁻³
-50
-40
-30
-20
-10
0
10
20
30
40 sp11 on Fluorite sp12 on Fluorite
ζ po
tent
ial (
mV)
Surfactant conc (M)
6 7 8 9 10 11 120
10
20
30
40
50
60
70
80
90
100
sp11 on Fluorite sp12 on Fluorite
Micr
o-flo
tatio
n re
cove
ry (%
)
pH
0.0 2.0x10⁻⁴ 4.0x10⁻⁴ 6.0x10⁻⁴ 8.0x10⁻⁴ 1.0x10⁻³⁰
10
20
30
40
50
60
70
80
90
100
sp11 on Fluorite sp12 on Fluorite
Micr
o-flo
tatio
n re
cove
ry (%
)
Surfactant conc (M)
a) b)
a) b)
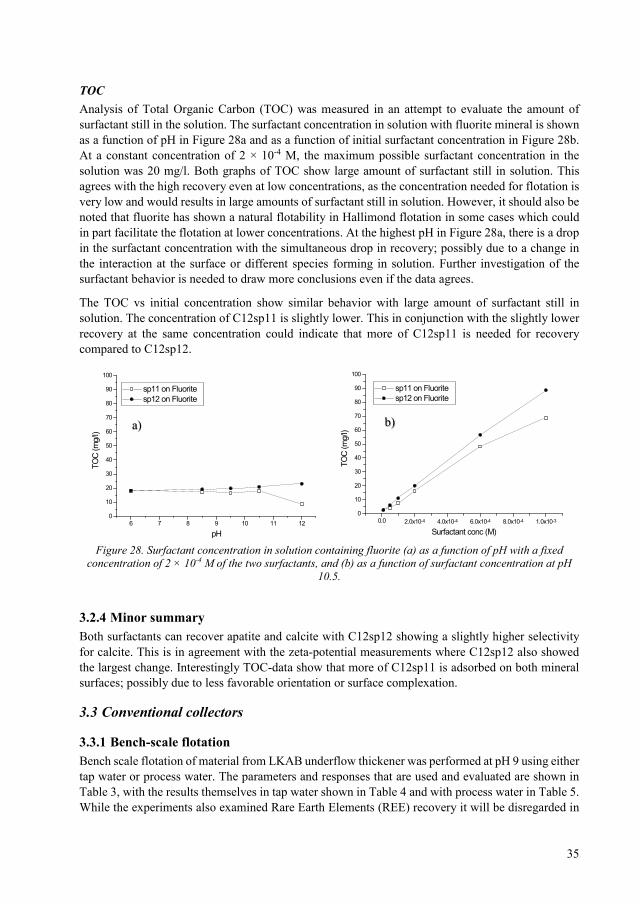
35
TOC Analysis of Total Organic Carbon (TOC) was measured in an attempt to evaluate the amount of surfactant still in the solution. The surfactant concentration in solution with fluorite mineral is shown as a function of pH in Figure 28a and as a function of initial surfactant concentration in Figure 28b. At a constant concentration of 2 × 10⁻⁴ M, the maximum possible surfactant concentration in the solution was 20 mg/l. Both graphs of TOC show large amount of surfactant still in solution. This agrees with the high recovery even at low concentrations, as the concentration needed for flotation is very low and would results in large amounts of surfactant still in solution. However, it should also be noted that fluorite has shown a natural flotability in Hallimond flotation in some cases which could in part facilitate the flotation at lower concentrations. At the highest pH in Figure 28a, there is a drop in the surfactant concentration with the simultaneous drop in recovery; possibly due to a change in the interaction at the surface or different species forming in solution. Further investigation of the surfactant behavior is needed to draw more conclusions even if the data agrees.
The TOC vs initial concentration show similar behavior with large amount of surfactant still in solution. The concentration of C12sp11 is slightly lower. This in conjunction with the slightly lower recovery at the same concentration could indicate that more of C12sp11 is needed for recovery compared to C12sp12.
Figure 28. Surfactant concentration in solution containing fluorite (a) as a function of pH with a fixed
concentration of 2 × 10⁻⁴ M of the two surfactants, and (b) as a function of surfactant concentration at pH 10.5.
3.2.4 Minor summary Both surfactants can recover apatite and calcite with C12sp12 showing a slightly higher selectivity for calcite. This is in agreement with the zeta-potential measurements where C12sp12 also showed the largest change. Interestingly TOC-data show that more of C12sp11 is adsorbed on both mineral surfaces; possibly due to less favorable orientation or surface complexation.
3.3 Conventional collectors
3.3.1 Bench-scale flotation Bench scale flotation of material from LKAB underflow thickener was performed at pH 9 using either tap water or process water. The parameters and responses that are used and evaluated are shown in Table 3, with the results themselves in tap water shown in Table 4 and with process water in Table 5. While the experiments also examined Rare Earth Elements (REE) recovery it will be disregarded in
6 7 8 9 10 11 120
10
20
30
40
50
60
70
80
90
100
sp11 on Fluorite sp12 on Fluorite
TOC
(mg/
l)
pH0.0 2.0x10⁻⁴ 4.0x10⁻⁴ 6.0x10⁻⁴ 8.0x10⁻⁴ 1.0x10⁻³
0
10
20
30
40
50
60
70
80
90
100
sp11 on Fluorite sp12 on Fluorite
TOC
(mg/
l)
Surfactant conc (M)
a) b)
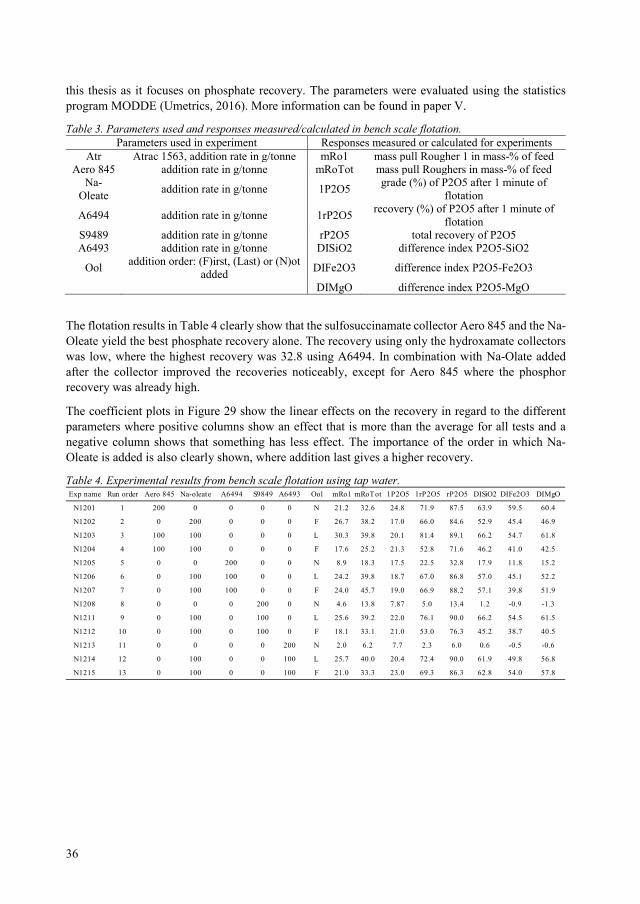
36
this thesis as it focuses on phosphate recovery. The parameters were evaluated using the statistics program MODDE (Umetrics, 2016). More information can be found in paper V.
Table 3. Parameters used and responses measured/calculated in bench scale flotation. Parameters used in experiment Responses measured or calculated for experiments
Atr Atrac 1563, addition rate in g/tonne mRo1 mass pull Rougher 1 in mass-% of feed Aero 845 addition rate in g/tonne mRoTot mass pull Roughers in mass-% of feed
Na-Oleate addition rate in g/tonne 1P2O5 grade (%) of P2O5 after 1 minute of
flotation
A6494 addition rate in g/tonne 1rP2O5 recovery (%) of P2O5 after 1 minute of flotation
S9489 addition rate in g/tonne rP2O5 total recovery of P2O5 A6493 addition rate in g/tonne DISiO2 difference index P2O5-SiO2
Ool addition order: (F)irst, (Last) or (N)ot added DIFe2O3 difference index P2O5-Fe2O3
DIMgO difference index P2O5-MgO
The flotation results in Table 4 clearly show that the sulfosuccinamate collector Aero 845 and the Na-Oleate yield the best phosphate recovery alone. The recovery using only the hydroxamate collectors was low, where the highest recovery was 32.8 using A6494. In combination with Na-Olate added after the collector improved the recoveries noticeably, except for Aero 845 where the phosphor recovery was already high.
The coefficient plots in Figure 29 show the linear effects on the recovery in regard to the different parameters where positive columns show an effect that is more than the average for all tests and a negative column shows that something has less effect. The importance of the order in which Na-Oleate is added is also clearly shown, where addition last gives a higher recovery.
Table 4. Experimental results from bench scale flotation using tap water.
Exp name Run order Aero 845 Na-oleate A6494 S9849 A6493 Ool mRo1 mRoTot 1P2O5 1rP2O5 rP2O5 DISiO2 DIFe2O3 DIMgO
N1201 1 200 0 0 0 0 N 21.2 32.6 24.8 71.9 87.5 63.9 59.5 60.4
N1202 2 0 200 0 0 0 F 26.7 38.2 17.0 66.0 84.6 52.9 45.4 46.9
N1203 3 100 100 0 0 0 L 30.3 39.8 20.1 81.4 89.1 66.2 54.7 61.8
N1204 4 100 100 0 0 0 F 17.6 25.2 21.3 52.8 71.6 46.2 41.0 42.5
N1205 5 0 0 200 0 0 N 8.9 18.3 17.5 22.5 32.8 17.9 11.8 15.2
N1206 6 0 100 100 0 0 L 24.2 39.8 18.7 67.0 86.8 57.0 45.1 52.2
N1207 7 0 100 100 0 0 F 24.0 45.7 19.0 66.9 88.2 57.1 39.8 51.9
N1208 8 0 0 0 200 0 N 4.6 13.8 7.87 5.0 13.4 1.2 -0.9 -1.3
N1211 9 0 100 0 100 0 L 25.6 39.2 22.0 76.1 90.0 66.2 54.5 61.5
N1212 10 0 100 0 100 0 F 18.1 33.1 21.0 53.0 76.3 45.2 38.7 40.5
N1213 11 0 0 0 0 200 N 2.0 6.2 7.7 2.3 6.0 0.6 -0.5 -0.6
N1214 12 0 100 0 0 100 L 25.7 40.0 20.4 72.4 90.0 61.9 49.8 56.8
N1215 13 0 100 0 0 100 F 21.0 33.3 23.0 69.3 86.3 62.8 54.0 57.8
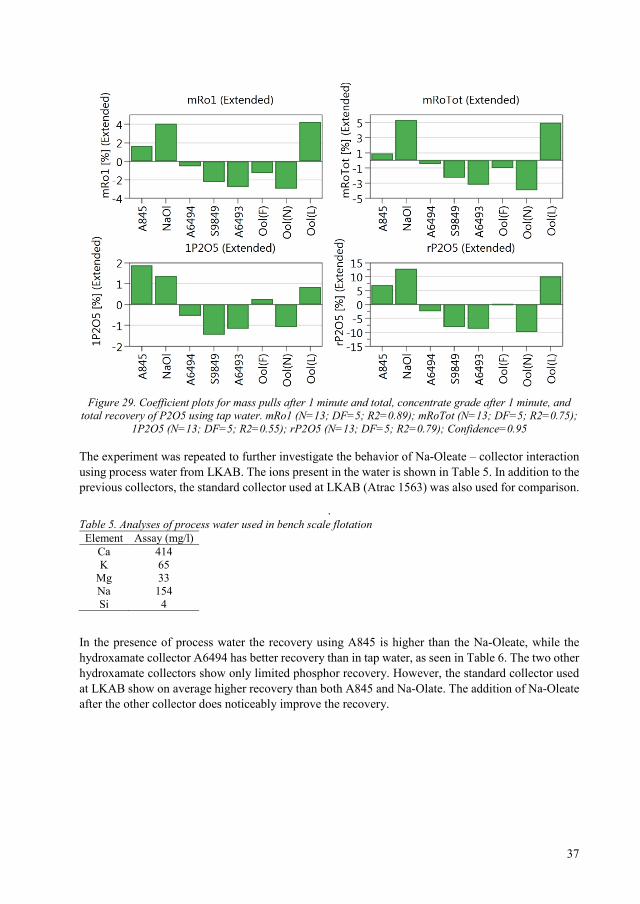
37
Figure 29. Coefficient plots for mass pulls after 1 minute and total, concentrate grade after 1 minute, and
total recovery of P2O5 using tap water. mRo1 (N=13; DF=5; R2=0.89); mRoTot (N=13; DF=5; R2=0.75); 1P2O5 (N=13; DF=5; R2=0.55); rP2O5 (N=13; DF=5; R2=0.79); Confidence=0.95
The experiment was repeated to further investigate the behavior of Na-Oleate – collector interaction using process water from LKAB. The ions present in the water is shown in Table 5. In addition to the previous collectors, the standard collector used at LKAB (Atrac 1563) was also used for comparison.
. Table 5. Analyses of process water used in bench scale flotation Element Assay (mg/l)
Ca 414 K 65
Mg 33 Na 154 Si 4
In the presence of process water the recovery using A845 is higher than the Na-Oleate, while the hydroxamate collector A6494 has better recovery than in tap water, as seen in Table 6. The two other hydroxamate collectors show only limited phosphor recovery. However, the standard collector used at LKAB show on average higher recovery than both A845 and Na-Olate. The addition of Na-Oleate after the other collector does noticeably improve the recovery.
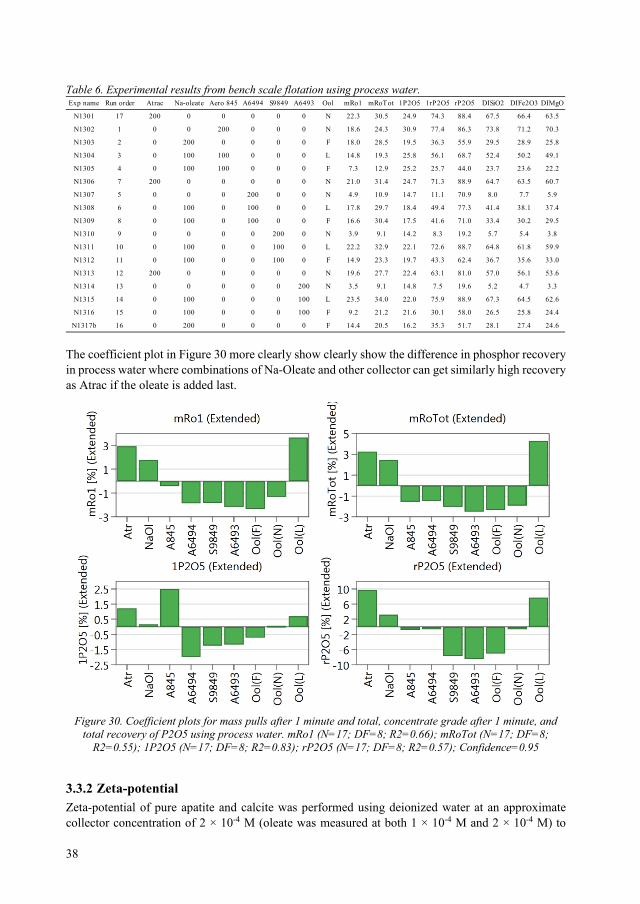
38
Table 6. Experimental results from bench scale flotation using process water.
The coefficient plot in Figure 30 more clearly show clearly show the difference in phosphor recovery in process water where combinations of Na-Oleate and other collector can get similarly high recovery as Atrac if the oleate is added last.
Figure 30. Coefficient plots for mass pulls after 1 minute and total, concentrate grade after 1 minute, and
total recovery of P2O5 using process water. mRo1 (N=17; DF=8; R2=0.66); mRoTot (N=17; DF=8; R2=0.55); 1P2O5 (N=17; DF=8; R2=0.83); rP2O5 (N=17; DF=8; R2=0.57); Confidence=0.95
3.3.2 Zeta-potential Zeta-potential of pure apatite and calcite was performed using deionized water at an approximate collector concentration of 2 × 10⁻⁴ M (oleate was measured at both 1 × 10⁻⁴ M and 2 × 10⁻⁴ M) to
Exp name Run order Atrac Na-oleate Aero 845 A6494 S9849 A6493 Ool mRo1 mRoTot 1P2O5 1rP2O5 rP2O5 DISiO2 DIFe2O3 DIMgO
N1301 17 200 0 0 0 0 0 N 22.3 30.5 24.9 74.3 88.4 67.5 66.4 63.5
N1302 1 0 0 200 0 0 0 N 18.6 24.3 30.9 77.4 86.3 73.8 71.2 70.3
N1303 2 0 200 0 0 0 0 F 18.0 28.5 19.5 36.3 55.9 29.5 28.9 25.8
N1304 3 0 100 100 0 0 0 L 14.8 19.3 25.8 56.1 68.7 52.4 50.2 49.1
N1305 4 0 100 100 0 0 0 F 7.3 12.9 25.2 25.7 44.0 23.7 23.6 22.2
N1306 7 200 0 0 0 0 0 N 21.0 31.4 24.7 71.3 88.9 64.7 63.5 60.7
N1307 5 0 0 0 200 0 0 N 4.9 10.9 14.7 11.1 70.9 8.0 7.7 5.9
N1308 6 0 100 0 100 0 0 L 17.8 29.7 18.4 49.4 77.3 41.4 38.1 37.4
N1309 8 0 100 0 100 0 0 F 16.6 30.4 17.5 41.6 71.0 33.4 30.2 29.5
N1310 9 0 0 0 0 200 0 N 3.9 9.1 14.2 8.3 19.2 5.7 5.4 3.8
N1311 10 0 100 0 0 100 0 L 22.2 32.9 22.1 72.6 88.7 64.8 61.8 59.9
N1312 11 0 100 0 0 100 0 F 14.9 23.3 19.7 43.3 62.4 36.7 35.6 33.0
N1313 12 200 0 0 0 0 0 N 19.6 27.7 22.4 63.1 81.0 57.0 56.1 53.6
N1314 13 0 0 0 0 0 200 N 3.5 9.1 14.8 7.5 19.6 5.2 4.7 3.3
N1315 14 0 100 0 0 0 100 L 23.5 34.0 22.0 75.9 88.9 67.3 64.5 62.6
N1316 15 0 100 0 0 0 100 F 9.2 21.2 21.6 30.1 58.0 26.5 25.8 24.4
N1317b 16 0 200 0 0 0 0 F 14.4 20.5 16.2 35.3 51.7 28.1 27.4 24.6
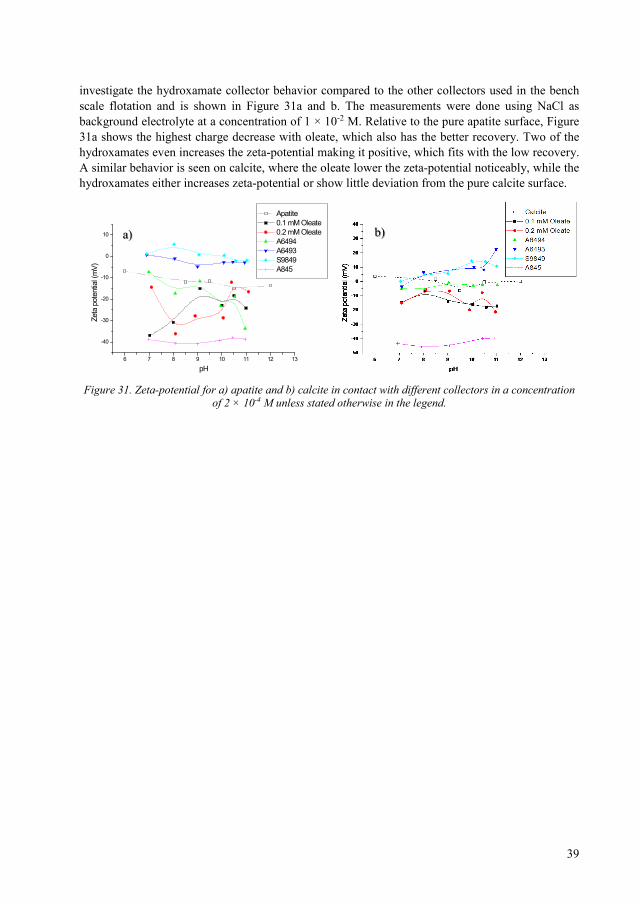
39
investigate the hydroxamate collector behavior compared to the other collectors used in the bench scale flotation and is shown in Figure 31a and b. The measurements were done using NaCl as background electrolyte at a concentration of 1 × 10⁻² M. Relative to the pure apatite surface, Figure 31a shows the highest charge decrease with oleate, which also has the better recovery. Two of the hydroxamates even increases the zeta-potential making it positive, which fits with the low recovery. A similar behavior is seen on calcite, where the oleate lower the zeta-potential noticeably, while the hydroxamates either increases zeta-potential or show little deviation from the pure calcite surface.
Figure 31. Zeta-potential for a) apatite and b) calcite in contact with different collectors in a concentration
of 2 × 10⁻⁴ M unless stated otherwise in the legend.
6 7 8 9 10 11 12 13
-40
-30
-20
-10
0
10
Apatite 0.1 mM Oleate 0.2 mM Oleate A6494 A6493 S9849 A845
Zeta
pot
entia
l (m
V)
pH
a) b)

40
41
4 Discussion
4.1 Monofunctional surfactants The only truly monofunctional surfactant examined in this thesis is Na-Oleate. However, we may speculate that the amine in C12GlyNa and C12sp01Na does not interact sufficiently with the mineral surface to be multifunctional and will behave similarly to oleate, hence their use as references. In addition, the tertiary amines does not undergo activation (i.e change to a charged form which is more likely to interact with surfaces) in this pH range, and no third pKa has been found for the amide reagents (Bordes et al., 2009). There is a possibility that C12sp01Na can undergo activation above pH 10 as it is very similar to sarcosine. As this range of surfactants has not yet been tested for their properties, the exact pKa is not known. Due to the lack of flotation and TOC-data, any conclusions for this surfactant will still be speculative and its use as a reference is not entirely consequential. In regard to assumed unselectivity at low pH, the discussion will revolve mostly around the results achieved at pH 10.5 to be able to focus as much as possible on the selective adsorption of surfactants. The traditional collectors were only tested in bench scale flotation and not Hallimond flotation. Therefore, the discussion around flotation with traditional collectors will have its own section and the comparison in the general discussion will only be in relation to zeta-potential.
The difference in calcium density for apatite, calcite and fluorite (>5, >8 and >11 μmol/m2 respectively) is indicative of the difference in distance between the calcium ions. Lower calcium density relates to longer distance between the calcium surface sites. As such, the difference in distance between apatite and fluorite is approximately the double, while the difference in distance for apatite-calcite is one and a half. The spacing between calcium ions will affect the surfactant load at the surface. Especially for surfactants with multiple functional groups, as the load is effectively halved compared to monofunctional surfactants like sodium oleate, based on the assumption that at least two groups are involved in the surfactant-mineral interaction.
4.2 Apatite The assumption made in the previous section (4.1) suggest that the groups with a longer distance between the functional groups (C12AspNa2, C12GluNa2, C12sp11, C12sp12 and C12sp22) was assumed to have more favorable surface interaction relative to the other surfactants on apatite, which has a larger spacing between the calcium ions. Unfortunately, this does not agree with either the zeta-potential measurements or the flotation recovery for C12AspNa2 or C12GluNa2 where surface adsorption only occur at lower pH, and flotation recovery does not occur at all. C12MalNa2, C12sp11, C12sp12 and C12sp22 on the other hand, show signs of surface interaction in the zeta-potential, as well as good flotation recovery (except for C12sp22 as no flotation data exist). This is good in general, but surprising as both the surfactant with the shortest space between the functional groups as well as the surfactants with the longest space between the groups (C12sp11 and C12sp12) show recovery, while the surfactants with similar spacing, like C12GluNa2, show neither surface interaction nor recovery.
C12GlyNa lower the zeta-potential of apatite at higher pH, agreeing well with the flotation data showing recovery at similar concentration. The conventional collectors show a change in zeta-potential with sodium oleate, while the hydroxamate A6493 results in an almost neutral zeta-potential. This is interesting as the hydroxamate is considered monofunctional in its interaction with calcium minerals (Pradip et al., 2002b) and as such could be expected to have an apatite interaction that is similar to oleate or C12GlyNa. A tentative explanation for the difference in interaction can be the
42
difference in electronegativity between the functional groups hydroxamate and carboxylic acid, with the electronegativity in the latter group being more concentrated, thereby making it stronger. Another thing to note is the difference between C12GlyNa and oleate in the zeta-potential, since the change in zeta-potential occur at much lower concentrations with oleate compared to C12GlyNa. This difference might be due to the slightly bulkier structure of the amide.
4.3 Calcite With a Ca-distance spanning in between apatite and fluorite, it was speculated before the experiments that the longer distanced surfactants would have lower affinity for calcite, compared to apatite. However, this was shown to be too much of a simplification. The zeta-potential measurements indicate that C12MalNa2, C12GlyNa, C12sp11 and C12sp12 have good interaction with calcite, while the long chained C12AspNa2 and C12GluNa2 does not. Despite the large zeta-potential change induced by C12MalNa2 and its success with apatite flotation, it did not recover calcite to any noticeable extent. This is of special interest as its recovery of both apatite and fluorite is high. The most likely reason to the difference in flotation response is the geometrical distance, as both a longer and shorter Ca-distance at the surface result in a flotation response. The only surfactant with good calcite recovery in the amide series was the monofunctional C12GlyNa. The recovery of calcite is almost twice that of apatite and might possibly be explained in part by the higher Ca-density in itself. None of the other multifunctional amides had any noticeable recovery, despite the change in zeta-potential seen at higher concentrations. The amine surfactants C12sp11 and C12sp12 both had good calcite recovery, similarly to the apatite recovery. This despite the spacing in the functional groups of C12sp11 being relatively close to that of C12GluNa2 which had no recovery. C12sp12 show recovery at lower concentrations compared to C12sp11 possibly indicating slightly better interaction with the mineral surface; however, at higher surfactant concentration the recoveries are comparable. The other surfactants in the amine series were unfortunately not tested for flotation. Comparing the zeta-potential responses of the surfactants with the same assumptions as earlier in the discussion indicate that C12sp22 would have similar recovery as C12sp12 while the monofunctional C12sp01, surprisingly, appear not to change the surface very much and is thereby unlikely to produce a flotation response. This despite the not so different structure of C12sp01 and C12AspNa with the only difference being an amine instead of an amide.
The zeta-potential measurements for the commercial flotation collectors indicate that the only good recovery of calcite would be with the oleate and A845 collectors, both showing a clear negative shift in zeta-potential.
4.4 Fluorite The shortest distance between the calcium ions at the surface can be found in fluorite with ~11 μmol/m2. This distance is approximately half of that of apatite, putting the calcite distance in the middle of the three minerals. The zeta-potential measurements indicate that all surfactants adsorb at the fluorite mineral surface. C12GlyNa, C12MalNa2 C12sp11 and C12sp12 all change the zeta-potential at low concentration, while C12AspNa2 and C12GluNa2 only show a zeta-potential change at higher concentration. This is interesting as fluorite was the only mineral with a large change in zeta-potential for all surfactants. As it has the shortest distance between the Ca-ions on the surface, it is possible that the medium spaced surfactants (C12AspNa2 and C12GluNa2) can template easier with the shorter distance on the fluorite surface by binding to every other Ca-ion instead to optimize its fit at the surface. Interestingly, both the monofunctional C12GlyNa and C12MalNa2 with the shortest distance can recover fluorite. At the higher concentrations examined, the other two surfactants in the amide series begin to show a tendency of recovery. It is the only mineral in this thesis where these surfactants showed any recovery over 25% at pH 10.5. Still, it should be noted that fluorite has shown
43
a natural tendency for flotation in Hallimond flotation. Nevertheless, the increase in recovery with concentration and the overlap with the zeta-potential change at the same concentration does indicate that this could be more than the natural recovery. The amine surfactants C12sp11 and C12sp12, show high recovery. C12sp12 had similar recovery on apatite and calcite, while sp11 has similar recovery at high concentrations only. Still, the recovery starts at lower concentrations compared to on apatite and calcite, which could be indicative of easier possibility of surface attachment. This data fit with the zeta-potential measurement, where the change in zeta can be seen at very low concentrations. While the high recovery might be due to easier surface attachment, it could also be related to the higher calcium density of fluorite compared to the other minerals. Another explanation for the relatively higher recovery could be the natural floatability of fluorite, especially seen in Hallimond flotation (Zawala, 2007).
4.5 Combined discussion/Comparison This was touched upon in the previous sections; correlating the number of atoms between the functional groups to the actual distance utilized in surface attachment disregards the importance of the flexibility that might be needed for the hydrophobic tails to orient themselves for optimal interaction with each other when forming a stable layer. However, the initial assumption that the number of atoms between the functional groups relates directly to the distance between the sites on the surface is needed due to the lack of modelling (molecular dynamics) data. The amine surfactants have recovery of all minerals while the amide C12GluNa2 only show recovery at lower pH, where surface precipitation might be the reason. Even more interesting is that the zeta-potential shows very little change of potential for C12GluNa2 which might be indicative of very little surface attachment, or it might just be adsorbed in such a way that it does not change the potential and facilitate flotation. As the distances between the functional groups are almost the same in C12GluNa2 and C12sp11 it is possible that the amide group does hinder further surfactant attachment, or at least block the hydrophobic tails from creating a stable hydrophobic layer in this surfactant. As both C12sp11 and C12sp12 show good recovery of all minerals, it is unlikely that it is related only to the spacing of the functional groups.
The surfactant with the shortest distance of only one atom between the functional groups is C12MalNa2. It has good recovery of apatite, which has the longest distance between the surface calcium ions, and fluorite, which has the shortest distance between them. On calcite, however, which has a calcium spacing laying approximately in the middle of the other two distances, there is no flotation recovery. Considering this, it is possible to hypothesize that the spacing in C12MalNa2 fits perfectly with the longer distance on apatite, while the shorter distance on calcite is too close. As the distance on the fluorite surface is even shorter, it is possible that by the surfactant attaching to the second closest calcium ion at the surface instead of the closest one, it would put the distance close to the distance on the apatite surface. This would put in the same distance as on apatite (where flotation recovery was also possible), while the distance between calcium ions on calcite could still be too far apart or too close. It is also possible that the calcite surface distance is just close enough to allow for the hindrance effect of the amides that was assumed earlier to take place. This might indicate that the surfactants with a larger distance between them like C12sp11 and C12sp12 can jump more calcium ions at the mineral surface, which might be why they have good recovery of all minerals tested here. This support the idea that good geometrical match might be able to selectively separate minerals with the same target ion. While these results are drawn mostly from the high pH experiments where the separation factors are higher, the adsorption and subsequent flotation at lower pH appear to be very unselective. This behavior can likely be attributed to surface precipitation as seen with other carboxylic acids (Finkelstein, 1989; Hanna and Somasundaran, 1976; Horta et al., 2016; Lu et al., 1998; Rao et al., 1991; Young and Miller, 2000).
44
The traditional collectors were only tested in bench scale flotation, which has a much more complex environment than in Hallimond flotation. To compare the different surfactants and collectors with each other, the assumption that the relative recoveries would have been similar in Hallimond flotation has to be made. Good flotation in a Hallimond tube cell does not necessarily mean that a reagent would be successful in bench scale flotation. However, it is reasonable to assume that the reverse is true. Assuming this, the recoveries using oleate or the sulfosuccinamate would have been good in Hallimond flotation. Discussing the A845 collector in regards to its ability fit with the distance between calcium sites at the surface is problematic. It has more than three functional groups, with distances equivalent to or larger than C12sp22 which can be utilized. While it is problematic to evaluate and discuss any of the surfactants without modelling. The hydroxamate, A6493, with the shortest distances of all reagents tested show very low recovery, despite having a similar structure to the other monofunctional surfactants. The less electronegative alcohol group of the hydroxamate collector might be too weak for optimal surface interaction by itself, as the other mono-functional collectors in this study have carboxylate groups with higher electronegativity. Another possibility is that the short distance makes it too stiff to orient the hydrophobic tail part after adsorption in a way that is good for optimal bubble-particle interaction.
Oleate is one of the most commonly used flotation collectors and its high recovery makes it a good reference or benchmark collector. However, the high reactivity of the collector makes separation between apatite/calcite/fluorite less than satisfactory, at least judging by the zeta-potential measurements. For more selective separation between these minerals, the new surfactants C12GlyNa and C12MalNa2 seem good to use for selective flotation of apatite and calcite. Even if they both are able to recover fluorite it is a step in the right direction, C12GlyNa can separate the calcite from apatite, while C12MalNa2 show a much larger preference towards apatite compared to calcite. The other surfactants in the same series show little recovery outside surface precipitation, despite the distance between the functional groups being similar or even shorter than C12sp12. This shorter distance may be too short and result in steric hindrance when adsorbed. Without doing any modelling this is speculative.
4.6 Zeta-potential, adsorption and flotation Zeta-potential measurement is a traditional way to evaluate the likelihood of surfactant success in mineral flotation. This despite the fact that the zeta-potential does not actually give any information about the stability of a hydrophobic layer. Instead, the information is deduced from the change in potential, where a change in potential is interpreted as surface adsorption of the investigated surfactant. While this is generally the case (at least, using traditional surfactants and not polymers or larger molecules), it is not the same as a stable hydrophobic layer suitable for flotation. In the investigations done in this thesis, there are no cases (at higher pH) where there is flotation without a change in zeta-potential. i.e., there is fair agreement between zeta-potential and flotation recovery. However, there are also cases where there is a noticeable change in zeta-potential, while there is no flotation recovery. An excellent example of this is C12MalNa2 on calcite at pH 10.5, where the zeta-potential show a charge reversal at low concentrations, getting more negative as the concentration increase while still not showing any recovery. This indicate that zeta-potential is a good way to evaluate surfactant adsorption at the mineral surface, while still not making it possible to evaluate its success as a collector.
4.7 Combination of collectors – addition orders The initial idea and most of the previous discussion has centered on physical templating of collectors to mineral surfaces. Although this idea coming from bio-mineralization has merits, it does probably not give the whole picture. In addition, hydrophobization of mineral surfaces, as measured by
45
Hallimond Tube flotation, does not always correlate with change in zeta-potential. On the other hand, zeta-potential reversal correlates well with bench-scale flotation results. A possible explanation for this behavior is that true flotation, i.e. bench-scale, requires both a selective adsorption of an entity on the mineral surface, and the formation of a hydrophobic multi-layer island on the mineral surface.
This interpretation would tentatively explain why certain combinations of collectors have been found useful in practice. It would also explain the results from the experiments with changed addition orders. In the latter case, the presumably more selective collector (hydroxamate) adsorbs first, and then serves as the contact point for the hydrophobic multi-layer created by the stronger collector (oleate). It could also be that the stronger collector co-adsorbs into the first layer. Such a co-adsorption could also explain the beneficial effect of adding non-ionic surfactants to flotation systems.
Interestingly, similar ideas of a two-stage process for sulphide mineral flotation have been forwarded by other authors (Forsling and Sun, 1997; Pålsson, 1988; Woods, 1987).
It is here suggested, that “true” flotation for combination of collectors shall be considered a two-stage process:
1. Adsorption of a selective entity to specific points in the mineral surface lattice. This entity may adsorb mono-dentate, bi-dentate or multi-dentate, but does not necessarily render the mineral surface sufficiently hydrophobic in itself.
2. Addition at the same time, or in a later stage, of a substance that creates a hydrophobic multi-layer. This multi-layer can be anchored to the firstly adsorbed entity by hydrophobic interaction or being co-adsorbed into the first layer.

46
47
5 Conclusion
• The amide surfactants show a higher trend of selective behavior on the minerals in this thesis compared to the amine surfactants. The reason for this difference needs to be investigated further
• C12MalNa2 is apatite and fluorite selective while C12GlyNa show a higher preference for calcite and fluorite over apatite. While not tested here, these results indicate that by carefully controlling concentration and pH there is a possibility to utilize these surfactants to separate apatite, calcite and fluorite from each other.
• Fluorite shows the highest recovery, followed by calcite and apatite when considering all surfactants, which is in agreement with the Ca-density. However, for C12MalNa2 specifically, the trend is different, where the recovery of apatite is higher than that of fluorite (there was only little recovery of calcite)
• Zeta-potential measurements, while important as supporting information, does not provide information on the surfactants success as collectors, only on their presence at the surface.
• When using multiple collectors, optimal flotation is a two-stage process where the first layer with the more selective surfactant attaches to the surface, and the second layer, which promotes hydrophobicity adsorbs into/on top of the first layer.
• Designing collectors by only matching the distance between the functional groups of the surfactants and the geometrical distance at the mineral surface is an oversimplification even if it promising. Other things has to be taken into account, or at least be investigated for higher success, e.g. how the surfactants interact to form a hydrophobic layer, their bulkiness and steric limitations

48
49
6 Future work
The general idea and concepts of molecular recognition mechanisms simultaneously satisfying the geometrical, stereo-chemical and electrostatic requirements at inorganic/organic interface was used for developing and testing of new reagents with two functional groups with varying spacing between them.
There are several interesting areas to study to bring the work from this thesis further:
• The solution chemistry of the amine surfactants would be interesting to study. For example, solubility, critical micelle concentration (CMC) and pKa-values will all help to further understand how the surfactants behave in solution.
• Modelling all the surfactants and mineral surfaces using molecular modeling and molecular dynamics simulations to better understand how they can interact with the surface as well as their orientation. This might also be a step towards creating other surfactants having even more selectivity.
• Study the surface using Atomic Force Microscopy (AFM) to get a better view of the structure and extent of the surface layer in solution.
• Study the combination of different mineral systems with mixtures of pure minerals to see how the amine and amide groups work in more complex environments. To further expand it would also be of interest to scale up the process further using bench scale flotation with real ore.
• More investigation on the addition order of surfactants and to examine the adsorption step vs the hydrobization/flotation step in more depth.

50
51
7 References
Abouzeid, A.-Z.M., 2008. Physical and thermal treatment of phosphate ores — An overview. Int. J. Miner. Process. 85, 59–84. doi:10.1016/j.minpro.2007.09.001
Addadi, L., Weiner, S., 1992. Control and Design Principles in Biological Mineralization. Angew. Chemie Int. Ed. English 31, 153–169. doi:10.1002/anie.199201531
Arad, D., Kaftory, M., Zolotoy, a. B., Finkelstein, N.P., Weissman, a., 1993. Molecular modeling for oxidative cross-linking of oleates adsorbed on surfaces of minerals. Langmuir 9, 1446–1448. doi:10.1021/la00030a003
Arnold, W.H., Gaengler, P., 2007. Quantitative analysis of the calcium and phosphorus content of developing and permanent human teeth. Ann. Anat. 189, 183–190. doi:10.1016/j.aanat.2006.09.008
Baldauf, H., Schubert, H., and Kramer, W., 1985. A new reagent regime for the flotation separation of fluorite and calcite, in: XV Int. Miner. Process. Congress (Cannes). Cannes, pp. 222–231.
Black, S.N., Bromley, L.A., Cottier, D., Davey, R.J., Dobbs, B., Rout, J.E., 1991. Interactions at the organic/inorganic interface: binding motifs for phosphonates at the surface of barite crystals. J. Chem. Soc. Faraday Trans. 87, 3409–3414. doi:10.1039/FT9918703409
Bordes, R., Holmberg, K., 2011. Physical chemical characteristics of dicarboxylic amino acid-based surfactants. Colloids Surfaces A Physicochem. Eng. Asp. 391, 32–41. doi:10.1016/j.colsurfa.2011.03.023
Bordes, R., Tropsch, J., Holmberg, K., 2009. Counterion specificity of surfactants based on dicarboxylic amino acids. J. Colloid Interface Sci. 338, 529–536. doi:10.1016/j.jcis.2009.06.032
Bordes, R., Tropsch, J., Holmberg, K., 2010. Role of an amide bond for self-assembly of surfactants. Langmuir 26, 3077–3083. doi:10.1021/la902979m
Bustamante, H., Shergold, H.L., 1983. Surface chemistry and flotation of zinc oxide minerals: 2 - Flotation with chelating reagents. Trans. Inst. Min. Metall. Sect. C 92, C208–C218.
Collins, D.N., Wright, R., Watson, D., 1984. Use of alkyl imino-bis-methylene phosphonic acids as collectors for oxide and salt-type minerals. Reagents Miner. Ind.
Cramer, F., 1995. Biochemical correctness: Emil Fischer’s lock and key hypothesis, a hundred years after - an essay. Pharm. Acta Helv. 69, 193–203. doi:10.1016/0031-6865(95)00012-X
Cyanamid, 1976. Mining Chemicals HANDBOOK, Mineral Dressing Notes No 26. American Cyanamid Company.
Cytec Industries, 2002. Mining Chemicals Handbook, Cytec Industries Inc., Wayne, NJ.
Davey, R.J., Black, S.N., Bromley, L. a., Cottier, D., Dobbs, B., Rout, J.E., 1991. Molecular design based on recognition at inorganic surfaces. Nature 353, 549–550. doi:10.1038/353549a0
Finkelstein, N.P., 1989. Review of interactions in flotation of sparingly soluble calcium minerals with anionic collectors. Trans. Inst. Min. Metall. Sect. C Miner. Process. Extr. Metall. 98, 157–177.
Fischer, E., 1894. Einfluss der Konfiguration auf die Wirkung der Enzyme. Ber. Ges. Dtsch. Chem. 27.
Forsling, W., Sun, Z., 1997. Use of surface complexation models in sulphide mineral flotation. Int. J. Miner. Process. 51, 81–95. doi:10.1016/S0301-7516(97)00020-3
52
Forsmo, S.P.E., Forsmo, S.E., Björkman, B.M.T., Samskog, P.O., 2008. Studies on the influence of a flotation collector reagent on iron ore green pellet properties. Powder Technol. 182, 444–452. doi:10.1016/j.powtec.2007.07.015
Fuerstenau, D.W., Metzger, P.H., Seele, G.D., 1957. How to Use this Modified Hallimond Tube for better flotation testing. Eng. Min. J. 158, 93–95.
Fuerstenau, D.W., Pradip, P., 2013. Design and development of novel flotation reagents for the beneficiation of Mountain Pass rare-earth ore. Miner. Metall. Process. 30, 1–9.
Fuerstenau, M.C., Miller, J.D., Kuhn, M.C., 1985. Chemistry of flotation. Soc of Mining Engineers of AIME.
Grases, F., Garcia-Raso, a., Palou, J., Costa-Bauza, a., March, J.G., 1991. A study of the relationship between the chemical structure of some carboxylic acids and their capacity to inhibit the crystal growth of calcium fluoride. Colloids and Surfaces 54, 313–319. doi:10.1016/0166-6622(91)80069-Z
Griffiths, P.R., Haseth, J.A. De, 2007. Fourier Transform Infrared Spectrometry, 2nd Editio. ed. John Wiley & Sons, Inc., Hoboken, New Jersey.
Hanna, H.S., Somasundaran, P., 1976. Flotation of Salt-Type Minerals, in: Flotation – A. M. Gaudin Memorial Volume – Volume 1. SME, pp. 197–272.
Hanumantha Rao, K., Forssberg, K.S.E., 1991. Mechanism of fatty acid adsorption in salt-type mineral flotation. Miner. Eng. 4, 879–890. doi:10.1016/0892-6875(91)90071-3
Hore, P.J., 1995. Nuclear Magnetic Resonance. Oxford University Press, New York.
Horta, D., De Mello Monte, M.B., De Salles Leal Filho, E.L., 2016. The effect of dissolution kinetics on flotation response of apatite with sodium oleate. Int. J. Miner. Process. 146, 97–104. doi:10.1016/j.minpro.2015.12.003
Kalyan, K. Das, Pradip, S., 1995. Role of molecular architecture and chain length in the flotation separation of oxidized copper--lead--zinc minerals using salicylaldoxime derivatives, in: Proceedings of XIX International Mineral Processing Congress, San Francisco, SME-AIME, USA. pp. 245–248.
Kawatra, S.K., Carlson, J.T., 2014. Beneficiation of Phosphate Ore. SME, Colorado.
Kotlyarevsky, I.L., Alferiev, I.S., Krasnukhina, A. V., Pomazov, V.D., Egorov, N. V., 1984. New phospho-organic collectors for flotation of non-sulphide minerals. Reagents Miner. Ind.
Leal Filho, L.S., Seidl, P.R., Correia, J.C.G., Cerqueira, L.C.K., 2000. Molecular modelling of reagents for flotation processes. Miner. Eng. 13, 1495–1503. doi:10.1016/S0892-6875(00)00133-3
Lu, Y., Drelich, J., Miller, J.D., 1998. Oleate Adsorption at an Apatite Surface Studied by Ex-Situ FTIR Internal Reflection Spectroscopy. J. Colloid Interface Sci. 476, 462–476. doi:10.1006/jcis.1998.5466
Mann, S., 1988. Molecular recognition in biomineralization. Nature 332, 119–124.
Mann, S., 1993. Molecular tectonics in biomineralization and biomimetic materials chemistry. Nature 365, 499–505.
Mann, S., Archibald, D.D., Didymus, J.M., Douglas, T., Brigid, R., Meldrum, F.C., Reeves, N.J., Mann, S., Archibald, D.D., Didymus, J.M., Douglas, T., Heywood, B.R., Meldrum, F.C., Reeves, N.J., 1993a. Crystallization at Inorganic-Organic Interfaces : Biominerals and
53
Biomimetic Synthesis Published by : American Association for the Advancement of Science Crystallization at Inorganic- Organic Interfaces : Biominerals and Biomimetic Synthesis. Science (80-. ). 261, 1286–1292.
Mann, S., Archibald, D.D., Didymus, J.M., Douglas, T., Heywood, B.R., Meldrum, F.C., Reeves, N.J., 1993b. Crystallization at Inorganic-organic Interfaces: Biominerals and Biomimetic Synthesis. Science (80-. ). 261, 1286 LP-1292.
Mann, S., Didymus, J.M., Sanderson, N.P., Heywood, B.R., Samper, E.J.A., 1990. Morphological influence of functionalized and non-functionalized α,ω-dicarboxylates on calcite crystallization. J. Chem. Soc. Faraday Trans. doi:10.1039/ft9908601873
Marabini, A.M., Ciriachi, M., Plescia, P., Barbaro, M., 2007. Chelating reagents for flotation. Miner. Eng. 20, 1014–1025. doi:10.1016/j.mineng.2007.03.012
Miller, J.D., Wang, X., Li, M., 2002a. Selective flotation of phosphate mienrals with hydroxamate collectors. US Patent 6,341,697 B1.
Miller, J.D., Wang, X., Li, M., 2002b. A selective collector for phosphate flotation, Publication No. 02-142-187. Bartow, Florida, USA.
Niiranen, K., 2015. Characterisation of the Kiirunavaara iron ore deposit for mineral processing with a focus on the high silica ore type B2. Dr. Thesis.
Parekh, B.K., Miller, J.D., 1999. Advances in Flotation Technology. Society for Mining, Metallurgy, and Exploration.
Patra, A., Karlkvist, T., Rao, K.H., Fredriksson, A., Bordes, R., Holmberg, K., 2014. Design and development of novel mineral-specific collectors for flotation, in: XXVII International Mineral Processing Congress. Santiago, Chile, pp. 1–10.
Potapova, E., Carabante, I., Grahn, M., Holmgren, a., Hedlund, J., 2010. Studies of Collector Adsorption on Iron Oxides by in Situ ATR-FTIR Spectroscopy. Ind. Eng. Chem. Res. 49, 1493–1502. doi:10.1021/ie901343f
Pradip, Rai, B., Rao, T.K., Krishnamurthy, S., Vetrivel, R., Mielczarski, J., Cases, J.M., 2002a. Molecular modeling of interactions of diphosphonic acid based surfactants with calcium minerals. Langmuir 18, 932–940. doi:10.1021/la010625q
Pradip, Rai, B., Rao, T.K., Krishnamurthy, S., Vetrivel, R., Mielczarski, J., Cases, J.M., 2002b. Molecular Modeling of Interactions of Alkyl Hydroxamates with Calcium Minerals. J. Colloid Interface Sci. 256, 106–113. doi:10.1006/jcis.2001.7994
Pålsson, B.I., 1988. Pulp chemistry of sulphide froth flotation. Doctoral thesis 1988:062 D. Luleå University of Technology.
Pålsson, B.I., 2017. Personal communication.
Pålsson, B.I., Fredriksson, A., 2012. Apatite for Extraction . II . Flotation of Apatite and Rare Earth Elements From Old Tailings Dumps, in: XXVI International Mineral Processing Congress (IMPC 2012). pp. 4064–4074.
Rai, B., 2008. Design of highly selective industrial performance chemicals: a molecular modelling approach. Mol. Simul. 34, 1209–1214. doi:10.1080/08927020802350927
Rao, K.H., Cases, J.M., Forssberg, K.S.E., 1991. Mechanism of oleate interaction on salt-type minerals. V. Adsorption and precipitation reactions in relation to the solid/liquid ratio in the synthetic fluorite-sodium oleate system. J. Colloid Interface Sci. 145, 330–348. doi:10.1016/0021-9797(91)90365-F
54
Rao, K.H., Forssberg, K.S.E., 1992. Interactions of Anionic Collectors in Flotation of Semi-Soluble Salt Minerals, in: Mavros, P., Matis, K.A. (Eds.), Innovations in Flotation Technology. Springer Netherlands, Dordrecht, pp. 331–356. doi:10.1007/978-94-011-2658-8_17
Rao, S.R., 2004. Surface Chemistry of Froth Flotation, 2nd ed. Kluwer Academic / Plenum Publishers, New York.
Scholz, R.W., Roy, A.H., Hellums, D.T., 2014. Sustainable phosphorus management: A transdisciplinary challenge, Sustainable Phosphorus Management: A Global Transdisciplinary Roadmap. doi:10.1007/978-94-007-7250-2_1
Shaw, D.J., 1992. Introduction to Colloid and Surface Chemistry, Chemical, Petrochemical & Process. Butterworth-Heinemann.
Sorensen, E., 1973. On the adsorption of some anionic collectors on fluoride minerals. J. Colloid Interface Sci. 45, 601–607. doi:10.1016/0021-9797(73)90177-X
Steiner, G., Geissler, B., Watson, I., Mew, M.C., 2015. Efficiency developments in phosphate rock mining over the last three decades. Resour. Conserv. Recycl. 105, 235–245. doi:10.1016/j.resconrec.2015.10.004
U.S. Geological Survey, 2016. Mineral Commodities Summaries, Mineral Commodity Summaries 2016. doi:10.3133/70140094
Vučinić, D.R., Radulović, D.S., Deušić, S.Đ., 2010. Electrokinetic properties of hydroxyapatite under flotation conditions. J. Colloid Interface Sci. 343, 239–245. doi:10.1016/j.jcis.2009.11.024
Weissbuch, I., Addadi, L., Lahav, M., Leiserowitz, L., 1991. Molecular Recognition at Crystal Interfaces. Science (80-. ). 253, 637–645. doi:10.1126/science.253.5020.637
Wills, B.A., 2006. Wills’ Mineral Processing Technology: An Introduction to the Practical Aspects of Ore Treatment and Mineral Recovery, 7th ed. Elsevier Ltd.
Woods, R., 1987. Electrochemistry of sulphide flotation, in: Jones, M.H., Woodcock, J.T. (Eds.), Principles of Mineral Flotation. The Wark Symposium, Symposia Series No. 40. Australasian Inst. Min. Met., Parkville, Victoria, Australia, pp. 91–115.
Young, C.A., Miller, J.D., 2000. Effect of temperature on oleate adsorption at a calcite surface: An FT-NIR/IRS study and review. Int. J. Miner. Process. doi:10.1016/S0301-7516(99)00057-5
Zawala, J., 2007. Natural Hydrophobicity and flotation of fluorite. Physicochem. Probl. Miner. Process. 41, 5–11.
Paper I Design and development of novel mineral-specific collectors for flotation. Patra, A., Karlkvist, T., Rao, K. H., Fredriksson, A., Bordes, R., & Holmberg, K. (2014). In XXVII International Mineral Processing Congress (pp. 1–10). Santiago, Chile.

ABSTRACT 160
Design and development of novel mineral specificcollectors for flotation
Anuttam Patra, Tommy Karlkvist, Kota Hanumantha RaoMinerals and Metallurgical Research Laboratory, Luleå University of Technology, SE 971 87 Luleå,Sweden
Andreas FredrikssonLKAB, SE 98186, Kiruna, Sweden
Romain Bordes, Krister HolmbergDepartment of Chemical and Biological Engineering, Chalmers University of Technology, SE 412 96Göteborg, Sweden
ABSTRACT
Almost all of the flotation reagents used today were discovered by continued application ofempirical methods and/or trial and error experimentation. Moreover, with the metal ion specificapproach used so far, it is difficult to separate the minerals containing the same constituent metalion. A critical assessment of molecular recognition processes involved in biomineralizationsuggested the possibility of using reagents which are surface specific. The concept that themolecules consisting of two or more functional groups having appropriate spacing between thoseso as to achieve structural/stereochemical compatibility during interaction with the mineral surfaceexhibit structure specificity, is thought to be extended to the design of specific collectors in flotationprocesses. In the present study, for the first time, a rational design of surface active molecules, andthereby the recognition of crystal faces (of minerals) by these molecules through structural andstereochemical matching is being utilized successfully to selectively float various minerals. For thispurpose, carboxylate and hydroxamate based collectors (for mineral specific flotation of calciumminerals) as well as xanthate based collectors (for mineral specific flotation of sulphide minerals)with a fixed alkyl chain length but having two functional groups with varying geometricaldistances (separated by a spacer of one, two and three carbon atoms) between them have beensynthesized. In this article, we have discussed the design, synthesis, purification of these novelmineral specific collectors as well as their important solution parameters in relation to flotationprocesses.
INTRODUCTION
The success of mineral flotation processes depends on the hydrophobization of the surface for the desiredmineral particles whilst keeping, or making, all other minerals hydrophilic. This is achieved by addingseveral reagents to the flotation pulp to adsorb selectively at the mineral/water interface. The reagents(surface active agents) which have selectivity for minerals to be floated are called collectors. Severalknown chelating agents have been appropriately modified to make those behave as selective flotationcollectors with some degree of success. The problem is that almost all of the chelating groups formcomplexes with almost all of the transition and many non transition metals. As a consequence, absoluteselectivity does not exist, (because this approach suffers from a major drawback). Besides beingunsatisfactory from a scientific viewpoint, it assumes that the metal ion specificity observed for afunctional group in bulk aqueous system would remain valid during surface chelation at the interface,while in actual practice, the specificity based on metal ion is neither valid nor useful where the cationsparticipating in the complexation reactions are the same.
It is clear that a selective reagent should be based on the reagent interactions not merely with the metalion on the surface, but with the whole surface. Is it possible to design reagents which can recognize thesurface structure of the substrate? Should the reagent design not take into account the differences in thecrystal structure of the mineral surfaces? If possible, it would be more appropriate to design reagentshaving functional groups so spaced that those are compatible with the relative positions of the metal ionsites available on the surface, that is, to design not just metal specific but structure specific reagents (Raoand Forssberg 1995).
A scientific approach of designing mineral separation reagents involves two important surface chemicalaspects, i) selection of the appropriate functional group, and ii) design of the corresponding moleculararchitecture depending on its end use.
The understandings of molecular interactions involved in the recognition of surfaces by organic moleculesin biomineralization process (Mann 1988; Mann 1993) suggest the possibility of reagents specific to thecrystal structure. The influence of organic additives on crystal growth processes suggest that moleculeshaving at least two groups can influence either the morphology of surfaces or inhibit crystal growthwhereas no marked changes have been observed with molecules containing one functional group(Heywood and Mann 1992; Grases et al. 1991; Mann et al. 1990). The spacing between the functionalgroups is found to be an important factor in the efficacy of crystal growth inhibition. These concepts havebeen successfully applied to the rational design and synthesis of molecules either for the control of crystalmorphology or to inhibit crystal growth processes through the recognition of specific crystal surfaces(Davey et al. 1991). The concept of molecules consisting of two groups having appropriate spacingbetween those so as to achieve structural compatibility during interaction with surface exhibit structurespecificity is of direct relevance to the reagents selectivity in flotation processes.
In the present study, for the first time, a rational design of surface active molecules, and thereby therecognition of crystal faces (of minerals) by these molecules through structural and stereochemicalmatching is being utilized successfully to selectively float various minerals. As mentioned earlier,carboxylate terminated collectors (for mineral specific flotation of calcium minerals, Fig. 1) as well as
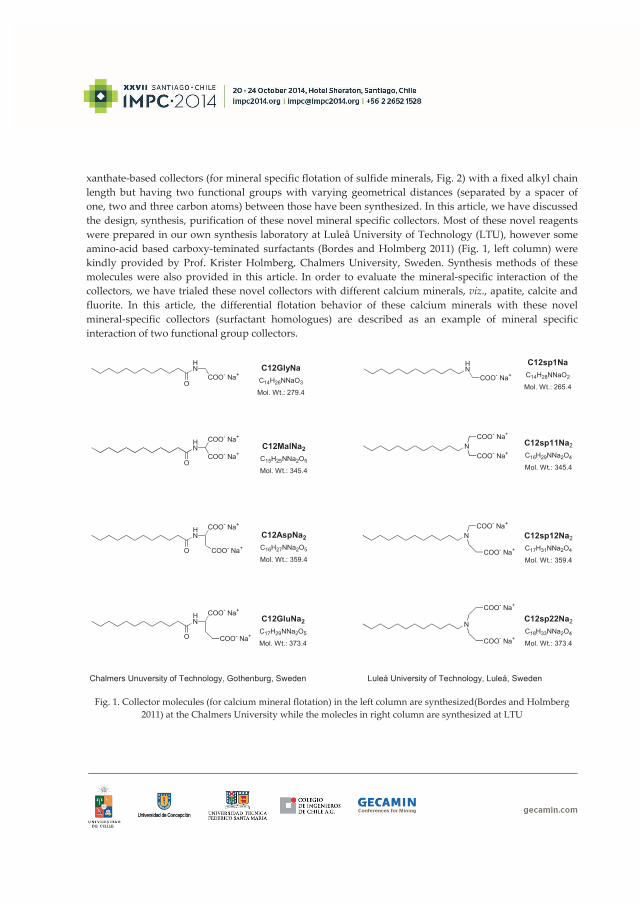
xanthate based collectors (for mineral specific flotation of sulfide minerals, Fig. 2) with a fixed alkyl chainlength but having two functional groups with varying geometrical distances (separated by a spacer ofone, two and three carbon atoms) between those have been synthesized. In this article, we have discussedthe design, synthesis, purification of these novel mineral specific collectors. Most of these novel reagentswere prepared in our own synthesis laboratory at Luleå University of Technology (LTU), however someamino acid based carboxy teminated surfactants (Bordes and Holmberg 2011) (Fig. 1, left column) werekindly provided by Prof. Krister Holmberg, Chalmers University, Sweden. Synthesis methods of thesemolecules were also provided in this article. In order to evaluate the mineral specific interaction of thecollectors, we have trialed these novel collectors with different calcium minerals, viz., apatite, calcite andfluorite. In this article, the differential flotation behavior of these calcium minerals with these novelmineral specific collectors (surfactant homologues) are described as an example of mineral specificinteraction of two functional group collectors.
Fig. 1. Collector molecules (for calcium mineral flotation) in the left column are synthesized(Bordes and Holmberg2011) at the Chalmers University while the molecles in right column are synthesized at LTU
HN
O
HN
O
HN
O
HN
O
C12GluNa2C17H29NNa2O5
Mol. Wt.: 373.4
C12AspNa2C16H27NNa2O5
Mol. Wt.: 359.4
C12MalNa2C15H25NNa2O5
Mol. Wt.: 345.4
C12GlyNaC14H26NNaO3
Mol. Wt.: 279.4
N
N
N
HN
C12sp1NaC14H28NNaO2
Mol. Wt.: 265.4
C12sp22Na2
C18H33NNa2O4
Mol. Wt.: 373.4
C12sp12Na2
C17H31NNa2O4
Mol. Wt.: 359.4
C12sp11Na2
C16H29NNa2O4
Mol. Wt.: 345.4
COO- Na+
COO- Na+
COO- Na+
COO- Na+
COO- Na+
COO- Na+
COO- Na+
COO- Na+
COO- Na+
COO- Na+
COO- Na+
COO- Na+
COO- Na+ COO- Na+
Chalmers Unuversity of Technology, Gothenburg, Sweden Luleå University of Technology, Luleå, Sweden
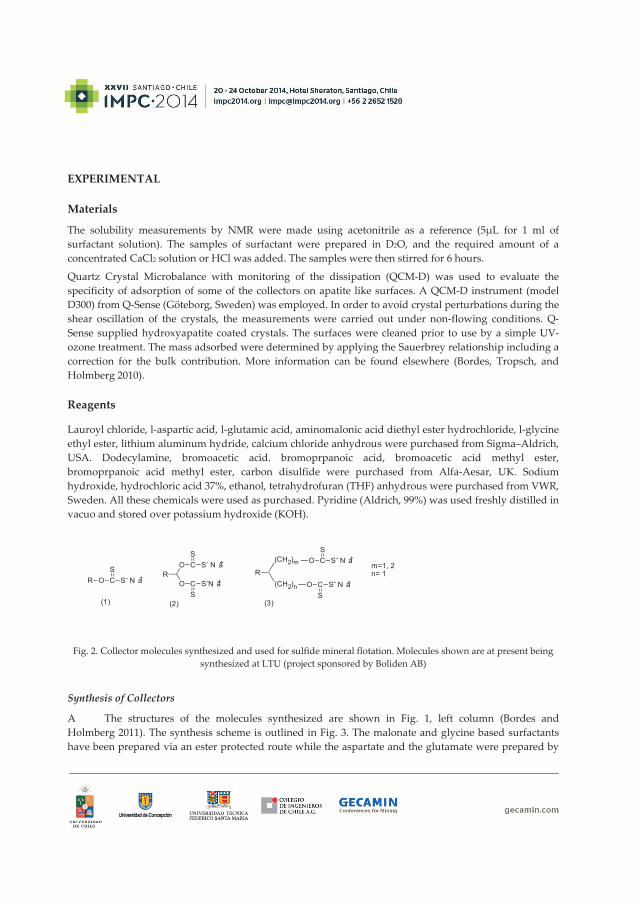
EXPERIMENTAL
Materials
The solubility measurements by NMR were made using acetonitrile as a reference (5 L for 1 ml ofsurfactant solution). The samples of surfactant were prepared in D2O, and the required amount of aconcentrated CaCl2 solution or HCl was added. The samples were then stirred for 6 hours.
Quartz Crystal Microbalance with monitoring of the dissipation (QCM D) was used to evaluate thespecificity of adsorption of some of the collectors on apatite like surfaces. A QCM D instrument (modelD300) from Q Sense (Göteborg, Sweden) was employed. In order to avoid crystal perturbations during theshear oscillation of the crystals, the measurements were carried out under non flowing conditions. QSense supplied hydroxyapatite coated crystals. The surfaces were cleaned prior to use by a simple UVozone treatment. The mass adsorbed were determined by applying the Sauerbrey relationship including acorrection for the bulk contribution. More information can be found elsewhere (Bordes, Tropsch, andHolmberg 2010).
Reagents
Lauroyl chloride, l aspartic acid, l glutamic acid, aminomalonic acid diethyl ester hydrochloride, l glycineethyl ester, lithium aluminum hydride, calcium chloride anhydrous were purchased from Sigma–Aldrich,USA. Dodecylamine, bromoacetic acid. bromoprpanoic acid, bromoacetic acid methyl ester,bromoprpanoic acid methyl ester, carbon disulfide were purchased from Alfa Aesar, UK. Sodiumhydroxide, hydrochloric acid 37%, ethanol, tetrahydrofuran (THF) anhydrous were purchased from VWR,Sweden. All these chemicals were used as purchased. Pyridine (Aldrich, 99%) was used freshly distilled invacuo and stored over potassium hydroxide (KOH).
Fig. 2. Collector molecules synthesized and used for sulfide mineral flotation. Molecules shown are at present beingsynthesized at LTU (project sponsored by Boliden AB)
Synthesis of Collectors
A The structures of the molecules synthesized are shown in Fig. 1, left column (Bordes andHolmberg 2011). The synthesis scheme is outlined in Fig. 3. The malonate and glycine based surfactantshave been prepared via an ester protected route while the aspartate and the glutamate were prepared by
RO
O(CH2)m
(CH2)n
O CS
S- N a+C
C
S
S
S- N a+
S-N a+ O C S- N a+
S
Rm=1, 2n= 1
O CS
S- N a+R
(1) (3)(2)
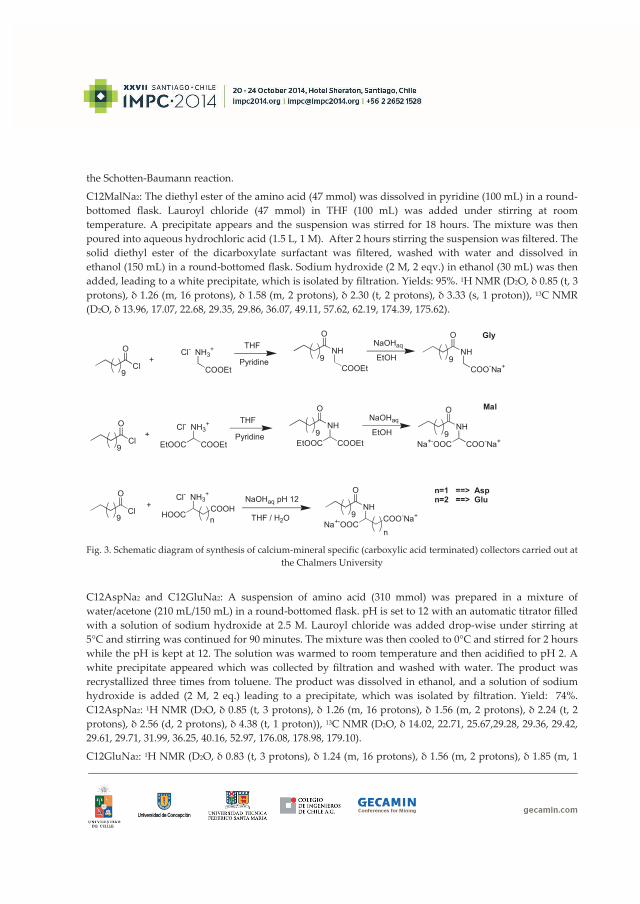
the Schotten Baumann reaction.
C12MalNa2: The diethyl ester of the amino acid (47 mmol) was dissolved in pyridine (100 mL) in a roundbottomed ask. Lauroyl chloride (47 mmol) in THF (100 mL) was added under stirring at roomtemperature. A precipitate appears and the suspension was stirred for 18 hours. The mixture was thenpoured into aqueous hydrochloric acid (1.5 L, 1 M). After 2 hours stirring the suspension was ltered. Thesolid diethyl ester of the dicarboxylate surfactant was ltered, washed with water and dissolved inethanol (150 mL) in a round bottomed ask. Sodium hydroxide (2 M, 2 eqv.) in ethanol (30 mL) was thenadded, leading to a white precipitate, which is isolated by ltration. Yields: 95%. 1H NMR (D2O, 0.85 (t, 3protons), 1.26 (m, 16 protons), 1.58 (m, 2 protons), 2.30 (t, 2 protons), 3.33 (s, 1 proton)), 13C NMR(D2O, 13.96, 17.07, 22.68, 29.35, 29.86, 36.07, 49.11, 57.62, 62.19, 174.39, 175.62).
Fig. 3. Schematic diagram of synthesis of calcium mineral specific (carboxylic acid terminated) collectors carried out atthe Chalmers University
C12AspNa2 and C12GluNa2: A suspension of amino acid (310 mmol) was prepared in a mixture ofwater/acetone (210 mL/150 mL) in a round bottomed ask. pH is set to 12 with an automatic titrator lledwith a solution of sodium hydroxide at 2.5 M. Lauroyl chloride was added drop wise under stirring at5°C and stirring was continued for 90 minutes. The mixture was then cooled to 0°C and stirred for 2 hourswhile the pH is kept at 12. The solution was warmed to room temperature and then acidi ed to pH 2. Awhite precipitate appeared which was collected by ltration and washed with water. The product wasrecrystallized three times from toluene. The product was dissolved in ethanol, and a solution of sodiumhydroxide is added (2 M, 2 eq.) leading to a precipitate, which was isolated by ltration. Yield: 74%.C12AspNa2: 1H NMR (D2O, 0.85 (t, 3 protons), 1.26 (m, 16 protons), 1.56 (m, 2 protons), 2.24 (t, 2protons), 2.56 (d, 2 protons), 4.38 (t, 1 proton)), 13C NMR (D2O, 14.02, 22.71, 25.67,29.28, 29.36, 29.42,29.61, 29.71, 31.99, 36.25, 40.16, 52.97, 176.08, 178.98, 179.10).
C12GluNa2: 1H NMR (D2O, 0.83 (t, 3 protons), 1.24 (m, 16 protons), 1.56 (m, 2 protons), 1.85 (m, 1
Cl
O NH3+
EtOOC COOEt
Cl-
9
O
NH
EtOOC COOEt9
O
NH
Na+-OOC COO-Na+9
THF
Pyridine+ EtOH
NaOHaq
Cl
O NH3+
HOOC
Cl-
9
O
NH
Na+-OOC9THF / H2O
+ COOHn
NaOHaq pH 12
COO-Na+
n
Cl
O NH3+
COOEt
Cl-
9
O
NH
COOEt9
O
NH
COO-Na+9
THF
Pyridine+ EtOH
NaOHaq
n=1 ==> Aspn=2 ==> Glu
Mal
Gly
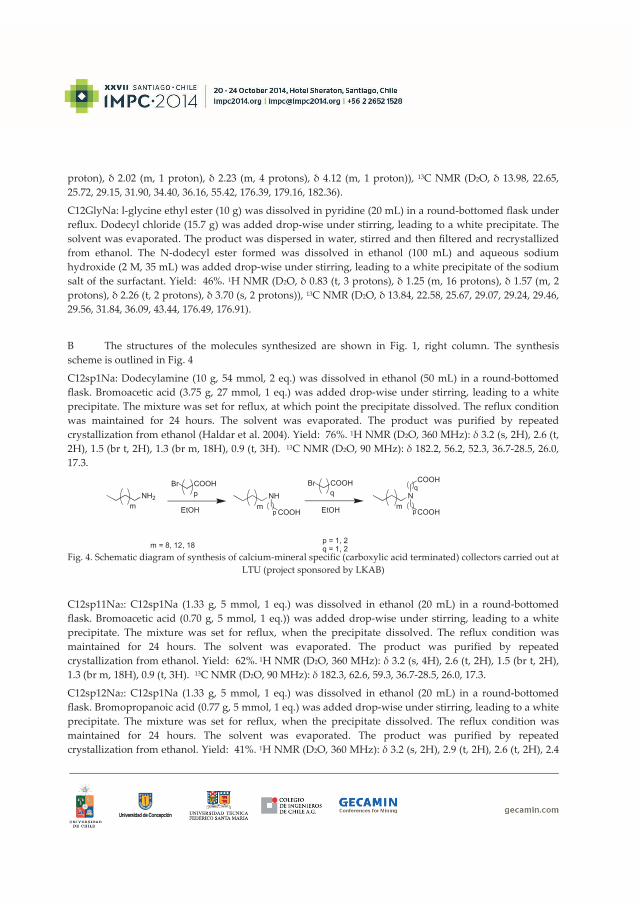
proton), 2.02 (m, 1 proton), 2.23 (m, 4 protons), 4.12 (m, 1 proton)), 13C NMR (D2O, 13.98, 22.65,25.72, 29.15, 31.90, 34.40, 36.16, 55.42, 176.39, 179.16, 182.36).
C12GlyNa: l glycine ethyl ester (10 g) was dissolved in pyridine (20 mL) in a round bottomed ask underre ux. Dodecyl chloride (15.7 g) was added drop wise under stirring, leading to a white precipitate. Thesolvent was evaporated. The product was dispersed in water, stirred and then ltered and recrystallizedfrom ethanol. The N dodecyl ester formed was dissolved in ethanol (100 mL) and aqueous sodiumhydroxide (2 M, 35 mL) was added drop wise under stirring, leading to a white precipitate of the sodiumsalt of the surfactant. Yield: 46%. 1H NMR (D2O, 0.83 (t, 3 protons), 1.25 (m, 16 protons), 1.57 (m, 2protons), 2.26 (t, 2 protons), 3.70 (s, 2 protons)), 13C NMR (D2O, 13.84, 22.58, 25.67, 29.07, 29.24, 29.46,29.56, 31.84, 36.09, 43.44, 176.49, 176.91).
B The structures of the molecules synthesized are shown in Fig. 1, right column. The synthesisscheme is outlined in Fig. 4
C12sp1Na: Dodecylamine (10 g, 54 mmol, 2 eq.) was dissolved in ethanol (50 mL) in a round bottomedask. Bromoacetic acid (3.75 g, 27 mmol, 1 eq.) was added drop wise under stirring, leading to a white
precipitate. The mixture was set for reflux, at which point the precipitate dissolved. The reflux conditionwas maintained for 24 hours. The solvent was evaporated. The product was purified by repeatedcrystallization from ethanol (Haldar et al. 2004). Yield: 76%. 1H NMR (D2O, 360 MHz): 3.2 (s, 2H), 2.6 (t,2H), 1.5 (br t, 2H), 1.3 (br m, 18H), 0.9 (t, 3H). 13C NMR (D2O, 90 MHz): 182.2, 56.2, 52.3, 36.7 28.5, 26.0,17.3.
Fig. 4. Schematic diagram of synthesis of calcium mineral specific (carboxylic acid terminated) collectors carried out atLTU (project sponsored by LKAB)
C12sp11Na2: C12sp1Na (1.33 g, 5 mmol, 1 eq.) was dissolved in ethanol (20 mL) in a round bottomedask. Bromoacetic acid (0.70 g, 5 mmol, 1 eq.)) was added drop wise under stirring, leading to a white
precipitate. The mixture was set for reflux, when the precipitate dissolved. The reflux condition wasmaintained for 24 hours. The solvent was evaporated. The product was purified by repeatedcrystallization from ethanol. Yield: 62%. 1H NMR (D2O, 360 MHz): 3.2 (s, 4H), 2.6 (t, 2H), 1.5 (br t, 2H),1.3 (br m, 18H), 0.9 (t, 3H). 13C NMR (D2O, 90 MHz): 182.3, 62.6, 59.3, 36.7 28.5, 26.0, 17.3.
C12sp12Na2: C12sp1Na (1.33 g, 5 mmol, 1 eq.) was dissolved in ethanol (20 mL) in a round bottomedask. Bromopropanoic acid (0.77 g, 5 mmol, 1 eq.) was added drop wise under stirring, leading to a white
precipitate. The mixture was set for reflux, when the precipitate dissolved. The reflux condition wasmaintained for 24 hours. The solvent was evaporated. The product was purified by repeatedcrystallization from ethanol. Yield: 41%. 1H NMR (D2O, 360 MHz): 3.2 (s, 2H), 2.9 (t, 2H), 2.6 (t, 2H), 2.4
NH2
Br COOH
mp NH
COOHm
N
COOH
COOHm
Br COOHq
q
p pEtOH EtOH
m = 8, 12, 18 p = 1, 2q = 1, 2
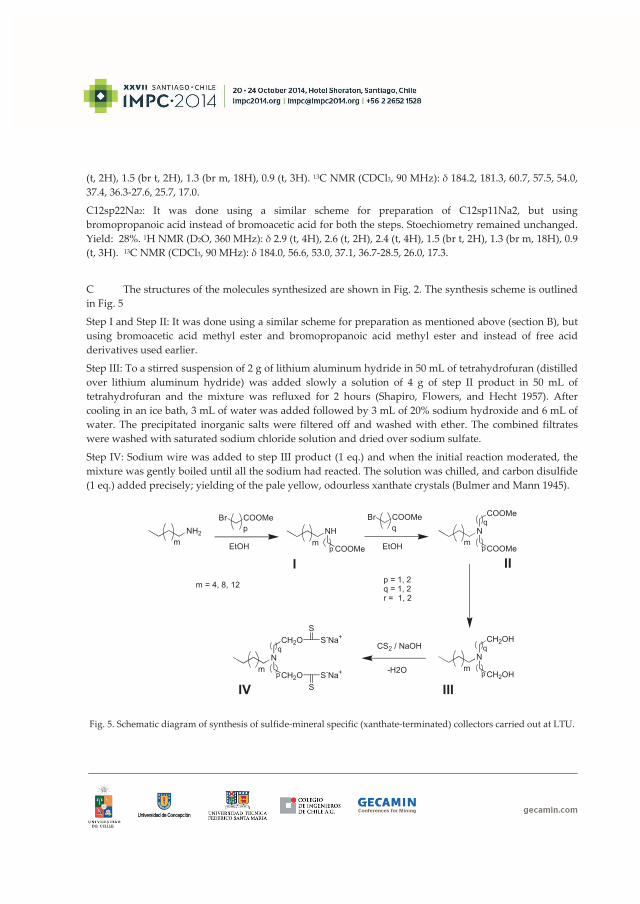
(t, 2H), 1.5 (br t, 2H), 1.3 (br m, 18H), 0.9 (t, 3H). 13C NMR (CDCl3, 90 MHz): 184.2, 181.3, 60.7, 57.5, 54.0,37.4, 36.3 27.6, 25.7, 17.0.
C12sp22Na2: It was done using a similar scheme for preparation of C12sp11Na2, but usingbromopropanoic acid instead of bromoacetic acid for both the steps. Stoechiometry remained unchanged.Yield: 28%. 1H NMR (D2O, 360 MHz): 2.9 (t, 4H), 2.6 (t, 2H), 2.4 (t, 4H), 1.5 (br t, 2H), 1.3 (br m, 18H), 0.9(t, 3H). 13C NMR (CDCl3, 90 MHz): 184.0, 56.6, 53.0, 37.1, 36.7 28.5, 26.0, 17.3.
C The structures of the molecules synthesized are shown in Fig. 2. The synthesis scheme is outlinedin Fig. 5
Step I and Step II: It was done using a similar scheme for preparation as mentioned above (section B), butusing bromoacetic acid methyl ester and bromopropanoic acid methyl ester and instead of free acidderivatives used earlier.
Step III: To a stirred suspension of 2 g of lithium aluminum hydride in 50 mL of tetrahydrofuran (distilledover lithium aluminum hydride) was added slowly a solution of 4 g of step II product in 50 mL oftetrahydrofuran and the mixture was refluxed for 2 hours (Shapiro, Flowers, and Hecht 1957). Aftercooling in an ice bath, 3 mL of water was added followed by 3 mL of 20% sodium hydroxide and 6 mL ofwater. The precipitated inorganic salts were filtered off and washed with ether. The combined filtrateswere washed with saturated sodium chloride solution and dried over sodium sulfate.
Step IV: Sodium wire was added to step III product (1 eq.) and when the initial reaction moderated, themixture was gently boiled until all the sodium had reacted. The solution was chilled, and carbon disulfide(1 eq.) added precisely; yielding of the pale yellow, odourless xanthate crystals (Bulmer and Mann 1945).
Fig. 5. Schematic diagram of synthesis of sulfide mineral specific (xanthate terminated) collectors carried out at LTU.
NH2
Br COOMe
mp NH
COOMem
N
COOMe
COOMem
Br COOMeq
q
p pEtOH EtOH
m = 4, 8, 12 p = 1, 2q = 1, 2r = 1, 2
N
CH2OH
CH2OHm
q
p
N
CH2O
CH2Om
q
p
CS2 / NaOH
SS-Na+
SS-Na+ -H2O
I II
IIIIV
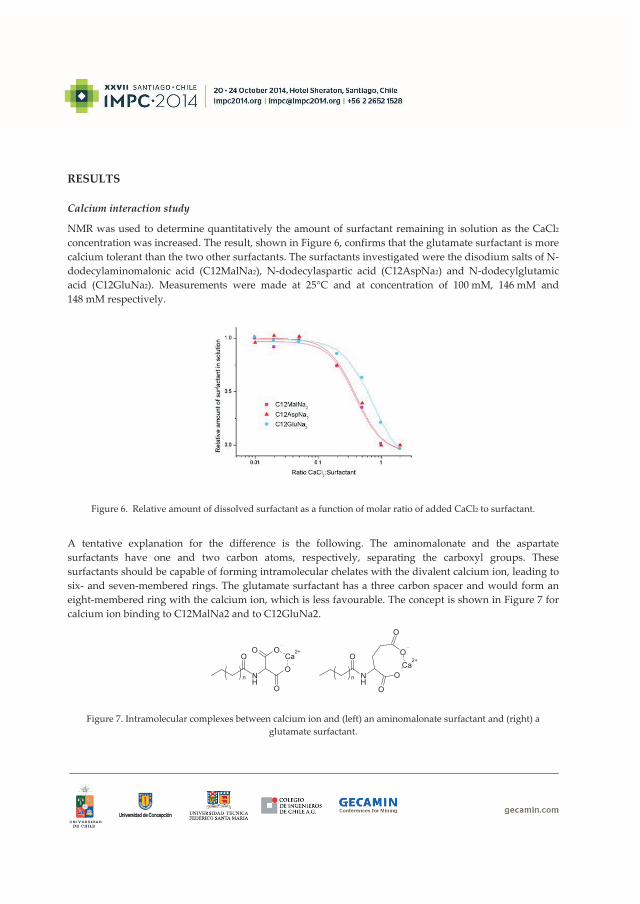
RESULTS
Calcium interaction study
NMR was used to determine quantitatively the amount of surfactant remaining in solution as the CaCl2concentration was increased. The result, shown in Figure 6, confirms that the glutamate surfactant is morecalcium tolerant than the two other surfactants. The surfactants investigated were the disodium salts of Ndodecylaminomalonic acid (C12MalNa2), N dodecylaspartic acid (C12AspNa2) and N dodecylglutamicacid (C12GluNa2). Measurements were made at 25°C and at concentration of 100 mM, 146 mM and148 mM respectively.
Figure 6. Relative amount of dissolved surfactant as a function of molar ratio of added CaCl2 to surfactant.
A tentative explanation for the difference is the following. The aminomalonate and the aspartatesurfactants have one and two carbon atoms, respectively, separating the carboxyl groups. Thesesurfactants should be capable of forming intramolecular chelates with the divalent calcium ion, leading tosix and seven membered rings. The glutamate surfactant has a three carbon spacer and would form aneight membered ring with the calcium ion, which is less favourable. The concept is shown in Figure 7 forcalcium ion binding to C12MalNa2 and to C12GluNa2.
NH
O
O
O
OOCa
2+
n NH
O
n
OCa
2+
O
O
O
Figure 7. Intramolecular complexes between calcium ion and (left) an aminomalonate surfactant and (right) aglutamate surfactant.
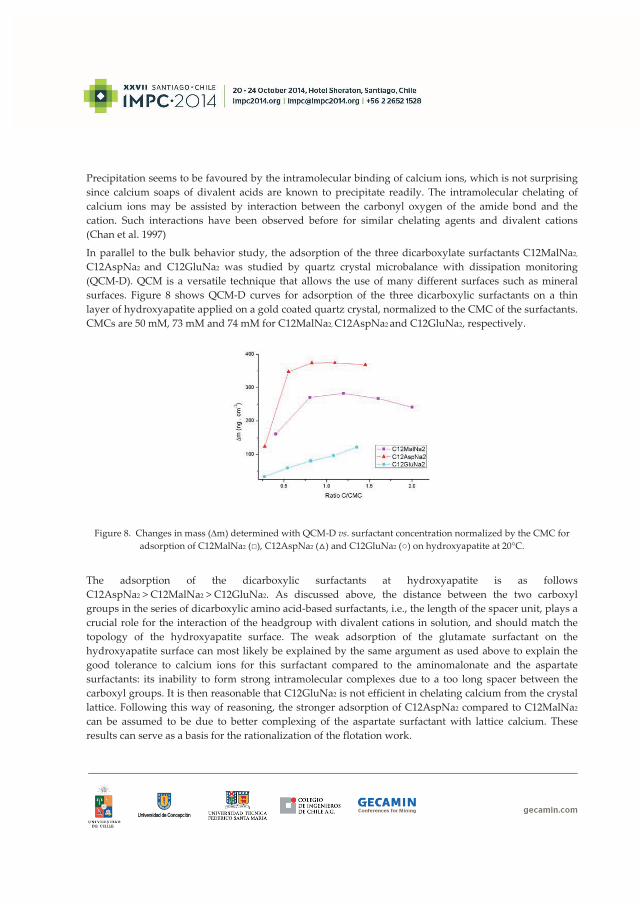
Precipitation seems to be favoured by the intramolecular binding of calcium ions, which is not surprisingsince calcium soaps of divalent acids are known to precipitate readily. The intramolecular chelating ofcalcium ions may be assisted by interaction between the carbonyl oxygen of the amide bond and thecation. Such interactions have been observed before for similar chelating agents and divalent cations(Chan et al. 1997)
In parallel to the bulk behavior study, the adsorption of the three dicarboxylate surfactants C12MalNa2,C12AspNa2 and C12GluNa2 was studied by quartz crystal microbalance with dissipation monitoring(QCM D). QCM is a versatile technique that allows the use of many different surfaces such as mineralsurfaces. Figure 8 shows QCM D curves for adsorption of the three dicarboxylic surfactants on a thinlayer of hydroxyapatite applied on a gold coated quartz crystal, normalized to the CMC of the surfactants.CMCs are 50 mM, 73 mM and 74 mM for C12MalNa2, C12AspNa2 and C12GluNa2, respectively.
Figure 8. Changes in mass ( m) determined with QCM D vs. surfactant concentration normalized by the CMC foradsorption of C12MalNa2 ( ), C12AspNa2 ( ) and C12GluNa2 ( ) on hydroxyapatite at 20°C.
The adsorption of the dicarboxylic surfactants at hydroxyapatite is as followsC12AspNa2 > C12MalNa2 > C12GluNa2. As discussed above, the distance between the two carboxylgroups in the series of dicarboxylic amino acid based surfactants, i.e., the length of the spacer unit, plays acrucial role for the interaction of the headgroup with divalent cations in solution, and should match thetopology of the hydroxyapatite surface. The weak adsorption of the glutamate surfactant on thehydroxyapatite surface can most likely be explained by the same argument as used above to explain thegood tolerance to calcium ions for this surfactant compared to the aminomalonate and the aspartatesurfactants: its inability to form strong intramolecular complexes due to a too long spacer between thecarboxyl groups. It is then reasonable that C12GluNa2 is not efficient in chelating calcium from the crystallattice. Following this way of reasoning, the stronger adsorption of C12AspNa2 compared to C12MalNa2can be assumed to be due to better complexing of the aspartate surfactant with lattice calcium. Theseresults can serve as a basis for the rationalization of the flotation work.
ACKNOWLEDGEMENT
Financial supports from the Hjalmar Lundbohm Research Centre (HLRC), Luossavaara Kiirunavaara AB(LKAB) and Boliden AB are gratefully acknowledged.
REFERENCES
Bordes, R. and K. Holmberg. 2011. Physical Chemical Characteristics of Dicarboxylic Amino Acid Based Surfactants.Colloids and Surfaces A: Physicochemical and Engineering Aspects 391 (1 3): 32 41.
Bordes, R., J. Tropsch, and K. Holmberg. 2010. Adsorption of Dianionic Surfactants Based on Amino Acids atDifferent Surfaces Studied by QCM D and SPR. Langmuir 26 (13): 10935 10942.
Bulmer, Gerald and Frederick G. Mann. 1945. Chemistry of Xanthic Acid Derivatives. I. Preparation andComparative Properties of Isomeric Xanthates and Dithiocarbonates. Journal of the Chemical Society: 666674.
Chan, Gabriel Y. S., Michael G. B. Drew, Michael J. Hudson, Peter B. Iveson, Jan Olov Liljenzin, Mats Skaalberg, LenaSpjuth, and Charles Madic. 1997. Solvent Extraction of Metal Ions from Nitric Acid Solution using N,NSubstituted Malonamides. Experimental and Crystallographic Evidence for Two Mechanisms of Extraction,Metal Complexation and Ion Pair Formation. Journal of the Chemical Society, Dalton Transactions:Inorganic Chemistry (4): 649 660.
Davey, R. J., S. N. Black, L. A. Bromley, D. Cottier, B. Dobbs, and J. E. Rout. 1991. Molecular Design Based onRecognition at Inorganic Surfaces. Nature 353 (6344): 549 550.
Grases, F., A. Garcia Raso, J. Palou, A. Costa Bauza, and J. G. March. 1991. A Study of the Relationship between theChemical Structure of some Carboxylic Acids and their Capacity to Inhibit the Crystal Growth of CalciumFluoride. Colloids and Surfaces 54 (C): 313 319.
Haldar, J., V. K. Aswal, P. S. Goyal, and S. Bhattacharya. 2004. Aggregation Properties of Novel Cationic Surfactantswith Multiple Pyridinium Headgroups. Small Angle Neutron Scattering and Conductivity Studies. Journalof Physical Chemistry B 108 (31): 11406 11411.
Hanumantha Rao, K. and K. S. E. Forssberg. 1995. Selectivity in Froth Flotation Based on Molecular Recognition atInorganic Interfaces. Proceedings Konferens i Mineralteknik, 14 16 February 1995, Luleå, Swedish MineralProcessing Research Foundation, Stockholm.
Heywood, B. R. and S. Mann. 1992. Crystal Recognition at Inorganic Organic Interfaces: Nucleation and Growth ofOriented BaSO4 Under Compressed Langmuir Monolayers. Advanced Materials 4 (4): 278 282.
Mann, S. 1993. Molecular Tectonics in Biomineralization and Biomimetic Materials Chemistry. Nature 365 (6446):499 505.
Mann, S. 1988. Molecular Recognition in Biomineralization. Nature 332 (6160): 119 124.
Mann, S., J. M. Didymus, N. P. Sanderson, B. R. Heywood, and E. J. A. Samper. 1990. Morphological Influence ofFunctionalized and Non Functionalized , Dicarboxylates on Calcite Crystallization. Journal of theChemical Society, Faraday Transactions 86 (10): 1873 1880.
Shapiro, D., H. M. Flowers, and E. Hecht. 1957. Synthesis of DL Threoninol. Journal of Organic Chemistry 22: 461462.
Paper II Flotation selectivity of novel alkyl dicarboxylate reagents for apatite–calcite separation. Karlkvist, T., Patra, A., Rao, K. H., Bordes, R., & Holmberg, K. (2015). Journal of Colloid and Interface Science, 445, 40–47.

Flotation selectivity of novel alkyl dicarboxylate reagentsfor apatite–calcite separation
Tommy Karlkvist a,⇑, Anuttam Patra a, Kota Hanumantha Rao a, Romain Bordes b, Krister Holmberg b
a Minerals and Metallurgical Research Laboratory, Luleå University of Technology, SE-971 87 Luleå, Swedenb Department of Chemical and Biological Engineering, Chalmers University of Technology, SE-412 96 Göteborg, Sweden
h i g h l i g h t s
� Demonstration of concepts behinddeveloping mineral specific reagentsfor flotation.� Application of novel dicarboxylate-
based surfactants with varying head-group distance.� Adsorption study of these new
reagents on pure apatite and purecalcite surfaces.� Measurements using Hallimond tube
flotation, f potential and FTIRspectroscopy.� Establishment of relation between
molecular structure and flotationrecovery.
g r a p h i c a l a b s t r a c t
C12GlyNa C12MalNa2 C12AspNa2 C12GluNa2HN
O
COO- Na+9
HN
O
COO- Na+
COO- Na+9
HN
O
COO- Na+
COO- Na+9
HN
O
COO- Na+
COO- Na+
9
NHOO
O- O-
O
Ca O CaO O CaCa
a r t i c l e i n f o
Article history:Received 13 August 2014Accepted 26 November 2014Available online 4 December 2014
Keywords:Froth flotationMineral processingAdsorptionMineral specific reagentsSurfactant
a b s t r a c t
The investigation aims to demonstrate the conceptual thoughts behind developing mineral specificreagents for use in flotation of calcium containing ores. For this purpose, a series of dicarboxylate-basedsurfactants with varying distance between the carboxylate groups (one, two or three methylene groups)was synthesized. A surfactant with the same alkyl chain length but with only one carboxylate group wasalso synthesized and evaluated. The adsorption behavior of these new reagents on pure apatite and purecalcite surfaces was studied using Hallimond tube flotation, FTIR and f potential measurements. The rela-tion between the adsorption behavior of a given surfactant at a specific mineral surface and its molecularstructure over a range of concentrations and pH values, as well as the region of maximum recovery, wasestablished. It was found that one of the reagents, with a specific distance between the carboxylategroups, was much more selective for a particular mineral surface than the other homologues. For exam-ple, out of the four compounds synthesized, only the one where the carboxylate groups were separatedby a single methylene group floated apatite but not calcite, whereas calcite was efficiently floated withthe monocarboxylic reagent, but not with the other reagents synthesized. This selective adsorption ofa given surfactant to a particular mineral surface relative to other mineral surfaces as evidenced in theflotation studies was substantiated by f potential and infra-red spectroscopy data.
� 2014 Elsevier Inc. All rights reserved.
1. Introduction
Design, development and selection of reagents, or industrialperformance chemicals such as surfactants, dispersants, and flocc-ulants, are important in many industrial fields, including mineral
http://dx.doi.org/10.1016/j.jcis.2014.11.0720021-9797/� 2014 Elsevier Inc. All rights reserved.
⇑ Corresponding author. Fax: +46 (0)920 973 64.E-mail address: [email protected] (T. Karlkvist).
Journal of Colloid and Interface Science 445 (2015) 40–47
Contents lists available at ScienceDirect
Journal of Colloid and Interface Science
www.elsevier .com/locate / jc is
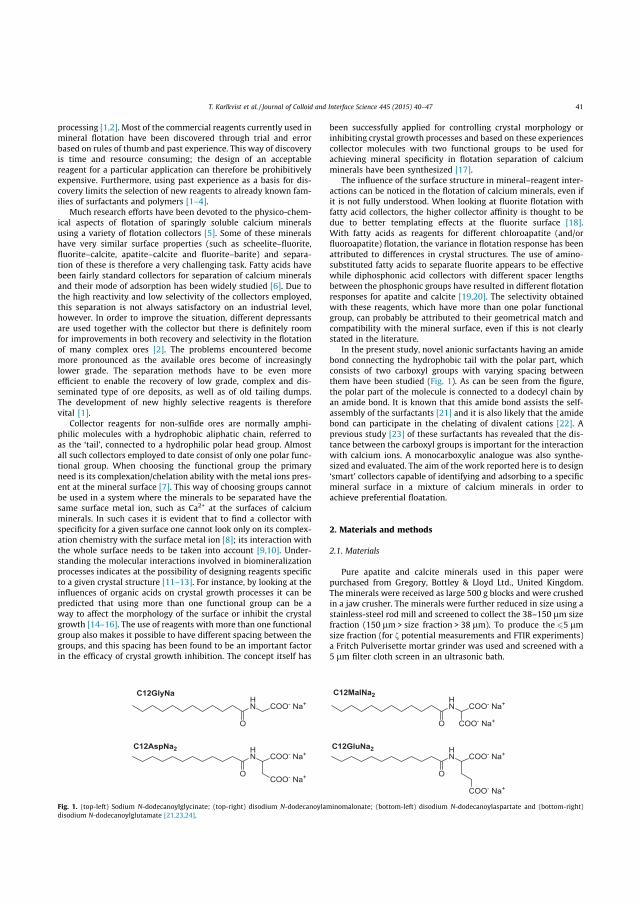
processing [1,2]. Most of the commercial reagents currently used inmineral flotation have been discovered through trial and errorbased on rules of thumb and past experience. This way of discoveryis time and resource consuming; the design of an acceptablereagent for a particular application can therefore be prohibitivelyexpensive. Furthermore, using past experience as a basis for dis-covery limits the selection of new reagents to already known fam-ilies of surfactants and polymers [1–4].
Much research efforts have been devoted to the physico-chem-ical aspects of flotation of sparingly soluble calcium mineralsusing a variety of flotation collectors [5]. Some of these mineralshave very similar surface properties (such as scheelite–fluorite,fluorite–calcite, apatite–calcite and fluorite–barite) and separa-tion of these is therefore a very challenging task. Fatty acids havebeen fairly standard collectors for separation of calcium mineralsand their mode of adsorption has been widely studied [6]. Due tothe high reactivity and low selectivity of the collectors employed,this separation is not always satisfactory on an industrial level,however. In order to improve the situation, different depressantsare used together with the collector but there is definitely roomfor improvements in both recovery and selectivity in the flotationof many complex ores [2]. The problems encountered becomemore pronounced as the available ores become of increasinglylower grade. The separation methods have to be even moreefficient to enable the recovery of low grade, complex and dis-seminated type of ore deposits, as well as of old tailing dumps.The development of new highly selective reagents is thereforevital [1].
Collector reagents for non-sulfide ores are normally amphi-philic molecules with a hydrophobic aliphatic chain, referred toas the ‘tail’, connected to a hydrophilic polar head group. Almostall such collectors employed to date consist of only one polar func-tional group. When choosing the functional group the primaryneed is its complexation/chelation ability with the metal ions pres-ent at the mineral surface [7]. This way of choosing groups cannotbe used in a system where the minerals to be separated have thesame surface metal ion, such as Ca2+ at the surfaces of calciumminerals. In such cases it is evident that to find a collector withspecificity for a given surface one cannot look only on its complex-ation chemistry with the surface metal ion [8]; its interaction withthe whole surface needs to be taken into account [9,10]. Under-standing the molecular interactions involved in biomineralizationprocesses indicates at the possibility of designing reagents specificto a given crystal structure [11–13]. For instance, by looking at theinfluences of organic acids on crystal growth processes it can bepredicted that using more than one functional group can be away to affect the morphology of the surface or inhibit the crystalgrowth [14–16]. The use of reagents with more than one functionalgroup also makes it possible to have different spacing between thegroups, and this spacing has been found to be an important factorin the efficacy of crystal growth inhibition. The concept itself has
been successfully applied for controlling crystal morphology orinhibiting crystal growth processes and based on these experiencescollector molecules with two functional groups to be used forachieving mineral specificity in flotation separation of calciumminerals have been synthesized [17].
The influence of the surface structure in mineral–reagent inter-actions can be noticed in the flotation of calcium minerals, even ifit is not fully understood. When looking at fluorite flotation withfatty acid collectors, the higher collector affinity is thought to bedue to better templating effects at the fluorite surface [18].With fatty acids as reagents for different chloroapatite (and/orfluoroapatite) flotation, the variance in flotation response has beenattributed to differences in crystal structures. The use of amino-substituted fatty acids to separate fluorite appears to be effectivewhile diphosphonic acid collectors with different spacer lengthsbetween the phosphonic groups have resulted in different flotationresponses for apatite and calcite [19,20]. The selectivity obtainedwith these reagents, which have more than one polar functionalgroup, can probably be attributed to their geometrical match andcompatibility with the mineral surface, even if this is not clearlystated in the literature.
In the present study, novel anionic surfactants having an amidebond connecting the hydrophobic tail with the polar part, whichconsists of two carboxyl groups with varying spacing betweenthem have been studied (Fig. 1). As can be seen from the figure,the polar part of the molecule is connected to a dodecyl chain byan amide bond. It is known that this amide bond assists the self-assembly of the surfactants [21] and it is also likely that the amidebond can participate in the chelating of divalent cations [22]. Aprevious study [23] of these surfactants has revealed that the dis-tance between the carboxyl groups is important for the interactionwith calcium ions. A monocarboxylic analogue was also synthe-sized and evaluated. The aim of the work reported here is to design‘smart’ collectors capable of identifying and adsorbing to a specificmineral surface in a mixture of calcium minerals in order toachieve preferential floatation.
2. Materials and methods
2.1. Materials
Pure apatite and calcite minerals used in this paper werepurchased from Gregory, Bottley & Lloyd Ltd., United Kingdom.The minerals were received as large 500 g blocks and were crushedin a jaw crusher. The minerals were further reduced in size using astainless-steel rod mill and screened to collect the 38–150 lm sizefraction (150 lm > size fraction > 38 lm). To produce the 65 lmsize fraction (for f potential measurements and FTIR experiments)a Fritch Pulverisette mortar grinder was used and screened with a5 lm filter cloth screen in an ultrasonic bath.
Fig. 1. (top-left) Sodium N-dodecanoylglycinate; (top-right) disodium N-dodecanoylaminomalonate; (bottom-left) disodium N-dodecanoylaspartate and (bottom-right)disodium N-dodecanoylglutamate [21,23,24].
T. Karlkvist et al. / Journal of Colloid and Interface Science 445 (2015) 40–47 41
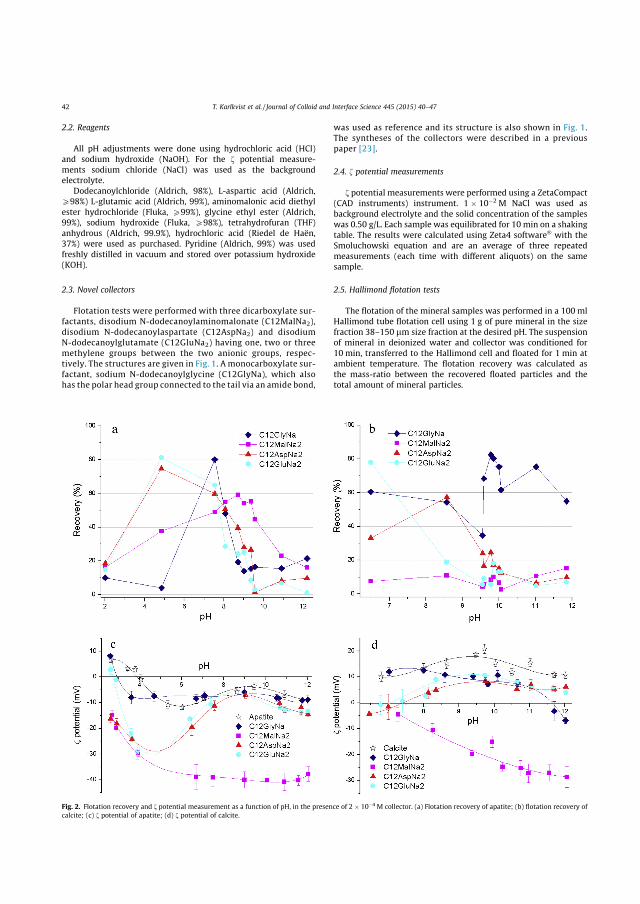
2.2. Reagents
All pH adjustments were done using hydrochloric acid (HCl)and sodium hydroxide (NaOH). For the f potential measure-ments sodium chloride (NaCl) was used as the backgroundelectrolyte.
Dodecanoylchloride (Aldrich, 98%), L-aspartic acid (Aldrich,P98%) L-glutamic acid (Aldrich, 99%), aminomalonic acid diethylester hydrochloride (Fluka, P99%), glycine ethyl ester (Aldrich,99%), sodium hydroxide (Fluka, P98%), tetrahydrofuran (THF)anhydrous (Aldrich, 99.9%), hydrochloric acid (Riedel de Haën,37%) were used as purchased. Pyridine (Aldrich, 99%) was usedfreshly distilled in vacuum and stored over potassium hydroxide(KOH).
2.3. Novel collectors
Flotation tests were performed with three dicarboxylate sur-factants, disodium N-dodecanoylaminomalonate (C12MalNa2),disodium N-dodecanoylaspartate (C12AspNa2) and disodiumN-dodecanoylglutamate (C12GluNa2) having one, two or threemethylene groups between the two anionic groups, respec-tively. The structures are given in Fig. 1. A monocarboxylate sur-factant, sodium N-dodecanoylglycine (C12GlyNa), which alsohas the polar head group connected to the tail via an amide bond,
was used as reference and its structure is also shown in Fig. 1.The syntheses of the collectors were described in a previouspaper [23].
2.4. f potential measurements
f potential measurements were performed using a ZetaCompact(CAD instruments) instrument. 1 � 10�2 M NaCl was used asbackground electrolyte and the solid concentration of the sampleswas 0.50 g/L. Each sample was equilibrated for 10 min on a shakingtable. The results were calculated using Zeta4 software� with theSmoluchowski equation and are an average of three repeatedmeasurements (each time with different aliquots) on the samesample.
2.5. Hallimond flotation tests
The flotation of the mineral samples was performed in a 100 mlHallimond tube flotation cell using 1 g of pure mineral in the sizefraction 38–150 lm size fraction at the desired pH. The suspensionof mineral in deionized water and collector was conditioned for10 min, transferred to the Hallimond cell and floated for 1 min atambient temperature. The flotation recovery was calculated asthe mass-ratio between the recovered floated particles and thetotal amount of mineral particles.
Fig. 2. Flotation recovery and f potential measurement as a function of pH, in the presence of 2 � 10�4 M collector. (a) Flotation recovery of apatite; (b) flotation recovery ofcalcite; (c) f potential of apatite; (d) f potential of calcite.
42 T. Karlkvist et al. / Journal of Colloid and Interface Science 445 (2015) 40–47
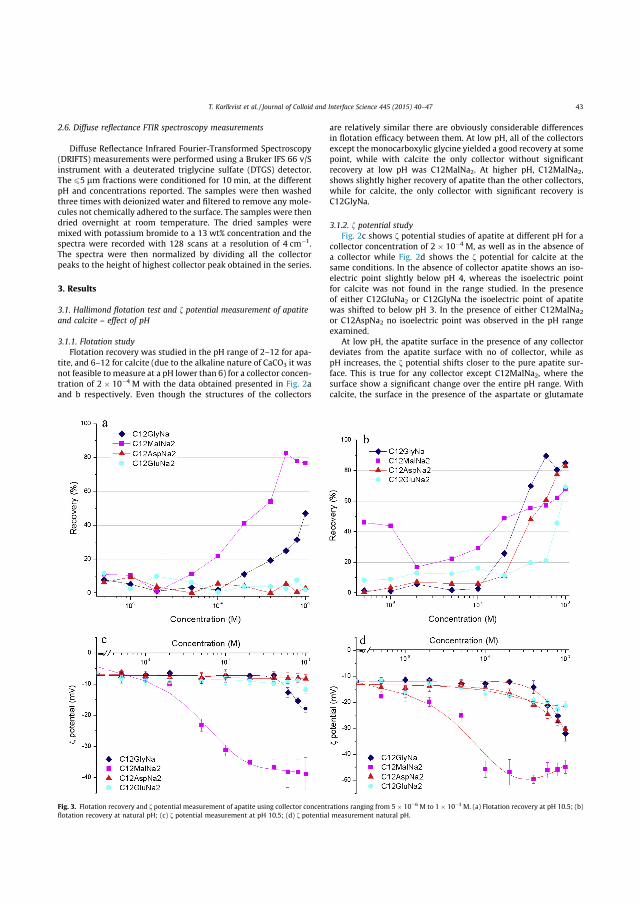
2.6. Diffuse reflectance FTIR spectroscopy measurements
Diffuse Reflectance Infrared Fourier-Transformed Spectroscopy(DRIFTS) measurements were performed using a Bruker IFS 66 v/Sinstrument with a deuterated triglycine sulfate (DTGS) detector.The 65 lm fractions were conditioned for 10 min, at the differentpH and concentrations reported. The samples were then washedthree times with deionized water and filtered to remove any mole-cules not chemically adhered to the surface. The samples were thendried overnight at room temperature. The dried samples weremixed with potassium bromide to a 13 wt% concentration and thespectra were recorded with 128 scans at a resolution of 4 cm�1.The spectra were then normalized by dividing all the collectorpeaks to the height of highest collector peak obtained in the series.
3. Results
3.1. Hallimond flotation test and f potential measurement of apatiteand calcite – effect of pH
3.1.1. Flotation studyFlotation recovery was studied in the pH range of 2–12 for apa-
tite, and 6–12 for calcite (due to the alkaline nature of CaCO3 it wasnot feasible to measure at a pH lower than 6) for a collector concen-tration of 2 � 10�4 M with the data obtained presented in Fig. 2aand b respectively. Even though the structures of the collectors
are relatively similar there are obviously considerable differencesin flotation efficacy between them. At low pH, all of the collectorsexcept the monocarboxylic glycine yielded a good recovery at somepoint, while with calcite the only collector without significantrecovery at low pH was C12MalNa2. At higher pH, C12MalNa2,shows slightly higher recovery of apatite than the other collectors,while for calcite, the only collector with significant recovery isC12GlyNa.
3.1.2. f potential studyFig. 2c shows f potential studies of apatite at different pH for a
collector concentration of 2 � 10�4 M, as well as in the absence ofa collector while Fig. 2d shows the f potential for calcite at thesame conditions. In the absence of collector apatite shows an iso-electric point slightly below pH 4, whereas the isoelectric pointfor calcite was not found in the range studied. In the presenceof either C12GluNa2 or C12GlyNa the isoelectric point of apatitewas shifted to below pH 3. In the presence of either C12MalNa2
or C12AspNa2 no isoelectric point was observed in the pH rangeexamined.
At low pH, the apatite surface in the presence of any collectordeviates from the apatite surface with no of collector, while aspH increases, the f potential shifts closer to the pure apatite sur-face. This is true for any collector except C12MalNa2, where thesurface show a significant change over the entire pH range. Withcalcite, the surface in the presence of the aspartate or glutamate
Fig. 3. Flotation recovery and f potential measurement of apatite using collector concentrations ranging from 5 � 10�6 M to 1 � 10�3 M. (a) Flotation recovery at pH 10.5; (b)flotation recovery at natural pH; (c) f potential measurement at pH 10.5; (d) f potential measurement natural pH.
T. Karlkvist et al. / Journal of Colloid and Interface Science 445 (2015) 40–47 43
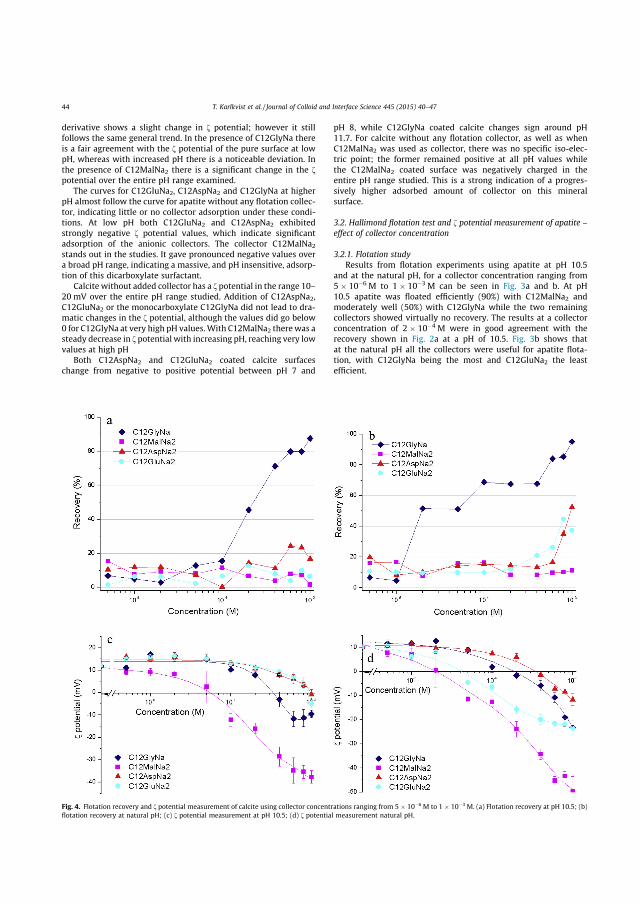
derivative shows a slight change in f potential; however it stillfollows the same general trend. In the presence of C12GlyNa thereis a fair agreement with the f potential of the pure surface at lowpH, whereas with increased pH there is a noticeable deviation. Inthe presence of C12MalNa2 there is a significant change in the fpotential over the entire pH range examined.
The curves for C12GluNa2, C12AspNa2 and C12GlyNa at higherpH almost follow the curve for apatite without any flotation collec-tor, indicating little or no collector adsorption under these condi-tions. At low pH both C12GluNa2 and C12AspNa2 exhibitedstrongly negative f potential values, which indicate significantadsorption of the anionic collectors. The collector C12MalNa2
stands out in the studies. It gave pronounced negative values overa broad pH range, indicating a massive, and pH insensitive, adsorp-tion of this dicarboxylate surfactant.
Calcite without added collector has a f potential in the range 10–20 mV over the entire pH range studied. Addition of C12AspNa2,C12GluNa2 or the monocarboxylate C12GlyNa did not lead to dra-matic changes in the f potential, although the values did go below0 for C12GlyNa at very high pH values. With C12MalNa2 there was asteady decrease in f potential with increasing pH, reaching very lowvalues at high pH
Both C12AspNa2 and C12GluNa2 coated calcite surfaceschange from negative to positive potential between pH 7 and
pH 8, while C12GlyNa coated calcite changes sign around pH11.7. For calcite without any flotation collector, as well as whenC12MalNa2 was used as collector, there was no specific iso-elec-tric point; the former remained positive at all pH values whilethe C12MalNa2 coated surface was negatively charged in theentire pH range studied. This is a strong indication of a progres-sively higher adsorbed amount of collector on this mineralsurface.
3.2. Hallimond flotation test and f potential measurement of apatite –effect of collector concentration
3.2.1. Flotation studyResults from flotation experiments using apatite at pH 10.5
and at the natural pH, for a collector concentration ranging from5 � 10�6 M to 1 � 10�3 M can be seen in Fig. 3a and b. At pH10.5 apatite was floated efficiently (90%) with C12MalNa2 andmoderately well (50%) with C12GlyNa while the two remainingcollectors showed virtually no recovery. The results at a collectorconcentration of 2 � 10�4 M were in good agreement with therecovery shown in Fig. 2a at a pH of 10.5. Fig. 3b shows thatat the natural pH all the collectors were useful for apatite flota-tion, with C12GlyNa being the most and C12GluNa2 the leastefficient.
Fig. 4. Flotation recovery and f potential measurement of calcite using collector concentrations ranging from 5 � 10�6 M to 1 � 10�3 M. (a) Flotation recovery at pH 10.5; (b)flotation recovery at natural pH; (c) f potential measurement at pH 10.5; (d) f potential measurement natural pH.
44 T. Karlkvist et al. / Journal of Colloid and Interface Science 445 (2015) 40–47
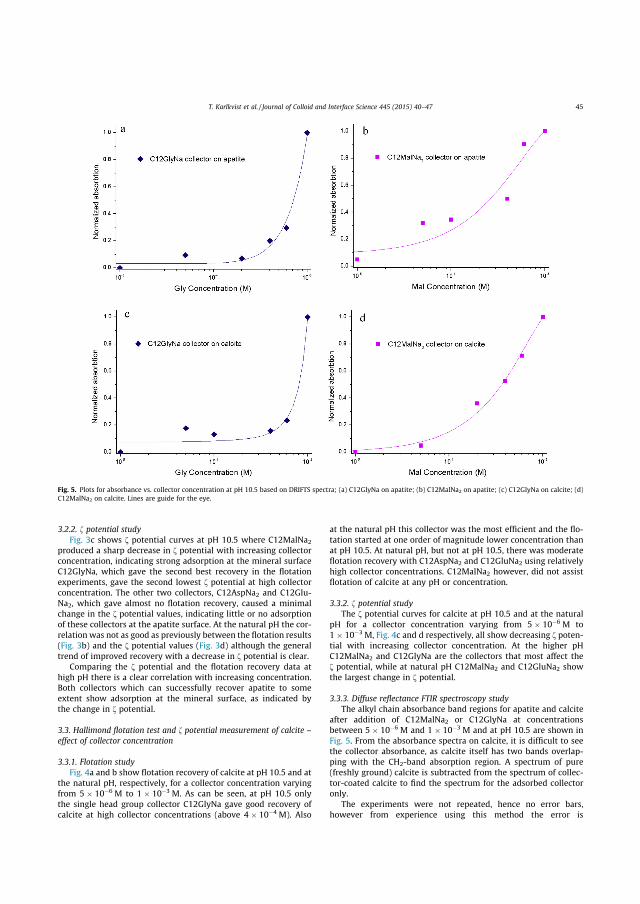
3.2.2. f potential studyFig. 3c shows f potential curves at pH 10.5 where C12MalNa2
produced a sharp decrease in f potential with increasing collectorconcentration, indicating strong adsorption at the mineral surfaceC12GlyNa, which gave the second best recovery in the flotationexperiments, gave the second lowest f potential at high collectorconcentration. The other two collectors, C12AspNa2 and C12Glu-Na2, which gave almost no flotation recovery, caused a minimalchange in the f potential values, indicating little or no adsorptionof these collectors at the apatite surface. At the natural pH the cor-relation was not as good as previously between the flotation results(Fig. 3b) and the f potential values (Fig. 3d) although the generaltrend of improved recovery with a decrease in f potential is clear.
Comparing the f potential and the flotation recovery data athigh pH there is a clear correlation with increasing concentration.Both collectors which can successfully recover apatite to someextent show adsorption at the mineral surface, as indicated bythe change in f potential.
3.3. Hallimond flotation test and f potential measurement of calcite –effect of collector concentration
3.3.1. Flotation studyFig. 4a and b show flotation recovery of calcite at pH 10.5 and at
the natural pH, respectively, for a collector concentration varyingfrom 5 � 10�6 M to 1 � 10�3 M. As can be seen, at pH 10.5 onlythe single head group collector C12GlyNa gave good recovery ofcalcite at high collector concentrations (above 4 � 10�4 M). Also
at the natural pH this collector was the most efficient and the flo-tation started at one order of magnitude lower concentration thanat pH 10.5. At natural pH, but not at pH 10.5, there was moderateflotation recovery with C12AspNa2 and C12GluNa2 using relativelyhigh collector concentrations. C12MalNa2 however, did not assistflotation of calcite at any pH or concentration.
3.3.2. f potential studyThe f potential curves for calcite at pH 10.5 and at the natural
pH for a collector concentration varying from 5 � 10�6 M to1 � 10�3 M, Fig. 4c and d respectively, all show decreasing f poten-tial with increasing collector concentration. At the higher pHC12MalNa2 and C12GlyNa are the collectors that most affect thef potential, while at natural pH C12MalNa2 and C12GluNa2 showthe largest change in f potential.
3.3.3. Diffuse reflectance FTIR spectroscopy studyThe alkyl chain absorbance band regions for apatite and calcite
after addition of C12MalNa2 or C12GlyNa at concentrationsbetween 5 � 10�6 M and 1 � 10�3 M and at pH 10.5 are shown inFig. 5. From the absorbance spectra on calcite, it is difficult to seethe collector absorbance, as calcite itself has two bands overlap-ping with the CH2-band absorption region. A spectrum of pure(freshly ground) calcite is subtracted from the spectrum of collec-tor-coated calcite to find the spectrum for the adsorbed collectoronly.
The experiments were not repeated, hence no error bars,however from experience using this method the error is
Fig. 5. Plots for absorbance vs. collector concentration at pH 10.5 based on DRIFTS spectra; (a) C12GlyNa on apatite; (b) C12MalNa2 on apatite; (c) C12GlyNa on calcite; (d)C12MalNa2 on calcite. Lines are guide for the eye.
T. Karlkvist et al. / Journal of Colloid and Interface Science 445 (2015) 40–47 45
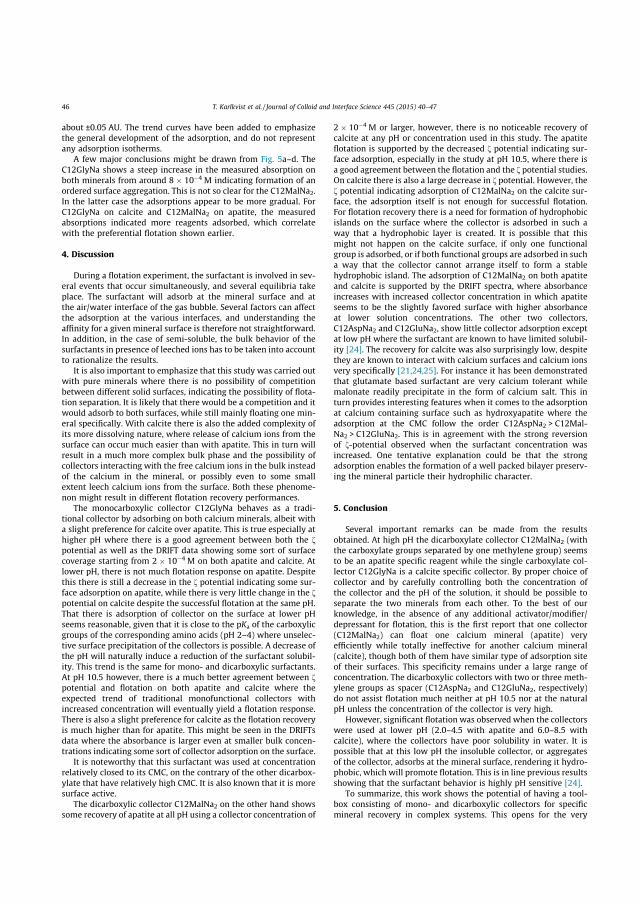
about ±0.05 AU. The trend curves have been added to emphasizethe general development of the adsorption, and do not representany adsorption isotherms.
A few major conclusions might be drawn from Fig. 5a–d. TheC12GlyNa shows a steep increase in the measured absorption onboth minerals from around 8 � 10�4 M indicating formation of anordered surface aggregation. This is not so clear for the C12MalNa2.In the latter case the adsorptions appear to be more gradual. ForC12GlyNa on calcite and C12MalNa2 on apatite, the measuredabsorptions indicated more reagents adsorbed, which correlatewith the preferential flotation shown earlier.
4. Discussion
During a flotation experiment, the surfactant is involved in sev-eral events that occur simultaneously, and several equilibria takeplace. The surfactant will adsorb at the mineral surface and atthe air/water interface of the gas bubble. Several factors can affectthe adsorption at the various interfaces, and understanding theaffinity for a given mineral surface is therefore not straightforward.In addition, in the case of semi-soluble, the bulk behavior of thesurfactants in presence of leeched ions has to be taken into accountto rationalize the results.
It is also important to emphasize that this study was carried outwith pure minerals where there is no possibility of competitionbetween different solid surfaces, indicating the possibility of flota-tion separation. It is likely that there would be a competition and itwould adsorb to both surfaces, while still mainly floating one min-eral specifically. With calcite there is also the added complexity ofits more dissolving nature, where release of calcium ions from thesurface can occur much easier than with apatite. This in turn willresult in a much more complex bulk phase and the possibility ofcollectors interacting with the free calcium ions in the bulk insteadof the calcium in the mineral, or possibly even to some smallextent leech calcium ions from the surface. Both these phenome-non might result in different flotation recovery performances.
The monocarboxylic collector C12GlyNa behaves as a tradi-tional collector by adsorbing on both calcium minerals, albeit witha slight preference for calcite over apatite. This is true especially athigher pH where there is a good agreement between both the fpotential as well as the DRIFT data showing some sort of surfacecoverage starting from 2 � 10�4 M on both apatite and calcite. Atlower pH, there is not much flotation response on apatite. Despitethis there is still a decrease in the f potential indicating some sur-face adsorption on apatite, while there is very little change in the fpotential on calcite despite the successful flotation at the same pH.That there is adsorption of collector on the surface at lower pHseems reasonable, given that it is close to the pKa of the carboxylicgroups of the corresponding amino acids (pH 2–4) where unselec-tive surface precipitation of the collectors is possible. A decrease ofthe pH will naturally induce a reduction of the surfactant solubil-ity. This trend is the same for mono- and dicarboxylic surfactants.At pH 10.5 however, there is a much better agreement between fpotential and flotation on both apatite and calcite where theexpected trend of traditional monofunctional collectors withincreased concentration will eventually yield a flotation response.There is also a slight preference for calcite as the flotation recoveryis much higher than for apatite. This might be seen in the DRIFTsdata where the absorbance is larger even at smaller bulk concen-trations indicating some sort of collector adsorption on the surface.
It is noteworthy that this surfactant was used at concentrationrelatively closed to its CMC, on the contrary of the other dicarbox-ylate that have relatively high CMC. It is also known that it is moresurface active.
The dicarboxylic collector C12MalNa2 on the other hand showssome recovery of apatite at all pH using a collector concentration of
2 � 10�4 M or larger, however, there is no noticeable recovery ofcalcite at any pH or concentration used in this study. The apatiteflotation is supported by the decreased f potential indicating sur-face adsorption, especially in the study at pH 10.5, where there isa good agreement between the flotation and the f potential studies.On calcite there is also a large decrease in f potential. However, thef potential indicating adsorption of C12MalNa2 on the calcite sur-face, the adsorption itself is not enough for successful flotation.For flotation recovery there is a need for formation of hydrophobicislands on the surface where the collector is adsorbed in such away that a hydrophobic layer is created. It is possible that thismight not happen on the calcite surface, if only one functionalgroup is adsorbed, or if both functional groups are adsorbed in sucha way that the collector cannot arrange itself to form a stablehydrophobic island. The adsorption of C12MalNa2 on both apatiteand calcite is supported by the DRIFT spectra, where absorbanceincreases with increased collector concentration in which apatiteseems to be the slightly favored surface with higher absorbanceat lower solution concentrations. The other two collectors,C12AspNa2 and C12GluNa2, show little collector adsorption exceptat low pH where the surfactant are known to have limited solubil-ity [24]. The recovery for calcite was also surprisingly low, despitethey are known to interact with calcium surfaces and calcium ionsvery specifically [21,24,25]. For instance it has been demonstratedthat glutamate based surfactant are very calcium tolerant whilemalonate readily precipitate in the form of calcium salt. This inturn provides interesting features when it comes to the adsorptionat calcium containing surface such as hydroxyapatite where theadsorption at the CMC follow the order C12AspNa2 > C12Mal-Na2 > C12GluNa2. This is in agreement with the strong reversionof f-potential observed when the surfactant concentration wasincreased. One tentative explanation could be that the strongadsorption enables the formation of a well packed bilayer preserv-ing the mineral particle their hydrophilic character.
5. Conclusion
Several important remarks can be made from the resultsobtained. At high pH the dicarboxylate collector C12MalNa2 (withthe carboxylate groups separated by one methylene group) seemsto be an apatite specific reagent while the single carboxylate col-lector C12GlyNa is a calcite specific collector. By proper choice ofcollector and by carefully controlling both the concentration ofthe collector and the pH of the solution, it should be possible toseparate the two minerals from each other. To the best of ourknowledge, in the absence of any additional activator/modifier/depressant for flotation, this is the first report that one collector(C12MalNa2) can float one calcium mineral (apatite) veryefficiently while totally ineffective for another calcium mineral(calcite), though both of them have similar type of adsorption siteof their surfaces. This specificity remains under a large range ofconcentration. The dicarboxylic collectors with two or three meth-ylene groups as spacer (C12AspNa2 and C12GluNa2, respectively)do not assist flotation much neither at pH 10.5 nor at the naturalpH unless the concentration of the collector is very high.
However, significant flotation was observed when the collectorswere used at lower pH (2.0–4.5 with apatite and 6.0–8.5 withcalcite), where the collectors have poor solubility in water. It ispossible that at this low pH the insoluble collector, or aggregatesof the collector, adsorbs at the mineral surface, rendering it hydro-phobic, which will promote flotation. This is in line previous resultsshowing that the surfactant behavior is highly pH sensitive [24].
To summarize, this work shows the potential of having a tool-box consisting of mono- and dicarboxylic collectors for specificmineral recovery in complex systems. This opens for the very
46 T. Karlkvist et al. / Journal of Colloid and Interface Science 445 (2015) 40–47
interesting possibility of using tailor-made collectors for specificmineral separation processes.
Acknowledgments
Financial support from the Hjalmar Lundbohm Research Centre(HLRC) and Luossavaara-Kiirunavaara AB (LKAB) is gratefullyacknowledged. Helpful discussions with Dr. Andreas Fredriksson,Assoc. Prof. Allan Holmgren, Assoc. Prof Bertil Pålsson and Assoc.Prof. Mattias Grahn are greatly appreciated.
References
[1] D.W. Fuerstenau, Proc. Int. Miner. Process Cong., 19th 3 (1995) 3–17.[2] Pradip, Met., Mater. Process. 10 (1) (1998) 41–54.[3] M.J. Pearse, Miner. Eng. 18 (2) (2005) 139–149.[4] A. Butcher, Australas. Inst. Min. Metall. Spectr. Ser. 16 (Flotation Plant
Optimisation) (2010) 83–93.[5] H. Baldauf, H. Schubert, W. Kramer, Aufbereit – Tech. 27 (5) (1986) 235–241.[6] J. Kou, D. Tao, G. Xu, Int. J. Miner. Process. 95 (1–4) (2010) 1–9.[7] A.M. Marabini, M. Ciriachi, P. Plescia, M. Barbaro, Miner. Eng. 20 (10) (2007)
1014–1025.[8] A.D. Read, C.T. Hollick, Miner. Sci. Eng. 8 (3) (1976) 202–213.[9] K. Hanumantha Rao, K.S.E. Forssberg, Selectivity in froth flotation based on
molecular recognition at inorganic interfaces, in: Conference in MineralProcessing, 14–16 February, 1995, Luleå, Sweden, 1995, pp. 53–66.
[10] S. Lu, Z. Song, C. Sun, Publ. Australas. Inst. Min. Metall. 7 (2010) (2010) 3269–3275.
[11] S. Mann, Nature 365 (6446) (1993) 499–505.[12] S. Mann, B.R. Heywood, S. Rajam, J.D. Birchall, Nature 334 (6184) (1988) 692–
695.[13] Pradip, B. Rai, T.K. Rao, et al., Langmuir 18 (3) (2002) 932–940.[14] F. Grases, A. Garcia-Raso, J. Palou, A. Costa-Bauza, J.G. March, Colloids Surf. 54
(C) (1991) 313–319.[15] B.R. Heywood, S. Mann, J. Am. Chem. Soc. 114 (12) (1992) 4681–4686.[16] S. Mann, J.M. Didymus, N.P. Sanderson, B.R. Heywood, E.J.A. Samper, J. Chem.
Soc., Farad. Trans. 86 (10) (1990) 1873–1880.[17] R.J. Davey, S.N. Black, L.A. Bromley, D. Cottier, B. Dobbs, J.E. Rout, Nature 353
(6344) (1991) 549–550.[18] D. Arad, M. Kaftory, A.B. Zolotoy, N.P. Finkelstein, A. Weissman, Langmuir 9 (6)
(1993) 1446–1448.[19] I.L. Kotlyarevsky, I.S. Alferiev, A.V. Krasnukhina, V.D. Pomazov, N.V. Egorov,
Reag. Miner. Ind. (1984) 173–179[20] D.N. Collins, R. Wright, D. Watson, Reag. Miner. Ind. (1984) 1–12[21] R. Bordes, J. Tropsch, K. Holmberg, Langmuir 26 (5) (2010) 3077–3083.[22] J. Rydberg, M. Cox, C. Musikas, G.R. Choppin, Solvent Extraction: Principles and
Practice, second ed., Marcel Dekker, New York, 2004.[23] R. Bordes, K. Holmberg, Colloids Surf. A: Physicochem. Eng. Aspects 391 (1–3)
(2011) 32–41.[24] R. Bordes, J. Tropsch, K. Holmberg, J. Colloid Interface Sci. 338 (2) (2009) 529–
536.[25] R. Bordes, J. Tropsch, K. Holmberg, Langmuir 26 (13) (2010) 10935–10942.
T. Karlkvist et al. / Journal of Colloid and Interface Science 445 (2015) 40–47 47
Paper III Flotation Selectivity of Novel Alkyl Dicarboxylate Reagents for Calcite-Fluorite Separation. Karlkvist, T., Patra, A., Bordes, R., Holmberg, K., & Rao, K. H. (2016). Tenside Surfactants Detergents, 53(6), 516–523.

y Tommy Karlkvist1, Anuttam Patra1, Romain Bordes2 , Krister Holmberg2 and Kota Hanumantha Rao3
Flotation Selectivity of Novel AlkylDicarboxylate Reagents for Calcite-Fluorite Separation
A series of amino acid-based surfactants with a fixed alkyl chainlength and with two carboxyl groups separated by a spacer ofone, two or three carbon atoms have been synthesized andevaluated as potential collectors for flotation of calcite and fluor-ite. A monocarboxylate amino acid-based surfactant having thesame length of the hydrocarbon tail was also included for com-parison in the study. Experiments using a Hallimond flotationtube showed that although the flotation reagents solely differin terms of spacer, their efficacy in terms of flotation recoveryvaried very much. Whereas on calcite at pH 10.5 only the mono-carboxylate collector gave a high yield, on fluorite at the samepH both the monocarboxylate and the dicarboxylate collectorswith one carbon between the carboxyl groups gave good re-sults. On calcite at the natural pH the monocarboxylate collectorwas most efficient but the dicarboxylate collectors with a two-and a three-carbon spacer also gave a reasonable recovery. Onfluorite at the natural pH the dicarboxylate collectors with atwo- and a three-carbon spacer were most efficient. The f-po-tential and the flotation recovery of the mineral particles as afunction of added collector were assessed and the adsorptionwas also monitored by diffuse reflectance infra-red spectro-scopy. Taken together, the results showed that small changes inthe head group region of the collector can radically affect flota-tion recovery. This type of knowledge is important to understandflotation selectivity in a mixture of similar minerals.
Key words: Froth flotation, mineral processing, adsorption,mineral specific reagents, surfactant
Selektivität der Flotation bei der Trennung von Calcit undFluorit mit neuen Alkyldicarboxilaten. Es wurde eine ReiheAminosäurenbasierter Tenside synthetisiert und als potenzielleKollektoren für die Flotation von Calcit und Fluorit bewertet. DieTenside besitzen eine konstante Alkylkettenlänge und zweiCarboxylgruppen, die durch einen Spacer, der ein, zwei oder dreiKohlenstoffatome enthalten kann, getrennt sind. Ein Monocarb-oxilataminosäuretensid mit der gleichen Kohlenstoffkettenlängewurde als Vergleichssubstanz in die Untersuchung einbezogen.Experimente in der Hallimond-Flotationsröhre ergaben, dass, ob-wohl die Flotationsreagenzien sich ausschließlich in Bezug auf dieSpacer voneinander unterschieden, deren Wirksamkeit im Hin-blick auf die Flotationsanreicherung sich sehr stark veränderte.Während auf Calcit bei pH 10,5 nur der Monocarboxilatsammlereine hohe Ausbeute lieferte, zeigten auf Fluorit beim gleichen pHsowohl der Monocarboxilat- als auch der Dicarboxilatsammler,dessen Spacer zwischen den Carboxylgruppen nur ein Kohlen-
stoffatom hatte, gute Ergebnisse. Auf Calcit beim natürlichen pH-Wert war der Monocarboxilatkollektor der effizienteste, aber dieDicarboxilatkollektoren mit einem Spacer, der zwei- bzw. dreiKohlenstoffatome enthielt, gab auch eine annehmbare Anreiche-rung. Dicarboxilatkollektoren mit einem zwei- oder einem dreiKohlenstoffatome enthaltenen Spacer waren auf Fluorit beim na-türlichen pH die effizientesten. Das f-Potential und die Flotations-anreicherung der Mineralpartikel als Funktion des zugegebenenKollektors wurden bewertet. Die Adsorption wurde durch diffuseReflexionsspektroskopie (DRIFTS) überwacht. Zusammengefasstzeigten die Ergebnisse, dass kleine Änderungen in dem Kopfgrup-penbereich des Kollektors die Flotationsanreicherung drastischbeeinflussen können. Diese Erkenntnis ist für das Verständnis derFlotationsselektivität in einer Mischung ähnlicher Mineralien vonBedeutung.
Stichwörter: Schaumflotation, Erzaufbereitung, Adsorption, Erz-spezifisches Reagenz, Tensid
1 Introduction
The success of mineral flotation processes depends on thehydrophobization of the desired mineral particle’s surfacewhilst keeping, or making, all other mineral surfaces hydro-philic [1]. This is achieved by adding to the flotation pulpreagents intended to adsorb selectively at the differentmineral/water interfaces [2–4]. The reagents (surface activeagents) which have selectivity for the minerals to be floatedare called collectors if they hydrophobize the desired miner-al surface. Several known chelating agents [5–7] have beenappropriately modified to behave as selective flotation collec-tors with some degree of success [8]. The problem is thatmost chelating groups form complexes with almost all tran-sition and many non-transition metals. As a consequence,absolute selectivity rarely exists. Chelating agents made sur-face active assumes that the metal ion specificity observedfor a functional group in a bulk aqueous system would beretained at the interface. This is seldom the case, however.The situation in terms of coordination limitations, stericconstraints, etc. for a lattice metal atom or surface metalion is very different from the situation when the correspond-ing metal ion is free in solution.
It is clear that in order to design a reagent with a high de-gree of selectivity, one must take into account not only theinteraction with the metal ion in the surface, but the wholesurface [9, 10]. Is it then possible to find and/or design re-agents which can recognize the surface structure of the sub-strate? How should the reagent design take into account thedifferences in the crystal structures of the surfaces of similarminerals? If possible, the reagents should have functionalgroups so spaced that they are compatible with the relative
APPLICATION
516 ª Carl Hanser Publisher, Munich Tenside Surf. Det. 53 (2016) 6
1 Minerals and Metallurgical Research Laboratory, Luleå University of Technology,Luleå, Sweden
2 Department of Chemical and Biological Engineering, Chalmers University ofTechnology, Göteborg, Sweden
3 Department of Geology and Mineral Resources Engineering, Norwegian Uni-versity of Science and Technology, Trondheim, Norway
positions of the metal ion sites available on the surface, thatis, the reagents should not be just metal-specific but struc-ture-specific [11].The claimed understandings of the molecular interactions
involved in the recognition of surfaces by organic moleculesin biomineralization processes hints at the possibility of re-agents specific to the crystal structure [12, 13]. The influenceof organic additives on crystal growth processes suggeststhat molecules having at least two functional groups caneither influence the morphology of surfaces or inhibit crys-tal growth whereas molecules containing only one func-tional group lack this ability [14–16]. The spacing betweenthe functional groups has been found to be an importantfactor in the efficacy of crystal growth inhibition. These con-cepts have been successfully applied either for the control ofcrystal morphology [17, 18] or for inhibiting crystal growthprocesses through the recognition of specific crystal surfaces[15, 19]. The concept of molecules having two functionalgroups with appropriate spacing between them so as toachieve structural compatibility with surface sites, i. e. max-imum interaction with the surface, is of direct relevance toreagent selectivity in flotation processes.
During the last several decades a considerable amount ofresearch has been devoted to the physico-chemical aspects offlotation of sparingly soluble calcium minerals using a vari-ety of flotation collectors [20–23]. These minerals have ahigher aqueous solubility than most other minerals. Thesemi-soluble character of the minerals increases the com-plexity of the mineral-reagent interactions: The mineralsthemselves contribute towards the nature of the aqueous en-vironment [24] which, in turn, controls the nature of the in-terfacial reactions. Separation of mixtures of these mineralswith highly similar surface properties (such as scheelite-fluorite, fluorite-calcite [25], apatite-calcite and fluorite-bar-ite) thus becomes a challenging task. Fatty acids are themost common collectors used for these systems but othertypes of collectors are also employed [3, 4]. However, the col-lectors generally give low selectivity and separation of theminerals has seldom been solved satisfactorily on an indus-trial level [2]. The complexity of selective flotation of theseminerals is at least partly due to the high reactivity of thecollectors employed for this purpose, whether of the anionicor the cationic type. Consequently, general research atten-tion turned to differential depression of minerals insteadand this methodology is today practiced in selective flotationof many complex ores, such as calcite-fluorite-scheelite,calcite-fluorite, barite-fluorite, calcite-apatite; however, withlimited success [2, 4].
In the present study we have examined four anionic ami-no acid-based surfactants as specific reagents for flotation ofcalcium minerals. Three of the surfactants have two carboxylgroups separated by a spacer of varying length and these re-agents can be regarded as chelating surfactants [26]. Thefourth surfactant has only one carboxyl as headgroup. Allfour reagents have the same 12-carbon hydrophobic tail, asa single tail. In order to evaluate the mineral-specific interac-tions with a \model" system, we have investigated these sur-factants as collectors for two calcium minerals, calcite(CaCO3) and fluorite (CaF2), both in the pure state. In thisarticle the flotation behavior of these calcium minerals, aswell as the build-up of adsorbate and the change in surfacecharge of the particles on addition of the flotation reagent, isdescribed. One of the main ideas behind this study is to ex-ploit this \model-mineral system" to establish the conceptof \mineral specific flotation" when the minerals have thesame counter-ions.
2 Experimental
2.1 Materials
The pure calcite and fluorite minerals used in this paperwere purchased from Gregory, Bottley & Lloyd Ltd., UnitedKingdom. The minerals were received as large 500 g blocksand were crushed in a jaw crusher. The minerals werefurther reduced in size using a dry stainless-steel rod milland wet-screened to collect the 38–150 lm size fraction. Toproduce the £5 lm size fraction (for f-potential measure-ments and FTIR experiments) a FRITCH PULVERISETTE2 mortar grinder was used and screened with a 5 lm poly-mer sieve (Nybolt PA-5/1) cloth screen in an ultrasonicwater bath.
2.2 Reagents
All pH adjustments were done using hydrochloric acid(HCl) and sodium hydroxide (NaOH). For the f-potentialmeasurements sodium chloride (NaCl) was used as thebackground electrolyte. All reagents, purchased fromMerck�, were of analytical grade and were used as received.
Surfactants used throughout the study were prepared ac-cording to a protocol described in previous work [26, 27].
2.3 Hallimond flotation test
The flotation of the mineral samples was performed in a100 ml Hallimond tube flotation cell using 1 g of puremineral in the size fraction 38–150 lm at the desired pH.The suspension of mineral in deionized water and collectorwas conditioned for 10 min, transferred to the Hallimondcell and floated for 1 minute at ambient temperature. Theflotation recovery was calculated as the mass-ratio betweenthe recovered floated particles and the total amount ofmineral particles. While there is no error bar in the Halli-mond flotation figures, it is known from other tests thatthe uncertainty is in the order of € 10% relative.
2.4 f-potential measurements
f-potential measurements were done using a ZetaCompact(CAD instruments) instrument. 1 · 10–2 M NaCl was usedas background electrolyte and the solid concentration of thesamples was 500 mg/dm3. The background electrolyte con-centration was chosen one order of magnitude higher thanthe maximum collector concentration used, so that the ionicstrength of all the solutions remains nearly the same duringthe measurements. Each sample was equilibrated for10 min on a laboratory shaker. The results were calculatedusing Zeta4� software with the Smoluchowski equationand are an average of three repeated measurements, eachtime with different aliquots.
2.5 Diffuse reflectance FTIR spectroscopy
Diffuse Reflectance Infrared Fourier-Transformed Spectro-scopy (DRIFTS) measurements were performed using aBruker IFS 66 v/S instrument with a deuterated triglycinesulfate (DTGS) detector. The £5 lm fractions were con-ditioned for 10 min, at the different pH and concentrationsreported. The samples were washed three times with de-ionized water and filtered to remove any molecules not che-mically adhered to the surface. The samples were then driedovernight at room temperature. The dried samples weremixed with potassium bromide to a 13 wt% concentration
Tommy Karlkvist et al.: Flotation selectivity of novel alkyl dicarboxylate reagents for calcite-fluorite separation
Tenside Surf. Det . 53 (2016) 6 517
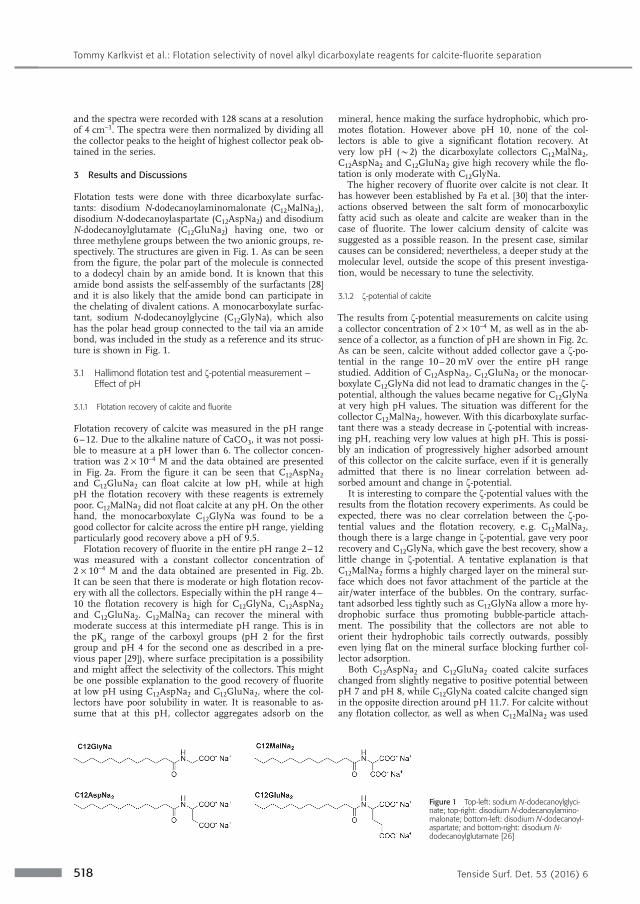
and the spectra were recorded with 128 scans at a resolutionof 4 cm–1. The spectra were then normalized by dividing allthe collector peaks to the height of highest collector peak ob-tained in the series.
3 Results and Discussions
Flotation tests were done with three dicarboxylate surfac-tants: disodium N-dodecanoylaminomalonate (C12MalNa2),disodium N-dodecanoylaspartate (C12AspNa2) and disodiumN-dodecanoylglutamate (C12GluNa2) having one, two orthree methylene groups between the two anionic groups, re-spectively. The structures are given in Fig. 1. As can be seenfrom the figure, the polar part of the molecule is connectedto a dodecyl chain by an amide bond. It is known that thisamide bond assists the self-assembly of the surfactants [28]and it is also likely that the amide bond can participate inthe chelating of divalent cations. A monocarboxylate surfac-tant, sodium N-dodecanoylglycine (C12GlyNa), which alsohas the polar head group connected to the tail via an amidebond, was included in the study as a reference and its struc-ture is shown in Fig. 1.
3.1 Hallimond flotation test and f-potential measurement –Effect of pH
3.1.1 Flotation recovery of calcite and fluorite
Flotation recovery of calcite was measured in the pH range6–12. Due to the alkaline nature of CaCO3, it was not possi-ble to measure at a pH lower than 6. The collector concen-tration was 2 · 10–4 M and the data obtained are presentedin Fig. 2a. From the figure it can be seen that C12AspNa2and C12GluNa2 can float calcite at low pH, while at highpH the flotation recovery with these reagents is extremelypoor. C12MalNa2 did not float calcite at any pH. On the otherhand, the monocarboxylate C12GlyNa was found to be agood collector for calcite across the entire pH range, yieldingparticularly good recovery above a pH of 9.5.
Flotation recovery of fluorite in the entire pH range 2–12was measured with a constant collector concentration of2 · 10–4 M and the data obtained are presented in Fig. 2b.It can be seen that there is moderate or high flotation recov-ery with all the collectors. Especially within the pH range 4–10 the flotation recovery is high for C12GlyNa, C12AspNa2and C12GluNa2. C12MalNa2 can recover the mineral withmoderate success at this intermediate pH range. This is inthe pKa range of the carboxyl groups (pH 2 for the firstgroup and pH 4 for the second one as described in a pre-vious paper [29]), where surface precipitation is a possibilityand might affect the selectivity of the collectors. This mightbe one possible explanation to the good recovery of fluoriteat low pH using C12AspNa2 and C12GluNa2, where the col-lectors have poor solubility in water. It is reasonable to as-sume that at this pH, collector aggregates adsorb on the
mineral, hence making the surface hydrophobic, which pro-motes flotation. However above pH 10, none of the col-lectors is able to give a significant flotation recovery. Atvery low pH (*2) the dicarboxylate collectors C12MalNa2,C12AspNa2 and C12GluNa2 give high recovery while the flo-tation is only moderate with C12GlyNa.The higher recovery of fluorite over calcite is not clear. It
has however been established by Fa et al. [30] that the inter-actions observed between the salt form of monocarboxylicfatty acid such as oleate and calcite are weaker than in thecase of fluorite. The lower calcium density of calcite wassuggested as a possible reason. In the present case, similarcauses can be considered; nevertheless, a deeper study at themolecular level, outside the scope of this present investiga-tion, would be necessary to tune the selectivity.
3.1.2 f-potential of calcite
The results from f-potential measurements on calcite usinga collector concentration of 2 · 10–4 M, as well as in the ab-sence of a collector, as a function of pH are shown in Fig. 2c.As can be seen, calcite without added collector gave a f-po-tential in the range 10–20 mV over the entire pH rangestudied. Addition of C12AspNa2, C12GluNa2 or the monocar-boxylate C12GlyNa did not lead to dramatic changes in the f-potential, although the values became negative for C12GlyNaat very high pH values. The situation was different for thecollector C12MalNa2, however. With this dicarboxylate surfac-tant there was a steady decrease in f-potential with increas-ing pH, reaching very low values at high pH. This is possi-bly an indication of progressively higher adsorbed amountof this collector on the calcite surface, even if it is generallyadmitted that there is no linear correlation between ad-sorbed amount and change in f-potential.
It is interesting to compare the f-potential values with theresults from the flotation recovery experiments. As could beexpected, there was no clear correlation between the f-po-tential values and the flotation recovery, e.g. C12MalNa2,though there is a large change in f-potential, gave very poorrecovery and C12GlyNa, which gave the best recovery, show alittle change in f-potential. A tentative explanation is thatC12MalNa2 forms a highly charged layer on the mineral sur-face which does not favor attachment of the particle at theair/water interface of the bubbles. On the contrary, surfac-tant adsorbed less tightly such as C12GlyNa allow a more hy-drophobic surface thus promoting bubble-particle attach-ment. The possibility that the collectors are not able toorient their hydrophobic tails correctly outwards, possiblyeven lying flat on the mineral surface blocking further col-lector adsorption.
Both C12AspNa2 and C12GluNa2 coated calcite surfaceschanged from slightly negative to positive potential betweenpH 7 and pH 8, while C12GlyNa coated calcite changed signin the opposite direction around pH 11.7. For calcite withoutany flotation collector, as well as when C12MalNa2 was used
Tommy Karlkvist et al.: Flotation selectivity of novel alkyl dicarboxylate reagents for calcite-fluorite separation
518 Tenside Surf. Det. 53 (2016) 6
Figure 1 Top-left: sodium N-dodecanoylglyci-nate; top-right: disodium N-dodecanoylamino-malonate; bottom-left: disodium N-dodecanoyl-aspartate; and bottom-right: disodium N-dodecanoylglutamate [26]
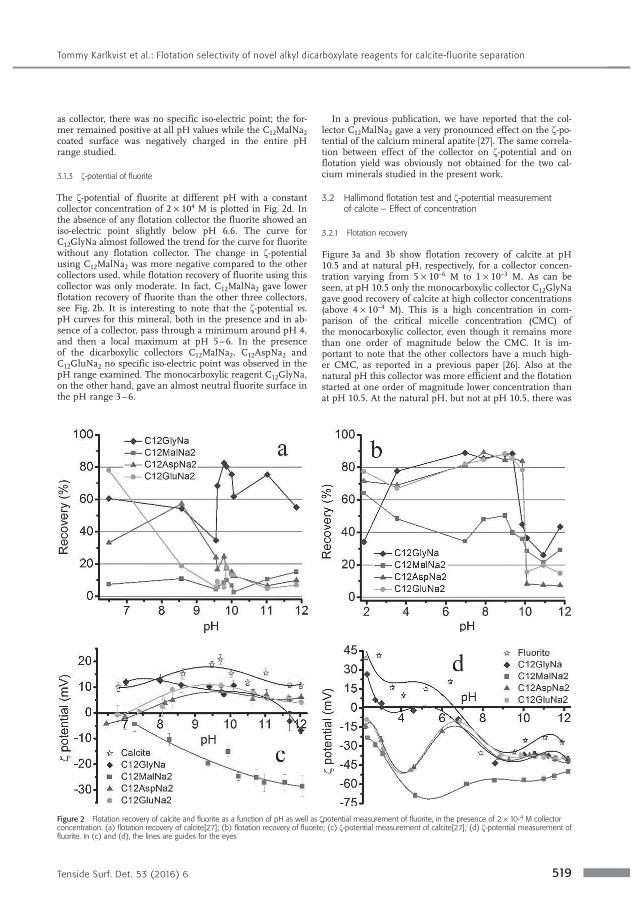
as collector, there was no specific iso-electric point; the for-mer remained positive at all pH values while the C12MalNa2coated surface was negatively charged in the entire pHrange studied.
3.1.3 f-potential of fluorite
The f-potential of fluorite at different pH with a constantcollector concentration of 2 · 104 M is plotted in Fig. 2d. Inthe absence of any flotation collector the fluorite showed aniso-electric point slightly below pH 6.6. The curve forC12GlyNa almost followed the trend for the curve for fluoritewithout any flotation collector. The change in f-potentialusing C12MalNa2 was more negative compared to the othercollectors used, while flotation recovery of fluorite using thiscollector was only moderate. In fact, C12MalNa2 gave lowerflotation recovery of fluorite than the other three collectors,see Fig. 2b. It is interesting to note that the f-potential vs.pH curves for this mineral, both in the presence and in ab-sence of a collector, pass through a minimum around pH 4,and then a local maximum at pH 5–6. In the presenceof the dicarboxylic collectors C12MalNa2, C12AspNa2 andC12GluNa2 no specific iso-electric point was observed in thepH range examined. The monocarboxylic reagent C12GlyNa,on the other hand, gave an almost neutral fluorite surface inthe pH range 3–6.
In a previous publication, we have reported that the col-lector C12MalNa2 gave a very pronounced effect on the f-po-tential of the calcium mineral apatite [27]. The same correla-tion between effect of the collector on f-potential and onflotation yield was obviously not obtained for the two cal-cium minerals studied in the present work.
3.2 Hallimond flotation test and f-potential measurementof calcite – Effect of concentration
3.2.1 Flotation recovery
Figure 3a and 3b show flotation recovery of calcite at pH10.5 and at natural pH, respectively, for a collector concen-tration varying from 5 · 10–6 M to 1 · 10–3 M. As can beseen, at pH 10.5 only the monocarboxylic collector C12GlyNagave good recovery of calcite at high collector concentrations(above 4 · 10–4 M). This is a high concentration in com-parison of the critical micelle concentration (CMC) ofthe monocarboxylic collector, even though it remains morethan one order of magnitude below the CMC. It is im-portant to note that the other collectors have a much high-er CMC, as reported in a previous paper [26]. Also at thenatural pH this collector was more efficient and the flotationstarted at one order of magnitude lower concentration thanat pH 10.5. At the natural pH, but not at pH 10.5, there was
Tommy Karlkvist et al.: Flotation selectivity of novel alkyl dicarboxylate reagents for calcite-fluorite separation
Tenside Surf. Det . 53 (2016) 6 519
Figure 2 Flotation recovery of calcite and fluorite as a function of pH as well as fpotential measurement of fluorite, in the presence of 2 · 10-4 M collectorconcentration. (a) flotation recovery of calcite[27]; (b) flotation recovery of fluorite; (c) f-potential measurement of calcite[27]; (d) f-potential measurement offluorite. In (c) and (d), the lines are guides for the eyes
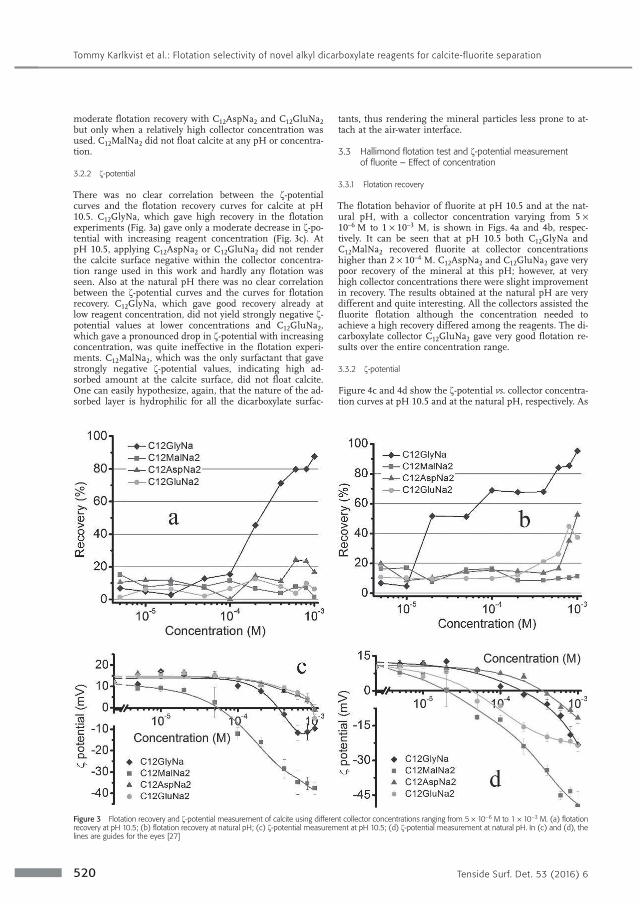
moderate flotation recovery with C12AspNa2 and C12GluNa2but only when a relatively high collector concentration wasused. C12MalNa2 did not float calcite at any pH or concentra-tion.
3.2.2 f-potential
There was no clear correlation between the f-potentialcurves and the flotation recovery curves for calcite at pH10.5. C12GlyNa, which gave high recovery in the flotationexperiments (Fig. 3a) gave only a moderate decrease in f-po-tential with increasing reagent concentration (Fig. 3c). AtpH 10.5, applying C12AspNa2 or C12GluNa2 did not renderthe calcite surface negative within the collector concentra-tion range used in this work and hardly any flotation wasseen. Also at the natural pH there was no clear correlationbetween the f-potential curves and the curves for flotationrecovery. C12GlyNa, which gave good recovery already atlow reagent concentration, did not yield strongly negative f-potential values at lower concentrations and C12GluNa2,which gave a pronounced drop in f-potential with increasingconcentration, was quite ineffective in the flotation experi-ments. C12MalNa2, which was the only surfactant that gavestrongly negative f-potential values, indicating high ad-sorbed amount at the calcite surface, did not float calcite.One can easily hypothesize, again, that the nature of the ad-sorbed layer is hydrophilic for all the dicarboxylate surfac-
tants, thus rendering the mineral particles less prone to at-tach at the air-water interface.
3.3 Hallimond flotation test and f-potential measurementof fluorite – Effect of concentration
3.3.1 Flotation recovery
The flotation behavior of fluorite at pH 10.5 and at the nat-ural pH, with a collector concentration varying from 5 ·10–6 M to 1 · 10–3 M, is shown in Figs. 4a and 4b, respec-tively. It can be seen that at pH 10.5 both C12GlyNa andC12MalNa2 recovered fluorite at collector concentrationshigher than 2 · 10–4 M. C12AspNa2 and C12GluNa2 gave verypoor recovery of the mineral at this pH; however, at veryhigh collector concentrations there were slight improvementin recovery. The results obtained at the natural pH are verydifferent and quite interesting. All the collectors assisted thefluorite flotation although the concentration needed toachieve a high recovery differed among the reagents. The di-carboxylate collector C12GluNa2 gave very good flotation re-sults over the entire concentration range.
3.3.2 f-potential
Figure 4c and 4d show the f-potential vs. collector concentra-tion curves at pH 10.5 and at the natural pH, respectively. As
Tommy Karlkvist et al.: Flotation selectivity of novel alkyl dicarboxylate reagents for calcite-fluorite separation
520 Tenside Surf. Det. 53 (2016) 6
Figure 3 Flotation recovery and f-potential measurement of calcite using different collector concentrations ranging from 5 · 10–6 M to 1 · 10–3 M. (a) flotationrecovery at pH 10.5; (b) flotation recovery at natural pH; (c) f-potential measurement at pH 10.5; (d) f-potential measurement at natural pH. In (c) and (d), thelines are guides for the eyes [27]
can be seen there is a reasonable agreement between thesecurves and the flotation results given in Fig. 4a and 4b. AtpH 10.5 the fluorite surface became strongly negativelycharged already at very low concentrations of the collectorsC12GlyNa and C12MalNa2, and these reagents were also theones that gave the highest flotation recovery of fluorite.Again at pH 10.5, with C12AspNa2 or C12GluNa2 as collectora high concentration was needed in order to achieve avery low f-potential. The collector concentration at whichthe sharp decline in f potential starts for C12AspNa2 orC12GluNa2, is around 6 · 10–4 M and corresponds well withthe reagent concentration where the flotation recovery startsto increase. (Although the recovery remained relatively lowwith these collectors also at high concentration.) One maynote that the f-potential was negative for all the collectorsat all concentrations and no iso-electric point was observed.
At the natural pH, there was a sharp decrease in f-poten-tial with increasing concentration for all the collectors. Allthe dicarboxylate reagents reached a plateau at a concentra-tion of around 2 · 10–5 M. This is approximately the concen-tration where the flotation recovery reached its maximumfor C12AspNa2 and C12MalNa2. C12GluNa2 gave highrecovery at even lower concentration. The monofunctionalreagent C12GlyNa behaved differently. The f-potentialdropped continuously as the reagent concentration wasincreased and the flotation recovery curve matched the f-po-tential curve reasonably well. A high concentration ofC12GlyNa was needed in order to reach a high flotation effi-cacy.The pronounced plateaus (Fig. 4d) obtained with all three
dicarboxylate collectors at the natural pH may indicate a com-plete surface coverage of the reagent. The remarkably low val-ue of f-potential obtained with C12MalNa2 already at very lowconcentrations stands out. This collector has evidently a verystrong affinity for the fluorite surface at natural pH.
3.4 Diffuse Reflectance FTIR Spectroscopy (DRIFTS)
The alkyl chain absorbance band region from the DRIFTSexperiments performed for calcite and fluorite with a collec-tor concentration of 6 · 10–4 M and at pH 10.5 are shown inFig. 5.The CH2-band region for the DRIFTS experiments on cal-
cite at 6 · 10–4 M collector concentration and pH 10.5 isshown in Fig. 5a. It is difficult to see the collector absor-bance, given that calcite itself has two bands in this regionoverlapping the CH2-band absorption. A spectrum obtainedfor pure (freshly ground) calcite is subtracted from the spec-trum of collector-coated calcite to find the spectrum for theadsorbed collector only. The figure indicates that all four re-agents adsorbed at the mineral surface at this collector con-centration and pH; however, the amount of adsorbate dif-fers. It is interesting to compare the data from Fig. 5a withthe f-potential data obtained at the same pH, which areshown in Fig. 3c. C12MalNa2, which adsorbed the most ac-cording to the DRIFTS data also gave the most pronounceddrop in f-potential. However, this reagent was not at all effi-cient in the flotation experiments. As can be seen fromFig. 3a, C12GlyNa was the only collector that gave high re-covery in the flotation of calcite but this reagent adsorbedthe least according to Fig. 5a. It is obviously not easy to pre-dict the flotation recovery from measurements of collectoradsorption even if parameters such as pH, temperature andreagent concentration are kept the same [31].
Figure 5b, which gives the adsorption of collector onfluorite, indicates that C12MalNa2 adsorbed the most fol-lowed by C12GlyNa. There seemed to be very little adsorp-
tion of the other two reagents. Also these results correspondwell with the f-potential data, seen in Fig. 4c, with C12Mal-Na2 giving the most negatively charged particles, followedby C12GlyNa. C12MalNa2 and C12GlyNa were also the twobest reagents in the flotation test (Fig. 4a). The other two col-lectors, C12AspNa2 and C12GluNa2, which gave poor adsorp-tion did not influence the f-potential much and gave rela-tively poor flotation recovery.
4 Conclusions
Several important conclusions can be drawn from the re-sults obtained. At pH 10.5 the monocarboxylate collectorC12GlyNa was the only reagent that gave high flotation re-covery of calcite. For fluorite, no good recovery was observedat pH above 10.5, both the monocarboxylate and the dicar-boxylate species.
Furthermore, there was a large difference in flotation be-havior between the three dicarboxylate collectors used in thestudy. C12MalNa2, which has one carbon between the car-boxyl groups, was a relatively efficient collector for fluorite,but not for calcite, until around pH 9. At the natural pH,C12AspNa2 and C12GluNa2, the dicarboxylate reagents witha two- or three-carbon spacer, were efficient collectors forfluorite down to very low reagent concentrations. On calcitethey were less efficient but they still gave higher flotation re-covery than C12MalNa2.With both minerals the flotation recovery was good for the
two collectors with a two- or three-carbon spacer (C12Asp
Tommy Karlkvist et al.: Flotation selectivity of novel alkyl dicarboxylate reagents for calcite-fluorite separation
Tenside Surf. Det . 53 (2016) 6 521
Mövenstrasse 12
CH-9015 St. Gallen
phone +41 71 311 80 55
fax +41 71 311 80 57
Swissatest Testmaterialien AG
swissatest.ch
Standardised soiled test fabrics
Test material for leather
Testing of washing systems
Testing of detergents and enzymes
Hygiene assessment
YOUR COMPETENCE CENTRE FOR TEST
MATERIALS AND TESTING IN THE DOMAINS
OF WASHING, CLEANING AND HYGIENE.
Certifie
dManagement Syste
m
ISO9001 / ISO 1
4001
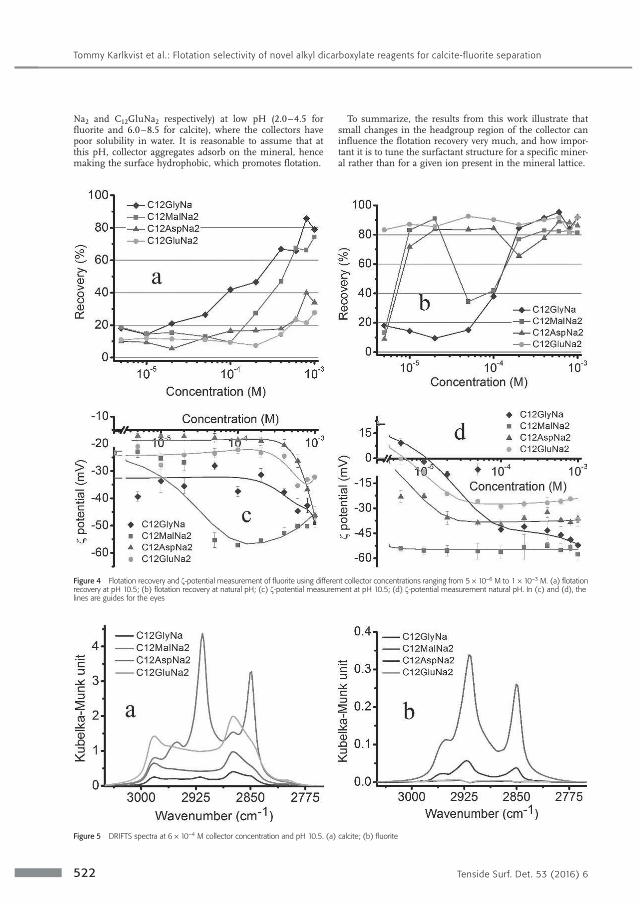
Na2 and C12GluNa2 respectively) at low pH (2.0–4.5 forfluorite and 6.0–8.5 for calcite), where the collectors havepoor solubility in water. It is reasonable to assume that atthis pH, collector aggregates adsorb on the mineral, hencemaking the surface hydrophobic, which promotes flotation.
To summarize, the results from this work illustrate thatsmall changes in the headgroup region of the collector caninfluence the flotation recovery very much, and how impor-tant it is to tune the surfactant structure for a specific miner-al rather than for a given ion present in the mineral lattice.
Tommy Karlkvist et al.: Flotation selectivity of novel alkyl dicarboxylate reagents for calcite-fluorite separation
522 Tenside Surf. Det. 53 (2016) 6
Figure 4 Flotation recovery and f-potential measurement of fluorite using different collector concentrations ranging from 5 · 10–6 M to 1 · 10–3 M. (a) flotationrecovery at pH 10.5; (b) flotation recovery at natural pH; (c) f-potential measurement at pH 10.5; (d) f-potential measurement natural pH. In (c) and (d), thelines are guides for the eyes
Figure 5 DRIFTS spectra at 6 · 10–4 M collector concentration and pH 10.5. (a) calcite; (b) fluorite
DRIFT and f-potential measurements, even though some-time difficult to interpret, have proven to provide valuableinformation to understand the change in nature of themineral surface upon adsorption of the collector, at variousconcentration and pH.This opens the possibility to tailor-made collectors to se-
lectively float one mineral from a mixture of similar miner-als.
Acknowledgements
Financial support from the Hjalmar Lundbohm Research Centre(HLRC) and Luossavaara-Kiirunavaara AB (LKAB) is grate-fully acknowledged. Helpful discussions with Assoc. Prof. AllanHolmgren and Assoc. Prof. Bertil P�lsson are greatly appre-ciated.
References
1. Wills, B. A.: Wills’ Mineral Processing Technology: An Introduction to the PracticalAspects of Ore Treatment and Mineral Recovery. 7th ed. Elsevier Ltd.; 2006.
2. Fuerstenau, D.: Where we are in flotation chemistry after 70 years of research.Proc XIX Int Miner Process Congr 1995.
3. Pearse, M. J.: An overview of the use of chemical reagents in mineral process-ing. Miner. Eng. 18 (2005) 139–49. DOI:10.1016/j.mineng.2004.09.015
4. Pradip: Reagents design and development for the mineral processing industry:Scientific challenges and engineering issues. Met. Mater. Process. 10 (1998)41–54.
5. Read, A. D. and Hollick, C. T.: Selective flocculation techniques for recovery offine particles. Min. Sci. Eng. 8 (1976) 202–13.
6. Singh, D, V., Baldauf, H. and Schubert, H.: Flotation of Cassiterite Ores withAlkane Dicarboxylic Acids and Organic Depressants. Aufbereitungs-Technik21 (1980) 566–78.
7. Marabini, A. M., Ciriachi, M., Plescia, P. and Barbaro, M.: Chelating reagents forflotation. Miner. Eng. 20 (2007) 1014–25. DOI:10.1016/j.mineng.2007.03.012
8. Butcher, A. R.: A practical guide to some aspects of mineralogy that affect flo-tation. In: Christopher J. Greet, editor. Flotat. Plant Optim., Australasian Instituteof Mining and Metallurgy; 2010, p. 83–93.
9. Rao, K. H. and Forssberg, K. S. E.: Selectivity in Froth Flotation Based on Mole-cular Recognition at Inorganic Interfaces. Konf. i Miner. 14–16 Febr., Luleå:1995, p. 53–66.
10. Lu, S., Song, Z. and Sun, C.: Review on some research methods of mineralcrystal chemistry and computer simulation on flotation. XXV Int. Miner. Process.Congr. 4 (2010) 3269–75.
11. Rai, B.: Molecular Modeling for the Design of Novel Performance Chemicalsand Materials. Boca Raton: CRC Press; 2012. DOI:10.1201/b11590
12. Mann, S.: Molecular recognition in biomineralization. Nature 332 (1988) 119–24. DOI:10.1038/332119a0
13. Pradip, Rai, B., Rao, T. K., Krishnamurthy, S., Vetrivel, R., Mielczarski, J.: Mole-cular modeling of interactions of diphosphonic acid based surfactants withcalcium minerals. Langmuir 18 (2002) 932–40. DOI:10.1021/la010625q
14. Mann, S.: Biomineralization and biomimetic materials chemistry. J. Mater.Chem. 5 (1995) 935. DOI:10.1039/jm9950500935
15. Grases, F., Garcia-Raso, A., Palou, J., Costa-Bauza, A. and March, J. G.: A studyof the relationship between the chemical structure of some carboxylic acidsand their capacity to inhibit the crystal growth of calcium fluoride. Colloids andSurfaces 54 (1991) 313–9. DOI:10.1016/0166-6622(91)80069-Z
16. Heywood, B. R. and Mann, S.: Crystal recognition at inorganic–organic inter-faces: Nucleation and growth of oriented BaSO4 under Compressed LangmuirMonolayers. Adv. Mater. 4 (1992) 278–282.DOI:10.1002/adma.19920040407
17. Mann, S., Didymus, J. M., Sanderson, N. P., Heywood, B. R. and Samper,E. J. A.: Morphological influence of functionalized and non-functionalized a,x-dicarboxylates on calcite crystallization. J. Chem. Soc. Faraday Trans. 86 (1990)1873. DOI:10.1039/ft9908601873
18. Mann, S., Heywood, B. R., Rajam, S. and Birchall, J. D.: Controlled crystalliza-tion of CaCO3 under stearic acid monolayers. Nature 334 (1988) 692–695.DOI:10.1038/334692a0
19. Heywood, B. R. and Mann, S.: Template-directed inorganic crystallization: ori-ented nucleation of barium sulfate under Langmuir monolayers of an aliphaticlong chain phosphonate. Langmuir 8 (1992) 1492–8.DOI:10.1021/la00041a041
20. Finkelstein, N. P.: Review of interactions in flotation of sparingly soluble calciumminerals with anionic collectors. Trans. Inst. Min. Metall. Sect. C Miner. ProcessExtr. Metall. 98 (1989) 157–77.
21. Hanna, H. S. and Somasundaran, P.: Flotation of Salt-Type Minerals. Flotat. –A. M. Gaudin Meml. Vol. – Vol. 1, SME; 1976, p. 197–272.
22. Hanumantha, R. K. and Forssberg, K. S. E.: Mechanism of fatty acid adsorptionin salt-type mineral flotation. Miner. Eng. 4 (1991) 879–890.DOI:10.1016/0892-6875(91)90071-3
23. Pugh, R. and Stenius, P.: Solution chemistry studies and flotation behaviour ofapatite, calcite and fluorite minerals with sodium oleate collector. Int. J. Miner.Process. 15 (1985) 193–218. DOI:10.1016/0301-7516(85)90035-3
24. Amankonah, J. O., Somasundaran, P. and Ananthapadmabhan, K. P.: Effectsof dissolved mineral species on the dissolution/precipitation characteristics ofcalcite and apatite. Colloids and Surfaces 15 (1985) 295–307.DOI:10.1016/0166-6622(85)80080-9
25. Baldauf, H., Schubert, H. and Kramer, W.: N-acylamino carboxylic acids – col-lectors for the flotation separation of fluorite and calcite. Aufbereitungs-Technik27 (1986) 235–41.
26. Bordes, R. and Holmberg, K.: Physical chemical characteristics of dicarboxylicamino acid-based surfactants. Colloids Surfaces A Physicochem. Eng. Asp. 391(2011) 32–41. DOI:10.1016/j.colsurfa.2011.03.023
27. Karlkvist, T., Patra, A., Rao, K. H., Bordes, R. and Holmberg, K.: Flotation selec-tivity of novel alkyl dicarboxylate reagents for apatite–calcite separation. J. Col-loid. Interface Sci. 445 (2015) 40–47. DOI:10.1016/j.jcis.2014.11.072
28. Ulman, A.: Formation and Structure of Self-Assembled Monolayers. Chem. Rev.86 (1996) 1533–54. DOI:10.1021/cr9502357
29. Bordes, R., Tropsch, J. and Holmberg, K.: Counterion specificity of surfactantsbased on dicarboxylic amino acids. J. Colloid. Interface. Sci. 338 (2009) 529–36. DOI:10.1016/j.jcis.2009.06.032
30. Fa, K., Jiang, T., Nalaskowski, J. and Miller, J.: Interaction forces between acalcium dioleate sphere and calcite/fluorite surfaces and their significance inflotation. Langmuir 1 (2003) 10523–30. DOI:10.1021/la035335j
31. Rao, S. R.: Surface Chemistry of Froth Flotation. 2nd ed. New York: KluwerAcademic/Plenum Publishers; 2004. DOI:10.1007/978-1-4419-9124-9
Received: 13. 04. 2016Revised: 17. 05. 2016
Bibliography
DOI 10.3139/113.110471Tenside Surf. Det.53 (2016) 6; page 516–523ª Carl Hanser Verlag GmbH & Co. KGISSN 0932-3414
y Correspondence address
Mr. Dr. Tommy KarlkvistMinerals and Metals Research Laboratory (MiMeR)Luleå University of TechnologySE-971 87 LuleåSwedenTel.: +46(0)920491765Fax: +46(0)92097364E-Mail: [email protected]
Tommy Karlkvist et al.: Flotation selectivity of novel alkyl dicarboxylate reagents for calcite-fluorite separation
Tenside Surf. Det . 53 (2016) 6 523
Paper IV Novel alkyl aminodicarboxylate reagents for mineral specific flotation. Karlkvist, T., Pålsson, B. I., Fredriksson, A., & Kota, H. R. (2016). Preprint 16-165 In 2016 SME Annual Conference and Expo: The Future for Mining in a Data-Driven World (pp. 807–810).

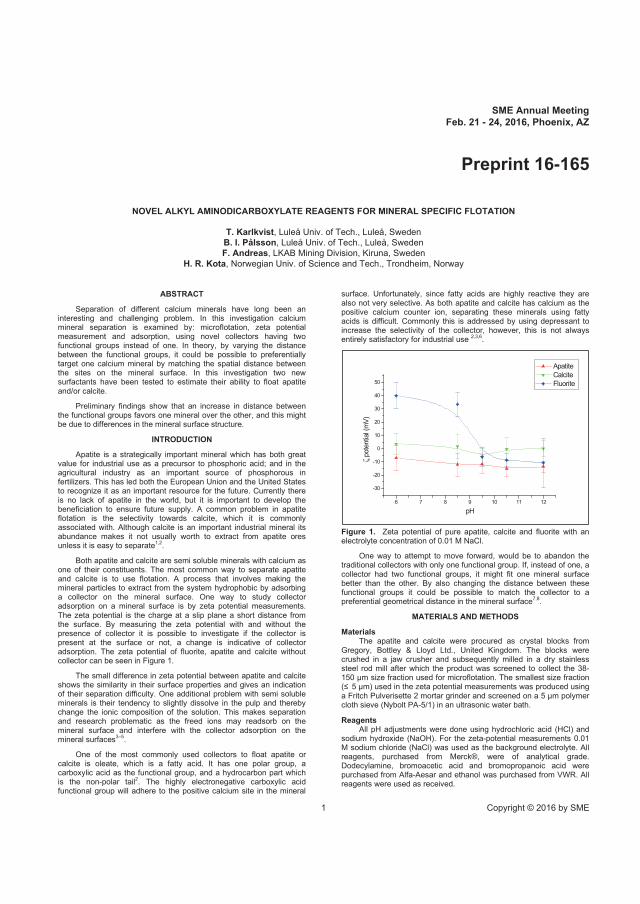
SME Annual MeetingFeb. 21 - 24, 2016, Phoenix, AZ
1 Copyright © 2016 by SME
Preprint 16-165
NOVEL ALKYL AMINODICARBOXYLATE REAGENTS FOR MINERAL SPECIFIC FLOTATION
T. Karlkvist, Luleå Univ. of Tech., Luleå, SwedenB. I. Pålsson, Luleå Univ. of Tech., Luleå, SwedenF. Andreas, LKAB Mining Division, Kiruna, Sweden
H. R. Kota, Norwegian Univ. of Science and Tech., Trondheim, Norway
ABSTRACT
Separation of different calcium minerals have long been aninteresting and challenging problem. In this investigation calcium mineral separation is examined by: microflotation, zeta potential measurement and adsorption, using novel collectors having two functional groups instead of one. In theory, by varying the distance between the functional groups, it could be possible to preferentially target one calcium mineral by matching the spatial distance between the sites on the mineral surface. In this investigation two new surfactants have been tested to estimate their ability to float apatite and/or calcite.
Preliminary findings show that an increase in distance between the functional groups favors one mineral over the other, and this mightbe due to differences in the mineral surface structure.
INTRODUCTION
Apatite is a strategically important mineral which has both great value for industrial use as a precursor to phosphoric acid; and in the agricultural industry as an important source of phosphorous in fertilizers. This has led both the European Union and the United States to recognize it as an important resource for the future. Currently there is no lack of apatite in the world, but it is important to develop the beneficiation to ensure future supply. A common problem in apatite flotation is the selectivity towards calcite, which it is commonly associated with. Although calcite is an important industrial mineral its abundance makes it not usually worth to extract from apatite ores unless it is easy to separate1,2.
Both apatite and calcite are semi soluble minerals with calcium as one of their constituents. The most common way to separate apatite and calcite is to use flotation. A process that involves making the mineral particles to extract from the system hydrophobic by adsorbing a collector on the mineral surface. One way to study collector adsorption on a mineral surface is by zeta potential measurements.The zeta potential is the charge at a slip plane a short distance from the surface. By measuring the zeta potential with and without the presence of collector it is possible to investigate if the collector is present at the surface or not, a change is indicative of collector adsorption. The zeta potential of fluorite, apatite and calcite without collector can be seen in Figure 1.
The small difference in zeta potential between apatite and calcite shows the similarity in their surface properties and gives an indication of their separation difficulty. One additional problem with semi soluble minerals is their tendency to slightly dissolve in the pulp and thereby change the ionic composition of the solution. This makes separation and research problematic as the freed ions may readsorb on the mineral surface and interfere with the collector adsorption on the mineral surfaces3–5.
One of the most commonly used collectors to float apatite or calcite is oleate, which is a fatty acid. It has one polar group, a carboxylic acid as the functional group, and a hydrocarbon part which is the non-polar tail2. The highly electronegative carboxylic acid functional group will adhere to the positive calcium site in the mineral
surface. Unfortunately, since fatty acids are highly reactive they are also not very selective. As both apatite and calcite has calcium as the positive calcium counter ion, separating these minerals using fatty acids is difficult. Commonly this is addressed by using depressant to increase the selectivity of the collector, however, this is not always entirely satisfactory for industrial use 2,3,6.
Figure 1. Zeta potential of pure apatite, calcite and fluorite with an electrolyte concentration of 0.01 M NaCl.
One way to attempt to move forward, would be to abandon the traditional collectors with only one functional group. If, instead of one, a collector had two functional groups, it might fit one mineral surfacebetter than the other. By also changing the distance between these functional groups it could be possible to match the collector to apreferential geometrical distance in the mineral surface7,8.
MATERIALS AND METHODS
MaterialsThe apatite and calcite were procured as crystal blocks from
Gregory, Bottley & Lloyd Ltd., United Kingdom. The blocks were crushed in a jaw crusher and subsequently milled in a dry stainlesssteel rod mill after which the product was screened to collect the 38-150 m size fraction used for microflotation. The smallest size fraction ( 5 m) used in the zeta potential measurements was produced using a Fritch Pulverisette 2 mortar grinder and screened on a 5 m polymer cloth sieve (Nybolt PA-5/1) in an ultrasonic water bath.
ReagentsAll pH adjustments were done using hydrochloric acid (HCl) and
sodium hydroxide (NaOH). For the zeta-potential measurements 0.01 M sodium chloride (NaCl) was used as the background electrolyte. All reagents, purchased from Merck®, were of analytical grade.Dodecylamine, bromoacetic acid and bromopropanoic acid were purchased from Alfa-Aesar and ethanol was purchased from VWR. All reagents were used as received.
6 7 8 9 10 11 12
-30
-20
-10
0
10
20
30
40
50
Apatite Calcite Fluorite
pot
entia
l (m
V)
pH
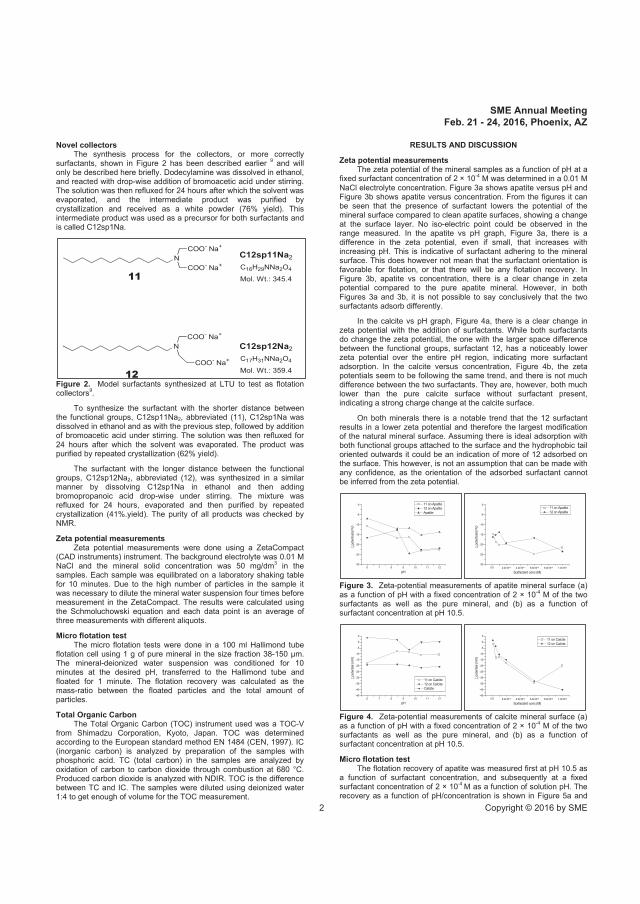
SME Annual MeetingFeb. 21 - 24, 2016, Phoenix, AZ
2 Copyright © 2016 by SME
Novel collectorsThe synthesis process for the collectors, or more correctly
surfactants, shown in Figure 2 has been described earlier 9 and will only be described here briefly. Dodecylamine was dissolved in ethanol, and reacted with drop-wise addition of bromoacetic acid under stirring. The solution was then refluxed for 24 hours after which the solvent was evaporated, and the intermediate product was purified by crystallization and received as a white powder (76% yield). This intermediate product was used as a precursor for both surfactants and is called C12sp1Na.
Figure 2. Model surfactants synthesized at LTU to test as flotation collectors9.
To synthesize the surfactant with the shorter distance between the functional groups, C12sp11Na2, abbreviated (11), C12sp1Na was dissolved in ethanol and as with the previous step, followed by addition of bromoacetic acid under stirring. The solution was then refluxed for 24 hours after which the solvent was evaporated. The product was purified by repeated crystallization (62% yield).
The surfactant with the longer distance between the functional groups, C12sp12Na2, abbreviated (12), was synthesized in a similar manner by dissolving C12sp1Na in ethanol and then adding bromopropanoic acid drop-wise under stirring. The mixture was refluxed for 24 hours, evaporated and then purified by repeated crystallization (41%.yield). The purity of all products was checked by NMR.
Zeta potential measurementsZeta potential measurements were done using a ZetaCompact
(CAD instruments) instrument. The background electrolyte was 0.01 MNaCl and the mineral solid concentration was 50 mg/dm3 in the samples. Each sample was equilibrated on a laboratory shaking table for 10 minutes. Due to the high number of particles in the sample it was necessary to dilute the mineral water suspension four times before measurement in the ZetaCompact. The results were calculated using the Schmoluchowski equation and each data point is an average of three measurements with different aliquots.
Micro flotation testThe micro flotation tests were done in a 100 ml Hallimond tube
flotation cell using 1 g of pure mineral in the size fraction 38-150 m. The mineral-deionized water suspension was conditioned for 10 minutes at the desired pH, transferred to the Hallimond tube and floated for 1 minute. The flotation recovery was calculated as the mass-ratio between the floated particles and the total amount of particles.
Total Organic CarbonThe Total Organic Carbon (TOC) instrument used was a TOC-V
from Shimadzu Corporation, Kyoto, Japan. TOC was determined according to the European standard method EN 1484 (CEN, 1997). IC (inorganic carbon) is analyzed by preparation of the samples with phosphoric acid. TC (total carbon) in the samples are analyzed by oxidation of carbon to carbon dioxide through combustion at 680 °C. Produced carbon dioxide is analyzed with NDIR. TOC is the difference between TC and IC. The samples were diluted using deionized water 1:4 to get enough of volume for the TOC measurement.
RESULTS AND DISCUSSION
Zeta potential measurementsThe zeta potential of the mineral samples as a function of pH at a
fixed surfactant concentration of 2 × 10⁻⁴ M was determined in a 0.01 MNaCl electrolyte concentration. Figure 3a shows apatite versus pH and Figure 3b shows apatite versus concentration. From the figures it can be seen that the presence of surfactant lowers the potential of the mineral surface compared to clean apatite surfaces, showing a change at the surface layer. No iso-electric point could be observed in the range measured. In the apatite vs pH graph, Figure 3a, there is a difference in the zeta potential, even if small, that increases with increasing pH. This is indicative of surfactant adhering to the mineral surface. This does however not mean that the surfactant orientation is favorable for flotation, or that there will be any flotation recovery. In Figure 3b, apatite vs concentration, there is a clear change in zetapotential compared to the pure apatite mineral. However, in both Figures 3a and 3b, it is not possible to say conclusively that the two surfactants adsorb differently.
In the calcite vs pH graph, Figure 4a, there is a clear change in zeta potential with the addition of surfactants. While both surfactants do change the zeta potential, the one with the larger space difference between the functional groups, surfactant 12, has a noticeably lower zeta potential over the entire pH region, indicating more surfactant adsorption. In the calcite versus concentration, Figure 4b, the zetapotentials seem to be following the same trend, and there is not much difference between the two surfactants. They are, however, both much lower than the pure calcite surface without surfactant present, indicating a strong charge change at the calcite surface.
On both minerals there is a notable trend that the 12 surfactant results in a lower zeta potential and therefore the largest modification of the natural mineral surface. Assuming there is ideal adsorption with both functional groups attached to the surface and the hydrophobic tail oriented outwards it could be an indication of more of 12 adsorbed on the surface. This however, is not an assumption that can be made with any confidence, as the orientation of the adsorbed surfactant cannot be inferred from the zeta potential.
Figure 3. Zeta-potential measurements of apatite mineral surface (a) as a function of pH with a fixed concentration of 2 × 10⁻⁴ M of the two surfactants as well as the pure mineral, and (b) as a function of surfactant concentration at pH 10.5.
Figure 4. Zeta-potential measurements of calcite mineral surface (a) as a function of pH with a fixed concentration of 2 × 10⁻⁴ M of the two surfactants as well as the pure mineral, and (b) as a function of surfactant concentration at pH 10.5.
Micro flotation testThe flotation recovery of apatite was measured first at pH 10.5 as
a function of surfactant concentration, and subsequently at a fixed surfactant concentration of 2 × 10⁻⁴ M as a function of solution pH. The recovery as a function of pH/concentration is shown in Figure 5a and
N
N
C12sp12Na2
C17H31NNa2O4
Mol. Wt.: 359.4
C12sp11Na2
C16H29NNa2O4
Mol. Wt.: 345.4
COO- Na+
COO- Na+
COO- Na+
COO- Na+
6 7 8 9 10 11 12-30
-25
-20
-15
-10
-5
0 11 on Apatite 12 on Apatite Apatite
pot
entia
l (m
V)
pH0.0 2.0x10⁻⁴ 4.0x10⁻⁴ 6.0x10⁻⁴ 8.0x10⁻⁴ 1.0x10⁻³
-30
-25
-20
-15
-10
-5
0 11 on Apatite 12 on Apatite
pot
entia
l (m
V)
Surfactant conc (M)
6 7 8 9 10 11 12-45
-40
-35
-30
-25
-20
-15
-10
-5
0
5
11 on Calcite 12 on Calcite Calcite
pot
entia
l (m
V)
pH0.0 2.0x10⁻⁴ 4.0x10⁻⁴ 6.0x10⁻⁴ 8.0x10⁻⁴ 1.0x10⁻³
-45
-40
-35
-30
-25
-20
-15
-10
-5
0
5 11 on Calcite 12 on Calcite
pot
entia
l (m
V)
Surfactant conc (M)
11
12
SME Annual MeetingFeb. 21 - 24, 2016, Phoenix, AZ
3 Copyright © 2016 by SME
Figure 5b respectively. The concentration range was from 5 × 10⁻⁵ M to 1 × 10⁻³ M, while the pH range was from 6 to 12. The flotation of apatite at low pH is quite successful for both surfactants, with increasing pH the recovery of apatite with the surfactant with the shorter distance, 11,decreases noticeably over the pH range, while 12 with the longer distance has high recovery over almost the entire range, only dropping after pH 10.5. When changing the concentration, while at a constant pH of 10.5, both surfactants have a low recovery at low concentration, but it increases with higher concentration. The surfactant with the larger distance between the groups shows slightly higher recovery at all concentration, except at the maximum one. The flotation recovery of calcite was measured in the same way as with apatite. First at pH 10.5 as a function of surfactant concentration, and subsequently at a fixed surfactant concentration as a function of solution pH, using the same range and surfactant concentration as well and is shown in Figure 6aand Figure 6b. As with the apatite, the calcite recovery vs pH was higher with surfactant 12 in the same range as for apatite, albeit at the highest pH the calcite recovery was still above 80 % compared to 50% for apatite. The calcite recovery vs concentration show the same trend as the apatite recovery except that the recovery of calcite is slightly higher and reaches higher recovery at a lower concentration compared with apatite.
Figure 5. Flotation recovery of apatite (a) as a function of pH with a fixed concentration of 2 × 10⁻⁴ M of the two surfactants, and (b) as a function of surfactant concentration at pH 10.5.
Figure 6. Flotation recovery of calcite (a) as a function of pH with a fixed concentration of 2 × 10⁻⁴ M of the two surfactants, and (b) as a function of surfactant concentration at pH 10.5.
When analyzing the flotation it is important to remember that it is an intricate process with many factors influencing the successful interaction between surfactant and mineral, especially so when semi soluble minerals are involved. Firstly there has to be a successful adsorption of the surfactant to the mineral surface, which also has to be correctly oriented with its hydrophobic tail oriented outwards, preferably in close proximity to other hydrophobic tails from other adsorbed surfactant molecules. This to create a slightly larger hydrophobic area. Lastly there also has to be successful surfactant-gas interaction, to actually float the surfactant. It is therefore interesting to examine the results of surfactants with two functional groups. The experiments were performed using pure minerals, in separate experiments, so there was no competition possible between the minerals. Due to this it is difficult to estimate the flotation recovery fairly from a selectivity point of view. Nevertheless, both surfactants appear to be fairly non-selective at a first glance, with the surfactant having the longer distance between the functional groups seeming to have the better recovery overall for both minerals. On apatite, the surfactant with the longer distance between the functional groups has the highest recovery over the entire pH range when using a constant concentration. This is partly in agreement with the zeta potential measurements which shows that the same surfactant has the most changed surface potential. The same trend of surfactant selectivity can
be seen in the flotation versus concentration, where surfactant 12 has the highest recovery over the range, except at the highest concentration. Surfactant 11 can also recover apatite over the entire pH range and at all concentrations, even if with noticeably lower recovery compared to surfactant 12. It is only at the highest concentration that the recovery is higher.
On calcite the trend is clearer. Surfactant 12, with the longer distance between the functional groups, has a higher recovery than surfactant 11, with the shorter distance between the groups, over almost the entire range examined. In the recovery vs pH graph surfactant 12 has a recovery above 80% while surfactant 11 almost never goes above 40%. This is the same trend as can be seen in the zeta potential measurement where the surfactant with the longer distance is noticeably more different from the clean calcite surface.
Total Organic CarbonAnalysis of Total Organic Carbon (TOC) was used in an attempt
to evaluate the amount of surfactant still in the solution. The surfactant concentration in solution with apatite mineral is shown as a function of pH in Figure 7a and as a function of initial surfactant concentration in Figure 7b. At a constant concentration, the maximum possible surfactant concentration in the solution was 20 mg/l. This was determined using pure surfactant solution at 2 × 10⁻⁴ M. Although surfactant 11 has a slightly lower concentration in solution which might indicate more surfactant adsorbed on the mineral surface compared to surfactant 12, cf. Figure 7a, the difference is too small to be deemed significant. The TOC as a function of surfactant concentration indicate that there seem to be only little additional adsorption of surfactant with increased addition, as can be seen in Figure 7b.
Figure 7. Surfactant concentration in solution containing apatite (a) as a function of pH with a fixed concentration of 2 × 10⁻⁴ M of the two surfactants, and (b) as a function of surfactant concentration at pH 10.5.
The same measurement was also done with calcite instead of apatite, which is shown as a function of pH in Figure 8a and as a function of initial surfactant concentration in Figure 8b. The general trend in Figure 8a is that there is a noticeably lesser amount of surfactant 11, with a shorter distance between the functional groups,while surfactant 12 shows fairly similar high solution concentration over the entire pH range. In the second graph, Figure 8b, with a constant pH and instead varying the concentration, surfactant 12 is still largelypresent in the solution, while the shorter distanced surfactant 11 has a much lower concentration compared to its starting value, despite the lower calcite recovery. Surfactant 12 show a similar trend in the flotation recovery versus concentration graph, where it can recover calcite from low concentrations. This is also in agreement with the zetapotential over most of the concentration range.
Figure 8. Surfactant concentration in solution containing calcite (a) as a function of pH with a fixed concentration of 2 × 10⁻⁴ M of the two
6 7 8 9 10 11 120
10
20
30
40
50
60
70
80
90
100
11 on Apatite 12 on ApatiteM
icro-
flota
tion
reco
very
(%)
pH0.0 2.0x10⁻⁴ 4.0x10⁻⁴ 6.0x10⁻⁴ 8.0x10⁻⁴ 1.0x10⁻³
0
10
20
30
40
50
60
70
80
90
100
11 on Apatite 12 on ApatiteM
icro-
flota
tion
reco
very
(%)
Sufactant conc (M)
6 7 8 9 10 11 120
10
20
30
40
50
60
70
80
90
100
11 on Calcite 12 on Calcite
Micr
o-flo
tatio
n re
cove
ry (%
)
pH0.0 2.0x10⁻⁴ 4.0x10⁻⁴ 6.0x10⁻⁴ 8.0x10⁻⁴ 1.0x10⁻³
0
10
20
30
40
50
60
70
80
90
100
11 on Calcite 12 on Calcite
Micr
o-flo
tatio
n re
cove
ry (%
)
Surfactant conc (M)
6 7 8 9 10 11 120
10
20
30
40
50
60
70
80
90
100 11 on Apatite 12 on Apatite
TOC
(mg/
l)
pH0.0 2.0x10⁻⁴ 4.0x10⁻⁴ 6.0x10⁻⁴ 8.0x10⁻⁴ 1.0x10⁻³
0
10
20
30
40
50
60
70
80
90
100
11 on Apatite 12 on Apatite
TOC
(mg/
l)
Surfactant conc (M)
6 7 8 9 10 11 120
10
20
30
40
50
60
70
80
90
100 11 on Calcite 12 on Calcite
TOC
(mg/
l)
pH0.0 2.0x10⁻⁴ 4.0x10⁻⁴ 6.0x10⁻⁴ 8.0x10⁻⁴ 1.0x10⁻³
0
10
20
30
40
50
60
70
80
90
100 11 on Calcite 12 on Calcite
TOC
(mg/
l)
Surfactant conc (M)
SME Annual MeetingFeb. 21 - 24, 2016, Phoenix, AZ
4 Copyright © 2016 by SME
surfactants, and (b) as a function of surfactant concentration at pH 10.5.
It is also interesting to see the much lower surfactant concentration in solution of surfactant 11 with calcite compared to with apatite, while surfactant 12 show similar values on both apatite and calcite. Several possibilities for the difference may be at hand. Either surfactant 11 forms complexes/precipitates in solution that adhere to other phase borders in the system, or it is adsorbing on the mineral surface in a way that does not lead to flotation. If surfactant 11 was precipitating out from the solution, it is likely that it would have been visible to the naked eye at higher concentrations if this was the cause of the concentration decease. Therefore, the most probable cause of the decreased amount of surfactant 11 in solution is aggregation ontothe mineral surface. However, as the recovery still is lower than for surfactant 12; it is probable that the majority of the adsorbed surfactant is adsorbed in such a way that it does not increase the hydrophobicity of the mineral surface. Possibly in some local dual layers or clusters.How the additional surfactant is adsorbed is speculative as these experiments yield little information in this regard.
CONCLUSION
Some general conclusions can be drawn from this study. First of all, both surfactants does change the zeta potential of the mineral surface. Especially surfactant 12 causing the largest change in zeta potential on both minerals. Furthermore, the surfactant with the longer distance between the functional group, surfactant 12, show a slightly higher selectivity for calcite of the two minerals tested in this study. This shows that changing the distance between the functional groups generates a difference in the selectivity of the collectors. To further strengthen this there was also a difference in the flotation response as the surfactant with the longer distance, 12, has a noticeably higher flotation recovery compared to the collector 11, with the shorter distance between the functional groups. As both surfactants have the same hydrophobic tail part, it is possible that this lowered recovery with surfactant 11 is due to constraints with adsorbance on the mineral surface, which is indicative of the possibility of designing collectors to match different surfaces. The idea is related to our previous work where other surfactants have shown selectivity towards different minerals due to distances between the functional groups7.
By matching the distance between the functional groups with the geometrical distances on the mineral surfaces, the collector would preferably adsorb on the most energetically favored mineral. When the minerals have the same counter-ion as with apatite and calcite both having calcium ions, the most energetically favored collector-mineral interaction would be where the collector does not have to stretch too far or compress too much to adsorb. This is just for the adsorption of surfactant on the mineral surface. For the actual flotation the hydrophobization of the mineral surface is also needed, where the surfactant tails have to interact to produce a stable layer, yet again in theory related to the distances between the functional groups to allow for the movement necessary. The higher flotation response of calcite over apatite is also slightly surprising, as in traditional oleate flotation apatite is generally found to be easier to float than calcite. This difference of course depends slightly on the composition of the apatite and is more of a general trend7,8,10.
The TOC-measurements show that there is a lower concentration of surfactant 11 free in the solution in the calcite experiment comparedto the apatite experiment. Thus, indicating noticeably more collector adsorbed on the calcite surface while the flotation response is slightly lower. This could be an indication that the collector is unable to orient itself sufficiently well for good flotation, or that some of the adsorbed collector molecules are hindering the other. With the concentrations of surfactant 12 still in solution being almost the same with both minerals, this additional adsorption of surfactant 11 on calcite is very interesting for further investigation of collectors with two functional groups.
At this time it is not possible to give definite answers as to what is happening at the mineral surface. There should be more investigationsinto how these molecules interact, perhaps by using molecular modelling as a first step to calculate the optimal interactions.
ACKNOWLEDGEMENTS
Financial support from the Hjalmar Lundbohm Research Centre (HLRC) and Luossavaara-Kiirunavaara AB (LKAB) is gratefully acknowledged. Anuttam Patra is acknowledged for the synthesis work and Desirée Nordmark for the TOC.
REFERENCES
1. U.S. Geological Survey. Mineral commodity summaries 2014: U.S. Geological Survey. 196 p. (2014).
2. Cao, Q. et al. A mixed collector system for phosphate flotation. Miner. Eng. 78, 114–121 (2015).
3. Sis, H. & Chander, S. Reagents used in the flotation of phosphate ores: a critical review. Miner. Eng. 16, 577–585 (2003).
4. Hanumantha Rao, K. & Forssberg, K. S. E. Mechanism of fatty acid adsorption in salt-type mineral flotation. Miner. Eng. 4, 879–890 (1991).
5. Fa, K., Jiang, T., Nalaskowski, J. & Miller, J. Interaction forces between a calcium dioleate sphere and calcite/fluorite surfaces and their significance in flotation. Langmuir 1, 10523–10530 (2003).
6. Abouzeid, A.-Z. M. Physical and thermal treatment of phosphate ores — An overview. Int. J. Miner. Process. 85, 59–84(2008).
7. Karlkvist, T., Patra, A., Rao, K. H., Bordes, R. & Holmberg, K. Flotation selectivity of novel alkyl dicarboxylate reagents for apatite–calcite separation. J. Colloid Interface Sci. 445, 40–47 (2015).
8. Pradip. Reagents design and development for the mineral processing industry: Scientific challenges and engineering issues. Met. Mater. Process. 10, 41–54 (1998).
9. Patra, A. et al. Design and development of novel mineral-specific collectors for flotation. in XXVII Int. Miner. Process. Congr. 1–10 (2014).
10. Finkelstein, N. P. Review of interactions in flotation of sparingly soluble calcium minerals with anionic collectors. Trans. Inst. Min. Metall. Sect. C Miner. Process. Extr. Metall. 98, 157–177 (1989).
Paper V Synergism among collectors used for flotation of apatite and REE minerals. Pålsson, B. I. Karlkvist, T., To be submitted to Minerals Engineering

Pålsson et al 2017-05-15 1(21)
SYNERGISM AMONG COLLECTORS USED FOR FLOTATION OF APATITE AND
REE MINERALS
Bertil I. Pålsson*a, Tommy Karlkvista a Minerals and Metallurgical Engineering, Luleå University of Technology, Sweden
Keywords: Apatite, Rare Earths, REE
ABSTRACT
Two major series of flotation tests are done for a range of collectors, one with tap water
and one with process water. The tests are statistically planned in a way that the influence
of the different collectors can be separated from their addition order. The results show
that the presumably REE mineral selective hydroxamates do not work well with the
apatite-iron ore tested. Instead a sulfosuccinamate on its own, or in combination with
oleate, gives good grade-recovery. The results clearly show that it is beneficial to first
add a weaker/more selective reagent than followed by a stronger collector. Comparing
the runs with tap water vs. the ones with process water, oleate and hydroxamates are much
more affected by the process water than the sulfosuccinamate. The reason is presumably
that calcium and magnesium ions reacts/complexes with these reagents in solution, and
thereby lowers the amount that can adsorb to the mineral surface.
1 INTRODUCTION Apatite from apatite-iron ores is a possible source for Rare Earth Elements (REE), and
for phosphorous. Recent flotation studies have revealed that the REE does not only follow
the apatite in flotation, but seem also to be present as separate REE minerals (Pålsson and
Fredriksson, 2012). However, the REE recoveries were reported to be only about half of
the phosphorus recovery.
More thorough investigation of the REE mineralogy for this type of ore gives that the
REE occurs in the apatite as inclusions of monazite, and possibly as lattice substituents.
The REE are also present as three major liberated mineral phases: monazite, allanite, and
titanite (Wanhainen et al., 2017).
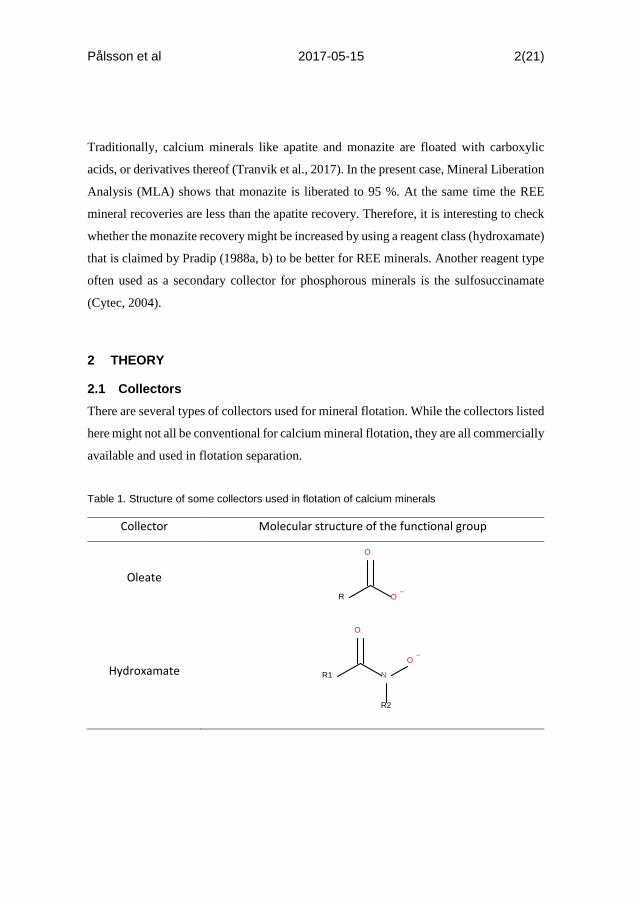
Pålsson et al 2017-05-15 2(21)
Traditionally, calcium minerals like apatite and monazite are floated with carboxylic
acids, or derivatives thereof (Tranvik et al., 2017). In the present case, Mineral Liberation
Analysis (MLA) shows that monazite is liberated to 95 %. At the same time the REE
mineral recoveries are less than the apatite recovery. Therefore, it is interesting to check
whether the monazite recovery might be increased by using a reagent class (hydroxamate)
that is claimed by Pradip (1988a, b) to be better for REE minerals. Another reagent type
often used as a secondary collector for phosphorous minerals is the sulfosuccinamate
(Cytec, 2004).
2 THEORY
2.1 Collectors There are several types of collectors used for mineral flotation. While the collectors listed
here might not all be conventional for calcium mineral flotation, they are all commercially
available and used in flotation separation.
Table 1. Structure of some collectors used in flotation of calcium minerals
Collector Molecular structure of the functional group
Oleate O
–
O
R
Hydroxamate N
R2
O–
O
R1
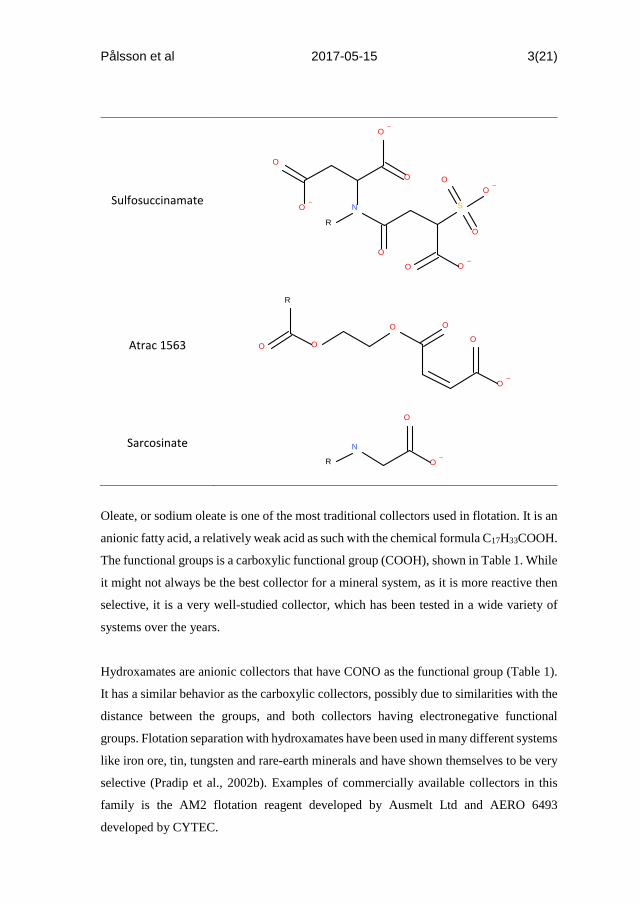
Pålsson et al 2017-05-15 3(21)
Sulfosuccinamate
O
O–
O–
O
N
R
O
O–
O
S
O–
O
O
Atrac 1563
R
O O
O O
O–
O
Sarcosinate N
R O–
O
Oleate, or sodium oleate is one of the most traditional collectors used in flotation. It is an
anionic fatty acid, a relatively weak acid as such with the chemical formula C17H33COOH.
The functional groups is a carboxylic functional group (COOH), shown in Table 1. While
it might not always be the best collector for a mineral system, as it is more reactive then
selective, it is a very well-studied collector, which has been tested in a wide variety of
systems over the years.
Hydroxamates are anionic collectors that have CONO as the functional group (Table 1).
It has a similar behavior as the carboxylic collectors, possibly due to similarities with the
distance between the groups, and both collectors having electronegative functional
groups. Flotation separation with hydroxamates have been used in many different systems
like iron ore, tin, tungsten and rare-earth minerals and have shown themselves to be very
selective (Pradip et al., 2002b). Examples of commercially available collectors in this
family is the AM2 flotation reagent developed by Ausmelt Ltd and AERO 6493
developed by CYTEC.
Pålsson et al 2017-05-15 4(21)
Sulfosucinnamate collectors are alkylated succinate acids with a sulphonate group
attached between the groups. The structure can be seen in Table 1. The reagent have
several carboxylic groups with different distances between them and has as such
similarities to the oleates. They were developed to be more selective than the oleates with
its many carboxylic groups and the varying distances between them (Cytec, 2002). A
commercial example of this type of collector is AERO 845 from CYTEC.
Atrac 1563 is a commercially available reagent from Akzo Nobel, Sweden. It is currently
used for apatite flotation by Luossavaara Kiirunavaara AB (LKAB) in their Kiruna and
Svappavaara plants in Sweden. The actual structure is not definitely known as it is
proprietary information, but from the safety data sheet, it is known to contain ethoxylated
tall oil ester of maleic acid and maleic anhydride. Based on this information a tentative
structure is shown in Table 1. It also contains noticeable amounts of the reactant maleic
acid. While the aim is apatite removal it has been shown that the collector also adsorbs
on iron mineral surfaces, which may lower the quality of the green pellets produced in
the balling process. Investigations by Potapova has proposed a structure for the groups
involved in the interactions with iron ore (Potapova, 2011). It is likely that the collector
interaction with apatite will be from the carboxylic groups.
Another group of collectors is based on sarcosine, a carboxylic acid coupled to a
methylated nitrogen via a spacer carbon, seen in Table 1. The methyl group on the
nitrogen will make it adsorb stronger on a suitable surface than similar glycine based
surfactants (same structure as sarcosinate if the methyl group is removed). A drawback
with the methyl group could be that the nitrogen lacks the possibility of hydrogen bonding
that the hydrogenated nitrogen has. The hydrogen bonding possibility is a little more
advantageous for good packing when used as a surfactant (Bordes et al., 2010). A
commercially available reagent of this type is Berol A3 from Akzo Nobel.
Pålsson et al 2017-05-15 5(21)
2.2 Mixtures of collectors At times using only one collector might not be sufficient or yield the best result.
Combining several surface active reagents could help by improving selectivity towards
one mineral over another or by further depressing gangue. One collectors in this study
(AERO 845) has a recommendation to combine it with other collectors, while A6494 is
a combination of the hydroxamate collector A6493 and vegetable oil. Historically, several
of the early dithiophosphate collectors offered by present-day CYTEC were mixtures
(Cyanamid, 1976):
• Aerofloat 208 – 50 % diethyldithiophosphate and 50 % disec-butyl-dithiophosphate,
• Aerofloat 242 – 94 % dicresyldithiophosphate and 6 % thiocarbanilide
The strategy for doing such combinations is not entirely clear. Most combinations appear
to have been found without much of scientific basis. One example of the benefit of using
an addition of long-chained alcohol to hydroxamate is published (Miller et al., 2002a,
2002b). However, it is not clear how the authors came to the conclusion to try this
mixture. In searching for background information for this article, no conclusive literature
references regarding how to select combinations of surface-active reagents to get the best
packing of a hydrophobic layer at the mineral surface have been found.
3 METHODS AND MATERIALS
3.1 Feed material The feed material for the flotation tests came from a sampling of underflow tailings
thickener in LKAB Kiruna concentrator KA2. Its main elements’ and REE analyses are
given in Table 2. Main elements and the REE are from analyses by ALS Scandinavia
using analytical package G-0 (ALS GLOBAL, 2017).
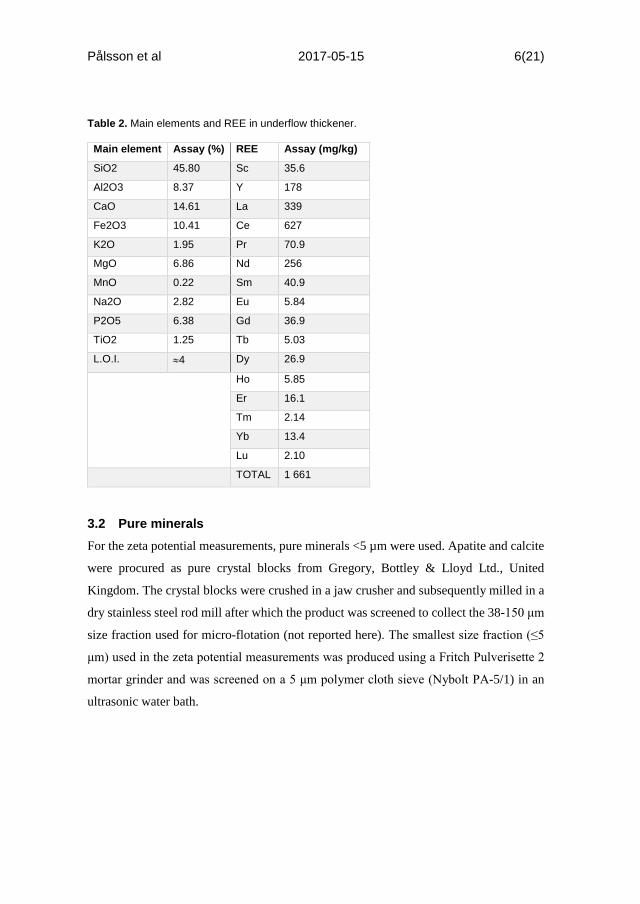
Pålsson et al 2017-05-15 6(21)
Table 2. Main elements and REE in underflow thickener.
Main element Assay (%) REE Assay (mg/kg)
SiO2 45.80 Sc 35.6
Al2O3 8.37 Y 178
CaO 14.61 La 339
Fe2O3 10.41 Ce 627
K2O 1.95 Pr 70.9
MgO 6.86 Nd 256
MnO 0.22 Sm 40.9
Na2O 2.82 Eu 5.84
P2O5 6.38 Gd 36.9
TiO2 1.25 Tb 5.03
L.O.I. ≈4 Dy 26.9
Ho 5.85
Er 16.1
Tm 2.14
Yb 13.4
Lu 2.10
TOTAL 1 661
3.2 Pure minerals For the zeta potential measurements, pure minerals <5 µm were used. Apatite and calcite
were procured as pure crystal blocks from Gregory, Bottley & Lloyd Ltd., United
Kingdom. The crystal blocks were crushed in a jaw crusher and subsequently milled in a
dry stainless steel rod mill after which the product was screened to collect the 38-150 μm
size fraction used for micro-flotation (not reported here). The smallest size fraction (≤5
μm) used in the zeta potential measurements was produced using a Fritch Pulverisette 2
mortar grinder and was screened on a 5 μm polymer cloth sieve (Nybolt PA-5/1) in an
ultrasonic water bath.
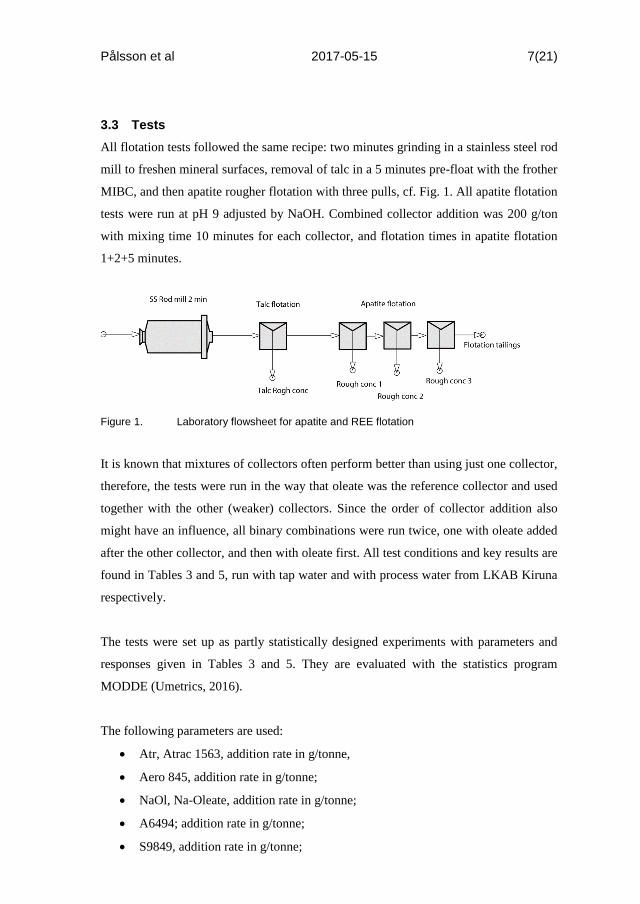
Pålsson et al 2017-05-15 7(21)
3.3 Tests All flotation tests followed the same recipe: two minutes grinding in a stainless steel rod
mill to freshen mineral surfaces, removal of talc in a 5 minutes pre-float with the frother
MIBC, and then apatite rougher flotation with three pulls, cf. Fig. 1. All apatite flotation
tests were run at pH 9 adjusted by NaOH. Combined collector addition was 200 g/ton
with mixing time 10 minutes for each collector, and flotation times in apatite flotation
1+2+5 minutes.
Figure 1. Laboratory flowsheet for apatite and REE flotation
It is known that mixtures of collectors often perform better than using just one collector,
therefore, the tests were run in the way that oleate was the reference collector and used
together with the other (weaker) collectors. Since the order of collector addition also
might have an influence, all binary combinations were run twice, one with oleate added
after the other collector, and then with oleate first. All test conditions and key results are
found in Tables 3 and 5, run with tap water and with process water from LKAB Kiruna
respectively.
The tests were set up as partly statistically designed experiments with parameters and
responses given in Tables 3 and 5. They are evaluated with the statistics program
MODDE (Umetrics, 2016).
The following parameters are used:
• Atr, Atrac 1563, addition rate in g/tonne,
• Aero 845, addition rate in g/tonne;
• NaOl, Na-Oleate, addition rate in g/tonne;
• A6494; addition rate in g/tonne;
• S9849, addition rate in g/tonne;
Pålsson et al 2017-05-15 8(21)
• A6493, addition rate in g/tonne;
• Ool, order of oleate addition (F=first, L=Last, N=neutral/not added)
Each response is fitted by MODDE to an equation 𝑅𝑅𝑅𝑅𝑅𝑅𝑅𝑅 = 𝑎𝑎0 + 𝑎𝑎1 ∙ 𝐴𝐴𝐴𝐴𝐴𝐴 + 𝑎𝑎2 ∙ 𝐴𝐴845 + 𝑎𝑎3 ∙ 𝑁𝑁𝑎𝑎𝑁𝑁𝑁𝑁 + 𝑎𝑎4 ∙ 𝐴𝐴6494 + 𝑎𝑎5 ∙ 𝑆𝑆9849 + 𝑎𝑎6 ∙ 𝐴𝐴6493 + 𝑎𝑎7 ∙ 𝐹𝐹 +
𝑎𝑎8 ∙ 𝐿𝐿 + 𝑎𝑎9 ∙ 𝑁𝑁
The order of oleate addition is caught by the indicator parameter Ool, and thus separates
the addition order from the oleate addition rate. In the way the research plan is structured,
it becomes a screening design without interactions.
The following responses are measured or calculated for each experiment:
• mRo1, mass pull Rougher 1 in mass-% of feed;
• mRoTot, mass pull Roughers in mass-% of feed;
• 1P2O5, grade (%) of P2O5 after 1 minute of flotation;
• 1rP2O5, recovery (%) of P2O5 after 1 minute of flotation;
• rP2O5, total recovery (%) of P2O5;
• DISiO2, difference index P2O5-SiO2;
• DIFe2O3, difference index P2O5-Fe2O3;
• DIMgO, difference index P2O5-MgO;
• rREE, total recovery (%) of REE;
• rHREE, total recovery (%) of Heavy REE.
3.4 Zeta-potential Zeta potential measurements were done using a ZetaCompact (CAD instruments)
instrument. The background electrolyte was 0.01 M NaCl and the mineral solid
concentration was 50 mg/dm³ in the samples. Each sample was equilibrated on a
laboratory shaking table for 10 minutes. Due to the high number of particles in the sample
it was necessary to dilute the mineral water suspension four times before measurement in
the ZetaCompact. The results were calculated using the Schmoluchowski equation and
each data point is an average of three measurements with different aliquots.
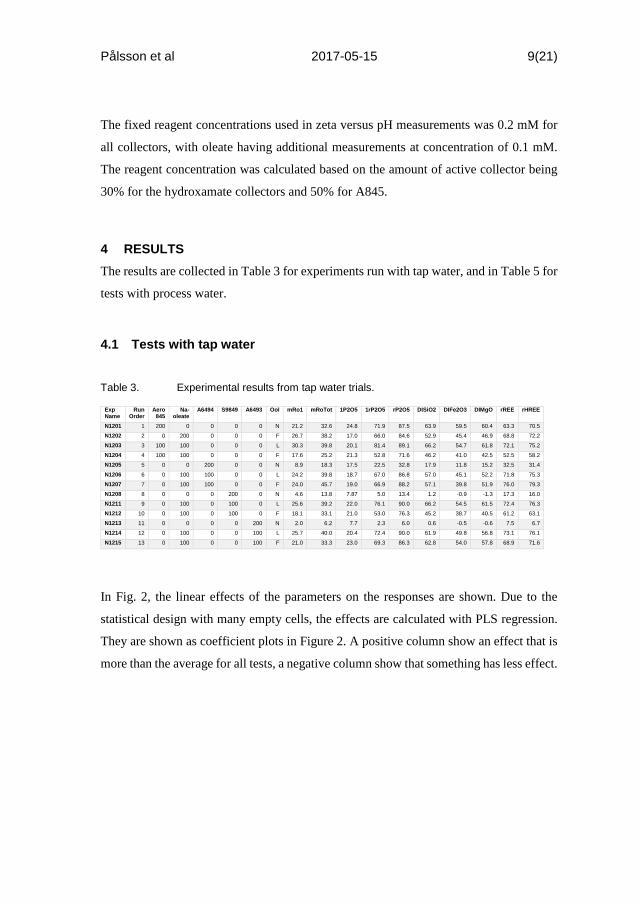
Pålsson et al 2017-05-15 9(21)
The fixed reagent concentrations used in zeta versus pH measurements was 0.2 mM for
all collectors, with oleate having additional measurements at concentration of 0.1 mM.
The reagent concentration was calculated based on the amount of active collector being
30% for the hydroxamate collectors and 50% for A845.
4 RESULTS The results are collected in Table 3 for experiments run with tap water, and in Table 5 for
tests with process water.
4.1 Tests with tap water Table 3. Experimental results from tap water trials.
In Fig. 2, the linear effects of the parameters on the responses are shown. Due to the
statistical design with many empty cells, the effects are calculated with PLS regression.
They are shown as coefficient plots in Figure 2. A positive column show an effect that is
more than the average for all tests, a negative column show that something has less effect.
Exp Name
Run Order
Aero 845
Na- oleate
A6494 S9849 A6493 Ool mRo1 mRoTot 1P2O5 1rP2O5 rP2O5 DISiO2 DIFe2O3 DIMgO rREE rHREE
N1201 1 200 0 0 0 0 N 21.2 32.6 24.8 71.9 87.5 63.9 59.5 60.4 63.3 70.5
N1202 2 0 200 0 0 0 F 26.7 38.2 17.0 66.0 84.6 52.9 45.4 46.9 68.8 72.2
N1203 3 100 100 0 0 0 L 30.3 39.8 20.1 81.4 89.1 66.2 54.7 61.8 72.1 75.2
N1204 4 100 100 0 0 0 F 17.6 25.2 21.3 52.8 71.6 46.2 41.0 42.5 52.5 58.2
N1205 5 0 0 200 0 0 N 8.9 18.3 17.5 22.5 32.8 17.9 11.8 15.2 32.5 31.4
N1206 6 0 100 100 0 0 L 24.2 39.8 18.7 67.0 86.8 57.0 45.1 52.2 71.8 75.3
N1207 7 0 100 100 0 0 F 24.0 45.7 19.0 66.9 88.2 57.1 39.8 51.9 76.0 79.3
N1208 8 0 0 0 200 0 N 4.6 13.8 7.87 5.0 13.4 1.2 -0.9 -1.3 17.3 16.0
N1211 9 0 100 0 100 0 L 25.6 39.2 22.0 76.1 90.0 66.2 54.5 61.5 72.4 76.3
N1212 10 0 100 0 100 0 F 18.1 33.1 21.0 53.0 76.3 45.2 38.7 40.5 61.2 63.1
N1213 11 0 0 0 0 200 N 2.0 6.2 7.7 2.3 6.0 0.6 -0.5 -0.6 7.5 6.7
N1214 12 0 100 0 0 100 L 25.7 40.0 20.4 72.4 90.0 61.9 49.8 56.8 73.1 76.1
N1215 13 0 100 0 0 100 F 21.0 33.3 23.0 69.3 86.3 62.8 54.0 57.8 68.9 71.6
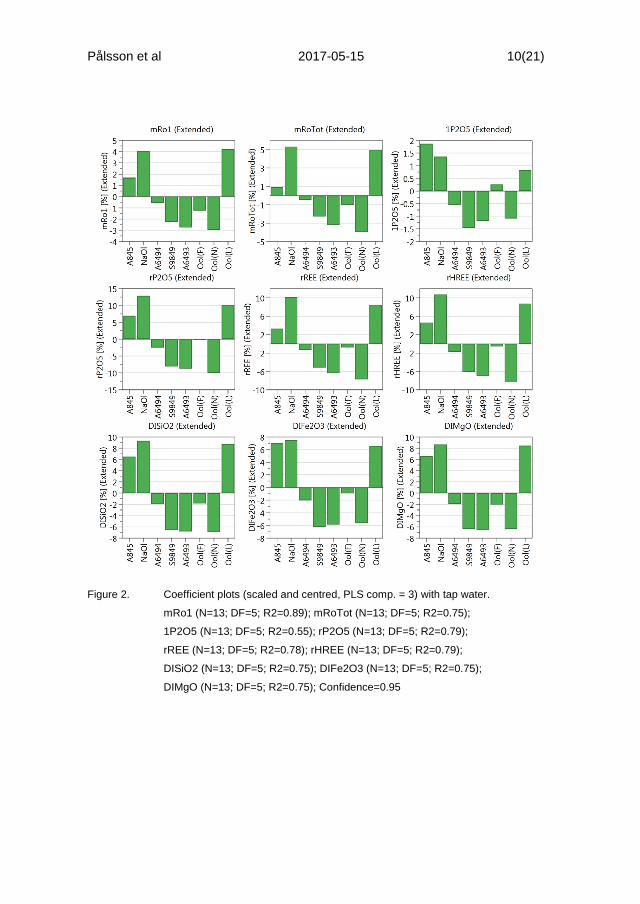
Pålsson et al 2017-05-15 10(21)
Figure 2. Coefficient plots (scaled and centred, PLS comp. = 3) with tap water.
mRo1 (N=13; DF=5; R2=0.89); mRoTot (N=13; DF=5; R2=0.75);
1P2O5 (N=13; DF=5; R2=0.55); rP2O5 (N=13; DF=5; R2=0.79);
rREE (N=13; DF=5; R2=0.78); rHREE (N=13; DF=5; R2=0.79);
DISiO2 (N=13; DF=5; R2=0.75); DIFe2O3 (N=13; DF=5; R2=0.75);
DIMgO (N=13; DF=5; R2=0.75); Confidence=0.95
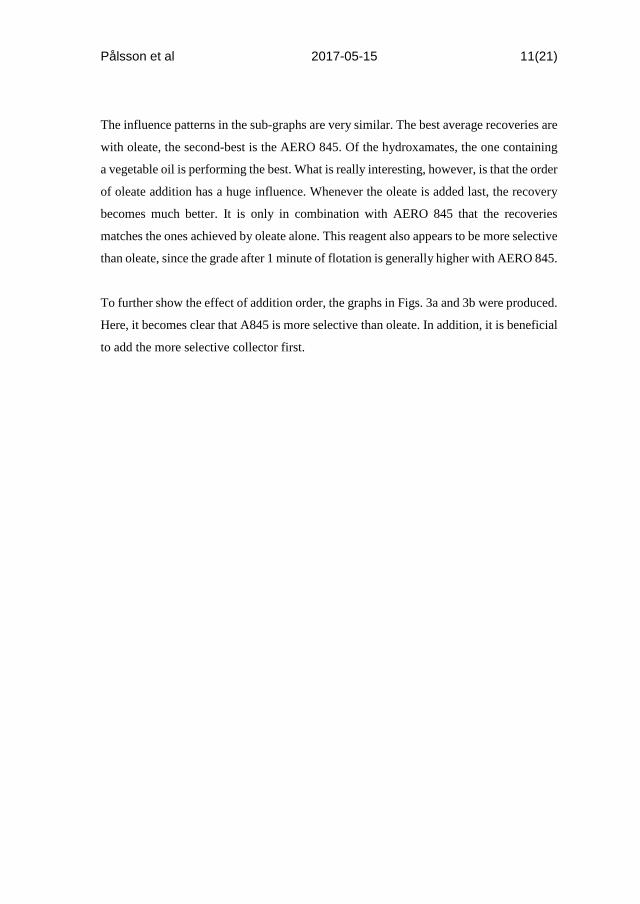
Pålsson et al 2017-05-15 11(21)
The influence patterns in the sub-graphs are very similar. The best average recoveries are
with oleate, the second-best is the AERO 845. Of the hydroxamates, the one containing
a vegetable oil is performing the best. What is really interesting, however, is that the order
of oleate addition has a huge influence. Whenever the oleate is added last, the recovery
becomes much better. It is only in combination with AERO 845 that the recoveries
matches the ones achieved by oleate alone. This reagent also appears to be more selective
than oleate, since the grade after 1 minute of flotation is generally higher with AERO 845.
To further show the effect of addition order, the graphs in Figs. 3a and 3b were produced.
Here, it becomes clear that A845 is more selective than oleate. In addition, it is beneficial
to add the more selective collector first.
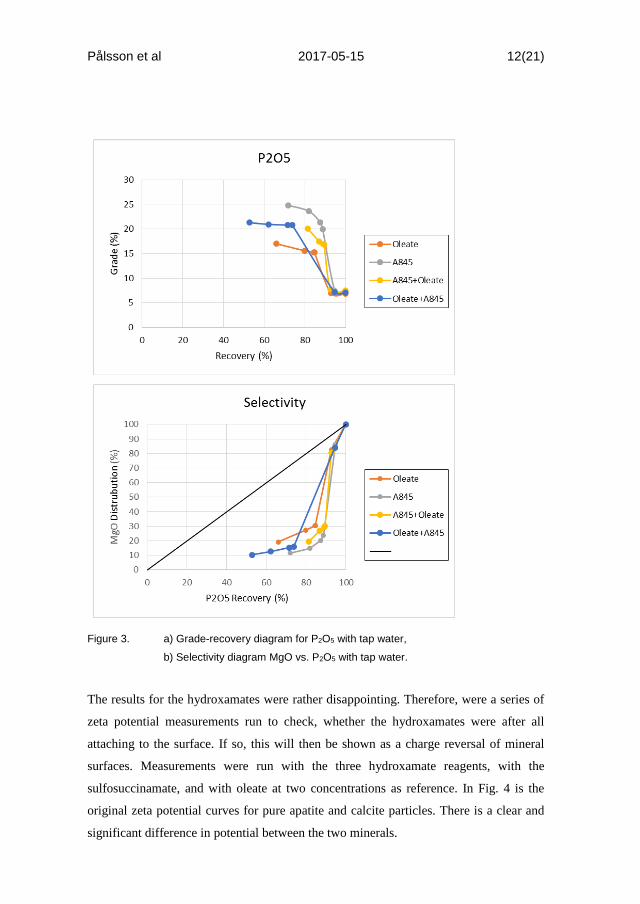
Pålsson et al 2017-05-15 12(21)
Figure 3. a) Grade-recovery diagram for P2O5 with tap water,
b) Selectivity diagram MgO vs. P2O5 with tap water.
The results for the hydroxamates were rather disappointing. Therefore, were a series of
zeta potential measurements run to check, whether the hydroxamates were after all
attaching to the surface. If so, this will then be shown as a charge reversal of mineral
surfaces. Measurements were run with the three hydroxamate reagents, with the
sulfosuccinamate, and with oleate at two concentrations as reference. In Fig. 4 is the
original zeta potential curves for pure apatite and calcite particles. There is a clear and
significant difference in potential between the two minerals.
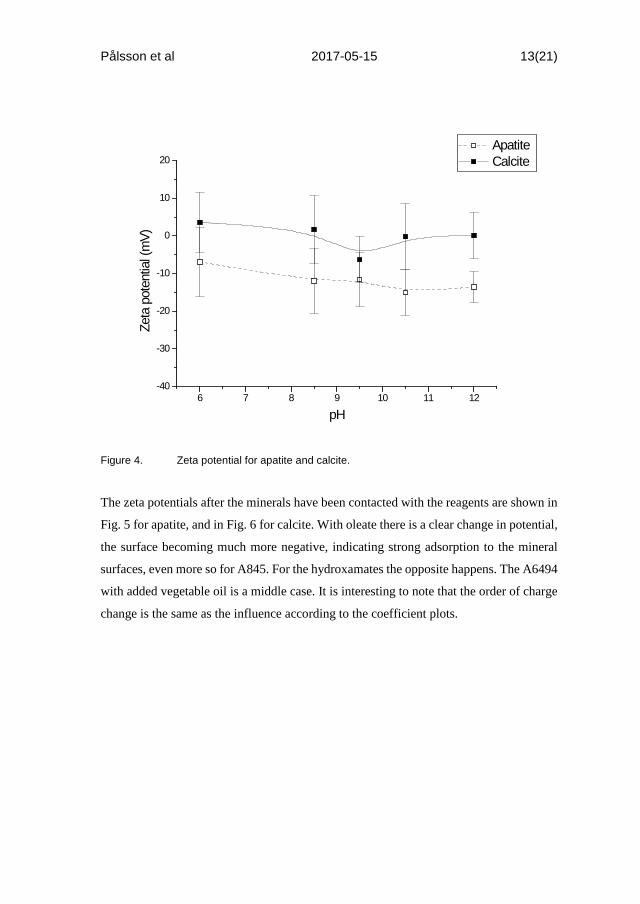
Pålsson et al 2017-05-15 13(21)
Figure 4. Zeta potential for apatite and calcite.
The zeta potentials after the minerals have been contacted with the reagents are shown in
Fig. 5 for apatite, and in Fig. 6 for calcite. With oleate there is a clear change in potential,
the surface becoming much more negative, indicating strong adsorption to the mineral
surfaces, even more so for A845. For the hydroxamates the opposite happens. The A6494
with added vegetable oil is a middle case. It is interesting to note that the order of charge
change is the same as the influence according to the coefficient plots.
6 7 8 9 10 11 12-40
-30
-20
-10
0
10
20 Apatite Calcite
Zeta
pot
entia
l (m
V)
pH
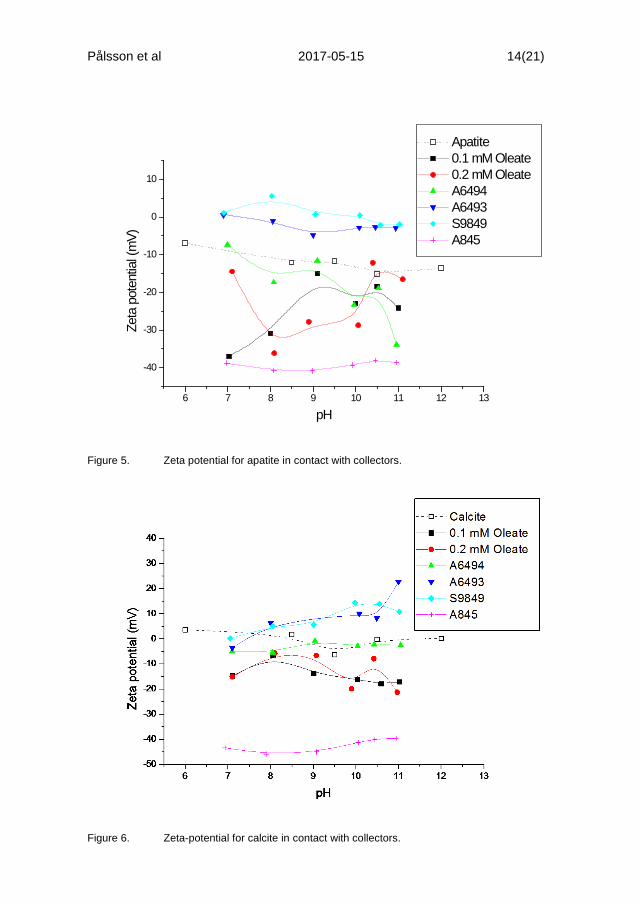
Pålsson et al 2017-05-15 14(21)
Figure 5. Zeta potential for apatite in contact with collectors.
Figure 6. Zeta-potential for calcite in contact with collectors.
6 7 8 9 10 11 12 13
-40
-30
-20
-10
0
10
Apatite 0.1 mM Oleate 0.2 mM Oleate A6494 A6493 S9849 A845
Zeta
pot
entia
l (m
V)
pH
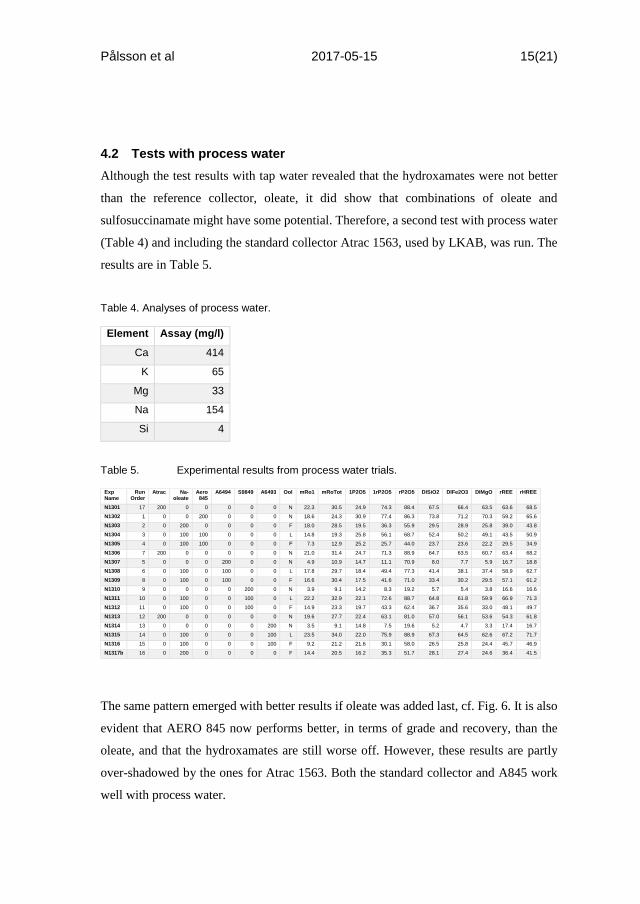
Pålsson et al 2017-05-15 15(21)
4.2 Tests with process water Although the test results with tap water revealed that the hydroxamates were not better
than the reference collector, oleate, it did show that combinations of oleate and
sulfosuccinamate might have some potential. Therefore, a second test with process water
(Table 4) and including the standard collector Atrac 1563, used by LKAB, was run. The
results are in Table 5.
Table 4. Analyses of process water.
Element Assay (mg/l)
Ca 414
K 65
Mg 33
Na 154
Si 4
Table 5. Experimental results from process water trials.
The same pattern emerged with better results if oleate was added last, cf. Fig. 6. It is also
evident that AERO 845 now performs better, in terms of grade and recovery, than the
oleate, and that the hydroxamates are still worse off. However, these results are partly
over-shadowed by the ones for Atrac 1563. Both the standard collector and A845 work
well with process water.
Exp Name
Run Order
Atrac Na- oleate
Aero 845
A6494 S9849 A6493 Ool mRo1 mRoTot 1P2O5 1rP2O5 rP2O5 DISiO2 DIFe2O3 DIMgO rREE rHREE
N1301 17 200 0 0 0 0 0 N 22.3 30.5 24.9 74.3 88.4 67.5 66.4 63.5 63.6 68.5
N1302 1 0 0 200 0 0 0 N 18.6 24.3 30.9 77.4 86.3 73.8 71.2 70.3 59.2 65.6
N1303 2 0 200 0 0 0 0 F 18.0 28.5 19.5 36.3 55.9 29.5 28.9 25.8 39.0 43.8
N1304 3 0 100 100 0 0 0 L 14.8 19.3 25.8 56.1 68.7 52.4 50.2 49.1 43.5 50.9
N1305 4 0 100 100 0 0 0 F 7.3 12.9 25.2 25.7 44.0 23.7 23.6 22.2 29.5 34.9
N1306 7 200 0 0 0 0 0 N 21.0 31.4 24.7 71.3 88.9 64.7 63.5 60.7 63.4 68.2
N1307 5 0 0 0 200 0 0 N 4.9 10.9 14.7 11.1 70.9 8.0 7.7 5.9 16.7 18.8
N1308 6 0 100 0 100 0 0 L 17.8 29.7 18.4 49.4 77.3 41.4 38.1 37.4 58.9 62.7
N1309 8 0 100 0 100 0 0 F 16.6 30.4 17.5 41.6 71.0 33.4 30.2 29.5 57.1 61.2
N1310 9 0 0 0 0 200 0 N 3.9 9.1 14.2 8.3 19.2 5.7 5.4 3.8 16.6 16.6
N1311 10 0 100 0 0 100 0 L 22.2 32.9 22.1 72.6 88.7 64.8 61.8 59.9 66.9 71.3
N1312 11 0 100 0 0 100 0 F 14.9 23.3 19.7 43.3 62.4 36.7 35.6 33.0 48.1 49.7
N1313 12 200 0 0 0 0 0 N 19.6 27.7 22.4 63.1 81.0 57.0 56.1 53.6 54.3 61.8
N1314 13 0 0 0 0 0 200 N 3.5 9.1 14.8 7.5 19.6 5.2 4.7 3.3 17.4 16.7
N1315 14 0 100 0 0 0 100 L 23.5 34.0 22.0 75.9 88.9 67.3 64.5 62.6 67.2 71.7
N1316 15 0 100 0 0 0 100 F 9.2 21.2 21.6 30.1 58.0 26.5 25.8 24.4 45.7 46.9
N1317b 16 0 200 0 0 0 0 F 14.4 20.5 16.2 35.3 51.7 28.1 27.4 24.6 36.4 41.5
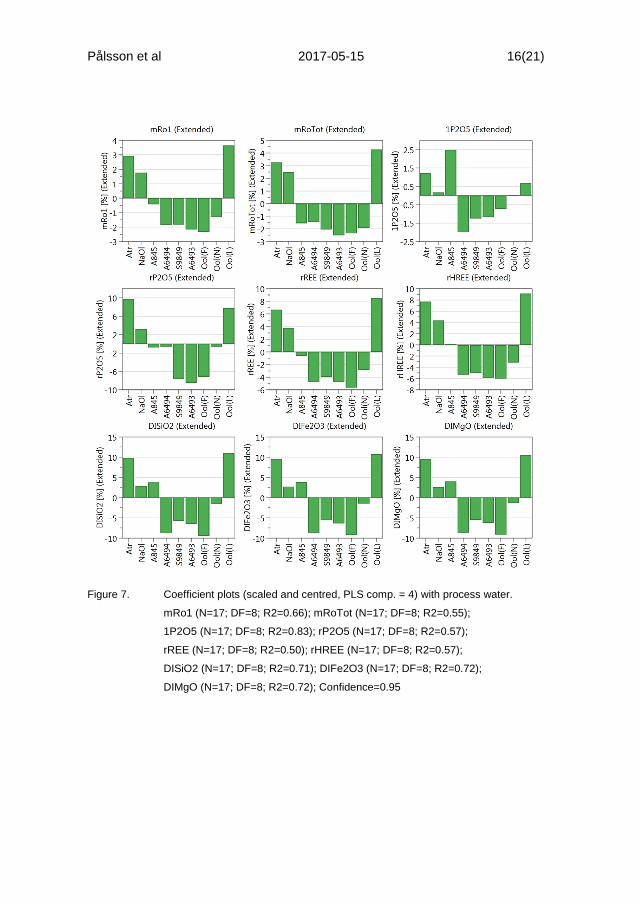
Pålsson et al 2017-05-15 16(21)
Figure 7. Coefficient plots (scaled and centred, PLS comp. = 4) with process water.
mRo1 (N=17; DF=8; R2=0.66); mRoTot (N=17; DF=8; R2=0.55);
1P2O5 (N=17; DF=8; R2=0.83); rP2O5 (N=17; DF=8; R2=0.57);
rREE (N=17; DF=8; R2=0.50); rHREE (N=17; DF=8; R2=0.57);
DISiO2 (N=17; DF=8; R2=0.71); DIFe2O3 (N=17; DF=8; R2=0.72);
DIMgO (N=17; DF=8; R2=0.72); Confidence=0.95
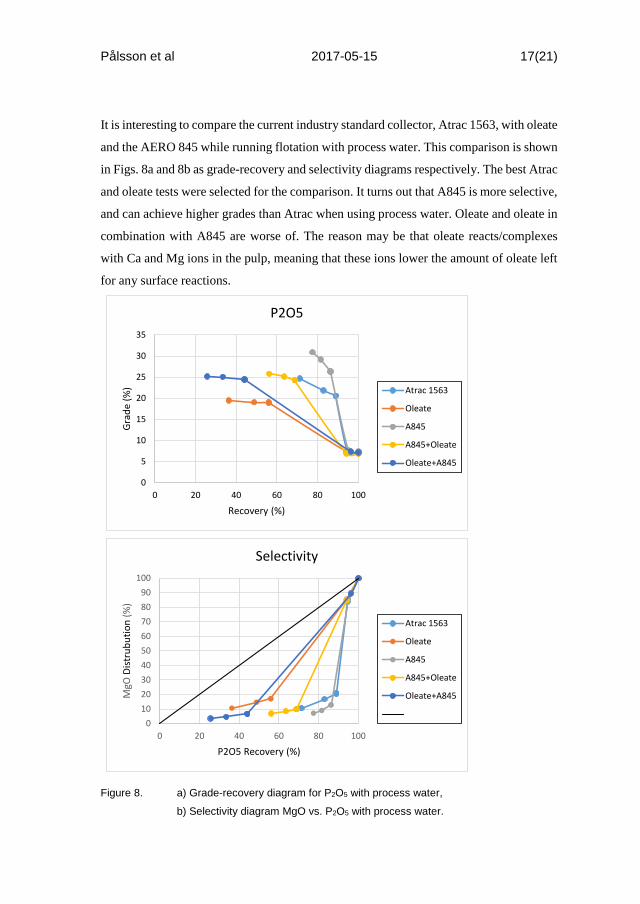
Pålsson et al 2017-05-15 17(21)
It is interesting to compare the current industry standard collector, Atrac 1563, with oleate
and the AERO 845 while running flotation with process water. This comparison is shown
in Figs. 8a and 8b as grade-recovery and selectivity diagrams respectively. The best Atrac
and oleate tests were selected for the comparison. It turns out that A845 is more selective,
and can achieve higher grades than Atrac when using process water. Oleate and oleate in
combination with A845 are worse of. The reason may be that oleate reacts/complexes
with Ca and Mg ions in the pulp, meaning that these ions lower the amount of oleate left
for any surface reactions.
Figure 8. a) Grade-recovery diagram for P2O5 with process water,
b) Selectivity diagram MgO vs. P2O5 with process water.
0
5
10
15
20
25
30
35
0 20 40 60 80 100
Grad
e (%
)
Recovery (%)
P2O5
Atrac 1563
Oleate
A845
A845+Oleate
Oleate+A845
0102030405060708090
100
0 20 40 60 80 100
MgO
Dist
rubu
tion
(%)
P2O5 Recovery (%)
Selectivity
Atrac 1563
Oleate
A845
A845+Oleate
Oleate+A845
Pålsson et al 2017-05-15 18(21)
It is also interesting to note that in the combinations between A845 and oleate, it is the
test with A845 added first and then oleate, which gives the best result.
5 DISCUSSION Two collectors, the A845 and Atrac 1563, are less affected by process water. A possible
explanation can be that both reagents have multiple polar groups/parts that can interact
with mineral surfaces, and that not all are carboxylic groups.
Zeta potential reversal correlates well with bench-scale flotation results. A possible
explanation for this behaviour is that true flotation, i.e. bench-scale, requires both a
selective adsorption of an entity on the mineral surface, and the formation of a
hydrophobic multi-layer island on the mineral surface. This interpretation would
tentatively explain why certain combinations of collectors have been found useful in
practice. It would also explain the results from the experiments with changed addition
orders. In the latter case, the presumably more selective collector (hydroxamate) adsorbs
first, and then serves as the contact point for the hydrophobic multi-layer created by the
stronger collector (oleate). It could also be that the stronger collector co-adsorbs into the
first layer. Such a co-adsorption could also explain the beneficial effect of adding non-
ionic surfactants to flotation systems.
Interestingly, similar ideas of a two-stage process for sulphide mineral flotation have been
forwarded by other authors (Forsling and Sun, 1997; Pålsson, 1988; Woods, 1987).
It is here suggested, that “true” flotation shall be considered a two-stage process:
1. Adsorption of a selective entity to specific points in the mineral surface
lattice. This entity may adsorb mono-dentate, bi-dentate or multi-dentate,
but does not necessarily render the mineral surface sufficiently hydrophobic
in itself.
2. Addition at the same time, or in a later stage, of a substance that creates a
hydrophobic multi-layer. This multi-layer can be anchored to the firstly
adsorbed entity by hydrophobic interaction or being co-adsorbed into the
first layer.
Pålsson et al 2017-05-15 19(21)
6 CONCLUSIONS When using multiple collectors, optimal flotation is a two-stage process where the first
layer with the more selective surfactant attaches to the surface, and the second layer,
which promotes hydrophobicity adsorbs into/on top of the first layer.
7 ACKNOWLEDGEMENT The work was funded by research grant EU FP7-603564 – REEcover, which is a
European FP7 project.
8 REFERENCES ALS GLOBAL, 2017. G-0 Metals in geological samples. (http://www.alsglobal.com,
fetched 2017-05-14)
Bordes, R., Tropsch, J., Holmberg, K., 2010. Role of an amide bond for self-assembly of
surfactants. Langmuir 26:3077–3083.
Cyanamid, 1976. Mining Chemicals HANDBOOK, Mineral Dressing Notes No 26.
American Cyanamid Company. 111 p.
Cytec, 2002. Mining Chemicals Handbook, Cytec Industries Inc., Wayne, NJ.
Cytec, 2004. AERO® 845 promoter boosts phosphate recovery and cuts bulk reagent
consumption helping to increase customer’s process efficiency. Case Study. 1 p.
Forsling, W., Sun, Z., 1997. Use of surface complexation models in sulphide mineral
flotation. Int. J. Miner. Process. 51:81–95.
Miller, J.D., Wang, X., Li, M., 2002a. US Patent 6,341,697 B1. Selective flotation of
phosphate minerals with hydroxamate collectors.
Pålsson et al 2017-05-15 20(21)
Miller, J.D., Wang, X., Li, M., 2002b. Publication No. 02-142-187. A selective collector
for phosphate flotation. Florida Institute of Phosphate Research, Bartow, Florida, USA.
77 p.
Potapova, E., 2011. Adsorption of surfactants and polymers on iron oxides: implications
for flotation and agglomeration of iron ore. Doctoral Thesis, Luleå University of
Tehnology. ISBN: 978-91-7439-309-5
Pradip, 1988a. Applications of chelating agents in mineral processing. Minerals and
Metallurgical Processing, May. pp. 80-89.
Pradip, 1988b. Testing and evaluation of reagents for mineral flotation. Minerals and
Metallurgical Processing, Aug. pp. 114-119.
Pradip, Rai, B., Rao, T.K., Krishnamurthy, S., Vetrivel, R., Mielczarski, J., Cases, J.M.,
2002a. Molecular modeling of interactions of diphosphonic acid based surfactants with
calcium minerals. Langmuir 18:932–940.
Pradip, Rai, B., Rao, T.K., Krishnamurthy, S., Vetrivel, R., Mielczarski, J., Cases, J.M.,
2002b. Molecular Modeling of Interactions of Alkyl Hydroxamates with Calcium
Minerals. J. Colloid Interface Sci. 256:106–113.
Pålsson, B.I., 1988. Doctoral thesis 1988:062 D. Pulp chemistry of sulphide froth
flotation. Luleå University of Technology.
Pålsson, B.I., and Fredriksson, A., 2012. Apatite for extraction. II. Flotation of apatite and
rare earth elements from old tailings dumps. XXVI International Mineral Processing
Congress – IMPC, New Delhi, India, 24-28 September, 2012. ISBN: 81-901714-3-7.
Tranvik, E., Becker, M., Pålsson, B.I., Franzidis, J.-P.and Bradshaw, D., 2017. Towards
cleaner production – Using flotation to recover monazite from a heavy mineral sands
zircon waste stream. Minerals Engineering 101:30-39.
Pålsson et al 2017-05-15 21(21)
Umetrics, 2016. http://umetrics.com/product/modde-pro (fetched 2016-11-26).
Wanhainen, C., Pålsson, B.I., Martinsson, O. and Lahaye, Y., 2017. Rare earth
mineralogy in tailings from the Kiirunavaara iron ore, northern Sweden: implications for
mineral processing. Submitted to Minerals & Metallurgical Processing Journal.
Woods, R., 1987. Electrochemistry of sulphide flotation. In: Jones, M.H., Woodcock, J.T.
(Eds.), Principles of Mineral Flotation. The Wark Symposium, Symposia Series No. 40.
Australasian Inst. Min. Met., Parkville, Victoria, Australia, pp. 91–115.


