selecting effective mathematics interventions in the rti
TRANSCRIPT
The University of Southern Mississippi The University of Southern Mississippi
The Aquila Digital Community The Aquila Digital Community
Dissertations
Summer 8-2009
Selecting Effective Mathematics Interventions in the RTI Process Selecting Effective Mathematics Interventions in the RTI Process
Via Brief Experimental Analyses Via Brief Experimental Analyses
Carmen Daniela Reisener University of Southern Mississippi
Follow this and additional works at: https://aquila.usm.edu/dissertations
Part of the Educational Psychology Commons, School Psychology Commons, and the Science and
Mathematics Education Commons
Recommended Citation Recommended Citation Reisener, Carmen Daniela, "Selecting Effective Mathematics Interventions in the RTI Process Via Brief Experimental Analyses" (2009). Dissertations. 1072. https://aquila.usm.edu/dissertations/1072
This Dissertation is brought to you for free and open access by The Aquila Digital Community. It has been accepted for inclusion in Dissertations by an authorized administrator of The Aquila Digital Community. For more information, please contact [email protected].
The University of Southern Mississippi
SELECTING EFFECTIVE MATHEMATICS INTERVENTIONS IN THE RTI
PROCESS VIA BRIEF EXPERIMENTAL ANALYSES
by
Carmen Daniela Reisener
A Dissertation Submitted to the Graduate Studies Office of The University of Southern Mississippi in Partial Fulfillment of the Requirements
for the Degree of Doctor of Philosophy
Approved:
August 2009

COPYRIGHT BY
CARMEN DANIELA REISENER
2009
The University of Southern Mississippi
SELECTING EFFECTIVE MATHEMATICS INTERVENTIONS IN THE RTI
PROCESS VIA BRIEF EXPERIMENTAL ANALYSES
by
Carmen Daniela Reisener
Abstract of a Dissertation Submitted to the Graduate School
of The University of Southern Mississippi in Partial Fulfillment of the Requirements
for the Degree of Doctor of Philosophy
August 2009
ABSTRACT
SELECTING EFFECTIVE MATHEMATICS INTERVENTIONS IN THE RTI
PROCESS VIA BRIEF EXPERIMENTAL ANALYSES
by Carmen Daniela Reisener
August 2009
The treatment utility of brief experimental analyses (BEAs) for identifying effective
treatments for individual students experiencing mathematics difficulties is a novel area of
research; especially in a Response-to-intervention (Rtl) framework. One fourth and three
sixth grade students served as participants in the current study. The effects of a variety of
evidence-based mathematics computation fluency interventions were examined in a BEA
format. Effective treatments identified from the BEA for each participant were alternated
during an extended analysis. The results of the current investigation indicated variability
within and across participants in response to a variety of evidence-based interventions.
Visual analysis of the data collected during the extended analysis revealed that effective
interventions identified during the BEA produced greater gains than the least effective
condition for all students. Hence, the current study provides preliminary evidence for the
treatment utility of BEAs in identifying effective math computation fluency
interventions.
n

DEDICATION
This dissertation is dedicated to Grandma Thea, who has always been interested
in everything that I do.
111

ACKNOWLEDGEMENTS
I would like to thank my dissertation committee members, Drs. Heather Sterling-
Turner, Joe Olmi, Daniel Tingstrom, and Sara Jordan for their advice and support
throughout the duration of the project. I am especially grateful for the guidance and
encouragement of my dissertation director and faculty advisor, Dr. Brad Dufrene. His
feedback and advice were instrumental in completing this project, and I am thankful for
his kindness and willingness to mentor me throughout my graduate career. I would also
like to thank my colleagues at The University of Southern Mississippi, especially
Debborah Smyth and Jennifer Abraham. They provided shoulders to lean on and made
my graduate school experience infinitely more fun. In addition, I would like to thank my
family and friends for their support and encouragement
IV
TABLE OF CONTENTS
ABSTRACT ii
DEDICATION iii
ACKNOWLEDGMENTS iv
LIST OF ILLUSTRATIONS vii
CHAPTER
I. INTRODUCTION 1
The Era of Accountability Statement of the Problem and Justification of Research Purpose of the Study Research Questions
II. REVIEW OF LITERATURE 7
The IQ-Achievement Discrepancy Model Response to Intervention Benefits and Limits of Rtl Curriculum-Based Assessment Instructional Hierarchy Brief Experimental Analysis Intervention for Mathematics Computational Accuracy and Fluency
III. METHODOLOGY 45
Participants and Setting Materials Dependent Variable Experimental Design Procedure Data Analysis
IV. RESULTS 57
Chris Adam Doris Irene
v

V. DISCUSSION 72
Limitations and Future Research Conclusion
APPENDICES , ..81
REFERENCES 92
VI

LIST OF ILLUSTRATIONS
Figure
1. BEAand Extended Analysis for Chris 58
2. BEA and Extended Analysis for Adam 62
3. BEA and Extended Analysis for Doris 65
4. BEA and Extended Analysis for Irene 68
vn
1
CHAPTER I
INTRODUCTION
Mathematics is frequently a subject area that is difficult not only for students
eligible for special education services (SPED) but for general education students alike.
According to Gross-Tsur, Manor, and Shalev (1996), approximately 6% of school-age
children have substantial math difficulties. Further, among students classified as learning
disabled, arithmetic difficulties are as pervasive as reading problems. As Rhymer and
colleagues (2000) pointed out, many students identified with a learning disability also
experience math problems. Specifically, more than 50% of students with a learning
disability have Individual Education Program (IEP) goals in math. In the most recent
National Assessment for Educational Progress (NAEP, 2005), 43% of 4l grade students
with disabilities scored below basic level in math. By the time students have completed
81 grade, this number increases to 68% (Neidorf, Binkley, & Stephens, 2006). The same
progress report revealed that while the mathematics performance of 35% of fourth-
graders was classified as proficient or above, 21% of the nation's fourth graders
demonstrated mathematics performance levels considered below basic.
Fuchs and Fuchs (2001) studied the math skills of 14-year old, general education
students, and found that only 85% mastered computational addition, 81% mastered
subtraction, 54% mastered multiplication, and 54% mastered division. Given those
numbers, there is a growing interest in early mathematics difficulties and a need for
implementing more effective teaching procedures to increase overall math proficiency.
As there is an alarming number of students experiencing difficulties in math, researchers
and educators alike are calling for assessment tools and effective interventions to be used
to address shortcomings in math performance (Fuchs & Fuchs, 2001).
As Carpenter (1985) documented, special education teachers may spend as much
as one-third of instructional time remediating math deficiencies. However, the time may
be used on ineffective instructional procedures without data to demonstrate math
performance improvement. The use of ineffective math practices is also apparent in the
general education classroom and might be a result of the lack of quality interventions
available for remediation in this subject area (Fuchs & Fuchs, 2001).
Further, it has been documented in the literature that students in the United States
(U.S.) perform significantly poorer on math tests than students from other industrialized
nations (Jitendra, Salmento, & Haydt, 1999; Stedman, 1997). Specifically, the average 8th
grade student in the U.S. is about two years behind students in other countries in math
performance. As a result of U.S. students' poor performance in math, the National
Council of Teachers of Math (NCTM; 1989) has developed curricula and evaluation
standards that require students to meet high levels of academic achievement. Yet, math
problems still remain widespread and serious.
Lloyd (1978) indicated that educational difficulties for dropouts begin as early as
elementary school. In third grade, numerous characteristics differentiate later high school
dropouts from students who will graduate. These predictors include achievement,
intelligence, socioeconomic status, retention, and absences. Lloyd demonstrated that 70%
of high school dropouts could be correctly identified in third grade when looking at those
predicting variables.
3
In a more recent study by Manzo and Galley (2003) less than one third of fourth
graders in 2003 met or exceeded the National Assessment of Educational Progress
proficiency standards in math, revealing how pressing the need for effective math
assessment and intervention is. The gap between low-achieving students in math and
high-achieving students may be remediated by providing effective instruction for all
students and remedial interventions for students at-risk for failure.
The Era of Accountability
Through various national initiatives, attempts are being made to provide early
intervention for academic deficits in areas such as math and reading. Two of the most
influential initiatives include the No Child Left Behind Act (NCLB, 2001) and the 2004
reauthorization of the Individuals with Disabilities Education Improvement Act (IDEA).
The Zeitgeist of the contemporary educational agenda requires professional accountability
with routine progress monitoring to ensure adequate student response to instructional and
intervention procedures.
Progress monitoring tools need to produce reliable and valid data that determine
whether all students are making adequate academic progress. Further, assessments need
to provide data that detect which students are in need of supplemental intervention early.
Assessments also need to be sensitive to instructional gains and intervention effects, time
efficient, and easy to administer by teachers. Finally, these systems need to yield
instructionally relevant data that can be used to alter instruction for students.
School officials are now urged to administer reliable, time-efficient, and valid
assessments and make data-based decisions regarding resource allocation, referrals,
instructional planning, and determining the least restrictive environment (Barnett, Daly,
4
Jones, & Lentz, 2004). No Child Left Behind (2001) focuses primarily on accountability
in the instructional process, the improvement of academic skills in those students who
exhibit deficits, and the elimination of the achievement gap between students of different
ethnic groups, socio-economic strata, and gender (Browder & Cooper-Duffy, 2003).
Identifying and intervening with students who have academic problems is reactive
and may not be sufficient for eliminating academic deficits; instead the prevention of
academic deficits should be a primary focus of educators and parents (Johnston &
Allington, 1991). Because traditionally administered standardized achievement tests have
numerous limitations (e.g., time consuming, expensive, insensitive to short-term gains),
educators and researchers alike have called for alternative assessments, specifically
educational assessment corresponding to a prevention and intervention-oriented
framework (Good, Simmons, & Kame'enui, 2001).
Statement of the Problem and Justification for Research
There is a growing body of research that describes evidence- and scientifically-
based assessment procedures that can be used to identify effective individualized
interventions for struggling readers. The brief experimental analysis (BEA) of reading
fluency interventions (Daly, Bonfiglio, Matson et al., 2006) has been used to quickly
identify effective individualized interventions for students who struggle with reading
fluency. Interventions identified during a brief experimental analysis have been shown to
produce an immediate impact on student performance and to be effective over longer
periods of time. Additionally, identified interventions have been shown to be superior to
least effective interventions during extended analyses. Such an approach to assessment
appears to hold promise for use within a response to intervention (Rtl) system.
5
While there is a research body demonstrating the effectiveness of the BEA of
reading fluency interventions for quickly identifying effective interventions, scant data
are available for assessment procedures that quickly identify effective math fluency
interventions. Such an approach to assessment may prove critical for the development of
a comprehensive Rtl system that goes beyond assessment and intervention for reading.
Purpose of the Study
Cover-copy-compare, interspersal techniques, contingent reward, and constant
time delay have been identified as effective interventions for improving academic
responding in terms of accuracy and fluency. However, the effects of these interventions
on improving math performance for individual students have been evaluated to a lesser
degree in sound research studies. Additionally, while these interventions are research
supported, individual student response to intervention may be idiographic (Noell,
Freeland, Witt, & Gansle, 2001). With the new accountability regulations of IDEA and
NCLB and within the Rtl framework, interventions have to be empirically validated and
provide adequate data to make educational decisions. According to Kazdin and Weisz
(2003), evidence-based or empirically validated treatments refer to those interventions
that have evidence on their behalf, use replicable procedures, have been evaluated in
well-controlled experiments, and have shown replication of effects.
Schools and teachers alike are now accountable for determining and documenting
progress for individual students. Given that students often respond differently to various
intervention components, individualized assessments are necessary to precisely identify
the most effective instructional components. The purpose of the present study was to
examine the utility and effectiveness of BEAs on multiplication and division
6
computational skills of fourth and sixth grade students considered to be at academic risk
on a mid-year administration of a M-CBM universal screening procedure. The main
objective was to analyze the stability and effectiveness of interventions that were
identified through a BEA of math interventions, and then confirm the results through an
extended analysis of the most versus least effective intervention.
Research Questions
Research Question # 1. During a BEA of math interventions will students
demonstrate differential responding across interventions with immediate gains in
performance?
Research Question # 2. Will an intervention identified as most effective during
the BEA, when compared to the least effective intervention, result in stable, valid, and
reliable data during an extended analysis?
7
CHAPTER II
REVIEW OF THE LITERATURE
The IQ-Achievement Discrepancy Model for Identifying Students with Learning
Disabilities
The idea of identifying children who struggle academically and providing
necessary services in schools led to the establishment of learning disability categories and
corresponding federal regulations (Vaughn, Linan-Thompson, & Hickman, 2003). Since
the first implementation of those regulations in 1977, the number of students identified as
learning disabled (LD) has continuously increased. According to Vaughn et al. (2003),
LD identifications have increased by as much as 200%, with more than 50% of students
in special education classes being served under the disability category, LD. According to
the National Education Association (2007), the cost of educating students in special
education is more than double that of students in general education. Currently, the cost
per student in general education averages $7,552, whereas the cost per special education
student averages $ 16,921 per year.
In the past, educational systems dealing with students suspected of having
academic difficulties have required students to be retained or to fail to make adequate
progress for lengthy periods before they qualify for special education services.
Characterized as a "wait to fail" model, students have to show a large discrepancy
between potential and actual achievement, usually indicated by the measured 15-point
difference between scores on an intelligence test and scores on an achievement test.
Several research studies have demonstrated numerous flaws associated with the
IQ-Achievement discrepancy model (Fuchs, Mock, Morgan, & Young, 2003; Gresham,
2001; Marston, Muyskens, Lau, & Canter, 2003). The following represents key problems
associated with the discrepancy model: (a) general reliability, (b) discriminative validity,
(c) wait-to-fail model, and (d) lack of treatment utility.
First, because the IQ-achievement discrepancy model relies upon one point in
time assessment data, it may lack reliability and stability. Achievement scores can change
over time and different assessment instruments may yield different scores in the same
area. Specific reliability problems for IQ-Achievement discrepancy models pertain to a
concept of measurement error and regression to the mean. All IQ and achievement tests
are measured with error because they contain constructs that are latent and can only be
measured partially. These small amounts of measurement error lead to regression effects
and hold for comparisons of correlated tests or re-administration of the same test (Fuchs,
et al., 2003; Gresham, 2001; Marston et al., 2003).
Regression to the mean occurs when there is an imperfect correlation between two
variables (i.e., IQ and achievement scores). The effects are such that extreme scores on
one variable are matched with scores that are less extreme on the other variable, resulting
in high scores regressing downward toward the mean, whereas low scores regress upward
toward the mean. Thus, individuals who score above the mean on the IQ test are likely to
obtain lower achievement test scores. In contrary, individuals with an IQ score below the
mean are likely to obtain achievement scores that move towards the population mean.
Ironically, regression to the mean may result in classifying higher IQ children with
achievement above the range as being learning disabled, or it may result in children
obtaining higher achievement scores than IQ scores (Fuchs et al., 2003; Gresham, 2001).
9
Further reliability problems of the discrepancy model pertain especially to
younger students in the lower grades. IQ scores may vary considerably so that they
provide only limited information about long-term abilities. As Fletcher and colleagues
(2005) pointed out, many years of research data have shown that the discrepancy model
does not reliably identify students with learning disabilities and does not establish or
confirm the presence of a learning disability, even though it does hold some apparent face
validity. Fletcher and colleagues also pointed out that reliability ultimately sets an upper
limit on validity because there can be no validity without reliability.
An important validity issue related to the IQ-Achievement model is that
classifications of children as discrepant versus low achieving lack discriminant validity.
In essence, the discrepancy approach fails to distinguish the qualitatively different
subgroup of students with a learning disability from a much larger group of low
achievers. Current research suggests that especially young, struggling readers with an IQ-
Achievement discrepancy perform similarly on many cognitive tasks related to reading,
phoneme awareness, orthographic awareness, short-term verbal memory, visual analysis,
and word retrieval as do students without the IQ-Achievement discrepancy. Taking these
findings into consideration, the discrepancy model is not necessarily a valid marker for
identifying the presence or absence of a learning disability (Stanovich & Siegel, 1994).
Another major flaw of the discrepancy model pertains to the time that has to pass
before a learning disability can be diagnosed. Historically, educational systems dealing
with students suspected of having learning difficulties have required students to be
retained or to fail to make adequate progress for lengthy periods before they are evaluated
for special education services (Brown-Chidsey & Steege, 2005; Marston, 2005).
10
Characterized as a "wait to fail" model, students have to struggle academically for a
lengthy period of time prior to receiving services.
Additionally, students must demonstrate a significant discrepancy between
aptitude and achievement, usually indicated by the measured 15-point difference between
scores on an intelligence test (IQ) and scores on an achievement test. It is often difficult
to obtain a significant discrepancy between IQ and achievement in the early grades. This
is the result of inflated achievement standard scores for early elementary students who
identify only a few correct answers on a norm-referenced test of achievement. In other
words, standardized tests of academic achievement often possess a poor floor for students
in the early grades. Inflated achievement scores make it very difficult to obtain a
significant discrepancy between the IQ and achievement scores. As a result, early
elementary students who are struggling academically and are in need of services must
continue to fall further and further behind their peers until standard scores on
achievement tests are low enough to result in a significant discrepancy between IQ and
achievement. Therefore, these struggling students are denied needed services for an
extended period of time increasing the probability that they will never "catch up"
(Brown-Chidsey & Steege, 2005; Marston, 2005).
This one-point-in-time assessment method has been also been criticized largely by
the educational community because of the lack of focus on problem solutions. There is
little connection between the IQ-Achievement assessment used for identifying students
with a learning disability and interventions necessary to remediate academic deficits.
Further, the "wait to fail" view does not lend itself to instructional decision-making. In
essence, the model assumes that the degree of discrepancy relates to the severity of the
11
disability, and it assumes that the performance of a student with an LD ruling differs from
that of other students in the classroom (Gresham, 2001).
For example, numerous studies have consistently documented that IQ is a poor
indicator of reading ability, and scores from the IQ-Achievement model do not predict
which students will benefit from intensive, supplemental instruction (Stanovich, 2001). If
scores obtained from the discrepancy assessment do not help determine which students
will benefit from intensive instruction and which students have a LD, there may be no
compelling argument to sustain the approach.
Overall, the discrepancy model delays struggling students access to remedial
instructions. These students must fall substantially behind in their academic performance
before becoming eligible for special services. Thus, over the past few years researchers
have called for an alternative approach to identifying children in need of supplemental
instruction (Gresham, 2001).
An alternative to the IQ-Achievement discrepancy approach that has received
more attention in recent years is Rtl (Gresham, 2001). First introduced into federal
legislation in the 2004 reauthorization of the Individuals with Disabilities Education
Improvement Act (IDEA), the Rtl approach provides school districts with a potentially
more viable alternative in the assessment of and service for students suspected of having
learning disabilities (Marston, 2005).
Response to Intervention
Rtl is defined as a change in behavior or performance as a function of an
intervention (Gresham, 1991). The Rtl approach is a data-driven, objective assessment
process between academic interventions and each individual student's response to that
12
specific intervention. It is designed to meet the instructional needs of all students and
allows for systematic identification of academic and behavior problems and resolving
those difficulties with strategic interventions (Brown-Chidsey & Steege, 2005).
Traditionally, the Rtl approach has been described in terms of a collaborative
general and special education process which provides increasingly intensive interventions
in a three tier system to students who are not meeting expectations in general education.
Each tier of the Rtl approach relates to a specific level of scientifically based instruction
and/or intervention. Movement through the tiers is based on data and is dynamic in
nature, as students can enter and exit each tier on a need-to-need basis (National Center
for Learning Disabilities, 2006).
According to Brown-Chidsey and Steege (2005), the three tiers consist of:
1. Tier I: Universal screening and high quality instruction.
2. Tier II: Targeted supplemental instruction and frequent progress monitoring.
3. Tier III: Intensive intervention and frequent progress monitoring.
The focus of Tier I is quality research-based instruction from the classroom teacher for all
students. Tier I instruction is effective for approximately 80% of the student body.
Universal screening occurs during this phase to identify students at-risk for academic
failure. Students are determined to be at-risk if they do not meet a predetermined
proficiency "cut-score." The identified at-risk students then moves to Tier II.
Secondary prevention or Tier II focuses on interventions through supplemental
instruction for students not meeting the predetermined "cut-score" in Tier I. About 10-
15% of the student body is targeted by Tier II interventions. Usually the supplemental
instruction is implemented in small groups outside the context of universal instruction.
13
The length of time for this step generally does not exceed eight weeks. During those eight
weeks, student progress is monitored using a validated screening system such as
curriculum-based measurement (CBM). At the end of this period, students showing
significant progress are returned to Tier I, whereas students not demonstrating adequate
progress are moved to the next tier (Brown-Chidsey & Steege, 2005; National Center for
Learning Disabilities, 2006).
In Tier III, students receive individualized, intensive intervention that targets the
student's specific skill deficit. Students who do not respond to intensive intervention are
then considered for special education placement. More specifically, students are referred
to special education only when they fail to demonstrate sufficient academic growth
during systematic interventions when educationally valid assessment and progress
monitoring have occurred (Fuchs, Mock, Morgan, & Young, 2003; Good, Simmons, &
Kame'enui, 2001; Marston, 2005).
Students who display a dual discrepancy between their performance level and
slope as it compares to that of peers are those who should be considered for special
education comprehensive assessment and/or placement. A dual discrepancy format refers
to a student being significantly below same grade peers on academic performance
measures and the student responds poorly to supplemental instruction provided through
the Rtl model. Hence, the criteria for the dual discrepancy are low academic performance
and poor response to appropriate, supplemental instruction (Gresham, 2001).
There are two basic approaches available for delivering intervention services
within an Rtl framework: (a) the standard protocol approach and (b) the problem-solving
approach (Christ, Burns, & Ysseldyke, 2005). In the standard protocol approach, at-risk
14
students are identified and moved through a series of three successive tiers of
intervention. Each tier uses a standard, rigorously research-based intervention with only
minimal analysis of the deficit skill. The central premise is that a standard set of
empirically supported instructional interventions are implemented to prevent and
remediate academic problems. Interventions might entail paired reading activities,
reinforcement of skills through computer based programs, or direct instruction for
phonological skills (Christ et al., 2005).
Furthermore, a standard protocol approach to Rtl requires use of the same
empirically validated treatment for all children with similar skill deficits. The advantages
of this approach include: (a) interventionists are trained to conduct one intervention
correctly and to assess the accuracy of implementation, (b) large numbers of students can
participate in a generally effective treatment protocol, and (c) the standard protocol
approach facilitates greater quality control. Given that the protocols are scripted in a
standard protocol approach to Rtl, these protocols can be used to ensure greater integrity
of instruction. One major limitation to the approach is the inflexibility to individualize
interventions based on prior analysis of instructional/environmental conditions and skill
deficits (Fuchs, Mock, Morgan, & Young, 2003).
The problem-solving approach is similar to the standard protocol approach in that
at-risk students are identified and referred for interventions through the three tier process.
The fundamental difference between the two approaches is that in the problem-solving
approach, the instructional intervention provided to students varies according to
individual student needs as identified through assessment. Thus, the level of
individualization and depth of problem analysis prior to selection and implementation of
15
remedial instruction provides more sensitivity to individual differences in the problem-
solving approach (Fuchs et al., 2003).
The problem-solving approach requires systematic progression through the four
steps of (a) problem identification, (b) problem analysis, (c) plan implementation and, (d)
program evaluation (Bergan & Kratochwill, 1990). During the problem identification
stage of the problem solving model the student's academic deficit is identified and
operationally defined. Operational definition of the student's academic deficit allows for
measurement of the behavior. This requires that specific data are being obtained using
clear, concise, and descriptive terminology. Data may be collected from multiple
informants, including teachers, parents, administrators, and students.
After the problem has been sufficiently defined, the problem needs to be analyzed
to identify an intervention that has an a priori likelihood of success. Specifically, the
nature of the problem needs to be evaluated in terms of identifying the variables
associated with or causally linked to the academic problem (e.g., acquisition problem).
Activities during this step of the process include evaluating the student's skills in specific
academic areas and evaluating potential solutions in the short-term (Deno, 2002; Fuchs et
al., 2003; Gresham, 1991).
Further, interventions delivered to students should be supported by evidence of
their effectiveness in order to increase the opportunity for students to benefit from the Rtl
framework. Methods need to be in place to help educators to more rapidly validate
intervention hypotheses or suggest validity evidence for interventions. The idea is to test
interventions for their effectiveness before recommending them to teachers for
implementation (Fuchs et al., 2003).
16
Evidence of an intervention's effectiveness can be obtained through single-case
experimental designs. In single-case experimental designs, student outcomes are
regularly monitored during an initial baseline phase to observe any improvement in
performance. Further, monitoring can take place during or after an intervention is
provided. Characterized by single-subject designs, experimental or functional analyses
have previously been used to test different intervention components to identify the most
effective treatment. As Daly and colleagues (2006) pointed out, the effects of academic
responding have been studied "under the conceptual and methodological umbrella of
functional or experimental analysis" (p. 323).
Using proven problem analysis strategies (i.e., BEA) for identifying effective
interventions increases the likelihood of implementing appropriate, high quality
supplemental instruction during the plan implementation stage of the problem solving
model. In essence, the interventions should directly address the target problem based on
the data collected, while following the standards of best practice and current research.
Following plan implementation, progress monitoring data are collected and evaluated to
determine the student's response to the intervention. Additionally, data are collected
regarding intervention implementation. Intervention implementation data may include
informant report, direct observation data, or permanent product review (Bergan &
Kratochwill, 1990; Fuchs et al., 2003; Gresham, 1991).
Although the problem-solving approach includes a number of strengths (e.g.,
individualized intervention), there are some drawbacks. First, problem-solving
approaches require some expertise to implement. School personnel may be lacking in the
skills necessary for accurate use of a problem-solving model. Second, the problem-
17
solving process may be time-consuming with regard to completing the individualized
assessments that are used to develop individualized interventions. Conversely, standard
protocol approaches include quickly placing students in intervention groups or programs
as soon as they are identified as needing intervention.
Benefits and Limitations ofRtl
As VanDerHeyden and Witt (2005) point out, the benefits of Rtl include a
proactive approach that allows for early identification and implementation of
interventions for academically at-risk students. Rtl proposes a comprehensive,
prevention-oriented framework for maximizing learning and educational outcomes for all
students (Brown-Chidsey & Steege, 2005). Further, Rtl reduces the time students wait
before receiving additional instructional assistance and ensures that those students receive
appropriate instruction before special education placement is considered. It is a cost-
effective approach that increases accountability for student learning and academic
progress by means of measuring growth rates and levels of achievement. The direct link
between assessment and intervention also benefits teachers as they can make instructional
decisions based on data that will allow them to meet the needs of students in their
classroom. Because of the data driven decision making and continuous monitoring of
students' progress, more accurate decisions can be made for necessary special education
placement (VanDerHeyden & Witt, 2005).
According to the National Center for Learning Disabilities (2006), limitations of
the Rtl approach include the limited research on the topic outside of the early elementary
grades and the academic area of reading. Additionally, Rtl alone is not a sufficient
approach to identify learning disabilities, and additional data need to be collected to
18
comply with the evaluation requirements of IDEA. Other concerns include issues related
to choosing the best intervention with the optimal length and intensity. As Gresham
(2002) stated, it is difficult to determine appropriate interventions especially given the
lack of research in certain academic areas. Without research to support the decision
making process, implementing the most effective intervention is a difficult endeavor.
Despite these limitations, if implemented correctly, Rtl enables students at risk for
learning difficulties to get early, more relevant academic assistance. Through the
research-based and data-based approach, instructional needs of all students can be
addressed and effective educational interventions can be implemented.
Curriculum-Based Assessment
Because Rtl is a data-based decision making approach and employs the use of a
variety of assessment and instructional methods, tools to obtain data on academic skills
are needed. Curriculum-based assessment (CBA) is one tool that allows for routine data
collection of academic skills. CBA measures are frequently being used to evaluate the
academic performance of students in the basic academic areas of reading, math, spelling,
and written expression. Deno (1987) defined CBA as any set of measurement activities
that uses "direct observation and recording of a student's performance in the local
curriculum as a basis for gathering information to make instructional decisions" (p. 41).
According to Hintze, Christ, and Methe (2006), CBA represents a variety of assessment
practices including (a) CBA for instructional design (CBA-ID), (b) criterion-referenced
CBA (CR-CBA), (c) curriculum-based evaluation (CBE), and (d) curriculum-based
measurement (CBM).
19
Even though all four assessment practices share commonalities, distinctions can
be made between the mastery measurement model (i.e., CBA-ID, CR-CBA, and CBE)
and the general outcome measurement model (i.e., CBM). The two main distinctions
between CBA and CBM are as follows: 1.) the difference in the skill that is being
measured at any given point in time, and 2.) mastery versus general outcome measure
(Hintze et al., 2006).
Functionally, the primary difference between CBA and CBM centers around the
skill that is being measured at any given point in time. CBA measures the behavior that is
being targeted, whereas CBM measures the behavior that is ultimately desired. For
example, if targeting the fluency rate of early literacy skills such as letter sounds, CBA
measures would monitor each session what production of letter sounds had been mastered
before moving on to the next logical steps (i.e., blending of sounds). Conversely, CBM
procedures would measure sound blending fluency each time despite the subskill that had
been targeted during the intervention session (Fuchs, 2004; Hintze et al., 2006).
Another difference between CBA and CBM is linked to the mastery versus
general outcome model. In a mastery measurement model such as CBA, skills within a
logical hierarchy are being taught and repeatedly measured. Once a skill is mastered the
next logical skill within the hierarchy is being taught. In contrast, the general outcome
measurement model (i.e., CBM) reflects a broader selection of skills required to
successfully perform any given desired outcome behavior. CBM can be used to monitor
the effectiveness of an intervention for a specific child over a longer period of time and
relates more closely to the functional outcome for which a specific intervention is being
provided (Hintze et al., 2006).
20
Both CBA and CBM are beneficial tools in demonstrating child growth and
development over time in response to instruction. Within a problem-solving framework,
CBA measurement data can be used to test instructional hypotheses and teachers can see
whether targeted skills have been taught effectively. Further, eligibility decisions can be
tied to CBM data through progress monitoring and response to instructional procedures
(Hintze et al., 2006).
Curriculum-Based Measurement
In an effort to screen for academic deficits, one general outcome measure of
students' achievement and progress is CBM. Initially, CBM was developed to evaluate
the effects of basic skills instructional programs, monitor students' growth in relevant
areas of school performance, and to formatively assess progress as outlined by
Individualized Education Plans (Salvia & Ysseldyke, 1978) with a focus on special
education progress monitoring. The initial focus has been extended over the past two
decades and currently includes universal screening and general education progress
monitoring (Shinn, 1989). Currently, CBM is most often used as an indicator of reading
development, or as part of the problem-solving model in the Rtl framework (Fuchs,
2004).
Because CBM as a standardized assessment procedure provides the tool for
screening, progress monitoring, and evaluating instruction, decision making using CBM
can take several forms. CBM can be used to identify high and low performers or it can be
used to make within-student comparisons. Student growth can be monitored over time
and instructional changes that may benefit the student can take place. With this in mind,
the progress monitoring data collected through CBM procedures can be used to make
21
decisions on the individual or group level (Christ, 2002).
The use of CBM as a sensitive progress monitoring and screening device in the
problem-solving model has been implemented in various settings because it is a quick
assessment tool based on the students' curriculum. It can be administered in a one-to-
three minute assessment session on a daily basis. As reported by Shinn (1989), these
standardized assessment strategies are valid and reliable tools to document student
performance continuously during instruction, especially in a special education setting,
and more recently, in general education settings as well. Further, screening of all children
on three different occasions during the year provides useful information about how
effective the core curriculum and instruction are in the school and allows for
identification of those students who are not making acceptable progress in the core
curriculum.
Universal screening and progress monitoring can be easily integrated into the
problem solving model because CBM screening measures are recognized as valid and
reliable indicators of student performance. Further, CBM is an appropriate tool in the
problem solving model because it assesses both current performance and rate of growth
(Fuchs & Fuchs, 1997; Shinn, 1989). Different CBM probes evaluate different assets
(e.g., mixed or single skill math probes), meaning multiple forms of probes are available
or can be constructed and then administered in little time and with little expense. Scoring
is simple and does not require extensive training (Deno, 1985).
One of the greatest advantages of CBM is the sensitivity to small changes over
short periods of time in students' academic performance. Most other assessment devices
such as published, norm-referenced achievement tests are logistically unfeasible to
22
measure students' growth and impractical to be administered on a frequent basis (Shapiro
& Derr, 1987). The sensitivity to change over a short period of time is an important
component of any ongoing formative evaluation as it allows for frequent decision making
about intervention and instruction effects (Daly, Martens, Dool, & Hintze, 1998).
In addition to being sensitive to student change over time, CBM measures are
appropriate for repeated administration. Both sensitivity and repeated administration are
desirable attributes of assessment instruments to assess academic skill development.
Currently, the literature has focused on providing examples of how the sensitivity of oral
reading fluency to appropriate interventions can be assessed (e.g., Daly et al., 1998; Daly
etal., 1999; Noelletal., 2001).
Math CBM
Student performance through the use of CBM can be assessed in four different
academic areas including reading, spelling, written expression, and math. Extensive
research has been conducted on reading CBM; however there has been less focus on the
three other academic areas. The research available on math CBM (M-CBM) has
documented only limited technical adequacy (Shinn, 1989).
M-CBM is expressed as a rate and the primary unit of measurement is digits
correct and/or incorrect per minute. Furthermore, M-CBM has been documented to
measure two broad constructs of math performance: computation and
application/problem solving. Computation requires students to work math problems
where knowledge about concepts, strategies, and facts is asked. Applications are math
problems that require the students to use and understand math concepts to solve more
complex problems such as applied word problems, volume, measurements, and
23
temperature. M-CBM was designed to measure both broad components and thus, is said
to be a measure of general math achievement (Schul Thurber, Shinn, & Smolkowski,
2002).
Relatively few studies have been conducted to examine M-CBM validity and
found generally lower criterion validity than it is the case for reading, writing, and
spelling CBM. Median correlations of .43 and .54 were found between problem solving
M-CBM and math operations with the Metropolitan Achievement Test (MAT). As Shinn
(1989) pointed out, reasons for the lower relations of M-CBM with other criterion
measures may be due to the limited content validity of those math criterion measures.
Additionally, correlations between M-CBM and math criterion measures have been
demonstrated to increase with the increase of students' reading skills. Hence, math tests
used as criterion could be measuring more than math computation skills (Skiba,
Magnusson, Marston, & Erickson, 1986). Generally speaking, the magnitude of math
validity does increase with the age of the students tested. Some research however has
demonstrated adequate validity for M-CBM. For example, Shinn and Marston (1985)
demonstrated adequate construct validity for CBM math measures, indicating that scores
on multiplication, division, and mixed-operations grade-level probes differentiated
students in regular versus special education classrooms.
Another validity study has focused on investigating the technical adequacy of
early math CBM probes. In order to acquire higher order math concepts, the acquisition
of basic numeral concepts serves as a foundation. A failure to acquire those early math
skills can have lasting, negative influences on later math performance and confidence a
student brings to experiences with math (Clark & Shinn, 2004). M-CBM probes used in
24
early identification have been constructed and validated to prevent math problems from
developing. These probes test number identification fluency, oral counting, missing
numbers, and quantity discrimination.
Clark and Shinn (2004) examined the reliability, validity, and sensitivity of four
experimental early mathematics measures (i.e., oral counting, number discrimination,
quantity discrimination, and missing number) designed for use in early identification and
formative evaluation. Fifty-two first grade students participated in the study and were
examined on interscorer, alternate form, test-retest reliability, and concurrent and
predictive validity. Clark and Shinn (2004) demonstrated that the four experimental
measures each resulted in sufficient evidence of their reliability, validity, and sensitivity.
In terms of reliability, research has found high internal consistency and interscorer
reliability with correlations ranging from .90 to .98. Further, M-CBM probes have been
demonstrated to be reliable when examining the test-retest and alternate form estimates
(Tindall, Marston, & Deno, 1983). Correlations for test-retest reliability ranged from .78
to .93, whereas reliability on alternate forms ranged from .48 to .72. Because of the
limited number of studies investigating validity and reliability components of M-CBM,
more research is needed to determine the validity of M-CBM procedures.
While CBM is an empirically sound approach that is useful for formative
evaluation and can be used in a problem-solving model to make important educational
decisions, it is limited in terms of identifying a specific intervention that is most effective
to remediate specific academic deficits for individual students. Methods that can be used
in conjunction with CBM measures include experimental approaches such as brief BEAs

25
of instructional components based on the instructional hierarchy (Daly, Witt, Martens, &
Dool, 1997).
Instructional Hierarchy
As students master new academic skills, they move through a predictable
sequence of learning stages. The instructional hierarchy is a behavior-analytic approach
to assessment and intervention comprised of four stages: (a) acquisition, (b) fluency, (c)
generalization, and (d) adaptation (Haring, Lovitt, Eaton, & Hanson, 1978). These four
stages of academic skill development are linked to appropriate instructional techniques.
At stage one, the acquisition stage, a new skill is being introduced and
measurements of the ability to accurately produce the skill are collected. Instructional
strategies used during the acquisition stage include modeling, prompting, student
practice, and immediate feedback. Once the student is able to accurately complete the
target skill, emphasis is placed on increasing the speed of responding (i.e. fluency). This
is stage two of the instructional hierarchy and involves drill and practice activities. The
goal of the generalization phase is to extend the student's use of the new skill to a variety
of settings and situations, while accurately discriminating between the target skill and
similar skills. For academic tasks this can be achieved by training students under criterion
stimulus conditions. After the student is able to generalize the skill to different settings
and situations, mastered skills are used in new and modified ways in order to adapt to
other demands or situations. Frequent teacher feedback and numerous practice
opportunities are necessary to successfully move through all four stages of the
instructional hierarchy and to promote maintenance of the newly acquired skill (Daly &
Martens, 1994).

26
The instructional hierarchy allows for the linkage between assessment and
intervention. Assessment may be used to identify where a student lies on the instructional
hierarchy and such information may be linked to intervention development. For example,
if assessment data indicate that a student performs a skill slowly while making many
errors then intervention may include modeling, prompting, practice, and immediate
feedback to increase accurate responding. Conversely, if a student performs a skill
accurately but slowly, then intervention may include independent drill and practice so
that the student begins to develop fluency for the skill (Daly, Lentz, & Boyer, 1996).
As Daly et al. (1997) stated, appropriate intervention depends largely on
assessment results measuring levels of student responding across the levels of the
instructional hierarchy. Each level can potentially be an intervention target. To elicit
academic responding, a functional link between responding and instructional procedures
must exist because instructional procedures contain relevant treatment components. In
order to link assessment to effective interventions, further analysis is warranted. One
method that can aid in those decisions about intervention selection is by conducting a
BEA of instructional procedures (Daly et al., 1997; Shinn & Bamonto, 1998).
Brief Experimental Analysis
BEA of instructional interventions has been found to be a valuable tool for
quickly identifying instructional interventions that have an a priori likelihood of success
(Daly et al., 1997). Similar to a brief functional analysis (Northup, Wacker, Sasso, &
Steege, 1991), BEA of academic interventions involves rapid manipulation of
experimental conditions; however, a BEA includes systematic evaluation of two or more
procedures designed to improve academic performance. Conversely, a brief functional
27
analysis manipulates environmental conditions in an attempt to identify the function or
cause of behavior. However, both assessment procedures are used to quickly identify
interventions that have an a priori likelihood of success.
As Barnett et al. (2004) described:
in brief experimental analysis, a series of independent hypothesis-derived
empirical treatments or combinations are implemented as needed in ascending
order of some relevant dimension, such as intrusiveness, ease, or difficulty.
Analyses are based on rapid, single exposures of interventions for only a few
sessions (i.e., less than three data points), and brief withdrawals and replications
are used to strengthen inferences, (pp. 72-73)
Further, in a BEA the effects of each instructional condition on the target academic
problem are compared to baseline and the most effective condition is implemented over
an extended period of time. Brief assessments allow for the use of experimental analyses
to directly measure problem behaviors while manipulating specific instructional variables
(Daly et al., 1997). Instructional variables identified through this process can then be
immediately implemented to target academic difficulties. Additionally, assessment
conditions in a BEA enable researchers and educators to test instructional strategies
directly and efficiently.
In order to apply a BEA to academic interventions, Martens et al. (1999)
mentioned several features that need to be considered. First, academic interventions
require the participant to learn new skills. This learning must occur quickly, resulting in
immediate, measurable changes in behavior. Only then is it possible to evaluate the
strength of the interventions using brief test conditions. Second, these measures should be
28
a direct assessment of the problem behavior, occur during or immediately following the
test condition, and involve a rate or frequency measure. Third, a strategy must be applied
allowing for comparison of multiple treatment alternatives to each other and to a no
treatment baseline. Additionally, this strategy (i.e., experimental design) must provide
data to conclude that treatment was responsible for the changes in the observed behavior.
Recent studies have demonstrated the usefulness of BEA methods for testing
performance versus skill deficits in academic areas such as math and reading. Daly et al.
(1997) proposed using BEA procedures to isolate several hypotheses for academic
failure. Performance deficits occur when an individual possesses the skill necessary to
competently perform a task but the individual is not performing the skill in a manner that
meets environmental expectations. Adequate performance occurs only infrequently
because the environment does not support the exhibition of the target behavior. To test
this hypothesis, incentives are provided for display of the academic skill. Skill deficits
occur when the individual does not possess the skill in their repertoire to competently
perform the skill to criterion. The skill may not yet have been mastered because of
insufficient opportunities to respond. The child has not yet acquired the necessary skill
and requires an increase in the number of successful learning trials. Each of the learning
trials must include modeling, rehearsal, and corrective feedback.
Duhon et al. (2005) conducted brief assessments and extended analyses of skill
versus performance deficits to identify effective interventions for students struggling with
various academic tasks (i.e., math fluency, written expression, grammar). Brief
assessments were conducted comparing reward and instructional procedures to test for
skill versus performance deficits. Following brief assessments, interventions were
29
implemented over an extended period of time to evaluate the utility of the brief
assessments at predicting students' long term response to instruction. Results indicated
that interventions identified as most effective during the brief assessments were most
effective during extended analyses. These results suggested that brief skill versus
performance deficit assessments may predict students' long term response to instruction.
Other studies have focused on utilizing BEA procedures for testing different
instructional strategies. The primary purpose of using BEA methods is to assess for
intervention effectiveness prior to long-term implementation. The brief analysis provides
for an a priori evaluation of the intervention's potential for long-term success. Thus, the
quality and effectiveness of interventions can successfully be linked to the
meaningfulness and relevance of the problem-solving process (Barnett et al., 2004).
BEA of Reading Fluency Interventions
Brief experimental analyses have been applied in school settings as a strategy for
comparing various interventions (e.g., Daly et al., 1999; Eckert, Ardoin, Daly, &
Martens, 2002). The majority of research evaluating the use of BEA of academic
concerns has focused on reading fluency. BEA for reading fluency has typically involved
manipulating two or more treatments as short test conditions while evaluating changes in
students' oral reading fluency. Generally, research has shown BEA approaches to be
successful for quickly identifying effective interventions for oral reading fluency (i.e.,
Daly et al., 1999; Jones & Wickstrom, 2002). Daly and colleagues (1998) suggested that
BEA methods could also help rule out ineffective interventions that fail to result in
immediate positive changes in student achievement and therefore may be unlikely to be
effective over an extended period of time.

30
Daly et al. (1998) used brief assessments to select interventions for oral reading
fluency. Three regular education students were included in the study. All of the
participants were recommended by their classroom teachers for reading interventions. In
a series of potential reading interventions, including repeated reading, listening passage
preview, phase drill, contingent reinforcement, and instructional match, effectiveness of
each intervention to improve oral reading fluency was examined for each individual
child. The assessment procedure led to the identification of a successful intervention,
which was then confirmed via a mini-replication. Daly et al. suggested that this method
could help evaluate interventions and help rule out ineffective interventions that fail to
have an immediate positive impact on the students' achievement.
In another study, Daly and colleagues (1999) extended BEA to include a
sequential application of reading interventions to improve oral reading fluency in four
students. Students were enrolled in first through sixth grade general education classrooms
and were referred by the teacher due to reading difficulties. All participants were
instructed on their instructional level of oral reading fluency. Instructional treatments
included a reward condition, repeated reading, sequential modification, and listening
passage preview. These interventions were administered individually and combined until
oral reading fluency improved on instructional passages and on passages with high
content overlap. Results indicated that all participants improved their reading fluency
during at least one of the treatment conditions. Further, results showed that a BEA could
be utilized to identify effective interventions and rule out ineffective interventions.
In a study conducted by Noell et al. (2001), a BEA was used to predict student's
response to instructional interventions when implemented during brief assessments and
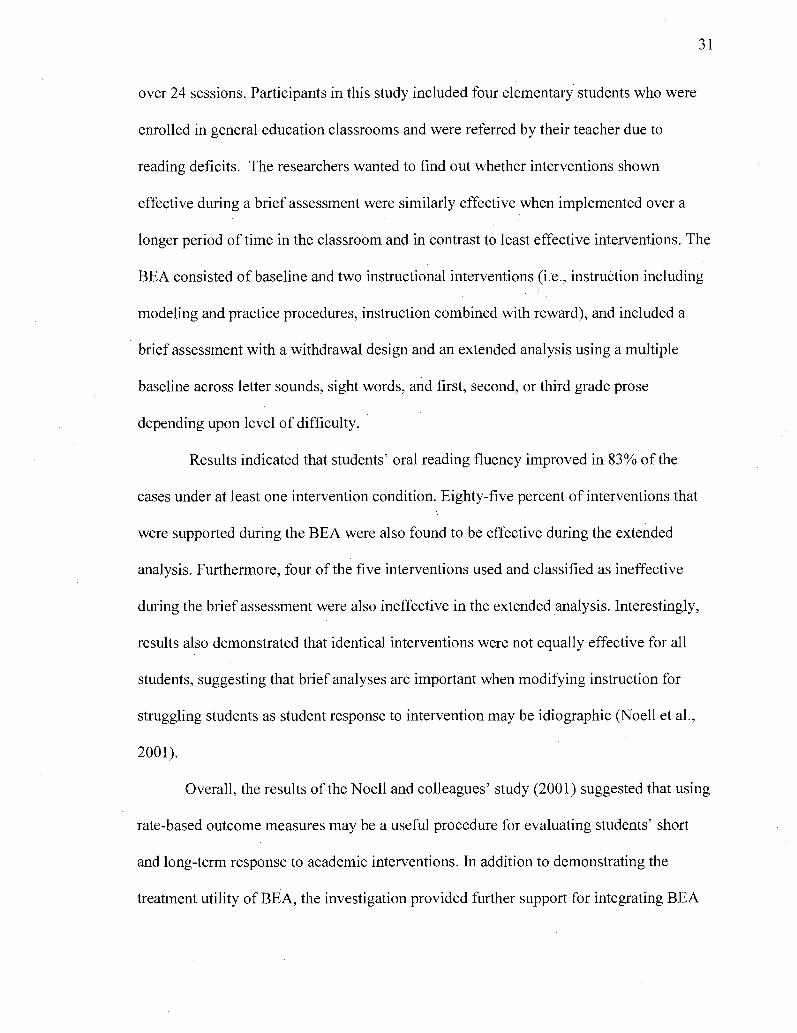
31
over 24 sessions. Participants in this study included four elementary students who were
enrolled in general education classrooms and were referred by their teacher due to
reading deficits. The researchers wanted to find out whether interventions shown
effective during a brief assessment were similarly effective when implemented over a
longer period of time in the classroom and in contrast to least effective interventions. The
BEA consisted of baseline and two instructional interventions (i.e., instruction including
modeling and practice procedures, instruction combined with reward), and included a
brief assessment with a withdrawal design and an extended analysis using a multiple
baseline across letter sounds, sight words, and first, second, or third grade prose
depending upon level of difficulty.
Results indicated that students' oral reading fluency improved in 83% of the
cases under at least one intervention condition. Eighty-five percent of interventions that
were supported during the BEA were also found to be effective during the extended
analysis. Furthermore, four of the five interventions used and classified as ineffective
during the brief assessment were also ineffective in the extended analysis. Interestingly,
results also demonstrated that identical interventions were not equally effective for all
students, suggesting that brief analyses are important when modifying instruction for
struggling students as student response to intervention may be idiographic (Noell et al.,
2001).
Overall, the results of the Noell and colleagues' study (2001) suggested that using
rate-based outcome measures may be a useful procedure for evaluating students' short
and long-term response to academic interventions. In addition to demonstrating the
treatment utility of BEA, the investigation provided further support for integrating BEA
32
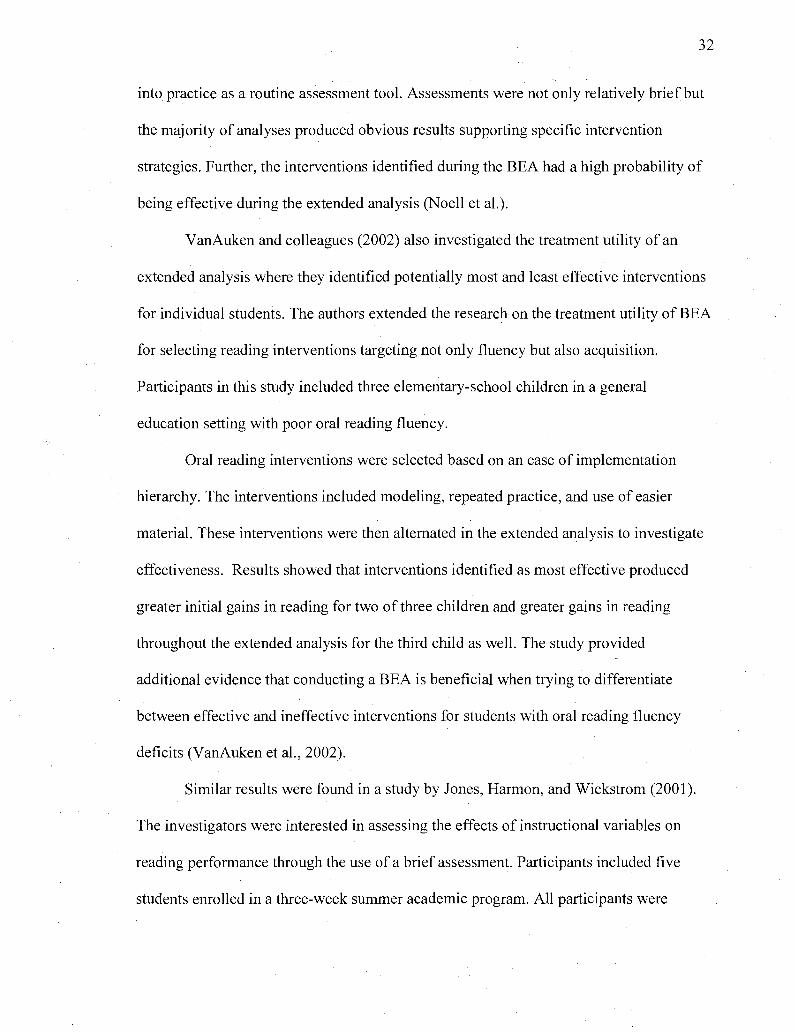
into practice as a routine assessment tool. Assessments were not only relatively brief but
the majority of analyses produced obvious results supporting specific intervention
strategies. Further, the interventions identified during the BEA had a high probability of
being effective during the extended analysis (Noell et al.).
VanAuken and colleagues (2002) also investigated the treatment utility of an
extended analysis where they identified potentially most and least effective interventions
for individual students. The authors extended the research on the treatment utility of BEA
for selecting reading interventions targeting not only fluency but also acquisition.
Participants in this study included three elementary-school children in a general
education setting with poor oral reading fluency.
Oral reading interventions were selected based on an ease of implementation
hierarchy. The interventions included modeling, repeated practice, and use of easier
material. These interventions were then alternated in the extended analysis to investigate
effectiveness. Results showed that interventions identified as most effective produced
greater initial gains in reading for two of three children and greater gains in reading
throughout the extended analysis for the third child as well. The study provided
additional evidence that conducting a BEA is beneficial when trying to differentiate
between effective and ineffective interventions for students with oral reading fluency
deficits (VanAuken et al., 2002).
Similar results were found in a study by Jones, Harmon, and Wickstrom (2001).
The investigators were interested in assessing the effects of instructional variables on
reading performance through the use of a brief assessment. Participants included five
students enrolled in a three-week summer academic program. All participants were
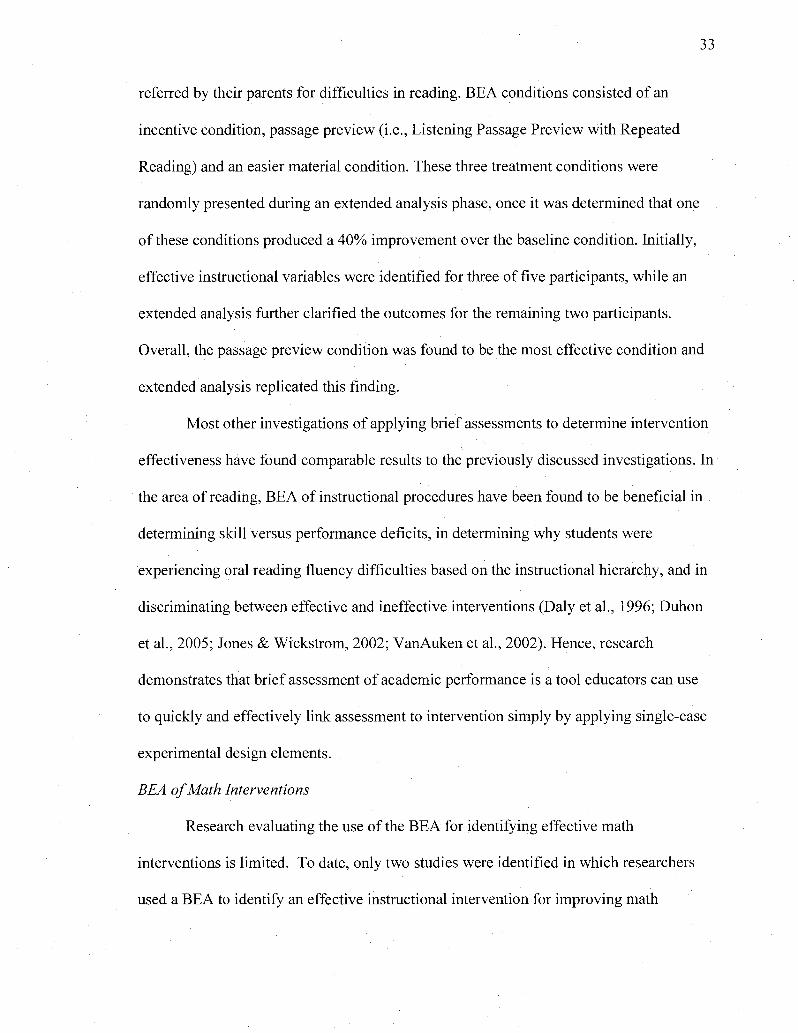
33
referred by their parents for difficulties in reading. BEA conditions consisted of an
incentive condition, passage preview (i.e., Listening Passage Preview with Repeated
Reading) and an easier material condition. These three treatment conditions were
randomly presented during an extended analysis phase, once it was determined that one
of these conditions produced a 40% improvement over the baseline condition. Initially,
effective instructional variables were identified for three of five participants, while an
extended analysis further clarified the outcomes for the remaining two participants.
Overall, the passage preview condition was found to be the most effective condition and
extended analysis replicated this finding.
Most other investigations of applying brief assessments to determine intervention
effectiveness have found comparable results to the previously discussed investigations. In
the area of reading, BEA of instructional procedures have been found to be beneficial in
determining skill versus performance deficits, in determining why students were
experiencing oral reading fluency difficulties based on the instructional hierarchy, and in
discriminating between effective and ineffective interventions (Daly et al., 1996; Duhon
et al., 2005; Jones & Wickstrom, 2002; VanAuken et al., 2002). Hence, research
demonstrates that brief assessment of academic performance is a tool educators can use
to quickly and effectively link assessment to intervention simply by applying single-case
experimental design elements.
BEA of Math Interventions
Research evaluating the use of the BEA for identifying effective math
interventions is limited. To date, only two studies were identified in which researchers
used a BEA to identify an effective instructional intervention for improving math
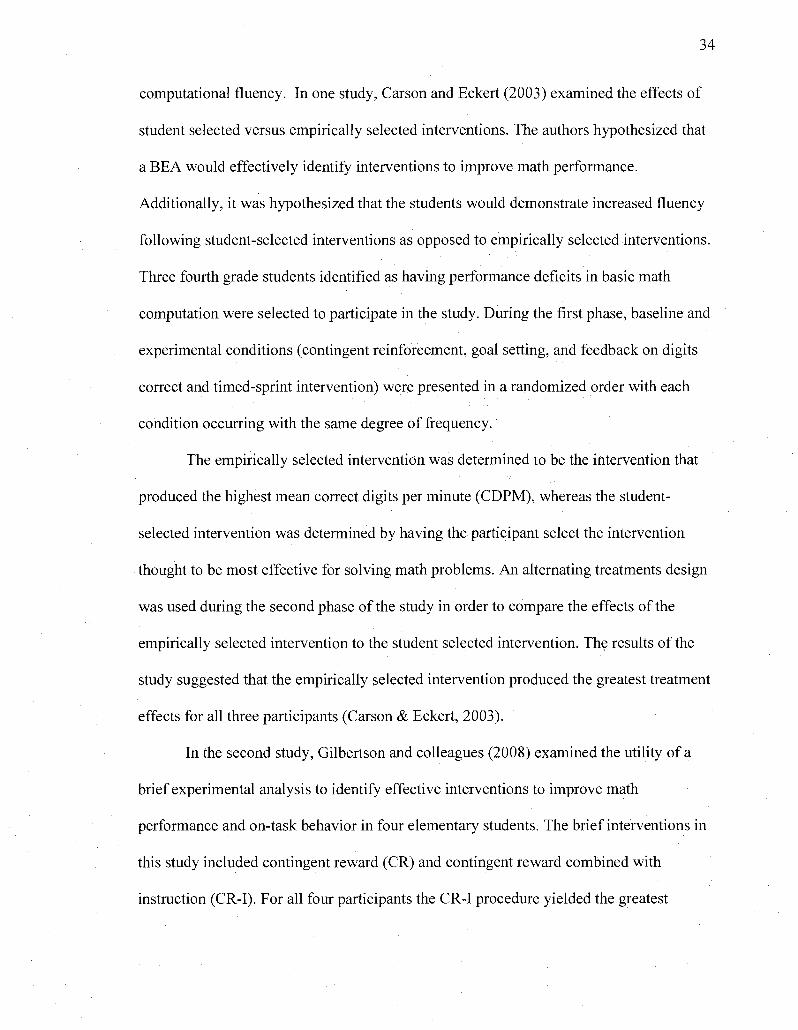
34
computational fluency. In one study, Carson and Eckert (2003) examined the effects of
student selected versus empirically selected interventions. The authors hypothesized that
a BEA would effectively identify interventions to improve math performance.
Additionally, it was hypothesized that the students would demonstrate increased fluency
following student-selected interventions as opposed to empirically selected interventions.
Three fourth grade students identified as having performance deficits in basic math
computation were selected to participate in the study. During the first phase, baseline and
experimental conditions (contingent reinforcement, goal setting, and feedback on digits
correct and timed-sprint intervention) were presented in a randomized order with each
condition occurring with the same degree of frequency.
The empirically selected intervention was determined to be the intervention that
produced the highest mean correct digits per minute (CDPM), whereas the student-
selected intervention was determined by having the participant select the intervention
thought to be most effective for solving math problems. An alternating treatments design
was used during the second phase of the study in order to compare the effects of the
empirically selected intervention to the student selected intervention. The results of the
study suggested that the empirically selected intervention produced the greatest treatment
effects for all three participants (Carson & Eckert, 2003).
In the second study, Gilbertson and colleagues (2008) examined the utility of a
brief experimental analysis to identify effective interventions to improve math
performance and on-task behavior in four elementary students. The brief interventions in
this study included contingent reward (CR) and contingent reward combined with
instruction (CR-I). For all four participants the CR-I procedure yielded the greatest
35
increase in math fluency during the brief assessment. A multiple baseline across
participants design was conducted to examine the effects of CR-I on math fluency and
on-task behavior relative to baseline performance. Data indicated an improvement in
math fluency and on-task behavior for all four participants when interventions were
administered on an instructional level. Results suggested that the treatment utility of a
brief assessment on academic performance and on-task behavior may be beneficial in
selecting effective and efficient interventions that can be easily implemented in a school
setting and meet academic accountability requirements.
Intervention for Mathematics Computational Accuracy and Fluency
If researchers are to examine the usefulness of the BEA method for identifying
instructional interventions for math computational fluency then instructional
interventions tested during analyses must be identified. Numerous academic
interventions that are likely to produce immediate, short-term impact have been
demonstrated as effective for improving accuracy, fluency, and even motivational
problems (Carson & Eckert, 2003). Among these specific, school-based interventions are
cover-copy-compare, interspersal techniques, contingent reward, and constant time delay.
Research thus far has mostly identified these components to be effective in increasing
math performance as part of a remedial instructional package. Less is known about the
effects of these intervention techniques when used in isolation.
Cover-Copy-Compare
The cover-copy-compare (CCC) method for increasing math accuracy was first
described by Skinner, Turco, Beatty, and Rasavage (1989). CCC is not only a widely-
known research-based intervention but it has been proven effective in teaching children
36
in both regular education and special education to evaluate and learn from their own
mistakes in order to eventually increase their math accuracy. Like other interventions
using previewing techniques, cover-copy-compare involves demonstration of the correct
procedure before students have to solve the actual math problem independently. It is most
appropriate for students at the accuracy level of the instructional hierarchy as it includes
modeling, practice, and feedback, albeit via self-monitoring (Skinner, McLaughlin, &
Logan, 1997).
CCC math fact worksheets may contain addition, subtraction, multiplication, and
division facts written vertically on the left side of the paper. The right side of the paper is
blank and contains enough space for the student to write down and work the problem
independently. Once the first math fact worksheet has been placed in front of the student,
the following step-by-step instructions are given: (a) look at the first problem on the
worksheet, (b) cover the problem and the answer with the index card., (c) copy the
problem in the white space next to it, while keeping the original problem covered, (d)
remove the index card from the problem and compare to original problem, (e) if the
problem is written correctly, move onto the next problem, otherwise the student has to
work the problem again (Skinner, McLaughlin, & Logan, 1997).
Previous research evaluating the effectiveness of cover-copy-compare showed
that this intervention was inexpensive, time efficient, and effective in increasing
academic performance for students struggling with math computation. Additionally,
researchers concluded that CCC required minimal student training and assistance from
others (Skinner et al., 1989).
37
Poncy and colleagues (2007) examined the effects of CCC and taped problems
with a control condition on basic math fact accuracy and fluency. One elementary school
student with a diagnosis of moderate mental retardation served as a participant. Results of
the study indicated that both CCC and taped problem interventions increased overall
computation accuracy and fluency levels. However, the taped problem condition took
30% less time compared to the CCC condition.
In another study by Codding and colleagues (2007) an alternating treatment
design was used to compare the effects of cover-copy-compare in isolation and in
combination with performance feedback to increase calculation fluency and accuracy.
Three general education students in sixth grade participated in the study. Three math
interventions were administered to the participants. These interventions included CCC,
CCC + performance feedback using digits correct per minute, and CCC + performance
feedback using digits incorrect per minute. Treatments were randomized and only one
treatment was administered daily. Results of the study indicated no difference between
interventions. All three treatments were effective in increasing math accuracy and fluency
across participants.
Similar results were found in other studies. For example, Codding and colleagues
(2007) compared the effectiveness and efficiency of two empirically supported math
interventions with a control condition on subtraction fluency. Nine-eight second and third
grade students were randomly assigned to one of the three conditions (i.e., CCC, explicit
timing, or control). Interventions were provided bi-weekly over the course of six weeks.
Results suggested that initial level of fluency was an important in determining overall
intervention effectiveness because initially all three conditions led to an increase in math
38
fluency over baseline. However, differences became apparent when initial CBM scores
were considered. Specifically, results suggested that for students in the frustrational range
CCC and the control condition were the most effective treatments, whereas for children
who scored in the instructional range explicit timing resulted in the best performance.
Overall, research studies on using CCC to increase academic skills support the findings
that repeated learning trials through CCC procedures promote academic accuracy
including increased math performance by providing struggling students with practice to
promote accurate responding.
Interspersal Techniques
Interspersal techniques can be used to increase math fluency and, thus,
instructional effectiveness through repeated practice with high levels of success and
frequent feedback. It is a method of drill and practice where the delivery of previously
learned skills is interspersed among trials of skills to be learned (MacQuarrie, Tucker,
Burns, & Hartman, 2002). Research studies have indicated that the most effective tool
that can be applied to learning new skills is to increase the amount of time students
engage in drill and practice activities (Cooke et al., 1993).
Numerous mathematics interspersal studies have been conducted involving
undergraduate students (e.g., Skinner et al. 1996; Wildmon et al., 1998; Billington and
Skinner, 2002. In one of the first research investigations on interspersal procedures,
Skinner et al. (1996) conducted a series of studies in which undergraduate students
completed either a control worksheet with challenging multiplication problems or an
interspersal worksheet that consisted of similar challenging multiplication problems with
easy multiplication problems interspersed.
39
Results showed that participants correctly completed a similar number of
challenging problems on the interspersal worksheet as they completed on the control
worksheets, resulting in the total number of problems (challenging + easy) correctly
completed being greater on the interspersal worksheet. Additionally, in comparison to the
control worksheet, students rated the interspersal assignment as being less difficult and
less time consuming as well as requiring less effort to complete. Numerous other studies
have found similar results.
For example, Logan and Skinner (1998) conducted a math interspersal study with
30 sixth-grade students. Participants spent 8 minutes working on experimental versus
control math assignments. Both assignments contained 25, four-digit by one-digit
multiplication problems. However, the experimental assignment contained nine
additional one-digit plus one-digit addition problems. That is, easier problems were
interspersed on the experimental assignment worksheet. A within-groups design was used
to compare each student's performance and preference across the two assignments.
Results of the study indicated that total problem-completion rates were higher on the
experimental assignment, and that significantly more students chose the experimental
condition over the control condition.
In a more recent study, McDonald and Ardoin (2007) evaluated interspersal
techniques on math fluency. Seventy-six fourth-grade, general education students
participated in the study. Students were asked to complete two different sets of
worksheets. The control condition consisted of 64 challenging problems (i.e., 3-digit by
3-digit subtraction problems, with regrouping from the 10's column only), while the
experimental condition (i.e., interspersal) consisted of the same type of challenging

40
problems contained on control worksheets but with the easier problem types
(multiplication facts 0-9) interspersed after every third challenging problem. Results
indicated that problems completed correctly on interspersal worksheets exceeded that of
problem completion on control worksheets.
Research studies provide evidence that students not only prefer interspersal items
but also complete interspersal worksheets with greater fluency and produce a greater
number of responses on interspersal worksheet assignments compared to control
conditions. Various other investigations have included the use of interspersal training
techniques across academic tasks and found it effective for teaching academic skills to
general education and special education students, (e.g., Cooke et al., 1993; Johnson,
Gersten, & Carnine, 1987).
Constant Time Delay
Constant time delay, as an instructional strategy to increase fluency of academic
skills, has been shown to be effective for a variety of academic areas including math
(Mattingly & Bott, 1990; Whalen, Schuster, & Hemmeter, 1996). This near-errorless
procedure involves the presentation of an instructional cue followed by the presentation
of a controlling prompt such as providing the correct answer. Thus, the student's
successful performance is ensured. Initially the controlling prompt is presented
simultaneously with the cue to teach the correct response. Subsequently, the instructional
cue is given but the presentation of the prompt is delayed for a brief period in order to
give the student an opportunity to respond independent of the prompt (Wolery et al.,
1992). Delay intervals used in this procedures usually range from 2 s to 5 s (Coleman-
Martin, Wolff, & Heller, 2004).
41
In a study by Mattingly and Bott (1990), CTD was used to teach multiplication
facts to two elementary school students with mental retardation. The effectiveness of the
intervention was assessed via a multiple probe design. After initial baseline session, CTD
was used in a 0-s delay format for 25 intervention sessions. During the 0-s delay format
the teacher presented flash cards with multiplication facts and immediately provided the
correct answer to the math problem while the students were required to repeat the correct
response. Following a correct response by the participants, a new flash card was
presented.
The remaining sessions used a 5-s time delay format. That is, the teacher waited
5-s for the participants to respond. If the students responded correctly verbal praise or
tokens were provided. If the participants did not respond within 5-s, the teacher repeated
the question and provided the correct response. An incorrect response resulted in verbal
reprimands. Results of the study indicated that both participants learned all 30
multiplication facts with almost no errors. Further, students were able to generalize and
maintain their accuracy rates.
Whalen, Schuster, and Hemmeter (1996) used a constant time delay procedure to
teach two elementary students with mild mental retardation nine target mathematics facts.
The intervention used a 3-second time delay procedure to present addition facts printed
on flash cards. If the participants responded correctly, the teacher presented an unrelated
sight word (e.g., cheese). Following an incorrect response or failing to wait for the
prompt, the teacher restated the fact and gave the answer followed by a presentation of a
sight word. Both participants reached their criterion (100% accuracy for two consecutive
42
trials) for each of the targeted math facts. Students also maintained their accuracy rates
and demonstrated generalization with other people and across settings.
Contingent Reward
Empirical support suggests that providing some form of incentive can help
increase academic performance (e.g., Lovitt, Eaton, Kirkwood, & Pelander, 1971).
Providing incentives through a contingent reward procedure involves the presentation of
a reward contingent upon meeting a pre-specified criterion. Through the use of
contingent reward, decisions can be made whether a skill or performance deficit is
present. Skill deficits result from a lack of ability and can be remediated through
antecedent manipulations (i.e., instruction), whereas performance deficits stem from a
lack of environmental support for performance or motivation (Jones & Wickstrom,
2002). Specifically, students responding to instruction and not rewards may indicate the
presence of a skill deficit. In contrast, responses only to the reward condition may
indicate a performance deficit. Providing rewards contingent on academic responding can
be a powerful tool in increasing skill levels as providing an incentive can be an
intervention in itself (Duhon et al., 2005).
In one of the earlier studies on contingent reward, Ayllon and Roberts (1974)
directly reinforced academic behavior. Systematic token reinforcement was applied to
reading performance of five fifth-grade students. The dependent variable was the
percentage of correct answers on a daily reading test. The presence of the token economy
was evaluated using an ABA reversal design. In the token economy points could be
exchanged for activities and privileges. Results indicated that reinforcement procedures
43
increased reading performance for all five participants. Further, disruptive behavior was
reduced by 87.5% over baseline levels.
In a study on math performance, Broughton and Lahey (1978) examined the
effects of positive reinforcement and response cost on academic and on-task behavior.
Thirty-three fourth and fifth-grade students in four remedial math classes served as
participants. The two dependent variables were the percent correct for the daily math
problems and the percentage of time on-task. Each of the four classes was randomly
assigned to a treatment condition. An ABA reversal design was used within in treatment
group.
During the baseline condition response feedback was the only contingency in
effect, whereas in the positive reinforcement condition students earned one point for each
correct math problem. The response cost condition consisted of students beginning with
20 points and losing one point for each incorrect response. The mixed condition consisted
of each student beginning with 20 points and either gaining or losing points, depending
on performance. All groups showed increases in percent correct when compared to
baseline; however, there was no difference between the three contingency groups. Each
contingency group showed increases in on-task behavior when compared to baseline.
In a more recent study by Gilbertson and colleagues (2008), a brief assessment
was used to identify potential interventions to improve math fluency and on-task
behavior. Four elementary, general education students participated in this study. All four
participants were referred by their classroom teachers to the Intervention Team due to
academic and behavioral problems.
44
Contingent reward and contingent reward + instruction were assessed for their
effectiveness in increasing math fluency and on-task behavior. During the contingent
reward condition, each participant was awarded a reward of his or her choice (e.g.,
edibles, small toys, school supply) for meeting or exceeding an individualized goal of
10% increase over the mean baseline score. In the contingent reward + instruction
condition instructions on the target operation (e.g., subtraction) were provided for three
minutes using flashcards. Specifically, students had to answer the problem on the
flashcard while receiving feedback from the research staff if necessary. After the
instructional procedure, a six-minute probe was administered and scored, and the student
received a reward if he or she met or exceeded the goal. Results of the study indicated that all
students made improvements in math computation of 23% to 42% over baseline levels
with the contingent reward condition alone. However, contingent reward + instruction
resulted in greater gains (42% to 86%) relative to baseline.
The studies described above indicate that a number of math interventions are
empirically supported for improving students' computational accuracy and fluency.
Across the various procedures, a number of instructional procedures appear important for
improving student performance. Students may benefit from additional practice,
interspersal of known and unknown items, modeling, prompting, and feedback, and
contingent reward. This study includes a variety of math interventions that include those
evidence-based procedures.
45
CHAPTER III
METHOD
Participants and Setting
Four participants were randomly selected from general and special education
classrooms in a public elementary and middle school located in a southeastern state.
Participants were selected based on one criterion: considered to be at academic risk (i.e.,
computing math facts at a frustrational level with a median of 0-19 CDPM) on a mid-year
administration of a M-CBM universal screening procedure. Students were drawn from
referrals by their teachers because of difficulty with basic multiplication and division
(i.e., multiplication facts 0-12, division with divisors 1-12 no remainder).
Chris was an eleven year-old, Caucasian male in sixth grade general education
who was referred by his math teacher for concerns about his math computation ability.
Adam was a twelve year-old, Caucasian male in sixth grade general education who was
also referred by his math teacher for concerns about his math computation ability. Doris
was a ten year-old, African American female in fourth grade receiving special education
services for a Specific Learning Disability in math reasoning. She was referred by her
special education teacher due to her difficulties with math computation. Irene was a
twelve year-old, African American female in sixth grade general education who was
referred by the middle school principal for concerns regarding math computation
performance. All four participants scored in the at-risk category during universal
screening on math CBM probes.
Student participation was contingent upon written parental consent (see Appendix
A). Intervention sessions were conducted in a room free from distraction located at the
46
students' school campus. Sessions were conducted approximately three times per week
and averaged 20 minutes in length. Sessions were scheduled after classroom instruction
in the core subject areas of math, language arts, and reading had been concluded. This
study was approved by a university-based Institutional Review Board to protect the
welfare of human participants.
Materials
Math Computation Probes
Using methods outlined by Shinn (1989) and Shapiro (2004), multiple-skill
mathematics calculation problems that included simple multiplication and division facts
were used for student participants. Multiple-skill math probes contained randomly
selected computational problems for multiplication facts from 0-12, and division facts
with divisors 1-12 with no remainders. A number of problems of each type (i.e., 1 digit x
1 digit multiplication or division and 2 digit x 2 digit multiplication or division) was
devised via a web-based math worksheet generator (i.e., interventioncentral.org). Each
probe contained math computation problems that were arranged vertically in six rows and
six columns on a single worksheet. Probes contained an equal number of multiplication
and division facts.
A specific set of multiplication and division problems was developed for each
experimental condition. No student completed the same probes twice. Problems for each
math probe were randomly selected from a larger pool of problems representing the
computational skills for multiplication and division problems. During baseline, three
probes were randomly generated from the entire skill set (i.e., multiplication 0-12,
division with divisors 1-12 with no remainder).
Randomized cover-copy-compare worksheets were generated using a web-based
cover-copy-compare math worksheet generator (i.e., interventioncentral.org). The
worksheets contained multiplication and division facts. Further, 4-by-6 inch index cards
displaying those multiplication and division problems were also used. Rewards included
a variety of items that are routinely rewarding for students (e.g., small edibles, stickers,
small toys, soda).
Dependent Variable
The primary dependent measure was correct digits per minute (CDPM) using
standard CBM procedures for math (Shinn, 1989). A digit was scored correct if the
correct number appeared in the correct column. For example, the multiplication problem
5 x 8 = could be scored as 0, 1, or 2 digits correct. An answer of 40 would result in 2
correct digits because the numerals in the tens and ones columns are correct. An answer
of 30 would result in 1 digit correct because only the ones column is correct, whereas an
answer of 22 would result in 0 correct digits per minute as neither the tens nor the ones
columns are correct (Deno & Mirkin, 1977).
The student was given credit for "place-holder" numerals that are included simply
to correctly align the problem. As long as the student included the correct space, credit
was given whether or not a "0" had actually been inserted. Further, the student was given
credit for all correct numbers that appeared below the line but not for any numbers
appearing above the line (e.g., numbers marked at the top of number columns to signify
regrouping).
The following formula was used to calculate CDPM:
48
Numbers of digits correct x 60 = Correct Digits Per Minute
Number of seconds worked
Experimental Design
The BEA for math computational fluency interventions included a brief
multielement design with a withdrawal. During the brief multielement phase, each
intervention condition was implemented once. Order of treatment conditions during the
brief multielement phase was randomized for each participant. Following the
withdrawal, there was an extended analysis in which the indicated treatment (i.e.,
treatment identified as most effective during the brief multielement phase) was compared
to the least effective during the brief multielement phase. The research plan also
included a plan to account for a BEA that resulted in undifferentiated results. In the
event of an undifferentiated BEA, conditions could be repeated or combined
interventions could be tested. BEA results for Irene and Doris were undifferentiated, and
as a result, additional test conditions were conducted. Details regarding additional test
conditions are provided below and again in the Results section.
Treatment components for the BEA and the extended analysis included the
following four conditions with unique sets of multiplication and division probes: reward
condition, cover-copy-compare, constant time delay, and control (see Appendices C, D,
E, and F respectively). Baseline was administered at the beginning of the BEA and prior
to the implementation of the extended analysis. The reward condition was chosen to test
for skill versus performance deficits (Duhon et al., 2005). Cover-copy-compare and
constant time delay were chosen to represent accuracy and fluency-based interventions
49
corresponding to the accuracy and fluency stages of the instructional hierarchy,
respectively.
Procedure
Math interventions were evaluated to determine their short-term impact on
multiplication and division computation. The BEA was implemented using a brief multi
element design that included four unique conditions presented in a randomized order.
Following baseline, instructional conditions were presented in a randomized order. For
the purposes of this study, a condition referred to the implementation of a distinct
experimental procedure such as cover-copy-compare, reward, constant time delay, or
control.
Once intervention conditions began, a random set of multiplication and division
problems was randomly assigned to a BEA condition. Where an intervention
demonstrated a clearly visible difference relative to baseline and the other instructional
conditions, a withdrawal consisting of a baseline condition was conducted. If during the
BEA no instructional component demonstrated effectiveness, a follow-up condition was
included. This condition included either a combination of cover-copy-compare, reward,
and constant time delay or other evidence-based math interventions (e.g., cover-copy-
compare and reward, or constant time delay and reward). Additionally, if there were
similar improvements in performance for two or more experimental conditions then
additional iterations were conducted until one experimental condition was superior.
Screening
Once participants meeting the inclusion criterion had been identified, the primary
investigator obtained written informed consent from the participant's parent or guardian.
50
To determine whether participants demonstrated math deficits in simple multiplication
and division, participants were asked to complete three mixed-skill M-CBM probes
comprised of simple multiplication and division problems. Standard M-CBM procedures
were used to assess the participants' math fluency rate.
Participants were provided with the M-CBM probes and a pencil. The participants
were told,
There are several types of problems on the sheet. Some are multiplication and
some are division. Look at each problem carefully before you answer it. When I
say start, turn them over and begin answering the problems. Start on the first
problem on the left on the top row [point]. Work across and then go to the next
row. If you can't answer the problem, make an 'X' on it and go to the next one. If
you finish one side, go to the back. Are there any questions? Start.
The examiner then started the stopwatch. At the end of two minutes, the examiner placed
a line after the last digit computed and removed the M-CBM probe. No instructional
intervention or feedback was provided during screening.
Based on Shapiro's (2004) inclusion criteria, students who scored at the
frustrational level on the M-CBM probes were eligible to participate in the study.
Frustrational level is defined as completing between 0-9 CDPM in third grade and
between 0-19 CDPM in grades four and above.
Experimental Conditions
Baseline. The primary investigator was responsible for conducting the BEA. No
instructional components were provided during baseline. During baseline, math fluency
rates with multiplication and division facts were identical to the CBM procedures for
51
math fluency described in the screening section. No intervention or feedback was
provided. At least three M-CBM probes were administered. These probes included a
random selection of multiplication and division facts from the entire skill set (i.e.,
multiplication 0-12 and division with divisors 1-12 with no remainder). Baseline sessions
lasted approximately 4-5 minutes. CDPM were assessed for each math probe. Baseline
continued until students' performance remained stable or a decreasing trend was
evidenced following at least three sessions.
Reward Condition. A unique set of multiplication and division facts was
randomly assigned to this condition. During this condition, participants were able to
select a reward from a prize box contingent upon the student's multiplication and division
fluency rate exceeding a pre-determined goal. Rewards included edibles (e.g., candy),
school materials (e.g., erasers, pencils, notebook paper), and small toys (e.g., cars, spin
tops, stencil rulers). The goals were determined by multiplying the participant's mean
baseline performance by 1.25 (25% increase; Carson & Eckert, 2003). Before the
academic task was presented, each student was shown sample rewards and told that he or
she may choose a reward from the prize box if he or she met the goal. Immediately
following the reward condition, the examiner scored the math probe and told the student
whether he/she could choose a reward.
Cover-copy-compare. During this condition the participants completed
multiplication and division problems using the cover-copy-compare procedure. The
student was told to look at the first math problem and answer on the worksheet. After that
the problem and the answer were covered with an index card. Then the student was to
copy the problem in the space next to the original problem, while keeping it covered.
52
After working the problem independently, the index card was removed and the student's
answer was compared to the original. If the problem was answered correctly, the student
was instructed to move on to the next problem. If the problem was answered incorrectly,
immediate corrective feedback was provided (Skinner et al., 1989) by comparing their
response to the correct response on the cover-copy-compare worksheet.
During the cover-copy-compare session, if the student did not implement an
intervention step correctly, she or he was immediately prompted to engage in the correct
step by an experimenter. Prompting was used to ensure accurate implementation of the
procedure and to maintain internal validity of the analysis. Immediately after the cover-
copy-compare session was completed, a M-CBM probe with those problems assigned to
the cover-copy-compare condition was administered to the student. The score from this
probe was used as the datum for the cover-copy-compare condition.
Constant time delay. Randomly selected multiplication and division facts were
presented to the student on 4-by-6 inch index cards. Facts were presented three times
during each trial in random order. During this condition, students were directed to read a
problem displayed on a flashcard aloud. The student then was to provide the answer to
the problem, if known. The experimenter provided the correct answer to the student, if
necessary. During the first two trials each multiplication and division problem employed
a zero-second delay followed with the controlling prompt being provided immediately
after the student read the problem. After two consecutive trials at 0-second delay with
100% accuracy, all subsequent trials used a 3-second delay between the students'
verbalization of the problem and the prompt being modeled by the experimenter.
Specifically, students were instructed to (a) read the problem aloud and provide the
53
correct answer, or (b) wait for the instructor to provide the correct answer if he or she did
not know or was unsure of the answer to the multiplication and division fact. After
hearing the prompt, the student was asked to read the problem aloud and provide the
correct answer.
Response categories included: (a) the student fails to respond or did not provide
the correct answer within three seconds after the experimenter's prompt, (b) the student
waited for the experimenter's prompt but incorrectly imitated that response, (c) the
student gave the incorrect response within three seconds of reading the problem aloud,
(d) the student waited for the correct response and then correctly repeated the answer
within three seconds, and (e) the student responded correctly within three seconds
without being prompted. After the constant time delay intervention session was
completed, the student received one M-CBM probe with those problems assigned to the
constant time delay condition and the student's score served as the datum for the constant
time delay condition.
Control. Similar to baseline, no instructional components or feedback were
provided during the control condition. The participants were asked to complete a unique
set of multiplication facts 0-12 and division with divisors 1-12 with no remainder.
Extended analysis
An extended analysis component was added to the study to see if results derived
from the BEAs were effective over a long period of time. The extended analysis included
rapid alternation of the indicated and least effective interventions identified during the
BEA. Conditions were implemented in random order except that no condition was
implemented for three consecutive sessions. Each student received 18-20 total
54
intervention sessions over the course of six to eight weeks. Interventions were
implemented for each student three to five times per week. Participants were removed
from the class during the sessions and all interventions were conducted in a room free of
distractions. Sessions occurred after classroom instruction in the core subjects of math,
language arts, and reading and lasted approximately 20 minutes.
Interscorer Agreement
Interscorer agreement was defined as the percentage of agreement of occurrences
and non-occurrences of the dependent variables between two independent data collectors.
Interscorer agreement was calculated by dividing the number of agreements by the
number of agreements plus disagreements and multiplying by 100. Independent scorers
were graduate students in school psychology and were trained to conduct M-CBM
procedures prior to the study. Agreement during training had to be above 90% before the
scorers were allowed to participate as data collectors in the study. Agreement was
assessed for at least 30% of the sessions conducted during the brief and extended
analysis. An acceptable amount of agreement met or exceeded 90%. If agreement fell
below 90% for a scorer then the scorer was retrained. Interscorer agreement ranged from
60% - 100% with an average of 99.15%.
Procedural Integrity
The primary investigator conducted the BEA for the four participants. A
procedural integrity checklist was developed for each experimental condition (see
Appendices G-J). A trained observer completed the procedural integrity checklist for all
of the BEA conditions. Additionally, integrity checklists were used to monitor integrity
during at least 30% of the intervention sessions for each condition during the extended
55
analysis. Procedural integrity was expressed as the percentage of procedural steps
completed accurately. Procedural integrity for all conditions ranged from 94%-100%,
averaging 99.29%. Specifically, procedural integrity for baseline, cover-copy-compare,
constant time delay, and contingent reward averaged 99%, while the control condition
averaged 100%.
During the training sessions, the primary investigator provided corrective
feedback to the examiners as well as additional opportunities for practice when
necessary. Training for the examiners was completed once 100% integrity was obtained
on a practice session. Procedural integrity was expected to be at 100% throughout the
study. If procedural integrity fell below 100% at any time, the examiner received
additional opportunities for practice before conducting further intervention sessions with
participants.
Procedural integrity was checked on three different occasions for each data
collector. Using a procedural integrity checklist (see Appendixes H, I, and J), an observer
noted whether procedures were followed on a step-by-step basis. Procedures included
whether data collectors had all materials present, followed administration procedures as
specified, timed each probe accurately, followed instructions verbatim, scored accurately,
and kept the scoring booklet out of sight of the student. Each procedural integrity
checklist was task analyzed into simple observable steps that could be easily coded and
scored as "yes, completed step," "no, did not complete step," or "not applicable." The
number of steps completed divided by the total number of possible steps during M-CBM
administration was calculated and expressed as a percentage.
56
Data Analysis
Data were graphed for all phases of the study. The analysis of data from the BEA
and extended analysis were presented for all subjects with CDPM across conditions being
graphically displayed. Visual analysis was used to evaluate data during the BEA and
extended analysis. Criteria for determining intervention effectiveness was derived from
the "decision-making steps used for selecting effective treatments based on brief
experimental analysis results" (p. 299) developed by Malloy, Gilbertson, and Maxfield
(2007). First, efficiency decisions were based on (a) the largest CDPM ratio when
compared to baseline on instructional passage or (b) larger CDPM ratio when compared
to baseline on generalization probe. When two treatments were shown to be equally
effective, test conditions were repeated or combined (e.g., cover-copy-compare plus
reward). The two intervention conditions resulting in the greatest gain during the BEA
over baseline levels were used as the combination treatment.
57
CHAPTER III
RESULTS
The results of the brief experimental analyses for all participants are displayed in
Figures 1, 2, 3, and 4. All participants demonstrated improvements in math computation
in the intervention phase relative to baseline. Experimental control was established by
means of a withdrawal for all participants after the multielement phase and by means of
an extended analysis phase. The following results are based on CDPM scores, mean
scores, and visual analysis of the changes in levels of responding to the different
interventions across conditions.
Chris
Baseline. During baseline, three CBM math probes were administered to Chris.
His mean CDPM score was 6.3, which placed him, according to national norms (Deno &
Mirkin, 1977), into the at-risk category for math computation. Graphic representation of
Chris' data is presented in Figure 1.
Brief multielement phase. For Chris, baseline was followed by cover-copy-
compare, reward, control, and constant time delay respectively. No change in level was
observed in CDPM between baseline and cover-copy-compare. With the cover-copy-
compare condition Chris computed math multiplication and division facts at a rate of 7
CDPM. In the reward and control condition, Chris' performance increased to 16 CDPM.
This resulted in an immediate change in level between the baseline and reward and
control condition. In the constant time delay condition, Chris' performance increased to
28 CDPM, indicating a substantial change in level from the baseline condition.
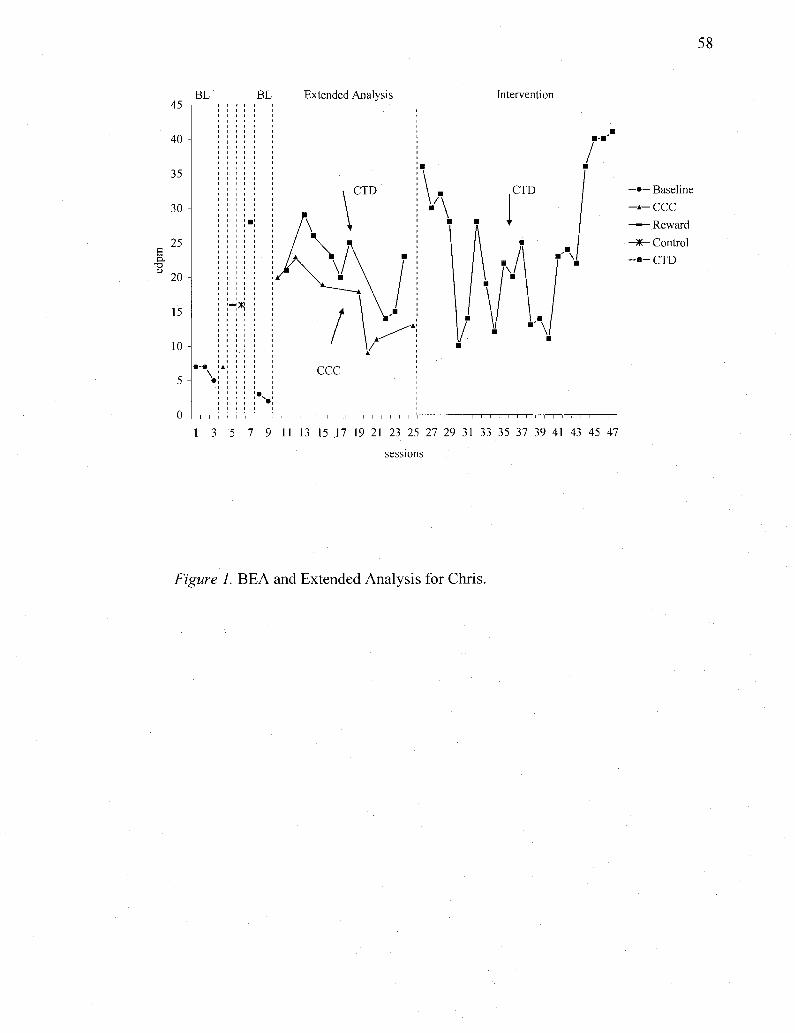
58
t
45 -,
40 -
35
30 -
25
20
15
5H
BL BL Extended Analysis Intervention
A
-:>
; •
• .
CTD
CCC
• •
/
—•—Baseline
- A - C C C
Reward
- * - Control
- • - CTD
1 3 5 7 9 11 13 15 17 19 21 23 25 27 29 31 33 35 37 39 41 43 45 47
Figure 1. BEA and Extended Analysis for Chris.
59
All math intervention conditions resulted in an increase in math computation compared to
the mean baseline score. The brief multielement phase revealed that constant time delay
was the indicated intervention for Chris, and cover-copy-compare was the least effective
intervention. Specifically, constant time delay resulted in the greatest increase in
correctly computed multiplication and division facts. The withdrawal of interventions
resulted in an immediate decrease in CDPM scores to a mean of 2.5.
Extended analysis phase. The extended analysis included rapid alteration of the
indicated and least effective interventions identified during the BEA. For Chris, this
included rapid alternations of constant time delay and cover-copy-compare. Chris
received 16 intervention sessions. Seven of these sessions consisted of cover-copy-
compare, while the remaining sessions consisted of constant time delay. The mean score
for the cover-copy-compare condition was 16.14 CDPM, while the mean score for
constant time delay was 21.78 CDPM.
Visual analysis of the data revealed that performance during constant time delay
was generally superior to performance for cover-copy-compare. However, there was
variability in performance across both conditions. For both conditions a downward trend
was visible; yet, separation between the indicated and least effective interventions at the
end of the extended analysis phase was displayed. However, it is important to note that
performance during constant time delay was substantially better than level of
performance observed during the initial baseline and the subsequent withdrawal.
Intervention phase. Chris received 22 constant time delay sessions during the
intervention phase. The mean score for the interventions phase was 24.55 CDPM with
scores ranging from 10 to 41 CDPM. Visual analysis of the data revealed an immediate
60
change in level after introduction of the intervention (compared to the extended analysis
phase) but substantial variability throughout the intervention phase. Overall, a slight
upward trend was visible for Chris during the intervention phase and all data points
stayed above the baseline data points. Moreover, performance during the intervention
phase was substantially greater than the level observed during the initial baseline or
subsequent withdrawal phase.
Summary. During baseline, Chris computed math multiplication and division facts
at a mean rate of 6.3 CDPM. With the implementation of the brief multielement phase
multiplication and division computation increased to 28 CDPM in the constant time delay
condition. The BEA of math interventions demonstrated not only a gain in responding
during the different conditions but also individualized responding across interventions.
For Chris, constant time delay resulted in the greatest gain in CDPM over the other
conditions.
During the extended analysis, visual analysis of the data indicated greater gains
during the indicated condition (mean of 21.78 CDPM) than the least effective condition
(mean of 16.14 CDPM); however, there was no clear distinction between both conditions.
Thus, the BEA of math instructional procedures was somewhat ineffective for identifying
an intervention that was more effective than the least effective intervention during the
extended analysis. Nevertheless, Chris' overall math computation increased during
intervention to a mean of 24.55 CDPM, resulting in an increase of 18.25 CDPM over
baseline.
61
Adam
Baseline. During baseline, three CBM math probes were administered to Adam.
His mean CDPM score was 7, which placed him, according to national norms (Deno &
Mirkin, 1977), into the at-risk category for math computation. Graphic representation of
Adam's data is presented in Figure 2.
Brief multielement phase. For Adam baseline was followed by control, constant
time delay, cover-copy-compare, and reward respectively. A decrease in level was
observed in CDPM between baseline and control. During the control condition Adam
accurately completed 6 CDPM. In the constant time delay condition, Adam's
performance increased to 19 CDPM. This resulted in an immediate change in level
between baseline and constant time delay condition. In the cover-copy-compare
condition, Adam's performance increased to 13 CDPM, indicating an immediate change
in level from the baseline condition. The reward condition resulted in an immediate
change in level from baseline with a CDPM score of 17. All math intervention conditions
but the control condition resulted in an increase in math computation compared to the
mean baseline score.
The brief multielement phase revealed that constant time delay was the indicated
intervention for Adam with the control condition being the least effective condition.
Specifically, constant time delay resulted in the greatest increase in correctly computed
multiplication and division facts. The withdrawal of interventions resulted in an
immediate decrease in CDPM scores to a mean of 15.4 from the constant time delay and
reward condition.
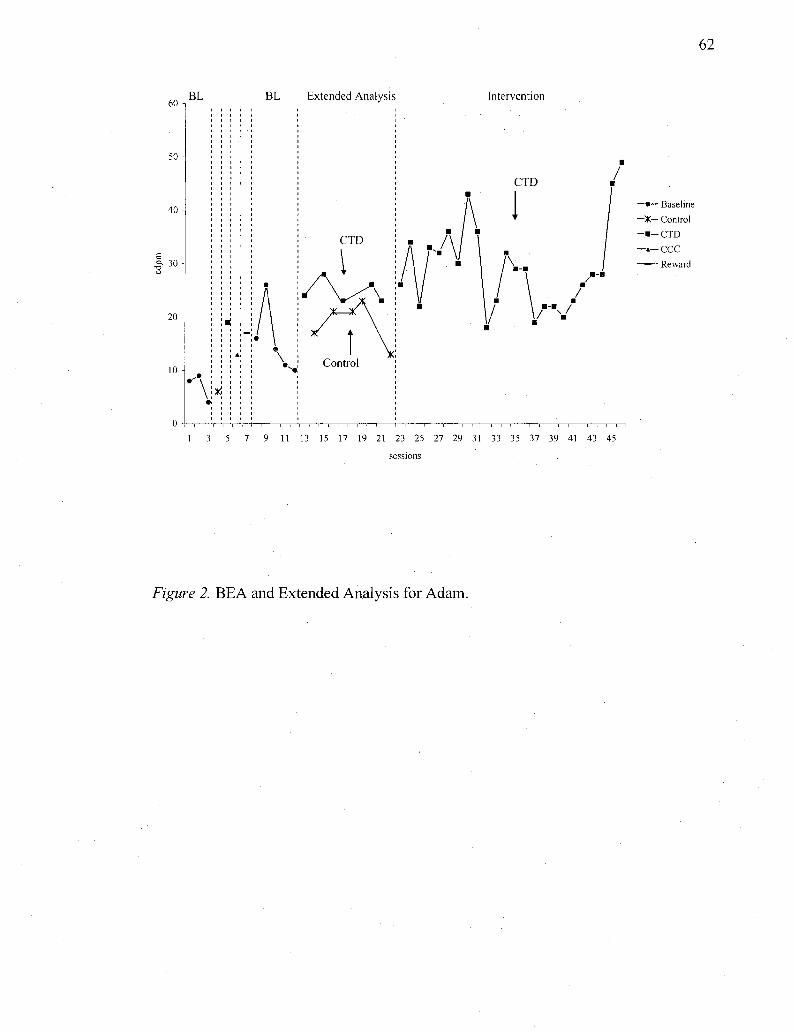
62
BL BL Extended Analysis Intervention
CTD
Control
CTD
—•—Baseline
—X— Control
- • - CTD
—*— ccc — — Reward
" s /
1 3 5 7 9 11 13 15 17 19 21 23 25 27 29 31 33 35 37 39 41 43 45
sessions
Figure 2. BEA and Extended Analysis for Adam.
63
Extended analysis phase. The extended analysis included rapid alteration of the
indicated and least effective conditions identified during the BEA. In Adam's case this
included rapid alternations of constant time delay and control. The mean score for the
constant time delay condition was 24.8 CDPM, while the mean score for control was 19
CDPM. Visual analysis of the data revealed separation between the indicated and least
effective conditions at the end of the extended analysis phase.
Intervention phase. Adam received 24 constant time delay sessions during the
intervention phase. The mean score for the interventions phase was 29.38 CDPM with
scores ranging from 18 to 49 CDPM. Visual analysis of the data revealed no initial
change in level after introduction of the intervention and substantial variability
throughout the intervention phase. However, an upward trend was visible during the final
two intervention sessions and rate of performance was substantially greater than rate
observed during baseline or the subsequent withdrawal. In fact, all intervention sessions
included rate of performance that was greater than any baseline or withdrawal session.
Summary. During baseline, Adam computed math multiplication and division
facts at a mean rate of 7 CDPM. With the implementation of the brief multielement phase
multiplication and division computation increased to 19 CDPM in the constant time delay
condition. The BEA of math interventions demonstrated not only a gain in rate during the
different conditions but also individualized responding across interventions. In Adam's
case, constant time delay resulted in the greatest gain in CDPM over the other conditions.
During the extended analysis, visual analysis of the data indicated greater gains
during the indicated condition (mean of 24.8 CDPM) than the least effective condition
(mean of 19 CDPM). The BEA of math instructional procedures was effective for
identifying an intervention that was more effective than the least effective condition
during the extended analysis. Adam's overall math computation increased during
intervention to a mean of 29.38 CDPM, resulting in an increase of 22.38 CDPM over
baseline.
Doris
Baseline. During baseline, three CBM math probes were administered to Doris.
Her mean CDPM score was 0, which placed her according to national norms (Deno &
Mirkin, 1977) into the at-risk category for math computation. Graphic representation of
Doris'data is presented in Figure 3.
Brief multielement phase. For Doris, baseline was followed by cover-copy-
compare, constant time delay, control, and reward respectively. Because none of these
intervention conditions demonstrated a clearly visible difference relative to baseline and
the other instructional conditions, a combination of constant time delay and reward was
administered as well. The intervention conditions resulting in the greatest gain in CDPM
over baseline were used for the combination treatment. No substantial difference in
CDPM between baseline and cover-copy-compare was observed. With the cover-copy-
compare condition Doris computed math multiplication and division facts at a 0 CDPM
rate, followed by 1 CDPM for constant time delay and the control condition. In the
reward condition, Doris' performance increased to 2 CDPM. During the combination of
constant time delay and reward, Doris' computed math problems at a 2 CDPM rate. All
math intervention conditions resulted in a minimal increase in math computation
compared to the mean baseline score; however, no intervention demonstrated a clearly
visible difference relative to baseline.
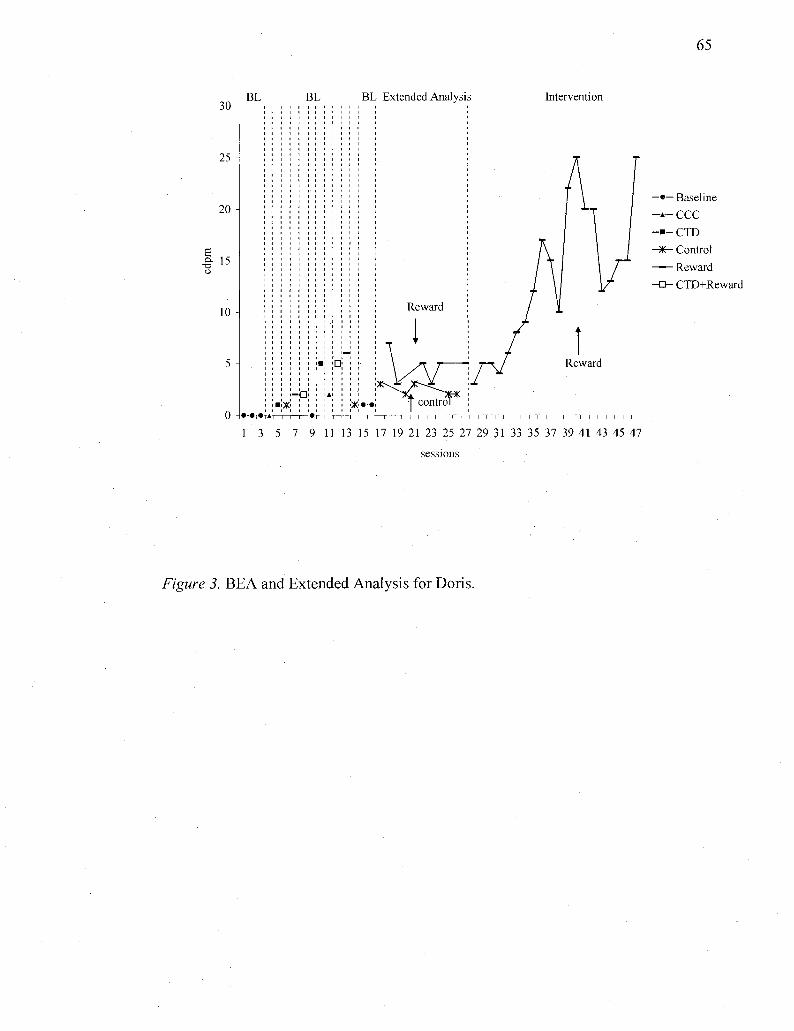
65
BL BL BL Extended Analysis Intervention
0 -k«T« • X
•
Reward
—»— Baseline
- A - CCC
- • - CTD
- * - Control
Reward
- D - CTD+Reward
1 3 5 7 9 11 13 15 17 19 21 23 25 27 29 31 33 35 37 39 41 43 45 47
sessions
Figure 3. BEA and Extended Analysis for Doris.
66
After a withdrawal of treatment, Doris' CDPM decreased to 0 CDPM and
another brief multielement phase was added to determine the most effective intervention.
Baseline was followed by constant time delay, cover-copy-compare, constant time delay
and reward, reward, and control in a randomized order. The brief multielement phase
revealed that reward (6 CDPM) was the indicated intervention for Doris with the control
condition (1 CDPM) being the least effective condition. Specifically, reward resulted in
the greatest increase in correctly computed multiplication and division facts. The
withdrawal of interventions resulted in an immediate decrease in CDPM scores to a mean
ofl .
Extended analysis phase. The extended analysis included rapid alteration of the
indicated and least effective conditions identified during the BEA. In Doris' case this
included rapid alternations of reward and control. The mean score for the reward
condition was 4.67 CDPM, while the mean score for control was 2.4 CDPM. Visual
analysis of the data revealed separation between the indicated and least effective
interventions at the end of the extended analysis phase.
Intervention phase. Doris received 19 reward sessions during the intervention
phase. The mean score for the interventions phase was 13.05 CDPM with scores ranging
from 3 to 25 CDPM. Visual analysis of the data revealed no initial change in level after
introduction of the intervention and some initial variability. However, following the
fourth reward session, an upward trend began that continued throughout the intervention
phase. All intervention sessions resulted in performance that was superior to rates
observed during baseline.
67
Summary. During baseline, Doris computed math multiplication and division facts
at a mean rate of 0 CDPM. With the implementation of the brief multielement phase
multiplication and division computation increased to 6 CDPM in the reward condition.
The BEA of math interventions demonstrated not only a gain in responding during the
different conditions but also individualized responding across interventions. For Doris,
the reward condition resulted in the greatest gain in CDPM over the other conditions.
During the extended analysis, visual analysis of the data indicated greater gains
during the indicated condition (mean of 4.67 CDPM) than the least effective condition
(mean of 2.4 CDPM); however, there was no clear distinction between both conditions.
Overall, the BEA of math instructional procedures was somewhat ineffective for
identifying an intervention that was more effective than the least effective condition
during the extended analysis. Nevertheless, Doris' overall math computation fluency
increased during intervention to a mean of 13.05 CDPM, resulting in an increase of 13.05
CDPM over baseline.
Irene
Baseline. During baseline, three CBM math probes were administered to Irene.
Her mean CDPM score was 4, which placed her into the at-risk category for math
computation according to national norms (Deno & Mirkin, 1977). It should be noted that
there was a small increasing trend in baseline for Irene. A change in phases was due to
the fact that Irene was getting remedial services through the Rtl process and her math
interventions served as data points in the Teacher Support Team process. Specifically, her
teachers asked for Irene to get math remedial services immediately. Graphic
representation of Irene's data is presented in Figure 4.
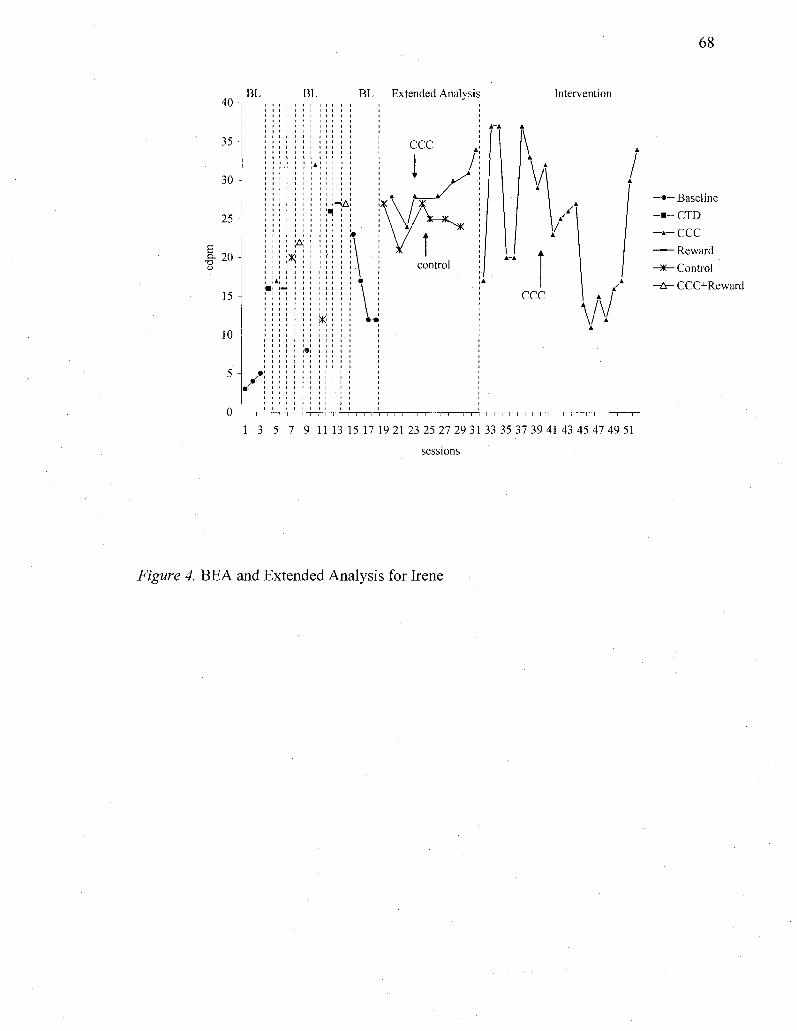
68
BL BL BL Extended Analysis
CCC
Intervention
- & • • ^
% -control
CCC
—'—Baseline
- • - CTD
- * - CCC
Reward
• Control
- CCC+Reward
\ / \ \ /V
1 3 5 7 9 1113 15 17 19 2123 25 27 29 3133 35 37 39 4143 45 47 49 51
sessions
Figure 4. BEA and Extended Analysis for Irene
69
Brief multielement phase. For Irene baseline was followed by constant time delay,
cover-copy-compare, reward, and control respectively. An immediate increase in level
was observed in CDPM between baseline and constant time delay. With the constant time
delay condition, Irene computed math multiplication and division facts at a rate of 16
CDPM. In the cover-copy-compare condition, Irene's performance increased to 17
CDPM. In the reward condition, Irene's performance resulted in 16 CDPM. The control
condition resulted in a substantial change in level compared to baseline with a CDPM
score of 20. After a withdrawal of treatment, Irene's CDPM dropped to a mean of 8
CDPM. Because none of these interventions demonstrated a clearly visible difference
relative to the other instructional conditions, a combination of cover-copy-compare and
reward was administered as well.
Following the initial multi-element phase, cover-copy compare, control,
constant time delay, reward, cover-copy-compare and reward were administered
respectively. Cover-copy-compare resulted in an immediate increase to 32 CDPM. The
introduction of the control condition resulted in a decrease to 12 CDPM. Both the cover-
copy-compare and reward condition resulted in 27 CDPM, while the constant time delay
condition resulted in 26 CDPM. All math intervention conditions resulted in an increase
in math computation compared to the mean baseline score.
The second brief multielement phase revealed that cover-copy-control (32
CDPM) was the indicated intervention for Irene with the control condition (12 CDPM)
being the least effective condition. Specifically, cover-copy-compare resulted in the
greatest increase in correctly computed multiplication and division facts. The withdrawal
of interventions resulted in an immediate decrease in CDPM scores to a mean of 16.
70
Extended analysis phase. The extended analysis included rapid alteration of the
indicated and least effective conditions identified during the BEA. For Irene this included
rapid alternations of cover-copy-compare and control. The mean score for the cover-
copy-compare condition was 29 CDPM, while the mean score for control was 24.83
CDPM. Visual analysis of the data revealed separation between the indicated and least
effective interventions at the end of the extended analysis phase.
Intervention phase. Irene received 21 cover-copy-compare sessions during the
intervention phase. The mean score for the interventions phase was 24.38 CDPM with
scores ranging from 11 to 37 CDPM. Visual analysis of the data revealed no initial
change in level after introduction of the intervention and substantial variability
throughout the intervention phase. During the intervention phase, there were instances of
downward trending performance. However, all intervention sessions resulted in
performance rates that were greater than those observed during baseline.
Summary. During baseline, Irene computed math multiplication and division facts
at a mean rate of 4 CDPM. With the implementation of the brief multielement phase
multiplication and division computation increased to 32 CDPM in the cover-copy-
compare condition. The BEA of math interventions demonstrated not only a gain in
fluency during the different conditions but also individualized responding across
interventions. For Irene, cover-copy-compare resulted in the greatest gain in CDPM over
the other conditions.
During the extended analysis, visual analysis of the data indicated greater gains
during the indicated condition (mean of 29 CDPM) than the least effective condition
(mean of 24.83 CDPM); however, there was no clear distinction between both conditions.
71
Overall, the BEA of math instructional procedures was somewhat ineffective for
identifying an intervention that was more effective than the least effective intervention
during the extended analysis. Nevertheless, Irene's overall math computation increased
during intervention to a mean of 24.38 CDPM, resulting in an increase of 20.38 CDPM
over baseline.
72
CHAPTER IV
DISCUSSION
The current study was driven by two separate research questions. The first sought
to answer the question of whether students demonstrate differential responding across
interventions during a BEA of math interventions and demonstrate immediate gains in
performance. The second sought to answer the question of whether the use of a BEA of
math instructional procedures would be useful for identifying interventions that are more
effective than least effective conditions during an extended analysis. Specifically, it
sought to answer the question of whether an intervention identified as most effective
during the BEA will result in stable, valid, and reliable data during an extended analysis.
With regard to the first research question, results from this study indicated that
clear differences between conditions during the BEA were evident for only one of the
four participants. For Chris, all math interventions resulted in an increase in math
computation compared to the mean baseline score. The BEA revealed that constant time
delay resulted in the greatest increase in correctly computed multiplication and division
facts. For the remaining participants, no clear distinction between interventions was
visible during the BEA. Consequently, additional trials were conducted (i.e., replicating
previous conditions, combination intervention components), or an intervention
component that was only slightly more effective than another was chosen.
For Doris and Irene, the BEA was replicated and combination intervention
packages were included in the analysis. Results from replicated BE As found greater
differences between conditions than were found during the initial BEAs. So, while the
initial BEA was not adequate for identifying interventions that were clearly more
73
effective than the other conditions, one additional brief analysis was sufficient for
discovering a condition that resulted in clearly greater performance. For Adam, clear
differences between conditions were not found during the BEA, but a slightly more
effective intervention was identified and chosen for evaluation during an extended
analysis.
One potential explanation for the lack of clear differentiation between
interventions during the initial BEA could be that math performance generalized across
conditions because of similarities in problem type across conditions. For example, even
though unique math facts were randomly assigned to different instructional components,
all basic multiplication facts may similar enough to result in generalized learning.
Further, a failure to differentiate between interventions could also be contributed
to the nature of the intervention itself (i.e., fluency building versus acquisition building).
Specifically, for two of the four participants (Adam and Chris) the most effective
interventions focused on fluency building strategies which resulted over time in the
greatest overall gain in CDPM. Even though the findings should have been predicted by
the instructional hierarchy that students were on, the current study only used a limited
array of interventions. Future research is needed to determine whether or not a BEA in
math might find differential responding in the brief format alone.
In Doris' case, the intervention (i.e., contingent reward) was the probe delivery
itself. No instructions were provided during the reward condition. Whereas students in all
other intervention conditions received an intervention with instructional components and
then were administered a math computational probe that served as the progress
monitoring datum, Doris received only one probe serving as both, the intervention and
74
the datum. Reward was provided contingent upon a 25% increase in CDPM over the
mean of the previous three data points. Thus, Doris' data may not truly depict the gains in
CDPM, especially when considering that Doris' level of accuracy and fluency with
simple multiplication and division facts was extremely low during the baseline and BEA
phase.
These findings are similar to findings by Noell and colleagues (2003). Noell et al.
examined the effects of reinforcement contingencies and modeling and practice to
increase oral reading fluency across three levels of reading materials. Results suggested
that, even though contingent reward initially was identified as an effective intervention
for some grade level probes, a combination treatment of reward, modeling, and practice
was even more effective in increasing oral reading fluency across the three participants.
Future research may want use the reward condition in combination with instructional
components.
With regard to the second research question, results from this study indicated that
BEA identified intervention procedures resulted in clearly greater gains than the least
effective treatment conditions for three of the four participants (i.e., Adam, Doris, Irene).
Additionally, Chris' results indicated at least marginal separation between the indicated
and least effective interventions. Consequently, results are consistent with VanAuken and
colleagues' study (2002), in which interventions identified during the BEA were superior
to least effective conditions.
It should be noted that there is less variability for all participants in the extended
analysis than during the intervention phase itself. This may be accounted for by the probe
selection set for each intervention condition. Each intervention had a unique set of math
75
computational problems assigned to it, whereas all multiplication and division problems
were presented in the extended analysis. For example, the multiplication problem 11x5
may have been a unique problem in only the CCC condition, whereas 3 x 8 may have
been randomly assigned to the CTD condition. If CCC was the indicated intervention for
a specific participant, this unique problem would have appeared in the extended analysis,
whereas 3 x 8 would not have been presented until the intervention phase. Only the
intervention phase included all multiplication and division problems.
Unfortunately in the current study, for three of four participants, indicated
interventions were compared to no intervention control conditions. As a result, a
conservative comparison of BEA identified interventions was not conducted. However,
more robust changes were visible during the extended analysis for the indicated
intervention as compared to the control condition. The control condition simulated
procedures similar to instructional services readily available and provided in a classroom
environment. That is, in typical classroom situations students may practice math
computational skills without receiving immediate direct intervention services (e.g.,
modeling, feedback) from teachers. Hence, growth in CDPM during the control condition
may be attributed to repeated practice effects. Results of the current study suggest that
growth during the control condition did not occur during the level when compared to an
active intervention. Despite this methodological limitation, results from the current study
are promising in that interventions identified during a brief format are effective at
increasing CDPM over an extended number of sessions when compared to a no
intervention control condition and in isolation (i.e., during follow-up).
76
Results of the study extend the growing body of research that has been published
on the use and benefits of conducting BEAs for academic interventions. Specifically, this
study includes a BEA of math instructional procedures. Previously, BEA research has
mainly focused on applying the procedure to reading. While future research is no doubt
needed to more fully examine the usefulness of BEAs of math intervention procedures,
this study provides a springboard and guidance for such research.
This study underscores the importance of recognizing students' idiosyncratic
response to evidence-based intervention procedures. In this study, students were exposed
to a variety of evidence-based procedures, yet students differed in their response to each
intervention. Specifically, Doris required modeling or prompting procedures for initial
acquisition of simple multiplication and division facts, while Adam benefited from
repetition exercises targeting the fluency stage of the instructional hierarchy. As Jones
and Wickstrom (2002) pointed out, BEAs provide a time efficient way by which to
identify effective intervention components for individual students. This asset of BEAs
can be easily incorporated into an Rtl framework, as well as the routine problem-solving
procedures in place in schools.
Limitations and Future Research
Even though the overall findings of this study contribute to and expand the
literature on BEAs in math, they are only preliminary in nature given the limited sample
size and some methodological issues. As with any research study, a number of limitations
exist that need to be addressed in future empirical research studies to fill important gaps
in the current knowledge base. Below are study limitations and areas for future research.
77
First, there are methodological issues in the current study that warrant discussion.
One of the purposes of the current study was to examine the usefulness of BEA identified
interventions when compared to a least effective intervention. The utility of an
assessment procedure, in part, hinges on the ability of the assessment to discriminate
between effective and ineffective interventions. In the context of a BEA, the identified
intervention should outperform the least effective intervention during an extended
analysis. As stated previously, the current study compared indicated interventions to a no
intervention control condition for three of four participants. The extended analysis would
have been strengthened if the least effective intervention versus the most effective
treatment would have been used. Future research should address this problem to show a
clear and meaningful difference between the two treatments in the extended analysis.
Comparing the indicated intervention to a no intervention control condition "loaded the
deck" in favor of the BEA identified intervention.
Second, the study was carried out by highly trained graduate students who not
only collected the data, but also interpreted the findings. Further, data collection took
place outside of the classroom. This raises a specific concern about the use and ultimate
feasibility of these methodologies in schools when teachers or school-based problem-
solving teams are asked to conduct BEAs and carry out the interventions without
consultant assistance. Given current research findings on a lack of integrity when
teachers implement interventions (DiGennaro, Martens, & Mclntyre, 2005; Mortenson &
Witt, 1998; Wickstrom, Jones, LaFleur, & Witt, 1998), it is questionable whether
teachers would be able and willing to administer BEA procedures without additional
assistance from highly trained individuals. Future research should examine the extent to
78
which teachers or other school personnel are able to collect and effectively use data for
intervention development.
A third limitation is the possibility that extraneous variables accounted for
students' math computation ability, as all students were enrolled in school and the study
took place during the regular school year. It is possible that participants' improvement for
CDPM was due to some undetermined cause not accounted for within the study design
(i.e., instructional time in the classroom, parental support, and students' motivational
level). Even though students enrolled in 4l and 6* grade classroom rarely work on
simple multiplication and division facts, it is plausible that teachers reviewed materials
during instructional time leading to a greater improvement in simple multiplication and
division. For example, Doris received special education services in math while
participating in the current study which may have included drill and practice for various
computation facts.
Another limitation is the small sample size (JV=4) that is typical of single case
experimental designs. Overall, there was little dispersion of characteristics (e.g., grade
level, demographic region, and educational classification) within the four participants.
Only one student received special education services and only two grade levels (i.e., 41
and 6l grade students) were selected for this study. While use of single case design
allowed for control of internal validity issues, the limited sample size and little dispersion
of characteristics limit the generalizability of the current findings. Future research should
include students with greater variability in grade level, educational classification, and
number to expand the external validity of the study.
79
Furthermore, the current study's lack of available social validity data should be
addressed in further studies. As study procedures were conducted by graduate students in
school psychology, teacher satisfaction and/or ease of implementation could not be
assessed. Practical aspects should be taken into account when conducting future research.
Specifically, in the current study interventions were conducted one-to-one, which may
not be feasible in a typical school setting with limited personnel and resources. Hence,
future research should not only examine the extent to which teachers value BEA
procedures but should also investigate whether interventions derived from BE As are
feasible when substantial outside resources (e.g., graduate practicum students) are not
available.
Another limitation of the study is the limited array of interventions that were
assessed in the BEAs. Even though interventions available in the BEAs were targeting
the different stages of the instructional hierarchy, more evidence-based interventions are
readily available. Future studies may evaluate BEAs of math interventions with a wider
variety of evidence-based interventions.
Conclusion
With recent legislative changes in eligibility criteria for special education, schools
are increasingly turning to Rtl approaches for identifying students for remedial and
intensive academic supports. Rtl places a great focus on early and timely intervention
activities. Early identification and remediation of academic difficulties is believed to be
essential for preventing later academic failure. The treatment utility of a brief
experimental analysis of academic interventions has been proven effective in linking
assessment to intervention, especially in the area of reading fluency. Even though math is
80
viewed as a basic skill that needs to be mastered by students as early as elementary
school, only one investigation to date has examined the feasibility of modifying this
assessment approach to the area of math.
The current study demonstrates that BEAs might serve as a useful method for
quickly testing numerous math interventions in order to identify an intervention which
has an a priori likelihood of success. BEAs are solution oriented and focus on academic
improvement rather than deficits, disorders, and limitations of individual students (Daly
et al., 1997). Previous research has mainly focused on targeting reading interventions;
hence more research is needed on the treatment utility of BEAs with math interventions.
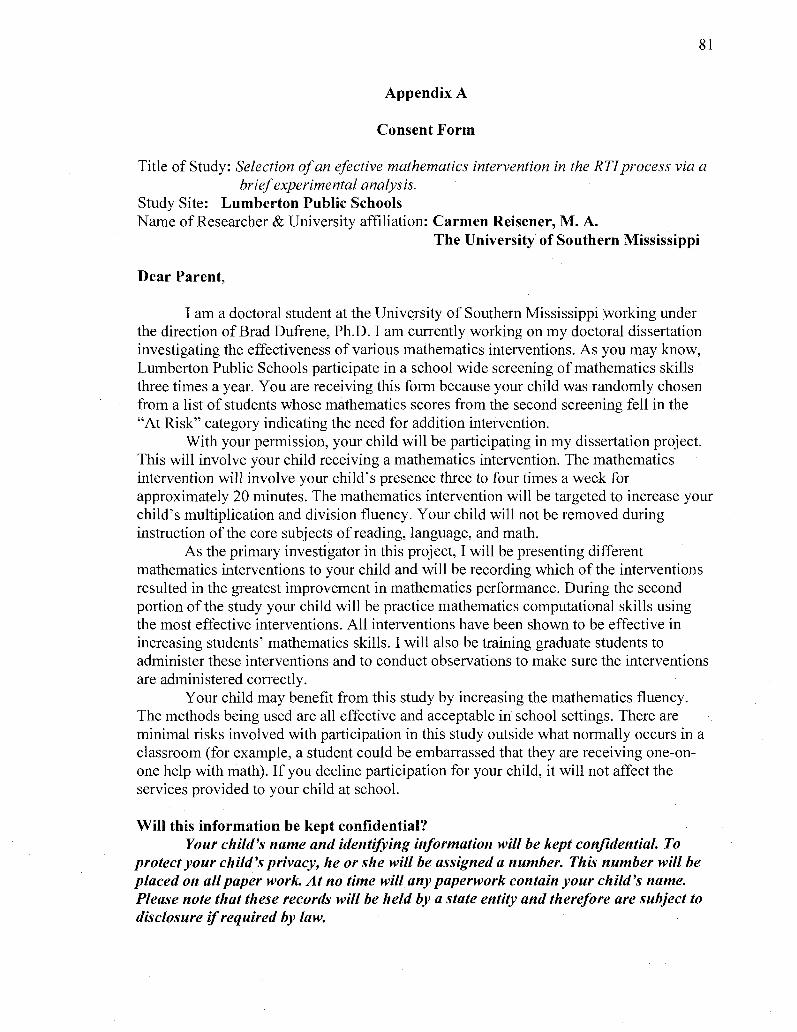
81
Appendix A
Consent Form
Title of Study: Selection of an efective mathematics intervention in the RTI process via a brief experimental analysis.
Study Site: Lumberton Public Schools Name of Researcher & University affiliation: Carmen Reisener, M. A.
The University of Southern Mississippi
Dear Parent,
I am a doctoral student at the University of Southern Mississippi working under the direction of Brad Dufrene, Ph.D. I am currently working on my doctoral dissertation investigating the effectiveness of various mathematics interventions. As you may know, Lumberton Public Schools participate in a school wide screening of mathematics skills three times a year. You are receiving this form because your child was randomly chosen from a list of students whose mathematics scores from the second screening fell in the "At Risk" category indicating the need for addition intervention.
With your permission, your child will be participating in my dissertation project. This will involve your child receiving a mathematics intervention. The mathematics intervention will involve your child's presence three to four times a week for approximately 20 minutes. The mathematics intervention will be targeted to increase your child's multiplication and division fluency. Your child will not be removed during instruction of the core subjects of reading, language, and math.
As the primary investigator in this project, I will be presenting different mathematics interventions to your child and will be recording which of the interventions resulted in the greatest improvement in mathematics performance. During the second portion of the study your child will be practice mathematics computational skills using the most effective interventions. All interventions have been shown to be effective in increasing students' mathematics skills. I will also be training graduate students to administer these interventions and to conduct observations to make sure the interventions are administered correctly.
Your child may benefit from this study by increasing the mathematics fluency. The methods being used are all effective and acceptable in school settings. There are minimal risks involved with participation in this study outside what normally occurs in a classroom (for example, a student could be embarrassed that they are receiving one-on-one help with math). If you decline participation for your child, it will not affect the services provided to your child at school.
Will this information be kept confidential? Your child's name and identifying information will be kept confidential. To
protect your child's privacy, he or she will be assigned a number. This number will be placed on all paper work. At no time will any paperwork contain your child's name. Please note that these records will be held by a state entity and therefore are subject to disclosure if required by law.

82
Who do I contact with research questions? If you should have any questions about this research project, please feel free to
contact Carmen Reisener, M.A. at (601) 266-5255 or Dr. Brad A. Dufrene at (601) 266-5256. For additional information regarding your rights as a research participant, please feel free to contact the USM Regulatory Compliance Office at (601) 266-4271.
What if I do not want to participate? Please understand that your participation is voluntary, your refusal to
participate will involve no penalty or loss of benefits to which you are otherwise entitled, and you may discontinue you and your child's participation at any time without penalty or loss of benefits.
What if I DO want my child to participate? If you would like your child to participate, please sign the bottom of this sheet. You may keep the second copy for your records.
Your Child's Name
Parent Signature Date
Investigator Signature Date

83
Appendix B
THE UNIVERSITY OF SOUTHERN MISSISSIPPI
Institutional Review Board 118 College Drive #5147 Hattiesburg, MS 39406-0001 Tel: 601.266.6820 Fax: 601.266.5509 www. usrn. edu/irb
HUMAN SUBJECTS PROTECTION REVIEW COMMITTEE NOTICE OF COMMITTEE ACTION
The project has been reviewed by The University of Southern Mississippi Human Subjects Protection Review Committee in accordance with Federal Drug Administration regulations (21 CFR 26, 111), Department of Health and Human Services (45 CFR Part 46), and university guidelines to ensure adherence to the following criteria:
• The risks to subjects are minimized. » The risks to subjects are reasonable in relation to the anticipated benefits. » The selection of subjects is equitable. « Informed consent is adequate and appropriately documented. « Where appropriate, the research plan makes adequate provisions for monitoring the
data collected to ensure the safety Of the subjects. • Where appropriate, there are adequate provisions to protect the privacy of subjects and
to maintain the confidentiality of all data. • Appropriate additional safeguards have been included to protect vulnerable subjects. « Any unanticipated, serious, or continuing problems encountered regarding risks to subjects
must be reported immediately, but not later than 10 days following the event. This should be reported to the IRB Office via the "Adverse Effect Report Form".
«• If approved, the maximum period of approval is limited to twelve months. Projects that exceed this period must submit an application for renewal or continuation.
PROTOCOL NUMBER: 28021802 PROJECT TITLE: Selection of an Effective Matehmatics Intervention in the RTI Process via a Brief Expermental Analysis PROPOSED PROJECT DATES: 02/13/08 to 02/13/09 PROJECT TYPE: Dissertation or Thesis PRINCIPAL INVESTIGATORS: Carmen Daniela Reisener COLLEGE/DIVISION: College of Education & Psycholgoy DEPARTMENT: Psychology FUNDING AGENCY: N/A HSPRC COMMITTEE ACTION: Expedited Review.Approval PERIOD OF APPROVAL: 02/18/08 to 02/17/09
•^fo^^ci' ^7, Lawrence A. Hosman, Ph.D. HSPRC Chair
Z- tq~ot Date

84
Appendix C
Protocol for Contingent Reward
Materials: timer, rewards box, math worksheet, pencil
Steps: 1. Place the math worksheet and the pencil in front of the student.
2. Tell the student: "Today you will be able to earn a prize if you exceed your goal of digits correct per minute. At the end of the session, I will calculate your digits correct per minute and tell you whether you can pick a prize out of rewards box. The sheet on your desk is math facts. There are several types of problems on the sheets. Some are multiplication and some are division. Look at each problem carefully before you answer it. When I say 'begin,' start answering the problems. Begin with the first problem and work across the page [demonstrate by pointing]. Then go to the next row [demonstrate by pointing]. If you cannot answer a problem, mark an 'X' through it and go to the next one. "
3. Say "Begin" and start timing. When 2 min. has elapsed, ask student to stop and mark sheet where they stopped.
4. Immediately score the math worksheet.
5. At the end of the session, tell the participant, "Today you have received digits correct per minute. Therefore, you may [or may not] choose
a prize from the rewards box."
6. Record digits correct per minute on the data collection sheet.

85
Appendix D
COVER, COPY, AND COMPARE INTERVENTION TO INCREASE MATH FLUENCY
Below are the steps for implementing an intervention designed to improve accuracy and speed with basic mathematics facts. The intervention should be implemented at least 3 times per week in order to obtain the desired educational gains.
Materials: Three training sheets of 10 math problems, with problems listed down the left side and the answer provided for each problem, one per student, one to three sets per session. You will also need assessment sheets with the same math problems listed down the left side but with blanks next to each problem for written responses.
Steps: 1. Tell the student he/she will be learning a new method of improving their
mathematics performance called Cover, Copy, and Compare. 2. Give training sheets to the students. 3. Conduct a training session in which you teach students to follow the Cover, Copy,
and Compare procedure: a. Silently read the first problem and the answer on the left side of the paper. b. Cover the problem and answer with an index card. c. Write the problem and answer from memory on the left side to check the
written response, d. Uncover the problem and answer on the left side to check the written
response. e. Evaluate the response. f. If the problem and answer are written incorrectly, repeat the procedure
with that item before proceeding to the next item. g. Repeat this procedure with the rest of the problems on the sheet.
4. After demonstrating the steps, have the student complete one or more training sheets and provide corrective feedback as needed.
5. For each session provide the student with sets of training sheets (one to three sets) and have them follow this procedure. After the training sheets are completed, administer the assessment sheets that correspond to the training sheets.
6. Allow the student to work on the assessment sheet for one minute. Use a timer to keep time. Tell the student to "BEGIN," and start the timer. At the end of two-minute, say "STOP," and mark the last item that the student completed. Count the number of correct DIGITS completed in one-minute.
7. Record the digits correct per minute on the data collection sheet.

86
Appendix E
PROTOCOL FOR CONSTANT TIME DELAY-MATH FACTS
Materials: Index cards with math facts printed in large font, digital kitchen timer, and data collection sheet
An initial assessment should be conducted to determine known and unknown multiplication and division facts. During the initial assessment, present a math fact card and allow the student three seconds to respond. If the student does not accurately identify the math fact in three seconds the math fact should be placed in the unknown pile. If the student accurately identifies the math fact in three seconds it should be placed in the known pile.
Procedure:
1. Assemble ten math facts flashcards. Eight cards should contain known facts while two should contain unknown facts. Shuffle the deck often math facts.
2. Set the timer for 10 minutes and begin presenting multiplication and division math facts. Present a card. Say, "What is the answer to this math fact?" Allow the student three seconds to respond. If the student responds incorrectly or fails to respond in three seconds then tell the student the correct answer and have her/him repeat the math fact. If the student responds correctly, say "Good job!"
3. Continue to present all math facts in the deck for ten minutes. Shuffle the deck periodically.
4. Shuffle the deck often math facts cards. Administer the ten multiplication and division cards three times. Present math facts cards using the same procedure described in Step 2.
5. On the data collection sheet, record newly mastered multiplication and division math facts. A math fact will be judged mastered if it is accurately identified on all three trials.
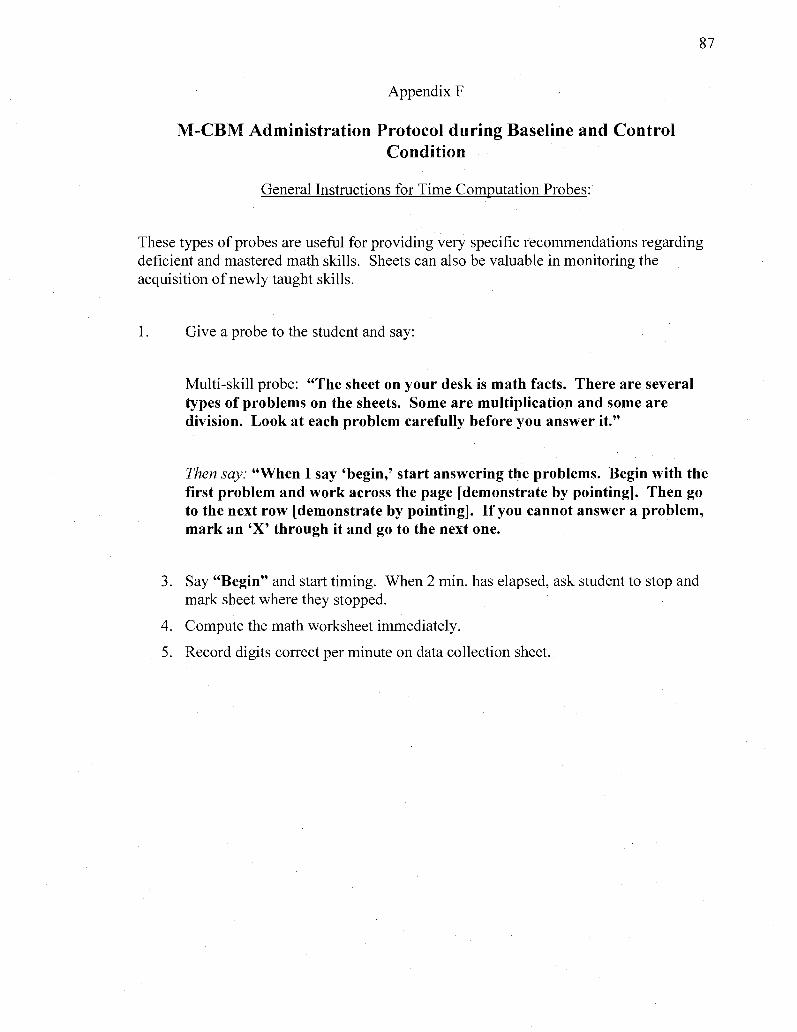
87
Appendix F
M-CBM Administration Protocol during Baseline and Control Condition
General Instructions for Time Computation Probes:
These types of probes are useful for providing very specific recommendations regarding deficient and mastered math skills. Sheets can also be valuable in monitoring the acquisition of newly taught skills.
Give a probe to the student and say:
Multi-skill probe: "The sheet on your desk is math facts. There are several types of problems on the sheets. Some are multiplication and some are division. Look at each problem carefully before you answer it."
Then say: "When I say 'begin,' start answering the problems. Begin with the first problem and work across the page [demonstrate by pointing]. Then go to the next row [demonstrate by pointing]. If you cannot answer a problem, mark an 'X' through it and go to the next one.
3. Say "Begin" and start timing. When 2 min. has elapsed, ask student to stop and mark sheet where they stopped.
4. Compute the math worksheet immediately.
5. Record digits correct per minute on data collection sheet.

88
Appendix G
Procedural Integrity Checklist for Contingent Reward
Materials Checklist: • Student Data Collection Form • Student Math Worksheet • Rewards Box • Stopwatch or Digital Timer • Pen or Pencil
Script: • 1. Places the math worksheet and the pencil in front of the student.
D 2. Tells the student: "Today you will be able to earn a prize if you exceed your goal of digits correct per minute. At the end of the session, I will calculate your digits correct per minute and tell you whether you can pick a prize out of rewards box. The sheet on your desk is math facts. There are several types of problems on the sheets. Some are multiplication and some are division. Look at each problem carefully before you answer it. When I say 'begin,' start answering the problems. Begin with the first problem and work across the page [demonstrate by pointing]. Then go to the next row [demonstrate by pointing]. If you cannot answer a problem, mark an 'X' through it and go to the next one."
• 3. Says "Begin" and start timing.
• 4. When 2 min. has elapsed, asks student to stop and marks sheet
where they stopped.
• 5. Immediately scores the math worksheet.
• 6. At the end of the session, tells the participant, "Today you have received digits correct per minute. Therefore, you may [or may not] choose a prize from the rewards box."
• 7. Lets student pick prize from the rewards box if pre-set criterion was met.
• 8. Records digits correct per minute on the data collection sheet.

89
Appendix H
Procedural Integrity Checklist for Cover-Copy-Compare
Materials Checklist: • Student Data Collection Form • Cover-Copy-Compare Worksheets • Stopwatch or Digital Timer • Pen or Pencil
Script: • 1. Tells the student he/she will be learning a new method of
improving their mathematics performance called Cover, Copy, and Compare.
• 2. Gives training sheets to the students. • 3. Conducts a training session in which you teach students to follow
the Cover, Copy, and Compare procedure: o Silently read the first problem and the answer on the left side of
the paper. o Cover the problem and answer with an index card. o Write the problem and answer from memory on the left side to
check the written response, o Uncover the problem and answer on the left side to check the
written response. o Evaluate the response. o If the problem and answer are written incorrectly, repeat the
procedure with that item before proceeding to the next item. o Repeat this procedure with the rest of the problems on the
sheet. • 4. After demonstrating the steps, has the student complete one or more
training sheets and provides corrective feedback as needed. • 5. Allows the student to work on the assessment sheet for one minute. • 6. Uses a timer to keep time. • 7. Tells the student to "BEGIN," and start the timer. • 8. At the end of two-minute, says "STOP." D 9. Marks the last item that the student completed. • 10.Counts the number of correct DIGITS completed in one-minute. D l l .Records the digits correct per minute on the data collection sheet.
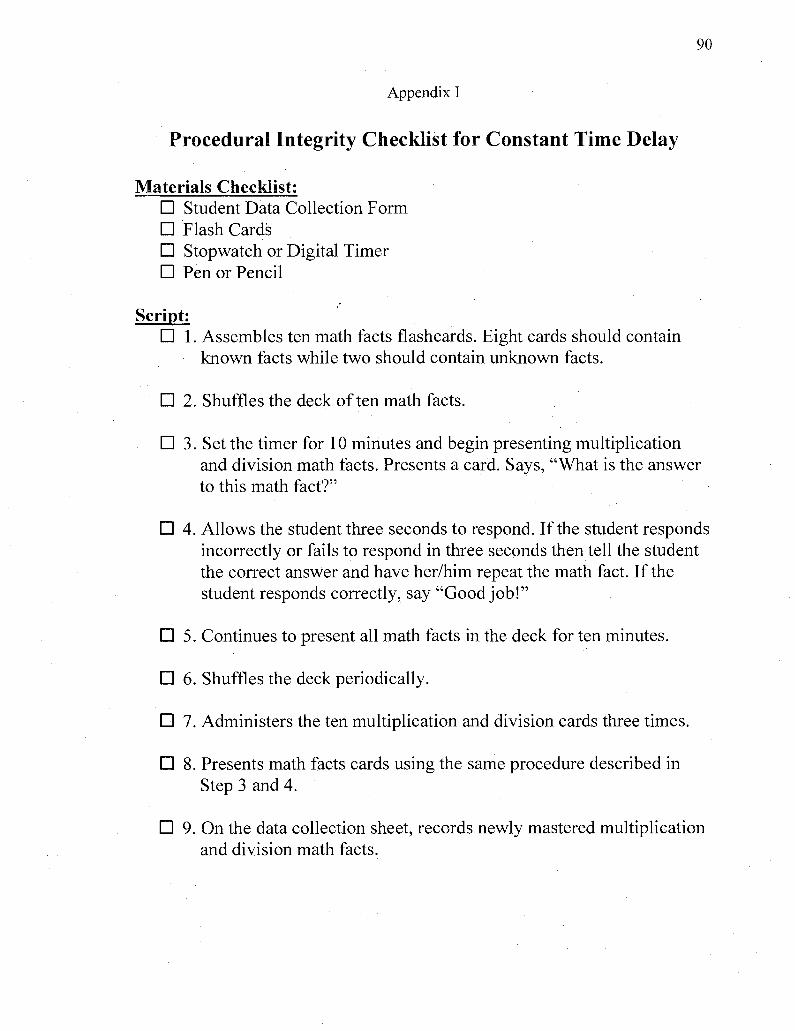
90
Appendix I
Procedural Integrity Checklist for Constant Time Delay
Materials Checklist: • Student Data Collection Form • Flash Cards • Stopwatch or Digital Timer • Pen or Pencil
Script: • 1. Assembles ten math facts flashcards. Eight cards should contain
known facts while two should contain unknown facts.
• 2. Shuffles the deck often math facts.
• 3. Set the timer for 10 minutes and begin presenting multiplication and division math facts. Presents a card. Says, "What is the answer to this math fact?"
• 4. Allows the student three seconds to respond. If the student responds incorrectly or fails to respond in three seconds then tell the student the correct answer and have her/him repeat the math fact. If the student responds correctly, say "Good job!"
• 5. Continues to present all math facts in the deck for ten minutes.
• 6. Shuffles the deck periodically.
• 7. Administers the ten multiplication and division cards three times.
• 8. Presents math facts cards using the same procedure described in Step 3 and 4.
• 9. On the data collection sheet, records newly mastered multiplication and division math facts.

91
Appendix J
Accuracy of Implementation Rating Scale Mathematics Computation Curriculum-Based Measurement (M-CBM) during Baseline and
Control Condition
X = completed accurately O = incorrectly completed
Testing Procedure Observation
1. Selects an appropriate math probe
2. Provides student with a pencil and math probe
3. Says appropriate standardized directions accurately
Says "There are several types of problems on the sheet. Some are multiplication and some are division. Look at each problem carefully before you answer it. When I say start, turn them over and begin answering the problems. Start on the first problem on the left on the top row [point]. Work across and then go to the next row. If you can't answer the problem, make an 'X' on it and go to the next one. If you finish one side, go to the back. Are there any questions? Start."
4. Starts stopwatch after directions
5. Corrects Skipping or Overuse of X-ing
6. Encourages student who stop to keep working
7. Times accurately (2 minutes)
8. Says "Stop; Put your pencil down"
9. Stops stopwatch
10. Places a ] behind last digit worked
11. Scores probe immediately after administration
Additional Comments:
92
REFERENCES
Allyon, T., & Roberts, M.D. (1974). Eliminating discipline problems by strengthening
academic performance. Journal of Applied Behavior Analysis, 7, 71-76.
Barnett, D. W., Daly, E. J. Ill, Jones, K. M., & Lentz, F. E., Jr. (2004). Response to
intervention: Empirically based special service decisions from single-case
designs of increasing and decreasing intensity. The Journal of Special
Education, 38, 66-79.
Bergan, J. R., & Kratochwill, T. R. (1990). Behavioral consultation and therapy. New
York: Plenum.
Billington, E. J., & Skinner, C. H. (2002). Getting students to choose to do more work:
Evidence of the effectiveness of the interspersal procedure. Journal of Behavioral
Education, II, 105-116.
Broughton, S.F., & Lahey, B.B. (1978). Direct and collateral effects of positive
reinforcement response cost, and mixed contingencies for academic performance.
Journal of School Psychology, 16, 126-136.
Browder, D. M., & Cooper-Duffy, K. (2003). Evidence-based practices for students with
severe disabilities and the NCLB requirement for adequate yearly progress in
reading, math, and science. Journal of Special Education, 37, 157-163.
Brown-Chidsey, R., & Steege, M. W. (2005). Response to intervention: Principles and
strategies for effective practice. New York: Guilford.
Carey, R.G., & Bucher, B. (1981). Identifying the educative and suppressive effects of
positive practice and restitutional overcorrection. Journal of Applied Behavior
Analysis, 14, 1, 71-80.
93
Carpenter, T. (1985). Learning to add and subtract: An exercise in problem solving. In E.
A. Silver (Ed.), Teaching and learning mathematical problem solving: Multiple
research perspectives. Hillsdale, NJ: LEA.
Garson, P. M., & Eckert, T. L. (2003). An experimental analysis of mathematics
instructional components: Examining the effects of student-selected versus
empirically-selected interventions. Journal of Behavioral Education, 12, 35-54.
Christ, T. J. (2002). The effects of passage-difficulty on CBM progress monitoring
outcomes: Stability and accuracy. Unpublished doctoral dissertation, University
of Massachusetts, Amherst.
Christ, T. J., Burns, M. K., & Ysseldyke, J. (2005). Conceptual confusion within
response-to-intervention vernacular: Clarifying meaningful differences.
Communique, 34, 1-7.
Clark, B., & Shinn, M. R. (2004). A preliminary investigation into the identification and
development of early mathematics curriculum-based measurement. School
Psychology Review, 33, 234-248.
Codding, R. S., Eckert, T. L., Fanning, E., Shiyko, M., & Solomon, E. (2007).
Comparing mathematics interventions: The effects of cover-copy-compare alone
and combined with performance feedback and digits correct and incorrect.
Journal of Behavioral Education, 16, 125-141.
Codding, R. S., Shiyko, M., Russo, M., Birch, S., Fanning, E., & Jaspen, D. (2007).
Comparing mathematics interventions: Does initial level of fluency predict
intervention effectiveness? Journal of School Psychology, 45, 603-617.
94
Coleman-Martin, M., & Wolff-Heller, K. (2004). Using a modified constant prompt-
delay procedure to teach spelling to students with physical disabilities. Journal of
Applied Behavior Analysis, 37, 469-480.
Cooke, N. L., Guzaukas, R., Pressley, J. S., & Kerr, K. (1993). Effects of using a ratio of
new items to review items during drill and practice: Three experiments. Education
& Treatment of Children, 16, 213-23 4.
Daly, E. J. II., Bonfiglio, C. M., Mattson, T., Persampieri, M., & Foreman-Ya, K. (2006).
Refining the experimental analysis of academic skills deficits: Part ii. Use of brief
experimental analysis to evaluate reading fluency treatments. Journal of Applied
Behavior Analysis, 39, 323-331.
Daly, E. J. Ill, Lentz, F. E., & Boyer, J. (1996). The instructional hierarchy: A
conceptual model for understanding the effective components of reading
interventions. School Psychology Review, 11, 369-386.
Daly, E. J. Ill, & Martens, B. K. (1994). A comparison of three interventions for
increasing oral reading performance: Application of the instructional hierarchy.
Journal of Applied Behavior Analysis, 27, 459-469.
Daly, E. J. Ill, Martens, B. K., Dool, E. J., & Hintze, J. M. (1998). Using brief functional
analysis to select interventions for oral reading. Journal of Behavioral Education,
5,203-218.
Daly, E. J., Ill, Martens, B. K., Handler, K. R., Dool, E. J., & Eckert, T. L. (1999). A
brief experimental analysis for identifying instructional components needed to
improve oralreading fluency. Journal of Applied Behavior Analysis, 32, 83-94.
95
Daly, E. J., Ill, Witt, J. C , Martens, B. K., & Dool, E. J. (1997). A model for conducting
functional analysis of academic performance problems. School Psychology
Review, 26, 554-574.
Deno, S. L. (1985). Curriculum-based measurement: The emerging alternative.
Exceptional Children, 52, 219-23.
Deno, S. L. (1987). Curriculum-based measurement. Teaching Exceptional Children, 20,
41-47.
Deno, S. L. (2002). Problem solving as "best practice." In A. Thomas & J. Grimes
(Eds.), Best practices in school psychology IV (No\. 1, pp. 37-56). Washington,
DC: National Association of School Psychologists.
Deno, S. L., & Mirkin, P. K. (1977). Data-based program modification: A manual.
Reston, VA: Council for Exception Children.
DiGennaro F. D., Martens, B. K., & Mclntyre, L. L. (2005). Increasing treatment
integrity through negative reinforcement: Effects on teacher and student behavior.
School Psychology Review, 34, 220-231.
Duhon, G. J., Noell, G. H., Witt, J. C, Freeland, J. T., Dufrene, B. A., & Gilbertson, D.
N. (2005). Identifying academic skill and performance deficits: The experimental
analysis of brief assessments of academic skills. School Psychology Review, 33,
429-443.
Eckert T. L., Ardoin S. P., Daly E. J. Ill, & Martens, B. K. (2002). Improving oral
reading fluency: An examination of the efficacy of combining skill-based and
performance-based interventions. Journal of Applied Behavior Analysis. 35, 271—
281.
96
Fletcher, J. M, Francis, D. J., Morris, R. D., & Lyon, G. R. (2005). Evidence-based
assessment of learning disabilities in children and adolescents. Journal of
Clinical Child and Adolescent Psychology, 34,506-522.
Fuchs, L. S. (2004). The past, present, and future of curriculum-based measurement
research. School Psychology Review, 33, 188-192.
Fuchs, L. S., & Fuchs, D. (1997). Use of curriculum-based measurement in identifying
students with disabilities. Focus on Exceptional Children, 30, 1-16.
Fuchs, L. S., & Fuchs, D. (2001). Principles for the prevention and intervention of
mathematics difficulties. Learning Disabilities Research & Practice, 16, 85-95.
Fuchs, D., Mock, D., Morgan, P. L., & Young, C. L. (2003). Responsiveness-to-
intervention: Definitions, evidence, and implications for the learning disabilities
construct. Learning Disabilities Research and Practice, 18, 157-171.
Gilbertson, D., Witt, J. C, Duhon, G., & Dufrene, B. (2008). Using brief assessments to
select math fluency and on-task behavior interventions: An investigation of
treatment utility. Education and Treatment of Children, 31, 167-181.
Good, R. H., Simmons, D. C , & Kame'enui, E. J. (2001). The importance of decision
making utility of a continuum of fluency-based indicators of foundational reading
skills for third-grade high stakes outcomes. Scientific Studies of Reading, 5, 257-
288.
Gresham, F. M. (1991). Conceptualizing behavior disorders in terms of resistance to
intervention. School Psychology Review, 20, 23-36.
97
Gresham, F. (2001). Response to intervention: An alternative approach to the
identification of learning disabilities. Retrieved 8/28/2007, from
www.cssponline.org/ppts/Gresham_Training_Powerpoint.ppt
Gresham, F. (2002). Responsiveness to intervention: An alternative approach to the
identification of learning disabilities. In R. Bradley & L. Danielson (Eds.),
Identification of learning disabilities: Research to practice (pp. 467-519).
Mahwah, NJ: Erlbaum.
Gross-Tsur, V., Manor, 0., & Shalev, R. S. (1996). Developmental dyscalculia:
Prevalence and de-mographic features. Developmental Medicine and Child
Neurology, 55,25-33.
Haring, N. G., Lovitt, T. C, Eaton, M. D., & Hanson, C. L. (1978). The fourth R:
Research in the classroom. Columbus, OH: Merrill.
Hasselbring, T. S., Goin, L. I., & Bransford, J. D. (1988). Developing math automaticity
in learning handicapped children: The role of computerized drill and practice.
Focus on Exceptional Children, 20, 2-7.
Hintze, J. M., Christ, T. J., & Methe, S. A. (2006). Curriculum-based assessment.
Psychology in the schools, 43,45-56.
Individuals with Disabilities Education Improvement Act (IDEA 2004), PL. 108-446
(2004).
Jitendra, A. K., Salmento, M., & Haydt, L. (1999). A case study of subtraction analysis in
basal mathematics programs: Adherence to important instructional design criteria.
Learning Disabilities Research & Practice, 14, 69-79.
98
Johnston, P., & Allington, R. L. (1991). "Remediation." In R. Barr, M. L. Kamil, P.
Mosenthal, & P. D. Pearson (Eds.), Handbook of reading research, Vol. II (pp.
984- 1012). White Plains, NY: Longman.
Johnson, G., Gersten, R., & Carnine, D. (1987). The effects of instructional design
variables on vocabulary acquisition of LD students: A study of computer-assisted
instruction. Journal of Learning Disabilities, 20,206-211.
Jones, K. M., Harmon, A. K., & Wickstrom, K. F. (2001). A comparison of brief and
extended experimental analyses of oral reading fluency. Proven Practice, 2, 61-
67.
Jones, K. M., & Wickstrom, K. F. (2002). Done in sixty seconds: Further analysis of the
briefassessment model for academic problems. School Psychology Review, 31,
554-568.
Kazdin, A. E., & Weisz, J. R. (Eds.). (2003). Evidence-based psychotherapies for
children and adolescents. New York: Guilford Press.
Lloyd, D. N. (1978). Prediction of school failure from third-grade data. Educational and
Psychological Measurement, 38, 1193-1200.
Logan, P., & Skinner, C. H. (1998). Improving students' perceptions of a mathematics
assignment by increasing problem completion rates: Is problem completion a
reinforcing event? School Psychology Quarterly, 13, 322-331.
Lovitt, T., Eaton, M., Kirkwood, M., & Pelander, J. (1971). Effects of various
reinforcement contingencies on oral reading rate. In E. Ramp & B. Hopkins
99
(Eds.), A new direction for education: Behavior analysis (pp. 54-71). Lawrence,
KS: University of Kansas.
MacQuarrie. L. L., Tucker, J. A., Burns, M. K., & Hartman, B. (2002). Comparison of
retention rates using traditional, Drill Sandwich, and Incremental Rehearsal
flashcard methods. School Psychology Review, 31, 584-595.
Malloy, K. J., Gilbertson, D., & Maxfield, J. (2007). Use of brief experimental analysis
for selecting reading interventions for English language learners. School
Psychology Review, 36,291-310.
Manzo, K. K., & Galley, M. (2003). Math climbs, reading flat on '03 NAEP. Education
Week, 23, 1-18.
Marston, D. (2005). Tiers of intervention in responsiveness to intervention: Prevention
outcomes and learning disabilities identification patterns. Journal of Learning
Disabilities, 38, 539-544.
Marston D., Muyskens, P., Lau, M., & Canter, A. (2003). Problem-solving model for
decision making with high-incidence disabilities: The Minneapolis experience.
Learning Disabilities Research & Practice, 18, 187-200.
Martens, B. K., Eckert, T. L., Bradley, T. A., & Ardoin, S. P. (1999). Identifying
effective treatments from a brief experimental analysis: Using single-case design
elements to aid decision making. School Psychology Quarterly, 14, 163-181.
Mattingly, J.C., & Bott, D.A. (1990). Teaching multiplication facts to students with
learning problems. Exceptional Children, 56, 438-449.
100
McDonald, E., & Ardoin, S. P. (2007). Interspersing easy math problems among
challenging problems: detection of interspersal effects in whole-class
applications. Journal of Behavioral Educaiton, 16, 342-354.
Mortenson, B. P. & Witt, J. C. (1998). The use of weekly performance feedback to
increase implementation if a prereferral academic intervention. School
Psychology Review, 27, 613-627.
National Assessment for Educational Progress. (2005). The nation's report card.
Retrieved on 10/06/2007 from
http://nationsreportcard.gov/reading_math_2005/s0017.asp
National Education Association. (2007). Special education and the Individuals with
Disabilities Education Act. Retrieved on 10/06/2007 from
http://www.nea.org/specialed/index.html
National Center for Learning Disabilities. (2006). A parent's guide to response-to-
interventions. Retrieved on 8/27/2007 from
http://www.swoserrc.org/uploads/Response.to.ntervention.pdf
National Council of Teachers of Mathematics. (1989/ Curriculum and Evaluation
Standards for School Mathematics. Reston, VA: Author.
Neidorf, T., Binkley, M., & Stephens, M. (2006). Comparing science content in the
National Assessment of Educational Progress (NAEP) 2000 and Trends in
International Mathematics and Science Study (TIMSS) 2003 assessments.
Washington, DC: NCES. Available: http://nces.ed.gov/pubs2006/2006026.pdf
No Child Left Behind Act of 2001, Pub. L. No. 107-110, 115 Stat. 1425 (2002). [On
line]. Available:
http://edworkforce.house.gov/issues/107th/education/nclb/nclb.htm
Noell, G. H., Freeland, J. T., Witt, J. C, & Gansle, K. A. (2001). Using brief assessments
to identify effective interventions for individual students. Journal of School
Psychology, 39, 335-355.
Northup, J., Wacker, D., Sasso, G., & Steege, M. (1991, September). A brief functional
analysis of aggressive and alternative behavior in an outclinic setting. Journal of
Applied Behavior Analysis, 24, 509-522.
Ollendick, T. H., Matson, J. L., Esveldt-Dawson, K., & Shapiro, E. S. (1980). Increasing
spelling achievement: An analysis of treatment procedures utilizing an alternating
treatments design. Journal of Applied Behavior Analysis, 13, 645-654.
Poncy, B. C., Skinner, C. H., & Jaspers, K. E. (2007). Evaluating and comparing
interventions designed to enhance math fact accuracy and fluency: Cover, copy,
and compare versus taped problems. Journal of Behavioral Education, 16, 27-37'.
Rhymer, K., Dittmer, K., & Skinner, C. H. (2000). Effectiveness of a multi-component
treatment for improving mathematics fluency. School Psychology Quarterly, 15,
40-51.
Ross, A. H., & Stevens, K. B. (2003). Teaching spelling of social studies content
vocabulary prior to Using the vocabulary in inclusive learning environments: An
examination of constant time delay, observational learning, and instructive
feedback. Journal of Behavioral Education, 12, 287-309.
102
Salvia, J., & Ysseldyke, J. (1978). Assessment in special and remedial education. Boston:
Houghton-Mifflin.
Schul Thurber, R. Shinn, M., & Smolkowski, K. (2002). What is measured in
mathematics tests? Construct validity of curriculum-based mathematics measures.
School Psychology Review, 31, 498-513.
Shapiro, E. S., & Derr, T F. (1987). An examination of overlap between reading curricula
and standardized achievement tests. Journal of Special Education, 21, 59-67.
Shapiro, E. S. (2004). Academic skills problems: Direct assessment and intervention (2nd
ed.). New York: Guilford.
Shinn, M.R. (Ed.). (1989). Curriculum-based measurement: Assessing special children.
NY: Guilford Press.
Shinn, M. R., & Bamonto, S. (1998). Advanced applications of curriculum-based
measurement: "Big ideas" and avoiding confusion. In M. R. Shinn (Ed.),
Advanced application of curriculum-based measurement (pp. 1-31). New York:
Guilford Press.
Shinn, M. R., & Marston, D. (1985). Differentiating mildly handicapped, low-achieving,
and regular education students: A curriculum-based approach. Remedial and
Special Education, 6, 31-38.
Skiba, R., Magnusson, D., Marston, D., & Erickson, K. (1986). The assessment of
mathematics performance in special education: Achievement tests, proficiency
tests, or formative evaluation. Minneapolis, MN: Minneapolis Public Schools.
103
Skinner, C. H., Fletcher, P. A., Wildmon, M., & Belfiore, P. J. (1996). Improving
assignment preference through interspersal: Problem completion rates versus easy
problems. Journal of Behavioral Education, 6, 427-437.
Skinner, C. H., McLaughlin, T. F., & Logan, P. (1997). Cover, copy, and compare: A
self-managed academic intervention across skills, students, and settings. Journal
of Behavioral Education, 7, 295-306.
Skinner, C. H., Turco, T. L., Beatty, K. L., & Rasavage, C. (1989). Cover, copy, and
compare: A method for increasing multiplication performance. School Psychology
Review, 7S, 412-420.
Scruggs, T. E., Mastropieri, M. A., Cook, S. B., & Escobar, C. (1986). Early intervention
for children with conduct disorders: A quantitative synthesis of single-subject
research. Behavioral Disorders, 11, 260-271.
Stanovich, K. E. (2001). The rationality of educating for wisdom. Educational
Psychologist, 36,247-251.
Stanovich, K., & Siegel, L. (1994). Phenotypic performance profile of children with
reading disabilities: A regression-based test of the phonological-core-variable-
difference model. Journal of Educational Psychology, 86, 24-53.
Stedman, L. C. (1997). International achievement differences: an assessment of a new
perspective. Educational Researcher, 26, 4-15.
Stevens, K. B., & Schuster, J. W. (1987). Effects of a constant time delay procedure on
the written spelling performance of a learning disabled student. Learning
Disability Quarterly, 10, 9-16.
104
Tindall, G., Marston, D., & Deno, S. L. (1983). The Reliability of Direct and Repeated
Measurement (Research Rep. No. 109). Minneapolis: University of Minnesota
Institute for Research on Learning Disabilities.
VanAuken, T. L., Chafouleas, S. M., Bradley, T. A., & Martens, B. K. (2002).
Using brief experimental analysis to select oral reading interventions: An
investigation of treatment utility. Journal of Behavioral Education, 11, 163-179.
VanDerHeyden, A. M., & Witt, J. C. (2005). Quantifying the context of assessment:
Capturing the effect of base rates on teacher referral and a problem-solving model
of identification. School Psychology Review, 34, 161 -183.
Vaughn, S., Linan-Thompson, S., & Hickman, P. (2003). Response to instruction as a
means of identifying students with reading/learning disabilities. Council for
Exceptional Children, 4, 391-409.
Whalen, C, Schuster, J.W., & Hemmeter, M.L. (1996). The use of unrelated instructive
feedback when teaching in a small group instructional arrangement. Education
and Training in Mental Retardation and Developmental Disabilities, 31, 188-202.
Wickstrom, K., Jones, K., LaFleur, L., & Witt, J. (1998). An analysis of treatment
integrity in school-based behavioral consultation. School Psychology Quarterly,
13, 141-154.
Wildmon, M. E., Skinner, C. H., & McDade, A. (1998). Interspersing additional brief
easy problems to increase assignment preference on mathematics reading
problems. Journal of Behavioral Education, 8, 337-346.

105
Wolery, M, Holcombe, A., Cybriwsky, C , Doyle, P. M., Schuster, J. W., Ault, M. J., &
Gast, D. L. (1992). Constant time delay with discrete responses: A review of
effectiveness and demographic, procedural, and methodological parameters.
Research in Developmental Disabilities, 13, 239-266.