sedimentology and diagenesis of some neocomianbarremian rocks (chouf formation), southern lebanon
TRANSCRIPT

AMERICAN UNIVERSITY OF BEIRUT
SEDIMENTOLOGY AND DIAGENESIS OF SOME NEOCOMIAN-BARREMIAN ROCKS (CHOUF FORMATION), SOUTHERN
LEBANON
by GEORGE SEBASTIAN BELLOS
A thesis submitted in partial fulfillment of the requirements
of the degree of Master of Science to the Department of Geology
of the Faculty of Arts and Sciences at the American University of Beirut
Beirut, Lebanon, June, 2008
AMERICAN UNIVERSITY OF BEIRUT
SEDIMENTOLOGY AND DIAGENESIS OF SOME NEOCOMIAN-BARREMIAN ROCKS (CHOUF FORMATION),
SOUTHERN LEBANON
by
GEORGE SEBASTIAN BELLOS
Approved by: ______________________________________________________________________ Dr. Maya El-Kibbi, Assistant Professor Advisor Geology ______________________________________________________________________ Dr. Abdel-Fattah M. Abdel-Rahman, Professor Member of Committee Geology ______________________________________________________________________ Dr. Fadi Henri Nader, Assistant Professor Member of Committee Institut Français du Pétrole (IFP), France Date of thesis/dissertation defense: June 6th, 2008.
AMERICAN UNIVERSITY OF BEIRUT
THESIS RELEASE FORM
I, George Sebastian Bellos authorize the American University of Beirut to supply copies of my thesis to
libraries or individuals upon request. do not authorize the American University of Beirut to supply copies of my thesis to
libraries or individuals for a period of two years starting with the date of the thesis defense.
____________________ Signature
____________________ Date
v
ACKNOWLEDGMENTS
First, I am grateful for the efforts and time invested by my M.S. Thesis advisor: Dr.
Maya El-Kibbi. Her advice and feedback were essential for the achievement of this project. I appreciate all what I have learnt throughout this thesis.
In addition, I acknowledge the valuable time given by all the examining committee
members (Drs. Abdel-Rahman and Fadi. H. Nader), as well as Ms. Nadine Knesevitch from Jaffet Library for their comments and corrections, without which my thesis dissertation would not have progressed. Merits are accredited to Mr. Philip Nassar as well for his help in examining the thesis, as he was not an exam committee member.
As this research was partially sponsored by Dr. Fadi. H. Nader, his contribution for
the successful completion of this thesis requires mentioning. I admit that his involvement was crucial; without which I would not have been able to complete this project.
Furthermore, I give credit to all the people who have assisted me during my field
work, and research work; namely Mr. Habib el Helou for logistics, Dr. Rudy Swennen for his guidance at the early stages of the study, and to all my colleagues (too numerous to mention) who helped me during the course of this thesis research as well as all the people who made an effort to reply to my questions at a time no one else was available. Therefore, I extend my gratitude especially to Profs. Daniel R. Muhs and David R. Lentz and others that are too numerous to mention.
Moreover, I owe recognition to all the people who have assisted me during the extra
work that was generated by this project; namely the Geology 222 students for conducting my last granulometric studies, under the guidance of Mr. Ahmad D. Hoteit and Dr. Ali T. Haidar as well as the Sedimentology Laboratory of the Institut Français du Pétrole (IFP), France, under the supervision of Dr. Fadi. H. Nader, for the high resolution conventional microscopic and cathodoluminescence photomicrographs and the pyrolisis results. Heghnar S. Skayan’s help is recognized for the laboratory work done on carbonate samples, and also both Mr. Joseph Beydoun and Mr. Rami M. Fakhry for allowing me to stay overtime in the Van Dyck Computer Laboratory in order to perform the last corrections for my M.S. Thesis.
Thanks are also extended to Dr. Youssef Mouneimne and his colleagues of the
Central Research Science Laboratory (CRSL) at the American University of Beirut, for granting me the possibility to use their facilities, and for guiding me through the procedure of the X-ray diffraction analysis during my research.
Special appreciation is attributed to Mr. Maroun Ijreiss for his assistance during
laboratory and pre-microscopic work, and Mrs. Huda Nisr for her moral and practical support. Last but not least, I value my family. As without their constant backing, this project
would have never been completed. Therefore, I extend deepest thanks to my parents, my grandfather and my brother, as I am greatly respectful of all their encouragements.

vi
AN ABSTRACT OF THE THESIS OF
George Sebastian Bellos for Master of Science Major: Geology
Title: Sedimentology and Diagenesis of some Neocomian-Barremian Rocks (Chouf
Formation), Southern Lebanon.
The Neocomian - Barremian rocks are well exposed in southern Lebanon (Jezzine), yet they were not properly studied to date. The present study involves modern detailed and state of the art petrographic and mineralogical analyses of these rocks.
The Chouf Formation was deposited both in fluvio-deltaic (aquatic based systems)
and eolian environments (terrigenous systems). Evidence of this is obtained in the field, looking at preserved primary structures (in the Lower parts of the Formation – for the aquatic dominated systems – and in the mid parts of the Formation – for the continentally-dominated systems). Thus, both types of sandstone strata are found involving different environments of deposition with cyclical control.
Lithostratigraphic and petrographic analyses revealed that the Homsiyeh outcrops include five distinct facies. Each of them was studied in detail with modern petrographic and x-ray diffraction methods.
This petrographic study sheds more light on the characteristics of the organic rich layers in the aquatic dominated facies mainly occurring in the lower part of the Chouf Formation. These bitumen resulted in corrosion and dissolution of the quartz grains (in the sandstones) increasing the porosity/ permeability of the bulk rocks upon initial hydrocarbon migration and later on the telogenic flushing with meteoric waters.
vii
CONTENTS
ACKNOWLEDGEMENTS ……………………………………………….... v
ABSTRACT .………………………………………………………………….... vi
LIST OF ILLUSTRATIONS ……………………………………………... xiii
LIST OF TABLES ………………………………………………………….... xxvi
Chapter
I. INTRODUCTION…………………………………………………….. 1
A. General Overview ………………………………………...…………..……...6
B. Sandstones ……………………………………………………..……..……...9
1. Origin ………………………………………………………….……...13 2. Field characteristics (primary structures) ……………….............……14
a. Continuous to Discontinuous Laminae .....................................14 b. Cross Stratifications ..................................................................14 c. Graded Bedding ........................................................................15 d. Bedload Structures ....................................................................15 e. Nodular or Concretional Formations ........................................15 f. Flaser (or Lenticular) Bedding ..................................................16 g. Ripple Marks ............................................................................16 i. Current Ripple Marks ....................................................17 ii. Wave-Formed Ripple Marks ........................................17 h. Downwards Accretion Structures .............................................17
3. Study Methods of Sandstones …………………………....……….…..18 4. Classification …………………………………………..………..….....19 5. Textural and Mineralogical Maturity ....................................................22 a. Clay Content as a Textural Maturity Boundary ........................24 b. Sorting as a Textural Maturity Boundary .................................25 c. Sphericity and Roundness as a Textural Maturity Boundary ..................................................................................26 6. Porosity Typing ....................................................................................27

viii
C. Previous Studies on the Chouf Formation ……………………..…….…........28
1. Early contributions ……………………….………..………..……......28 2. Contributions of the Period Extending from 1950 to 1965 …..............29 3. Contributions of the Period Extending from 1965 to 1987 ..…............30 4. Recent Contributions ……………………………………..…..............39 5. Contributions Related to Preserved Organisms and Fossils ….............41
a. Fossil and Other Remains .........................................................42 b. Amber .......................................................................................42 c. Summary ..................................................................................43
D. Study Area …………………………………………………………......…....43
E. Objectives …………………………………………………………..……......45
II. GEOLOGIC SETTING …..……………………………………….... 46
A. Stratigraphy…………………………………………………………….….…...50
1. Early-Middle Jurassic ……………………………………….…..…......50 2. Late Jurassic ………………………………………...…...………..........52
a. The Bhannes Formation …………………………………..........52 b. The Bikfaya formation ………………………….…..….............52 c. Salima Formation ...………………………………….………....53
3. Early Cretaceous ………………………………………….……….…...54 4. Late Cretaceous ………………………………………..….……….…...56
a. The Sannine Formation ………………………………………....56 b. The Maameltain Formation ………………………..…………...57 c. The Chekka Formation ……………………………...….............58
5. Cenozoic ………………………………………………….……............58
B. Structural aspects and volcanic activity …………………………...…….….....61
1. Structural Aspects ………………………………………..…….............61 a. The Roum Fault ………………………………………………...63 b. The Yammouneh Fault …………………………………............63 c. The Hasbaya Fault ………………………………………...........64 d. The Rachaya Fault ………………………………………..........64 e. The Serghaya Fault ……………………………...………..........65 f. Other minor faults ……………………………...………............65
2. Volcanic Activity ………………………………………………............65
C. Neocomian-Barremian Sandstones (Chouf Formation) ....................................66

ix
III. METHODOLOGY ………………………………. 71
A. Field work ……………………………………………………………….…….71
B. Laboratory and Pre-microscopic Work ……………………………….…….....75
1. Sieving Analysis …………………………………………….….……...75 a. Preparation of Samples for Grain-Size Analysis ……………....75 b. Sieving and Interpretation ……………………………………...77 2. Binocular studies …………………………………………………….....83
C. Petrography ……………………………………………………………….…....83 1. Thin-section Preparation ……………………………...………………..83 2. Microscopic Work ………………………………………………..….....85
D. Mineralogy ………………………………………………………………..…....86
IV. FIELD WORK ………………………………….. 89
A. Toumatt-Jezzine/ Aazibi …………………..………………………….…......90
1. Introduction ………………………………………………………......90 2. Collected data ………………………………………………………...94 a. Lower Unit …………………………………………..……......94 b. Middle Unit …………………………………………...……....94 c. Top Unit ………………………………………...…….............96
B. Homsiyeh Sections ………………………………………………...……….....96
1. Homsiyeh section 1 …………………………………..……….............97 a. Layer H-1 …..............................................................................100 b. Layer H-2 ..................................................................................101
c. Layer H-3 …………………………………….……….............109 d. Layer H-4 …………………………………….…….………....111
2. Homsiyeh Section 2 ……………………………………….….............113 a. Layer H-10 …………………………………............................115 b. Layer H-11 .....................……………………………...............123 c. Layer H-12 ........................................................……................124 d. Layer H-13 ..............…………………………………..............126 e. Layer H-14 …………………………………………................130
C. Synopsis ………………………………………………………..…….............131
x
V. PETRPGRAPHY ………………………………… 132
A. Toumatt-Jezzine/ Aazibi ……………………………………………...……..132
B. Homsiyeh Section 1 …………………………………………….……............136 1. Layer H-1 .................................…………………………….………...138
a. H 1.2 ...………………………………………….…….............138 b. H 1.4 .....…………………………………………..…..............138
2. Layer H-2 .............................................................................…..........139 3. Layer H-3 …………………………………………………….............141 4. Layer H-4 ................................................…………………….............145
C. Homsiyeh Section 2 …………………………………………….……............145
1. Layer H-10 …………………………………........................................148 2. Layer H-11 ……………………..……………………..…...….............154 3. Layer H-12 .......................................................……….………………155 4. Layer H-13 ……………………………………………..…..................159 5. Layer H-14 …........................................................……………………161
D. Microfacies characterization …………………………………………............163
1. Quartz Arenites ..……………………………………………...............163 2. Muddy-Quartz-Rich Sandstones …………………………...…………164 3. Clayey-Muddy Quartz-Rich Sandstones ……………………………..164
4. Graywacke ………………………………………………....…............165 5. Clays (and/ or Shale) ……………………………...……….................166 6. Limestone ………………………………………………..…...............166 E. Synopsis ……………………………………………………………......167
VI.
X-RAY DIFFRACTION DATA ……………………….... 168
A. Data Presentation …………………………………………………...............169
1. Toumatt-Jezzine/ Aazibi Section ……………………………............170
2. Mineralogy data for both Homsiyeh Sections ……………….............170 a. Quartz Arenite ……………………………………….............170
b. Muddy Quartz-Rich Sandstones……………………...............173 c. Clayey-Muddy Quartz-Rich Sandstones ..................................174 d. Graywacke ..…………………………………………..............174 e. Clay (and/ or Shale) ..................................……........................176 f. Limestone ...........................................................…....…………178
xi
C. Synopsis …………………………………………………….….…….....179
VII. DISCUSSION …………………………………….
180
A. Facies Analysis ……………………………………………….…….............180
1. Lower Aquatic Facies ……………………………………………….180 2. Limestone Facies ……………………………………………............182 3. “Transition” Facies ………………………………………….............182 4. Eolian Facies ………………………………………………...............182 5. Upper Aquatic Facies ……………………………….……...………..183 B. Observations on the Toumatt-Jezzine/ Aazibi Section ………………...........184
C. Microfacies analysis for both Homsiyeh Sections ………………..…............185
1. Quartz Arenite ………………………………………….……............185 2. Muddy Quartz-Rich Sandstones ..…………………………................186 3. Clayey-Muddy Quartz-Rich Sandstones ..........................……...........187 4. Graywacke .…………………………………………………..............188 5. Clay (and/ or Shale) .............................................……………............189
6. Limestone .......................................................………….….................189 D. Paragenetic Sequence and Burial History of the Chouf Formation ………....190
1. Paragenesis of Sandstones ……………………………………….…..191 a. Deposition ................................................................................191 b. Eogenesis and Shallow Burial Diagenesis ...............................191 c. Burial ........................................................................................192 d. Telogenesis ...............................................................................193
2. Paragenesis of Limestones ………………………………….………..194
a. Deposition ................................................................................194 b. Eogenesis and Shallow Burial .................................................195 c. Burial .......................................................................................195 d. Telogenesis ..............................................................................195
3. Burial History and Pyrolisis .................................................................196
VIII. CONCLUSIONS AND RECOMMENDATIONS 200
A. Conclusions …………………………………………………………………..200
B. Recommendations …………………………………………………………....202
xii
REFERENCES ………………………………... 205
Appendices
I. FORMS…………….…….……............................... 220
II. SEDIMENTARY STRUCTURES ………….. 231
III. X-RAY DIFFRACTION TABLES …………. 237
xiii
ILLUSTRATIONS Figure Page 1.1. Generalized geologic map showing the Chouf Formation Outcrops in
Lebanon (e.g. Dubertret and Wetzel, 1955; Wakim, 1968; and Khalaf, 1986) …………………………………………………………………..
4
1.2 Yellowish cross-bedded sandstone, Bsalim area. ….…………………..
6
1.3. Simplified map of Lebanon showing the three structurally controlled geomorphic provinces, and drainage patterns (modified from Gedeon, 1999). Important elevations are: Qornet es Sawda (3083m), Mount Lebanon (2092 and 2629m) and Mount Hermon (2814m). Fault data is provided from Renouard (1951), Dubertret and Wetzel (1955), and Walley (2001) ……….............................................................................
7
1.4 Transmitted light (PPL) photomicrograph of a sandstone facies that is rich in quartz (Q), that also contains vacuoles (Va), voids (Vo) and cement (Cm) ……………………………………………...……………
9
1.5 Arkose is typically composed of semi-mature sands comprising quartz and over 25% feldspar with occasional clay, calcite or silica cements. Example taken from Blatt (1997) .……………...………………….…..
10
1.6 Transmitted light (PPL) photomicrograph from a very fine sandstone containing lots of clay (over 15%). In this example, quartz (Q), matrix (most likely clay) and opaque material (Op; including iron rich deposits and/ or organic matter) were identified in this facies ………...
11
1.7 Big Mac calcarenite concretion with central indentation (Jacobs et al., 2005) ……………………………………………………......................
12
1.8 A. Typical sediment classification diagram, used for classifying
unconsolidated sediment on basis of grain size (Shepard, 1954). B. Retraced Sediment classification (based on Shepard, 1954) ..................
19
1.9 Sandstone classifications where both Folk (1965) and Pettijohn et al. (1973) classification schemes were based on. “Arenites” refer to as “clean” sandstones (with clay content between 0 and 15%), whereas
xiv
“wackes” are considered as ‘dirty” sandstones, and are classified as such based on their higher clay content (i.e. 15-75%). Any rocks with clay content over 75% are referred to as mudrocks. Data adapted from Dott (1964); and Boggs (1995). Note that the individual sandstone constituents have each their own classification diagrams and are shown in the next figure .................................................………………
20
1.10 A. Reviewed Folk (1980) Sandstone (or arenite) Classification Chart (cf. Adams et al., 1994). Note that Q = quartz; F = feldspar; RF = rock fragments; VRF = volcanic rock fragments; MRF = metamorphic rock fragments; SRF = sedimentary rock fragments (divided into CHT = chert; Ss-Sh = sandstone-shale; and CRF carbonate rock fragments). B. Graywacke Classification (Adams et al., 1994). The listed rock names show some examples of the identified clastic rocks in the literature ………………..........................................................................
21
1.11 Folk (1951) Textural Maturity. Textural maturity chart explaining the relationship of textural maturity with clay content, sediment sorting, and roundness, with kinetic energy and depositional environments …..
23
1.12 Folk (1951) Textural Maturity flow chart. Retraced from Folk (1980) .
24
1.13 Grain sorting images for sediments with different degrees of sorting (e.g. Folk, 1968; Boggs, 1995). Textural maturity boundary represented (From Folk, 1951). Note that the s values represent the sediment sorting (or standard deviation); and will discussed in more details in Chapter III. …..........................................................................
25
1.14 Roundness and Sphericity scales. According to Folk (1980), well sorted and well rounded grains are supermature (i.e. beach sands). V = very; Ang =- angular; S. = sub; Round. = rounded; W.= well. Adapted from Folk (1951) and Powers (1953) ...………………………………..
26
1.15 Generalized porosity chart. (e.g. Murray, 1960; Choquette and pray, 1970; and Tucker, 1988) .………………………………………………
27
1.16 Retraced isopach map (from Ukla, 1970) for the Chouf Formation ….. 32
1.17 Fig. 1.17. Basal Cretaceous Sandstone outcrop map of Lebanon
(Dubertret and Wetzel, 1955, 1956; Kanaan, 1966; Wakim, 1968, Tixier, 1971-1972, Touma, 1985; Khalaf, 1986), showing extrapolated isopach data (Ukla, 1970) .......………………........................................
33
1.18 Geologic sketch map representing Mesozoic Formations of the Middle East. Note the locations of various sandstone reservoirs (modified from Beydoun, 1995) …….....................................................................
39
xv
1.19 Stratigraphic position of the Mesozoic source rocks in the western party of the Middle East, the hydrocarbon productive sandstone reservoirs, and regional evaporative seals (Beydoun, 1995) ..................
40
1.20 Geological sketch map of the study area showing the location of both Homsiyeh sections (F = Fault and, 222, and 223 are the reference numbers (and locations on the index map) for the two air photos used to construct the detailed geologic map of the study area (see Fig. 4.3))
44
2.1 Map of the eastern Mediterranean area showing general locations (modified from Walley, 1998) ………………………………………..
47
2.2 Simplified regional tectonic map, explaining the formation of the
Palmyride basin, with respect to the Levantine margin (Walley, 1998)
48
2.3 Simplified map showing the Palmyride Basin and the two major tectonic features that affected the Levantine region: the Syrian Arc Deformation and the Dead Sea Fault System (modified from Walley, 2001) …………………………………………………………………..
49
2.4 Stratigraphic log showing the main rocks exposed in Lebanon (e.g. Dubertret, 1975; and Walley, 1997) ................................................…...
51
2.5 Marine sandstone. Toumatt-Jezzine/ Aazibi (Mrah Aazibi area) ...…... 55
2.6 Eolian sandstone. Jabal Chammis, Toumatt-Jezzine/ Aazibi ..…….... 56
2.7 Major structural features of Lebanon (cf. Renouard, 1951; Dubertret,
et al., 1955, Dubertret, 1975; Walley, 1998, 2001). Cross-section lines A-A’ and B-B’ are represented. Note Jz. = Jezzine Syncline, Nh. = Niha anticline, HF = Hasbaya Fault and RcF = Rachaya Fault .............
62
2.8 Summary cross-sections of (A) northern Lebanon and B) southern Lebanon showing differing structural style. Locations shown in Fig. 2.8. Data from Dubertret et al. (1955), Sabbagh (1961), Guerre (1969), Dubertret (1975), and Walley (1998) .....................................................
63
2.9 Revised stratigraphy of the Cretaceous of Lebanon (Ferry et al., 2007) showing sequence stratigraphic data recorded as transgressions and regressions (regressions for the Chouf Sandstone), volcanic activity and valley incisements (shallow in the Chouf Formation). The formation names in red are new and numbers 1-3 on the left column refer to the three periods of the Cretaceous in Lebanon, discussed in more details in the text ...........................................................................
70
3.1 Geologic sketch map of southern central Lebanon. The rectangle marks the area of study and points out the location of two important
xvi
sites in the area, Jezzine and Toumatt-Jezzine (for the detailed geologic map, refer to Fig. 4.1). Note that j = Jurassic limestones, c1-2 = Chouf and Abeih Formations, c3-5 = Hammana, Sannine and Maameltain Formations, and q = Quaternary Deposits. Data adapted from Tixier (1971-1972) …………………….........................................
72
3.2 Photograph displaying key facies (from the middle part of the Chouf Formation) from Homsiyeh Section 2 (Jezzine). Note that the clear dark coal bed in contrast to the thick sandstone strata ......…….……....
73
3.3 Improved high-precision Jacob's staff design (Brand, 1995). A. Photograph of aluminum bracket with Abney level attached to a hardwood staff by 1cm markings. B. Sketches illustrating bucket design and dimensions. C. Elder's (1989) Jacob Staff Model, used at the Geology Department at American University of Beirut…….....…...
74
3.4 Ro - Tap Shaker, Geology Department, American University of Beirut 75
3.5 Graphical representation methods for Particle Size Distribution. A. Histogram and frequency curve relationships. B. Cumulative curve with arithmetic scale, where the percentile values are used for calculations (From Boggs, 1995) ………………………………….......
78
3.6 Frequency curve for a normal distribution of values showing the relationship of standard deviation to the mean. One standard deviation (1s) on either side of the mean accounts for 68 percent of the area under the frequency curve (Boggs, 1995) .......………………………...
80
3.7 Cathodoluminescence microscope (used also for conventional microscopy). Geology Department, American University of Beirut. A. Complete setup, showing vacuum pump (left), current and voltmeter (middle), and microscope (right). B. Close-up of the microscope shown in A .....................................................................................….....
86
3.8 Schematic of an X-ray powder diffractometer, showing the diffraction of the X ray beam once it strikes a powdered rock sample. The recorded angle (q) indicates the amount of diffraction; and is usually taken as twice its value for X-Ray Diffraction estimations ……………
87
3.9 Bruker D8 Discover X-Ray Diffractometer (which operates by Bragg’s Law, see below). Central Research Science Laboratory (CRSL), American University of Beirut ……………………………....
88
4.1 General geologic map of Jezzine and surroundings. (Heybroek and Dubertret, 1945). Note that j = Jurassic, c = Cretaceous, b = volcanics, and e = Eocene. The boxed area in the inset map represents the study area..............…………………………………………………………....
90
xvii
4.2 Simplified Geologic map of the Toumatt-Jezzine Aazibi Section showing the traverse, which included parts of the Barouk Chains, traced from the 1/ 20,000 Jezzine and Machghara topographic maps (Ministère de la Défense Nationale, 1963), including data from Heybroek and Dubertret (1945); Dubertret et al., 1955; and Tixier, 1971-1972) .............................................................................................
91
4.3 Detailed geologic map of the Homsiyeh Sections. Geologic data was traced from Heybroek and Dubertret (1945), and the contour line and drainage data from the 1/ 20,000 Jezzine topographic map (Ministère de la Défense Nationale, 1963) ..........………………………………....
92
4.4 Complete stratigraphic log of the Toumatt-Jezzine Aazibi Section (e.g. Tixier, 1971-1972, Vail et al., 1977; Haq et al, 1987; and Walley, 1997). Sample # M 3 is located between 50 and 108m (Dist. = distance in meters, recorded from Tixier’s (1971-1972) log) .…….......
94
4.5 Field photograph showing the base of the Chouf Formation (Toumatt-Jezzine Aazibi section; Mrah Aazibi), showing incised channels. These beds are stratigraphically below the exposed strata of the Formation cropping out in the Homsiyeh Sections …………………....
96
4.6 A. Middle unit of the Chouf Formation with thick layers of sandstone (Toumatt-Jezzine/ Aazibi section). B. Collected field Sample representing these strata, with arrow showing approximate location .....
96
4.7 Sandstones with secondary iron (Fe) deposits. Homsiyeh Section 1 (Jezzine) ..................................................................................................
99
4.8 Photograph showing convolutions and disturbances (or slumping) in
sandstones. Homsiyeh Section 1 (Jezzine). Width of view is approximately 1.5m ................................................................................
99
4.9 Detailed stratigraphic log of Homsiyeh Section 1 …………………….. 100
4.10 Photograph of sandstone facies (# H 1.4, sample 2) in the Homsiyeh Section 1 (Jezzine.) Note the presence of alternating dark and light wavy laminae, indicating the presence of some organic matter (dark) and sandy material (light) .......................................................................
101
4.11 Photograph of a sandstone facies (located near the sandstone facies of Subunit H 2) in the Homsiyeh Section 1 (Jezzine). Note the presence of clay drapes …………………………………………………………..
103
4.12 Photograph showing an example of a sandstone facies (e.g. # H 2.1, sample 3) from the Homsiyeh Section 1 (Jezzine). Note the presence of cross stratification with low angle foresets ...……………………….
104

xviii
4.13 Photograph showing an example of a sandstone facies (# H2.2a, samples 4 and 7) in the Homsiyeh Section 2 (Jezzine). Note the presence of calcite (Ca) cement. Arrow points to stratigraphic orientation ......................................................................................……
105
4.14 Photograph of a of sandstone facies (# H2.2a, e.g. samples 5 and 6) in the Homsiyeh Section 2 (Jezzine). Note the presence of rubefied and calcified (i.e. cemented) zones, and the presence of a distinct dark deposit (probably of organic matter) shown by the arrow .....................
106
4.15 Photograph of a of sandstone facies (# H2.2b, sample 8) in the Homsiyeh Section 2 (Jezzine). Scale is in cm ........................................
107
4.16 Photograph of a of sandstone facies (# H2.2b, sample 9) in the
Homsiyeh Section 1 (Jezzine). Note that the arrow indicates stratigraphic orientation, and that the scale is in cm ..............................
°
108
4.17 Glauconitized marls that apparently underlie the clay beds (i.e. # H 4.2). This photograph is a close-up of Fig. 4.21 which clearly shows the glauconitic horizon ...........................................................................
109
4.18 Photograph of a sandstone facies (# H 3.1, sample 11) in the Homsiyeh Section 1 (Jezzine). Note the presence of calcite veins ……
110
4.19 Photograph of a limestone facies (H 3.3b, sample 15) in the Homsiyeh
Section 1 (Jezzine). Note the presence of fossil and plant remains. The arrow indicates stratigraphic orientation ................................................
111
4.20 Field photograph of a reddish claystone facies (# H4.2, sample 16) in the Homsiyeh Section 2 (Jezzine). Note the presence of bioturbations .
112
4.21 Flame (dewatering) structures in clays and soil (Homsiyeh Section 1)
from subunit H-4. This photograph shows the underlying glauconitic horizons (for close up view on the glauconitic marls, refer to Fig. 4.17) that most likely have been identified in the limestone-rich subunit H-3. Note the presence of clear bioturbations in the red soils, and their absence in the glauconitic marl horizon ………………….….
113
4.22 Detailed stratigraphic log of Homsiyeh Section 2 representing the sixteen distinct beds studied from the five subunits (OM = organic matter) .....................................................................................................
116
4.23 Photograph of a sandstone facies (# H 10.1, sample 1) in the Homsiyeh Section 2 (Jezzine). The arrow indicates stratigraphic orientation ...............................................................................................
117
4.24 Photograph of a sandstone facies (# H 10.5, sample 3.1) in the
xix
Homsiyeh Section 2 (Jezzine). Note the presence of traces of organic matter. The arrow indicates stratigraphic orientation .............................
118
4.25 Photograph of a sandstone facies (# H 10.7, sample 5.1) in the
Homsiyeh Section 2 (Jezzine). Note the presence of iron-rich deposits and apparent cementation .......................................................................
119
4.26 Photograph of a graywacke facies (H 10.9b, sample 7.2, 8.1) in the Homsiyeh Section 2 (Jezzine). Note the presence of organic matter .…
120
4.27 Photograph of a limestone facies (# H 10.11, sample 9.1) in the
Homsiyeh Section 2 (Jezzine). Note the presence of organic matter and plant remains. The arrow shows stratigraphic up direction .………
121
4.28 Photograph of a of clay facies (# H 10.12, sample 10.1) in the Homsiyeh Section 2 (Jezzine). Note the presence of iron rich deposits
122
4.29 Slab photographs representing the sandstone lag deposits (# H 11.1).
A. Sample 12.1. B. Sample 12.2, where the arrow marks the stratigraphic orientation and the scale is in cm.………..........................
123
4.30 Hand drawn sketch representing the Roum Cliff (Facing 350º; Trending E-W). Note the layers I-V (e.g. III, IV are cross-bedded sandstones (i.e. beds 13, 14), V is brownish friable material (bed 15); located on top of the cliff). X= approximate locations of collected samples ...................................................................................................
124
4.31 Slab photographs of the cross-bedded sandstones. A-D. Strata of H 12.1 to 12.4, respectively. To see their emplacement, refer to the next figure (Fig. 4.33). In C, the arrow indicates stratigraphic direction .......
125
4.32 Field sketch representing the strata of Homsiyeh Section 2 depicting the middle and upper middle strata of the Chouf Formation. Subunits H 12, H 13, H 14 are represented by their corresponding bed numbers (see Table 4.2). H 13.1 is only located on the hanging-wall side of the fault. However, H 13.2 is located both on the footwall and on the hanging wall side of the fault .................................................................
127
4.33 Photograph of a sandstone facies (# H 13.1b, sample 14.2) in the Homsiyeh Section 2 (Jezzine). Note the variations in colour, and the presence of laminations …………………….…………………………
128
4.34 Photograph of a ferruginous sandstone (# H 14.1, sample 16.1) in the Homsiyeh Section 2 (Jezzine). ……..….........…………………………
130
5.1 Binocular stereophotograph of a sandstone facies (# M 3) in the
Toumatt-Jezzine/ Aazibi section. Note the presence of different grains,
xx
and their sizes as well as their composition and colours ............……… 133
5.2 Sieving results of the sandstone facies (# M 3) from the Toumatt-Jezzine/ Aazibi section. As shown in the figure, clay content is high (about 9%) and sorting is poor. Note that si and sg stand for inclusive and graphic standard deviation respectively ...........................................
133
5.3 Sieving data of representative facies from the Homsiyeh Section 1 (Jezzine). Most tested samples appear to be moderately sorted. ………
135
5.4 Binocular stereophotograph of an argillaceous sandstone facies (# H
1.4, sample 2) from the Homsiyeh Section 1 (Jezzine). Note the presence of laminated layers, and the shiny material.…....……….........
137
5.5 Binocular stereophotograph of a sandstone facies (# H 2.2a, sample 4) from the Homsiyeh Section 1 (Jezzine) …………………….....………
138
5.6 Binocular stereophotograph of a sandstone facies (# H 2.2b, sample 8)
from the Homsiyeh Section 1 (Jezzine) …………………….....………
139
5.7 Binocular stereophotograph of a carbonate facies (# H 3.2, sample 12) from the Homsiyeh Section 1 (Jezzine) ….………………….....………
140
5.8 Transmitted light (PPL) photomicrograph of a limestone facies (# H
3.3b, sample 15) from the Homsiyeh Section 1 (Jezzine). Note the presence of plant roots (Ro) …………..…………………….....………
141
5.9 Transmitted light (PPL; A) and CL (B) photomicrographs showing a limestone facies, Homsiyeh section 1 (Jezzine), displaying a limestone rich in calcite (Ca) with non luminescent cement (Cm) refilling fossil moulds (Fm)...........................................................…………………….
142
5.10 Granulometric data from representative key facies from the lower and middle parts of the Chouf Formation, from the Homsiyeh Section 2 (Jezzine). Note that most samples appear to be moderately sorted ……
145
5.11 Transmitted light (PPL) photomicrograph of a bitumen impregnated sandstone facies (# H 10.1, sample 1.1) from the Homsiyeh Section 2 (Jezzine). Note the presence of quartz (Q), opaque material (Op; including iron rich deposits and/ or organic matter), voids and/ or cement (V/C), and corrosion (Co), most likely caused by the maturating organic matter. Width of field of view is approximately 5mm…………………………….............….………..………………….
146
5.12 Transmitted light (PPL) photomicrograph of a sandstone facies (H 10.3, sample 1.3), Homsiyeh Section 2 (Jezzine). Note the presence of corroded quartz (Q), opaque materials (Op; including iron rich

xxi
deposits and/ or organic matter), and voids (Vo) ……..................……. 147
5.13 Transmitted light (PPL) photomicrograph of a sandstone facies (# H 10.5, sample 3.1) in the Homsiyeh Section 2 (Jezzine). Note the presence of corroded and non-corroded quartz (Q), opaque materials (Op; including iron rich deposits and/ or organic matter), and voids (Vo). Width of field of view is approximately 5mm ….............……….
148
5.14 Transmitted light (PPL) photomicrograph of a sandstone facies (H 10.7, sample 5.1), Homsiyeh Section 2 (Jezzine). Note the presence of corroded quartz (Q), opaque materials (Op; including iron rich deposits and/ or organic matter), and voids (Vo) …......................…….
149
5.15 Transmitted light (PPL) photomicrograph of a clay facies (H 10.3, sample 1.3), Homsiyeh Section 2 (Jezzine). Note the presence of traces of organic matter (OM) ………………………………...……….
150
5.16 Transmitted light (PPL) photomicrograph of a limestone facies (H 10.11, sample 9.1), Homsiyeh Section 2 (Jezzine). Note the presence of organic matter (OM), fossils (Fo) and biomoulds (Bm). Arrow indicates a probable fossil mould (Fm) ……………………………..…
151
5.17 Transmitted light (PPL) photomicrograph of a sandstone facies (H 11.1, sample 12.1), Homsiyeh Section 2 (Jezzine). Note the presence of quartz (Q), opaque materials (Op; including iron rich deposits and/ or organic matter)), and voids (Vo) ………….............................……...
152
5.18 Transmitted light (PPL) photomicrograph of a sandstone facies (H 12.1, sample 13.1), Homsiyeh Section 2 (Jezzine). Note the presence of quartz (Q), opaque materials (Op; including iron rich deposits and/ or organic matter)), and voids (Vo) .....................................…………...
153
5.19 Transmitted light (PPL) photomicrograph of a sandstone facies (#H 12.2; sample 13.2) in the Homsiyeh Section 2 (Jezzine). Note the presence of corroded quartz grains (Q), opaque materials (Op; including iron rich deposits and/ or organic matter), cements (Cm), and voids (Vo) ..................................................................…...........…...
154
5.20 Transmitted light (PPL) photomicrograph of a sandstone facies (H 12.3; sample 13.3) in the Homsiyeh Section 2 (Jezzine). Note the presence of embayed/ corroded quartz grains (Q), voids/ cement (V/C), and opaque material (Op; including iron rich deposits and/ or organic matter). Arrows shows embayment ...........................................
155
5.21 Transmitted light (PPL) photomicrograph of a sandstone facies (H 12.4; sample 13.4) in the Homsiyeh Section 2 (Jezzine). Note the presence of embayed/ corroded quartz grains (Q), opaque material
xxii
(Op; including iron rich deposits and/ or organic matter), voids (Vo), and Cement (Cm) .………………………..............................................
156 5.22 Transmitted light (PPL) photomicrograph of a sandstone facies (# H
13.1a, sample 14.1) in the Homsiyeh Section 2 (Jezzine). Note the presence of quartz (Q), corrosion (Co), voids/ cement (V/C), and opaque materials (Op; including iron-rich deposits and organic matter)
157
5.23 Transmitted light (PPL) photomicrograph of a sandstone facies (H 13.1bsample 14.2) in the Homsiyeh Section 2 (Jezzine). Clear evidence of corroded quartz (Q), opaque materials (Op; including iron rich deposits and/ or organic matter) and voids (Vo) is shown ………..
158
5.24 Transmitted light (PPL), photomicrograph of a sandstone facies in the Homsiyeh Section 2 (Jezzine). Quartz (Q), opaque materials (Op; including iron rich deposits and/ or organic matter)) and voids (Vo) are detected. As incident light was shined on the micrograph, it was possible to differentiate between organic matter (OM) and iron-rich deposits (Fe) .……………......................................................................
159
5.25 Transmitted light (PPL; A) and CL (B) photomicrographs of a sandstone facies in the Homsiyeh Section 2 (Jezzine). Note the presence of corroded quartz grains (Q), voids (Vo), and vacuoles (Va) as well as fluorite (Fl) in the center of the CL view ...............................
161
5.26 Transmitted light (A, PPL) and CL (B) photomicrographs of the same sandstone facies in the Homsiyeh Section 2 (Jezzine). Note the presence of quartz (Q), voids (Vo) and some opaque material (Op; including iron rich deposits and/ or organic matter) in the PPL photo (A), and of detrital quartz (DQ) and authigenic quartz (AQ) in the CL photo (B) .................................................................................................
162
6.1 Uncorrected X-ray diffractogram from the Toumatt-Jezzine/ Aazibi section. A similar XRD plot is shown in Appendix 1. Note the presence of quartz (20.8º 2q), calcite (29.5º 2q) and clays (45º and 67.5º 2q) ………………….……………………………………………
171
6.2 Uncorrected X-ray diffractogram showing the mineralogy con tent of a typical quartz arenite (e.g. H 12.2). As shown on the plot, these strata contain very little (if any) clay …..………………………………
172
6.3 Uncorrected X-ray diffractogram showing the mineralogical content of a sandstone facies (# H 2.2b, sample 8) in Homsiyeh Section 1 (Jezzine). Four or more varieties of quartz and various clays (i.e. illite (26.6º 2q), kaolinite (45º 2q), and/ or nontronite (67.5º 2q)) are detected. Note that Nontr = nontronite and pyr = pyrite .……………...
173

xxiii
6.4 Uncorrected X-ray diffractogram showing the mineralogical content of a clayey-muddy quartz-rich sandstone facies (H 10.5, sample 3.1) in Homsiyeh Section 2 (Jezzine) ………………………………………
175
6.5 Uncorrected X-ray diffractogram showing the mineralogical content of a sandstone facies (# H 1.2, sample 1) in Homsiyeh Section 1 (Jezzine). Similar general components are found (see Figs. 6.1, 6.2) ....
176
6.6 Uncorrected X-ray diffractogram showing the mineralogical content of a clay facies from the upper middle part of the Chouf formation (H 13.2, sample 15.1) in Homsiyeh Section 2 (Jezzine) …….............……
177
6.7 Uncorrected X-ray diffractogram showing the mineralogical content of a sandstone facies (# H 3.3b, sample 15) in Homsiyeh Section 1 (Jezzine). Three (or more) calcite phases are identified, indicating different types (e.g. Mn-Calcite, etc...) ...………………………………
178
7.1 Illustrative sketch representing clay draping in channel sandstone facies, associated with tidal/ flooding events (Boggs, 1995). A. Sketch of typical cross-beds found in cross-stratified sandstone strata. B. Flooding/ tidal curve showing differing current flow speeds. At its lowest points (e.g. A & B), clay drapes are said to be formed (the clays cover the lee side of ripples). C. C. Sketch of ripple laminations (A, B) showing clay draping (see Fig. 4.11; Chapter IV) ……………..
181
7.2 Sequence of diagenetic phases for the sandstone facies exposed in the Toumatt-Jezzine/ Aazibi and Homsiyeh sections (southern Lebanon). Aren. = Arenite, O.M. = organic matter Qtz. = quartz, Lit. = Lithification, Telog. = teleogenesis, and Oxid. = oxidation ...................
192
7.3 Sequence of diagenetic phases for the sandstone facies exposed in the Toumatt-Jezzine/ Aazibi and Homsiyeh sections (southern Lebanon). O.M. = organic matter, Prim. = primary, Dissol. = dissolution, sol. coll. = solution collapse, arag. = aragonite, Telo. = telogenic, Frac. = fracture, and Oxid. = oxidation ..............….……………………………
196
7.4 Burial curve with recorded diagenetic history of the Chouf Formation. Note that the recorded burial is estimated at 1800m, thickness is 300m, and the resulting curve is uncorrected for compaction (Creta. = Cretaceous, Pli = Pliocene, R. = Recent, and O.M. = organic matter). Figure constructed based on data and forms presented in Doummar, 2005; Nader et al, 2006; and Al Haddad, 2007) .…............................…
197
7.5 Pyrolisis results of an organic matter sample from the Lower part of the Chouf Formation. the pyrolisis was conducted at the Sedimentology Laboratory of the Institut Français du Pétrole (IFP), France. Note that the total organic carbon (TOC) content was

xxiv
estimated at 67.54% ............................................................................... 199

xxv
TABLES
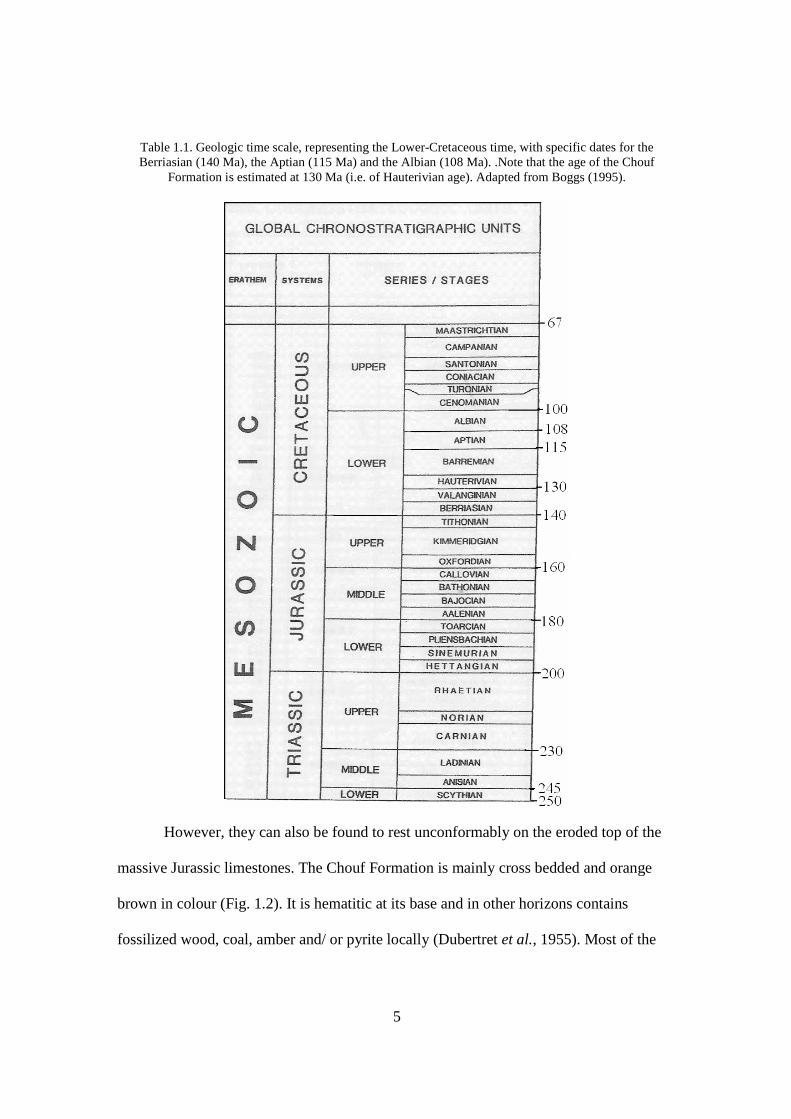
Table Page 1.1 Geologic time scale, representing the Lower-Cretaceous time, with
specific dates for the Berriasian (140 Ma), the Aptian (115 Ma) and the Albian (108 Ma). .Note that the age of the Chouf Formation is estimated at 130 Ma (i.e. of Hauterivian age). Adapted from Boggs (1995) ......……..................................................................................….
5
1.2 Mesozoic Petroleum producing Formations of parts of the Middle East (Beydoun, 1995) .....................................................................................
41
3.1 Standard values for standard deviation used by sedimentologists to
estimate grain sorting, upon granulometric investigations. Boundaries of s = 0.50f denote submature from supermature sandstones and of s = 1.0f denotes immature from submature sandstones (Folk, 1951, 1974, and 1980) ......................................................................................
80
3.2 Sample fill in table for sieving analyses. The screens' mesh grades are listed from coarse to fine and the last one is that of the pan (for additional information see Appendix I, where an example is shown) ...
81
4.1 Comprehensive list of the Homsiyeh Section 1 samples with field work descriptions that underwent detailed sedimentological analysis both in the field work and laboratory work ……………………………
98 .
4.2 Comprehensive list of the Homsiyeh Section 2 samples with field work descriptions that underwent detailed sedimentological analysis both in the field work and laboratory work …………………................
114
4.3 Generalized sedimentological characteristics of the lithostratigraphic units observed in the Toumatt-Jezzine/ Aazibi section (Chouf Formation - Lower Cretaceous), southern Lebanon …..........................
130
4.4 Detailed sedimentological characteristics of the lithostratigraphic units observed in the Homsiyeh Section 1 (including parts of the Lower Unit from the Chouf Formation), southern Lebanon …….....................
131
xxvi
4.5 Detailed sedimentological characteristics of the lithostratigraphic units observed in the Homsiyeh Section 2 (including key strata from the lower and middle units of the Chouf Formation), southern Lebanon ….
131
5.1 Quantitative petrographic and sedimentological table showing the average composition of the studies strata of the Toumatt-Jezzine/ Aazibi section. Calculated percentages were based on the visual estimation chart .…………………………………………………….....
133
5.2 Quantitative petrographic and sedimentological table showing the average composition of the studies strata of the Homsiyeh Section 1. Calculated percentages were based on the visual estimation chart ........
134
5.3 Quantitative petrographic and sedimentological table showing the average composition of the studies strata of the Homsiyeh Section 2. Calculated percentages were based on the visual estimation chart ........
145
5.4 Petrographic characteristics of the microfacies of the Toumatt-Jezzine/ Aazibi and Homsiyeh Chouf Formation successions (southern Lebanon) .................................................................................................
167
6.1 Summary X-Ray Diffraction Data table showing the 2-theta values with associated d-distances, of the representative facies of the Chouf Formation (e.g. Tixier, 1971-1972; Moore and Reynolds, 1997; Muhs et al., 2003; Muhs, 2004; and Al Haddad, 2007) ...............................…
169
6.2 General table representing the mineralogical data of the key facies from the Chouf Formation ……………………………………………..
179
7.1 Observed facies from the Chouf Formation, with their respective
depositional environments ......................................................................
183
To Georges, Ans, Michael, and Gerard
1
CHAPTER I
INTRODUCTION
Several studies in the Middle East were undertaken on sandstones of Neocomian-
Barremian age. The Heletz/ Gevar Am strata in Israel/ Palestine (Cohen, 1976; and
Beydoun, 1995), the Nubian sandstones in the Gulf of Suez (Beydoun, 1995), and
Cheriffe Formation (i.e. Ruthbah) in Syria (Beydoun, 1995; Brew, 2001; and Brew et al.,
2001a, b) were studied to assess source and reservoir rock potentials. These Levantine
clastic formations were proven to contain hydrocarbon, also show similarities with the
Chouf Formation (Neocomian-Barremian) in Lebanon.
In general, the permeability of sandstones permits fluids to transit through them
(regardless whether the fluid is water or petroleum) and often these rocks act as aquifers/
reservoirs. In the case of sandstone aquifers, waters will be fresh and filtered, as
contaminants will be trapped by the network of pores (cf. Fetter, 1994), whereas for
petroleum, uncemented clean arenites tend to be usually reasonably good reservoir rocks
(Du Bernard and Carrio-Schaffhauser, 2003). According to Hobson and Tiratsoo (1985),
in terms of volume, the largest sandstone reservoirs are the Mesozoic Formations of East
Texas, USA (140,000 acres), the Cretaceous oilfields of Burgan, Kuwait (where
productive thicknesses exceed 1300ft), and the Cretaceous fields of Pembina, Canada
(755,000 acres), as well as the deltaic Athabaska tar sands of Alberta, Canada.
Based on Hobson and Tiratsoo (1985), 59% of the world oil production is
generated by sandstone rocks (i.e. arenites, graywacke, arkose, grit, and conglomerate);
whereas carbonate rocks (marly or reefal limestones and/ or dolomites) comprise 40% of
2
the world oil production. Only 1 % of oil produced is generated from fractured igneous
and metamorphic rocks; as well as siltstones and claystones (Hobson and Tiratsoo, 1985).
Porosity and permeability are important factors in reservoir rocks. Porosity types
can be depositional (e.g. cubic, 48% or rhombic, 26%), and/ or diagenetic (i.e. post-
depositional) and size-dependant or secondary (i.e. developing through diagenetic
processes which either cause void enhancement by dissolution, or destruction by
cementation). Cements may reduce bulk rock porosity by 10 to 40%. For geometrically
similar grains, porosity is the same but permeability will be proportional to the square of
the grain size (Hobson and Tiratsoo, 1985). Permeability measurements normal to
bedding will give a lower value than the original permeability value of the bed (as
measured along bedding planes). Deep burial increases overall pressure, and as a result,
the bulk rock porosity of sandstones may drop from 35% to 25% at depths of about 5km
(e.g. Hobson and Tiratsoo, 1985; Ramm and Bjorlykke, 1994). Therefore, increases in
temperature and pressure will result in a general determination of both porosity and
permeability in sandstones (e.g. Hobson and Tiratsoo, 1985; Ramm, 1992; Ramm and
Bjorlykke, 1994; and Jahren and Ramm, 2000).
Sandstones depositing in deltaic or in regressive sea environments take form as
small lenticular sand bodies which rapidly grade into clays and shales (Hobson and
Tiratsoo, 1985). Other siliceous rocks such as grits and conglomerates can produce
excellent reservoir rocks (grits are formed from trapped feldspars in deltas). Arkosic
rocks, with high feldspar content derived from the disintegration of highly acidic felsic
rocks, have some hydrocarbon potentials (Hobson and Tiratsoo, 1985). Calcarenites have
grain sizes similar to sandstones, and are common source rocks in Saudi Arabia (e.g.
3
Folk, 1974, 1980; Hobson and Tiratsoo, 1985). Sand bars and barrier sand beaches
(grading outwards into marine silts and clays in which some organic matter is entrapped)
can sometimes produce hydrocarbon (Hobson and Tiratsoo, 1985).
Prior to the 1960s, the sandstones in Lebanon were only investigated with a rather
stratigraphic approach, where field mapping of the Chouf Formation surface exposures
comprised the main achievement (Dubertret et al., 1955; Dubertret et al., 1963; and
Dubertret, 1975). Later on they were analyzed petrographically as sedimentological and
diagenetic techniques were made available which contributed to petroleum exploration
studies in Lebanon. However, the boundaries of the Chouf Formation with the Salima
and the Abeih Formations are still not well-defined. The Neocomian-Barremian rocks in
southern Lebanon are characterized by large quantities of quartz-rich sandstones, which
have been studied macroscopically up to the 1960s. At the time, modern techniques of
sedimentary research (as petrographic and X-ray diffraction methods) were barely
available. Therefore, the results of this research are used to elaborate a diagenetic history
for these sandstones that may provide answers for their origin.
The Chouf Formation is also known for its lignite beds, traces of amber, presence
of iron, and, rarely, a few fossilized materials (Dubertret, et al., 1955; Tixier, 1971-1972;
and Dubertret, 1975). Figure 1.1 shows the surface exposures of the Chouf Formation all
throughout Lebanon. They are widely recognized in the field, as being covered with pine
trees (Pinus Pinea) and by showing strata mainly prevailing in clastic regimes, as opposed
to the Jurassic and Cretaceous dominantly carbonate sequences (e.g. Dubertret et al.,
1955; Kanaan, 1966; Wakim, 1968; Tixier, 1971-1972; Dubertret, 1975; Massaad, 1976
and Walley, 1983, 1997).

4
Fig. 1.1. Generalized geologic map showing the Chouf Formation outcrops in Lebanon (Dubertret et al., 1955; Wakim, 1968; and Khalaf, 1986).
According to Walley (1997), the Basal Cretaceous strata mainly consist of the
Neocomian Sandstones of the 'Grès de Base’ (Table 1.1) recently estimated to be 130 Ma
(i.e. of Hauterivian age). They occur near Mount Lebanon, and are typically seen to rest
unconformably over the oolitic Salima Formation, recently dated to extend until the
Valangianian (Noujaim-Clark and Boudagher-Fadel, 2001).
5
Table 1.1. Geologic time scale, representing the Lower-Cretaceous time, with specific dates for the Berriasian (140 Ma), the Aptian (115 Ma) and the Albian (108 Ma). .Note that the age of the Chouf
Formation is estimated at 130 Ma (i.e. of Hauterivian age). Adapted from Boggs (1995).
However, they can also be found to rest unconformably on the eroded top of the
massive Jurassic limestones. The Chouf Formation is mainly cross bedded and orange
brown in colour (Fig. 1.2). It is hematitic at its base and in other horizons contains
fossilized wood, coal, amber and/ or pyrite locally (Dubertret et al., 1955). Most of the
6
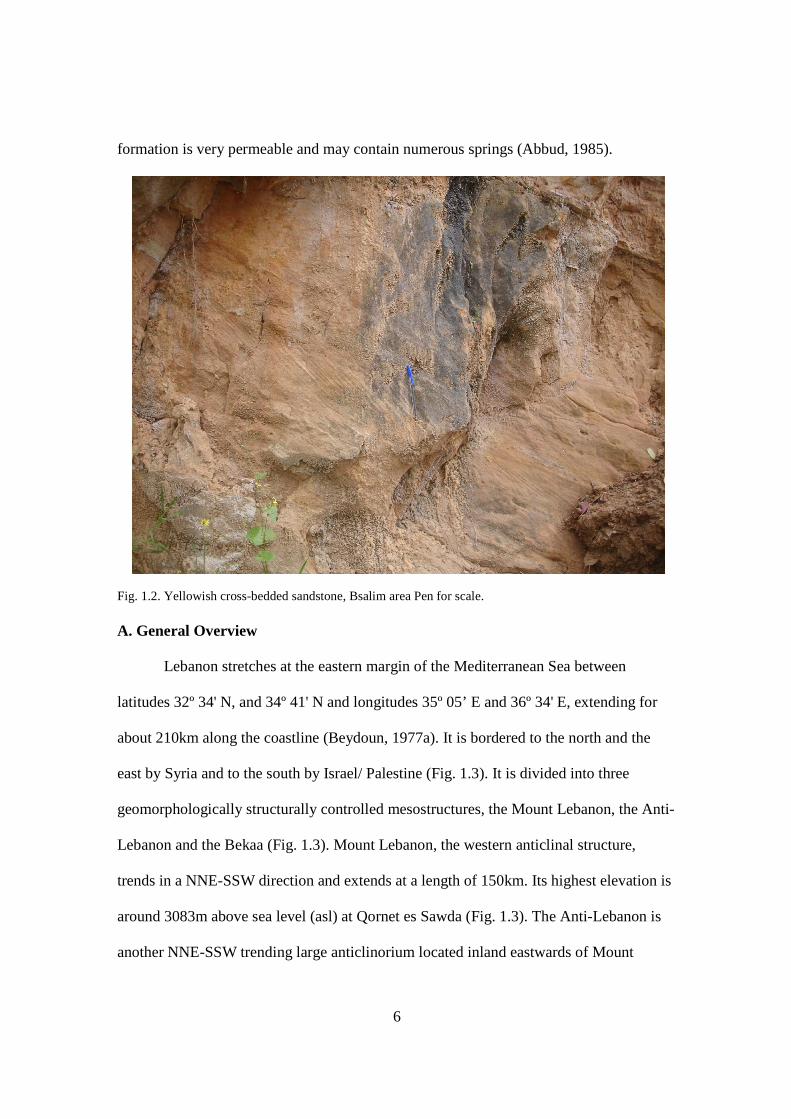
formation is very permeable and may contain numerous springs (Abbud, 1985).
Fig. 1.2. Yellowish cross-bedded sandstone, Bsalim area Pen for scale.
A. General Overview
Lebanon stretches at the eastern margin of the Mediterranean Sea between
latitudes 32º 34' N, and 34º 41' N and longitudes 35º 05’ E and 36º 34' E, extending for
about 210km along the coastline (Beydoun, 1977a). It is bordered to the north and the
east by Syria and to the south by Israel/ Palestine (Fig. 1.3). It is divided into three
geomorphologically structurally controlled mesostructures, the Mount Lebanon, the Anti-
Lebanon and the Bekaa (Fig. 1.3). Mount Lebanon, the western anticlinal structure,
trends in a NNE-SSW direction and extends at a length of 150km. Its highest elevation is
around 3083m above sea level (asl) at Qornet es Sawda (Fig. 1.3). The Anti-Lebanon is
another NNE-SSW trending large anticlinorium located inland eastwards of Mount

7
Lebanon. Its highest point is at Mount Hermon (Jabal Cheikh) and culminates at about
2814m asl (Fig. 1.3). The Bekaa valley is a high plain ranging between 700-1000m asl in
altitude that separates the two mountain chains (Gedeon, 1999).
Fig. 1.3. Simplified map of Lebanon showing the three structurally controlled geomorphic provinces, and drainage patterns (modified from Gedeon, 1999). Important elevations are: Qornet Es Sawda (3083m), Mount Lebanon (e.g. 2092 and 2628m) and Mount Hermon (2814m). Fault data is provided from Renouard (1951); and Dubertret et al. (1955). Inset map taken from Walley (1997). Note: C.M. = Chouf Monocline.

8
Figure 1.3 also shows tow important structures, the Nabatiyeh anticline and the
Chouf monocline (see Fig. 2.7; Chapter II), which, according to Nemer (1999) is the
northern trace of the Roum Fault.
The complete Jurassic to Quaternary rock succession is well-exposed in Lebanon,
except for two major unconformities (and periods of hiatus, hereafter) that were widely
recognized. The missing stratigraphic units include the Early Cretaceous (Berriasian-
Hauterivian) and the Late Paleogene - Early Neogene strata. According to Noujaim-Clark
and Boudagher-Fadel (2001), the dating of the benthic forams of the Salima Formation
attests that these strata deposited as early as the Late Jurassic (Tithonian) and that they
ended as late as the Early Cretaceous (Berriasian-Valanginian). Even though it was found
that the Salima Formation occurs both in Jurassic and Cretaceous strata, the authors of
this study did not challenge the previous findings of the age of the Neocomian-Barremian
'Grès de Base'. The Chouf Formation (previously referred to as “Grès de Base”) consists
of yellowish-reddish cross-bedded sandstones, of alternating sand and clay beds, with
volcanics, locally, at its base, and a fossiliferous argillaceous carbonate bed, at mid-
section. It is also found to be deposited in fluvio-deltaic environments (i.e. showing both
dune and fluvial structures as well as marine-dominated strata), and has apparently
originated from the Nubian sandstones of Egypt and/ or the Jordanian sandstones
(Dubertret et al., 1955; McKee, 1963; Kanaan, 1966; Wakim, 1968; Tixier, 1971-1972;
Dubertret, 1975; Massaad, 1976, Walley, 1983, 1997; and Touma, 1985). The industry
has also shown specific interest in the Chouf Formation, namely because of its iron
content and potential uses for the manufacturing of glass (e.g. Dubertret et al., 1955;
Dubertret, 1975; Khalaf, 1986; and Walley 1997).
9
B. Sandstones
Sandstones form by the breakdown of crystalline rocks and are generally formed
by detrital quartz grains, and less commonly by feldspars, and varying proportions of
cementing agents (as carbonates, silica, or iron oxides). Four types exist, and are arenite,
arkose, graywacke and calcarenite. Each type is defined by the amount of each of the
main constituents with respect to the other (see Figs. 1.9 and 1.10 for classification).
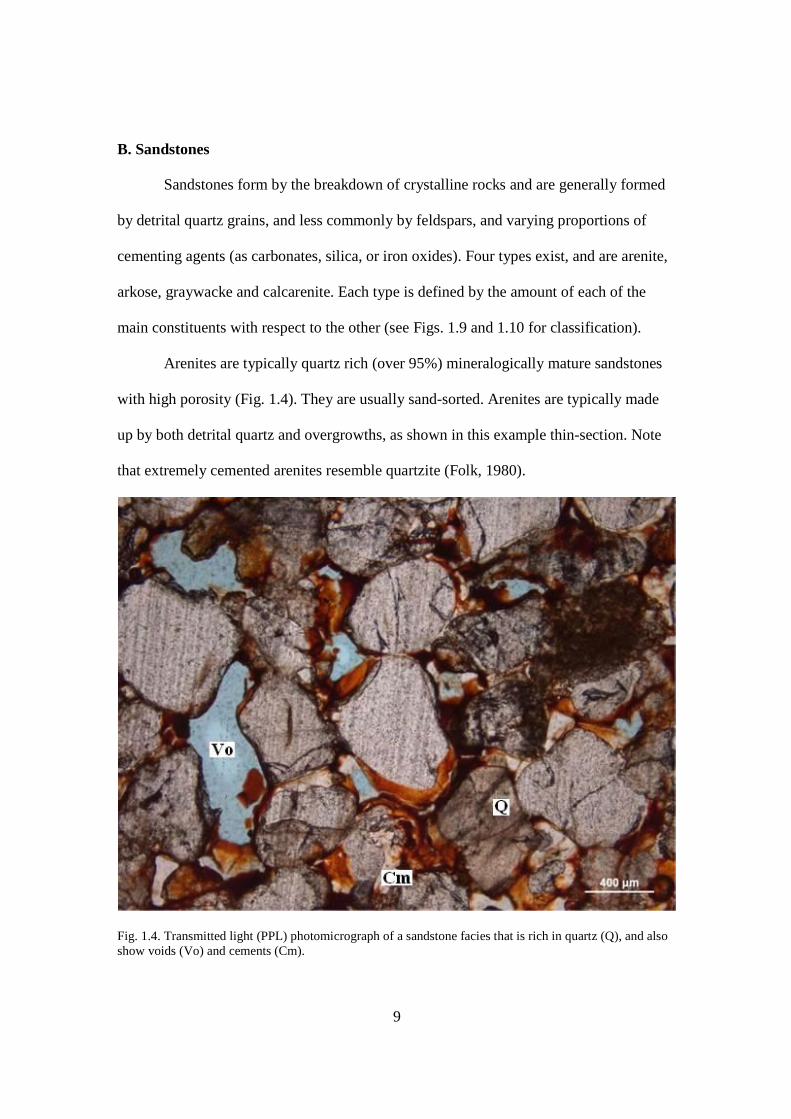
Arenites are typically quartz rich (over 95%) mineralogically mature sandstones
with high porosity (Fig. 1.4). They are usually sand-sorted. Arenites are typically made
up by both detrital quartz and overgrowths, as shown in this example thin-section. Note
that extremely cemented arenites resemble quartzite (Folk, 1980).
Fig. 1.4. Transmitted light (PPL) photomicrograph of a sandstone facies that is rich in quartz (Q), and also show voids (Vo) and cements (Cm).
10
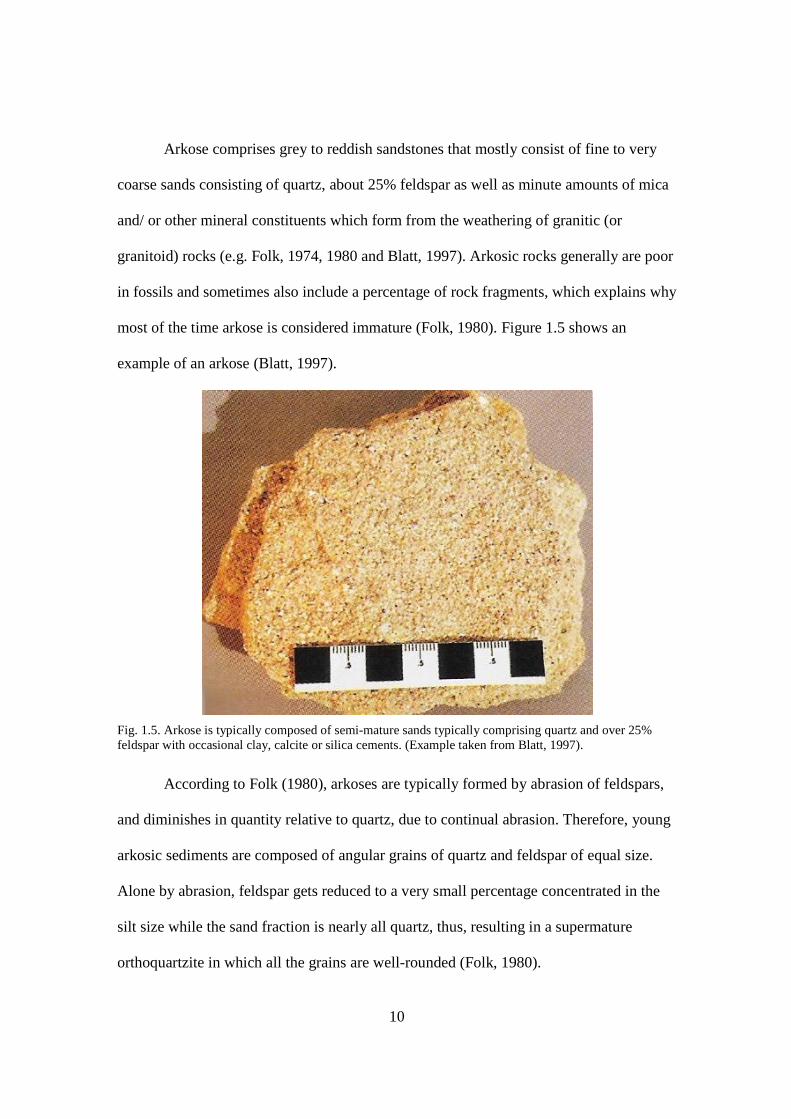
Arkose comprises grey to reddish sandstones that mostly consist of fine to very
coarse sands consisting of quartz, about 25% feldspar as well as minute amounts of mica
and/ or other mineral constituents which form from the weathering of granitic (or
granitoid) rocks (e.g. Folk, 1974, 1980 and Blatt, 1997). Arkosic rocks generally are poor
in fossils and sometimes also include a percentage of rock fragments, which explains why
most of the time arkose is considered immature (Folk, 1980). Figure 1.5 shows an
example of an arkose (Blatt, 1997).
Fig. 1.5. Arkose is typically composed of semi-mature sands typically comprising quartz and over 25% feldspar with occasional clay, calcite or silica cements. (Example taken from Blatt, 1997).
According to Folk (1980), arkoses are typically formed by abrasion of feldspars,
and diminishes in quantity relative to quartz, due to continual abrasion. Therefore, young
arkosic sediments are composed of angular grains of quartz and feldspar of equal size.
Alone by abrasion, feldspar gets reduced to a very small percentage concentrated in the
silt size while the sand fraction is nearly all quartz, thus, resulting in a supermature
orthoquartzite in which all the grains are well-rounded (Folk, 1980).
11
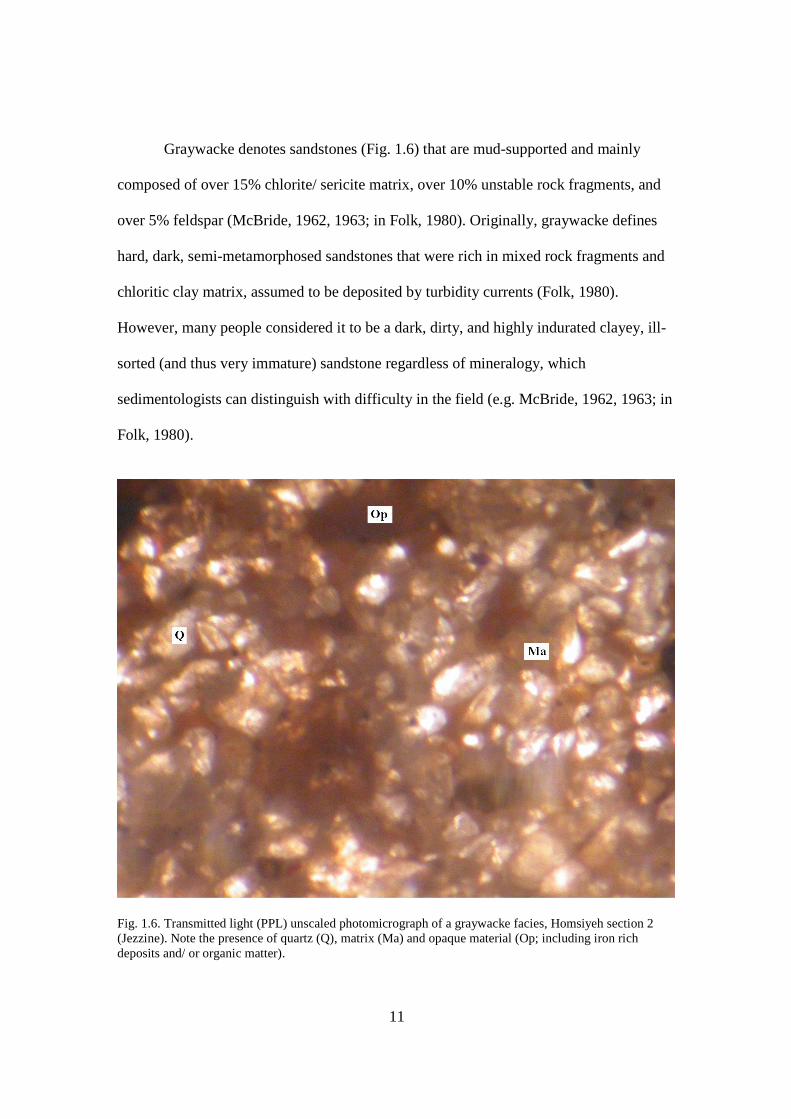
Graywacke denotes sandstones (Fig. 1.6) that are mud-supported and mainly
composed of over 15% chlorite/ sericite matrix, over 10% unstable rock fragments, and
over 5% feldspar (McBride, 1962, 1963; in Folk, 1980). Originally, graywacke defines
hard, dark, semi-metamorphosed sandstones that were rich in mixed rock fragments and
chloritic clay matrix, assumed to be deposited by turbidity currents (Folk, 1980).
However, many people considered it to be a dark, dirty, and highly indurated clayey, ill-
sorted (and thus very immature) sandstone regardless of mineralogy, which
sedimentologists can distinguish with difficulty in the field (e.g. McBride, 1962, 1963; in
Folk, 1980).
Fig. 1.6. Transmitted light (PPL) unscaled photomicrograph of a graywacke facies, Homsiyeh section 2 (Jezzine). Note the presence of quartz (Q), matrix (Ma) and opaque material (Op; including iron rich deposits and/ or organic matter).
12
Alternatively, “phyllarenite” or “schist-arenite” could also refer to graywacke
(e.g. Knopf, 1930; in Folk, 1980). “Phyllarenite” implies that the major constituents are
foliated metamorphic rock fragments: slate, phyllite and schist. Most commonly, this
generates litharenites dominantly composed of pelitic rock fragments. On the other hand,
schist-arenites are light-colored sandstone containing more than 20% rock fragments
derived from an area of regionally metamorphosed rocks (Knopf, 1930; in Folk, 1980).
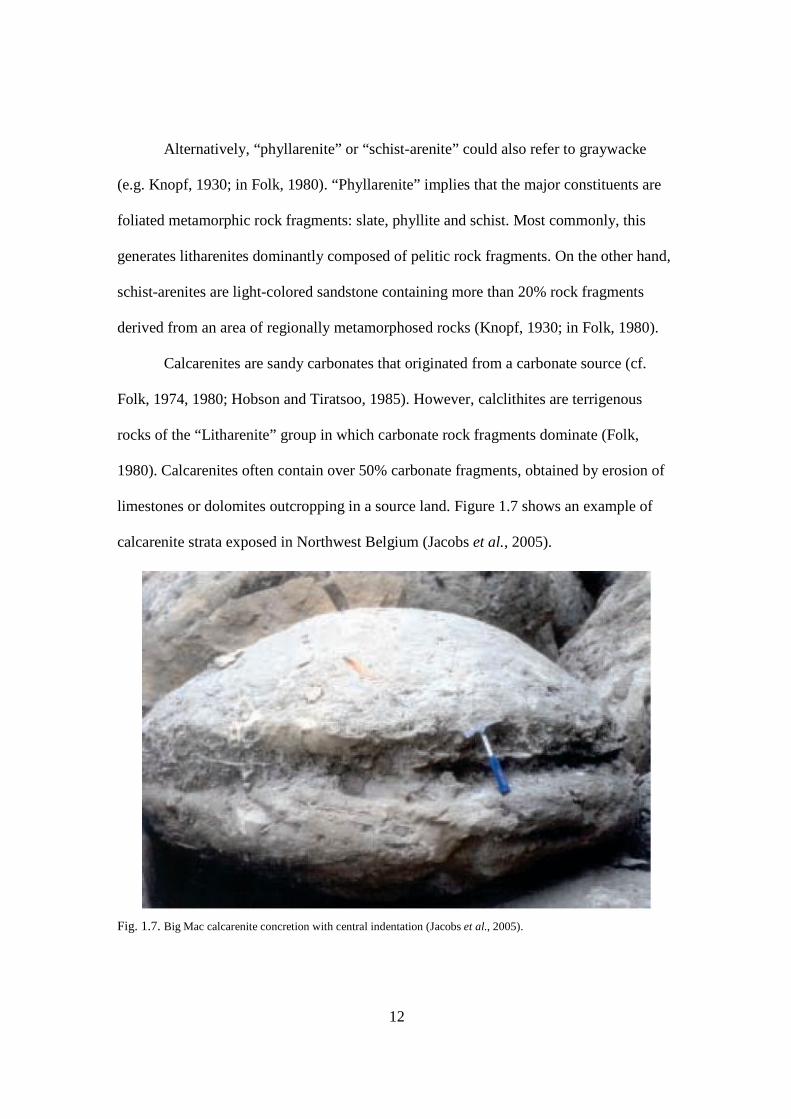
Calcarenites are sandy carbonates that originated from a carbonate source (cf.
Folk, 1974, 1980; Hobson and Tiratsoo, 1985). However, calclithites are terrigenous
rocks of the “Litharenite” group in which carbonate rock fragments dominate (Folk,
1980). Calcarenites often contain over 50% carbonate fragments, obtained by erosion of
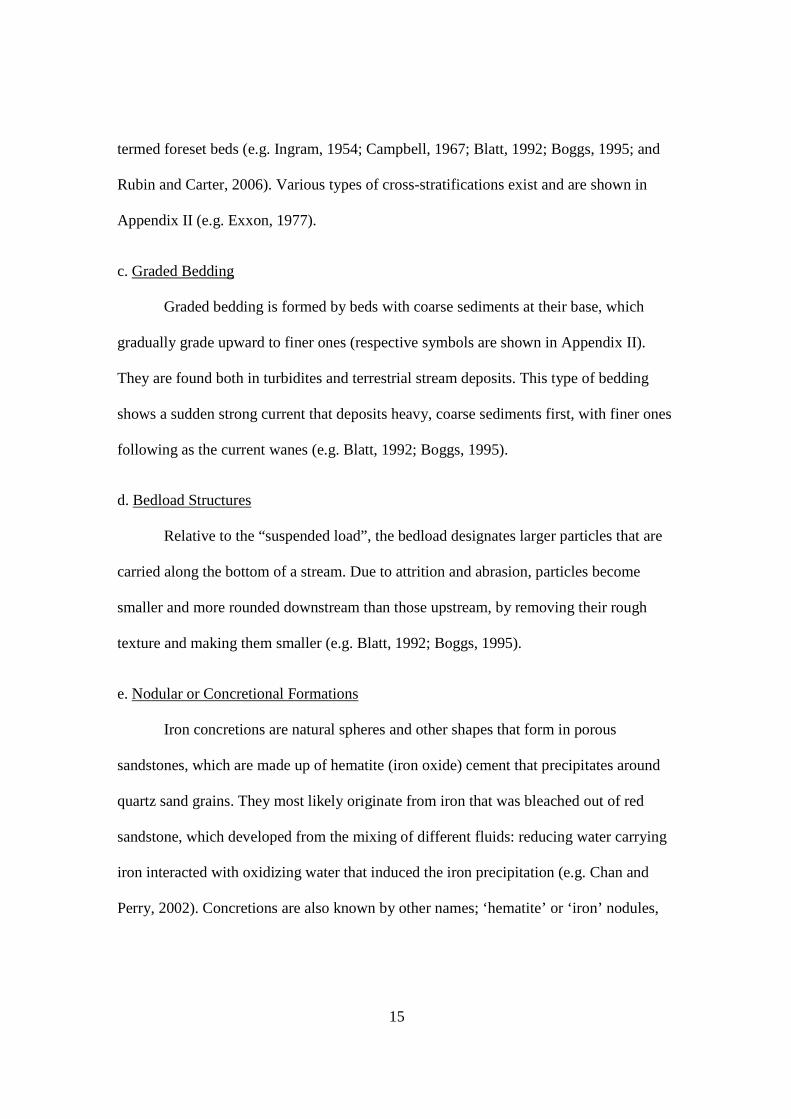
limestones or dolomites outcropping in a source land. Figure 1.7 shows an example of
calcarenite strata exposed in Northwest Belgium (Jacobs et al., 2005).
Fig. 1.7. Big Mac calcarenite concretion with central indentation (Jacobs et al., 2005).
13
As calclithites are dominantly sandy, like arkoses, graywackes, and/ or
calcarenites, they cannot be considered as limestones, although they contain a large
amount of carbonates (Folk, 1980).
1. Origin
Sandstones are clastic sedimentary rocks that are usually made up of medium-
sized quartz grains (e.g. 0.5-1mm) and other detrital, authigenic or accessory constituents,
typically of sand-size (Blatt, 1992; Boggs, 1995; Skinner and Porter, 1995). They are
more commonly deposited on land, but can also occur in marine environments, (e.g.
Krumbein, 1939; Touma, 1985). An example is marine deep-water sandstones containing
dish structures (cf. Hurst and Cronin, 2001). They are characterized by thin dark-colored
sub-horizontal, flat to concave-upward clayey laminations, occurring in sandstone and
siltstone nits (Boggs, 1995).
The sandstones in the Eastern Mediterranean region are mostly originating from the
Nubian Sandstones of Egypt, are mostly arenites, or “clean sandstones” typically devoid
of clays. They plot on the "arenite" classification diagram of Dott (1964) and the
sandstone classification diagram of Folk (1980) which are shown in Figures 1.9A and
1.10. While "dirty" sandstones having a larger clay content, which plot on the "wacke"
portion of the Dott (1964) classification diagram and on the graywacke classification
diagram (e.g. Pettijohn et al., 1973; Adams et al., 1994), are considered as a range
between the "arenite" and "wacke" end-members (Figs 1.9A and 1.10B). In Lebanon, by
means of this project, both types of sandstones (i.e. arenites and wackes) are found in the
Chouf Formation, and in this research thesis these sandstones were classified using the
sandstone diagrams, based on amounts of quartz and impurities (i.e. lithic fragments, etc).
14
2. Field characteristics
The primary structures observed in the field investigations in this project,
differentiating between beds and laminae (over 1cm these subdivisions/ strata are beds,
and under 1cm, they are laminae), were discussed by various authors (e.g. Ingram, 1954;
Campbell, 1967; Blatt, 1992; and Boggs, 1995). After which, a detailed classification
(list) can be constructed (see Appendix II). The list is as follows: i) even-wavy parallel to
nonparallel continuous to discontinuous laminae, ii) cross-stratifications, iii) graded
bedding, iv) bed load structures, v) nodular, or concretional formations, vi) flaser/
lenticular bedding, vii) ripple marks and viii) , downward accretion structures. A more
extensive list, which was used during field work to describe the studied sections, is found
in Appendix II. Descriptions of the individual structures are found below (and are further
explained in Appendix II).
a. Continuous to Discontinuous Laminae
Laminae are thin plates, sheets or layers (mostly under 1cm in thickness)
composed of sediment in sedimentary rocks and soils, that are uniform in structure, and
are never (or rarely) internally stratified (e.g. Campbell, 1967; Blatt, 1992; Boggs, 1995).
Ingram (1954) presented the various examples of laminae (see Appendix II).
b. Cross Stratifications
Cross-bedding/ lamination refers to inclined sedimentary structures in a horizontal
unit of rock, representing environments of deposition driven by water or wind flows,
where sand or gravel exists on the bed of the system. It is most common in stream
deposits, tidal areas, as well as in sand dunes, where thick laminae (of 25cm) may be
found. Cross-bedded sediments that form along the outer portion of a river delta are
15
termed foreset beds (e.g. Ingram, 1954; Campbell, 1967; Blatt, 1992; Boggs, 1995; and
Rubin and Carter, 2006). Various types of cross-stratifications exist and are shown in
Appendix II (e.g. Exxon, 1977).
c. Graded Bedding
Graded bedding is formed by beds with coarse sediments at their base, which
gradually grade upward to finer ones (respective symbols are shown in Appendix II).
They are found both in turbidites and terrestrial stream deposits. This type of bedding
shows a sudden strong current that deposits heavy, coarse sediments first, with finer ones
following as the current wanes (e.g. Blatt, 1992; Boggs, 1995).
d. Bedload Structures
Relative to the “suspended load”, the bedload designates larger particles that are
carried along the bottom of a stream. Due to attrition and abrasion, particles become
smaller and more rounded downstream than those upstream, by removing their rough
texture and making them smaller (e.g. Blatt, 1992; Boggs, 1995).
e. Nodular or Concretional Formations
Iron concretions are natural spheres and other shapes that form in porous
sandstones, which are made up of hematite (iron oxide) cement that precipitates around
quartz sand grains. They most likely originate from iron that was bleached out of red
sandstone, which developed from the mixing of different fluids: reducing water carrying
iron interacted with oxidizing water that induced the iron precipitation (e.g. Chan and
Perry, 2002). Concretions are also known by other names; ‘hematite’ or ‘iron’ nodules,
16
‘iron sandstone balls’, and/ or ‘Moki marbles’ (e.g. Chan and Parry 2002; Chan et al.
2005).
Concretions form within already deposited layers of sedimentary strata during
their early burial history. Therefore, in most cases concretion nodules are more resistant
to weathering than the quartz-rich sandstone host rock, as mineral cements tend to fill up
the available porosity. An example of concretions is shown in calcarenites in Northwest
Belgium (see Fig. 1.7), where septaria (typical crack patterns) are observed (cf. Jacobs et
al., 2005).
f. Flaser (or Lenticular) Bedding
Wavy and "flaser" bedding is typical of the ebb and flow of tides (Rolle, 1977).
According to Boggs (1995), flaser bedding commonly forms in relatively high energy
environments (i.e. sand flats). This favours sand deposits (i.e. sand ripples) that are
covered by clay lenses (i.e. drapes), and are typical of strong currents depositional
environments. Wavy bedding commonly forms in environments that alternate frequently
from higher to lower energies (i.e. mixed flats composed of a mixture of sand ripples and
mud deposits), favouring neither sand not mud; as this environment indicates currents
that alternate between a relatively strong period followed by a calm period (e.g. Blatt,
1992; Boggs, 1995). Lenticular bedding commonly forms in relatively low energy
environments (i.e. mud flats). This environment favors mud deposits (calm periods with a
few short periods of strong currents) as deposits indicate mud dominated strata with
lenses of sand (Boggs, 1995).
17
g. Ripple Marks
Ripple marks are sedimentary structures that indicate agitation by water (current
or waves) or wind. Ripple marks tend to be small (in the order of a few centimeters), but
some have wavelengths as long as 100 meters (e.g. Blatt, 1992; Boggs, 1995). Two types
of ripple marks exist (Appendix II) and are discussed below (and in Appendix II).
i. Current Ripple Marks
Current ripple marks are asymmetrical in profile, with a gentle up-current slope
(stoss) and a steeper down-current slope (lee). Sediments that propagate on ripples are
found to go up the stoss side (as a form of bedload), and due to local turbulences, they
would avalanche down the lee side (e.g. Blatt, 1992; Boggs, 1995).
ii. Wave-Formed Ripple Marks
These ripple marks have a symmetrical, almost sinusoidal profile. This is because
they indicate an environment with weak currents where water motion is dominated by
wave oscillations (e.g. Blatt, 1992; Boggs, 1995).
h. Downwards Accretion Structures
Accretion (in beach environments) is the process of coastal sediments which
return to the visible portion of a beach or foreshore following a submersion event. A
sustainable beach or foreshore often goes through a cycle of submersion during rough
weather then accretion during calmer periods (e.g. Blatt, 1992; Boggs, 1995). Similar
structures are found in the area under study (see Fig. 4.9; Chapter V).
18
3. Study methods of sandstones
Sandstones are generally studied through grain-size distribution analyses,
petrography, X -ray diffractometry and/ or geochemistry. If the material is friable and not
cemented, it is best to use granulometric methods. This is a good alternative, and Folk
(1968) discusses their main beliefs and applications (refer to Chapter III for more details).
Grain size distribution studies require statistical methods and standard charts comparing
millimeter scales to sizes and mesh numbers. Hence, stratigraphic studies were enhanced
by studying the grain-size distribution of sandstones, and thus the methods of moments,
and the phi sizes as well as quartile statistical methods (of size distribution) were used by
sedimentologists to complement their studies (e.g. Wentworth, 1929; Trask, 1932; and
Folk, 1955, 1968, 1974 and 1980). For the purpose of this research project, sediments
were classified using the Wentworth (1929) grain-size scale and the Shepard (1954)
scheme of sediment classification prior to the laboratory tests (introduced in Chapter III).
Another method of studying sandstones (if cemented and hard) is through
petrographic means, which involves the production of rock chips of about 2cm from the
original sample, through grinding. As in the cases of sandstone petrography it is often
required to use an epoxy solution of resin and colour staining (more details are given in
Chapter III) that is added to the chips in order to increase cohesiveness (this is important
for the case of loosely cemented grains, like very mature sands). El-Hinnawi (1966)
presents the grinding technique which involves systematic grinding of chips from coarser
abrasives (e.g. 120 or 200 grades) to finer abrasives (e.g. 600 or 800 grades). The staining
technique (e.g. Evamy, 1963) is useful in carbonate sedimentology, and is discussed in
more details in Doummar (2005) and Al Haddad (2007).
19
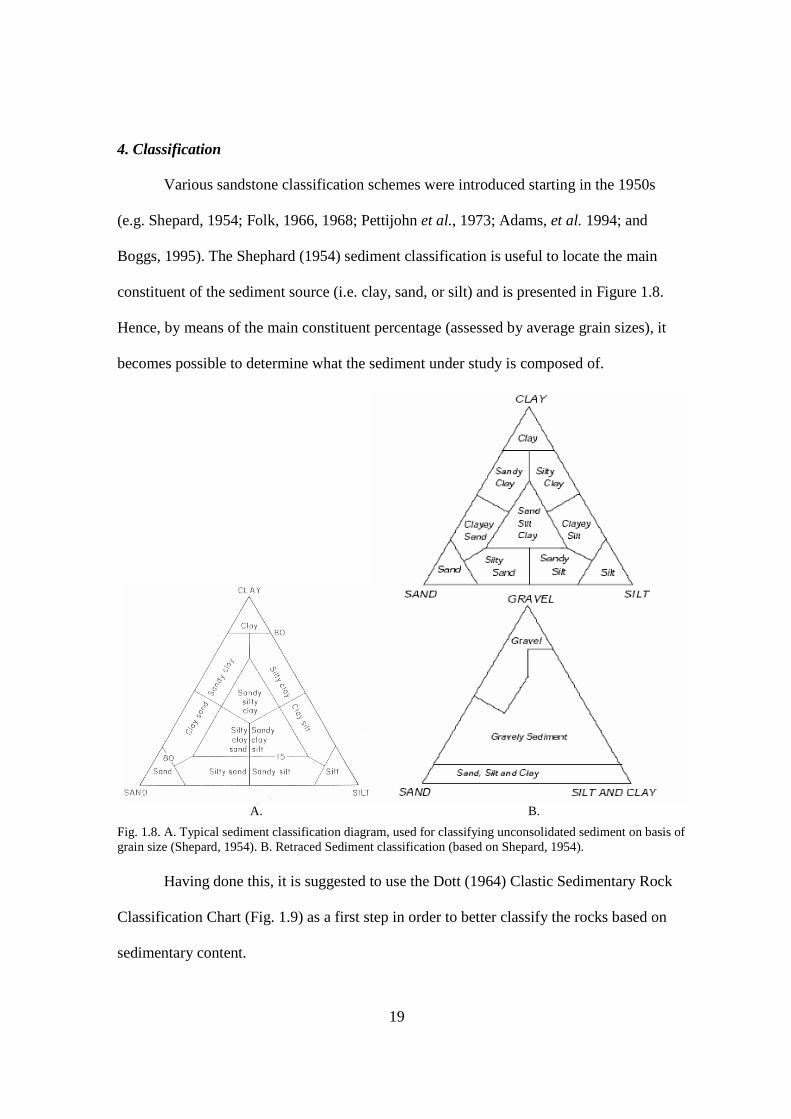
4. Classification
Various sandstone classification schemes were introduced starting in the 1950s
(e.g. Shepard, 1954; Folk, 1966, 1968; Pettijohn et al., 1973; Adams, et al. 1994; and
Boggs, 1995). The Shephard (1954) sediment classification is useful to locate the main
constituent of the sediment source (i.e. clay, sand, or silt) and is presented in Figure 1.8.
Hence, by means of the main constituent percentage (assessed by average grain sizes), it
becomes possible to determine what the sediment under study is composed of.
A. B.
Fig. 1.8. A. Typical sediment classification diagram, used for classifying unconsolidated sediment on basis of grain size (Shepard, 1954). B. Retraced Sediment classification (based on Shepard, 1954).
Having done this, it is suggested to use the Dott (1964) Clastic Sedimentary Rock
Classification Chart (Fig. 1.9) as a first step in order to better classify the rocks based on
sedimentary content.
20
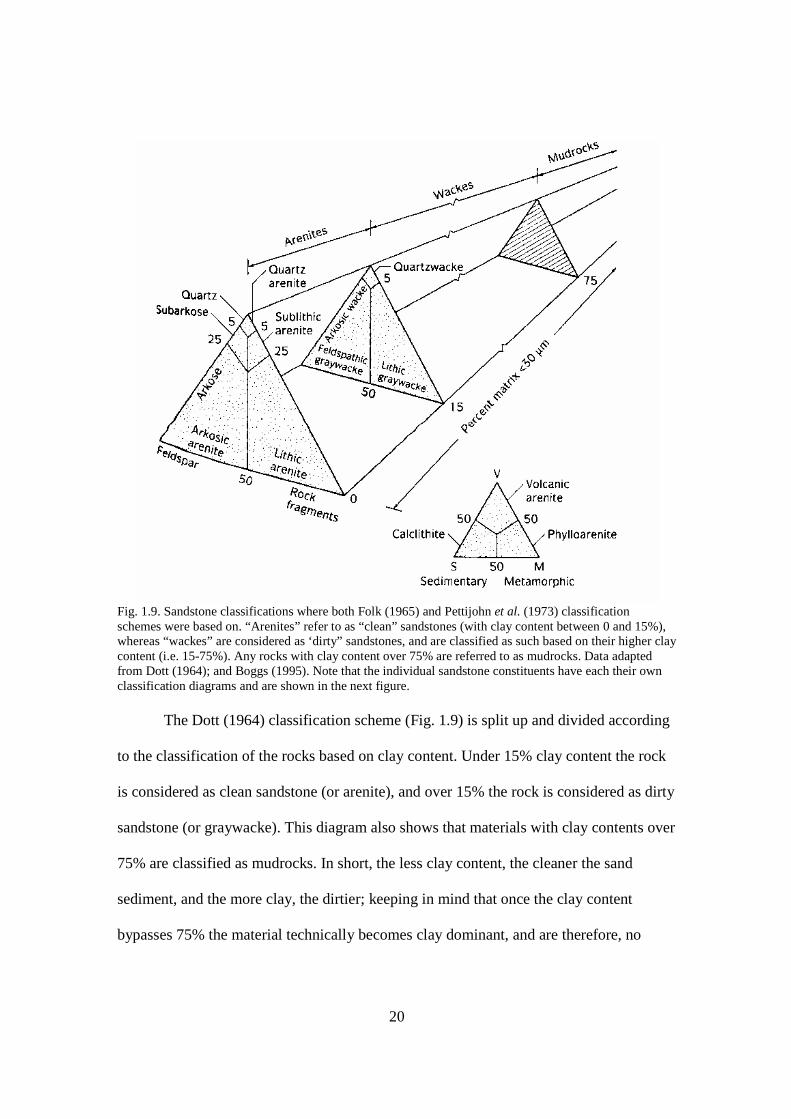
Fig. 1.9. Sandstone classifications where both Folk (1965) and Pettijohn et al. (1973) classification schemes were based on. “Arenites” refer to as “clean” sandstones (with clay content between 0 and 15%), whereas “wackes” are considered as ‘dirty” sandstones, and are classified as such based on their higher clay content (i.e. 15-75%). Any rocks with clay content over 75% are referred to as mudrocks. Data adapted from Dott (1964); and Boggs (1995). Note that the individual sandstone constituents have each their own classification diagrams and are shown in the next figure.
The Dott (1964) classification scheme (Fig. 1.9) is split up and divided according
to the classification of the rocks based on clay content. Under 15% clay content the rock
is considered as clean sandstone (or arenite), and over 15% the rock is considered as dirty
sandstone (or graywacke). This diagram also shows that materials with clay contents over
75% are classified as mudrocks. In short, the less clay content, the cleaner the sand
sediment, and the more clay, the dirtier; keeping in mind that once the clay content
bypasses 75% the material technically becomes clay dominant, and are therefore, no
21
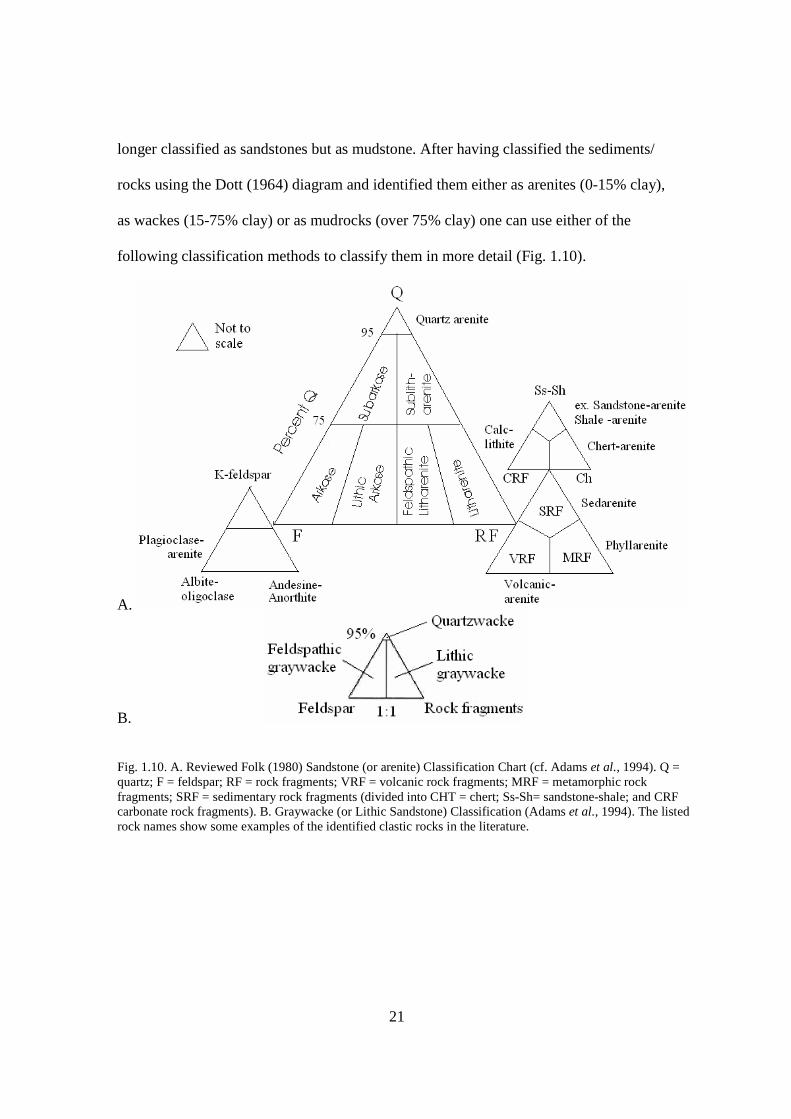
longer classified as sandstones but as mudstone. After having classified the sediments/
rocks using the Dott (1964) diagram and identified them either as arenites (0-15% clay),
as wackes (15-75% clay) or as mudrocks (over 75% clay) one can use either of the
following classification methods to classify them in more detail (Fig. 1.10).
A.
B.
Fig. 1.10. A. Reviewed Folk (1980) Sandstone (or arenite) Classification Chart (cf. Adams et al., 1994). Q = quartz; F = feldspar; RF = rock fragments; VRF = volcanic rock fragments; MRF = metamorphic rock fragments; SRF = sedimentary rock fragments (divided into CHT = chert; Ss-Sh= sandstone-shale; and CRF carbonate rock fragments). B. Graywacke (or Lithic Sandstone) Classification (Adams et al., 1994). The listed rock names show some examples of the identified clastic rocks in the literature.
22
5. Textural and Mineralogical Maturity
These classification schemes (discussed above) were developed alongside the
development of the Folk (1951) Textural Maturity and Flow charts (Figs. 1.11 and 1.12),
sorting (Fig. 1.13) roundness and sphericity (Fig. 1.14) and classification scales,
regardless whether the sandstones are studied granolumetrically or petrographically
(Powers, 1953; Pettijohn, et al., 1973; Folk, 1974, 1980; and Adams et al., 1994). Figure
1.14 presents a relationship with void space and roundness, each increasing
proportionally with respect to the other. Finally, in Figure 1.15 the porosity typing
definition from Adams et al., (1994) is presented.
Mineralogical maturity indicates how resistant a mineral is, and is as measure of
mineral stability and/ or resistance to weathering/ abrasion. Hence, by nature, arenites are
more mature than arkoses, as quartz is more resistant than feldspars. This also applies to
textural maturity; which is defined mostly on clay content, sorting and roundness (e.g.
Folk, 1980; Adams et al., 1994). Thus, based on that, upon this research, the studied
sandstones were classified based on textural maturity following the Folk (1951) textural
maturity chart.
Figure 1.11 expresses the relationships of textural maturity (measured through
sieving analysis), kinetic energy, and depositional environments (Folk, 1951). Based on
this, a maturity flow-chart can be constructed (Fig. 1.12), which helps the sedimentary
petrologists in identifying the studied rocks. Hence, immature rocks have much clay
(over 5%), and are poorly sorted (sorting (s) is over 1.0f; as overbank and/ or turbidites).
Submature rocks are low in clay content, but are not well sorted (s is over 0.5f; as fluvial
sands). Mature rocks are “well sorted”, but not rounded (degree is less than 3.0r; as
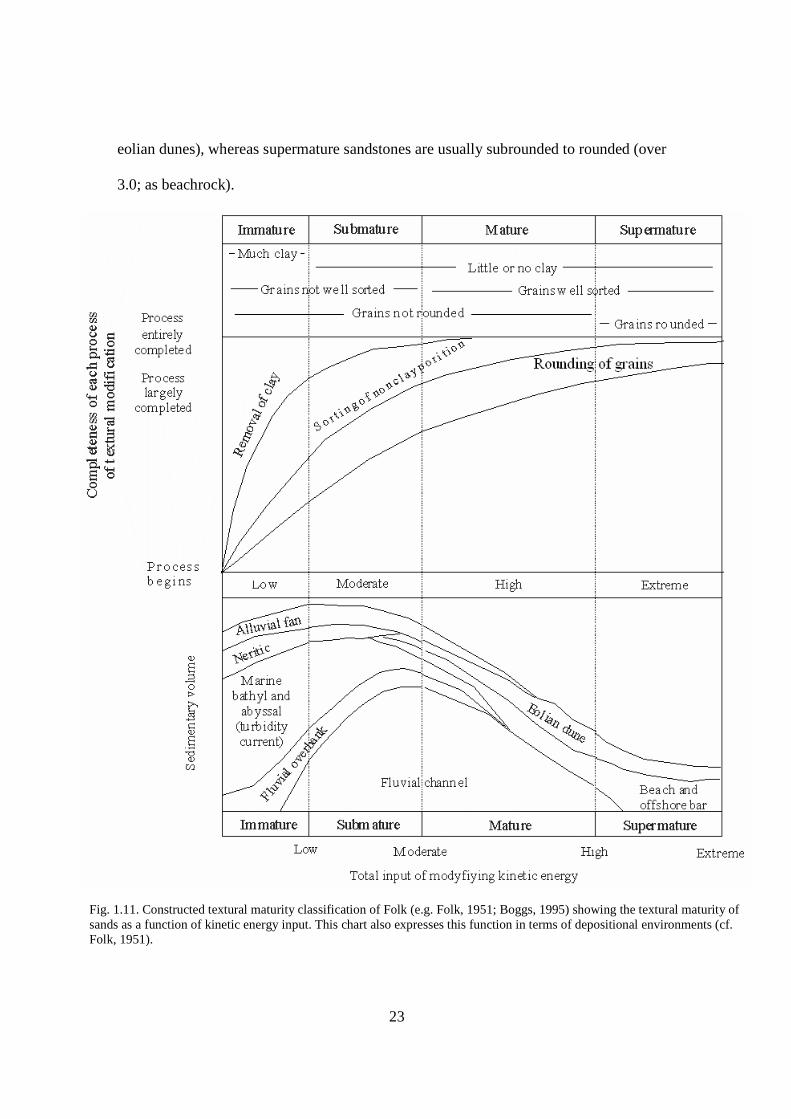
23
eolian dunes), whereas supermature sandstones are usually subrounded to rounded (over
3.0; as beachrock).
Fig. 1.11. Constructed textural maturity classification of Folk (e.g. Folk, 1951; Boggs, 1995) showing the textural maturity of sands as a function of kinetic energy input. This chart also expresses this function in terms of depositional environments (cf. Folk, 1951).
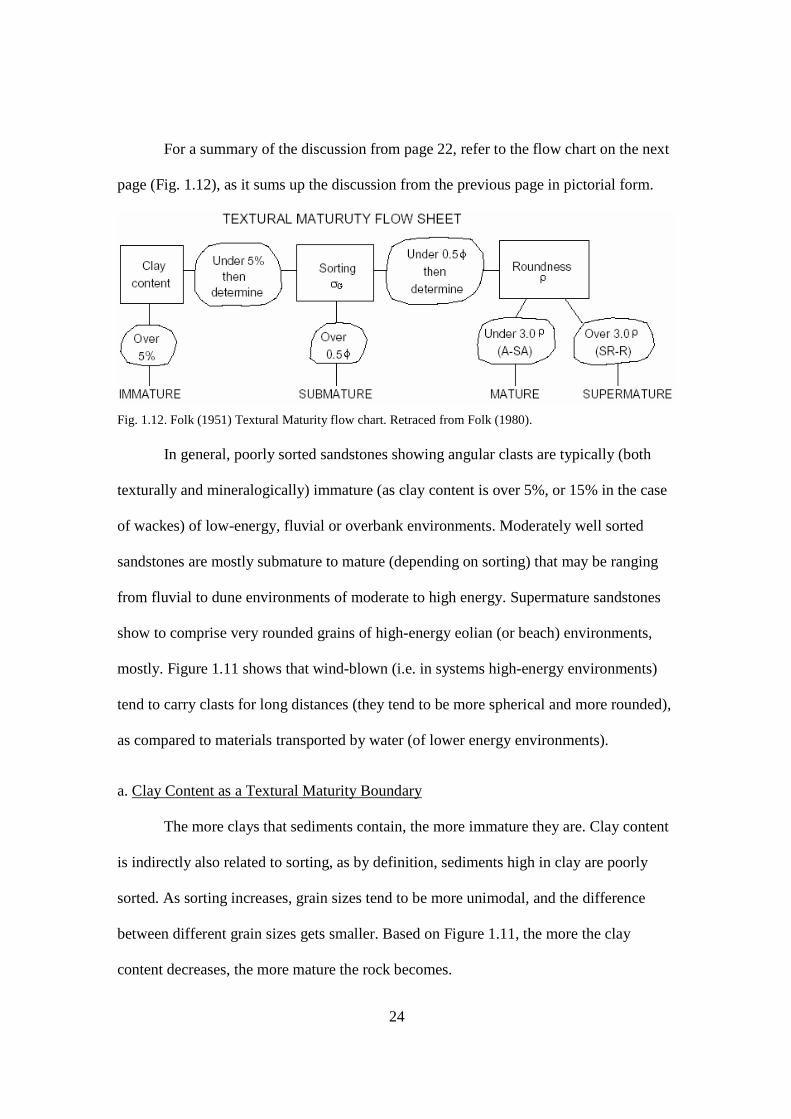
24
For a summary of the discussion from page 22, refer to the flow chart on the next
page (Fig. 1.12), as it sums up the discussion from the previous page in pictorial form.
Fig. 1.12. Folk (1951) Textural Maturity flow chart. Retraced from Folk (1980). In general, poorly sorted sandstones showing angular clasts are typically (both
texturally and mineralogically) immature (as clay content is over 5%, or 15% in the case
of wackes) of low-energy, fluvial or overbank environments. Moderately well sorted
sandstones are mostly submature to mature (depending on sorting) that may be ranging
from fluvial to dune environments of moderate to high energy. Supermature sandstones
show to comprise very rounded grains of high-energy eolian (or beach) environments,
mostly. Figure 1.11 shows that wind-blown (i.e. in systems high-energy environments)
tend to carry clasts for long distances (they tend to be more spherical and more rounded),
as compared to materials transported by water (of lower energy environments).
a. Clay Content as a Textural Maturity Boundary
The more clays that sediments contain, the more immature they are. Clay content
is indirectly also related to sorting, as by definition, sediments high in clay are poorly
sorted. As sorting increases, grain sizes tend to be more unimodal, and the difference
between different grain sizes gets smaller. Based on Figure 1.11, the more the clay
content decreases, the more mature the rock becomes.
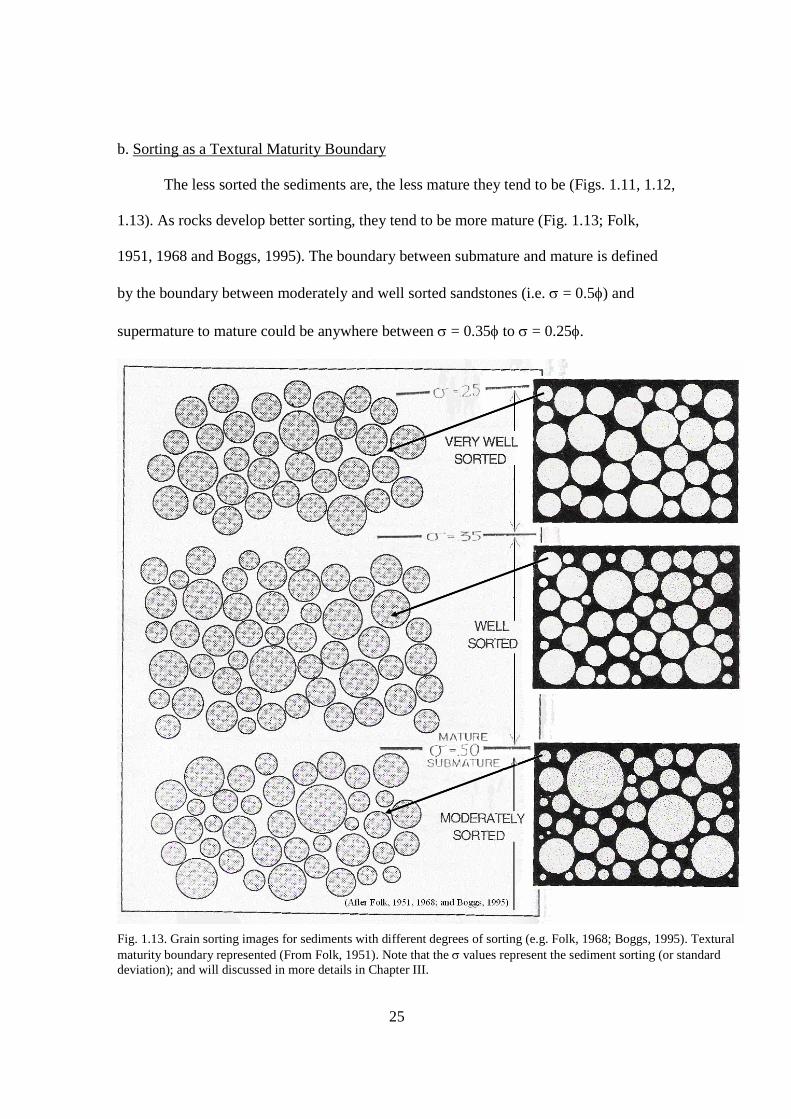
25
b. Sorting as a Textural Maturity Boundary
The less sorted the sediments are, the less mature they tend to be (Figs. 1.11, 1.12,
1.13). As rocks develop better sorting, they tend to be more mature (Fig. 1.13; Folk,
1951, 1968 and Boggs, 1995). The boundary between submature and mature is defined
by the boundary between moderately and well sorted sandstones (i.e. s = 0.5f) and
supermature to mature could be anywhere between s = 0.35f to s = 0.25f.
Fig. 1.13. Grain sorting images for sediments with different degrees of sorting (e.g. Folk, 1968; Boggs, 1995). Textural maturity boundary represented (From Folk, 1951). Note that the s values represent the sediment sorting (or standard deviation); and will discussed in more details in Chapter III.
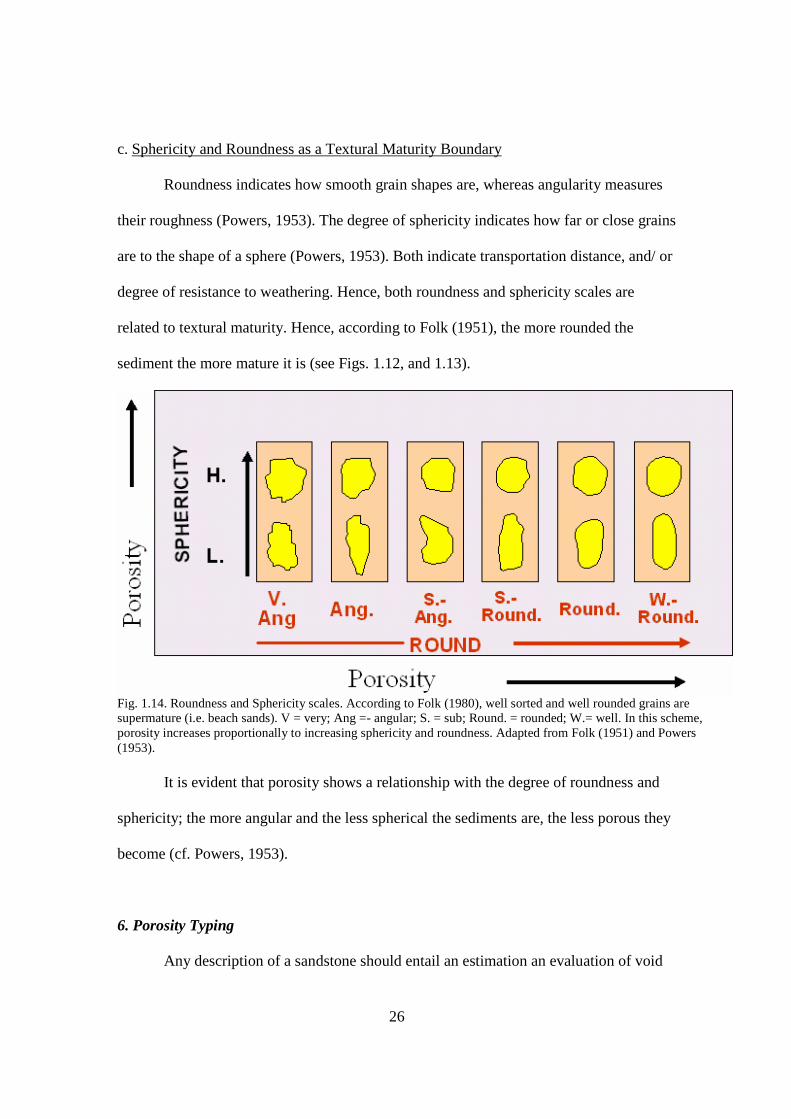
26
c. Sphericity and Roundness as a Textural Maturity Boundary
Roundness indicates how smooth grain shapes are, whereas angularity measures
their roughness (Powers, 1953). The degree of sphericity indicates how far or close grains
are to the shape of a sphere (Powers, 1953). Both indicate transportation distance, and/ or
degree of resistance to weathering. Hence, both roundness and sphericity scales are
related to textural maturity. Hence, according to Folk (1951), the more rounded the
sediment the more mature it is (see Figs. 1.12, and 1.13).
Fig. 1.14. Roundness and Sphericity scales. According to Folk (1980), well sorted and well rounded grains are supermature (i.e. beach sands). V = very; Ang =- angular; S. = sub; Round. = rounded; W.= well. In this scheme, porosity increases proportionally to increasing sphericity and roundness. Adapted from Folk (1951) and Powers (1953).
It is evident that porosity shows a relationship with the degree of roundness and
sphericity; the more angular and the less spherical the sediments are, the less porous they
become (cf. Powers, 1953).
6. Porosity Typing
Any description of a sandstone should entail an estimation an evaluation of void
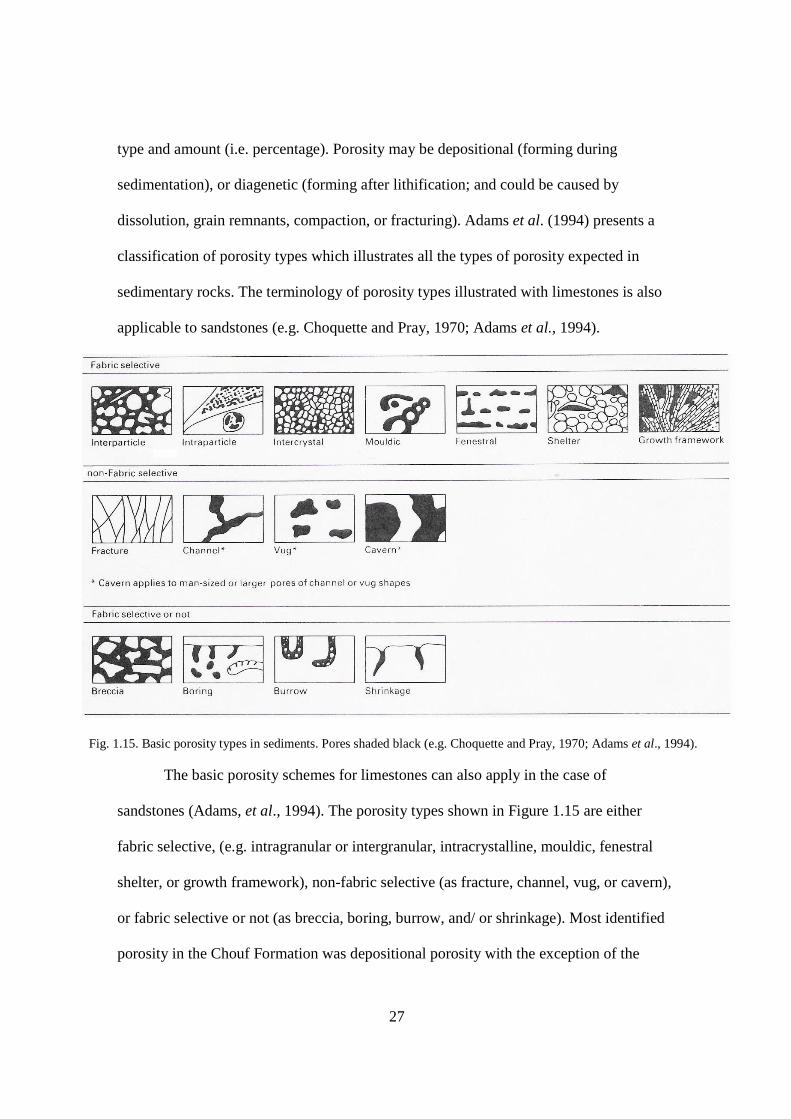
27
type and amount (i.e. percentage). Porosity may be depositional (forming during
sedimentation), or diagenetic (forming after lithification; and could be caused by
dissolution, grain remnants, compaction, or fracturing). Adams et al. (1994) presents a
classification of porosity types which illustrates all the types of porosity expected in
sedimentary rocks. The terminology of porosity types illustrated with limestones is also
applicable to sandstones (e.g. Choquette and Pray, 1970; Adams et al., 1994).
Fig. 1.15. Basic porosity types in sediments. Pores shaded black (e.g. Choquette and Pray, 1970; Adams et al., 1994).
The basic porosity schemes for limestones can also apply in the case of
sandstones (Adams, et al., 1994). The porosity types shown in Figure 1.15 are either
fabric selective, (e.g. intragranular or intergranular, intracrystalline, mouldic, fenestral
shelter, or growth framework), non-fabric selective (as fracture, channel, vug, or cavern),
or fabric selective or not (as breccia, boring, burrow, and/ or shrinkage). Most identified
porosity in the Chouf Formation was depositional porosity with the exception of the

28
larger porosity obtained through dissolution (e.g. Adams et al., 1994).
C. Previous Studies on the Chouf Formation
1. Early Contributions (before 1950)
Sandstones were first studied (and referred to as ''Terrain sablonneux”) by Botta
(1833). They were later studied by Russeger (1842) and later by Lartet (1869) who
referred to them as being a derivative of the "Nubian Sandstones". However, both Fraas
(1878) and Whitefield (1981) considered the basal Cretaceous sandstones as the "Abeih
Sandstones" clearly referring to the stratigraphically higher, Abeih Formation. It is
possible that in the 19th century, the basal Cretaceous sandstones were considered to be
younger than they actually are.
Coal beds were detected in the base of the base of the Chouf Formation (e.g.
Douvillé, 1910; Zumoffen, 1926). The sandstones referred to as "Grès Lignitifères" are
reported to be made up of sandy to clayey beds with various detrital, oolitic to sub-reefal
limey intercalations, from the Basal Cretaceous up to the Aptian (Zumoffen, 1926).
Various studies including Dubertret's early publications were conducted on lower
Cretaceous sandstones. In the 1920-1930s, scientists found that the Basal Cretaceous
"Grès de Base" included wood remains (as they were thought to deposit in swampy/
marshy conditions) and comprise sand hills and clay valleys, of continental origin
actually forming from the eroded remains of anticlines (e.g. Day, 1930).
Several important studies in the 1940s were carried out in various areas in Central
Lebanon, discussing the Chouf Sandstone and other Formations were done (e.g. Vokes,
1941a, b; Heybroek, 1942; and Heybroek and Dubertret, 1945). Heybroek (1942)
suggested that the type location for the Chouf Formation should be at Jisr el Qadi, where
29
the Formation was found to be at its thickest. Douvillé (1910), Zumoffen (1926) and
Vokes (1941b) defined the Neocomian Chouf Formation as principally continental
argillaceous, bright red and purple sandstones with nodules of iron that are interstratified
with red and varicoloured shales and lenses of gray and black shales containing lignite
lenses. However, casts of plant stems are abundant, and dinosaur bones were found
(Vokes, 1941b).
The Cretaceous successions in Lebanon were first described in the late 1930s
(Dubertret and Vautrin, 1937) where important findings on the formations were obtained.
This was followed by extensive field mapping undertaken in Lebanon by Louis Dubertret
in the 1940s. These maps included descriptive notes on the Lower Cretaceous "Grès de
Base" that included several names, which were in use until the mid 1970s.
2. Contributions of the Period Extending from 1950 to 1965
There were widespread mapping campaigns conducted by Louis Dubertret and his
colleagues, during which various rock formations were studied in some details, focusing
on the Neocomian-Barremian Chouf Formation. It is recognized in the field by the Pinus
Pinea (pine) trees. At its type location (Chouf area), the thicknesses of the strata of the
Formation were estimated to be about 250-300m (or more). Anywhere else, the bed
thicknesses range from 0-250m (e.g. around 10m in the Sir el Daniyeh area, to 150m in
various locations in Northern Central Mount Lebanon (including Qartaba and
Broummana), to 220-230m near Jezzine to about 250m in Baskinta area (e.g. Heybroek
and Dubertret, 1945, Dubertret and Wetzel, 1951; Dubertret et al., 1955).
In the Jezzine area, volcanics and conglomerate beds are found near the base of
the Formation; acting as a transitional rock unit between the underlying and overlying
30
carbonate successions, in which their contacts were hard to establish (Heybroek and
Dubertret, 1945; Dubertret et al., 1955). Therefore, in some areas the Chouf and the
Aptian Formations were merged together (Dubertret et al., 1955). Sabbagh (1961) has
investigated the Jezzine sandstones quite well in his study, where a detailed stratigraphic
section was presented on the Chouf Formation. Dubertret et al. (1963) contributed to
reestablishing the stratigraphy of Lebanon, in his “Lexique stratigraphique”, where data
on the Chouf Sandstone was recorded, as he identified various sections for the Formation.
3. Contributions of the Period Extending from 1965 to 1987
Based on advanced sedimentological studies, various studies were provided on
the Lower Cretaceous "Grès de Base". These included stratigraphic, petrographic,
hydrogeologic, geotechnical and industrial data (e.g. Karcz, 1965; Kanaan, 1966; Ukla,
1970; Searle, 1972; Tixier, 1971-1972; Kozma, 1973; Shuayb 1974; Massaad, 1976;
Walley, 1983b; Khawlie, 1985; Touma, 1985; and Khalaf, 1986).
The Chouf Formation is predominantly deposited in fluvio-deltaic environments,
and that it is similar in nature to the Jordanian Hathira Formation, and the Cheriffe
Formation (i.e. Ruthabah sandstones) in Syria, itself a derivative of the Jordanian Hathira
Formation (Kanaan, 1966). The basal Cretaceous sandstone thicknesses vary in Lebanon;
where the Formation dies out on a northerly direction, thins in a northeasterly direction
and may gradually grade to limestone (or marine carbonate beds) in a westerly direction
(Kanaan, 1966).
Kanaan (1966) suggested that the Chouf Formation’s prevalent depositional
environment was not stationary during the Basal Cretaceous times, because it was in
contact with the Tethys and its shorelines were connected to the Jezzine and Adloun

31
areas. This was indicated by interfingering of fluvial and continental clastic sediments
with carbonates and marine clays and shales, and sandstones both in Lebanon and the
Levant (Kanaan, 1966).
The detailed study of Kanaan (1966) was followed by a detailed sedimentological
and petrographic study of the Chouf Formation (Wakim, 1968). The investigated strata
are found to be largely composed of medium-grained well-sorted arenites (these data are
accompanied by various macroscopic and granulometric observations, see Appendix II).
It was found that the tidal effects modified the earlier hypothesis about the Chouf
Formation’s deltaic origin, as there were some minor difficulties with the deltaic model,
as transgressions and tides may have considerably modified the deltaic character of the
Formation (cf. Kanaan, 1966; in Wakim 1968).
The study of detrital and heavy mineral content and composition compared to
older Jordanian sandstones, confirms the impression that the basal sandstones were not
derived from direct deviation of the Arabian shield (Kanaan, 1966; in Wakim 1968).
Various Formations in Northern and Central Lebanon were studied in the 1970s
and isopach maps were constructed for each one (e.g. Ukla, 1970), including one for the
‘Grès de Base’ (Fig. 1.16). Findings demonstrated that the Chouf Sandstone Formation
was deposited in a basin, of an elliptical form, where the thickest deposits are in the
Chouf region, coinciding with the basin's center (which may be related to the Palmyrides
depocenter). Based on the isopach map of the Chouf Formation from Ukla (1970) it was
found that the Sandstone beds decrease in thickness in a northerly direction (and
disappear at the Terbol, EI Qaa and Hermel areas) and did likewise in a southerly
direction.
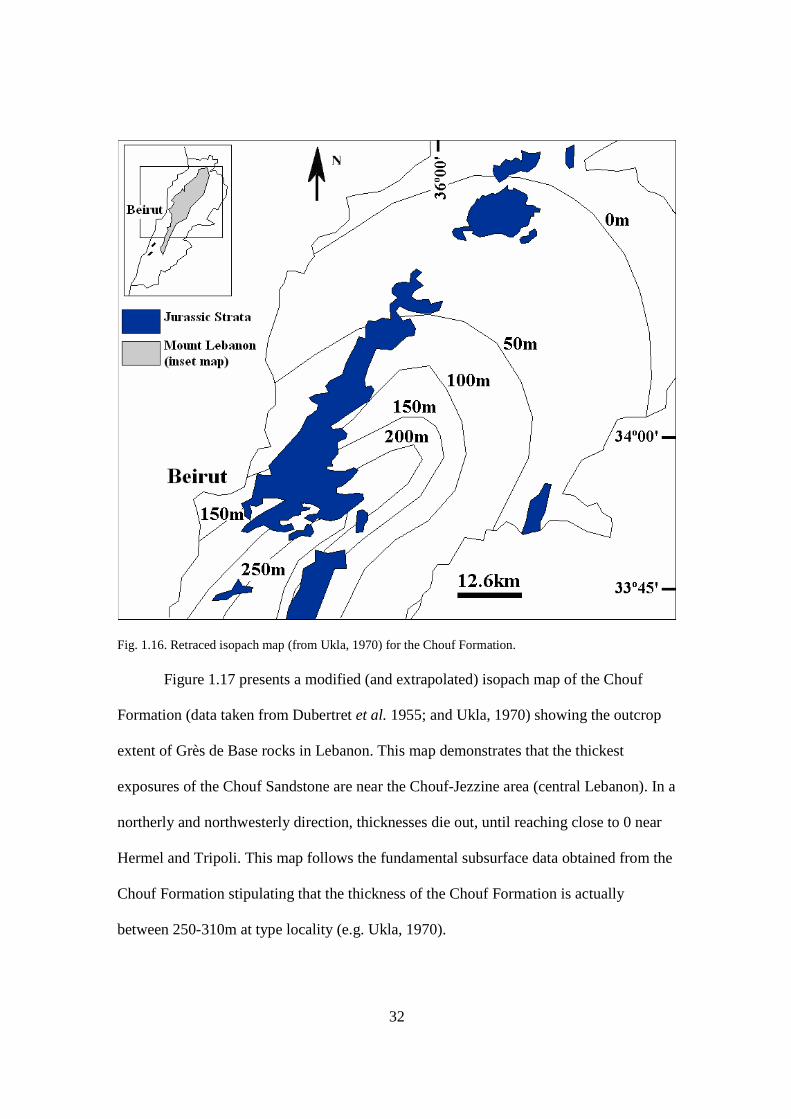
32
Fig. 1.16. Retraced isopach map (from Ukla, 1970) for the Chouf Formation. Figure 1.17 presents a modified (and extrapolated) isopach map of the Chouf
Formation (data taken from Dubertret et al. 1955; and Ukla, 1970) showing the outcrop
extent of Grès de Base rocks in Lebanon. This map demonstrates that the thickest
exposures of the Chouf Sandstone are near the Chouf-Jezzine area (central Lebanon). In a
northerly and northwesterly direction, thicknesses die out, until reaching close to 0 near
Hermel and Tripoli. This map follows the fundamental subsurface data obtained from the
Chouf Formation stipulating that the thickness of the Chouf Formation is actually
between 250-310m at type locality (e.g. Ukla, 1970).
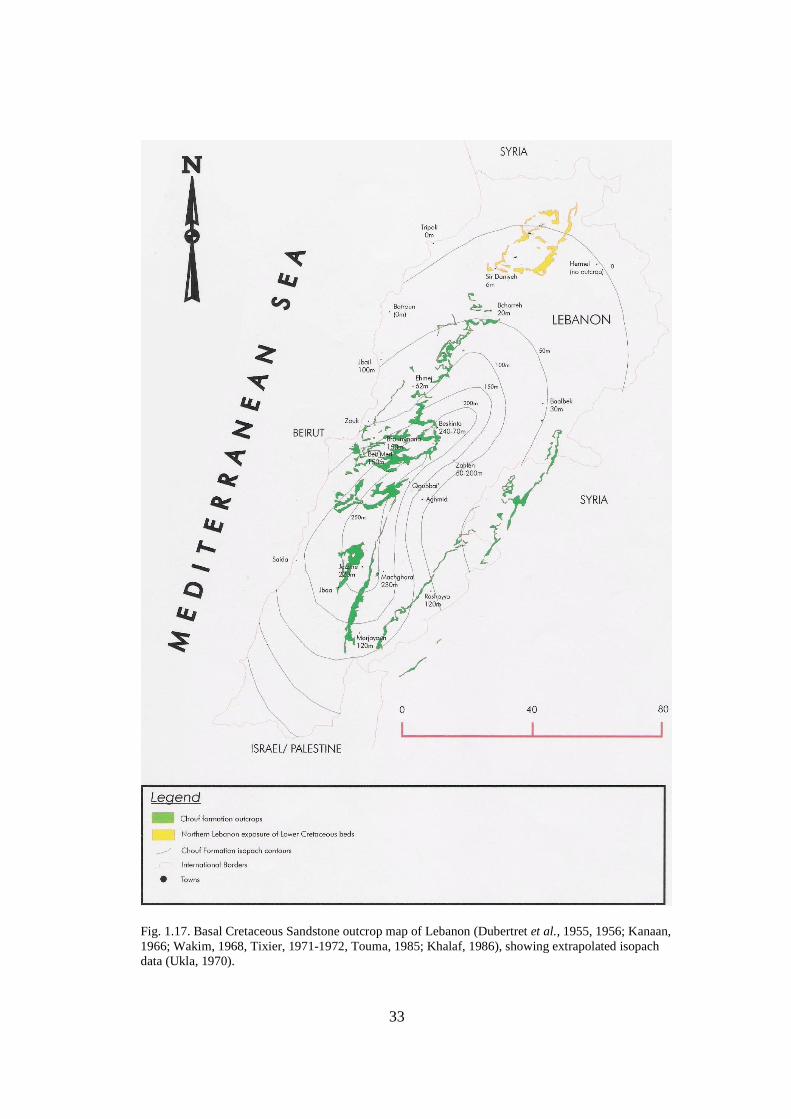
33
Fig. 1.17. Basal Cretaceous Sandstone outcrop map of Lebanon (Dubertret et al., 1955, 1956; Kanaan, 1966; Wakim, 1968, Tixier, 1971-1972, Touma, 1985; Khalaf, 1986), showing extrapolated isopach data (Ukla, 1970).

34
Searle (1972) demonstrated, by studying the “Grès de Base layers in Khardaleh,
that the Chouf Formation contains several clay strata acting as impervious beds, as they
were deposited as interbeds rather than continuous layers. This was confirmed by Shuayb
(1974). Indeed, he pointed out (in his hydrogeology report on the Chouf Formation) that
some beds (probably clays) were non-porous to impermeable; thus hampering infiltration
(see Shuayb, 1974; in Touma, 1985). It also proves that the Chouf Formation shows
transgression from South to North (i.e. the sand beds are shown to thin in a northerly to
northeasterly direction).as a result, the Chouf Sandstones act as aquitards or semi-
aquifers (see Tabet, 1978; Abbud, 1985; Abbud and Aker 1986; and Hamzeh, 2000).
Several stratigraphic sections, completed by Tixier (1971-1972), show the
presence of dark clays and volcanics at the base of the Formation, and cross-laminated
dune sands exhibiting reddish color are found at mid section (granulometric studies are
available, see appendix I). The presence of montmorillonite and kaolinite, in the Chouf
Formation at Jezzine, were revealed through powder diffraction studies. These studies
also point out the analyzed clays show quick erosion rates (Tixier, 1971-1972). It was
concluded that the Jezzine sandstones are not dunal because they show evidence of
fluvio-deltaic regimes. It was also found that the Cretaceous transgression that followed
the deposition of these sands made it clear that the "Grès de Base" acted as a precursor of
the overlying Cretaceous marine deposits. It was also found that (in the littoral zones), a
deltaic origin of the sandstones was considered; the deposition of sands in continental
systems (in dune systems) should not be neglected).
35
Dubertret (1975) described the stratigraphy of the Chouf, Jezzine and other areas
where sandstones occur, and according to him, the Chouf Formation is believed to derive
from the Nubian sandstones of Egypt and Northeast Africa. The rocks comprising the
Chouf Formation are ferruginous quartz-rich sandstones with obliquely deposited
stratified lenses, showing a relationship with volcanics, including the presence of
argillaceous coquina beds rich in oysters cemented by calcareous agents.
Cohen (1976) discussed the petroleum prospects in the Hauterivian Heletz
Formation in Israel/ Palestine and estimated that it is an oilfield as it contains
hydrocarbon. The Heletz oilfield shows to be related somehow to the Gevar Am reservoir
system. Massaad (1976) confirmed the fluvio-deltaic model (formerly presented by
Kanaan, 1966) and pointed out that the strata show variable thicknesses (ranging between
0-310m). It was also indicated that the Chouf Sandstone strata are affected by the NE
trending Deir el Zor high.
The Lower Cretaceous "Grès de Base" were found to be deposited after the late
Jurassic uplift (and block faulting) events during the Early Cretaceous (Beydoun, 1977b).
In Palestine, a more recent study found that the base of the sandstone strata was dated to
the Hauterivian age (Shirmon and Lang, 1989). This study agrees with the former, as the
hiatus event occurred during the Berriasian, resulting in a relative fall in sea-level.
Walley (1983) revised the entire Lower Cretaceous strata, including the
Neocomian-Barremian sandstones. These beds to display a diachronous lower boundary
with the underlying oolitic grainstones of the Salima Formation (Walley, 1983b).
However, the upper contact with the Abeih Formation is clear, as the layer above the
contact shows to be abundant in oysters, and is dated to the Barremian (e.g. Mroueh,
36
1960; in Walley, 1983b). The beds of Abeih were also reported to contain pisolites, thus
aiding in establishing a contact in the field (Walley, 1983b).
Touma (1985) studied the engineering properties of sandstone beds in the vicinity
of the Broummana locality were investigated. In this study, two types of sandstones were
identified; i) a compact marine facies, and ii) a terrigenous (and more friable) facies
(provided that it is not cemented). It was concluded that the compact facies constituted
mostly of moderately to highly siliceous and ferruginous cements that are commonly
exposed in the lower portions of the Formation (e.g. the aquatic strata from Tixier (1971-
1972)), whereas the friable facies are associated with lose and poorly cemented sandstone
types and are invariably distributed within the Formation (Touma, 1985), and also
constitute most of the strata exposed in middle part of the Formation.
The “Grès de Base” strata include a hematitic base with chocolate clays, and
volcanics, among others (cf. Zumoffen, 1926; Dubertret et al., 1955 and Khalaf, 1986).
Because of the hematite, they display orange-brown colours (the percentage of hematite
and the presence of volcanics yield these purplish colours). The white sands (e.g. Safa),
lacking hematite, were used for the glass industry (cf. Khalaf, 1986). In other horizons,
the Chouf Formation contains fossilized wood, lignite, pyrite and/ or amber (where
fossils were studied). As the potential (raw) material that the white sands of Chouf
Formation could generate for the glass industry was assessed (Khalaf, 1986), it was found
that these strata could produce about 650 tons of material for the glass industry.
37
4. Recent Contributions (after 1987)
This period coincides with additional tectonic data that were made available on
the Levantine region (e.g. Beydoun, 1988, 1995; Girdler 1990; Butler et al. 1997, 1998;
Khair et al., 1993, 1997, 2000; Griffiths et al., 2000; Gomez et al., 2001a, 2001b, 2003,
2006, 2007; Nemer 1999, 2005, Nemer and Meghraoui, 2006; Walley, 1988, 1997; 1998,
2001; and Brew et al, 2001, 2003). The Basal Cretaceous "Grès de Base" did not deposit
during the Berriasian times, but during the late Valangianian, or possibly during the early
Hauterivian in the Levant (Shirmon and Lang, 1989; Walley, 1997).
Walley (1988) believes that the first-order structures of Lebanon appear to be
essentially compressional and to pre-date any motion on the Dead Sea Fault Zone.
Transpressional effects are thus more recent (essentially post-Miocene) and have a less
major and more localized role than previously assumed. According to him, the major
fault in Lebanon is the NNE–SSW-trending Yammouneh Fault, which runs along the
eastern flank of Mount Lebanon, forming the chief link between the broadly N–S
structures of the Dead Sea Fault to the south and the Ghab Fault System to the north.
According to Walley (1988), a number of sub-parallel and divergent fault splays
(which divide up much of the country) split off from the southern part of the Yammouneh
Fault. One such splays, the Serghaya Fault (a sinistral strike-slip fault of 20km
displacement) is thought to be related to the near-by Palmyrides trend. He believes that
not only was Lebanon affected by Syrian Arc events but also that in this area they were
of major significance. There has been a tendency to consider the Lebanese structures as
being largely generated by transpression this cannot now be considered the only
mechanism.

38
Shirmon and Lang (1989) pointed out that the Chouf Sandstone are of Hauterivian
age (by dating similar strata in Israel/ Palestine), and also confirm what Beydoun (1977)
claim about the hiatus during the Early Cretaceous.
Important regional studies were conducted by Beydoun (1995) in which he
assesses the hydrocarbon potential of the Early-Cretaceous sandstones of the Middle East
(i.e. the Helez in Israel, the Nubia C, in the Gulf of Suez, and the Ruthbah/ Cheriffe in
Syria, all equivalent to the Chouf Formation, which are all dated to the Hauterivian age).
He confirms that the Helez/ Gevar Am complex acts as source rocks (Fig. 1.18; cf.
Cohen, 1976) and also found that the Ruthabah sandstones (i.e. Cheriffe Formation) act
as reservoirs (Fig. 1.18; cf. Brew 2001).
In the Levant, there are several prominent reservoir systems, the Heletz-Brur-
Kohav complexes of Southern Israel/ Palestine and the Kurnub reservoirs of Palestine,
those of the Gulf of Suez, the Qishin clastics of Yemen as well as the Cheriffe (Ruthbah)
of Syria (Fig. 1.19 and Table 1.2). In the case of the Nubian Sandstones, although there
are three distinctive units, Nubia A, Nubia B, and Nubia C (cf. Beydoun, 1995) only one
is of interest (for the sake of this discussion). Therefore, only “Nubia A” will be
mentioned further in the text, as it is Early Cretaceous in age (Nubia B and Nubia C are
dated to the Paleozoic) and it may be the one that is considered to be the precursor of the
"Grès de Base" in Lebanon. In the Gulf of Suez, the Malha oilfield is found to be
associated with the strata of Nubia “A” (Table 1.2).

39
Fig. 1.18. Geologic sketch map of the Mesozoic Formations of the Middle-East. Note the locations of the various sandstone reservoirs. Adapted from Beydoun (1995).

40
Fig. 1.19. Stratigraphic position of the Mesozoic source rocks in the western part of the Middle East, the hydrocarbon productive sandstone reservoirs and regional evaporative seals (Beydoun, 1995)
Walley (1997) proposed a revision of the entire Lebanese lithostratigraphy, and
revised his descriptions of the Lebanese Formations, including the Chouf Formation, and
presented some tectonic issues. Among these issues are the age relationships of the
boundary of the Jurassic Salima Formation and the Neocomian-Barremian Chouf
Sandstone. His study confirmed what Tixier (1971-1972) concluded about the
dominantly clastic regimes of the Chouf Formation. Although there was recorded
evidence of marine influence, in the Hauterivian deposits, there was clear evidence of
regressive trends. Therefore Chouf Formation acted as a transition zone between the
shallow marine Salima and Abeih Limestones, which acted as a precursor to the
Cretaceous transgressions (e.g. Tixier, 1971-1972; Walley, 1997; and Ferry et al., 2007).
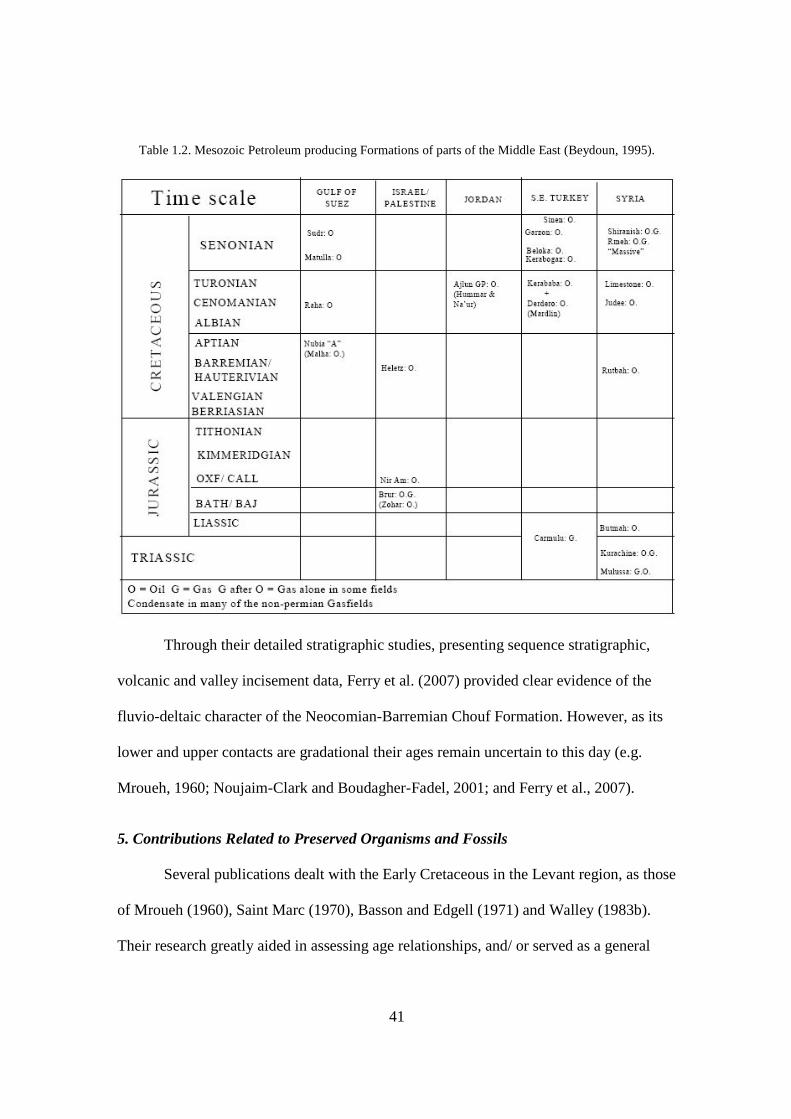
41
Table 1.2. Mesozoic Petroleum producing Formations of parts of the Middle East (Beydoun, 1995).
Through their detailed stratigraphic studies, presenting sequence stratigraphic,
volcanic and valley incisement data, Ferry et al. (2007) provided clear evidence of the
fluvio-deltaic character of the Neocomian-Barremian Chouf Formation. However, as its
lower and upper contacts are gradational their ages remain uncertain to this day (e.g.
Mroueh, 1960; Noujaim-Clark and Boudagher-Fadel, 2001; and Ferry et al., 2007).
5. Contributions Related to Preserved Organisms and Fossils
Several publications dealt with the Early Cretaceous in the Levant region, as those
of Mroueh (1960), Saint Marc (1970), Basson and Edgell (1971) and Walley (1983b).
Their research greatly aided in assessing age relationships, and/ or served as a general
42
study of the flora and fauna at the time.
a. Fossil and Other Remains
Wakim (1968) indicated that the depositional environment of the Neocomian-
Barremian sandstones was of a brackish lagoonal setting, in which the Unio pelycipods
and lignitic and oil-bearing shales with ostracods were found. The carbonate strata
showed glauconite, fish teeth, oysters and echinoid spines. Tixier (1971-1972) indicated
that the Chouf Formation is devoid of fossils, except for the presence of lignites
associated with clayey or argillaceous layers, and wood imprints. These (i.e. lignites)
rarely bypass 25cm, and their deposits (i.e. accumulations) rarely exceed 40cm.
Fossiliferous calcite beds have been also reported within the strata of the basal
Cretaceous sandstone beds (e.g. in Beit Meri and in Toumatt-Jezzine/ Aazibi). A more
recent study in the region by Buffetaut et al. (2006) shows that two sauropod teeth found
in the sandstone beds near Jezzine, (at Jouar Es-Souss). These are the first nonavian
dinosaur remains to be reported from Lebanon (where their distinctive character places
them within Brachiosauridae).
b. Amber
Deans, et al. (2004), Azar and Ziadé (2005), and Azar (2007) revised several
Lower-Cretaceous amber-bearing strata in Lebanon. It is clear that the Chouf Sandstone
was deposited in a dominantly continental environment; although amber favours more
humid climates. Insect remains (as wasps or psychodoid flies) have been studied in the
Lebanese record as a result (e.g. Deans et al., 2004; Azar and Ziadé, 2005) which enabled
scientists to study the Early Cretaceous insect diversity.
43
c. Summary
Basson and Edgell (1971) studied various deposits of Lower-Cretaceous Algae in
Lebanon. They concluded that the Chouf Formation was a zone of non-deposition of
algae, as opposed to the other Formations; stressing the continental aspect of the Chouf
Sandstone. Azar (2007) and others also provided related information about Lower
Cretaceous Ambers. Hence, these studies show that the Basal Cretaceous sandstone has
been deposited in a continental setting (considering that these deposits were found in the
eolian strata and not in the lower or upper aquatic strata). The findings of Basson and
Edgell (1971), Deans et al. (2004), Azar and Ziadé (2005), and Buffetaut et al. (2006)
also corroborate that.
D. Study Area
The study area, located in Southern Lebanon near the Mohafazat Jezzine, consists
of two sections showing key beds from the basal Cretaceous sandstones. The first one,
following the Barouk uplift, includes the entire thickness of the Formation (some 230m)
and the second one, occurring west of Jezzine and barely covering 220m, is located near
the Roum, Aazour and Homsiyeh villages. As the larger section near the Barouk uplift is
not easily accessible and is not risk-free, the second site was selected for the purpose of
the sedimentological and diagenetic study.
Figure 1.20 shows a sketch map of the study area which shows the respective
locations of both sections near the Homsiyeh village. The first section is located near a
house in the Homsiyeh village (N 33º33' 113", E 035º33' 391"). The second one is
located on a road-cut section near Aazour (section starts at N 33º33' 006", E 035º32' 966"
and ends at N 33º33' 010", E 035º33' 036").
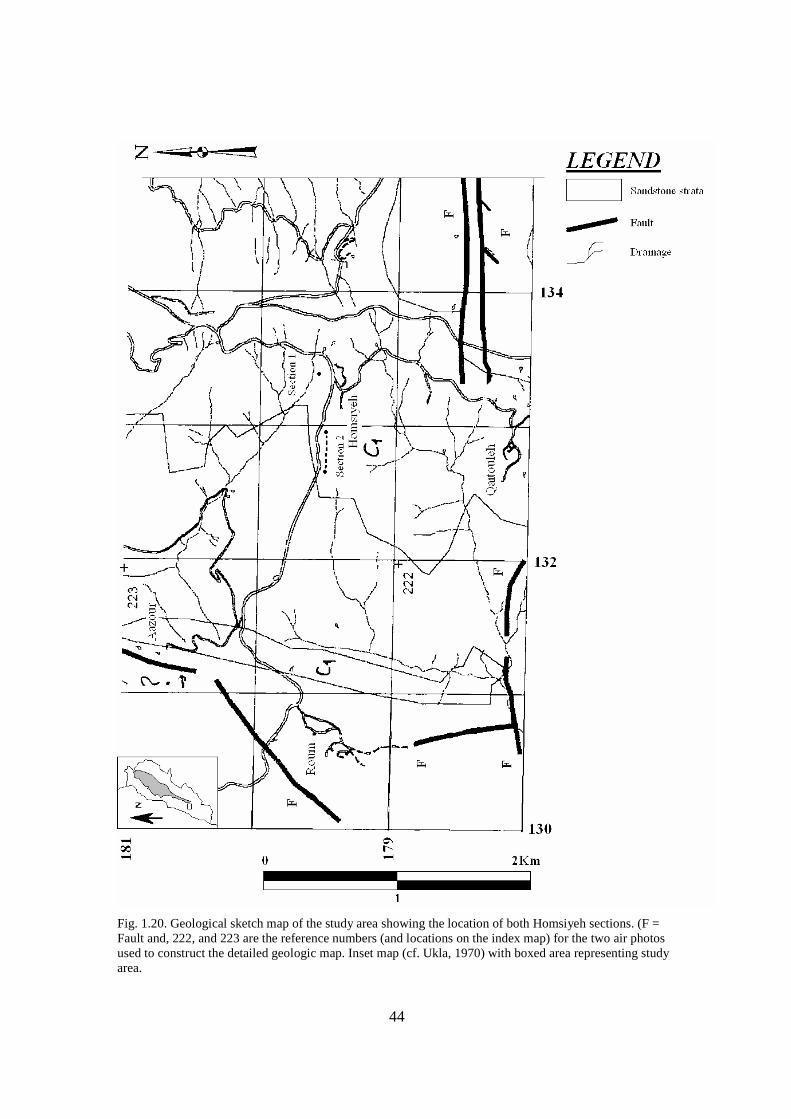
44
Fig. 1.20. Geological sketch map of the study area showing the location of both Homsiyeh sections. (F = Fault and, 222, and 223 are the reference numbers (and locations on the index map) for the two air photos used to construct the detailed geologic map. Inset map (cf. Ukla, 1970) with boxed area representing study area.
45
E. Objectives
The main objectives of this thesis include the sedimentological and petrographic
studies of representative facies forming the Neocomian-Barremian clastic rocks in the
Jezzine area (southern Lebanon). The provided data helps in answering important
questions related to the evolution of the environments of deposition (the mechanisms of
sedimentation as well as diagenesis) of the Chouf Sandstone. By compiling new
sedimentological and diagenetic data, provided by this thesis, a better understanding of
the Chouf Formation is achieved with respect to its organic content (bitumen, coal, etc…)
and reservoir characteristics (diagenetic porosity evolution). For this purpose, two
stratigraphic sections, covering part of the Neocomian Chouf Formation in the Homsiyeh
area, are discussed in the following chapters.
This chapter introduces the present study and includes information about the
previous work related to the study of Neocomian Sandstones in Lebanon and the
objectives of this thesis project. Chapter II summarizes the general geologic setting.
Chapter III explains the methodology and the techniques used to conduct this research,
which is meant to be used as a technical manual for those interested in clastic and
terrigenous rock studies. Chapter IV exposes the sedimentological and field observations,
by discussing both outcrops stratigraphic columns. Chapter V lays out the results of the
petrographic analysis conducted on the selected samples of the two outcrops. Chapter VI
provides the results of mineralogy, by X-ray diffraction. Chapter VII discusses the results
obtained from the study, by presenting a detailed paragenesis as well as a burial history of
that Formation through time (in order to assess whether there was oil in it or not),
whereas Chapter VIII lists the conclusion and some recommendations.
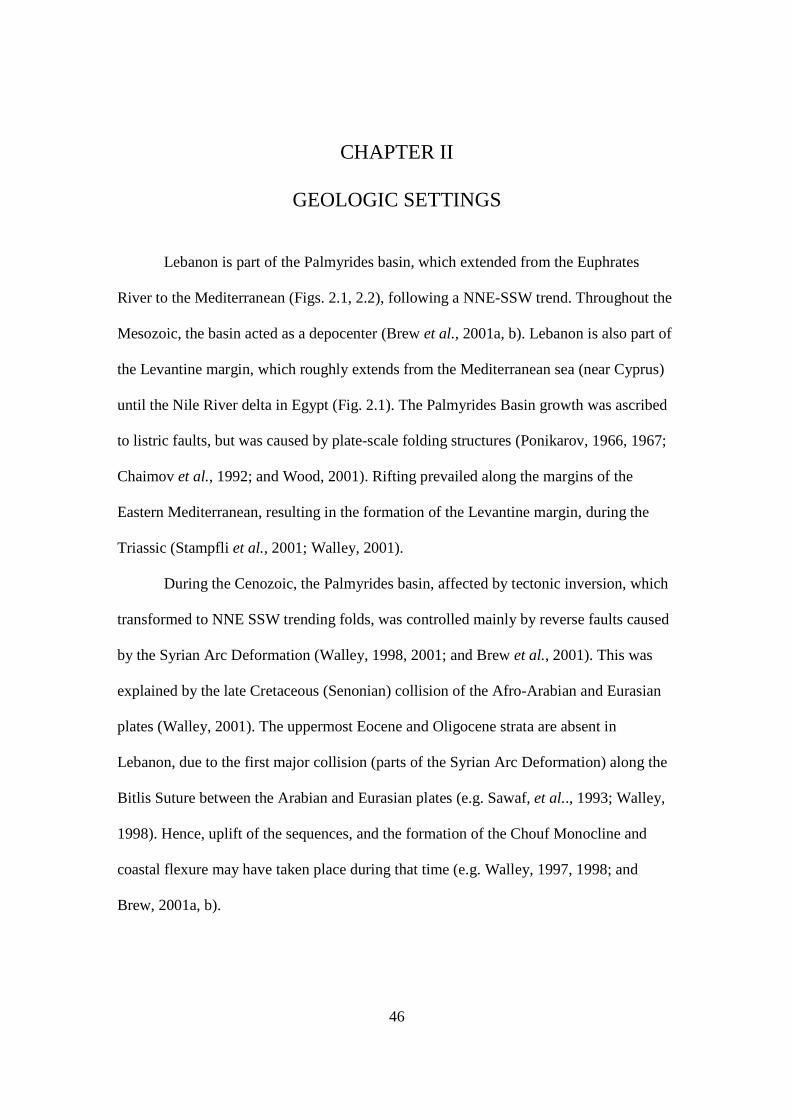
46
CHAPTER II
GEOLOGIC SETTINGS
Lebanon is part of the Palmyrides basin, which extended from the Euphrates
River to the Mediterranean (Figs. 2.1, 2.2), following a NNE-SSW trend. Throughout the
Mesozoic, the basin acted as a depocenter (Brew et al., 2001a, b). Lebanon is also part of
the Levantine margin, which roughly extends from the Mediterranean sea (near Cyprus)
until the Nile River delta in Egypt (Fig. 2.1). The Palmyrides Basin growth was ascribed
to listric faults, but was caused by plate-scale folding structures (Ponikarov, 1966, 1967;
Chaimov et al., 1992; and Wood, 2001). Rifting prevailed along the margins of the
Eastern Mediterranean, resulting in the formation of the Levantine margin, during the
Triassic (Stampfli et al., 2001; Walley, 2001).
During the Cenozoic, the Palmyrides basin, affected by tectonic inversion, which
transformed to NNE SSW trending folds, was controlled mainly by reverse faults caused
by the Syrian Arc Deformation (Walley, 1998, 2001; and Brew et al., 2001). This was
explained by the late Cretaceous (Senonian) collision of the Afro-Arabian and Eurasian
plates (Walley, 2001). The uppermost Eocene and Oligocene strata are absent in
Lebanon, due to the first major collision (parts of the Syrian Arc Deformation) along the
Bitlis Suture between the Arabian and Eurasian plates (e.g. Sawaf, et al.., 1993; Walley,
1998). Hence, uplift of the sequences, and the formation of the Chouf Monocline and
coastal flexure may have taken place during that time (e.g. Walley, 1997, 1998; and
Brew, 2001a, b).

47
Fig. 2.1. Map of the eastern Mediterranean area (modified from Walley, 1998). In the Pliocene times, the Red Sea opening resulted in the formation of the Dead
Sea Fault System (DSFS). This fault is considered to be an active strike-slip fault and
extends from the Gulf of Aqaba in Palestine through the Wadi el Araba and the Dead Sea
in Jordan/ Palestine, the Bekaa in Lebanon, then through Al Ghab and Safita in Syria, to
end in the Karasu valley in Turkey (Fig. 2.3). All over its path, the DSFS is trending N-S,
except in Lebanon, where it diverts in a N 30° E direction (Yammouneh Fault), forming a
restraining bend (Butler et al., 1998).
Eyal (1996) postulated that the present stress field fluctuates between the Syrian
Arc fold belt (WNW shortening, NNE extension) and the Dead Sea transform (NNW
shortening, ENE extension). Clearly, the main tectonic processes are caused as a result of
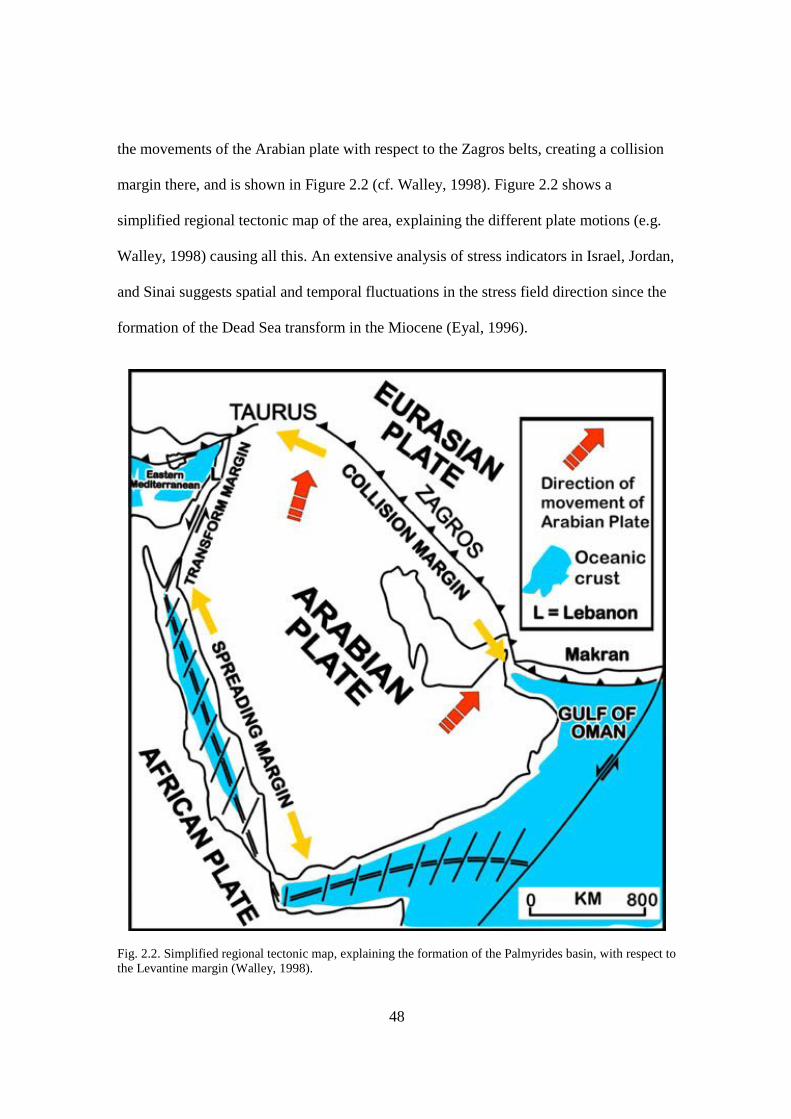
48
the movements of the Arabian plate with respect to the Zagros belts, creating a collision
margin there, and is shown in Figure 2.2 (cf. Walley, 1998). Figure 2.2 shows a
simplified regional tectonic map of the area, explaining the different plate motions (e.g.
Walley, 1998) causing all this. An extensive analysis of stress indicators in Israel, Jordan,
and Sinai suggests spatial and temporal fluctuations in the stress field direction since the
formation of the Dead Sea transform in the Miocene (Eyal, 1996).
Fig. 2.2. Simplified regional tectonic map, explaining the formation of the Palmyrides basin, with respect to the Levantine margin (Walley, 1998).
49
Figure 2.3 shows a sketch of the extent of the Palmyrides basin (e.g. Walley,
2001). This simplified regional map of the Levant shows the extent of the Palmyrides
(fold belt) trend. Both the Syrian Arc Deformation and the DSFS affected the tectonics of
the Levantine region.
Fig. 2.3. Simplified map showing the two major tectonic features that affected the Levantine region: the Syrian Arc Deformation and the Dead Sea Fault System (DSFS). Map modified from Walley (2001).
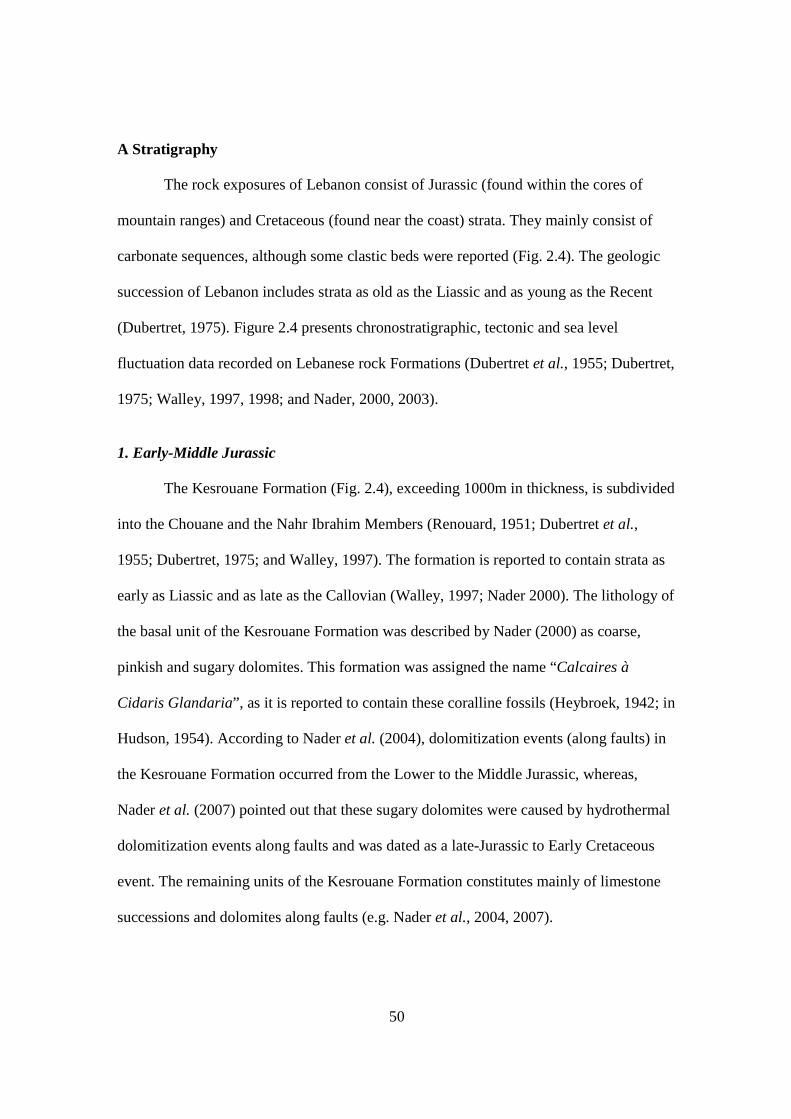
50
A Stratigraphy
The rock exposures of Lebanon consist of Jurassic (found within the cores of
mountain ranges) and Cretaceous (found near the coast) strata. They mainly consist of
carbonate sequences, although some clastic beds were reported (Fig. 2.4). The geologic
succession of Lebanon includes strata as old as the Liassic and as young as the Recent
(Dubertret, 1975). Figure 2.4 presents chronostratigraphic, tectonic and sea level
fluctuation data recorded on Lebanese rock Formations (Dubertret et al., 1955; Dubertret,
1975; Walley, 1997, 1998; and Nader, 2000, 2003).
1. Early-Middle Jurassic
The Kesrouane Formation (Fig. 2.4), exceeding 1000m in thickness, is subdivided
into the Chouane and the Nahr Ibrahim Members (Renouard, 1951; Dubertret et al.,
1955; Dubertret, 1975; and Walley, 1997). The formation is reported to contain strata as
early as Liassic and as late as the Callovian (Walley, 1997; Nader 2000). The lithology of
the basal unit of the Kesrouane Formation was described by Nader (2000) as coarse,
pinkish and sugary dolomites. This formation was assigned the name “Calcaires à
Cidaris Glandaria”, as it is reported to contain these coralline fossils (Heybroek, 1942; in
Hudson, 1954). According to Nader et al. (2004), dolomitization events (along faults) in
the Kesrouane Formation occurred from the Lower to the Middle Jurassic, whereas,
Nader et al. (2007) pointed out that these sugary dolomites were caused by hydrothermal
dolomitization events along faults and was dated as a late-Jurassic to Early Cretaceous
event. The remaining units of the Kesrouane Formation constitutes mainly of limestone
successions and dolomites along faults (e.g. Nader et al., 2004, 2007).

51
Fig. 2.4. Stratigraphic log showing the main rocks exposed in Lebanon (e.g. Dubertret, 1975; and Walley, 1997).
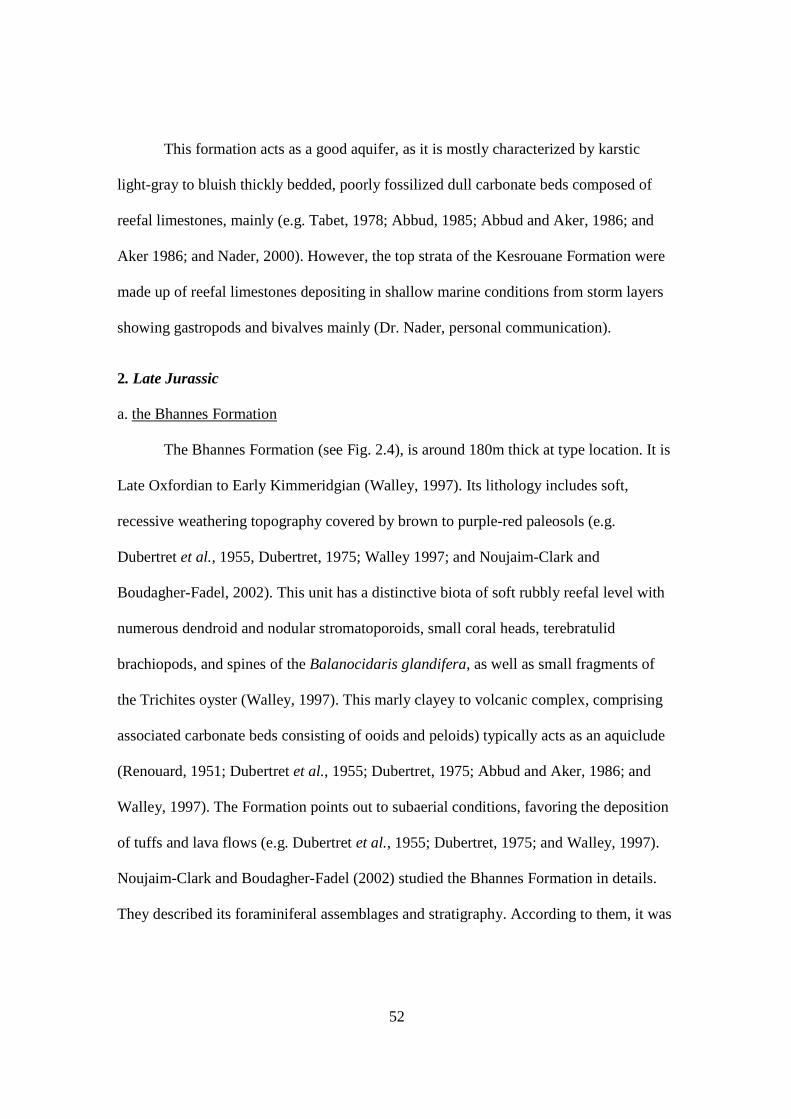
52
This formation acts as a good aquifer, as it is mostly characterized by karstic
light-gray to bluish thickly bedded, poorly fossilized dull carbonate beds composed of
reefal limestones, mainly (e.g. Tabet, 1978; Abbud, 1985; Abbud and Aker, 1986; and
Aker 1986; and Nader, 2000). However, the top strata of the Kesrouane Formation were
made up of reefal limestones depositing in shallow marine conditions from storm layers
showing gastropods and bivalves mainly (Dr. Nader, personal communication).
2. Late Jurassic
a. the Bhannes Formation
The Bhannes Formation (see Fig. 2.4), is around 180m thick at type location. It is
Late Oxfordian to Early Kimmeridgian (Walley, 1997). Its lithology includes soft,
recessive weathering topography covered by brown to purple-red paleosols (e.g.
Dubertret et al., 1955, Dubertret, 1975; Walley 1997; and Noujaim-Clark and
Boudagher-Fadel, 2002). This unit has a distinctive biota of soft rubbly reefal level with
numerous dendroid and nodular stromatoporoids, small coral heads, terebratulid
brachiopods, and spines of the Balanocidaris glandifera, as well as small fragments of
the Trichites oyster (Walley, 1997). This marly clayey to volcanic complex, comprising
associated carbonate beds consisting of ooids and peloids) typically acts as an aquiclude
(Renouard, 1951; Dubertret et al., 1955; Dubertret, 1975; Abbud and Aker, 1986; and
Walley, 1997). The Formation points out to subaerial conditions, favoring the deposition
of tuffs and lava flows (e.g. Dubertret et al., 1955; Dubertret, 1975; and Walley, 1997).
Noujaim-Clark and Boudagher-Fadel (2002) studied the Bhannes Formation in details.
They described its foraminiferal assemblages and stratigraphy. According to them, it was
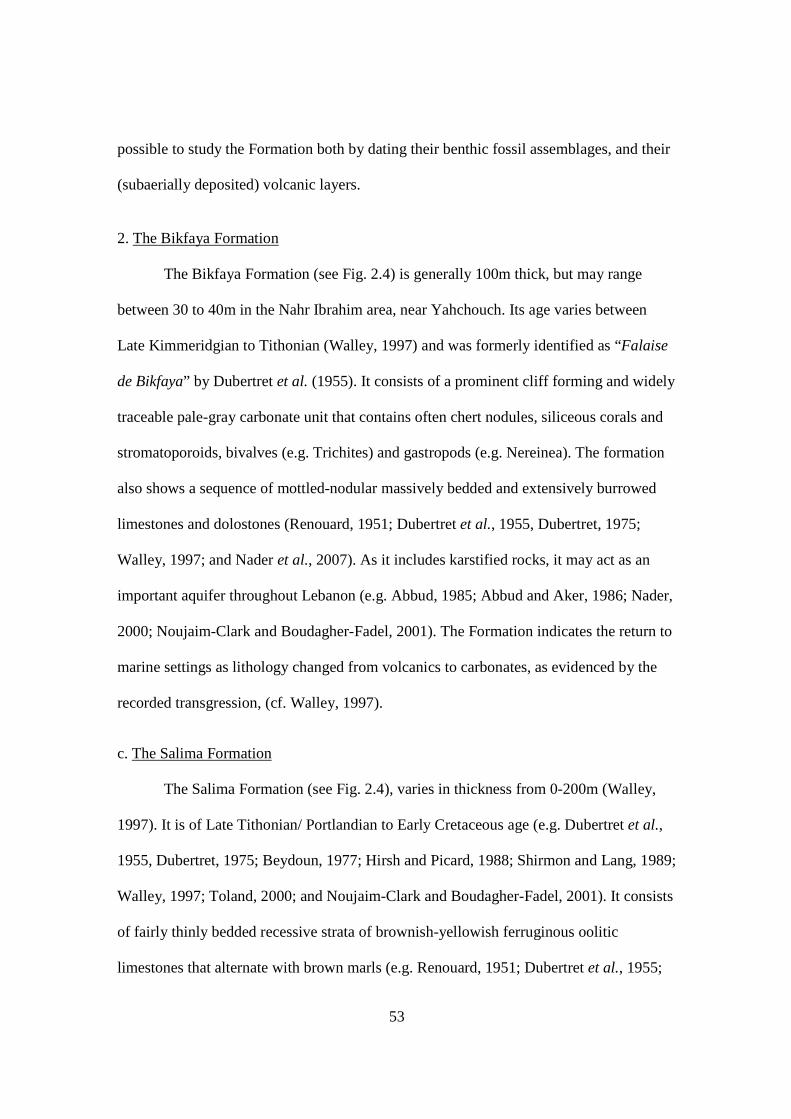
53
possible to study the Formation both by dating their benthic fossil assemblages, and their
(subaerially deposited) volcanic layers.
2. The Bikfaya Formation
The Bikfaya Formation (see Fig. 2.4) is generally 100m thick, but may range
between 30 to 40m in the Nahr Ibrahim area, near Yahchouch. Its age varies between
Late Kimmeridgian to Tithonian (Walley, 1997) and was formerly identified as “Falaise
de Bikfaya” by Dubertret et al. (1955). It consists of a prominent cliff forming and widely
traceable pale-gray carbonate unit that contains often chert nodules, siliceous corals and
stromatoporoids, bivalves (e.g. Trichites) and gastropods (e.g. Nereinea). The formation
also shows a sequence of mottled-nodular massively bedded and extensively burrowed
limestones and dolostones (Renouard, 1951; Dubertret et al., 1955, Dubertret, 1975;
Walley, 1997; and Nader et al., 2007). As it includes karstified rocks, it may act as an
important aquifer throughout Lebanon (e.g. Abbud, 1985; Abbud and Aker, 1986; Nader,
2000; Noujaim-Clark and Boudagher-Fadel, 2001). The Formation indicates the return to
marine settings as lithology changed from volcanics to carbonates, as evidenced by the
recorded transgression, (cf. Walley, 1997).
c. The Salima Formation
The Salima Formation (see Fig. 2.4), varies in thickness from 0-200m (Walley,
1997). It is of Late Tithonian/ Portlandian to Early Cretaceous age (e.g. Dubertret et al.,
1955, Dubertret, 1975; Beydoun, 1977; Hirsh and Picard, 1988; Shirmon and Lang, 1989;
Walley, 1997; Toland, 2000; and Noujaim-Clark and Boudagher-Fadel, 2001). It consists
of fairly thinly bedded recessive strata of brownish-yellowish ferruginous oolitic
limestones that alternate with brown marls (e.g. Renouard, 1951; Dubertret et al., 1955;

54
Dubertret, 1975; Walley, 1997). Although, on its topmost parts, massive oolitic beds
containing the Berriacella richeri ammonite are reported, therefore estimating the
Formation to be Late Tithonian in age (Hirsh and Picard, 1988; in Walley, 1997).
However, it is also likely that its upper contact with the Basal Cretaceous sandstones
gradually grades from carbonates to clastics, owing to the presence of a clear
unconformity, making an age estimate uncertain (cf. Noujaim-Clark and Boudagher-
Fadel, 2001). According to Shirmon and Lang (1989) there is a similar hiatus detected in
several Israeli sandstones that may coincide with the Chouf Sandstone (Shirmon and
Lang, 1989; in Walley, 1997). This Formation represents an extensive shallow-water
carbonate sequence, acting as an aquiclude (e.g. Abbud, 1985: Abbud and Aker, 1986;
and Walley, 1997).
3. Early Cretaceous
The lowest Cretaceous strata consist of the Neocomian-Barremian Chouf
Sandstone (Fig. 2.4) that unconformably rest over the Jurassic strata. The Formation has a
variable thickness, ranging between a few meters to 300 meters throughout Lebanon
(Massaad, 1976; Walley, 1997). The Formation is mainly composed of cross bedded
ferruginous brown to white quartz-rich sandstones (with associated shales, clays, amber,
pyrite and lignites, and some volcanics) often showing an orange brown colour with a
hematitic base. In general, the sandstones are made up of loosely cemented quartz grains,
and are interbedded with marl and clay strata (Nader, 2000). Although fossils are scarce,
in other horizons the presence of fossilized (or silicified) wood is reported. It is possible
to find, within them coal, marcasite, pyrite and amber as well (Walley, 1997). Animal
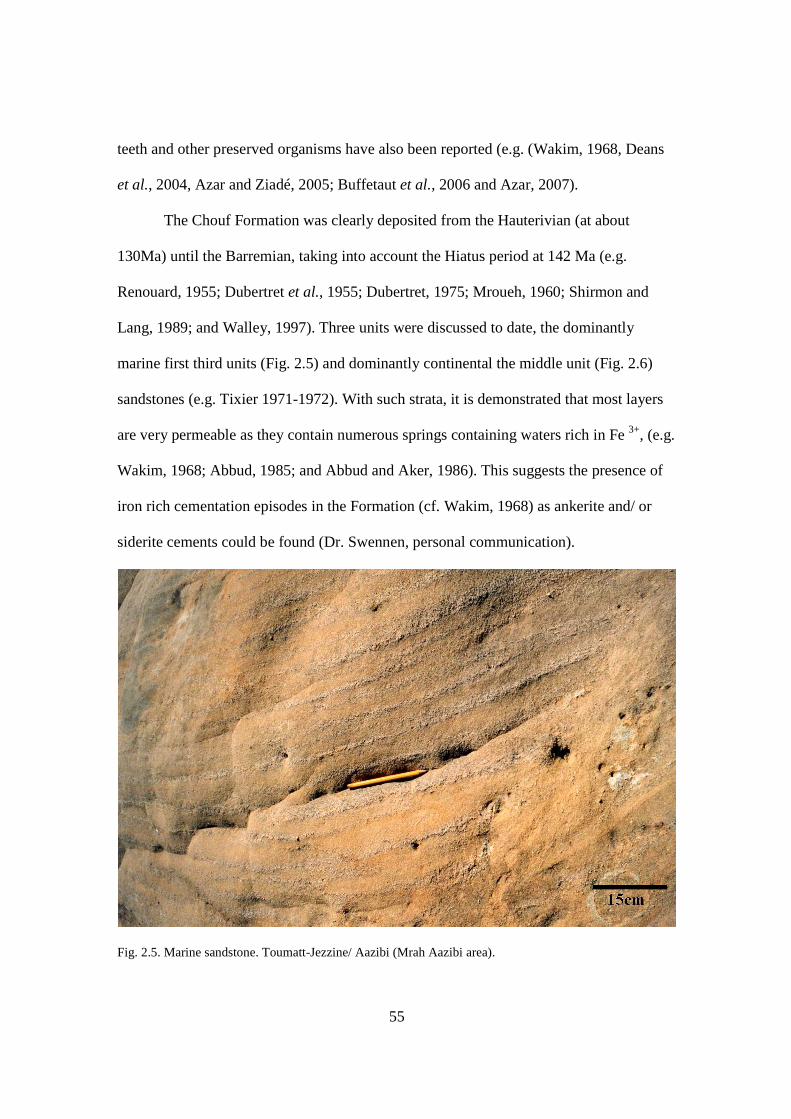
55
teeth and other preserved organisms have also been reported (e.g. (Wakim, 1968, Deans
et al., 2004, Azar and Ziadé, 2005; Buffetaut et al., 2006 and Azar, 2007).
The Chouf Formation was clearly deposited from the Hauterivian (at about
130Ma) until the Barremian, taking into account the Hiatus period at 142 Ma (e.g.
Renouard, 1955; Dubertret et al., 1955; Dubertret, 1975; Mroueh, 1960; Shirmon and
Lang, 1989; and Walley, 1997). Three units were discussed to date, the dominantly
marine first third units (Fig. 2.5) and dominantly continental the middle unit (Fig. 2.6)
sandstones (e.g. Tixier 1971-1972). With such strata, it is demonstrated that most layers
are very permeable as they contain numerous springs containing waters rich in Fe 3+, (e.g.
Wakim, 1968; Abbud, 1985; and Abbud and Aker, 1986). This suggests the presence of
iron rich cementation episodes in the Formation (cf. Wakim, 1968) as ankerite and/ or
siderite cements could be found (Dr. Swennen, personal communication).
Fig. 2.5. Marine sandstone. Toumatt-Jezzine/ Aazibi (Mrah Aazibi area).
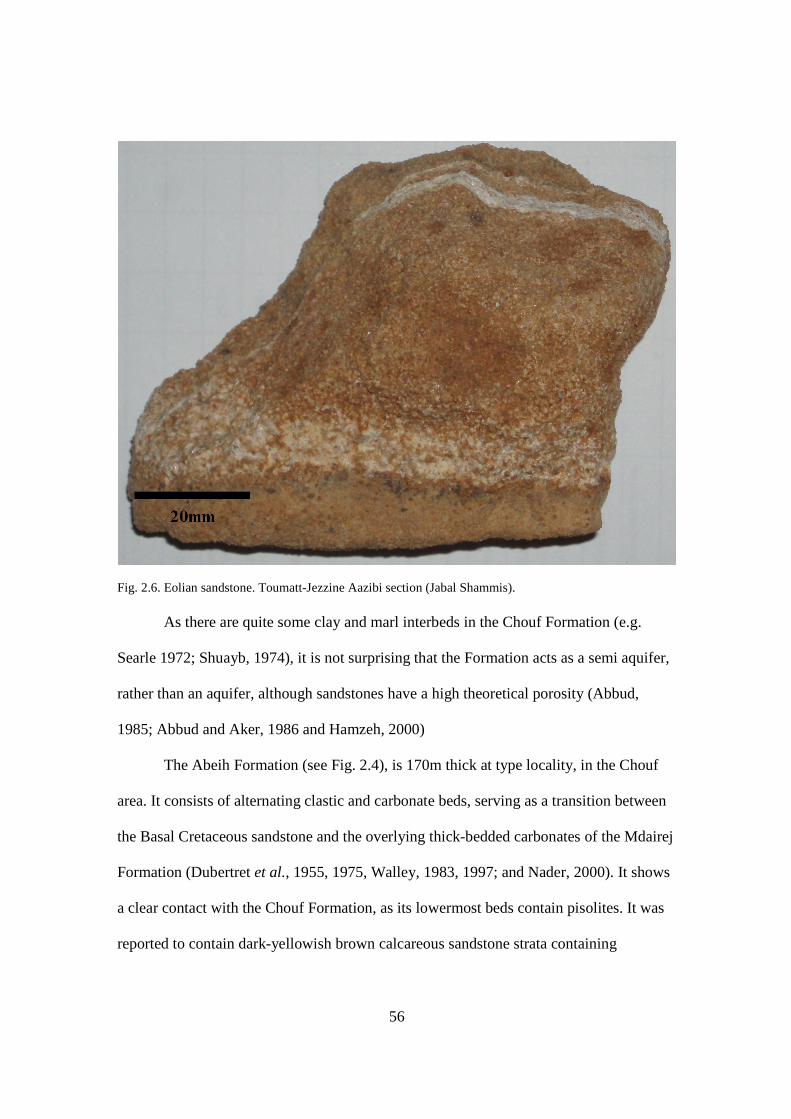
56
Fig. 2.6. Eolian sandstone. Toumatt-Jezzine Aazibi section (Jabal Shammis). As there are quite some clay and marl interbeds in the Chouf Formation (e.g.
Searle 1972; Shuayb, 1974), it is not surprising that the Formation acts as a semi aquifer,
rather than an aquifer, although sandstones have a high theoretical porosity (Abbud,
1985; Abbud and Aker, 1986 and Hamzeh, 2000)
The Abeih Formation (see Fig. 2.4), is 170m thick at type locality, in the Chouf
area. It consists of alternating clastic and carbonate beds, serving as a transition between
the Basal Cretaceous sandstone and the overlying thick-bedded carbonates of the Mdairej
Formation (Dubertret et al., 1955, 1975, Walley, 1983, 1997; and Nader, 2000). It shows
a clear contact with the Chouf Formation, as its lowermost beds contain pisolites. It was
reported to contain dark-yellowish brown calcareous sandstone strata containing

57
orbitulina, gastropods and bivalves, that may also contain amber locally, of Lower Aptian
in age, although, it includes strata dated as early as the Barremian (e.g. Mroueh, 1960;
Walley, 1997; and Nader, 2000).
The Mdairej Formation (see Fig. 2.4) is a very distinctive and widely traceable
pale gray massive limestone unit, occurring almost everywhere as a sheer-sided cliff
(reaching 80m in thickness). It is reported to be of Lower-Aptian age and is reported to
contain limited microfauna (Dubertret et al., 1955; Dubertret, 1975; Walley, 1997; and
Nader, 2000). The Mdairej Formation exhibits aquiferous properties (e.g. Abbud, 1985;
and Abbud and Aker, 1986).
The Hammana Formation (see Fig. 2.4) is a 130m thick composite rock unit
including clays, sandstones, glauconitic marls, dolomites and limestones (Doummar,
2005) that can be split into two end Members, the Dahr El Baidar, and Kneisseh members
respectively (Walley, 1983, 1997; and Nader, 2000). the Dahr El Baidar member is
considered to be of an upper Aptian age, and therefore, is not considered to belong to the
Hammana Formation that is estimated to the Lower-Middle Albian (e.g. Walley, 1997;
Nader, 2000 and Doummar, 2005). It was found that the pervasive dolomitization events
of the Albian strata were caused by hypersaline, supratidal and seepage reflux fluids that
were forced into the underlying strata (Doummar, 2005).
4. Late Cretaceous
a. The Sannine Formation
The Sannine Formation (see Fig. 2.4), of 600m thickness, includes strata as old as
the upper Albian, and includes strata as young as the Turonian. Near Ghazir, Late
Cenomanian marly strata, showing a different lithology than the other exposed strata, are
58
reported (e.g. Saint Marc, 1974, Dubertret, 1975; and Walley, 1997). The Formation is
characterized by hard-compact, thickly bedded rocks containing chert nodules and chert
bands, and by the presence of thinly bedded, chalky and cherty sediments. Light to dark
creamy and thinly bedded to laminated marl strata are also present as well (e.g. Dubertret
et al., 1955; Dubertret, 1975; Walley, 1997; and Nader et al., 2006). Within these strata,
chert and siliceous geodes occur, where only a limited biota is reported to contain
echinoids, gastropods, bivalves and rudists (Walley, 1997).
Ja’ouni (1971) has subdivided the Formation into three subgroups. These are from
bottom to top: i) the Afqa dolostone member (of Late Albian age), ii) the Aaquoura
Marly Limestone member, and iii) the Mneitra limestone member(Ja’ouni, 1971). Due to
the worldwide anticipated transgressions. The pelagic carbonate rock sequences of the
Sannine Formation were caused by the worldwide anticipated transgressions, in which
many fossil fish (e.g. the Teleostei) are found (Othero, 1997; Walley 1997; and Brew et
al., 2001).
b. The Maameltain Formation
The Maameltain Formation (see Fig. 2.4), of 200-400m thickness, which
comprises the strata stratigraphically overlying the Sannine Formation and mainly
exposed in coastal areas, was dated to the Turonian (e.g. Dubertret et al., 1955; and
Walley, 1997, 2001). The Formation consists of alternations of marl, marly limestones
and massive to thinly bedded limestones (with volcanics near Batroun) containing the
Hippurites bivalves, whereas the ammonites (Thomasites rollandi) are found in its lower
beds (e.g. Dubertret et al., 1955; Dubertret, 1975). Chert, phosphate and organic rich
horizons are also present, and are typically present at the contact between the upper

59
thicker beds and the lower thinly stratified chalky limestone (e.g. Dubertret et al., 1955,
1963, 1975; Walley 1997; and Nader, 2000).
c. The Chekka Formation
The Chekka Formation (see Fig. 2.4), comprising the 200m thick strata overlying
the Turonian carbonates, is of Senonian age (Dubertret et al., 1955; Renouard, 1955; and
Walley, 1997). This Formation consists of gray to white, chalky to marly limestone
rocks, alternating with white to light gray marl beds, generally acting as aquicludes (e.g.
Abbud, 1985; and Abbud and Aker, 1986). Chert bands and phosphate nodules are
present in the chalky facies, due to its well-bedded nature. These strata reveal a
Milankovitch cyclicity, and were deposited in high sea level depositional environments,
on the outer part of a continental platform with pelagic chalk deposition (Walley, 1997).
This was caused by the uplift events produced as a result of the Syrian Arc Deformation
that occurred during the Senonian (Walley, 1998) explaining why the Chekka Formation
recorded deep pelagic strata.
5. Cenozoic
The Paleogene strata consist of chalky, cherty limestones and marls and are
around 400m in the Bekaa area (Fig. 2.4). It was reported that the Chekka marls graded
without break to the Eocene strata (Dubertret et al., 1955, 1975). Two Eocene Formations
were studied, an Early Eocene chalky-marly facies, and a middle-Eocene nummulitic
limestone facies (Dubertret et al., 1955; Dubertret, 1975; Walley, 1997). The Eocene
strata are 900m in the Bekaa, and are well exposed in Zahlé (Walley, 1997). Late
Paleogene to Early Neogene strata were absent in the stratigraphic record, due to a period
of non-deposition, comparable to the Early Neocomian hiatus, the Middle Miocene
60
Formations conformably overlie the Middle-Eocene strata (e.g. Dubertret et al., 1955;
Dubertret, 1975; Beydoun, 1977; and Walley, 1997). Hence the uplift event (and relative
sea-level fall), coinciding with the Neogene "second phase" of the Syrian Arc
Deformation, resulted in a change in facies (e.g. Walley, 1997, 1998, 2001).
The Neogene (or Middle Miocene) strata comprise two main facies, a littoral
sequence, along the coast, and the lacustrine (or Bekaa) sequence (e.g. Dubertret et al.,
1955; Dubertret, 1975; Hinai, 1979; and Walley, 1997). This system can be subdivided
into: Miocene and Pliocene respectively. The Nahr EI Kalb Formation (Middle Miocene)
is a massive littoral limestone (200-300m thick) with corals, algae and bivalves passing
rapidly landward into sands and conglomerates. A similar section is observed in Jabal
Terbol, near Tripoli, where the 265m thick Miocene limestones unconformably overly
the Chekka Formation, that are overlain by later lacustrine and fluvial sediment, in the
Terbol-Akkar area (Dubertret et al., 1955; Dubertret, 1975 and Walley, 1997). In the
interior, the Zahlé Formation is a sequence of clastics with calcareous breccias and
conglomerates, sandy-silty marly lignites, lacustrine limestones and marls, with variable
thickness between 200-800m, and are overlain by alluvial fan conglomerates of 500-
600m (Dubertret et al., 1955; Dubertret, 1975; and Walley, 1997). The Pliocene beds in
northern Lebanon conformably overlie the Late Miocene continental sediment, (Walley,
1997). In general, the carbonate Cenozoic strata tend to act as aquifers (especially if
fractured, and/ or karstic) and the marly strata tend to act as an aquiclude (e.g. Abbud,
1985; Abbud and Aker, 1986, Sha'aban, 1987; and Hamzeh, 2000).
61
Quaternary deposits are mainly found along the present coastline and in the Bekaa
Valley, and consist of conglomerates, sand deposits (acting as semi-aquifers), clays and
soil which generally reach up to 30m in thickness (e.g. Dubertret et al., 1955; Sanlaville,
1973; Abbud, 1985; Abbud and Aker, 1986; and Hamzeh, 2000). In mountainous areas,
glacial cirque and ancient river deposits as well as mudflows are also reported (e.g.
Dubertret et al., 1955; Dubertret, 1975).
B. Structural aspects and volcanic activity
1. Structural aspects
The major structures in Lebanon were believed to have resulted from the regional
inversion and folding event that were associated with the Syrian Arc Deformation
(Walley, 1998). Therefore, the Mount Lebanon and Anti-Lebanon anticlinoria were
formed and separated by the large Bekaa synclinorium, which prevailed since the Late
Cretaceous and were accentuated due to the Syrian Arc Deformation (e.g. Walley, 1998,
Brew, 2001; and Nader, 2003). Other folding systems, of lesser extent and reflecting
recent tectonic events, were also reported (Gedeon, 1999).
The main fault systems in Lebanon are related to the Dead-Sea Fault System
(DSFS). In the Southern part of Lebanon (Hula depression) the DSFS splays in five
different segments (Butler et al., 1997, 1998, Brew et al. 2001a, 2001b, Gomez et al.
2001, 2003, 2006; and Walley, 1988, 1998 and 2001), the Roum, the Yammouneh, the
Hasbaya, the Rachaya and the Serghaya Faults. Out of all these faults, the Yammouneh
and the Roum faults are considered to be the most active in the present day (Nemer,
2005).

62
Figure 2.7 shows a generalized structural map of Lebanon representing the locations and
trends of the main DSFS splays in Lebanon. Figure 2.8 shows two cross-sections
representing different structural modes in northern and southern Mount Lebanon (i.e. A-
A’ and B-B’ in Fig. 2.7).
Fig. 2.7. Major structural features of Lebanon (cf. Renouard, 1951; Dubertret et al., 1955, Dubertret, 1975; Walley, 1998, 2001). Cross-section lines A-A’ and B-B’ are represented. Note Jz. = Jezzine Syncline, Nh. = Jebel Niha (includes Niha anticline), Z.S. = Zahrani-Sreifa anticline (includes Nabatiyeh anticline), H.F. = Hasbaya Fault, and RcF. = Rachaya Fault. Inset map from Walley (1997).
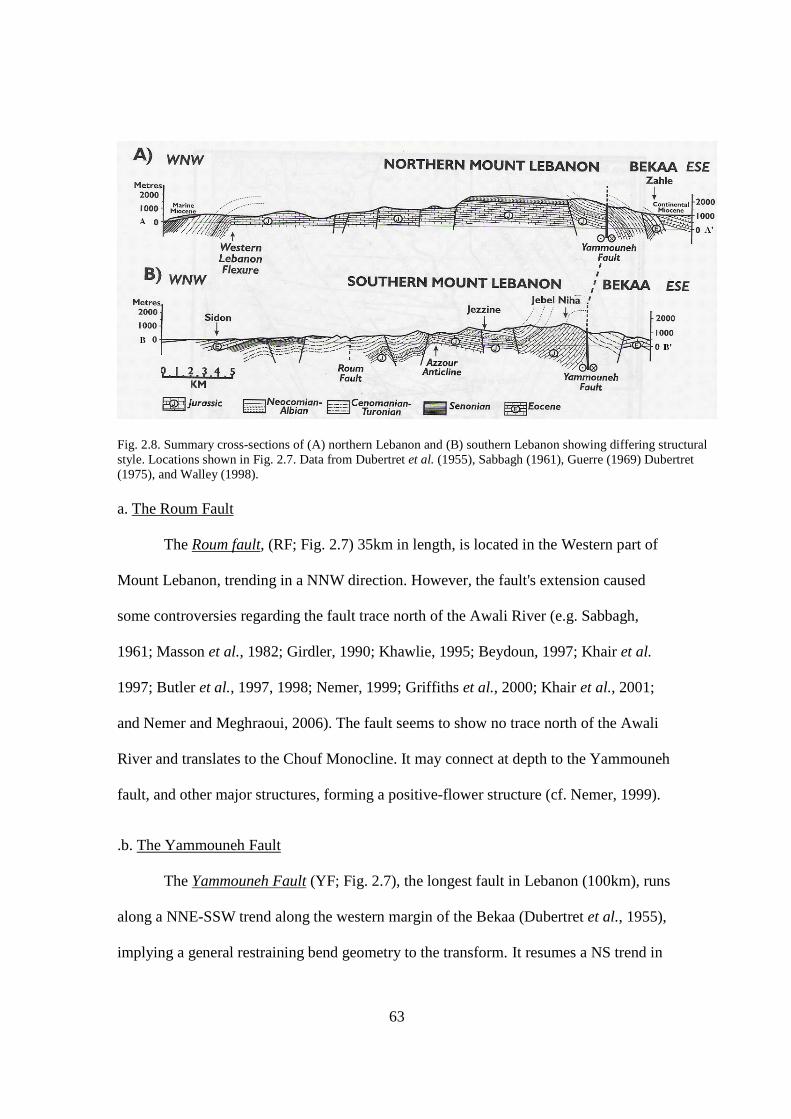
63
Fig. 2.8. Summary cross-sections of (A) northern Lebanon and (B) southern Lebanon showing differing structural style. Locations shown in Fig. 2.7. Data from Dubertret et al. (1955), Sabbagh (1961), Guerre (1969) Dubertret (1975), and Walley (1998). a. The Roum Fault
The Roum fault, (RF; Fig. 2.7) 35km in length, is located in the Western part of
Mount Lebanon, trending in a NNW direction. However, the fault's extension caused
some controversies regarding the fault trace north of the Awali River (e.g. Sabbagh,
1961; Masson et al., 1982; Girdler, 1990; Khawlie, 1995; Beydoun, 1997; Khair et al.
1997; Butler et al., 1997, 1998; Nemer, 1999; Griffiths et al., 2000; Khair et al., 2001;
and Nemer and Meghraoui, 2006). The fault seems to show no trace north of the Awali
River and translates to the Chouf Monocline. It may connect at depth to the Yammouneh
fault, and other major structures, forming a positive-flower structure (cf. Nemer, 1999).
.b. The Yammouneh Fault
The Yammouneh Fault (YF; Fig. 2.7), the longest fault in Lebanon (100km), runs
along a NNE-SSW trend along the western margin of the Bekaa (Dubertret et al., 1955),
implying a general restraining bend geometry to the transform. It resumes a NS trend in

64
the Ghab plains of Syria. It links the major faults of the Jordan Valley and the Ghab
Valley, and is assumed to be a major (i.e. braided) sinistral active strike-slip fault with 7
to 50-100km displacement, and dated to be 14 Ma (cf. Quennel, 1958; Hancock and
Attiya, 1979; Bartov et al. 1980; Khair et al., 1993; Walley, 1998; Gedeon 1999; and
Nemer 2005).
c. The Hasbaya Fault
The Hasbaya Fault (HF; Fig. 2.7), with a total length of 50km, shows a trend of
N40º E along the Hasbani River, across the Bekaa and into the western flanks of Mount
Anti-Lebanon. This fault is controlled by a subsurface fault, and was found to be inactive,
but slight dip-slip movement has been reported (Dubertret and Wetzel, 1951; Nemer,
2005).
d. The Rachaya Fault
The Rachaya Fault (RcF; Fig. 2.7), of NNE-SSW trend, was found to be capable
of generating large earthquakes in the region. This sinistral fault, about 45km long, found
near Mount Hermon, disappears at the northern edge of the Rachaya village (Heinman
and Ron, 1987; Nemer, 2005).
e. The Serghaya Fault
The Serghaya Fault (SF; Fig. 2.7), a sinistral strike-slip fault, was shown to have
a 20km displacement. It is also thought to be related to the near-by Palmyrides trend
(Heinman and Ron, 1987; Walley, 1988; Khair et al., 1993; Gomez et al., 2000, 2001,
2003; and Nemer, 2005).
f. Other minor faults

65
The contribution of dense networks of minor (E-W trending) dextral faults, that
transversely crosscut the Lebanese mountain chains, to the general structural framework
was reported (Renouard, 1955). Displacements along these faults were recorded to be
100-300m or more (e.g. Renouard, 1951; Shaheed, 1969). However, displacements in the
order of 2-5km were also recorded (e.g. Freund and Tarling, 1979; Hancock and Attiya,
1979; Bou-Jawdeh, 1999; and Gedeon, 1999).
2. Volcanic activity
A modified geologic sketch map of Lebanon representing the sites of volcanic
rock exposures represents the locations of Mesozoic and Cenozoic volcanics. The
Mesozoic Basalts of Lebanon (MBL) cover a surface area of about 150 km² in Central
Lebanon (Noubani, 2000) and some further evidence of their presence in Cretaceous beds
is recorded by Ferry et al (2007), including in the Chouf Formation.
The MBL are present as massif flows varying in thickness from half a meter to
several tens of meters. These basalts show amygdaloidal, vesicular, aphanitic, and
porphyritic textures and range in color from pale yellowish to yellow brownish to grayish
black, and occasionally show pillow-like structures and/or spheroidal basaltic masses
(Noubani, 2000). The MBL extend from the Late Jurassic to Early Cretaceous in age, and
are exposed in a NNE-SSW direction along the eastern and western margins of the
Kesrouane Formation. Studies indicate that these basalts were cross-cut by faults and
emplaced along deep-seated fractures, probably associated by rifting (cf. Dubertret et al.,
1955; Renouard, 1955; Noubani, 2000; Abdel-Rahman and Nader, 2002).
The oldest volcanic rocks in Lebanon are believed to be of Kimmeridgian age (i.e.
155 Ma), and constitute part of the Bhannes Formation, which are found to be associated
66
to block-faulting and local uplifts, and/ or the opening of the Neo-Tethys (e.g. Dubertret
et al., 1955, Renouard, 1955, An Nadi, 1966; Raad, 1979; and May, 1991). Volcanism
has persisted intermittently during the Early Cretaceous, whereby interstratified deposits
are reported in the base of the Chouf Formation, and in the Abeih and Mdairej
Formations (Dubertret et al., 1955, 1975). The Neocomian basalts (Valanginian -
Hauterivian), less abundant than those of Aptian or Albian age, typically consist of
basaltic flows and tuffs (Kuttayneh, 1967; Noubani 2000). Early Aptian volcanics (i.e.
118 Ma) in Mairouba (Raad, 1979), and Albian volcanics at the Sir el Daniyeh area
(Dubertret, 1975) were also reported. Even though Cenomanian volcanics were reported
from Western Syria, no equivalent basalts were found in Lebanon to date. Nevertheless
some basalt flows dated to 90 Ma are found, even though these may be overestimated
(Ponikarov, 1966, 1967; Laws and Wilson, 1997; and Walley, 1997).
All Kimmeridgian basalts contain olivine, augite (often altered to chlorite and
pigeonite) and some orthopyroxenes (textures are not affected by spheroidal weathering)
and also some plagioclase (An-59). On the other hand, the volcanics of the Lower
Cretaceous “Grès de Base” show a different type of plagioclase (An-50). Hence, it seems
that Kimmeridgian basalts appear to be more calcic than those of the basal Cretaceous
(Kuttayneh, 1967). The tested olivine and augite samples show ophitic texture and that
the chlorite samples are lateralized (Kuttayneh, 1967).
Volcanism, which was reactivated during the Miocene time, is reported at the
northern and southern peripheries of Lebanon (Dubertret, 1975; Mouty et al., 1992).
They are associated to mantle plumes along leaky transform faults (e.g. Abdel-Rahman,
2002; and Abdel-Rahman and Nassar, 2003, 2004). These episodes (see Fig. 2.7), which
67
are found in the Northern Akkar-Homs plains and in the South, near in the Hermon area,
were dated to the Pliocene age (Nassar, 1999; Kallas, 2001). They are reported to be
related to fissure eruptions which are caused by the friction in the subsurface due to the
restraining bends created as a result of the DSFS changing from a N-S to a NNE-SSW
direction in Lebanon (e.g. Abdel-Rahman, 2000; Abdel-Rahman and Nassar, 2003; and
Chorowicz et al. 2004); this is shown in Figure 2.7.
C. The Neocomian-Barremian Sandstones (Chouf Formation)
The basal Cretaceous strata of the Middle East are assumed to be deposited
between 140 and 122 Ma (e.g. Dubertret and Vautrin, 1937, Dubertret et al., 1955;
Dubertret, 1975; Massaad, 1976; and Walley 1983, 1997). Detailed studies on the Lower
Cretaceous were conducted by Ferry et al., (2007). They discuss three important periods
subdividing the Cretaceous, (1) the Valanginian to Upper Aptian, (2) the Upper Albian to
the Turonian, and (3) Post Turonian to the Eocene. For the following discussion, the first
period (discussed by Ferry et al. (2007) is of interest. As shown in Figure 2.9, this period
contains the Valanginian Salima Formation (or Tithonian-Valanginian if we include the
results of Noujaim-Clark and Boudagher-Fadel (2001), the Berriasian Chouf Sandstone,
the Lower Aptian Jeita and Jezzine Formations and finally the Upper Aptian Dahr el
Baidar Formation. They are represented by several depositional sequences each bounded
by emersion surfaces (Ferry et al, 2007). The second period contains the Albian,
Cenomanian and Turonian Formations, whereas the third includes the Senonian strata.
The Salima Formation is the first formation (in period 1) to have been studied by
Ferry et al. (2007). This Formation is dated to an Early Cretaceous age (Berriasian–
Valanginian), but may be extended to the late Tithonian (Toland, 2000; Noujaim-Clark

68
and Boudagher-Fadel, 2001). As there is a major unconformity (hiatus), various uplift
and block-faulting events have been recorded (Beydoun, 1977; Walley, 1997; and
Noujaim-Clark and Boudagher-Fadel, 2001) making the Berriasian–Valanginian strata to
be preserved only in some half-grabens in northern Lebanon. In these areas they are lying
more or less conformably (see D2; Fig. 2.9) under the Neocomian-Barremian Chouf
Sandstone (e.g. Ferry et al, 2007). In Figure 2.9 the detailed stratigraphic work conducted
by Ferry et al. (2007) is presented. Evidence of the regressive trends displayed by the
Chouf Sandstone, minor volcanic episodes and shallow valley incisements are shown
(Fig. 2.9). According to them, it is dated to extend from the Valanginian to the Aptian.
The lowest “known” Cretaceous Formation consists of the 'Grès de Base’. The
Chouf Sandstone crops out at Ain Qenia (located near Jezzine, at Latitude 33º23’46.3 and
Longitude 35º42’30.0). South of this village, the Formation rests unconformably over the
underlying ferruginous oolitic Salima Formation. However, its lower parts consist of
sandy to clayey limestone beds (e.g. in the Jeita area), which then grades to more
terrigenous strata (Dubertret et al., 1955). Most of the formation is very permeable, as
contains numerous springs (Abbud and Aker, 1986; and Hamzeh, 2000). Its thickness has
been estimated at about 230m at the Jezzine locality (Heybroek and Dubertret, 1945;
Dubertret et al., 1955, Tixier 1971-1972; and Dubertret, 1975). The basal Cretaceous
Sandstone Formation is fluvial at its base, and becomes deltaic to marginal marine only
towards its topmost strata (Ferry et al., 2007). The Formation was deposited most
abundantly in a W-E oriented saddle west of the Levant (i.e. Yammouneh) fault. To the
east of the fault the thickness of the sandstone formation abruptly decreases (Ukla, 1970).
69
The Basal Cretaceous Chouf Sandstones were believed to have been deposited
during the Neocomian time (Shirmon and Lang, 1989; Walley, 1997) and are generally
classified as clean quartzitic and arenaceous fluvio-deltaic sands originating from the
erosion of the Nubian sandstones of NE Africa (e.g. Russeger, 1842, Lartet, 1869,
Kanaan, 1966; Wakim, 1968; Tixier, 1971-1972; Dubertret, 1975; Massaad. 1976;
Beydoun, 1995; and Ferry et al., 2007). The lower portion of the poorly dated sandstones
of the Kurnub Group in Syria and Jordan, as well as their equivalent in Israel have been
tentatively attributed to the lower and upper Aptian rather than to a lateral equivalent of
the Chouf sandstones (Ferry et al., 2007). The Chouf Formation has been derived from
older sandstone Formations in the region. This can be reflected through heavy mineral
contents. Hence, by using heavy minerals, it was found that the Neocomian-Barremian
rocks of Lebanon have been derived from Silurian sandstones in Jordan (e.g. Kanaan,
1966; Wakim, 1968; Tixier, 1971-1972). Both sandstones have shown similarities in
garnet compositions as well as apatite, zircon, or other heavy granitic minerals (Tixier,
1971-1972).
In Lebanon, the only exposed sandstone beds are of early Cretaceous age, are best
exposed in Central Lebanon, and crop out throughout Mount Lebanon and comprise cross
bedded sandstones, containing heavy minerals and/ or various iron oxides. As the Chouf
Sandstone is haematitic at its base (and includes chocolate clays, and volcanics, among
others), it displays orange-brown to purplish colours. The white sands (most likely from
the eolian strata; as those found at Safa) have a good potential for the manufacturing of
glass, as the industry searches for a sand substrate lacking impurities (cf. Khalaf, 1986).
However, in its composite strata (of marine origin), interbedding with clays and or other

70
beds, the Chouf Sandstone Formation contains fossilized wood, lignite, pyrite and/ or
amber (e.g. Tixier, 1971-1972).
Fig. 2.9. Revised stratigraphy of the Cretaceous of Lebanon (Ferry et al., 2007) showing sequence stratigraphic data (recorded as transgressions and regressions), volcanic events and valley incisements. D1 to D6 represent the recorded unconformities and V1 to V4 represent the studied volcanic events.
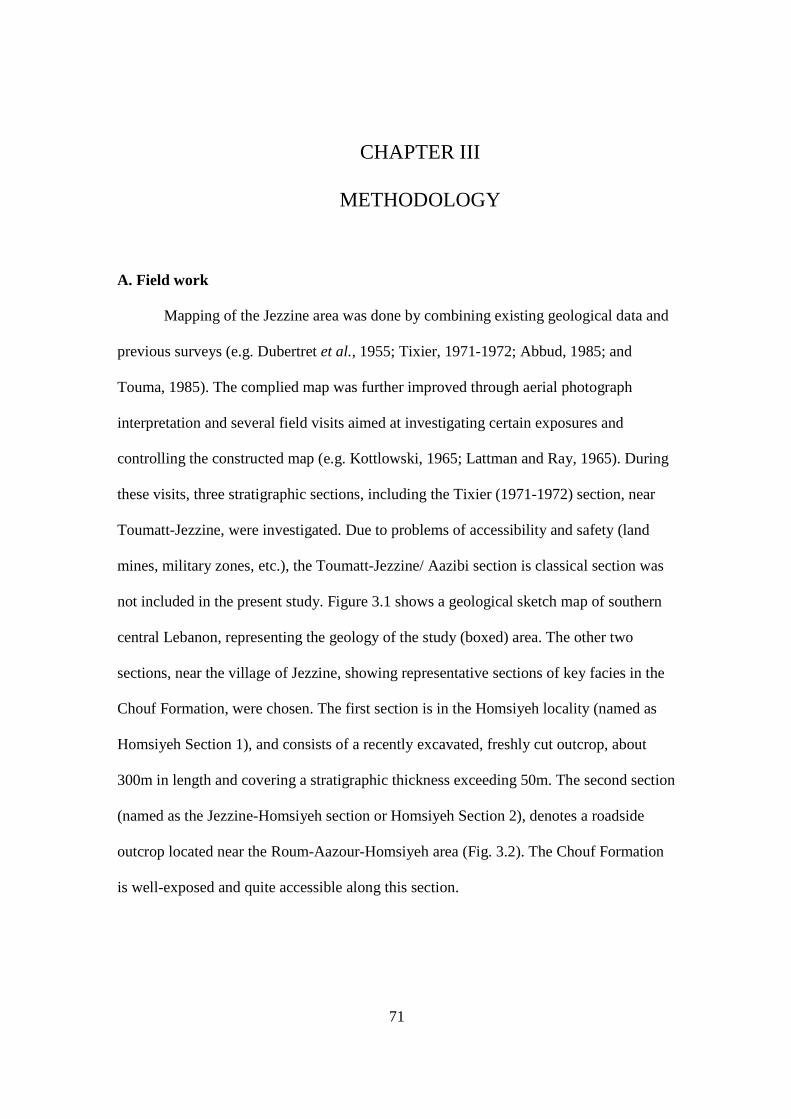
71
CHAPTER III
METHODOLOGY
A. Field work
Mapping of the Jezzine area was done by combining existing geological data and
previous surveys (e.g. Dubertret et al., 1955; Tixier, 1971-1972; Abbud, 1985; and
Touma, 1985). The complied map was further improved through aerial photograph
interpretation and several field visits aimed at investigating certain exposures and
controlling the constructed map (e.g. Kottlowski, 1965; Lattman and Ray, 1965). During
these visits, three stratigraphic sections, including the Tixier (1971-1972) section, near
Toumatt-Jezzine, were investigated. Due to problems of accessibility and safety (land
mines, military zones, etc.), the Toumatt-Jezzine/ Aazibi section is classical section was
not included in the present study. Figure 3.1 shows a geological sketch map of southern
central Lebanon, representing the geology of the study (boxed) area. The other two
sections, near the village of Jezzine, showing representative sections of key facies in the
Chouf Formation, were chosen. The first section is in the Homsiyeh locality (named as
Homsiyeh Section 1), and consists of a recently excavated, freshly cut outcrop, about
300m in length and covering a stratigraphic thickness exceeding 50m. The second section
(named as the Jezzine-Homsiyeh section or Homsiyeh Section 2), denotes a roadside
outcrop located near the Roum-Aazour-Homsiyeh area (Fig. 3.2). The Chouf Formation
is well-exposed and quite accessible along this section.
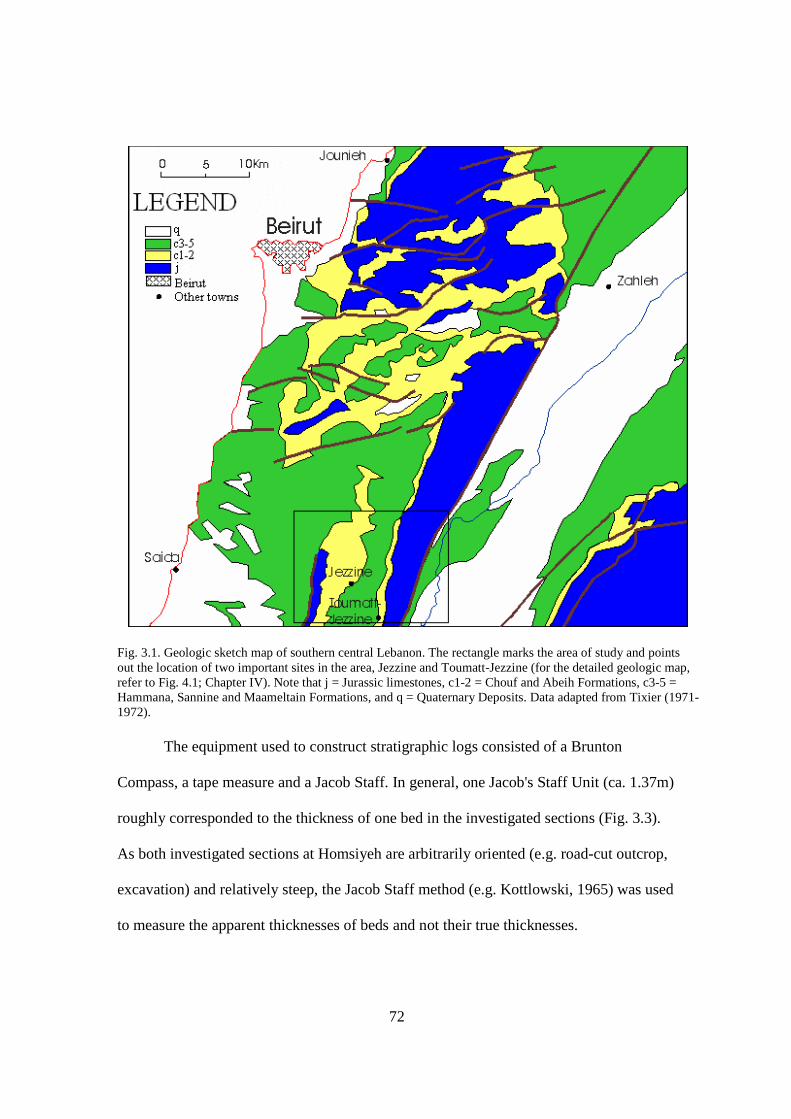
72
Fig. 3.1. Geologic sketch map of southern central Lebanon. The rectangle marks the area of study and points out the location of two important sites in the area, Jezzine and Toumatt-Jezzine (for the detailed geologic map, refer to Fig. 4.1; Chapter IV). Note that j = Jurassic limestones, c1-2 = Chouf and Abeih Formations, c3-5 = Hammana, Sannine and Maameltain Formations, and q = Quaternary Deposits. Data adapted from Tixier (1971-1972).
The equipment used to construct stratigraphic logs consisted of a Brunton
Compass, a tape measure and a Jacob Staff. In general, one Jacob's Staff Unit (ca. 1.37m)
roughly corresponded to the thickness of one bed in the investigated sections (Fig. 3.3).
As both investigated sections at Homsiyeh are arbitrarily oriented (e.g. road-cut outcrop,
excavation) and relatively steep, the Jacob Staff method (e.g. Kottlowski, 1965) was used
to measure the apparent thicknesses of beds and not their true thicknesses.

73
The use of Jacob staff is not a simple matter and there are many limitations, based
on strata and ground dips. In measuring large sequences, it is necessary to draw a sketch
profile in which points of changing strata of ground dips are fixed, in order to avoid
duplication of measurements (cf. Broggi, 1946).
Fig. 3.2. Photograph displaying key sandstone facies of the Middle part of the Chouf Formation, Homsiyeh Section 2 (Jezzine). Note the clear dark coal bed, in contrast with the thick sandstone strata.
The advantages of utilizing the Jacob staff method employing standard Abney
level equipped with auxiliary clinometers are: 1) its usefulness in traversing along as well
as across strike, 2) the length of the staff is adjustable, 3) the various staff components are
detachable, and 4) the procedures of measuring sections along strike, or up and down dip
are quite simple (e.g. Hansen, 1960).
High-resolution stratigraphic research is facilitated by Jacob Staff designs that
allow for Abney levels or Brunton Compass (Fig. 3.3A, C) to be moved up or down the
74
staff, quickly and precisely for measuring thin lithologic contacts (Brand, 1995). For this
purpose, a design with a bracket clamped in the staff with a thumb screw was used.
However, in order to simplify this even further, the original design is modified by
replacing the thumb screw array with a spring loaded clamp (Elder, 1989; Brand, 1995).
The Abney level (Fig. 3.3) is fastened to the bracket with «U» bolts and with screws that
pass through the corresponding holes (Fig. 3.3A, B) drilled into the bracket (Brand,
1995). Brackets can also be used with a Brunton Compass (Fig. 3.3C), instead of the
Abney Level, by modifying the top of the bracket such that the Brunton Compass can be
clamped in place (Elder, 1989; in Brand, 1995).
A B C
Fig. 3.3. Improved high-precision Jacob's staff design (Brand, 1995). A. Photograph of aluminum bracket with Abney level attached to a hardwood staff by 1cm markings. B. Sketches illustrating bucket design and dimensions. C. Elder's (1989) Jacob Staff Model, used at the Geology Department at American University of Beirut.
Exposed beds as well as the macro and micro sedimentary structures (primary and
diagenetic) were observed first in the field. Representative samples were taken from each
bed, following the stratigraphic-up direction, by recording the sample’s original

75
orientation in the field (e.g. Doummar, 2005). Field observation sheets were used
(Appendix 1) and provided fast and uniform observations of each recorded bed.
B. Laboratory and Premicroscopic Work
Prior to microscopic analyses of thin sections, a series of laboratory work
procedures were undertaken. These are grouped in two parts: sieving analyses and cut-
face studies. Sieving analysis was applied on the samples that could be manually
disintegrated (for the detailed process, refer to Folk, 1968), while all the samples that
could be cut and polished without being fragmented were used for cut-face studies. The
selected samples (for laboratory studies, including sieving and petrographic analyses) are
listed in Chapter IV (and presented in Tables 4.1 and 4.2).
1. Sieving analysis
Granulometric studies are quite important in order to determine the sandstone
rock nomenclature, degree of maturity, kinetic energy amount and the depositional
settings (Folk, 1968). First the samples are prepared (disaggregated), then they are sieved,
and finally the results are interpreted.
a. Preparation of samples for grain-size analysis
The purpose of grain size analysis is to obtain the grain size of the clastics
(particles) as they were deposited. Therefore, the sediments need to be disaggregated and
dispersed by separating all the individual grains without smashing any of them. There is
also a need, if possible, to remove chemically-precipitated substances (cement). Usually,
the carbonate cement in the investigated rocks, whenever found, is calcite and a rapid
76
HCl test (whether in the field or in the lab) allows for its identification.
Unconsolidated to weakly consolidated sand samples are dried (by placing them
in an oven overnight), then placed on a large sheet of glazed paper and crushed with
fingers. The sediments spread out on the paper are examined with a hand lens to make
sure that all aggregates are crushed.
When aggregates are found, they are rubbed with fingers or hit gently with a
rubber-hammer so that they disaggregate. If there are a lot of aggregates, a screen with
mesh-size just larger than the size of most of the sediment individual grains is used to
catch most aggregates and remove them from the sample to be analyzed (modified from
Folk, 1968).
Sand samples that contain clay (as a binding phase) need to be removed before
sieving. This is done either by placing the sample in a dish with some water and rubbing
it with a cork until the clay is in suspension and the grains are separated, or by
decantation or wet sieving. The clay is weighted before being washed away.
Carbonate-cemented rocks are crushed with a mortar and pestle down to small
fragments, which are immersed in dilute hydrochloric acid until effervescence ceases. For
dolomite cement, heating usually accelerates the solution. Ferruginous-cemented rocks
are also crushed in a mortar and the fragments are immersed in 50% HCl, warmed over a
hot plate. Heating of the sample remains until the sand turns white. The remaining acid is
removed by filtering the solution and whitened sand (use a filter paper). If the cement is
opal or chalcedonic or microcrystalline quartz (i.e. chert), warm concentrated KOH is
used, but the best method of grain-size analysis for such materials, remains through
petrographic examination of thin sections (Folk, 1968).
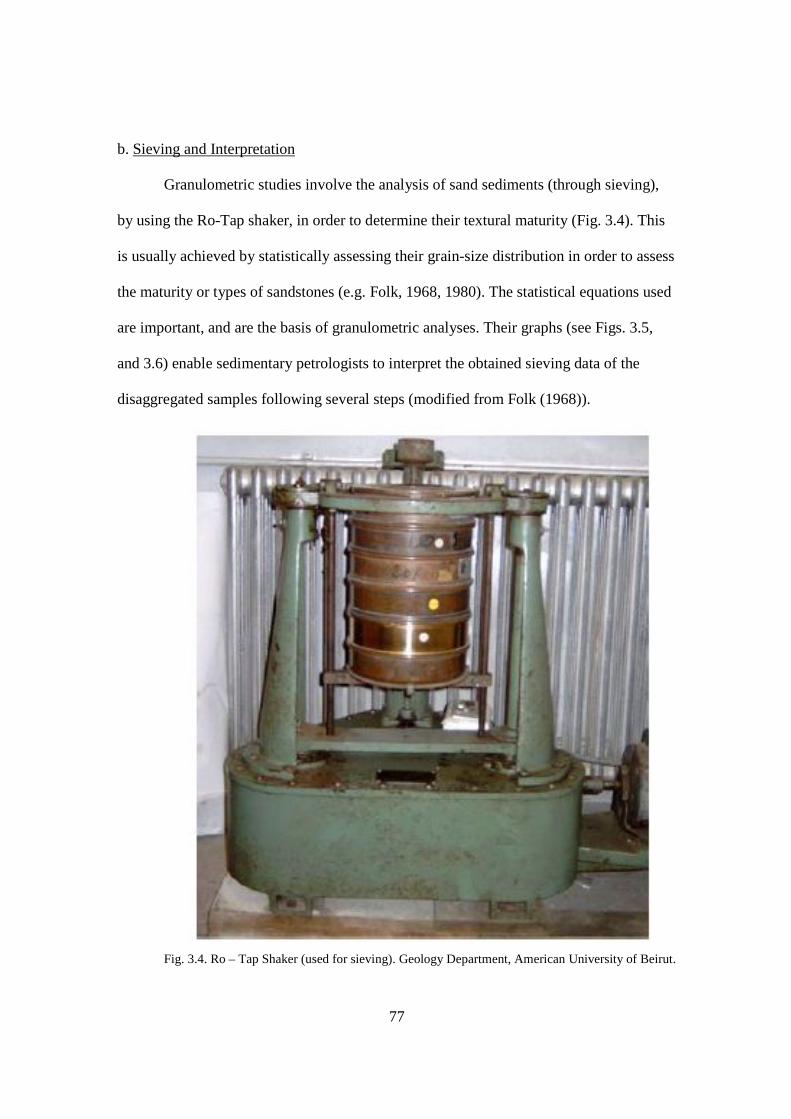
77
b. Sieving and Interpretation
Granulometric studies involve the analysis of sand sediments (through sieving),
by using the Ro-Tap shaker, in order to determine their textural maturity (Fig. 3.4). This
is usually achieved by statistically assessing their grain-size distribution in order to assess
the maturity or types of sandstones (e.g. Folk, 1968, 1980). The statistical equations used
are important, and are the basis of granulometric analyses. Their graphs (see Figs. 3.5,
and 3.6) enable sedimentary petrologists to interpret the obtained sieving data of the
disaggregated samples following several steps (modified from Folk (1968)).
Fig. 3.4. Ro – Tap Shaker (used for sieving). Geology Department, American University of Beirut.
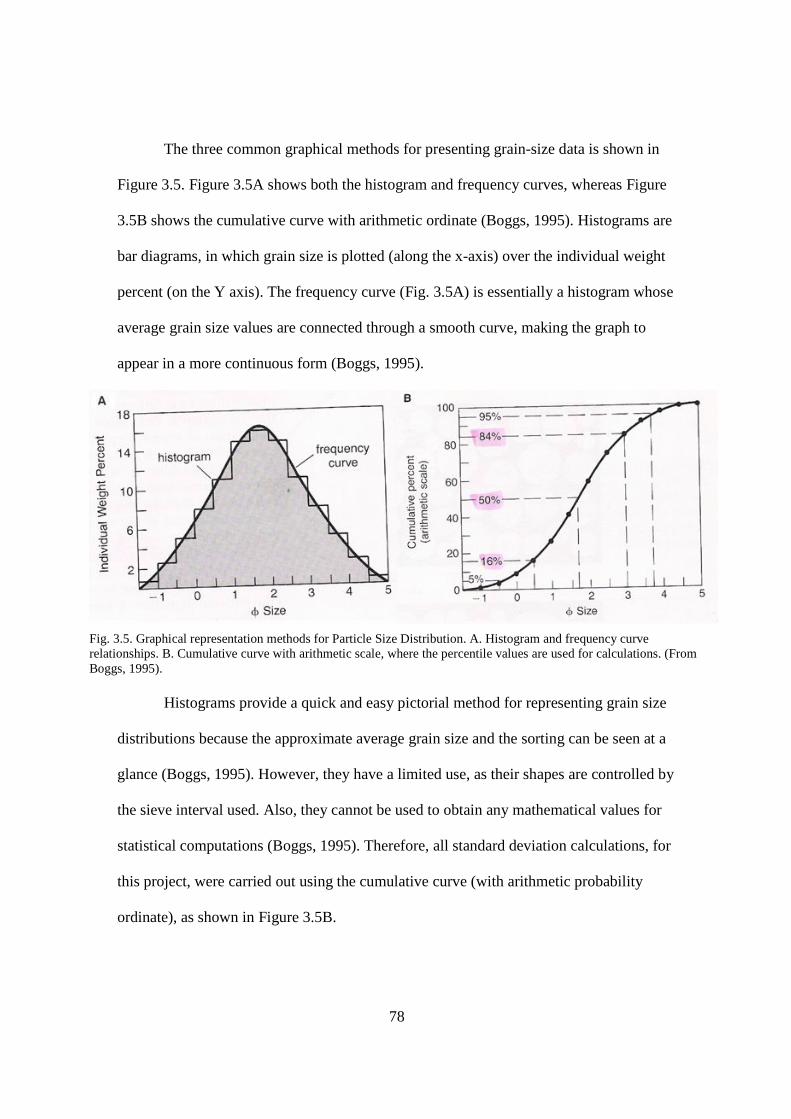
78
The three common graphical methods for presenting grain-size data is shown in
Figure 3.5. Figure 3.5A shows both the histogram and frequency curves, whereas Figure
3.5B shows the cumulative curve with arithmetic ordinate (Boggs, 1995). Histograms are
bar diagrams, in which grain size is plotted (along the x-axis) over the individual weight
percent (on the Y axis). The frequency curve (Fig. 3.5A) is essentially a histogram whose
average grain size values are connected through a smooth curve, making the graph to
appear in a more continuous form (Boggs, 1995).
Fig. 3.5. Graphical representation methods for Particle Size Distribution. A. Histogram and frequency curve relationships. B. Cumulative curve with arithmetic scale, where the percentile values are used for calculations. (From Boggs, 1995).
Histograms provide a quick and easy pictorial method for representing grain size
distributions because the approximate average grain size and the sorting can be seen at a
glance (Boggs, 1995). However, they have a limited use, as their shapes are controlled by
the sieve interval used. Also, they cannot be used to obtain any mathematical values for
statistical computations (Boggs, 1995). Therefore, all standard deviation calculations, for
this project, were carried out using the cumulative curve (with arithmetic probability
ordinate), as shown in Figure 3.5B.
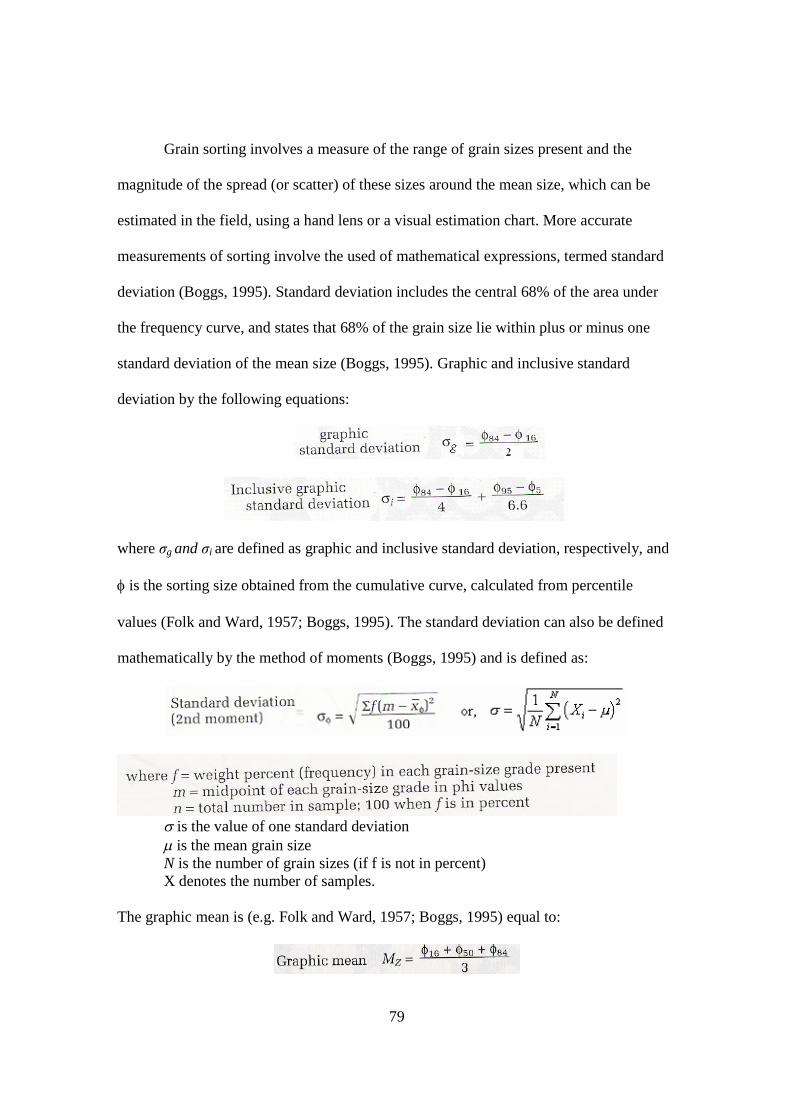
79
Grain sorting involves a measure of the range of grain sizes present and the
magnitude of the spread (or scatter) of these sizes around the mean size, which can be
estimated in the field, using a hand lens or a visual estimation chart. More accurate
measurements of sorting involve the used of mathematical expressions, termed standard
deviation (Boggs, 1995). Standard deviation includes the central 68% of the area under
the frequency curve, and states that 68% of the grain size lie within plus or minus one
standard deviation of the mean size (Boggs, 1995). Graphic and inclusive standard
deviation by the following equations:
where σg and σi are defined as graphic and inclusive standard deviation, respectively, and
f is the sorting size obtained from the cumulative curve, calculated from percentile
values (Folk and Ward, 1957; Boggs, 1995). The standard deviation can also be defined
mathematically by the method of moments (Boggs, 1995) and is defined as:
s is the value of one standard deviation m is the mean grain size N is the number of grain sizes (if f is not in percent) X denotes the number of samples.
The graphic mean is (e.g. Folk and Ward, 1957; Boggs, 1995) equal to:
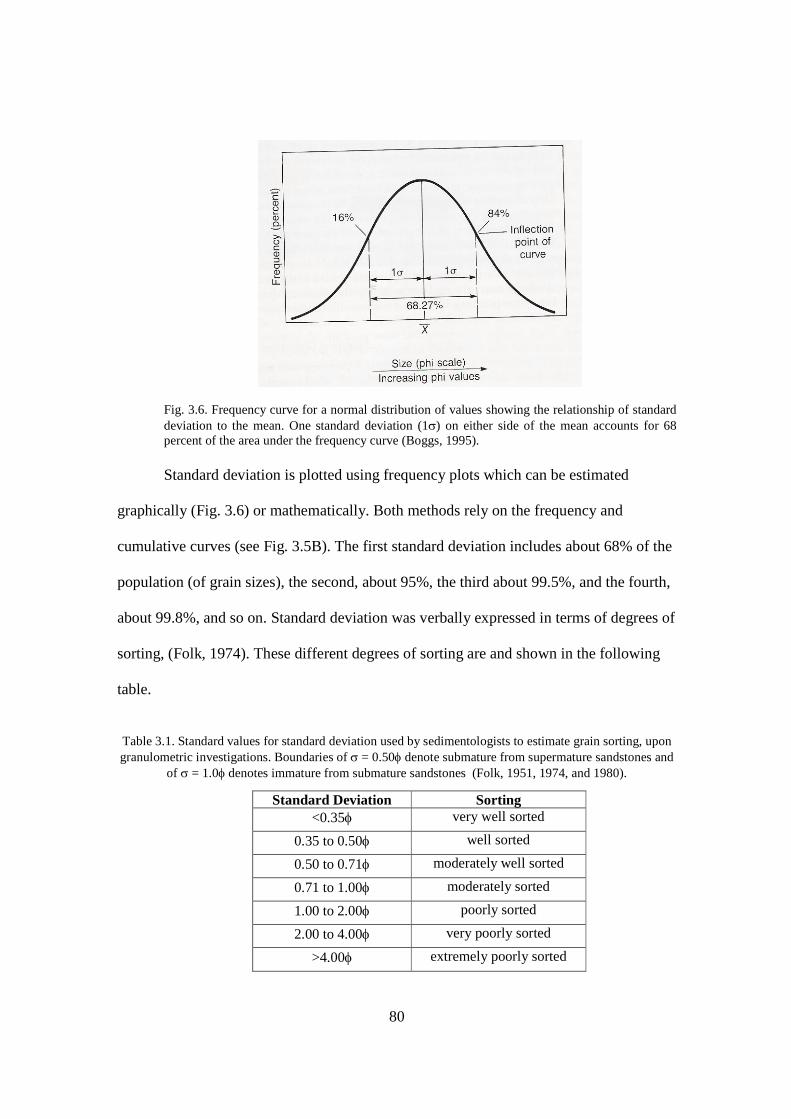
80
Fig. 3.6. Frequency curve for a normal distribution of values showing the relationship of standard deviation to the mean. One standard deviation (1s) on either side of the mean accounts for 68 percent of the area under the frequency curve (Boggs, 1995). Standard deviation is plotted using frequency plots which can be estimated
graphically (Fig. 3.6) or mathematically. Both methods rely on the frequency and
cumulative curves (see Fig. 3.5B). The first standard deviation includes about 68% of the
population (of grain sizes), the second, about 95%, the third about 99.5%, and the fourth,
about 99.8%, and so on. Standard deviation was verbally expressed in terms of degrees of
sorting, (Folk, 1974). These different degrees of sorting are and shown in the following
table.
Table 3.1. Standard values for standard deviation used by sedimentologists to estimate grain sorting, upon granulometric investigations. Boundaries of s = 0.50f denote submature from supermature sandstones and
of s = 1.0f denotes immature from submature sandstones (Folk, 1951, 1974, and 1980).
Standard Deviation Sorting <0.35f very well sorted
0.35 to 0.50f well sorted
0.50 to 0.71f moderately well sorted
0.71 to 1.00f moderately sorted
1.00 to 2.00f poorly sorted
2.00 to 4.00f very poorly sorted
>4.00f extremely poorly sorted

81
Table 3.1 presents the standard values for grain sorting used in this project, which
served in the classification of the studied sandstone samples from all investigated sites
within the Jezzine area. These values of sorting are also used in setting up the textural
maturity for the samples (see Chapter I), whereby all moderately sorted (standard
deviation values are less than 0.50f) are submature.
Granulometry takes place following certain steps (e.g. listed in Folk, 1968) which
include sieving a number of set sandstone samples, followed by their interpretations
based on the values obtained from Table 3.2:
Table 3.2. Sample fill in table for sieving analyses. The screens’ mesh grades are listed from coarse to fine and
the last one is that of the pan (for additional information see Appendix I, where an example is shown).
The procedure is as follows:
1. Six to seven screens are selected, cleaned thoroughly, and then nested in order,
coarsest at the top, pan on the bottom.
2. About l00g of disaggregated sample are weighted.
3. The weighed sample is poured in to the top sieve and shaken gently by hand. All the
screens that are too coarse to catch any grains are removed and a cover is placed on
the stack.
4. The screens are placed in the Ro-Tap shaker (Fig. 3.4), fastened very tightly, and

82
sieved at a constant time (i.e. 15 minutes).
5. After the sieving is done, the coarsest screen with the cover on it, are removed from
the screens’ stack. The cover is taken out and the coarsest screen is placed over an A3
paper, creased in the centre. The sand is carefully poured onto the paper. Then the
screen is inverted and tapped gently with the heel of the hand (in a diagonal motion)
to get all the remaining sand.
6. A piece of glazed, creased paper (weighing paper) is placed on the balance pan. The
sand, piled on the A3 paper, is carefully poured onto the glazed paper into the balance
pan.
7. The split sample (for one screen) is weighted to 0.01g and then poured into a tube,
labeled and sealed with a cork.
8. Steps 5, 6 and 7 are repeated for all the used screens (make sure to always replace the
cover on the screen to be removed from the stack in order to avoid spilling the
sample).
9. Each sieve fraction is examined (after it is weighed and stored in a tube) under the
binocular microscope (determining mineralogy, sorting and roundness/ sphericity)
and the percent of remaining aggregates in each fraction is estimated. If the
aggregates account for more than 25%, the sieving has to be redone.
10. The recorded data (Table 3.2) are then used in order to construct the representative
graphs (histograms and cumulative curves) and to calculate the mean average grain
size and the standard deviations (graphic and inclusive).

83
2. Binocular studies
Thirty-eight samples (from both investigated sections) were examined with
binocular stereomicroscopy. These were then cut into slabs (cut-faces) and then polished
with silicon carbide abrasive powder (200 to 800 grades), successively (e.g. Doummar,
2005; and Al Haddad, 2007). Since most of the samples were clastic, staining and etching
were not required. However, in order to separate calcite from dolomite or other residues,
a few carbonate samples were etched following the methodology outlined in Nader
(2003). For details on the staining techniques, refer to Evamy (1963).
The samples, which were too unconsolidated to be cut into thin-sections, were
investigated with the binocular upon breaking them gently with a hammer to obtain a
fresh cut. The binocular observations enabled the estimation of the grain size distribution,
the different mineralogical components, sorting, roundness and sphericity of grains as
well as primary sedimentary structures. Fill in sheets (Appendix 1) were used for all
investigated samples in order to achieve efficient and uniform sedimentological
characterization of the studied strata.
C. Petrography
1. Thin-section Preparation.
Fourty thin-sections were made out of the slabs (cut-faces), which have been
investigated through low magnification stereoscopic techniques. Some of them have also
been analyzed through sieving. All these thin-sections were done at the Department of
Geology (under the supervision of Mr. Maroun Ijreiss). The in-house methods concern
primarily the preparation of carbonate rock thin-sections (e.g. Doummar, 2005; and Al
Haddad, 2007), whereby the 400 and 600 grades of silicon carbide powder are enough for

84
trimming and polishing the thin-sections. Therefore the impregnation of the samples prior
to the grinding of the rock chips on these glass plates is not necessary.
In this study, the prepared sandstone rock chips had to be impregnated with an
epoxy solution consisting of ¼ resin mixed with ¾ hardener and a colouring additive.
The epoxy solution stays for about one hour without hardening and must be put in a
vacuum chamber in order to remove all air bubbles. Then, the next step lies in the
impregnation itself, which requires a systematic pouring of the solution in vacuum, over a
tray in which all the chips (8 to 15 per time) are laid. This step is crucial, as hardening the
chips (of sandstone) glues the pores together (avoiding their collapse in the grinding
stage) and serves to clearly the pore spaces during microscopic viewing. After the
impregnation is complete, the chips are taken out of the tray and laid down to dry. Since
sandstones are quite resistant, and in order to save time, often the 80 or 220 silicon
carbide (coarse) abrasive powders were used. If the excess resin is removed prior to the
drying, then it is possible to start grinding using a finer abrasive powder. Washing each
chip and the glass thoroughly after each grinding session with specific abrasive grades is
imperative in order to avoid scratching the polished surface. After a successful grinding
and washing, the chip should dry prior to the gluing on a glass slide. The resin solution is
prepared using the same parts of resin to hardener (¼ to ¾ respectively). The gluing
procedure is the same as the one presented in Doummar (2005). After the gluing is done,
a period of 24 hours is required for drying. Then, grinding on a coarse abrasive grinding
wheel is necessary for the final trimming of the chip prior to the polishing (e.g. El-
Hinnawi, 1966; Doummar, 2005; Al Haddad, 2007). Following this stage, a manual
trimming on glass plates (with constant checking under the microscope in order to see if

85
the optimum thickness is required (usually around 30 mm is reached). The final polishing
stage, in which the sample is polished using a very fine abrasive powder (aluminum
oxides), allows for the thin-sections to be studied both under conventional and
cathodoluminescence microscopic techniques.
2. Microscopic Work
Conventional microscopic investigation was done on all available thin-sections,
using petrographic (and cathodoluminescence) microscopes (Fig. 3.7). Each thin-section
was examined and valuable sedimentological and diagenetic characteristics were defined
and recorded on fill in sheets that were designed for this purpose (Appendix I). All
investigated thin-sections have been successfully investigated where photomicrographs
were taken, in order to illustrate major features and microfabrics.
The principle of conventional microscopy is rather straightforward, as it allows
for normal or plane light (NP, N) and/ or polarizing light (CP, XPL) to penetrate through
a glass thin-section for studying its optical characteristics. Cathodoluminescence is a
method generating a different image than transmitted light of a given sample, which is
the emission of visible light from the specimen due to its interaction with the primary
electron beam (see Fig. 3.7; Technosyn: Cold Cathodoluminescence model 8200 MkII).
This sometimes permits to see some structures, or chemical zonations, otherwise
imperceptible. It also permits distinguishing some minerals like quartz/ feldspar, calcite/
dolomite, and others. The phenomenon is generally attributed to point defects in the
lattice and large elements (i.e. lanthanides) which might manifest effects similar to point
defects (e.g. Tucker, 1988; Marshall, 1988; Pagel et al., 2000; and Boggs and Krinsley
2006).
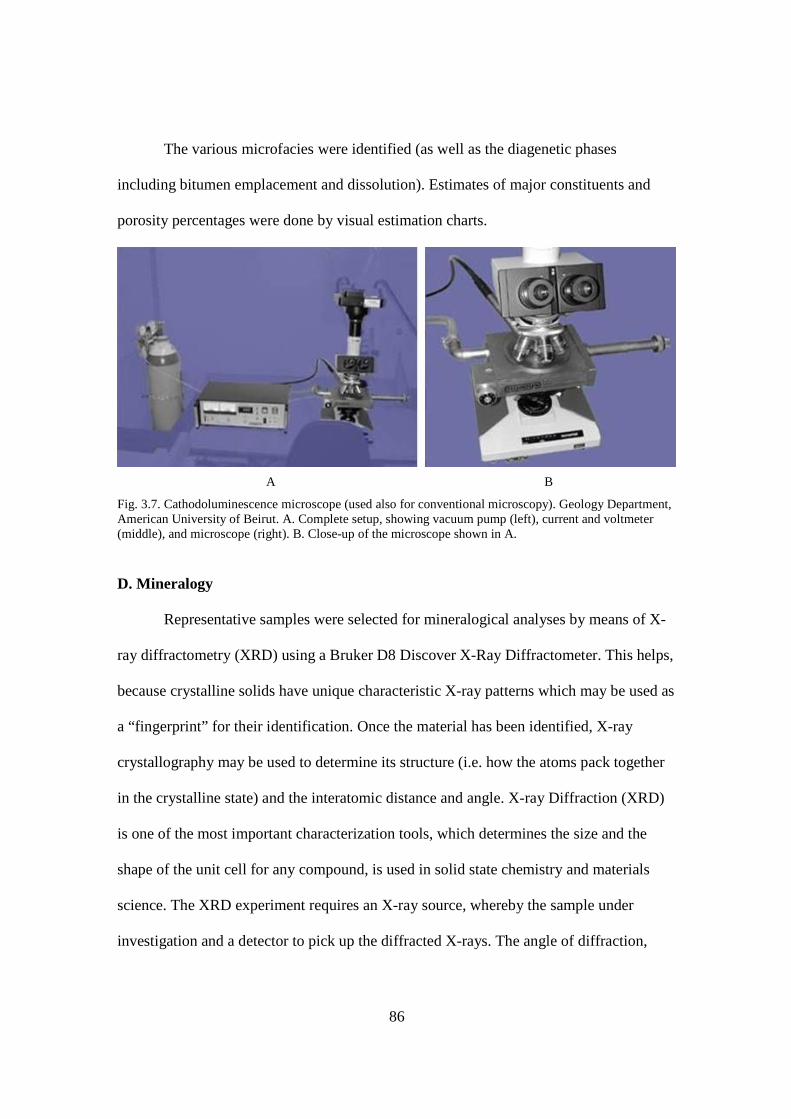
86
The various microfacies were identified (as well as the diagenetic phases
including bitumen emplacement and dissolution). Estimates of major constituents and
porosity percentages were done by visual estimation charts.
A B
Fig. 3.7. Cathodoluminescence microscope (used also for conventional microscopy). Geology Department, American University of Beirut. A. Complete setup, showing vacuum pump (left), current and voltmeter (middle), and microscope (right). B. Close-up of the microscope shown in A.
D. Mineralogy
Representative samples were selected for mineralogical analyses by means of X-
ray diffractometry (XRD) using a Bruker D8 Discover X-Ray Diffractometer. This helps,
because crystalline solids have unique characteristic X-ray patterns which may be used as
a “fingerprint” for their identification. Once the material has been identified, X-ray
crystallography may be used to determine its structure (i.e. how the atoms pack together
in the crystalline state) and the interatomic distance and angle. X-ray Diffraction (XRD)
is one of the most important characterization tools, which determines the size and the
shape of the unit cell for any compound, is used in solid state chemistry and materials
science. The XRD experiment requires an X-ray source, whereby the sample under
investigation and a detector to pick up the diffracted X-rays. The angle of diffraction,
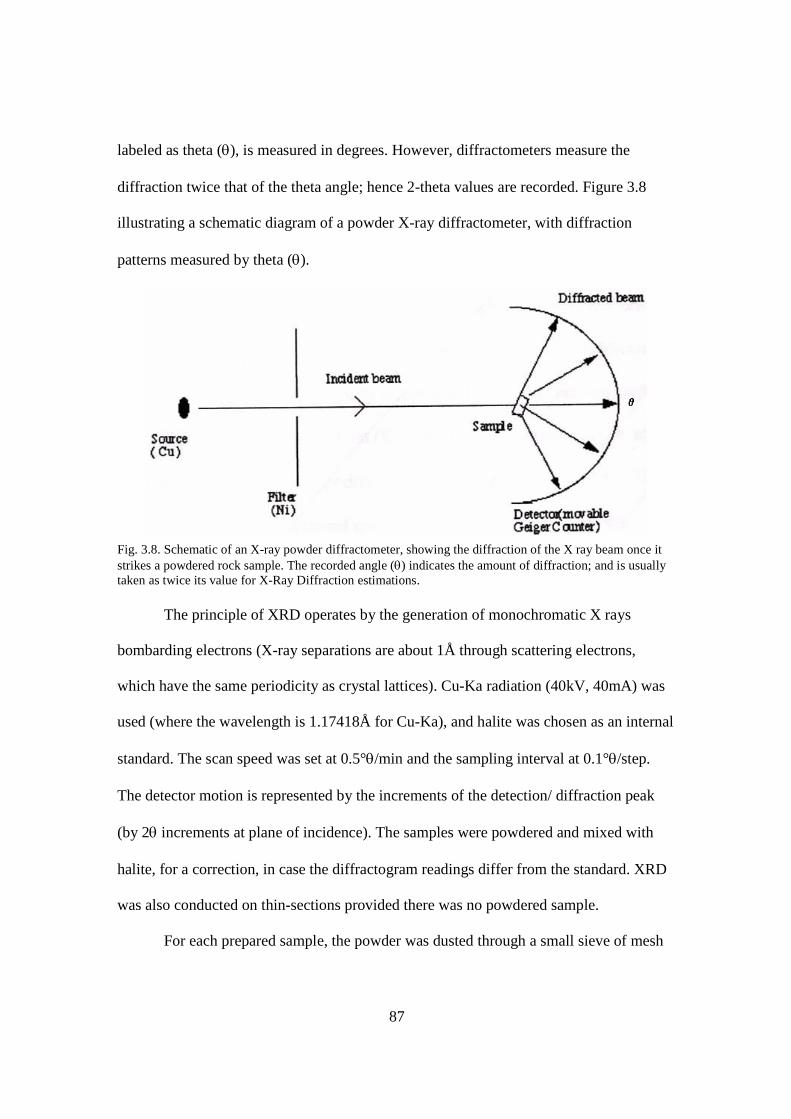
87
labeled as theta (q), is measured in degrees. However, diffractometers measure the
diffraction twice that of the theta angle; hence 2-theta values are recorded. Figure 3.8
illustrating a schematic diagram of a powder X-ray diffractometer, with diffraction
patterns measured by theta (q).
Fig. 3.8. Schematic of an X-ray powder diffractometer, showing the diffraction of the X ray beam once it strikes a powdered rock sample. The recorded angle (q) indicates the amount of diffraction; and is usually taken as twice its value for X-Ray Diffraction estimations.
The principle of XRD operates by the generation of monochromatic X rays
bombarding electrons (X-ray separations are about 1Å through scattering electrons,
which have the same periodicity as crystal lattices). Cu-Ka radiation (40kV, 40mA) was
used (where the wavelength is 1.17418Å for Cu-Ka), and halite was chosen as an internal
standard. The scan speed was set at 0.5°q/min and the sampling interval at 0.1°q/step.
The detector motion is represented by the increments of the detection/ diffraction peak
(by 2q increments at plane of incidence). The samples were powdered and mixed with
halite, for a correction, in case the diffractogram readings differ from the standard. XRD
was also conducted on thin-sections provided there was no powdered sample.
For each prepared sample, the powder was dusted through a small sieve of mesh
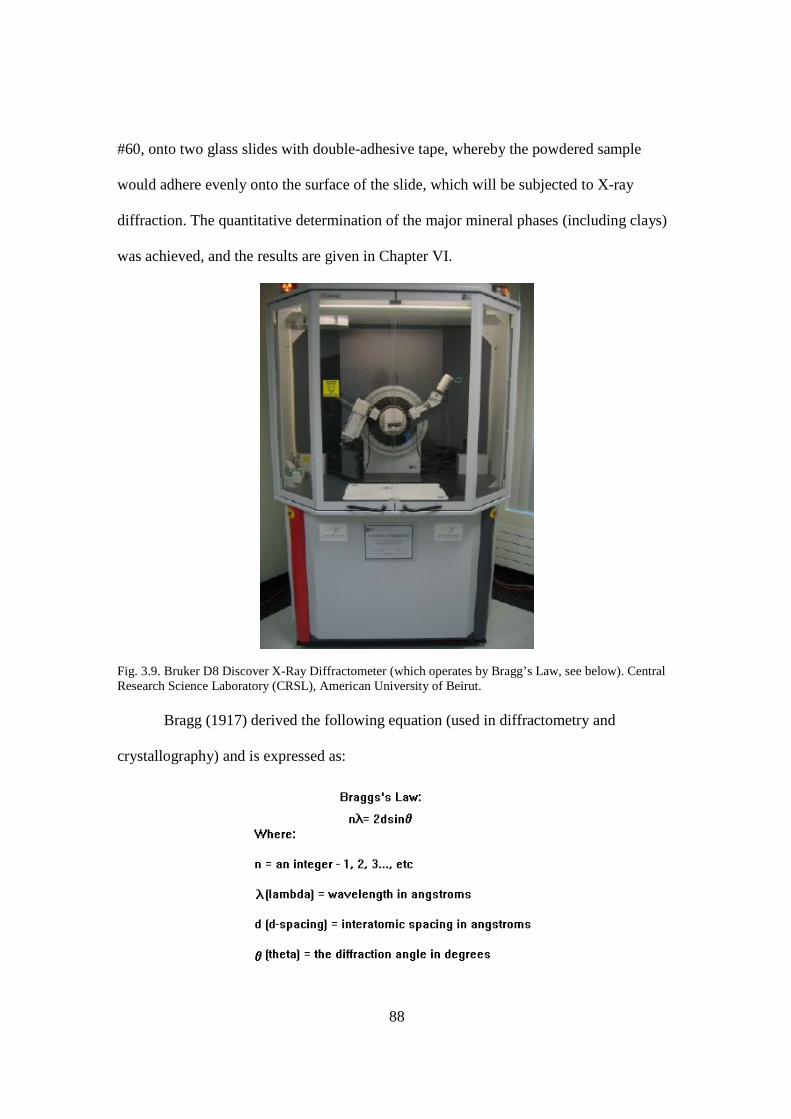
88
#60, onto two glass slides with double-adhesive tape, whereby the powdered sample
would adhere evenly onto the surface of the slide, which will be subjected to X-ray
diffraction. The quantitative determination of the major mineral phases (including clays)
was achieved, and the results are given in Chapter VI.
Fig. 3.9. Bruker D8 Discover X-Ray Diffractometer (which operates by Bragg’s Law, see below). Central Research Science Laboratory (CRSL), American University of Beirut.
Bragg (1917) derived the following equation (used in diffractometry and
crystallography) and is expressed as:

89
CHAPTER IV
FIELD WORK
The Toumatt-Jezzine/ Aazibi section as well as two other sections near the
Homsiyeh village (Jezzine area) were investigated, through many reconnaissance visits,
which permitted the collection of representative samples. Then, this was followed by
detailed field work which led to their investigation, in order to describe the key strata of
the Chouf Formation. Figure 4.1 shows a general geologic map (1/50,000) of the Jezzine
area that represents the locations of all sites of interest for this study (e.g. Aazour,
Homsiyeh, Jezzine, Aazibi and Toumatt-Jezzine). The rocks are relatively well-exposed,
especially near the Barouk-Niha uplift, where most of the geological formations are
outcropping (from the Upper Jurassic to the Upper Cretaceous).
The first section, the Toumatt-Jezzine-Machghara section includes the strata that
Tixier (1971-1972) studied. Actually, this covers all the investigated strata of the Lower
Cretaceous formations (Chouf to Hammana Formations). The second section, located
near a goat shed (at Mrah Aazibi), includes similar strata to the ones investigated at
Toumatt-Jezzine. In this section, a traverse, covering all the Formations from The
Jurassic to the Albian was done, (Fig. 4.2). Both the Machghara and Mrah Aazibi
sections represent the entire thicknesses of the Chouf Formation (230m). The last section,
located near the Homsiyeh village, shows about 220m of exposed ‘Grès de Base’ rocks.
It includes strata that are worthwhile to study for diagenetic purposes.
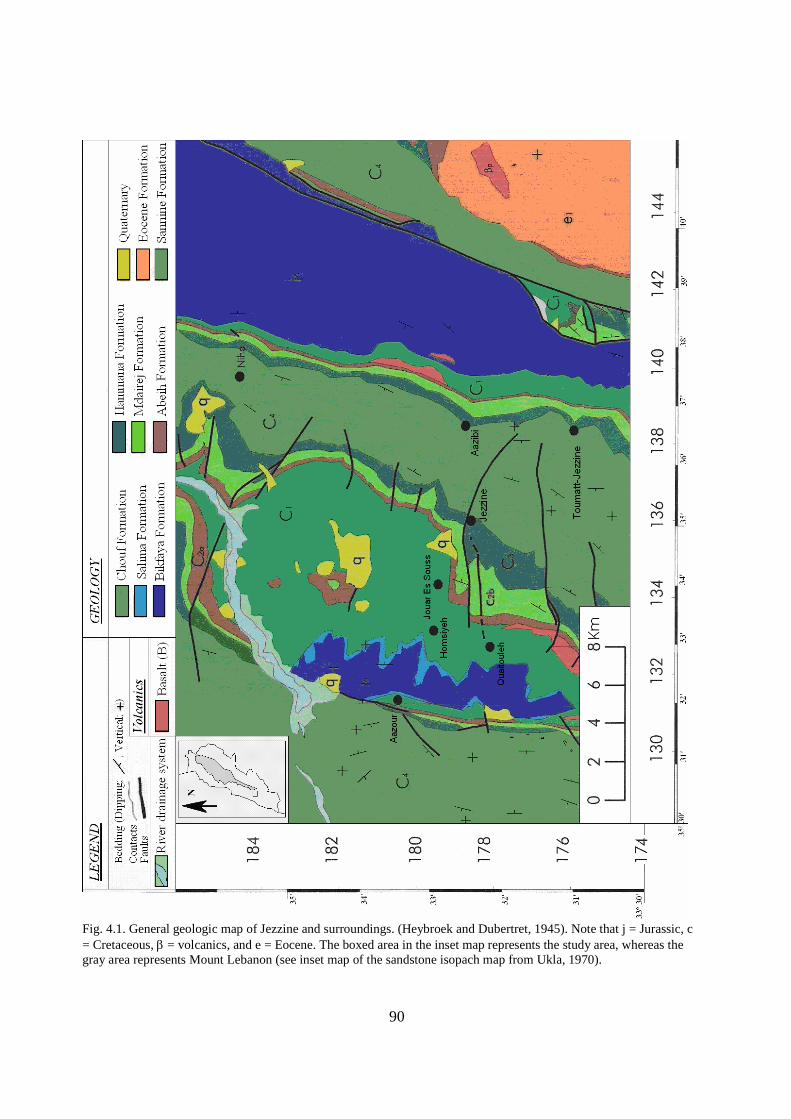
90
Fig. 4.1. General geologic map of Jezzine and surroundings. (Heybroek and Dubertret, 1945). Note that j = Jurassic, c = Cretaceous, b = volcanics, and e = Eocene. The boxed area in the inset map represents the study area, whereas the gray area represents Mount Lebanon (see inset map of the sandstone isopach map from Ukla, 1970).

91
Fig. 4.2. Simplified Geologic map of the Toumatt-Jezzine Aazibi Section showing the traverse, which included parts of the Barouk Chains, traced from the 1/ 20,000 Jezzine and Machghara topographic maps (Ministère de la Défense Nationale, 1963), including data from Heybroek and Dubertret (1945); Dubertret et al., 1955; and Tixier, 1971-1972).
Figure 4.3 illustrates the detailed geologic map (1/10,000) of both Homsiyeh
sections that was designed using air photo correction. The geology of the Homsiyeh area
includes the Jurassic (the Bikfaya, and Salima Formations), as well as beds of the Lower
Cretaceous (the Chouf, Abeih and Hammana Formations) and the Upper Cretaceous (the
Sannine Formation). It also includes various river deposits and Quaternary outcrops (e.g.
Heybroek and Dubertret, 1945; Dubertret, et al., 1955).
In the Toumatt-Jezzine/ Aazibi section, seven samples were collected (and studied
in the lab), in order to best represent the key beds of the lower and middle parts of the
Chouf Formation. In both Homsiyeh sections, a total of about 50 samples were taken.
The two Homsiyeh Sections (Homsiyeh 1 and 2) reveal important diagenetic and
sedimentological features. They were sampled and investigated in detail, where
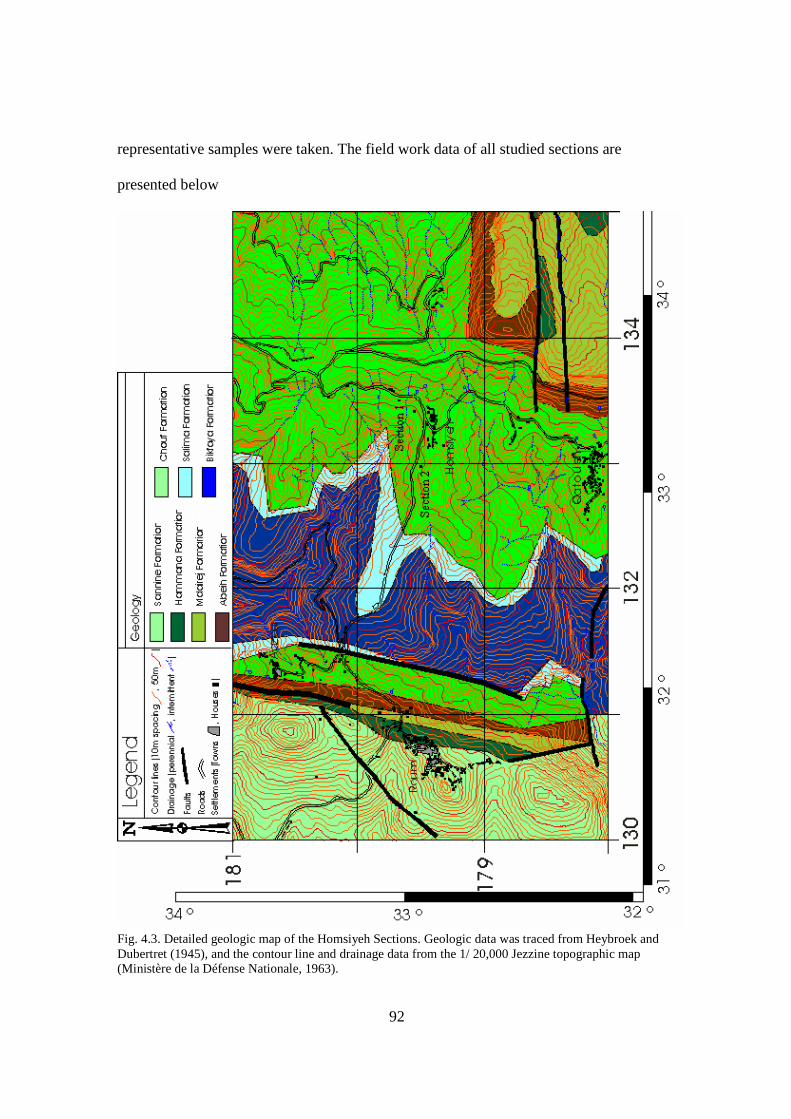
92
representative samples were taken. The field work data of all studied sections are
presented below
Fig. 4.3. Detailed geologic map of the Homsiyeh Sections. Geologic data was traced from Heybroek and Dubertret (1945), and the contour line and drainage data from the 1/ 20,000 Jezzine topographic map (Ministère de la Défense Nationale, 1963).
93
A. Toumatt-Jezzine/ Aazibi
1. Introduction
The Toumatt-Jezzine/ Aazibi section, located west of Jabal Niha (at 1-5 km SE of
Jezzine) along the Machghara road, formerly studied by Tixier (1971-1972), includes the
entire Lower-Cretaceous clastic and carbonate Formations from Neocomian to Albian
strata (cf. Tixier, 1971-1972). The base of the surveyed section has an elevation of
1350m asl. The section ends at an approximate elevation of 1120m asl. This area was
visited to check the complete (220-230m) sandstone succession, grading from the
boundary of the Salima Formation (Upper-Jurassic; oolitic grainstones) to the pisolitic
horizons of the Abeih Formation (Lower Aptian). The Chouf Formation is divided into
86 beds which are grouped into three main zones (ca. basal, middle and upper units) in
which cyclical patterns are observed (Tixier, 1971-1972). The lithology encountered at
the base of the Chouf Formation includes about 10m of coal and “aquatic" sand and clay
(e.g. Tixier, 1971-1972). The middle part consists mainly of sand, whereas the upper part
is roughly similar to the basal part.
Figure 4.4 shows the detailed stratigraphic log of the ‘Grès de Base’ (e.g. Tixier,
1971-1972; Dubertret, 1975; and Walley, 1997) as well as chronostratigraphic data
obtained from Vail et al. (1977); Haq et al. (1987, 1988), as sea level information was
incorporated. It was found that the present sea level is at –210m, and was the same during
the early Hauterivian (Haq et al., 1987, 1988). The sea level during the Portlandian (e.g.
latest? Jurassic) was -280 m. During the Basal Cretaceous (Berriasian), it was -230m; the
same was reported for the late Valanginian to early Hauterivian (Haq et al., 1987, 1988).
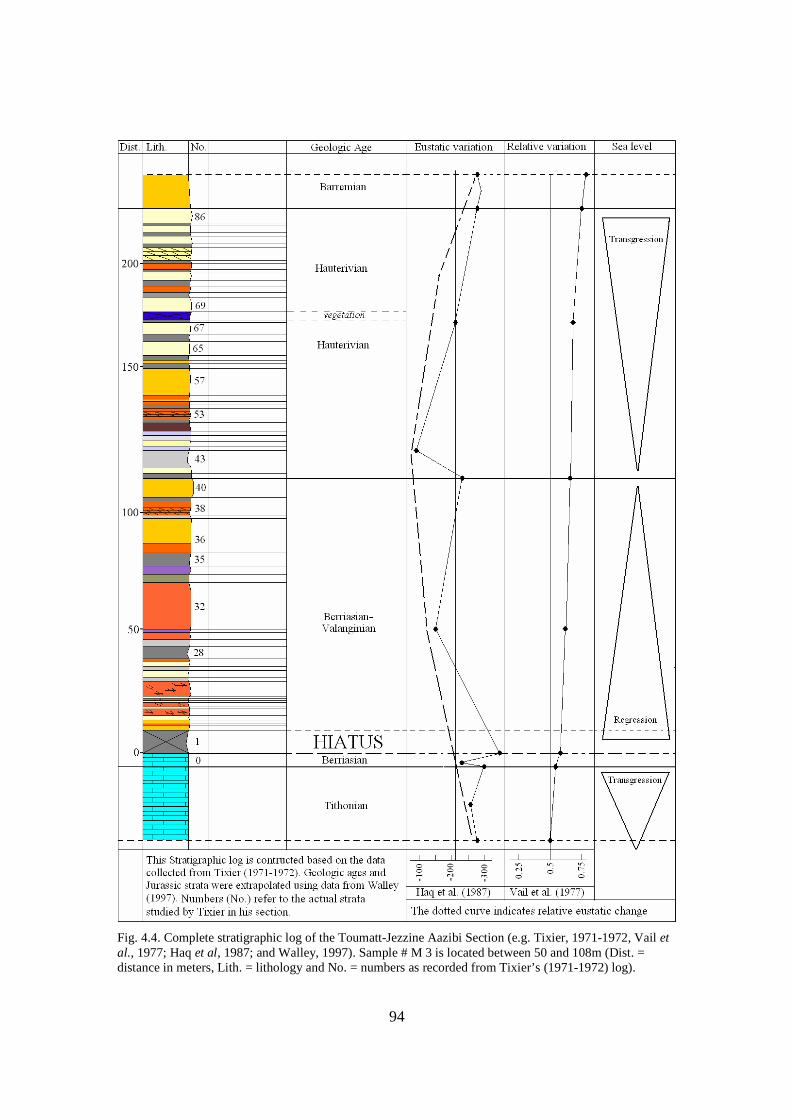
94
Fig. 4.4. Complete stratigraphic log of the Toumatt-Jezzine Aazibi Section (e.g. Tixier, 1971-1972, Vail et al., 1977; Haq et al, 1987; and Walley, 1997). Sample # M 3 is located between 50 and 108m (Dist. = distance in meters, Lith. = lithology and No. = numbers as recorded from Tixier’s (1971-1972) log).
95
Sea level was highest (-330m) during the late Berriasian to early Valanginian;
corresponding roughly to the lower aquatic unit of the Chouf Formation. Regressions
occurred during middle Valanginian (and were moderate then). Lowest recorded sea
levels (-90m) were during the Early Hauterivian, which corresponds to the eolian strata of
the middle unit of the Chouf Formation (Haq et al., 1987, 1988). Finally, during late
Hauterivian to early Barremian the sea level was about -260m (Haq et al., 1987, 1988).
2. Collected Data:
a. Lower unit
The lower unit of the Toumatt-Jezzine/ Aazibi section covers the first 50m of the
Formation. It includes aquatic sandstones and clayey sand beds (10m), chocolate clays
(rich in organic matter) and volcanics with high recorded sea levels (Fig. 4.4). These
sands typically show thin bedding and display grayish to purplish colors (Fig. 4.5).
Therefore, dark clays, and/ or volcanics followed by sandstones typically show the
lithology of this part of the Formation. This unit is represented in both Homsiyeh
Sections and the Toumatt-Aazibi sections, where the basal contact with the Tithonian-
Valanginian Salima Formation is observed.
b. Middle unit:
This unit, found to be between 50 and 108m, mainly comprises yellowish to reddish
sandstone strata that are generally devoid of clays. These strata, grading to a more thickly
bedded lithology, often display cross-stratifications and graded bedding. The studied beds
indicate the presence of yellowish strata that are cross stratified, and are moderately
sorted. They also most probably contain amounts of calcite (# M 3; Fig. 4.6). Other
samples (# M 1, 2, and 5) bear a close resemblance. Similar strata are also found in
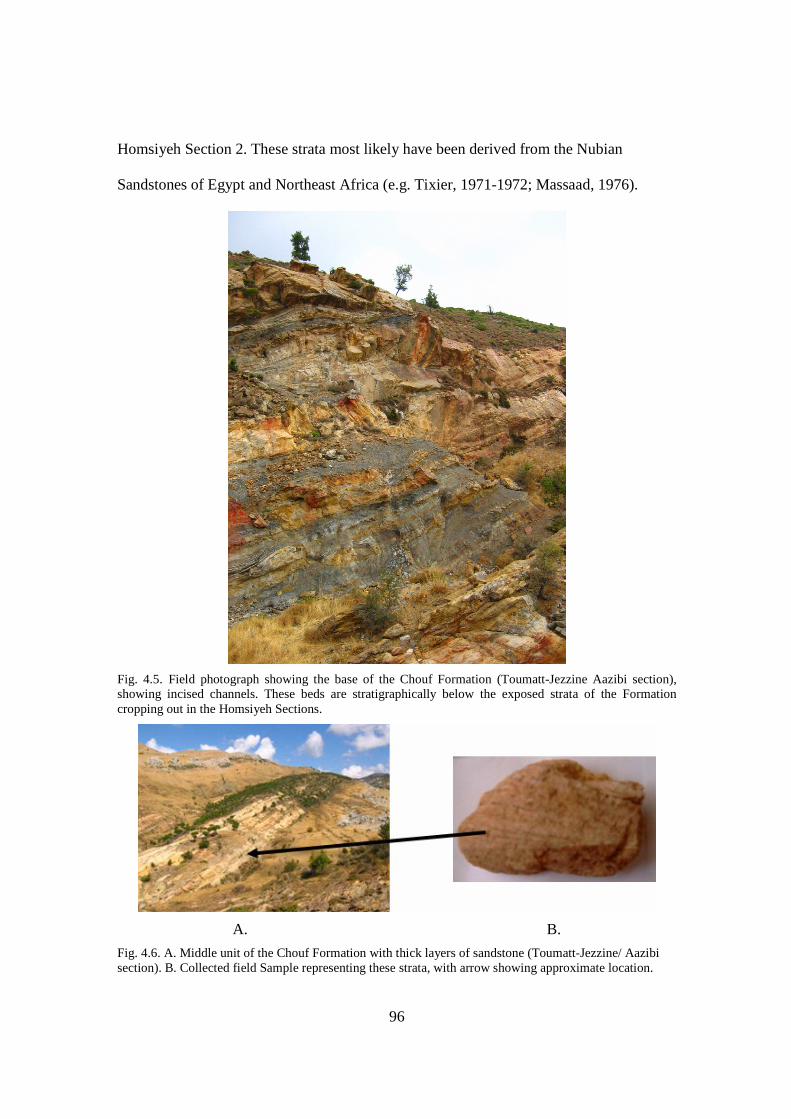
96
Homsiyeh Section 2. These strata most likely have been derived from the Nubian
Sandstones of Egypt and Northeast Africa (e.g. Tixier, 1971-1972; Massaad, 1976).
Fig. 4.5. Field photograph showing the base of the Chouf Formation (Toumatt-Jezzine Aazibi section), showing incised channels. These beds are stratigraphically below the exposed strata of the Formation cropping out in the Homsiyeh Sections.
A. B.
Fig. 4.6. A. Middle unit of the Chouf Formation with thick layers of sandstone (Toumatt-Jezzine/ Aazibi section). B. Collected field Sample representing these strata, with arrow showing approximate location.

97
c. Top unit:
The upper unit is between 108 and 230m, and shows a lithology that is similar to
the lower unit (see Fig. 4.5 and Fig. 4.4 for the recorded sea level curve data); as it
indicates cyclicity in the systematic repetition of sand and clay strata towards the top
parts of the unit, where pure sandy to clayey successions are noticed (cf. Tixier, 1971-
1972). Like in the lower part, beds are also dominantly marine/ aquatic. They are shown
in the Machghara section of Tixier (1971-1972), where they were well documented. On
the other hand, these strata are lacking in Homsiyeh section 2, but are present
stratigraphically above the section, as the contact with the Abeih Formation is not far
away. According to Tixier (1971-1972, there is a layer of vegetation that is recorded in
this layer, which is most likely acting as a paleosol.
B. Homsiyeh Sections
The base of the first section, located near a house in the Homsiyeh village, has an
elevation of 938m asl. Its approximate termination is estimated at an elevation of 968m
asl. This section is chiefly composed of 11 beds representing several sand, clay, and
carbonate deposits (Table 4.1), representing the basal layers of the ’Grès de Base’ (i.e.
their contact with the Salima Formation is not far). The second section, part of a road-cut
outcrop is located near the Roum-Homsiyeh-Aazour crossing has an elevation of 922m
asl, and has a thickness of approximately 10m. It includes 16 well-studied layers (Table
4.2) representing clays, carbonates and different types of sandstones. Both sections
include key representative facies of the Lower part (1st Homsiyeh Section) and the lower
to middle parts (2nd Homsiyeh Section) of the Chouf Formation.
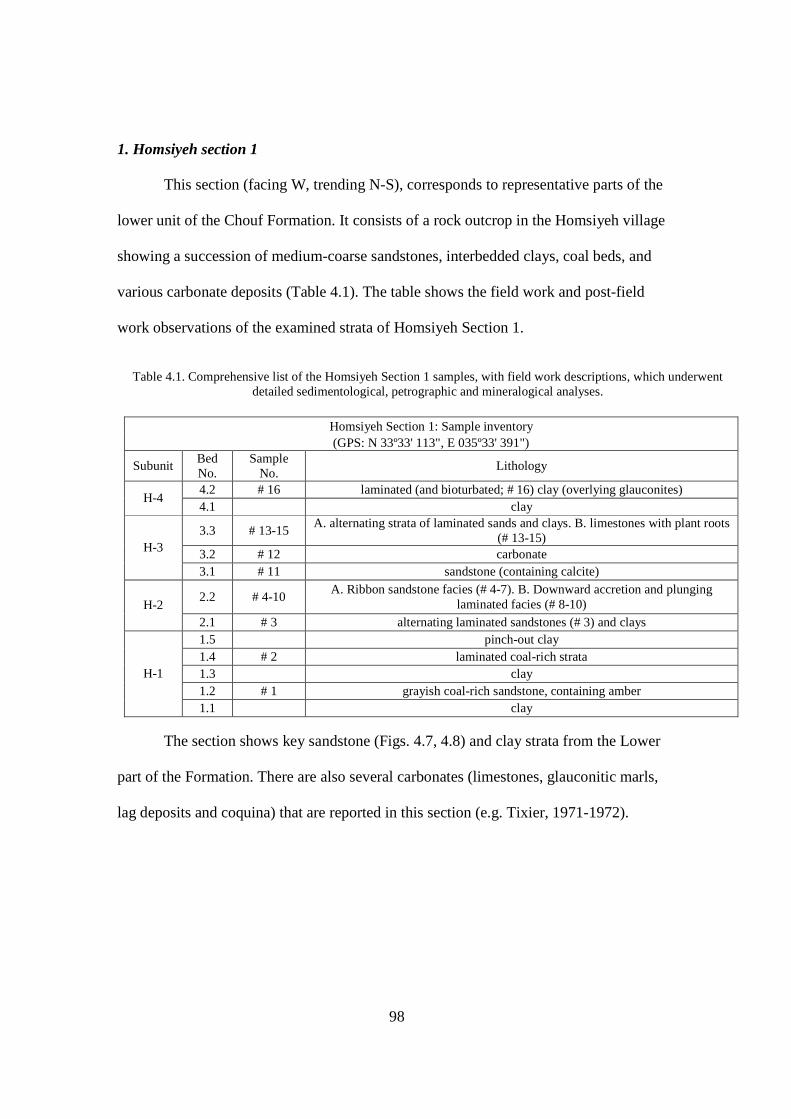
98
1. Homsiyeh section 1
This section (facing W, trending N-S), corresponds to representative parts of the
lower unit of the Chouf Formation. It consists of a rock outcrop in the Homsiyeh village
showing a succession of medium-coarse sandstones, interbedded clays, coal beds, and
various carbonate deposits (Table 4.1). The table shows the field work and post-field
work observations of the examined strata of Homsiyeh Section 1.
Table 4.1. Comprehensive list of the Homsiyeh Section 1 samples, with field work descriptions, which underwent
detailed sedimentological, petrographic and mineralogical analyses.
Homsiyeh Section 1: Sample inventory (GPS: N 33º33' 113", E 035º33' 391")
Subunit Bed No.
Sample No.
Lithology
4.2 # 16 laminated (and bioturbated; # 16) clay (overlying glauconites) H-4
4.1 clay
3.3 # 13-15 A. alternating strata of laminated sands and clays. B. limestones with plant roots
(# 13-15) 3.2 # 12 carbonate H-3
3.1 # 11 sandstone (containing calcite)
2.2 # 4-10 A. Ribbon sandstone facies (# 4-7). B. Downward accretion and plunging
laminated facies (# 8-10) H-2 2.1 # 3 alternating laminated sandstones (# 3) and clays 1.5 pinch-out clay 1.4 # 2 laminated coal-rich strata 1.3 clay 1.2 # 1 grayish coal-rich sandstone, containing amber
H-1
1.1 clay The section shows key sandstone (Figs. 4.7, 4.8) and clay strata from the Lower
part of the Formation. There are also several carbonates (limestones, glauconitic marls,
lag deposits and coquina) that are reported in this section (e.g. Tixier, 1971-1972).
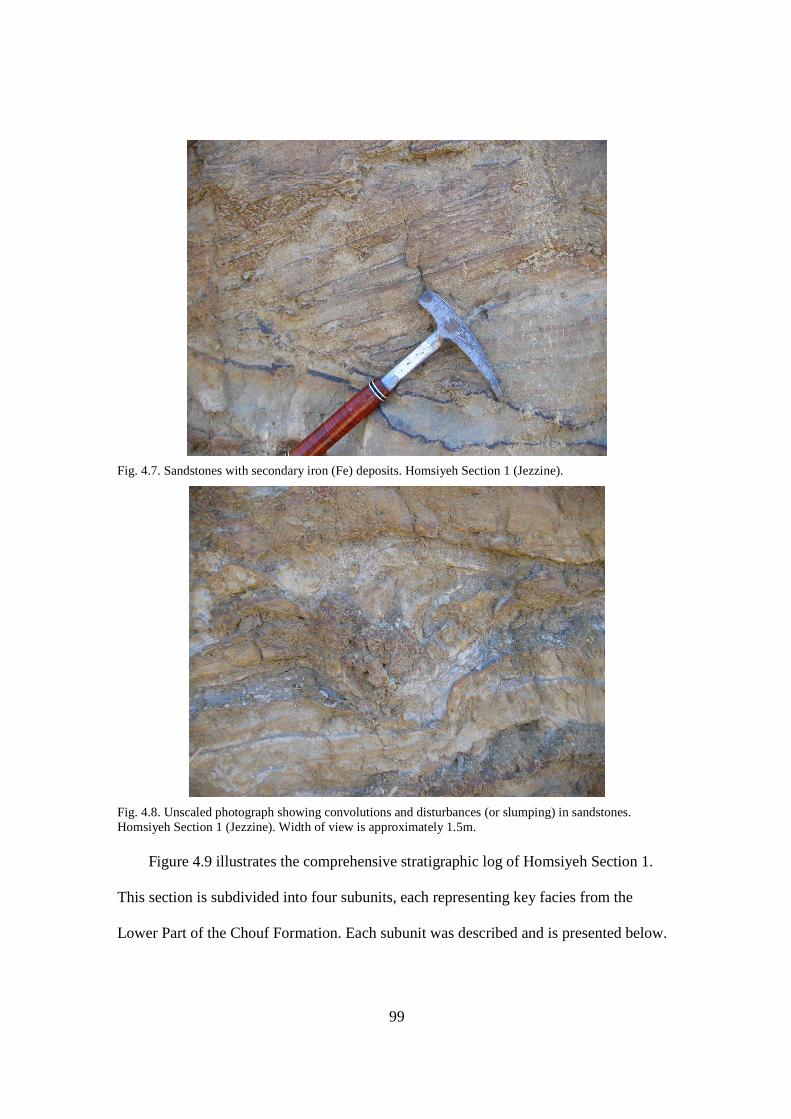
99
Fig. 4.7. Sandstones with secondary iron (Fe) deposits. Homsiyeh Section 1 (Jezzine).
Fig. 4.8. Unscaled photograph showing convolutions and disturbances (or slumping) in sandstones. Homsiyeh Section 1 (Jezzine). Width of view is approximately 1.5m. Figure 4.9 illustrates the comprehensive stratigraphic log of Homsiyeh Section 1.
This section is subdivided into four subunits, each representing key facies from the
Lower Part of the Chouf Formation. Each subunit was described and is presented below.

100
Fig. 4.9. Detailed stratigraphic log of Homsiyeh Section 1. Labels adapted from Exxon (1977).

101
a. Layer H-1
The first subunit (thickness: 3.l5m; Fig. 4.9) includes the first two beds (# 1 and 2;
referred to as H 1.1 and H 1.2, hereafter). The base of this section comprises lenticular
bedding in clays with sand laminae (# H 1.1). It is overlain by alternating coal-rich
sandstones (with amber locally). This bed is composed of fine grained whitish, yellowish
to grayish sandstones with coal and amber inclusions (# H 1.2). These are very fine
sandstones containing coal and amber. They comprise moderately sorted, moderately
packed, subangular to subrounded grains showing moderate sphericity. They show weak
uneven and nonparallel laminations and show vague and mixed bedding. These are
overlain by a clay rich in organic matter, displaying sand laminae (# H 1.3). Above this
bed, laminated argillaceous sandstones and clays were found (# H 1.4; Fig. 4.10).
Fig. 4.10. Photograph of sandstone facies (# H 1.4, sample 2) in the Homsiyeh Section 1 (Jezzine.) Note the presence of alternating dark and light wavy laminae, indicating the presence of some organic matter (dark) and sandy material (light).
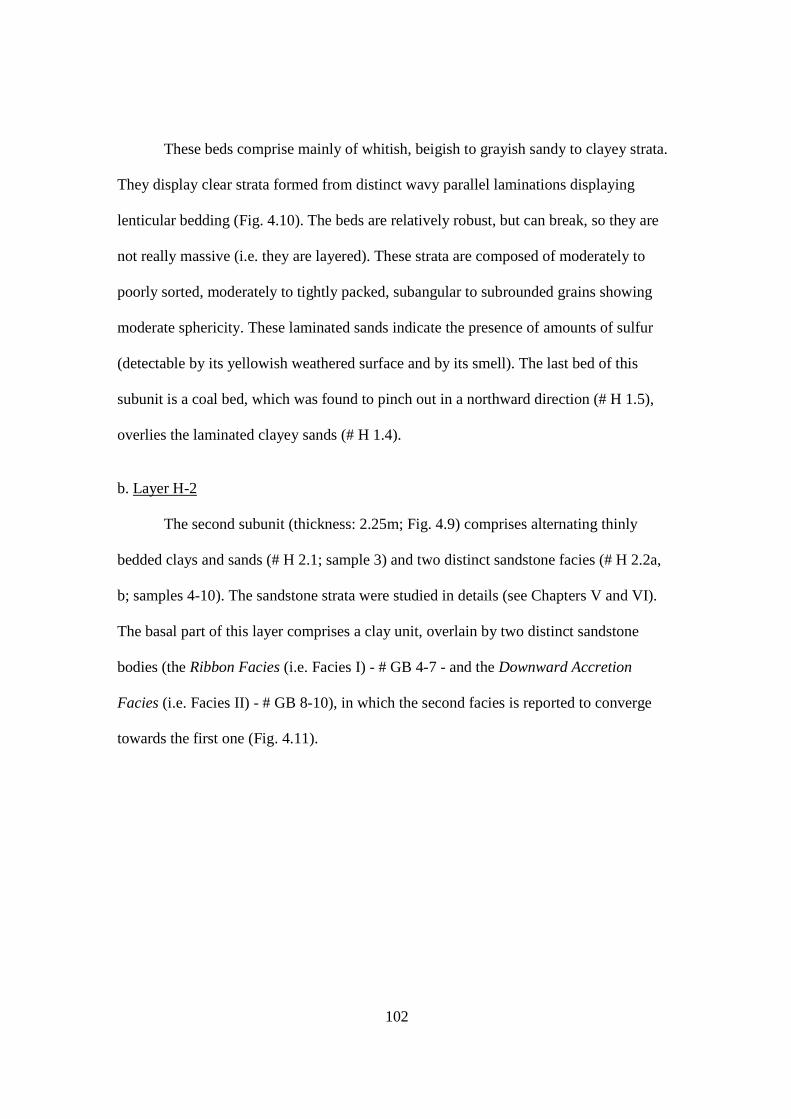
102
These beds comprise mainly of whitish, beigish to grayish sandy to clayey strata.
They display clear strata formed from distinct wavy parallel laminations displaying
lenticular bedding (Fig. 4.10). The beds are relatively robust, but can break, so they are
not really massive (i.e. they are layered). These strata are composed of moderately to
poorly sorted, moderately to tightly packed, subangular to subrounded grains showing
moderate sphericity. These laminated sands indicate the presence of amounts of sulfur
(detectable by its yellowish weathered surface and by its smell). The last bed of this
subunit is a coal bed, which was found to pinch out in a northward direction (# H 1.5),
overlies the laminated clayey sands (# H 1.4).
b. Layer H-2
The second subunit (thickness: 2.25m; Fig. 4.9) comprises alternating thinly
bedded clays and sands (# H 2.1; sample 3) and two distinct sandstone facies (# H 2.2a,
b; samples 4-10). The sandstone strata were studied in details (see Chapters V and VI).
The basal part of this layer comprises a clay unit, overlain by two distinct sandstone
bodies (the Ribbon Facies (i.e. Facies I) - # GB 4-7 - and the Downward Accretion
Facies (i.e. Facies II) - # GB 8-10), in which the second facies is reported to converge
towards the first one (Fig. 4.11).
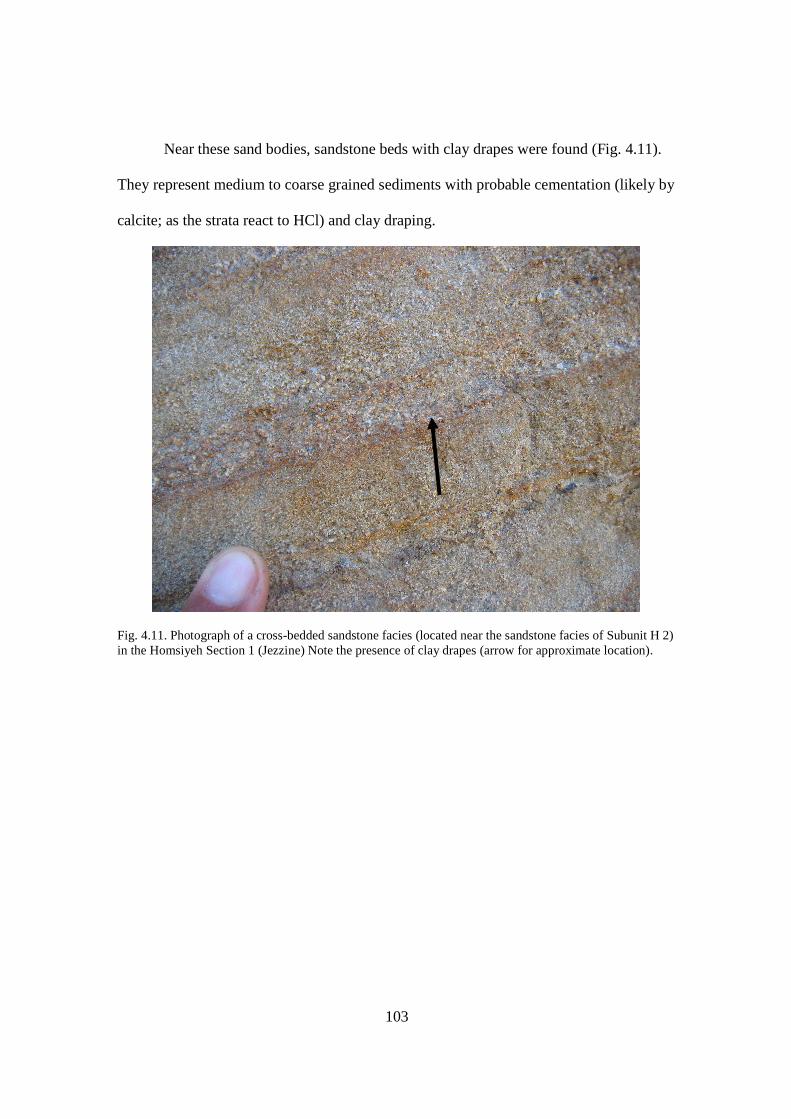
103
Near these sand bodies, sandstone beds with clay drapes were found (Fig. 4.11).
They represent medium to coarse grained sediments with probable cementation (likely by
calcite; as the strata react to HCl) and clay draping.
Fig. 4.11. Photograph of a cross-bedded sandstone facies (located near the sandstone facies of Subunit H 2) in the Homsiyeh Section 1 (Jezzine) Note the presence of clay drapes (arrow for approximate location).
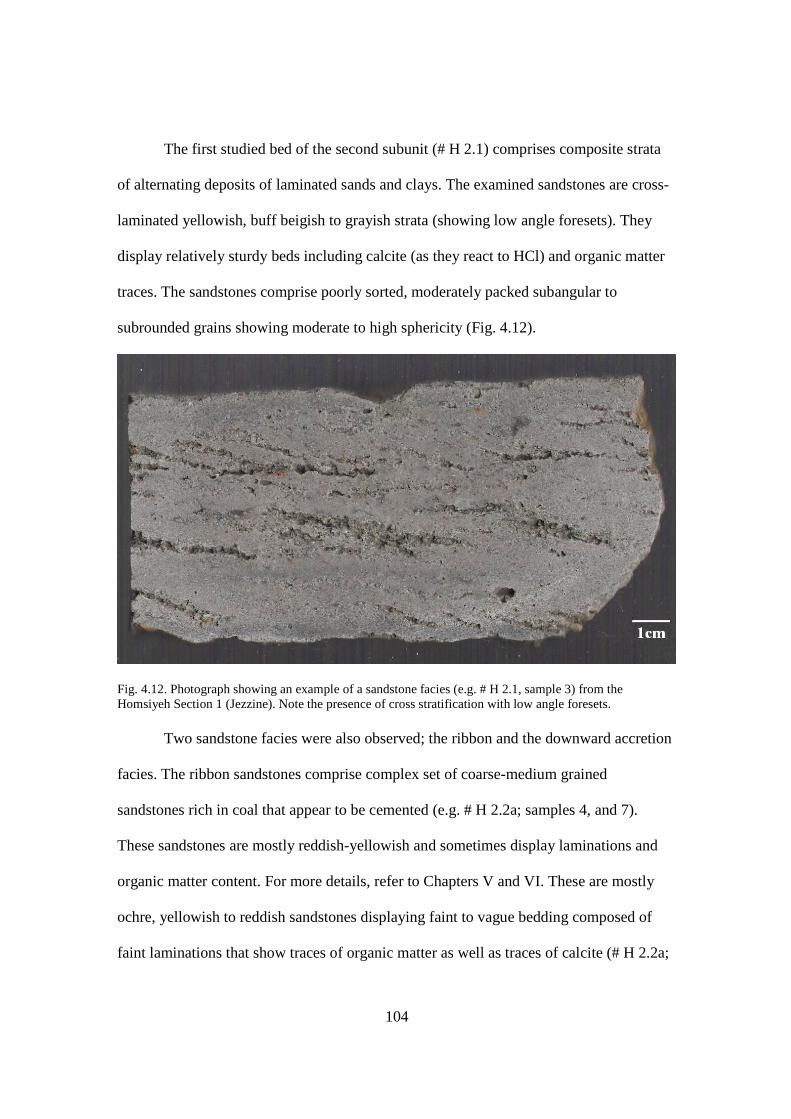
104
The first studied bed of the second subunit (# H 2.1) comprises composite strata
of alternating deposits of laminated sands and clays. The examined sandstones are cross-
laminated yellowish, buff beigish to grayish strata (showing low angle foresets). They
display relatively sturdy beds including calcite (as they react to HCl) and organic matter
traces. The sandstones comprise poorly sorted, moderately packed subangular to
subrounded grains showing moderate to high sphericity (Fig. 4.12).
Fig. 4.12. Photograph showing an example of a sandstone facies (e.g. # H 2.1, sample 3) from the Homsiyeh Section 1 (Jezzine). Note the presence of cross stratification with low angle foresets.
Two sandstone facies were also observed; the ribbon and the downward accretion
facies. The ribbon sandstones comprise complex set of coarse-medium grained
sandstones rich in coal that appear to be cemented (e.g. # H 2.2a; samples 4, and 7).
These sandstones are mostly reddish-yellowish and sometimes display laminations and
organic matter content. For more details, refer to Chapters V and VI. These are mostly
ochre, yellowish to reddish sandstones displaying faint to vague bedding composed of
faint laminations that show traces of organic matter as well as traces of calcite (# H 2.2a;
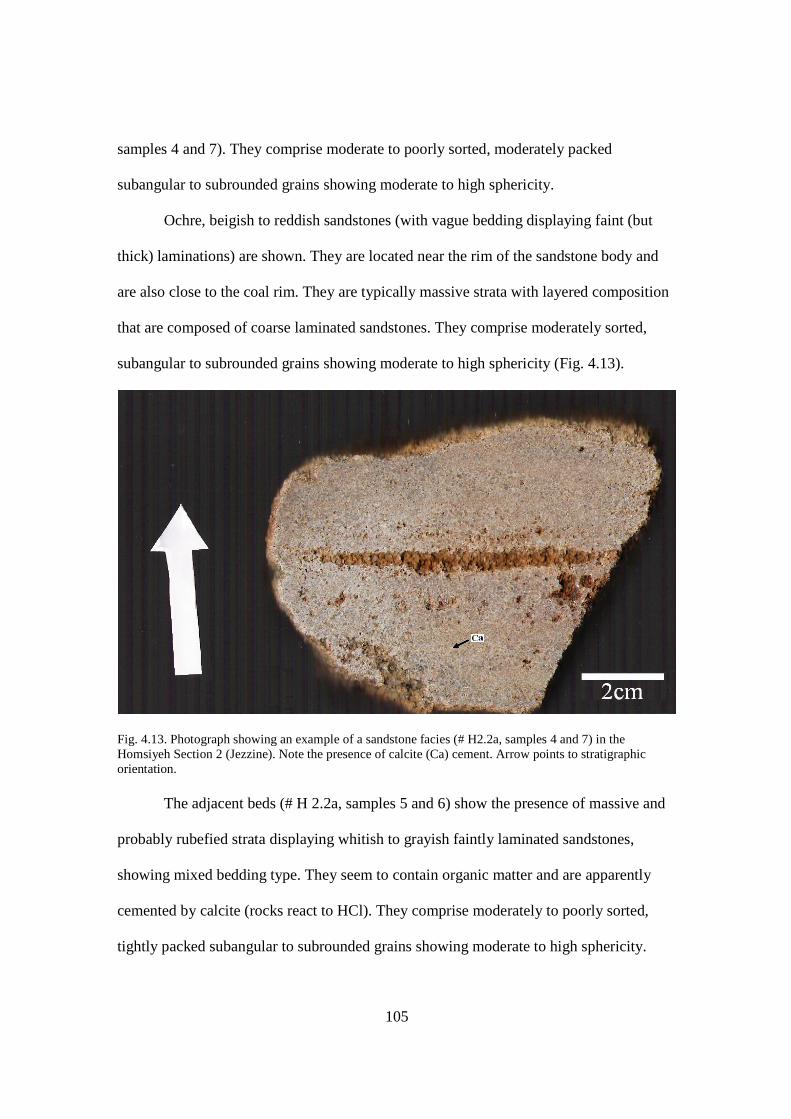
105
samples 4 and 7). They comprise moderate to poorly sorted, moderately packed
subangular to subrounded grains showing moderate to high sphericity.
Ochre, beigish to reddish sandstones (with vague bedding displaying faint (but
thick) laminations) are shown. They are located near the rim of the sandstone body and
are also close to the coal rim. They are typically massive strata with layered composition
that are composed of coarse laminated sandstones. They comprise moderately sorted,
subangular to subrounded grains showing moderate to high sphericity (Fig. 4.13).
Fig. 4.13. Photograph showing an example of a sandstone facies (# H2.2a, samples 4 and 7) in the Homsiyeh Section 2 (Jezzine). Note the presence of calcite (Ca) cement. Arrow points to stratigraphic orientation.
The adjacent beds (# H 2.2a, samples 5 and 6) show the presence of massive and
probably rubefied strata displaying whitish to grayish faintly laminated sandstones,
showing mixed bedding type. They seem to contain organic matter and are apparently
cemented by calcite (rocks react to HCl). They comprise moderately to poorly sorted,
tightly packed subangular to subrounded grains showing moderate to high sphericity.
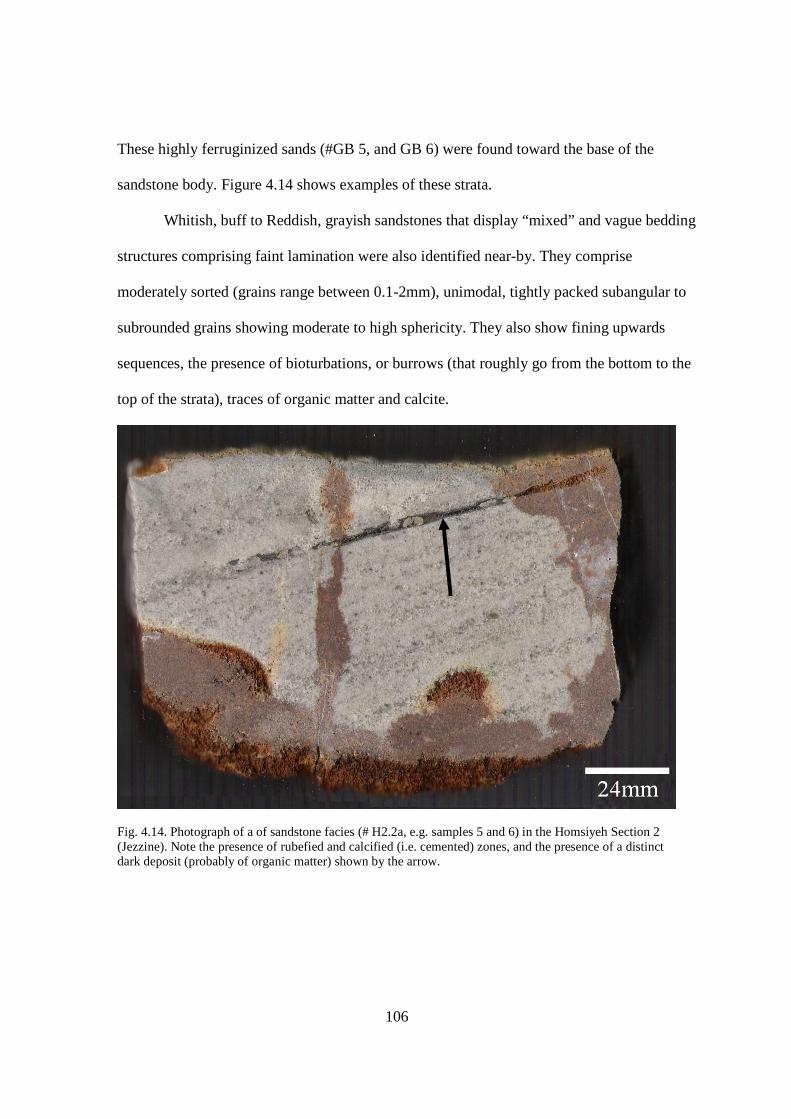
106
These highly ferruginized sands (#GB 5, and GB 6) were found toward the base of the
sandstone body. Figure 4.14 shows examples of these strata.
Whitish, buff to Reddish, grayish sandstones that display “mixed” and vague bedding
structures comprising faint lamination were also identified near-by. They comprise
moderately sorted (grains range between 0.1-2mm), unimodal, tightly packed subangular to
subrounded grains showing moderate to high sphericity. They also show fining upwards
sequences, the presence of bioturbations, or burrows (that roughly go from the bottom to the
top of the strata), traces of organic matter and calcite.
Fig. 4.14. Photograph of a of sandstone facies (# H2.2a, e.g. samples 5 and 6) in the Homsiyeh Section 2 (Jezzine). Note the presence of rubefied and calcified (i.e. cemented) zones, and the presence of a distinct dark deposit (probably of organic matter) shown by the arrow.

107
The second sandstone facies (i.e. downwards accretion facies; # H 2.2b) indicate the
presence of two sets of deposits, overlying each other. They consist of the lower downwards
accretion sands, which comprise laminated and coarse sandstones. They are overlain by
plunging laminated yellowish graded sandstone strata. For more details, refer to Chapters V
and VI). Whitish, yellowish to reddish friable sandstones displaying distinct bedding
composed of somewhat clear (plunging) cross-laminations, including traces of organic matter
(samples 8A and 8B). They comprise moderately sorted, moderately packed subangular to
subrounded grains (0.1-1mm sizes) showing moderate sphericity (Fig. 4.15).
Fig. 4.15. Photograph of a of sandstone facies (# H2.2b, sample 8) in the Homsiyeh Section 2 (Jezzine). Scale is in cm.
The adjacent strata (from the same bed (sample 9)) comprise hard (because
cemented, most likely) beigish, buff to reddish sandstones. They show vague bedding
displaying faint (often indiscernible) laminations containing organic matter. They are
composed of moderately sorted, tightly packed subangular to subrounded grains (0.1-
1mm sizes) showing moderate to high sphericity. Figure 4.16 shows an example of these
strata.

108
Fig. 4.16. Photograph of a of sandstone facies (# H2.2b, sample 9) in the Homsiyeh Section 1 (Jezzine). Note that the arrow indicates stratigraphic orientation, and that the scale is in cm.
Overlying these plunging laminated sands, there was a bed of (plunging) beigish
to reddish sandstones that were detected (# H 2.2b; sample 10). They comprise clearly
bedded deposits containing graded and plunging cross-laminated deposits. These layered
deposits are friable (easily breakable) and contain traces of organic matter. They
comprise moderately sorted, tightly packed subangular to subrounded grains (0.1-2mm
sizes) showing moderate sphericity.
c. Layer H-3
The third subunit (thickness: 1.1m; Fig. 4.9) comprises sandstones (# H-3.1),
calcite rich lag deposits (# H 3.2), and y-muddy strata (# H 3a), overlain by limestone (#
H 3b). Three parts comprise this subunit: (1) sandstones, (2) a carbonate-rich channel lag
deposit, and (3) a top part comprising alternating sand and clay beds, overlain by
fossiliferous limestones; that were found to include cemented oyster shells and coquina,
as well as glauconitic marls.
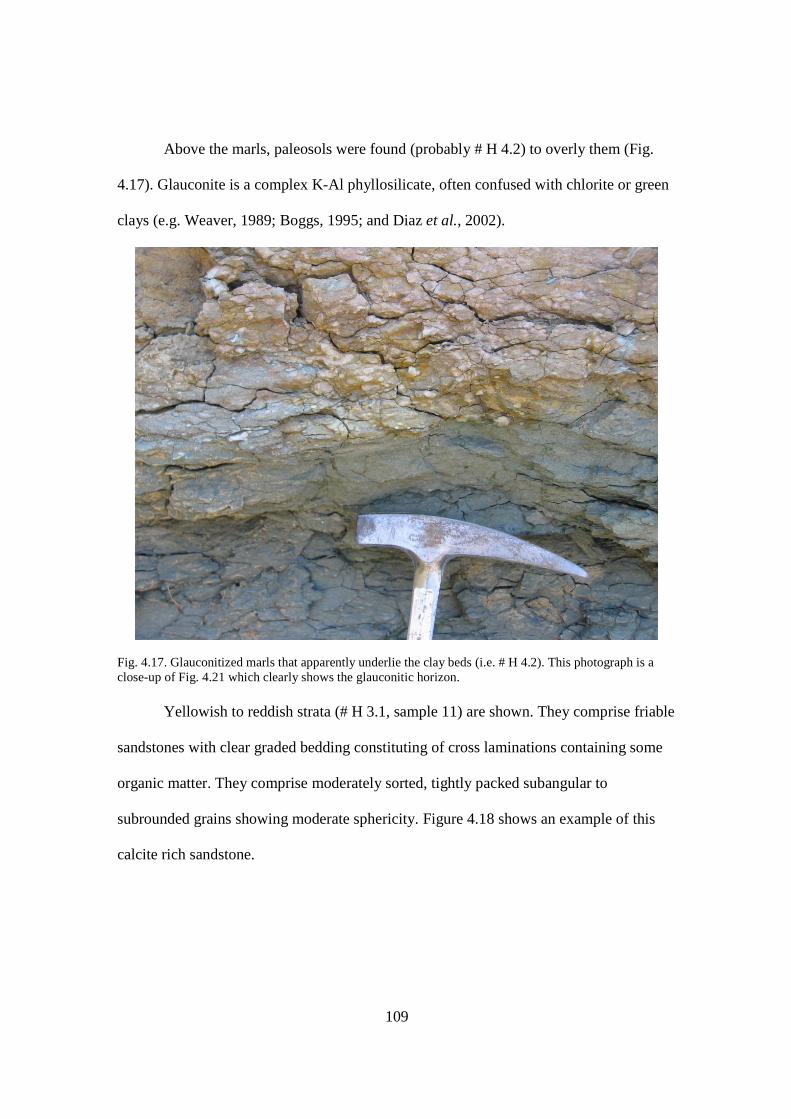
109
Above the marls, paleosols were found (probably # H 4.2) to overly them (Fig.
4.17). Glauconite is a complex K-Al phyllosilicate, often confused with chlorite or green
clays (e.g. Weaver, 1989; Boggs, 1995; and Diaz et al., 2002).
Fig. 4.17. Glauconitized marls that apparently underlie the clay beds (i.e. # H 4.2). This photograph is a close-up of Fig. 4.21 which clearly shows the glauconitic horizon.
Yellowish to reddish strata (# H 3.1, sample 11) are shown. They comprise friable
sandstones with clear graded bedding constituting of cross laminations containing some
organic matter. They comprise moderately sorted, tightly packed subangular to
subrounded grains showing moderate sphericity. Figure 4.18 shows an example of this
calcite rich sandstone.
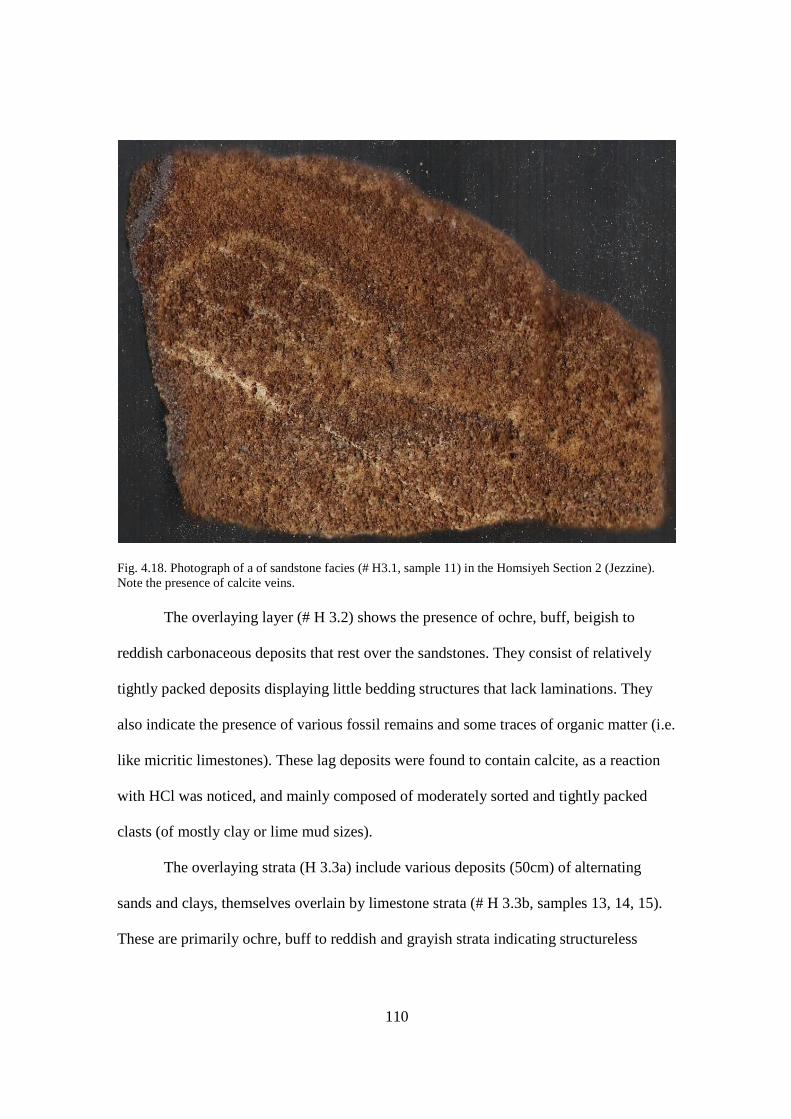
110
Fig. 4.18. Photograph of a of sandstone facies (# H3.1, sample 11) in the Homsiyeh Section 2 (Jezzine). Note the presence of calcite veins.
The overlaying layer (# H 3.2) shows the presence of ochre, buff, beigish to
reddish carbonaceous deposits that rest over the sandstones. They consist of relatively
tightly packed deposits displaying little bedding structures that lack laminations. They
also indicate the presence of various fossil remains and some traces of organic matter (i.e.
like micritic limestones). These lag deposits were found to contain calcite, as a reaction
with HCl was noticed, and mainly composed of moderately sorted and tightly packed
clasts (of mostly clay or lime mud sizes).
The overlaying strata (H 3.3a) include various deposits (50cm) of alternating
sands and clays, themselves overlain by limestone strata (# H 3.3b, samples 13, 14, 15).
These are primarily ochre, buff to reddish and grayish strata indicating structureless
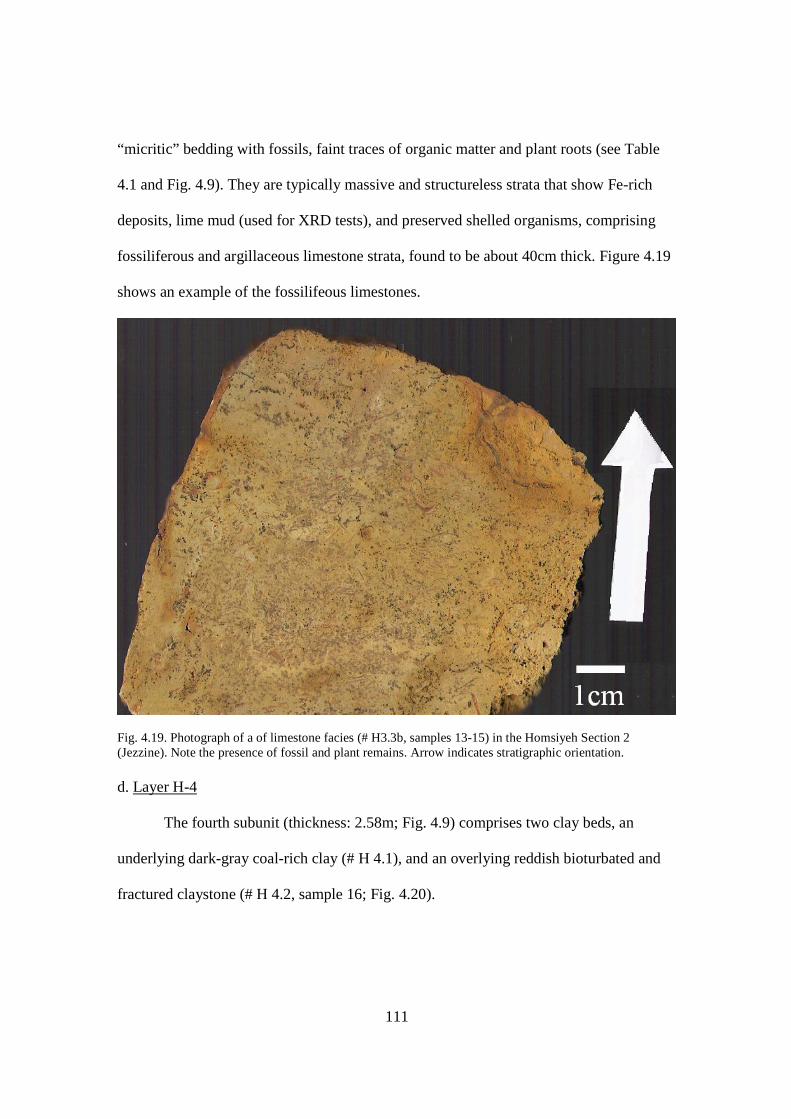
111
“micritic” bedding with fossils, faint traces of organic matter and plant roots (see Table
4.1 and Fig. 4.9). They are typically massive and structureless strata that show Fe-rich
deposits, lime mud (used for XRD tests), and preserved shelled organisms, comprising
fossiliferous and argillaceous limestone strata, found to be about 40cm thick. Figure 4.19
shows an example of the fossilifeous limestones.
Fig. 4.19. Photograph of a of limestone facies (# H3.3b, samples 13-15) in the Homsiyeh Section 2 (Jezzine). Note the presence of fossil and plant remains. Arrow indicates stratigraphic orientation. d. Layer H-4
The fourth subunit (thickness: 2.58m; Fig. 4.9) comprises two clay beds, an
underlying dark-gray coal-rich clay (# H 4.1), and an overlying reddish bioturbated and
fractured claystone (# H 4.2, sample 16; Fig. 4.20).
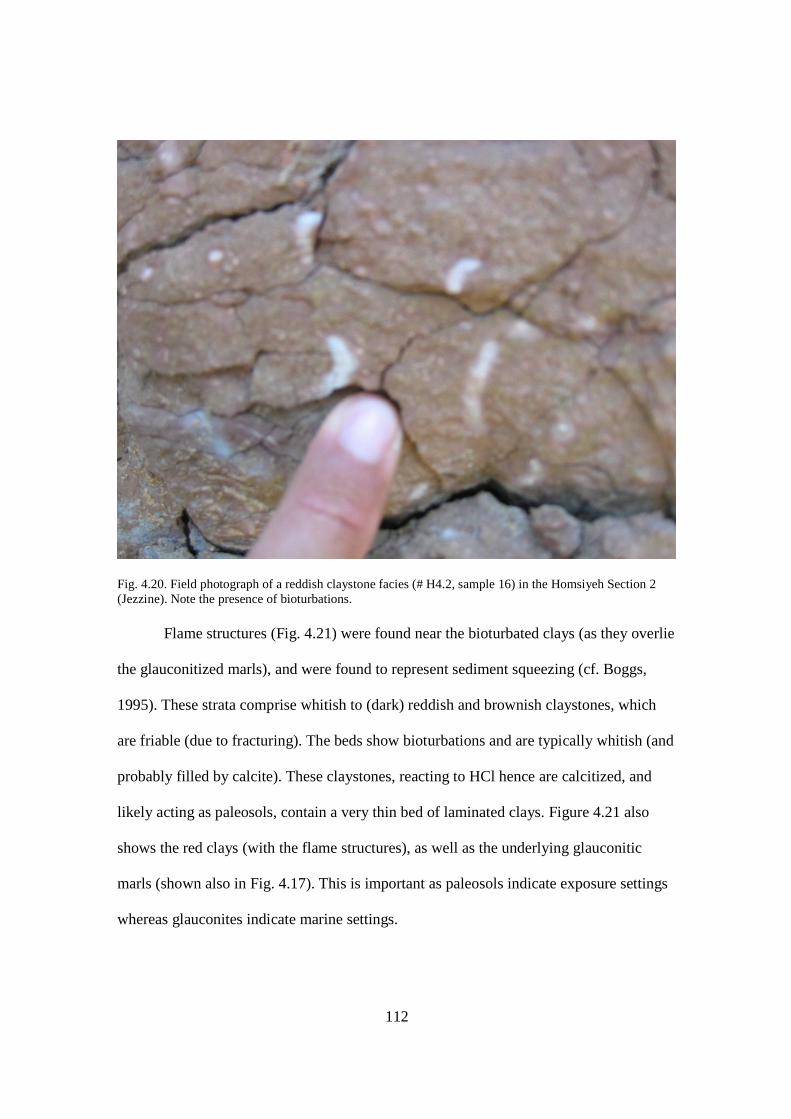
112
Fig. 4.20. Field photograph of a reddish claystone facies (# H4.2, sample 16) in the Homsiyeh Section 2 (Jezzine). Note the presence of bioturbations.
Flame structures (Fig. 4.21) were found near the bioturbated clays (as they overlie
the glauconitized marls), and were found to represent sediment squeezing (cf. Boggs,
1995). These strata comprise whitish to (dark) reddish and brownish claystones, which
are friable (due to fracturing). The beds show bioturbations and are typically whitish (and
probably filled by calcite). These claystones, reacting to HCl hence are calcitized, and
likely acting as paleosols, contain a very thin bed of laminated clays. Figure 4.21 also
shows the red clays (with the flame structures), as well as the underlying glauconitic
marls (shown also in Fig. 4.17). This is important as paleosols indicate exposure settings
whereas glauconites indicate marine settings.
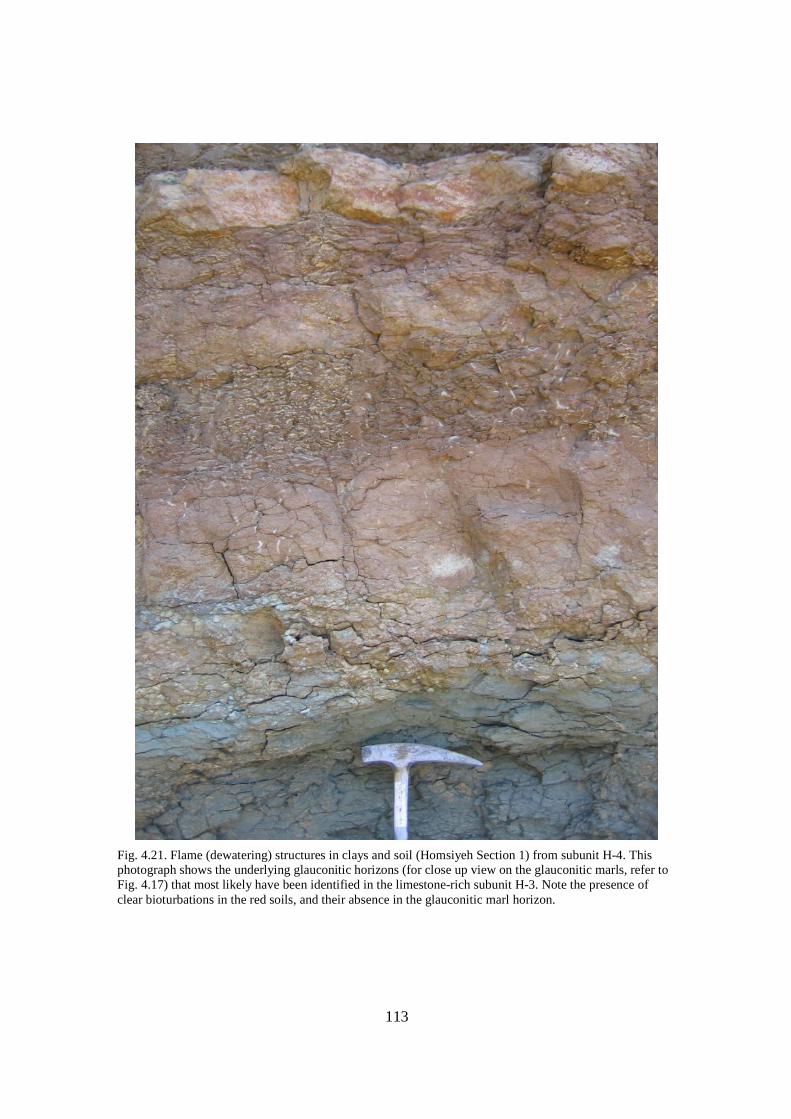
113
Fig. 4.21. Flame (dewatering) structures in clays and soil (Homsiyeh Section 1) from subunit H-4. This photograph shows the underlying glauconitic horizons (for close up view on the glauconitic marls, refer to Fig. 4.17) that most likely have been identified in the limestone-rich subunit H-3. Note the presence of clear bioturbations in the red soils, and their absence in the glauconitic marl horizon.
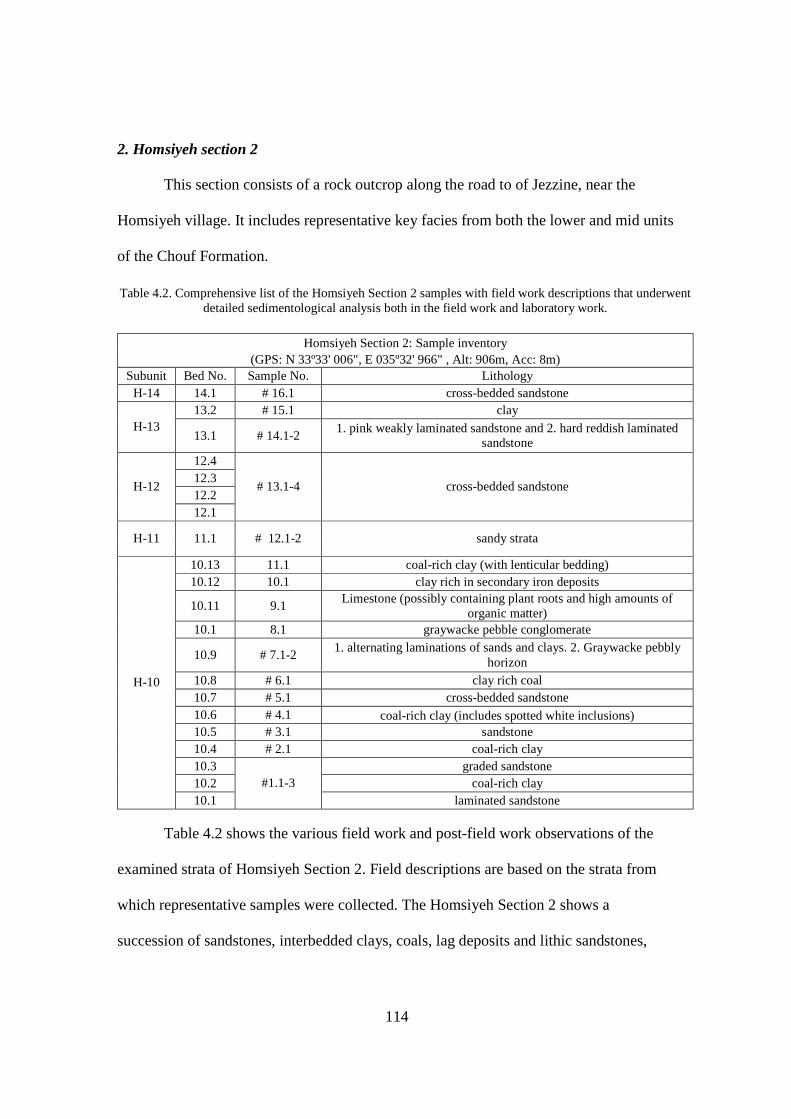
114
2. Homsiyeh section 2
This section consists of a rock outcrop along the road to of Jezzine, near the
Homsiyeh village. It includes representative key facies from both the lower and mid units
of the Chouf Formation.
Table 4.2. Comprehensive list of the Homsiyeh Section 2 samples with field work descriptions that underwent detailed sedimentological analysis both in the field work and laboratory work.
Homsiyeh Section 2: Sample inventory
(GPS: N 33º33' 006", E 035º32' 966" , Alt: 906m, Acc: 8m) Subunit Bed No. Sample No. Lithology
H-14 14.1 # 16.1 cross-bedded sandstone 13.2 # 15.1 clay
H-13 13.1 # 14.1-2
1. pink weakly laminated sandstone and 2. hard reddish laminated sandstone
12.4 12.3 12.2
H-12
12.1
# 13.1-4 cross-bedded sandstone
H-11 11.1 # 12.1-2 sandy strata
10.13 11.1 coal-rich clay (with lenticular bedding) 10.12 10.1 clay rich in secondary iron deposits
10.11 9.1 Limestone (possibly containing plant roots and high amounts of organic matter)
10.1 8.1 graywacke pebble conglomerate
10.9 # 7.1-2 1. alternating laminations of sands and clays. 2. Graywacke pebbly
horizon 10.8 # 6.1 clay rich coal 10.7 # 5.1 cross-bedded sandstone 10.6 # 4.1 coal-rich clay (includes spotted white inclusions) 10.5 # 3.1 sandstone 10.4 # 2.1 coal-rich clay 10.3 graded sandstone 10.2 coal-rich clay
H-10
10.1 #1.1-3
laminated sandstone Table 4.2 shows the various field work and post-field work observations of the
examined strata of Homsiyeh Section 2. Field descriptions are based on the strata from
which representative samples were collected. The Homsiyeh Section 2 shows a
succession of sandstones, interbedded clays, coals, lag deposits and lithic sandstones,
115
coinciding with several key facies from the lower (aquatic) part of the Chouf Formation.
The section represents a lower unit of various coal-rich clays and sands and an overlying
layer of thick sandstones (coinciding with the middle part of the Chouf formation). As the
section is about 500m away from the fist one, the base of the section is not detected with
certainty, and is, therefore, extrapolated. Figure 4.22 shows the detailed stratigraphic log
of the Homsiyeh section 2. It provides a description of twenty strata from which twenty-
four representative samples were collected. For simplicity, the studied strata (20) are
arranged in sixteen distinct beds in order to best represent the five “key” facies (# H 10 to
H 14). The different subunits are described below:
a. Layer H-10:
The first subunit (thickness: 9.93m; Fig. 4.22) consists of sand (1, 3, 5, and 7),
graywacke (9, and 10), limestone (11) and coal-rich clay strata (2, 4, 6, 8, 12, and 13).
The first bed of this subunit (# H 10.1) comprises friable whitish, yellowish, reddish to
blackish sandstones (Fig. 4.23). They display vague bedding consisting of thin alternating
white to dark laminations. They comprise poorly to moderately sorted subangular to
subrounded, and moderately packed grains (0.1-0.5mm sizes) showing moderate to high
sphericity.
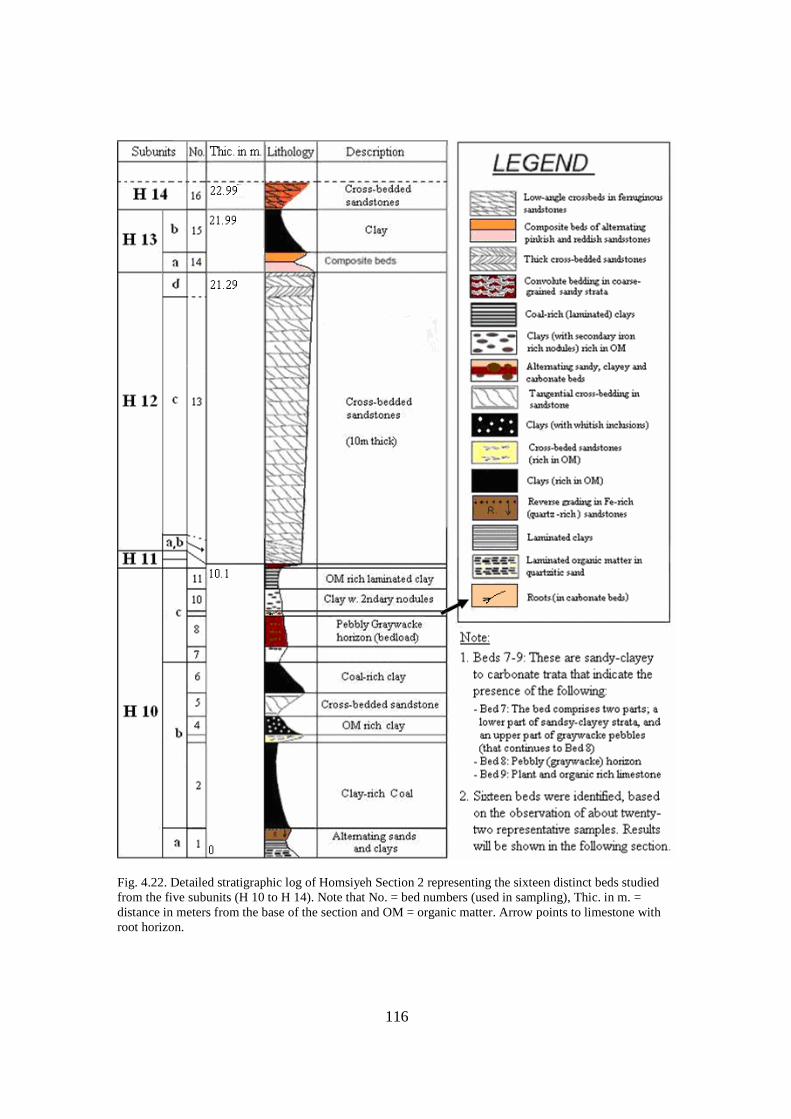
116
Fig. 4.22. Detailed stratigraphic log of Homsiyeh Section 2 representing the sixteen distinct beds studied from the five subunits (H 10 to H 14). Note that No. = bed numbers (used in sampling), Thic. in m. = distance in meters from the base of the section and OM = organic matter. Arrow points to limestone with root horizon.
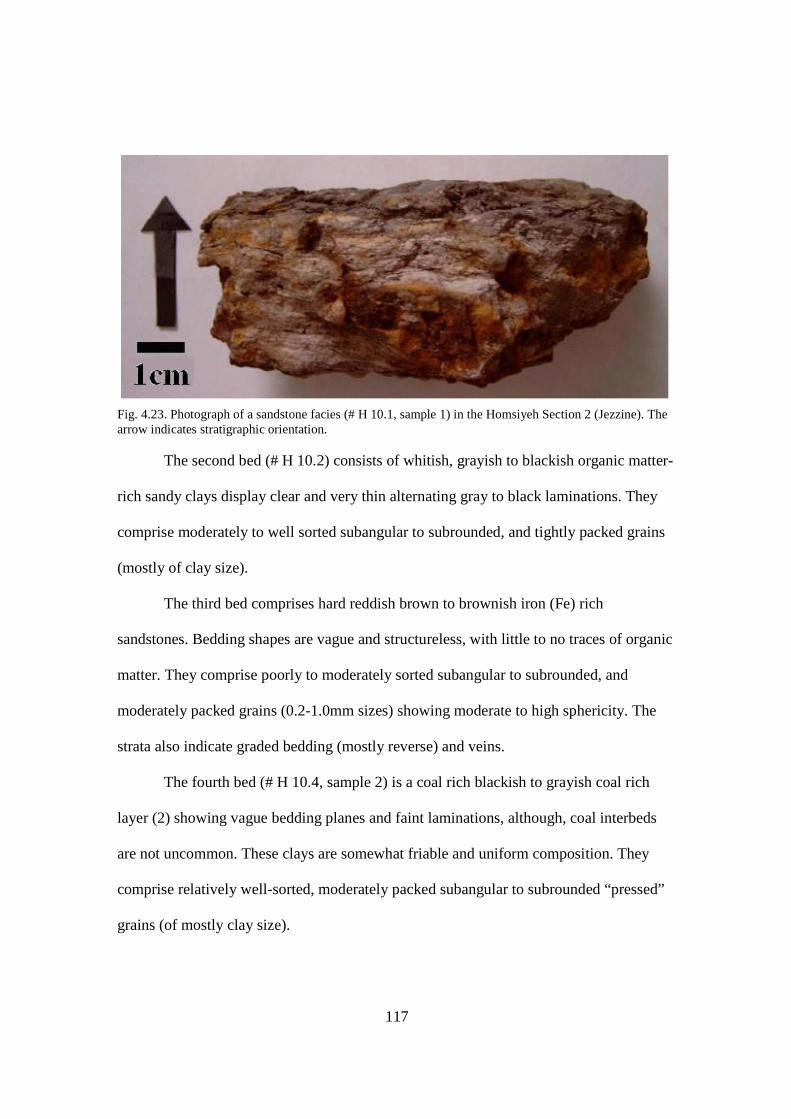
117
Fig. 4.23. Photograph of a sandstone facies (# H 10.1, sample 1) in the Homsiyeh Section 2 (Jezzine). The arrow indicates stratigraphic orientation.
The second bed (# H 10.2) consists of whitish, grayish to blackish organic matter-
rich sandy clays display clear and very thin alternating gray to black laminations. They
comprise moderately to well sorted subangular to subrounded, and tightly packed grains
(mostly of clay size).
The third bed comprises hard reddish brown to brownish iron (Fe) rich
sandstones. Bedding shapes are vague and structureless, with little to no traces of organic
matter. They comprise poorly to moderately sorted subangular to subrounded, and
moderately packed grains (0.2-1.0mm sizes) showing moderate to high sphericity. The
strata also indicate graded bedding (mostly reverse) and veins.
The fourth bed (# H 10.4, sample 2) is a coal rich blackish to grayish coal rich
layer (2) showing vague bedding planes and faint laminations, although, coal interbeds
are not uncommon. These clays are somewhat friable and uniform composition. They
comprise relatively well-sorted, moderately packed subangular to subrounded “pressed”
grains (of mostly clay size).
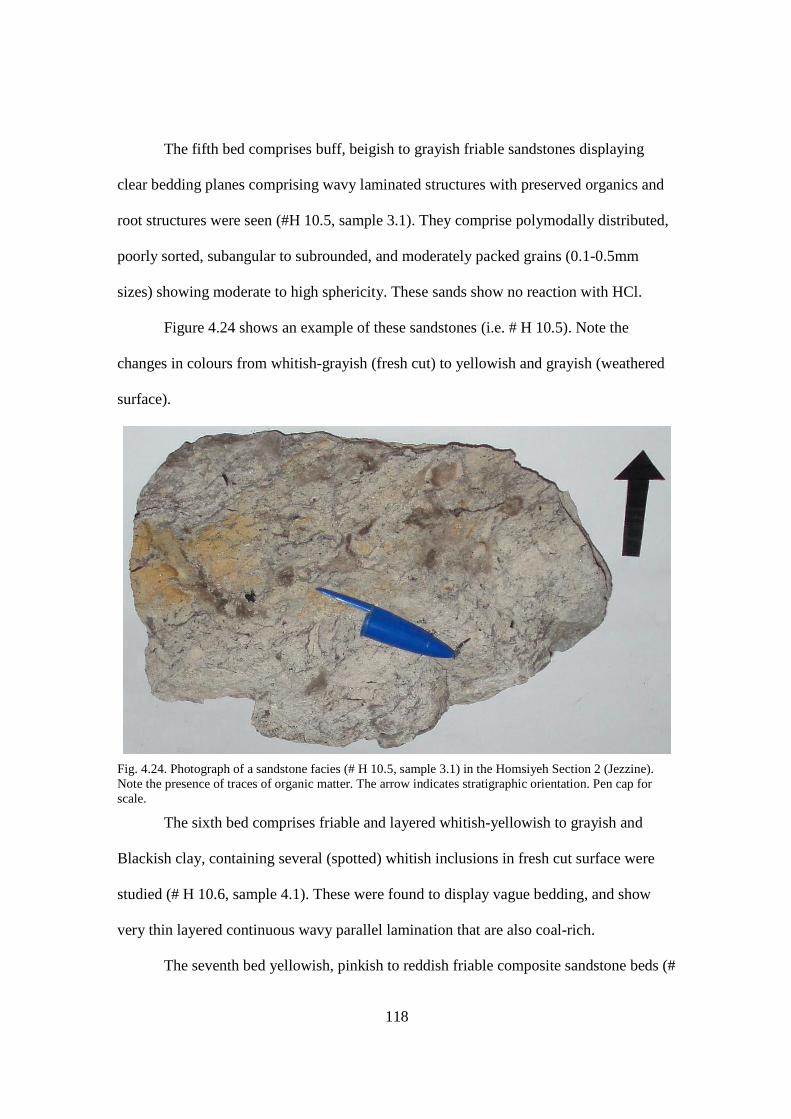
118
The fifth bed comprises buff, beigish to grayish friable sandstones displaying
clear bedding planes comprising wavy laminated structures with preserved organics and
root structures were seen (#H 10.5, sample 3.1). They comprise polymodally distributed,
poorly sorted, subangular to subrounded, and moderately packed grains (0.1-0.5mm
sizes) showing moderate to high sphericity. These sands show no reaction with HCl.
Figure 4.24 shows an example of these sandstones (i.e. # H 10.5). Note the
changes in colours from whitish-grayish (fresh cut) to yellowish and grayish (weathered
surface).
Fig. 4.24. Photograph of a sandstone facies (# H 10.5, sample 3.1) in the Homsiyeh Section 2 (Jezzine). Note the presence of traces of organic matter. The arrow indicates stratigraphic orientation. Pen cap for scale.
The sixth bed comprises friable and layered whitish-yellowish to grayish and
Blackish clay, containing several (spotted) whitish inclusions in fresh cut surface were
studied (# H 10.6, sample 4.1). These were found to display vague bedding, and show
very thin layered continuous wavy parallel lamination that are also coal-rich.
The seventh bed yellowish, pinkish to reddish friable composite sandstone beds (#

119
H 10.7, sample 5.1) showing vague bedding comprising hard and mixed deposits were
seen. They indicate traces of organic matter, and no reaction to HCl. The sands consist
primarily of moderately well sorted subangular to subrounded, and moderately packed
grains (0.15-1.75mm sizes) showing low to moderate sphericity. Figure 4.25 shows an
example from these sandstones. Note the clear presence of reddish-yellowish to ochre
colours and also the presence of iron-rich deposits.
Fig. 4.25. Photograph of a sandstone facies (# H 10.7, sample 5.1) in the Homsiyeh Section 2 (Jezzine). Note the presence of iron-rich deposits and apparent cementation. Scale is in cm.
The eighth bed comprises shining brownish to blackish clays (# H 10.8, sample
6.1), overlying the reddish to yellowish sandstones, show vague bedding and some thin
apparent cleavage lines, or fracturing planes. They contain some organic matter content
and indicate the presence of concoidal fracturing (coal beds). The strata are friable, as the
materials split on the cleavages. This coal is most probably of intermediate (or lignites).
The ninth bed includes two parts; a lower sand and clay consists of alternating
whitish beigish to grayish composite strata showing vague bedding structures comprising
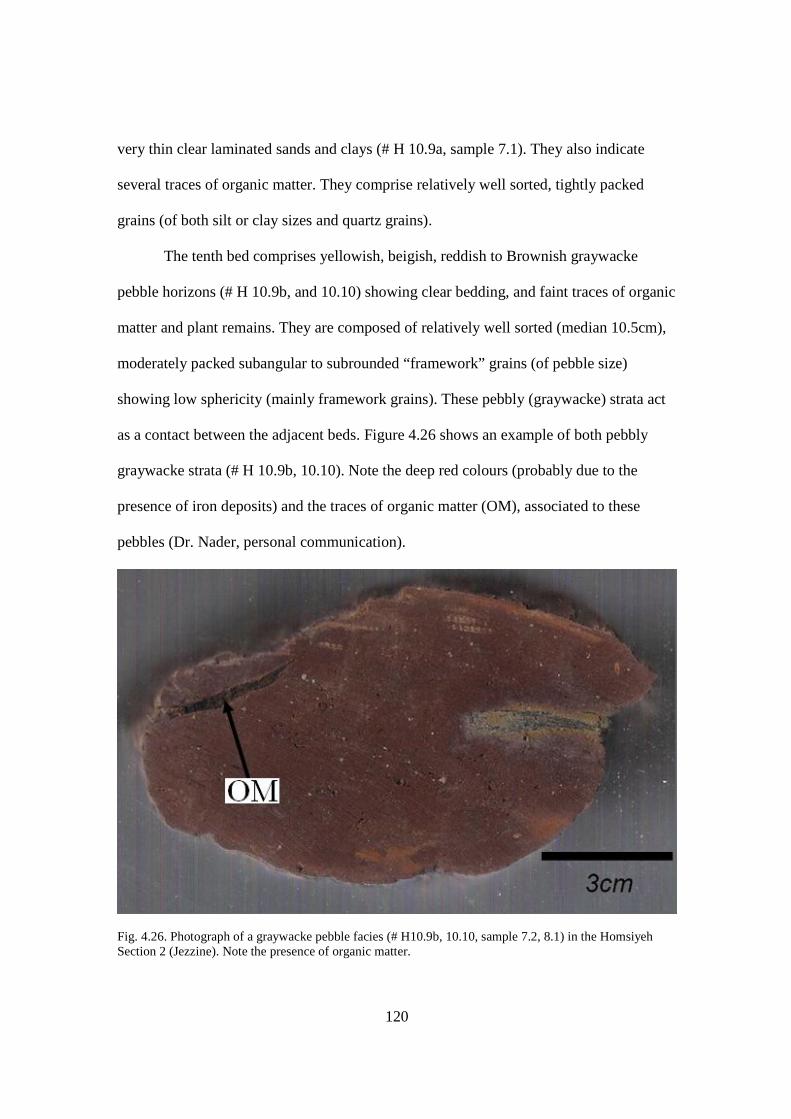
120
very thin clear laminated sands and clays (# H 10.9a, sample 7.1). They also indicate
several traces of organic matter. They comprise relatively well sorted, tightly packed
grains (of both silt or clay sizes and quartz grains).
The tenth bed comprises yellowish, beigish, reddish to Brownish graywacke
pebble horizons (# H 10.9b, and 10.10) showing clear bedding, and faint traces of organic
matter and plant remains. They are composed of relatively well sorted (median 10.5cm),
moderately packed subangular to subrounded “framework” grains (of pebble size)
showing low sphericity (mainly framework grains). These pebbly (graywacke) strata act
as a contact between the adjacent beds. Figure 4.26 shows an example of both pebbly
graywacke strata (# H 10.9b, 10.10). Note the deep red colours (probably due to the
presence of iron deposits) and the traces of organic matter (OM), associated to these
pebbles (Dr. Nader, personal communication).
Fig. 4.26. Photograph of a graywacke pebble facies (# H10.9b, 10.10, sample 7.2, 8.1) in the Homsiyeh Section 2 (Jezzine). Note the presence of organic matter.

121
The eleventh bed (# H 10.11, sample 9.1) comprise composite, friable ochre,
yellowish to beigish carbonate-rich strata (HCl reaction) that indicate the presence of
organic matter traces and plant remains. They show no laminations, but matrix fills. They
are composed of very poorly to poorly sorted, moderately packed subrounded to rounded
grains showing moderate to high sphericity. Figure 4.27 shows an example of these
“carbonate” beds.
Fig. 4.27. Photograph of a limestone facies (# H 10.11, sample 9.1) in the Homsiyeh Section 2 (Jezzine). The arrow indicates stratigraphic orientation.
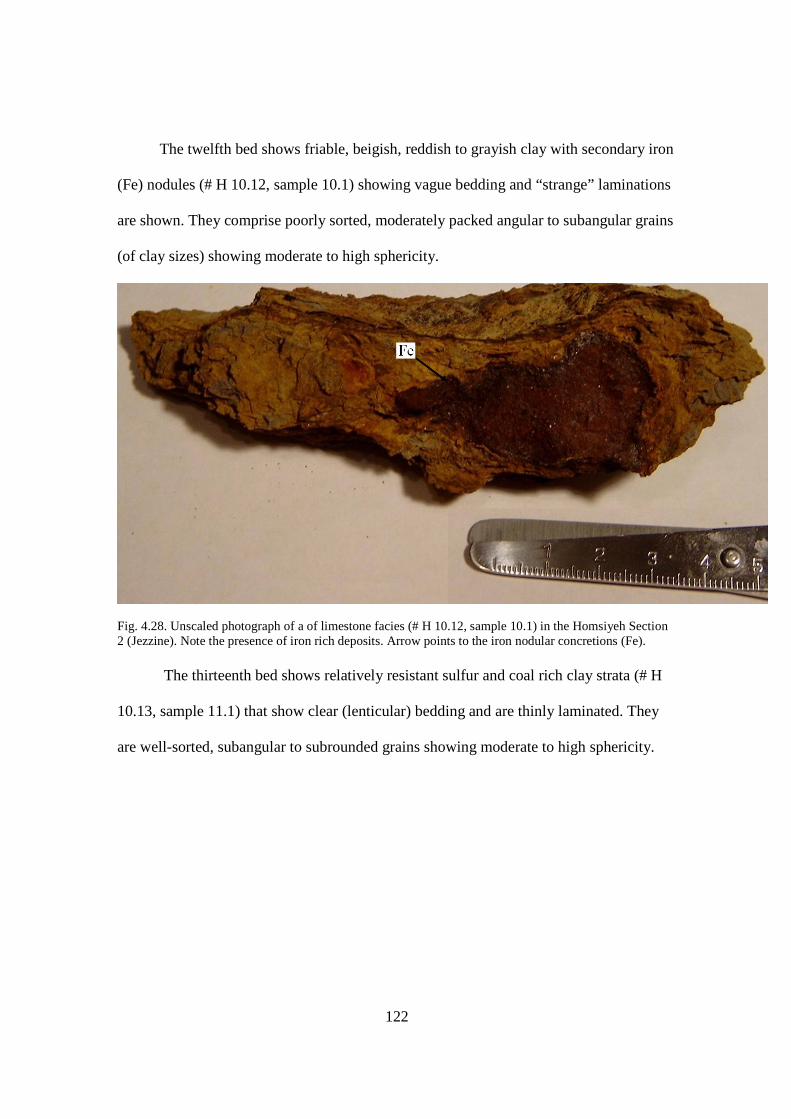
122
The twelfth bed shows friable, beigish, reddish to grayish clay with secondary iron
(Fe) nodules (# H 10.12, sample 10.1) showing vague bedding and “strange” laminations
are shown. They comprise poorly sorted, moderately packed angular to subangular grains
(of clay sizes) showing moderate to high sphericity.
Fig. 4.28. Unscaled photograph of a of limestone facies (# H 10.12, sample 10.1) in the Homsiyeh Section 2 (Jezzine). Note the presence of iron rich deposits. Arrow points to the iron nodular concretions (Fe).
The thirteenth bed shows relatively resistant sulfur and coal rich clay strata (# H
10.13, sample 11.1) that show clear (lenticular) bedding and are thinly laminated. They
are well-sorted, subangular to subrounded grains showing moderate to high sphericity.

123
b. Layer H 11
The second subunit (thickness: 0.17m; Bed H 11.1, samples 12.1, 12.2; Figs. 4.22
and 4.29) consists of coarse-grained reddish sandy deposits (i.e. bed 14) that are rich in
iron (Fe) deposits, with some preserved organic matter that are hard (e.g. structureless)
and probably cemented. These (vague) beds indicate the presence of wavy undulations of
black material. They comprise poorly sorted, tightly packed, angular to subangular grains
(0.25-4mm) showing moderate to high sphericity. Due to their hard and compact nature
granulometric studies were almost impossible to conduct on these strata; so microscopic
and mineralogical methods were used instead (see Chapters V and VI).
Figure 4.29 shows an example of these coarse grained iron-rich sandy strata. Note
the reddish to darter preserved in these strata. A cliff forming rock sequence of yellowish
sandstones overly these iron-rich sandstones.
A. B.
Fig. 4.29. Slab photographs representing the sandstone lag deposits (# H 11.1). A. Sample 12.1. B. Sample 12.2, where the arrow marks the stratigraphic orientation and the scale is in cm.
This subunit (Layer H 11) marks the base of a thickly bedded dominant sandstone
cliff (# JH 12) that coincides with parts of the continental strata of the Chouf Formation.
This cliff was surveyed and was found to include three major layers that appear to repeat
themselves (Fig 4.30). The cliff coincides with the mid (terrigenous) part of the Chouf

124
Formation. Near-by, not too far from its base (see Fig. 3.2), just above the clay-coal
complex (well defined in the previous section), various nodules and other concretions
were identified.
The cliff (Fig. 4.30) is about 10m thick (facing 350º N trending E-W). The five
layers (shown in the sketch), which were studied, include massive and cross-bedded
yellowish to reddish sand strata (e.g. Layers III, IV; beds 13 and 14 to represent cross-
stratified sandstone) and brownish friable strata (e.g. Layer V; bed 15) have been
analyzed in detail. Note that “X” shows the locations of collected samples taken
throughout the field work investigations on the cliff (Chapter III; Fig. 3.2).
Fig. 4.30. Hand drawn sketch representing the Roum Cliff (Facing 350º; Trending E-W). Note the layers I-V (e.g. III, IV are cross-bedded sandstones, V is brownish friable material; located on top of the cliff). X= approximate locations of collected samples. c. Layer H 12
The third subunit (thickness: 11.19m; Fig. 4.22) consists of thick yellowish to
orange red cross-bedded sandstone strata that represent key strata of the Middle part of
the Chouf Formation. Overall, they are characterized by medium grained and friable
(when uncemented) “clean” sandstones, devoid of clays (e.g. Tixier, 1971-1972;
Pettijohn et al., 1973). The strata are both cross-bedded and friable (Figs. 4.31A, B) to
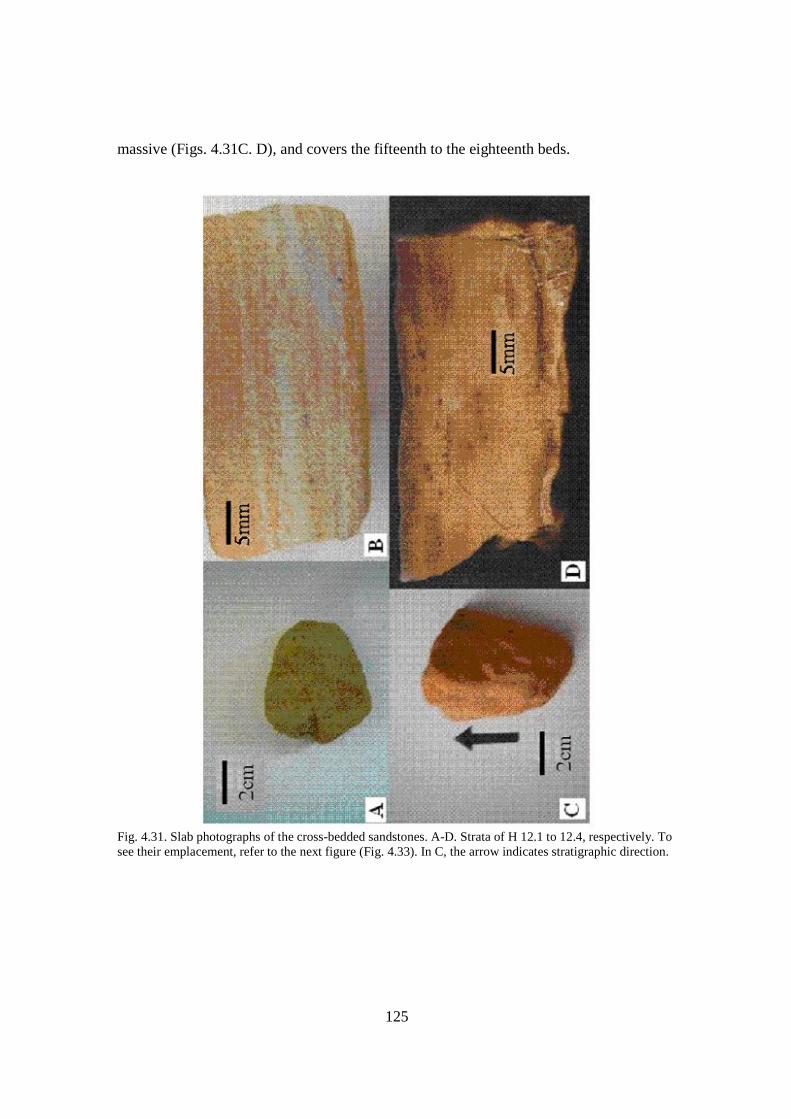
125
massive (Figs. 4.31C. D), and covers the fifteenth to the eighteenth beds.
Fig. 4.31. Slab photographs of the cross-bedded sandstones. A-D. Strata of H 12.1 to 12.4, respectively. To see their emplacement, refer to the next figure (Fig. 4.33). In C, the arrow indicates stratigraphic direction.
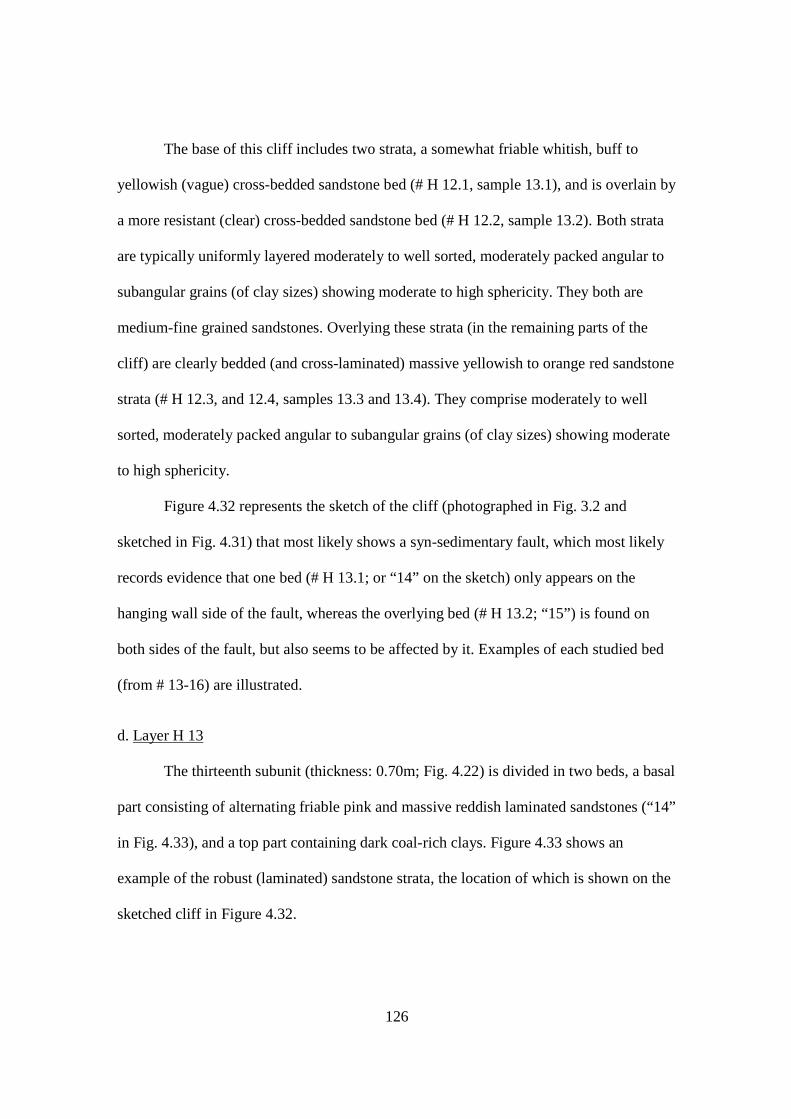
126
The base of this cliff includes two strata, a somewhat friable whitish, buff to
yellowish (vague) cross-bedded sandstone bed (# H 12.1, sample 13.1), and is overlain by
a more resistant (clear) cross-bedded sandstone bed (# H 12.2, sample 13.2). Both strata
are typically uniformly layered moderately to well sorted, moderately packed angular to
subangular grains (of clay sizes) showing moderate to high sphericity. They both are
medium-fine grained sandstones. Overlying these strata (in the remaining parts of the
cliff) are clearly bedded (and cross-laminated) massive yellowish to orange red sandstone
strata (# H 12.3, and 12.4, samples 13.3 and 13.4). They comprise moderately to well
sorted, moderately packed angular to subangular grains (of clay sizes) showing moderate
to high sphericity.
Figure 4.32 represents the sketch of the cliff (photographed in Fig. 3.2 and
sketched in Fig. 4.31) that most likely shows a syn-sedimentary fault, which most likely
records evidence that one bed (# H 13.1; or “14” on the sketch) only appears on the
hanging wall side of the fault, whereas the overlying bed (# H 13.2; “15”) is found on
both sides of the fault, but also seems to be affected by it. Examples of each studied bed
(from # 13-16) are illustrated.
d. Layer H 13
The thirteenth subunit (thickness: 0.70m; Fig. 4.22) is divided in two beds, a basal
part consisting of alternating friable pink and massive reddish laminated sandstones (“14”
in Fig. 4.33), and a top part containing dark coal-rich clays. Figure 4.33 shows an
example of the robust (laminated) sandstone strata, the location of which is shown on the
sketched cliff in Figure 4.32.
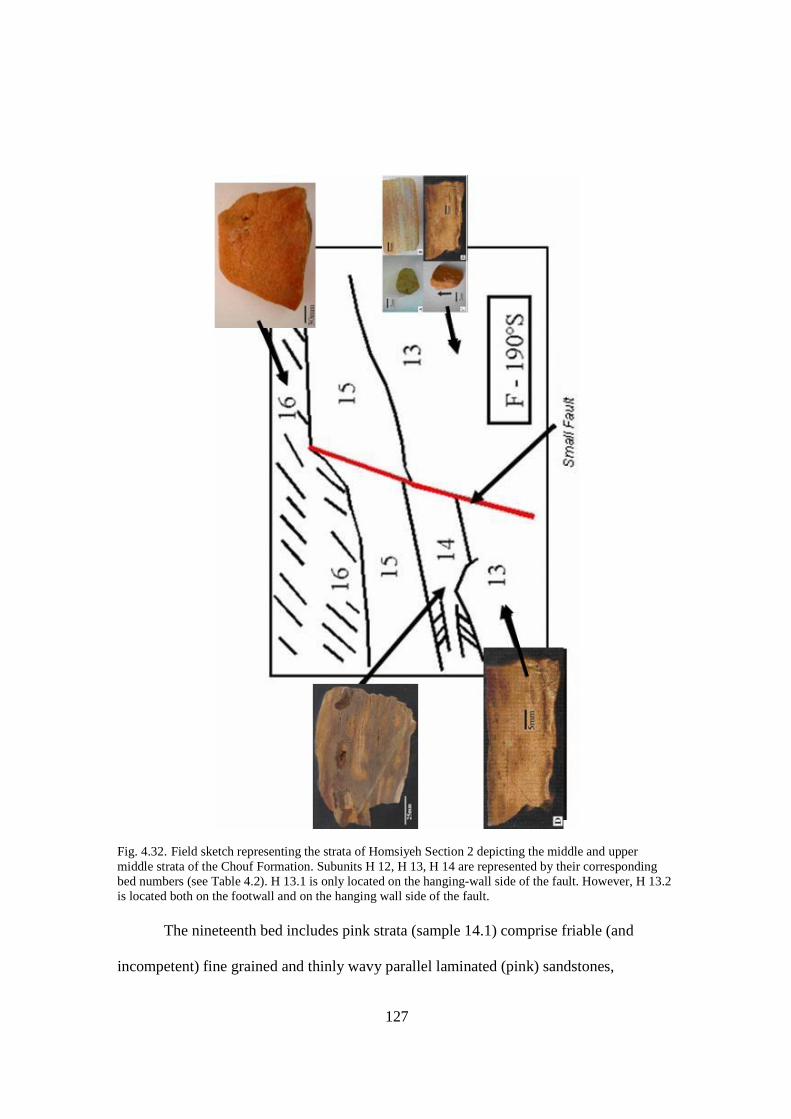
127
Fig. 4.32. Field sketch representing the strata of Homsiyeh Section 2 depicting the middle and upper middle strata of the Chouf Formation. Subunits H 12, H 13, H 14 are represented by their corresponding bed numbers (see Table 4.2). H 13.1 is only located on the hanging-wall side of the fault. However, H 13.2 is located both on the footwall and on the hanging wall side of the fault.
The nineteenth bed includes pink strata (sample 14.1) comprise friable (and
incompetent) fine grained and thinly wavy parallel laminated (pink) sandstones,
128
containing layered strata of very weak composition. They are relatively well-sorted,
polymodally distributed, moderately packed, and subangular to subrounded grains (0.1-
0.25 mm size) of moderate sphericity. The robust and massive strata (Fig. 4.33) consist of
yellowish to uniformly deposited reddish and clearly stratified (with wavy laminations)
sandstones with organic matter traces. They are relatively well-sorted, polymodally
distributed, tightly packed grains of moderate sphericity. Thus, both sandstone strata (# H
13.1, samples 14.1 and 14.2) have sharp indications of changes in lithology.
Fig. 4.33. Photograph of a sandstone facies (# H 13.1b, sample 14.2) Homsiyeh Section 2 (Jezzine). Note the variations in colour, and the presence of laminations.
The twentieth bed consists of friable reddish to grayish to blackish coal-rich clay
strata (“15” in Fig. 4.32) that deposited. They display very thin wavy non continuous
laminae, with traces of organic matter found within them. They were found to be layered
deposits of relatively well-sorted tightly packed clay sized grains that were studied in
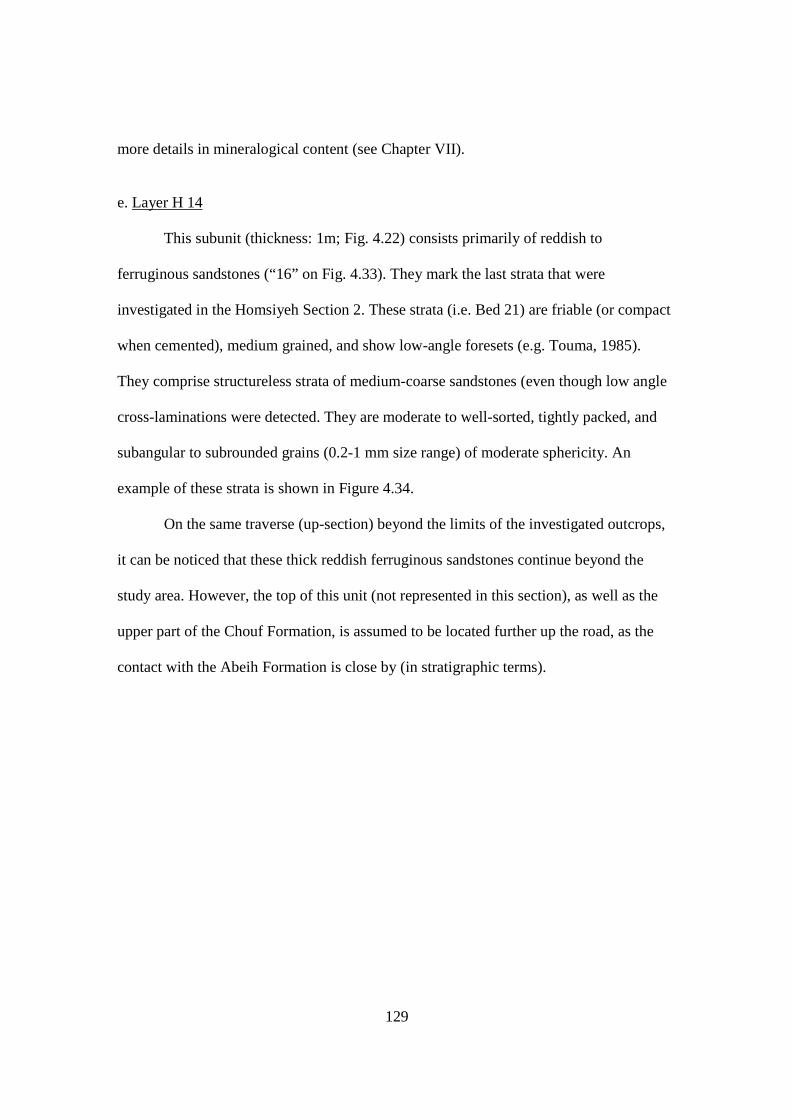
129
more details in mineralogical content (see Chapter VII).
e. Layer H 14
This subunit (thickness: 1m; Fig. 4.22) consists primarily of reddish to
ferruginous sandstones (“16” on Fig. 4.33). They mark the last strata that were
investigated in the Homsiyeh Section 2. These strata (i.e. Bed 21) are friable (or compact
when cemented), medium grained, and show low-angle foresets (e.g. Touma, 1985).
They comprise structureless strata of medium-coarse sandstones (even though low angle
cross-laminations were detected. They are moderate to well-sorted, tightly packed, and
subangular to subrounded grains (0.2-1 mm size range) of moderate sphericity. An
example of these strata is shown in Figure 4.34.
On the same traverse (up-section) beyond the limits of the investigated outcrops,
it can be noticed that these thick reddish ferruginous sandstones continue beyond the
study area. However, the top of this unit (not represented in this section), as well as the
upper part of the Chouf Formation, is assumed to be located further up the road, as the
contact with the Abeih Formation is close by (in stratigraphic terms).
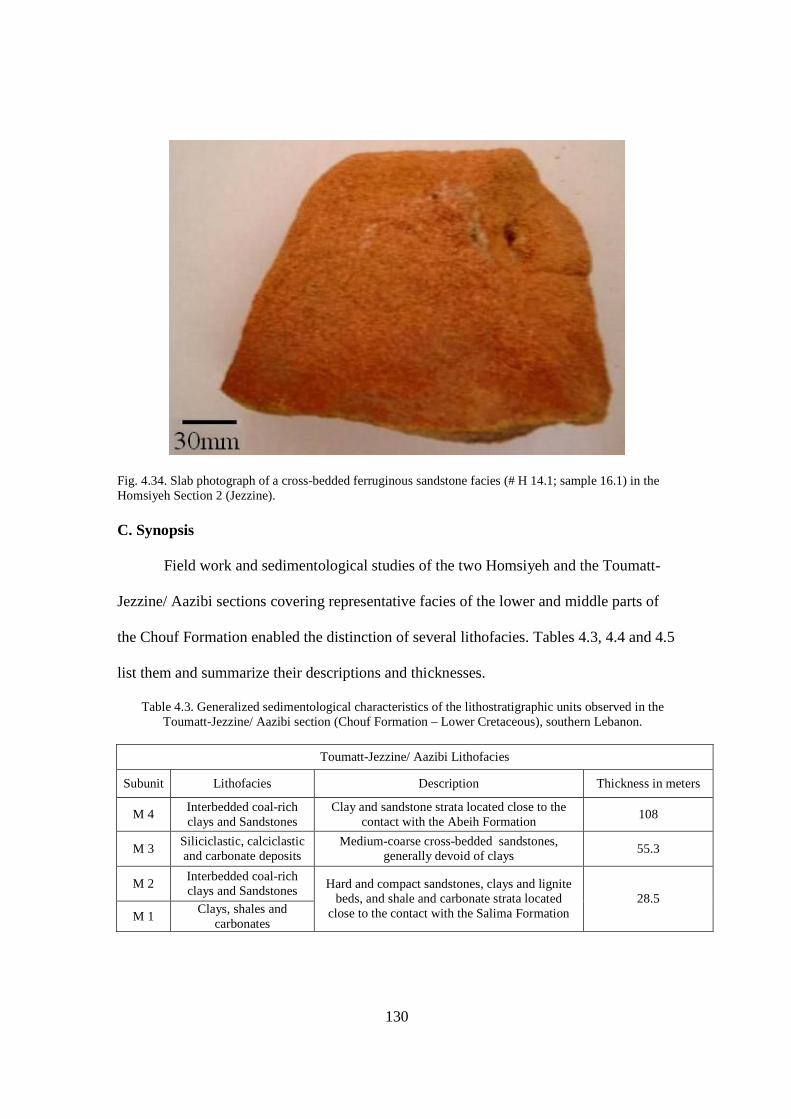
130
Fig. 4.34. Slab photograph of a cross-bedded ferruginous sandstone facies (# H 14.1; sample 16.1) in the Homsiyeh Section 2 (Jezzine). C. Synopsis
Field work and sedimentological studies of the two Homsiyeh and the Toumatt-
Jezzine/ Aazibi sections covering representative facies of the lower and middle parts of
the Chouf Formation enabled the distinction of several lithofacies. Tables 4.3, 4.4 and 4.5
list them and summarize their descriptions and thicknesses.
Table 4.3. Generalized sedimentological characteristics of the lithostratigraphic units observed in the Toumatt-Jezzine/ Aazibi section (Chouf Formation – Lower Cretaceous), southern Lebanon.
Toumatt-Jezzine/ Aazibi Lithofacies
Subunit Lithofacies Description Thickness in meters
M 4 Interbedded coal-rich clays and Sandstones
Clay and sandstone strata located close to the contact with the Abeih Formation
108
M 3 Siliciclastic, calciclastic and carbonate deposits
Medium-coarse cross-bedded sandstones, generally devoid of clays 55.3
M 2 Interbedded coal-rich clays and Sandstones
M 1 Clays, shales and
carbonates
Hard and compact sandstones, clays and lignite beds, and shale and carbonate strata located
close to the contact with the Salima Formation 28.5

131
Table 4.4. Detailed sedimentological characteristics of the lithostratigraphic units observed in the Homsiyeh Section 1 (including parts of Lower Unit from the Chouf Formation), southern Lebanon.
Homsiyeh Section 1 Lithofacies
Subunit Lithofacies Description Thickness in meters
H 4 Coal-rich to
bioturbated clays and claystones
Friable and bioturbated reddish-claystone. 2.58
H 3 Siliciclastic,
calciclastic and carbonate deposits
Sandstone, calcareous lag deposits, and a mixed sandy-clayey bed,
overlain by fossiliferous argillaceous strata cemented by carbonates, comprising a coquina showing
oyster and other types of organisms
1.1
H 2
Alternating laminated clays, sandstones and channel facies
Clay, associated with a ribbon facies massive cemented sandstones, and
plunging downwards accretion cross-stratified and graded
sandstones
2.25
H 1 Coal-rich clays and sandstones
Friable-coal and amber bearing sandstones, laminated organic
matter rich sandy clays and thinly deposited low-angle cross-stratified
sandstones
3.15
Table 4.5. Detailed sedimentological characteristics of the lithostratigraphic units observed in the Homsiyeh
Section 2 (including key strata from both the lower and middle units of the Chouf Formation), southern Lebanon.
Homsiyeh Section 2 Lithofacies
Subunit Lithofacies Description Thickness in meters
H 14 Massive and cross bedded
ferruginous sandstone Medium-coarse grained cross bedded
sandstone 1
H 13 Alternating massive/ laminated to friable sandstones and clays
Alternating competent resistant and incompetent weak sandy deposits and
clays 0.70
H 12 Massive to cross-stratified
yellowish sandstones
Cross-stratified yellowish to reddish massive-cross bedded eolian sandstone
strata 11.19
H 11 Sandy deposits Coarse-grained Fe-rich reddish
(erosional) deposits of dominantly sandy composition
0.17
H 10 Sandstones, lithic
sandstones, and clays, (rich in coal)
Hard-compact and often cemented sandstone strata, alternating with
laminated clays, graywacke, and/ or fluvial-overbank poorly-sorted
sandstones, that may contain some amounts of organic material
9.93
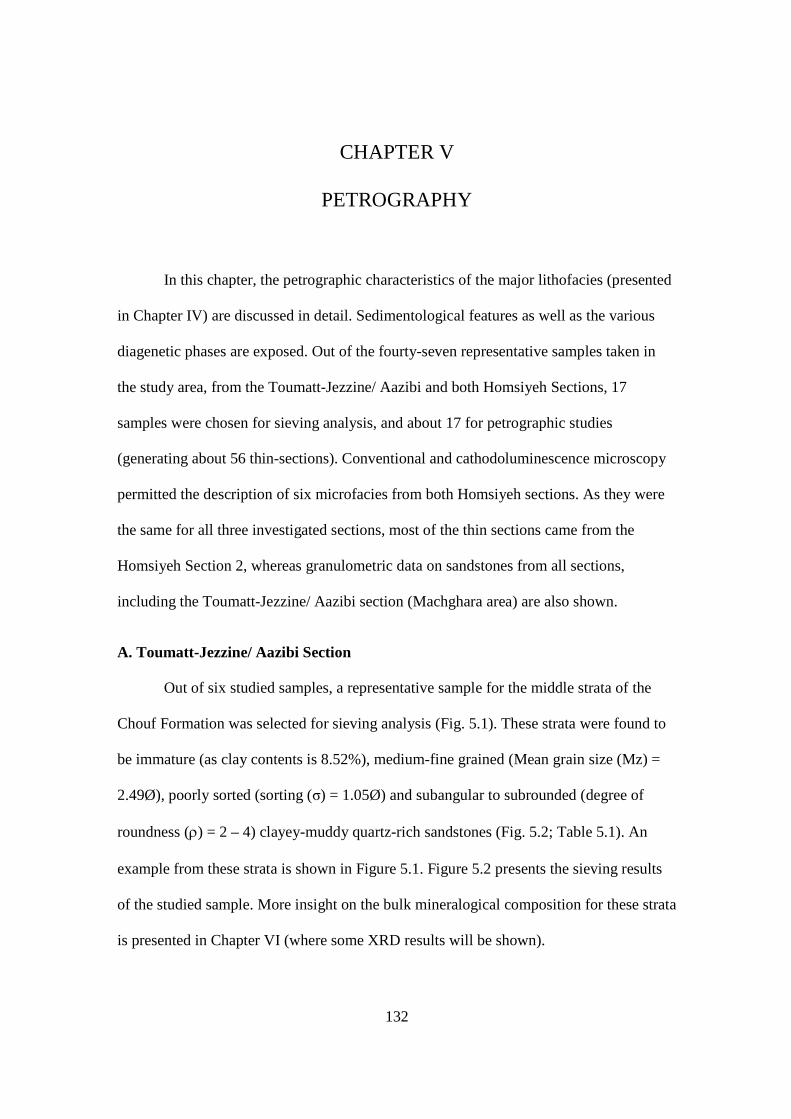
132
CHAPTER V
PETROGRAPHY
In this chapter, the petrographic characteristics of the major lithofacies (presented
in Chapter IV) are discussed in detail. Sedimentological features as well as the various
diagenetic phases are exposed. Out of the fourty-seven representative samples taken in
the study area, from the Toumatt-Jezzine/ Aazibi and both Homsiyeh Sections, 17
samples were chosen for sieving analysis, and about 17 for petrographic studies
(generating about 56 thin-sections). Conventional and cathodoluminescence microscopy
permitted the description of six microfacies from both Homsiyeh sections. As they were
the same for all three investigated sections, most of the thin sections came from the
Homsiyeh Section 2, whereas granulometric data on sandstones from all sections,
including the Toumatt-Jezzine/ Aazibi section (Machghara area) are also shown.
A. Toumatt-Jezzine/ Aazibi Section
Out of six studied samples, a representative sample for the middle strata of the
Chouf Formation was selected for sieving analysis (Fig. 5.1). These strata were found to
be immature (as clay contents is 8.52%), medium-fine grained (Mean grain size (Mz) =
2.49Ø), poorly sorted (sorting (σ) = 1.05Ø) and subangular to subrounded (degree of
roundness (r) = 2 – 4) clayey-muddy quartz-rich sandstones (Fig. 5.2; Table 5.1). An
example from these strata is shown in Figure 5.1. Figure 5.2 presents the sieving results
of the studied sample. More insight on the bulk mineralogical composition for these strata
is presented in Chapter VI (where some XRD results will be shown).
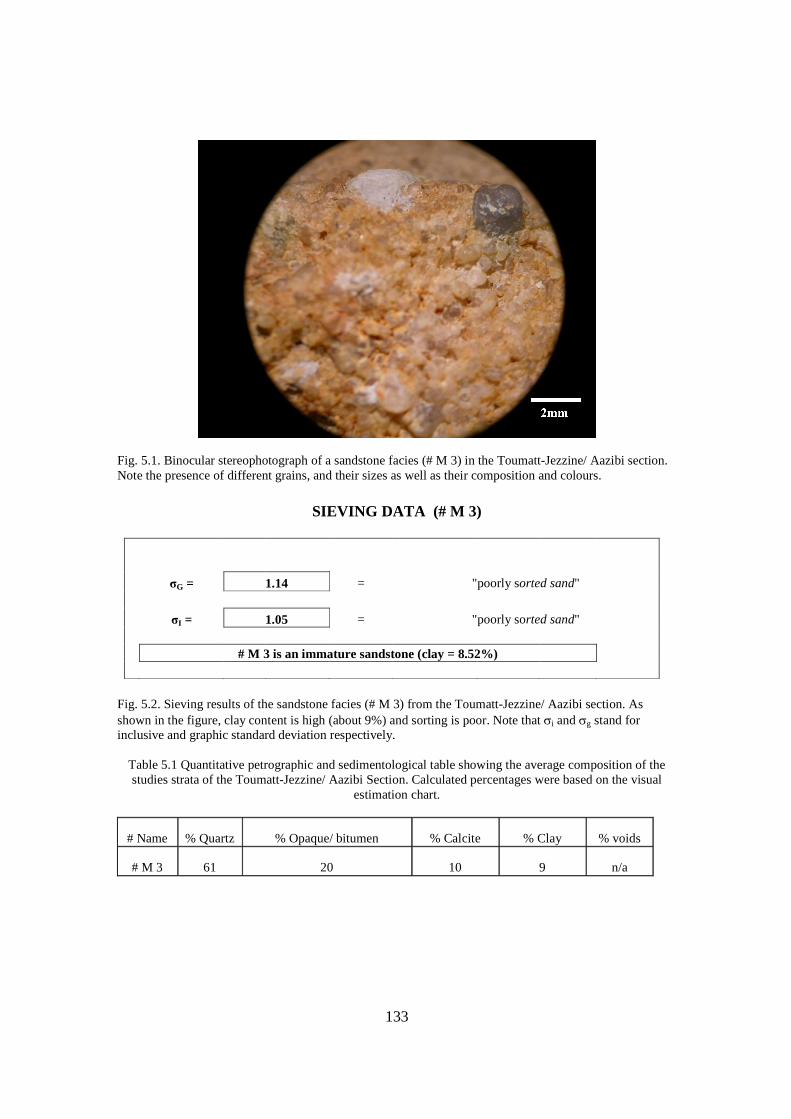
133
Fig. 5.1. Binocular stereophotograph of a sandstone facies (# M 3) in the Toumatt-Jezzine/ Aazibi section. Note the presence of different grains, and their sizes as well as their composition and colours.
SIEVING DATA (# M 3)
σG = 1.14 = "poorly sorted sand"
σI = 1.05 = "poorly sorted sand" # M 3 is an immature sandstone (clay = 8.52%)
Fig. 5.2. Sieving results of the sandstone facies (# M 3) from the Toumatt-Jezzine/ Aazibi section. As shown in the figure, clay content is high (about 9%) and sorting is poor. Note that si and sg stand for inclusive and graphic standard deviation respectively.
Table 5.1 Quantitative petrographic and sedimentological table showing the average composition of the studies strata of the Toumatt-Jezzine/ Aazibi Section. Calculated percentages were based on the visual
estimation chart.
# Name % Quartz % Opaque/ bitumen % Calcite % Clay % voids
# M 3 61 20 10 9 n/a
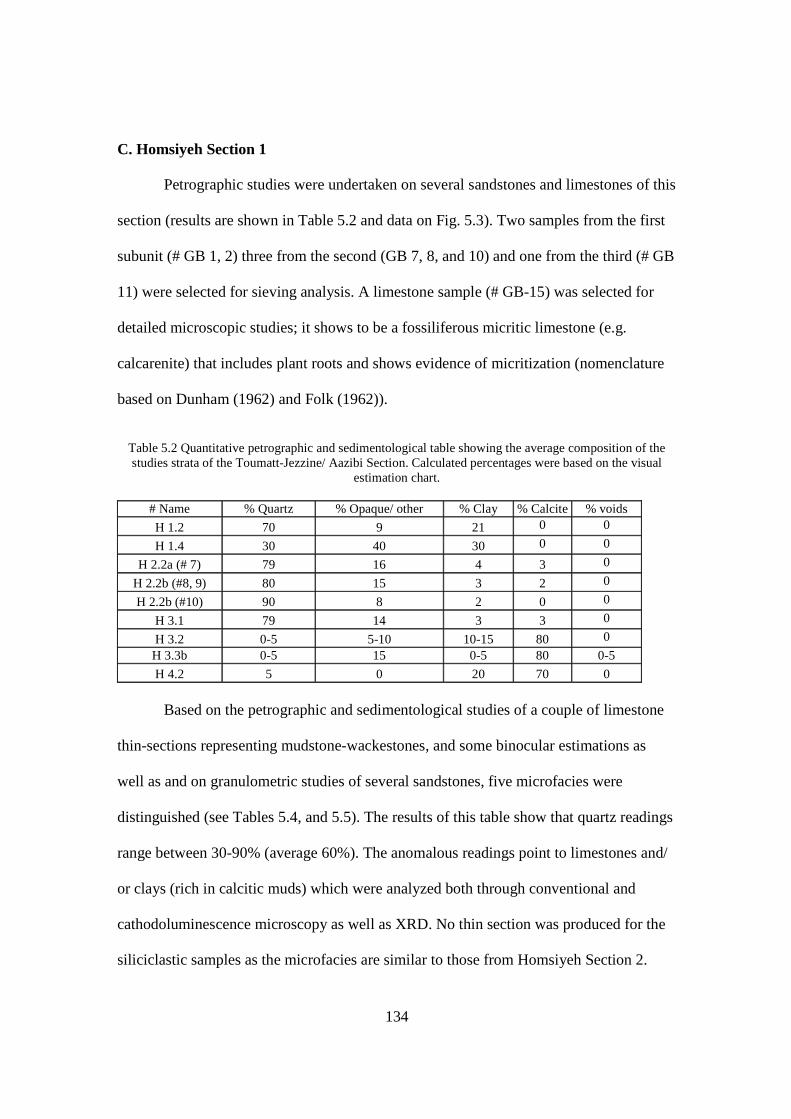
134
C. Homsiyeh Section 1
Petrographic studies were undertaken on several sandstones and limestones of this
section (results are shown in Table 5.2 and data on Fig. 5.3). Two samples from the first
subunit (# GB 1, 2) three from the second (GB 7, 8, and 10) and one from the third (# GB
11) were selected for sieving analysis. A limestone sample (# GB-15) was selected for
detailed microscopic studies; it shows to be a fossiliferous micritic limestone (e.g.
calcarenite) that includes plant roots and shows evidence of micritization (nomenclature
based on Dunham (1962) and Folk (1962)).
Table 5.2 Quantitative petrographic and sedimentological table showing the average composition of the studies strata of the Toumatt-Jezzine/ Aazibi Section. Calculated percentages were based on the visual
estimation chart.
# Name % Quartz % Opaque/ other % Clay % Calcite % voids
H 1.2 70 9 21 0 0 H 1.4 30 40 30 0 0
H 2.2a (# 7) 79 16 4 3 0 H 2.2b (#8, 9) 80 15 3 2 0 H 2.2b (#10) 90 8 2 0 0
H 3.1 79 14 3 3 0 H 3.2 0-5 5-10 10-15 80 0 H 3.3b 0-5 15 0-5 80 0-5
H 4.2 5 0 20 70 0
Based on the petrographic and sedimentological studies of a couple of limestone
thin-sections representing mudstone-wackestones, and some binocular estimations as
well as and on granulometric studies of several sandstones, five microfacies were
distinguished (see Tables 5.4, and 5.5). The results of this table show that quartz readings
range between 30-90% (average 60%). The anomalous readings point to limestones and/
or clays (rich in calcitic muds) which were analyzed both through conventional and
cathodoluminescence microscopy as well as XRD. No thin section was produced for the
siliciclastic samples as the microfacies are similar to those from Homsiyeh Section 2.

135
SIEVING DATA (# H 1.4)
Results:
σG = 1.37 = “poorly sorted sand”
σI = 1.23 = “poorly sorted sand” # H 1.4 is an immature clay rich sandstone (clay content = 30.3%, σ = 1.23Ø)
SIEVING DATA (# H 2.2a)
Results:
σG = 0.89 = "moderately sorted sand "
σI = 0.99 = "moderately sorted sand " # H 2.2a is a submature sandstone (clay content = 3.89%, σ = 0.99Ø)
SIEVING DATA (# H 2.2b)
Results:
σG = 0.85 = "moderately sorted sand"
σI = 0.86 = "moderately sorted sand" # H 2.2b is a submature sandstone (clay content = 1.86%, σ = 0.86Ø)
SIEVING DATA (H 3.1)
Results:
σG = 0.78 = "moderately sorted sand"
σI = 0.77 = "moderately sorted sand" # H 3.1 is a submature sandstone (clay content = 2.94%, σ = 0.77Ø)
Fig. 5.3. Sieving data of representative facies of Homsiyeh Section 1 (Jezzine). The Ø values represent the individual sizes retained by the sieve mesh of the granulometric shaker. In this case they are also used to represent grain sorting in order to represent textural/ mineralogical maturity.
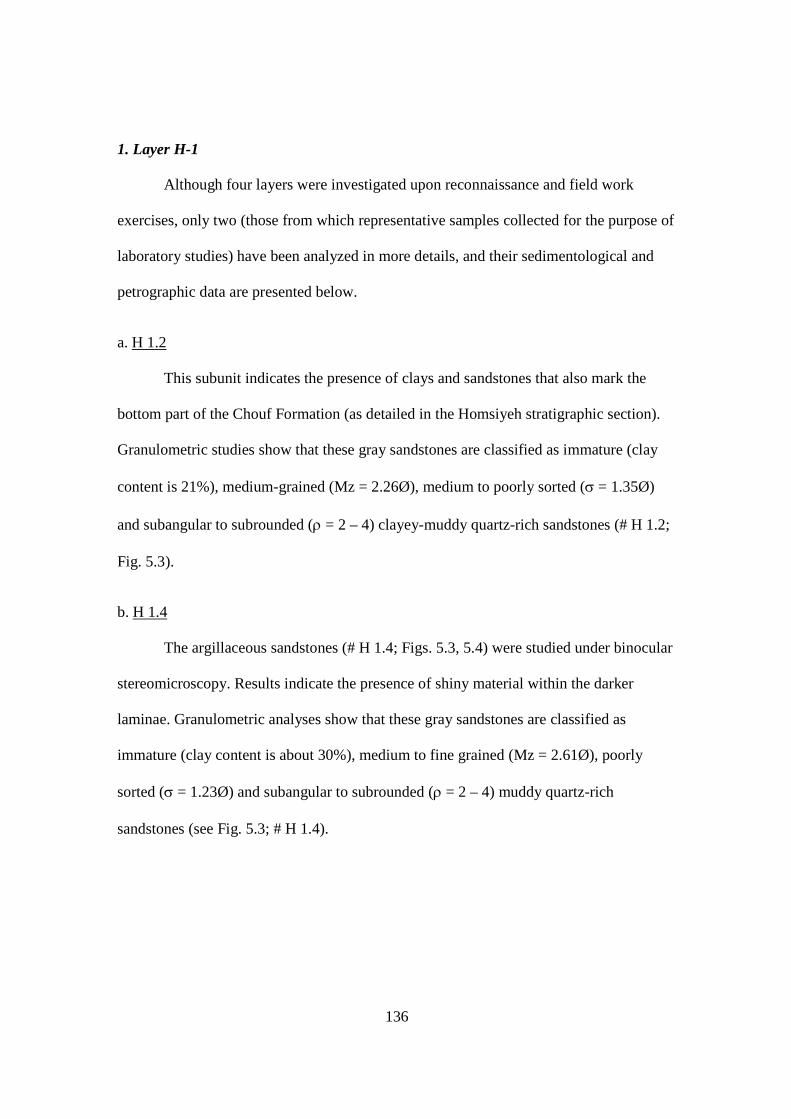
136
1. Layer H-1
Although four layers were investigated upon reconnaissance and field work
exercises, only two (those from which representative samples collected for the purpose of
laboratory studies) have been analyzed in more details, and their sedimentological and
petrographic data are presented below.
a. H 1.2
This subunit indicates the presence of clays and sandstones that also mark the
bottom part of the Chouf Formation (as detailed in the Homsiyeh stratigraphic section).
Granulometric studies show that these gray sandstones are classified as immature (clay
content is 21%), medium-grained (Mz = 2.26Ø), medium to poorly sorted (s = 1.35Ø)
and subangular to subrounded (r = 2 – 4) clayey-muddy quartz-rich sandstones (# H 1.2;
Fig. 5.3).
b. H 1.4
The argillaceous sandstones (# H 1.4; Figs. 5.3, 5.4) were studied under binocular
stereomicroscopy. Results indicate the presence of shiny material within the darker
laminae. Granulometric analyses show that these gray sandstones are classified as
immature (clay content is about 30%), medium to fine grained (Mz = 2.61Ø), poorly
sorted (s = 1.23Ø) and subangular to subrounded (r = 2 – 4) muddy quartz-rich
sandstones (see Fig. 5.3; # H 1.4).
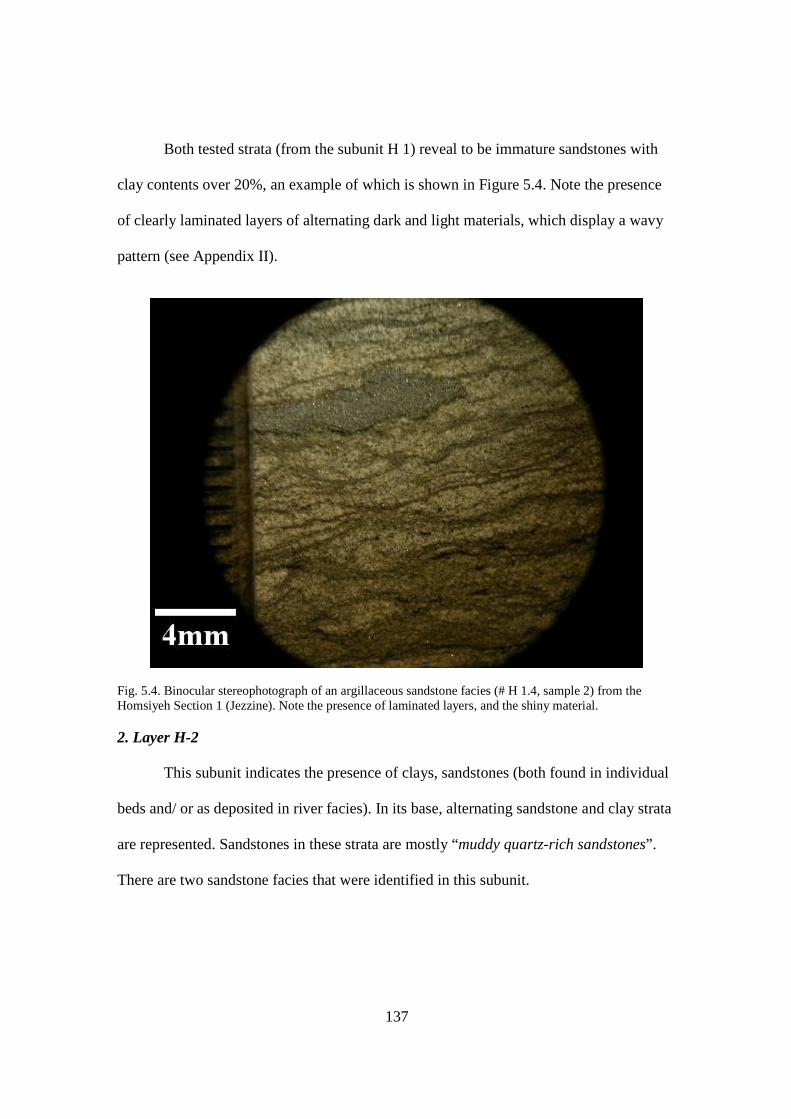
137
Both tested strata (from the subunit H 1) reveal to be immature sandstones with
clay contents over 20%, an example of which is shown in Figure 5.4. Note the presence
of clearly laminated layers of alternating dark and light materials, which display a wavy
pattern (see Appendix II).
Fig. 5.4. Binocular stereophotograph of an argillaceous sandstone facies (# H 1.4, sample 2) from the Homsiyeh Section 1 (Jezzine). Note the presence of laminated layers, and the shiny material. 2. Layer H-2
This subunit indicates the presence of clays, sandstones (both found in individual
beds and/ or as deposited in river facies). In its base, alternating sandstone and clay strata
are represented. Sandstones in these strata are mostly “muddy quartz-rich sandstones”.
There are two sandstone facies that were identified in this subunit.
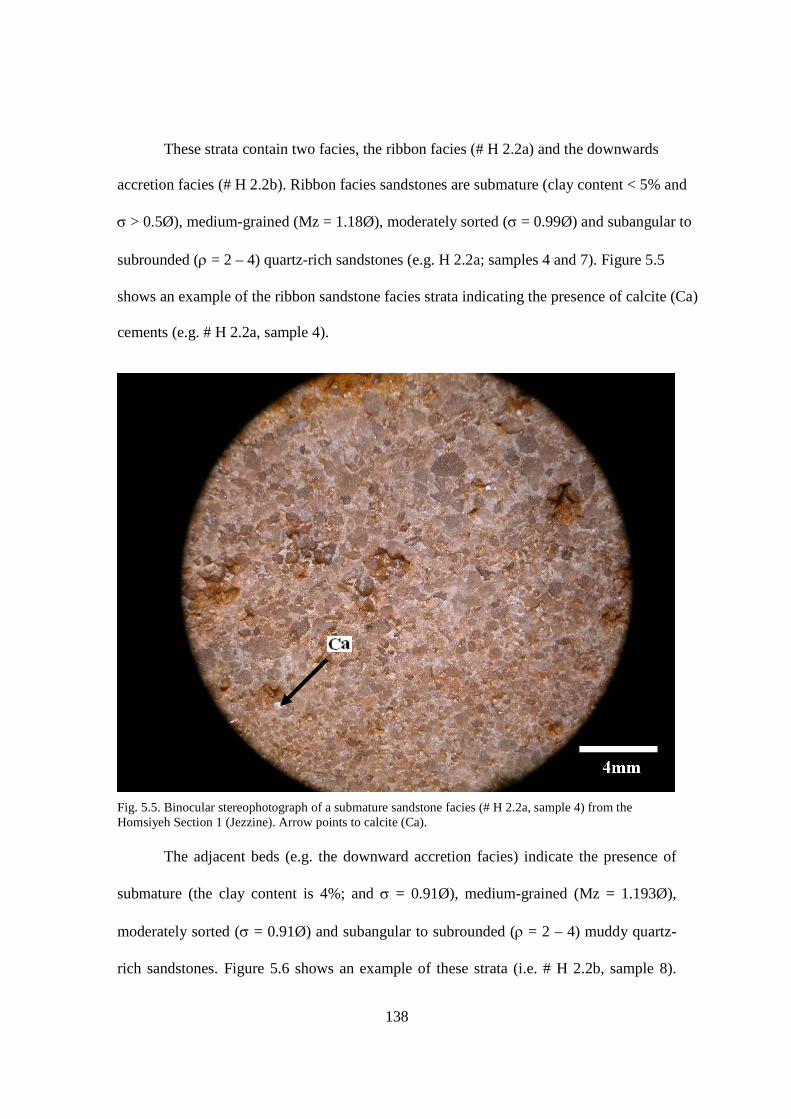
138
These strata contain two facies, the ribbon facies (# H 2.2a) and the downwards
accretion facies (# H 2.2b). Ribbon facies sandstones are submature (clay content < 5% and
s > 0.5Ø), medium-grained (Mz = 1.18Ø), moderately sorted (s = 0.99Ø) and subangular to
subrounded (r = 2 – 4) quartz-rich sandstones (e.g. H 2.2a; samples 4 and 7). Figure 5.5
shows an example of the ribbon sandstone facies strata indicating the presence of calcite (Ca)
cements (e.g. # H 2.2a, sample 4).
Fig. 5.5. Binocular stereophotograph of a submature sandstone facies (# H 2.2a, sample 4) from the Homsiyeh Section 1 (Jezzine). Arrow points to calcite (Ca).
The adjacent beds (e.g. the downward accretion facies) indicate the presence of
submature (the clay content is 4%; and s = 0.91Ø), medium-grained (Mz = 1.193Ø),
moderately sorted (s = 0.91Ø) and subangular to subrounded (r = 2 – 4) muddy quartz-
rich sandstones. Figure 5.6 shows an example of these strata (i.e. # H 2.2b, sample 8).
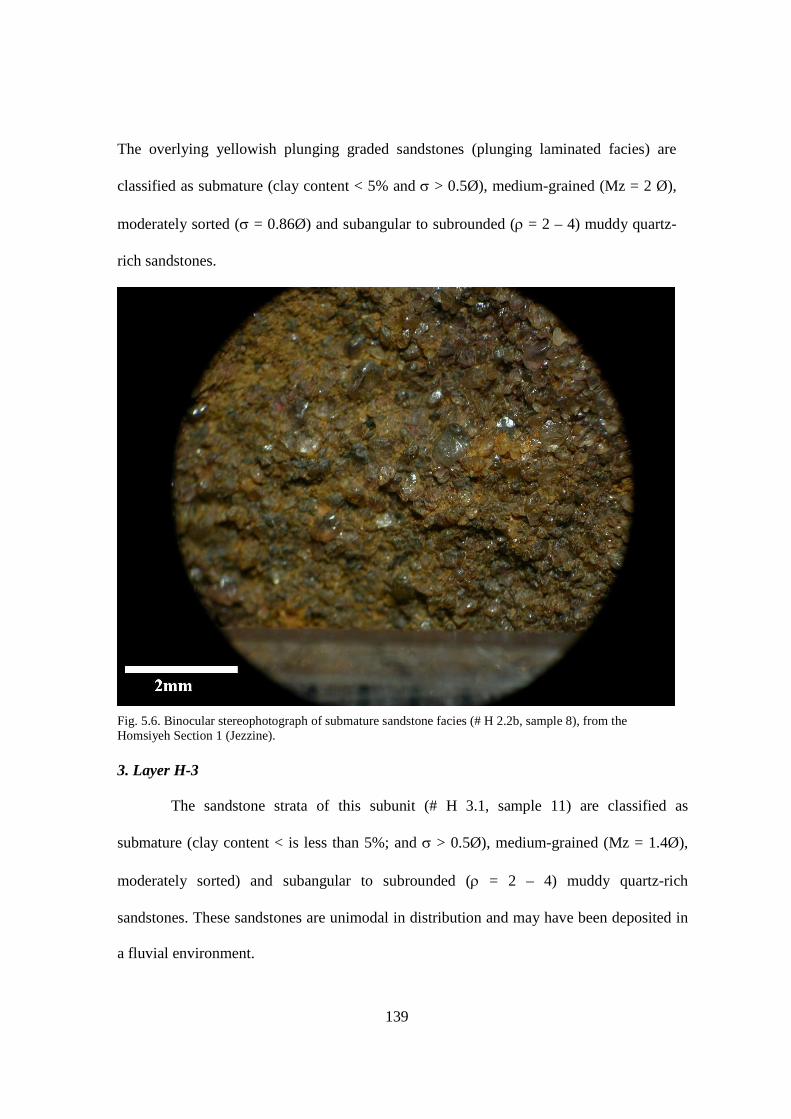
139
The overlying yellowish plunging graded sandstones (plunging laminated facies) are
classified as submature (clay content < 5% and s > 0.5Ø), medium-grained (Mz = 2 Ø),
moderately sorted (s = 0.86Ø) and subangular to subrounded (r = 2 – 4) muddy quartz-
rich sandstones.
Fig. 5.6. Binocular stereophotograph of submature sandstone facies (# H 2.2b, sample 8), from the Homsiyeh Section 1 (Jezzine). 3. Layer H-3
The sandstone strata of this subunit (# H 3.1, sample 11) are classified as
submature (clay content < is less than 5%; and s > 0.5Ø), medium-grained (Mz = 1.4Ø),
moderately sorted) and subangular to subrounded (r = 2 – 4) muddy quartz-rich
sandstones. These sandstones are unimodal in distribution and may have been deposited in
a fluvial environment.

140
The overlying bed (# H 3.2, sample 12) comprises channel lag deposits (# H 3.2,
sample 12) that are apparently composed of clastic and carbonate mixtures. These comprise
mainly assemblages of calcareous fragments (mainly consisting of calcite), as well as some
siliciclastic material (i.e. detrital channel particles) chaotically deposited together (Fig. 5.7).
They are composed of about 80% calcite, 10-15% clay, 5-10% opaque/ other materials and
0-5% quartz, if any.
Fig. 5.7. Binocular stereophotograph showing a carbonate facies (# H 3.2, sample 12) in the Homsiyeh Section 1.
The limestone strata (# H 3.3a, samples 13-15) containing 80% calcite, 15%
organic matter, and 5% porosity were classified as mudstone-wackestone, based on
matrix content, as the rock is dominantly micritic, containing some preserved fossils (Fig.
5.8). Based on thin-section identification (Figs. 5.8, and 5.9), some cementation and
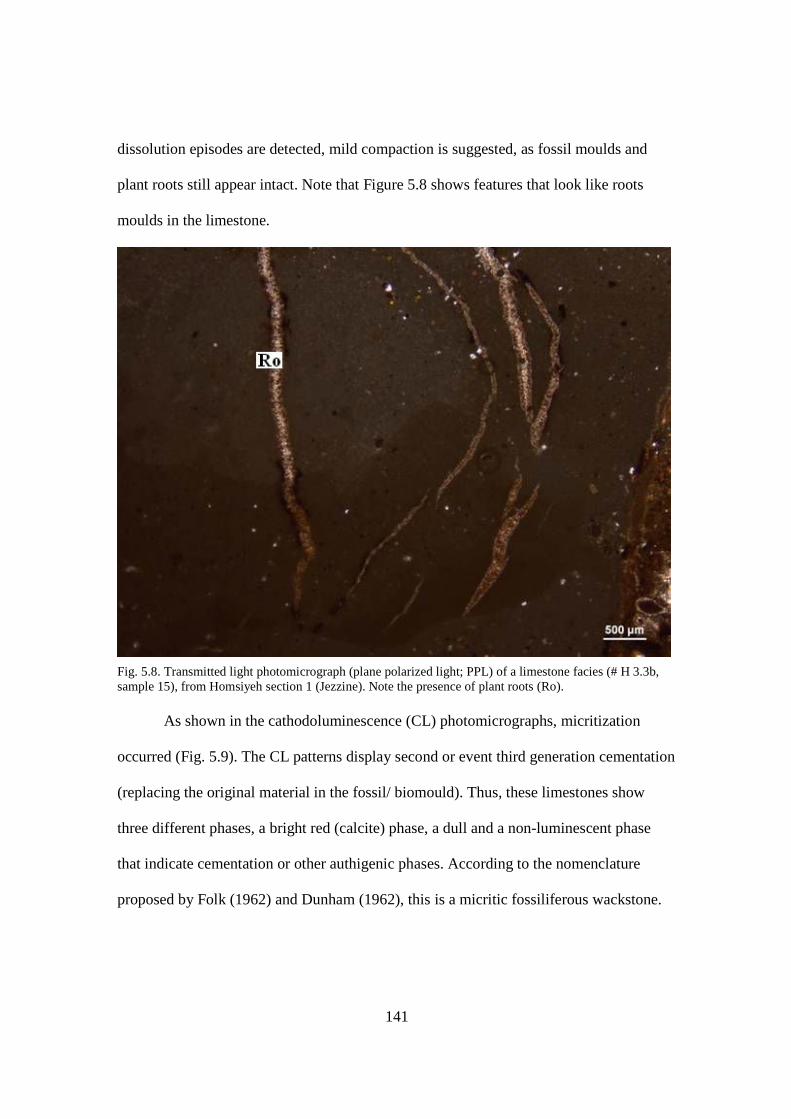
141
dissolution episodes are detected, mild compaction is suggested, as fossil moulds and
plant roots still appear intact. Note that Figure 5.8 shows features that look like roots
moulds in the limestone.
Fig. 5.8. Transmitted light photomicrograph (plane polarized light; PPL) of a limestone facies (# H 3.3b, sample 15), from Homsiyeh section 1 (Jezzine). Note the presence of plant roots (Ro).
As shown in the cathodoluminescence (CL) photomicrographs, micritization
occurred (Fig. 5.9). The CL patterns display second or event third generation cementation
(replacing the original material in the fossil/ biomould). Thus, these limestones show
three different phases, a bright red (calcite) phase, a dull and a non-luminescent phase
that indicate cementation or other authigenic phases. According to the nomenclature
proposed by Folk (1962) and Dunham (1962), this is a micritic fossiliferous wackstone.
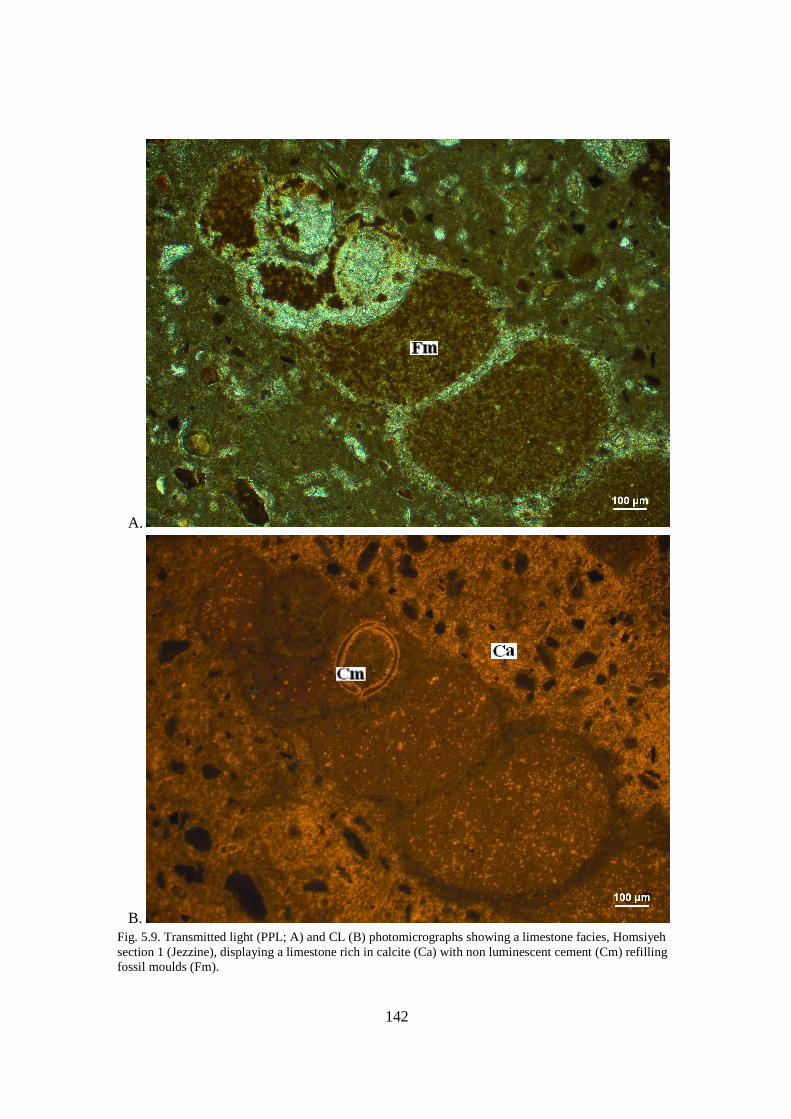
142
A.
B.
Fig. 5.9. Transmitted light (PPL; A) and CL (B) photomicrographs showing a limestone facies, Homsiyeh section 1 (Jezzine), displaying a limestone rich in calcite (Ca) with non luminescent cement (Cm) refilling fossil moulds (Fm).
143
4. Layer H-4
The fourth layer represents a coal-rich bioturbated reddish claystone succession
(grain sizes vary between 1/16 and 1/256 mm). These appear to be moderately packed, are
friable and fractured. They seem to contain some calcareous components (detected from
reaction with HCl acid), as well as some amount of glauconitic soils within these strata
(see Chapter IV; Figs. 4.17, 4.20 and 4.21).
C. Homsiyeh Section 2
Granulometric analyses were conducted on ten sandstone samples chosen to
represent the “key” facies from the second Homsiyeh Section. Out of all the samples
prepared for sieving analysis # H 10.3 was cohesive, and # H 13.1 showed a large clay
content. However, # H 11.1 was impossible to disaggregate, because it was very hard,
therefore, it was only possible to study this sample by thin-section analysis. Results of the
sieving analysis are included in Figure 5.10.
The summary petrographic analysis results (conducted on 56 thin-sections
representing the Neocomian-Barremian rocks exposed at the Homsiyeh Section 2 chosen
to describe “key” major Basal Cretaceous Sandstone microfacies and diagenetic phases in
the Jezzine area (southern Lebanon)) are shown in Table 5.3. The following section
details both the granulometric results and the petrographic data obtained from studying
these samples.

144
SIEVING DATA (# H 10.1)
Results:
σG = 0.70 = "moderately sorted sand"
σI = 0.73 = "moderately sorted sand" # H 10.1 is a poorly sorted, immature sandstone (clay content = 9%, σ < 0.5Ø)
SIEVING DATA (# H 10.3)
Results:
σG = 0.70 = “moderately Sorted sand”
σI = 0.73 = “moderately Sorted sand” # H 10.3 is a submature sandstone (clay content = 0.39%, σ < 0.5Ø)
SIEVING DATA (# H 12.1)
Results:
σG = 0.54 = "moderately sorted sand"
σI = 0.47 = "well sorted sand" # H 12.1 is a mature sandstone (clay content = 1.01%, σ = 0.47Ø)
SIEVING DATA (# H 13.1a)
Results:
σG = 0.68 = “moderately sorted sand”
σI = 0.63 = “ moderately sorted sand” # H 13.1a is an immature graywacke (clay content = 14.59%, σ = 0.63Ø)
Fig. 5.10. Granulometric Data of representative facies from the Homsiyeh Section 2 (Jezzine).

145
SIEVING DATA (# H 14.1)
Results:
σG = 0.77 = "moderately sorted sand"
σI = 0.85 = "moderately sorted sand" # H 14.1 is a submature Sandstone (Clay = 2.13%, σ = 0.85Ø)
Fig. 5.10 cont’d
Most samples were sieved more than once and the best data is recorded (see Fig.
5.10). This is also the case for the data shown in Figures 5.2, and 5.4. Therefore, the data
posted in Figures 5.2, 5.4, and 5.10 best represent the investigated key facies of the Chouf
Formation. Table 5.3 presents an extensive summary of the petrographic data of
Homsiyeh Section 2, which include some granulometric observations.
Table 5.3. Quantitative petrographic and sedimentological table showing the average composition of the studied strata of the Homsiyeh Section 2. For more detailed strata composition (especially for clays), refer
to Chapter VI. Calculated percentages were based on the visual estimation chart.
All beds discussed below are mostly composed of sandstones, limestones and
graywacke. As there was no data recorded from the petrography of clay thin-sections,
clay mineralogy will be discussed in Chapter VI.
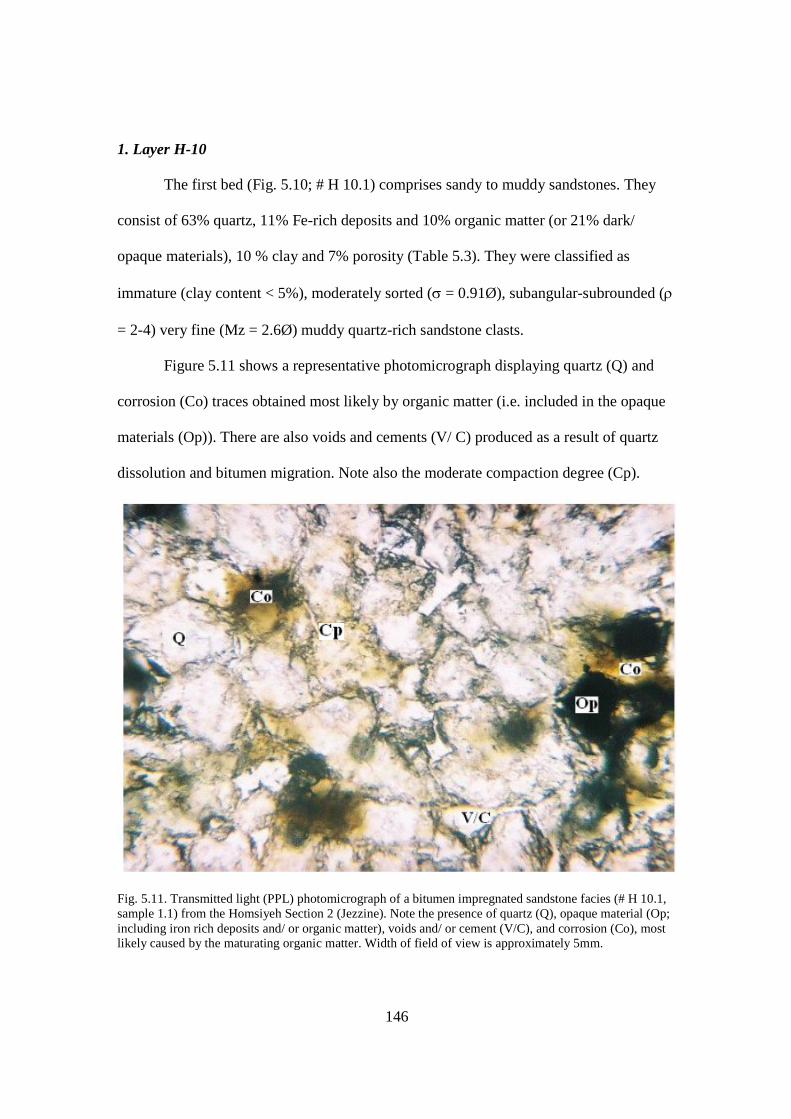
146
1. Layer H-10
The first bed (Fig. 5.10; # H 10.1) comprises sandy to muddy sandstones. They
consist of 63% quartz, 11% Fe-rich deposits and 10% organic matter (or 21% dark/
opaque materials), 10 % clay and 7% porosity (Table 5.3). They were classified as
immature (clay content < 5%), moderately sorted (s = 0.91Ø), subangular-subrounded (r
= 2-4) very fine (Mz = 2.6Ø) muddy quartz-rich sandstone clasts.
Figure 5.11 shows a representative photomicrograph displaying quartz (Q) and
corrosion (Co) traces obtained most likely by organic matter (i.e. included in the opaque
materials (Op)). There are also voids and cements (V/ C) produced as a result of quartz
dissolution and bitumen migration. Note also the moderate compaction degree (Cp).
Fig. 5.11. Transmitted light (PPL) photomicrograph of a bitumen impregnated sandstone facies (# H 10.1, sample 1.1) from the Homsiyeh Section 2 (Jezzine). Note the presence of quartz (Q), opaque material (Op; including iron rich deposits and/ or organic matter), voids and/ or cement (V/C), and corrosion (Co), most likely caused by the maturating organic matter. Width of field of view is approximately 5mm.
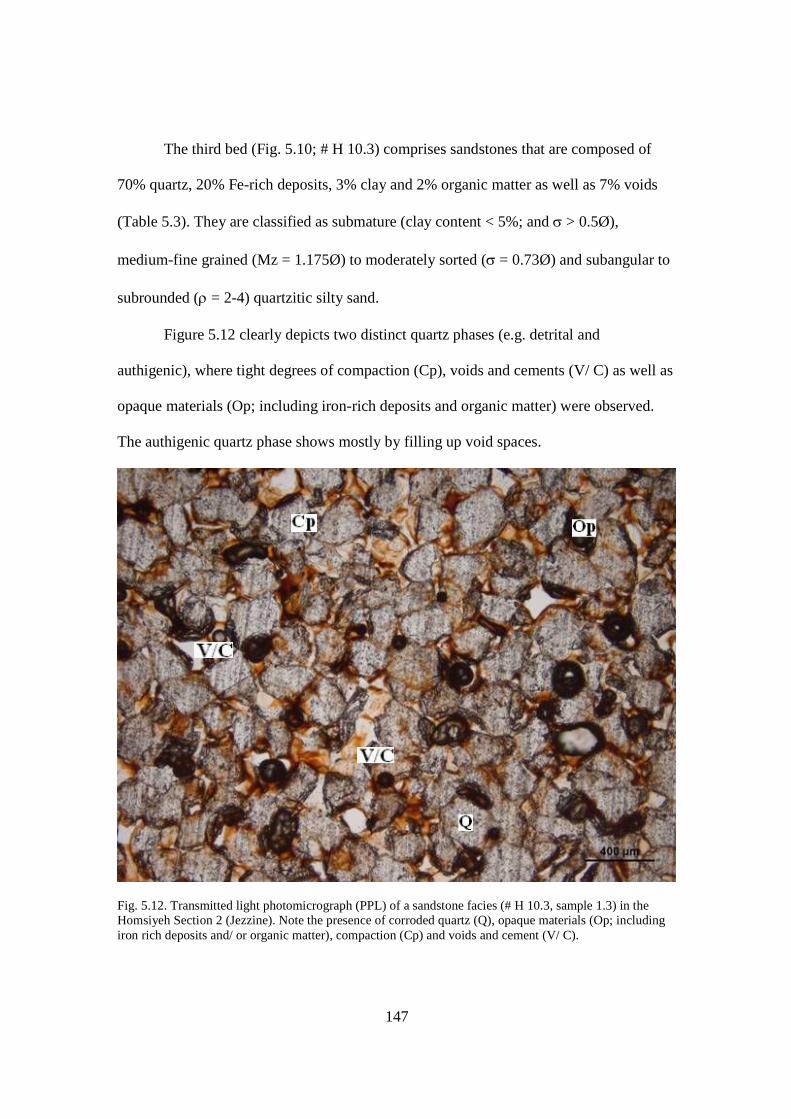
147
The third bed (Fig. 5.10; # H 10.3) comprises sandstones that are composed of
70% quartz, 20% Fe-rich deposits, 3% clay and 2% organic matter as well as 7% voids
(Table 5.3). They are classified as submature (clay content < 5%; and s > 0.5Ø),
medium-fine grained (Mz = 1.175Ø) to moderately sorted (s = 0.73Ø) and subangular to
subrounded (r = 2-4) quartzitic silty sand.
Figure 5.12 clearly depicts two distinct quartz phases (e.g. detrital and
authigenic), where tight degrees of compaction (Cp), voids and cements (V/ C) as well as
opaque materials (Op; including iron-rich deposits and organic matter) were observed.
The authigenic quartz phase shows mostly by filling up void spaces.
Fig. 5.12. Transmitted light photomicrograph (PPL) of a sandstone facies (# H 10.3, sample 1.3) in the Homsiyeh Section 2 (Jezzine). Note the presence of corroded quartz (Q), opaque materials (Op; including iron rich deposits and/ or organic matter), compaction (Cp) and voids and cement (V/ C).
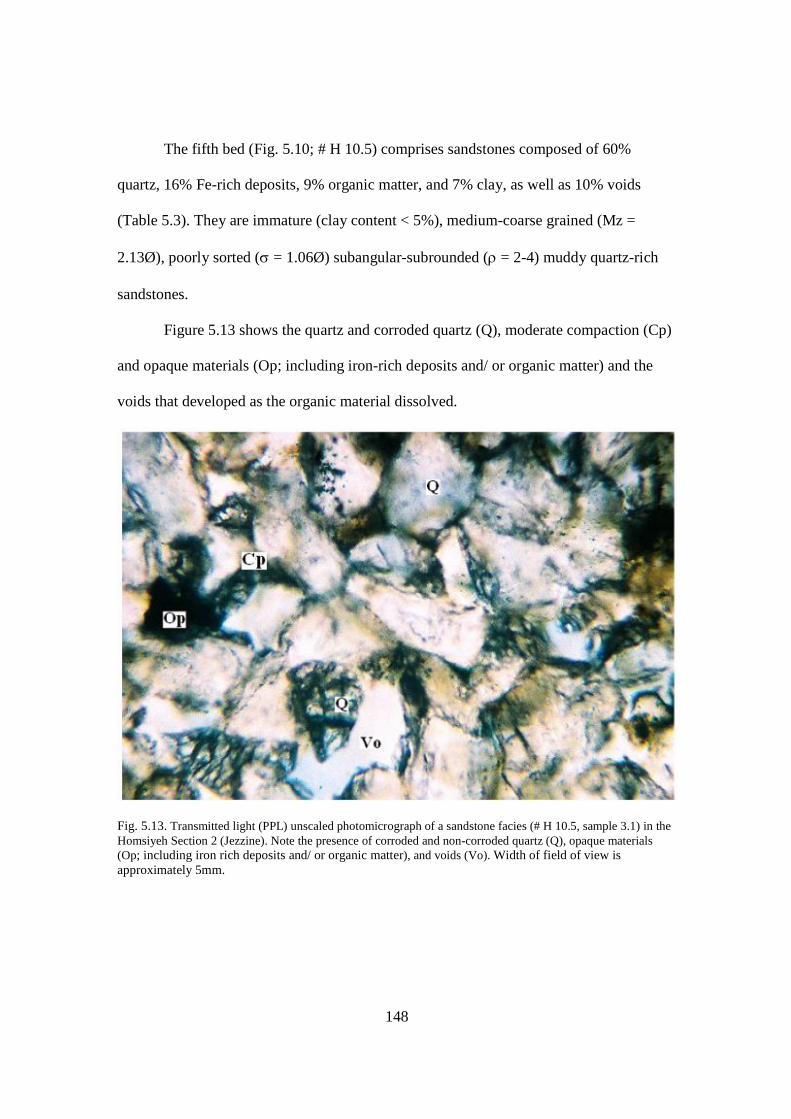
148
The fifth bed (Fig. 5.10; # H 10.5) comprises sandstones composed of 60%
quartz, 16% Fe-rich deposits, 9% organic matter, and 7% clay, as well as 10% voids
(Table 5.3). They are immature (clay content < 5%), medium-coarse grained (Mz =
2.13Ø), poorly sorted (s = 1.06Ø) subangular-subrounded (r = 2-4) muddy quartz-rich
sandstones.
Figure 5.13 shows the quartz and corroded quartz (Q), moderate compaction (Cp)
and opaque materials (Op; including iron-rich deposits and/ or organic matter) and the
voids that developed as the organic material dissolved.
Fig. 5.13. Transmitted light (PPL) unscaled photomicrograph of a sandstone facies (# H 10.5, sample 3.1) in the Homsiyeh Section 2 (Jezzine). Note the presence of corroded and non-corroded quartz (Q), opaque materials (Op; including iron rich deposits and/ or organic matter), and voids (Vo). Width of field of view is approximately 5mm.
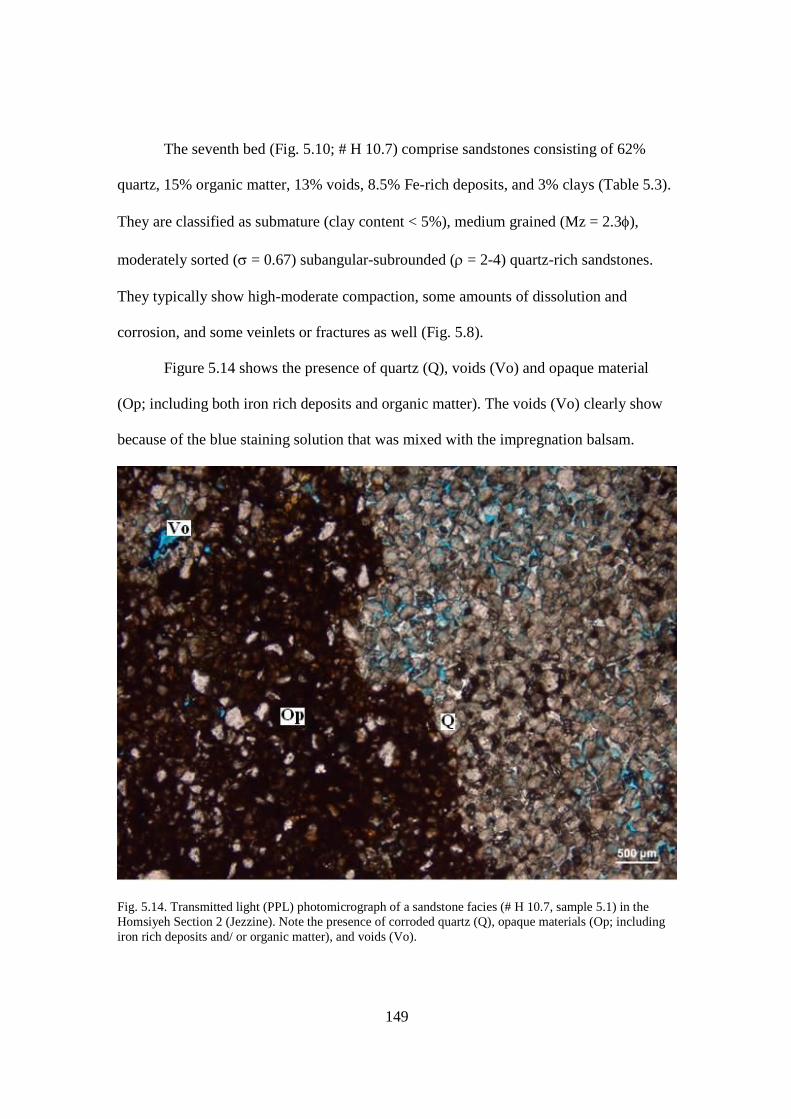
149
The seventh bed (Fig. 5.10; # H 10.7) comprise sandstones consisting of 62%
quartz, 15% organic matter, 13% voids, 8.5% Fe-rich deposits, and 3% clays (Table 5.3).
They are classified as submature (clay content < 5%), medium grained (Mz = 2.3f),
moderately sorted (s = 0.67) subangular-subrounded (r = 2-4) quartz-rich sandstones.
They typically show high-moderate compaction, some amounts of dissolution and
corrosion, and some veinlets or fractures as well (Fig. 5.8).
Figure 5.14 shows the presence of quartz (Q), voids (Vo) and opaque material
(Op; including both iron rich deposits and organic matter). The voids (Vo) clearly show
because of the blue staining solution that was mixed with the impregnation balsam.
Fig. 5.14. Transmitted light (PPL) photomicrograph of a sandstone facies (# H 10.7, sample 5.1) in the Homsiyeh Section 2 (Jezzine). Note the presence of corroded quartz (Q), opaque materials (Op; including iron rich deposits and/ or organic matter), and voids (Vo).
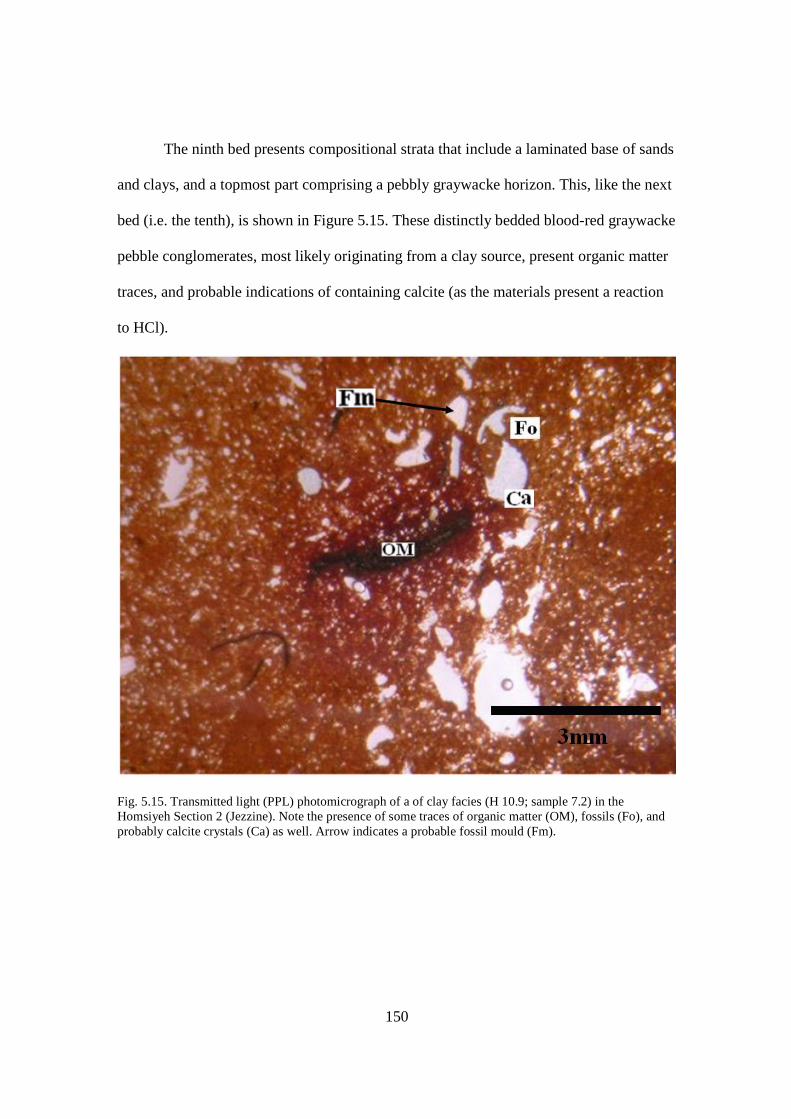
150
The ninth bed presents compositional strata that include a laminated base of sands
and clays, and a topmost part comprising a pebbly graywacke horizon. This, like the next
bed (i.e. the tenth), is shown in Figure 5.15. These distinctly bedded blood-red graywacke
pebble conglomerates, most likely originating from a clay source, present organic matter
traces, and probable indications of containing calcite (as the materials present a reaction
to HCl).
Fig. 5.15. Transmitted light (PPL) photomicrograph of a of clay facies (H 10.9; sample 7.2) in the Homsiyeh Section 2 (Jezzine). Note the presence of some traces of organic matter (OM), fossils (Fo), and probably calcite crystals (Ca) as well. Arrow indicates a probable fossil mould (Fm).
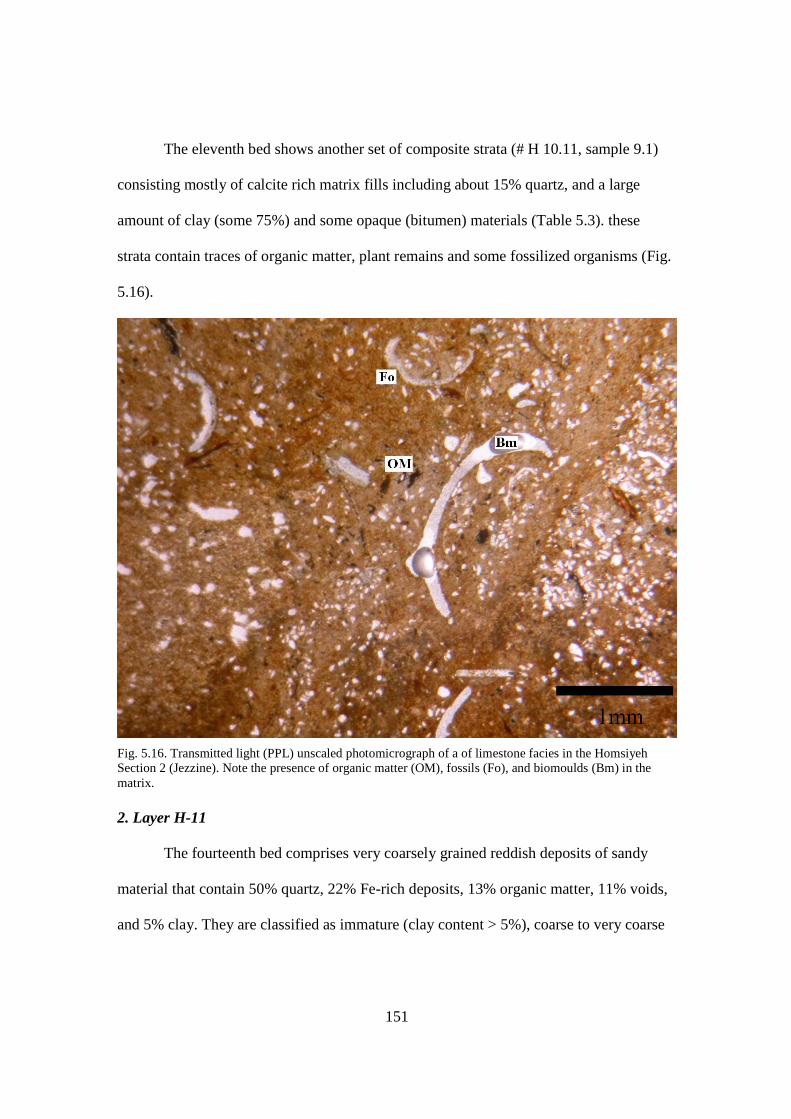
151
The eleventh bed shows another set of composite strata (# H 10.11, sample 9.1)
consisting mostly of calcite rich matrix fills including about 15% quartz, and a large
amount of clay (some 75%) and some opaque (bitumen) materials (Table 5.3). these
strata contain traces of organic matter, plant remains and some fossilized organisms (Fig.
5.16).
Fig. 5.16. Transmitted light (PPL) unscaled photomicrograph of a of limestone facies in the Homsiyeh Section 2 (Jezzine). Note the presence of organic matter (OM), fossils (Fo), and biomoulds (Bm) in the matrix. 2. Layer H-11
The fourteenth bed comprises very coarsely grained reddish deposits of sandy
material that contain 50% quartz, 22% Fe-rich deposits, 13% organic matter, 11% voids,
and 5% clay. They are classified as immature (clay content > 5%), coarse to very coarse
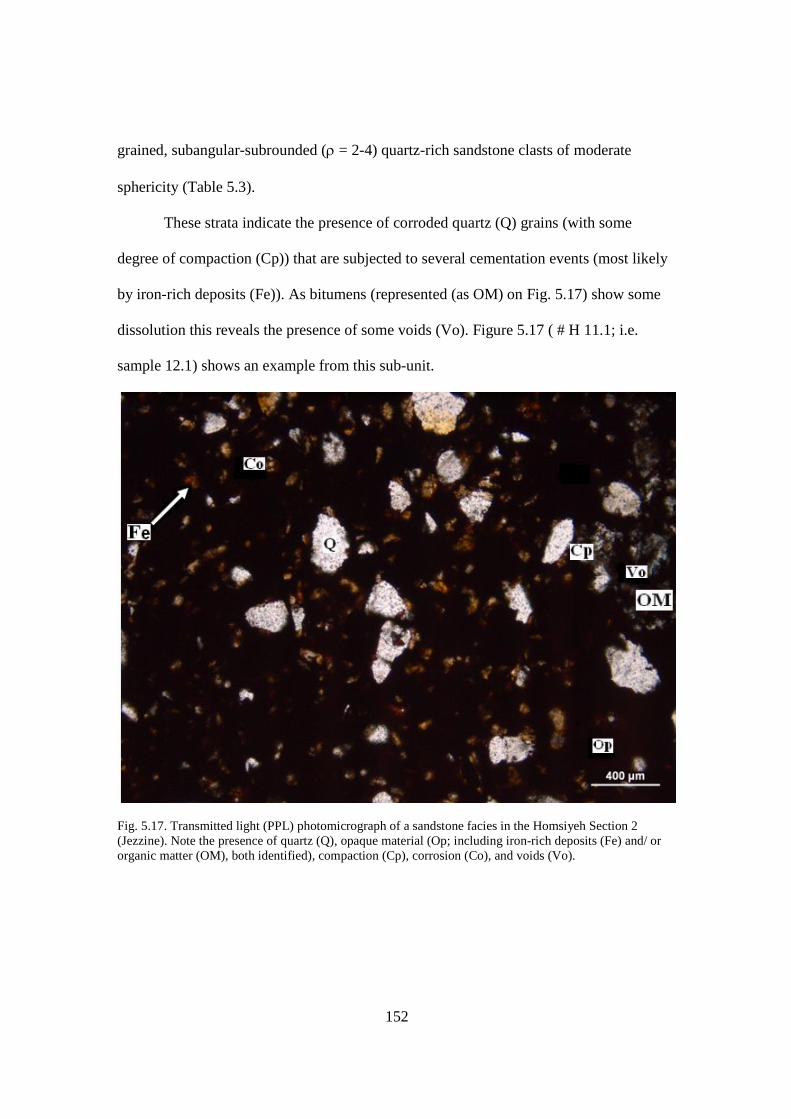
152
grained, subangular-subrounded (r = 2-4) quartz-rich sandstone clasts of moderate
sphericity (Table 5.3).
These strata indicate the presence of corroded quartz (Q) grains (with some
degree of compaction (Cp)) that are subjected to several cementation events (most likely
by iron-rich deposits (Fe)). As bitumens (represented (as OM) on Fig. 5.17) show some
dissolution this reveals the presence of some voids (Vo). Figure 5.17 ( # H 11.1; i.e.
sample 12.1) shows an example from this sub-unit.
Fig. 5.17. Transmitted light (PPL) photomicrograph of a sandstone facies in the Homsiyeh Section 2 (Jezzine). Note the presence of quartz (Q), opaque material (Op; including iron-rich deposits (Fe) and/ or organic matter (OM), both identified), compaction (Cp), corrosion (Co), and voids (Vo).
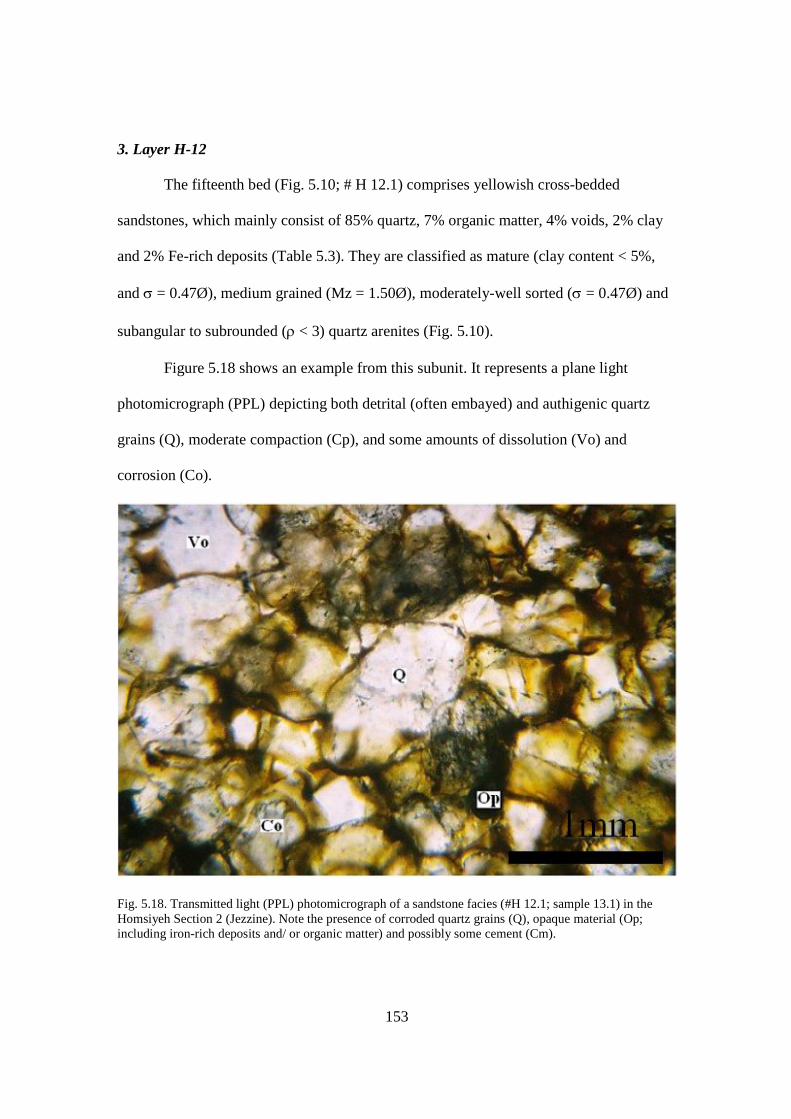
153
3. Layer H-12
The fifteenth bed (Fig. 5.10; # H 12.1) comprises yellowish cross-bedded
sandstones, which mainly consist of 85% quartz, 7% organic matter, 4% voids, 2% clay
and 2% Fe-rich deposits (Table 5.3). They are classified as mature (clay content < 5%,
and s = 0.47Ø), medium grained (Mz = 1.50Ø), moderately-well sorted (s = 0.47Ø) and
subangular to subrounded (r < 3) quartz arenites (Fig. 5.10).
Figure 5.18 shows an example from this subunit. It represents a plane light
photomicrograph (PPL) depicting both detrital (often embayed) and authigenic quartz
grains (Q), moderate compaction (Cp), and some amounts of dissolution (Vo) and
corrosion (Co).
Fig. 5.18. Transmitted light (PPL) photomicrograph of a sandstone facies (#H 12.1; sample 13.1) in the Homsiyeh Section 2 (Jezzine). Note the presence of corroded quartz grains (Q), opaque material (Op; including iron-rich deposits and/ or organic matter) and possibly some cement (Cm).
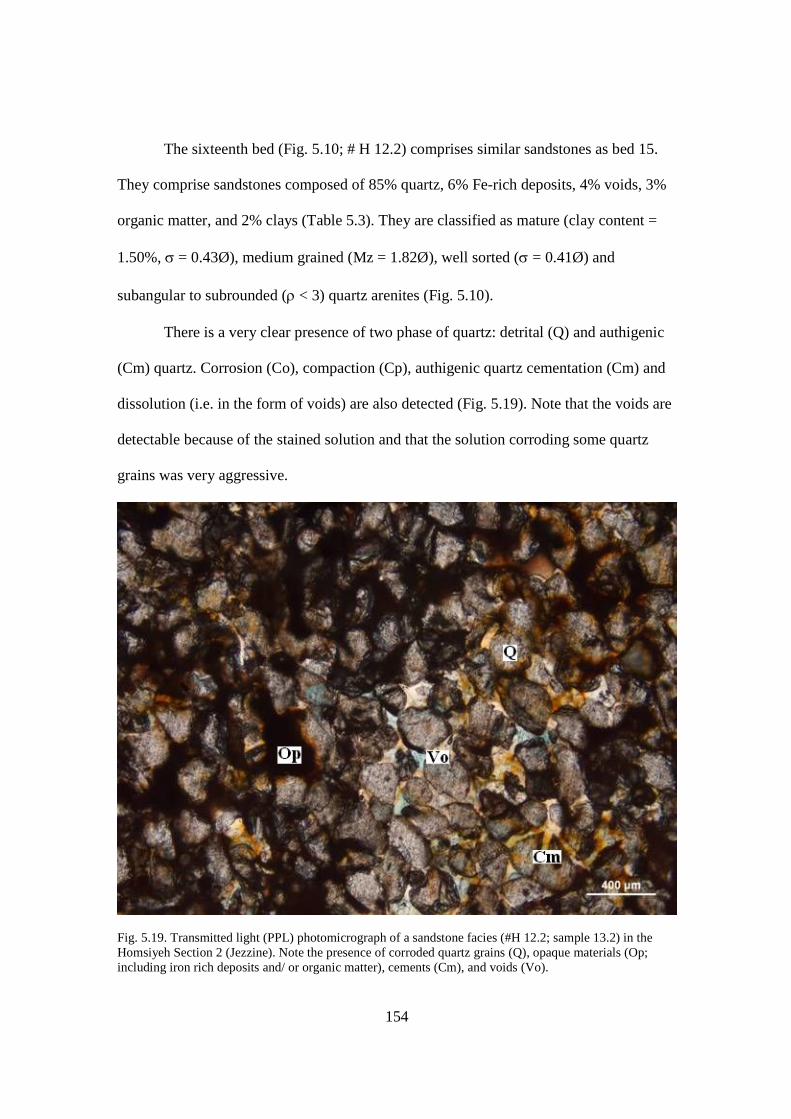
154
The sixteenth bed (Fig. 5.10; # H 12.2) comprises similar sandstones as bed 15.
They comprise sandstones composed of 85% quartz, 6% Fe-rich deposits, 4% voids, 3%
organic matter, and 2% clays (Table 5.3). They are classified as mature (clay content =
1.50%, s = 0.43Ø), medium grained (Mz = 1.82Ø), well sorted (s = 0.41Ø) and
subangular to subrounded (r < 3) quartz arenites (Fig. 5.10).
There is a very clear presence of two phase of quartz: detrital (Q) and authigenic
(Cm) quartz. Corrosion (Co), compaction (Cp), authigenic quartz cementation (Cm) and
dissolution (i.e. in the form of voids) are also detected (Fig. 5.19). Note that the voids are
detectable because of the stained solution and that the solution corroding some quartz
grains was very aggressive.
Fig. 5.19. Transmitted light (PPL) photomicrograph of a sandstone facies (#H 12.2; sample 13.2) in the Homsiyeh Section 2 (Jezzine). Note the presence of corroded quartz grains (Q), opaque materials (Op; including iron rich deposits and/ or organic matter), cements (Cm), and voids (Vo).
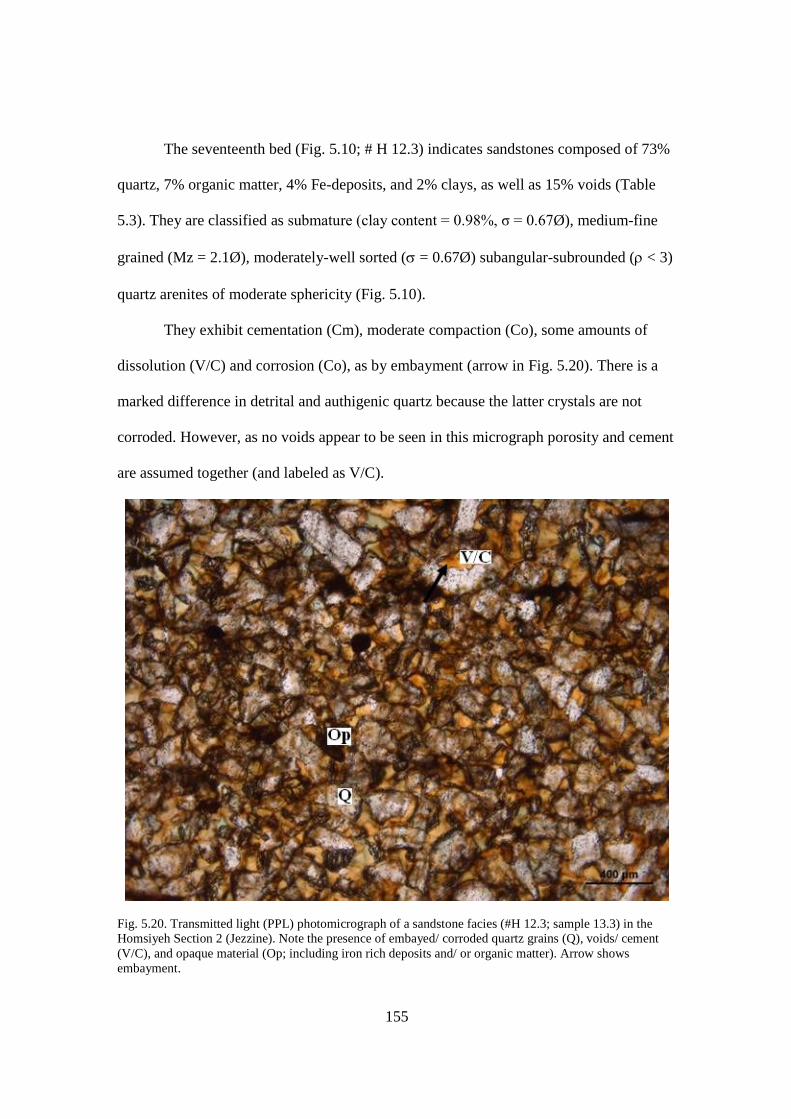
155
The seventeenth bed (Fig. 5.10; # H 12.3) indicates sandstones composed of 73%
quartz, 7% organic matter, 4% Fe-deposits, and 2% clays, as well as 15% voids (Table
5.3). They are classified as submature (clay content = 0.98%, σ = 0.67Ø), medium-fine
grained (Mz = 2.1Ø), moderately-well sorted (s = 0.67Ø) subangular-subrounded (r < 3)
quartz arenites of moderate sphericity (Fig. 5.10).
They exhibit cementation (Cm), moderate compaction (Co), some amounts of
dissolution (V/C) and corrosion (Co), as by embayment (arrow in Fig. 5.20). There is a
marked difference in detrital and authigenic quartz because the latter crystals are not
corroded. However, as no voids appear to be seen in this micrograph porosity and cement
are assumed together (and labeled as V/C).
Fig. 5.20. Transmitted light (PPL) photomicrograph of a sandstone facies (#H 12.3; sample 13.3) in the Homsiyeh Section 2 (Jezzine). Note the presence of embayed/ corroded quartz grains (Q), voids/ cement (V/C), and opaque material (Op; including iron rich deposits and/ or organic matter). Arrow shows embayment.
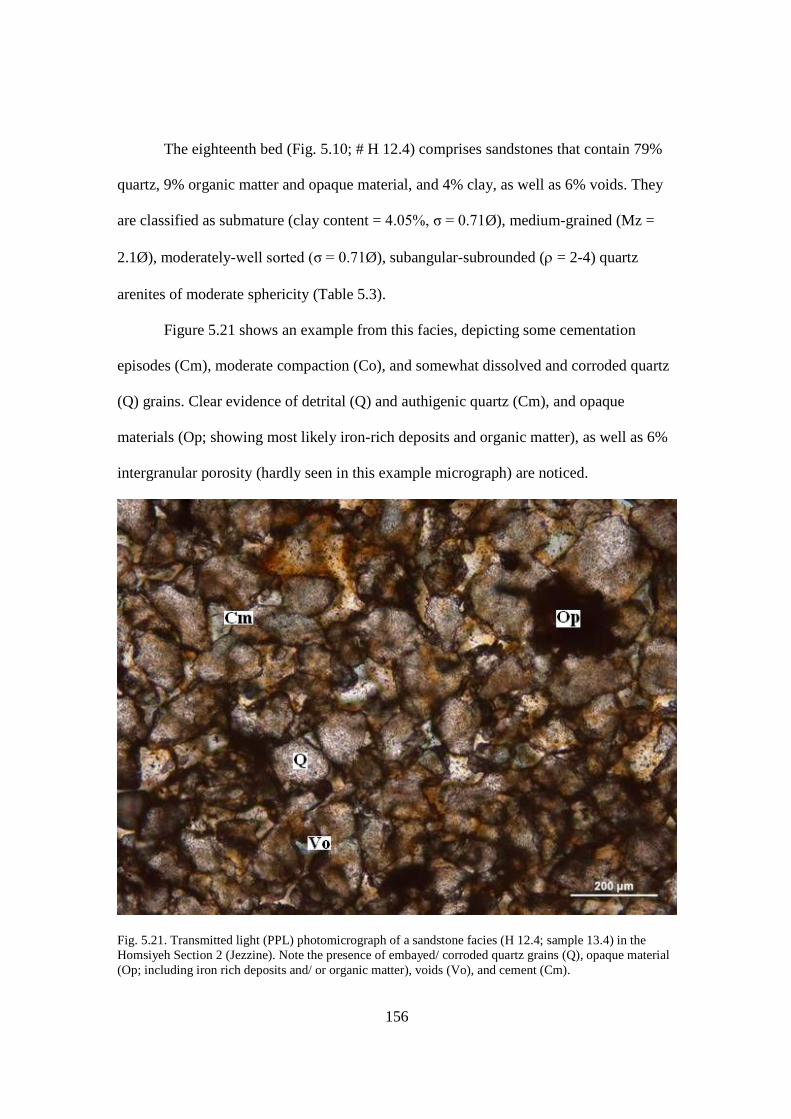
156
The eighteenth bed (Fig. 5.10; # H 12.4) comprises sandstones that contain 79%
quartz, 9% organic matter and opaque material, and 4% clay, as well as 6% voids. They
are classified as submature (clay content = 4.05%, σ = 0.71Ø), medium-grained (Mz =
2.1Ø), moderately-well sorted (σ = 0.71Ø), subangular-subrounded (r = 2-4) quartz
arenites of moderate sphericity (Table 5.3).
Figure 5.21 shows an example from this facies, depicting some cementation
episodes (Cm), moderate compaction (Co), and somewhat dissolved and corroded quartz
(Q) grains. Clear evidence of detrital (Q) and authigenic quartz (Cm), and opaque
materials (Op; showing most likely iron-rich deposits and organic matter), as well as 6%
intergranular porosity (hardly seen in this example micrograph) are noticed.
Fig. 5.21. Transmitted light (PPL) photomicrograph of a sandstone facies (H 12.4; sample 13.4) in the Homsiyeh Section 2 (Jezzine). Note the presence of embayed/ corroded quartz grains (Q), opaque material (Op; including iron rich deposits and/ or organic matter), voids (Vo), and cement (Cm).
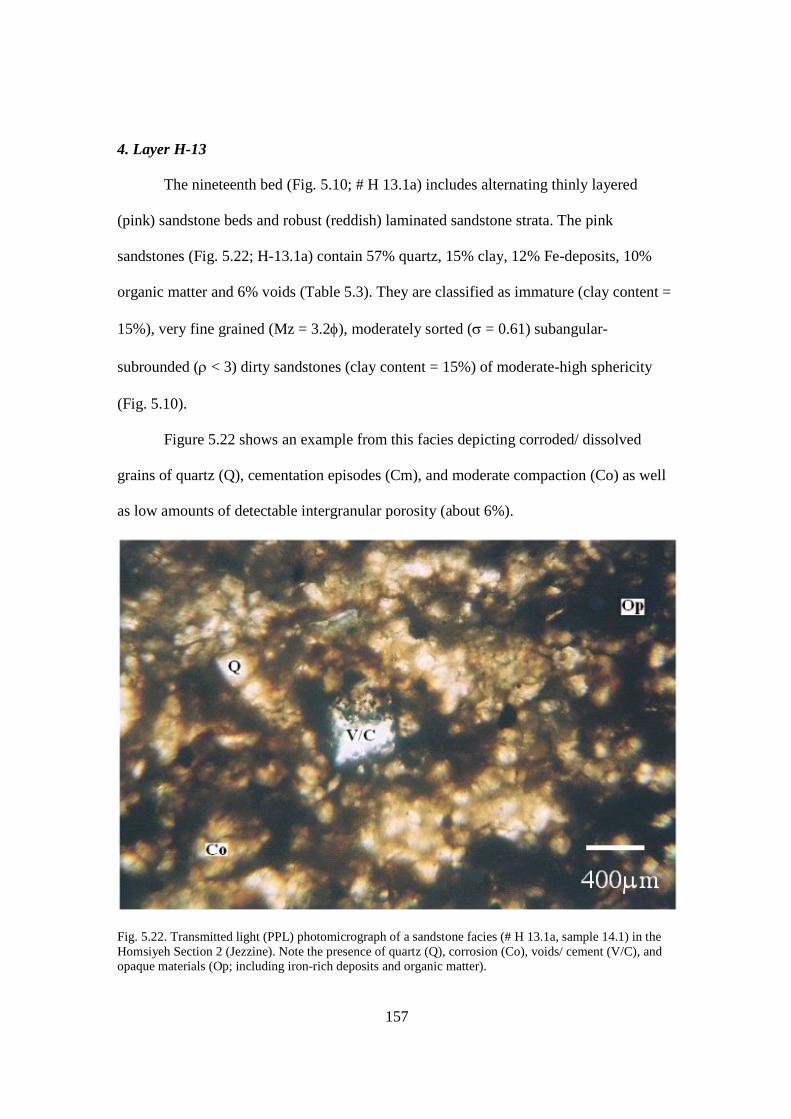
157
4. Layer H-13
The nineteenth bed (Fig. 5.10; # H 13.1a) includes alternating thinly layered
(pink) sandstone beds and robust (reddish) laminated sandstone strata. The pink
sandstones (Fig. 5.22; H-13.1a) contain 57% quartz, 15% clay, 12% Fe-deposits, 10%
organic matter and 6% voids (Table 5.3). They are classified as immature (clay content =
15%), very fine grained (Mz = 3.2f), moderately sorted (s = 0.61) subangular-
subrounded (r < 3) dirty sandstones (clay content = 15%) of moderate-high sphericity
(Fig. 5.10).
Figure 5.22 shows an example from this facies depicting corroded/ dissolved
grains of quartz (Q), cementation episodes (Cm), and moderate compaction (Co) as well
as low amounts of detectable intergranular porosity (about 6%).
Fig. 5.22. Transmitted light (PPL) photomicrograph of a sandstone facies (# H 13.1a, sample 14.1) in the Homsiyeh Section 2 (Jezzine). Note the presence of quartz (Q), corrosion (Co), voids/ cement (V/C), and opaque materials (Op; including iron-rich deposits and organic matter).
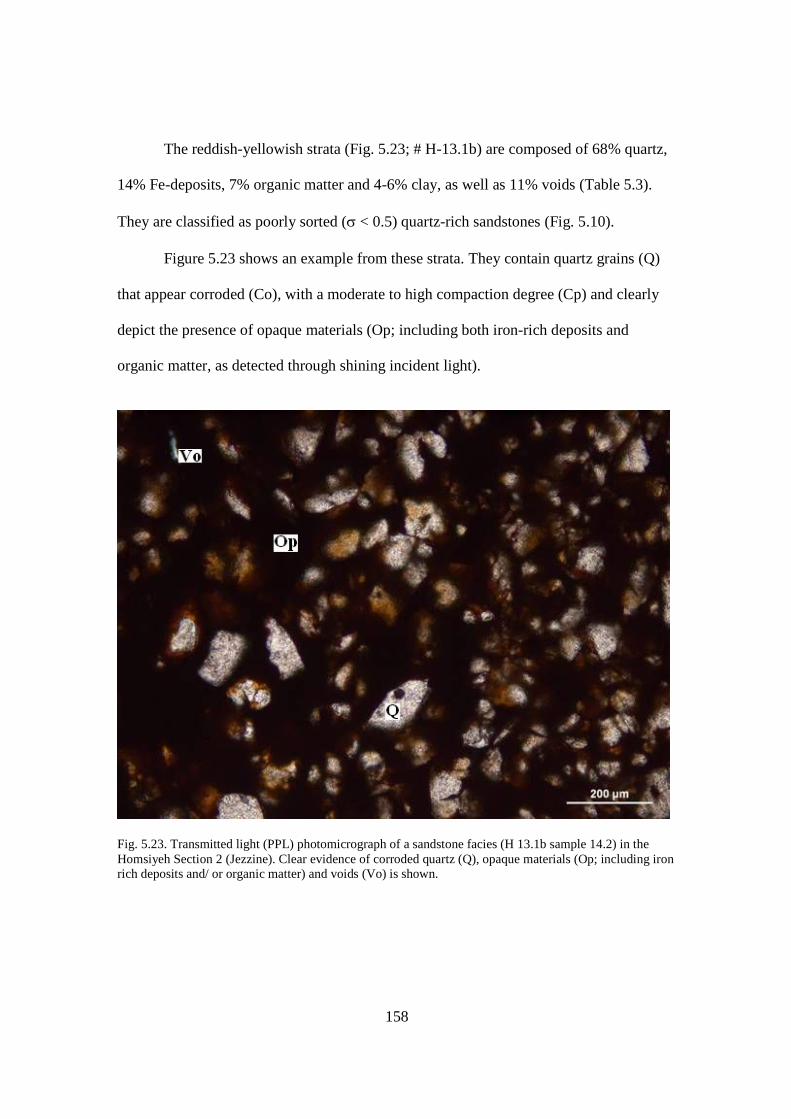
158
The reddish-yellowish strata (Fig. 5.23; # H-13.1b) are composed of 68% quartz,
14% Fe-deposits, 7% organic matter and 4-6% clay, as well as 11% voids (Table 5.3).
They are classified as poorly sorted (s < 0.5) quartz-rich sandstones (Fig. 5.10).
Figure 5.23 shows an example from these strata. They contain quartz grains (Q)
that appear corroded (Co), with a moderate to high compaction degree (Cp) and clearly
depict the presence of opaque materials (Op; including both iron-rich deposits and
organic matter, as detected through shining incident light).
Fig. 5.23. Transmitted light (PPL) photomicrograph of a sandstone facies (H 13.1b sample 14.2) in the Homsiyeh Section 2 (Jezzine). Clear evidence of corroded quartz (Q), opaque materials (Op; including iron rich deposits and/ or organic matter) and voids (Vo) is shown.
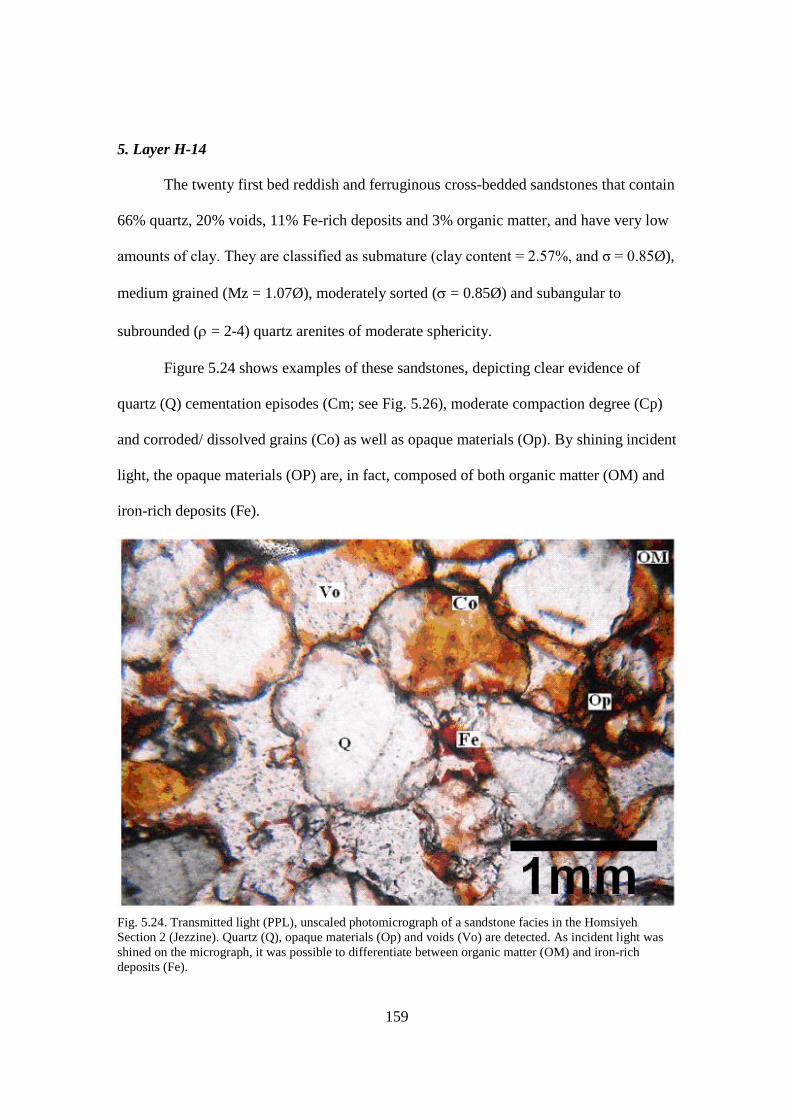
159
5. Layer H-14
The twenty first bed reddish and ferruginous cross-bedded sandstones that contain
66% quartz, 20% voids, 11% Fe-rich deposits and 3% organic matter, and have very low
amounts of clay. They are classified as submature (clay content = 2.57%, and σ = 0.85Ø),
medium grained (Mz = 1.07Ø), moderately sorted (s = 0.85Ø) and subangular to
subrounded (r = 2-4) quartz arenites of moderate sphericity.
Figure 5.24 shows examples of these sandstones, depicting clear evidence of
quartz (Q) cementation episodes (Cm; see Fig. 5.26), moderate compaction degree (Cp)
and corroded/ dissolved grains (Co) as well as opaque materials (Op). By shining incident
light, the opaque materials (OP) are, in fact, composed of both organic matter (OM) and
iron-rich deposits (Fe).
Fig. 5.24. Transmitted light (PPL), unscaled photomicrograph of a sandstone facies in the Homsiyeh Section 2 (Jezzine). Quartz (Q), opaque materials (Op) and voids (Vo) are detected. As incident light was shined on the micrograph, it was possible to differentiate between organic matter (OM) and iron-rich deposits (Fe).
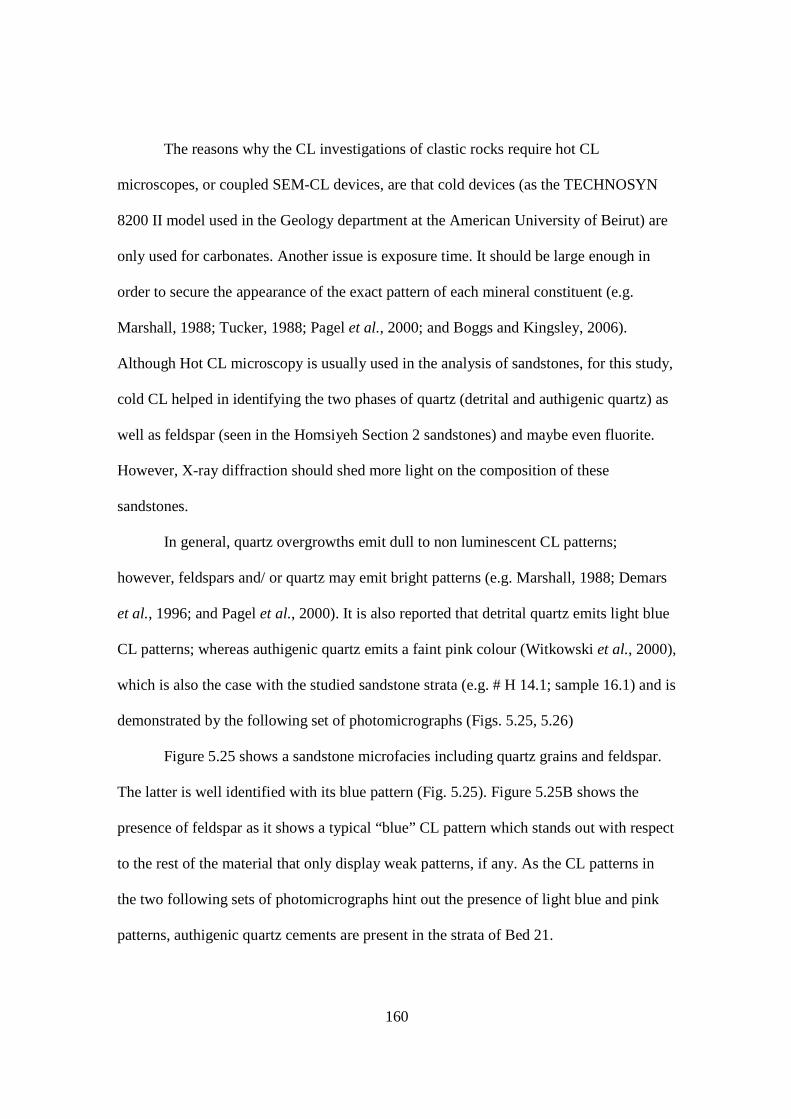
160
The reasons why the CL investigations of clastic rocks require hot CL
microscopes, or coupled SEM-CL devices, are that cold devices (as the TECHNOSYN
8200 II model used in the Geology department at the American University of Beirut) are
only used for carbonates. Another issue is exposure time. It should be large enough in
order to secure the appearance of the exact pattern of each mineral constituent (e.g.
Marshall, 1988; Tucker, 1988; Pagel et al., 2000; and Boggs and Kingsley, 2006).
Although Hot CL microscopy is usually used in the analysis of sandstones, for this study,
cold CL helped in identifying the two phases of quartz (detrital and authigenic quartz) as
well as feldspar (seen in the Homsiyeh Section 2 sandstones) and maybe even fluorite.
However, X-ray diffraction should shed more light on the composition of these
sandstones.
In general, quartz overgrowths emit dull to non luminescent CL patterns;
however, feldspars and/ or quartz may emit bright patterns (e.g. Marshall, 1988; Demars
et al., 1996; and Pagel et al., 2000). It is also reported that detrital quartz emits light blue
CL patterns; whereas authigenic quartz emits a faint pink colour (Witkowski et al., 2000),
which is also the case with the studied sandstone strata (e.g. # H 14.1; sample 16.1) and is
demonstrated by the following set of photomicrographs (Figs. 5.25, 5.26)
Figure 5.25 shows a sandstone microfacies including quartz grains and feldspar.
The latter is well identified with its blue pattern (Fig. 5.25). Figure 5.25B shows the
presence of feldspar as it shows a typical “blue” CL pattern which stands out with respect
to the rest of the material that only display weak patterns, if any. As the CL patterns in
the two following sets of photomicrographs hint out the presence of light blue and pink
patterns, authigenic quartz cements are present in the strata of Bed 21.

161
A.
B. Fig. 5.25. Transmitted light (PPL; A) and CL (B) photomicrographs of a sandstone facies in the Homsiyeh Section 2 (Jezzine). Note the presence of corroded quartz grains (Q), voids (Vo), and opaque materials (Op; including iron-rich deposits and organic matter) as well as feldspar (Fr) in the center of the CL view.
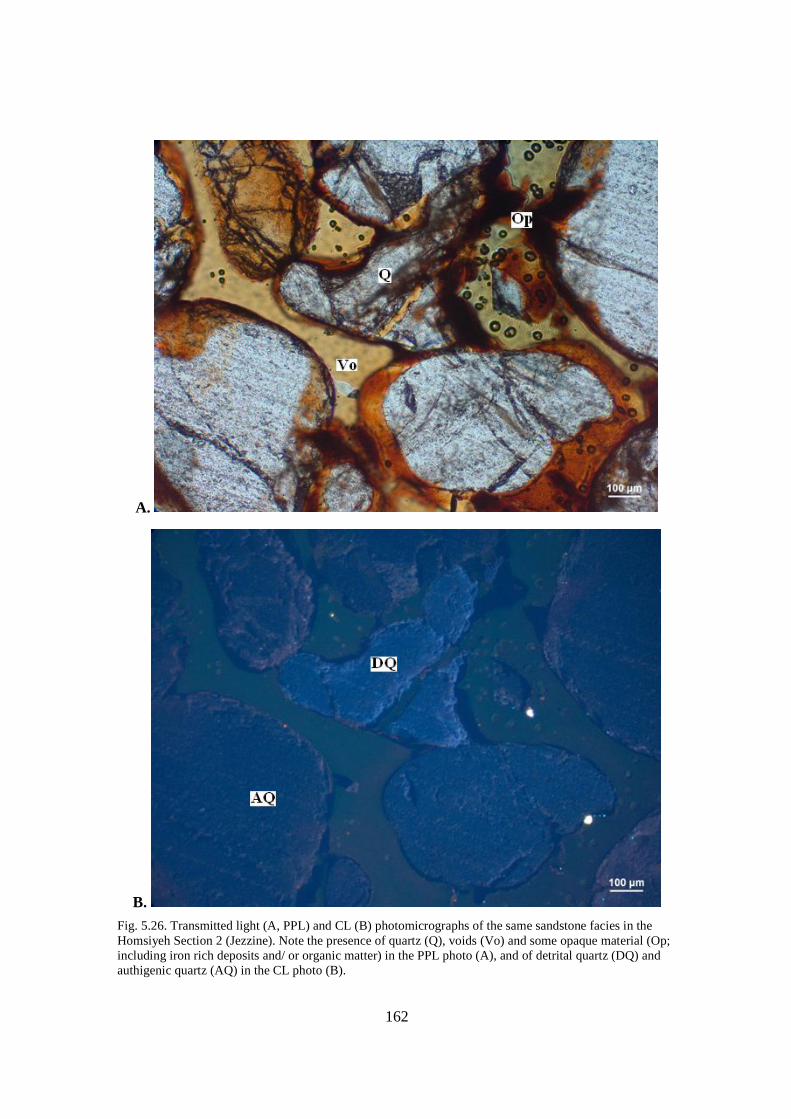
162
A.
B.
Fig. 5.26. Transmitted light (A, PPL) and CL (B) photomicrographs of the same sandstone facies in the Homsiyeh Section 2 (Jezzine). Note the presence of quartz (Q), voids (Vo) and some opaque material (Op; including iron rich deposits and/ or organic matter) in the PPL photo (A), and of detrital quartz (DQ) and authigenic quartz (AQ) in the CL photo (B).

163
D. Microfacies characterization
1. Quartz arenites
Quartz arenites are the most common sandstone type in the Chouf Formation at
the Jezzine locality (Wakim, 1968). They are almost completely made up of detrital
quartz grains including or excluding their authigenic cements (mostly quartz), which are
almost totally devoid of clays. They are usually moderately well- to well-sorted (medium
grained) strata that display mostly rounded clasts and are typically submature to mature
(e.g. Unit H 12; Homsiyeh Section 2). Sandstones of this facies are mostly clean, and
yellowish, but not always massive if not cemented (Touma, 1985). On average, these
strata contain 77% quartz, 10.5% opaque material, and about 2.3% clay and 9.8% voids.
Arenites have on average an intergranular porosity of about 10%. Therefore, they act as
good reservoirs.
Rocks belonging to this microfacies include all quartz-rich sandstones (content is
over 75%) showing distinct laminations, primary porosity, embayment (e.g. see Fig.
5.20), traces of organic matter and evidence of cementation. As expected, under the
microscope, quartz arenites display low birefringence, low relief and wavy extinction
(owing to their very high “recalculated” quartz content, bypassing 95%, following the
Folk 1980 sandstone classification diagram). ‘Pervasive cementation’ often occurs when
authigenic quartz grains (showing optical continuity with detrital quartz grains) are
represented. These arenites generally indicate low compaction, but occasionally show
traces of bitumen dissolution. As extensive cementation may be recorded, pores are most
likely occluded, and only about 10% remains.
164
2. Muddy (or argillaceous) - quartz-rich sandstones
These sandstones show well to moderate sorting, and contain some clays (less
than 5%). Unlike the first second sub-facies, the sandstones belonging to this one tend to
develop slightly less sorted, and less rounded clasts. On average, these strata contain 77%
quartz, 16% opaque material, 2% clay, and 2% calcite as well as 3% voids (information
includes all samples, even those not assessed on thin-sections). Muddy quartz-rich
sandstones have on average an intergranular porosity of about 3%. Therefore, they act as
poor reservoirs.
Cementation does occur, but is not always made up of quartz overgrowths. Iron-
rich cements can be detected in many cases. As these strata develop into hard rather than
friable beds, compaction rates are expected to be moderate to high. Dissolution of
maturing organic matter is very clear as pores are present (3%).
3. Clayey-muddy quartz-rich sandstones
This sub-facies indicates sandstones that comprise the bottom part of the Chouf
Formation, which are typically poorly sorted and immature (having clay contents over
5%). They generally show coarse-grained textures (e.g. H 11; samples 12.1, 12.2;
Homsiyeh Section 2) that tend to tend to show less sorted and less rounded clasts. Unlike
the first sub-facies, all strata belonging to this group show less sorted and less rounded
grains. On average, these strata contain 59% quartz, 25% opaque material, 7% clay, 4.5%
calcite, and 4.5% voids. These act as poor reservoirs.
As these strata mostly develop into hard (i.e. resistant and massive) beds rather
than weak and friable beds, compaction rates are expected to be moderate to high. The
rates of cementation may help compaction rates, and sometimes, evidence of organic

165
matter dissolution is recorded. Voids are about 5%.
4. Graywacke
Lithic sandstones are immature sandstones that contain less clay content than
graywacke (cf. Greensmith, 1989). Wackes are greenish to grayish sandstones, which are
typically very poorly sorted, dirty looking rocks (e.g. Folk, 1980; Leet, 1982; and Skinner
and Porter, 1995). They tend to show polymodal grain distributions, as they contain a
wide range of grain-sizes (i.e. from coarse sands to fine silts and/ or clay). As these strata
contain are very rich in clay, grain-sizes are hard to estimate (e.g. #GB 1, #GB 2, H 10.1
and #H 13.1a). Graywackes also include various lithic components, as chlorites, arkose
(i.e. Feldspathic graywacke), and/ or glauconite, owing to their green color (Folk, 1980;
Adams et al., 1994; Boggs, 1995; and Skinner and Porter, 1995). Glauconite occurs in
marine greensands (e.g. Greensmith, 1989; Adams et al., 1994). On average, these strata
contain 55% quartz, 21 clay, 20%opaque material, and 4% voids. Graywackes have on
average an intergranular porosity of about 4% and are therefore act as poor reservoirs.
Cementation does occur, but is not always made up of quartz overgrowths; as
iron-rich cements can be detected in such cases. Compaction rates are expected to be
moderate to high, even though these strata are very poorly-sorted. Dissolution of
maturing organic matter is suggested, as pores are present (4%).
5. Clays (and/ or shale)
This sub-facies indicates strata that are almost impossible to study
petrographically, due to their very small grain sizes. Therefore, X-ray diffraction is
needed for a thorough examination of mineralogy content (e.g. Moore and Reynolds,
166
1997; Al Haddad, 2007). Based on what can be observed under the petrographic
microscope, it is assumed that any mineral too small to identify is classified as “clay”.
Most clays indicate about over 75% clay particles, some 15% opaque material (and
bitumen), 5% quartz and/ or other constituents, and, at most, 1% calcite/ carbonate
materials. As Porosity is close to 0%, reservoir properties are very low, and clays often
act as seals anyway.
Unfortunately, as no new data was made available for the clay strata, their internal
composition will be defined in the next chapter (i.e. Chapter VI). However it can be
assumed that these strata comprise various paleosols and contain bitumen.
6. Limestone
The matrix of these fossiliferous calciclastic deposits (rich in organic matter, plant
remains and fossils - typically comprising limestone beds, or calcareous lag deposits (e.g.
H 3.3b; sample 15 and H 10.11; sample 1)) is mostly composed of calcite, and/ or calcite
cements, as found within moulds, and occluded pores (see CL Photo; Fig. 5.9). They also
show many other oyster and bivalve shells in coquina beds (nearby), among other
organisms probably cemented by calcite.
All limestone strata point out to be fully (or almost fully) composed of calcite
grains (around 80%). Minute amounts of clays and quartz components were also detected
(1% at most). Cementation does occur, but neomorphism and grain replacement seems
more abundant (although, through CL microscopy, various calcite phases were detected).
There are various traces of organic matter and plant root activity that were detected
(15%); as well as pores (2.5%) and probably, clays and/ or other carbonates (2.5%).
Henceforth, limestones act as very poor reservoirs.

167
E. Synopsis
A total of six microfacies were identified and studied from the Toumatt-Jezzine/
Aazibi section and both Homsiyeh sections, and were summarized in Tables 5.1, 5.2 and
5.3. The petrographic characteristics of the analyzed microfacies are presented in Table
5.4 and provide a description and illustrated examples for each studied sample.
Table 5.4. Petrographic characteristics of the microfacies of the studied Chouf Formation successions (southern Lebanon).
Studied microfacies in both Homsiyeh Sections and Toumatt/ Jezzine Aazibi
No. Microfacies Description Diagenetic Phases (size
in mm) Reservoir properties
I Quartz arenite
Sandstones containing over 95% quartz in composition.
They are generally devoid of clays and are both
mineralogically and texturally mature.
Detrital (corroded) and authigenic quartz
very good
II Muddy quartz-rich
sandstones
Moderately sorted sandstones that are generally texturally submature, which are low in
clay content
Detrital quartz, corrosion and authigenic quartz,
including matrix poor
III Clayey-muddy-quartz-
rich sandstones
Poorly sorted sandstones that show a high clay content,
which are both mineralogically and texturally immature.
Quartz (detrital, authigenic), corrosion, and high clay content
poor
IV Graywacke
Very poorly sorted sandstones showing clay (and matrix)
content well over 15%. Cementation, dissolution and
corrosion are detected
Compaction poor
V Clays
Strata that comprise generally very fine grain sizes (less than
1/256mm). They need to be identified by X-ray diffraction, as the conventional microscopy
resolution does not permit mineral identification.
Clays Poor/ seal
VI Limestone
Calcite rich carbonate deposits that show hydrocarbon
impregnation and preserved fossils
Authigenic cements and calcite replacement/
neomorphism very poor
168
CHAPTER VI
X-RAY DIFFRACTION DATA
In this study, mineralogy was determined semi-quantitatively by X-ray
diffractometry, on a selection of 44 representative samples taken from the Toumatt-
Jezzine/ Aazibi section and both Homsiyeh sections. Six samples were selected from
Tixier’s (1971-1972) section (cf. Fig 4.4). Fourteen samples were taken from Homsiyeh
Section 1, and twenty-four samples from Homsiyeh section 2. Overall, they represent
sandstones, graywacke, clays and limestone. They were chosen to assess the rock bulk
mineralogical compositions of each facies of the Chouf Formation. Therefore, quartz
(diffraction angle equals 20.8º 2q), K-feldspar (27.4º 2q), and plagioclase (27.8º 2q) and
calcite (29.9 º 2q) were determined by measuring X-ray diffractogram peak heights on
bulk sands, shales and limestones (based on studies from Moore and Reynolds, 1997;
Muhs et al., 2003; Muhs, 2004; and Al Haddad, 2007).
Some important clay (and other) minerals from the Chouf Formation were
identified (e.g. Moore and Reynolds, 1997). These were formerly studied by Tixier
(1971-1972). The clays include goethite (21.24º 2q), kaolinite (23.15º 2q), illite (26.6º
2q) and montmorillonite (38.2º 2q). Each powdered sample has been duplicated and
subjected to several XRD scans, using the halite standard, but the X-ray diffractograms
were uncorrected.
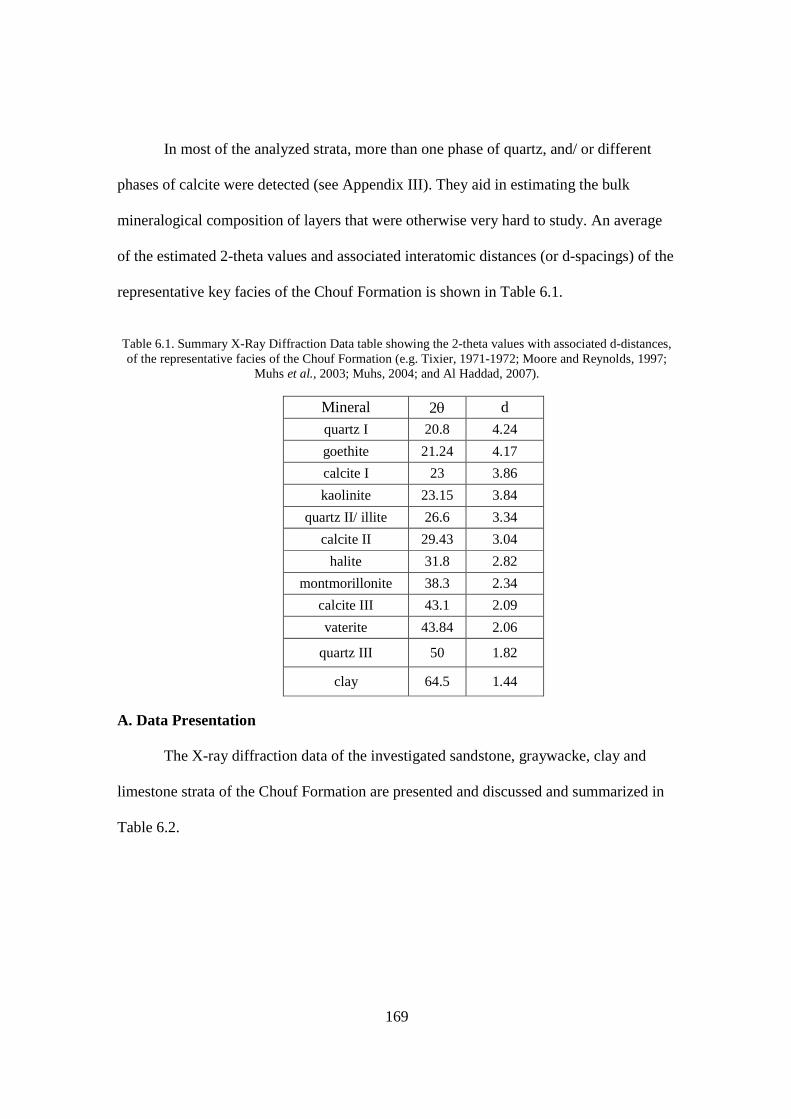
169
In most of the analyzed strata, more than one phase of quartz, and/ or different
phases of calcite were detected (see Appendix III). They aid in estimating the bulk
mineralogical composition of layers that were otherwise very hard to study. An average
of the estimated 2-theta values and associated interatomic distances (or d-spacings) of the
representative key facies of the Chouf Formation is shown in Table 6.1.
Table 6.1. Summary X-Ray Diffraction Data table showing the 2-theta values with associated d-distances, of the representative facies of the Chouf Formation (e.g. Tixier, 1971-1972; Moore and Reynolds, 1997;
Muhs et al., 2003; Muhs, 2004; and Al Haddad, 2007).
Mineral 2q d quartz I 20.8 4.24
goethite 21.24 4.17
calcite I 23 3.86
kaolinite 23.15 3.84
quartz II/ illite 26.6 3.34
calcite II 29.43 3.04
halite 31.8 2.82
montmorillonite 38.3 2.34
calcite III 43.1 2.09
vaterite 43.84 2.06
quartz III 50 1.82
clay 64.5 1.44
A. Data Presentation
The X-ray diffraction data of the investigated sandstone, graywacke, clay and
limestone strata of the Chouf Formation are presented and discussed and summarized in
Table 6.2.
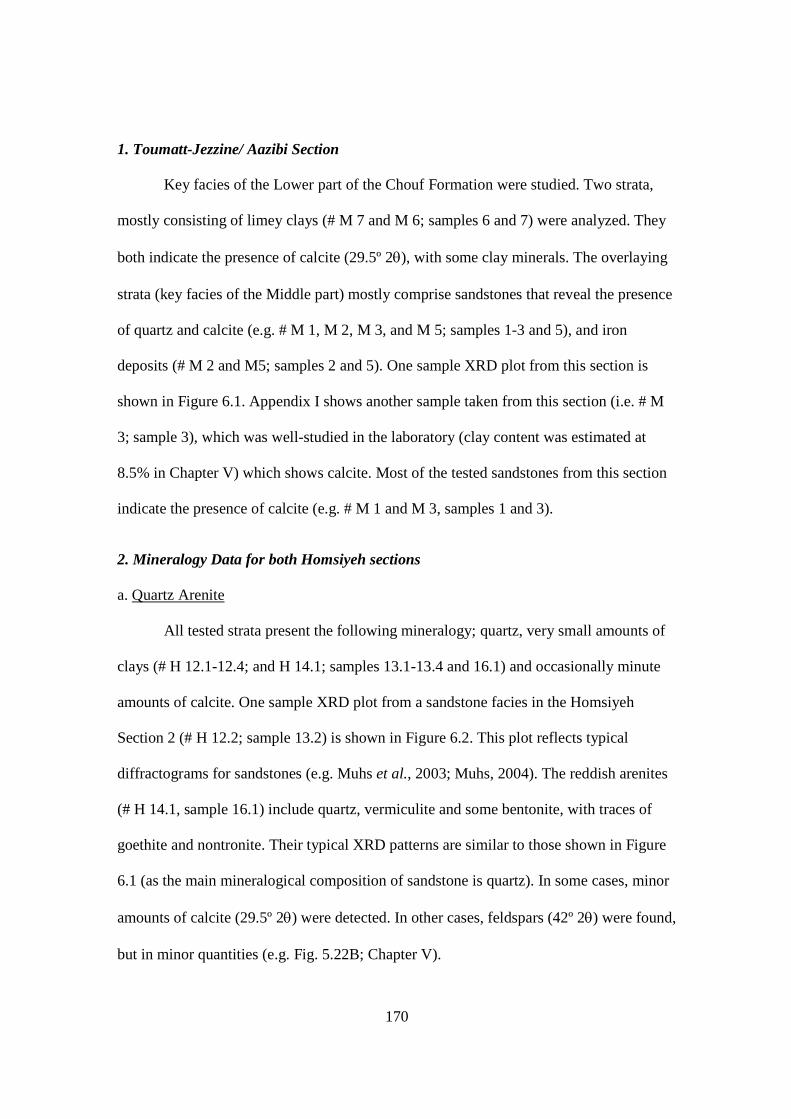
170
1. Toumatt-Jezzine/ Aazibi Section
Key facies of the Lower part of the Chouf Formation were studied. Two strata,
mostly consisting of limey clays (# M 7 and M 6; samples 6 and 7) were analyzed. They
both indicate the presence of calcite (29.5º 2q), with some clay minerals. The overlaying
strata (key facies of the Middle part) mostly comprise sandstones that reveal the presence
of quartz and calcite (e.g. # M 1, M 2, M 3, and M 5; samples 1-3 and 5), and iron
deposits (# M 2 and M5; samples 2 and 5). One sample XRD plot from this section is
shown in Figure 6.1. Appendix I shows another sample taken from this section (i.e. # M
3; sample 3), which was well-studied in the laboratory (clay content was estimated at
8.5% in Chapter V) which shows calcite. Most of the tested sandstones from this section
indicate the presence of calcite (e.g. # M 1 and M 3, samples 1 and 3).
2. Mineralogy Data for both Homsiyeh sections
a. Quartz Arenite
All tested strata present the following mineralogy; quartz, very small amounts of
clays (# H 12.1-12.4; and H 14.1; samples 13.1-13.4 and 16.1) and occasionally minute
amounts of calcite. One sample XRD plot from a sandstone facies in the Homsiyeh
Section 2 (# H 12.2; sample 13.2) is shown in Figure 6.2. This plot reflects typical
diffractograms for sandstones (e.g. Muhs et al., 2003; Muhs, 2004). The reddish arenites
(# H 14.1, sample 16.1) include quartz, vermiculite and some bentonite, with traces of
goethite and nontronite. Their typical XRD patterns are similar to those shown in Figure
6.1 (as the main mineralogical composition of sandstone is quartz). In some cases, minor
amounts of calcite (29.5º 2q) were detected. In other cases, feldspars (42º 2q) were found,
but in minor quantities (e.g. Fig. 5.22B; Chapter V).

171
Fig. 6.1. Uncorrected X-ray diffractogram from the Toumatt Jezzine/ Aazibi section. A similar XRD plot is shown in Appendix I. Note the presence of quartz (20.8º 2q), calcite (29.5º 2q) and clays (45º and 67.5º 2q).

172
Fig. 6.2. Uncorrected XRD plot showing the typical mineralogy content of quartz arenite (e.g. # H 12.2). As shown on the plot, these strata contain very little (if any) clay.

173
b. Muddy Quartz-Rich Sandstones
The tested strata from Homsiyeh sections 1 and 2 (that belong to this facies)
indicate similar diffractogram patterns to those shown before (see Figs. 6.1 and 6.2).
Figure 6.3 shows a sample XRD plot from Homsiyeh section 1 (# H 2.2b; sample 8). The
clay amount previously estimated to be 4% (see granulometric studies; Chapter V)
contains nontronite, bentonite and clay (NR). Other samples, which were tested from this
facies, indicate the presence of calcite.
Fig. 6.3. Uncorrected X-ray diffractogram showing the mineralogical content of a sandstone facies (# H 2.2b, sample 8) in Homsiyeh Section 1 (Jezzine). Four or more varieties of quartz and various clays (i.e. illite (26.6º 2q) and/ or nontronite (67.5º 2q) are detected. Note that Nontr. = nontronite and pyr. = pyrite.
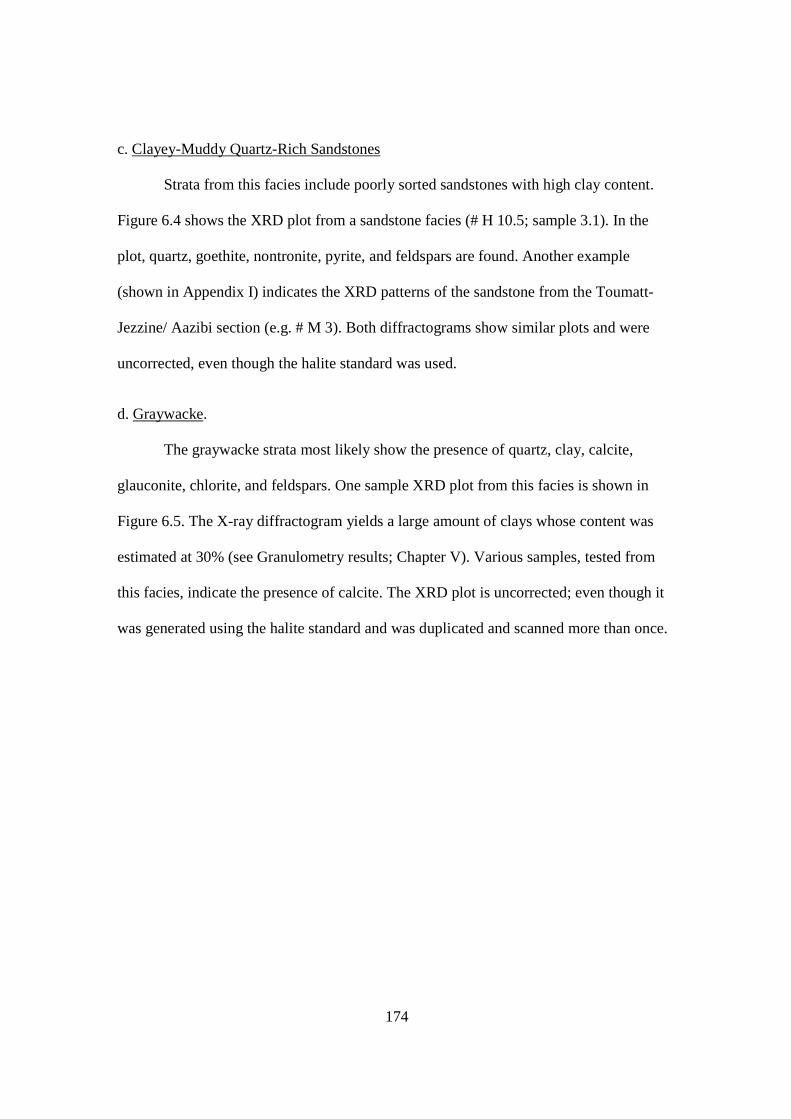
174
c. Clayey-Muddy Quartz-Rich Sandstones
Strata from this facies include poorly sorted sandstones with high clay content.
Figure 6.4 shows the XRD plot from a sandstone facies (# H 10.5; sample 3.1). In the
plot, quartz, goethite, nontronite, pyrite, and feldspars are found. Another example
(shown in Appendix I) indicates the XRD patterns of the sandstone from the Toumatt-
Jezzine/ Aazibi section (e.g. # M 3). Both diffractograms show similar plots and were
uncorrected, even though the halite standard was used.
d. Graywacke.
The graywacke strata most likely show the presence of quartz, clay, calcite,
glauconite, chlorite, and feldspars. One sample XRD plot from this facies is shown in
Figure 6.5. The X-ray diffractogram yields a large amount of clays whose content was
estimated at 30% (see Granulometry results; Chapter V). Various samples, tested from
this facies, indicate the presence of calcite. The XRD plot is uncorrected; even though it
was generated using the halite standard and was duplicated and scanned more than once.

175
Fig. 6.4. Uncorrected X-ray diffractogram showing the mineralogical content of a sandstone facies (# H 10.5, sample 3.1) in Homsiyeh Section 2 (Jezzine).
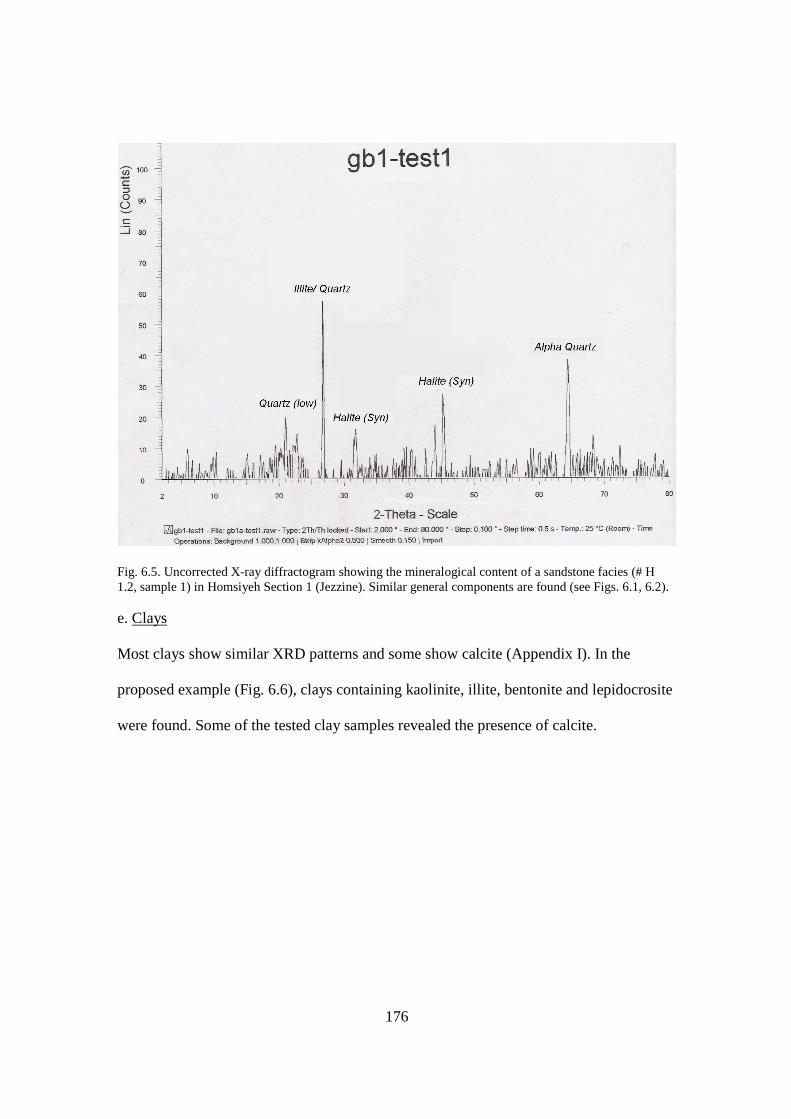
176
Fig. 6.5. Uncorrected X-ray diffractogram showing the mineralogical content of a sandstone facies (# H 1.2, sample 1) in Homsiyeh Section 1 (Jezzine). Similar general components are found (see Figs. 6.1, 6.2). e. Clays
Most clays show similar XRD patterns and some show calcite (Appendix I). In the
proposed example (Fig. 6.6), clays containing kaolinite, illite, bentonite and lepidocrosite
were found. Some of the tested clay samples revealed the presence of calcite.
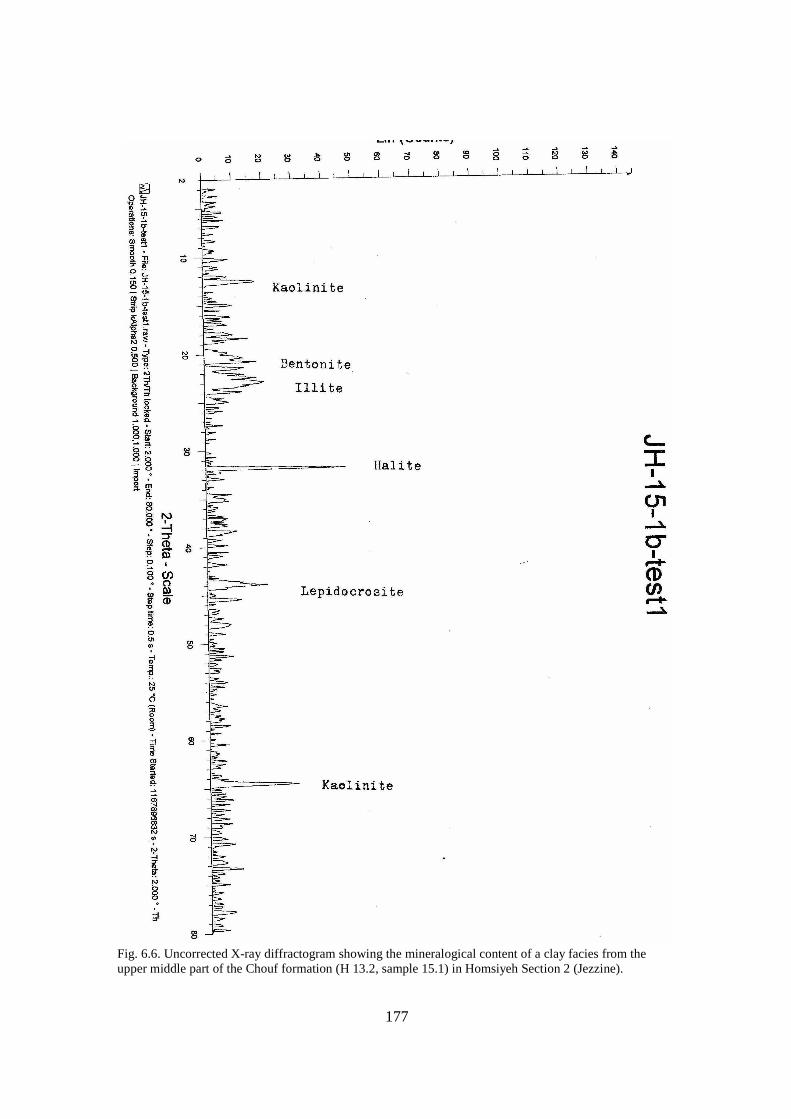
177
Fig. 6.6. Uncorrected X-ray diffractogram showing the mineralogical content of a clay facies from the upper middle part of the Chouf formation (H 13.2, sample 15.1) in Homsiyeh Section 2 (Jezzine).
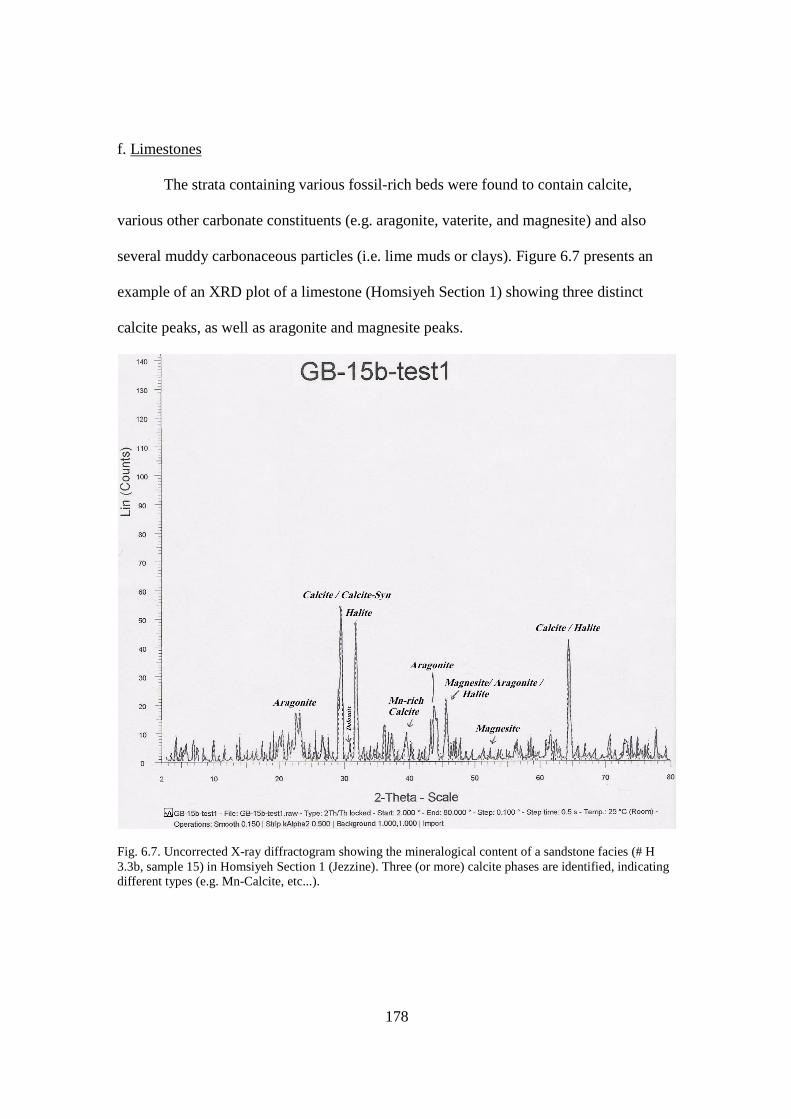
178
f. Limestones
The strata containing various fossil-rich beds were found to contain calcite,
various other carbonate constituents (e.g. aragonite, vaterite, and magnesite) and also
several muddy carbonaceous particles (i.e. lime muds or clays). Figure 6.7 presents an
example of an XRD plot of a limestone (Homsiyeh Section 1) showing three distinct
calcite peaks, as well as aragonite and magnesite peaks.
Fig. 6.7. Uncorrected X-ray diffractogram showing the mineralogical content of a sandstone facies (# H 3.3b, sample 15) in Homsiyeh Section 1 (Jezzine). Three (or more) calcite phases are identified, indicating different types (e.g. Mn-Calcite, etc...).
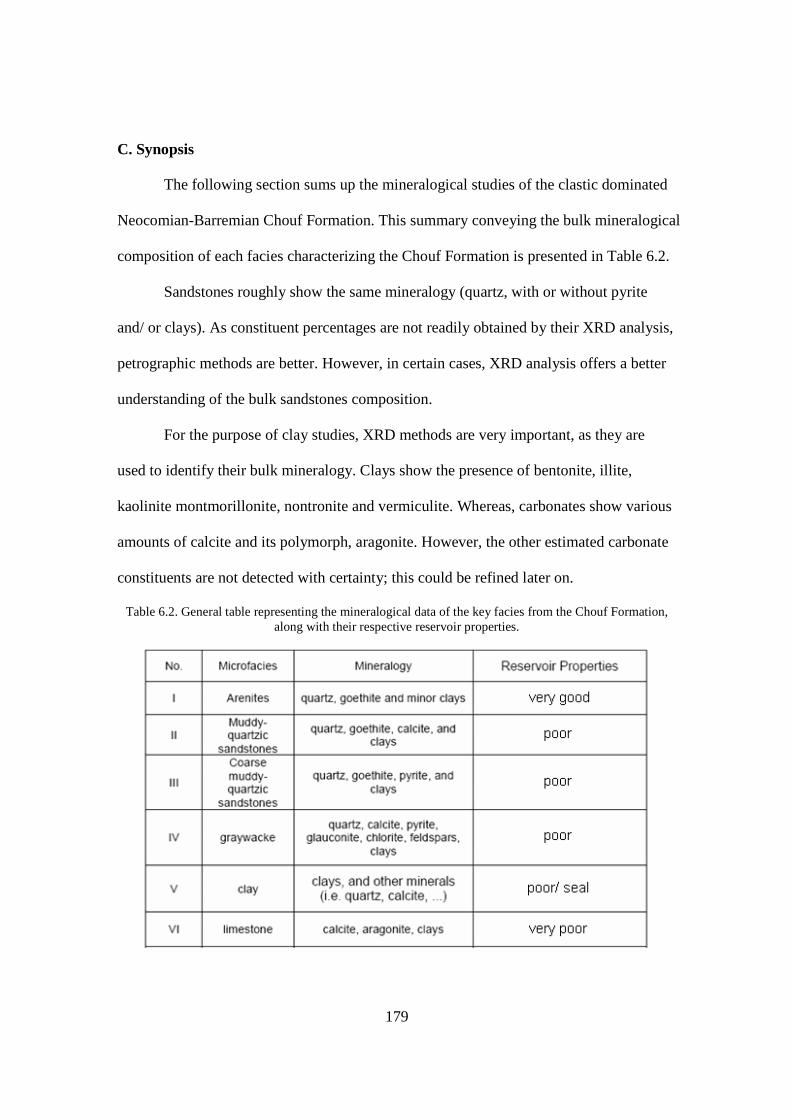
179
C. Synopsis
The following section sums up the mineralogical studies of the clastic dominated
Neocomian-Barremian Chouf Formation. This summary conveying the bulk mineralogical
composition of each facies characterizing the Chouf Formation is presented in Table 6.2.
Sandstones roughly show the same mineralogy (quartz, with or without pyrite
and/ or clays). As constituent percentages are not readily obtained by their XRD analysis,
petrographic methods are better. However, in certain cases, XRD analysis offers a better
understanding of the bulk sandstones composition.
For the purpose of clay studies, XRD methods are very important, as they are
used to identify their bulk mineralogy. Clays show the presence of bentonite, illite,
kaolinite montmorillonite, nontronite and vermiculite. Whereas, carbonates show various
amounts of calcite and its polymorph, aragonite. However, the other estimated carbonate
constituents are not detected with certainty; this could be refined later on.
Table 6.2. General table representing the mineralogical data of the key facies from the Chouf Formation, along with their respective reservoir properties.
180
CHAPTER VII
DISCUSSION
A. Facies Analysis
Sedimentological investigations during field work (Chapter IV), further detailed
petrographic examination (Chapter V), and mineralogical identification (Chapter VI) led
to the characterization of six major facies within the lower and middle parts of the
Neocomian-Barremian rock succession in southern Lebanon. These facies are discussed
from bottom to top.
1. Lower aquatic facies
The lowermost strata of the ‘Grès de Base’ comprise sandstone, greywacke and
clays beds (see Chapter IV, units M1 and 2, H 1-4 and H 10), which overlie the Late
Jurassic to Early Cretaceous limestones. These deposits are mostly friable and include
considerable amounts of organic matter.
These sandstones are immature to submature, may indicate the presence of
preserved amber (e.g. # H 1.2) and are typically medium to fine grained (average Mz =
1.881). Occasionally, fossil, plants or root remains were identified (in the clastic
dominated strata). Various beds were found to contain goethite, calcite (cements),
glauconite and/ or other evidence pertaining to marine environments, or turbidity
controlled systems (graywacke). However, it is very possible that these, are in fact
uniform concretionary pebbles that formed from iron-rich sandy beds (Dr. Nader,
personal communication).

181
Within some sandstone bodies, clay draping was detected (see Fig. 4.11) clearly a
sign of flooding (Fig. 7.1), further evidence pointing to flooding is the presence of
herringbone cross-stratifications, and/ or tide and ebb currents.
Fig. 7.1. Illustrative sketch representing clay draping in channel sandstone facies, associated with tidal/ flooding events (Boggs, 1995). A. Sketch of typical cross-beds found in cross-stratified sandstone strata. B. Flooding/ tidal curve showing differing current flow speeds. At its lowest points (e.g. A & B), clay drapes are said to be formed (the clays cover the lee side of ripples). C. Sketch of ripple laminations (A, B) showing clay draping (see Fig. 4.11; Chapter IV).
Glauconitic marls were observed within these strata. They indicate shallow-
marine to tidal flat depositional environments (ancient glauconites). Modern glauconites,
forming at cool temperatures, are represented by rather quiescent systems (e.g. Chafetz
and Reid, 2000). However, according to Porrenga (1967), not all glauconites are marine,
as many modern glauconites form at depths ranging from 10 to 800m. Oxygen isotope
signatures (of glauconite) mainly depend on the water in which they were generated; this
suggests a very shallow marine to tidal flat depositional environment (e.g. Faure, 1986; in
Doummar, 2005).

182
2. Limestone facies
This facies comprises both carbonate (lag) deposits and limestones (Table 7.1). It
is likely that in a westerly direction, sandstone and clays gradually grade to limestones.
Assuming the coastlines were very close (in the case of Jezzine), this is not surprising.
The limestones dominantly tend to be mudstones-wackestones as suggested by the
amounts of particles (fossils, etc…) with respect to matrix (Dunham, 1962; Folk, 1962).
Various soil horizons, containing glauconite (and probably limestone), were found near
the Homsiyeh section 1.
Microscopic (including cathodoluminescence) and mineralogical studies reveal
the presence of various calcite phases (four oxidizing and reducing calcite phases, in
which three act as cements), and root (plant) activity (a probable indication of a soil
horizon) seen in Figures 5.8 and 5.9 (see Chapter V).
3. “Transition” facies
Iron-rich sandy (lag) deposits (Table 7.1) were found at the transition between the
key facies representing the lower and middle parts of the Chouf Formation (subunits # H
10 and # H 12). They are mostly polymodally distributed coarse grained immature iron-
rich sandstones. They show various degrees of compaction and quartz corrosion and have
a pervasive cementation of iron rich deposits (see Chapter V; Fig. 5.17).
4. Eolian Facies
This facies contains yellowish and reddish cross-bedded/ massive quartz arenites
that are typically found in the middle part of the Chouf Formation. They are mostly
composed of submature to mature moderately sorted (Mz = 1.824) fluvial or eolian
(dune) sands that are almost solely composed of quartz (over 95%) and are devoid of
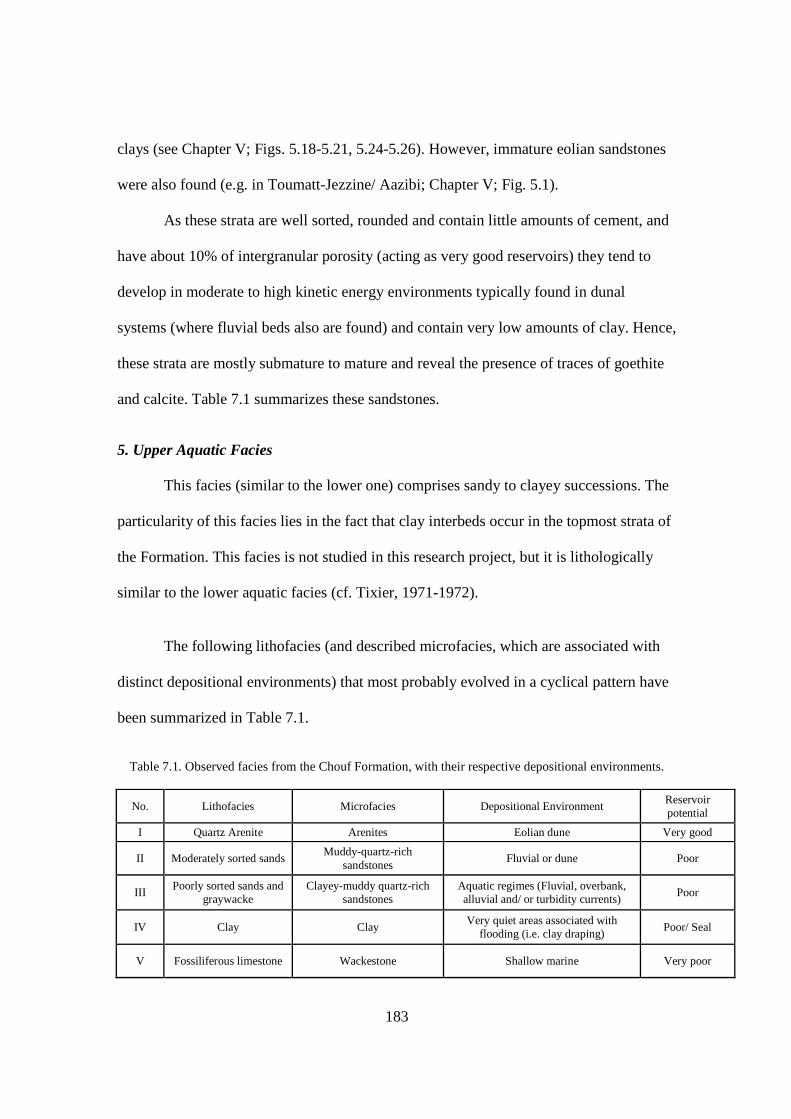
183
clays (see Chapter V; Figs. 5.18-5.21, 5.24-5.26). However, immature eolian sandstones
were also found (e.g. in Toumatt-Jezzine/ Aazibi; Chapter V; Fig. 5.1).
As these strata are well sorted, rounded and contain little amounts of cement, and
have about 10% of intergranular porosity (acting as very good reservoirs) they tend to
develop in moderate to high kinetic energy environments typically found in dunal
systems (where fluvial beds also are found) and contain very low amounts of clay. Hence,
these strata are mostly submature to mature and reveal the presence of traces of goethite
and calcite. Table 7.1 summarizes these sandstones.
5. Upper Aquatic Facies
This facies (similar to the lower one) comprises sandy to clayey successions. The
particularity of this facies lies in the fact that clay interbeds occur in the topmost strata of
the Formation. This facies is not studied in this research project, but it is lithologically
similar to the lower aquatic facies (cf. Tixier, 1971-1972).
The following lithofacies (and described microfacies, which are associated with
distinct depositional environments) that most probably evolved in a cyclical pattern have
been summarized in Table 7.1.
Table 7.1. Observed facies from the Chouf Formation, with their respective depositional environments.
No. Lithofacies Microfacies Depositional Environment Reservoir potential
I Quartz Arenite Arenites Eolian dune Very good
II Moderately sorted sands Muddy-quartz-rich
sandstones Fluvial or dune Poor
III Poorly sorted sands and
graywacke Clayey-muddy quartz-rich
sandstones Aquatic regimes (Fluvial, overbank, alluvial and/ or turbidity currents)
Poor
IV Clay Clay Very quiet areas associated with
flooding (i.e. clay draping) Poor/ Seal
V Fossiliferous limestone Wackestone Shallow marine Very poor
184
B. Facies analysis of the Toumatt-Jezzine/ Aazibi Section
This is the only section in the Jezzine district that includes all three units of the
Chouf Formation, as described by Tixier (1971-1972) in his study of the Neocomian-
Barremian rocks (‘Grès de Base’) near the Machghara locality.
The sandstones from this section are mostly immature (see Chapter V). This
indicates that these rocks either originated from granitic rocks (high in feldspar) and/ or
indicated short distances of transport, explaining probably why sediment sorting was
moderate to poor (owing to the relatively large clay content, of about 9%; as with # M 3),
and why quartz grains were not well-rounded (e.g. Muhs et al, 1997). Their X-ray
diffractogram peak readings should not differ too much from the tested sandstones from
the other sections (i.e. as those displaying quartz (20.8º 2q), K-feldspar (27.4º 2q), and
plagioclase (27.8º 2q)), even though they are not necessarily immature (e.g. Muhs, et al.
1997; Muhs, 2004).
The immature clayey-muddy sandstone strata (of the Toumatt-Jezzine/ Aazibi
section) may indicate that they are eolian sandstones, located close to the source. They
are most probably arkosic in composition, and are therefore, immature eolian sandstones
that appear to be both texturally and mineralogically immature (e.g. Muhs et al., 1997a,
b). Such sandstones exist, and, are in theory, located close to the source, or did not travel
for far distances (Muhs et al., 1997). According to Folk (1980), they may comprise
mineralogically immature minerals (such as feldspars).

185
C. Microfacies analysis of both Homsiyeh Sections
All investigated strata representing key beds of the Chouf Formation provided the
identification of six microfacies. Their interpretations are discussed below.
1. Quartz arenite
According to Wakim (1968) arenites are the most common sandstone facies of the
Jezzine area. This study also confirms that. This system indicates purely continental
deposits, as sea levels were found to be lowest during the mid Hauterivian (i.e. at some
-90m). Therefore, according to Haq et al. (1987), Walley (1997), and Ferry et al. (2007),
during this time, a regression was observed.
All sandstones containing 95% quartz (by composition), yielding very clear XRD
plots that appear to be mostly composed of mature to submature medium-grained and
well to moderately well sorted sandstones are composed of arenites. These are mostly
found in continental systems, as recorded sea levels were very low (e.g. Vail et al., 1977,
Haq et al., 1987; Walley, 1997; Ferry et al, 2007). These strata are mostly composed by
unimodally distributed eolian material that deposited in high to moderately high kinetic
energy systems. These strata typically comprise dunes, or well-sorted fluvial beds, which
are mostly friable and display cross-strata. The only clays that may be found are clay
cements such as kaolinite and/ or illite.
On average, these strata contain 77% quartz, 10.5% opaque material, and about
2.3% clay, as well as 9.8% voids,. The mineralogical contents reveal the presence of
quartz, some goethite and very low amounts of clay, therefore confirming the
microscopic observations. These rocks have some amounts of recorded organic matter
settling with the sedimentation process; the first (depositional) porosity is clearly detected
186
and is almost similar to the detrital grains. There also are traces of compaction,
dissolution and cementation, as the bitumen has evolved (due to burial) and indicates that
its fluids cause the partial dissolution of quartz grains. It is likely that cementation was
caused by migration later on during the diagenetic history. Using XRD methods the clay
content of arenites revealed the presence of bentonite, and/ or kaolinite. Bentonite
includes a variety of mudrock types composed mostly of smectite and glassy volcanic
debris. Hence due to their low clay content and high intergranular porosity, arenites are
good reservoirs, especially when the quartz pores are coated with diagenetic clay.
2. Muddy quartz-rich sandstones
As muddy quartz-rich sandstones were found in both aquatic and continental
systems, in either case, it can be assumed that, the conditions of their formation of these
sandstones did not differ. So, with respect to sea-level, a transition zone could be
expected at the times of sedimentation of these sands. Therefore, according to Haq et al
(1987), it can be considered that these strata were deposited during the times the sea-
levels were at about -175m (during the Berriasian-Valanginian, and/ or during the upper
lower Hauterivian). Therefore, at these times, sea levels were moderately high (i.e. about
-150 to -200m); at transitions between regressions and transgressions. It is also noted that
some marine-fluvial sandstones indicate the presence of nontronite and clay (NR). Hence,
these rocks are considered to be submature sandstones, which include moderately sorted
sandy strata indicating the deposition of moderately sorted fluvial beds, occurring in both
aquatic and continental systems. These strata occasionally comprise hard strata and/ or
traces of organic matter. These strata (like quartz arenites) comprise unimodally

187
distributed moderately sorted strata deposited in both continental and aquatic
environments in moderate kinetic energy systems.
These rocks contain about 77% quartz, 16% opaque (containing both organic
matter and iron-rich deposits), and 2% clay, as well as 2% calcite; 3% voids (if present),
as it is common that muddy sands get cemented by calcite. The paragenesis involves
sedimentation that occurs through deposition and primary porosity development, which is
followed by eogenesis and compaction, then by dissolution and therefore secondary
porosity enhancement, and finally by pore occlusion (cementation). As bitumen was
found, it is assumed to have deposited by settling decaying organic matter, during
sedimentation. Bitumen maturation caused the quartz dissolution and corrosion until
migration, which kept pores intact. As maturation was affected by burial, pores were
preserved; hence, after the bitumen migrated, pores occluded. Telogenesis involved uplift
and erosion. With their 3% porosity, these act as poor reservoirs.
3. Clayey-muddy quartz-rich sandstones
These strata are mostly composed of immature sands from both eolian and marine
environments that generally comprise sandstones with large proportions of
mineralogically unstable minerals (as arkoses with 25% or more feldspars) and clay
contents that are generally over 5%. The marine strata were well-studied in the Homsiyeh
sections, and the evidence for eolian immature sandstones comes from the Toumatt-
Jezzine/ Aazibi section. Those sands may very well be formed close to the source, or
were not well developed, and still contain large amounts of arkosic components, which
will, by further abrasion and transport distance, become more mature, as feldspars get
altered and leave the system (cf. Folk, 1980)
188
These strata generally comprise clay-rich strata containing some traces of calcite.
These beds show the presence of 59% quartz, 25% opaque material (including organic
matter) and 7% clay. Voids and calcite together equally account for the remaining 9%.
This may indicate deposition of polymodally distributed clasts that were laid down in low
to extremely low kinetic energy conditions, typically favouring fluvial, overbank or
alluvial environments. The presence of humid or swampy conditions may be debatable
and account for the presence of large quantities of organic matter As conditions of
deposition may be influenced by marine systems, the presence of calcite cements should
not be ignored. Hence, these beds were believed to be deposited during the late Berriasian
to the early Valanginian. During those times, sea levels were considered to be very high
(i.e. around 270-330m (Haq et al., 1987, 1988)), and during the late Hauterivian to early
Barremian, sea-levels were about 280m.
4. Graywacke
Graywacke is a type of sandstone that is very poorly sorted and contains very
large amounts of clays (over 15%), feldspar (about 5%) and other components, as
chlorites, and micas, which account for over 20%. The remainder being that of quartz
(i.e. between 50 and 60%). In this study graywackes comprise about 55% quartz, 20%
opaque materials (including bitumen), and about 21% clay. The remaining percentages
therefore, mostly account for the presence of chlorite, feldspar and calcite, including 4%
void spaces; these strata show to be poor reservoirs. They are essentially found in
turbidity environments, and deposit in systems of extremely low kinetic energy (Folk,
1980). As these strata were encountered in the first and last parts of the Chouf Formation,
189
according to Tixier (1971-1972), it is likely that these strata were deposited during
transgressive seas.
Deposition (sedimentation and settling of organic matter) mainly occurred with
the primary porosity development. Then, during eogenesis, it is likely that the strata
underwent compaction. Dissolution occurred due to the maturation of the organic matter
into bitumen. This was coupled by pore enhancement (secondary porosity), and by
occlusion as the bitumen began to dissolve and corroded the surrounding quartz grains.
5. Clays (and/ or Shale)
The clays occurred in very quiescent environments, accounting for the settling of
particles in suspension. These strata contain large amounts of preserved organic matter
and plant activity (soil horizons, root traces, etc ...); accounting that many of these strata
acted as paleosols. As X-ray diffraction studies indicate, these are mostly composed of
kaolinite, illite and montmorillonite, although sometimes bentonite and other clays were
detected.
Ukla (1970) assumed that clays act as a transition between sandstone and
carbonates (i.e. limestone). The clay strata also show indications of the alteration process
of various unstable minerals (e.g. feldspars) into clays (Folk, 1980; Boggs, 1995). As
porosity values are very low, clays act as barriers or impermeable seals (Shuayb, 1974).
6. Limestones
The presence of limestones indicates marine to shallow marine conditions, which
is demonstrated by Tixier (1971-1972) as the conditions prevailing during the lower and
upper parts of the Chouf Formation was such that the coastlines were very close during
deposition (e.g. refer to Tixier, 1971-1972; and the discussion of the Jezzine and Adloun

190
localities). Coquina beds, lag deposits and glauconitic marls were also identified within
the marine/ aquatic layers. Therefore, brief marine episodes appeared during the
deposition of the dominantly clastic Chouf Formation. As plant activity was noticed (and
roots found), it is likely that vegetation from the above (paleo) soils penetrated to this
horizon (it may be considered as parts of the soil horizon above) which indicate an
episode of exposure.
Limestone composition was estimated to be 80% calcite, 15% cements, bitumen,
clays, quartz and accessory minerals (i.e. aragonite, magnesite, and traces of dolomite),
and was supported by mineralogical analysis. XRD analysis detected aragonite,
magnesite and dolomite, as well as several different calcite phases (refer to the CL photos
in Chapter V).
Limestone paragenesis involves the deposition and sedimentation of various
shelled organisms (aragonite for some), that later changed to calcite (neomorphism).
Depositional porosity was low, as the studied beds appear mostly micritic, but upon
Eogenesis and burial, some carbonate material dissolved (enlarging pores). These may
have been due to either calcite replacing aragonite, or to the meteoric waters that caused
the dissolution of calcite that were released from maturating organic materials. Hence,
evidence of pore occlusion is shown, as great amounts of cement was found in the strata
(see Chapter V; Fig. 5.9). With their very low recorded effective porosity, limestone beds
act as very poor reservoirs.
D. Paragenetic Sequence and Burial History
The sequence of diagenetic phases for the Neocomian-Barremian rock
successions exposed in southern Lebanon (Jezzine locality) was deduced from the
191
petrographic observations of 40 thin sections. The summary of these diagenetic phases
and their sequential order are presented in Figures 7.2 and 7.3, whereas the burial history
is summed up in Figure 7.4.
All examined strata (sandstone, clay and limestone) were deposited and
transformed during diagenesis. These diagenetic events, showing the results and
interpretations of this project, are presented below.
1. Paragenesis of sandstones
The diagenetic history of most sandstone strata within the Chouf Formation (Fig.
7.2) indicates that depositional environments, having favored sandstone deposition, were
linked to fluvial, overbank and/ or eolian systems. Note that the primary porosity, organic
matter and detrital grains were present since early sedimentation during the Neocomian-
Barremian time (starting from the Berriasian-Valanginian until the Late Hauterivian to
Early Barremian). Moderate to high compaction, burial and large porosity are settings
ideal for the presence of organic matter and bitumen. Upon bitumen maturation
aggressive fluids are released that attacked some of the quartz grains by dissolving and
corroding them.
a. Deposition
It is believed that the various sandstone facies of the Chouf Formation were
deposited in both marine and continental settings. This is supported by the presence of
various cross-stratifications and laminations that have stressed their terrigenous nature.
As sandstones is known to contain relatively high theoretical primary porosity values and
of abundant organic matter, the conditions of deposition must have been dominated by
continental systems.
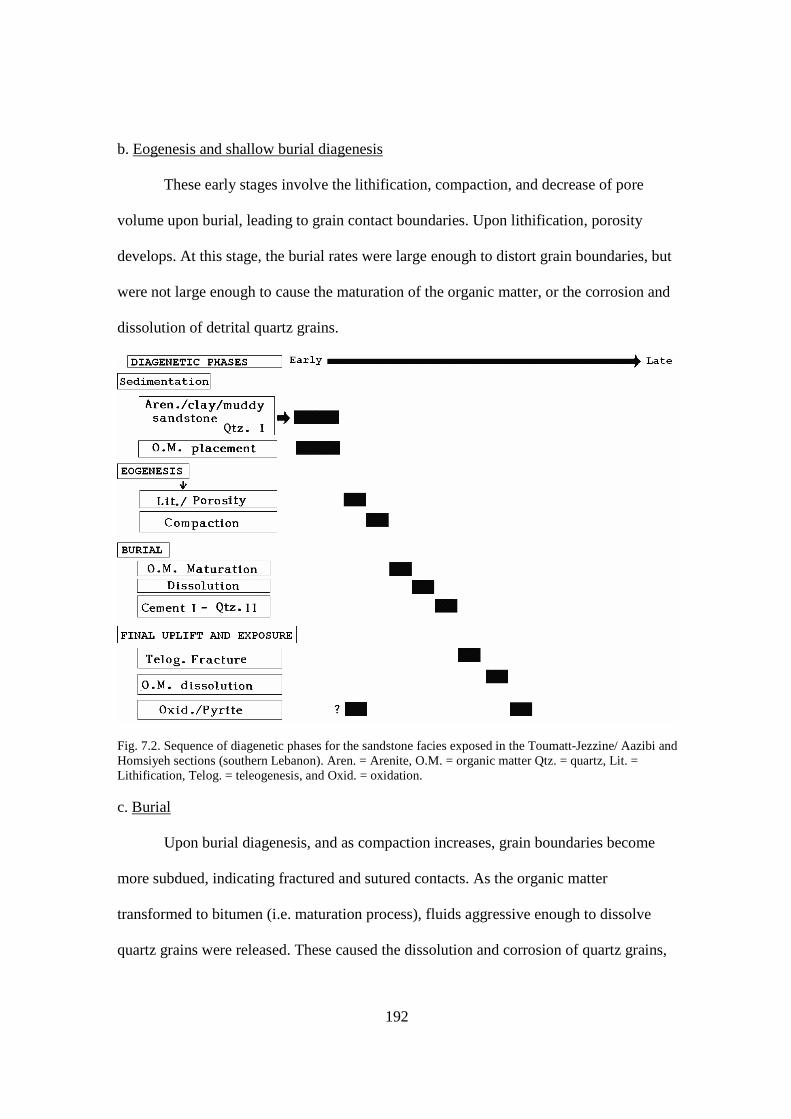
192
b. Eogenesis and shallow burial diagenesis
These early stages involve the lithification, compaction, and decrease of pore
volume upon burial, leading to grain contact boundaries. Upon lithification, porosity
develops. At this stage, the burial rates were large enough to distort grain boundaries, but
were not large enough to cause the maturation of the organic matter, or the corrosion and
dissolution of detrital quartz grains.
Fig. 7.2. Sequence of diagenetic phases for the sandstone facies exposed in the Toumatt-Jezzine/ Aazibi and Homsiyeh sections (southern Lebanon). Aren. = Arenite, O.M. = organic matter Qtz. = quartz, Lit. = Lithification, Telog. = teleogenesis, and Oxid. = oxidation.
c. Burial
Upon burial diagenesis, and as compaction increases, grain boundaries become
more subdued, indicating fractured and sutured contacts. As the organic matter
transformed to bitumen (i.e. maturation process), fluids aggressive enough to dissolve
quartz grains were released. These caused the dissolution and corrosion of quartz grains,

193
resulting in porosity enhancement; however the maturing organic matter soon filled these
cavities, impinging on cementation, as some grain surfaces may have been coated with
illite. However, the authigenic quartz cement phase could have precipitated anytime from
the first dissolution of the grains until the later telogenic dissolution of the bitumens.
d. Telogenesis
This period (Late Eocene to Recent) is marked by the final uplift and exposure
stages of diagenesis, which are linked to the known tectonic history of Lebanon (see
Chapter II). The tectonic history ascribes the final uplift of Mount Lebanon to the latest
Turonian to Senonian (Late Cretaceous), as part of the more regional Syrian Arc
Deformation. Therefore, Since the Eocene times Mount Lebanon is believed to be at least
partially exposed (Dubertret et al., 1955). The eminent telogenic phases accounted for the
loss of stress upon tectonic uplift and erosion are the bitumen biodegradation and the
resulting void occlusion that followed. These phases were well-studied in the
petrographic analyses (see Chapters V and VI; Figs. 5.25, 5.26 and 6.2-6.5), where at
least two phases of quartz were identified (e.g. each showing differing CL patterns; see
Fig. 5.26).
Pyritization and oxidation of the sandstone strata can occur during Telogenesis
and could be ascribed to an early sulfate reduction phase (Morad, 1998). As the iron rich
oxides and hydroxides appear to be telogenic, the early diagenetic (eugenic) pyritization
should not be overruled, especially since many investigated organic rich strata appear to
be influenced by marine conditions.
194
2. Limestone Paragenesis
The diagenetic history of limestone strata within the Chouf formation (Fig. 7.3)
shows that the conditions of sedimentation, having favored calcarenite (or calciclastic)
deposits, were linked to the relative proximity of the coastlines to the Jezzine locality.
These limestones were likely deposited in marine conditions, probably a precursor to the
following Early Cretaceous transgression. These strata appear to have undergone several
pulses of oxidation/ reduction, marked by the presence of secondary or tertiary calcite
(e.g. dull-luminescent calcite cements; see Fig. 5.9 in Chapter V) which indicates zones
of oxidation (i.e. primary calcite deposits in reducing environments).
The fossiliferous calcarenites (Fig. 7.3) were found to be rich in organic matter,
roots (see Chapter V; Fig. 5.8), and fossilized materials. The preserved shell organisms
(oysters and coquina) indicate quiet energy areas, pointing to shallow marine or lagoonal
depositional environments.
a. Deposition
The analyzed limestone facies, found to be composed of lithified gastropod,
oyster and other preserved shell organisms (e.g. fossiliferous limestone), showing signs
of micritization, were believed to be deposited in a shallow marine environment. Another
evidence of this environment can be assessed from the presence of glauconitic strata and
coquina beds, nearby. These carbonates were also found to contain appreciable amounts
of organic matter and preserved roots (see Chapter V; Fig. 5.8).
195
b. Eogenesis and Shallow Burial
Original fossil moulds have shown replacement by calcite, and possibly also a
generation of a calcite cement, attested both by cathodoluminescence microscopy and X-
ray diffractometry (see Chapter V; Fig. 5.9, and Chapter VI; Fig. 6.7). These cements
(equant sparry calcite cement 1 (C-I) of dull CL pattern) indicate early forms of
micritization. Even though there was well preserved paleoroots, some compaction degree
was recorded.
c. Burial
Extended burial caused the maturation of organic matter and the dissolution of
host material, as aggressive waters were released. However, as pores were enhanced,
some calcite cementation was noticed (equant sparry calcite cement 2 (C-II) of dull CL
pattern; discussed in Chapter V; Fig. 5.9).
d. Telogenesis
The final stages of diagenesis were caused by uplift and final exposure of the
limestone strata of the Chouf Formation. These strata present the development and the
formation of a final stage of calcite cementation (equant sparry calcite cement 3 (C-III) of
dull CL patterns) as was identified in various limestone microfacies that were studied by
cathodoluminescence and standard microscopy. These were also identified by X-ray
diffraction. This cement phase could have been precipitated as the mildly cooking
organic matter released their corrosive waters during catagenesis. Telogenic pyritization
also occurred (Morad, 1998). However, shallow diagenetic pyritization should not be
ignored.
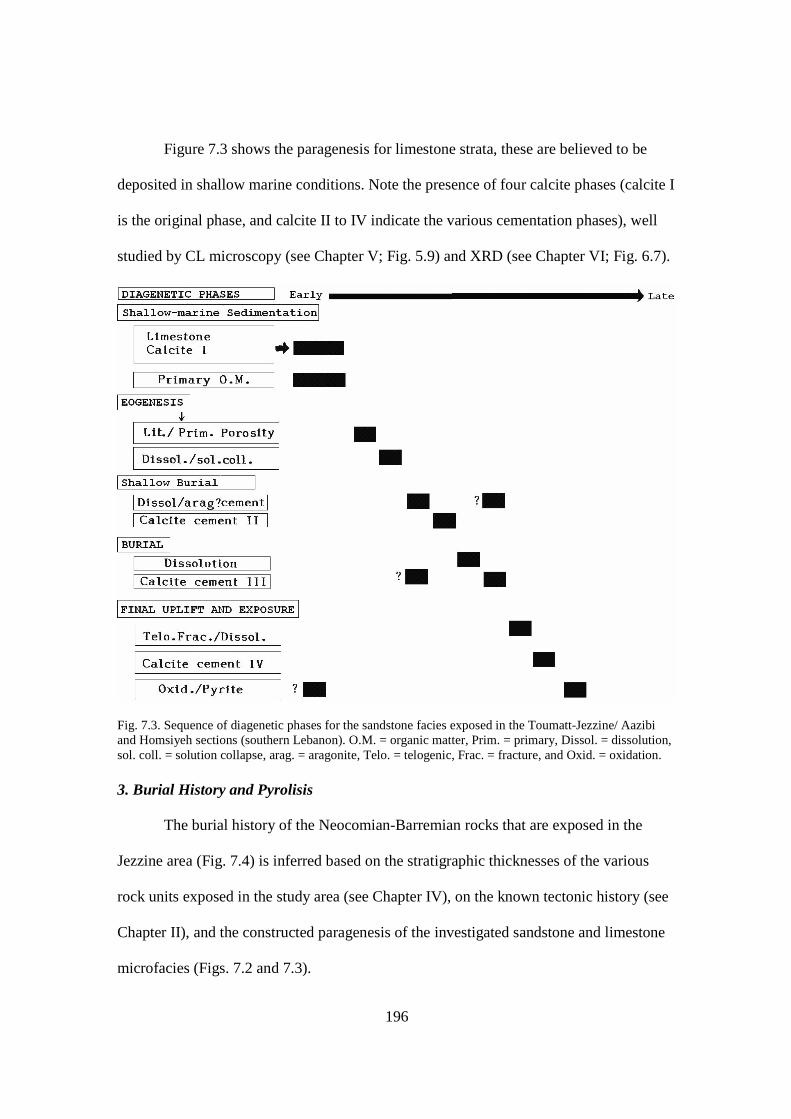
196
Figure 7.3 shows the paragenesis for limestone strata, these are believed to be
deposited in shallow marine conditions. Note the presence of four calcite phases (calcite I
is the original phase, and calcite II to IV indicate the various cementation phases), well
studied by CL microscopy (see Chapter V; Fig. 5.9) and XRD (see Chapter VI; Fig. 6.7).
Fig. 7.3. Sequence of diagenetic phases for the sandstone facies exposed in the Toumatt-Jezzine/ Aazibi and Homsiyeh sections (southern Lebanon). O.M. = organic matter, Prim. = primary, Dissol. = dissolution, sol. coll. = solution collapse, arag. = aragonite, Telo. = telogenic, Frac. = fracture, and Oxid. = oxidation. 3. Burial History and Pyrolisis
The burial history of the Neocomian-Barremian rocks that are exposed in the
Jezzine area (Fig. 7.4) is inferred based on the stratigraphic thicknesses of the various
rock units exposed in the study area (see Chapter IV), on the known tectonic history (see
Chapter II), and the constructed paragenesis of the investigated sandstone and limestone
microfacies (Figs. 7.2 and 7.3).

197
The investigated strata of Chouf Formation was probably buried at a maximum of
1800m depth prior to the mid-Eocene, when the Syrian Arc Deformation began (e.g.
Walley, 1998; Brew et al., 2001a, b and Nader et al., 2006). The burial curve summarizes
the paragenesis and is shown in Figure 7.4. The curve presents all the diagenetic phases
and relates them to the burial history of the Chouf Formation.
Fig. 7.4. Burial curve with recorded diagenetic history of the Chouf Formation. Note that the recorded burial is estimated at 1800m, thickness is 300m, and the resulting curve is uncorrected for compaction (Creta. = Cretaceous, Pli = Pliocene, R. = Recent, and O.M. = organic matter). Figure constructed based on data and forms presented in Doummar, 2005; Nader et al, 2006; and Al Haddad, 2007).
As the Chouf Formation was buried at about 1800m (Eocene), the temperature of
organic matter maturation is estimated at about 65-70ºC (assuming a geothermal gradient
of 25ºC/km and a surface temperature was 25ºC at the time of deposition). Thus, the
organic matter may have been mildly cooked releasing corrosive fluids. Figure 7.5 shows
the pyrolisis results obtained from a coal sample from the clay beds of the lower part of
the Chouf Formation, where a value of 67.5% total organic carbon (TOC) was found.
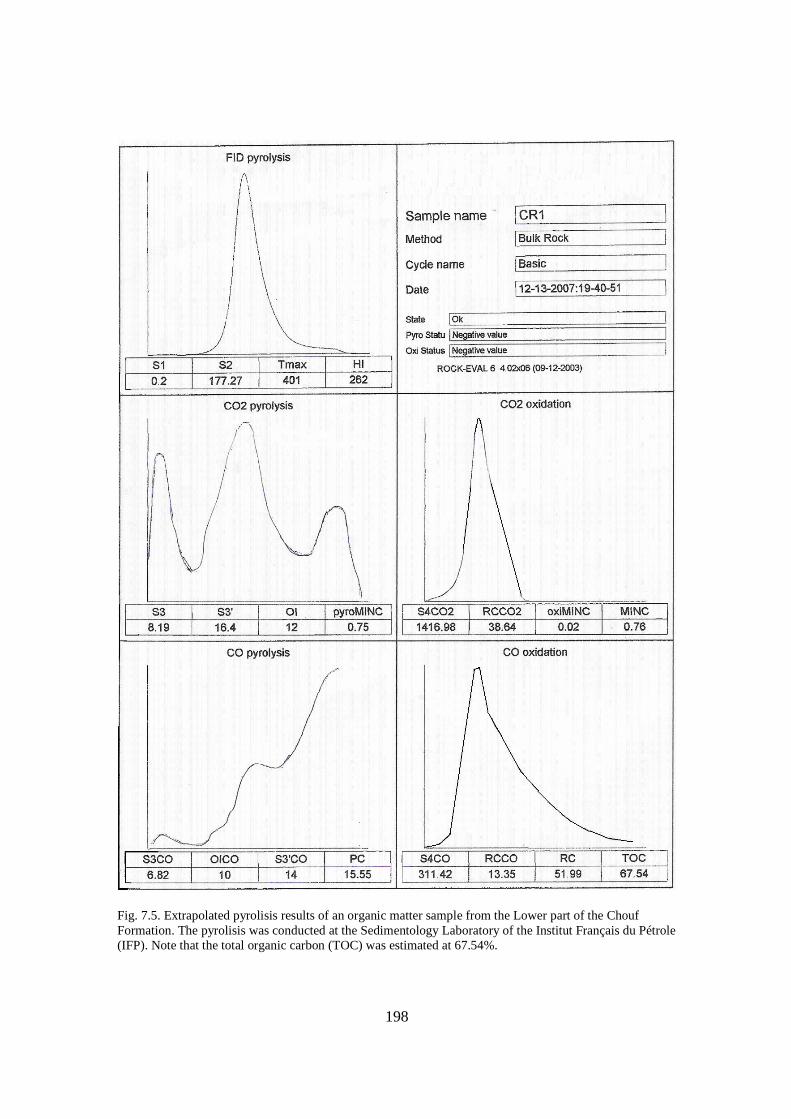
198
Fig. 7.5. Extrapolated pyrolisis results of an organic matter sample from the Lower part of the Chouf Formation. The pyrolisis was conducted at the Sedimentology Laboratory of the Institut Français du Pétrole (IFP). Note that the total organic carbon (TOC) was estimated at 67.54%.
199
This shows a very high organic carbon content (TOC), estimated at 67.5%, which
attests the presence of coal/ lignite rather than petroleum. As the investigated rocks are
dominantly terrigenous clastic (and not carbonate), the dominant source of organic matter
was found to be mostly originating from terrestrial plants. However due to a Hydrogen
Index (HI) that is relatively low, no good maturation appears to have occurred, as
evidenced by the estimated burial temperature – estimated just barely at the oil window
(~70°C), thus preventing the hydrocarbon to migrate.
As burial temperatures (70ºC) were calculated, maturation was insufficient to
produce oil, and the pyrolisis led to the formation of lignite. This shows that the trapped
organic matter in the Chouf Formation is organic rich coal with high TOC values (i.e.
67.5%). Based on the petrologic, diagenetic and pyrolisis results, this coal, produced at
temperatures barely reaching the oil window (60-160ºC), and has been mildly cooked as
a result, and had remained in-situ (without migration). As that coal transformed to lignite,
aggressive fluids were released attacking near-by quartz grains, causing some of them to
dissolve and produce authigenic cements. This was summarized from the petrography,
the paragenesis, and the burial curve data.
200
CHAPTER VIII
CONCLUSIONS AND RECOMMENDATIONS
A. Conclusions
This project includes the results of detailed field work, as well as petrographic and
mineralogical studies conducted on several representative key Neocomian-Barremian
rock facies of the Chouf Formation in the Jezzine region (southern Lebanon). Based on
field observations of sandstone strata, and regional correlation, as well as petrographic
and XRD characterization of the investigated rocks, the following conclusions are drawn.
Six microfacies are identified in the current study, within both investigated
sections, at Homsiyeh. They are listed and described as follows: i) arenites, ii) muddy
quartz-rich sandstones, iii) clayey-muddy quartz-rich sandstones, iv) graywacke, v) clay,
and vi) limestones.
Arenites, the most abundant microfacies of the Chouf Formation, mostly
representing the middle part of the formation, are composed of submature to mature
sandstones almost devoid of clays showing eolian characteristics and are quartz-rich
(content is over 95%, according to the Folk (1980) sandstone classification chart). They
are typically well-sorted and develop in areas of moderate to high kinetic energy. Since
they are well-sorted and the average intergranular porosity is around 10%, they may act
as very good reservoir rocks. XRD studies show two or more phases of quartz, clays and
goethite, and, in some cases, probable traces of calcite. The two identified phases of
quartz (detrital and authigenic) were identified under CL microscopy (Fig. 5.26; Chapter
V). In some cases, feldspar was also detected by its light blue CL pattern (see Fig. 5.25B;
201
Chapter V), which is confirmed through XRD analysis.
Most of the submature sandstones were classified as muddy quartz-rich
sandstones, as they were moderately sorted and contained some clay (less than 5%). They
are dominantly fluvial (and likely marine, as well) and of moderate energy environments.
Since they are moderately sorted and the average intergranular porosity is about 10%,
they may also act as good reservoir rocks. XRD tests helped in identifying the presence
of two or more quartz phases, several clays (including nontronite (lacking smectite)), and
calcite.
Clayey-muddy quartz-rich sandstones include all immature sandstones that have
clay contents over 5% and are poorly sorted. They are found in dominantly fluvial or
overbank channel environments, of low-energy. Since they are poorly sorted and the
average intergranular porosity is about 5% or less, they may act as poor reservoir rocks.
XRD tests show the presence of different phases of quartz, including calcite among
others, pyrite and clays.
Graywackes include all strata which are extremely poorly sorted and include clay
contents over 15% (feldspars and micas and other components account for about 25%).
They are typically fine grained strata found in turbidity deposits of low kinetic energy.
Since they are poorly sorted and the average intergranular porosity is about 5% or less,
they may act as poor reservoir rocks. XRD tests indicate that these strata show different
phases of quartz, including other constituents as calcite, pyrite, glauconite, chlorite,
feldspars, and clays.
Clays (generally containing lignite) were identified using X-ray diffraction. Thus,
various amounts of bentonite, illite, kaolinite montmorillonite, nontronite and vermiculite
202
were found. Most beds show the presence of kaolinite, illite and montmorillonite (e.g.
Tixier, 1971-1972). However, chlorite, goethite, vermiculite often recur in some beds. In
a few instances, illite/ montmorillonite interstratified layers were found (these
interstratified layers have a diagenetic signature, just like the illite/ smectite or
montmorillonite/ illite ratios). Since they are characterized by very low average
intergranular porosity, they may act cap rocks or seals. The clays also led to a dramatic
decrease in the aquiferous properties of the Chouf Formation (e.g. Shuayb, 1974).
The limestones (defined as fossiliferous micritic muddy-wackestones, based on
the carbonate classification schemes of Dunham (1962), and Folk (1962)) dominantly
comprise calcite (four phases – XRD, CL microscopy) and aragonite, including other
minor amounts of other carbonates, such as dolomite (based on XRD). The limestones,
which were found to be se shallow marine carbonates, show plant activity, and appear to
be associated with various glauconitic marly beds that were found nearby. Since they are
poorly sorted and the average intergranular porosity is about 2.5% or less, they may act
as very poor reservoir rocks.
In earlier studies dealing with hydrocarbon potential, the organic matter found in
terrigenous clastic rocks was thought to yield bitumens and oilshales (e.g. May, 1991).
The results of this study point out that the organic matter of the Chouf Formation was
transformed to lignite, as the burial/thermal history was recorded at 65ºC towards the
mid-Eocene, causing the improperly maturing organic matter to produce coal rather than
oil (due to high TOC and low HI values). Due to the telogenic fracturing, as a result of
the Syrian Arc Deformation, uplifting, fracturing and erosion occurred.
This research demonstrated that the studied hydrocarbon, in the lower aquatic
203
facies of the Chouf Formation (southern Lebanon), is immature. During mild cooking at
low temperature aggressive fluids helped in increasing the general porosity through
dissolution and yet still led to quartz cementation. Finally, the eolian arenites (of the
middle part of the Chouf Formation) could act as reservoirs due to their relatively high
intergranular porosity (of about 10%) caused by good sorting and roundness. These
arenites contain low amounts of cements, if any.
B. Recommendations
More detailed field work in the area should be conducted. The outcrops in the
proximity of Machghara, Jabal Shammis, and Qaitouleh should be investigated. Such
studies should yield more stratigraphic data, which should include detailed paleocurrent
measurement.
XRD analysis provided good information on clay mineralogy. However, for a
future study, it is recommended to conduct a more thorough mineralogy analysis; by
running as many tests as possible. Ideally, XRD tests should be run (at least once) on
every representative sample. It is also recommended to subject the studied samples to
scanning electron microscopy (SEM). Their results will be beneficial in clay studies, as
SEM enables to generate 3-dimensional views of the studied clays.
For a better resolution, a good alternative could be to combine the XRD and SEM
results in providing very detailed assessments for clay studies. As several cements were
detected, it is also recommended to do a hot CL-SEM study, in order to complete a
detailed cement stratigraphy in order to complement the study.
As the hydrocarbon potential of the Chouf formation has been discussed, it is
recommended to study these hydrocarbons in further detail, using gas chromatography, as

204
well as analyzing the different constituents of the bitumens under fluorescence
microscopy. It is also suggested to carry out a detailed geochemical analysis of the Chouf
Formation by relying on geochemical methods (e.g. REE, isotope studies, fluid
inclusions), and heavy mineral analysis.
205
REFERENCES
Abbud, M., 1985. The study of the aquiferous formations of Lebanon through the
chemistry of their Typical springs. M.S. Thesis, American University of Beirut, Beirut, Lebanon. 108p.
Abbud. M., and Aker, N., 1986. The study of the aquiferous formations of Lebanon
through the chemistry of their Typical springs. Lebanese Science Bulletin, Vol. 2 (2).
Abdel-Rahman, A.F.M., 2000. Pliocene alkali basaltic volcanism in northern Lebanon.
Geological Association of Canada - Mineralogical Association of Canada. (Geoscience Canada), Vol. 25, pp. 330. Calgary, Alberta, Canada.
Abdel-Rahman, A.F.M., 2002. Mesozoic volcanism in the Middle East: geochemical,
isotopic, and petrogenetic evolution of rift -related alkali basalts from central Lebanon. Geological Magazine Vol. 139 (6), pp. 621-640.
Abdel-Rahman, A.F.M., and Nader, F.H., 2002. Characterization of the Lebanese
Jurassic-Cretaceous carbonate stratigraphic sequence: A geochemical Approach. Geological Journal, Vol. 37, pp. 69-91.
Abdel-Rahman, A.F.M., and Nassar, P.E., 2003. Chemical and isotopic evolution of the
Akkar Cenozoic Volcanic Field of Northern Lebanon, and implications for the origin of alkali basaltic magmas. Geol. Assoc. Canada - Mineral. Assoc. Canada, Vol. 28, pp. 6-7.
Abdel-Rahman, A.F.M. and Nassar, P.E., 2004. Cenozoic volcanism in the Middle East:
Petrogenesis of alkali basalts from northern Lebanon. Geol. Mag., vol. 141, no. 5, pp. 545-563.
Adams A.E., MacKenzie, W.S., and Guilford, C., 1994. Atlas of the Sedimentary rocks
under the microscope. John Wiley and Sons. Al Haddad, S.S., 2007. Petrographic and Geochemical Characterization of the Hasbaya
Asphalt and related host rock (Senonian Chekka Formation - South Lebanon). M.S. Thesis, American University of Beirut, Beirut, Lebanon. 164p.
An-Nadi, I., 1966. Late-Jurassic vulcanicity in Kartaba- Tannourine District of Central
Lebanon. M.S. Thesis, American University of Beirut, Beirut, Lebanon. 49p. Azar, D., and, Ziadé, K., 2005. Xenopsychoda harbi a new psychodoid fly from the
Lower Cretaceous amber of Lebanon (Diptera Psychodoidea). C. R. Palevol. Vol. 4, pp 25-30.

206
Bartov, Y., Lewy, Z., Steinitz G. and Zak, I. 1980. Mesozoic and Tertiary Stratigraphy, Paleogeography and Structural History of the Gebel Arejf en Naqa Area, Eastern Sinai. Israel Journal of Earth Sciences, 29, 114-139.
Basson, P.W., Edgell, H.S., 1971. Calcareous Algae from the Jurassic and Cretaceous of
Lebanon. Micropaleontology, Vol. 17 (4), pp. 411-416. Beydoun, Z.R., 1977a. The Levantine Countries: The Geology of Syria and Lebanon
(Maritime Regions), in The Ocean Basins and Margins, vol. 4A, p. 319-353, Edited by A. E. M. Nairn, W.H. Kanes and F.G. Stehli.
Beydoun, Z.R., 1977b. Petroleum Prospects of Lebanon: Reevaluation. American
Association of Petroleum Geologists Bulletin, Vol. 61, (I) pp 43-64 Beydoun, Z.R., 1988. The Middle-East: Regional Geology and Petroleum Resources.
Scientific Press. 293p. Beydoun, Z.R., 1995. Productive Middle-East chiastic oil and gas reservoirs: their
depositional settings and origins of their hydrocarbons. Spec. Pubs int. Ass. Sediment. Vol. 23, pp. 331-354.
Blatt, H., 1997. Our Geologic Environment. Prentice Hall, New Jersey. Blatt, H. 1992. Sedimentary Petrology. W.H. Freeman, New York. Boggs, S., 1995. Principles of Sedimentology and Stratigraphy. 2nd edition, Prentice
Hall, 774 p. Boggs, S., and Kringsley, D., 2006. Application of cathodoluminescence imaging to study
of sedimentary rocks: Cambridge University Press, 163p. Boggs, S., Kwon, Y. I., Goles, G. G., Rusk, B. G., Krins1ey, D. and Seyedolali, A. 2002.
Is quartz cathodoluminescence color a reliable provenance tool? A quantitative examination. Journal of Sedimentary Research; Vol. 72; no. 3; p. 408-415.
Botta, P.E., 1833. Observations sur le Liban et l'Anti-Liban. Mémoire de la Société
Géologique Française. Vol. 1 (8), pp. 135-160. Bou-Jawdeh, I., 1999. Evidence for the tectonic evolution of central-north Lebanon from
structural and geomorphological data. M.S. Thesis, American University of Beirut, Beirut, Lebanon. 181p.
Bragg W.L., 1917. "The Diffraction of Short Electromagnetic Waves by a Crystal",
Proceedings of the Cambridge Philosophical Society, 17, p43–57.

207
Brand L., 1995. An improved high-precision Jacob's staff design. Journal of Sedimentary Research, Vol. 65, (3) pp. 561.
Brew, G., 2001. Tectonic evolution of Syria interpreted from integrated geophysical and
Geological Analysis. Ph.D. Thesis, University of Cornell. Brew G., Lupa, J., Barazangi, M., Sawaf, T., AL-Imam A., and Zaza T., 2001a. Structure
and tectonic development of the Ghab basin and the Dead Sea fault system, Syria. Journal of the Geological Society, London.
Brew, G., Barazangi, M., Al-Maleh, M.K., and Sawaf, T., 2001b. Tectonic and Geologic
evolution of Syria. GeoArabia, Vol. 6, (4), pp 573-615. Brew, G., Best, J., Barazangi, M., and Sawaf, T., 2003. Tectonic evolution of the NE
Palmyride mountain belt, Syria: the Bishri crustal block. Journal of the Geological Society, London, Vol. 160, pp. 677–685.
Broggi, J.A., 1946. "Jacob staff" and measurements of stratigraphic sequences. American
Association of Petroleum Geologists Bulletin, Vol. 30 (5), pp. 716-725. Buffetaut, E., Azar, D., Nell, A., Ziadé, K., Accra, A., 2006. First nonavian dinosaur from
Lebanon: a brachiosaurid sauropod from the Lower Cretaceous of the Jezzine District. Naturwissenschaften, short communication.
Butler, R.W.H., Spencer, S., and Griffiths. H.M., 1997. Transcurrent-fault activity on the
Dead Sea Transform in Lebanon, and its implications for plate tectonics and seismic hazard. Journal of the Geological Society, London, Vol. 154, pp. 757-760.
Butler, R.W.H., Spencer, S., and Griffiths, H.M., 1998. The structural response to
evolving plate tectonics during transpression: evolution of the Lebanese restraining bend of the Dead Sea Transform. In Holdsworth, R.E., Strachan R.A., and Dewey, J.F., eds., 1998. Continental Transpressional and Transtensional Tectonics. Journal of the Geological Society, London. Special Publications, Vol. 135, pp 81-106.
Campbell, C.V., 1967. Lamina, Laminaset, Bed and Bedset; Sedimentology, Vol. 8; pp.
7-26. Chafetz, H.S., and Reid, A., 2000. Syn-depositional shallow-water precipitation of
glauconitic minerals. Sedimentary Geology. Vol. 136, pp. 29-42. Chaimov, T., Barazangi, M., Al-Saad, D., Sawaf, T., and Gebran, A., 1992. Mesozoic
and Cenozoic deformation inferred from seismic stratigraphy in the southwestern intracontinental Palmyride fold-thrust belt, Syria. Geological Society of America Bulletin, 104, N6, 704-715.
208
Chan, M. Beitler, A., Bowen, B., Parry, W.T., Ormö, J. and Komatsu, G., 2005, Red Rock and Red Planet Diagenesis: Comparisons of Earth and Mars Concretions: GSA Today, Vol. 15 n. 8, pp. 4-10.
Chan, M.A. and Parry, W.T., 2002. ‘Mysteries of Sandstone Colors and Concretions in
Colorado Plateau Canyon Country’: Utah Geological Survey Public Information Series. n. 77, pp. 1-19.
Cohen, Z., 1976. Early Cretaceous buried canyon: Influence on accumulation of
hydrocarbons in Helez Oil Field, Israel. American Association of Petroleum Geologists Bulletin, Vol. 60, (1): pp. 108-114.
Day, A.E., 1930. Geology of Lebanon and of Syria, Palestine and neighboring countries.
American Press, Beirut. Deans, A.R, Basibuyuk, H.H., Azar, D., Nel, A., 2004. Descriptions of two new Early
Cretaceous (Hauterivian) ensign wasp genera (Hymenoptera: Evaniidae) horn Lebanese amber. Cretaceous Research, Vol. 25, pp. 509-516.
Diener, C., 1886. « Libanon. Grundligen der Physischen geographie und Geologie von
Mittel Syrien ». Geol. Kartel: 1/ 500 000 A Holder, Wien. Doummar, J.J., 2005. Sedimentology and Diagenesis of the Albian Rock Sequence
(Upper Hammana-Lower Sannine Formations), Northern Lebanon. Unpublished M.S. Thesis American University of Beirut. 201p.
Douvillé, H., 1910. Études sur les Rudistes du Liban. Mémoire de la Société Géologique
Française. Vol. 41, pp. 52-75. Du Bernard, X. and Carrio-Schaffhauser, E., 2003. Kaolinitic meniscus bridges as an
indicator of early diagenesis in Nubian sandstones, Sinai, Egypt. Sedimentology 50 (6), 1221-1229.
Dubertret, L., 1951. «Cartes Géologiques du Liban 1/50000e. Feuille de Mardjayoun»
avec notice explicative. République Libanaise, Ministère des Travaux Publics, Beyrouth.
Dubertret L., 1975. Introduction a la carte Géologique à 1/ 50 000 du Liban. Notes et
Mémoires sur Le Moyen Orient, vol. 13. p. 345-402. Dubertret L., and Vautrin H., 1937. Révision de la stratigraphie du Crétacé du Liban.
Notes et Mémoires, Haut-Commissariat de la République Française en Syrie et au Liban, T. II, p. 43-73.

209
Dubertret, L., and Wetzel, R., 1951. «Cartes Géologiques du Liban 1/50 000e. Feuille de Kartaba» avec notice explicative (56p.). République Libanaise, Ministère des Travaux Publics, Beyrouth.
Dubertret L., Daniel, E.J., and Bender, F., 1963. Liban, Syrie: Chaîne des grands Massifs
côtiers et confins à l'Est, in Lexique stratigraphique international. Vol. 3, Fascicule 10c1, Liban, Syrie. Centre Nat. Rech. Sci., Paris, p. 1-155.
Dubertret, L., Keller, A., Vautrin, H, Birembault, C., Heybroek, H.F., Canaple, G.,
Combaz, A, A, Mandersheid, G, and Renouard, G., 1955. «Cartes Géologiques du Liban 1/ 200 000e». Avec notice explicative. République Libanaise, Ministère des Travaux Publics, Beyrouth.
Dunham, R. J., 1962. Classification of Carbonate rocks according to their depositional
texture, in W. E. Ham, ed., Classification of Carbonate Rocks: Tulsa. OK, AAPG Memoir 1, p. 108-121.
Elder, W.P., 1989. A simple high-precision Jacob's staff design for the high-resolution
stratigrapher. Palaios, Vol. 4, pp.196-197. El-Hinnawi, E.E., 1966. Methods in Chemical and Mineral Microscopy, Elsevier
Publishing Company, Amsterdam. Evamy, B.D. 1963. The application of a chemical staining technique to a study of
dedolomitisation. Sedimentology, Vol. 2:164-170. Exxon Production Research Company, 1977. Facies Description Handbook. USA. Eyal, Y., 1996. stress field fluctuation along the Dead Sea Rift, since the Miocene,
Tectonics, v. 15, pp. 157-170. Faure, G., 1986. Principles of Isotope Geology. New York, Wiley. Ferry, S., Merran, Y., Grosheny, D. and Mroueh, M., 2007. The Cretaceous of Lebanon
in the Middle East (Levant) context. In: Bulot, L.G., Ferry, S., and Grosheny, D. (Eds.), Relations entre les marges septentrionale et méridionale de la Téthys au Carnets de Géologie, Brest, Memoir 2007/02, Abstract 08.
Fetter, C.W., 1994. Applied Hydrogeology, 3 rd Ed., Prentice hall, Englewood Cliffs, NJ.,
691 pp. Folk, R.L., 1951. Stages of textural maturity in sedimentary rocks. Journal of
Sedimentary Petrology, Vol. 21 (3), pp. 127-130. Folk, R.L., 1955. Student operator error in determination of roundness, sphericity and
grain size. Journal of Sedimentary Petrology. Vol. 25 (4), pp. 297-301

210
Folk, R.L., 1962. Practical petrographical classification of limestones. AAPG Memoir 1,
p. 108-121. Folk, R.L., 1966. "A review of grain-size parameters"; Sedimentology, Vol. 6 (2), pp. 77-
93. Folk, R.L., 1968. Petrology of sedimentary rocks. Austin TX, Hemphill Publishing Co.
177p. Folk, R.L. 1974. Petrology of Sedimentary Rocks. Hemphill Publishing Co. Folk, R.L., 1980. Petrography of Sedimentary Rocks. Hemphill Publishing Company,
Austin, Texas 78703. 182p. Folk, R.L., and Ward, W.L, 1957. Brazos river bar: A study in the significance of grain
size parameters: Jour. Sed. Petr., Vol. 27, No. 1, pp. 3-26. Fraas, O., 1878. «Aus dem Orient, Vol. 2. Geologische Beobachtungen am Libanon».
Wuttemb. naturwiss. Jahreshefte, Stuttgart, pp. 257-392. Freund, R., and Tarling, D.H., 1979. Preliminary paleomagnetic results from Israel and
inferences for a microscopic structure in the Lebanon. Tectonophysics, Vol. 60, pp. 189-205.
Gedeon, M. A., 1999. Structural analysis of the latitudinal faults in the Mount Lebanon
north of Beirut; their kinematics and their role in the tectonic evolution of Lebanon. M.S. Thesis, American University of Beirut, Beirut, Lebanon. 226p.
Girdler, R.W. 1990. The Dead Sea transform fault system. Tectonophysics, Vol. 180, pp
1-13. Gomez, F., Meghraoui, M., Darkal, A. N., Sbeinati, R., Darawcheh, R., Tabet, C,
Khawlie M., Charabe M., Khair K., Barazangi M., 2000. Coseismic displacements along the Serghaya fault: An active branch of the Dead Sea fault system in Syria and Lebanon. Journal of the Geological Society, London.
Gomez, F., Meghraoui, M., Darkal, A.N., Sbeinati, R., Darawcheh, R., Tabet, C.,
Khawlie, M., Charabe, M., Khair, K., and Barazangi, M., 2001. Coseismic displacements along the Serghaya fault; an active branch of the Dead Sea fault system in Syria and Lebanon, J. Geol. Soc. (Lond.), Vol. 15.
Gomez, F., M. Meghraoui, Darkal, A.N., Hiajzi, F., Mouty, M., Suleiman, Y., Sbeinati,
R., Darawcheh, R., Al-Ghazzi, R., and Barazangi, M., 2003. Holocene faulting and earthquake recurrence along the Serghaya branch of the Dead Sea fault system in Syria and Lebanon, Geophys. J. Int. Vol. 153 (3).
211
Gomez, F., Khawlie, M, Tabet, C., Darkal, A. N., Khair, K., Barazangi, M., 2006. Late Cenozoic uplift along the northern Dead Sea transform in Lebanon and Syria. Earth and Planetary Science Letters, Vol. 241, pp 913- 931.
Gomez, F., Nemer, T., Tabet, C., Khawlie, M., Meghraoui, M., and Barazangi, M., 2007.
Strain partitioning of active transpression within the Lebanese restraining bend of the Dead Sea fault (Lebanon and SW Syria). Geological Society of London, Special Paper (Tectonics of Strike-Slip Restraining and Releasing Bends in Continental and Oceanic Settings), in press.
Gradstein, F.M. and Ogg, J., 1996. A Pharenozoic Time-Scale. Episodes, Vol. 19, pp. 3-4.
Griffiths, H.M. et al. 2000. Strain accommodation at the lateral margin of an active
transpressive evidence from the Lebanese restraining bend. Journal of the Geological Society, Vol. 157 (2), 289-302.
Guerre, A., 1969. Carte Géologique Fascicule République Libanaise, Ministère des
Ressources Hydrauliques et Électriques. Beyrouth. Hancock, P.L., and Attiya, M.S., 1979. Tectonic significance of mesofracture systems
associated with the Lebanese segment of the Dead Sea Transform Fault. Journal of Structural Geology, Vol. 1, (2), pp. 143-153.
Hansen, W.R., 1960. Improved Jacob staff for measuring inclined stratigraphic intervals
American Association of Petroleum Geologists Bulletin, Vol. 44, (2), pp. 252-254.
Hamzeh, M., 2000. Groundwater conditions in South Lebanon between the Awali and
Litani rivers. M.S. Thesis, American University of Beirut, Beirut, Lebanon. 107p. Haq, B.U., Hardenbol, J., Vail, P.R., 1987. Chronology of fluctuating sea levels since the
Triassic. Science Vol. 235, 1156–1166. Haq, B.D., Hardenbol, J. and Vail, P.R., 1988. Mesozoic and Cenozoic chronostratigraphy
and cycles of sea-level change. In C.K. Wilgus, B.S. Hastings, C.A. Ross et al. (Eds.), Sea-level changes: an integrated approach, Special Publication - Society of Economic Paleontologists and Mineralogists, Vol. 42, pp. 72-108.
Heinman A., and Ron, H., 1987. Young faults in the Hula pull-apart basin, central Dead
Sea Transform. Tectonophysics, Vol. 141, pp. 117-124. Heybroek, M.F., 1942. «La Géologie d'une partie du Liban Sud» Leidsche Geologische
Mededeelingen. Vol. 12 (2), pp. 251-470.
212
Heybroek, M.F. and Dubertret L., 1945. «Cartes Géologiques du Liban 1/ 50 000e. Feuille de Jezzine» avec notice explicative. République Libanaise, Ministère des Travaux Publics, Beyrouth.
Hinai, K.G., 1979. The Neogene conglomerates of the Bekaa. M.S. Thesis, American
University of Beirut, Beirut, Lebanon. 51p. Hirsch, F. and Picard, L. 1988. The Jurassic facies in the Levant. Journal of Petroleum
Geology, 11, 277-308. Hobson, G.D. and Tiratsoo, E.N., 1985. Introduction to Petroleum Geology. 2nd Edition,
Revised. Gulf Publishing Co. Hurst, A. and Cronin, B., 2001. The origin of consolidation laminae and dish structures in
some deep-water sandstones. Journal of Sedimentary Research; Vol. 71; no. 1; p. 136-143.
Ingram, R.L., 1954. Terminology for the thickness of stratification and parting units in
sedimentary rocks. Bull. Geol. Soc. Am., 65: 937-938. Jacobs, P., Olivier, I. and Swennen, R., 2005. ‘Big Mac’ calcarenite concretions (Lower
Oligocene, NW-Belgium): conceptual growth model derived from stratigraphy, petrography and geochemistry. Geologica Belgica; Vol. 8/1-2: 15-32
Jahren, J., and Ramm, M., 2000. The porosity-preserving effects of microcrystalline
quartz coatings in arenitic sandstones: examples from the Norwegian continental shelf, in R. H. Worden and S. Morad, eds., Quartz cementation in sandstones: International Association of Sedimentologists Special Publication 29, p. 253-270.
Ja'ouni, A.K., 1971. Stratigraphy of North-Central Lebanon. M.S. Thesis, American
University of Beirut, Beirut, Lebanon. 108p. Kallas, L., 2001. Geochemical evolution of Upper Tertiary basalts from Southern
Lebanon. M.S. Thesis, American University of Beirut, Beirut, Lebanon. 176p. Kanaan, F.M., 1966. Sedimentary structures and thicknesses and facies variation in the
Basal Cretaceous sandstones of Central Lebanon. M.S. Thesis, American University of Beirut, Beirut, Lebanon. 117p.
Karcz, I., 1965. “Lower Cretaceous fluviatites in the Levant”. Nature, Vol. 207; No.
5002, pp. 1145-1146. Khair, K., Khawlie, M., Barazangi, M., Serber, D., Chaimov, T., 1993. Bouguer gravity
and crustal structure of the Dead Sea Transform Fault and adjacent mountain belts in Lebanon. Geology, Vol. 21, pp 739-742.
213
Khair, K. Tsokas, G. N., Sawaf, T., 1997. Crustal structure of the Northern Levant region: multiple source Werner deconvolution estimates for Bouguer gravity anomalies. Geophys. Journ. Int., Vol. 128, pp. 605-616.
Khair, K., Karakaisis, G. F., Papadimitriou, E. E., 2000. Seismic zonation of the Dead
Sea Transform Fault area. Annali di Geophysica, Vol. 43, (1), 61-79. Khair, K. 2001. Geomorphology and seismicity of the Roum Fault as one of the active
branches of the Dead Sea Fault system in Lebanon. Journal of Geophysical Research, Vol. 106, pp. 4233-4245.
Khalaf, L.K., 1986. The economic geology of the quartz sands as raw materials for the
glass industry in Lebanon. M.S. Thesis, American University of Beirut, Beirut, Lebanon. 118p.
Khawlie, M., 1985. Mass movements: a national plan for their assessment in Lebanon.
Proceedings of the 2nd Geological Congress on the Middle East (GEOCOME-II), Arab Geologist Association, Baghdad, 141-147
Khawlie, M., 1995. Fault-controlled Eastern Mediterranean coast, Lebanon: Geological
contribution to coastal management. Coastal Management, Vol. 23, pp 41-55. Kottlowski, F.E., 1965. Measuring Stratigraphic sections. In R. H. Jahns (Eds.), Field
Geology Techniques. New York: Jolt, Rinehart and Winston. Kozma, F.S. 1973. “The stratigraphy and structure of part of the Western Metn, Mount
Lebanon. M.S. Thesis, American University of Beirut, Beirut, Lebanon. 110p. Krumbein, W.C., 1939. Graphic presentation and statistical analysis of sedimentary data,
in P.D. Trask (Ed.): Recent marine sediments (A.A.P.G.), pp. 558-591. Kuttayneh, S.M., 1967. Petrography of the Mesozoic basalts of Lebanon. M.S. Thesis,
American University of Beirut, Beirut, Lebanon. 41p. Lartet, L. 1869. "Essai sur la Géologie de la Palestine”. 292p., 29 fig. Paris, Masson et
Fils. Lattman, H.L and Ray, R.G., 1965. Aerial photographs in field geology. In R. H. Jahns
(Eds.), Field Geology Techniques. New York: Holt, Rinehart and Winston. Laws, E.D. and Wilson, M., 1997. Tectonics and magmatism associated with the
Mesozoic passive continental margin development in the Middle East. Journal of the Geological Society, London, 154, 459-464.
Marshall, D.J., 1988. Cathodoluminiscence of Geological Materials. Unwin-Hyman, 146
pp, Londres.

214
Massaad, M., 1976. Origin and environment of deposition of the Lebanese Basal Sandstones, Ecologae Geologicae Helvetiae, Vol. 69, pp. 85-91.
Masson, P. Chavel. P., Equilibey, S. and Marion, A., 1982. Apports du traîtement
numérique d'images LANDSAT à l'étude des failles libano-syriennes. Bulletin de la Société Géologique de France, Vol. 7, Tome 13 (1), pp. 63-71.
May, P.R., 1991. The Eastern Mediterranean Basin: Evolution and Oil Habitat. AAPG
Bulletin, Vol. 75, No. 7; pp 1215-1232. McBride, E. G., 1962, "Flysch and Associated Beds of the Martinsburg Formation
(Ordovician), Central Appalachians:" Journal of Sedimentary Petrology, v. 32, no. 1, pp. 39-91.
McBride, 1963. E. F., 1963, A classification of common sandstones: Journal of
Sedimentary Petrology, v. 33, no. 3, p. 664-669 McKee, E.D., 1963. Origin of the Nubian and similar Sandstones. International Journal
of Earth Sciences, Vol. 52, (2). Ministère de la Défense Nationale, 1963. Carte Topographique 1:20,000e. Feuille de
Jezzine. Établie en collaboration de l’Armée Libanaise et l’Institut Géographique National (IGN) Français.
Ministère de la Défense Nationale, 1963. Carte Topographique 1:20,000e. Feuille de
Machghara. Établie en collaboration de l’Armée Libanaise et l’Institut Géographique National (IGN) Français.
Moore, D.M., and Reynolds, R.C., 1997. X-ray diffraction and the identification and
analysis of clay minerals. Oxford University Press. Morad, S., 1998. Carbonate cementation in sandstones: distribution patterns and
geochemical evolution. Spec. Publ. int. Ass. Sediment. 26, 1-26. Mouty, M., Delaloye, D., Fontignie, D., Piskin, O., and Wagner, J.J., 1992. The volcanic
activity in Syria and Lebanon between Jurassic and Actual. Schmwizerische Mineralogische und Petrographische Mitteilungen. Vol. 72, pp. 91-105.
Mroueh, M., 1960. Spores and Pollens from Lower Cretaceous Sediments. Central
Lebanon, Abstract 26th Int. Geol. Congress, Paris. Muhs, D.R., 2004. Mineralogical maturity in dunefields of North America, Africa and
Australia. Geomorphology, Vol. 59, pp. 247–269. Muhs, D.R., Stafford, T.W., Jr., Swinehart, J.B., Cowherd, S.D., Mahan, S.A., Bush,
C.A., Madole, R.F., and Maat, P.B., 1997a. Late Holocene eolian activity in the

215
mineralogically mature Nebraska Sand Hills. Quaternary Research Vol. 48, 162–176.
Muhs, D.R., Stafford, T.W., Jr., Been, J., Mahan, S., Burdett, J., Skipp, G., and Rowland,
Z.M., 1997b. Late Holocene eolian sand deposition in the Minot dune field, North Dakota. Canadian Journal of Earth Sciences Vol. 34, 1442–1459.
Murray, R.C., 1960. Origin of porosity in carbonate rocks. Journ. Sed. Petrol., Vol. 30,
pp. 59-84. Nader, F.H., 2000. Petrographic and Geochemical characterization of the Jurassic-
Cretaceous Carbonate sequence of the Nahr Ibrahim region, Lebanon. M.S. Thesis, American University of Beirut, Beirut, Lebanon. 227p.
Nader, F.H., 2003. Petrographic and geochemical study of the Kesrouane Formation
(Jurassic) Mount Lebanon. Implication on dolomitization and Petroleum Geology. Ph.D. Thesis, Katolieke Universiteit, Leuven. 232p.
Nader F.H., Abdel-Rahman, A.F.M. and Haidar, A. T., 2006. Petrographic and chemical
traits of Cenomanian platform carbonates (central Lebanon): implications for depositional environments. Cretaceous Research, Vol. 27; pp. 689-706.
Nader, F., Swennen, R., Ellam, R., 2007. Reflux stratabound dolostone and hydrothermal
volcanism-associated dolostone: a two-stage dolomitization model (Jurassic, Lebanon). Sedimentology Vol. 51 (2), pp. 339-360
Nader, F., Swennen, R., Ellam, R., 2007. Field geometry, petrography and geochemistry
of a dolomitization front (Late Jurassic, central Lebanon). Sedimentology. Vol. 54, (5), pp. 1093–1120.
Nassar, P.E., 1999. Geochemistry of the Pliocene basalts nom the Akkar area, Lebanon.
M.S. Thesis, American University of Beirut, Beirut, Lebanon. 166p. Nemer, T., 1999. The Room Fault: extent and associated structures. M.S. Thesis,
American University of Beirut, Beirut, Lebanon. 149p. Nemer, T., 2005. Sismotectonique et comportement sismique du relais transpressive de la
faille du Levant: rôles et effets des branches de failles sur l'aléa sismique au Liban. Ph.D. Thesis, École et Observatoires de la Terre, Université Louis Pasteur.
Nemer, T., and Meghraoui, M, 2006. Evidence of coseismic ruptures along the Roum
fault (Lebanon): a possible candidate for the AD 1837 earthquake. Journal of Structural Geology, Vol. 28, pp 1483-1495.
Noubani, K.Y., 2000. Petrology and Geochemistry of some Mesozoic Basalts from
Lebanon. M.S. Thesis, American University of Beirut, Beirut, Lebanon. 174p.
216
Noujaim-Clark, G. and Boudagher-Fadel, M.K., 2001. The larger benthic foraminifera
and stratigraphy of the Upper Jurassic-Lower Cretaceous of Central Lebanon. Revue de Micropaléontologie, Vol. 44 (3), pp. 215-232.
Noujaim-Clark G. and Boudagher-Fadel M.K., 2002. "Larger" foraminifera assemblages
and stratigraphy of the Upper Jurassic Bhannes Complex Formation, Central Lebanon. Revue de Paléobiologie, Genève, vol. 21, (2), pp. 679-695.
Otero, O., 1997. A new genus of Alpichthyoidea (Teleostei, Acanthomorpha) from the
Lower Cenomanian of Hgula (Lebanon): Description and phylogenetic relationships. Earth and Planetary Sciences. Vol. 325, pp. 457-458.
Pagel, M., Barbin, V., Blanc, P. and Ohnenstatter, D., 2000. Cathodoluminescence in
Geosciences. Springer, Berlin. 514p. Pettijohn, F.J., Potter, P.E., and Siever, R., 1973. Sand and Sandstone. Springer-Verlag,
Berlin. 618p. Ponikarov, V.P. (Ed.), 1966. The Geology of Syria: Explanatory Notes on the Geological
Map of Syria, Scale 1:200,000. Ministry of Industry, Damascus, Syrian Arab Republic.
Ponikarov, V.P. (Ed.), 1967. The geology of Syria: Explanatory notes on the geological
map of Syria, scale 1:500,000. Part I, Stratigraphy, Igneous Rocks and Tectonics, 229 pp., Syrian Arab Republic, Ministry of Industry, Damascus, Syria.
Porrenga, 1967. Glauconite and chamosite as depth indicators in the marine environment.
Marine Geology, Vol. 5, pp. 495-501. Powers, M., 1953. A new roundness scale for sedimentary particles. Journal of
Sedimentary Petrology, Vol. 23 (2), pp. 117-119. Quennel, A.M., 1958. The Structural and Geomorphologic evolution of the Dead Sea
Rift. Quarterly Journ. Geol. Soc. Lond. Vol. 114, pp. 1-24. Raad, K., 1979. Les formations volcaniques du Liban. Docteur 3ème Cycle, Université de
Paris-Sud, Centre d'Orsay, France, 114 p. Ramm, M., 1992. Porosity-depth trends in reservoir sandstones. Theoretical models
related to Jurassic sandstones offshore Norway. Marine and Petroleum Geology, Vol. 9 (5): pp. 553-567.
Renouard, G., 1951. Sur la découverte du Jurassique inférieur (?) et du Jurassique Moyen
au Liban. CR Acad. Sci., Vol. 232, pp. 992-994.
217
Renouard, G., 1955. Oil prospects of Lebanon. American Association of Petroleum Geologists Bulletin, 39, (11), pp. 2125-2169.
Rolle, F. 1977. Lokalitet 36. Galløkken. In, Hansen, M. and Poulsen, V. (eds.), Geologi
på Bornholm, p. 62-68. Varv Ekskursionsfører Nr. 1. Rubin, David M. and Carter, Carissa L., 2006. Bedforms and cross-bedding in animation,
Society for Sedimentary Geology (SEPM), Atlas Series 2. Sabbagh, G., 1961. Stratigraphie et Tectonique du Liban, Généralités. Thèse de Doctorat,
Université de Grenoble. Grenoble, France. Présentée à l’Institut Industriel de Beyrouth. 88p.
Saint Marc, P., 1970. Contribution à la connaissance du Crétacé Basal au Liban. Rev.
Micropal., Vol. 4, pp. 224-233. Saint Marc, P., 1974. Étude stratigraphique et micropaléontologique de I' Albien, du
Cénomanien, et du Turonien du Liban. Notes et Mémoires sur Le Moyen Orient, Paris, Musée d'Histoire Naturelle, Vol. 13, pp. 8-342.
Sawaf, T., Al-Saad, D., Gebran, A., Barazangi, M., Best, J., and Chaimov, T., 1993.
Stratigraphy and structure of Eastern Syria across the Euphrates depression, Tectonophysics, 220, 267-281.
Searle, T.R., 1972. The geotechnical properties of Cretaceous clay shales in Lebanon.
Ph.D. Thesis. Sha'aban, A.M., 1987. Geology and hydrogeology of Nabatiyeh area. M.S. Thesis,
American University of Beirut, Beirut, Lebanon. 103p. Shaheed, B.L., 1969. The nature and occurrence of surface seepages of petroleum in
Hasbaya area, in relation to the petroleum prospects of Lebanon. M.S. Thesis, American University of Beirut, Beirut, Lebanon. 41p.
Shepard, F.P., 1954. Nomenclature based on sand-silt-clay ratios. Journal of Sedimentary
Petrology, Vol. 42, pp. 122-134. Shirmon, A.E. and Lang, B., 1989. Cretaceous magmatism along the Southwestern flank
of Mount Lebanon. Israel Journ. Of Earth Sci., Vol. 38; pp. 125-142. Shuayb, S. 1974. Hydrology structures of the Aintoura-Tarshish and Qurnayel region,
northern Metn, Mount Lebanon. Unpublished M.S. Thesis, American University of Beirut, Beirut, Lebanon. 84p.
Skinner, B.J., and Porter, S.C., 1995. The dynamic Earth. 3rd ed. John Wiley and Sons.
218
Stampfli, G. M., Borel, G. D., Cavazza, Mosar, W., J., and Ziegler, P. A. Palaeotectonic and palaeogeographic evolution of the western Tethys and PeriTethyan domain (IGCP Project 369). Episodes, Vol. 24, no. 4.
Swennen, R. Keppens, E., and Steingrobe, B., 1996. Sedimentology, diagenesis and
burial history of Westphalian Sandstones of the Floverich 2E-l borehole (Aachen-Erkelenz coal district: Germany). Zbl. Geol. Paläont. Tei1 1, pp 1237-1260.
Tabet, C., 1978. Geology and hydrogeology of the Baskinta-Sannine region, Central
Lebanon. Unpublished M.S. Thesis, American University of Beirut, Beirut, Lebanon. 123p.
Terry, R. D. and Chilingar, C. V. (1955) Summary of "Concerning some additional aids
in studying sedimentary formations" by M. S. Shvetsov. Journal of Sedimentary Petrology, 25,229-214.
Tixier, B., 1971-1972. Le Grès de Base" Crétacé du Liban: Étude Stratigraphique et
Granulométrique. Notes et Mémoires sur Le Moyen Orient, Tome 12. Muséum d'Histoire Naturelle, Paris Ve, pp 207-213.
Toland, C., 2000. A sequence stratigraphic reference section for the Tithonian of
Lebanon. Middle East models of Jurassic/Cretaceous carbonate systems. SEPM, Special Publication 69:53-64.
Touma, G., 1985. The geology, physical, and mechanical properties of the Lower
Cretaceous Sandstone. Broummana area, Lebanon. M.S. Thesis, American University of Beirut, Beirut, Lebanon. 215p.
Trask, P.D., 1932. Origin and environment of source sediments of petroleum; Houston,
TX, Gulf Publication Company, 323p. Tucker, M.E., 1988. Techniques in Sedimentology: Palo Alto, CA, Blackwell Scientific
Publications, 394p. Ukla, S.M., 1970. Subsurface and well correlation in North and Central Lebanon.
Unpublished M.S. Thesis, American University of Beirut, Beirut, Lebanon. 125p. Vail, P.R., Mitchum Jr., R.M., Thompson, S., 1977. Seismic stratigraphy and global
changes of sea level. Part 3: relative changes of sea level from coastal onlap. In: Payton, C.E. (Ed.), Seismic Stratigraphy––Applications to Hydrocarbon Exploration, vol. 26. American Association of Petroleum Geologists Memoir, pp. 63–81.
Vokes H. E. 1941a. Contributions of the paleontology of the Lebanon Mountains,
Republic of Lebanon. American Museum Novitates, 1145: 1-53.
219
Vokes, H.E., 1941b. Geological observations in the Lebanon mountains of western Asia.
GSA Bulletin; November 1940; v. 52; no. 11; p. 1715-1732. Walderhaug, O., 2000b. In R.H. Worden and S. Morad, (Eds.), Quartz cementation in
sandstones: International Association of Sedimentologists Special Publication 29, P. 39.
Wakim, S.B., 1968. Petrography of the Basal Cretaceous Sandstones of Central Lebanon.
M.S. Thesis, American University of Beirut, Beirut, Lebanon. 35p. Walley, C.D., 1983b. A revision of the lower Cretaceous lithostratigraphy of Lebanon.
Geologische Rundschau, Vol. 72; pp 377-388. Walley, C.D., 1988. A braided strike-slip model for the northern continuation of the Dead
Sea Fault and its implications for the Levantine tectonics. Tectonophysics, Vol. 145, p. 63-72.
Walley, C.D., 1997. The Lithostratigraphy of Lebanon: A review. Lebanese Science
Bulletin, Vol. 10, (I), pp. 81-108. Walley, C.D., 1998. Some outstanding issues in the geology of Lebanon and their
importance in the tectonic evolution of the Levantine region. Tectonophysics, Vol. 298, pp 37-62.
Walley, C.D., 2000, Mesozoic and Cenozoic Paleogeographic Maps of the Lebanon
Area. In G. Stampfli, G Borel, W. Cavazza, J. Mosar and P.A. Ziegler, The Paleotectonic Atlas of the Peritethyan Domain: European Geophysical Society CD-ROM.
Walley, C.D., 2001. The Lebanon Passive Margin and the evolution of the Levantine
Neo-Tethys. In Cavazza W., Robertson, A. H. F., and Ziegler, P. eds., 2001. Peri-Tethys Memoir 6: Peri-Tethyan rift/ wrench basins and margins. Mémoires du Museum National d’Histoire Naturelle, Paris, pp. 407-420.
Weaver, C.E., 1989, Clays, muds, and shales: New York, Elsierver, Developments in
sedimentology 44, p 396. Wentworth, C.K., 1929. Method of computing mechanical composition of sediments.
Geol. Soc. Am. Bull., Vol. 40, pp. 771-790. Wood, B.G.M., 2001. Intraplate primary and subsidiary basin formation and deformation:
An example from central Syria. Ph.D. Thesis, University of Oxford, United Kingdom.

220
Zumoffen, G.S.J., 1926. Géologie du Liban. Avec carte géologique 1/ 200 000e. Henri Fascicule, Paris. 165p.
221
APPENDIX I
FORMS

222

223
Fig. A.2. Stratigraphic logging sheet template used in our field work.

224
Fig. A.3. Sedimentary textures and structures field record sheet used in the field work.

225

226
Fig. A.5. Sandstone petrography sheet templates used upon microscopic identification (Shown also on the following page).

227
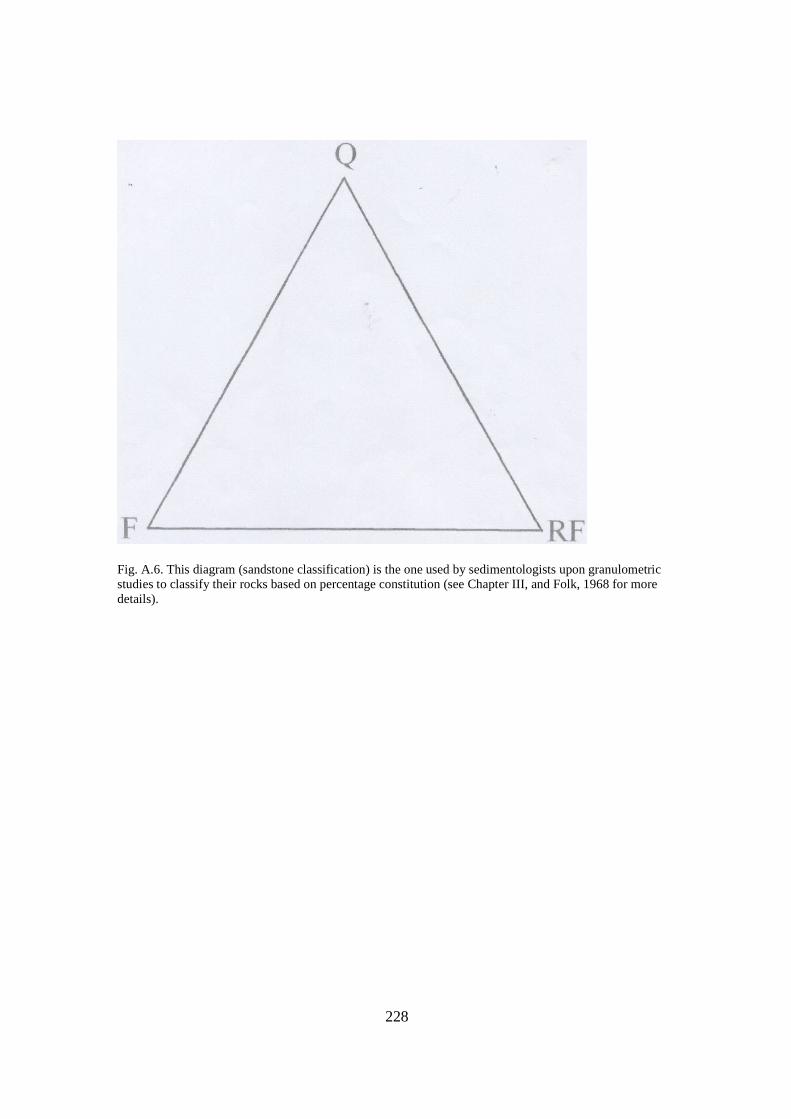
228
Fig. A.6. This diagram (sandstone classification) is the one used by sedimentologists upon granulometric studies to classify their rocks based on percentage constitution (see Chapter III, and Folk, 1968 for more details).
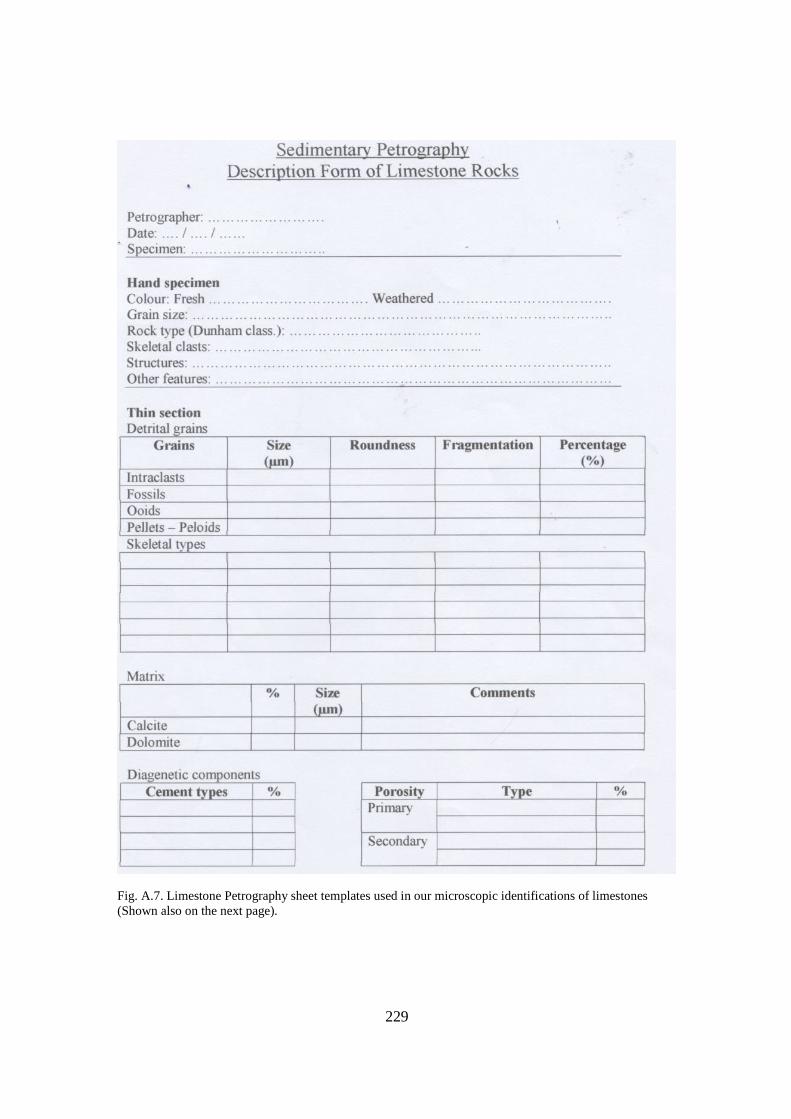
229
Fig. A.7. Limestone Petrography sheet templates used in our microscopic identifications of limestones (Shown also on the next page).

230

231
Fig. A.8. Template used to record all photomicrographs used for this research.
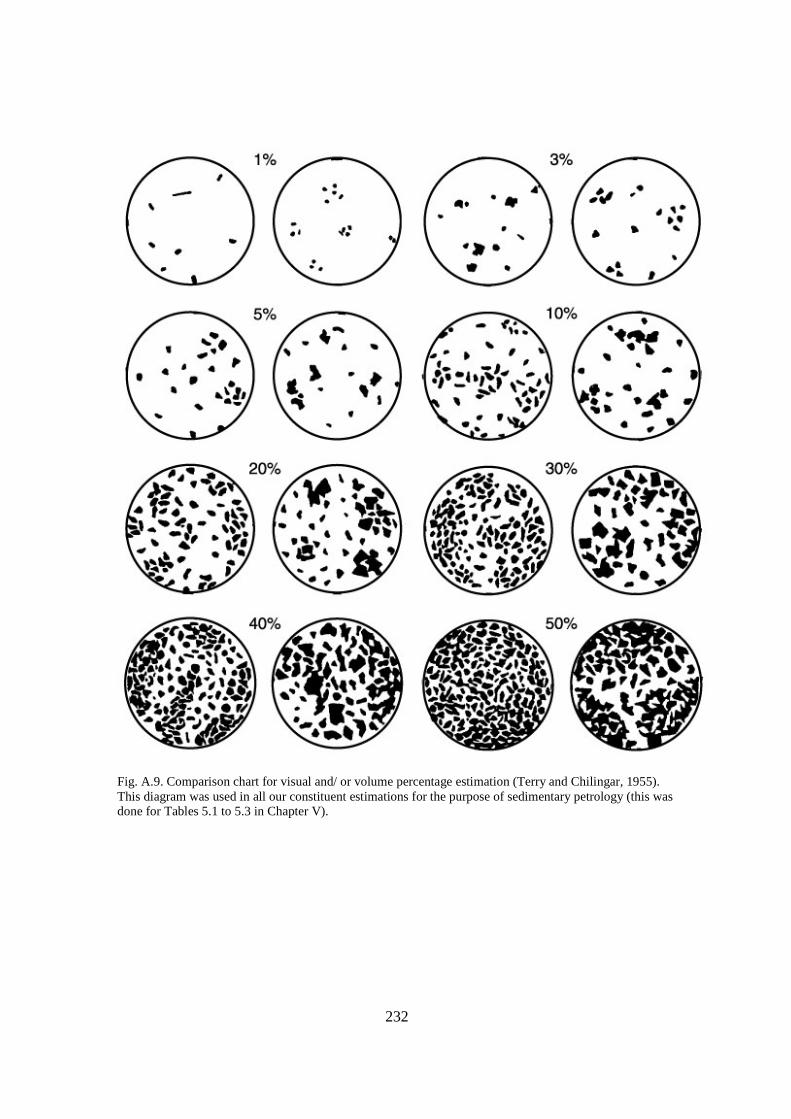
232
Fig. A.9. Comparison chart for visual and/ or volume percentage estimation (Terry and Chilingar, 1955). This diagram was used in all our constituent estimations for the purpose of sedimentary petrology (this was done for Tables 5.1 to 5.3 in Chapter V).

233
Fig. A.10. Definitions from Folk (1968) of the parameters from Table 3.2 (Chapter III). These parameters were used for the granulometric analyses conducted in this thesis.

234
Fig. A.11. Granulometric analysis results of the Toumatt-Jezzine/ Aazibi sandstone (# M-3). These results clearly state that that this is an immature eolian sandstone. Note that the adjacent strata (e.g. # M-1) should show similar results.

235
Fig. A.12. Uncalibrated X-ray diffractogram the same immature sandstone facies from Toumatt-Jezzine/ Aazibi (shown in Fig. A.11) presenting its approximate mineralogical content. Therefore, it can be seen that the presence of quartz (20.8º 2q), calcite (29.5º 2q) and clays (45º and 67.5º 2q). Both identified clays were named. More XRD plots from this section were conducted, and most of the tested sandstones reveal the presence of quartz, calcite, among other impurities (as iron-rich deposits) and clays.
236
APPENDIX II
SEDIMENTARY STRUCTURES
237
Fig. A.13. A3 foldout of the Sedimentary textures and structures taken from Exxon (1977). Information from Ingram (1954), Campbell (1967), Exxon (1977), Rolle (1977), Blatt (1982), Boggs (1995), Rubin and Carter (2006), and others was collected for the production of this detailed diagram. Continued on the next page.

238
Fig. A.13 Cont’d. A3 foldout of the Sedimentary textures and structures taken from Exxon (1977). Information from Ingram (1954), Campbell (1967), Exxon (1977), Rolle (1977), Blatt (1982), Boggs (1995), Rubin and Carter (2006), and others was collected for the production of this detailed diagram. Continued on the next page.

239
APPENDIX II
Figures adapted from Exxon (1977)

240
Fig. A.14. Sedimentary textures and structures diagram showing the basic symbols used in stratigraphic logging (adapted from Exxon, 1977)
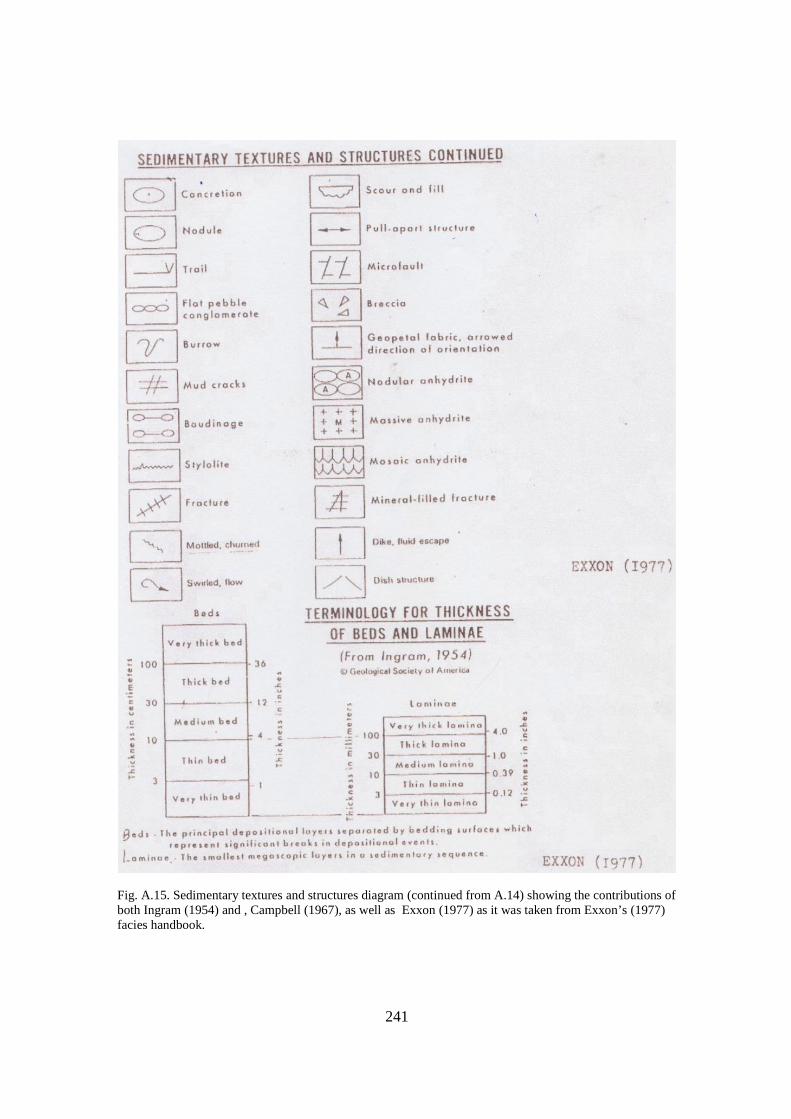
241
Fig. A.15. Sedimentary textures and structures diagram (continued from A.14) showing the contributions of both Ingram (1954) and , Campbell (1967), as well as Exxon (1977) as it was taken from Exxon’s (1977) facies handbook.
242
APPENDIX III
X-RAY DIFFRACTION TABLES (X-ray diffraction Data of the Jezzine Sandstones obtained from
Moore and Reynolds, 1997)
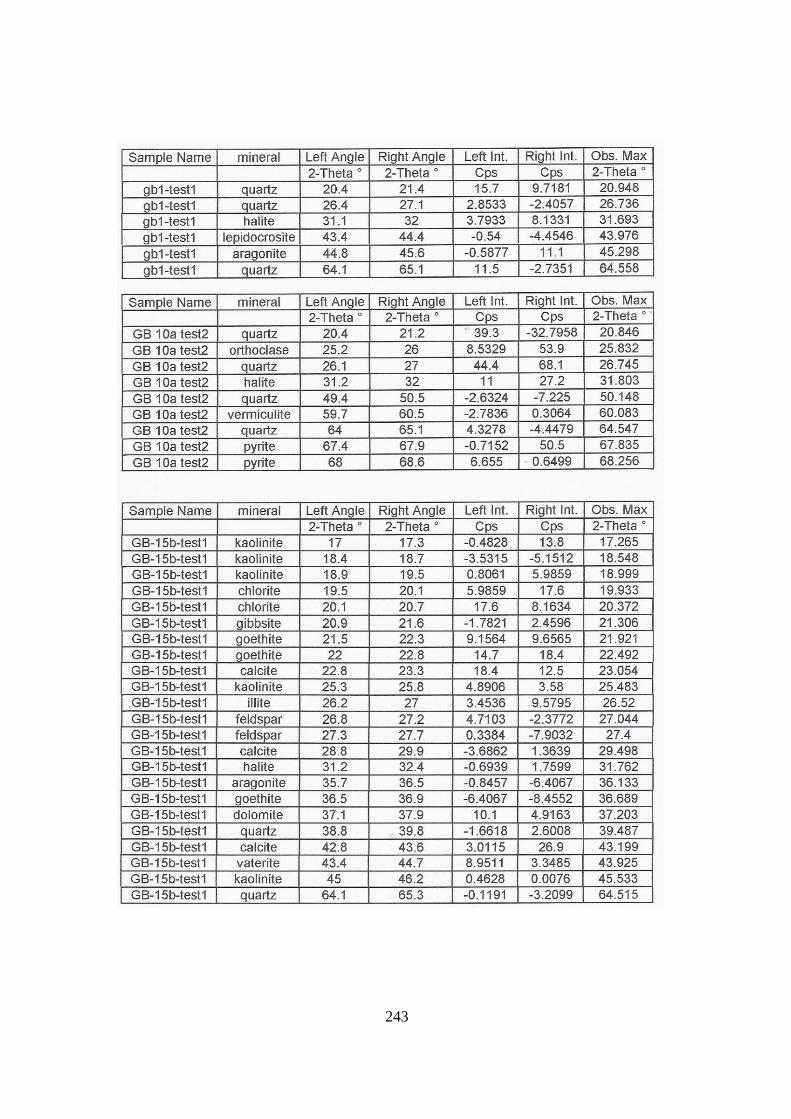
243
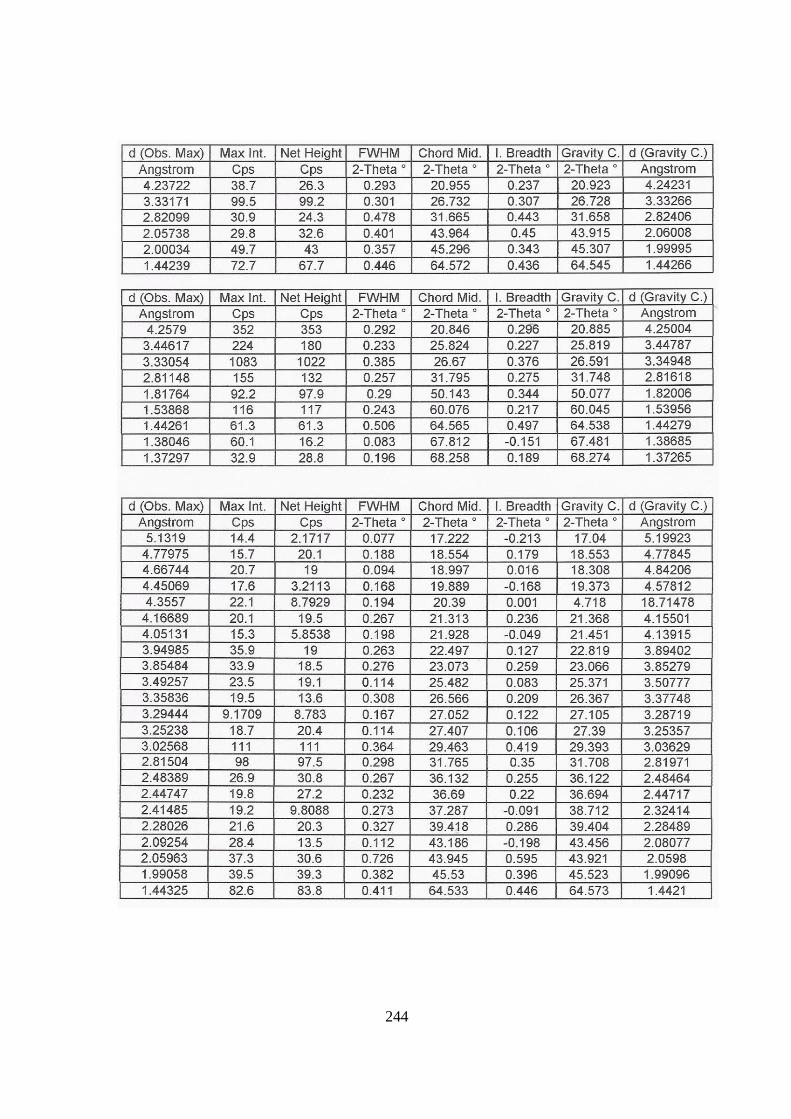
244
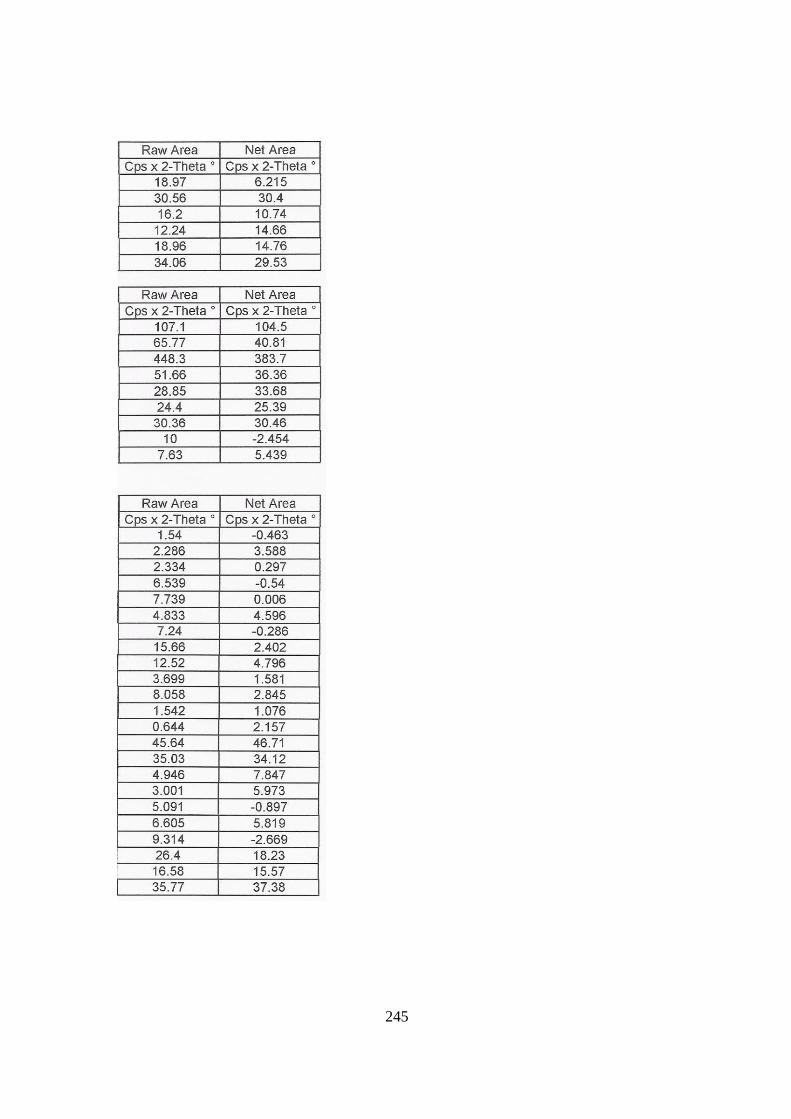
245
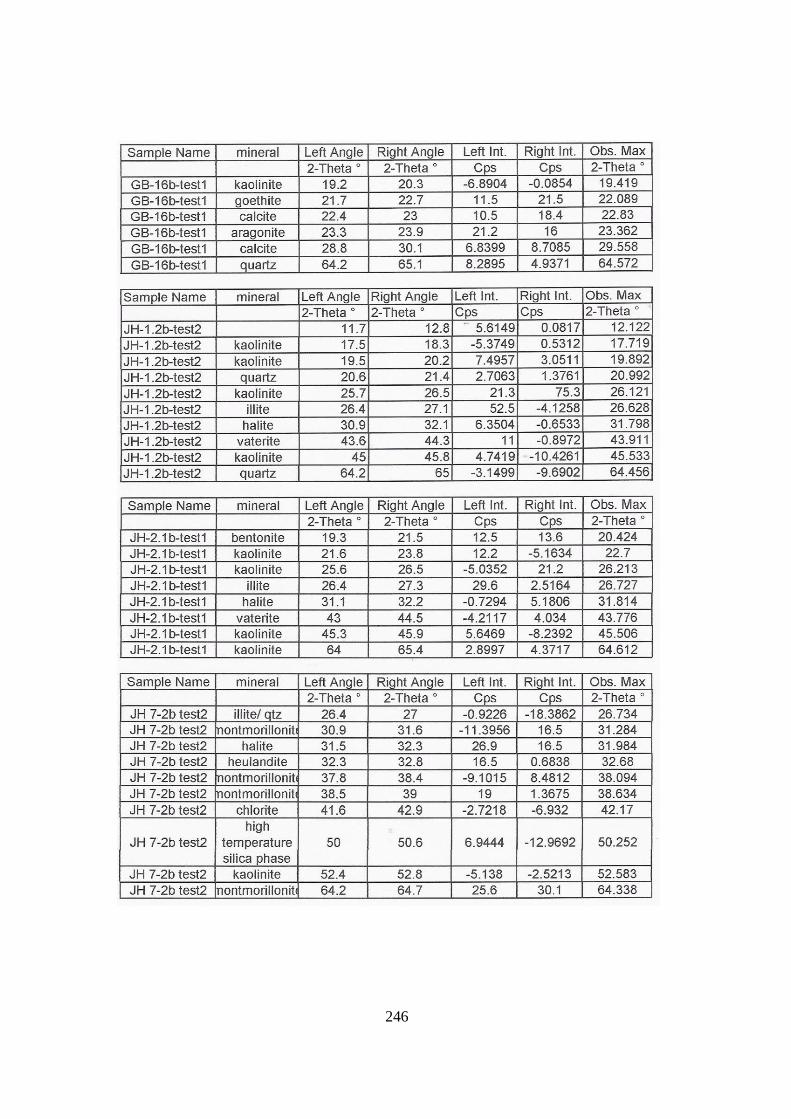
246

247

248
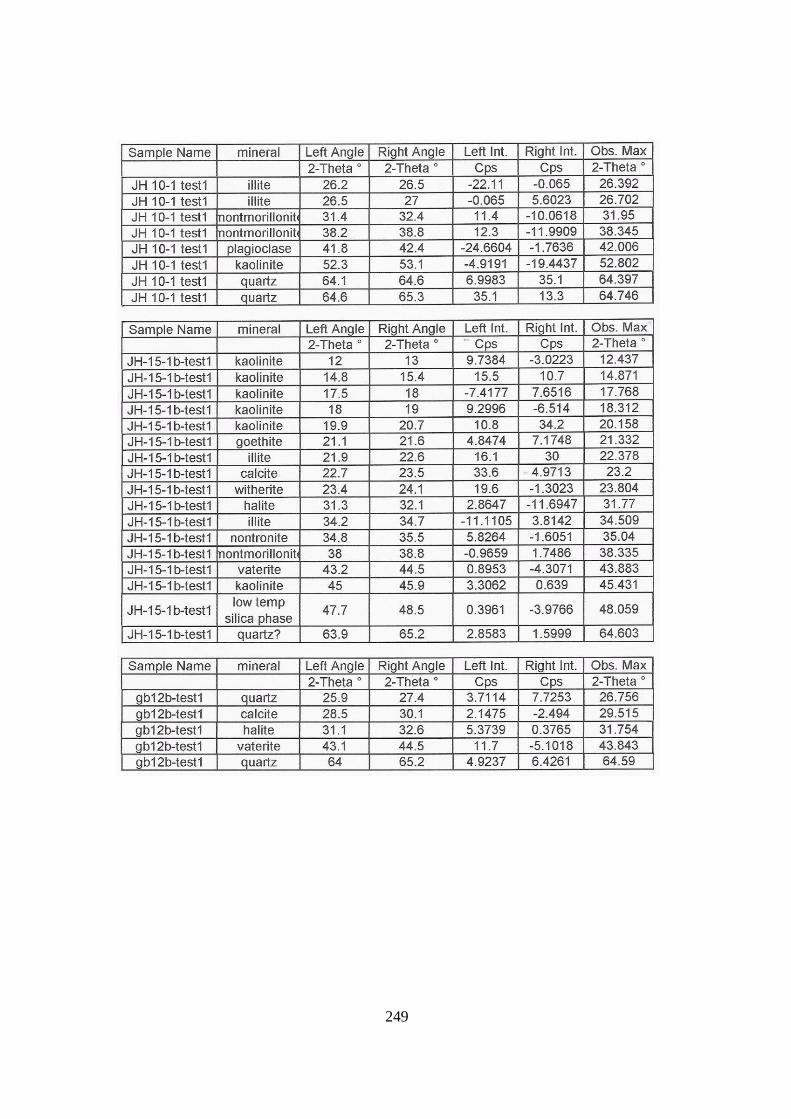
249
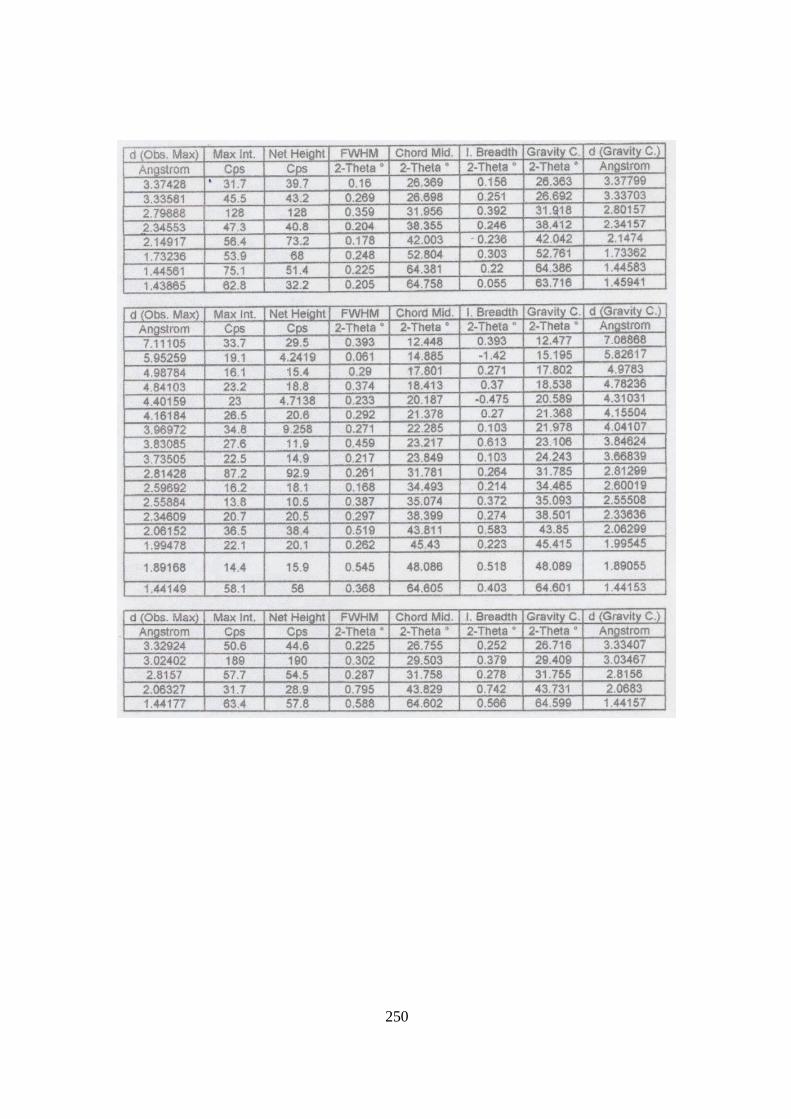
250

251