lebanon bur4 2021.pdf - unfccc
TRANSCRIPT
This document should be referenced as:
MoE/UNDP/GEF (2021). Lebanon’s Fourth Biennial update report the UNFCCC. Beirut, Lebanon.
UNFCCC focal point
Samar Malek, Acting Head of Service of Environmental Technology, Ministry of Environment
Copyright © 2021 by the Ministry of Environment – United Nations Development Programme
Reproduction is authorized provided the source is acknowledged and provided the reproduction is not
sold.
UNDP is the leading United Nations organization fighting to end the injustice of poverty, inequality, and climate change. Working with our broad network of experts and partners in 170 countries, we help nations to build integrated, lasting solutions for people and planet.
Learn more at undp.org or follow at @UNDP.
For more information
http://climatechange.moe.gov.lb/
Disclaimer
The contents of this document are the sole responsibility of its authors, and do not necessarily reflect the opinion of the Ministry of Environment or the United Nations Development Programme, who will not
accept any liability derived from its use.
This study can be used for research, teaching and private study purposes. Please give credit where it is due.
Lebanon’s Fourth Biennial Update Report the UNFCCC
Executed by
Ministry of Environment
Funded by
Global Environment Facility
Implemented by
United Nations Development Programme, Lebanon
Main author
Lea Kai
Contributing authors
Mary Awad Menassa
Yara Daou Chalfoun
Technical Reviewer
Vahakn Kabakian
Editorial Reviewer
Danielle El Chemaly
TABLE OF CONTENT
GEOGRAPHIC AND CLIMATE PROFILE ........................................................................................................... 1
POPULATION AND SOCIAL PROFILE ............................................................................................................. 2
ECONOMIC PROFILE ............................................................................................................................... 2
SECTORS OVERVIEW IN 2018 ................................................................................................................... 4
EDUCATION AND CLIMATE CHANGE AWARENESS ............................................................................................. 9
GOVERNANCE .................................................................................................................................... 11
CLIMATE CHANGE KEY LEGISLATION AND MAINSTREAMING ............................................................................... 12
GENDER-RESPONSIVENESS OF CLIMATE ACTION ........................................................................................... 21
SYNCHRONIZATION OF NDC AND SDGS .................................................................................................... 24
2.1 INSTITUTIONAL ARRANGEMENTS FOR THE PREPARATION OF BIENNIAL UPDATE REPORTS ......................................... 27
2.2 GHG INVENTORY SYSTEM...................................................................................................................... 28
2.3 MRV OF SUPPORT NEEDED AND SUPPORT RECEIVED ...................................................................................... 32
3.1 METHODOLOGY .................................................................................................................................. 35
3.2 RESULTS .......................................................................................................................................... 36
3.3 KEY CATEGORY ANALYSIS ....................................................................................................................... 38
3.4 TREND ANALYSIS ................................................................................................................................. 40
3.5 UNCERTAINTY ASSESSMENT ................................................................................................................... 43
3.6 RECALCULATIONS ............................................................................................................................... 45
3.7 COMPARISON BETWEEN THE SECTORAL APPROACH AND THE REFERENCE APPROACH ............................................... 46
3.8 INDIRECT GHG EMISSIONS .................................................................................................................... 47
3.9 BREAKDOWN OF EMISSIONS BY IPCC SECTOR FOR 2018 ................................................................................ 53
1. ENERGY ............................................................................................................................................ 53
2. INDUSTRIAL PROCESSES AND PRODUCTS USE (IPPU) ................................................................................... 79
3. AGRICULTURE, FORESTRY AND OTHER LAND USE (AFOLU) ............................................................................ 91
4. WASTE AND WASTEWATER ................................................................................................................... 131
4.1 ENERGY ..................................................................................................................................... 151
4.2 TRANSPORT ................................................................................................................................ 160
4.3 AGRICULTURE .............................................................................................................................. 163
4.4 FORESTRY AND LAND USE ............................................................................................................... 164
4.5 SOLID WASTE AND WASTEWATER ....................................................................................................... 166
4.6 INFORMATION ON INTERNATIONAL MARKET MECHANISMS ......................................................................... 175
6.1 CLIMATE CHANGE REPORTING .......................................................................................................... 192
6.2 IMPLEMENTATION OF CLIMATE ACTION ................................................................................................ 199
6.3 ENGAGEMENT OF NON-STATE ACTORS ............................................................................................... 211
6.4 GENDER MAINSTREAMING ................................................................................................................ 212
LIST OF FIGURES
Figure 1: Lebanon’s real GDP growth (World Bank, 2020a) ...................................................................................... 3
Figure 2: GDP Lebanon’s Debt to GDP ratio (World Bank 2020a) .............................................................................. 3
Figure 3: Overview of Lebanon’s Nationally Determined Contribution 2020......................................................... 15
Figure 4: Main finding of the climate-proofing Lebanon’s development plans (UNDP, 2021) .............................. 19
Figure 5: Gender and Climate Change in Lebanon .................................................................................................. 23
Figure 6: Interlinkages between Lebanon ‘s NDC and SDG ..................................................................................... 25
Figure 7: GHG Inventory preparation process for the inventory of 2018 ................................................................ 29
Figure 8: Suggested basic structure of MRV of finance system ............................................................................... 32
Figure 9: Global Warming Potential (IPCC, 2014) .................................................................................................... 35
Figure 10: Lebanon's national greenhouse gas inventory by category in 2018 ..................................................... 36
Figure 11: Lebanon's national greenhouse gas inventory by gas in 2018 .............................................................. 36
Figure 12: Trend in GHG emissions including share of emissions per sector for the period 1994-2018................ 41
Figure 13: Trend in total and sectoral GHG emissions 1994-2018 .......................................................................... 42
Figure 14: Trend of emissions from Industrial Processes and Product Use ........................................................... 43
Figure 15: Impact of recalculation undertaken in the BUR4 ................................................................................... 45
Figure 16: Emissions of indirect GHGs per category ............................................................................................... 48
Figure 17: NOx Emissions per Energy sub-categories .............................................................................................. 49
Figure 18: NOx Emissions per Energy fuel types ...................................................................................................... 49
Figure 19: Emissions distribution per type of vehicle for the indirect GHG in 2018 ............................................... 51
Figure 20: Trend of the indirect GHG emission factors ........................................................................................... 52
Figure 21. Trend in fleet and emissions growth from 1994 to 2018 ........................................................................ 52
Figure 22: Classification of the Lebanese vehicle fleet per type ............................................................................. 62
Figure 23: Classification of the passenger cars per emission reduction technology for IPCC ............................... 62
Figure 24: Classification of the passenger cars per emission reduction technology for Euro standards ............. 63
Figure 25: Contribution of energy emission sources to the sector’s total for 2018 ............................................... 69
Figure 26: GHG emissions from 1.A Energy for the time series 1994-2018 ............................................................. 70
Figure 27: Fuel import per type for 1.A Energy for the time series 1994-2018........................................................ 70
Figure 28: Diesel Oil Consumption per Energy sub-category ................................................................................. 71
Figure 29: Greenhouse gas emissions per MWh generated .................................................................................... 72
Figure 30: Power plants efficiency ........................................................................................................................... 72
Figure 31: Grid Emission Factor (tonnes CO2eq./MWh) ........................................................................................... 74
Figure 32: Emissions distribution per type of vehicle in 2018................................................................................. 75
Figure 33: Changes in GHG emissions and fleet size during the period 1994-2018................................................ 76
Figure 34: Change in CO2eq. emission factor over the 1994-2018 period............................................................... 77
Figure 35: GHG Emissions trend in IPPU sector for 1994-2018 ............................................................................... 89
Figure 36: Total HFC emissions ................................................................................................................................ 89
Figure 37: Impact of recalculation on IPPU emissions............................................................................................ 90
Figure 38: Total emissions from the AFOLU sector excluding the land category for the period 1994-2016 ....... 113
Figure 39: Emissions from the livestock category compared to populations of main livestock species in Lebanon
for the period 1994-2018 ......................................................................................................................................... 114
Figure 40: Trend analysis for net CO2 emissions/removals from the FOLU sector ............................................... 117
Figure 41: The CO2 emissions/removals from the changes in the FOLU sector for 1994-2018 ............................ 120
Figure 42: Areas of land categories converted to settlements ............................................................................. 121
Figure 43: Areas of forest lands converted to settlements by subcategory ......................................................... 121
Figure 44: Areas of croplands converted to settlements by subcategory ............................................................ 122
Figure 45: Areas of grassland converted to settlements ....................................................................................... 122
Figure 46: Forest lands remaining forest lands over the inventory period (1994-2018) ...................................... 123
Figure 47: Yearly afforested areas (1999-2018) ..................................................................................................... 123
Figure 48: Cumulative lands converted to forests over the inventory period ...................................................... 124
Figure 49: Annual CO2 removal from land converted to forest between 1999 and 2018 ..................................... 124
Figure 50: CO2 removals due to biomass increments and increase in soil carbon stocks from afforestation .... 125
Figure 51: Areas of cropland remaining cropland over the inventory period ..................................................... 125
Figure 52: Trend of GHG emissions from Aggregate sources and non-CO2 emission sources (3.C) and breakdown
of N2O emissions per subcategory for the period 1994-2018 ................................................................................. 127
Figure 53: Annual spatial changes in burned areas .............................................................................................. 128
Figure 54: Annual change in areas of forest fires by subcategory........................................................................ 128
Figure 55: Time series CH4 emissions from biomass burning ............................................................................... 129
Figure 56: Time series N2O emissions from biomass burning ............................................................................... 129
Figure 57: Time series total non-CO2 emissions from biomass burning............................................................... 130
Figure 58: Distribution of waste management systems........................................................................................ 134
Figure 59: Waste composition in Lebanon ............................................................................................................ 135
Figure 60: Domestic wastewater treatment systems and discharge pathways in Lebanon for 2018 ................. 142
Figure 61: Percentages of the wastewater treatment systems and discharge pathways ................................... 143
Figure 62: GHG emission from the waste sector in 2018 per subcategory ........................................................... 148
Figure 63: Trend in GHG emissions from the waste category ............................................................................... 149
Figure 64: Domestic wastewater GHG emission for 2018 ..................................................................................... 149
Figure 65: Solar PV Capacity and Annual additions (MoEW/LCEC, 2019). ............................................................ 154
Figure 66: Solar PV capacity per sector (MWp) (MoEW/LCEC, 2019a) ................................................................... 154
LIST OF TABLES
Table 1: Lebanese Municipalities members of the Covenant of Mayors ................................................................ 10
Table 2: Lebanon’s NDC 2015 vs. 2020 ..................................................................................................................... 14
Table 3: Summary of Information necessary for clarity, transparency and understanding (ICTU) of Lebanon’s
mitigation part of the NDC update ........................................................................................................................... 16
Table 4: Examples of climate change mainstreaming in sectoral initiatives ......................................................... 20
Table 5: Capacity building needs related to MRV, as identified during the ICA 2020 ............................................. 31
Table 6: Key Stakeholders for tracking and reporting climate finance flows ......................................................... 33
Table 7: Lebanon’s GHG emissions and removals for 2018 per gas and category ................................................. 37
Table 8: Key categories by level assessment (LA) for 2018 evaluated with LULUCF (Approach 1) ........................ 39
Table 9: Key categories by trend assessment (TA) for 2018 evaluated with LULUCF (Approach 1) ....................... 39
Table 10: Key categories by level assessment (LA) for 2018 evaluated without LULUCF (Approach 1) ................ 39
Table 11: Key categories by trend assessment (TA) for 2018 evaluated without LULUCF (Approach 1) ............... 40
Table 12: Trend in GHG inventory (in Gg) for the time series 1994-2018 with year-to-year percent change ........ 40
Table 13: Trend of emissions during the period 1994-2018 (in Gg) ........................................................................ 41
Table 14: Impact of recalculation on the Lebanese GHG inventory ....................................................................... 46
Table 15: Energy emissions using the reference approache for 2018 .................................................................... 47
Table 16: Difference between reference and sectoral approach ............................................................................ 47
Table 17: Indirect Emissions for Lebanon 1994-2018 .............................................................................................. 48
Table 18: Transport sector’s indirect GHG emissions for 2018 ............................................................................... 50
Table 19: Reporting categories under stationary combustion ............................................................................... 53
Table 20: Reporting categories under mobile combustion (1.A.3) ......................................................................... 54
Table 21: Fuel consumed by 1.A.1 Energy Industries .............................................................................................. 56
Table 22: General parameters by fuel type .............................................................................................................. 56
Table 23: CO2, CH4 and N2O emission factors for 1.A.1 Energy Industries .............................................................. 57
Table 24: Fuel consumption in 1.A.2 Manufacturing Industries and Construction ................................................ 58
Table 25: CO2, CH4 and N2O emission factors for 1.A.2 Manufacturing Industries and Construction .................... 59
Table 26: Description of the vehicle categories used in the calculation of road transport emissions .................. 60
Table 27: Lebanese fleet categories and numbers from 2016 to 2018 ................................................................... 61
Table 28: Default CO2 emission factors for 1.A.3 Transport .................................................................................... 64
Table 29: Default emission factors for CH4 and N2O emissions for 1.A.3Transport ................................................ 64
Table 30: Parameters for road transport ................................................................................................................. 65
Table 31: Direct GHG default emission factors for international bunkers and domestic aviation ........................ 66
Table 32: Fuel consumption for aviation and marine international bunkers 2016-2018 ....................................... 66
Table 33: Fuel consumption in 1.A.4 Other Sectors ................................................................................................ 67
Table 34: CO2, CH4 and N2O emission factors for stationary sources ...................................................................... 68
Table 35: GHG emissions per type of fuel used in power plants ............................................................................. 71
Table 36: Summary of GHG emissions for electricity generation in Lebanon ........................................................ 73
Table 37: Transport sector GHG emissions for 2018 ............................................................................................... 75
Table 38: Emissions from international bunkers .................................................................................................... 77
Table 39: GHG emissions categories the IPPU category ......................................................................................... 79
Table 40: Amount of clinker produced in Lebanon for the years 1994 – 2018 ........................................................ 82
Table 41: Amount of lime produced in Lebanon for the years 1994-2018 .............................................................. 82
Table 42: Quantities of soda ash imported, exported and used in Lebanon from 1994 to 2018 ........................... 83
Table 43: Paraffin Wax used for 1994-2018 .............................................................................................................. 84
Table 44: RAC subsectors and appliance types ....................................................................................................... 85
Table 45: Parameters for the HFCs emissions estimates ........................................................................................ 86
Table 46: Consumption of and emissions from substitutes of ODS ........................................................................ 87
Table 47: Activity data used for estimation of N2O emissions from medical use ................................................... 88
Table 48: Livestock population in Lebanon (heads) from 1994 to 2018 ................................................................. 93
Table 49: Fraction of Manure Nitrogen per Manure Management System in Lebanon ......................................... 94
Table 50: Methane emission factors for enteric fermentation ................................................................................ 94
Table 51: Methane emission factors for manure management .............................................................................. 95
Table 52: Nitrogen excretion rate for animal species and typical animal mass for livestock categories .............. 96
Table 53: Fraction of Nitrogen loss in manure management system (FracLossMS) ................................................... 96
Table 54: Emission factors for Nitrous Oxide emissions for each utilized manure management system ............. 96
Table 55: Land use categories and subcategories, carbon pools and non-CO2 gases accounted for in the inventory
estimation of the AFOLU sector in Lebanon ............................................................................................................. 98
Table 56: Main assumptions for FOLU - Land Use Categories for 1994-2018 ......................................................... 99
Table 57: Type of data sources, databases and references used for data collection .......................................... 101
Table 58: Activity Data for selected years .............................................................................................................. 101
Table 59: Causes of GHG emissions and removals reported for the land categories ........................................... 102
Table 60: Area of burned biomass ......................................................................................................................... 105
Table 61: Employed Emission Factors from biomass burning for the years 1994-2018 ...................................... 105
Table 62: Types of fertilizers and Nitrogen content used in Lebanon .................................................................. 106
Table 63: Breakdown of total amount of nitrogenous synthetic fertilizers used in Lebanon per type of fertilizer
for selected years (in tonnes) .................................................................................................................................. 107
Table 64: Amount of synthetic fertilizer applied to soil in Lebanon and corresponding FSN ............................. 107
Table 65: Crop production in tonnes per crop type and total amount of N in crop residues (FCR) ...................... 108
Table 66: Crop production in tonnes per crop type and total amount of N ......................................................... 108
Table 67: Type of crops in Lebanon and related parameters ............................................................................... 109
Table 68: Fraction of managed N manure lost and amount of N bedding per animal and manure management
system ...................................................................................................................................................................... 110
Table 69: Emission factors for direct N2O emissions from managed soils ........................................................... 110
Table 70: Factors and parameters used for the calculation of indirect N2O emissions ....................................... 110
Table 71: Fraction of managed manure nitrogen for livestock category T that volatizes as NH3 and NOx in the
manure management system ................................................................................................................................. 111
Table 72: Results of the GHG emissions/removals from AFOLU in 2018 .............................................................. 111
Table 73: Emissions from livestock category per gas and subcategory from 1994-2018 in Gg CO2eq. ............... 115
Table 74. Changes in emissions/removals between 2015 and 2016 ..................................................................... 116
Table 75. Changes in emissions/removals between 2016 and 2017 ..................................................................... 116
Table 76. Changes in emissions/removals between 2017 and 2018 ..................................................................... 116
Table 77: A summary of the total CO2 and non-CO2 emissions/removals in Gg CO2eq. from the FOLU sector for the
period 1994-2018 (a) ............................................................................................................................................... 118
Table 78: A summary of the total CO2 and non-CO2 emissions/removals in Gg CO2 equivalent from the FOLU sector
for the period 1994-2018 (b) .................................................................................................................................... 119
Table 79: Total emissions from category 3.C and their distribution per gas ........................................................ 126
Table 80: Emissions from subcategories of aggregate sources and non-CO2 emission sources on land in Lebanon
for 2015 and their share from the category 3.C (values in Gg CO2eq.) ................................................................... 126
Table 81: Emissions from burned areas in 2018 .................................................................................................... 127
Table 82: Sources of GHG emissions in the waste category .................................................................................. 131
Table 83: Activity data and main assumptions for solid waste emissions calculations ...................................... 132
Table 84: Main activity data collected and computed for solid waste generation and disposal ......................... 134
Table 85: Description of solid waste disposal sites categories ............................................................................. 136
Table 86: Other parameters considered in GHG emission calculations for solid waste disposal ........................ 137
Table 87: Amount of waste biologically treated and methane recovered ........................................................... 138
Table 88: Default emission factors for CH4 and N2O from biological treatment of waste .................................... 138
Table 89: Quantities of waste being incinerated ................................................................................................... 139
Table 90: Amount of waste open-burned .............................................................................................................. 139
Table 91: Parameters for incineration and open burning ..................................................................................... 140
Table 92: Emission factors for incineration and open burning ............................................................................. 140
Table 93: Population considered in the assessment (2016-2018) ........................................................................ 141
Table 94: Types of discharge systems in Lebanon ............................................................................................... 142
Table 95: WWTPs in Lebanon determined by type, status and number of served population ........................... 144
Table 96: Weighted average of degradable organic component (kg BOD/cap/yr) (2016-2018) ......................... 146
Table 97: Wastewater parameters and conversion factors for CH4 emissions for 2018 ....................................... 146
Table 98: Wastewater parameters for CH4 emissions from industrial wastewater .............................................. 147
Table 99: Wastewater parameters and conversion factors for N2O emissions..................................................... 147
Table 100: Summary of emissions reduction from energy related mitigation measures .................................... 152
Table 101: Solar PV installed by the Government of Lebanon in public buildings .............................................. 155
Table 102: Summary of Energy Efficiency measures undertaken at power plant level for 2016-2018 ............... 157
Table 103: Prioritization of actions to be taken to address the Derisking of Renewable Energy Investments ... 159
Table 104: Summary of achieved removals in forestry for 2016-2018 .................................................................. 166
Table 105: Overview of OMSAR projects under the SWMP project ....................................................................... 167
Table 106: Signed contracts of wastewater systems during 2016-2018 ............................................................... 169
Table 107: Changes in discharge/treatment system for industrial wastewater .................................................. 174
Table 108: Financial and technical support for general climate change related projects ................................... 177
Table 109: Funding received for mitigation measures in the energy sector since 2016 ..................................... 179
Table 110: Funding received for adaptation and mitigation measures in the agriculture sector in since 2016 . 184
Table 111: Funding received for adaptation and mitigation measures in the forestry and land use sector in since
2016 ......................................................................................................................................................................... 186
Table 112: Funding received for mitigation and adaptation measures in waste and wastewater since 2016 ... 189
Table 113: Gaps and needs identified by the technical team of experts during the ICA2020 of BUR3 ................ 193
Table 114: Status of Lebanon in implementing MPGs on National Inventory Report as reflected in the GHG
inventory submitted within BUR4 .......................................................................................................................... 195
Table 115: Implementation gaps and needs for the energy sector ...................................................................... 199
Table 116: Implementation gaps and needs for the transport sector .................................................................. 201
Table 117: Implementation gaps and needs for the waste sector ........................................................................ 204
Table 118: Implementation gaps and needs for the forestry sector..................................................................... 206
Table 119: Implementation gaps and needs for the agriculture sector ............................................................... 207
Table 120: Implementation gaps and needs for the water sector ........................................................................ 209
Table 121: Support needed to coordinate climate action by non-state actors and align it with the NDC.......... 211
ACRONYMS
ACE Action for Climate Empowerment
AFD Agence Française de Développement
AFDC Association for Forests, Development and Conservation
AFOLU Agriculture and Forestry and Other Land Uses
AR Assessment Report
ARDAC Assisting Reforestation and forest Development Activities
ARDP Agriculture and Rural Development Project
BAU Business-As-Usual
BDL Banque Du Liban
BEEP BIM for Energy Efficiency in the Public sector
BRT Bus Rapid Transit
BTR Biennial Transparency Report
BUR Biennial Update Report
CAS Central Administration of Statistics
CBD Convention on Biological Diversity
CBIT Capacity Building Initiative on Transparency
CCXG Climate Change Expert Group
CC Cropland remaining Cropland
CD Cartagena Dialogue
CDM Clean Development Mechanism
CDR Council for Development and Reconstruction
CEDAW Convention on the Elimination of all forms of Discrimination Against Women
CEDRE Conférence Economique pour le Développement par les Reformes avec les Entreprises
CEDRO Country Energy Efficiency and Renewable Energy Demonstration for the Recovery of Lebanon
CFL Compact Fluorescent Lamp
CMU Cash Management Unit
CNG Compressed Natural Gas
CoM Council of Ministers
CS Cropland converted to Settlement
CTCN Climate Technology Center and Network
CVF Climate Vulnerable Forum
DMFAS Debt Management and Financial Analysis System
DNA Designated National Authority
DOC Degradable Organic Carbon
DREG Decentralized Renewable Energy Power Generation
DREI Derisking Renewable Energy Investment
EBRD European Bank for Reconstruction and Development
ECM Energy Conservation Measures
EDL Electricité du Liban
EF Emission Factor
EMEP European Monitoring and Evaluation Programme
ENS Energy-Not-Supplied
EPA Exploration and Production Agreement
EPC Engineering, Procurement and Construction
ETF Enhanced Transparency Framework
ESMES Energy Smart Mediterranean Schools
EU European Union
FAO Food and Agriculture Organization
FEV Fuel-Efficient Vehicles
FF Forest Land remaining Forest Land
FLRM Forest Landscape Restoration Mechanism
FOD First Order Decay
FOLU Forest and Land Use
ForFITS For Future Inland Transport Systems
FS Forest Land converted to Settlement
FSV Facilitative sharing of views
GBA Greater Beirut Area
GCF Green Climate Fund
GDO Gas Diesel Oil
GDP Gross Domestic Product
GEF Global Environment Facility
GEFF Green Economy Financing Facility
GG Grassland remaining Grassland
GHG Greenhouse Gas
GoL Government of Lebanon
GPG Good Practice Guidance
GS Grassland converted to Settlement
GW Grassland converted to Wetland
GWP Global Warming Potential
HDV Heavy-Duty Vehicles
HFO Heavy Fuel Oil
HPS High Pressure Sodium
ICA International Consultation and Analysis
ICAT Initiative for Climate Action Transparency
ICDF International Cooperation and Development Fund
ICTU Information necessary for Clarity, Transparency and Understanding
IMELS Italian Ministry for the Environment, Land and Sea
ISWM Integrated Solid Waste Management
IPCC Intergovernmental Panel on Climate Change
IPPU Industrial Processes and Product Use
IPTEC IPT Energy Center
KCEP Kigali Cooling Efficiency Programme
KPI Key Performance Indicators
LA Level Assessment
LBP Lebanese Pound
LCA Lebanon Climate Act
LCEC Lebanese Center for Energy Conservation
LDV Light-Duty Vehicles
LEAP Low Emissions Analysis Platform
LECB Low Emission Capacity Building Project
LEDS Low Emission Development Strategy
LEEREFF Lebanon Energy Efficiency and Renewable Energy Finance Facility
LF Land converted to Forest Land
LGIF Lebanon’s Green Investment Facility
LLWB Lebanese League for Women in business
LPA Lebanese Petroleum Administration
LPG Liquefied Petroleum Gas
LRI Lebanese Reforestation Initiative
LS Land converted to Settlement
LULUCF Land Use, Land Use Change and Forestry
LW Land converted to Wetland
MENA Middle East and North Africa
MCM Million Cubic Meters
MISCA Management Information System for Climate Action
MINARET Model of NEXUS Approach and Renewable Energy Technologies
MMS Manure Management System
MoA Ministry of Agriculture
MoE Ministry of Environment
MoEW Ministry of Energy and Water
MoF Ministry of Finance
MoFA Ministry of Foreign Affairs and Emigrants
MoI Ministry of Industry
MoIM Ministry of Interior and Municipalities
MoPWT Ministry of Public Works and Transport
MoU Memorandum of Understanding
MPG Modalities, Procedures and Guidelines
MRV Measuring, Reporting and Verifying
MRVCE Measuring, Reporting and Verifying Coordinating Entity
MSW Municipal Solid Waste
NA Not Applicable
NAMA Nationally Appropriate Mitigation Action
NAP National Adaptation Programme
NC National Communication
NCLW National Commission for Lebanese Women
NCV Net Calorific Value
NDC Nationally Determined Contribution
NDCSP Nationally Determined Contribution Support Programme
NE Not Estimated
NEEAP National Energy Efficiency Action Plan
NEEREA National Energy Efficiency and Renewable Energy Action
NFP National Forest Plan
NGO Non-Governmental Organization
NHR Net Heat Rate
NIR National Inventory Report
NMVOC Non-Methane Organic Volatile Compound
NO Not Occurring
ODS Ozone Depleting Substances
OECD Organisation for Economic Co-operation and Development
OF Other land converted to Forest Land
OMSAR Office of the Minister of State for Administrative Reform
OO Other land remaining Other land
PA Protected Areas
PATPA Partnership on Transparency in the Paris Agreement
PC Passenger Cars
PCM Presidency of the Council of Ministers
POP Persistent Organic Pollutants
PRP Pasture Range and Paddock
PV Photovoltaics
QA/QC Quality Assurance/Quality Control
RPTA Railway and Public Transport Authority
ROI Return on Investment
SALMA Smart Adaptation of Forest Landscapes in Mountain Areas
SAVR Selection of Adaptive Varieties and Rootstocks
SCF Sub-national Climate Fund
SDG Sustainable Development Goal
SEA Strategic Environmental Assessment
SECAP Sustainable Energy and Climate Action Plans
SGBL Société Générale de Banque au Liban
SFOC Specific Fuel Oil Consumption
SLMQ Sustainable Land Management in the Qaraoun Watershed Project
SNC Second National Communication
SOER State of the Environment Report and Future Outlook
SOP Standard Operating Procedures
SPV Special Purpose Vehicle
STG Steam Turbine Generator
SUV Sport Utility Vehicles
SWAM Solid Waste Management
SWDS Solid Waste Disposal sites
SWH Solar Water Heaters
TA Trend Assessment
TACCC Transparency, Accuracy, Completeness, Comparability and Consistency
TNC Third National Communication
UN United Nations
UNCCD United Nations Convention to Combat Desertification
UNDP United Nations Development Programme
UNEP United Nations Environment Programme
UNFCCC United Nations Framework Convention on Climate Change
UFM Union for the Mediterranean
UNHCR United Nations High Commissioner for Refugees
USAID United States Agency for International Development
USD United States Dollar
USEK Holy Spirit University of Kaslik
USFS United States Forest Service
WSA Whole School Approach
WUI Wildland-Urban Interface
WWTP Waste Water Treatment Plant

1
NATIONAL CIRCUMSTANCES
Lebanon’s Fourth Biennial Update Report presents an update of the country’s GHG inventory for the
period 2016 - 2018, mitigation actions undertaken and/or planned for the period 2016-2018 and an overview of climate change direct and indirect support received for the same period.
However, it is worth noting that while this report is being prepared in 2021, Lebanon’s national circumstances changed drastically between 2018 and 2021, due to an unprecedented economic, financial, monetary, banking crises and amidst the global COVID-19 pandemic.
An accumulation of large budget deficits throughout the years has significantly increased the debt-
to- Gross Domestic Product (GDP) ratio. Moreover, the Lebanese Pound (LBP) has devalued by as much as 80%, while inflation rates soared, impacting the Purchasing Power Parity of Lebanese
citizens. The fact that Lebanon relies on imports for most of its food and energy supplies has aggravated the situation even further. The cost of fuel increased drastically since 2018, which
significantly changed the domestic, institutional, and industrial pattern of fuel consumption for electricity and heat generation as well as transport. The COVID-19 pandemic has exacerbated conditions whereby the government-imposed lockdowns that further lowered economic activity.
On August 4th, 2020, an explosion occurred at the port of Beirut which damaged the Port
infrastructure, and surrounding area; the cost of damage is estimated between 3.8 and 4.6 billion US Dollars1. This further sets back an already struggling economy and has halted a large area of commercial activity and essential services; the consequent physical capital losses of the blast are
expected to cause an additional decline in GDP, estimated at 0.4 to 0.6 percentage points (World Bank, 2020a).
Furthermore, Lebanon has been dealing with a crippling humanitarian crisis since 2011 due the
displaced Syrian population, which has stretched an already fragile public infrastructure with
demands exceeding the capacity of institutions to meet the required needs.
Therefore, for the purpose of reporting obligations under the Fourth Biennial Update Report, and in
order to better reflect the circumstances of the year that the GHG inventory covers, this chapter
describes Lebanon’s National Circumstances for the year 2018 only.
Geographic and climate profile
Lebanon is located on the eastern basin of the Mediterranean Sea and is characterized by a long
narrow coastal plain and 2 mountainous areas separated by the Bekaa Valley.
Lebanon has a Mediterranean-type climate characterized by hot and dry summers (June to
September) and cool and rainy winters (December to mid-March). Spring and autumn are warm and
pleasant. The average annual temperature is 15°C.
Along the coast, summers are hot and humid with temperatures crossing 35°C in August. But due to
the moderating effect of the sea, the daily temperature range is narrower than it is inland. January is
the coldest month, with temperatures around 5 to 10°C. The mean annual rainfall on the coast ranges
between 700 and 1,000 mm. About 70% of the average rainfall in the country falls between November
and March and is concentrated during only a few days of the rainy season, falling in heavy cloudbursts
or violent storms. Rainfall in inland Lebanon is higher with snow in the mountains than that along the
coast.
2
Population and social profile
Lebanon’s population is estimated to be 5.97 million in 2018, including foreign workers, Palestinian and Syrian displaced (the latter estimated at 968,529). The working age population (15+ years)
accounts for around 3.7 million persons and the total labor force participation rate is 48.8% with a
large difference between men (70.4%) and women (29.3%). The general unemployment rate is estimated to 11.4% in 2018, with differences observed between women (14%) and men (10%), and with a high rate of 23.3%. among youth (15–24 years old). The public sector share of employment (ministries, public administration, and government-owned institutions) in Lebanon is 14% while the
private sector accounts for the remaining 86%.
The estimated total number of households in Lebanon is around 1.266 million. The most common kind of household composition was of 4 persons on average; just 10% of households were composed
of only one person.
Lebanon’s educational attainment is relatively high compared to the region. Only 2% of residents
aged 3 years and above are not enrolled in education and 7% are illiterate. The percentage of
residents holding a university degree is 21%, with almost no difference between women and men (CAS, 2020, UNRWA, 2020 and UNHCR, 2020).
In Lebanon, women and men have different socially attributed roles and responsibilities
regarding productive, reproductive and community work (related to their gender roles).
Lebanon is a patriarchal society where men are generally expected to be the master of the family and women to be responsible for the organization of the house and raising
the children. Therefore, the place of women in the social organization, the work force, the economy and the political institutions has a direct impact on their vulnerability to
climate change. Indeed, the extent of women’s control over resources, their access to technology and financial means, are critical to mitigation and adaptation actions.
Women comprise 51.6% and men 48.4% of the total residential population. Among
women of working age, the labor force participation rate is 29.3%. Despite the relatively high degree of gender occupational segregation (index = 43.8%), the proportion of women in managerial positions (28.9%) is roughly in proportion to their overall share in
total employment (30.5%). Women benefit from a relative gender equality status when it comes to access to education and jobs, but some legislative aspects undermine their
possibility to exercise their rights like men (i.e., impossibility to pass on the Lebanese nationality to foreign husbands and their offspring, unequal rights when it comes to divorce, inheritance or child custody).
Along with the Convention on the Elimination of All Forms of Discrimination Against Women (CEDAW), the Rio Convention, Sendaï Framework on Disaster Risk Reduction and the UNFCCC set a solid ground for Lebanon to implement policies that are in line
with gender equality and women’s empowerment in climate actions. In addition,
Lebanon’s constitution mentions the equality between all its citizens.
Economic profile
Gross Domestic Product (GDP) has been fluctuating in the recent years, due to the economic crisis that Lebanon has been facing since 2019.
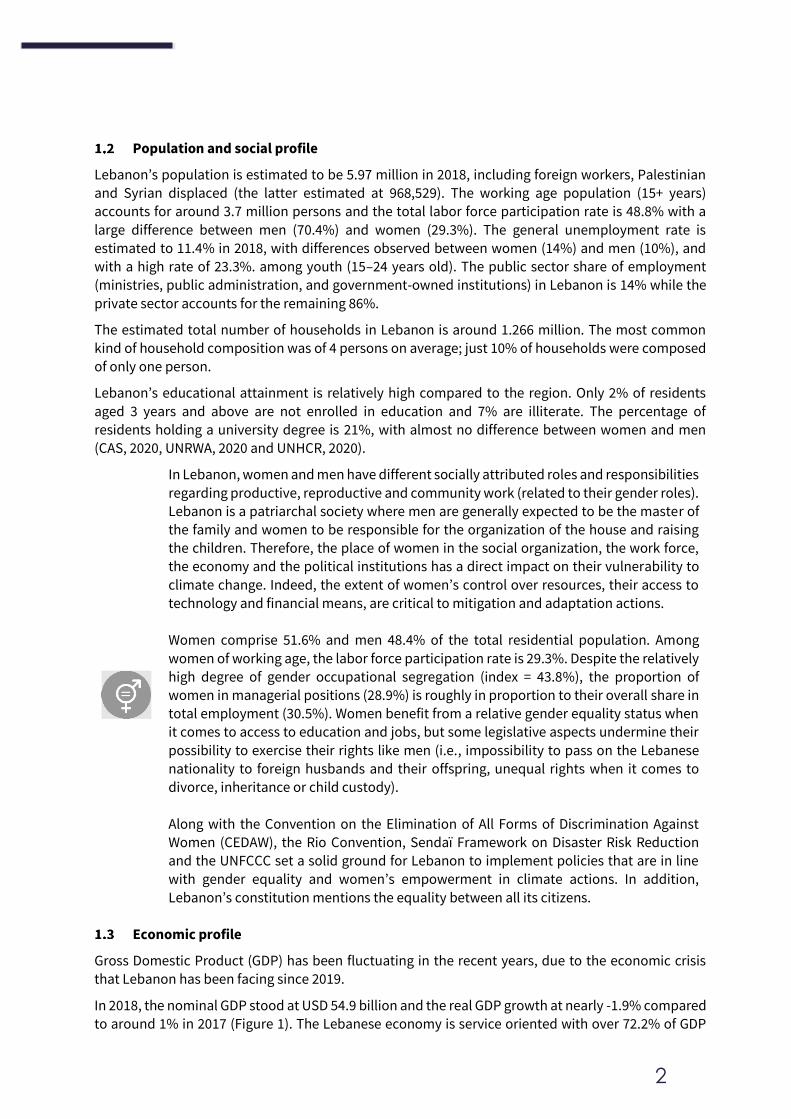
In 2018, the nominal GDP stood at USD 54.9 billion and the real GDP growth at nearly -1.9% compared to around 1% in 2017 (Figure 1). The Lebanese economy is service oriented with over 72.2% of GDP
3
generated from services. Agriculture and Industry contributed to 4.4% and 12% respectively. The
remaining 11.4% are revenues from indirect tax returns. (World Bank, 2020a).
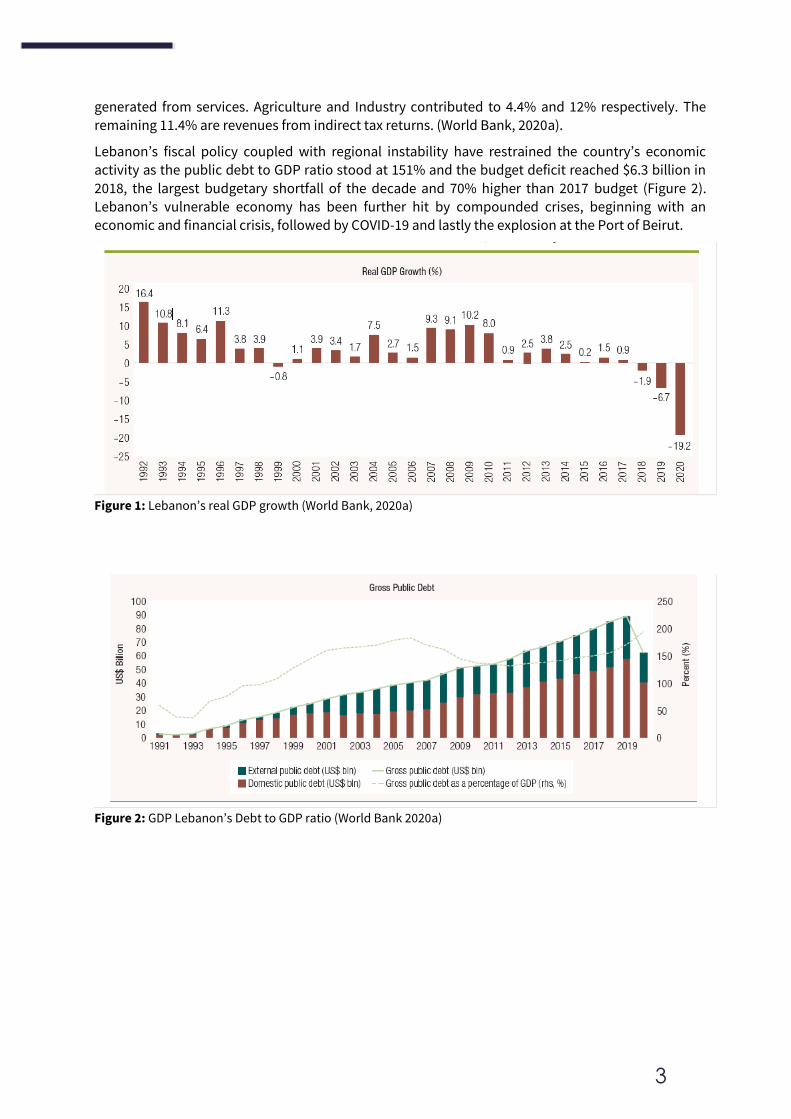
Lebanon’s fiscal policy coupled with regional instability have restrained the country’s economic activity as the public debt to GDP ratio stood at 151% and the budget deficit reached $6.3 billion in
2018, the largest budgetary shortfall of the decade and 70% higher than 2017 budget (Figure 2). Lebanon’s vulnerable economy has been further hit by compounded crises, beginning with an economic and financial crisis, followed by COVID-19 and lastly the explosion at the Port of Beirut.
Figure 1: Lebanon’s real GDP growth (World Bank, 2020a)
Figure 2: GDP Lebanon’s Debt to GDP ratio (World Bank 2020a)
4
Sectors Overview in 2018
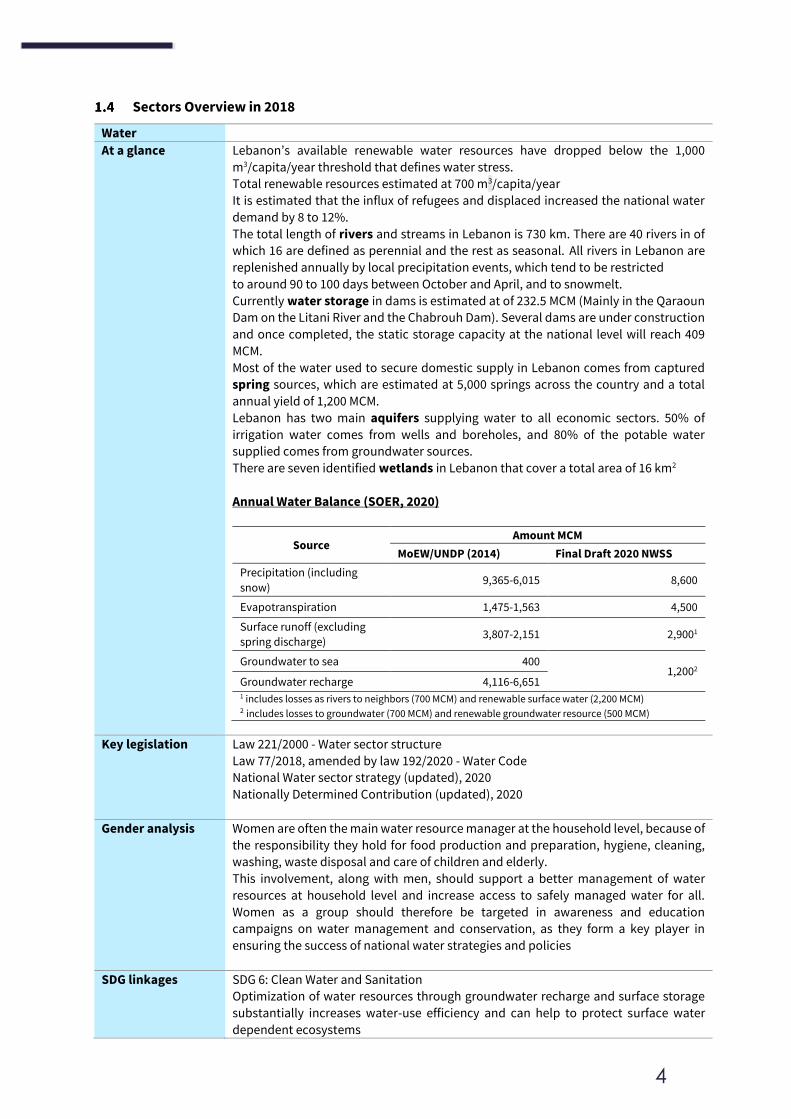
Water
At a glance Lebanon’s available renewable water resources have dropped below the 1,000
m3/capita/year threshold that defines water stress.
Total renewable resources estimated at 700 m3/capita/year
It is estimated that the influx of refugees and displaced increased the national water
demand by 8 to 12%.
The total length of rivers and streams in Lebanon is 730 km. There are 40 rivers in of
which 16 are defined as perennial and the rest as seasonal. All rivers in Lebanon are
replenished annually by local precipitation events, which tend to be restricted
to around 90 to 100 days between October and April, and to snowmelt.
Currently water storage in dams is estimated at of 232.5 MCM (Mainly in the Qaraoun
Dam on the Litani River and the Chabrouh Dam). Several dams are under construction
and once completed, the static storage capacity at the national level will reach 409
MCM.
Most of the water used to secure domestic supply in Lebanon comes from captured
spring sources, which are estimated at 5,000 springs across the country and a total
annual yield of 1,200 MCM.
Lebanon has two main aquifers supplying water to all economic sectors. 50% of
irrigation water comes from wells and boreholes, and 80% of the potable water
supplied comes from groundwater sources. There are seven identified wetlands in Lebanon that cover a total area of 16 km2
Annual Water Balance (SOER, 2020)
Source Amount MCM
MoEW/UNDP (2014) Final Draft 2020 NWSS
Precipitation (including
snow) 9,365-6,015 8,600
Evapotranspiration 1,475-1,563 4,500
Surface runoff (excluding
spring discharge) 3,807-2,151 2,9001
Groundwater to sea 400 1,2002
Groundwater recharge 4,116-6,651 1 includes losses as rivers to neighbors (700 MCM) and renewable surface water (2,200 MCM) 2 includes losses to groundwater (700 MCM) and renewable groundwater resource (500 MCM)
Key legislation Law 221/2000 - Water sector structure
Law 77/2018, amended by law 192/2020 - Water Code
National Water sector strategy (updated), 2020
Nationally Determined Contribution (updated), 2020
Gender analysis
Women are often the main water resource manager at the household level, because of
the responsibility they hold for food production and preparation, hygiene, cleaning,
washing, waste disposal and care of children and elderly.
This involvement, along with men, should support a better management of water
resources at household level and increase access to safely managed water for all.
Women as a group should therefore be targeted in awareness and education
campaigns on water management and conservation, as they form a key player in
ensuring the success of national water strategies and policies
SDG linkages SDG 6: Clean Water and Sanitation
Optimization of water resources through groundwater recharge and surface storage
substantially increases water-use efficiency and can help to protect surface water
dependent ecosystems
5
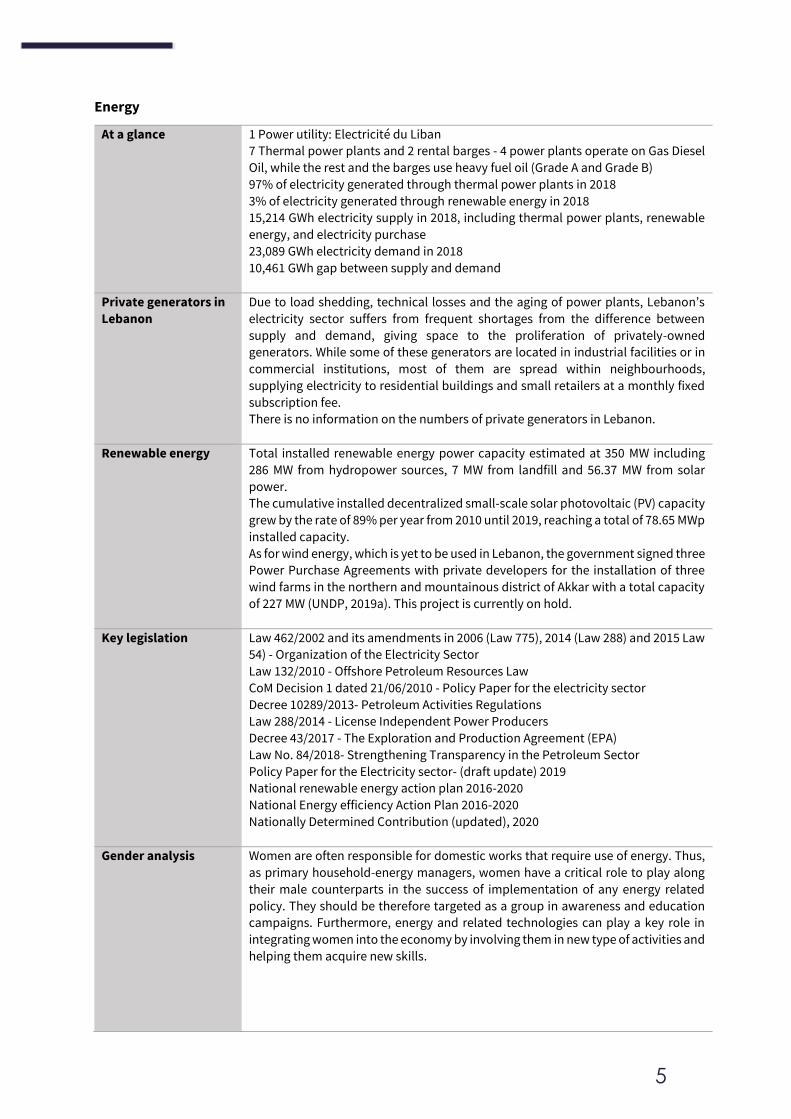
Energy
At a glance 1 Power utility: Electricité du Liban
7 Thermal power plants and 2 rental barges - 4 power plants operate on Gas Diesel
Oil, while the rest and the barges use heavy fuel oil (Grade A and Grade B)
97% of electricity generated through thermal power plants in 2018
3% of electricity generated through renewable energy in 2018
15,214 GWh electricity supply in 2018, including thermal power plants, renewable
energy, and electricity purchase
23,089 GWh electricity demand in 2018
10,461 GWh gap between supply and demand
Private generators in
Lebanon
Due to load shedding, technical losses and the aging of power plants, Lebanon’s
electricity sector suffers from frequent shortages from the difference between
supply and demand, giving space to the proliferation of privately-owned
generators. While some of these generators are located in industrial facilities or in
commercial institutions, most of them are spread within neighbourhoods,
supplying electricity to residential buildings and small retailers at a monthly fixed
subscription fee.
There is no information on the numbers of private generators in Lebanon.
Renewable energy Total installed renewable energy power capacity estimated at 350 MW including
286 MW from hydropower sources, 7 MW from landfill and 56.37 MW from solar
power.
The cumulative installed decentralized small-scale solar photovoltaic (PV) capacity
grew by the rate of 89% per year from 2010 until 2019, reaching a total of 78.65 MWp
installed capacity.
As for wind energy, which is yet to be used in Lebanon, the government signed three
Power Purchase Agreements with private developers for the installation of three
wind farms in the northern and mountainous district of Akkar with a total capacity
of 227 MW (UNDP, 2019a). This project is currently on hold.
Key legislation Law 462/2002 and its amendments in 2006 (Law 775), 2014 (Law 288) and 2015 Law
54) - Organization of the Electricity Sector
Law 132/2010 - Offshore Petroleum Resources Law
CoM Decision 1 dated 21/06/2010 - Policy Paper for the electricity sector
Decree 10289/2013- Petroleum Activities Regulations
Law 288/2014 - License Independent Power Producers
Decree 43/2017 - The Exploration and Production Agreement (EPA)
Law No. 84/2018- Strengthening Transparency in the Petroleum Sector
Policy Paper for the Electricity sector- (draft update) 2019
National renewable energy action plan 2016-2020
National Energy efficiency Action Plan 2016-2020
Nationally Determined Contribution (updated), 2020
Gender analysis
Women are often responsible for domestic works that require use of energy. Thus,
as primary household-energy managers, women have a critical role to play along
their male counterparts in the success of implementation of any energy related
policy. They should be therefore targeted as a group in awareness and education
campaigns. Furthermore, energy and related technologies can play a key role in
integrating women into the economy by involving them in new type of activities and
helping them acquire new skills.
6
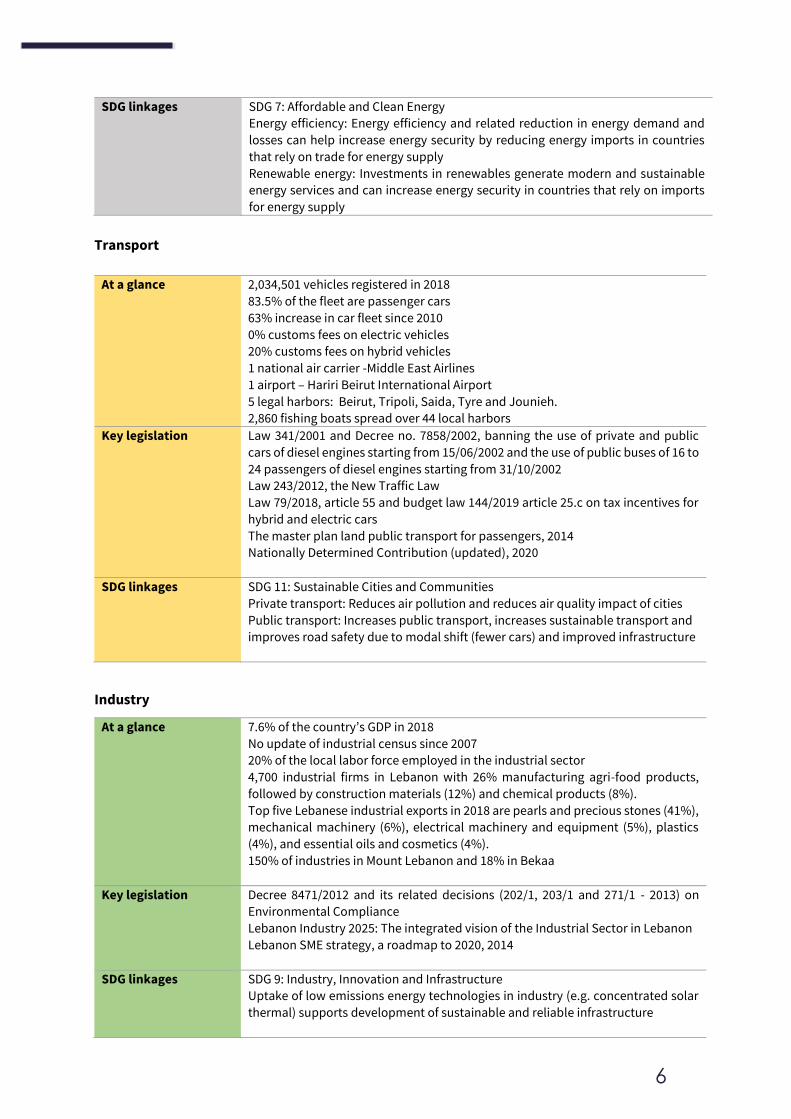
SDG linkages SDG 7: Affordable and Clean Energy
Energy efficiency: Energy efficiency and related reduction in energy demand and
losses can help increase energy security by reducing energy imports in countries
that rely on trade for energy supply
Renewable energy: Investments in renewables generate modern and sustainable
energy services and can increase energy security in countries that rely on imports
for energy supply
Transport
At a glance 2,034,501 vehicles registered in 2018
83.5% of the fleet are passenger cars
63% increase in car fleet since 2010
0% customs fees on electric vehicles
20% customs fees on hybrid vehicles
1 national air carrier -Middle East Airlines
1 airport – Hariri Beirut International Airport
5 legal harbors: Beirut, Tripoli, Saida, Tyre and Jounieh.
2,860 fishing boats spread over 44 local harbors Key legislation Law 341/2001 and Decree no. 7858/2002, banning the use of private and public
cars of diesel engines starting from 15/06/2002 and the use of public buses of 16 to
24 passengers of diesel engines starting from 31/10/2002
Law 243/2012, the New Traffic Law
Law 79/2018, article 55 and budget law 144/2019 article 25.c on tax incentives for
hybrid and electric cars
The master plan land public transport for passengers, 2014
Nationally Determined Contribution (updated), 2020
SDG linkages SDG 11: Sustainable Cities and Communities
Private transport: Reduces air pollution and reduces air quality impact of cities
Public transport: Increases public transport, increases sustainable transport and
improves road safety due to modal shift (fewer cars) and improved infrastructure
Industry
At a glance 7.6% of the country’s GDP in 2018
No update of industrial census since 2007
20% of the local labor force employed in the industrial sector
4,700 industrial firms in Lebanon with 26% manufacturing agri-food products,
followed by construction materials (12%) and chemical products (8%).
Top five Lebanese industrial exports in 2018 are pearls and precious stones (41%),
mechanical machinery (6%), electrical machinery and equipment (5%), plastics
(4%), and essential oils and cosmetics (4%).
150% of industries in Mount Lebanon and 18% in Bekaa
Key legislation Decree 8471/2012 and its related decisions (202/1, 203/1 and 271/1 - 2013) on
Environmental Compliance
Lebanon Industry 2025: The integrated vision of the Industrial Sector in Lebanon
Lebanon SME strategy, a roadmap to 2020, 2014
SDG linkages SDG 9: Industry, Innovation and Infrastructure
Uptake of low emissions energy technologies in industry (e.g. concentrated solar
thermal) supports development of sustainable and reliable infrastructure
7
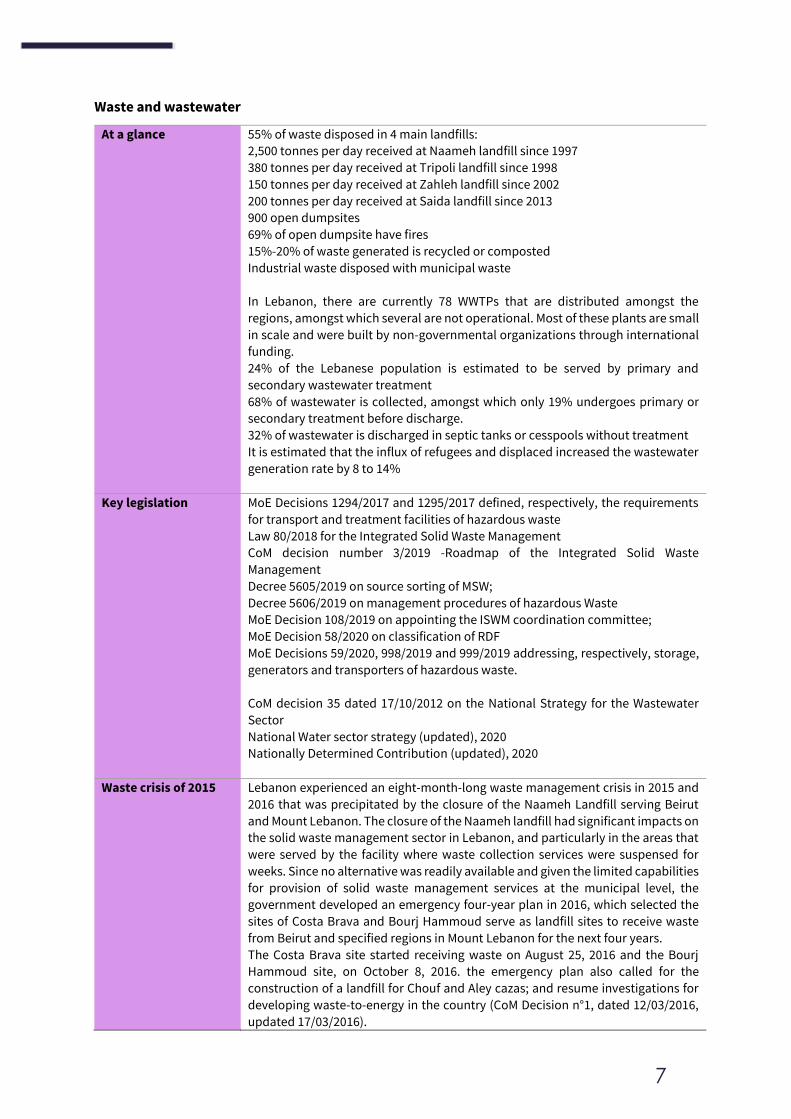
Waste and wastewater
At a glance 55% of waste disposed in 4 main landfills:
2,500 tonnes per day received at Naameh landfill since 1997
380 tonnes per day received at Tripoli landfill since 1998
150 tonnes per day received at Zahleh landfill since 2002
200 tonnes per day received at Saida landfill since 2013
900 open dumpsites
69% of open dumpsite have fires
15%-20% of waste generated is recycled or composted
Industrial waste disposed with municipal waste
In Lebanon, there are currently 78 WWTPs that are distributed amongst the
regions, amongst which several are not operational. Most of these plants are small
in scale and were built by non-governmental organizations through international
funding.
24% of the Lebanese population is estimated to be served by primary and
secondary wastewater treatment
68% of wastewater is collected, amongst which only 19% undergoes primary or
secondary treatment before discharge.
32% of wastewater is discharged in septic tanks or cesspools without treatment
It is estimated that the influx of refugees and displaced increased the wastewater
generation rate by 8 to 14%
Key legislation MoE Decisions 1294/2017 and 1295/2017 defined, respectively, the requirements
for transport and treatment facilities of hazardous waste
Law 80/2018 for the Integrated Solid Waste Management
CoM decision number 3/2019 -Roadmap of the Integrated Solid Waste
Management
Decree 5605/2019 on source sorting of MSW;
Decree 5606/2019 on management procedures of hazardous Waste
MoE Decision 108/2019 on appointing the ISWM coordination committee;
MoE Decision 58/2020 on classification of RDF
MoE Decisions 59/2020, 998/2019 and 999/2019 addressing, respectively, storage,
generators and transporters of hazardous waste.
CoM decision 35 dated 17/10/2012 on the National Strategy for the Wastewater
Sector
National Water sector strategy (updated), 2020
Nationally Determined Contribution (updated), 2020
Waste crisis of 2015 Lebanon experienced an eight-month-long waste management crisis in 2015 and
2016 that was precipitated by the closure of the Naameh Landfill serving Beirut
and Mount Lebanon. The closure of the Naameh landfill had significant impacts on
the solid waste management sector in Lebanon, and particularly in the areas that
were served by the facility where waste collection services were suspensed for
weeks. Since no alternative was readily available and given the limited capabilities
for provision of solid waste management services at the municipal level, the
government developed an emergency four-year plan in 2016, which selected the
sites of Costa Brava and Bourj Hammoud serve as landfill sites to receive waste
from Beirut and specified regions in Mount Lebanon for the next four years.
The Costa Brava site started receiving waste on August 25, 2016 and the Bourj
Hammoud site, on October 8, 2016. the emergency plan also called for the
construction of a landfill for Chouf and Aley cazas; and resume investigations for
developing waste-to-energy in the country (CoM Decision n°1, dated 12/03/2016,
updated 17/03/2016).
8
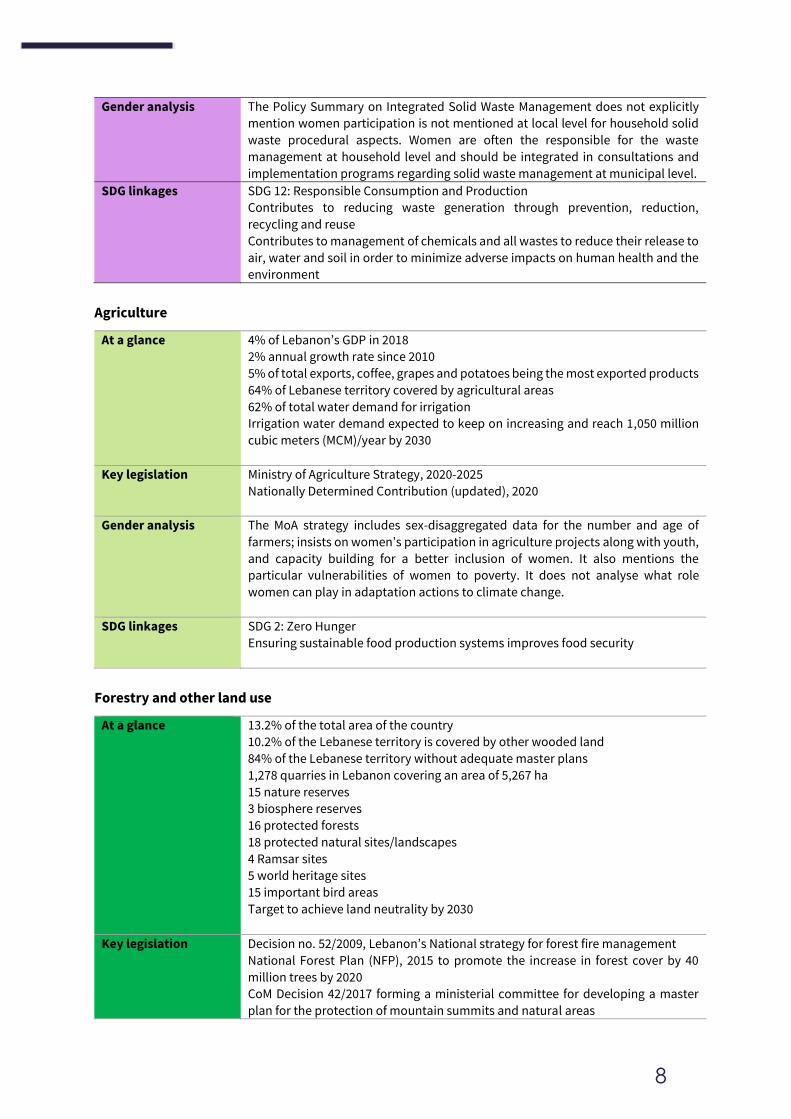
Gender analysis The Policy Summary on Integrated Solid Waste Management does not explicitly
mention women participation is not mentioned at local level for household solid
waste procedural aspects. Women are often the responsible for the waste
management at household level and should be integrated in consultations and
implementation programs regarding solid waste management at municipal level. SDG linkages SDG 12: Responsible Consumption and Production
Contributes to reducing waste generation through prevention, reduction,
recycling and reuse
Contributes to management of chemicals and all wastes to reduce their release to
air, water and soil in order to minimize adverse impacts on human health and the
environment
Agriculture
At a glance 4% of Lebanon’s GDP in 2018
2% annual growth rate since 2010
5% of total exports, coffee, grapes and potatoes being the most exported products
64% of Lebanese territory covered by agricultural areas
62% of total water demand for irrigation
Irrigation water demand expected to keep on increasing and reach 1,050 million
cubic meters (MCM)/year by 2030
Key legislation Ministry of Agriculture Strategy, 2020-2025
Nationally Determined Contribution (updated), 2020
Gender analysis
The MoA strategy includes sex-disaggregated data for the number and age of
farmers; insists on women’s participation in agriculture projects along with youth,
and capacity building for a better inclusion of women. It also mentions the
particular vulnerabilities of women to poverty. It does not analyse what role
women can play in adaptation actions to climate change.
SDG linkages SDG 2: Zero Hunger
Ensuring sustainable food production systems improves food security
Forestry and other land use
At a glance 13.2% of the total area of the country
10.2% of the Lebanese territory is covered by other wooded land
84% of the Lebanese territory without adequate master plans
1,278 quarries in Lebanon covering an area of 5,267 ha
15 nature reserves
3 biosphere reserves
16 protected forests
18 protected natural sites/landscapes
4 Ramsar sites
5 world heritage sites
15 important bird areas
Target to achieve land neutrality by 2030
Key legislation Decision no. 52/2009, Lebanon’s National strategy for forest fire management
National Forest Plan (NFP), 2015 to promote the increase in forest cover by 40
million trees by 2020
CoM Decision 42/2017 forming a ministerial committee for developing a master
plan for the protection of mountain summits and natural areas
9
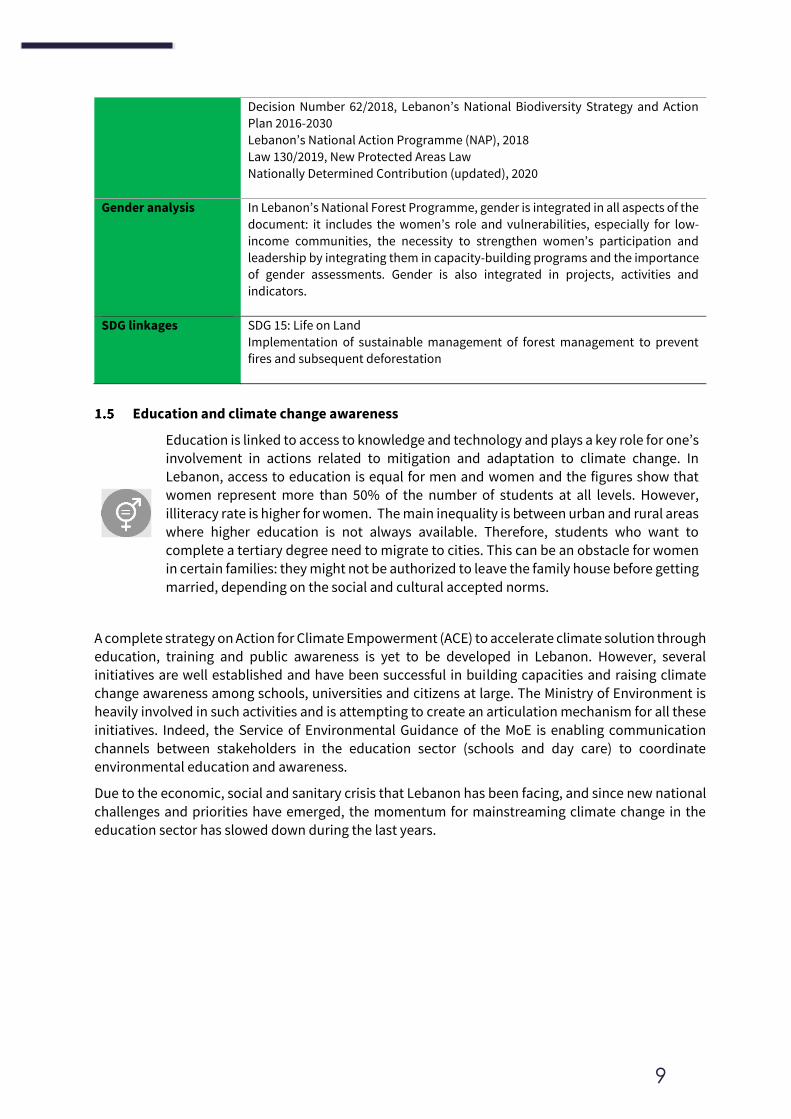
Decision Number 62/2018, Lebanon’s National Biodiversity Strategy and Action
Plan 2016-2030
Lebanon’s National Action Programme (NAP), 2018
Law 130/2019, New Protected Areas Law
Nationally Determined Contribution (updated), 2020
Gender analysis In Lebanon’s National Forest Programme, gender is integrated in all aspects of the
document: it includes the women’s role and vulnerabilities, especially for low-
income communities, the necessity to strengthen women’s participation and
leadership by integrating them in capacity-building programs and the importance
of gender assessments. Gender is also integrated in projects, activities and
indicators.
SDG linkages SDG 15: Life on Land
Implementation of sustainable management of forest management to prevent
fires and subsequent deforestation
Education and climate change awareness
Education is linked to access to knowledge and technology and plays a key role for one’s
involvement in actions related to mitigation and adaptation to climate change. In Lebanon, access to education is equal for men and women and the figures show that
women represent more than 50% of the number of students at all levels. However,
illiteracy rate is higher for women. The main inequality is between urban and rural areas
where higher education is not always available. Therefore, students who want to complete a tertiary degree need to migrate to cities. This can be an obstacle for women in certain families: they might not be authorized to leave the family house before getting
married, depending on the social and cultural accepted norms.
A complete strategy on Action for Climate Empowerment (ACE) to accelerate climate solution through
education, training and public awareness is yet to be developed in Lebanon. However, several initiatives are well established and have been successful in building capacities and raising climate
change awareness among schools, universities and citizens at large. The Ministry of Environment is heavily involved in such activities and is attempting to create an articulation mechanism for all these
initiatives. Indeed, the Service of Environmental Guidance of the MoE is enabling communication channels between stakeholders in the education sector (schools and day care) to coordinate environmental education and awareness.
Due to the economic, social and sanitary crisis that Lebanon has been facing, and since new national
challenges and priorities have emerged, the momentum for mainstreaming climate change in the education sector has slowed down during the last years.
10
Engagement of non-state actors in climate action
The Lebanon Climate Act (LCA) was enacted in June 2016. It has been developed by the NGO Green
Mind in partnership with the United Nations Development Program (UNDP) and the Banque Du Liban (the Central Bank of Lebanon), and in cooperation with the Federation of Chambers of Commerce,
Industry and Agriculture in Lebanon as well as the Lebanese Ministry of Environment (LCA, 2021). The LCA has been established in line with Lebanon’s NDC and has a threefold objective:
• to create a network of companies and institutions contributing to climate change efforts;
• to involve and mobilise the private sector in the broader climate change community by giving this stakeholder group a space to showcase and support climate action through initiatives;
• to build partnerships between businesses and non-governmental organisations in key sectors.
LCA members are expected to enhance their company’s ability to address climate risks, and in tandem
comply with environmental regulations and increase market competitiveness in the long term. A
guidebook titled ‘How to create value from climate change’ (or LCA guidebook) has been prepared under this initiative, to steer the process of shifting to sustainable actions and enhancing resource efficiency of business operations, and in turn reduce operational costs and create cost-efficient
supply chains (LCA, 2017).
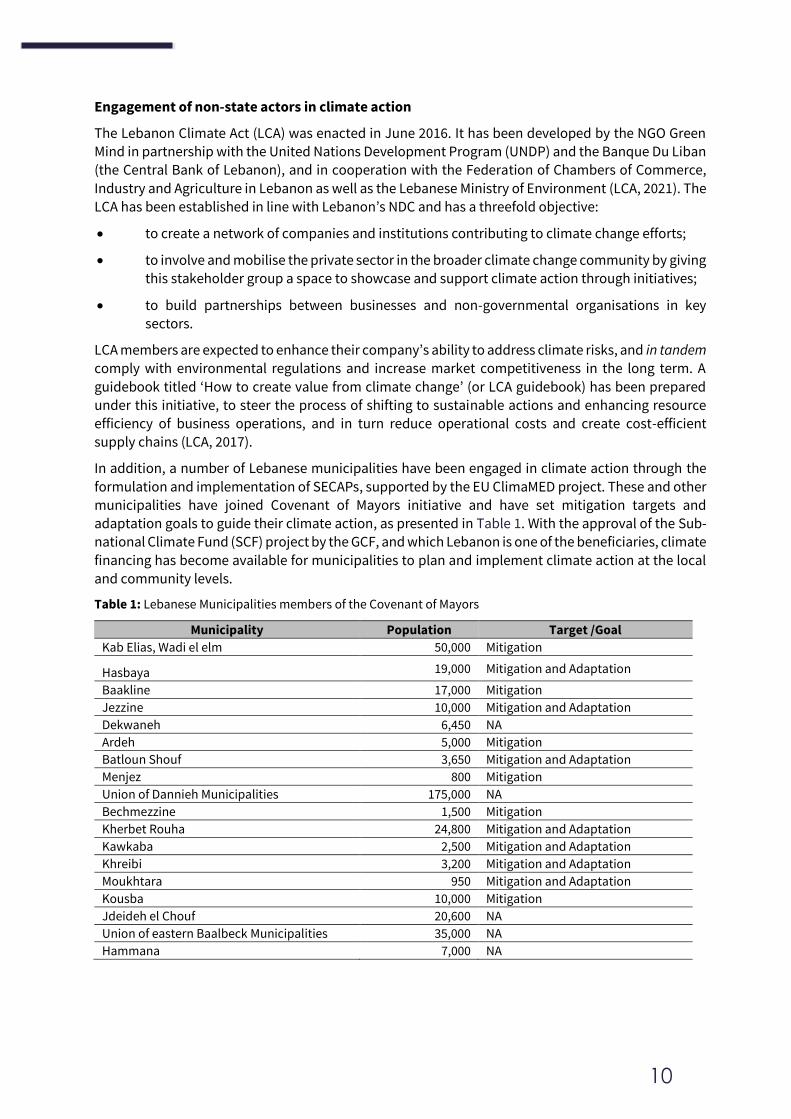
In addition, a number of Lebanese municipalities have been engaged in climate action through the
formulation and implementation of SECAPs, supported by the EU ClimaMED project. These and other
municipalities have joined Covenant of Mayors initiative and have set mitigation targets and adaptation goals to guide their climate action, as presented in Table 1. With the approval of the Sub-national Climate Fund (SCF) project by the GCF, and which Lebanon is one of the beneficiaries, climate
financing has become available for municipalities to plan and implement climate action at the local and community levels.
Table 1: Lebanese Municipalities members of the Covenant of Mayors
Municipality Population Target /Goal
Kab Elias, Wadi el elm 50,000 Mitigation
Hasbaya 19,000 Mitigation and Adaptation
Baakline 17,000 Mitigation
Jezzine 10,000 Mitigation and Adaptation
Dekwaneh 6,450 NA
Ardeh 5,000 Mitigation
Batloun Shouf 3,650 Mitigation and Adaptation
Menjez 800 Mitigation
Union of Dannieh Municipalities 175,000 NA
Bechmezzine 1,500 Mitigation
Kherbet Rouha 24,800 Mitigation and Adaptation
Kawkaba 2,500 Mitigation and Adaptation
Khreibi 3,200 Mitigation and Adaptation
Moukhtara 950 Mitigation and Adaptation
Kousba 10,000 Mitigation
Jdeideh el Chouf 20,600 NA
Union of eastern Baalbeck Municipalities 35,000 NA
Hammana 7,000 NA
11
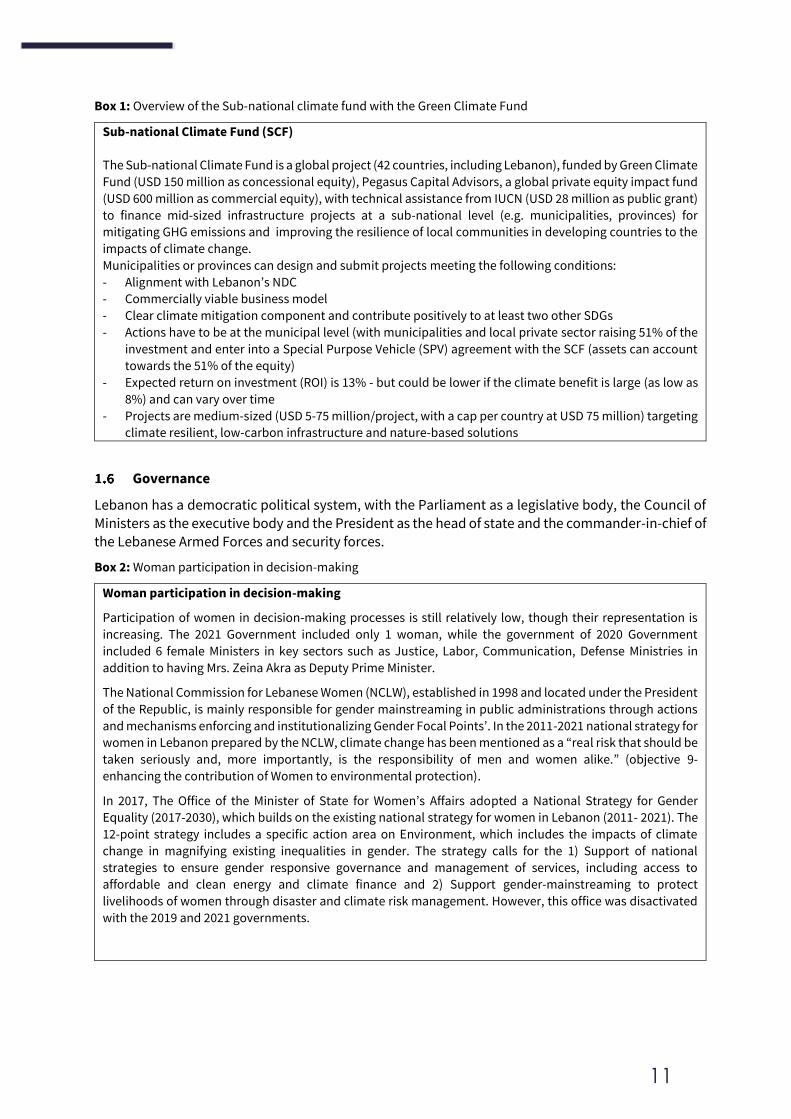
Box 1: Overview of the Sub-national climate fund with the Green Climate Fund
Sub-national Climate Fund (SCF)
The Sub-national Climate Fund is a global project (42 countries, including Lebanon), funded by Green Climate
Fund (USD 150 million as concessional equity), Pegasus Capital Advisors, a global private equity impact fund
(USD 600 million as commercial equity), with technical assistance from IUCN (USD 28 million as public grant)
to finance mid-sized infrastructure projects at a sub-national level (e.g. municipalities, provinces) for
mitigating GHG emissions and improving the resilience of local communities in developing countries to the
impacts of climate change.
Municipalities or provinces can design and submit projects meeting the following conditions:
- Alignment with Lebanon’s NDC
- Commercially viable business model
- Clear climate mitigation component and contribute positively to at least two other SDGs
- Actions have to be at the municipal level (with municipalities and local private sector raising 51% of the
investment and enter into a Special Purpose Vehicle (SPV) agreement with the SCF (assets can account
towards the 51% of the equity)
- Expected return on investment (ROI) is 13% - but could be lower if the climate benefit is large (as low as
8%) and can vary over time
- Projects are medium-sized (USD 5-75 million/project, with a cap per country at USD 75 million) targeting
climate resilient, low-carbon infrastructure and nature-based solutions
Governance
Lebanon has a democratic political system, with the Parliament as a legislative body, the Council of
Ministers as the executive body and the President as the head of state and the commander-in-chief of the Lebanese Armed Forces and security forces.
Box 2: Woman participation in decision-making
Woman participation in decision-making
Participation of women in decision-making processes is still relatively low, though their representation is
increasing. The 2021 Government included only 1 woman, while the government of 2020 Government
included 6 female Ministers in key sectors such as Justice, Labor, Communication, Defense Ministries in
addition to having Mrs. Zeina Akra as Deputy Prime Minister.
The National Commission for Lebanese Women (NCLW), established in 1998 and located under the President
of the Republic, is mainly responsible for gender mainstreaming in public administrations through actions
and mechanisms enforcing and institutionalizing Gender Focal Points’. In the 2011-2021 national strategy for
women in Lebanon prepared by the NCLW, climate change has been mentioned as a “real risk that should be
taken seriously and, more importantly, is the responsibility of men and women alike.” (objective 9-
enhancing the contribution of Women to environmental protection).
In 2017, The Office of the Minister of State for Women’s Affairs adopted a National Strategy for Gender
Equality (2017-2030), which builds on the existing national strategy for women in Lebanon (2011- 2021). The
12-point strategy includes a specific action area on Environment, which includes the impacts of climate
change in magnifying existing inequalities in gender. The strategy calls for the 1) Support of national
strategies to ensure gender responsive governance and management of services, including access to
affordable and clean energy and climate finance and 2) Support gender-mainstreaming to protect
livelihoods of women through disaster and climate risk management. However, this office was disactivated
with the 2019 and 2021 governments.
12
Lebanon is internationally involved in numerous platforms which tackle climate change:
• The Cartagena Dialogue for Progressive Action: the dialogue is an informal space, open to forward-looking countries who support ambitious and expeditious implementation of the
Paris Agreement, and who are committed, domestically, to becoming or remaining low
carbon. Lebanon hosted the 21st meeting of the Cartagena Dialogue in September 2017 in Beirut, reaffirming its ambitious role in the region.
• The Climate Vulnerable Forum (CVF): this South-South cooperation acts as a voice to
accelerate climate action as soon as possible in order to avoid the worst climatic disasters in
vulnerable countries. Moreover, Lebanon is part of the V20 (Vulnerable 20 Group) as an economy heavily threatened by the changing climate. Lebanon hosted the MENA regional meeting in May 2015 in Geneva, Switzerland.
• The Partnership on Transparency in the Paris Agreement (PATPA): The Partnership supports international efforts to engage in practical exchanges and political dialogue on climate
transparency. The new enhanced transparency system is of particular importance for the Partnership for building up mutual trust, accelerate ambitions, and tracking progress towards the Paris Agreement Goal. Lebanon hosted the 8th Annual Partnership Retreat in Broumana
in October 2019, with 65 participants from 40 countries attending.
• The NDC Partnership: the NDC partnership is a coalition of countries and institutions working to mobilize support and achieve ambitious climate goals. Lebanon became a member of the NDC Partnership on 25 March 2019, appointing Focal Points in the Ministry of Environment
(MoE) and the Council for Development and Reconstruction (CDR). Moreover, Lebanon sits on the NDC Partnership steering committee, and task force of the NDC financing strategy.
• The Initiative for Climate Action Transparency (ICAT): the ICAT initiative responds to the critical need to support improved transparency and capacity building under the Paris
Agreement. The initiative integrates guidance, capacity building and knowledge sharing to
engage countries in the use of a common framework to assess the impacts of their policies and actions and report progress, fostering greater transparency, effectiveness and ambition.
Lebanon currently sits as a member on the ICAT Advisory Committee.
• The Union for the Mediterranean (UfM): Lebanon is an active member of the Union for the
Mediterranean, which is an intergovernmental institution bringing together the European Union Member States and 15 countries from the Southern and Eastern shores of the
Mediterranean to promote dialogue and cooperation.
• The OECD Climate Change Expert Group (CCXG): the aim of the group is to promote dialogue and enhance understanding on technical issues in the international climate change
negotiations.
Climate change key legislation and mainstreaming
Lebanon has been a Party to the United Nations Framework Convention on Climate Change (UNFCCC)
since 1994 (Law 359/1994), ratified the Kyoto Protocol in 2006 (Law 738/2006), and the Paris Agreement to the UNFCCC (Law 115/2019 and Decree 5599/2019).
No major legislation directly addresses climate change action in Lebanon, other than the Nationally
Determined Contribution (NDC), as dictated by the Paris Agreement. Lebanon submitted its first NDC in 2015 and the updated version in 2021.
In 2017, the Ministry of Environment requested to become the coordinator of the NDC committee and received approval from the Council of Ministers (CoM), as per decision 33/2017. The committee is chaired by the MoE and includes nominated representatives from the Ministry of Energy and Water
13
(MoEW), Presidency of the Council of Ministers (PCM), Electricité du Liban (EDL), Ministry of Public
Works and Transport (MoPWT), Ministry of Agriculture (MoA), Lebanese Petroleum Administration
(LPA), Ministry of Foreign Affairs (MoFA) and Ministry of Finance (MoF).
The main role of the NDC committee is to follow-up the implementation of all NDC elements. The
mandate of the committee also includes:
- Update on the progress of the ministries and institutions’ plans and strategies that make up Lebanon’s Nationally Determined Contribution (NDC).
- Implement the United Nations Framework Convention on Climate Change (UNFCCC) decisions
related to the NDC and related transparency of action and support requirements.
- Assess gaps and needs related to the implementation of sectoral and cross-cutting activities under the NDC and related to the reporting of progress (needs could be financial support, capacity-building
support, technology support or technical support).
- Update Lebanon’s NDC to move to a more ambitious target every 5 years, with the first update in 2020.
- Find linkages and opportunities to better implement Lebanon’s NDC and relevant Sustainable Development Goals (SDGs).
- Ensure that the implementation of Lebanon’s NDC respects human rights and gender equality.
- Prepare the report on the NDC progress and communicate it to the Council of Ministers periodically.
Nationally Determined Contribution targets
In compliance with the provisions of the Paris Agreement, Lebanon published its Nationally Determined contribution (NDC) to mobilize international finance and set a long-term strategy to reduce national GHG emissions and improve resilience to negative impacts of climate change.
Lebanon has set targets to reduce its GHG emissions by 15% as an unconditional target and 30% as a conditional one by 2030, compared to a Business-as-usual scenario.
In 2020, and in accordance with Articles 4.9 and 4.11 of the Paris Agreement (and Law 115/2019),
Lebanon updated its Nationally Determined Contribution to respond to the call for enhancement and
to meet the goals of the Agreement. The NDC update put forward an ambitious mitigation target of 20% emission reduction as an unconditional target by 2030. with clear sector- specific objectives and
provided more clarity on Lebanon’s adaptation guiding principles and priorities (Table 2).
The preparation of the NDC document and its update was led by the Ministry of Environment (MoE) in
close coordination with the official NDC committee. The update was based on a series of meetings virtually conducted in 2020 to ensure institutional ownership, public participation and engagement with local communities in a gender-responsive manner. These included meetings with sectoral
mitigation and adaptation experts from line ministries to assess where additional ambition in the NDC could be allocated and assess the enhanced adaptation targets, and their appropriateness
considering Lebanon’s special circumstances. Consultations were also organized with Non-State Actors academic experts, youth, the private sector and civil society organizations. Finally, the results
were presented to the official inter-ministerial NDC committee, headed by the Ministry of Environment. Once feedback was received, the NDC was sent to the Council of Ministers for official
approval and was submitted in January 2021 to the UNFCCC Secretariat.
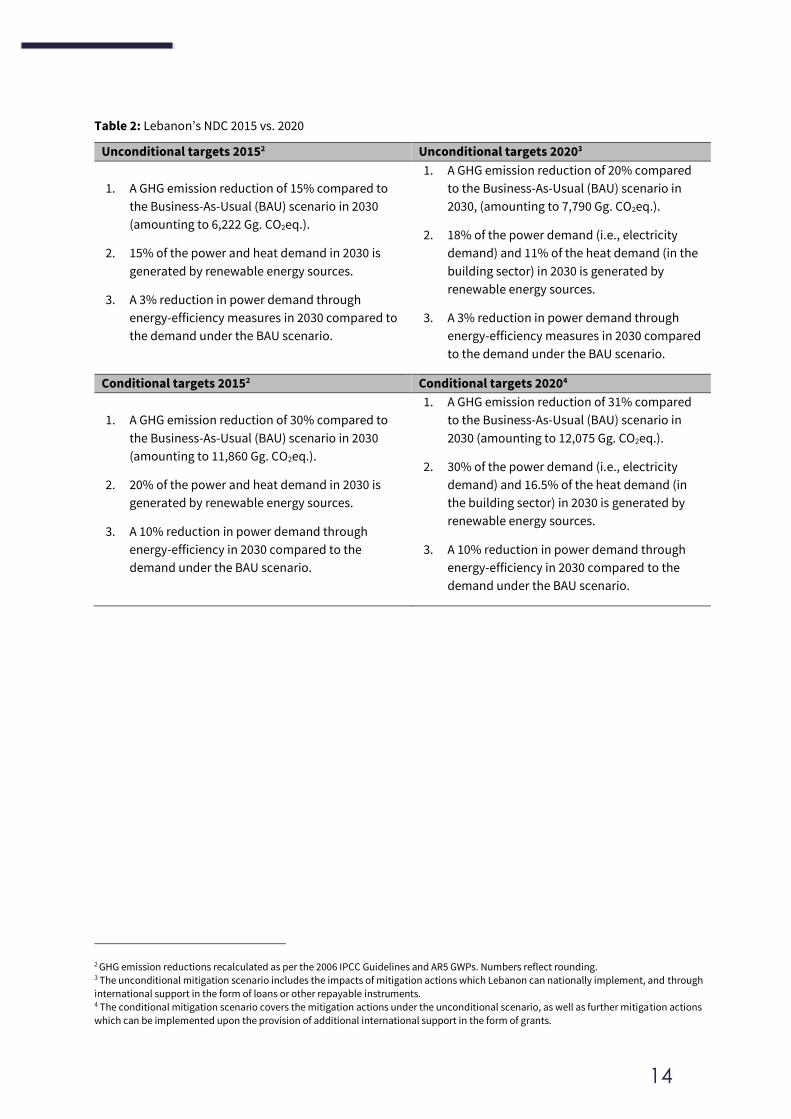
14
Table 2: Lebanon’s NDC 2015 vs. 2020
Unconditional targets 20152 Unconditional targets 20203
1. A GHG emission reduction of 15% compared to
the Business-As-Usual (BAU) scenario in 2030
(amounting to 6,222 Gg. CO2eq.).
2. 15% of the power and heat demand in 2030 is
generated by renewable energy sources.
3. A 3% reduction in power demand through
energy-efficiency measures in 2030 compared to
the demand under the BAU scenario.
1. A GHG emission reduction of 20% compared
to the Business-As-Usual (BAU) scenario in
2030, (amounting to 7,790 Gg. CO2eq.).
2. 18% of the power demand (i.e., electricity
demand) and 11% of the heat demand (in the
building sector) in 2030 is generated by
renewable energy sources.
3. A 3% reduction in power demand through
energy-efficiency measures in 2030 compared
to the demand under the BAU scenario.
Conditional targets 20152 Conditional targets 20204
1. A GHG emission reduction of 30% compared to
the Business-As-Usual (BAU) scenario in 2030
(amounting to 11,860 Gg. CO2eq.).
2. 20% of the power and heat demand in 2030 is
generated by renewable energy sources.
3. A 10% reduction in power demand through
energy-efficiency in 2030 compared to the
demand under the BAU scenario.
1. A GHG emission reduction of 31% compared
to the Business-As-Usual (BAU) scenario in
2030 (amounting to 12,075 Gg. CO2eq.).
2. 30% of the power demand (i.e., electricity
demand) and 16.5% of the heat demand (in
the building sector) in 2030 is generated by
renewable energy sources.
3. A 10% reduction in power demand through
energy-efficiency in 2030 compared to the
demand under the BAU scenario.
2 GHG emission reductions recalculated as per the 2006 IPCC Guidelines and AR5 GWPs. Numbers reflect rounding. 3 The unconditional mitigation scenario includes the impacts of mitigation actions which Lebanon can nationally implement, and through
international support in the form of loans or other repayable instruments. 4 The conditional mitigation scenario covers the mitigation actions under the unconditional scenario, as well as further mitigation actions
which can be implemented upon the provision of additional international support in the form of grants.
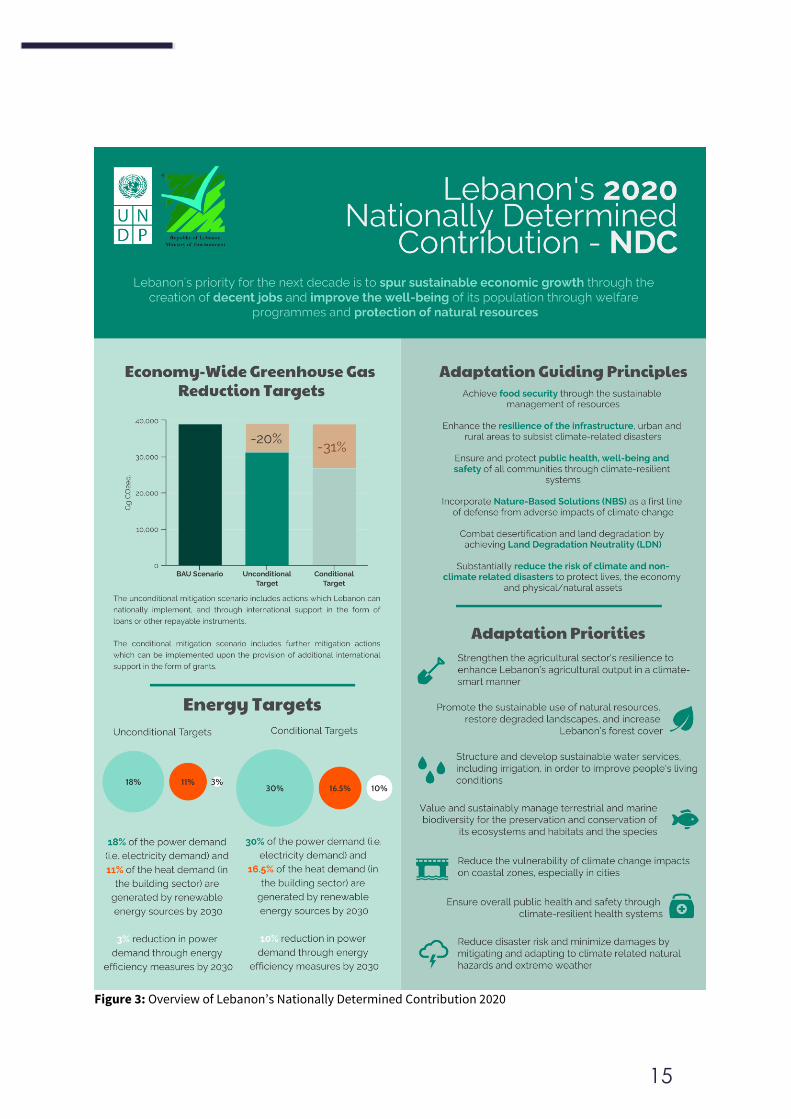
15
Figure 3: Overview of Lebanon’s Nationally Determined Contribution 2020
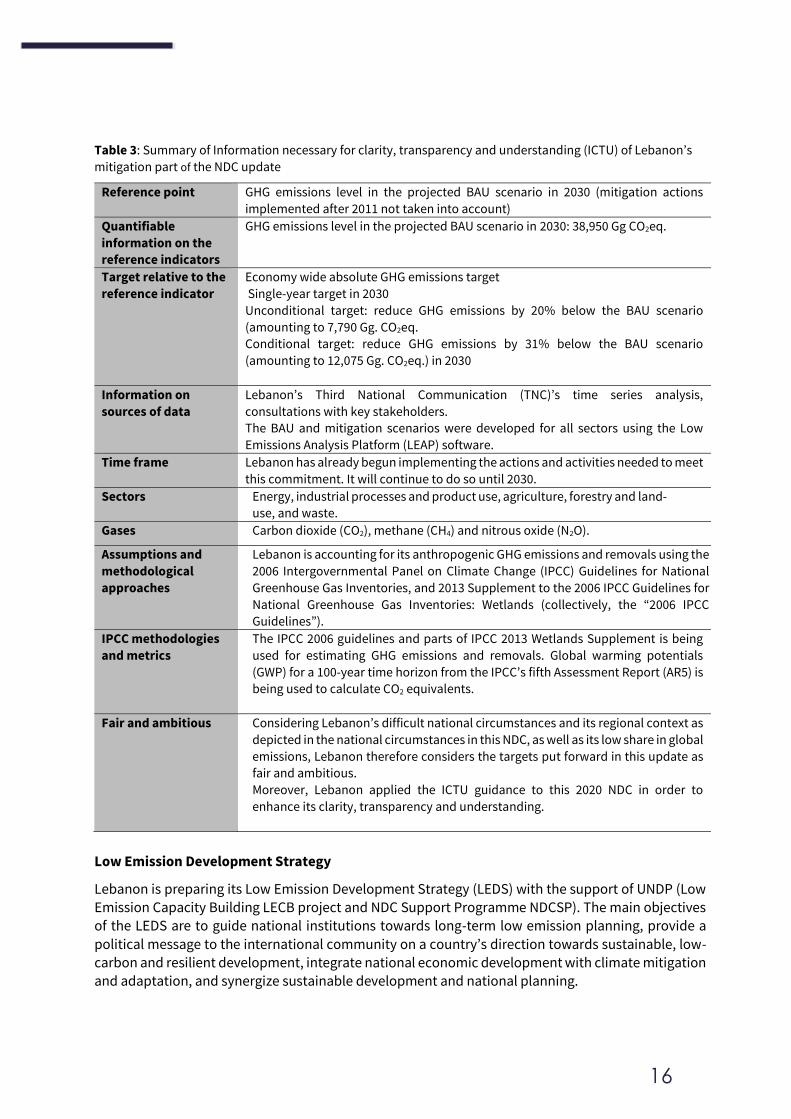
16
Table 3: Summary of Information necessary for clarity, transparency and understanding (ICTU) of Lebanon’s
mitigation part of the NDC update
Reference point GHG emissions level in the projected BAU scenario in 2030 (mitigation actions
implemented after 2011 not taken into account)
Quantifiable
information on the
reference indicators
GHG emissions level in the projected BAU scenario in 2030: 38,950 Gg CO2eq.
Target relative to the
reference indicator
Economy wide absolute GHG emissions target
Single-year target in 2030
Unconditional target: reduce GHG emissions by 20% below the BAU scenario
(amounting to 7,790 Gg. CO2eq.
Conditional target: reduce GHG emissions by 31% below the BAU scenario
(amounting to 12,075 Gg. CO2eq.) in 2030
Information on
sources of data
Lebanon’s Third National Communication (TNC)’s time series analysis,
consultations with key stakeholders.
The BAU and mitigation scenarios were developed for all sectors using the Low
Emissions Analysis Platform (LEAP) software.
Time frame Lebanon has already begun implementing the actions and activities needed to meet
this commitment. It will continue to do so until 2030.
Sectors Energy, industrial processes and product use, agriculture, forestry and land-
use, and waste.
Gases Carbon dioxide (CO2), methane (CH4) and nitrous oxide (N2O).
Assumptions and
methodological
approaches
Lebanon is accounting for its anthropogenic GHG emissions and removals using the
2006 Intergovernmental Panel on Climate Change (IPCC) Guidelines for National
Greenhouse Gas Inventories, and 2013 Supplement to the 2006 IPCC Guidelines for
National Greenhouse Gas Inventories: Wetlands (collectively, the “2006 IPCC
Guidelines”).
IPCC methodologies
and metrics
The IPCC 2006 guidelines and parts of IPCC 2013 Wetlands Supplement is being
used for estimating GHG emissions and removals. Global warming potentials
(GWP) for a 100-year time horizon from the IPCC’s fifth Assessment Report (AR5) is
being used to calculate CO2 equivalents.
Fair and ambitious Considering Lebanon’s difficult national circumstances and its regional context as
depicted in the national circumstances in this NDC, as well as its low share in global
emissions, Lebanon therefore considers the targets put forward in this update as
fair and ambitious.
Moreover, Lebanon applied the ICTU guidance to this 2020 NDC in order to
enhance its clarity, transparency and understanding.
Low Emission Development Strategy
Lebanon is preparing its Low Emission Development Strategy (LEDS) with the support of UNDP (Low Emission Capacity Building LECB project and NDC Support Programme NDCSP). The main objectives of the LEDS are to guide national institutions towards long-term low emission planning, provide a
political message to the international community on a country’s direction towards sustainable, low-carbon and resilient development, integrate national economic development with climate mitigation and adaptation, and synergize sustainable development and national planning.
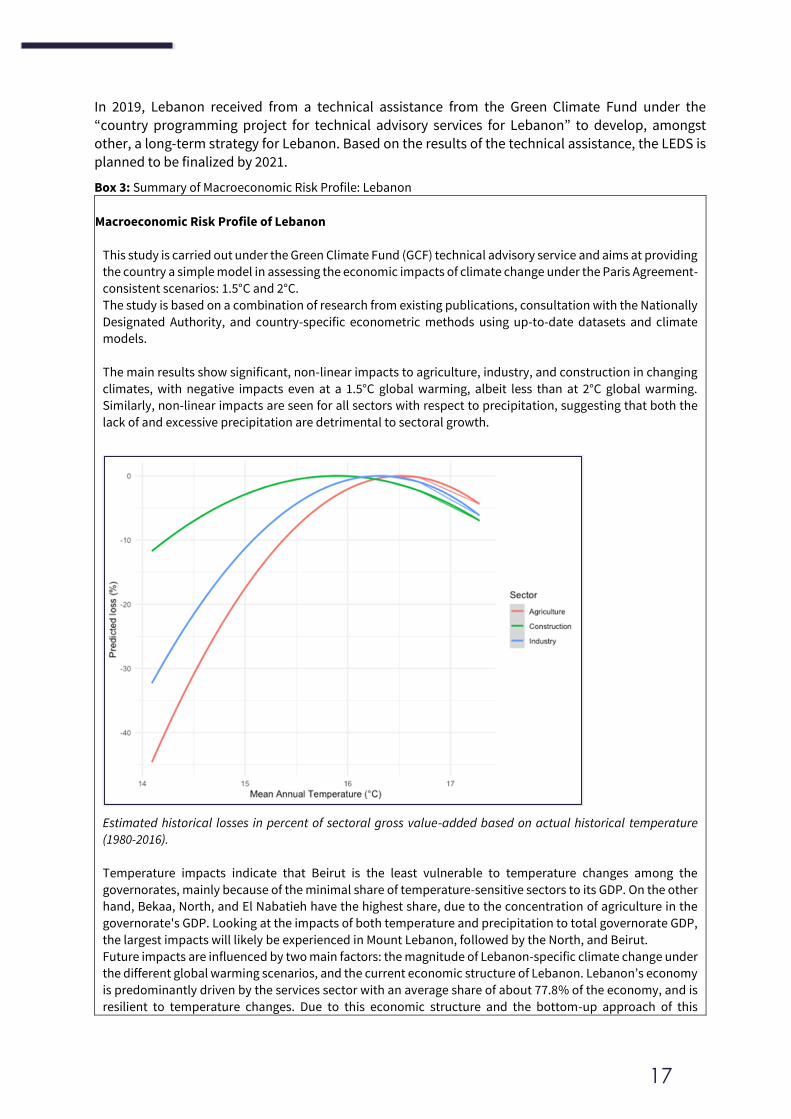
17
In 2019, Lebanon received from a technical assistance from the Green Climate Fund under the
“country programming project for technical advisory services for Lebanon” to develop, amongst
other, a long-term strategy for Lebanon. Based on the results of the technical assistance, the LEDS is planned to be finalized by 2021.
Box 3: Summary of Macroeconomic Risk Profile: Lebanon
Macroeconomic Risk Profile of Lebanon
This study is carried out under the Green Climate Fund (GCF) technical advisory service and aims at providing
the country a simple model in assessing the economic impacts of climate change under the Paris Agreement-
consistent scenarios: 1.5°C and 2°C.
The study is based on a combination of research from existing publications, consultation with the Nationally
Designated Authority, and country-specific econometric methods using up-to-date datasets and climate
models.
The main results show significant, non-linear impacts to agriculture, industry, and construction in changing
climates, with negative impacts even at a 1.5°C global warming, albeit less than at 2°C global warming.
Similarly, non-linear impacts are seen for all sectors with respect to precipitation, suggesting that both the
lack of and excessive precipitation are detrimental to sectoral growth.
Estimated historical losses in percent of sectoral gross value-added based on actual historical temperature
(1980-2016).
Temperature impacts indicate that Beirut is the least vulnerable to temperature changes among the
governorates, mainly because of the minimal share of temperature-sensitive sectors to its GDP. On the other
hand, Bekaa, North, and El Nabatieh have the highest share, due to the concentration of agriculture in the
governorate's GDP. Looking at the impacts of both temperature and precipitation to total governorate GDP,
the largest impacts will likely be experienced in Mount Lebanon, followed by the North, and Beirut.
Future impacts are influenced by two main factors: the magnitude of Lebanon-specific climate change under
the different global warming scenarios, and the current economic structure of Lebanon. Lebanon’s economy
is predominantly driven by the services sector with an average share of about 77.8% of the economy, and is
resilient to temperature changes. Due to this economic structure and the bottom-up approach of this
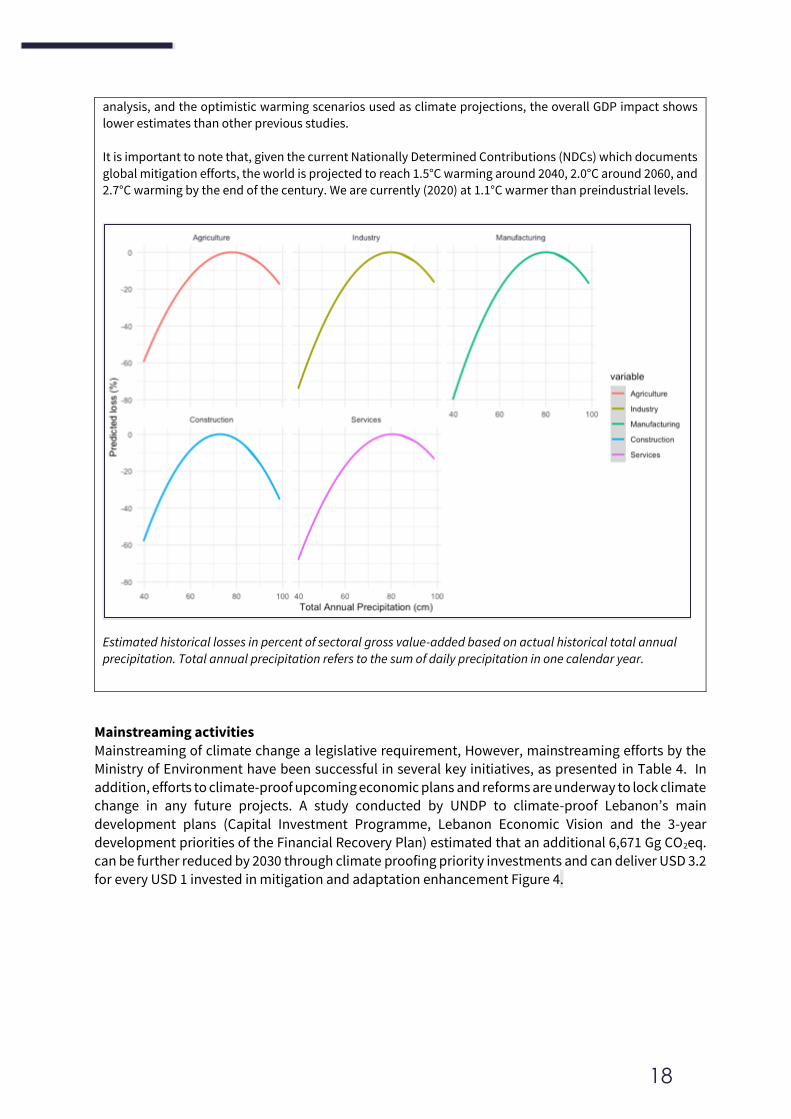
18
analysis, and the optimistic warming scenarios used as climate projections, the overall GDP impact shows
lower estimates than other previous studies.
It is important to note that, given the current Nationally Determined Contributions (NDCs) which documents
global mitigation efforts, the world is projected to reach 1.5°C warming around 2040, 2.0°C around 2060, and
2.7°C warming by the end of the century. We are currently (2020) at 1.1°C warmer than preindustrial levels.
Estimated historical losses in percent of sectoral gross value-added based on actual historical total annual
precipitation. Total annual precipitation refers to the sum of daily precipitation in one calendar year.
Mainstreaming activities
Mainstreaming of climate change a legislative requirement, However, mainstreaming efforts by the Ministry of Environment have been successful in several key initiatives, as presented in Table 4. In addition, efforts to climate-proof upcoming economic plans and reforms are underway to lock climate
change in any future projects. A study conducted by UNDP to climate-proof Lebanon’s main
development plans (Capital Investment Programme, Lebanon Economic Vision and the 3-year development priorities of the Financial Recovery Plan) estimated that an additional 6,671 Gg CO2eq. can be further reduced by 2030 through climate proofing priority investments and can deliver USD 3.2
for every USD 1 invested in mitigation and adaptation enhancement Figure 4.
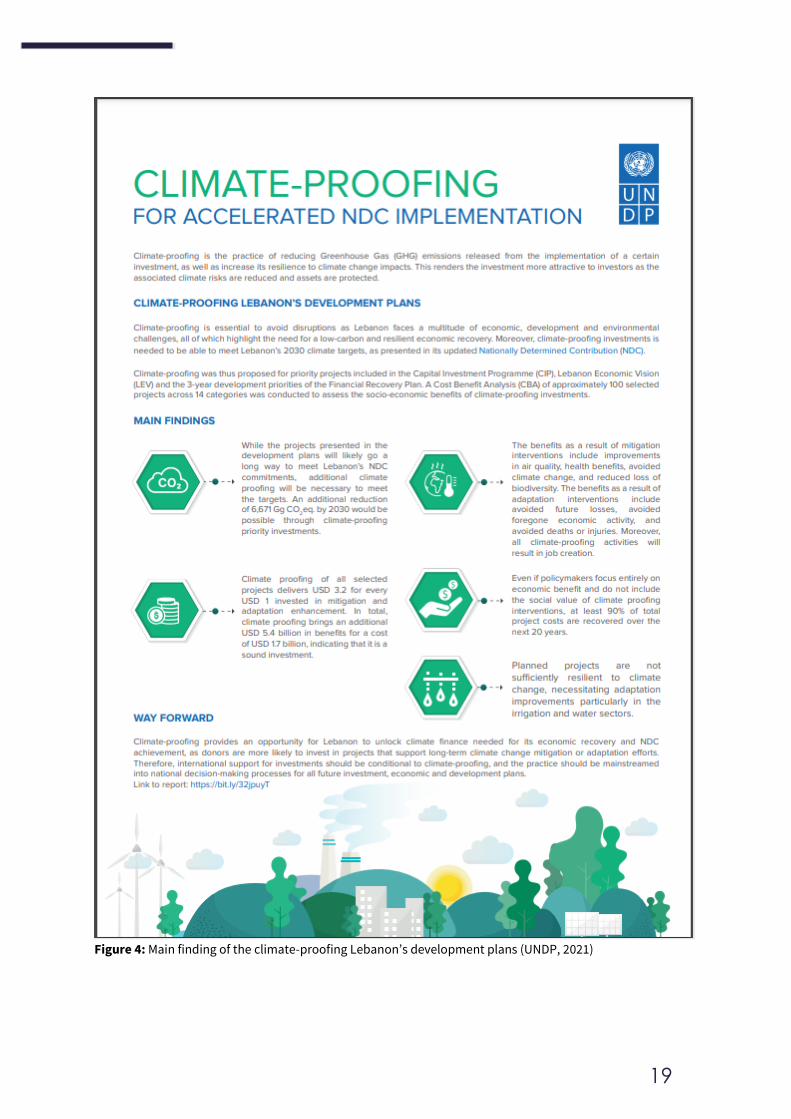
19
Figure 4: Main finding of the climate-proofing Lebanon’s development plans (UNDP, 2021)
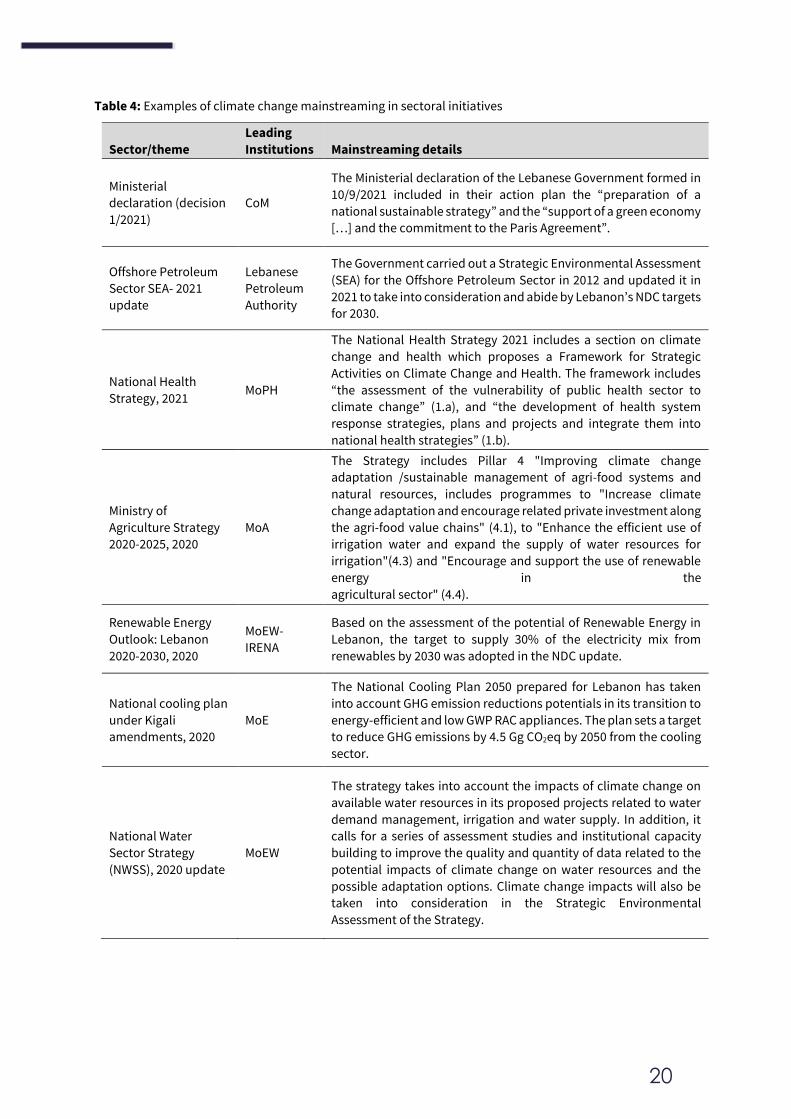
20
Table 4: Examples of climate change mainstreaming in sectoral initiatives
Sector/theme
Leading
Institutions Mainstreaming details
Ministerial
declaration (decision
1/2021)
CoM
The Ministerial declaration of the Lebanese Government formed in
10/9/2021 included in their action plan the “preparation of a
national sustainable strategy” and the “support of a green economy
[…] and the commitment to the Paris Agreement”.
Offshore Petroleum
Sector SEA- 2021
update
Lebanese
Petroleum
Authority
The Government carried out a Strategic Environmental Assessment
(SEA) for the Offshore Petroleum Sector in 2012 and updated it in
2021 to take into consideration and abide by Lebanon’s NDC targets
for 2030.
National Health
Strategy, 2021 MoPH
The National Health Strategy 2021 includes a section on climate
change and health which proposes a Framework for Strategic
Activities on Climate Change and Health. The framework includes
“the assessment of the vulnerability of public health sector to
climate change” (1.a), and “the development of health system
response strategies, plans and projects and integrate them into
national health strategies” (1.b).
Ministry of
Agriculture Strategy
2020-2025, 2020
MoA
The Strategy includes Pillar 4 "Improving climate change
adaptation /sustainable management of agri-food systems and
natural resources, includes programmes to "Increase climate
change adaptation and encourage related private investment along
the agri-food value chains" (4.1), to "Enhance the efficient use of
irrigation water and expand the supply of water resources for
irrigation"(4.3) and "Encourage and support the use of renewable
energy in the
agricultural sector" (4.4).
Renewable Energy
Outlook: Lebanon
2020-2030, 2020
MoEW-
IRENA
Based on the assessment of the potential of Renewable Energy in
Lebanon, the target to supply 30% of the electricity mix from
renewables by 2030 was adopted in the NDC update.
National cooling plan
under Kigali
amendments, 2020
MoE
The National Cooling Plan 2050 prepared for Lebanon has taken
into account GHG emission reductions potentials in its transition to
energy-efficient and low GWP RAC appliances. The plan sets a target
to reduce GHG emissions by 4.5 Gg CO2eq by 2050 from the cooling
sector.
National Water
Sector Strategy
(NWSS), 2020 update
MoEW
The strategy takes into account the impacts of climate change on
available water resources in its proposed projects related to water
demand management, irrigation and water supply. In addition, it
calls for a series of assessment studies and institutional capacity
building to improve the quality and quantity of data related to the
potential impacts of climate change on water resources and the
possible adaptation options. Climate change impacts will also be
taken into consideration in the Strategic Environmental
Assessment of the Strategy.
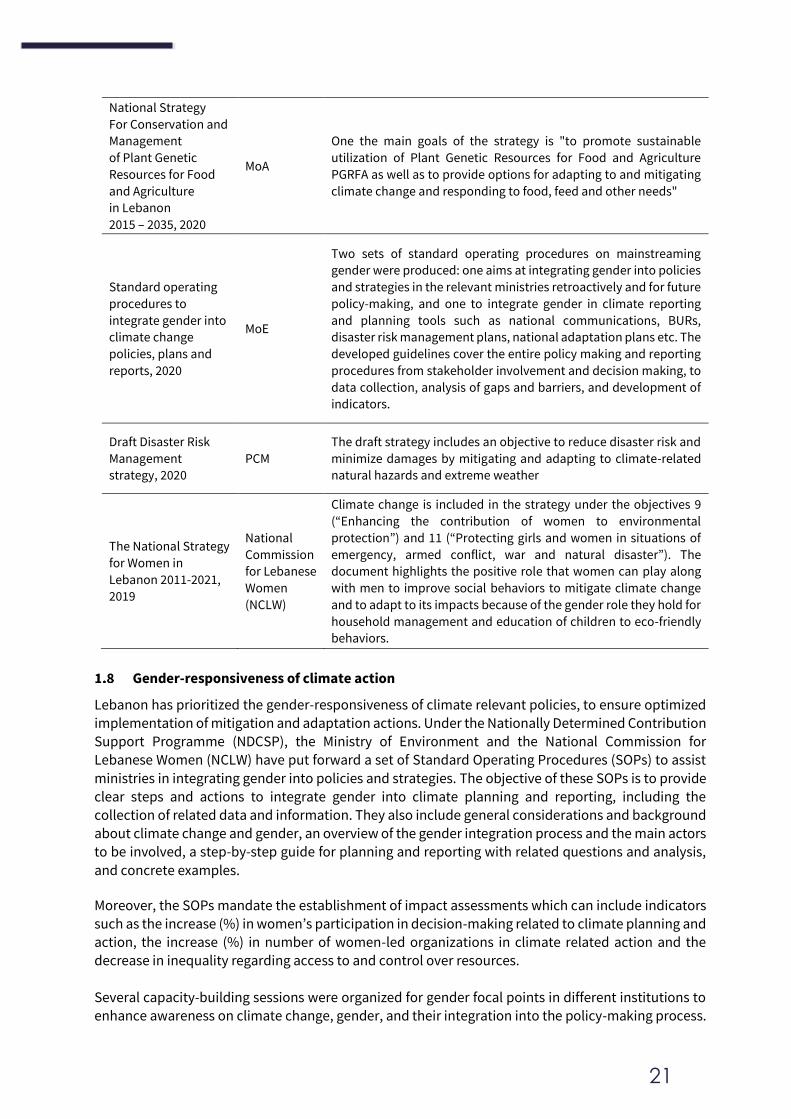
21
National Strategy
For Conservation and
Management
of Plant Genetic
Resources for Food
and Agriculture
in Lebanon
2015 – 2035, 2020
MoA
One the main goals of the strategy is "to promote sustainable
utilization of Plant Genetic Resources for Food and Agriculture
PGRFA as well as to provide options for adapting to and mitigating
climate change and responding to food, feed and other needs"
Standard operating
procedures to
integrate gender into
climate change
policies, plans and
reports, 2020
MoE
Two sets of standard operating procedures on mainstreaming
gender were produced: one aims at integrating gender into policies
and strategies in the relevant ministries retroactively and for future
policy-making, and one to integrate gender in climate reporting
and planning tools such as national communications, BURs,
disaster risk management plans, national adaptation plans etc. The
developed guidelines cover the entire policy making and reporting
procedures from stakeholder involvement and decision making, to
data collection, analysis of gaps and barriers, and development of
indicators.
Draft Disaster Risk
Management
strategy, 2020
PCM
The draft strategy includes an objective to reduce disaster risk and
minimize damages by mitigating and adapting to climate-related
natural hazards and extreme weather
The National Strategy
for Women in
Lebanon 2011-2021,
2019
National
Commission
for Lebanese
Women
(NCLW)
Climate change is included in the strategy under the objectives 9
(“Enhancing the contribution of women to environmental
protection”) and 11 (“Protecting girls and women in situations of
emergency, armed conflict, war and natural disaster”). The
document highlights the positive role that women can play along
with men to improve social behaviors to mitigate climate change
and to adapt to its impacts because of the gender role they hold for
household management and education of children to eco-friendly
behaviors.
Gender-responsiveness of climate action
Lebanon has prioritized the gender-responsiveness of climate relevant policies, to ensure optimized implementation of mitigation and adaptation actions. Under the Nationally Determined Contribution
Support Programme (NDCSP), the Ministry of Environment and the National Commission for Lebanese Women (NCLW) have put forward a set of Standard Operating Procedures (SOPs) to assist
ministries in integrating gender into policies and strategies. The objective of these SOPs is to provide clear steps and actions to integrate gender into climate planning and reporting, including the collection of related data and information. They also include general considerations and background
about climate change and gender, an overview of the gender integration process and the main actors to be involved, a step-by-step guide for planning and reporting with related questions and analysis,
and concrete examples.
Moreover, the SOPs mandate the establishment of impact assessments which can include indicators such as the increase (%) in women’s participation in decision-making related to climate planning and
action, the increase (%) in number of women-led organizations in climate related action and the decrease in inequality regarding access to and control over resources.
Several capacity-building sessions were organized for gender focal points in different institutions to enhance awareness on climate change, gender, and their integration into the policy-making process.
22
Moreover, this exercise has also allowed for improved gender integration in Lebanon’s updated NDC,
prioritizing it in mitigation and adaptation, as well as listing it as a climate action enabler.
Examples of gender aspects in climate change mitigation and adaptation:
- Energy: Energy plays a key role for household needs, education, health care, access to clean water and other services. Energy has a direct impact on women’s lives as women are often
responsible for domestic work that requires energy and act as primary household-energy
managers. Women have a critical role to play alongside their male counterparts in the success of energy related measures.
- Solid waste: Gender roles are often clearly defined when it comes to solid waste management. Women are responsible for domestic tasks such as gathering the waste, while men will collect and dispose of it (depending on the region). As both men and women are involved in solid waste management, both need to be part of the solutions the sector seeks.
For instance, if women are involved in waste management at the household level, increasing their participation in recycling and designing capacity-building activities can provide opportunities for source reduction as well as increasing re-use and sorting-at-source.
- Water: Women are often the main water resource manager at home because of their responsibilities in food production and preparation, hygiene, cleaning, washing, waste
disposal and care of children and the elderly. As such, women should be directly involved in
decisions regarding water to increase efficiency of water distribution and improve water
management by understanding behaviors and practices around water usage.
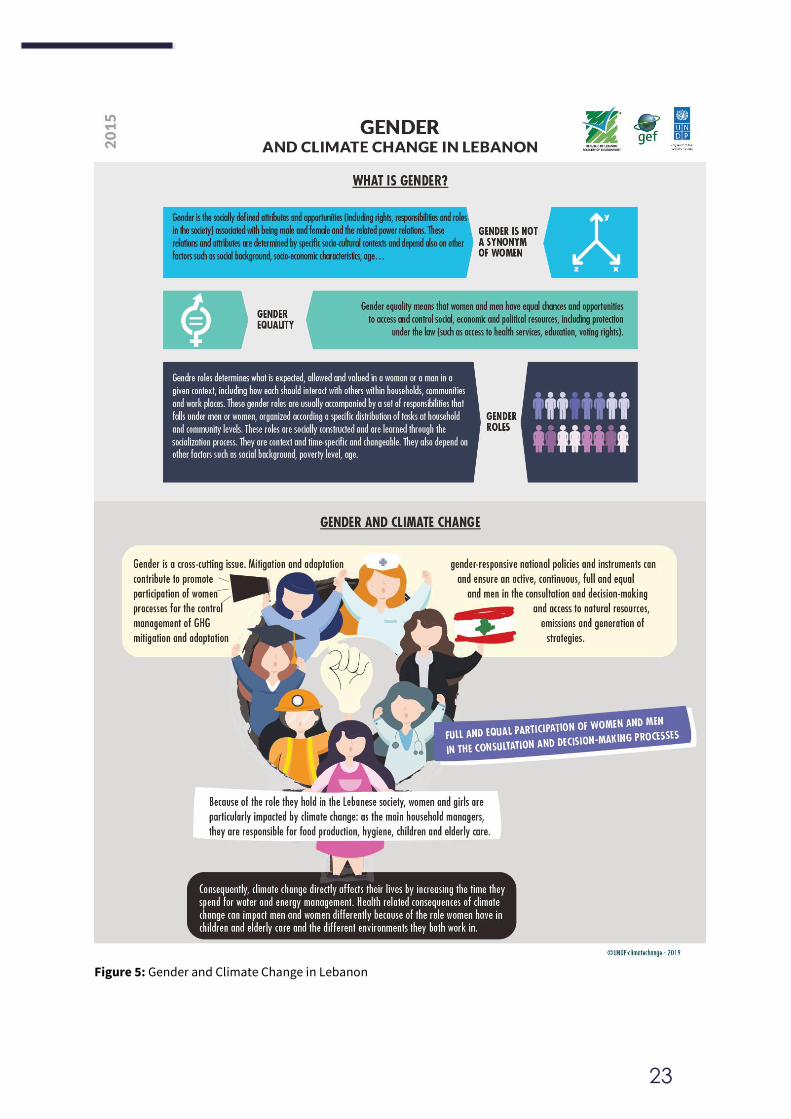
23
Figure 5: Gender and Climate Change in Lebanon
24
Synchronization of NDC and SDGs
In order to synchronize the preparation, update and tracking of Lebanon’s NDC, an NDC-SDG
assessment was conducted to explore opportunities for complementarity of climate action and sustainable development implementation and support, under the Nationally Determined
Contribution Support Programme (NDCSP). The assessment had important implications for Lebanon’s NDC update, which merges climate action under the NDC with the SDGs, along with a green and blue economy, leaving no one behind.
Under the synchronization exercise, the mitigation and adaptation strategies that constitute Lebanon’s NDC were matched with the different Sustainable Development Goals (SDGs) sub-targets, using the SDG Climate Action Nexus tool (SCAN-tool), developed under the umbrella of the NDC
Support Cluster. This tool identifies the climate mitigation and adaptation actions that may impact specific SDG targets.
By linking 12 strategies with the 169 SDG sub-targets, the main findings showed a high rate of synchronization between climate action and sustainable development in Lebanon, making the achievement of SDG 13 (Climate Action) an enabler for the implementation of other SDGs. It was also
found that a large number of linkages were made with non-environment SDGs, such as SDG 3 (Good
Health and Well-Being) and SDG 8 (Decent Work and Economic Growth), among others.
For each strategy/sector (energy, waste, transport, water, biodiversity, industry) a guidance document was produced to showcase the primary SDG linkage, along with other important linkages,
based on the tool’s matching properties. Moreover, the guidance document recommended further possible linkages with SDGs, to be taken up in the next policy-making cycle. Examples of linkages
include:
- Agriculture is a primary source of income and employment in rural areas reaching up to 25% of the labor force and representing 80% of its GDP. Socio-economic stability can be maintained for
low-income workers through introducing more sustainable agricultural processes that reduce environmental impact, increases resiliency, and uses water and land resources more efficiently (SDGs
1, 2, 6 and 12). - Renewable energy technologies such as hydro, solar and wind power, can greatly reduce
greenhouse gas emissions and greatly reduce premature deaths from air pollutants. Deploying cleaner energy sources that enable the phasing out of diesel generators can therefore, have a
significant impact on SDGs 3.4 and 3.9 which relate to achieving more positive health outcomes by reducing harmful pollutants.
- Mass transit strategies can reduce transport cost as part of the household budget by providing
public transit as an alternative to car ownership, which could potentially positively impact low-income families (SDG 1) and household income (SDG 4). Further, mass transit that aims to increase
mobility and accessibility can greatly improve access to jobs and income potential and provide more equitable access to other important places such as schools, hospitals, and shopping (SDG 10).
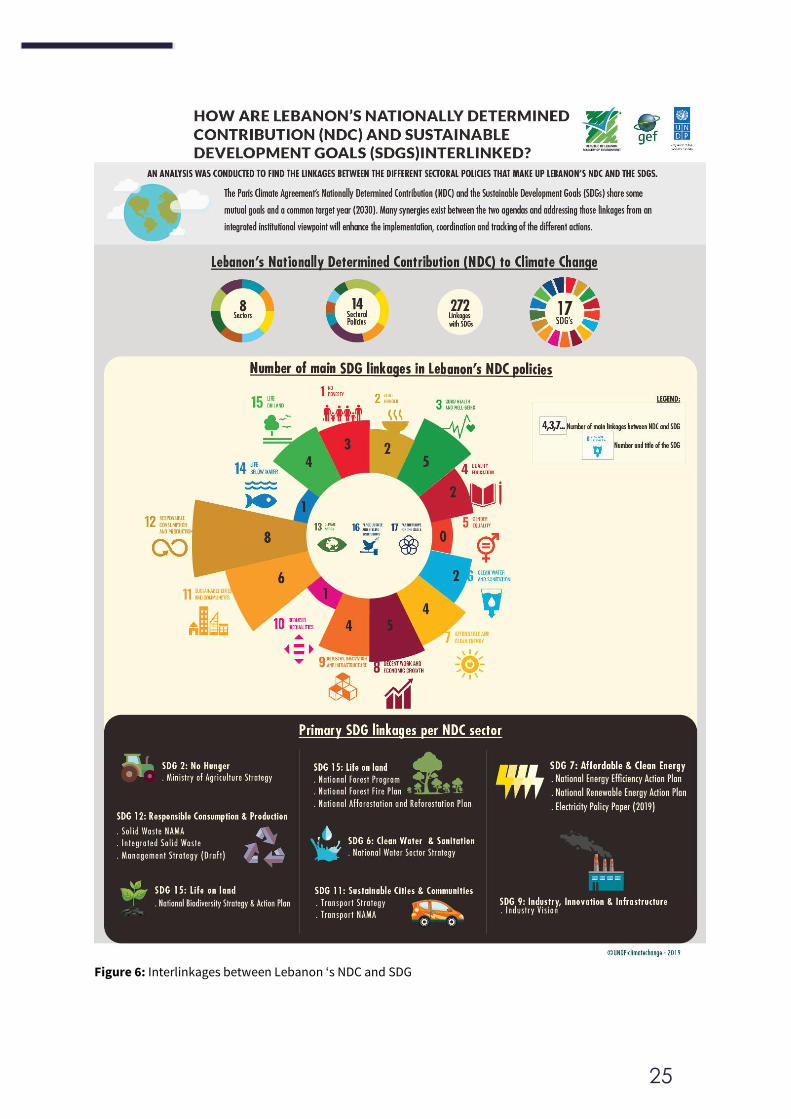
25
Figure 6: Interlinkages between Lebanon ‘s NDC and SDG
27
INSTITUTIONAL ARRANGEMENTS RELATED TO MRV
2.1 Institutional arrangements for the preparation of Biennial Update reports
In Lebanon, the Ministry of Environment (MoE) is the national focal point for climate change and is also the focal point of the following climate change related international organizations (in addition to
the UN Organisations, such as UNDP, UNEP, FAO, WHO, World Bank, UNHABITAT, UNICEF, etc.):
• United Nations Framework Convention on Climate Change (UNFCCC)
• The Adaptation Fund
• NDC Partnership
• Green Climate Fund (GCF)
• Climate Technology Centre and Network (CTCN)
• Climate Vulnerable Forum (CVF)
• Cartagena Dialogue for Progressive Action (CD)
• Partnership on Transparency in the Paris Agreement (PATPA)
• Initiative for Climate Action Transparency (ICAT)
• Union for the Mediterranean (UfM)
A climate change team, supported by multilateral funds, works under the Service of Environmental
Technology at the Ministry of Environment, and is responsible amongst other, for the preparation and
submission of the Biennial Update Report, and the participation in the international consultation and analysis (ICA) and Facilitative Sharing of Views (FSV) processes.
Box 4: Mandate of the climate change team at MoE
• Prepare Biennial Update Reports and National Communications,
• Prepare and update of Nationally Determined Contributions along with implementation follow up,
• Develop climate change policy (i.e., Low-Emission Development Strategy, financial incentives),
• Follow-up and lead on institutional arrangements to enhance national climate action, finance and
transparency,
• Follow-up on mainstreaming climate change in national sectoral policies, strategies and institutions
including energy, water, transport, agriculture, forestry, solid waste, wastewater, oil and gas, finance,
gender, sustainable development, education, research, disaster risk, cities, etc.
• Establish linkages and synergizing work with other international conventions such as the United Nations
Convention to Combat Desertification, the UN Convention on Biological Diversity, the Sendai Framework
for Disaster Risk Reduction, the Montreal Protocol on Ozone Depleting Substances, and its Kigali
amendments, the Agenda 2030 for Sustainable Development, etc.
• Follow-up on international climate change negotiations,
• Coordinate regional and international climate change related projects,
• Assume the role of focal point to the UNFCCC, Green Climate Fund, Adaptation Fund, Global Environment
Facility, Climate Technology Center and Network and Intergovernmental Panel on Climate Change.
Accordingly, the Ministry of Environment was responsible for coordinating the preparation of
Lebanon’s first, second, third and fourth Biennial Update report, with the support of the Global
Environment Facility (GEF), and the collaboration of the United Nations Development Programme
(UNDP).
In order to prepare and submit BURs on a continuous basis, institutional arrangements have been put
in place according to the following elements:
1- GHG inventory: The Ministry of Environment is the lead compiler of the GHG inventory. Various
Lebanese ministries such as the Ministry of Energy and Water, the Ministry of Agriculture, the
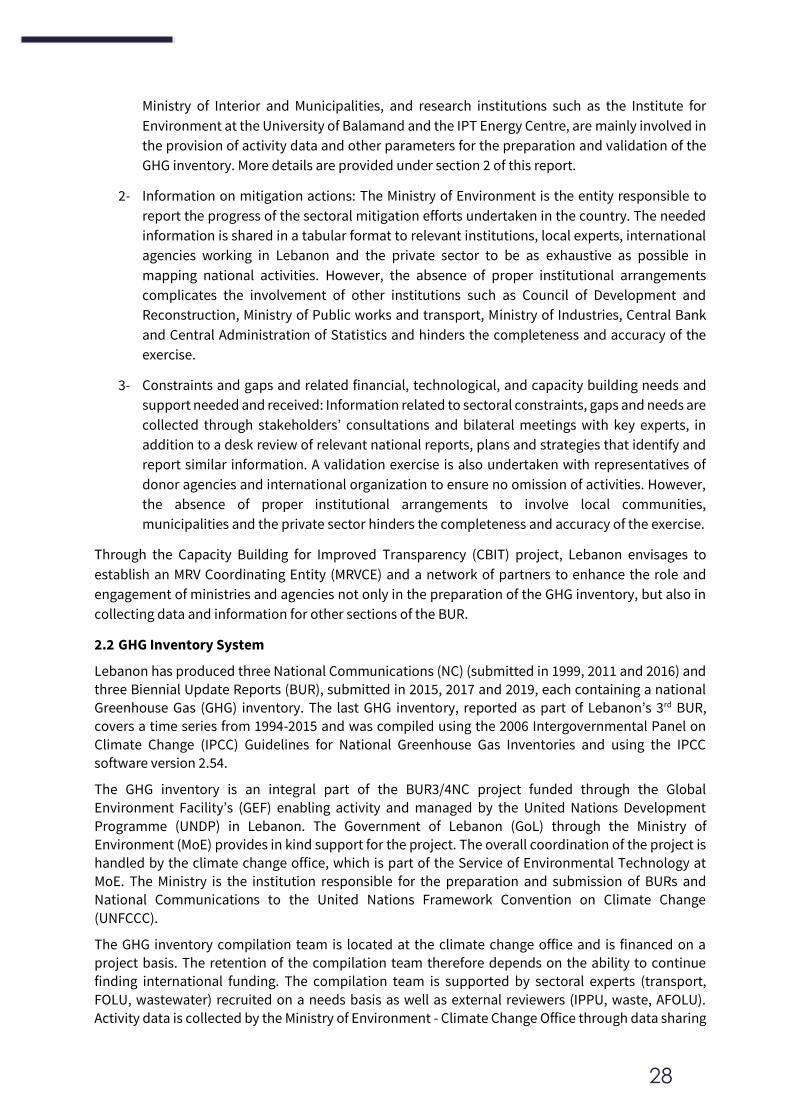
28
Ministry of Interior and Municipalities, and research institutions such as the Institute for
Environment at the University of Balamand and the IPT Energy Centre, are mainly involved in
the provision of activity data and other parameters for the preparation and validation of the
GHG inventory. More details are provided under section 2 of this report.
2- Information on mitigation actions: The Ministry of Environment is the entity responsible to
report the progress of the sectoral mitigation efforts undertaken in the country. The needed
information is shared in a tabular format to relevant institutions, local experts, international
agencies working in Lebanon and the private sector to be as exhaustive as possible in
mapping national activities. However, the absence of proper institutional arrangements
complicates the involvement of other institutions such as Council of Development and
Reconstruction, Ministry of Public works and transport, Ministry of Industries, Central Bank
and Central Administration of Statistics and hinders the completeness and accuracy of the
exercise.
3- Constraints and gaps and related financial, technological, and capacity building needs and
support needed and received: Information related to sectoral constraints, gaps and needs are
collected through stakeholders’ consultations and bilateral meetings with key experts, in
addition to a desk review of relevant national reports, plans and strategies that identify and
report similar information. A validation exercise is also undertaken with representatives of
donor agencies and international organization to ensure no omission of activities. However,
the absence of proper institutional arrangements to involve local communities,
municipalities and the private sector hinders the completeness and accuracy of the exercise.
Through the Capacity Building for Improved Transparency (CBIT) project, Lebanon envisages to
establish an MRV Coordinating Entity (MRVCE) and a network of partners to enhance the role and
engagement of ministries and agencies not only in the preparation of the GHG inventory, but also in
collecting data and information for other sections of the BUR.
2.2 GHG Inventory System
Lebanon has produced three National Communications (NC) (submitted in 1999, 2011 and 2016) and
three Biennial Update Reports (BUR), submitted in 2015, 2017 and 2019, each containing a national Greenhouse Gas (GHG) inventory. The last GHG inventory, reported as part of Lebanon’s 3rd BUR,
covers a time series from 1994-2015 and was compiled using the 2006 Intergovernmental Panel on
Climate Change (IPCC) Guidelines for National Greenhouse Gas Inventories and using the IPCC software version 2.54.
The GHG inventory is an integral part of the BUR3/4NC project funded through the Global Environment Facility’s (GEF) enabling activity and managed by the United Nations Development
Programme (UNDP) in Lebanon. The Government of Lebanon (GoL) through the Ministry of Environment (MoE) provides in kind support for the project. The overall coordination of the project is handled by the climate change office, which is part of the Service of Environmental Technology at
MoE. The Ministry is the institution responsible for the preparation and submission of BURs and National Communications to the United Nations Framework Convention on Climate Change
(UNFCCC).
The GHG inventory compilation team is located at the climate change office and is financed on a project basis. The retention of the compilation team therefore depends on the ability to continue finding international funding. The compilation team is supported by sectoral experts (transport,
FOLU, wastewater) recruited on a needs basis as well as external reviewers (IPPU, waste, AFOLU). Activity data is collected by the Ministry of Environment - Climate Change Office through data sharing
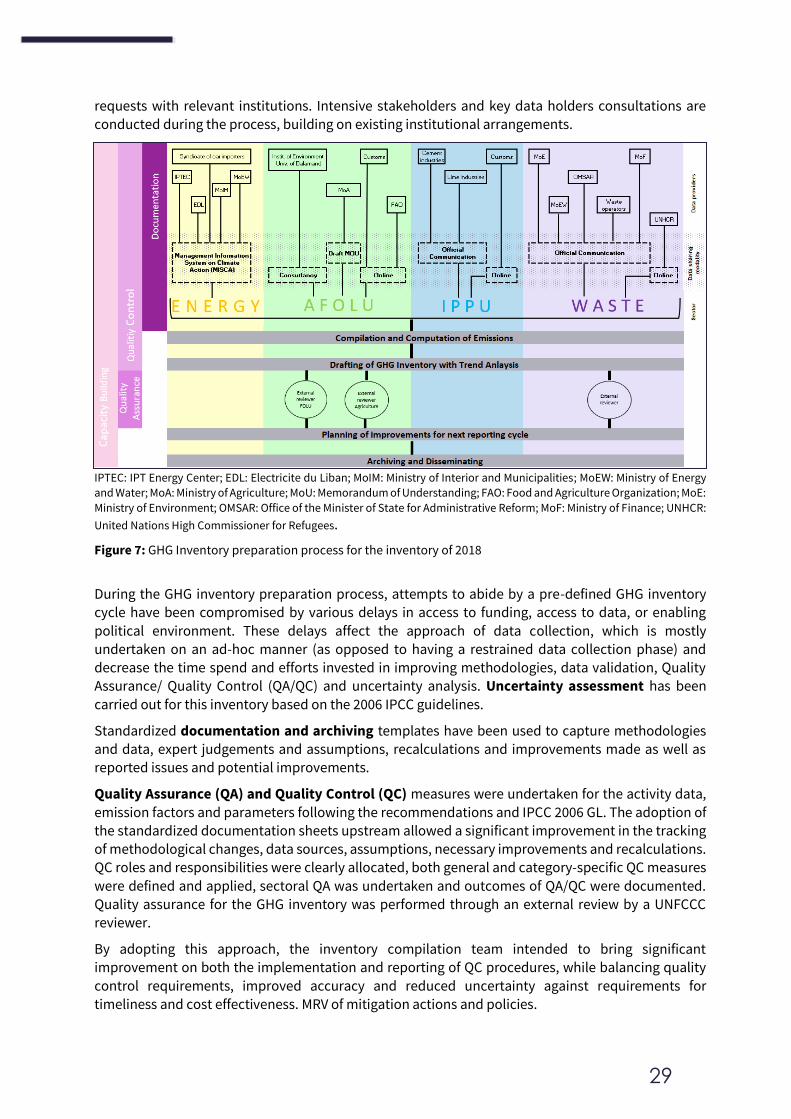
29
requests with relevant institutions. Intensive stakeholders and key data holders consultations are
conducted during the process, building on existing institutional arrangements.
IPTEC: IPT Energy Center; EDL: Electricite du Liban; MoIM: Ministry of Interior and Municipalities; MoEW: Ministry of Energy
and Water; MoA: Ministry of Agriculture; MoU: Memorandum of Understanding; FAO: Food and Agriculture Organization; MoE:
Ministry of Environment; OMSAR: Office of the Minister of State for Administrative Reform; MoF: Ministry of Finance; UNHCR:
United Nations High Commissioner for Refugees.
Figure 7: GHG Inventory preparation process for the inventory of 2018
During the GHG inventory preparation process, attempts to abide by a pre-defined GHG inventory cycle have been compromised by various delays in access to funding, access to data, or enabling
political environment. These delays affect the approach of data collection, which is mostly undertaken on an ad-hoc manner (as opposed to having a restrained data collection phase) and
decrease the time spend and efforts invested in improving methodologies, data validation, Quality
Assurance/ Quality Control (QA/QC) and uncertainty analysis. Uncertainty assessment has been
carried out for this inventory based on the 2006 IPCC guidelines.
Standardized documentation and archiving templates have been used to capture methodologies
and data, expert judgements and assumptions, recalculations and improvements made as well as reported issues and potential improvements.
Quality Assurance (QA) and Quality Control (QC) measures were undertaken for the activity data,
emission factors and parameters following the recommendations and IPCC 2006 GL. The adoption of the standardized documentation sheets upstream allowed a significant improvement in the tracking
of methodological changes, data sources, assumptions, necessary improvements and recalculations. QC roles and responsibilities were clearly allocated, both general and category-specific QC measures
were defined and applied, sectoral QA was undertaken and outcomes of QA/QC were documented. Quality assurance for the GHG inventory was performed through an external review by a UNFCCC
reviewer.
By adopting this approach, the inventory compilation team intended to bring significant improvement on both the implementation and reporting of QC procedures, while balancing quality
control requirements, improved accuracy and reduced uncertainty against requirements for timeliness and cost effectiveness. MRV of mitigation actions and policies.
30
Currently Lebanon has no specific methodology for monitoring the progress of actions described.
Sectoral experts with recruited to collect information on mitigation activities being undertaken in the
energy, transport and wastewater sectors and consultations with project proponents and main stakeholders helped identify mitigation actions being implemented or being planned. However, this
exercise is not undertaken on a systematic and regular basis and linkages between sectoral policies and actions and climate change are still not well clarified. Indeed, institutionalized communication
and reporting channels are crucial to avoid double counting, assign specific activities to specific plans and/or commitments, and identify the multitude of actors working on mitigation actions beyond the sectoral actors. For example, the private sector and municipalities are responsible for a significant
part of emission reduction, however, due to the unavailability and scattering of relevant data, their activities are not completely covered under this reporting exercise. The current approach to assessing
impacts of mitigation actions does not allow filtering through different levels of information to identify cluster of information including emission reduction impact.
Based on the above, tracking mitigation actions accurately and comprehensively has become an
important need to better assess emission reduction progress against committed targets and the
impact of mitigation action on the wide economy. Lebanon plans to enhance the robustness and institutionalization of reporting mitigation actions through 2 main workstreams:
Mapping of planned and implemented activities through the NDC Partnership:
Lebanon became a member of the NDC Partnership in 2019, and as the main focal point, the Ministry
of Environment has coordinated with several ministries to develop sectoral Partnership Plans (PPs)
for the energy, transport, waste, water and wastewater, agriculture, and forestry sectors. These plans
will present Lebanon’s priorities related to climate change actions in a framework that allows tracking progress against results. It will therefore present new and planned climate action work as well as ongoing projects and programs, including sectoral barriers and needs with corresponding enabling
technical and financial assistance activities.
The Partnership Plans are being re-evaluated by respective ministries to reflect the recent national
circumstances before being shared with the NDC Partnership partners in order to mobilize support.
Institutionalized tracking of activities through the Capacity Building Initiative on Transparency (CBIT):
As part of the proposed CBIT project, a Measuring, Reporting and Verifying Coordinating Entity
(MRVCE) is planned to be established with the responsibility to develop a long-term transparency strategy which will be a strong reference point for all stakeholders in planning their activities when it
comes to reporting, capacity-building and institutional arrangements. Under the proposed project,
the MRVCE is expected to set up a cross-cutting system that tracks GHG emissions, mitigation and adaptation actions, support received and needed, and capacity building needs.
More specifically, and according to the CBIT project document, the MRVCE is planned to undertake the following tasks:
- Tracking the implementation of Lebanon’s NDC through regular national stock take towards
achieving the NDC goals, and the implementation and enhancement of the transparency framework.
- Tracking progress of climate policies through the development of progress indicators, the quantification of emission reduction potential from policies and strategies and through building capacities of partner agencies on tools and methodologies to collect the necessary data to quantify
- Assessing impacts and analyze the progress of mitigation, adaptation and means of implementation.
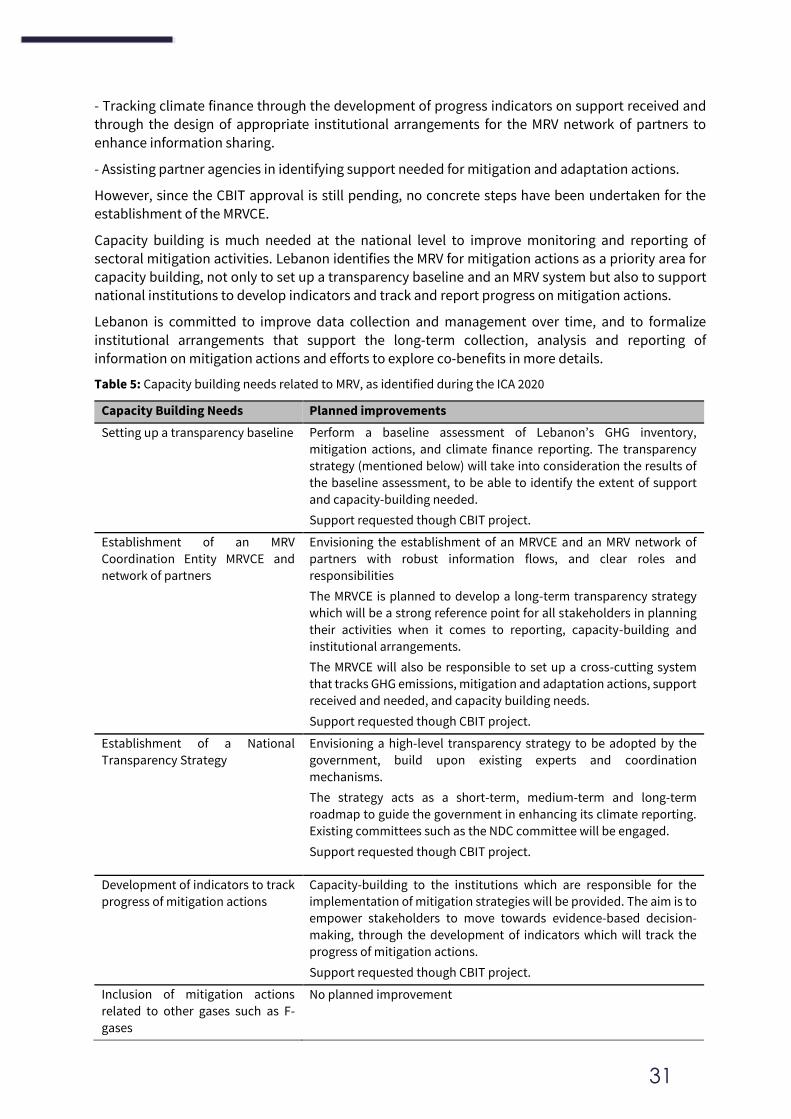
31
- Tracking climate finance through the development of progress indicators on support received and
through the design of appropriate institutional arrangements for the MRV network of partners to
enhance information sharing.
- Assisting partner agencies in identifying support needed for mitigation and adaptation actions.
However, since the CBIT approval is still pending, no concrete steps have been undertaken for the establishment of the MRVCE.
Capacity building is much needed at the national level to improve monitoring and reporting of sectoral mitigation activities. Lebanon identifies the MRV for mitigation actions as a priority area for capacity building, not only to set up a transparency baseline and an MRV system but also to support
national institutions to develop indicators and track and report progress on mitigation actions.
Lebanon is committed to improve data collection and management over time, and to formalize
institutional arrangements that support the long-term collection, analysis and reporting of information on mitigation actions and efforts to explore co-benefits in more details.
Table 5: Capacity building needs related to MRV, as identified during the ICA 2020
Capacity Building Needs Planned improvements
Setting up a transparency baseline Perform a baseline assessment of Lebanon’s GHG inventory,
mitigation actions, and climate finance reporting. The transparency
strategy (mentioned below) will take into consideration the results of
the baseline assessment, to be able to identify the extent of support
and capacity-building needed.
Support requested though CBIT project.
Establishment of an MRV
Coordination Entity MRVCE and
network of partners
Envisioning the establishment of an MRVCE and an MRV network of
partners with robust information flows, and clear roles and
responsibilities
The MRVCE is planned to develop a long-term transparency strategy
which will be a strong reference point for all stakeholders in planning
their activities when it comes to reporting, capacity-building and
institutional arrangements.
The MRVCE will also be responsible to set up a cross-cutting system
that tracks GHG emissions, mitigation and adaptation actions, support
received and needed, and capacity building needs.
Support requested though CBIT project.
Establishment of a National
Transparency Strategy
Envisioning a high-level transparency strategy to be adopted by the
government, build upon existing experts and coordination
mechanisms.
The strategy acts as a short-term, medium-term and long-term
roadmap to guide the government in enhancing its climate reporting.
Existing committees such as the NDC committee will be engaged.
Support requested though CBIT project.
Development of indicators to track
progress of mitigation actions
Capacity-building to the institutions which are responsible for the
implementation of mitigation strategies will be provided. The aim is to
empower stakeholders to move towards evidence-based decision-
making, through the development of indicators which will track the
progress of mitigation actions.
Support requested though CBIT project.
Inclusion of mitigation actions
related to other gases such as F-
gases
No planned improvement
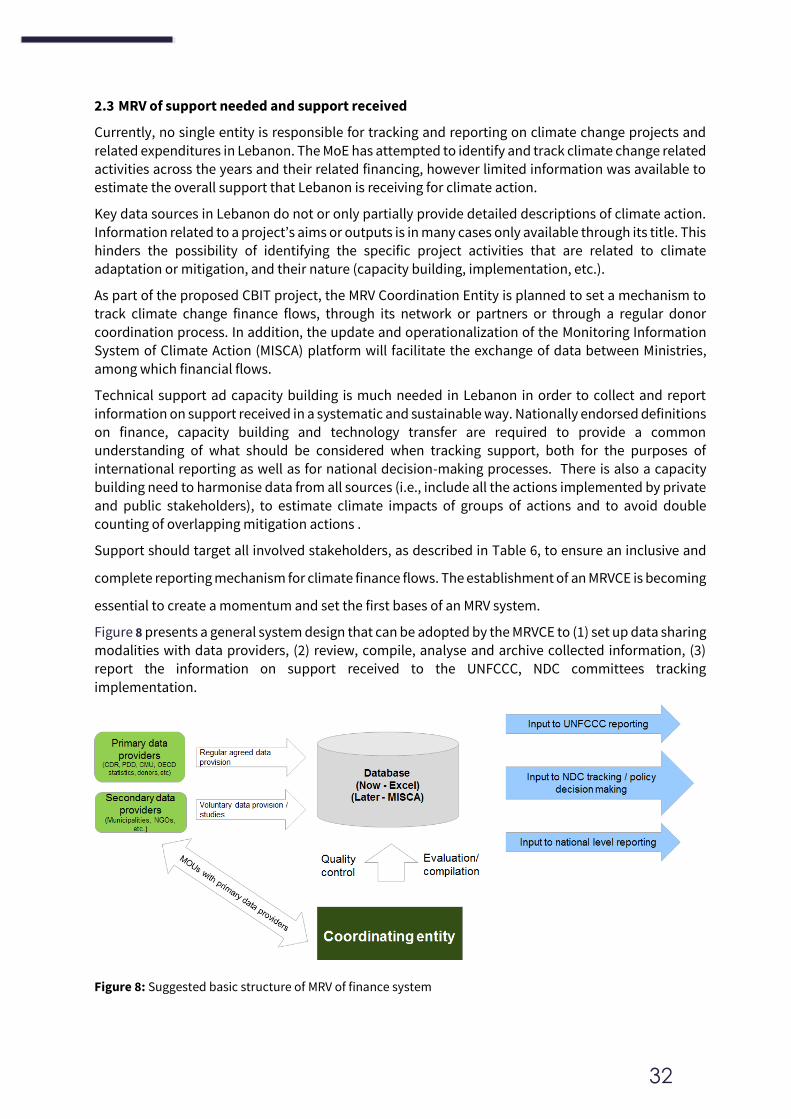
32
2.3 MRV of support needed and support received
Currently, no single entity is responsible for tracking and reporting on climate change projects and
related expenditures in Lebanon. The MoE has attempted to identify and track climate change related activities across the years and their related financing, however limited information was available to
estimate the overall support that Lebanon is receiving for climate action.
Key data sources in Lebanon do not or only partially provide detailed descriptions of climate action.
Information related to a project’s aims or outputs is in many cases only available through its title. This hinders the possibility of identifying the specific project activities that are related to climate adaptation or mitigation, and their nature (capacity building, implementation, etc.).
As part of the proposed CBIT project, the MRV Coordination Entity is planned to set a mechanism to track climate change finance flows, through its network or partners or through a regular donor
coordination process. In addition, the update and operationalization of the Monitoring Information System of Climate Action (MISCA) platform will facilitate the exchange of data between Ministries,
among which financial flows.
Technical support ad capacity building is much needed in Lebanon in order to collect and report
information on support received in a systematic and sustainable way. Nationally endorsed definitions on finance, capacity building and technology transfer are required to provide a common understanding of what should be considered when tracking support, both for the purposes of international reporting as well as for national decision-making processes. There is also a capacity
building need to harmonise data from all sources (i.e., include all the actions implemented by private
and public stakeholders), to estimate climate impacts of groups of actions and to avoid double
counting of overlapping mitigation actions .
Support should target all involved stakeholders, as described in Table 6, to ensure an inclusive and
complete reporting mechanism for climate finance flows. The establishment of an MRVCE is becoming
essential to create a momentum and set the first bases of an MRV system.
Figure 8 presents a general system design that can be adopted by the MRVCE to (1) set up data sharing
modalities with data providers, (2) review, compile, analyse and archive collected information, (3) report the information on support received to the UNFCCC, NDC committees tracking
implementation.
Figure 8: Suggested basic structure of MRV of finance system
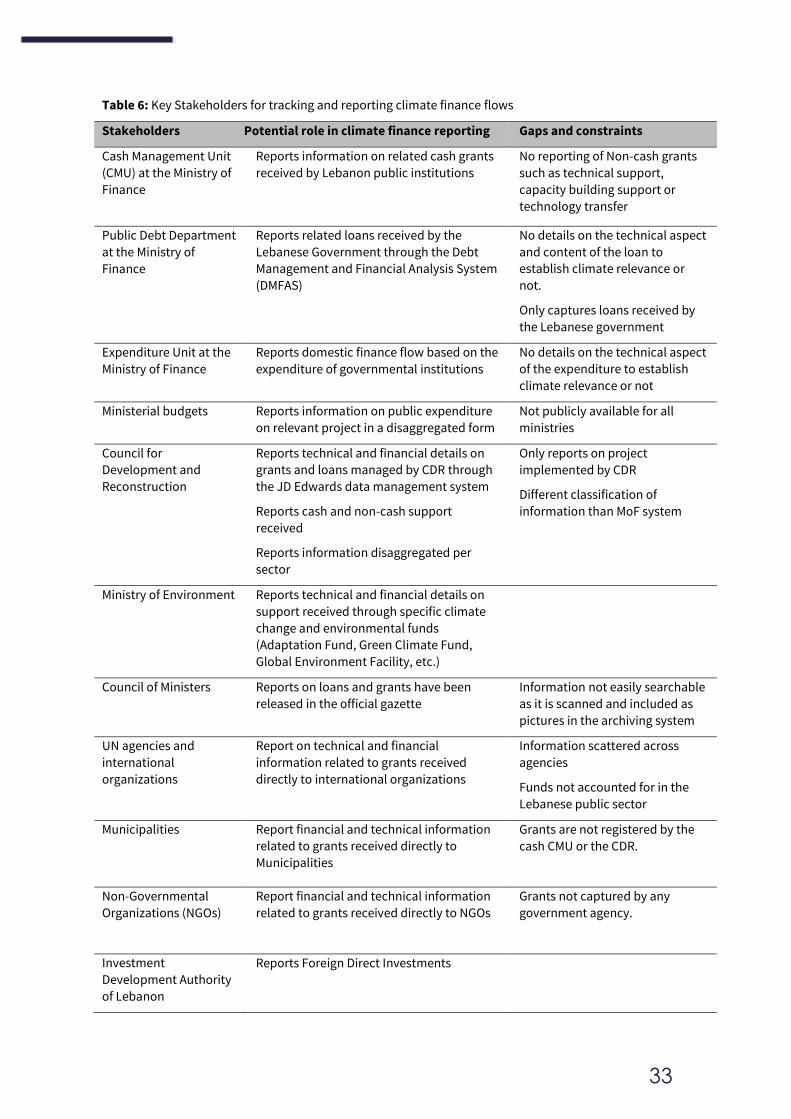
33
Table 6: Key Stakeholders for tracking and reporting climate finance flows
Stakeholders Potential role in climate finance reporting Gaps and constraints
Cash Management Unit
(CMU) at the Ministry of
Finance
Reports information on related cash grants
received by Lebanon public institutions
No reporting of Non-cash grants
such as technical support,
capacity building support or
technology transfer
Public Debt Department
at the Ministry of
Finance
Reports related loans received by the
Lebanese Government through the Debt
Management and Financial Analysis System
(DMFAS)
No details on the technical aspect
and content of the loan to
establish climate relevance or
not.
Only captures loans received by
the Lebanese government
Expenditure Unit at the
Ministry of Finance
Reports domestic finance flow based on the
expenditure of governmental institutions
No details on the technical aspect
of the expenditure to establish
climate relevance or not
Ministerial budgets Reports information on public expenditure
on relevant project in a disaggregated form
Not publicly available for all
ministries
Council for
Development and
Reconstruction
Reports technical and financial details on
grants and loans managed by CDR through
the JD Edwards data management system
Reports cash and non-cash support
received
Reports information disaggregated per
sector
Only reports on project
implemented by CDR
Different classification of
information than MoF system
Ministry of Environment Reports technical and financial details on
support received through specific climate
change and environmental funds
(Adaptation Fund, Green Climate Fund,
Global Environment Facility, etc.)
Council of Ministers Reports on loans and grants have been
released in the official gazette
Information not easily searchable
as it is scanned and included as
pictures in the archiving system
UN agencies and
international
organizations
Report on technical and financial
information related to grants received
directly to international organizations
Information scattered across
agencies
Funds not accounted for in the
Lebanese public sector
Municipalities Report financial and technical information
related to grants received directly to
Municipalities
Grants are not registered by the
cash CMU or the CDR.
Non-Governmental
Organizations (NGOs)
Report financial and technical information
related to grants received directly to NGOs
Grants not captured by any
government agency.
Investment
Development Authority
of Lebanon
Reports Foreign Direct Investments
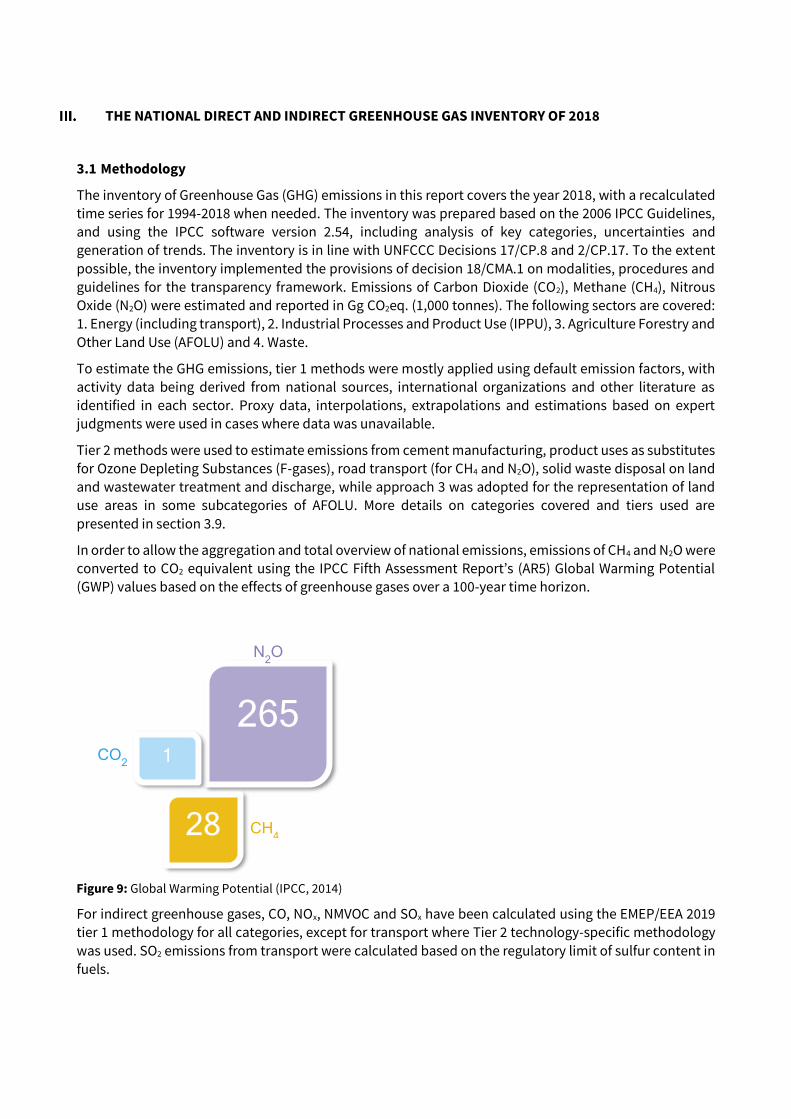
THE NATIONAL DIRECT AND INDIRECT GREENHOUSE GAS INVENTORY OF 2018
3.1 Methodology
The inventory of Greenhouse Gas (GHG) emissions in this report covers the year 2018, with a recalculated
time series for 1994-2018 when needed. The inventory was prepared based on the 2006 IPCC Guidelines, and using the IPCC software version 2.54, including analysis of key categories, uncertainties and generation of trends. The inventory is in line with UNFCCC Decisions 17/CP.8 and 2/CP.17. To the extent
possible, the inventory implemented the provisions of decision 18/CMA.1 on modalities, procedures and
guidelines for the transparency framework. Emissions of Carbon Dioxide (CO2), Methane (CH4), Nitrous Oxide (N2O) were estimated and reported in Gg CO2eq. (1,000 tonnes). The following sectors are covered: 1. Energy (including transport), 2. Industrial Processes and Product Use (IPPU), 3. Agriculture Forestry and
Other Land Use (AFOLU) and 4. Waste.
To estimate the GHG emissions, tier 1 methods were mostly applied using default emission factors, with activity data being derived from national sources, international organizations and other literature as identified in each sector. Proxy data, interpolations, extrapolations and estimations based on expert
judgments were used in cases where data was unavailable.
Tier 2 methods were used to estimate emissions from cement manufacturing, product uses as substitutes for Ozone Depleting Substances (F-gases), road transport (for CH4 and N2O), solid waste disposal on land and wastewater treatment and discharge, while approach 3 was adopted for the representation of land
use areas in some subcategories of AFOLU. More details on categories covered and tiers used are
presented in section 3.9.
In order to allow the aggregation and total overview of national emissions, emissions of CH4 and N2O were converted to CO2 equivalent using the IPCC Fifth Assessment Report’s (AR5) Global Warming Potential
(GWP) values based on the effects of greenhouse gases over a 100-year time horizon.
For indirect greenhouse gases, CO, NOx, NMVOC and SOx have been calculated using the EMEP/EEA 2019 tier 1 methodology for all categories, except for transport where Tier 2 technology-specific methodology
was used. SO2 emissions from transport were calculated based on the regulatory limit of sulfur content in fuels.
Figure 9: Global Warming Potential (IPCC, 2014)
265
28
1 CO2
N2O
CH4
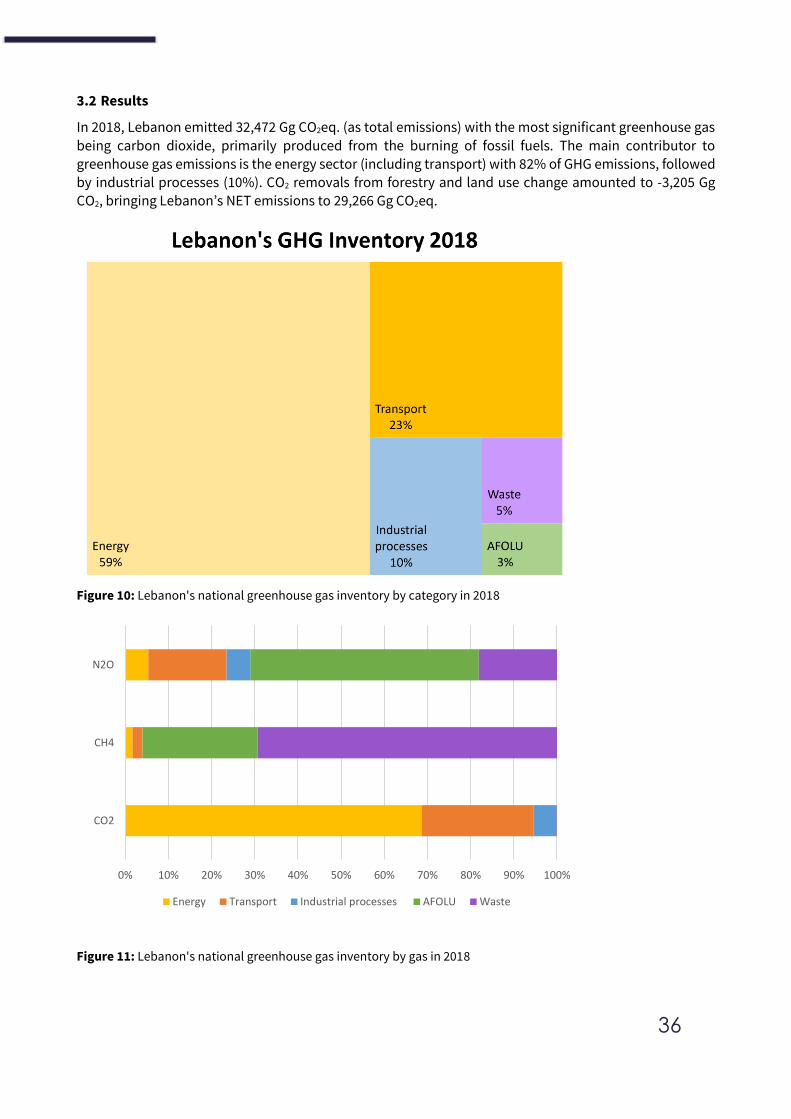
36
3.2 Results
In 2018, Lebanon emitted 32,472 Gg CO2eq. (as total emissions) with the most significant greenhouse gas
being carbon dioxide, primarily produced from the burning of fossil fuels. The main contributor to greenhouse gas emissions is the energy sector (including transport) with 82% of GHG emissions, followed by industrial processes (10%). CO2 removals from forestry and land use change amounted to -3,205 Gg CO2, bringing Lebanon’s NET emissions to 29,266 Gg CO2eq.
Figure 10: Lebanon's national greenhouse gas inventory by category in 2018
Figure 11: Lebanon's national greenhouse gas inventory by gas in 2018
0% 10% 20% 30% 40% 50% 60% 70% 80% 90% 100%
CO2
CH4
N2O
Energy Transport Industrial processes AFOLU Waste
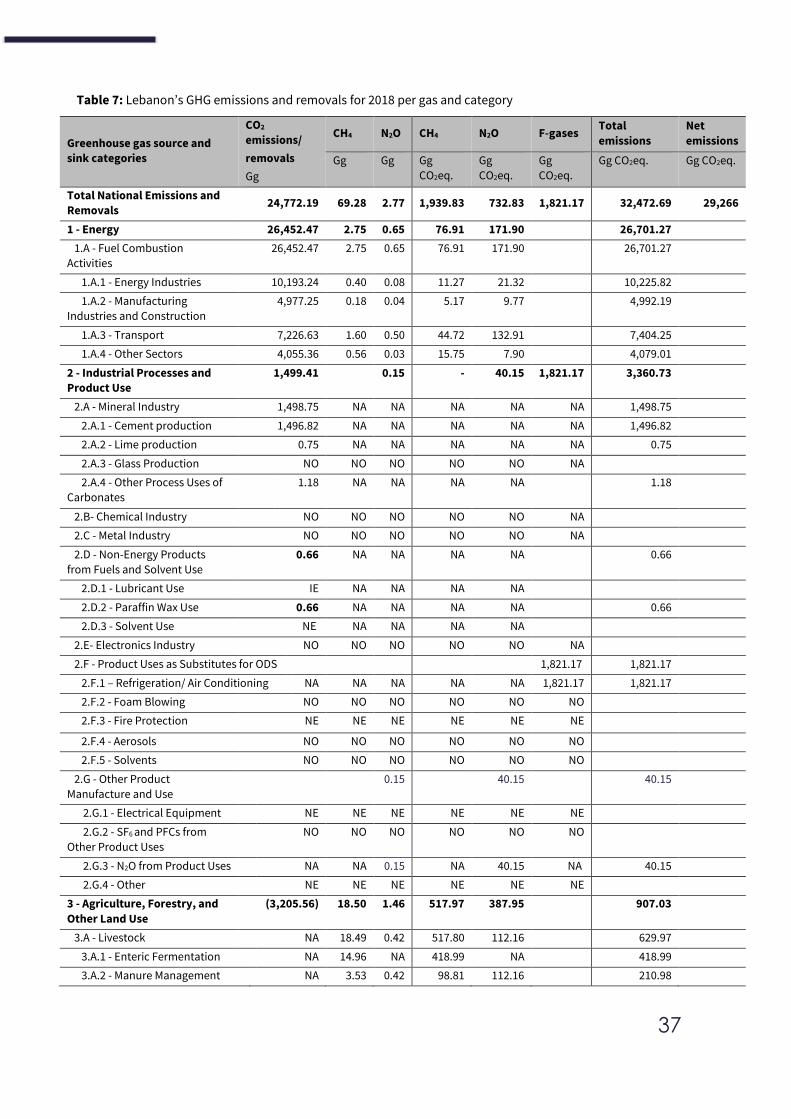
37
Table 7: Lebanon’s GHG emissions and removals for 2018 per gas and category
Greenhouse gas source and
sink categories
CO2
emissions/
removals
Gg
CH4 N2O CH4 N2O F-gases Total
emissions
Net
emissions
Gg Gg Gg
CO2eq.
Gg
CO2eq.
Gg
CO2eq.
Gg CO2eq. Gg CO2eq.
Total National Emissions and
Removals 24,772.19 69.28 2.77 1,939.83 732.83 1,821.17 32,472.69 29,266
1 - Energy 26,452.47 2.75 0.65 76.91 171.90 26,701.27
1.A - Fuel Combustion
Activities
26,452.47 2.75 0.65 76.91 171.90 26,701.27
1.A.1 - Energy Industries 10,193.24 0.40 0.08 11.27 21.32 10,225.82
1.A.2 - Manufacturing
Industries and Construction
4,977.25 0.18 0.04 5.17 9.77 4,992.19
1.A.3 - Transport 7,226.63 1.60 0.50 44.72 132.91 7,404.25
1.A.4 - Other Sectors 4,055.36 0.56 0.03 15.75 7.90 4,079.01
2 - Industrial Processes and
Product Use
1,499.41
0.15 - 40.15 1,821.17 3,360.73
2.A - Mineral Industry 1,498.75
NA NA NA NA NA 1,498.75
2.A.1 - Cement production 1,496.82 NA NA NA NA NA 1,496.82
2.A.2 - Lime production 0.75 NA NA NA NA NA 0.75
2.A.3 - Glass Production NO NO NO NO NO NA
2.A.4 - Other Process Uses of
Carbonates
1.18 NA NA NA NA 1.18
2.B- Chemical Industry NO NO NO NO NO NA
2.C - Metal Industry NO NO NO NO NO NA
2.D - Non-Energy Products
from Fuels and Solvent Use
0.66
NA NA NA NA 0.66
2.D.1 - Lubricant Use IE NA NA NA NA
2.D.2 - Paraffin Wax Use 0.66 NA NA NA NA 0.66
2.D.3 - Solvent Use NE NA NA NA NA
2.E- Electronics Industry NO NO NO NO NO NA
2.F - Product Uses as Substitutes for ODS 1,821.17 1,821.17
2.F.1 – Refrigeration/ Air Conditioning NA NA NA NA NA 1,821.17 1,821.17
2.F.2 - Foam Blowing NO NO NO NO NO NO
2.F.3 - Fire Protection NE NE NE NE NE NE
2.F.4 - Aerosols NO NO NO NO NO NO
2.F.5 - Solvents NO NO NO NO NO NO
2.G - Other Product
Manufacture and Use
0.15 40.15 40.15
2.G.1 - Electrical Equipment NE NE NE NE NE NE
2.G.2 - SF6 and PFCs from
Other Product Uses
NO NO NO NO NO NO
2.G.3 - N2O from Product Uses NA NA 0.15 NA 40.15 NA 40.15
2.G.4 - Other NE NE NE NE NE NE
3 - Agriculture, Forestry, and
Other Land Use
(3,205.56)
18.50 1.46 517.97 387.95 907.03
3.A - Livestock NA 18.49 0.42 517.80 112.16 629.97
3.A.1 - Enteric Fermentation NA 14.96 NA 418.99 NA 418.99
3.A.2 - Manure Management NA 3.53 0.42 98.81 112.16 210.98
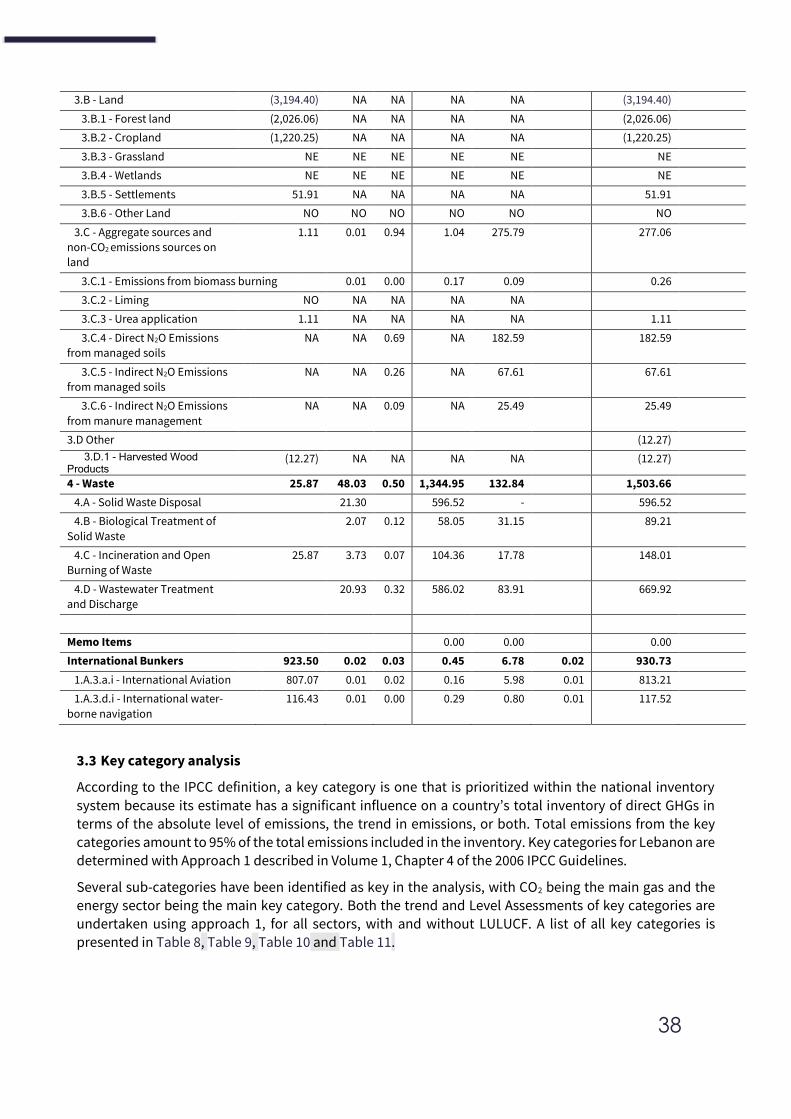
38
3.B - Land (3,194.40) NA NA NA NA (3,194.40)
3.B.1 - Forest land (2,026.06) NA NA NA NA (2,026.06)
3.B.2 - Cropland (1,220.25) NA NA NA NA (1,220.25)
3.B.3 - Grassland NE NE NE NE NE NE
3.B.4 - Wetlands NE NE NE NE NE NE
3.B.5 - Settlements 51.91
NA NA NA NA 51.91
3.B.6 - Other Land NO NO NO NO NO NO
3.C - Aggregate sources and
non-CO2 emissions sources on
land
1.11 0.01 0.94 1.04 275.79 277.06
3.C.1 - Emissions from biomass burning
0.01 0.00 0.17 0.09 0.26
3.C.2 - Liming NO NA NA NA NA
3.C.3 - Urea application 1.11
NA NA NA NA 1.11
3.C.4 - Direct N2O Emissions
from managed soils
NA NA 0.69 NA 182.59 182.59
3.C.5 - Indirect N2O Emissions
from managed soils
NA NA 0.26 NA 67.61 67.61
3.C.6 - Indirect N2O Emissions
from manure management
NA NA 0.09 NA 25.49 25.49
3.D Other (12.27)
3.D.1 - Harvested Wood Products
(12.27) NA NA NA NA (12.27)
4 - Waste 25.87 48.03 0.50 1,344.95 132.84 1,503.66
4.A - Solid Waste Disposal
21.30
596.52 - 596.52
4.B - Biological Treatment of
Solid Waste
2.07 0.12 58.05 31.15 89.21
4.C - Incineration and Open
Burning of Waste
25.87 3.73 0.07 104.36 17.78 148.01
4.D - Wastewater Treatment
and Discharge
20.93 0.32 586.02 83.91 669.92
Memo Items 0.00 0.00 0.00
International Bunkers 923.50 0.02 0.03 0.45 6.78 0.02 930.73
1.A.3.a.i - International Aviation 807.07 0.01 0.02 0.16 5.98 0.01 813.21
1.A.3.d.i - International water-
borne navigation
116.43 0.01 0.00 0.29 0.80 0.01 117.52
3.3 Key category analysis
According to the IPCC definition, a key category is one that is prioritized within the national inventory
system because its estimate has a significant influence on a country’s total inventory of direct GHGs in terms of the absolute level of emissions, the trend in emissions, or both. Total emissions from the key categories amount to 95% of the total emissions included in the inventory. Key categories for Lebanon are determined with Approach 1 described in Volume 1, Chapter 4 of the 2006 IPCC Guidelines.
Several sub-categories have been identified as key in the analysis, with CO2 being the main gas and the energy sector being the main key category. Both the trend and Level Assessments of key categories are undertaken using approach 1, for all sectors, with and without LULUCF. A list of all key categories is
presented in Table 8, Table 9, Table 10 and Table 11.
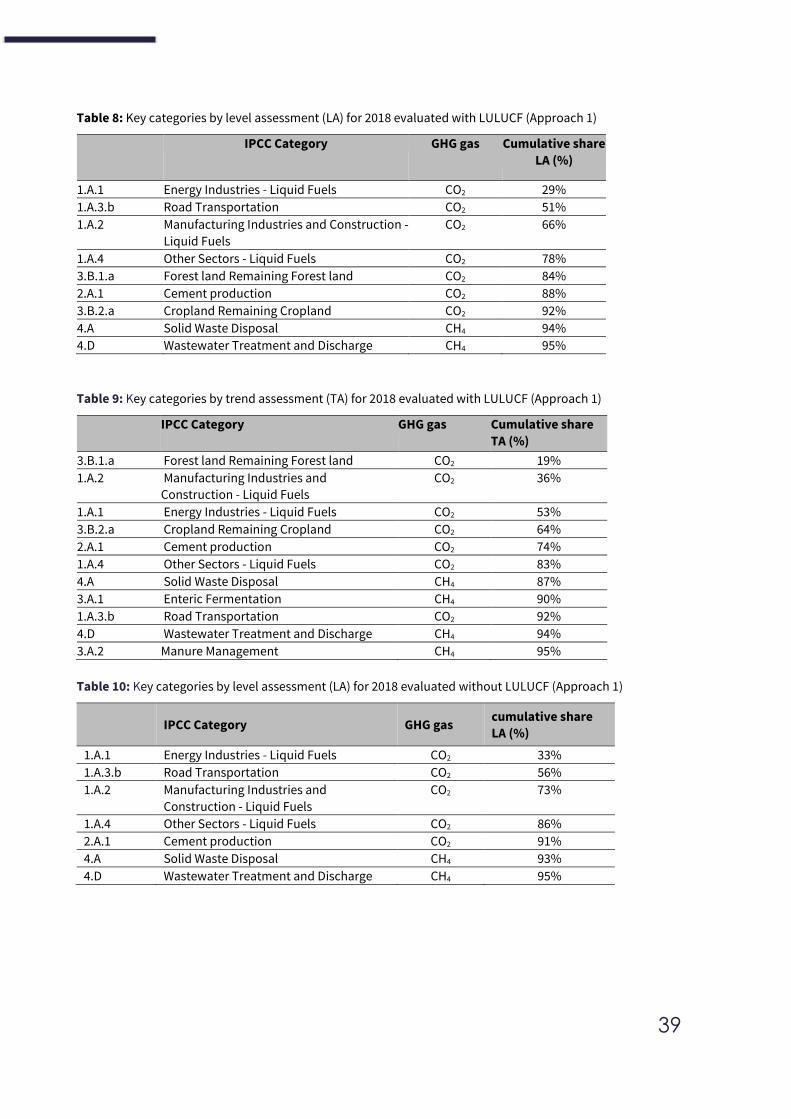
39
Table 8: Key categories by level assessment (LA) for 2018 evaluated with LULUCF (Approach 1)
IPCC Category GHG gas Cumulative share
LA (%)
1.A.1 Energy Industries - Liquid Fuels CO2 29%
1.A.3.b Road Transportation CO2 51%
1.A.2 Manufacturing Industries and Construction -
Liquid Fuels
CO2 66%
1.A.4 Other Sectors - Liquid Fuels CO2 78%
3.B.1.a Forest land Remaining Forest land CO2 84%
2.A.1 Cement production CO2 88%
3.B.2.a Cropland Remaining Cropland CO2 92%
4.A Solid Waste Disposal CH4 94%
4.D Wastewater Treatment and Discharge CH4 95%
Table 9: Key categories by trend assessment (TA) for 2018 evaluated with LULUCF (Approach 1)
IPCC Category GHG gas Cumulative share
TA (%)
3.B.1.a Forest land Remaining Forest land CO2 19%
1.A.2 Manufacturing Industries and
Construction - Liquid Fuels
CO2 36%
1.A.1 Energy Industries - Liquid Fuels CO2 53%
3.B.2.a Cropland Remaining Cropland CO2 64%
2.A.1 Cement production CO2 74%
1.A.4 Other Sectors - Liquid Fuels CO2 83%
4.A Solid Waste Disposal CH4 87%
3.A.1 Enteric Fermentation CH4 90%
1.A.3.b Road Transportation CO2 92%
4.D Wastewater Treatment and Discharge CH4 94%
3.A.2 Manure Management CH4 95%
Table 10: Key categories by level assessment (LA) for 2018 evaluated without LULUCF (Approach 1)
IPCC Category GHG gas cumulative share
LA (%)
1.A.1 Energy Industries - Liquid Fuels CO2 33%
1.A.3.b Road Transportation CO2 56%
1.A.2 Manufacturing Industries and
Construction - Liquid Fuels
CO2 73%
1.A.4 Other Sectors - Liquid Fuels CO2 86%
2.A.1 Cement production CO2 91%
4.A Solid Waste Disposal CH4 93%
4.D Wastewater Treatment and Discharge CH4 95%
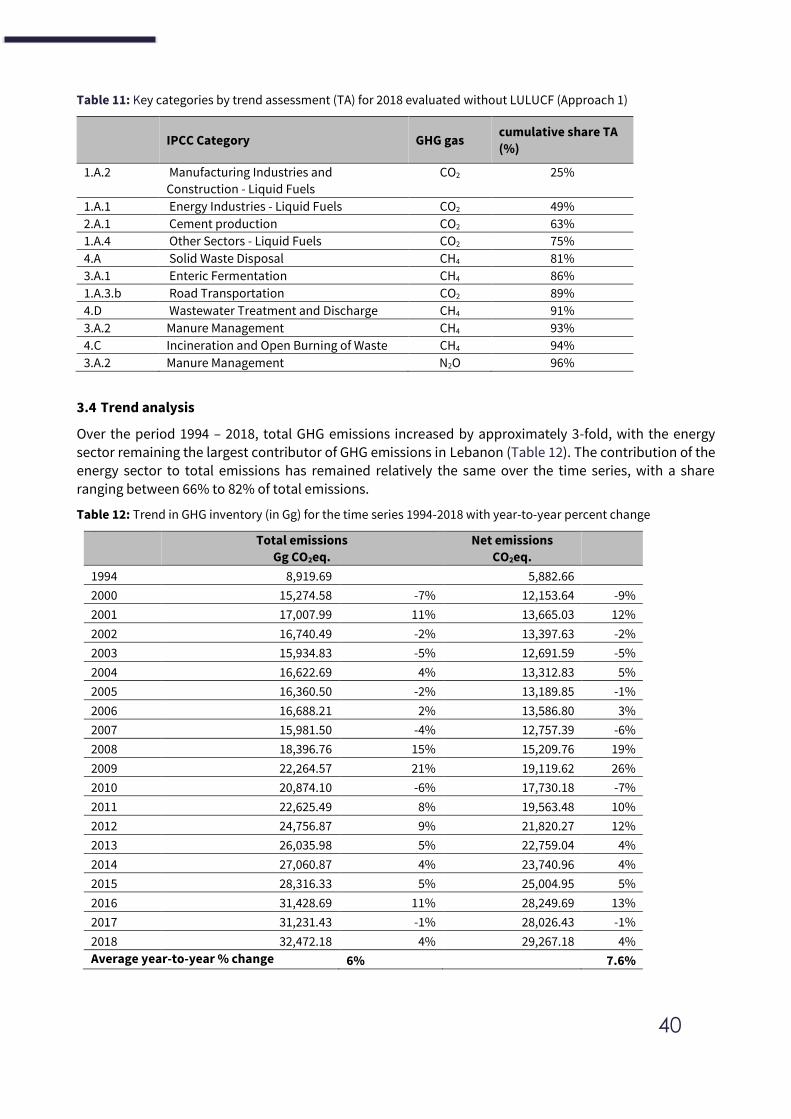
40
Table 11: Key categories by trend assessment (TA) for 2018 evaluated without LULUCF (Approach 1)
IPCC Category GHG gas cumulative share TA
(%)
1.A.2 Manufacturing Industries and
Construction - Liquid Fuels
CO2 25%
1.A.1 Energy Industries - Liquid Fuels CO2 49%
2.A.1 Cement production CO2 63%
1.A.4 Other Sectors - Liquid Fuels CO2 75%
4.A Solid Waste Disposal CH4 81%
3.A.1 Enteric Fermentation CH4 86%
1.A.3.b Road Transportation CO2 89%
4.D Wastewater Treatment and Discharge CH4 91%
3.A.2 Manure Management CH4 93%
4.C Incineration and Open Burning of Waste CH4 94%
3.A.2 Manure Management N2O 96%
3.4 Trend analysis
Over the period 1994 – 2018, total GHG emissions increased by approximately 3-fold, with the energy
sector remaining the largest contributor of GHG emissions in Lebanon (Table 12). The contribution of the energy sector to total emissions has remained relatively the same over the time series, with a share ranging between 66% to 82% of total emissions.
Table 12: Trend in GHG inventory (in Gg) for the time series 1994-2018 with year-to-year percent change
Total emissions
Gg CO2eq.
Net emissions
CO2eq.
1994 8,919.69 5,882.66
2000 15,274.58 -7% 12,153.64 -9%
2001 17,007.99 11% 13,665.03 12%
2002 16,740.49 -2% 13,397.63 -2%
2003 15,934.83 -5% 12,691.59 -5%
2004 16,622.69 4% 13,312.83 5%
2005 16,360.50 -2% 13,189.85 -1%
2006 16,688.21 2% 13,586.80 3%
2007 15,981.50 -4% 12,757.39 -6%
2008 18,396.76 15% 15,209.76 19%
2009 22,264.57 21% 19,119.62 26%
2010 20,874.10 -6% 17,730.18 -7%
2011 22,625.49 8% 19,563.48 10%
2012 24,756.87 9% 21,820.27 12%
2013 26,035.98 5% 22,759.04 4%
2014 27,060.87 4% 23,740.96 4%
2015 28,316.33 5% 25,004.95 5%
2016 31,428.69 11% 28,249.69 13%
2017 31,231.43 -1% 28,026.43 -1%
2018 32,472.18 4% 29,267.18 4%
Average year-to-year % change 6% 7.6%

41
Table 13: Trend of emissions during the period 1994-2018 (in Gg)
Total GHG
emissions Energy Industry
AFOLU
(without
LULUCF)
AFOLU
(with
LULUCF)
Waste
1994 8,920 5,919 1,275 747 -2,290 978
2018 32,472 26,701 3,361 907 -2,297 1,504
% change
1994-2018 264% 351% 164% 21% 0% 54%
% change
average yearly 6% 5% 4.3% 1% 0.32% 2.5%
Figure 12: Trend in GHG emissions including share of emissions per sector for the period 1994-2018
0
5,000
10,000
15,000
20,000
25,000
30,000
35,000
19
94
19
95
19
96
19
97
19
98
19
99
20
00
20
01
20
02
20
03
20
04
20
05
20
06
20
07
20
08
20
09
20
10
20
11
20
12
20
13
20
14
20
15
20
16
20
17
20
18
Gg
CO
2e
q.
Energy total Total AFOLU IPPU Waste
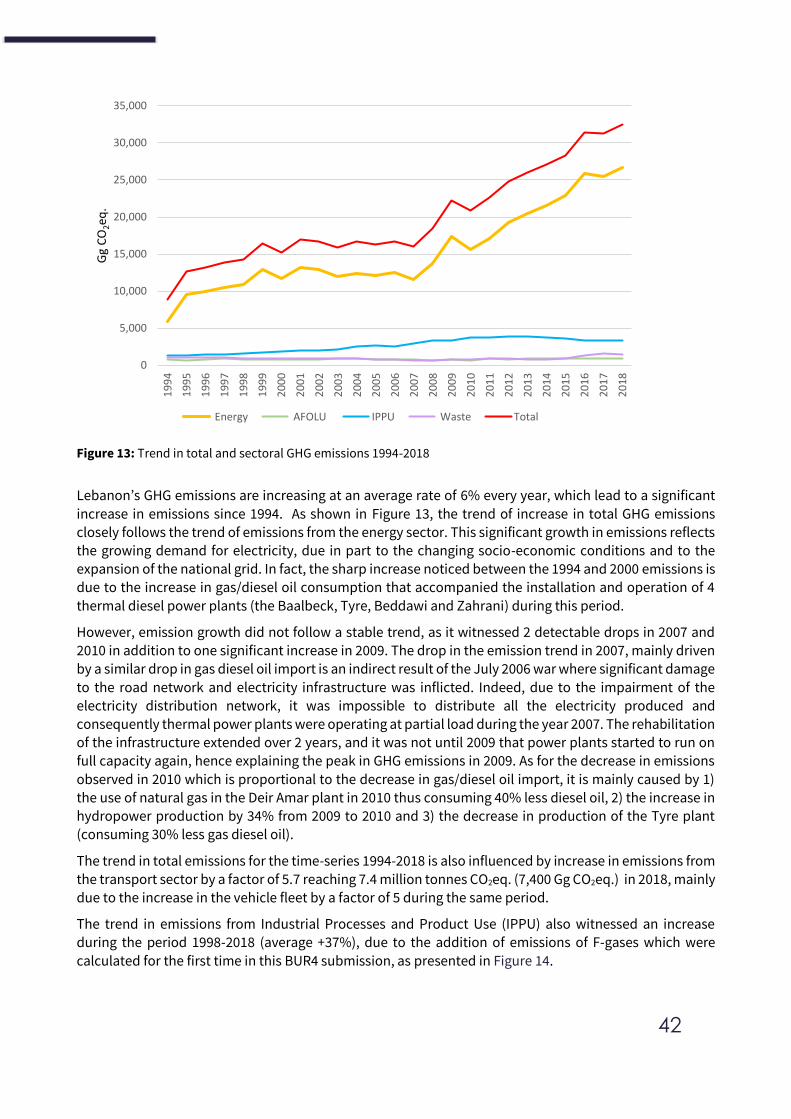
42
Figure 13: Trend in total and sectoral GHG emissions 1994-2018
Lebanon’s GHG emissions are increasing at an average rate of 6% every year, which lead to a significant
increase in emissions since 1994. As shown in Figure 13, the trend of increase in total GHG emissions
closely follows the trend of emissions from the energy sector. This significant growth in emissions reflects the growing demand for electricity, due in part to the changing socio-economic conditions and to the
expansion of the national grid. In fact, the sharp increase noticed between the 1994 and 2000 emissions is due to the increase in gas/diesel oil consumption that accompanied the installation and operation of 4
thermal diesel power plants (the Baalbeck, Tyre, Beddawi and Zahrani) during this period.
However, emission growth did not follow a stable trend, as it witnessed 2 detectable drops in 2007 and
2010 in addition to one significant increase in 2009. The drop in the emission trend in 2007, mainly driven by a similar drop in gas diesel oil import is an indirect result of the July 2006 war where significant damage
to the road network and electricity infrastructure was inflicted. Indeed, due to the impairment of the
electricity distribution network, it was impossible to distribute all the electricity produced and consequently thermal power plants were operating at partial load during the year 2007. The rehabilitation of the infrastructure extended over 2 years, and it was not until 2009 that power plants started to run on full capacity again, hence explaining the peak in GHG emissions in 2009. As for the decrease in emissions
observed in 2010 which is proportional to the decrease in gas/diesel oil import, it is mainly caused by 1)
the use of natural gas in the Deir Amar plant in 2010 thus consuming 40% less diesel oil, 2) the increase in hydropower production by 34% from 2009 to 2010 and 3) the decrease in production of the Tyre plant (consuming 30% less gas diesel oil).
The trend in total emissions for the time-series 1994-2018 is also influenced by increase in emissions from
the transport sector by a factor of 5.7 reaching 7.4 million tonnes CO2eq. (7,400 Gg CO2eq.) in 2018, mainly due to the increase in the vehicle fleet by a factor of 5 during the same period.
The trend in emissions from Industrial Processes and Product Use (IPPU) also witnessed an increase
during the period 1998-2018 (average +37%), due to the addition of emissions of F-gases which were
calculated for the first time in this BUR4 submission, as presented in Figure 14.
0
5,000
10,000
15,000
20,000
25,000
30,000
35,000
19
94
19
95
19
96
19
97
19
98
19
99
20
00
20
01
20
02
20
03
20
04
20
05
20
06
20
07
20
08
20
09
20
10
20
11
20
12
20
13
20
14
20
15
20
16
20
17
20
18
Gg
CO
2eq
.
Energy AFOLU IPPU Waste Total
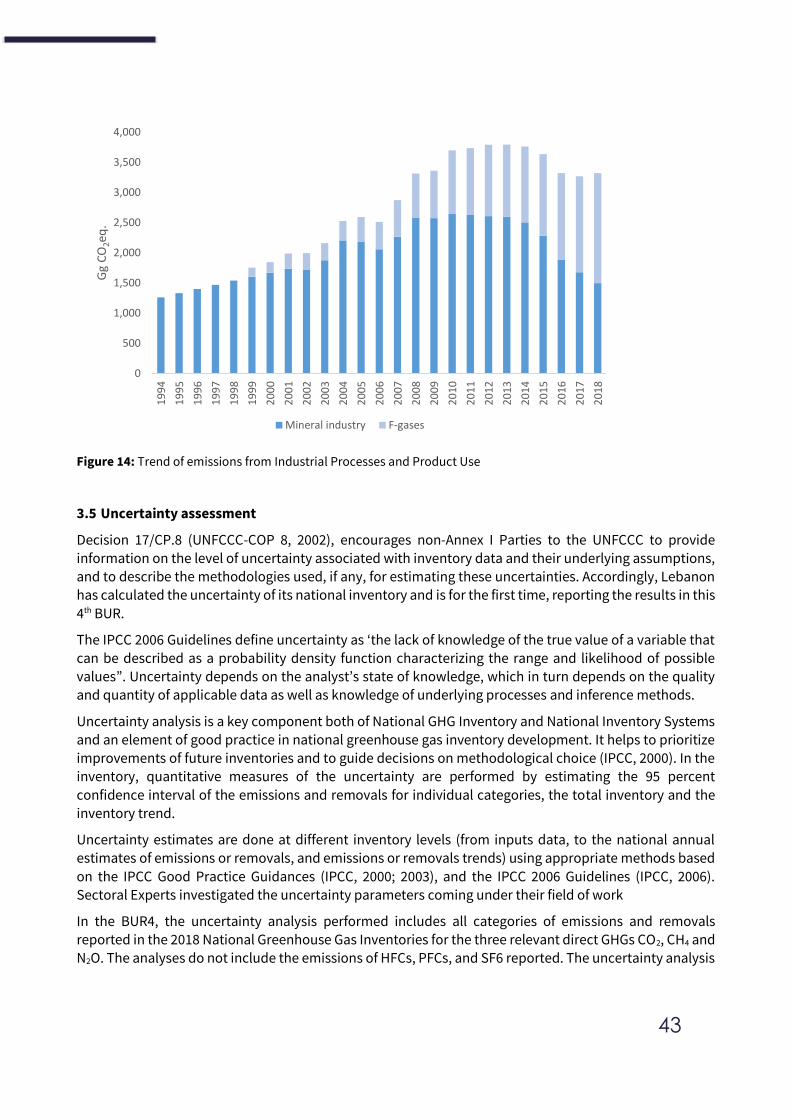
43
Figure 14: Trend of emissions from Industrial Processes and Product Use
3.5 Uncertainty assessment
Decision 17/CP.8 (UNFCCC-COP 8, 2002), encourages non-Annex I Parties to the UNFCCC to provide information on the level of uncertainty associated with inventory data and their underlying assumptions, and to describe the methodologies used, if any, for estimating these uncertainties. Accordingly, Lebanon
has calculated the uncertainty of its national inventory and is for the first time, reporting the results in this
4th BUR.
The IPCC 2006 Guidelines define uncertainty as ‘the lack of knowledge of the true value of a variable that can be described as a probability density function characterizing the range and likelihood of possible
values”. Uncertainty depends on the analyst’s state of knowledge, which in turn depends on the quality and quantity of applicable data as well as knowledge of underlying processes and inference methods.
Uncertainty analysis is a key component both of National GHG Inventory and National Inventory Systems and an element of good practice in national greenhouse gas inventory development. It helps to prioritize
improvements of future inventories and to guide decisions on methodological choice (IPCC, 2000). In the inventory, quantitative measures of the uncertainty are performed by estimating the 95 percent
confidence interval of the emissions and removals for individual categories, the total inventory and the
inventory trend.
Uncertainty estimates are done at different inventory levels (from inputs data, to the national annual estimates of emissions or removals, and emissions or removals trends) using appropriate methods based
on the IPCC Good Practice Guidances (IPCC, 2000; 2003), and the IPCC 2006 Guidelines (IPCC, 2006). Sectoral Experts investigated the uncertainty parameters coming under their field of work
In the BUR4, the uncertainty analysis performed includes all categories of emissions and removals reported in the 2018 National Greenhouse Gas Inventories for the three relevant direct GHGs CO2, CH4 and
N2O. The analyses do not include the emissions of HFCs, PFCs, and SF6 reported. The uncertainty analysis
0
500
1,000
1,500
2,000
2,500
3,000
3,500
4,000
19
94
19
95
19
96
19
97
19
98
19
99
20
00
20
01
20
02
20
03
20
04
20
05
20
06
20
07
20
08
20
09
20
10
20
11
20
12
20
13
20
14
20
15
20
16
20
17
20
18
Gg
CO
2eq
.
Mineral industry F-gases
44
was performed following the estimation of emissions and removals for all categories evaluated and the
overall inventory for 2018, and prior to carrying out the identification of key categories.
The estimated overall uncertainty total inventory reached 12% in 2018, with the corresponding uncertainty in trend 1994-2018 estimated to 171%. Details of uncertainty calculation are presented in Annex I.
Uncertainties for the input data in this report were initially associated to the following main general sources:
a) Direct determination of estimation parameters,
b) Model outputs,
c) Activity data gathered for the inventory from national sources,
d) Estimation parameters and activity data obtained from published references including the IPCC
e) Expert judgment
The activity data and its uncertainties are classified into four general types and about twenty subtypes (according to the inventory sector) with its corresponding identification numbers.
I. National activity data gathered from national data providers and other sources including reports and national published references.
II. International data sources: Basically, obtained from international agencies and organizations, selected from national GHG inventories of other countries, international published references etc.
III. IPCC activity data. Data provided in the IPCC Guidelines (1996 and 2006) and the IPCC Good Practice Guidances (2000 and 2003).
IV. Other activity data. Obtained from other sources or estimated using expert judgment.
The uncertainty values for the activity data used in this report were obtained mainly from the general types
I (54%), II (16%) and IV (29%) above (this last basically derived from expert judgment). Similarly, the
estimation parameters used in the inventory and its uncertainties were classified into four general types
and about twenty subtypes with its corresponding identification numbers.
I. Country-specific estimation parameters obtained from international and national peer reviewed journals, reports, measurement and monitoring data, academy/research institutions etc.
II. International estimation parameters obtained from international peer-reviewed journals,
international agencies and organizations, taken from other recognized international methodologies or national inventory reports etc.
III. IIPCC estimation parameters (basically default values) provided in the IPCC Guidelines (1996 and 2006), the IPCC Good Practice Guidances (2000 and 2003) and the IPCC EFDB.
IV. Other estimation parameters. Obtained from other sources or estimated using expert judgment.
The uncertainty values for the estimation parameters used in this report mostly (67%) correspond to the
default uncertainty values provided in the IPCC Good Practice Guidance 2000 and 2003 and the 2006 IPCC
Guidelines (Type III). A 31% was taking (or they helped select the default IPCC recommended value) from
international sources, fundamentally national GHG inventories of other countries (Type II).
For some categories and estimation parameters in which the IPCC Guidelines and Guidances suggest wide uncertainty ranges especially towards the upper bound, a comparison was made with uncertainty ranges
reported in the National Inventory Reports submitted in 2018 by several non-Annex I Parties as support for
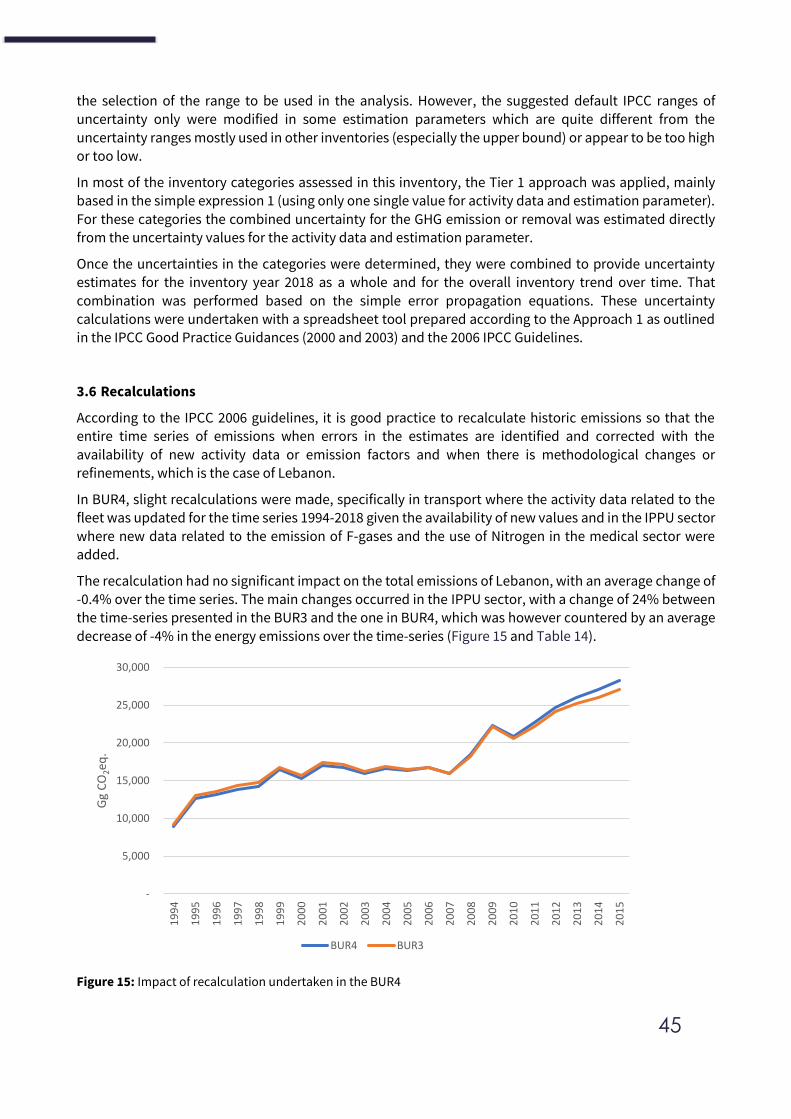
45
the selection of the range to be used in the analysis. However, the suggested default IPCC ranges of
uncertainty only were modified in some estimation parameters which are quite different from the
uncertainty ranges mostly used in other inventories (especially the upper bound) or appear to be too high or too low.
In most of the inventory categories assessed in this inventory, the Tier 1 approach was applied, mainly based in the simple expression 1 (using only one single value for activity data and estimation parameter).
For these categories the combined uncertainty for the GHG emission or removal was estimated directly from the uncertainty values for the activity data and estimation parameter.
Once the uncertainties in the categories were determined, they were combined to provide uncertainty estimates for the inventory year 2018 as a whole and for the overall inventory trend over time. That
combination was performed based on the simple error propagation equations. These uncertainty
calculations were undertaken with a spreadsheet tool prepared according to the Approach 1 as outlined in the IPCC Good Practice Guidances (2000 and 2003) and the 2006 IPCC Guidelines.
3.6 Recalculations
According to the IPCC 2006 guidelines, it is good practice to recalculate historic emissions so that the entire time series of emissions when errors in the estimates are identified and corrected with the
availability of new activity data or emission factors and when there is methodological changes or refinements, which is the case of Lebanon.
In BUR4, slight recalculations were made, specifically in transport where the activity data related to the fleet was updated for the time series 1994-2018 given the availability of new values and in the IPPU sector
where new data related to the emission of F-gases and the use of Nitrogen in the medical sector were added.
The recalculation had no significant impact on the total emissions of Lebanon, with an average change of -0.4% over the time series. The main changes occurred in the IPPU sector, with a change of 24% between
the time-series presented in the BUR3 and the one in BUR4, which was however countered by an average
decrease of -4% in the energy emissions over the time-series (Figure 15 and Table 14).
Figure 15: Impact of recalculation undertaken in the BUR4
-
5,000
10,000
15,000
20,000
25,000
30,000
19
94
19
95
19
96
19
97
19
98
19
99
20
00
20
01
20
02
20
03
20
04
20
05
20
06
20
07
20
08
20
09
20
10
20
11
20
12
20
13
20
14
20
15
Gg
CO
2eq
.
BUR4 BUR3
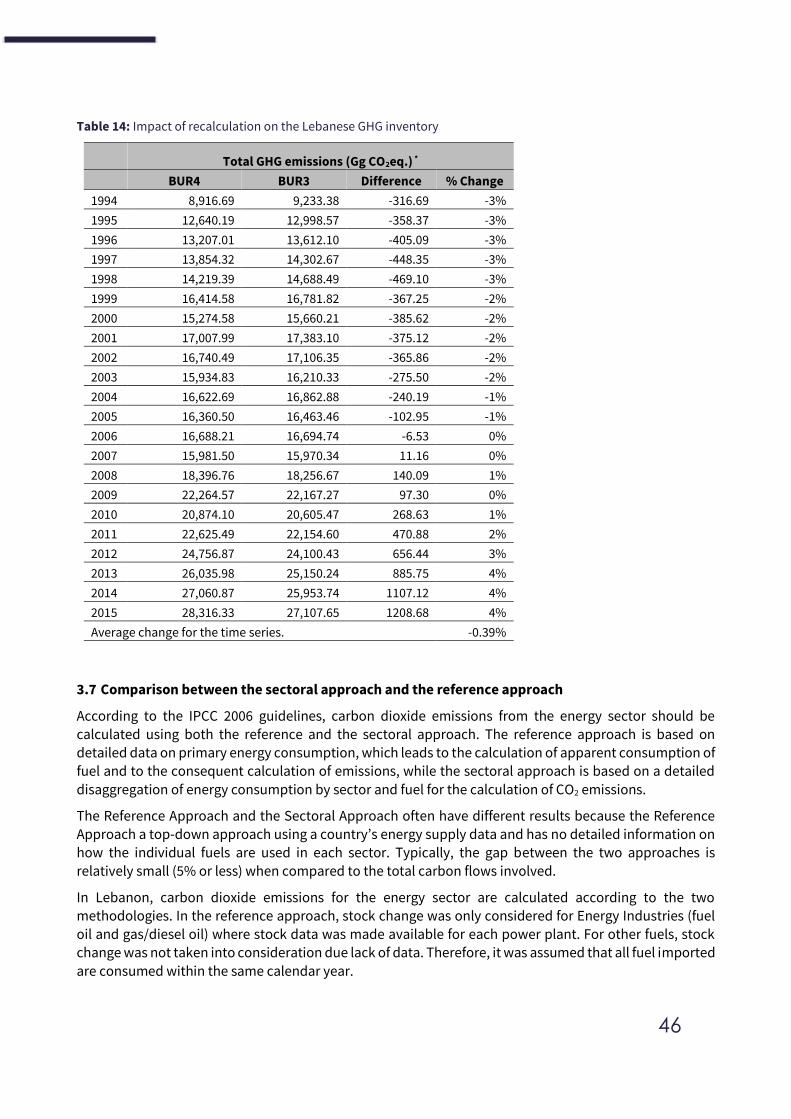
46
Table 14: Impact of recalculation on the Lebanese GHG inventory
Total GHG emissions (Gg CO2eq.) *
BUR4 BUR3 Difference % Change
1994 8,916.69 9,233.38 -316.69 -3%
1995 12,640.19 12,998.57 -358.37 -3%
1996 13,207.01 13,612.10 -405.09 -3%
1997 13,854.32 14,302.67 -448.35 -3%
1998 14,219.39 14,688.49 -469.10 -3%
1999 16,414.58 16,781.82 -367.25 -2%
2000 15,274.58 15,660.21 -385.62 -2%
2001 17,007.99 17,383.10 -375.12 -2%
2002 16,740.49 17,106.35 -365.86 -2%
2003 15,934.83 16,210.33 -275.50 -2%
2004 16,622.69 16,862.88 -240.19 -1%
2005 16,360.50 16,463.46 -102.95 -1%
2006 16,688.21 16,694.74 -6.53 0%
2007 15,981.50 15,970.34 11.16 0%
2008 18,396.76 18,256.67 140.09 1%
2009 22,264.57 22,167.27 97.30 0%
2010 20,874.10 20,605.47 268.63 1%
2011 22,625.49 22,154.60 470.88 2%
2012 24,756.87 24,100.43 656.44 3%
2013 26,035.98 25,150.24 885.75 4%
2014 27,060.87 25,953.74 1107.12 4%
2015 28,316.33 27,107.65 1208.68 4%
Average change for the time series. -0.39%
3.7 Comparison between the sectoral approach and the reference approach
According to the IPCC 2006 guidelines, carbon dioxide emissions from the energy sector should be
calculated using both the reference and the sectoral approach. The reference approach is based on detailed data on primary energy consumption, which leads to the calculation of apparent consumption of fuel and to the consequent calculation of emissions, while the sectoral approach is based on a detailed
disaggregation of energy consumption by sector and fuel for the calculation of CO2 emissions.
The Reference Approach and the Sectoral Approach often have different results because the Reference Approach a top-down approach using a country’s energy supply data and has no detailed information on how the individual fuels are used in each sector. Typically, the gap between the two approaches is
relatively small (5% or less) when compared to the total carbon flows involved.
In Lebanon, carbon dioxide emissions for the energy sector are calculated according to the two methodologies. In the reference approach, stock change was only considered for Energy Industries (fuel
oil and gas/diesel oil) where stock data was made available for each power plant. For other fuels, stock change was not taken into consideration due lack of data. Therefore, it was assumed that all fuel imported
are consumed within the same calendar year.
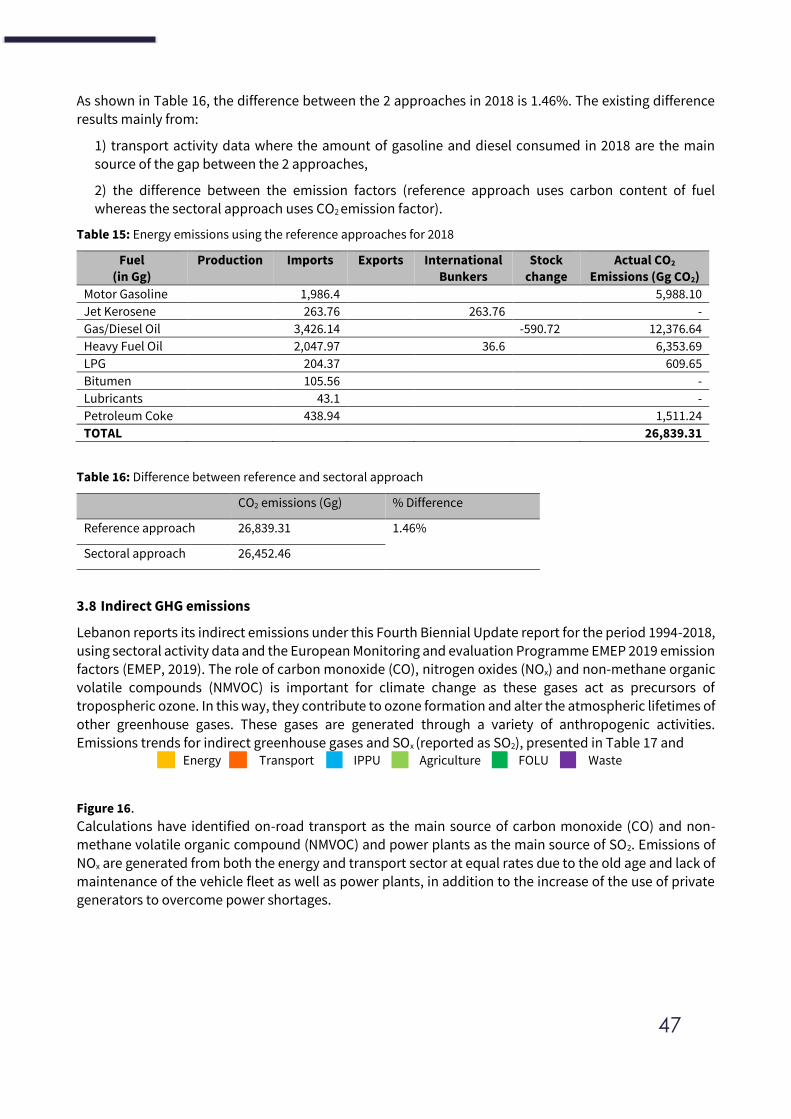
47
As shown in Table 16, the difference between the 2 approaches in 2018 is 1.46%. The existing difference
results mainly from:
1) transport activity data where the amount of gasoline and diesel consumed in 2018 are the main source of the gap between the 2 approaches,
2) the difference between the emission factors (reference approach uses carbon content of fuel whereas the sectoral approach uses CO2 emission factor).
Table 15: Energy emissions using the reference approaches for 2018
Fuel
(in Gg)
Production Imports Exports International
Bunkers
Stock
change
Actual CO2
Emissions (Gg CO2)
Motor Gasoline 1,986.4 5,988.10
Jet Kerosene 263.76 263.76 -
Gas/Diesel Oil 3,426.14 -590.72 12,376.64
Heavy Fuel Oil 2,047.97 36.6 6,353.69
LPG 204.37 609.65
Bitumen 105.56 -
Lubricants 43.1 -
Petroleum Coke 438.94 1,511.24
TOTAL 26,839.31
Table 16: Difference between reference and sectoral approach
CO2 emissions (Gg) % Difference
Reference approach 26,839.31 1.46%
Sectoral approach 26,452.46
3.8 Indirect GHG emissions
Lebanon reports its indirect emissions under this Fourth Biennial Update report for the period 1994-2018, using sectoral activity data and the European Monitoring and evaluation Programme EMEP 2019 emission factors (EMEP, 2019). The role of carbon monoxide (CO), nitrogen oxides (NOx) and non-methane organic volatile compounds (NMVOC) is important for climate change as these gases act as precursors of
tropospheric ozone. In this way, they contribute to ozone formation and alter the atmospheric lifetimes of
other greenhouse gases. These gases are generated through a variety of anthropogenic activities. Emissions trends for indirect greenhouse gases and SOx (reported as SO2), presented in Table 17 and
Energy Transport IPPU Agriculture FOLU Waste
Figure 16. Calculations have identified on-road transport as the main source of carbon monoxide (CO) and non-methane volatile organic compound (NMVOC) and power plants as the main source of SO2. Emissions of
NOx are generated from both the energy and transport sector at equal rates due to the old age and lack of
maintenance of the vehicle fleet as well as power plants, in addition to the increase of the use of private generators to overcome power shortages.
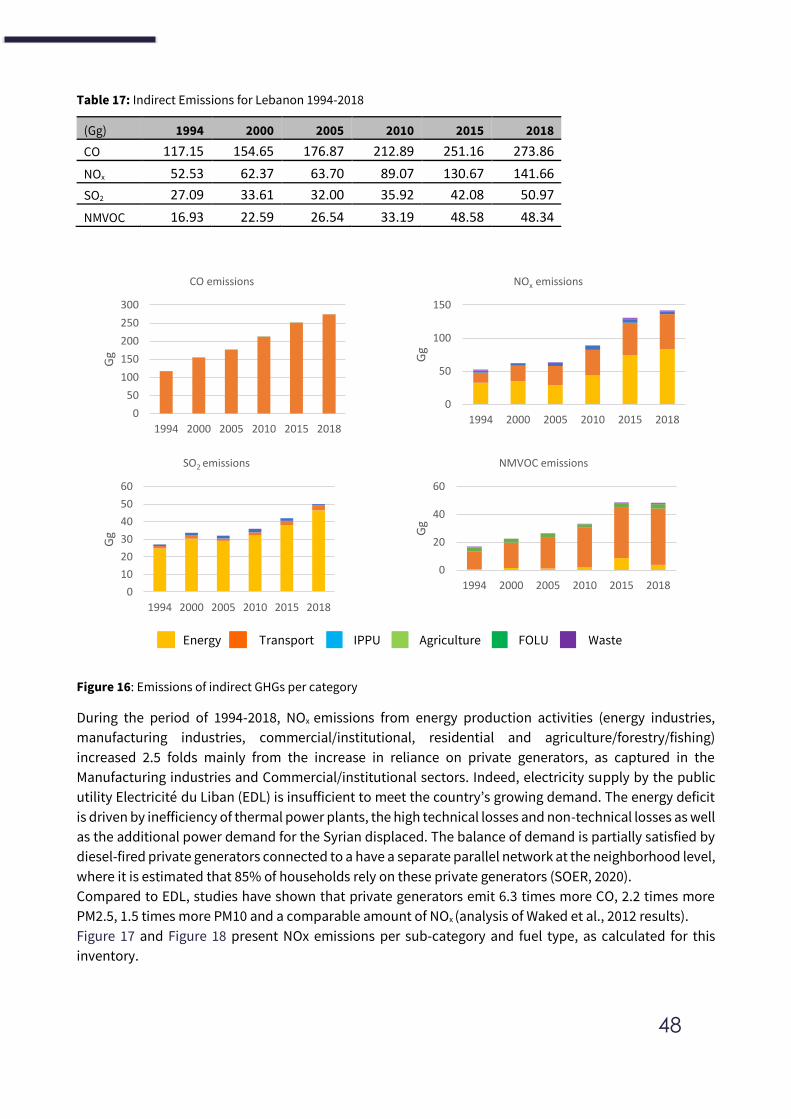
48
Table 17: Indirect Emissions for Lebanon 1994-2018
(Gg) 1994 2000 2005 2010 2015 2018
CO 117.15 154.65 176.87 212.89 251.16 273.86
NOx 52.53 62.37 63.70 89.07 130.67 141.66
SO2 27.09 33.61 32.00 35.92 42.08 50.97
NMVOC 16.93 22.59 26.54 33.19 48.58 48.34
Energy Transport IPPU Agriculture FOLU Waste
Figure 16: Emissions of indirect GHGs per category
During the period of 1994-2018, NOx emissions from energy production activities (energy industries,
manufacturing industries, commercial/institutional, residential and agriculture/forestry/fishing)
increased 2.5 folds mainly from the increase in reliance on private generators, as captured in the
Manufacturing industries and Commercial/institutional sectors. Indeed, electricity supply by the public
utility Electricité du Liban (EDL) is insufficient to meet the country’s growing demand. The energy deficit
is driven by inefficiency of thermal power plants, the high technical losses and non-technical losses as well
as the additional power demand for the Syrian displaced. The balance of demand is partially satisfied by
diesel-fired private generators connected to a have a separate parallel network at the neighborhood level,
where it is estimated that 85% of households rely on these private generators (SOER, 2020).
Compared to EDL, studies have shown that private generators emit 6.3 times more CO, 2.2 times more
PM2.5, 1.5 times more PM10 and a comparable amount of NOx (analysis of Waked et al., 2012 results).
Figure 17 and Figure 18 present NOx emissions per sub-category and fuel type, as calculated for this
inventory.
0
50
100
150
200
250
300
1994 2000 2005 2010 2015 2018
Gg
CO emissions
0
50
100
150
1994 2000 2005 2010 2015 2018G
g
NOx emissions
0
10
20
30
40
50
60
1994 2000 2005 2010 2015 2018
Gg
SO2 emissions
0
20
40
60
1994 2000 2005 2010 2015 2018
Gg
NMVOC emissions
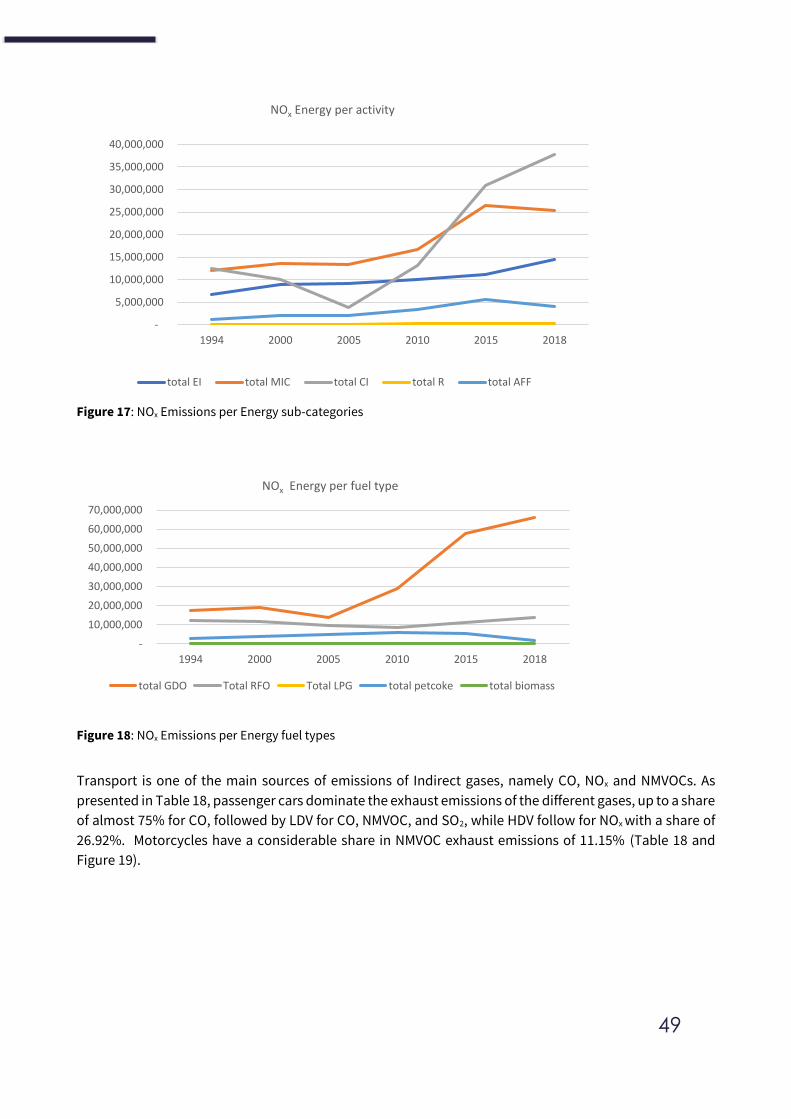
49
Figure 17: NOx Emissions per Energy sub-categories
Figure 18: NOx Emissions per Energy fuel types
Transport is one of the main sources of emissions of Indirect gases, namely CO, NOx and NMVOCs. As
presented in Table 18, passenger cars dominate the exhaust emissions of the different gases, up to a share
of almost 75% for CO, followed by LDV for CO, NMVOC, and SO2, while HDV follow for NOx with a share of
26.92%. Motorcycles have a considerable share in NMVOC exhaust emissions of 11.15% (Table 18 and
Figure 19).
-
5,000,000
10,000,000
15,000,000
20,000,000
25,000,000
30,000,000
35,000,000
40,000,000
1994 2000 2005 2010 2015 2018
NOx Energy per activity
total EI total MIC total CI total R total AFF
-
10,000,000
20,000,000
30,000,000
40,000,000
50,000,000
60,000,000
70,000,000
1994 2000 2005 2010 2015 2018
NOx Energy per fuel type
total GDO Total RFO Total LPG total petcoke total biomass
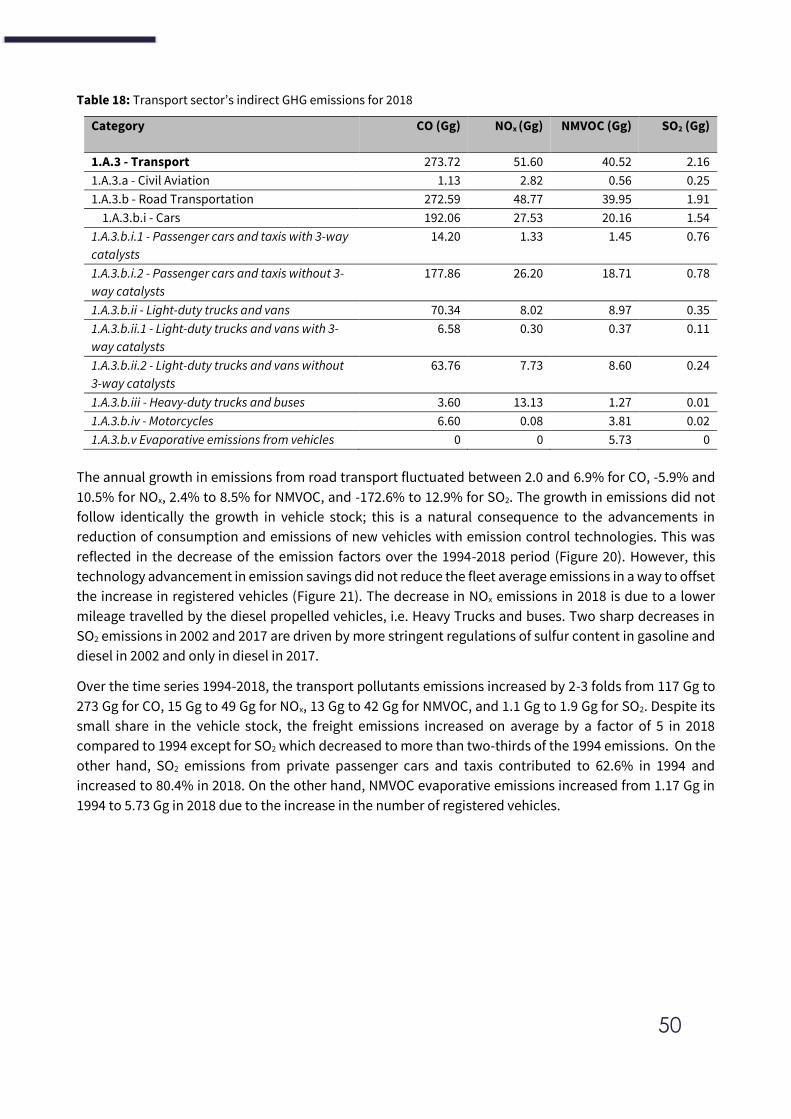
50
Table 18: Transport sector’s indirect GHG emissions for 2018
Category CO (Gg) NOx (Gg) NMVOC (Gg) SO2 (Gg)
1.A.3 - Transport 273.72 51.60 40.52 2.16
1.A.3.a - Civil Aviation 1.13 2.82 0.56 0.25
1.A.3.b - Road Transportation 272.59 48.77 39.95 1.91
1.A.3.b.i - Cars 192.06 27.53 20.16 1.54
1.A.3.b.i.1 - Passenger cars and taxis with 3-way
catalysts
14.20 1.33 1.45 0.76
1.A.3.b.i.2 - Passenger cars and taxis without 3-
way catalysts
177.86 26.20 18.71 0.78
1.A.3.b.ii - Light-duty trucks and vans 70.34 8.02 8.97 0.35
1.A.3.b.ii.1 - Light-duty trucks and vans with 3-
way catalysts
6.58 0.30 0.37 0.11
1.A.3.b.ii.2 - Light-duty trucks and vans without
3-way catalysts
63.76 7.73 8.60 0.24
1.A.3.b.iii - Heavy-duty trucks and buses 3.60 13.13 1.27 0.01
1.A.3.b.iv - Motorcycles 6.60 0.08 3.81 0.02
1.A.3.b.v Evaporative emissions from vehicles 0 0 5.73 0
The annual growth in emissions from road transport fluctuated between 2.0 and 6.9% for CO, -5.9% and
10.5% for NOx, 2.4% to 8.5% for NMVOC, and -172.6% to 12.9% for SO2. The growth in emissions did not
follow identically the growth in vehicle stock; this is a natural consequence to the advancements in
reduction of consumption and emissions of new vehicles with emission control technologies. This was
reflected in the decrease of the emission factors over the 1994-2018 period (Figure 20). However, this
technology advancement in emission savings did not reduce the fleet average emissions in a way to offset
the increase in registered vehicles (Figure 21). The decrease in NOx emissions in 2018 is due to a lower
mileage travelled by the diesel propelled vehicles, i.e. Heavy Trucks and buses. Two sharp decreases in
SO2 emissions in 2002 and 2017 are driven by more stringent regulations of sulfur content in gasoline and
diesel in 2002 and only in diesel in 2017.
Over the time series 1994-2018, the transport pollutants emissions increased by 2-3 folds from 117 Gg to
273 Gg for CO, 15 Gg to 49 Gg for NOx, 13 Gg to 42 Gg for NMVOC, and 1.1 Gg to 1.9 Gg for SO2. Despite its
small share in the vehicle stock, the freight emissions increased on average by a factor of 5 in 2018
compared to 1994 except for SO2 which decreased to more than two-thirds of the 1994 emissions. On the
other hand, SO2 emissions from private passenger cars and taxis contributed to 62.6% in 1994 and
increased to 80.4% in 2018. On the other hand, NMVOC evaporative emissions increased from 1.17 Gg in
1994 to 5.73 Gg in 2018 due to the increase in the number of registered vehicles.
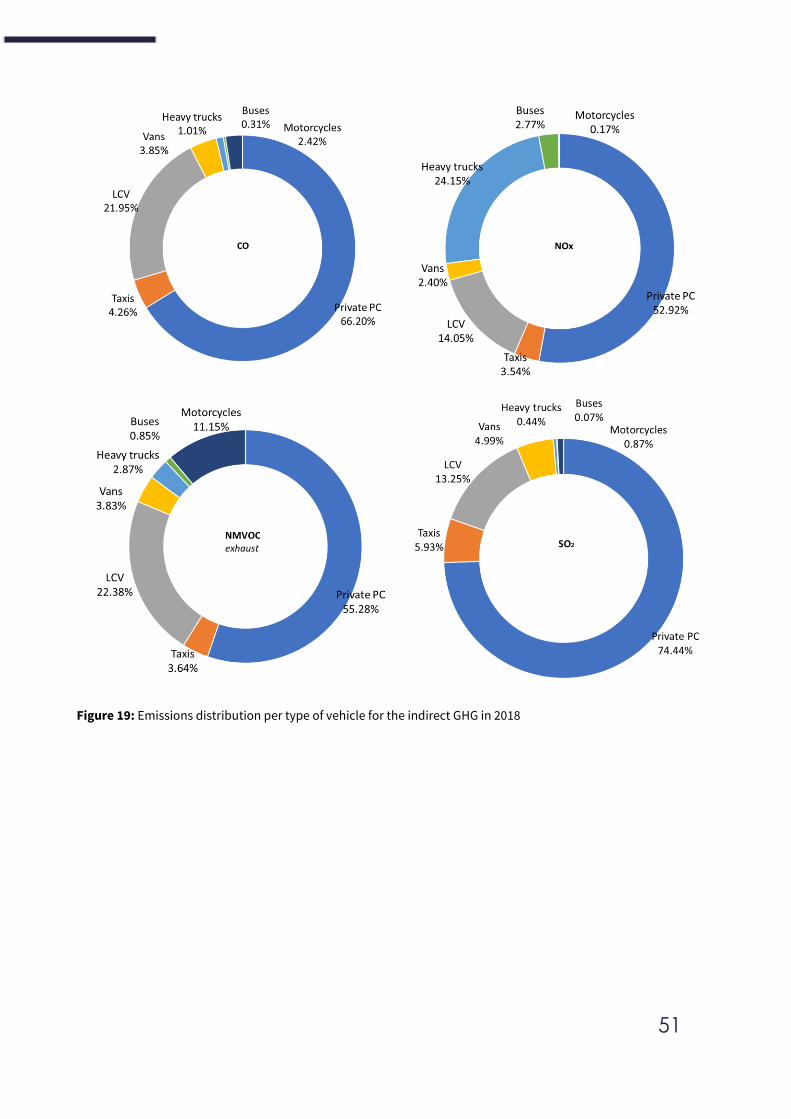
51
Figure 19: Emissions distribution per type of vehicle for the indirect GHG in 2018
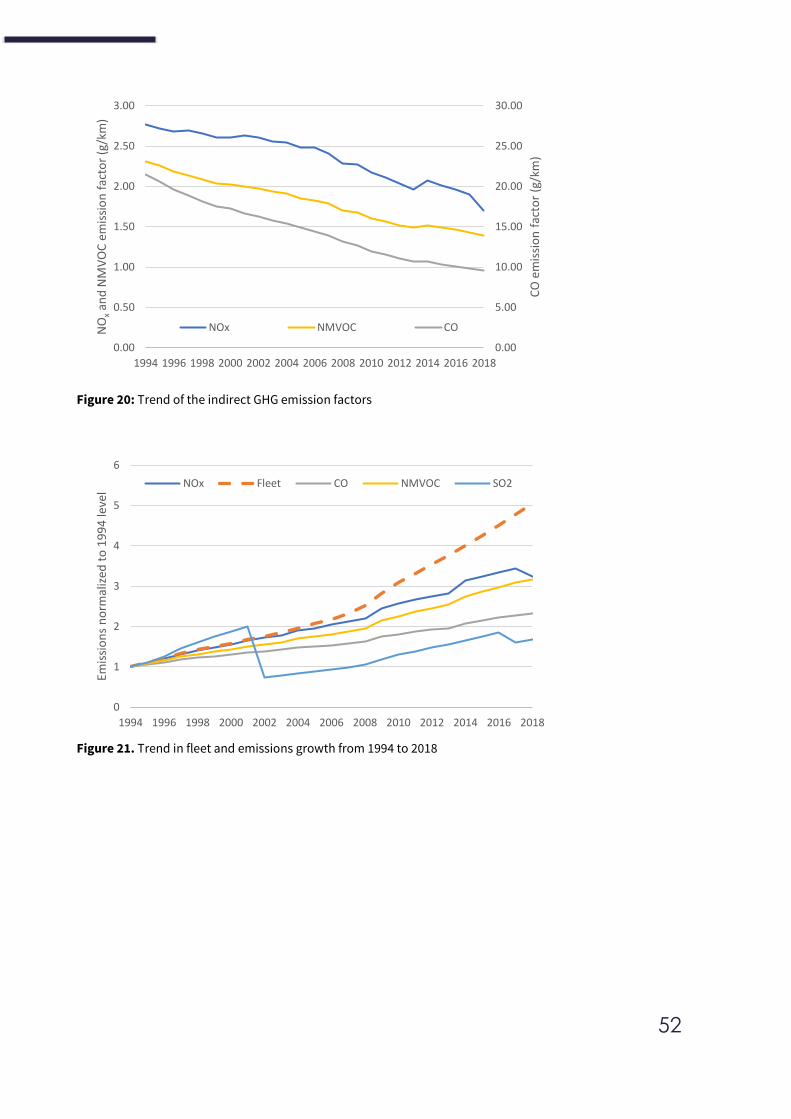
52
Figure 20: Trend of the indirect GHG emission factors
Figure 21. Trend in fleet and emissions growth from 1994 to 2018
0.00
5.00
10.00
15.00
20.00
25.00
30.00
0.00
0.50
1.00
1.50
2.00
2.50
3.00
1994 1996 1998 2000 2002 2004 2006 2008 2010 2012 2014 2016 2018
CO
em
issi
on
fac
tor
(g/k
m)
NO
xan
d N
MV
OC
em
issi
on
fac
tor
(g/k
m)
NOx NMVOC CO
0
1
2
3
4
5
6
1994 1996 1998 2000 2002 2004 2006 2008 2010 2012 2014 2016 2018
Emis
sio
ns
no
rmal
ized
to
19
94
leve
l
NOx Fleet CO NMVOC SO2
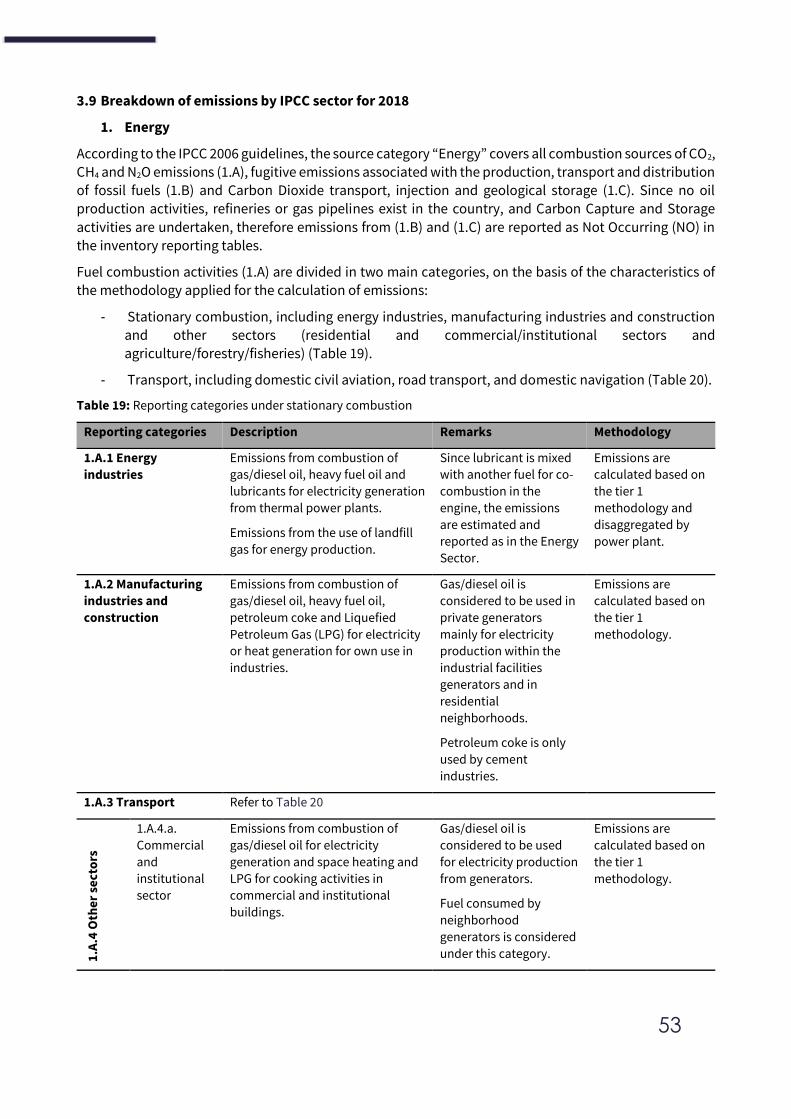
53
3.9 Breakdown of emissions by IPCC sector for 2018
1. Energy
According to the IPCC 2006 guidelines, the source category “Energy” covers all combustion sources of CO2, CH4 and N2O emissions (1.A), fugitive emissions associated with the production, transport and distribution of fossil fuels (1.B) and Carbon Dioxide transport, injection and geological storage (1.C). Since no oil production activities, refineries or gas pipelines exist in the country, and Carbon Capture and Storage
activities are undertaken, therefore emissions from (1.B) and (1.C) are reported as Not Occurring (NO) in the inventory reporting tables.
Fuel combustion activities (1.A) are divided in two main categories, on the basis of the characteristics of the methodology applied for the calculation of emissions:
- Stationary combustion, including energy industries, manufacturing industries and construction
and other sectors (residential and commercial/institutional sectors and agriculture/forestry/fisheries) (Table 19).
- Transport, including domestic civil aviation, road transport, and domestic navigation (Table 20).
Table 19: Reporting categories under stationary combustion
Reporting categories Description Remarks Methodology
1.A.1 Energy
industries
Emissions from combustion of
gas/diesel oil, heavy fuel oil and
lubricants for electricity generation
from thermal power plants.
Emissions from the use of landfill
gas for energy production.
Since lubricant is mixed
with another fuel for co-
combustion in the
engine, the emissions
are estimated and
reported as in the Energy
Sector.
Emissions are
calculated based on
the tier 1
methodology and
disaggregated by
power plant.
1.A.2 Manufacturing
industries and
construction
Emissions from combustion of
gas/diesel oil, heavy fuel oil,
petroleum coke and Liquefied
Petroleum Gas (LPG) for electricity
or heat generation for own use in
industries.
Gas/diesel oil is
considered to be used in
private generators
mainly for electricity
production within the
industrial facilities
generators and in
residential
neighborhoods.
Petroleum coke is only
used by cement
industries.
Emissions are
calculated based on
the tier 1
methodology.
1.A.3 Transport Refer to Table 20
1.A
.4 O
the
r se
cto
rs
1.A.4.a.
Commercial
and
institutional
sector
Emissions from combustion of
gas/diesel oil for electricity
generation and space heating and
LPG for cooking activities in
commercial and institutional
buildings.
Gas/diesel oil is
considered to be used
for electricity production
from generators.
Fuel consumed by
neighborhood
generators is considered
under this category.
Emissions are
calculated based on
the tier 1
methodology.
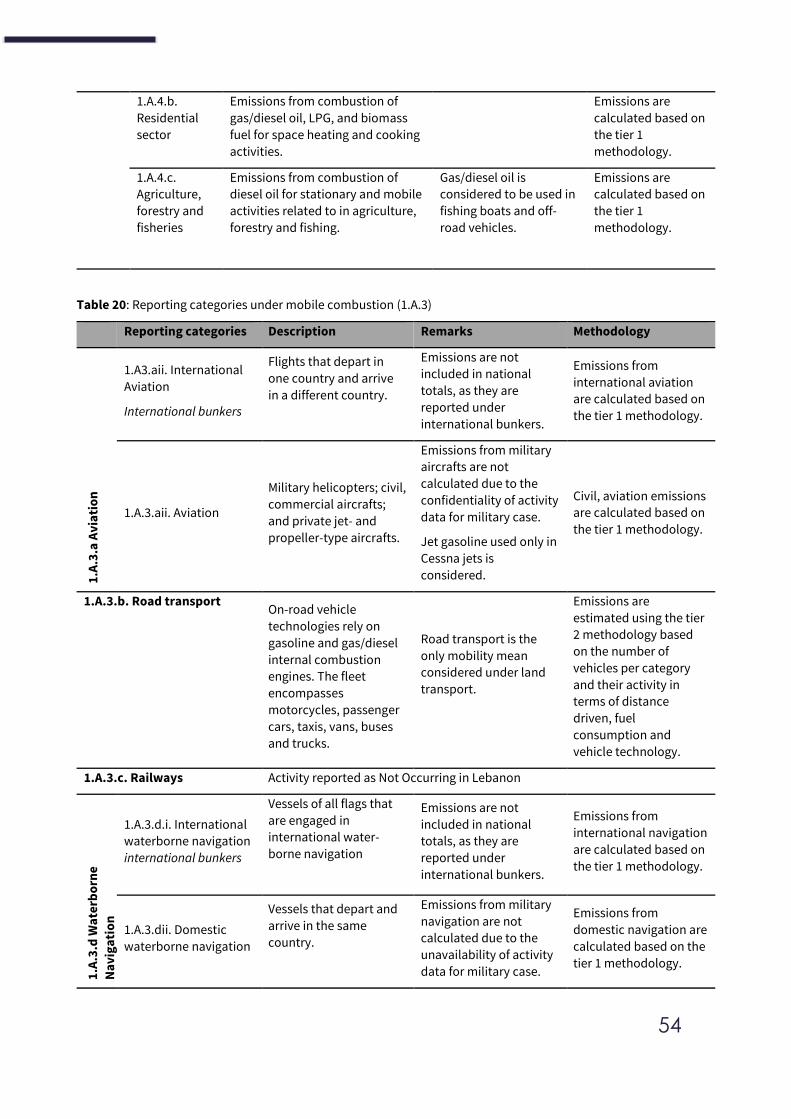
54
1.A.4.b.
Residential
sector
Emissions from combustion of
gas/diesel oil, LPG, and biomass
fuel for space heating and cooking
activities.
Emissions are
calculated based on
the tier 1
methodology.
1.A.4.c.
Agriculture,
forestry and
fisheries
Emissions from combustion of
diesel oil for stationary and mobile
activities related to in agriculture,
forestry and fishing.
Gas/diesel oil is
considered to be used in
fishing boats and off-
road vehicles.
Emissions are
calculated based on
the tier 1
methodology.
Table 20: Reporting categories under mobile combustion (1.A.3)
Reporting categories Description Remarks Methodology
1.A
.3.a
Av
iati
on
1.A3.aii. International
Aviation
International bunkers
Flights that depart in
one country and arrive
in a different country.
Emissions are not
included in national
totals, as they are
reported under
international bunkers.
Emissions from
international aviation
are calculated based on
the tier 1 methodology.
1.A.3.aii. Aviation
Military helicopters; civil,
commercial aircrafts;
and private jet- and
propeller-type aircrafts.
Emissions from military
aircrafts are not
calculated due to the
confidentiality of activity
data for military case.
Jet gasoline used only in
Cessna jets is
considered.
Civil, aviation emissions
are calculated based on
the tier 1 methodology.
1.A.3.b. Road transport On-road vehicle
technologies rely on
gasoline and gas/diesel
internal combustion
engines. The fleet
encompasses
motorcycles, passenger
cars, taxis, vans, buses
and trucks.
Road transport is the
only mobility mean
considered under land
transport.
Emissions are
estimated using the tier
2 methodology based
on the number of
vehicles per category
and their activity in
terms of distance
driven, fuel
consumption and
vehicle technology.
1.A.3.c. Railways Activity reported as Not Occurring in Lebanon
1.A
.3.d
Wa
terb
orn
e
Na
vig
ati
on
1.A.3.d.i. International
waterborne navigation
international bunkers
Vessels of all flags that
are engaged in
international water-
borne navigation
Emissions are not
included in national
totals, as they are
reported under
international bunkers.
Emissions from
international navigation
are calculated based on
the tier 1 methodology.
1.A.3.dii. Domestic
waterborne navigation
Vessels that depart and
arrive in the same
country.
Emissions from military
navigation are not
calculated due to the
unavailability of activity
data for military case.
Emissions from
domestic navigation are
calculated based on the
tier 1 methodology.
55
Emissions from fishing
are not reported under
transport, but rather
under the 1A4ciii,
agriculture/forestry
/fisheries category of the
energy sector.
Due to the absence of an energy balance for Lebanon, and the absence of adequate information on specific
carbon content of the imported fuel, the tier 1 methodology was used for the calculation of the power-related categories.
In the transport sector, due to the unavailability of default tier 2 values as per the 2006 IPCC guidelines and the absence of country-specific emission factors, the tier 1 methodology was adopted for the
calculation of CO2 emissions from road transport for BUR4. The Tier 2 methodology was however used for
the calculation of emissions of CH4 and N2O where respective emissions factors are disaggregated by vehicle technology, fuel and operating conditions.
1.A.1 Energy industries
Methodology
The category covered under 1.A.1 energy industries is 1.A.1.a.i electricity generation. The remaining categories such as 1.A.1.B petroleum refining and 1.A.1.c. manufacture of solid fuels are reported as not occurring.
In Lebanon, the category 1.A.1 energy industries considers all heavy fuel oil and gas/diesel oil consumed by public thermal power plants to generate electricity, including the 2 rented power barges located in
Zouk and Jiyeh. Emissions from lubricant use for co-combustion and, since 2017, emissions from the use of the Naameh landfill gas for energy production, are included under this category.
Emissions from purchases of electricity from Syria are not accounted in the national totals.
Although this category is a key category under the level and trend assessments, tier 1 methodology is used with annual fuel consumption per power plant as activity data, fuel-specific NCV and default emission factors. The inventory team is making efforts in estimating the carbon content of the imported fuel to be able to use a higher tier. Improvements will be reported in subsequent inventories.
Activity data, emission factors and other parameters
The amounts of fuel consumed in power plants and barges as well as the annual stock has been provided by Electricité du Liban (EDL) for the years 2016-2018, disaggregated per power plant and per fuel type. The amount of electricity being generated by the recovery of the landfill gas of the Naameh landfill has been
provided by the Ministry of Energy and Water.
The amount of lubricants is provided by the Lebanese Customs database (HS Code 2170.19.90; by net
weight of import). Since insignificant amounts of lubricants are used in industries and other facilities, it is assumed that all imported lubricants are consumed by EDL power plants in co-combustion processes.
Due to the lack of country specific emission factors and emissions measurements, default emission factors for CO2, CH4 and N2O have been used based on the 2006 IPCC Guidelines. Fuel-specific Net Calorific Value
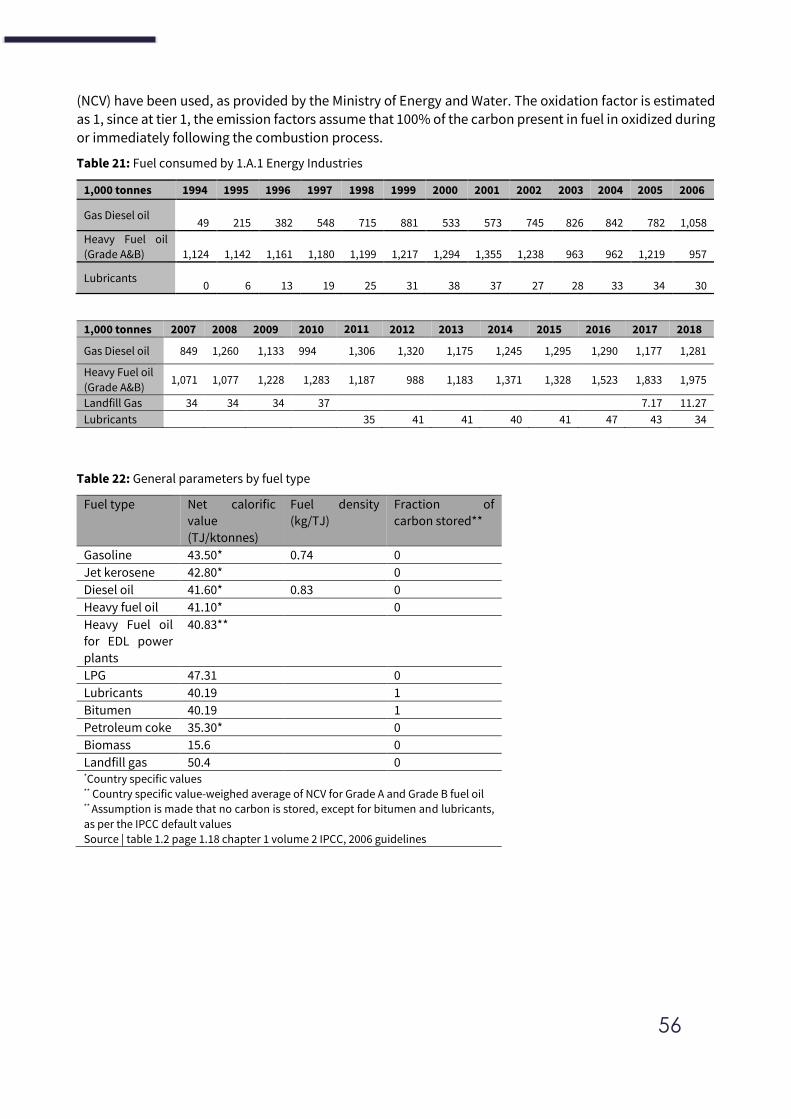
56
(NCV) have been used, as provided by the Ministry of Energy and Water. The oxidation factor is estimated
as 1, since at tier 1, the emission factors assume that 100% of the carbon present in fuel in oxidized during
or immediately following the combustion process.
Table 21: Fuel consumed by 1.A.1 Energy Industries
1,000 tonnes 1994 1995 1996 1997 1998 1999 2000 2001 2002 2003 2004 2005 2006
Gas Diesel oil
49
215
382
548
715
881
533
573
745
826
842
782
1,058
Heavy Fuel oil
(Grade A&B)
1,124
1,142
1,161
1,180
1,199
1,217
1,294
1,355
1,238
963
962
1,219
957
Lubricants
0
6
13
19
25
31
38
37
27
28
33
34
30
Table 22: General parameters by fuel type
Fuel type Net calorific
value
(TJ/ktonnes)
Fuel density
(kg/TJ)
Fraction of
carbon stored**
Gasoline 43.50* 0.74 0
Jet kerosene 42.80* 0
Diesel oil 41.60* 0.83 0
Heavy fuel oil 41.10* 0
Heavy Fuel oil
for EDL power
plants
40.83**
LPG 47.31 0
Lubricants 40.19 1
Bitumen 40.19 1
Petroleum coke 35.30* 0
Biomass 15.6 0
Landfill gas 50.4 0 *Country specific values ** Country specific value-weighed average of NCV for Grade A and Grade B fuel oil ** Assumption is made that no carbon is stored, except for bitumen and lubricants,
as per the IPCC default values
Source | table 1.2 page 1.18 chapter 1 volume 2 IPCC, 2006 guidelines
1,000 tonnes 2007 2008 2009 2010 2011 2012 2013 2014 2015 2016 2017 2018
Gas Diesel oil 849 1,260 1,133 994 1,306 1,320 1,175 1,245 1,295 1,290 1,177 1,281
Heavy Fuel oil
(Grade A&B) 1,071 1,077 1,228 1,283 1,187 988 1,183 1,371 1,328 1,523 1,833 1,975
Landfill Gas 34 34 34 37 7.17 11.27
Lubricants 35 41 41 40 41 47 43 34
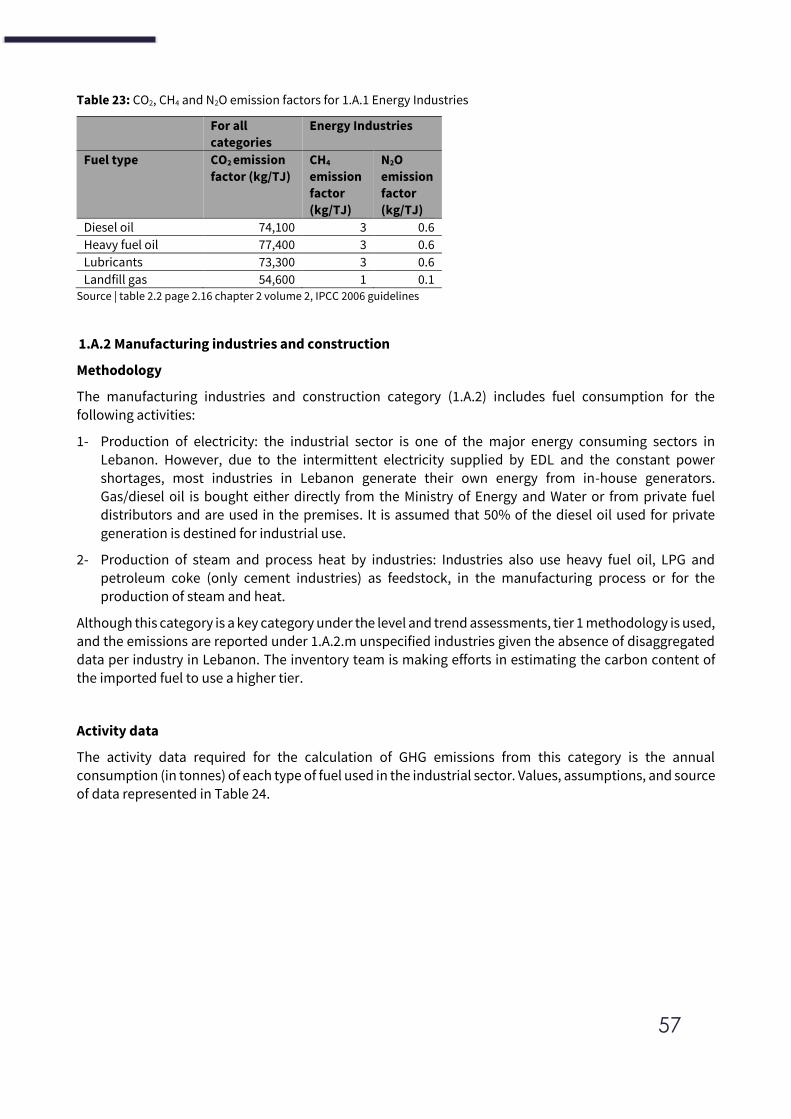
57
Table 23: CO2, CH4 and N2O emission factors for 1.A.1 Energy Industries
For all
categories
Energy Industries
Fuel type CO2 emission
factor (kg/TJ)
CH4
emission
factor
(kg/TJ)
N2O
emission
factor
(kg/TJ)
Diesel oil 74,100 3 0.6
Heavy fuel oil 77,400 3 0.6
Lubricants 73,300 3 0.6
Landfill gas 54,600 1 0.1 Source | table 2.2 page 2.16 chapter 2 volume 2, IPCC 2006 guidelines
1.A.2 Manufacturing industries and construction
Methodology
The manufacturing industries and construction category (1.A.2) includes fuel consumption for the following activities:
1- Production of electricity: the industrial sector is one of the major energy consuming sectors in Lebanon. However, due to the intermittent electricity supplied by EDL and the constant power
shortages, most industries in Lebanon generate their own energy from in-house generators. Gas/diesel oil is bought either directly from the Ministry of Energy and Water or from private fuel distributors and are used in the premises. It is assumed that 50% of the diesel oil used for private
generation is destined for industrial use.
2- Production of steam and process heat by industries: Industries also use heavy fuel oil, LPG and
petroleum coke (only cement industries) as feedstock, in the manufacturing process or for the production of steam and heat.
Although this category is a key category under the level and trend assessments, tier 1 methodology is used, and the emissions are reported under 1.A.2.m unspecified industries given the absence of disaggregated
data per industry in Lebanon. The inventory team is making efforts in estimating the carbon content of
the imported fuel to use a higher tier.
Activity data
The activity data required for the calculation of GHG emissions from this category is the annual consumption (in tonnes) of each type of fuel used in the industrial sector. Values, assumptions, and source
of data represented in Table 24.
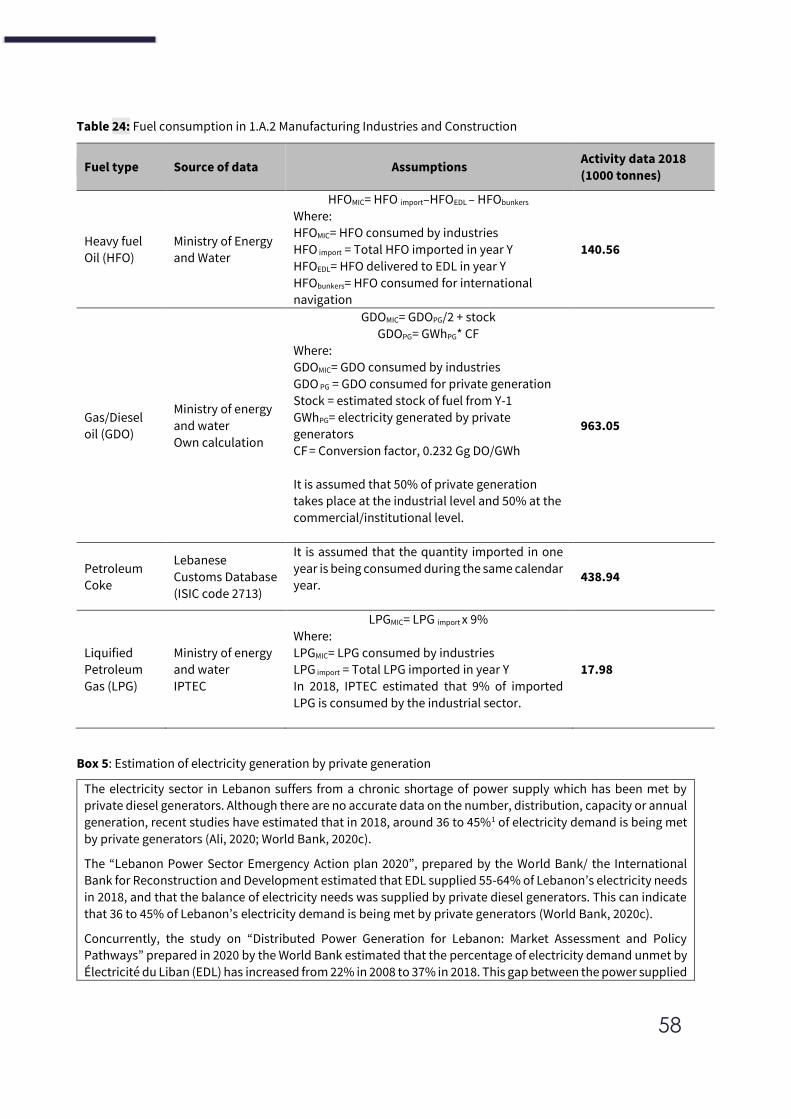
58
Table 24: Fuel consumption in 1.A.2 Manufacturing Industries and Construction
Fuel type Source of data Assumptions Activity data 2018
(1000 tonnes)
Heavy fuel
Oil (HFO)
Ministry of Energy
and Water
HFOMIC= HFO import–HFOEDL – HFObunkers
Where:
HFOMIC= HFO consumed by industries
HFO import = Total HFO imported in year Y
HFOEDL= HFO delivered to EDL in year Y
HFObunkers= HFO consumed for international
navigation
140.56
Gas/Diesel
oil (GDO)
Ministry of energy
and water
Own calculation
GDOMIC= GDOPG/2 + stock
GDOPG= GWhPG* CF
Where:
GDOMIC= GDO consumed by industries
GDO PG = GDO consumed for private generation
Stock = estimated stock of fuel from Y-1
GWhPG= electricity generated by private
generators
CF = Conversion factor, 0.232 Gg DO/GWh
It is assumed that 50% of private generation
takes place at the industrial level and 50% at the
commercial/institutional level.
963.05
Petroleum
Coke
Lebanese
Customs Database
(ISIC code 2713)
It is assumed that the quantity imported in one
year is being consumed during the same calendar
year.
438.94
Liquified
Petroleum
Gas (LPG)
Ministry of energy
and water
IPTEC
LPGMIC= LPG import x 9%
Where:
LPGMIC= LPG consumed by industries
LPG import = Total LPG imported in year Y
In 2018, IPTEC estimated that 9% of imported
LPG is consumed by the industrial sector.
17.98
Box 5: Estimation of electricity generation by private generation
The electricity sector in Lebanon suffers from a chronic shortage of power supply which has been met by
private diesel generators. Although there are no accurate data on the number, distribution, capacity or annual
generation, recent studies have estimated that in 2018, around 36 to 45%1 of electricity demand is being met
by private generators (Ali, 2020; World Bank, 2020c).
The “Lebanon Power Sector Emergency Action plan 2020”, prepared by the World Bank/ the International
Bank for Reconstruction and Development estimated that EDL supplied 55-64% of Lebanon’s electricity needs
in 2018, and that the balance of electricity needs was supplied by private diesel generators. This can indicate
that 36 to 45% of Lebanon’s electricity demand is being met by private generators (World Bank, 2020c).
Concurrently, the study on “Distributed Power Generation for Lebanon: Market Assessment and Policy
Pathways” prepared in 2020 by the World Bank estimated that the percentage of electricity demand unmet by
Électricité du Liban (EDL) has increased from 22% in 2008 to 37% in 2018. This gap between the power supplied
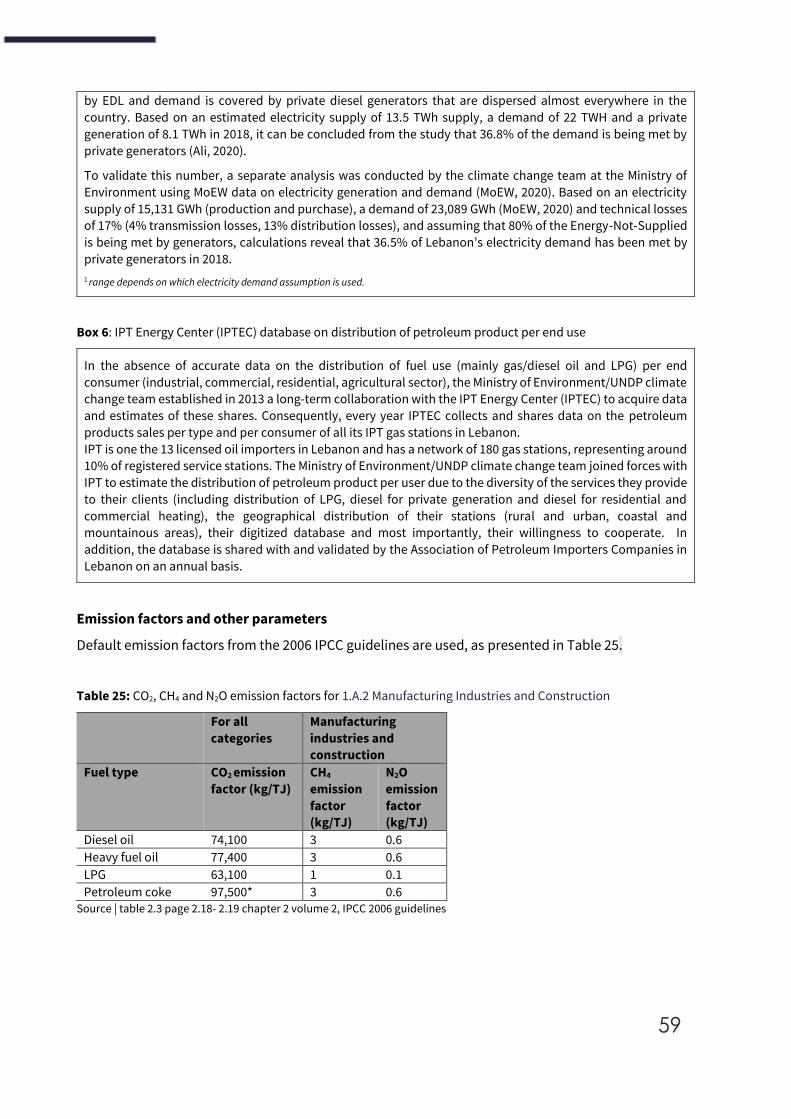
59
by EDL and demand is covered by private diesel generators that are dispersed almost everywhere in the
country. Based on an estimated electricity supply of 13.5 TWh supply, a demand of 22 TWH and a private
generation of 8.1 TWh in 2018, it can be concluded from the study that 36.8% of the demand is being met by
private generators (Ali, 2020).
To validate this number, a separate analysis was conducted by the climate change team at the Ministry of
Environment using MoEW data on electricity generation and demand (MoEW, 2020). Based on an electricity
supply of 15,131 GWh (production and purchase), a demand of 23,089 GWh (MoEW, 2020) and technical losses
of 17% (4% transmission losses, 13% distribution losses), and assuming that 80% of the Energy-Not-Supplied
is being met by generators, calculations reveal that 36.5% of Lebanon’s electricity demand has been met by
private generators in 2018.
1 range depends on which electricity demand assumption is used.
Box 6: IPT Energy Center (IPTEC) database on distribution of petroleum product per end use
In the absence of accurate data on the distribution of fuel use (mainly gas/diesel oil and LPG) per end
consumer (industrial, commercial, residential, agricultural sector), the Ministry of Environment/UNDP climate
change team established in 2013 a long-term collaboration with the IPT Energy Center (IPTEC) to acquire data
and estimates of these shares. Consequently, every year IPTEC collects and shares data on the petroleum
products sales per type and per consumer of all its IPT gas stations in Lebanon.
IPT is one the 13 licensed oil importers in Lebanon and has a network of 180 gas stations, representing around
10% of registered service stations. The Ministry of Environment/UNDP climate change team joined forces with
IPT to estimate the distribution of petroleum product per user due to the diversity of the services they provide
to their clients (including distribution of LPG, diesel for private generation and diesel for residential and
commercial heating), the geographical distribution of their stations (rural and urban, coastal and
mountainous areas), their digitized database and most importantly, their willingness to cooperate. In
addition, the database is shared with and validated by the Association of Petroleum Importers Companies in
Lebanon on an annual basis.
Emission factors and other parameters
Default emission factors from the 2006 IPCC guidelines are used, as presented in Table 25.
Table 25: CO2, CH4 and N2O emission factors for 1.A.2 Manufacturing Industries and Construction
For all
categories
Manufacturing
industries and
construction
Fuel type CO2 emission
factor (kg/TJ)
CH4
emission
factor
(kg/TJ)
N2O
emission
factor
(kg/TJ)
Diesel oil 74,100 3 0.6
Heavy fuel oil 77,400 3 0.6
LPG 63,100 1 0.1
Petroleum coke 97,500* 3 0.6 Source | table 2.3 page 2.18- 2.19 chapter 2 volume 2, IPCC 2006 guidelines
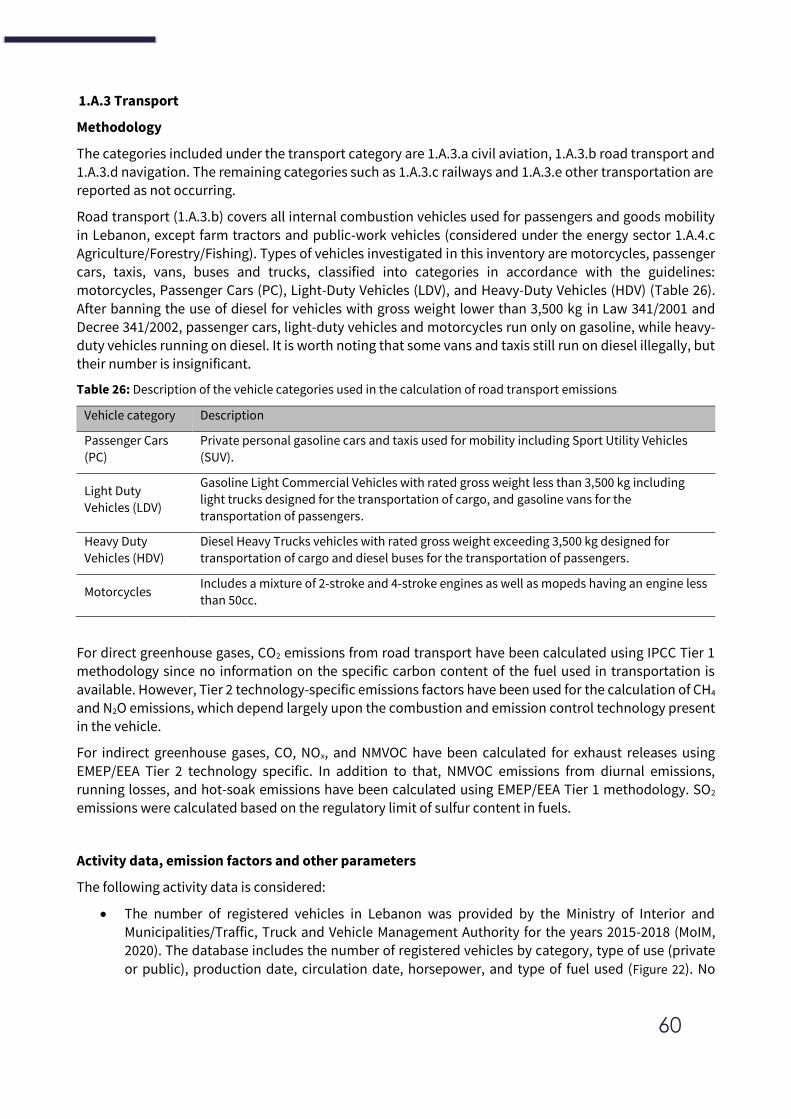
60
1.A.3 Transport
Methodology
The categories included under the transport category are 1.A.3.a civil aviation, 1.A.3.b road transport and 1.A.3.d navigation. The remaining categories such as 1.A.3.c railways and 1.A.3.e other transportation are reported as not occurring.
Road transport (1.A.3.b) covers all internal combustion vehicles used for passengers and goods mobility
in Lebanon, except farm tractors and public-work vehicles (considered under the energy sector 1.A.4.c Agriculture/Forestry/Fishing). Types of vehicles investigated in this inventory are motorcycles, passenger cars, taxis, vans, buses and trucks, classified into categories in accordance with the guidelines: motorcycles, Passenger Cars (PC), Light-Duty Vehicles (LDV), and Heavy-Duty Vehicles (HDV) (Table 26).
After banning the use of diesel for vehicles with gross weight lower than 3,500 kg in Law 341/2001 and
Decree 341/2002, passenger cars, light-duty vehicles and motorcycles run only on gasoline, while heavy-duty vehicles running on diesel. It is worth noting that some vans and taxis still run on diesel illegally, but their number is insignificant.
Table 26: Description of the vehicle categories used in the calculation of road transport emissions
Vehicle category Description
Passenger Cars
(PC)
Private personal gasoline cars and taxis used for mobility including Sport Utility Vehicles
(SUV).
Light Duty
Vehicles (LDV)
Gasoline Light Commercial Vehicles with rated gross weight less than 3,500 kg including
light trucks designed for the transportation of cargo, and gasoline vans for the
transportation of passengers.
Heavy Duty
Vehicles (HDV)
Diesel Heavy Trucks vehicles with rated gross weight exceeding 3,500 kg designed for
transportation of cargo and diesel buses for the transportation of passengers.
Motorcycles Includes a mixture of 2-stroke and 4-stroke engines as well as mopeds having an engine less
than 50cc.
For direct greenhouse gases, CO2 emissions from road transport have been calculated using IPCC Tier 1 methodology since no information on the specific carbon content of the fuel used in transportation is
available. However, Tier 2 technology-specific emissions factors have been used for the calculation of CH4 and N2O emissions, which depend largely upon the combustion and emission control technology present
in the vehicle.
For indirect greenhouse gases, CO, NOx, and NMVOC have been calculated for exhaust releases using
EMEP/EEA Tier 2 technology specific. In addition to that, NMVOC emissions from diurnal emissions,
running losses, and hot-soak emissions have been calculated using EMEP/EEA Tier 1 methodology. SO2 emissions were calculated based on the regulatory limit of sulfur content in fuels.
Activity data, emission factors and other parameters
The following activity data is considered:
• The number of registered vehicles in Lebanon was provided by the Ministry of Interior and Municipalities/Traffic, Truck and Vehicle Management Authority for the years 2015-2018 (MoIM,
2020). The database includes the number of registered vehicles by category, type of use (private
or public), production date, circulation date, horsepower, and type of fuel used (Figure 22). No
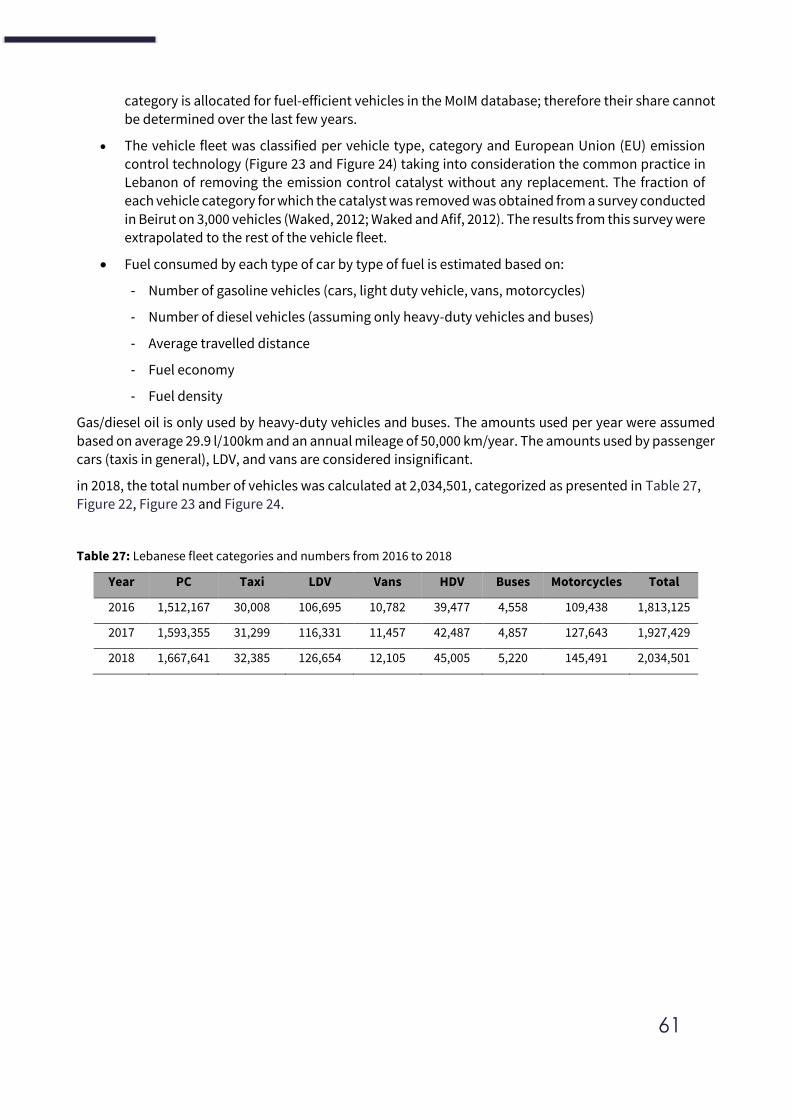
61
category is allocated for fuel-efficient vehicles in the MoIM database; therefore their share cannot
be determined over the last few years.
• The vehicle fleet was classified per vehicle type, category and European Union (EU) emission control technology (Figure 23 and Figure 24) taking into consideration the common practice in Lebanon of removing the emission control catalyst without any replacement. The fraction of each vehicle category for which the catalyst was removed was obtained from a survey conducted
in Beirut on 3,000 vehicles (Waked, 2012; Waked and Afif, 2012). The results from this survey were extrapolated to the rest of the vehicle fleet.
• Fuel consumed by each type of car by type of fuel is estimated based on:
- Number of gasoline vehicles (cars, light duty vehicle, vans, motorcycles)
- Number of diesel vehicles (assuming only heavy-duty vehicles and buses)
- Average travelled distance
- Fuel economy
- Fuel density
Gas/diesel oil is only used by heavy-duty vehicles and buses. The amounts used per year were assumed
based on average 29.9 l/100km and an annual mileage of 50,000 km/year. The amounts used by passenger
cars (taxis in general), LDV, and vans are considered insignificant.
in 2018, the total number of vehicles was calculated at 2,034,501, categorized as presented in Table 27,
Figure 22, Figure 23 and Figure 24.
Table 27: Lebanese fleet categories and numbers from 2016 to 2018
Year PC Taxi LDV Vans HDV Buses Motorcycles Total
2016 1,512,167 30,008 106,695 10,782 39,477 4,558 109,438 1,813,125
2017 1,593,355 31,299 116,331 11,457 42,487 4,857 127,643 1,927,429
2018 1,667,641 32,385 126,654 12,105 45,005 5,220 145,491 2,034,501
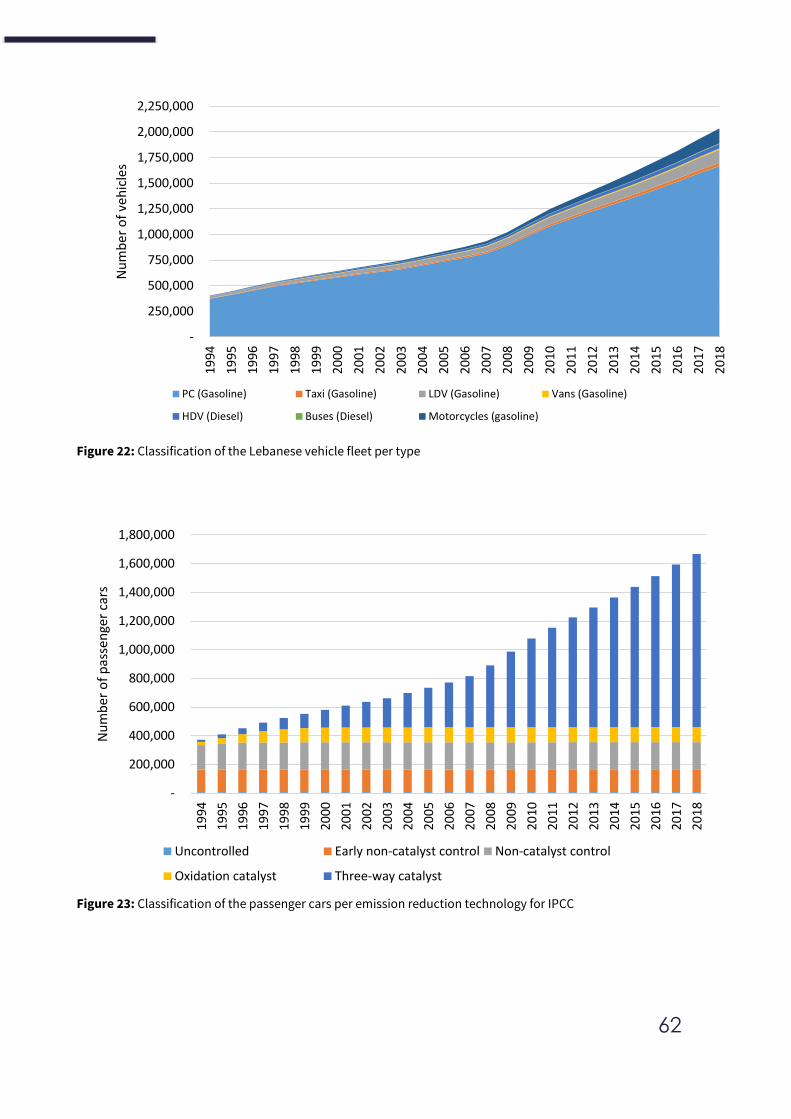
62
Figure 22: Classification of the Lebanese vehicle fleet per type
Figure 23: Classification of the passenger cars per emission reduction technology for IPCC
-
250,000
500,000
750,000
1,000,000
1,250,000
1,500,000
1,750,000
2,000,000
2,250,000
19
94
19
95
19
96
19
97
19
98
19
99
2000
20
01
20
02
20
03
20
04
2005
20
06
20
07
20
08
20
09
20
10
20
11
20
12
20
13
20
14
20
15
20
16
20
17
20
18
Nu
mb
er o
f ve
hic
les
PC (Gasoline) Taxi (Gasoline) LDV (Gasoline) Vans (Gasoline)
HDV (Diesel) Buses (Diesel) Motorcycles (gasoline)
-
200,000
400,000
600,000
800,000
1,000,000
1,200,000
1,400,000
1,600,000
1,800,000
1994
1995
1996
1997
1998
1999
2000
2001
2002
2003
2004
2005
2006
2007
2008
2009
2010
2011
2012
2013
2014
2015
2016
2017
2018
Nu
mb
er o
f p
asse
nge
r ca
rs
Uncontrolled Early non-catalyst control Non-catalyst control
Oxidation catalyst Three-way catalyst
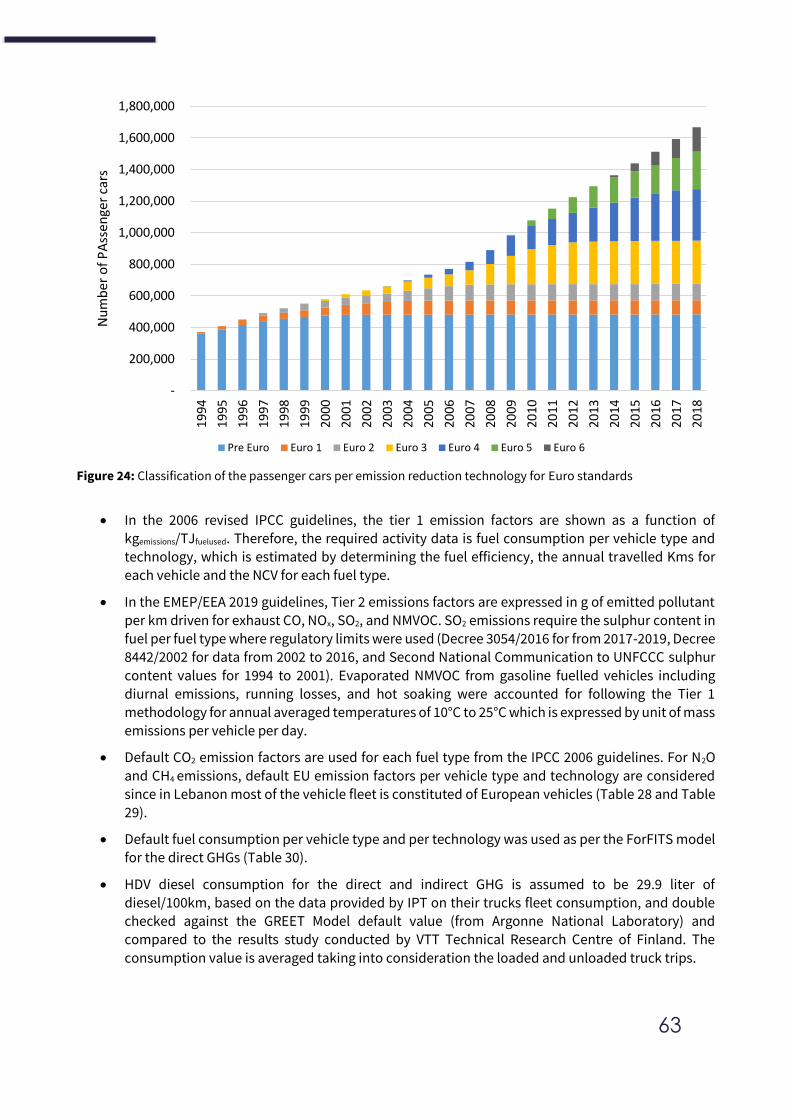
63
Figure 24: Classification of the passenger cars per emission reduction technology for Euro standards
• In the 2006 revised IPCC guidelines, the tier 1 emission factors are shown as a function of kgemissions/TJfuelused. Therefore, the required activity data is fuel consumption per vehicle type and technology, which is estimated by determining the fuel efficiency, the annual travelled Kms for
each vehicle and the NCV for each fuel type.
• In the EMEP/EEA 2019 guidelines, Tier 2 emissions factors are expressed in g of emitted pollutant
per km driven for exhaust CO, NOx, SO2, and NMVOC. SO2 emissions require the sulphur content in fuel per fuel type where regulatory limits were used (Decree 3054/2016 for from 2017-2019, Decree 8442/2002 for data from 2002 to 2016, and Second National Communication to UNFCCC sulphur
content values for 1994 to 2001). Evaporated NMVOC from gasoline fuelled vehicles including
diurnal emissions, running losses, and hot soaking were accounted for following the Tier 1 methodology for annual averaged temperatures of 10°C to 25°C which is expressed by unit of mass emissions per vehicle per day.
• Default CO2 emission factors are used for each fuel type from the IPCC 2006 guidelines. For N2O
and CH4 emissions, default EU emission factors per vehicle type and technology are considered since in Lebanon most of the vehicle fleet is constituted of European vehicles (Table 28 and Table 29).
• Default fuel consumption per vehicle type and per technology was used as per the ForFITS model
for the direct GHGs (Table 30).
• HDV diesel consumption for the direct and indirect GHG is assumed to be 29.9 liter of
diesel/100km, based on the data provided by IPT on their trucks fleet consumption, and double checked against the GREET Model default value (from Argonne National Laboratory) and compared to the results study conducted by VTT Technical Research Centre of Finland. The
consumption value is averaged taking into consideration the loaded and unloaded truck trips.
-
200,000
400,000
600,000
800,000
1,000,000
1,200,000
1,400,000
1,600,000
1,800,000
19
94
19
95
19
96
19
97
19
98
19
99
20
00
20
01
20
02
20
03
20
04
20
05
20
06
20
07
20
08
20
09
20
10
2011
20
12
20
13
20
14
20
15
20
16
20
17
2018
Nu
mb
er o
f P
Ass
enge
r ca
rs
Pre Euro Euro 1 Euro 2 Euro 3 Euro 4 Euro 5 Euro 6
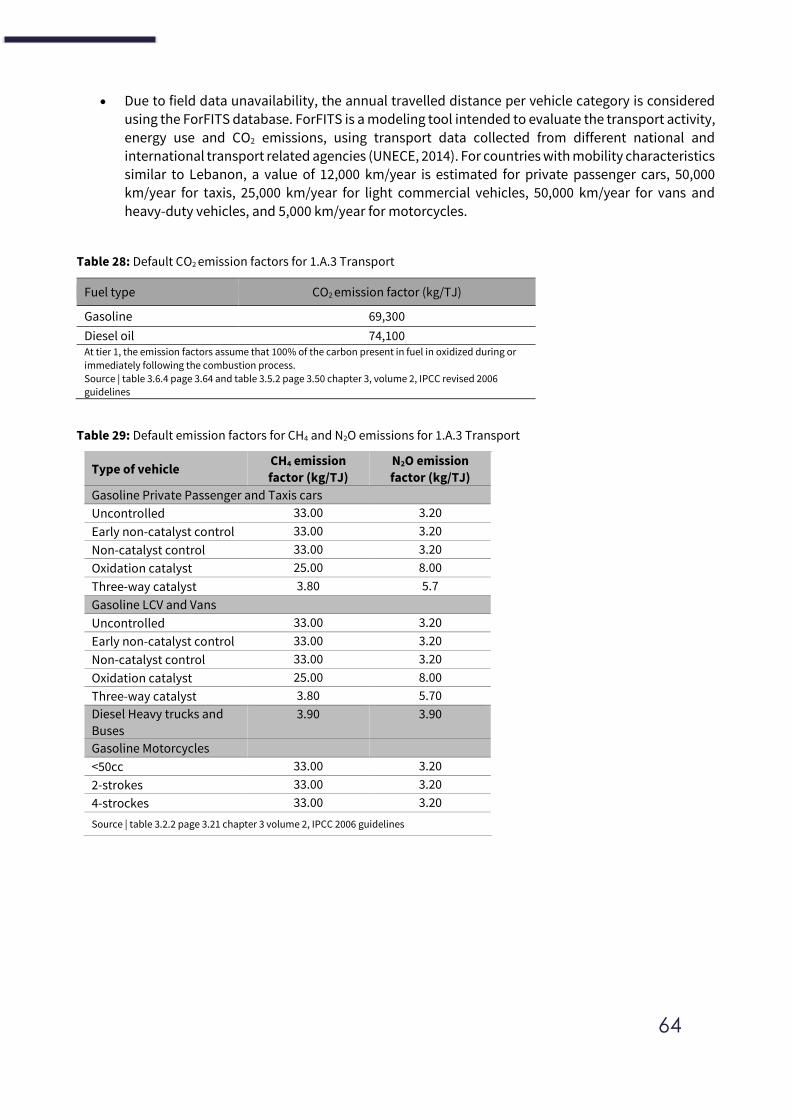
64
• Due to field data unavailability, the annual travelled distance per vehicle category is considered
using the ForFITS database. ForFITS is a modeling tool intended to evaluate the transport activity,
energy use and CO2 emissions, using transport data collected from different national and international transport related agencies (UNECE, 2014). For countries with mobility characteristics similar to Lebanon, a value of 12,000 km/year is estimated for private passenger cars, 50,000 km/year for taxis, 25,000 km/year for light commercial vehicles, 50,000 km/year for vans and
heavy-duty vehicles, and 5,000 km/year for motorcycles.
Table 28: Default CO2 emission factors for 1.A.3 Transport
Fuel type CO2 emission factor (kg/TJ)
Gasoline 69,300
Diesel oil 74,100 At tier 1, the emission factors assume that 100% of the carbon present in fuel in oxidized during or
immediately following the combustion process.
Source | table 3.6.4 page 3.64 and table 3.5.2 page 3.50 chapter 3, volume 2, IPCC revised 2006 guidelines
Table 29: Default emission factors for CH4 and N2O emissions for 1.A.3 Transport
Type of vehicle CH4 emission
factor (kg/TJ)
N2O emission
factor (kg/TJ)
Gasoline Private Passenger and Taxis cars
Uncontrolled 33.00 3.20
Early non-catalyst control 33.00 3.20
Non-catalyst control 33.00 3.20
Oxidation catalyst 25.00 8.00
Three-way catalyst 3.80 5.7
Gasoline LCV and Vans
Uncontrolled 33.00 3.20
Early non-catalyst control 33.00 3.20
Non-catalyst control 33.00 3.20
Oxidation catalyst 25.00 8.00
Three-way catalyst 3.80 5.70
Diesel Heavy trucks and
Buses
3.90 3.90
Gasoline Motorcycles
<50cc 33.00 3.20
2-strokes 33.00 3.20
4-strockes 33.00 3.20
Source | table 3.2.2 page 3.21 chapter 3 volume 2, IPCC 2006 guidelines
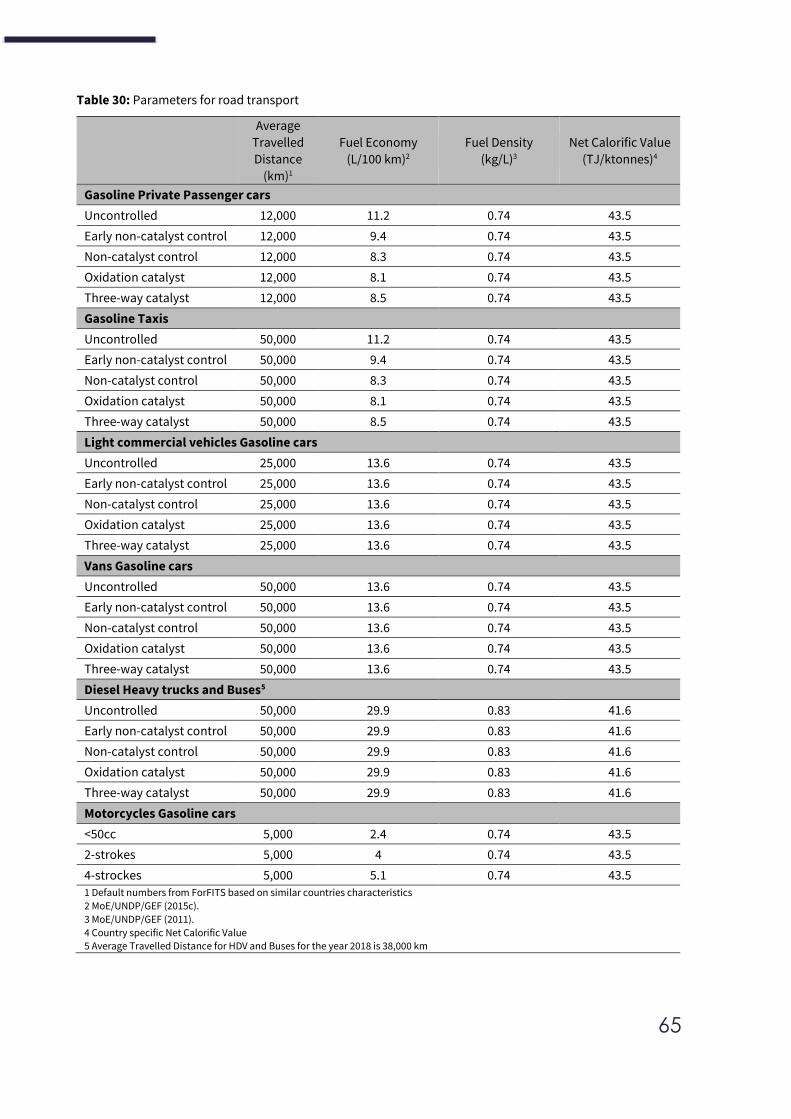
65
Table 30: Parameters for road transport
Average
Travelled
Distance
(km)1
Fuel Economy
(L/100 km)2
Fuel Density
(kg/L)3
Net Calorific Value
(TJ/ktonnes)4
Gasoline Private Passenger cars
Uncontrolled 12,000 11.2 0.74 43.5
Early non-catalyst control 12,000 9.4 0.74 43.5
Non-catalyst control 12,000 8.3 0.74 43.5
Oxidation catalyst 12,000 8.1 0.74 43.5
Three-way catalyst 12,000 8.5 0.74 43.5
Gasoline Taxis
Uncontrolled 50,000 11.2 0.74 43.5
Early non-catalyst control 50,000 9.4 0.74 43.5
Non-catalyst control 50,000 8.3 0.74 43.5
Oxidation catalyst 50,000 8.1 0.74 43.5
Three-way catalyst 50,000 8.5 0.74 43.5
Light commercial vehicles Gasoline cars
Uncontrolled 25,000 13.6 0.74 43.5
Early non-catalyst control 25,000 13.6 0.74 43.5
Non-catalyst control 25,000 13.6 0.74 43.5
Oxidation catalyst 25,000 13.6 0.74 43.5
Three-way catalyst 25,000 13.6 0.74 43.5
Vans Gasoline cars
Uncontrolled 50,000 13.6 0.74 43.5
Early non-catalyst control 50,000 13.6 0.74 43.5
Non-catalyst control 50,000 13.6 0.74 43.5
Oxidation catalyst 50,000 13.6 0.74 43.5
Three-way catalyst 50,000 13.6 0.74 43.5
Diesel Heavy trucks and Buses5
Uncontrolled 50,000 29.9 0.83 41.6
Early non-catalyst control 50,000 29.9 0.83 41.6
Non-catalyst control 50,000 29.9 0.83 41.6
Oxidation catalyst 50,000 29.9 0.83 41.6
Three-way catalyst 50,000 29.9 0.83 41.6
Motorcycles Gasoline cars
<50cc 5,000 2.4 0.74 43.5
2-strokes 5,000 4 0.74 43.5
4-strockes 5,000 5.1 0.74 43.5 1 Default numbers from ForFITS based on similar countries characteristics
2 MoE/UNDP/GEF (2015c).
3 MoE/UNDP/GEF (2011).
4 Country specific Net Calorific Value 5 Average Travelled Distance for HDV and Buses for the year 2018 is 38,000 km
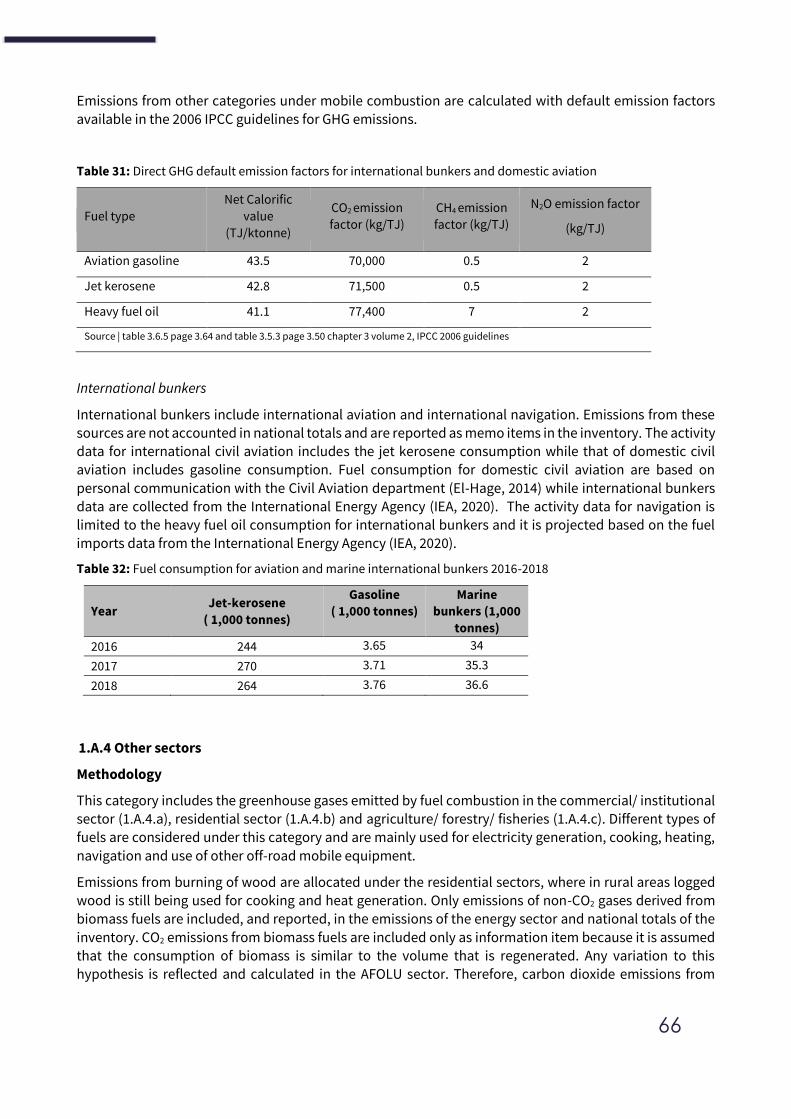
66
Emissions from other categories under mobile combustion are calculated with default emission factors
available in the 2006 IPCC guidelines for GHG emissions.
Table 31: Direct GHG default emission factors for international bunkers and domestic aviation
Fuel type
Net Calorific
value
(TJ/ktonne)
CO2 emission
factor (kg/TJ)
CH4 emission
factor (kg/TJ)
N2O emission factor
(kg/TJ)
Aviation gasoline 43.5 70,000 0.5 2
Jet kerosene 42.8 71,500 0.5 2
Heavy fuel oil 41.1 77,400 7 2
Source | table 3.6.5 page 3.64 and table 3.5.3 page 3.50 chapter 3 volume 2, IPCC 2006 guidelines
International bunkers
International bunkers include international aviation and international navigation. Emissions from these sources are not accounted in national totals and are reported as memo items in the inventory. The activity
data for international civil aviation includes the jet kerosene consumption while that of domestic civil aviation includes gasoline consumption. Fuel consumption for domestic civil aviation are based on
personal communication with the Civil Aviation department (El-Hage, 2014) while international bunkers data are collected from the International Energy Agency (IEA, 2020). The activity data for navigation is limited to the heavy fuel oil consumption for international bunkers and it is projected based on the fuel
imports data from the International Energy Agency (IEA, 2020).
Table 32: Fuel consumption for aviation and marine international bunkers 2016-2018
Year Jet-kerosene
( 1,000 tonnes)
Gasoline
( 1,000 tonnes)
Marine
bunkers (1,000
tonnes)
2016 244 3.65 34
2017 270 3.71 35.3
2018 264 3.76 36.6
1.A.4 Other sectors
Methodology
This category includes the greenhouse gases emitted by fuel combustion in the commercial/ institutional sector (1.A.4.a), residential sector (1.A.4.b) and agriculture/ forestry/ fisheries (1.A.4.c). Different types of
fuels are considered under this category and are mainly used for electricity generation, cooking, heating,
navigation and use of other off-road mobile equipment.
Emissions from burning of wood are allocated under the residential sectors, where in rural areas logged wood is still being used for cooking and heat generation. Only emissions of non-CO2 gases derived from biomass fuels are included, and reported, in the emissions of the energy sector and national totals of the
inventory. CO2 emissions from biomass fuels are included only as information item because it is assumed that the consumption of biomass is similar to the volume that is regenerated. Any variation to this
hypothesis is reflected and calculated in the AFOLU sector. Therefore, carbon dioxide emissions from
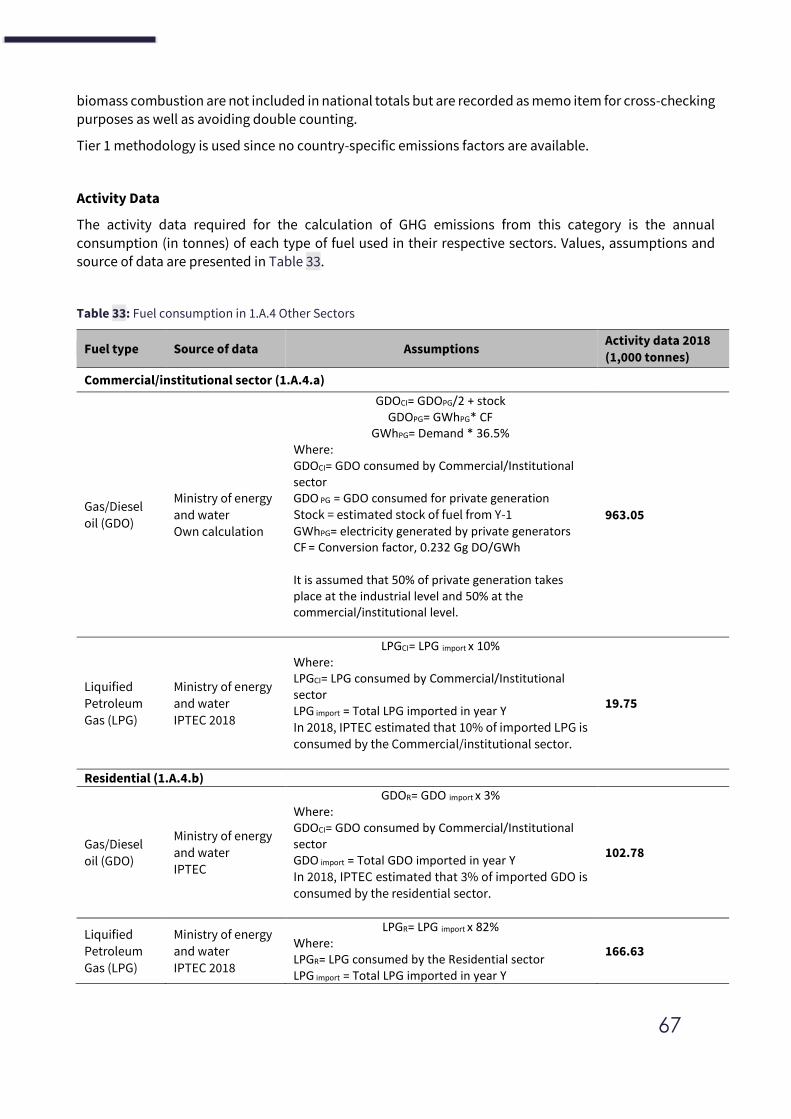
67
biomass combustion are not included in national totals but are recorded as memo item for cross-checking
purposes as well as avoiding double counting.
Tier 1 methodology is used since no country-specific emissions factors are available.
Activity Data
The activity data required for the calculation of GHG emissions from this category is the annual
consumption (in tonnes) of each type of fuel used in their respective sectors. Values, assumptions and source of data are presented in Table 33.
Table 33: Fuel consumption in 1.A.4 Other Sectors
Fuel type Source of data Assumptions Activity data 2018
(1,000 tonnes)
Commercial/institutional sector (1.A.4.a)
Gas/Diesel
oil (GDO)
Ministry of energy
and water
Own calculation
GDOCI= GDOPG/2 + stock GDOPG= GWhPG* CF
GWhPG= Demand * 36.5% Where: GDOCI= GDO consumed by Commercial/Institutional sector GDO PG = GDO consumed for private generation
Stock = estimated stock of fuel from Y-1 GWhPG= electricity generated by private generators CF = Conversion factor, 0.232 Gg DO/GWh It is assumed that 50% of private generation takes place at the industrial level and 50% at the commercial/institutional level.
963.05
Liquified
Petroleum
Gas (LPG)
Ministry of energy
and water
IPTEC 2018
LPGCI= LPG import x 10%
Where: LPGCI= LPG consumed by Commercial/Institutional sector LPG import = Total LPG imported in year Y
In 2018, IPTEC estimated that 10% of imported LPG is
consumed by the Commercial/institutional sector.
19.75
Residential (1.A.4.b)
Gas/Diesel
oil (GDO)
Ministry of energy
and water
IPTEC
GDOR= GDO import x 3%
Where: GDOCI= GDO consumed by Commercial/Institutional sector GDO import = Total GDO imported in year Y
In 2018, IPTEC estimated that 3% of imported GDO is
consumed by the residential sector.
102.78
Liquified
Petroleum
Gas (LPG)
Ministry of energy
and water
IPTEC 2018
LPGR= LPG import x 82%
Where: LPGR= LPG consumed by the Residential sector LPG import = Total LPG imported in year Y
166.63
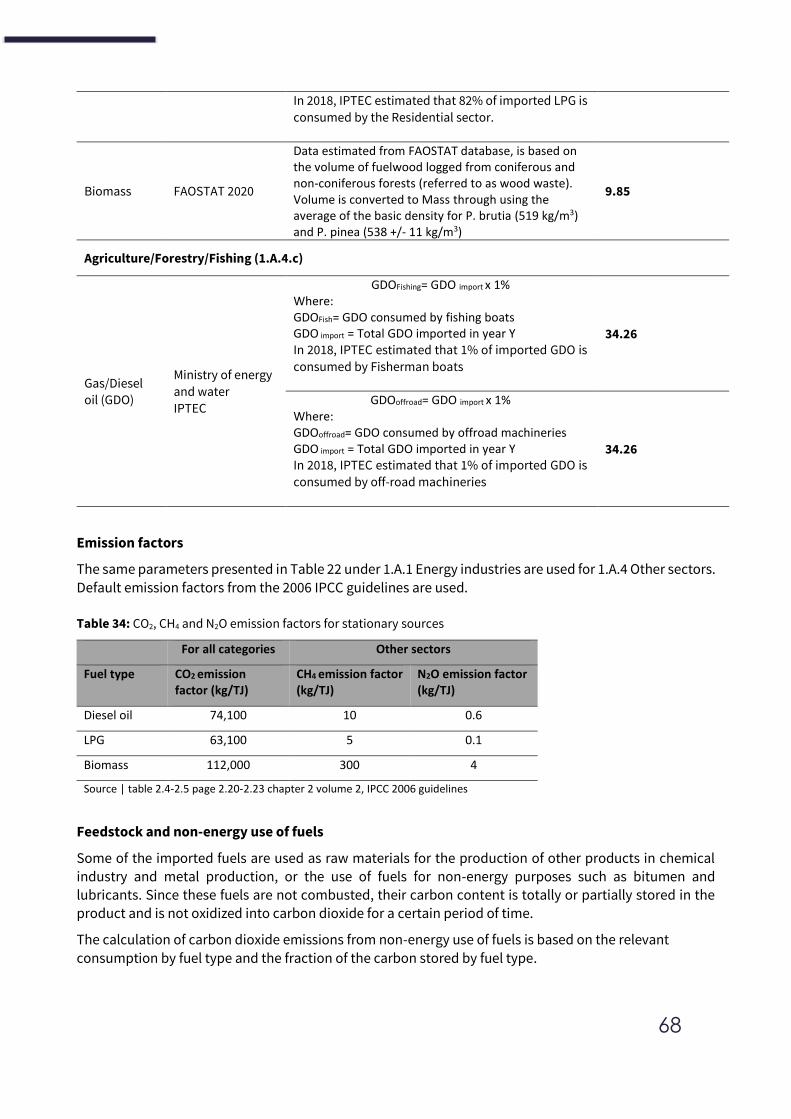
68
In 2018, IPTEC estimated that 82% of imported LPG is
consumed by the Residential sector.
Biomass FAOSTAT 2020
Data estimated from FAOSTAT database, is based on the volume of fuelwood logged from coniferous and non-coniferous forests (referred to as wood waste). Volume is converted to Mass through using the average of the basic density for P. brutia (519 kg/m3) and P. pinea (538 +/- 11 kg/m3)
9.85
Agriculture/Forestry/Fishing (1.A.4.c)
Gas/Diesel
oil (GDO)
Ministry of energy
and water
IPTEC
GDOFishing= GDO import x 1%
Where: GDOFish= GDO consumed by fishing boats GDO import = Total GDO imported in year Y
In 2018, IPTEC estimated that 1% of imported GDO is
consumed by Fisherman boats
34.26
GDOoffroad= GDO import x 1%
Where: GDOoffroad= GDO consumed by offroad machineries GDO import = Total GDO imported in year Y In 2018, IPTEC estimated that 1% of imported GDO is
consumed by off-road machineries
34.26
Emission factors
The same parameters presented in Table 22 under 1.A.1 Energy industries are used for 1.A.4 Other sectors.
Default emission factors from the 2006 IPCC guidelines are used.
Table 34: CO2, CH4 and N2O emission factors for stationary sources
For all categories Other sectors
Fuel type CO2 emission factor (kg/TJ)
CH4 emission factor (kg/TJ)
N2O emission factor (kg/TJ)
Diesel oil 74,100 10 0.6
LPG 63,100 5 0.1
Biomass 112,000 300 4
Source | table 2.4-2.5 page 2.20-2.23 chapter 2 volume 2, IPCC 2006 guidelines
Feedstock and non-energy use of fuels
Some of the imported fuels are used as raw materials for the production of other products in chemical
industry and metal production, or the use of fuels for non-energy purposes such as bitumen and lubricants. Since these fuels are not combusted, their carbon content is totally or partially stored in the product and is not oxidized into carbon dioxide for a certain period of time.
The calculation of carbon dioxide emissions from non-energy use of fuels is based on the relevant
consumption by fuel type and the fraction of the carbon stored by fuel type.
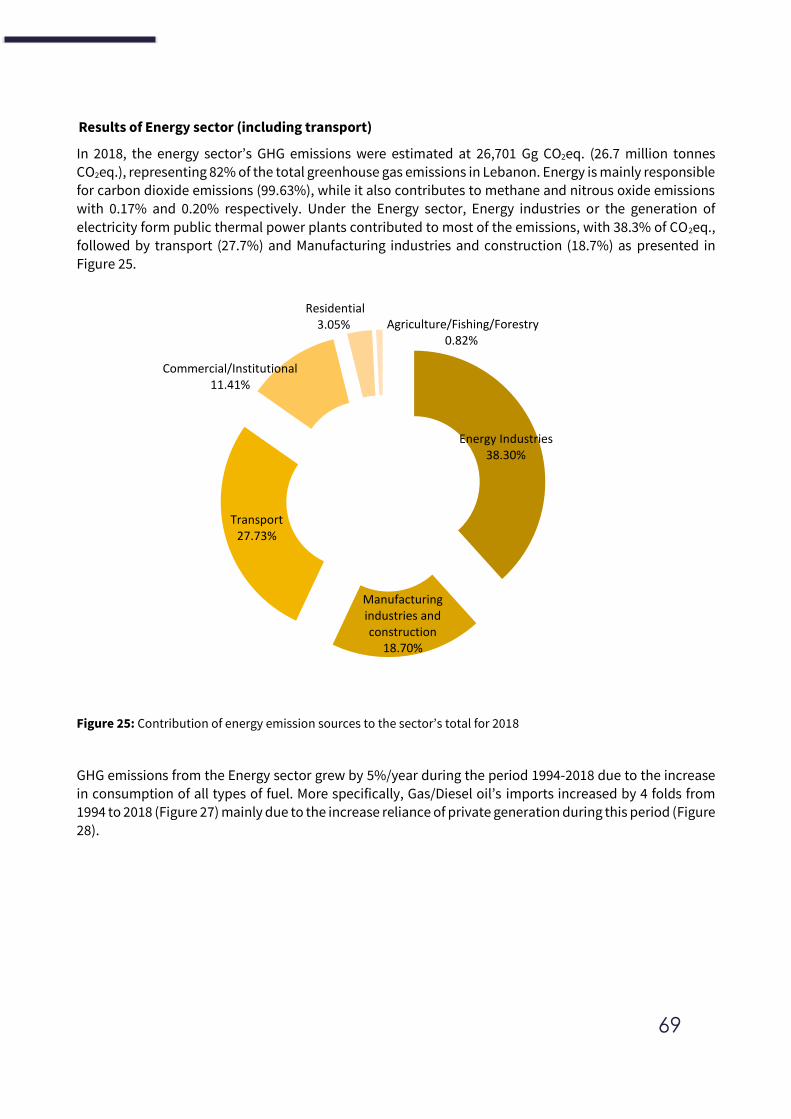
69
Results of Energy sector (including transport)
In 2018, the energy sector’s GHG emissions were estimated at 26,701 Gg CO2eq. (26.7 million tonnes CO2eq.), representing 82% of the total greenhouse gas emissions in Lebanon. Energy is mainly responsible for carbon dioxide emissions (99.63%), while it also contributes to methane and nitrous oxide emissions with 0.17% and 0.20% respectively. Under the Energy sector, Energy industries or the generation of
electricity form public thermal power plants contributed to most of the emissions, with 38.3% of CO2eq., followed by transport (27.7%) and Manufacturing industries and construction (18.7%) as presented in Figure 25.
Figure 25: Contribution of energy emission sources to the sector’s total for 2018
GHG emissions from the Energy sector grew by 5%/year during the period 1994-2018 due to the increase
in consumption of all types of fuel. More specifically, Gas/Diesel oil’s imports increased by 4 folds from 1994 to 2018 (Figure 27) mainly due to the increase reliance of private generation during this period (Figure 28).
Energy Industries38.30%
Manufacturing industries and construction
18.70%
Transport 27.73%
Commercial/Institutional11.41%
Residential 3.05% Agriculture/Fishing/Forestry
0.82%
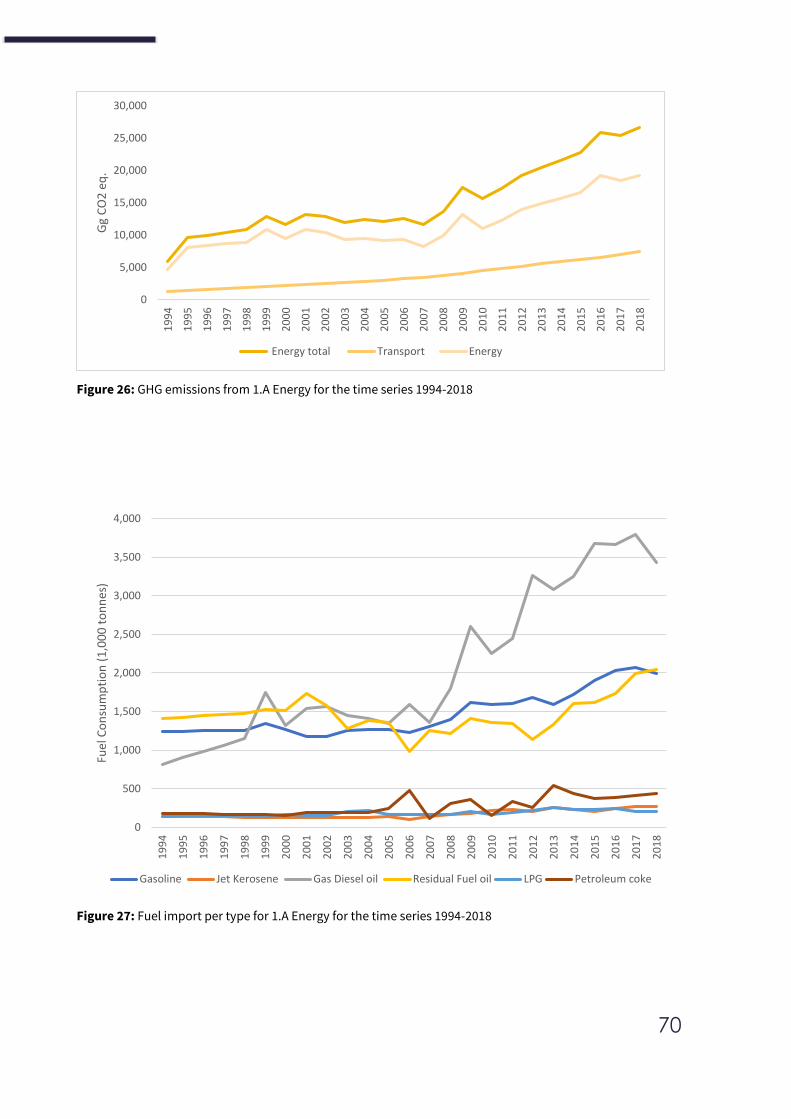
70
Figure 26: GHG emissions from 1.A Energy for the time series 1994-2018
Figure 27: Fuel import per type for 1.A Energy for the time series 1994-2018
0
5,000
10,000
15,000
20,000
25,000
30,000
19
94
19
95
19
96
19
97
19
98
19
99
20
00
20
01
20
02
20
03
20
04
20
05
20
06
20
07
20
08
20
09
20
10
20
11
20
12
20
13
20
14
20
15
20
16
20
17
20
18
Gg
CO
2 e
q.
Energy total Transport Energy
0
500
1,000
1,500
2,000
2,500
3,000
3,500
4,000
19
94
19
95
19
96
19
97
19
98
19
99
20
00
20
01
20
02
20
03
20
04
20
05
20
06
20
07
20
08
20
09
20
10
20
11
20
12
20
13
20
14
20
15
20
16
20
17
20
18
Fuel
Co
nsu
mp
tio
n (
1,0
00
to
nn
es)
Gasoline Jet Kerosene Gas Diesel oil Residual Fuel oil LPG Petroleum coke
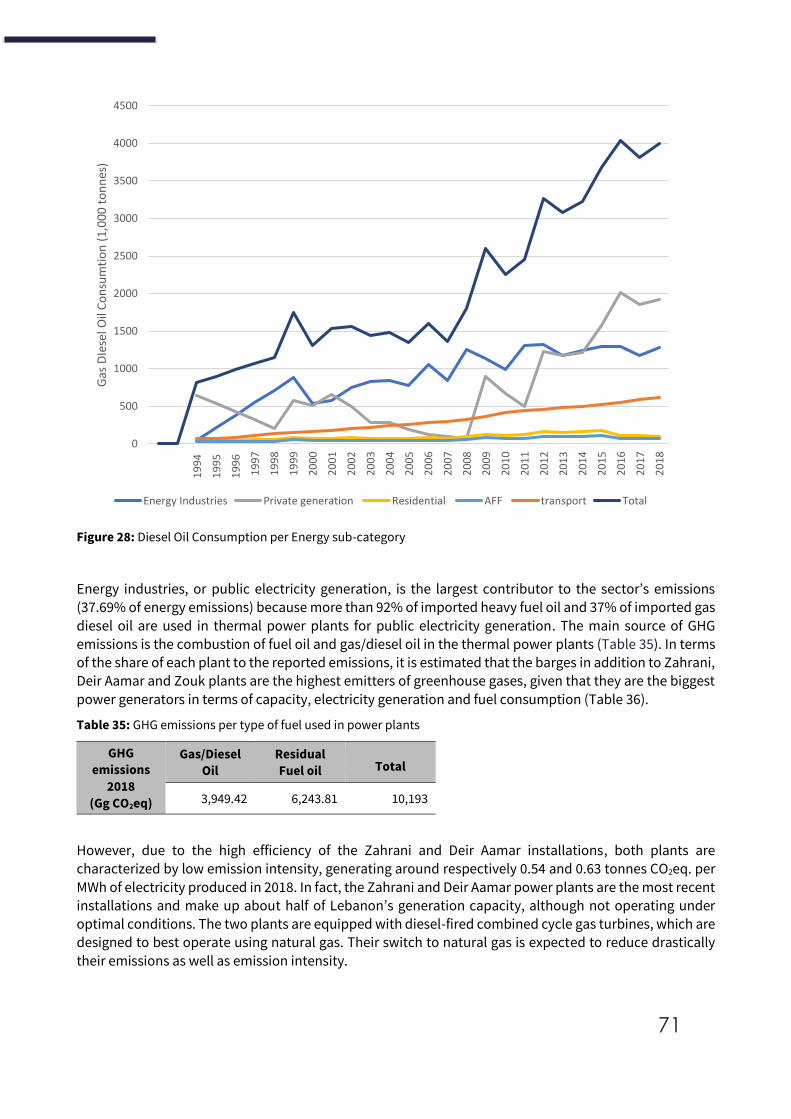
71
Figure 28: Diesel Oil Consumption per Energy sub-category
Energy industries, or public electricity generation, is the largest contributor to the sector’s emissions (37.69% of energy emissions) because more than 92% of imported heavy fuel oil and 37% of imported gas
diesel oil are used in thermal power plants for public electricity generation. The main source of GHG emissions is the combustion of fuel oil and gas/diesel oil in the thermal power plants (Table 35). In terms
of the share of each plant to the reported emissions, it is estimated that the barges in addition to Zahrani, Deir Aamar and Zouk plants are the highest emitters of greenhouse gases, given that they are the biggest
power generators in terms of capacity, electricity generation and fuel consumption (Table 36).
Table 35: GHG emissions per type of fuel used in power plants
GHG
emissions
2018
(Gg CO2eq)
Gas/Diesel
Oil
Residual
Fuel oil Total
3,949.42 6,243.81 10,193
However, due to the high efficiency of the Zahrani and Deir Aamar installations, both plants are
characterized by low emission intensity, generating around respectively 0.54 and 0.63 tonnes CO2eq. per
MWh of electricity produced in 2018. In fact, the Zahrani and Deir Aamar power plants are the most recent installations and make up about half of Lebanon’s generation capacity, although not operating under optimal conditions. The two plants are equipped with diesel-fired combined cycle gas turbines, which are
designed to best operate using natural gas. Their switch to natural gas is expected to reduce drastically
their emissions as well as emission intensity.
0
500
1000
1500
2000
2500
3000
3500
4000
4500
19
94
19
95
19
96
19
97
19
98
19
99
20
00
20
01
20
02
20
03
20
04
20
05
20
06
20
07
20
08
20
09
20
10
20
11
20
12
20
13
20
14
20
15
20
16
20
17
20
18
Gas
DIe
sel O
il C
on
sum
tio
n (
1,0
00
to
nn
es)
Energy Industries Private generation Residential AFF transport Total
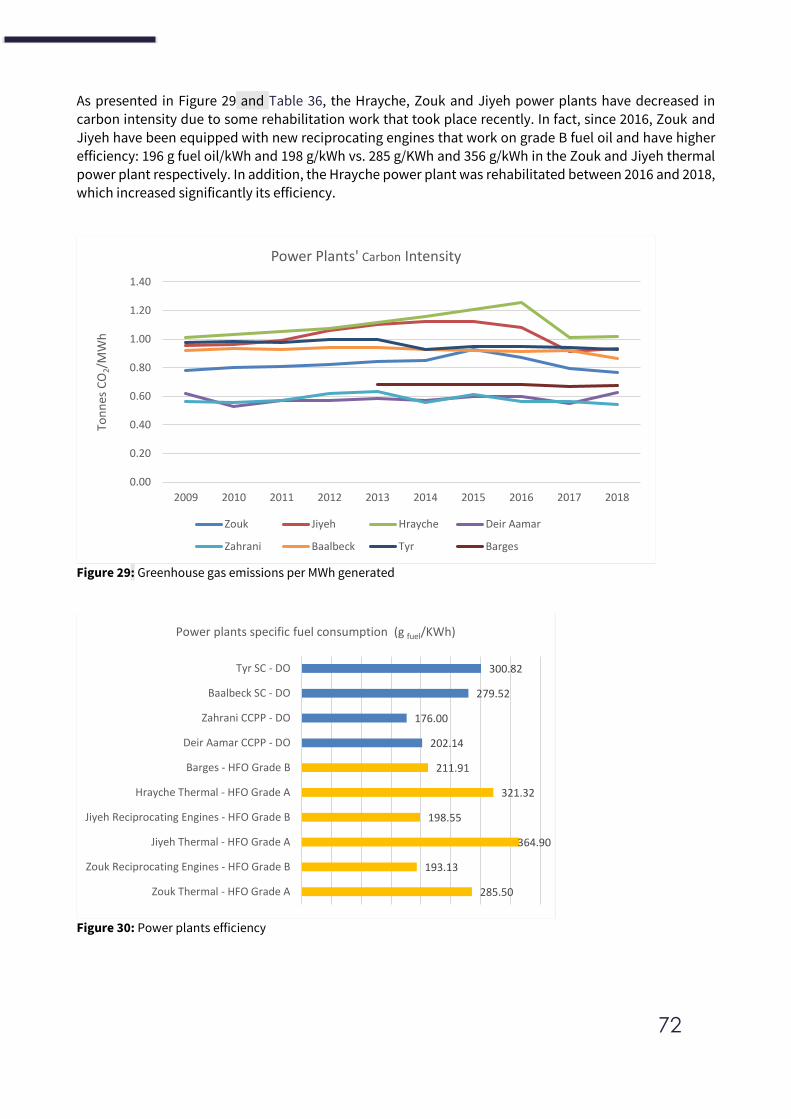
72
As presented in Figure 29 and Table 36, the Hrayche, Zouk and Jiyeh power plants have decreased in
carbon intensity due to some rehabilitation work that took place recently. In fact, since 2016, Zouk and
Jiyeh have been equipped with new reciprocating engines that work on grade B fuel oil and have higher efficiency: 196 g fuel oil/kWh and 198 g/kWh vs. 285 g/KWh and 356 g/kWh in the Zouk and Jiyeh thermal power plant respectively. In addition, the Hrayche power plant was rehabilitated between 2016 and 2018, which increased significantly its efficiency.
Figure 29: Greenhouse gas emissions per MWh generated
Figure 30: Power plants efficiency
0.00
0.20
0.40
0.60
0.80
1.00
1.20
1.40
2009 2010 2011 2012 2013 2014 2015 2016 2017 2018
Ton
nes
CO
2/M
Wh
Power Plants' Carbon Intensity
Zouk Jiyeh Hrayche Deir Aamar
Zahrani Baalbeck Tyr Barges
285.50
193.13
364.90
198.55
321.32
211.91
202.14
176.00
279.52
300.82
Zouk Thermal - HFO Grade A
Zouk Reciprocating Engines - HFO Grade B
Jiyeh Thermal - HFO Grade A
Jiyeh Reciprocating Engines - HFO Grade B
Hrayche Thermal - HFO Grade A
Barges - HFO Grade B
Deir Aamar CCPP - DO
Zahrani CCPP - DO
Baalbeck SC - DO
Tyr SC - DO
Power plants specific fuel consumption (g fuel/KWh)
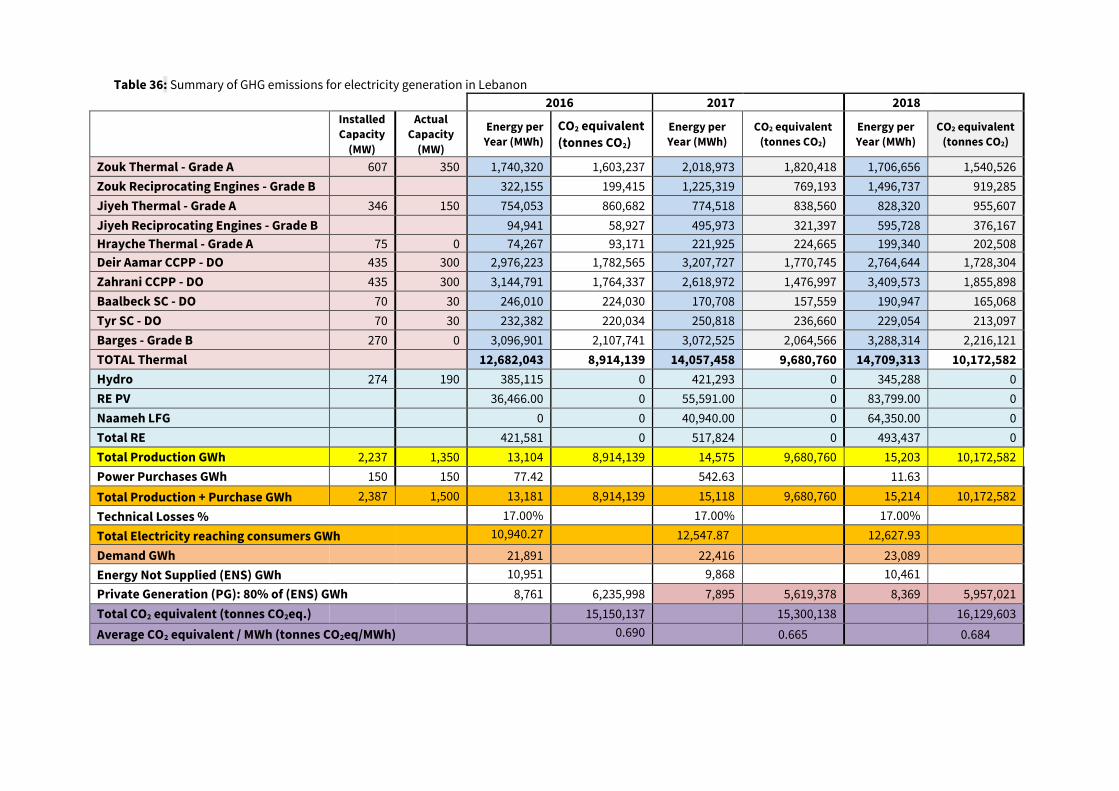
Table 36: Summary of GHG emissions for electricity generation in Lebanon 2016 2017 2018
Installed
Capacity
(MW)
Actual
Capacity
(MW)
Energy per
Year (MWh) CO2 equivalent
(tonnes CO2) Energy per
Year (MWh)
CO2 equivalent
(tonnes CO2)
Energy per
Year (MWh)
CO2 equivalent
(tonnes CO2)
Zouk Thermal - Grade A 607 350 1,740,320 1,603,237 2,018,973 1,820,418 1,706,656 1,540,526
Zouk Reciprocating Engines - Grade B 322,155 199,415 1,225,319 769,193 1,496,737 919,285
Jiyeh Thermal - Grade A 346 150 754,053 860,682 774,518 838,560 828,320 955,607
Jiyeh Reciprocating Engines - Grade B 94,941 58,927 495,973 321,397 595,728 376,167
Hrayche Thermal - Grade A 75 0 74,267 93,171 221,925 224,665 199,340 202,508
Deir Aamar CCPP - DO 435 300 2,976,223 1,782,565 3,207,727 1,770,745 2,764,644 1,728,304
Zahrani CCPP - DO 435 300 3,144,791 1,764,337 2,618,972 1,476,997 3,409,573 1,855,898
Baalbeck SC - DO 70 30 246,010 224,030 170,708 157,559 190,947 165,068
Tyr SC - DO 70 30 232,382 220,034 250,818 236,660 229,054 213,097
Barges - Grade B 270 0 3,096,901 2,107,741 3,072,525 2,064,566 3,288,314 2,216,121
TOTAL Thermal 12,682,043 8,914,139 14,057,458 9,680,760 14,709,313 10,172,582
Hydro 274 190 385,115 0 421,293 0 345,288 0
RE PV 36,466.00 0 55,591.00 0 83,799.00 0
Naameh LFG 0 0 40,940.00 0 64,350.00 0
Total RE 421,581 0 517,824 0 493,437 0
Total Production GWh 2,237 1,350 13,104 8,914,139 14,575 9,680,760 15,203 10,172,582
Power Purchases GWh 150 150 77.42 542.63 11.63
Total Production + Purchase GWh 2,387 1,500 13,181 8,914,139 15,118 9,680,760 15,214 10,172,582
Technical Losses % 17.00% 17.00% 17.00%
Total Electricity reaching consumers GWh 10,940.27 12,547.87 12,627.93
Demand GWh 21,891 22,416 23,089
Energy Not Supplied (ENS) GWh 10,951 9,868 10,461
Private Generation (PG): 80% of (ENS) GWh 8,761 6,235,998 7,895 5,619,378 8,369 5,957,021
Total CO2 equivalent (tonnes CO2eq.) 15,150,137 15,300,138 16,129,603
Average CO2 equivalent / MWh (tonnes CO2eq/MWh) 0.690 0.665 0.684
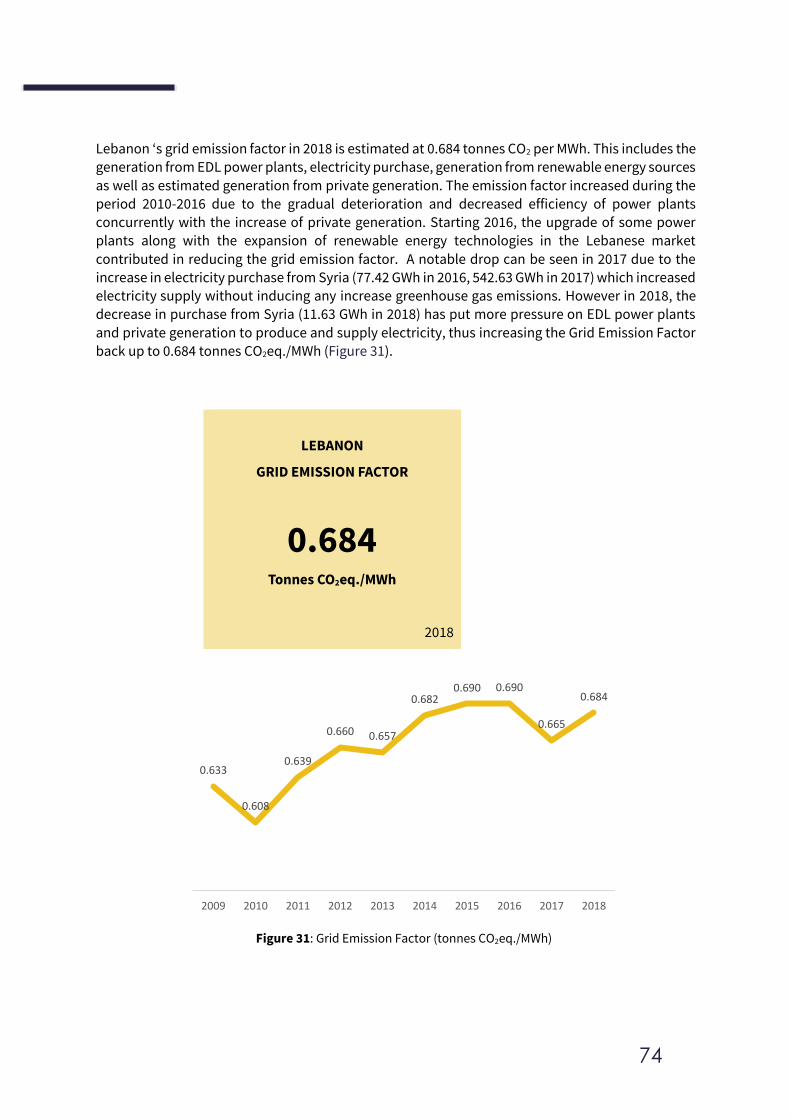
74
Lebanon ‘s grid emission factor in 2018 is estimated at 0.684 tonnes CO2 per MWh. This includes the generation from EDL power plants, electricity purchase, generation from renewable energy sources
as well as estimated generation from private generation. The emission factor increased during the period 2010-2016 due to the gradual deterioration and decreased efficiency of power plants concurrently with the increase of private generation. Starting 2016, the upgrade of some power plants along with the expansion of renewable energy technologies in the Lebanese market
contributed in reducing the grid emission factor. A notable drop can be seen in 2017 due to the increase in electricity purchase from Syria (77.42 GWh in 2016, 542.63 GWh in 2017) which increased electricity supply without inducing any increase greenhouse gas emissions. However in 2018, the decrease in purchase from Syria (11.63 GWh in 2018) has put more pressure on EDL power plants
and private generation to produce and supply electricity, thus increasing the Grid Emission Factor
back up to 0.684 tonnes CO2eq./MWh (Figure 31).
LEBANON
GRID EMISSION FACTOR
0.684 Tonnes CO2eq./MWh
2018
Figure 31: Grid Emission Factor (tonnes CO2eq./MWh)
0.633
0.608
0.639
0.660 0.657
0.6820.690 0.690
0.665
0.684
2009 2010 2011 2012 2013 2014 2015 2016 2017 2018
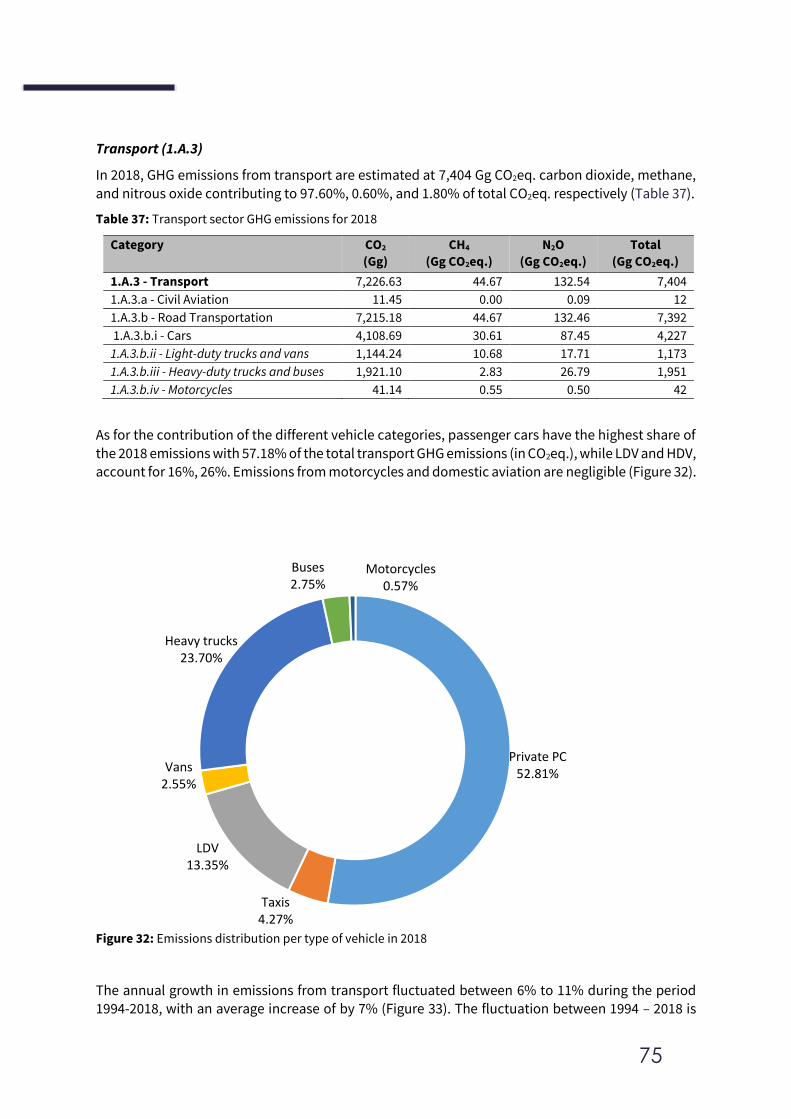
75
Transport (1.A.3)
In 2018, GHG emissions from transport are estimated at 7,404 Gg CO2eq. carbon dioxide, methane,
and nitrous oxide contributing to 97.60%, 0.60%, and 1.80% of total CO2eq. respectively (Table 37).
Table 37: Transport sector GHG emissions for 2018
Category CO2
(Gg)
CH4
(Gg CO2eq.)
N2O
(Gg CO2eq.)
Total
(Gg CO2eq.)
1.A.3 - Transport 7,226.63 44.67 132.54 7,404
1.A.3.a - Civil Aviation 11.45 0.00 0.09 12
1.A.3.b - Road Transportation 7,215.18 44.67 132.46 7,392
1.A.3.b.i - Cars 4,108.69 30.61 87.45 4,227
1.A.3.b.ii - Light-duty trucks and vans 1,144.24 10.68 17.71 1,173
1.A.3.b.iii - Heavy-duty trucks and buses 1,921.10 2.83 26.79 1,951
1.A.3.b.iv - Motorcycles 41.14 0.55 0.50 42
As for the contribution of the different vehicle categories, passenger cars have the highest share of
the 2018 emissions with 57.18% of the total transport GHG emissions (in CO2eq.), while LDV and HDV, account for 16%, 26%. Emissions from motorcycles and domestic aviation are negligible (Figure 32).
Figure 32: Emissions distribution per type of vehicle in 2018
The annual growth in emissions from transport fluctuated between 6% to 11% during the period 1994-2018, with an average increase of by 7% (Figure 33). The fluctuation between 1994 – 2018 is
Private PC52.81%
Taxis4.27%
LDV13.35%
Vans2.55%
Heavy trucks23.70%
Buses2.75%
Motorcycles0.57%
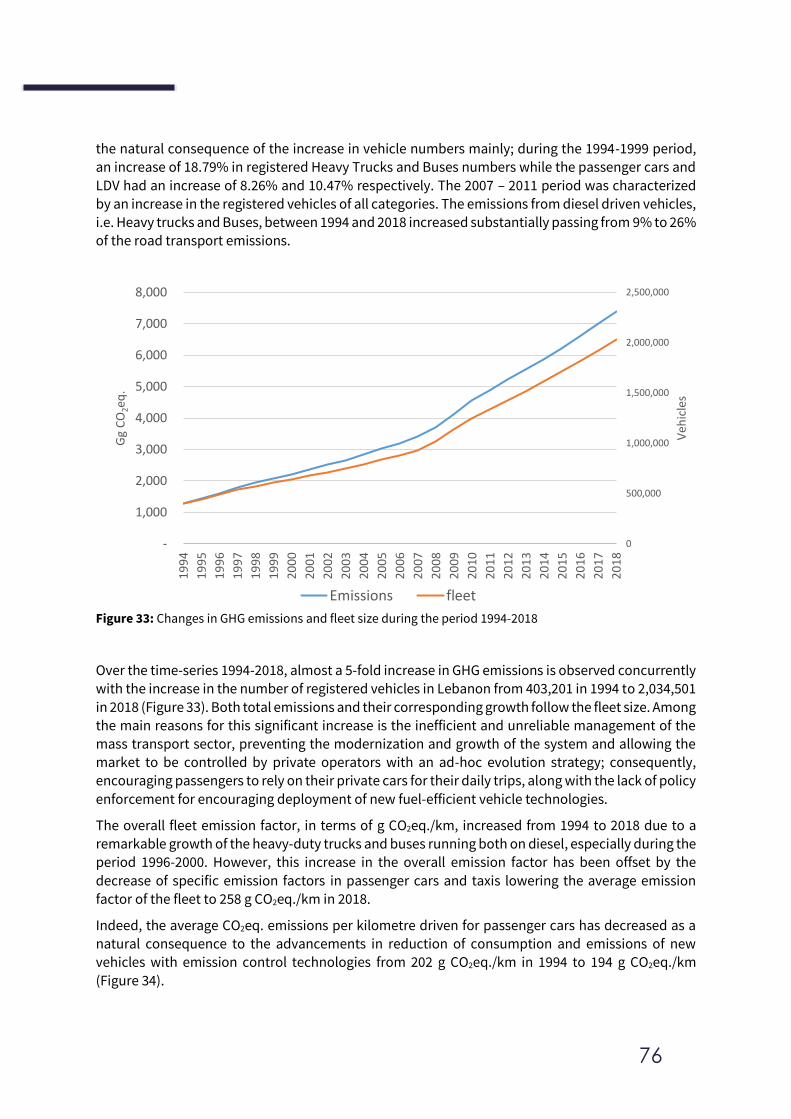
76
the natural consequence of the increase in vehicle numbers mainly; during the 1994-1999 period, an increase of 18.79% in registered Heavy Trucks and Buses numbers while the passenger cars and
LDV had an increase of 8.26% and 10.47% respectively. The 2007 – 2011 period was characterized by an increase in the registered vehicles of all categories. The emissions from diesel driven vehicles, i.e. Heavy trucks and Buses, between 1994 and 2018 increased substantially passing from 9% to 26% of the road transport emissions.
Figure 33: Changes in GHG emissions and fleet size during the period 1994-2018
Over the time-series 1994-2018, almost a 5-fold increase in GHG emissions is observed concurrently with the increase in the number of registered vehicles in Lebanon from 403,201 in 1994 to 2,034,501
in 2018 (Figure 33). Both total emissions and their corresponding growth follow the fleet size. Among
the main reasons for this significant increase is the inefficient and unreliable management of the mass transport sector, preventing the modernization and growth of the system and allowing the
market to be controlled by private operators with an ad-hoc evolution strategy; consequently, encouraging passengers to rely on their private cars for their daily trips, along with the lack of policy
enforcement for encouraging deployment of new fuel-efficient vehicle technologies.
The overall fleet emission factor, in terms of g CO2eq./km, increased from 1994 to 2018 due to a remarkable growth of the heavy-duty trucks and buses running both on diesel, especially during the period 1996-2000. However, this increase in the overall emission factor has been offset by the
decrease of specific emission factors in passenger cars and taxis lowering the average emission factor of the fleet to 258 g CO2eq./km in 2018.
Indeed, the average CO2eq. emissions per kilometre driven for passenger cars has decreased as a natural consequence to the advancements in reduction of consumption and emissions of new
vehicles with emission control technologies from 202 g CO2eq./km in 1994 to 194 g CO2eq./km
(Figure 34).
0
500,000
1,000,000
1,500,000
2,000,000
2,500,000
-
1,000
2,000
3,000
4,000
5,000
6,000
7,000
8,000
19
94
19
95
19
96
19
97
19
98
19
99
20
00
20
01
20
02
20
03
20
04
20
05
20
06
20
07
20
08
20
09
20
10
20
11
20
12
20
13
20
14
20
15
20
16
20
17
20
18
Veh
icle
s
Gg
CO
2eq
.
Emissions fleet
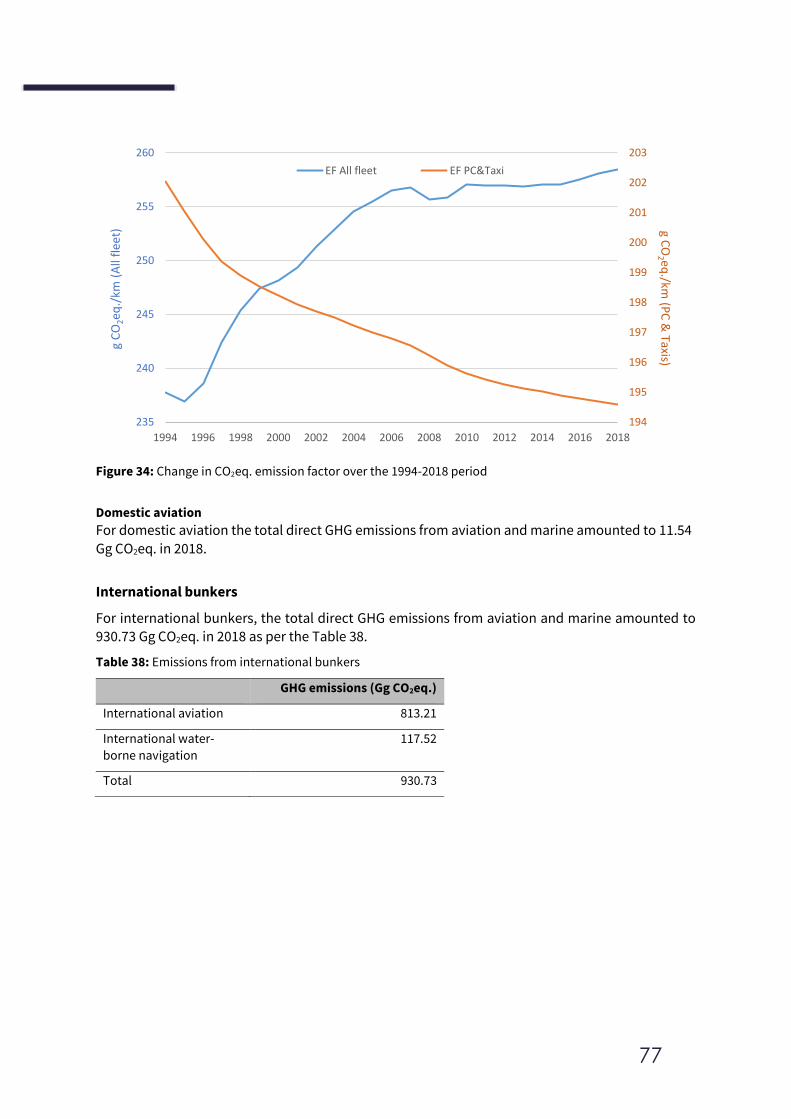
77
Figure 34: Change in CO2eq. emission factor over the 1994-2018 period
Domestic aviation
For domestic aviation the total direct GHG emissions from aviation and marine amounted to 11.54
Gg CO2eq. in 2018.
International bunkers
For international bunkers, the total direct GHG emissions from aviation and marine amounted to
930.73 Gg CO2eq. in 2018 as per the Table 38.
Table 38: Emissions from international bunkers
194
195
196
197
198
199
200
201
202
203
235
240
245
250
255
260
1994 1996 1998 2000 2002 2004 2006 2008 2010 2012 2014 2016 2018
g CO
2 eq./km
(PC
& Taxis)
g C
O2e
q./
km (
All
flee
t)
EF All fleet EF PC&Taxi
GHG emissions (Gg CO2eq.)
International aviation 813.21
International water-
borne navigation
117.52
Total 930.73
78
Box 7: Relationship between fuel quality and emissions
Does higher fuel quality decrease CO2 emissions?
For an internal combustion engine to move a vehicle down the road, it must convert the energy stored in
the fuel into mechanical energy to drive the wheels. This process produces carbon dioxide (CO2).
Fuel contains complex mixture of several types of hydrocarbon molecules mainly formed by carbon and
hydrogen atoms. During combustion, the carbon (C) from the fuel combines with oxygen (O2) from the air
to produce carbon dioxide (CO2). Consequently, the CO2 emissions are related mainly to fuel consumption.
The relationship between fuel standards and fuel consumption is not straightforward, with more stringent
fuel standards for some parameters not necessarily leading to lower fuel consumption.
Nevertheless, many of the technologies used to achieve improved fuel efficiency of vehicles rely on high
fuel quality. For example, the decision to adopt a 10ppm Sulphur limit in the European petrol standard was
made primarily to support carbon dioxide emissions reductions by assisting improvements in fuel
efficiency - an important consideration in the context of European fuel efficiency standards for motor
vehicles (Hart Energy 2014, European Union 2009).
Therefore, adopting vehicle emissions standards such as Euro 5 or Euro 6 will not directly affect the
greenhouse emissions. The emissions standard will require the introduction of higher fuel quality
standards which allows for the use of more fuel-efficient vehicle technology, which in turn requires less
fuel leading to the reduction of greenhouse emissions.
79
2. Industrial Processes and Products Use (IPPU)
The IPPU category includes the following 2 sources of the emissions:
- Industrial processes that chemically or physically transform products, thus releasing greenhouse gases.
- Product use that releases gradually greenhouse gases that are contained in the products such as refrigerators, foams and aerosol cans.
Industrial activities are quite limited Lebanon, and the GHG emissions from the sector are mainly generated from mineral production (cement and lime production), HFC uses for refrigeration and air conditioning and some processes that use CO2 carbonates. Emissions of F-gases from Refrigeration and Air conditioning and N2O emissions from medical applications have been
calculated for the first time in this BUR4 submission. A time-series calculation was also performed
for the period 1994-2018 for consistency and completeness of the inventory.
The development of the complete and consistent time series limits reporting of GHG emissions from
some categories as data collection remains a challenging task in Lebanon. Extensive efforts have been deployed during previous inventories to collect data to estimate emissions from a number of
industries (food and beverages), but the data quality remained highly uncertain. Due to limited capacity, estimation of emissions from NE categories is included into the planned improvements
for later submissions.
The present section covers the following IPPU subcategories:
• 2.A.1 Cement production
• 2.A.2 Lime production
• 2.A.4.b Other process Uses of CO2 carbonates- soda ash use
• 2.D.1 Lubricant use
• 2.D.2 Paraffin wax use
• 2.F.1 Refrigeration and air conditioning
• 2.G.3 N2O from product uses Methodology
The GHG inventory of industrial processes in Lebanon is carried out based on calculation methodologies of the 2006 IPCC Guidelines for national greenhouse gas inventories, using tier 1
methodologies with national and default emission factors and adopting the Global Warming Potential of the IPCC Fifth Assessment Report. Only cement production and emissions of f-gases adopted a tier 2 methodology.
Emissions from fuel combustion in the industrial sector for energy purpose is not included under
the IPPU sector, but rather in the energy sector (1.A.2). Table 39: GHG emissions categories the IPPU category
Reporting
categories Methodology, description and remarks
2.A Mineral industries
2.A.1 Cement
production
All 3 cement industries in Lebanon are covered in this calculation. Cement manufacturing
is a key category in Lebanon. Tier 2 is adopted to calculate emissions from this category
as per equations 2.4 and 2.5 of the IPCC 2006 guidelines.
80
2.A.2 Lime
production
The only lime production plant in Lebanon is covered in this calculation. Lime is also
produced in cement manufacturing; however, it is already accounted for in clinker
production in cement industries. CO2 resulting from lime production is not a key category
in Lebanon. The tier 1 method, an output-based approach that uses default values for
emission estimates was adopted based on equation 2.8 of the IPCC 2006 guidelines.
2.A.3 Glass
production
The 2 glass producing factories in Lebanon shut down in the early 2000s. Glass is imported
and manufactured into different shapes (containers, windows, etc.) using carbonates.
Since there is no survey of the exact amount of carbonates used in glass production,
related emissions are not reported under this category, but embedded within the
emissions of category 2.A.4 (other carbonates). The notation key Included Elsewhere is
therefore used.
2.A.4 Other
process Uses of
Carbonates
Subcategories from which emissions occur in Lebanon include ceramics (2.A.4.a) and
other uses of soda ash (2.A.4.b). Other subcategories do not occur and are reported as
such.
Data on ceramics is considered incomplete as it only includes the main ceramics
production facilities in the country (sanitary and tile) and does not cover the entire time
series considered in this inventory. Therefore, the emissions from ceramics is Not
Estimated in the current inventory. Note that category 2.A.4.a is not expected to be a key
category.
There is no soda ash production in Lebanon. Therefore, all soda ash used is imported and
it is assumed that all imported soda ash is used during the year of import in the industrial
sector. Percentages of soda ash used for each type of industry (glass manufacturing, soap
and detergents, water treatment etc.) are not available. CO2 resulting from soda ash used
is not a key category in Lebanon. Thus, the tier 1 methodology was adopted as per
equation 2.14 of the IPCC 2006 guidelines.
2.D Non-Energy Products from Fuels and Solvent Use
2.D.1 Lubricant
Use
There is no disaggregated data on the use of lubricants in Lebanon. Therefore, it is
assumed that all lubricants are used in the power generation plants. Emissions from this
subcategory are therefore reported as Included Elsewhere (reported under 1.A.1 Energy
Industries).
2.D.2 Paraffin
Wax Use CO2 resulting from the use of paraffin wax is not a key category is Lebanon. Therefore,
the tier 1 approach was adopted as per equation 5.4. of the IPCC 2006 guidelines.
2.F Product uses as substitutes for ODS
2.F.1
Refrigeration
and A/C
HFC are mainly used in Lebanon under the Refrigeration and Air Conditioning (RAC)
sector. The main HFC refrigerants are HFC-134a (48% in 2018) and the mixtures R404A,
R407C, R410A resulting in emissions of HFC-125 (38% in 2018), HFC-32 and HFC-143a.
2.F.2 Foam
blowing Agents
There is no HFC applications in the foam manufacturing sector. The notation key Not
Occurring is therefore used.
2.F.3 Fire
protection
There are limited applications of HFCs in fire suppression systems. due to lack of activity
data, emissions from this category have not been estimated. The notation key NE is
therefore used.
2.G. Other product manufacture and use
2.G.3 N2O use
for medical
purposes
N2O is used for medical applications in anesthetic use, analgesic use and veterinary use
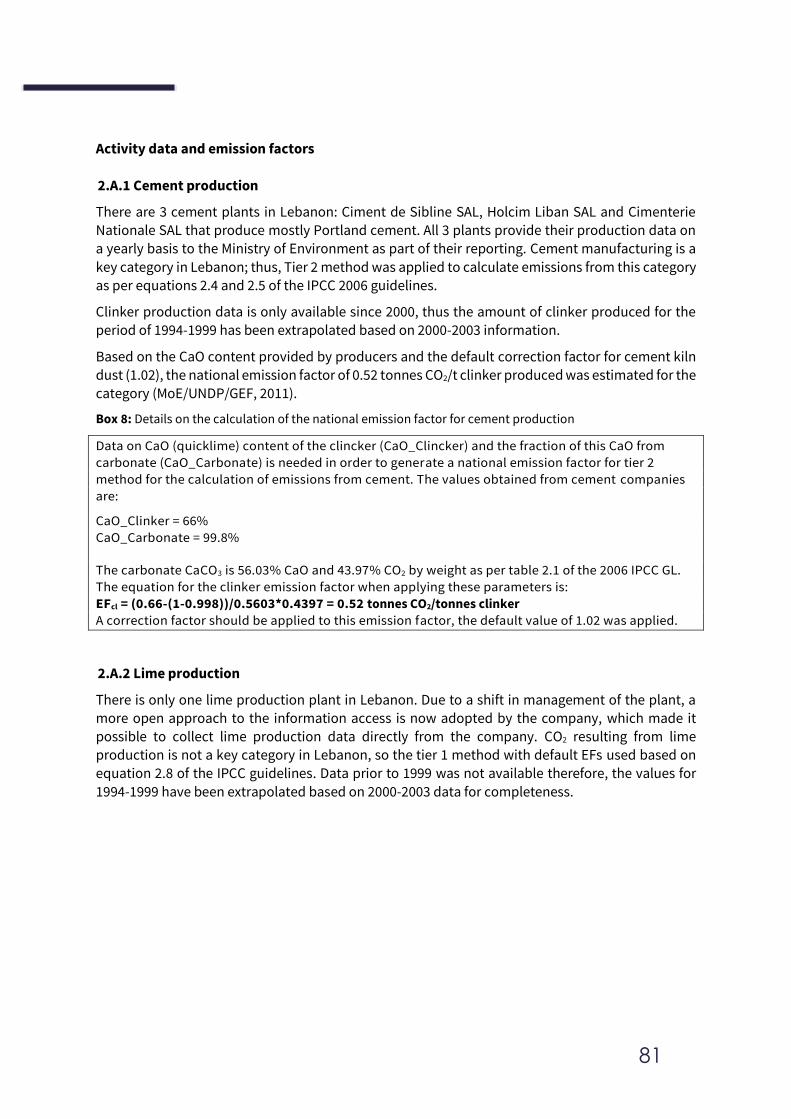
81
Activity data and emission factors
2.A.1 Cement production
There are 3 cement plants in Lebanon: Ciment de Sibline SAL, Holcim Liban SAL and Cimenterie Nationale SAL that produce mostly Portland cement. All 3 plants provide their production data on a yearly basis to the Ministry of Environment as part of their reporting. Cement manufacturing is a
key category in Lebanon; thus, Tier 2 method was applied to calculate emissions from this category as per equations 2.4 and 2.5 of the IPCC 2006 guidelines.
Clinker production data is only available since 2000, thus the amount of clinker produced for the period of 1994-1999 has been extrapolated based on 2000-2003 information.
Based on the CaO content provided by producers and the default correction factor for cement kiln
dust (1.02), the national emission factor of 0.52 tonnes CO2/t clinker produced was estimated for the category (MoE/UNDP/GEF, 2011).
Box 8: Details on the calculation of the national emission factor for cement production
Data on CaO (quicklime) content of the clincker (CaO_Clincker) and the fraction of this CaO from
carbonate (CaO_Carbonate) is needed in order to generate a national emission factor for tier 2
method for the calculation of emissions from cement. The values obtained from cement companies
are:
CaO_Clinker = 66%
CaO_Carbonate = 99.8%
The carbonate CaCO3 is 56.03% CaO and 43.97% CO2 by weight as per table 2.1 of the 2006 IPCC GL.
The equation for the clinker emission factor when applying these parameters is:
EFcl = (0.66-(1-0.998))/0.5603*0.4397 = 0.52 tonnes CO2/tonnes clinker
A correction factor should be applied to this emission factor, the default value of 1.02 was applied.
2.A.2 Lime production
There is only one lime production plant in Lebanon. Due to a shift in management of the plant, a
more open approach to the information access is now adopted by the company, which made it possible to collect lime production data directly from the company. CO2 resulting from lime production is not a key category in Lebanon, so the tier 1 method with default EFs used based on
equation 2.8 of the IPCC guidelines. Data prior to 1999 was not available therefore, the values for
1994-1999 have been extrapolated based on 2000-2003 data for completeness.
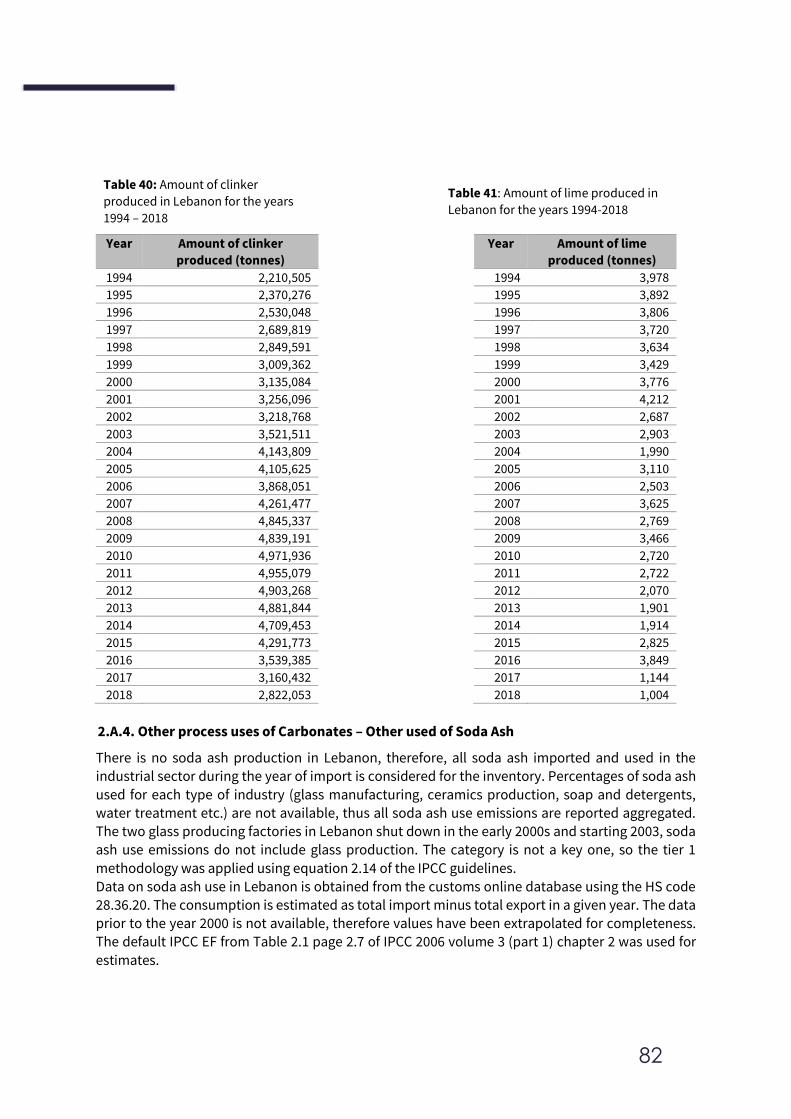
82
Table 40: Amount of clinker
produced in Lebanon for the years
1994 – 2018
Table 41: Amount of lime produced in
Lebanon for the years 1994-2018
Year Amount of clinker
produced (tonnes)
Year Amount of lime
produced (tonnes)
1994 2,210,505 1994 3,978
1995 2,370,276 1995 3,892
1996 2,530,048 1996 3,806
1997 2,689,819 1997 3,720
1998 2,849,591 1998 3,634
1999 3,009,362 1999 3,429
2000 3,135,084 2000 3,776
2001 3,256,096 2001 4,212
2002 3,218,768 2002 2,687
2003 3,521,511 2003 2,903
2004 4,143,809 2004 1,990
2005 4,105,625 2005 3,110
2006 3,868,051 2006 2,503
2007 4,261,477 2007 3,625
2008 4,845,337 2008 2,769
2009 4,839,191 2009 3,466
2010 4,971,936 2010 2,720
2011 4,955,079 2011 2,722
2012 4,903,268 2012 2,070
2013 4,881,844 2013 1,901
2014 4,709,453 2014 1,914
2015 4,291,773 2015 2,825
2016 3,539,385 2016 3,849
2017 3,160,432 2017 1,144
2018 2,822,053 2018 1,004
2.A.4. Other process uses of Carbonates – Other used of Soda Ash
There is no soda ash production in Lebanon, therefore, all soda ash imported and used in the industrial sector during the year of import is considered for the inventory. Percentages of soda ash
used for each type of industry (glass manufacturing, ceramics production, soap and detergents, water treatment etc.) are not available, thus all soda ash use emissions are reported aggregated. The two glass producing factories in Lebanon shut down in the early 2000s and starting 2003, soda
ash use emissions do not include glass production. The category is not a key one, so the tier 1
methodology was applied using equation 2.14 of the IPCC guidelines.
Data on soda ash use in Lebanon is obtained from the customs online database using the HS code 28.36.20. The consumption is estimated as total import minus total export in a given year. The data prior to the year 2000 is not available, therefore values have been extrapolated for completeness. The default IPCC EF from Table 2.1 page 2.7 of IPCC 2006 volume 3 (part 1) chapter 2 was used for
estimates.
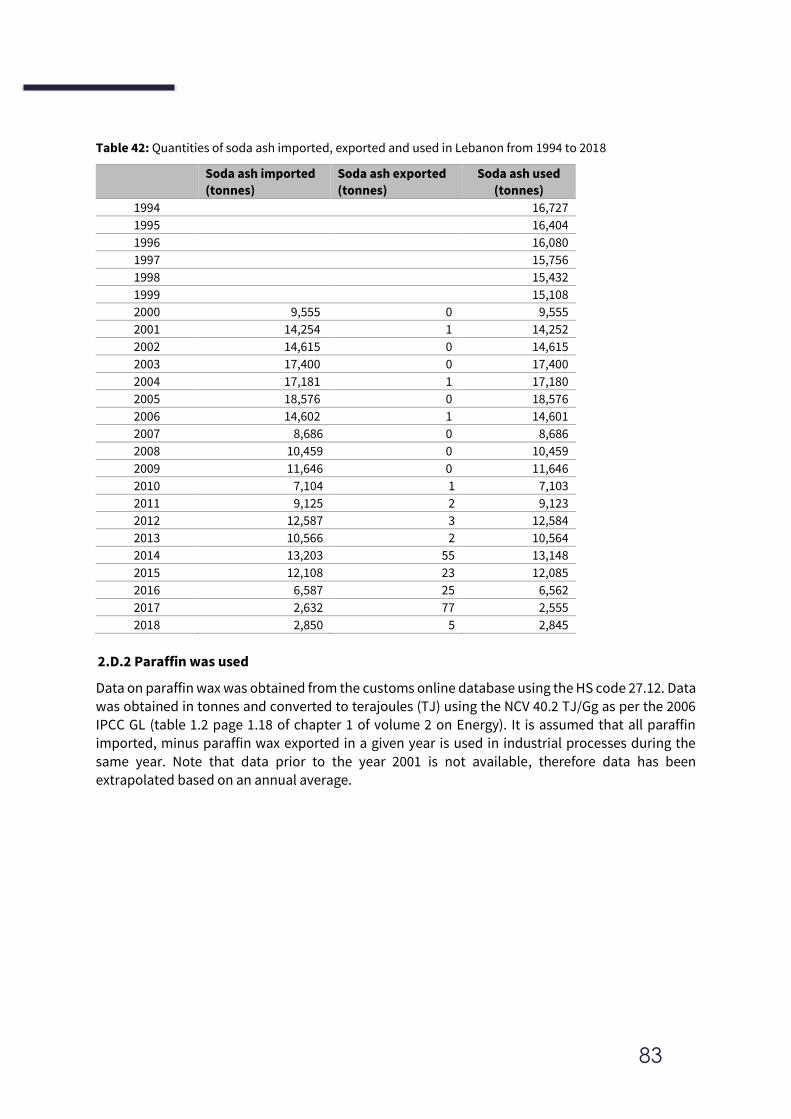
83
Table 42: Quantities of soda ash imported, exported and used in Lebanon from 1994 to 2018
Soda ash imported
(tonnes)
Soda ash exported
(tonnes)
Soda ash used
(tonnes)
1994 16,727
1995 16,404
1996 16,080
1997 15,756
1998 15,432
1999 15,108
2000 9,555 0 9,555
2001 14,254 1 14,252
2002 14,615 0 14,615
2003 17,400 0 17,400
2004 17,181 1 17,180
2005 18,576 0 18,576
2006 14,602 1 14,601
2007 8,686 0 8,686
2008 10,459 0 10,459
2009 11,646 0 11,646
2010 7,104 1 7,103
2011 9,125 2 9,123
2012 12,587 3 12,584
2013 10,566 2 10,564
2014 13,203 55 13,148
2015 12,108 23 12,085
2016 6,587 25 6,562
2017 2,632 77 2,555
2018 2,850 5 2,845
2.D.2 Paraffin was used
Data on paraffin wax was obtained from the customs online database using the HS code 27.12. Data
was obtained in tonnes and converted to terajoules (TJ) using the NCV 40.2 TJ/Gg as per the 2006 IPCC GL (table 1.2 page 1.18 of chapter 1 of volume 2 on Energy). It is assumed that all paraffin imported, minus paraffin wax exported in a given year is used in industrial processes during the
same year. Note that data prior to the year 2001 is not available, therefore data has been extrapolated based on an annual average.
84
Table 43: Paraffin Wax used for 1994-2018
Year Import
(tonnes)
Export
(tonnes)
Import -
Export
(tonnes)
Import -
Export
(TeraJoules)
1994 2,572 103
1995 2,497 100
1996 2,484 100
1997 2,481 100
1998 2,471 99
1999 2,459 99
2000 2513 101
2001 3,150 25 3,125 126
2002 2,632 89 2,543 102
2003 2,008 106 1,902 76
2004 2,483 108 2,375 95
2005 2,476 94 2,382 96
2006 2,499 71 2,428 98
2007 3,195 36 3,159 127
2008 1,898 98 1,009 41
2009 2,685 62 2,623 105
2010 1,815 33 1,782 72
2011 1,877 29 1,848 74
2012 2,545 55 2,490 100
2013 3,077 2 3,075 124
2014 1,746 65 1,681 68
2015 1,503 35 1,468 59
2016 1,050 13 1,037 41
2017 1,060 50 1,010 40
2018 1,114 11 1,103 44
2.F Product uses as substitutes for Ozone Depleting Substances (ODS)
In 2016, with support from the Multilateral Fund for the Implementation of the Montreal Protocol,
the Government of Lebanon through the National Ozone unit has undertaken an Ozone Depleting Substances (ODS) Alternative Survey. The survey was conducted with support from UNDP and in
accordance with the ExCom guidelines and was based on the 2012-2015 consumption data (baseline).
The survey indicated a wide range of HFC uses in Lebanon mainly under the Refrigeration and Air
Conditioning (RAC) sector. Whereas, there were limited applications of HFCs in fire suppression systems, the survey did not result in any indication of HFC applications in the foam, solvent and
aerosol sectors. All ODS alternatives including HFCs are imported primarily from USA, UK, Spain,
UAE, Japan and China. Based on the available information, only emissions from refrigeration and air conditioning systems (2.F.1) were estimated and reported in this category. Also, according to the Table 7.3 of the 2006 IPCC Guidelines (Volume 3, chapter 7, p.7.16), Aerosols (2.F.4) and Solvents (2.F.5) contribute a small percentage to the total reported emissions in a number of Annex 1 Parties.
Thus, the assumption was made that these categories do not produce HFC emissions in Lebanon.
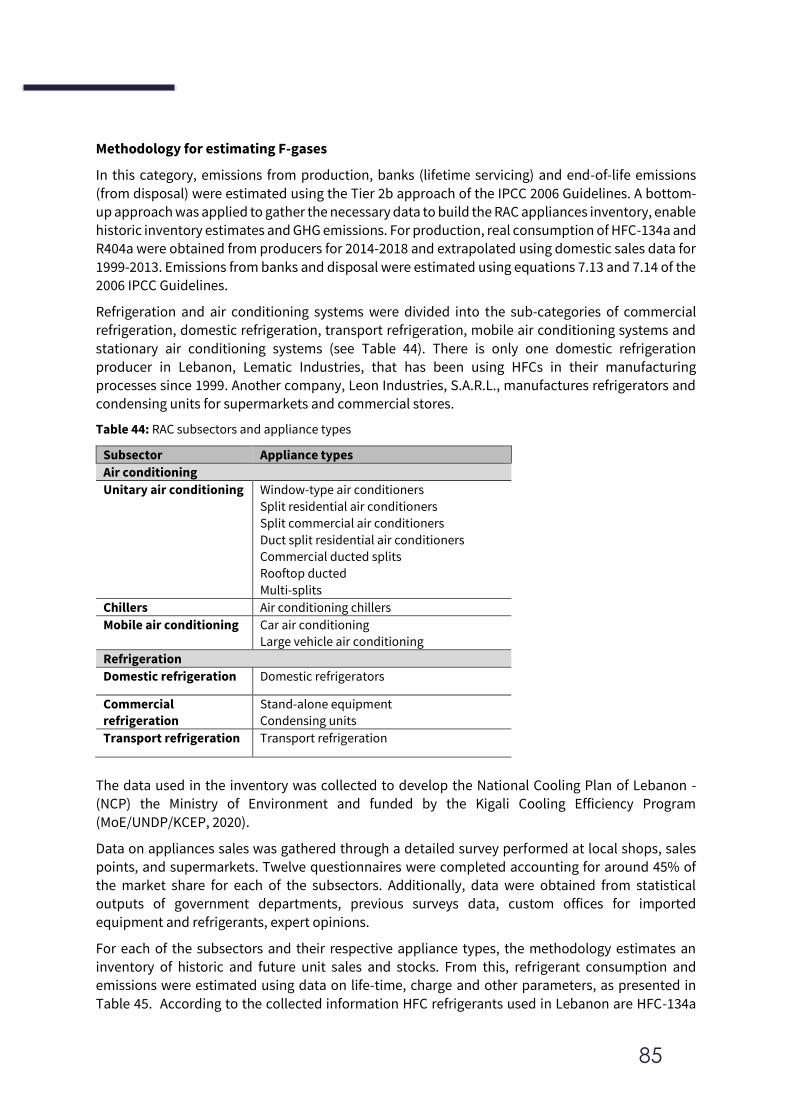
85
Methodology for estimating F-gases
In this category, emissions from production, banks (lifetime servicing) and end-of-life emissions
(from disposal) were estimated using the Tier 2b approach of the IPCC 2006 Guidelines. A bottom-up approach was applied to gather the necessary data to build the RAC appliances inventory, enable historic inventory estimates and GHG emissions. For production, real consumption of HFC-134a and R404a were obtained from producers for 2014-2018 and extrapolated using domestic sales data for
1999-2013. Emissions from banks and disposal were estimated using equations 7.13 and 7.14 of the 2006 IPCC Guidelines.
Refrigeration and air conditioning systems were divided into the sub-categories of commercial refrigeration, domestic refrigeration, transport refrigeration, mobile air conditioning systems and
stationary air conditioning systems (see Table 44). There is only one domestic refrigeration
producer in Lebanon, Lematic Industries, that has been using HFCs in their manufacturing processes since 1999. Another company, Leon Industries, S.A.R.L., manufactures refrigerators and
condensing units for supermarkets and commercial stores.
Table 44: RAC subsectors and appliance types
Subsector Appliance types
Air conditioning
Unitary air conditioning Window-type air conditioners
Split residential air conditioners
Split commercial air conditioners
Duct split residential air conditioners
Commercial ducted splits
Rooftop ducted
Multi-splits
Chillers Air conditioning chillers
Mobile air conditioning Car air conditioning
Large vehicle air conditioning
Refrigeration
Domestic refrigeration Domestic refrigerators
Commercial
refrigeration
Stand-alone equipment
Condensing units
Transport refrigeration Transport refrigeration
The data used in the inventory was collected to develop the National Cooling Plan of Lebanon - (NCP) the Ministry of Environment and funded by the Kigali Cooling Efficiency Program
(MoE/UNDP/KCEP, 2020).
Data on appliances sales was gathered through a detailed survey performed at local shops, sales points, and supermarkets. Twelve questionnaires were completed accounting for around 45% of
the market share for each of the subsectors. Additionally, data were obtained from statistical outputs of government departments, previous surveys data, custom offices for imported
equipment and refrigerants, expert opinions.
For each of the subsectors and their respective appliance types, the methodology estimates an inventory of historic and future unit sales and stocks. From this, refrigerant consumption and emissions were estimated using data on life-time, charge and other parameters, as presented in
Table 45. According to the collected information HFC refrigerants used in Lebanon are HFC-134a
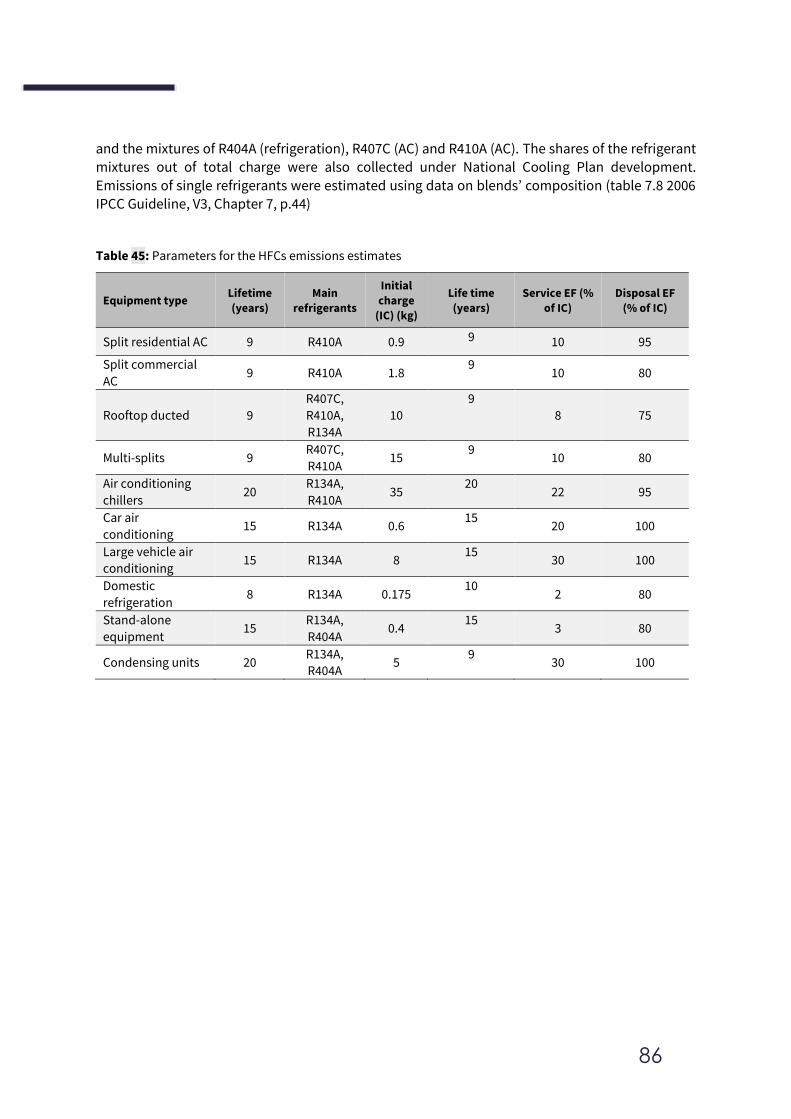
86
and the mixtures of R404A (refrigeration), R407C (AC) and R410A (AC). The shares of the refrigerant mixtures out of total charge were also collected under National Cooling Plan development.
Emissions of single refrigerants were estimated using data on blends’ composition (table 7.8 2006 IPCC Guideline, V3, Chapter 7, p.44)
Table 45: Parameters for the HFCs emissions estimates
Equipment type Lifetime
(years)
Main
refrigerants
Initial
charge
(IC) (kg)
Life time
(years)
Service EF (%
of IC)
Disposal EF
(% of IC)
Split residential AC 9 R410A 0.9 9 10 95
Split commercial
AC 9 R410A 1.8
9 10 80
Rooftop ducted 9
R407C,
R410A,
R134A
10
9
8 75
Multi-splits 9 R407C,
R410A 15
9 10 80
Air conditioning
chillers 20
R134A,
R410A 35
20 22 95
Car air
conditioning 15 R134A 0.6
15 20 100
Large vehicle air
conditioning 15 R134A 8
15 30 100
Domestic
refrigeration 8 R134A 0.175
10 2 80
Stand-alone
equipment 15
R134A,
R404A 0.4
15 3 80
Condensing units 20 R134A,
R404A 5
9 30 100
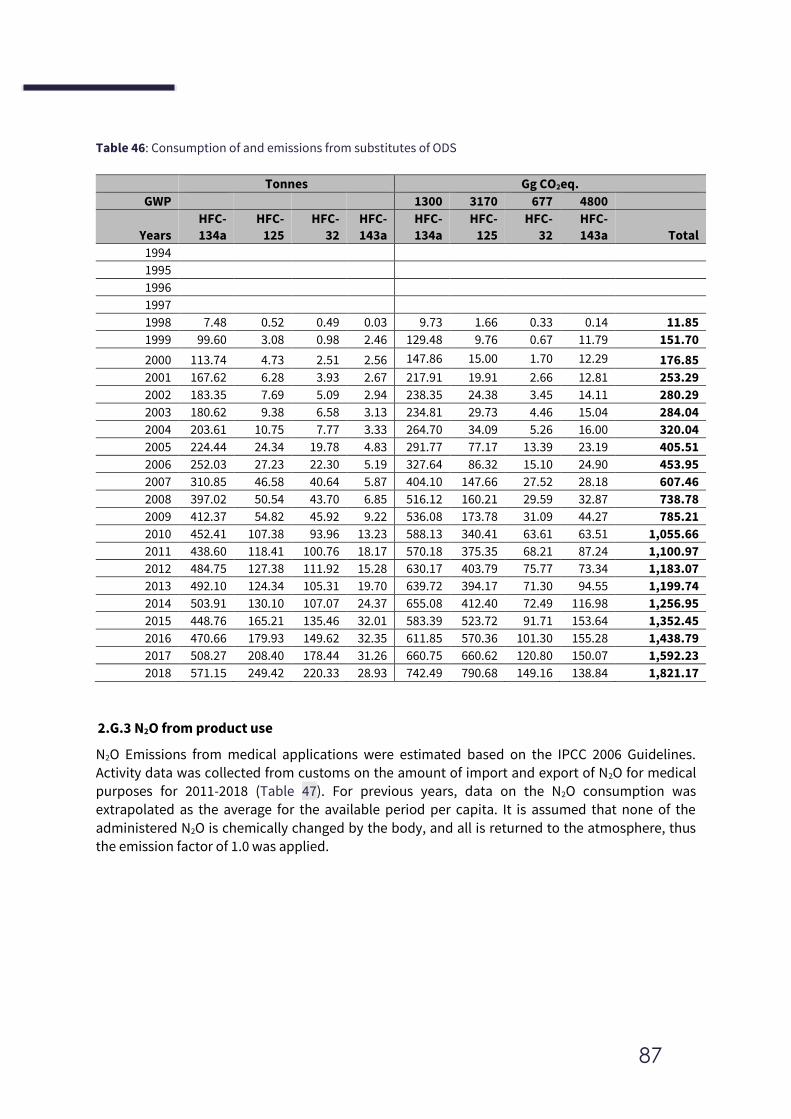
87
Table 46: Consumption of and emissions from substitutes of ODS
Tonnes Gg CO2eq.
GWP 1300 3170 677 4800
Years
HFC-
134a
HFC-
125
HFC-
32
HFC-
143a
HFC-
134a
HFC-
125
HFC-
32
HFC-
143a Total
1994
1995
1996
1997
1998 7.48 0.52 0.49 0.03 9.73 1.66 0.33 0.14 11.85
1999 99.60 3.08 0.98 2.46 129.48 9.76 0.67 11.79 151.70
2000 113.74 4.73 2.51 2.56 147.86 15.00 1.70 12.29 176.85
2001 167.62 6.28 3.93 2.67 217.91 19.91 2.66 12.81 253.29
2002 183.35 7.69 5.09 2.94 238.35 24.38 3.45 14.11 280.29
2003 180.62 9.38 6.58 3.13 234.81 29.73 4.46 15.04 284.04
2004 203.61 10.75 7.77 3.33 264.70 34.09 5.26 16.00 320.04
2005 224.44 24.34 19.78 4.83 291.77 77.17 13.39 23.19 405.51
2006 252.03 27.23 22.30 5.19 327.64 86.32 15.10 24.90 453.95
2007 310.85 46.58 40.64 5.87 404.10 147.66 27.52 28.18 607.46
2008 397.02 50.54 43.70 6.85 516.12 160.21 29.59 32.87 738.78
2009 412.37 54.82 45.92 9.22 536.08 173.78 31.09 44.27 785.21
2010 452.41 107.38 93.96 13.23 588.13 340.41 63.61 63.51 1,055.66
2011 438.60 118.41 100.76 18.17 570.18 375.35 68.21 87.24 1,100.97
2012 484.75 127.38 111.92 15.28 630.17 403.79 75.77 73.34 1,183.07
2013 492.10 124.34 105.31 19.70 639.72 394.17 71.30 94.55 1,199.74
2014 503.91 130.10 107.07 24.37 655.08 412.40 72.49 116.98 1,256.95
2015 448.76 165.21 135.46 32.01 583.39 523.72 91.71 153.64 1,352.45
2016 470.66 179.93 149.62 32.35 611.85 570.36 101.30 155.28 1,438.79
2017 508.27 208.40 178.44 31.26 660.75 660.62 120.80 150.07 1,592.23
2018 571.15 249.42 220.33 28.93 742.49 790.68 149.16 138.84 1,821.17
2.G.3 N2O from product use
N2O Emissions from medical applications were estimated based on the IPCC 2006 Guidelines. Activity data was collected from customs on the amount of import and export of N2O for medical purposes for 2011-2018 (Table 47). For previous years, data on the N2O consumption was
extrapolated as the average for the available period per capita. It is assumed that none of the
administered N2O is chemically changed by the body, and all is returned to the atmosphere, thus the emission factor of 1.0 was applied.
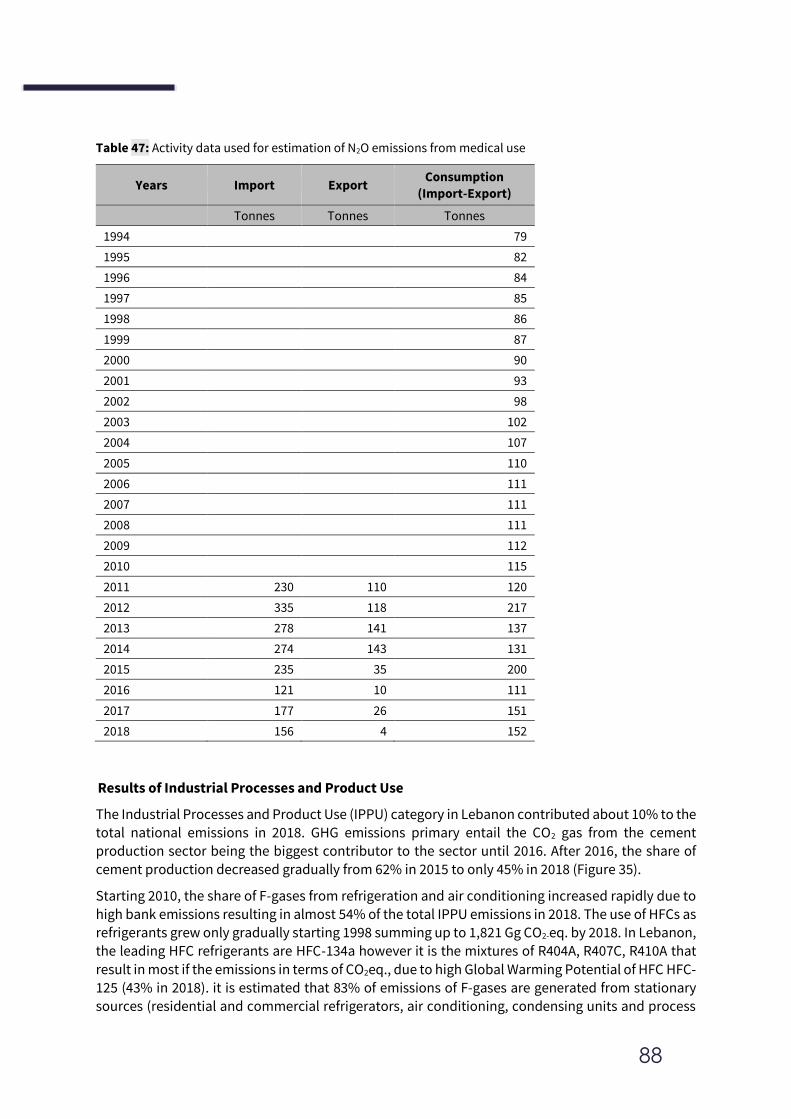
88
Table 47: Activity data used for estimation of N2O emissions from medical use
Years Import Export Consumption
(Import-Export)
Tonnes Tonnes Tonnes
1994 79
1995 82
1996 84
1997 85
1998 86
1999 87
2000 90
2001 93
2002 98
2003 102
2004 107
2005 110
2006 111
2007 111
2008 111
2009 112
2010 115
2011 230 110 120
2012 335 118 217
2013 278 141 137
2014 274 143 131
2015 235 35 200
2016 121 10 111
2017 177 26 151
2018 156 4 152
Results of Industrial Processes and Product Use
The Industrial Processes and Product Use (IPPU) category in Lebanon contributed about 10% to the total national emissions in 2018. GHG emissions primary entail the CO2 gas from the cement production sector being the biggest contributor to the sector until 2016. After 2016, the share of
cement production decreased gradually from 62% in 2015 to only 45% in 2018 (Figure 35).
Starting 2010, the share of F-gases from refrigeration and air conditioning increased rapidly due to
high bank emissions resulting in almost 54% of the total IPPU emissions in 2018. The use of HFCs as refrigerants grew only gradually starting 1998 summing up to 1,821 Gg CO2-eq. by 2018. In Lebanon, the leading HFC refrigerants are HFC-134a however it is the mixtures of R404A, R407C, R410A that
result in most if the emissions in terms of CO2eq., due to high Global Warming Potential of HFC HFC-125 (43% in 2018). it is estimated that 83% of emissions of F-gases are generated from stationary sources (residential and commercial refrigerators, air conditioning, condensing units and process
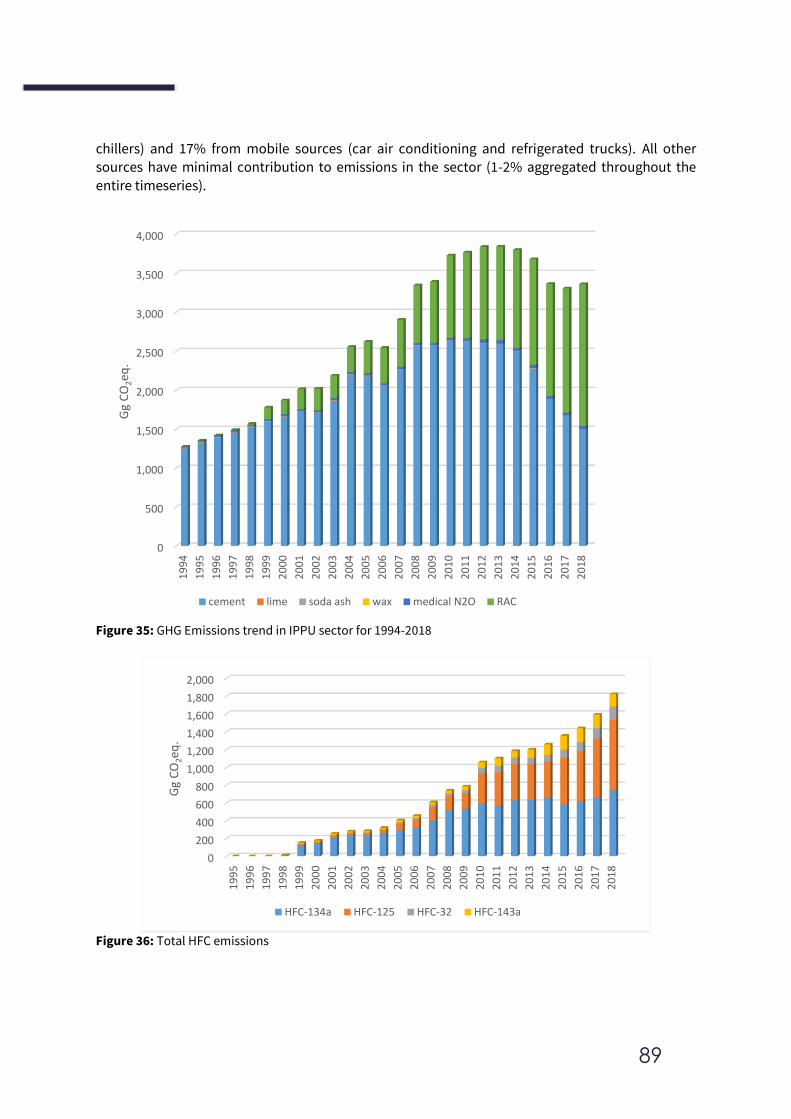
89
chillers) and 17% from mobile sources (car air conditioning and refrigerated trucks). All other sources have minimal contribution to emissions in the sector (1-2% aggregated throughout the
entire timeseries).
Figure 35: GHG Emissions trend in IPPU sector for 1994-2018
Figure 36: Total HFC emissions
0
500
1,000
1,500
2,000
2,500
3,000
3,500
4,000
19
94
19
95
19
96
19
97
19
98
19
99
20
00
20
01
20
02
20
03
20
04
20
05
20
06
20
07
20
08
20
09
20
10
20
11
20
12
20
13
20
14
20
15
20
16
20
17
20
18
Gg
CO
2eq
.
cement lime soda ash wax medical N2O RAC
0
200
400
600
800
1,000
1,200
1,400
1,600
1,800
2,000
19
95
19
96
19
97
19
98
19
99
20
00
20
01
20
02
20
03
20
04
20
05
20
06
20
07
20
08
20
09
20
10
20
11
20
12
20
13
20
14
20
15
20
16
20
17
20
18
Gg
CO
2eq
.
HFC-134a HFC-125 HFC-32 HFC-143a
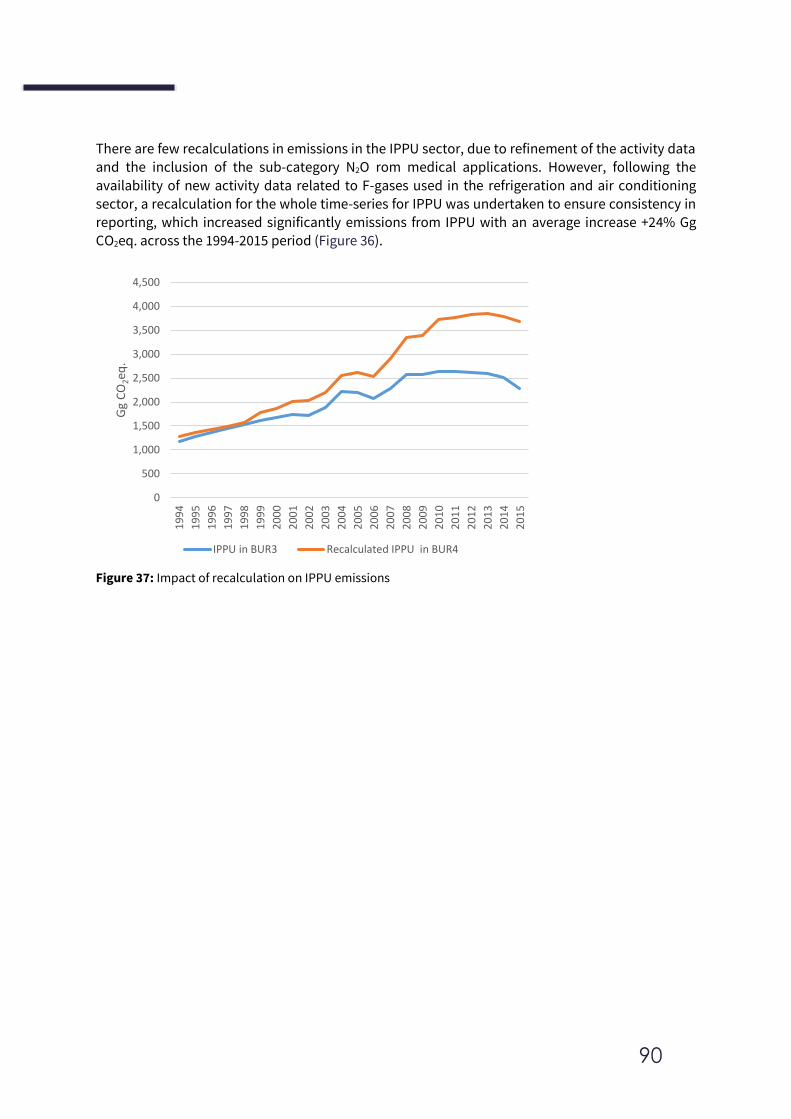
90
There are few recalculations in emissions in the IPPU sector, due to refinement of the activity data and the inclusion of the sub-category N2O rom medical applications. However, following the
availability of new activity data related to F-gases used in the refrigeration and air conditioning sector, a recalculation for the whole time-series for IPPU was undertaken to ensure consistency in reporting, which increased significantly emissions from IPPU with an average increase +24% Gg CO2eq. across the 1994-2015 period (Figure 36).
Figure 37: Impact of recalculation on IPPU emissions
0
500
1,000
1,500
2,000
2,500
3,000
3,500
4,000
4,500
19
94
19
95
19
96
19
97
19
98
19
99
20
00
20
01
20
02
20
03
20
04
20
05
20
06
20
07
20
08
20
09
20
10
20
11
20
12
20
13
20
14
20
15
Gg
CO
2eq
.
IPPU in BUR3 Recalculated IPPU in BUR4
91
3. Agriculture, Forestry and Other Land Use (AFOLU)
Methodology
The present section covers the following AFOLU subcategories:
3.A. Livestock
o 3.A.1 Enteric fermentation o 3.A.2 Manure management
3.B Land
o 3.B.1 Forest land
o 3.B.2 Cropland
o 3.B.3 Grassland
o 3.B.4 Wetland
o 3.B.5 Settlements 3.C. Aggregate sources and non-CO2 emission sources on land
o 3.C.1 Emissions from biomass burning
o 3.C.3 Urea application
o 3.C.4 Direct N2O emissions from managed soils o 3.C.5 Indirect N2O emissions from managed soils
o 3.C.6 Indirect N2O emissions from manure management 3.D. Other
o 3.D.1 Harvested Wood Products
The following subcategories are not occurring in Lebanon and reported as such:
• 3.B.6 Other land
• 3.C.2 Liming
• 3.C.7 Rice cultivation
• 3.C.8 Other
3.A Livestock
This category estimates CH4 emissions from enteric fermentation in livestock, and CH4 and N2O
emissions from manure management. As per the guidelines, CO2 emissions from livestock are not estimated because annual net CO2 emissions are assumed to be zero (the CO2 photosynthesized by
plants is returned to the atmosphere as respired CO2). A portion of the C is returned as CH4 and for this reason, CH4 requires separate consideration. Cattle are an important source of CH4 in many countries because of their large population and high CH4 emissions rate due to their ruminant
digestive system. N2O emissions from manure management vary significantly between the types of
management system used and can also result in indirect emissions due to other forms of nitrogen loss from the system.
Methodology
The tier 1 methodology was adopted for the calculation of GHG emissions from enteric fermentation and manure management as information on dietary regimes, rate of pregnancy, rate of lactation
and average amount of work done by livestock, manure characteristics and practices required for
92
tier 2 is not available. Basic characterization was therefore performed to assess the animal population in Lebanon. Population of some species was adjusted to number of days alive as
appropriate using equation 10.1. For non-dairy cattle, imported population was added to national population and adjusted to number of days alive.
For enteric fermentation (3.A.1): emission factors for each species were selected from the list of defaults provided in the 2006 IPCC guidelines. Each population subgroup was multiplied by the
corresponding emission factor to estimate emissions from each species as per equation 10.19.
Finally, total emissions from livestock enteric fermentation were summed up as per equation 10.20. except for poultry since they do not cause enteric fermentation emissions. For CH4 emissions from manure management (3.A.2): emission factors for each species were selected
from the list of defaults provided in the 2006 IPCC guidelines. The sum of each population subgroup
multiplied by its corresponding emission factor was performed to calculate total CH4 emissions
form manure management as per equation 10.22. For direct N2O emissions from manure management (3.A.2): definition of manure management
systems in Lebanon and attribution of fraction of total nitrogen excretion managed in each manure management system was estimated through stakeholder consultation and expert judgement, as there is no coherent published data on the matter. Emission factors for each species in each manure
management system were selected from the list of defaults provided in the 2006 IPCC guidelines. The following parameters were also defined: default nitrogen excretion rate per head per species,
typical animal mass per species, fraction of total annual nitrogen excretion that is managed in each manure management system. Annual nitrogen excretion rate per type of livestock was calculated
as per equation 10.30 and total direct N2O emissions from manure management was calculated as per equation 10.25.
Activity data
The livestock categories found in Lebanon are: dairy cattle, non-dairy cattle, sheep, goats, poultry (laying hens, broilers and traditional), swine, horses, mules, asses, and camels. According to experts
at the Ministry of Agriculture (MoA), some buffaloes exist in Lebanon in one farm in the country that
produces mozzarella di buffala. However, statistics on buffaloes are not included in the MoA database nor in the FAOSTAT. While it is estimated that this farm currently has around 80 buffaloes,
clear information on historical data is not available nor known. Therefore, emissions from this category are Not Estimated and reported as such.
Activity data was updated for the years 2016-2018 as per new data provided by MoA and available on FAOSTAT. Data on imported beef was estimated by MoA expert judgement for the years 2016-
2018 since published information could not be obtained. Populations of imported beef and broilers
were adjusted to 60 and 30 days alive respectively.
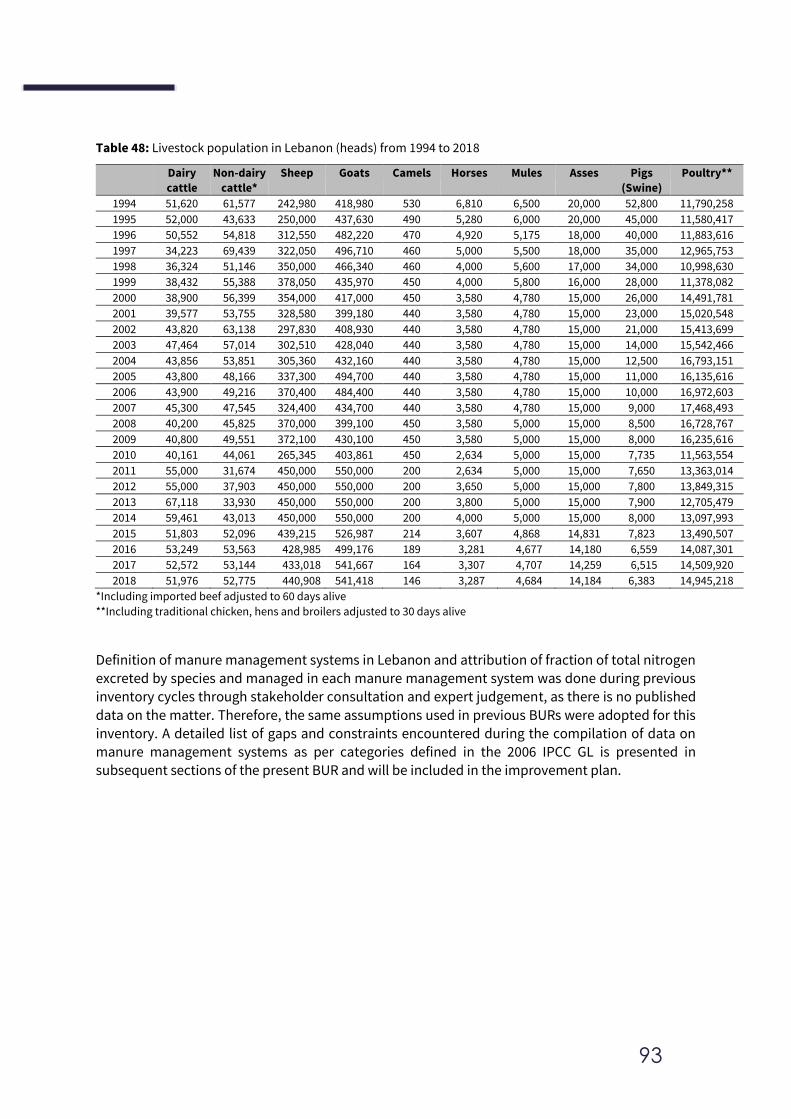
93
Table 48: Livestock population in Lebanon (heads) from 1994 to 2018
Dairy
cattle
Non-dairy
cattle*
Sheep Goats Camels Horses Mules Asses Pigs
(Swine)
Poultry**
1994 51,620 61,577 242,980 418,980 530 6,810 6,500 20,000 52,800 11,790,258
1995 52,000 43,633 250,000 437,630 490 5,280 6,000 20,000 45,000 11,580,417
1996 50,552 54,818 312,550 482,220 470 4,920 5,175 18,000 40,000 11,883,616
1997 34,223 69,439 322,050 496,710 460 5,000 5,500 18,000 35,000 12,965,753
1998 36,324 51,146 350,000 466,340 460 4,000 5,600 17,000 34,000 10,998,630
1999 38,432 55,388 378,050 435,970 450 4,000 5,800 16,000 28,000 11,378,082
2000 38,900 56,399 354,000 417,000 450 3,580 4,780 15,000 26,000 14,491,781
2001 39,577 53,755 328,580 399,180 440 3,580 4,780 15,000 23,000 15,020,548
2002 43,820 63,138 297,830 408,930 440 3,580 4,780 15,000 21,000 15,413,699
2003 47,464 57,014 302,510 428,040 440 3,580 4,780 15,000 14,000 15,542,466
2004 43,856 53,851 305,360 432,160 440 3,580 4,780 15,000 12,500 16,793,151
2005 43,800 48,166 337,300 494,700 440 3,580 4,780 15,000 11,000 16,135,616
2006 43,900 49,216 370,400 484,400 440 3,580 4,780 15,000 10,000 16,972,603
2007 45,300 47,545 324,400 434,700 440 3,580 4,780 15,000 9,000 17,468,493
2008 40,200 45,825 370,000 399,100 450 3,580 5,000 15,000 8,500 16,728,767
2009 40,800 49,551 372,100 430,100 450 3,580 5,000 15,000 8,000 16,235,616
2010 40,161 44,061 265,345 403,861 450 2,634 5,000 15,000 7,735 11,563,554
2011 55,000 31,674 450,000 550,000 200 2,634 5,000 15,000 7,650 13,363,014
2012 55,000 37,903 450,000 550,000 200 3,650 5,000 15,000 7,800 13,849,315
2013 67,118 33,930 450,000 550,000 200 3,800 5,000 15,000 7,900 12,705,479
2014 59,461 43,013 450,000 550,000 200 4,000 5,000 15,000 8,000 13,097,993
2015 51,803 52,096 439,215 526,987 214 3,607 4,868 14,831 7,823 13,490,507
2016 53,249 53,563 428,985 499,176 189 3,281 4,677 14,180 6,559 14,087,301
2017 52,572 53,144 433,018 541,667 164 3,307 4,707 14,259 6,515 14,509,920
2018 51,976 52,775 440,908 541,418 146 3,287 4,684 14,184 6,383 14,945,218
*Including imported beef adjusted to 60 days alive
**Including traditional chicken, hens and broilers adjusted to 30 days alive
Definition of manure management systems in Lebanon and attribution of fraction of total nitrogen
excreted by species and managed in each manure management system was done during previous inventory cycles through stakeholder consultation and expert judgement, as there is no published
data on the matter. Therefore, the same assumptions used in previous BURs were adopted for this
inventory. A detailed list of gaps and constraints encountered during the compilation of data on manure management systems as per categories defined in the 2006 IPCC GL is presented in
subsequent sections of the present BUR and will be included in the improvement plan.
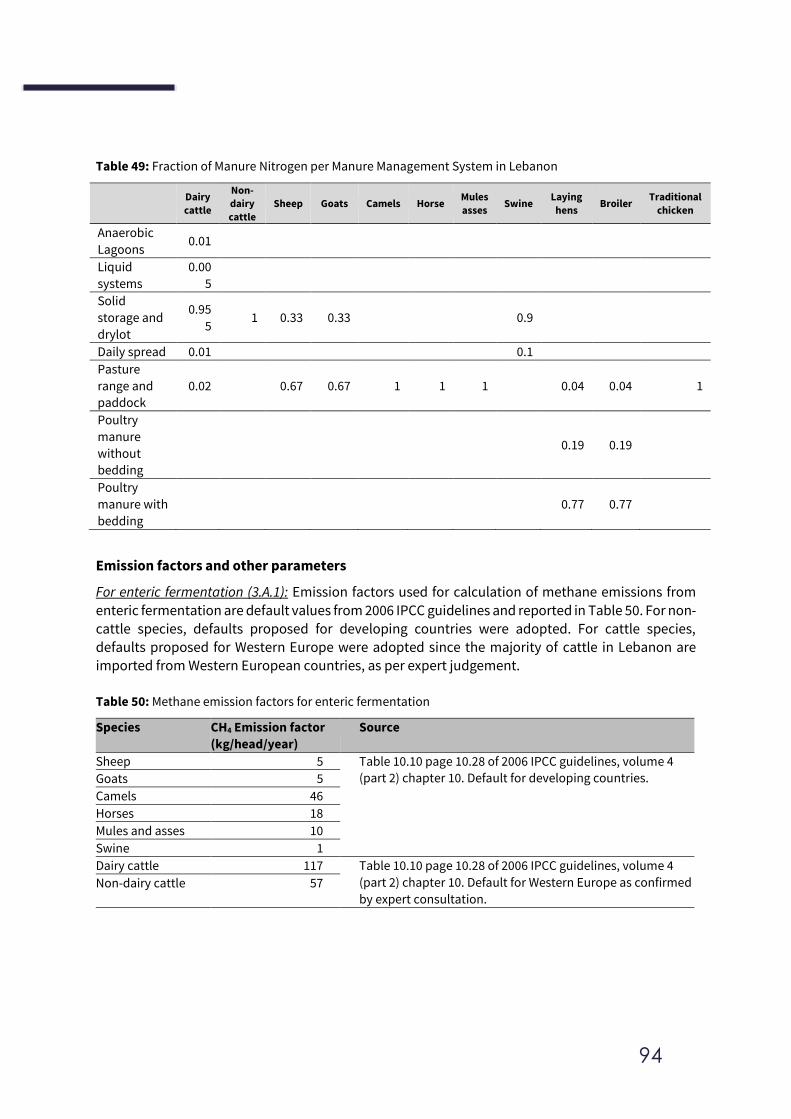
94
Table 49: Fraction of Manure Nitrogen per Manure Management System in Lebanon
Dairy
cattle
Non-dairy
cattle
Sheep Goats Camels Horse Mules
asses Swine
Laying
hens Broiler
Traditional
chicken
Anaerobic
Lagoons 0.01
Liquid
systems
0.00
5
Solid
storage and
drylot
0.95
5 1 0.33 0.33 0.9
Daily spread 0.01 0.1
Pasture
range and
paddock
0.02 0.67 0.67 1 1 1 0.04 0.04 1
Poultry
manure
without
bedding
0.19 0.19
Poultry
manure with
bedding
0.77 0.77
Emission factors and other parameters
For enteric fermentation (3.A.1): Emission factors used for calculation of methane emissions from
enteric fermentation are default values from 2006 IPCC guidelines and reported in Table 50. For non-
cattle species, defaults proposed for developing countries were adopted. For cattle species, defaults proposed for Western Europe were adopted since the majority of cattle in Lebanon are
imported from Western European countries, as per expert judgement.
Table 50: Methane emission factors for enteric fermentation
Species CH4 Emission factor
(kg/head/year)
Source
Sheep 5 Table 10.10 page 10.28 of 2006 IPCC guidelines, volume 4
(part 2) chapter 10. Default for developing countries. Goats 5
Camels 46
Horses 18
Mules and asses 10
Swine 1
Dairy cattle 117 Table 10.10 page 10.28 of 2006 IPCC guidelines, volume 4
(part 2) chapter 10. Default for Western Europe as confirmed
by expert consultation. Non-dairy cattle 57
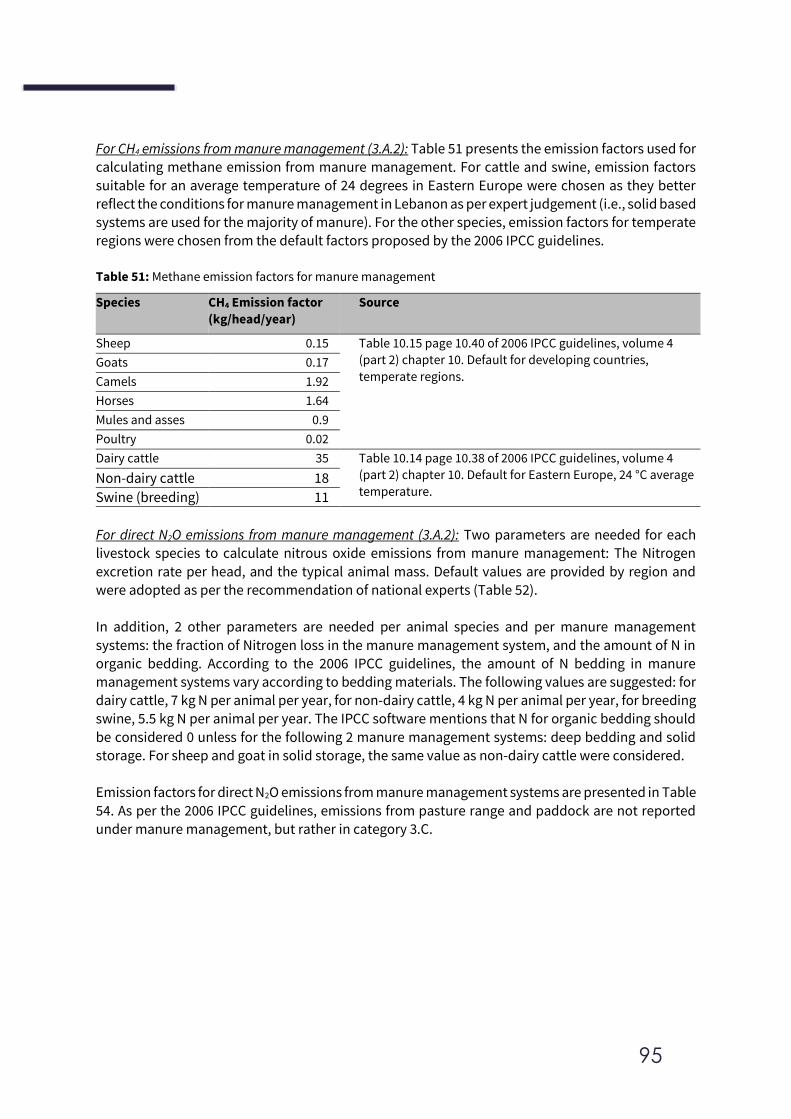
95
For CH4 emissions from manure management (3.A.2): Table 51 presents the emission factors used for calculating methane emission from manure management. For cattle and swine, emission factors
suitable for an average temperature of 24 degrees in Eastern Europe were chosen as they better reflect the conditions for manure management in Lebanon as per expert judgement (i.e., solid based systems are used for the majority of manure). For the other species, emission factors for temperate regions were chosen from the default factors proposed by the 2006 IPCC guidelines.
Table 51: Methane emission factors for manure management
Species CH4 Emission factor
(kg/head/year)
Source
Sheep 0.15 Table 10.15 page 10.40 of 2006 IPCC guidelines, volume 4
(part 2) chapter 10. Default for developing countries,
temperate regions. Goats 0.17
Camels 1.92
Horses 1.64
Mules and asses 0.9
Poultry 0.02
Dairy cattle 35 Table 10.14 page 10.38 of 2006 IPCC guidelines, volume 4
(part 2) chapter 10. Default for Eastern Europe, 24 °C average
temperature. Non-dairy cattle 18
Swine (breeding) 11
For direct N2O emissions from manure management (3.A.2): Two parameters are needed for each
livestock species to calculate nitrous oxide emissions from manure management: The Nitrogen
excretion rate per head, and the typical animal mass. Default values are provided by region and
were adopted as per the recommendation of national experts (Table 52).
In addition, 2 other parameters are needed per animal species and per manure management
systems: the fraction of Nitrogen loss in the manure management system, and the amount of N in
organic bedding. According to the 2006 IPCC guidelines, the amount of N bedding in manure
management systems vary according to bedding materials. The following values are suggested: for dairy cattle, 7 kg N per animal per year, for non-dairy cattle, 4 kg N per animal per year, for breeding swine, 5.5 kg N per animal per year. The IPCC software mentions that N for organic bedding should
be considered 0 unless for the following 2 manure management systems: deep bedding and solid storage. For sheep and goat in solid storage, the same value as non-dairy cattle were considered.
Emission factors for direct N2O emissions from manure management systems are presented in Table
54. As per the 2006 IPCC guidelines, emissions from pasture range and paddock are not reported
under manure management, but rather in category 3.C.
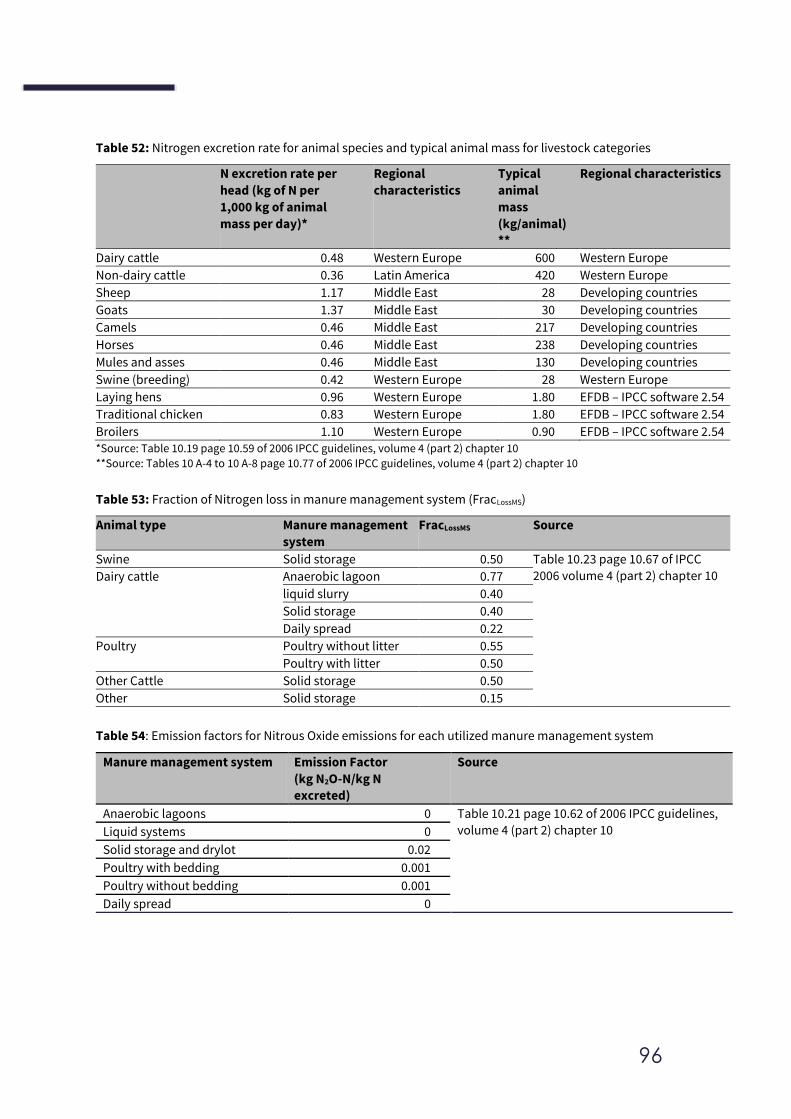
96
Table 52: Nitrogen excretion rate for animal species and typical animal mass for livestock categories
N excretion rate per
head (kg of N per
1,000 kg of animal
mass per day)*
Regional
characteristics
Typical
animal
mass
(kg/animal)
**
Regional characteristics
Dairy cattle 0.48 Western Europe 600 Western Europe
Non-dairy cattle 0.36 Latin America 420 Western Europe
Sheep 1.17 Middle East 28 Developing countries
Goats 1.37 Middle East 30 Developing countries
Camels 0.46 Middle East 217 Developing countries
Horses 0.46 Middle East 238 Developing countries
Mules and asses 0.46 Middle East 130 Developing countries
Swine (breeding) 0.42 Western Europe 28 Western Europe
Laying hens 0.96 Western Europe 1.80 EFDB – IPCC software 2.54
Traditional chicken 0.83 Western Europe 1.80 EFDB – IPCC software 2.54
Broilers 1.10 Western Europe 0.90 EFDB – IPCC software 2.54 *Source: Table 10.19 page 10.59 of 2006 IPCC guidelines, volume 4 (part 2) chapter 10
**Source: Tables 10 A-4 to 10 A-8 page 10.77 of 2006 IPCC guidelines, volume 4 (part 2) chapter 10
Table 53: Fraction of Nitrogen loss in manure management system (FracLossMS)
Animal type Manure management
system
FracLossMS Source
Swine Solid storage 0.50 Table 10.23 page 10.67 of IPCC
2006 volume 4 (part 2) chapter 10 Dairy cattle
Anaerobic lagoon 0.77
liquid slurry 0.40
Solid storage 0.40
Daily spread 0.22
Poultry
Poultry without litter 0.55
Poultry with litter 0.50
Other Cattle Solid storage 0.50
Other Solid storage 0.15
Table 54: Emission factors for Nitrous Oxide emissions for each utilized manure management system
Manure management system Emission Factor
(kg N2O-N/kg N
excreted)
Source
Anaerobic lagoons 0 Table 10.21 page 10.62 of 2006 IPCC guidelines,
volume 4 (part 2) chapter 10 Liquid systems 0
Solid storage and drylot 0.02
Poultry with bedding 0.001
Poultry without bedding 0.001
Daily spread 0
97
3.B Land
There are many factors governing emissions and removals of greenhouse gases that can be both natural and anthropogenic and it can be difficult to clearly distinguish between causal factors.
Under the 2006 IPCC guidelines, only anthropogenic GHG emissions and removals are estimated, as all those occur on ‘managed land’, which is “land where human interventions and practices have
been applied to perform production, ecological or social functions” (IPCC, 2006).
Methodology
The representation of most land-use areas and land conversions was done following the Approach
3 of the IPCC guidelines. The nationally adopted land-use classification system of the Land Cover / Land Use map of 1998 was employed for the inventory estimation. Each land category was further
subdivided into lands remaining in the same land use (for example, forest lands remaining forest lands) and lands converted into another land-use category (for example, forest lands converted into
croplands) during the inventory period. See Annex III for more details. The tier levels of the activity data acquired by surveys and personal communications depended on the accuracy and completeness of the nationally available estimates. The selection of the
appropriate tier level for the land categories and subcategories, non-CO2 gases and carbon pools,
was mostly based on the resources available for the inventory process. The Tier 1 approach, which
employs the basic method and the default emission factors provided in the IPCC Guidelines, was typically used in these inventory calculations. The Tier 3 approach, which uses higher order methods including models and inventory measurement systems was used for the representation of
most land-use areas and land conversions. This allowed the generation of data about land use changes such as forest, croplands and grasslands conversions to settlements as well as the extent
of burned areas in forest, croplands and grasslands. It is the most complex, accurate and spatially
explicit method, provided by the IPCC guidelines, which ensured the consistency of the inventory calculations.
Multi-temporal satellite images were employed for mapping changes in land cover and land use changes. These included Landsat TM, ETM+ (1994-2012) and Landsat 8 imagery (2013-2018). The
analysis of acquired data comprised mapping and comparing changes in land cover and land use
using comparable satellite data of the same spatial resolution and spectral bands.
Quality Control (QC) procedures were adopted to ensure data integrity, correctness and completeness, in addition to identifying errors and omissions. GHG emissions and removals were reported using the IPCC 2006 Guidelines and software. This allowed documenting and archiving for
all information used to produce the inventory, including all activity data, emission/removal factors and sources of data. In addition, FOLU documentation sheets for Land Use categories and biomass
burned were filled in and reviewed. Main activity data and assumptions taken into consideration for the Land Use Categories of the FOLU sector are presented in the tables below, respectively (Table
55 and Table 56).
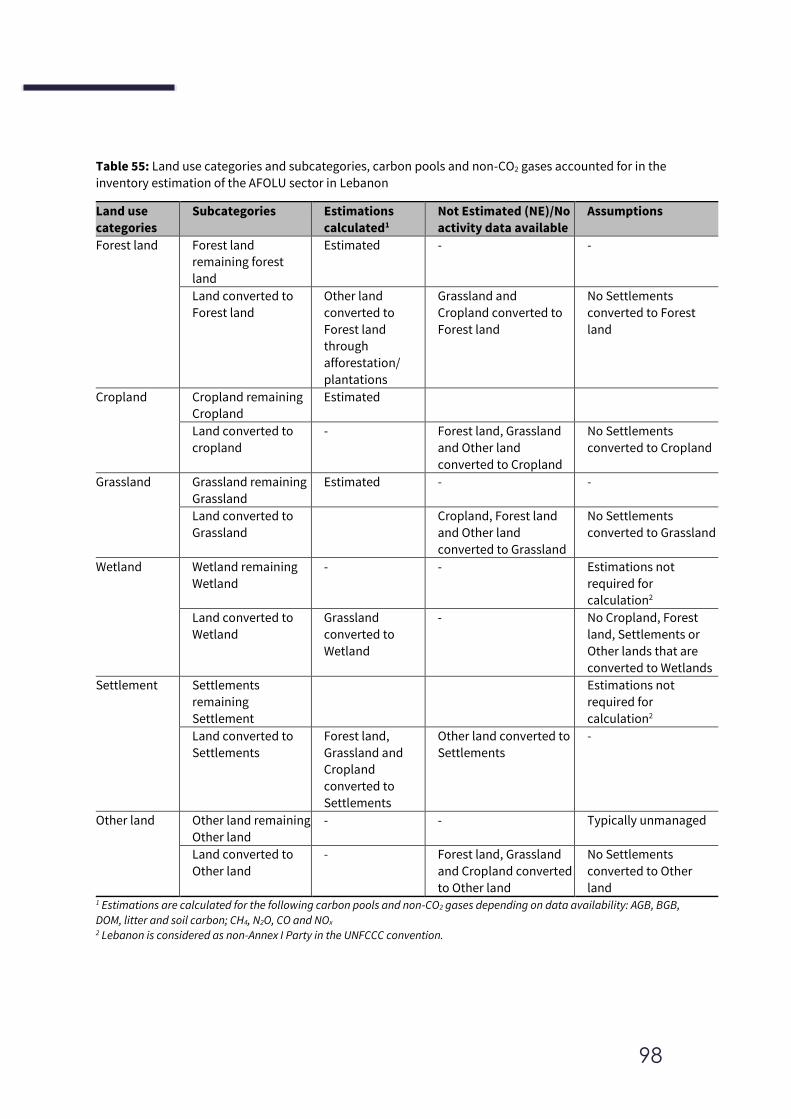
98
Table 55: Land use categories and subcategories, carbon pools and non-CO2 gases accounted for in the
inventory estimation of the AFOLU sector in Lebanon
Land use
categories
Subcategories Estimations
calculated1
Not Estimated (NE)/No
activity data available
Assumptions
Forest land Forest land
remaining forest
land
Estimated - -
Land converted to
Forest land
Other land
converted to
Forest land
through
afforestation/
plantations
Grassland and
Cropland converted to
Forest land
No Settlements
converted to Forest
land
Cropland Cropland remaining
Cropland
Estimated
Land converted to
cropland
- Forest land, Grassland
and Other land
converted to Cropland
No Settlements
converted to Cropland
Grassland Grassland remaining
Grassland
Estimated - -
Land converted to
Grassland
Cropland, Forest land
and Other land
converted to Grassland
No Settlements
converted to Grassland
Wetland Wetland remaining
Wetland
- - Estimations not
required for
calculation2
Land converted to
Wetland
Grassland
converted to
Wetland
- No Cropland, Forest
land, Settlements or
Other lands that are
converted to Wetlands
Settlement Settlements
remaining
Settlement
Estimations not
required for
calculation2
Land converted to
Settlements
Forest land,
Grassland and
Cropland
converted to
Settlements
Other land converted to
Settlements
-
Other land Other land remaining
Other land
- - Typically unmanaged
Land converted to
Other land
- Forest land, Grassland
and Cropland converted
to Other land
No Settlements
converted to Other
land 1 Estimations are calculated for the following carbon pools and non-CO2 gases depending on data availability: AGB, BGB,
DOM, litter and soil carbon; CH4, N2O, CO and NOx 2 Lebanon is considered as non-Annex I Party in the UNFCCC convention.
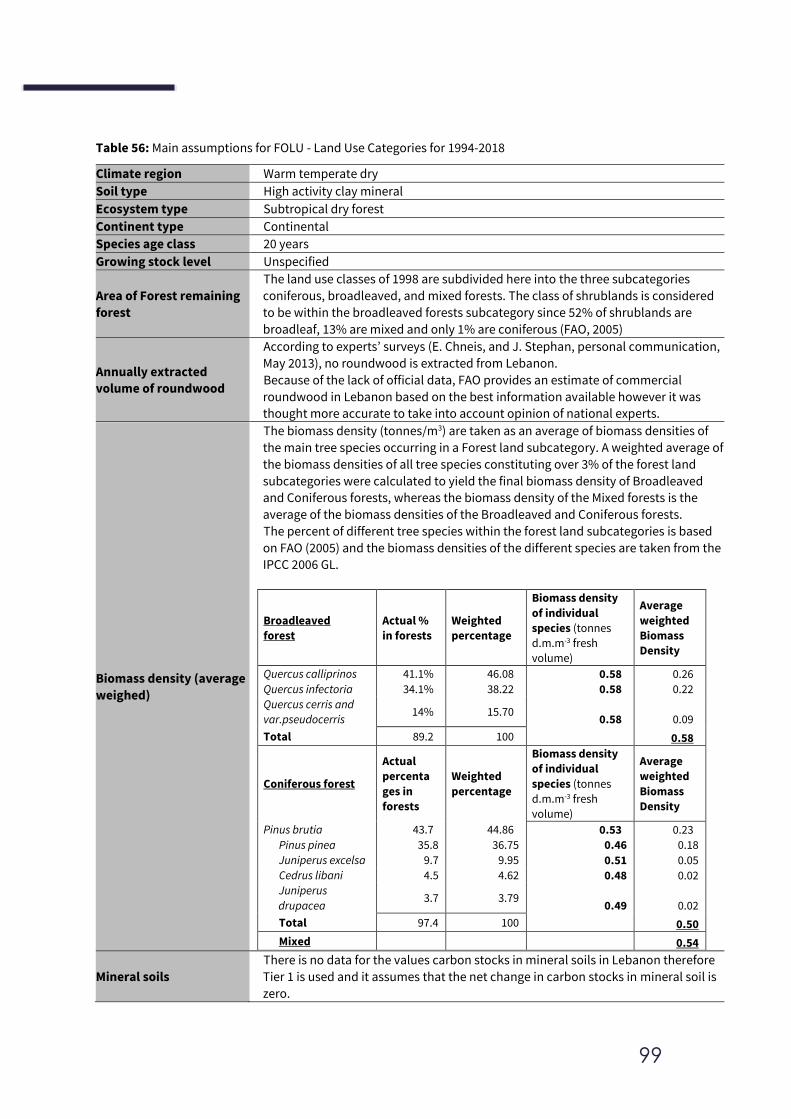
99
Table 56: Main assumptions for FOLU - Land Use Categories for 1994-2018
Climate region Warm temperate dry
Soil type High activity clay mineral
Ecosystem type Subtropical dry forest
Continent type Continental
Species age class 20 years
Growing stock level Unspecified
Area of Forest remaining
forest
The land use classes of 1998 are subdivided here into the three subcategories
coniferous, broadleaved, and mixed forests. The class of shrublands is considered
to be within the broadleaved forests subcategory since 52% of shrublands are
broadleaf, 13% are mixed and only 1% are coniferous (FAO, 2005)
Annually extracted
volume of roundwood
According to experts’ surveys (E. Chneis, and J. Stephan, personal communication,
May 2013), no roundwood is extracted from Lebanon.
Because of the lack of official data, FAO provides an estimate of commercial
roundwood in Lebanon based on the best information available however it was
thought more accurate to take into account opinion of national experts.
Biomass density (average
weighed)
The biomass density (tonnes/m3) are taken as an average of biomass densities of
the main tree species occurring in a Forest land subcategory. A weighted average of
the biomass densities of all tree species constituting over 3% of the forest land
subcategories were calculated to yield the final biomass density of Broadleaved
and Coniferous forests, whereas the biomass density of the Mixed forests is the
average of the biomass densities of the Broadleaved and Coniferous forests.
The percent of different tree species within the forest land subcategories is based
on FAO (2005) and the biomass densities of the different species are taken from the
IPCC 2006 GL.
Broadleaved
forest
Actual %
in forests
Weighted
percentage
Biomass density
of individual
species (tonnes
d.m.m-3 fresh
volume)
Average
weighted
Biomass
Density
Quercus calliprinos 41.1% 46.08 0.58 0.26
Quercus infectoria 34.1% 38.22 0.58 0.22
Quercus cerris and
var.pseudocerris 14% 15.70
0.58 0.09
Total 89.2 100 0.58
Coniferous forest
Actual
percenta
ges in
forests
Weighted
percentage
Biomass density
of individual
species (tonnes
d.m.m-3 fresh
volume)
Average
weighted
Biomass
Density
Pinus brutia 43.7 44.86 0.53 0.23
Pinus pinea 35.8 36.75 0.46 0.18
Juniperus excelsa 9.7 9.95 0.51 0.05
Cedrus libani 4.5 4.62 0.48 0.02
Juniperus
drupacea 3.7 3.79
0.49 0.02
Total 97.4 100 0.50
Mixed 0.54
Mineral soils
There is no data for the values carbon stocks in mineral soils in Lebanon therefore
Tier 1 is used and it assumes that the net change in carbon stocks in mineral soil is
zero.
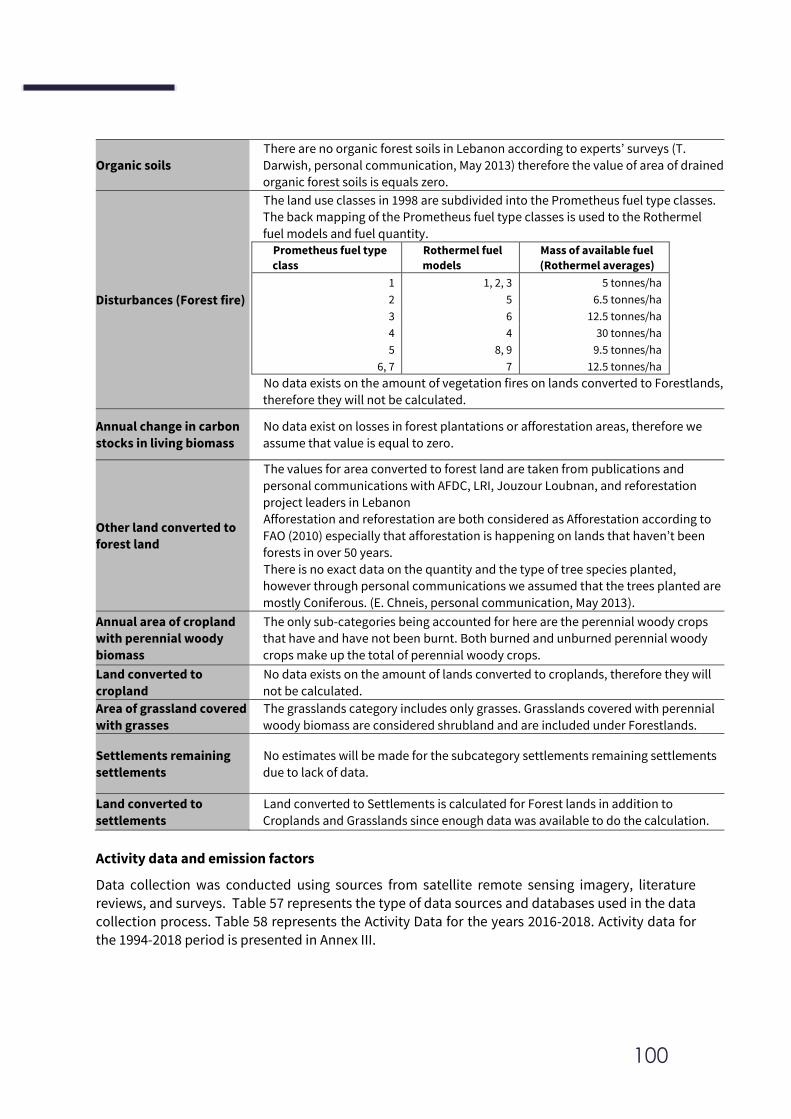
100
Organic soils
There are no organic forest soils in Lebanon according to experts’ surveys (T.
Darwish, personal communication, May 2013) therefore the value of area of drained
organic forest soils is equals zero.
Disturbances (Forest fire)
The land use classes in 1998 are subdivided into the Prometheus fuel type classes.
The back mapping of the Prometheus fuel type classes is used to the Rothermel
fuel models and fuel quantity. Prometheus fuel type
class
Rothermel fuel
models
Mass of available fuel
(Rothermel averages)
1 1, 2, 3 5 tonnes/ha
2 5 6.5 tonnes/ha
3 6 12.5 tonnes/ha
4 4 30 tonnes/ha
5 8, 9 9.5 tonnes/ha
6, 7 7 12.5 tonnes/ha
No data exists on the amount of vegetation fires on lands converted to Forestlands,
therefore they will not be calculated.
Annual change in carbon
stocks in living biomass
No data exist on losses in forest plantations or afforestation areas, therefore we
assume that value is equal to zero.
Other land converted to
forest land
The values for area converted to forest land are taken from publications and
personal communications with AFDC, LRI, Jouzour Loubnan, and reforestation
project leaders in Lebanon
Afforestation and reforestation are both considered as Afforestation according to
FAO (2010) especially that afforestation is happening on lands that haven’t been
forests in over 50 years.
There is no exact data on the quantity and the type of tree species planted,
however through personal communications we assumed that the trees planted are
mostly Coniferous. (E. Chneis, personal communication, May 2013).
Annual area of cropland
with perennial woody
biomass
The only sub-categories being accounted for here are the perennial woody crops
that have and have not been burnt. Both burned and unburned perennial woody
crops make up the total of perennial woody crops.
Land converted to
cropland
No data exists on the amount of lands converted to croplands, therefore they will
not be calculated.
Area of grassland covered
with grasses
The grasslands category includes only grasses. Grasslands covered with perennial
woody biomass are considered shrubland and are included under Forestlands.
Settlements remaining
settlements
No estimates will be made for the subcategory settlements remaining settlements
due to lack of data.
Land converted to
settlements
Land converted to Settlements is calculated for Forest lands in addition to
Croplands and Grasslands since enough data was available to do the calculation.
Activity data and emission factors
Data collection was conducted using sources from satellite remote sensing imagery, literature reviews, and surveys. Table 57 represents the type of data sources and databases used in the data collection process. Table 58 represents the Activity Data for the years 2016-2018. Activity data for the 1994-2018 period is presented in Annex III.
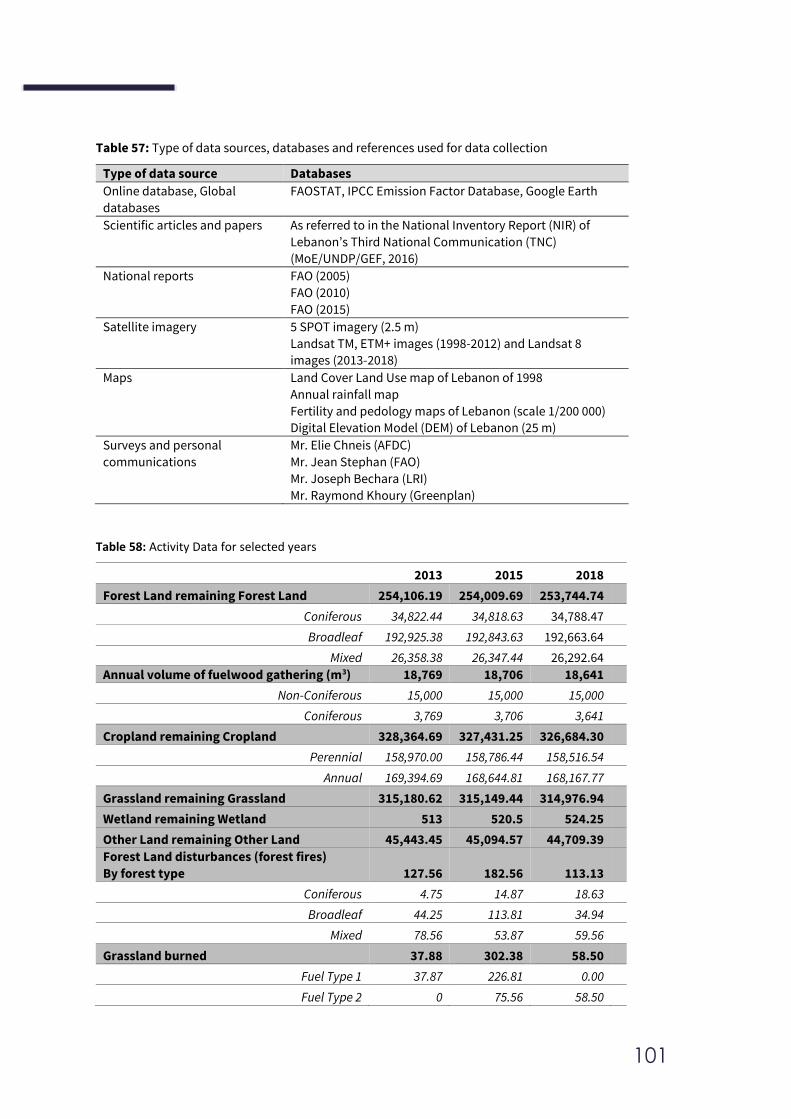
101
Table 57: Type of data sources, databases and references used for data collection
Type of data source Databases
Online database, Global
databases
FAOSTAT, IPCC Emission Factor Database, Google Earth
Scientific articles and papers As referred to in the National Inventory Report (NIR) of
Lebanon’s Third National Communication (TNC)
(MoE/UNDP/GEF, 2016)
National reports FAO (2005)
FAO (2010)
FAO (2015)
Satellite imagery 5 SPOT imagery (2.5 m)
Landsat TM, ETM+ images (1998-2012) and Landsat 8
images (2013-2018)
Maps Land Cover Land Use map of Lebanon of 1998
Annual rainfall map
Fertility and pedology maps of Lebanon (scale 1/200 000)
Digital Elevation Model (DEM) of Lebanon (25 m)
Surveys and personal
communications
Mr. Elie Chneis (AFDC)
Mr. Jean Stephan (FAO)
Mr. Joseph Bechara (LRI)
Mr. Raymond Khoury (Greenplan)
Table 58: Activity Data for selected years
2013 2015 2018
Forest Land remaining Forest Land 254,106.19 254,009.69 253,744.74
Coniferous 34,822.44 34,818.63 34,788.47
Broadleaf 192,925.38 192,843.63 192,663.64
Mixed 26,358.38 26,347.44 26,292.64
Annual volume of fuelwood gathering (m3) 18,769 18,706 18,641
Non-Coniferous 15,000 15,000 15,000
Coniferous 3,769 3,706 3,641
Cropland remaining Cropland 328,364.69 327,431.25 326,684.30
Perennial 158,970.00 158,786.44 158,516.54
Annual 169,394.69 168,644.81 168,167.77
Grassland remaining Grassland 315,180.62 315,149.44 314,976.94
Wetland remaining Wetland 513 520.5 524.25
Other Land remaining Other Land 45,443.45 45,094.57 44,709.39
Forest Land disturbances (forest fires)
By forest type 127.56 182.56 113.13
Coniferous 4.75 14.87 18.63
Broadleaf 44.25 113.81 34.94
Mixed 78.56 53.87 59.56
Grassland burned 37.88 302.38 58.50
Fuel Type 1 37.87 226.81 0.00
Fuel Type 2 0 75.56 58.50
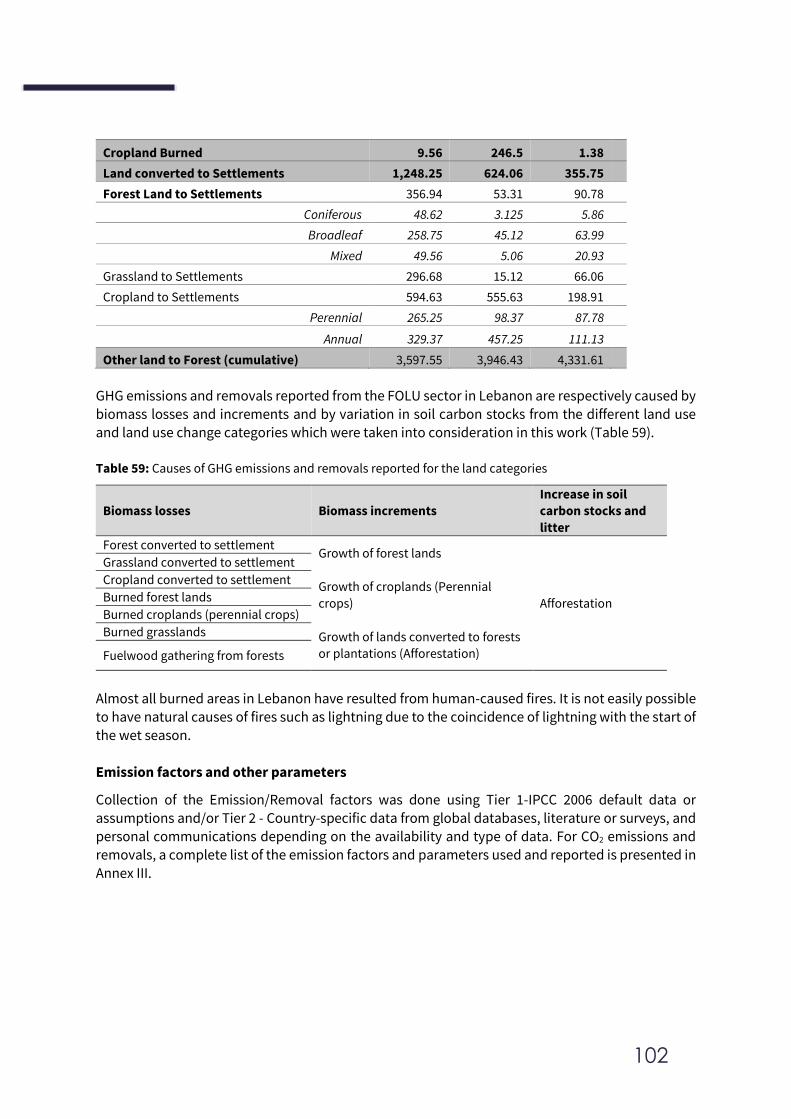
102
Cropland Burned 9.56 246.5 1.38
Land converted to Settlements 1,248.25 624.06 355.75
Forest Land to Settlements 356.94 53.31 90.78
Coniferous 48.62 3.125 5.86
Broadleaf 258.75 45.12 63.99
Mixed 49.56 5.06 20.93
Grassland to Settlements 296.68 15.12 66.06
Cropland to Settlements 594.63 555.63 198.91
Perennial 265.25 98.37 87.78
Annual 329.37 457.25 111.13
Other land to Forest (cumulative) 3,597.55 3,946.43 4,331.61
GHG emissions and removals reported from the FOLU sector in Lebanon are respectively caused by biomass losses and increments and by variation in soil carbon stocks from the different land use and land use change categories which were taken into consideration in this work (Table 59). Table 59: Causes of GHG emissions and removals reported for the land categories
Biomass losses Biomass increments
Increase in soil
carbon stocks and
litter
Forest converted to settlement Growth of forest lands
Growth of croplands (Perennial
crops)
Growth of lands converted to forests
or plantations (Afforestation)
Afforestation
Grassland converted to settlement
Cropland converted to settlement
Burned forest lands
Burned croplands (perennial crops)
Burned grasslands
Fuelwood gathering from forests
Almost all burned areas in Lebanon have resulted from human-caused fires. It is not easily possible to have natural causes of fires such as lightning due to the coincidence of lightning with the start of the wet season.
Emission factors and other parameters
Collection of the Emission/Removal factors was done using Tier 1-IPCC 2006 default data or assumptions and/or Tier 2 - Country-specific data from global databases, literature or surveys, and personal communications depending on the availability and type of data. For CO2 emissions and removals, a complete list of the emission factors and parameters used and reported is presented in
Annex III.
103
3.C Aggregate sources and non-CO2 emissions sources on land
Non-CO2 emissions are derived from a variety of sources, including emissions from soils, livestock and manure, and from combustion of biomass, dead wood and litter. Direct emissions of N2O from soils are based on the amount of N applied to soils from the following sources:
- Managed soils: Synthetic Fertilizers FSN Organic N applied as fertilizer: FON (animal manure, sewage sludge, composting). N in crop residues: FCR
N mineralization: FSOM
- Drainage/management of organic soils: FOS. According to expert judgement, no organic soils exist
in Lebanon as per the IPCC guidelines definition (i.e., 12 to 20% of organic matter content per mass). Soils in Lebanon do not contain more than 5% organic matter. Therefore, this category is
reported as Not Occurring.
- Nitrogen contained in urine and manure deposited by grazing animals: FPRP
Indirect nitrous oxide emissions also occur from all the categories above except the FOS. Indirect emissions occur when nitrogen moves away from the site where it was deposited and is converted
into N2O somewhere else. This phenomenon is referred to as nitrogen loss by volatilization and/or leaching and runoff.
Finally, CO2 emissions occur during application of fertilization of soils with Urea, due to a loss of CO2 that was fixed in the industrial production process. Methodology
For emissions from biomass burning (3.C.1): Under the tier 1 approach, the Equation 2.27 was used
to estimate CO2 and non-CO2 emissions from fire, using the default data. Almost all burned areas in
Lebanon have resulted from human-caused fires. It is not easily possible to have natural causes of
fires such as lightning due to the coincidence of lightning with the start of the wet season. For CO2 emissions from urea applications (3.C.3): Since this is not a key category, tier 1 equation 11.13
was used where the amount of urea applied in tonnes was used with CO2 default emission factor. For direct N2O emissions from managed soils (3.C.4): The tier 1 methodology consists in estimating the amount of nitrogen added to soils from each source. Each group has a unique emission factor that is multiplied by the total amount of N applied. Then the three estimates of the three groups are
added for the total direct N2O emissions from soils as per equation 11.1. The tier 1 methodology assumes that N2O emissions occur the year the N is added to soils. Tier 2 methodology was not
adopted since this is not a key category and information on conditions under which N is applied/deposited is not available.
• To calculate the amount of N in synthetic fertilizers applied to soils (FSN): multiply amount of Nitrogenous fertilizers by the fraction of N content (p.11.12 of IPCC 2006 volume 4 (part 2) chapter 11)
104
• To calculate the amount of N from organic N additions applied to soils (FON): equation 11.3
and equation 11.4.
o The amounts of N in sewage sludge (FSEW) and composting (FCOMP) were not considered as there is no information on the Nitrogen content of the sludge and compost. According to expert judgements, the amounts of imported compost decrease over time as more local compost is used. The imported compost is often not fully rotted, so further rotting
on the field might take place depending on conditions. Improvement on information related to FSEW and FCOMP is needed and is included in the improvement plan in the subsequent section.
o The IPCC guidelines do not provide a method for estimating other organic amendments which should be included in FON. the MoA does not have these figures either. Therefore,
the emissions from this subcategory are Not Estimated.
o Other than compost, the amount of N in animal waste that is intentionally applied to
soils should also be included here (FAM), and this figure does not include manure that is deposited by grazing animals. This value is calculated using the equation 10.34. In
addition to data and parameters already used for calculating emissions from the
manure management category (number of livestock, annual average excretion rate per animal, fraction of total annual N excretion for each livestock category that is managed
in each manure management system), two additional parameters are needed: Fraction of managed N manure for livestock species that is lost in the manure management
system (FracLOSS) and amount of nitrogen from bedding (NbeddingMS, to be applied only for
solid storage and deep bedding systems)
• To calculate the amount of N from crop residues (FCR): equation 11.6. the following
parameters are needed for each crop type: dry weight correction of crop yield (equation 11.7), the area of the crop, the above ground residue (RAG) and below ground residue (RBG)
(equations page 11.14, the N content of the above ground residue (NAG) and below ground residue (NBG), the fraction of crop area that is renewed (FracRENEW), the fraction of above-
ground residue removed from field. No data is available on the practice of removing
residues, therefore fractions were adopted by expert judgement.
• To calculate the amount of N in urine and dung deposited by grazing animals (FPRP):
equation 11.5. parameters needed for this equation have been determined in the manure
management category.
For indirect N2O emissions from managed soils (3.C.5): the same quantities of N calculated for direct N2O emissions are used for indirect emissions (FSN, FON, and FPRP for volatilization, and FSN, FON, and FPRP FSOM and FCR for leaching and runoff). In addition, default values for the fractions of FSN that
volatizes (FracGASF) and of FON and FPRP that volatizes (FracGASM) are needed to calculate indirect emissions of N volatilized as per equation 11.9. The fraction of N lost through leaching and runoff
(FracLEACH) is needed to calculate indirect N2O emissions from N leaching and runoff as per equation 11.10.
For indirect N2O emissions from manure management (3.C.6): nitrogen losses due to volatilisation from manure management was calculated as per equation 10.26, using the values for the fraction of managed nitrogen manure that volatizes per species and per manure management species (FracGasMS) from the list of defaults provided in the 2006 IPCC guidelines, in addition to data identified
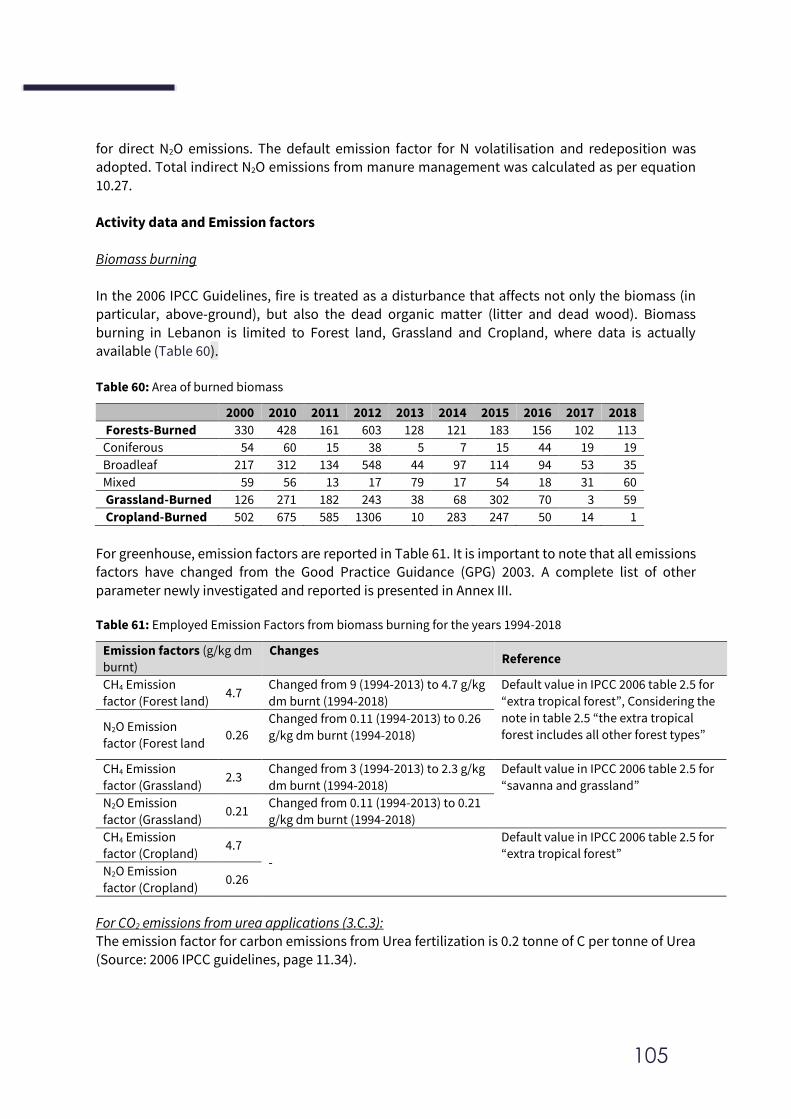
105
for direct N2O emissions. The default emission factor for N volatilisation and redeposition was adopted. Total indirect N2O emissions from manure management was calculated as per equation
10.27. Activity data and Emission factors
Biomass burning In the 2006 IPCC Guidelines, fire is treated as a disturbance that affects not only the biomass (in particular, above-ground), but also the dead organic matter (litter and dead wood). Biomass
burning in Lebanon is limited to Forest land, Grassland and Cropland, where data is actually
available (Table 60).
Table 60: Area of burned biomass
2000 2010 2011 2012 2013 2014 2015 2016 2017 2018
Forests-Burned 330 428 161 603 128 121 183 156 102 113
Coniferous 54 60 15 38 5 7 15 44 19 19
Broadleaf 217 312 134 548 44 97 114 94 53 35
Mixed 59 56 13 17 79 17 54 18 31 60
Grassland-Burned 126 271 182 243 38 68 302 70 3 59
Cropland-Burned 502 675 585 1306 10 283 247 50 14 1
For greenhouse, emission factors are reported in Table 61. It is important to note that all emissions
factors have changed from the Good Practice Guidance (GPG) 2003. A complete list of other
parameter newly investigated and reported is presented in Annex III.
Table 61: Employed Emission Factors from biomass burning for the years 1994-2018
Emission factors (g/kg dm
burnt)
Changes Reference
CH4 Emission
factor (Forest land) 4.7
Changed from 9 (1994-2013) to 4.7 g/kg
dm burnt (1994-2018)
Default value in IPCC 2006 table 2.5 for
“extra tropical forest”, Considering the
note in table 2.5 “the extra tropical
forest includes all other forest types”
N2O Emission
factor (Forest land 0.26
Changed from 0.11 (1994-2013) to 0.26
g/kg dm burnt (1994-2018)
CH4 Emission
factor (Grassland) 2.3
Changed from 3 (1994-2013) to 2.3 g/kg
dm burnt (1994-2018)
Default value in IPCC 2006 table 2.5 for
“savanna and grassland”
N2O Emission
factor (Grassland) 0.21
Changed from 0.11 (1994-2013) to 0.21
g/kg dm burnt (1994-2018)
CH4 Emission
factor (Cropland) 4.7
-
Default value in IPCC 2006 table 2.5 for
“extra tropical forest”
N2O Emission
factor (Cropland) 0.26
For CO2 emissions from urea applications (3.C.3): The emission factor for carbon emissions from Urea fertilization is 0.2 tonne of C per tonne of Urea (Source: 2006 IPCC guidelines, page 11.34).
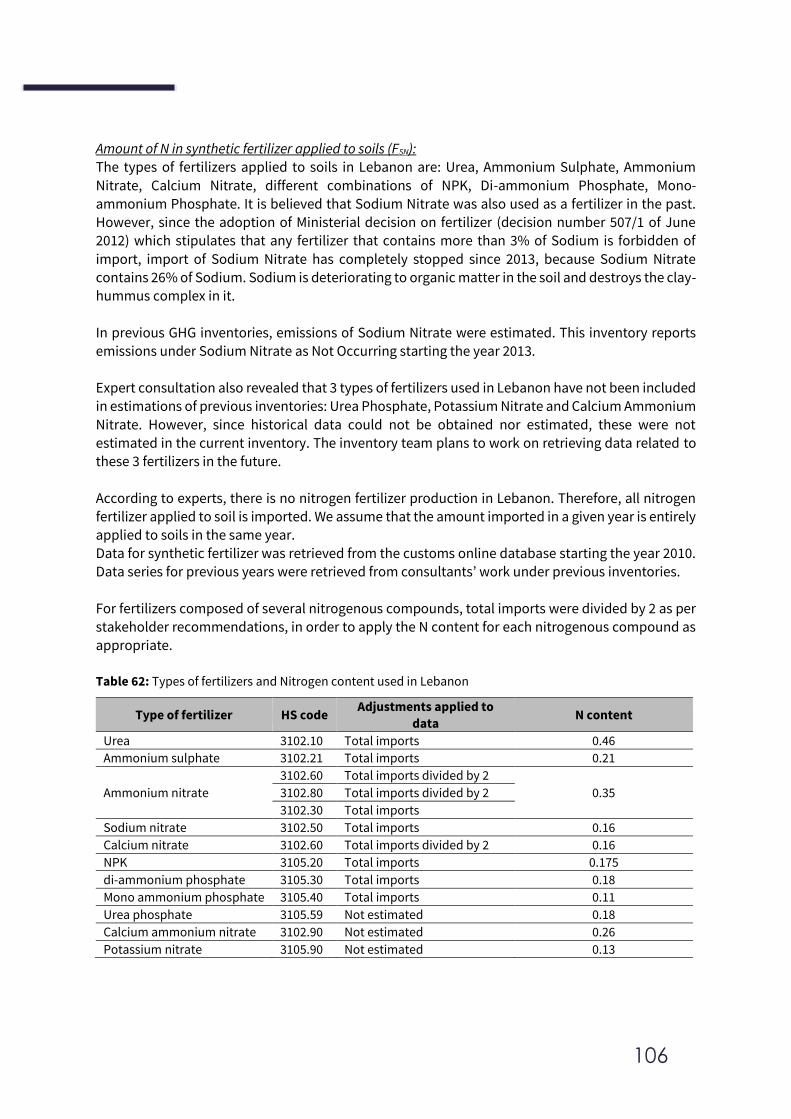
106
Amount of N in synthetic fertilizer applied to soils (FSN): The types of fertilizers applied to soils in Lebanon are: Urea, Ammonium Sulphate, Ammonium
Nitrate, Calcium Nitrate, different combinations of NPK, Di-ammonium Phosphate, Mono-ammonium Phosphate. It is believed that Sodium Nitrate was also used as a fertilizer in the past. However, since the adoption of Ministerial decision on fertilizer (decision number 507/1 of June 2012) which stipulates that any fertilizer that contains more than 3% of Sodium is forbidden of
import, import of Sodium Nitrate has completely stopped since 2013, because Sodium Nitrate contains 26% of Sodium. Sodium is deteriorating to organic matter in the soil and destroys the clay-hummus complex in it.
In previous GHG inventories, emissions of Sodium Nitrate were estimated. This inventory reports
emissions under Sodium Nitrate as Not Occurring starting the year 2013.
Expert consultation also revealed that 3 types of fertilizers used in Lebanon have not been included in estimations of previous inventories: Urea Phosphate, Potassium Nitrate and Calcium Ammonium
Nitrate. However, since historical data could not be obtained nor estimated, these were not estimated in the current inventory. The inventory team plans to work on retrieving data related to
these 3 fertilizers in the future.
According to experts, there is no nitrogen fertilizer production in Lebanon. Therefore, all nitrogen fertilizer applied to soil is imported. We assume that the amount imported in a given year is entirely
applied to soils in the same year. Data for synthetic fertilizer was retrieved from the customs online database starting the year 2010. Data series for previous years were retrieved from consultants’ work under previous inventories.
For fertilizers composed of several nitrogenous compounds, total imports were divided by 2 as per
stakeholder recommendations, in order to apply the N content for each nitrogenous compound as appropriate.
Table 62: Types of fertilizers and Nitrogen content used in Lebanon
Type of fertilizer HS code Adjustments applied to
data N content
Urea 3102.10 Total imports 0.46
Ammonium sulphate 3102.21 Total imports 0.21
Ammonium nitrate
3102.60 Total imports divided by 2
0.35 3102.80 Total imports divided by 2
3102.30 Total imports
Sodium nitrate 3102.50 Total imports 0.16
Calcium nitrate 3102.60 Total imports divided by 2 0.16
NPK 3105.20 Total imports 0.175
di-ammonium phosphate 3105.30 Total imports 0.18
Mono ammonium phosphate 3105.40 Total imports 0.11
Urea phosphate 3105.59 Not estimated 0.18
Calcium ammonium nitrate 3102.90 Not estimated 0.26
Potassium nitrate 3105.90 Not estimated 0.13
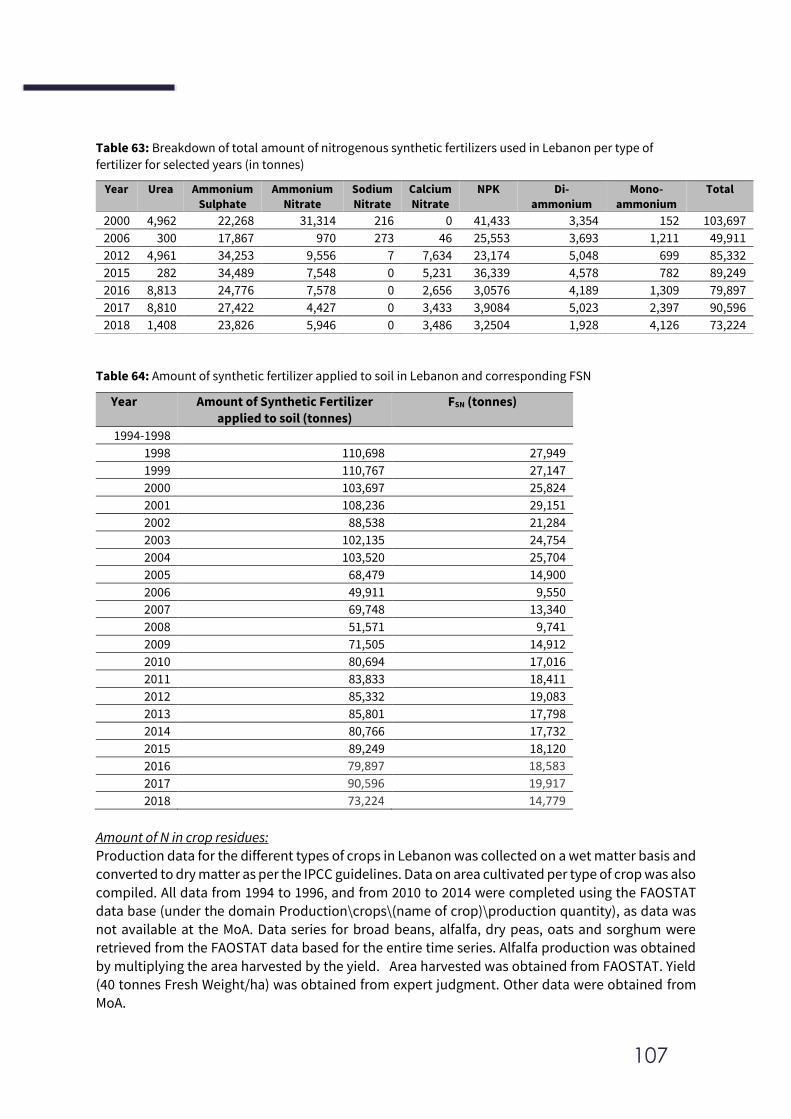
107
Table 63: Breakdown of total amount of nitrogenous synthetic fertilizers used in Lebanon per type of
fertilizer for selected years (in tonnes)
Year Urea Ammonium
Sulphate
Ammonium
Nitrate
Sodium
Nitrate
Calcium
Nitrate
NPK Di-
ammonium
Mono-
ammonium
Total
2000 4,962 22,268 31,314 216 0 41,433 3,354 152 103,697
2006 300 17,867 970 273 46 25,553 3,693 1,211 49,911
2012 4,961 34,253 9,556 7 7,634 23,174 5,048 699 85,332
2015 282 34,489 7,548 0 5,231 36,339 4,578 782 89,249
2016 8,813 24,776 7,578 0 2,656 3,0576 4,189 1,309 79,897
2017 8,810 27,422 4,427 0 3,433 3,9084 5,023 2,397 90,596
2018 1,408 23,826 5,946 0 3,486 3,2504 1,928 4,126 73,224
Table 64: Amount of synthetic fertilizer applied to soil in Lebanon and corresponding FSN
Year Amount of Synthetic Fertilizer
applied to soil (tonnes)
FSN (tonnes)
1994-1998
1998 110,698 27,949
1999 110,767 27,147
2000 103,697 25,824
2001 108,236 29,151
2002 88,538 21,284
2003 102,135 24,754
2004 103,520 25,704
2005 68,479 14,900
2006 49,911 9,550
2007 69,748 13,340
2008 51,571 9,741
2009 71,505 14,912
2010 80,694 17,016
2011 83,833 18,411
2012 85,332 19,083
2013 85,801 17,798
2014 80,766 17,732
2015 89,249 18,120
2016 79,897 18,583
2017 90,596 19,917
2018 73,224 14,779
Amount of N in crop residues: Production data for the different types of crops in Lebanon was collected on a wet matter basis and
converted to dry matter as per the IPCC guidelines. Data on area cultivated per type of crop was also
compiled. All data from 1994 to 1996, and from 2010 to 2014 were completed using the FAOSTAT data base (under the domain Production\crops\(name of crop)\production quantity), as data was not available at the MoA. Data series for broad beans, alfalfa, dry peas, oats and sorghum were retrieved from the FAOSTAT data based for the entire time series. Alfalfa production was obtained
by multiplying the area harvested by the yield. Area harvested was obtained from FAOSTAT. Yield (40 tonnes Fresh Weight/ha) was obtained from expert judgment. Other data were obtained from MoA.
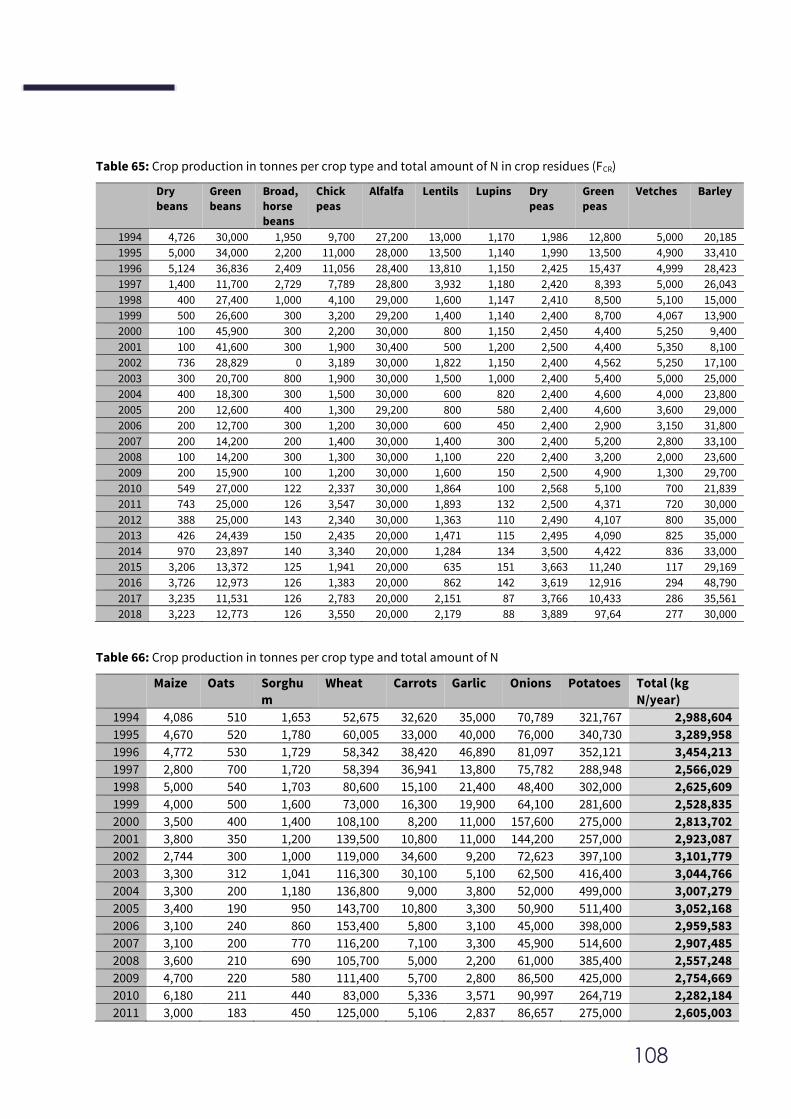
108
Table 65: Crop production in tonnes per crop type and total amount of N in crop residues (FCR)
Dry
beans
Green
beans
Broad,
horse
beans
Chick
peas
Alfalfa Lentils Lupins Dry
peas
Green
peas
Vetches Barley
1994 4,726 30,000 1,950 9,700 27,200 13,000 1,170 1,986 12,800 5,000 20,185
1995 5,000 34,000 2,200 11,000 28,000 13,500 1,140 1,990 13,500 4,900 33,410
1996 5,124 36,836 2,409 11,056 28,400 13,810 1,150 2,425 15,437 4,999 28,423
1997 1,400 11,700 2,729 7,789 28,800 3,932 1,180 2,420 8,393 5,000 26,043
1998 400 27,400 1,000 4,100 29,000 1,600 1,147 2,410 8,500 5,100 15,000
1999 500 26,600 300 3,200 29,200 1,400 1,140 2,400 8,700 4,067 13,900
2000 100 45,900 300 2,200 30,000 800 1,150 2,450 4,400 5,250 9,400
2001 100 41,600 300 1,900 30,400 500 1,200 2,500 4,400 5,350 8,100
2002 736 28,829 0 3,189 30,000 1,822 1,150 2,400 4,562 5,250 17,100
2003 300 20,700 800 1,900 30,000 1,500 1,000 2,400 5,400 5,000 25,000
2004 400 18,300 300 1,500 30,000 600 820 2,400 4,600 4,000 23,800
2005 200 12,600 400 1,300 29,200 800 580 2,400 4,600 3,600 29,000
2006 200 12,700 300 1,200 30,000 600 450 2,400 2,900 3,150 31,800
2007 200 14,200 200 1,400 30,000 1,400 300 2,400 5,200 2,800 33,100
2008 100 14,200 300 1,300 30,000 1,100 220 2,400 3,200 2,000 23,600
2009 200 15,900 100 1,200 30,000 1,600 150 2,500 4,900 1,300 29,700
2010 549 27,000 122 2,337 30,000 1,864 100 2,568 5,100 700 21,839
2011 743 25,000 126 3,547 30,000 1,893 132 2,500 4,371 720 30,000
2012 388 25,000 143 2,340 30,000 1,363 110 2,490 4,107 800 35,000
2013 426 24,439 150 2,435 20,000 1,471 115 2,495 4,090 825 35,000
2014 970 23,897 140 3,340 20,000 1,284 134 3,500 4,422 836 33,000
2015 3,206 13,372 125 1,941 20,000 635 151 3,663 11,240 117 29,169
2016 3,726 12,973 126 1,383 20,000 862 142 3,619 12,916 294 48,790
2017 3,235 11,531 126 2,783 20,000 2,151 87 3,766 10,433 286 35,561
2018 3,223 12,773 126 3,550 20,000 2,179 88 3,889 97,64 277 30,000
Table 66: Crop production in tonnes per crop type and total amount of N
Maize Oats Sorghu
m
Wheat Carrots Garlic Onions Potatoes Total (kg
N/year)
1994 4,086 510 1,653 52,675 32,620 35,000 70,789 321,767 2,988,604
1995 4,670 520 1,780 60,005 33,000 40,000 76,000 340,730 3,289,958
1996 4,772 530 1,729 58,342 38,420 46,890 81,097 352,121 3,454,213
1997 2,800 700 1,720 58,394 36,941 13,800 75,782 288,948 2,566,029
1998 5,000 540 1,703 80,600 15,100 21,400 48,400 302,000 2,625,609
1999 4,000 500 1,600 73,000 16,300 19,900 64,100 281,600 2,528,835
2000 3,500 400 1,400 108,100 8,200 11,000 157,600 275,000 2,813,702
2001 3,800 350 1,200 139,500 10,800 11,000 144,200 257,000 2,923,087
2002 2,744 300 1,000 119,000 34,600 9,200 72,623 397,100 3,101,779
2003 3,300 312 1,041 116,300 30,100 5,100 62,500 416,400 3,044,766
2004 3,300 200 1,180 136,800 9,000 3,800 52,000 499,000 3,007,279
2005 3,400 190 950 143,700 10,800 3,300 50,900 511,400 3,052,168
2006 3,100 240 860 153,400 5,800 3,100 45,000 398,000 2,959,583
2007 3,100 200 770 116,200 7,100 3,300 45,900 514,600 2,907,485
2008 3,600 210 690 105,700 5,000 2,200 61,000 385,400 2,557,248
2009 4,700 220 580 111,400 5,700 2,800 86,500 425,000 2,754,669
2010 6,180 211 440 83,000 5,336 3,571 90,997 264,719 2,282,184
2011 3,000 183 450 125,000 5,106 2,837 86,657 275,000 2,605,003
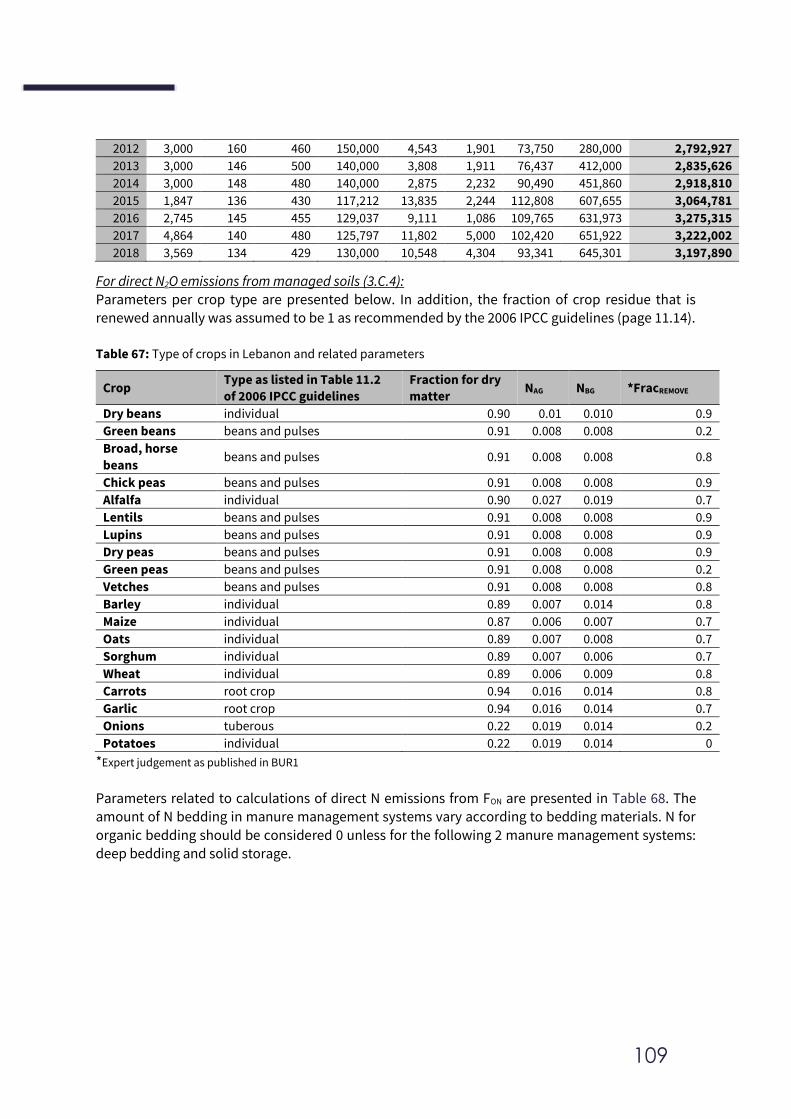
109
2012 3,000 160 460 150,000 4,543 1,901 73,750 280,000 2,792,927
2013 3,000 146 500 140,000 3,808 1,911 76,437 412,000 2,835,626
2014 3,000 148 480 140,000 2,875 2,232 90,490 451,860 2,918,810
2015 1,847 136 430 117,212 13,835 2,244 112,808 607,655 3,064,781
2016 2,745 145 455 129,037 9,111 1,086 109,765 631,973 3,275,315
2017 4,864 140 480 125,797 11,802 5,000 102,420 651,922 3,222,002
2018 3,569 134 429 130,000 10,548 4,304 93,341 645,301 3,197,890
For direct N2O emissions from managed soils (3.C.4): Parameters per crop type are presented below. In addition, the fraction of crop residue that is renewed annually was assumed to be 1 as recommended by the 2006 IPCC guidelines (page 11.14). Table 67: Type of crops in Lebanon and related parameters
Crop Type as listed in Table 11.2
of 2006 IPCC guidelines
Fraction for dry
matter NAG NBG *FracREMOVE
Dry beans individual 0.90 0.01 0.010 0.9
Green beans beans and pulses 0.91 0.008 0.008 0.2
Broad, horse
beans beans and pulses 0.91 0.008 0.008 0.8
Chick peas beans and pulses 0.91 0.008 0.008 0.9
Alfalfa individual 0.90 0.027 0.019 0.7
Lentils beans and pulses 0.91 0.008 0.008 0.9
Lupins beans and pulses 0.91 0.008 0.008 0.9
Dry peas beans and pulses 0.91 0.008 0.008 0.9
Green peas beans and pulses 0.91 0.008 0.008 0.2
Vetches beans and pulses 0.91 0.008 0.008 0.8
Barley individual 0.89 0.007 0.014 0.8
Maize individual 0.87 0.006 0.007 0.7
Oats individual 0.89 0.007 0.008 0.7
Sorghum individual 0.89 0.007 0.006 0.7
Wheat individual 0.89 0.006 0.009 0.8
Carrots root crop 0.94 0.016 0.014 0.8
Garlic root crop 0.94 0.016 0.014 0.7
Onions tuberous 0.22 0.019 0.014 0.2
Potatoes individual 0.22 0.019 0.014 0
*Expert judgement as published in BUR1 Parameters related to calculations of direct N emissions from FON are presented in Table 68. The amount of N bedding in manure management systems vary according to bedding materials. N for
organic bedding should be considered 0 unless for the following 2 manure management systems:
deep bedding and solid storage.
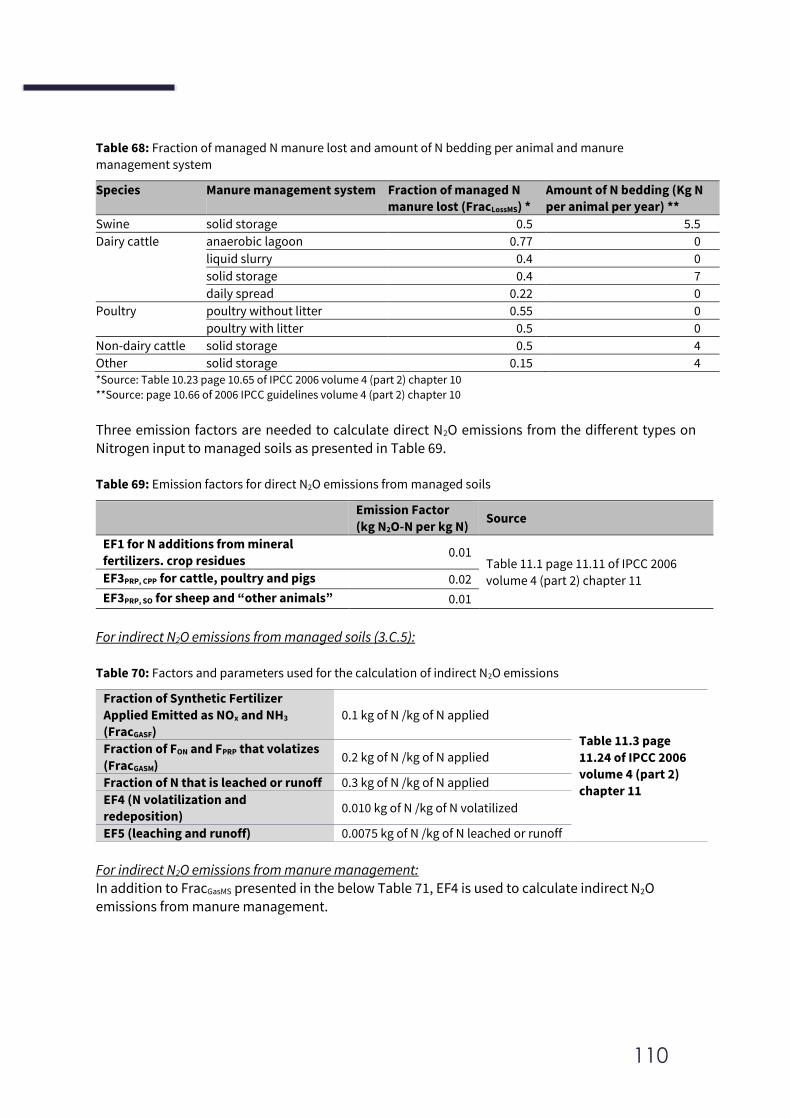
110
Table 68: Fraction of managed N manure lost and amount of N bedding per animal and manure
management system
Species Manure management system Fraction of managed N
manure lost (FracLossMS) *
Amount of N bedding (Kg N
per animal per year) **
Swine solid storage 0.5 5.5
Dairy cattle
anaerobic lagoon 0.77 0
liquid slurry 0.4 0
solid storage 0.4 7
daily spread 0.22 0
Poultry
poultry without litter 0.55 0
poultry with litter 0.5 0
Non-dairy cattle solid storage 0.5 4
Other solid storage 0.15 4 *Source: Table 10.23 page 10.65 of IPCC 2006 volume 4 (part 2) chapter 10
**Source: page 10.66 of 2006 IPCC guidelines volume 4 (part 2) chapter 10
Three emission factors are needed to calculate direct N2O emissions from the different types on Nitrogen input to managed soils as presented in Table 69. Table 69: Emission factors for direct N2O emissions from managed soils
Emission Factor
(kg N2O-N per kg N) Source
EF1 for N additions from mineral
fertilizers. crop residues 0.01
Table 11.1 page 11.11 of IPCC 2006
volume 4 (part 2) chapter 11 EF3PRP, CPP for cattle, poultry and pigs 0.02
EF3PRP, SO for sheep and “other animals” 0.01
For indirect N2O emissions from managed soils (3.C.5):
Table 70: Factors and parameters used for the calculation of indirect N2O emissions
Fraction of Synthetic Fertilizer
Applied Emitted as NOx and NH3
(FracGASF)
0.1 kg of N /kg of N applied
Table 11.3 page
11.24 of IPCC 2006
volume 4 (part 2)
chapter 11
Fraction of FON and FPRP that volatizes
(FracGASM) 0.2 kg of N /kg of N applied
Fraction of N that is leached or runoff 0.3 kg of N /kg of N applied
EF4 (N volatilization and
redeposition) 0.010 kg of N /kg of N volatilized
EF5 (leaching and runoff) 0.0075 kg of N /kg of N leached or runoff
For indirect N2O emissions from manure management: In addition to FracGasMS presented in the below Table 71, EF4 is used to calculate indirect N2O
emissions from manure management.
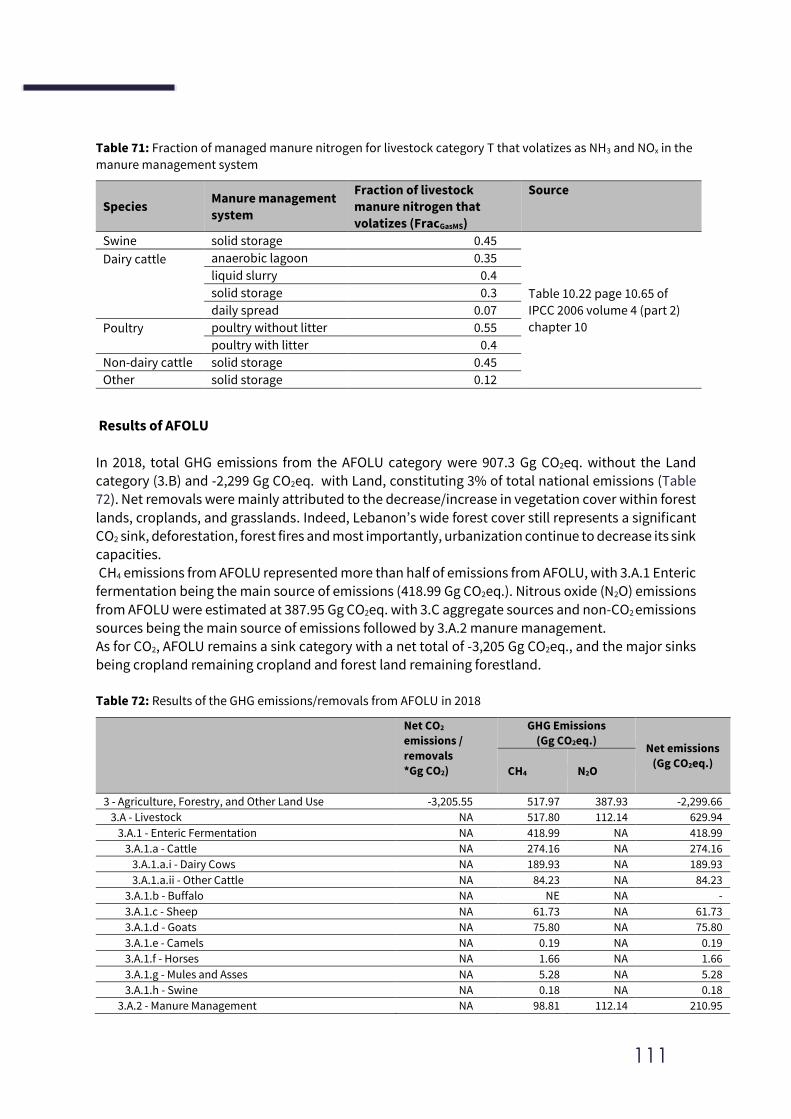
111
Table 71: Fraction of managed manure nitrogen for livestock category T that volatizes as NH3 and NOx in the
manure management system
Species Manure management
system
Fraction of livestock
manure nitrogen that
volatizes (FracGasMS)
Source
Swine solid storage 0.45
Table 10.22 page 10.65 of
IPCC 2006 volume 4 (part 2)
chapter 10
Dairy cattle
anaerobic lagoon 0.35
liquid slurry 0.4
solid storage 0.3
daily spread 0.07
Poultry
poultry without litter 0.55
poultry with litter 0.4
Non-dairy cattle solid storage 0.45
Other solid storage 0.12
Results of AFOLU
In 2018, total GHG emissions from the AFOLU category were 907.3 Gg CO2eq. without the Land category (3.B) and -2,299 Gg CO2eq. with Land, constituting 3% of total national emissions (Table
72). Net removals were mainly attributed to the decrease/increase in vegetation cover within forest
lands, croplands, and grasslands. Indeed, Lebanon’s wide forest cover still represents a significant
CO2 sink, deforestation, forest fires and most importantly, urbanization continue to decrease its sink capacities. CH4 emissions from AFOLU represented more than half of emissions from AFOLU, with 3.A.1 Enteric
fermentation being the main source of emissions (418.99 Gg CO2eq.). Nitrous oxide (N2O) emissions
from AFOLU were estimated at 387.95 Gg CO2eq. with 3.C aggregate sources and non-CO2 emissions
sources being the main source of emissions followed by 3.A.2 manure management.
As for CO2, AFOLU remains a sink category with a net total of -3,205 Gg CO2eq., and the major sinks being cropland remaining cropland and forest land remaining forestland.
Table 72: Results of the GHG emissions/removals from AFOLU in 2018
Net CO2
emissions /
removals
*Gg CO2)
GHG Emissions
(Gg CO2eq.) Net emissions
(Gg CO2eq.)
CH4 N2O
3 - Agriculture, Forestry, and Other Land Use -3,205.55 517.97 387.93 -2,299.66
3.A - Livestock NA 517.80 112.14 629.94
3.A.1 - Enteric Fermentation NA 418.99 NA 418.99
3.A.1.a - Cattle NA 274.16 NA 274.16
3.A.1.a.i - Dairy Cows NA 189.93 NA 189.93
3.A.1.a.ii - Other Cattle NA 84.23 NA 84.23
3.A.1.b - Buffalo NA NE NA -
3.A.1.c - Sheep NA 61.73 NA 61.73
3.A.1.d - Goats NA 75.80 NA 75.80
3.A.1.e - Camels NA 0.19 NA 0.19
3.A.1.f - Horses NA 1.66 NA 1.66
3.A.1.g - Mules and Asses NA 5.28 NA 5.28
3.A.1.h - Swine NA 0.18 NA 0.18
3.A.2 - Manure Management NA 98.81 112.14 210.95
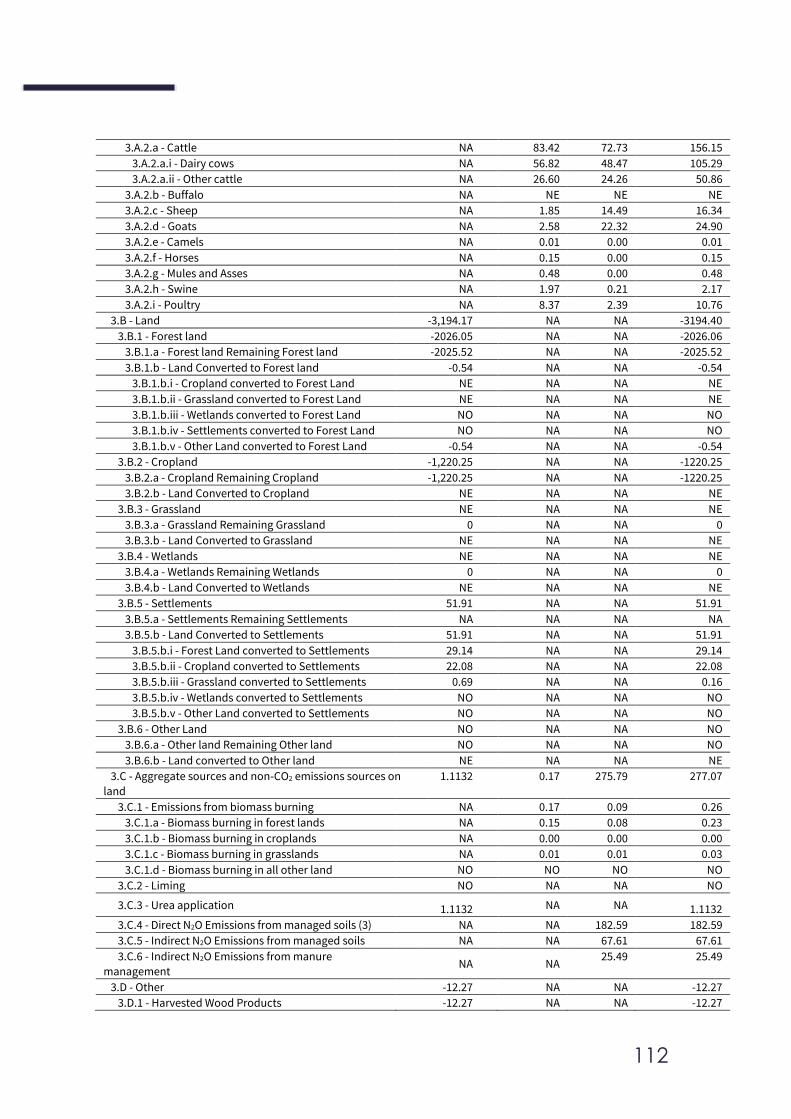
112
3.A.2.a - Cattle NA 83.42 72.73 156.15
3.A.2.a.i - Dairy cows NA 56.82 48.47 105.29
3.A.2.a.ii - Other cattle NA 26.60 24.26 50.86
3.A.2.b - Buffalo NA NE NE NE
3.A.2.c - Sheep NA 1.85 14.49 16.34
3.A.2.d - Goats NA 2.58 22.32 24.90
3.A.2.e - Camels NA 0.01 0.00 0.01
3.A.2.f - Horses NA 0.15 0.00 0.15
3.A.2.g - Mules and Asses NA 0.48 0.00 0.48
3.A.2.h - Swine NA 1.97 0.21 2.17
3.A.2.i - Poultry NA 8.37 2.39 10.76
3.B - Land -3,194.17 NA NA -3194.40
3.B.1 - Forest land -2026.05 NA NA -2026.06
3.B.1.a - Forest land Remaining Forest land -2025.52 NA NA -2025.52
3.B.1.b - Land Converted to Forest land -0.54 NA NA -0.54
3.B.1.b.i - Cropland converted to Forest Land NE NA NA NE
3.B.1.b.ii - Grassland converted to Forest Land NE NA NA NE
3.B.1.b.iii - Wetlands converted to Forest Land NO NA NA NO
3.B.1.b.iv - Settlements converted to Forest Land NO NA NA NO
3.B.1.b.v - Other Land converted to Forest Land -0.54 NA NA -0.54
3.B.2 - Cropland -1,220.25 NA NA -1220.25
3.B.2.a - Cropland Remaining Cropland -1,220.25 NA NA -1220.25
3.B.2.b - Land Converted to Cropland NE NA NA NE
3.B.3 - Grassland NE NA NA NE
3.B.3.a - Grassland Remaining Grassland 0 NA NA 0
3.B.3.b - Land Converted to Grassland NE NA NA NE
3.B.4 - Wetlands NE NA NA NE
3.B.4.a - Wetlands Remaining Wetlands 0 NA NA 0
3.B.4.b - Land Converted to Wetlands NE NA NA NE
3.B.5 - Settlements 51.91 NA NA 51.91
3.B.5.a - Settlements Remaining Settlements NA NA NA NA
3.B.5.b - Land Converted to Settlements 51.91 NA NA 51.91
3.B.5.b.i - Forest Land converted to Settlements 29.14 NA NA 29.14
3.B.5.b.ii - Cropland converted to Settlements 22.08 NA NA 22.08
3.B.5.b.iii - Grassland converted to Settlements 0.69 NA NA 0.16
3.B.5.b.iv - Wetlands converted to Settlements NO NA NA NO
3.B.5.b.v - Other Land converted to Settlements NO NA NA NO
3.B.6 - Other Land NO NA NA NO
3.B.6.a - Other land Remaining Other land NO NA NA NO
3.B.6.b - Land converted to Other land NE NA NA NE
3.C - Aggregate sources and non-CO2 emissions sources on
land
1.1132 0.17 275.79 277.07
3.C.1 - Emissions from biomass burning NA 0.17 0.09 0.26
3.C.1.a - Biomass burning in forest lands NA 0.15 0.08 0.23
3.C.1.b - Biomass burning in croplands NA 0.00 0.00 0.00
3.C.1.c - Biomass burning in grasslands NA 0.01 0.01 0.03
3.C.1.d - Biomass burning in all other land NO NO NO NO
3.C.2 - Liming NO NA NA NO
3.C.3 - Urea application 1.1132 NA NA 1.1132
3.C.4 - Direct N2O Emissions from managed soils (3) NA NA 182.59 182.59
3.C.5 - Indirect N2O Emissions from managed soils NA NA 67.61 67.61
3.C.6 - Indirect N2O Emissions from manure
management NA NA
25.49 25.49
3.D - Other -12.27 NA NA -12.27
3.D.1 - Harvested Wood Products -12.27 NA NA -12.27
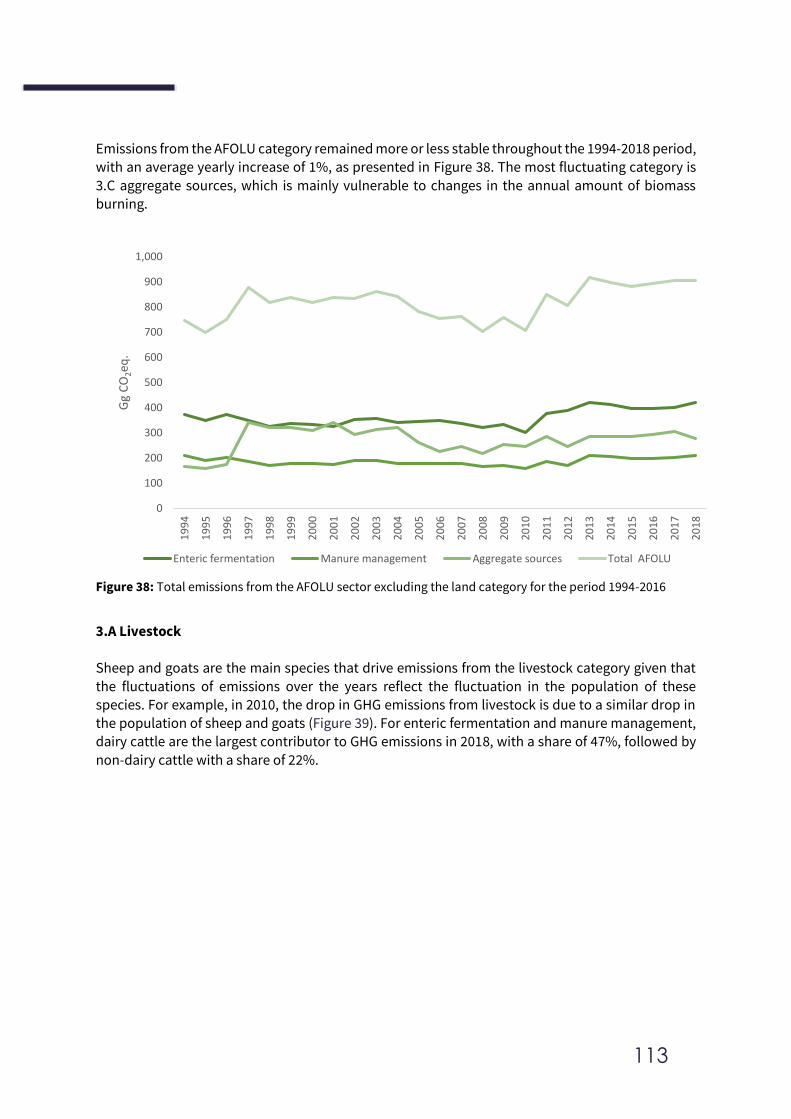
113
Emissions from the AFOLU category remained more or less stable throughout the 1994-2018 period, with an average yearly increase of 1%, as presented in Figure 38. The most fluctuating category is
3.C aggregate sources, which is mainly vulnerable to changes in the annual amount of biomass burning.
Figure 38: Total emissions from the AFOLU sector excluding the land category for the period 1994-2016
3.A Livestock
Sheep and goats are the main species that drive emissions from the livestock category given that
the fluctuations of emissions over the years reflect the fluctuation in the population of these species. For example, in 2010, the drop in GHG emissions from livestock is due to a similar drop in the population of sheep and goats (Figure 39). For enteric fermentation and manure management,
dairy cattle are the largest contributor to GHG emissions in 2018, with a share of 47%, followed by
non-dairy cattle with a share of 22%.
0
100
200
300
400
500
600
700
800
900
1,000
19
94
19
95
19
96
19
97
19
98
19
99
20
00
20
01
20
02
20
03
20
04
20
05
20
06
20
07
20
08
20
09
20
10
20
11
20
12
20
13
20
14
20
15
20
16
20
17
20
18
Gg
CO
2eq
.
Enteric fermentation Manure management Aggregate sources Total AFOLU
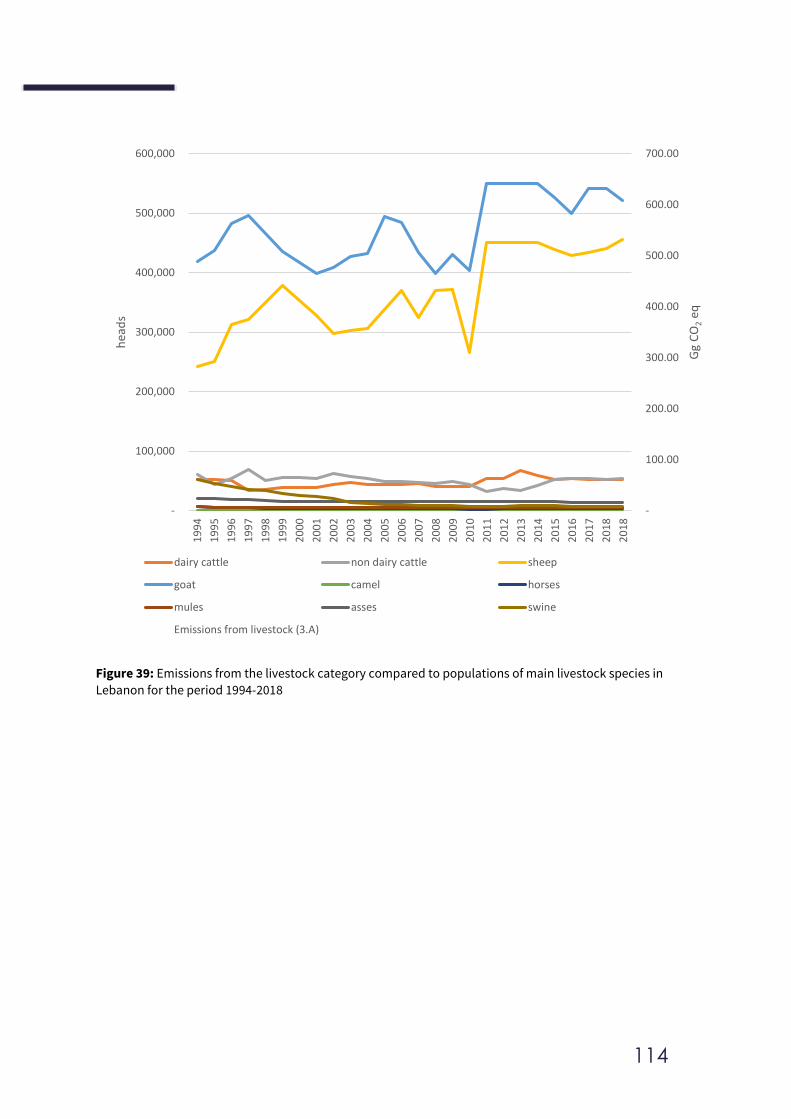
114
Figure 39: Emissions from the livestock category compared to populations of main livestock species in
Lebanon for the period 1994-2018
-
100.00
200.00
300.00
400.00
500.00
600.00
700.00
-
100,000
200,000
300,000
400,000
500,000
600,000
19
94
19
95
19
96
19
97
19
98
19
99
20
00
20
01
20
02
20
03
20
04
20
05
20
06
20
07
20
08
20
09
20
10
20
11
20
12
20
13
20
14
20
15
20
16
20
17
20
18
20
18
Gg
CO
2eq
hea
ds
dairy cattle non dairy cattle sheep
goat camel horses
mules asses swine
Emissions from livestock (3.A)
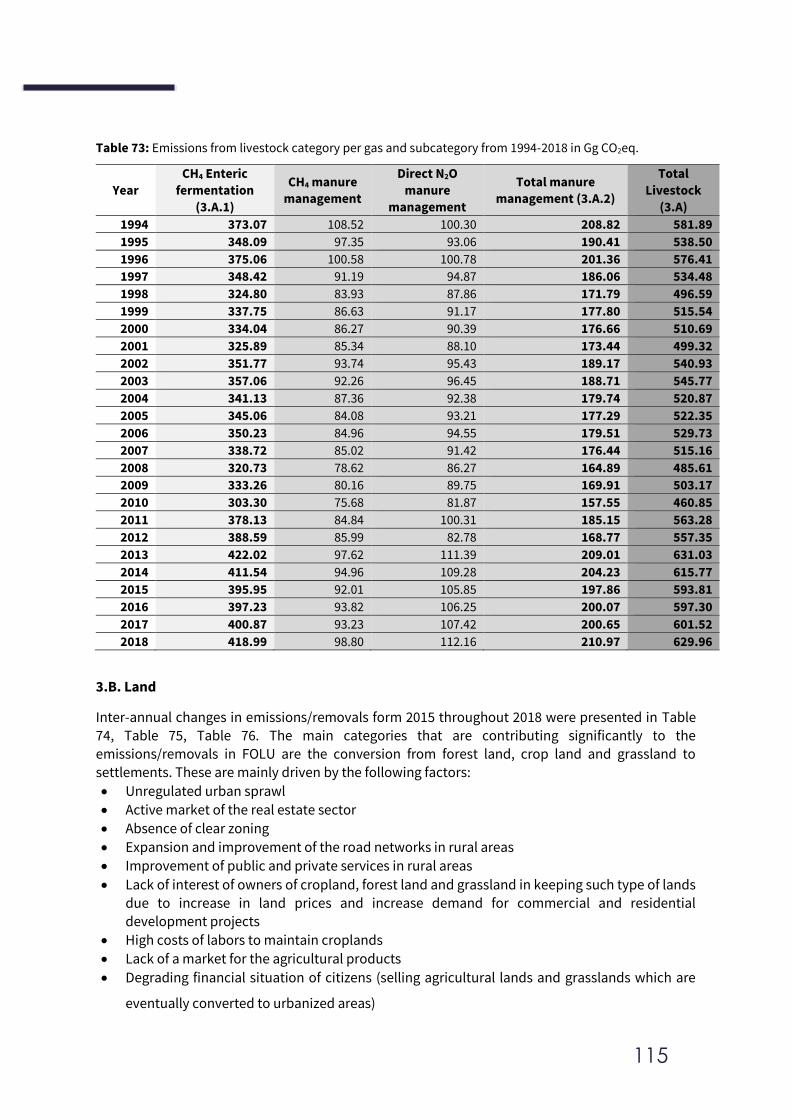
115
Table 73: Emissions from livestock category per gas and subcategory from 1994-2018 in Gg CO2eq.
Year
CH4 Enteric
fermentation
(3.A.1)
CH4 manure
management
Direct N2O
manure
management
Total manure
management (3.A.2)
Total
Livestock
(3.A)
1994 373.07 108.52 100.30 208.82 581.89
1995 348.09 97.35 93.06 190.41 538.50
1996 375.06 100.58 100.78 201.36 576.41
1997 348.42 91.19 94.87 186.06 534.48
1998 324.80 83.93 87.86 171.79 496.59
1999 337.75 86.63 91.17 177.80 515.54
2000 334.04 86.27 90.39 176.66 510.69
2001 325.89 85.34 88.10 173.44 499.32
2002 351.77 93.74 95.43 189.17 540.93
2003 357.06 92.26 96.45 188.71 545.77
2004 341.13 87.36 92.38 179.74 520.87
2005 345.06 84.08 93.21 177.29 522.35
2006 350.23 84.96 94.55 179.51 529.73
2007 338.72 85.02 91.42 176.44 515.16
2008 320.73 78.62 86.27 164.89 485.61
2009 333.26 80.16 89.75 169.91 503.17
2010 303.30 75.68 81.87 157.55 460.85
2011 378.13 84.84 100.31 185.15 563.28
2012 388.59 85.99 82.78 168.77 557.35
2013 422.02 97.62 111.39 209.01 631.03
2014 411.54 94.96 109.28 204.23 615.77
2015 395.95 92.01 105.85 197.86 593.81
2016 397.23 93.82 106.25 200.07 597.30
2017 400.87 93.23 107.42 200.65 601.52
2018 418.99 98.80 112.16 210.97 629.96
3.B. Land
Inter-annual changes in emissions/removals form 2015 throughout 2018 were presented in Table 74, Table 75, Table 76. The main categories that are contributing significantly to the
emissions/removals in FOLU are the conversion from forest land, crop land and grassland to settlements. These are mainly driven by the following factors:
• Unregulated urban sprawl
• Active market of the real estate sector
• Absence of clear zoning
• Expansion and improvement of the road networks in rural areas
• Improvement of public and private services in rural areas
• Lack of interest of owners of cropland, forest land and grassland in keeping such type of lands due to increase in land prices and increase demand for commercial and residential development projects
• High costs of labors to maintain croplands
• Lack of a market for the agricultural products
• Degrading financial situation of citizens (selling agricultural lands and grasslands which are
eventually converted to urbanized areas)
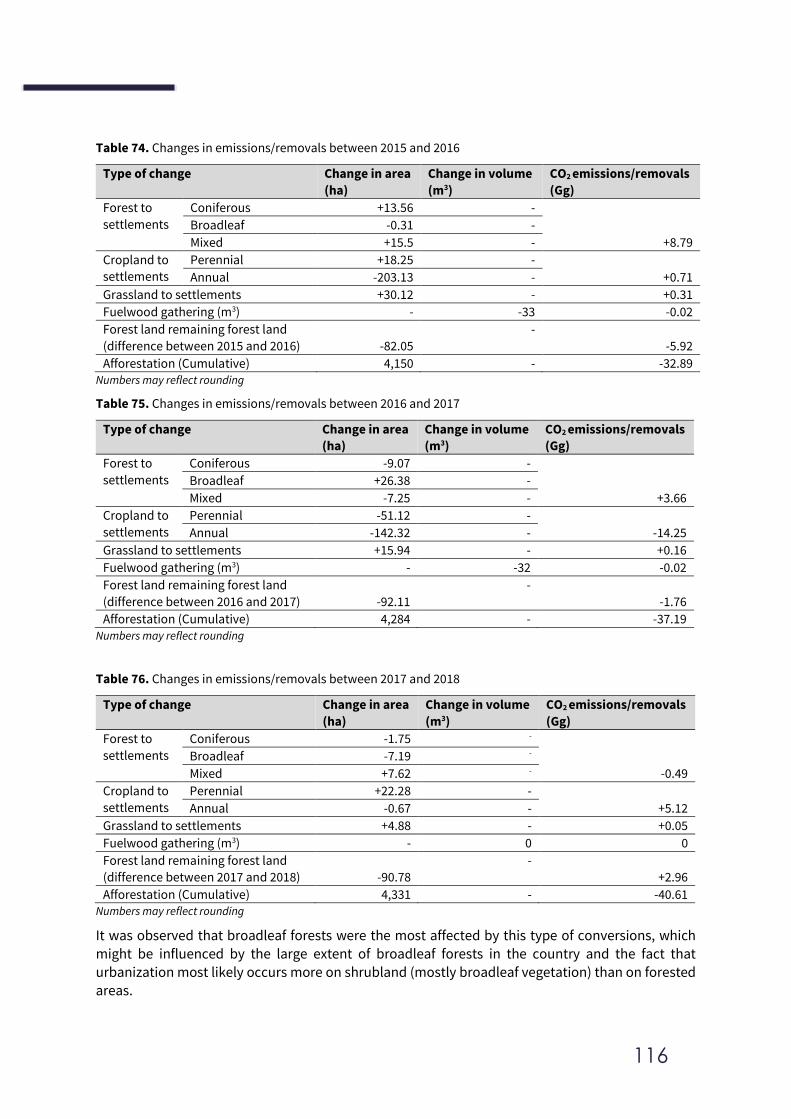
116
Table 74. Changes in emissions/removals between 2015 and 2016
Type of change Change in area
(ha)
Change in volume
(m3)
CO2 emissions/removals
(Gg)
Forest to
settlements
Coniferous +13.56 -
+8.79
Broadleaf -0.31 -
Mixed +15.5 -
Cropland to
settlements
Perennial +18.25 -
+0.71 Annual -203.13 -
Grassland to settlements +30.12 - +0.31
Fuelwood gathering (m3) - -33 -0.02
Forest land remaining forest land
(difference between 2015 and 2016) -82.05
-
-5.92
Afforestation (Cumulative) 4,150 - -32.89 Numbers may reflect rounding
Table 75. Changes in emissions/removals between 2016 and 2017
Type of change Change in area
(ha)
Change in volume
(m3)
CO2 emissions/removals
(Gg)
Forest to
settlements
Coniferous -9.07 -
+3.66
Broadleaf +26.38 -
Mixed -7.25 -
Cropland to
settlements
Perennial -51.12 -
-14.25 Annual -142.32 -
Grassland to settlements +15.94 - +0.16
Fuelwood gathering (m3) - -32 -0.02
Forest land remaining forest land
(difference between 2016 and 2017) -92.11
-
-1.76
Afforestation (Cumulative) 4,284 - -37.19 Numbers may reflect rounding
Table 76. Changes in emissions/removals between 2017 and 2018
Type of change Change in area
(ha)
Change in volume
(m3)
CO2 emissions/removals
(Gg)
Forest to
settlements
Coniferous -1.75 -
-0.49
Broadleaf -7.19 -
Mixed +7.62 -
Cropland to
settlements
Perennial +22.28 -
+5.12 Annual -0.67 -
Grassland to settlements +4.88 - +0.05
Fuelwood gathering (m3) - 0 0
Forest land remaining forest land
(difference between 2017 and 2018) -90.78
-
+2.96
Afforestation (Cumulative) 4,331 - -40.61 Numbers may reflect rounding
It was observed that broadleaf forests were the most affected by this type of conversions, which might be influenced by the large extent of broadleaf forests in the country and the fact that
urbanization most likely occurs more on shrubland (mostly broadleaf vegetation) than on forested areas.
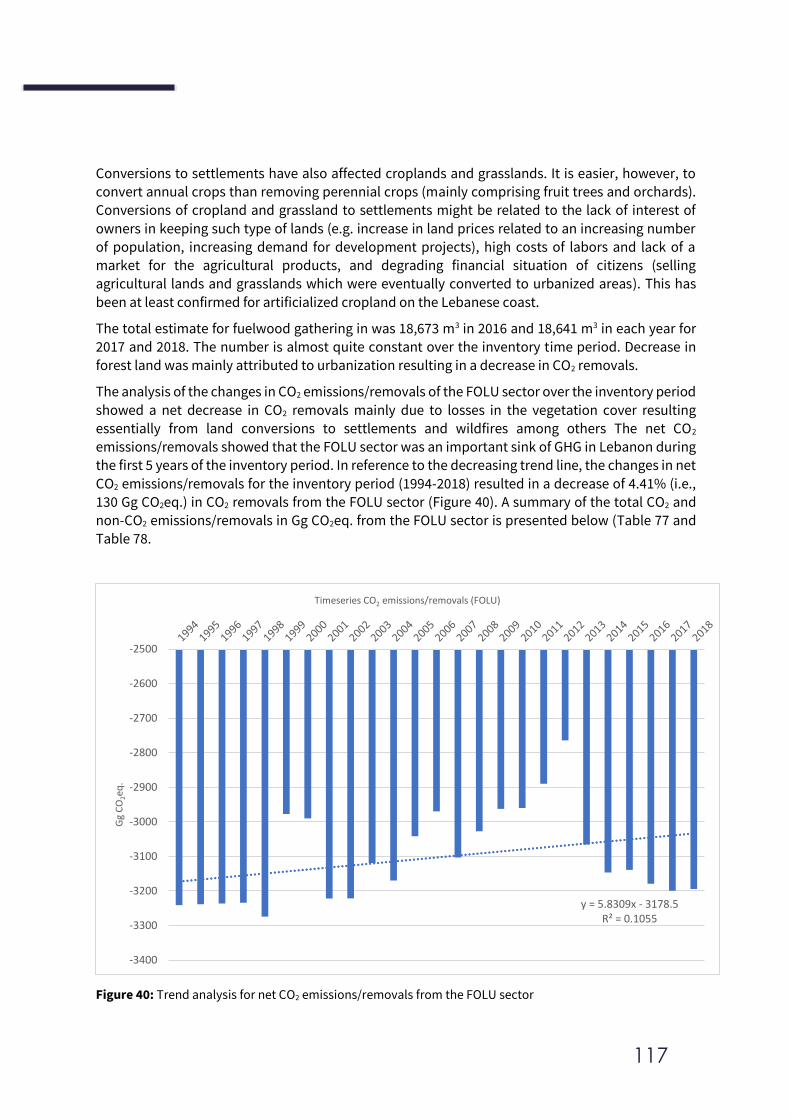
117
Conversions to settlements have also affected croplands and grasslands. It is easier, however, to convert annual crops than removing perennial crops (mainly comprising fruit trees and orchards). Conversions of cropland and grassland to settlements might be related to the lack of interest of
owners in keeping such type of lands (e.g. increase in land prices related to an increasing number of population, increasing demand for development projects), high costs of labors and lack of a
market for the agricultural products, and degrading financial situation of citizens (selling agricultural lands and grasslands which were eventually converted to urbanized areas). This has
been at least confirmed for artificialized cropland on the Lebanese coast.
The total estimate for fuelwood gathering in was 18,673 m3 in 2016 and 18,641 m3 in each year for
2017 and 2018. The number is almost quite constant over the inventory time period. Decrease in
forest land was mainly attributed to urbanization resulting in a decrease in CO2 removals.
The analysis of the changes in CO2 emissions/removals of the FOLU sector over the inventory period
showed a net decrease in CO2 removals mainly due to losses in the vegetation cover resulting essentially from land conversions to settlements and wildfires among others The net CO2 emissions/removals showed that the FOLU sector was an important sink of GHG in Lebanon during
the first 5 years of the inventory period. In reference to the decreasing trend line, the changes in net
CO2 emissions/removals for the inventory period (1994-2018) resulted in a decrease of 4.41% (i.e.,
130 Gg CO2eq.) in CO2 removals from the FOLU sector (Figure 40). A summary of the total CO2 and non-CO2 emissions/removals in Gg CO2eq. from the FOLU sector is presented below (Table 77 and Table 78.
Figure 40: Trend analysis for net CO2 emissions/removals from the FOLU sector
y = 5.8309x - 3178.5R² = 0.1055
-3400
-3300
-3200
-3100
-3000
-2900
-2800
-2700
-2600
-2500
Gg
CO
2eq
.
Timeseries CO2 emissions/removals (FOLU)
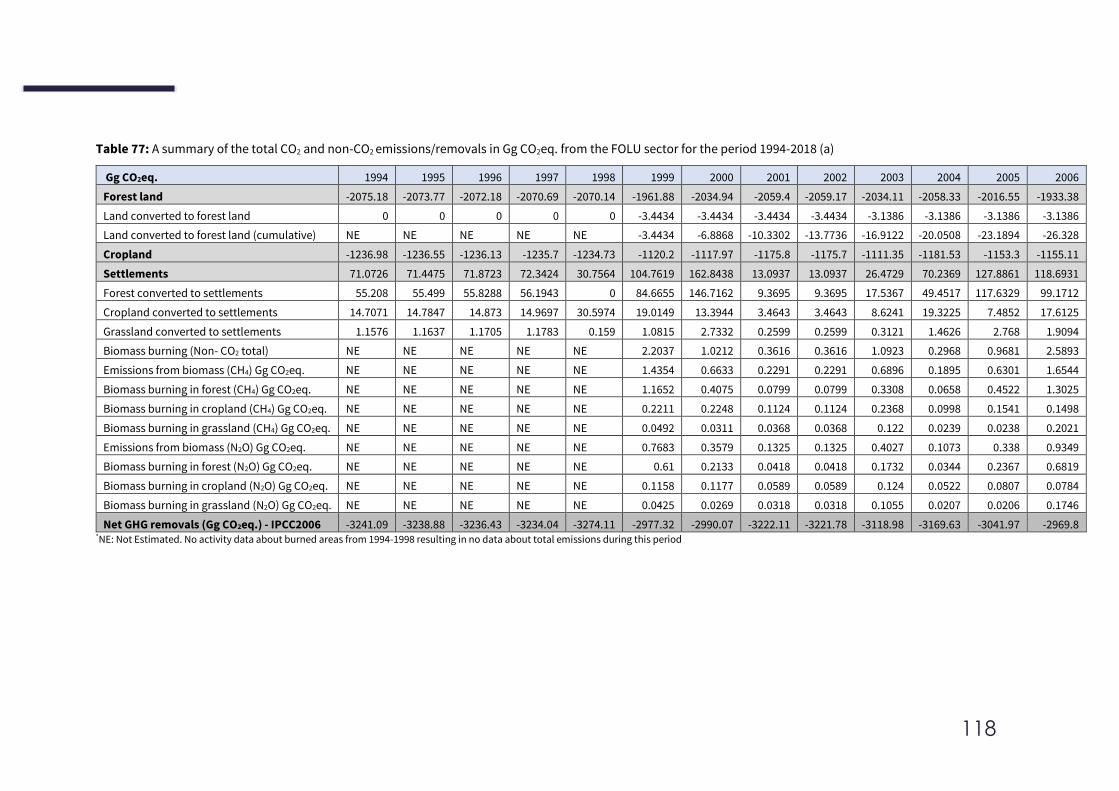
118
Table 77: A summary of the total CO2 and non-CO2 emissions/removals in Gg CO2eq. from the FOLU sector for the period 1994-2018 (a)
Gg CO2eq. 1994 1995 1996 1997 1998 1999 2000 2001 2002 2003 2004 2005 2006
Forest land -2075.18 -2073.77 -2072.18 -2070.69 -2070.14 -1961.88 -2034.94 -2059.4 -2059.17 -2034.11 -2058.33 -2016.55 -1933.38
Land converted to forest land 0 0 0 0 0 -3.4434 -3.4434 -3.4434 -3.4434 -3.1386 -3.1386 -3.1386 -3.1386
Land converted to forest land (cumulative) NE NE NE NE NE -3.4434 -6.8868 -10.3302 -13.7736 -16.9122 -20.0508 -23.1894 -26.328
Cropland -1236.98 -1236.55 -1236.13 -1235.7 -1234.73 -1120.2 -1117.97 -1175.8 -1175.7 -1111.35 -1181.53 -1153.3 -1155.11
Settlements 71.0726 71.4475 71.8723 72.3424 30.7564 104.7619 162.8438 13.0937 13.0937 26.4729 70.2369 127.8861 118.6931
Forest converted to settlements 55.208 55.499 55.8288 56.1943 0 84.6655 146.7162 9.3695 9.3695 17.5367 49.4517 117.6329 99.1712
Cropland converted to settlements 14.7071 14.7847 14.873 14.9697 30.5974 19.0149 13.3944 3.4643 3.4643 8.6241 19.3225 7.4852 17.6125
Grassland converted to settlements 1.1576 1.1637 1.1705 1.1783 0.159 1.0815 2.7332 0.2599 0.2599 0.3121 1.4626 2.768 1.9094
Biomass burning (Non- CO2 total) NE NE NE NE NE 2.2037 1.0212 0.3616 0.3616 1.0923 0.2968 0.9681 2.5893
Emissions from biomass (CH4) Gg CO2eq. NE NE NE NE NE 1.4354 0.6633 0.2291 0.2291 0.6896 0.1895 0.6301 1.6544
Biomass burning in forest (CH4) Gg CO2eq. NE NE NE NE NE 1.1652 0.4075 0.0799 0.0799 0.3308 0.0658 0.4522 1.3025
Biomass burning in cropland (CH4) Gg CO2eq. NE NE NE NE NE 0.2211 0.2248 0.1124 0.1124 0.2368 0.0998 0.1541 0.1498
Biomass burning in grassland (CH4) Gg CO2eq. NE NE NE NE NE 0.0492 0.0311 0.0368 0.0368 0.122 0.0239 0.0238 0.2021
Emissions from biomass (N2O) Gg CO2eq. NE NE NE NE NE 0.7683 0.3579 0.1325 0.1325 0.4027 0.1073 0.338 0.9349
Biomass burning in forest (N2O) Gg CO2eq. NE NE NE NE NE 0.61 0.2133 0.0418 0.0418 0.1732 0.0344 0.2367 0.6819
Biomass burning in cropland (N2O) Gg CO2eq. NE NE NE NE NE 0.1158 0.1177 0.0589 0.0589 0.124 0.0522 0.0807 0.0784
Biomass burning in grassland (N2O) Gg CO2eq. NE NE NE NE NE 0.0425 0.0269 0.0318 0.0318 0.1055 0.0207 0.0206 0.1746
Net GHG removals (Gg CO2eq.) - IPCC2006 -3241.09 -3238.88 -3236.43 -3234.04 -3274.11 -2977.32 -2990.07 -3222.11 -3221.78 -3118.98 -3169.63 -3041.97 -2969.8 *NE: Not Estimated. No activity data about burned areas from 1994-1998 resulting in no data about total emissions during this period
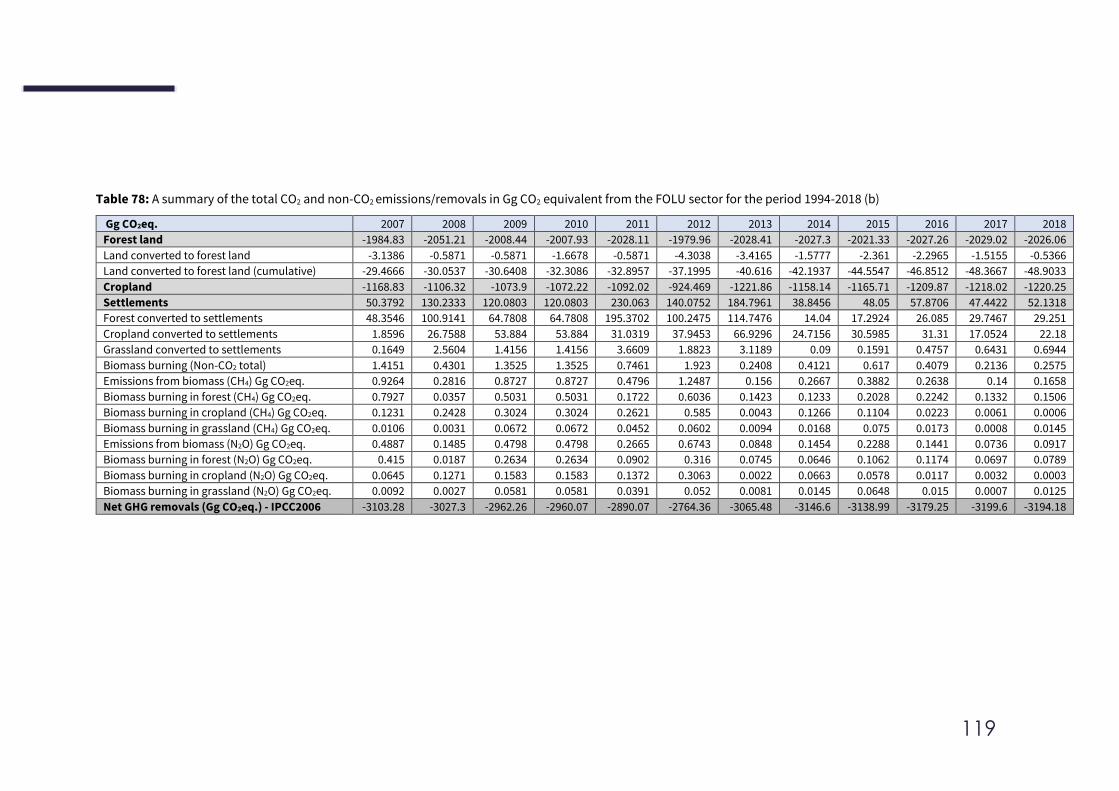
119
Table 78: A summary of the total CO2 and non-CO2 emissions/removals in Gg CO2 equivalent from the FOLU sector for the period 1994-2018 (b)
Gg CO2eq. 2007 2008 2009 2010 2011 2012 2013 2014 2015 2016 2017 2018
Forest land -1984.83 -2051.21 -2008.44 -2007.93 -2028.11 -1979.96 -2028.41 -2027.3 -2021.33 -2027.26 -2029.02 -2026.06
Land converted to forest land -3.1386 -0.5871 -0.5871 -1.6678 -0.5871 -4.3038 -3.4165 -1.5777 -2.361 -2.2965 -1.5155 -0.5366
Land converted to forest land (cumulative) -29.4666 -30.0537 -30.6408 -32.3086 -32.8957 -37.1995 -40.616 -42.1937 -44.5547 -46.8512 -48.3667 -48.9033
Cropland -1168.83 -1106.32 -1073.9 -1072.22 -1092.02 -924.469 -1221.86 -1158.14 -1165.71 -1209.87 -1218.02 -1220.25
Settlements 50.3792 130.2333 120.0803 120.0803 230.063 140.0752 184.7961 38.8456 48.05 57.8706 47.4422 52.1318
Forest converted to settlements 48.3546 100.9141 64.7808 64.7808 195.3702 100.2475 114.7476 14.04 17.2924 26.085 29.7467 29.251
Cropland converted to settlements 1.8596 26.7588 53.884 53.884 31.0319 37.9453 66.9296 24.7156 30.5985 31.31 17.0524 22.18
Grassland converted to settlements 0.1649 2.5604 1.4156 1.4156 3.6609 1.8823 3.1189 0.09 0.1591 0.4757 0.6431 0.6944
Biomass burning (Non-CO2 total) 1.4151 0.4301 1.3525 1.3525 0.7461 1.923 0.2408 0.4121 0.617 0.4079 0.2136 0.2575
Emissions from biomass (CH4) Gg CO2eq. 0.9264 0.2816 0.8727 0.8727 0.4796 1.2487 0.156 0.2667 0.3882 0.2638 0.14 0.1658
Biomass burning in forest (CH4) Gg CO2eq. 0.7927 0.0357 0.5031 0.5031 0.1722 0.6036 0.1423 0.1233 0.2028 0.2242 0.1332 0.1506
Biomass burning in cropland (CH4) Gg CO2eq. 0.1231 0.2428 0.3024 0.3024 0.2621 0.585 0.0043 0.1266 0.1104 0.0223 0.0061 0.0006
Biomass burning in grassland (CH4) Gg CO2eq. 0.0106 0.0031 0.0672 0.0672 0.0452 0.0602 0.0094 0.0168 0.075 0.0173 0.0008 0.0145
Emissions from biomass (N2O) Gg CO2eq. 0.4887 0.1485 0.4798 0.4798 0.2665 0.6743 0.0848 0.1454 0.2288 0.1441 0.0736 0.0917
Biomass burning in forest (N2O) Gg CO2eq. 0.415 0.0187 0.2634 0.2634 0.0902 0.316 0.0745 0.0646 0.1062 0.1174 0.0697 0.0789
Biomass burning in cropland (N2O) Gg CO2eq. 0.0645 0.1271 0.1583 0.1583 0.1372 0.3063 0.0022 0.0663 0.0578 0.0117 0.0032 0.0003
Biomass burning in grassland (N2O) Gg CO2eq. 0.0092 0.0027 0.0581 0.0581 0.0391 0.052 0.0081 0.0145 0.0648 0.015 0.0007 0.0125
Net GHG removals (Gg CO2eq.) - IPCC2006 -3103.28 -3027.3 -2962.26 -2960.07 -2890.07 -2764.36 -3065.48 -3146.6 -3138.99 -3179.25 -3199.6 -3194.18
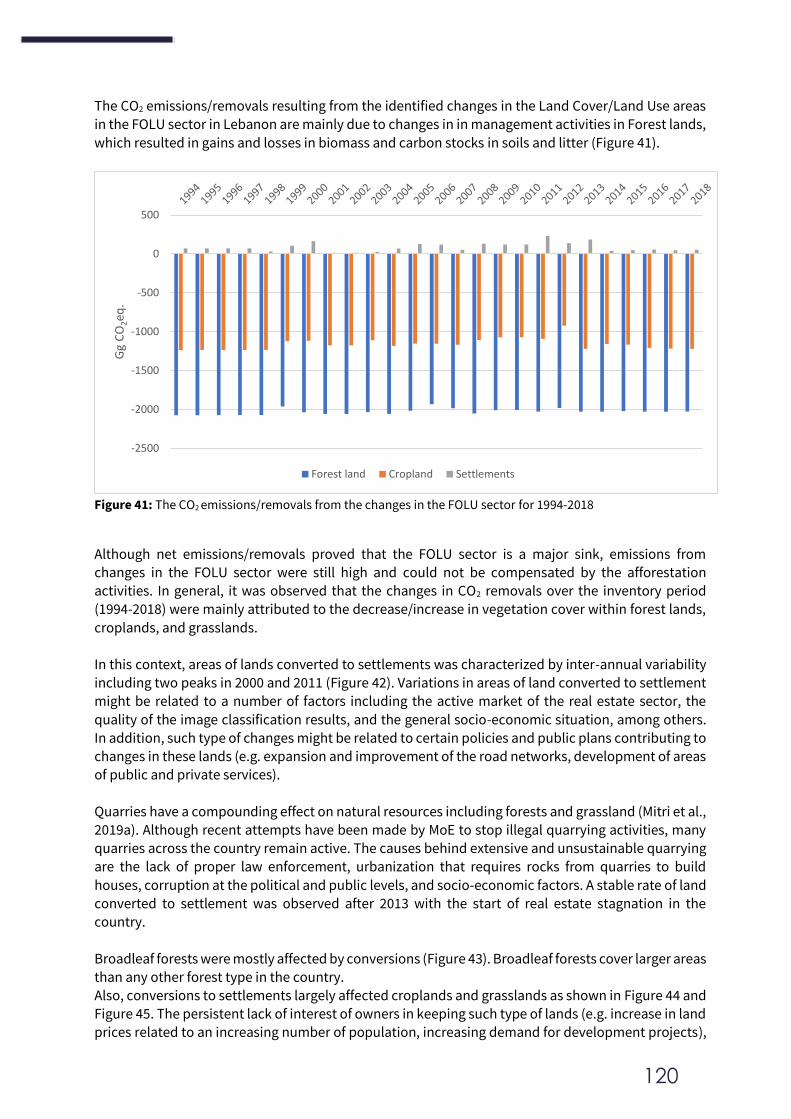
120
The CO2 emissions/removals resulting from the identified changes in the Land Cover/Land Use areas
in the FOLU sector in Lebanon are mainly due to changes in in management activities in Forest lands,
which resulted in gains and losses in biomass and carbon stocks in soils and litter (Figure 41).
Figure 41: The CO2 emissions/removals from the changes in the FOLU sector for 1994-2018
Although net emissions/removals proved that the FOLU sector is a major sink, emissions from changes in the FOLU sector were still high and could not be compensated by the afforestation
activities. In general, it was observed that the changes in CO2 removals over the inventory period (1994-2018) were mainly attributed to the decrease/increase in vegetation cover within forest lands,
croplands, and grasslands.
In this context, areas of lands converted to settlements was characterized by inter-annual variability including two peaks in 2000 and 2011 (Figure 42). Variations in areas of land converted to settlement might be related to a number of factors including the active market of the real estate sector, the
quality of the image classification results, and the general socio-economic situation, among others.
In addition, such type of changes might be related to certain policies and public plans contributing to changes in these lands (e.g. expansion and improvement of the road networks, development of areas of public and private services).
Quarries have a compounding effect on natural resources including forests and grassland (Mitri et al.,
2019a). Although recent attempts have been made by MoE to stop illegal quarrying activities, many quarries across the country remain active. The causes behind extensive and unsustainable quarrying are the lack of proper law enforcement, urbanization that requires rocks from quarries to build
houses, corruption at the political and public levels, and socio-economic factors. A stable rate of land converted to settlement was observed after 2013 with the start of real estate stagnation in the
country.
Broadleaf forests were mostly affected by conversions (Figure 43). Broadleaf forests cover larger areas than any other forest type in the country. Also, conversions to settlements largely affected croplands and grasslands as shown in Figure 44 and Figure 45. The persistent lack of interest of owners in keeping such type of lands (e.g. increase in land prices related to an increasing number of population, increasing demand for development projects),
-2500
-2000
-1500
-1000
-500
0
500
Gg
CO
2eq
.
Forest land Cropland Settlements
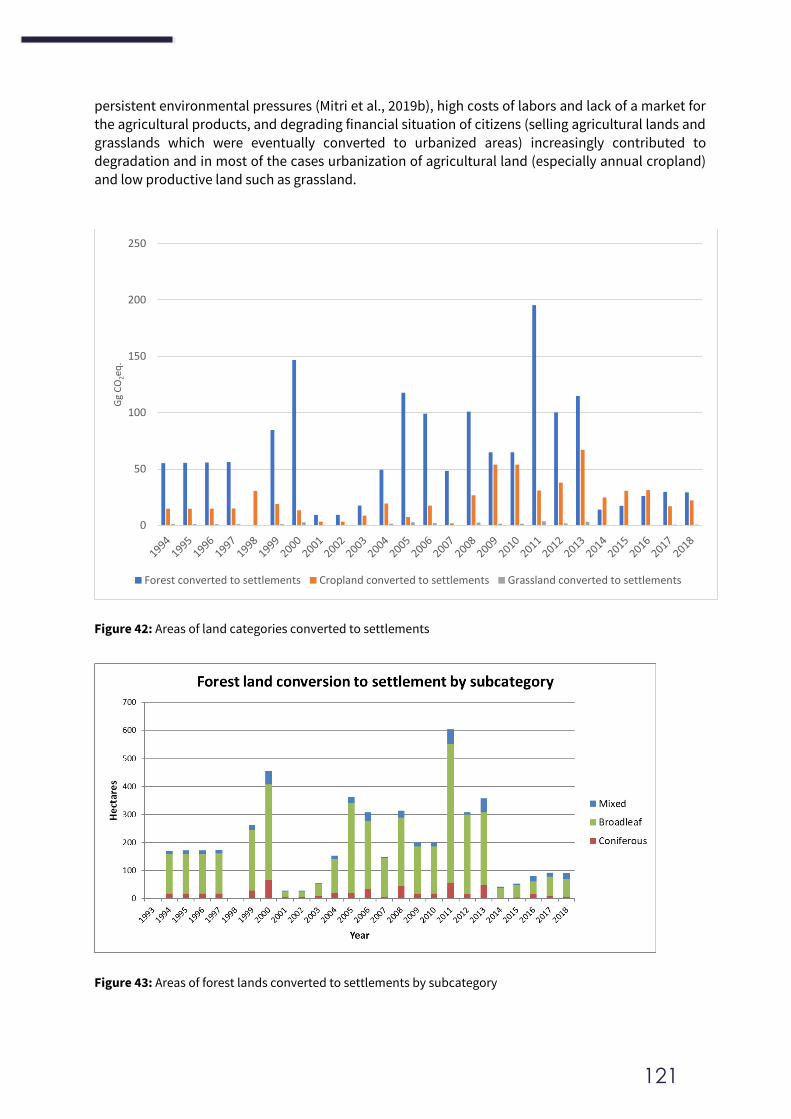
121
persistent environmental pressures (Mitri et al., 2019b), high costs of labors and lack of a market for
the agricultural products, and degrading financial situation of citizens (selling agricultural lands and
grasslands which were eventually converted to urbanized areas) increasingly contributed to degradation and in most of the cases urbanization of agricultural land (especially annual cropland)
and low productive land such as grassland.
Figure 42: Areas of land categories converted to settlements
Figure 43: Areas of forest lands converted to settlements by subcategory
0
50
100
150
200
250
Gg
CO
2eq
.
Forest converted to settlements Cropland converted to settlements Grassland converted to settlements
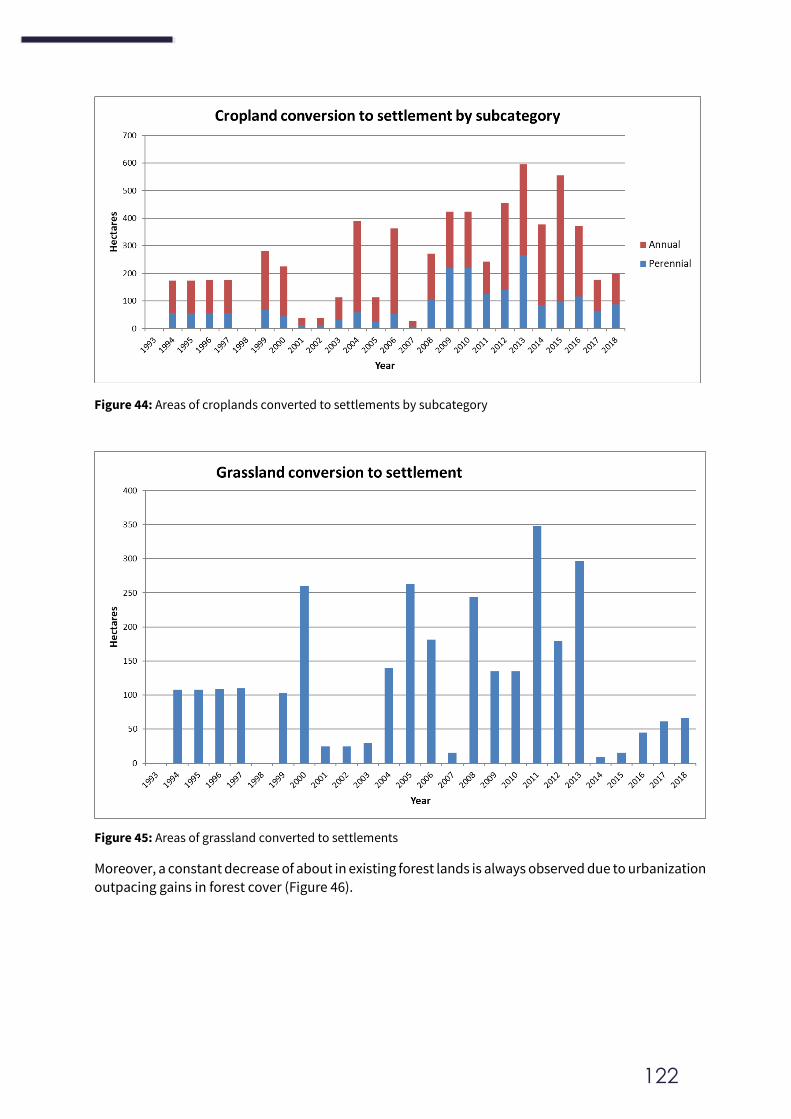
122
Figure 44: Areas of croplands converted to settlements by subcategory
Figure 45: Areas of grassland converted to settlements
Moreover, a constant decrease of about in existing forest lands is always observed due to urbanization
outpacing gains in forest cover (Figure 46).
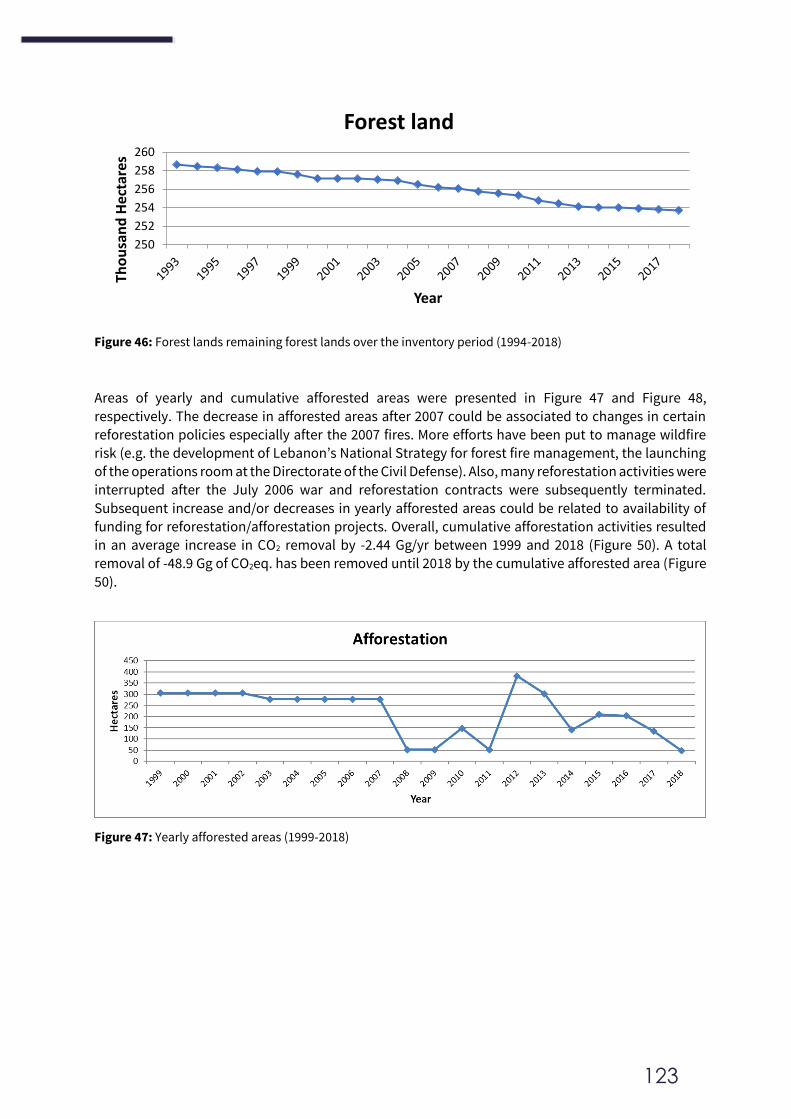
123
Figure 46: Forest lands remaining forest lands over the inventory period (1994-2018)
Areas of yearly and cumulative afforested areas were presented in Figure 47 and Figure 48,
respectively. The decrease in afforested areas after 2007 could be associated to changes in certain reforestation policies especially after the 2007 fires. More efforts have been put to manage wildfire risk (e.g. the development of Lebanon’s National Strategy for forest fire management, the launching
of the operations room at the Directorate of the Civil Defense). Also, many reforestation activities were interrupted after the July 2006 war and reforestation contracts were subsequently terminated.
Subsequent increase and/or decreases in yearly afforested areas could be related to availability of funding for reforestation/afforestation projects. Overall, cumulative afforestation activities resulted
in an average increase in CO2 removal by -2.44 Gg/yr between 1999 and 2018 (Figure 50). A total removal of -48.9 Gg of CO2eq. has been removed until 2018 by the cumulative afforested area (Figure
50).
Figure 47: Yearly afforested areas (1999-2018)
250
252
254
256
258
260
Tho
usa
nd
Hec
tare
s
Year
Forest land
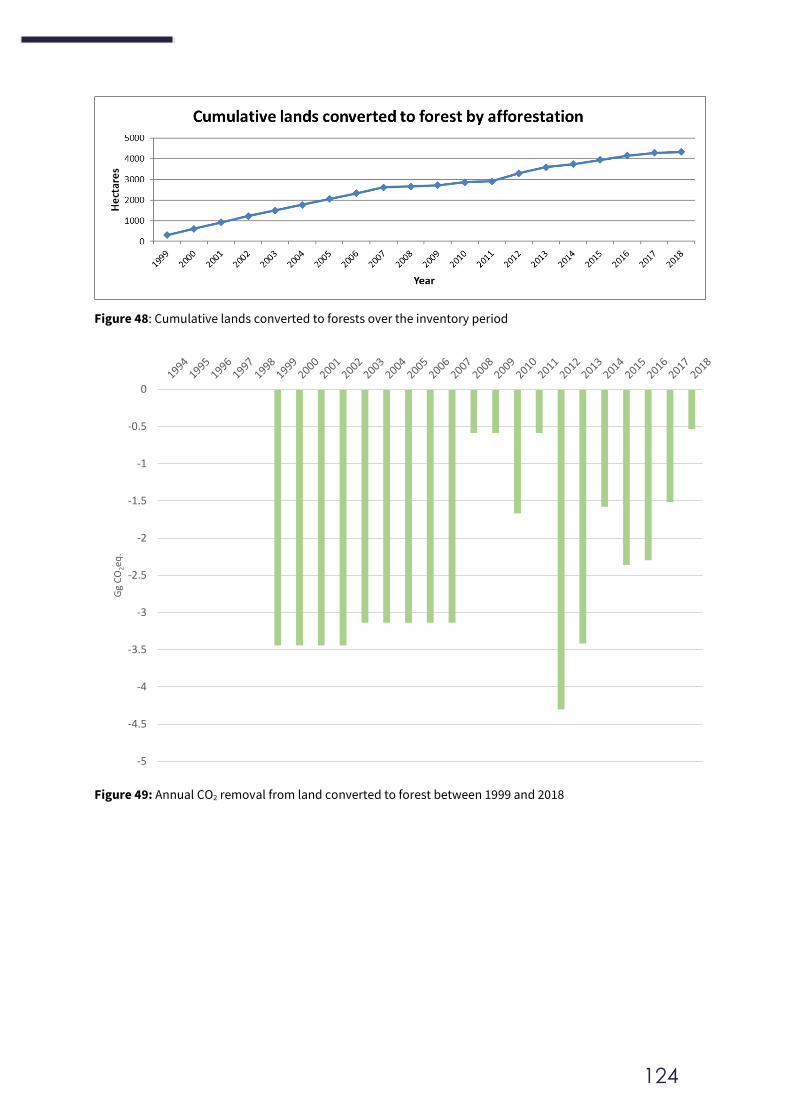
124
Figure 48: Cumulative lands converted to forests over the inventory period
Figure 49: Annual CO2 removal from land converted to forest between 1999 and 2018
-5
-4.5
-4
-3.5
-3
-2.5
-2
-1.5
-1
-0.5
0
Gg
CO
2eq
.
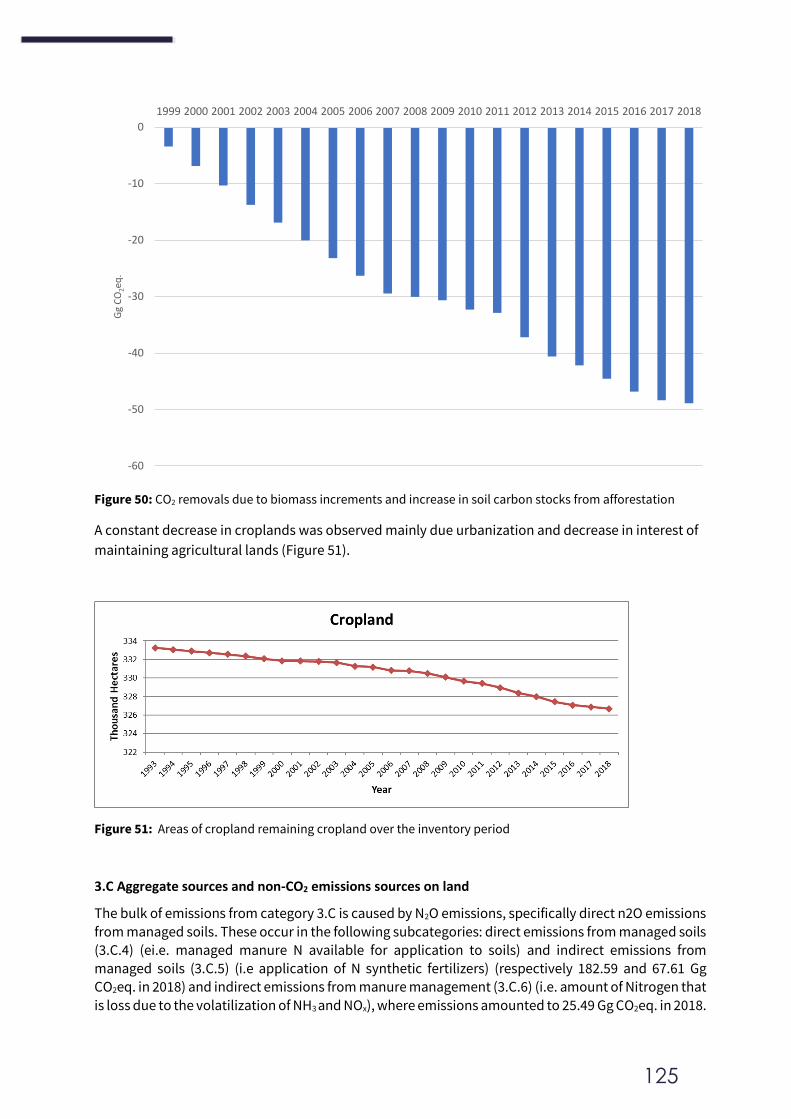
125
Figure 50: CO2 removals due to biomass increments and increase in soil carbon stocks from afforestation
A constant decrease in croplands was observed mainly due urbanization and decrease in interest of
maintaining agricultural lands (Figure 51).
Figure 51: Areas of cropland remaining cropland over the inventory period
3.C Aggregate sources and non-CO2 emissions sources on land
The bulk of emissions from category 3.C is caused by N2O emissions, specifically direct n2O emissions
from managed soils. These occur in the following subcategories: direct emissions from managed soils
(3.C.4) (ei.e. managed manure N available for application to soils) and indirect emissions from managed soils (3.C.5) (i.e application of N synthetic fertilizers) (respectively 182.59 and 67.61 Gg CO2eq. in 2018) and indirect emissions from manure management (3.C.6) (i.e. amount of Nitrogen that
is loss due to the volatilization of NH3 and NOx), where emissions amounted to 25.49 Gg CO2eq. in 2018.
-60
-50
-40
-30
-20
-10
0
1999 2000 2001 2002 2003 2004 2005 2006 2007 2008 2009 2010 2011 2012 2013 2014 2015 2016 2017 2018G
g C
O2eq
.
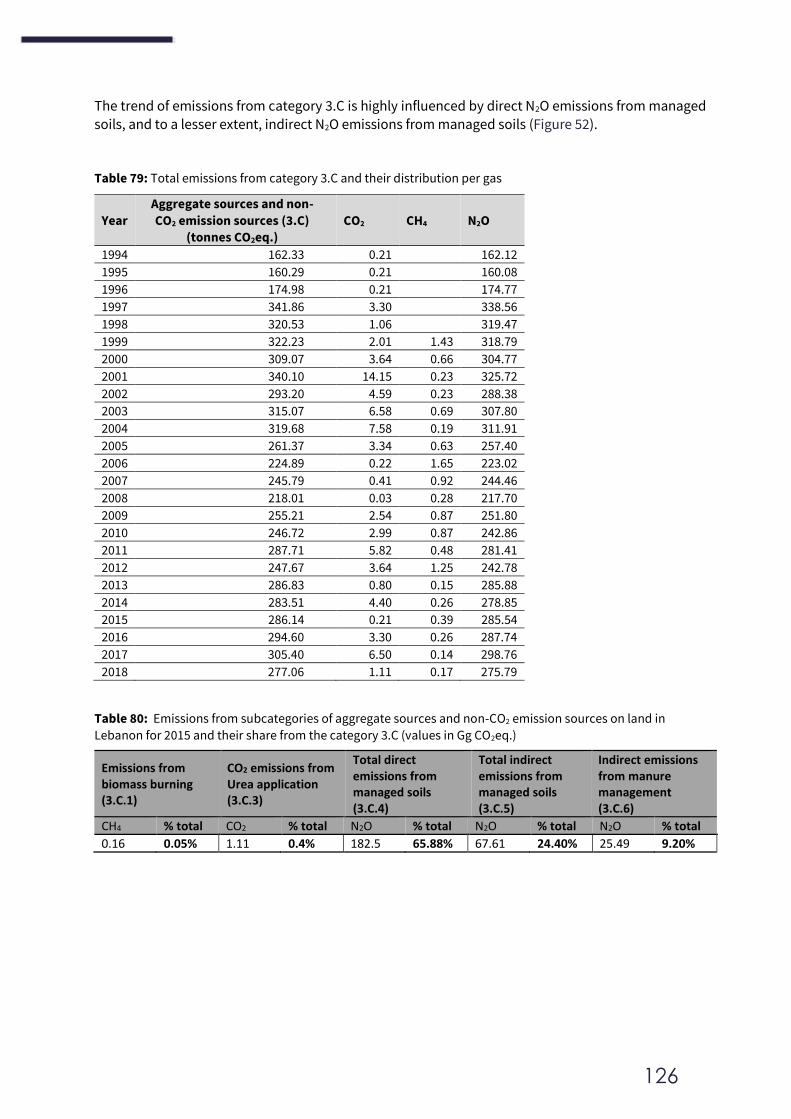
126
The trend of emissions from category 3.C is highly influenced by direct N2O emissions from managed
soils, and to a lesser extent, indirect N2O emissions from managed soils (Figure 52).
Table 79: Total emissions from category 3.C and their distribution per gas
Year
Aggregate sources and non-
CO2 emission sources (3.C)
(tonnes CO2eq.)
CO2 CH4 N2O
1994 162.33 0.21 162.12
1995 160.29 0.21 160.08
1996 174.98 0.21 174.77
1997 341.86 3.30 338.56
1998 320.53 1.06 319.47
1999 322.23 2.01 1.43 318.79
2000 309.07 3.64 0.66 304.77
2001 340.10 14.15 0.23 325.72
2002 293.20 4.59 0.23 288.38
2003 315.07 6.58 0.69 307.80
2004 319.68 7.58 0.19 311.91
2005 261.37 3.34 0.63 257.40
2006 224.89 0.22 1.65 223.02
2007 245.79 0.41 0.92 244.46
2008 218.01 0.03 0.28 217.70
2009 255.21 2.54 0.87 251.80
2010 246.72 2.99 0.87 242.86
2011 287.71 5.82 0.48 281.41
2012 247.67 3.64 1.25 242.78
2013 286.83 0.80 0.15 285.88
2014 283.51 4.40 0.26 278.85
2015 286.14 0.21 0.39 285.54
2016 294.60 3.30 0.26 287.74
2017 305.40 6.50 0.14 298.76
2018 277.06 1.11 0.17 275.79
Table 80: Emissions from subcategories of aggregate sources and non-CO2 emission sources on land in
Lebanon for 2015 and their share from the category 3.C (values in Gg CO2eq.)
Emissions from biomass burning (3.C.1)
CO2 emissions from Urea application (3.C.3)
Total direct emissions from managed soils (3.C.4)
Total indirect emissions from managed soils (3.C.5)
Indirect emissions from manure management (3.C.6)
CH4 % total CO2 % total N2O % total N2O % total N2O % total
0.16 0.05% 1.11 0.4% 182.5 65.88% 67.61 24.40% 25.49 9.20%
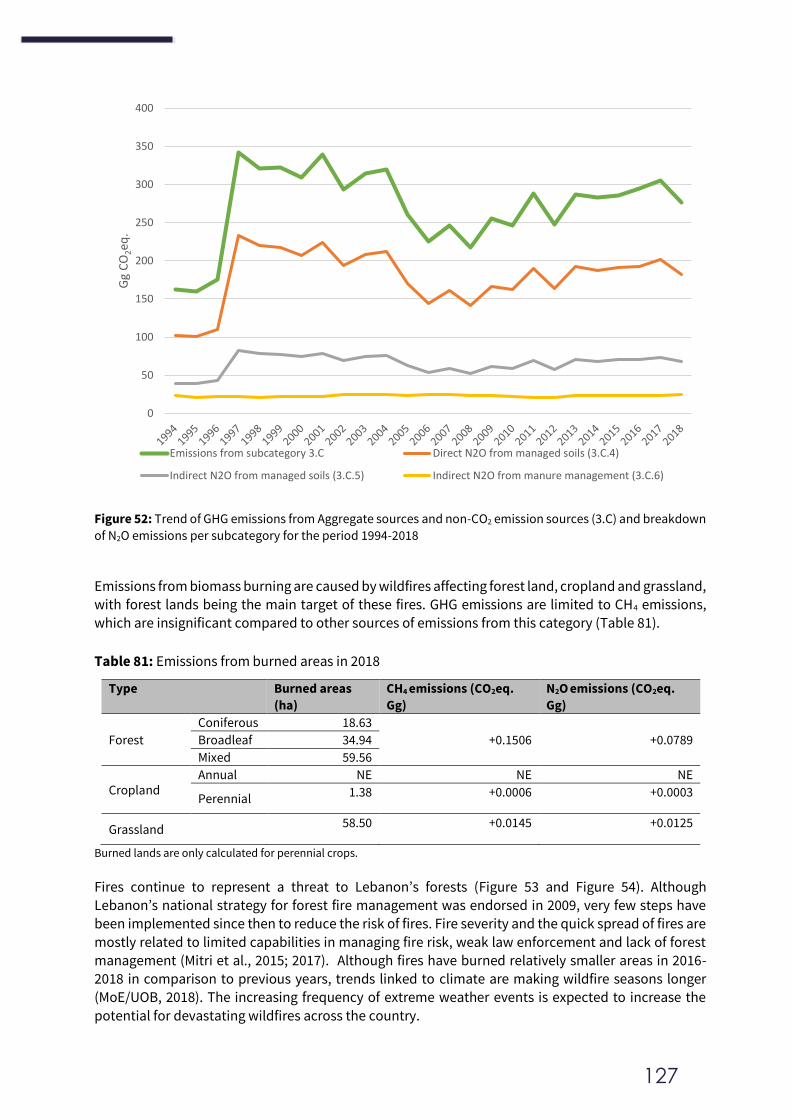
127
Figure 52: Trend of GHG emissions from Aggregate sources and non-CO2 emission sources (3.C) and breakdown
of N2O emissions per subcategory for the period 1994-2018
Emissions from biomass burning are caused by wildfires affecting forest land, cropland and grassland, with forest lands being the main target of these fires. GHG emissions are limited to CH4 emissions,
which are insignificant compared to other sources of emissions from this category (Table 81).
Table 81: Emissions from burned areas in 2018
Type Burned areas
(ha)
CH4 emissions (CO2eq.
Gg)
N2O emissions (CO2eq.
Gg)
Forest
Coniferous 18.63
+0.1506 +0.0789 Broadleaf 34.94
Mixed 59.56
Cropland Annual NE NE NE
Perennial 1.38 +0.0006 +0.0003
Grassland 58.50 +0.0145 +0.0125
Burned lands are only calculated for perennial crops.
Fires continue to represent a threat to Lebanon’s forests (Figure 53 and Figure 54). Although Lebanon’s national strategy for forest fire management was endorsed in 2009, very few steps have been implemented since then to reduce the risk of fires. Fire severity and the quick spread of fires are
mostly related to limited capabilities in managing fire risk, weak law enforcement and lack of forest management (Mitri et al., 2015; 2017). Although fires have burned relatively smaller areas in 2016-2018 in comparison to previous years, trends linked to climate are making wildfire seasons longer (MoE/UOB, 2018). The increasing frequency of extreme weather events is expected to increase the
potential for devastating wildfires across the country.
0
50
100
150
200
250
300
350
400G
g C
O2eq
.
Emissions from subcategory 3.C Direct N2O from managed soils (3.C.4)
Indirect N2O from managed soils (3.C.5) Indirect N2O from manure management (3.C.6)
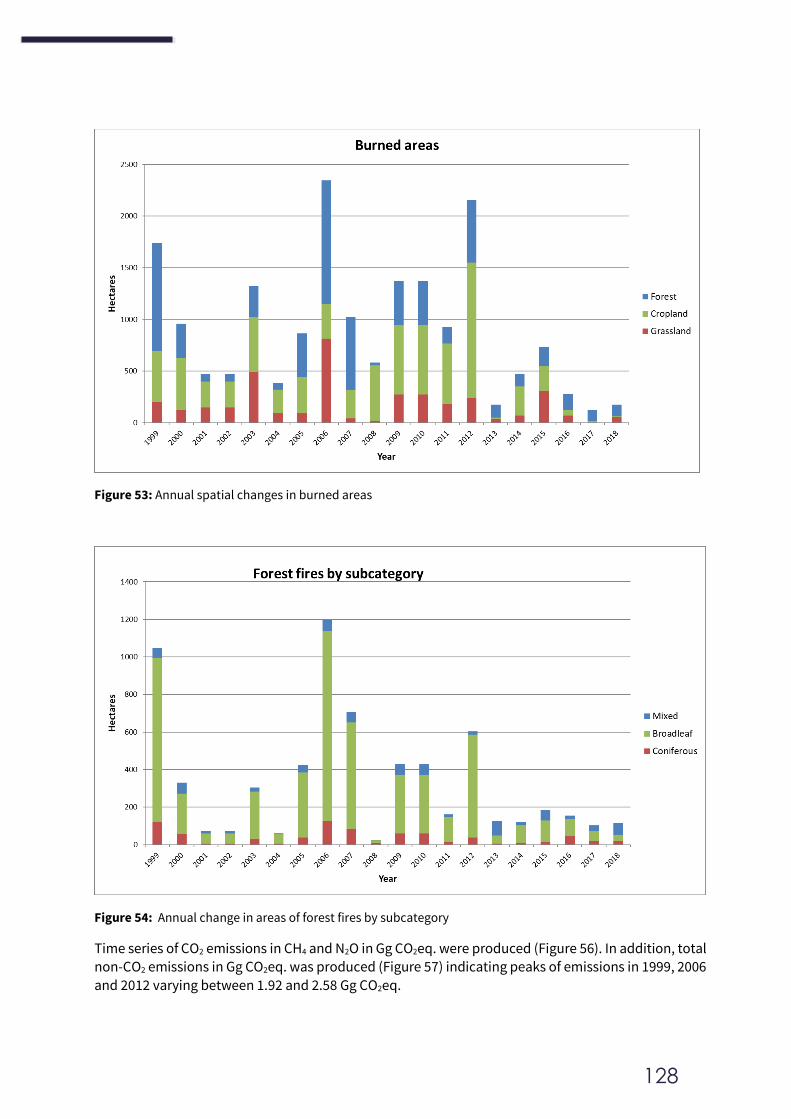
128
Figure 53: Annual spatial changes in burned areas
Figure 54: Annual change in areas of forest fires by subcategory
Time series of CO2 emissions in CH4 and N2O in Gg CO2eq. were produced (Figure 56). In addition, total non-CO2 emissions in Gg CO2eq. was produced (Figure 57) indicating peaks of emissions in 1999, 2006
and 2012 varying between 1.92 and 2.58 Gg CO2eq.
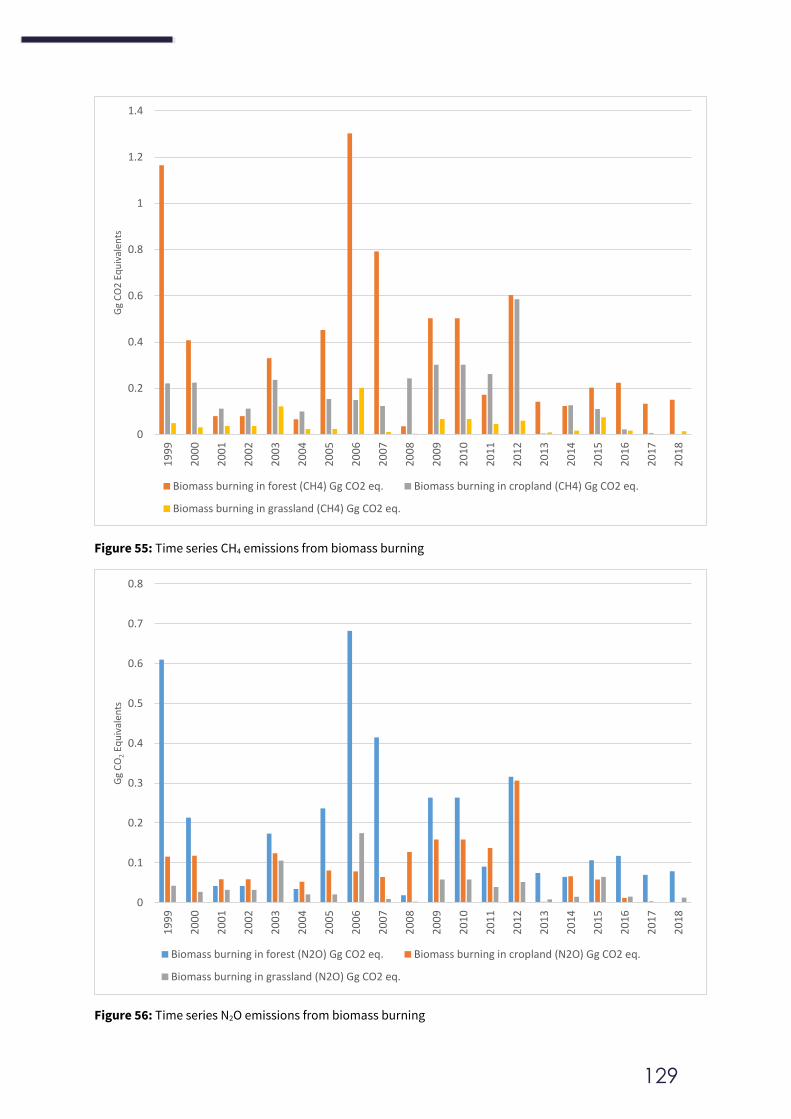
129
Figure 55: Time series CH4 emissions from biomass burning
Figure 56: Time series N2O emissions from biomass burning
0
0.2
0.4
0.6
0.8
1
1.2
1.4
19
99
20
00
20
01
20
02
20
03
20
04
20
05
20
06
20
07
20
08
20
09
20
10
20
11
20
12
20
13
20
14
20
15
20
16
20
17
20
18
Gg
CO
2 E
qu
ival
ents
Biomass burning in forest (CH4) Gg CO2 eq. Biomass burning in cropland (CH4) Gg CO2 eq.
Biomass burning in grassland (CH4) Gg CO2 eq.
0
0.1
0.2
0.3
0.4
0.5
0.6
0.7
0.8
19
99
20
00
20
01
20
02
20
03
20
04
20
05
20
06
20
07
20
08
20
09
20
10
20
11
20
12
20
13
20
14
20
15
20
16
20
17
20
18
Gg
CO
2Eq
uiv
alen
ts
Biomass burning in forest (N2O) Gg CO2 eq. Biomass burning in cropland (N2O) Gg CO2 eq.
Biomass burning in grassland (N2O) Gg CO2 eq.
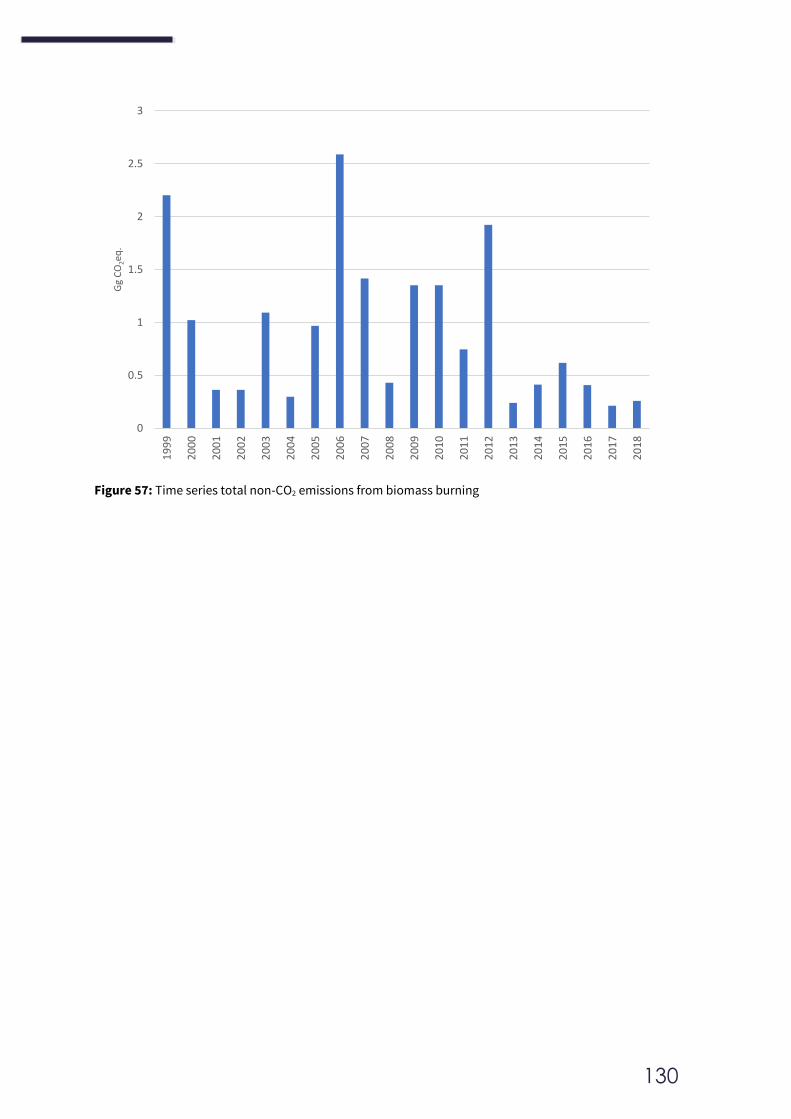
130
Figure 57: Time series total non-CO2 emissions from biomass burning
0
0.5
1
1.5
2
2.5
3
19
99
20
00
20
01
20
02
20
03
20
04
20
05
20
06
20
07
20
08
20
09
20
10
20
11
20
12
20
13
20
14
20
15
20
16
20
17
20
18
Gg
CO
2eq
.
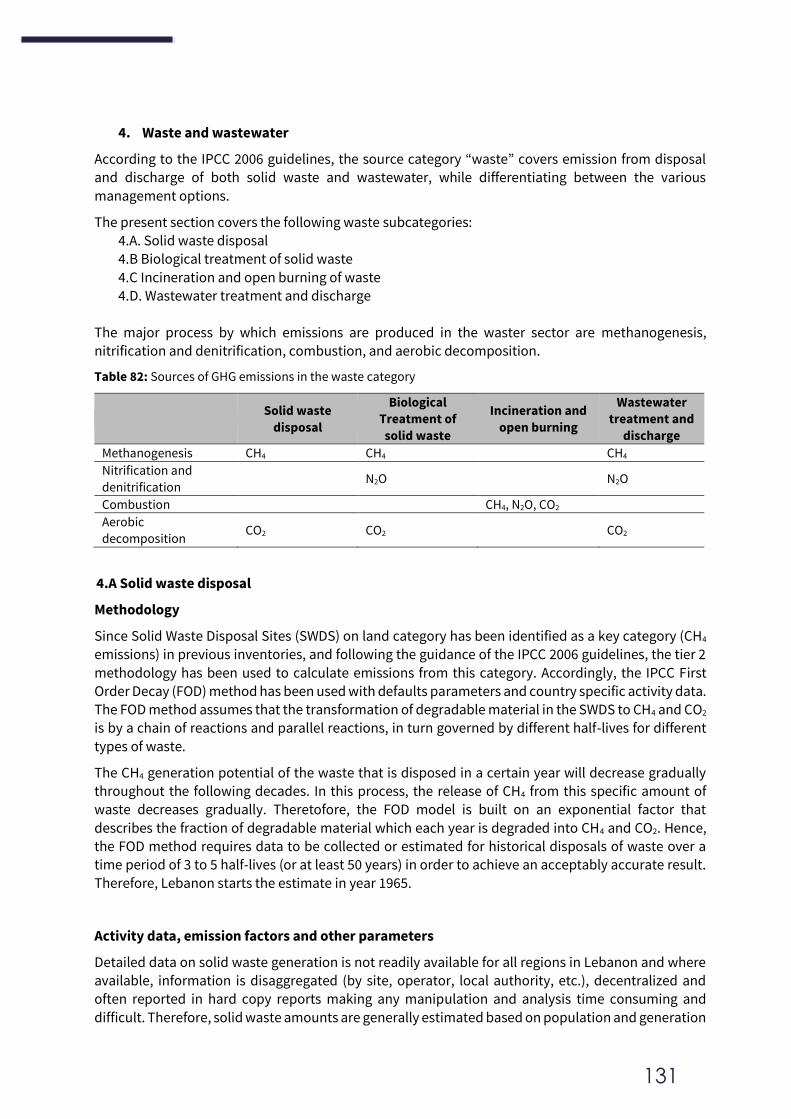
131
4. Waste and wastewater
According to the IPCC 2006 guidelines, the source category “waste” covers emission from disposal
and discharge of both solid waste and wastewater, while differentiating between the various
management options.
The present section covers the following waste subcategories: 4.A. Solid waste disposal 4.B Biological treatment of solid waste
4.C Incineration and open burning of waste 4.D. Wastewater treatment and discharge
The major process by which emissions are produced in the waster sector are methanogenesis,
nitrification and denitrification, combustion, and aerobic decomposition.
Table 82: Sources of GHG emissions in the waste category
Solid waste
disposal
Biological
Treatment of
solid waste
Incineration and
open burning
Wastewater
treatment and
discharge
Methanogenesis CH4 CH4 CH4
Nitrification and
denitrification N2O N2O
Combustion CH4, N2O, CO2
Aerobic
decomposition CO2 CO2 CO2
4.A Solid waste disposal
Methodology
Since Solid Waste Disposal Sites (SWDS) on land category has been identified as a key category (CH4
emissions) in previous inventories, and following the guidance of the IPCC 2006 guidelines, the tier 2
methodology has been used to calculate emissions from this category. Accordingly, the IPCC First Order Decay (FOD) method has been used with defaults parameters and country specific activity data.
The FOD method assumes that the transformation of degradable material in the SWDS to CH4 and CO2 is by a chain of reactions and parallel reactions, in turn governed by different half-lives for different
types of waste.
The CH4 generation potential of the waste that is disposed in a certain year will decrease gradually throughout the following decades. In this process, the release of CH4 from this specific amount of
waste decreases gradually. Theretofore, the FOD model is built on an exponential factor that
describes the fraction of degradable material which each year is degraded into CH4 and CO2. Hence, the FOD method requires data to be collected or estimated for historical disposals of waste over a time period of 3 to 5 half-lives (or at least 50 years) in order to achieve an acceptably accurate result.
Therefore, Lebanon starts the estimate in year 1965.
Activity data, emission factors and other parameters
Detailed data on solid waste generation is not readily available for all regions in Lebanon and where available, information is disaggregated (by site, operator, local authority, etc.), decentralized and often reported in hard copy reports making any manipulation and analysis time consuming and
difficult. Therefore, solid waste amounts are generally estimated based on population and generation
132
rate per capita estimations. Surveys and assessment conducted across the years are used to estimate
waste generation rates, collection rate and disposal pathways. (El Fadel and Sbayti, 2000; CDR, 2006;
MoE, 2010; OMSAR, 2018 and MoE, 2019). In addition, expert consultation meetings were held in order to validate assumptions and findings to fill the data gaps. Extrapolations and interpolations were used
when data was unavailable.
Table 83: Activity data and main assumptions for solid waste emissions calculations
Population
The population of 2018 was taken from 1) the recent Household Survey prepared by
the Central Administration of Statistics (CAS, 2020), 2) UNRWA reports on the
Palestinians refugees (UNRWA, 2020) and 3) the UNHCR database on Syrian displaced
(UNHCR, 2020).
For the time series, the population of Lebanon was adopted from the World Bank
database, the 2007 CAS Household survey and the 2018 updated CAS survey (World
Bank, 2019, CAS 2007, CAS, 2020). The Syrian displaced population is included in total
population starting 2011, and as reported by UNHCR.
Per capita waste
generation rate
The generation rate for the Lebanese population, including foreign workers and
Palestinian refugees, was extrapolated based on publications issued for the years 1994
(El Fadel and Sbayti, 2000), 2006 (CDR, 2006) and 2010 (MoE, 2010) for the time series
1965-2015. Starting 2016, or other years, the rate used is 1.16 kg/cap/day based on
Lebanon’s draft solid waste strategy (MoE, 2019).
The generation rate used for Syrian displaced was adapted from Lebanon
Environmental Assessment of the Syrian Conflict. The rate for Syrian displaced varies
between 0.47 for the Bekaa region, 0.5 for the south, 0.51 for the north and 0.53 for
Beirut and Mount Lebanon (MoE/EU/UNDP, 2014). An average amount of 0.5
kg/displaced/year has been used (Amounts are based on weight of wet waste).
Municipal solid
waste generation
Waste generation for the years 1994 through 2018 was calculated based on the “per
capita waste generation rate” (tonnes/capita/year) and the population (capita and
displaced) for each year respectively. It includes both urban and rural populations.
Waste
composition
The national waste composition is adapted from the Integrated Solid Waste Strategy
of the Ministry of Environment, published in 2019 (MoE, 2019), the Office of the
Minister of State for Administrative Reform (OMSAR) reports (OMSAR, 2018) and the
Assessment of Solid Waste Management Practices in Lebanon (MoE/EU/GFA, 2017).
Industrial waste
No amounts of industrial waste generated in Lebanon is available.
Therefore, industrial waste generation is estimated based on the Gross Domestic
Product (GDP) and the industrial waste generation per GDP per year, according to the
2006 IPCC guidelines.
The GDP for the time-series 1970-2015 was adopted from the IMF and World bank
databases (2021). The GDP of 1970 was kept the same for the period 1965-1970.
In Lebanon, the rate is estimated at 0.04 Gg of industrial waste/million USD in GDP.
The calculation is based on the industrial waste generated of 188,850 tonnes in 2014
(Sweep-net, 2014) and a GDP of 47,833 million USD in 2014 (World Bank, 2019) and
extrapolated for the rest of the years.
Industrial waste is considered to be disposed with the regular waste stream.
Municipal solid
waste disposed
in Solid Waste
Disposal Sites
(SWDS)
Information on the waste quantities landfilled in SWDS was retrieved from the
managing entities of these landfills: LACECO reports for the Naameh Landfill, Moores
for the Zahleh landfill, BATCO for Tripoli landfill, Sidon Environmental for Saida and
OMSAR for Minieh and Baalbeck for the period before 2015.
However, due to the waste crisis in 2015 and after the closure of the main landfill in
Lebanon, the share of waste disposed in each type pf disposal site changed
significantly. It is assumed that in 2016 around 24% of generated waste is disposed in
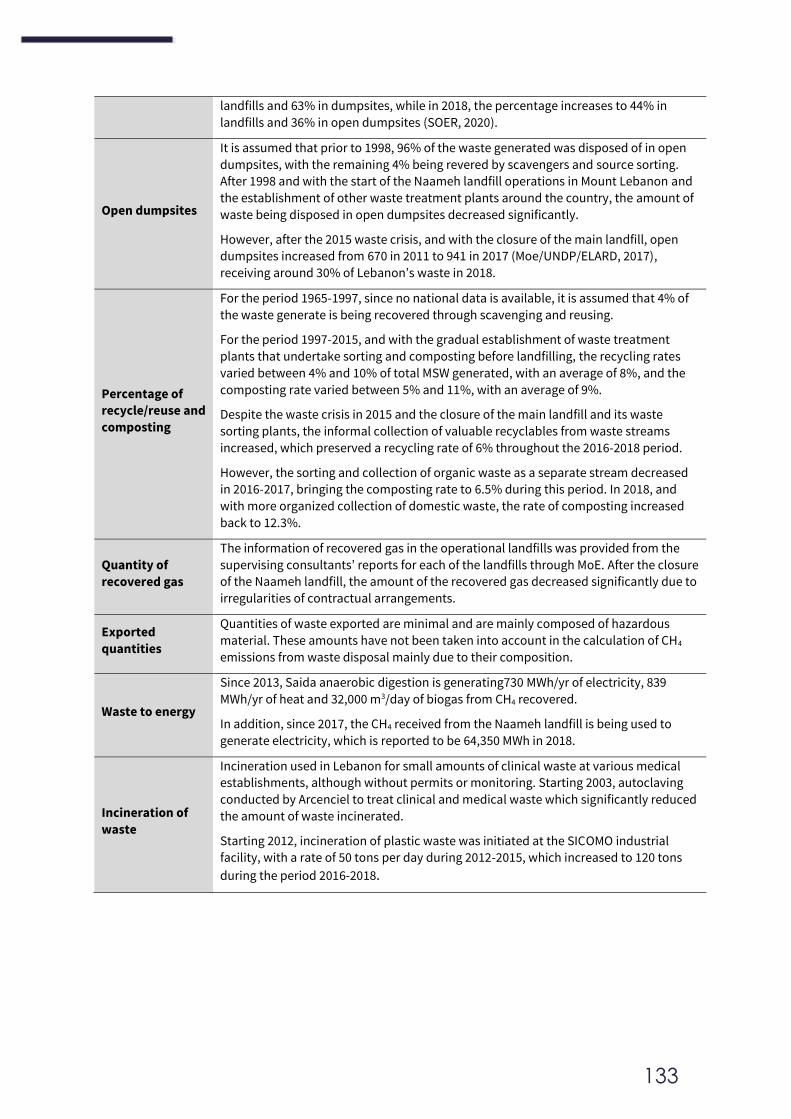
133
landfills and 63% in dumpsites, while in 2018, the percentage increases to 44% in
landfills and 36% in open dumpsites (SOER, 2020).
Open dumpsites
It is assumed that prior to 1998, 96% of the waste generated was disposed of in open
dumpsites, with the remaining 4% being revered by scavengers and source sorting.
After 1998 and with the start of the Naameh landfill operations in Mount Lebanon and
the establishment of other waste treatment plants around the country, the amount of
waste being disposed in open dumpsites decreased significantly.
However, after the 2015 waste crisis, and with the closure of the main landfill, open
dumpsites increased from 670 in 2011 to 941 in 2017 (Moe/UNDP/ELARD, 2017),
receiving around 30% of Lebanon’s waste in 2018.
Percentage of
recycle/reuse and
composting
For the period 1965-1997, since no national data is available, it is assumed that 4% of
the waste generate is being recovered through scavenging and reusing.
For the period 1997-2015, and with the gradual establishment of waste treatment
plants that undertake sorting and composting before landfilling, the recycling rates
varied between 4% and 10% of total MSW generated, with an average of 8%, and the
composting rate varied between 5% and 11%, with an average of 9%.
Despite the waste crisis in 2015 and the closure of the main landfill and its waste
sorting plants, the informal collection of valuable recyclables from waste streams
increased, which preserved a recycling rate of 6% throughout the 2016-2018 period.
However, the sorting and collection of organic waste as a separate stream decreased
in 2016-2017, bringing the composting rate to 6.5% during this period. In 2018, and
with more organized collection of domestic waste, the rate of composting increased
back to 12.3%.
Quantity of
recovered gas
The information of recovered gas in the operational landfills was provided from the
supervising consultants’ reports for each of the landfills through MoE. After the closure
of the Naameh landfill, the amount of the recovered gas decreased significantly due to
irregularities of contractual arrangements.
Exported
quantities
Quantities of waste exported are minimal and are mainly composed of hazardous
material. These amounts have not been taken into account in the calculation of CH4
emissions from waste disposal mainly due to their composition.
Waste to energy
Since 2013, Saida anaerobic digestion is generating730 MWh/yr of electricity, 839
MWh/yr of heat and 32,000 m3/day of biogas from CH4 recovered.
In addition, since 2017, the CH4 received from the Naameh landfill is being used to
generate electricity, which is reported to be 64,350 MWh in 2018.
Incineration of
waste
Incineration used in Lebanon for small amounts of clinical waste at various medical
establishments, although without permits or monitoring. Starting 2003, autoclaving
conducted by Arcenciel to treat clinical and medical waste which significantly reduced
the amount of waste incinerated.
Starting 2012, incineration of plastic waste was initiated at the SICOMO industrial
facility, with a rate of 50 tons per day during 2012-2015, which increased to 120 tons
during the period 2016-2018.
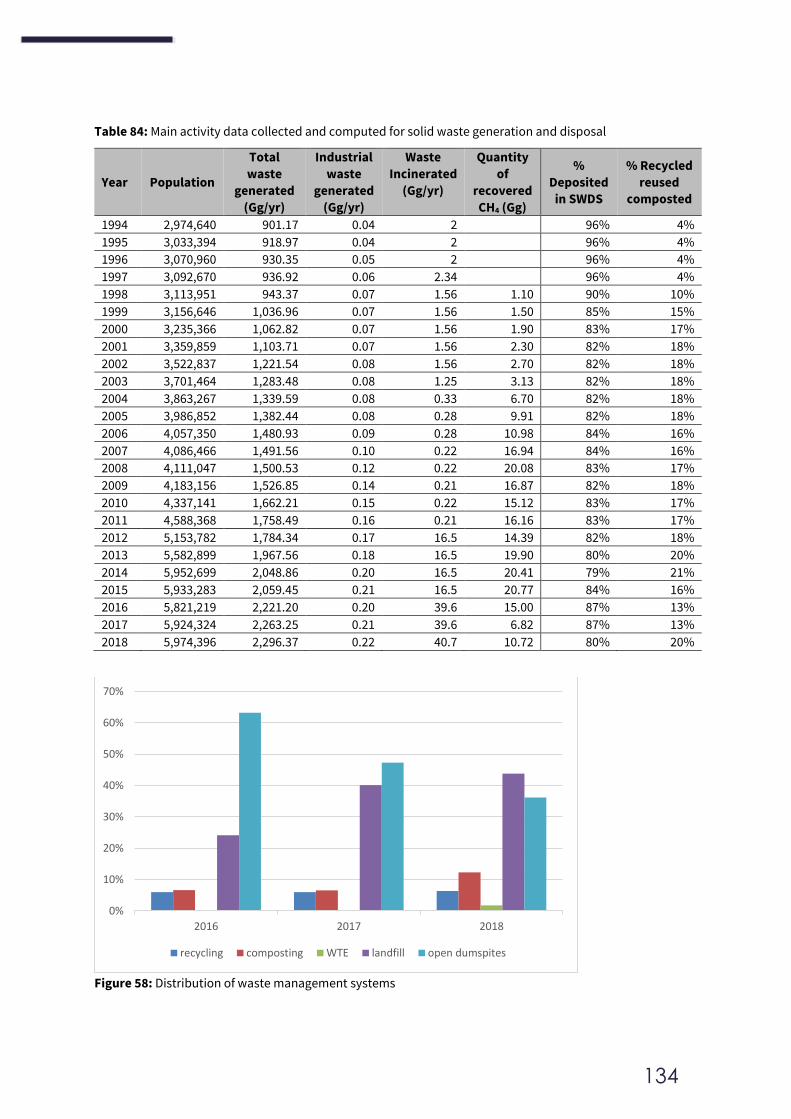
134
Table 84: Main activity data collected and computed for solid waste generation and disposal
Year Population
Total
waste
generated
(Gg/yr)
Industrial
waste
generated
(Gg/yr)
Waste
Incinerated
(Gg/yr)
Quantity
of
recovered
CH4 (Gg)
%
Deposited
in SWDS
% Recycled
reused
composted
1994 2,974,640 901.17 0.04 2 96% 4%
1995 3,033,394 918.97 0.04 2 96% 4%
1996 3,070,960 930.35 0.05 2 96% 4%
1997 3,092,670 936.92 0.06 2.34 96% 4%
1998 3,113,951 943.37 0.07 1.56 1.10 90% 10%
1999 3,156,646 1,036.96 0.07 1.56 1.50 85% 15%
2000 3,235,366 1,062.82 0.07 1.56 1.90 83% 17%
2001 3,359,859 1,103.71 0.07 1.56 2.30 82% 18%
2002 3,522,837 1,221.54 0.08 1.56 2.70 82% 18%
2003 3,701,464 1,283.48 0.08 1.25 3.13 82% 18%
2004 3,863,267 1,339.59 0.08 0.33 6.70 82% 18%
2005 3,986,852 1,382.44 0.08 0.28 9.91 82% 18%
2006 4,057,350 1,480.93 0.09 0.28 10.98 84% 16%
2007 4,086,466 1,491.56 0.10 0.22 16.94 84% 16%
2008 4,111,047 1,500.53 0.12 0.22 20.08 83% 17%
2009 4,183,156 1,526.85 0.14 0.21 16.87 82% 18%
2010 4,337,141 1,662.21 0.15 0.22 15.12 83% 17%
2011 4,588,368 1,758.49 0.16 0.21 16.16 83% 17%
2012 5,153,782 1,784.34 0.17 16.5 14.39 82% 18%
2013 5,582,899 1,967.56 0.18 16.5 19.90 80% 20%
2014 5,952,699 2,048.86 0.20 16.5 20.41 79% 21%
2015 5,933,283 2,059.45 0.21 16.5 20.77 84% 16%
2016 5,821,219 2,221.20 0.20 39.6 15.00 87% 13%
2017 5,924,324 2,263.25 0.21 39.6 6.82 87% 13%
2018 5,974,396 2,296.37 0.22 40.7 10.72 80% 20%
Figure 58: Distribution of waste management systems
0%
10%
20%
30%
40%
50%
60%
70%
2016 2017 2018
recycling composting WTE landfill open dumspites
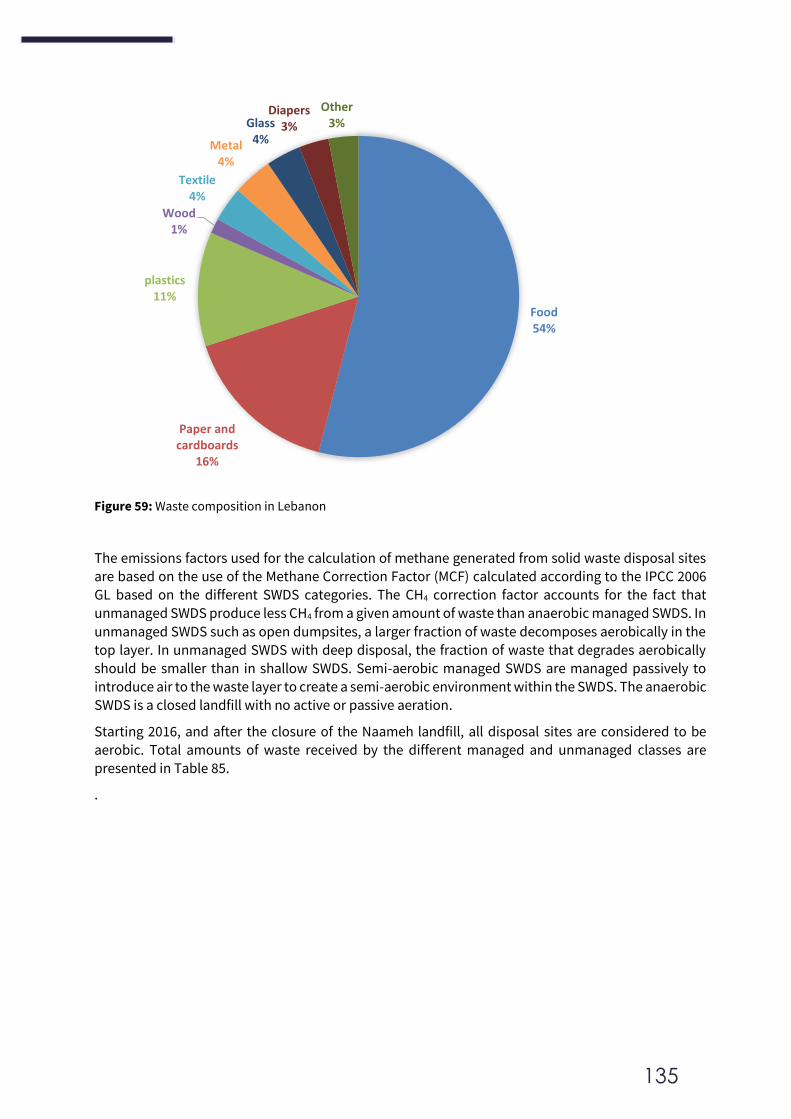
135
Figure 59: Waste composition in Lebanon
The emissions factors used for the calculation of methane generated from solid waste disposal sites are based on the use of the Methane Correction Factor (MCF) calculated according to the IPCC 2006
GL based on the different SWDS categories. The CH4 correction factor accounts for the fact that unmanaged SWDS produce less CH4 from a given amount of waste than anaerobic managed SWDS. In
unmanaged SWDS such as open dumpsites, a larger fraction of waste decomposes aerobically in the top layer. In unmanaged SWDS with deep disposal, the fraction of waste that degrades aerobically
should be smaller than in shallow SWDS. Semi-aerobic managed SWDS are managed passively to introduce air to the waste layer to create a semi-aerobic environment within the SWDS. The anaerobic SWDS is a closed landfill with no active or passive aeration.
Starting 2016, and after the closure of the Naameh landfill, all disposal sites are considered to be
aerobic. Total amounts of waste received by the different managed and unmanaged classes are presented in Table 85.
.
Food54%
Paper and cardboards
16%
plastics 11%
Wood 1%
Textile4%
Metal4%
Glass4%
Diapers3%
Other3%
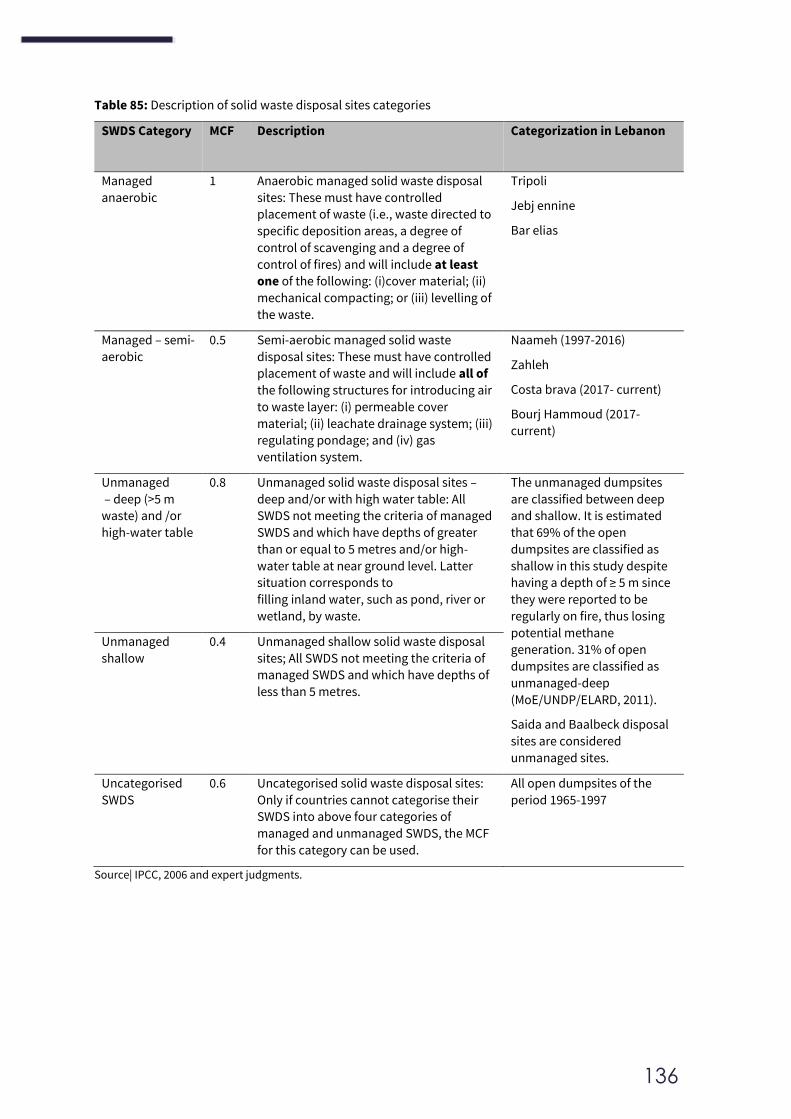
136
Table 85: Description of solid waste disposal sites categories
SWDS Category MCF Description
Categorization in Lebanon
Managed
anaerobic
1 Anaerobic managed solid waste disposal
sites: These must have controlled
placement of waste (i.e., waste directed to
specific deposition areas, a degree of
control of scavenging and a degree of
control of fires) and will include at least
one of the following: (i)cover material; (ii)
mechanical compacting; or (iii) levelling of
the waste.
Tripoli
Jebj ennine
Bar elias
Managed – semi-
aerobic
0.5 Semi-aerobic managed solid waste
disposal sites: These must have controlled
placement of waste and will include all of
the following structures for introducing air
to waste layer: (i) permeable cover
material; (ii) leachate drainage system; (iii)
regulating pondage; and (iv) gas
ventilation system.
Naameh (1997-2016)
Zahleh
Costa brava (2017- current)
Bourj Hammoud (2017-
current)
Unmanaged
– deep (>5 m
waste) and /or
high-water table
0.8 Unmanaged solid waste disposal sites –
deep and/or with high water table: All
SWDS not meeting the criteria of managed
SWDS and which have depths of greater
than or equal to 5 metres and/or high-
water table at near ground level. Latter
situation corresponds to
filling inland water, such as pond, river or
wetland, by waste.
The unmanaged dumpsites
are classified between deep
and shallow. It is estimated
that 69% of the open
dumpsites are classified as
shallow in this study despite
having a depth of ≥ 5 m since
they were reported to be
regularly on fire, thus losing
potential methane
generation. 31% of open
dumpsites are classified as
unmanaged-deep
(MoE/UNDP/ELARD, 2011).
Saida and Baalbeck disposal
sites are considered
unmanaged sites.
Unmanaged
shallow
0.4 Unmanaged shallow solid waste disposal
sites; All SWDS not meeting the criteria of
managed SWDS and which have depths of
less than 5 metres.
Uncategorised
SWDS
0.6 Uncategorised solid waste disposal sites:
Only if countries cannot categorise their
SWDS into above four categories of
managed and unmanaged SWDS, the MCF
for this category can be used.
All open dumpsites of the
period 1965-1997
Source| IPCC, 2006 and expert judgments.
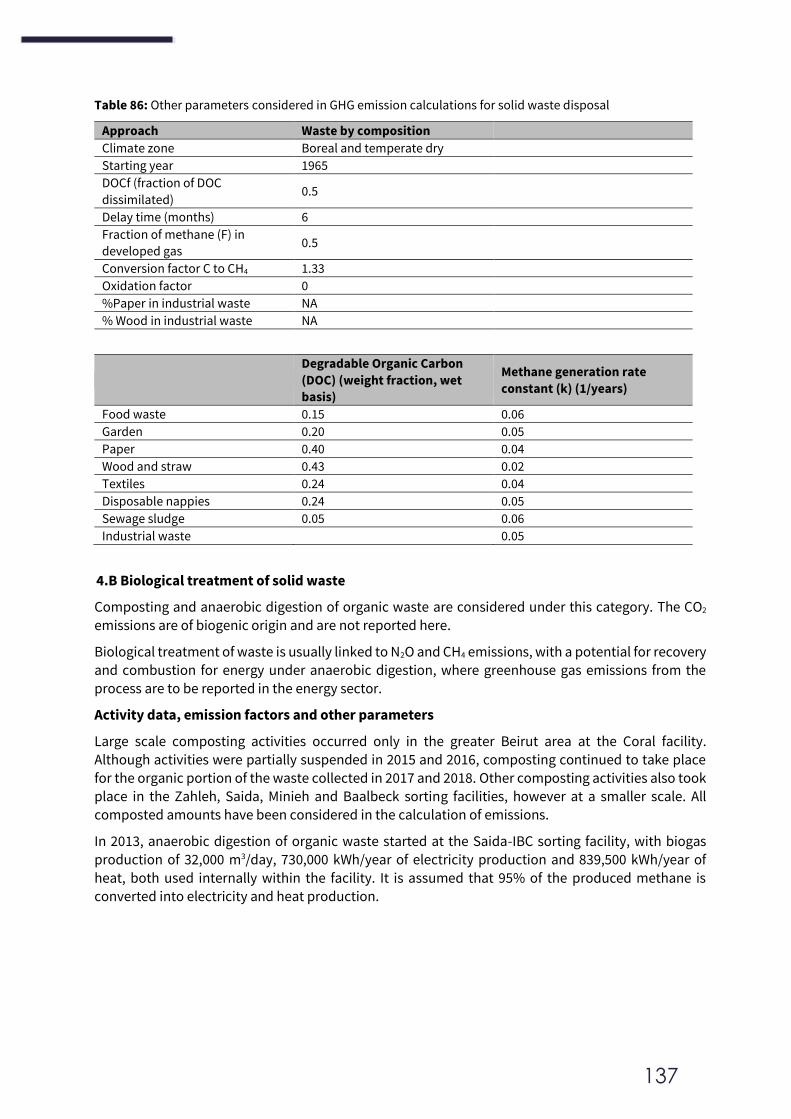
137
Table 86: Other parameters considered in GHG emission calculations for solid waste disposal
Approach Waste by composition
Climate zone Boreal and temperate dry
Starting year 1965
DOCf (fraction of DOC
dissimilated) 0.5
Delay time (months) 6
Fraction of methane (F) in
developed gas 0.5
Conversion factor C to CH4 1.33
Oxidation factor 0
%Paper in industrial waste NA
% Wood in industrial waste NA
Degradable Organic Carbon
(DOC) (weight fraction, wet
basis)
Methane generation rate
constant (k) (1/years)
Food waste 0.15 0.06
Garden 0.20 0.05
Paper 0.40 0.04
Wood and straw 0.43 0.02
Textiles 0.24 0.04
Disposable nappies 0.24 0.05
Sewage sludge 0.05 0.06
Industrial waste 0.05
4.B Biological treatment of solid waste
Composting and anaerobic digestion of organic waste are considered under this category. The CO2
emissions are of biogenic origin and are not reported here.
Biological treatment of waste is usually linked to N2O and CH4 emissions, with a potential for recovery and combustion for energy under anaerobic digestion, where greenhouse gas emissions from the
process are to be reported in the energy sector.
Activity data, emission factors and other parameters
Large scale composting activities occurred only in the greater Beirut area at the Coral facility. Although activities were partially suspended in 2015 and 2016, composting continued to take place
for the organic portion of the waste collected in 2017 and 2018. Other composting activities also took place in the Zahleh, Saida, Minieh and Baalbeck sorting facilities, however at a smaller scale. All composted amounts have been considered in the calculation of emissions.
In 2013, anaerobic digestion of organic waste started at the Saida-IBC sorting facility, with biogas production of 32,000 m3/day, 730,000 kWh/year of electricity production and 839,500 kWh/year of
heat, both used internally within the facility. It is assumed that 95% of the produced methane is converted into electricity and heat production.
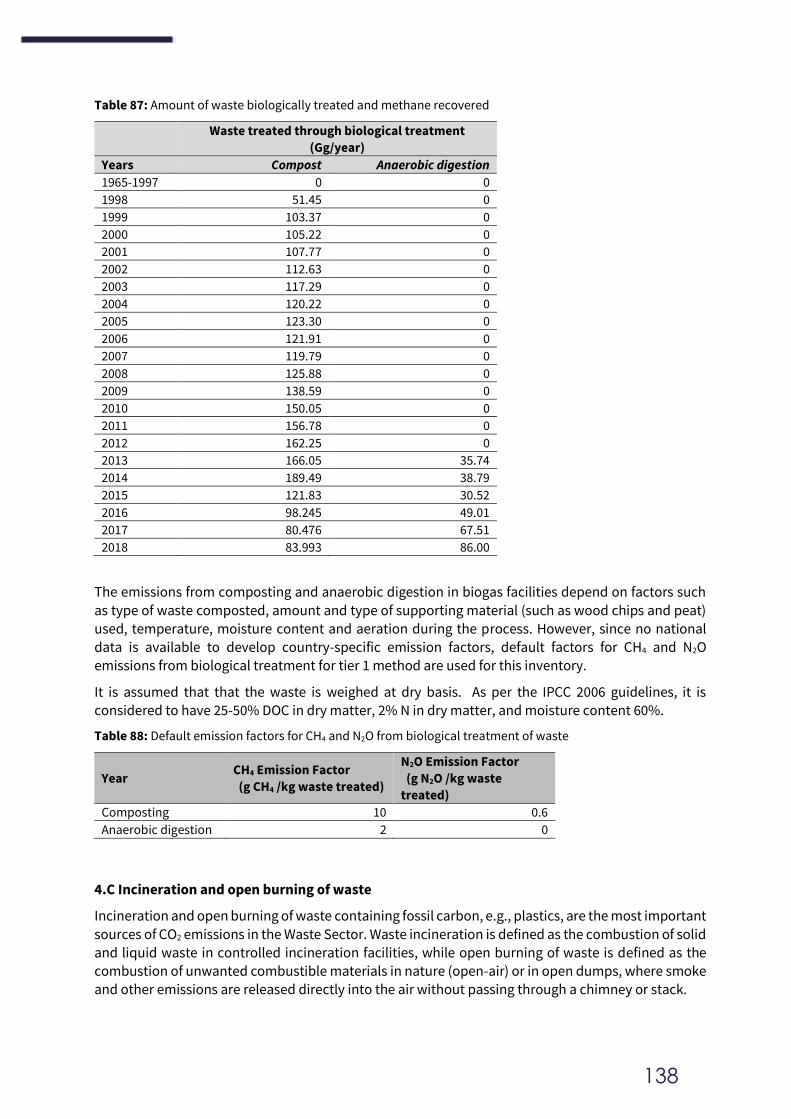
138
Table 87: Amount of waste biologically treated and methane recovered
Waste treated through biological treatment
(Gg/year)
Years Compost Anaerobic digestion
1965-1997 0 0
1998 51.45 0
1999 103.37 0
2000 105.22 0
2001 107.77 0
2002 112.63 0
2003 117.29 0
2004 120.22 0
2005 123.30 0
2006 121.91 0
2007 119.79 0
2008 125.88 0
2009 138.59 0
2010 150.05 0
2011 156.78 0
2012 162.25 0
2013 166.05 35.74
2014 189.49 38.79
2015 121.83 30.52
2016 98.245 49.01
2017 80.476 67.51
2018 83.993 86.00
The emissions from composting and anaerobic digestion in biogas facilities depend on factors such
as type of waste composted, amount and type of supporting material (such as wood chips and peat)
used, temperature, moisture content and aeration during the process. However, since no national data is available to develop country-specific emission factors, default factors for CH4 and N2O
emissions from biological treatment for tier 1 method are used for this inventory.
It is assumed that that the waste is weighed at dry basis. As per the IPCC 2006 guidelines, it is
considered to have 25-50% DOC in dry matter, 2% N in dry matter, and moisture content 60%.
Table 88: Default emission factors for CH4 and N2O from biological treatment of waste
Year CH4 Emission Factor
(g CH4 /kg waste treated)
N2O Emission Factor
(g N2O /kg waste
treated)
Composting 10 0.6
Anaerobic digestion 2 0
4.C Incineration and open burning of waste
Incineration and open burning of waste containing fossil carbon, e.g., plastics, are the most important
sources of CO2 emissions in the Waste Sector. Waste incineration is defined as the combustion of solid and liquid waste in controlled incineration facilities, while open burning of waste is defined as the combustion of unwanted combustible materials in nature (open-air) or in open dumps, where smoke and other emissions are released directly into the air without passing through a chimney or stack.
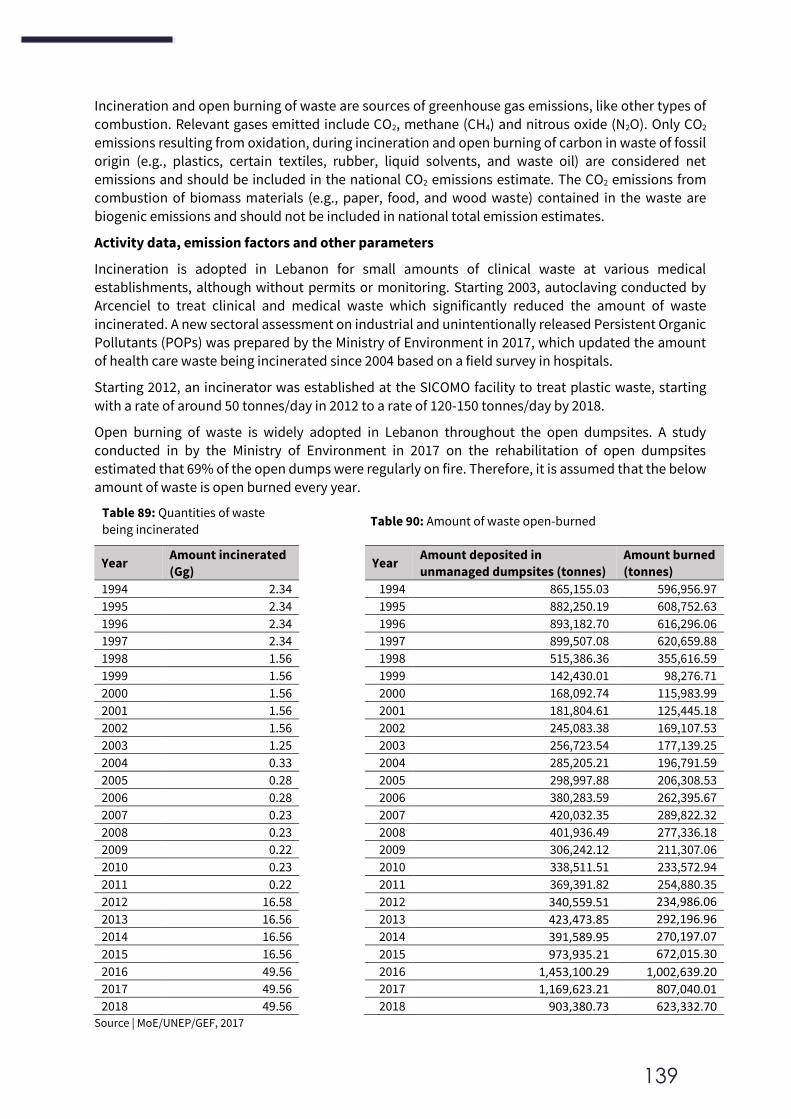
139
Incineration and open burning of waste are sources of greenhouse gas emissions, like other types of
combustion. Relevant gases emitted include CO2, methane (CH4) and nitrous oxide (N2O). Only CO2
emissions resulting from oxidation, during incineration and open burning of carbon in waste of fossil origin (e.g., plastics, certain textiles, rubber, liquid solvents, and waste oil) are considered net
emissions and should be included in the national CO2 emissions estimate. The CO2 emissions from combustion of biomass materials (e.g., paper, food, and wood waste) contained in the waste are
biogenic emissions and should not be included in national total emission estimates.
Activity data, emission factors and other parameters
Incineration is adopted in Lebanon for small amounts of clinical waste at various medical
establishments, although without permits or monitoring. Starting 2003, autoclaving conducted by Arcenciel to treat clinical and medical waste which significantly reduced the amount of waste
incinerated. A new sectoral assessment on industrial and unintentionally released Persistent Organic Pollutants (POPs) was prepared by the Ministry of Environment in 2017, which updated the amount
of health care waste being incinerated since 2004 based on a field survey in hospitals.
Starting 2012, an incinerator was established at the SICOMO facility to treat plastic waste, starting
with a rate of around 50 tonnes/day in 2012 to a rate of 120-150 tonnes/day by 2018.
Open burning of waste is widely adopted in Lebanon throughout the open dumpsites. A study conducted in by the Ministry of Environment in 2017 on the rehabilitation of open dumpsites estimated that 69% of the open dumps were regularly on fire. Therefore, it is assumed that the below
amount of waste is open burned every year.
Table 89: Quantities of waste
being incinerated Table 90: Amount of waste open-burned
Year Amount incinerated
(Gg)
Year
Amount deposited in
unmanaged dumpsites (tonnes)
Amount burned
(tonnes)
1994 2.34 1994 865,155.03 596,956.97
1995 2.34 1995 882,250.19 608,752.63
1996 2.34 1996 893,182.70 616,296.06
1997 2.34 1997 899,507.08 620,659.88
1998 1.56 1998 515,386.36 355,616.59
1999 1.56 1999 142,430.01 98,276.71
2000 1.56 2000 168,092.74 115,983.99
2001 1.56 2001 181,804.61 125,445.18
2002 1.56 2002 245,083.38 169,107.53
2003 1.25 2003 256,723.54 177,139.25
2004 0.33 2004 285,205.21 196,791.59
2005 0.28 2005 298,997.88 206,308.53
2006 0.28 2006 380,283.59 262,395.67
2007 0.23 2007 420,032.35 289,822.32
2008 0.23 2008 401,936.49 277,336.18
2009 0.22 2009 306,242.12 211,307.06
2010 0.23 2010 338,511.51 233,572.94
2011 0.22 2011 369,391.82 254,880.35
2012 16.58 2012 340,559.51 234,986.06
2013 16.56 2013 423,473.85 292,196.96
2014 16.56 2014 391,589.95 270,197.07
2015 16.56 2015 973,935.21 672,015.30
2016 49.56 2016 1,453,100.29 1,002,639.20
2017 49.56 2017 1,169,623.21 807,040.01
2018 49.56 2018 903,380.73 623,332.70 Source | MoE/UNEP/GEF, 2017
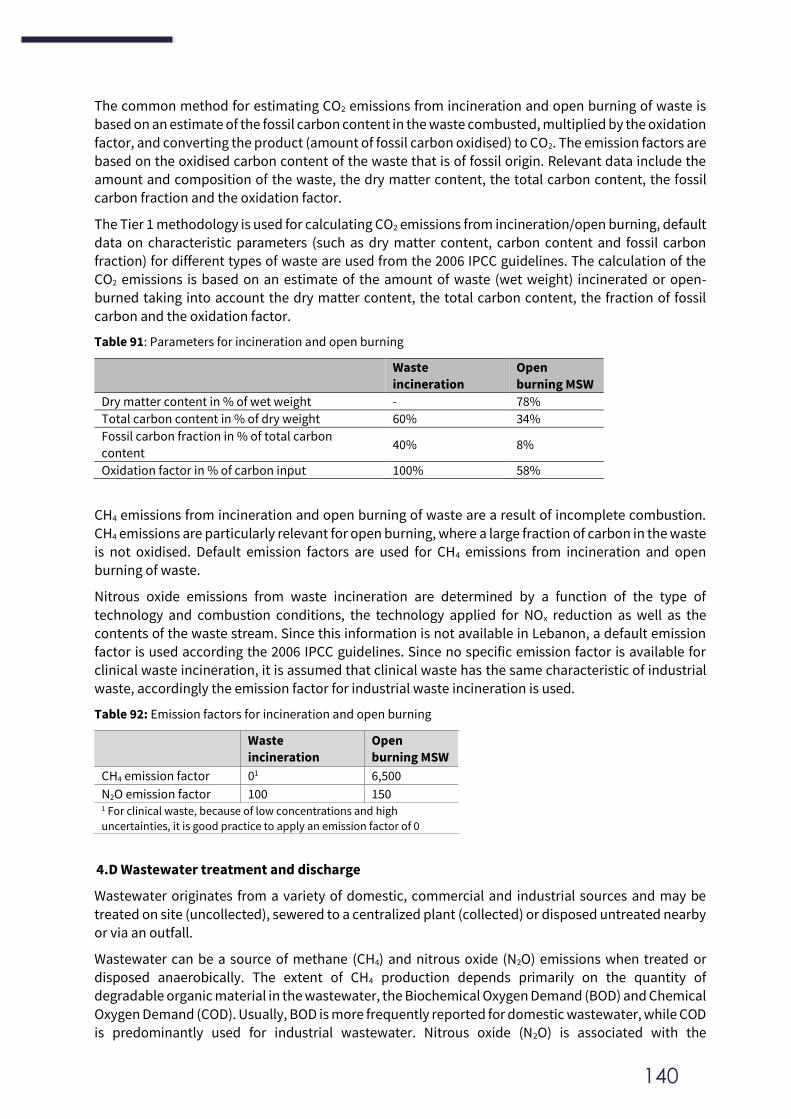
140
The common method for estimating CO2 emissions from incineration and open burning of waste is
based on an estimate of the fossil carbon content in the waste combusted, multiplied by the oxidation
factor, and converting the product (amount of fossil carbon oxidised) to CO2. The emission factors are based on the oxidised carbon content of the waste that is of fossil origin. Relevant data include the
amount and composition of the waste, the dry matter content, the total carbon content, the fossil carbon fraction and the oxidation factor.
The Tier 1 methodology is used for calculating CO2 emissions from incineration/open burning, default data on characteristic parameters (such as dry matter content, carbon content and fossil carbon fraction) for different types of waste are used from the 2006 IPCC guidelines. The calculation of the
CO2 emissions is based on an estimate of the amount of waste (wet weight) incinerated or open-burned taking into account the dry matter content, the total carbon content, the fraction of fossil
carbon and the oxidation factor.
Table 91: Parameters for incineration and open burning
Waste
incineration
Open
burning MSW
Dry matter content in % of wet weight - 78%
Total carbon content in % of dry weight 60% 34%
Fossil carbon fraction in % of total carbon
content 40% 8%
Oxidation factor in % of carbon input 100% 58%
CH4 emissions from incineration and open burning of waste are a result of incomplete combustion.
CH4 emissions are particularly relevant for open burning, where a large fraction of carbon in the waste
is not oxidised. Default emission factors are used for CH4 emissions from incineration and open burning of waste.
Nitrous oxide emissions from waste incineration are determined by a function of the type of
technology and combustion conditions, the technology applied for NOx reduction as well as the
contents of the waste stream. Since this information is not available in Lebanon, a default emission factor is used according the 2006 IPCC guidelines. Since no specific emission factor is available for clinical waste incineration, it is assumed that clinical waste has the same characteristic of industrial
waste, accordingly the emission factor for industrial waste incineration is used.
Table 92: Emission factors for incineration and open burning
Waste
incineration
Open
burning MSW
CH4 emission factor 01 6,500
N2O emission factor 100 150 1 For clinical waste, because of low concentrations and high
uncertainties, it is good practice to apply an emission factor of 0
4.D Wastewater treatment and discharge
Wastewater originates from a variety of domestic, commercial and industrial sources and may be
treated on site (uncollected), sewered to a centralized plant (collected) or disposed untreated nearby or via an outfall.
Wastewater can be a source of methane (CH4) and nitrous oxide (N2O) emissions when treated or disposed anaerobically. The extent of CH4 production depends primarily on the quantity of degradable organic material in the wastewater, the Biochemical Oxygen Demand (BOD) and Chemical
Oxygen Demand (COD). Usually, BOD is more frequently reported for domestic wastewater, while COD is predominantly used for industrial wastewater. Nitrous oxide (N2O) is associated with the
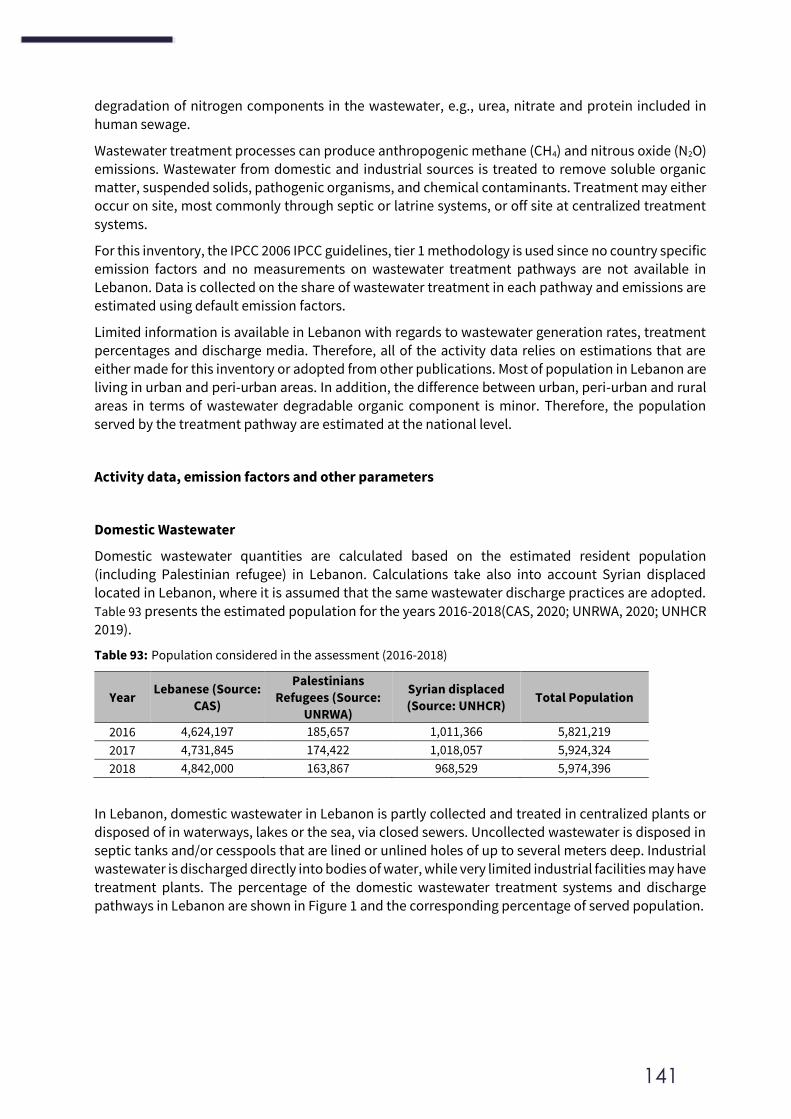
141
degradation of nitrogen components in the wastewater, e.g., urea, nitrate and protein included in
human sewage.
Wastewater treatment processes can produce anthropogenic methane (CH4) and nitrous oxide (N2O) emissions. Wastewater from domestic and industrial sources is treated to remove soluble organic
matter, suspended solids, pathogenic organisms, and chemical contaminants. Treatment may either occur on site, most commonly through septic or latrine systems, or off site at centralized treatment
systems.
For this inventory, the IPCC 2006 IPCC guidelines, tier 1 methodology is used since no country specific emission factors and no measurements on wastewater treatment pathways are not available in
Lebanon. Data is collected on the share of wastewater treatment in each pathway and emissions are estimated using default emission factors.
Limited information is available in Lebanon with regards to wastewater generation rates, treatment percentages and discharge media. Therefore, all of the activity data relies on estimations that are
either made for this inventory or adopted from other publications. Most of population in Lebanon are living in urban and peri-urban areas. In addition, the difference between urban, peri-urban and rural
areas in terms of wastewater degradable organic component is minor. Therefore, the population served by the treatment pathway are estimated at the national level.
Activity data, emission factors and other parameters
Domestic Wastewater
Domestic wastewater quantities are calculated based on the estimated resident population (including Palestinian refugee) in Lebanon. Calculations take also into account Syrian displaced located in Lebanon, where it is assumed that the same wastewater discharge practices are adopted.
Table 93 presents the estimated population for the years 2016-2018(CAS, 2020; UNRWA, 2020; UNHCR
2019).
Table 93: Population considered in the assessment (2016-2018)
Year Lebanese (Source:
CAS)
Palestinians
Refugees (Source:
UNRWA)
Syrian displaced
(Source: UNHCR) Total Population
2016 4,624,197 185,657 1,011,366 5,821,219
2017 4,731,845 174,422 1,018,057 5,924,324
2018 4,842,000 163,867 968,529 5,974,396
In Lebanon, domestic wastewater in Lebanon is partly collected and treated in centralized plants or disposed of in waterways, lakes or the sea, via closed sewers. Uncollected wastewater is disposed in septic tanks and/or cesspools that are lined or unlined holes of up to several meters deep. Industrial
wastewater is discharged directly into bodies of water, while very limited industrial facilities may have
treatment plants. The percentage of the domestic wastewater treatment systems and discharge pathways in Lebanon are shown in Figure 1 and the corresponding percentage of served population.
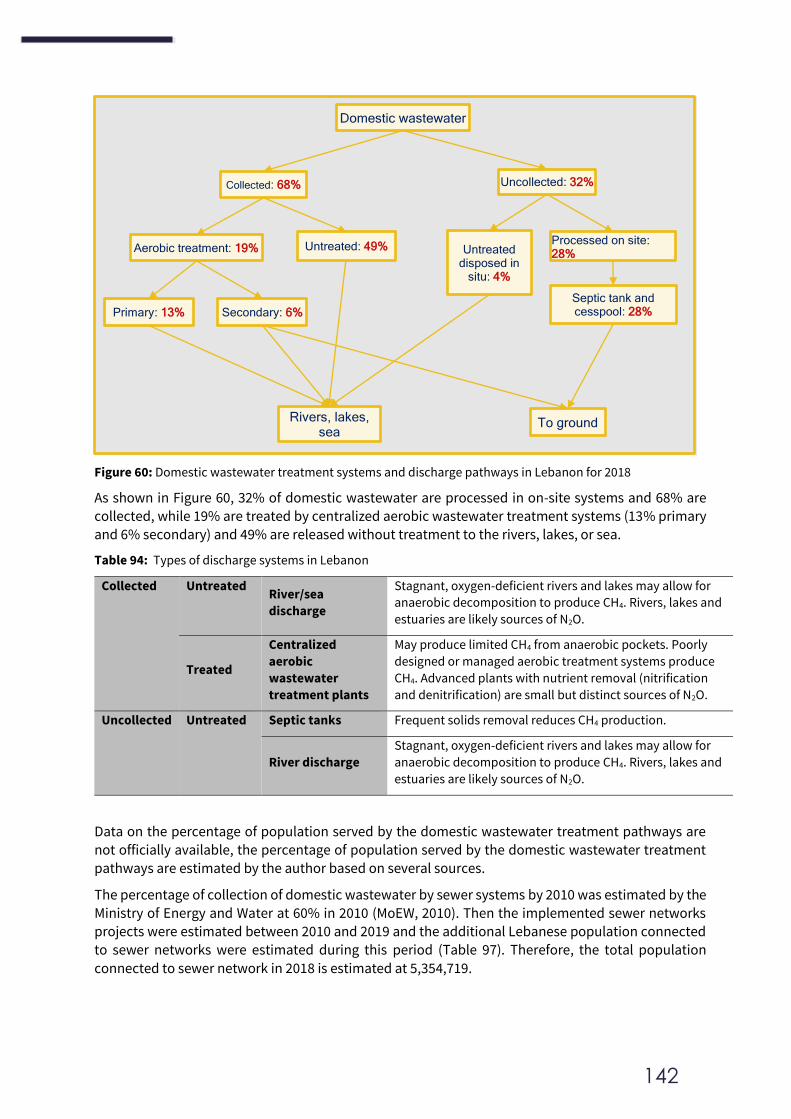
142
Figure 60: Domestic wastewater treatment systems and discharge pathways in Lebanon for 2018
As shown in Figure 60, 32% of domestic wastewater are processed in on-site systems and 68% are
collected, while 19% are treated by centralized aerobic wastewater treatment systems (13% primary and 6% secondary) and 49% are released without treatment to the rivers, lakes, or sea.
Table 94: Types of discharge systems in Lebanon
Collected Untreated River/sea
discharge
Stagnant, oxygen-deficient rivers and lakes may allow for
anaerobic decomposition to produce CH4. Rivers, lakes and
estuaries are likely sources of N2O.
Treated
Centralized
aerobic
wastewater
treatment plants
May produce limited CH4 from anaerobic pockets. Poorly
designed or managed aerobic treatment systems produce
CH4. Advanced plants with nutrient removal (nitrification
and denitrification) are small but distinct sources of N2O.
Uncollected Untreated Septic tanks Frequent solids removal reduces CH4 production.
River discharge
Stagnant, oxygen-deficient rivers and lakes may allow for
anaerobic decomposition to produce CH4. Rivers, lakes and
estuaries are likely sources of N2O.
Data on the percentage of population served by the domestic wastewater treatment pathways are
not officially available, the percentage of population served by the domestic wastewater treatment pathways are estimated by the author based on several sources.
The percentage of collection of domestic wastewater by sewer systems by 2010 was estimated by the Ministry of Energy and Water at 60% in 2010 (MoEW, 2010). Then the implemented sewer networks projects were estimated between 2010 and 2019 and the additional Lebanese population connected to sewer networks were estimated during this period (Table 97). Therefore, the total population
connected to sewer network in 2018 is estimated at 5,354,719.
Domestic wastewater
Collected: 68%
Untreated: 49%
Rivers, lakes, sea
Aerobic treatment: 19%
Uncollected: 32%
Processed on site: 28% Untreated
disposed in situ: 4%
To ground
Septic tank and cesspool: 28% Primary: 13% Secondary: 6%
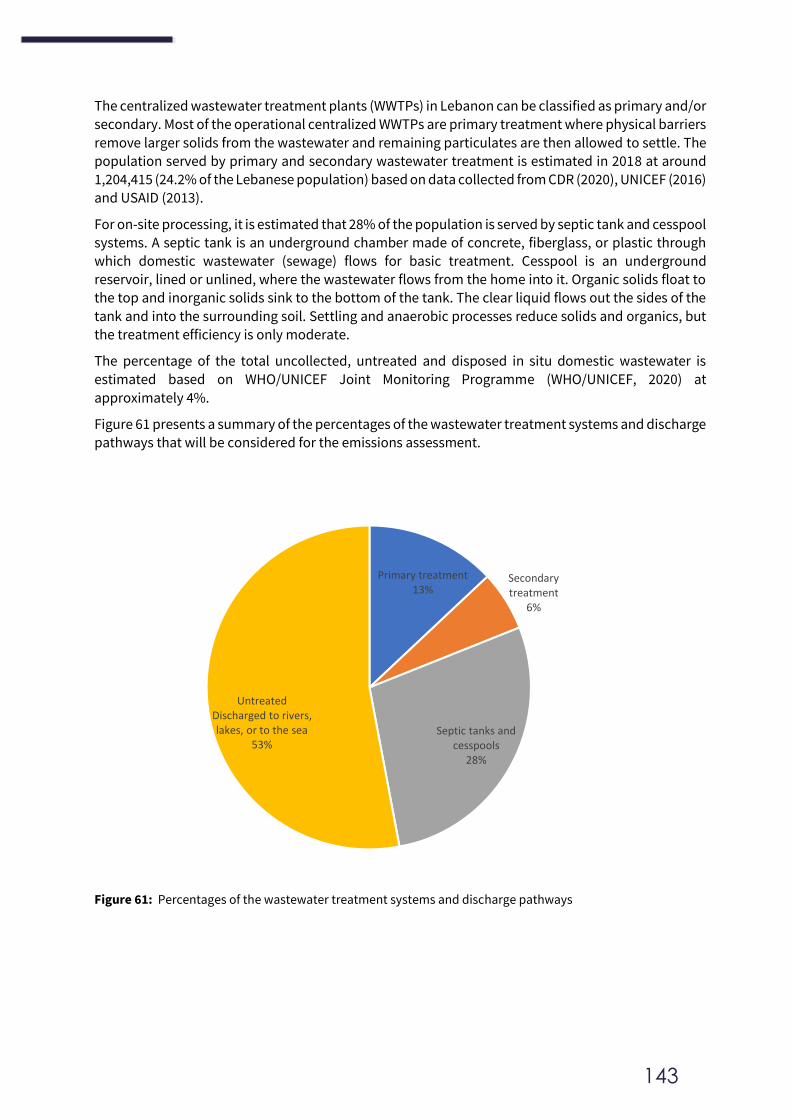
143
The centralized wastewater treatment plants (WWTPs) in Lebanon can be classified as primary and/or
secondary. Most of the operational centralized WWTPs are primary treatment where physical barriers
remove larger solids from the wastewater and remaining particulates are then allowed to settle. The population served by primary and secondary wastewater treatment is estimated in 2018 at around
1,204,415 (24.2% of the Lebanese population) based on data collected from CDR (2020), UNICEF (2016) and USAID (2013).
For on-site processing, it is estimated that 28% of the population is served by septic tank and cesspool systems. A septic tank is an underground chamber made of concrete, fiberglass, or plastic through which domestic wastewater (sewage) flows for basic treatment. Cesspool is an underground
reservoir, lined or unlined, where the wastewater flows from the home into it. Organic solids float to the top and inorganic solids sink to the bottom of the tank. The clear liquid flows out the sides of the
tank and into the surrounding soil. Settling and anaerobic processes reduce solids and organics, but the treatment efficiency is only moderate.
The percentage of the total uncollected, untreated and disposed in situ domestic wastewater is
estimated based on WHO/UNICEF Joint Monitoring Programme (WHO/UNICEF, 2020) at
approximately 4%.
Figure 61 presents a summary of the percentages of the wastewater treatment systems and discharge pathways that will be considered for the emissions assessment.
Figure 61: Percentages of the wastewater treatment systems and discharge pathways
Primary treatment13%
Secondary treatment
6%
Septic tanks and cesspools
28%
Untreated Discharged to rivers, lakes, or to the sea
53%
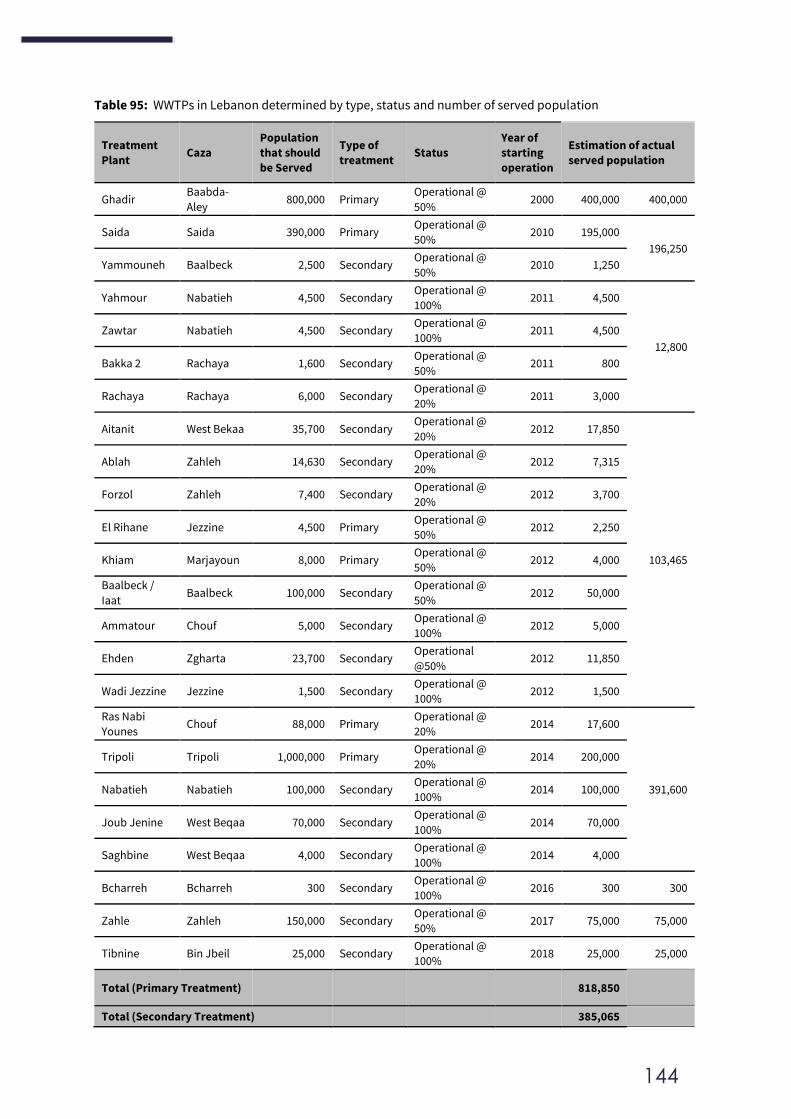
144
Table 95: WWTPs in Lebanon determined by type, status and number of served population
Treatment
Plant Caza
Population
that should
be Served
Type of
treatment Status
Year of
starting
operation
Estimation of actual
served population
Ghadir Baabda-
Aley 800,000 Primary
Operational @
50% 2000 400,000 400,000
Saida Saida 390,000 Primary Operational @
50% 2010 195,000
196,250
Yammouneh Baalbeck 2,500 Secondary Operational @
50% 2010 1,250
Yahmour Nabatieh 4,500 Secondary Operational @
100% 2011 4,500
12,800
Zawtar Nabatieh 4,500 Secondary Operational @
100% 2011 4,500
Bakka 2 Rachaya 1,600 Secondary Operational @
50% 2011 800
Rachaya Rachaya 6,000 Secondary Operational @
20% 2011 3,000
Aitanit West Bekaa 35,700 Secondary Operational @
20% 2012 17,850
103,465
Ablah Zahleh 14,630 Secondary Operational @
20% 2012 7,315
Forzol Zahleh 7,400 Secondary Operational @
20% 2012 3,700
El Rihane Jezzine 4,500 Primary Operational @
50% 2012 2,250
Khiam Marjayoun 8,000 Primary Operational @
50% 2012 4,000
Baalbeck /
Iaat Baalbeck 100,000 Secondary
Operational @
50% 2012 50,000
Ammatour Chouf 5,000 Secondary Operational @
100% 2012 5,000
Ehden Zgharta 23,700 Secondary Operational
@50% 2012 11,850
Wadi Jezzine Jezzine 1,500 Secondary Operational @
100% 2012 1,500
Ras Nabi
Younes Chouf 88,000 Primary
Operational @
20% 2014 17,600
391,600
Tripoli Tripoli 1,000,000 Primary Operational @
20% 2014 200,000
Nabatieh Nabatieh 100,000 Secondary Operational @
100% 2014 100,000
Joub Jenine West Beqaa 70,000 Secondary Operational @
100% 2014 70,000
Saghbine West Beqaa 4,000 Secondary Operational @
100% 2014 4,000
Bcharreh Bcharreh 300 Secondary Operational @
100% 2016 300 300
Zahle Zahleh 150,000 Secondary Operational @
50% 2017 75,000 75,000
Tibnine Bin Jbeil 25,000 Secondary Operational @
100% 2018 25,000 25,000
Total (Primary Treatment) 818,850
Total (Secondary Treatment) 385,065
145
Industrial Wastewater
No amounts of industrial products generated in Lebanon are available, however, the values of the
gross domestic production in USD of industrial products are available in the National Accounts Estimates of relevant categories including: i) manufacturing of food products; ii) beverages and
tobacco manufacturing; iii) textile and leather manufacturing; iv) wood and paper manufacturing and printing; and v) chemicals, rubber and plastics manufacturing. The estimation of production
quantities of products relevant to these categories will be discussed in sequence:
i) Manufacturing of food products
The average productions by weight are estimated for the manufacturing of food products based on
the production value in USD per year (National Accounts Estimates CAS, 2018). The rate used to convert the USD production per year to ton per year is estimated at 1,490 USD/ton of food products
(BLOMinvest BANK, 2014). This average rate will be applied to calculate the production quantities for all years.
ii) Beverages manufacturing
The annual production of Arak in Lebanon is estimated to be around 2 billion bottles of 0.70 liters in
2016, equal to 1,372,000 tonnes (unit weight of Arak is 0.98 kg/liter) (BLOMINVEST BANK, 2016). The annual production of beer in Lebanon is estimated to be around 23.3 million liters in 2013, equal to 24,232 tonnes (unit weight of beer is 1.04 kg/liter) (BLOMINVEST BANK, 2013). The quantities for all years are estimated based on the percent of growth of beverages manufacturing in USD per year
(National Accounts Estimates CAS, 2018).
iii) Tobacco manufacturing
No significant wastewater produced from the tobacco manufacturing in Lebanon.
iv) Textile and leather manufacturing
The textile and leather manufacturing in Lebanon does not involve the processing and production of
textile and leather raw material. Therefore, wastewater of these products is not significant.
v) Wood and paper manufacturing
The wood and paper manufacturing in Lebanon does not involve the processing and production of
wood raw material or dried pulp. The wood raw material and pulp are imported. Therefore, wastewater of these products is not significant.
vi) Chemicals, rubber and plastics manufacturing
The chemicals, rubber and plastics manufacturing in Lebanon does not involve the processing and production of raw materials. The raw materials are imported. Therefore, wastewater of these products is not significant.
For completeness of reporting, the data of industrial production of 2016 was interpolated based for the 1994-2018 time series, and the category was recalculated.
Activity data, emission factors and other parameters
The emission factor for a wastewater treatment and discharge pathway is a function of the maximum
CH4 producing potential (Bo) and the MCF for the wastewater treatment and discharge system.
The Bo is the maximum amount of CH4 that can be produced from a given quantity of organics, based on the BOD of wastewater. The MCF indicates the extent to which the CH4 producing capacity (Bo) is realised in each type of discharge pathway and system. Expert judgment was used to estimate some
of the below parameters.
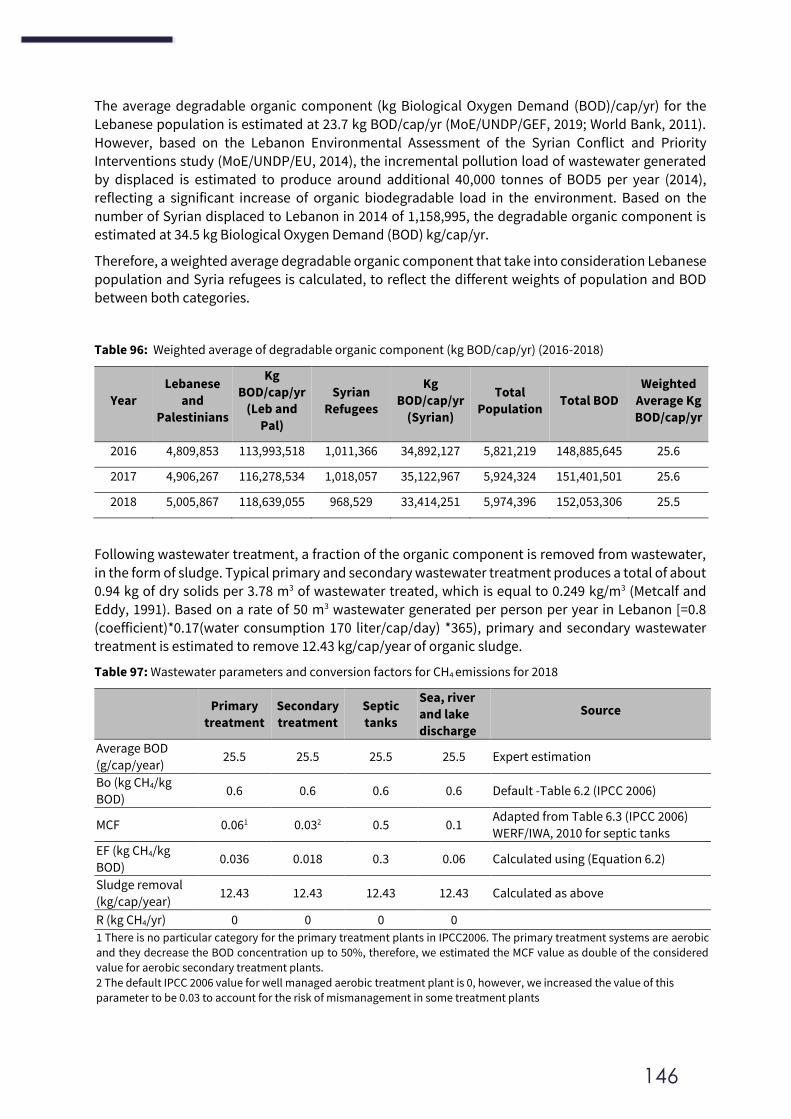
146
The average degradable organic component (kg Biological Oxygen Demand (BOD)/cap/yr) for the
Lebanese population is estimated at 23.7 kg BOD/cap/yr (MoE/UNDP/GEF, 2019; World Bank, 2011).
However, based on the Lebanon Environmental Assessment of the Syrian Conflict and Priority Interventions study (MoE/UNDP/EU, 2014), the incremental pollution load of wastewater generated
by displaced is estimated to produce around additional 40,000 tonnes of BOD5 per year (2014), reflecting a significant increase of organic biodegradable load in the environment. Based on the
number of Syrian displaced to Lebanon in 2014 of 1,158,995, the degradable organic component is estimated at 34.5 kg Biological Oxygen Demand (BOD) kg/cap/yr.
Therefore, a weighted average degradable organic component that take into consideration Lebanese
population and Syria refugees is calculated, to reflect the different weights of population and BOD between both categories.
Table 96: Weighted average of degradable organic component (kg BOD/cap/yr) (2016-2018)
Year
Lebanese
and
Palestinians
Kg
BOD/cap/yr
(Leb and
Pal)
Syrian
Refugees
Kg
BOD/cap/yr
(Syrian)
Total
Population Total BOD
Weighted
Average Kg
BOD/cap/yr
2016 4,809,853 113,993,518 1,011,366 34,892,127 5,821,219 148,885,645 25.6
2017 4,906,267 116,278,534 1,018,057 35,122,967 5,924,324 151,401,501 25.6
2018 5,005,867 118,639,055 968,529 33,414,251 5,974,396 152,053,306 25.5
Following wastewater treatment, a fraction of the organic component is removed from wastewater,
in the form of sludge. Typical primary and secondary wastewater treatment produces a total of about
0.94 kg of dry solids per 3.78 m3 of wastewater treated, which is equal to 0.249 kg/m3 (Metcalf and Eddy, 1991). Based on a rate of 50 m3 wastewater generated per person per year in Lebanon [=0.8
(coefficient)*0.17(water consumption 170 liter/cap/day) *365), primary and secondary wastewater treatment is estimated to remove 12.43 kg/cap/year of organic sludge.
Table 97: Wastewater parameters and conversion factors for CH4 emissions for 2018
Primary
treatment
Secondary
treatment
Septic
tanks
Sea, river
and lake
discharge
Source
Average BOD
(g/cap/year) 25.5 25.5 25.5 25.5 Expert estimation
Bo (kg CH4/kg
BOD) 0.6 0.6 0.6 0.6 Default -Table 6.2 (IPCC 2006)
MCF 0.061 0.032 0.5 0.1 Adapted from Table 6.3 (IPCC 2006)
WERF/IWA, 2010 for septic tanks
EF (kg CH4/kg
BOD) 0.036 0.018 0.3 0.06 Calculated using (Equation 6.2)
Sludge removal
(kg/cap/year) 12.43 12.43 12.43 12.43 Calculated as above
R (kg CH4/yr) 0 0 0 0
1 There is no particular category for the primary treatment plants in IPCC2006. The primary treatment systems are aerobic
and they decrease the BOD concentration up to 50%, therefore, we estimated the MCF value as double of the considered
value for aerobic secondary treatment plants.
2 The default IPCC 2006 value for well managed aerobic treatment plant is 0, however, we increased the value of this
parameter to be 0.03 to account for the risk of mismanagement in some treatment plants
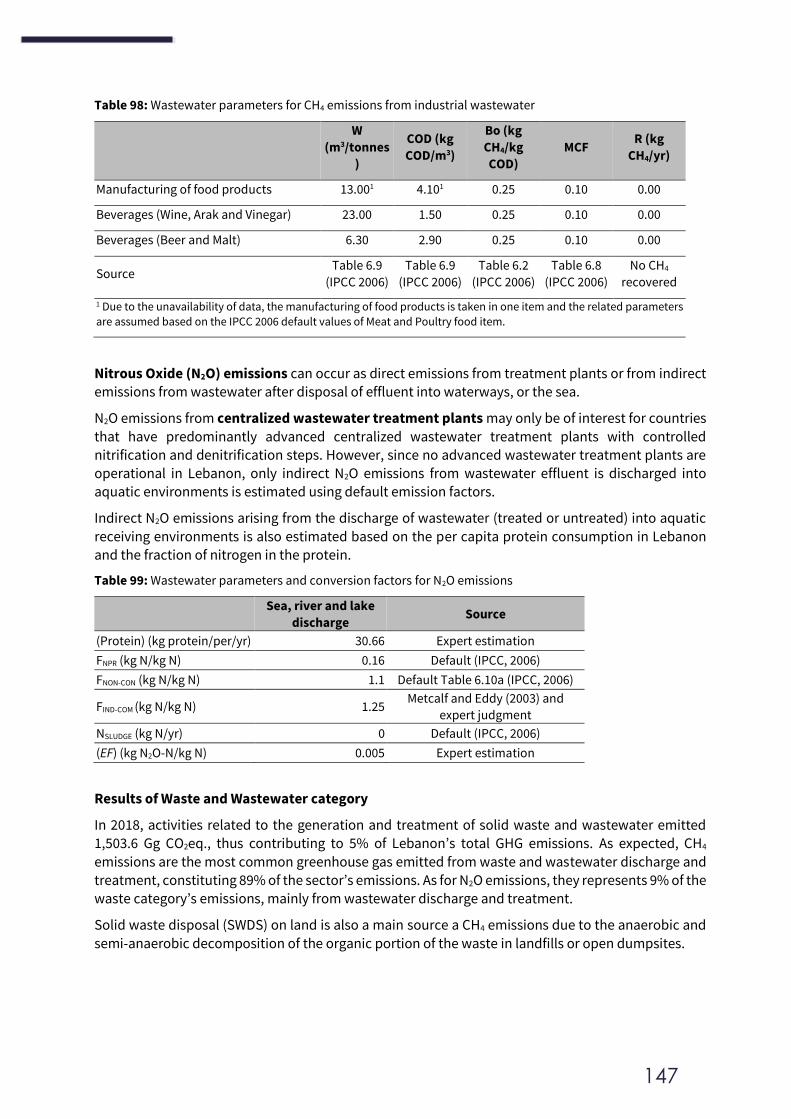
147
Table 98: Wastewater parameters for CH4 emissions from industrial wastewater
W
(m3/tonnes
)
COD (kg
COD/m3)
Bo (kg
CH4/kg
COD)
MCF R (kg
CH4/yr)
Manufacturing of food products 13.001 4.101 0.25 0.10 0.00
Beverages (Wine, Arak and Vinegar) 23.00 1.50 0.25 0.10 0.00
Beverages (Beer and Malt) 6.30 2.90 0.25 0.10 0.00
Source Table 6.9
(IPCC 2006)
Table 6.9
(IPCC 2006)
Table 6.2
(IPCC 2006)
Table 6.8
(IPCC 2006)
No CH4
recovered
1 Due to the unavailability of data, the manufacturing of food products is taken in one item and the related parameters
are assumed based on the IPCC 2006 default values of Meat and Poultry food item.
Nitrous Oxide (N2O) emissions can occur as direct emissions from treatment plants or from indirect
emissions from wastewater after disposal of effluent into waterways, or the sea.
N2O emissions from centralized wastewater treatment plants may only be of interest for countries
that have predominantly advanced centralized wastewater treatment plants with controlled nitrification and denitrification steps. However, since no advanced wastewater treatment plants are
operational in Lebanon, only indirect N2O emissions from wastewater effluent is discharged into aquatic environments is estimated using default emission factors.
Indirect N2O emissions arising from the discharge of wastewater (treated or untreated) into aquatic
receiving environments is also estimated based on the per capita protein consumption in Lebanon
and the fraction of nitrogen in the protein.
Table 99: Wastewater parameters and conversion factors for N2O emissions
Sea, river and lake
discharge Source
(Protein) (kg protein/per/yr) 30.66 Expert estimation
FNPR (kg N/kg N) 0.16 Default (IPCC, 2006)
FNON-CON (kg N/kg N) 1.1 Default Table 6.10a (IPCC, 2006)
FIND-COM (kg N/kg N) 1.25 Metcalf and Eddy (2003) and
expert judgment
NSLUDGE (kg N/yr) 0 Default (IPCC, 2006)
(EF) (kg N2O-N/kg N) 0.005 Expert estimation
Results of Waste and Wastewater category
In 2018, activities related to the generation and treatment of solid waste and wastewater emitted 1,503.6 Gg CO2eq., thus contributing to 5% of Lebanon’s total GHG emissions. As expected, CH4
emissions are the most common greenhouse gas emitted from waste and wastewater discharge and
treatment, constituting 89% of the sector’s emissions. As for N2O emissions, they represents 9% of the
waste category’s emissions, mainly from wastewater discharge and treatment.
Solid waste disposal (SWDS) on land is also a main source a CH4 emissions due to the anaerobic and
semi-anaerobic decomposition of the organic portion of the waste in landfills or open dumpsites.
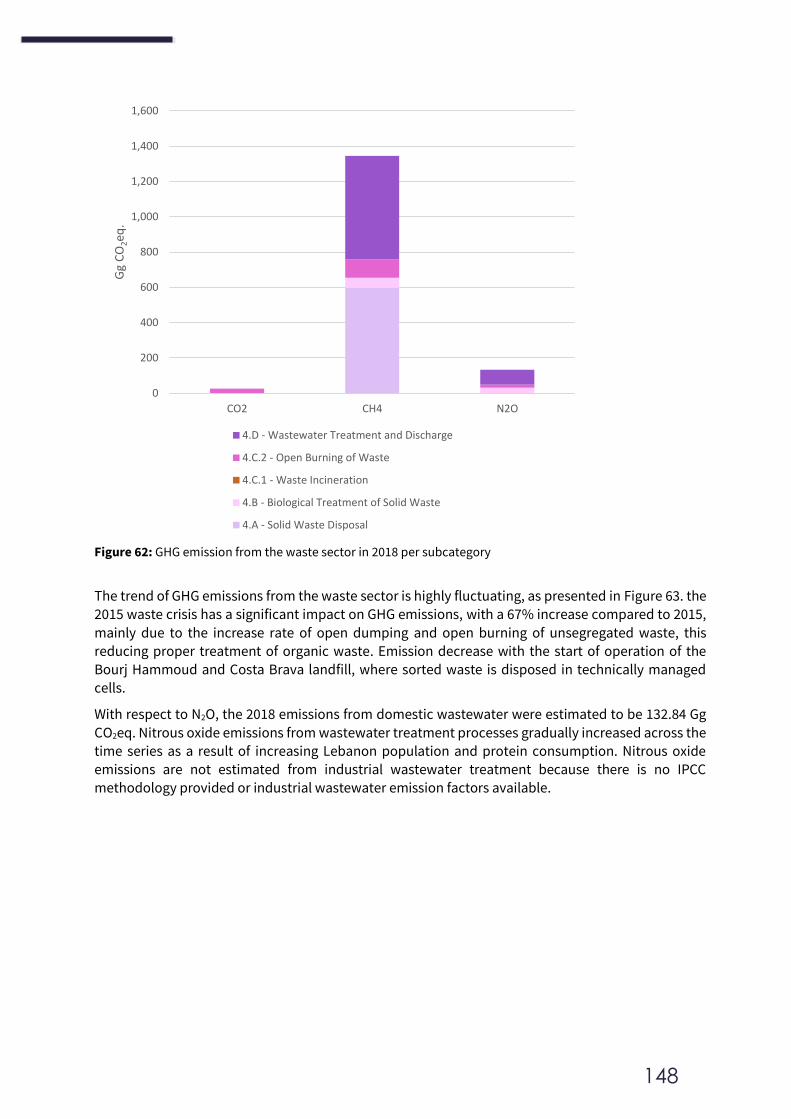
148
Figure 62: GHG emission from the waste sector in 2018 per subcategory
The trend of GHG emissions from the waste sector is highly fluctuating, as presented in Figure 63. the 2015 waste crisis has a significant impact on GHG emissions, with a 67% increase compared to 2015,
mainly due to the increase rate of open dumping and open burning of unsegregated waste, this reducing proper treatment of organic waste. Emission decrease with the start of operation of the
Bourj Hammoud and Costa Brava landfill, where sorted waste is disposed in technically managed cells.
With respect to N2O, the 2018 emissions from domestic wastewater were estimated to be 132.84 Gg
CO2eq. Nitrous oxide emissions from wastewater treatment processes gradually increased across the time series as a result of increasing Lebanon population and protein consumption. Nitrous oxide
emissions are not estimated from industrial wastewater treatment because there is no IPCC methodology provided or industrial wastewater emission factors available.
0
200
400
600
800
1,000
1,200
1,400
1,600
CO2 CH4 N2O
Gg
CO
2eq
.
4.D - Wastewater Treatment and Discharge
4.C.2 - Open Burning of Waste
4.C.1 - Waste Incineration
4.B - Biological Treatment of Solid Waste
4.A - Solid Waste Disposal
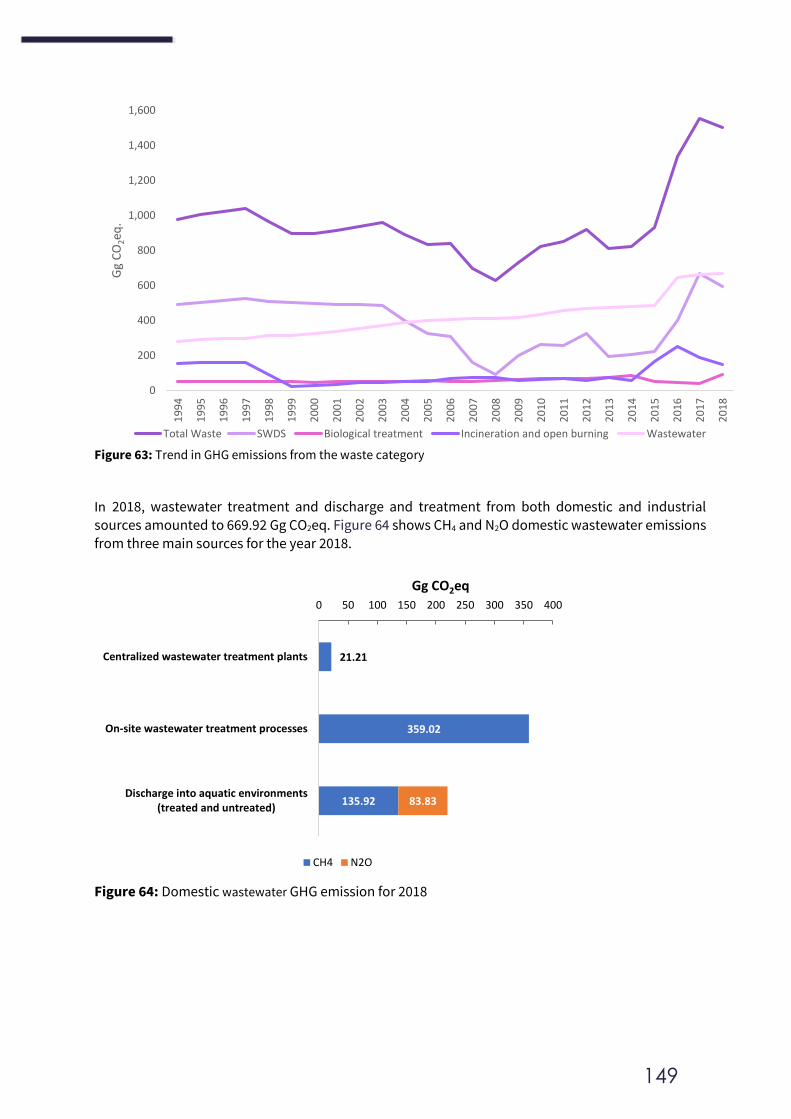
149
Figure 63: Trend in GHG emissions from the waste category
In 2018, wastewater treatment and discharge and treatment from both domestic and industrial
sources amounted to 669.92 Gg CO2eq. Figure 64 shows CH4 and N2O domestic wastewater emissions from three main sources for the year 2018.
Figure 64: Domestic wastewater GHG emission for 2018
0
200
400
600
800
1,000
1,200
1,400
1,600
19
94
19
95
19
96
19
97
19
98
19
99
20
00
20
01
20
02
20
03
20
04
20
05
20
06
20
07
20
08
20
09
20
10
20
11
20
12
20
13
20
14
20
15
20
16
20
17
20
18
Gg
CO
2eq
.
Total Waste SWDS Biological treatment Incineration and open burning Wastewater
21.21
359.02
135.92 83.83
0 50 100 150 200 250 300 350 400
Centralized wastewater treatment plants
On-site wastewater treatment processes
Discharge into aquatic environments(treated and untreated)
Gg CO2eq
CH4 N2O
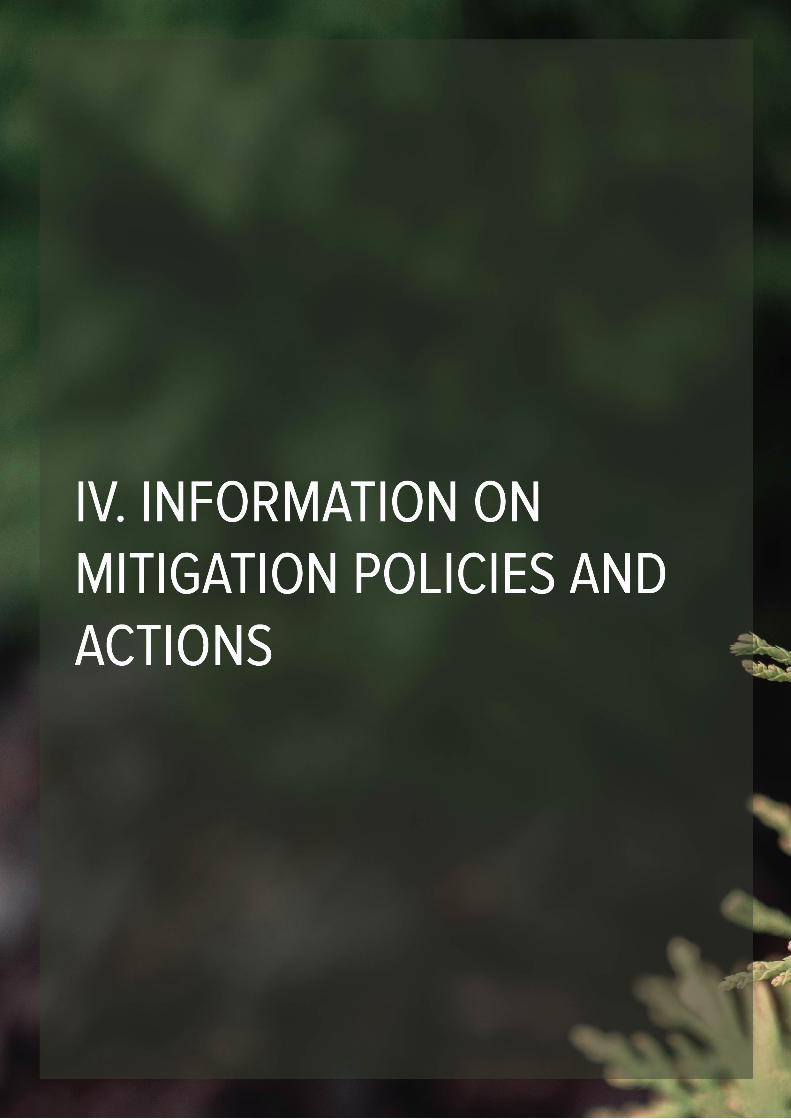
151
INFORMATION ON MITIGATION POLICIES AND ACTIONS
As a Party to the UNFCCC, Lebanon has made efforts to implement activities that lead to emission
reductions based on its capabilities and taking into account its national circumstances. Information on these mitigation actions and their effects has been documented, to the extent possible, following the guidelines on BUR, including the associated methodologies and assumptions. Emission reductions have been estimated from some of the activities depending on data availability, while
other have only been described qualitatively in the below sections. The methodology adopted for the calculation of emission reductions of the identified mitigation actions is based on the 2006 IPCC revised guidelines, as already adopted in the preparation of the inventory. Gases covered include CO2, CH4 and N2O, reported in terms of CO2 equivalent and using the AR5 GWP.
The main national policy on climate change in Lebanon is the Nationally Determined Contribution
(NDC) which was updated in 2020 and which sets clear emission reduction targets. The progress of the implementation of the NDC is not reported in this BUR4, as it will be reported in Lebanon’s first
BTR according to Decision 18/CMA.1.
Currently, Lebanon has no specific methodology for monitoring the progress of actions described.
Consultations with main stakeholders including ministries, research institutions and international organizations helped identify the extent to which each mitigation action was implemented and
accordingly, percentages of completion were used to calculate emission reductions achieved. However, due to lack of systematic collection of information, the list of measures reported in this
section is not exhaustive, which underestimates the emission reduction that Lebanon is undertaking to combat climate change. The current section captures the mitigation measures that
have been implemented in the energy, transport, agriculture, forestry and waste/wastewater sectors.
Sectoral mitigation actions and policies
4.1 Energy
As reported in the national greenhouse gas inventory, the majority of Lebanon’s emissions come
from the energy sector. Therefore, climate mitigation in this sector plays an important role in
reducing national emissions while achieving positive environmental, economic, and social impact through demand side management and cleaner energy production.
Reducing GHG emissions from the energy sector includes planning and implementing activities related to fuel switch, increasing the share of renewable energy, improving energy efficiency at
plant and consumer levels, while being supported by proper institutional and legal framework and
financing mechanisms.
Emissions reduction from mitigation actions in the energy sector is estimated at 615,663 tonnes
CO2eq. per year for the period 2016-2018 (Table 100). It is important to note that due to the absence
of institutional arrangements for reporting mitigation actions in a systematic and sustainable way, the list of actions presented in the following sections is not exhaustive, which underestimates
emission reduction efforts undertaken in Lebanon during the period 2016-2018.
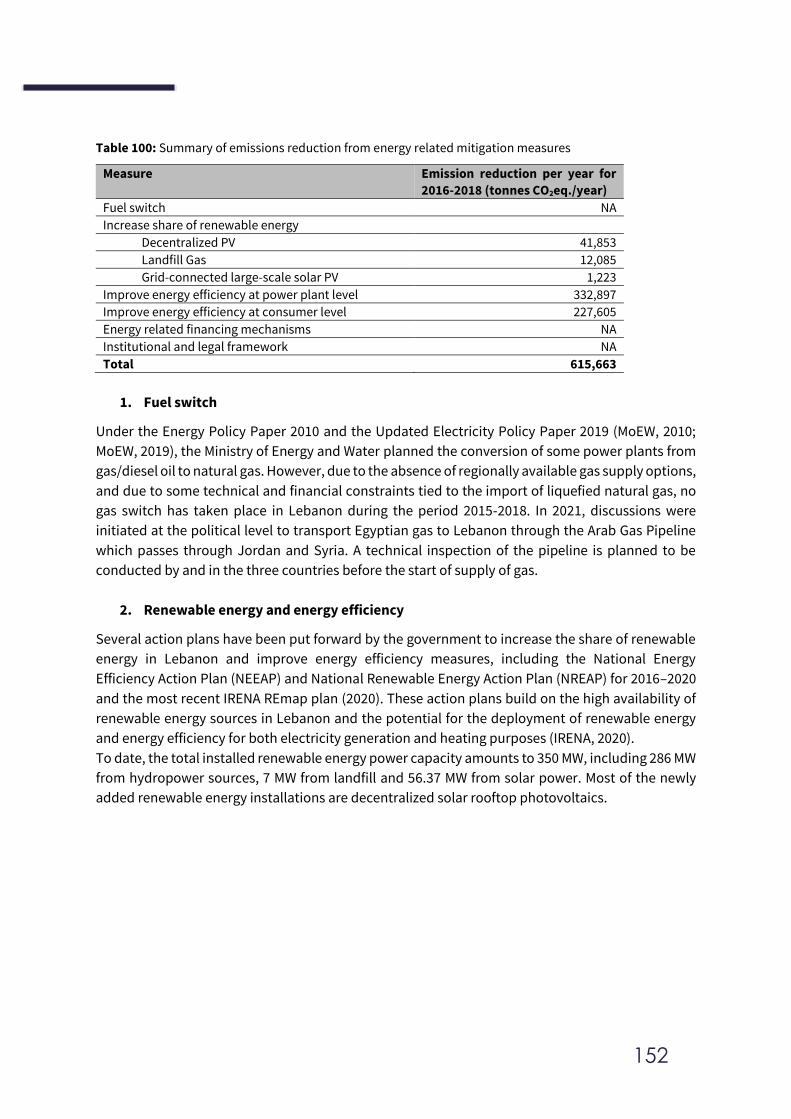
152
Table 100: Summary of emissions reduction from energy related mitigation measures
Measure Emission reduction per year for
2016-2018 (tonnes CO2eq./year)
Fuel switch NA
Increase share of renewable energy
Decentralized PV 41,853
Landfill Gas 12,085
Grid-connected large-scale solar PV 1,223
Improve energy efficiency at power plant level 332,897
Improve energy efficiency at consumer level 227,605
Energy related financing mechanisms NA
Institutional and legal framework NA
Total 615,663
1. Fuel switch
Under the Energy Policy Paper 2010 and the Updated Electricity Policy Paper 2019 (MoEW, 2010;
MoEW, 2019), the Ministry of Energy and Water planned the conversion of some power plants from
gas/diesel oil to natural gas. However, due to the absence of regionally available gas supply options,
and due to some technical and financial constraints tied to the import of liquefied natural gas, no
gas switch has taken place in Lebanon during the period 2015-2018. In 2021, discussions were
initiated at the political level to transport Egyptian gas to Lebanon through the Arab Gas Pipeline
which passes through Jordan and Syria. A technical inspection of the pipeline is planned to be
conducted by and in the three countries before the start of supply of gas.
2. Renewable energy and energy efficiency
Several action plans have been put forward by the government to increase the share of renewable
energy in Lebanon and improve energy efficiency measures, including the National Energy
Efficiency Action Plan (NEEAP) and National Renewable Energy Action Plan (NREAP) for 2016–2020
and the most recent IRENA REmap plan (2020). These action plans build on the high availability of
renewable energy sources in Lebanon and the potential for the deployment of renewable energy
and energy efficiency for both electricity generation and heating purposes (IRENA, 2020).
To date, the total installed renewable energy power capacity amounts to 350 MW, including 286 MW
from hydropower sources, 7 MW from landfill and 56.37 MW from solar power. Most of the newly
added renewable energy installations are decentralized solar rooftop photovoltaics.
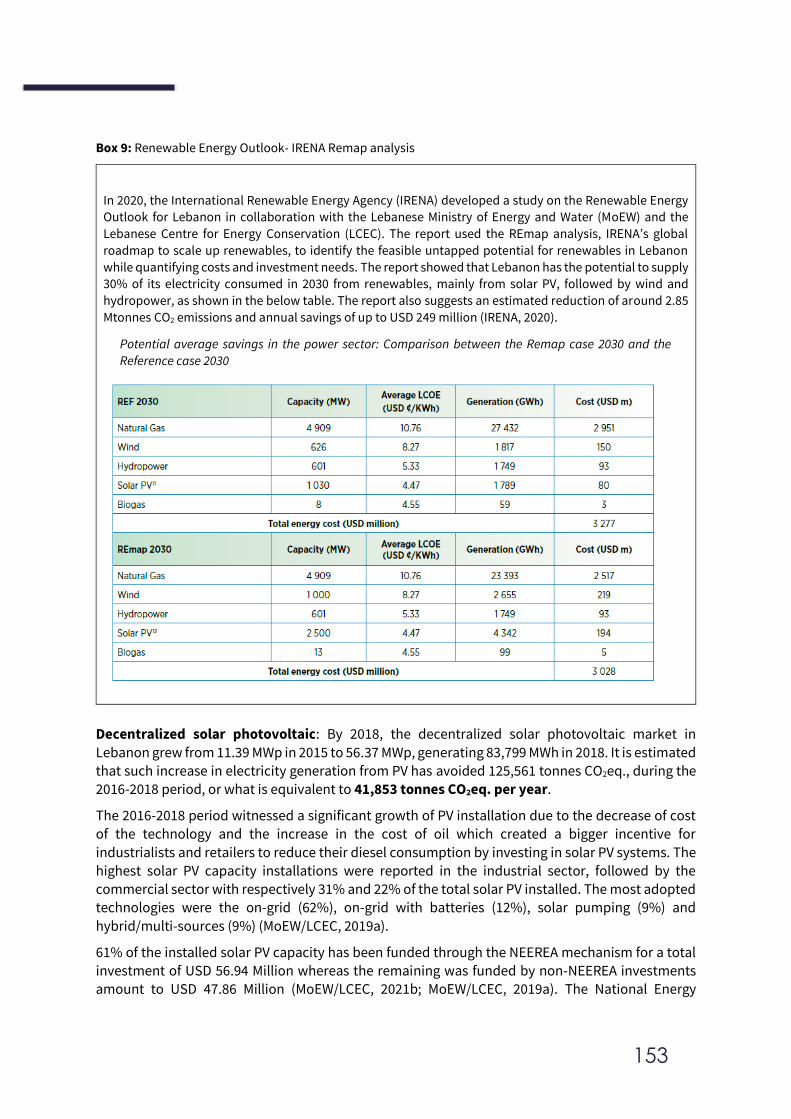
153
Box 9: Renewable Energy Outlook- IRENA Remap analysis
In 2020, the International Renewable Energy Agency (IRENA) developed a study on the Renewable Energy
Outlook for Lebanon in collaboration with the Lebanese Ministry of Energy and Water (MoEW) and the
Lebanese Centre for Energy Conservation (LCEC). The report used the REmap analysis, IRENA’s global
roadmap to scale up renewables, to identify the feasible untapped potential for renewables in Lebanon
while quantifying costs and investment needs. The report showed that Lebanon has the potential to supply
30% of its electricity consumed in 2030 from renewables, mainly from solar PV, followed by wind and
hydropower, as shown in the below table. The report also suggests an estimated reduction of around 2.85
Mtonnes CO2 emissions and annual savings of up to USD 249 million (IRENA, 2020).
Potential average savings in the power sector: Comparison between the Remap case 2030 and the
Reference case 2030
Decentralized solar photovoltaic: By 2018, the decentralized solar photovoltaic market in
Lebanon grew from 11.39 MWp in 2015 to 56.37 MWp, generating 83,799 MWh in 2018. It is estimated that such increase in electricity generation from PV has avoided 125,561 tonnes CO2eq., during the
2016-2018 period, or what is equivalent to 41,853 tonnes CO2eq. per year.
The 2016-2018 period witnessed a significant growth of PV installation due to the decrease of cost
of the technology and the increase in the cost of oil which created a bigger incentive for
industrialists and retailers to reduce their diesel consumption by investing in solar PV systems. The
highest solar PV capacity installations were reported in the industrial sector, followed by the commercial sector with respectively 31% and 22% of the total solar PV installed. The most adopted technologies were the on-grid (62%), on-grid with batteries (12%), solar pumping (9%) and
hybrid/multi-sources (9%) (MoEW/LCEC, 2019a).
61% of the installed solar PV capacity has been funded through the NEEREA mechanism for a total investment of USD 56.94 Million whereas the remaining was funded by non-NEEREA investments amount to USD 47.86 Million (MoEW/LCEC, 2021b; MoEW/LCEC, 2019a). The National Energy
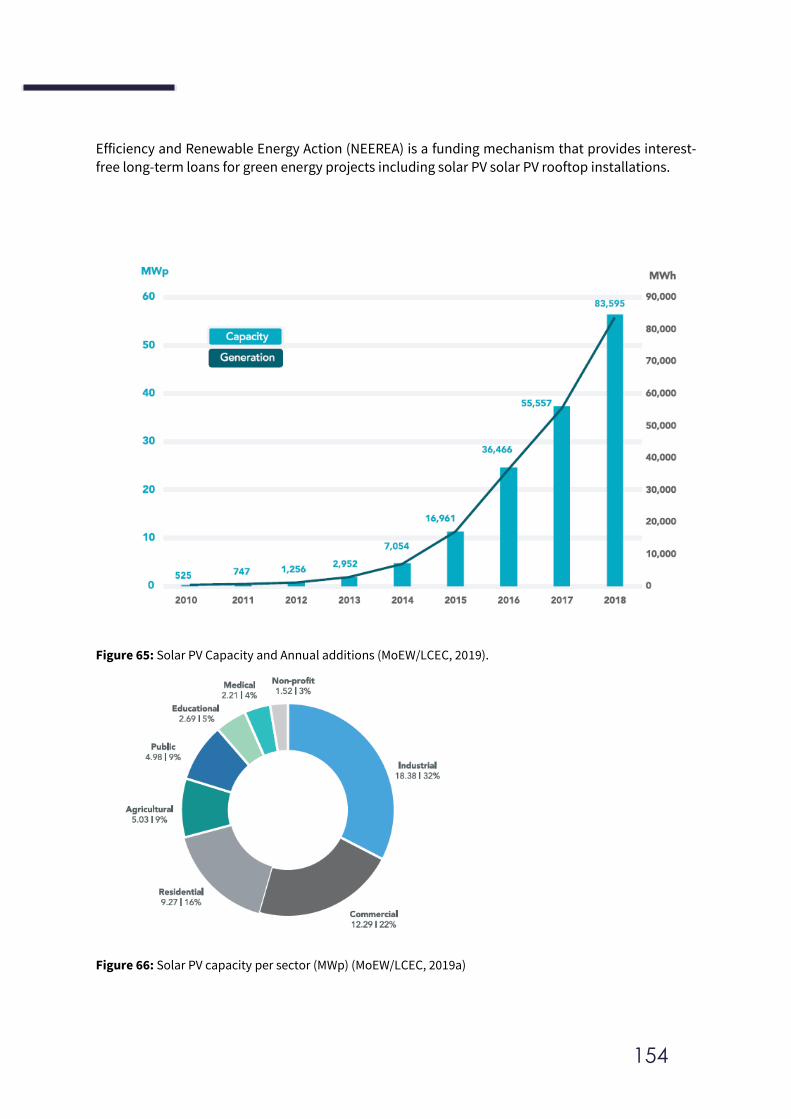
154
Efficiency and Renewable Energy Action (NEEREA) is a funding mechanism that provides interest-free long-term loans for green energy projects including solar PV solar PV rooftop installations.
Figure 65: Solar PV Capacity and Annual additions (MoEW/LCEC, 2019).
Figure 66: Solar PV capacity per sector (MWp) (MoEW/LCEC, 2019a)
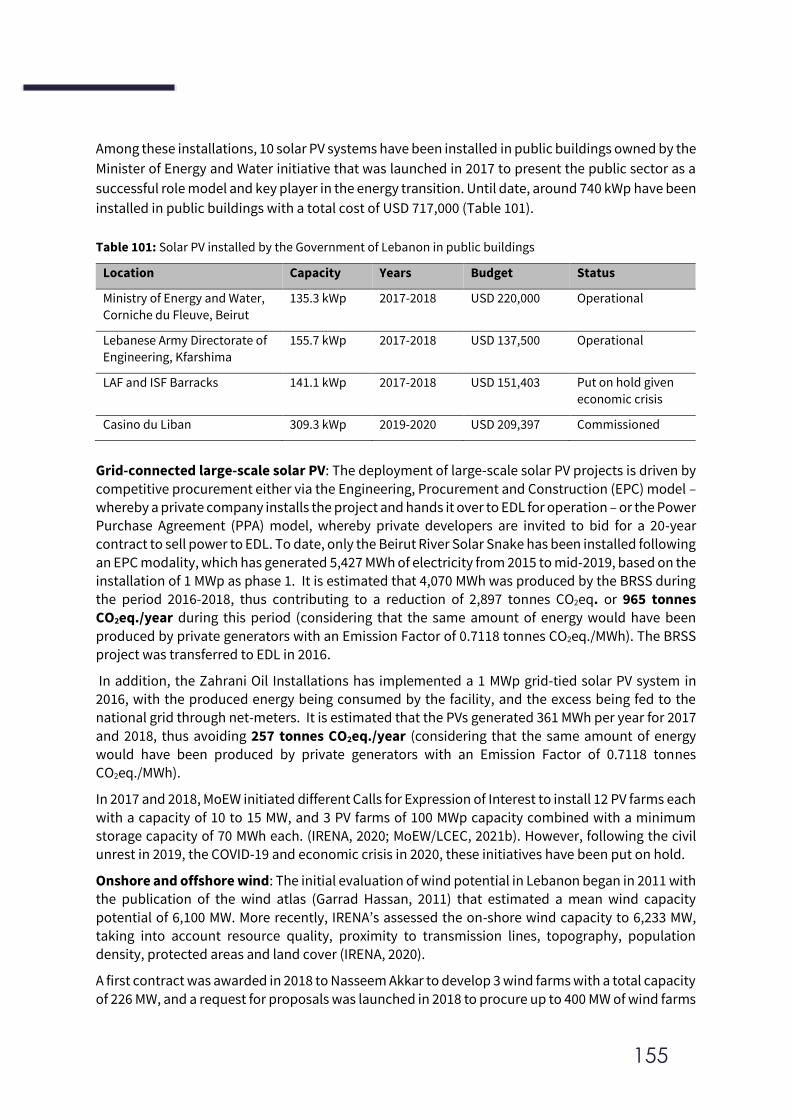
155
Among these installations, 10 solar PV systems have been installed in public buildings owned by the
Minister of Energy and Water initiative that was launched in 2017 to present the public sector as a
successful role model and key player in the energy transition. Until date, around 740 kWp have been
installed in public buildings with a total cost of USD 717,000 (Table 101).
Table 101: Solar PV installed by the Government of Lebanon in public buildings
Location Capacity Years Budget Status
Ministry of Energy and Water,
Corniche du Fleuve, Beirut
135.3 kWp 2017-2018 USD 220,000 Operational
Lebanese Army Directorate of
Engineering, Kfarshima
155.7 kWp 2017-2018 USD 137,500 Operational
LAF and ISF Barracks 141.1 kWp 2017-2018 USD 151,403 Put on hold given
economic crisis
Casino du Liban 309.3 kWp 2019-2020 USD 209,397 Commissioned
Grid-connected large-scale solar PV: The deployment of large-scale solar PV projects is driven by
competitive procurement either via the Engineering, Procurement and Construction (EPC) model –
whereby a private company installs the project and hands it over to EDL for operation – or the Power Purchase Agreement (PPA) model, whereby private developers are invited to bid for a 20-year
contract to sell power to EDL. To date, only the Beirut River Solar Snake has been installed following
an EPC modality, which has generated 5,427 MWh of electricity from 2015 to mid-2019, based on the
installation of 1 MWp as phase 1. It is estimated that 4,070 MWh was produced by the BRSS during the period 2016-2018, thus contributing to a reduction of 2,897 tonnes CO2eq. or 965 tonnes
CO2eq./year during this period (considering that the same amount of energy would have been
produced by private generators with an Emission Factor of 0.7118 tonnes CO2eq./MWh). The BRSS
project was transferred to EDL in 2016.
In addition, the Zahrani Oil Installations has implemented a 1 MWp grid-tied solar PV system in 2016, with the produced energy being consumed by the facility, and the excess being fed to the
national grid through net-meters. It is estimated that the PVs generated 361 MWh per year for 2017
and 2018, thus avoiding 257 tonnes CO2eq./year (considering that the same amount of energy would have been produced by private generators with an Emission Factor of 0.7118 tonnes CO2eq./MWh).
In 2017 and 2018, MoEW initiated different Calls for Expression of Interest to install 12 PV farms each
with a capacity of 10 to 15 MW, and 3 PV farms of 100 MWp capacity combined with a minimum storage capacity of 70 MWh each. (IRENA, 2020; MoEW/LCEC, 2021b). However, following the civil unrest in 2019, the COVID-19 and economic crisis in 2020, these initiatives have been put on hold.
Onshore and offshore wind: The initial evaluation of wind potential in Lebanon began in 2011 with the publication of the wind atlas (Garrad Hassan, 2011) that estimated a mean wind capacity
potential of 6,100 MW. More recently, IRENA’s assessed the on-shore wind capacity to 6,233 MW, taking into account resource quality, proximity to transmission lines, topography, population
density, protected areas and land cover (IRENA, 2020).
A first contract was awarded in 2018 to Nasseem Akkar to develop 3 wind farms with a total capacity
of 226 MW, and a request for proposals was launched in 2018 to procure up to 400 MW of wind farms
156
to add to the total installed capacity of wind energy and bring the national energy mix a step closer to the renewable energy targets. However, following the civil unrest in 2019, the COVID-19 and
economic crisis in 2020, these projects have been put on hold.
Landfill gas: Since 2012, landfill gas is being collected for energy production from the Naameh landfill, which is the biggest sanitary controlled landfill in Lebanon, serving the Greater Beirut and Mount Lebanon area since 1997. After the closure of the landfill in 2015, a gas collection system has
been installed to generate energy from methane and other gaseous emission. It is reported that the landfill generated 40,940 MWh and 64,350 MWh in 2017 and 2018 respectively, which has contributed in avoiding the emissions of 24,170 tonnes CO2eq. during this period (or 12,085 tonnes CO2eq./year) (considering that the same amount of energy would have been produced by private
generators with an Emission Factor of 0.7118 tonnes CO2eq. /MWh).
Briquettes: In order to find sustainable solutions to the use of biomass for heating in rural areas, several initiatives were launched in Lebanon to pilot the feasibility of biomass briquetting. The
briquettes, which have a relatively high energy content compared to other wood heating fuels, are sold in the local market to substitute the use diesel stoves and electric heating in Lebanon.
A first plant was established in 2012 at the Shouf biosphere reserve that uses woodchips from the forest, from agricultural waste and olive pomace to produce briquettes. The production grew from
1,300 tonnes per year in 2013 to 3,532 tonnes in 2018 and the main market is rural areas around the forest (SBR, 2015).
Through the UNDP-CEDRO project and with EU funding, 2 other briquetting facilities were implemented in two villages, Andaket Akkar and Bkassine. Briquettes are made at the municipal
level by using forest's pruning residues as the main source of raw material (85%) and agricultural residues from the surrounding area's vines (10%) and olive (5%) plantations for the remaining share. By 2018, 2.5 tonnes of briquettes were produced at the Bkassine facility and sold in the local market.
No emission reductions have been estimated from the use of briquettes for heating due to the lack
of disaggregated data on the quantity that has actually been used by households and the technology that biomass is replacing. efforts will be undertaken to estimate such amounts, and report resulting emission reduction in subsequent reporting.
Energy efficiency
Under the 2016-2020 NREAP and in the Electricity Policy Paper 2010 and its update in 2019 (MoEW, 2010 and MoEW, 2019), several measures aiming at increasing the efficiency of production and distribution of electricity were planned at the plants and consumer levels.
EDL’s losses in 2018 exceeded 36% in total (as per electricity billed), with 4% loss of energy in the
transmission network and 34% in the distribution system (of which technical losses were estimated at 1% and non-technical at 21%) (World Bank, 2019). Therefore, the updated Policy Paper calls for
the reduction of technical and non-technical losses from 34% to 12% at the end of 2021 through the
implementation of the transmission and distribution initiatives and the resolution of the non-technical losses. In addition, the Paper calls for the increase in generation capacity through
improved efficiency and type of fuel used and the replacement of old plants by new ones.
As a step forward to implement the policy paper, the Council of Ministers endorsed the Transmission Master Plan in 2017, which aims at lowering the technical losses on the transmission grid and
subsequently increasing the revenues of EDL. This includes the completion of the 220 KV loop at
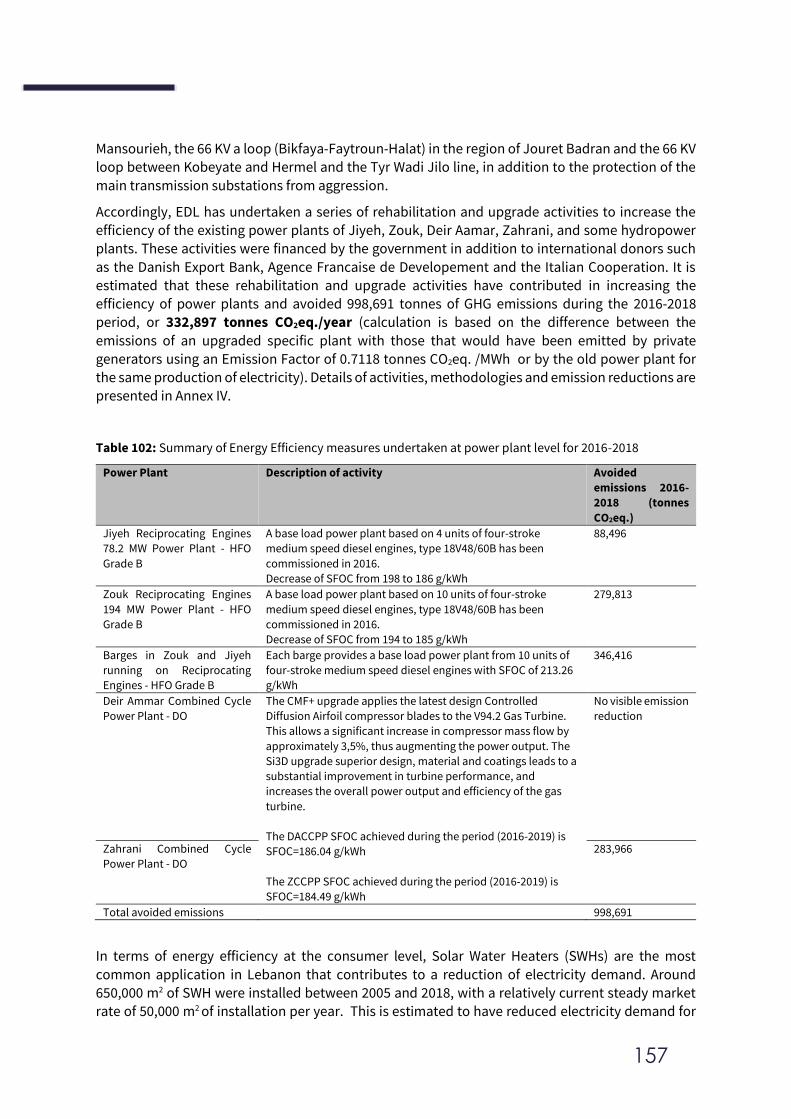
157
Mansourieh, the 66 KV a loop (Bikfaya-Faytroun-Halat) in the region of Jouret Badran and the 66 KV loop between Kobeyate and Hermel and the Tyr Wadi Jilo line, in addition to the protection of the
main transmission substations from aggression.
Accordingly, EDL has undertaken a series of rehabilitation and upgrade activities to increase the efficiency of the existing power plants of Jiyeh, Zouk, Deir Aamar, Zahrani, and some hydropower plants. These activities were financed by the government in addition to international donors such
as the Danish Export Bank, Agence Francaise de Developement and the Italian Cooperation. It is estimated that these rehabilitation and upgrade activities have contributed in increasing the efficiency of power plants and avoided 998,691 tonnes of GHG emissions during the 2016-2018 period, or 332,897 tonnes CO2eq./year (calculation is based on the difference between the
emissions of an upgraded specific plant with those that would have been emitted by private
generators using an Emission Factor of 0.7118 tonnes CO2eq. /MWh or by the old power plant for
the same production of electricity). Details of activities, methodologies and emission reductions are
presented in Annex IV.
Table 102: Summary of Energy Efficiency measures undertaken at power plant level for 2016-2018
Power Plant Description of activity Avoided
emissions 2016-
2018 (tonnes
CO2eq.)
Jiyeh Reciprocating Engines
78.2 MW Power Plant - HFO
Grade B
A base load power plant based on 4 units of four-stroke
medium speed diesel engines, type 18V48/60B has been
commissioned in 2016.
Decrease of SFOC from 198 to 186 g/kWh
88,496
Zouk Reciprocating Engines
194 MW Power Plant - HFO
Grade B
A base load power plant based on 10 units of four-stroke
medium speed diesel engines, type 18V48/60B has been
commissioned in 2016.
Decrease of SFOC from 194 to 185 g/kWh
279,813
Barges in Zouk and Jiyeh
running on Reciprocating
Engines - HFO Grade B
Each barge provides a base load power plant from 10 units of
four-stroke medium speed diesel engines with SFOC of 213.26
g/kWh
346,416
Deir Ammar Combined Cycle
Power Plant - DO
The CMF+ upgrade applies the latest design Controlled
Diffusion Airfoil compressor blades to the V94.2 Gas Turbine.
This allows a significant increase in compressor mass flow by
approximately 3,5%, thus augmenting the power output. The
Si3D upgrade superior design, material and coatings leads to a
substantial improvement in turbine performance, and
increases the overall power output and efficiency of the gas
turbine.
The DACCPP SFOC achieved during the period (2016-2019) is
SFOC=186.04 g/kWh
The ZCCPP SFOC achieved during the period (2016-2019) is
SFOC=184.49 g/kWh
No visible emission
reduction
Zahrani Combined Cycle
Power Plant - DO
283,966
Total avoided emissions 998,691
In terms of energy efficiency at the consumer level, Solar Water Heaters (SWHs) are the most
common application in Lebanon that contributes to a reduction of electricity demand. Around 650,000 m2 of SWH were installed between 2005 and 2018, with a relatively current steady market rate of 50,000 m2 of installation per year. This is estimated to have reduced electricity demand for
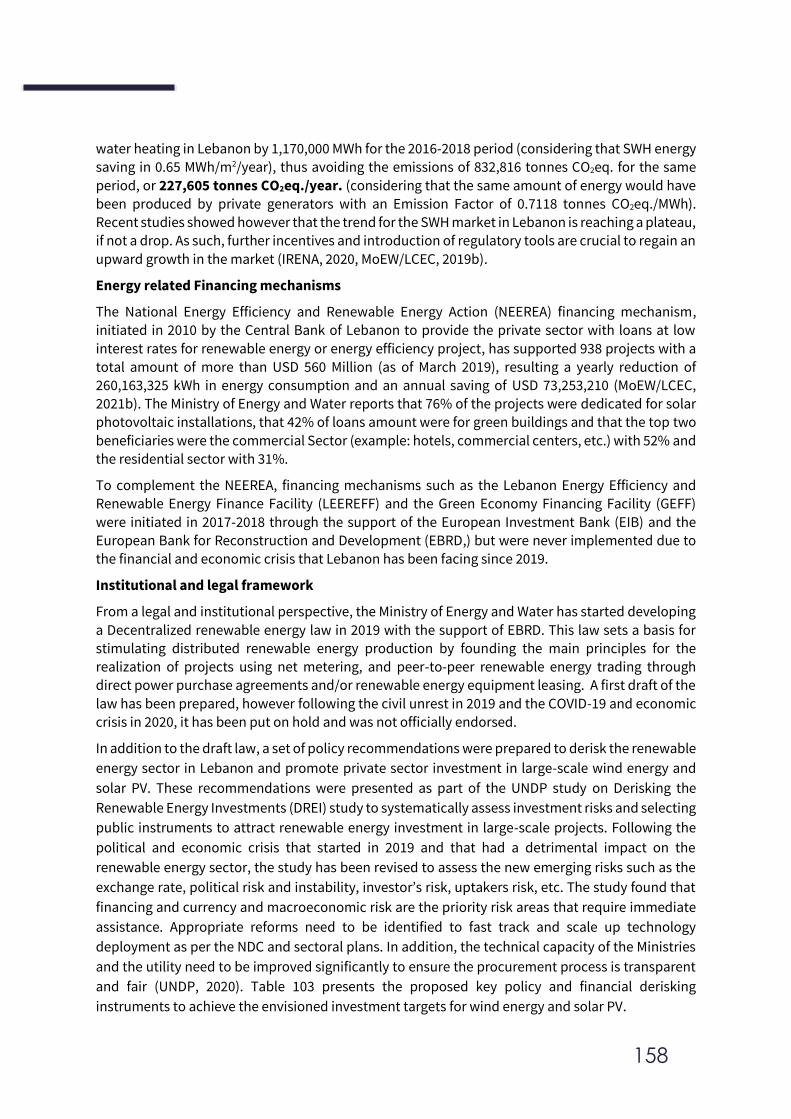
158
water heating in Lebanon by 1,170,000 MWh for the 2016-2018 period (considering that SWH energy saving in 0.65 MWh/m2/year), thus avoiding the emissions of 832,816 tonnes CO2eq. for the same
period, or 227,605 tonnes CO2eq./year. (considering that the same amount of energy would have been produced by private generators with an Emission Factor of 0.7118 tonnes CO2eq./MWh). Recent studies showed however that the trend for the SWH market in Lebanon is reaching a plateau, if not a drop. As such, further incentives and introduction of regulatory tools are crucial to regain an
upward growth in the market (IRENA, 2020, MoEW/LCEC, 2019b).
Energy related Financing mechanisms
The National Energy Efficiency and Renewable Energy Action (NEEREA) financing mechanism, initiated in 2010 by the Central Bank of Lebanon to provide the private sector with loans at low
interest rates for renewable energy or energy efficiency project, has supported 938 projects with a
total amount of more than USD 560 Million (as of March 2019), resulting a yearly reduction of 260,163,325 kWh in energy consumption and an annual saving of USD 73,253,210 (MoEW/LCEC,
2021b). The Ministry of Energy and Water reports that 76% of the projects were dedicated for solar photovoltaic installations, that 42% of loans amount were for green buildings and that the top two
beneficiaries were the commercial Sector (example: hotels, commercial centers, etc.) with 52% and the residential sector with 31%.
To complement the NEEREA, financing mechanisms such as the Lebanon Energy Efficiency and Renewable Energy Finance Facility (LEEREFF) and the Green Economy Financing Facility (GEFF)
were initiated in 2017-2018 through the support of the European Investment Bank (EIB) and the European Bank for Reconstruction and Development (EBRD,) but were never implemented due to
the financial and economic crisis that Lebanon has been facing since 2019.
Institutional and legal framework
From a legal and institutional perspective, the Ministry of Energy and Water has started developing
a Decentralized renewable energy law in 2019 with the support of EBRD. This law sets a basis for
stimulating distributed renewable energy production by founding the main principles for the realization of projects using net metering, and peer-to-peer renewable energy trading through direct power purchase agreements and/or renewable energy equipment leasing. A first draft of the
law has been prepared, however following the civil unrest in 2019 and the COVID-19 and economic
crisis in 2020, it has been put on hold and was not officially endorsed.
In addition to the draft law, a set of policy recommendations were prepared to derisk the renewable
energy sector in Lebanon and promote private sector investment in large-scale wind energy and
solar PV. These recommendations were presented as part of the UNDP study on Derisking the
Renewable Energy Investments (DREI) study to systematically assess investment risks and selecting
public instruments to attract renewable energy investment in large-scale projects. Following the
political and economic crisis that started in 2019 and that had a detrimental impact on the
renewable energy sector, the study has been revised to assess the new emerging risks such as the
exchange rate, political risk and instability, investor’s risk, uptakers risk, etc. The study found that
financing and currency and macroeconomic risk are the priority risk areas that require immediate
assistance. Appropriate reforms need to be identified to fast track and scale up technology
deployment as per the NDC and sectoral plans. In addition, the technical capacity of the Ministries
and the utility need to be improved significantly to ensure the procurement process is transparent
and fair (UNDP, 2020). Table 103 presents the proposed key policy and financial derisking
instruments to achieve the envisioned investment targets for wind energy and solar PV.
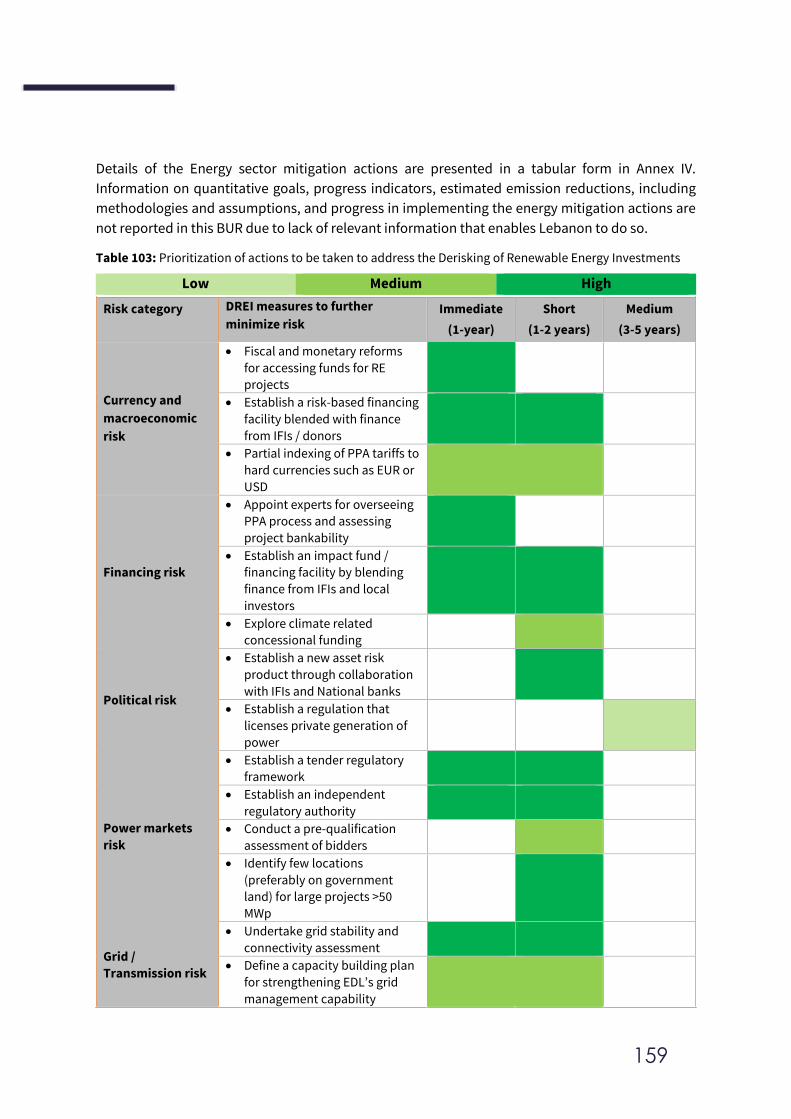
159
Details of the Energy sector mitigation actions are presented in a tabular form in Annex IV.
Information on quantitative goals, progress indicators, estimated emission reductions, including
methodologies and assumptions, and progress in implementing the energy mitigation actions are
not reported in this BUR due to lack of relevant information that enables Lebanon to do so.
Table 103: Prioritization of actions to be taken to address the Derisking of Renewable Energy Investments
Low Medium High
Risk category DREI measures to further
minimize risk Immediate
(1-year)
Short
(1-2 years)
Medium
(3-5 years)
Currency and
macroeconomic
risk
• Fiscal and monetary reforms
for accessing funds for RE
projects
• Establish a risk-based financing
facility blended with finance
from IFIs / donors
• Partial indexing of PPA tariffs to
hard currencies such as EUR or
USD
Financing risk
• Appoint experts for overseeing
PPA process and assessing
project bankability
• Establish an impact fund /
financing facility by blending
finance from IFIs and local
investors
• Explore climate related
concessional funding
Political risk
• Establish a new asset risk
product through collaboration
with IFIs and National banks
• Establish a regulation that
licenses private generation of
power
Power markets
risk
• Establish a tender regulatory
framework
• Establish an independent
regulatory authority
• Conduct a pre-qualification
assessment of bidders
• Identify few locations
(preferably on government
land) for large projects >50
MWp
Grid /
Transmission risk
• Undertake grid stability and
connectivity assessment
• Define a capacity building plan
for strengthening EDL’s grid
management capability
160
Developer risk
• Conduct resource mapping
study for solar and wind with
optimal location for projects
• Develop a safeguard strategy to
secure land for developer
Counterparty risk
• Decommission expensive
thermal power plants and add
solar and wind to recover some
deficits
• EDL organization restructuring
exercise
• Government backed 6-month
guarantee for PPA payments by
EDL must be in USD
Social Acceptance
risk
• Implement a legislation that
allows developers to setup mini
grids or micro grids
• Undertake mini grid / micro
grid technical assessment
Permits risk • Fast track approval of permits
4.2 Transport
Since 2015, no major mitigation measure has targeted the transport sector and lead to significant
emission reductions from the sector. The majority of the government-lead projects have focused on roadway and parking construction which are not considered sustainable solutions for the state of
transportation in Lebanon and are therefore not covered in this section. In addition, the progress
toward implementing the National Transport Policy issued in 2014 has been slowed down,
especially after the compounded crises that Lebanon has been facing since 2019 that has reshuffled the government’s priorities. However, some relevant activities have been put in place to improve
the planning and performance of the sector:
From the planning side, 2 major initiatives were implemented during the 2016-2018 period to build institutional capacities and provide strategic support to the sector. The “Institutional capacity
development of the Railways and Public Transportation Authority (RPTA)” project was launched in 2015 with UNDP to provide the necessary institutional capacity to the RPTA. The project
aimed at developing a public transportation master plan and providing technical assistance for the
implementation of reforms of the institution and the public transport sector in Lebanon. The project’s total budget of USD 1,288,300 was provided by the Lebanese Government through the
RPTA to implement the activities. The project, which was closed in 2019, submitted to the RPTA a master plan and a two-year implementation strategy for public transportation, and updated the
institutional and technical structural capacities of the RPTA.
In addition, the European Union-funded “Support Programme for Infrastructure Sector Strategies and Alternative Financing”, prepared and published a baseline study sector and a Strategic Environmental Assessment (SEA) of the Lebanese Land Transport Sector. The project also drafted a National Strategy for the Land Transport sector, but was never endorsed by the Lebanese
Government.
161
The Ministry of Public Works and Transport also initiated contact with EuroMED to regulate public transport and restructure its government authorities, introduce new modes of public transport on
the congested main routes, construct transport terminals at entrances of Greater Beirut and main cities and organize on-street and off-street parking. The “Revitalization of the Public Transport in Greater Beirut” project, which drafted licensing and enforcement systems for public transport services and launched tenders for the preparation of engineering designs for the railway line along
the major corridor was however put on hold following the 2019 economic crisis in Lebanon. This initiative was complemented by the preparation of a Regional Transport Action Plan 2014-2020 as part of the regional EuroMed Transport Support Project and the EuroMed Transport Rail Project.
From the infrastructure side, 2 initiatives were also been planned during the 2016-2018 period to
shift the share of personal transportation from passenger cars to public transport, which is currently
dominated by private operators relying on small, low-performance vehicles. Primary among those
is the World Bank’s “Greater Beirut Public Transport Project” which consisted mainly of
constructing a Bus Rapid Transport service along the busy northern coastal highway entrance into the Greater Beirut Area as well as further building the capacities of the RPTA for project
implementation, supervision and management. The project, signed in 2018 with total cost of USD 345,000,000 (mostly as a loan to the GoL) was put on hold following the economic and financial
crises that hit Lebanon in 2019.
In Tripoli, the country’s second largest city, another initiative to modernize public transport was
launched in 2018 by the EIB and UNDP with a budget of EUR 1 million. The “Sustainable Urban Public Transport Investment Program” in Greater Tripoli drafted the EUMEDRAIL Action Plan for
Lebanon 2018-2020 to support decision makers in the revitalization of the railway network and revised the organizational structure, functional job descriptions, internal institutional bylaws and working procedures of the RPTA.
To complement these activities and contribute to the deployment of clean technology in the
transport sector, a tax incentive scheme has been issued by the Government in the budget Law 79/2018 (article 55) and renewed in 2019 (Law 144/2019 – article 25.c) and 2020, providing cuts on customs and registration fees for the purchase of hybrid and electric vehicles in Lebanon. This has
created a momentum in the market with the deployment of new lines of fuel-efficient vehicles
across car importers as expressed in the first E-Motorshow 2019 in Beirut. It has also increased the interest of the public, academic and private sector to explore research investment opportunities in the infrastructure for electric mobility. Since no disaggregated data is available on the increase
penetration rate of hybrid and electric car in the Lebanese market, no emission reduction was
estimated from the implementation of this financial measure.
162
Box 10: National Transport Policy 2014
In 2014, the MoPWT presented to the Council of Ministers the National Transport Policy, with a master
plan to revitalize the land public transport for passengers. The objectives of the Policy, as stated in the
official document, are the following:
- Ensure an integrated transport system with affordable prices
- Diversify the modes of land transport available for passengers
- Supply the country with an efficient internal transportation system with affordable prices for
freight in cities and rural areas
- Remove all barriers that hinder the competitive advantage of Lebanese freight transporters
- Provide Lebanon with a regional competitive role for the supply of logistic services
- Decrease the financial load on the national budgets from transport activities
- Apply specific standards on the infrastructure to conserve natural landscapes
- Ensure public road safety
- Maintain and protect the existing infrastructure
The main actions that are expected to have a direct impact on reducing GHG emissions are:
On the short term:
- Implementation of phase 1 of the rail transportation plan, namely the lane connecting port of
Tripoli to the Syrian border.
- Revitalization and restructuring of the operation of public buses inside cities.
- Continuing the development project of traffic management in Great Beirut Area (GBA).
- Improvement of the pedestrian infrastructure.
On the long term:
- Deployment of a Bus Rapid Transit (BRT) on Beirut north and south gates, commuting Jounieh to
Jiyeh.
- Development of a mass transit system covering territories all over Lebanon and commuting
cities.
- Restructuring the freight transport.
Making up for the slow progress on sustainable transportation projects in the public sector is a host
of initiatives by the private sector and NGOs, ranging from proposed plans to awareness building
and actual implementations. Notable awareness raising activities included a number of national conferences by international organizations in collaboration with academia and NGOs about sustainable transportation modes and their environmental and cost benefits. Examples include the annual “Automotive Engineering Day” event at the Lebanese American University in collaboration
with local car dealers to raise awareness about the transition to electric vehicle technologies
through discussion forums and demonstrations, the October 2018 conference by the Agency for Technical Cooperation and Development (ACTED) for promoting environmentally sustainable transportation in Lebanon in collaboration with the Lebanon Hybrid Automotive Club and the first E-Motorshow in Lebanon organized in 2019 by E-ecoslutions to promote hybrid and electric cars.
Beyond awareness building capabilities, the Lebanese private sector and civil society have been
dynamic in introducing innovative technological solutions to tackle the main transportation and mobility challenges in the country. Most noteworthy are the mapping initiatives of informal public
transport services by the NGO “Bus Map Project” and the startup “Yalla Bus”, both of which evolved
from paper maps into mobile applications. In fact, a range of mobile applications have been developed by local entrepreneurs to deliver a variety of functions, from facilitating carpooling (“Carpolo”, “Autopooling” and “Bbeep” apps) to automating parking access and payment (“Soffa” and “Viamobile” apps), to helping drivers navigate congested roadways (“3aj2aaWein?” and “Tari2ak” apps). Only one such application was developed by the public sector, namely the Traffic
163
Management Organization’s (TMO) official app offering live traffic maps, pictures and news reports about traffic and roadway conditions.
Other grassroots initiatives include an annual “Bike to work day” to promote cycling to work and raise awareness about the importance of using environmentally friendly transportation. The event has been held for 3 consecutive years by the “Chain Effect” NGO in collaboration with Beirut municipality and bicycle shops, with increasing participation and endorsement by public figures.
International organizations have also been actively supporting and organizing workshops to raise events, network stakeholders and set an agenda for future actions in the sector. Most notable of these efforts is UNDP’s “Sustainable Mobility Conference” in March 2019 held in collaboration with the Ministry of Environment, Ministry of Energy and Water and the Lebanese American University
(LAU) to develop a roadmap for the transition to electric mobility. Similarly, the UN ESCWA
organized the “Regional Workshop on the Development of Transport Statistics and Transport related Sustainable Development Indicators in the Arab Countries” in September 2019, where
recommendations were developed for improving transport data in order to enhance decision-making in transportation and contribute to sustainable transport development.
A series of additional activities and projects are planned for the sector, including:
- Lebanon Sustainable Low-Emission Transport Systems to promote innovation and
technology transfer for electric drive technologies and electric mobility in greater Beirut and Jbeil – pending funding
- Nationally Appropriate Mitigation Action (NAMA) in Lebanon’s Private Road Transport Sector to create a car scrappage program for replacing old conventional vehicles with
newer more efficient and alternative fuel vehicle technologies – pending funding
- Rehabilitation of the northern coastal railway line to shift to a rail trans-border freight
transport system between Tripoli port and Syria – pending funding from CEDRE
- Construction of bike lanes in Beirut which includes 28 km of dedicated bike lanes inside
Beirut in three phases to encourage the use of zero-emission alternative transportation means- pending tendering for phase I and funding for phase I and II
Details of the transport sector mitigation actions are presented in a tabular form in Annex V.
Information on quantitative goals, progress indicators, estimated emission reductions, including
methodologies and assumptions, and progress in implementing the transport mitigation actions are not reported in this BUR due to lack of relevant information that enables Lebanon to do so.
4.3 Agriculture
Limited activities with an emission reduction potential from agricultural activities have been
implemented in Lebanon. Pilot projects related to water pumping and irrigation using renewable
energy have recently been initiated across the country, but information is not available to estimate
the scale of emission reductions from such projects.
Other activities are being explored through research and knowledge generation, capacity building,
policy and regulatory framework support. Most climate change related projects and programmes in
the agriculture sector are adaptation oriented with the aim to decrease climate change impacts and
improve resilience and adaptive capacity of farmers’ communities.
164
An indicative list of climate change projects implemented in Lebanon related to the agriculture
sector is presented in Table 110, under the support received section. However due to lack of
information, no emission reduction potential has been estimated for such activities. Efforts will be
undertaken to report such information in subsequent reporting.
4.4 Forestry and Land Use
The Government of Lebanon launched through Ministry of Agriculture the ambitious “40 Million Trees” national initiative, aiming at planting some 40 million forest trees in public lands by 2030.
Accordingly, several, Non-Governmental Organizations, municipalities and governmental
institutions have been involved in reforestation projects in the country. Although a National Forest Program (NFP) in Lebanon has been finalized , forest legislations are still being reviewed, while technical and financial resources need to be secured.
Recognizing the need for action against land degradation, the GoL through the Ministries of Agriculture and Environment are also taking measures to reduce and restore degraded ecosystems
both at the policy and at the implementation levels.
In this context, the Ministry of Environment with the support of the UNDP and financing from the
Global Environment Facility (GEF), has started the implementation (2016 – 2021) of the Sustainable Land Management in the Qaraoun Watershed Project (SLMQ) that aims at embedding sustainability
considerations in land use planning and entailing the rehabilitation of degraded natural ecosystems, among which forestlands, through reforestation and afforestation. The project also
aimed at preventing further degradation through the promotion of sustainable forest management at the national and local levels. Under this project, many activities of relevance to forest landscape restoration have been undertaken in addition to developing tools to improve the management of
forests in Lebanon.
Lebanon’s National Biodiversity Strategy and Action Plan (NBSAP) 2016-2030 was issued by MoE in 2016 and endorsed by the Council of Ministers through Decision Number 62/2018, addressing Lebanon’s obligations under Article 6a of the Convention on Biological Diversity. More specifically,
the new NBSAP was aligned with the new CBD strategic goals and integrated the 2020 Aichi Biodiversity targets while taking into account both global and local needs and aspirations
(MoE/UNEP/GEF, 2015; 2016). Forestry was relevant for all 18 National Targets.
Updating Lebanon’s National Action Programme (NAP) for the United Nations Convention to
Combat Desertification (UNCCD) was completed in 2018 to align national work to the 10-year
convention’s Strategy (2008-2018). More specifically, this work was coupled with setting the national targets towards Land Degradation Neutrality. This work resulted in the assessment of
baseline trends in Land Use and Land Use change, land productivity, and Soil Organic Carbon (SOC) stocks using geo-processing tools, mapping exposure to land degradation, and setting national
voluntary targets for LDN. Lebanon has set the following voluntary national LDN targets:
• Improve land productivity and SOC stock, in forests, croplands and grasslands.
• Improve the mosaic of the landscape, including forests, other wooded lands, grasslands
and croplands and limit their conversion to other land covers.
• Enhance the role of forests and trees in urban and rural areas in providing sustainable
products and services.
165
LDN, however, would only be achieved through its leveraging into political and development
processes, at the national level. The MoA is the lead institution for the implementation and
coordination of LDN. It is committed to work with all line ministries, in particular MoE, along with
national organizations.
Several other national initiatives have been undertaken at the national level. In this context, the Forest Landscape Restoration Mechanism (FLRM), a 2-year Food and Agriculture Organization (FAO) managed project, aimed at supporting national actions for better forest and natural landscape
restoration. Some of the main achieved results implemented during the first phase of the project
(2016-2018) included 1) implement model landscape restoration activities, 2) support restoration work in areas vulnerable to climate change, 3) support the development of the methodology for identifying, mapping, assessing and characterizing landscapes across all Lebanese territories and 3) develop a solid foundation for the establishment of a National Forest Fund.
The Smart Adaptation of Forest Landscapes in Mountain Areas (SALMA) is a 5-year project (that
effectively started in December 2016) implemented by the FAO in collaboration with the MoA and
funded by the GEF. Its activities include the restoration of 1,000 ha of forests and the sustainable management of another 1,000 ha. Other interventions of SALMA focus on the adoption of improved and innovative integrated forest management practices.
In addition, the French Development Agency (AFD) introduced in 2017 the PARSIFAL project, with four main interventions 1) consolidation of infrastructure in rural areas, 2) reforestation, 3)
capacity building to allow vulnerable Syrian refugees to acquire skills in agriculture and forestry and 4) institutional capacity building.
At the legislation front, the CoM issued in 2017 Decision #42 (dated 26-10-2017) to form a ministerial
committee presided by the Prime Minister to study a request by MoE for developing a master plan for the protection of mountain summits and natural areas. Also, a new Protected Areas law was
endorsed by the parliament in 2019, addressing the various categories of protected areas, including objectives, classification, management and financing mechanisms
In order to estimate the amount of carbon that has been sequestered through these activities, and based on the disaggregated information available from implementing entities, the following main
categories are considered:
- Protecting existing carbon reservoirs from losses associated with deforestation, forest and
land degradation, urbanization, and other land management practices.
- Enhancing carbon sequestration and expanding carbon stores in forests, other biomass, soils, and wood products (including through reforestation, afforestation, and forest
management efforts).
- Reducing emissions of other greenhouse gases, primarily CH4 and N2O, from land use
interventions on from fire management
During the period 2016-2018, afforestation and reforestation activities were sustained and increased by the Ministry of Agriculture and leader organizations in the country such as Lebanon Reforestation Initiative (LRI), Association for Forest Development and Conservation (AFDC) and
Jouzour Loubnan, increasing carbon sequestration by 4.33 Gg CO2eq. during this period.
Other impactful developments include the continuation Lebanon’s Reforestation Initiative and Managing Wildfire Risk in the Wildland-Urban Interface, in addition to four new reforestation/afforestation projects across the country.
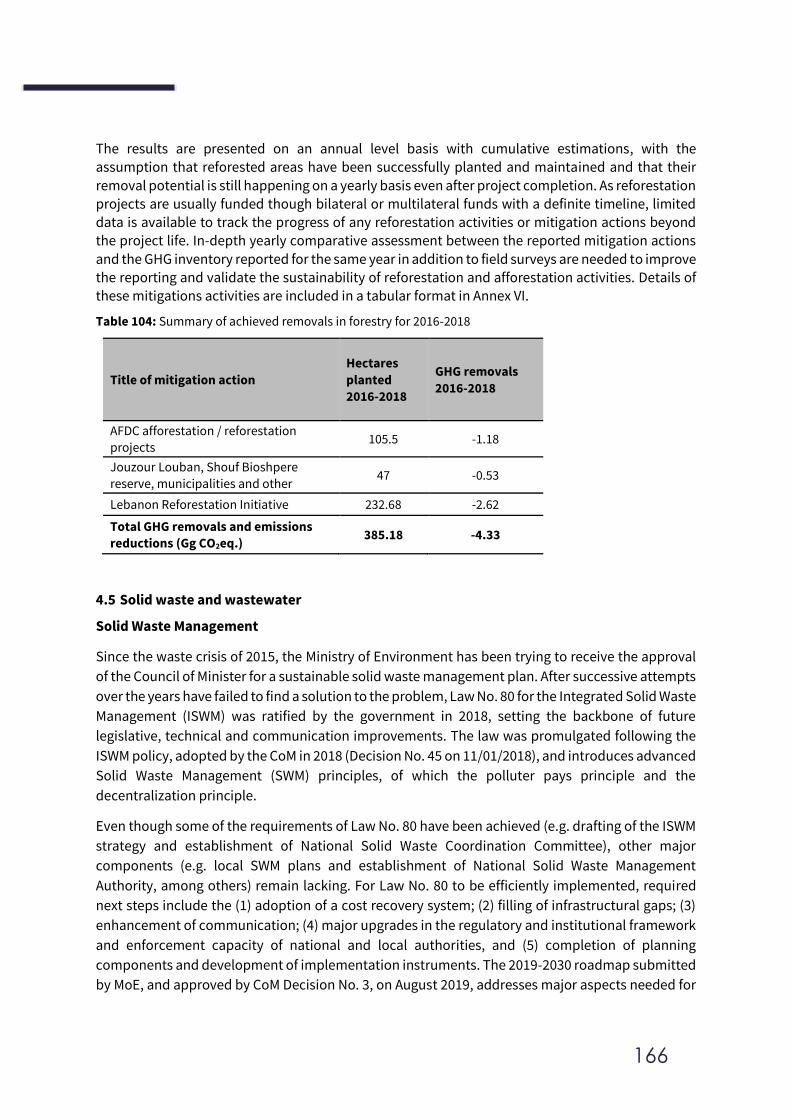
166
The results are presented on an annual level basis with cumulative estimations, with the assumption that reforested areas have been successfully planted and maintained and that their
removal potential is still happening on a yearly basis even after project completion. As reforestation projects are usually funded though bilateral or multilateral funds with a definite timeline, limited data is available to track the progress of any reforestation activities or mitigation actions beyond the project life. In-depth yearly comparative assessment between the reported mitigation actions
and the GHG inventory reported for the same year in addition to field surveys are needed to improve the reporting and validate the sustainability of reforestation and afforestation activities. Details of these mitigations activities are included in a tabular format in Annex VI.
Table 104: Summary of achieved removals in forestry for 2016-2018
Title of mitigation action
Hectares
planted
2016-2018
GHG removals
2016-2018
AFDC afforestation / reforestation
projects 105.5 -1.18
Jouzour Louban, Shouf Bioshpere
reserve, municipalities and other 47 -0.53
Lebanon Reforestation Initiative 232.68 -2.62
Total GHG removals and emissions
reductions (Gg CO2eq.) 385.18 -4.33
4.5 Solid waste and wastewater
Solid Waste Management
Since the waste crisis of 2015, the Ministry of Environment has been trying to receive the approval
of the Council of Minister for a sustainable solid waste management plan. After successive attempts
over the years have failed to find a solution to the problem, Law No. 80 for the Integrated Solid Waste
Management (ISWM) was ratified by the government in 2018, setting the backbone of future
legislative, technical and communication improvements. The law was promulgated following the
ISWM policy, adopted by the CoM in 2018 (Decision No. 45 on 11/01/2018), and introduces advanced
Solid Waste Management (SWM) principles, of which the polluter pays principle and the
decentralization principle.
Even though some of the requirements of Law No. 80 have been achieved (e.g. drafting of the ISWM
strategy and establishment of National Solid Waste Coordination Committee), other major
components (e.g. local SWM plans and establishment of National Solid Waste Management
Authority, among others) remain lacking. For Law No. 80 to be efficiently implemented, required
next steps include the (1) adoption of a cost recovery system; (2) filling of infrastructural gaps; (3)
enhancement of communication; (4) major upgrades in the regulatory and institutional framework
and enforcement capacity of national and local authorities, and (5) completion of planning
components and development of implementation instruments. The 2019-2030 roadmap submitted
by MoE, and approved by CoM Decision No. 3, on August 2019, addresses major aspects needed for
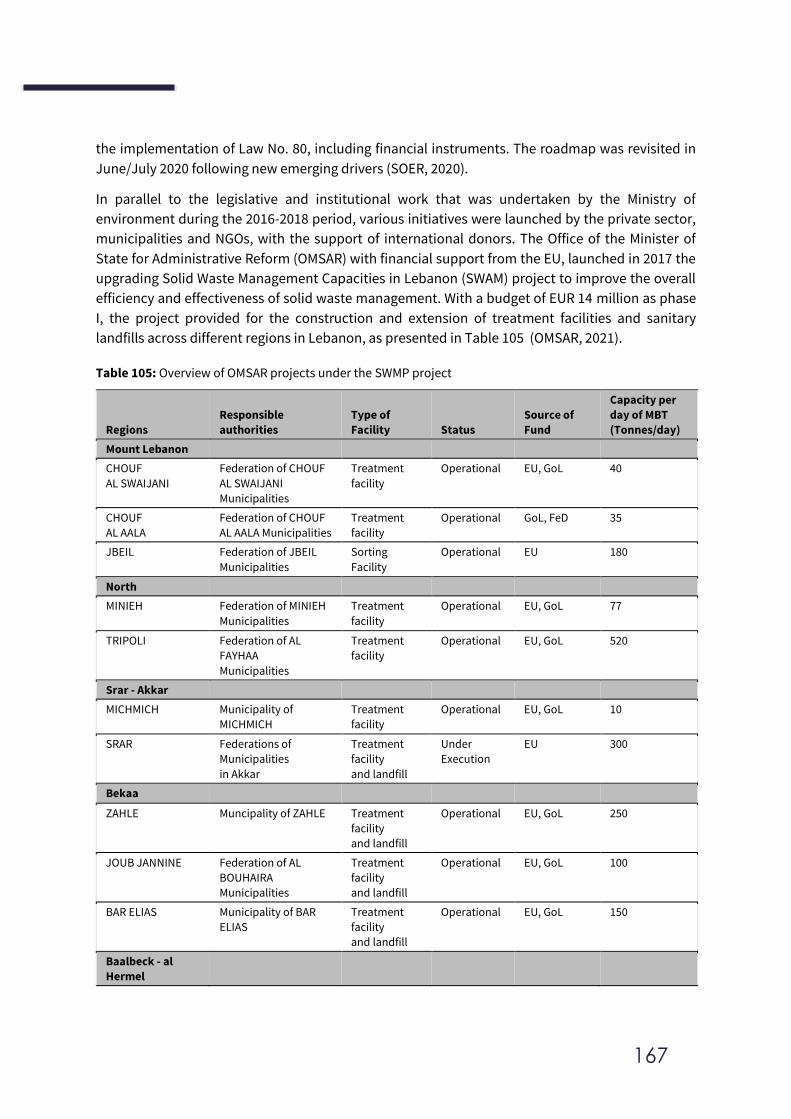
167
the implementation of Law No. 80, including financial instruments. The roadmap was revisited in
June/July 2020 following new emerging drivers (SOER, 2020).
In parallel to the legislative and institutional work that was undertaken by the Ministry of
environment during the 2016-2018 period, various initiatives were launched by the private sector,
municipalities and NGOs, with the support of international donors. The Office of the Minister of
State for Administrative Reform (OMSAR) with financial support from the EU, launched in 2017 the
upgrading Solid Waste Management Capacities in Lebanon (SWAM) project to improve the overall
efficiency and effectiveness of solid waste management. With a budget of EUR 14 million as phase
I, the project provided for the construction and extension of treatment facilities and sanitary
landfills across different regions in Lebanon, as presented in Table 105 (OMSAR, 2021).
Table 105: Overview of OMSAR projects under the SWMP project
Regions
Responsible
authorities
Type of
Facility Status
Source of
Fund
Capacity per
day of MBT
(Tonnes/day)
Mount Lebanon
CHOUF
AL SWAIJANI
Federation of CHOUF
AL SWAIJANI
Municipalities
Treatment
facility
Operational EU, GoL 40
CHOUF
AL AALA
Federation of CHOUF
AL AALA Municipalities
Treatment
facility
Operational GoL, FeD 35
JBEIL Federation of JBEIL
Municipalities
Sorting
Facility
Operational EU 180
North
MINIEH Federation of MINIEH
Municipalities
Treatment
facility
Operational EU, GoL 77
TRIPOLI Federation of AL
FAYHAA
Municipalities
Treatment
facility
Operational EU, GoL 520
Srar - Akkar
MICHMICH Municipality of
MICHMICH
Treatment
facility
Operational EU, GoL 10
SRAR Federations of
Municipalities
in Akkar
Treatment
facility
and landfill
Under
Execution
EU 300
Bekaa
ZAHLE Muncipality of ZAHLE Treatment
facility
and landfill
Operational EU, GoL 250
JOUB JANNINE Federation of AL
BOUHAIRA
Municipalities
Treatment
facility
and landfill
Operational EU, GoL 100
BAR ELIAS Municipality of BAR
ELIAS
Treatment
facility
and landfill
Operational EU, GoL 150
Baalbeck - al
Hermel
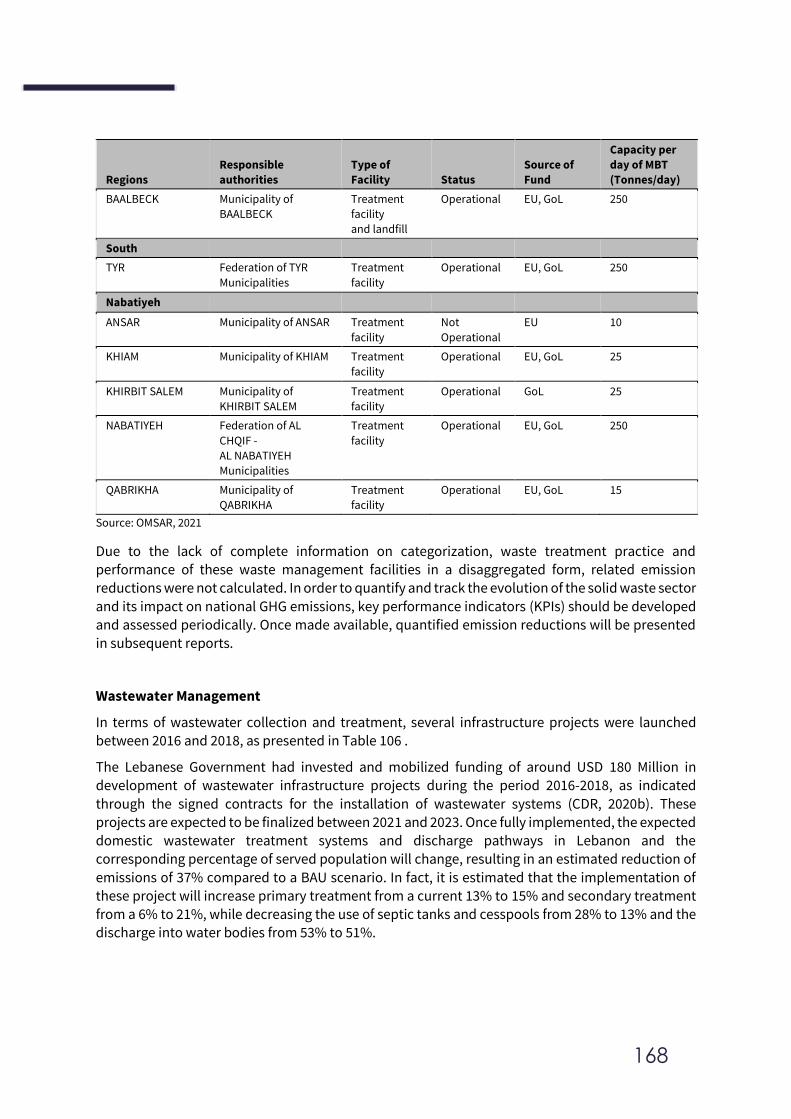
168
Regions
Responsible
authorities
Type of
Facility Status
Source of
Fund
Capacity per
day of MBT
(Tonnes/day)
BAALBECK Municipality of
BAALBECK
Treatment
facility
and landfill
Operational EU, GoL 250
South
TYR Federation of TYR
Municipalities
Treatment
facility
Operational EU, GoL 250
Nabatiyeh
ANSAR Municipality of ANSAR Treatment
facility
Not
Operational
EU 10
KHIAM Municipality of KHIAM Treatment
facility
Operational EU, GoL 25
KHIRBIT SALEM Municipality of
KHIRBIT SALEM
Treatment
facility
Operational GoL 25
NABATIYEH Federation of AL
CHQIF -
AL NABATIYEH
Municipalities
Treatment
facility
Operational EU, GoL 250
QABRIKHA Municipality of
QABRIKHA
Treatment
facility
Operational EU, GoL 15
Source: OMSAR, 2021
Due to the lack of complete information on categorization, waste treatment practice and performance of these waste management facilities in a disaggregated form, related emission
reductions were not calculated. In order to quantify and track the evolution of the solid waste sector
and its impact on national GHG emissions, key performance indicators (KPIs) should be developed
and assessed periodically. Once made available, quantified emission reductions will be presented in subsequent reports.
Wastewater Management
In terms of wastewater collection and treatment, several infrastructure projects were launched between 2016 and 2018, as presented in Table 106 .
The Lebanese Government had invested and mobilized funding of around USD 180 Million in
development of wastewater infrastructure projects during the period 2016-2018, as indicated
through the signed contracts for the installation of wastewater systems (CDR, 2020b). These projects are expected to be finalized between 2021 and 2023. Once fully implemented, the expected domestic wastewater treatment systems and discharge pathways in Lebanon and the corresponding percentage of served population will change, resulting in an estimated reduction of
emissions of 37% compared to a BAU scenario. In fact, it is estimated that the implementation of these project will increase primary treatment from a current 13% to 15% and secondary treatment
from a 6% to 21%, while decreasing the use of septic tanks and cesspools from 28% to 13% and the discharge into water bodies from 53% to 51%.
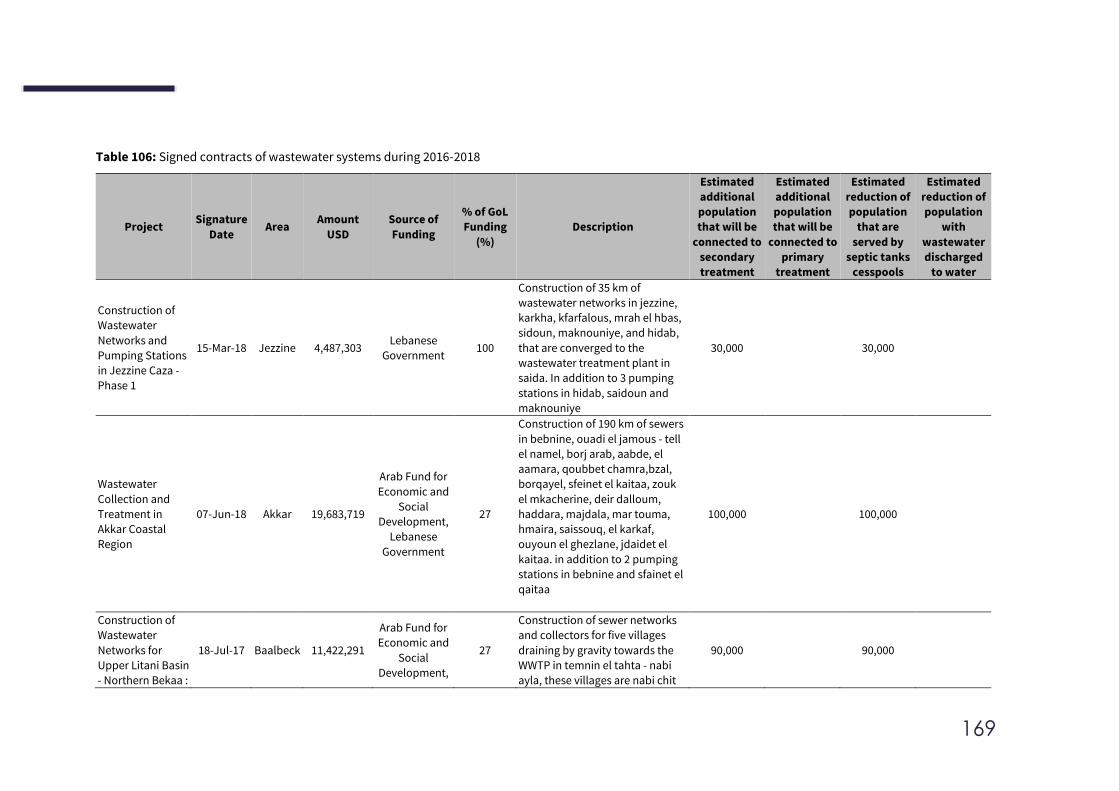
169
Table 106: Signed contracts of wastewater systems during 2016-2018
Project Signature
Date Area
Amount
USD
Source of
Funding
% of GoL
Funding
(%)
Description
Estimated
additional
population
that will be
connected to
secondary
treatment
Estimated
additional
population
that will be
connected to
primary
treatment
Estimated
reduction of
population
that are
served by
septic tanks
cesspools
Estimated
reduction of
population
with
wastewater
discharged
to water
Construction of
Wastewater
Networks and
Pumping Stations
in Jezzine Caza -
Phase 1
15-Mar-18 Jezzine 4,487,303 Lebanese
Government 100
Construction of 35 km of
wastewater networks in jezzine,
karkha, kfarfalous, mrah el hbas,
sidoun, maknouniye, and hidab,
that are converged to the
wastewater treatment plant in
saida. In addition to 3 pumping
stations in hidab, saidoun and
maknouniye
30,000 30,000
Wastewater
Collection and
Treatment in
Akkar Coastal
Region
07-Jun-18 Akkar 19,683,719
Arab Fund for
Economic and
Social
Development,
Lebanese
Government
27
Construction of 190 km of sewers
in bebnine, ouadi el jamous - tell
el namel, borj arab, aabde, el
aamara, qoubbet chamra,bzal,
borqayel, sfeinet el kaitaa, zouk
el mkacherine, deir dalloum,
haddara, majdala, mar touma,
hmaira, saissouq, el karkaf,
ouyoun el ghezlane, jdaidet el
kaitaa. in addition to 2 pumping
stations in bebnine and sfainet el
qaitaa
100,000 100,000
Construction of
Wastewater
Networks for
Upper Litani Basin
- Northern Bekaa :
18-Jul-17 Baalbeck 11,422,291
Arab Fund for
Economic and
Social
Development,
27
Construction of sewer networks
and collectors for five villages
draining by gravity towards the
WWTP in temnin el tahta - nabi
ayla, these villages are nabi chit
90,000 90,000
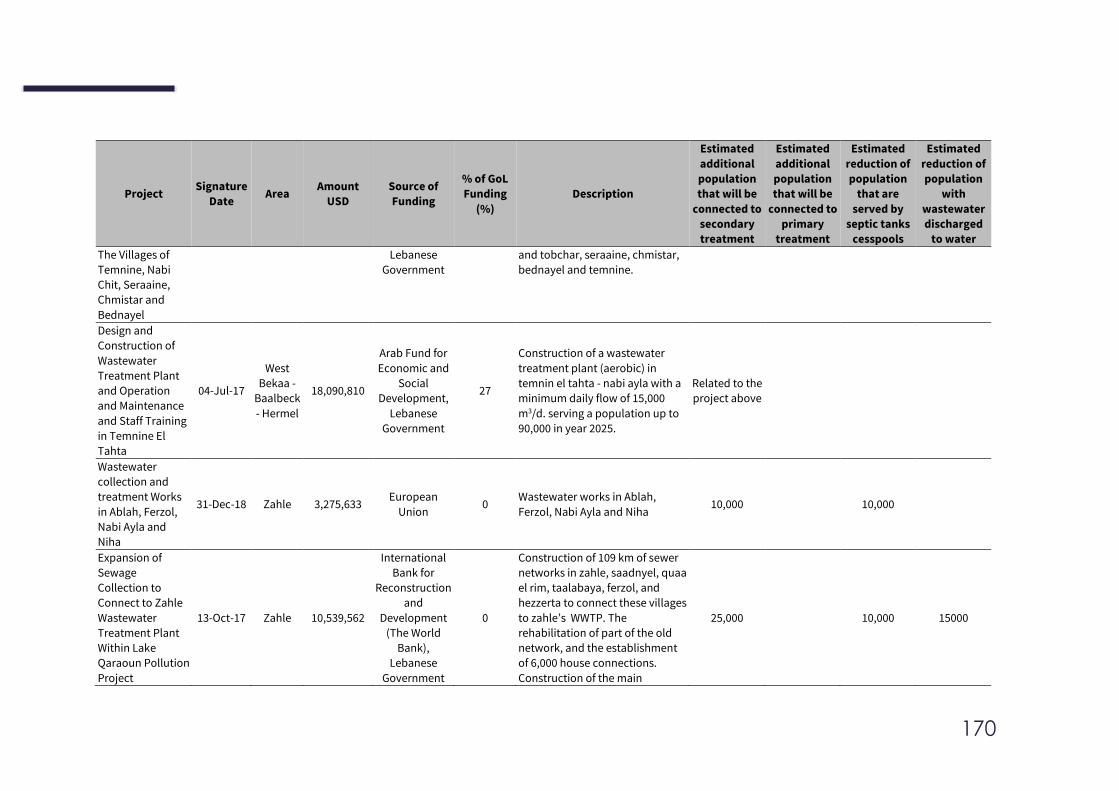
170
Project Signature
Date Area
Amount
USD
Source of
Funding
% of GoL
Funding
(%)
Description
Estimated
additional
population
that will be
connected to
secondary
treatment
Estimated
additional
population
that will be
connected to
primary
treatment
Estimated
reduction of
population
that are
served by
septic tanks
cesspools
Estimated
reduction of
population
with
wastewater
discharged
to water
The Villages of
Temnine, Nabi
Chit, Seraaine,
Chmistar and
Bednayel
Lebanese
Government
and tobchar, seraaine, chmistar,
bednayel and temnine.
Design and
Construction of
Wastewater
Treatment Plant
and Operation
and Maintenance
and Staff Training
in Temnine El
Tahta
04-Jul-17
West
Bekaa -
Baalbeck
- Hermel
18,090,810
Arab Fund for
Economic and
Social
Development,
Lebanese
Government
27
Construction of a wastewater
treatment plant (aerobic) in
temnin el tahta - nabi ayla with a
minimum daily flow of 15,000
m3/d. serving a population up to
90,000 in year 2025.
Related to the
project above
Wastewater
collection and
treatment Works
in Ablah, Ferzol,
Nabi Ayla and
Niha
31-Dec-18 Zahle 3,275,633 European
Union 0
Wastewater works in Ablah,
Ferzol, Nabi Ayla and Niha 10,000 10,000
Expansion of
Sewage
Collection to
Connect to Zahle
Wastewater
Treatment Plant
Within Lake
Qaraoun Pollution
Project
13-Oct-17 Zahle 10,539,562
International
Bank for
Reconstruction
and
Development
(The World
Bank),
Lebanese
Government
0
Construction of 109 km of sewer
networks in zahle, saadnyel, quaa
el rim, taalabaya, ferzol, and
hezzerta to connect these villages
to zahle’s WWTP. The
rehabilitation of part of the old
network, and the establishment
of 6,000 house connections.
Construction of the main
25,000 10,000 15000
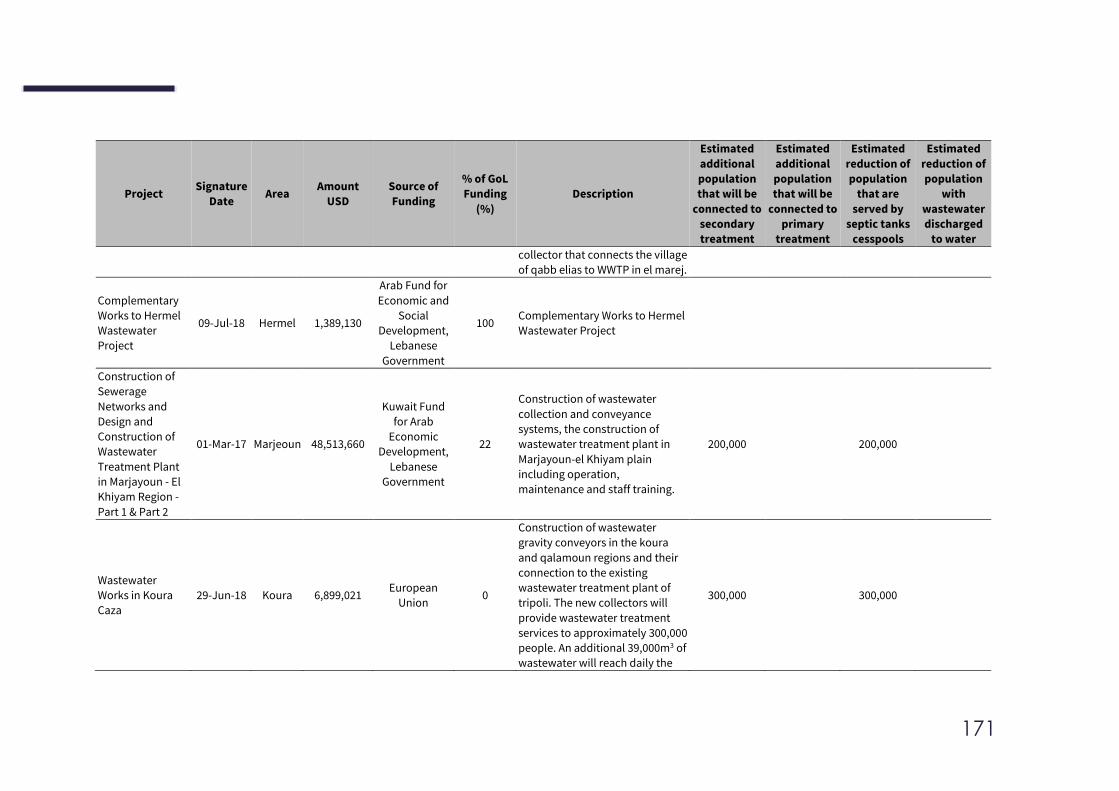
171
Project Signature
Date Area
Amount
USD
Source of
Funding
% of GoL
Funding
(%)
Description
Estimated
additional
population
that will be
connected to
secondary
treatment
Estimated
additional
population
that will be
connected to
primary
treatment
Estimated
reduction of
population
that are
served by
septic tanks
cesspools
Estimated
reduction of
population
with
wastewater
discharged
to water
collector that connects the village
of qabb elias to WWTP in el marej.
Complementary
Works to Hermel
Wastewater
Project
09-Jul-18 Hermel 1,389,130
Arab Fund for
Economic and
Social
Development,
Lebanese
Government
100 Complementary Works to Hermel
Wastewater Project
Construction of
Sewerage
Networks and
Design and
Construction of
Wastewater
Treatment Plant
in Marjayoun - El
Khiyam Region -
Part 1 & Part 2
01-Mar-17 Marjeoun 48,513,660
Kuwait Fund
for Arab
Economic
Development,
Lebanese
Government
22
Construction of wastewater
collection and conveyance
systems, the construction of
wastewater treatment plant in
Marjayoun-el Khiyam plain
including operation,
maintenance and staff training.
200,000 200,000
Wastewater
Works in Koura
Caza
29-Jun-18 Koura 6,899,021 European
Union 0
Construction of wastewater
gravity conveyors in the koura
and qalamoun regions and their
connection to the existing
wastewater treatment plant of
tripoli. The new collectors will
provide wastewater treatment
services to approximately 300,000
people. An additional 39,000m3 of
wastewater will reach daily the
300,000 300,000
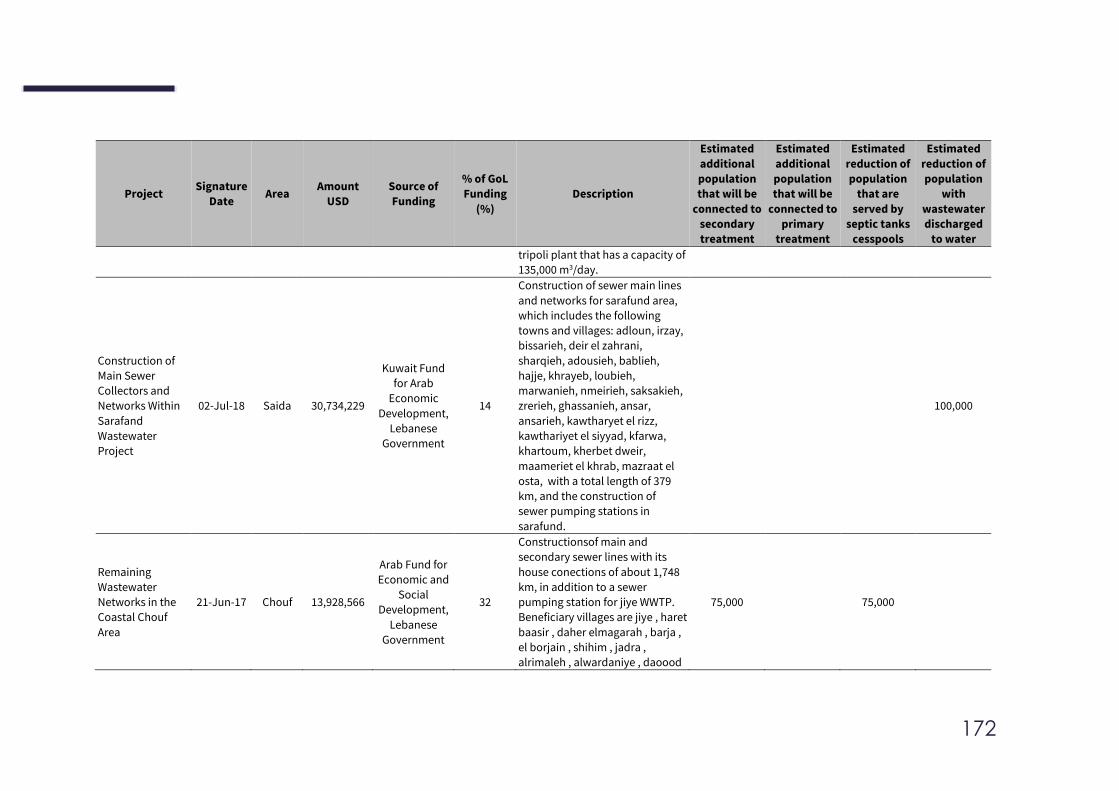
172
Project Signature
Date Area
Amount
USD
Source of
Funding
% of GoL
Funding
(%)
Description
Estimated
additional
population
that will be
connected to
secondary
treatment
Estimated
additional
population
that will be
connected to
primary
treatment
Estimated
reduction of
population
that are
served by
septic tanks
cesspools
Estimated
reduction of
population
with
wastewater
discharged
to water
tripoli plant that has a capacity of
135,000 m3/day.
Construction of
Main Sewer
Collectors and
Networks Within
Sarafand
Wastewater
Project
02-Jul-18 Saida 30,734,229
Kuwait Fund
for Arab
Economic
Development,
Lebanese
Government
14
Construction of sewer main lines
and networks for sarafund area,
which includes the following
towns and villages: adloun, irzay,
bissarieh, deir el zahrani,
sharqieh, adousieh, bablieh,
hajje, khrayeb, loubieh,
marwanieh, nmeirieh, saksakieh,
zrerieh, ghassanieh, ansar,
ansarieh, kawtharyet el rizz,
kawthariyet el siyyad, kfarwa,
khartoum, kherbet dweir,
maameriet el khrab, mazraat el
osta, with a total length of 379
km, and the construction of
sewer pumping stations in
sarafund.
100,000
Remaining
Wastewater
Networks in the
Coastal Chouf
Area
21-Jun-17 Chouf 13,928,566
Arab Fund for
Economic and
Social
Development,
Lebanese
Government
32
Constructionsof main and
secondary sewer lines with its
house conections of about 1,748
km, in addition to a sewer
pumping station for jiye WWTP.
Beneficiary villages are jiye , haret
baasir , daher elmagarah , barja ,
el borjain , shihim , jadra ,
alrimaleh , alwardaniye , daoood
75,000 75,000
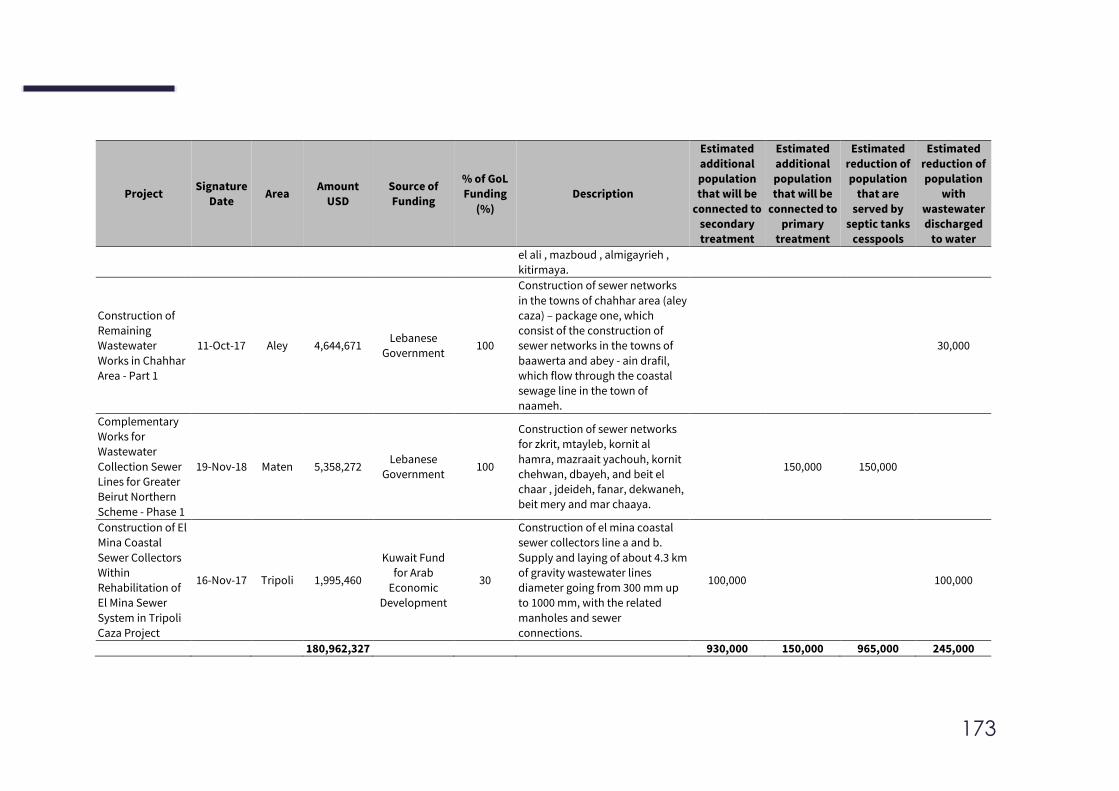
173
Project Signature
Date Area
Amount
USD
Source of
Funding
% of GoL
Funding
(%)
Description
Estimated
additional
population
that will be
connected to
secondary
treatment
Estimated
additional
population
that will be
connected to
primary
treatment
Estimated
reduction of
population
that are
served by
septic tanks
cesspools
Estimated
reduction of
population
with
wastewater
discharged
to water
el ali , mazboud , almigayrieh ,
kitirmaya.
Construction of
Remaining
Wastewater
Works in Chahhar
Area - Part 1
11-Oct-17 Aley 4,644,671 Lebanese
Government 100
Construction of sewer networks
in the towns of chahhar area (aley
caza) – package one, which
consist of the construction of
sewer networks in the towns of
baawerta and abey - ain drafil,
which flow through the coastal
sewage line in the town of
naameh.
30,000
Complementary
Works for
Wastewater
Collection Sewer
Lines for Greater
Beirut Northern
Scheme - Phase 1
19-Nov-18 Maten 5,358,272 Lebanese
Government 100
Construction of sewer networks
for zkrit, mtayleb, kornit al
hamra, mazraait yachouh, kornit
chehwan, dbayeh, and beit el
chaar , jdeideh, fanar, dekwaneh,
beit mery and mar chaaya.
150,000 150,000
Construction of El
Mina Coastal
Sewer Collectors
Within
Rehabilitation of
El Mina Sewer
System in Tripoli
Caza Project
16-Nov-17 Tripoli 1,995,460
Kuwait Fund
for Arab
Economic
Development
30
Construction of el mina coastal
sewer collectors line a and b.
Supply and laying of about 4.3 km
of gravity wastewater lines
diameter going from 300 mm up
to 1000 mm, with the related
manholes and sewer
connections.
100,000 100,000
180,962,327 930,000 150,000 965,000 245,000
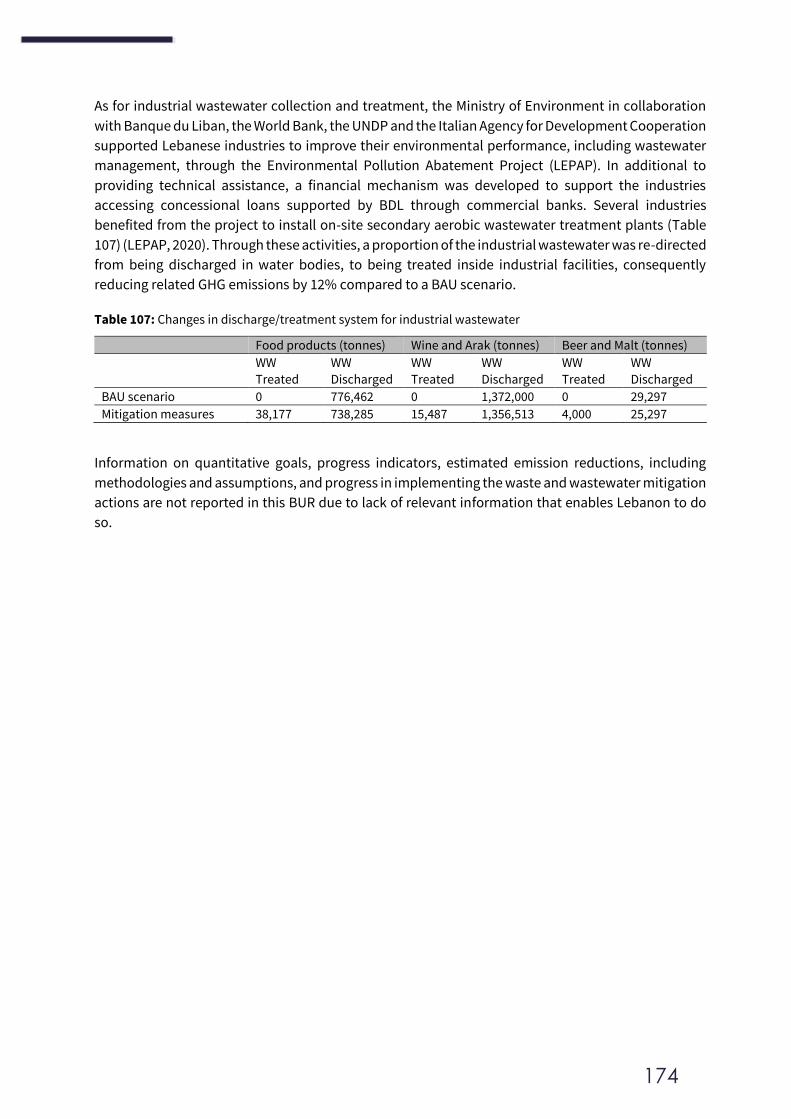
174
As for industrial wastewater collection and treatment, the Ministry of Environment in collaboration
with Banque du Liban, the World Bank, the UNDP and the Italian Agency for Development Cooperation
supported Lebanese industries to improve their environmental performance, including wastewater
management, through the Environmental Pollution Abatement Project (LEPAP). In additional to
providing technical assistance, a financial mechanism was developed to support the industries
accessing concessional loans supported by BDL through commercial banks. Several industries
benefited from the project to install on-site secondary aerobic wastewater treatment plants (Table
107) (LEPAP, 2020). Through these activities, a proportion of the industrial wastewater was re-directed
from being discharged in water bodies, to being treated inside industrial facilities, consequently
reducing related GHG emissions by 12% compared to a BAU scenario.
Table 107: Changes in discharge/treatment system for industrial wastewater
Food products (tonnes) Wine and Arak (tonnes) Beer and Malt (tonnes)
WW
Treated
WW
Discharged
WW
Treated
WW
Discharged
WW
Treated
WW
Discharged
BAU scenario 0 776,462 0 1,372,000 0 29,297
Mitigation measures 38,177 738,285 15,487 1,356,513 4,000 25,297
Information on quantitative goals, progress indicators, estimated emission reductions, including
methodologies and assumptions, and progress in implementing the waste and wastewater mitigation
actions are not reported in this BUR due to lack of relevant information that enables Lebanon to do
so.
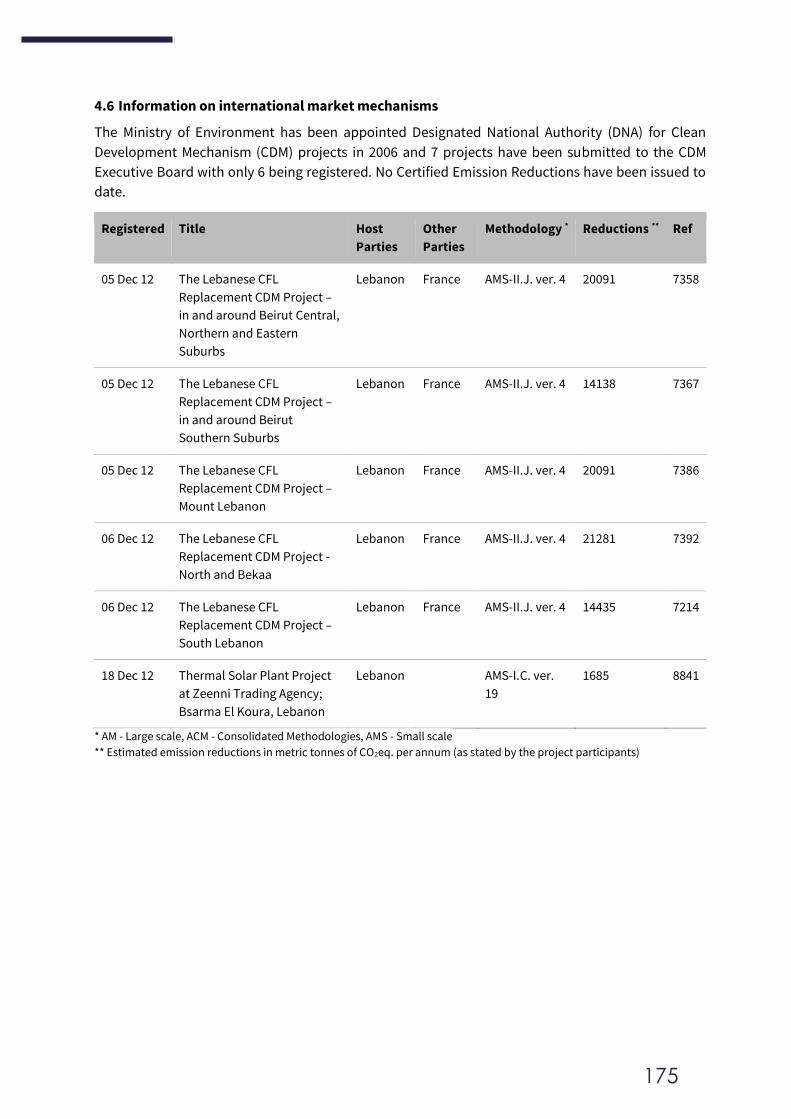
175
4.6 Information on international market mechanisms
The Ministry of Environment has been appointed Designated National Authority (DNA) for Clean
Development Mechanism (CDM) projects in 2006 and 7 projects have been submitted to the CDM
Executive Board with only 6 being registered. No Certified Emission Reductions have been issued to
date.
Registered Title Host
Parties
Other
Parties
Methodology * Reductions ** Ref
05 Dec 12 The Lebanese CFL
Replacement CDM Project –
in and around Beirut Central,
Northern and Eastern
Suburbs
Lebanon France AMS-II.J. ver. 4 20091 7358
05 Dec 12 The Lebanese CFL
Replacement CDM Project –
in and around Beirut
Southern Suburbs
Lebanon France AMS-II.J. ver. 4 14138 7367
05 Dec 12 The Lebanese CFL
Replacement CDM Project –
Mount Lebanon
Lebanon France AMS-II.J. ver. 4 20091 7386
06 Dec 12 The Lebanese CFL
Replacement CDM Project -
North and Bekaa
Lebanon France AMS-II.J. ver. 4 21281 7392
06 Dec 12 The Lebanese CFL
Replacement CDM Project –
South Lebanon
Lebanon France AMS-II.J. ver. 4 14435 7214
18 Dec 12 Thermal Solar Plant Project
at Zeenni Trading Agency;
Bsarma El Koura, Lebanon
Lebanon AMS-I.C. ver.
19
1685 8841
* AM - Large scale, ACM - Consolidated Methodologies, AMS - Small scale
** Estimated emission reductions in metric tonnes of CO2eq. per annum (as stated by the project participants)
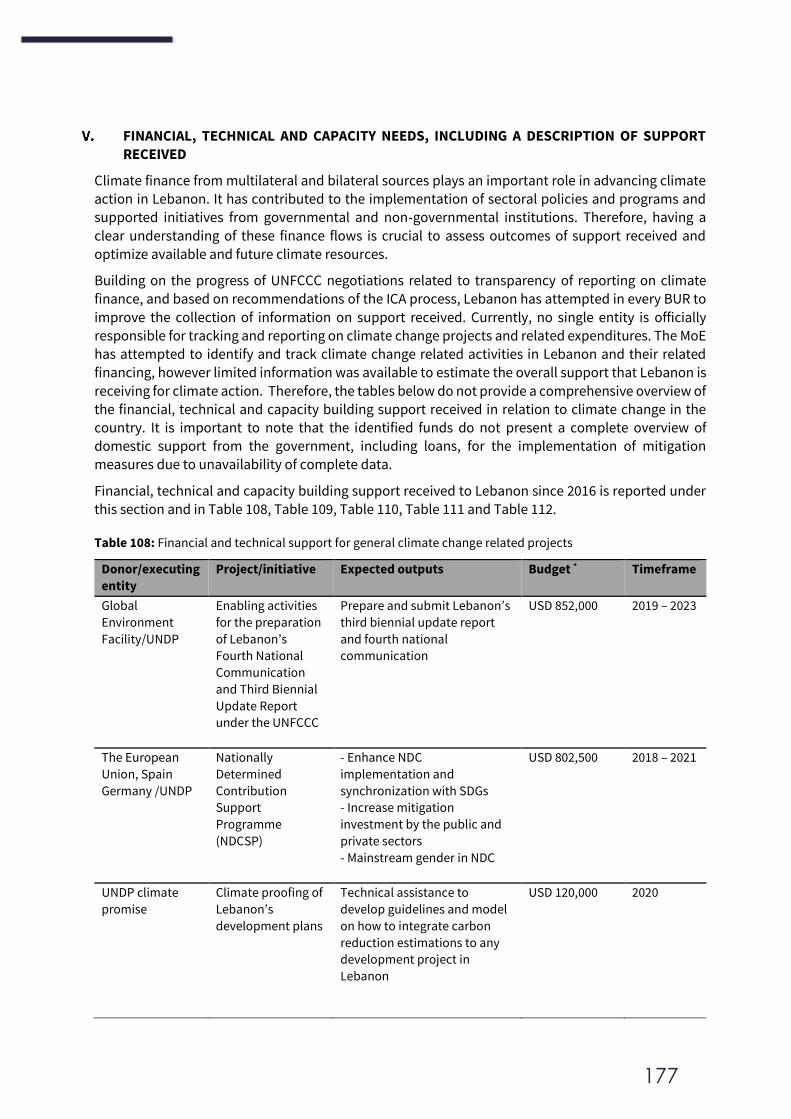
177
FINANCIAL, TECHNICAL AND CAPACITY NEEDS, INCLUDING A DESCRIPTION OF SUPPORT RECEIVED
Climate finance from multilateral and bilateral sources plays an important role in advancing climate action in Lebanon. It has contributed to the implementation of sectoral policies and programs and
supported initiatives from governmental and non-governmental institutions. Therefore, having a
clear understanding of these finance flows is crucial to assess outcomes of support received and optimize available and future climate resources.
Building on the progress of UNFCCC negotiations related to transparency of reporting on climate finance, and based on recommendations of the ICA process, Lebanon has attempted in every BUR to
improve the collection of information on support received. Currently, no single entity is officially responsible for tracking and reporting on climate change projects and related expenditures. The MoE has attempted to identify and track climate change related activities in Lebanon and their related
financing, however limited information was available to estimate the overall support that Lebanon is
receiving for climate action. Therefore, the tables below do not provide a comprehensive overview of the financial, technical and capacity building support received in relation to climate change in the
country. It is important to note that the identified funds do not present a complete overview of domestic support from the government, including loans, for the implementation of mitigation
measures due to unavailability of complete data.
Financial, technical and capacity building support received to Lebanon since 2016 is reported under
this section and in Table 108, Table 109, Table 110, Table 111 and Table 112.
Table 108: Financial and technical support for general climate change related projects
Donor/executing
entity
Project/initiative Expected outputs Budget * Timeframe
Global
Environment
Facility/UNDP
Enabling activities
for the preparation
of Lebanon’s
Fourth National
Communication
and Third Biennial
Update Report
under the UNFCCC
Prepare and submit Lebanon’s
third biennial update report
and fourth national
communication
USD 852,000 2019 – 2023
The European
Union, Spain
Germany /UNDP
Nationally
Determined
Contribution
Support
Programme
(NDCSP)
- Enhance NDC
implementation and
synchronization with SDGs
- Increase mitigation
investment by the public and
private sectors
- Mainstream gender in NDC
USD 802,500 2018 – 2021
UNDP climate
promise
Climate proofing of
Lebanon’s
development plans
Technical assistance to
develop guidelines and model
on how to integrate carbon
reduction estimations to any
development project in
Lebanon
USD 120,000 2020
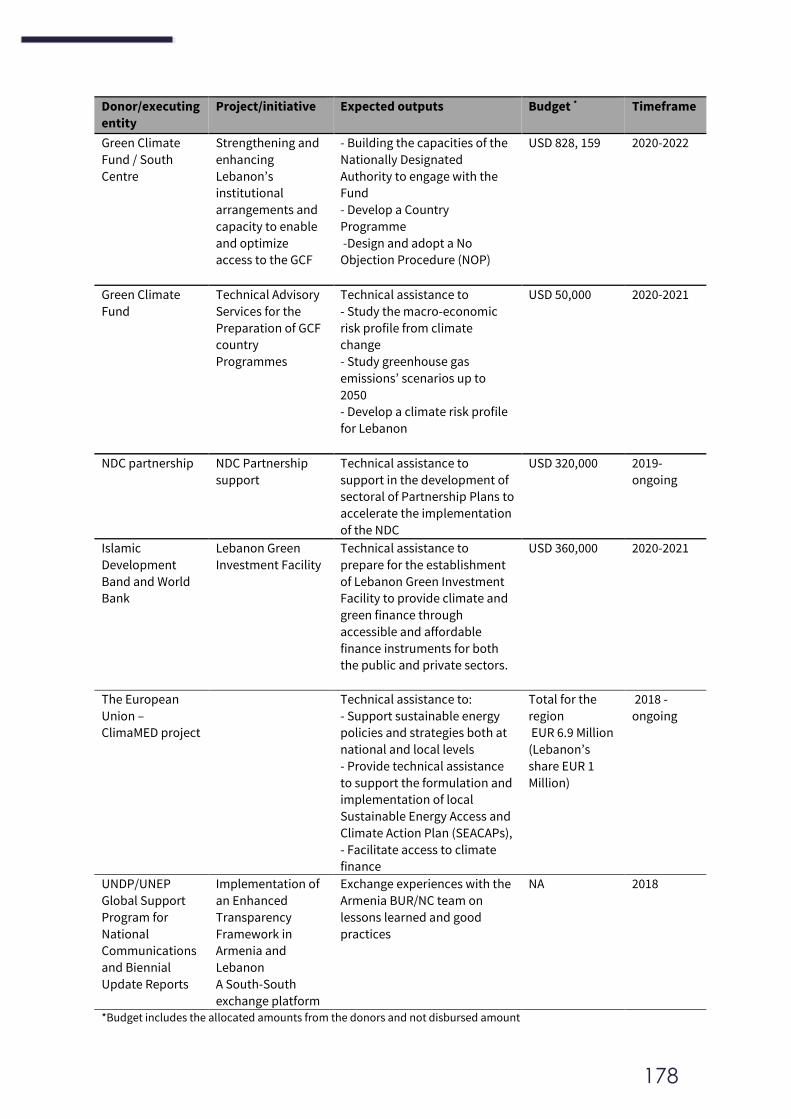
178
Donor/executing
entity
Project/initiative Expected outputs Budget * Timeframe
Green Climate
Fund / South
Centre
Strengthening and
enhancing
Lebanon’s
institutional
arrangements and
capacity to enable
and optimize
access to the GCF
- Building the capacities of the
Nationally Designated
Authority to engage with the
Fund
- Develop a Country
Programme
-Design and adopt a No
Objection Procedure (NOP)
USD 828, 159 2020-2022
Green Climate
Fund
Technical Advisory
Services for the
Preparation of GCF
country
Programmes
Technical assistance to
- Study the macro-economic
risk profile from climate
change
- Study greenhouse gas
emissions’ scenarios up to
2050
- Develop a climate risk profile
for Lebanon
USD 50,000 2020-2021
NDC partnership NDC Partnership
support
Technical assistance to
support in the development of
sectoral of Partnership Plans to
accelerate the implementation
of the NDC
USD 320,000 2019-
ongoing
Islamic
Development
Band and World
Bank
Lebanon Green
Investment Facility
Technical assistance to
prepare for the establishment
of Lebanon Green Investment
Facility to provide climate and
green finance through
accessible and affordable
finance instruments for both
the public and private sectors.
USD 360,000 2020-2021
The European
Union –
ClimaMED project
Technical assistance to:
- Support sustainable energy
policies and strategies both at
national and local levels
- Provide technical assistance
to support the formulation and
implementation of local
Sustainable Energy Access and
Climate Action Plan (SEACAPs),
- Facilitate access to climate
finance
Total for the
region
EUR 6.9 Million
(Lebanon’s
share EUR 1
Million)
2018 -
ongoing
UNDP/UNEP
Global Support
Program for
National
Communications
and Biennial
Update Reports
Implementation of
an Enhanced
Transparency
Framework in
Armenia and
Lebanon
A South-South
exchange platform
Exchange experiences with the
Armenia BUR/NC team on
lessons learned and good
practices
NA 2018
*Budget includes the allocated amounts from the donors and not disbursed amount
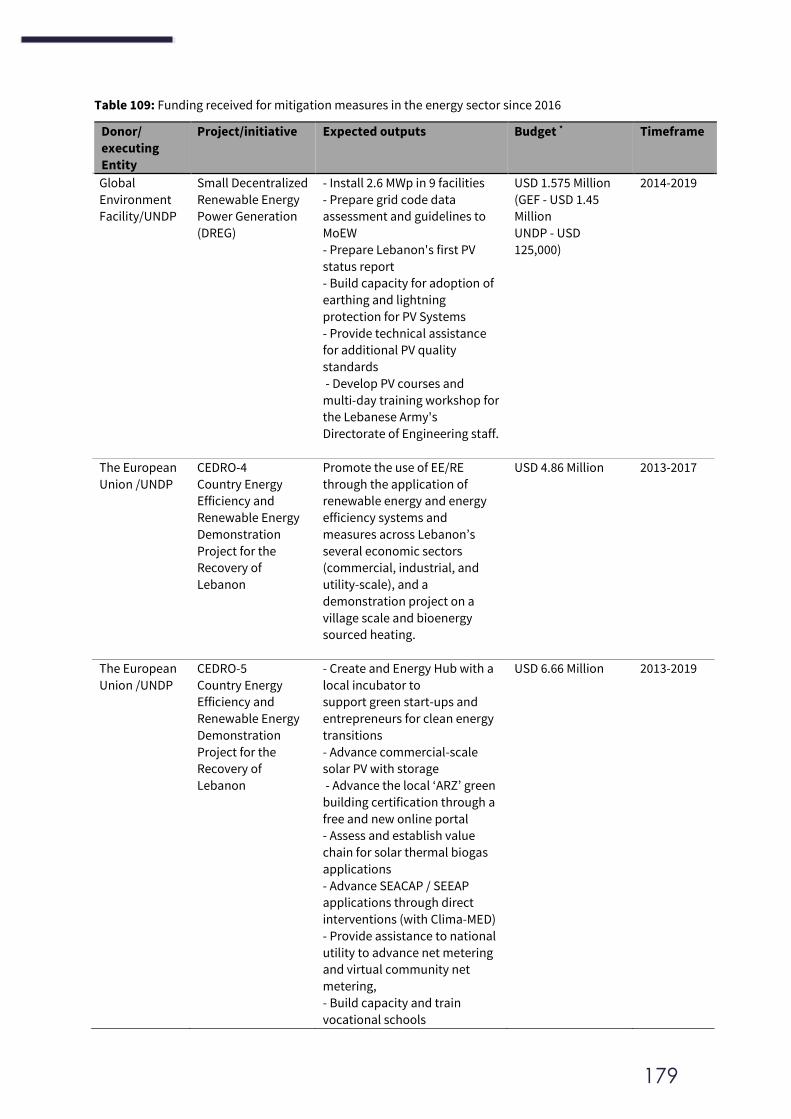
179
Table 109: Funding received for mitigation measures in the energy sector since 2016
Donor/
executing
Entity
Project/initiative Expected outputs Budget * Timeframe
Global
Environment
Facility/UNDP
Small Decentralized
Renewable Energy
Power Generation
(DREG)
- Install 2.6 MWp in 9 facilities
- Prepare grid code data
assessment and guidelines to
MoEW
- Prepare Lebanon's first PV
status report
- Build capacity for adoption of
earthing and lightning
protection for PV Systems
- Provide technical assistance
for additional PV quality
standards
- Develop PV courses and
multi-day training workshop for
the Lebanese Army's
Directorate of Engineering staff.
USD 1.575 Million
(GEF - USD 1.45
Million
UNDP - USD
125,000)
2014-2019
The European
Union /UNDP
CEDRO-4
Country Energy
Efficiency and
Renewable Energy
Demonstration
Project for the
Recovery of
Lebanon
Promote the use of EE/RE
through the application of
renewable energy and energy
efficiency systems and
measures across Lebanon’s
several economic sectors
(commercial, industrial, and
utility-scale), and a
demonstration project on a
village scale and bioenergy
sourced heating.
USD 4.86 Million 2013-2017
The European
Union /UNDP
CEDRO-5
Country Energy
Efficiency and
Renewable Energy
Demonstration
Project for the
Recovery of
Lebanon
- Create and Energy Hub with a
local incubator to
support green start-ups and
entrepreneurs for clean energy
transitions
- Advance commercial-scale
solar PV with storage
- Advance the local ‘ARZ’ green
building certification through a
free and new online portal
- Assess and establish value
chain for solar thermal biogas
applications
- Advance SEACAP / SEEAP
applications through direct
interventions (with Clima-MED)
- Provide assistance to national
utility to advance net metering
and virtual community net
metering,
- Build capacity and train
vocational schools
USD 6.66 Million 2013-2019
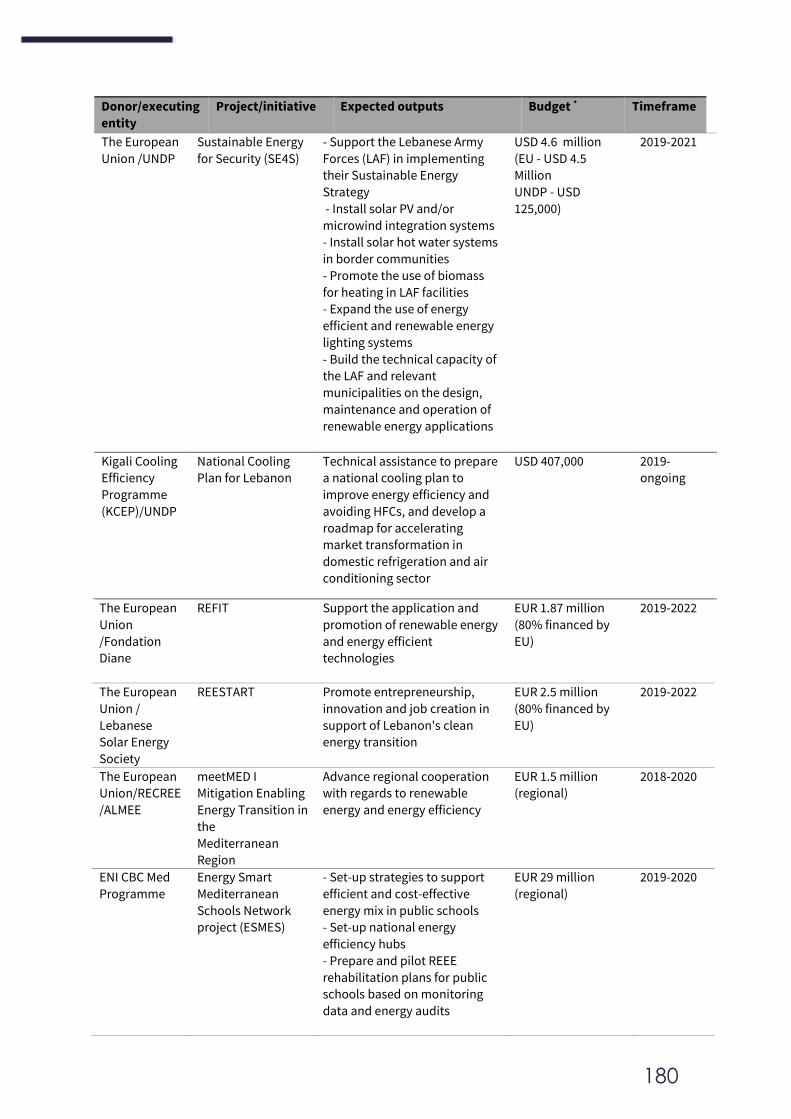
180
Donor/executing
entity
Project/initiative Expected outputs Budget * Timeframe
The European
Union /UNDP
Sustainable Energy
for Security (SE4S)
- Support the Lebanese Army
Forces (LAF) in implementing
their Sustainable Energy
Strategy
- Install solar PV and/or
microwind integration systems
- Install solar hot water systems
in border communities
- Promote the use of biomass
for heating in LAF facilities
- Expand the use of energy
efficient and renewable energy
lighting systems
- Build the technical capacity of
the LAF and relevant
municipalities on the design,
maintenance and operation of
renewable energy applications
USD 4.6 million
(EU - USD 4.5
Million
UNDP - USD
125,000)
2019-2021
Kigali Cooling
Efficiency
Programme
(KCEP)/UNDP
National Cooling
Plan for Lebanon
Technical assistance to prepare
a national cooling plan to
improve energy efficiency and
avoiding HFCs, and develop a
roadmap for accelerating
market transformation in
domestic refrigeration and air
conditioning sector
USD 407,000 2019-
ongoing
The European
Union
/Fondation
Diane
REFIT Support the application and
promotion of renewable energy
and energy efficient
technologies
EUR 1.87 million
(80% financed by
EU)
2019-2022
The European
Union / Lebanese
Solar Energy
Society
REESTART Promote entrepreneurship,
innovation and job creation in
support of Lebanon's clean
energy transition
EUR 2.5 million
(80% financed by
EU)
2019-2022
The European
Union/RECREE
/ALMEE
meetMED I
Mitigation Enabling
Energy Transition in
the
Mediterranean
Region
Advance regional cooperation
with regards to renewable
energy and energy efficiency
EUR 1.5 million
(regional)
2018-2020
ENI CBC Med
Programme
Energy Smart
Mediterranean
Schools Network
project (ESMES)
- Set-up strategies to support
efficient and cost-effective
energy mix in public schools
- Set-up national energy
efficiency hubs
- Prepare and pilot REEE
rehabilitation plans for public
schools based on monitoring
data and energy audits
EUR 29 million
(regional)
2019-2020
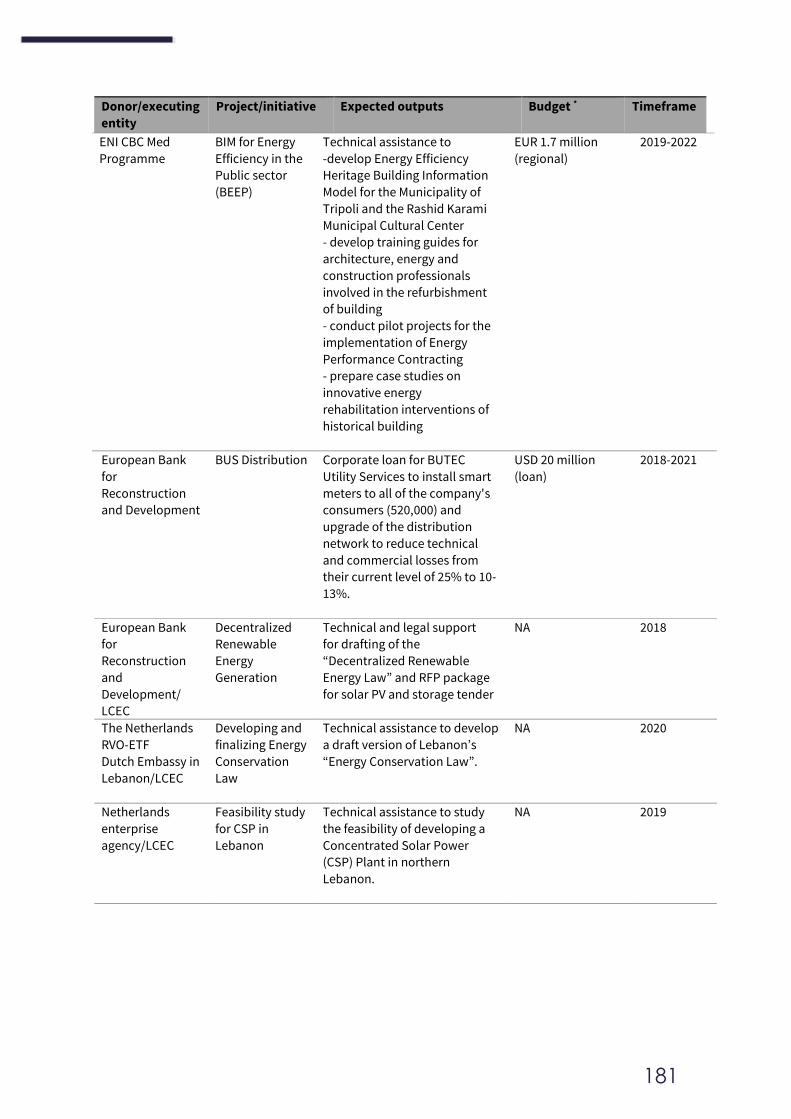
181
Donor/executing
entity
Project/initiative Expected outputs Budget * Timeframe
ENI CBC Med
Programme
BIM for Energy
Efficiency in the
Public sector
(BEEP)
Technical assistance to
-develop Energy Efficiency
Heritage Building Information
Model for the Municipality of
Tripoli and the Rashid Karami
Municipal Cultural Center
- develop training guides for
architecture, energy and
construction professionals
involved in the refurbishment
of building
- conduct pilot projects for the
implementation of Energy
Performance Contracting
- prepare case studies on
innovative energy
rehabilitation interventions of
historical building
EUR 1.7 million
(regional)
2019-2022
European Bank
for
Reconstruction
and Development
BUS Distribution Corporate loan for BUTEC
Utility Services to install smart
meters to all of the company's
consumers (520,000) and
upgrade of the distribution
network to reduce technical
and commercial losses from
their current level of 25% to 10-
13%.
USD 20 million
(loan)
2018-2021
European Bank
for
Reconstruction
and
Development/
LCEC
Decentralized
Renewable
Energy
Generation
Technical and legal support
for drafting of the
“Decentralized Renewable
Energy Law” and RFP package
for solar PV and storage tender
NA 2018
The Netherlands
RVO-ETF
Dutch Embassy in
Lebanon/LCEC
Developing and
finalizing Energy
Conservation
Law
Technical assistance to develop
a draft version of Lebanon’s
“Energy Conservation Law”.
NA 2020
Netherlands
enterprise
agency/LCEC
Feasibility study
for CSP in
Lebanon
Technical assistance to study
the feasibility of developing a
Concentrated Solar Power
(CSP) Plant in northern
Lebanon.
NA 2019
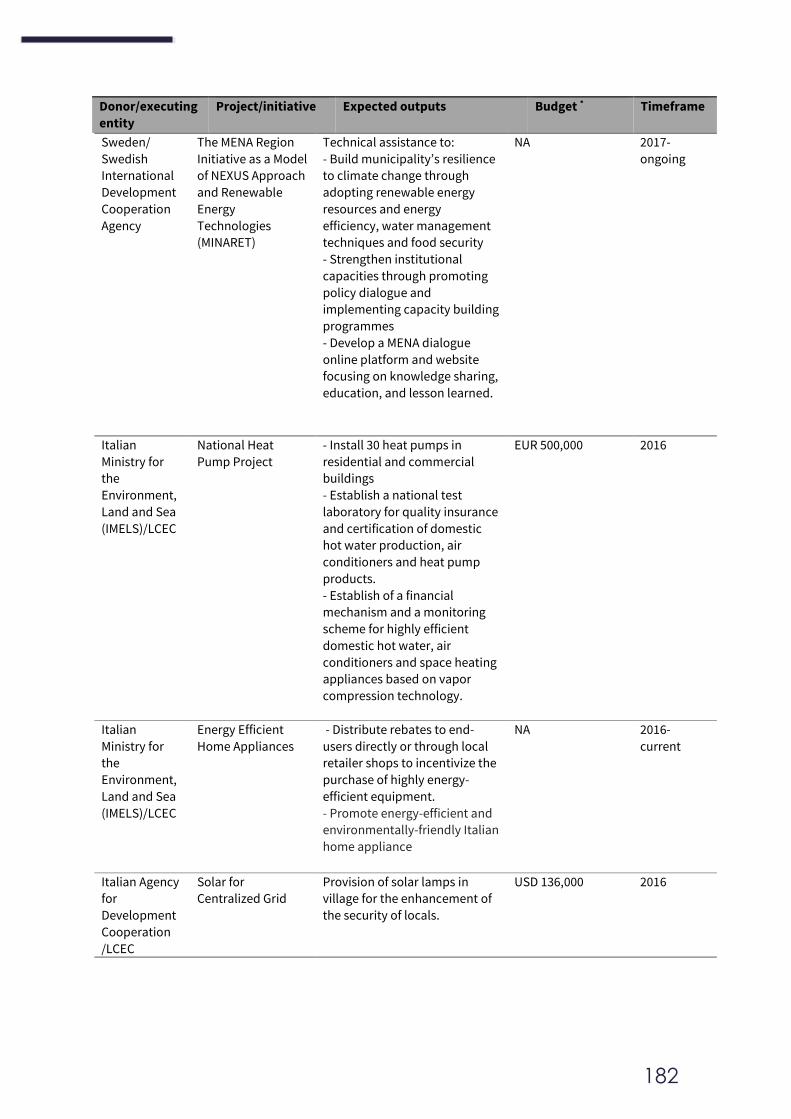
182
Donor/executing
entity
Project/initiative Expected outputs Budget * Timeframe
Sweden/ Swedish
International
Development
Cooperation
Agency
The MENA Region
Initiative as a Model
of NEXUS Approach
and Renewable
Energy
Technologies
(MINARET)
Technical assistance to:
- Build municipality’s resilience
to climate change through
adopting renewable energy
resources and energy
efficiency, water management
techniques and food security
- Strengthen institutional
capacities through promoting
policy dialogue and
implementing capacity building
programmes
- Develop a MENA dialogue
online platform and website
focusing on knowledge sharing,
education, and lesson learned.
NA 2017-
ongoing
Italian
Ministry for
the
Environment,
Land and Sea
(IMELS)/LCEC
National Heat
Pump Project
- Install 30 heat pumps in
residential and commercial
buildings
- Establish a national test
laboratory for quality insurance
and certification of domestic
hot water production, air
conditioners and heat pump
products.
- Establish of a financial
mechanism and a monitoring
scheme for highly efficient
domestic hot water, air
conditioners and space heating
appliances based on vapor
compression technology.
EUR 500,000 2016
Italian
Ministry for
the
Environment,
Land and Sea
(IMELS)/LCEC
Energy Efficient
Home Appliances
- Distribute rebates to end-
users directly or through local
retailer shops to incentivize the
purchase of highly energy-
efficient equipment.
- Promote energy-efficient and
environmentally-friendly Italian
home appliance
NA 2016-
current
Italian Agency
for
Development
Cooperation
/LCEC
Solar for
Centralized Grid
Provision of solar lamps in
village for the enhancement of
the security of locals.
USD 136,000 2016
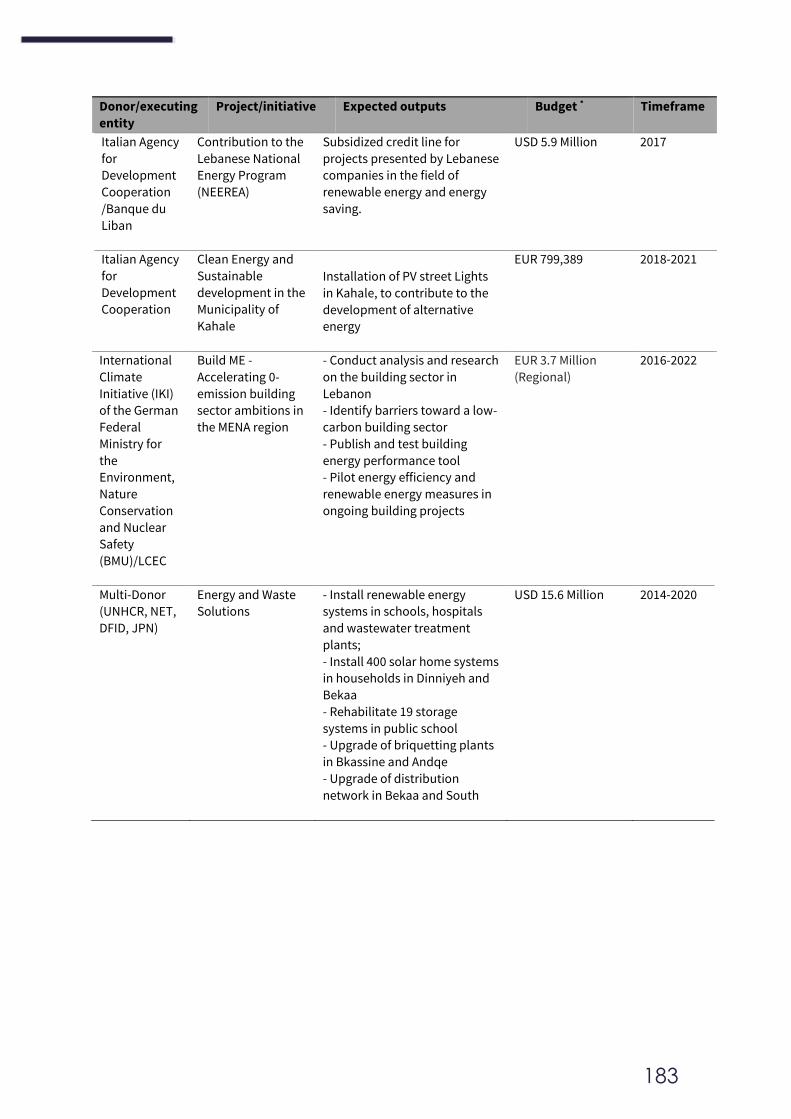
183
Donor/executing
entity
Project/initiative Expected outputs Budget * Timeframe
Italian Agency
for
Development
Cooperation
/Banque du
Liban
Contribution to the
Lebanese National
Energy Program
(NEEREA)
Subsidized credit line for
projects presented by Lebanese
companies in the field of
renewable energy and energy
saving.
USD 5.9 Million 2017
Italian Agency
for
Development
Cooperation
Clean Energy and
Sustainable
development in the
Municipality of
Kahale
Installation of PV street Lights
in Kahale, to contribute to the
development of alternative
energy
EUR 799,389 2018-2021
International
Climate
Initiative (IKI)
of the German
Federal
Ministry for
the
Environment,
Nature
Conservation
and Nuclear
Safety
(BMU)/LCEC
Build ME -
Accelerating 0-
emission building
sector ambitions in
the MENA region
- Conduct analysis and research
on the building sector in
Lebanon
- Identify barriers toward a low-
carbon building sector
- Publish and test building
energy performance tool
- Pilot energy efficiency and
renewable energy measures in
ongoing building projects
EUR 3.7 Million
(Regional)
2016-2022
Multi-Donor
(UNHCR, NET,
DFID, JPN)
Energy and Waste
Solutions
- Install renewable energy
systems in schools, hospitals
and wastewater treatment
plants;
- Install 400 solar home systems
in households in Dinniyeh and
Bekaa
- Rehabilitate 19 storage
systems in public school
- Upgrade of briquetting plants
in Bkassine and Andqe
- Upgrade of distribution
network in Bekaa and South
USD 15.6 Million 2014-2020
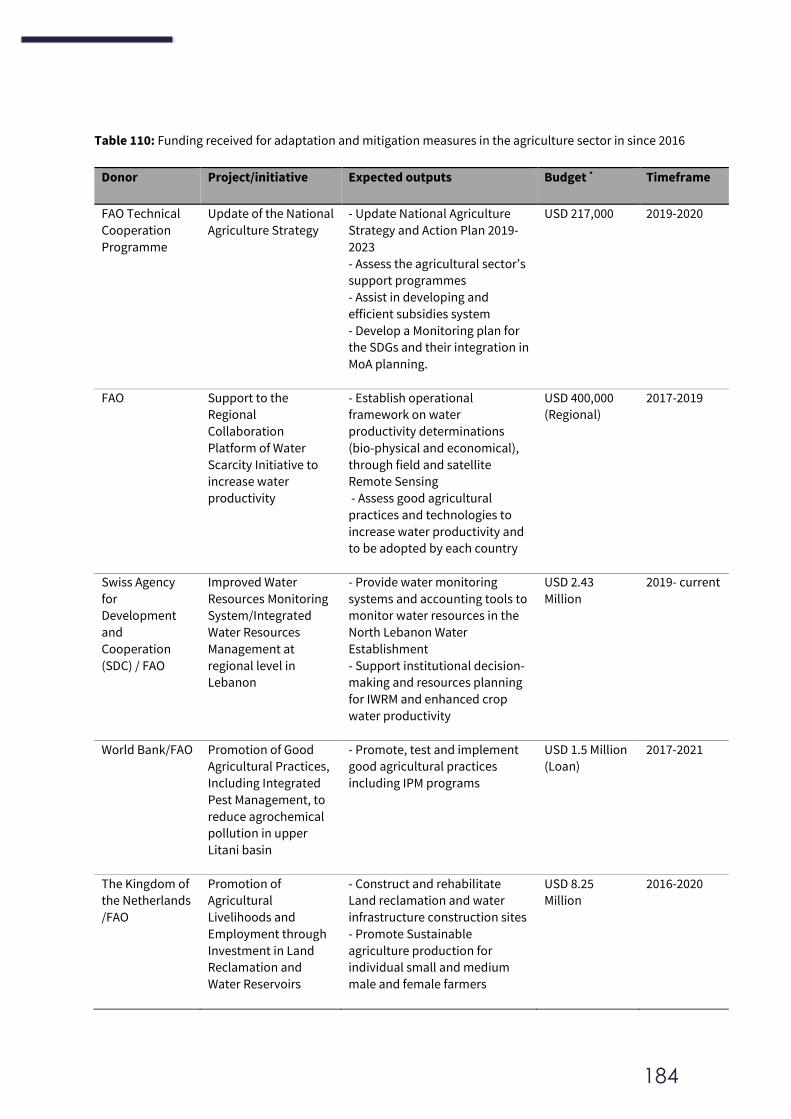
184
Table 110: Funding received for adaptation and mitigation measures in the agriculture sector in since 2016
Donor Project/initiative Expected outputs Budget * Timeframe
FAO Technical
Cooperation
Programme
Update of the National
Agriculture Strategy
- Update National Agriculture
Strategy and Action Plan 2019-
2023
- Assess the agricultural sector’s
support programmes
- Assist in developing and
efficient subsidies system
- Develop a Monitoring plan for
the SDGs and their integration in
MoA planning.
USD 217,000 2019-2020
FAO Support to the
Regional
Collaboration
Platform of Water
Scarcity Initiative to
increase water
productivity
- Establish operational
framework on water
productivity determinations
(bio-physical and economical),
through field and satellite
Remote Sensing
- Assess good agricultural
practices and technologies to
increase water productivity and
to be adopted by each country
USD 400,000
(Regional)
2017-2019
Swiss Agency
for
Development
and
Cooperation
(SDC) / FAO
Improved Water
Resources Monitoring
System/Integrated
Water Resources
Management at
regional level in
Lebanon
- Provide water monitoring
systems and accounting tools to
monitor water resources in the
North Lebanon Water
Establishment
- Support institutional decision-
making and resources planning
for IWRM and enhanced crop
water productivity
USD 2.43
Million
2019- current
World Bank/FAO Promotion of Good
Agricultural Practices,
Including Integrated
Pest Management, to
reduce agrochemical
pollution in upper
Litani basin
- Promote, test and implement
good agricultural practices
including IPM programs
USD 1.5 Million
(Loan)
2017-2021
The Kingdom of
the Netherlands
/FAO
Promotion of
Agricultural
Livelihoods and
Employment through
Investment in Land
Reclamation and
Water Reservoirs
- Construct and rehabilitate
Land reclamation and water
infrastructure construction sites
- Promote Sustainable
agriculture production for
individual small and medium
male and female farmers
USD 8.25
Million
2016-2020
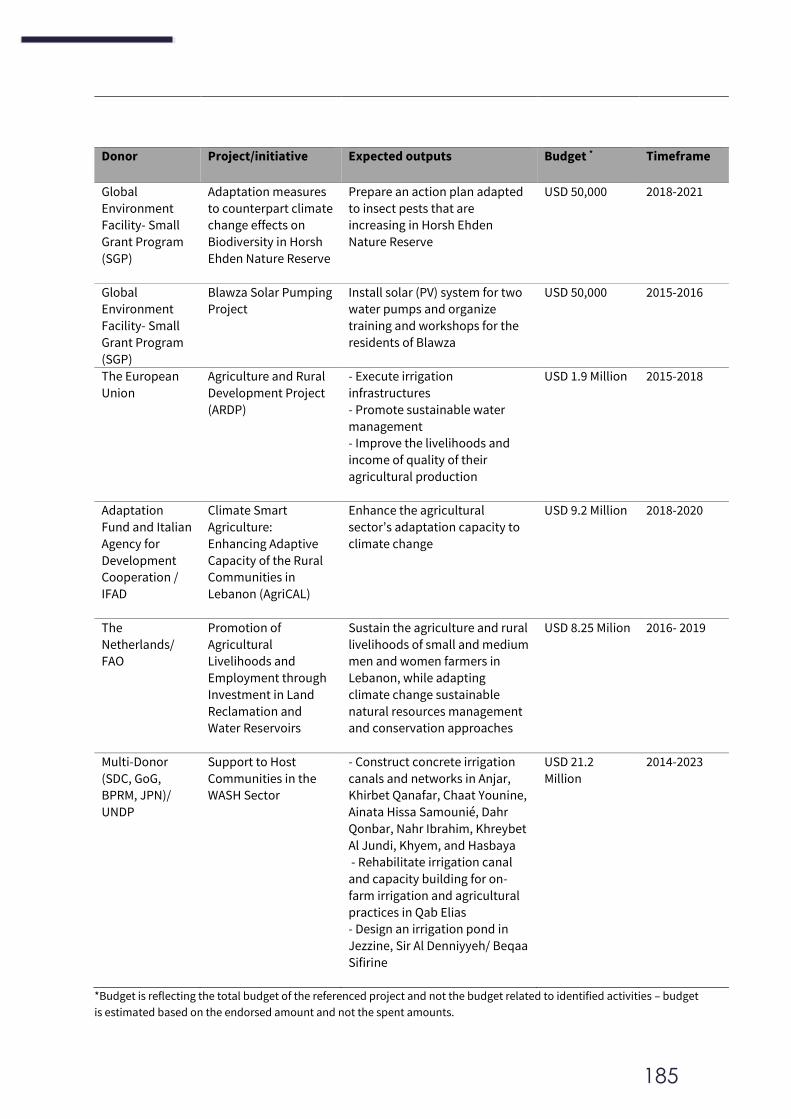
185
Donor Project/initiative Expected outputs Budget * Timeframe
Global
Environment
Facility- Small
Grant Program
(SGP)
Adaptation measures
to counterpart climate
change effects on
Biodiversity in Horsh
Ehden Nature Reserve
Prepare an action plan adapted
to insect pests that are
increasing in Horsh Ehden
Nature Reserve
USD 50,000 2018-2021
Global
Environment
Facility- Small
Grant Program
(SGP)
Blawza Solar Pumping
Project
Install solar (PV) system for two
water pumps and organize
training and workshops for the
residents of Blawza
USD 50,000 2015-2016
The European
Union
Agriculture and Rural
Development Project
(ARDP)
- Execute irrigation
infrastructures
- Promote sustainable water
management
- Improve the livelihoods and
income of quality of their
agricultural production
USD 1.9 Million 2015-2018
Adaptation
Fund and Italian
Agency for
Development
Cooperation /
IFAD
Climate Smart
Agriculture:
Enhancing Adaptive
Capacity of the Rural
Communities in
Lebanon (AgriCAL)
Enhance the agricultural
sector’s adaptation capacity to
climate change
USD 9.2 Million 2018-2020
The
Netherlands/
FAO
Promotion of
Agricultural
Livelihoods and
Employment through
Investment in Land
Reclamation and
Water Reservoirs
Sustain the agriculture and rural
livelihoods of small and medium
men and women farmers in
Lebanon, while adapting
climate change sustainable
natural resources management
and conservation approaches
USD 8.25 Milion 2016- 2019
Multi-Donor
(SDC, GoG,
BPRM, JPN)/
UNDP
Support to Host
Communities in the
WASH Sector
- Construct concrete irrigation
canals and networks in Anjar,
Khirbet Qanafar, Chaat Younine,
Ainata Hissa Samounié, Dahr
Qonbar, Nahr Ibrahim, Khreybet
Al Jundi, Khyem, and Hasbaya
- Rehabilitate irrigation canal
and capacity building for on-
farm irrigation and agricultural
practices in Qab Elias
- Design an irrigation pond in
Jezzine, Sir Al Denniyyeh/ Beqaa
Sifirine
USD 21.2
Million
2014-2023
*Budget is reflecting the total budget of the referenced project and not the budget related to identified activities – budget
is estimated based on the endorsed amount and not the spent amounts.
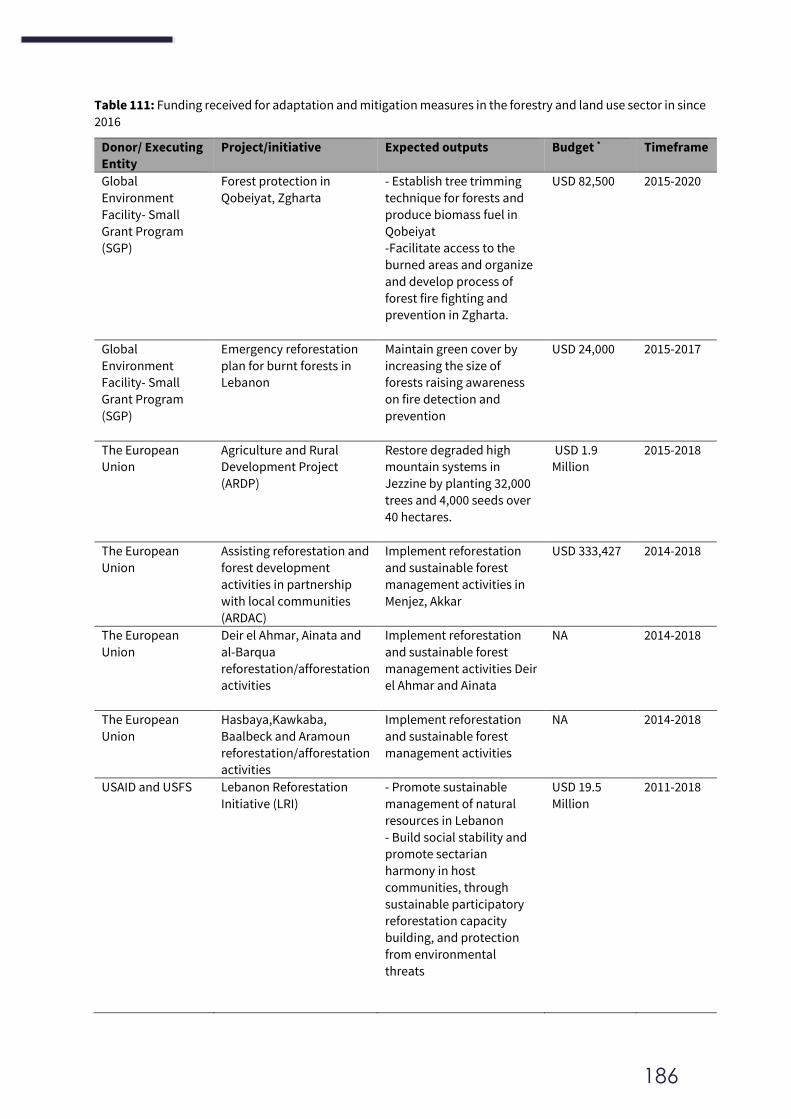
186
Table 111: Funding received for adaptation and mitigation measures in the forestry and land use sector in since
2016
Donor/ Executing
Entity
Project/initiative Expected outputs Budget * Timeframe
Global
Environment
Facility- Small
Grant Program
(SGP)
Forest protection in
Qobeiyat, Zgharta
- Establish tree trimming
technique for forests and
produce biomass fuel in
Qobeiyat
-Facilitate access to the
burned areas and organize
and develop process of
forest fire fighting and
prevention in Zgharta.
USD 82,500 2015-2020
Global
Environment
Facility- Small
Grant Program
(SGP)
Emergency reforestation
plan for burnt forests in
Lebanon
Maintain green cover by
increasing the size of
forests raising awareness
on fire detection and
prevention
USD 24,000 2015-2017
The European
Union
Agriculture and Rural
Development Project
(ARDP)
Restore degraded high
mountain systems in
Jezzine by planting 32,000
trees and 4,000 seeds over
40 hectares.
USD 1.9
Million
2015-2018
The European
Union
Assisting reforestation and
forest development
activities in partnership
with local communities
(ARDAC)
Implement reforestation
and sustainable forest
management activities in
Menjez, Akkar
USD 333,427 2014-2018
The European
Union
Deir el Ahmar, Ainata and
al-Barqua
reforestation/afforestation
activities
Implement reforestation
and sustainable forest
management activities Deir
el Ahmar and Ainata
NA 2014-2018
The European
Union
Hasbaya,Kawkaba,
Baalbeck and Aramoun
reforestation/afforestation
activities
Implement reforestation
and sustainable forest
management activities
NA 2014-2018
USAID and USFS Lebanon Reforestation
Initiative (LRI)
- Promote sustainable
management of natural
resources in Lebanon
- Build social stability and
promote sectarian
harmony in host
communities, through
sustainable participatory
reforestation capacity
building, and protection
from environmental
threats
USD 19.5
Million
2011-2018
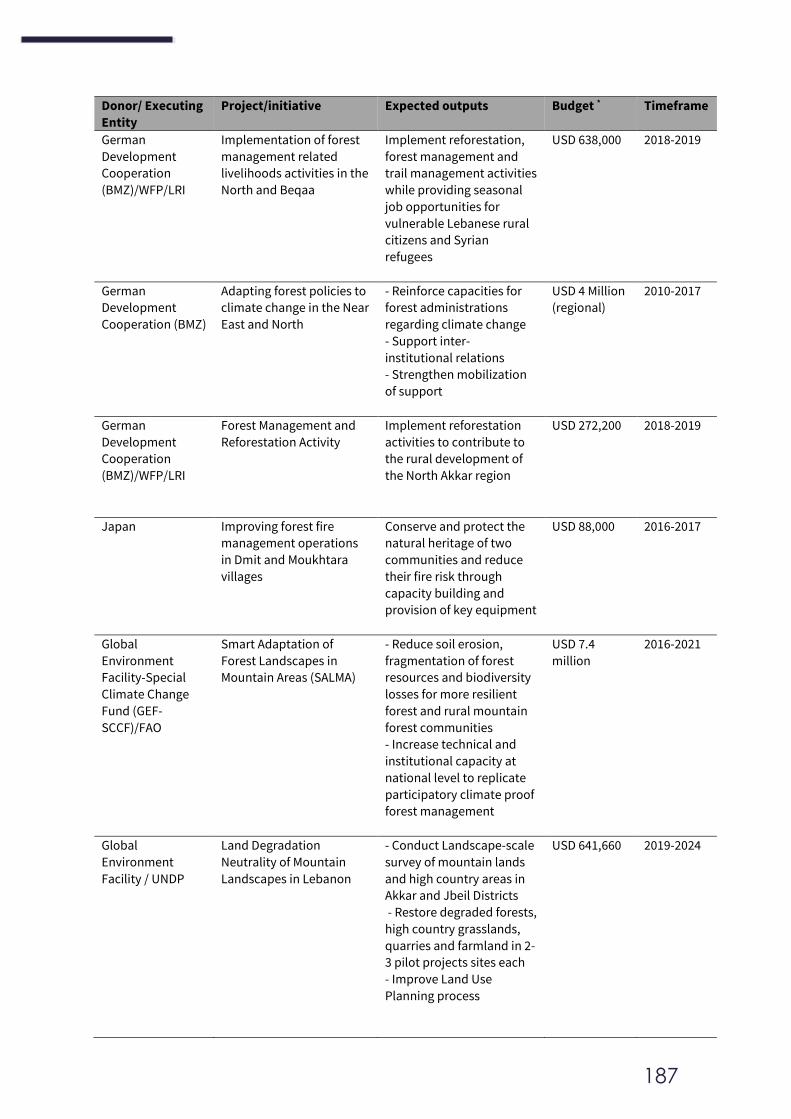
187
Donor/ Executing
Entity
Project/initiative Expected outputs Budget * Timeframe
German
Development
Cooperation
(BMZ)/WFP/LRI
Implementation of forest
management related
livelihoods activities in the
North and Beqaa
Implement reforestation,
forest management and
trail management activities
while providing seasonal
job opportunities for
vulnerable Lebanese rural
citizens and Syrian
refugees
USD 638,000 2018-2019
German
Development
Cooperation (BMZ)
Adapting forest policies to
climate change in the Near
East and North
- Reinforce capacities for
forest administrations
regarding climate change
- Support inter-
institutional relations
- Strengthen mobilization
of support
USD 4 Million
(regional)
2010-2017
German
Development
Cooperation
(BMZ)/WFP/LRI
Forest Management and
Reforestation Activity
Implement reforestation
activities to contribute to
the rural development of
the North Akkar region
USD 272,200 2018-2019
Japan Improving forest fire
management operations
in Dmit and Moukhtara
villages
Conserve and protect the
natural heritage of two
communities and reduce
their fire risk through
capacity building and
provision of key equipment
USD 88,000 2016-2017
Global
Environment
Facility-Special
Climate Change
Fund (GEF-
SCCF)/FAO
Smart Adaptation of
Forest Landscapes in
Mountain Areas (SALMA)
- Reduce soil erosion,
fragmentation of forest
resources and biodiversity
losses for more resilient
forest and rural mountain
forest communities
- Increase technical and
institutional capacity at
national level to replicate
participatory climate proof
forest management
USD 7.4
million
2016-2021
Global
Environment
Facility / UNDP
Land Degradation
Neutrality of Mountain
Landscapes in Lebanon
- Conduct Landscape-scale
survey of mountain lands
and high country areas in
Akkar and Jbeil Districts
- Restore degraded forests,
high country grasslands,
quarries and farmland in 2-
3 pilot projects sites each
- Improve Land Use
Planning process
USD 641,660 2019-2024
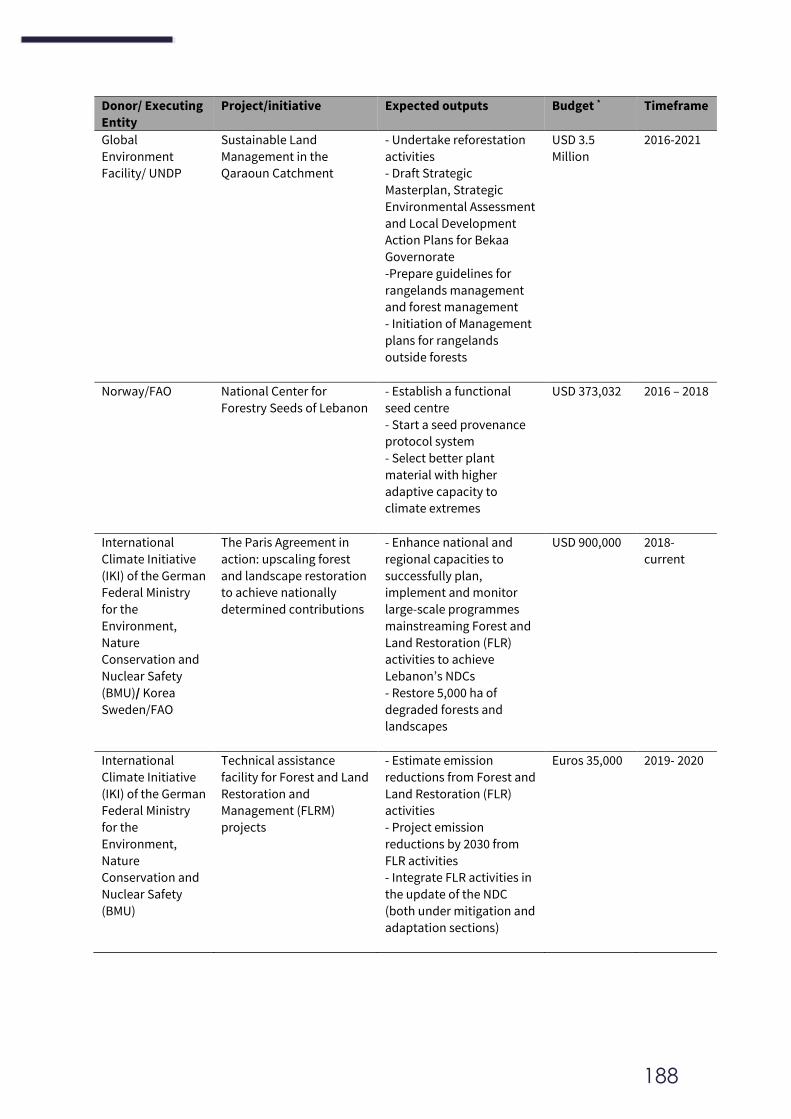
188
Donor/ Executing
Entity
Project/initiative Expected outputs Budget * Timeframe
Global
Environment
Facility/ UNDP
Sustainable Land
Management in the
Qaraoun Catchment
- Undertake reforestation
activities
- Draft Strategic
Masterplan, Strategic
Environmental Assessment
and Local Development
Action Plans for Bekaa
Governorate
-Prepare guidelines for
rangelands management
and forest management
- Initiation of Management
plans for rangelands
outside forests
USD 3.5
Million
2016-2021
Norway/FAO National Center for
Forestry Seeds of Lebanon
- Establish a functional
seed centre
- Start a seed provenance
protocol system
- Select better plant
material with higher
adaptive capacity to
climate extremes
USD 373,032 2016 – 2018
International
Climate Initiative
(IKI) of the German
Federal Ministry
for the
Environment,
Nature
Conservation and
Nuclear Safety
(BMU)/ Korea
Sweden/FAO
The Paris Agreement in
action: upscaling forest
and landscape restoration
to achieve nationally
determined contributions
- Enhance national and
regional capacities to
successfully plan,
implement and monitor
large-scale programmes
mainstreaming Forest and
Land Restoration (FLR)
activities to achieve
Lebanon’s NDCs
- Restore 5,000 ha of
degraded forests and
landscapes
USD 900,000 2018-
current
International
Climate Initiative
(IKI) of the German
Federal Ministry
for the
Environment,
Nature
Conservation and
Nuclear Safety
(BMU)
Technical assistance
facility for Forest and Land
Restoration and
Management (FLRM)
projects
- Estimate emission
reductions from Forest and
Land Restoration (FLR)
activities
- Project emission
reductions by 2030 from
FLR activities
- Integrate FLR activities in
the update of the NDC
(both under mitigation and
adaptation sections)
Euros 35,000 2019- 2020
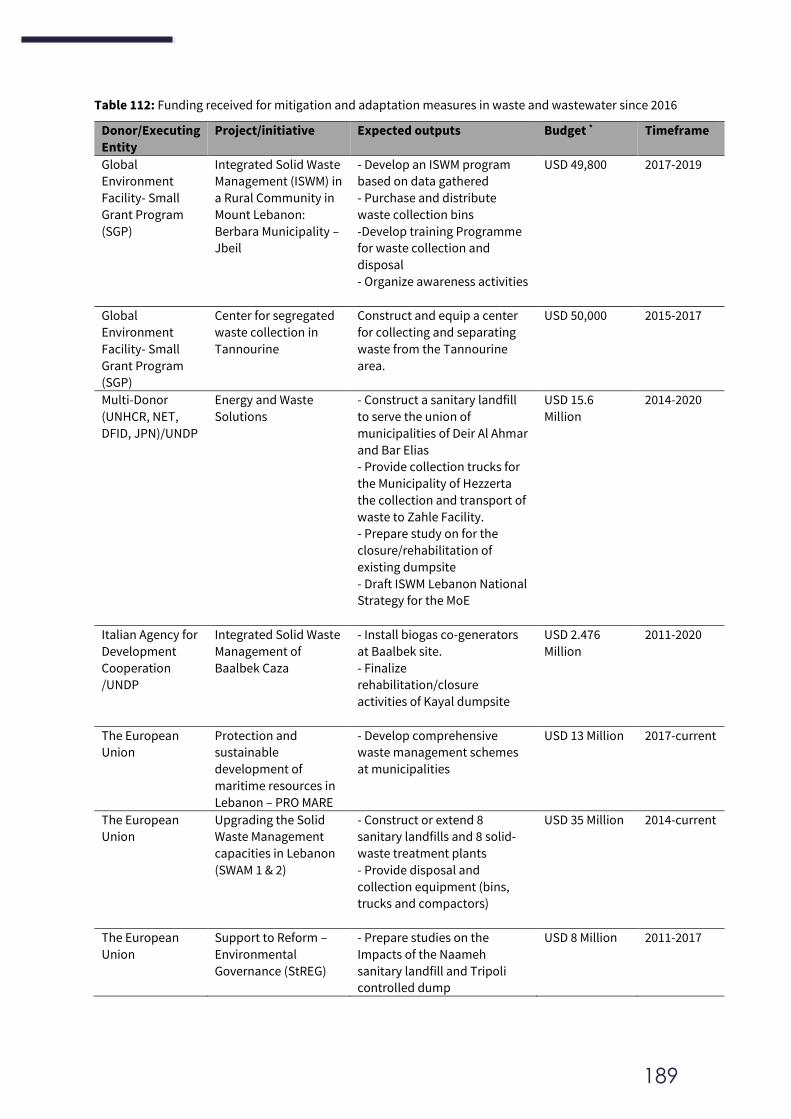
189
Table 112: Funding received for mitigation and adaptation measures in waste and wastewater since 2016
Donor/Executing
Entity
Project/initiative Expected outputs Budget * Timeframe
Global
Environment
Facility- Small
Grant Program
(SGP)
Integrated Solid Waste
Management (ISWM) in
a Rural Community in
Mount Lebanon:
Berbara Municipality –
Jbeil
- Develop an ISWM program
based on data gathered
- Purchase and distribute
waste collection bins
-Develop training Programme
for waste collection and
disposal
- Organize awareness activities
USD 49,800 2017-2019
Global
Environment
Facility- Small
Grant Program
(SGP)
Center for segregated
waste collection in
Tannourine
Construct and equip a center
for collecting and separating
waste from the Tannourine
area.
USD 50,000 2015-2017
Multi-Donor
(UNHCR, NET,
DFID, JPN)/UNDP
Energy and Waste
Solutions
- Construct a sanitary landfill
to serve the union of
municipalities of Deir Al Ahmar
and Bar Elias
- Provide collection trucks for
the Municipality of Hezzerta
the collection and transport of
waste to Zahle Facility.
- Prepare study on for the
closure/rehabilitation of
existing dumpsite
- Draft ISWM Lebanon National
Strategy for the MoE
USD 15.6
Million
2014-2020
Italian Agency for
Development
Cooperation
/UNDP
Integrated Solid Waste
Management of
Baalbek Caza
- Install biogas co-generators
at Baalbek site.
- Finalize
rehabilitation/closure
activities of Kayal dumpsite
USD 2.476
Million
2011-2020
The European
Union
Protection and
sustainable
development of
maritime resources in
Lebanon – PRO MARE
- Develop comprehensive
waste management schemes
at municipalities
USD 13 Million 2017-current
The European
Union
Upgrading the Solid
Waste Management
capacities in Lebanon
(SWAM 1 & 2)
- Construct or extend 8
sanitary landfills and 8 solid-
waste treatment plants
- Provide disposal and
collection equipment (bins,
trucks and compactors)
USD 35 Million 2014-current
The European
Union
Support to Reform –
Environmental
Governance (StREG)
- Prepare studies on the
Impacts of the Naameh
sanitary landfill and Tripoli
controlled dump
USD 8 Million 2011-2017
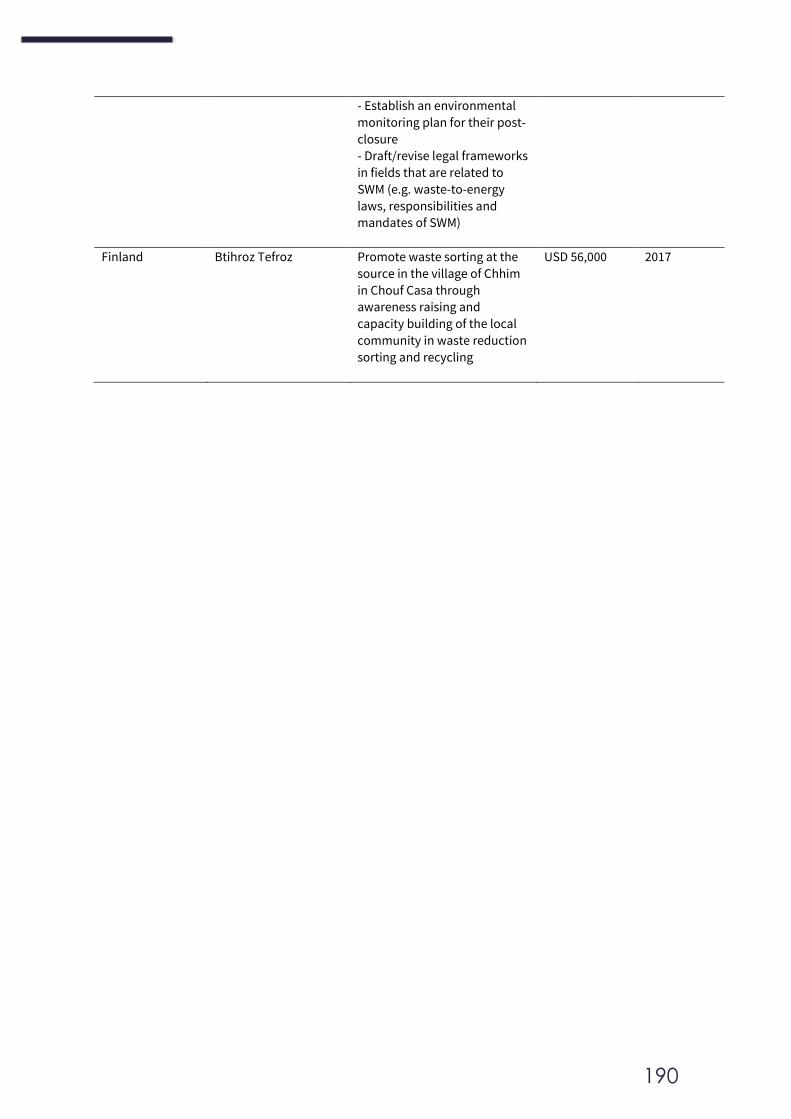
190
- Establish an environmental
monitoring plan for their post-
closure
- Draft/revise legal frameworks
in fields that are related to
SWM (e.g. waste-to-energy
laws, responsibilities and
mandates of SWM)
Finland Btihroz Tefroz Promote waste sorting at the
source in the village of Chhim
in Chouf Casa through
awareness raising and
capacity building of the local
community in waste reduction
sorting and recycling
USD 56,000 2017

192
GAPS, CONSTRAINTS AND NEEDS
Throughout the chapters on the greenhouse gas inventory, mitigation actions, and support received
of Lebanon’s 4th Biennial Update Report, progress and improvement made thus far were presented, reflecting the several challenges that Lebanon still faces to increase its ambition in climate action and transparency in reporting.
A well-defined and institutionalized methodology to systematically identify and quantify the
technical, financial, technological and capacity building and other needs is yet to be developed and implemented. This section presents an overview on Lebanon’s needs to improve 1) climate change reporting, 2) climate action implementation, 3) non-state actors engagement, and 4) gender mainstreaming. Work to label these needs as capacity building needs or financial needs and
categorize and prioritize those needs in a nationally endorsed and standardized system is yet to be
deployed.
6.1 Climate Change Reporting
Through the progressive preparation of the 4 BURs, Lebanon is preparing itself to transition to Biennial Transparency Reports (BTR), as per the Modalities, Procedures and Guidelines (MPG) for the
transparency framework referred to in Article 13 of the Paris Agreement.
Many provisions in the MPGs are already being applied by Lebanon and are reflected in the present
BUR. Some other provisions include flexibility which Lebanon is using and will continue to use while clearly improving the documentation of rationales for the needed flexibility and planning for their
achievement in the areas of improvement. Table 114 provides a summary of the status of Lebanon in implementing MPGs related to the NIR as per the current BUR. The provisions that could not be tackled
in this BUR are considered as the gaps that need to be tackled in order to further comply with the MPGs.
In addition, gaps and needs have been identified and compiled through the International
Consultation and Analysis (ICA) process in order to improve Lebanon’s reporting (Table 113). Most of
these listed needs are still valid, even though many of them have been tackled in at least one of Lebanon’s 4 submitted BURs. However, given the iterative nature of submissions under the UNFCCC, improvements are always possible, especially in light of the newly adopted MPGs, with which Lebanon
is planning to comply.
Box 11: Main results of the UNFCCC ICA 2020 for Lebanon’s BUR3
“The TTE noted improvements in the reporting in the Party’s current BUR compared with that in the previous BUR
analysed. Information on the GHG inventory, mitigation actions and their effects, and needs and support reported in the
Party’s third BUR demonstrates that it has taken into consideration the areas for enhancing transparency noted by the
previous TTEs in the summary reports on the technical analysis of the Party’s previous BURs. Specifically, the Party
improved documentation of AD and EFs for the various sectors, upgraded to using the 2006 IPCC Guidelines and GWP
values from the AR5, provided recalculated emissions for the time series and documented the effects of the recalculations
on emissions for each year, and enhanced the capacity of its local inventory team to support the sustainability of
reporting on a continuous basis.”
“Regarding the areas for enhancing understanding of the extent of the information reported in the BUR noted by the
previous TTE in the summary report on the technical analysis of the Party’s previous BUR, Lebanon identified the areas
that were not addressed in its current BUR. They include the lack of an institutionalized GHG inventory team with capacity
to track emissions from all sources and sinks, and the lack of a data repository provided for under law that facilitates data
acquisition from all data providers, which are potential areas for enhancing national capacity.”
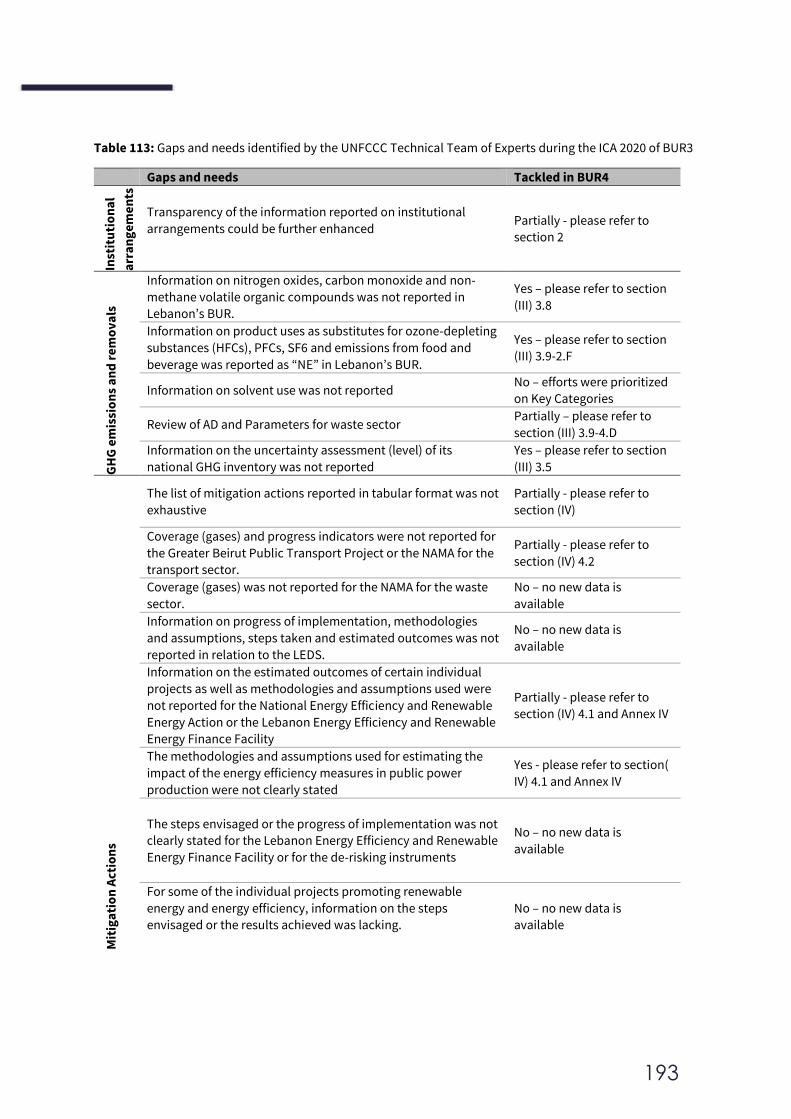
193
Table 113: Gaps and needs identified by the UNFCCC Technical Team of Experts during the ICA 2020 of BUR3
Gaps and needs Tackled in BUR4
Inst
itu
tio
na
l
arr
an
ge
me
nts
Transparency of the information reported on institutional
arrangements could be further enhanced
Partially - please refer to
section 2
GH
G e
mis
sio
ns
an
d r
em
ov
als
Information on nitrogen oxides, carbon monoxide and non-
methane volatile organic compounds was not reported in
Lebanon’s BUR.
Yes – please refer to section
(III) 3.8
Information on product uses as substitutes for ozone-depleting
substances (HFCs), PFCs, SF6 and emissions from food and
beverage was reported as “NE” in Lebanon’s BUR.
Yes – please refer to section
(III) 3.9-2.F
Information on solvent use was not reported No – efforts were prioritized
on Key Categories
Review of AD and Parameters for waste sector Partially – please refer to
section (III) 3.9-4.D
Information on the uncertainty assessment (level) of its
national GHG inventory was not reported
Yes – please refer to section
(III) 3.5
Mit
iga
tio
n A
ctio
ns
The list of mitigation actions reported in tabular format was not
exhaustive
Partially - please refer to
section (IV)
Coverage (gases) and progress indicators were not reported for
the Greater Beirut Public Transport Project or the NAMA for the
transport sector.
Partially - please refer to
section (IV) 4.2
Coverage (gases) was not reported for the NAMA for the waste
sector.
No – no new data is
available
Information on progress of implementation, methodologies
and assumptions, steps taken and estimated outcomes was not
reported in relation to the LEDS.
No – no new data is
available
Information on the estimated outcomes of certain individual
projects as well as methodologies and assumptions used were
not reported for the National Energy Efficiency and Renewable
Energy Action or the Lebanon Energy Efficiency and Renewable
Energy Finance Facility
Partially - please refer to
section (IV) 4.1 and Annex IV
The methodologies and assumptions used for estimating the
impact of the energy efficiency measures in public power
production were not clearly stated
Yes - please refer to section(
IV) 4.1 and Annex IV
The steps envisaged or the progress of implementation was not
clearly stated for the Lebanon Energy Efficiency and Renewable
Energy Finance Facility or for the de-risking instruments
No – no new data is
available
For some of the individual projects promoting renewable
energy and energy efficiency, information on the steps
envisaged or the results achieved was lacking.
No – no new data is
available
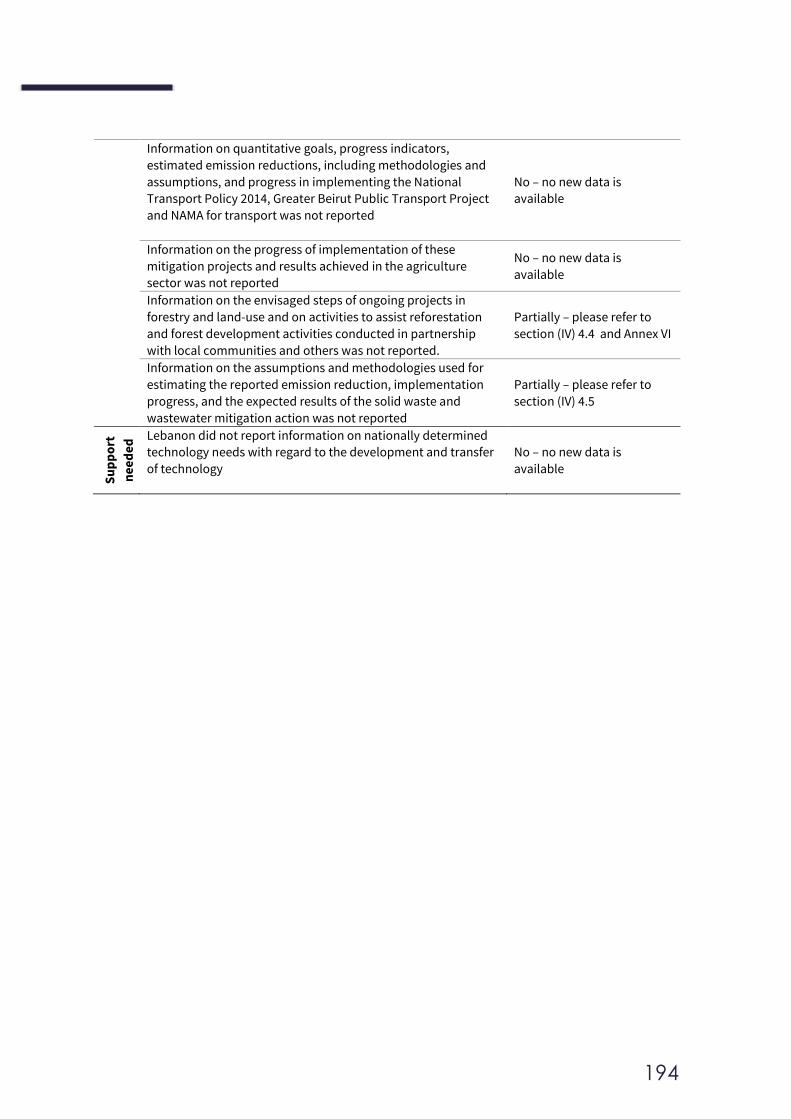
194
Information on quantitative goals, progress indicators,
estimated emission reductions, including methodologies and
assumptions, and progress in implementing the National
Transport Policy 2014, Greater Beirut Public Transport Project
and NAMA for transport was not reported
No – no new data is
available
Information on the progress of implementation of these
mitigation projects and results achieved in the agriculture
sector was not reported
No – no new data is
available
Information on the envisaged steps of ongoing projects in
forestry and land-use and on activities to assist reforestation
and forest development activities conducted in partnership
with local communities and others was not reported.
Partially – please refer to
section (IV) 4.4 and Annex VI
Information on the assumptions and methodologies used for
estimating the reported emission reduction, implementation
progress, and the expected results of the solid waste and
wastewater mitigation action was not reported
Partially – please refer to
section (IV) 4.5
Su
pp
ort
ne
ed
ed
rece
ive
d Lebanon did not report information on nationally determined
technology needs with regard to the development and transfer
of technology
No – no new data is
available
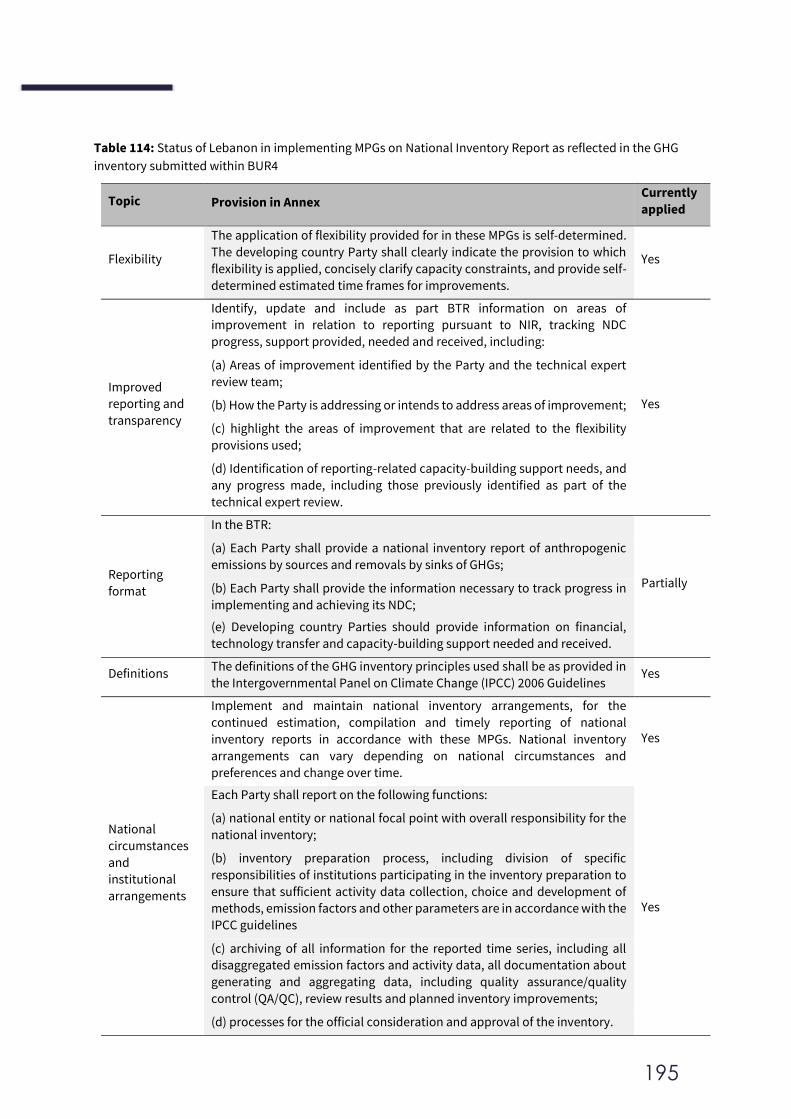
195
Table 114: Status of Lebanon in implementing MPGs on National Inventory Report as reflected in the GHG
inventory submitted within BUR4
Topic Provision in Annex Currently
applied
Flexibility
The application of flexibility provided for in these MPGs is self-determined.
The developing country Party shall clearly indicate the provision to which
flexibility is applied, concisely clarify capacity constraints, and provide self-
determined estimated time frames for improvements.
Yes
Improved
reporting and
transparency
Identify, update and include as part BTR information on areas of
improvement in relation to reporting pursuant to NIR, tracking NDC
progress, support provided, needed and received, including:
Yes
(a) Areas of improvement identified by the Party and the technical expert
review team; (b) How the Party is addressing or intends to address areas of improvement; (c) highlight the areas of improvement that are related to the flexibility
provisions used; (d) Identification of reporting-related capacity-building support needs, and
any progress made, including those previously identified as part of the
technical expert review.
Reporting
format
In the BTR:
Partially
(a) Each Party shall provide a national inventory report of anthropogenic
emissions by sources and removals by sinks of GHGs; (b) Each Party shall provide the information necessary to track progress in
implementing and achieving its NDC;
(e) Developing country Parties should provide information on financial,
technology transfer and capacity-building support needed and received.
Definitions The definitions of the GHG inventory principles used shall be as provided in
the Intergovernmental Panel on Climate Change (IPCC) 2006 Guidelines Yes
National
circumstances
and
institutional
arrangements
Implement and maintain national inventory arrangements, for the
continued estimation, compilation and timely reporting of national
inventory reports in accordance with these MPGs. National inventory
arrangements can vary depending on national circumstances and
preferences and change over time.
Yes
Each Party shall report on the following functions:
Yes
(a) national entity or national focal point with overall responsibility for the
national inventory; (b) inventory preparation process, including division of specific
responsibilities of institutions participating in the inventory preparation to
ensure that sufficient activity data collection, choice and development of
methods, emission factors and other parameters are in accordance with the
IPCC guidelines (c) archiving of all information for the reported time series, including all
disaggregated emission factors and activity data, all documentation about
generating and aggregating data, including quality assurance/quality
control (QA/QC), review results and planned inventory improvements; (d) processes for the official consideration and approval of the inventory.
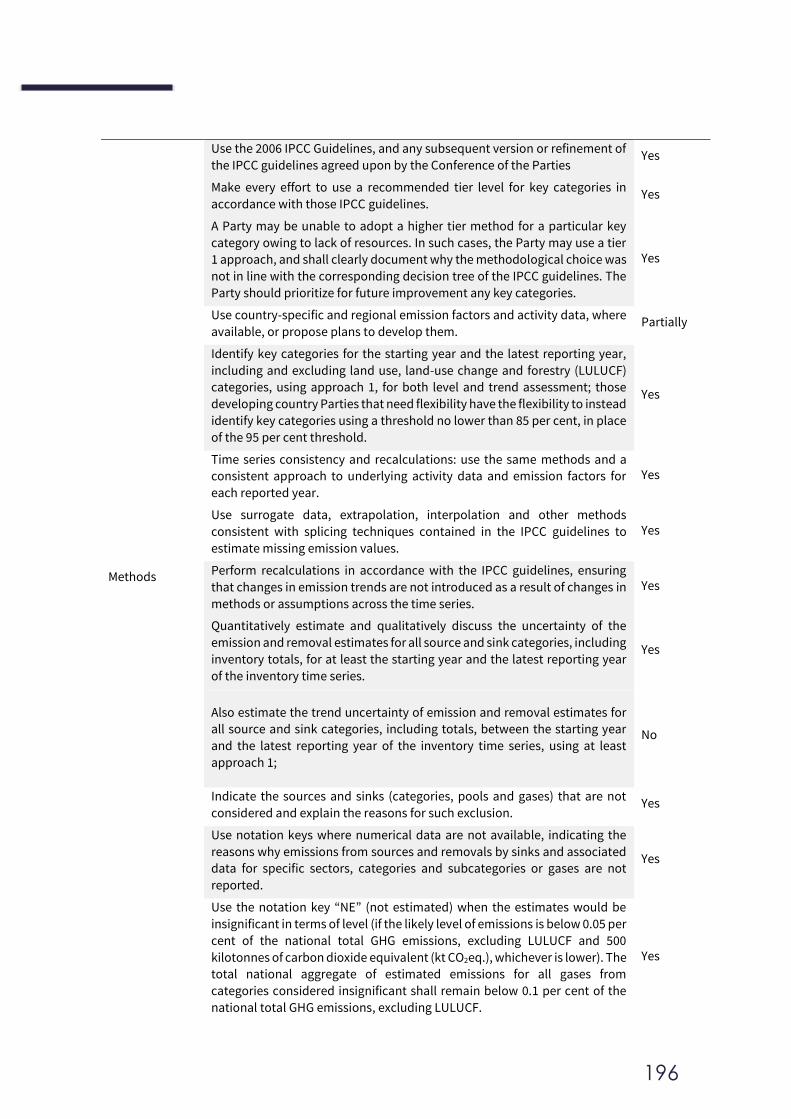
196
Methods
Use the 2006 IPCC Guidelines, and any subsequent version or refinement of
the IPCC guidelines agreed upon by the Conference of the Parties Yes
Make every effort to use a recommended tier level for key categories in
accordance with those IPCC guidelines. Yes
A Party may be unable to adopt a higher tier method for a particular key
category owing to lack of resources. In such cases, the Party may use a tier
1 approach, and shall clearly document why the methodological choice was
not in line with the corresponding decision tree of the IPCC guidelines. The
Party should prioritize for future improvement any key categories.
Yes
Use country-specific and regional emission factors and activity data, where
available, or propose plans to develop them. Partially
Identify key categories for the starting year and the latest reporting year,
including and excluding land use, land-use change and forestry (LULUCF)
categories, using approach 1, for both level and trend assessment; those
developing country Parties that need flexibility have the flexibility to instead
identify key categories using a threshold no lower than 85 per cent, in place
of the 95 per cent threshold.
Yes
Time series consistency and recalculations: use the same methods and a
consistent approach to underlying activity data and emission factors for
each reported year.
Yes
Use surrogate data, extrapolation, interpolation and other methods
consistent with splicing techniques contained in the IPCC guidelines to
estimate missing emission values.
Yes
Perform recalculations in accordance with the IPCC guidelines, ensuring
that changes in emission trends are not introduced as a result of changes in
methods or assumptions across the time series.
Yes
Quantitatively estimate and qualitatively discuss the uncertainty of the
emission and removal estimates for all source and sink categories, including
inventory totals, for at least the starting year and the latest reporting year
of the inventory time series.
Yes
No
Also estimate the trend uncertainty of emission and removal estimates for
all source and sink categories, including totals, between the starting year
and the latest reporting year of the inventory time series, using at least
approach 1;
Indicate the sources and sinks (categories, pools and gases) that are not
considered and explain the reasons for such exclusion. Yes
Use notation keys where numerical data are not available, indicating the
reasons why emissions from sources and removals by sinks and associated
data for specific sectors, categories and subcategories or gases are not
reported.
Yes
Use the notation key “NE” (not estimated) when the estimates would be
insignificant in terms of level (if the likely level of emissions is below 0.05 per
cent of the national total GHG emissions, excluding LULUCF and 500
kilotonnes of carbon dioxide equivalent (kt CO2eq.), whichever is lower). The
total national aggregate of estimated emissions for all gases from
categories considered insignificant shall remain below 0.1 per cent of the
national total GHG emissions, excluding LULUCF.
Yes
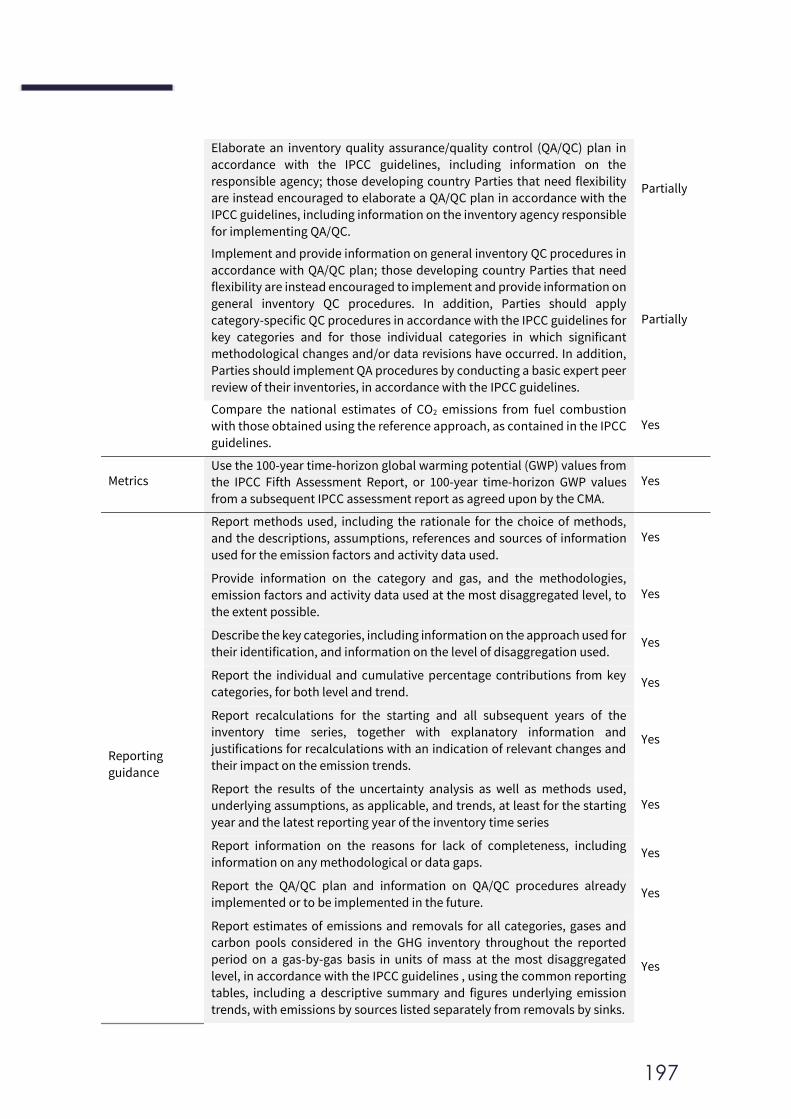
197
Elaborate an inventory quality assurance/quality control (QA/QC) plan in
accordance with the IPCC guidelines, including information on the
responsible agency; those developing country Parties that need flexibility
are instead encouraged to elaborate a QA/QC plan in accordance with the
IPCC guidelines, including information on the inventory agency responsible
for implementing QA/QC.
Partially
Implement and provide information on general inventory QC procedures in
accordance with QA/QC plan; those developing country Parties that need
flexibility are instead encouraged to implement and provide information on
general inventory QC procedures. In addition, Parties should apply
category-specific QC procedures in accordance with the IPCC guidelines for
key categories and for those individual categories in which significant
methodological changes and/or data revisions have occurred. In addition,
Parties should implement QA procedures by conducting a basic expert peer
review of their inventories, in accordance with the IPCC guidelines.
Partially
Compare the national estimates of CO2 emissions from fuel combustion
with those obtained using the reference approach, as contained in the IPCC
guidelines.
Yes
Metrics Use the 100-year time-horizon global warming potential (GWP) values from
the IPCC Fifth Assessment Report, or 100-year time-horizon GWP values
from a subsequent IPCC assessment report as agreed upon by the CMA.
Yes
Reporting
guidance
Report methods used, including the rationale for the choice of methods,
and the descriptions, assumptions, references and sources of information
used for the emission factors and activity data used.
Yes
Provide information on the category and gas, and the methodologies,
emission factors and activity data used at the most disaggregated level, to
the extent possible.
Yes
Describe the key categories, including information on the approach used for
their identification, and information on the level of disaggregation used. Yes
Report the individual and cumulative percentage contributions from key
categories, for both level and trend. Yes
Report recalculations for the starting and all subsequent years of the
inventory time series, together with explanatory information and
justifications for recalculations with an indication of relevant changes and
their impact on the emission trends.
Yes
Report the results of the uncertainty analysis as well as methods used,
underlying assumptions, as applicable, and trends, at least for the starting
year and the latest reporting year of the inventory time series
Yes
Report information on the reasons for lack of completeness, including
information on any methodological or data gaps. Yes
Report the QA/QC plan and information on QA/QC procedures already
implemented or to be implemented in the future. Yes
Report estimates of emissions and removals for all categories, gases and
carbon pools considered in the GHG inventory throughout the reported
period on a gas-by-gas basis in units of mass at the most disaggregated
level, in accordance with the IPCC guidelines , using the common reporting
tables, including a descriptive summary and figures underlying emission
trends, with emissions by sources listed separately from removals by sinks.
Yes
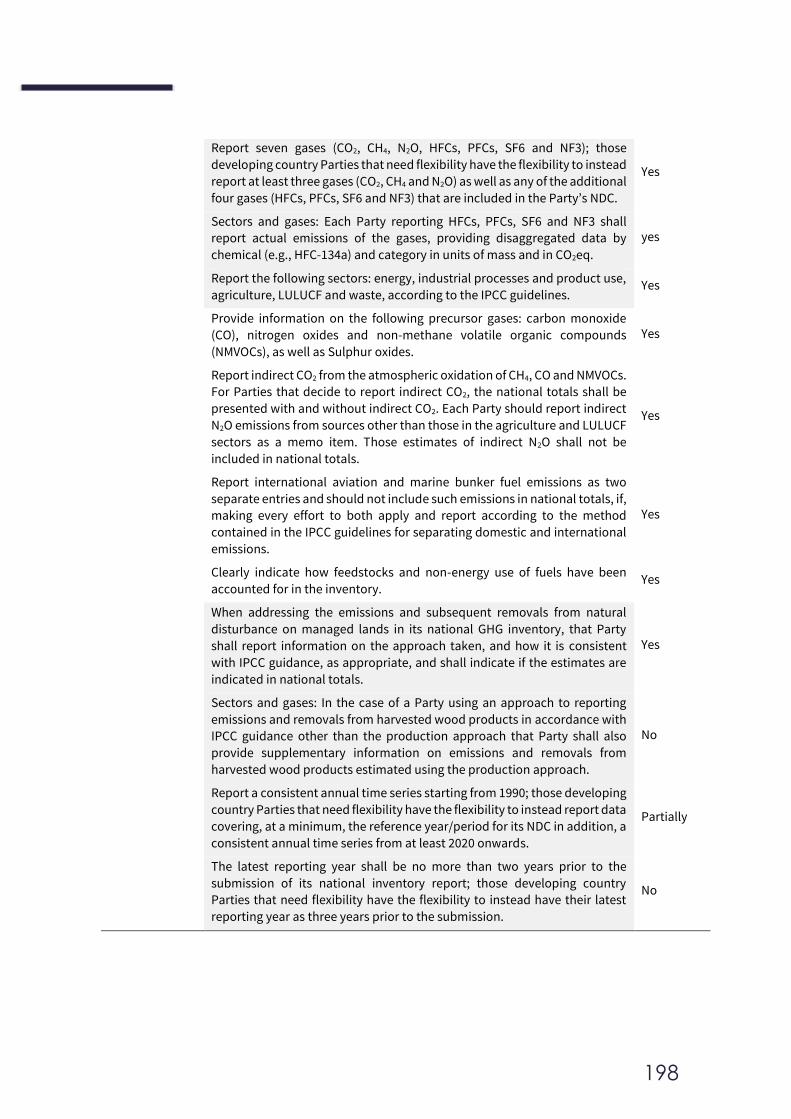
198
Report seven gases (CO2, CH4, N2O, HFCs, PFCs, SF6 and NF3); those
developing country Parties that need flexibility have the flexibility to instead
report at least three gases (CO2, CH4 and N2O) as well as any of the additional
four gases (HFCs, PFCs, SF6 and NF3) that are included in the Party’s NDC.
Yes
Sectors and gases: Each Party reporting HFCs, PFCs, SF6 and NF3 shall
report actual emissions of the gases, providing disaggregated data by
chemical (e.g., HFC-134a) and category in units of mass and in CO2eq.
yes
Report the following sectors: energy, industrial processes and product use,
agriculture, LULUCF and waste, according to the IPCC guidelines. Yes
Provide information on the following precursor gases: carbon monoxide
(CO), nitrogen oxides and non-methane volatile organic compounds
(NMVOCs), as well as Sulphur oxides.
Yes
Report indirect CO2 from the atmospheric oxidation of CH4, CO and NMVOCs.
For Parties that decide to report indirect CO2, the national totals shall be
presented with and without indirect CO2. Each Party should report indirect
N2O emissions from sources other than those in the agriculture and LULUCF
sectors as a memo item. Those estimates of indirect N2O shall not be
included in national totals.
Yes
Report international aviation and marine bunker fuel emissions as two
separate entries and should not include such emissions in national totals, if,
making every effort to both apply and report according to the method
contained in the IPCC guidelines for separating domestic and international
emissions.
Yes
Clearly indicate how feedstocks and non-energy use of fuels have been
accounted for in the inventory. Yes
When addressing the emissions and subsequent removals from natural
disturbance on managed lands in its national GHG inventory, that Party
shall report information on the approach taken, and how it is consistent
with IPCC guidance, as appropriate, and shall indicate if the estimates are
indicated in national totals.
Yes
Sectors and gases: In the case of a Party using an approach to reporting
emissions and removals from harvested wood products in accordance with
IPCC guidance other than the production approach that Party shall also
provide supplementary information on emissions and removals from
harvested wood products estimated using the production approach.
No
Report a consistent annual time series starting from 1990; those developing
country Parties that need flexibility have the flexibility to instead report data
covering, at a minimum, the reference year/period for its NDC in addition, a
consistent annual time series from at least 2020 onwards.
Partially
The latest reporting year shall be no more than two years prior to the
submission of its national inventory report; those developing country
Parties that need flexibility have the flexibility to instead have their latest
reporting year as three years prior to the submission.
No
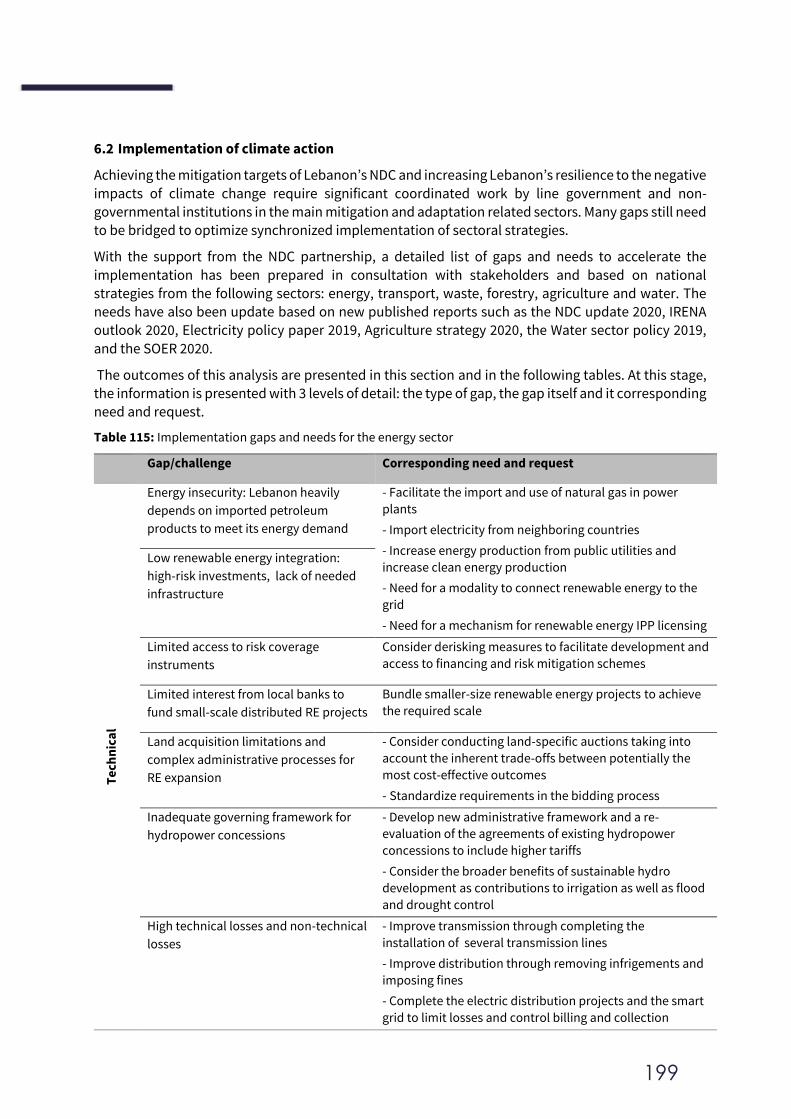
199
6.2 Implementation of climate action
Achieving the mitigation targets of Lebanon’s NDC and increasing Lebanon’s resilience to the negative
impacts of climate change require significant coordinated work by line government and non-governmental institutions in the main mitigation and adaptation related sectors. Many gaps still need to be bridged to optimize synchronized implementation of sectoral strategies.
With the support from the NDC partnership, a detailed list of gaps and needs to accelerate the
implementation has been prepared in consultation with stakeholders and based on national strategies from the following sectors: energy, transport, waste, forestry, agriculture and water. The needs have also been update based on new published reports such as the NDC update 2020, IRENA outlook 2020, Electricity policy paper 2019, Agriculture strategy 2020, the Water sector policy 2019,
and the SOER 2020.
The outcomes of this analysis are presented in this section and in the following tables. At this stage, the information is presented with 3 levels of detail: the type of gap, the gap itself and it corresponding
need and request.
Table 115: Implementation gaps and needs for the energy sector
Gap/challenge Corresponding need and request
Te
chn
ica
l
Energy insecurity: Lebanon heavily
depends on imported petroleum
products to meet its energy demand
- Facilitate the import and use of natural gas in power
plants
- Import electricity from neighboring countries
- Increase energy production from public utilities and
increase clean energy production
- Need for a modality to connect renewable energy to the
grid
- Need for a mechanism for renewable energy IPP licensing
Low renewable energy integration:
high-risk investments, lack of needed
infrastructure
Limited access to risk coverage
instruments
Consider derisking measures to facilitate development and
access to financing and risk mitigation schemes
Limited interest from local banks to
fund small-scale distributed RE projects
Bundle smaller-size renewable energy projects to achieve
the required scale
Land acquisition limitations and
complex administrative processes for
RE expansion
- Consider conducting land-specific auctions taking into
account the inherent trade-offs between potentially the
most cost-effective outcomes
- Standardize requirements in the bidding process
Inadequate governing framework for
hydropower concessions
- Develop new administrative framework and a re-
evaluation of the agreements of existing hydropower
concessions to include higher tariffs
- Consider the broader benefits of sustainable hydro
development as contributions to irrigation as well as flood
and drought control
High technical losses and non-technical
losses
- Improve transmission through completing the
installation of several transmission lines
- Improve distribution through removing infrigements and
imposing fines
- Complete the electric distribution projects and the smart
grid to limit losses and control billing and collection
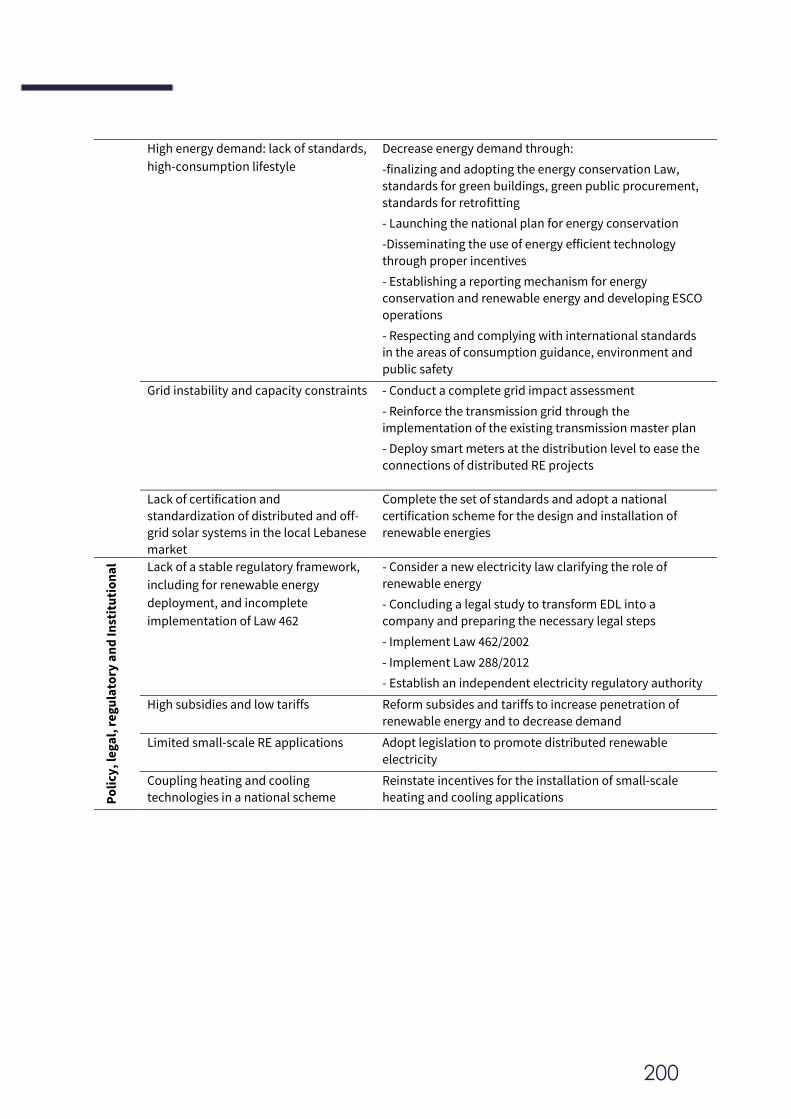
200
High energy demand: lack of standards,
high-consumption lifestyle
Decrease energy demand through:
-finalizing and adopting the energy conservation Law,
standards for green buildings, green public procurement,
standards for retrofitting
- Launching the national plan for energy conservation
-Disseminating the use of energy efficient technology
through proper incentives
- Establishing a reporting mechanism for energy
conservation and renewable energy and developing ESCO
operations
- Respecting and complying with international standards
in the areas of consumption guidance, environment and
public safety
Grid instability and capacity constraints - Conduct a complete grid impact assessment
- Reinforce the transmission grid through the
implementation of the existing transmission master plan
- Deploy smart meters at the distribution level to ease the
connections of distributed RE projects
Lack of certification and
standardization of distributed and off-
grid solar systems in the local Lebanese
market
Complete the set of standards and adopt a national
certification scheme for the design and installation of
renewable energies
Po
licy
, le
ga
l, r
eg
ula
tory
an
d I
nst
itu
tio
na
l Lack of a stable regulatory framework,
including for renewable energy
deployment, and incomplete
implementation of Law 462
- Consider a new electricity law clarifying the role of
renewable energy
- Concluding a legal study to transform EDL into a
company and preparing the necessary legal steps
- Implement Law 462/2002
- Implement Law 288/2012
- Establish an independent electricity regulatory authority
High subsidies and low tariffs Reform subsides and tariffs to increase penetration of
renewable energy and to decrease demand
Limited small-scale RE applications
Adopt legislation to promote distributed renewable
electricity
Coupling heating and cooling
technologies in a national scheme
Reinstate incentives for the installation of small-scale
heating and cooling applications
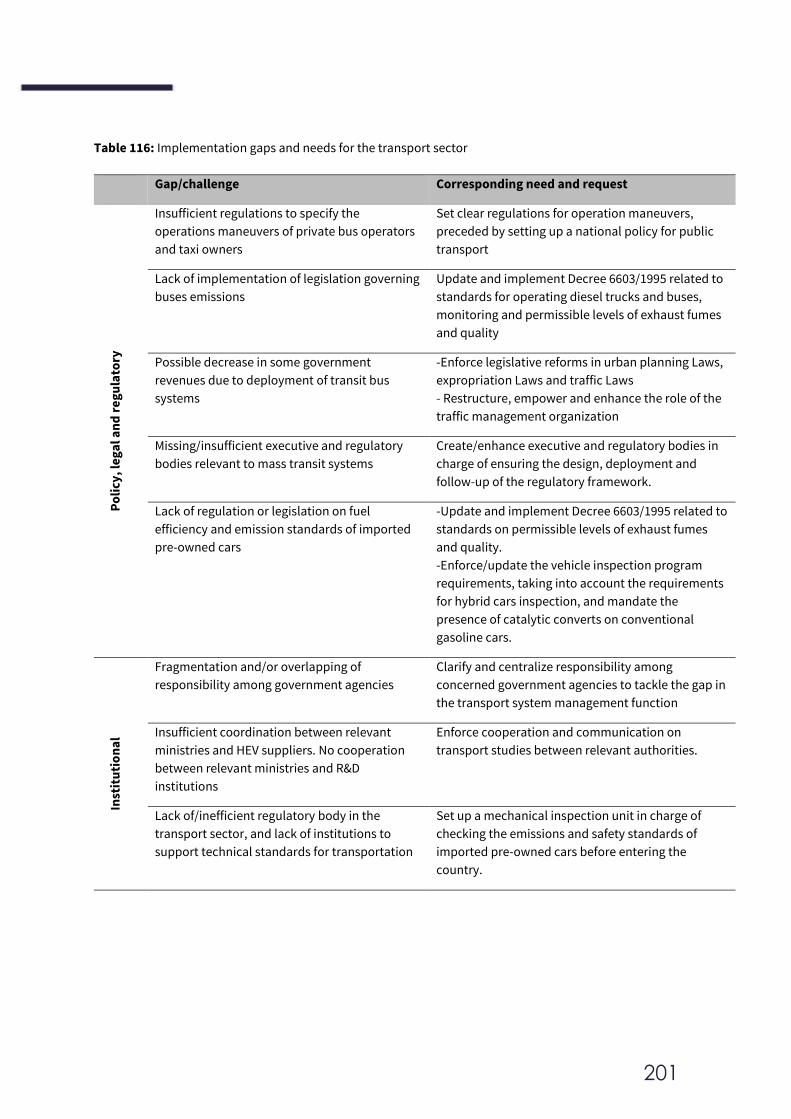
201
Table 116: Implementation gaps and needs for the transport sector
Gap/challenge Corresponding need and request
Po
licy
, le
ga
l an
d r
eg
ula
tory
Insufficient regulations to specify the
operations maneuvers of private bus operators
and taxi owners
Set clear regulations for operation maneuvers,
preceded by setting up a national policy for public
transport
Lack of implementation of legislation governing
buses emissions
Update and implement Decree 6603/1995 related to
standards for operating diesel trucks and buses,
monitoring and permissible levels of exhaust fumes
and quality
Possible decrease in some government
revenues due to deployment of transit bus
systems
-Enforce legislative reforms in urban planning Laws,
expropriation Laws and traffic Laws
- Restructure, empower and enhance the role of the
traffic management organization
Missing/insufficient executive and regulatory
bodies relevant to mass transit systems
Create/enhance executive and regulatory bodies in
charge of ensuring the design, deployment and
follow-up of the regulatory framework.
Lack of regulation or legislation on fuel
efficiency and emission standards of imported
pre-owned cars
-Update and implement Decree 6603/1995 related to
standards on permissible levels of exhaust fumes
and quality.
-Enforce/update the vehicle inspection program
requirements, taking into account the requirements
for hybrid cars inspection, and mandate the
presence of catalytic converts on conventional
gasoline cars.
Inst
itu
tio
na
l
Fragmentation and/or overlapping of
responsibility among government agencies
Clarify and centralize responsibility among
concerned government agencies to tackle the gap in
the transport system management function
Insufficient coordination between relevant
ministries and HEV suppliers. No cooperation
between relevant ministries and R&D
institutions
Enforce cooperation and communication on
transport studies between relevant authorities.
Lack of/inefficient regulatory body in the
transport sector, and lack of institutions to
support technical standards for transportation
Set up a mechanical inspection unit in charge of
checking the emissions and safety standards of
imported pre-owned cars before entering the
country.
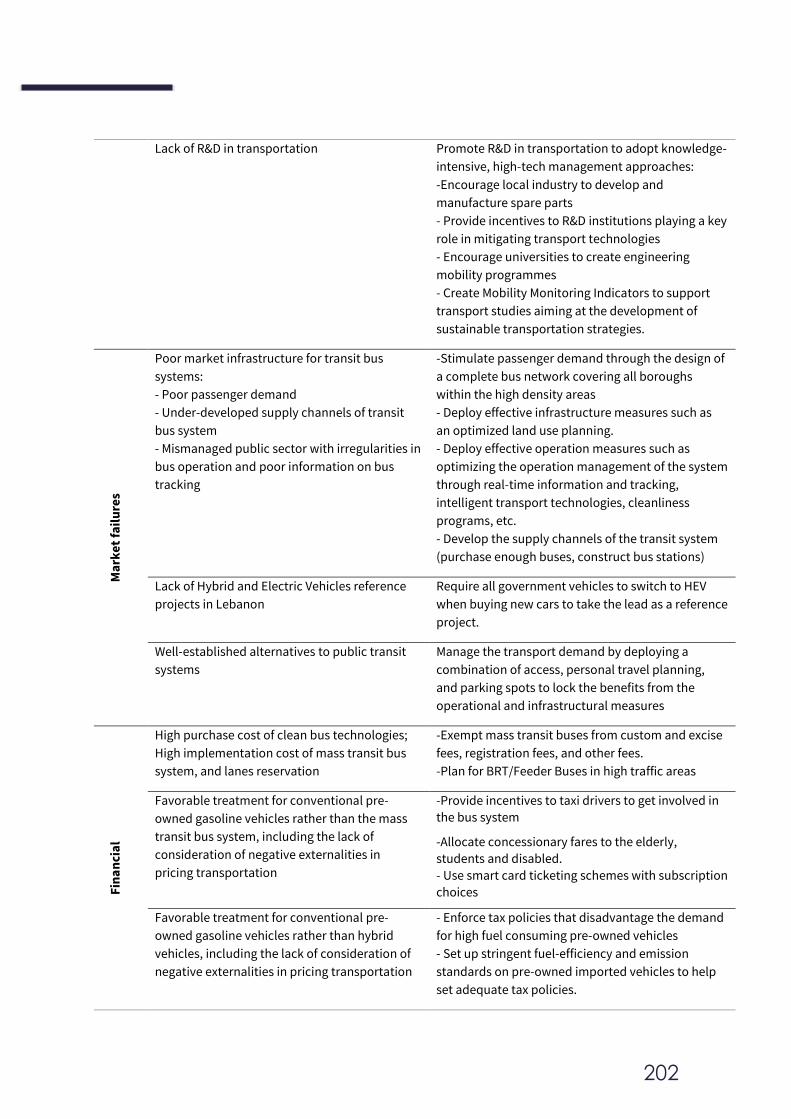
202
Lack of R&D in transportation Promote R&D in transportation to adopt knowledge-
intensive, high-tech management approaches:
-Encourage local industry to develop and
manufacture spare parts
- Provide incentives to R&D institutions playing a key
role in mitigating transport technologies
- Encourage universities to create engineering
mobility programmes
- Create Mobility Monitoring Indicators to support
transport studies aiming at the development of
sustainable transportation strategies.
Ma
rke
t fa
ilu
res
Poor market infrastructure for transit bus
systems:
- Poor passenger demand
- Under-developed supply channels of transit
bus system
- Mismanaged public sector with irregularities in
bus operation and poor information on bus
tracking
-Stimulate passenger demand through the design of
a complete bus network covering all boroughs
within the high density areas
- Deploy effective infrastructure measures such as
an optimized land use planning.
- Deploy effective operation measures such as
optimizing the operation management of the system
through real-time information and tracking,
intelligent transport technologies, cleanliness
programs, etc.
- Develop the supply channels of the transit system
(purchase enough buses, construct bus stations)
Lack of Hybrid and Electric Vehicles reference
projects in Lebanon
Require all government vehicles to switch to HEV
when buying new cars to take the lead as a reference
project.
Well-established alternatives to public transit
systems
Manage the transport demand by deploying a
combination of access, personal travel planning,
and parking spots to lock the benefits from the
operational and infrastructural measures
Fin
an
cia
l
High purchase cost of clean bus technologies;
High implementation cost of mass transit bus
system, and lanes reservation
-Exempt mass transit buses from custom and excise
fees, registration fees, and other fees.
-Plan for BRT/Feeder Buses in high traffic areas
Favorable treatment for conventional pre-
owned gasoline vehicles rather than the mass
transit bus system, including the lack of
consideration of negative externalities in
pricing transportation
-Provide incentives to taxi drivers to get involved in
the bus system
-Allocate concessionary fares to the elderly,
students and disabled.
- Use smart card ticketing schemes with subscription
choices
Favorable treatment for conventional pre-
owned gasoline vehicles rather than hybrid
vehicles, including the lack of consideration of
negative externalities in pricing transportation
- Enforce tax policies that disadvantage the demand
for high fuel consuming pre-owned vehicles
- Set up stringent fuel-efficiency and emission
standards on pre-owned imported vehicles to help
set adequate tax policies.
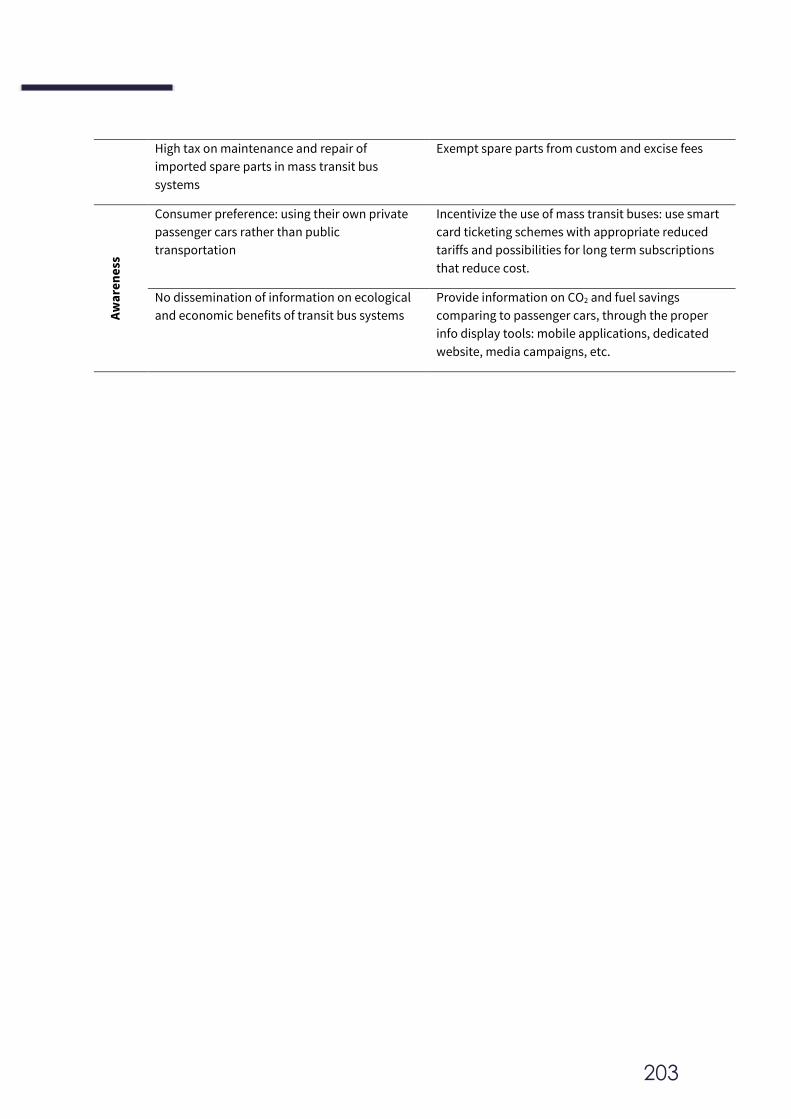
203
High tax on maintenance and repair of
imported spare parts in mass transit bus
systems
Exempt spare parts from custom and excise fees
Aw
are
ne
ss
Consumer preference: using their own private
passenger cars rather than public
transportation
Incentivize the use of mass transit buses: use smart
card ticketing schemes with appropriate reduced
tariffs and possibilities for long term subscriptions
that reduce cost.
No dissemination of information on ecological
and economic benefits of transit bus systems
Provide information on CO2 and fuel savings
comparing to passenger cars, through the proper
info display tools: mobile applications, dedicated
website, media campaigns, etc.
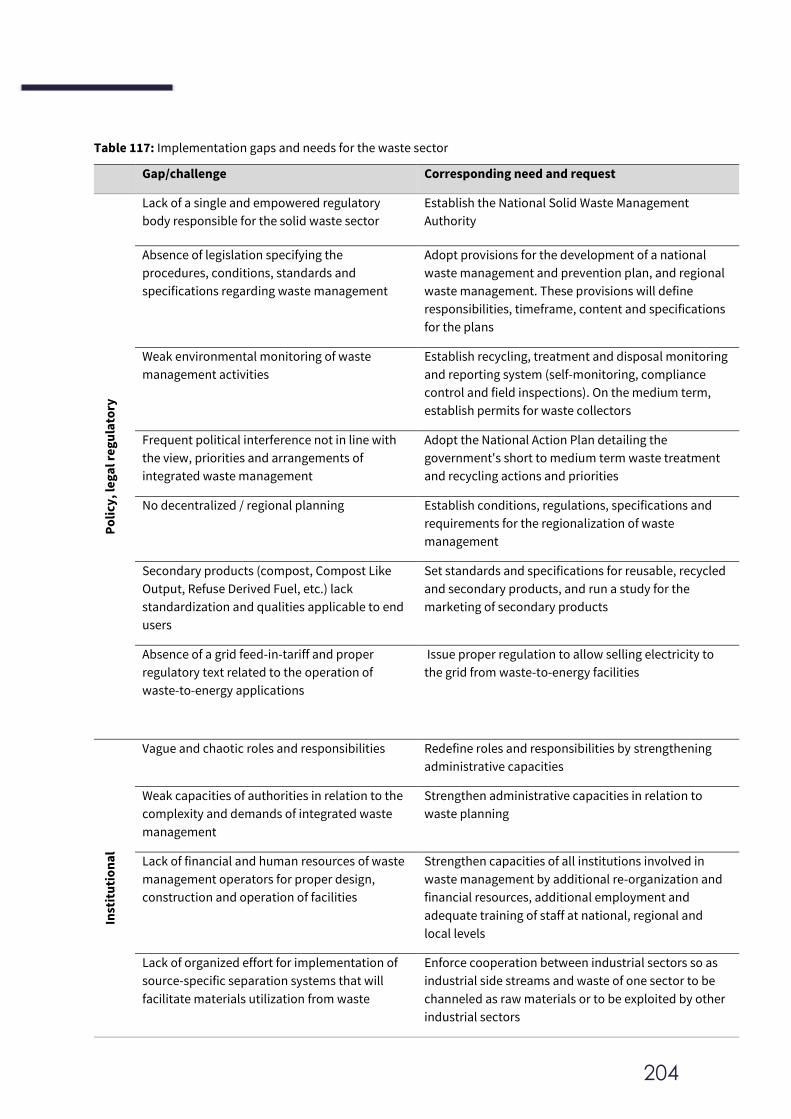
204
Table 117: Implementation gaps and needs for the waste sector
Gap/challenge Corresponding need and request
Po
licy
, le
ga
l re
gu
lato
ry
Lack of a single and empowered regulatory
body responsible for the solid waste sector
Establish the National Solid Waste Management
Authority
Absence of legislation specifying the
procedures, conditions, standards and
specifications regarding waste management
Adopt provisions for the development of a national
waste management and prevention plan, and regional
waste management. These provisions will define
responsibilities, timeframe, content and specifications
for the plans
Weak environmental monitoring of waste
management activities
Establish recycling, treatment and disposal monitoring
and reporting system (self-monitoring, compliance
control and field inspections). On the medium term,
establish permits for waste collectors
Frequent political interference not in line with
the view, priorities and arrangements of
integrated waste management
Adopt the National Action Plan detailing the
government's short to medium term waste treatment
and recycling actions and priorities
No decentralized / regional planning Establish conditions, regulations, specifications and
requirements for the regionalization of waste
management
Secondary products (compost, Compost Like
Output, Refuse Derived Fuel, etc.) lack
standardization and qualities applicable to end
users
Set standards and specifications for reusable, recycled
and secondary products, and run a study for the
marketing of secondary products
Absence of a grid feed-in-tariff and proper
regulatory text related to the operation of
waste-to-energy applications
Issue proper regulation to allow selling electricity to
the grid from waste-to-energy facilities
Inst
itu
tio
na
l
Vague and chaotic roles and responsibilities Redefine roles and responsibilities by strengthening
administrative capacities
Weak capacities of authorities in relation to the
complexity and demands of integrated waste
management
Strengthen administrative capacities in relation to
waste planning
Lack of financial and human resources of waste
management operators for proper design,
construction and operation of facilities
Strengthen capacities of all institutions involved in
waste management by additional re-organization and
financial resources, additional employment and
adequate training of staff at national, regional and
local levels
Lack of organized effort for implementation of
source-specific separation systems that will
facilitate materials utilization from waste
Enforce cooperation between industrial sectors so as
industrial side streams and waste of one sector to be
channeled as raw materials or to be exploited by other
industrial sectors
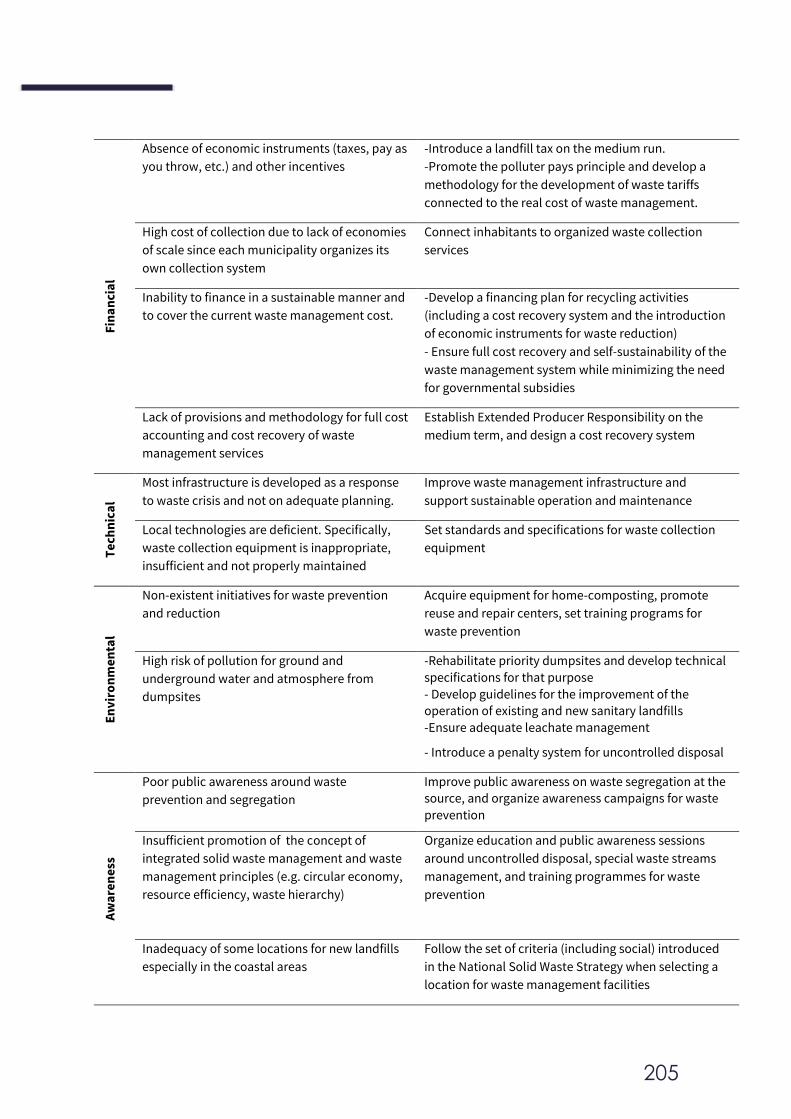
205
Fin
an
cia
l
Absence of economic instruments (taxes, pay as
you throw, etc.) and other incentives
-Introduce a landfill tax on the medium run.
-Promote the polluter pays principle and develop a
methodology for the development of waste tariffs
connected to the real cost of waste management.
High cost of collection due to lack of economies
of scale since each municipality organizes its
own collection system
Connect inhabitants to organized waste collection
services
Inability to finance in a sustainable manner and
to cover the current waste management cost.
-Develop a financing plan for recycling activities
(including a cost recovery system and the introduction
of economic instruments for waste reduction)
- Ensure full cost recovery and self-sustainability of the
waste management system while minimizing the need
for governmental subsidies
Lack of provisions and methodology for full cost
accounting and cost recovery of waste
management services
Establish Extended Producer Responsibility on the
medium term, and design a cost recovery system
Te
chn
ica
l
Most infrastructure is developed as a response
to waste crisis and not on adequate planning.
Improve waste management infrastructure and
support sustainable operation and maintenance
Local technologies are deficient. Specifically,
waste collection equipment is inappropriate,
insufficient and not properly maintained
Set standards and specifications for waste collection
equipment
En
vir
on
me
nta
l
Non-existent initiatives for waste prevention
and reduction
Acquire equipment for home-composting, promote
reuse and repair centers, set training programs for
waste prevention
High risk of pollution for ground and
underground water and atmosphere from
dumpsites
-Rehabilitate priority dumpsites and develop technical
specifications for that purpose
- Develop guidelines for the improvement of the
operation of existing and new sanitary landfills
-Ensure adequate leachate management
- Introduce a penalty system for uncontrolled disposal
Aw
are
ne
ss
Poor public awareness around waste
prevention and segregation
Improve public awareness on waste segregation at the
source, and organize awareness campaigns for waste
prevention
Insufficient promotion of the concept of
integrated solid waste management and waste
management principles (e.g. circular economy,
resource efficiency, waste hierarchy)
Organize education and public awareness sessions
around uncontrolled disposal, special waste streams
management, and training programmes for waste
prevention
Inadequacy of some locations for new landfills
especially in the coastal areas
Follow the set of criteria (including social) introduced
in the National Solid Waste Strategy when selecting a
location for waste management facilities
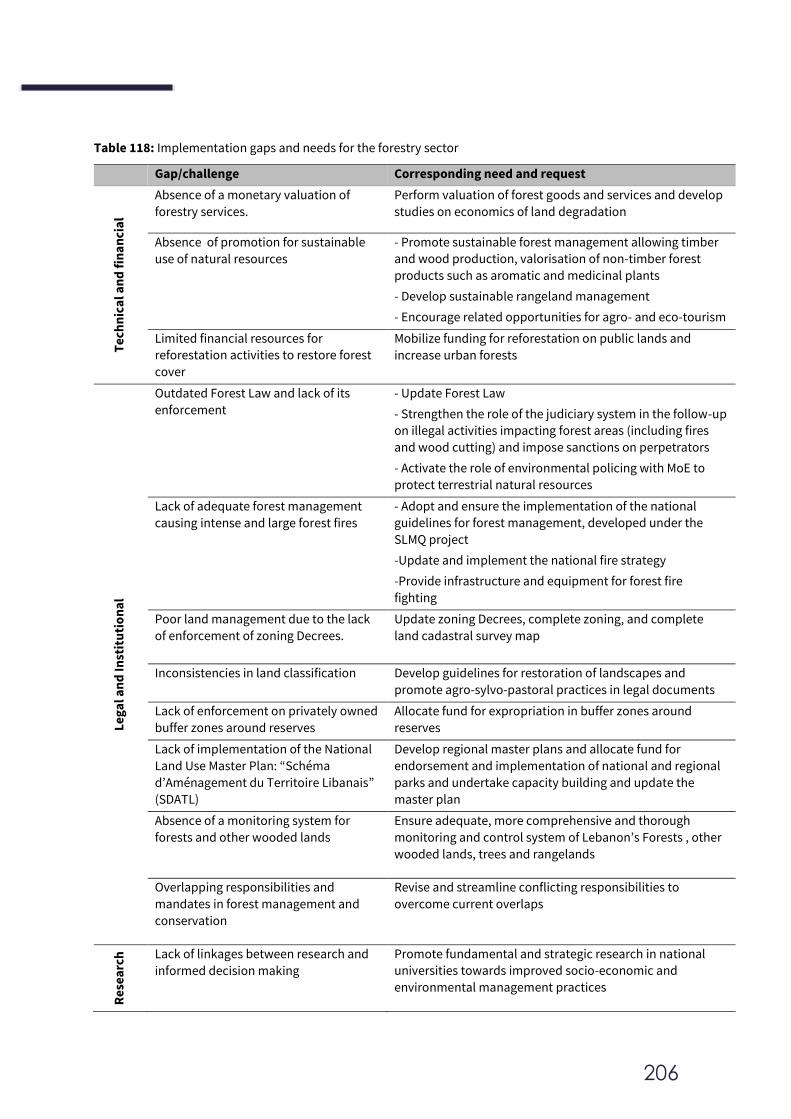
206
Table 118: Implementation gaps and needs for the forestry sector
Gap/challenge Corresponding need and request
Te
chn
ica
l an
d f
ina
nci
al
Absence of a monetary valuation of
forestry services.
Perform valuation of forest goods and services and develop
studies on economics of land degradation
Absence of promotion for sustainable
use of natural resources
- Promote sustainable forest management allowing timber
and wood production, valorisation of non-timber forest
products such as aromatic and medicinal plants
- Develop sustainable rangeland management
- Encourage related opportunities for agro- and eco-tourism
Limited financial resources for
reforestation activities to restore forest
cover
Mobilize funding for reforestation on public lands and
increase urban forests
Le
ga
l an
d I
nst
itu
tio
na
l
Outdated Forest Law and lack of its
enforcement
- Update Forest Law
- Strengthen the role of the judiciary system in the follow-up
on illegal activities impacting forest areas (including fires
and wood cutting) and impose sanctions on perpetrators
- Activate the role of environmental policing with MoE to
protect terrestrial natural resources
Lack of adequate forest management
causing intense and large forest fires
- Adopt and ensure the implementation of the national
guidelines for forest management, developed under the
SLMQ project
-Update and implement the national fire strategy
-Provide infrastructure and equipment for forest fire
fighting
Poor land management due to the lack
of enforcement of zoning Decrees.
Update zoning Decrees, complete zoning, and complete
land cadastral survey map
Inconsistencies in land classification Develop guidelines for restoration of landscapes and
promote agro-sylvo-pastoral practices in legal documents
Lack of enforcement on privately owned
buffer zones around reserves
Allocate fund for expropriation in buffer zones around
reserves
Lack of implementation of the National
Land Use Master Plan: “Schéma
d’Aménagement du Territoire Libanais”
(SDATL)
Develop regional master plans and allocate fund for
endorsement and implementation of national and regional
parks and undertake capacity building and update the
master plan
Absence of a monitoring system for
forests and other wooded lands
Ensure adequate, more comprehensive and thorough
monitoring and control system of Lebanon’s Forests , other
wooded lands, trees and rangelands
Overlapping responsibilities and
mandates in forest management and
conservation
Revise and streamline conflicting responsibilities to
overcome current overlaps
Re
sea
rch
Lack of linkages between research and
informed decision making
Promote fundamental and strategic research in national
universities towards improved socio-economic and
environmental management practices
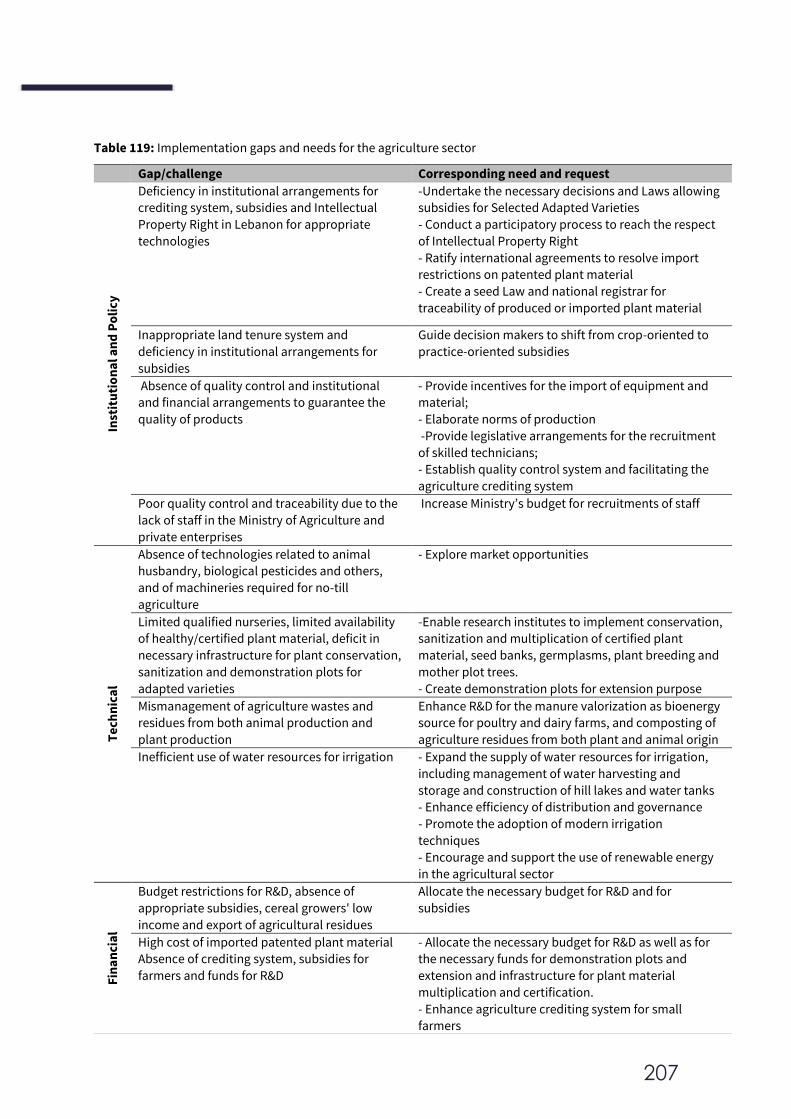
207
Table 119: Implementation gaps and needs for the agriculture sector
Gap/challenge Corresponding need and request
Inst
itu
tio
na
l an
d P
oli
cy
Deficiency in institutional arrangements for
crediting system, subsidies and Intellectual
Property Right in Lebanon for appropriate
technologies
-Undertake the necessary decisions and Laws allowing
subsidies for Selected Adapted Varieties
- Conduct a participatory process to reach the respect
of Intellectual Property Right
- Ratify international agreements to resolve import
restrictions on patented plant material
- Create a seed Law and national registrar for
traceability of produced or imported plant material
Inappropriate land tenure system and
deficiency in institutional arrangements for
subsidies
Guide decision makers to shift from crop-oriented to
practice-oriented subsidies
Absence of quality control and institutional
and financial arrangements to guarantee the
quality of products
- Provide incentives for the import of equipment and
material;
- Elaborate norms of production
-Provide legislative arrangements for the recruitment
of skilled technicians;
- Establish quality control system and facilitating the
agriculture crediting system
Poor quality control and traceability due to the
lack of staff in the Ministry of Agriculture and
private enterprises
Increase Ministry’s budget for recruitments of staff
Te
chn
ica
l
Absence of technologies related to animal
husbandry, biological pesticides and others,
and of machineries required for no-till
agriculture
- Explore market opportunities
Limited qualified nurseries, limited availability
of healthy/certified plant material, deficit in
necessary infrastructure for plant conservation,
sanitization and demonstration plots for
adapted varieties
-Enable research institutes to implement conservation,
sanitization and multiplication of certified plant
material, seed banks, germplasms, plant breeding and
mother plot trees.
- Create demonstration plots for extension purpose
Mismanagement of agriculture wastes and
residues from both animal production and
plant production
Enhance R&D for the manure valorization as bioenergy
source for poultry and dairy farms, and composting of
agriculture residues from both plant and animal origin
Inefficient use of water resources for irrigation - Expand the supply of water resources for irrigation,
including management of water harvesting and
storage and construction of hill lakes and water tanks
- Enhance efficiency of distribution and governance
- Promote the adoption of modern irrigation
techniques
- Encourage and support the use of renewable energy
in the agricultural sector
Fin
an
cia
l
Budget restrictions for R&D, absence of
appropriate subsidies, cereal growers' low
income and export of agricultural residues
Allocate the necessary budget for R&D and for
subsidies
High cost of imported patented plant material
Absence of crediting system, subsidies for
farmers and funds for R&D
- Allocate the necessary budget for R&D as well as for
the necessary funds for demonstration plots and
extension and infrastructure for plant material
multiplication and certification.
- Enhance agriculture crediting system for small
farmers
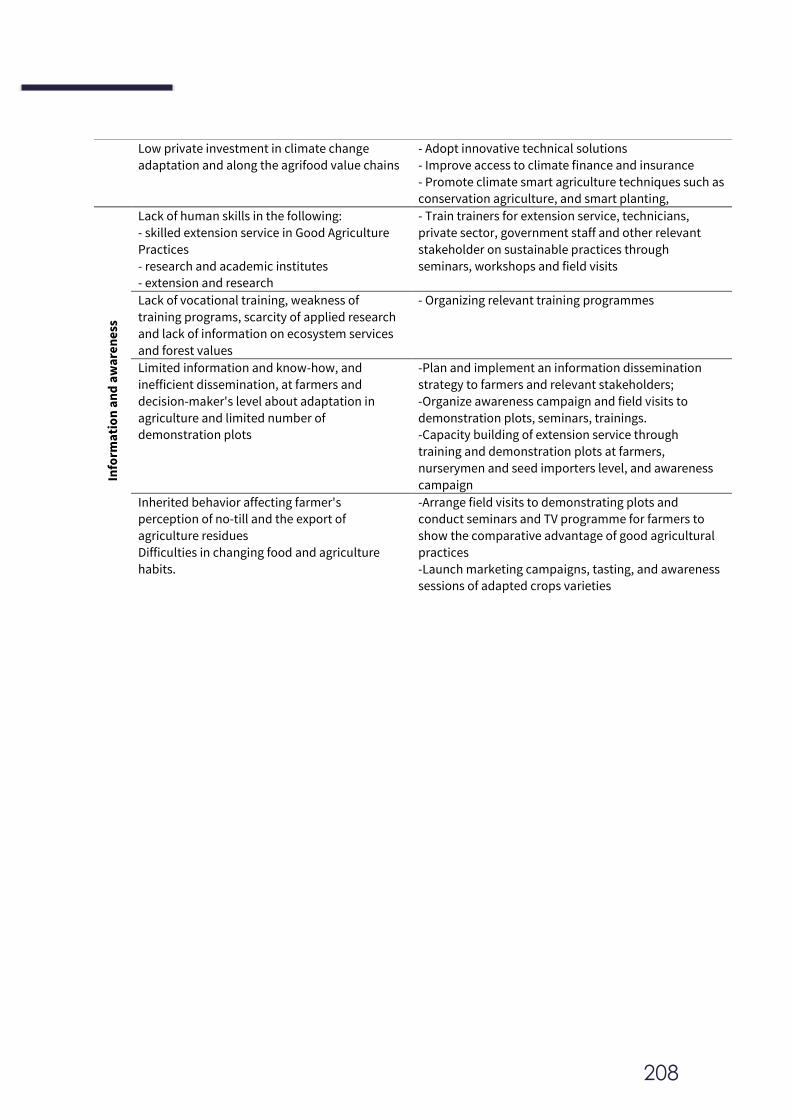
208
Low private investment in climate change
adaptation and along the agrifood value chains
- Adopt innovative technical solutions
- Improve access to climate finance and insurance
- Promote climate smart agriculture techniques such as
conservation agriculture, and smart planting,
Info
rma
tio
n a
nd
aw
are
ne
ss
Lack of human skills in the following:
- skilled extension service in Good Agriculture
Practices
- research and academic institutes
- extension and research
- Train trainers for extension service, technicians,
private sector, government staff and other relevant
stakeholder on sustainable practices through
seminars, workshops and field visits
Lack of vocational training, weakness of
training programs, scarcity of applied research
and lack of information on ecosystem services
and forest values
- Organizing relevant training programmes
Limited information and know-how, and
inefficient dissemination, at farmers and
decision-maker's level about adaptation in
agriculture and limited number of
demonstration plots
-Plan and implement an information dissemination
strategy to farmers and relevant stakeholders;
-Organize awareness campaign and field visits to
demonstration plots, seminars, trainings.
-Capacity building of extension service through
training and demonstration plots at farmers,
nurserymen and seed importers level, and awareness
campaign
Inherited behavior affecting farmer's
perception of no-till and the export of
agriculture residues
Difficulties in changing food and agriculture
habits.
-Arrange field visits to demonstrating plots and
conduct seminars and TV programme for farmers to
show the comparative advantage of good agricultural
practices
-Launch marketing campaigns, tasting, and awareness
sessions of adapted crops varieties
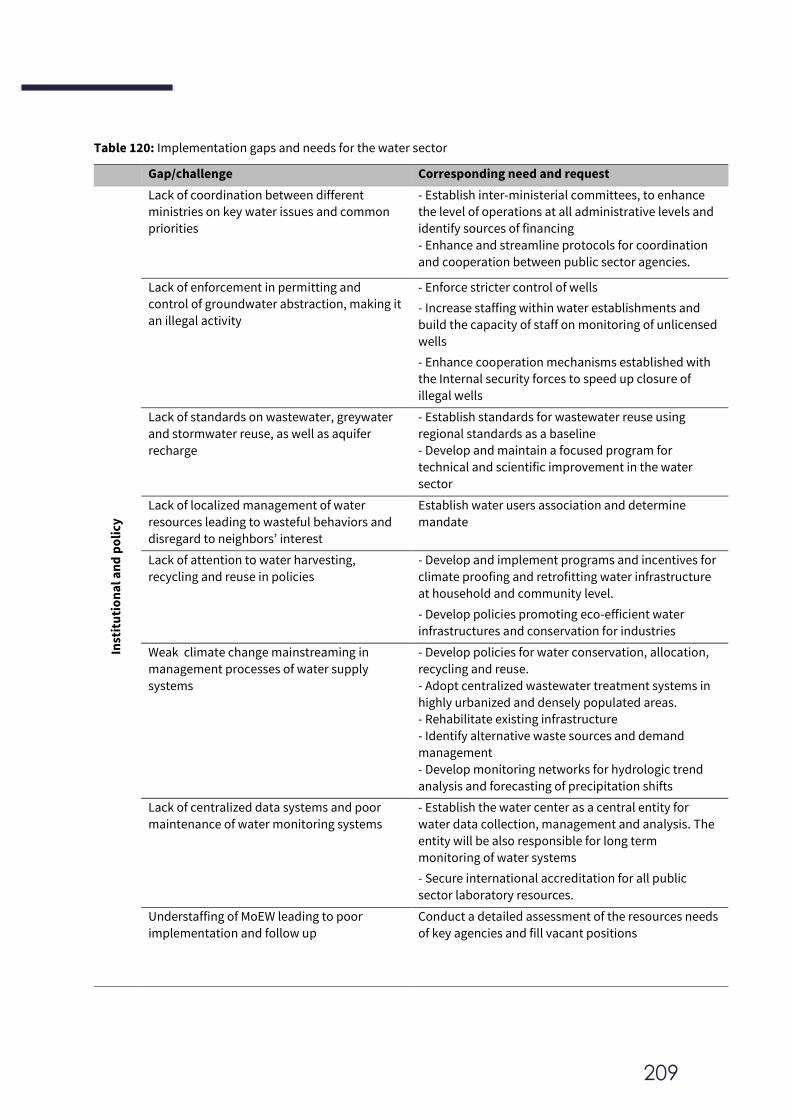
209
Table 120: Implementation gaps and needs for the water sector
Gap/challenge Corresponding need and request
Inst
itu
tio
na
l an
d p
oli
cy
Lack of coordination between different
ministries on key water issues and common
priorities
- Establish inter-ministerial committees, to enhance
the level of operations at all administrative levels and
identify sources of financing
- Enhance and streamline protocols for coordination
and cooperation between public sector agencies.
Lack of enforcement in permitting and
control of groundwater abstraction, making it
an illegal activity
- Enforce stricter control of wells
- Increase staffing within water establishments and
build the capacity of staff on monitoring of unlicensed
wells
- Enhance cooperation mechanisms established with
the Internal security forces to speed up closure of
illegal wells
Lack of standards on wastewater, greywater
and stormwater reuse, as well as aquifer
recharge
- Establish standards for wastewater reuse using
regional standards as a baseline
- Develop and maintain a focused program for
technical and scientific improvement in the water
sector
Lack of localized management of water
resources leading to wasteful behaviors and
disregard to neighbors’ interest
Establish water users association and determine
mandate
Lack of attention to water harvesting,
recycling and reuse in policies
- Develop and implement programs and incentives for
climate proofing and retrofitting water infrastructure
at household and community level.
- Develop policies promoting eco-efficient water
infrastructures and conservation for industries
Weak climate change mainstreaming in
management processes of water supply
systems
- Develop policies for water conservation, allocation,
recycling and reuse.
- Adopt centralized wastewater treatment systems in
highly urbanized and densely populated areas.
- Rehabilitate existing infrastructure
- Identify alternative waste sources and demand
management
- Develop monitoring networks for hydrologic trend
analysis and forecasting of precipitation shifts
Lack of centralized data systems and poor
maintenance of water monitoring systems
- Establish the water center as a central entity for
water data collection, management and analysis. The
entity will be also responsible for long term
monitoring of water systems
- Secure international accreditation for all public
sector laboratory resources.
Understaffing of MoEW leading to poor
implementation and follow up
Conduct a detailed assessment of the resources needs
of key agencies and fill vacant positions
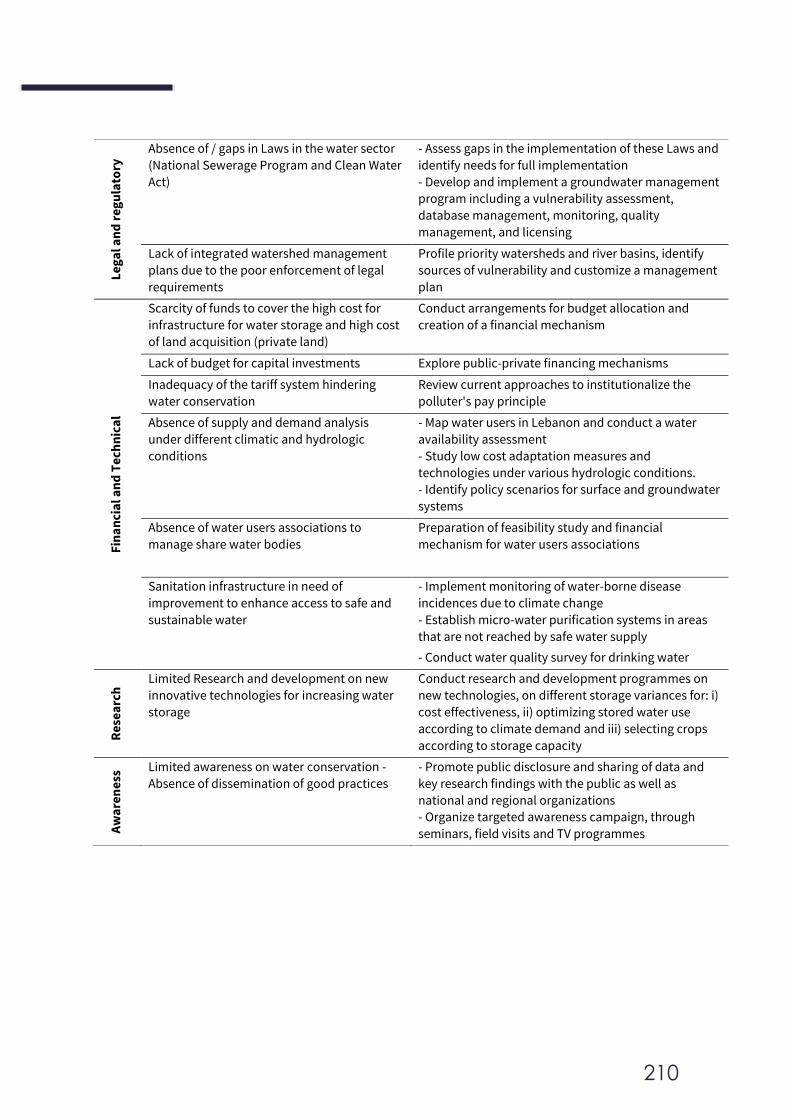
210
Le
ga
l an
d r
eg
ula
tory
Absence of / gaps in Laws in the water sector
(National Sewerage Program and Clean Water
Act)
- Assess gaps in the implementation of these Laws and
identify needs for full implementation
- Develop and implement a groundwater management
program including a vulnerability assessment,
database management, monitoring, quality
management, and licensing
Lack of integrated watershed management
plans due to the poor enforcement of legal
requirements
Profile priority watersheds and river basins, identify
sources of vulnerability and customize a management
plan
Fin
an
cia
l an
d T
ech
nic
al
Scarcity of funds to cover the high cost for
infrastructure for water storage and high cost
of land acquisition (private land)
Conduct arrangements for budget allocation and
creation of a financial mechanism
Lack of budget for capital investments Explore public-private financing mechanisms
Inadequacy of the tariff system hindering
water conservation
Review current approaches to institutionalize the
polluter's pay principle
Absence of supply and demand analysis
under different climatic and hydrologic
conditions
- Map water users in Lebanon and conduct a water
availability assessment
- Study low cost adaptation measures and
technologies under various hydrologic conditions.
- Identify policy scenarios for surface and groundwater
systems
Absence of water users associations to
manage share water bodies
Preparation of feasibility study and financial
mechanism for water users associations
Sanitation infrastructure in need of
improvement to enhance access to safe and
sustainable water
- Implement monitoring of water-borne disease
incidences due to climate change
- Establish micro-water purification systems in areas
that are not reached by safe water supply
- Conduct water quality survey for drinking water
Re
sea
rch
Limited Research and development on new
innovative technologies for increasing water
storage
Conduct research and development programmes on
new technologies, on different storage variances for: i)
cost effectiveness, ii) optimizing stored water use
according to climate demand and iii) selecting crops
according to storage capacity
Aw
are
ne
ss Limited awareness on water conservation -
Absence of dissemination of good practices
- Promote public disclosure and sharing of data and
key research findings with the public as well as
national and regional organizations
- Organize targeted awareness campaign, through
seminars, field visits and TV programmes
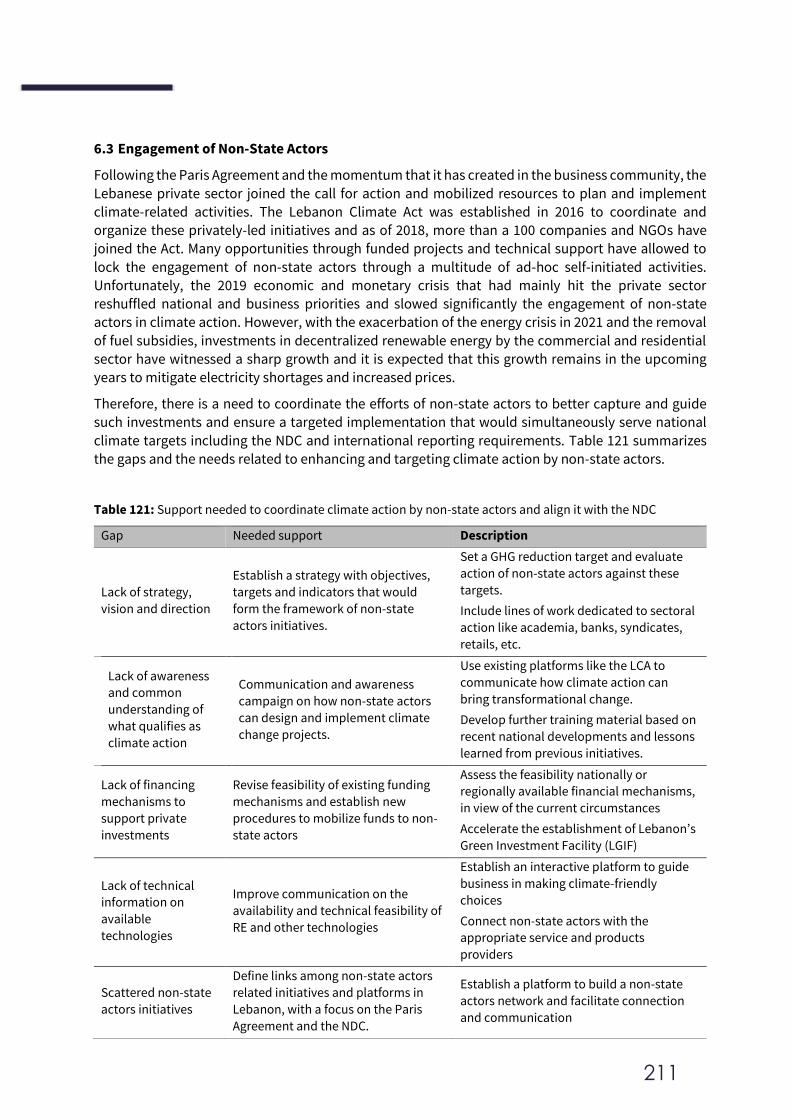
211
6.3 Engagement of Non-State Actors
Following the Paris Agreement and the momentum that it has created in the business community, the
Lebanese private sector joined the call for action and mobilized resources to plan and implement climate-related activities. The Lebanon Climate Act was established in 2016 to coordinate and organize these privately-led initiatives and as of 2018, more than a 100 companies and NGOs have joined the Act. Many opportunities through funded projects and technical support have allowed to
lock the engagement of non-state actors through a multitude of ad-hoc self-initiated activities. Unfortunately, the 2019 economic and monetary crisis that had mainly hit the private sector reshuffled national and business priorities and slowed significantly the engagement of non-state actors in climate action. However, with the exacerbation of the energy crisis in 2021 and the removal
of fuel subsidies, investments in decentralized renewable energy by the commercial and residential
sector have witnessed a sharp growth and it is expected that this growth remains in the upcoming
years to mitigate electricity shortages and increased prices.
Therefore, there is a need to coordinate the efforts of non-state actors to better capture and guide such investments and ensure a targeted implementation that would simultaneously serve national
climate targets including the NDC and international reporting requirements. Table 121 summarizes the gaps and the needs related to enhancing and targeting climate action by non-state actors.
Table 121: Support needed to coordinate climate action by non-state actors and align it with the NDC
Gap Needed support Description
Lack of strategy,
vision and direction
Establish a strategy with objectives,
targets and indicators that would
form the framework of non-state
actors initiatives.
Set a GHG reduction target and evaluate
action of non-state actors against these
targets.
Include lines of work dedicated to sectoral
action like academia, banks, syndicates,
retails, etc.
Lack of awareness
and common
understanding of
what qualifies as
climate action
Communication and awareness
campaign on how non-state actors
can design and implement climate
change projects.
Use existing platforms like the LCA to
communicate how climate action can
bring transformational change.
Develop further training material based on
recent national developments and lessons
learned from previous initiatives.
Lack of financing
mechanisms to
support private
investments
Revise feasibility of existing funding
mechanisms and establish new
procedures to mobilize funds to non-
state actors
Assess the feasibility nationally or
regionally available financial mechanisms,
in view of the current circumstances
Accelerate the establishment of Lebanon’s
Green Investment Facility (LGIF)
Lack of technical
information on
available
technologies
Improve communication on the
availability and technical feasibility of
RE and other technologies
Establish an interactive platform to guide
business in making climate-friendly
choices
Connect non-state actors with the
appropriate service and products
providers
Scattered non-state
actors initiatives
Define links among non-state actors
related initiatives and platforms in
Lebanon, with a focus on the Paris
Agreement and the NDC.
Establish a platform to build a non-state
actors network and facilitate connection
and communication
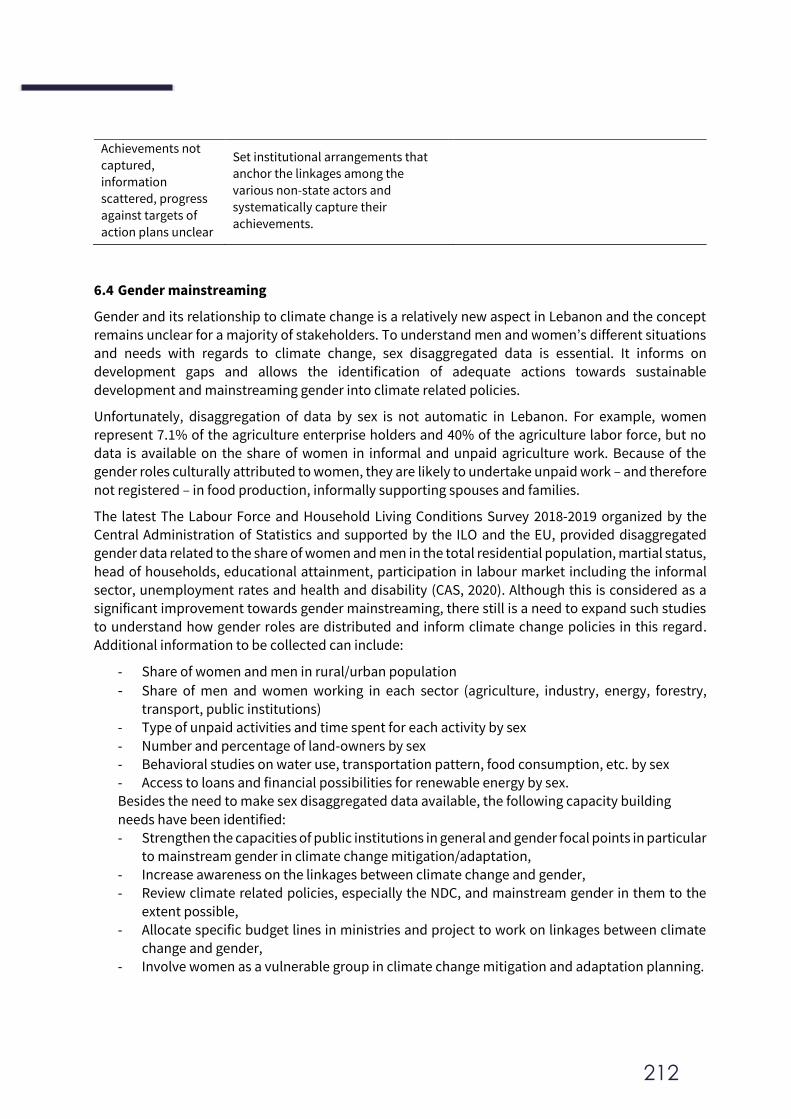
212
Achievements not
captured,
information
scattered, progress
against targets of
action plans unclear
Set institutional arrangements that
anchor the linkages among the
various non-state actors and
systematically capture their
achievements.
6.4 Gender mainstreaming
Gender and its relationship to climate change is a relatively new aspect in Lebanon and the concept
remains unclear for a majority of stakeholders. To understand men and women’s different situations and needs with regards to climate change, sex disaggregated data is essential. It informs on
development gaps and allows the identification of adequate actions towards sustainable
development and mainstreaming gender into climate related policies.
Unfortunately, disaggregation of data by sex is not automatic in Lebanon. For example, women represent 7.1% of the agriculture enterprise holders and 40% of the agriculture labor force, but no
data is available on the share of women in informal and unpaid agriculture work. Because of the gender roles culturally attributed to women, they are likely to undertake unpaid work – and therefore
not registered – in food production, informally supporting spouses and families.
The latest The Labour Force and Household Living Conditions Survey 2018-2019 organized by the Central Administration of Statistics and supported by the ILO and the EU, provided disaggregated
gender data related to the share of women and men in the total residential population, martial status,
head of households, educational attainment, participation in labour market including the informal
sector, unemployment rates and health and disability (CAS, 2020). Although this is considered as a significant improvement towards gender mainstreaming, there still is a need to expand such studies
to understand how gender roles are distributed and inform climate change policies in this regard. Additional information to be collected can include:
- Share of women and men in rural/urban population
- Share of men and women working in each sector (agriculture, industry, energy, forestry, transport, public institutions)
- Type of unpaid activities and time spent for each activity by sex
- Number and percentage of land-owners by sex - Behavioral studies on water use, transportation pattern, food consumption, etc. by sex - Access to loans and financial possibilities for renewable energy by sex. Besides the need to make sex disaggregated data available, the following capacity building
needs have been identified:
- Strengthen the capacities of public institutions in general and gender focal points in particular to mainstream gender in climate change mitigation/adaptation,
- Increase awareness on the linkages between climate change and gender, - Review climate related policies, especially the NDC, and mainstream gender in them to the
extent possible,
- Allocate specific budget lines in ministries and project to work on linkages between climate change and gender,
- Involve women as a vulnerable group in climate change mitigation and adaptation planning.
213
REFERENCES
Al-Hassan (2011). A National Consultancy on the Fertilizer Supply Chain in Lebanon. Survey Report
submitted to Food and Agriculture Organization (FAO).
Ali, A. (2020). Distributed Power Generation for Lebanon- Market Assessment and Policy Pathways. World
Bank, Washington, DC. https://openknowledge.worldbank.org/handle/10986/33788 License: CC BY 3.0 IGO.
Asmar, F. (2011). FAO Country Pasture/Forage Resource Profiles: Lebanon. Available:
http://www.fao.org/ag/AGP/AGPC/doc/counprof/lebanon/lebanon.html. Accessed November 2014.
BLOMINVEST BANK, (2014). Agro-Industry in Lebanon: Looming Potential Restrained by Numerous
Deficiencies. Available: https://blog.blominvestbank.com/wp-content/uploads/2014/09/2014-06-Agro-
industry-in-Lebanon-Looming-Potential-Restrained-by-Numerous-Deficiencies.pdf. Accessed September
2020.
BLOMINVEST BANK (2016). Arak: Lebanon’s Noble Drink. https://blog.blominvestbank.com/wp-
content/uploads/2016/08/Arak-Lebanons-Noble-Drink.pdf. Accessed September 2020.
CAS (2007). Households Living Conditions Survey 2007 Lebanon. Available:
http://www.cas.gov.lb/images/PDFs/Living%20conditions%20survey%202007.zip. Accessed September
2019.
CAS (2018). National Accounts Estimates for 2018. Available: http://www.cas.gov.lb/index.php/national-
accounts-en. Accessed August 2020.
CAS (2020). Labor Force and Household Living Conditions Survey 2018-2019 Lebanon. Available:
http://www.cas.gov.lb/index.php/demographic-and-social-en/population-en. Accessed September 2020.
CCAC (2020). Estimation of waste sector greenhouse gas emissions in Tyre caza, Lebanon using the Solid
Waste Emissions Estimation Tool (SWEET). Climate and Clean Air Coalition, International Solid Waste
Association, SCS engineers.
CDR (2006). Municipal Solid Waste Management in Lebanon. Council for Development and Reconstruction.
Beirut, Lebanon.
CDR (2014). Personal communication. Council for Development and Reconstruction. October 2014, Beirut,
Lebanon.
CDR (2016). Supervision of Greater Beirut solid waste treatment plants. 18th annual report. Council for
Development and Reconstruction. Beirut, Lebanon.
CDR (2020a). CDR website. Available: https://cdr.gov.lb/en-US/Projects.aspx. Accessed September 2020.
Council for Development and Reconstruction. Beirut, Lebanon.
CDR (2020b). Personal Communication with Mr. Talal Farhat, Head of the wastewater department. Council
for Development and Reconstruction. Beirut, Lebanon.
CEDRO (2020). CEDRO website. Available: https://www.cedro-undp.org/ accessed August 2020. Country
Energy Efficiency and Renewable Energy Demonstration Project for the Recovery of Lebanon. Beirut,
Lebanon.
Chneis and Stephan (2013). Personal Communication. Beirut, Lebanon.
Darwish, T., and Faour, G., (2008). Rangeland Degradation in Two Watersheds of Lebanon. Lebanese Science
Journal, 9, 71-80.
214
EastMED (2012). Report of the FAO EastMED Support to the Fishing Trials Carried Out of the South Lebanese
Coasts. Retrieved from www.faoeastmed.org.
EBRD (2021). Green Economy Financing Facility, European Bank for Reconstruction and Development.
Available: https://ebrdgeff.com/
El Fadel and Sbayti (2000). Economics of mitigation greenhouse gas emissions from solid waste in Lebanon.
Waste Management and Research (18), 329-340.
El-Hage (2014). Personal communication with captain Said El-Hage. Environment Affairs Manager, Middle
East Airlines. Beirut, Lebanon.
FAO (2000). Global ecological zoning for the global forest resources assessment 2000. Final report. Available:
http://www.fao.org/3/ad652e/ad652e00.htm#TopOfPage. Food and Agriculture Organization, Rome.
FAO (2005). Global Forest Resources Assessment 2005. Country Report: Lebanon, Forestry Department,
Rome.
FAO (2005). National Forest and Tree Resources Assessment 2003-05 (TCP/LEB/2903). Working paper 95,
Forest Resources Assessment, Forestry, Beirut.
FAO (2010). Global Forest Resources Assessment 2010. Country Report: Lebanon, Forestry Department,
Rome.
FAO (2011). FAOSTAT- Lebanon- Land Use. Food and Agriculture Organization Statistics, Rome.
FAO (2015). Global Forest Resources Assessment 2015. Country Report: Lebanon, Forestry Department,
Rome.
FAO (2017). FAOSTAT- Food and Agriculture Organization of the United Nations Statistical Database.
Accessed on September 2017.
FAOstat (2020). Food and Agriculture Organization of the United Nations Statistical Database. Accessed on
September 2021.
Garrad Hassan (2011). The national wind atlas for Lebanon, UNDP-CEDRO, Beirut.
GoL (2018). Capital Investment Plan. Conference Economique pour le Developpement par les Reformes avec
les Entreprises (CEDRE). Government of Lebanon, Beirut.
Hreiche, A. (2009). Integrated Water Resources Management Planning in the Republic of Lebanon- Irrigation
Needs and Management, EUWI MED.
IEA (2020). Fuel imports from 2005 to 2020: International Energy Agency.
IKI (2021). BUILD ME – Boosting ambitions to achieve a climate-neutral building standard in the MENA
region- International Climate Initiative, Federal Ministry for the Environment, Nature Conservation and
Nuclear Safety. accessed in August 2021 - Available: https://www.international-climate-
initiative.com/en/details/project/build-me-boosting-ambitions-to-achieve-a-climateneutral-building-
standard-in-the-mena-region-16_I_276-502.
IPCC (1997). Revised 1996 IPCC guidelines for national greenhouse inventories. Houghton J.T., Meira Filho
L.G., Lim B., Tréanton K., Mamaty I., Bonduki Y. et al. (Eds). London: Intergovernmental Panel on Climate
Change WGI technical support unit.
IPCC (2000). Good practice guidance and uncertainty management in national greenhouse gas inventories.
Pennman J., Kruger D., Galbally I., Hiraishi T., buruhani N., Emmanuel S. et al. (Eds). Japan: Institute for
Global Environmental Strategies.
215
IPCC (2003). Good Practice Guidance for Land Use, Land-Use Change and Forestry. Hayama, Kanagawa,
Japan: Institute for Global Environmental Strategies (IGES).
IPCC (2006). 2006 IPCC Guidelines for National Greenhouse Gas Inventories, Prepared by the National
Greenhouse Gas Inventories Programme, Eggleston H.S., Buendia L., Miwa K., Ngara T. and Tanabe K. (eds).
Published: IGES, Japan.
IPCC (2014). Climate Change 2014: Synthesis Report. Contribution of Working Groups I, II and III to the Fifth
Assessment Report of the Intergovernmental Panel on Climate Change [Core Writing Team, R.K. Pachauri
and L.A. Meyer (eds.)]. IPCC, Geneva, Switzerland, 151 pp.
IPT (2019). Survey on fuel consumption by end user. IPT Energy Center: Beirut, Lebanon.
IRENA (2020). Renewable Energy Outlook: Lebanon. International Renewable Energy Agency, Abu Dhabi.
Jordan and Kurtz (2012). Photovoltaic Degradation Rates - An Analytical Review (NREL/JA-5200-51664,
Publication). Available: http://www.nrel.gov/docs/fy12osti/51664.pdf
LACECO (2020). Annual reports of solid waste management. Ministry of Environment, Beirut, Lebanon.
LCA (2017). How to create value from climate change. Lebanon Climate Act, Greenmind, UNDP. Available:
https://www.lebanonclimateact.com/files/guidebook.pdf
LCA (2021). Lebanon Climate Act Website. Available: https://www.lebanonclimateact.com/
LCRP (2019). Lebanon Crisis Response Plan- Energy projects database. Beirut, Lebanon.
Lebanese Customs (2020). Annual trade statistic Data- www.customs.gov.lb- accessed on May 2020. Beirut,
Lebanon.
LEPAP (2020). Lebanon Environmental Pollution Abatement Project. UNDP, Ministry of Environment. Beirut,
Lebanon. https://lepap.moe.gov.lb/
Mansour, C. (2011). Evaluating impact of electrified vehicles on fuel consumption and CO2 emissions
reduction in Lebanese driving conditions using onboard GPS survey. Mansour C., Zgheib E., Saba S., Journal
of Energy Procedia, Elsevier, 2011, vol. 6, pp. 261-276.
McKinsey (2018). Lebanon's Economic Vision. Ministry of Economy and Trade, Beirut, Lebanon.
Mitri et al., (2019). State of Lebanon's forests 2018. Beirut, Lebanon.
Mitri, G., Boufakhreddine, S., Amidi, J., Azzam, C., Chnais, E., Bouazza, K., Mansour, S., and Asmar, F. (2019a).
State of Lebanon’s Forests 2018 (Mitri, G., Ed). Association for Forests, Development and
Conservation/Ministry of Agriculture/Ministry of Environment/Lebanon Reforestation Initiative/United
Nations Development Programmed/Global Environment Facility, Beirut. Pp.166.
Mitri, G., Nasrallah, G., Gebrael, K., Bou Nassar, M., Abou Dagher, M., Nader, M., Masri, N., and Choueiter, D.
(2019b). Assessing land degradation and identifying potential sustainable land management practices at
the subnational level in Lebanon. Environmental Monitoring and Assessment 191: 567.
https://doi.org/10.1007/s10661-019-7739-y.
Mitri, G., Jazi, M., and McWethy, D. (2015). Assessment of wildfire risk in Lebanon using Geographic Object-
based image analysis. Photogrammetric Engineering & Remote Sensing 81, 499–506.
Mitri, G., Saba, S., Nader, M., and McWethy, D. (2017). Developing Lebanon’s fire danger forecast.
International Journal of Disaster Risk Reduction 24, 332-339.
Mitri, G., Salloum, L., and Nader, M. (2012). Forest fuel type mapping in Lebanon. 18th International science
meeting. 22-24 March 2013. Lebanon.
216
MoA (2010a). Ministry of Agriculture. Lebanon, Strategy 2010-2014. Retrieved from
http://www.agriculture.gov.lb/Arabic/AboutUs/Strategy_2010_2014/Pages/default.aspx
MoA (2010b). Ministry of Agriculture, Lebanon. Agriculture Census 2010. Retrieved from
http://www.agriculture.gov.lb/Arabic/DataAndAgriStatistics/OverallAgriStatistics/Pages/defaul.aspx
MoA (2015). Lebanon National Forest Program 2015 - 2025. Rural Development and Natural Resources
Directorate, Ministry of Agriculture, Beirut, Lebanon.
MoA, (2018). Integration of Lebanon’s Land Degradation Neutrality (LDN) Targets within the National Action
Program (NAP) to Combat Desertification. Ministry of Agriculture, Beirut, Lebanon.
MoA/FAO (2005). National Forest and Tree Resources Assessment 2003-05 (TCP/LEB/2903). Ministry of
Agriculture, Food and Agriculture Organization. Working Paper 95, Forest Resources Assessment, Forestry.
MoA/FAO (2015). Global Forest Resources Assessment 2015. Country Report: Lebanon, Forestry Department,
Rome. Ministry of Agriculture, Food and Agriculture Organization. Beirut, Lebanon.
MoE (2010). Country Report on the Solid Waste Management in Lebanon. Ministry of Environment, Beirut,
Lebanon.
MoE (2012). Lebanon’s National Report to the United Nations Conference on Sustainable Development -
RIO+20. Lebanon: Wide Expertise Group. Ministry of Environment, Beirut, Lebanon.
MoE (2019). Integrated Solid Waste Management Strategy - Roadmap. Ministry of Environment, Beirut,
Lebanon.
MoE (2020). Lebanon Recycling rates. Personal Communication Mr. Bassam Sabbagh, April 2020. Ministry of
Environment, Beirut, Lebanon.
MoE/EU/GFA (2017). Support to Reforms – Environmental Governance (STREG): Assessment of Solid Waste
Management Practices in Lebanon in 2015. Ministry of Environment (MoE), European Union (EU), GFA
Consulting Group (2017).
MoE/UNDP/ELARD (2011). Provision of consultancy services for the Preparation of a Master Plan for the
Closure and Rehabilitation of Uncontrolled Dumps throughout the country of Lebanon.
MoE/UNDP/ELARD (2017). Updated Masterplan for the Closure and Rehabilitation of Uncontrolled
Dumpsites. Lebanon.
MoE/UNDP/EU (2014) Lebanon Environmental Assessment of the Syrian Conflict & Priority Interventions.
Beirut, Lebanon.
MoE/UNDP/GEF (2011). Lebanon’s Second National Communication (SNC) to the United Nations Framework
Convention on Climate Change (UNFCCC).
MoE/UNDP/GEF (2015a). National Greenhouse Gas Inventory Report and Mitigation Analysis for the
Agriculture Sector in Lebanon. Beirut, Lebanon.
MoE/UNDP/GEF (2015b). Energy consumption in the commercial and institutional sector. Beirut, Lebanon.
MoE/UNDP/GEF (2015c). National Greenhouse Gas Inventory Report and Mitigation Analysis for the Energy
Sector in Lebanon. Beirut, Lebanon. MoE/UNDP/GEF (2016). Lebanon’s Third National Communication report to the UNFCCC. Beirut Lebanon.
MoE/UNDP/GEF (2019) Lebanon’s Third Biennial Update Report (BUR) to the UNFCCC. Beirut, Lebanon.
MoE/UNDP/KCEP (2020). National Cooling Plan for Lebanon. Beirut, Lebanon.
217
MoE/UNEP (2013). Environmental Resources Monitoring in Lebanon Project, Analysis of the Current Land
Use and Socio-Economic Activities in the Coastal Zone (to be published). Ministry of Environment.
MoE/UNEP/GEF (2015). Fifth National Report of Lebanon to the Convention on Biological Diversity, Beirut.
MoE/UNEP/GEF (2017). National Assessment of POPs Impacts and Management - Pesticides, Industrial and
Unintentionally Released. Beirut, Lebanon.
MoE/UNEP/GEF, (2016). Lebanon's National Biodiversity Strategy and Action Plan. Ministry of Environment,
Beirut, Lebanon.
MoE/UOB (2018). State of Lebanon's wildfires reports (2008-2017). Ministry of Environment and the
University of Balamand, Beirut, Lebanon.
MoE/URC/GEF (2012). Lebanon Technology Needs Assessment Report for Climate Change. Ministry of
Environment, Beirut, Lebanon.
MoEW (2010). National Water Sector Strategy. Ministry of Energy and Water. Beirut, Lebanon.
MoEW (2010a). National Water Sector Strategy. Ministry of Energy and Water, Beirut, Lebanon.
MoEW (2010b). Policy Paper for the Electricity Sector. Ministry of Energy and Water, Beirut, Lebanon.
MoEW (2018). Fuel import data sheet 2015-2018. Ministry of Energy and Water, Directorate General of
Petroleum, Beirut, Lebanon.
MoEW (2019). Updated Electricity Policy Paper. Ministry of Energy and Water, Beirut, Lebanon.
MoEW (2020). Data on EDL power generation, fuel oil and Gas/diesel oil consumption, power plants stock
and estimated demand for 2018-2019. Official communication, 19/2/2020, Ministry of Energy and Water,
Beirut, Lebanon.
MoEW/LCEC (2019a). The 2018 Solar PV status report. Ministry of Energy and Water, Lebanese Center for
Energy Conservation, Beirut, Lebanon.
MoEW/LCEC (2019b). The evolution of the solar water heaters market in Lebanon, 2012-2017 and beyond.
Ministry of Energy and Water, Lebanese Center for Energy Conservation, Beirut.
MoEW/LCEC (2011). The National Energy Efficiency Action Plan for Lebanon NEEAP 2011-2015. Ministry of
Energy and Water, Lebanese Center for Energy Conservation, Beirut, Lebanon.
MoEW/LCEC (2012a). Net Metering in Lebanon. Lebanese Center for Energy Conservation. UNDP, September
2012.
MoEW/LCEC (2012b). The Residential Solar Heaters Market in Lebanon. Ministry of Energy and Water,
Lebanese Center for Energy Conservation, Beirut, Lebanon.
MoEW/LCEC (2013). National Milestones for Energy Efficient Lighting and Solar Water Heaters. Ministry of
Energy and Water, Lebanese Center for Energy Conservation, Beirut, Lebanon.
MoEW/LCEC (2016a). National Energy Efficiency Action Plan 2016-2020. Ministry of Energy and Water,
Lebanese Center for Energy Conservation, Beirut.
MoEW/LCEC (2016b). National Renewable Energy Action Plan 2016-2010. Ministry of Energy and Water,
Lebanese Center for Energy Conservation, Beirut, Lebanon.
MoEW/LCEC (2020). The Beirut River Solar Snake, the dawn of the solar market in Lebanon. Ministry of
Energy and Water, Lebanese Center for Energy Conservation, Beirut, Lebanon.
218
MoEW/LCEC, (2021a). LCEC website. Ministry of Energy and Water, Lebanese Center for Energy
Conservation, Beirut. Available: https://lcec.org.lb/our-work
MoEW/LCEC, (2021b). The 2019 Solar PV status report. Ministry of Energy and Water, Lebanese Center for
Energy Conservation, Beirut, Lebanon.
MoEW/UNDP/GEF (2016). The 2016 Solar PV Status Report for Lebanon. Small Decentralized Renewable
Energy Power Generation (DREG) Project, Ministry of Energy and Water, Beirut, Lebanon.
MoEW/UNDP/GEF (2017). The 2017 Solar PV Status Report for Lebanon. Small Decentralized Renewable
Energy Power Generation (DREG) Project, Ministry of Energy and Water, Beirut, Lebanon.
MoIM (2017). Database of vehicle fleet characteristics 2015. Ministry of Interior and Municipalities, Traffic,
Trucks and Vehicles Management Authority, Beirut, Lebanon.
MoInd (2015). Industrial sector database. Ministry of Industry, Beirut, Lebanon.
MoInd/ALI/UNIDO (2010). The Lebanese Industrial Sector: Facts and Findings – 2007. Ministry of Industry,
Beirut, Lebanon.
Nakat, Z. (2018). The Greater Beirut Public Transport Project. Presentation at International Beirut Energy
Forum on 27-09-2018.
OECD (2021). OECD DAC External Development Finance Statistics. Available:
https://www.oecd.org/dac/financing-sustainable-development/development-finance-topics/climate-
change.htm
OMSAR (2018). Technical support to upgrading the solid waste management capacities in Lebanon -
ENPI/2017/389-095.
OMSAR (2021). Status of SWAM project. Office of the Minister of State for Administrative Reforms- Available:
http://swmp.omsar.gov.lb/en/our-projects. Beirut, Lebanon.
SBR (2015). Thermal Biomass for Lebanon: Meditterarean Mosaic Project for the Shouf Biosphere Reserve. Mediterranean Mosaics: strengthening the resilience of Mediterranean landscape to socio-economic and climate change. Shouf Biosphere Reserve, Lebanon.
SOER (2011). State and trends of the Lebanese Environment 2010. Beirut: Ministry of Environment. Beirut,
Lebanon.
SOER (2020). Lebanon State of the Environment and future outlook: turning the crises into opportunities.
UNDP, UNICEF, UNHCR, Ministry of Environment, Beirut, Lebanon.
SWEEP-Net (2010). Country Report on the Solid Waste Management in Lebanon. Beirut, Lebanon.
SWEEP-Net (2014). Cost Assessment of Solid Waste Degradation due to waste Management Practices in
Beirut and Mount Lebanon. Beirut, Lebanon.
TRAGSA (2012). General Protection Plan Against Forest Fires in Lebanon. Beirut, Lebanon.
Tripoli port statistics (2014). Annual number of incoming ships from 2005 to 2009. Available:
www.portdetripoli.com.
UNDP (2015). Solar-Powered Pumping in Lebanon: A Comprehensive Guide on Solar Water Pumping
Solutions. UNDP, Beirut, Lebanon.
UNDP (2017). Lebanon: Derisking Renewable Energy Investment. New York, NY: United Nations
Development Programme. UNDP, Beirut, Lebanon.
219
UNDP (2020). Analysis of Lebanon’s Nationally Determined Contributions (NDC)-Current State Assessment
of Derisking Renewable Energy Instruments. UNDP, Beirut, Lebanon.
UNDP (2021). Climate-Proofing Lebanon’s Development Plans. Beirut, Lebanon.
UNEP (2016). Solar Water Heaters’ Market Evaluation: Case Study of Lebanon 2015.
UNHCR (2015). Syrian Refugees in Lebanon. Daily Statistics. UNHCR registration Unit, December 31, 2015
UNHCR (2019) 2019 Year-End report. Available: https://reporting.unhcr.org/node/2520. Accessed August
2020.
UNRWA (2020). United Nations Relief and Works Agency for Palestine refugees in the near east -Lebanon
Profile. Available: https://www.unrwa.org/where-we-work/lebanon. Accessed September 2020.
USAID (2013). Small villages wastewater treatment systems program (SVWTS): Final External Evaluation.
Available: https://files.globalwaters.org/water-links-files/svts-program-lebanon-final-evaluation-2013.pdf.
Accessed August 2020.
VNR (2018). Voluntary National review report on sustainable development goals. Government of Lebanon,
Beirut.
Waked (2012). Caractérisation des aerosols organiques à Beyrouth, Liban: Unpublished data.
Waked and Afif (2012). Emissions of air pollutants from road transport in 987 Lebanon and other countries in
the Middle East region. Atmos. Environ. 988 61, 446–452.
WERF/IWA (2010). Evaluation of Greenhouse Gas Emissions from Septic Systems. Water Environment
Research Foundation (WERF)/International Water Association (IWA) London, UK. Available:
http://geoflow.com/wp-content/uploads/2017/pdfs/WERF%20Report.pdf. Accessed August 2020.
WHO/UNICEF (2020). Joint Monitoring Programme Database. Available: https://washdata.org. Accessed
August 2020.
World Bank (2011). Republic of Lebanon: Country Environmental Analysis. The World Bank Group,
Washington DC.
World Bank (2019). Lebanon Electricity Transmission Project (P170769), project information document. The
World Bank Group, Washington DC.
World Bank (2020a). Lebanon Economic Monitor The Deliberate Depression- The World Bank Group,
Washington DC.
World Bank (2020b). Beirut Rapid Damage and Needs Assessment (RDNA), The World Bank Group,
Washington DC.
World Bank (2020c). Lebanon Power Sector Emergency Action Plan, 2020. International Bank for
Reconstruction and Development/The World Bank Group, Washington DC.
220
ANNEXES
Annex I. QA/QC procedures and Uncertainty assessment
Quality control
The team uses standardized notations in the documentation sheets to document changes, data sources and necessary improvements.
Recalculation of the time series for the gases CO2, CH4 and N2O for all sectors caused changes to the
greenhouse gas calculations which were verified by sum checks and by using the previous data sets
to compare the results. The sum checks were performed for the totals and for the sectors to ensure no data was lost. Also, the transfer of activity data from the documentation sheets to IPCC model was
made more automatic decreasing a chance for inserting errors. Recalculations files, comparing the current and the previous submission, allow to check that no changes were made unless necessary and
documented. General and sectoral QC activities include cross-checking of outputs, tables and calculation files at various stages of the inventory compilation process.
Table A.1.1: List of general QC procedures applied to BUR4
QC Activity Procedures
Collection, input and computation of data
Transcription
errors between
data input and
reference
Cross-check descriptions of activity data and emission factors with information on
categories and ensure that these are properly recorded and archived
Confirm that bibliographical data references are properly cited in the internal
documentation
Cross-check a sample of input data from each category for transcription errors.
Utilize electronic data where possible to minimize transcription errors
Use automatization (e.g. calculation formulae and Lookup functions in Excel) to minimize
user/entry error
Do not include values like emission factors, net calorific values, assumptions into
formulae, rather link them to documented cells
Ensure spreadsheets contain clear instructions for updating and a description of how the
spreadsheet works
Ensure a record is kept in the spreadsheets of developments, how these have been
implemented and checked
Calculations Reproduce a representative sample of emissions/removals calculations
Record the work done and the findings. Record any improvements identified
Units and
conversion
factors
Check that units are properly labelled in calculation sheets and the data and methodology
documentation sheet
Check that units are correctly carried through from beginning to end of calculations
Check that conversion factors are correct
Check that temporal and spatial adjustment factors are used correctly
Consistency Identify parameters (e.g., activity data, constants) that are common to multiple categories
and confirm that there is consistency in the values used for these parameters in the
emissions/removals calculations
Documentation
Check that there is detailed internal documentation to support the estimates and enable duplication of
calculations
Check that every primary data element has a reference for the source of the data
Check that inventory data, supporting data, and inventory records are archived and stored to facilitate
detailed review
Check that the archive is closed and retained in secure place following completion of the inventory Calculation
221
Completeness Confirm that estimates are reported for all categories and for all years from the
appropriate base year over the period of the current inventory
For subcategories, confirm that the entire category is being covered
Check that known data gaps that result in incomplete category emissions/removals
estimates are documented, including qualitative evaluation of the importance of the
estimate in relation to total net emissions (e.g. subcategories classified as ‘not estimated’)
Recalculations Check for consistency in time series input data for each category
Check for consistency in the method used for calculations throughout the time series
Reproduce a representative sample of emission calculations to ensure mathematical
correctness
Time series
consistency
Check for consistency in time series input data for each category
Check for consistency in the method used for calculations throughout the time series
Check methodological and data changes resulting in recalculations
Trend For each category, compare current inventory estimates to previous estimates, if
available.
Check if there any unusual or unexplained trends noticed for activity data or other
parameters across the time series
Table A.1.2: List of specific QC procedures applied to BUR4
QC Activity Procedures
Emission factors
Evaluate whether national conditions are similar to those used to develop the IPCC default factors
Compare country-specific factors to IPCC defaults; document any significant discrepancies
Consider options for obtaining country-specific factors
Document results of this assessment
Time series consistency
Review changes in year-on-year estimates for categories and sub-categories
Where possible, use alternative methodologies to cross check results (i.e., reference and sectoral approach
for energy sector)
Activity data
Determine the level of QC performed by the data collection agency and document it.
Ensure that qualifications of individuals providing expert judgement for estimates are appropriate and
properly recorded
Quality assurance
Lebanon’s GHG inventory reported under BUR3 has been subject to review by international sectoral
experts for the Waste, Agriculture and Forestry and Other Land Uses (AFOLU) categories. Some of the
recommended improvements were applied in the preparation this BUR4. Other improvements -requiring time and resources- will be applied in subsequent GHG inventories. The results of the
reviews are prioritized in terms of their contribution to total GHG emissions and the magnitude of the flagged issue.
Results and recommendations from the reviews of previous BURs through the International
Consultation and Analysis (ICA) were considered also in the BUR4.
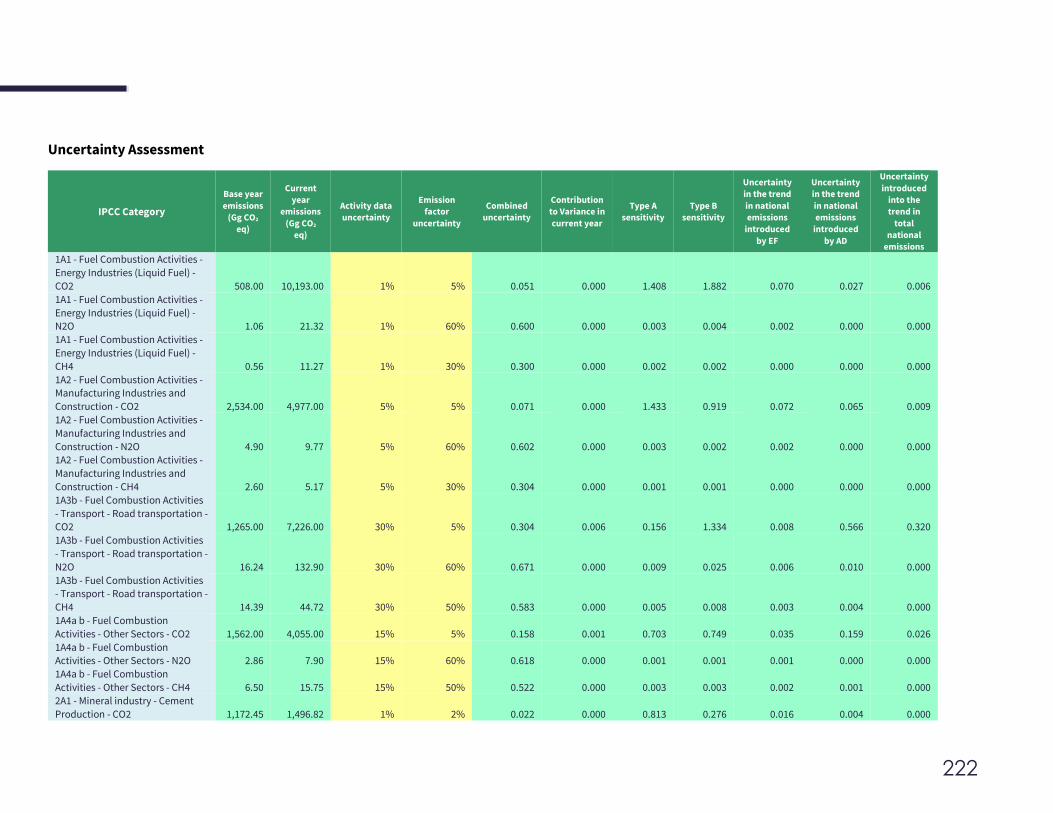
222
Uncertainty Assessment
IPCC Category
Base year
emissions
(Gg CO2
eq)
Current
year
emissions
(Gg CO2
eq)
Activity data
uncertainty
Emission
factor
uncertainty
Combined
uncertainty
Contribution
to Variance in
current year
Type A
sensitivity
Type B
sensitivity
Uncertainty
in the trend
in national
emissions
introduced
by EF
Uncertainty
in the trend
in national
emissions
introduced
by AD
Uncertainty
introduced
into the
trend in
total
national
emissions
1A1 - Fuel Combustion Activities -
Energy Industries (Liquid Fuel) -
CO2 508.00 10,193.00 1% 5% 0.051 0.000 1.408 1.882 0.070 0.027 0.006
1A1 - Fuel Combustion Activities -
Energy Industries (Liquid Fuel) - N2O 1.06 21.32 1% 60% 0.600 0.000 0.003 0.004 0.002 0.000 0.000
1A1 - Fuel Combustion Activities -
Energy Industries (Liquid Fuel) -
CH4 0.56 11.27 1% 30% 0.300 0.000 0.002 0.002 0.000 0.000 0.000
1A2 - Fuel Combustion Activities - Manufacturing Industries and
Construction - CO2 2,534.00 4,977.00 5% 5% 0.071 0.000 1.433 0.919 0.072 0.065 0.009
1A2 - Fuel Combustion Activities -
Manufacturing Industries and
Construction - N2O 4.90 9.77 5% 60% 0.602 0.000 0.003 0.002 0.002 0.000 0.000 1A2 - Fuel Combustion Activities -
Manufacturing Industries and
Construction - CH4 2.60 5.17 5% 30% 0.304 0.000 0.001 0.001 0.000 0.000 0.000
1A3b - Fuel Combustion Activities
- Transport - Road transportation - CO2 1,265.00 7,226.00 30% 5% 0.304 0.006 0.156 1.334 0.008 0.566 0.320
1A3b - Fuel Combustion Activities
- Transport - Road transportation -
N2O 16.24 132.90 30% 60% 0.671 0.000 0.009 0.025 0.006 0.010 0.000
1A3b - Fuel Combustion Activities - Transport - Road transportation -
CH4 14.39 44.72 30% 50% 0.583 0.000 0.005 0.008 0.003 0.004 0.000
1A4a b - Fuel Combustion
Activities - Other Sectors - CO2 1,562.00 4,055.00 15% 5% 0.158 0.001 0.703 0.749 0.035 0.159 0.026
1A4a b - Fuel Combustion Activities - Other Sectors - N2O 2.86 7.90 15% 60% 0.618 0.000 0.001 0.001 0.001 0.000 0.000
1A4a b - Fuel Combustion
Activities - Other Sectors - CH4 6.50 15.75 15% 50% 0.522 0.000 0.003 0.003 0.002 0.001 0.000
2A1 - Mineral industry - Cement
Production - CO2 1,172.45 1,496.82 1% 2% 0.022 0.000 0.813 0.276 0.016 0.004 0.000
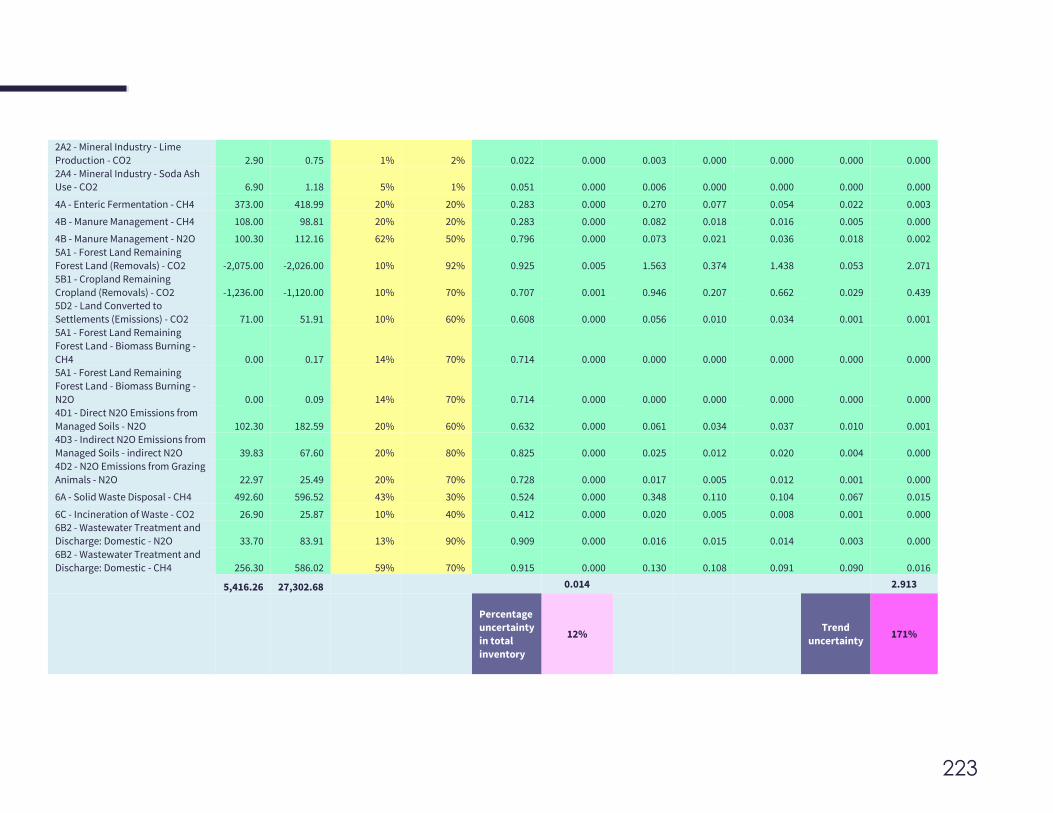
223
2A2 - Mineral Industry - Lime
Production - CO2 2.90 0.75 1% 2% 0.022 0.000 0.003 0.000 0.000 0.000 0.000
2A4 - Mineral Industry - Soda Ash Use - CO2 6.90 1.18 5% 1% 0.051 0.000 0.006 0.000 0.000 0.000 0.000
4A - Enteric Fermentation - CH4 373.00 418.99 20% 20% 0.283 0.000 0.270 0.077 0.054 0.022 0.003
4B - Manure Management - CH4 108.00 98.81 20% 20% 0.283 0.000 0.082 0.018 0.016 0.005 0.000
4B - Manure Management - N2O 100.30 112.16 62% 50% 0.796 0.000 0.073 0.021 0.036 0.018 0.002
5A1 - Forest Land Remaining
Forest Land (Removals) - CO2 -2,075.00 -2,026.00 10% 92% 0.925 0.005 1.563 0.374 1.438 0.053 2.071
5B1 - Cropland Remaining
Cropland (Removals) - CO2 -1,236.00 -1,120.00 10% 70% 0.707 0.001 0.946 0.207 0.662 0.029 0.439 5D2 - Land Converted to
Settlements (Emissions) - CO2 71.00 51.91 10% 60% 0.608 0.000 0.056 0.010 0.034 0.001 0.001
5A1 - Forest Land Remaining
Forest Land - Biomass Burning -
CH4 0.00 0.17 14% 70% 0.714 0.000 0.000 0.000 0.000 0.000 0.000 5A1 - Forest Land Remaining
Forest Land - Biomass Burning -
N2O 0.00 0.09 14% 70% 0.714 0.000 0.000 0.000 0.000 0.000 0.000
4D1 - Direct N2O Emissions from
Managed Soils - N2O 102.30 182.59 20% 60% 0.632 0.000 0.061 0.034 0.037 0.010 0.001 4D3 - Indirect N2O Emissions from
Managed Soils - indirect N2O 39.83 67.60 20% 80% 0.825 0.000 0.025 0.012 0.020 0.004 0.000
4D2 - N2O Emissions from Grazing
Animals - N2O 22.97 25.49 20% 70% 0.728 0.000 0.017 0.005 0.012 0.001 0.000
6A - Solid Waste Disposal - CH4 492.60 596.52 43% 30% 0.524 0.000 0.348 0.110 0.104 0.067 0.015
6C - Incineration of Waste - CO2 26.90 25.87 10% 40% 0.412 0.000 0.020 0.005 0.008 0.001 0.000 6B2 - Wastewater Treatment and
Discharge: Domestic - N2O 33.70 83.91 13% 90% 0.909 0.000 0.016 0.015 0.014 0.003 0.000
6B2 - Wastewater Treatment and
Discharge: Domestic - CH4 256.30 586.02 59% 70% 0.915 0.000 0.130 0.108 0.091 0.090 0.016
5,416.26 27,302.68 0.014 2.913
Percentage uncertainty
in total
inventory
12% Trend
uncertainty 171%
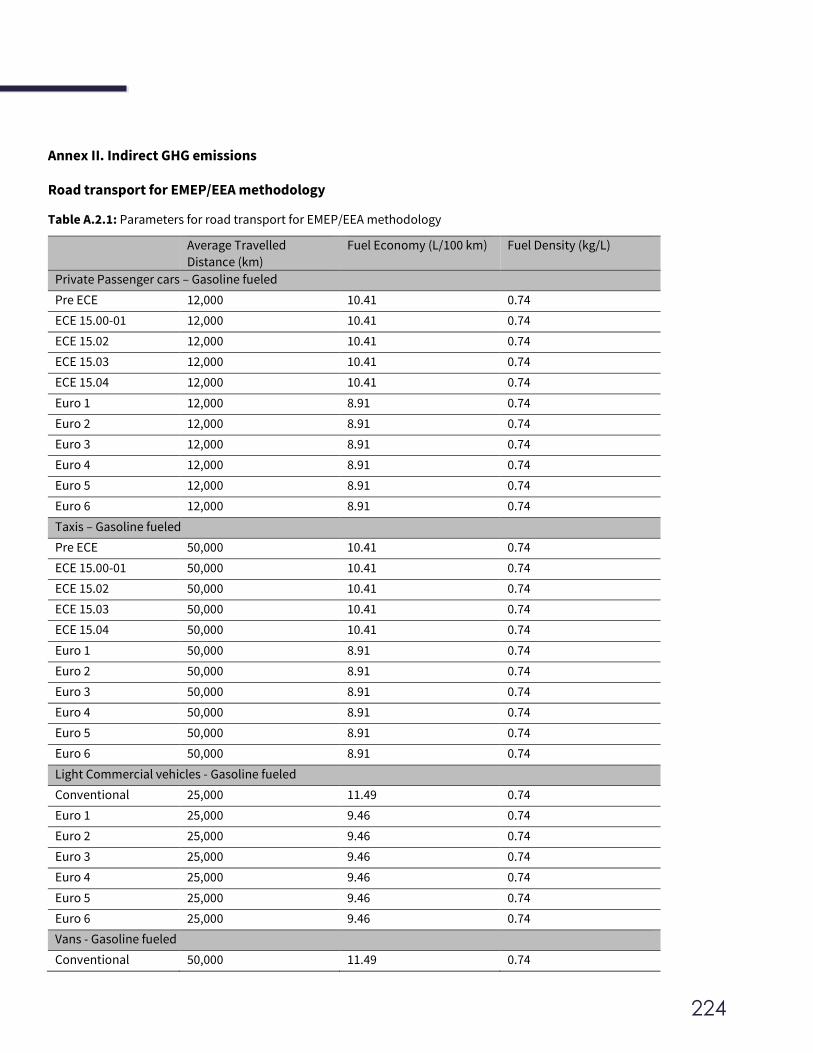
224
Annex II. Indirect GHG emissions
Road transport for EMEP/EEA methodology
Table A.2.1: Parameters for road transport for EMEP/EEA methodology
Average Travelled
Distance (km)
Fuel Economy (L/100 km) Fuel Density (kg/L)
Private Passenger cars – Gasoline fueled
Pre ECE 12,000 10.41 0.74
ECE 15.00-01 12,000 10.41 0.74
ECE 15.02 12,000 10.41 0.74
ECE 15.03 12,000 10.41 0.74
ECE 15.04 12,000 10.41 0.74
Euro 1 12,000 8.91 0.74
Euro 2 12,000 8.91 0.74
Euro 3 12,000 8.91 0.74
Euro 4 12,000 8.91 0.74
Euro 5 12,000 8.91 0.74
Euro 6 12,000 8.91 0.74
Taxis – Gasoline fueled
Pre ECE 50,000 10.41 0.74
ECE 15.00-01 50,000 10.41 0.74
ECE 15.02 50,000 10.41 0.74
ECE 15.03 50,000 10.41 0.74
ECE 15.04 50,000 10.41 0.74
Euro 1 50,000 8.91 0.74
Euro 2 50,000 8.91 0.74
Euro 3 50,000 8.91 0.74
Euro 4 50,000 8.91 0.74
Euro 5 50,000 8.91 0.74
Euro 6 50,000 8.91 0.74
Light Commercial vehicles - Gasoline fueled
Conventional 25,000 11.49 0.74
Euro 1 25,000 9.46 0.74
Euro 2 25,000 9.46 0.74
Euro 3 25,000 9.46 0.74
Euro 4 25,000 9.46 0.74
Euro 5 25,000 9.46 0.74
Euro 6 25,000 9.46 0.74
Vans - Gasoline fueled
Conventional 50,000 11.49 0.74
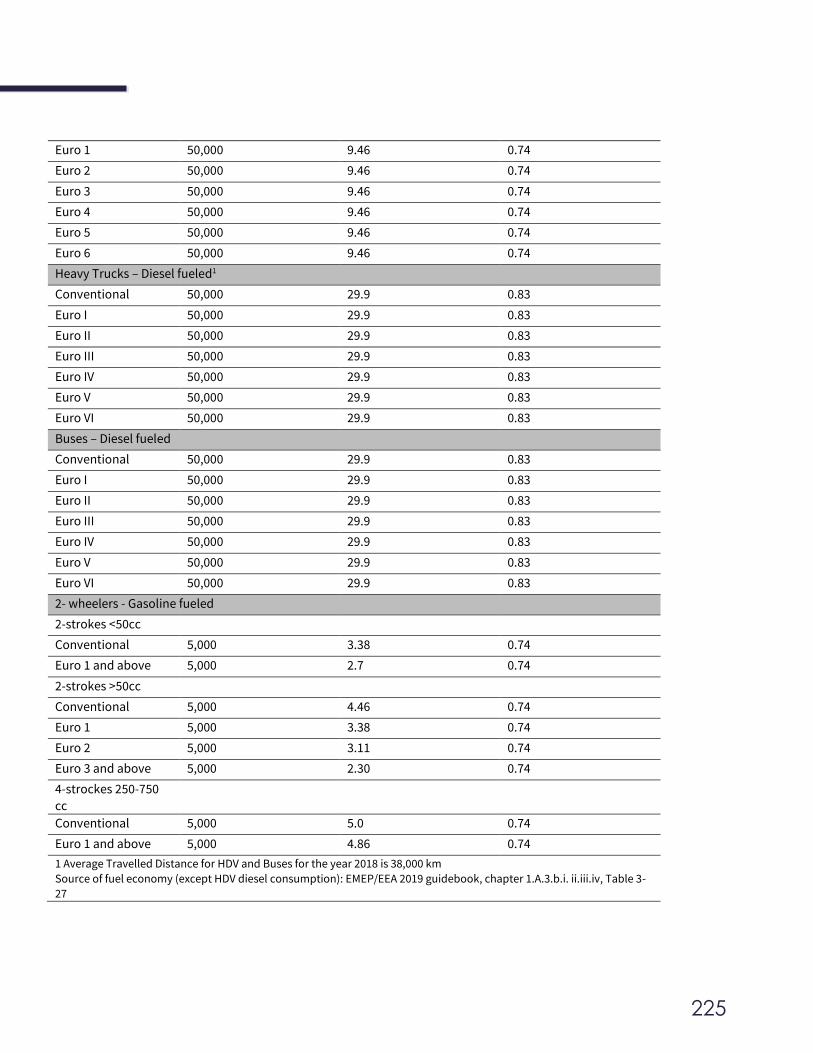
225
Euro 1 50,000 9.46 0.74
Euro 2 50,000 9.46 0.74
Euro 3 50,000 9.46 0.74
Euro 4 50,000 9.46 0.74
Euro 5 50,000 9.46 0.74
Euro 6 50,000 9.46 0.74
Heavy Trucks – Diesel fueled1
Conventional 50,000 29.9 0.83
Euro I 50,000 29.9 0.83
Euro II 50,000 29.9 0.83
Euro III 50,000 29.9 0.83
Euro IV 50,000 29.9 0.83
Euro V 50,000 29.9 0.83
Euro VI 50,000 29.9 0.83
Buses – Diesel fueled
Conventional 50,000 29.9 0.83
Euro I 50,000 29.9 0.83
Euro II 50,000 29.9 0.83
Euro III 50,000 29.9 0.83
Euro IV 50,000 29.9 0.83
Euro V 50,000 29.9 0.83
Euro VI 50,000 29.9 0.83
2- wheelers - Gasoline fueled
2-strokes <50cc
Conventional 5,000 3.38 0.74
Euro 1 and above 5,000 2.7 0.74
2-strokes >50cc
Conventional 5,000 4.46 0.74
Euro 1 5,000 3.38 0.74
Euro 2 5,000 3.11 0.74
Euro 3 and above 5,000 2.30 0.74
4-strockes 250-750
cc
Conventional 5,000 5.0 0.74
Euro 1 and above 5,000 4.86 0.74
1 Average Travelled Distance for HDV and Buses for the year 2018 is 38,000 km
Source of fuel economy (except HDV diesel consumption): EMEP/EEA 2019 guidebook, chapter 1.A.3.b.i. ii.iii.iv, Table 3-
27
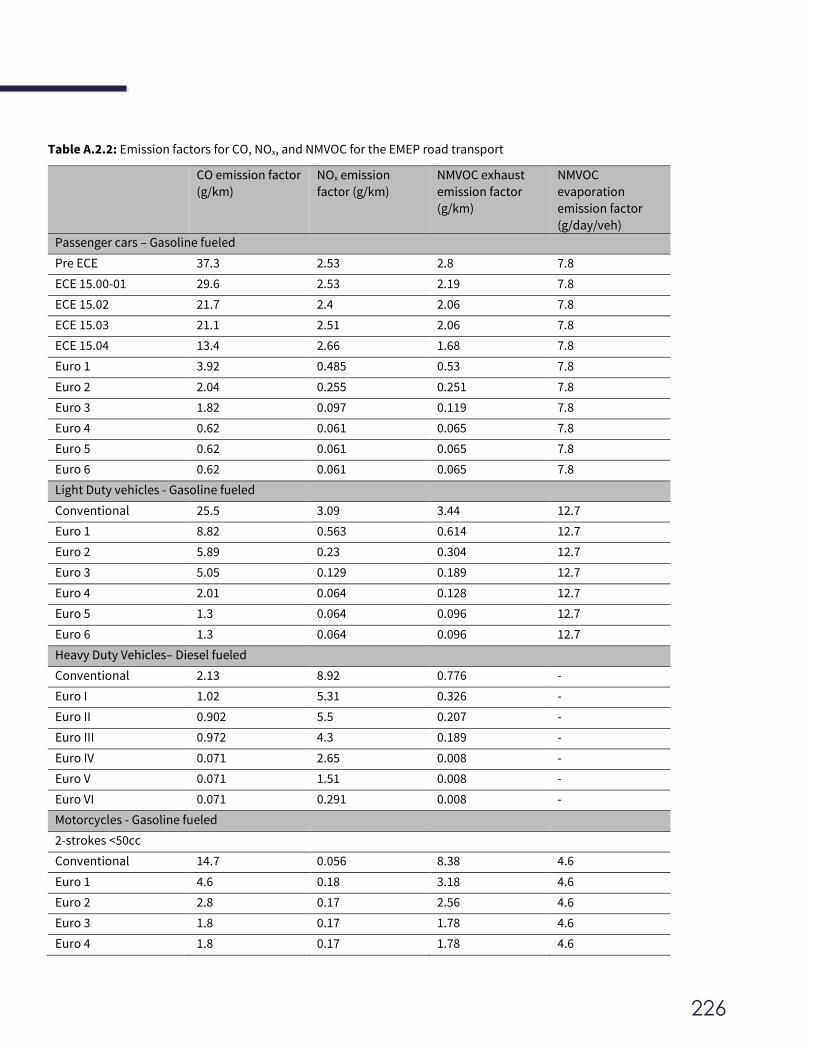
226
Table A.2.2: Emission factors for CO, NOx, and NMVOC for the EMEP road transport
CO emission factor
(g/km)
NOx emission
factor (g/km)
NMVOC exhaust
emission factor
(g/km)
NMVOC
evaporation
emission factor
(g/day/veh)
Passenger cars – Gasoline fueled
Pre ECE 37.3 2.53 2.8 7.8
ECE 15.00-01 29.6 2.53 2.19 7.8
ECE 15.02 21.7 2.4 2.06 7.8
ECE 15.03 21.1 2.51 2.06 7.8
ECE 15.04 13.4 2.66 1.68 7.8
Euro 1 3.92 0.485 0.53 7.8
Euro 2 2.04 0.255 0.251 7.8
Euro 3 1.82 0.097 0.119 7.8
Euro 4 0.62 0.061 0.065 7.8
Euro 5 0.62 0.061 0.065 7.8
Euro 6 0.62 0.061 0.065 7.8
Light Duty vehicles - Gasoline fueled
Conventional 25.5 3.09 3.44 12.7
Euro 1 8.82 0.563 0.614 12.7
Euro 2 5.89 0.23 0.304 12.7
Euro 3 5.05 0.129 0.189 12.7
Euro 4 2.01 0.064 0.128 12.7
Euro 5 1.3 0.064 0.096 12.7
Euro 6 1.3 0.064 0.096 12.7
Heavy Duty Vehicles– Diesel fueled
Conventional 2.13 8.92 0.776 -
Euro I 1.02 5.31 0.326 -
Euro II 0.902 5.5 0.207 -
Euro III 0.972 4.3 0.189 -
Euro IV 0.071 2.65 0.008 -
Euro V 0.071 1.51 0.008 -
Euro VI 0.071 0.291 0.008 -
Motorcycles - Gasoline fueled
2-strokes <50cc
Conventional 14.7 0.056 8.38 4.6
Euro 1 4.6 0.18 3.18 4.6
Euro 2 2.8 0.17 2.56 4.6
Euro 3 1.8 0.17 1.78 4.6
Euro 4 1.8 0.17 1.78 4.6
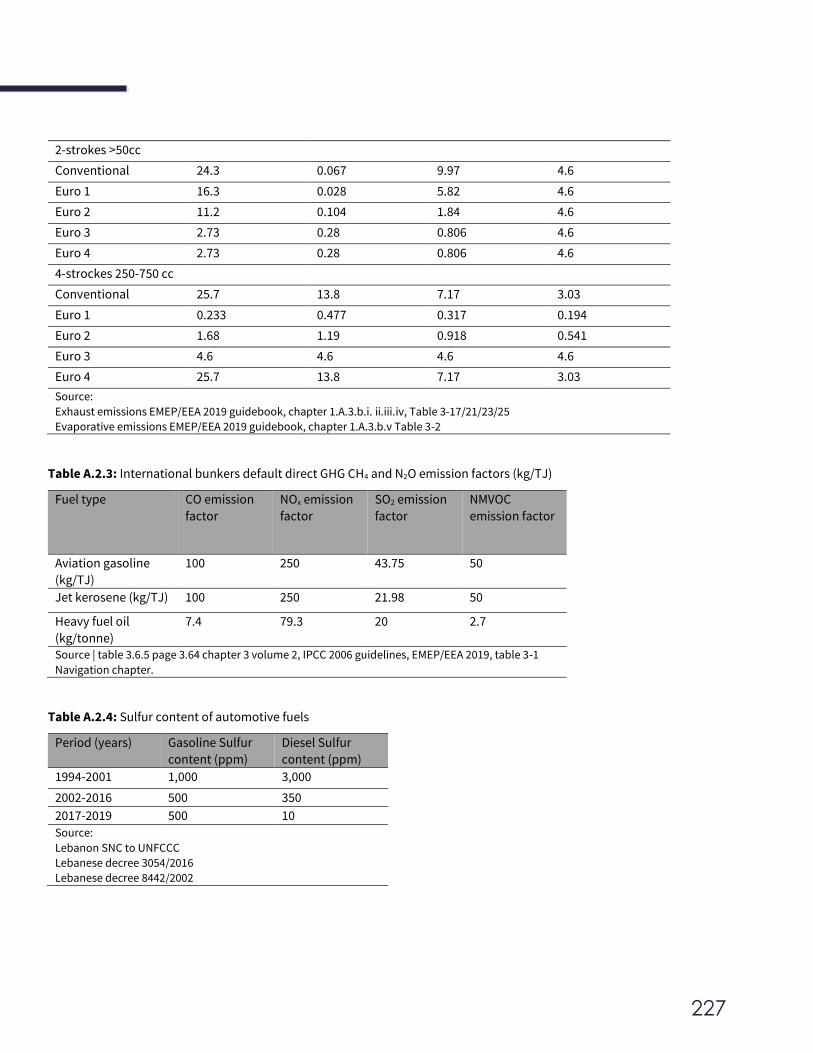
227
2-strokes >50cc
Conventional 24.3 0.067 9.97 4.6
Euro 1 16.3 0.028 5.82 4.6
Euro 2 11.2 0.104 1.84 4.6
Euro 3 2.73 0.28 0.806 4.6
Euro 4 2.73 0.28 0.806 4.6
4-strockes 250-750 cc
Conventional 25.7 13.8 7.17 3.03
Euro 1 0.233 0.477 0.317 0.194
Euro 2 1.68 1.19 0.918 0.541
Euro 3 4.6 4.6 4.6 4.6
Euro 4 25.7 13.8 7.17 3.03
Source:
Exhaust emissions EMEP/EEA 2019 guidebook, chapter 1.A.3.b.i. ii.iii.iv, Table 3-17/21/23/25
Evaporative emissions EMEP/EEA 2019 guidebook, chapter 1.A.3.b.v Table 3-2
Table A.2.3: International bunkers default direct GHG CH4 and N2O emission factors (kg/TJ)
Fuel type CO emission
factor
NOx emission
factor
SO2 emission
factor
NMVOC
emission factor
Aviation gasoline
(kg/TJ)
100 250 43.75 50
Jet kerosene (kg/TJ) 100 250 21.98 50
Heavy fuel oil
(kg/tonne)
7.4 79.3 20 2.7
Source | table 3.6.5 page 3.64 chapter 3 volume 2, IPCC 2006 guidelines, EMEP/EEA 2019, table 3-1
Navigation chapter.
Table A.2.4: Sulfur content of automotive fuels
Period (years) Gasoline Sulfur
content (ppm)
Diesel Sulfur
content (ppm)
1994-2001 1,000 3,000
2002-2016 500 350
2017-2019 500 10
Source:
Lebanon SNC to UNFCCC
Lebanese decree 3054/2016
Lebanese decree 8442/2002
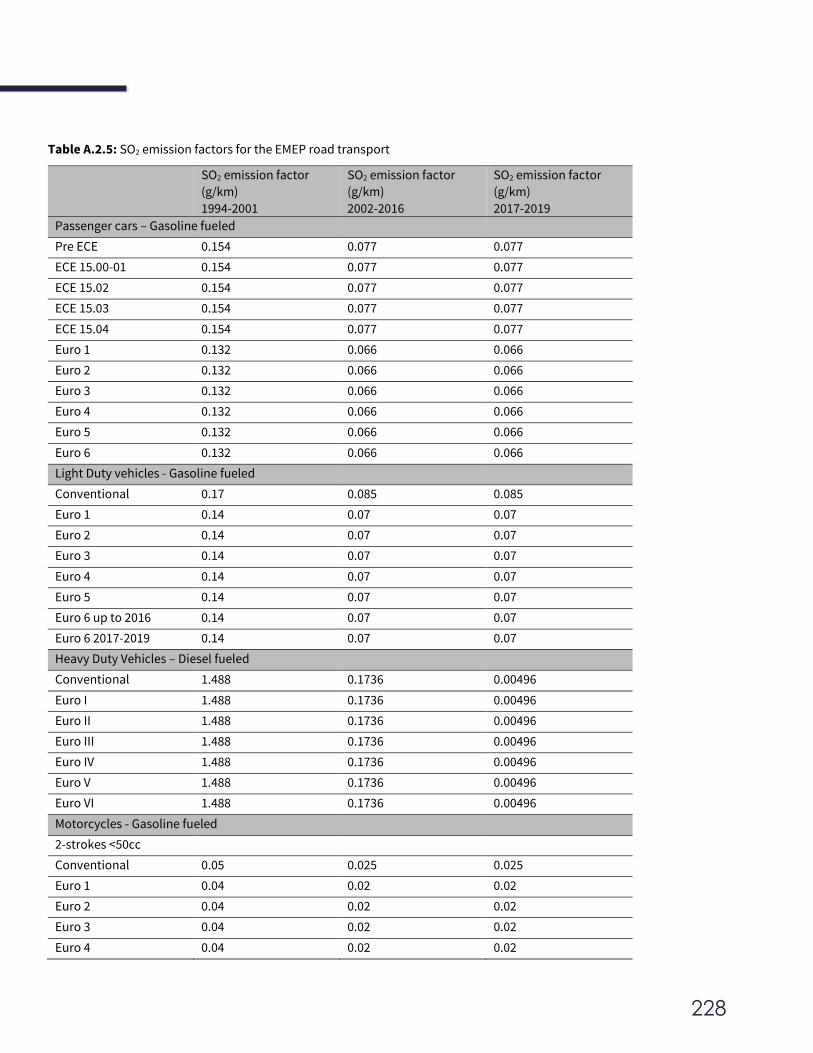
228
Table A.2.5: SO2 emission factors for the EMEP road transport
SO2 emission factor
(g/km)
1994-2001
SO2 emission factor
(g/km)
2002-2016
SO2 emission factor
(g/km)
2017-2019
Passenger cars – Gasoline fueled
Pre ECE 0.154 0.077 0.077
ECE 15.00-01 0.154 0.077 0.077
ECE 15.02 0.154 0.077 0.077
ECE 15.03 0.154 0.077 0.077
ECE 15.04 0.154 0.077 0.077
Euro 1 0.132 0.066 0.066
Euro 2 0.132 0.066 0.066
Euro 3 0.132 0.066 0.066
Euro 4 0.132 0.066 0.066
Euro 5 0.132 0.066 0.066
Euro 6 0.132 0.066 0.066
Light Duty vehicles - Gasoline fueled
Conventional 0.17 0.085 0.085
Euro 1 0.14 0.07 0.07
Euro 2 0.14 0.07 0.07
Euro 3 0.14 0.07 0.07
Euro 4 0.14 0.07 0.07
Euro 5 0.14 0.07 0.07
Euro 6 up to 2016 0.14 0.07 0.07
Euro 6 2017-2019 0.14 0.07 0.07
Heavy Duty Vehicles – Diesel fueled
Conventional 1.488 0.1736 0.00496
Euro I 1.488 0.1736 0.00496
Euro II 1.488 0.1736 0.00496
Euro III 1.488 0.1736 0.00496
Euro IV 1.488 0.1736 0.00496
Euro V 1.488 0.1736 0.00496
Euro VI 1.488 0.1736 0.00496
Motorcycles - Gasoline fueled
2-strokes <50cc
Conventional 0.05 0.025 0.025
Euro 1 0.04 0.02 0.02
Euro 2 0.04 0.02 0.02
Euro 3 0.04 0.02 0.02
Euro 4 0.04 0.02 0.02
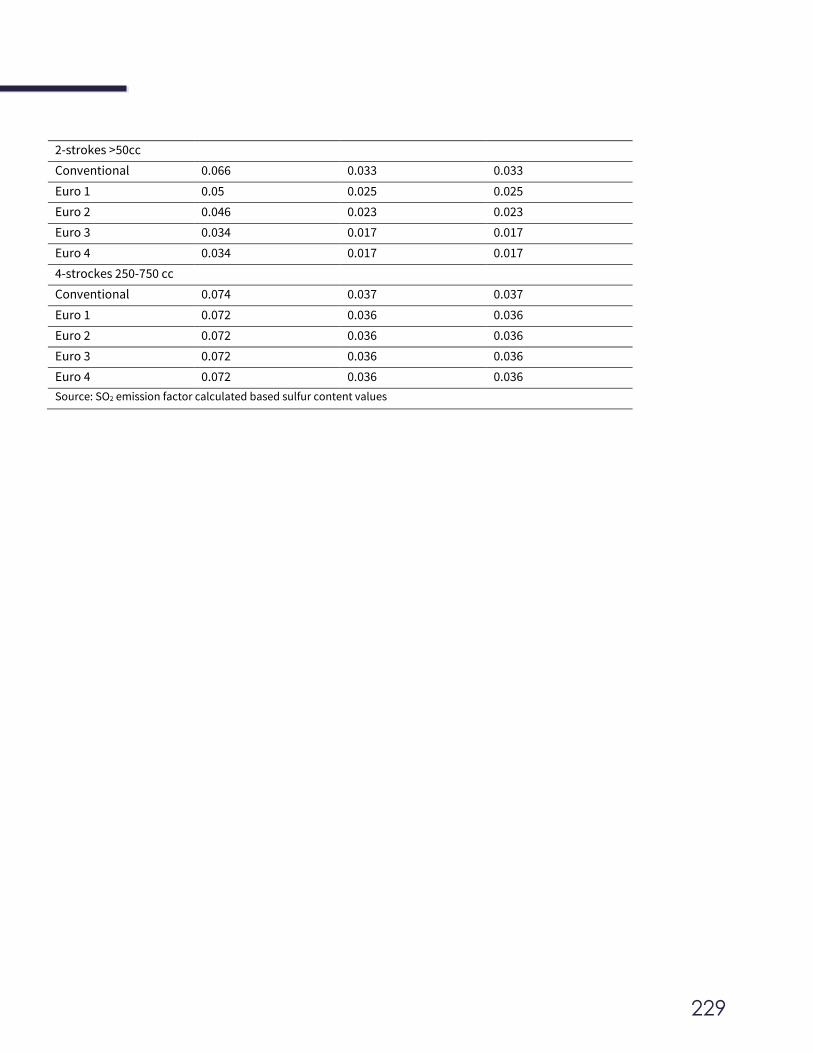
229
2-strokes >50cc
Conventional 0.066 0.033 0.033
Euro 1 0.05 0.025 0.025
Euro 2 0.046 0.023 0.023
Euro 3 0.034 0.017 0.017
Euro 4 0.034 0.017 0.017
4-strockes 250-750 cc
Conventional 0.074 0.037 0.037
Euro 1 0.072 0.036 0.036
Euro 2 0.072 0.036 0.036
Euro 3 0.072 0.036 0.036
Euro 4 0.072 0.036 0.036
Source: SO2 emission factor calculated based sulfur content values
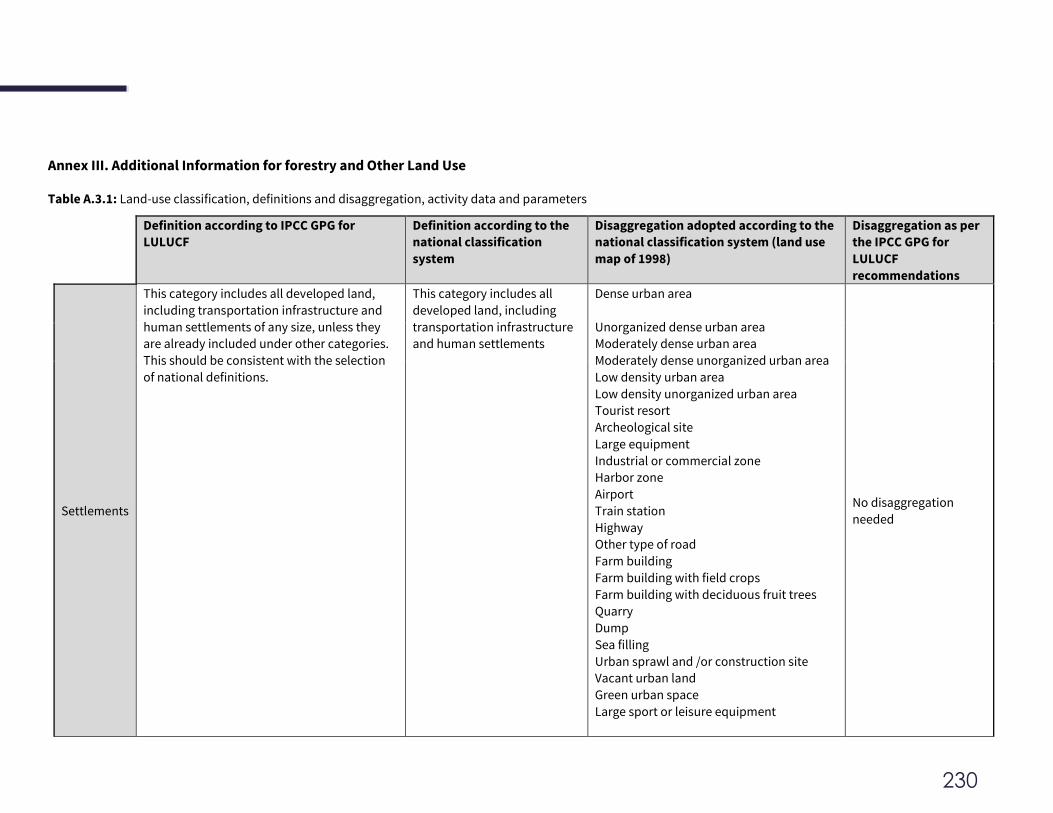
230
Annex III. Additional Information for forestry and Other Land Use
Table A.3.1: Land-use classification, definitions and disaggregation, activity data and parameters
Definition according to IPCC GPG for
LULUCF
Definition according to the
national classification
system
Disaggregation adopted according to the
national classification system (land use
map of 1998)
Disaggregation as per
the IPCC GPG for
LULUCF
recommendations
Settlements
This category includes all developed land,
including transportation infrastructure and
human settlements of any size, unless they
are already included under other categories.
This should be consistent with the selection
of national definitions.
This category includes all
developed land, including
transportation infrastructure
and human settlements
Dense urban area
Unorganized dense urban area
Moderately dense urban area
Moderately dense unorganized urban area
Low density urban area
Low density unorganized urban area
Tourist resort
Archeological site
Large equipment
Industrial or commercial zone
Harbor zone
Airport
Train station
Highway
Other type of road
Farm building
Farm building with field crops
Farm building with deciduous fruit trees
Quarry
Dump
Sea filling
Urban sprawl and /or construction site
Vacant urban land
Green urban space
Large sport or leisure equipment
No disaggregation
needed
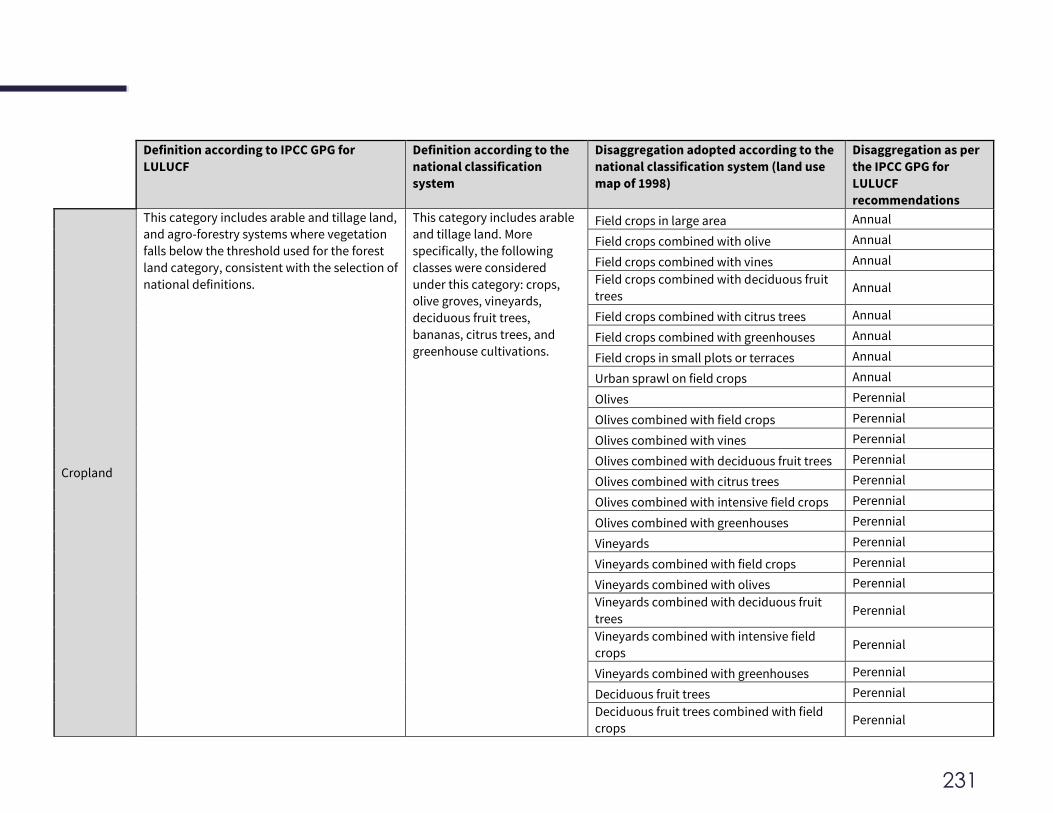
231
Definition according to IPCC GPG for
LULUCF
Definition according to the
national classification
system
Disaggregation adopted according to the
national classification system (land use
map of 1998)
Disaggregation as per
the IPCC GPG for
LULUCF
recommendations
Cropland
This category includes arable and tillage land,
and agro-forestry systems where vegetation
falls below the threshold used for the forest
land category, consistent with the selection of
national definitions.
This category includes arable
and tillage land. More
specifically, the following
classes were considered
under this category: crops,
olive groves, vineyards,
deciduous fruit trees,
bananas, citrus trees, and
greenhouse cultivations.
Field crops in large area Annual
Field crops combined with olive Annual
Field crops combined with vines Annual
Field crops combined with deciduous fruit
trees Annual
Field crops combined with citrus trees Annual
Field crops combined with greenhouses Annual
Field crops in small plots or terraces Annual
Urban sprawl on field crops Annual
Olives Perennial
Olives combined with field crops Perennial
Olives combined with vines Perennial
Olives combined with deciduous fruit trees Perennial
Olives combined with citrus trees Perennial
Olives combined with intensive field crops Perennial
Olives combined with greenhouses Perennial
Vineyards Perennial
Vineyards combined with field crops Perennial
Vineyards combined with olives Perennial
Vineyards combined with deciduous fruit
trees Perennial
Vineyards combined with intensive field
crops Perennial
Vineyards combined with greenhouses Perennial
Deciduous fruit trees Perennial
Deciduous fruit trees combined with field
crops Perennial
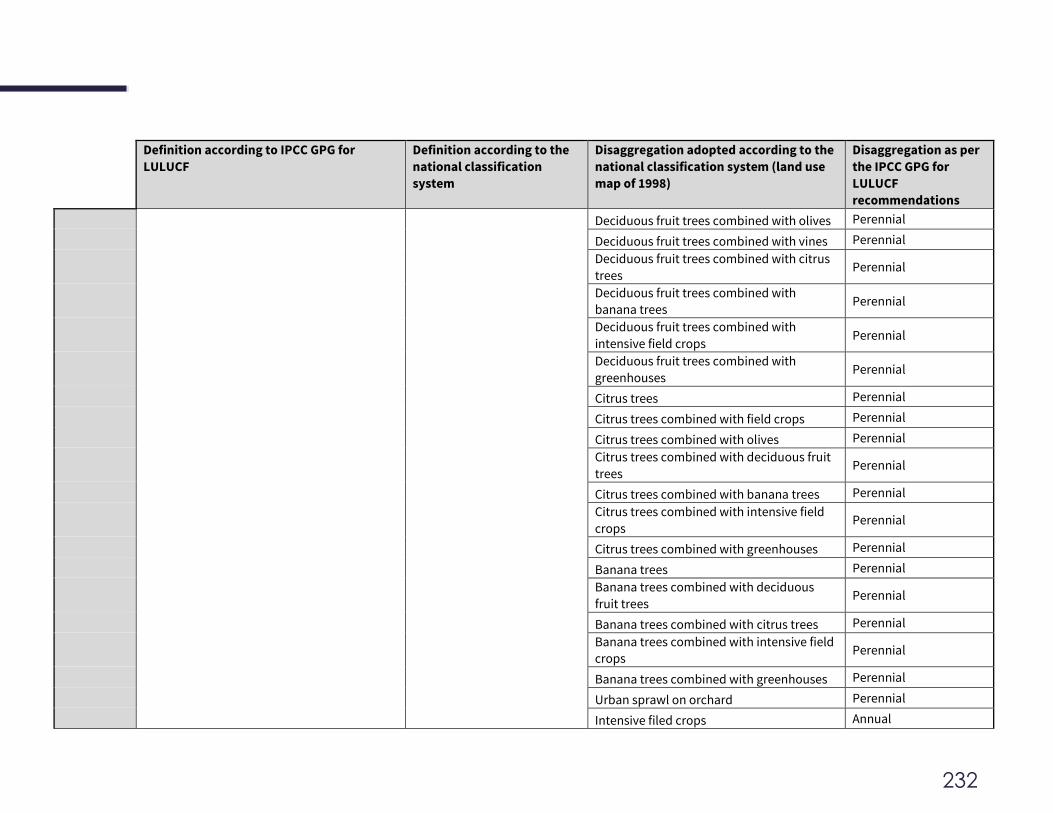
232
Definition according to IPCC GPG for
LULUCF
Definition according to the
national classification
system
Disaggregation adopted according to the
national classification system (land use
map of 1998)
Disaggregation as per
the IPCC GPG for
LULUCF
recommendations
Deciduous fruit trees combined with olives Perennial
Deciduous fruit trees combined with vines Perennial
Deciduous fruit trees combined with citrus
trees Perennial
Deciduous fruit trees combined with
banana trees Perennial
Deciduous fruit trees combined with
intensive field crops Perennial
Deciduous fruit trees combined with
greenhouses Perennial
Citrus trees Perennial
Citrus trees combined with field crops Perennial
Citrus trees combined with olives Perennial
Citrus trees combined with deciduous fruit
trees Perennial
Citrus trees combined with banana trees Perennial
Citrus trees combined with intensive field
crops Perennial
Citrus trees combined with greenhouses Perennial
Banana trees Perennial
Banana trees combined with deciduous
fruit trees Perennial
Banana trees combined with citrus trees Perennial
Banana trees combined with intensive field
crops Perennial
Banana trees combined with greenhouses Perennial
Urban sprawl on orchard Perennial
Intensive filed crops Annual
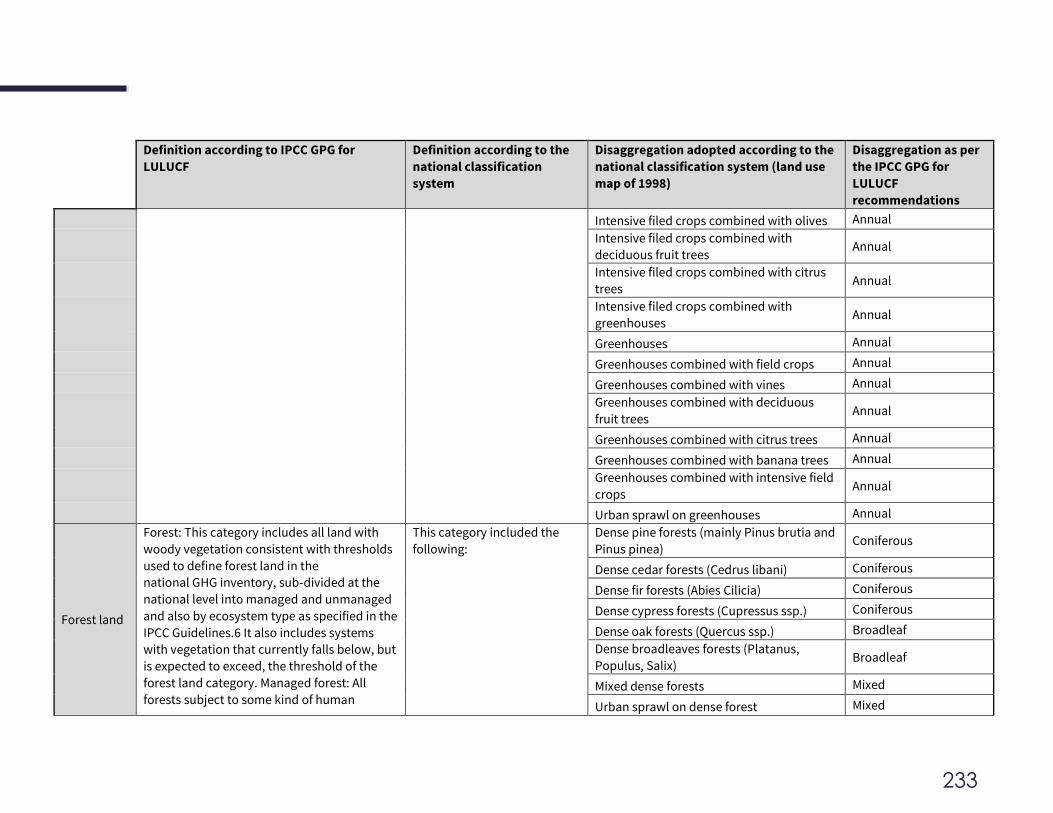
233
Definition according to IPCC GPG for
LULUCF
Definition according to the
national classification
system
Disaggregation adopted according to the
national classification system (land use
map of 1998)
Disaggregation as per
the IPCC GPG for
LULUCF
recommendations
Intensive filed crops combined with olives Annual
Intensive filed crops combined with
deciduous fruit trees Annual
Intensive filed crops combined with citrus
trees Annual
Intensive filed crops combined with
greenhouses Annual
Greenhouses Annual
Greenhouses combined with field crops Annual
Greenhouses combined with vines Annual
Greenhouses combined with deciduous
fruit trees Annual
Greenhouses combined with citrus trees Annual
Greenhouses combined with banana trees Annual
Greenhouses combined with intensive field
crops Annual
Urban sprawl on greenhouses Annual
Forest land
Forest: This category includes all land with
woody vegetation consistent with thresholds
used to define forest land in the
national GHG inventory, sub-divided at the
national level into managed and unmanaged
and also by ecosystem type as specified in the
IPCC Guidelines.6 It also includes systems
with vegetation that currently falls below, but
is expected to exceed, the threshold of the
forest land category. Managed forest: All
forests subject to some kind of human
This category included the
following:
Dense pine forests (mainly Pinus brutia and
Pinus pinea) Coniferous
Dense cedar forests (Cedrus libani) Coniferous
Dense fir forests (Abies Cilicia) Coniferous
Dense cypress forests (Cupressus ssp.) Coniferous
Dense oak forests (Quercus ssp.) Broadleaf
Dense broadleaves forests (Platanus,
Populus, Salix) Broadleaf
Mixed dense forests Mixed
Urban sprawl on dense forest Mixed
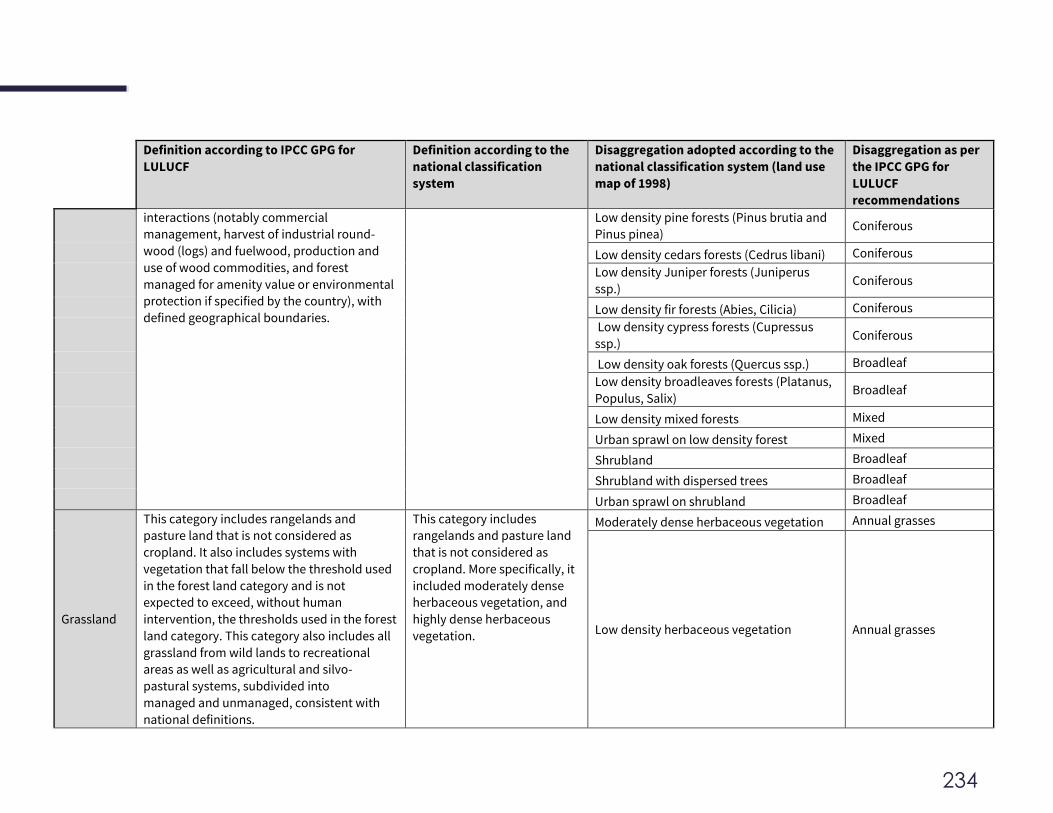
234
Definition according to IPCC GPG for
LULUCF
Definition according to the
national classification
system
Disaggregation adopted according to the
national classification system (land use
map of 1998)
Disaggregation as per
the IPCC GPG for
LULUCF
recommendations
interactions (notably commercial
management, harvest of industrial round-
wood (logs) and fuelwood, production and
use of wood commodities, and forest
managed for amenity value or environmental
protection if specified by the country), with
defined geographical boundaries.
Low density pine forests (Pinus brutia and
Pinus pinea) Coniferous
Low density cedars forests (Cedrus libani) Coniferous
Low density Juniper forests (Juniperus
ssp.) Coniferous
Low density fir forests (Abies, Cilicia) Coniferous
Low density cypress forests (Cupressus
ssp.) Coniferous
Low density oak forests (Quercus ssp.) Broadleaf
Low density broadleaves forests (Platanus,
Populus, Salix) Broadleaf
Low density mixed forests Mixed
Urban sprawl on low density forest Mixed
Shrubland Broadleaf
Shrubland with dispersed trees Broadleaf
Urban sprawl on shrubland Broadleaf
Grassland
This category includes rangelands and
pasture land that is not considered as
cropland. It also includes systems with
vegetation that fall below the threshold used
in the forest land category and is not
expected to exceed, without human
intervention, the thresholds used in the forest
land category. This category also includes all
grassland from wild lands to recreational
areas as well as agricultural and silvo-
pastural systems, subdivided into
managed and unmanaged, consistent with
national definitions.
This category includes
rangelands and pasture land
that is not considered as
cropland. More specifically, it
included moderately dense
herbaceous vegetation, and
highly dense herbaceous
vegetation.
Moderately dense herbaceous vegetation Annual grasses
Low density herbaceous vegetation Annual grasses
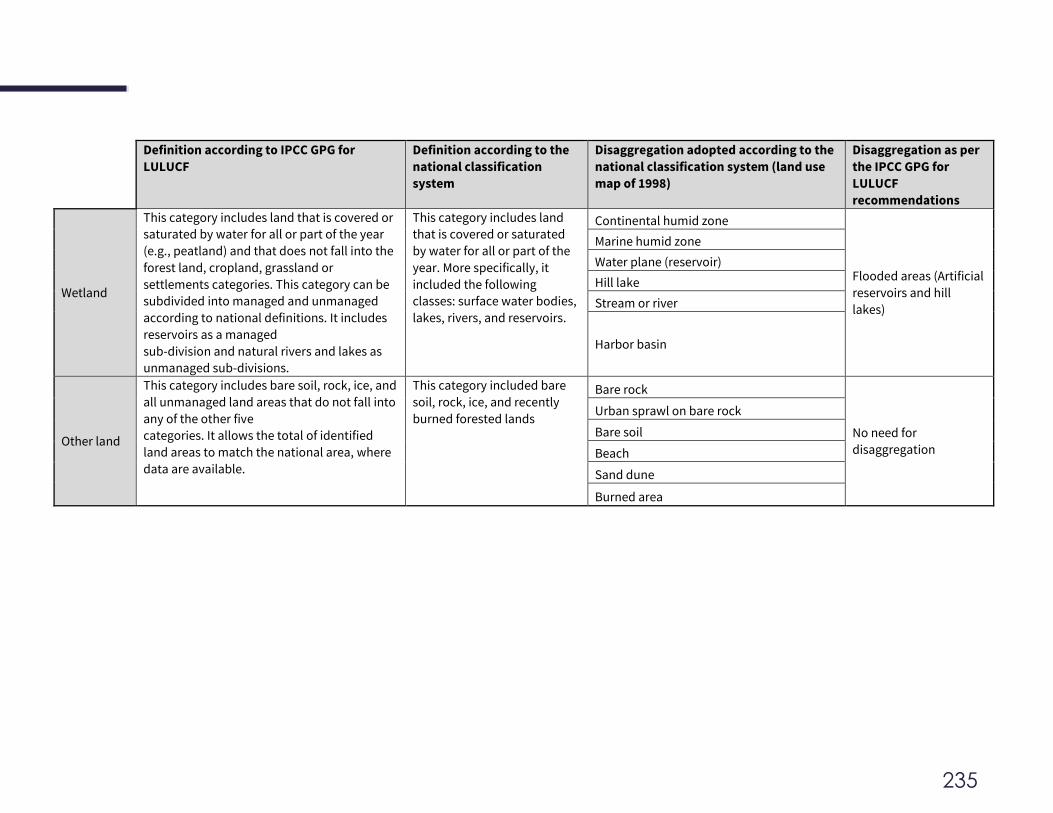
235
Definition according to IPCC GPG for
LULUCF
Definition according to the
national classification
system
Disaggregation adopted according to the
national classification system (land use
map of 1998)
Disaggregation as per
the IPCC GPG for
LULUCF
recommendations
Wetland
This category includes land that is covered or
saturated by water for all or part of the year
(e.g., peatland) and that does not fall into the
forest land, cropland, grassland or
settlements categories. This category can be
subdivided into managed and unmanaged
according to national definitions. It includes
reservoirs as a managed
sub-division and natural rivers and lakes as
unmanaged sub-divisions.
This category includes land
that is covered or saturated
by water for all or part of the
year. More specifically, it
included the following
classes: surface water bodies,
lakes, rivers, and reservoirs.
Continental humid zone
Flooded areas (Artificial
reservoirs and hill
lakes)
Marine humid zone
Water plane (reservoir)
Hill lake
Stream or river
Harbor basin
Other land
This category includes bare soil, rock, ice, and
all unmanaged land areas that do not fall into
any of the other five
categories. It allows the total of identified
land areas to match the national area, where
data are available.
This category included bare
soil, rock, ice, and recently
burned forested lands
Bare rock
No need for
disaggregation
Urban sprawl on bare rock
Bare soil
Beach
Sand dune
Burned area
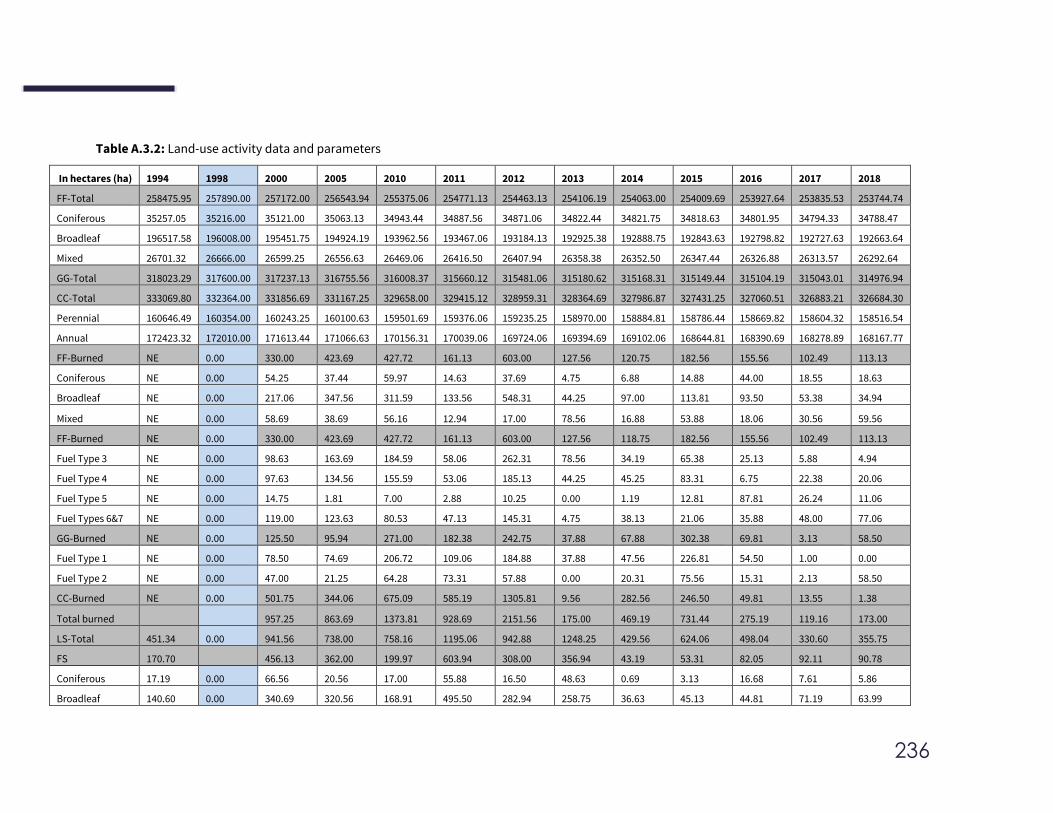
236
Table A.3.2: Land-use activity data and parameters
In hectares (ha) 1994 1998 2000 2005 2010 2011 2012 2013 2014 2015 2016 2017 2018
FF-Total 258475.95 257890.00 257172.00 256543.94 255375.06 254771.13 254463.13 254106.19 254063.00 254009.69 253927.64 253835.53 253744.74
Coniferous 35257.05 35216.00 35121.00 35063.13 34943.44 34887.56 34871.06 34822.44 34821.75 34818.63 34801.95 34794.33 34788.47
Broadleaf 196517.58 196008.00 195451.75 194924.19 193962.56 193467.06 193184.13 192925.38 192888.75 192843.63 192798.82 192727.63 192663.64
Mixed 26701.32 26666.00 26599.25 26556.63 26469.06 26416.50 26407.94 26358.38 26352.50 26347.44 26326.88 26313.57 26292.64
GG-Total 318023.29 317600.00 317237.13 316755.56 316008.37 315660.12 315481.06 315180.62 315168.31 315149.44 315104.19 315043.01 314976.94
CC-Total 333069.80 332364.00 331856.69 331167.25 329658.00 329415.12 328959.31 328364.69 327986.87 327431.25 327060.51 326883.21 326684.30
Perennial 160646.49 160354.00 160243.25 160100.63 159501.69 159376.06 159235.25 158970.00 158884.81 158786.44 158669.82 158604.32 158516.54
Annual 172423.32 172010.00 171613.44 171066.63 170156.31 170039.06 169724.06 169394.69 169102.06 168644.81 168390.69 168278.89 168167.77
FF-Burned NE 0.00 330.00 423.69 427.72 161.13 603.00 127.56 120.75 182.56 155.56 102.49 113.13
Coniferous NE 0.00 54.25 37.44 59.97 14.63 37.69 4.75 6.88 14.88 44.00 18.55 18.63
Broadleaf NE 0.00 217.06 347.56 311.59 133.56 548.31 44.25 97.00 113.81 93.50 53.38 34.94
Mixed NE 0.00 58.69 38.69 56.16 12.94 17.00 78.56 16.88 53.88 18.06 30.56 59.56
FF-Burned NE 0.00 330.00 423.69 427.72 161.13 603.00 127.56 118.75 182.56 155.56 102.49 113.13
Fuel Type 3 NE 0.00 98.63 163.69 184.59 58.06 262.31 78.56 34.19 65.38 25.13 5.88 4.94
Fuel Type 4 NE 0.00 97.63 134.56 155.59 53.06 185.13 44.25 45.25 83.31 6.75 22.38 20.06
Fuel Type 5 NE 0.00 14.75 1.81 7.00 2.88 10.25 0.00 1.19 12.81 87.81 26.24 11.06
Fuel Types 6&7 NE 0.00 119.00 123.63 80.53 47.13 145.31 4.75 38.13 21.06 35.88 48.00 77.06
GG-Burned NE 0.00 125.50 95.94 271.00 182.38 242.75 37.88 67.88 302.38 69.81 3.13 58.50
Fuel Type 1 NE 0.00 78.50 74.69 206.72 109.06 184.88 37.88 47.56 226.81 54.50 1.00 0.00
Fuel Type 2 NE 0.00 47.00 21.25 64.28 73.31 57.88 0.00 20.31 75.56 15.31 2.13 58.50
CC-Burned NE 0.00 501.75 344.06 675.09 585.19 1305.81 9.56 282.56 246.50 49.81 13.55 1.38
Total burned 957.25 863.69 1373.81 928.69 2151.56 175.00 469.19 731.44 275.19 119.16 173.00
LS-Total 451.34 0.00 941.56 738.00 758.16 1195.06 942.88 1248.25 429.56 624.06 498.04 330.60 355.75
FS 170.70 456.13 362.00 199.97 603.94 308.00 356.94 43.19 53.31 82.05 92.11 90.78
Coniferous 17.19 0.00 66.56 20.56 17.00 55.88 16.50 48.63 0.69 3.13 16.68 7.61 5.86
Broadleaf 140.60 0.00 340.69 320.56 168.91 495.50 282.94 258.75 36.63 45.13 44.81 71.19 63.99
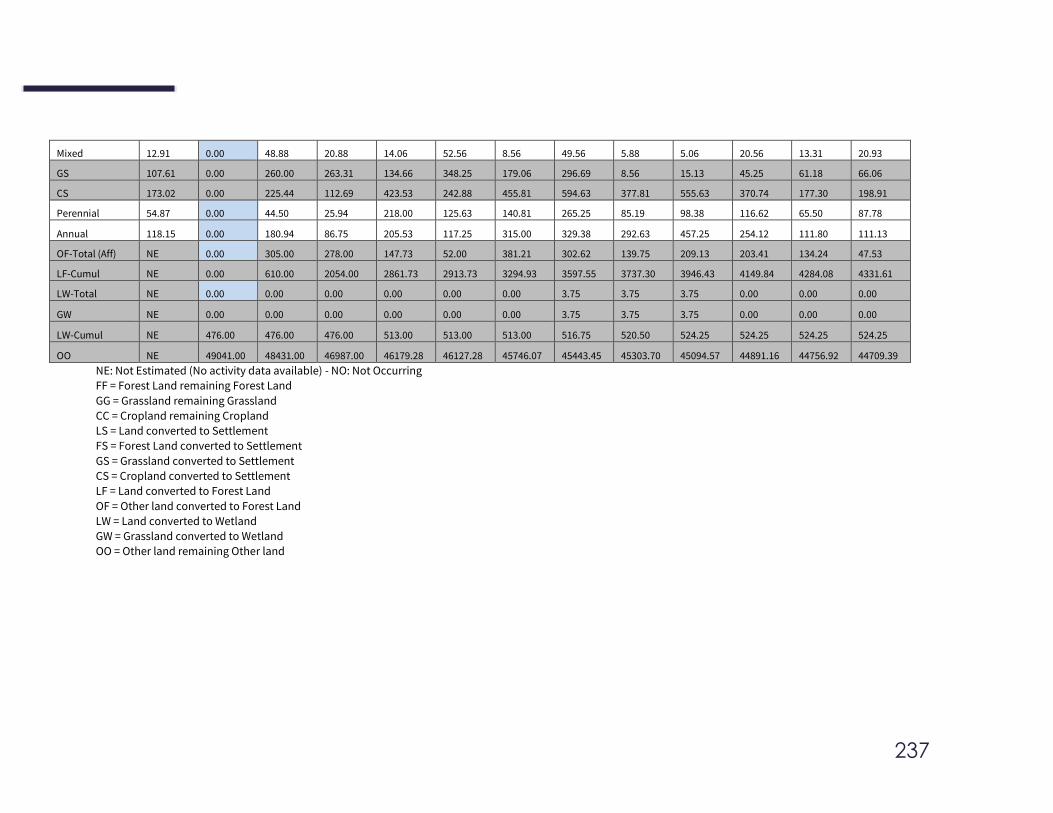
237
Mixed 12.91 0.00 48.88 20.88 14.06 52.56 8.56 49.56 5.88 5.06 20.56 13.31 20.93
GS 107.61 0.00 260.00 263.31 134.66 348.25 179.06 296.69 8.56 15.13 45.25 61.18 66.06
CS 173.02 0.00 225.44 112.69 423.53 242.88 455.81 594.63 377.81 555.63 370.74 177.30 198.91
Perennial 54.87 0.00 44.50 25.94 218.00 125.63 140.81 265.25 85.19 98.38 116.62 65.50 87.78
Annual 118.15 0.00 180.94 86.75 205.53 117.25 315.00 329.38 292.63 457.25 254.12 111.80 111.13
OF-Total (Aff) NE 0.00 305.00 278.00 147.73 52.00 381.21 302.62 139.75 209.13 203.41 134.24 47.53
LF-Cumul NE 0.00 610.00 2054.00 2861.73 2913.73 3294.93 3597.55 3737.30 3946.43 4149.84 4284.08 4331.61
LW-Total NE 0.00 0.00 0.00 0.00 0.00 0.00 3.75 3.75 3.75 0.00 0.00 0.00
GW NE 0.00 0.00 0.00 0.00 0.00 0.00 3.75 3.75 3.75 0.00 0.00 0.00
LW-Cumul NE 476.00 476.00 476.00 513.00 513.00 513.00 516.75 520.50 524.25 524.25 524.25 524.25
OO NE 49041.00 48431.00 46987.00 46179.28 46127.28 45746.07 45443.45 45303.70 45094.57 44891.16 44756.92 44709.39
NE: Not Estimated (No activity data available) - NO: Not Occurring
FF = Forest Land remaining Forest Land
GG = Grassland remaining Grassland
CC = Cropland remaining Cropland
LS = Land converted to Settlement
FS = Forest Land converted to Settlement
GS = Grassland converted to Settlement
CS = Cropland converted to Settlement
LF = Land converted to Forest Land
OF = Other land converted to Forest Land
LW = Land converted to Wetland
GW = Grassland converted to Wetland
OO = Other land remaining Other land
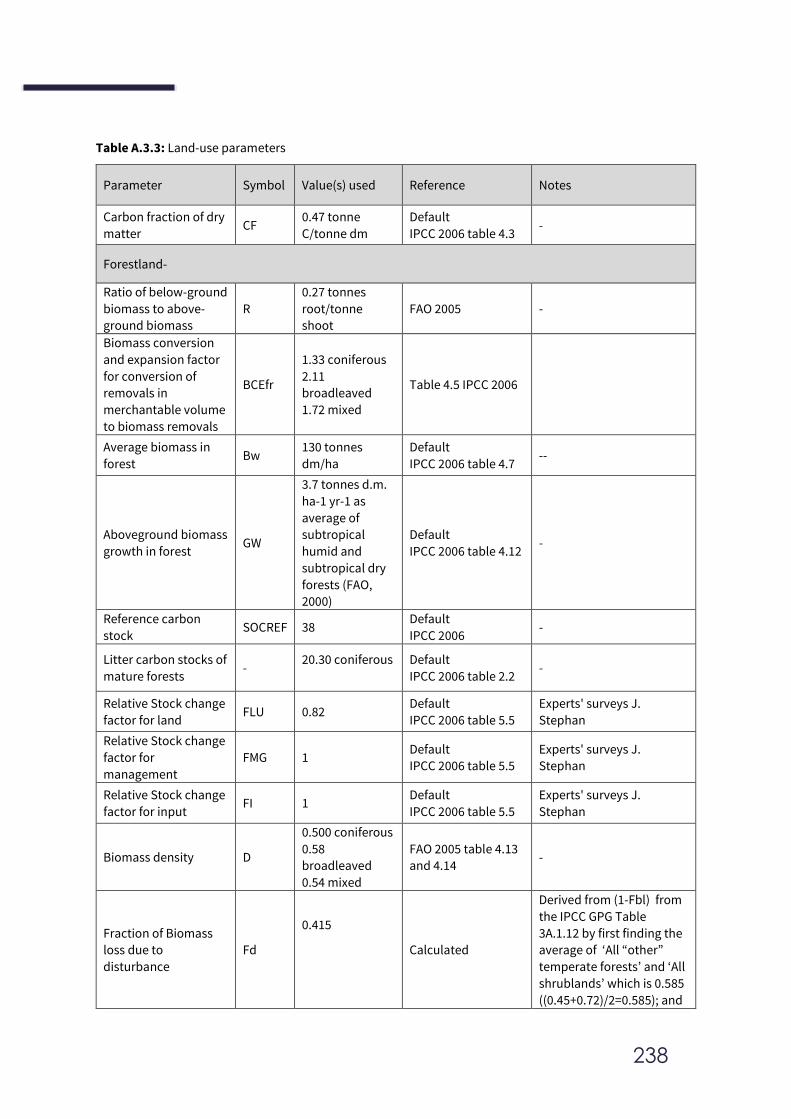
238
Table A.3.3: Land-use parameters
Parameter Symbol Value(s) used Reference Notes
Carbon fraction of dry
matter CF
0.47 tonne
C/tonne dm
Default
IPCC 2006 table 4.3 -
Forestland-
Ratio of below-ground
biomass to above-
ground biomass
R
0.27 tonnes
root/tonne
shoot
FAO 2005 -
Biomass conversion
and expansion factor
for conversion of
removals in
merchantable volume
to biomass removals
BCEfr
1.33 coniferous
2.11
broadleaved
1.72 mixed
Table 4.5 IPCC 2006
Average biomass in
forest Bw
130 tonnes
dm/ha
Default
IPCC 2006 table 4.7 --
Aboveground biomass
growth in forest GW
3.7 tonnes d.m.
ha-1 yr-1 as
average of
subtropical
humid and
subtropical dry
forests (FAO,
2000)
Default
IPCC 2006 table 4.12 -
Reference carbon
stock SOCREF 38
Default
IPCC 2006 -
Litter carbon stocks of
mature forests -
20.30 coniferous
Default
IPCC 2006 table 2.2 -
Relative Stock change
factor for land FLU 0.82
Default
IPCC 2006 table 5.5
Experts' surveys J.
Stephan
Relative Stock change
factor for
management
FMG 1 Default
IPCC 2006 table 5.5
Experts' surveys J.
Stephan
Relative Stock change
factor for input FI 1
Default
IPCC 2006 table 5.5
Experts' surveys J.
Stephan
Biomass density D
0.500 coniferous
0.58
broadleaved
0.54 mixed
FAO 2005 table 4.13
and 4.14 -
Fraction of Biomass
loss due to
disturbance
Fd
0.415
Calculated
Derived from (1-Fbl) from
the IPCC GPG Table
3A.1.12 by first finding the
average of ‘All “other”
temperate forests’ and ‘All
shrublands’ which is 0.585
((0.45+0.72)/2=0.585); and
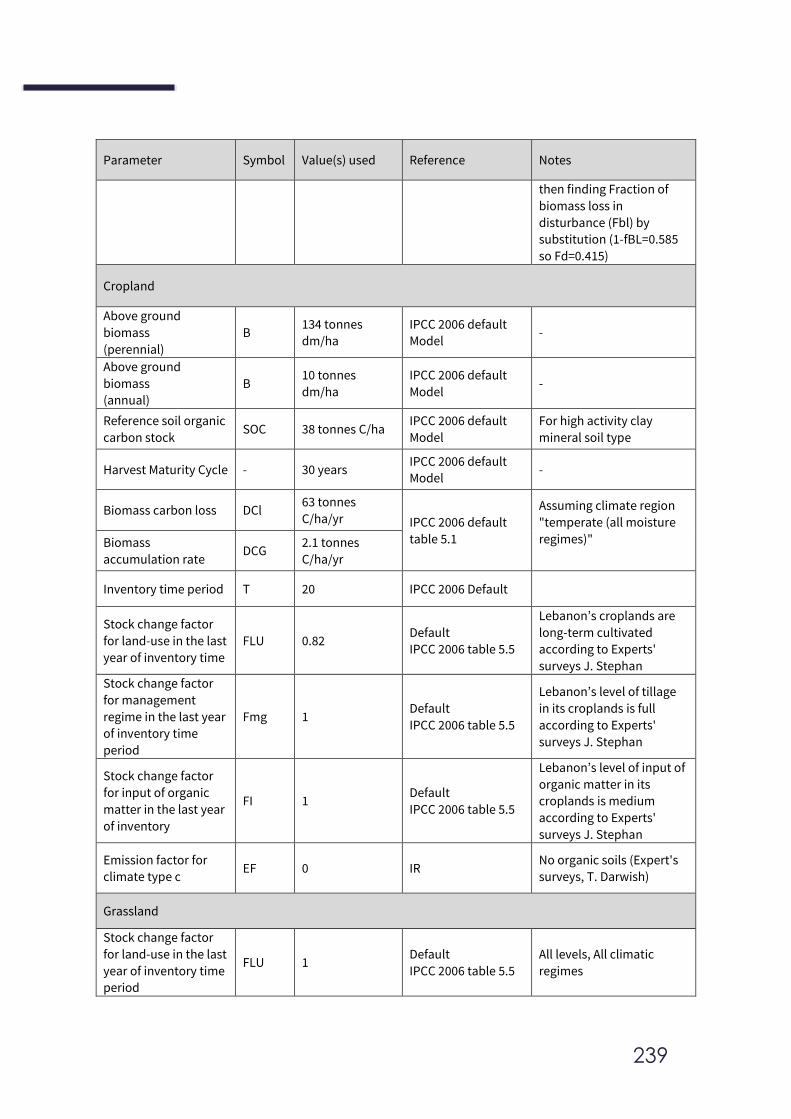
239
Parameter Symbol Value(s) used Reference Notes
then finding Fraction of
biomass loss in
disturbance (Fbl) by
substitution (1-fBL=0.585
so Fd=0.415)
Cropland
Above ground
biomass
(perennial)
B 134 tonnes
dm/ha
IPCC 2006 default
Model -
Above ground
biomass
(annual)
B 10 tonnes
dm/ha
IPCC 2006 default
Model -
Reference soil organic
carbon stock SOC 38 tonnes C/ha
IPCC 2006 default
Model
For high activity clay
mineral soil type
Harvest Maturity Cycle - 30 years IPCC 2006 default
Model -
Biomass carbon loss DCl 63 tonnes
C/ha/yr IPCC 2006 default
table 5.1
Assuming climate region
"temperate (all moisture
regimes)"
Biomass
accumulation rate DCG
2.1 tonnes
C/ha/yr
Inventory time period T 20 IPCC 2006 Default
Stock change factor
for land-use in the last
year of inventory time
FLU 0.82 Default
IPCC 2006 table 5.5
Lebanon’s croplands are
long-term cultivated
according to Experts'
surveys J. Stephan
Stock change factor
for management
regime in the last year
of inventory time
period
Fmg 1 Default
IPCC 2006 table 5.5
Lebanon’s level of tillage
in its croplands is full
according to Experts'
surveys J. Stephan
Stock change factor
for input of organic
matter in the last year
of inventory
FI 1 Default
IPCC 2006 table 5.5
Lebanon’s level of input of
organic matter in its
croplands is medium
according to Experts'
surveys J. Stephan
Emission factor for
climate type c EF 0 IR
No organic soils (Expert's
surveys, T. Darwish)
Grassland
Stock change factor
for land-use in the last
year of inventory time
period
FLU 1 Default
IPCC 2006 table 5.5
All levels, All climatic
regimes
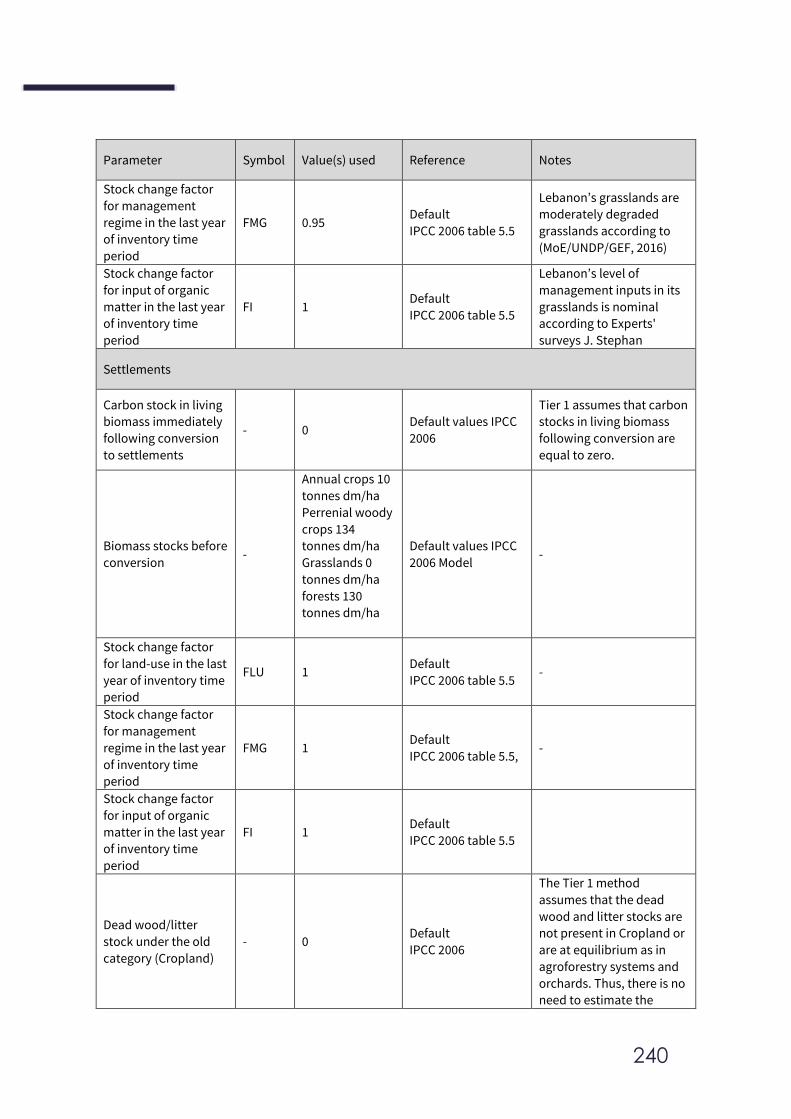
240
Parameter Symbol Value(s) used Reference Notes
Stock change factor
for management
regime in the last year
of inventory time
period
FMG 0.95 Default
IPCC 2006 table 5.5
Lebanon’s grasslands are
moderately degraded
grasslands according to
(MoE/UNDP/GEF, 2016)
Stock change factor
for input of organic
matter in the last year
of inventory time
period
FI 1 Default
IPCC 2006 table 5.5
Lebanon’s level of
management inputs in its
grasslands is nominal
according to Experts'
surveys J. Stephan
Settlements
Carbon stock in living
biomass immediately
following conversion
to settlements
- 0 Default values IPCC
2006
Tier 1 assumes that carbon
stocks in living biomass
following conversion are
equal to zero.
Biomass stocks before
conversion -
Annual crops 10
tonnes dm/ha
Perrenial woody
crops 134
tonnes dm/ha
Grasslands 0
tonnes dm/ha
forests 130
tonnes dm/ha
Default values IPCC
2006 Model -
Stock change factor
for land-use in the last
year of inventory time
period
FLU 1 Default
IPCC 2006 table 5.5 -
Stock change factor
for management
regime in the last year
of inventory time
period
FMG 1 Default
IPCC 2006 table 5.5, -
Stock change factor
for input of organic
matter in the last year
of inventory time
period
FI 1 Default
IPCC 2006 table 5.5
Dead wood/litter
stock under the old
category (Cropland)
- 0 Default
IPCC 2006
The Tier 1 method
assumes that the dead
wood and litter stocks are
not present in Cropland or
are at equilibrium as in
agroforestry systems and
orchards. Thus, there is no
need to estimate the
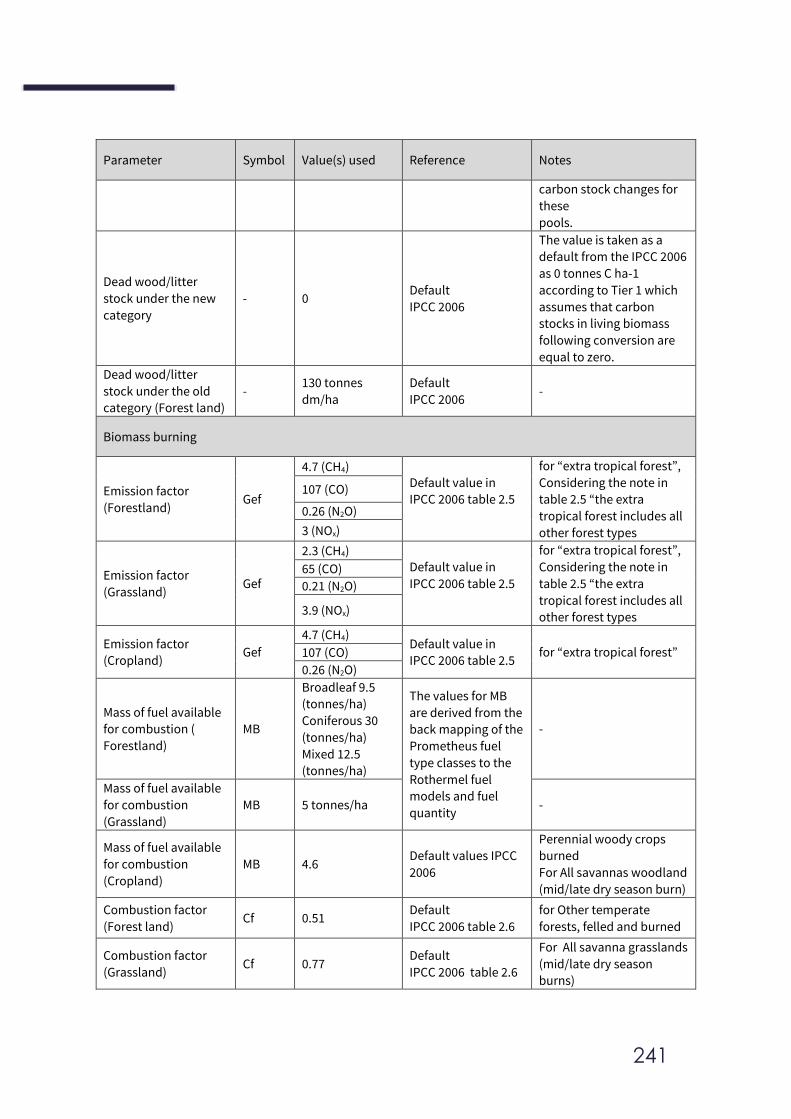
241
Parameter Symbol Value(s) used Reference Notes
carbon stock changes for
these
pools.
Dead wood/litter
stock under the new
category
- 0 Default
IPCC 2006
The value is taken as a
default from the IPCC 2006
as 0 tonnes C ha-1
according to Tier 1 which
assumes that carbon
stocks in living biomass
following conversion are
equal to zero.
Dead wood/litter
stock under the old
category (Forest land)
- 130 tonnes
dm/ha
Default
IPCC 2006 -
Biomass burning
Emission factor
(Forestland) Gef
4.7 (CH4) Default value in
IPCC 2006 table 2.5
for “extra tropical forest”,
Considering the note in
table 2.5 “the extra
tropical forest includes all
other forest types
107 (CO)
0.26 (N2O)
3 (NOx)
Emission factor
(Grassland) Gef
2.3 (CH4) Default value in
IPCC 2006 table 2.5
for “extra tropical forest”,
Considering the note in
table 2.5 “the extra
tropical forest includes all
other forest types
65 (CO)
0.21 (N2O)
3.9 (NOx)
Emission factor
(Cropland) Gef
4.7 (CH4) Default value in
IPCC 2006 table 2.5 for “extra tropical forest” 107 (CO)
0.26 (N2O)
Mass of fuel available
for combustion (
Forestland)
MB
Broadleaf 9.5
(tonnes/ha)
Coniferous 30
(tonnes/ha)
Mixed 12.5
(tonnes/ha)
The values for MB
are derived from the
back mapping of the
Prometheus fuel
type classes to the
Rothermel fuel
models and fuel
quantity
-
Mass of fuel available
for combustion
(Grassland)
MB 5 tonnes/ha -
Mass of fuel available
for combustion
(Cropland)
MB 4.6 Default values IPCC
2006
Perennial woody crops
burned
For All savannas woodland
(mid/late dry season burn)
Combustion factor
(Forest land) Cf 0.51
Default
IPCC 2006 table 2.6
for Other temperate
forests, felled and burned
Combustion factor
(Grassland) Cf 0.77
Default
IPCC 2006 table 2.6
For All savanna grasslands
(mid/late dry season
burns)
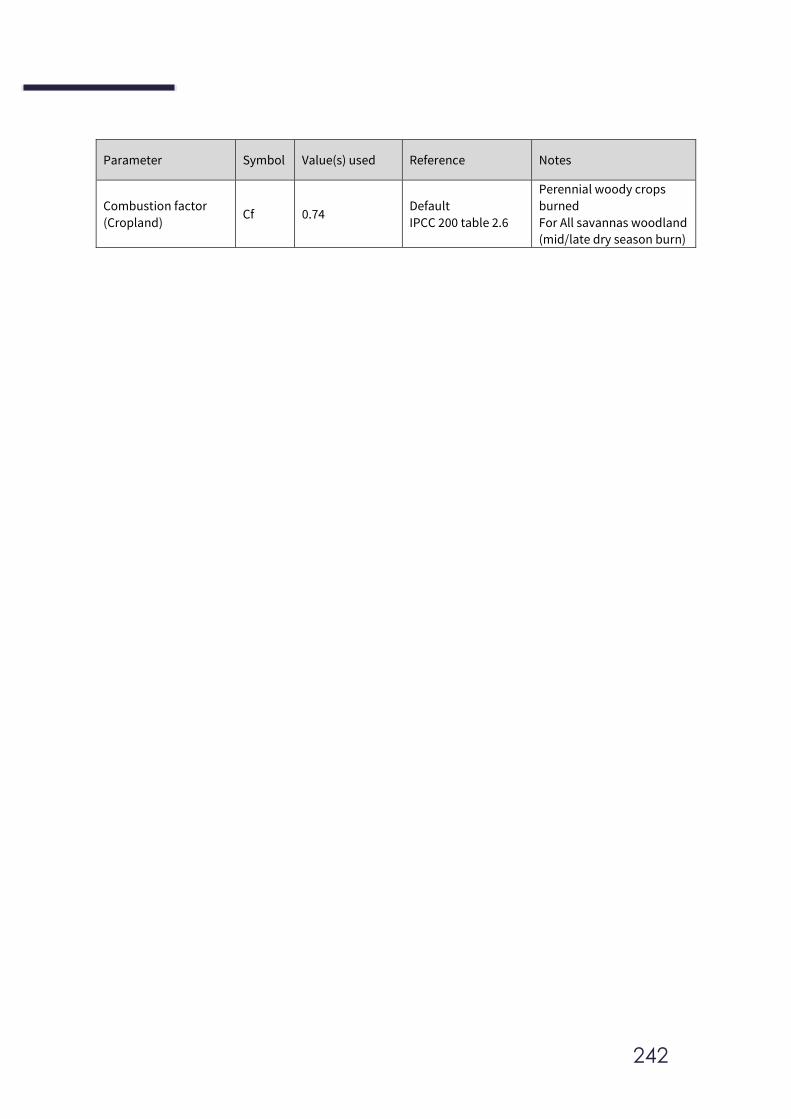
242
Parameter Symbol Value(s) used Reference Notes
Combustion factor
(Cropland) Cf 0.74
Default
IPCC 200 table 2.6
Perennial woody crops
burned
For All savannas woodland
(mid/late dry season burn)
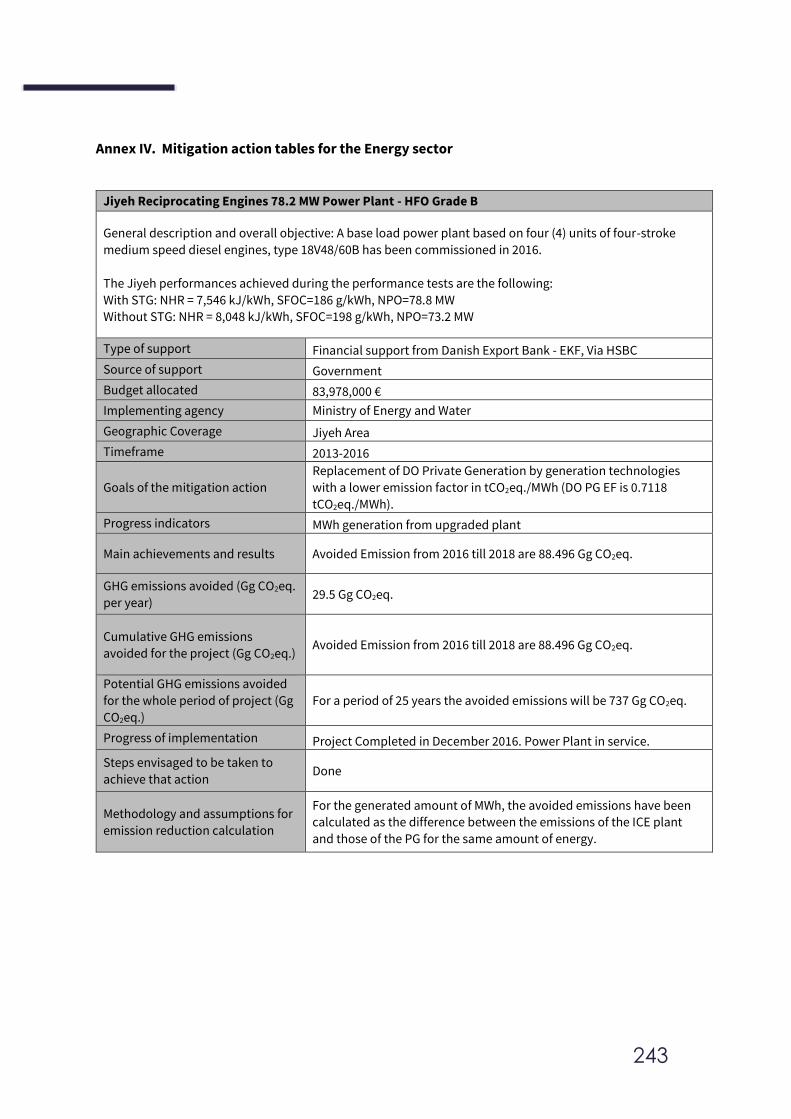
243
Annex IV. Mitigation action tables for the Energy sector
Jiyeh Reciprocating Engines 78.2 MW Power Plant - HFO Grade B
General description and overall objective: A base load power plant based on four (4) units of four-stroke
medium speed diesel engines, type 18V48/60B has been commissioned in 2016.
The Jiyeh performances achieved during the performance tests are the following:
With STG: NHR = 7,546 kJ/kWh, SFOC=186 g/kWh, NPO=78.8 MW
Without STG: NHR = 8,048 kJ/kWh, SFOC=198 g/kWh, NPO=73.2 MW
Type of support Financial support from Danish Export Bank - EKF, Via HSBC
Source of support Government
Budget allocated 83,978,000 €
Implementing agency Ministry of Energy and Water
Geographic Coverage Jiyeh Area
Timeframe 2013-2016
Goals of the mitigation action
Replacement of DO Private Generation by generation technologies
with a lower emission factor in tCO2eq./MWh (DO PG EF is 0.7118
tCO2eq./MWh).
Progress indicators MWh generation from upgraded plant
Main achievements and results Avoided Emission from 2016 till 2018 are 88.496 Gg CO2eq.
GHG emissions avoided (Gg CO2eq.
per year) 29.5 Gg CO2eq.
Cumulative GHG emissions
avoided for the project (Gg CO2eq.) Avoided Emission from 2016 till 2018 are 88.496 Gg CO2eq.
Potential GHG emissions avoided
for the whole period of project (Gg
CO2eq.)
For a period of 25 years the avoided emissions will be 737 Gg CO2eq.
Progress of implementation Project Completed in December 2016. Power Plant in service.
Steps envisaged to be taken to
achieve that action Done
Methodology and assumptions for
emission reduction calculation
For the generated amount of MWh, the avoided emissions have been
calculated as the difference between the emissions of the ICE plant
and those of the PG for the same amount of energy.
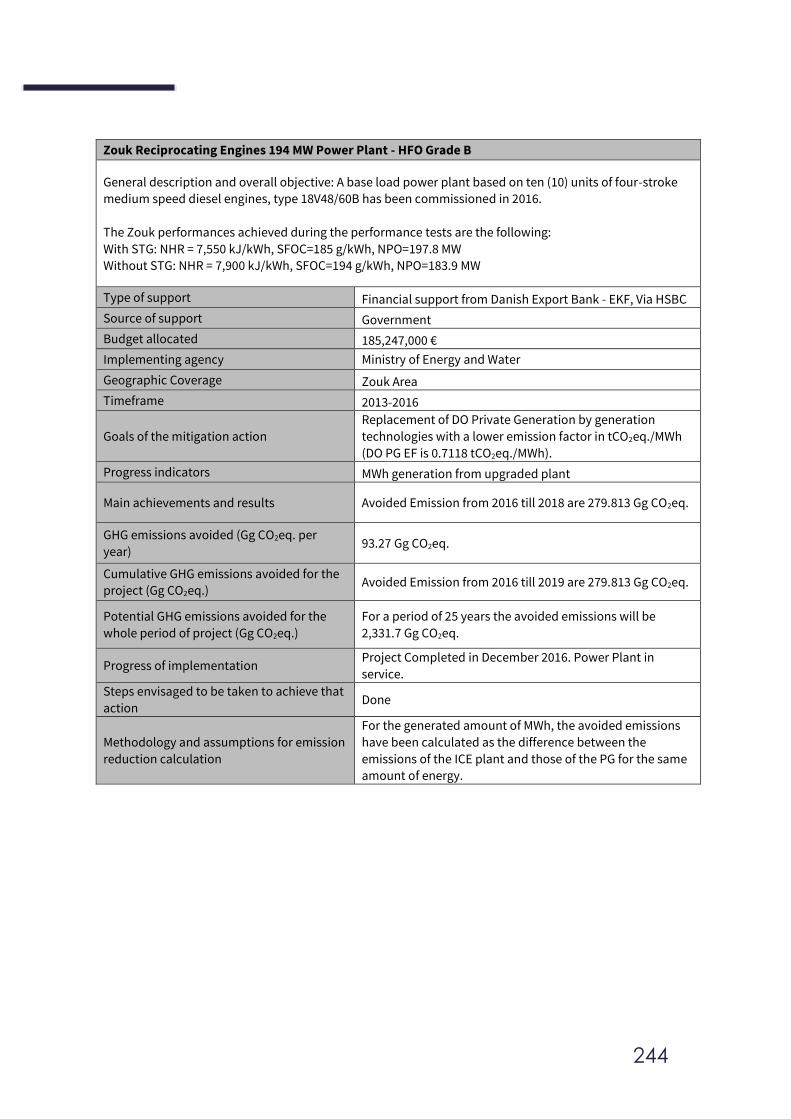
244
Zouk Reciprocating Engines 194 MW Power Plant - HFO Grade B
General description and overall objective: A base load power plant based on ten (10) units of four-stroke
medium speed diesel engines, type 18V48/60B has been commissioned in 2016.
The Zouk performances achieved during the performance tests are the following:
With STG: NHR = 7,550 kJ/kWh, SFOC=185 g/kWh, NPO=197.8 MW
Without STG: NHR = 7,900 kJ/kWh, SFOC=194 g/kWh, NPO=183.9 MW
Type of support Financial support from Danish Export Bank - EKF, Via HSBC
Source of support Government
Budget allocated 185,247,000 €
Implementing agency Ministry of Energy and Water
Geographic Coverage Zouk Area
Timeframe 2013-2016
Goals of the mitigation action
Replacement of DO Private Generation by generation
technologies with a lower emission factor in tCO2eq./MWh
(DO PG EF is 0.7118 tCO2eq./MWh).
Progress indicators MWh generation from upgraded plant
Main achievements and results Avoided Emission from 2016 till 2018 are 279.813 Gg CO2eq.
GHG emissions avoided (Gg CO2eq. per
year) 93.27 Gg CO2eq.
Cumulative GHG emissions avoided for the
project (Gg CO2eq.) Avoided Emission from 2016 till 2019 are 279.813 Gg CO2eq.
Potential GHG emissions avoided for the
whole period of project (Gg CO2eq.)
For a period of 25 years the avoided emissions will be
2,331.7 Gg CO2eq.
Progress of implementation Project Completed in December 2016. Power Plant in
service.
Steps envisaged to be taken to achieve that
action Done
Methodology and assumptions for emission
reduction calculation
For the generated amount of MWh, the avoided emissions
have been calculated as the difference between the
emissions of the ICE plant and those of the PG for the same
amount of energy.
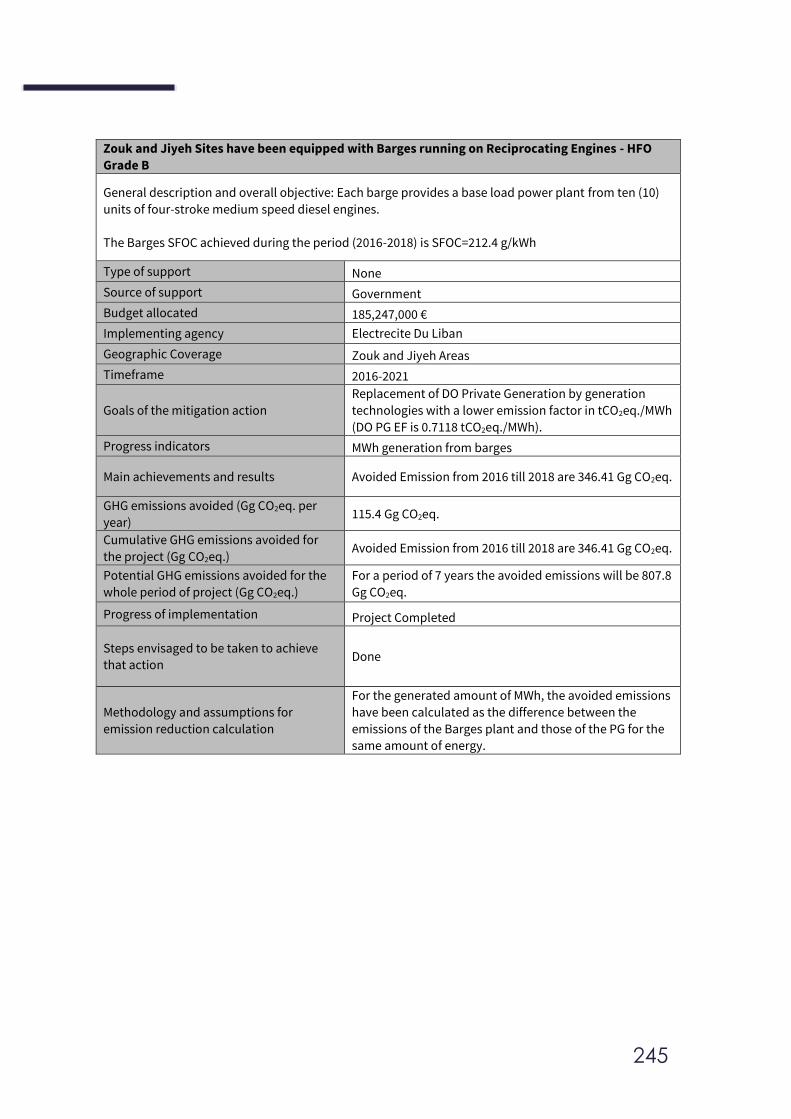
245
Zouk and Jiyeh Sites have been equipped with Barges running on Reciprocating Engines - HFO
Grade B
General description and overall objective: Each barge provides a base load power plant from ten (10)
units of four-stroke medium speed diesel engines.
The Barges SFOC achieved during the period (2016-2018) is SFOC=212.4 g/kWh
Type of support None
Source of support Government
Budget allocated 185,247,000 €
Implementing agency Electrecite Du Liban
Geographic Coverage Zouk and Jiyeh Areas
Timeframe 2016-2021
Goals of the mitigation action
Replacement of DO Private Generation by generation
technologies with a lower emission factor in tCO2eq./MWh
(DO PG EF is 0.7118 tCO2eq./MWh).
Progress indicators MWh generation from barges
Main achievements and results Avoided Emission from 2016 till 2018 are 346.41 Gg CO2eq.
GHG emissions avoided (Gg CO2eq. per
year) 115.4 Gg CO2eq.
Cumulative GHG emissions avoided for
the project (Gg CO2eq.) Avoided Emission from 2016 till 2018 are 346.41 Gg CO2eq.
Potential GHG emissions avoided for the
whole period of project (Gg CO2eq.)
For a period of 7 years the avoided emissions will be 807.8
Gg CO2eq.
Progress of implementation Project Completed
Steps envisaged to be taken to achieve
that action Done
Methodology and assumptions for
emission reduction calculation
For the generated amount of MWh, the avoided emissions
have been calculated as the difference between the
emissions of the Barges plant and those of the PG for the
same amount of energy.
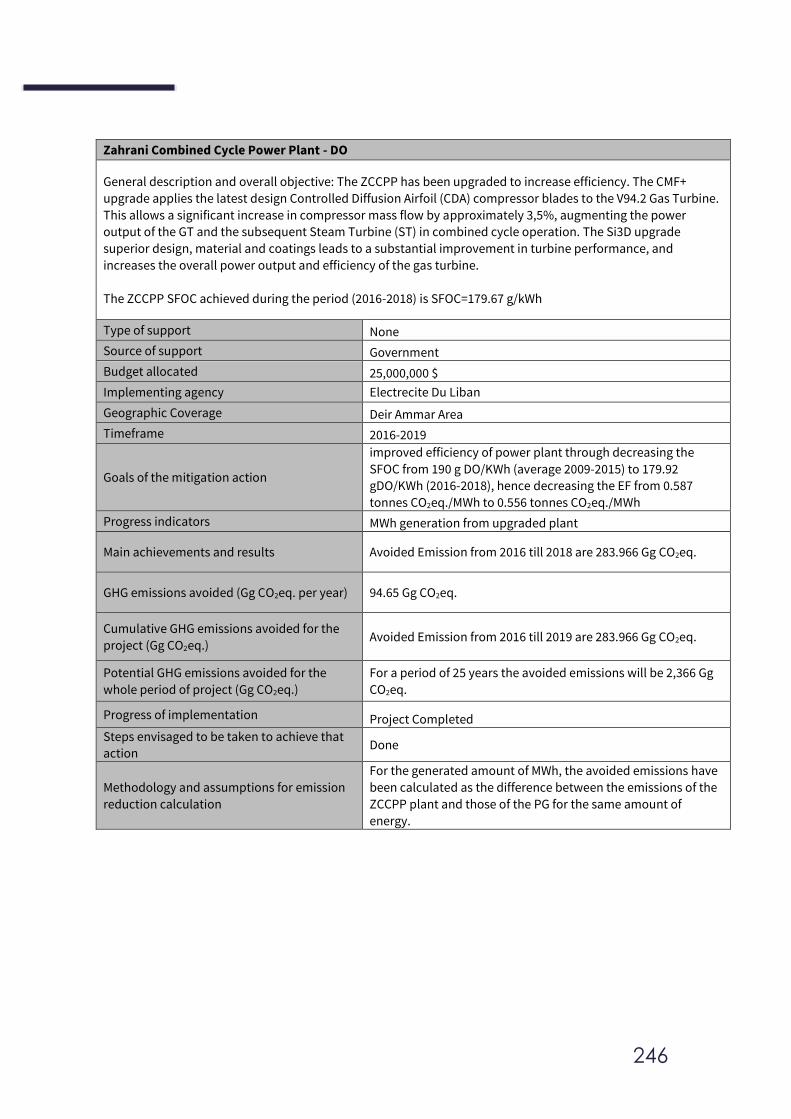
246
Zahrani Combined Cycle Power Plant - DO
General description and overall objective: The ZCCPP has been upgraded to increase efficiency. The CMF+
upgrade applies the latest design Controlled Diffusion Airfoil (CDA) compressor blades to the V94.2 Gas Turbine.
This allows a significant increase in compressor mass flow by approximately 3,5%, augmenting the power
output of the GT and the subsequent Steam Turbine (ST) in combined cycle operation. The Si3D upgrade
superior design, material and coatings leads to a substantial improvement in turbine performance, and
increases the overall power output and efficiency of the gas turbine.
The ZCCPP SFOC achieved during the period (2016-2018) is SFOC=179.67 g/kWh
Type of support None
Source of support Government
Budget allocated 25,000,000 $
Implementing agency Electrecite Du Liban
Geographic Coverage Deir Ammar Area
Timeframe 2016-2019
Goals of the mitigation action
improved efficiency of power plant through decreasing the
SFOC from 190 g DO/KWh (average 2009-2015) to 179.92
gDO/KWh (2016-2018), hence decreasing the EF from 0.587
tonnes CO2eq./MWh to 0.556 tonnes CO2eq./MWh
Progress indicators MWh generation from upgraded plant
Main achievements and results Avoided Emission from 2016 till 2018 are 283.966 Gg CO2eq.
GHG emissions avoided (Gg CO2eq. per year) 94.65 Gg CO2eq.
Cumulative GHG emissions avoided for the
project (Gg CO2eq.) Avoided Emission from 2016 till 2019 are 283.966 Gg CO2eq.
Potential GHG emissions avoided for the
whole period of project (Gg CO2eq.)
For a period of 25 years the avoided emissions will be 2,366 Gg
CO2eq.
Progress of implementation Project Completed
Steps envisaged to be taken to achieve that
action Done
Methodology and assumptions for emission
reduction calculation
For the generated amount of MWh, the avoided emissions have
been calculated as the difference between the emissions of the
ZCCPP plant and those of the PG for the same amount of
energy.
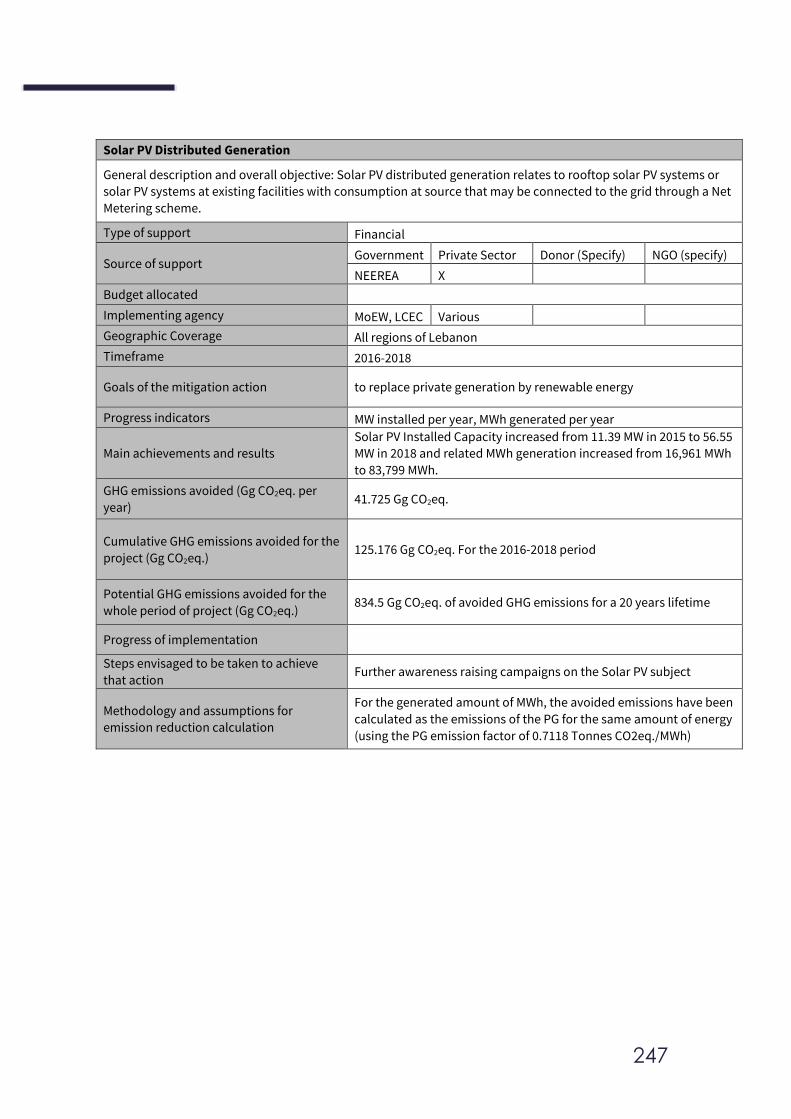
247
Solar PV Distributed Generation
General description and overall objective: Solar PV distributed generation relates to rooftop solar PV systems or
solar PV systems at existing facilities with consumption at source that may be connected to the grid through a Net
Metering scheme.
Type of support Financial
Source of support Government Private Sector Donor (Specify) NGO (specify)
NEEREA X
Budget allocated
Implementing agency MoEW, LCEC Various
Geographic Coverage All regions of Lebanon
Timeframe 2016-2018
Goals of the mitigation action to replace private generation by renewable energy
Progress indicators MW installed per year, MWh generated per year
Main achievements and results
Solar PV Installed Capacity increased from 11.39 MW in 2015 to 56.55
MW in 2018 and related MWh generation increased from 16,961 MWh
to 83,799 MWh.
GHG emissions avoided (Gg CO2eq. per
year) 41.725 Gg CO2eq.
Cumulative GHG emissions avoided for the
project (Gg CO2eq.) 125.176 Gg CO2eq. For the 2016-2018 period
Potential GHG emissions avoided for the
whole period of project (Gg CO2eq.) 834.5 Gg CO2eq. of avoided GHG emissions for a 20 years lifetime
Progress of implementation
Steps envisaged to be taken to achieve
that action Further awareness raising campaigns on the Solar PV subject
Methodology and assumptions for
emission reduction calculation
For the generated amount of MWh, the avoided emissions have been
calculated as the emissions of the PG for the same amount of energy
(using the PG emission factor of 0.7118 Tonnes CO2eq./MWh)
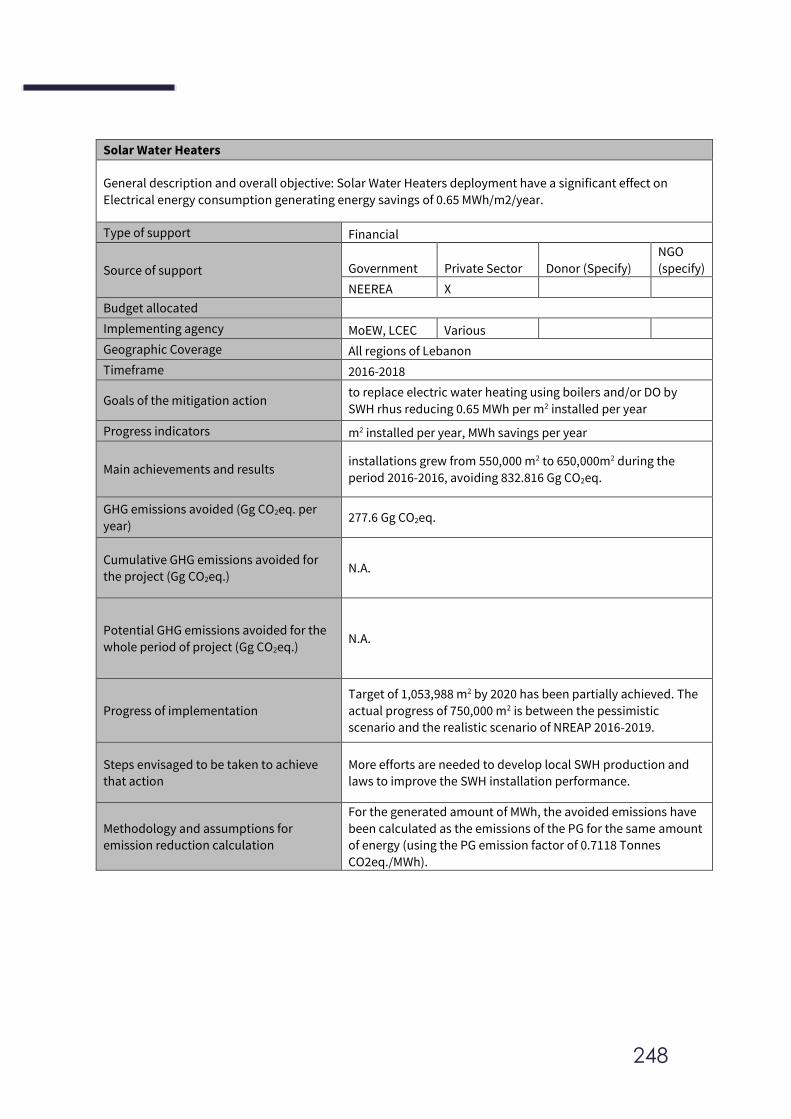
248
Solar Water Heaters
General description and overall objective: Solar Water Heaters deployment have a significant effect on
Electrical energy consumption generating energy savings of 0.65 MWh/m2/year.
Type of support Financial
Source of support Government Private Sector Donor (Specify)
NGO
(specify)
NEEREA X
Budget allocated
Implementing agency MoEW, LCEC Various
Geographic Coverage All regions of Lebanon
Timeframe 2016-2018
Goals of the mitigation action to replace electric water heating using boilers and/or DO by
SWH rhus reducing 0.65 MWh per m2 installed per year
Progress indicators m2 installed per year, MWh savings per year
Main achievements and results installations grew from 550,000 m2 to 650,000m2 during the
period 2016-2016, avoiding 832.816 Gg CO2eq.
GHG emissions avoided (Gg CO2eq. per
year) 277.6 Gg CO2eq.
Cumulative GHG emissions avoided for
the project (Gg CO2eq.) N.A.
Potential GHG emissions avoided for the
whole period of project (Gg CO2eq.) N.A.
Progress of implementation
Target of 1,053,988 m2 by 2020 has been partially achieved. The
actual progress of 750,000 m2 is between the pessimistic
scenario and the realistic scenario of NREAP 2016-2019.
Steps envisaged to be taken to achieve
that action
More efforts are needed to develop local SWH production and
laws to improve the SWH installation performance.
Methodology and assumptions for
emission reduction calculation
For the generated amount of MWh, the avoided emissions have
been calculated as the emissions of the PG for the same amount
of energy (using the PG emission factor of 0.7118 Tonnes
CO2eq./MWh).
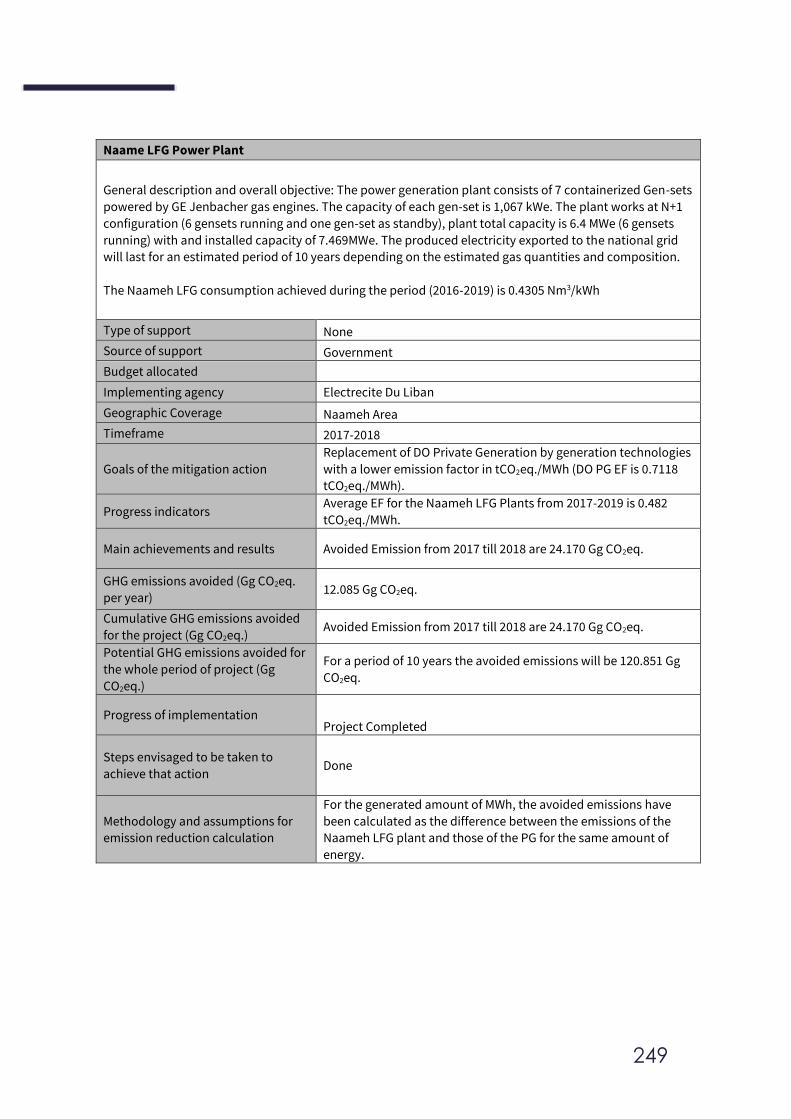
249
Naame LFG Power Plant
General description and overall objective: The power generation plant consists of 7 containerized Gen-sets
powered by GE Jenbacher gas engines. The capacity of each gen-set is 1,067 kWe. The plant works at N+1
configuration (6 gensets running and one gen-set as standby), plant total capacity is 6.4 MWe (6 gensets
running) with and installed capacity of 7.469MWe. The produced electricity exported to the national grid
will last for an estimated period of 10 years depending on the estimated gas quantities and composition.
The Naameh LFG consumption achieved during the period (2016-2019) is 0.4305 Nm3/kWh
Type of support None
Source of support Government
Budget allocated
Implementing agency Electrecite Du Liban
Geographic Coverage Naameh Area
Timeframe 2017-2018
Goals of the mitigation action
Replacement of DO Private Generation by generation technologies
with a lower emission factor in tCO2eq./MWh (DO PG EF is 0.7118
tCO2eq./MWh).
Progress indicators Average EF for the Naameh LFG Plants from 2017-2019 is 0.482
tCO2eq./MWh.
Main achievements and results Avoided Emission from 2017 till 2018 are 24.170 Gg CO2eq.
GHG emissions avoided (Gg CO2eq.
per year) 12.085 Gg CO2eq.
Cumulative GHG emissions avoided
for the project (Gg CO2eq.) Avoided Emission from 2017 till 2018 are 24.170 Gg CO2eq.
Potential GHG emissions avoided for
the whole period of project (Gg
CO2eq.)
For a period of 10 years the avoided emissions will be 120.851 Gg
CO2eq.
Progress of implementation Project Completed
Steps envisaged to be taken to
achieve that action Done
Methodology and assumptions for
emission reduction calculation
For the generated amount of MWh, the avoided emissions have
been calculated as the difference between the emissions of the
Naameh LFG plant and those of the PG for the same amount of
energy.
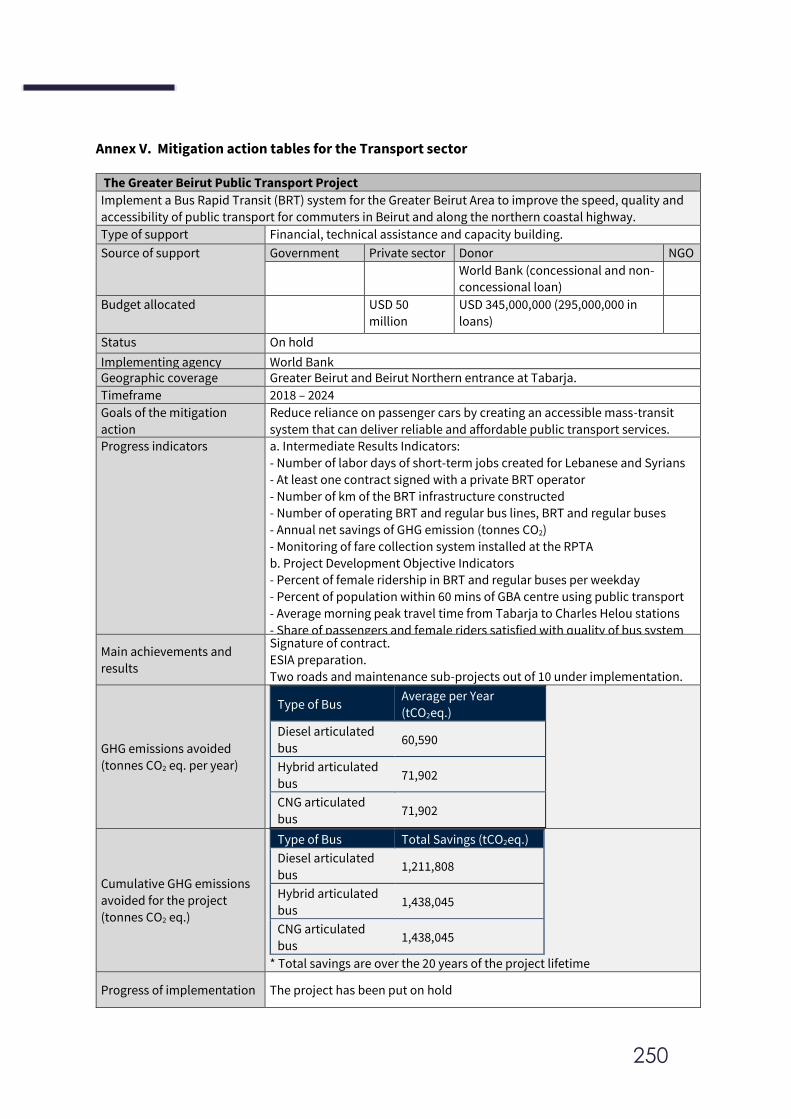
250
Annex V. Mitigation action tables for the Transport sector
The Greater Beirut Public Transport Project
Implement a Bus Rapid Transit (BRT) system for the Greater Beirut Area to improve the speed, quality and
accessibility of public transport for commuters in Beirut and along the northern coastal highway.
Type of support Financial, technical assistance and capacity building.
Source of support Government Private sector Donor NGO
World Bank (concessional and non-
concessional loan)
Budget allocated USD 50
million
USD 345,000,000 (295,000,000 in
loans)
Status On hold
Implementing agency World Bank Geographic coverage Greater Beirut and Beirut Northern entrance at Tabarja.
Timeframe 2018 – 2024
Goals of the mitigation
action
Reduce reliance on passenger cars by creating an accessible mass-transit
system that can deliver reliable and affordable public transport services.
Progress indicators a. Intermediate Results Indicators:
- Number of labor days of short-term jobs created for Lebanese and Syrians
- At least one contract signed with a private BRT operator
- Number of km of the BRT infrastructure constructed
- Number of operating BRT and regular bus lines, BRT and regular buses
- Annual net savings of GHG emission (tonnes CO2)
- Monitoring of fare collection system installed at the RPTA
b. Project Development Objective Indicators
- Percent of female ridership in BRT and regular buses per weekday
- Percent of population within 60 mins of GBA centre using public transport
- Average morning peak travel time from Tabarja to Charles Helou stations
- Share of passengers and female riders satisfied with quality of bus system
Main achievements and
results
Signature of contract.
ESIA preparation.
Two roads and maintenance sub-projects out of 10 under implementation.
GHG emissions avoided
(tonnes CO2 eq. per year)
Type of Bus Average per Year
(tCO2eq.)
Diesel articulated
bus 60,590
Hybrid articulated
bus 71,902
CNG articulated
bus 71,902
Cumulative GHG emissions
avoided for the project
(tonnes CO2 eq.)
Type of Bus Total Savings (tCO2eq.)
Diesel articulated
bus 1,211,808
Hybrid articulated
bus 1,438,045
CNG articulated
bus 1,438,045
* Total savings are over the 20 years of the project lifetime
Progress of implementation The project has been put on hold
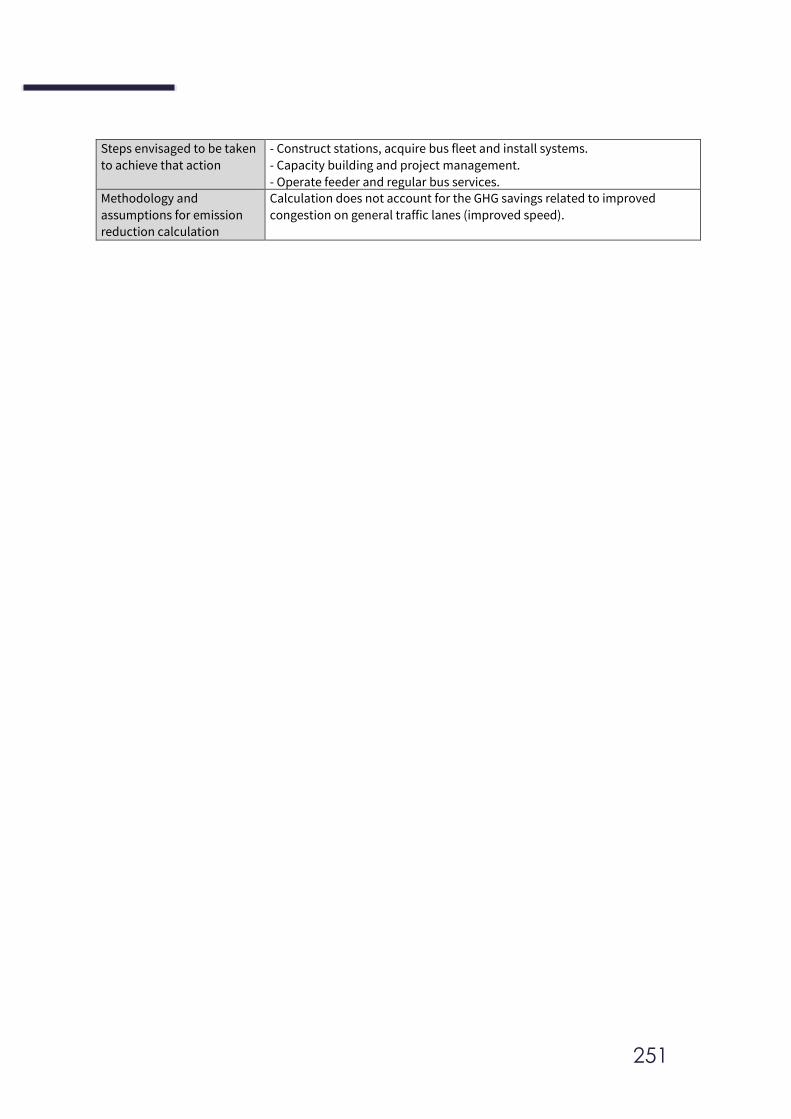
251
Steps envisaged to be taken
to achieve that action
- Construct stations, acquire bus fleet and install systems.
- Capacity building and project management.
- Operate feeder and regular bus services.
Methodology and
assumptions for emission
reduction calculation
Calculation does not account for the GHG savings related to improved
congestion on general traffic lanes (improved speed).
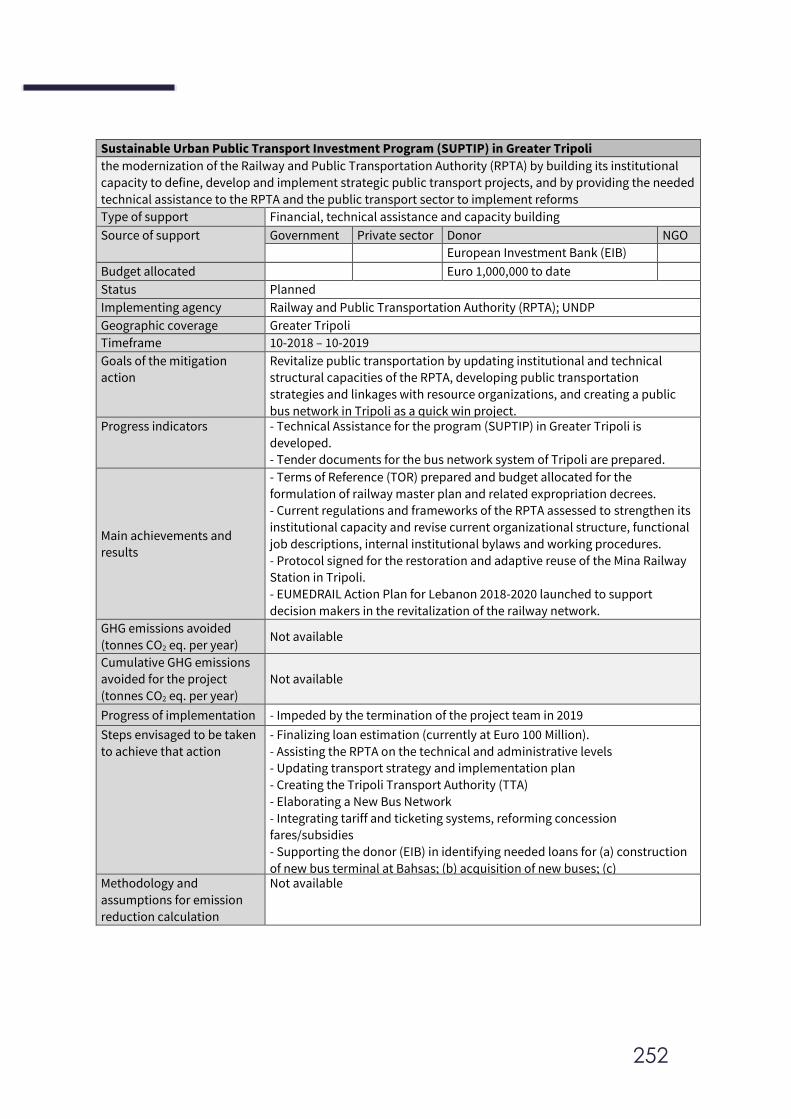
252
Sustainable Urban Public Transport Investment Program (SUPTIP) in Greater Tripoli
the modernization of the Railway and Public Transportation Authority (RPTA) by building its institutional
capacity to define, develop and implement strategic public transport projects, and by providing the needed
technical assistance to the RPTA and the public transport sector to implement reforms
Type of support Financial, technical assistance and capacity building
Source of support Government Private sector Donor NGO
European Investment Bank (EIB)
Budget allocated Euro 1,000,000 to date
Status Planned
Implementing agency Railway and Public Transportation Authority (RPTA); UNDP
Geographic coverage Greater Tripoli
Timeframe 10-2018 – 10-2019
Goals of the mitigation
action
Revitalize public transportation by updating institutional and technical
structural capacities of the RPTA, developing public transportation
strategies and linkages with resource organizations, and creating a public
bus network in Tripoli as a quick win project. Progress indicators - Technical Assistance for the program (SUPTIP) in Greater Tripoli is
developed.
- Tender documents for the bus network system of Tripoli are prepared.
- Detailed design for constructing the Tripoli Bus Network is prepared.
Main achievements and
results
- Terms of Reference (TOR) prepared and budget allocated for the
formulation of railway master plan and related expropriation decrees.
- Current regulations and frameworks of the RPTA assessed to strengthen its
institutional capacity and revise current organizational structure, functional
job descriptions, internal institutional bylaws and working procedures.
- Protocol signed for the restoration and adaptive reuse of the Mina Railway
Station in Tripoli.
- EUMEDRAIL Action Plan for Lebanon 2018-2020 launched to support
decision makers in the revitalization of the railway network.
GHG emissions avoided
(tonnes CO2 eq. per year) Not available
Cumulative GHG emissions
avoided for the project
(tonnes CO2 eq. per year)
Not available
Progress of implementation - Impeded by the termination of the project team in 2019
Steps envisaged to be taken
to achieve that action
- Finalizing loan estimation (currently at Euro 100 Million).
- Assisting the RPTA on the technical and administrative levels
- Updating transport strategy and implementation plan
- Creating the Tripoli Transport Authority (TTA)
- Elaborating a New Bus Network
- Integrating tariff and ticketing systems, reforming concession
fares/subsidies
- Supporting the donor (EIB) in identifying needed loans for (a) construction
of new bus terminal at Bahsas; (b) acquisition of new buses; (c)
implementation of intelligent transport systems (ITS) for traffic
management, passenger information, and priority of public transport on
roadways.
Methodology and
assumptions for emission
reduction calculation
Not available
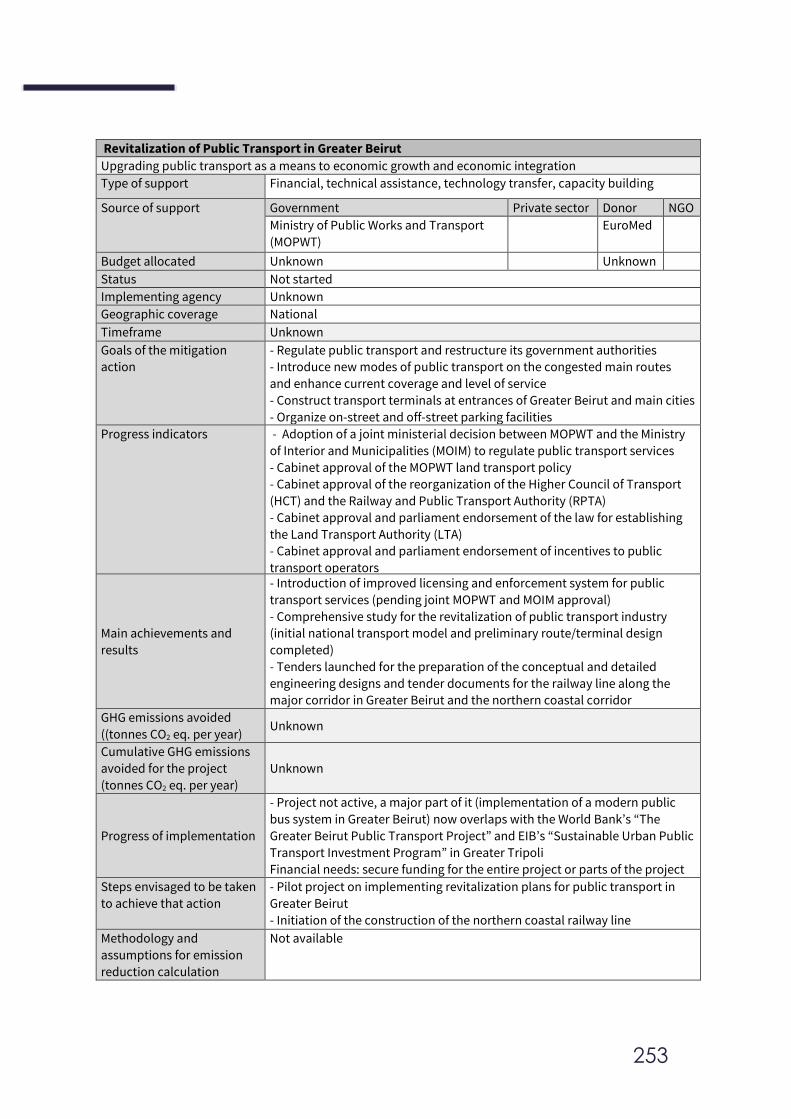
253
Revitalization of Public Transport in Greater Beirut
Upgrading public transport as a means to economic growth and economic integration
Type of support Financial, technical assistance, technology transfer, capacity building
Source of support Government Private sector Donor NGO
Ministry of Public Works and Transport
(MOPWT)
EuroMed
Budget allocated Unknown Unknown
Status Not started
Implementing agency Unknown
Geographic coverage National
Timeframe Unknown
Goals of the mitigation
action
- Regulate public transport and restructure its government authorities
- Introduce new modes of public transport on the congested main routes
and enhance current coverage and level of service
- Construct transport terminals at entrances of Greater Beirut and main cities
- Organize on-street and off-street parking facilities
Progress indicators - Adoption of a joint ministerial decision between MOPWT and the Ministry
of Interior and Municipalities (MOIM) to regulate public transport services
- Cabinet approval of the MOPWT land transport policy
- Cabinet approval of the reorganization of the Higher Council of Transport
(HCT) and the Railway and Public Transport Authority (RPTA)
- Cabinet approval and parliament endorsement of the law for establishing
the Land Transport Authority (LTA)
- Cabinet approval and parliament endorsement of incentives to public
transport operators
Main achievements and
results
- Introduction of improved licensing and enforcement system for public
transport services (pending joint MOPWT and MOIM approval)
- Comprehensive study for the revitalization of public transport industry
(initial national transport model and preliminary route/terminal design
completed)
- Tenders launched for the preparation of the conceptual and detailed
engineering designs and tender documents for the railway line along the
major corridor in Greater Beirut and the northern coastal corridor
GHG emissions avoided
((tonnes CO2 eq. per year) Unknown
Cumulative GHG emissions
avoided for the project
(tonnes CO2 eq. per year)
Unknown
Progress of implementation
- Project not active, a major part of it (implementation of a modern public
bus system in Greater Beirut) now overlaps with the World Bank’s “The
Greater Beirut Public Transport Project” and EIB’s “Sustainable Urban Public
Transport Investment Program” in Greater Tripoli
Financial needs: secure funding for the entire project or parts of the project
Steps envisaged to be taken
to achieve that action
- Pilot project on implementing revitalization plans for public transport in
Greater Beirut
- Initiation of the construction of the northern coastal railway line
Methodology and
assumptions for emission
reduction calculation
Not available
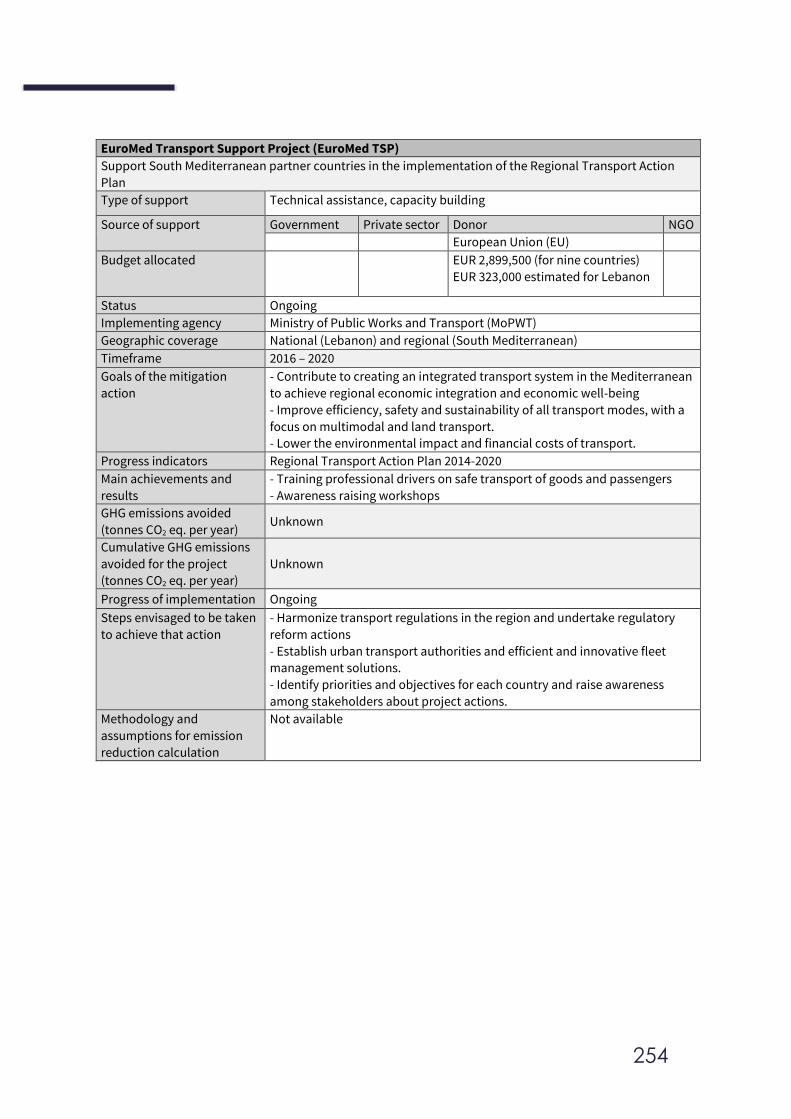
254
EuroMed Transport Support Project (EuroMed TSP)
Support South Mediterranean partner countries in the implementation of the Regional Transport Action
Plan
Type of support Technical assistance, capacity building
Source of support Government Private sector Donor NGO
European Union (EU)
Budget allocated EUR 2,899,500 (for nine countries)
EUR 323,000 estimated for Lebanon
Status Ongoing
Implementing agency Ministry of Public Works and Transport (MoPWT)
Geographic coverage National (Lebanon) and regional (South Mediterranean)
Timeframe 2016 – 2020
Goals of the mitigation
action
- Contribute to creating an integrated transport system in the Mediterranean
to achieve regional economic integration and economic well-being
- Improve efficiency, safety and sustainability of all transport modes, with a
focus on multimodal and land transport.
- Lower the environmental impact and financial costs of transport.
Progress indicators Regional Transport Action Plan 2014-2020
Main achievements and
results
- Training professional drivers on safe transport of goods and passengers
- Awareness raising workshops
GHG emissions avoided
(tonnes CO2 eq. per year) Unknown
Cumulative GHG emissions
avoided for the project
(tonnes CO2 eq. per year)
Unknown
Progress of implementation Ongoing
Steps envisaged to be taken
to achieve that action
- Harmonize transport regulations in the region and undertake regulatory
reform actions
- Establish urban transport authorities and efficient and innovative fleet
management solutions.
- Identify priorities and objectives for each country and raise awareness
among stakeholders about project actions.
Methodology and
assumptions for emission
reduction calculation
Not available
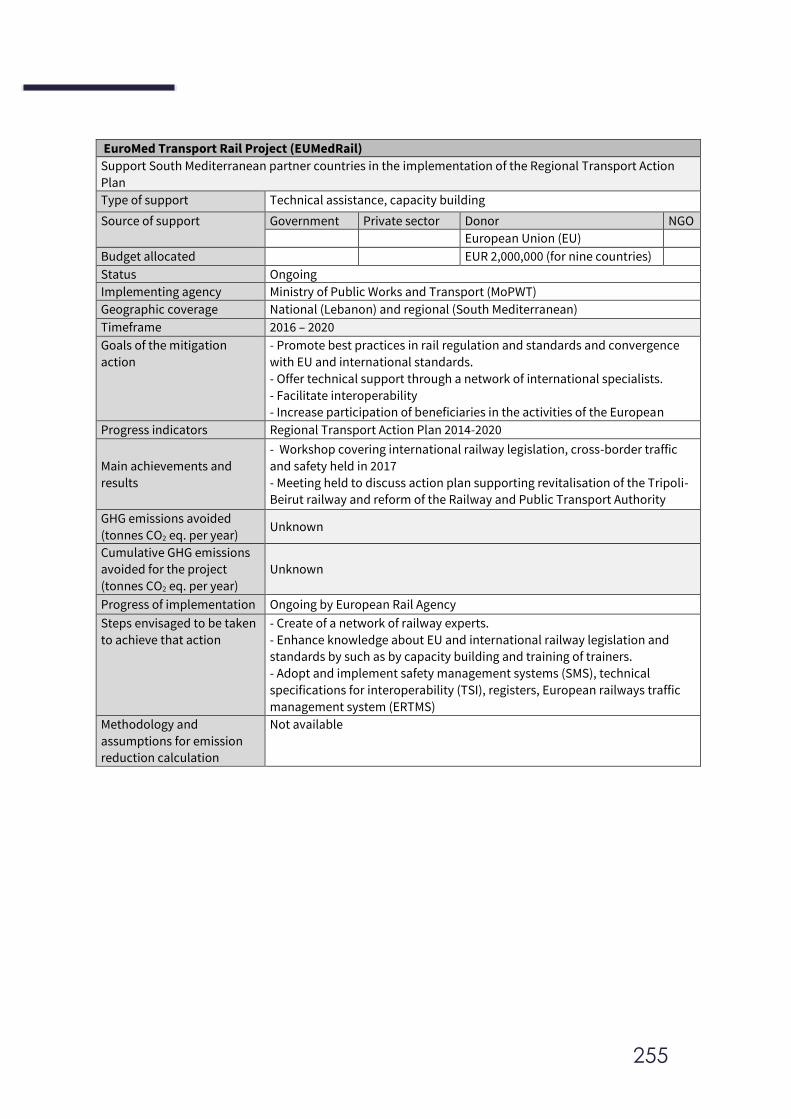
255
EuroMed Transport Rail Project (EUMedRail)
Support South Mediterranean partner countries in the implementation of the Regional Transport Action
Plan
Type of support Technical assistance, capacity building
Source of support Government Private sector Donor NGO
European Union (EU)
Budget allocated EUR 2,000,000 (for nine countries)
Status Ongoing
Implementing agency Ministry of Public Works and Transport (MoPWT)
Geographic coverage National (Lebanon) and regional (South Mediterranean)
Timeframe 2016 – 2020
Goals of the mitigation
action
- Promote best practices in rail regulation and standards and convergence
with EU and international standards.
- Offer technical support through a network of international specialists.
- Facilitate interoperability
- Increase participation of beneficiaries in the activities of the European
- Lower the environmental impact and financial costs of transport. Progress indicators Regional Transport Action Plan 2014-2020
Main achievements and
results
- Workshop covering international railway legislation, cross-border traffic
and safety held in 2017
- Meeting held to discuss action plan supporting revitalisation of the Tripoli-
Beirut railway and reform of the Railway and Public Transport Authority
GHG emissions avoided
(tonnes CO2 eq. per year) Unknown
Cumulative GHG emissions
avoided for the project
(tonnes CO2 eq. per year)
Unknown
Progress of implementation Ongoing by European Rail Agency
Steps envisaged to be taken
to achieve that action
- Create of a network of railway experts.
- Enhance knowledge about EU and international railway legislation and
standards by such as by capacity building and training of trainers.
- Adopt and implement safety management systems (SMS), technical
specifications for interoperability (TSI), registers, European railways traffic
management system (ERTMS)
Methodology and
assumptions for emission
reduction calculation
Not available
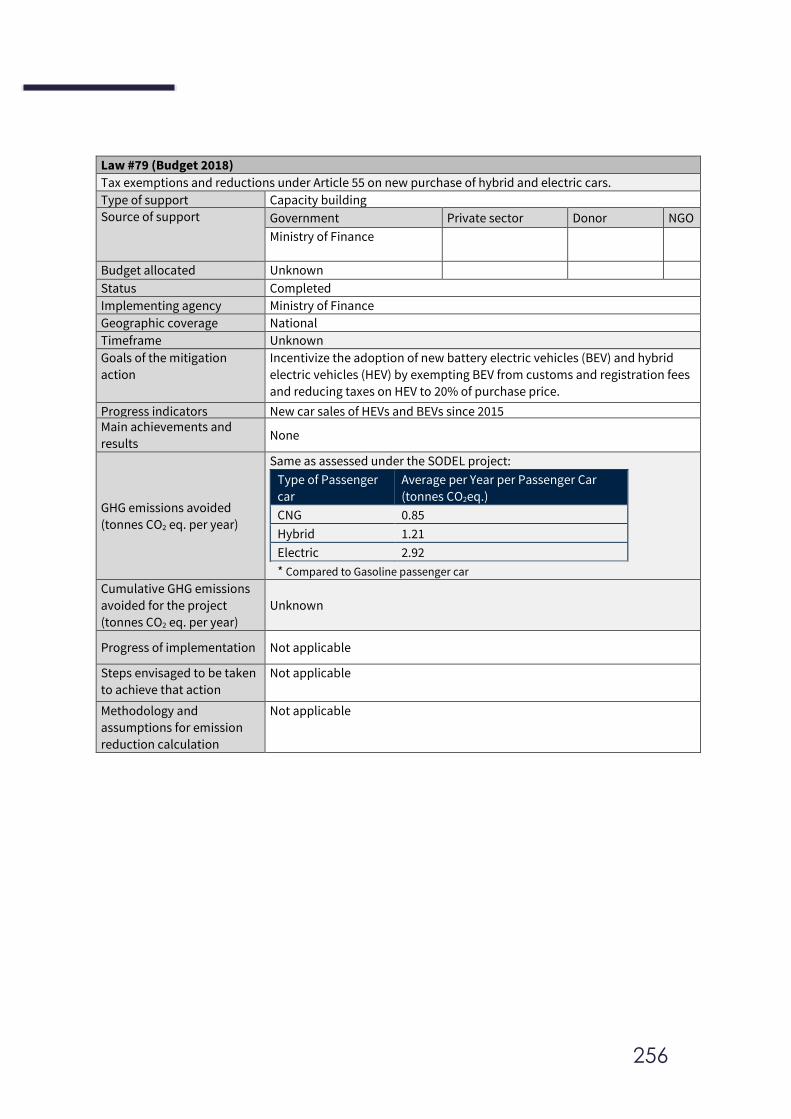
256
Law #79 (Budget 2018)
Tax exemptions and reductions under Article 55 on new purchase of hybrid and electric cars.
Type of support Capacity building
Source of support Government Private sector Donor NGO
Ministry of Finance
Budget allocated Unknown
Status Completed
Implementing agency Ministry of Finance
Geographic coverage National
Timeframe Unknown
Goals of the mitigation
action
Incentivize the adoption of new battery electric vehicles (BEV) and hybrid
electric vehicles (HEV) by exempting BEV from customs and registration fees
and reducing taxes on HEV to 20% of purchase price.
Progress indicators New car sales of HEVs and BEVs since 2015 Main achievements and
results None
GHG emissions avoided
(tonnes CO2 eq. per year)
Same as assessed under the SODEL project:
Type of Passenger
car
Average per Year per Passenger Car
(tonnes CO2eq.)
CNG 0.85
Hybrid 1.21
Electric 2.92
* Compared to Gasoline passenger car
Cumulative GHG emissions
avoided for the project
(tonnes CO2 eq. per year)
Unknown
Progress of implementation Not applicable
Steps envisaged to be taken
to achieve that action
Not applicable
Methodology and
assumptions for emission
reduction calculation
Not applicable
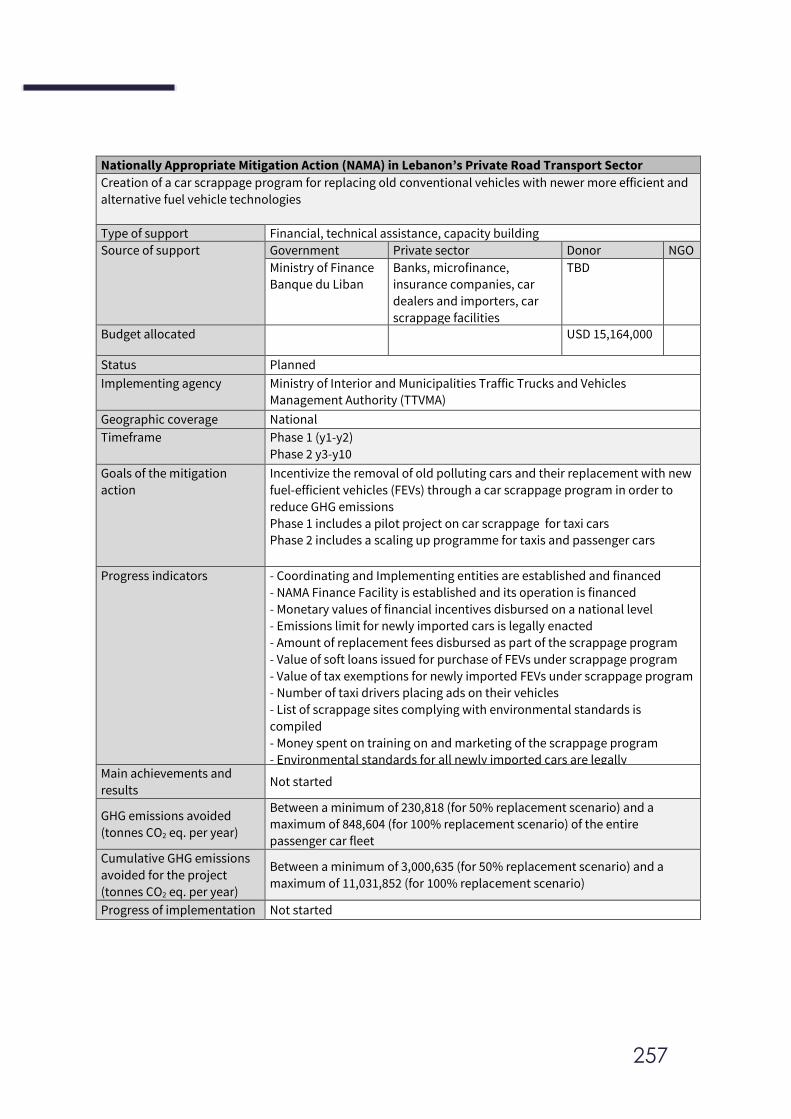
257
Nationally Appropriate Mitigation Action (NAMA) in Lebanon’s Private Road Transport Sector
Creation of a car scrappage program for replacing old conventional vehicles with newer more efficient and
alternative fuel vehicle technologies
Type of support Financial, technical assistance, capacity building
Source of support Government Private sector Donor NGO
Ministry of Finance
Banque du Liban
Banks, microfinance,
insurance companies, car
dealers and importers, car
scrappage facilities
TBD
Budget allocated USD 15,164,000
Status Planned
Implementing agency Ministry of Interior and Municipalities Traffic Trucks and Vehicles
Management Authority (TTVMA)
Geographic coverage National
Timeframe Phase 1 (y1-y2)
Phase 2 y3-y10
Goals of the mitigation
action
Incentivize the removal of old polluting cars and their replacement with new
fuel-efficient vehicles (FEVs) through a car scrappage program in order to
reduce GHG emissions
Phase 1 includes a pilot project on car scrappage for taxi cars
Phase 2 includes a scaling up programme for taxis and passenger cars
Progress indicators - Coordinating and Implementing entities are established and financed
- NAMA Finance Facility is established and its operation is financed
- Monetary values of financial incentives disbursed on a national level
- Emissions limit for newly imported cars is legally enacted
- Amount of replacement fees disbursed as part of the scrappage program
- Value of soft loans issued for purchase of FEVs under scrappage program
- Value of tax exemptions for newly imported FEVs under scrappage program
- Number of taxi drivers placing ads on their vehicles
- List of scrappage sites complying with environmental standards is
compiled
- Money spent on training on and marketing of the scrappage program
- Environmental standards for all newly imported cars are legally
implemented
- Amount of additional fuel tax collected
Main achievements and
results Not started
GHG emissions avoided
(tonnes CO2 eq. per year)
Between a minimum of 230,818 (for 50% replacement scenario) and a
maximum of 848,604 (for 100% replacement scenario) of the entire
passenger car fleet
Cumulative GHG emissions
avoided for the project
(tonnes CO2 eq. per year)
Between a minimum of 3,000,635 (for 50% replacement scenario) and a
maximum of 11,031,852 (for 100% replacement scenario)
Progress of implementation Not started
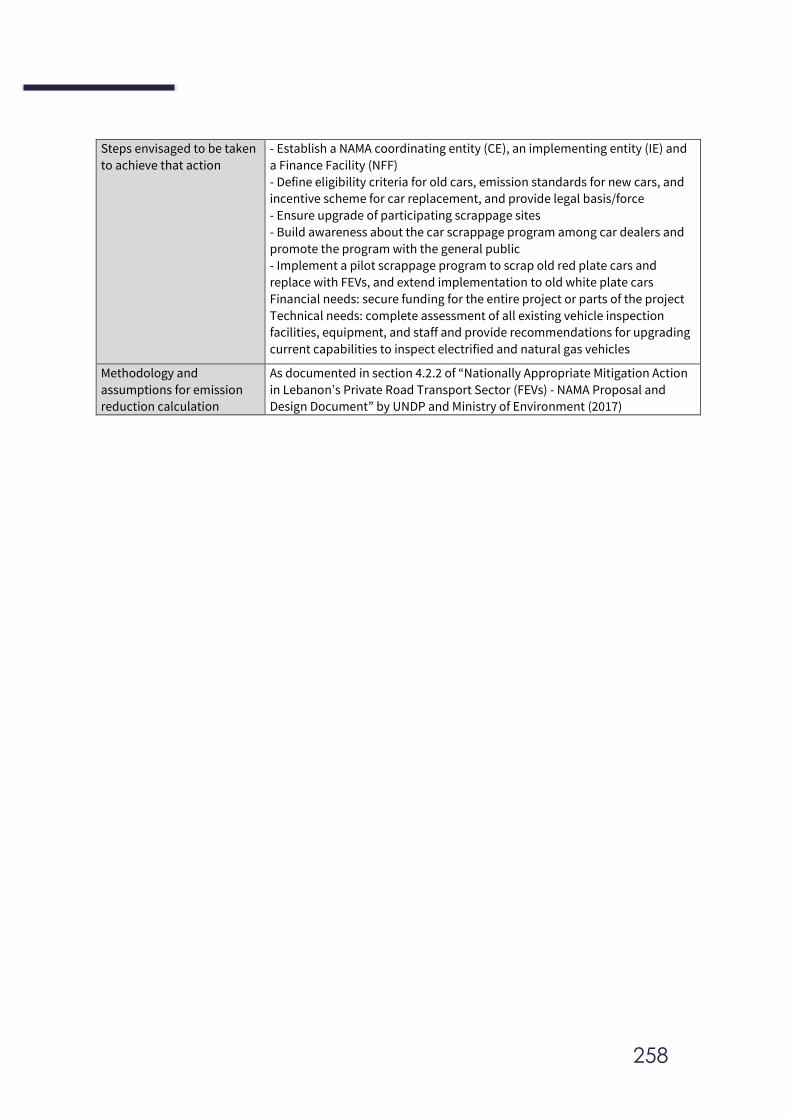
258
Steps envisaged to be taken
to achieve that action
- Establish a NAMA coordinating entity (CE), an implementing entity (IE) and
a Finance Facility (NFF)
- Define eligibility criteria for old cars, emission standards for new cars, and
incentive scheme for car replacement, and provide legal basis/force
- Ensure upgrade of participating scrappage sites
- Build awareness about the car scrappage program among car dealers and
promote the program with the general public
- Implement a pilot scrappage program to scrap old red plate cars and
replace with FEVs, and extend implementation to old white plate cars
Financial needs: secure funding for the entire project or parts of the project
Technical needs: complete assessment of all existing vehicle inspection
facilities, equipment, and staff and provide recommendations for upgrading
current capabilities to inspect electrified and natural gas vehicles
Methodology and
assumptions for emission
reduction calculation
As documented in section 4.2.2 of “Nationally Appropriate Mitigation Action
in Lebanon’s Private Road Transport Sector (FEVs) - NAMA Proposal and
Design Document” by UNDP and Ministry of Environment (2017)
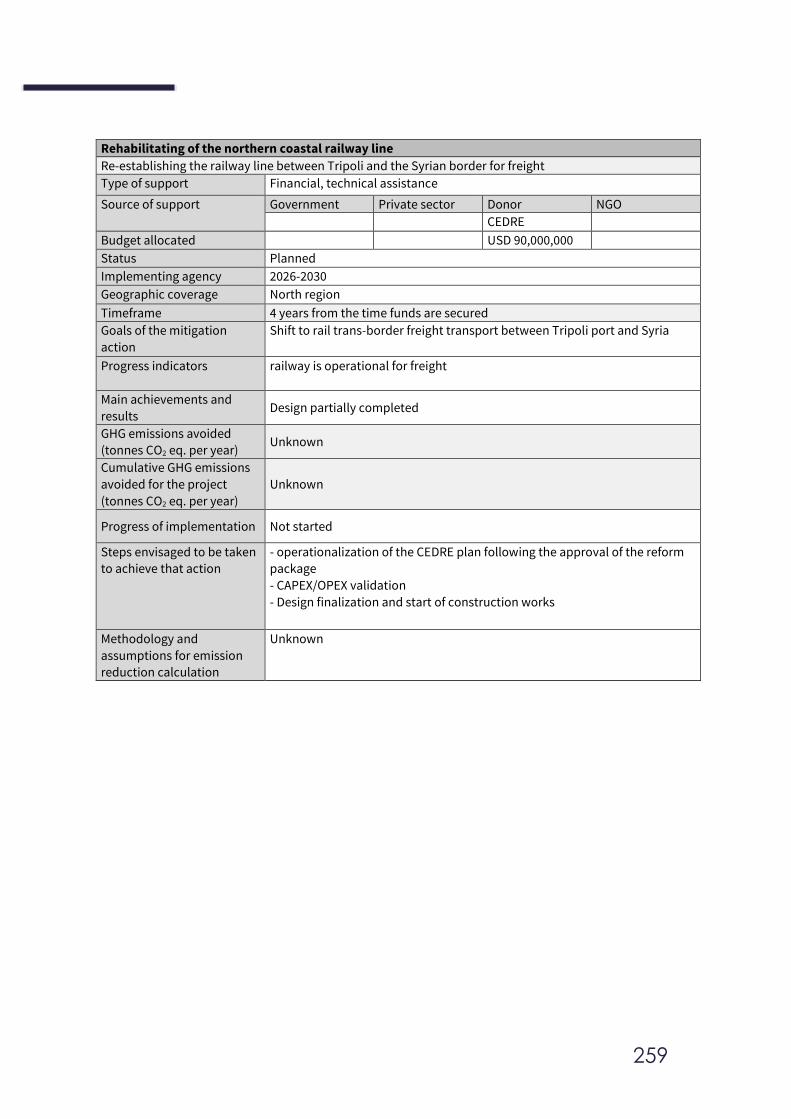
259
Rehabilitating of the northern coastal railway line
Re-establishing the railway line between Tripoli and the Syrian border for freight
Type of support Financial, technical assistance
Source of support Government Private sector Donor NGO
CEDRE
Budget allocated USD 90,000,000
Status Planned
Implementing agency 2026-2030
Geographic coverage North region
Timeframe 4 years from the time funds are secured
Goals of the mitigation
action
Shift to rail trans-border freight transport between Tripoli port and Syria
Progress indicators railway is operational for freight
Main achievements and
results Design partially completed
GHG emissions avoided
(tonnes CO2 eq. per year) Unknown
Cumulative GHG emissions
avoided for the project
(tonnes CO2 eq. per year)
Unknown
Progress of implementation Not started
Steps envisaged to be taken
to achieve that action
- operationalization of the CEDRE plan following the approval of the reform
package
- CAPEX/OPEX validation
- Design finalization and start of construction works
Methodology and
assumptions for emission
reduction calculation
Unknown
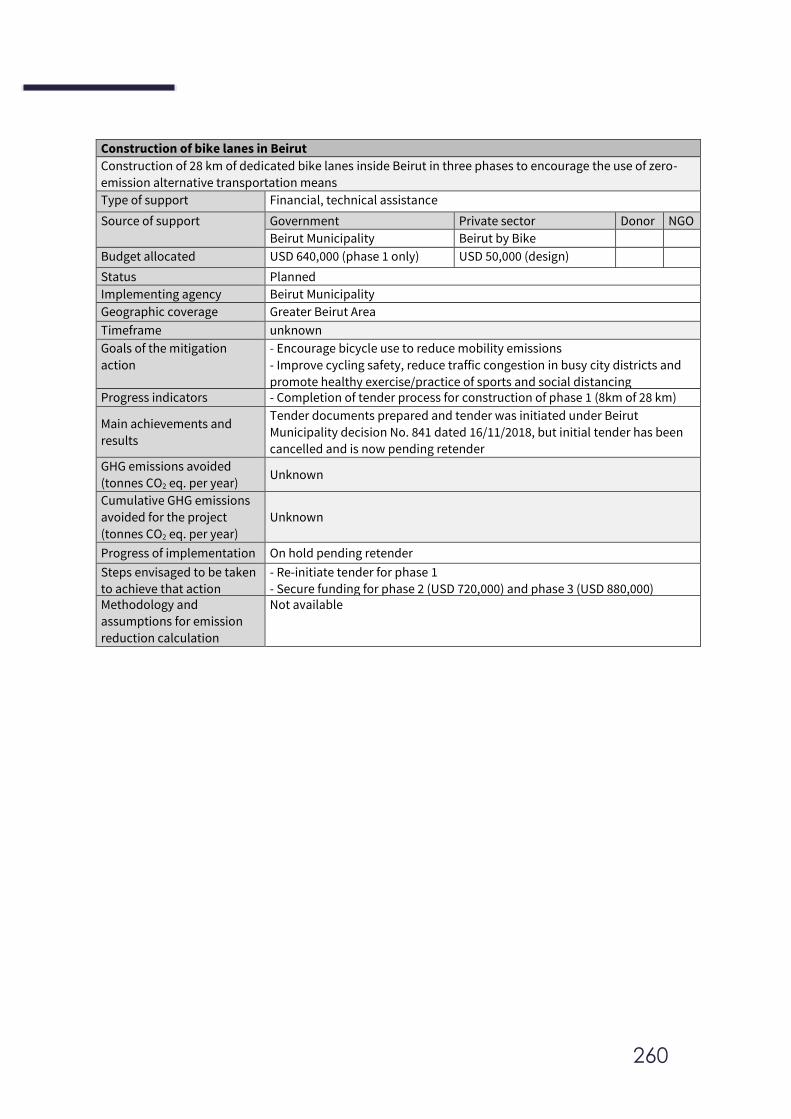
260
Construction of bike lanes in Beirut
Construction of 28 km of dedicated bike lanes inside Beirut in three phases to encourage the use of zero-
emission alternative transportation means
Type of support Financial, technical assistance
Source of support Government Private sector Donor NGO
Beirut Municipality Beirut by Bike
Budget allocated USD 640,000 (phase 1 only) USD 50,000 (design)
Status Planned
Implementing agency Beirut Municipality
Geographic coverage Greater Beirut Area
Timeframe unknown
Goals of the mitigation
action
- Encourage bicycle use to reduce mobility emissions
- Improve cycling safety, reduce traffic congestion in busy city districts and
promote healthy exercise/practice of sports and social distancing Progress indicators - Completion of tender process for construction of phase 1 (8km of 28 km)
Main achievements and
results
Tender documents prepared and tender was initiated under Beirut
Municipality decision No. 841 dated 16/11/2018, but initial tender has been
cancelled and is now pending retender
GHG emissions avoided
(tonnes CO2 eq. per year) Unknown
Cumulative GHG emissions
avoided for the project
(tonnes CO2 eq. per year)
Unknown
Progress of implementation On hold pending retender
Steps envisaged to be taken
to achieve that action
- Re-initiate tender for phase 1
- Secure funding for phase 2 (USD 720,000) and phase 3 (USD 880,000) Methodology and
assumptions for emission
reduction calculation
Not available
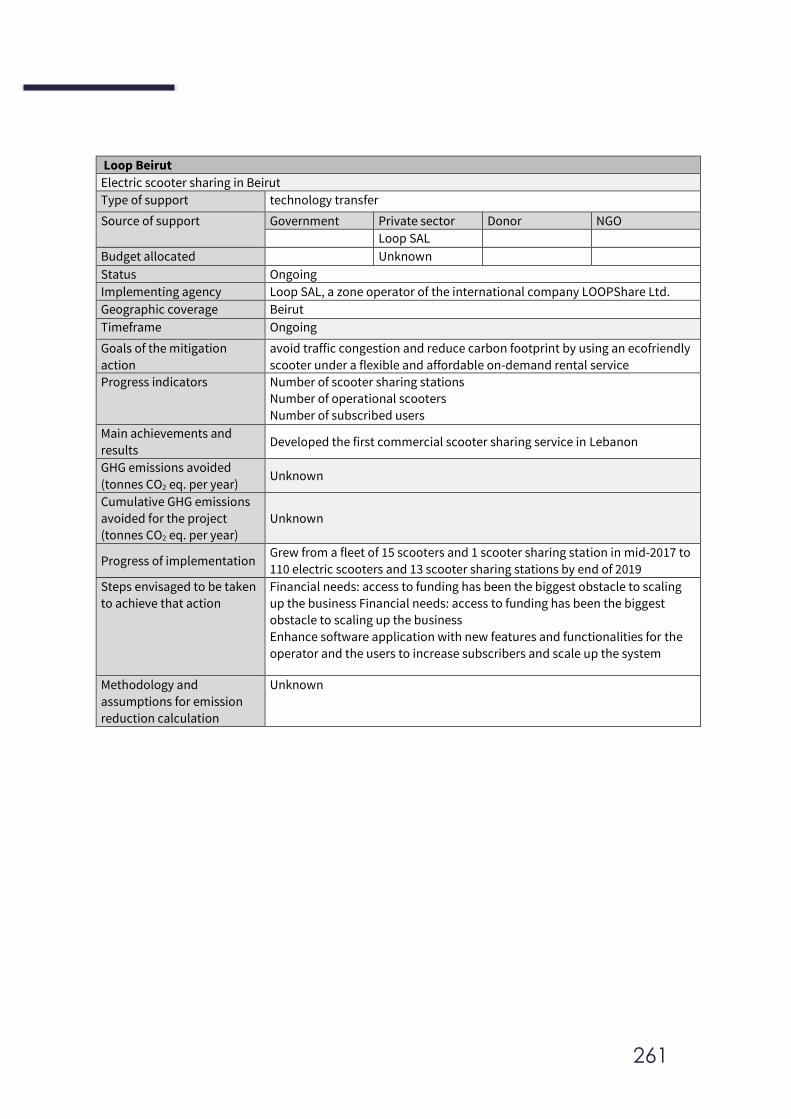
261
Loop Beirut
Electric scooter sharing in Beirut
Type of support technology transfer
Source of support Government Private sector Donor NGO
Loop SAL
Budget allocated Unknown
Status Ongoing
Implementing agency Loop SAL, a zone operator of the international company LOOPShare Ltd.
Geographic coverage Beirut
Timeframe Ongoing
Goals of the mitigation
action
avoid traffic congestion and reduce carbon footprint by using an ecofriendly
scooter under a flexible and affordable on-demand rental service
Progress indicators Number of scooter sharing stations
Number of operational scooters
Number of subscribed users
Main achievements and
results Developed the first commercial scooter sharing service in Lebanon
GHG emissions avoided
(tonnes CO2 eq. per year) Unknown
Cumulative GHG emissions
avoided for the project
(tonnes CO2 eq. per year)
Unknown
Progress of implementation Grew from a fleet of 15 scooters and 1 scooter sharing station in mid-2017 to
110 electric scooters and 13 scooter sharing stations by end of 2019
Steps envisaged to be taken
to achieve that action
Financial needs: access to funding has been the biggest obstacle to scaling
up the business Financial needs: access to funding has been the biggest
obstacle to scaling up the business
Enhance software application with new features and functionalities for the
operator and the users to increase subscribers and scale up the system
Methodology and
assumptions for emission
reduction calculation
Unknown
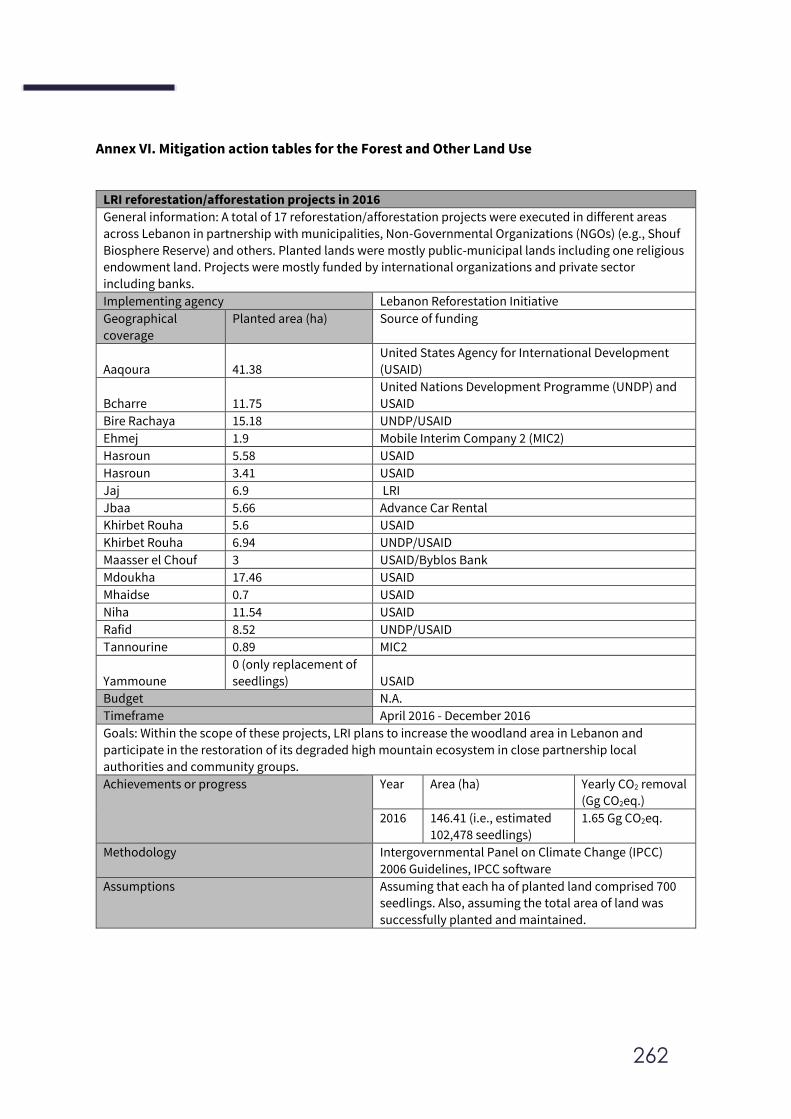
262
Annex VI. Mitigation action tables for the Forest and Other Land Use
LRI reforestation/afforestation projects in 2016
General information: A total of 17 reforestation/afforestation projects were executed in different areas
across Lebanon in partnership with municipalities, Non-Governmental Organizations (NGOs) (e.g., Shouf
Biosphere Reserve) and others. Planted lands were mostly public-municipal lands including one religious
endowment land. Projects were mostly funded by international organizations and private sector
including banks.
Implementing agency Lebanon Reforestation Initiative
Geographical
coverage
Planted area (ha) Source of funding
Aaqoura 41.38
United States Agency for International Development
(USAID)
Bcharre 11.75
United Nations Development Programme (UNDP) and
USAID
Bire Rachaya 15.18 UNDP/USAID
Ehmej 1.9 Mobile Interim Company 2 (MIC2)
Hasroun 5.58 USAID
Hasroun 3.41 USAID
Jaj 6.9 LRI
Jbaa 5.66 Advance Car Rental
Khirbet Rouha 5.6 USAID
Khirbet Rouha 6.94 UNDP/USAID
Maasser el Chouf 3 USAID/Byblos Bank
Mdoukha 17.46 USAID
Mhaidse 0.7 USAID
Niha 11.54 USAID
Rafid 8.52 UNDP/USAID
Tannourine 0.89 MIC2
Yammoune
0 (only replacement of
seedlings) USAID
Budget N.A.
Timeframe April 2016 - December 2016
Goals: Within the scope of these projects, LRI plans to increase the woodland area in Lebanon and
participate in the restoration of its degraded high mountain ecosystem in close partnership local
authorities and community groups.
Achievements or progress Year Area (ha) Yearly CO2 removal
(Gg CO2eq.)
2016 146.41 (i.e., estimated
102,478 seedlings)
1.65 Gg CO2eq.
Methodology Intergovernmental Panel on Climate Change (IPCC)
2006 Guidelines, IPCC software
Assumptions Assuming that each ha of planted land comprised 700
seedlings. Also, assuming the total area of land was
successfully planted and maintained.
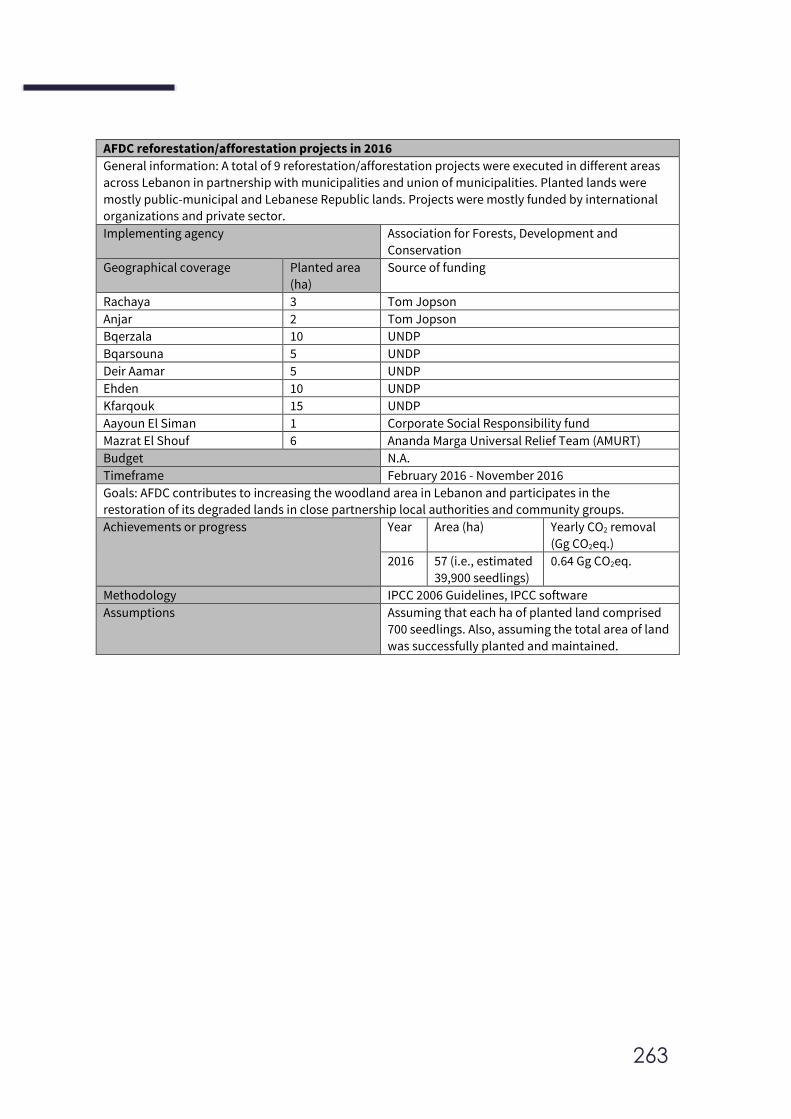
263
AFDC reforestation/afforestation projects in 2016
General information: A total of 9 reforestation/afforestation projects were executed in different areas
across Lebanon in partnership with municipalities and union of municipalities. Planted lands were
mostly public-municipal and Lebanese Republic lands. Projects were mostly funded by international
organizations and private sector.
Implementing agency Association for Forests, Development and
Conservation
Geographical coverage Planted area
(ha)
Source of funding
Rachaya 3 Tom Jopson
Anjar 2 Tom Jopson
Bqerzala 10 UNDP
Bqarsouna 5 UNDP
Deir Aamar 5 UNDP
Ehden 10 UNDP
Kfarqouk 15 UNDP
Aayoun El Siman 1 Corporate Social Responsibility fund
Mazrat El Shouf 6 Ananda Marga Universal Relief Team (AMURT)
Budget N.A.
Timeframe February 2016 - November 2016
Goals: AFDC contributes to increasing the woodland area in Lebanon and participates in the
restoration of its degraded lands in close partnership local authorities and community groups.
Achievements or progress Year Area (ha) Yearly CO2 removal
(Gg CO2eq.)
2016 57 (i.e., estimated
39,900 seedlings)
0.64 Gg CO2eq.
Methodology IPCC 2006 Guidelines, IPCC software
Assumptions Assuming that each ha of planted land comprised
700 seedlings. Also, assuming the total area of land
was successfully planted and maintained.
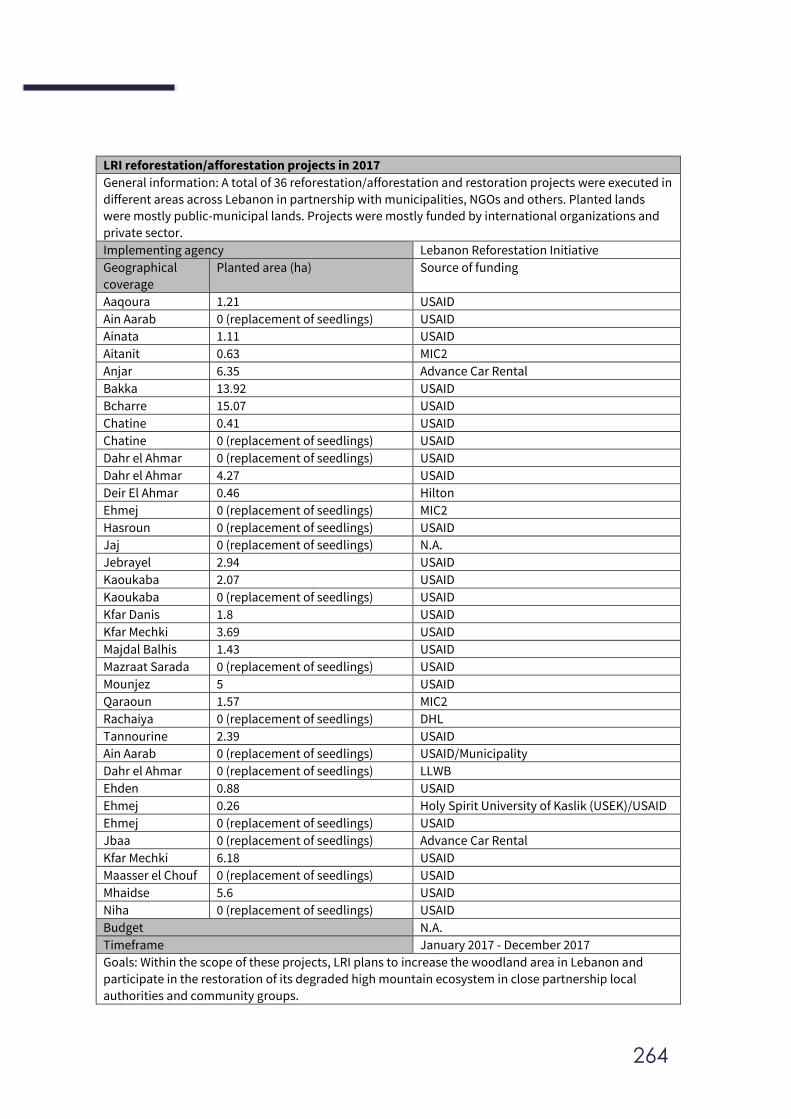
264
LRI reforestation/afforestation projects in 2017
General information: A total of 36 reforestation/afforestation and restoration projects were executed in
different areas across Lebanon in partnership with municipalities, NGOs and others. Planted lands
were mostly public-municipal lands. Projects were mostly funded by international organizations and
private sector.
Implementing agency Lebanon Reforestation Initiative
Geographical
coverage
Planted area (ha) Source of funding
Aaqoura 1.21 USAID
Ain Aarab 0 (replacement of seedlings) USAID
Ainata 1.11 USAID
Aitanit 0.63 MIC2
Anjar 6.35 Advance Car Rental
Bakka 13.92 USAID
Bcharre 15.07 USAID
Chatine 0.41 USAID
Chatine 0 (replacement of seedlings) USAID
Dahr el Ahmar 0 (replacement of seedlings) USAID
Dahr el Ahmar 4.27 USAID
Deir El Ahmar 0.46 Hilton
Ehmej 0 (replacement of seedlings) MIC2
Hasroun 0 (replacement of seedlings) USAID
Jaj 0 (replacement of seedlings) N.A.
Jebrayel 2.94 USAID
Kaoukaba 2.07 USAID
Kaoukaba 0 (replacement of seedlings) USAID
Kfar Danis 1.8 USAID
Kfar Mechki 3.69 USAID
Majdal Balhis 1.43 USAID
Mazraat Sarada 0 (replacement of seedlings) USAID
Mounjez 5 USAID
Qaraoun 1.57 MIC2
Rachaiya 0 (replacement of seedlings) DHL
Tannourine 2.39 USAID
Ain Aarab 0 (replacement of seedlings) USAID/Municipality
Dahr el Ahmar 0 (replacement of seedlings) LLWB
Ehden 0.88 USAID
Ehmej 0.26 Holy Spirit University of Kaslik (USEK)/USAID
Ehmej 0 (replacement of seedlings) USAID
Jbaa 0 (replacement of seedlings) Advance Car Rental
Kfar Mechki 6.18 USAID
Maasser el Chouf 0 (replacement of seedlings) USAID
Mhaidse 5.6 USAID
Niha 0 (replacement of seedlings) USAID
Budget N.A.
Timeframe January 2017 - December 2017
Goals: Within the scope of these projects, LRI plans to increase the woodland area in Lebanon and
participate in the restoration of its degraded high mountain ecosystem in close partnership local
authorities and community groups.
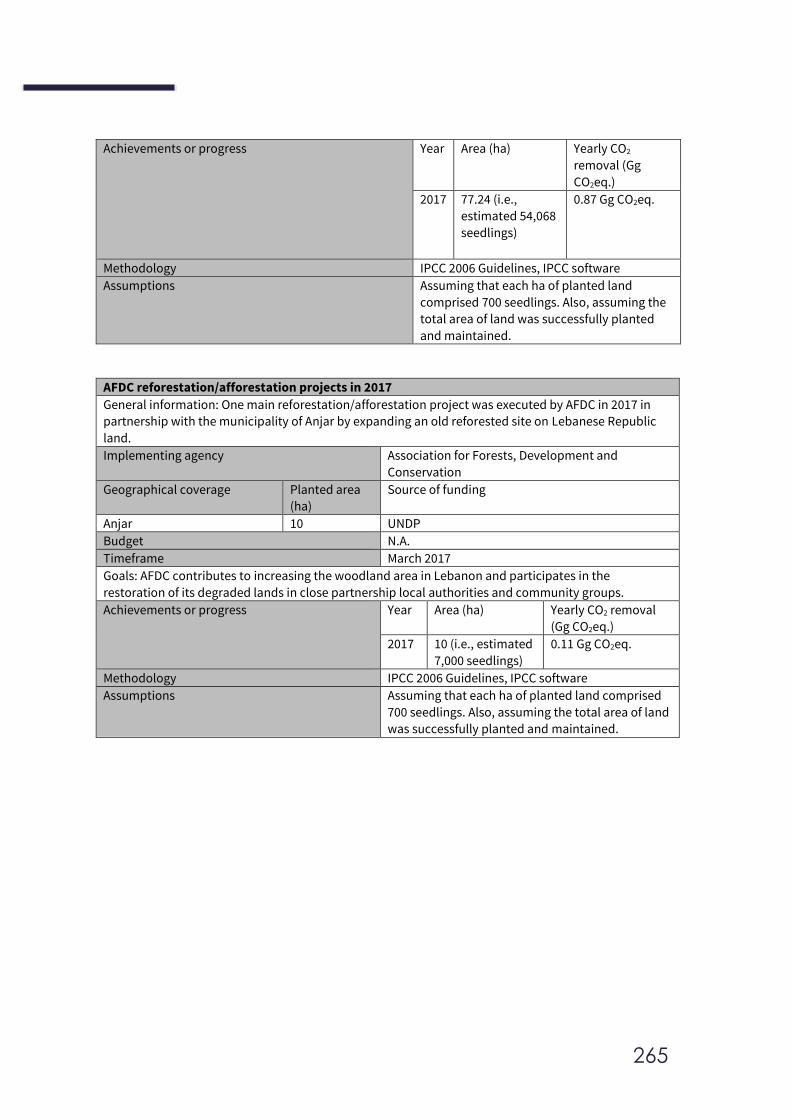
265
Achievements or progress Year Area (ha) Yearly CO2
removal (Gg
CO2eq.)
2017 77.24 (i.e.,
estimated 54,068
seedlings)
0.87 Gg CO2eq.
Methodology IPCC 2006 Guidelines, IPCC software
Assumptions Assuming that each ha of planted land
comprised 700 seedlings. Also, assuming the
total area of land was successfully planted
and maintained.
AFDC reforestation/afforestation projects in 2017
General information: One main reforestation/afforestation project was executed by AFDC in 2017 in
partnership with the municipality of Anjar by expanding an old reforested site on Lebanese Republic
land.
Implementing agency Association for Forests, Development and
Conservation
Geographical coverage Planted area
(ha)
Source of funding
Anjar 10 UNDP
Budget N.A.
Timeframe March 2017
Goals: AFDC contributes to increasing the woodland area in Lebanon and participates in the
restoration of its degraded lands in close partnership local authorities and community groups.
Achievements or progress Year Area (ha) Yearly CO2 removal
(Gg CO2eq.)
2017 10 (i.e., estimated
7,000 seedlings)
0.11 Gg CO2eq.
Methodology IPCC 2006 Guidelines, IPCC software
Assumptions Assuming that each ha of planted land comprised
700 seedlings. Also, assuming the total area of land
was successfully planted and maintained.
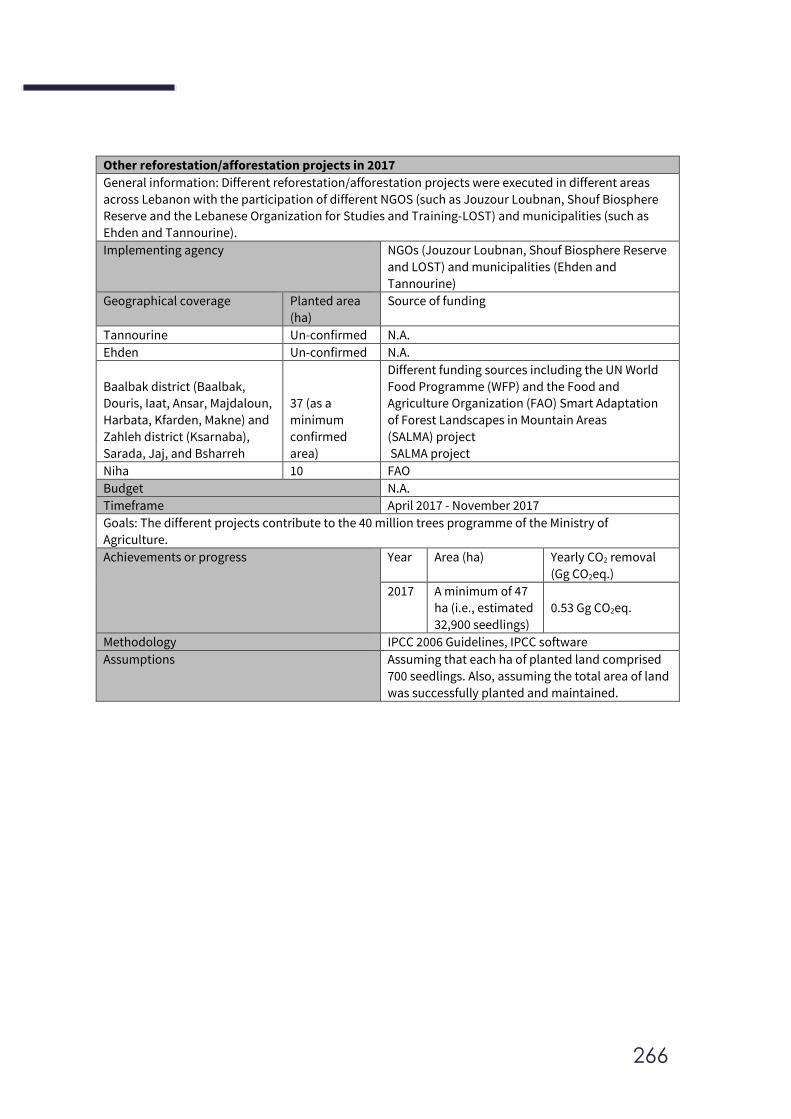
266
Other reforestation/afforestation projects in 2017
General information: Different reforestation/afforestation projects were executed in different areas
across Lebanon with the participation of different NGOS (such as Jouzour Loubnan, Shouf Biosphere
Reserve and the Lebanese Organization for Studies and Training-LOST) and municipalities (such as
Ehden and Tannourine).
Implementing agency NGOs (Jouzour Loubnan, Shouf Biosphere Reserve
and LOST) and municipalities (Ehden and
Tannourine)
Geographical coverage Planted area
(ha)
Source of funding
Tannourine Un-confirmed N.A.
Ehden Un-confirmed N.A.
Baalbak district (Baalbak,
Douris, Iaat, Ansar, Majdaloun,
Harbata, Kfarden, Makne) and
Zahleh district (Ksarnaba),
Sarada, Jaj, and Bsharreh
37 (as a
minimum
confirmed
area)
Different funding sources including the UN World
Food Programme (WFP) and the Food and
Agriculture Organization (FAO) Smart Adaptation
of Forest Landscapes in Mountain Areas
(SALMA) project
SALMA project
Niha 10 FAO
Budget N.A.
Timeframe April 2017 - November 2017
Goals: The different projects contribute to the 40 million trees programme of the Ministry of
Agriculture.
Achievements or progress Year Area (ha) Yearly CO2 removal
(Gg CO2eq.)
2017 A minimum of 47
ha (i.e., estimated
32,900 seedlings)
0.53 Gg CO2eq.
Methodology IPCC 2006 Guidelines, IPCC software
Assumptions Assuming that each ha of planted land comprised
700 seedlings. Also, assuming the total area of land
was successfully planted and maintained.
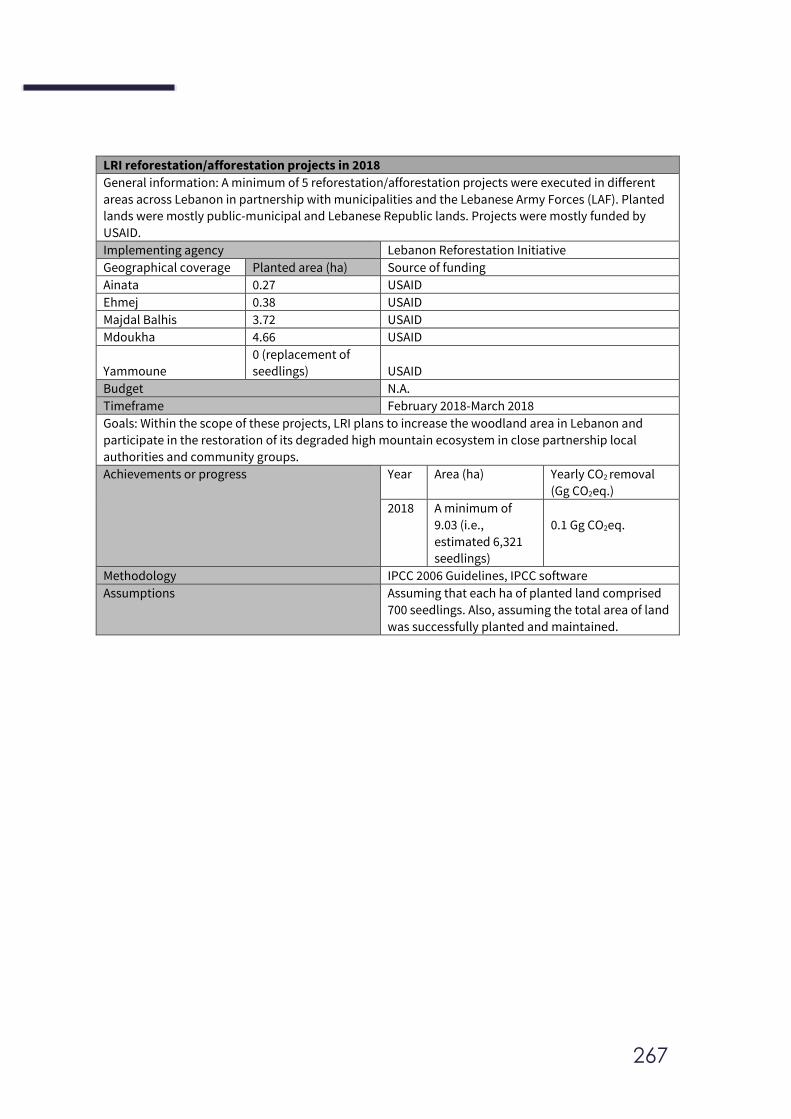
267
LRI reforestation/afforestation projects in 2018
General information: A minimum of 5 reforestation/afforestation projects were executed in different
areas across Lebanon in partnership with municipalities and the Lebanese Army Forces (LAF). Planted
lands were mostly public-municipal and Lebanese Republic lands. Projects were mostly funded by
USAID.
Implementing agency Lebanon Reforestation Initiative
Geographical coverage Planted area (ha) Source of funding
Ainata 0.27 USAID
Ehmej 0.38 USAID
Majdal Balhis 3.72 USAID
Mdoukha 4.66 USAID
Yammoune
0 (replacement of
seedlings) USAID
Budget N.A.
Timeframe February 2018-March 2018
Goals: Within the scope of these projects, LRI plans to increase the woodland area in Lebanon and
participate in the restoration of its degraded high mountain ecosystem in close partnership local
authorities and community groups.
Achievements or progress Year Area (ha) Yearly CO2 removal
(Gg CO2eq.)
2018 A minimum of
9.03 (i.e.,
estimated 6,321
seedlings)
0.1 Gg CO2eq.
Methodology IPCC 2006 Guidelines, IPCC software
Assumptions Assuming that each ha of planted land comprised
700 seedlings. Also, assuming the total area of land
was successfully planted and maintained.
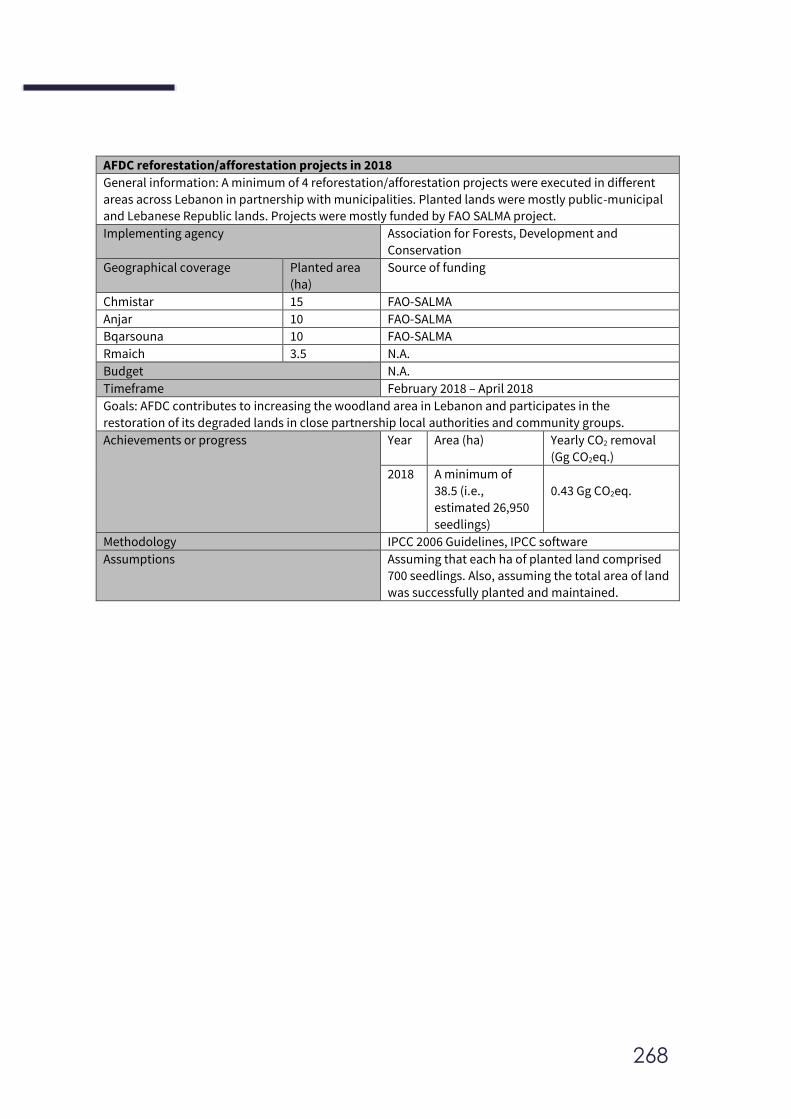
268
AFDC reforestation/afforestation projects in 2018
General information: A minimum of 4 reforestation/afforestation projects were executed in different
areas across Lebanon in partnership with municipalities. Planted lands were mostly public-municipal
and Lebanese Republic lands. Projects were mostly funded by FAO SALMA project.
Implementing agency Association for Forests, Development and
Conservation
Geographical coverage Planted area
(ha)
Source of funding
Chmistar 15 FAO-SALMA
Anjar 10 FAO-SALMA
Bqarsouna 10 FAO-SALMA
Rmaich 3.5 N.A.
Budget N.A.
Timeframe February 2018 – April 2018
Goals: AFDC contributes to increasing the woodland area in Lebanon and participates in the
restoration of its degraded lands in close partnership local authorities and community groups.
Achievements or progress Year Area (ha) Yearly CO2 removal
(Gg CO2eq.)
2018 A minimum of
38.5 (i.e.,
estimated 26,950
seedlings)
0.43 Gg CO2eq.
Methodology IPCC 2006 Guidelines, IPCC software
Assumptions Assuming that each ha of planted land comprised
700 seedlings. Also, assuming the total area of land
was successfully planted and maintained.