sediment yields estimation and identification of their sources in tanganyika bassin, case of...
TRANSCRIPT
International Research Journal of Geology and Mining (IRJGM) (2276-6618) Vol. 4(1) pp. xxx-xxx, January, 2014 Available online http://www.interesjournals.org/irjgm
Copyright©2014 International Research Journals
Full Length Research Paper
Sediment Yields Estimation and Sources Identification in Lake Tanganyika Basin: The Case of Mulongwe Sub
Catchment – Uvira City – DR Congo
Ongezo Muzaliwa Séverin*1, Joel Norbert2, Felix Mtalo3, Preksedis M. Ndomba4
Université Officielle de Bukavu (UOB) / DR Congo, B.P 570 BUKAVU University of Dar es Salaam, College of Engineering and Technology,
Department of Water Resources Engineering.
*Corresponding author Email: [email protected]
ABSTRACT
Soil erosion and/or sedimentation are immense problems that have threatened water resources development in the Tanganyika basin, particularly in the northwest of Lake Tanganyika (Mulongwe sub catchment in Uvira City). The total area of Mulongwe sub catchment is 115.15 km
2. This study was
conducted in Mulongwe sub catchment (DRCongo) to set up and calibrate model, to estimate the sediment yields in the sub catchment and identify the sediment sources. The required input data for this study were Digital Elevation Model (DEM) with spatial resolution of 30x30m, Land use/cover and soil map of year 2004. Eight types of land use/cover and two types of soil in the study area have been determined. The hydro-meteorological observations around the Mulongwe sub catchment were used. Intermittent Stream flows and sediment loads were monitored from two years 1999 and 2004 at Mulongwe gauging site on the main Mulongwe River. Sediment sources have been determined by finger printing techniques. Model performance evaluation statistics for stream flow and sediment were satisfactory calibrated on daily basis with CE and R
2 0.62 and 0.71, respectively. For the validation the
NSE and R2
were 0.56 and 0.63, respectively. Sediment erosion rates were in the range of 0.17-5.23 tons/ha/yr with average of 0.53tons/ha/yr and average sediment yields of 6,096 tons/yr. Keywords: Sedimentation, Erosion, AVSWAT2005, Weathering and Landslide
INTRODUCTION The town of Uvira located in the southern hemisphere on the edge of NW of Lake Tanganyika between latitudes 3°21'S and 3°27'S and longitudes 29°7'E and 29°12'E, is a quickly growing agglomeration of 200,000 people located within 16 km
2 series of alluvial fans, actively
progressing into the Tanganyika rift lake at a rate of some meters since the last 50 years. These fans form the only more or less flat area between the rugged and rough Mitumba – Itombwe plateau rift shoulder and the lake. The increasingly hazardous character of the flash flood events asks for an explanation in order to maintain the site habitable. The increasing river activity goes hand in
hand with intensification of the occurrence of soil erosion and landslide in the mountain fan catchments. Inhabitants of the Itombwe uplands report growing soil erosion and landslide activities in the area. The soil erosion intensification is more than a local phenomenon (Munyololo et al. 1999).
The city of Uvira extends the fan of the Kalimabenge (sub catchment: 22 km and 91 km
2), Mulongwe (sub
catchment: 25.5 km and 115 km2) and Kavimvira (sub
catchment: 17.5 km and 42 km2) torrents. The water
temperatures for these three rivers are between: 16.8 - 25.2 ºC; 15.9 - 26.8 °C and 20.0 - 29.4 ºC, respectively.
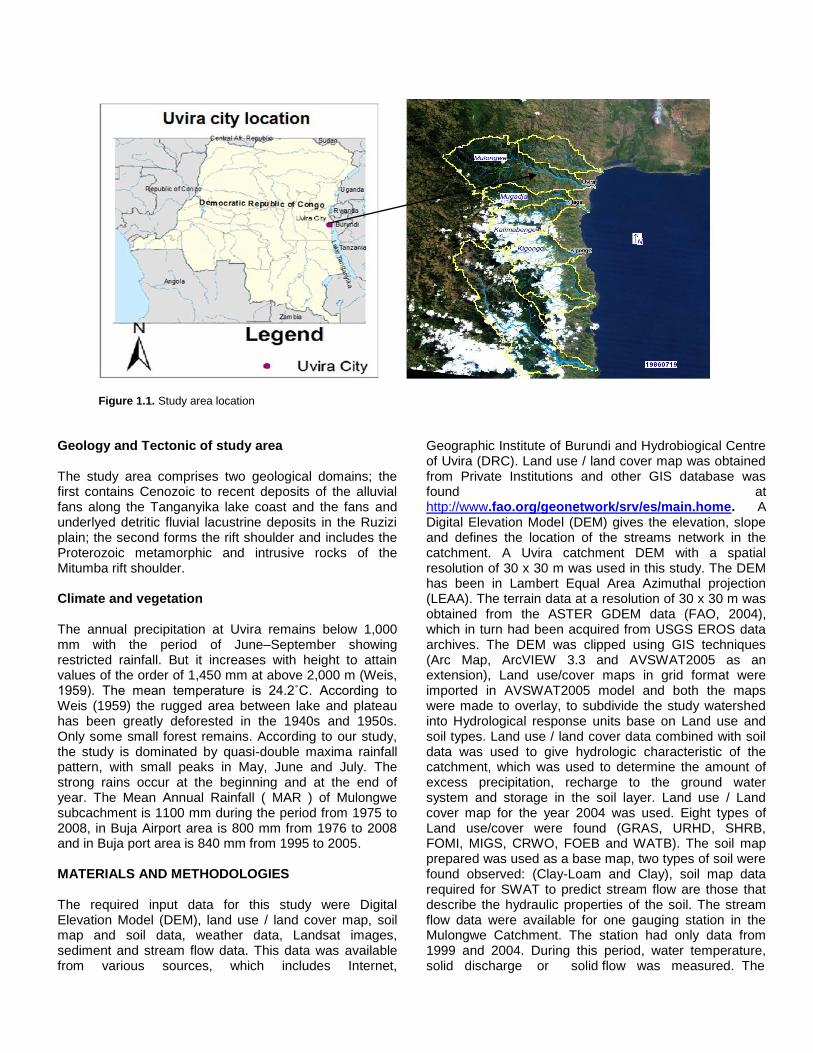
Figure 1.1. Study area location
Geology and Tectonic of study area The study area comprises two geological domains; the first contains Cenozoic to recent deposits of the alluvial fans along the Tanganyika lake coast and the fans and underlyed detritic fluvial lacustrine deposits in the Ruzizi plain; the second forms the rift shoulder and includes the Proterozoic metamorphic and intrusive rocks of the Mitumba rift shoulder. Climate and vegetation The annual precipitation at Uvira remains below 1,000 mm with the period of June–September showing restricted rainfall. But it increases with height to attain values of the order of 1,450 mm at above 2,000 m (Weis, 1959). The mean temperature is 24.2˚C. According to Weis (1959) the rugged area between lake and plateau has been greatly deforested in the 1940s and 1950s. Only some small forest remains. According to our study, the study is dominated by quasi-double maxima rainfall pattern, with small peaks in May, June and July. The strong rains occur at the beginning and at the end of year. The Mean Annual Rainfall ( MAR ) of Mulongwe subcachment is 1100 mm during the period from 1975 to 2008, in Buja Airport area is 800 mm from 1976 to 2008 and in Buja port area is 840 mm from 1995 to 2005. MATERIALS AND METHODOLOGIES The required input data for this study were Digital Elevation Model (DEM), land use / land cover map, soil map and soil data, weather data, Landsat images, sediment and stream flow data. This data was available from various sources, which includes Internet,
Geographic Institute of Burundi and Hydrobiogical Centre of Uvira (DRC). Land use / land cover map was obtained from Private Institutions and other GIS database was found at http://www.fao.org/geonetwork/srv/es/main.home. A Digital Elevation Model (DEM) gives the elevation, slope and defines the location of the streams network in the catchment. A Uvira catchment DEM with a spatial resolution of 30 x 30 m was used in this study. The DEM has been in Lambert Equal Area Azimuthal projection (LEAA). The terrain data at a resolution of 30 x 30 m was obtained from the ASTER GDEM data (FAO, 2004), which in turn had been acquired from USGS EROS data archives. The DEM was clipped using GIS techniques (Arc Map, ArcVIEW 3.3 and AVSWAT2005 as an extension), Land use/cover maps in grid format were imported in AVSWAT2005 model and both the maps were made to overlay, to subdivide the study watershed into Hydrological response units base on Land use and soil types. Land use / land cover data combined with soil data was used to give hydrologic characteristic of the catchment, which was used to determine the amount of excess precipitation, recharge to the ground water system and storage in the soil layer. Land use / Land cover map for the year 2004 was used. Eight types of Land use/cover were found (GRAS, URHD, SHRB, FOMI, MIGS, CRWO, FOEB and WATB). The soil map prepared was used as a base map, two types of soil were found observed: (Clay-Loam and Clay), soil map data required for SWAT to predict stream flow are those that describe the hydraulic properties of the soil. The stream flow data were available for one gauging station in the Mulongwe Catchment. The station had only data from 1999 and 2004. During this period, water temperature, solid discharge or solid flow was measured. The
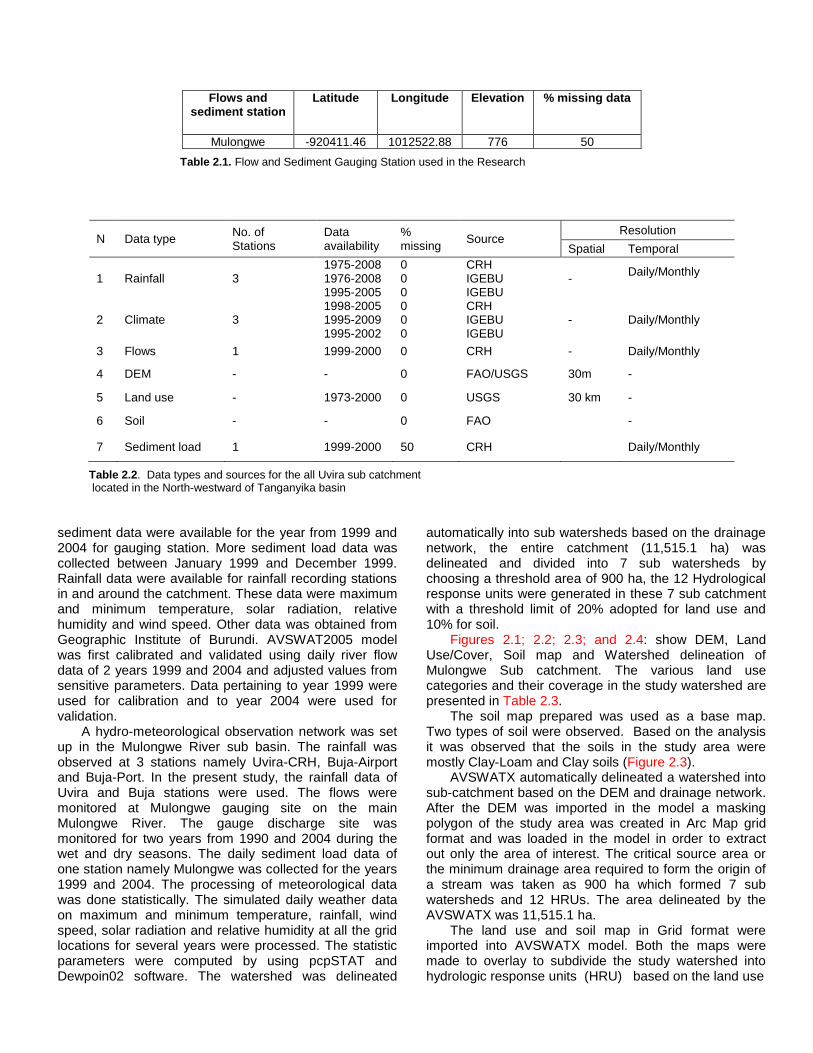
Flows and sediment station
Latitude Longitude Elevation % missing data
Mulongwe -920411.46 1012522.88 776 50
Table 2.1. Flow and Sediment Gauging Station used in the Research
N Data type No. of Stations
Data availability
% missing
Source Resolution
Spatial Temporal
1 Rainfall 3 1975-2008 1976-2008 1995-2005
0 0 0
CRH IGEBU IGEBU
- Daily/Monthly
2 Climate 3 1998-2005 1995-2009 1995-2002
0 0 0
CRH IGEBU IGEBU
- Daily/Monthly
3 Flows 1 1999-2000 0 CRH - Daily/Monthly
4 DEM - - 0 FAO/USGS 30m -
5 Land use - 1973-2000 0 USGS 30 km -
6 Soil - - 0 FAO -
7 Sediment load 1 1999-2000 50 CRH Daily/Monthly
Table 2.2. Data types and sources for the all Uvira sub catchment located in the North-westward of Tanganyika basin
sediment data were available for the year from 1999 and 2004 for gauging station. More sediment load data was collected between January 1999 and December 1999. Rainfall data were available for rainfall recording stations in and around the catchment. These data were maximum and minimum temperature, solar radiation, relative humidity and wind speed. Other data was obtained from Geographic Institute of Burundi. AVSWAT2005 model was first calibrated and validated using daily river flow data of 2 years 1999 and 2004 and adjusted values from sensitive parameters. Data pertaining to year 1999 were used for calibration and to year 2004 were used for validation.
A hydro-meteorological observation network was set up in the Mulongwe River sub basin. The rainfall was observed at 3 stations namely Uvira-CRH, Buja-Airport and Buja-Port. In the present study, the rainfall data of Uvira and Buja stations were used. The flows were monitored at Mulongwe gauging site on the main Mulongwe River. The gauge discharge site was monitored for two years from 1990 and 2004 during the wet and dry seasons. The daily sediment load data of one station namely Mulongwe was collected for the years 1999 and 2004. The processing of meteorological data was done statistically. The simulated daily weather data on maximum and minimum temperature, rainfall, wind speed, solar radiation and relative humidity at all the grid locations for several years were processed. The statistic parameters were computed by using pcpSTAT and Dewpoin02 software. The watershed was delineated
automatically into sub watersheds based on the drainage network, the entire catchment (11,515.1 ha) was delineated and divided into 7 sub watersheds by choosing a threshold area of 900 ha, the 12 Hydrological response units were generated in these 7 sub catchment with a threshold limit of 20% adopted for land use and 10% for soil.
Figures 2.1; 2.2; 2.3; and 2.4: show DEM, Land Use/Cover, Soil map and Watershed delineation of Mulongwe Sub catchment. The various land use categories and their coverage in the study watershed are presented in Table 2.3.
The soil map prepared was used as a base map. Two types of soil were observed. Based on the analysis it was observed that the soils in the study area were mostly Clay-Loam and Clay soils (Figure 2.3).
AVSWATX automatically delineated a watershed into sub-catchment based on the DEM and drainage network. After the DEM was imported in the model a masking polygon of the study area was created in Arc Map grid format and was loaded in the model in order to extract out only the area of interest. The critical source area or the minimum drainage area required to form the origin of a stream was taken as 900 ha which formed 7 sub watersheds and 12 HRUs. The area delineated by the AVSWATX was 11,515.1 ha.
The land use and soil map in Grid format were imported into AVSWATX model. Both the maps were made to overlay to subdivide the study watershed into hydrologic response units (HRU) based on the land use
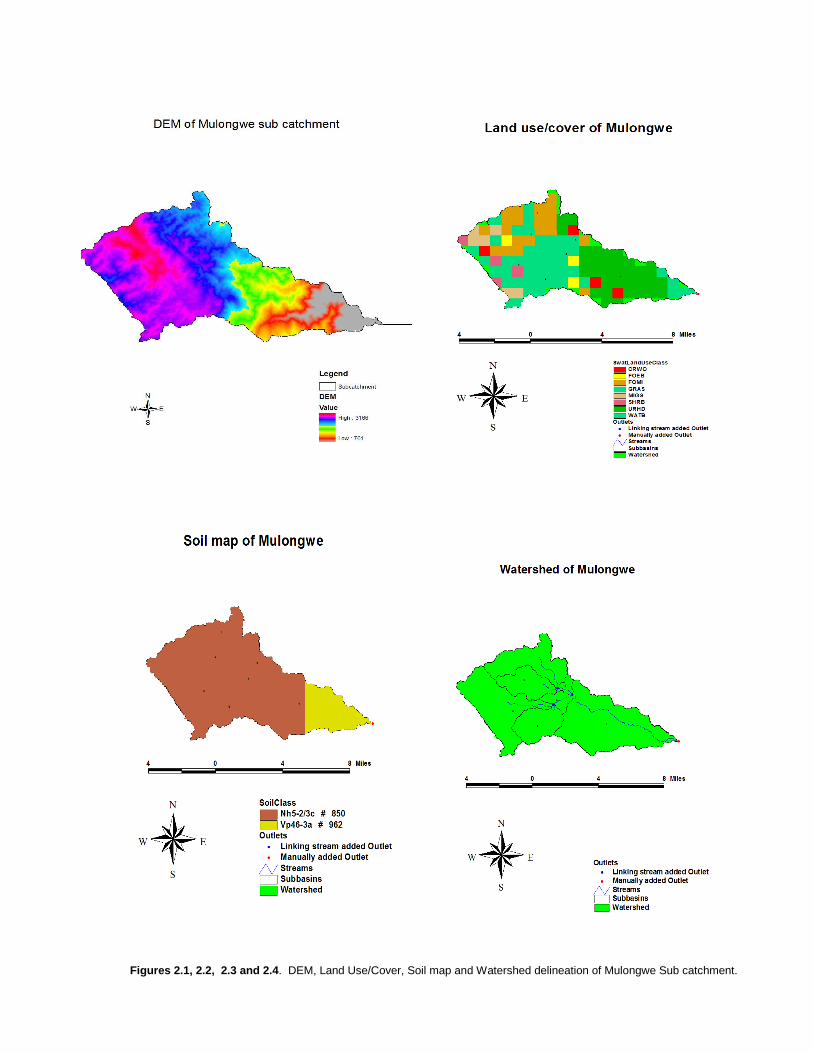
Figures 2.1, 2.2, 2.3 and 2.4. DEM, Land Use/Cover, Soil map and Watershed delineation of Mulongwe Sub catchment.
Land use category SWAT Code Area (%) Dominancy rank
Grassland GRAS 34.67 1 Urban residential-High density URHD 29.13 2 Shrubland SHRB 3.07 7 Forest mixed FOMI 17.46 3 Mixed grassland/Shrubland MIGS 4.89 4 Cropland/Woodland mosaic CRWO 3.59 6 Evergreen needleleaf forest FOEB 2.67 8 Water table WATB 4.51 5
Table 2.3. Coverage of various land use categories in the study area
Soil categories Code Area (ha) Area (%)
lay loam Nh5-2/3c# 850 9888.9175 85.88
Clay Vp46-3a# 962 1626.1608 14.12
Table 2.4. Soil Data Categories for Catchment
S/N Station name XPR (LEAA) YPR (LEAA) Elevation (Masl)
1 Uvira_CRH 1017679.41 -924666.61 790
2 Buja_Airport 1037117.43 -914461.60 783
3 Buja_Port 1040789.20 -921800.93 780
Table 2.5. Rainfall, Temperature batch File
and soil types. Subdividing the areas into hydrologic response units enables the model to reflect the evapotranspiration and other hydrologic conditions for different land cover and soils. One of the main sets of input for simulating the hydrological processes in SWAT is climate data. Climate data input to SWAT consists of precipitation, maximum and minimum temperature, wind speed, solar radiation, relative humidity and the weather generator (.dbf) file. .. Additional inputs to SWAT are management data, soil chemical data, Manning‟s roughness coefficient for overland flow and in stream water quality parameters. These input files were set up and edited as per the requirement and objective of the study. In the management data file, runoff curve numbers for Uvira conditions as well as those prescribed in SWAT user manual were adopted for different land use classes based on the land use type and hydrologic soil group (HSG). Finally the SWAT model was run to simulate the various hydrological components.
Weather Generator Data Weather generator stations are locations having statistical parameters, which used to fill in data gaps in measured climatic records or to simulate climatic records. Statistical data was prepared using the monthly average data summarized over the entire period of the daily records of rainfall, maximum and minimum temperature, daily rainfall and relative humidity using the FORTRAN
program called pcpSTAT.exe and DEW02.exe, which was applied to derive representative climatic parameters. Wind speed and solar radiation were simulated by SWAT weather generator. The gaps were filled using HEC_DSSVue. Tables for Climatic Data The batch file was prepared to show a location of the gauges for the measured climatic data. Table 2.5 shows the location of the gauges for precipitation, maximum and minimum temperature, wend speed, solar radiation and relative humidity in all cases the „NAME‟ field is the name of the station, which contains the data, XPR and YPR are the X and Y coordinates in Decimal degree system, respectively Sediment Data Sediment data was not enough to be used as observed data for calibrating and validating the model. Therefore observed sediment flow data were used to develop corrected sediment rating curve equation as recommended by Ferguson (1986). Model performance evaluation Model evaluation is an essential measure to verify the robustness of the model. In this study, model evaluations
were conducted as recommended by Moriasi et al. (2007). These performance indices are (i) Nash-Sutcliffe efficiency (CE), (ii) percent bias (PBIAS), (iii) ratio of the root mean square error to the standard deviation of measured data (RSR), (iv) the coefficient of determination (r
2), and (v) the Index volumetric fit (IVF).
CE
n
i
n
i
XX
XX
meanobsi
simi
obsi
NSE
1
2
1
2
1 (1)
where;
- Xobs
i = observed variable (flow in m3s
-1 or
sediment concentration in mgl-1
).
- Xsim
i = simulated variable (flow in m3s
-1 or
sediment concentration in mgl-1
).
- Xmean
= mean of n values.
- n= number of observations. The Percent bias (PBIAS) measures the average tendency of the simulated data to be larger or smaller than their observed counterparts (Gupta et al., 1999).
100
1
1 XPBIASn
i
obs
i
n
i
sim
i
obs
i
X
XX (2)
The ratio of root mean square error to the standard deviation of measured data (RSR) is calculated as the ration of the root Mean Square Error (RMSE) and standard deviation of the observed data (Moriasi et al., 2007), as shown in Equation 3
n
i
n
i
obs
XX
XX
STDEV meanobsi
simi
obsiRMSE
RSR
1
2
1
2
(3)
The coefficient of determination r
2 is defined as the
squared value of the coefficient of correlation according to Bravais-Pearson (Equation 4)
n
ii
n
ii
n
iii
SSOO
SSOO
r
1
2
1
2
1
2
2
(4)
Where O and S signify observed and simulated values, respectively
The Index of Volumetric Fit (IVF) is the ratio of the total volume of simulated discharge to the total volume of the observed discharge.
N
i
o
N
i
e
iQ
iQ
IVF
1
1
Where IVF the index of
volumetric fit, iQe )( is the estimated discharge at the ith
time step, iQo )( is the observed discharge at the ith time
step, N is the total number of discharge values.
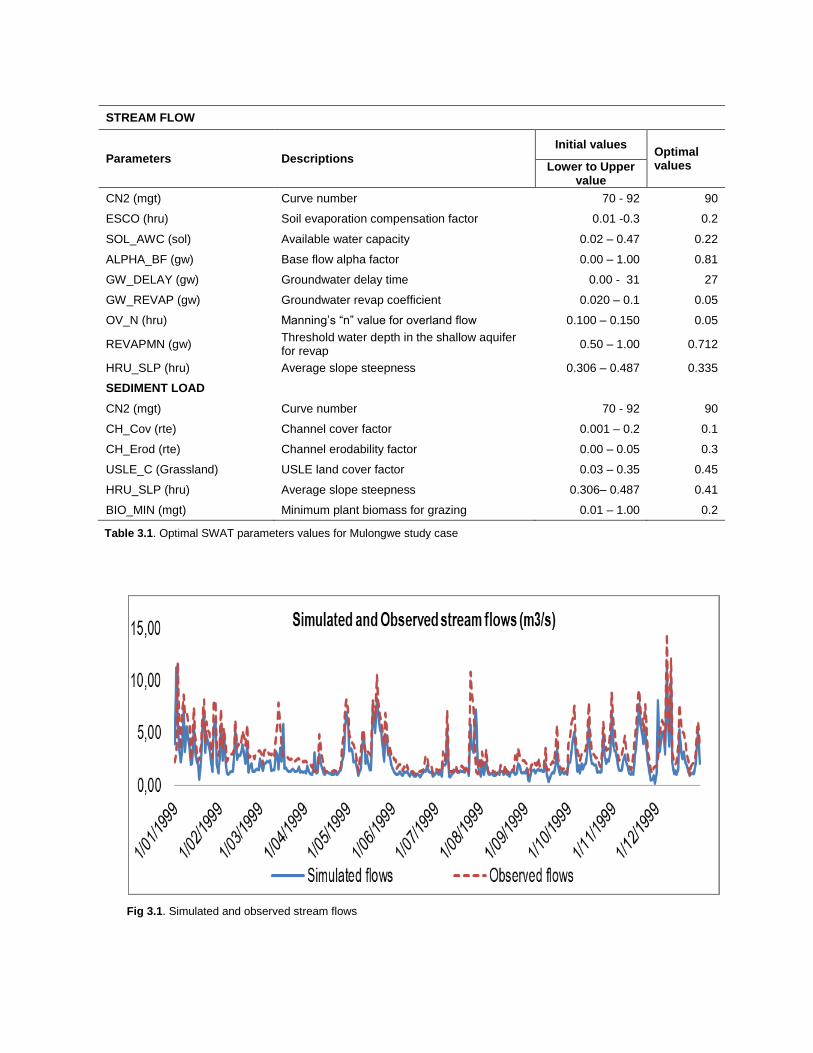
Sub basin Outlet Identification The catchment outlet was selected manually during catchment delineation which is used to compare observed or measured data with the result of SWAT model. In this study the sub basin outlet location was specified at the outlet of the sub basin. RESULTS AND DISCUSSIONS Results The calibrated model performance on daily basis showed acceptable agreement as indicated by NSE, R
2 , PBIAS,
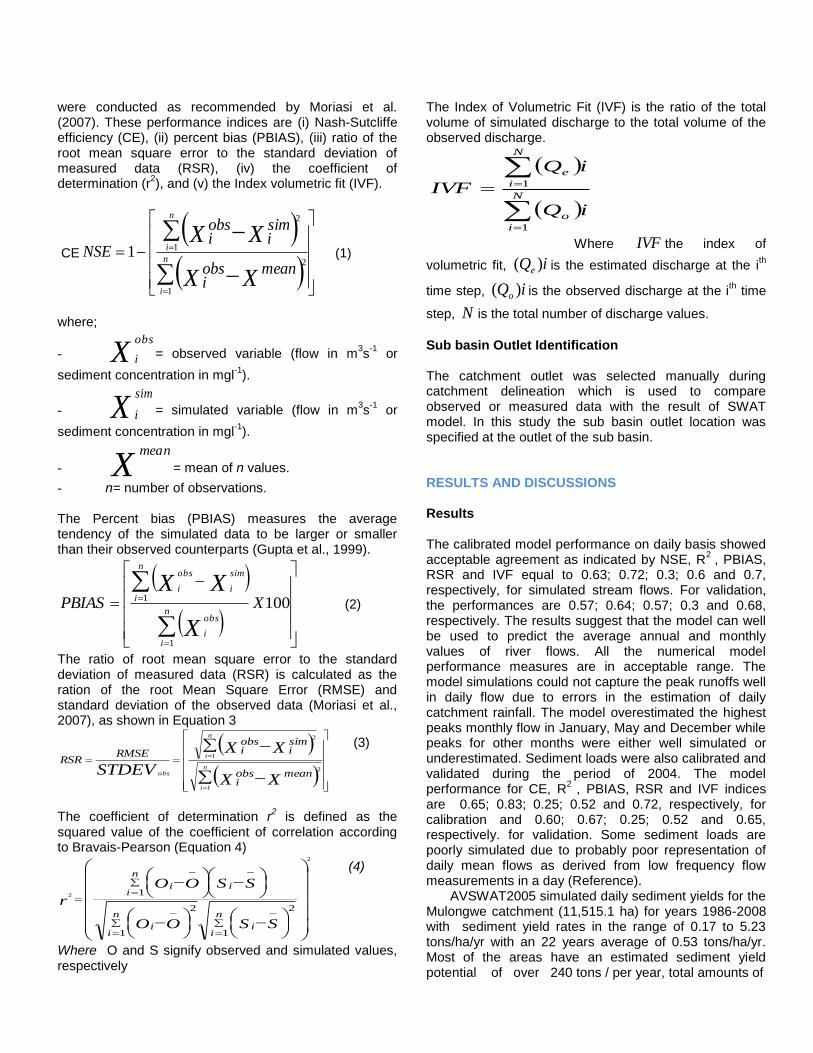
RSR and IVF equal to 0.63; 0.72; 0.3; 0.6 and 0.7, respectively, for simulated stream flows. For validation, the performances are 0.57; 0.64; 0.57; 0.3 and 0.68, respectively. The results suggest that the model can well be used to predict the average annual and monthly values of river flows. All the numerical model performance measures are in acceptable range. The model simulations could not capture the peak runoffs well in daily flow due to errors in the estimation of daily catchment rainfall. The model overestimated the highest peaks monthly flow in January, May and December while peaks for other months were either well simulated or underestimated. Sediment loads were also calibrated and validated during the period of 2004. The model performance for CE, R
2 , PBIAS, RSR and IVF indices
are 0.65; 0.83; 0.25; 0.52 and 0.72, respectively, for calibration and 0.60; 0.67; 0.25; 0.52 and 0.65, respectively. for validation. Some sediment loads are poorly simulated due to probably poor representation of daily mean flows as derived from low frequency flow measurements in a day (Reference).
AVSWAT2005 simulated daily sediment yields for the Mulongwe catchment (11,515.1 ha) for years 1986-2008 with sediment yield rates in the range of 0.17 to 5.23 tons/ha/yr with an 22 years average of 0.53 tons/ha/yr. Most of the areas have an estimated sediment yield potential of over 240 tons / per year, total amounts of
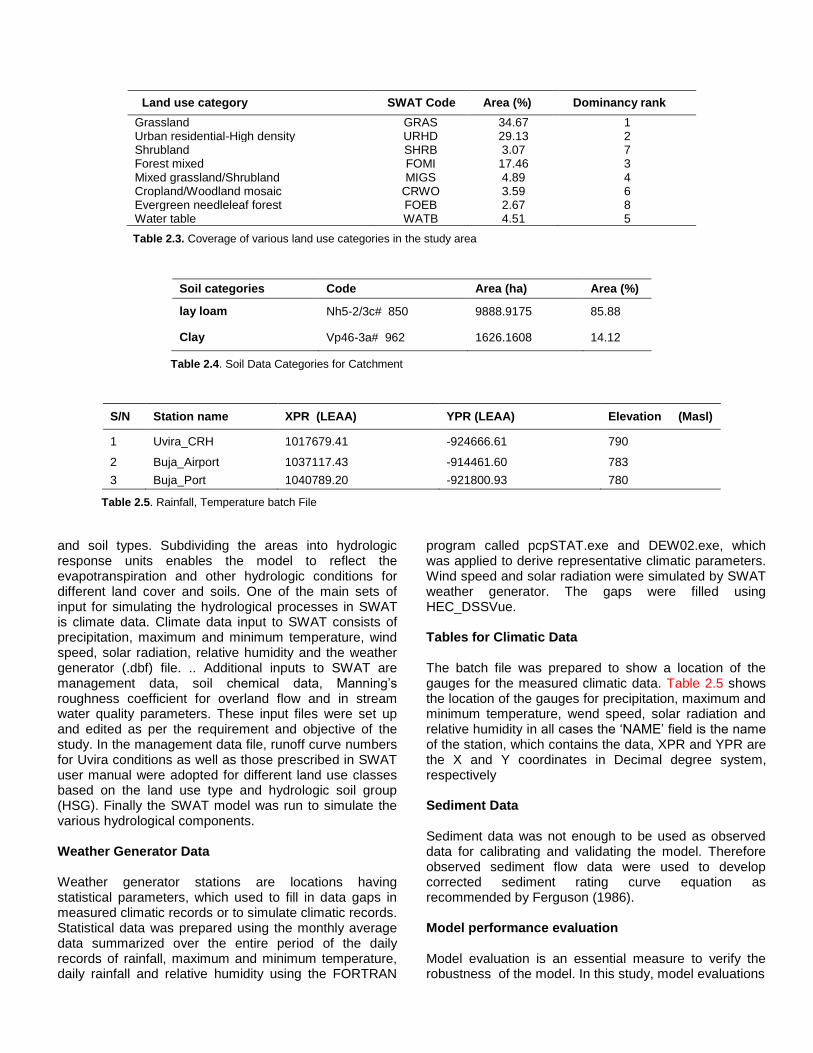
STREAM FLOW
Parameters Descriptions
Initial values Optimal values Lower to Upper
value
CN2 (mgt) Curve number 70 - 92 90
ESCO (hru) Soil evaporation compensation factor 0.01 -0.3 0.2
SOL_AWC (sol) Available water capacity 0.02 – 0.47 0.22
ALPHA_BF (gw) Base flow alpha factor 0.00 – 1.00 0.81
GW_DELAY (gw) Groundwater delay time 0.00 - 31 27
GW_REVAP (gw) Groundwater revap coefficient 0.020 – 0.1 0.05
OV_N (hru) Manning‟s “n” value for overland flow 0.100 – 0.150 0.05
REVAPMN (gw) Threshold water depth in the shallow aquifer for revap
0.50 – 1.00 0.712
HRU_SLP (hru) Average slope steepness 0.306 – 0.487 0.335
SEDIMENT LOAD
CN2 (mgt) Curve number 70 - 92 90
CH_Cov (rte) Channel cover factor 0.001 – 0.2 0.1
CH_Erod (rte) Channel erodability factor 0.00 – 0.05 0.3
USLE_C (Grassland) USLE land cover factor 0.03 – 0.35 0.45
HRU_SLP (hru) Average slope steepness 0.306– 0.487 0.41
BIO_MIN (mgt) Minimum plant biomass for grazing 0.01 – 1.00 0.2
Table 3.1. Optimal SWAT parameters values for Mulongwe study case
Fig 3.1. Simulated and observed stream flows
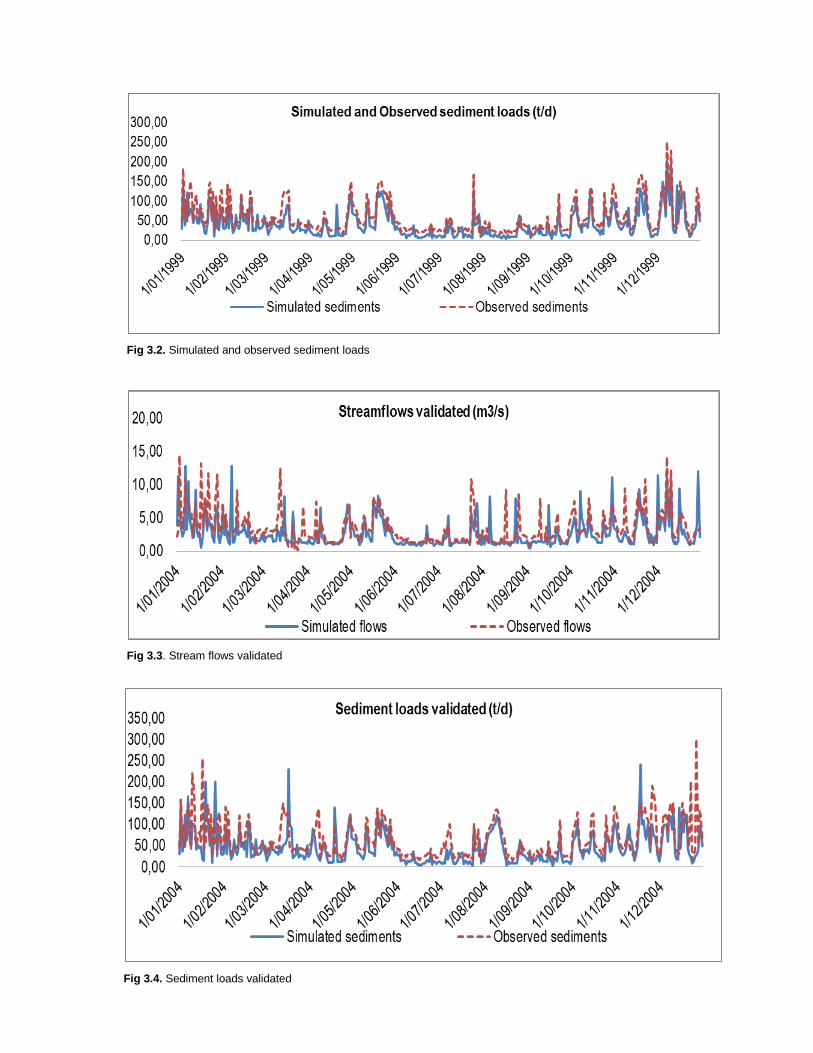
Fig 3.2. Simulated and observed sediment loads
Fig 3.3. Stream flows validated
Fig 3.4. Sediment loads validated
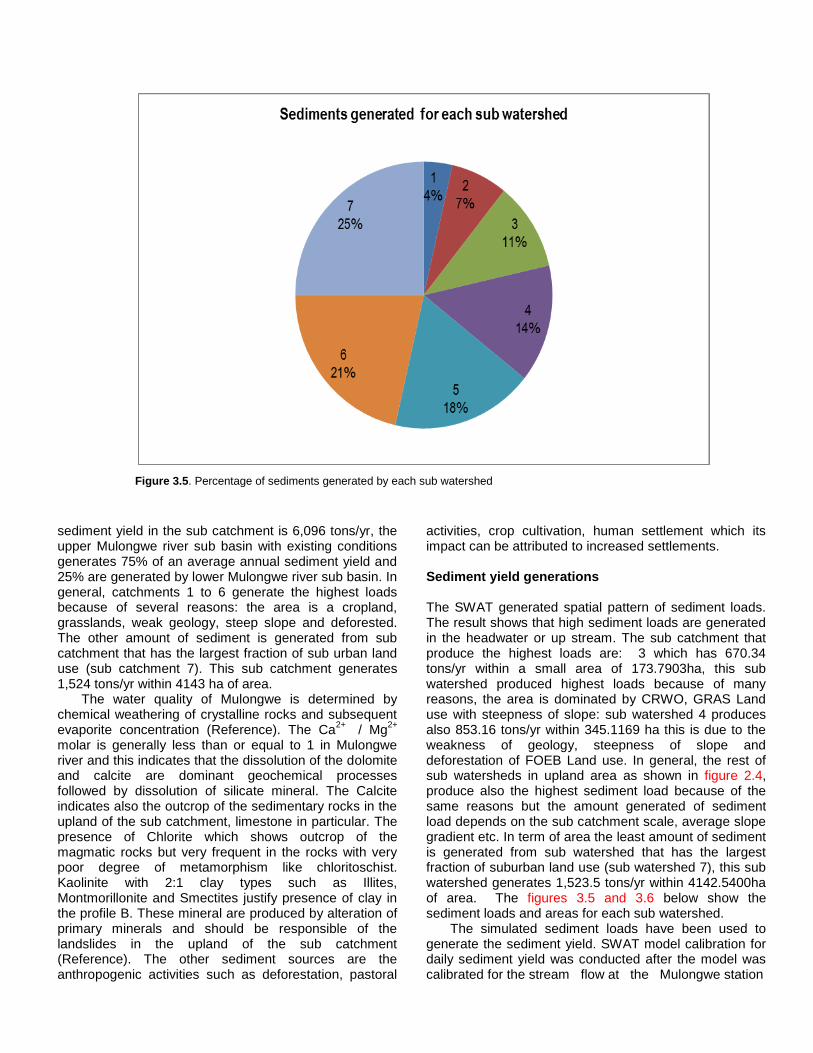
Figure 3.5. Percentage of sediments generated by each sub watershed
sediment yield in the sub catchment is 6,096 tons/yr, the upper Mulongwe river sub basin with existing conditions generates 75% of an average annual sediment yield and 25% are generated by lower Mulongwe river sub basin. In general, catchments 1 to 6 generate the highest loads because of several reasons: the area is a cropland, grasslands, weak geology, steep slope and deforested. The other amount of sediment is generated from sub catchment that has the largest fraction of sub urban land use (sub catchment 7). This sub catchment generates 1,524 tons/yr within 4143 ha of area.
The water quality of Mulongwe is determined by chemical weathering of crystalline rocks and subsequent evaporite concentration (Reference). The Ca
2+ / Mg
2+
molar is generally less than or equal to 1 in Mulongwe river and this indicates that the dissolution of the dolomite and calcite are dominant geochemical processes followed by dissolution of silicate mineral. The Calcite indicates also the outcrop of the sedimentary rocks in the upland of the sub catchment, limestone in particular. The presence of Chlorite which shows outcrop of the magmatic rocks but very frequent in the rocks with very poor degree of metamorphism like chloritoschist. Kaolinite with 2:1 clay types such as Illites, Montmorillonite and Smectites justify presence of clay in the profile B. These mineral are produced by alteration of primary minerals and should be responsible of the landslides in the upland of the sub catchment (Reference). The other sediment sources are the anthropogenic activities such as deforestation, pastoral
activities, crop cultivation, human settlement which its impact can be attributed to increased settlements. Sediment yield generations The SWAT generated spatial pattern of sediment loads. The result shows that high sediment loads are generated in the headwater or up stream. The sub catchment that produce the highest loads are: 3 which has 670.34 tons/yr within a small area of 173.7903ha, this sub watershed produced highest loads because of many reasons, the area is dominated by CRWO, GRAS Land use with steepness of slope: sub watershed 4 produces also 853.16 tons/yr within 345.1169 ha this is due to the weakness of geology, steepness of slope and deforestation of FOEB Land use. In general, the rest of sub watersheds in upland area as shown in figure 2.4, produce also the highest sediment load because of the same reasons but the amount generated of sediment load depends on the sub catchment scale, average slope gradient etc. In term of area the least amount of sediment is generated from sub watershed that has the largest fraction of suburban land use (sub watershed 7), this sub watershed generates 1,523.5 tons/yr within 4142.5400ha of area. The figures 3.5 and 3.6 below show the sediment loads and areas for each sub watershed.
The simulated sediment loads have been used to generate the sediment yield. SWAT model calibration for daily sediment yield was conducted after the model was calibrated for the stream flow at the Mulongwe station
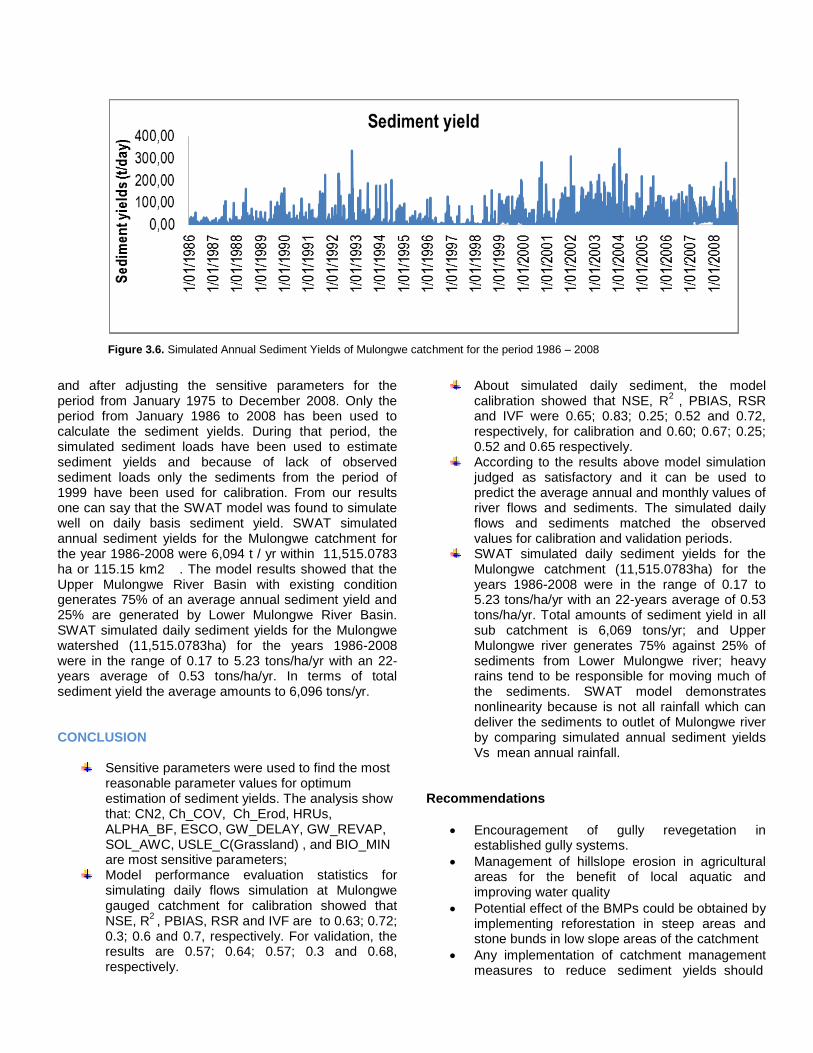
Figure 3.6. Simulated Annual Sediment Yields of Mulongwe catchment for the period 1986 – 2008
and after adjusting the sensitive parameters for the period from January 1975 to December 2008. Only the period from January 1986 to 2008 has been used to calculate the sediment yields. During that period, the simulated sediment loads have been used to estimate sediment yields and because of lack of observed sediment loads only the sediments from the period of 1999 have been used for calibration. From our results one can say that the SWAT model was found to simulate well on daily basis sediment yield. SWAT simulated annual sediment yields for the Mulongwe catchment for the year 1986-2008 were 6,094 t / yr within 11,515.0783 ha or 115.15 km2 . The model results showed that the Upper Mulongwe River Basin with existing condition generates 75% of an average annual sediment yield and 25% are generated by Lower Mulongwe River Basin. SWAT simulated daily sediment yields for the Mulongwe watershed (11,515.0783ha) for the years 1986-2008 were in the range of 0.17 to 5.23 tons/ha/yr with an 22-years average of 0.53 tons/ha/yr. In terms of total sediment yield the average amounts to 6,096 tons/yr. CONCLUSION
Sensitive parameters were used to find the most reasonable parameter values for optimum estimation of sediment yields. The analysis show that: CN2, Ch_COV, Ch_Erod, HRUs, ALPHA_BF, ESCO, GW_DELAY, GW_REVAP, SOL_AWC, USLE_C(Grassland) , and BIO_MIN are most sensitive parameters;
Model performance evaluation statistics for simulating daily flows simulation at Mulongwe gauged catchment for calibration showed that NSE, R
2 , PBIAS, RSR and IVF are to 0.63; 0.72;
0.3; 0.6 and 0.7, respectively. For validation, the results are 0.57; 0.64; 0.57; 0.3 and 0.68, respectively.
About simulated daily sediment, the model calibration showed that NSE, R
2 , PBIAS, RSR
and IVF were 0.65; 0.83; 0.25; 0.52 and 0.72, respectively, for calibration and 0.60; 0.67; 0.25; 0.52 and 0.65 respectively.
According to the results above model simulation judged as satisfactory and it can be used to predict the average annual and monthly values of river flows and sediments. The simulated daily flows and sediments matched the observed values for calibration and validation periods.
SWAT simulated daily sediment yields for the Mulongwe catchment (11,515.0783ha) for the years 1986-2008 were in the range of 0.17 to 5.23 tons/ha/yr with an 22-years average of 0.53 tons/ha/yr. Total amounts of sediment yield in all sub catchment is 6,069 tons/yr; and Upper Mulongwe river generates 75% against 25% of sediments from Lower Mulongwe river; heavy rains tend to be responsible for moving much of the sediments. SWAT model demonstrates nonlinearity because is not all rainfall which can deliver the sediments to outlet of Mulongwe river by comparing simulated annual sediment yields Vs mean annual rainfall.
Recommendations
Encouragement of gully revegetation in established gully systems.
Management of hillslope erosion in agricultural areas for the benefit of local aquatic and improving water quality
Potential effect of the BMPs could be obtained by implementing reforestation in steep areas and stone bunds in low slope areas of the catchment
Any implementation of catchment management measures to reduce sediment yields should
involve the use of resources and willingness of decision makers
Local mapping of riverbank erosion to highlight eroding hotspots
We wish a further research to improve our results.
REFERENCES Ahmed AA (2004). Sediment transport and watershed management
component, Friend/Nile Project, Khartoum. Bourouillec JL (1990). Sédimentation superficielle et tectonique du
basin Nord Tanganyika, Rift – Africain.- Mém. DEA Univ . Bretagne Occidentale, 65pp.
Cohen AS (1989). Facies relationships and sedimentations in large rift Lakes: examples from Lakes Turkana and Tanganyika. – Palaeogeography, Palaeoclimatology, Palaeoecology, 70, 65-80.
Cough II AS, Baffaut JCC, Nearing MA, Liu BY(1997). The WEPP watershed model: I Hydrology and erosion. Trans. ASAE 40(4):
921‐933. Dietrich WE, Dunne T, Humphrey NF, Reid LM (1982). Construction of
sediment budgets for Drainage basins. In: Sediment Budgets and Routing in Forested Drainage Basins. General Technical Report PNW-141, Pacific Northwest Forest and Range Experiment Station, Forest Service, Portland, Oregon, USA.
Haan CT, Barfiel BJ, Hayes JC (1994).”Design Hydrology and Sedimentology for small catchments” Academic press, Inc.
Ilunga L (1990). Climatic oscillations as registered through the Rusizi Plain deposits (North Lake Tanganyika), Zaire, Burundi, Rwanda. NATO ASI Series. Series C: Mathematical and Physical Sciences 287–299.
Ilunga L (1991). Morphologie, volcanisme et se´dimentation dans le rift du Sud-Kivu. Bulletin de la Societe´ Geographique de Liege 27, 209–228.
Moeyersons J, Trefois PH (2008). Desertification and changes in river regime in Central Africa: possible ways to prevention and remediation. In: Proceedings of the Conference of desertification, Ghent.
Muhigwa JB (1999). Analyse des perturbations dans le re´gime pluviome´trique du Sud-Kivu durant les 50 dernie`res anne´es. Mus. roy. Afr. centr., De´pt. Ge´ol. Min, Rapp. Ann. 1997 & 1998, 112–121.
Neitsch SL, Arnold JG, Kiniry J, Williams JR (2005). Soil and water assessment tool theoretical documentation, USDA Agricultural Research.
Ndomba PM, Mtalo F, Killingtveit A (2005). The Suitability of SWAT Model is Sediment Yield Modeling for Ungauged Catchments. A Case of Simiyu Sub catchment, Tanzania. Proceedings of the 3rd International SWAT conference, pp61-69. EAWAG-Zurich, Switzerland, Sourced at http://www.brc.tamus.edu/swat.
Ndomba PM (2007). Modeling of Erosion Processes and Reservoir Sedimentation Upstream of Nyumba ya Mungu Reservoir in the Pangani River Basin. A PhD Thesis (Water Resources Engineering) of University of Dar es Salaam.
Thomas RB (1985). Estimating total suspended sediment yield with probability sampling. Wat. Resources Res. 21 (9), 1381-1388.