distinct population structure in a phenotypically homogeneous rock-dwelling cichlid fish from lake...
TRANSCRIPT
Molecular Ecology (2006)
15
, 2381–2395 doi: 10.1111/j.1365-294X.2006.02949.x
© 2006 The AuthorsJournal compilation © 2006 Blackwell Publishing Ltd
Blackwell Publishing Ltd
Distinct population structure in a phenotypically homogeneous rock-dwelling cichlid fish from Lake Tanganyika
NINA DUFTNER,
*†
KRISTINA M. SEFC,
*
STEPHAN KOBLMÜLLER,
*
BRUNO NEVADO,
‡
ERIK VERHEYEN,
‡
HARRIS PHIRI
§
and CHRISTIAN STURMBAUER
*
*
Department of Zoology, University of Graz, Universitätsplatz 2, 8010 Graz, Austria,
†
Bauer Center for Genomics Research, Harvard University, 7 Divinity Avenue, Cambridge, MA 02138, USA,
‡
Vertebrate Department, Royal Belgian Institute of Natural Sciences, Vautierstraat 29, 1000 Brussels, Belgium,
§
Department of Research and Specialist Services, Fisheries Research Division, Ministry of Agriculture, Food and Fisheries, PO Box 55, Mpulungu, Zambia
Abstract
Several lineages of cichlid fishes in the East African Great Lakes display stunning levelsof morphological diversification. The rapid evolution of rock-dwelling polygynousmouthbrooders in Lake Malawi, for example, was in part ascribed to their allopatric distribu-tion on disjunct stretches of rocky coast, where even short habitat discontinuities reducegene flow effectively. However, as seen in other cichlids, ecological barriers do not alwaysprevent gene flow, whereas genetic structure can develop along continuous habitat, andmorphological diversification does not necessarily accompany genetic differentiation.The present study investigates the population structure of
Variabilichromis moorii
, amonogamous substrate-brooding lamprologine of rocky coasts in Lake Tanganyika, whichoccurs over about 1000 km of shoreline almost without phenotypic variation. Phylogeographicanalyses of mitochondrial DNA sequences indicated that dispersal is infrequent andgenerally occurs between adjacent locations only. Exceptions to this pattern are closelyrelated haplotypes from certain locations on opposite lakeshores, a phenomenon which hasbeen observed in other species and is thought to reflect lake crossing along an underwaterridge in times of low water level. Genetic population differentiation, estimated frommitochondrial DNA and microsatellite data in six adjacent populations, was equally highacross localities separated by sandy shores and along uninterrupted stretches of rockyshore. Our results suggest that ecological barriers are not required to induce philopatricbehavior in
Variabilichromis
, and that morphological stasis persists in the face of highlevels of neutral genetic differentiation.
Keywords
: Lake Tanganyika, Lamprologini , microsatellites, mitochondrial DNA haplotype network,
Variabilichromis moorii
Received 23 August 2005; revision received 14 December 2005; accepted 23 February 2006
Introduction
The cichlids of Lake Tanganyika represent the oldest,morphologically and ecologically most diverse, speciescommunity among the renowned species-rich cichlidflocks of the three East African Great Lakes, and have beenpromoted as a model system for the study of explosivespeciation and adaptive radiation (Fryer & Iles 1972;
Nishida 1991; Rossiter 1995; Sturmbauer 1998; Kornfield& Smith 2000; Danley & Kocher 2001; Takahashi
et al
. 2001;Turner
et al
. 2001; Verheyen
et al
. 2003). In addition tomorphological surveys (Poll 1986; Takahashi 2003), sub-stantial contributions to the taxonomy of the Tanganyikancichlid species flock were made by numerous compre-hensive phylogenetic studies (Sturmbauer & Meyer 1992;Kocher
et al
. 1995; Meyer
et al
. 1996; Nishida 1997; Takahashi
et al
. 1998; Salzburger
et al
. 2002; Sturmbauer
et al
. 2003;Koblmüller
et al
. 2004, 2005; Brandstätter
et al
. 2005; Duftner
et al
. 2005), such that the sequence of diversification and the
Correspondence: Christian Sturmbauer, Fax: +43 316 380 9875;E-mail: [email protected]
2382
N . D U F T N E R
E T A L .
© 2006 The AuthorsJournal compilation © 2006 Blackwell Publishing Ltd
evolutionary relationships between species are compara-tively well understood today. Genetic analyses havealso identified historical lake level fluctuations (Scholz &Rosendahl 1988; Lezzar
et al
. 1996; Cohen
et al
. 1997; Scholz
et al
. 2003) as one of the most important determinantsof diversification patterns, species distribution and intra-specific population structure (Sturmbauer & Meyer 1992;Verheyen
et al
. 1996; Rüber
et al
. 1998, 2001; Sturmbauer
et al
. 2001; Baric
et al
. 2003; Brandstätter
et al
. 2005; Duftner
et al
. 2005; Koblmüller
et al
. 2005). Intrinsic factors, such asspecies-specific dispersal ability and degree of stenotopy,have been shown to modulate the effect of habitat changeson population demography in diverse cichlid populations.
Several studies of the genetic structure among cichlidpopulations have focused on mouthbrooding rock-dwellers(mbuna) of Lake Malawi, which are confined to shoresections of rocky substrate and are isolated by barriersconsisting of unsuitable sandy or deep water habitat. Instenotopic rock-dwelling species, gene flow was shown tobe interrupted by habitat barriers such as short stretches ofsand or marsh, river estuaries or deep waters (van Oppen
et al
. 1997; Markert
et al
. 1999; Rico & Turner 2002; Pereyra
et al
. 2004), while gene flow was unrestricted withincontinuous rocky shores (Arnegard
et al
. 1999). Cichlidsthat are less confined to any specific habitat type displayhigher rates of gene flow (Shaw
et al
. 2000; Taylor &Verheyen 2001; Pereyra
et al
. 2004).In Lake Tanganyika, habitat disturbances have repeatedly
been caused by lake level fluctuations (Scholz & Rosendahl1988; Lezzar
et al
. 1996; Cohen
et al
. 1997; Scholz
et al
. 2003).Habitat instabilities should have the strongest impact onspecialist species with limited mobility; and indeed, theresults of phylogeographic studies of strictly rock-dwelling species,
Tropheus
spp. and members of the tribeEretmodini, reflected this influence of lake level fluctuations(Rüber
et al
. 2001; Baric
et al
. 2003; Sturmbauer
et al
. 2005).Furthermore, there is increasing evidence that theseexternal factors also affect patterns of gene flow and migra-tion in rock-dwelling cichlids of Lake Tanganyika (Taylor
et al
. 2001).Despite the occurrence of within-population-polymorphism
in some Lamprologine species (
Telmatochromis temporalis
,
Neolamprologus leleupi
), and geographic colour variation inmost lamprologini (e.g.
Neolamprologus brichardi
complexand
Julidochromis
spp.) (Kohda
et al
. 1996), species distinc-tion is based mainly on eco-morphological characters. Inthe current study, we use a member of the
Lamprologini
tribe to examine the genetic structure of a habitat specialistlacking conspicuous geographic variation in colour ormorphology.
Variabilichromis moorii
is an abundant her-bivorous rock-dweller with a distribution in the southernhalf of the lake from Kalemie (D. R. Congo) to CapeMpimbwe (Tanzania). Formerly known as
Neolamprologusmoorii
, the species represents an ancestral lineage in the
lamprologine phylogeny (Colombe & Allgayer 1985; Poll1986; Sturmbauer
et al
. 1994) and was placed in a monotypicgenus based on morphological characters (Stiassny 1997).
V. moorii
is a monogamous substrate breeder (Karino 1997)where both male and female defend their territory againstintruders (Karino 1998). While
V. moorii
should exhibit highlevels of population differentiation similar to other rock-dwelling taxa with similar life histories, the apparent lackof morphological variation between localities suggests thatgene flow prevents diversification of the geographicallydisjunct populations. Young evolutionary age of thecurrent populations would reconcile low dispersal with theabsence of geographic variation. Alternatively, geograph-ically monochromatic populations could persist in the faceof high levels of genetic structure due to environmental orgenetic constraints.
The present study characterises the phylogeographicstructure of
V. moorii
along its distribution range in Zambiaand Tanzania, and measures genetic differentiation amongpopulations along continuous rocky shore and across largesandy bays. We evaluate the relationship between geneticand geographic distance among six selected popula-tions based on both DNA sequence data and microsatellitemarkers and infer population structure by applying aBayesian assignment approach. The assessment of geneticcontinuity within the species will provide a foundationfor the discussion of morphological stasis in this highlystenotopic cichlid.
Materials and methods
Sampling and DNA extraction
For this study, 201 individuals of
Variabilichromis moorii
wereanalysed from 18 localities in the southern part of LakeTanganyika. All samples were used for phylogeographicanalysis, and a subset of 179 individuals from six popu-lations (each comprising 28–31 individuals) was selectedfor population genetic analyses. Most of the populationswere sampled during field expeditions in 1999 and 2003,while several additional sequences were obtained fromGenBank (Appendix). Fin clips were taken of all specimensand preserved in 96% ethanol. Whole genomic DNA wasextracted applying a proteinase K digestion followed byprotein precipitation with ammonium acetate.
Amplification and sequencing of the mitochondrial DNA control region
We amplified the most variable part of the mitochondrialDNA (mtDNA) control region with the primer L-Pro-F(Meyer
et al
. 1994), which binds to the flanking proline-tRNA, and the reverse primer TDK-D (Kocher
et al
. 1989).Polymerase chain reactions (PCR) were prepared for a total
D I S T I N C T P O P U L A T I O N S T R U C T U R E I N
V . M O O R I I
2383
© 2006 The AuthorsJournal compilation © 2006 Blackwell Publishing Ltd
volume of 17
µ
L, containing 0.085
µ
L of
Taq
DNA polymerase(BioTherm™), 1.7
µ
L of each primer (10
µ
m
), 1.7
µ
L 10
×
dNTP mix, 1.7
µ
L 10
×
MgCl
2
buffer, 1.62
µ
L enzyme diluent,6
µ
L high performance liquid chromatography (HPLC)water and 2.5
µ
L of the extracted DNA. Amplificationwas performed on a GeneAmp PCR system 9700 (AppliedBiosystems) under the following conditions: an initialdenaturation phase at 94
°
C for 3 min followed 43 cycleswith denaturation at 94
°
C for 30 s, primer annealing at52
°
C for 30 s and extension at 72
°
C for 30 s, with a finalextension phase at 72
°
C for 5 min. The PCR productswere purified with ExoSAP-IT (Exonuclease I and ShrimpAlkaline Phoshatase in buffer) prior to being added astemplate for chain termination sequencing with the primerL-Pro-F, following the protocol described in Duftner
et al
.(2005). DNA fragments were purified with Sephadex™ G-50 (Amersham Biosciences) following the manufacturer’sinstruction and subsequently visualized on a 3100 capillarysequencer (Applied Biosystems).
Microsatellite markers
Six microsatellite loci were chosen for population geneticanalysis of the six selected populations after an initialscreening for allele polymorphism among 14 published locifor cichlid fishes: UNH952 and UNH890 (Carleton
et al
.2002); Pzeb1 and Pzeb3 (van Oppen
et al
. 1997); UME003(Parker & Kornfield 1996); and TmoM11 (Zardoya
et al
.1996). The microsatellites were PCR-amplified in areaction cocktail comprising 0.2
µ
L
Taq
DNA polymerase(BioTherm™), 0.5
µ
L of each primer (10
µ
m
), 0.5
µ
L 10
×
dNTP mix, 2
µ
L 15 m
m
MgCl
2
buffer, 2.5
µ
L of theextracted DNA, and HPLC water up to a total volume of20
µ
L. Forward primers were labelled with the fluorescentdyes FAM, HEX, and TET. PCR conditions were as describedabove with specific annealing temperatures selected foreach locus. For determining the quantity of PCR product tobe analysed we loaded 10
µ
L per sample on a 2% agarosegel. The appropriate amount of DNA was evaporatedand subsequently re-suspended in 1.1
µ
L formamide,0.2
µ
L loading dye, and 0.2
µ
L TAMRA-500 sizestandard. The samples were then denaturated at 94
°
Cfor 2 min and instantly transferred to a cold plate beforebeing analysed on an ABI 377 automated sequencer (AppliedBiosystems).
Phylogeographic analysis
DNA sequences obtained for the first part of the controlregion were controlled and edited in Sequence Navigator(Applied Biosystem), and subsequently aligned in
se
-
al
(Rambaut 1996). The alignment consisted of sequences witha total length of 361 base pairs (bp). In order to visualize thephylogeographic relationships among the 78 haplotypes
found, a network based on statistical parsimony wasconstructed with the computer program
tcs
(Clement
et al
.2000). First of all, a distance matrix was composedof all pairwise comparisons of haplotypes, for which themaximum number of mutations was determined that didnot exceed the probability of parsimony by 0.95 (as definedin Templeton
et al
. 1992). All haplotypes satisfying thisparsimony criterion were then connected to a single network,while those of which the probability exceeded 0.95 wereresolved as a separate network. A detailed descriptionof the individual samples, assigned haplotypes, GenBankaccession numbers and locality information with geographiccoordinates is given in the Appendix.
Population genetic structure inferred from mtDNA haplotypes
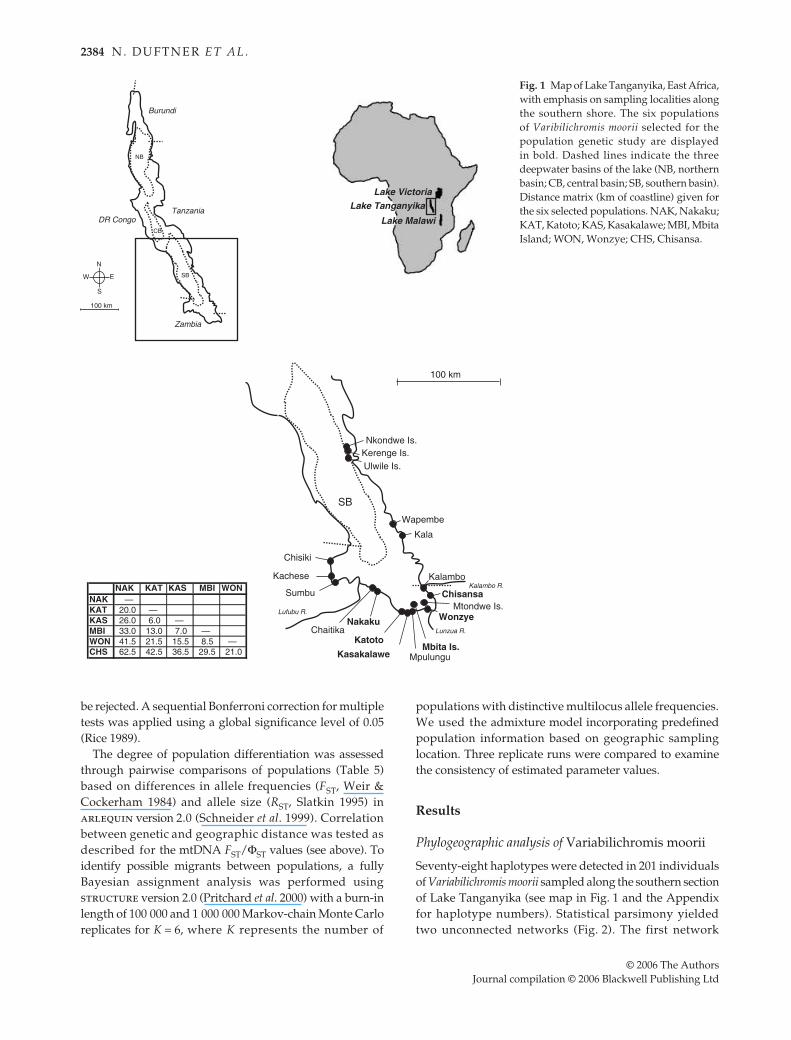
For the mtDNA haplotypes of the six selected popula-tions (see localities displayed in bold in Fig. 1, and see theAppendix), diversity indices (Table 1) were calculated inDnaSP 4.0 (Rozas
et al
. 2003) and the degree of populationdifferentiation was evaluated (Table 2) by applying
F
-statistics implemented in the program
arlequin
version2.0 (Schneider
et al
. 1999). We tested for correlationbetween genetic and geographic distance by computing aregression of both
F
ST
/(1 –
F
ST
) and
ΦST/(1 – ΦST) on lineargeographic distance using the program zt (Bonnet & Vande Peer 2002). Mantel tests were performed with 10 000permutations. Geographic distances were estimated bymeasuring the distance between sampling sites followingthe coastline (see Fig. 1), since V. moorii is restricted toshallow rocky habitat and would most likely migrate alongthe shoreline.
Population genetic structure inferred from microsatellite markers
We calculated the number of alleles (NA), the expected(HE) and the observed (HO) heterozygosity per locusand population (Tables 3 and 4) in the computer program(Goudet 2001). Departure from Hardy–Weinberg equilibriumfor each locus was assessed in genepop version 3.4 (Raymond& Rousset 1995), using both the exact Hardy–Weinbergtest (Guo & Thompson 1992) and the more accurate one-sided test for heterozygote deficiency with a Markov-chain algorithm (dememorization number, 10 000; numberof batches, 600; iterations per batch, 5000). Deviationfrom Hardy–Weinberg equilibrium was detected only forlocus TmoM11 in the Katoto population after correcting formultiple comparisons. Linkage disequilibrium was testedfor each pair of loci in each population, as well as for allpossible pairs of loci across all populations in genepop,and did not yield a significant result (P > 0.05), meaningthat the null hypothesis of independence of loci could not
2384 N . D U F T N E R E T A L .
© 2006 The AuthorsJournal compilation © 2006 Blackwell Publishing Ltd
be rejected. A sequential Bonferroni correction for multipletests was applied using a global significance level of 0.05(Rice 1989).
The degree of population differentiation was assessedthrough pairwise comparisons of populations (Table 5)based on differences in allele frequencies (FST, Weir &Cockerham 1984) and allele size (RST, Slatkin 1995) inarlequin version 2.0 (Schneider et al. 1999). Correlationbetween genetic and geographic distance was tested asdescribed for the mtDNA FST/ΦST values (see above). Toidentify possible migrants between populations, a fullyBayesian assignment analysis was performed usingstructure version 2.0 (Pritchard et al. 2000) with a burn-inlength of 100 000 and 1 000 000 Markov-chain Monte Carloreplicates for K = 6, where K represents the number of
populations with distinctive multilocus allele frequencies.We used the admixture model incorporating predefinedpopulation information based on geographic samplinglocation. Three replicate runs were compared to examinethe consistency of estimated parameter values.
Results
Phylogeographic analysis of Variabilichromis moorii
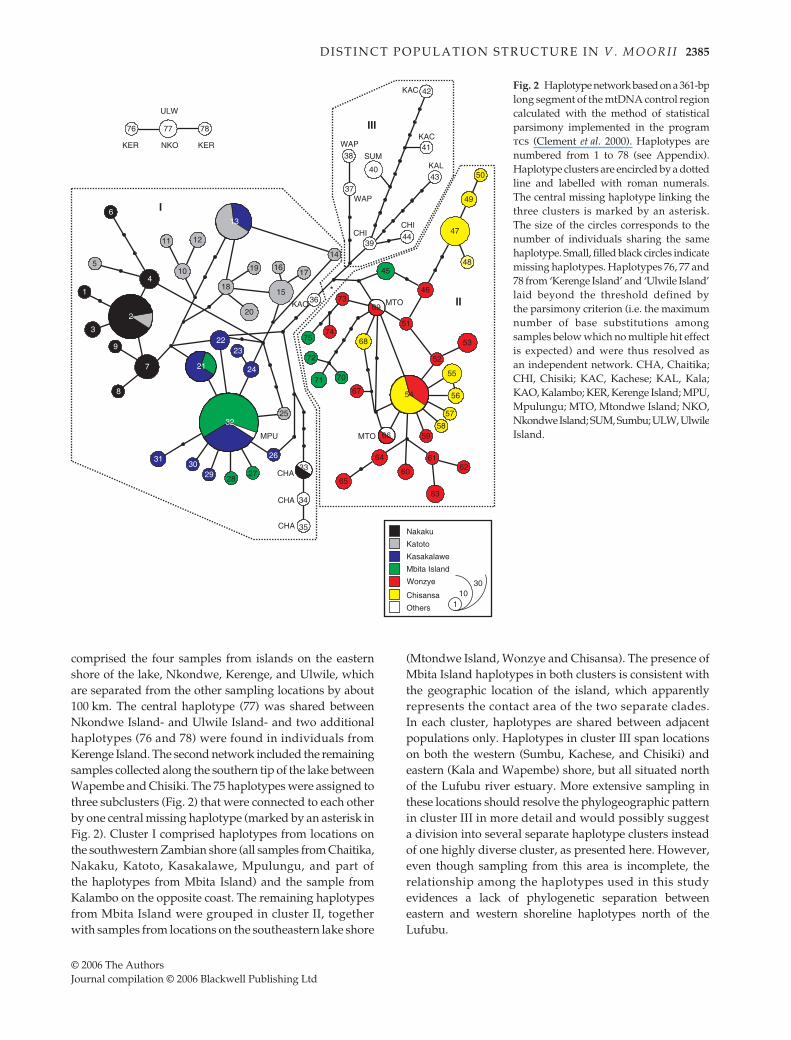
Seventy-eight haplotypes were detected in 201 individualsof Variabilichromis moorii sampled along the southern sectionof Lake Tanganyika (see map in Fig. 1 and the Appendixfor haplotype numbers). Statistical parsimony yieldedtwo unconnected networks (Fig. 2). The first network
Fig. 1 Map of Lake Tanganyika, East Africa,with emphasis on sampling localities alongthe southern shore. The six populationsof Varibilichromis moorii selected for thepopulation genetic study are displayedin bold. Dashed lines indicate the threedeepwater basins of the lake (NB, northernbasin; CB, central basin; SB, southern basin).Distance matrix (km of coastline) given forthe six selected populations. NAK, Nakaku;KAT, Katoto; KAS, Kasakalawe; MBI, MbitaIsland; WON, Wonzye; CHS, Chisansa.
D I S T I N C T P O P U L A T I O N S T R U C T U R E I N V . M O O R I I 2385
© 2006 The AuthorsJournal compilation © 2006 Blackwell Publishing Ltd
comprised the four samples from islands on the easternshore of the lake, Nkondwe, Kerenge, and Ulwile, whichare separated from the other sampling locations by about100 km. The central haplotype (77) was shared betweenNkondwe Island- and Ulwile Island- and two additionalhaplotypes (76 and 78) were found in individuals fromKerenge Island. The second network included the remainingsamples collected along the southern tip of the lake betweenWapembe and Chisiki. The 75 haplotypes were assigned tothree subclusters (Fig. 2) that were connected to each otherby one central missing haplotype (marked by an asterisk inFig. 2). Cluster I comprised haplotypes from locations onthe southwestern Zambian shore (all samples from Chaitika,Nakaku, Katoto, Kasakalawe, Mpulungu, and part ofthe haplotypes from Mbita Island) and the sample fromKalambo on the opposite coast. The remaining haplotypesfrom Mbita Island were grouped in cluster II, togetherwith samples from locations on the southeastern lake shore
(Mtondwe Island, Wonzye and Chisansa). The presence ofMbita Island haplotypes in both clusters is consistent withthe geographic location of the island, which apparentlyrepresents the contact area of the two separate clades.In each cluster, haplotypes are shared between adjacentpopulations only. Haplotypes in cluster III span locationson both the western (Sumbu, Kachese, and Chisiki) andeastern (Kala and Wapembe) shore, but all situated northof the Lufubu river estuary. More extensive sampling inthese locations should resolve the phylogeographic patternin cluster III in more detail and would possibly suggesta division into several separate haplotype clusters insteadof one highly diverse cluster, as presented here. However,even though sampling from this area is incomplete, therelationship among the haplotypes used in this studyevidences a lack of phylogenetic separation betweeneastern and western shoreline haplotypes north of theLufubu.
Fig. 2 Haplotype network based on a 361-bplong segment of the mtDNA control regioncalculated with the method of statisticalparsimony implemented in the programtcs (Clement et al. 2000). Haplotypes arenumbered from 1 to 78 (see Appendix).Haplotype clusters are encircled by a dottedline and labelled with roman numerals.The central missing haplotype linking thethree clusters is marked by an asterisk.The size of the circles corresponds to thenumber of individuals sharing the samehaplotype. Small, filled black circles indicatemissing haplotypes. Haplotypes 76, 77 and78 from ‘Kerenge Island’ and ‘Ulwile Island’laid beyond the threshold defined bythe parsimony criterion (i.e. the maximumnumber of base substitutions amongsamples below which no multiple hit effectis expected) and were thus resolved asan independent network. CHA, Chaitika;CHI, Chisiki; KAC, Kachese; KAL, Kala;KAO, Kalambo; KER, Kerenge Island; MPU,Mpulungu; MTO, Mtondwe Island; NKO,Nkondwe Island; SUM, Sumbu; ULW, UlwileIsland.
2386 N . D U F T N E R E T A L .
© 2006 The AuthorsJournal compilation © 2006 Blackwell Publishing Ltd
Genetic differentiation among populations
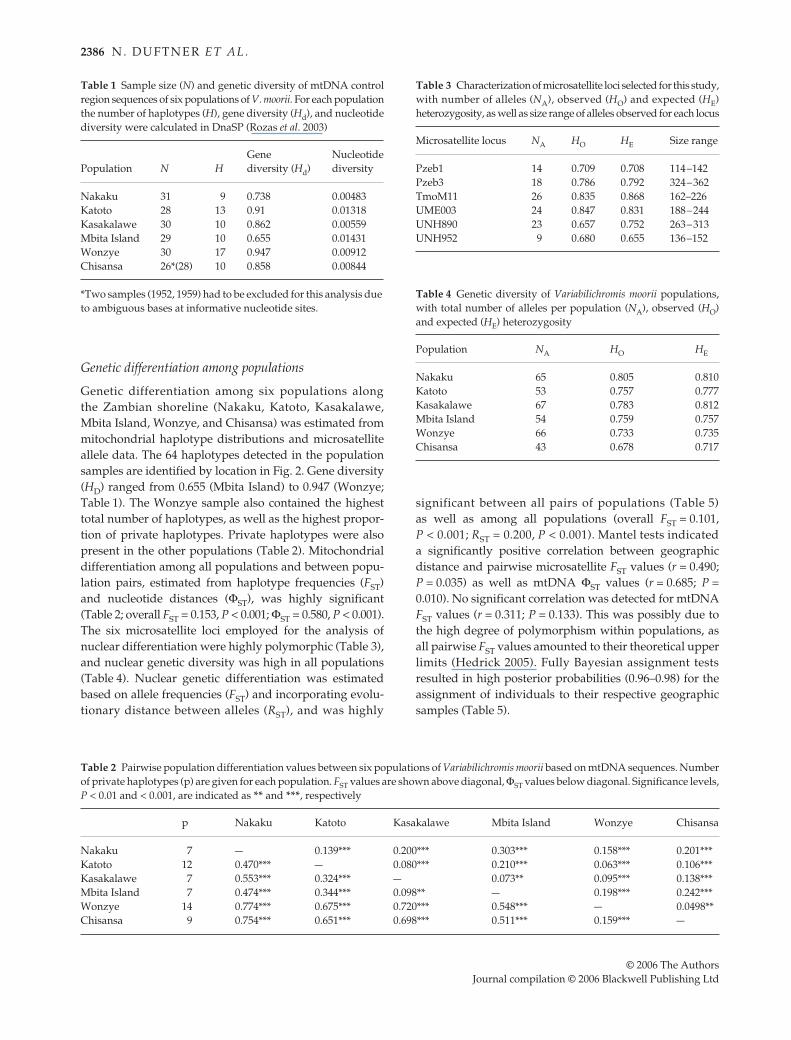
Genetic differentiation among six populations alongthe Zambian shoreline (Nakaku, Katoto, Kasakalawe,Mbita Island, Wonzye, and Chisansa) was estimated frommitochondrial haplotype distributions and microsatelliteallele data. The 64 haplotypes detected in the populationsamples are identified by location in Fig. 2. Gene diversity(HD) ranged from 0.655 (Mbita Island) to 0.947 (Wonzye;Table 1). The Wonzye sample also contained the highesttotal number of haplotypes, as well as the highest propor-tion of private haplotypes. Private haplotypes were alsopresent in the other populations (Table 2). Mitochondrialdifferentiation among all populations and between popu-lation pairs, estimated from haplotype frequencies (FST)and nucleotide distances (ΦST), was highly significant(Table 2; overall FST = 0.153, P < 0.001; ΦST = 0.580, P < 0.001).The six microsatellite loci employed for the analysis ofnuclear differentiation were highly polymorphic (Table 3),and nuclear genetic diversity was high in all populations(Table 4). Nuclear genetic differentiation was estimatedbased on allele frequencies (FST) and incorporating evolu-tionary distance between alleles (RST), and was highly
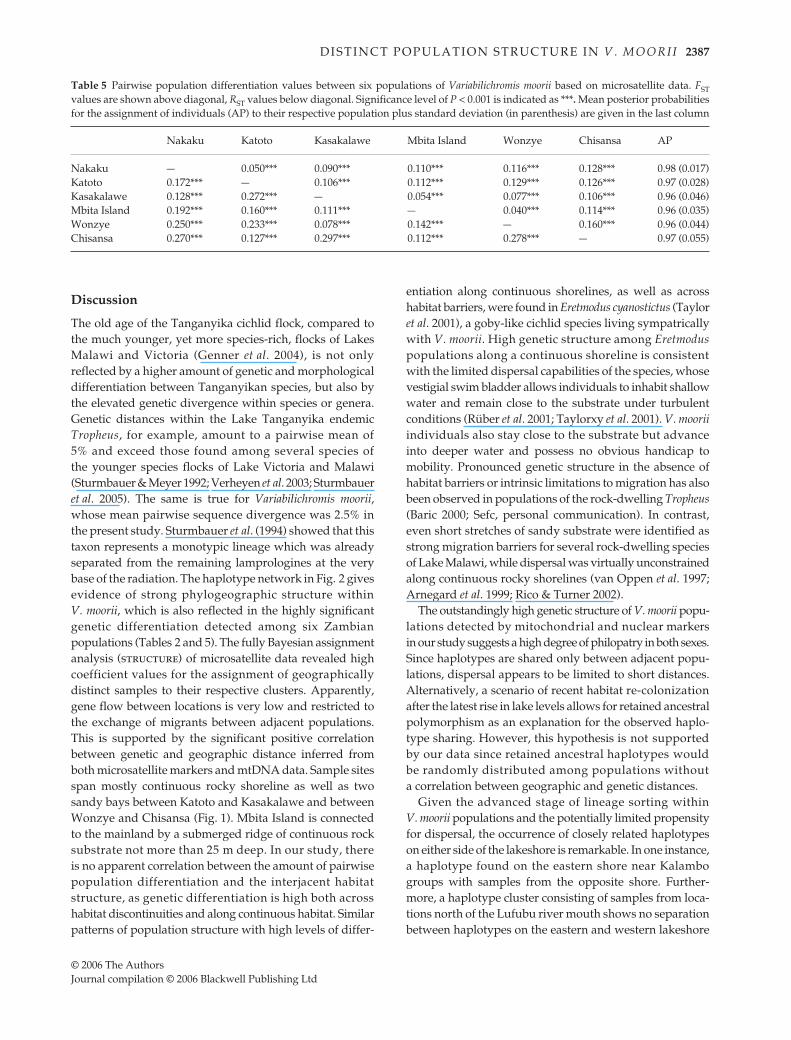
significant between all pairs of populations (Table 5)as well as among all populations (overall FST = 0.101,P < 0.001; RST = 0.200, P < 0.001). Mantel tests indicateda significantly positive correlation between geographicdistance and pairwise microsatellite FST values (r = 0.490;P = 0.035) as well as mtDNA ΦST values (r = 0.685; P =0.010). No significant correlation was detected for mtDNAFST values (r = 0.311; P = 0.133). This was possibly due tothe high degree of polymorphism within populations, asall pairwise FST values amounted to their theoretical upperlimits (Hedrick 2005). Fully Bayesian assignment testsresulted in high posterior probabilities (0.96–0.98) for theassignment of individuals to their respective geographicsamples (Table 5).
Table 1 Sample size (N) and genetic diversity of mtDNA controlregion sequences of six populations of V. moorii. For each populationthe number of haplotypes (H), gene diversity (Hd), and nucleotidediversity were calculated in DnaSP (Rozas et al. 2003)
Population N HGene diversity (Hd)
Nucleotidediversity
Nakaku 31 9 0.738 0.00483Katoto 28 13 0.91 0.01318Kasakalawe 30 10 0.862 0.00559Mbita Island 29 10 0.655 0.01431Wonzye 30 17 0.947 0.00912Chisansa 26*(28) 10 0.858 0.00844
*Two samples (1952, 1959) had to be excluded for this analysis due to ambiguous bases at informative nucleotide sites.
Table 2 Pairwise population differentiation values between six populations of Variabilichromis moorii based on mtDNA sequences. Numberof private haplotypes (p) are given for each population. FST values are shown above diagonal, ΦST values below diagonal. Significance levels,P < 0.01 and < 0.001, are indicated as ** and ***, respectively
p Nakaku Katoto Kasakalawe Mbita Island Wonzye Chisansa
Nakaku 7 — 0.139*** 0.200*** 0.303*** 0.158*** 0.201***Katoto 12 0.470*** — 0.080*** 0.210*** 0.063*** 0.106***Kasakalawe 7 0.553*** 0.324*** — 0.073** 0.095*** 0.138***Mbita Island 7 0.474*** 0.344*** 0.098** — 0.198*** 0.242***Wonzye 14 0.774*** 0.675*** 0.720*** 0.548*** — 0.0498**Chisansa 9 0.754*** 0.651*** 0.698*** 0.511*** 0.159*** —
Table 3 Characterization of microsatellite loci selected for this study,with number of alleles (NA), observed (HO) and expected (HE)heterozygosity, as well as size range of alleles observed for each locus
Microsatellite locus NA HO HE Size range
Pzeb1 14 0.709 0.708 114–142Pzeb3 18 0.786 0.792 324–362TmoM11 26 0.835 0.868 162–226UME003 24 0.847 0.831 188–244UNH890 23 0.657 0.752 263–313UNH952 9 0.680 0.655 136–152
Table 4 Genetic diversity of Variabilichromis moorii populations,with total number of alleles per population (NA), observed (HO)and expected (HE) heterozygosity
Population NA HO HE
Nakaku 65 0.805 0.810Katoto 53 0.757 0.777Kasakalawe 67 0.783 0.812Mbita Island 54 0.759 0.757Wonzye 66 0.733 0.735Chisansa 43 0.678 0.717
D I S T I N C T P O P U L A T I O N S T R U C T U R E I N V . M O O R I I 2387
© 2006 The AuthorsJournal compilation © 2006 Blackwell Publishing Ltd
Discussion
The old age of the Tanganyika cichlid flock, compared tothe much younger, yet more species-rich, flocks of LakesMalawi and Victoria (Genner et al. 2004), is not onlyreflected by a higher amount of genetic and morphologicaldifferentiation between Tanganyikan species, but also bythe elevated genetic divergence within species or genera.Genetic distances within the Lake Tanganyika endemicTropheus, for example, amount to a pairwise mean of5% and exceed those found among several species ofthe younger species flocks of Lake Victoria and Malawi(Sturmbauer & Meyer 1992; Verheyen et al. 2003; Sturmbaueret al. 2005). The same is true for Variabilichromis moorii,whose mean pairwise sequence divergence was 2.5% inthe present study. Sturmbauer et al. (1994) showed that thistaxon represents a monotypic lineage which was alreadyseparated from the remaining lamprologines at the verybase of the radiation. The haplotype network in Fig. 2 givesevidence of strong phylogeographic structure withinV. moorii, which is also reflected in the highly significantgenetic differentiation detected among six Zambianpopulations (Tables 2 and 5). The fully Bayesian assignmentanalysis (structure) of microsatellite data revealed highcoefficient values for the assignment of geographicallydistinct samples to their respective clusters. Apparently,gene flow between locations is very low and restricted tothe exchange of migrants between adjacent populations.This is supported by the significant positive correlationbetween genetic and geographic distance inferred fromboth microsatellite markers and mtDNA data. Sample sitesspan mostly continuous rocky shoreline as well as twosandy bays between Katoto and Kasakalawe and betweenWonzye and Chisansa (Fig. 1). Mbita Island is connectedto the mainland by a submerged ridge of continuous rocksubstrate not more than 25 m deep. In our study, thereis no apparent correlation between the amount of pairwisepopulation differentiation and the interjacent habitatstructure, as genetic differentiation is high both acrosshabitat discontinuities and along continuous habitat. Similarpatterns of population structure with high levels of differ-
entiation along continuous shorelines, as well as acrosshabitat barriers, were found in Eretmodus cyanostictus (Tayloret al. 2001), a goby-like cichlid species living sympatricallywith V. moorii. High genetic structure among Eretmoduspopulations along a continuous shoreline is consistentwith the limited dispersal capabilities of the species, whosevestigial swim bladder allows individuals to inhabit shallowwater and remain close to the substrate under turbulentconditions (Rüber et al. 2001; Taylorxy et al. 2001). V. mooriiindividuals also stay close to the substrate but advanceinto deeper water and possess no obvious handicap tomobility. Pronounced genetic structure in the absence ofhabitat barriers or intrinsic limitations to migration has alsobeen observed in populations of the rock-dwelling Tropheus(Baric 2000; Sefc, personal communication). In contrast,even short stretches of sandy substrate were identified asstrong migration barriers for several rock-dwelling speciesof Lake Malawi, while dispersal was virtually unconstrainedalong continuous rocky shorelines (van Oppen et al. 1997;Arnegard et al. 1999; Rico & Turner 2002).
The outstandingly high genetic structure of V. moorii popu-lations detected by mitochondrial and nuclear markersin our study suggests a high degree of philopatry in both sexes.Since haplotypes are shared only between adjacent popu-lations, dispersal appears to be limited to short distances.Alternatively, a scenario of recent habitat re-colonizationafter the latest rise in lake levels allows for retained ancestralpolymorphism as an explanation for the observed haplo-type sharing. However, this hypothesis is not supportedby our data since retained ancestral haplotypes wouldbe randomly distributed among populations withouta correlation between geographic and genetic distances.
Given the advanced stage of lineage sorting withinV. moorii populations and the potentially limited propensityfor dispersal, the occurrence of closely related haplotypeson either side of the lakeshore is remarkable. In one instance,a haplotype found on the eastern shore near Kalambogroups with samples from the opposite shore. Further-more, a haplotype cluster consisting of samples from loca-tions north of the Lufubu river mouth shows no separationbetween haplotypes on the eastern and western lakeshore
Table 5 Pairwise population differentiation values between six populations of Variabilichromis moorii based on microsatellite data. FSTvalues are shown above diagonal, RST values below diagonal. Significance level of P < 0.001 is indicated as ***. Mean posterior probabilitiesfor the assignment of individuals (AP) to their respective population plus standard deviation (in parenthesis) are given in the last column
Nakaku Katoto Kasakalawe Mbita Island Wonzye Chisansa AP
Nakaku — 0.050*** 0.090*** 0.110*** 0.116*** 0.128*** 0.98 (0.017)Katoto 0.172*** — 0.106*** 0.112*** 0.129*** 0.126*** 0.97 (0.028)Kasakalawe 0.128*** 0.272*** — 0.054*** 0.077*** 0.106*** 0.96 (0.046)Mbita Island 0.192*** 0.160*** 0.111*** — 0.040*** 0.114*** 0.96 (0.035)Wonzye 0.250*** 0.233*** 0.078*** 0.142*** — 0.160*** 0.96 (0.044)Chisansa 0.270*** 0.127*** 0.297*** 0.112*** 0.278*** — 0.97 (0.055)
2388 N . D U F T N E R E T A L .
© 2006 The AuthorsJournal compilation © 2006 Blackwell Publishing Ltd
(Fig. 2), whereas genetic distances between samples on thesame shore north and south of the Lufubu are high. TheLufubu River is one of the few major tributaries to the lake,and its lower water temperatures and different chemicalparameters add to the lakeshore discontinuity introducedby the sedimentation of the estuary. A huge canyonintersects the lake bed from the river mouth northeastwardinto the otherwise relatively shallow southern lake basin.One can imagine that the abyss of the canyon, whichpersists through periods of low lake levels, permanentlyprevents substrate-bound species from crossing the ‘Lufubuline’ made up by river mouth and the extending canyon.However, migration across the lake along either side of thecanyon during periods of low water levels would explainthe occurrence of related haplotypes on opposite lakeshores.The effect of the Lufubu River on the genetic structure ofcichlid populations has already been described in otherrock-dwelling species. In the philopatric Tropheus, repre-sentatives of two mtDNA lineages were found either northor south of the estuary with not a single case of past orrecent migration detected across the Lufubu estuary (Baricet al. 2003; Sturmbauer et al. 2005). However, as in V. moorii,closely related haplotypes were located on the oppositeshores of the lake both north and south of the Lufubuline (Sturmbauer et al. 2005). Similar evidence of past lakecrossings along lake basin ridges was reported from otherlineages within Tropheus (Baric et al. 2003; Sturmbaueret al. 2005), and from the highly specialized rock-dwellingEretmodini (Verheyen et al. 1996). The concordant phylo-geographic distribution of haplotypes from differentspecies testifies to the influence of lake level fluctuationsand the associated habitat changes on population structureand demography (Sturmbauer et al. 1997, 2001).
Despite the high level of philopatry and genetic structureamong V. moorii populations, there is no apparent geographicdifferentiation in colour and morphology (Konings 1998;Snoeks, personal communication). However, Kohda et al.(1996) report differences in the timing of the switch to adultcolouration between populations. V. moorii juvenilesare yellow–orange coloured whereas adults are dark witha shiny blue edging to their fins. In their comprehensivestudy on geographic colour variation in several cichlidspecies at the southern end of Lake Tanganyika, Kohdaet al. (1996) categorized juvenile V. moorii of a total lengthof about 1 cm into ‘yellow’ and ‘black’ colour types.They found almost 100% black individuals along the shorenorthwest of the sandy bay between Katoto and Kasakalawe,different proportions of black and yellow juveniles furthereast toward the Lunzua River estuary, and nearly 100%yellow fry northeast of the Lunzua river mouth. Our studydid not include a systematic survey of juvenile V. moorii,but measurements of individuals during sampling yieldedoverlapping size distributions of yellow and black individualsbetween localities.
Of all Lake Tanganyika rock-cichlids, the genus Tropheusis the most spectacular example for the formation ofmultiple geographic colour morphs. Tropheus occursalong the entire shoreline of the lake and is subdivided intoabout 100 distinctly coloured populations (Konings 1998;Schupke 2003). Interestingly, Tropheus populations showlower population differentiation estimates than the mono-chromatic V. moorii along the southern shore (Baric 2000).However, deep genetic divergence is observed amongTropheus samples across the entire lake, whereas no variationof ecologically relevant morphological characters hasyet been described, and identical niches are occupied byTropheus populations along the entire lake. The apparenteco-morphological stasis in Tropheus was attributed to theaction of stabilizing selection favouring a certain optimummorphology, while colour patterns were less evolutionar-ily constrained and subject to diversifying sexual or socialselection (Sturmbauer & Meyer 1992). Similar constraintson eco-morphological trait variation seem to act in V. moorii.In contrast to Tropheus, however, colour polymorphism inV. moorii is either eliminated due to selection constraintsas well or does not develop readily in the first place. Thesedifferences might be a result of hagoromo gene productvariation (Terai et al. 2002, 2003), due to different substitu-tion rates and different numbers of alternative mRNAsplicing variants between the ‘modern haplochromines’(including Tropheus, Salzburger et al. 2005) and evolutionaryolder lineages such as the lamprologini. This hypothesishowever, has to be further tested by analysing hagoromogene products in V. moorii and closely related species withinthe lamprologini clade.
Our results suggest that ecological barriers are not requiredto induce philopatric behaviour in V. moorii, and thatmorphological stasis persists in the face of high levelsof neutral genetic differentiation. In both respects, V. mooriidiffers from the rock-dwelling mbuna of Lake Malawi. Thephylogeographic structure and pattern of populationdifferentiation in V. moorii is similar to that of the sympatricTropheus and Eretmodus, and the three taxa also share theabsence of eco-morphological diversification amongpopulations. However, V. moorii populations are uniformlycoloured across the entire species range, while subtlecolour differences occur across the geographic range ofEretmodus, and striking colour pattern variability is displayedby Tropheus populations. Lineage-specific genetic constraintsact directly on colour variability of both Eretmodus andV. moorii, but ultimately, morphological diversificationmay be counteracted by stabilizing selection in the twotaxa with their similar life history traits.
Acknowledgements
We thank C. Kapasa, P. Ngalande, L. Makasa, R. Sinyinza, R.Shapola, D. Sinyinza and the team at the Mpulungu Station of the
D I S T I N C T P O P U L A T I O N S T R U C T U R E I N V . M O O R I I 2389
© 2006 The AuthorsJournal compilation © 2006 Blackwell Publishing Ltd
Ministry of Agriculture and Cooperatives, Republic of Zambia, aswell as L. Mumba, G. Mutenda, and C. Katongo from the Univer-sity of Zambia in Lusaka, for their cooperation during fieldwork.We are further grateful to four anonymous reviewers for valuablecomments on the manuscript. This study was supported bythe Austrian Science Foundation (grant P15239). N.D. and S.K.were further supported by the University of Graz. N.D. receiveda DOC-FFORTE-fellowship (Women in research and technology),and S.K. a DOC-fellowship, both provided by the AustrianAcademy of Sciences. E.V. and B.N. were funded by the BelgianFederal Office for Scientific, Technical and Cultural Affairs. B.N.was also supported by SYNTHESIS grant BE-TAF-1263.
References
Arnegard ME, Markert JA, Danley PD, Stauffer JR Jr, Ambali AJ,Kocher TD (1999) Population structure and colour variation ofthe cichlid fish Labeotropheus fuelleborni Ahl along a recentlyformed archipelago of rocky habitat patches in southern LakeMalawi. Proceedings of the Royal Society of London. Series B,Biological Sciences, 266, 119–130.
Baric S (2000) Impact on lake level fluctuations on population structureand speciation in rock dwelling cichlids from Lake Tanganyika. PhDThesis, University of Innsbruck, Austria.
Baric S, Salzburger W, Sturmbauer C (2003) Phylogeographyand evolution of the Tanganyikan cichlid genus Tropheus basedupon mitochondrial DNA sequences. Journal of Molecular Evolu-tion, 56, 54–68.
Bonnet E, Van de Peer Y (2002) zt: a software tool for simple andpartial Mantel tests. Journal of Statistical Software, 7, 1–12.
Brandstätter A, Salzburger W, Sturmbauer C (2005) Mitochondrialphylogeny of the Cyprichromini, a lineage of open-watercichlid fishes endemic to Lake Tanganyika, East Africa. MolecularPhylogenetics and Evolution, 34, 382–391.
Carleton KL, Streelman JT, Lee B-Y, Garnhart N, Kidd M, KocherTD (2002) Rapid isolation of CA microsatellites from the tilapiagenome. Animal Genetics, 33, 140–144.
Clement M, Posada D, Crandall KA (2000) TCS: a computerprogram to estimate gene genealogies. Molecular Ecology, 9, 1657–1659.
Cohen AS, Lezzar KE, Tiercelin JJ, Soreghan M (1997) Newpalaeographic and lake-level reconstructions of Lake Tanganyika:implications for tectonic, climatic and biological evolution ina rift lake. Basin Research, 9, 107–132.
Colombe J, Allgayer R (1985) Déscription de Variabilichromis,Neolamprologus et Paleolamprologus, genres nouveaux du lacTanganyika, avec redescription des genres Lamprologus Schilthuis1891 et de Lepidiolamprologus Pellegrin 1904. Revue Francaise desCichlidophiles, 49, 9–28.
Danley PD, Kocher TD (2001) Speciation in rapidly diverging systems:lessons from Lake Malawi. Molecular Ecology, 10, 1075–1086.
Duftner N, Koblmüller S, Sturmbauer C (2005) Evolutionaryrelationships of the Limnochromini, a tribe of benthic deepwatercichlid fish endemic to Lake Tanganyika, East Africa. Journal ofMolecular Evolution, 60, 277–289.
Fryer G, Iles TD (1972) The Cichlid Fishes of the Great Lakes of Africa.T.H.F., Neptune, New Jersey.
Genner MJ, Seehausen O, Cleary DFR, Knight ME, Michel E,Turner GF (2004) How does the taxonomic status of allopatricpopulations influence species richness within African cichlidfish assemblages? Journal of Biogeography, 31, 93–102.
Goudet J (2001) FSTAT, version 2.9.3, A program to estimate and test genediversities and fixation indices. Available at http://www2.unil.ch/popgen/softwares/fstat.htm [accessed on 4 April 2006].
Guo S, Thompson E (1992) Performing the exact test ofHardy–Weinberg proportion for multiple alleles. Biometrics, 48,361–372.
Hedrick PW (2005) A standardized genetic differentiation measure.Evolution, 59, 1633–1638.
Karino K (1997) Influence of brood size and offspring size onparental investment in a biparental cichlid fish, Neolamprologusmoorii. Journal of Ethology, 15, 39–43.
Karino K (1998) Depth-related differences in territory size anddefense in the herbivorous cichlid, Neolamprologus moorii, inLake Tanganyika. Ichthyological Research, 45, 89–94.
Koblmüller S, Salzburger W, Sturmbauer C (2004) Evolutionaryrelationships in the sand-dwelling cichlid lineage of LakeTanganyika suggest multiple colonization of rocky habitatsand convergent origin of biparental mouthbrooding. Journal ofMolecular Evolution, 58, 79–96.
Koblmüller S, Duftner N, Katongo C, Phiri H, Sturmbauer C (2005)Ancient divergence in bathypelagic Lake Tanganyika deepwatercichlids: mitochondrial phylogeny of the tribe Bathybatini. Journalof Molecular Evolution, 60, 297–314.
Kocher TD, Thomas WK, Meyer A et al. (1989) Dynamics ofmitochondrial DNA evolution in animals: amplification andsequencing with conserved primers. Proceedings of the NationalAcademy of Sciences USA, 86, 6196–6200.
Kocher TD, Conroy JA, McKaye KR, Stauffer JR, Lockwood SF(1995) Evolution of NADH dehydrogenase subunit 2 in EastAfrican cichlid fish. Molecular Phylogenetics and Evolution, 4 (4),420–432.
Kohda M, Yanagisawa Y, Sato T et al. (1996) Geographical colourvariation in cichlid fishes at the southern end of Lake Tanganyika.Environmental Biology of Fishes, 45, 237–248.
Konings A (1998) Tanganjika Cichlids in Their Natural Habitat.Cichlid Press, El Paso, Texas.
Kornfield I, Smith PF (2000) African cichlid fishes: model systemsfor evolutionary biology. Annual Review of Ecology and Systematics,31, 163–196.
Lezzar KE, Tiercelin JJ, De Batist M et al. (1996) New seismicstratigraphy and late Tertiary history of the north Tanganyikanbasin, East African Rift system, deduced from multichanneland high-resolution reflection seismic data and piston coreevidence. Basin Research, 8, 1–28.
Markert JA, Arnegard ME, Danley PD, Kocher TD (1999) Bio-geography and population genetics of the Lake Malawi cichlidMelanochromis auratus: habitat transience, philopatry and speci-ation. Molecular Ecology, 8, 1013–1026.
Meyer A, Morrissey JM, Schartl M (1994) Recurrent origin ofsexually selected trait in Xiphophorus fishes inferred from amolecular phylogeny. Nature, 368, 539–542.
Meyer A, Montero CM, Spreinat A (1996) Molecular phylogeneticinferences about the evolutionary history of East African cichlidfish radiations. In: IDEAL (Internal Decade of East African Lakes).The Limnology, Climatology and Palaeoclimatology of the EastAfrican Lakes (eds Johnson T, Odada E), pp. 303–323. Gordonand Breach Scientific Publishers, London.
Nishida M (1991) Lake Tanganyika as an evolutionary reservoirof old lineages of East African cichlid fishes: inferences fromallozyme data. Experientia, 47, 974–979.
Nishida M (1997) Phylogenetic relationships and evolution ofTanganyika cichlids: a molecular perspective. In: Fish Communities
2390 N . D U F T N E R E T A L .
© 2006 The AuthorsJournal compilation © 2006 Blackwell Publishing Ltd
in Lake Tanganyika (eds Kwanabe H, Hori M, Nagoshi M), pp. 3–23. Kyoto University Press, Kyoto, Japan.
Parker A, Kornfield I (1996) Polygynandry in Pseudotropheus zebra,a cichlid fish from Lake Malawi. Environmental Biology of Fishes,47, 345–352.
Pereyra R, Taylor MI, Turner GF, Rico C (2004) Variation in habitatpreference and population structure among three species ofthe Lake Malawi cichlid genus Protomelas. Molecular Ecology, 13,2691–2697.
Poll M (1986) Classification des Cichlidae du lac Tanganyika: tribus,genre et espèces. Academie Royale de Belgique Memoires de la Classedes Sciences, 45, 1–163.
Pritchard JK, Stephens M, Donnelly P (2000) Inference of populationstructure using multilocus genotype data. Genetics, 155, 945–959.
Rambaut A (1996) SE-AL: Sequence Alignment Editor Available at http://evolve.zoo.ox.ac.uk/ [accessed on 4 April 2006].
Raymond M, Rousset F (1995) genepop (version 1.2): populationgenetics software for exact tests and ecumenicism. Journal ofHeredity, 86, 248–249.
Rice WR (1989) Analyzing tables of statistical tests. Evolution, 43,223–225.
Rico C, Turner GF (2002) Extreme microallopatric divergence ina cichlid species from Lake Malawi. Molecular Ecology, 11, 1585–1590.
Rossiter A (1995) The cichlid fish assemblage of Lake Tanganyika:ecology, behaviour, and evolution of its species flocks. Advancesin Ecological Research, 26, 10230–10235.
Rozas J, Sánchez-DelBarrio JC, Messeguer X, Rozas R (2003)DnaSP, DNA polymorphism analyses by the coalescent andother methods. Bioinformatics, 19, 2496–2497.
Rüber L, Verheyen E, Sturmbauer C, Meyer A (1998) Lake levelfluctuations and speciation in rock-dwelling cichlid fish in LakeTanganyika, East Africa. In: Evolution on Islands (ed. Grant P),pp. 225–240. Oxford University Press, Oxford.
Rüber L, Meyer A, Sturmbauer C, Verheyen E (2001) Populationstructure in two sympatric species of the Lake Tanganyikacichlid tribe Eretmodini: evidence for introgression. MolecularEcology, 10, 1207–1225.
Salzburger W, Mack T, Verheyen E, Meyer A (2005) Out ofTanganyika: genesis, explosive speciation, key-innovationsand phylogeography of the haplochromine cichlid fishes. BMCEvolutionary Biology, 5, 17.
Salzburger W, Meyer A, Baric S, Verheyen E, Sturmbauer C (2002)Phylogeny of the Lake Tanganyika cichlid species flock and itsrelationship to the Central and East African haplochrominecichlid fish faunas. Systematic Biology, 51, 113–135.
Schneider S, Roessli D, Excoffier L (1999) ARLEQUIN, version 2.0: Asoftware for population genetic data analysis. Genetics and BiometryLaboratory, Department of Anthropology, University of Geneva,Geneva, Switzerland.
Scholz CA, Rosendahl BR (1988) Low lake stands in Lakes Malawiand Tanganyika, East Africa, delineated with multifold seismicdata. Science, 240, 1645–1648.
Scholz CA, King JW, Ellis GS, Swart PK, Stager JC, Colman SM(2003) Paleolimnology of Lake Tanganyika, East Africa, over thepast 100 k yr. Journal of Paleolimnology, 30, 139–150.
Schupke P (2003) Cichlids of Lake Tanganyika, Part 1: The Species ofthe Genus Tropheus, 190 pp. Aqualog, Rodgau, Germany.
Shaw PW, Turner GF, Idid MR, Robinson RL, Carvalho GR (2000)Genetic population structure indicates sympatric speciation ofLake Malawi pelagic cichlids. Proceedings of the Royal Society ofLondon. Series B, Biological Sciences, 267, 2273–2280.
Slatkin M (1995) A measure of population subdivision based onmicrosatellite allele frequencies. Genetics, 139, 457–462.
Stiassny M (1997) A pyhlogenetic overview of the lamprologinecichlids of Africa (Teleostei, Cichlidae): a morphological perspec-tive. South African Journal of Science, 93, 513–523.
Sturmbauer C (1998) Explosive speciation in cichlid fishes of theAfrican Great Lakes: a dynamic model of adaptive radiation.Journal of Fish Biology, 53 (Suppl. A), 18–36.
Sturmbauer C, Meyer A (1992) Genetic divergence, speciationand morphological stasis in a lineage of African cichlid fishes.Nature, 358, 578–581.
Sturmbauer C, Verheyen E, Meyer A (1994) Mitochondrialphylogeny of the Lamprologini, the major substrate spawninglineage of cichlid fishes from Lake Tanganyika in Eastern Africa.Molecular Biology and Evolution, 11, 691–703.
Sturmbauer C, Verheyen E, Rüber L, Meyer A (1997) Phylogeo-graphic patterns in populations of cichlid fishes from rockyhabitats in Lake Tanganyika. In: Molecular Systematics of Fishes(eds Kocher TD, Stepien C), pp. 97–111. Academic Press, New York.
Sturmbauer C, Baric S, Salzburger W, Rüber L, Verheyen E (2001)Lake level fluctuations synchronize genetic divergence ofcichlid fishes in African lakes. Molecular Biology and Evolution,18, 144–154.
Sturmbauer C, Hainz U, Baric S, Verheyen E, Salzburger W (2003)Evolution of the tribe Tropheini from Lake Tanganyika:Synchronized explosive speciation producing multiple evolu-tionary parallelism. Hydrobiologia, 500, 51–64.
Sturmbauer C, Koblmüller S, Sefc KM, Duftner N (2005) Phylo-geographic history of the genus Tropheus, a lineage of rock-dwellingcichlid fishes endemic to Lake Tanganyika. Hydrobiologia, 542,335–366.
Takahashi T (2003) Systematics of Tanganyikan cichlid fishes(Teleostei: Perciformes). Ichthyological Research, 50, 367–382.
Takahashi K, Terai Y, Nishida M, Okada N (1998) A novel familyof short interspersed repetitive elements (SINEs) from cichlids:The patterns of insertion of SINEs at orthologous loci supportthe proposed monophyly of four major groups of cichlid fishesin Lake Tanganyika. Molecular Biology and Evolution, 15, 391–407.
Takahashi K, Terai Y, Nishida M, Okada N (2001) Phylogeneticrelationships and ancient incomplete lineages sorting amongcichlid fishes in Lake Tanganyika as revealed by analysis ofinsertion of retroposons. Molecular Biology and Evolution, 18,2057–2066.
Taylor MI, Verheyen E (2001) Microsatellite data reveals weakpopulation substructuring in Copadichromis sp. ‘viriginalis kajose’,a demersal cichlid from Lake Malawi, Africa. Journal of FishBiology, 59, 593–604.
Taylor MI, Rüber L, Verheyen E (2001) Microsatellites reveal highlevels of population substructuring in the species-poor Eretmodinecichlid lineage from Lake Tanganyika. Proceedings of the RoyalSociety of London. Series B, Biological Sciences, 268, 803–808.
Templeton AR, Crandall KA, Sing CF (1992) A cladistic analysis ofphenotypic associations with haplotypes inferred from restrictionendonuclease mapping and DNA sequence data. III. Cladogramestimation. Genetics, 132, 619–633.
Terai Y, Morikawa N, Kawakami K, Okada N (2002) Acceleratedevolution of the surface amino acids in the WD-repeat domainencoded by the hagoromo gene in an explosively speciatedlineage of East African cichlid fishes. Molecular Biology andEvolution, 19, 574–578.
Terai Y, Morikawa N, Kawakami K, Okada N (2003) The complexityof alternative splicing of hagoromo mRNAs is increased in an
D I S T I N C T P O P U L A T I O N S T R U C T U R E I N V . M O O R I I 2391
© 2006 The AuthorsJournal compilation © 2006 Blackwell Publishing Ltd
explosively speciated lineage in East African cichlids. Proceedingsof the National Academy of Sciences, USA, 100, 12798–12803.
Turner GF, Seehausen O, Knight KE, Allender CJ, Robinson RL(2001) How many species of cichlid fishes are there in Africanlakes? Molecular Ecology, 10, 793–806.
Van Oppen MJH, Turner GF, Rico C et al. (1997) Unusually fine-scale genetic structuring found in rapidly speciating Malawicichlid fishes. Proceedings of the Royal Society of London. Series B,Biological Sciences, 264, 1803–1812.
Verheyen E, Rüber L, Snoeks J, Meyer A (1996) Mitochondrialphylogeography of rock-dwelling cichlid fishes reveals evolu-tionary influence of historical lake level fluctuations of LakeTanganyika. Philosophical Transactions of the Royal Society ofLondon Series B, Biological Sciences, 351, 797–805.
Verheyen E, Salzburger W, Snoeks J, Meyer A (2003) Origin of thesuperflock of cichlid fishes from Lake Victoria, East Africa.Science, 300, 325–329.
Weir BS, Cockerham CC (1984) Estimating F-statistics for theanalysis of population structure. Evolution, 38, 1358–1370.
Zardoya R, Vollmer DM, Craddock C, Streelman JT, Karl S, Meyer A(1996) Evolutionary conservation of microsatellite flanking regionsand their use in resolving the phylogeny of cichlid fishes (Pisces:Perciformes). Proceedings of the Royal Society of London. Series B,Biological Sciences, 263, 1589–1598.
The research is part of the PhD theses of N. Duftner and S.Koblmueller undertaken at the University of Graz under thesupervision of C. Sturmbauer. N. Duftner is now holding an ErwinSchroedinger Postdoctoral Fellowship at the Bauer Center forGenomics Research at Harvard University and is working onthe genetic mechanisms and the evolution of mating behaviourin Lake Tanganyika cichlids. S. Koblmueller is currently aPostdoctoral Fellow at the Iniversity of Graz. K.M. Sefc is AssistantProfessor at the University of Graz. The group is collectivelyinterested in the ecology, evolution and diversity of East Africancichlid fishes, mainly focusing on Lake Tanganyika. E. Verheyenhas been involved with phylogenetic and phylogeographicstudies of African awuatic and terrestrial vertebrates, withemphasis on the study of vicariance events resulting fromPleistoccne climate changes and a recent interest in the potentialuse of mtDNA sequences as DNA barcodes in taxonomic research.B. Nevado is a PhD student in E. Verheyen’s research group. H.Phiri is Head of the Department of Fisheries in Mpulungu andinterested in the ecology of lamprologine cichlids. The research isa result of a project of C. Sturmbauer’s research group on LakeTanganyika cichlids.
2392 N . D U F T N E R E T A L .
© 2006 The AuthorsJournal compilation © 2006 Blackwell Publishing Ltd
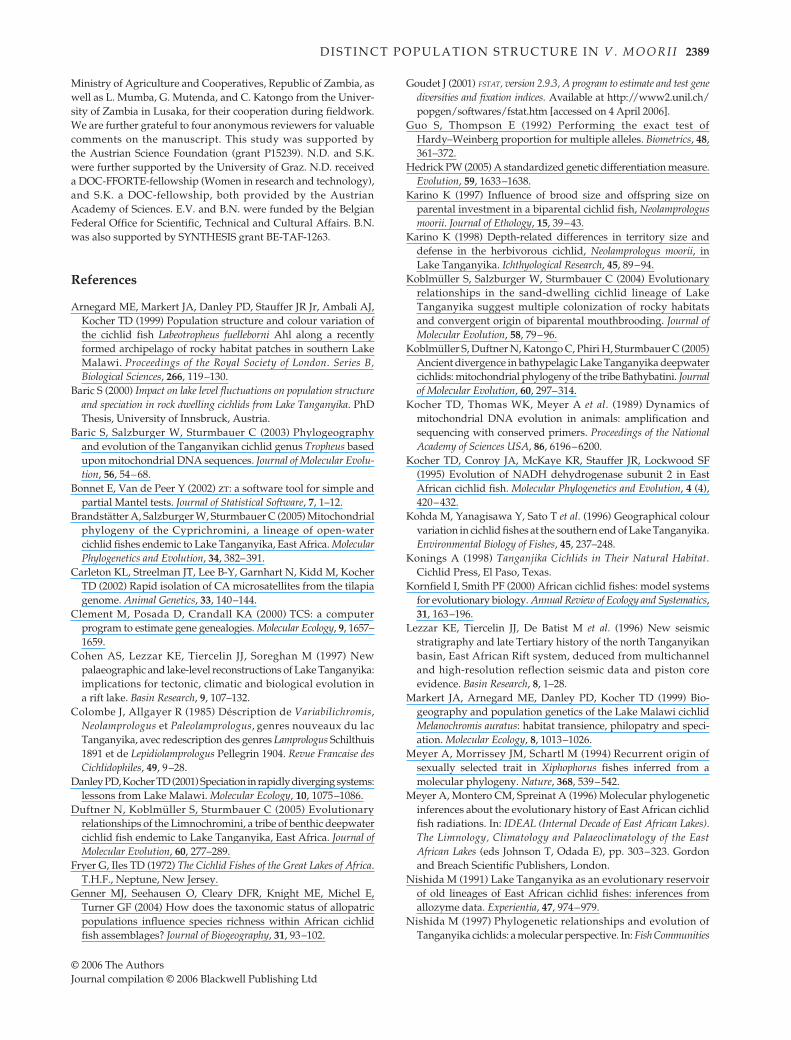
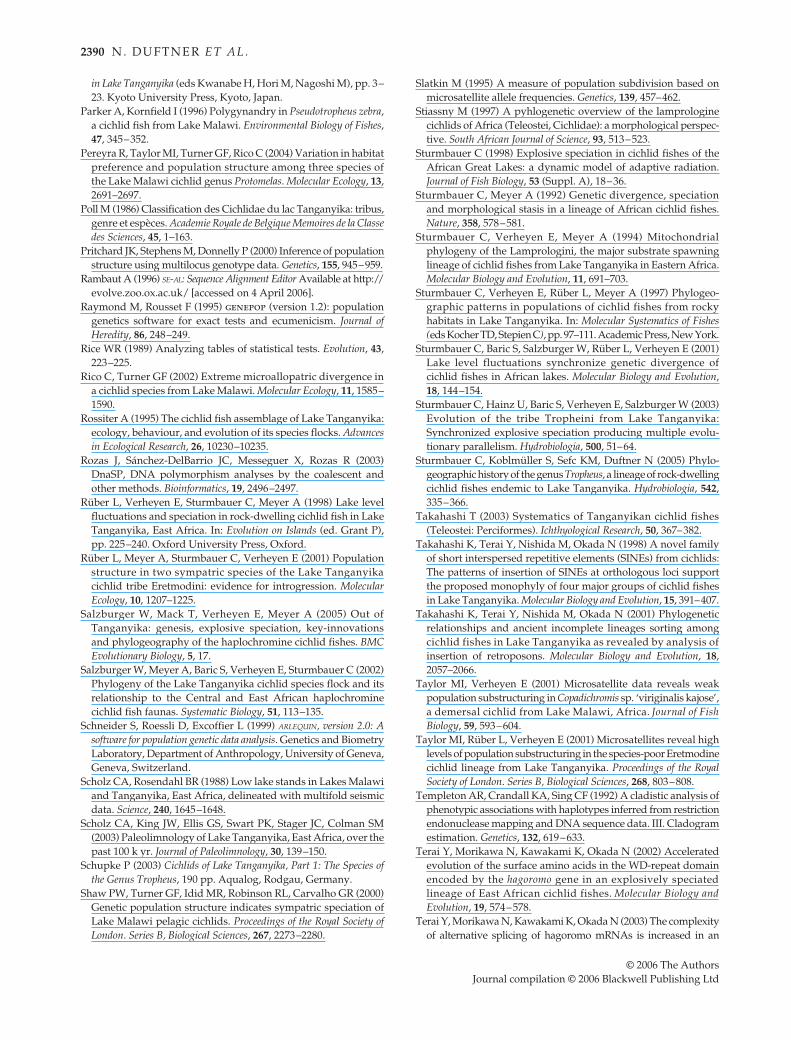
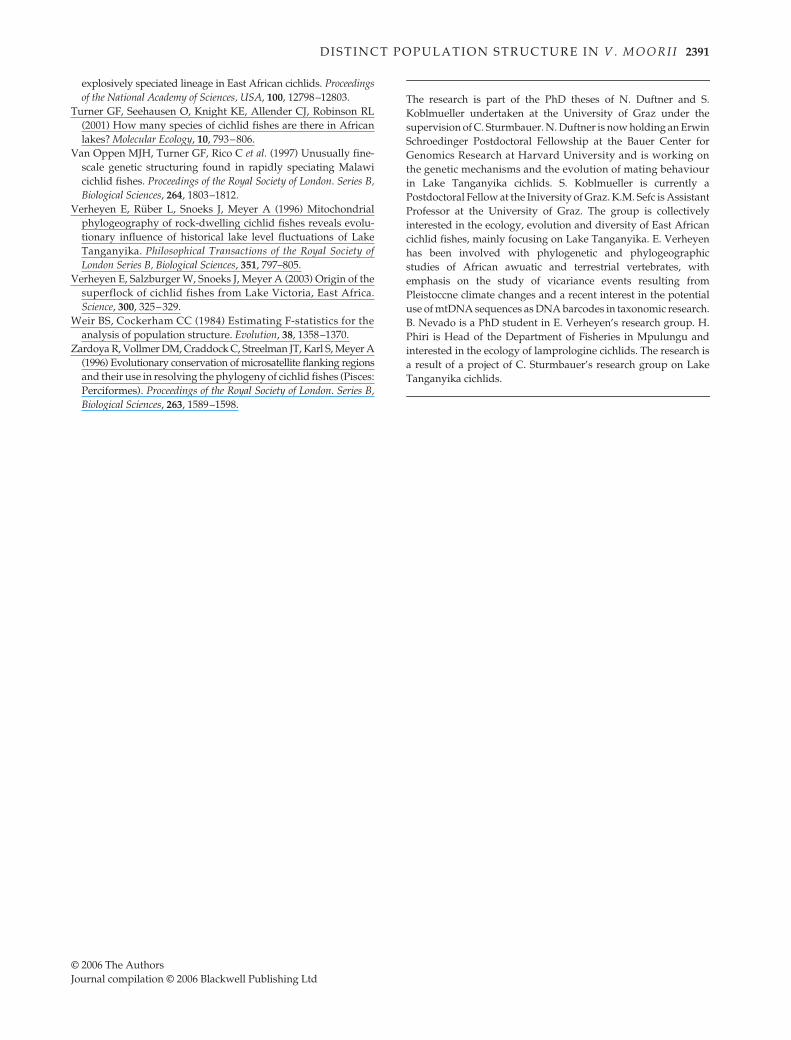
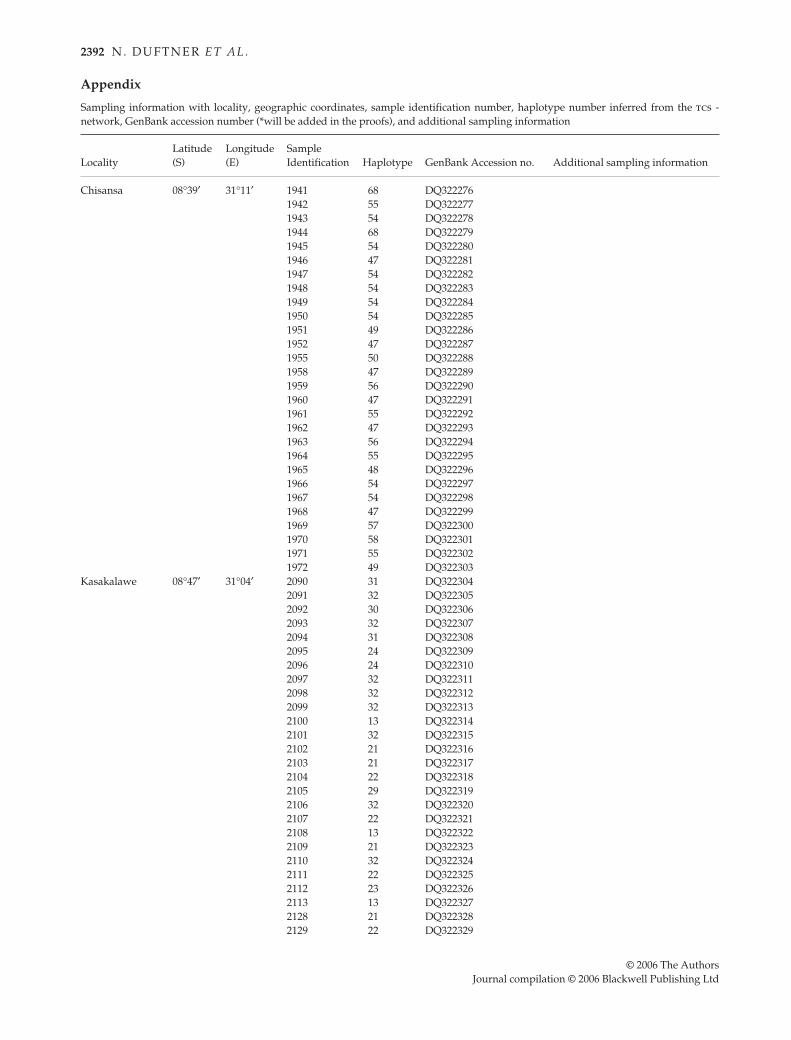
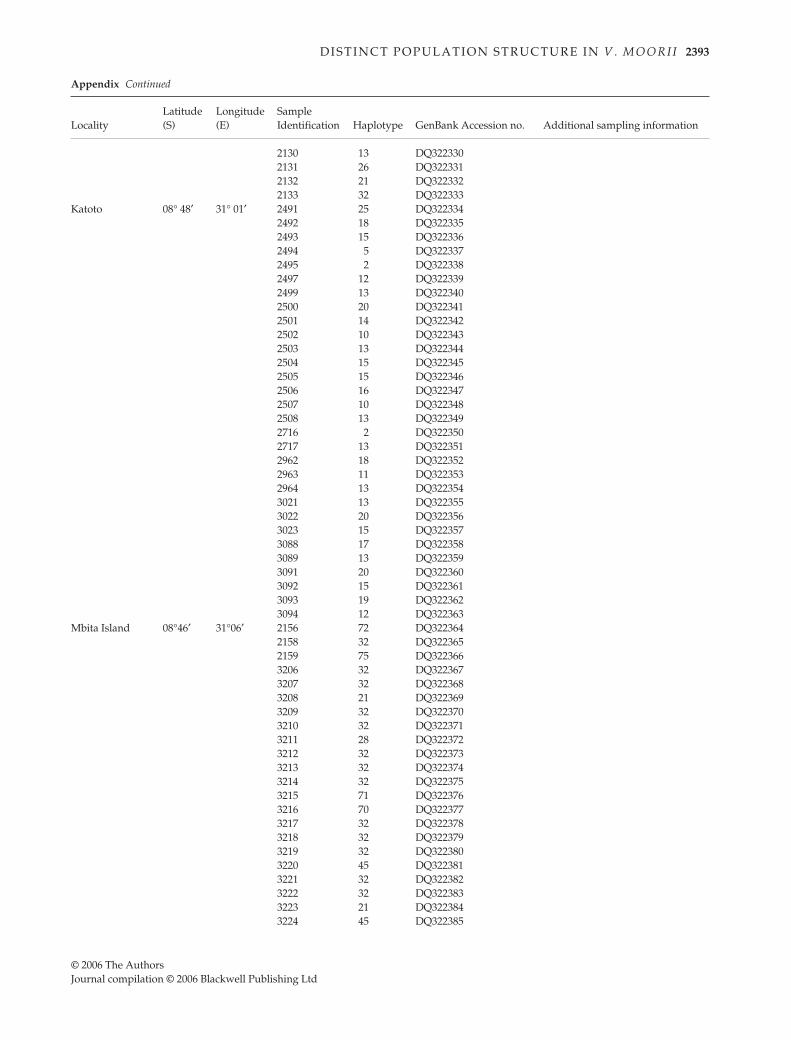
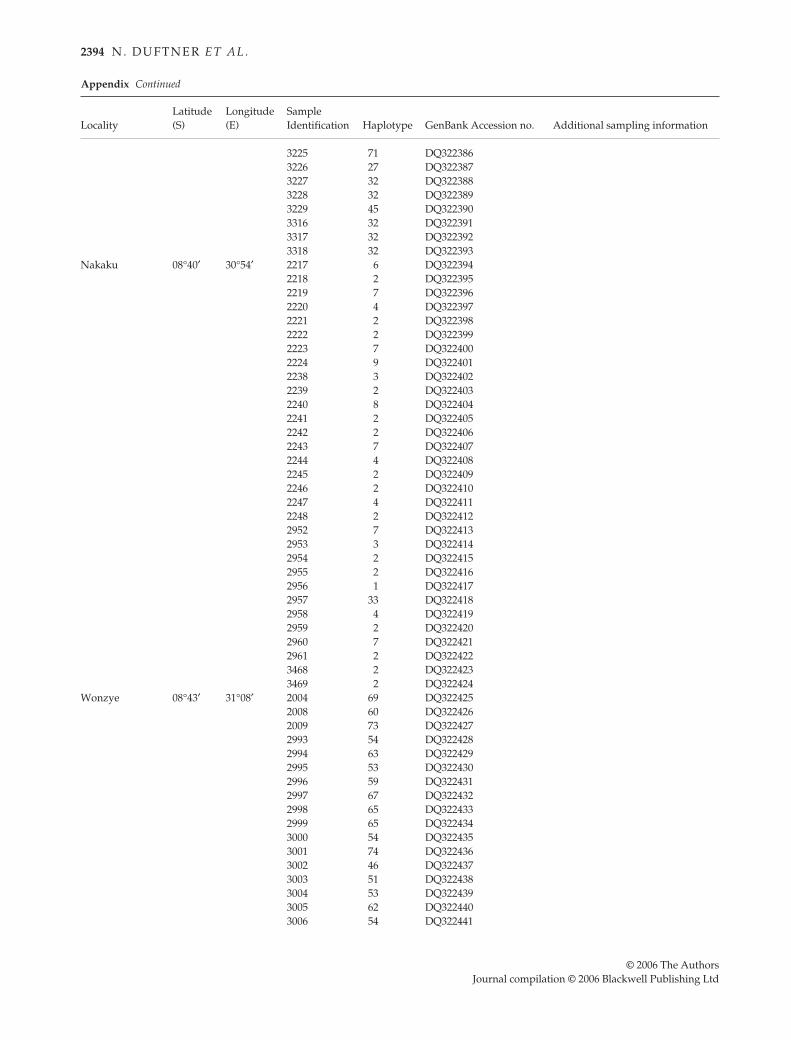
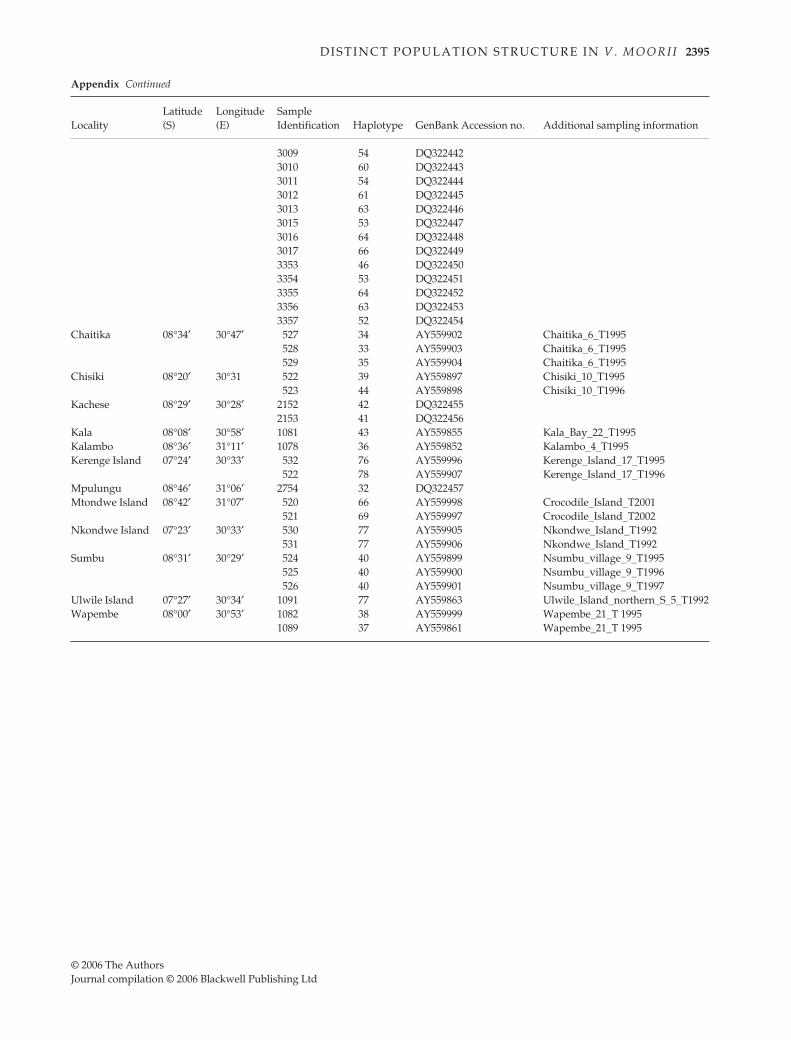
Appendix
Sampling information with locality, geographic coordinates, sample identification number, haplotype number inferred from the tcs -network, GenBank accession number (*will be added in the proofs), and additional sampling information
LocalityLatitude (S)
Longitude (E)
Sample Identification Haplotype GenBank Accession no. Additional sampling information
Chisansa 08°39′ 31°11′ 1941 68 DQ3222761942 55 DQ3222771943 54 DQ3222781944 68 DQ3222791945 54 DQ3222801946 47 DQ3222811947 54 DQ3222821948 54 DQ3222831949 54 DQ3222841950 54 DQ3222851951 49 DQ3222861952 47 DQ3222871955 50 DQ3222881958 47 DQ3222891959 56 DQ3222901960 47 DQ3222911961 55 DQ3222921962 47 DQ3222931963 56 DQ3222941964 55 DQ3222951965 48 DQ3222961966 54 DQ3222971967 54 DQ3222981968 47 DQ3222991969 57 DQ3223001970 58 DQ3223011971 55 DQ3223021972 49 DQ322303
Kasakalawe 08°47′ 31°04′ 2090 31 DQ3223042091 32 DQ3223052092 30 DQ3223062093 32 DQ3223072094 31 DQ3223082095 24 DQ3223092096 24 DQ3223102097 32 DQ3223112098 32 DQ3223122099 32 DQ3223132100 13 DQ3223142101 32 DQ3223152102 21 DQ3223162103 21 DQ3223172104 22 DQ3223182105 29 DQ3223192106 32 DQ3223202107 22 DQ3223212108 13 DQ3223222109 21 DQ3223232110 32 DQ3223242111 22 DQ3223252112 23 DQ3223262113 13 DQ3223272128 21 DQ3223282129 22 DQ322329
D I S T I N C T P O P U L A T I O N S T R U C T U R E I N V . M O O R I I 2393
© 2006 The AuthorsJournal compilation © 2006 Blackwell Publishing Ltd
2130 13 DQ3223302131 26 DQ3223312132 21 DQ3223322133 32 DQ322333
Katoto 08° 48′ 31° 01′ 2491 25 DQ3223342492 18 DQ3223352493 15 DQ3223362494 5 DQ3223372495 2 DQ3223382497 12 DQ3223392499 13 DQ3223402500 20 DQ3223412501 14 DQ3223422502 10 DQ3223432503 13 DQ3223442504 15 DQ3223452505 15 DQ3223462506 16 DQ3223472507 10 DQ3223482508 13 DQ3223492716 2 DQ3223502717 13 DQ3223512962 18 DQ3223522963 11 DQ3223532964 13 DQ3223543021 13 DQ3223553022 20 DQ3223563023 15 DQ3223573088 17 DQ3223583089 13 DQ3223593091 20 DQ3223603092 15 DQ3223613093 19 DQ3223623094 12 DQ322363
Mbita Island 08°46′ 31°06′ 2156 72 DQ3223642158 32 DQ3223652159 75 DQ3223663206 32 DQ3223673207 32 DQ3223683208 21 DQ3223693209 32 DQ3223703210 32 DQ3223713211 28 DQ3223723212 32 DQ3223733213 32 DQ3223743214 32 DQ3223753215 71 DQ3223763216 70 DQ3223773217 32 DQ3223783218 32 DQ3223793219 32 DQ3223803220 45 DQ3223813221 32 DQ3223823222 32 DQ3223833223 21 DQ3223843224 45 DQ322385
LocalityLatitude (S)
Longitude (E)
Sample Identification Haplotype GenBank Accession no. Additional sampling information
Appendix Continued
2394 N . D U F T N E R E T A L .
© 2006 The AuthorsJournal compilation © 2006 Blackwell Publishing Ltd
3225 71 DQ3223863226 27 DQ3223873227 32 DQ3223883228 32 DQ3223893229 45 DQ3223903316 32 DQ3223913317 32 DQ3223923318 32 DQ322393
Nakaku 08°40′ 30°54′ 2217 6 DQ3223942218 2 DQ3223952219 7 DQ3223962220 4 DQ3223972221 2 DQ3223982222 2 DQ3223992223 7 DQ3224002224 9 DQ3224012238 3 DQ3224022239 2 DQ3224032240 8 DQ3224042241 2 DQ3224052242 2 DQ3224062243 7 DQ3224072244 4 DQ3224082245 2 DQ3224092246 2 DQ3224102247 4 DQ3224112248 2 DQ3224122952 7 DQ3224132953 3 DQ3224142954 2 DQ3224152955 2 DQ3224162956 1 DQ3224172957 33 DQ3224182958 4 DQ3224192959 2 DQ3224202960 7 DQ3224212961 2 DQ3224223468 2 DQ3224233469 2 DQ322424
Wonzye 08°43′ 31°08′ 2004 69 DQ3224252008 60 DQ3224262009 73 DQ3224272993 54 DQ3224282994 63 DQ3224292995 53 DQ3224302996 59 DQ3224312997 67 DQ3224322998 65 DQ3224332999 65 DQ3224343000 54 DQ3224353001 74 DQ3224363002 46 DQ3224373003 51 DQ3224383004 53 DQ3224393005 62 DQ3224403006 54 DQ322441
LocalityLatitude (S)
Longitude (E)
Sample Identification Haplotype GenBank Accession no. Additional sampling information
Appendix Continued
D I S T I N C T P O P U L A T I O N S T R U C T U R E I N V . M O O R I I 2395
© 2006 The AuthorsJournal compilation © 2006 Blackwell Publishing Ltd
3009 54 DQ3224423010 60 DQ3224433011 54 DQ3224443012 61 DQ3224453013 63 DQ3224463015 53 DQ3224473016 64 DQ3224483017 66 DQ3224493353 46 DQ3224503354 53 DQ3224513355 64 DQ3224523356 63 DQ3224533357 52 DQ322454
Chaitika 08°34′ 30°47′ 527 34 AY559902 Chaitika_6_T1995528 33 AY559903 Chaitika_6_T1995529 35 AY559904 Chaitika_6_T1995
Chisiki 08°20′ 30°31 522 39 AY559897 Chisiki_10_T1995523 44 AY559898 Chisiki_10_T1996
Kachese 08°29′ 30°28′ 2152 42 DQ3224552153 41 DQ322456
Kala 08°08′ 30°58′ 1081 43 AY559855 Kala_Bay_22_T1995Kalambo 08°36′ 31°11′ 1078 36 AY559852 Kalambo_4_T1995Kerenge Island 07°24′ 30°33′ 532 76 AY559996 Kerenge_Island_17_T1995
522 78 AY559907 Kerenge_Island_17_T1996Mpulungu 08°46′ 31°06′ 2754 32 DQ322457Mtondwe Island 08°42′ 31°07′ 520 66 AY559998 Crocodile_Island_T2001
521 69 AY559997 Crocodile_Island_T2002Nkondwe Island 07°23′ 30°33′ 530 77 AY559905 Nkondwe_Island_T1992
531 77 AY559906 Nkondwe_Island_T1992Sumbu 08°31′ 30°29′ 524 40 AY559899 Nsumbu_village_9_T1995
525 40 AY559900 Nsumbu_village_9_T1996526 40 AY559901 Nsumbu_village_9_T1997
Ulwile Island 07°27′ 30°34′ 1091 77 AY559863 Ulwile_Island_northern_S_5_T1992Wapembe 08°00′ 30°53′ 1082 38 AY559999 Wapembe_21_T 1995
1089 37 AY559861 Wapembe_21_T 1995
LocalityLatitude (S)
Longitude (E)
Sample Identification Haplotype GenBank Accession no. Additional sampling information
Appendix Continued