epigenetic alterations differ in phenotypically distinct human neuroblastoma cell lines
TRANSCRIPT

Yang et al. BMC Cancer 2010, 10:286http://www.biomedcentral.com/1471-2407/10/286
Open AccessR E S E A R C H A R T I C L E
Research articleEpigenetic alterations differ in phenotypically distinct human neuroblastoma cell linesQiwei Yang1, Yufeng Tian1, Kelly R Ostler2, Alexandre Chlenski1, Lisa J Guerrero1, Helen R Salwen1, Lucy A Godley3 and Susan L Cohn*4
AbstractBackground: Epigenetic aberrations and a CpG island methylator phenotype have been shown to be associated with poor outcomes in children with neuroblastoma (NB). Seven cancer related genes (THBS-1, CASP8, HIN-1, TIG-1, BLU, SPARC, and HIC-1) that have been shown to have epigenetic changes in adult cancers and play important roles in the regulation of angiogenesis, tumor growth, and apoptosis were analyzed to investigate the role epigenetic alterations play in determining NB phenotype.
Methods: Two NB cell lines (tumorigenic LA1-55n and non-tumorigenic LA1-5s) that differ in their ability to form colonies in soft agar and tumors in nude mice were used. Quantitative RNA expression analyses were performed on seven genes in LA1-5s, LA1-55n and 5-Aza-dC treated LA1-55n NB cell lines. The methylation status around THBS-1, HIN-1, TIG-1 and CASP8 promoters was examined using methylation specific PCR. Chromatin immunoprecipitation assay was used to examine histone modifications along the THBS-1 promoter. Luciferase assay was used to determine THBS-1 promoter activity. Cell proliferation assay was used to examine the effect of 5-Aza-dC on NB cell growth. The soft agar assay was used to determine the tumorigenicity.
Results: Promoter methylation values for THBS-1, HIN-1, TIG-1, and CASP8 were higher in LA1-55n cells compared to LA1-5s cells. Consistent with the promoter methylation status, lower levels of gene expression were detected in the LA1-55n cells. Histone marks associated with repressive chromatin states (H3K9Me3, H3K27Me3, and H3K4Me3) were identified in the THBS-1 promoter region in the LA1-55n cells, but not the LA1-5s cells. In contrast, the three histone codes associated with an active chromatin state (acetyl H3, acetyl H4, and H3K4Me3) were present in the THBS-1 promoter region in LA1-5s cells, but not the LA1-55n cells, suggesting that an accessible chromatin structure is important for THBS-1 expression. We also show that 5-Aza-dC treatment of LA1-55n cells alters the DNA methylation status and the histone code in the THBS-1 promoter modifies cell morphology, and inhibits their ability to form colonies in soft agar.
Conclusion: Our results suggest that epigenetic aberrations contribute to NB phenotype, and that tumorigenic properties can be inhibited by reversing the epigenetic changes with 5-Aza-dC.
BackgroundThe pediatric cancer neuroblastoma (NB) is character-ized by a broad spectrum of clinical behavior, reflective ofthe biologic heterogeneity of this neoplasm [1,2].Although specific genetic abnormalities have been shownto be predictive of the outcome in NB, recent studies haveindicated that epigenetic aberrations also contribute toNB pathogenesis. Our group and others have shown that
poor outcome is associated with hypermethylation of anumber of tumor suppressor genes including RASSF1A,CASP8, HIN-1, and DCR2 [3-5]. We have also demon-strated that NB tumor growth is impaired following treat-ment with drugs that inhibit histone deacetylase and/orDNA methylation in preclinical models [6].
Biologic differences are commonly seen in NB cell linesestablished from human NB tumors, and morphologi-cally distinct cell types [neuroblastic (N-type) and sub-strate-adherent (S-type)] have been extensivelycharacterized. N-type cells have small, rounded, loosely
* Correspondence: [email protected] Department of Pediatrics, University of Chicago, 900 Ease 57th Street, KCBD Rm. 5100, Chicago, IL 60637, USAFull list of author information is available at the end of the article
© 2010 Yang et al; licensee BioMed Central Ltd. This is an Open Access article distributed under the terms of the Creative CommonsAttribution License (http://creativecommons.org/licenses/by/2.0), which permits unrestricted use, distribution, and reproduction inany medium, provided the original work is properly cited.
Yang et al. BMC Cancer 2010, 10:286http://www.biomedcentral.com/1471-2407/10/286
Page 2 of 10
adherent cell bodies with numerous neurite-like pro-cesses and express neuronal markers, such as tyrosinehydroxylase. S-type cells are substrate-adherent large, flatcells that resemble epithelial cells or fibroblasts and lackneuronal markers [7,8]. Interestingly, purified N-type andS-type NB cells can spontaneously interconvert from onecell type to the other, suggesting that epigenetic changesthat are reversible may play a role in determining pheno-type.
A CpG island methylator phenotype (CIMP) has beenshown to be predictive of poor outcome in a variety ofdifferent cancers, including NB [9]. In studies by Abe andcoworkers, CIMP was detected in almost all MYCN-amplified NB tumors, a genetic marker of poor prognosis.However, CIMP was also shown to be predictive of pooroutcome in cases without MYCN amplification [10-12].Further, in this study the prognostic influence of CIMPand MYCN-amplification was independent of age anddisease stage, both powerful clinical prognostic factors inNB.
To further investigate the role epigenetic changes playin determining NB phenotype, we analyzed the status ofpromoter methylation and the level of expression ofseven genes with tumor suppressor function (THBS-1,HIC-1, HIN-1 TIG-1, CASP8, BLU, and SPARC), that areepigenetically silenced in subsets of adult cancers, in anN-type tumorigenic NB cell line (LA1-55n) and an S-typenon-tumorigenic NB cell line (LA1-5s). Changes in NBcell morphology and soft agar colony growth followingpharmacological reversal of the epigenetic aberrationswere also examined.
MethodsCells and culture conditionsThe biological and genetic characteristics of the NB celllines used in this study have been previously reported[13]. NB cell lines were grown at 5% CO2 in RPMI 1640(Invitrogen, Carlsbad, CA) supplemented with 10% heat-inactivated fetal bovine serum (Invitrogen), L-Glutamineand antibiotics.
5-Aza-dC and VPA treatmentCells were treated with either the DNA methyltransferaseinhibitor 5-Aza-dC or the histone deacetylase inhibitorVPA as shown in Table 1.
cDNA synthesis and SYBR green real-time PCRRNA was isolated from untreated and 5-Aza-dC-treatedLA1-55n and LA1-5s cells using Trizol reagent (Invitro-gen). Reverse transcription was performed using Super-script III (Invitrogen) and 50 μM oligo(dT)20 at 50°C for50 min. SYBR green real-time PCR reactions were set upcontaining 1X Power SYBR Green Master Mix (AppliedBiosystems, Foster City, CA), 250 nM forward and
reverse primers in a 20 μl reaction. All assays were carriedout in a 96-well format. Real-time fluorescent detectionof PCR products was performed with an 7500 Fast Real-Time PCR System (Applied Biosystems) using the follow-ing thermocycling conditions: 1 cycle of 50°C for 2 minand 95°C for 20 s; 40 cycles of 95°C for 30 s, and 60°C for1 min. The primers and PCR conditions are shown inTable 2. GAPDH was used as an endogenous control forgene expression. For data analysis, the comparativemethod (∇∇Ct) was used to calculate relative quantitiesof a nucleic acid sequence. Non-treated LA1-55n cellswere used as the calibrator sample, and GAPDH was usedas an endogenous control detector.
DNA isolation and bisulfite modificationTotal genomic DNA was extracted from the NB cell linesusing the Puregene Core Kit A (Qiagen, Valencia, CA)and modified by sodium bisulfite using the CpGenomeDNA Modification Kit (Intergen Co., Purchase, NY).Genomic DNA from normal human adrenal tissue waspurchased from BioChain Institute, Inc. (Hayward, CA).As previously described [13], 1 μg of genomic DNA wasdenatured by NaOH and modified by sodium bisulfite,which converts all unmethylated cytosines to uracils. Themodified DNA was desulfonated with NaOH and puri-fied.
DNA methylation analysisDNA methylation degree was measured using real-timequantitative methylation-specific PCR (QMSP). The real-time PCR conditions were 95°C for 10 minutes, then 40cycles at 95°C for 15 seconds, and 58°C to 60°C (depend-ing on the primer set and/or optimization conditions) for1 minute. Fluorescence data was collected during theannealing/extension step for determining the cycle
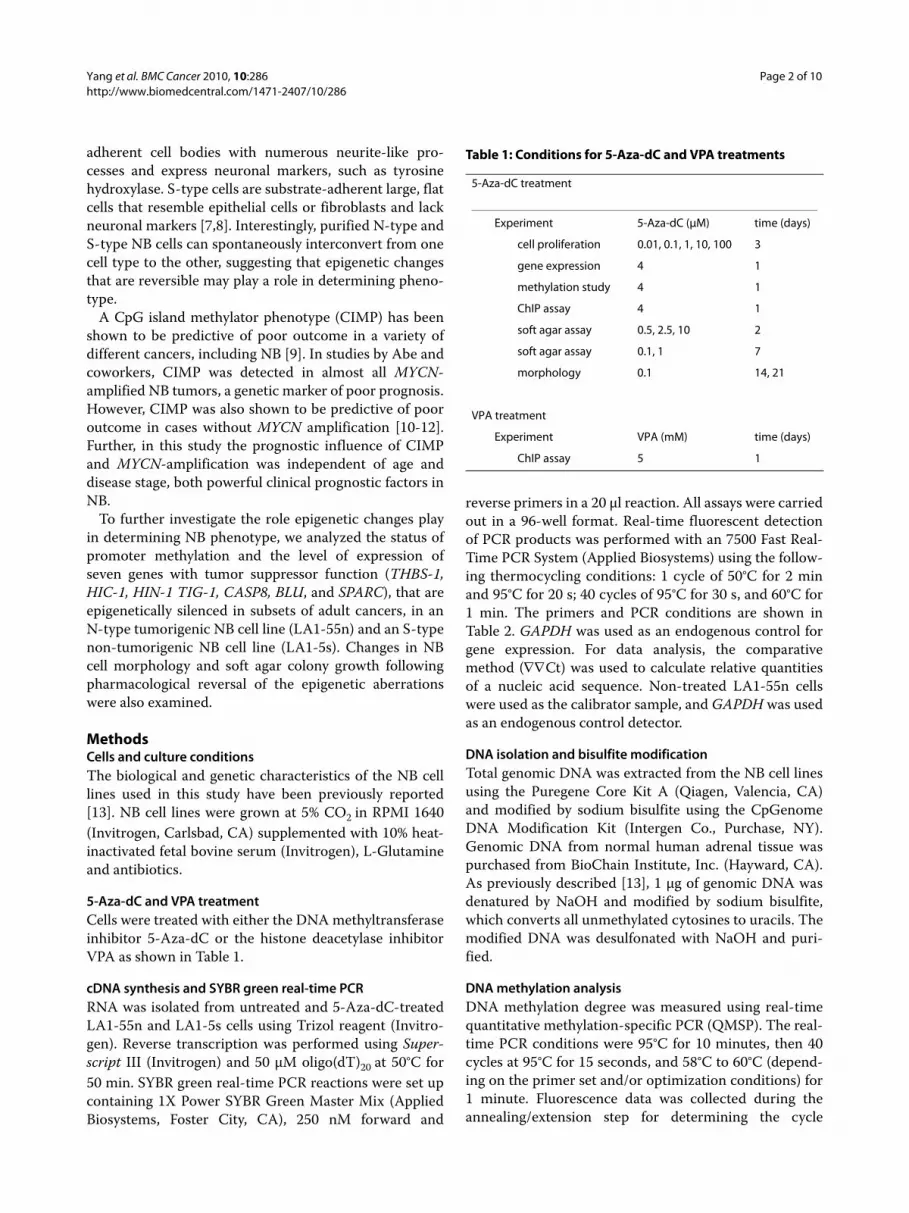
Table 1: Conditions for 5-Aza-dC and VPA treatments
5-Aza-dC treatment
Experiment 5-Aza-dC (μM) time (days)
cell proliferation 0.01, 0.1, 1, 10, 100 3
gene expression 4 1
methylation study 4 1
ChIP assay 4 1
soft agar assay 0.5, 2.5, 10 2
soft agar assay 0.1, 1 7
morphology 0.1 14, 21
VPA treatment
Experiment VPA (mM) time (days)
ChIP assay 5 1

Yang et al. BMC Cancer 2010, 10:286http://www.biomedcentral.com/1471-2407/10/286
Page 3 of 10
threshold (Ct). After amplification, melting curve analysiswas performed for PCR product identification that con-sisted of one cycle of 95°C for 1 minute, 58-60°C for 30seconds, and 95°C for 30 seconds, with data collectionthroughout the linear increase of temperature from 58 to95°C. Serial dilutions of the LA1-55n DNA template wereused to generate standard curves from Ct values to assessthe sensitivity, amplification efficiency, and linear rangefor quantification. All real-time QMSP assays were per-formed in duplicate or triplicate, and at least three inde-pendent experiments were performed for each conditiontested. The primer sequences and conditions are shownin Table 2. Both β-actin and MYOD1 were used as inter-nal reference genes. Primers of the β-actin andMYOD1genes were located in an area without CpGnucleotides; thus, amplification of β-actin and MYOD1by QMSP occurs independently of a CpG island methyla-tion status, whereas the amplification of THBS1, HIN1,TIG1, and CASP8 is proportional to the degree of cyto-sine methylation within their promoters.
Chromatin immunoprecipitation (ChIP) assayNB cells (1 × 10⁷) were treated with 1% formaldehyde for10 min to crosslink histones to DNA. After washing withcold PBS, the cell pellets were resuspended in a cell lysisbuffer (10 mM Tris, pH8.0, 10 mM NaCl, 0.2% NP40).Nuclei were resuspended in nuclei lysis buffer (50 mMTris pH 8.0, 10 mM EDTA, 1% SDS) and sonicated 15min for LA1-55n and 20 min for LA1-5s cells. The solu-ble chromatin fraction was collected, and 5 μl of antibodyfor acetyl-H3 (Upstate, Waltham, MA), acetyl-H4(Upstate), trimethyl-H3-K4 (Abcam, Cambridge, MA),trimethyl-H3-K9 (Upstate), trimethyl-H3-K27 (Upstate),dimethyl-H3-K27 (Abcam), or normal rabbit IgG wasadded. After incubation, chromatin-antibody complexeswere collected using salmon sperm DNA/protein A aga-rose beads (Upstate). After washing, immunoprecipitatedDNA was treated with RNase and the crosslinks werethen reversed by heating the samples at 65°C for 6 h.DNA was extracted with a QIAquick PCR Purification kit(Qiagen) and analyzed by SYBR green real-time PCR.
Table 2: Primer sequences for PCR
Gene Purpose Sense primer Antisense primer
BLU Q-PCR CACGAGGCCTCCATCATCA ACTCACACACCTCCTTGTGGAA
CASP8 Q-PCR TGCAGAGGGAACCTGGTACAT TCGAGGACATCGCTCTCTCA
GAPDH Q-PCR CCATGGGGAAGGTGAAGGTCGGACTC GGTGGTGCAGGCATTGCTGATG
HIC-1 Q-PCR TGCTGCAGCTCAACAACCA GGCGTTCTGCACCACGAT
HIN-1 Q-PCR CACCCTCAACCCGCTGAA ACACTTCTGGGAGCCCTCTATG
SPARC Q-PCR TCTTCCCTGTACACTGGCAGTTC AGCTCGGTGTGGGAGAGGTA
THBS1 Q-PCR TGGAACTATGGGCTTGAGAAAAC CACTGATGCAAGCACAGAAAAGA
TIG-1 Q-PCR CCTGGCAAACCTCTTAAAGTGAA GGAGGCTTCTTCTGGTGTCTGT
Actin QMSP TGGTGATGGAGGAGGTTTAGTAAGT AACCAATAAAACCTACTCCTCCCTTAA
BLU QMSP GTAGTTATGGAAACGGGTTAGTC CGCTAAAAATCCAAATACTATAACG
CASP8 QMSP AGGTAGGAGAATCGTTTGAATTC AACGAAATTTCGCTCTTATTACC
HIC-1 QMSP GTTAGGCGGTTAGGGCGTC CCGAACGCCTCCATCGTAT
HIN-1 QMSP AGGGACGATTAGGTTTTATTTTC CTAATTTCGAAAACAAAAAAACG
MYOD1 QMSP CCAACTCCAAATCCCCTCTCTAT TGATTAATTTAGATTGGGTTTAGAGAAGGA
SPARC QMSP GTTGTTATATTCGGGGACGAC TAACCCGTTTCCATAACTACGA
THBS1 QMSP GAAAGGGTTCGAAGGTAGC CCGAACGCCTATCCTAAA
TIG-1 QMSP GTTTAGTGTTAGGATGCGGTATC AAAACGCGATACGAAATAACA
THBS1 ChIP-1 ATGACAACTTGGCAAAAAAGAGAA GGCCGAAGTGATGGACCTT
THBS1 ChIP-2 AATGTGGGTGAATTCCTGTTAAGG GGGTGGAAAGGAAAGGTCATAGA
THBS1 ChIP-3 TGGGTGCCGATTCCAGAA TCCCGCAAATCATAGGTAATGA
THBS1 ChIP-4 CCACGCAAGAAAAGCGAAA TGCTGCAAACAGCCAAGTG
THBS1 ChIP-5 GGGCAGGTACTTTAACGAATGG CTGGGCCCGTTTTGTAAAAA
THBS1 ChIP-6 GGCGGGCACCGACTTT GCGCAACTTTCCAGCTAGAAA
Yang et al. BMC Cancer 2010, 10:286http://www.biomedcentral.com/1471-2407/10/286
Page 4 of 10
The primer pairs used for ChIP assays are also shown inTable 2.
Luciferase assaysA series of THBS-1 reporter plasmids [13] were used todetermine the THBS-1 promoter activity. LA1-55n andLA1-5s cells were seeded in a 24-well dish and grown to90% confluence in the growth medium. For each well, 0.5μg of reporter construct was cotransfected with 25 ng ofthe Renilla luciferase plasmid, pRL-CMV (Promega,Madison, WI), into NB cells using Lipofectamine2000(Invitrogen). Cells were harvested 36 h after transfection,and the reporter activity for the two cell lines was mea-sured at the same time using the Dual Luciferase Assay(Promega) according to the manufacturer's instructions.Experimental luciferase activities were normalized forefficiency against control Renilla luciferase readings.
Cell proliferation, examination of morphological alteration, and soft agar clonogenic assayMTS colorimetric assays were performed to measure cellproliferation. Briefly, LA1-55n cells were seeded into 96-well plates at a density of 5 × 10³ cells/well. After 24 h, 5-Aza-dC was added at various concentrations to each qua-druplicate well. After 72 h treatment, MTS labeling mix-ture (Promega) was added, and cells were furtherincubated for 3 h. The absorbance of the samples wasmeasured using a Bio-Kinetics Microplate Reader (Bio-Tek Instruments, Winooski, VT). Percentage of N-typecells with or without treatment with 5-Aza-dC wasobtained by quantifying 5 consecutive high power fields.Anchorage-independent growth was assayed by colonyformation on soft agar. Briefly, approximately 2 × 10³ cellsfrom the 5-Aza-dC treated and nontreated LA1-55n cellsand LA1-5s cells were plated on an upper layer of 0.3%Bacto-Agar in RPMI 1640 and 20% fetal bovine serumover an underlayer of 0.51% Bacto-Agar with 20% fetalbovine serum, RPMI 1640, and antibiotics in a 35-mmdish as described previously [14]. Colonies were countedon day 28.
Statistical analysesStatistical analyses were performed using a two-tailedStudent's t test. A p value of ≤ 0.05 was considered statis-tically significant.
ResultsExpression analysis of cancer related genesTo investigate the relationship between epigeneticchanges and NB phenotype, we analyzed the level ofexpression of seven genes with tumor suppressor func-tion that are epigenetically silenced in a variety of adult
and pediatric cancers (THBS-1, HIC-1, HIN-1 TIG-1,CASP8, BLU, and SPARC), in a tumorigenic N-type NBcell line (LA1-55n) and a non-tumorigenic S-type cell line(LA1-5s). Lower levels of THBS-1, SPARC, HIC-1, HIN-1,TIG-1 and CASP8 expression were detected in the tum-origenic LA1-55n cells compared to non-tumorigenicLA1-5s cells (Figure 1A). No difference in the level ofBLU gene expression was seen.
Treatment with 5-Aza-dC restores gene expressionTo test if the decreased levels of gene expression detectedin the tumorigenic LA1-55n cells were due to promoterhypermethylation, the level of gene expression was exam-ined in LA1-55n cells following treatment with 5-Aza-dC, a DNA-methyltransferase inhibitor. As shown in Fig-ure 1B, the level of expression of five of the genes (HIN-1,CASP8, HIC-1, THBS-1, and TIG-1) was upregulatedwith 4 μM of 5-Aza-dC treatment at 24 h. This dose andtime point has previously been shown to restore geneexpression in NB cells [13]. THBS-1 was especially sensi-tive to 5-Aza-dC treatment, and the level of transcriptexpression was increased by 20 folds following 24 h oftreatment. However, no significant upregulation of BLUand SPARC was seen following 24 h of 5-Aza-dC treat-ment.
DNA methylation profiling of cytosine methylationTo examine the status of promoter DNA methylation ofthese genes in the tumorigenic LA1-55n and non-tumori-genic LA1-5s NB cells, quantitative methylation analysiswas performed for the promoter regions of four genes. Asshown in Figure 2, we found a higher degree of DNAmethylation within the THBS-1, CASP8, HIN-1, and TIG-1 promoters in tumorigenic LA1-55n cells versus thenon-tumorigenic LA1-5s cells. In addition, the methyla-tion degree for the promoter regions of four genes wasdecreased after treatment with 5-Aza-dC.
THBS-1 promoter histone acetylation and methylationTo investigate if histone modifications contributed to thesignificant differences in THBS-1 expression levels in thetumorigenic versus non-tumorigenic NB cells, we ana-lyzed histone marks along the THBS-1 promoter. Asshown in Figure 3, acetylated H3 (acetyl H3), acetylatedH4 (acetyl H4), and H3K4Me3 marks associated with anopen chromatin state, are enriched in the THBS-1 pro-moter regions in the non-tumorigenic LA1-5s cells thatexpress high levels of this gene. However, consistent withthe low levels of THBS-1 expression in the tumorigenicNB cells, an enrichment of marks associated with a closedchromatin state (H3K9Me3, H3K27Me3, and

Yang et al. BMC Cancer 2010, 10:286http://www.biomedcentral.com/1471-2407/10/286
Page 5 of 10
H3K27Me2) are present in THBS-1 promoter in the LA1-55n cells.
We also performed detailed mapping of histone acety-lation and histone methylation across a 1.2 kb region ofthe THBS-1 promoter in the tumorigenic LA1-55n andnon-tumorigenic LA1-5s NB cell lines using the ChIPassay (Figure 4A). Overall, acetylated histone H3 and H4were enriched throughout the unmethylated THBS-1promoter in the non-tumorigenic LA1-5s cells. In con-trast, there was no acetylation of these sites along thehypermethylated promoter in the tumorigenic LA1-55ncells (Figure 4B and 4C). A similar pattern of acetylationin the THBS-1 promoter in the NB cells lines was seen for
H3K4Me3 (Figure 4D). In contrast, the three histonecodes associated with a repressive chromatin state(H3K9Me3, H3K27Me3, H3K27Me3) were enrichedalong the entire hypermethylated THBS-1 promoter intumorigenic LA1-55n cells (Figure 4E, F, G).
Figure 1 Cancer related gene expression in tumorigenic, non-tu-morigenic, and 5Aza-dC treated tumorigenic NB cell lines. A, Quantitative RT-PCR analysis of RNA expression of seven cancer related genes was performed in tumorigenic LA1-55n and non-tumorigenic LA1-5s NB cell lines. GAPDH was used as an endogenous control. B, LA1-55n cells were treated with 4 μM 5-Aza-dC for 1 day. Quantitative RT-PCR analysis of seven cancer related genes was performed in tum-origenic LA1-55n treated with 5-Aza-dC. GAPDH was used as an endog-enous control.
0
5
10
15
20
25
30
35
40
45
50 LA1-55n
LA1-5s
20000
25000
Rel
ativ
e R
NA
exp
ress
ion
BL
U
HIC
-1
TIG
-1
SP
AR
C
CA
SP
8
HIN
-1
TH
BS
-1
Rel
ativ
e R
NA
exp
ress
ion
0
5
10
15
20
25
control
5-Aza-dC
A
B
BL
U
HIC
-1
TIG
-1
SP
AR
C
CA
SP
8
HIN
-1
TH
BS
-1
Figure 2 Alteration of DNA methylation degree after treatment with 5-Aza-dC. Genomic DNA from LA1-55n, LA1-5s, and LA1-55n treated with 4 μM 5-Aza-dC was isolated and modified by sodium bisulfite. Quantitative methylation-specific PCR was performed to ex-amine the methylation degree around promoter regions for four can-cer related genes (THBS-1, HIN-1, TIG-1, and CASP8) in LA1-55n, LA1-5s as well as LA1-55n cells treated with 5-Aza-dC.
TH
BS
1
HIN
1
TIG
1
CA
SP
8
Rel
ativ
e m
eth
ylat
ion
deg
ree
0
0.2
0.4
0.6
0.8
1
1.2
1.4 LA1-5s
LA1-55n
LA1-55n, 5-Aza-dC
Figure 3 ChIP assays of the THBS-1 CpG islands. DNA was immuno-precipitated with antibodies specific for acetyl H3, acetyl H4, H3K4Me3, H3K9Me3, H3K27Me3, and H3K27Me2 respectively. Q-PCR analysis of ChIP assay on LA1-55n and LA1-5s cells were performed in THBS-1 pro-moter region.
0
5
10
15
20
25
LA1-5s
LA1-55n
Ace
tyl
H3
Ace
tyl
H4
H3K
4Me3
H3K
9Me3
H3K
27M
e3
H3K
27M
e2
His
ton
e M
od
ific
atio
n o
f T
HB
S1
Pro
mo
ter
(fo
ld)
open chromatin
marks
closed chromatin
marks

Yang et al. BMC Cancer 2010, 10:286http://www.biomedcentral.com/1471-2407/10/286
Page 6 of 10
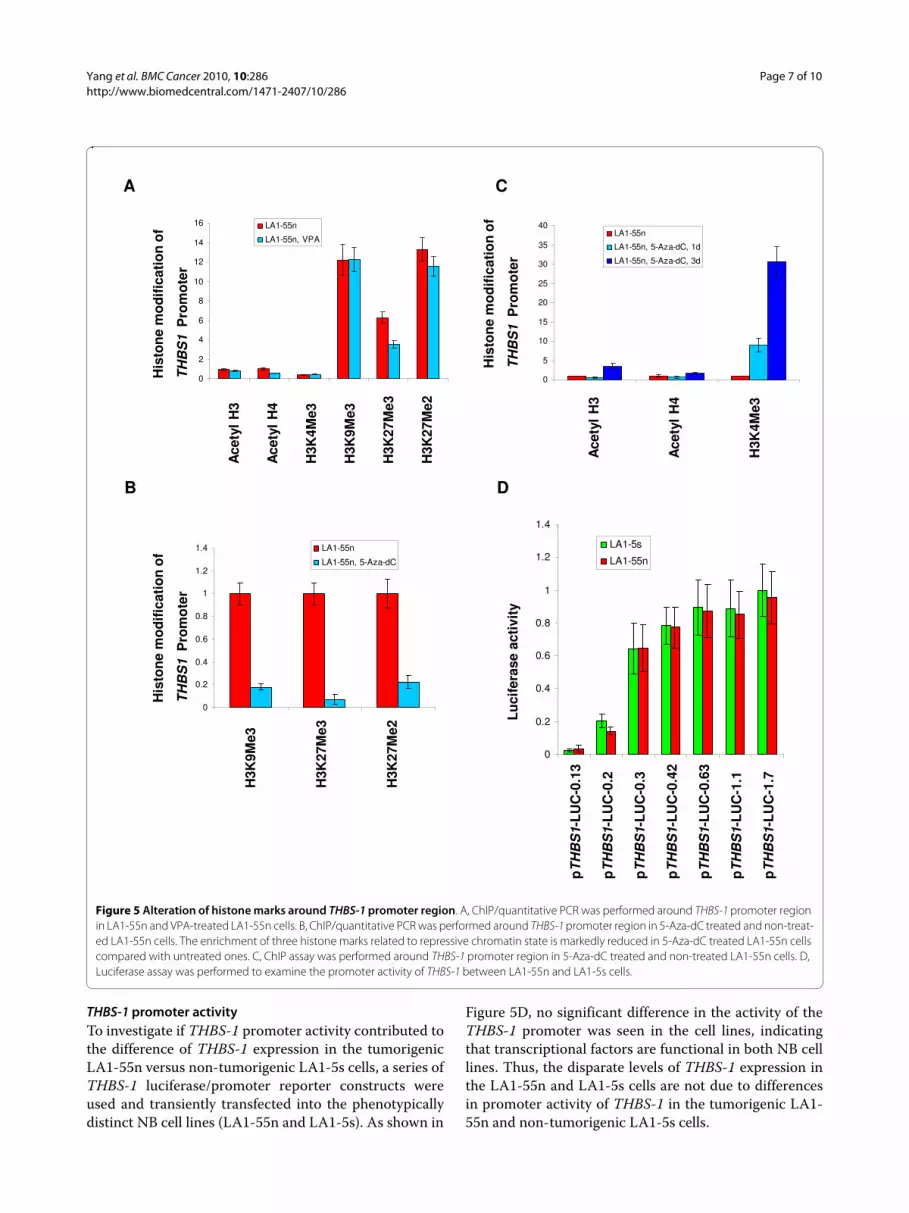
Treatment with 5-Aza-dC induces histone modifications in the THBS-1 promoterIn a previous study, we showed that administration of theHDAC inhibitor valproic acid (VPA) changed geneexpression in NB cells [6]. The cells were treated with 1mM VPA for 2-48 h. Based on these results, we treatedthe tumorigenic LA1-55n cells with 5mM VPA for 1 dayand investigated its effects on histone modifications.Unexpectantly, the ChIP assays revealed that VPA treat-ment alone did not induce an enrichment of markersassociated with open chromatin state along the THBS-1promoter region. Furthermore, VPA treatment did notdecrease an enrichment of marks associated with closedchromatin state, except for H3K27Me3 (Figure 5A).
To determine the relation between DNA methylationand histone modification, we next tested the effects of 5-Aza-dC, an inhibitor of DNMT, on the histone marks,and found that this DNA methyltransferase inhibitor didinduce histone modifications. Following treatment of thetumorigenic LA1-55n cells with 5-Aza-dC, the levels ofH3K9Me3, H3K27Me3, and H3K27Me2 were severelydepleted (Figure 5B). Whereas the level of acetylatedH3K4Me3,acetyl H3, and acetyl H4 along the THBS-1promoter region was markedly enriched after 3 d treat-ment with 5-Aza-dC (Figure 5C). After 24 h of 5-Aza-dC-treatment, only the enrichment of H3K4Me3 is observed.
Figure 4 Histone code map of THBS-1 promoter region. ChIP assay was performed on tumorigenic LA1-55n and non-tumorigenic LA1-5s cells. A, Schematic of the THBS-1 promoter. The vertical lines represent the location of CpG dinucleotide, and the orange line indicates the CpG island of the THBS-1 promoter region. The horizontal bars below the schematic indicate the location of the DNA fragments amplified by Q-PCR done on DNA re-covered from ChIP experiments. B, C, and D, The enrichment of THBS-1 promoter DNA immunoprecipitated with antibodies specific for acetylated H3, acetyl H4, and H3K4Me3, respectively in LA1-5s cells. E, F, and G, The enrichment of THBS-1 promoter DNA immunoprecipitated with antibodies spe-cific for H3K9Me3, H3K27Me3, and H3K27Me2, respectively in LA1-55n cells.
37657771 37660771
Chr 15
1 2 3 4 5 6
A
B
C
D
E
F
G
Transcriptional start site
Acetyl H3
-0.2
0
0.2
0.4
0.6
0.8
1
1.2
1.4
1 2 3 4 5 6
LA1-55n
LA1-5s
Acetyl H4
-0.2
0
0.2
0.4
0.6
0.8
1 2 3 4 5 6
LA1-55n
LA1-5s
H3K4Me3
-0.2
0
0.2
0.4
0.6
0.8
1 2 3 4 5 6
LA1-55n
LA1-5s
H3K9Me3
0
0.2
0.4
0.6
1 2 3 4 5 6
LA1-55n
LA1-5s
H3K27Me3
-0.04
0
0.04
0.08
0.12
0.16
1 2 3 4 5 6
LA1-55n
LA1-5s
H3K27Me2
0
0.05
0.1
0.15
0.2
0.25
1 2 3 4 5 6
LA1-55n
LA1-5s
Ace
tyl H
3 en
rich
men
tA
cety
l H4
enri
chm
ent
H3K
4Me3
en
rich
men
t
H3K
9Me3
en
rich
men
tH
3K27
Me3
en
rich
men
tH
3K27
Me2
en
rich
men
t
Position Position
Yang et al. BMC Cancer 2010, 10:286http://www.biomedcentral.com/1471-2407/10/286
Page 7 of 10
THBS-1 promoter activityTo investigate if THBS-1 promoter activity contributed tothe difference of THBS-1 expression in the tumorigenicLA1-55n versus non-tumorigenic LA1-5s cells, a series ofTHBS-1 luciferase/promoter reporter constructs wereused and transiently transfected into the phenotypicallydistinct NB cell lines (LA1-55n and LA1-5s). As shown in
Figure 5D, no significant difference in the activity of theTHBS-1 promoter was seen in the cell lines, indicatingthat transcriptional factors are functional in both NB celllines. Thus, the disparate levels of THBS-1 expression inthe LA1-55n and LA1-5s cells are not due to differencesin promoter activity of THBS-1 in the tumorigenic LA1-55n and non-tumorigenic LA1-5s cells.
Figure 5 Alteration of histone marks around THBS-1 promoter region. A, ChIP/quantitative PCR was performed around THBS-1 promoter region in LA1-55n and VPA-treated LA1-55n cells. B, ChIP/quantitative PCR was performed around THBS-1 promoter region in 5-Aza-dC treated and non-treat-ed LA1-55n cells. The enrichment of three histone marks related to repressive chromatin state is markedly reduced in 5-Aza-dC treated LA1-55n cells compared with untreated ones. C, ChIP assay was performed around THBS-1 promoter region in 5-Aza-dC treated and non-treated LA1-55n cells. D, Luciferase assay was performed to examine the promoter activity of THBS-1 between LA1-55n and LA1-5s cells.
His
ton
e m
od
ific
atio
n o
f
TH
BS
1P
rom
ote
r
His
ton
e m
od
ific
atio
n o
f
TH
BS
1 P
rom
ote
r
Ace
tyl
H3
Ace
tyl
H4
H3K
4Me3
A
B D
C
Ace
tyl
H3
Ace
tyl
H4
H3K
4Me3
H3K
9Me3
H3K
27M
e3
H3K
27M
e2
0
2
4
6
8
10
12
14
16 LA1-55n
LA1-55n, VPA
0
5
10
15
20
25
30
35
40LA1-55n
LA1-55n, 5-Aza-dC, 1d
LA1-55n, 5-Aza-dC, 3d
1.4
H3K
9Me3
H3K
27M
e3
H3K
27M
e2
His
ton
e m
od
ific
atio
n o
f
TH
BS
1P
rom
ote
r
Lu
cife
rase
act
ivit
y
pT
HB
S1-
LU
C-0
.13
pT
HB
S1-
LU
C-0
.2
pT
HB
S1-
LU
C-0
.3
pT
HB
S1-
LU
C-0
.42
pT
HB
S1-
LU
C-0
.63
pT
HB
S1-
LU
C-1
.1
pT
HB
S1-
LU
C-1
.7
0
0.2
0.4
0.6
0.8
1
1.2
1.4 LA1-55n
LA1-55n, 5-Aza-dC
0
0.2
0.4
0.6
0.8
1
1.2LA1-5s
LA1-55n

Yang et al. BMC Cancer 2010, 10:286http://www.biomedcentral.com/1471-2407/10/286
Page 8 of 10
5-Aza-dC treatment modifies the tumorigenic phenotype of LA1-55n NB cellsTo investigate if reversal of the epigenetic aberrations inthe tumorigenic LA1-55n cells with 5-Aza-dC treatmentwas sufficient to induce changes in phenotype, we firstexamined its effects on cell proliferation. We found thatthe treatment inhibited the proliferation of LA1-55n NBcells in vitro in a dose-dependent manner, with an ID50 of10 μM (Figure 6A). We next assessed whether treatmentwith 5-Aza-dC would induce changes in the morphologyof the N-type LA1-55n cells. For these studies, the cellswere treated with 0.1 μM 5-Aza-dC, a dose that is notcytotoxic. Following 21 days of 5-Aza-dC treatment, sub-strate-adherent cells, resembling S-type NB cells, wereseen (Figure 6B, as shown with arrows), and the number
of cells with neurites decreased by ~20% (p = 0.0062)(Figure 6C). Treatment with 5-Aza-dC also decreased theability of LA1-55n to form colonies in soft agar in a dosedependent manner (Figure 6D). At a concentration of 10μM, the ID50, the number of colonies was decreased by95% compared to controls (p < 0.001). The colony forma-tion was markedly decreased after 7 days of treatmenteven at concentrations of 0.1 μM (p < 0.001). As expected,the non-tumorigenic NB cell line, LA1-5s did not formcolonies on the soft agar.
DiscussionEpigenetic changes play an important role in the patho-genesis of cancer, and a CpG island methylator phenotypehas been shown to be predictive of poor outcome. To
Figure 6 Effect of 5-Aza-dC on NB growth and tumorigenicity in vitro. A, In vitro cell proliferation assay demonstrating dose-response effects of 5-Aza-dC on LA1-55n cells. Each point represents the mean of four replicate experiments. B, Morphological alteration after treatment with 5-Aza-dC. LA1-55n cells were treated with 0.1 μM of 5-Aza-dC for 14 and 21 days respectively. Top photos (a and b) show the morphology of nontreated LA1-55n cells. Middle photos (c and d) show the morphology of LA1-55n cells treated with 5-Aza-dC for 14 days. Bottom photos (e and f) show the mor-phology of LA1-55n cells treated with 5-Aza-dC for 21 days. Green arrows indicated the flat "S" type cells. C, Quantitative analysis of percentage of N- type cells after treatment with 5-Aza-dC for 14 and 21 days. D, Quantitative analysis of colony formation on soft agar for 5-Aza-dC treated and untreat-ed NB cells. Colonies were counted under a microscope. The average number of colonies was calculated and is shown as a percentage of the average number of colonies in the untreated group per cell line. Error bars represent standard deviation of colony numbers between different plates for each group.
0 0.01 0.1 1 10 100
Ab
sorb
ance
490
(%
of
con
tro
l)
Concentration (μM)
0
0.2
0.4
0.6
0.8
1
1.2C
on
tro
l
5-A
za-d
C, 1
4 d
5-A
za-d
C, 2
1 d
% o
f N
-ty
pe
cells
0
0.2
0.4
0.6
0.8
1
1.2
B
C
D
A
a b
f
d
e
cc
5-A
za-d
C
Tre
atm
ent
0 μM
, 2d
0.5
μM, 2
d
2.5
μM, 2
d
10 μ
M, 2
d
0.1
μM ,
7d
1 μM
7d
0 μM
Co
lon
y fo
rmat
ion
Cel
l lin
es
LA
1-55
n
LA
1-5s
0
0.2
0.4
0.6
0.8
1
1.2
1.4
1.6
Yang et al. BMC Cancer 2010, 10:286http://www.biomedcentral.com/1471-2407/10/286
Page 9 of 10
investigate if epigenetic aberrations contribute to NBphenotype, we examined the methylation status and levelof expression of seven genes with known tumor suppres-sor function (HIC-1, TIG-1, HIN-1, CASP8, THBS-1,SPARC, and BLU) in a N-type tumorigenic NB cell line(LA1-55n) and an S-type, non-tumorigenic NB cell line(LA1-5s). We show that the tumorigenic LA1-55n cellshave higher levels of promoter methylation and lower lev-els of expression of five of the genes (THBS-1, HIC-1,HIN-1, TIG-1, and CASP8) compared to the non-tumori-genic LA1-5s cells. We also show that cell morphologyand phenotype of the tumorigenic LA1-55n cells aremodified following treatment with the demethylatingagent 5-Aza-dC.
Each of the genes analyzed in this study has previouslybeen shown to be epigenetically silenced in other types ofcancer, and in some cases, the presence of abnormal pro-moter methylation has been shown to be associated witha more aggressive phenotype in adult or pediatric can-cers. SPARC is an extracellular matrix protein that hasbeen shown to function as an inhibitor of angiogenesis[15], and in lung adenocarcinomas SPARC methylationhas been correlated with a negative prognosis [16].Athough disparate levels of SPARC expression was seenin the NB cell lines, there was no evidence of SPARCmethylation in the NB cells, indicating that alternativemechanisms regulate SPARC expression in NB. In con-trast, we did find higher levels of methylation of the pro-apoptotic gene CASP8 in the tumorigenic LA1-55n cells,which is consistent with the association between CASP8methylation and high-risk disease and poor outcome thathas been reported in primary NB tumors [4]. BLU func-tions as a tumor supressor in many cancer types [17]. Inhuman nasopharyngeal carcinoma, the frequency of BLUpromoter methylation was much higher compared withnon-neoplastic nasopharyngeal epithelia [18]. However,we found no significant difference in the level of expres-sion of this gene in the NB cell lines.
HIC-1 is a newly discovered tumor suppressor andtranscriptional repressor which is located at 17p13.3, aregion which frequently undergoes allelic loss in humancancers [19]. A recent study indicated that HIC-1 is a cen-tral molecule in a novel mechanism controlling cellgrowth and that the disruption of the HIC-1 mediatedpathway may lead to abnormal cell proliferation [20].Moreover, low to undetected expression of HIC-1 is asso-ciated with poor outcome in breast cancer [21]. In thisstudy, expression of HIC-1 is higher in non-tumorigenicNB cells compared with tumorigenic cells.
TIG-1, which has been linked to retinoic acid signaling,was shown to be downregulated in many cancers [22,23].Forced expression of TIG1 in cancer cells results indecreased invasiveness and tumorigenicity, indicatingthat diminished expression of TIG1 is involved in the
malignant progression of cancer. Our study showed thatlower level expression of TIG-1 in tumorigenic NB cells isassociated with hypermethylation of its promoter. HIN-1is a putative cytokine with growth inhibitory activities.HIN-1 was initially found to be significantly downregu-lated in human breast carcinomas and in preinvasivelesions. HIN-1 is a potent inhibitor of anchorage-depen-dent and anchorage-independent cell growth, cell migra-tion, and invasion [24,25]. Our previous study indicatedthat methylation of HIN-1 is associated with poor out-come in NB [4]. In this study we showed that the methy-lation degree of HIN-1 promoter region is much higher intumorigenic NB cells compared with non-tumorigenicNB cells.
Because of the remarkable up-regulation of THBS-1expression that was seen in the LA1-55n cells followingtreatment with 5-Aza-dC, we performed additional stud-ies examining the histone marks along the promoterregions of this gene in the NB cell lines. Histone marksassociated with a repressive chromatin state (H3K9Me3,H3K27Me3, and H3K4Me3) were detected in the tumori-genic LA1-55n cells, whereas histone codes associatedwith an active chromatin state (acetyl H3, acetyl H4, andH3K4Me3) were present in non-tumorigenic LA1-5scells. THBS-1 is a well-known natural inhibitor of angio-genesis, and down-regulation of THBS-1 plays a criticalrole in the angiogenic switch in several tumor types. Wehave previously shown that the THBS-1 promoter ismethylated and silenced in tumorigenic NB cell lines andin a cohort of NB primary tumors [13]. In this study, wecompiled a detailed map of histone acetylation and meth-ylation across a 1.2 kb region of the THBS-1 promoterwhich indicates that histone acetylation also plays animportant role in regulating THBS-1 expression. Further-more, the results of our ChIP assay indicate that an acces-sible chromatin structure is important in THBS-1expression. To our knowledge, this is the first reportshowing that THBS-1 expression is regulated by histonemodification. Our results further suggest that the altera-tion of key parameters of the histone code depend uponinhibition of the DNMTs, and DNA hypermethylationmediated by DNMTs may be essential for maintaining aparticular combination of histone modifications at genepromoters silenced with aberrant DNA methylation.
ConclusionTaken together, our results indicate that epigenetic genesilencing contributes to NB phenotype and that by restor-ing the expression of tumor suppressor genes, 5-Aza-dCcan inhibit tumorigenic properties of NB cells. Additionalexperiments investigating the global changes in genemethylation and expression in control and 5-Aza-dC-treated NB cells are needed to identify the cellular path-ways that are modified by this treatment that influence
Yang et al. BMC Cancer 2010, 10:286http://www.biomedcentral.com/1471-2407/10/286
Page 10 of 10
NB phenotype. Further studies investigating the anti-NBeffects of agents capable of reversing these epigeneticchanges are warranted.
AbbreviationsThe abbreviations used are: HIC-1: Hypermethylated in cancer 1; SPARC:Secreted protein, acidic and rich in cysteine; TIG-1: Tazarotene-induced gene 1;HIN-1: High in Normal 1; THBS-1: Thrombospondin-1; HDAC: Histone deacetyla-tion; DNMT: DNA methyltransferase.
Competing interestsThe authors declare that they have no competing interests.
Authors' contributionsQY designed cellular and molecular experiments, performed molecular experiments,and drafted the manuscript. YT and LJG performed cellular experients. KRO,AC, and HRS participated in the design of the study and revised the manuscript.LAG participated in the design of the study, study coordination, and revised themanuscript critically. SLC participated in the overall design, study coordinationand finalized the draft of the manuscript. All authors read and approved thefinal manuscript.
AcknowledgementsThis work was supported in part by the Neuroblastoma Children's Cancer Society(SLC), Little Heroes Cancer Research Fund (SLC), Alex's Lemonade Stand (SLC), and Children's Cancer Fund (QY). We would like to thank Amy Gill for technical assistance.
Author Details1Department of Pediatrics, University of Chicago, 900 Ease 57th Street, KCBD Rm. 5240, Chicago, IL 60637, USA, 2Department of Medicine, University of Chicago, 900 Ease 57th Street, KCBD Rm. 7230, Chicago, IL 60637, USA, 3Department of Medicine, University of Chicago, 900 Ease 57th Street, KCBD Rm. 7124, Chicago, IL 60637, USA and 4Department of Pediatrics, University of Chicago, 900 Ease 57th Street, KCBD Rm. 5100, Chicago, IL 60637, USA
References1. Maris JM, Hogarty MD, Bagatell R, Cohn SL: Neuroblastoma. Lancet 2007,
369:2106-20.2. Brodeur GM, Maris JM: Neuroblastoma. Principles and Practice of
Pediatric Oncology. 4th edition. Edited by: Pizzo PA, Poplack DG. Philadelphia: Lippincott-Raven; 2001:895-937.
3. Yang Q, Zage P, Kagan D, Tian Y, Seshadri R, Salwen HR, Liu S, Chlenski A, Cohn SL: Association of epigenetic inactivation of RASSF1A with poor outcome in human neuroblastoma. Clin Cancer Res 2004, 10:8493-500.
4. Yang Q, Kiernan CM, Tian Y, Salwen HR, Chlenski A, Brumback BA, London WB, Cohn SL: Methylation of CASP8, DCR2, and HIN-1 in neuroblastoma is associated with poor outcome. Clin Cancer Res 2007, 13:3191-7.
5. Teitz T, Wei T, Valentine MB, Vanin EF, Grenet J, Valentine VA, Behm FG, Look AT, Lahti JM, Kidd VJ: Caspase 8 is deleted or silenced preferentially in childhood neuroblastomas with amplification of MYCN. Nature Medicine 2000, 6:529-35.
6. Yang Q, Tian Y, Liu S, Zeine R, Chlenski A, Salwen HR, Henkin J, Cohn SL: Thrombospondin-1 peptide ABT-510 combined with valproic acid is an effective antiangiogenesis strategy in neuroblastoma. Cancer Res 2007, 67:1716-24.
7. Reynolds CP, Tomayko MM, Donner L, Helson L, Seeger RC, Triche TJ, Brodeur GM: Biological classification of cell lines derived from human extra-cranial neural tumors. Prog Clin Biol Res 1988, 271:291-306.
8. Foley J, Cohn SL, Salwen HR, Chagnovich D, Cowan J, Mason KL, Parysek LM: Differential expression of N-myc in phenotypically distinct subclones of a human neuroblastoma cell line. Cancer Res 1991, 51:6338-45.
9. Issa JP: CpG island methylator phenotype in cancer. Nat Rev Cancer 2004, 4:988-93.
10. Abe M, Ohira M, Kaneda A, Yagi Y, Yamamoto S, Kitano Y, Takato T, Nakagawara A, Ushijima T: CpG island methylator phenotype is a strong
determinant of poor prognosis in neuroblastomas. Cancer Res 2005, 65:828-34.
11. Abe M, Watanabe N, McDonell N, Takato T, Ohira M, Nakagawara A, Ushijima T: Identification of genes targeted by CpG island methylator phenotype in neuroblastomas, and their possible integrative involvement in poor prognosis. Oncology 2008, 74:50-60.
12. Abe M, Westermann F, Nakagawara A, Takato T, Schwab M, Ushijima T: Marked and independent prognostic significance of the CpG island methylator phenotype in neuroblastomas. Cancer Lett 2007, 247:253-8.
13. Yang QW, Liu S, Tian Y, Salwen HR, Chlenski A, Weinstein J, Cohn SL: Methylation-associated Silencing of the Thrombospondin-1 Gene in Human Neuroblastoma. Cancer Res 2003, 63:6299-310.
14. Schmidt ML, Salwen HR, Manohar CF, Ikegaki N, Cohn SL: The biologic effects of antisense N-myc expression in human neuroblastoma. Cell Growth & Differ 1994, 5:171-8.
15. Chlenski A, Liu S, Crawford SE, Volpert OV, DeVries GH, Evangelista A, Yang Q, Salwen HR, Farrer R, Bray J, Cohn SL: SPARC is a key Schwannian-derived inhibitor controlling neuroblastoma tumor angiogenesis. Cancer Res 2002, 62:7357-63.
16. Suzuki M, Hao C, Takahashi T, Shigematsu H, Shivapurkar N, Sathyanarayana UG, Iizasa T, Fujisawa T, Hiroshima K, Gazdar AF: Aberrant methylation of SPARC in human lung cancers. Br J Cancer 2005, 92:942-8.
17. Hesson LB, Cooper WN, Latif F: Evaluation of the 3p21.3 tumour-suppressor gene cluster. Oncogene 2007, 26:7283-301.
18. Liu XQ, Chen HK, Zhang XS, Pan ZG, Li A, Feng QS, Long QX, Wang XZ, Zeng YX: Alterations of BLU, a candidate tumor suppressor gene on chromosome 3p21.3, in human nasopharyngeal carcinoma. Int J Cancer 2003, 106:60-5.
19. Wales MM, Biel MA, el DW, Nelkin BD, Issa JP, Cavenee WK, Kuerbitz SJ, Baylin SB: p53 activates expression of HIC-1, a new candidate tumour suppressor gene on 17p13.3. Nat Med 1995, 1:570-7.
20. Zhang B, Chambers KJ, Leprince D, Faller DV, Wang S: Requirement for chromatin-remodeling complex in novel tumor suppressor HIC1-mediated transcriptional repression and growth control. Oncogene 2009, 28:651-61.
21. Nicoll G, Crichton DN, McDowell HE, Kernohan N, Hupp TR, Thompson AM: Expression of the Hypermethylated in Cancer gene (HIC-1) is associated with good outcome in human breast cancer. Br J Cancer 2001, 85:1878-82.
22. Zhang J, Liu L, Pfeifer GP: Methylation of the retinoid response gene TIG1 in prostate cancer correlates with methylation of the retinoic acid receptor beta gene. Oncogene 2004, 23:2241-9.
23. Jing C, El-Ghany MA, Beesley C, Foster CS, Rudland PS, Smith P, Ke Y: Tazarotene-induced gene 1 (TIG1) expression in prostate carcinomas and its relationship to tumorigenicity. J Natl Cancer Inst 2002, 94:482-90.
24. Krop IE, Sgroi D, Porter DA, Lunetta KL, LeVangie R, Seth P, Kaelin CM, Rhei E, Bosenberg M, Schnitt S, Marks JR, Pagon Z, Belina D, Razumovic J, Polyak K: HIN-1, a putative cytokine highly expressed in normal but not cancerous mammary epithelial cells. Proc Natl Acad Sci USA 2001, 98:9796-801.
25. Krop I, Parker MT, Bloushtain-Qimron N, Porter D, Gelman R, Sasaki H, Maurer M, Terry MB, Parsons R, Polyak K: HIN-1, an inhibitor of cell growth, invasion, and AKT activation. Cancer Res 2005, 65:9659-69.
Pre-publication historyThe pre-publication history for this paper can be accessed here:http://www.biomedcentral.com/1471-2407/10/286/prepub
doi: 10.1186/1471-2407-10-286Cite this article as: Yang et al., Epigenetic alterations differ in phenotypically distinct human neuroblastoma cell lines BMC Cancer 2010, 10:286
Received: 8 January 2010 Accepted: 14 June 2010 Published: 14 June 2010This article is available from: http://www.biomedcentral.com/1471-2407/10/286© 2010 Yang et al; licensee BioMed Central Ltd. This is an Open Access article distributed under the terms of the Creative Commons Attribution License (http://creativecommons.org/licenses/by/2.0), which permits unrestricted use, distribution, and reproduction in any medium, provided the original work is properly cited.BMC Cancer 2010, 10:286