ancient divergence in bathypelagic lake tanganyika deepwater cichlids: mitochondrial phylogeny of...
TRANSCRIPT
Ancient Divergence in Bathypelagic Lake Tanganyika Deepwater Cichlids:
Mitochondrial Phylogeny of the Tribe Bathybatini
Stephan Koblmuller,1 Nina Duftner,1 Cyprian Katongo,1,2 Harris Phiri,3 Christian Sturmbauer1
1 Department of Zoology, Karl-Franzens-University of Graz, Universitatsplatz 2, A-8010 Graz, Austria2 Department of Biological Sciences, University of Zambia, P.O. 32379, Lusaka, Zambia3 Department of Research and Specialist Services, Fisheries Research Division, Ministry of Agriculture, Food and Fisheries, P.O. Box 55,
Mpulungu, Zambia
Received: 29 January 2004 / Accepted: 9 September 2004 [Reviewing Editor: Dr. Axel Meyer]
Abstract. The cichlid species flock of Lake Tang-anyika represents a polyphyletic assemblage of eightancestral lineages, which colonized the emerging lakeindependently. Our study is focused on one of theselineages, the Bathybatini, a tribe of specializedpiscivorous cichlids of the deep pelagic zone. Byanalyzing three mtDNA gene segments of all eightspecies of the tribe and two species of the closelyrelated Trematocarini, we propose on the basis of alinearized tree analysis that the Bathybatini comprisetwo distinct lineages, the genera Hemibates andBathybates, that seeded the primary lacustrineTanganyika radiation independently. The genusHemibates is likely to represent a distinct lineage thatemerged simultaneously with the tribe Trematocariniand the genus Bathybates and should be thereforetreated as a distinct tribe. Within the genus Bathy-bates, B. minor clearly represents the most ancestralsplit and is likely to have diverged from the remainingspecies in the course of the ‘‘primary lacustrineTanganyika radiation’’ during which also the radia-tions of the Lamprologini and the H-lineage tookplace. The remaining ‘‘large’’ Bathybates species alsodiversified almost simultaneously and in step with thediversification of other Tanganyikan lineages—theLimnochromini and Cyprichromini—with B. grauerioccupying the most ancestral branch, suggesting thatthese were induced by the same environmental
changes. The lack of geographic color morphs sug-gests that competition and resource partitioning, ra-ther than allopatric speciation, promoted speciationwithin the genus Bathybates.
Key words: Adaptive radiation — mtDNA se-quences — Control region — Cytochrome b —NADH dehydrogenase subunit 2 — Resource parti-tioning
Introduction
The Great East African lakes are excellent modelsystems for the study of adaptive radiation. Each ofthose lakes is inhabited by flocks of cichlid fishescounting hundreds of endemic species, which evolvedindependently via intralacustrine speciation (Kocheret al. 1993; Meyer 1993). With an age of 9–12 Myr,Lake Tanganyika is by far the oldest of the Africanlakes, containing the morphologically, ecologically,and behaviorally most complex species flock ofcichlid fishes, with about 200 described species in 54genera and several more awaiting scientific descrip-tion (Poll 1986; Snoeks 2000; Turner et al. 2001). TheLake Tanganyika basin has a long and complexgeological history. The formation of the lake inter-rupted the flow of the ancient Proto-Malagarazi-Congo River and progressed in step with the forma-
Correspondence to: Christian Sturmbauer; email: christian.stur-
J Mol Evol (2005) 60:297–314DOI: 10.1007/s00239-004-0033-8
tion of the East African rift valley (Tiercelin andMondeguer 1991). The eight seeding lineages for theLake Tanganyika cichlid fish radiation (Salzburgeret al. 2002) may thus have originated from the Proto-Malagarazi-Congo River and other tributaries of thebasin catchment. According to the time estimate ofTiercelin and Mondeguer (1991) for the establish-ment of deepwater conditions, the primary lacustrineradiation, during which species adapted to the newlyavailable ecological niches, can thus be constrained toabout 5–6 MYA. The dynamic basin morphology ischaracterized by repeated lake level fluctuationscaused by changes in precipitation and temperature(Scholz and Rosendahl 1988; Tiercelin and Monde-guer 1992; Cohen et al. 1993, 1997; Lezzar et al. 1996;Scholz et al. 2003). The importance of lake levelfluctuations as modulators of gene flow, on the onehand, and diversification, on the other hand, has beendemonstrated by a series of recent studies (Sturm-bauer and Meyer 1992; Rossiter 1995; Verheyen et al.1996; Sturmbauer et al. 1997, 2001, 2003; Sturmbauer1998; Ruber et al. 2001; Baric et al. 2003). The phy-logeny of Lake Tanganyika cichlids has been ad-dressed by comparative morphological (Stiassny1991; Takahashi 2003a,b), lepidological (Lippitsch1998), and allozyme (Nishida 1991, 1997) analysisand on the basis of mtDNA sequences (Sturmbauerand Meyer 1993; Sturmbauer et al. 1994; Salzburgeret al. 2002; Koblmuller et al. 2004) and SINEs (Ta-kahashi et al. 1998, 2001; Terai et al. 2003). Theseefforts to clarify the phylogenetic relationships of theLake Tanganyika cichlid species flock have resultedin a detailed phylogenetic hypothesis for the interre-lationships of all 12 cichlid tribes in the lake (Salz-burger et al. 2002). However, the phylogeneticrelationships within and among two of the ancestralseeding lineages, the Bathybatini and Trematocarini,still remain unclear.The tribe Bathybatini comprises piscivorous
deepwater cichlids endemic to Lake Tanganyika. Itcontains two genera, the monotypic species Hemi-bates stenosoma and seven species of the genusBathybates (Coulter 1991). Very little is known aboutthe biology of the Bathybatini. Except for Bathybatesminor, the Bathybatini are rather large cichlids, of amaximum size between almost 30 and more than 40cm. All species are maternal mouthbrooders (Ku-wamura 1997) and produce some of the largestcichlid eggs known (7 mm [Konings 1998]). Strongsexual dichromatism is found within the Bathybatini:While females have silvery body coloration, malesshow a species-specific pattern of dark blotches andstripes. Despite the lakewide distribution of allbathybatine species, distinct color morphs are knownonly in Hemibates stenosoma. For this species twocolor variants of males have been described whichoccur in sympatry: Some display distinct dark bars on
the anterior part of the flank, while others haveirregular black blotches (Konings 1998). Whetherthese two phenotypes represent morphs of a singlepolychromatic species or distinct sister species is notknown to date.At present, the phylogenetic relationships of the
Bathybatini to other African cichlid lineages areuncertain. Poll (1986) recognized the Bathybatini andthe Trematocarini as two distinct tribes. Two morerecent works suggest that the genus Hemibates is thesister group to both the Trematocarini and the genusBathybates (Stiassny 1981; Takahashi 2003b). Basedon allozyme data, Nishida (1997) confirmed Poll�s(1986) classification and described a clade consistingof the tribe Trematocarini and the tribe Bathybatini,consisting of the sister genera Bathybates and Hemi-bates. In summary, while each of the studies citedabove demonstrated the monophyly of the Tremat-ocarini, there is considerable disagreement about themonophyly of the two genera presently included inthe tribe Bathybatini. The present study is the first touse mitochondrial DNA sequence data to address thephylogenetic relationships among all species of thetribe Bathybatini and their relationships to theremaining tribes of the Tanganyikan cichlid speciesflock. In addition, the evolutionary characteristicsand phylogenetic performance of three mitochondrialgene segments were evaluated.
Materials and Methods
DNA Extraction, Amplification, and Sequencing
This study is based on a total of 56 individuals, including all 8
described species of the tribe Bathybatini (23 individuals), 2 species
of the presumably closely related tribe Trematocarini, and several
potential outgroup taxa from elsewhere in Africa published earlier
(Table 1, Fig. 1). All taxa of the Bathybatini and Trematocarini
were caught in the years 1992 to 2003 during several expeditions to
Lake Tanganyika. Voucher specimens are available from the au-
thors.
We analyzed 1047 bp of the entire NADH dehydrogenase
subunit 2 gene (ND2) of 51 specimens (including outgroup taxa), a
362-bp segment of the most variable part of the control region (D-
loop) of 29 specimens (including outgroup taxa), and 402 bp of the
cytochrome b gene (cyt b) of 27 specimens (including outgroup
taxa). When available, previously published sequences were used
(Sturmbauer and Meyer 1993; Sturmbauer et al. 1994; Kocher et al.
1995; Kumazawa et al. 1999; Klett and Meyer 2002; Koblmuller
et al. 2004) (for accession numbers see Table 1).
Total DNA extraction from ethanol preserved fin-clips or white
muscle tissue, polymerase chain reaction (PCR), and chain termi-
nation sequencing followed standard protocols (Walsh et al. 1991;
Salzburger et al. 2002; Koblmuller et al. 2004). As primers for both
amplification and sequencing of the control region we used L-Pro-
F (Koblmuller et al. 2004) and TDK-D (Kocher et al. 1989). For
cytochrome b we used the primers L14724 and H15149 (Kocher et
al. 1989), and for ND2 we used the primers MET, ND2.2A, and
TRP (Kocher et al. 1995) as well as the newly designed primer
ND2.T-R, 5¢GGGGCTTTTGTTCAGGATGT3¢. Both strands
were sequenced and visualized on an ABI 3100 Sequencer (Applied
298
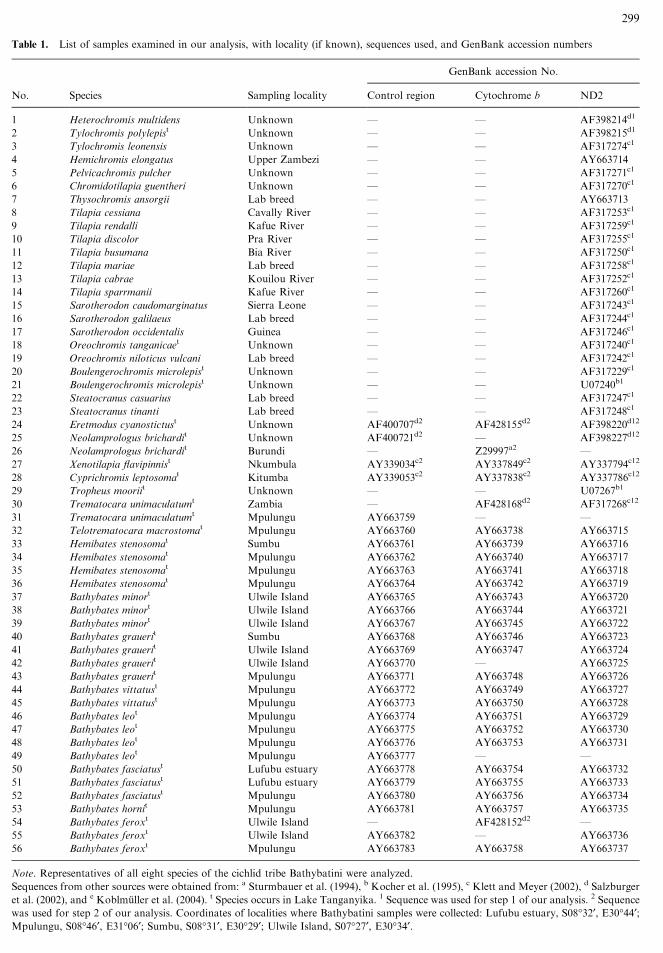
Table 1. List of samples examined in our analysis, with locality (if known), sequences used, and GenBank accession numbers
GenBank accession No.
No. Species Sampling locality Control region Cytochrome b ND2
1 Heterochromis multidens Unknown — — AF398214d1
2 Tylochromis polylepist Unknown — — AF398215d1
3 Tylochromis leonensis Unknown — — AF317274c1
4 Hemichromis elongatus Upper Zambezi — — AY663714
5 Pelvicachromis pulcher Unknown — — AF317271c1
6 Chromidotilapia guentheri Unknown — — AF317270c1
7 Thysochromis ansorgii Lab breed — — AY663713
8 Tilapia cessiana Cavally River — — AF317253c1
9 Tilapia rendalli Kafue River — — AF317259c1
10 Tilapia discolor Pra River — — AF317255c1
11 Tilapia busumana Bia River — — AF317250c1
12 Tilapia mariae Lab breed — — AF317258c1
13 Tilapia cabrae Kouilou River — — AF317252c1
14 Tilapia sparrmanii Kafue River — — AF317260c1
15 Sarotherodon caudomarginatus Sierra Leone — — AF317243c1
16 Sarotherodon galilaeus Lab breed — — AF317244c1
17 Sarotherodon occidentalis Guinea — — AF317246c1
18 Oreochromis tanganicaet Unknown — — AF317240c1
19 Oreochromis niloticus vulcani Lab breed — — AF317242c1
20 Boulengerochromis microlepist Unknown — — AF317229c1
21 Boulengerochromis microlepist Unknown — — U07240b1
22 Steatocranus casuarius Lab breed — — AF317247c1
23 Steatocranus tinanti Lab breed — — AF317248c1
24 Eretmodus cyanostictust Unknown AF400707d2 AF428155d2 AF398220d12
25 Neolamprologus brichardit Unknown AF400721d2 — AF398227d12
26 Neolamprologus brichardit Burundi — Z29997a2 —
27 Xenotilapia flavipinnist Nkumbula AY339034c2 AY337849c2 AY337794c12
28 Cyprichromis leptosomat Kitumba AY339053c2 AY337838c2 AY337786c12
29 Tropheus mooriit Unknown — — U07267b1
30 Trematocara unimaculatumt Zambia — AF428168d2 AF317268c12
31 Trematocara unimaculatumt Mpulungu AY663759 — —
32 Telotrematocara macrostomat Mpulungu AY663760 AY663738 AY663715
33 Hemibates stenosomat Sumbu AY663761 AY663739 AY663716
34 Hemibates stenosomat Mpulungu AY663762 AY663740 AY663717
35 Hemibates stenosomat Mpulungu AY663763 AY663741 AY663718
36 Hemibates stenosomat Mpulungu AY663764 AY663742 AY663719
37 Bathybates minort Ulwile Island AY663765 AY663743 AY663720
38 Bathybates minort Ulwile Island AY663766 AY663744 AY663721
39 Bathybates minort Ulwile Island AY663767 AY663745 AY663722
40 Bathybates grauerit Sumbu AY663768 AY663746 AY663723
41 Bathybates grauerit Ulwile Island AY663769 AY663747 AY663724
42 Bathybates grauerit Ulwile Island AY663770 — AY663725
43 Bathybates grauerit Mpulungu AY663771 AY663748 AY663726
44 Bathybates vittatust Mpulungu AY663772 AY663749 AY663727
45 Bathybates vittatust Mpulungu AY663773 AY663750 AY663728
46 Bathybates leot Mpulungu AY663774 AY663751 AY663729
47 Bathybates leot Mpulungu AY663775 AY663752 AY663730
48 Bathybates leot Mpulungu AY663776 AY663753 AY663731
49 Bathybates leot Mpulungu AY663777 — —
50 Bathybates fasciatust Lufubu estuary AY663778 AY663754 AY663732
51 Bathybates fasciatust Lufubu estuary AY663779 AY663755 AY663733
52 Bathybates fasciatust Mpulungu AY663780 AY663756 AY663734
53 Bathybates hornit Mpulungu AY663781 AY663757 AY663735
54 Bathybates feroxt Ulwile Island — AF428152d2 —
55 Bathybates feroxt Ulwile Island AY663782 — AY663736
56 Bathybates feroxt Mpulungu AY663783 AY663758 AY663737
Note. Representatives of all eight species of the cichlid tribe Bathybatini were analyzed.
Sequences from other sources were obtained from: a Sturmbauer et al. (1994), b Kocher et al. (1995), c Klett and Meyer (2002), d Salzburger
et al. (2002), and e Koblmuller et al. (2004). t Species occurs in Lake Tanganyika. 1 Sequence was used for step 1 of our analysis. 2 Sequence
was used for step 2 of our analysis. Coordinates of localities where Bathybatini samples were collected: Lufubu estuary, S08�32¢, E30�44¢;Mpulungu, S08�46¢, E31�06¢; Sumbu, S08�31¢, E30�29¢; Ulwile Island, S07�27¢, E30�34¢.
299
Biosystems). All new sequences are available from GenBank under
the accession numbers given in Table 1.
Phylogenetic Analyses
Alignment of the DNA sequences was performed using Clustal X
(Thompson et al. 1997) and improved by eye for the control region.
For all data sets a likelihood mapping analysis (Strimmer and von
Haeseler 1997) using the program TREE-PUZZLE 5.1 (Schmidt
et al. 2001) was performed to visualize the strength of the overall
phylogenetic signal. For phylogenetic reconstruction we applied
maximum parsimony (MP), neighbor joining (NJ), and maximum
likelihood (ML) in parallel using the PAUP* program package
(version 4.0b5; Swofford 2002). To evaluate an appropriate sub-
stitution model for NJ and ML analysis, we calculated hierarchical
likelihood ratio test statistics (Huelsenbeck and Crandall 1997)
using the programModeltest 3.06 (Posada and Crandall 1998). For
obtaining MP and ML topologies we applied heuristic search
procedures with random addition of taxa and TBR branch swap-
ping (1000 replicates for MP, 100 replicates for ML). As standard
measures of confidence we applied bootstrapping (1000
pseudoreplicates for NJ and MP) and quartet puzzling (Strimmer
and von Haeseler 1996; 10,000 random quartets for ML). Phylo-
genetic relationships were also reconstructed by Bayesian inference
using MrBayes 3.0b4 (Huelsenbeck and Ronquist 2001). Posterior
probabilities were obtained from a 2-million-generation Metropo-
lis-coupled Markov chain Monte Carlo simulation (10 chains;
chain temperature, 0.2; trees sampled every 100 generations), with
parameters estimated from the data set. A 50% majority-rule
consensus tree was constructed after a 1-million-generation burn-in
to allow likelihood values to reach stationarity.
In the first step of analysis we aimed to position the tribe
Bathybatini within the phylogenetic framework of the African
cichlids and to determine the most appropriate outgroup for a
detailed analysis of the Bathybatini. To this end we used 34 ND2
sequences, representing 3 species of the Bathybatini, 2 species of the
tribe Trematocarini, 1 species of the tribes Eretmodini, Lamprol-
ogini, Cyprichromini, Ectodini, and Tropheini, 15 species of the
tribe Tilapiini, 2 species of the tribe Tylochromini, and the West
African cichlids Hemichromis elongatus, Thysochromis ansorgii,
Pelvicachromis pulcher, and Chromidotilapia guentheri. As out-
group we used the West African cichlid species Heterochromis
multidens. To evaluate the degree of saturation of transition and
transversion mutations for each codon postition of the ND2 gene,
we plotted the absolute number of the two types of mutations
against the percentage of sequence divergence of 528 pairwise dis-
tances (uncorrected p-distances; data not shown), excluding the
outgroup taxon Heterochromis multidens. A weighted MP analysis
was performed for this ND2 data set, in which transitions at the
third codon position were weighted 1:8 with respect to transver-
sions, based on the estimated transition/transversion ratio (TI/TV
ratio) of 7.8554. Transitions in third codon positions of fourfold
degenerate amino acid sites and synonymous transitions at first
positions of leucine codons were excluded because of the demon-
strated effect of saturation. The hierarchical likelihood ratio test
(Huelsenbeck and Crandall 1997) justified the use of the GTR
model of molecular evolution (Yang 1994), including invariable
sites (I) and a gamma correction (G) for NJ and ML analysis. Weapplied the proportion of invariable sites of 0.3733, the gamma
shape parameter 0.8925, and the following base frequencies: A,
0.3073; C, 0.3665; G, 0.1001; and T, 0.2259. To depict a clock-
constrained tree showing major diversification events among the
major lineages of African cichlids, we applied the linearized tree
method, as described by Takezaki et al. (1995), implemented in the
program LINTRE (Takezaki et al. 1995). We excluded all taxa
with a significantly deviating rate of base substitution after carrying
out the branch length test, implemented in the program LINTRE.
To find the most appropriate outgroup we performed weighted MP
analyses using selected taxa of distinct monophyletic groups, based
on the previous analysis, and compared the resulting topologies.
Outgroup set 1 consisted of Tilapia cessiana and T. rendalli, out-
group 2 contained Boulengerochromis microlepis, outgroup 3
comprised Sarotherodon caudomarginatus, S. galilaeus, and Oreo-
chromis tanganicae, and outgroup 4 included Eretmodus cyanos-
tictus, Neolamprologus brichardi, Xenotilapia flavipinnis, and
Cyprichromis leptosoma. Since the topologies did not change with
respect to the chosen outgroup taxa (trees not shown) we decided
to use Eretmodus cyanostictus, Neolamprologus brichardi, Xenoti-
lapia flavipinnis, and Cyprichromis leptosoma, four representatives
of another monophyletic assemblage of the Tanganyika radiation,
as outgroup taxa for all further analyses.
In the second step of analysis we focused on the phylogeny
within the tribe Bathybatini and its relationship to the closely re-
lated tribe Trematocarini. To this end we analyzed each of the three
mitochondrial genes separately, as well as a data set combining all
three genes. Based on the results of the first step we chose Eretm-
odus cyanostictus, Neolamprologus brichardi, Cyprichromis lepto-
soma, and Xenotilapia flavipinnis as outgroup taxa. The most
appropriate substitution model for each data set, estimated using
the program Modeltest 3.06 (Posada and Crandall 1998), was
TrN+I+G (Tamura and Nei 1993) for the ND2 data set,
K81uf+G (Kimura 1981) for the cyt b data set, HKY+G (Ha-
segawa et al. 1985) for the control region, and HKY+I+G for thecombined data set. The estimated likelihood parameters were as
follows: For ND2 we obtained the following base frequencies: A,
0.2629; C, 0.3533; G, 0.1153; and T, 0.2685. The proportion of
invariable sites (I) was 0.4838, and the gamma shape parameter awas estimated as 1.4782. For cyt b we estimated A, 0.2573; C,
0.3307; G, 0.1427; T, 0.2693; and a, 0.1812, for the control regionA, 0.3752; C, 0.2040; G, 0.1222; T, 0.2986; and a, 0.3164. The basefrequencies for the combined data set were A, 0.2904; C, 0.3022; G,
0.1326; and T, 0.2748. The proportion of invariable sites amounted
to 0.4613 and a was estimated as 0.9871. For MP analysis transi-tions and transversions at third codon positions were weighted 1:6
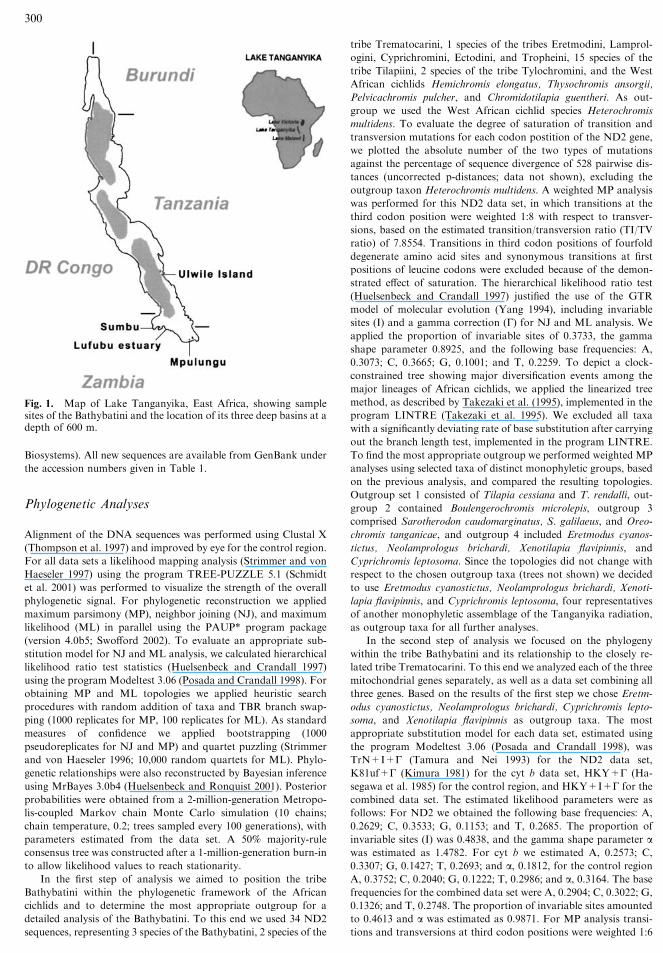
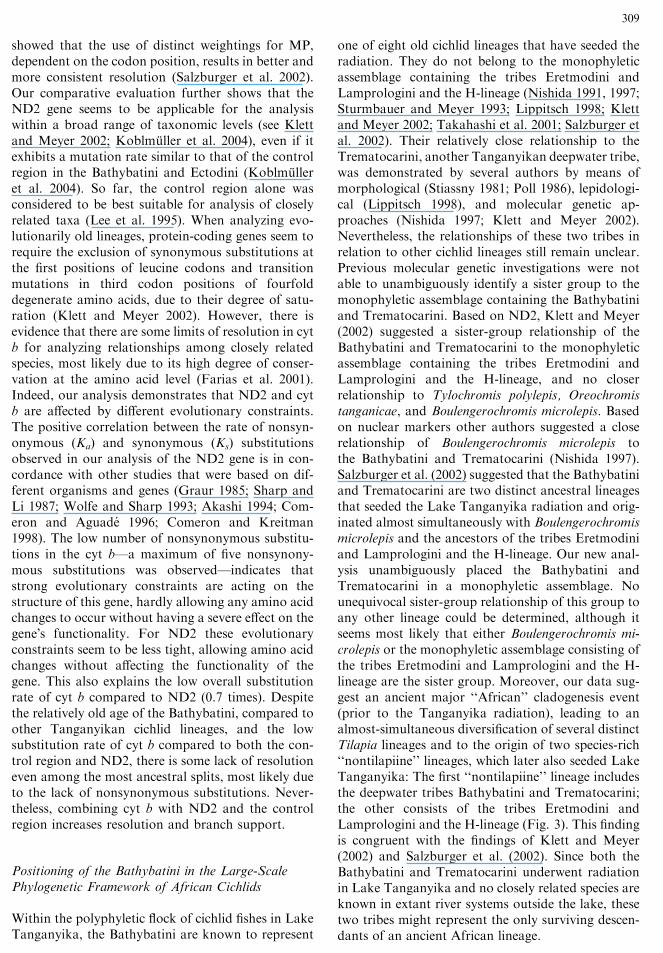
Fig. 1. Map of Lake Tanganyika, East Africa, showing samplesites of the Bathybatini and the location of its three deep basins at adepth of 600 m.
300
for ND2 and 1:12 for cyt b, based on the estimated TI/TV ratio of
5.9882 for ND2 and 12.0462 for cyt b. Transversions at third codon
positions of fourfold degenerate amino acids were down-weighted
two times more than transversions at third codon positions of
twofold degenerate amino acids according to the estimated TI/TV
ratio of 3.0382 for ND2 and 5.8187 for cyt b. C/T substitutions at
the first codon position of leucine were treated as a fifth base and
down-weighted to the same weight as transitions at the third codon
positions. To evaluate if the two protein coding genes ND2 and cyt
b are affected by different evolutionary constraints, we estimated
the numbers of synonymous (Ks) and nonsynonymous (Ka) sub-
stitutions per site for all members of the tribe Bathybatini using the
computer program DnaSP version 4.0 (Rozas et al. 2003). This
comparative analysis was based on a 24-taxon set for ND2 and a 23
taxon set for cyt b, including all available bathybatine sequences
plus two representatives of the tribe Trematocarini (Trematocara
unimaculatum, Telotrematocara macrostoma).
To find themost appropriateweighting for the control region and
to investigate the effect of different weightings on the tree topology,
we applied four different weighting schemes and compared the
resulting MP topologies and consistency indices (Kluge and Farris
1969). First, we did an unweighted MP analysis followed by two
analyses in which various weightings were assigned according to
regions showing different genetic variation (low-variable, 0–10%;
high-variable, 10–20%; hypervariable, >20%). We performed a
slidingwindowanalysis (Sturmbauer andMeyer 1992) to define these
regions. According to the estimated TI/TV ratios of 4.3952 for the
low-variable regions and 1.0521 for the high-variable regions, tran-
sitions were weighted 1:4 relative to transversions in low-variable
regions and equally weighted as transversions in high-variable re-
gions. In one case transitions in hypervariable regions were weighted
1:4 with respect to transversions according to the estimatedTI/TV of
3.8622 and excluded due to their degree of saturation in the second
case. The fourth MP analysis of the control region was based on
transversions only. The combined data set, including all three genes,
was weighted according to the appropriate weighting scheme for
each gene. A four-cluster likelihoodmapping analysis (Strimmer and
vonHaeseler 1997) using the programTREE-PUZZLE5.1 (Schmidt
et al. 2001) was applied on the combined data set to evaluate the
support of distinct internal branches that are critical for the inter-
pretation of the evolutionary pathways.
In the third step we applied the linearized tree method as
described in Takezaki et al. (1995) on the ND2 data set to derive
a relative dating of major diversification events. As outgroup
taxa we used Eretmodus cyanostictus, Neolamprologus brichardi,
Cyprichromis leptosoma, and Xenotilapia flavipinnis. Constancy of
the rate of base substitution among all taxa was tested using the
branch length test implemented in the program LINTRE
(Takezaki et al. 1995) based on TrN+G (a = 0.2868) distances.
Those taxa that showed significantly different substitution rates
at the 1% level were excluded from further analyses. The
remaining taxa were used to calculate a clock-constrained tree
based on TrN+G distances using the program LINTRE (Take-
zaki et al. 1995). For a relative dating of the major diversification
events during the evolution of the Bathybatini, the mean and
standard deviation of average pairwise TrN+G distances were
calculated among the Trematocarini and the Bathybatini and
among the major lineages of this tribe.
Results
Positioning of the Bathybatini Within a RepresentativeSubset of African Cichlids
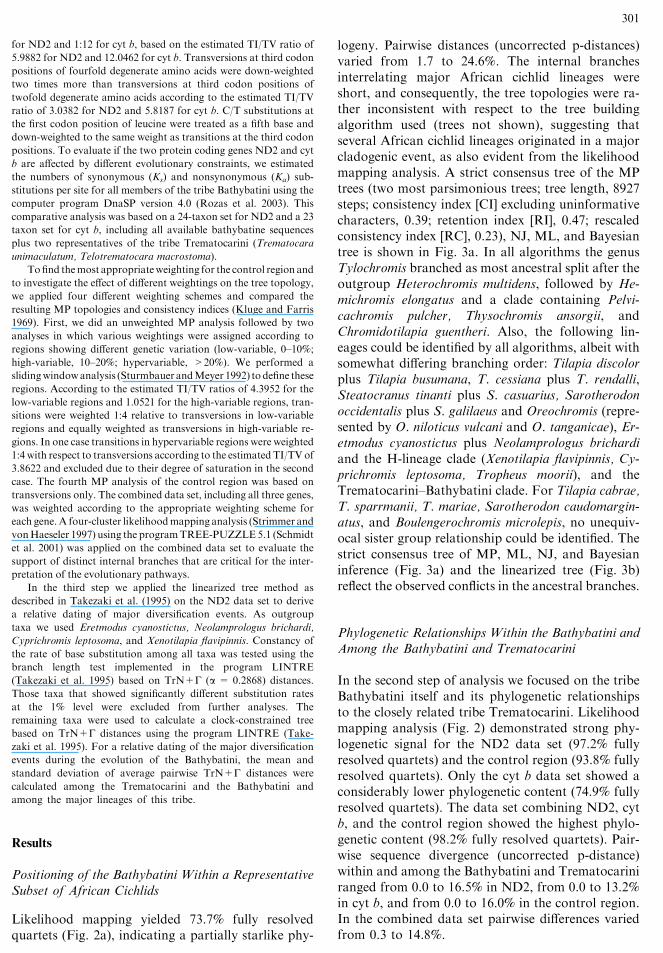
Likelihood mapping yielded 73.7% fully resolvedquartets (Fig. 2a), indicating a partially starlike phy-
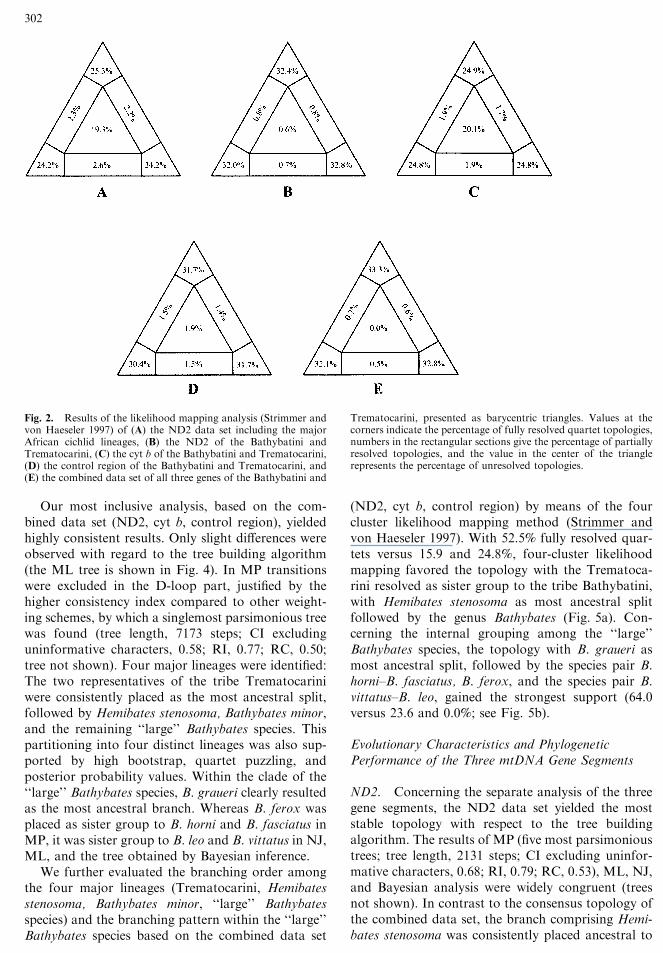
logeny. Pairwise distances (uncorrected p-distances)varied from 1.7 to 24.6%. The internal branchesinterrelating major African cichlid lineages wereshort, and consequently, the tree topologies were ra-ther inconsistent with respect to the tree buildingalgorithm used (trees not shown), suggesting thatseveral African cichlid lineages originated in a majorcladogenic event, as also evident from the likelihoodmapping analysis. A strict consensus tree of the MPtrees (two most parsimonious trees; tree length, 8927steps; consistency index [CI] excluding uninformativecharacters, 0.39; retention index [RI], 0.47; rescaledconsistency index [RC], 0.23), NJ, ML, and Bayesiantree is shown in Fig. 3a. In all algorithms the genusTylochromis branched as most ancestral split after theoutgroup Heterochromis multidens, followed by He-michromis elongatus and a clade containing Pelvi-cachromis pulcher, Thysochromis ansorgii, andChromidotilapia guentheri. Also, the following lin-eages could be identified by all algorithms, albeit withsomewhat differing branching order: Tilapia discolorplus Tilapia busumana, T. cessiana plus T. rendalli,Steatocranus tinanti plus S. casuarius, Sarotherodonoccidentalis plus S. galilaeus and Oreochromis (repre-sented by O. niloticus vulcani and O. tanganicae), Er-etmodus cyanostictus plus Neolamprologus brichardiand the H-lineage clade (Xenotilapia flavipinnis, Cy-prichromis leptosoma, Tropheus moorii), and theTrematocarini–Bathybatini clade. For Tilapia cabrae,T. sparrmanii, T. mariae, Sarotherodon caudomargin-atus, and Boulengerochromis microlepis, no unequiv-ocal sister group relationship could be identified. Thestrict consensus tree of MP, ML, NJ, and Bayesianinference (Fig. 3a) and the linearized tree (Fig. 3b)reflect the observed conflicts in the ancestral branches.
Phylogenetic Relationships Within the Bathybatini andAmong the Bathybatini and Trematocarini
In the second step of analysis we focused on the tribeBathybatini itself and its phylogenetic relationshipsto the closely related tribe Trematocarini. Likelihoodmapping analysis (Fig. 2) demonstrated strong phy-logenetic signal for the ND2 data set (97.2% fullyresolved quartets) and the control region (93.8% fullyresolved quartets). Only the cyt b data set showed aconsiderably lower phylogenetic content (74.9% fullyresolved quartets). The data set combining ND2, cytb, and the control region showed the highest phylo-genetic content (98.2% fully resolved quartets). Pair-wise sequence divergence (uncorrected p-distance)within and among the Bathybatini and Trematocariniranged from 0.0 to 16.5% in ND2, from 0.0 to 13.2%in cyt b, and from 0.0 to 16.0% in the control region.In the combined data set pairwise differences variedfrom 0.3 to 14.8%.
301
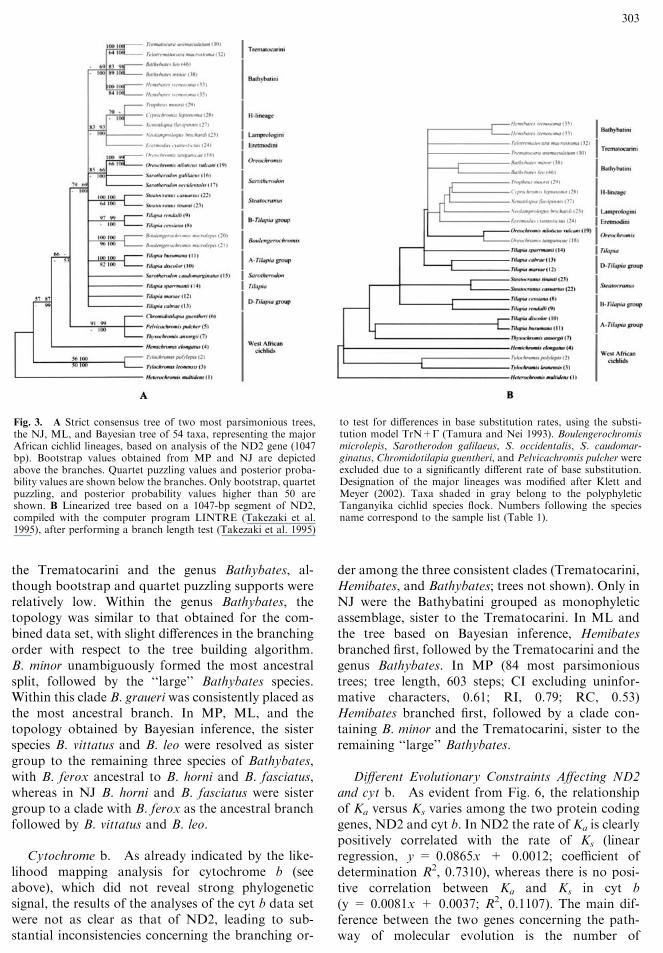
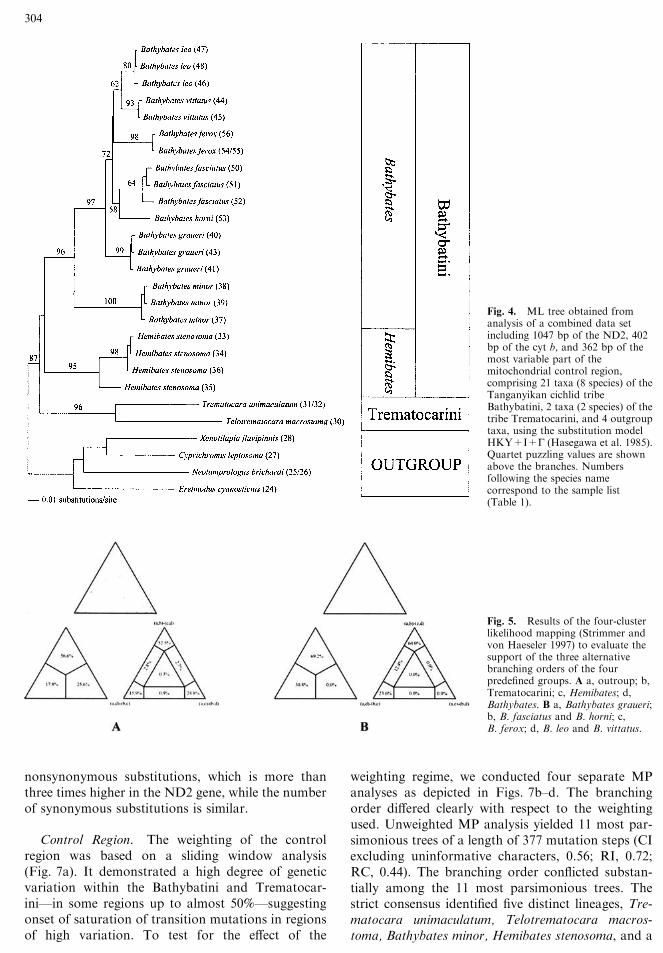
Our most inclusive analysis, based on the com-bined data set (ND2, cyt b, control region), yieldedhighly consistent results. Only slight differences wereobserved with regard to the tree building algorithm(the ML tree is shown in Fig. 4). In MP transitionswere excluded in the D-loop part, justified by thehigher consistency index compared to other weight-ing schemes, by which a singlemost parsimonious treewas found (tree length, 7173 steps; CI excludinguninformative characters, 0.58; RI, 0.77; RC, 0.50;tree not shown). Four major lineages were identified:The two representatives of the tribe Trematocariniwere consistently placed as the most ancestral split,followed by Hemibates stenosoma, Bathybates minor,and the remaining ‘‘large’’ Bathybates species. Thispartitioning into four distinct lineages was also sup-ported by high bootstrap, quartet puzzling, andposterior probability values. Within the clade of the‘‘large’’ Bathybates species, B. graueri clearly resultedas the most ancestral branch. Whereas B. ferox wasplaced as sister group to B. horni and B. fasciatus inMP, it was sister group to B. leo and B. vittatus in NJ,ML, and the tree obtained by Bayesian inference.We further evaluated the branching order among
the four major lineages (Trematocarini, Hemibatesstenosoma, Bathybates minor, ‘‘large’’ Bathybatesspecies) and the branching pattern within the ‘‘large’’Bathybates species based on the combined data set
(ND2, cyt b, control region) by means of the fourcluster likelihood mapping method (Strimmer andvon Haeseler 1997). With 52.5% fully resolved quar-tets versus 15.9 and 24.8%, four-cluster likelihoodmapping favored the topology with the Trematoca-rini resolved as sister group to the tribe Bathybatini,with Hemibates stenosoma as most ancestral splitfollowed by the genus Bathybates (Fig. 5a). Con-cerning the internal grouping among the ‘‘large’’Bathybates species, the topology with B. graueri asmost ancestral split, followed by the species pair B.horni–B. fasciatus, B. ferox, and the species pair B.vittatus–B. leo, gained the strongest support (64.0versus 23.6 and 0.0%; see Fig. 5b).
Evolutionary Characteristics and PhylogeneticPerformance of the Three mtDNA Gene Segments
ND2. Concerning the separate analysis of the threegene segments, the ND2 data set yielded the moststable topology with respect to the tree buildingalgorithm. The results of MP (five most parsimonioustrees; tree length, 2131 steps; CI excluding uninfor-mative characters, 0.68; RI, 0.79; RC, 0.53), ML, NJ,and Bayesian analysis were widely congruent (treesnot shown). In contrast to the consensus topology ofthe combined data set, the branch comprising Hemi-bates stenosoma was consistently placed ancestral to
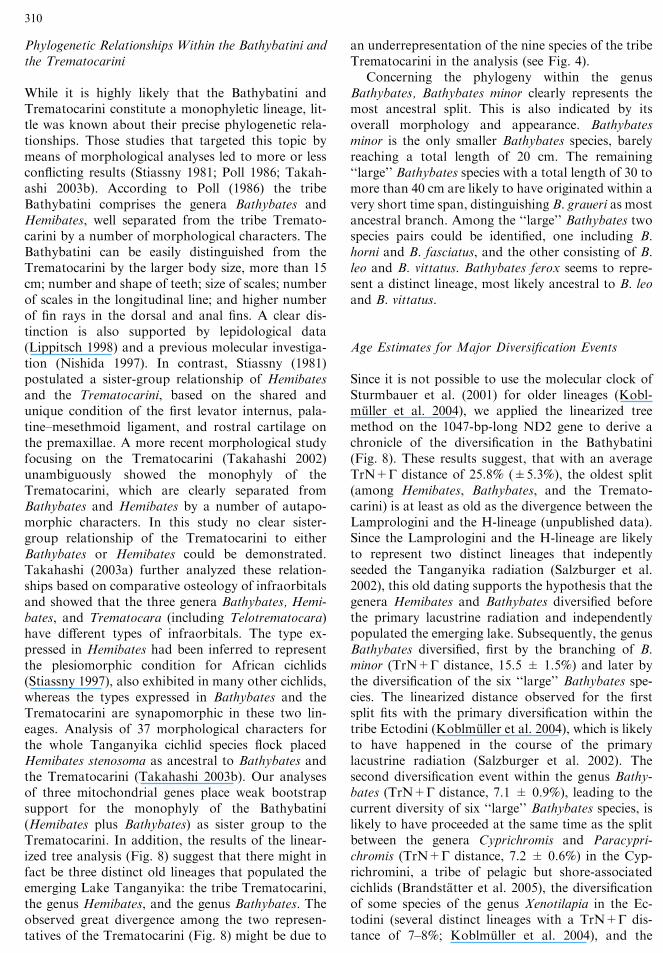
Fig. 2. Results of the likelihood mapping analysis (Strimmer andvon Haeseler 1997) of (A) the ND2 data set including the majorAfrican cichlid lineages, (B) the ND2 of the Bathybatini andTrematocarini, (C) the cyt b of the Bathybatini and Trematocarini,(D) the control region of the Bathybatini and Trematocarini, and(E) the combined data set of all three genes of the Bathybatini and
Trematocarini, presented as barycentric triangles. Values at thecorners indicate the percentage of fully resolved quartet topologies,numbers in the rectangular sections give the percentage of partiallyresolved topologies, and the value in the center of the trianglerepresents the percentage of unresolved topologies.
302
the Trematocarini and the genus Bathybates, al-though bootstrap and quartet puzzling supports wererelatively low. Within the genus Bathybates, thetopology was similar to that obtained for the com-bined data set, with slight differences in the branchingorder with respect to the tree building algorithm.B. minor unambiguously formed the most ancestralsplit, followed by the ‘‘large’’ Bathybates species.Within this clade B. graueri was consistently placed asthe most ancestral branch. In MP, ML, and thetopology obtained by Bayesian inference, the sisterspecies B. vittatus and B. leo were resolved as sistergroup to the remaining three species of Bathybates,with B. ferox ancestral to B. horni and B. fasciatus,whereas in NJ B. horni and B. fasciatus were sistergroup to a clade with B. ferox as the ancestral branchfollowed by B. vittatus and B. leo.
Cytochrome b. As already indicated by the like-lihood mapping analysis for cytochrome b (seeabove), which did not reveal strong phylogeneticsignal, the results of the analyses of the cyt b data setwere not as clear as that of ND2, leading to sub-stantial inconsistencies concerning the branching or-
der among the three consistent clades (Trematocarini,Hemibates, and Bathybates; trees not shown). Only inNJ were the Bathybatini grouped as monophyleticassemblage, sister to the Trematocarini. In ML andthe tree based on Bayesian inference, Hemibatesbranched first, followed by the Trematocarini and thegenus Bathybates. In MP (84 most parsimonioustrees; tree length, 603 steps; CI excluding uninfor-mative characters, 0.61; RI, 0.79; RC, 0.53)Hemibates branched first, followed by a clade con-taining B. minor and the Trematocarini, sister to theremaining ‘‘large’’ Bathybates.
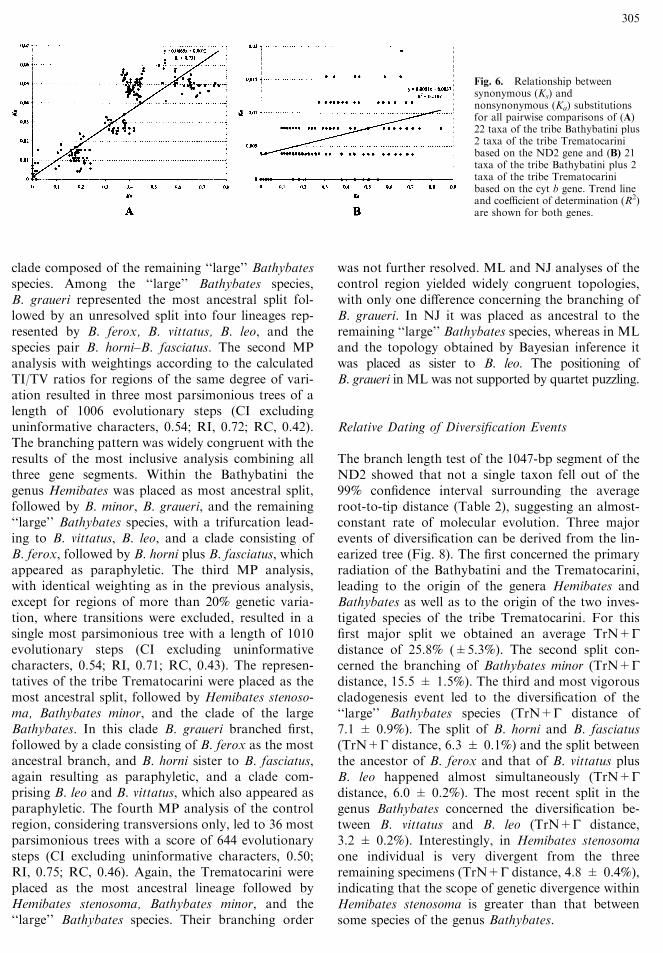
Different Evolutionary Constraints Affecting ND2and cyt b. As evident from Fig. 6, the relationshipof Ka versus Ks varies among the two protein codinggenes, ND2 and cyt b. In ND2 the rate of Ka is clearlypositively correlated with the rate of Ks (linearregression, y = 0.0865x + 0.0012; coefficient ofdetermination R2, 0.7310), whereas there is no posi-tive correlation between Ka and Ks in cyt b(y = 0.0081x + 0.0037; R2, 0.1107). The main dif-ference between the two genes concerning the path-way of molecular evolution is the number of
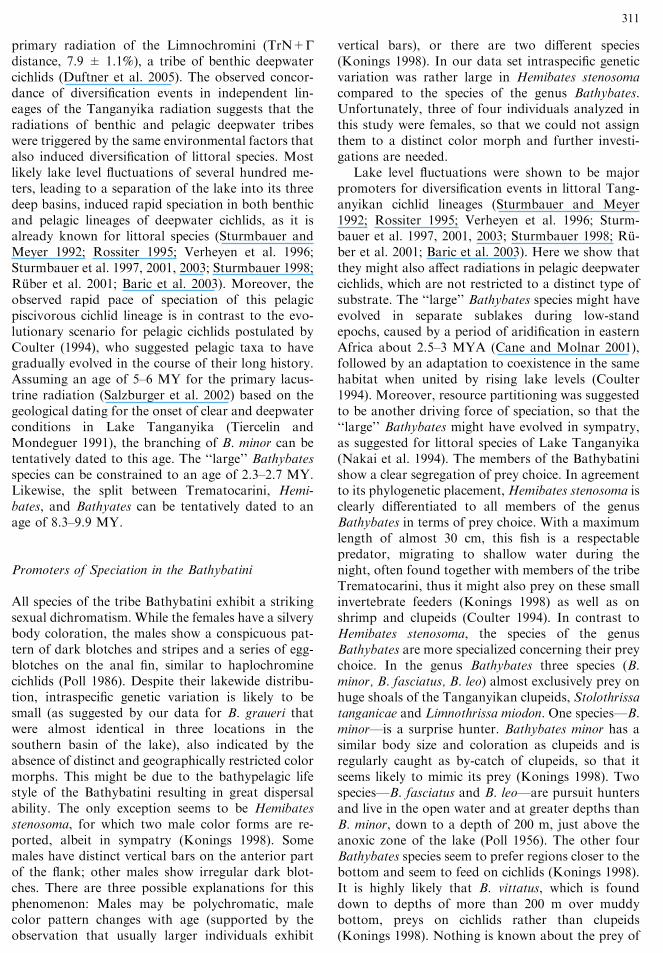
Fig. 3. A Strict consensus tree of two most parsimonious trees,the NJ, ML, and Bayesian tree of 54 taxa, representing the majorAfrican cichlid lineages, based on analysis of the ND2 gene (1047bp). Bootstrap values obtained from MP and NJ are depictedabove the branches. Quartet puzzling values and posterior proba-bility values are shown below the branches. Only bootstrap, quartetpuzzling, and posterior probability values higher than 50 areshown. B Linearized tree based on a 1047-bp segment of ND2,compiled with the computer program LINTRE (Takezaki et al.1995), after performing a branch length test (Takezaki et al. 1995)
to test for differences in base substitution rates, using the substi-tution model TrN+G (Tamura and Nei 1993). Boulengerochromismicrolepis, Sarotherodon galilaeus, S. occidentalis, S. caudomar-ginatus, Chromidotilapia guentheri, and Pelvicachromis pulcher wereexcluded due to a significantly different rate of base substitution.Designation of the major lineages was modified after Klett andMeyer (2002). Taxa shaded in gray belong to the polyphyleticTanganyika cichlid species flock. Numbers following the speciesname correspond to the sample list (Table 1).
303
nonsynonymous substitutions, which is more thanthree times higher in the ND2 gene, while the numberof synonymous substitutions is similar.
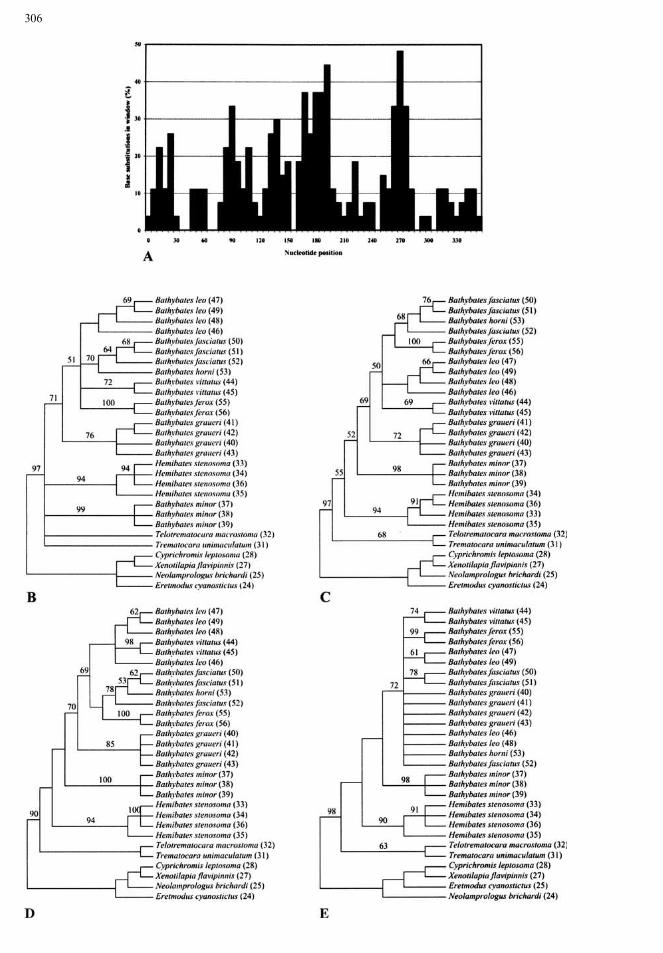
Control Region. The weighting of the controlregion was based on a sliding window analysis(Fig. 7a). It demonstrated a high degree of geneticvariation within the Bathybatini and Trematocar-ini—in some regions up to almost 50%—suggestingonset of saturation of transition mutations in regionsof high variation. To test for the effect of the
weighting regime, we conducted four separate MPanalyses as depicted in Figs. 7b–d. The branchingorder differed clearly with respect to the weightingused. Unweighted MP analysis yielded 11 most par-simonious trees of a length of 377 mutation steps (CIexcluding uninformative characters, 0.56; RI, 0.72;RC, 0.44). The branching order conflicted substan-tially among the 11 most parsimonious trees. Thestrict consensus identified five distinct lineages, Tre-matocara unimaculatum, Telotrematocara macros-toma, Bathybates minor, Hemibates stenosoma, and a
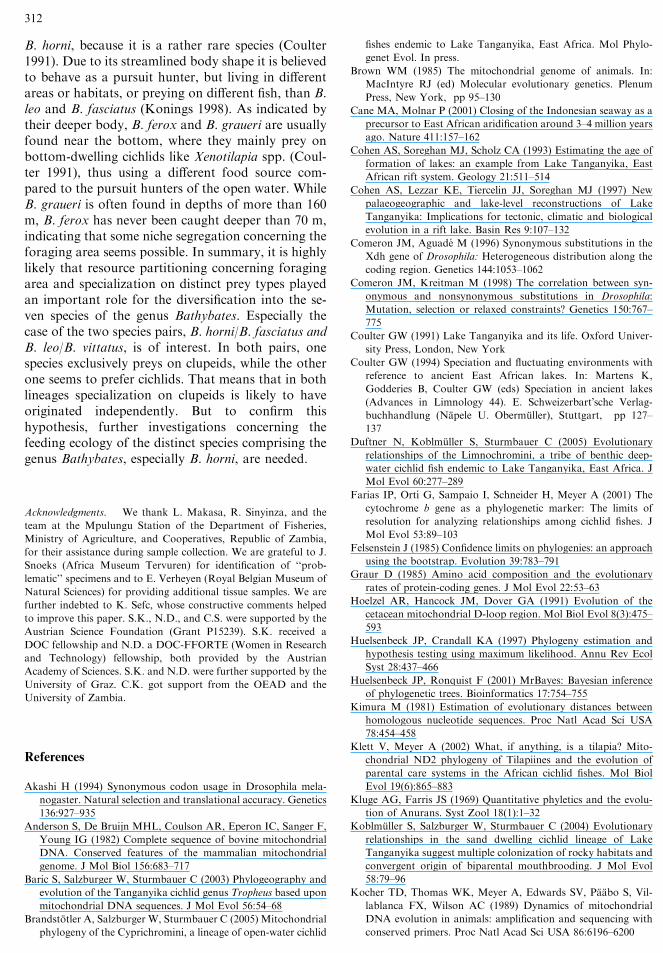
Fig. 4. ML tree obtained fromanalysis of a combined data setincluding 1047 bp of the ND2, 402bp of the cyt b, and 362 bp of themost variable part of themitochondrial control region,comprising 21 taxa (8 species) of theTanganyikan cichlid tribeBathybatini, 2 taxa (2 species) of thetribe Trematocarini, and 4 outgrouptaxa, using the substitution modelHKY+I+G (Hasegawa et al. 1985).Quartet puzzling values are shownabove the branches. Numbersfollowing the species namecorrespond to the sample list(Table 1).
Fig. 5. Results of the four-clusterlikelihood mapping (Strimmer andvon Haeseler 1997) to evaluate thesupport of the three alternativebranching orders of the fourpredefined groups. A a, outroup; b,Trematocarini; c, Hemibates; d,Bathybates. B a, Bathybates graueri;b, B. fasciatus and B. horni; c,B. ferox; d, B. leo and B. vittatus.
304
clade composed of the remaining ‘‘large’’ Bathybatesspecies. Among the ‘‘large’’ Bathybates species,B. graueri represented the most ancestral split fol-lowed by an unresolved split into four lineages rep-resented by B. ferox, B. vittatus, B. leo, and thespecies pair B. horni–B. fasciatus. The second MPanalysis with weightings according to the calculatedTI/TV ratios for regions of the same degree of vari-ation resulted in three most parsimonious trees of alength of 1006 evolutionary steps (CI excludinguninformative characters, 0.54; RI, 0.72; RC, 0.42).The branching pattern was widely congruent with theresults of the most inclusive analysis combining allthree gene segments. Within the Bathybatini thegenus Hemibates was placed as most ancestral split,followed by B. minor, B. graueri, and the remaining‘‘large’’ Bathybates species, with a trifurcation lead-ing to B. vittatus, B. leo, and a clade consisting ofB. ferox, followed by B. horni plus B. fasciatus, whichappeared as paraphyletic. The third MP analysis,with identical weighting as in the previous analysis,except for regions of more than 20% genetic varia-tion, where transitions were excluded, resulted in asingle most parsimonious tree with a length of 1010evolutionary steps (CI excluding uninformativecharacters, 0.54; RI, 0.71; RC, 0.43). The represen-tatives of the tribe Trematocarini were placed as themost ancestral split, followed by Hemibates stenoso-ma, Bathybates minor, and the clade of the largeBathybates. In this clade B. graueri branched first,followed by a clade consisting of B. ferox as the mostancestral branch, and B. horni sister to B. fasciatus,again resulting as paraphyletic, and a clade com-prising B. leo and B. vittatus, which also appeared asparaphyletic. The fourth MP analysis of the controlregion, considering transversions only, led to 36 mostparsimonious trees with a score of 644 evolutionarysteps (CI excluding uninformative characters, 0.50;RI, 0.75; RC, 0.46). Again, the Trematocarini wereplaced as the most ancestral lineage followed byHemibates stenosoma, Bathybates minor, and the‘‘large’’ Bathybates species. Their branching order
was not further resolved. ML and NJ analyses of thecontrol region yielded widely congruent topologies,with only one difference concerning the branching ofB. graueri. In NJ it was placed as ancestral to theremaining ‘‘large’’ Bathybates species, whereas in MLand the topology obtained by Bayesian inference itwas placed as sister to B. leo. The positioning ofB. graueri in ML was not supported by quartet puzzling.
Relative Dating of Diversification Events
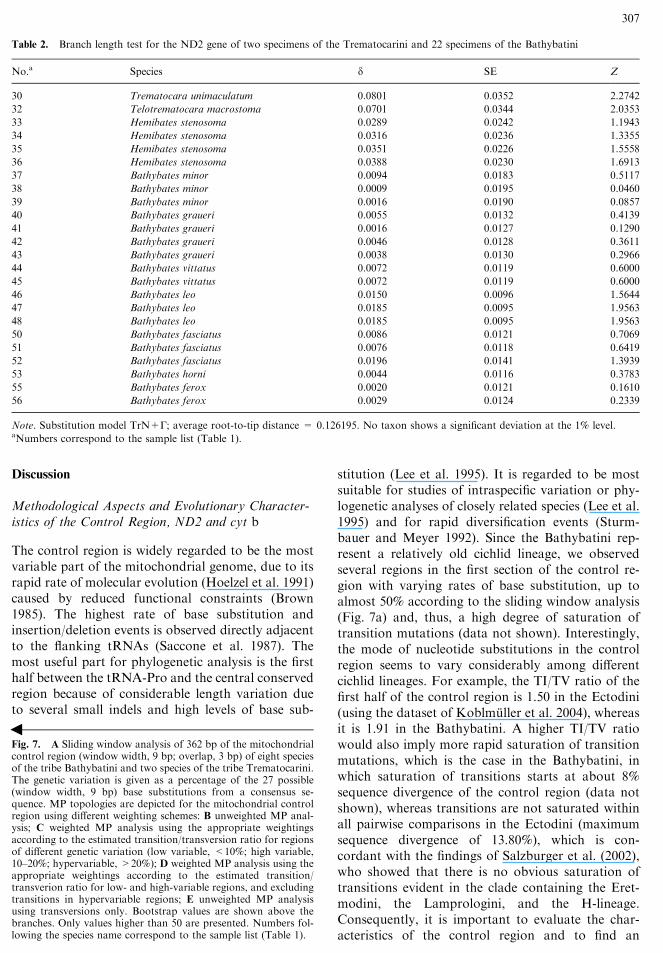
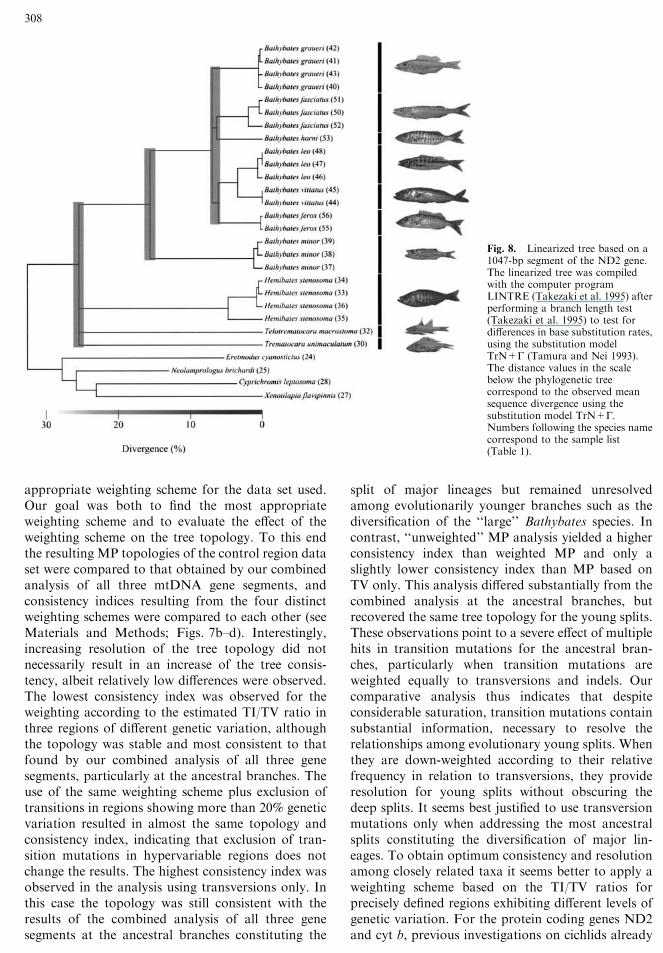
The branch length test of the 1047-bp segment of theND2 showed that not a single taxon fell out of the99% confidence interval surrounding the averageroot-to-tip distance (Table 2), suggesting an almost-constant rate of molecular evolution. Three majorevents of diversification can be derived from the lin-earized tree (Fig. 8). The first concerned the primaryradiation of the Bathybatini and the Trematocarini,leading to the origin of the genera Hemibates andBathybates as well as to the origin of the two inves-tigated species of the tribe Trematocarini. For thisfirst major split we obtained an average TrN+Gdistance of 25.8% (±5.3%). The second split con-cerned the branching of Bathybates minor (TrN+Gdistance, 15.5 ± 1.5%). The third and most vigorouscladogenesis event led to the diversification of the‘‘large’’ Bathybates species (TrN+G distance of7.1 ± 0.9%). The split of B. horni and B. fasciatus(TrN+G distance, 6.3 ± 0.1%) and the split betweenthe ancestor of B. ferox and that of B. vittatus plusB. leo happened almost simultaneously (TrN+Gdistance, 6.0 ± 0.2%). The most recent split in thegenus Bathybates concerned the diversification be-tween B. vittatus and B. leo (TrN+G distance,3.2 ± 0.2%). Interestingly, in Hemibates stenosomaone individual is very divergent from the threeremaining specimens (TrN+G distance, 4.8 ± 0.4%),indicating that the scope of genetic divergence withinHemibates stenosoma is greater than that betweensome species of the genus Bathybates.
Fig. 6. Relationship betweensynonymous (Ks) andnonsynonymous (Ka) substitutionsfor all pairwise comparisons of (A)22 taxa of the tribe Bathybatini plus2 taxa of the tribe Trematocarinibased on the ND2 gene and (B) 21taxa of the tribe Bathybatini plus 2taxa of the tribe Trematocarinibased on the cyt b gene. Trend lineand coefficient of determination (R2)are shown for both genes.
305
306
Discussion
Methodological Aspects and Evolutionary Character-istics of the Control Region, ND2 and cyt b
The control region is widely regarded to be the mostvariable part of the mitochondrial genome, due to itsrapid rate of molecular evolution (Hoelzel et al. 1991)caused by reduced functional constraints (Brown1985). The highest rate of base substitution andinsertion/deletion events is observed directly adjacentto the flanking tRNAs (Saccone et al. 1987). Themost useful part for phylogenetic analysis is the firsthalf between the tRNA-Pro and the central conservedregion because of considerable length variation dueto several small indels and high levels of base sub-
stitution (Lee et al. 1995). It is regarded to be mostsuitable for studies of intraspecific variation or phy-logenetic analyses of closely related species (Lee et al.1995) and for rapid diversification events (Sturm-bauer and Meyer 1992). Since the Bathybatini rep-resent a relatively old cichlid lineage, we observedseveral regions in the first section of the control re-gion with varying rates of base substitution, up toalmost 50% according to the sliding window analysis(Fig. 7a) and, thus, a high degree of saturation oftransition mutations (data not shown). Interestingly,the mode of nucleotide substitutions in the controlregion seems to vary considerably among differentcichlid lineages. For example, the TI/TV ratio of thefirst half of the control region is 1.50 in the Ectodini(using the dataset of Koblmuller et al. 2004), whereasit is 1.91 in the Bathybatini. A higher TI/TV ratiowould also imply more rapid saturation of transitionmutations, which is the case in the Bathybatini, inwhich saturation of transitions starts at about 8%sequence divergence of the control region (data notshown), whereas transitions are not saturated withinall pairwise comparisons in the Ectodini (maximumsequence divergence of 13.80%), which is con-cordant with the findings of Salzburger et al. (2002),who showed that there is no obvious saturation oftransitions evident in the clade containing the Eret-modini, the Lamprologini, and the H-lineage.Consequently, it is important to evaluate the char-acteristics of the control region and to find an
Fig. 7. A Sliding window analysis of 362 bp of the mitochondrialcontrol region (window width, 9 bp; overlap, 3 bp) of eight speciesof the tribe Bathybatini and two species of the tribe Trematocarini.The genetic variation is given as a percentage of the 27 possible(window width, 9 bp) base substitutions from a consensus se-quence. MP topologies are depicted for the mitochondrial controlregion using different weighting schemes: B unweighted MP anal-ysis; C weighted MP analysis using the appropriate weightingsaccording to the estimated transition/transversion ratio for regionsof different genetic variation (low variable, <10%; high variable,10–20%; hypervariable, >20%); D weighted MP analysis using theappropriate weightings according to the estimated transition/transverion ratio for low- and high-variable regions, and excludingtransitions in hypervariable regions; E unweighted MP analysisusing transversions only. Bootstrap values are shown above thebranches. Only values higher than 50 are presented. Numbers fol-lowing the species name correspond to the sample list (Table 1).
b
Table 2. Branch length test for the ND2 gene of two specimens of the Trematocarini and 22 specimens of the Bathybatini
No.a Species d SE Z
30 Trematocara unimaculatum 0.0801 0.0352 2.2742
32 Telotrematocara macrostoma 0.0701 0.0344 2.0353
33 Hemibates stenosoma 0.0289 0.0242 1.1943
34 Hemibates stenosoma 0.0316 0.0236 1.3355
35 Hemibates stenosoma 0.0351 0.0226 1.5558
36 Hemibates stenosoma 0.0388 0.0230 1.6913
37 Bathybates minor 0.0094 0.0183 0.5117
38 Bathybates minor 0.0009 0.0195 0.0460
39 Bathybates minor 0.0016 0.0190 0.0857
40 Bathybates graueri 0.0055 0.0132 0.4139
41 Bathybates graueri 0.0016 0.0127 0.1290
42 Bathybates graueri 0.0046 0.0128 0.3611
43 Bathybates graueri 0.0038 0.0130 0.2966
44 Bathybates vittatus 0.0072 0.0119 0.6000
45 Bathybates vittatus 0.0072 0.0119 0.6000
46 Bathybates leo 0.0150 0.0096 1.5644
47 Bathybates leo 0.0185 0.0095 1.9563
48 Bathybates leo 0.0185 0.0095 1.9563
50 Bathybates fasciatus 0.0086 0.0121 0.7069
51 Bathybates fasciatus 0.0076 0.0118 0.6419
52 Bathybates fasciatus 0.0196 0.0141 1.3939
53 Bathybates horni 0.0044 0.0116 0.3783
55 Bathybates ferox 0.0020 0.0121 0.1610
56 Bathybates ferox 0.0029 0.0124 0.2339
Note. Substitution model TrN+G; average root-to-tip distance = 0.126195. No taxon shows a significant deviation at the 1% level.aNumbers correspond to the sample list (Table 1).
307
appropriate weighting scheme for the data set used.Our goal was both to find the most appropriateweighting scheme and to evaluate the effect of theweighting scheme on the tree topology. To this endthe resulting MP topologies of the control region dataset were compared to that obtained by our combinedanalysis of all three mtDNA gene segments, andconsistency indices resulting from the four distinctweighting schemes were compared to each other (seeMaterials and Methods; Figs. 7b–d). Interestingly,increasing resolution of the tree topology did notnecessarily result in an increase of the tree consis-tency, albeit relatively low differences were observed.The lowest consistency index was observed for theweighting according to the estimated TI/TV ratio inthree regions of different genetic variation, althoughthe topology was stable and most consistent to thatfound by our combined analysis of all three genesegments, particularly at the ancestral branches. Theuse of the same weighting scheme plus exclusion oftransitions in regions showing more than 20% geneticvariation resulted in almost the same topology andconsistency index, indicating that exclusion of tran-sition mutations in hypervariable regions does notchange the results. The highest consistency index wasobserved in the analysis using transversions only. Inthis case the topology was still consistent with theresults of the combined analysis of all three genesegments at the ancestral branches constituting the
split of major lineages but remained unresolvedamong evolutionarily younger branches such as thediversification of the ‘‘large’’ Bathybates species. Incontrast, ‘‘unweighted’’ MP analysis yielded a higherconsistency index than weighted MP and only aslightly lower consistency index than MP based onTV only. This analysis differed substantially from thecombined analysis at the ancestral branches, butrecovered the same tree topology for the young splits.These observations point to a severe effect of multiplehits in transition mutations for the ancestral bran-ches, particularly when transition mutations areweighted equally to transversions and indels. Ourcomparative analysis thus indicates that despiteconsiderable saturation, transition mutations containsubstantial information, necessary to resolve therelationships among evolutionary young splits. Whenthey are down-weighted according to their relativefrequency in relation to transversions, they provideresolution for young splits without obscuring thedeep splits. It seems best justified to use transversionmutations only when addressing the most ancestralsplits constituting the diversification of major lin-eages. To obtain optimum consistency and resolutionamong closely related taxa it seems better to apply aweighting scheme based on the TI/TV ratios forprecisely defined regions exhibiting different levels ofgenetic variation. For the protein coding genes ND2and cyt b, previous investigations on cichlids already
Fig. 8. Linearized tree based on a1047-bp segment of the ND2 gene.The linearized tree was compiledwith the computer programLINTRE (Takezaki et al. 1995) afterperforming a branch length test(Takezaki et al. 1995) to test fordifferences in base substitution rates,using the substitution modelTrN+G (Tamura and Nei 1993).The distance values in the scalebelow the phylogenetic treecorrespond to the observed meansequence divergence using thesubstitution model TrN+G.Numbers following the species namecorrespond to the sample list(Table 1).
308
showed that the use of distinct weightings for MP,dependent on the codon position, results in better andmore consistent resolution (Salzburger et al. 2002).Our comparative evaluation further shows that theND2 gene seems to be applicable for the analysiswithin a broad range of taxonomic levels (see Klettand Meyer 2002; Koblmuller et al. 2004), even if itexhibits a mutation rate similar to that of the controlregion in the Bathybatini and Ectodini (Koblmulleret al. 2004). So far, the control region alone wasconsidered to be best suitable for analysis of closelyrelated taxa (Lee et al. 1995). When analyzing evo-lutionarily old lineages, protein-coding genes seem torequire the exclusion of synonymous substitutions atthe first positions of leucine codons and transitionmutations in third codon positions of fourfolddegenerate amino acids, due to their degree of satu-ration (Klett and Meyer 2002). However, there isevidence that there are some limits of resolution in cytb for analyzing relationships among closely relatedspecies, most likely due to its high degree of conser-vation at the amino acid level (Farias et al. 2001).Indeed, our analysis demonstrates that ND2 and cytb are affected by different evolutionary constraints.The positive correlation between the rate of nonsyn-onymous (Ka) and synonymous (Ks) substitutionsobserved in our analysis of the ND2 gene is in con-cordance with other studies that were based on dif-ferent organisms and genes (Graur 1985; Sharp andLi 1987; Wolfe and Sharp 1993; Akashi 1994; Com-eron and Aguade 1996; Comeron and Kreitman1998). The low number of nonsynonymous substitu-tions in the cyt b—a maximum of five nonsynony-mous substitutions was observed—indicates thatstrong evolutionary constraints are acting on thestructure of this gene, hardly allowing any amino acidchanges to occur without having a severe effect on thegene�s functionality. For ND2 these evolutionaryconstraints seem to be less tight, allowing amino acidchanges without affecting the functionality of thegene. This also explains the low overall substitutionrate of cyt b compared to ND2 (0.7 times). Despitethe relatively old age of the Bathybatini, compared toother Tanganyikan cichlid lineages, and the lowsubstitution rate of cyt b compared to both the con-trol region and ND2, there is some lack of resolutioneven among the most ancestral splits, most likely dueto the lack of nonsynonymous substitutions. Never-theless, combining cyt b with ND2 and the controlregion increases resolution and branch support.
Positioning of the Bathybatini in the Large-ScalePhylogenetic Framework of African Cichlids
Within the polyphyletic flock of cichlid fishes in LakeTanganyika, the Bathybatini are known to represent
one of eight old cichlid lineages that have seeded theradiation. They do not belong to the monophyleticassemblage containing the tribes Eretmodini andLamprologini and the H-lineage (Nishida 1991, 1997;Sturmbauer and Meyer 1993; Lippitsch 1998; Klettand Meyer 2002; Takahashi et al. 2001; Salzburger etal. 2002). Their relatively close relationship to theTrematocarini, another Tanganyikan deepwater tribe,was demonstrated by several authors by means ofmorphological (Stiassny 1981; Poll 1986), lepidologi-cal (Lippitsch 1998), and molecular genetic ap-proaches (Nishida 1997; Klett and Meyer 2002).Nevertheless, the relationships of these two tribes inrelation to other cichlid lineages still remain unclear.Previous molecular genetic investigations were notable to unambiguously identify a sister group to themonophyletic assemblage containing the Bathybatiniand Trematocarini. Based on ND2, Klett and Meyer(2002) suggested a sister-group relationship of theBathybatini and Trematocarini to the monophyleticassemblage containing the tribes Eretmodini andLamprologini and the H-lineage, and no closerrelationship to Tylochromis polylepis, Oreochromistanganicae, and Boulengerochromis microlepis. Basedon nuclear markers other authors suggested a closerelationship of Boulengerochromis microlepis tothe Bathybatini and Trematocarini (Nishida 1997).Salzburger et al. (2002) suggested that the Bathybatiniand Trematocarini are two distinct ancestral lineagesthat seeded the Lake Tanganyika radiation and orig-inated almost simultaneously with Boulengerochromismicrolepis and the ancestors of the tribes Eretmodiniand Lamprologini and the H-lineage. Our new anal-ysis unambiguously placed the Bathybatini andTrematocarini in a monophyletic assemblage. Nounequivocal sister-group relationship of this group toany other lineage could be determined, although itseems most likely that either Boulengerochromis mi-crolepis or the monophyletic assemblage consisting ofthe tribes Eretmodini and Lamprologini and the H-lineage are the sister group. Moreover, our data sug-gest an ancient major ‘‘African’’ cladogenesis event(prior to the Tanganyika radiation), leading to analmost-simultaneous diversification of several distinctTilapia lineages and to the origin of two species-rich‘‘nontilapiine’’ lineages, which later also seeded LakeTanganyika: The first ‘‘nontilapiine’’ lineage includesthe deepwater tribes Bathybatini and Trematocarini;the other consists of the tribes Eretmodini andLamprologini and the H-lineage (Fig. 3). This findingis congruent with the findings of Klett and Meyer(2002) and Salzburger et al. (2002). Since both theBathybatini and Trematocarini underwent radiationin Lake Tanganyika and no closely related species areknown in extant river systems outside the lake, thesetwo tribes might represent the only surviving descen-dants of an ancient African lineage.
309
Phylogenetic Relationships Within the Bathybatini andthe Trematocarini
While it is highly likely that the Bathybatini andTrematocarini constitute a monophyletic lineage, lit-tle was known about their precise phylogenetic rela-tionships. Those studies that targeted this topic bymeans of morphological analyses led to more or lessconflicting results (Stiassny 1981; Poll 1986; Takah-ashi 2003b). According to Poll (1986) the tribeBathybatini comprises the genera Bathybates andHemibates, well separated from the tribe Tremato-carini by a number of morphological characters. TheBathybatini can be easily distinguished from theTrematocarini by the larger body size, more than 15cm; number and shape of teeth; size of scales; numberof scales in the longitudinal line; and higher numberof fin rays in the dorsal and anal fins. A clear dis-tinction is also supported by lepidological data(Lippitsch 1998) and a previous molecular investiga-tion (Nishida 1997). In contrast, Stiassny (1981)postulated a sister-group relationship of Hemibatesand the Trematocarini, based on the shared andunique condition of the first levator internus, pala-tine–mesethmoid ligament, and rostral cartilage onthe premaxillae. A more recent morphological studyfocusing on the Trematocarini (Takahashi 2002)unambiguously showed the monophyly of theTrematocarini, which are clearly separated fromBathybates and Hemibates by a number of autapo-morphic characters. In this study no clear sister-group relationship of the Trematocarini to eitherBathybates or Hemibates could be demonstrated.Takahashi (2003a) further analyzed these relation-ships based on comparative osteology of infraorbitalsand showed that the three genera Bathybates, Hemi-bates, and Trematocara (including Telotrematocara)have different types of infraorbitals. The type ex-pressed in Hemibates had been inferred to representthe plesiomorphic condition for African cichlids(Stiassny 1997), also exhibited in many other cichlids,whereas the types expressed in Bathybates and theTrematocarini are synapomorphic in these two lin-eages. Analysis of 37 morphological characters forthe whole Tanganyika cichlid species flock placedHemibates stenosoma as ancestral to Bathybates andthe Trematocarini (Takahashi 2003b). Our analysesof three mitochondrial genes place weak bootstrapsupport for the monophyly of the Bathybatini(Hemibates plus Bathybates) as sister group to theTrematocarini. In addition, the results of the linear-ized tree analysis (Fig. 8) suggest that there might infact be three distinct old lineages that populated theemerging Lake Tanganyika: the tribe Trematocarini,the genus Hemibates, and the genus Bathybates. Theobserved great divergence among the two represen-tatives of the Trematocarini (Fig. 8) might be due to
an underrepresentation of the nine species of the tribeTrematocarini in the analysis (see Fig. 4).Concerning the phylogeny within the genus
Bathybates, Bathybates minor clearly represents themost ancestral split. This is also indicated by itsoverall morphology and appearance. Bathybatesminor is the only smaller Bathybates species, barelyreaching a total length of 20 cm. The remaining‘‘large’’ Bathybates species with a total length of 30 tomore than 40 cm are likely to have originated within avery short time span, distinguishing B. graueri as mostancestral branch. Among the ‘‘large’’ Bathybates twospecies pairs could be identified, one including B.horni and B. fasciatus, and the other consisting of B.leo and B. vittatus. Bathybates ferox seems to repre-sent a distinct lineage, most likely ancestral to B. leoand B. vittatus.
Age Estimates for Major Diversification Events
Since it is not possible to use the molecular clock ofSturmbauer et al. (2001) for older lineages (Kobl-muller et al. 2004), we applied the linearized treemethod on the 1047-bp-long ND2 gene to derive achronicle of the diversification in the Bathybatini(Fig. 8). These results suggest, that with an averageTrN+G distance of 25.8% (±5.3%), the oldest split(among Hemibates, Bathybates, and the Tremato-carini) is at least as old as the divergence between theLamprologini and the H-lineage (unpublished data).Since the Lamprologini and the H-lineage are likelyto represent two distinct lineages that indepentlyseeded the Tanganyika radiation (Salzburger et al.2002), this old dating supports the hypothesis that thegenera Hemibates and Bathybates diversified beforethe primary lacustrine radiation and independentlypopulated the emerging lake. Subsequently, the genusBathybates diversified, first by the branching of B.minor (TrN+G distance, 15.5 ± 1.5%) and later bythe diversification of the six ‘‘large’’ Bathybates spe-cies. The linearized distance observed for the firstsplit fits with the primary diversification within thetribe Ectodini (Koblmuller et al. 2004), which is likelyto have happened in the course of the primarylacustrine radiation (Salzburger et al. 2002). Thesecond diversification event within the genus Bathy-bates (TrN+G distance, 7.1 ± 0.9%), leading to thecurrent diversity of six ‘‘large’’ Bathybates species, islikely to have proceeded at the same time as the splitbetween the genera Cyprichromis and Paracypri-chromis (TrN+G distance, 7.2 ± 0.6%) in the Cyp-richromini, a tribe of pelagic but shore-associatedcichlids (Brandstatter et al. 2005), the diversificationof some species of the genus Xenotilapia in the Ec-todini (several distinct lineages with a TrN+G dis-tance of 7–8%; Koblmuller et al. 2004), and the
310
primary radiation of the Limnochromini (TrN+Gdistance, 7.9 ± 1.1%), a tribe of benthic deepwatercichlids (Duftner et al. 2005). The observed concor-dance of diversification events in independent lin-eages of the Tanganyika radiation suggests that theradiations of benthic and pelagic deepwater tribeswere triggered by the same environmental factors thatalso induced diversification of littoral species. Mostlikely lake level fluctuations of several hundred me-ters, leading to a separation of the lake into its threedeep basins, induced rapid speciation in both benthicand pelagic lineages of deepwater cichlids, as it isalready known for littoral species (Sturmbauer andMeyer 1992; Rossiter 1995; Verheyen et al. 1996;Sturmbauer et al. 1997, 2001, 2003; Sturmbauer 1998;Ruber et al. 2001; Baric et al. 2003). Moreover, theobserved rapid pace of speciation of this pelagicpiscivorous cichlid lineage is in contrast to the evo-lutionary scenario for pelagic cichlids postulated byCoulter (1994), who suggested pelagic taxa to havegradually evolved in the course of their long history.Assuming an age of 5–6 MY for the primary lacus-trine radiation (Salzburger et al. 2002) based on thegeological dating for the onset of clear and deepwaterconditions in Lake Tanganyika (Tiercelin andMondeguer 1991), the branching of B. minor can betentatively dated to this age. The ‘‘large’’ Bathybatesspecies can be constrained to an age of 2.3–2.7 MY.Likewise, the split between Trematocarini, Hemi-bates, and Bathyates can be tentatively dated to anage of 8.3–9.9 MY.
Promoters of Speciation in the Bathybatini
All species of the tribe Bathybatini exhibit a strikingsexual dichromatism. While the females have a silverybody coloration, the males show a conspicuous pat-tern of dark blotches and stripes and a series of egg-blotches on the anal fin, similar to haplochrominecichlids (Poll 1986). Despite their lakewide distribu-tion, intraspecific genetic variation is likely to besmall (as suggested by our data for B. graueri thatwere almost identical in three locations in thesouthern basin of the lake), also indicated by theabsence of distinct and geographically restricted colormorphs. This might be due to the bathypelagic lifestyle of the Bathybatini resulting in great dispersalability. The only exception seems to be Hemibatesstenosoma, for which two male color forms are re-ported, albeit in sympatry (Konings 1998). Somemales have distinct vertical bars on the anterior partof the flank; other males show irregular dark blot-ches. There are three possible explanations for thisphenomenon: Males may be polychromatic, malecolor pattern changes with age (supported by theobservation that usually larger individuals exhibit
vertical bars), or there are two different species(Konings 1998). In our data set intraspecific geneticvariation was rather large in Hemibates stenosomacompared to the species of the genus Bathybates.Unfortunately, three of four individuals analyzed inthis study were females, so that we could not assignthem to a distinct color morph and further investi-gations are needed.Lake level fluctuations were shown to be major
promoters for diversification events in littoral Tang-anyikan cichlid lineages (Sturmbauer and Meyer1992; Rossiter 1995; Verheyen et al. 1996; Sturm-bauer et al. 1997, 2001, 2003; Sturmbauer 1998; Ru-ber et al. 2001; Baric et al. 2003). Here we show thatthey might also affect radiations in pelagic deepwatercichlids, which are not restricted to a distinct type ofsubstrate. The ‘‘large’’ Bathybates species might haveevolved in separate sublakes during low-standepochs, caused by a period of aridification in easternAfrica about 2.5–3 MYA (Cane and Molnar 2001),followed by an adaptation to coexistence in the samehabitat when united by rising lake levels (Coulter1994). Moreover, resource partitioning was suggestedto be another driving force of speciation, so that the‘‘large’’ Bathybates might have evolved in sympatry,as suggested for littoral species of Lake Tanganyika(Nakai et al. 1994). The members of the Bathybatinishow a clear segregation of prey choice. In agreementto its phylogenetic placement,Hemibates stenosoma isclearly differentiated to all members of the genusBathybates in terms of prey choice. With a maximumlength of almost 30 cm, this fish is a respectablepredator, migrating to shallow water during thenight, often found together with members of the tribeTrematocarini, thus it might also prey on these smallinvertebrate feeders (Konings 1998) as well as onshrimp and clupeids (Coulter 1994). In contrast toHemibates stenosoma, the species of the genusBathybates are more specialized concerning their preychoice. In the genus Bathybates three species (B.minor, B. fasciatus, B. leo) almost exclusively prey onhuge shoals of the Tanganyikan clupeids, Stolothrissatanganicae and Limnothrissa miodon. One species—B.minor—is a surprise hunter. Bathybates minor has asimilar body size and coloration as clupeids and isregularly caught as by-catch of clupeids, so that itseems likely to mimic its prey (Konings 1998). Twospecies—B. fasciatus and B. leo—are pursuit huntersand live in the open water and at greater depths thanB. minor, down to a depth of 200 m, just above theanoxic zone of the lake (Poll 1956). The other fourBathybates species seem to prefer regions closer to thebottom and seem to feed on cichlids (Konings 1998).It is highly likely that B. vittatus, which is founddown to depths of more than 200 m over muddybottom, preys on cichlids rather than clupeids(Konings 1998). Nothing is known about the prey of
311
B. horni, because it is a rather rare species (Coulter1991). Due to its streamlined body shape it is believedto behave as a pursuit hunter, but living in differentareas or habitats, or preying on different fish, than B.leo and B. fasciatus (Konings 1998). As indicated bytheir deeper body, B. ferox and B. graueri are usuallyfound near the bottom, where they mainly prey onbottom-dwelling cichlids like Xenotilapia spp. (Coul-ter 1991), thus using a different food source com-pared to the pursuit hunters of the open water. WhileB. graueri is often found in depths of more than 160m, B. ferox has never been caught deeper than 70 m,indicating that some niche segregation concerning theforaging area seems possible. In summary, it is highlylikely that resource partitioning concerning foragingarea and specialization on distinct prey types playedan important role for the diversification into the se-ven species of the genus Bathybates. Especially thecase of the two species pairs, B. horni/B. fasciatus andB. leo/B. vittatus, is of interest. In both pairs, onespecies exclusively preys on clupeids, while the otherone seems to prefer cichlids. That means that in bothlineages specialization on clupeids is likely to haveoriginated independently. But to confirm thishypothesis, further investigations concerning thefeeding ecology of the distinct species comprising thegenus Bathybates, especially B. horni, are needed.
Acknowledgments. We thank L. Makasa, R. Sinyinza, and the
team at the Mpulungu Station of the Department of Fisheries,
Ministry of Agriculture, and Cooperatives, Republic of Zambia,
for their assistance during sample collection. We are grateful to J.
Snoeks (Africa Museum Tervuren) for identification of ‘‘prob-
lematic’’ specimens and to E. Verheyen (Royal Belgian Museum of
Natural Sciences) for providing additional tissue samples. We are
further indebted to K. Sefc, whose constructive comments helped
to improve this paper. S.K., N.D., and C.S. were supported by the
Austrian Science Foundation (Grant P15239). S.K. received a
DOC fellowship and N.D. a DOC-FFORTE (Women in Research
and Technology) fellowship, both provided by the Austrian
Academy of Sciences. S.K. and N.D. were further supported by the
University of Graz. C.K. got support from the OEAD and the
University of Zambia.
References
Akashi H (1994) Synonymous codon usage in Drosophila mela-
nogaster. Natural selection and translational accuracy. Genetics
136:927–935
Anderson S, De Bruijn MHL, Coulson AR, Eperon IC, Sanger F,
Young IG (1982) Complete sequence of bovine mitochondrial
DNA. Conserved features of the mammalian mitochondrial
genome. J Mol Biol 156:683–717
Baric S, Salzburger W, Sturmbauer C (2003) Phylogeography and
evolution of the Tanganyika cichlid genus Tropheus based upon
mitochondrial DNA sequences. J Mol Evol 56:54–68
Brandstotler A, Salzburger W, Sturmbauer C (2005) Mitochondrial
phylogeny of the Cyprichromini, a lineage of open-water cichlid
fishes endemic to Lake Tanganyika, East Africa. Mol Phylo-
genet Evol. In press.
Brown WM (1985) The mitochondrial genome of animals. In:
MacIntyre RJ (ed) Molecular evolutionary genetics. Plenum
Press, New York, pp 95–130
Cane MA, Molnar P (2001) Closing of the Indonesian seaway as a
precursor to East African aridification around 3–4 million years
ago. Nature 411:157–162
Cohen AS, Soreghan MJ, Scholz CA (1993) Estimating the age of
formation of lakes: an example from Lake Tanganyika, East
African rift system. Geology 21:511–514
Cohen AS, Lezzar KE, Tiercelin JJ, Soreghan MJ (1997) New
palaeogeographic and lake-level reconstructions of Lake
Tanganyika: Implications for tectonic, climatic and biological
evolution in a rift lake. Basin Res 9:107–132
Comeron JM, Aguade M (1996) Synonymous substitutions in the
Xdh gene of Drosophila: Heterogeneous distribution along the
coding region. Genetics 144:1053–1062
Comeron JM, Kreitman M (1998) The correlation between syn-
onymous and nonsynonymous substitutions in Drosophila:
Mutation, selection or relaxed constraints? Genetics 150:767–
775
Coulter GW (1991) Lake Tanganyika and its life. Oxford Univer-
sity Press, London, New York
Coulter GW (1994) Speciation and fluctuating environments with
reference to ancient East African lakes. In: Martens K,
Godderies B, Coulter GW (eds) Speciation in ancient lakes
(Advances in Limnology 44). E. Schweizerbart�sche Verlag-
buchhandlung (Napele U. Obermuller), Stuttgart, pp 127–
137
Duftner N, Koblmuller S, Sturmbauer C (2005) Evolutionary
relationships of the Limnochromini, a tribe of benthic deep-
water cichlid fish endemic to Lake Tanganyika, East Africa. J
Mol Evol 60:277–289
Farias IP, Ortı G, Sampaio I, Schneider H, Meyer A (2001) The
cytochrome b gene as a phylogenetic marker: The limits of
resolution for analyzing relationships among cichlid fishes. J
Mol Evol 53:89–103
Felsenstein J (1985) Confidence limits on phylogenies: an approach
using the bootstrap. Evolution 39:783–791
Graur D (1985) Amino acid composition and the evolutionary
rates of protein-coding genes. J Mol Evol 22:53–63
Hoelzel AR, Hancock JM, Dover GA (1991) Evolution of the
cetacean mitochondrial D-loop region. Mol Biol Evol 8(3):475–
593
Huelsenbeck JP, Crandall KA (1997) Phylogeny estimation and
hypothesis testing using maximum likelihood. Annu Rev Ecol
Syst 28:437–466
Huelsenbeck JP, Ronquist F (2001) MrBayes: Bayesian inference
of phylogenetic trees. Bioinformatics 17:754–755
Kimura M (1981) Estimation of evolutionary distances between
homologous nucleotide sequences. Proc Natl Acad Sci USA
78:454–458
Klett V, Meyer A (2002) What, if anything, is a tilapia? Mito-
chondrial ND2 phylogeny of Tilapiines and the evolution of
parental care systems in the African cichlid fishes. Mol Biol
Evol 19(6):865–883
Kluge AG, Farris JS (1969) Quantitative phyletics and the evolu-
tion of Anurans. Syst Zool 18(1):1–32
Koblmuller S, Salzburger W, Sturmbauer C (2004) Evolutionary
relationships in the sand dwelling cichlid lineage of Lake
Tanganyika suggest multiple colonization of rocky habitats and
convergent origin of biparental mouthbrooding. J Mol Evol
58:79–96
Kocher TD, Thomas WK, Meyer A, Edwards SV, Paabo S, Vil-
lablanca FX, Wilson AC (1989) Dynamics of mitochondrial
DNA evolution in animals: amplification and sequencing with
conserved primers. Proc Natl Acad Sci USA 86:6196–6200
312
Kocher TD, Conroy JA, McKaye KR, Stauffer JR (1993) Similar
morphologies of cichlid fishes in Lakes Tanganyika and Malawi
are due to convergence. Mol Phylogenet Evol 4:420–432
Kocher TD, Conroy JA, McKaye KR, Stauffer JR, Lockwood SF
(1995) Evolution of NADH dehydrogenase in East African
cichlid fish. Mol Phylogenet Evol 4(4):420–432
Konings A (1998) Tanganyika cichlids in their natural habitat.
Cichlid Press, El Paso, TX
Kumazawa Y, Yamaguchi M, Nishida M (1999) Mitochondrial
molecular clocks and the origin of euteleostean biodiversity:
Familial radiation of perciforms may have predated the Cre-
taceous/Tertiary boundary. In: Ato M (ed) The biology of
biodiversity. Springer Verlag, Tokyo, pp 35–52
Kuwamura T (1997) The evolution of parental care and mating
systems among Tanganyikan cichlids. In: Kawanabe H, More
M, Nagoshi M (eds) Fish communities in Lake Tanganyika.
Kyoto University Press, Kyoto, Japan, pp 59–86
Lee WJ, Conroy J, Howell WH, Kocher TD (1995) Structure and
evolution of the teleost mitochondrial control regions. J Mol
Evol 41:54–66
Lezzar KE, Tiercelin JJ, De Batist M, Cohen AS, Bandora R, Van
Rensbergen C, Le Turdu C, Mifundu W, Klerkx J (1996) New
seismic stratigraphy and Late Tertiary history of the North
Tanganyika basin, East African rift system deduced from
multichannel and high-piston core evidence. Basin Res 8:1–28
Lippitsch E (1998) Phylogenetic study of cichlid fishes in Lake
Tanganyika: a lepidological approach. J Fish Biol 53:752–766
Meyer A (1993) Phylogenetic relationships and evolutionary pro-
cesses in East African cichlid fishes. Trends Ecol Evol 8:279–284
Nakai K, Kawanabe H, Gashagaza MM (1994) Ecological studies
on the littoral cichlid communities of Lake Tanganyika: The
coexistence of many endemic species. In: Martens K, Godderies
B, Coulter GW (eds) Speciation in ancient lakes (Advances in
Limnology 44). E. Schweizerbart�sche Verlagbuchhandlung
(Napele U. Obermuller), Stuttgart, pp 373–389
Nishida M (1991) Lake Tanganyika as an evolutionary reservoir of
old lineages of East African fishes: Inferences from allozyme
data. Experientia 47:974–979
Nishida M (1997) Phylogenetic relationships and evolution of
Tanganyikan cichlids: a molecular perspective. In: Kawanabe
H, Hori M, Nagoshi M (eds) Fish communities in Lake
Tanganyika. Kyoto University Press, Kyoto, Japan, pp 1–23
Poll M (1956) Poissons Cichlidae. Result. scient. Explor. hydrobiol.
belge Lac Tanganika (1946–1947), III(5b): 1–629
Poll M (1986) Classification des cichlidae du lac Tanganika. Tribus,
genres et especes. Acad R Belg Mem Cl Sci 45:1–163
Posada D, Crandall K (1998) MODEL TEST: Testing the model of
DNA substitution. Bioinformatics 14:817–818
Rossiter A (1995) The cichlid fish assemblages of Lake Tanganyi-
ka: Ecology, behaviour and evolution of its species flocks. Adv
Ecol Res 26:187–252
Rozas J, Sanchesz-DelBarrio JC, Messeguer X, Rozas R (2003)
DnaSP, DNA polymorphism analyses by coalescent and other
methods. Bioinformatics 19:2496–2497
Ruber L, Meyer A, Sturmbauer C, Verheyen E (2001) Population
structure in two sympatric species of the Lake Tanganyika
cichlid tribe Eretmodini: Evidence for introgression. Mol Ecol
10:1207–1225
Saccone C, Attimonelli M, Sbisa E (1991) Structural elements
highly preserved during the evolution of the D-loop-containing
region in vertebrate mitochondrial DNA. J Mol Evol 26:205–
211
Salzburger W, Meyer A, Baric S, Verheyen E, Sturmbauer C (2002)
Phylogeny of the Lake Tanganyika cichlid species flock and its
relationships to Central and East African haplochromine cichlid
fish faunas. Syst Biol 51:113–135
Schmidt HA, Strimmer K, Vingron M, von Haeseler A (2002)
TREE-PUZZLE: maximum likelihood phylogenetic analysis
using quartets and parallel computing. Bioinformatics
18(3):502–504
Scholz CA, Rosendahl B (1988) Low lake stands in Lakes Malawi
and Tanganyika, delineated with multifold seismic data. Science
240:1645–1648
Scholz CA, King JW, Ellis GS, Swart PK, Stager JC, Colman SM
(2003) Palaeolimnology of Lake Tanganyika, East Africa, over
the past 100 kyr. J Palaeolimn 30:139–150
Sharp PM, Li WH (1987) The rate of synonymous substitution in
enterobacterial genes is inversely related to codon usage bias.
Mol Biol Evol 4:222–230
Snoeks J (2000) How well known is the ichthyodiversity of the large
East African lakes? Adv Ecol Res 31:17–38
Stiassny MLJ (1981) Phylogenetic versus convergent relationship
between piscivorous cichlid fishes from Lakes Malawi and
Tanganyika. Bull Br Mus Nat Hist Zool 40:67–101
Stiassny MLJ (1991) Phylogenetic intrarelationships of the family
Cichlidae: An overview. In: Keenleyside MHA (ed) Cichlid
fishes. Behaviour, ecology and evolution. Chapman & Hall,
London, pp 1–35
Stiassny MLJ (1997) A phylogenetic overview of the lamprologine
cichlids of Africa (Teleostei: Cichlidae): A morphological per-
spective. S Afr J Sc 93:512–523
Strimmer K, von Haeseler A (1996) Quartet puzzling: A quartet
maximum-likelihood method for reconstructing tree topologies.
Mol Biol Evol 13:964–969
Strimmer K, von Haeseler A (1997) Likelihood-mapping: A simple
method to visualize phylogenetic content of a sequence align-
ment. Proc Natl Acad Sci USA 94:6815–6819
Sturmbauer C (1998) Explosive speciation in cichlid fishes of the
African Great Lakes: A dynamic model of adaptive radiation. J
Fish Biol 53 (Suppl A):18–36
Sturmbauer C, Meyer A (1992) Genetic divergence, speciation and
morphological stasis in a lineage of African cichlid fishes.
Nature 358:578–581
Sturmbauer C, Meyer A (1993) Mitochondrial phylogeny of
the endemic mouthbrooding lineages of cichlid fishes from
Lake Tanganyika in Eastern Africa. Mol Biol Evol 10(4):
751–768
Sturmbauer C, Verheyen E, Meyer A (1994) Mitochondrial phy-
logeny of the Lamprologini, the major substrate spawning
lineage of cichlid fishes from Lake Tanganyika in Eastern
Africa. Mol Biol Evol 11:691–703
Sturmbauer C, Verheyen E, Ruber L, Meyer A (1997) Phylogeo-
graphic patterns in populations of cichlid fishes from rocky
habitats in Lake Tanganyika. In: Kocher TD, Stepien C (eds)
Molecular phylogeny of fishes. Academic Press, San Diego, pp
91–111
Sturmbauer C, Baric S, Salzburger W, Ruber L, Verheyen E (2001)
Lake level fluctuations synchronize genetic divergence of cichlid
fishes in African lakes. Mol Biol Evol 18:144–154
Sturmbauer C, Hainz U, Baric S, Verheyen E, Salzburger W (2003)
Evolution of the tribe Tropheini from Lake Tanganyika: Syn-
chronized explosive speciation producing multiple evolutionary
parallelism. Hydrobiologia 500:51–64
Swofford DL (2000) PAUP*: Phylogenetic analysis using parsi-
mony (and other methods), version 4.0b2a. Sinauer, Sunder-
land, MA
Takahashi T (2002) Systematics of the tribe Trematocarini (Perci-
formes: Cichlidae) from Lake Tanganyika, Africa. Ichthyol Res
49:253–259
Takahashi K, Terai Y, Nishida M, Okada N (1998) A novel family
of short interspersed elements (SINEs) from cichlids: The pat-
terns of inserions of SINEs at orthologous loci support the
proposed monophyly of four major groups of cichlid fishes in
Lake Tanganyika. Mol Biol Evol 15:391–407
Takahashi K, Terai Y, Nishida M, Okada N (2001) Phylogenetic
relationships and ancient incomplete lineage sorting among
313

cichlid fishes in Lake Tanganyika as revealed by analysis of the
insertion of retroposons. Mol Biol Evol 18(11):2057–2066
Takahashi T (2003a) Comparative osteology of the infraorbitals in
cichlid fishes (Osteichthyes: Teleostei: Perciformes) from Lake
Tanganyika. Species Diversity 8(1):1–26
Takahashi T (2003b) Systematics of Tanganyikan cichlid fishes
(Teleostei: Perciformes). Ichthyol Res 50:367–382
Takezaki N, Rzhetsky A, Nei M (1995) Phylogenetic test of the
molecular clock and linearized trees. Mol Biol Evol 12(5):823–
833
Tamura K, Nei M (1993) Estimation of the number of nucle-
otide substitutions in the control region of mitochondrial
DNA in humans and chimpanzees. Mol Biol Evol 10(3):512–
526
Terai Y, Takahashi K, Nishida M, Sato T, Okada N (2003) Using
SINEs to probe ancient explosive speciation: ‘‘Hidden’’ radia-
tion of African cichlids? Mol Biol Evol 20(6):924–930
Thompson JD, Gibson TJ, Plewniak F, Jeanmougin F, Higgins
DG (1997) The Clustal X Windows interface: flexible strategies
for multiple sequence alignment aided by quality analysis tools.
Nucleic Acids Res 24:4876–4882
Tiercelin JJ, Mondeguer A (1991) The geology of the Tanganyika
trough. In: Martens K, Goddeeris B, Coulter G (eds) Lake
Tanganyika and its life. Oxford University Press, Oxford, pp 7–
48
Turner GF, Seehausen O, Knight KE, Allender CJ, Robinson RL
(2001) How many species of cichlid fishes are there in African
lakes? Mol Ecol 10:793–806
Verheyen E, Ruber L, Snoeks J, Meyer A (1996) Mitochondrial
phylogeny of rock-dwelling cichlid fishes reveals evolutionary
influence of historical lake level fluctuations of Lake Tangany-
ika, Africa. Phil Trans R Soc Lond B 351:797–805
Walsh PS, Metzger DA, Higuchi R (1991) Chelex 100 as a medium
for simple extraction of DNA for PCR-based typing from
forensic material. Biotechniques 10:506–513
Wolfe KH, Sharp PM (1993) Mammalian gene evolution: Nucle-
otide sequence divergence between mouse and rat. J Mol Evol
37:441–456
314