s41467_017_01285_x.pdf - dtu orbit
TRANSCRIPT
General rights Copyright and moral rights for the publications made accessible in the public portal are retained by the authors and/or other copyright owners and it is a condition of accessing publications that users recognise and abide by the legal requirements associated with these rights.
Users may download and print one copy of any publication from the public portal for the purpose of private study or research.
You may not further distribute the material or use it for any profit-making activity or commercial gain
You may freely distribute the URL identifying the publication in the public portal If you believe that this document breaches copyright please contact us providing details, and we will remove access to the work immediately and investigate your claim.
Downloaded from orbit.dtu.dk on: Jul 03, 2022
The challenge of mapping the human connectome based on diffusion tractography
Maier-Hein, Klaus H.; Neher, Peter F.; Houde, Jean-Christophe; Cote, Marc-Alexandre; Garyfallidis,Eleftherios; Zhong, Jidan; Chamberland, Maxime; Yeh, Fang-Cheng; Lin, Ying-Chia; Ji, QingTotal number of authors:77
Published in:Nature Communications
Link to article, DOI:10.1038/s41467-017-01285-x
Publication date:2017
Document VersionPublisher's PDF, also known as Version of record
Link back to DTU Orbit
Citation (APA):Maier-Hein, K. H., Neher, P. F., Houde, J-C., Cote, M-A., Garyfallidis, E., Zhong, J., Chamberland, M., Yeh, F-C., Lin, Y-C., Ji, Q., Reddick, W. E., Glass, J. O., Chen, D. Q., Feng, Y., Gao, C., Wu, Y., Ma, J., Renjie, H., Li,Q., ... Descoteaux, M. (2017). The challenge of mapping the human connectome based on diffusiontractography. Nature Communications, 8(1), [1349]. https://doi.org/10.1038/s41467-017-01285-x
ARTICLE
The challenge of mapping the human connectomebased on diffusion tractographyKlaus H. Maier-Hein
Tractography based on non-invasive diffusion imaging is central to the study of human brain
connectivity. To date, the approach has not been systematically validated in ground truth
studies. Based on a simulated human brain data set with ground truth tracts, we organized an
open international tractography challenge, which resulted in 96 distinct submissions from 20
research groups. Here, we report the encouraging finding that most state-of-the-art algo-
rithms produce tractograms containing 90% of the ground truth bundles (to at least some
extent). However, the same tractograms contain many more invalid than valid bundles, and
half of these invalid bundles occur systematically across research groups. Taken together, our
results demonstrate and confirm fundamental ambiguities inherent in tract reconstruction
based on orientation information alone, which need to be considered when interpreting
tractography and connectivity results. Our approach provides a novel framework for esti-
mating reliability of tractography and encourages innovation to address its current
limitations.
DOI: 10.1038/s41467-017-01285-x OPEN
Correspondence and requests for materials should be addressed to K.H.M.-H. (email: [email protected])or to M.D. (email: [email protected])#A full list of authors and their affliations appears at the end of the paper
NATURE COMMUNICATIONS |8: 1349 |DOI: 10.1038/s41467-017-01285-x |www.nature.com/naturecommunications 1
1234
5678
90
Tractography, a computational reconstruction method basedon diffusion-weighted magnetic resonance imaging (DWI),attempts to reveal the trajectories of white matter pathways
in vivo and to infer the underlying structural connectome of thehuman brain1. Numerous algorithms for tractography have beendeveloped and applied to connectome research in the field ofneuroscience2 and psychiatry3. Given the broad interest in thisapproach, advantages and shortcomings of tractography havebeen addressed using a wide range of approaches1, 4–8. Particu-larly, in vivo tractography of the human brain has been evaluatedby subjective assessment of plausibility9, 10 or qualitative visualagreement with post-mortem Klingler-like dissections11, 12.Reproducibility13 or data prediction errors14–16 have been eval-uated in the context of tractography model verification. However,these evaluations cannot validate the accuracy of reconstructionsdue to the lack of ground truth information17. Ex vivo imagingand tracing17–23 or physically24–30 and numerically simulatedphantoms31–34 allow validation to some extent, and in specificcircumstances such as basic fiber configurations. The nervoussystem, however, is complex and precise ground truth informa-tion on the trajectories of pathways and their origins, as well asterminations in the human brain is lacking. This makes it hard toobtain quantitative and comprehensive reliability estimations oftractography and to determine which discoveries are reliablewhen regarding brain connectivity in health and disease.
State-of-the-art tractography algorithms are driven by localorientation fields estimated from DWI, representing the localtangent direction to the white matter tract of interest1.
Conceptually, the principle of inferring connectivity from localorientation fields can lead to problems as soon as pathwaysoverlap, cross, branch, and have complex geometries7, 35, 36. Sincethe invention of diffusion tractography, these problems have beendiscussed in schematic representations or theoreticalarguments7, 8, 37, but have not yet been quantified in brainimaging. To determine the current state of the art in tractography,we organized an international tractography competition(tractometer.org/ismrm_2015_challenge). We employedsimulated DWI of a brain-like geometry as a novel reliabilityestimation method that allowed for a quantitative evaluationof the submissions based on the Tractometer connectivitymetrics38.
At the closing of the competition, we evaluated 96 distincttractography pipelines submitted by 20 different research groups,in order to assess how well the algorithms were able to reproducethe known connectivity. We also assessed essential processingsteps to pinpoint critical flaws that many current pipelines have incommon. An important positive finding is that most proposedalgorithms are able to produce tractograms containing 90% of theground truth bundles, recovering about one-third of their volu-metric extent. At the same time, most algorithms produce largeamounts of false-positive bundles, even though they are not partof the ground truth. Results do not improve when employinghigher-quality data or even using the gold standard field of localtract orientations at high spatial resolution. The findings highlightthat novel technological and conceptual developments are neededto address these limitations.
Real MRI image Bundlesegmentation
Syntheticbundle model
Combinedsynthetic model
Synthetic diffusion-weightedand T1 image
CC
Cg
OR
Fx
CP CA
SCP
MCP
ICP
POPT
CST
FPT
ILF
SLF
UF
MC
P-T
SC
P-R
TIC
P-R
HF
PT-
RT
CS
T-R
TP
OP
T-R
T
SCP-
RH
OR
-RTCP-TIL
F-RTSLF-R
TOR-RHPOPT-RHCA-TFx-TUF-RT
ICP
-RT
ICP
-LTP
OP
T-LTC
ST-LT
FP
T-LTIC
P-LH
SC
P-LT
MC
P-HSCP-LH
OR-LT
CP-H
ILF-LT
SLF-LT
OR-LH
POPT-LH
CA-H
Fx-H
UF-LT
Cg-LT
CST-LHFPT-LHILF-LHUF-LH
Cg-LH
SLF
-LH
CC
-HC
C-T
SLF-RH
Cg-RH
UF-RHILF-RH
FPT-RH
CST-RH
Tractography
Cg-RT
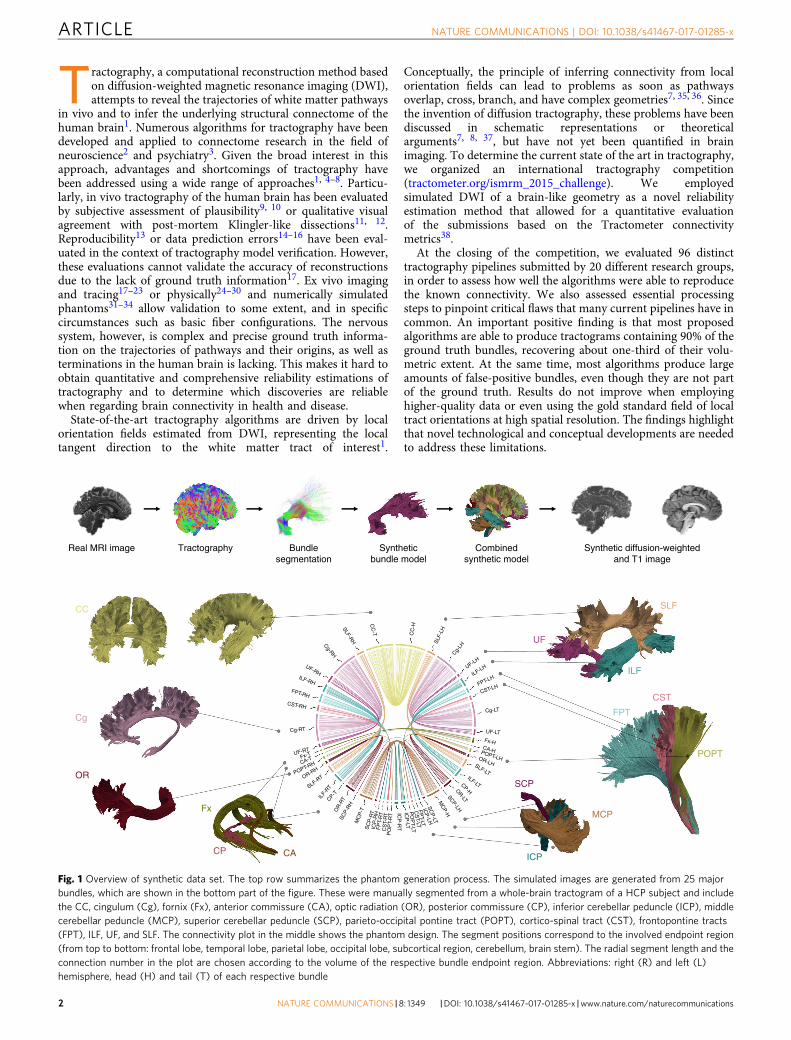
Fig. 1 Overview of synthetic data set. The top row summarizes the phantom generation process. The simulated images are generated from 25 majorbundles, which are shown in the bottom part of the figure. These were manually segmented from a whole-brain tractogram of a HCP subject and includethe CC, cingulum (Cg), fornix (Fx), anterior commissure (CA), optic radiation (OR), posterior commissure (CP), inferior cerebellar peduncle (ICP), middlecerebellar peduncle (MCP), superior cerebellar peduncle (SCP), parieto-occipital pontine tract (POPT), cortico-spinal tract (CST), frontopontine tracts(FPT), ILF, UF, and SLF. The connectivity plot in the middle shows the phantom design. The segment positions correspond to the involved endpoint region(from top to bottom: frontal lobe, temporal lobe, parietal lobe, occipital lobe, subcortical region, cerebellum, brain stem). The radial segment length and theconnection number in the plot are chosen according to the volume of the respective bundle endpoint region. Abbreviations: right (R) and left (L)hemisphere, head (H) and tail (T) of each respective bundle
ARTICLE NATURE COMMUNICATIONS | DOI: 10.1038/s41467-017-01285-x
2 NATURE COMMUNICATIONS | 8: 1349 |DOI: 10.1038/s41467-017-01285-x |www.nature.com/naturecommunications
ResultsData sets and submissions. Prior investigations of tractographymethodology have chosen artificial fiber geometries to constructsynthetic ground truth models26, 38. Here, we defined our modelsbased on the fiber bundle geometry of a high-quality HumanConnectome Project (HCP) data set that was constructed frommultiple whole-brain global tractography maps39 (Fig. 1). Followingthe concepts introduced in ref. 40, an expert radiologist(B.S.) extracted 25 major tracts (i.e., bundles of streamlines) fromthe tractogram. This ground truth data set included association,projection, and commissural tracts that have been previouslydescribed using post-mortem anatomical and electrophysiologicalmethods41. In total the tracts occupy 71% of the white mattervolume in the human brain. The data set features a brain-likemacro-structure of long-range connections, mimicking in vivo DWIclinical-like acquisitions based on a simulated diffusion signal. Anadditional anatomical image with T1-like contrast was simulated asa reference. The final data sets and all files necessary to perform thesimulation are openly available (see Data availability).
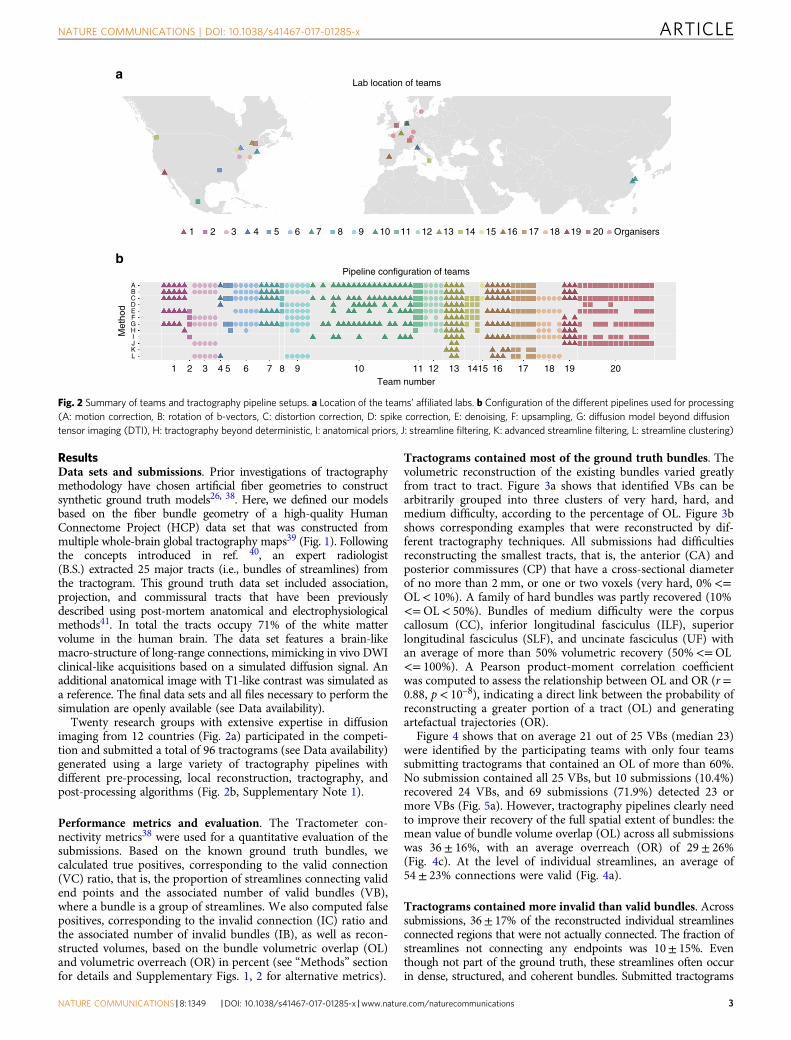
Twenty research groups with extensive expertise in diffusionimaging from 12 countries (Fig. 2a) participated in the competi-tion and submitted a total of 96 tractograms (see Data availability)generated using a large variety of tractography pipelines withdifferent pre-processing, local reconstruction, tractography, andpost-processing algorithms (Fig. 2b, Supplementary Note 1).
Performance metrics and evaluation. The Tractometer con-nectivity metrics38 were used for a quantitative evaluation of thesubmissions. Based on the known ground truth bundles, wecalculated true positives, corresponding to the valid connection(VC) ratio, that is, the proportion of streamlines connecting validend points and the associated number of valid bundles (VB),where a bundle is a group of streamlines. We also computed falsepositives, corresponding to the invalid connection (IC) ratio andthe associated number of invalid bundles (IB), as well as recon-structed volumes, based on the bundle volumetric overlap (OL)and volumetric overreach (OR) in percent (see “Methods” sectionfor details and Supplementary Figs. 1, 2 for alternative metrics).
Tractograms contained most of the ground truth bundles. Thevolumetric reconstruction of the existing bundles varied greatlyfrom tract to tract. Figure 3a shows that identified VBs can bearbitrarily grouped into three clusters of very hard, hard, andmedium difficulty, according to the percentage of OL. Figure 3bshows corresponding examples that were reconstructed by dif-ferent tractography techniques. All submissions had difficultiesreconstructing the smallest tracts, that is, the anterior (CA) andposterior commissures (CP) that have a cross-sectional diameterof no more than 2 mm, or one or two voxels (very hard, 0%<=OL< 10%). A family of hard bundles was partly recovered (10%<=OL< 50%). Bundles of medium difficulty were the corpuscallosum (CC), inferior longitudinal fasciculus (ILF), superiorlongitudinal fasciculus (SLF), and uncinate fasciculus (UF) withan average of more than 50% volumetric recovery (50%<=OL<= 100%). A Pearson product-moment correlation coefficientwas computed to assess the relationship between OL and OR (r=0.88, p< 10–8), indicating a direct link between the probability ofreconstructing a greater portion of a tract (OL) and generatingartefactual trajectories (OR).
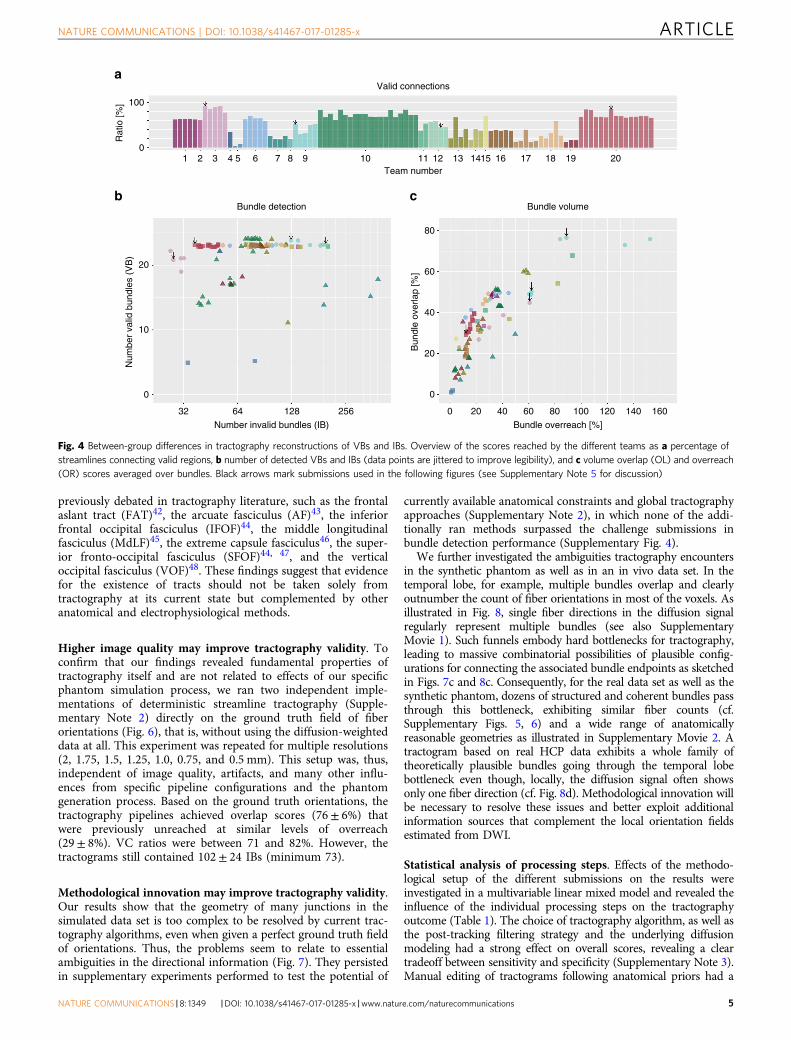
Figure 4 shows that on average 21 out of 25 VBs (median 23)were identified by the participating teams with only four teamssubmitting tractograms that contained an OL of more than 60%.No submission contained all 25 VBs, but 10 submissions (10.4%)recovered 24 VBs, and 69 submissions (71.9%) detected 23 ormore VBs (Fig. 5a). However, tractography pipelines clearly needto improve their recovery of the full spatial extent of bundles: themean value of bundle volume overlap (OL) across all submissionswas 36± 16%, with an average overreach (OR) of 29± 26%(Fig. 4c). At the level of individual streamlines, an average of54± 23% connections were valid (Fig. 4a).
Tractograms contained more invalid than valid bundles. Acrosssubmissions, 36± 17% of the reconstructed individual streamlinesconnected regions that were not actually connected. The fraction ofstreamlines not connecting any endpoints was 10± 15%. Eventhough not part of the ground truth, these streamlines often occurin dense, structured, and coherent bundles. Submitted tractograms
Met
hod
ABCDEFGHIJKL
Team number
Pipeline configuration of teams
Lab location of teams
1 2 3 4 5 6 7 8 9
1 2 3 4 5 6 7 8 9
10 11 12 13 1415 16 17 18 19 20
20 Organisers10 11 12 13 14 15 16 17 18 19
a
b
Fig. 2 Summary of teams and tractography pipeline setups. a Location of the teams’ affiliated labs. b Configuration of the different pipelines used for processing(A: motion correction, B: rotation of b-vectors, C: distortion correction, D: spike correction, E: denoising, F: upsampling, G: diffusion model beyond diffusiontensor imaging (DTI), H: tractography beyond deterministic, I: anatomical priors, J: streamline filtering, K: advanced streamline filtering, L: streamline clustering)
NATURE COMMUNICATIONS | DOI: 10.1038/s41467-017-01285-x ARTICLE
NATURE COMMUNICATIONS |8: 1349 |DOI: 10.1038/s41467-017-01285-x |www.nature.com/naturecommunications 3
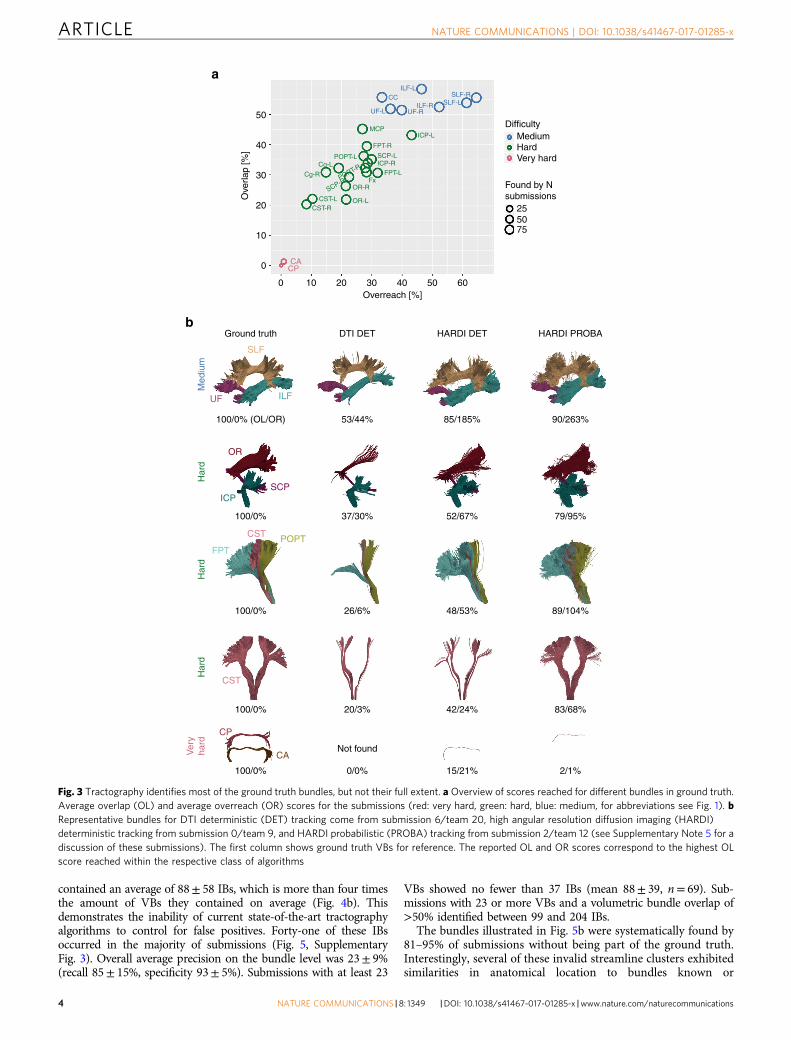
contained an average of 88± 58 IBs, which is more than four timesthe amount of VBs they contained on average (Fig. 4b). Thisdemonstrates the inability of current state-of-the-art tractographyalgorithms to control for false positives. Forty-one of these IBsoccurred in the majority of submissions (Fig. 5, SupplementaryFig. 3). Overall average precision on the bundle level was 23± 9%(recall 85± 15%, specificity 93± 5%). Submissions with at least 23
VBs showed no fewer than 37 IBs (mean 88± 39, n= 69). Sub-missions with 23 or more VBs and a volumetric bundle overlap of>50% identified between 99 and 204 IBs.
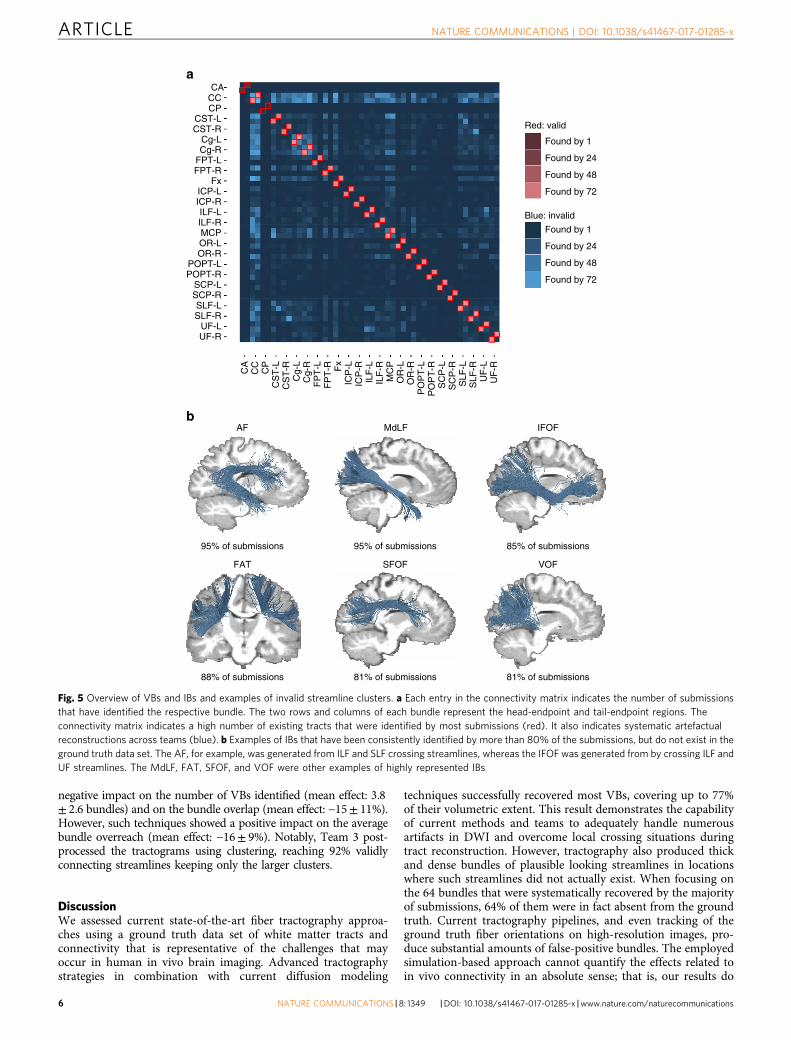
The bundles illustrated in Fig. 5b were systematically found by81–95% of submissions without being part of the ground truth.Interestingly, several of these invalid streamline clusters exhibitedsimilarities in anatomical location to bundles known or
Ground truth DTI DET HARDI DET
MediumDifficulty
ILF-LSLF-R
SLF-LILF-RUF-R
CC
UF-L
ICP-LMCP
FPT-R
SCP-LICP-R
FPT-LFx
OR-R Found by Nsubmissions
HardVery hard
755025
0 10 20 30 40 50 60Overreach [%]
Ove
rlap
[%]
HARDI PROBA
100/0% (OL/OR) 53/44% 85/185% 90/263%
100/0% 37/30% 52/67% 79/95%
100/0% 26/6% 48/53% 89/104%
100/0%
100/0%
CA
CST
CST POPT
SCP
OR
UF
CACP
ILF
SLF
CP
ICP
FPT
Har
dH
ard
Med
ium
Har
dV
ery
hard
20/3%
Not found
0/0% 15/21% 2/1%
42/24% 83/68%
50
40
30
20
10
0
POPT-LCg-L
Cg-R
SCP-RPORT-R
CST-LCST-R
OR-L
a
b
Fig. 3 Tractography identifies most of the ground truth bundles, but not their full extent. a Overview of scores reached for different bundles in ground truth.Average overlap (OL) and average overreach (OR) scores for the submissions (red: very hard, green: hard, blue: medium, for abbreviations see Fig. 1). bRepresentative bundles for DTI deterministic (DET) tracking come from submission 6/team 20, high angular resolution diffusion imaging (HARDI)deterministic tracking from submission 0/team 9, and HARDI probabilistic (PROBA) tracking from submission 2/team 12 (see Supplementary Note 5 for adiscussion of these submissions). The first column shows ground truth VBs for reference. The reported OL and OR scores correspond to the highest OLscore reached within the respective class of algorithms
ARTICLE NATURE COMMUNICATIONS | DOI: 10.1038/s41467-017-01285-x
4 NATURE COMMUNICATIONS | 8: 1349 |DOI: 10.1038/s41467-017-01285-x |www.nature.com/naturecommunications
previously debated in tractography literature, such as the frontalaslant tract (FAT)42, the arcuate fasciculus (AF)43, the inferiorfrontal occipital fasciculus (IFOF)44, the middle longitudinalfasciculus (MdLF)45, the extreme capsule fasciculus46, the super-ior fronto-occipital fasciculus (SFOF)44, 47, and the verticaloccipital fasciculus (VOF)48. These findings suggest that evidencefor the existence of tracts should not be taken solely fromtractography at its current state but complemented by otheranatomical and electrophysiological methods.
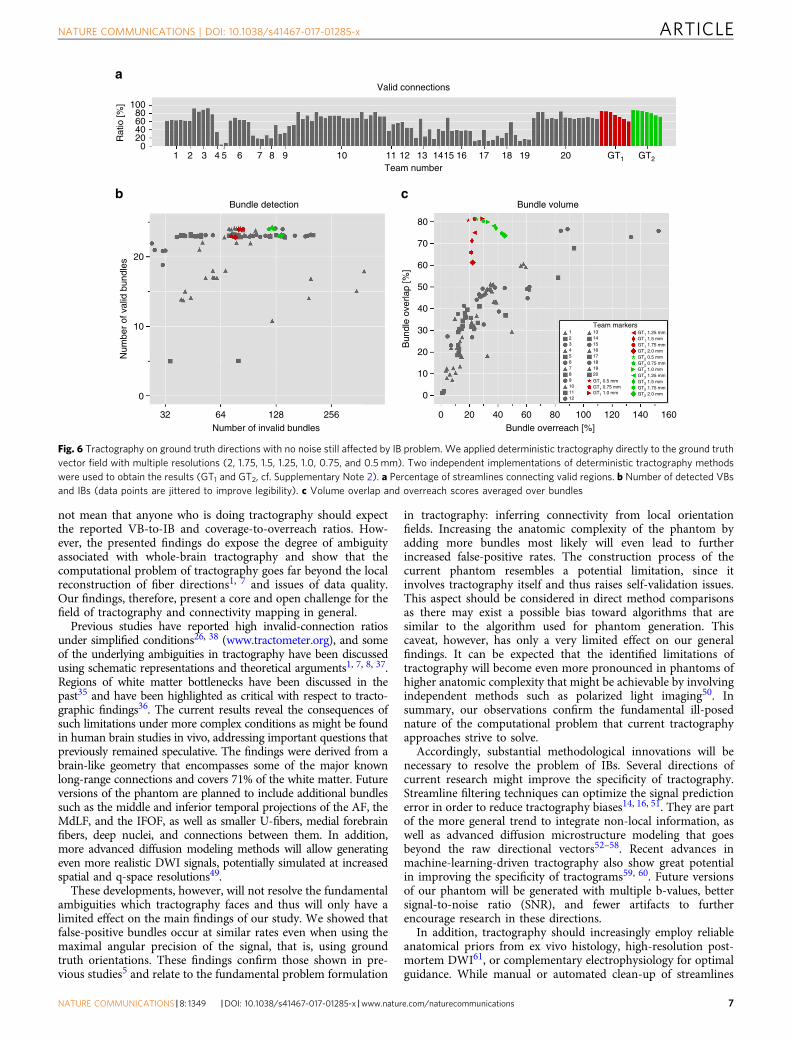
Higher image quality may improve tractography validity. Toconfirm that our findings revealed fundamental properties oftractography itself and are not related to effects of our specificphantom simulation process, we ran two independent imple-mentations of deterministic streamline tractography (Supple-mentary Note 2) directly on the ground truth field of fiberorientations (Fig. 6), that is, without using the diffusion-weighteddata at all. This experiment was repeated for multiple resolutions(2, 1.75, 1.5, 1.25, 1.0, 0.75, and 0.5 mm). This setup was, thus,independent of image quality, artifacts, and many other influ-ences from specific pipeline configurations and the phantomgeneration process. Based on the ground truth orientations, thetractography pipelines achieved overlap scores (76± 6%) thatwere previously unreached at similar levels of overreach(29± 8%). VC ratios were between 71 and 82%. However, thetractograms still contained 102± 24 IBs (minimum 73).
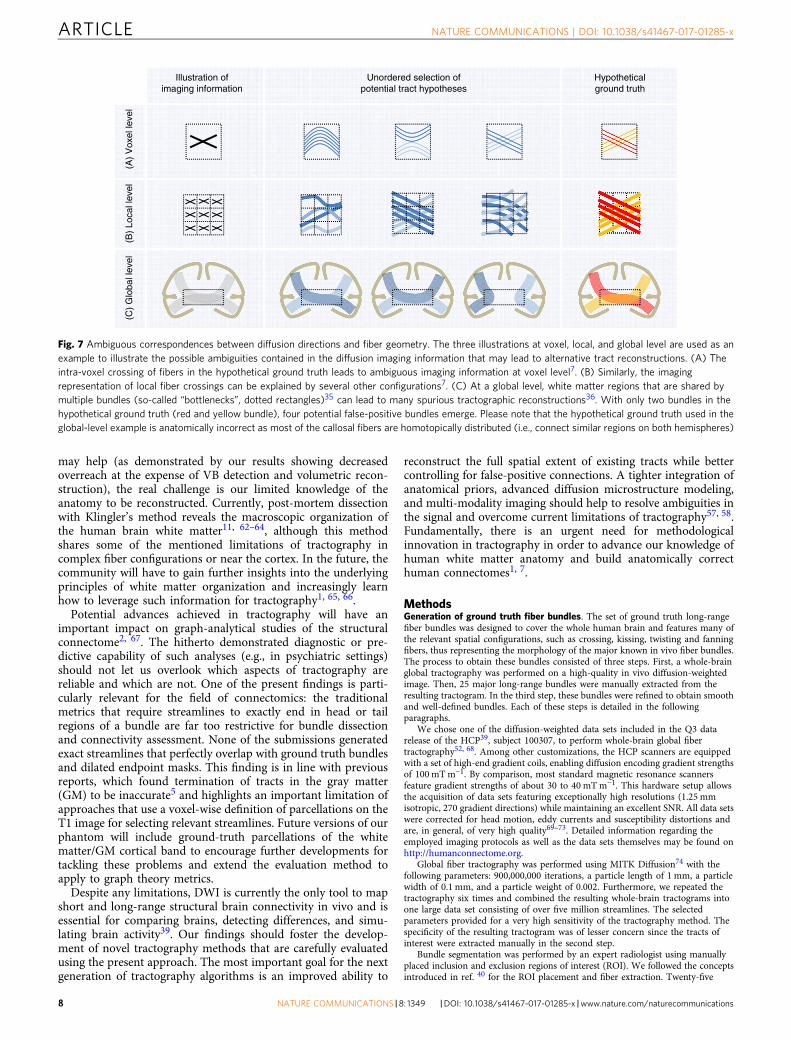
Methodological innovation may improve tractography validity.Our results show that the geometry of many junctions in thesimulated data set is too complex to be resolved by current trac-tography algorithms, even when given a perfect ground truth fieldof orientations. Thus, the problems seem to relate to essentialambiguities in the directional information (Fig. 7). They persistedin supplementary experiments performed to test the potential of
currently available anatomical constraints and global tractographyapproaches (Supplementary Note 2), in which none of the addi-tionally ran methods surpassed the challenge submissions inbundle detection performance (Supplementary Fig. 4).
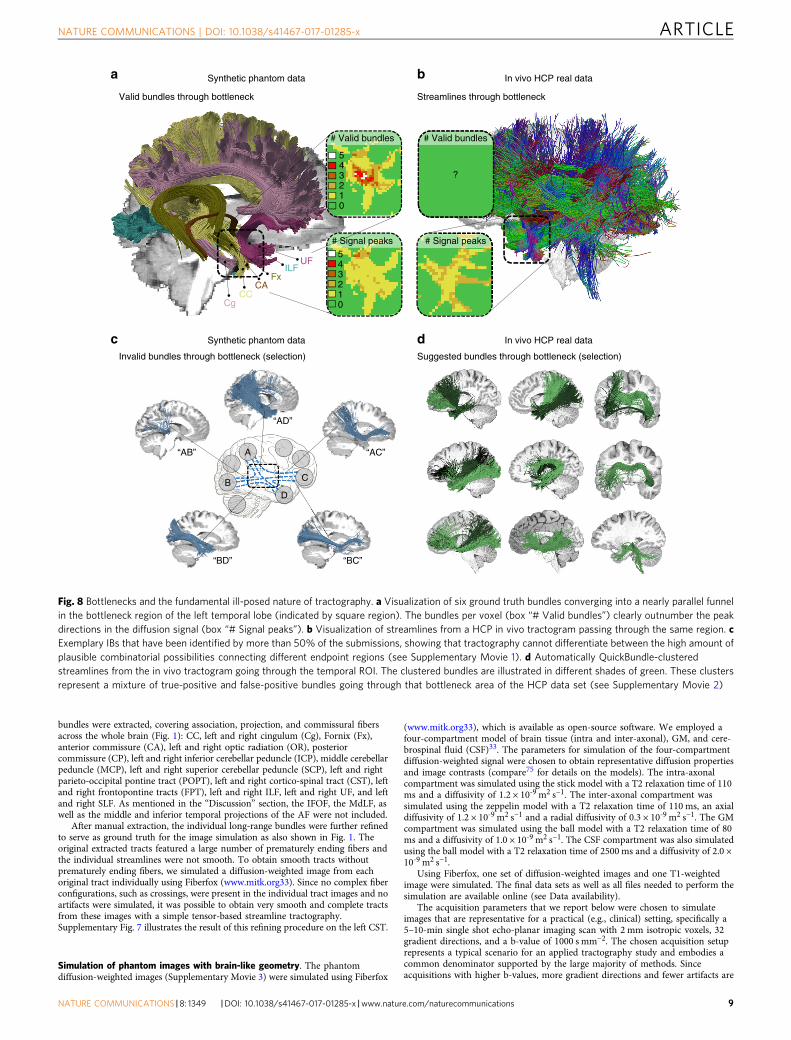
We further investigated the ambiguities tractography encountersin the synthetic phantom as well as in an in vivo data set. In thetemporal lobe, for example, multiple bundles overlap and clearlyoutnumber the count of fiber orientations in most of the voxels. Asillustrated in Fig. 8, single fiber directions in the diffusion signalregularly represent multiple bundles (see also SupplementaryMovie 1). Such funnels embody hard bottlenecks for tractography,leading to massive combinatorial possibilities of plausible config-urations for connecting the associated bundle endpoints as sketchedin Figs. 7c and 8c. Consequently, for the real data set as well as thesynthetic phantom, dozens of structured and coherent bundles passthrough this bottleneck, exhibiting similar fiber counts (cf.Supplementary Figs. 5, 6) and a wide range of anatomicallyreasonable geometries as illustrated in Supplementary Movie 2. Atractogram based on real HCP data exhibits a whole family oftheoretically plausible bundles going through the temporal lobebottleneck even though, locally, the diffusion signal often showsonly one fiber direction (cf. Fig. 8d). Methodological innovation willbe necessary to resolve these issues and better exploit additionalinformation sources that complement the local orientation fieldsestimated from DWI.
Statistical analysis of processing steps. Effects of the methodo-logical setup of the different submissions on the results wereinvestigated in a multivariable linear mixed model and revealed theinfluence of the individual processing steps on the tractographyoutcome (Table 1). The choice of tractography algorithm, as well asthe post-tracking filtering strategy and the underlying diffusionmodeling had a strong effect on overall scores, revealing a cleartradeoff between sensitivity and specificity (Supplementary Note 3).Manual editing of tractograms following anatomical priors had a
Team number1 2 3 4 5 6 7 8 9 10
Valid connections
100
0
Rat
io [%
]
11 12 13 1415 16 17 18 19 20
Bundle detection
Number invalid bundles (IB)
Num
ber
valid
bun
dles
(V
B)
32 64 128 256
20
10
0
a
b
Bundle overreach [%]
Bundle volume
Bun
dle
over
lap
[%]
80
60
40
20
0
60 80 16014012010040200
c
Fig. 4 Between-group differences in tractography reconstructions of VBs and IBs. Overview of the scores reached by the different teams as a percentage ofstreamlines connecting valid regions, b number of detected VBs and IBs (data points are jittered to improve legibility), and c volume overlap (OL) and overreach(OR) scores averaged over bundles. Black arrows mark submissions used in the following figures (see Supplementary Note 5 for discussion)
NATURE COMMUNICATIONS | DOI: 10.1038/s41467-017-01285-x ARTICLE
NATURE COMMUNICATIONS |8: 1349 |DOI: 10.1038/s41467-017-01285-x |www.nature.com/naturecommunications 5
negative impact on the number of VBs identified (mean effect: 3.8± 2.6 bundles) and on the bundle overlap (mean effect: −15± 11%).However, such techniques showed a positive impact on the averagebundle overreach (mean effect: −16± 9%). Notably, Team 3 post-processed the tractograms using clustering, reaching 92% validlyconnecting streamlines keeping only the larger clusters.
DiscussionWe assessed current state-of-the-art fiber tractography approa-ches using a ground truth data set of white matter tracts andconnectivity that is representative of the challenges that mayoccur in human in vivo brain imaging. Advanced tractographystrategies in combination with current diffusion modeling
techniques successfully recovered most VBs, covering up to 77%of their volumetric extent. This result demonstrates the capabilityof current methods and teams to adequately handle numerousartifacts in DWI and overcome local crossing situations duringtract reconstruction. However, tractography also produced thickand dense bundles of plausible looking streamlines in locationswhere such streamlines did not actually exist. When focusing onthe 64 bundles that were systematically recovered by the majorityof submissions, 64% of them were in fact absent from the groundtruth. Current tractography pipelines, and even tracking of theground truth fiber orientations on high-resolution images, pro-duce substantial amounts of false-positive bundles. The employedsimulation-based approach cannot quantify the effects related toin vivo connectivity in an absolute sense; that is, our results do
AF MdLF IFOF
FAT SFOF VOF
85% of submissions
81% of submissions
95% of submissions
81% of submissions
95% of submissions
88% of submissions
CACCCP
CST-LCST-R
Cg-LCg-R
FPT-LFPT-R
FxICP-LICP-RILF-LILF-RMCPOR-LOR-R
POPT-LPOPT-R
SCP-LSCP-RSLF-LSLF-R
UF-LUF-R
CA
CC
CP
CS
T-L
CS
T-R
Cg-
LC
g-R
FP
T-L
FP
T-R Fx
ICP
-LIC
P-R
ILF
-LIL
F-R
MC
PO
R-L
OR
-RP
OP
T-L
PO
PT
-RS
CP
-LS
CP
-RS
LF-L
SLF
-RU
F-L
UF
-R
Found by 1
Found by 24
Found by 48
Found by 72
Found by 1
Found by 24
Found by 48
Found by 72
Red: valid
Blue: invalid
a
b
Fig. 5 Overview of VBs and IBs and examples of invalid streamline clusters. a Each entry in the connectivity matrix indicates the number of submissionsthat have identified the respective bundle. The two rows and columns of each bundle represent the head-endpoint and tail-endpoint regions. Theconnectivity matrix indicates a high number of existing tracts that were identified by most submissions (red). It also indicates systematic artefactualreconstructions across teams (blue). b Examples of IBs that have been consistently identified by more than 80% of the submissions, but do not exist in theground truth data set. The AF, for example, was generated from ILF and SLF crossing streamlines, whereas the IFOF was generated from by crossing ILF andUF streamlines. The MdLF, FAT, SFOF, and VOF were other examples of highly represented IBs
ARTICLE NATURE COMMUNICATIONS | DOI: 10.1038/s41467-017-01285-x
6 NATURE COMMUNICATIONS | 8: 1349 |DOI: 10.1038/s41467-017-01285-x |www.nature.com/naturecommunications
not mean that anyone who is doing tractography should expectthe reported VB-to-IB and coverage-to-overreach ratios. How-ever, the presented findings do expose the degree of ambiguityassociated with whole-brain tractography and show that thecomputational problem of tractography goes far beyond the localreconstruction of fiber directions1, 7 and issues of data quality.Our findings, therefore, present a core and open challenge for thefield of tractography and connectivity mapping in general.
Previous studies have reported high invalid-connection ratiosunder simplified conditions26, 38 (www.tractometer.org), and someof the underlying ambiguities in tractography have been discussedusing schematic representations and theoretical arguments1, 7, 8, 37.Regions of white matter bottlenecks have been discussed in thepast35 and have been highlighted as critical with respect to tracto-graphic findings36. The current results reveal the consequences ofsuch limitations under more complex conditions as might be foundin human brain studies in vivo, addressing important questions thatpreviously remained speculative. The findings were derived from abrain-like geometry that encompasses some of the major knownlong-range connections and covers 71% of the white matter. Futureversions of the phantom are planned to include additional bundlessuch as the middle and inferior temporal projections of the AF, theMdLF, and the IFOF, as well as smaller U-fibers, medial forebrainfibers, deep nuclei, and connections between them. In addition,more advanced diffusion modeling methods will allow generatingeven more realistic DWI signals, potentially simulated at increasedspatial and q-space resolutions49.
These developments, however, will not resolve the fundamentalambiguities which tractography faces and thus will only have alimited effect on the main findings of our study. We showed thatfalse-positive bundles occur at similar rates even when using themaximal angular precision of the signal, that is, using groundtruth orientations. These findings confirm those shown in pre-vious studies5 and relate to the fundamental problem formulation
in tractography: inferring connectivity from local orientationfields. Increasing the anatomic complexity of the phantom byadding more bundles most likely will even lead to furtherincreased false-positive rates. The construction process of thecurrent phantom resembles a potential limitation, since itinvolves tractography itself and thus raises self-validation issues.This aspect should be considered in direct method comparisonsas there may exist a possible bias toward algorithms that aresimilar to the algorithm used for phantom generation. Thiscaveat, however, has only a very limited effect on our generalfindings. It can be expected that the identified limitations oftractography will become even more pronounced in phantoms ofhigher anatomic complexity that might be achievable by involvingindependent methods such as polarized light imaging50. Insummary, our observations confirm the fundamental ill-posednature of the computational problem that current tractographyapproaches strive to solve.
Accordingly, substantial methodological innovations will benecessary to resolve the problem of IBs. Several directions ofcurrent research might improve the specificity of tractography.Streamline filtering techniques can optimize the signal predictionerror in order to reduce tractography biases14, 16, 51. They are partof the more general trend to integrate non-local information, aswell as advanced diffusion microstructure modeling that goesbeyond the raw directional vectors52–58. Recent advances inmachine-learning-driven tractography also show great potentialin improving the specificity of tractograms59, 60. Future versionsof our phantom will be generated with multiple b-values, bettersignal-to-noise ratio (SNR), and fewer artifacts to furtherencourage research in these directions.
In addition, tractography should increasingly employ reliableanatomical priors from ex vivo histology, high-resolution post-mortem DWI61, or complementary electrophysiology for optimalguidance. While manual or automated clean-up of streamlines
Team number1 2 3 4 5 6 7 8 9 10
Valid connections
10080604020
0
Rat
io [%
]
11 12 13 1415 16 17 18 19 20 GT1 GT2
Bundle detection
Number of invalid bundles
Num
ber
of v
alid
bun
dles
32 64 128 256
20
10
0
Bundle overreach [%]
Bundle volume
Bun
dle
over
lap
[%]
80
60
40
20
10
30
50
70
0
Team markers
60 80 16014012010040200
1 13141516
GT1 1.25 mmGT1 1.5 mmGT1 1.75 mmGT1 2.0 mmGT2 0.5 mmGT2 0.75 mmGT2 1.0 mmGT2 1.25 mmGT2 1.5 mmGT2 1.75 mmGT2 2.0 mm
17181920GT1 0.5 mmGT1 0.75 mmGT1 1.0 mm
23456789101112
a
b c
Fig. 6 Tractography on ground truth directions with no noise still affected by IB problem. We applied deterministic tractography directly to the ground truthvector field with multiple resolutions (2, 1.75, 1.5, 1.25, 1.0, 0.75, and 0.5 mm). Two independent implementations of deterministic tractography methodswere used to obtain the results (GT1 and GT2, cf. Supplementary Note 2). a Percentage of streamlines connecting valid regions. b Number of detected VBsand IBs (data points are jittered to improve legibility). c Volume overlap and overreach scores averaged over bundles
NATURE COMMUNICATIONS | DOI: 10.1038/s41467-017-01285-x ARTICLE
NATURE COMMUNICATIONS |8: 1349 |DOI: 10.1038/s41467-017-01285-x |www.nature.com/naturecommunications 7
may help (as demonstrated by our results showing decreasedoverreach at the expense of VB detection and volumetric recon-struction), the real challenge is our limited knowledge of theanatomy to be reconstructed. Currently, post-mortem dissectionwith Klingler’s method reveals the macroscopic organization ofthe human brain white matter11, 62–64, although this methodshares some of the mentioned limitations of tractography incomplex fiber configurations or near the cortex. In the future, thecommunity will have to gain further insights into the underlyingprinciples of white matter organization and increasingly learnhow to leverage such information for tractography1, 65, 66.
Potential advances achieved in tractography will have animportant impact on graph-analytical studies of the structuralconnectome2, 67. The hitherto demonstrated diagnostic or pre-dictive capability of such analyses (e.g., in psychiatric settings)should not let us overlook which aspects of tractography arereliable and which are not. One of the present findings is parti-cularly relevant for the field of connectomics: the traditionalmetrics that require streamlines to exactly end in head or tailregions of a bundle are far too restrictive for bundle dissectionand connectivity assessment. None of the submissions generatedexact streamlines that perfectly overlap with ground truth bundlesand dilated endpoint masks. This finding is in line with previousreports, which found termination of tracts in the gray matter(GM) to be inaccurate5 and highlights an important limitation ofapproaches that use a voxel-wise definition of parcellations on theT1 image for selecting relevant streamlines. Future versions of ourphantom will include ground-truth parcellations of the whitematter/GM cortical band to encourage further developments fortackling these problems and extend the evaluation method toapply to graph theory metrics.
Despite any limitations, DWI is currently the only tool to mapshort and long-range structural brain connectivity in vivo and isessential for comparing brains, detecting differences, and simu-lating brain activity39. Our findings should foster the develop-ment of novel tractography methods that are carefully evaluatedusing the present approach. The most important goal for the nextgeneration of tractography algorithms is an improved ability to
reconstruct the full spatial extent of existing tracts while bettercontrolling for false-positive connections. A tighter integration ofanatomical priors, advanced diffusion microstructure modeling,and multi-modality imaging should help to resolve ambiguities inthe signal and overcome current limitations of tractography57, 58.Fundamentally, there is an urgent need for methodologicalinnovation in tractography in order to advance our knowledge ofhuman white matter anatomy and build anatomically correcthuman connectomes1, 7.
MethodsGeneration of ground truth fiber bundles. The set of ground truth long-rangefiber bundles was designed to cover the whole human brain and features many ofthe relevant spatial configurations, such as crossing, kissing, twisting and fanningfibers, thus representing the morphology of the major known in vivo fiber bundles.The process to obtain these bundles consisted of three steps. First, a whole-brainglobal tractography was performed on a high-quality in vivo diffusion-weightedimage. Then, 25 major long-range bundles were manually extracted from theresulting tractogram. In the third step, these bundles were refined to obtain smoothand well-defined bundles. Each of these steps is detailed in the followingparagraphs.
We chose one of the diffusion-weighted data sets included in the Q3 datarelease of the HCP39, subject 100307, to perform whole-brain global fibertractography52, 68. Among other customizations, the HCP scanners are equippedwith a set of high-end gradient coils, enabling diffusion encoding gradient strengthsof 100 mTm−1. By comparison, most standard magnetic resonance scannersfeature gradient strengths of about 30 to 40 mTm−1. This hardware setup allowsthe acquisition of data sets featuring exceptionally high resolutions (1.25 mmisotropic, 270 gradient directions) while maintaining an excellent SNR. All data setswere corrected for head motion, eddy currents and susceptibility distortions andare, in general, of very high quality69–73. Detailed information regarding theemployed imaging protocols as well as the data sets themselves may be found onhttp://humanconnectome.org.
Global fiber tractography was performed using MITK Diffusion74 with thefollowing parameters: 900,000,000 iterations, a particle length of 1 mm, a particlewidth of 0.1 mm, and a particle weight of 0.002. Furthermore, we repeated thetractography six times and combined the resulting whole-brain tractograms intoone large data set consisting of over five million streamlines. The selectedparameters provided for a very high sensitivity of the tractography method. Thespecificity of the resulting tractogram was of lesser concern since the tracts ofinterest were extracted manually in the second step.
Bundle segmentation was performed by an expert radiologist using manuallyplaced inclusion and exclusion regions of interest (ROI). We followed the conceptsintroduced in ref. 40 for the ROI placement and fiber extraction. Twenty-five
(A)
Vox
el le
vel
(B)
Loca
l lev
el(C
) G
loba
l lev
el
Hypotheticalground truth
Illustration ofimaging information
Unordered selection ofpotential tract hypotheses
Fig. 7 Ambiguous correspondences between diffusion directions and fiber geometry. The three illustrations at voxel, local, and global level are used as anexample to illustrate the possible ambiguities contained in the diffusion imaging information that may lead to alternative tract reconstructions. (A) Theintra-voxel crossing of fibers in the hypothetical ground truth leads to ambiguous imaging information at voxel level7. (B) Similarly, the imagingrepresentation of local fiber crossings can be explained by several other configurations7. (C) At a global level, white matter regions that are shared bymultiple bundles (so-called “bottlenecks”, dotted rectangles)35 can lead to many spurious tractographic reconstructions36. With only two bundles in thehypothetical ground truth (red and yellow bundle), four potential false-positive bundles emerge. Please note that the hypothetical ground truth used in theglobal-level example is anatomically incorrect as most of the callosal fibers are homotopically distributed (i.e., connect similar regions on both hemispheres)
ARTICLE NATURE COMMUNICATIONS | DOI: 10.1038/s41467-017-01285-x
8 NATURE COMMUNICATIONS | 8: 1349 |DOI: 10.1038/s41467-017-01285-x |www.nature.com/naturecommunications
bundles were extracted, covering association, projection, and commissural fibersacross the whole brain (Fig. 1): CC, left and right cingulum (Cg), Fornix (Fx),anterior commissure (CA), left and right optic radiation (OR), posteriorcommissure (CP), left and right inferior cerebellar peduncle (ICP), middle cerebellarpeduncle (MCP), left and right superior cerebellar peduncle (SCP), left and rightparieto-occipital pontine tract (POPT), left and right cortico-spinal tract (CST), leftand right frontopontine tracts (FPT), left and right ILF, left and right UF, and leftand right SLF. As mentioned in the “Discussion” section, the IFOF, the MdLF, aswell as the middle and inferior temporal projections of the AF were not included.
After manual extraction, the individual long-range bundles were further refinedto serve as ground truth for the image simulation as also shown in Fig. 1. Theoriginal extracted tracts featured a large number of prematurely ending fibers andthe individual streamlines were not smooth. To obtain smooth tracts withoutprematurely ending fibers, we simulated a diffusion-weighted image from eachoriginal tract individually using Fiberfox (www.mitk.org33). Since no complex fiberconfigurations, such as crossings, were present in the individual tract images and noartifacts were simulated, it was possible to obtain very smooth and complete tractsfrom these images with a simple tensor-based streamline tractography.Supplementary Fig. 7 illustrates the result of this refining procedure on the left CST.
Simulation of phantom images with brain-like geometry. The phantomdiffusion-weighted images (Supplementary Movie 3) were simulated using Fiberfox
(www.mitk.org33), which is available as open-source software. We employed afour-compartment model of brain tissue (intra and inter-axonal), GM, and cere-brospinal fluid (CSF)33. The parameters for simulation of the four-compartmentdiffusion-weighted signal were chosen to obtain representative diffusion propertiesand image contrasts (compare75 for details on the models). The intra-axonalcompartment was simulated using the stick model with a T2 relaxation time of 110ms and a diffusivity of 1.2 × 10⁻⁹ m2 s−1. The inter-axonal compartment wassimulated using the zeppelin model with a T2 relaxation time of 110 ms, an axialdiffusivity of 1.2 × 10⁻⁹ m2 s−1 and a radial diffusivity of 0.3 × 10⁻⁹ m2 s−1. The GMcompartment was simulated using the ball model with a T2 relaxation time of 80ms and a diffusivity of 1.0 × 10⁻⁹ m2 s−1. The CSF compartment was also simulatedusing the ball model with a T2 relaxation time of 2500 ms and a diffusivity of 2.0 ×10⁻⁹ m2 s−1.
Using Fiberfox, one set of diffusion-weighted images and one T1-weightedimage were simulated. The final data sets as well as all files needed to perform thesimulation are available online (see Data availability).
The acquisition parameters that we report below were chosen to simulateimages that are representative for a practical (e.g., clinical) setting, specifically a5–10-min single shot echo-planar imaging scan with 2 mm isotropic voxels, 32gradient directions, and a b-value of 1000 s mm−2. The chosen acquisition setuprepresents a typical scenario for an applied tractography study and embodies acommon denominator supported by the large majority of methods. Sinceacquisitions with higher b-values, more gradient directions and fewer artifacts are
Synthetic phantom data
# Signal peaks
C
DB
A
Invalid bundles through bottleneck (selection)
Valid bundles through bottleneck
Suggested bundles through bottleneck (selection)
Streamlines through bottleneck
CCCg
FxILF
CA
UF
“AB”
“AD”
“AC”
“BC”“BD”
# Signal peaks
# Valid bundles
543210
543210
?
# Valid bundles
In vivo HCP real data
Synthetic phantom data In vivo HCP real data
a b
c d
Fig. 8 Bottlenecks and the fundamental ill-posed nature of tractography. a Visualization of six ground truth bundles converging into a nearly parallel funnelin the bottleneck region of the left temporal lobe (indicated by square region). The bundles per voxel (box “# Valid bundles”) clearly outnumber the peakdirections in the diffusion signal (box “# Signal peaks”). b Visualization of streamlines from a HCP in vivo tractogram passing through the same region. cExemplary IBs that have been identified by more than 50% of the submissions, showing that tractography cannot differentiate between the high amount ofplausible combinatorial possibilities connecting different endpoint regions (see Supplementary Movie 1). d Automatically QuickBundle-clusteredstreamlines from the in vivo tractogram going through the temporal ROI. The clustered bundles are illustrated in different shades of green. These clustersrepresent a mixture of true-positive and false-positive bundles going through that bottleneck area of the HCP data set (see Supplementary Movie 2)
NATURE COMMUNICATIONS | DOI: 10.1038/s41467-017-01285-x ARTICLE
NATURE COMMUNICATIONS |8: 1349 |DOI: 10.1038/s41467-017-01285-x |www.nature.com/naturecommunications 9
beneficial for tractography, we additionally report a least upper bound tractographyperformance under perfect image quality conditions using a data set that directlycontains ground truth fiber orientation information at high spatial resolution withno artifacts (Fig. 6 and Supplementary Note 2).
The parameters are a matrix size of 90 × 108 × 90, echo time (TE) 108 ms, dwelltime 1 ms; T2′ relaxation time 50 ms. The simulation corresponded to a single-coilacquisition with constant coil sensitivity, no partial Fourier and no parallelimaging. Phase encoding was posterior-anterior. Two unweighted images withposterior-anterior/anterior-posterior phase encoding were also generated.
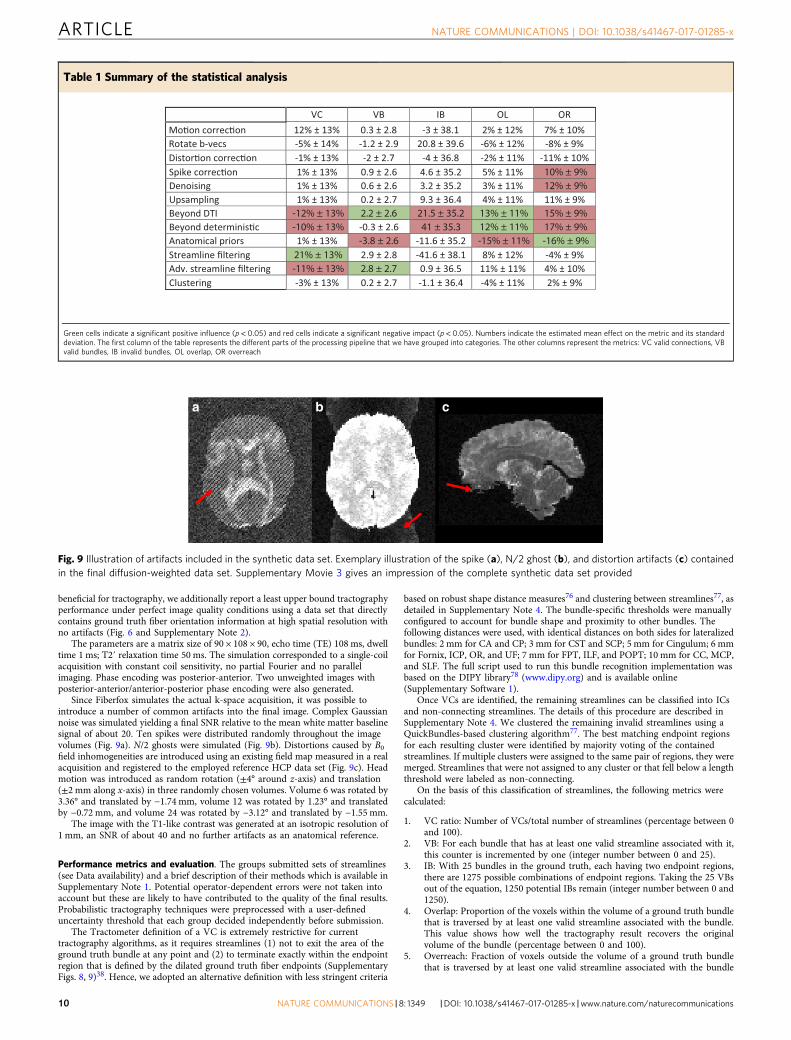
Since Fiberfox simulates the actual k-space acquisition, it was possible tointroduce a number of common artifacts into the final image. Complex Gaussiannoise was simulated yielding a final SNR relative to the mean white matter baselinesignal of about 20. Ten spikes were distributed randomly throughout the imagevolumes (Fig. 9a). N/2 ghosts were simulated (Fig. 9b). Distortions caused by B0field inhomogeneities are introduced using an existing field map measured in a realacquisition and registered to the employed reference HCP data set (Fig. 9c). Headmotion was introduced as random rotation (±4° around z-axis) and translation(±2 mm along x-axis) in three randomly chosen volumes. Volume 6 was rotated by3.36° and translated by −1.74 mm, volume 12 was rotated by 1.23° and translatedby −0.72 mm, and volume 24 was rotated by −3.12° and translated by −1.55 mm.
The image with the T1-like contrast was generated at an isotropic resolution of1 mm, an SNR of about 40 and no further artifacts as an anatomical reference.
Performance metrics and evaluation. The groups submitted sets of streamlines(see Data availability) and a brief description of their methods which is available inSupplementary Note 1. Potential operator-dependent errors were not taken intoaccount but these are likely to have contributed to the quality of the final results.Probabilistic tractography techniques were preprocessed with a user-defineduncertainty threshold that each group decided independently before submission.
The Tractometer definition of a VC is extremely restrictive for currenttractography algorithms, as it requires streamlines (1) not to exit the area of theground truth bundle at any point and (2) to terminate exactly within the endpointregion that is defined by the dilated ground truth fiber endpoints (SupplementaryFigs. 8, 9)38. Hence, we adopted an alternative definition with less stringent criteria
based on robust shape distance measures76 and clustering between streamlines77, asdetailed in Supplementary Note 4. The bundle-specific thresholds were manuallyconfigured to account for bundle shape and proximity to other bundles. Thefollowing distances were used, with identical distances on both sides for lateralizedbundles: 2 mm for CA and CP; 3 mm for CST and SCP; 5 mm for Cingulum; 6 mmfor Fornix, ICP, OR, and UF; 7 mm for FPT, ILF, and POPT; 10 mm for CC, MCP,and SLF. The full script used to run this bundle recognition implementation wasbased on the DIPY library78 (www.dipy.org) and is available online(Supplementary Software 1).
Once VCs are identified, the remaining streamlines can be classified into ICsand non-connecting streamlines. The details of this procedure are described inSupplementary Note 4. We clustered the remaining invalid streamlines using aQuickBundles-based clustering algorithm77. The best matching endpoint regionsfor each resulting cluster were identified by majority voting of the containedstreamlines. If multiple clusters were assigned to the same pair of regions, they weremerged. Streamlines that were not assigned to any cluster or that fell below a lengththreshold were labeled as non-connecting.
On the basis of this classification of streamlines, the following metrics werecalculated:
1. VC ratio: Number of VCs/total number of streamlines (percentage between 0and 100).
2. VB: For each bundle that has at least one valid streamline associated with it,this counter is incremented by one (integer number between 0 and 25).
3. IB: With 25 bundles in the ground truth, each having two endpoint regions,there are 1275 possible combinations of endpoint regions. Taking the 25 VBsout of the equation, 1250 potential IBs remain (integer number between 0 and1250).
4. Overlap: Proportion of the voxels within the volume of a ground truth bundlethat is traversed by at least one valid streamline associated with the bundle.This value shows how well the tractography result recovers the originalvolume of the bundle (percentage between 0 and 100).
5. Overreach: Fraction of voxels outside the volume of a ground truth bundlethat is traversed by at least one valid streamline associated with the bundle
a b c
Fig. 9 Illustration of artifacts included in the synthetic data set. Exemplary illustration of the spike (a), N/2 ghost (b), and distortion artifacts (c) containedin the final diffusion-weighted data set. Supplementary Movie 3 gives an impression of the complete synthetic data set provided
Table 1 Summary of the statistical analysis
Green cells indicate a significant positive influence (p< 0.05) and red cells indicate a significant negative impact (p< 0.05). Numbers indicate the estimated mean effect on the metric and its standarddeviation. The first column of the table represents the different parts of the processing pipeline that we have grouped into categories. The other columns represent the metrics: VC valid connections, VBvalid bundles, IB invalid bundles, OL overlap, OR overreach
ARTICLE NATURE COMMUNICATIONS | DOI: 10.1038/s41467-017-01285-x
10 NATURE COMMUNICATIONS | 8: 1349 |DOI: 10.1038/s41467-017-01285-x |www.nature.com/naturecommunications
over the total number of voxels within the ground truth bundle. This valueshows how much the VCs extend beyond the ground truth bundle volume(percentage between 0 and 100). This value is always zero for the traditionaldefinition of a VC, but can be non-zero for the non-stringent criteria weadopted in our study.
Following previously defined criteria of evaluation79, our study is mainly aboutaccuracy with respect to the reference, rather than reproducibility or robustness oftractography.
Statistical multi-variable analysis. Effects of the experimental settings wereinvestigated in a multivariable linear mixed model. The experimental variablesdescribing the methods used for the different submissions were included as fixedeffects (Fig. 2b). The VC ratio, the VB count, the IB count, the bundle overlappercentage, and the bundle overreach percentage were modeled as dependentvariables, each of which is used for the calculation of a separate model. Thesubmitting group was modeled as a random effect. The software SAS 9.2, ProcMixed, SAS Institute Inc., Cary, NC, USA, was used for the analysis.
Data availability. The authors declare that the data supporting the findings of thisstudy are available within the paper and its Supplementary Information files. TheISMRM 2015 Tractography Challenge data sets and the submitted tractograms areavailable under doi.org/10.5281/zenodo.572345 and doi.org/10.5281/zenodo.840086, respectively.
Received: 21 November 2016 Accepted: 1 September 2017
References1. Jbabdi, S., Sotiropoulos, S. N., Haber, S. N., Van Essen, D. C. & Behrens, T. E.
Measuring macroscopic brain connections in vivo. Nat. Neurosci. 18,1546–1555 (2015).
2. Bullmore, E. & Sporns, O. Complex brain networks: graph theoretical analysisof structural and functional systems. Nat. Rev. Neurosci. 10, 186–198 (2009).
3. Deco, G. & Kringelbach, M. L. Great expectations: using whole-braincomputational connectomics for understanding neuropsychiatric disorders.Neuron 84, 892–905 (2014).
4. Craddock, R. C. et al. Imaging human connectomes at the macroscale. Nat.Methods 10, 524–539 (2013).
5. Thomas, C. et al. Anatomical accuracy of brain connections derived fromdiffusion MRI tractography is inherently limited. Proc. Natl Acad. Sci. USA 111,16574–16579 (2014).
6. Reveley, C. et al. Superficial white matter fiber systems impede detection oflong-range cortical connections in diffusion MR tractography. Proc. Natl. Acad.Sci. USA 112, E2820–E2828 (2015).
7. Jbabdi, S. & Johansen-Berg, H. Tractography: where do we go from here? BrainConnect. 1, 169–183 (2011).
8. Jones, D. K. Challenges and limitations of quantifying brain connectivity in vivowith diffusion MRI. Imaging Med. 2, 341–355 (2010).
9. Pujol, S. et al. The DTI challenge: toward standardized evaluation of diffusiontensor imaging tractography for neurosurgery. J. Neuroimaging 25, 875–882(2015).
10. Feigl, G. C. et al. Magnetic resonance imaging diffusion tensor tractography:evaluation of anatomic accuracy of different fiber tracking software packages.World Neurosurg. 81, 144–150 (2014).
11. Martino, J. et al. Cortex-sparing fiber dissection: an improved method for thestudy of white matter anatomy in the human brain. J. Anat. 219, 531–541(2011).
12. Wang, X. et al. Subcomponents and connectivity of the superior longitudinalfasciculus in the human brain. Brain Struct. Funct. 221, 2075–2092 (2015).
13. Wakana, S. et al. Reproducibility of quantitative tractography methods appliedto cerebral white matter. Neuroimage 36, 630–644 (2007).
14. Pestilli, F., Yeatman, J. D., Rokem, A., Kay, K. N. & Wandell, B. A. Evaluationand statistical inference for human connectomes. Nat. Methods 11, 1058–1063(2014).
15. Neher, P. F., Descoteaux, M., Houde, J.-C., Stieltjes, B. & Maier-Hein, K. H.Strengths and weaknesses of state of the art fiber tractography pipelines—acomprehensive in-vivo and phantom evaluation study using Tractometer. Med.Image Anal. 26, 287–305 (2015).
16. Daducci, A., Dal Palù, A., Lemkaddem, A. & Thiran, J.-P. COMMIT: convexoptimization modeling for microstructure informed tractography. IEEE Trans.Med. Imaging 34, 246–257 (2015).
17. Dyrby, T. B. et al. Validation of in vitro probabilistic tractography. Neuroimage37, 1267–1277 (2007).
18. Campbell, J. S., Siddiqi, K., Rymar, V. V., Sadikot, A. F. & Pike, G. B. Flow-based fiber tracking with diffusion tensor and q-ball data: validation andcomparison to principal diffusion direction techniques. Neuroimage 27,725–736 (2005).
19. Dauguet, J. et al. Comparison of fiber tracts derived from in-vivo DTItractography with 3D histological neural tract tracer reconstruction on amacaque brain. Neuroimage 37, 530–538 (2007).
20. Schmahmann, J. D. et al. Association fibre pathways of the brain: parallelobservations from diffusion spectrum imaging and autoradiography. Brain 130,630–653 (2007).
21. Seehaus, A. K. et al. Histological validation of DW-MRI tractography in humanpostmortem tissue. Cereb. Cortex 23, 442–450 (2013).
22. Knösche, T. R., Anwander, A., Liptrot, M. & Dyrby, T. B. Validation oftractography: comparison with manganese tracing. Hum. Brain Mapp. 36,4116–4134 (2015).
23. Donahue, C. J. et al. Using diffusion tractography to predict cortical connectionstrength and distance: a quantitative comparison with tracers in the monkey. J.Neurosci. 36, 6758–6770 (2016).
24. Bach, M., Maier-Hein (ne Fritzsche), K. H., Stieltjes, B. & Laun, F. B.Investigation of resolution effects using a specialized diffusion tensor phantom.Magn. Reson. Med. 71, 1108–1116 (2013).
25. Fieremans, E. et al. The design of anisotropic diffusion phantoms for thevalidation of diffusion weighted magnetic resonance imaging. Phys. Med. Biol.53, 5405–5421 (2008).
26. Fillard, P. et al. Quantitative evaluation of 10 tractography algorithms on arealistic diffusion MR phantom. Neuroimage 56, 220–234 (2011).
27. Maier-Hein (ne Fritzsche), K. H., Laun, F. B., Meinzer, H.-P. & Stieltjes, B.Opportunities and pitfalls in the quantification of fiber integrity: what can wegain from Q-ball imaging? Neuroimage 51, 242–251 (2010).
28. Moussavi-Biugui, A., Stieltjes, B., Fritzsche, K., Semmler, W. & Laun, F. B.Novel spherical phantoms for Q-ball imaging under in vivo conditions. Magn.Reson. Med. 65, 190–194 (2011).
29. Poupon, C. et al. New diffusion phantoms dedicated to the study and validationof high-angular-resolution diffusion imaging (HARDI) models. Magn. Reson.Med. 60, 1276–1283 (2008).
30. Pullens, P., Roebroeck, A. & Goebel, R. Ground truth hardware phantoms forvalidation of diffusion-weighted MRI applications. J. Magn. Reson. Imaging 32,482–488 (2010).
31. Close, T. G. et al. A software tool to generate simulated white matter structures forthe assessment of fibre-tracking algorithms. Neuroimage 47, 1288–1300 (2009).
32. Leemans, A., Sijbers, J., Verhoye, M., Van der Linden, A. & Van Dyck, D.Mathematical framework for simulating diffusion tensor MR neural fiberbundles. Magn. Reson. Med. 53, 944–953 (2005).
33. Neher, P. F., Laun, F. B., Stieltjes, B. & Maier-Hein, K. H. Fiberfox: facilitatingthe creation of realistic white matter software phantoms. Magn. Reson. Med. 72,1460–1470 (2014).
34. Perrone, D. et al. D-BRAIN: anatomically accurate simulated diffusion MRIbrain data. PLoS ONE 11, e0149778 (2016).
35. Mangin, J.-F., Regis, J. & Frouin, V. Shape bottlenecks and conservative flowsystems. In Proceedings of the 1996 Workshop on Mathematical Methods inBiomedical Image Analysis 131-138 (IEEE Computer Society, 1996).
36. Guevara, P. et al. Robust clustering of massive tractography datasets.Neuroimage 54, 1975–1993 (2011).
37. Basser, P. J. Fiber-tractography via diffusion tensor MRI. in Proc. InternationalSociety for Magnetic Resonance in Medicine 1226 (1998).
38. Cote, M. A. et al. Tractometer: towards validation of tractography pipelines.Med. Image Anal. 17, 844–857 (2013).
39. Glasser, M. F. et al. The Human Connectome Project’s neuroimaging approach.Nat. Neurosci. 19, 1175–1187 (2016).
40. Stieltjes, B., Brunner, R. M., Maier-Hein (ne Fritzsche), K. H. & Laun, F. B.DiffusionTensor Imaging: Introduction and Atlas. (Springer, Berlin Heidelberg, 2013).
41. Catani, M. & Schotten, M. T. de. Atlas of Human Brain Connections. (OUP,Oxford, 2012).
42. Catani, M. et al. A novel frontal pathway underlies verbal fluency in primaryprogressive aphasia. Brain J. Neurol. 136, 2619–2628 (2013).
43. de Schotten, M. T. et al. A lateralized brain network for visuospatial attention.Nat. Neurosci. 14, 1245–1246 (2011).
44. Forkel, S. J. et al. The anatomy of fronto-occipital connections from early bluntdissections to contemporary tractography. Cortex 56, 73–84 (2014).
45. Makris, N. et al. Human middle longitudinal fascicle: variations in patterns ofanatomical connections. Brain Struct. Funct. 218, 951–968 (2013).
46. Mars, R. B. et al. The extreme capsule fiber complex in humans and macaquemonkeys: a comparative diffusion MRI tractography study. Brain Struct. Funct.221, 4059–4071 (2015).
47. Meola, A., Comert, A., Yeh, F.-C., Stefaneanu, L. & Fernandez-Miranda, J. C.The controversial existence of the human superior fronto-occipital fasciculus:connectome-based tractographic study with microdissection validation. Hum.Brain Mapp. 36, 4964–4971 (2015).
NATURE COMMUNICATIONS | DOI: 10.1038/s41467-017-01285-x ARTICLE
NATURE COMMUNICATIONS |8: 1349 |DOI: 10.1038/s41467-017-01285-x |www.nature.com/naturecommunications 11
48. Yeatman, J. D. et al. The vertical occipital fasciculus: a century of controversyresolved by in vivo measurements. Proc. Natl Acad. Sci. USA 111, E5214–E5223(2014).
49. Maier-Hein, K. H. et al. Tractography challenge ISMRM 2015 high-resolutiondata. Zenodo https://doi.org/10.5281/zenodo.579933 (2017).
50. Larsen, L., Griffin, L. D., Graessel, D., Witte, O. W. & Axer, H. Polarized lightimaging of white matter architecture. Microsc. Res. Tech. 70, 851–863 (2007).
51. Smith, R. E., Tournier, J.-D., Calamante, F. & Connelly, A. The effects of SIFTon the reproducibility and biological accuracy of the structural connectome.Neuroimage 104, 253–265 (2015).
52. Neher, P. F. et al. MITK global tractography. In SPIE Medical Imaging: ImageProcessing (Eds. Haynor, D. R. & Ourselin, S.) 83144D (SPIE, 2012).
53. Mangin, J.-F. et al. Toward global tractography. Neuroimage 80, 290–296(2013).
54. Jbabdi, S., Woolrich, M. W., Andersson, J. L. R. & Behrens, T. E. J. A Bayesianframework for global tractography. Neuroimage 37, 116–129 (2007).
55. Christiaens, D. et al. Global tractography of multi-shell diffusion-weightedimaging data using a multi-tissue model. Neuroimage 123, 89–101 (2015).
56. Reisert, M., Kiselev, V. G., Dihtal, B., Kellner, E. & Novikov, D. S. MesoFT:unifying diffusion modelling and fiber tracking. Med. Image Comput. Comput.Assist. Interv. 17, 201–208 (2014).
57. Girard, G., Fick, R., Descoteaux, M., Deriche, R. & Wassermann, D. AxTract:microstructure-driven tractography based on the ensemble average propagator.Inf. Process. Med. Imaging Proc. Conf. 24, 675–686 (2015).
58. Daducci, A., Dal Palú, A., Descoteaux, M. & Thiran, J.-P. Microstructureinformed Tractography: pitfalls and open challenges. Front. Neurosci. 10, 247(2016).
59. Neher, P. F., Götz, M., Norajitra, T., Weber, C. & Maier-Hein, K. H. A machinelearning based approach to fiber tractography using classifier voting. inInternational Conference on Medical Image Computing and Computer-AssistedIntervention (Eds. Navab, N., Hornegger, J., Wells, W. & Frangi, A.) 45–52(Springer, 2015).
60. Neher, P. F., Côté, M.-A., Houde, J.-C., Descoteaux, M. & Maier-Hein, K. H.Fiber tractography using machine learning. Neuroimage 158, 417–429 (2017).
61. Dell’Acqua, F., Bodi, I., Slater, D., Catani, M. & Modo, M. MR diffusionhistology and micro-tractography reveal mesoscale features of the humancerebellum. Cerebellum 12, 923–931 (2013).
62. Zemmoura, I. et al. FIBRASCAN: a novel method for 3D white matter tractreconstruction in MR space from cadaveric dissection. Neuroimage 103,106–118 (2014).
63. De Benedictis, A. et al. New insights in the homotopic and heterotopic connectivityof the frontal portion of the human corpus callosum revealed by microdissectionand diffusion tractography. Hum. Brain Mapp. 37, 4718–4735 (2016).
64. Hau, J. et al. Revisiting the human uncinate fasciculus, its subcomponents andasymmetries with stem-based tractography and microdissection validation.Brain Struct. Funct. 222, 1645–1662 (2016).
65. Wedeen, V. J. et al. The geometric structure of the brain fiber pathways. Science335, 1628–1634 (2012).
66. Galinsky, V. L. & Frank, L. R. The lamellar structure of the brain fiberpathways. Neural Comput. 28, 2533–2556 (2016).
67. Sporns, O. Contributions and challenges for network models in cognitiveneuroscience. Nat. Neurosci. 17, 652–660 (2014).
68. Reisert, M. et al. Global fiber reconstruction becomes practical. Neuroimage 54,955–962 (2011).
69. Andersson, J. et al. A comprehensive Gaussian process framework forcorrecting distortions and movements in diffusion images. in Proceedings ofInternational Society of Magnetic Resonance in Medicine 2426 (2012).
70. Andersson, J. L. R., Skare, S. & Ashburner, J. How to correct susceptibilitydistortions in spin-echo echo-planar images: application to diffusion tensorimaging. Neuroimage 20, 870–888 (2003).
71. Fischl, B. FreeSurfer. Neuroimage 62, 774–781 (2012).72. Jenkinson, M., Beckmann, C. F., Behrens, T. E. J., Woolrich, M. W. & Smith, S.
M. FSL. Neuroimage 62, 782–790 (2012).73. Jenkinson, M., Bannister, P., Brady, M. & Smith, S. Improved optimization for
the robust and accurate linear registration and motion correction of brainimages. Neuroimage 17, 825–841 (2002).
74. Maier-Hein (ne Fritzsche), K. H. et al. MITK diffusion imaging. Methods Inf.Med. 51, 441–448 (2012).
75. Panagiotaki, E. et al. Compartment models of the diffusion MR signal in brainwhite matter: a taxonomy and comparison. Neuroimage 59, 2241–2254 (2012).
76. Garyfallidis, E., Ocegueda, O., Wassermann, D. & Descoteaux, M. Robust andefficient linear registration of white-matter fascicles in the space of streamlines.Neuroimage 117, 124–140 (2015).
77. Garyfallidis, E., Brett, M., Correia, M. M., Williams, G. B. & Nimmo-Smith, I.QuickBundles, a method for tractography simplification. Front. Neurosci. 6, 175(2012).
78. Garyfallidis, E. et al. Dipy, a library for the analysis of diffusion MRI data.Front. Neuroinform. 8, 8 (2014).
79. Jannin, P. et al. Validation of medical image processing in image-guidedtherapy. IEEE Trans. Med. Imaging 21, 1445–1449 (2002).
AcknowledgementsK.H.M.-H. was supported by the German Research Foundation (DFG), grants MA6340/10-1, MA 6340/12-1. M.D. was supported by the NSERC Discovery Grant programas well as the institutional Université de Sherbrooke Research Chair in Neuroinformatics.C.M.W.T. was supported by a grant (No. 612.001.104) from the Physical Sciencesdivision of the Netherlands Organization for Scientific Research (NWO). The research ofH.Y.M., S.D., S.S., A.M.H., and A.L. was supported by VIDI grant 639.072.411 fromNWO. The research of F.G. was funded by the Chinese Scholarship Council (CSC).M.Ch. was supported by the Alexander Graham Bell Canada Graduate Scholarships-Doctoral Program (CGS-D3) from the Natural Sciences and Engineering ResearchCouncil of Canada (NSERC). M.C. was supported by the Investigator Award No. 103759/Z/14/Z from the Wellcome Trust. C.C.H. was supported by DFG SFB grants 936/A1, Z3and TRR 169/A2. The research of J.-P.T., D.R., M.B., A.A., A.L., and A.D. was supportedby the Center for Biomedical Imaging (CIBM) of the Geneva-Lausanne Universities andthe EPFL, as well as the foundations Leenaards and Louis-Jeantet, and by the SwissNational Science Foundation grants 205321_144529 and 31003A_157063. W.E.R. wassupported by CA90246 from National Cancer Institute. The research of Y.F., C.G., Y.W.,J.M., H.R., Q.L., and C.-F.W. was supported by grant 61379020 from National NatureScience Foundation of China. C.-F.W. was supported by NIH grants P41EB015902 andP41EB015898.
Author contributionsK.H.M.-H., M.D., and J.-C.H. performed the data analysis and wrote the paper withinput from all authors. P.F.N. and B.S. designed the phantom. P.F.N. and J.-C.H. sup-ported the data analysis and J.-C.H. handled the Tractometer scoring and evaluationmetrics proposed. M.-A.C. and E.G. developed the clustering and bundle recognitionalgorithm for the relaxed scoring system. K.H.M.-H., P.F.N., J.-C.H., E.C., A.D., T.D.,B.S., and M.D. coordinated the tractography challenge at the International Society forMagnetic Resonance in Medicine (ISMRM) 2015 Diffusion Study Group meeting.T.H.-L. set up the multivariable statistical model. P.F.N. wrote parts of the OnlineMethods. L.P. and C.C.H. were mentors in the discussion of the paper and neuroana-tomical, as well as neuroscientific context. Submissions were made by the followingteams: J.Z. team 1; M.Ch. and C.M.W.T. team 2; F.-C.Y. team 3; Y.-C.L. team 4; Q.J. team5; D.Q.C. team 6; Y.F., C.G., Y.W., J.M., H.R., Q.L., and C.-F.W. team 7; S.D.-G., J.O.O.G., M.P., S.S.-J., and G.G. team 8; S.S.-J., F.R., and J.S. team 9; C.M.W.T., F.G., H.Y.M., S.D., M.F., A.M.H., and A.L. team 10; S.S.-J., G.G., and F.R. team 11; J.O.O.G., M.P., G.G.,and F.R. team 12; A.B., B.P., C.B., M.D., S.B., and J.D. team 13; A.S., R.V., A.C., A.Q., andJ.Y. team 14; A.R.K., W.H., and S.A. team 15; D.R., M.B., A.A., O.E., A.L., and J.-P.T.team 16; D.R., M.B., A.A., O.E., A.L., and J.-P.T. team 17; H.E.C., B.L.O., B.M., and M.S.N. team 18; F.P., G.P., J.E.V.-R., J.G., and P.M.T. team 19; F.D.S.R., P.L.L., L.M.L., R.B.,and F.D.’A. team 20.
Additional informationSupplementary Information accompanies this paper at doi:10.1038/s41467-017-01285-x.
Competing interests: The authors declare no competing financial interests.
Reprints and permission information is available online at http://npg.nature.com/reprintsandpermissions/
Publisher's note: Springer Nature remains neutral with regard to jurisdictional claims inpublished maps and institutional affiliations.
Open Access This article is licensed under a Creative CommonsAttribution 4.0 International License, which permits use, sharing,
adaptation, distribution and reproduction in any medium or format, as long as you giveappropriate credit to the original author(s) and the source, provide a link to the CreativeCommons license, and indicate if changes were made. The images or other third partymaterial in this article are included in the article’s Creative Commons license, unlessindicated otherwise in a credit line to the material. If material is not included in thearticle’s Creative Commons license and your intended use is not permitted by statutoryregulation or exceeds the permitted use, you will need to obtain permission directly fromthe copyright holder. To view a copy of this license, visit http://creativecommons.org/licenses/by/4.0/.
© The Author(s) 2017
ARTICLE NATURE COMMUNICATIONS | DOI: 10.1038/s41467-017-01285-x
12 NATURE COMMUNICATIONS | 8: 1349 |DOI: 10.1038/s41467-017-01285-x |www.nature.com/naturecommunications
Klaus H. Maier-Hein1, Peter F. Neher 1, Jean-Christophe Houde2, Marc-Alexandre Côté2,
Eleftherios Garyfallidis 2,3, Jidan Zhong4, Maxime Chamberland2, Fang-Cheng Yeh5, Ying-Chia Lin6, Qing Ji7,
Wilburn E. Reddick 7, John O. Glass 7, David Qixiang Chen8, Yuanjing Feng 9, Chengfeng Gao9, Ye Wu9,
Jieyan Ma10, H. Renjie10, Qiang Li10,11, Carl-Fredrik Westin12, Samuel Deslauriers-Gauthier 2,
J. Omar Ocegueda González13, Michael Paquette2, Samuel St-Jean 2, Gabriel Girard2, François Rheault 2,
Jasmeen Sidhu2, Chantal M.W. Tax14,15, Fenghua Guo14, Hamed Y. Mesri14, Szabolcs Dávid 14,
Martijn Froeling 16, Anneriet M. Heemskerk14, Alexander Leemans14, Arnaud Boré17, Basile Pinsard 17,18,
Christophe Bedetti17,19, Matthieu Desrosiers17, Simona Brambati17, Julien Doyon17, Alessia Sarica 20,
Roberta Vasta20, Antonio Cerasa 20, Aldo Quattrone20,21, Jason Yeatman22, Ali R. Khan 23,
Wes Hodges24, Simon Alexander24, David Romascano25, Muhamed Barakovic 25, Anna Auría25,
Oscar Esteban26, Alia Lemkaddem25, Jean-Philippe Thiran 25,26, H. Ertan Cetingul28, Benjamin L. Odry28,
Boris Mailhe28, Mariappan S. Nadar28, Fabrizio Pizzagalli 29, Gautam Prasad29, Julio E. Villalon-Reina29,
Justin Galvis29, Paul M. Thompson29, Francisco De Santiago Requejo30, Pedro Luque Laguna30,
Luis Miguel Lacerda30, Rachel Barrett30, Flavio Dell’Acqua30, Marco Catani30, Laurent Petit31,
Emmanuel Caruyer32, Alessandro Daducci 24,27, Tim B. Dyrby33,34, Tim Holland-Letz35, Claus C. Hilgetag 36,
Bram Stieltjes37 & Maxime Descoteaux2
1Division of Medical Image Computing, German Cancer Research Center (DKFZ), Heidelberg, 69120, Germany. 2Sherbrooke Connectivity ImagingLab (SCIL), Université de Sherbrooke, Sherbrooke, QC J1K 0A5 QC, Canada. 3Department of Intelligent Systems Engineering, School of Informaticsand Computing, Indiana University, Bloomington, IN 47408, USA. 4Krembil Research Institute, University Health Network, Toronto, Canada M5G2C4. 5Department of Neurological Surgery, University of Pittsburgh School of Medicine, Pittsburgh, PA 15213, USA. 6IMT—Institute for AdvancedStudies, Lucca, 55100, Italy. 7Department of Diagnostic Imaging, St. Jude Children’s Research Hospital, Memphis, TN 38105, USA. 8University ofToronto Institute of Medical Science, Toronto, Canada M5S 1A8. 9Institute of Information Processing and Automation, Zhejiang University ofTechnology, Hangzhou, 310023 Zhejiang, China. 10United Imaging Healthcare Co., Shanghai, 201807, China. 11Shanghai Advanced ResearchInstitute, Shanghai, 201210, China. 12Laboratory of Mathematics in Imaging, Harvard Medical School, Boston, MA 02215, USA. 13Center forResearch in Mathematics, Guanajuato, 36023, Mexico. 14PROVIDI Lab, Image Sciences Institute, University Medical Center Utrecht, Utrecht, 3508,The Netherlands. 15Cardiff University Brain Research Imaging Centre, School of Psychology, Cardiff University, Maindy Road, Cardiff, CF24 4HQ,UK. 16Department of Radiology, University Medical Center Utrecht, Utrecht, 3508, The Netherlands. 17Centre de recherche institut universitaire degeriatrie de Montreal (CRIUGM), Université de Montréal, Montreal, QC, Canada H3W 1W5. 18Sorbonne Universités, UPMC Univ Paris 06, CNRS,INSERM, Laboratoire d’Imagerie Biomédicale (LIB), 75013 Paris, France. 19Center for Advanced Research in Sleep Medicine, Hôpital du Sacré-Coeurde Montréal, Montreal, Canada H4J 1C5. 20Neuroimaging Unit, Institute of Bioimaging and Molecular Physiology (IBFM), National Research Council(CNR), Policlinico Magna Graecia, Germaneto, 88100 CZ, Italy. 21Institute of Neurology, University Magna Graecia, Germaneto, 88100 CZ, Italy.22Institute for Learning & Brain Sciences and Department of Speech & Hearing Sciences, University of Washington, Seattle, WA 98195, USA.23Departments of Medical Biophysics & Medical Imaging, Schulich School of Medicine and Dentistry, Western University, 1151 Richmond St N,London, ON, Canada N6A 5C1. 24Synaptive Medical Inc., MaRS Discovery District, 101 College Street, Suite 200, Toronto, M5V 3B1 ON, Canada.25Signal Processing Lab (LTS5), Ecole Polytechnique Federale de Lausanne, Lausanne, 1015, Switzerland. 26Biomedical Image Technologies (BIT),ETSI Telecom., U. Politécnica de Madrid and CIBER-BBN, Madrid, 28040, Spain. 27Department of Radiology, University Hospital Center (CHUV)and University of Lausanne (UNIL), Lausanne, 1011, Switzerland. 28Medical Imaging Technologies, Siemens Healthcare, Princeton, NJ 08540, USA.29Imaging Genetics Center, Stevens Neuro Imaging and Informatics Institute, Keck School of Medicine of USC, Marina del Rey, CA 90033, USA.30NatBrainLab, Institute of Psychiatry, Psychology & Neuroscience, King’s College London, London, SE5 8AF, UK. 31Groupe d’imagerieNeurofonctionnelle—Institut des Maladies Neurodégénératives (GIN-IMN), UMR5293 CNRS, CEA, University of Bordeaux, Bordeaux, 33000,France. 32Centre national de la recherche scientifique (CNRS), Institute for Research in IT and Random Systems (IRISA), UMR 6074 VISAGESProject-Team, Rennes, 35042, France. 33Danish Research Centre for Magnetic Resonance, Center for Functional and Diagnostic Imaging andResearch, Copenhagen University Hospital Hvidovre, Hvidovre, 2650, Denmark. 34Department of Applied Mathematics and Computer Science,Technical University of Denmark, Kongens Lyngby, 2800, Denmark. 35Division of Biostatistics, German Cancer Research Center (DKFZ),Heidelberg, 69120, Germany. 36Department of Computational Neuroscience, University Medical Center Eppendorf, Hamburg, 20246, Germany.37University Hospital Basel, Radiology & Nuclear Medicine Clinic, Basel, 4031, Switzerland
NATURE COMMUNICATIONS | DOI: 10.1038/s41467-017-01285-x ARTICLE
NATURE COMMUNICATIONS |8: 1349 |DOI: 10.1038/s41467-017-01285-x |www.nature.com/naturecommunications 13