rotating scans for systematic error removal
TRANSCRIPT

Eurographics Symposium on Geometry Processing 2009Marc Alexa and Michael Kazhdan(Guest Editors)
Volume 28 (2009), Number 5
Rotating Scans for Systematic Error Removal
Fatemeh Abbasinejad, Yong Joo Kil, Andrei Sharf, Nina Amenta
University of California, Davis
AbstractOptical triangulation laser scanners produce errors at surface discontinuities and sharp features. These system-atic errors are anisotropic. We examine the causes of these errors theoretically, and we study the correlation ofsystematic error with edge size and orientation experimentally. We then present a novel processing method forremoving systematic errors, by combining scans taken at several different orientations. We apply an anisotropicfilter to the separate scans, and use it to weight the data in a final combination step. Unlike previous approaches,our method does not require access to the scanner’s internal data or firmware. We demonstrate the technique ondata from laser range scanners by two different manufacturers.
Categories and Subject Descriptors (according to ACM CCS): Computer Graphics [I.3.3]: Range Scanning—
1. Introduction
Progress in range scanning techniques has been driving alarge amount of work in geometric modeling over the pasttwo decades. There are many different methodologies andapplications, including satellite and airplane stereographicscanning of the earth, LIDAR systems acquiring street viewsat driving speed and structured light scanners acquiring dy-namic scenes. Nevertheless optical triangulation laser rangescanning remains the most common technique for capturingsurface data, at least in computer graphics.
The accuracy of optical triangulation hinges on the abilityto locate the intensity peak of a beam of laser light reflectedby the surface. Variations in surface reflectance and shape re-sult in systematic errors in the captured depth map [SLPA90,BLS92, CL95]. The systematic error is anisotropic, as seenin Figure 1. The error is most pronounced at sharp surfaceedges that are perpendicular to the triangulation baseline (thedirection separating the optical sensor and the laser emitter),and does not appear at surface edges running in the directionparallel to the baseline.
Curless and Levoy treated this problem, among others, ina pioneering paper [CL95] about improving the internal peakdetection and triangulation firmware in a Cyberware scan-ner, using a “space-time" analysis which considered multi-ple charged coupled device (CCD) sensor frames when de-tecting the intensity peaks in each individual frame. Both ofthe modern scanners we experimented with, however, pro-
Figure 1: Removing systematic error from a scanned reliefof a wall in Persepolis. In the close-up, upper right, we seean extra ridge to the right of the spear. Errors at depth dis-continuity edges perpendicular to the triangulation baselineare typical of optical triangulation laser scanners. Below,capturing four depth maps at different orientations and com-bining them using our novel anisotropic filter removes thesesystematic errors.
duce anisotropic systematic errors which might have beeneliminated by better internal processing. Since out-of-thebox scanners do display systematic error, we present a post-
c© 2009 The Author(s)Journal compilation c© 2009 The Eurographics Association and Blackwell Publishing Ltd.Published by Blackwell Publishing, 9600 Garsington Road, Oxford OX4 2DQ, UK and350 Main Street, Malden, MA 02148, USA.

Fatemeh Abbasinejad & Yong Joo Kil & Andrei Sharf & Nina Amenta / Rotating Scans for Systematic Error Removal
Figure 2: Left, a close-up of a depth map captured fromour customized bulls-eye calibration object (see Figure 3and Section 5), produced with a high-precision laser rangescanner (Minolta Vivid 910). The corners should all be90◦. A side view of a strip cut along the scanner’s sensor-emitter axis shows the systematic error: a stair-step error oneach rising edge, and an overshoot before each falling edge.Right, combining four such depth maps successfully removesthe systematic error.
processing option which can be employed by the averageuser in search of better quality data.
One reason, perhaps, that removing systematic error is nota priority for scanner manufacturers is that it is not usuallyobvious in captured scans. This is because the systematic er-ror is usually masked by larger, more random errors. Othersources of error include the difficulty of peak detection in therasterized CCD image even in the absence of sharp edges, in-terpolation and quantization error, random noise in the CCDsensor and laser speckle, a physical phenomenon producedby interference between the reflected waves of the coherentlight of the laser. Random error is comparatively easy to re-move, as shown in recent work by Kil et al. [KMA06] (by av-eraging large amounts of data) or Diebel et al. [DTB06] (us-ing a Bayesian approach). When random error is removed,however, the systematic error becomes far more obvious (seeFigure 1 and Figure 2). In these situations the removal ofsystematic error becomes important.
Systematic errors also appear at sharp reflectance discon-tinuities as well as at the sharp depth discontinuities that westudy here. These errors tend to be smaller, and are oftenavoided in practice by covering the object with a matte pow-der or paint, or scanning a cast rather than the original object.Depth discontinuities, of course, present a more fundamentalproblem that cannot be handled with physical work-arounds.
Our basic approach is to collect multiple scans using anout-of-the box scanner, differing by a rotation of the objectaround the scanner’s z-axis. Each edge appears without sys-tematic error in at least one of these orientations. We com-
bine the scans in software, weighting parts of the scan whichwe believe to be accurate heavily and giving low weights tothe parts which we expect have systematic errors.
We apply this approach in two situations in which randomerror has already been removed from the input scans by av-eraging. The first context is the super-resolution techniqueof Kil et al. [KMA06]. Super-resolution is an image pro-cessing technique for combining many low-resolution im-ages to make a single high-resolution image. They general-ized super-resolution to laser scanner data; systematic errorbecomes more obvious as noise is removed and resolution isimproved. In this paper, we very successfully remove sys-tematic error from super-resolved depth maps made fromdata collected using a Minolta Vivid 910 scanner; Figure 1and Figure 2 are examples of this application.
Additionally, we remove noise from scans produced bya “commodity" scanner made by NextEngine. The Next-Engine is much less expensive than the Minolta Vivid 910and the scans it produces are noisier. Hence, improving thedepth maps produced by the NextEngine by post-processingin software would give a low-cost, high-quality scanning so-lution. Averaging only few scans does greatly reduce thenoise; but again, when random noise is removed the system-atic error becomes apparent. We apply our method to com-bine several de-noised depth maps, producing output that isdramatically better than the raw NextEngine scans, as seenin Figures 9 and 11.
2. Related work
The problem of accurately selecting the peak from the noisy,rasterized image of a reflected beam of laser light in theCCD sensor has received a fair amount of attention; for asurvey see [FN96]. Several works [BR86, FSCP04] handlethe noise and rasterization error by applying finite impulseresponse (FIR) filters to smooth the signal and increase theprecision of the peak position; some averaging, smoothingor fitting is necessary because of the noise.
[BLS92] presents a thorough study of optical triangu-lation performance and measurement limitations. The au-thors note that at sharp edges, the detected peak shifts andproduces an erroneous measurement of surface height. In[KGC91], the authors design a VLSI sensor array that gath-ers depth data in parallel as a scene is swept by a movingstripe. They notice that the parallel lightstripe method in-creases the accuracy of the depth measurement. In this set-ting the peak is detected using the additional time domainof the same position. Similarly [CL95] perform a specificspace-time analysis by recording a sequence of correspond-ing CCD images across time. The improved signal is com-puted by using a Gaussian fit.
All of these approaches directly access the signalsrecorded on CCD sensors, or even explicitly alter the CCDdevice. In contrast, in this paper we treat the range scanner
c© 2009 The Author(s)Journal compilation c© 2009 The Eurographics Association and Blackwell Publishing Ltd.

Fatemeh Abbasinejad & Yong Joo Kil & Andrei Sharf & Nina Amenta / Rotating Scans for Systematic Error Removal
as a black box, and process the point clouds that it outputs,a more realistic and useful approach for end users.
Diebel, Thrun and Bruenig [DTB06] proposed a compu-tational method for noise reduction, based on a Bayesian for-mulation combining a model of the process introducing theerror with a prior on the true shape of the surface. They as-sumed Gaussian error, which indeed removes random noise,but does nothing about systematic error. One could imaginedeveloping a similar Bayesian algorithm using a computa-tional model for systematic error, and indeed we consideredthis approach. But developing an accurate error model seemsfar from trivial, as we discuss in Section 3, and an inaccurateerror model might introduce artifacts of its own (whereas theworst one fears from their Gaussian is over-smoothing).
Kil et al. [KMA06], in their super-resolution work, madethe observation that systematic error becomes grossly evi-dent when random sources of error are removed, and we usetheir technique to generate super-resolved scans.
More generally, combining data is an important idea ingeometry acquisition, for example in the work of Nehab etal. [NRDR05], in which captured normals and surface posi-tion data were combined to greatly improve the resolution ofthe final models. Our use of scans taken from multiple orien-tations is also somewhat reminiscent of the fascinating workof Raskar et al. [RTF∗04], in which flashes from multiple di-rections were used to extract edges in photographic imagesfor non-photorealistic rendering.
In the following sections, we first describe our experimen-tal observations of systematic error and discuss why this spe-cific pattern of error occurs at sharp depth discontinuities.Then in Section 4, we present the algorithm for weightingand combining the scans. In Section 5 we discuss our dataacquisition and pre-processing, and we present our resultsand experiments in Section 6, and we conclude by describ-ing future directions and limitations.
3. Systematic Error
In an optical triangulation scanner, the laser emitter and theCCD sensor have to be well separated from each other toprovide a baseline for accurate triangulation. This causesocclusion and anisotropic variation in brightness near sharpdepth discontinuities, producing systematic errors.
To explore these errors experimentally we built aprecision-milled calibration object. The object consists ofbulls-eye shaped grooves of different depths, as seen in Fig-ure 3 left. The large bulls-eyes are 37mm in diameter, andthey range linearly in depth from 4.6mm to 1.0mm, provid-ing sharp edges at all orientations with different magnitudes.
De-noised depth maps acquired from the calibration ob-ject with our two scanners clearly exhibit similar systematicartifacts as shown in Figure 3. On rising edges (depth de-creases sharply along the baseline in the sensor-to-emitter
Figure 3: On the left is a photograph of our bulls-eye cal-ibration object. On the right, we show cross-sections, takenalong the sensor-emitter axis, for three bulls-eyes of differ-ent edge depths (4.7mm, 3.5mm and 2.3mm). A greater depthdiscontinuity causes a sharper overshoot, makes the stair-step artifact more prominent, and spreads both of them outover a wider area.
direction), we see a characteristic stair-step artifact, with anextraneous bump on the edge. On falling edges, we see anovershoot, a small bump occurring just before the edge it-self.
A gradient image of the bulls-eye depth map capturedfrom the calibration object is seen in Figure 6b. The errorsare most prominent at edges perpendicular to the baseline,decreasing roughly linearly with the angle over a range ofabout 45◦. The greater the depth disparity at the edge, themore significant the systematic errors and the wider the re-gion which they affect (Figure 3 right).
The pattern of systematic error observed with a Cyber-ware scanner by Curless and Levoy [CL95] had overshootartifacts on rising edges (see their Figure 2c), which surpris-ingly is inconsistent with our experiments. This may be re-lated to the fact that the Cyberware scanner moved both thelaser and camera together, rather than rotating the laser asthe Minolta 910 and the NextEngine do.
To explain the errors, we assume that the laser light beamhas a Gaussian intensity profile, and that the surface is per-fectly Lambertian. At a rising edge (Figure 4, left) the imageof the laser stripe is split into two parts. If the peak is de-tected somewhere between the two parts, triangulation withthe erroneous peak places an extra stair-step on the risingedge. On the right in Figure 4, the surface at the falling edgefaces the emitter, and is brightly illuminated. We believe thatthis causes the peak to shift towards the emitter, producingthe overshoot error.
Developing a quantitative, computational model of thiserror process from first principles seems to be far fromstraightforward. It should be possible to build a data-drivenmodel of the error generation process for a specific scan-
c© 2009 The Author(s)Journal compilation c© 2009 The Eurographics Association and Blackwell Publishing Ltd.

Fatemeh Abbasinejad & Yong Joo Kil & Andrei Sharf & Nina Amenta / Rotating Scans for Systematic Error Removal
Figure 4: This 1D illustration of systematic error showsthe two scenarios in which the error occurs. In both figureswe see the laser emitter and the sensor that captures the re-flected intensity from an illuminated surface. The figure onthe left shows a rising edge. The light emitted from the laserappears to be split, when viewed from the sensor, producinga bi-modal intensity profile in the sensor image, which leadsto the stair-step error. The right image illustrates a fallingedge. Because of the illumination discontinuity, the reflectedintensity profile is skewed, resulting in an overshoot error.
ner, given enough ground-truth data, Unfortunately, our datais “ground truth" in only a limited sense, because althoughwe have a precise model of the shape of the calibration ob-ject, we do not know the registration of that shape with thecollected data. Every registration we computed of the pre-cise synthetic model with the data was clearly offset slightlyalong the dimension which suffered from the systematic er-rors.
4. Removing Systematic Errors
We remove the systematic error by combining several depthmaps, captured by scanning the object in different orienta-tions. Our approach (see Figure 5) requires as input a setof acquired depth maps at several orientations {hθ1 , ...,hθn},differing by a rotation around the z-axis of the scanner (thedepth direction in each depth map). We use the term “depthmap" rather than “scan" since each input hθi is itself ex-pected to be the result of combining several raw scans byaveraging or super-resolution. Each hθi is used to computeweights wθi at each pixel. The weighted input depth maps{hθ1 , ...,hθn} are then registered and merged to form a sin-gle output depth map h f .
4.1. Weight Computation
Based on the observations in Section 4, we devised a weight-ing scheme that down-weights the regions of each depth map
Systematic-error-free Depth Map
Combined Depth MapInput Scans Weight Computation
hθ1
hf
hθn
wθ1
wθnθn
θ1
Figure 5: Input scans per orientation are combined to pro-duce {hθ1 , ...,hθn}. Weight wi is computed for each hθi . Thecombined depth maps and weights are used to compute thefinal depth map h f free of systematic error.
that we expect to contain errors, that is, the points on edgesperpendicular to the baseline. The weights are based on thegradient of the depth function. Since the gradient is sensitiveto noise, we compute the weights based on the processeddepth maps from which random noise was removed, ratherthan on the noisy raw input (this is also of course faster).
Edge detection: We use the magnitude of the gradient,|∇ f (p)|, as our edge filter kernel where f is one of the hθi .Second-order kernels such as the Laplacian are also oftenused for edge detection, but we prefer the first-order kernelhere because it provides the edge orientation and becausesecond-order kernels tend to amplify noise [dMCOT89].
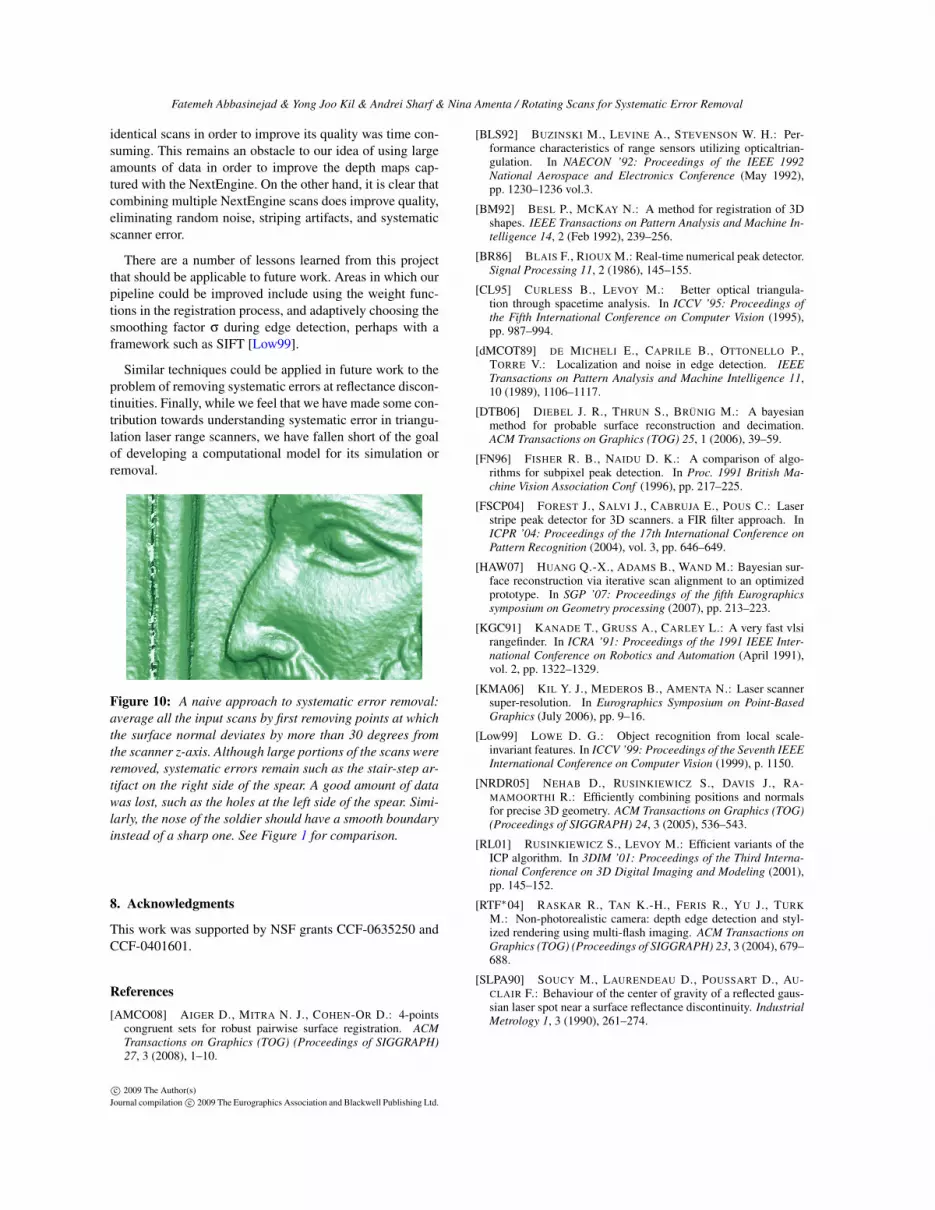
As is standard in feature detection, we smooth f (p) witha Gaussian Gσ(·) before computing the gradient, so thatg(p) = |∇(Gσ ∗ f )(p)|. To smooth the stair-step artifacts,which increase with the depth discontinuity, we choose thewidth σ of the Gaussian to be larger on objects with largediscontinuities (see Figure 8). In our experiments, a singlechoice of σ for each entire object was sufficient, in the range0.5-3.0 depending on the object.
We can compute the gradient magnitude directly on ourinput depth map, for reasonably flat objects; but for general
Figure 6: Visualizations of the systematic errors of the4.6mm depth bulls-eye(a). The gradient magnitude (b) is vi-sualized with blue-to-red representing low to high magni-tude, and the gradient orientation (c) with blue-to-red repre-senting the angle from sensor-emitter baseline. Notice in im-age (b) that the erroneous low gradients due to the stair-steperrors on the rising edges appear at edges perpendicular tothe baseline, as well as high gradients on falling edges dueto overshoot.
c© 2009 The Author(s)Journal compilation c© 2009 The Eurographics Association and Blackwell Publishing Ltd.
Fatemeh Abbasinejad & Yong Joo Kil & Andrei Sharf & Nina Amenta / Rotating Scans for Systematic Error Removal
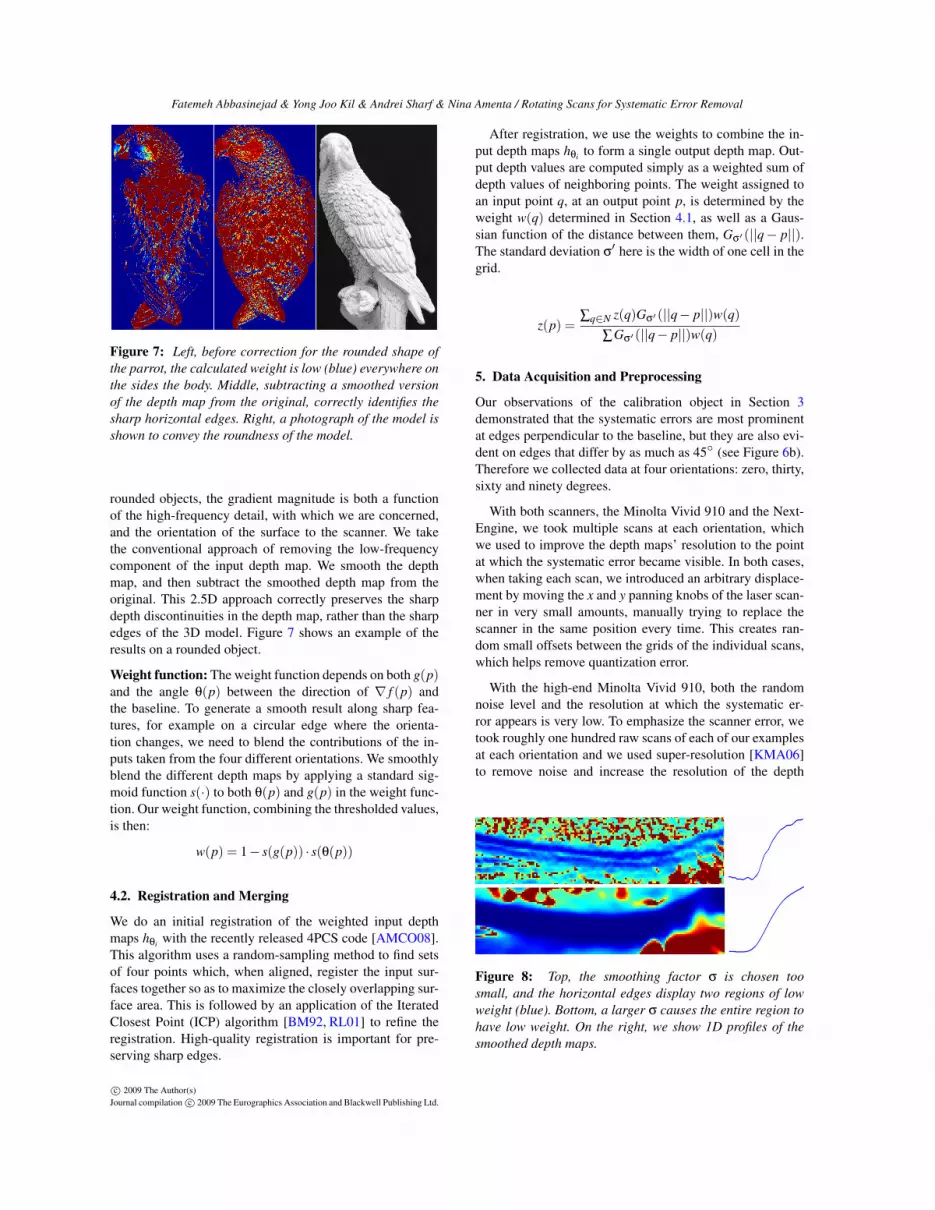
Figure 7: Left, before correction for the rounded shape ofthe parrot, the calculated weight is low (blue) everywhere onthe sides the body. Middle, subtracting a smoothed versionof the depth map from the original, correctly identifies thesharp horizontal edges. Right, a photograph of the model isshown to convey the roundness of the model.
rounded objects, the gradient magnitude is both a functionof the high-frequency detail, with which we are concerned,and the orientation of the surface to the scanner. We takethe conventional approach of removing the low-frequencycomponent of the input depth map. We smooth the depthmap, and then subtract the smoothed depth map from theoriginal. This 2.5D approach correctly preserves the sharpdepth discontinuities in the depth map, rather than the sharpedges of the 3D model. Figure 7 shows an example of theresults on a rounded object.
Weight function: The weight function depends on both g(p)and the angle θ(p) between the direction of ∇ f (p) andthe baseline. To generate a smooth result along sharp fea-tures, for example on a circular edge where the orienta-tion changes, we need to blend the contributions of the in-puts taken from the four different orientations. We smoothlyblend the different depth maps by applying a standard sig-moid function s(·) to both θ(p) and g(p) in the weight func-tion. Our weight function, combining the thresholded values,is then:
w(p) = 1− s(g(p)) · s(θ(p))
4.2. Registration and Merging
We do an initial registration of the weighted input depthmaps hθi with the recently released 4PCS code [AMCO08].This algorithm uses a random-sampling method to find setsof four points which, when aligned, register the input sur-faces together so as to maximize the closely overlapping sur-face area. This is followed by an application of the IteratedClosest Point (ICP) algorithm [BM92, RL01] to refine theregistration. High-quality registration is important for pre-serving sharp edges.
After registration, we use the weights to combine the in-put depth maps hθi to form a single output depth map. Out-put depth values are computed simply as a weighted sum ofdepth values of neighboring points. The weight assigned toan input point q, at an output point p, is determined by theweight w(q) determined in Section 4.1, as well as a Gaus-sian function of the distance between them, Gσ′(||q− p||).The standard deviation σ
′ here is the width of one cell in thegrid.
z(p) =∑q∈N z(q)Gσ′(||q− p||)w(q)
∑Gσ′(||q− p||)w(q)
5. Data Acquisition and Preprocessing
Our observations of the calibration object in Section 3demonstrated that the systematic errors are most prominentat edges perpendicular to the baseline, but they are also evi-dent on edges that differ by as much as 45◦ (see Figure 6b).Therefore we collected data at four orientations: zero, thirty,sixty and ninety degrees.
With both scanners, the Minolta Vivid 910 and the Next-Engine, we took multiple scans at each orientation, whichwe used to improve the depth maps’ resolution to the pointat which the systematic error became visible. In both cases,when taking each scan, we introduced an arbitrary displace-ment by moving the x and y panning knobs of the laser scan-ner in very small amounts, manually trying to replace thescanner in the same position every time. This creates ran-dom small offsets between the grids of the individual scans,which helps remove quantization error.
With the high-end Minolta Vivid 910, both the randomnoise level and the resolution at which the systematic er-ror appears is very low. To emphasize the scanner error, wetook roughly one hundred raw scans of each of our examplesat each orientation and we used super-resolution [KMA06]to remove noise and increase the resolution of the depth
Figure 8: Top, the smoothing factor σ is chosen toosmall, and the horizontal edges display two regions of lowweight (blue). Bottom, a larger σ causes the entire region tohave low weight. On the right, we show 1D profiles of thesmoothed depth maps.
c© 2009 The Author(s)Journal compilation c© 2009 The Eurographics Association and Blackwell Publishing Ltd.

Fatemeh Abbasinejad & Yong Joo Kil & Andrei Sharf & Nina Amenta / Rotating Scans for Systematic Error Removal
Persepolis
ParrotMayan
GearA Bullse
ye
A Bullseye
Scans per orientations 100 100 100 102 24 10Minolta or NextEngine
Scanning per orientation (min) 20-30 20-30 20-30 20-30 15-20 10-15Raw scan resolution (mm) 0.2 0.3 0.7 0.5 0.1 0.12
Points per raw scan 132K 59K 9K 1.5K 2K 143KPreprocessing for hθi (min) 29 15 28 20 11 9
Resolution of h f (mm) 0.07 0.1 0.2 0.17 0.1 0.12Points in h f 1257K 550K 1844K 19K 63K 184K
Computing h f (min) 2 3-4 3-4 <1 <1 <1
M M M M N N
Table 1: Our experimental results. The time required to com-bine the depth maps from the different orientations is smallin comparison to data collection and pre-processing.
maps at each orientation by a factor of three. The super-resolution algorithm uses an iterative registration and surfacereconstruction pipeline, similar to the one recently adoptedby [HAW07] for surface reconstruction.
With the inexpensive NextEngine scanner, the laser beamis wider, and the systematic error is clearly evident at the res-olution of the scans, once random noise is removed. We usedroughly ten to twenty scans per orientation, and averagedthem using the iterative registration and surface reconstruc-tion pipeline of the super-resolution algorithm, but withoutactually attempting to increase the resolution. This removedboth random noise and striping artifacts, but greatly empha-sized the systematic error, as seen in Figure 9 and Figure 11.
6. Results and Discussion
We begin with the results for the NextEngine scanner, wherecombining multiple scans to improve the quality of the out-put proved to be a successful strategy. On the bulls-eye cal-ibration object we can remove the systematic error almostperfectly, as seen in Figure 9. We also scanned a gear frominside of a toy gumball machine, shown in Figure 11. Thegear is about 5cm in diameter. As can be seen, the systematicerrors in the scans of the gear are very pronounced. Nonethe-less they could be removed using the same technique, pro-ducing a much improved output depth map.
Super-resolved depth maps taken with the Minolta Vivid910 are of very high quality except for the systematic er-ror. In the bulls-eye calibration object, Figure 2 shows onebulls-eye with grooves of 4.6 mm deep, represented on asuper-resolution grid at .17 mm resolution. Our processingsuccessfully removes the systematic errors. In Figure 12 weshow our output depth map from scans of cast of a Mayan hi-eroglyphic (25cm wide). Here again, the technique was verysuccessful.
Our technique is quite simple, and one might wonder ifsomething even simpler might work as well. In Figure 12c,we show the result of combining the four input orientationswithout using the weighting of Section 4.1. The system-
atic error remains noticeable, which demonstrates the im-portance of our weighting scheme. In another experiment,we removed any points at which the surface normal devi-ated by more than 30 degrees from the scanner’s z-axis dur-ing the acquisition phase. Again we combined the trimmedscans without using the weighting scheme. Not only doesthis remove data that does not have the systematic error, in-troducing holes, but it also sometimes fails to remove thehorizontal part of the stair-step error, for instance near thespear in Figure 10.
Table 1 shows the resolution and timings for our exam-ples. Although the resolutions of the models scanned withthe NextEngine are nominally higher than those scannedwith the Minolta, not only is the signal-to-noise ratio higher,but high-frequency features seem to be smoothed away.
The technique worked well on surfaces which have sharpedges, deep grooves, or other large features, and also on sur-faces with anisotropic detail. Figure 13 shows a close-upof the back of the parrot statue which appears in Figure 7.While the systematic errors incorrectly emphasize the finevertical details in the feathers in one of the input orienta-tions (13b), the output is dominated by the scans from theother orientations, in which the edges are correct (13a).
Figure 9: Top, a single scan from the NextEngine Scanner.The systematic error is masked by noise. Center, averaging24 such scans removes most of the noise and reveals the typ-ical pattern of systematic error. At the bottom, merging fourscans using our method produces a final depth map that isdramatically better than the input scans.
7. Limitations and future work
We found that the NextEngine had to be positioned verycarefully to fully capture the details of the bulls-eye and thegear surface, since the range within which we could capturehigh frequencies well was rather small. Also, because Next-Engine’s scanning speed is slow, capturing multiple nearly
c© 2009 The Author(s)Journal compilation c© 2009 The Eurographics Association and Blackwell Publishing Ltd.
Fatemeh Abbasinejad & Yong Joo Kil & Andrei Sharf & Nina Amenta / Rotating Scans for Systematic Error Removal
identical scans in order to improve its quality was time con-suming. This remains an obstacle to our idea of using largeamounts of data in order to improve the depth maps cap-tured with the NextEngine. On the other hand, it is clear thatcombining multiple NextEngine scans does improve quality,eliminating random noise, striping artifacts, and systematicscanner error.
There are a number of lessons learned from this projectthat should be applicable to future work. Areas in which ourpipeline could be improved include using the weight func-tions in the registration process, and adaptively choosing thesmoothing factor σ during edge detection, perhaps with aframework such as SIFT [Low99].
Similar techniques could be applied in future work to theproblem of removing systematic errors at reflectance discon-tinuities. Finally, while we feel that we have made some con-tribution towards understanding systematic error in triangu-lation laser range scanners, we have fallen short of the goalof developing a computational model for its simulation orremoval.
Figure 10: A naive approach to systematic error removal:average all the input scans by first removing points at whichthe surface normal deviates by more than 30 degrees fromthe scanner z-axis. Although large portions of the scans wereremoved, systematic errors remain such as the stair-step ar-tifact on the right side of the spear. A good amount of datawas lost, such as the holes at the left side of the spear. Simi-larly, the nose of the soldier should have a smooth boundaryinstead of a sharp one. See Figure 1 for comparison.
8. Acknowledgments
This work was supported by NSF grants CCF-0635250 andCCF-0401601.
References
[AMCO08] AIGER D., MITRA N. J., COHEN-OR D.: 4-pointscongruent sets for robust pairwise surface registration. ACMTransactions on Graphics (TOG) (Proceedings of SIGGRAPH)27, 3 (2008), 1–10.
[BLS92] BUZINSKI M., LEVINE A., STEVENSON W. H.: Per-formance characteristics of range sensors utilizing opticaltrian-gulation. In NAECON ’92: Proceedings of the IEEE 1992National Aerospace and Electronics Conference (May 1992),pp. 1230–1236 vol.3.
[BM92] BESL P., MCKAY N.: A method for registration of 3Dshapes. IEEE Transactions on Pattern Analysis and Machine In-telligence 14, 2 (Feb 1992), 239–256.
[BR86] BLAIS F., RIOUX M.: Real-time numerical peak detector.Signal Processing 11, 2 (1986), 145–155.
[CL95] CURLESS B., LEVOY M.: Better optical triangula-tion through spacetime analysis. In ICCV ’95: Proceedings ofthe Fifth International Conference on Computer Vision (1995),pp. 987–994.
[dMCOT89] DE MICHELI E., CAPRILE B., OTTONELLO P.,TORRE V.: Localization and noise in edge detection. IEEETransactions on Pattern Analysis and Machine Intelligence 11,10 (1989), 1106–1117.
[DTB06] DIEBEL J. R., THRUN S., BRÜNIG M.: A bayesianmethod for probable surface reconstruction and decimation.ACM Transactions on Graphics (TOG) 25, 1 (2006), 39–59.
[FN96] FISHER R. B., NAIDU D. K.: A comparison of algo-rithms for subpixel peak detection. In Proc. 1991 British Ma-chine Vision Association Conf (1996), pp. 217–225.
[FSCP04] FOREST J., SALVI J., CABRUJA E., POUS C.: Laserstripe peak detector for 3D scanners. a FIR filter approach. InICPR ’04: Proceedings of the 17th International Conference onPattern Recognition (2004), vol. 3, pp. 646–649.
[HAW07] HUANG Q.-X., ADAMS B., WAND M.: Bayesian sur-face reconstruction via iterative scan alignment to an optimizedprototype. In SGP ’07: Proceedings of the fifth Eurographicssymposium on Geometry processing (2007), pp. 213–223.
[KGC91] KANADE T., GRUSS A., CARLEY L.: A very fast vlsirangefinder. In ICRA ’91: Proceedings of the 1991 IEEE Inter-national Conference on Robotics and Automation (April 1991),vol. 2, pp. 1322–1329.
[KMA06] KIL Y. J., MEDEROS B., AMENTA N.: Laser scannersuper-resolution. In Eurographics Symposium on Point-BasedGraphics (July 2006), pp. 9–16.
[Low99] LOWE D. G.: Object recognition from local scale-invariant features. In ICCV ’99: Proceedings of the Seventh IEEEInternational Conference on Computer Vision (1999), p. 1150.
[NRDR05] NEHAB D., RUSINKIEWICZ S., DAVIS J., RA-MAMOORTHI R.: Efficiently combining positions and normalsfor precise 3D geometry. ACM Transactions on Graphics (TOG)(Proceedings of SIGGRAPH) 24, 3 (2005), 536–543.
[RL01] RUSINKIEWICZ S., LEVOY M.: Efficient variants of theICP algorithm. In 3DIM ’01: Proceedings of the Third Interna-tional Conference on 3D Digital Imaging and Modeling (2001),pp. 145–152.
[RTF∗04] RASKAR R., TAN K.-H., FERIS R., YU J., TURKM.: Non-photorealistic camera: depth edge detection and styl-ized rendering using multi-flash imaging. ACM Transactions onGraphics (TOG) (Proceedings of SIGGRAPH) 23, 3 (2004), 679–688.
[SLPA90] SOUCY M., LAURENDEAU D., POUSSART D., AU-CLAIR F.: Behaviour of the center of gravity of a reflected gaus-sian laser spot near a surface reflectance discontinuity. IndustrialMetrology 1, 3 (1990), 261–274.
c© 2009 The Author(s)Journal compilation c© 2009 The Eurographics Association and Blackwell Publishing Ltd.

Fatemeh Abbasinejad & Yong Joo Kil & Andrei Sharf & Nina Amenta / Rotating Scans for Systematic Error Removal
Figure 11: An input scan of a gear, taken with the NextEngine scanner (left). Averaging ten scans (mid-left) removes generalnoise, but very large systematic errors become evident. Another de-noised depth map (mid-right), scanned in a different orien-tation shows equally large systematic errors, but in different regions. Finally, combining the depth maps captured at the fourdifferent orientations (right) produces a high-quality output depth map, dramatically better than any of the input scans.
Figure 12: Systematic error removal from scans of a cast of a Mayan hieroglyphic. The output depth map is in the center.On either side, close-ups of selected regions, with cross sections highlighted and shown beneath. (a) shows the super-resolveddepth map from scans taken at zero degrees, with systematic errors near the deep horizontal grooves. (b) is the super-resolveddepth map taken at ninety degrees, with errors near vertical edges. The depth map created by equally averaging all four inputorientations with equal weight shows in (c). Finally (d) shows our result. While the averaging method in (c) does reduce thesystematic errors, it clearly fails to eliminate them, indicating that our weighting scheme is necessary.
Figure 13: Fine feather features of the parrot model from Figure 7. The super-resolution scan (a) taken at zero degrees. Thereare systematic errors in the vertical direction but the mostly vertical fine details in the feathers are captured correctly. In the scantaken at ninety degrees (b), the systematic errors, in particular the overshoot, serves to emphasize the texture. The combinedfinal output (c) is similar to a very high-resolution scan (d), taken by focusing the laser scanner at the small region shown.
c© 2009 The Author(s)Journal compilation c© 2009 The Eurographics Association and Blackwell Publishing Ltd.