role of neuroinflammation in hypertension-induced brain amyloid pathology
TRANSCRIPT

m
Neurobiology of Aging 33 (2012) 205.e19–205.e29
Role of neuroinflammation in hypertension-induced brainamyloid pathology
Daniela Carnevalea,*, Giada Mascioa, Maria Antonietta Ajmone-Catb, Ivana D’Andreac,Giuseppe Cifellia, Michele Madonnaa, Germana Cocozzaa, Alessandro Fratid,
Pierluigi Carulloa, Lorenzo Carnevalea, Enrico Allevac, Igor Branchic, Giuseppe Lemboa,e,Luisa Minghettib
a Department of Angio-Cardio-Neurology, IRCCS “Neuromed”, 86,077 Pozzilli (IS), Italyb Section of Experimental Neurology, Department of Cell Biology and Neurosciences, Istituto Superiore di Sanità, 00161 Rome, Italy
c Section of Behavioral Neurosciences, Department of Cell Biology and Neurosciences, Istituto Superiore di Sanità, 00161 Rome, Italyd Department of Neurosurgery, IRCCS “Neuromed”, 86,077 Pozzilli (IS), Italy
e Department of Molecular Medicine, “Sapienza” University, 00161 Rome, Italy
Received 5 March 2010; received in revised form 18 August 2010; accepted 24 August 2010
Abstract
Hypertension and sporadic Alzheimer’s disease (AD) have been associated but clear pathophysiological links have not yet beendemonstrated. Hypertension and AD share inflammation as a pathophysiological trait. Thus, we explored if modulating neuroinflammationcould influence hypertension-induced �-amyloid (A�) deposition.
Possible interactions among hypertension, inflammation and A�-deposition were studied in hypertensive mice with transverse aorticcoarctation (TAC). Given that brain A� deposits are detectable as early as 4 weeks after TAC, brain pathology was analyzed in 3-week TAC
ice, before A� deposition, and at a later time (8-week TAC mice).Microglial activation and interleukin (IL)-1� upregulation were already found in 3-week TAC mice. At a later time, along with evident
A� deposition, microglia was still activated. Finally, immune system stimulation (LPS) or inhibition (ibuprofen), strategies described topositively or negatively modulate neuroinflammation, differently affected A� deposition.
We demonstrate that hypertension per se triggers neuroinflammation before A� deposition. The finding that only immune systemactivation, but not its inhibition, strongly reduced amyloid burden suggests that stimulating inflammation in the appropriate time windowmay represent a promising strategy to limit vascular-triggered AD-pathology.© 2012 Elsevier Inc. All rights reserved.
Keywords: Alzheimer’s disease; Cerebral hemodynamics; Glial cells; Hypertension; Inflammation
www.elsevier.com/locate/neuaging
1. Introduction
Several epidemiological studies show a clear associationbetween late-life dementia/sporadic Alzheimer’s disease(AD) and a wide range of vascular risk factors (de La Torre,2003; Fotuhi et al., 2009; Skoog and Gustafson, 2006;Zlokovic, 2008). Among them, hypertension seems to playa prominent role. In addition to its well-known peripheral
* Corresponding author. Tel.: �39 0865 915243; fax: �39 0865 927575.
E-mail address: [email protected] (D. Carnevale).0197-4580/$ – see front matter © 2012 Elsevier Inc. All rights reserved.doi:10.1016/j.neurobiolaging.2010.08.013
outcomes, hypertension exerts detrimental effects on thebrain (Hainsworth and Markus, 2008; Iadecola and Davis-son, 2008), and recent experimental studies using antihy-pertensive therapies further support the association betweenhypertension and cerebral amyloid pathology (Tsukuda etal., 2009; Wang et al., 2007).
Recent evidence suggests that inflammation may be thebridge connecting hypertension and target organ damage (Liand Chen, 2005). Inflammation in the brain parenchyma canoccur as a local process that can be triggered and sustained
by activated glial cells, in the absence of immune cells
hatiptata
tjtumtsc
2e
dEmF
tApR
2
tB
205.e20 D. Carnevale et al. / Neurobiology of Aging 33 (2012) 205.e19–205.e29
recruited from the periphery, and it is thought to contributeto pathogenesis of several diseases (Minghetti, 2005; Wyss-Coray, 2006).
Hemodynamic changes due to hypertension can be ex-pected to activate neurovascular unit signaling, eventuallyleading to activation of microglia, the brain resident mac-rophages, and to neuroinflammation. Thus, hypertensioncould influence onset/progression of late-life dementia/spo-radic AD by promoting neuroinflammatory processes.
To investigate the possible link among hypertension,inflammation and amyloid pathology, we focused on a par-ticular model of hypertension, obtained by transverse aorticcoarctation (TAC), in which pressure overload impact isselectively driven to the cerebral circulation. In previousstudies, we demonstrated a significant A� deposition inippocampus and cortex of TAC mice, as early as 4 weeksfter the induction of hypertension (Gentile et al., 2009). Inhe present study we aimed at exploring the role of neuro-nflammation in the hypertension-driven amyloid-relatedathology by monitoring the process of microglial activa-ion and the expression of typical pro-inflammatory andnti-inflammatory/immunoregulatory genes, at an earlyime preceding A� deposition (3 weeks after TAC), and atlater time (8 weeks after TAC), characterized by overt A�
deposition. Finally, to clarify the role of neuroinflammationin hypertension-induced amyloid pathology, one of themain traits of the disease, we explored the effects of twostrategies aimed at modulating inflammatory responses: thefirst one stimulating immune system with a peripheralLPS challenge (Perry et al., 2007; Yong and Rivest,2009); the second one inhibiting it through a chronic,long-term treatment with the nonsteroidal anti-inflamma-tory drug (NSAIDs) ibuprofen.
2. Methods
2.1. Animals and surgery
All experiments were conducted in conformity with Eu-ropean Communities Council Directive. C57Bl/6J Malemice 12–15 week old were used and kept under 12-hourlight-dark cycle at 22–25 °C. Standard chow and water wereprovided ad libitum. TAC-induced hypertension was ob-tained as previously described (Brancaccio et al., 2003).Mice anesthesized with ketamine/xylazine were placed onthermal beds and respiration was assisted with a volume-cycled ventilator (Basile, Milan, Italy) connected to an 18-gauge cannula inserted into the trachea. Transverse aorticcoarctation was performed between truncus anonymous andleft carotid, with a 7.0 nylon suture ligature placed aroundthe aorta. Sham mice underwent the same surgical proce-dures without realizing aortic stenosis.
A systolic trans-stenotic gradient was measured by echoDoppler (VeVo 770, Visualsonics, Inc., Canada), position-
ing the probe on the aortic banding and only animals with agradient ranging from 70 to 90 mmHg were selected forfurther analyses.
2.2. Cerebral blood perfusion
Mice anesthetized as above were placed in prone posi-tion, ECG monitored and body temperature was maintainedat 37 °C with a heating pad. A T-shaped skin incision wasperformed for skull exposition. An acoustic window forimaging was obtained by bilateral parietal craniotomy start-ing from the bregma (4 mm along the interparietal suture;2.5 mm laterally towards the temporal bone).
A microbubbles suspension of 60 �L (MicroMarker non-argeted Contrast Agent, Visualsonics, Inc., Canada) was in-ected with a catheter in jugular vein. Imaging was acquiredhrough the acoustic window by a 30 MHz probe equippedltrasound device (VeVo 770, Visualsonics, Inc., Canada). Aeasure of cerebral blood perfusion was obtained by plotting
he Contrast Region time versus Intensity and fitting the re-ulting curve by a Visualsonics dedicated software. Relativeerebral blood velocity was the slope of the curve.
.3. Dissection of brain areas for RNA and metabolitesxtraction
After decapitation, brain areas were dissected, frozen onry ice and stored at �80 °C. TRIzol reagent (Invitrogen,ugene, OR) was used for RNA extraction according toanufacturer’s instructions. A detailed procedure for 15-
2t-IsopP extraction has been described elsewhere (Ming-hetti et al., 2000).
2.4. Reverse transcription and quantitative PCR
RNA was transcribed into cDNA using the SuperscriptIII kit (Invitrogen, Eugene, OR) according to manufactur-er’s instructions. Real-time PCR was performed with Sybrgreen PCR master mix, following manufacturer’s instruc-tions, using an ABI Prism 7,500 Sequence Detection Sys-tem (Applied Biosystems, Inc, Foster City, CA). Primersequences are indicated in Table 1. Samples were run intriplicate and gene expression levels were determined usingthe Relative Quantification (���Ct) Study of Applied Bio-systems 7500 System SDS Software.
2.5. 15-F2t-IsoP measurement
15-F2t-IsoP levels were measured in duplicate for eachissue extract by a high sensitivity EIA kit (Cayman Chemical,nn Arbor, MI). Results are expressed as pg/mg of totalroteins (measured by the BCA Protein Assay kit; Pierce,ockford, IL) in pellets obtained after the extraction procedure.
.6. Immunohistochemistry, histology and image analysis
After an overdose of sodium penthobarbital mice wereranscardially perfused with saline followed by formaldehyde.rains were removed, postfixed overnight and sectioned (30
�m) on a cryostat. Primary antibodies used were rabbit anti-
Iba-1 (1:1000, Wako Chemicals, GmbH, Neuss, Germany); rat
agmo
g
TP
ITT
205.e21D. Carnevale et al. / Neurobiology of Aging 33 (2012) 205.e19–205.e29
anti-CD68 and rat anti-CD11b (1:200, AbD Serotec, Oxford,UK); rabbit anti-�-Amyloid (1:100, Santa Cruz Biotechnol-ogy, Inc., Santa Cruz, CA). Secondary antibodies wereCy3-conjugated donkey anti-rat IgG (1:200, JacksonImmunoResearch, West Grove, PA); biotinylated horse anti-rabbit IgG (1:200, Vector Laboratories, Burlingame, CA) fol-lowed by streptavidin Alexa Fluor 488 (1:200, MolecularProbes, the Netherlands). Where indicated, Dapi (Prolonggold, Invitrogen, Molecular-Probes, Eugene, OR) was used fornuclear counterstaining. Thioflavin-S (Sigma-Aldrich, St.Louis, MO) was used at 1% (w/vol) in 70% ethanol.
Images were acquired using a DMI3000B Leica fluores-cence microscope provided of a Leica DFC340FX camera(Leica Microsystems, Wetzlar, Germany). For Thioflavin-Squantification we analyzed three sections through cortex
Fig. 1. TAC impairs cerebral blood perfusion and metabolism both beforein both hemispheres in TAC pre-A� and TAC post-A� mice (n � 5 for eacof 15-F2t-IsoP. n � 6–8 for each group; **p � 0.01 and ***p � 0.001 vGLUT-1 (C) and GLUT-3 (D). Data are expressed as the fold changes in
able 1rimer pairs sequences
Gene Forward sequence
HPRT CAG GCC AGA CTT TGT TGG ATIL-1� AAG GAG AGC CGG GTG ACA GTL-1� CGA CAA AAT ACC TGT GGC CTNF-� AGC CCC CAG TCT GTA TCC TTGF-� TGA CGT CAC TGG AGT TGT ACG G
IL-10 TTA AGC TGT TTC CAT TGG GGGLUT-1 GGT GTG CAG CAG CCT GTG TAGLUT-3 GAC TGC TTC TGA GTG CTG CTA
roup) and represented as scatter plot. **p � 0.01 vs sham.
and hippocampus (bregma �2.40, �3.60 and �4.5 mm)and processed images with the Leica Application Suite(LAS V3.3) Image Analysis. Data are reported as the per-centage of labeled area divided by the full area.
2.7. LPS and anti-inflammatory treatments
Three-weeks TAC and sham mice received an intraper-itoneal injection of LPS (Salmonella equine abortus; Sigma-Aldrich, St. Louis, MO; 500 �g/kg b.w.) or vehicle (non-pyrogenic saline) in 100 �l injection volume (Combrinck etl., 2002). Another group of TAC and sham mice wereiven ibuprofen (Angelini) or vehicle in drinking water (5g/kg b.w.) starting at 3 weeks from the surgery till the end
f the experiment.
ter A� deposition. (A) Cerebral blood velocity was significantly reduced). *p � 0.05 and **p � 0.01 vs sham. (B) Hippocampal and cortical levels. (C, D) Hippocampal and cortical expression of the glucose transporterspression normalized to HPRT and relative to sham mice (n � 4 for each
Reverse sequence Accession no.
TTG CGC TCA TCT TAG GCT TT NM013556. 2GAA ACT CAG CCG TCT CTT CTT CA NM010554. 4TTC TTT GGG TAT TGC TTG GG NM008361. 3ACA GTC CAG GTC ACT GTC CC NM013693. 2GGT TCA TGT CAT GGA TGG TGC NM_011577AAG TGT GGC CAG CCT TAG AA NM010548. 1AAT GAG GTG CAG GGT CCG T NM_011400CAT TGG CGA TCT GGT CAA CC NM_011401
and afh groups shamgene ex

f
205.e22 D. Carnevale et al. / Neurobiology of Aging 33 (2012) 205.e19–205.e29
2.8. Statistical analysis
Data are presented as mean � SE. Multiple comparisonswere evaluated by 2-way ANOVA followed by post hoc test(StatView II, Abacus Concepts, CA, USA).
Fig. 2. Microglial reactivity and cytokine expression profile in TAC miceincreased CD68 expression in TAC mice, colocalized with Iba-1 staining,or each group are presented. Scale bar 20 �m. (B) Hippocampal mRNA
changes in gene expression normalized to HPRT and relative to sham mice
#p � 0.05 and ##p � 0.01 vs TAC pre-A�.3. Results
3.1. TAC impact on brain hemodynamic and metabolism
We first analyzed effects of hypertension-induced hemo-dynamic changes on cerebral blood perfusion at 3 weeks
and after A� deposition. (A) Double-labeling of Iba-1 and CD68 showse- and post-A� deposition. Hippocampus representative images of n � 4f IL-1�, IL-1�, TNF-�, TGF-� and IL-10. Data are expressed as the foldresented as scatter plot. *p � 0.05, **p � 0.01 and ***p � 0.001 vs sham;
beforeboth pr
levels oand rep

1raGcft
3T
vcwbacgeimadcm(np(
t
bmi
3T
A
205.e23D. Carnevale et al. / Neurobiology of Aging 33 (2012) 205.e19–205.e29
after TAC (TAC preA�), an early time at which there is noevident A� deposition, and at 8 weeks after TAC (TACpostA�), a later time with overt A� deposition. Cerebralblood velocity was significantly reduced in both hemi-spheres of TAC mice at the earliest time point and remainedstill impaired at later time (Fig. 1A).
As for cerebral blood velocity, all subsequent analysesrevealed overlapping results for both hemispheres, thus dataof the left side are given as representative of both hemi-spheres. Expression of GLUT-1, the endothelial glucosetransporter isoform, was found reduced in both hippocam-pus and cortex of TAC preA� and TAC postA� mice (Fig.C, Table 1S). In contrast, the expression of GLUT-3 neu-onal isoform (Fig. 1D, Table 2S) remained unmodified inll conditions tested. The unbalanced expression ofLUT-1 was coupled by a decreased hippocampal and
ortical levels of the 15-F2t-isoprostanes (15-F2t-IsoP), aree radical dependent lipid peroxidation product, at bothimes analyzed (Fig. 1B).
.2. A� deposition and neuroinflammatory response inAC mice
Microglia in the hippocampus, displayed a highly acti-ated ameboid morphology, with large bodies and few thickellular processes in 3- and 8-week TAC mice comparedith sham (Fig. 2A and 1S). In particular, TAC mice, atoth times analyzed, exhibited robust expression of CD68nd Iba-1. The lysosomal marker CD68 was used as aommon antigen upregulated during the process of micro-lia activation while Iba-1 is a cytoplasmic protein that isxpressed in resting microglia and further upregulated dur-ng the activation process. Since morphological changes oficroglia preceded A� deposition and remained sustained
t later time point, it is likely that microglial activation isriven by the hemodynamic challenge rather than A� ac-umulation. This hypothesis is supported by the strongicroglial activation detectable as early as 1 day after TAC
Fig. 2S). Despite the robust microglial activation, we didot find evidence of neuronal death, neither pre- norost-A� deposition, as assessed by FluoroJade stainingdata not shown). Interestingly, A� deposits, detectable
only in 8-week TAC mice, overlapped with CD11b, anothermicroglial marker, exclusively in proximity of blood vessels(arrow heads), but not in the parenchyma (arrows), suggestinga colocalization of A� and perivascular macrophages (Fig. 3).
To gain functional evidence of an ongoing inflammatoryresponse, we analyzed the mRNAs levels of several genesinvolved in the regulation of inflammation, before and afterthe formation of A� deposits. In the hippocampus (Fig. 2B,Table 2S) the expression of interleukin (IL)-1� and IL-10was increased at early time (TAC pre-A�) but not at laterime (TAC post-A�). On the contrary, IL-1� and transform-
ing growth factor (TGF)-� were significantly increased onlyin the later phase (TAC post-A�). No significant change of
tumor necrosis factor (TNF)-� expression was detected atoth time points examined. Similar results (A� deposition,icroglial activation and cytokine expression) were found
n cortex (data not shown).
.3. Effects of immune system modulation onAC-induced A� deposits
In a further group of sham and 3-week TAC mice weanalyzed the effect of immune activation obtained by asingle i.p. LPS/vehicle injection. As expected, 24 hoursafter injection, a clear increase in immunoreactivities forIba-1 and CD68 was observed in LPS-treated sham micecompared with vehicle. Interestingly, Iba-1 and CD68 im-munoreactivities in TAC mice were further increased byLPS injection compared with vehicle injection, an increasewhich is suggestive of a more reactive microglia (Fig. 4A).Furthermore, 6 hours after injection, LPS evoked a signif-icant increase in all pro-inflammatory cytokines in the hip-pocampus of sham animals, compared with vehicle. In con-trast, the pattern of cytokine expression in TAC miceremained substantially unaltered after LPS injection com-pared with vehicle-treated TAC mice, with the exception of
Fig. 3. Double-labeling of CD11b and A� reveals colocalization only inperivascular spaces of TAC post-A� mice (arrow heads). Arrows indicate
� deposits in the parenchyma, which are not immunopositive for CD11b.Representative images of cortex are presented. Scale bar, 50 �m.
IL-10, whose expression was reduced (Fig. 4B, Table 3S).

o
(n t. *p �
205.e24 D. Carnevale et al. / Neurobiology of Aging 33 (2012) 205.e19–205.e29
A similar response was observed in the cortex (data notshown).
Five weeks after LPS challenge, when TAC and shammice reached 8 weeks after surgery, microglial activationwas reinforced as displayed by the more pronounced mor-phological alterations in LPS-treated TAC mice comparedwith vehicle-treated TAC mice. Interestingly, at this latertime, LPS-treated TAC mice showed a further increase inthe expression of IL-1� and IL-1� in the hippocampus and
Fig. 4. Acute brain response to LPS challenge in 3-week TAC mice. (A)in TAC mice, 24 hours after LPS, compared with sham mice. HippocampuB) Relative mRNA levels in sham and TAC mice, 6 hours after LPS-injecormalized to HPRT and relative to vehicle and represented as scatter plo
nly of IL-1� in the cortex and compared with vehicle-
treated TAC mice (Table 2; *p � 0.05). In contrast, micro-glial morphology (Fig. 5A) and cytokine expression (Table2; *p � 0.05) in LPS-treated sham mice were almost com-parable to that observed in vehicle-treated sham mice.
Then, to verify whether the LPS-induced alterations inmicroglial reactivity and inflammatory gene expression inTAC-mice had any effect on the progression of the amyloidpathology, we performed a histological evaluation of TACbrains with Thioflavin-S, a fluorescent dye for A� deposits.
-labeling of Iba-1 and CD68 indicates a more intense CD68 upregulationentative images of n � 4 for each group are presented. Scale bar, 100 �m.ata are expressed as the fold changes in hippocampal cytokines expression
0.05 vs vehicle and #p � 0.05 vs sham-LPS.
Doubles represtion. D
Our analysis revealed a clear-cut reduction in the A� de-

bnicatflm
ptA
(
dtmlhltrtaAsptn
amA
o(suoI
205.e25D. Carnevale et al. / Neurobiology of Aging 33 (2012) 205.e19–205.e29
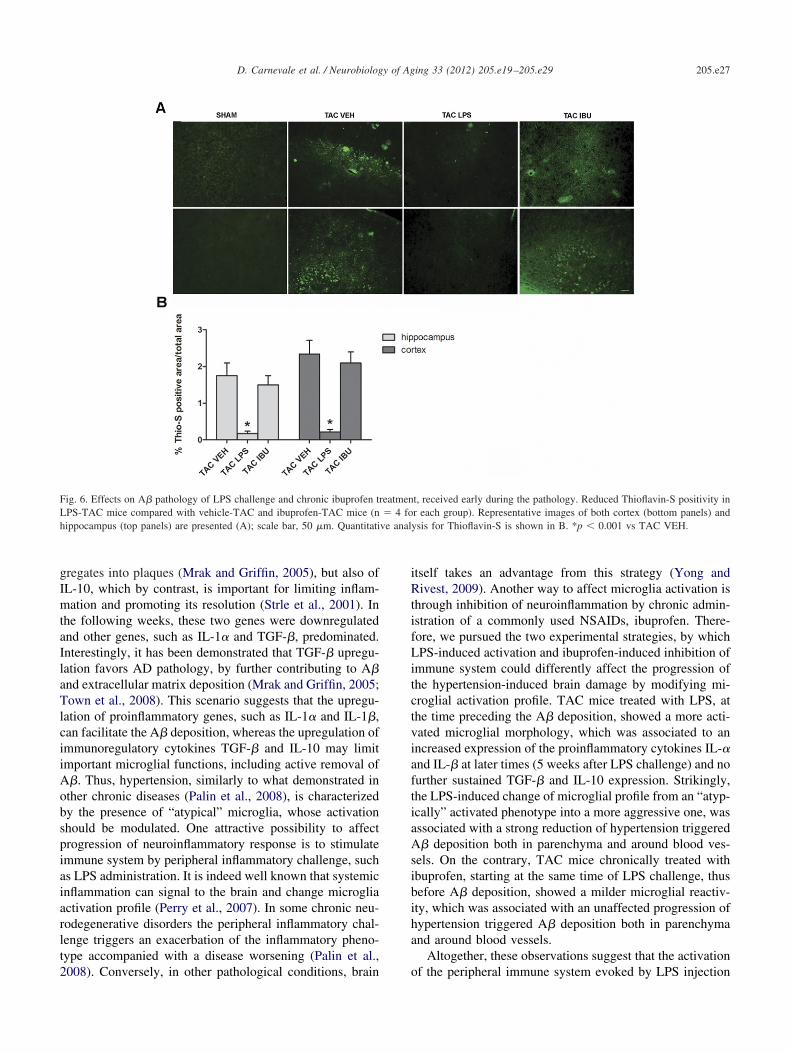
posits in the parenchyma (Fig. 6A) and around blood vessels(not shown) in TAC mice after LPS challenge. As shown inFig. 6B, the quantitative analysis demonstrated a significantstrong reduction in the A� deposition in LPS-treated TACmice, compared with vehicle-treated TAC mice. Two lastgroups of mice were administered with ibuprofen or vehicleto explore the effect of immune system inhibition on mi-croglial reactivity and A� deposition. As shown in Fig. 5Bmicroglial activation was reduced, as displayed by themilder morphological alterations in ibuprofen-treated TACmice compared with vehicle-treated TAC mice. Interest-ingly, this decreased microglial reactivity in ibuprofen-treated TAC mice was accompanied by a progression ofamyloid pathology comparable to that of vehicle-treated TACmice (Fig. 6A). Indeed, the quantitative analysis indicated noreduction in the A� deposition in ibuprofen-treated TAC mice,compared with vehicle-treated TAC mice (Fig. 6B).
4. Discussion
Our study demonstrates that a particular murine model ofhypertension developing cerebral amyloid deposition, oc-curring as early as 4 weeks after TAC, is preceded byhypoperfusion and neuroinflammation in both cortex andhippocampus. The inflammatory response becomes evenmore pronounced later on, when A� deposition aroundlood vessels and in parenchyma is detectable. However,euroinflammation appears to be not causal to hypertension-nduced amyloid pathology. Indeed, hypertensive micehronically treated with an NSAIDs to slow down immunectivation, develop a cerebral amyloid pathology similarlyo untreated hypertensive mice, despite a milder neuroin-ammatory response. Furthermore, the stimulation of im-
Table 2Relative mRNA levels in vehicle/lps treated TAC mice vs SHAM
Hippocampus Cortex
TAC vehicle TAC LPS TAC vehicle TAC LPS
IL-1� 3.09 � 0.45 4.67 � 0.56* 1.68 � 0.58 1.17 � 0.34IL-1� 1.58 � 0.58 3.86 � 0.97* 0.49 � 0.07 0.96 � 0.08*TNF-� 1.97 � 0.76 1.01 � 0.45 4.41 � 1.37 3.28 � 1.13TGF-� 3.34 � 0.90 3.86 � 0.57 2.32 � 0.08 2.26 � 0.41IL-10 0.36 � 0.20 0.11 � 0.05 1.51 � 0.22 1.12 � 0.68
Modification of 8 week TAC cytokine expression profile in the hippocam-pus and cortex by the peripheral inflammatory challenge received beforethe A� deposition period, at 3 weeks after TAC. An equal number (n � 4)f 3 week TAC and sham mice received an intraperitoneal injection of LPS500 �g/kg of b.w.) or nonpyrogenic saline (vehicle). The animals wereacrificed 5 weeks later the lps/vehicle injection (TAC post A�) and weresed for Real Time PCR. The table reports the relative mRNA levels in lpsr vehicle treated TAC mice of typical pro-inflammatory cytokines (IL-1�,L-1� and TNF-�) and of anti-inflammatory and immunoregulatory ones
(TGF-� and IL-10). Data are expressed as the fold changes in gene expressionnormalized to an endogenous gene (HPRT) and relative to sham mice. Com-parisons were performed using one-way analysis of variance (ANOVA),followed by post hoc Fisher’s (*p � 0.05).
une system through an LPS injection during the phase
receding A� deposition, exacerbates the neuroinflamma-ory reaction and strongly decreases hypertension-induced� burden.With this study we reinforce our previous observations
Gentile et al., 2009) by demonstrating, not only with anti-A�antibodies, but also with Thioflavin-S, the occurrence of A�deposition as early as 4 weeks after TAC, both in cerebralparenchyma and in proximity of blood vessels. In addition,the present results reveal that adaptations of cerebral circu-lation to TAC, obtained between the two carotids, result ina condition of whole brain hypoperfusion, suggesting thatWillis’s Circle is able to spread the asymmetric hyperten-sive challenge on whole cerebral circulation. Interestingly,the brain hypoperfusion anticipates the A� deposition and isnot further affected by the increased cerebral amyloidosisfew weeks later. This cerebral hemodynamic response tohypertension is linked to profound changes in brain metab-olism, in both cortex and hippocampus. We observed thatTAC induces a selective downregulation of GLUT-1 ex-pression, pointing to a specific impairment of endothelialmechanisms of energy supply to the brain. This result,coupled to the reduced levels of 15-F2t-IsoP, a lipid peroxi-ation product and common marker of free radical genera-ion associated to oxidative stress or, more generally, toetabolic activity, further suggests a state of hypometabo-
ism and/or decreased neuronal activity in brain subjected toypertensive challenge. Like hypoperfusion, hypometabo-ism is triggered by hypertension challenge and is not fur-her aggravated by A� deposition. Of note, it has beeneported that GLUT-1 expression in capillaries as well ashe total surface area at the Blood Brain Barrier (BBB)vailable for glucose transport are substantially reduced inD brains (Bailey et al., 2004; Wu et al., 2005). This
uggests that hypertension-induced hypoperfusion and hy-ometabolism may contribute, since the very early phases ofhe disease, to the continuous shortage of pivotal energyutrients observed in sporadic AD.
The present findings also indicate that TAC mice displaylterations of brain immune surveillance, as revealed byicroglial morphological changes, at a time preceding overt� deposition. It is becoming increasingly clear that A�
may be present in its oligomeric form and may have detri-mental effects even before the overt deposition to formplaques, possibly triggering also a neuroinflammatory re-sponse. However, TAC mice show clear-cut microglialmorphological changes already at 1 day after the hemody-namic challenge, thus strongly suggesting that the neuroin-flammatory reaction is most likely the consequence of hyper-tension. The occurrence of TAC induced neuroinflammatoryprocesses is further demonstrated by changes in mRNA levelsof both pro- and anti-inflammatory cytokines. In the periodpreceding A� deposition, TAC mice had increased levels ofIL-1�, thought to play a central role in self-propagation of
neuroinflammation and in transformation of diffuse A� ag-
C
205.e26 D. Carnevale et al. / Neurobiology of Aging 33 (2012) 205.e19–205.e29
Fig. 5. Modification of microglia reactivity in 8-week TAC and sham mice (n � 4 for each group) after LPS/ibuprofen. (A) Double-labeling of Iba-1 andCD68, with DAPI nuclear counterstaining, indicates that LPS-TAC mice have a stronger CD68 upregulation and different cell morphology, compared withvehicle-TAC mice. Representative images of hippocampus are presented. Scale bar, 50 �m. (B) The same staining in ibuprofen-TAC mice shows a milder
D68 upregulation and cell morphology comparable to vehicle-TAC mice. Representative images of hippocampus are presented. Scale bar, 50 �m.
l
iiA
vi
f
sib
a
ve anal
205.e27D. Carnevale et al. / Neurobiology of Aging 33 (2012) 205.e19–205.e29
gregates into plaques (Mrak and Griffin, 2005), but also ofIL-10, which by contrast, is important for limiting inflam-mation and promoting its resolution (Strle et al., 2001). Inthe following weeks, these two genes were downregulatedand other genes, such as IL-1� and TGF-�, predominated.Interestingly, it has been demonstrated that TGF-� upregu-ation favors AD pathology, by further contributing to A�
and extracellular matrix deposition (Mrak and Griffin, 2005;Town et al., 2008). This scenario suggests that the upregu-lation of proinflammatory genes, such as IL-1� and IL-1�,can facilitate the A� deposition, whereas the upregulation ofmmunoregulatory cytokines TGF-� and IL-10 may limitmportant microglial functions, including active removal of�. Thus, hypertension, similarly to what demonstrated in
other chronic diseases (Palin et al., 2008), is characterizedby the presence of “atypical” microglia, whose activationshould be modulated. One attractive possibility to affectprogression of neuroinflammatory response is to stimulateimmune system by peripheral inflammatory challenge, suchas LPS administration. It is indeed well known that systemicinflammation can signal to the brain and change microgliaactivation profile (Perry et al., 2007). In some chronic neu-rodegenerative disorders the peripheral inflammatory chal-lenge triggers an exacerbation of the inflammatory pheno-type accompanied with a disease worsening (Palin et al.,
Fig. 6. Effects on A� pathology of LPS challenge and chronic ibuprofen tLPS-TAC mice compared with vehicle-TAC and ibuprofen-TAC mice (nhippocampus (top panels) are presented (A); scale bar, 50 �m. Quantitati
2008). Conversely, in other pathological conditions, brain o
itself takes an advantage from this strategy (Yong andRivest, 2009). Another way to affect microglia activation isthrough inhibition of neuroinflammation by chronic admin-istration of a commonly used NSAIDs, ibuprofen. There-fore, we pursued the two experimental strategies, by whichLPS-induced activation and ibuprofen-induced inhibition ofimmune system could differently affect the progression ofthe hypertension-induced brain damage by modifying mi-croglial activation profile. TAC mice treated with LPS, atthe time preceding the A� deposition, showed a more acti-ated microglial morphology, which was associated to anncreased expression of the proinflammatory cytokines IL-�
and IL-� at later times (5 weeks after LPS challenge) and nourther sustained TGF-� and IL-10 expression. Strikingly,
the LPS-induced change of microglial profile from an “atyp-ically” activated phenotype into a more aggressive one, wasassociated with a strong reduction of hypertension triggeredA� deposition both in parenchyma and around blood ves-els. On the contrary, TAC mice chronically treated withbuprofen, starting at the same time of LPS challenge, thusefore A� deposition, showed a milder microglial reactiv-
ity, which was associated with an unaffected progression ofhypertension triggered A� deposition both in parenchymand around blood vessels.
Altogether, these observations suggest that the activation
t, received early during the pathology. Reduced Thioflavin-S positivity inr each group). Representative images of both cortex (bottom panels) andysis for Thioflavin-S is shown in B. *p � 0.001 vs TAC VEH.
reatmen� 4 fo
f the peripheral immune system evoked by LPS injection

c logy p
205.e28 D. Carnevale et al. / Neurobiology of Aging 33 (2012) 205.e19–205.e29
might result in an increased capacity of microglia andperivascular macrophages to remove the accumulating A�rather than exacerbating the course of the disease (see sche-matic diagram in Fig. 7). The evidence that only a moderatestimulation of peripheral immune/inflammatory response,but not its inhibition, is beneficial to A� removal highlightsthe need of a proper microglial activation in our model ofspontaneous amyloid pathology. Indeed, the final outcomeof both experimental strategies is not obvious since differentresults have been reported both for LPS (Di Carlo et al.,2001; Sheng et al., 2003) and NSAIDs (McGeer andMcGeer, 2007; McKee et al., 2008; Vervel et al., 2009)effects on amyloid pathology. Thus it is likely that the finaloutcome is strictly dependent on the whole inflammatorymilieu of the brain.
Overall, our findings point to a central role of hyperten-sion-driven brain damage in the pathogenic mechanismsleading to amyloid pathology. Hypertension-triggered hy-poperfusion and hypometabolism of brain regions, such ascortex and hippocampus, are intertwined with early andlong-lasting microglial activation and with the modulationof genes regulating inflammation. The reduced amyloidburden following mild stimulation of peripheral immunesystem, together with the evidence that NSAIDs treatmentunaffected amyloid pathology, suggests that neuroinflam-mation is not causal to amyloid pathology. But, instead,potentiating inflammation in the appropriate time windowmay be successful in limiting vascular triggered AD neuro-degenerative processes, probably by sufficiently activating
Fig. 7. Models of hypertension-induced brain amyloid pathology and n“atypical” microglia activation in relation to A� deposition. (B) More ahallenge. (C) Milder microglia activation and no effect on amyloid patho
microglia to remove A�.
Disclosure statement
The authors do not have any actual or potential conflictsof interests to disclose.
Acknowledgments
This work was supported by the Italian Ministry ofHealth, grants. Ex Art 56/05/20(LM) and “ricerca corrente”(GL) and by “Sapienza” University of Rome, grant. “ricercauniversitaria”.
Appendix. Supplementary data
Supplementary data associated with this article can befound, in the online version, at doi:10.1016/j.neurobiolaging.2010.08.013.
References
Bailey, T.L., Rivara, C.B., Rocher, A.B., Hof, P.R., 2004. The nature andeffects of cortical microvascular pathology in aging and Alzheimer’sdisease. Neurol. Res. 26, 573–578.
Brancaccio, M., Fratta, L., Notte, A., Hirsch, E., Poulet, R., Guazzone, S.,De Acetis, M., Vecchione, C., Marino, G., Altruda, F., Silengo, L.,Tarone, G., Lembo, G., 2003. Melusin, a muscle-specific integrinbeta1-interacting protein, is required to prevent cardiac failure in re-sponse to chronic pressure overload. Nat. Med. 9, 68–75.
Combrinck, M.I., Perry, V.H., Cunningham, C., 2002. Peripheral infectionevokes exaggerated sickness behaviour in pre-clinical murine priondisease. Neuroscience 12, 7–11.
de La Torre, J.C., 2003. Alzheimer disease as a vascular disorder: noso-
ammation. (A) Pathophysiological progression of hypertension-inducede microglia and rescue of amyloid plaques formation triggered by LPS
rogression by ibuprofen treatment.
euroinflggressiv
logical evidence. Stroke 33, 1152–1162.

205.e29D. Carnevale et al. / Neurobiology of Aging 33 (2012) 205.e19–205.e29
DiCarlo, G., Wilcock, D., Henderson, D., Gordon, M., Morgan, D., 2001.Intrahippocampal LPS injections reduce Abeta load in APP�PS1transgenic mice. Neurobiol. Aging 22, 1007–1012.
Fotuhi, M., Hachinski, V., Whitehouse, P.J., 2009. Changing perspectivesregarding late-life dementia. Nat. Rev. Neurol. 5, 649–658.
Gentile, M.T., Poulet, R., Di Pardo, A., Cifelli, G., Maffei, A., Vecchione,C., Passarelli, F., Landolfi, A., Carullo, P., Lembo, G., 2009. Beta-amyloid deposition in brain is enhanced in mouse models of arterialhypertension. Neurobiol. Aging 30, 222–228.
Hainsworth, A.H., Markus, H.S., 2008. Do in vivo experimental modelsreflect human cerebral small vessel disease? A systematic review. J.Cereb. Blood Flow Metab. 28, 1877–1891.
Iadecola, C., Davisson, R.L., 2008. Hypertension and cerebrovasculardysfunction. Cell Metab. 7, 476–484.
Li, J.J., Chen, J.L., 2005. Inflammation may be a bridge connecting hy-pertension and atherosclerosis. Med. Hypotheses 64, 925–929.
McGeer, P.L., McGeer, E.G., 2007. NSAIDs and Alzheimer disease: epi-demiological, animal model and clinical studies. Neurobiol. Aging 28,639–647.
McKee, A.C., Carreras, I., Hossain, L., Ryu, H., Klein, W.L., Oddo, S.,LaFerla, F.M., Jenkins, B.G., Kowall, N.W., Dedeoglu, A., 2008.Ibuprofen reduces Abeta, hyperphosphorylated tau and memory deficitsin Alzheimer mice. Brain Res. 1207, 225–236.
Minghetti, L., 2005. Role of inflammation in neurodegenerative diseases.Curr. Opin. Neurol. 18, 315–321.
Minghetti, L., Greco, A., Cardone, F., Puopolo, M., Ladogana, A., Al-monti, S., Cunningham, C., Perry, V.H., Pocchiari, M., Levi, G., 2000.Increased brain synthesis of prostaglandin E2 and F2-isoprostane inhuman and experimental transmissible spongiform encephalopathies. J.Neuropathol. Exp. Neurol. 59, 866–871.
Mrak, R.E., Griffin, W.S., 2005. Glia and their cytokines in progression ofneurodegeneration. Neurobiol. Aging 26, 349–354.
Palin, K., Cunningham, C., Forse, P., Perry, V.H., Platt, N., 2008. Systemicinflammation switches the inflammatory cytokine profile in CNS Wal-lerian degeneration. Neurobiol. Dis. 30, 19–29.
Perry, V.H., Cunningham, C., Holmes, C., 2007. Systemic infections andinflammation affect chronic neurodegeneration. Nat. Rev. Immunol. 7,
161–167.Sheng, J.G., Bora, S.H., Xu, G., Borchelt, D.R., Price, D.L., Koliatsos,V.E., 2003. Lipopolysaccharide-induced-neuroinflammation increasesintracellular accumulation of amyloid precursor protein and amyloidbeta peptide in APPswe transgenic mice. Neurobiol. Dis. 14, 133–145.
Skoog, I., Gustafson, D., 2006. Update on hypertension and Alzheimer’sDisease. Neurol. Res. 28, 605–611.
Strle, K., Zhou, J.H., Shen, W.H., Broussard, S.R., Johnson, R.W., Freund,G.G., Dantzer, R., Kelley, K.W., 2001. Interleukin-10 in the brain. Crit.Rev. Immunol. 21, 427–449.
Town, T., Laouar, Y., Pittenger, C., Mori, T., Szekely, C.A., Tan, J.,Duman, R.S., Flavell, R.A., 2008. Blocking TGFbeta-Smad2/3 innateimmune signaling mitigates Alzheimer-like pathology. Nat. Med. 14,681–687.
Tsukuda, K., Mogi, M., Iwanami, J., Min, L.J., Sakata, A., Jing, F., Iwai,M., Horiuchi, M., 2009. Cognitive Deficit in Amyloid-{beta}-InjectedMice Was Improved by Pretreatment With a Low Dose of TelmisartanPartly Because of Peroxisome Proliferator-Activated Receptor-{gamma}Activation. Hypertension 54, 782–787.
Varvel, N.H., Bhaskar, K., Kounnas, M.Z., Wagner, S.L., Yang, Y., Lamb,B.T., Herrup, K., 2009. NSAIDs prevent, but do not reverse, neuronalcell cycle reentry in a mouse model of Alzheimer disease. J. Clin.Invest. 119, 3692–3702.
Wang, J., Ho, L., Chen, L., Zhao, Z., Zhao, W., Qian, X., Humala, N.,Seror, I., Bartholomew, S., Rosendorff, C., Pasinetti, G.M., 2007.Valsartan lowers brain beta-amyloid protein levels and improves spa-tial learning in a mouse model of Alzheimer disease. J. Clin. Invest.117, 3393–3402.
Wu, Z., Guo, H., Chow, N., Sallstrom, J., Bell, R.D., Deane, R., Brooks,A.I., Kanagala, S., Rubio, A., Sagare, A., Liu, D., Li, F., Armstrong, D.,Gasiewicz, T., Zidovetzki, R., Song, X., Hofman, F., Zlokovic, B.V.,2005. Role of the MEOX2 homeobox gene in neurovascular dysfunc-tion in Alzheimer disease. Nat. Med. 11, 959–965.
Wyss-Coray, T., 2006. Inflammation in Alzheimer disease: driving force,bystander or beneficial response? Nat. Med. 12, 1005–1015.
Yong, V.W., Rivest, S., 2009. Taking advantage of the systemic immunesystem to cure brain diseases. Neuron 15, 55–60.
Zlokovic, B.V., 2008. The blood–brain barrier in health and chronic
neurodegenerative disorders. Neuron 57, 178–201.