robust algorithm for alignment of liquid chromatography-mass spectrometry analyses in an accurate...
TRANSCRIPT
Robust Algorithm for Alignment of LiquidChromatography-Mass Spectrometry Analyses inan Accurate Mass and Time Tag Data AnalysisPipelineNavdeep Jaitly,† Matthew E. Monroe,‡ Vladislav A. Petyuk,† Therese R. W. Clauss,†Joshua N. Adkins,‡ and Richard D. Smith*,‡
Environmental Molecular Science Laboratory and Biological Sciences Division, Pacific Northwest National Laboratory,Richland, Washington 99352
Liquid chromatography coupled to mass spectrometry(LC-MS) and tandem mass spectrometry (LC-MS/MS)has become a standard technique for analyzing complexpeptide mixtures to determine composition and relativeabundance. Several high-throughput proteomics tech-niques attempt to combine complementary results frommultiple LC-MS and LC-MS/MS analyses to providemore comprehensive and accurate results. To effectivelycollate and use results from these techniques, variationsin mass and elution time measurements between relatedanalyses need to be corrected using algorithms designedto align the various types of data: LC-MS/MS versus LC-MS/MS, LC-MS versus LC-MS/MS, and LC-MS versusLC-MS. Described herein are new algorithms referredto collectively as liquid chromatography-based massspectrometric warping and alignment of retention timesof peptides (LCMSWARP), which use a dynamic elutiontime warping approach similar to traditional algorithmsthat correct for variations in LC elution times usingpiecewise linear functions. LCMSWARP is compared tothe equivalent approach based upon linear transformationof elution times. LCMSWARP additionally corrects fortemporal drift in mass measurement accuracies. We alsodescribe the alignment of LC-MS results and demon-strate their application to the alignment of analyses fromdifferent chromatographic systems, showing the suitabilityof the present approach for more complex transforma-tions.
Liquid chromatography-mass spectrometry (LC-MS)-basedproteomics analyses of peptide mixtures can provide globalqualitative and quantitative information about biological systems.1
Qualitative information in the form of protein identifications isgenerated by software such as SEQUEST,2 Mascot,3 ProteinLynxGlobal Server, Spectrum Mill,4 Protein Prospector,5 ProbID,6 and
X!Tandem7-9 that analyze MS/MS spectra of peptides derivedfrom a global protease digestion (e.g., trypsin). Quantitativeinformation is generally extracted from the precursor ion (MS1)scans in these analyses or from all scans using higher resolutionmass accuracy LC-MS analyses (i.e., without MS/MS). The latteranalyses generally provide better quantitative information becauseof a higher ion sampling rate and improved ion discriminationthan achieved in lower resolution analyses. Programs such asDecon2LS (http://ncrr.pnl.gov/software) and MSInspect (http://proteomics.fhcrc.org/) implement deisotoping algorithms such asTHRASH10 that extract masses and elution times of the ion speciespresent in LC-MS spectra. However, due to challenges with run-to-run variations in both the separation and mass analysisdimensions, more sophisticated alignment algorithms are neededto extract higher quality information from large scale experimentsinvolving multiple analyses.
A number of approaches have been developed and applied forhigh-throughput proteomic applications that rely on combinedresults obtained from different experimental platforms.11-13 Whilethe computational steps used in each approach are unique, all ofthe methods rely on using the mass and LC elution timeinformation of detected species observed across several experi-ments to find common chemical species. Some approaches useraw m/z ions and the entire elution profile of each m/z bin14-16
while others use monoisotopic masses and the peak apex of
* To whom correspondence should be addressed. E-mail: [email protected].† Environmental Molecular Science Laboratory.‡ Biological Sciences Division.
(1) Aebersold, R.; Mann, M. Nature 2003, 422, 198-207.(2) Eng, K.; McCormack, A. L.; Yates, J. R., III. J. Am. Soc. Mass Spectrom.
1994, 5, 976-989.(3) Perkins, D. N.; Pappin, D. J. C.; Creasy, D. M.; Cottrell, J. S. Electrophoresis
1999, 20, 3551-3567.
(4) Clauser, K. R.; Baker, P.; Burlingame, A. L. In 44th ASMS Conference onMass Spectrometry and Allied Topics; Portland, OR, May 12-16, 1996; 365.
(5) Clauser, K. R.; Baker, P.; Burlingame, A. L. Anal. Chem. 1999, 71, 2871-2882.
(6) Zhang, N.; Aebersold, R.; Schwikowski, B. Proteomics 2002, 2, 1406-1412.(7) Craig, R.; Beavis, R. C. Bioinformatics 2004, 20, 1466-1467.(8) Kapp, E. A.; Schutz, F.; Connolly, L. M.; Chakel, J. A.; Meza, J. E.; Miller,
C. A.; Fenyo, D.; Eng, J. K.; Adkins, J. N.; Omenn, G. S.; Simpson, R. J.Proteomics 2005, 5, 3475-3490.
(9) Field, H. I.; Fenyo, D.; Beavis, R. C. Proteomics 2002, 2, 36-47.(10) Horn, D. M.; Zubarev, R. A.; McLafferty, F. W. J. Am. Soc. Mass Spectrom.
2000, 11, 320-332.(11) Conrads, T. P.; Anderson, G. A.; Veenstra, T. D.; Pasa-Tolic, L.; Smith, R.
D. Anal. Chem. 2000, 72, 3349-3354.(12) Palmblad, M.; Ramstrom, M.; Markides, K. E.; Hakansson, P.; Bergquist, J.
Anal. Chem. 2002, 74, 5826-5830.(13) Smith, R. D.; Pasa-Tolic, L.; Lipton, M. S.; Jensen, P. K.; Anderson, G. A.;
Shen, Y.; Conrads, T. P.; Udseth, H. R.; Harkewicz, R.; Belov, M. E.;Masselon, C.; Veenstra, T. D. Electrophoresis 2001, 22, 1652-1668.
(14) Pierce, K. M.; Wood, L. F.; Wright, B. W.; Synovec, R. E. Anal. Chem. 2005,77, 7735-7743.
Anal. Chem. 2006, 78, 7397-7409
10.1021/ac052197p CCC: $33.50 © 2006 American Chemical Society Analytical Chemistry, Vol. 78, No. 21, November 1, 2006 7397Published on Web 10/04/2006
elution profiles of chemical species inferred to be in the samplesusing preprocessing algorithms.13,17,18 For example, the accuratemass and time (AMT) tag approach developed at our laboratorycombines LC-MS/MS analyses with high mass measurementaccuracy (MMA) LC-Fourier transform ion cyclotron resonance(FTICR) MS analyses in a relatively high-throughput pipeline. Inthis approach, results from both LC-MS and LC-MS/MSanalyses are converted into lists of monoisotopic masses andelution times. Results from different data sets are combined byfinding the transformation functions of mass and elution timesthat are required to remove variability in mass and elution timemeasurements between analyses. An alternative approach byRadulovic et al. utilizes a software suite for finding featurescommon to LC-MS and LC-MS/MS experiments performedusing ion trap mass spectrometers. The software bins peaks fromMS scans by m/z bins and uses signal processing algorithms todiscover peaks in the chromatographic dimension and to create“pamphlets”, which contain pixels for peaks identified. Pamphletsfrom different experiments are aligned by using a 2D smoothingspline in the m/z and time dimensions to correct for m/z andtime drift.16 Because of the lower resolution of the instrumentsused, these data sets are hard to deisotope, and processing is doneon peak level information. Signal processing algorithms are usedto reduce noise, by requiring that detectable peaks be observedover multiple consecutive spectra in the chromatographic dimen-sion. Due to the use of LC-MS/MS data sets, this approachprovides peptide identifications with the quantitative informationavailable from precursor ion MS scans. Listgarten et al. describea method to concurrently align multiple data sets and normalizeintensities by using a continuous profile model.19 While thisapproach has the additional appealing feature in that it providesa consensus alignment across all data sets simultaneously, it iscomputationally intensive and is based upon use of total ionchromatogram data. Another recently proposed pipeline creates“signal maps” from MS peaks of an LC-MS analysis and usessimilarities and differences in signal maps to identify changingfeatures.15 Noise peaks are removed by assuming that peakswithout any corresponding peaks in ( 5 scans or without otherpeaks in the expected isotopic envelope of the peak are spuriousnoise peaks. It performs a dynamic programming alignment usinga score that assumes the similarity of intensity profiles of massspectra in different LC-MS analyses. Multiple analyses arecombined in a progressive strategy of aligning and merging datasets based on similarity. Several other approaches for aligningLC-MS and gas chromatography (GC/MS) data sets have alsopreviously been described in the literature.20,21 Each of theseapproaches has its own computational requirements and implicit
challenges based on how the data are preprocessed. Approachesdealing with data that have been minimally preprocessed tend tobe more computationally intensive and complicated, but potentiallymore accurate.
Here we describe an algorithm for alignment of LC-MS datasets in the context of an AMT tag approach and involvingalignment in two different scenarios: (1) LC-MS analyses withLC-MS/MS analyses and (2) LC-MS analyses with other LC-MS analyses. LC-MS/MS analyses are also aligned to each other,but that procedure will not be discussed in this paper. Beforedescribing the algorithm, we briefly describe a statistical modelto characterize the variability of the mass and LC elution timemeasurements we have observed for the preprocessed data inLC-MS and LC-MS/MS measurements. The liquid chromatog-raphy-based mass spectrometric warping and alignment of reten-tion times of peptides (LCMSWARP) algorithm uses a scoringmethod based on this model to quantify the similarity betweenchromatographic subsections of the experiments and uses thescores to find a transformation function of mass and elution timeto produce the best piecewise linear alignment between twoexperiments. We show that LCMSWARP effectively corrects forboth mass and elution time variability in a typical LC-FTICR MSanalysis of a complex sample. Finally, we illustrate additional utilityof the algorithm by demonstrating alignments of data sets fromtwo disparate LC systems that use different separation columnsand different gradient shapes (i.e., linear versus exponential) andby aligning two experiments with missing subsections, an impor-tant development for dissemination of analytical methods todifferent laboratories and analysis platforms.
EXPERIMENTAL PROCEDURESSample Preparation. Two different Salmonella typhimurium
strains were grown in three different culture conditions (onemimicking macrophage cell infection) and then subjected to offlinestrong cation exchange followed by online reversed-phase LC-MS/MS. A detailed methods description can be found elsewhere.22
The same sample preparation method was used for related LC-MS experiments.
Liquid Chromatography and Mass Spectrometry. Sampleseparation was achieved using a constant-pressure capillary HPLCsystem that was manufactured in-house. Details of this systemare described elsewhere.22,23 Reversed-phase capillary HPLCcolumns were manufactured in-house by slurry packing 5-µmJupiter C18 stationary phase (Phenomenex, Torrence, CA) into a60-cm length of 360 µm o.d. × 150 µm i.d. fused-silica capillarytubing (Polymicro Technologies Inc., Phoenix, AZ) incorporatinga 2-µm retaining screen in a 1/16-in. capillary-bore union (ValcoInstruments Co., Houston, TX).
The HPLC system was equilibrated at 5000 psi with 100%mobile phase A (0.2% acetic acid and 0.05% TFA in water) for initialstarting conditions. Mobile phase switched from A to B (0.1% TFAin 90% acetonitrile/10% water) 20 min after sample injection,creating an exponential gradient as mobile phase B displaced Ain the mixer. Approximately 5 cm of 360-µm-i.d. fused-silica tubing
(15) Prakash, A.; Mallick, P.; Whiteaker, J.; Zhang, H.; Paulovich, A.; Flory, M.;Lee, H.; Aebersold, R.; Schwikowski, B. Mol. Cell. Proteomics 2006, 5, 423-432.
(16) Radulovic, D.; Jelveh, S.; Ryu, S.; Hamilton, T. G.; Foss, E.; Mao, Y.; Emili,A. Mol. Cell. Proteomics 2004, 3, 984-997.
(17) Kearney, P.; Thibault, P. J. Bioinf. Comput. Biol. 2003, 1, 183-200.(18) Wang, W.; Zhou, H.; Lin, H.; Roy, S.; Shaler, T. A.; Hill, L. R.; Norton, S.;
Kumar, P.; Anderle, M.; Becker, C. H. Anal. Chem. 2003, 75, 4818-4826.(19) Listgarten, J.; Neal, R. M.; Roweis, S. T.; Emili, A. In Advances in Neural
Information Processing Systems 17; MIT Press: Cambridge, MA, 2005.(20) Bylund, D.; Danielsson, R.; Malmquist, G.; Markides, K. E. J. Chromatogr.,
A 2002, 961, 237-244.(21) Zimmer, J. S.; Monroe, M. E.; Qian, W. J.; Smith, R. D. Mass Spectrom. Rev.
2006, 25, 450-482.
(22) Adkins, J.; Mottaz, H. M.; Norbeck, A. D.; Rue, J.; Clauss, T.; Purvine, S.O.; Heffron, F.; Smith, R. D. Mol. Cell Proteomics 2006, 5, 1450-1461.
(23) Shen, Y.; Tolic, N.; Zhao, R.; Pasa-Tolic, L.; Li, L.; Berger, S. J.; Harkewicz,R.; Anderson, G. A.; Belov, M. E.; Smith, R. D. Anal. Chem. 2001, 73, 3011-3021.
7398 Analytical Chemistry, Vol. 78, No. 21, November 1, 2006
packed with 5 µm of C18 was used to split ∼25 µL/min of flowbefore the injection valve. The split flow controls gradient speedunder conditions of constant-pressure operation. Flow through thecapillary HPLC column was ∼2 µL/min when equilibrated to 100%mobile phase A.
FTICR-MS analysis was performed using a ThermoElectronmodel LTQ-FT linear ion trap-FTICR hybrid mass spectrometer(ThermoElectron Corp., San Jose, CA) with electrospray ionization(ESI). The HPLC column was coupled to the mass spectrometerusing an in-house-manufactured interface. No sheath gas ormakeup liquid was used. The heated capillary temperature andspray voltage were 200 °C and 2.2 kV, respectively. Data acquisi-tion began 20 min after sample injection and continued for 100min over a mass (m/z) range of 400-2000. The automatic gaincontrol target for full scan ion trap was 30 000 and 106 for theFTICR cell. For each cycle, the two most abundant ions from MSanalysis were selected for MS/MS analysis using a collisionenergy setting of 35%. A dynamic exclusion time of 60 s and asingle repeat count was used to discriminate against previouslyanalyzed ions.
Tandem mass spectral analysis was performed using a Ther-moElectron model LTQ ion trap mass spectrometer (Thermo-Electron Corp., San Jose, CA) with ESI. For each cycle, the tenmost abundant ions from MS analysis were selected for MS/MSanalysis, using a collision energy setting of 45%. Dynamic exclu-sion was used to discriminate against previously analyzed ions.
An Agilent 1100 2D nanoflow system (Palo Alto, CA) was usedfor the comparative study of alignment across LC systems. AZorbax 300SB-C18, 5 mm × 300 µm, 5-µm column was used forenrichment, while a Zorbax SB-C18, 30 cm × 75 µm column with300-Å pores and 3.5-µm particles was used for separation. Mobilephase A was 0.02% TFA, 0.1% acetic acid in water, and mobilephase B was 0.02% TFA, 0.1% acetic acid in acetonitrile. Theenrichment column was switched to position 1 at 0 min, switchedto position 2 at 5 min, and returned to position 1 at 135 min. Unlikethe constant-pressure system described above, the Agilent 11002D maintained a constant flow rate of 300 nL/min, with thepressure varying as needed.
DISCUSSIONTerminology. Chemical species in LC-MS experiments
display a three-dimensional signature in the data correspondingto the dimensions of m/z, elution time, and intensity. In each massspectrum, a detected species generally gives rise to an isotopicprofile (envelope) in the m/z dimension with peaks observablefor each isotope (depending on the resolution of the instrumentand the charge of the ions). In the chromatographic dimension,each resolvable charged species also gives rise to LC elutionprofiles (peaks). Similarly, LC-MS/MS provides a three-dimen-sional signature in m/z, LC elution time, and intensity from MSspectra along with additionally associated MS/MS spectra, whichare typically interpreted using a database searching tool such asSEQUEST to provide peptide sequence identification.
Here we use the term feature to refer to the unique chargedspecies that is inferred to give rise to the three-dimensional profile(with additional MS/MS spectra in LC-MS/MS experiments) thatis observed in the data. Each such feature has a representativemonoisotopic mass and an LC elution time that is the time of thepeak apex of its elution profile (From here on, elution time will
be used to refer to the time of the apex of the LC elution profileof a feature.) A chemical species when observed by LC-MS isreferred to as an LC-MS feature, while the same species observedin an LC-MS/MS experiment is referred to as an LC-MS/MSfeature, although both features are observations of the sameunderlying chemical species. The mass of an LC-MS feature isthe monoisotopic mass determined from deisotoping the isotopicprofile using a modified version of the THRASH algorithm,10 whilethe mass of the LC-MS/MS feature is the mass of the theoreticalpeptide sequence and posttranslational modifications (if any) ofthe peptide. More details of the algorithms used to discover theLC-MS and LC-MS/MS features can be found elsewhere21 andin the Supporting Information.
Importantly, the same chemical species detected in multipleanalyses are grouped together by assuming that features withsimilar mass and elution times in different experiments arise fromthe same underlying chemical species. This grouping of featuresacross different experiments (regardless of the type of experiment)is referred to as finding common features, but actually representsthe grouping of features based on the assumption that within somedefined limits the same chemical species gave rise to eachobserved feature. A feature common to multiple LC-MS experi-ments is referred to as a feature cluster, while a feature commonto multiple LC-MS/MS measurements, which is identified withsome level of confidence from database search scores (such ascross correlation in SEQUEST and probability values in Peptide-Prophet24), is referred to as a mass and time tag (MT). In ourprevious work, we have applied linear correction of elution timeto adjust for variability in elution time before finding commonfeatures (see ref 21 and Supporting Information).
Monoisotopic Mass and Peak Apex Elution Time Vari-ability Model. LC separation of a complex peptide mixture ispossible because of inherent differences in chemical and physicalproperties of the peptides. Different peptides interact with varyingspecificity with the mobile and stationary phases, which resultsin a wide range of elution times depending on factors that includethe flow rate, system design (e.g., dead volumes), initial sampleinjection (e.g., variations in sample volume), temperature, reversed-phase gradient shape, noise in the gradient, e.g., due to mixingof the two solvents, variations in flow rate (or pressure, dependingupon the system design), etc. In multiple liquid chromatographyexperiments with exactly the same configuration and same sample,a peptide would ideally elute at exactly the same time becauseeach of these factors would be identical. In practice, however, theobserved elution time is the result of small deviations in severalof these factors. The greatest differences from analysis to analysisin our measurements are manifested as differences in the deadtime and relative separation speeds, i.e., the time between thestart of an analysis and when the first analyte elutes from theseparation column and the speed of the reversed gradient profile.These differences are actually linked and arise from the use of aconstant-pressure LC system, which will unavoidably result insome flow rate variations due to unavoidable changes in thesolvent flow arising from changes of the porosity of either theanalytical column or the flow splitter (in practice, another columnjoined at a tee just before the sample injection valve). As a result,
(24) Keller, A.; Nesvizhskii, A. I.; Kolker, E.; Aebersold, R. Anal. Chem. 2002,74, 5383-5392.
Analytical Chemistry, Vol. 78, No. 21, November 1, 2006 7399
an elution time correction is needed to effectively compareanalyses, which we have found can be effectively done using asuitable global linear transformation between analyses21 (moredetails can be found in the Supporting Information).
While such global or “macroscopic” corrections address theflow rate variability from experiment to experiment, they cannotcorrect for changes during an analysis, such as due to gradientnoise, or to some extent for other types of variations betweenanalyses, e.g., due to temperature changes, variations in solventcomposition, or changes to the stationary phase due to incompletecolumn regeneration. It is expected from central limit theoremthat even after correcting for global trends of dead time and flowrate changes, the effect of these lesser understood microscopicfactors can result in the observed elution times being a normallydistributed variable around an ideal elution time. The width ofthe distribution is dependent on how well variations in experi-mental conditions are minimized and how well behaved eachpeptide is with respect to small changes in separation parameters.While detailed research has been performed on characterizingthe elution profiles of chemical species,25 in this work, we attempt
to model the elution time (as defined earlier) of a peptide fromexperiment to experiment as a Gaussian distribution, under theassumption of similar experimental configuration. Evaluation ofthe Gaussian model with 14 690 different peptides observed in atleast 10 of 572 LC-MS/MS analyses showed that the data fit themodel well (see the Model Testing section in the SupportingInformation). Alternative models were also tested, but the normaldistribution performed best and had the advantage that thevariability was encompassed by one parameter, the standarddeviation of the variability of elution time, rather than multipleparameters that affect the shape of the distributions and theunderstanding of the variability for different peptides.
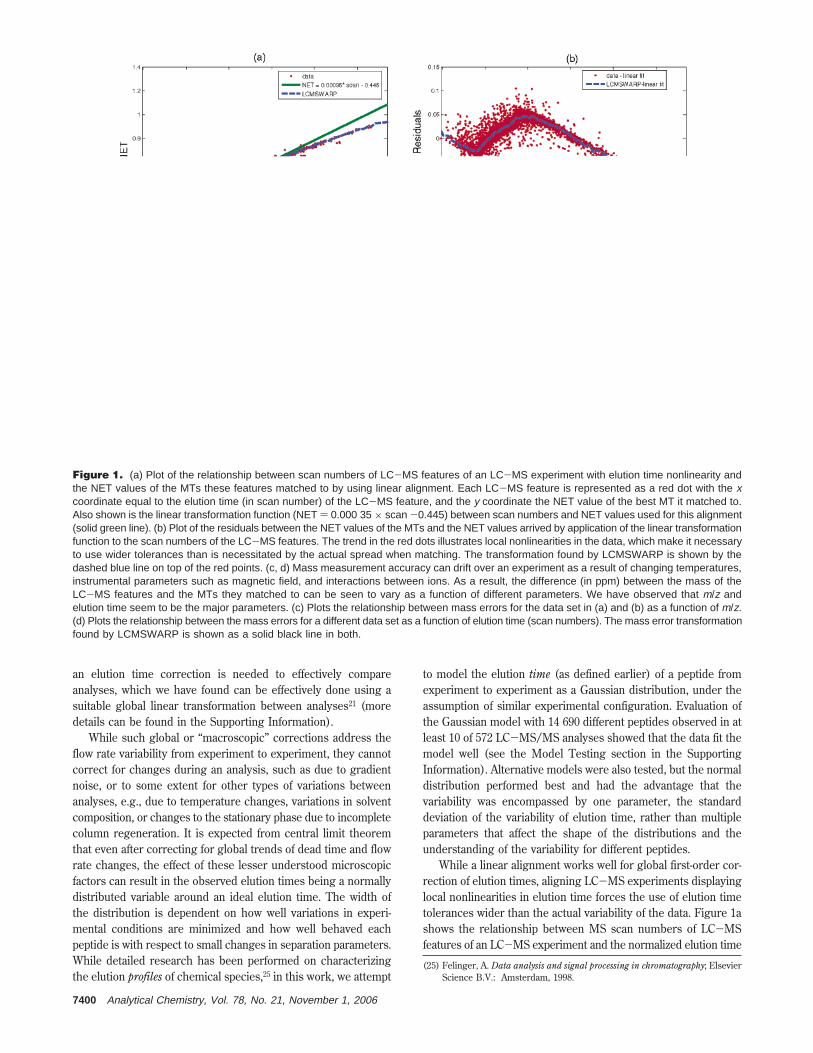
While a linear alignment works well for global first-order cor-rection of elution times, aligning LC-MS experiments displayinglocal nonlinearities in elution time forces the use of elution timetolerances wider than the actual variability of the data. Figure 1ashows the relationship between MS scan numbers of LC-MSfeatures of an LC-MS experiment and the normalized elution time
(25) Felinger, A. Data analysis and signal processing in chromatography; ElsevierScience B.V.: Amsterdam, 1998.
Figure 1. (a) Plot of the relationship between scan numbers of LC-MS features of an LC-MS experiment with elution time nonlinearity andthe NET values of the MTs these features matched to by using linear alignment. Each LC-MS feature is represented as a red dot with the xcoordinate equal to the elution time (in scan number) of the LC-MS feature, and the y coordinate the NET value of the best MT it matched to.Also shown is the linear transformation function (NET ) 0.000 35 × scan -0.445) between scan numbers and NET values used for this alignment(solid green line). (b) Plot of the residuals between the NET values of the MTs and the NET values arrived by application of the linear transformationfunction to the scan numbers of the LC-MS features. The trend in the red dots illustrates local nonlinearities in the data, which make it necessaryto use wider tolerances than is necessitated by the actual spread when matching. The transformation found by LCMSWARP is shown by thedashed blue line on top of the red points. (c, d) Mass measurement accuracy can drift over an experiment as a result of changing temperatures,instrumental parameters such as magnetic field, and interactions between ions. As a result, the difference (in ppm) between the mass of theLC-MS features and the MTs they matched to can be seen to vary as a function of different parameters. We have observed that m/z andelution time seem to be the major parameters. (c) Plots the relationship between mass errors for the data set in (a) and (b) as a function of m/z.(d) Plots the relationship between the mass errors for a different data set as a function of elution time (scan numbers). The mass error transformationfound by LCMSWARP is shown as a solid black line in both.
7400 Analytical Chemistry, Vol. 78, No. 21, November 1, 2006
(NET) values of the MTs these features are matched using a linearalignment (the NET for a mass tag is the average elution timefor the mass tag in multiple LC-MS/MS experiments, which havebeen normalized to a baseline; see Supporting Information formore details). Also shown is the linear transformation functionbetween MS scan numbers and NET values used for thisalignment. Figure 1b shows the residuals between the NET valuesof the MTs and the NET values obtained by application of thelinear transformation function to the scan numbers of the LC-MS features. As can be seen, the residuals display nonlinearbehavior as a function of scan number. Because of the nonlinearitypresent in these data, the comparison of LC-MS features to MTswould need a tolerance of ∼0.08 NET, even though it is evidentthat the width of the distribution of residuals around the mean isactually much smaller. Thus, the use of a nonlinear trend, suchas the one shown passing through the center of the residuals,would enable the use of smaller NET tolerances and thus providemore confident matches.
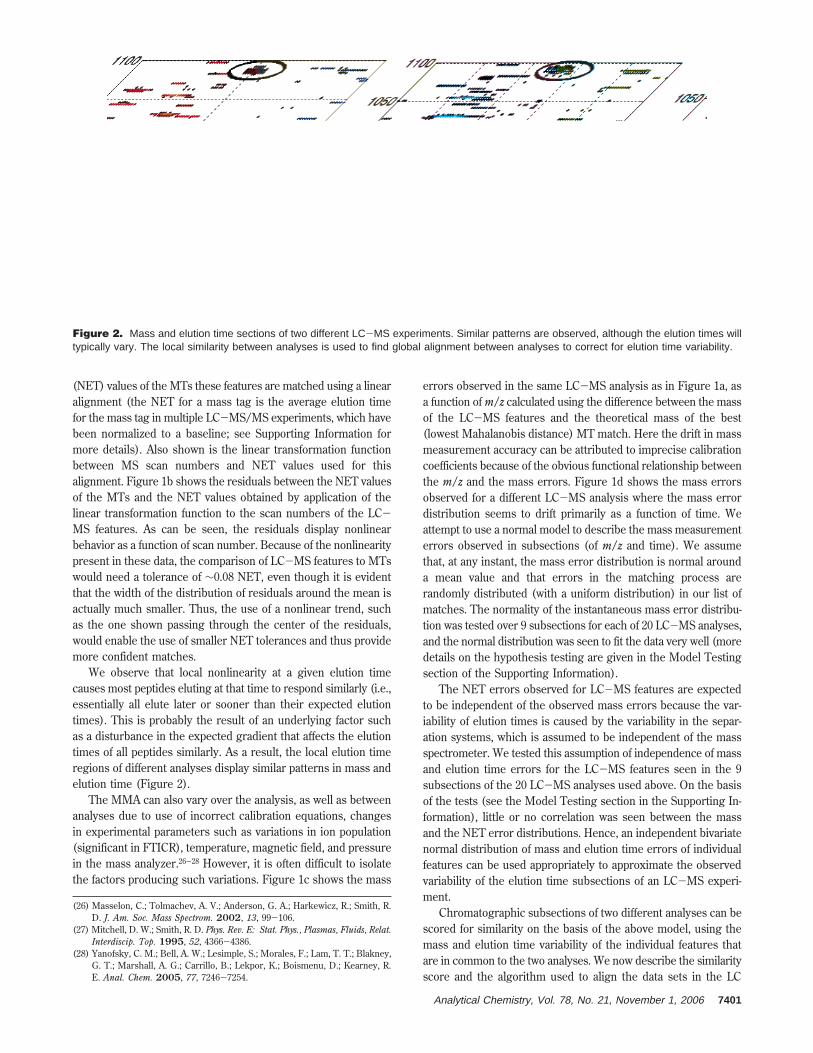
We observe that local nonlinearity at a given elution timecauses most peptides eluting at that time to respond similarly (i.e.,essentially all elute later or sooner than their expected elutiontimes). This is probably the result of an underlying factor suchas a disturbance in the expected gradient that affects the elutiontimes of all peptides similarly. As a result, the local elution timeregions of different analyses display similar patterns in mass andelution time (Figure 2).
The MMA can also vary over the analysis, as well as betweenanalyses due to use of incorrect calibration equations, changesin experimental parameters such as variations in ion population(significant in FTICR), temperature, magnetic field, and pressurein the mass analyzer.26-28 However, it is often difficult to isolatethe factors producing such variations. Figure 1c shows the mass
errors observed in the same LC-MS analysis as in Figure 1a, asa function of m/z calculated using the difference between the massof the LC-MS features and the theoretical mass of the best(lowest Mahalanobis distance) MT match. Here the drift in massmeasurement accuracy can be attributed to imprecise calibrationcoefficients because of the obvious functional relationship betweenthe m/z and the mass errors. Figure 1d shows the mass errorsobserved for a different LC-MS analysis where the mass errordistribution seems to drift primarily as a function of time. Weattempt to use a normal model to describe the mass measurementerrors observed in subsections (of m/z and time). We assumethat, at any instant, the mass error distribution is normal arounda mean value and that errors in the matching process arerandomly distributed (with a uniform distribution) in our list ofmatches. The normality of the instantaneous mass error distribu-tion was tested over 9 subsections for each of 20 LC-MS analyses,and the normal distribution was seen to fit the data very well (moredetails on the hypothesis testing are given in the Model Testingsection of the Supporting Information).
The NET errors observed for LC-MS features are expectedto be independent of the observed mass errors because the var-iability of elution times is caused by the variability in the separ-ation systems, which is assumed to be independent of the massspectrometer. We tested this assumption of independence of massand elution time errors for the LC-MS features seen in the 9subsections of the 20 LC-MS analyses used above. On the basisof the tests (see the Model Testing section in the Supporting In-formation), little or no correlation was seen between the massand the NET error distributions. Hence, an independent bivariatenormal distribution of mass and elution time errors of individualfeatures can be used appropriately to approximate the observedvariability of the elution time subsections of an LC-MS experi-ment.
Chromatographic subsections of two different analyses can bescored for similarity on the basis of the above model, using themass and elution time variability of the individual features thatare in common to the two analyses. We now describe the similarityscore and the algorithm used to align the data sets in the LC
(26) Masselon, C.; Tolmachev, A. V.; Anderson, G. A.; Harkewicz, R.; Smith, R.D. J. Am. Soc. Mass Spectrom. 2002, 13, 99-106.
(27) Mitchell, D. W.; Smith, R. D. Phys. Rev. E: Stat. Phys., Plasmas, Fluids, Relat.Interdiscip. Top. 1995, 52, 4366-4386.
(28) Yanofsky, C. M.; Bell, A. W.; Lesimple, S.; Morales, F.; Lam, T. T.; Blakney,G. T.; Marshall, A. G.; Carrillo, B.; Lekpor, K.; Boismenu, D.; Kearney, R.E. Anal. Chem. 2005, 77, 7246-7254.
Figure 2. Mass and elution time sections of two different LC-MS experiments. Similar patterns are observed, although the elution times willtypically vary. The local similarity between analyses is used to find global alignment between analyses to correct for elution time variability.
Analytical Chemistry, Vol. 78, No. 21, November 1, 2006 7401
elution time and mass dimensions.Methods. Algorithm. Definitions and Parameters. A fea-
ture f from an LC-MS or an LC-MS/MS analysis is representedas a mass and time pair: (fmass, ftime), while a MT, g from a massand time tag database is represented as a mass and time pair,with additional information on the number of times (count) theMT was observed in the LC-MS/MS experiments: (gmass, gtime,gc). A feature and a MT will both be referred to interchangeablyas features when only mass and elution time information isconsidered since these descriptors are common to both. Anexperiment E is described by the set of features discovered byour preprocessing algorithms when applied to data from theexperiment; i.e., E ) {f : f is a feature discovered by ourpreprocessing algorithm}. N is the user-specified number ofelution time sections that the alignee data set is broken into(usually 100 with each section covering ∼1% of the run) for theNET alignment, while Nc is the number of elution time sectionsthe reference data set is broken into, where c is referred to asthe contraction/expansion factor. Nmass is the number of sectionsthe alignee data set is broken into for the mass recalibration whileM is the number of sections the reference data set is broken intofor the same purpose. Dnet is the number of discontinuous sectionsthe LCMSWARP NET transformation function can jump (de-scribed in the next section), and Dmass is the number of discon-tinuous sections the corresponding LCMSWARP mass transfor-mation function can jump (see next section). σnet and σmass arethe standard deviations in the normalized elution time dimension(0-1) and the mass dimension (in parts per million, ppm),respectively, while tolmass and tolnet are the user-supplied mass (alsoin ppm) and normalized elution time tolerances. When the elutiontime of a feature f from an alignee data set is transformed to theelution time frame of the reference data set, we refer to thetransformed elution time as fnet to refer to the fact that thisnormalized time is different from the original elution time ftime
and is now in the scale of the reference data set. When thereference data set is a mass and time tag database, the elutiontimes are in the NET scale. When the reference data set is anotherLC-MS experiment, the scale is converted from scan number ofelution time to a scale of 0-1 by linearly scaling the scan numbersor elution times of features in the data set to cover the range of0-1.
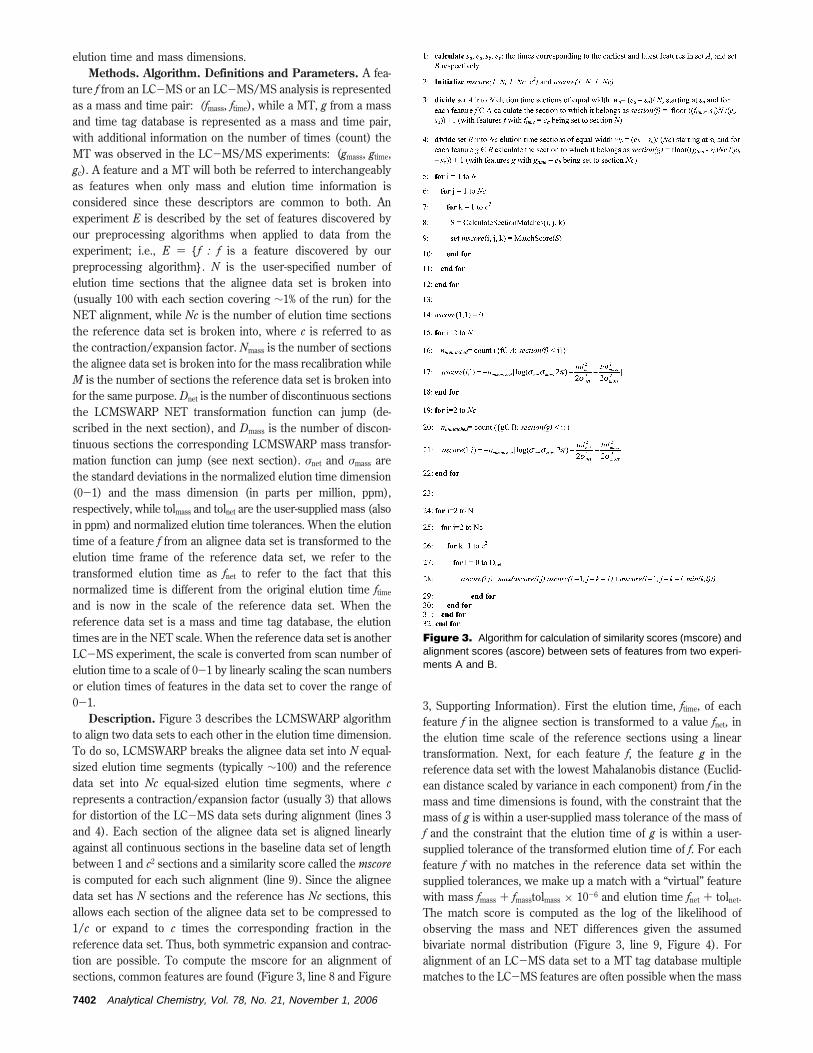
Description. Figure 3 describes the LCMSWARP algorithmto align two data sets to each other in the elution time dimension.To do so, LCMSWARP breaks the alignee data set into N equal-sized elution time segments (typically ∼100) and the referencedata set into Nc equal-sized elution time segments, where crepresents a contraction/expansion factor (usually 3) that allowsfor distortion of the LC-MS data sets during alignment (lines 3and 4). Each section of the alignee data set is aligned linearlyagainst all continuous sections in the baseline data set of lengthbetween 1 and c2 sections and a similarity score called the mscoreis computed for each such alignment (line 9). Since the aligneedata set has N sections and the reference has Nc sections, thisallows each section of the alignee data set to be compressed to1/c or expand to c times the corresponding fraction in thereference data set. Thus, both symmetric expansion and contrac-tion are possible. To compute the mscore for an alignment ofsections, common features are found (Figure 3, line 8 and Figure
3, Supporting Information). First the elution time, ftime, of eachfeature f in the alignee section is transformed to a value fnet, inthe elution time scale of the reference sections using a lineartransformation. Next, for each feature f, the feature g in thereference data set with the lowest Mahalanobis distance (Euclid-ean distance scaled by variance in each component) from f in themass and time dimensions is found, with the constraint that themass of g is within a user-supplied mass tolerance of the mass off and the constraint that the elution time of g is within a user-supplied tolerance of the transformed elution time of f. For eachfeature f with no matches in the reference data set within thesupplied tolerances, we make up a match with a “virtual” featurewith mass fmass + fmasstolmass × 10-6 and elution time fnet + tolnet.The match score is computed as the log of the likelihood ofobserving the mass and NET differences given the assumedbivariate normal distribution (Figure 3, line 9, Figure 4). Foralignment of an LC-MS data set to a MT tag database multiplematches to the LC-MS features are often possible when the mass
Figure 3. Algorithm for calculation of similarity scores (mscore) andalignment scores (ascore) between sets of features from two experi-ments A and B.
7402 Analytical Chemistry, Vol. 78, No. 21, November 1, 2006

and time tag database is large. Thus, it is important to factor inthe prior probability that the MT that a feature matched to isindeed real. This can be done by multiplying each conditionalprobability of mass error and NET error term (from assignmentof an LC-MS feature to a MT) with the prior probability that aMT was present in the sample. Since a mass and time tag databaseis usually a collection of a large number of LC-MS/MS experi-ments, the coverage of observable peptides is expected to be muchlarger than that for a single LC-MS experiment. We thusapproximate the probability that a MT was present in the LC-MS sample using the empirical fraction of the total number ofLC-MS/MS runs in the mass and time tag database that the MTwas seen in. Since the denominator for the prior probability isconstant for all MTs (equal to the number of the LC-MS/MSexperiments used to build the mass and time tag database) andthe denominator from Bayes rule (for conditional and priorprobabilities) is just a normalizing constant, these can be ignoredin the mscore. Therefore, the only term needed in the mscore isthe log(number of observations of MT). When aligning an LC-MS data set to another LC-MS data set, the prior probabilitiescannot be estimated. We would like to make the mscore moresymmetric because the alignment algorithm should be symmetric(i.e., not affected by which of the LC-MS experiments was chosenas the baseline). We do so by also penalizing for features that aremissing in the reference data set. While this approach is ad hoc,this symmetric addition helps with the quality of alignment whenthe alignee and the reference data set have a significantly differentnumber of features.
An alignment score (ascore) is computed for all possiblealignments by summing together the match scores of thesubsections that are matched as a result of the alignment. This isdone by using a dynamic programming algorithm similar to theone used to align biological sequences. Discontinuities are alsoallowed in the alignment process by a user-supplied value Dnet
that specifies how many extra sections can be present in the dataset (since it is usually assumed that the alignee data set will bethe more complete data set). After alignment is performed,features from the two data sets are matched by choosing for eachfeature in the alignee data set the feature in the reference dataset that is the closest in Mahalanobis distance. When the referencedata set is a mass and time tag database, the probability ofobservation is also factored in as explained earlier. As a result, apair of candidate matches of features is generated. If masscalibration is to be performed, we use a larger than necessarymass tolerance to generate this set of candidate matches so thatdrift in measurement accuracy does not cause real matches to bemissed. These candidate matches are used to discover a massrecalibration function, with elution time, m/z of the aligneefeatures, or both as the predictor variable that characterizes thedrift in the mass measurement error over the course of the
experiment. One of the possibilities to discover this function wasto use smoothing spline regression.29 However, this procedurewas strongly affected by outliers and incorrect matches that werenot always symmetrically distributed around the central trend.Thus, a dynamic programming algorithm is used to generate afirst-pass piecewise linear transformation function that is appliedto the data. Candidate matches are regenerated for mass recali-bration by rematching based on the Mahalanobis distance afterrecalibration, and then the final transformation function is dis-covered by using a natural cubic regression spline in the secondpass. The dynamic programming algorithm to calculate thealignment score for the piecewise alignments is shown in Figure5. The mass errors are divided into 2M equal width bins of widthtolmass/M. The MMA of the instrument is allowed to drift linearlyfrom one elution time bin to another with the ends of the driftlying on the boundaries of the mass error bins. The mass errorfunction is constrained to jump less than a user specifiedparameter, Dmass. The goodness of each possible jump in MMAfrom one elution time section to the next is calculated by the sum
(29) Hastie, T.; Hastie, T.; Tibshirani, R.; Friedman, J. H. The elements of statisticallearning: data mining, inference, and prediction; Springer: New York, 2001.
Figure 4. Algorithm for calculation of match score for a set of featurematches.
Figure 5. Algorithm for calculation of the mass drift score matricesbetween two experiments A and B by using set S of feature matches.
Analytical Chemistry, Vol. 78, No. 21, November 1, 2006 7403
of the squares of the mass differences after the transformation isscaled by the variance of mass errors observed in the section afterthe transformation (line 15). It was observed that the matcheschosen after alignment contain a mixture of incorrect and correctanswers. To reduce the effect of outliers, every match with a masserror greater than a user-specified tolerance, Zmassσmass is treatedas having a mass error equal to Zmassσmass. A global alignment scoreis calculated using dynamic programming to find the lowestpossible score among all alignments. The piecewise alignmentfunction can be recovered from this alignment score by backtrack-ing. While Figure 5 shows the dynamic programming workingwith scan number as the predictor variable, the same routine isalternatively used with m/z as the predictor variable instead ofscan number. In our production environment, a two-pass routinehas been observed to be the most stable, where the dynamicprogramming algorithm first performs recalibration as a functionof m/z and then performs another recalibration as a function ofscan number.
LCMSWARP also operates in two passes. In the first pass, itperforms NET alignment using historical mass and NET standarddeviations and extra wide tolerances in mass (∼50 ppm for FT-MS analyses and ∼200 ppm for QTOF) and NET (∼0.05).Following this first pass, an initial alignment is computed and massmeasurements are corrected using the algorithm describedpreviously. Using this initial alignment and mass correction, bestmatches are found and used to compute the actual NET and massstandard deviations for the alignee data set. These real standard
deviations are then used to recalculate the alignment function andthe matching process is repeated.
Clustering of LC-MS Analyses. Metabolomics and manyproteomics analyses using LC-MS for candidate biomarkerdiscovery often involve aligning analyses to uncover initiallyunidentified features that change in some interesting fashionbetween samples. Alignment of a pair of LC-MS and LC-MSanalyses is accomplished by LCMSWARP as described above.Once all data sets are aligned to the same chromatographiccoordinate scale, a complete or single-linkage hierarchical cluster-ing is applied to the mass and NET (transformed) coordinatefeatures to group common features into feature clusters. Thedistance function used to represent the difference between twofeatures f and g is again the Mahalanobis distance between thetwo if their mass difference and NET difference is within thespecified tolerance; otherwise, the distance is infinite. By usingthis alignment and clustering approach, unidentified features inseveral data sets can be grouped into a master list. A two-passprocedure is again employed to avoid having to depend on onebaseline for alignment. Once data sets are aligned and clustersare detected, a representative mass and elution time is computedfor the features in each cluster and then used as the baseline forthe next round of alignment in which clusters are reselected. Toreduce computational time, the entire merged set of features fromall experiments is sorted by mass and broken down into partitionsat indices where consecutive features are separated by a massdifference greater than 3σmass. Because of the natural isotopic
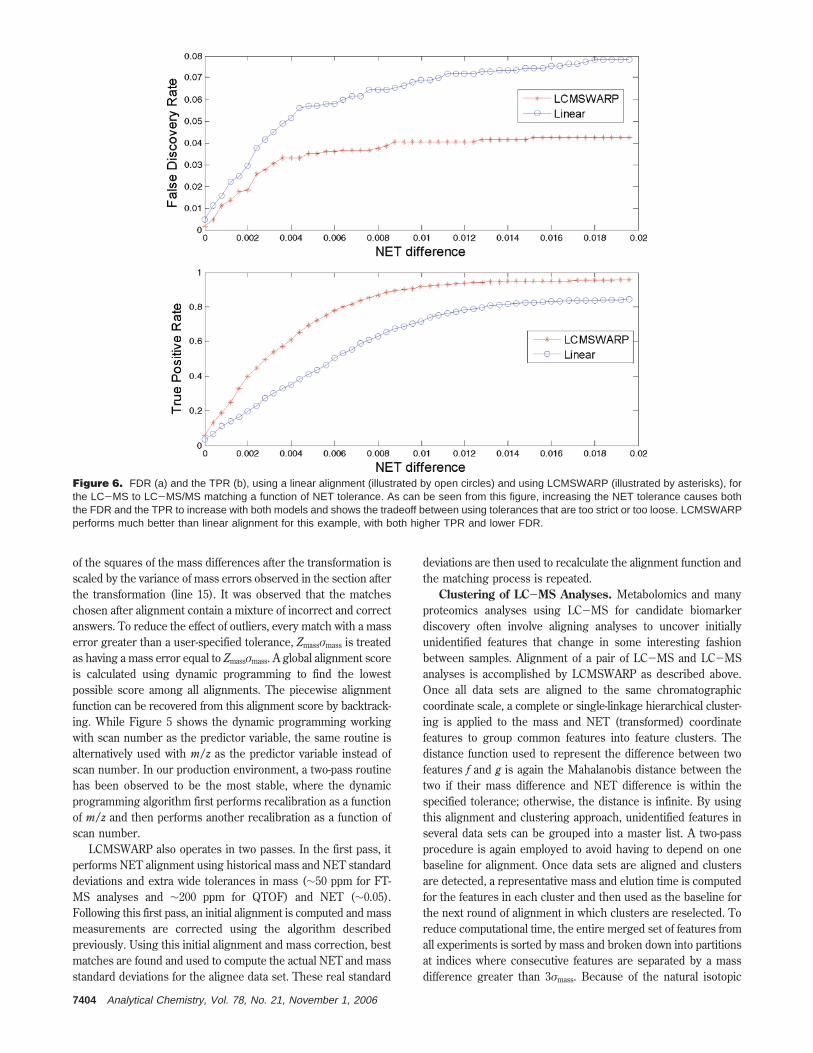
Figure 6. FDR (a) and the TPR (b), using a linear alignment (illustrated by open circles) and using LCMSWARP (illustrated by asterisks), forthe LC-MS to LC-MS/MS matching a function of NET tolerance. As can be seen from this figure, increasing the NET tolerance causes boththe FDR and the TPR to increase with both models and shows the tradeoff between using tolerances that are too strict or too loose. LCMSWARPperforms much better than linear alignment for this example, with both higher TPR and lower FDR.
7404 Analytical Chemistry, Vol. 78, No. 21, November 1, 2006
distribution of carbon, nitrogen, hydrogen, oxygen, and sulfur,the mass distributions for organic compounds lie primarily aroundwell-defined centers. For example, peptides of mass around 1000are mostly concentrated at 1000.5 and very few peptides exist withmasses between 1000.7 and 1001.3 Da and between 999.7 and1000.3 Da. This allows natural partitioning of masses to exist inpeptides. The in silico partitioning we apply before clusteringbreaks the high MMA data set into numerous smaller partitions(each of size of the order of the number of data sets) and allowsfast clustering without an observable effect on results.
RESULTSThe existence of local nonlinear trends in LC-MS data (Figure
1) can potentially lead to either incorrect matches (e.g., falsepeptide identifications), since one would otherwise use widermatching tolerances (i.e., cut-offs) than actually necessary ifnonlinear correction were applied, or lead to missed identifications(i.e., false negatives) when narrow tolerances are applied. Thelatter gives rise to more “missing data” when a given species may
be within tolerances in one run, but outside in another. Increasingthe elution time tolerance causes fewer false negatives, but morefalse positives. We illustrate this using an LC-MS analysis wherethe identity of LC-MS features is already known from anorthogonal means and then matching these features to MTs in amass and time tag database by using linear alignment to performthe alignment and matching. Once the alignment and matchingare performed, we can compare the matches obtained for the LC-MS features from the alignment against the true identity of thefeatures we already know and assess the true positive and falsediscovery rates. The data set we used was generated by analyzingtrypsin-digested proteins from S. typhimurium using a FinniganLTQ-FT instrument to obtain moderately high MMA MS precur-sor ion scans while concurrently performing MS/MS fragmenta-tion analyses in the linear ion trap stage. The MS precursor scanswere used to generate the LC-MS features that were then tiedto the MS/MS spectra by comparing the theoretical massgenerated from SEQUEST database searches to the mass in therelated high MMA precursor MS scans. Using Washburn/Yates
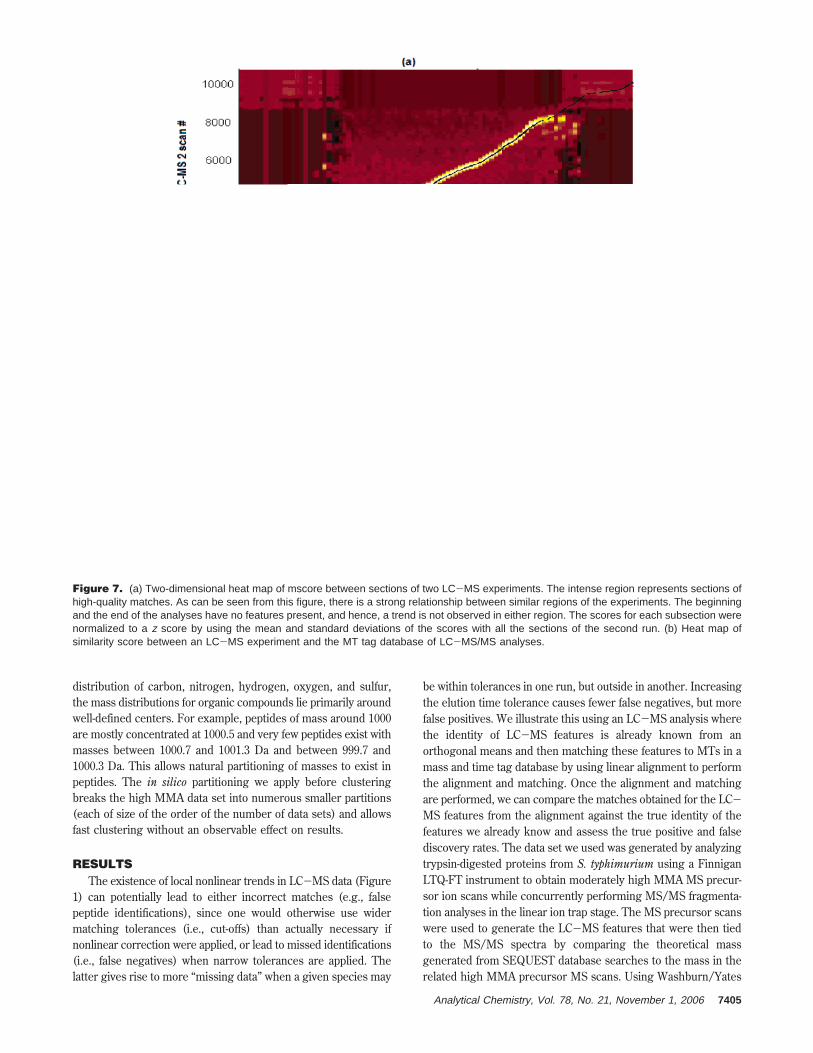
Figure 7. (a) Two-dimensional heat map of mscore between sections of two LC-MS experiments. The intense region represents sections ofhigh-quality matches. As can be seen from this figure, there is a strong relationship between similar regions of the experiments. The beginningand the end of the analyses have no features present, and hence, a trend is not observed in either region. The scores for each subsection werenormalized to a z score by using the mean and standard deviations of the scores with all the sections of the second run. (b) Heat map ofsimilarity score between an LC-MS experiment and the MT tag database of LC-MS/MS analyses.
Analytical Chemistry, Vol. 78, No. 21, November 1, 2006 7405
criteria to filter the MS/MS identifications from SEQUEST, a setof 1088 LC-MS features were identified. The error rate of thealgorithm was assessed by comparing the sequences assigned tothese features from the MS/MS search with those obtained fromthe matching process after alignment. The true positive rates(TPR) and false discovery rates (FDR) achieved by performingalignment at different NET tolerances are shown in Figure 6. Ascan be seen from this curve, increasing the NET tolerance resultsin an increase in the TPR but also causes an increase in the FDRfor this data set.
The relative rates of change of FDR and TPR depend on thepercent of ambiguous/false matches present, which depends onthe complexity of the samples and the types of samples beingcompared. More complex samples are more likely to have differentpeptides with similar mass and elution times that can causeambiguity in the matching. Additionally, when samples areincreasingly different, the random rate of errors in matchingincreases compared to the rate of correct matches and also resultsin more ambiguous matches. Indeed, we have observed thatincreasing the size of the mass and time tag database, by looseningthe filters applied to the MS/MS data sets, causes the error rateof matching to increase, making it attractive to optimize thisaspect, as well as the overall the alignment process. For the samedata set, we also show the FDR and TPR obtained by usingLCMSWARP for the above matching (Figure 6). In this example,LCMSWARP performs much better than linear alignment showinga higher TPR and lower FDR through most of the range oftolerances. Of course, the difference in performance depends onthe nature of the data set. For data sets with a high degree ofnonlinearity, LCMSWARP provides much better results than linearalignment, but for data sets with less nonlinearity, the performancein alignment of both algorithms is increasing similar, althoughLCMSWARP is never worse and also much faster (see below).
Figure 7 shows two example heat maps that representsimilarity scores (mscore) between data sets for two differentalignments. In the first heat map, two LC-MS analyses with over10 000 LC-MS features each were aligned to each other, whilein the second heat map, an LC-MS data set with over 10 000LC-MS features was aligned to a mass and time tag databasecontaining over 30 000 high-quality MTs built from over 1000 LC-MS/MS analyses. As can be seen, the mscore is able to highlightvery clearly not only the similarity between related regions of theanalyses but also the transformation function between the two. Itis interesting to note from this figure that the residuals at higherscan numbers are further away from the linear fit for this dataset. Higher residuals are often observed at higher scan numbersin our LC-MS analyses for the more hydrophobic components.Importantly, the ascore is able to find an appropriate transforma-tion function in NET, and the ascoremass is able to find anappropriate transformation function in mass, as can be seen inthe central trend lines in Figure 1. The two-pass algorithm usedby LCMSWARP is able to reduce the distribution of mass andNET errors (Figure 8) when such nonlinear variabilities arepresent in the elution time or the MMA.
In this work, the LCMSWARP algorithm was also adapted tofind groups of features common to different LC-MS experiments.Figure 9 shows the results following alignment of five LC-MSdata sets. These results were then clustered to determine features
in common among the analyses. The intensities of elements fromdifferent clusters are compared to a random baseline data set inFigure 10, which illustrates how features from different analysesappear to exhibit similar intensities. This behavior can be usedto detect species exhibiting significant changes in abundance ina population of clusters.
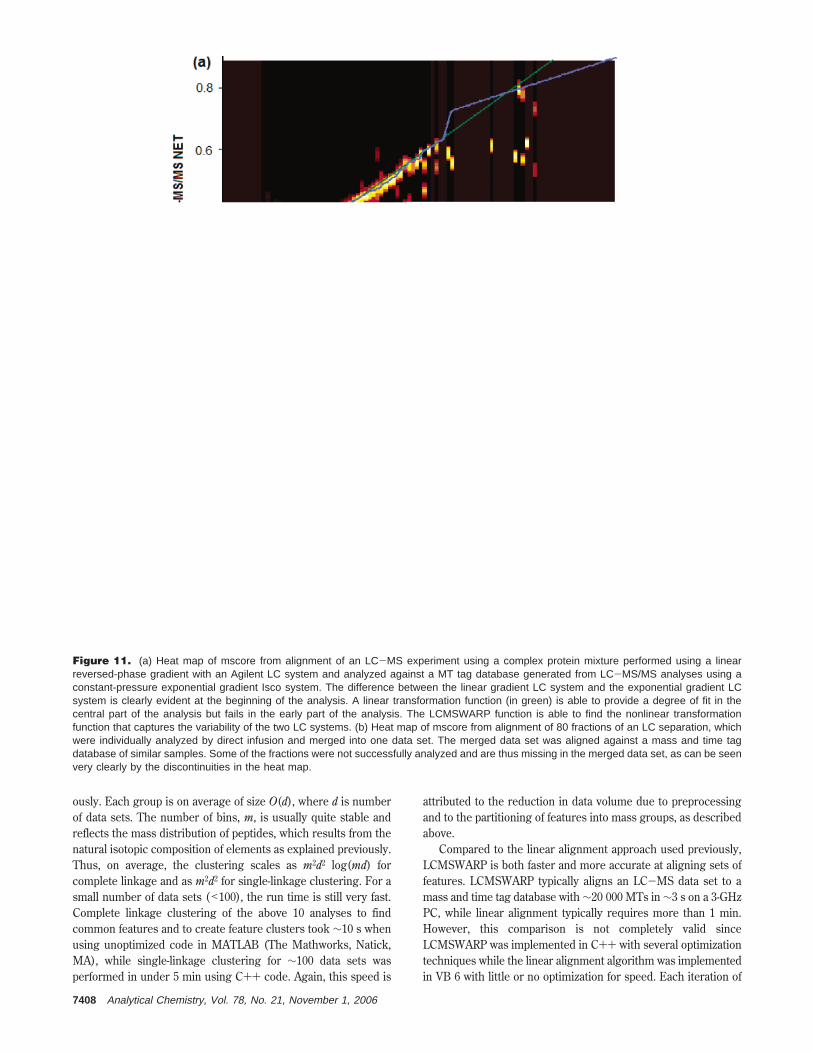
The robustness of the LCMSWARP method was evaluated bycomparing results obtained from different LC systems operatingwith a different gradient shape and also by aligning samples withmissing sections. An Agilent 1100 capillary LC system coupled toa Finnigan Orbitrap mass spectrometer was used to analyze amixture of 12 proteins and 23 peptides.30 The resulting data werealigned to a MT tag database that had been constructed usingthe same samples, but analyzed using our constant-pressure LCsystem coupled to Finnigan LCQ and LTQ mass spectrometers.The Agilent capillary LC system employed a linear mobile-phasegradient, while the constant-pressure system used an exponentialmobile-phase gradient. The differences in these gradients areexemplified by the mscore trends shown in Figure 11a. Despitethese differences, LCMSWARP was able to find the function totransform the results from the two different separation systems(blue line). Figure 11b shows results of a different experiment,where 80 fractions of an LC separation were analyzed by directinfusion with a NanoMate (Advion BioSciences, Ithaca, NY) intoa mass spectrometer. Missing data are present because some ofthe fractions were not successfully analyzed. After the 80 direct-infusion MS experiments were merged together to create onemaster data set, the merged data set was aligned against thecorresponding mass and time tag database using LCMSWARP,allowing for discontinuities in the NET dimension. LCMSWARPwas able to find the correct transformation function despite themissing fractions, as illustrated by the blue line in Figure11b.These examples show LCMSWARP to be a robust algorithmfor effectively tightening the error distribution of NET values andmass error values when local nonlinearities in chromatographyor drift in MMA of the mass spectrometer are observed.
The time complexity of LCMSWARP is O(N2c3) for computingall mscores in the NET dimension and O(N2c3Dnet) for computingall the ascores in the NET dimension. Finding all of the closest
(30) Purvine, S.; Picone, A. F.; Kolker, E. Omics 2004, 8, 79-92.
Figure 8. Histogram of NET errors after linear alignment andLCMSWARP are applied. As can be seen from this figure, thevariability in NET measurements is corrected. This effect is moredramatic for a more distorted data set such as the one illustratedhere. Reduction in the width of the error distribution allows us to usetighter tolerances in the matching process and reduce the rate of falsepositive matches.
7406 Analytical Chemistry, Vol. 78, No. 21, November 1, 2006

features for each mscore computation between two sets isquadratic in the worst case while scoring them is linear in thenumber of pairs. Since the number of pairs is less than the numberof features, n, and the number of features is much larger thanDnet, the complexity of LCMSWARP is O(N2c3n2) in the worst case.However, the average run time for finding all pairs of closestfeatures is really much closer to O(n log n + m log m + (m +n)) ) O(n log n + m log m), where n, m are the number offeatures in the two sets, because after sorting the features, allpossible pairs can be precomputed using the tight partitionsformed by the mass and NET distributions. By sorting featuresin the mass dimension, stepping through the sorted list, andmatching each current feature to only the range of features withinthe mass tolerances, we are able to reduce the candidate set ofmatches to a size that is, on average, similar for most features.This size reflects the complexity of the sample.
When implemented in C++, the LCMSWARP algorithm is ableto align features from an LC-MS experiment with over 10 000features to a mass and time tag database with over 200 000 MTswithin 10 s on a 3-GHz PC. This time, of course, includes onlythe time required to perform alignment on the preprocessed datain feature space and not the time for feature detection in thesamples. The feature detection is, in fact, a time-consumingprocedure currently taking between 1 and 3 h for one LC-MSexperiment. In contrast, aligning 10 LC-MS experiments, eachwith ∼10 000 features, takes less than 5 s.
It is well known that the worst case time complexity ofcomplete-linkage clustering is at most O(n2 log n) while the timecomplexity of single-linkage clustering is O(n2), where n is thenumber of features to be clustered. However, for our clusteringoperation, we partition features into groups by mass differencesbetween consecutively higher mass features, as described previ-
Figure 9. Two-dimensional view of zoomed in mass regions of five LC-MS data sets before and after alignment with LCMSWARP. Asillustrated, clusters of features become more obvious after alignment.
Figure 10. Intensity of elements of different clusters compared to a random baseline data set. Note, most features show similar intensitypatterns in each of the analyses.
Analytical Chemistry, Vol. 78, No. 21, November 1, 2006 7407
ously. Each group is on average of size O(d), where d is numberof data sets. The number of bins, m, is usually quite stable andreflects the mass distribution of peptides, which results from thenatural isotopic composition of elements as explained previously.Thus, on average, the clustering scales as m2d2 log(md) forcomplete linkage and as m2d2 for single-linkage clustering. For asmall number of data sets (<100), the run time is still very fast.Complete linkage clustering of the above 10 analyses to findcommon features and to create feature clusters took ∼10 s whenusing unoptimized code in MATLAB (The Mathworks, Natick,MA), while single-linkage clustering for ∼100 data sets wasperformed in under 5 min using C++ code. Again, this speed is
attributed to the reduction in data volume due to preprocessingand to the partitioning of features into mass groups, as describedabove.
Compared to the linear alignment approach used previously,LCMSWARP is both faster and more accurate at aligning sets offeatures. LCMSWARP typically aligns an LC-MS data set to amass and time tag database with ∼20 000 MTs in ∼3 s on a 3-GHzPC, while linear alignment typically requires more than 1 min.However, this comparison is not completely valid sinceLCMSWARP was implemented in C++ with several optimizationtechniques while the linear alignment algorithm was implementedin VB 6 with little or no optimization for speed. Each iteration of
Figure 11. (a) Heat map of mscore from alignment of an LC-MS experiment using a complex protein mixture performed using a linearreversed-phase gradient with an Agilent LC system and analyzed against a MT tag database generated from LC-MS/MS analyses using aconstant-pressure exponential gradient Isco system. The difference between the linear gradient LC system and the exponential gradient LCsystem is clearly evident at the beginning of the analysis. A linear transformation function (in green) is able to provide a degree of fit in thecentral part of the analysis but fails in the early part of the analysis. The LCMSWARP function is able to find the nonlinear transformationfunction that captures the variability of the two LC systems. (b) Heat map of mscore from alignment of 80 fractions of an LC separation, whichwere individually analyzed by direct infusion and merged into one data set. The merged data set was aligned against a mass and time tagdatabase of similar samples. Some of the fractions were not successfully analyzed and are thus missing in the merged data set, as can be seenvery clearly by the discontinuities in the heat map.
7408 Analytical Chemistry, Vol. 78, No. 21, November 1, 2006
the linear alignment algorithm is a least-squares operation totransform scans into NETs and is linear in the number of matches.However, because the greedy iterative strategy of the linearalignment algorithm has not been improved, e.g., using hillclimbing or simulated annealing, this algorithm has a slower runtime as it enumerates a large number of possible slopes andintercepts before settling on a final solution.
LCMSWARP is thus a robust alignment solution that we havefound highly effective in the context of our AMT tag pipeline. Ithas also allowed us to effectively align together LC-MS and LC-MS/MS data sets from different platforms and setups and opensup the possibility of cross-laboratory collation of data sets. Thecombination of a dynamic programming algorithm and a multipassrefinement of both elution time and mass calibration curves hasprovided us with a robust solution with little need for manualintervention over thousands of data sets we have processed onour analytical pipeline implemented in PRISM.31
ACKNOWLEDGMENTWe thank Nikola Tolic and Lars Kangas for the original linear
alignment algorithm. Angela Norbeck and Samuel Purvine are
acknowledged for discussions related to the MS analyses. We alsothank Dr. Feng Yang for LC-MS data involving data-directedanalysis of phosphopeptides, and Dr. Aleksey Tolmachev fordiscussions related to mass measurement drift. Portions of thiswork were supported by the NIH National Center for ResearchResources (RR18522), National Institute of Allergy and InfectiousDiseases (NIH/DHHS through interagency agreement Y1-AI-4894-01), NIDA grant 1P30DA01562501, and the Genomes:GtL Pro-gram, Office of Biological and Environmental Research, U.S.Department of Energy (DOE). Work was performed in theEnvironmental Molecular Sciences Laboratory, a DOE nationalscientific user facility at the Pacific Northwest National Laboratory(PNNL) in Richland, WA. PNNL is a multiprogram nationallaboratory operated by Battelle for the DOE under Contract DE-AC05-76RL01830.
SUPPORTING INFORMATION AVAILABLEAdditional information as noted in text. This material is
available free of charge via the Internet at http://pubs.acs.org.
Received for review December 12, 2005. Accepted August7, 2006.
AC052197P
(31) Kiebel, G. R.; Auberry, K. J.; Jaitly, N.; Clark, D. A.; Monroe, M. E.; Peterson,E. S.; Tolic, N.; Anderson, G. A.; Smith, R. D. Proteomics 2006, 6, 1783-1790.
Analytical Chemistry, Vol. 78, No. 21, November 1, 2006 7409