automated reprocessing pipeline for searching heterogeneous mass spectrometric data of the hupo...
TRANSCRIPT

RESEARCH ARTICLE
Automated reprocessing pipeline for searching
heterogeneous mass spectrometric data of the HUPO
Brain Proteome Project pilot phase
Christian Stephan1, Kai A. Reidegeld1, Michael Hamacher1, André van Hall1,Katrin Marcus1, Chris Taylor2, Philip Jones2, Michael Müller2, Rolf Apweiler2,Lennart Martens3, Gerhard Körting4, Daniel C. Chamrad4, Herbert Thiele5,Martin Blüggel4, David Parkinson6, Pierre-Alain Binz7, 8, Andrew Lyall9
and Helmut E. Meyer1
1 Medizinisches Proteom-Center, Ruhr-Universität Bochum, Bochum, Germany2 European Bioinformatics Institute, Hinxton, UK3 Department of Biochemistry, Faculty of Medicine and Health Sciences, Ghent University, Ghent, Belgium4 Protagen AG, Dortmund, Germany5 Bruker Daltonik GmbH, Bremen, Germany6 Biomedical Research Centre, Sheffield Hallam University, Sheffield, UK7 GeneBio, Geneva, Switzerland8 Swiss Institute of Bioinformatics, Geneva, Switzerland9 SurGen, The Royal College of Surgeons in Ireland, Dublin, Ireland
The newly available techniques for sensitive proteome analysis and the resulting amount of datarequire a new bioinformatics focus on automatic methods for spectrum reprocessing and pep-tide/protein validation. Manual validation of results in such studies is not feasible and objectiveenough for quality relevant interpretation. The necessity for tools enabling an automatic qualitycontrol is, therefore, important to produce reliable and comparable data in such big consortia asthe Human Proteome Organization Brain Proteome Project. Standards and well-defined pro-cessing pipelines are important for these consortia. We show a way for choosing the right data-base model, through collecting data, processing these with a decoy database and end up with aquality controlled protein list merged from several search engines, including a known false-positive rate.
Received: April 19, 2006Revised: June 21, 2006
Accepted: June 22, 2006
Keywords:
Composite decoy database / Data analysis / Database / High throughput / Proteinidentification
Proteomics 2006, 6, 5015–5029 5015
1 Introduction
In advanced proteomics research, the inconsiderate use ofmass spectra and search engines is insufficient for produc-ing reliable and quantitatively correct results. Many researchgroups underestimate the role of the bioinformatics in inter-preting these data. Indeed, the heterogeneity, the amount ofspectra and the results obtained are all enormous.
Correspondence: Dr. Christian Stephan, Medizinisches Proteom-Center, Ruhr-Universität Bochum, ZKF E.143, Universitätsstrasse150, 44801 Bochum, GermanyE-mail: [email protected]: 149-234-321-4554
Abbreviations: DCC, data collection center; FPR, false-positiverate; HUPO BPP, Human Proteome Organization Brain ProteomeProject; IPI, International Protein Index
DOI 10.1002/pmic.200600294
© 2006 WILEY-VCH Verlag GmbH & Co. KGaA, Weinheim www.proteomics-journal.com

5016 C. Stephan et al. Proteomics 2006, 6, 5015–5029
As the second big initiative of the Human ProteomeOrganization (HUPO) after the HUPO Plasma ProteomeProject, the Brain Proteome Project (BPP) had the chanceto learn from the bioinformatics pitfalls of combinedproteome analyses. The BPP is the initiative dedicated toinvestigating development and correlated diseases of thebrain. Two pilot studies have been performed aimingat the comparison of techniques, laboratories and ap-proaches. The main bioinformatics challenges were thedifferent techniques used within different groups, thedata storage concept and the different use of search pa-rameters for true positive proteins. The lack of standardsfor storing MS and MS/MS spectra as peak lists, are achallenge for common software solutions. First standardshave already been addressed by the HUPO ProteomicsStandards Initiative (HUPO PSI), but were not commonlyimplemented in most software tools previously. Thus, thebioinformatics group of the HUPO BPP have started withtheir work early in parallel with the first wet lab experi-ments and adapted the strategy for the ongoing experi-ments [1–4].
At the start of the bioinformatics work an anonymousquestionnaire was passed to the participating laboratoriesto determine the amount of data that would be generatedand to choose the right database concept. The ques-tionnaire indicated that the amount of data would be veryhigh and the used methods as well as search strategies ofthe participating labs would be very different. So the firstgoal has been to collect all the data in the so-called DataCollection Center (DCC) located at the MedizinischesProteom-Center (MPC) in Bochum.
Another main aspect was the unification of the resultsby elaborating a semi-automated data reprocessing inregard to the high amount of data as well as to define aknown false-positive rate (FPR) for the protein and tominimize false-positive hits [5, 6].
This publication shows the method adopted by theBioinformatics Committee to produce comparable andwell-defined results of different participating groups, anddescribes the technical features of our work as a proces-sing pipeline for similar projects.
Furthermore, the additional information concerningthis unified and central approach is addressed here andshows the necessity for big proteomics consortia.
2 Materials and methods
2.1 Experimental data
Datasets concerning the human and mouse samples wereused from nine submitting proteomics laboratories. Thedatasets originated from a diversity of techniques, meth-ods and data processing procedures.
2.2 Database (International Protein Index)
For the interpretation of the MS and MS/MS spectra, severalsearch engines were used with the International ProteinIndex (IPI) database, a non-redundant protein set that wasoriginally used in the primary analysis of the human genomesequence [7, 8]. The IPI databases (http://www.ebi.ac.uk/IPI/) of human and mouse in version 3.05 was used as acomposite decoy database generated with the Peakardt soft-ware (http://www.peakardt.org).
2.3 Composite decoy database generation
It is notoriously difficult to distinguish true positive proteinidentifications from false positives, the more since the pro-teins are essentially assembled from peptide identifications inwhich it is, in turn, problematic to separate all false-positiveidentifications. To solve this problem, we took the IPI databasev3.05 and shuffled each protein sequence. Doing so maintainsthe mass of the original protein as well as the amino acidcomposition. To be able to differentiate shuffled from originalsequences later on, the accession number of the shuffled pro-tein sequence was changed. We can now construct a proteindatabase that contains both target protein sequences from theoriginal sample-specific database and deliberately chosendecoy protein sequences. As explained above, those decoyproteins have some similarity to real proteins, which isimportant to be chosen by the search engine on the same sta-tistical basis. After a protein search against the decoy databasethe numbers of proteins identified from target and decoy pro-tein entries are counted and the FPR is determined.
We can now define the FPR of a protein search as thequotient of the number of shuffled proteins identified, andthe sum of original and shuffled proteins identified. Toassure a certain FPR for a particular experiment, e.g., 5%, wechose to order the identified proteins according to theiridentification score value and to take only those proteins ascorrectly identified where the accumulated FPR does notexceed the 5% mark.
Such composite decoy databases can be created using toolssuch as DBToolkit [9] and the Decoy Database Builder, the lat-ter being a part of the Peakardt software suite for proteomicsresearch (http://www.peakardt.org), which was used here.
2.4 Data Collection Center
2.4.1 ProteinScape™
The proteome bioinformatics platform ProteinScape™
(Buker Daltonik GmbH, Bremen, Germany and ProtagenAG, Dortmund, Germany) contains a relational databasesystem, which is embedded in a client-server architecturewith the user interface running in a web browser. All datathat are relevant for proteome studies are stored in a rela-tional form, including protein separation, acquired MS dataand corresponding sequence database search results. MS
© 2006 WILEY-VCH Verlag GmbH & Co. KGaA, Weinheim www.proteomics-journal.com

Proteomics 2006, 6, 5015–5029 Bioinformatics 5017
data formats of various vendors are supported. Besides datastorage, ProteinScape™ integrates extensive evaluation cap-abilities. ProteinScape™ features various analysis tools suchas automatic searching of large MS datasets with severaldatabase search engines, automatic calibration and contami-nant filtering of PMF data (ScoreBooster) [10], or protein listgeneration from MS/MS results of complex protein mixtures(ProteinExtractor). The whole central reprocessing of the MSand MS/MS data of all HUPO BPP participants was donewithin ProteinScape™.
2.4.2 ProteinExtractor
ProteinExtractor generates a protein list, which contains aminimal set of proteins with only those isoforms that can bedistinguished by MS/MS data. It has especially beendesigned to handle LC-MS/MS data from complex peptidemixtures. The algorithm is part of ProteinScape™. It uses aniterative approach: First, select the most likely protein candi-date (highest summed peptide score), write this protein intothe result list, then mark all spectra explainable by this pro-tein as ‘used’, then select the most probable next proteincandidate from the still unused spectra, and repeat this, untilall spectra are marked as ‘used’. The algorithm obeys rulesset by MS/MS experts for the proteins, which should appearin a minimal protein list.
2.5 Cluster solution and search engines
2.5.1 BioClust
In the data reprocessing of the HUPO DCC, a total of 33million MS/MS searches were done. To reduce processingtime, a 128 CPU cluster was used at the MPC. The clusterruns BioClust [11], a job distribution software written byBruker Daltonik GmbH (Bremen, Germany) and ProtagenAG (Dortmund, Germany). Clusters are usually either spe-cialized for a specific task only, or flexible systems capable ofintegrating many tasks, but the latter are often difficult toadministrate and use. BioClust uses a third way (“ServiceOriented Clustering”, SOC), which gives access to serviceswith a standardized interface, but that can be extended easily.Currently, SEQUEST [12, 13], MASCOT [14], ProteinSolver,Blast [15], and peakpicking algorithms are working undercontrol of BioClust.
2.5.2 Search engines
For MS spectra, MASCOT [14] and ProFound [16] were used.MASCOT was used in the same way and using version as forthe MS/MS spectra, and ProFound was used in version2002.03.01.
The search engines SEQUEST™ [12, 13], MASCOT andProteinSolver were used for analyzing the masses of MS/MSspectra correlated to the IPI protein sequence database ver-sion 3.05 for human or mouse (http://www.ebi.ac.uk/IPI/).
In case of SEQUEST™, the TurboSEQUEST v.27 wasused, MASCOT [14] was used in version 2.0.04 and Pro-teinSolver version 0.97. Free temporary MASCOT licensesare provided by Matrix Science (Boston, USA).
ProteinSolver (Bruker Daltonik and Protagen) is a novelalgorithm for identification of peptide MS/MS data bysequence database search, comparable to software tools suchas MASCOT or SEQUEST. Each peptide match is evaluatedby ProteinSolver using a significance analysis, which is cal-culated by intensity, mass accuracy and ion series type of thematching signals. The obtained significance score rangesfrom 0–100, where 100 means greatest significance.
The used search strategy for analyzing MS and MS/MSspectra has been described in detail by the “HUPO BPP DCCReprocessing Guideline” (see Appendix A).
2.6 Search strategies and parameters
See Appendix A: “HUPO BPP DCC Reprocessing Guideline”.
3 Results and discussion
3.1 Calculating the expected amount of data
In the first phase of the project, the bioinformatics commit-tee tried to estimate the diversity of the techniques thatwould be applied and the total amount of data that would begenerated. For this purpose a questionnaire was developedconcerning the used techniques, mass spectrometers and theexpected amount of spectra generated. The result of thisquestionnaire predicted many different techniques andabout 550 gel images, with 240 000 spot/band/fractions, 1.3million MS spectra and , 26 million MS/MS spectra.
To collect this high amount of MS data and to be able tostore all this heterogeneous information, the bioinformaticscommittee decided to use the proven ProteinScape™ softwareat the central DCC at Bochum.
3.2 Establishing a consortium-wide data collection
platform
Every participating laboratory could obtain a free softwarelicense for ProteinScape™ provided by Bruker DaltonikGmbH. The concept for this client server structure is shownin Fig. 1. Generated data are stored at a local database centerand can later be exported by a newly implemented import/export tool that copies the Brain Proteome Project relevantdata into a new SQL database. This database is subsequentlycompressed into 640 MB parts and can be downloadedinteractively by a specially designed webpage from the Pro-teinScape™ server to burn them on a CD or to transfer thesefiles by FTP to the DCC. At the DCC, these datasets areimported by the corresponding import tool. During this stepall datasets are anonymized and are solely labeled by aunique identifier for every laboratory.
© 2006 WILEY-VCH Verlag GmbH & Co. KGaA, Weinheim www.proteomics-journal.com

5018 C. Stephan et al. Proteomics 2006, 6, 5015–5029
Figure 1. The client-server architecture for collecting data withinthe HUPO BPP pilot phase using ProteinScape™ as DCC and LocalDatabase Center (LDBC). The Data Producers (DP) use their nor-mal PC to connect to both the LDBC and the DCC.
At the data submission deadline (31 March 2005), nineparticipating laboratories had been submitted datasets to theDCC. The total number of spectra amounted to 1350(,0.2%) MS and 740 066 (,99.8%) MS/MS spectra. Thedistribution in regard to the distinct participating labora-tories is shown in Fig. 2A. Four out of nine laboratories sent
Figure 2. (A) Contributions of the participating laboratories to thetotal number of spectra submitted (741,416). (B) Spectra dis-tribution from all participating laboratories according to the twospecies analyzed.
in 99% of the mass spectra. This does not necessarily reflectthe work done within the project however, because some ofthe groups focused on differentially expressed proteins basedon 2-D gel data prior to MS, while other groups used moregeneral approaches to analyze as many proteins as possible.
The distribution in regard to species shows a preferentialanalysis of the human samples (more than 80% of the data)as compared to the mouse samples (less than 20%) (Fig. 2B).A look at the techniques used shows that ,40% of spectraare based on 1-D gel, ,28% are based on 2-D gel and ,32%of spectra are based on 2-D LC approaches (Fig. 3A).
3.3 Establishing a central reprocessing pipeline
In summary, over 37 different datasets were submitted to theDCC resulting from 1692 separations (band/spot/fraction).The results of the participating laboratories were analyzed bydifferent search engines, databases and validation criteria bythe different users. In some cases not all spectra have beenanalyzed, but just submitted to the DCC (see also Reidegeldet al. in this issue). Therefore, a central reprocessing of thespectra was necessary to compare the results betweenlaboratories. To enhance the results, four search engineswere used for generating the protein list. For MS spectra,ProFound and MASCOT had been used, for MS/MS spectra,MASCOT, SEQUEST and ProteinSolver had been used intheir analysis.
However, to automate the searches and the validation ofidentified proteins a detailed data reprocessing guideline waselaborated for all different technical requirements (seeAppendix A). The first decision was to use the IPI databasesfor human and mouse, respectively [7, 8]. The database ver-sion v3.05 was frozen to allow data comparison with latersubmissions of laboratories. Both human and mouse data-bases were used as a composite decoy database [5, 6], thismeans that the databases were enlarged by a shuffled decoypart of themselves.
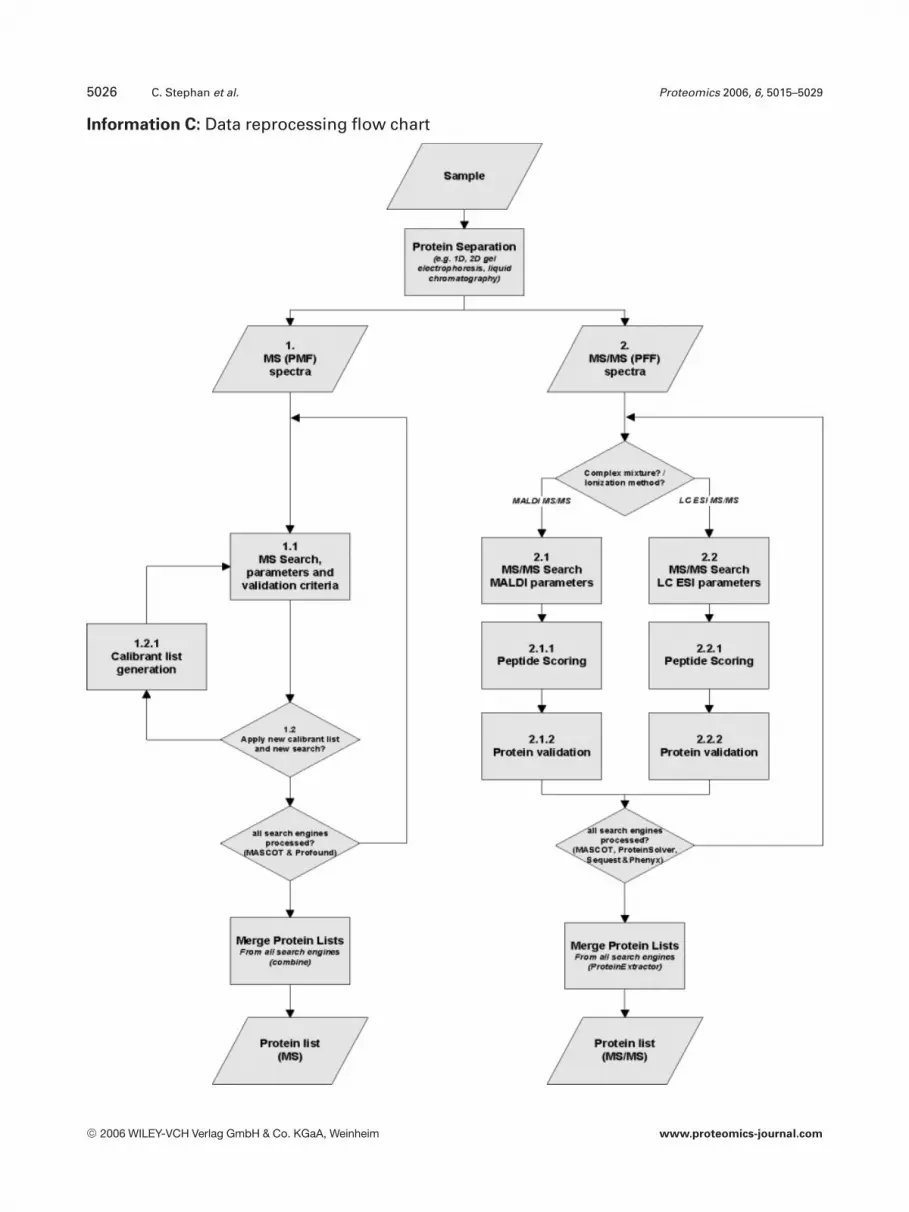
To find the best search strategies for MS and MS/MSspectra, two different approaches were elaborated separately.Figure 4 shows the strategy for the MS-based researchapproaches. The MS spectra were sent to MASCOT and
Figure 3. The distribution of MS/MS spectra according to thetechniques used shows predominantly gel-based approacheswithin the pilot phase of the HUPO BPP.
© 2006 WILEY-VCH Verlag GmbH & Co. KGaA, Weinheim www.proteomics-journal.com

Proteomics 2006, 6, 5015–5029 Bioinformatics 5019
Figure 4. The approach for analyzing MS data based on twosearch engines, ProFound and MASCOT, as used for analyzingthe MS spectra. The results were merged into one list andcoupled into a Metascore. All proteins identified with a Meta-score of 90 and higher were considered identified.
ProFound as described in the data reprocessing guideline.The Metascore and the Scorebooster were used as describedby Chamrad et al. [10]. All protein results with a Metascorehigher than 90 were assigned as identified.
The strategy for analyzing MS/MS spectra was slightlydifferent from the MS-based approach (Fig. 5), as no Meta-score or Scorebooster are available for analyzing the MS/MSdata. The spectra from the distinct separation types (spot/band/fraction) were sent separately to MASCOT, Pro-teinSolver and SEQUEST. The results of the searches weretaken as a peptide assignment to the spectra with the corre-sponding score and were stored in ProteinScape™. The nextstep was the use of the ProteinExtractor algorithm, whichassembles the proteins according to the discovered peptides.To estimate the best peptide threshold score for generatingthe pool of peptides that will be used for assembly of theproteins, the search parameters were evaluated for eachsearch engine prior to their use for the automated approach.This enhances the maximum of identified proteins by adefined FPR of 5%. The evaluation of parameters were cal-culated by analyzing a subset of 12 000 spectra from aThermo Finnigan LCQ mass spectra instrument and also ofapproximately 60 000 spectra from a Thermo Finnigan LTQwithout FT. Figure 6 shows the evaluation as an example for
the MASCOT search. The maximum number of proteinsusing a defined FPR of 5% in case of MASCOT can be foundusing a minimal peptide score of 22.5. A higher score wouldbe too stringent, resulting in too many false-negative proteinidentifications. On the other hand if the peptide thresholdscore were set too low, the level of 5% FPR would be reachedearlier, because numerous low scoring peptides would beaccumulated. Interestingly, the optimal minimum peptidescore changes with the number of spectra and the massspectrometer employed. This is probably due to the differentmass accuracies of the different mass spectrometers, butcertainly other parameters are also involved. The scores inTable 1 define the compromise between the evaluated 12 000spectra derived from the LCQ and the 60 000 spectra origi-nating from the LTQ for each search engine. The protein listsof each search engine have been sorted by the sum of thepeptide scores. If one peptide is identified several times(according to different spectra, charge state or modification)only the one with the highest score is used. The proteinswere marked as identified from the top until the ratio offalse-positive identified proteins exceeded 5% (false-positiveprotein hits can be recognized by their decoy accessionnumber).
In the next step, the three different protein lists accord-ing to the search engines were merged into one list using theProteinExtractor again. In this approach, the number ofmatched peptides for the identified proteins in any of thesearch engines was used rather than the sum of the peptidescores. The resulting merged protein list was sorted by thesum of the individual sum scores of the algorithms, andproteins were marked as identified until the list contains 5%of the decoy proteins. Only 0–3% of peptides corresponded toa decoy entry on the peptide level in a list containing lessthan 5% false-positive proteins.
The searches were additionally constrained by the exclu-sion of proteins with a mass above 250 kDa, because it is thehighest logical protein mass in most of the 2-D gels. Forcomparisons between the data resulting from different
Figure 5. The approach for analyzing MS/MS spectra was slightly different from the approach used for the MS spectra. All spectra weresearched with three search engines and the resulting peptides were considered by the ProteinScape™ algorithm ProteinExtractor toassemble protein lists. These per-search engine lists were again submitted to a modified ProteinExtractor to merge the protein lists basedon the peptide count of the identified proteins. The three protein lists and the merged protein list were cut off at an FPR of 5% on the proteinlevel. The searches with Phenyx will be integrated soon.
© 2006 WILEY-VCH Verlag GmbH & Co. KGaA, Weinheim www.proteomics-journal.com

5020 C. Stephan et al. Proteomics 2006, 6, 5015–5029
Figure 6. The diagram shows the number of proteins assembledby the ProteinExtractor algorithm depending on the MASCOTscore. The black line shows the number of proteins with the cut-off at 5% FPR on the protein level. The dashed line is the totalamount of proteins using the ProteinExtractor at the same scorewithout any cut-off.
Table 1. Parameter set for using the ProteinExtractor in assem-bling the protein lists
MASCOT SEQUEST ProteinSolver
Min. peptide score for calculation 22.5 4.0 7.5Min. peptide score for display 22.5 4.0 7.5Min. peptides per protein 2 2 2Min. protein score 0 0 0Max. number of proteins displayed 3000 3000 3000Remove redundancies Yes Yes Yes
separation techniques, this parameter was used for all sear-ches. This constraint also applied to the resulting decoy pro-tein entries, because many low-scoring spectra matching to avery large decoy protein would accumulate together to a highranking protein entry in the result list. This would thenincrease the total number of false-positive proteins. Finally,the resulting protein lists were reduced by leaving out thetrypsin and keratin entries. The problem here is to differ-entiate between natural, intrinsic trypsin and keratin andthose artificial identifications, which are based on con-taminations resulting from sample processing.
The 37 reprocessed datasets amounted to a total of 5470proteins; 1468 proteins were identified from the mouse sam-ples, and 4002 proteins from the human samples. These areredundant protein lists with 753 human entries and 289 mouseproteins belonging to two or more identifications. The humannon-redundant protein list based on different IPI accessionnumbers contains 1832 protein entries and the mouse non-redundant list includes 792 protein entries (Fig. 7A, B). How-ever, 1079 of 1832 human proteins, and 503 of 792 mouse pro-teins, had been identified by one laboratory only.
Figure 7. (A) Human proteins that have been identified severaltimes; 753 non-redundant proteins have been discovered two ormore times, but 1079 have been found only once. (B) 289 mouseproteins have been identified two or more times and 503 proteinsonly once.
Looking at the resulting protein lists and focusing on thedifferent number of proteins identified for each searchengine, a higher identification rate is observed for the Pro-teinSolver algorithm. Of the 5470 protein identifications(mouse and human together), 4961 protein entries had beendiscovered with ProteinSolver, 4793 with MASCOT and 3945with SEQUEST. This is the reason why in the central repro-cessing three different search engines were used. The sameanalyzed spectra result partially in different proteins. Theoverlap is 80–90% [6] but 10–20% more proteins can befound with this approach.
A closer look to the different identified number of pro-teins shows that the mass tolerance interpretation is differ-ent for ProteinSolver and MASCOT/SEQUEST. Figure 8A, Bshows the differences of the mass accuracy interpretation ofProteinSolver and MASCOT/SEQUEST concerning the MS/MS spectra from all participating labs. Most of the searcheshave been done with a mass tolerance of 1.5 so in case ofMASCOT and SEQUEST nearly 23% of the parent massescomparing to the interpretation of ProteinSolver were not
© 2006 WILEY-VCH Verlag GmbH & Co. KGaA, Weinheim www.proteomics-journal.com

Proteomics 2006, 6, 5015–5029 Bioinformatics 5021
Figure 8. (A) Mass tolerance interpretation of all MS/MS spectrausing ProteinSolver. (B) Mass tolerance interpretation of all MS/MS spectra using MASCOT and SEQUEST.
used for identifying spectra. This is the reason why the Pro-teinSolver identifies more proteins than the other searchengines. To compare the search engines, we used severaldatasets from one participating laboratory where the massaccuracy interpretation of ProteinSolver and MASCOT/SEQUEST resulted in the same amount of used parent mas-ses. In this case, the highest number of proteins was foundby MASCOT (877 proteins = 100%) and 97% of them wherealso found with ProteinSolver. Only 77.3% of these proteinswere also found with SEQUEST.
Nevertheless, the mass accuracy of the collected MS/MSspectra are suboptimal, as there are two peaks right and leftof the best mass accuracy of zero. The right peak is based onthe spectra from one laboratory and shows a suboptimalmass accuracy shifted 1.5 Da to the positive side. The otherpeak, shifted 0.5 to the negative, is based on the other MS/MS spectra (Fig. 9A, B). Still, using a mass accuracy of 1.5 Dafor MASCOT and SEQUEST, the community of the HUPOBPP lost 23% of the information. The mass tolerance pa-rameter of 1.5 Da was set after a community-wide discussionand shows the overestimated mass accuracy of the labora-tories instruments.
Figure 9. (A) Mass accuracy interpretation of MASCOT andSEQUEST concerning the MS/MS spectra from all participatinglaboratories except one distinct laboratory. (B) Mass accuracyinterpretation of MASCOT and SEQUEST concerning the MS/MSspectra from this distinct laboratory.
4 Concluding remarks and outlook
4.1 Conclusions
To determine an appropriate strategy and the right parame-ters, as well as to test the whole approach, over 30 millionMS/MS searches were performed in several repeats. Thanksto the knowledge gathered throughout the pilot projects, it isnow possible to analyze the whole dataset within 2 weekswith the three different search engines as discussed here.The resulting protein lists are well defined with an FPRsmaller than 5%. This automated processing approach is afast and objective way to determine true positive proteins,while keeping the advantages of one shared search protocolfor all submitted data. The objective results of this standard-ized reprocessing allow a comparison of the heterogeneousdatasets submitted by several groups (see Hamacher et al.and Martens et al. in this issue). As such, the HUPO BPPdata reprocessing constitutes a sophisticated approach whichtries to define stringent criteria for data integration and sub-sequent protein identification.
© 2006 WILEY-VCH Verlag GmbH & Co. KGaA, Weinheim www.proteomics-journal.com

5022 C. Stephan et al. Proteomics 2006, 6, 5015–5029
The central repository (DCC) allows a long-term stand-ardized storage of data and offers the possibility to collectfurther community-wide data later on, as well as to send thereprocessing results back to the participating labs by meansof the ProteinScape™ import/export tools. With Protein-Scape™, we had the possibility to import nearly all kinds ofcontributed data as well as to seamlessly integrate ourdefined workflow for the analysis of large datasets.
4.2 Outlook
The collected data and the centrally reprocessed informationare now freely accessible to all participating laboratories, butin the near future the data will be exported in a standardizedmzData and analysisXML format with the right ontology. Itis aimed to bring the results of this pilot phase to the PRIDEdatabase [17, 18] at the European Bioinformatics Institute.This will bring access to the HUPO BPP data to the wholescientific community. The estimation of an FPR will becomemandatory in the near future for the publishing of results injournals; also the deposition of the spectra and correspond-ing results in a public, standardized data repository likePRIDE will become compulsory for publications [19, 20].
More extensive analysis work will be done. Additionaldatasets arrived at the DCC after the submission deadlineand will be processed according to the described pipeline.Phenyx (licenses provided by Genebio, Geneva, Switzerland)will be used in the actual version to analyze the new as wellas the original submitted data (results will be publishedelsewhere). Additionally, all spectra were exported from Pro-teinScape™ as peak lists and were sent to other bioinfor-matics groups (Steve Stein, Mass Spectrometry Data CenterPhysical and Chemical Properties, Division NIST, Gaithers-burg, USA, and Eugene Kapp, Joint Proteomics Laboratory,Ludwig Institute for Cancer Research, Royal MelbourneHospital, Australia) to analyze the data with their own searchparameters (results will be published elsewhere).
The HUPO BPP will step now into the main phase toaddress neurodegenerative diseases in the human brain. Thestrategy and capacity for storing data in large consortia likethe Brain Proteome Project is now proven and established.The processing pipeline is defined and the approach to eval-uate biological markers is ready to use.
Coordination of the HUPO BPP is supported by the GermanMinistry for Education and Research with grants 0313318B and01GR0440. Lennart Martens would like to thank Prof. Kris
Gevaert and Prof. Joël Vandekerckhove for their support. L.M. is aResearch Assistant of the Fund for Scientific Research-Flanders(Belgium) (F.W.O. Vlaanderen).
5 References
[1] Blüggel, M., Bailey, S., Korting, G., Stephan, C. et al., Prote-omics 2004, 4, 2361–2362.
[2] Stephan, C., Reidegeld, K., Meyer, H. E., Hamacher, M., Pro-teomics 2005, 5, 2716–2717.
[3] Stephan, C., Hamacher, M., Bluggel, M., Korting, G. et al.,Proteomics 2005, 5, 3560–3562.
[4] Reidegeld, K. A., Blüggel, M., Körting, G., Chamrad, D. et al.,Eur. Pharm. Rev. 2006, 11, 33–38.
[5] Higdon, R., Hogan, J. M., Van Belle, G., Kolker, E., OMICS2005, 9, 364–79.
[6] Elias, J. E., Haas, W., Faherty, B. K., Gygi, S. P., Nat. Methods2005, 2, 667–675.
[7] The Genome International Sequencing Consortium, Nature2001, 409, 860–921.
[8] Kersey, P. J., Duarte, J., Williams, A., Karavidopoulou, Y. etal., Proteomics 2004, 4, 1985–1988.
[9] Martens, L., Vandekerckhove, J., Gevaert, K., Bioinformatics2005, 21, 3584–3585.
[10] Chamrad, D. C., Koerting, G., Gobom, J., Thiele, H. et al.,Anal. Bioanal. Chem. 2003, 376, 1014–22.
[11] Yates, J. R. III, Eng, J., McCormack, A. L., Schieltz, D., Anal.Chem. 1995, 67, 1426–1436.
[12] Reinhardt, R., Blüggel, M., Stephan, C., Meyer, H. E. et al., it –Information Technology 2005, 47, 343–351.
[13] Eng, J., McCormack, A.L., Yates, J. R. III, J. Am. Soc. MassSpectrom. 1994, 5, 976–989.
[14] Perkins, D. N., Pappin, D. J., Creasy, D. M., Cottrell, J. S.,Electrophoresis 1999, 18, 3551–3667.
[15] Altschul, S. F., Gish, W., Miller, W., Myers, E. W., Lipman, D.J., J. Mol. Biol. 1990, 215, 403–410.
[16] Zhang, W., Chait, B. T., Anal. Chem. 2000, 72, 2482–2489.
[17] Martens, L., Hermjakob, H., Jones, P., Adamski, M. et al.,Proteomics 2005, 5, 3537–3545.
[18] Jones, P., Cote, R. G., Martens, L., Quinn, A. F. et al., NucleicAcids Res. 2006, 34, 659–663.
[19] Wilkins, M. R., Appel, R. D., Van Eyk, J. E., Chung, M. C. et al.,Proteomics 2006, 6, 4–8.
[20] Carr, S., Aebersold, R., Baldwin, M., Burlingame, A. et al.,Mol. Cell. Proteomics 2004, 3, 531–533.
© 2006 WILEY-VCH Verlag GmbH & Co. KGaA, Weinheim www.proteomics-journal.com

Proteomics 2006, 6, 5015–5029 Bioinformatics 5023
Appendix A:
HUPO BPP DCC reprocessing guideline
Table of contents:
1 Processing parameters for MS (PMF) spectra1.1 MS search, parameters and validation criteria1.2 Apply new calibrant list and new search?1.2.1 Calibrant list generation2 Processing parameters for MS/MS (PFF) spectra2.1 MS/MS search, MALDI parameters2.1.1 Peptide scoring2.1.2 Protein validation2.2 MS/MS search, LC ESI parameters2.2.1 Peptide Scoring2.2.2 Protein validation
Information A:SEQUESTMetaScoreInformation B:Search parameter for different mass spectrometersInformation C:Flow chart of data reprocessingInformation D:Determining false positive rate and protein assignment by acomposite decoy protein database
1 Processing parameters for MS (PMF) spectra
1.1 MS Search, parameters and validation criteria
Search parameters:(i) search engines: MASCOT, ProFound,(ii) variable modifications: oxidation (methionine)(iii) fixed modifications: carbamidomethyl (cysteine) for IPGgels; propionamide (cysteine) for Klose and 1-D gels(iv) cleavage enzyme: Trypsin (*KR)(v) max missed cleavages: 1(vi) mass type: mono(vii) mass tolerance: 0.5 Da(viii) database: IPI.Decoy[mouse, human].shuffle, depend-ing on sample organism(ix) taxonomy: all taxa(x) molecular mass range:0.0–250.0 kDa (ProFound search algorithm)0.0, i.e., infinite (MASCOT search algorithm)(xi) pI range: 0.0–14.0
Spectra calibration with Scorebooster:(i) calibrant list: default list of ProteinScape™ (see AddendumA Section 1.2.1)(ii) calibration: yes(iii) incl. masses explained by identified protein: noRemoved masses:(v) automatic: yes(vi) known calibrants from list: yes(vii) suspected calibrants from list: yes(viii) polymers: yes(ix) explained by identified protein: no
Validation criteriaTo evaluate the search results for MS spectra the establishedprotein identification scoring system called “Metascore” isused. The best result with a Metascore higher than 90 will beset as identified [10].
1.2 Apply new calibrant list and new search?
To increase the identification rate of a sample or gel, it isuseful to repeat searches with iterative generated calibrantlists [10]. The first protein search is performed with thedefault calibration list of ProteinScape™, two additionalsearches are performed with iterative calibration lists if thecriteria in Addendum A Section 1.2.1 are fulfilled. Thesearch method parameters are the same as described inAddendum A Section 1.1.
1.2.1 Calibrant list generation
The parameter for the generation of the calibrant lists for theadditional searches are:(i) participant-related calibrant list(ii) calibration status: good, excellent(iii) mass has to be found in at least: 15% of selected spectraor minimum 10 spectra.
2 Processing parameters for MS/MS (PFF) spectra
For peptide identification the MS/MS spectra are analyzed inparallel by four different search engines to benefit from theparticular identification strengths of each search engines.MASCOT, ProteinSolver, SEQUEST and Phenyx searchengines are used. For ESI-MS/MS the identified peptide listsfrom each search engine are then combined by the ProteinExtractor algorithm of ProteinScape™.
2.1 MS/MS search, MALDI parameters
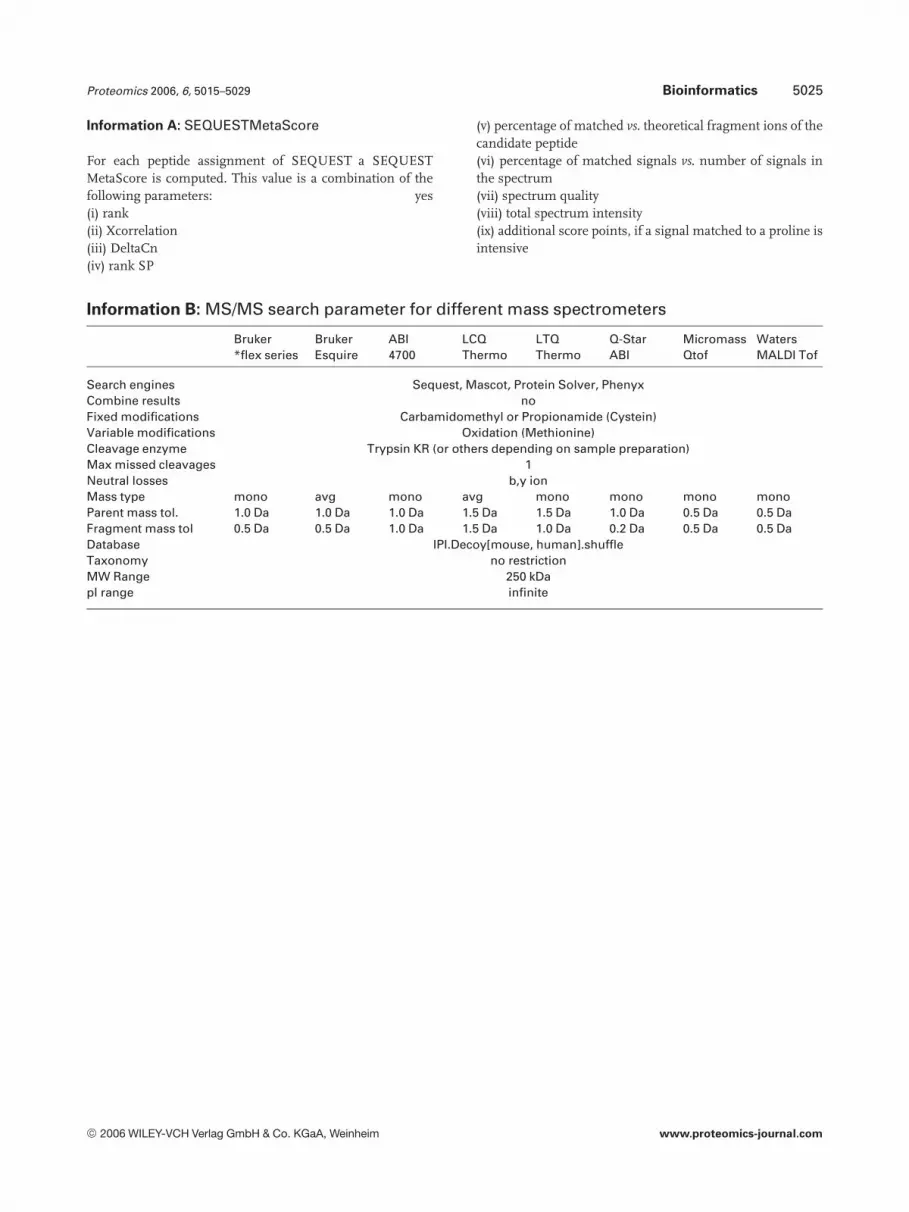
Search parameter for MALDI-TOF/TOF are mostly depend-ent on specifications of the different mass spectrometers andsample processing steps. In Information B a PFF search pa-rameter list for different mass spectrometers is shown.In contrast to LC ESI-MS/MS the ProteinExtractor is notused.
Search method:All searches with these engines are performed at once.Selected search engines:(i) ProteinSolver(ii) Phenyx(iii) SEQUEST(iv) MASCOTSearch parameters:(i) do not combine search results: do not choose(ii) combine results by search engine: do not choose(iii) prepare results for ProteinExtractor: yes
© 2006 WILEY-VCH Verlag GmbH & Co. KGaA, Weinheim www.proteomics-journal.com

5024 C. Stephan et al. Proteomics 2006, 6, 5015–5029
(iv) fixed modifications: carbamidomethyl (cysteine) for IPGgels; propionamide (cysteine) for Klose and 1-D gels or oth-ers depending on sample preparation(v) variable modifications: oxidation (methionine)(vi) cleavage enzyme: Trypsin (*KR) (or others depending onsample preparation)(vii) max missed cleavages: 1(viii) mass spectrometer: depending on used instrumentMasses:(i) peptide/fragment mass tolerance: Depending on instru-ment, see Information B(ii) search for SILE tags: no
ProteinExtractor method:None (processing will be started afterwards manually)
Database parameters:(i) database: IPI.Decoy[Human, Mouse].shuffle(ii) reading frame: none(iii) taxonomy: all taxa(iv) molecular mass range:0.0–250.0 kDa250 kDa (MASCOT)(v) pI range: 0.0–14.0(vi) protein name filter: -(vii) sequence tag: -
Evaluation of results:Result is assigned correct: no selection (will be processedafterwards manually)
2.1.1 Peptide scoring
For every peptide search result an individual score is com-puted. In case of SEQUEST a ProteinScape™ internal scorenamed SEQUESTMetaScore is used (see Information A).
2.1.2 Protein validation
Proteins are assigned correct if at least two different peptidesare identified significantly with a false-positive rate of max.5%, determined by the search in the shuffled decoy compo-site database.
2.2 MS/MS search, LC ESI parameters
Search parameters for LC ESI-MS/MS are mostly dependingon specifications of the different mass spectrometers andsample processing steps. In Information B a PFF search pa-rameter list for different mass spectrometers is shown.
Search parameters:(i) prepare results for ProteinExtractor: yes(ii) fixed modification: carbamidomethyl (cysteine) for IPGgels; propionamide (cysteine) for Klose and 1-D gels or oth-ers depending on sample preparation(iii) variable modifications: oxidation (methionine)
(iv) cleavage enzyme: Trypsin (*KR) (or others depending onsample preparation)(v) max. missed cleavages: 1(vi) mass spectrometer: depending on used instrument
Masses:(i) peptide/fragment mass tolerance: Depending on instru-ment, see Information B(ii) search for SILE tags: noProteinExtractor method:Depending on search engine, see Addendum A Section 2.2.1
Database parameters:(i) database: IPI.Decoy[Human, Mouse].shuffle(ii) reading frame: none(iii) taxonomy: all taxa(iv) molecular mass range:0.0–250.0 kDa250.0 kDa (MASCOT)(v) pI range: 0.0–14.0(vi) protein name filter: -(v) sequence tag: -
Evaluation of results:No automatic correct assignment, ProteinExtractor is usedmanual assignment of correct protein identification by theuse of the decoy composite database and different parallelsearch engines.
2.2.1 Peptide scoring
(see Addendum A Section 2.1.1 additionally)Peptides identified by a search engine are further pro-
cessed with ProteinExtractor if following criteria are met:(i) Mascot peptide score: .22.5(ii) SEQUEST peptide score: .4.0(iii) Phenyx peptide score: to be evaluated(iv) ProteinSolver peptide score: .7.5
2.2.2 Protein validation criteria
The peptide results for each search engine are merged byProteinExtractor to get reliable protein results:ProteinExtractor method:
Peptide filter:(i) protein score calculation: peptide score depending onsearch engine, (see Addendum A Section 2.1.1)(ii) protein display: same value as for “protein score calcula-tion”Extracted proteins:Min. number of peptides per protein: 2Min. protein score: 0Max. number of displayed proteins: 3,000Remove redundancies and proteinswhich cannot be distinguished: yes
© 2006 WILEY-VCH Verlag GmbH & Co. KGaA, Weinheim www.proteomics-journal.com
Proteomics 2006, 6, 5015–5029 Bioinformatics 5025
Information A: SEQUESTMetaScore
For each peptide assignment of SEQUEST a SEQUESTMetaScore is computed. This value is a combination of thefollowing parameters: yes(i) rank(ii) Xcorrelation(iii) DeltaCn(iv) rank SP
(v) percentage of matched vs. theoretical fragment ions of thecandidate peptide(vi) percentage of matched signals vs. number of signals inthe spectrum(vii) spectrum quality(viii) total spectrum intensity(ix) additional score points, if a signal matched to a proline isintensive
Information B: MS/MS search parameter for different mass spectrometers
Bruker*flex series
BrukerEsquire
ABI4700
LCQThermo
LTQThermo
Q-StarABI
MicromassQtof
WatersMALDI Tof
Search engines Sequest, Mascot, Protein Solver, PhenyxCombine results noFixed modifications Carbamidomethyl or Propionamide (Cystein)Variable modifications Oxidation (Methionine)Cleavage enzyme Trypsin KR (or others depending on sample preparation)Max missed cleavages 1Neutral losses b,y ionMass type mono avg mono avg mono mono mono monoParent mass tol. 1.0 Da 1.0 Da 1.0 Da 1.5 Da 1.5 Da 1.0 Da 0.5 Da 0.5 DaFragment mass tol 0.5 Da 0.5 Da 1.0 Da 1.5 Da 1.0 Da 0.2 Da 0.5 Da 0.5 DaDatabase IPI.Decoy[mouse, human].shuffleTaxonomy no restrictionMW Range 250 kDapI range infinite
© 2006 WILEY-VCH Verlag GmbH & Co. KGaA, Weinheim www.proteomics-journal.com
5026 C. Stephan et al. Proteomics 2006, 6, 5015–5029
Information C: Data reprocessing flow chart
© 2006 WILEY-VCH Verlag GmbH & Co. KGaA, Weinheim www.proteomics-journal.com
Proteomics 2006, 6, 5015–5029 Bioinformatics 5027
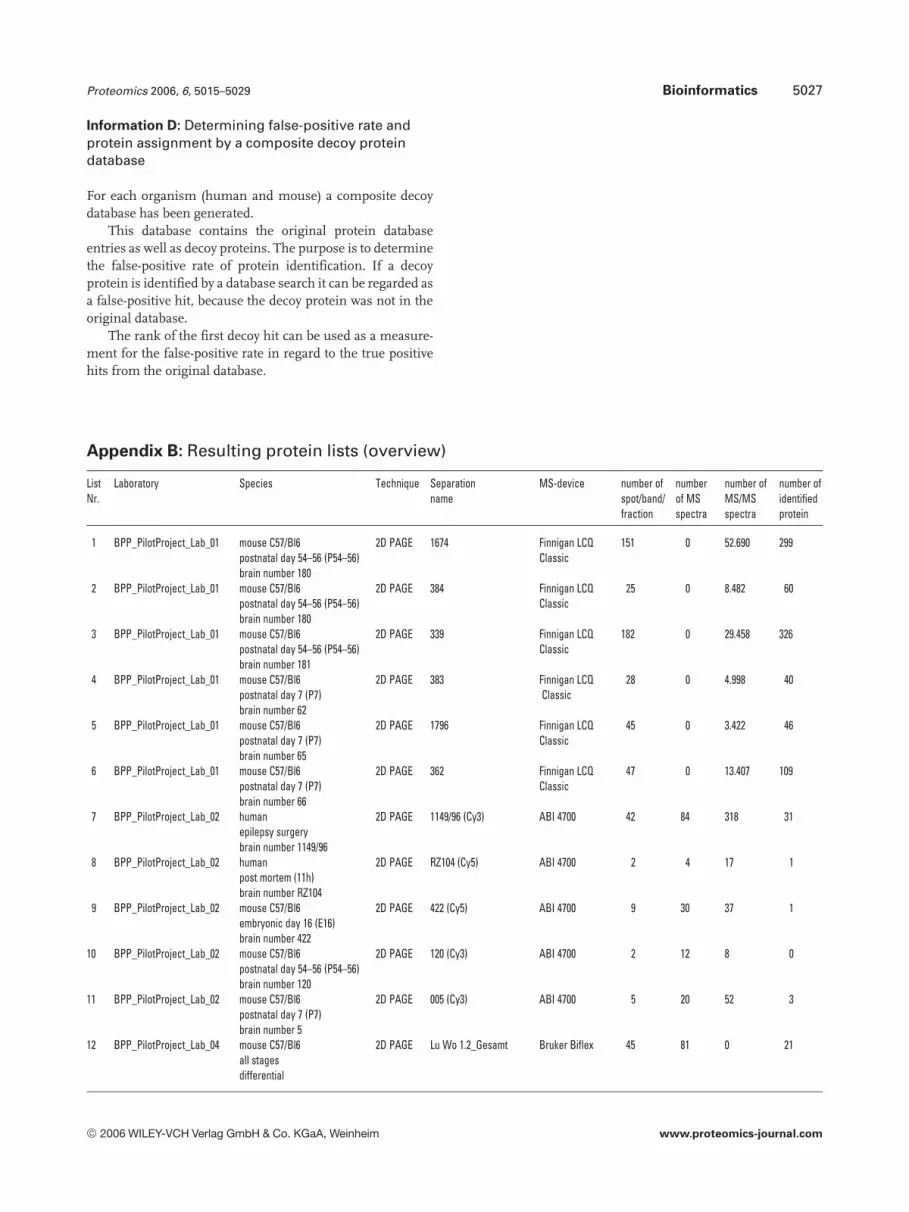
Information D: Determining false-positive rate andprotein assignment by a composite decoy proteindatabase
For each organism (human and mouse) a composite decoydatabase has been generated.
This database contains the original protein databaseentries as well as decoy proteins. The purpose is to determinethe false-positive rate of protein identification. If a decoyprotein is identified by a database search it can be regarded asa false-positive hit, because the decoy protein was not in theoriginal database.
The rank of the first decoy hit can be used as a measure-ment for the false-positive rate in regard to the true positivehits from the original database.
Appendix B: Resulting protein lists (overview)
ListNr.
Laboratory Species Technique Separationname
MS-device number ofspot/band/fraction
numberof MSspectra
number ofMS/MSspectra
number ofidentifiedprotein
1 BPP_PilotProject_Lab_01 mouse C57/Bl6postnatal day 54–56 (P54–56)brain number 180
2D PAGE 1674 Finnigan LCQClassic
151 0 52.690 299
2 BPP_PilotProject_Lab_01 mouse C57/Bl6postnatal day 54–56 (P54–56)brain number 180
2D PAGE 384 Finnigan LCQClassic
25 0 8.482 60
3 BPP_PilotProject_Lab_01 mouse C57/Bl6postnatal day 54–56 (P54–56)brain number 181
2D PAGE 339 Finnigan LCQClassic
182 0 29.458 326
4 BPP_PilotProject_Lab_01 mouse C57/Bl6postnatal day 7 (P7)brain number 62
2D PAGE 383 Finnigan LCQClassic
28 0 4.998 40
5 BPP_PilotProject_Lab_01 mouse C57/Bl6postnatal day 7 (P7)brain number 65
2D PAGE 1796 Finnigan LCQClassic
45 0 3.422 46
6 BPP_PilotProject_Lab_01 mouse C57/Bl6postnatal day 7 (P7)brain number 66
2D PAGE 362 Finnigan LCQClassic
47 0 13.407 109
7 BPP_PilotProject_Lab_02 humanepilepsy surgerybrain number 1149/96
2D PAGE 1149/96 (Cy3) ABI 4700 42 84 318 31
8 BPP_PilotProject_Lab_02 humanpost mortem (11h)brain number RZ104
2D PAGE RZ104 (Cy5) ABI 4700 2 4 17 1
9 BPP_PilotProject_Lab_02 mouse C57/Bl6embryonic day 16 (E16)brain number 422
2D PAGE 422 (Cy5) ABI 4700 9 30 37 1
10 BPP_PilotProject_Lab_02 mouse C57/Bl6postnatal day 54–56 (P54–56)brain number 120
2D PAGE 120 (Cy3) ABI 4700 2 12 8 0
11 BPP_PilotProject_Lab_02 mouse C57/Bl6postnatal day 7 (P7)brain number 5
2D PAGE 005 (Cy3) ABI 4700 5 20 52 3
12 BPP_PilotProject_Lab_04 mouse C57/Bl6all stagesdifferential
2D PAGE Lu Wo 1.2_Gesamt Bruker Biflex 45 81 0 21
© 2006 WILEY-VCH Verlag GmbH & Co. KGaA, Weinheim www.proteomics-journal.com

5028 C. Stephan et al. Proteomics 2006, 6, 5015–5029
Appendix B: Continued
ListNr.
Laboratory Species Technique Separationname
MS-device number ofspot/band/fraction
numberof MSspectra
number ofMS/MSspectra
number ofidentifiedprotein
13 BPP_PilotProject_Lab_06 mouse C57/Bl6all stagesdifferential
2D PAGE 04–359 ABI 4700 32 132 325 20
14 BPP_PilotProject_Lab_10 humanepilepsy surgeryvs. post mortem
2D-LC cICAT 2D-LC-MS-MS run
Finnigan LTQnon FT
1(6) 0 64.426 234
15 BPP_PilotProject_Lab_10 humanpost mortem (11h)brain number RZ104
2D PAGE 1149–96–7-RZ104pH 4–7 Overlay
ABI 4700 5 5 0 5
16 BPP_PilotProject_Lab_10 humanpost mortem (11h)brain number RZ104
2D-LC 2D-LC-MS/MS run v1 Finnigan LTQnon FT
1(6) 0 34.062 406
17 BPP_PilotProject_Lab_10 humanpost mortem (11h)brain number RZ104
2D-LC 2D-LC-MS/MS run v2 Finnigan LTQnon FT
1(6) 0 57.948 481
18 BPP_PilotProject_Lab_10 humanpost mortem (11h)brain number RZ104
2D PAGE RZ 104-(1) pH 3–10Sypro-Ruby
ABI 4700 66 66 619 72
19 BPP_PilotProject_Lab_10 identified spotsin DIGE-gel pH 4–7 overlaymouse
2D PAGE DIGE pH 4–7 Overlay ABI 4700 42 42 315 46
20 BPP_PilotProject_Lab_10 identified spotsin DIGE-gel pH 6–9 overlaymouse
2D PAGE DIGE pH 6–9 Overlay ABI 4700 31 31 218 38
21 BPP_PilotProject_Lab_10 identified spotsin mouse-gelpH 4–7 qualitative
2D PAGE Sypro Stain ABI 4700 48 55 587 48
22 BPP_PilotProject_Lab_10 mouse C57/Bl6postnatal day 7 (P7)brain number 81
2D-LC Qualitative 2D LC-MS Finnigan LTQnon FT
1(6) 0 17.431 253
23 BPP_PilotProject_Lab_10 mouse C57/Bl6postnatal day 7 (P7)brain number 81
2D-LC Qualitative 2DLC-MS run
Finnigan LTQnon FT
1(4) 0 7.117 152
24 BPP_PilotProject_Lab_11 mouse C57/Bl6postnatal day 54–56 (P54–56)brain number 225_2
2D PAGE Gel225_2 Bruker Ultraflex 5 5 28 3
25 BPP_PilotProject_Lab_11 mouse C57/Bl6postnatal day 7 (P7)brain number 315_2
2D PAGE Gel315_2 Bruker Ultraflex 5 10 22 3
26 BPP_PilotProject_Lab_12 humanepilepsy surgerybrain number 1149/96
2D PAGE 1149/96 200œg Finnigan LCQClassic
12 0 17.874 44
27 BPP_PilotProject_Lab_12 humanepilepsy surgerybrain number 1149/96
2D-LC 1149/96 2DLC Finnigan LCQClassic
1(46) 0 25.867 169
28 BPP_PilotProject_Lab_12 humanepilepsy surgerybrain number 1149/96
2D PAGE 1149/96 300 œg Finnigan LCQClassic
10 0 11.621 30
29 BPP_PilotProject_Lab_12 humanepilepsy surgerybrain number 1149/96
1D Page 1149/96 4œg 1DE Finnigan LCQClassic
1(12) 0 13.236 45
30 BPP_PilotProject_Lab_12 humanpost mortem (11h)brain number RZ104
2D PAGE RZ104 200 œg Finnigan LCQClassic
19 0 24.984 99
31 BPP_PilotProject_Lab_12 humanpost mortem (11h)brain number RZ104
2D-LC RZ104 2D-LC Finnigan LCQClassic
1(46) 0 19.815 118
© 2006 WILEY-VCH Verlag GmbH & Co. KGaA, Weinheim www.proteomics-journal.com

Proteomics 2006, 6, 5015–5029 Bioinformatics 5029
Appendix B: Continued
ListNr.
Laboratory Species Technique Separationname
MS-device number ofspot/band/fraction
numberof MSspectra
number ofMS/MSspectra
number ofidentifiedprotein
32 BPP_PilotProject_Lab_12 humanpost mortem (11h)brain number RZ104
2D PAGE RZ104 300 œg Finnigan LCQClassic
23 0 31.629 39
33 BPP_PilotProject_Lab_12 humanpost mortem (11h)brain number RZ104
1D Page RZ104 4œg 1DE Finnigan LCQClassic
1(11) 0 15.236 55
34 BPP_PilotProject_Lab_12 humanpost mortem (11h)brain number RZ104
2D-LC RZ104 gas phase Finnigan LCQClassic
1(6) 0 12.297 137
35 BPP_PilotProject_Lab_13 humanepilepsy surgerybrain number 1149/96 PE
1D Page 1DE_PE Finnigan LTQ FT 1(51) 0 220.466 1.235
36 BPP_PilotProject_Lab_13 humanepilepsy surgerybrain number 1149/96 S12
1D Page 1DE_S12 Finnigan LTQ FT 1(54) 0 50.333 480
37 BPP_PilotProject_Lab_14 humanpost mortem (11h)brain number RZ104
2D PAGE RZ104 human temporallobe auto
Bruker Ultraflex 557 773 721 321
sum 1.350 740.066 5.470
© 2006 WILEY-VCH Verlag GmbH & Co. KGaA, Weinheim www.proteomics-journal.com