advances in miniaturized uv-vis spectrometric systems
TRANSCRIPT
Trends in Analytical Chemistry, Vol. 30, No. 10, 2011 Trends
Advances in miniaturized UV-Visspectrometric systemsFrancisco Pena-Pereira, Isabel Costas-Mora, Vanesa Romero, Isela Lavilla,
Carlos Bendicho
UV-Vis spectrometry has become a widespread analytical technique due to its inherent features (e.g., simplicity, ease of oper-
ation, convenience and economy). The necessity to decrease the consumption of valuable and scarce samples, together with the
application of novel sample-retention technologies, the improvement of materials and the development of microfluidics, has
enabled development of a new generation of miniaturized UV-Vis spectrometric systems and accessories. This article surveys the
state of the art on microsample-quantitation systems in UV-Vis spectrometry.
ª 2011 Elsevier Ltd. All rights reserved.
Keywords: Drop-based system; Liquid-core waveguide; Microcell system; Microfluidics; Microsample quantitation; Micro-total analysis system;
Miniaturization; Sample retention; UV-Vis spectrometry; Variable path-length system
Francisco Pena-Pereira,
Isabel Costas-Mora,
Vanesa Romero,
Isela Lavilla,
Carlos Bendicho*
Departamento de Quımica
Analıtica y Alimentaria, Area de
Quımica Analıtica, Facultad de
Quımica, Universidad de Vigo,
Campus As Lagoas-Marcosende
s/n, 36310 Vigo, Spain
*Corresponding author.
Tel.: +34 986 812281;
Fax: +34 986 812556.;
E-mail: [email protected]
0165-9936/$ - see front matter ª 2011
1. Introduction
UV-Vis spectrometry is widely employedin different scientific areas all around theworld, especially in biochemistry andanalytical chemistry, due to its simplicity,flexibility, low cost and convenience.Hundreds of analytical methods con-cerning UV-Vis spectrometry can befound in the literature, including officialand standard methods of analysis. How-ever, the current necessity of reducingthe amounts of sample and/or reagentsneeded to perform an analytical mea-surement, especially when scarce samplesor toxic organic solvents are involved,has promoted the development of mic-rovolume UV-Vis spectrometric instru-mentation.
Miniaturization of detection, separationand sample preparation constitutes aclear trend in analytical chemistry. Inte-gration of different analytical steps, reli-ability, portability and ease of operationcan be considered the main factors to-wards the development of miniaturizedanalytical devices [1,2]. Also, miniaturi-zation in analytical chemistry is com-monly accompanied by low consumptionof sample and reagents, and so negligiblegeneration of wastes. Miniaturized ana-lytical systems that fulfill the latter can
Elsevier Ltd. All rights reserved. doi:10.1016/j.trac.2011.04.018
be ascribed to green analytical chemistry[3]. Advances in microvolume UV-Visspectrometry mainly derive from effortsto miniaturize the sample compartment,as described below. Nevertheless, itshould not be forgotten that thesedevelopments in microvolume quantita-tion have also been accompanied byimprovements in radiation sources anddetectors, and the extended use of fiberoptics.
In the literature, there are a few articlesdealing with the features of specific mic-rovolume UV-Vis spectrometric systems[4,5] or concerning strategies for theimprovement of sensitivity in UV-Visspectrometry [6]. However, none of themfocuses on miniaturization of UV-Visspectrometric systems or provides an up-dated description of the different possibili-ties in this field.
In the present work, we provide anoverview of the analytical tools developedfor microsample UV-Vis spectrometricquantitation. We emphasize miniaturiza-tion of analytical instrumentation andemployment of novel materials and sys-tems that allow replacement of standardcuvettes with the general purpose of pro-viding analytical characteristics with lLor nL sample consumption comparable toconventional analytical systems.
1637
Trends Trends in Analytical Chemistry, Vol. 30, No. 10, 2011
2. From conventional to microvolume UV-Visspectrometry
As mentioned above, conventional UV-Vis spectrometryhas been greatly employed for the analysis of a largevariety of samples, with several official and standardmethods of analysis involving determination of targetanalytes in samples including waters, foods, beveragesand pharmaceuticals. For such UV-Vis spectrometricanalysis, 10-mm optical path cuvettes are typically em-ployed as absorption cells, although cuvettes showinglarger (or shorter) optical path can be useful under cer-tain circumstances. However, these cuvettes suffer frompractical limitations, which may be significant foraccurate UV-Vis spectrometric analysis of scarcesamples. Thus, conventional cuvettes yield a relativelypoor path length (10 mm) for the large sample volumeneeded to perform UV-Vis spectrometric analysis(2–3 mL), bearing in mind that sensitivity is directlyproportional to the path length of the absorption cell inaccordance with the Lambert-Beer law. ‘‘Semi-micro’’cuvettes have also been employed for the analysis oflimited sample volumes, keeping a 10-mm path length butreducing the sample-volume requirements to 0.65 mL.The increase in the ratio of optical path length to samplevolume has been a way to achieve acceptable sensitivitywith reduced sample consumption. In this sense, U-cells[7], Z-cells [8], and bubble-shaped cells [9] have beendeveloped for UV-Vis spectrometric systems coupled withseparation techniques [e.g., liquid chromatography (LC)or capillary electrophoresis (CE)]. Also, capillary tubeswith wall transmission were proposed for near-infrared(NIR) spectroscopy measurements [10].
Further advances have been made towards improve-ment and miniaturization of UV-Vis spectrometry bymaking use of new materials and technologies that allowthe employment of microvolumes or nanovolumes ofsamples and/or organic solvents with sensitivity close tothat provided by conventional UV-Vis spectrometers, asdescribed below.
3. Microsample quantitation
One of the challenges in the development of miniaturizedanalytical devices is the miniaturization of detectors [1].As far as UV-Vis spectrometry is concerned, the decreasein the sample volume needed to carry out a singlemeasurement is the key to extending even more theapplicability of this widespread analytical technique. Inthis sense, different UV-Vis spectrometric systems andaccessories have been developed in recent years, andsome of them can currently be found in the market,including confined drop-based systems, liquid-corewaveguides (LCWs), microcells, UV-transmissive pipettetips and variable path-length systems. We describe each
1638 http://www.elsevier.com/locate/trac
of these commercial alternatives to conventional UV-Visspectrometric systems briefly below and summarize theircharacteristics of detection volume and path length inTable 1. Also, we describe other microvolume systems[e.g., drops and films that act as windowless optical cells,polymeric porous tubes, microfluidic systems and cavityring-down spectrometers (CRDSs)].
3.1. Confined drop-based systemsTwo different designs of confined drop-based UV-Visspectrometers have been sample-retention systems basedon surface tension and hydrophobicity, respectively.
The use of the surface tension of a low sample volumeto hold it in place between two planar surfaces wasproposed and patented by Robertson in 2003 [11]. Thissample-retention technology is employed in microvo-lume UV-Vis spectrometers marketed by Thermo FisherScientific (Nanodrop ND-1000, Nanodrop 2000, Nano-drop 2000C and Nanodrop 8000) [12]. These mic-rovolume UV-Vis spectrometers allow the spectrometricmeasurement of sample volumes of 0.5–2 lL in a fewseconds. In these systems, the lL sample volume isconfined by surface-tension forces in the optical path ofthe optical fibers embedded in stainless-steel surfacesdrawing up the sample-measurement column. The pathlength is mechanically controlled between the ends oftwo optical surfaces. This confined drop-based system isdepicted in Fig. 1A. Light from a xenon flash lamp passesthrough the sample by means of the above-mentionedoptical fiber and the intensity of the transmitted light ismeasured by means of a CCD detector.
Shimadzu has introduced a UV-Vis spectrometer,named BioSpec nano, based on the same sample-reten-tion system [13]. Furthermore, measurement andcleaning are conducted automatically with this instru-ment. However, the path length of this system dependson the sample volume, the optical path length of 0.7 mmbeing larger, as shown in Table 1.
A different system marketed by GE Healthcare asNanovue uses a hydrophobic sample-plate coating tohold a sample microdrop in place during the measure-ment cycle [14]. The sample is pipetted onto thehydrophobic surface and flattened by lowering thesampling head. A short path length (0.2 mm or 0.5 mm)is then automatically adjusted.
Both confined drop-based systems allow the analysisof microvolume samples in an easy way without theneed to use cuvettes or capillaries. Moreover, they offerquick and easy cleaning, so minimizing the risk ofcross-contamination. However, physical properties ofthe microvolume sample (e.g., boiling point and vaporpressure) should be taken into account when usingthese UV-Vis spectrometric systems, since the micro-drop is partly exposed to air during drop depositionand UV-Vis spectrometric measurement, so evaporationcould occur.
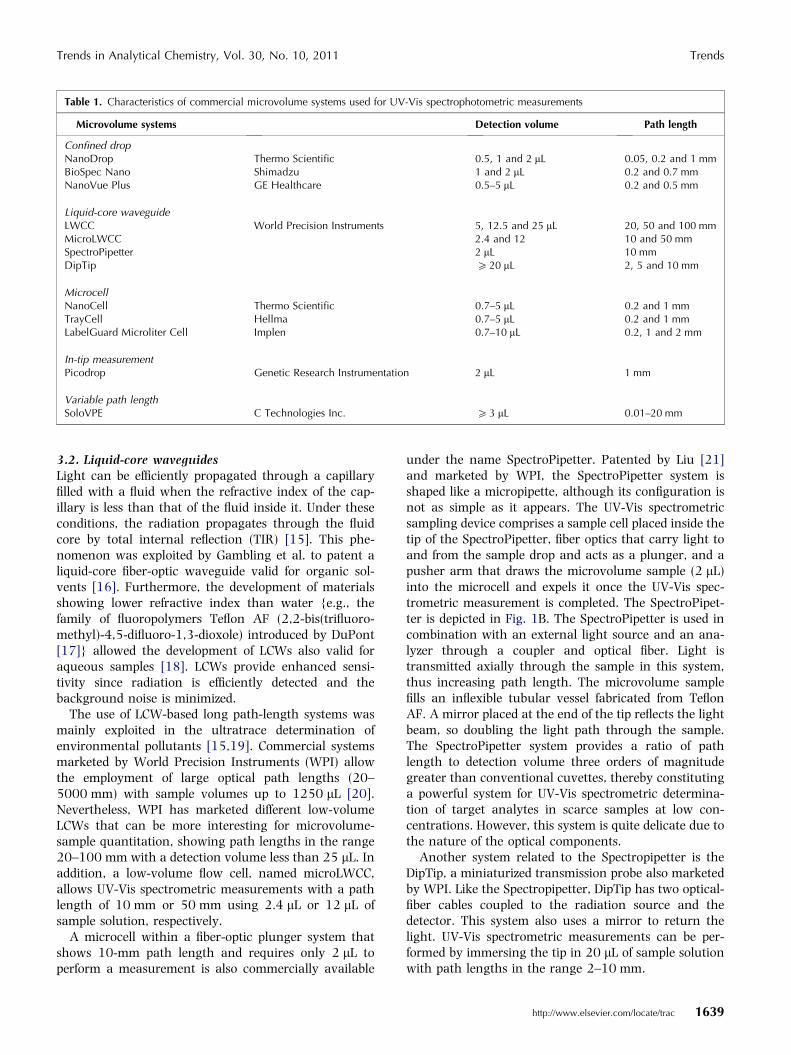
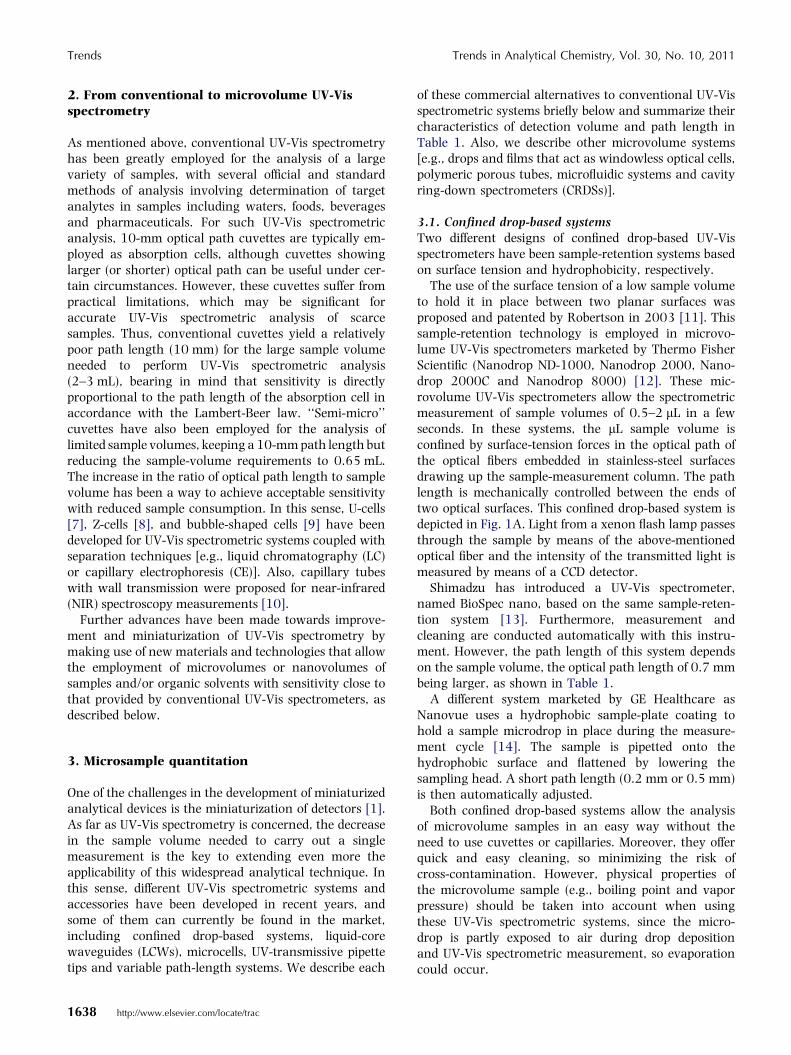
Table 1. Characteristics of commercial microvolume systems used for UV-Vis spectrophotometric measurements
Microvolume systems Detection volume Path length
Confined dropNanoDrop Thermo Scientific 0.5, 1 and 2 lL 0.05, 0.2 and 1 mmBioSpec Nano Shimadzu 1 and 2 lL 0.2 and 0.7 mmNanoVue Plus GE Healthcare 0.5–5 lL 0.2 and 0.5 mm
Liquid-core waveguideLWCC World Precision Instruments 5, 12.5 and 25 lL 20, 50 and 100 mmMicroLWCC 2.4 and 12 10 and 50 mmSpectroPipetter 2 lL 10 mmDipTip P 20 lL 2, 5 and 10 mm
MicrocellNanoCell Thermo Scientific 0.7–5 lL 0.2 and 1 mmTrayCell Hellma 0.7–5 lL 0.2 and 1 mmLabelGuard Microliter Cell Implen 0.7–10 lL 0.2, 1 and 2 mm
In-tip measurementPicodrop Genetic Research Instrumentation 2 lL 1 mm
Variable path lengthSoloVPE C Technologies Inc. P 3 lL 0.01–20 mm
Trends in Analytical Chemistry, Vol. 30, No. 10, 2011 Trends
3.2. Liquid-core waveguidesLight can be efficiently propagated through a capillaryfilled with a fluid when the refractive index of the cap-illary is less than that of the fluid inside it. Under theseconditions, the radiation propagates through the fluidcore by total internal reflection (TIR) [15]. This phe-nomenon was exploited by Gambling et al. to patent aliquid-core fiber-optic waveguide valid for organic sol-vents [16]. Furthermore, the development of materialsshowing lower refractive index than water {e.g., thefamily of fluoropolymers Teflon AF (2,2-bis(trifluoro-methyl)-4,5-difluoro-1,3-dioxole) introduced by DuPont[17]} allowed the development of LCWs also valid foraqueous samples [18]. LCWs provide enhanced sensi-tivity since radiation is efficiently detected and thebackground noise is minimized.
The use of LCW-based long path-length systems wasmainly exploited in the ultratrace determination ofenvironmental pollutants [15,19]. Commercial systemsmarketed by World Precision Instruments (WPI) allowthe employment of large optical path lengths (20–5000 mm) with sample volumes up to 1250 lL [20].Nevertheless, WPI has marketed different low-volumeLCWs that can be more interesting for microvolume-sample quantitation, showing path lengths in the range20–100 mm with a detection volume less than 25 lL. Inaddition, a low-volume flow cell, named microLWCC,allows UV-Vis spectrometric measurements with a pathlength of 10 mm or 50 mm using 2.4 lL or 12 lL ofsample solution, respectively.
A microcell within a fiber-optic plunger system thatshows 10-mm path length and requires only 2 lL toperform a measurement is also commercially available
under the name SpectroPipetter. Patented by Liu [21]and marketed by WPI, the SpectroPipetter system isshaped like a micropipette, although its configuration isnot as simple as it appears. The UV-Vis spectrometricsampling device comprises a sample cell placed inside thetip of the SpectroPipetter, fiber optics that carry light toand from the sample drop and acts as a plunger, and apusher arm that draws the microvolume sample (2 lL)into the microcell and expels it once the UV-Vis spec-trometric measurement is completed. The SpectroPipet-ter is depicted in Fig. 1B. The SpectroPipetter is used incombination with an external light source and an ana-lyzer through a coupler and optical fiber. Light istransmitted axially through the sample in this system,thus increasing path length. The microvolume samplefills an inflexible tubular vessel fabricated from TeflonAF. A mirror placed at the end of the tip reflects the lightbeam, so doubling the light path through the sample.The SpectroPipetter system provides a ratio of pathlength to detection volume three orders of magnitudegreater than conventional cuvettes, thereby constitutinga powerful system for UV-Vis spectrometric determina-tion of target analytes in scarce samples at low con-centrations. However, this system is quite delicate due tothe nature of the optical components.
Another system related to the Spectropipetter is theDipTip, a miniaturized transmission probe also marketedby WPI. Like the Spectropipetter, DipTip has two optical-fiber cables coupled to the radiation source and thedetector. This system also uses a mirror to return thelight. UV-Vis spectrometric measurements can be per-formed by immersing the tip in 20 lL of sample solutionwith path lengths in the range 2–10 mm.
http://www.elsevier.com/locate/trac 1639
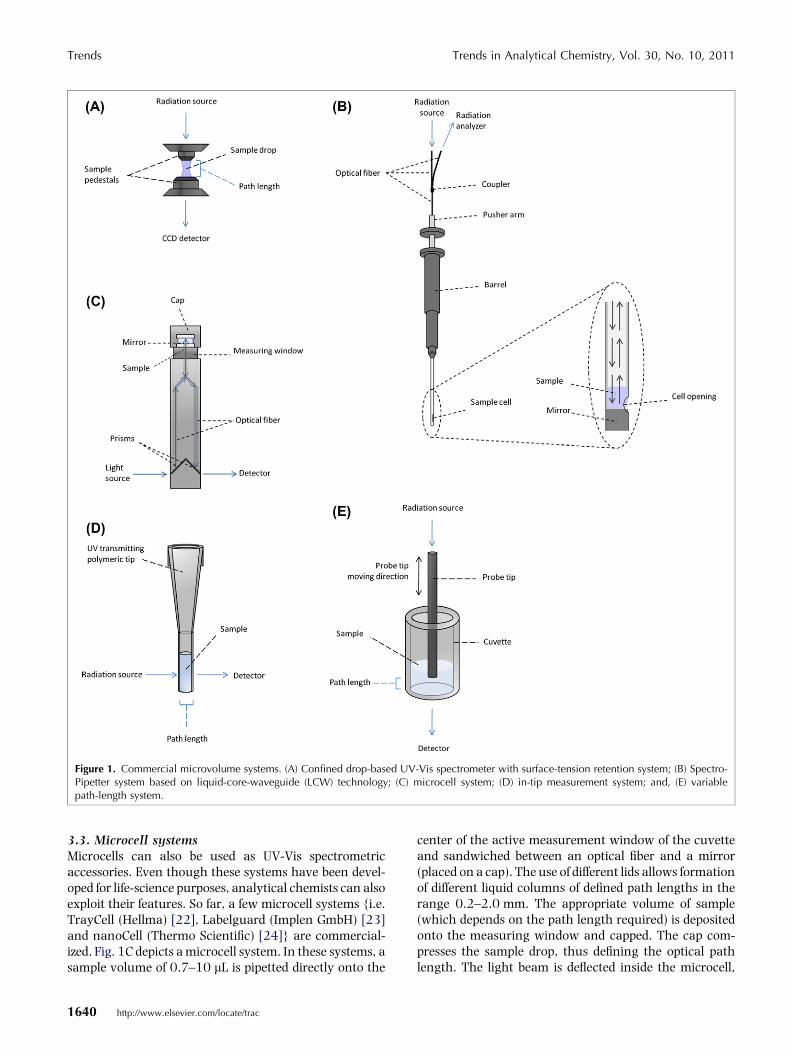
Figure 1. Commercial microvolume systems. (A) Confined drop-based UV-Vis spectrometer with surface-tension retention system; (B) Spectro-Pipetter system based on liquid-core-waveguide (LCW) technology; (C) microcell system; (D) in-tip measurement system; and, (E) variablepath-length system.
Trends Trends in Analytical Chemistry, Vol. 30, No. 10, 2011
3.3. Microcell systemsMicrocells can also be used as UV-Vis spectrometricaccessories. Even though these systems have been devel-oped for life-science purposes, analytical chemists can alsoexploit their features. So far, a few microcell systems {i.e.TrayCell (Hellma) [22], Labelguard (Implen GmbH) [23]and nanoCell (Thermo Scientific) [24]} are commercial-ized. Fig. 1C depicts a microcell system. In these systems, asample volume of 0.7–10 lL is pipetted directly onto the
1640 http://www.elsevier.com/locate/trac
center of the active measurement window of the cuvetteand sandwiched between an optical fiber and a mirror(placed on a cap). The use of different lids allows formationof different liquid columns of defined path lengths in therange 0.2–2.0 mm. The appropriate volume of sample(which depends on the path length required) is depositedonto the measuring window and capped. The cap com-presses the sample drop, thus defining the optical pathlength. The light beam is deflected inside the microcell,
Trends in Analytical Chemistry, Vol. 30, No. 10, 2011 Trends
thanks to the internal prism, and conducted to the samplemicrovolume through optical fiber. The transmitted lightbeam is reflected by the mirror and conducted towards thedetector via the optical fiber and a second internal prism.
Microcells show a size equivalent to conventionalcuvettes, so that they can be placed in the samplecompartment of conventional UV-Vis spectrometers. Inaddition, evaporation of the microvolume of sample/or-ganic solvent is reduced, since it is not exposed to airduring the UV-Vis spectrometric measurement.
3.4. In-tip measurement systemThe development of polymer technology makes possiblethe use of UV-light-transmitting polymers to replaceconventional quartz cuvettes used typically in UV-Visspectrometry. Polymers having good UV and visible-lighttransmission are achievable by polymerization of at leastone compound having a substantially non-UV absorbingcore group (i.e. linear or branched aliphatic hydrocarbonsthat may contain an aliphatic ring or polydialkylsilox-anes) [25].
A copolymer based on cyclic olefins showing hightransparency in the UV range is commercially availableas TOPAS 8007X10 [26]. The high transparency of thismaterial was exploited by Redfern, who patented UV-transmissive pipette tips as containment vessels formicrovolume samples [27,28].
In these inventions, the narrower section of the tip(Fig. 1D) shows constant diameter inside and out. A col-umn of liquid is formed when sufficient sample volume fillsthis section of the pipette tip. The use of two optical fibers(one fiber being the source and the other the receiver)mounted coaxially and perpendicular to the tip allows UV-Vis spectrometric analysis of the sample solution.
Polymeric materials that can transmit light between220 nm and 850 nm have been employed by PicoDrop[29] to make disposable pipette tips (UVpette tips). A 2-lL sample is aspirated with an UV-transmitting poly-meric tip, and the pipette tip is then placed between twooptical fibers for a single UV-Vis spectrometric mea-surement. The path length (1 mm) is defined by theinternal diameter of the tip.
The use of disposable tips eliminates the need totransfer the sample to another container in order toperform a UV-Vis spectrometric measurement, and alsoavoids any possible cross-contamination and evapora-tion of the sample microdrop, as described above withdrop-based systems. However, the need to replace the tipfor subsequent analysis may increase uncertainty aboutthe path length, which may give rise to measurementerrors. Furthermore, additional cost derives from theneed to renew the consumable UVpette tips.
3.5. Variable path-length systemThe systems described above allow the absorbancemeasurement of sample solutions to be made at fixed
path lengths. Another possibility easily derived from theLambert-Beer law is employment of variable pathlengths to perform UV-Vis spectrometric measurements.This concept was recently patented by Salerno et al.[30].
The development of a probe for use with a UV-Visspectrometer and a light source in making UV-Visspectrometric measurements at variable path lengthsopens up new possibilities for UV-Vis spectrometricanalysis. A novel commercial system that takes advan-tage of the use of tunable, controlled path length wasmarketed by C Technologies Inc. as SoloVPE (variablepath-length extension) [31]. Unlike conventional UV-Visspectrometers, which use fixed path-length cuvettes, theSoloVPE provides fine control over the path length usedin measurements across a wide range of path lengths(0.01–20 mm) with a path-length resolution of0.005 mm. Fig. 1E shows this system.
The light beam passes through an optical fiber (calleda Fibrette) and the sample solution. The optical fiber canbe mechanically moved up or down relative to the bot-tom of the sample vessel holding the solution. The mo-tion of the Fibrette is precisely and accurately controlledby computer. The path length is defined by the positionof the probe tip with respect to the bottom of the samplevessel. The light transmitted through the sample solu-tion is finally captured by a detector mounted below thesample vessel.
The use of such a large path-length range allows thissystem to perform measurements over a wide range ofconcentrations without the need to dilute concentratedsamples. It should be noted that the lowest sample vol-ume needed to perform a measurement is 3 lL. How-ever, the available path lengths that can be used withthis volume are not specified and are presumably lowerthan those used in the commercial systems describedabove. Nevertheless, at 20 mm, the SoloVPE has thelargest path length available, although the sample vol-ume needed to carry out measurements under theseconditions is not specified.
3.6. Drops, liquid films and porous tubes as collectorsand optical cellsThe use of lL-volume drops and liquid films as bothextractant phases and windowless sample compartmentswas introduced by Dasgupta�s group in 1995 [32–34].Radiation from a light-emitting diode (LED) passesthrough the liquid drop [35] or film [36] and thetransmitted radiation is conducted by means of anoptical fiber to a detector photodiode to obtain the cor-responding absorbance measurement. These systemsallow extraction and preconcentration of target analyteswith in-situ derivatization, when necessary, and, moreimportantly, simplification and integration of the differ-ent steps needed to perform a chemical analysis. Thewindowless nature of these systems can solve problems
http://www.elsevier.com/locate/trac 1641
Trends Trends in Analytical Chemistry, Vol. 30, No. 10, 2011
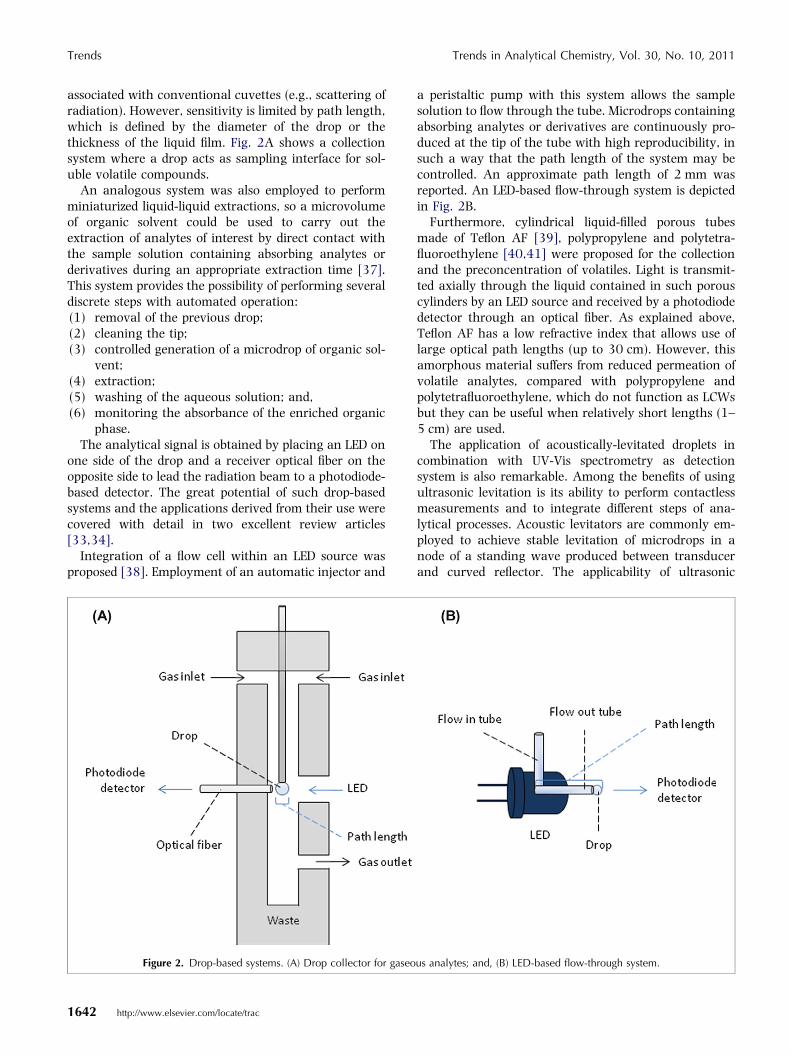
associated with conventional cuvettes (e.g., scattering ofradiation). However, sensitivity is limited by path length,which is defined by the diameter of the drop or thethickness of the liquid film. Fig. 2A shows a collectionsystem where a drop acts as sampling interface for sol-uble volatile compounds.
An analogous system was also employed to performminiaturized liquid-liquid extractions, so a microvolumeof organic solvent could be used to carry out theextraction of analytes of interest by direct contact withthe sample solution containing absorbing analytes orderivatives during an appropriate extraction time [37].This system provides the possibility of performing severaldiscrete steps with automated operation:(1) removal of the previous drop;(2) cleaning the tip;(3) controlled generation of a microdrop of organic sol-
vent;(4) extraction;(5) washing of the aqueous solution; and,(6) monitoring the absorbance of the enriched organic
phase.The analytical signal is obtained by placing an LED on
one side of the drop and a receiver optical fiber on theopposite side to lead the radiation beam to a photodiode-based detector. The great potential of such drop-basedsystems and the applications derived from their use werecovered with detail in two excellent review articles[33,34].
Integration of a flow cell within an LED source wasproposed [38]. Employment of an automatic injector and
Figure 2. Drop-based systems. (A) Drop collector for gaseo
1642 http://www.elsevier.com/locate/trac
a peristaltic pump with this system allows the samplesolution to flow through the tube. Microdrops containingabsorbing analytes or derivatives are continuously pro-duced at the tip of the tube with high reproducibility, insuch a way that the path length of the system may becontrolled. An approximate path length of 2 mm wasreported. An LED-based flow-through system is depictedin Fig. 2B.
Furthermore, cylindrical liquid-filled porous tubesmade of Teflon AF [39], polypropylene and polytetra-fluoroethylene [40,41] were proposed for the collectionand the preconcentration of volatiles. Light is transmit-ted axially through the liquid contained in such porouscylinders by an LED source and received by a photodiodedetector through an optical fiber. As explained above,Teflon AF has a low refractive index that allows use oflarge optical path lengths (up to 30 cm). However, thisamorphous material suffers from reduced permeation ofvolatile analytes, compared with polypropylene andpolytetrafluoroethylene, which do not function as LCWsbut they can be useful when relatively short lengths (1–5 cm) are used.
The application of acoustically-levitated droplets incombination with UV-Vis spectrometry as detectionsystem is also remarkable. Among the benefits of usingultrasonic levitation is its ability to perform contactlessmeasurements and to integrate different steps of ana-lytical processes. Acoustic levitators are commonly em-ployed to achieve stable levitation of microdrops in anode of a standing wave produced between transducerand curved reflector. The applicability of ultrasonic
us analytes; and, (B) LED-based flow-through system.
Trends in Analytical Chemistry, Vol. 30, No. 10, 2011 Trends
levitation with UV-Vis spectrometry was demonstratedthrough the development of liquid-liquid extractions,acid-based microtitrations, or monitoring volatile uptakeby the levitated microdrop [42,43]. In such systems, theconfiguration employed to achieve UV-Vis spectrometricmeasurements is similar to that explained above fordrops or films. Recent reviews concerning the principlesand the general application of levitated droplets in ana-lytical chemistry can be consulted for further details[44,45].
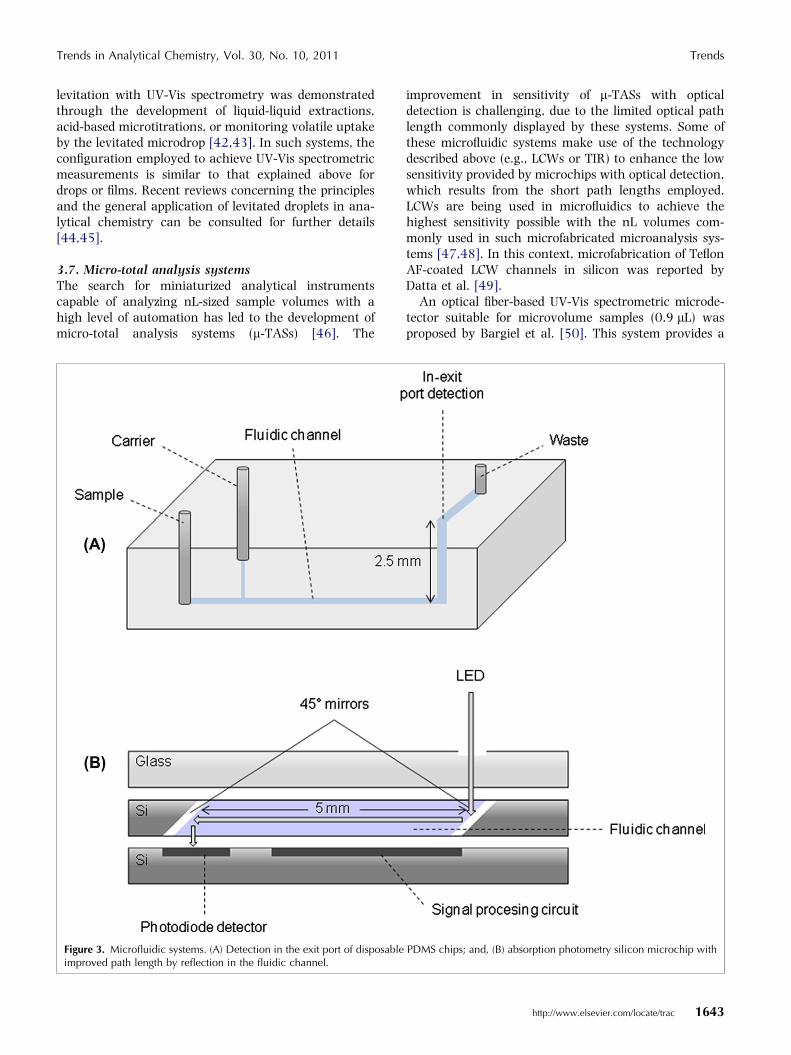
3.7. Micro-total analysis systemsThe search for miniaturized analytical instrumentscapable of analyzing nL-sized sample volumes with ahigh level of automation has led to the development ofmicro-total analysis systems (l-TASs) [46]. The
Figure 3. Microfluidic systems. (A) Detection in the exit port of disposableimproved path length by reflection in the fluidic channel.
improvement in sensitivity of l-TASs with opticaldetection is challenging, due to the limited optical pathlength commonly displayed by these systems. Some ofthese microfluidic systems make use of the technologydescribed above (e.g., LCWs or TIR) to enhance the lowsensitivity provided by microchips with optical detection,which results from the short path lengths employed.LCWs are being used in microfluidics to achieve thehighest sensitivity possible with the nL volumes com-monly used in such microfabricated microanalysis sys-tems [47,48]. In this context, microfabrication of TeflonAF-coated LCW channels in silicon was reported byDatta et al. [49].
An optical fiber-based UV-Vis spectrometric microde-tector suitable for microvolume samples (0.9 lL) wasproposed by Bargiel et al. [50]. This system provides a
PDMS chips; and, (B) absorption photometry silicon microchip with
http://www.elsevier.com/locate/trac 1643
Trends Trends in Analytical Chemistry, Vol. 30, No. 10, 2011
path length of 10 mm, and is compatible with the l-TAStechnology, but also with conventional analyticalinstrumentation as an alternative optical cuvette.
Gaspar et al. combined a projection microscope and afiber-optic, miniaturized UV-Vis spectrometer to performabsorbance measurements on disposable poly-dimethylsiloxane (PDMS) chips [51]. This instrumentselects a very small area of the channel pattern in orderto perform a measurement, thus allowing analysis ofmicrovolume samples (the volume of the cell is only120 nL) with a 2.5-mm optical path length in the chip(Fig. 3A).
Minas et al. developed a portable, low-cost, disposable,lab-on-a-chip system, which combines a microfluidicsystem, highly selective optical filters and a detectionand readout system, and is useful for UV-Vis spectro-metric determination of biomolecules in biological fluids[52].
Pan et al. presented an small (12 · 4.5 · 2.1 cm),light (less than 70 g), hand-held photometer, whichintegrated an LCW flow cell, a light source, a photodiodedetector, a dropper pump for aspiration of the sampleinto the flow cell, an electronic circuit for instrumentcontrol and data processing, a liquid-crystal displayscreen and a battery [53]. This miniaturized systemdetermined target analytes with lower sample con-sumption (0.35 lL) and larger path length (15 mm)than those of conventional UV-Vis spectrometers.
Duggan et al. developed an on-chip UV-Vis spectro-metric system by coupling the light source, the micro-fluidic chip and the detection system to form a polymerbased-LCW along a single microfluidic channel [54]. Theauthors used different cladding materials [i.e. Teflonpolytetrafluoroethylene (PTFE), Teflon fluoroethylene-
Figure 4. Cavity ring-down spe
1644 http://www.elsevier.com/locate/trac
propylene (FEP) and Teflon AF polymers] for the LCW.The combination of LCW with 3D-chip architecture,where the LCW was perpendicular to the mixing chan-nel, provided a path length of 5 mm using sample vol-umes in the range 0.35–1.1 lL.
An absorption photometry silicon microchip waspresented by Noda et al. [55]. The system, constructed inaccordance with micro-electro-mechanical system(MEMS) technology, provides an extended optical pathlength (5 mm) as a result of using two 45� mirrorsplaced at each end of the fluidic channel, as shown inFig. 3B. Accordingly, light from a LED source is irradi-ated from the top side and reflected by the first mirrorthat propagates the light through the fluidic channel. Atthe end of the fluidic channel the light is reflected by asecond mirror, thus reaching a photodiode fabricated onthe bottom layer.
TIR, also known as attenuated total reflection (ATR),was used by Steigert et al. to improve sensitivity by oneorder of magnitude with a centrifugal �lab-on-a-disk�system [56]. These so-called centrifugal microfluidicsplatforms integrate several analytical steps by takingadvantage from both centrifugal and capillary forces.
Fang et al. developed miniaturized systems based onstopped-flow liquid-liquid extraction and a Teflon AFcapillary LCW [48,57]. These systems extract analytes ofinterest with consumption of sample and organic solventbelow 10 lL and 1 lL, respectively.
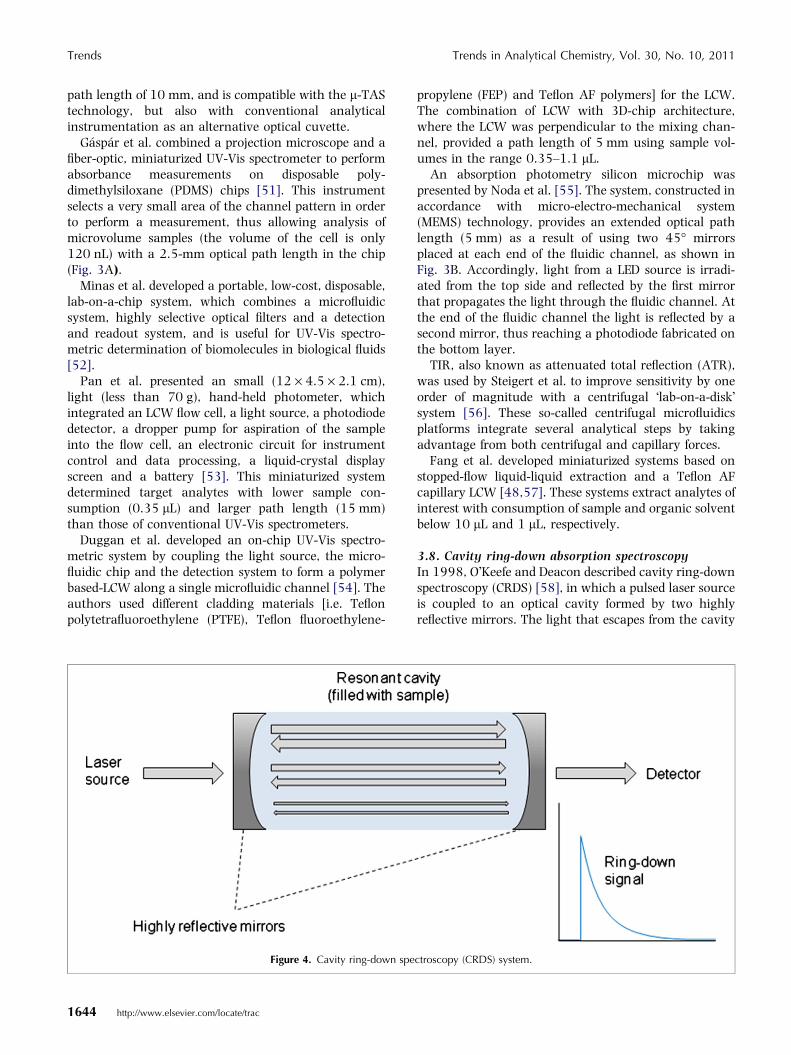
3.8. Cavity ring-down absorption spectroscopyIn 1998, O�Keefe and Deacon described cavity ring-downspectroscopy (CRDS) [58], in which a pulsed laser sourceis coupled to an optical cavity formed by two highlyreflective mirrors. The light that escapes from the cavity
ctroscopy (CRDS) system.
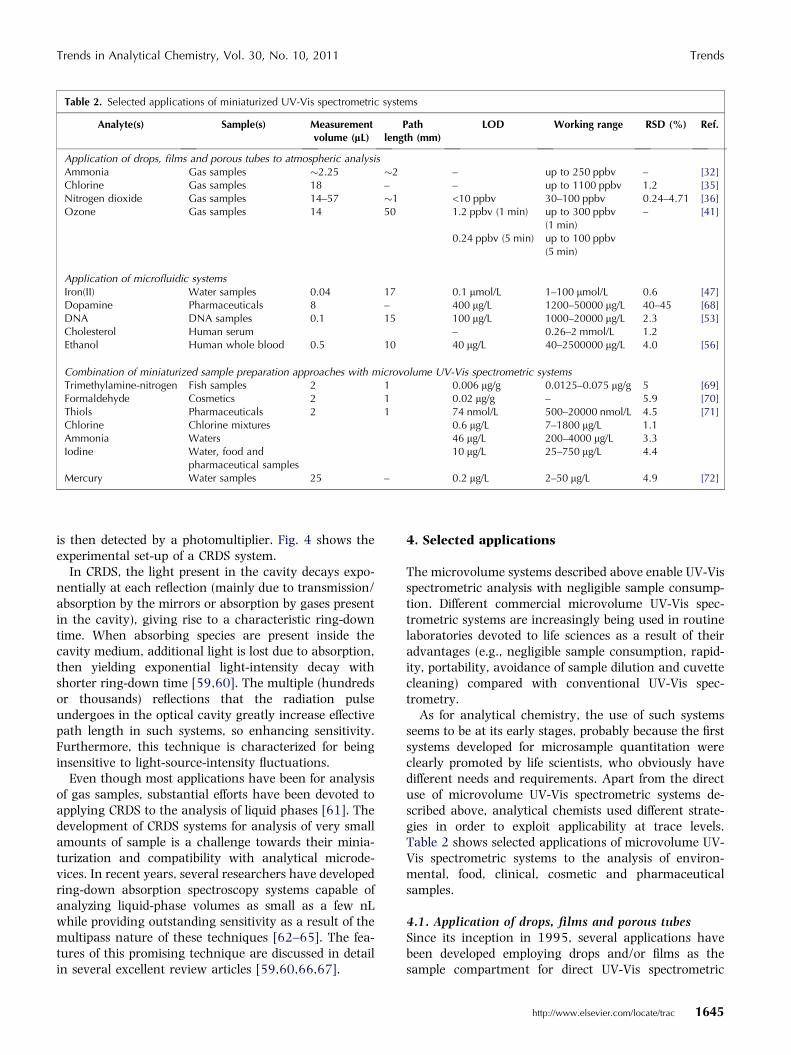
Table 2. Selected applications of miniaturized UV-Vis spectrometric systems
Analyte(s) Sample(s) Measurementvolume (lL)
Pathlength (mm)
LOD Working range RSD (%) Ref.
Application of drops, films and porous tubes to atmospheric analysisAmmonia Gas samples �2.25 �2 – up to 250 ppbv – [32]Chlorine Gas samples 18 – – up to 1100 ppbv 1.2 [35]Nitrogen dioxide Gas samples 14–57 �1 <10 ppbv 30–100 ppbv 0.24–4.71 [36]Ozone Gas samples 14 50 1.2 ppbv (1 min) up to 300 ppbv
(1 min)– [41]
0.24 ppbv (5 min) up to 100 ppbv(5 min)
Application of microfluidic systemsIron(II) Water samples 0.04 17 0.1 lmol/L 1–100 lmol/L 0.6 [47]Dopamine Pharmaceuticals 8 – 400 lg/L 1200–50000 lg/L 40–45 [68]DNA DNA samples 0.1 15 100 lg/L 1000–20000 lg/L 2.3 [53]Cholesterol Human serum – 0.26–2 mmol/L 1.2Ethanol Human whole blood 0.5 10 40 lg/L 40–2500000 lg/L 4.0 [56]
Combination of miniaturized sample preparation approaches with microvolume UV-Vis spectrometric systemsTrimethylamine-nitrogen Fish samples 2 1 0.006 lg/g 0.0125–0.075 lg/g 5 [69]Formaldehyde Cosmetics 2 1 0.02 lg/g – 5.9 [70]Thiols Pharmaceuticals 2 1 74 nmol/L 500–20000 nmol/L 4.5 [71]Chlorine Chlorine mixtures 0.6 lg/L 7–1800 lg/L 1.1Ammonia Waters 46 lg/L 200–4000 lg/L 3.3Iodine Water, food and
pharmaceutical samples10 lg/L 25–750 lg/L 4.4
Mercury Water samples 25 – 0.2 lg/L 2–50 lg/L 4.9 [72]
Trends in Analytical Chemistry, Vol. 30, No. 10, 2011 Trends
is then detected by a photomultiplier. Fig. 4 shows theexperimental set-up of a CRDS system.
In CRDS, the light present in the cavity decays expo-nentially at each reflection (mainly due to transmission/absorption by the mirrors or absorption by gases presentin the cavity), giving rise to a characteristic ring-downtime. When absorbing species are present inside thecavity medium, additional light is lost due to absorption,then yielding exponential light-intensity decay withshorter ring-down time [59,60]. The multiple (hundredsor thousands) reflections that the radiation pulseundergoes in the optical cavity greatly increase effectivepath length in such systems, so enhancing sensitivity.Furthermore, this technique is characterized for beinginsensitive to light-source-intensity fluctuations.
Even though most applications have been for analysisof gas samples, substantial efforts have been devoted toapplying CRDS to the analysis of liquid phases [61]. Thedevelopment of CRDS systems for analysis of very smallamounts of sample is a challenge towards their minia-turization and compatibility with analytical microde-vices. In recent years, several researchers have developedring-down absorption spectroscopy systems capable ofanalyzing liquid-phase volumes as small as a few nLwhile providing outstanding sensitivity as a result of themultipass nature of these techniques [62–65]. The fea-tures of this promising technique are discussed in detailin several excellent review articles [59,60,66,67].
4. Selected applications
The microvolume systems described above enable UV-Visspectrometric analysis with negligible sample consump-tion. Different commercial microvolume UV-Vis spec-trometric systems are increasingly being used in routinelaboratories devoted to life sciences as a result of theiradvantages (e.g., negligible sample consumption, rapid-ity, portability, avoidance of sample dilution and cuvettecleaning) compared with conventional UV-Vis spec-trometry.
As for analytical chemistry, the use of such systemsseems to be at its early stages, probably because the firstsystems developed for microsample quantitation wereclearly promoted by life scientists, who obviously havedifferent needs and requirements. Apart from the directuse of microvolume UV-Vis spectrometric systems de-scribed above, analytical chemists used different strate-gies in order to exploit applicability at trace levels.Table 2 shows selected applications of microvolume UV-Vis spectrometric systems to the analysis of environ-mental, food, clinical, cosmetic and pharmaceuticalsamples.
4.1. Application of drops, films and porous tubesSince its inception in 1995, several applications havebeen developed employing drops and/or films as thesample compartment for direct UV-Vis spectrometric
http://www.elsevier.com/locate/trac 1645
Trends Trends in Analytical Chemistry, Vol. 30, No. 10, 2011
measurement. Specifically, the development of differentanalytical approaches for atmospheric analysis wastackled by Dasgupta�s group using drops and liquid filmsas not only sample compartment but also extractantphase of the corresponding volatile analyte. Thus, Car-doso and Dasgupta employed a liquid film of Griess/Saltzman reagent as extractant phase of nitrogen diox-ide, achieving a limit of detection (LOD) lower than10 ppb by volume using a 5-min sampling time [36].
Also, a drop-based sensor was proposed for determi-nation of gaseous chorine. The method is based on thecollection of the volatile analyte onto an 18-lL dropcontaining tetramethylbenzidine, and subsequent reac-tion yielding a yellow product that can be determined byUV-Vis spectrometry [35]. Fig. 2A shows the systemsemployed for the analysis of gaseous samples.
Dasgupta and co-workers also demonstrated the ana-lytical usefulness of porous tubes as collectors of volatileanalytes [41]. In such systems, porous tubes are filledwith a selective reagent-containing aqueous solutionand exposed to a continuous flow of gaseous sample.Low LODs were obtained with these systems for nitrogendioxide and ozone, on the basis of the Griess-Saltzmanand indigotrisulfonate colorimetric assays, respectively.
4.2. Application of microfluidic systemsDifferent microfluidic systems with UV-Vis spectrometricdetection were developed and employed for the analysisof microvolumes of samples in a wide variety of matrices.
A microfluidic flow-injection-analysis system with anLCW flow cell was presented by Du et al. [47] for high-throughput UV-Vis spectrometric determination of Fe(II)by complexation with o-phenantroline. The systemprovides better sensitivity than conventional UV-Visspectrometry, as a result of an effective path length of17 mm, with a cell volume of 40 nL.
Maminski et al. proposed two UV-Vis spectrometricprocedures for the determination of dopamine in phar-maceutical samples, employing a microfluidic reactionchamber based on PDMS technology [68]. An 8-lL flow-through cuvette was used in combination with a 6-lL Y-shaped microreactor for absorbance measurement. Theprocedures developed involved coupling dopamine withisoniazid and reaction with sodium nitroprusside,respectively.
Pan et al. applied a portable, miniaturized photometerbased on LCW absorption detection to the analysis ofDNA samples and determination of cholesterol in hu-man-serum samples, respectively [53]. The use of dual-wavelength detection (by employing two UV LEDs (k =260 nm and 280 nm) as light sources) allowed assess-ment of the quality of DNA, while a single, bluish-greenLED source (k = 497 nm) was used for the determinationof total cholesterol in clinical samples.
A colorimetric assay for the determination of ethanolin a single drop (0.5 lL) of untreated human whole
1646 http://www.elsevier.com/locate/trac
blood was reported by Steigert et al., using a centrifugal‘‘lab-on-a-disk’’ system [56]. The assay protocol is basedon four different steps. In the first, a 0.5-lL sample ofblood is metered precisely and the disk is spun at 35 Hzto transport the liquids to the detection cell. The direc-tion of rotation is frequently reversed to improve mixingat a lower frequency (�10 Hz) and, subsequently, thefrequency is increased to 30 Hz to clear the cellularcomponents of the blood. Finally, ethanol is determinedby a two-step enzymatic reaction with spinning at 8 Hz.
4.3. Combination of miniaturized approaches to samplepreparation with microvolume UV-Vis spectrometricsystemsSeveral UV-Vis spectrometric-based analytical methodsinvolve use of large amounts of reagents, including toxicorganic solvents. Efforts to develop miniaturized mic-rovolume systems commented on above are also re-flected in the improvement of these analytical methods,since available miniaturized sample-preparation tech-niques can be combined with them, resulting in largedecreases in the reagents needed and the waste pro-duced. In this way, the combination of microvolume UV-Vis spectrometry with miniaturized approaches to sam-ple preparation [e.g., liquid-phase microextraction(LPME)] constitutes an appropriate way to improveconventional analytical methods in terms of sensitivity(due to the large enrichment factors provided by thesetechniques), integration of steps and consumption ofreagents.
A few examples concerning the coupling of microvo-lume UV-Vis spectrometry with LPME approaches can befound in the literature. For example, improvements andminiaturization of the AOAC Official Method 971.14 fordetermination of trimethylamine-nitrogen (TMA-N) infish samples [69], and the European Official Method ofAnalysis of formaldehyde in cosmetic products [70] wereachieved using confined based-drop systems in combi-nation with headspace single-drop microextraction (HS-SDME) and ultrasound-assisted emulsification microex-traction, respectively. In both cases, low LODs were ob-tained as a result of the large enrichment factorsachieved with LPME, which largely compensated for thereduced path length provided by the microvolume UV-Vis spectrometer employed.
Sharma et al. employed the same confined drop-basedsystem in combination with different modes of LPME(direct-SDME, HS-SDME and liquid-liquid-liquid mic-roextraction) and solid-phase extraction (SPE) for thedetermination of thiols, chlorine, ammonia and iodine ina variety of sample matrices [71].
Yang et al. presented a direct-SDME method, in whichan organic drop was used as collector and samplecompartment for the determination of mercury inwater samples, and an LED and a hand-held chargecoupled device (CCD) as radiation source and detector,
Trends in Analytical Chemistry, Vol. 30, No. 10, 2011 Trends
respectively [72]. The method, based on extraction andin-drop derivatization of mercury by a 25-lL microdrop,comprising carbon tetrachloride and dithizone, providedan enrichment factor of 69 after 15 min microextraction.
5. Concluding remarks
Miniaturization of detection systems is a challenge thathas been met with different degrees of success in ana-lytical chemistry. Specifically, miniaturization of con-ventional UV-Vis spectrometry has been achieved tosome extent by implementing different technologicaladvances. Thus, several miniaturized UV-Vis spectro-meters and/or accessories compatible with conventionalinstrumentation are currently available, allowing theUV-Vis spectrometric determination of target analyteswith negligible sample consumption and increased pathlength-to-detection volume ratio as compared to classicalUV-Vis spectrometers. Nonetheless, additional work isneeded to improve the performance of such microvolumesystems, thereby meeting current needs in analyticalchemistry, especially with respect to sensitivity andsimplicity.
AcknowledgementsFinancial support from the Spanish Ministry of Scienceand Innovation (Project CTQ2009-06956/BQU) and theVigo University (Contract for Reference Research Groups09VIA08) is gratefully acknowledged.
References
[1] A. Rıos, A. Escarpa, M.C. Gonzalez, A.G. Crevillen, Trends Anal.
Chem. 25 (2006) 467.
[2] M. Chudy, I. Grabowska, P. Ciosek, A. Filipowicz-Szymanska, D.
Stadnik, I. Wyzkiewicz, E. Jedrych, M. Juchniewicz, M. Skolimow-
ski, K. Ziolkowska, R. Kwapiszewski, Anal. Bioanal. Chem. 395
(2009) 647.
[3] S. Armenta, S. Garrigues, M. De la Guardia, Trends Anal. Chem.
27 (2008) 497.
[4] C. Robertson, Am. Biotechnol. Lab. 21 (2003) 23.
[5] R. Kartha, F. Trotier, A. Kreuz, A. Huber, Am. Biotechnol. Lab. 26
(2008) 14.
[6] F.R.P. Rocha, L.S.G. Teixeira, Quim. Nova 27 (2004) 807.
[7] N.J. Petersen, K.B. Mogensen, J.P. Kutter, Electrophoresis 23
(2002) 3528.
[8] J.P. Chervet, R.E.J. van Soest, M. Ursem, J. Chromatogr. 543
(1991) 439.
[9] W.L. Tseng, Y.W. Lin, K.C. Chen, H.T. Chang, Electrophoresis 23
(2002) 2477.
[10] K. Murayama, B. Yuan, Y. Ozaki, M. Tomida, S. Era, Analyst
(Cambridge, UK) 128 (2003) 957].
[11] C.W. Robertson, US Patent No. 6,628,382 B2, Sep. 30, 2003.
[12] http://www.nanodrop.com.
[13] http://www.shimadzu.com.
[14] http://www.gelifesciences.com.
[15] T. Dallas, P.K. Dasgupta, Trends Anal. Chem. 23 (2004) 385.
[16] W.A. Gambling, D.N. Payne, US Patent No. 3,894,788, Jul. 15,
1975.
[17] DuPont Fluoroproducts, Teflon AF Amorphous Fluoropolymers.
H-16577-1, DuPont, Wilmington, DE, USA, 1989.
[18] S.Y. Liu, US Patent No. 5,570,447, Oct. 29, 1996.
[19] L.J. Gimbert, P.J. Worsfold, Trends Anal. Chem. 26 (2007) 914.
[20] http://www.wpiinc.com.
[21] S.Y. Liu, US Patent No. 5,416,879, May 16, 1995.
[22] http://www.hellma-analytics.com.
[23] http://www.implen.de.
[24] http://www.thermo.com.
[25] R.A. Pethrick, M.D. Dawson, E. Gu, A.R. Mackintosh, A.J.C.
Kuehne, US Patent No. 0,065,871 A1, Mar. 18, 2010.
[26] http://www.topas.com.
[27] J. Redfern, WO 2007/057655 A1, May 24, 2007.
[28] J. Redfern, US Patent No. 0,253,933 A1, Oct. 16, 2008.
[29] http://www.picodrop.com.
[30] M.C. Salerno, T. Shih, C. Harriston, US Patent No. 0,027,678 A1,
Jan. 29, 2009.
[31] http://solovpe.com.
[32] S. Liu, P.K. Dasgupta, Anal. Chem. 67 (1995) 2042.
[33] H. Liu, P.K. Dasgupta, Trends Anal. Chem. 15 (1996) 468.
[34] H. Liu, P.K. Dasgupta, Microchem. J. 57 (1997) 127.
[35] H. Liu, P.K. Dasgupta, Anal. Chem. 67 (1995) 4221.
[36] A.A. Cardoso, P.K. Dasgupta, Anal. Chem. 67 (1995) 2562.
[37] H. Liu, P.K. Dasgupta, Anal. Chem. 68 (1996) 1817.
[38] C. Ugucione, A.A. Cardoso, Anal. Bioanal. Chem. 389 (2007)
1647.
[39] P.K. Dasgupta, S.Y. Liu, US Patent No. 6,011,882, Jan. 4, 2000.
[40] K. Toda, K.I. Yoshioka, S.I. Ohira, J. Li, P.K. Dasgupta, Anal.
Chem. 75 (2003) 4050.
[41] J. Li, Q. Li, J.V. Dyke, P.K. Dasgupta, Talanta 74 (2008) 958.
[42] E. Welter, B. Neidhart, Fresenius� J, Anal. Chem. 357 (1997) 345.
[43] O. Rohling, C. Weitkamp, B. Neidhart, Fresenius� J, Anal. Chem.
368 (2000) 125.
[44] F. Priego-Capote, L. De Castro, Trends Anal. Chem. 25 (2006)
856.
[45] S. Santesson, S. Nilsson, Anal. Bioanal. Chem. 378 (2004) 1704.
[46] K. Huikko, R. Kostiainen, T. Kotiaho, Eur. J. Pharm. Sci. 20
(2003) 149.
[47] W.B. Du, Q. Fang, Q.H. He, Z.L. Fang, Anal. Chem. 77 (2005)
1330.
[48] Q. Fang, X.T. Shi, W.B. Du, Q.H. He, H. Shen, Z.L. Fang, Trends
Anal. Chem. 27 (2008) 521.
[49] A. Datta, I.Y. Eom, A. Dhar, P. Kuban, R. Manor, I. Ahmad, S.
Gangopadhyay, T. Dallas, M. Holtz, H. Temkin, P.K. Dasgupta, IEE
Sens. J. 3 (2003) 788.
[50] S. Bargiel, A. Gorecka-Drzazga, J.A. Dziuban, P. Prokaryn, M.
Chudy, A. Dybko, Z. Brzozka, Sens. Actuators, A 115 (2004) 245.
[51] A. Gaspar, I. Bacsi, E.F. Garcia, M. Braun, F.A. Gomez, Anal.
Bioanal. Chem. 395 (2009) 473.
[52] G. Minas, R.F. Wolffenbuttel, J.H. Correia, Lab Chip 5 (2005)
1303.
[53] J.Z. Pan, B. Yao, Q. Fang, Anal. Chem. 82 (2010) 3394.
[54] M.P. Duggan, T. McCreedy, J.W. Aylott, Analyst (Cambridge, UK)
128 (2003) 1336.
[55] T. Noda, H. Takao, K. Yoshioka, N. Oku, M. Ashiki, K. Sawada, K.
Matsumoto, M. Ishida, Sens. Actuators, B 119 (2006) 245.
[56] J. Steigert, M. Grumann, T. Brenner, L. Riegger, J. Harter, R.
Zengerle, J. Ducree, Lab Chip 6 (2006) 1040.
[57] M. Sun, W.B. Du, Q. Fang, Talanta 70 (2006) 392.
[58] A. O�Keefe, D.A.G. Deacon, Rev. Sci. Instrum. 59 (1988) 2544.
[59] L. van der Sneppen, F. Ariese, C. Gooijer, W. Ubachs, Annu. Rev.
Anal. Chem. 2 (2009) 13.
[60] C. Vallance, New J. Chem. 29 (2005) 867.
[61] A.J. Hallock, E.S.F. Berman, R.N. Zare, Anal. Chem. 74 (2002)
1741.
http://www.elsevier.com/locate/trac 1647
Trends Trends in Analytical Chemistry, Vol. 30, No. 10, 2011
[62] Z. Tong, M. Jakubinek, A. Wright, A. Gillies, H.P. Loock, Rev. Sci.
Instrum. 74 (2003) 4818.
[63] A. O�Keefe, M. Gupta, US Patent No. 6,839,140 B1, Jan. 4,
2005.
[64] B. Bahnev, L. van der Sneppen, A.E. Wiskerke, F. Ariese, C.
Gooijer, W. Ubachs, Anal. Chem. 77 (2005) 1188.
[65] H. Waechter, K. Bescherer, C.J. Durr, R.D. Oleschuk, H.P. Loock,
Anal. Chem. 81 (2009) 9048.
[66] S.M. Ball, R.L. Jones, Chem. Rev. 103 (2003) 5239.
[67] H.P. Loock, Trends Anal. Chem. 25 (2006) 655.
1648 http://www.elsevier.com/locate/trac
[68] M. Maminski, M. Olejniczak, M. Chudy, A. Dybko, Z. Brzozka,
Anal. Chim. Acta 540 (2005) 153.
[69] F. Pena-Pereira, I. Lavilla, C. Bendicho, Food Chem 119 (2010)
402.
[70] I. Lavilla, N. Cabaleiro, F. Pena, I. de la Calle, C. Bendicho, Anal.
Chim. Acta 674 (2010) 59.
[71] N. Sharma, A.K.K.V. Pillai, N. Pathak, A. Jain, K.K. Verma, Anal.
Chim. Acta 648 (2009) 183.
[72] F. Yang, R. Liu, Z. Tan, X. Wen, C. Zheng, Y. Lv, J. Hazard. Mater.
183 (2010) 549.