robotic platform for automated search and rescue missions of humans
TRANSCRIPT

International Journal of Advanced Robotic Systems Robotic Platform for Automated Search and Rescue Missions of Humans Regular Paper
Eli Kolberg1, Yevgeny Beiderman1, Roy Talyosef1, Raphi Amsalem1, Javier Garcia2 and Zeev Zalevsky1,*
1 Faculty of Engineering, Bar Ilan University, Ramat-Gan, Israel 2 Departamento de Óptica, Universitat de València, Burjassot, Spain * Corresponding author E-mail: [email protected] Received 4 Jun 2012; Accepted 26 Oct 2012 DOI: 10.5772/54714 © 2013 Kolberg et al.; licensee InTech. This is an open access article distributed under the terms of the Creative Commons Attribution License (http://creativecommons.org/licenses/by/3.0), which permits unrestricted use, distribution, and reproduction in any medium, provided the original work is properly cited.
Abstract We present a novel type of model incorporating a special remote life signals sensing optical system on top of a controllable robotic platform. The remote sensing system consists of a laser and a camera. By properly adapting our optics and by applying a proper image processing algorithm we can sense within the field of view, illuminated by the laser and imaged by the camera, the heartbeats and the blood pulse pressure of subjects (even several simultaneously). The task is to use the developed robotic system for search and rescue mission such as saving survivals from a fire. Keywords Remote Sensing, Biomedical Monitoring, Robotic Platform, Automated Search, Rescue Missions
1. Introduction
The proposed device consists of a combination between a photonic remote vital life signal sensing device and a robotic platform. The photonic device can be used for continuous and accurate monitoring of various biomedical parameters, and especially, the sensing of
blood pulse pressure and heartbeat, as part of the remote detection of vital life signals in smoky conditions. The system includes a camera and a laser. The laser illuminates a given field of view, while the camera takes images at a high sampling rate. A close range demo of the proposed system was constructed before, to monitor various biomedical parameters such as heartbeat [1, 2], blood pulse pressure [3] and glucose concentration [4], as well as to track the 3D movement of spontaneous contractions of rat cardiac muscle cells [5]. High precision inspection of the 3D movement of red blood cells allowed early detection of malaria [6]. Note that in our photonic device we inspect the secondary reflected speckle pattern. The speckles are self‐interference random patterns [7] and have the remarkable quality that each individual speckle serves as a reference point from which one may track the changes in the phase of the light that is being scattered from the surface [7]. Because of that, speckle techniques, such as electronic speckle‐pattern interferometry (ESPI), have been widely used for displacement measuring and vibration analysis (amplitudes, slopes and modes of vibration), as well as characterization of deformations [8‐14]. Usage of speckles was also applied for improving the
1Eli Kolberg, Yevgeny Beiderman, Roy Talyosef, Raphi Amsalem, Javier Garcia and Zeev Zalevsky: Robotic Platform for Automated Search and Rescue Missions of Humans
www.intechopen.com
ARTICLE
www.intechopen.com Int J Adv Robotic Sy, 2013, Vol. 10, 91:2013
resolving capabilities of imaging sensors [15], as well as ranging and 3D estimation [16]. However, we do not use regular ESPI configuration, but rather defocus the optics of our camera to allow the reflected secondary speckle pattern to shift, rather than to change due to tilting of the reflecting surface. By tracking the shift of those patterns, one may accurately estimate the movement of the reflecting surface and from that to be able to estimate various biomedical parameters such as heartbeats. The developed robotic system is applicable for search and rescue missions such as saving survivors from a fire. When a fire starts in an apartment or an office, it takes time until the fire fighting forces come to take care of it. At that time the apartment/office is already full of smoke and this makes it difficult for the fire fighters to see the apartment structure and observe survivors. The system we present here can help in decreasing the time for finding casualties by first reporting the finding of any casualties and second, the location of the casualties in the apartment. A map of the apartment is built as the search progresses. The navigation procedure is a classic SLAM (Simultaneous Localization and Mapping) problem [17]. Using a camera or infrared (IR) sensors for mapping or localization as appears in the literature [18‐20], or a combination of sensors like USB cameras, microphones, pyro‐electric sensors and infrared cameras as appears in [21 and 22], are good solutions for detecting victims in many environments but are less effective in fire and heavy smoke. Therefore, the SLAM process will be based upon ultrasonic sensors, particle filters and navigation algorithms. The robot will start searching an apartment, while the above‐mentioned laser system scans the area for human heartbeats. When a room with human survivors is found, the robot will pass the doorway and approach the human survivors, evaluate their vital life signs and transmit the data regarding their medical state, as well as their current location, to a control station via a wireless communication channel. There is no need for absolute accuracy on the exact location of a survivor within the room. The control station supervisor can then make a decision whether there is enough information to take action. The robot, if a human was found, will signal immediately to the rescue team, while continue its search in the other areas of the apartment. If no human was found, the robot will send a special signal to the rescue team, avoiding potential damage and risk to the fire fighting team members. The main benefit in the configuration we propose in this paper is related to the fact that there is an automated robotic platform that is capable of the remote detection of life signals and performing rescue operations without endangering human rescue crew members. Currently
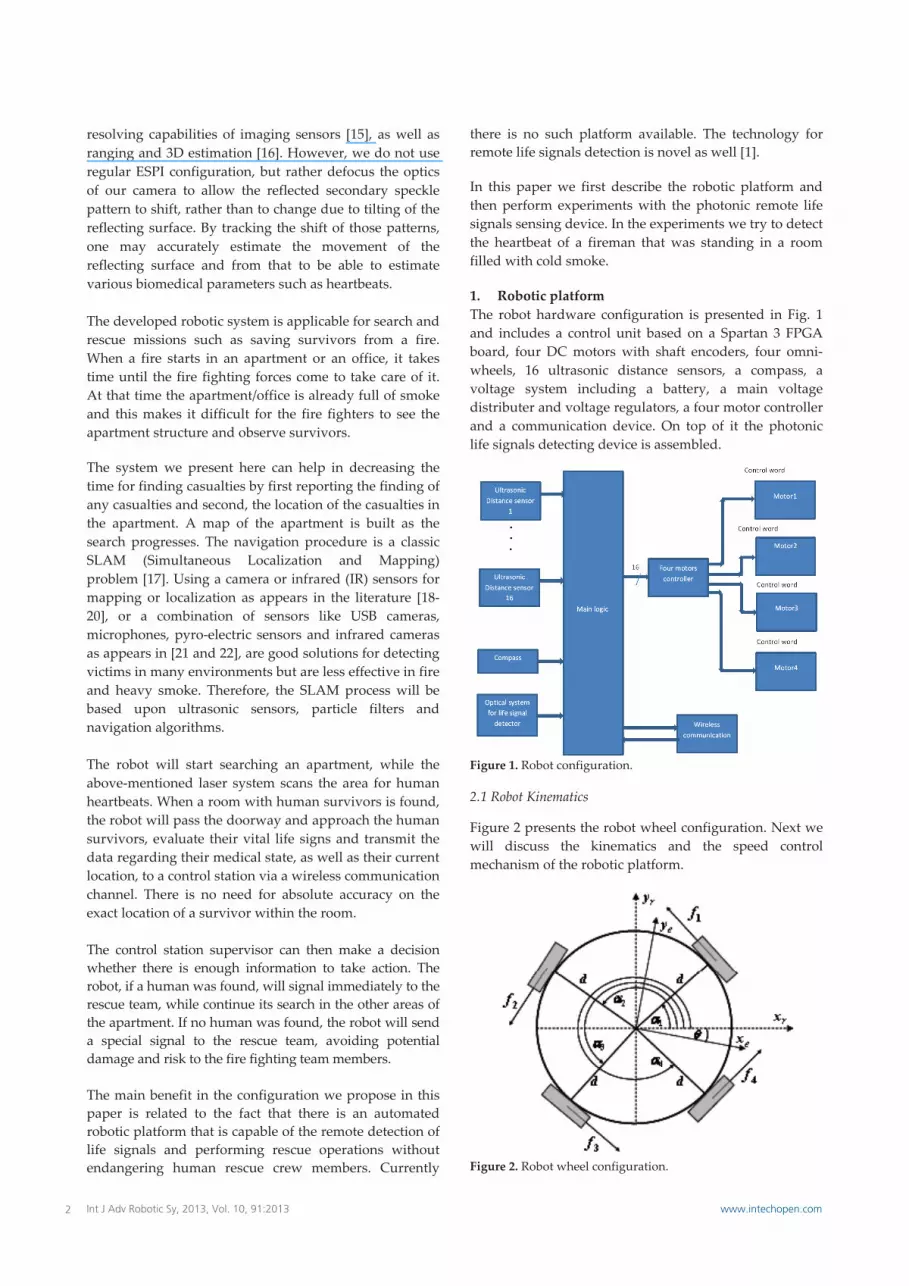
there is no such platform available. The technology for remote life signals detection is novel as well [1]. In this paper we first describe the robotic platform and then perform experiments with the photonic remote life signals sensing device. In the experiments we try to detect the heartbeat of a fireman that was standing in a room filled with cold smoke. 1. Robotic platform The robot hardware configuration is presented in Fig. 1 and includes a control unit based on a Spartan 3 FPGA board, four DC motors with shaft encoders, four omni‐wheels, 16 ultrasonic distance sensors, a compass, a voltage system including a battery, a main voltage distributer and voltage regulators, a four motor controller and a communication device. On top of it the photonic life signals detecting device is assembled.
Figure 1. Robot configuration.
2.1 Robot Kinematics
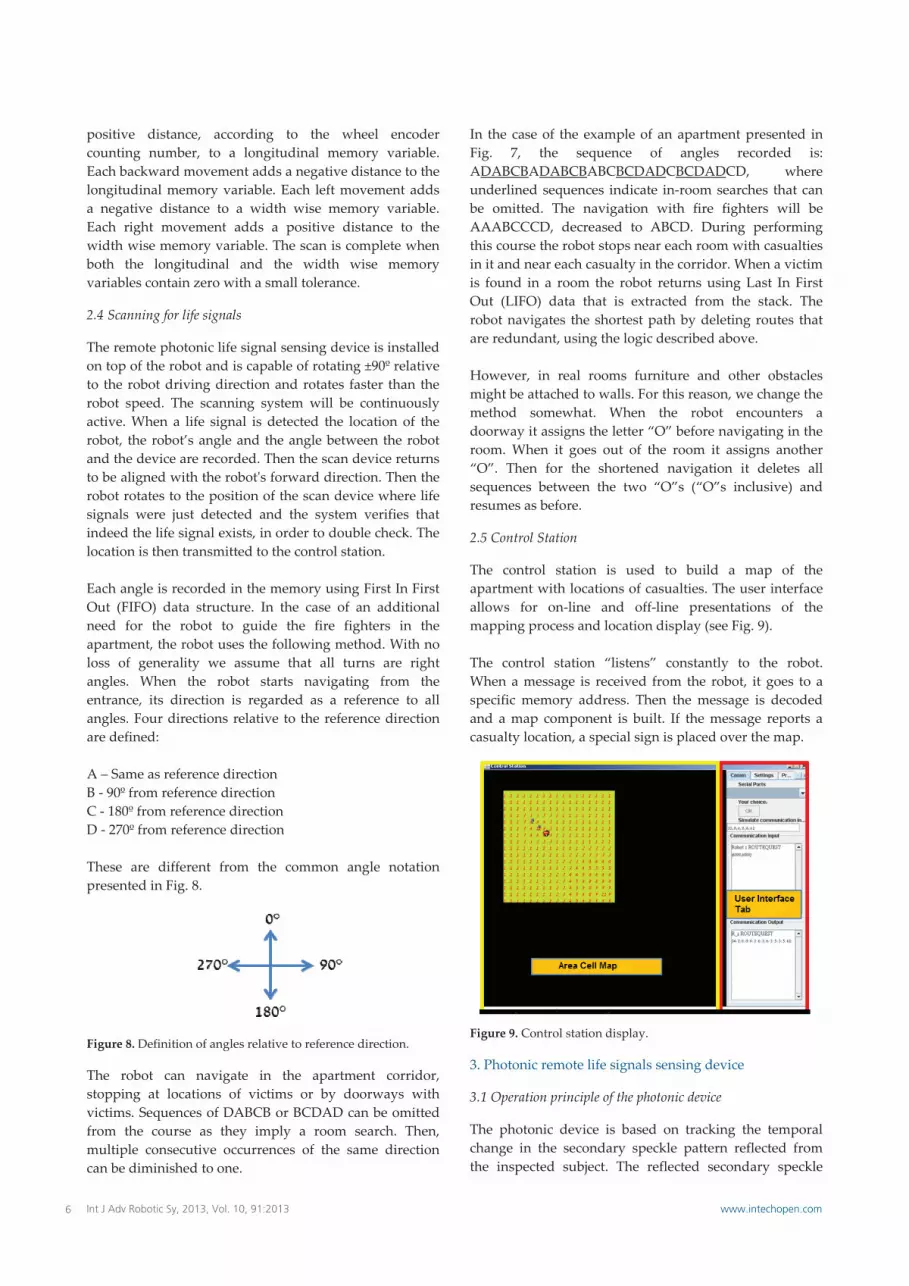
Figure 2 presents the robot wheel configuration. Next we will discuss the kinematics and the speed control mechanism of the robotic platform.
Figure 2. Robot wheel configuration.
2 Int J Adv Robotic Sy, 2013, Vol. 10, 91:2013 www.intechopen.com

The common robot kinematics can be written as:
r desired (1)
where,
1 2 3 4
T
r
T
desired x y
1 1 1 1
2 2 2 2
3 3 3 3
4 4 4 4
cos sin cos sin sin sin cos coscos sin cos sin sin sin cos coscos sin cos sin sin sin cos coscos sin cos sin sin sin cos cos
dddd
where i is the angle between wheel i and the robot x‐axis, i
is the angular velocity of wheel i,
is the robot
angular velocity about the z‐axis of the global reference frame and d is the distance between wheels and the robot centre. Desired robot velocity ( desired ) is used to generate the robotʹs wheel angular velocity vector ( r ). This wheel angular vector is the control signal, which is sent from the FPGA processing board. The output angular velocity ( sensed ) of each wheel is sensed by each motor encoder. The output velocity contains information about disturbances. The disturbance error can be found by comparing the desired velocity and the sensed velocity. The output velocity can be defined as in Eq. (2), where it is assumed that the disturbance is constant for a specific surface. Two kinds of disturbance are modelled in Eq. (2):
†( )sensed r (2)
where † is the pseudo inverse of the kinematic equation, is the disturbance gain matrix due to the robot coupling velocity friction and is the disturbance vector due to the surface friction. The correction of the speed of each motor is done by a PID algorithm for each motor speed. The four motor control adds additional PID controllers for the robot translation and rotational vectors. The implemented control system is shown in Fig. 3. It uses wheel encoders as feedback sensors to close the control loop. Each wheel PID controller is responsible for making it rotate at the commanded speed. Interleaved with them are two PID controllers responsible for the robot motion. The robot drives faster when no object is sensed by the distance sensors or when the distance to the front wall or object is above a predefined threshold.
ss a
ss a
ss a
ss a
Figure 3. Control loop using four motor wheel encoders, desired robot speed and distance to be travelled.
We tested the validity of pulse width modulation (PWM) pulses for motor speed with the test bench presented in Fig. 4.
Figure 4. Test bench for 70% duty cycle PWM signal.
2.2 Localization and mapping using particle filter
In particle filters, the samples of a posterior distribution are called particles [23] and are denoted as:
[1] [2] [ ]: , ,..., Mt t t tX x x x (3)
Each particle [ ]Mtx (with 1 � m � M) is a concrete
instantiation of the state at time t, i.e., a hypothesis as to what the true world state may be at time t. Here M denotes the number of particles in the particle set tX . In practice, the number of particles M is often a large number. In some implementations M is a function of t or of other quantities related to the belief ( )tbel x . The particle filter [23], which is nonparametric filter, relies on Bayes filter posterior: 1: Algorithm Particle_filter 1( , , ) :t t tu z 2: 0t t 3: for m = 1 toM do4: Sample 1( , )mm
t t t tx p x u x 5:
( )m mt t tw p z x
a
3Eli Kolberg, Yevgeny Beiderman, Roy Talyosef, Raphi Amsalem, Javier Garcia and Zeev Zalevsky: Robotic Platform for Automated Search and Rescue Missions of Humans
www.intechopen.com

6: ,m m
t t t tx w
7: endfor 8: for m = 1 to M do 9:
draw i with probability α itw
10: add itx to t
11: endfor 12: return t
where particle m
tx (with 1 m M ) is a concrete instantiation of the state at time t, i.e., a hypothesis as to what the true world state may be at time t. t is the particle set or the samples of a posterior distribution, M is the number of particles and m
tw is the weight of a particle. Here the robot localization is carried out using particle filtering, or the sequential Monte Carlo method as just described. The inputs we use are objects detected by the distance sensors, motors tracking and the compass data. By using the filter, we were able to make an educated guess of the robotʹs location and direction, relative to the fixed objects in the field (corners, doorways or obstacles).
(a) (b)
(c) (d)
Figure 5. Localization using particle filter.
The algorithm goes as follows: M particles represent the robotʹs position estimation. The initial global uncertainty is achieved by randomly generating M particles (Fig. 5(a)). Given the sensorsʹ data, particles are graded by the
angle the object is seen at and by distance. Noise is added to each input (Fig. 5(b)). After a few iterations, the particles converge to the robotʹs real location (Fig. 5(c)). After some more iterations, the particles are very close to the robotʹs real location. Note that some randomly scattered particles (10%) are added to the particle sets in each iteration (Fig. 5(d)), in order to be able to handle failures such as robot kidnapping or global localization failures.
2.3 Navigation
We will interpret an apartment as a maze and use maze‐solving methods for navigating through the apartment. The maze is built with a main course, with sideways (rooms) breaching from the main course. In order to decide upon the navigation procedure we used QFD (quality function deployment) [24], the Pugh concept selection method [25] and FMEA (Failure Mode and Effects Analysis) [26] design tools. The layout of the QFD diagram is shown in Fig. 6. It is often called the house of quality because of this configuration. Each room in the house has a name that implies its function. Table 1 describes what is found in each of the “rooms” of this house.
Figure 6. House of quality rooms’ function. Another popular conceptual design tool is the Pugh concept selection method. This tool compares each concept relative to a reference or datum concept and for each criterion determines whether the concept in question is better than (+), poorer than (‐), or about the same as the reference concept (S). Thus, it is a relative comparison technique. Studies show that a small group is better than an individual at selecting ideas. One of the design tools for preventing failures is Failure Mode and Effects Analysis (FMEA). This is a proactive design tool technique and quality method that enables the identification and prevention of process or product
4 Int J Adv Robotic Sy, 2013, Vol. 10, 91:2013 www.intechopen.com

errors before they occur. It assists in identifying the different failure modes of a system and might be used for reliability evaluation. The FMEA procedure is composed of 15 steps: 1. Describe the product/process and its function. 2. Use a diagram to begin listing items or functions. 3. Identify failure modes. 4. Each failure should be listed in technical terms. Failure modes should be listed for functions of each component or process step. 5. Describe the effects of those failure modes. 6. Establish a numerical ranking for the severity of the effect. 7. Identify the causes for each failure mode. 8. Enter the probability factor (probability of the cause
occurring). 9. Identify current controls (design or process). 10. Determine the likelihood of detection. 11. Review Risk Priority Numbers (RPN). The Risk Priority Number is a mathematical product of the numerical severity, probability and detection ratings: RPN = (severity) x (probability) x (detection). 12. Determine the recommended action(s) to address potential failures that have a high RPN. 13. Assign responsibility and a target completion date for these actions. 14. Indicate actions taken. 15. Update the FMEA as the design or process changes, the assessment changes, or new information becomes available.
Room No.
What is found in each of the “rooms” of the house of quality
Customer requirements (whats). Can be a problem statement etc. Competitive assessment shows how the top two or three competitive products, ideas or algorithms etc. rank with respect
to customer requirements. This section starts with ranking each customer requirement on a scale of 1 to 5 and then by considering the planned improvement and any requirements that are planned for special attention and then builds up to an importance rating.
Importance rating: Here the importance of each requirement is evaluated based on customer importance rate, the existing product and the planned product.
Engineering characteristics (hows) that enable satisfying the customer requirements are listed in columns. The correlation matrix shows the degree of interdependence among the engineering characteristics in the “roof of the
house”. Often this “roof” is not used because either the EC correlation is irrelevant or the supply information is useless. In cases where trade‐offs should be made, the “roof” data is important.
The relationship matrix determines the correlation between the engineering characteristics (EC) and the customer requirements (CR). To do this, each CR is taken and for each EC, in turn, it is asked whether it will significantly, moderately, slightly, or not at all impact the customer need. Generally a nonlinear 9/3/1/0 scale (sometimes five is added) is used to weight disproportionately those ECs that strongly affect CR.
To determine the absolute importance, first multiply the numerical value in each of the cells of the relationship matrix (6) by the importance rating (3). Then, sum the numbers in the cells of each column. These totals show the absolute importance of each EC in meeting the CR.
Relative importance is the absolute importance, normalized on a scale from 1 to 100, by taking each absolute importance value, dividing it by the sum of absolute importance values and multiplying it by 100. Those ECs with the highest rating should be given special attention, for these are the ones that have the greatest effect upon customer satisfaction.
The technical competitive assessment benchmarks your company performance against two or three top competitors for each of the engineering characteristics. Generally a scale of 1‐5 (five being the best) is used. Often this information is obtained by acquiring examples of the competitorʹs product and testing them.
Technical difficulty indicates the ease with which each of the engineering characteristics can be achieved. Setting target values. By knowing which the most important ECs are, understanding the technical competition and
having a feel for the technical difficulty, the team is in a good position to set the targets for each engineering characteristic.
Table 1. Description of what is found in each of the “rooms” of the house of quality.
Using the FMEA, Pugh and QFD analyses we decided upon the following left wall navigation, presented in Fig. 7.
Figure 7. Left side wall navigation.
The algorithm allows for complete area cover with a complexity of order of O(n). In each junction the robot checks (with ultrasonic distance sensors) for a left turn option or a right turn in each 90 degree vertex following wall on the left side of the robot. Each robot’s turn and driving direction is recorded based on compass data. Locked doors are identified as such by taking into account a standard lintel length of 10cm‐20cm and a door length of 75cm‐85cm. The positions of locked doors are recorded and saved in the memory and reported to the control station. The robot uses a special memory location for keeping track of its movements. Each forward movement adds a
5Eli Kolberg, Yevgeny Beiderman, Roy Talyosef, Raphi Amsalem, Javier Garcia and Zeev Zalevsky: Robotic Platform for Automated Search and Rescue Missions of Humans
www.intechopen.com
positive distance, according to the wheel encoder counting number, to a longitudinal memory variable. Each backward movement adds a negative distance to the longitudinal memory variable. Each left movement adds a negative distance to a width wise memory variable. Each right movement adds a positive distance to the width wise memory variable. The scan is complete when both the longitudinal and the width wise memory variables contain zero with a small tolerance.
2.4 Scanning for life signals
The remote photonic life signal sensing device is installed on top of the robot and is capable of rotating ±90º relative to the robot driving direction and rotates faster than the robot speed. The scanning system will be continuously active. When a life signal is detected the location of the robot, the robot’s angle and the angle between the robot and the device are recorded. Then the scan device returns to be aligned with the robotʹs forward direction. Then the robot rotates to the position of the scan device where life signals were just detected and the system verifies that indeed the life signal exists, in order to double check. The location is then transmitted to the control station. Each angle is recorded in the memory using First In First Out (FIFO) data structure. In the case of an additional need for the robot to guide the fire fighters in the apartment, the robot uses the following method. With no loss of generality we assume that all turns are right angles. When the robot starts navigating from the entrance, its direction is regarded as a reference to all angles. Four directions relative to the reference direction are defined: A – Same as reference direction B ‐ 90º from reference direction C ‐ 180º from reference direction D ‐ 270º from reference direction These are different from the common angle notation presented in Fig. 8.
Figure 8. Definition of angles relative to reference direction.
The robot can navigate in the apartment corridor, stopping at locations of victims or by doorways with victims. Sequences of DABCB or BCDAD can be omitted from the course as they imply a room search. Then, multiple consecutive occurrences of the same direction can be diminished to one.
In the case of the example of an apartment presented in Fig. 7, the sequence of angles recorded is: ADABCBADABCBABCBCDADCBCDADCD, where underlined sequences indicate in‐room searches that can be omitted. The navigation with fire fighters will be AAABCCCD, decreased to ABCD. During performing this course the robot stops near each room with casualties in it and near each casualty in the corridor. When a victim is found in a room the robot returns using Last In First Out (LIFO) data that is extracted from the stack. The robot navigates the shortest path by deleting routes that are redundant, using the logic described above. However, in real rooms furniture and other obstacles might be attached to walls. For this reason, we change the method somewhat. When the robot encounters a doorway it assigns the letter “O” before navigating in the room. When it goes out of the room it assigns another “O”. Then for the shortened navigation it deletes all sequences between the two “O”s (“O”s inclusive) and resumes as before.
2.5 Control Station
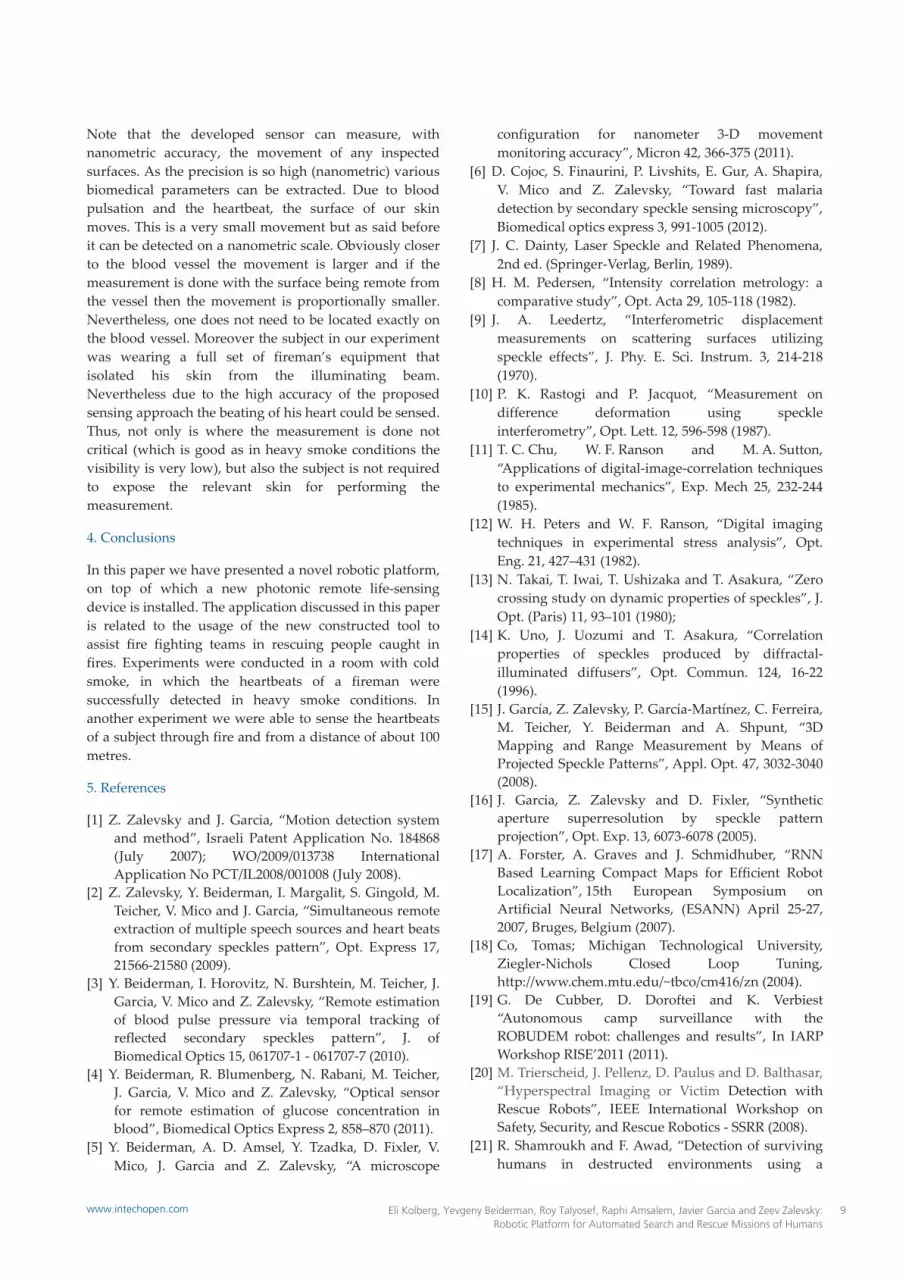
The control station is used to build a map of the apartment with locations of casualties. The user interface allows for on‐line and off‐line presentations of the mapping process and location display (see Fig. 9). The control station “listens” constantly to the robot. When a message is received from the robot, it goes to a specific memory address. Then the message is decoded and a map component is built. If the message reports a casualty location, a special sign is placed over the map.
Figure 9. Control station display.
3. Photonic remote life signals sensing device
3.1 Operation principle of the photonic device
The photonic device is based on tracking the temporal change in the secondary speckle pattern reflected from the inspected subject. The reflected secondary speckle
6 Int J Adv Robotic Sy, 2013, Vol. 10, 91:2013 www.intechopen.com

pattern is actually localized self interfering patterns (and therefore the detection module does not require an external interferometer). In the case of movement of the reflecting surface, those self‐interference random patterns are randomly changed. We have previously demonstrated [1, 2] that properly defocusing the imaging lens of the camera yields the movement of the reflecting surface and its tilting is mainly expressed not in a random change of those patterns, but rather in their movement. Thus, the change of the tilting of the reflecting surface in time causes the movement of the random pattern in time. Capturing a set of images versus time and correlating each sequential image with another can yield the relative movement of the patterns. This relative movement is obtained simply by allocating the time varying position of the correlation peak for each one of the correlation images (simply by allocating the position of the maximum in the correlation image). This temporal movement of the position of the correlation peak is plotted versus time after proper high pass filtering to remove possible noises. The obtained curve is related to the temporal movement of the surface of the skin and as this movement is connected to the mechanics of the beating of the heart, the desired sensing is extracted. As previously stated in our setup we measured a relative value of the spatial displacement of correlation peaks between two adjacent frames taken by a fast digital camera. Relative displacement under proper defocusing is equal to:
4 tan 4
(4)
where is a relative spatial shift of the speckle pattern due to object displacement, is the tilting angle of the object and is an optical wavelength. Assuming that the change in the angle is small enough, we obtain a linear proportion between the relative shift and the actual relative radial movement of the inspected surface:
tan ~ ~ d (5)
where d is the axial displacement of the vibrating object. The measurement of this displacement is done with nanometre accuracy because the shift of the speckle pattern is a function of a fraction of the optical wavelength (which in our experiment was 532nm).
3.2 Smoke and fire experiments with the photonic device
The goal of the cold smoke experiment was to obtain a good pulse reading in thick smoke conditions using the developed photonic sensing device. In the experiment we wanted to check the capability of the photonic system to find heartbeats of a subject who was located in a shed wrapped in smoke. As previously mentioned, the final aim is rescuing people during a fire involving difficulties
such as bad vision conditions, mainly because of the smoke. The experimental setup included a computer (the processing was done with Matlab software), a laser that projected light at wavelength of 532nm (SUWTECH, DPGL ‐2100, CW @ 532nm), high‐resolution camera (Pixelink BL‐771) and a power source. The light beam was projected by the laser source onto the fireman’s chest, positioned within a room with cold and dense smoke. With the camera we can observe the modulations and the software finds out if there is a heartbeat. The schematic sketch of the experimental setup is seen in Fig. 10(a), where the square resembles the shed, which was filled with the dense, cold smoke.
(a)
(b)
Figure 10. (a). Top view schematic sketch of the experimental setup. (b). The obtained experimental results.
The fireman who was positioned in the smoke shed was equipped with an oxygen balloon and a mask. He was
8m
Laser and a high resolution camera
Human A computer
0 1 2 3 4 [sec]
Without smoke
With heavy smoke
7Eli Kolberg, Yevgeny Beiderman, Roy Talyosef, Raphi Amsalem, Javier Garcia and Zeev Zalevsky: Robotic Platform for Automated Search and Rescue Missions of Humans
www.intechopen.com

positioned about 8 metres away from the laser‐based system. We took a reference and measured his pulse. Afterwards we filled the room with smoke, until the visibility was zero. We measured the man’s pulse, while we kept filling the room with smoke as the smoke began to scatter. It is important to mention that when the shed was full of smoke one could not see anything but the reflections coming back from the laser beam. The experiment was run about 20 times. An example of the obtained results is seen in Fig. 10(b), where one may see the remote sensing of the heartbeat without and with the presence of the heavy, cold smoke. The pulse shapes are easily seen in the graphs. Each black arrow points at a pulse. Each pulse represents one heartbeat. The measured patterns presented in Fig. 10(b) were very repeatable. The deviations in the heart rate were less than 5%. Thus, in the experiment we proved that the remote life detecting system is capable of measuring heartbeats at a distance of several metres, even in heavy smoke conditions. Note that although the provided results were applied on a single fireman due to security and safety reasons, they were collected over a long period of recording, including 20 separate experiments in different smoke conditions. Another important point to mention is related to the fact that in bad visual conditions, as in a smoky environment, one may have difficulty distinguishing between humans and pets, for example. However, as the heartbeat signature of humans is very different from animals in the rate of the beating, as well as by the shape of each beat, such discrimination is actually quite a simple task. In the second experiment we validated the capability of the optical remote sensing platform to sense the heart beating through fire. In this experiment we sent a subject to a distance of 100 metres away from the sensing optics (the white rectangle mark in Fig. 11(a) designates the subject as it was seen with our optical infra‐red sensor) and placed a strong fire (we used a barbecue device) in front of him (Fig. 11(b)). This time we used remote sensing optics that work in infrared, rather than at 532nm. In Fig. 11(c) we show the experimentally obtained heartbeat of the subject while the sensing was done and while illuminating through the fire with our laser. One can see the periodic beating repeating itself every second (approximately) and a repeated beating pattern very well. This experiment was run 25 times. The measured patterns presented in Fig. 11 were very repeatable. The deviations in the heart rate were less than 3%. For a better understanding of the principles described in this paper, in Fig. 12 we show one of the prototypes we worked with for the photonic remote sensing device (left) as well as the robotic platform (on the right).
(a)
(b)
(c)
Figure 11. (a). The target as being seen in the infrared sensor of our optical remote sensing platform, from a distance of 100m. (b). The subject of the experiment was sitting in a chair while a large fire was set in front of him. (c). The sensing of the heartbeat of the subject while the sensing was performed by illuminating with the laser through the fire.
Figure 12. Image of two prototypes for the photonic remote sensing device (left) and the robotic platform (right).
One period of the remote photonic extraction of the phonocardiogram
8 Int J Adv Robotic Sy, 2013, Vol. 10, 91:2013 www.intechopen.com
Note that the developed sensor can measure, with nanometric accuracy, the movement of any inspected surfaces. As the precision is so high (nanometric) various biomedical parameters can be extracted. Due to blood pulsation and the heartbeat, the surface of our skin moves. This is a very small movement but as said before it can be detected on a nanometric scale. Obviously closer to the blood vessel the movement is larger and if the measurement is done with the surface being remote from the vessel then the movement is proportionally smaller. Nevertheless, one does not need to be located exactly on the blood vessel. Moreover the subject in our experiment was wearing a full set of fireman’s equipment that isolated his skin from the illuminating beam. Nevertheless due to the high accuracy of the proposed sensing approach the beating of his heart could be sensed. Thus, not only is where the measurement is done not critical (which is good as in heavy smoke conditions the visibility is very low), but also the subject is not required to expose the relevant skin for performing the measurement.
4. Conclusions
In this paper we have presented a novel robotic platform, on top of which a new photonic remote life‐sensing device is installed. The application discussed in this paper is related to the usage of the new constructed tool to assist fire fighting teams in rescuing people caught in fires. Experiments were conducted in a room with cold smoke, in which the heartbeats of a fireman were successfully detected in heavy smoke conditions. In another experiment we were able to sense the heartbeats of a subject through fire and from a distance of about 100 metres.
5. References
[1] Z. Zalevsky and J. Garcia, “Motion detection system and method”, Israeli Patent Application No. 184868 (July 2007); WO/2009/013738 International Application No PCT/IL2008/001008 (July 2008).
[2] Z. Zalevsky, Y. Beiderman, I. Margalit, S. Gingold, M. Teicher, V. Mico and J. Garcia, “Simultaneous remote extraction of multiple speech sources and heart beats from secondary speckles pattern”, Opt. Express 17, 21566‐21580 (2009).
[3] Y. Beiderman, I. Horovitz, N. Burshtein, M. Teicher, J. Garcia, V. Mico and Z. Zalevsky, “Remote estimation of blood pulse pressure via temporal tracking of reflected secondary speckles pattern”, J. of Biomedical Optics 15, 061707‐1 ‐ 061707‐7 (2010).
[4] Y. Beiderman, R. Blumenberg, N. Rabani, M. Teicher, J. Garcia, V. Mico and Z. Zalevsky, “Optical sensor for remote estimation of glucose concentration in blood”, Biomedical Optics Express 2, 858–870 (2011).
[5] Y. Beiderman, A. D. Amsel, Y. Tzadka, D. Fixler, V. Mico, J. Garcia and Z. Zalevsky, “A microscope
configuration for nanometer 3‐D movement monitoring accuracy”, Micron 42, 366‐375 (2011).
[6] D. Cojoc, S. Finaurini, P. Livshits, E. Gur, A. Shapira, V. Mico and Z. Zalevsky, “Toward fast malaria detection by secondary speckle sensing microscopy”, Biomedical optics express 3, 991‐1005 (2012).
[7] J. C. Dainty, Laser Speckle and Related Phenomena, 2nd ed. (Springer‐Verlag, Berlin, 1989).
[8] H. M. Pedersen, “Intensity correlation metrology: a comparative study”, Opt. Acta 29, 105‐118 (1982).
[9] J. A. Leedertz, “Interferometric displacement measurements on scattering surfaces utilizing speckle effects”, J. Phy. E. Sci. Instrum. 3, 214‐218 (1970).
[10] P. K. Rastogi and P. Jacquot, “Measurement on difference deformation using speckle interferometry”, Opt. Lett. 12, 596‐598 (1987).
[11] T. C. Chu, W. F. Ranson and M. A. Sutton, “Applications of digital‐image‐correlation techniques to experimental mechanics”, Exp. Mech 25, 232‐244 (1985).
[12] W. H. Peters and W. F. Ranson, “Digital imaging techniques in experimental stress analysis”, Opt. Eng. 21, 427–431 (1982).
[13] N. Takai, T. Iwai, T. Ushizaka and T. Asakura, “Zero crossing study on dynamic properties of speckles”, J. Opt. (Paris) 11, 93–101 (1980);
[14] K. Uno, J. Uozumi and T. Asakura, “Correlation properties of speckles produced by diffractal‐illuminated diffusers”, Opt. Commun. 124, 16‐22 (1996).
[15] J. García, Z. Zalevsky, P. García‐Martínez, C. Ferreira, M. Teicher, Y. Beiderman and A. Shpunt, “3D Mapping and Range Measurement by Means of Projected Speckle Patterns”, Appl. Opt. 47, 3032‐3040 (2008).
[16] J. Garcia, Z. Zalevsky and D. Fixler, “Synthetic aperture superresolution by speckle pattern projection”, Opt. Exp. 13, 6073‐6078 (2005).
[17] A. Forster, A. Graves and J. Schmidhuber, “RNN Based Learning Compact Maps for Efficient Robot Localization”, 15th European Symposium on Artificial Neural Networks, (ESANN) April 25‐27, 2007, Bruges, Belgium (2007).
[18] Co, Tomas; Michigan Technological University, Ziegler‐Nichols Closed Loop Tuning, http://www.chem.mtu.edu/~tbco/cm416/zn (2004).
[19] G. De Cubber, D. Doroftei and K. Verbiest “Autonomous camp surveillance with the ROBUDEM robot: challenges and results”, In IARP Workshop RISE’2011 (2011).
[20] M. Trierscheid, J. Pellenz, D. Paulus and D. Balthasar, “Hyperspectral Imaging or Victim Detection with Rescue Robots”, IEEE International Workshop on Safety, Security, and Rescue Robotics ‐ SSRR (2008).
[21] R. Shamroukh and F. Awad, “Detection of surviving humans in destructed environments using a
9Eli Kolberg, Yevgeny Beiderman, Roy Talyosef, Raphi Amsalem, Javier Garcia and Zeev Zalevsky: Robotic Platform for Automated Search and Rescue Missions of Humans
www.intechopen.com

simulated autonomous robot”, 6th International Symposium on Mechatronics and its Applications, 2009. ISMA ʹ09, 6, 1‐6 (2009).
[22] S. Burion, J. Gennari, M. Koes, M. Lewis, T. Loboda, J. Manjlovich, I. Nourbakhsh, K. Oishi, S. Patel, J. Polvichai, K. Sycara, J. Wang and M. Yong, “RoboCupRescue ‐ Robot League Team Team Corky, United States”, RoboCup2004 – US Open, Rescue Robot League Competition (2004).
[23] S. Thrun, W. Burgard and D. Fox, Probabilistic Robotics, MIT Press (2006).
[24] Y. Akao and G. H. Mazur, “The Leading Edge in QFD Past, Present and Future”, International Journal of Quality & Reliability Management 20, 1: 20‐35 (2003).
[25] S. Pugh, Total Design – Integrated Methods for Successful Product Engineering, Addison‐Wesley, GB (1991).
[26] S. J. Rhee and K. Ishii, “Using cost based FMEA to enhance reliability and serviceability”, Advanced Engineering Informatics, 17, 3‐4: 179–188, (2003).
10 Int J Adv Robotic Sy, 2013, Vol. 10, 91:2013 www.intechopen.com