risedronate reduces intracortical porosity in postmenopausal women with osteoporosis as measured by...
TRANSCRIPT
ORIGINAL ARTICLE JJBMR
Risedronate Reduces Intracortical Porosity inWomen With OsteoporosisBabul Borah,1 Tom Dufresne,1 Joe Nurre,1 Roger Phipps,1,2 Paula Chmielewski,1 Leigh Wagner,1
Mark Lundy,1 Mary Bouxsein,3 Roger Zebaze,4 and Ego Seeman4
1New Drug Development, Procter & Gamble Pharmaceuticals, Mason, OH, USA2Maine Institute for Human Genetics and Health, Brewer, ME, USA3Ortho Biomechanics Laboratory, Harvard Medical School, Boston, MA, USA4Austin Health, University of Melbourne, Australia
ABSTRACTNonvertebral fractures account for 80% of all fractures and their accompanying morbidity and mortality. Despite this, the effect of drug
therapy on cortical morphology has received limited attention, partly because cortical bone is believed to remodel less and decrease less
with age than trabecular bone. However, the haversian canals traversing the cortex provide a surface for remodeling that produces bone
loss, porosity, and cortical fragility. We developed a new method of 3D micro-computed tomography (mCT) to quantify intracortical
porosity and the effects of treatment. Women with osteoporosis randomized to risedronate (5 mg/day, n¼ 28) or placebo (n¼ 21) had
paired transiliac biopsies at baseline and 5 years imaged using 3DmCT. Pores determined from 8 to 12 slices were stratified by their minor
axis length into those 25 to 100 mm (closing cone of haversian canals), 100 to 300 mm (cutting cone of haversian canals), and >300 mm
(coalescent cavities). Porosity was analyzed as pore area (percent bone area) and pore density (pore number/mm2). Medians are
reported. Risedronate reduced pore area in the 25 to 100, 100 to 300, and 300 to 500 mm ranges over 5 years (p¼ .0008, .04, NS,
respectively) corresponding to an 18% to 25% reduction. In the placebo group, pore area was unchanged. At 5 years, pore area and pore
number/mm2 in the 25 to 100 mm range were each 17% lower in the risedronate group than in the placebo group (p¼ .02 and .04,
respectively). Risedronate is likely to maintain bone strength and reduce nonvertebral fracture risk in part by reducing remodeling and
therefore the number and size of intracortical cavities. � 2010 American Society for Bone and Mineral Research.
KEY WORDS: CORTICAL POROSITY; HAVERSIAN CANALS; OSTEOPOROSIS; 3D MICRO-COMPUTED TOMOGRAPHY; RISEDRONATE
Introduction
Research efforts in preventing fractures have focused on the
pathogenesis of accelerated trabecular bone loss and
vertebral fragility in postmenopausal women.(1–4) However,
80% of all fractures and 80% of all the accompanying morbidity,
mortality, and health costs in the community are the result of
nonvertebral fractures.(5) Moreover, these fractures occur at sites
that are 70% to 80% cortical bone, which is believed to be lost
more slowly than trabecular bone during advancing age because
it is remodeled more slowly.(1–4)
Recent evidence suggests that several of these notions need
reappraisal.(6) Remodeling requires a surface to occur upon.(7,8)
Although trabecular bone is fashioned with more surface per
unit volume than cortical bone, haversian canals traversing the
cortex provide a large intracortical surface area, exposing cortical
bone to the high remodeling after menopause in women and
Submitted for publication on 19 January 2009. Accepted in revised form on 24 Ap
Address correspondence to: Babul Borah, Procter & Gamble Pharmaceuticals, MBC
E-mail: [email protected]
Journal of Bone and Mineral Research, Vol. 25, No. 1, January 2010, pp 41–47
DOI: 10.1359/jbmr.090711
� 2010 American Society for Bone and Mineral Research
late in life in both sexes due to secondary hyperparathyroidism.
For example, Han et al.(8) reported higher remodeling intensity
on the intracortical than on trabecular or endocortical surfaces.
More recently, Zebaze et al.(6) reported that most of the bone lost
with age from the distal radius was intracortical not trabecular in
origin.
Given the role of cortical bone in bone strength, the
predominantly cortical composition of the appendicular skele-
ton, the common occurrence of nonvertebral fractures, and the
lack of information concerning the effects of drug therapy on
cortical morphology, we developed a new method of high-
resolution micro-computed tomography (mCT) to reconstruct
and visualize the 3D longitudinal intersecting haversian canals
within the iliac crest cortex that are seen as ‘‘porosity’’ in 2D
histomorphometric images. We quantified the morphology of
porosity according to pore size and number and determined
whether 5 years of treatment with risedronate reduced
ril 2009. Published ahead of print on 6 July 2009.
SB3-3J8, 8700 Mason Montgomery Road, Mason, OH 45040, USA.
41
intracortical porosity in postmenopausal women with osteo-
porosis.
Materials and Methods
Postmenopausal women in the Vertebral Efficacy with Rise-
dronate Therapy North American (VERT NA) trial with either two
vertebral fractures at baseline or one prevalent vertebral fracture
and a lumbar spine bone mineral density (BMD) T-score of �2
or less received daily risedronate 5 mg or placebo for up to
5 years.(9) All received 1000mg/day elemental calcium carbonate
and vitamin D if deficient at baseline (500 IU/day cholecalciferol).
Transiliac bone biopsies were obtained at baseline and 3 and
5 years for histomorphometric analysis.(10,11) The 5-year biopsy
was taken from the same side as the baseline but at least 2 cm
distant from the previous biopsy. Only subjects with a biopsy at
baseline and 5 years were included (risedronate n¼ 28 and
placebo n¼ 21) in the present study. To be included, the biopsy
was required to have at least one evaluable cortex. When both
cortices were present, analysis was performed on the thicker
cortex. The biopsies were imaged using the Scanco mCT40 with a
resolution of 8 mm. The 16-bit gray-level cortical images were
segmented into bone and pores using a fixed threshold.
Conventional 2D histomorphometric measurement of poros-
ity is associated with a high variance arising from sampling
variations, intersection heterogeneity of pore size and number,
and subjective separation of the corticomedullary junction.(12)
The 3D mCT method addresses several sources of this variability.
The intersection variability was reduced by averaging porosity
for each biopsy over 8 to 12 digital mCT slices, approximately 300
to 400 mm apart, parallel to the original histologic cut face.
Porosity measurement using a single slice as performed in
conventional histomorphometry had a coefficient of variation of
more than 40% and this was reduced to less than 5% when 8 to
12 slices, 300 to 400 mm apart, were used.
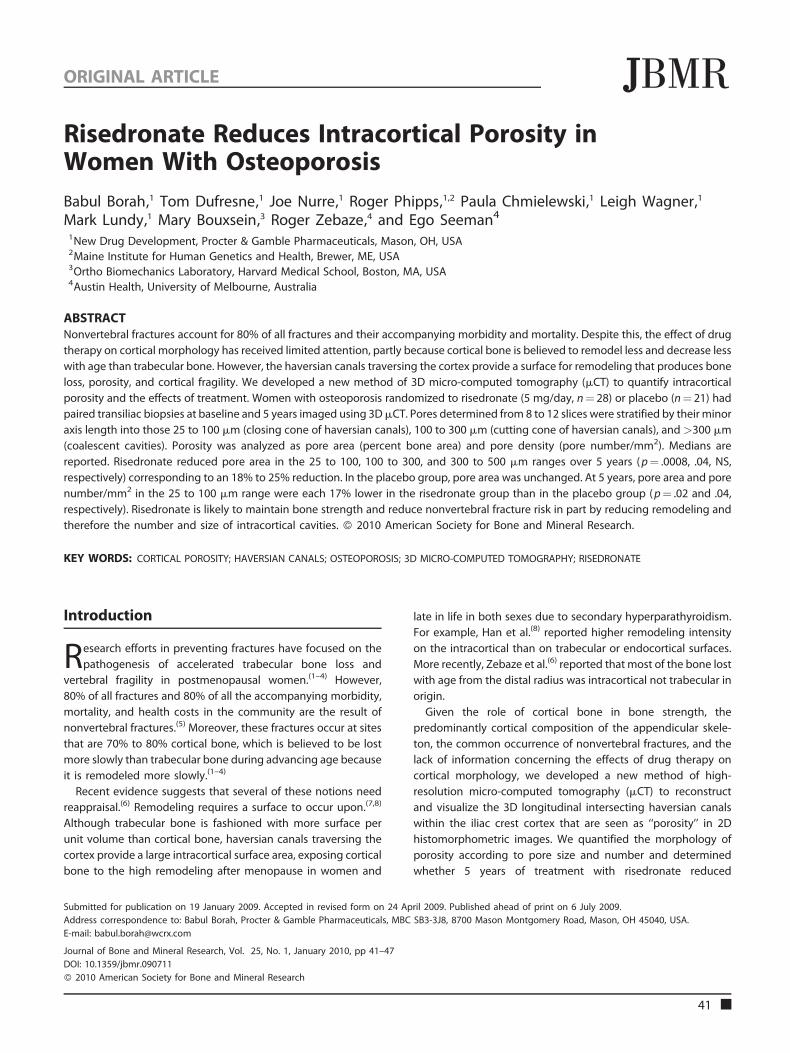
Fig. 1. (Left) Porosity is measured on a single mCT slice with three different arb
cavities close to the periosteum. (B) The boundary includes cavities in the perio
further into the endocortical zone and includes large trabecularized holes. (Righ
increases from �5% (A) to >20% (C). When porosity is measured for a defined r
the absolute pore area and bone area changed, porosity at �6% remained re
42 Journal of Bone and Mineral Research
In iliac crest biopsies, the demarcation between compact
cortex and trabecular compartments is indistinct due to trabe-
cularization of the cortex adjacent to the marrow cavity.(7,12–15)
Subjective separation of cortex and trabecular bone introduces
variability, as illustrated in Fig. 1. Intracortical porosity may be 5%
if ‘‘compact’’ cortex adjacent to the periosteum is chosen or may
be greater than 20% if large cavities adjacent to the marrow are
chosen. To avoid arbitrary demarcation between ‘‘compact’’ and
trabecular bone, we quantified porosity as a continuous variable
by cavity sizes andmeasured porosity for a defined range of pore
sizes, which reduces variability (see Fig. 1). Initially, a boundary
between the cortex and trabecular bone was arbitrarily defined
on the endosteal surface of a slice to include the intracortical
and endocortical regions. All pores within the boundary were
identified using connected components analysis and fitted to an
ellipse to determine their minor axis.(16) Pores were stratified by
their minor-axis length in multiples of 8 mm (minimum pixel
size) and partitioned into ranges of increasing pore size of
approximately 100 mm (increments of 12 pixels). Pores with a
minor axis of less than approximately 25 mm (area with 3 pixels,
osteocyte lacunae) were excluded.(17) Pores in the approximate
range of 25 to 100 mm approximate haversian canals in the
closing cone,(18–20) and pores in the range of 100 to 300 mm
were attributed to the cutting cone excavated during the
resorptive phase of remodeling.(7,21–23) Pores with minor axis of
300 mm or higher were assumed to result from coalescent
cutting cones of adjacent remodeling units.(24)
Analyses were performed blinded to treatment group and
were automated using Matlab scripts and standard Matlab
imaging functions.(25) The area of a pore was the number of
pixels contained within the pore multiplied by the area of a pixel
with dimensions of 8� 8 mm2. The pore area and bone area of all
selected slices were summed to provide a total pore and bone
area, respectively, for the entire biopsy. Porosity was expressed
as pore area/bone area (%) and pore density as pore number per
unit bone area (number/mm2) stratified by pore size, defined as
itrary boundaries shaded yellow in A, B, and C. (A) The boundary includes
steum and part of the endocortical envelope. (C) The boundary extends
t) When all pores within the boundary are included, porosity (%) gradually
ange of pores (�400 mm in this case), the variability is reduced. Although
latively unchanged within the three boundaries.
BORAH ET AL.
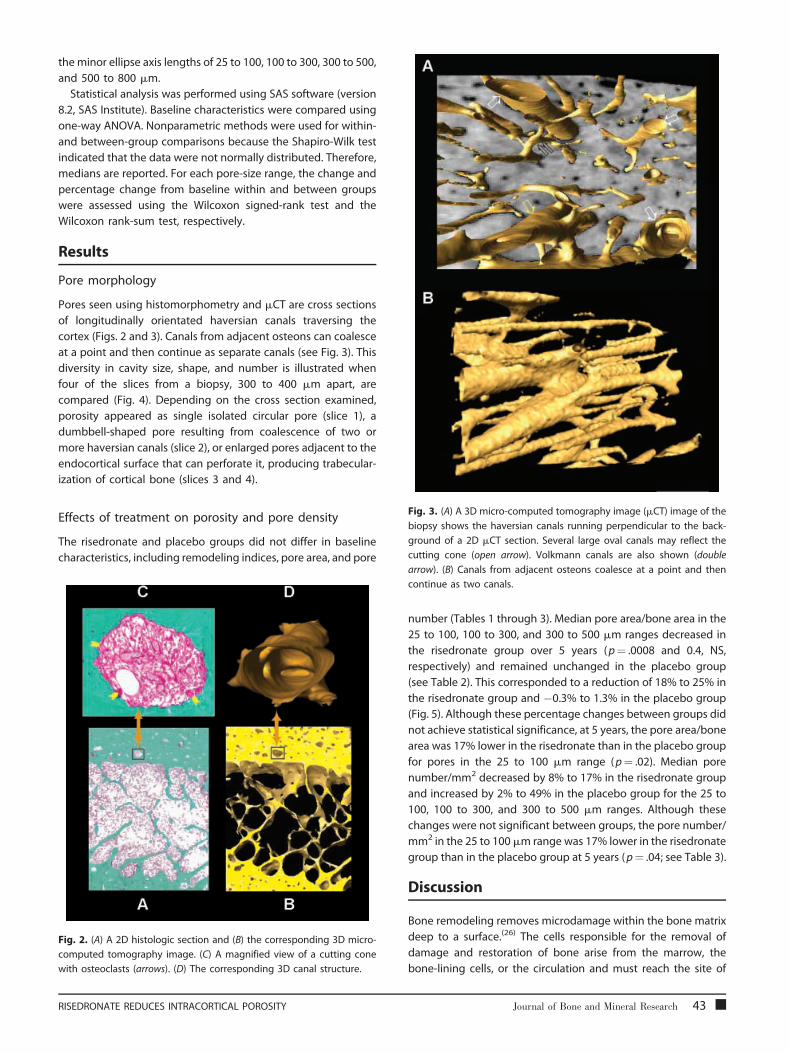
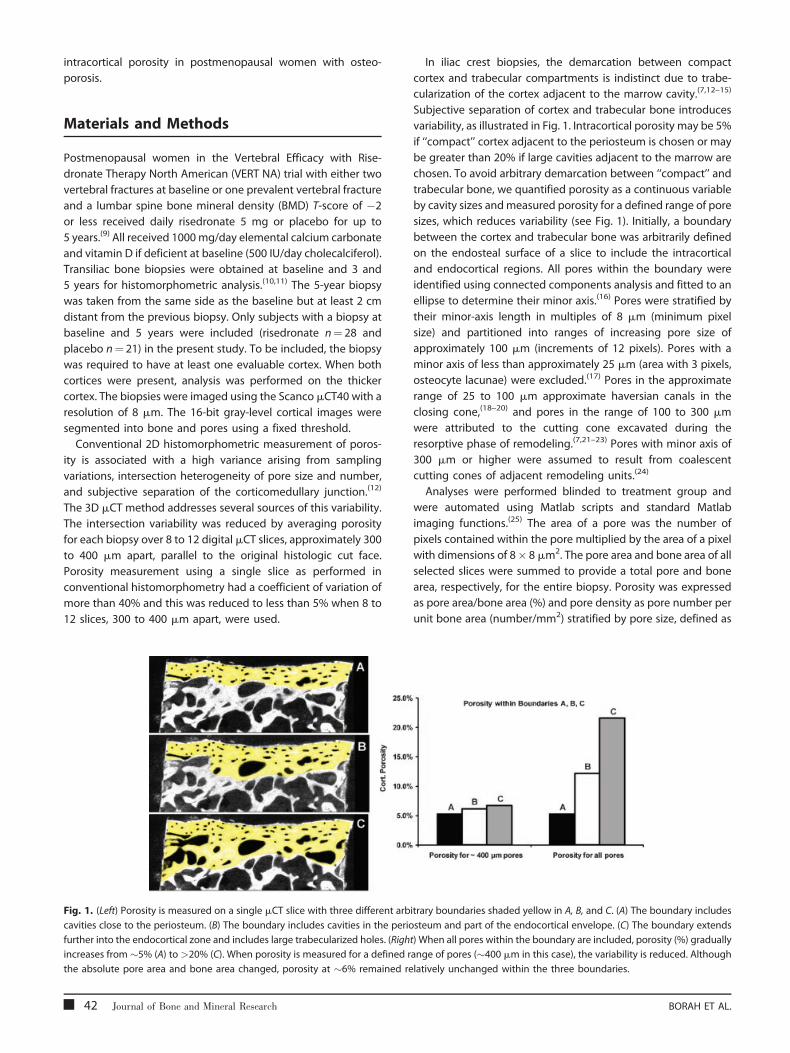
Fig. 3. (A) A 3D micro-computed tomography image (mCT) image of the
biopsy shows the haversian canals running perpendicular to the back-
ground of a 2D mCT section. Several large oval canals may reflect the
cutting cone (open arrow). Volkmann canals are also shown (double
the minor ellipse axis lengths of 25 to 100, 100 to 300, 300 to 500,
and 500 to 800 mm.
Statistical analysis was performed using SAS software (version
8.2, SAS Institute). Baseline characteristics were compared using
one-way ANOVA. Nonparametric methods were used for within-
and between-group comparisons because the Shapiro-Wilk test
indicated that the data were not normally distributed. Therefore,
medians are reported. For each pore-size range, the change and
percentage change from baseline within and between groups
were assessed using the Wilcoxon signed-rank test and the
Wilcoxon rank-sum test, respectively.
Results
Pore morphology
Pores seen using histomorphometry and mCT are cross sections
of longitudinally orientated haversian canals traversing the
cortex (Figs. 2 and 3). Canals from adjacent osteons can coalesce
at a point and then continue as separate canals (see Fig. 3). This
diversity in cavity size, shape, and number is illustrated when
four of the slices from a biopsy, 300 to 400 mm apart, are
compared (Fig. 4). Depending on the cross section examined,
porosity appeared as single isolated circular pore (slice 1), a
dumbbell-shaped pore resulting from coalescence of two or
more haversian canals (slice 2), or enlarged pores adjacent to the
endocortical surface that can perforate it, producing trabecular-
ization of cortical bone (slices 3 and 4).
Effects of treatment on porosity and pore density
The risedronate and placebo groups did not differ in baseline
characteristics, including remodeling indices, pore area, and pore
Fig. 2. (A) A 2D histologic section and (B) the corresponding 3D micro-
computed tomography image. (C) A magnified view of a cutting cone
with osteoclasts (arrows). (D) The corresponding 3D canal structure.
arrow). (B) Canals from adjacent osteons coalesce at a point and then
continue as two canals.
RISEDRONATE REDUCES INTRACORTICAL POROSITY
number (Tables 1 through 3). Median pore area/bone area in the
25 to 100, 100 to 300, and 300 to 500 mm ranges decreased in
the risedronate group over 5 years (p¼ .0008 and 0.4, NS,
respectively) and remained unchanged in the placebo group
(see Table 2). This corresponded to a reduction of 18% to 25% in
the risedronate group and �0.3% to 1.3% in the placebo group
(Fig. 5). Although these percentage changes between groups did
not achieve statistical significance, at 5 years, the pore area/bone
area was 17% lower in the risedronate than in the placebo group
for pores in the 25 to 100 mm range (p¼ .02). Median pore
number/mm2 decreased by 8% to 17% in the risedronate group
and increased by 2% to 49% in the placebo group for the 25 to
100, 100 to 300, and 300 to 500 mm ranges. Although these
changes were not significant between groups, the pore number/
mm2 in the 25 to 100mm range was 17% lower in the risedronate
group than in the placebo group at 5 years (p¼ .04; see Table 3).
Discussion
Bone remodeling removes microdamage within the bone matrix
deep to a surface.(26) The cells responsible for the removal of
damage and restoration of bone arise from the marrow, the
bone-lining cells, or the circulation and must reach the site of
Journal of Bone and Mineral Research 43
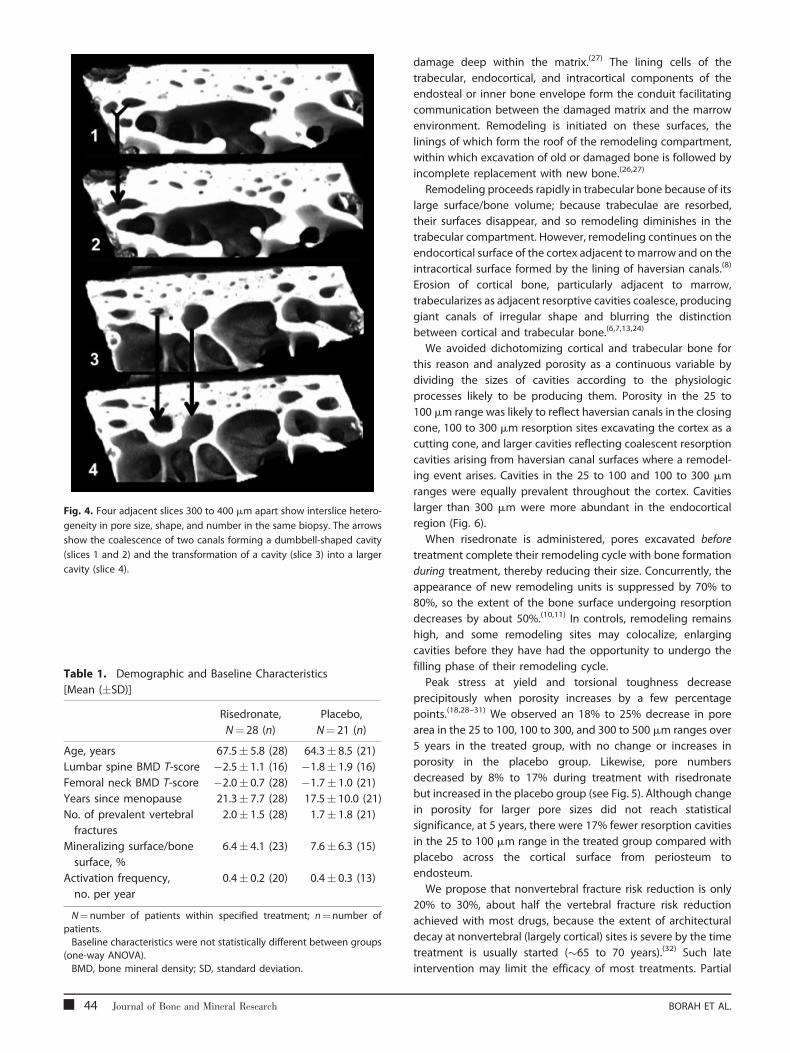
Fig. 4. Four adjacent slices 300 to 400 mm apart show interslice hetero-
geneity in pore size, shape, and number in the same biopsy. The arrows
show the coalescence of two canals forming a dumbbell-shaped cavity
(slices 1 and 2) and the transformation of a cavity (slice 3) into a larger
cavity (slice 4).
Table 1. Demographic and Baseline Characteristics
[Mean (�SD)]
Risedronate,
N¼ 28 (n)
Placebo,
N¼ 21 (n)
Age, years 67.5� 5.8 (28) 64.3� 8.5 (21)
Lumbar spine BMD T-score �2.5� 1.1 (16) �1.8� 1.9 (16)
Femoral neck BMD T-score �2.0� 0.7 (28) �1.7� 1.0 (21)
Years since menopause 21.3� 7.7 (28) 17.5� 10.0 (21)
No. of prevalent vertebral
fractures
2.0� 1.5 (28) 1.7� 1.8 (21)
Mineralizing surface/bone
surface, %
6.4� 4.1 (23) 7.6� 6.3 (15)
Activation frequency,
no. per year
0.4� 0.2 (20) 0.4� 0.3 (13)
N¼number of patients within specified treatment; n¼number of
patients.
Baseline characteristics were not statistically different between groups(one-way ANOVA).
BMD, bone mineral density; SD, standard deviation.
44 Journal of Bone and Mineral Research
damage deep within the matrix.(27) The lining cells of the
trabecular, endocortical, and intracortical components of the
endosteal or inner bone envelope form the conduit facilitating
communication between the damaged matrix and the marrow
environment. Remodeling is initiated on these surfaces, the
linings of which form the roof of the remodeling compartment,
within which excavation of old or damaged bone is followed by
incomplete replacement with new bone.(26,27)
Remodeling proceeds rapidly in trabecular bone because of its
large surface/bone volume; because trabeculae are resorbed,
their surfaces disappear, and so remodeling diminishes in the
trabecular compartment. However, remodeling continues on the
endocortical surface of the cortex adjacent to marrow and on the
intracortical surface formed by the lining of haversian canals.(8)
Erosion of cortical bone, particularly adjacent to marrow,
trabecularizes as adjacent resorptive cavities coalesce, producing
giant canals of irregular shape and blurring the distinction
between cortical and trabecular bone.(6,7,13,24)
We avoided dichotomizing cortical and trabecular bone for
this reason and analyzed porosity as a continuous variable by
dividing the sizes of cavities according to the physiologic
processes likely to be producing them. Porosity in the 25 to
100 mm range was likely to reflect haversian canals in the closing
cone, 100 to 300 mm resorption sites excavating the cortex as a
cutting cone, and larger cavities reflecting coalescent resorption
cavities arising from haversian canal surfaces where a remodel-
ing event arises. Cavities in the 25 to 100 and 100 to 300 mm
ranges were equally prevalent throughout the cortex. Cavities
larger than 300 mm were more abundant in the endocortical
region (Fig. 6).
When risedronate is administered, pores excavated before
treatment complete their remodeling cycle with bone formation
during treatment, thereby reducing their size. Concurrently, the
appearance of new remodeling units is suppressed by 70% to
80%, so the extent of the bone surface undergoing resorption
decreases by about 50%.(10,11) In controls, remodeling remains
high, and some remodeling sites may colocalize, enlarging
cavities before they have had the opportunity to undergo the
filling phase of their remodeling cycle.
Peak stress at yield and torsional toughness decrease
precipitously when porosity increases by a few percentage
points.(18,28–31) We observed an 18% to 25% decrease in pore
area in the 25 to 100, 100 to 300, and 300 to 500 mm ranges over
5 years in the treated group, with no change or increases in
porosity in the placebo group. Likewise, pore numbers
decreased by 8% to 17% during treatment with risedronate
but increased in the placebo group (see Fig. 5). Although change
in porosity for larger pore sizes did not reach statistical
significance, at 5 years, there were 17% fewer resorption cavities
in the 25 to 100 mm range in the treated group compared with
placebo across the cortical surface from periosteum to
endosteum.
We propose that nonvertebral fracture risk reduction is only
20% to 30%, about half the vertebral fracture risk reduction
achieved with most drugs, because the extent of architectural
decay at nonvertebral (largely cortical) sites is severe by the time
treatment is usually started (�65 to 70 years).(32) Such late
intervention may limit the efficacy of most treatments. Partial
BORAH ET AL.
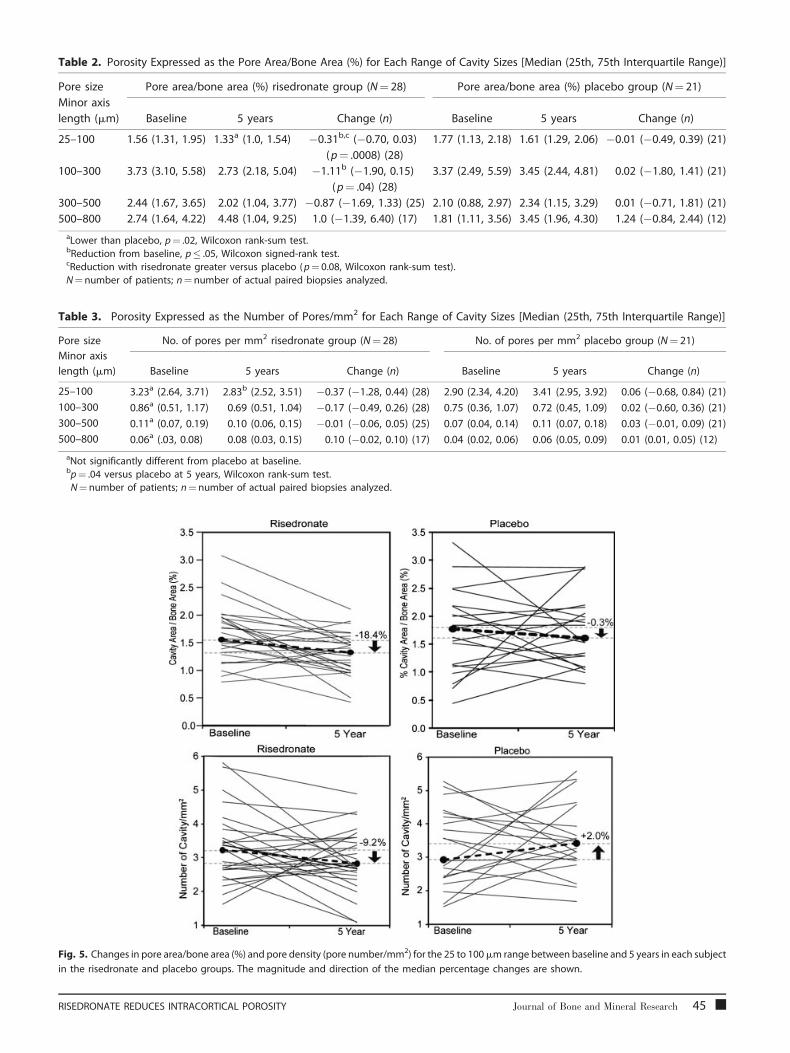
Table 2. Porosity Expressed as the Pore Area/Bone Area (%) for Each Range of Cavity Sizes [Median (25th, 75th Interquartile Range)]
Pore size
Minor axis
length (mm)
Pore area/bone area (%) risedronate group (N¼ 28) Pore area/bone area (%) placebo group (N¼ 21)
Baseline 5 years Change (n) Baseline 5 years Change (n)
25–100 1.56 (1.31, 1.95) 1.33a (1.0, 1.54) �0.31b,c (�0.70, 0.03)
(p¼ .0008) (28)
1.77 (1.13, 2.18) 1.61 (1.29, 2.06) �0.01 (�0.49, 0.39) (21)
100–300 3.73 (3.10, 5.58) 2.73 (2.18, 5.04) �1.11b (�1.90, 0.15)
(p¼ .04) (28)
3.37 (2.49, 5.59) 3.45 (2.44, 4.81) 0.02 (�1.80, 1.41) (21)
300–500 2.44 (1.67, 3.65) 2.02 (1.04, 3.77) �0.87 (�1.69, 1.33) (25) 2.10 (0.88, 2.97) 2.34 (1.15, 3.29) 0.01 (�0.71, 1.81) (21)
500–800 2.74 (1.64, 4.22) 4.48 (1.04, 9.25) 1.0 (�1.39, 6.40) (17) 1.81 (1.11, 3.56) 3.45 (1.96, 4.30) 1.24 (�0.84, 2.44) (12)
aLower than placebo, p¼ .02, Wilcoxon rank-sum test.bReduction from baseline, p� .05, Wilcoxon signed-rank test.cReduction with risedronate greater versus placebo (p¼ 0.08, Wilcoxon rank-sum test).
N¼number of patients; n¼number of actual paired biopsies analyzed.
Table 3. Porosity Expressed as the Number of Pores/mm2 for Each Range of Cavity Sizes [Median (25th, 75th Interquartile Range)]
Pore size
Minor axis
length (mm)
No. of pores per mm2 risedronate group (N¼ 28) No. of pores per mm2 placebo group (N¼ 21)
Baseline 5 years Change (n) Baseline 5 years Change (n)
25–100 3.23a (2.64, 3.71) 2.83b (2.52, 3.51) �0.37 (�1.28, 0.44) (28) 2.90 (2.34, 4.20) 3.41 (2.95, 3.92) 0.06 (�0.68, 0.84) (21)
100–300 0.86a (0.51, 1.17) 0.69 (0.51, 1.04) �0.17 (�0.49, 0.26) (28) 0.75 (0.36, 1.07) 0.72 (0.45, 1.09) 0.02 (�0.60, 0.36) (21)
300–500 0.11a (0.07, 0.19) 0.10 (0.06, 0.15) �0.01 (�0.06, 0.05) (25) 0.07 (0.04, 0.14) 0.11 (0.07, 0.18) 0.03 (�0.01, 0.09) (21)
500–800 0.06a (.03, 0.08) 0.08 (0.03, 0.15) 0.10 (�0.02, 0.10) (17) 0.04 (0.02, 0.06) 0.06 (0.05, 0.09) 0.01 (0.01, 0.05) (12)
aNot significantly different from placebo at baseline.bp¼ .04 versus placebo at 5 years, Wilcoxon rank-sum test.N¼number of patients; n¼ number of actual paired biopsies analyzed.
Fig. 5. Changes in pore area/bone area (%) and pore density (pore number/mm2) for the 25 to 100mm range between baseline and 5 years in each subject
in the risedronate and placebo groups. The magnitude and direction of the median percentage changes are shown.
RISEDRONATE REDUCES INTRACORTICAL POROSITY Journal of Bone and Mineral Research 45
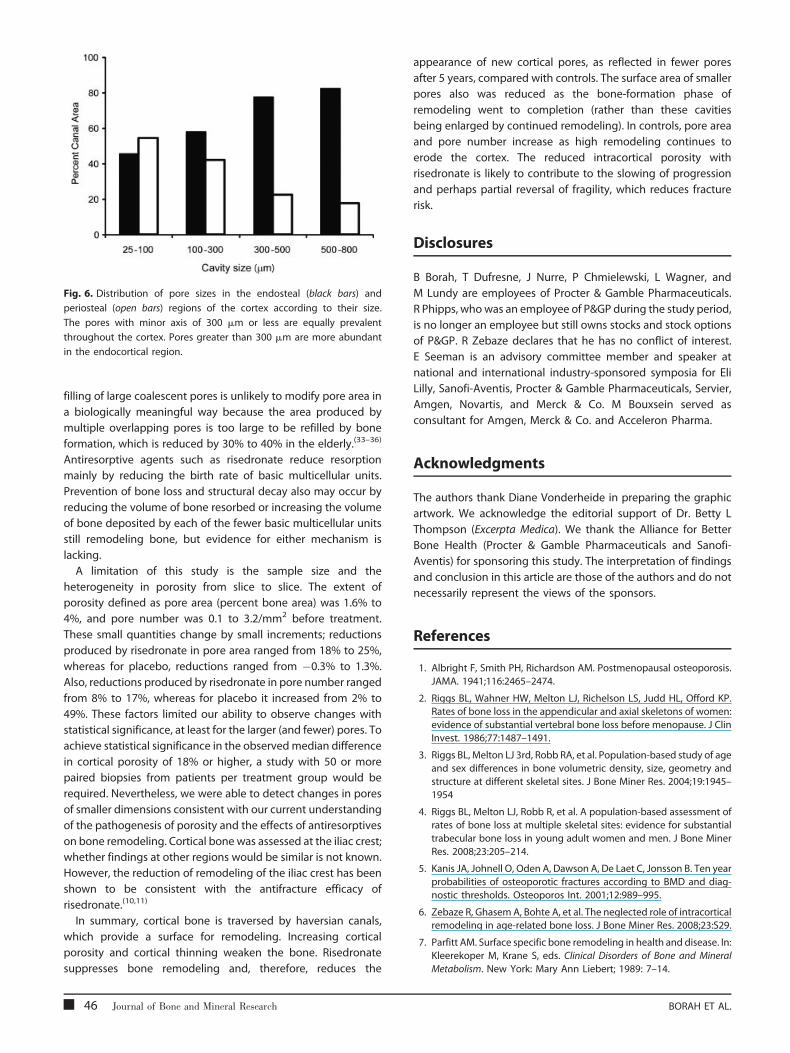
Fig. 6. Distribution of pore sizes in the endosteal (black bars) and
periosteal (open bars) regions of the cortex according to their size.
The pores with minor axis of 300 mm or less are equally prevalent
throughout the cortex. Pores greater than 300 mm are more abundant
in the endocortical region.
filling of large coalescent pores is unlikely to modify pore area in
a biologically meaningful way because the area produced by
multiple overlapping pores is too large to be refilled by bone
formation, which is reduced by 30% to 40% in the elderly.(33–36)
Antiresorptive agents such as risedronate reduce resorption
mainly by reducing the birth rate of basic multicellular units.
Prevention of bone loss and structural decay also may occur by
reducing the volume of bone resorbed or increasing the volume
of bone deposited by each of the fewer basic multicellular units
still remodeling bone, but evidence for either mechanism is
lacking.
A limitation of this study is the sample size and the
heterogeneity in porosity from slice to slice. The extent of
porosity defined as pore area (percent bone area) was 1.6% to
4%, and pore number was 0.1 to 3.2/mm2 before treatment.
These small quantities change by small increments; reductions
produced by risedronate in pore area ranged from 18% to 25%,
whereas for placebo, reductions ranged from �0.3% to 1.3%.
Also, reductions produced by risedronate in pore number ranged
from 8% to 17%, whereas for placebo it increased from 2% to
49%. These factors limited our ability to observe changes with
statistical significance, at least for the larger (and fewer) pores. To
achieve statistical significance in the observedmedian difference
in cortical porosity of 18% or higher, a study with 50 or more
paired biopsies from patients per treatment group would be
required. Nevertheless, we were able to detect changes in pores
of smaller dimensions consistent with our current understanding
of the pathogenesis of porosity and the effects of antiresorptives
on bone remodeling. Cortical bone was assessed at the iliac crest;
whether findings at other regions would be similar is not known.
However, the reduction of remodeling of the iliac crest has been
shown to be consistent with the antifracture efficacy of
risedronate.(10,11)
In summary, cortical bone is traversed by haversian canals,
which provide a surface for remodeling. Increasing cortical
porosity and cortical thinning weaken the bone. Risedronate
suppresses bone remodeling and, therefore, reduces the
46 Journal of Bone and Mineral Research
appearance of new cortical pores, as reflected in fewer pores
after 5 years, compared with controls. The surface area of smaller
pores also was reduced as the bone-formation phase of
remodeling went to completion (rather than these cavities
being enlarged by continued remodeling). In controls, pore area
and pore number increase as high remodeling continues to
erode the cortex. The reduced intracortical porosity with
risedronate is likely to contribute to the slowing of progression
and perhaps partial reversal of fragility, which reduces fracture
risk.
Disclosures
B Borah, T Dufresne, J Nurre, P Chmielewski, L Wagner, and
M Lundy are employees of Procter & Gamble Pharmaceuticals.
R Phipps, whowas an employee of P&GP during the study period,
is no longer an employee but still owns stocks and stock options
of P&GP. R Zebaze declares that he has no conflict of interest.
E Seeman is an advisory committee member and speaker at
national and international industry-sponsored symposia for Eli
Lilly, Sanofi-Aventis, Procter & Gamble Pharmaceuticals, Servier,
Amgen, Novartis, and Merck & Co. M Bouxsein served as
consultant for Amgen, Merck & Co. and Acceleron Pharma.
Acknowledgments
The authors thank Diane Vonderheide in preparing the graphic
artwork. We acknowledge the editorial support of Dr. Betty L
Thompson (Excerpta Medica). We thank the Alliance for Better
Bone Health (Procter & Gamble Pharmaceuticals and Sanofi-
Aventis) for sponsoring this study. The interpretation of findings
and conclusion in this article are those of the authors and do not
necessarily represent the views of the sponsors.
References
1. Albright F, Smith PH, Richardson AM. Postmenopausal osteoporosis.
JAMA. 1941;116:2465–2474.
2. Riggs BL, Wahner HW, Melton LJ, Richelson LS, Judd HL, Offord KP.Rates of bone loss in the appendicular and axial skeletons of women:
evidence of substantial vertebral bone loss before menopause. J Clin
Invest. 1986;77:1487–1491.
3. Riggs BL, Melton LJ 3rd, Robb RA, et al. Population-based study of ageand sex differences in bone volumetric density, size, geometry and
structure at different skeletal sites. J Bone Miner Res. 2004;19:1945–
1954
4. Riggs BL, Melton LJ, Robb R, et al. A population-based assessment ofrates of bone loss at multiple skeletal sites: evidence for substantial
trabecular bone loss in young adult women and men. J Bone Miner
Res. 2008;23:205–214.
5. Kanis JA, Johnell O, Oden A, Dawson A, De Laet C, Jonsson B. Ten year
probabilities of osteoporotic fractures according to BMD and diag-
nostic thresholds. Osteoporos Int. 2001;12:989–995.
6. Zebaze R, GhasemA, Bohte A, et al. The neglected role of intracorticalremodeling in age-related bone loss. J Bone Miner Res. 2008;23:S29.
7. Parfitt AM. Surface specific bone remodeling in health and disease. In:
Kleerekoper M, Krane S, eds. Clinical Disorders of Bone and Mineral
Metabolism. New York: Mary Ann Liebert; 1989: 7–14.
BORAH ET AL.
8. Han Z-H, Palnitkar S, Rao DS, Nelson D, Parfitt AM. Effect of ethnicityand age or menopause on the structure and geometry of iliac bone.
J Bone Miner Res. 1996;11:1967–1975.
9. Harris ST, Watts NB, Genant HK, et al. Effects of risedronate treatment
on vertebral and nonvertebral fractures in women with postmeno-pausal osteoporosis: a randomized, controlled trial. Vertebral Efficacy
with Risedronate Therapy (VERT) Study Group. JAMA. 1999;282:1344–
1352.
10. Eriksen EF, Melsen F, Sod E, Barton I, Chines A. Effects of long-term
risedronate on bone quality and bone turnover in women with
postmenopausal osteoporosis. Bone. 2002;31:620–625.
11. Ste-Marie L-G, Sod E, Johnson T, Chines A. Five years of treatmentwith risedronate and its effects on bone safety in women with
postmenopausal osteoporosis. Calcif Tissue Int. 2004;75:469–476.
12. Compston JE, Vedi S, Stellon AJ. Inter-observer and intra-observer
variation in bone histomorphometry. Calcif Tissue Int. 1986;38:67–70.
13. Power J, Loveridge N, Lyon A, Rushton N, Parker M, Reeve J. Bone
remodeling at the endocortical surface of the human femoral neck: a
mechanism for regional cortical thinning in cases of hip fracture.J Bone Miner Res. 2003;18:1775–1780.
14. Keshawarz NM, Recker RB. Expansion of the medullary cavity at the
expense of cortex in postmenopausal osteoporosis. Metab Bone DisRelat Res. 1984;5:223–228.
15. Bousson V, Meunier A, Bergot C, et al. Distribution of intracortical
porosity in human midfemoral cortex by age and gender. J Bone
Miner Res. 2001;16:1308–1317.
16. Harlick RM, Shapiro LG. Computer and Robot Vision. Vol. 1 Reading,
MA: Addison-Wesley; 1992.
17. Parfitt AM. The physiologic and clinical significance of bone histo-
morphometric data. In: Recker RR, ed. Bone Histomorphometry:Techniques and Interpretation. Boca Raton, FL: CRC Press; 1983:
143–223.
18. Martin RB, Burr DB. The microscopic structure of bone. In: Structure,Function, and Adaptation of Compact Bone. New York: Raven Press;
1989:18–56.
19. Brockstedt H, Kassem M, Eriksen EF, Mosekilde L, Melsen F. Age- and
sex-related changes in iliac cortical bonemass and remodeling. Bone.1993;14:681–691.
20. Barth RW, Williams JL, Kaplan FS. Osteon morphometry in females
with femoral neck fractures. Clin Orthop Relat Res. 1992;283:178–186.
21. Parfitt AM. Osteonal and hemi-osteonal remodeling: the spatial andtemporal framework for signal traffic in adult human bone. J Cell
Biochem. 1994;55:273–286.
22. Qiu S, Fyhrie DP, Palnitkar S, Rao DS. Histomorphometric assessment
of haversian canal and osteocyte lacunae in different-sized osteons
RISEDRONATE REDUCES INTRACORTICAL POROSITY
in human rib. Anat Rec A Discov Mol Cell Evol Biol. 2003;272:520–525.
23. Broulik P, Kragstrup J, Moskilde L, Melsen F. Osteon cross-sectional
size in the iliac crest: variation in normals and patients with osteo-
porosis, hyperparathyroidism, acromegaly, hypothyroidism and trea-ted epilepsia. Acta Pathol Microbiol Immunol Scand [A]. 1982;90:339–
344.
24. Bell KL, Loveridge N, Jordan GR, Power J, Constant CR, Reeve J.A novel mechanism for induction of increased cortical porosity in
cases of intracapsular hip fracture. Bone 2000;27:297–304.
25. The Mathworks, Inc. Image Processing Toolbox for Use with Matlab:
User’s Guide. Natick, MA: Mathworks Inc.; 2004.
26. Parfitt AM. Skeletal heterogeneity and the purposes of bone remo-
deling: implications for the understanding of osteoporosis. In: Marcus
R, Feldman D, Kelsey J, eds. Osteoporosis. San Diego: Academic Press;
1996:315–339.
27. Modder UI, Khosla S. Skeletal stem/osteoprogenitor cells: current
concepts, alternate hypotheses, and relationship to the bone remo-
deling compartment. J Cell Biochem. 2008;103:393–400.
28. Yeni YN, Brown CU, Wang Z, Norman TL. The influence of bonemorphology on fracture toughness of the human femur and tibia.
Bone. 1997;21:453–459.
29. Martin RB, Boardman DL. The effects of collagen fiber orientation,porosity, density, and mineralization on bovine cortical bone bend-
ing properties. J Biomech. 1993;26:1047–1054.
30. Martin RB, Ishida J. The relative effects of collagen fiber orientation,
porosity, density, and mineralization on bone strength. J Biomech.1989;22:419–426.
31. Schaffler MB, Burr DB. Stiffness of compact bone: effects of porosity
and density. J Biomech. 1988;21:13–16.
32. Delmas PD. Treatment of postmenopausal osteoporosis. Lancet.2002;359: 2018–2026.
33. Lips P, Courpron P, Meunier PJ. Mean wall thickness of trabecular
bone packets in the human iliac crest: changes with age. Calcif TissueRes. 1978;26:13–17.
34. Croucher PI, Garrahan NJ, Mellish RWE, Compston JE. Age-related
changes in resorption cavity characteristics in human trabecular
bone. Osteoporos Int. 1991;1:257–261.
35. Power J, Loveridge N, Lyon A, Rushton N, Parker M, Reeve J.
Osteoclastic cortical erosion as a determinant of subperiosteal
osteoblastic bone formation in the femoral neck’s response to
BMU imbalance: effects of stance-related loading and hip fracture.Osteoporos Int. 2005;16:1049–1056.
36. Mayhew PM, Thomas CD, Clement JG, et al. Relation between age,
femoral neck cortical stability, and hip fracture risk. Lancet
2005;366:129–135.
Journal of Bone and Mineral Research 47