restaurant sector - initiation of coverage - credit suisse
TRANSCRIPT
DISCLOSURE APPENDIX AT THE BACK OF THIS REPORT CONTAINS IMPORTANT DISCLOSURES, ANALYST CERTIFICATIONS, AND THE STATU.S.
OF NON-U.S. ANALYSTS. U.S. Disclosure: Credit Suisse does and seeks to do business with companies covered in its research reports. As a result, investors
should be aware that the Firm may have a conflict of interest that could affect the objectivity of this report. Investors should consider this report as only a single
factor in making their investment decision.
CREDIT SUISSE SECURITIES RESEARCH & ANALYTICS BEYOND INFORMATION™
Client-Driven Solutions, Insights and Access
Credit Suisse Equity Research
Americas/United States
Restaurant Sector Initiation of Coverage: Entering Happy Hour, but Without the Discount
March 10, 2015
RESEARCH TEAM
Jason West, CFA
Research Analyst +1 617-556-5745 [email protected]
1
-8%
-6%
-4%
-2%
0%
2%
4%
6%
8%
10%
1999 2001 2003 2005 2008 2010 2012 2014 2016
Knapp CD Industry SSS Listed Restaurants SSS Black Box SSS
Sector Rating / Key Charts
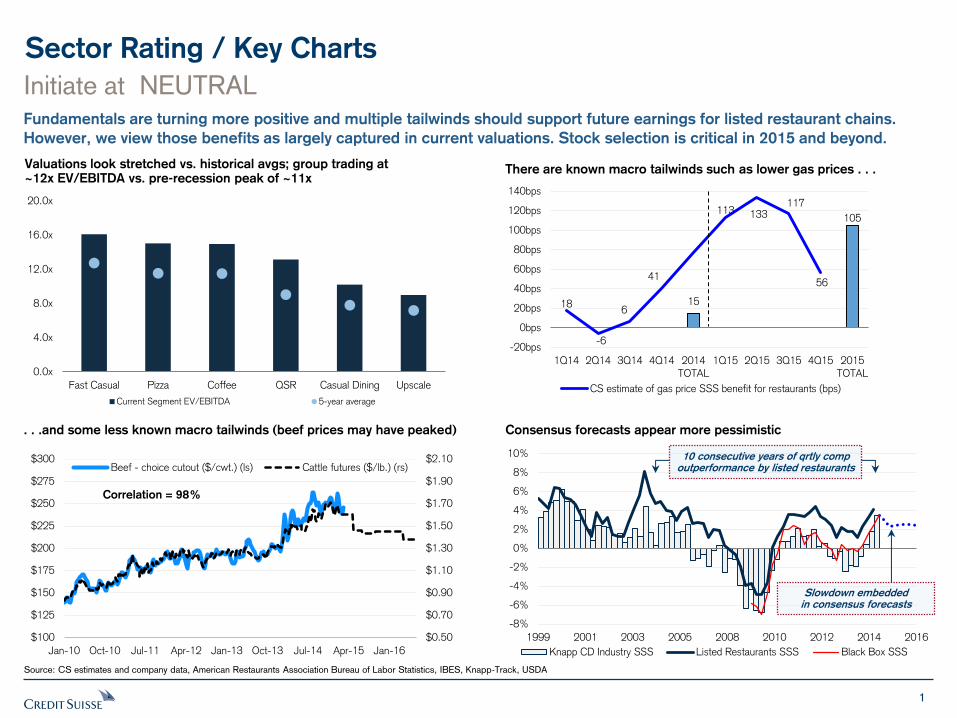
Initiate at NEUTRAL Fundamentals are turning more positive and multiple tailwinds should support future earnings for listed restaurant chains.
However, we view those benefits as largely captured in current valuations. Stock selection is critical in 2015 and beyond.
Source: CS estimates and company data, American Restaurants Association Bureau of Labor Statistics, IBES, Knapp-Track, USDA
Valuations look stretched vs. historical avgs; group trading at ~12x EV/EBITDA vs. pre-recession peak of ~11x
There are known macro tailwinds such as lower gas prices . . .
. . .and some less known macro tailwinds (beef prices may have peaked) Consensus forecasts appear more pessimistic
Slowdown embedded in consensus forecasts
10 consecutive years of qrtly comp outperformance by listed restaurants
0.0x
4.0x
8.0x
12.0x
16.0x
20.0x
Fast Casual Pizza Coffee QSR Casual Dining Upscale
Current Segment EV/EBITDA 5-year average
$0.50
$0.70
$0.90
$1.10
$1.30
$1.50
$1.70
$1.90
$2.10
$100
$125
$150
$175
$200
$225
$250
$275
$300
Jan-10 Oct-10 Jul-11 Apr-12 Jan-13 Oct-13 Jul-14 Apr-15 Jan-16
Beef - choice cutout ($/cwt.) (ls) Cattle futures ($/lb.) (rs)
Correlation = 98%
15
105
18
-6
6
41
113 133 117
56
-20bps
0bps
20bps
40bps
60bps
80bps
100bps
120bps
140bps
1Q14 2Q14 3Q14 4Q14 2014TOTAL
1Q15 2Q15 3Q15 4Q15 2015TOTAL
CS estimate of gas price SSS benefit for restaurants (bps)
2
Sector Rating / Key Charts
Initiate at NEUTRAL
Source: CS estimates and company data, U.S. Census, Technomic
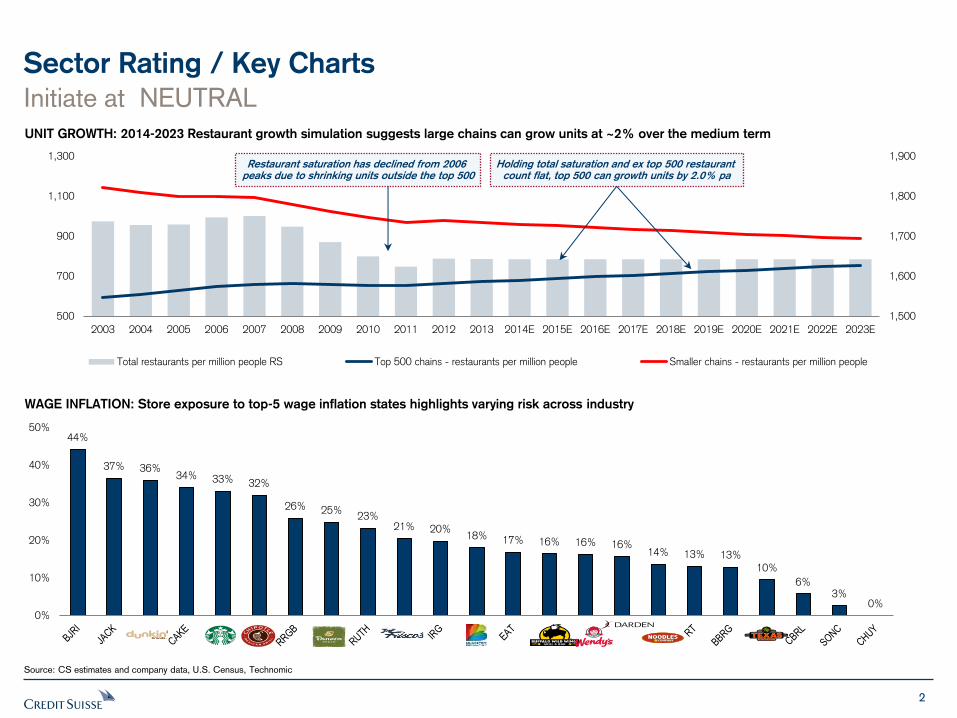
UNIT GROWTH: 2014-2023 Restaurant growth simulation suggests large chains can grow units at ~2% over the medium term
WAGE INFLATION: Store exposure to top-5 wage inflation states highlights varying risk across industry
44%
37% 36% 34% 33% 32%
26% 25% 23%
21% 20% 18% 17% 16% 16% 16%
14% 13% 13% 10%
6% 3%
0% 0%
10%
20%
30%
40%
50%
1,500
1,600
1,700
1,800
1,900
500
700
900
1,100
1,300
2003 2004 2005 2006 2007 2008 2009 2010 2011 2012 2013 2014E 2015E 2016E 2017E 2018E 2019E 2020E 2021E 2022E 2023E
Total restaurants per million people RS Top 500 chains - restaurants per million people Smaller chains - restaurants per million people
Restaurant saturation has declined from 2006 peaks due to shrinking units outside the top 500
Holding total saturation and ex top 500 restaurant count flat, top 500 can growth units by 2.0% pa
3
Table of Contents
Coverage Introduction
Stock Picks / Company Tear Sheets
FOCUS ISSUE: Gasoline Price Impact
Appendix
FOCUS ISSUE: Minimum Wage Analysis
Coverage Introduction
Sector Overview
Valuation & Risks
Tear Sheets
Appendix
Discussion Points
5
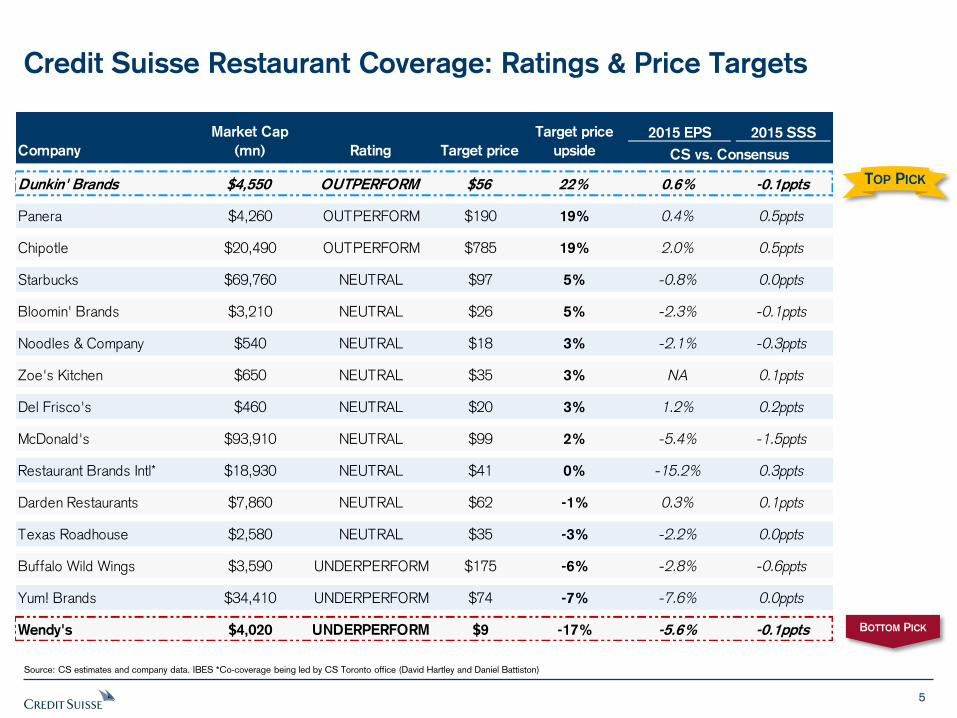
Credit Suisse Restaurant Coverage: Ratings & Price Targets
Source: CS estimates and company data. IBES *Co-coverage being led by CS Toronto office (David Hartley and Daniel Battiston)
TOP PICK
BOTTOM PICK
2015 EPS 2015 SSS
Dunkin' Brands $4,550 OUTPERFORM $56 22% 0.6% -0.1ppts
Panera $4,260 OUTPERFORM $190 19% 0.4% 0.5ppts
Chipotle $20,490 OUTPERFORM $785 19% 2.0% 0.5ppts
Starbucks $69,760 NEUTRAL $97 5% -0.8% 0.0ppts
Bloomin' Brands $3,210 NEUTRAL $26 5% -2.3% -0.1ppts
Noodles & Company $540 NEUTRAL $18 3% -2.1% -0.3ppts
Zoe's Kitchen $650 NEUTRAL $35 3% NA 0.1ppts
Del Frisco's $460 NEUTRAL $20 3% 1.2% 0.2ppts
McDonald's $93,910 NEUTRAL $99 2% -5.4% -1.5ppts
Restaurant Brands Intl* $18,930 NEUTRAL $41 0% -15.2% 0.3ppts
Darden Restaurants $7,860 NEUTRAL $62 -1% 0.3% 0.1ppts
Texas Roadhouse $2,580 NEUTRAL $35 -3% -2.2% 0.0ppts
Buffalo Wild Wings $3,590 UNDERPERFORM $175 -6% -2.8% -0.6ppts
Yum! Brands $34,410 UNDERPERFORM $74 -7% -7.6% 0.0ppts
Wendy's $4,020 UNDERPERFORM $9 -17% -5.6% -0.1ppts
CS vs. ConsensusCompany
Market Cap
(mn) Rating Target price
Target price
upside
6
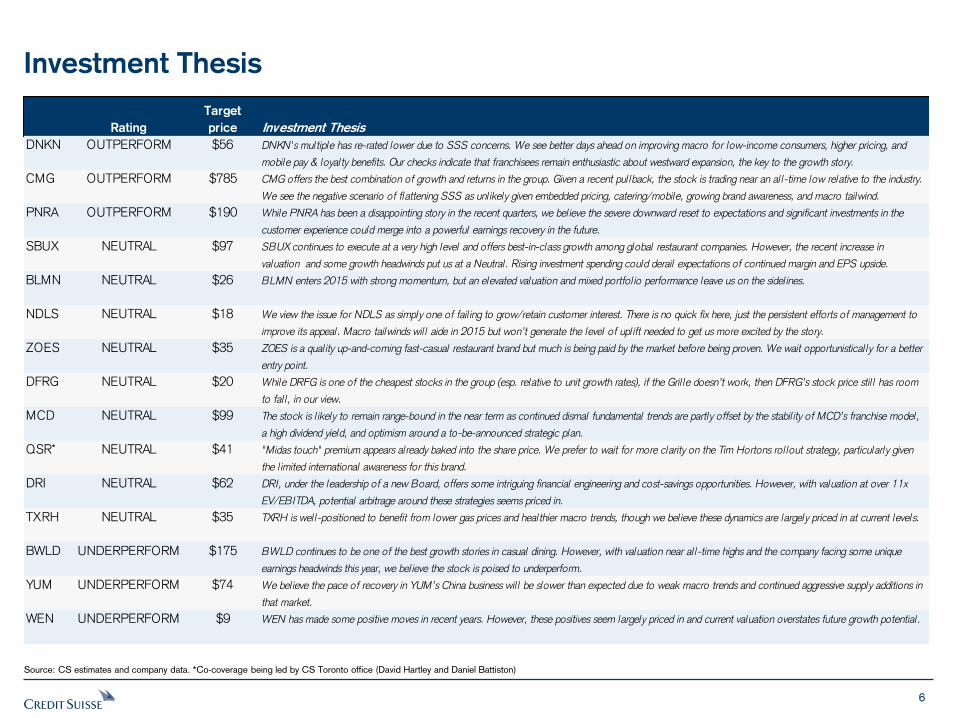
Investment Thesis
Source: CS estimates and company data. *Co-coverage being led by CS Toronto office (David Hartley and Daniel Battiston)
DNKN OUTPERFORM $56
CMG OUTPERFORM $785
PNRA OUTPERFORM $190
SBUX NEUTRAL $97
BLMN NEUTRAL $26
NDLS NEUTRAL $18
ZOES NEUTRAL $35
DFRG NEUTRAL $20
MCD NEUTRAL $99
QSR* NEUTRAL $41
DRI NEUTRAL $62
TXRH NEUTRAL $35
BWLD UNDERPERFORM $175
YUM UNDERPERFORM $74
WEN UNDERPERFORM $9 WEN has made some positive moves in recent years. However, these positives seem largely priced in and current valuation overstates future growth potential .
TXRH is wel l-positioned to benefit from lower gas prices and healthier macro trends, though we bel ieve these dynamics are largely priced in at current levels.
We view the issue for NDLS as simply one of fail ing to grow/retain customer interest. There is no quick fix here, just the persistent efforts of management to
improve its appeal. Macro tailwinds wil l aide in 2015 but won’t generate the level of upl ift needed to get us more excited by the story.
We bel ieve the pace of recovery in YUM’s China business wil l be slower than expected due to weak macro trends and continued aggressive supply additions in
that market.
The stock is l ikely to remain range-bound in the near term as continued dismal fundamental trends are partly offset by the stabil ity of MCD’s franchise model,
a high dividend yield, and optimism around a to-be-announced strategic plan.
DRI, under the leadership of a new Board, offers some intriguing financial engineering and cost-savings opportunities. However, with valuation at over 11x
EV/EBITDA, potential arbitrage around these strategies seems priced in.
While DRFG is one of the cheapest stocks in the group (esp. relative to unit growth rates), if the Gril le doesn’t work, then DFRG’s stock price stil l has room
to fal l , in our view.
BWLD continues to be one of the best growth stories in casual dining. However, with valuation near al l-time highs and the company facing some unique
earnings headwinds this year, we bel ieve the stock is poised to underperform.
"Midas touch" premium appears already baked into the share price. We prefer to wait for more clarity on the Tim Hortons rol lout strategy, particularly given
the l imited international awareness for this brand.
DNKN's multiple has re-rated lower due to SSS concerns. We see better days ahead on improving macro for low-income consumers, higher pricing, and
mobile pay & loyalty benefits. Our checks indicate that franchisees remain enthusiastic about westward expansion, the key to the growth story.
BLMN enters 2015 with strong momentum, but an elevated valuation and mixed portfol io performance leave us on the sidel ines.
ZOES is a qual ity up-and-coming fast-casual restaurant brand but much is being paid by the market before being proven. We wait opportunistical ly for a better
entry point.
Investment ThesisRating
Target
price
While PNRA has been a disappointing story in the recent quarters, we bel ieve the severe downward reset to expectations and significant investments in the
customer experience could merge into a powerful earnings recovery in the future.
CMG offers the best combination of growth and returns in the group. Given a recent pul lback, the stock is trading near an al l-time low relative to the industry.
We see the negative scenario of flattening SSS as unl ikely given embedded pricing, catering/mobile, growing brand awareness, and macro tailwind.
SBUX continues to execute at a very high level and offers best-in-class growth among global restaurant companies. However, the recent increase in
valuation and some growth headwinds put us at a Neutral. Rising investment spending could derail expectations of continued margin and EPS upside.
7
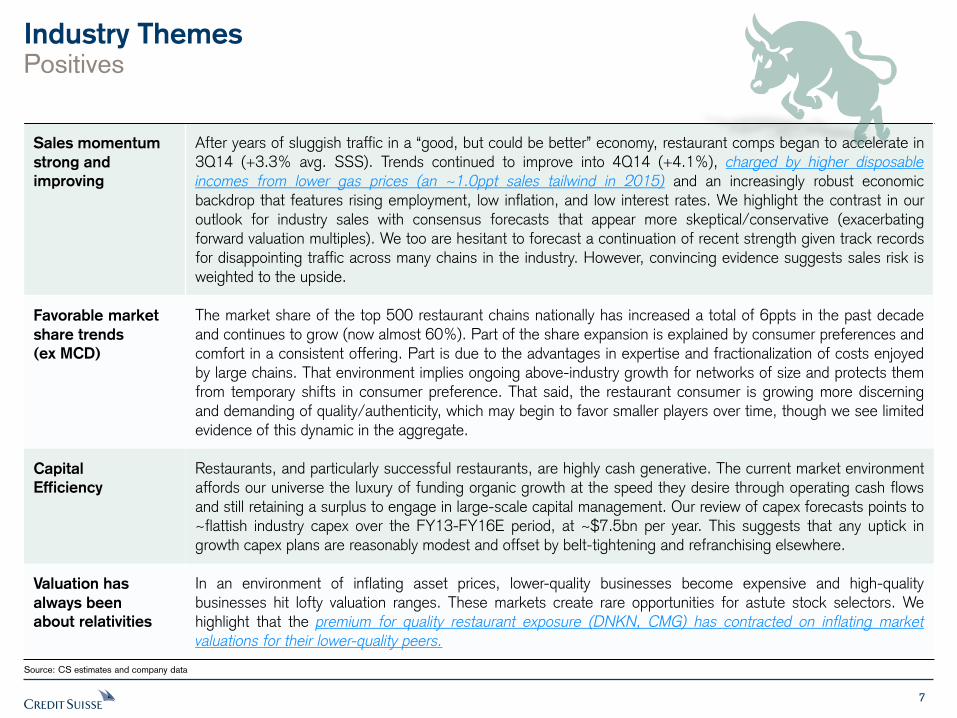
Industry Themes Positives
Source: CS estimates and company data
Sales momentum
strong and
improving
After years of sluggish traffic in a “good, but could be better” economy, restaurant comps began to accelerate in 3Q14 (+3.3% avg. SSS). Trends continued to improve into 4Q14 (+4.1%), charged by higher disposable
incomes from lower gas prices (an ~1.0ppt sales tailwind in 2015) and an increasingly robust economic backdrop that features rising employment, low inflation, and low interest rates. We highlight the contrast in our outlook for industry sales with consensus forecasts that appear more skeptical/conservative (exacerbating forward valuation multiples). We too are hesitant to forecast a continuation of recent strength given track records for disappointing traffic across many chains in the industry. However, convincing evidence suggests sales risk is
weighted to the upside.
Favorable market
share trends
(ex MCD)
The market share of the top 500 restaurant chains nationally has increased a total of 6ppts in the past decade and continues to grow (now almost 60%). Part of the share expansion is explained by consumer preferences and
comfort in a consistent offering. Part is due to the advantages in expertise and fractionalization of costs enjoyed by large chains. That environment implies ongoing above-industry growth for networks of size and protects them from temporary shifts in consumer preference. That said, the restaurant consumer is growing more discerning
and demanding of quality/authenticity, which may begin to favor smaller players over time, though we see limited
evidence of this dynamic in the aggregate.
Capital
Efficiency
Restaurants, and particularly successful restaurants, are highly cash generative. The current market environment
affords our universe the luxury of funding organic growth at the speed they desire through operating cash flows and still retaining a surplus to engage in large-scale capital management. Our review of capex forecasts points to
~flattish industry capex over the FY13-FY16E period, at ~$7.5bn per year. This suggests that any uptick in growth capex plans are reasonably modest and offset by belt-tightening and refranchising elsewhere.
Valuation has
always been
about relativities
In an environment of inflating asset prices, lower-quality businesses become expensive and high-quality businesses hit lofty valuation ranges. These markets create rare opportunities for astute stock selectors. We highlight that the premium for quality restaurant exposure (DNKN, CMG) has contracted on inflating market valuations for their lower-quality peers.
8
Industry Themes
Negatives
Source: CS estimates and company data
Valuation looking
bubbly
The Restaurants sector is trading at a decade-high 12-month forward PE of ~27x. The sector currently trades at nearly 12x EV/EBITDA. These valuations will likely be difficult for some investors to swallow. Trading at such elevated multiples, the pitfalls of poor stock selection are severe. However, sector fundamentals are arguably the best we’ve seen since 2005. (Industry SSS +3.7% that year. 2015E consensus = +2.8%.) Sector P/E avg’d ~22.5x that year, with the relative P/E at ~147% (vs. ~155% currently).
Cost pressures Strong price awareness among consumers and an emphasis on value can make it difficult for restaurants to pass through COGS inflation. That jeopardizes margins during periods of rising food prices. We believe that 2015
could see a modest uptick in food inflation relative to 2014 (~+2.8% industry median infl. in 2015 vs. +2.0% in 2014). Beef will again be the biggest culprit of food basket increases, with dairy/coffee on the favorable end of
the spectrum. Restaurant companies are increasingly pointing to tightening labor markets as a cost pressure, which is evident in the recent Employment Cost Index trends (+2.3% in 4Q14, post-recession high). Minimum and tipped wages are also on the rise. While a Federal increase seems unlikely, 26 states are planning to raise minimum wages
over 2015-17 and 16 are planning to raise tipped wages. On a population-weighted basis, these initiatives could
cause a step up in minimum wage growth from ~1.8% in 2014 to ~3.2% in 2015 and 2016. The impact should
be isolated to particular states. Restaurants with high exposure to these states face a significant labor cost headwind (BJRI, JACK, CAKE, SBUX, CMG). Of course, the silver lining here is higher consumer incomes.
Each 1% change in food or labor inflation impacts typical restaurant earnings by ~3-4% (though this
figure is much lower for franchise models).
Currency
headwinds for
large-caps
Significant recent USD appreciation could act as a headwind to 2015 results for restaurant chains with large overseas exposure (MCD ,YUM, SBUX, QSR). We are below consensus on all four of these names. Against a
basket of overseas currency exposures, we note that the USD has appreciated by an average of 11% in 1Q15 vs 1Q14.
9
Price Performance
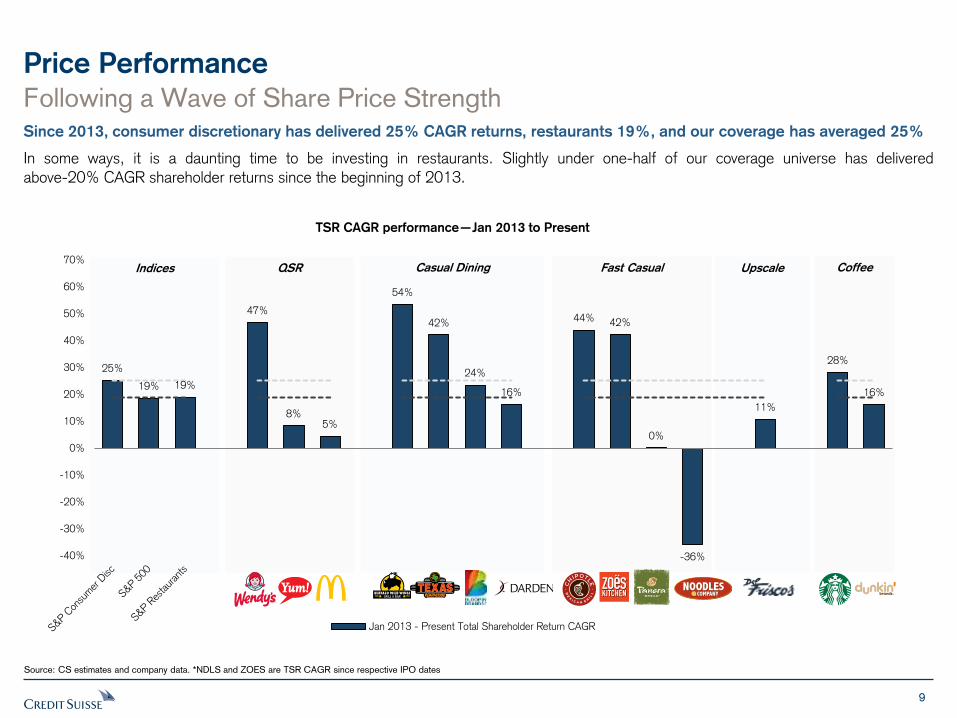
Following a Wave of Share Price Strength Since 2013, consumer discretionary has delivered 25% CAGR returns, restaurants 19%, and our coverage has averaged 25%
In some ways, it is a daunting time to be investing in restaurants. Slightly under one-half of our coverage universe has delivered
above-20% CAGR shareholder returns since the beginning of 2013.
Source: CS estimates and company data. *NDLS and ZOES are TSR CAGR since respective IPO dates
TSR CAGR performance—Jan 2013 to Present
25%
19% 19%
47%
8% 5%
54%
42%
24%
16%
44% 42%
0%
-36%
11%
28%
16%
-40%
-30%
-20%
-10%
0%
10%
20%
30%
40%
50%
60%
70%
Jan 2013 - Present Total Shareholder Return CAGR
Indices QSR Casual Dining Fast Casual Upscale Coffee
10
4
6
8
10
12
14
2005 2007 2009 2011 2013 2015
Restaurants NTM EV/EBITDA 10 yr Avg sd +/-1
Valuation
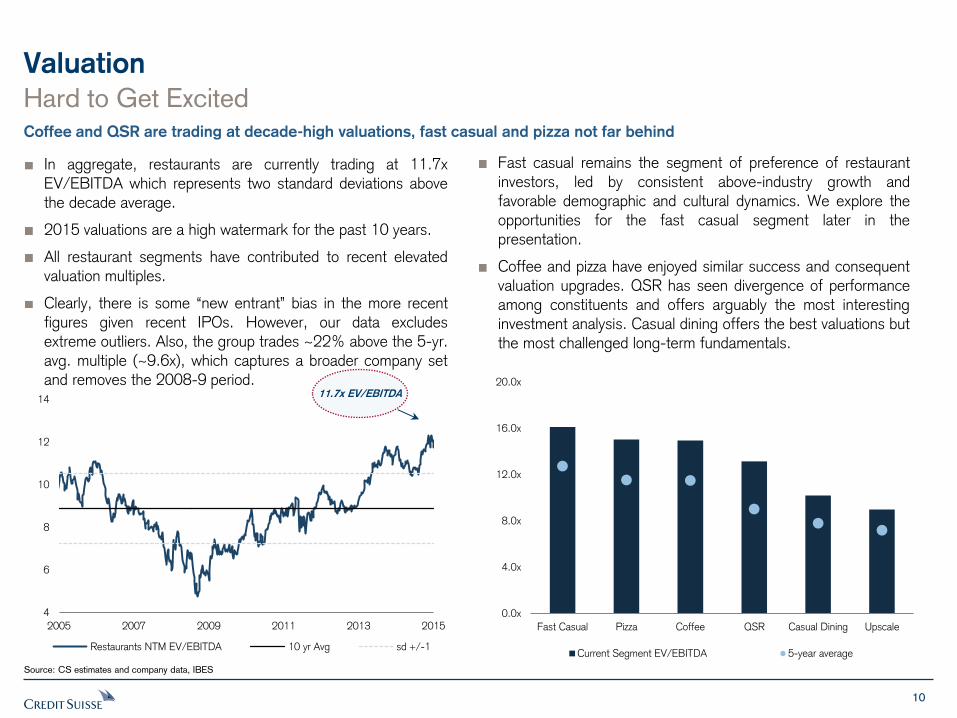
Hard to Get Excited Coffee and QSR are trading at decade-high valuations, fast casual and pizza not far behind
Fast casual remains the segment of preference of restaurant investors, led by consistent above-industry growth and
favorable demographic and cultural dynamics. We explore the opportunities for the fast casual segment later in the presentation.
Coffee and pizza have enjoyed similar success and consequent valuation upgrades. QSR has seen divergence of performance
among constituents and offers arguably the most interesting investment analysis. Casual dining offers the best valuations but the most challenged long-term fundamentals.
In aggregate, restaurants are currently trading at 11.7x EV/EBITDA which represents two standard deviations above the decade average.
2015 valuations are a high watermark for the past 10 years.
All restaurant segments have contributed to recent elevated valuation multiples.
Clearly, there is some “new entrant” bias in the more recent figures given recent IPOs. However, our data excludes
extreme outliers. Also, the group trades ~22% above the 5-yr. avg. multiple (~9.6x), which captures a broader company set and removes the 2008-9 period.
Source: CS estimates and company data, IBES
11.7x EV/EBITDA
0.0x
4.0x
8.0x
12.0x
16.0x
20.0x
Fast Casual Pizza Coffee QSR Casual Dining Upscale
Current Segment EV/EBITDA 5-year average
11
6.0x
10.0x
14.0x
18.0x
22.0x
26.0x
30.0x
1999 2001 2003 2005 2007 2009 2011 2013 2015
Restaurants NTM PE 10 yr Avg sd +/-1
Valuation
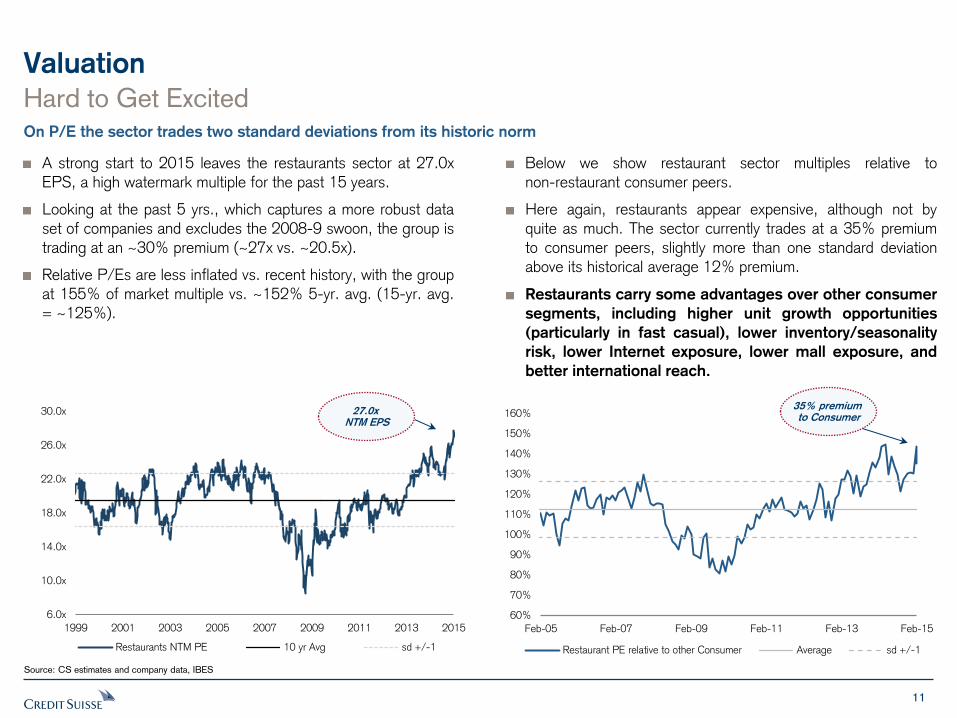
Hard to Get Excited On P/E the sector trades two standard deviations from its historic norm
A strong start to 2015 leaves the restaurants sector at 27.0x EPS, a high watermark multiple for the past 15 years.
Looking at the past 5 yrs., which captures a more robust data
set of companies and excludes the 2008-9 swoon, the group is trading at an ~30% premium (~27x vs. ~20.5x).
Relative P/Es are less inflated vs. recent history, with the group at 155% of market multiple vs. ~152% 5-yr. avg. (15-yr. avg.
= ~125%).
Below we show restaurant sector multiples relative to non-restaurant consumer peers.
Here again, restaurants appear expensive, although not by
quite as much. The sector currently trades at a 35% premium to consumer peers, slightly more than one standard deviation above its historical average 12% premium.
Restaurants carry some advantages over other consumer
segments, including higher unit growth opportunities
(particularly in fast casual), lower inventory/seasonality
risk, lower Internet exposure, lower mall exposure, and
better international reach.
Source: CS estimates and company data, IBES
60%
70%
80%
90%
100%
110%
120%
130%
140%
150%
160%
Feb-05 Feb-07 Feb-09 Feb-11 Feb-13 Feb-15
Restaurant PE relative to other Consumer Average sd +/-1
27.0x NTM EPS
35% premium to Consumer
12
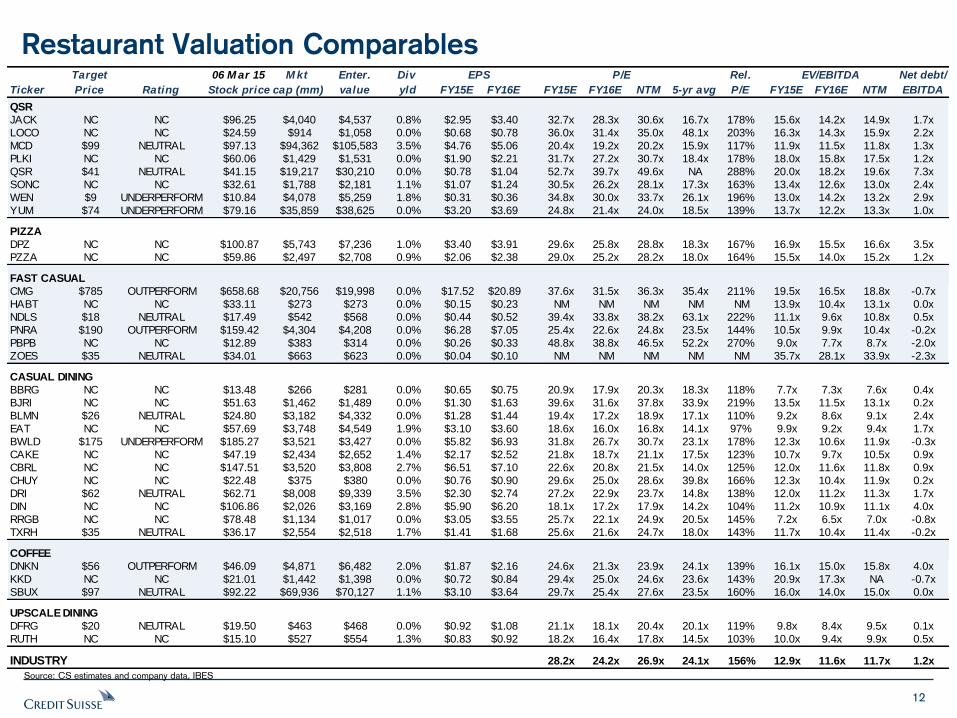
Restaurant Valuation Comparables
Source: CS estimates and company data, IBES
Target 06 M ar 15 M kt Enter. Div Rel. Net debt/
Ticker Price Rating Stock price cap (mm) value yld FY15E FY16E FY15E FY16E NTM 5-yr avg P/E FY15E FY16E NTM EBITDA
QSR
JACK NC NC $96.25 $4,040 $4,537 0.8% $2.95 $3.40 32.7x 28.3x 30.6x 16.7x 178% 15.6x 14.2x 14.9x 1.7x
LOCO NC NC $24.59 $914 $1,058 0.0% $0.68 $0.78 36.0x 31.4x 35.0x 48.1x 203% 16.3x 14.3x 15.9x 2.2x
MCD $99 NEUTRAL $97.13 $94,362 $105,583 3.5% $4.76 $5.06 20.4x 19.2x 20.2x 15.9x 117% 11.9x 11.5x 11.8x 1.3x
PLKI NC NC $60.06 $1,429 $1,531 0.0% $1.90 $2.21 31.7x 27.2x 30.7x 18.4x 178% 18.0x 15.8x 17.5x 1.2x
QSR $41 NEUTRAL $41.15 $19,217 $30,210 0.0% $0.78 $1.04 52.7x 39.7x 49.6x NA 288% 20.0x 18.2x 19.6x 7.3x
SONC NC NC $32.61 $1,788 $2,181 1.1% $1.07 $1.24 30.5x 26.2x 28.1x 17.3x 163% 13.4x 12.6x 13.0x 2.4x
WEN $9 UNDERPERFORM $10.84 $4,078 $5,259 1.8% $0.31 $0.36 34.8x 30.0x 33.7x 26.1x 196% 13.0x 14.2x 13.2x 2.9x
YUM $74 UNDERPERFORM $79.16 $35,859 $38,625 0.0% $3.20 $3.69 24.8x 21.4x 24.0x 18.5x 139% 13.7x 12.2x 13.3x 1.0x
PIZZA
DPZ NC NC $100.87 $5,743 $7,236 1.0% $3.40 $3.91 29.6x 25.8x 28.8x 18.3x 167% 16.9x 15.5x 16.6x 3.5x
PZZA NC NC $59.86 $2,497 $2,708 0.9% $2.06 $2.38 29.0x 25.2x 28.2x 18.0x 164% 15.5x 14.0x 15.2x 1.2x
FAST CASUAL
CMG $785 OUTPERFORM $658.68 $20,756 $19,998 0.0% $17.52 $20.89 37.6x 31.5x 36.3x 35.4x 211% 19.5x 16.5x 18.8x -0.7x
HABT NC NC $33.11 $273 $273 0.0% $0.15 $0.23 NM NM NM NM NM 13.9x 10.4x 13.1x 0.0x
NDLS $18 NEUTRAL $17.49 $542 $568 0.0% $0.44 $0.52 39.4x 33.8x 38.2x 63.1x 222% 11.1x 9.6x 10.8x 0.5x
PNRA $190 OUTPERFORM $159.42 $4,304 $4,208 0.0% $6.28 $7.05 25.4x 22.6x 24.8x 23.5x 144% 10.5x 9.9x 10.4x -0.2x
PBPB NC NC $12.89 $383 $314 0.0% $0.26 $0.33 48.8x 38.8x 46.5x 52.2x 270% 9.0x 7.7x 8.7x -2.0x
ZOES $35 NEUTRAL $34.01 $663 $623 0.0% $0.04 $0.10 NM NM NM NM NM 35.7x 28.1x 33.9x -2.3x
CASUAL DINING
BBRG NC NC $13.48 $266 $281 0.0% $0.65 $0.75 20.9x 17.9x 20.3x 18.3x 118% 7.7x 7.3x 7.6x 0.4x
BJRI NC NC $51.63 $1,462 $1,489 0.0% $1.30 $1.63 39.6x 31.6x 37.8x 33.9x 219% 13.5x 11.5x 13.1x 0.2x
BLMN $26 NEUTRAL $24.80 $3,182 $4,332 0.0% $1.28 $1.44 19.4x 17.2x 18.9x 17.1x 110% 9.2x 8.6x 9.1x 2.4x
EAT NC NC $57.69 $3,748 $4,549 1.9% $3.10 $3.60 18.6x 16.0x 16.8x 14.1x 97% 9.9x 9.2x 9.4x 1.7x
BWLD $175 UNDERPERFORM $185.27 $3,521 $3,427 0.0% $5.82 $6.93 31.8x 26.7x 30.7x 23.1x 178% 12.3x 10.6x 11.9x -0.3x
CAKE NC NC $47.19 $2,434 $2,652 1.4% $2.17 $2.52 21.8x 18.7x 21.1x 17.5x 123% 10.7x 9.7x 10.5x 0.9x
CBRL NC NC $147.51 $3,520 $3,808 2.7% $6.51 $7.10 22.6x 20.8x 21.5x 14.0x 125% 12.0x 11.6x 11.8x 0.9x
CHUY NC NC $22.48 $375 $380 0.0% $0.76 $0.90 29.6x 25.0x 28.6x 39.8x 166% 12.3x 10.4x 11.9x 0.2x
DRI $62 NEUTRAL $62.71 $8,008 $9,339 3.5% $2.30 $2.74 27.2x 22.9x 23.7x 14.8x 138% 12.0x 11.2x 11.3x 1.7x
DIN NC NC $106.86 $2,026 $3,169 2.8% $5.90 $6.20 18.1x 17.2x 17.9x 14.2x 104% 11.2x 10.9x 11.1x 4.0x
RRGB NC NC $78.48 $1,134 $1,017 0.0% $3.05 $3.55 25.7x 22.1x 24.9x 20.5x 145% 7.2x 6.5x 7.0x -0.8x
TXRH $35 NEUTRAL $36.17 $2,554 $2,518 1.7% $1.41 $1.68 25.6x 21.6x 24.7x 18.0x 143% 11.7x 10.4x 11.4x -0.2x
COFFEE
DNKN $56 OUTPERFORM $46.09 $4,871 $6,482 2.0% $1.87 $2.16 24.6x 21.3x 23.9x 24.1x 139% 16.1x 15.0x 15.8x 4.0x
KKD NC NC $21.01 $1,442 $1,398 0.0% $0.72 $0.84 29.4x 25.0x 24.6x 23.6x 143% 20.9x 17.3x NA -0.7x
SBUX $97 NEUTRAL $92.22 $69,936 $70,127 1.1% $3.10 $3.64 29.7x 25.4x 27.6x 23.5x 160% 16.0x 14.0x 15.0x 0.0x
UPSCALE DINING
DFRG $20 NEUTRAL $19.50 $463 $468 0.0% $0.92 $1.08 21.1x 18.1x 20.4x 20.1x 119% 9.8x 8.4x 9.5x 0.1x
RUTH NC NC $15.10 $527 $554 1.3% $0.83 $0.92 18.2x 16.4x 17.8x 14.5x 103% 10.0x 9.4x 9.9x 0.5x
INDUSTRY 28.2x 24.2x 26.9x 24.1x 156% 12.9x 11.6x 11.7x 1.2x
P/E EV/EBITDAEPS
13
Review of Industry Fundamentals
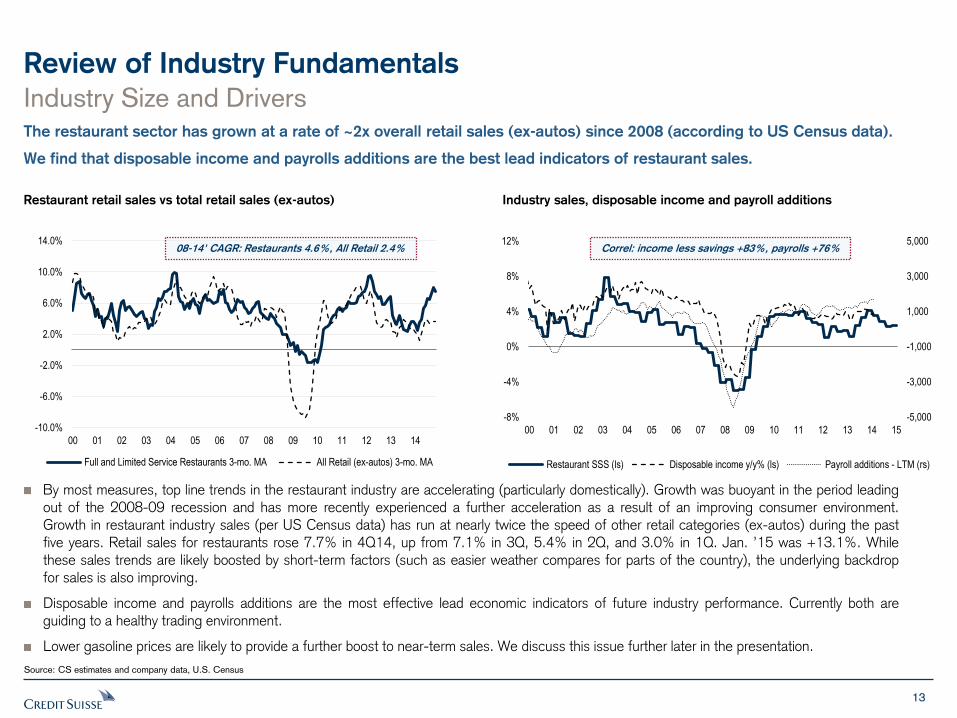
By most measures, top line trends in the restaurant industry are accelerating (particularly domestically). Growth was buoyant in the period leading out of the 2008-09 recession and has more recently experienced a further acceleration as a result of an improving consumer environment. Growth in restaurant industry sales (per US Census data) has run at nearly twice the speed of other retail categories (ex-autos) during the past five years. Retail sales for restaurants rose 7.7% in 4Q14, up from 7.1% in 3Q, 5.4% in 2Q, and 3.0% in 1Q. Jan. ’15 was +13.1%. While these sales trends are likely boosted by short-term factors (such as easier weather compares for parts of the country), the underlying backdrop for sales is also improving.
Disposable income and payrolls additions are the most effective lead economic indicators of future industry performance. Currently both are guiding to a healthy trading environment.
Lower gasoline prices are likely to provide a further boost to near-term sales. We discuss this issue further later in the presentation.
Industry Size and Drivers The restaurant sector has grown at a rate of ~2x overall retail sales (ex-autos) since 2008 (according to US Census data).
We find that disposable income and payrolls additions are the best lead indicators of restaurant sales.
Restaurant retail sales vs total retail sales (ex-autos) Industry sales, disposable income and payroll additions
Source: CS estimates and company data, U.S. Census
Correl: income less savings +83%, payrolls +76%
-5,000
-3,000
-1,000
1,000
3,000
5,000
-8%
-4%
0%
4%
8%
12%
00 01 02 03 04 05 06 07 08 09 10 11 12 13 14 15
Restaurant SSS (ls) Disposable income y/y% (ls) Payroll additions - LTM (rs)
-10.0%
-6.0%
-2.0%
2.0%
6.0%
10.0%
14.0%
00 01 02 03 04 05 06 07 08 09 10 11 12 13 14
Full and Limited Service Restaurants 3-mo. MA All Retail (ex-autos) 3-mo. MA
08-14' CAGR: Restaurants 4.6%, All Retail 2.4%
14
Review of Industry Fundamentals
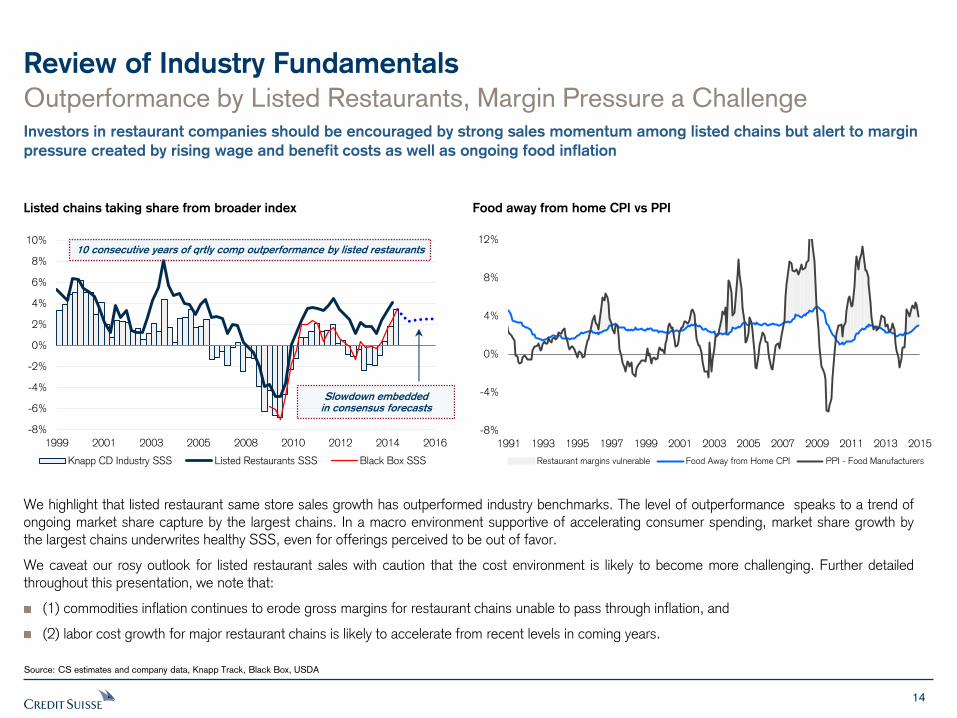
We highlight that listed restaurant same store sales growth has outperformed industry benchmarks. The level of outperformance speaks to a trend of ongoing market share capture by the largest chains. In a macro environment supportive of accelerating consumer spending, market share growth by the largest chains underwrites healthy SSS, even for offerings perceived to be out of favor.
We caveat our rosy outlook for listed restaurant sales with caution that the cost environment is likely to become more challenging. Further detailed throughout this presentation, we note that:
(1) commodities inflation continues to erode gross margins for restaurant chains unable to pass through inflation, and
(2) labor cost growth for major restaurant chains is likely to accelerate from recent levels in coming years.
Outperformance by Listed Restaurants, Margin Pressure a Challenge Investors in restaurant companies should be encouraged by strong sales momentum among listed chains but alert to margin
pressure created by rising wage and benefit costs as well as ongoing food inflation
Listed chains taking share from broader index Food away from home CPI vs PPI
Source: CS estimates and company data, Knapp Track, Black Box, USDA
-8%
-4%
0%
4%
8%
12%
1991 1993 1995 1997 1999 2001 2003 2005 2007 2009 2011 2013 2015
Restaurant margins vulnerable Food Away from Home CPI PPI - Food Manufacturers
-8%
-6%
-4%
-2%
0%
2%
4%
6%
8%
10%
1999 2001 2003 2005 2008 2010 2012 2014 2016
Knapp CD Industry SSS Listed Restaurants SSS Black Box SSS
Slowdown embedded in consensus forecasts
10 consecutive years of qrtly comp outperformance by listed restaurants
15
Macro Indicators
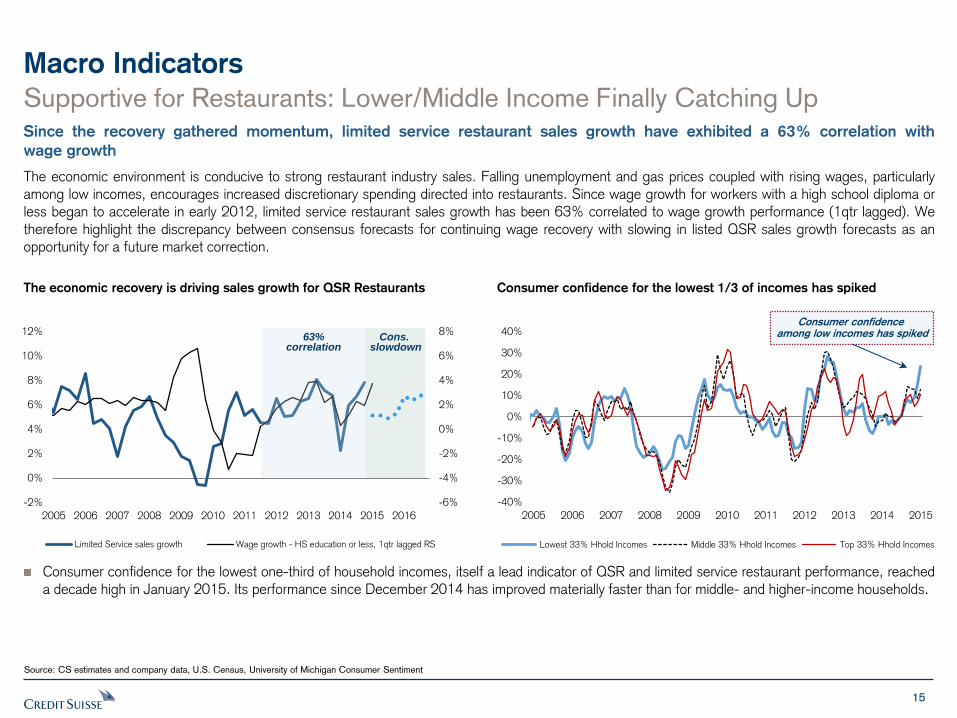
Supportive for Restaurants: Lower/Middle Income Finally Catching Up Since the recovery gathered momentum, limited service restaurant sales growth have exhibited a 63% correlation with
wage growth
The economic environment is conducive to strong restaurant industry sales. Falling unemployment and gas prices coupled with rising wages, particularly among low incomes, encourages increased discretionary spending directed into restaurants. Since wage growth for workers with a high school diploma or less began to accelerate in early 2012, limited service restaurant sales growth has been 63% correlated to wage growth performance (1qtr lagged). We therefore highlight the discrepancy between consensus forecasts for continuing wage recovery with slowing in listed QSR sales growth forecasts as an opportunity for a future market correction.
The economic recovery is driving sales growth for QSR Restaurants Consumer confidence for the lowest 1/3 of incomes has spiked
Consumer confidence for the lowest one-third of household incomes, itself a lead indicator of QSR and limited service restaurant performance, reached a decade high in January 2015. Its performance since December 2014 has improved materially faster than for middle- and higher-income households.
Source: CS estimates and company data, U.S. Census, University of Michigan Consumer Sentiment
-6%
-4%
-2%
0%
2%
4%
6%
8%
-2%
0%
2%
4%
6%
8%
10%
12%
2005 2006 2007 2008 2009 2010 2011 2012 2013 2014 2015 2016
Limited Service sales growth Wage growth - HS education or less, 1qtr lagged RS
63% correlation
Cons. slowdown
-40%
-30%
-20%
-10%
0%
10%
20%
30%
40%
2005 2006 2007 2008 2009 2010 2011 2012 2013 2014 2015
Lowest 33% Hhold Incomes Middle 33% Hhold Incomes Top 33% Hhold Incomes
Consumer confidence among low incomes has spiked
16
Macro Indicators
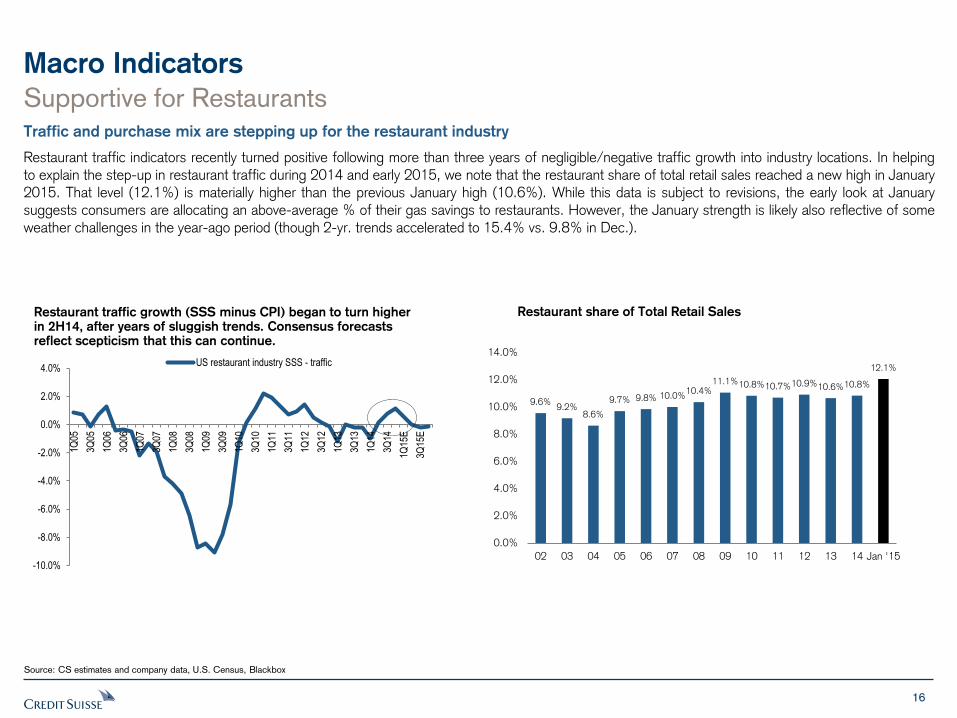
Supportive for Restaurants Traffic and purchase mix are stepping up for the restaurant industry
Restaurant traffic indicators recently turned positive following more than three years of negligible/negative traffic growth into industry locations. In helping to explain the step-up in restaurant traffic during 2014 and early 2015, we note that the restaurant share of total retail sales reached a new high in January 2015. That level (12.1%) is materially higher than the previous January high (10.6%). While this data is subject to revisions, the early look at January suggests consumers are allocating an above-average % of their gas savings to restaurants. However, the January strength is likely also reflective of some weather challenges in the year-ago period (though 2-yr. trends accelerated to 15.4% vs. 9.8% in Dec.).
Source: CS estimates and company data, U.S. Census, Blackbox
9.6% 9.2%
8.6%
9.7% 9.8% 10.0% 10.4%
11.1% 10.8% 10.7% 10.9% 10.6% 10.8%
12.1%
0.0%
2.0%
4.0%
6.0%
8.0%
10.0%
12.0%
14.0%
02 03 04 05 06 07 08 09 10 11 12 13 14 Jan '15
Restaurant traffic growth (SSS minus CPI) began to turn higher in 2H14, after years of sluggish trends. Consensus forecasts reflect scepticism that this can continue.
Restaurant share of Total Retail Sales
-10.0%
-8.0%
-6.0%
-4.0%
-2.0%
0.0%
2.0%
4.0%
1Q05
3Q05
1Q06
3Q06
1Q07
3Q07
1Q08
3Q08
1Q09
3Q09
1Q10
3Q10
1Q11
3Q11
1Q12
3Q12
1Q13
3Q13
1Q14
3Q14
1Q15
E
3Q15
E
US restaurant industry SSS - traffic
17
Market Share
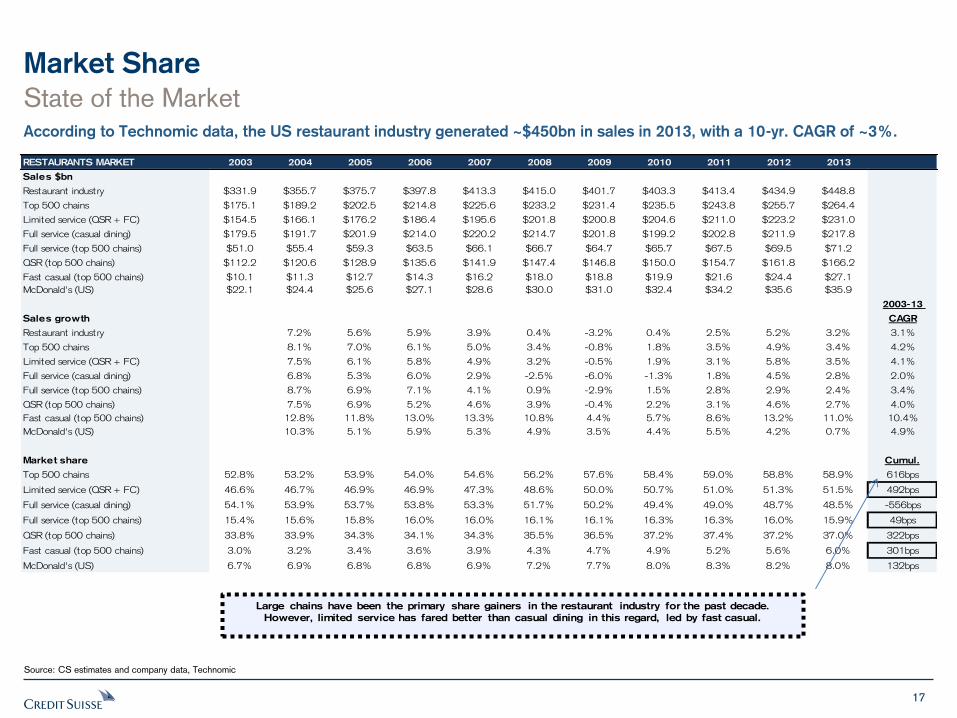
State of the Market According to Technomic data, the US restaurant industry generated ~$450bn in sales in 2013, with a 10-yr. CAGR of ~3%.
Source: CS estimates and company data, Technomic
RESTAURANTS MARKET 2003 2004 2005 2006 2007 2008 2009 2010 2011 2012 2013
Sales $bn
Restaurant industry $331.9 $355.7 $375.7 $397.8 $413.3 $415.0 $401.7 $403.3 $413.4 $434.9 $448.8
Top 500 chains $175.1 $189.2 $202.5 $214.8 $225.6 $233.2 $231.4 $235.5 $243.8 $255.7 $264.4
Limited service (QSR + FC) $154.5 $166.1 $176.2 $186.4 $195.6 $201.8 $200.8 $204.6 $211.0 $223.2 $231.0
Full service (casual dining) $179.5 $191.7 $201.9 $214.0 $220.2 $214.7 $201.8 $199.2 $202.8 $211.9 $217.8
Full service (top 500 chains) $51.0 $55.4 $59.3 $63.5 $66.1 $66.7 $64.7 $65.7 $67.5 $69.5 $71.2
QSR (top 500 chains) $112.2 $120.6 $128.9 $135.6 $141.9 $147.4 $146.8 $150.0 $154.7 $161.8 $166.2
Fast casual (top 500 chains) $10.1 $11.3 $12.7 $14.3 $16.2 $18.0 $18.8 $19.9 $21.6 $24.4 $27.1
McDonald's (US) $22.1 $24.4 $25.6 $27.1 $28.6 $30.0 $31.0 $32.4 $34.2 $35.6 $35.9
2003-13
Sales growth CAGR
Restaurant industry 7.2% 5.6% 5.9% 3.9% 0.4% -3.2% 0.4% 2.5% 5.2% 3.2% 3.1%
Top 500 chains 8.1% 7.0% 6.1% 5.0% 3.4% -0.8% 1.8% 3.5% 4.9% 3.4% 4.2%
Limited service (QSR + FC) 7.5% 6.1% 5.8% 4.9% 3.2% -0.5% 1.9% 3.1% 5.8% 3.5% 4.1%
Full service (casual dining) 6.8% 5.3% 6.0% 2.9% -2.5% -6.0% -1.3% 1.8% 4.5% 2.8% 2.0%
Full service (top 500 chains) 8.7% 6.9% 7.1% 4.1% 0.9% -2.9% 1.5% 2.8% 2.9% 2.4% 3.4%
QSR (top 500 chains) 7.5% 6.9% 5.2% 4.6% 3.9% -0.4% 2.2% 3.1% 4.6% 2.7% 4.0%
Fast casual (top 500 chains) 12.8% 11.8% 13.0% 13.3% 10.8% 4.4% 5.7% 8.6% 13.2% 11.0% 10.4%
McDonald's (US) 10.3% 5.1% 5.9% 5.3% 4.9% 3.5% 4.4% 5.5% 4.2% 0.7% 4.9%
Market share Cumul.
Top 500 chains 52.8% 53.2% 53.9% 54.0% 54.6% 56.2% 57.6% 58.4% 59.0% 58.8% 58.9% 616bps
Limited service (QSR + FC) 46.6% 46.7% 46.9% 46.9% 47.3% 48.6% 50.0% 50.7% 51.0% 51.3% 51.5% 492bps
Full service (casual dining) 54.1% 53.9% 53.7% 53.8% 53.3% 51.7% 50.2% 49.4% 49.0% 48.7% 48.5% -556bps
Full service (top 500 chains) 15.4% 15.6% 15.8% 16.0% 16.0% 16.1% 16.1% 16.3% 16.3% 16.0% 15.9% 49bps
QSR (top 500 chains) 33.8% 33.9% 34.3% 34.1% 34.3% 35.5% 36.5% 37.2% 37.4% 37.2% 37.0% 322bps
Fast casual (top 500 chains) 3.0% 3.2% 3.4% 3.6% 3.9% 4.3% 4.7% 4.9% 5.2% 5.6% 6.0% 301bps
McDonald's (US) 6.7% 6.9% 6.8% 6.8% 6.9% 7.2% 7.7% 8.0% 8.3% 8.2% 8.0% 132bps
Large chains have been the primary share gainers in the restaurant industry for the past decade.
However, limited service has fared better than casual dining in this regard, led by fast casual.
18
Fast Casual
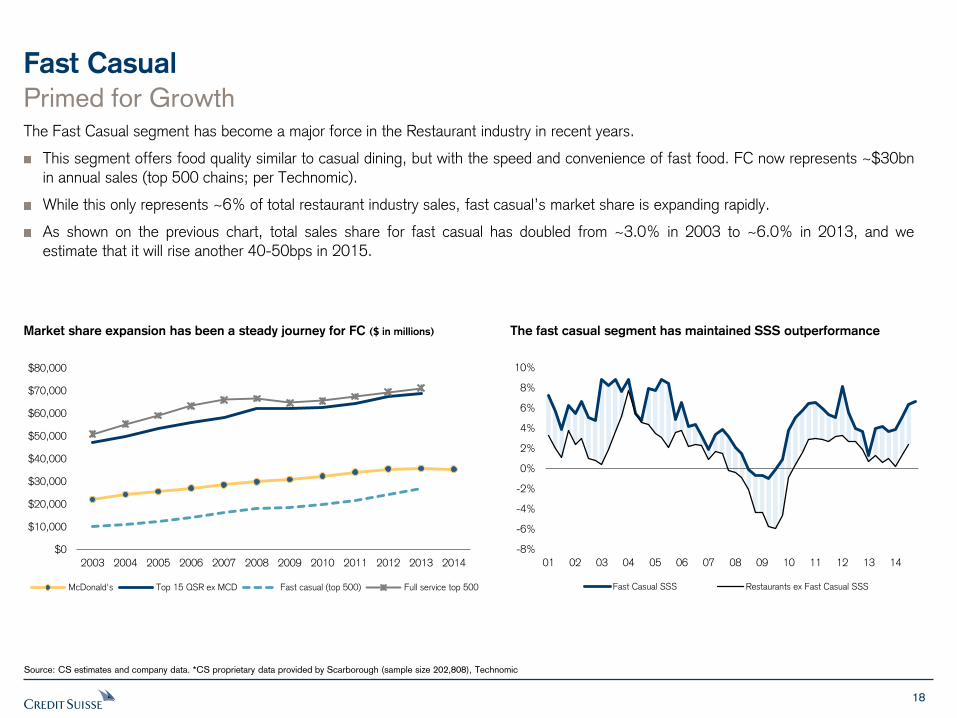
Primed for Growth The Fast Casual segment has become a major force in the Restaurant industry in recent years.
This segment offers food quality similar to casual dining, but with the speed and convenience of fast food. FC now represents ~$30bn
in annual sales (top 500 chains; per Technomic).
While this only represents ~6% of total restaurant industry sales, fast casual’s market share is expanding rapidly.
As shown on the previous chart, total sales share for fast casual has doubled from ~3.0% in 2003 to ~6.0% in 2013, and we estimate that it will rise another 40-50bps in 2015.
Source: CS estimates and company data. *CS proprietary data provided by Scarborough (sample size 202,808), Technomic
Market share expansion has been a steady journey for FC ($ in millions)
$0
$10,000
$20,000
$30,000
$40,000
$50,000
$60,000
$70,000
$80,000
2003 2004 2005 2006 2007 2008 2009 2010 2011 2012 2013 2014
McDonald's Top 15 QSR ex MCD Fast casual (top 500) Full service top 500
The fast casual segment has maintained SSS outperformance
-8%
-6%
-4%
-2%
0%
2%
4%
6%
8%
10%
01 02 03 04 05 06 07 08 09 10 11 12 13 14
Fast Casual SSS Restaurants ex Fast Casual SSS
19
Fast Casual Primed for Growth What does this mean for the restaurant industry?
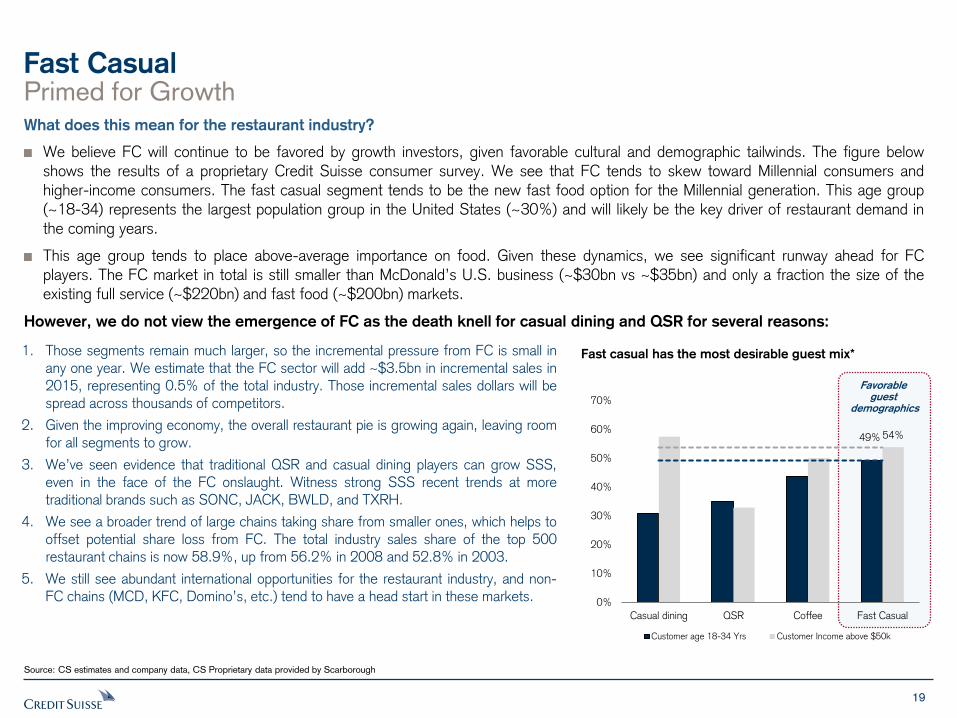
We believe FC will continue to be favored by growth investors, given favorable cultural and demographic tailwinds. The figure below shows the results of a proprietary Credit Suisse consumer survey. We see that FC tends to skew toward Millennial consumers and higher-income consumers. The fast casual segment tends to be the new fast food option for the Millennial generation. This age group
(~18-34) represents the largest population group in the United States (~30%) and will likely be the key driver of restaurant demand in
the coming years.
This age group tends to place above-average importance on food. Given these dynamics, we see significant runway ahead for FC players. The FC market in total is still smaller than McDonald’s U.S. business (~$30bn vs ~$35bn) and only a fraction the size of the existing full service (~$220bn) and fast food (~$200bn) markets.
However, we do not view the emergence of FC as the death knell for casual dining and QSR for several reasons:
Source: CS estimates and company data, CS Proprietary data provided by Scarborough
Fast casual has the most desirable guest mix*
Favorable guest
demographics
1. Those segments remain much larger, so the incremental pressure from FC is small in any one year. We estimate that the FC sector will add ~$3.5bn in incremental sales in 2015, representing 0.5% of the total industry. Those incremental sales dollars will be spread across thousands of competitors.
2. Given the improving economy, the overall restaurant pie is growing again, leaving room for all segments to grow.
3. We’ve seen evidence that traditional QSR and casual dining players can grow SSS, even in the face of the FC onslaught. Witness strong SSS recent trends at more traditional brands such as SONC, JACK, BWLD, and TXRH.
4. We see a broader trend of large chains taking share from smaller ones, which helps to offset potential share loss from FC. The total industry sales share of the top 500 restaurant chains is now 58.9%, up from 56.2% in 2008 and 52.8% in 2003.
5. We still see abundant international opportunities for the restaurant industry, and non-FC chains (MCD, KFC, Domino’s, etc.) tend to have a head start in these markets.
49% 54%
0%
10%
20%
30%
40%
50%
60%
70%
Casual dining QSR Coffee Fast Casual
Customer age 18-34 Yrs Customer Income above $50k
20
Market Share
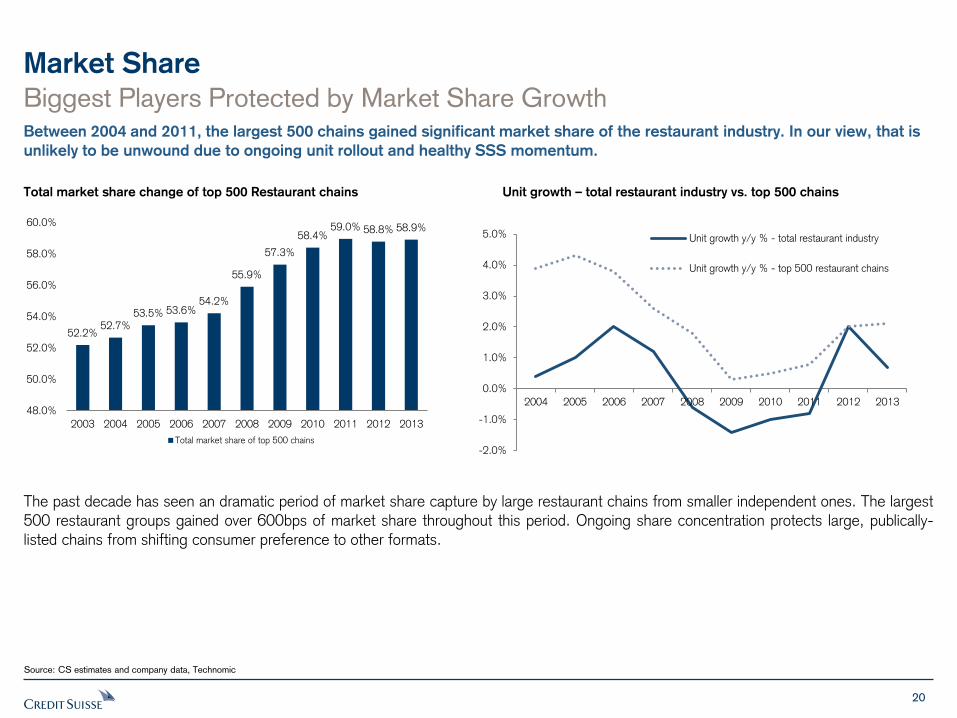
The past decade has seen an dramatic period of market share capture by large restaurant chains from smaller independent ones. The largest
500 restaurant groups gained over 600bps of market share throughout this period. Ongoing share concentration protects large, publically-listed chains from shifting consumer preference to other formats.
Biggest Players Protected by Market Share Growth Between 2004 and 2011, the largest 500 chains gained significant market share of the restaurant industry. In our view, that is
unlikely to be unwound due to ongoing unit rollout and healthy SSS momentum.
Total market share change of top 500 Restaurant chains Unit growth – total restaurant industry vs. top 500 chains
Source: CS estimates and company data, Technomic
52.2% 52.7%
53.5% 53.6% 54.2%
55.9%
57.3%
58.4% 59.0% 58.8% 58.9%
48.0%
50.0%
52.0%
54.0%
56.0%
58.0%
60.0%
2003 2004 2005 2006 2007 2008 2009 2010 2011 2012 2013
Total market share of top 500 chains-2.0%
-1.0%
0.0%
1.0%
2.0%
3.0%
4.0%
5.0%
2004 2005 2006 2007 2008 2009 2010 2011 2012 2013
Unit growth y/y % - total restaurant industry
Unit growth y/y % - top 500 restaurant chains
21
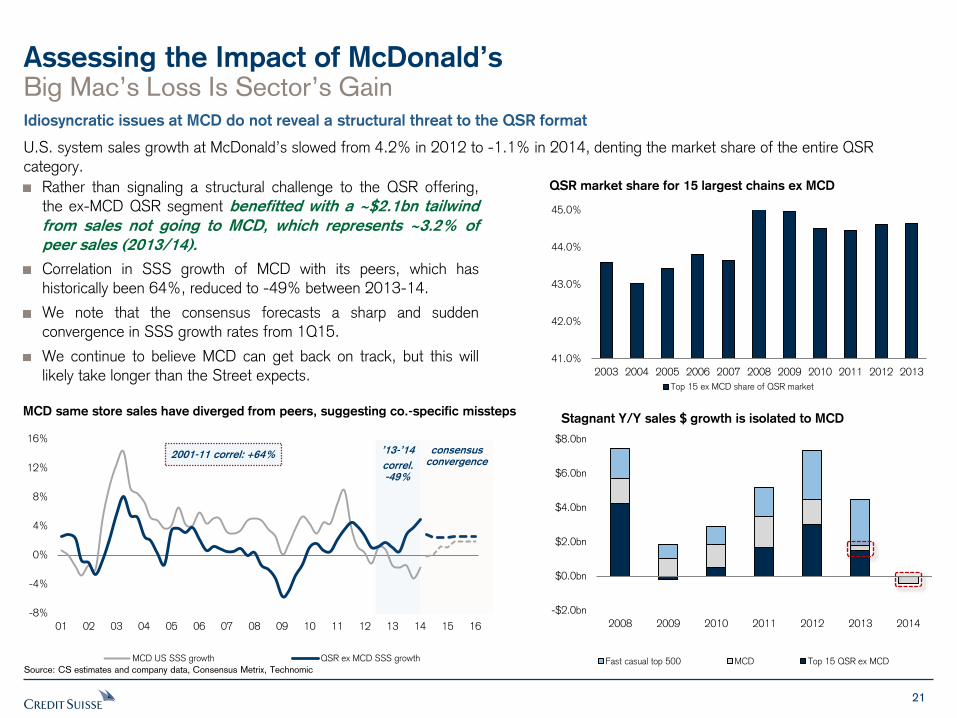
Assessing the Impact of McDonald’s
Rather than signaling a structural challenge to the QSR offering, the ex-MCD QSR segment benefitted with a ~$2.1bn tailwind
from sales not going to MCD, which represents ~3.2% of
peer sales (2013/14).
Correlation in SSS growth of MCD with its peers, which has historically been 64%, reduced to -49% between 2013-14.
We note that the consensus forecasts a sharp and sudden convergence in SSS growth rates from 1Q15.
We continue to believe MCD can get back on track, but this will likely take longer than the Street expects.
QSR market share for 15 largest chains ex MCD
Big Mac’s Loss Is Sector’s Gain Idiosyncratic issues at MCD do not reveal a structural threat to the QSR format
U.S. system sales growth at McDonald’s slowed from 4.2% in 2012 to -1.1% in 2014, denting the market share of the entire QSR
category.
Source: CS estimates and company data, Consensus Metrix, Technomic
Stagnant Y/Y sales $ growth is isolated to MCD
-8%
-4%
0%
4%
8%
12%
16%
01 02 03 04 05 06 07 08 09 10 11 12 13 14 15 16
MCD US SSS growth QSR ex MCD SSS growth
2001-11 correl: +64% ’13-’14
correl. -49%
consensus convergence
MCD same store sales have diverged from peers, suggesting co.-specific missteps
41.0%
42.0%
43.0%
44.0%
45.0%
2003 2004 2005 2006 2007 2008 2009 2010 2011 2012 2013
Top 15 ex MCD share of QSR market
-$2.0bn
$0.0bn
$2.0bn
$4.0bn
$6.0bn
$8.0bn
2008 2009 2010 2011 2012 2013 2014
Fast casual top 500 MCD Top 15 QSR ex MCD
22
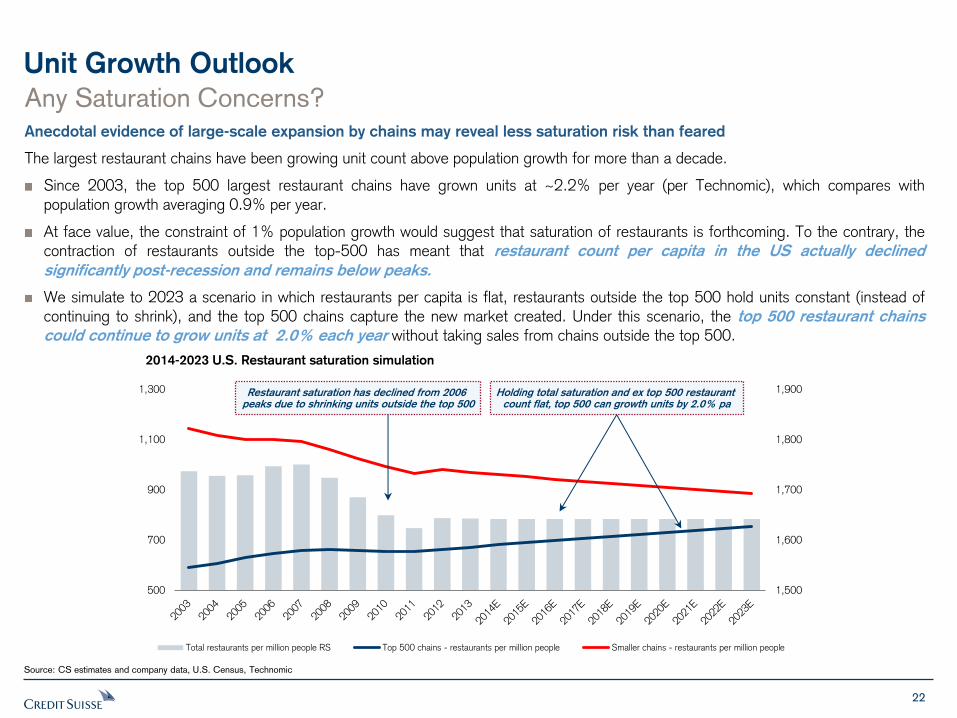
Unit Growth Outlook
Any Saturation Concerns? Anecdotal evidence of large-scale expansion by chains may reveal less saturation risk than feared
The largest restaurant chains have been growing unit count above population growth for more than a decade.
Since 2003, the top 500 largest restaurant chains have grown units at ~2.2% per year (per Technomic), which compares with population growth averaging 0.9% per year.
At face value, the constraint of 1% population growth would suggest that saturation of restaurants is forthcoming. To the contrary, the contraction of restaurants outside the top-500 has meant that restaurant count per capita in the US actually declined
significantly post-recession and remains below peaks.
We simulate to 2023 a scenario in which restaurants per capita is flat, restaurants outside the top 500 hold units constant (instead of continuing to shrink), and the top 500 chains capture the new market created. Under this scenario, the top 500 restaurant chains
could continue to grow units at 2.0% each year without taking sales from chains outside the top 500.
Source: CS estimates and company data, U.S. Census, Technomic
2014-2023 U.S. Restaurant saturation simulation
1,500
1,600
1,700
1,800
1,900
500
700
900
1,100
1,300
Total restaurants per million people RS Top 500 chains - restaurants per million people Smaller chains - restaurants per million people
Restaurant saturation has declined from 2006 peaks due to shrinking units outside the top 500
Holding total saturation and ex top 500 restaurant count flat, top 500 can growth units by 2.0% pa
FOCUS ISSUE: Minimum Wage Analysis
24
Wages Are on the Rise
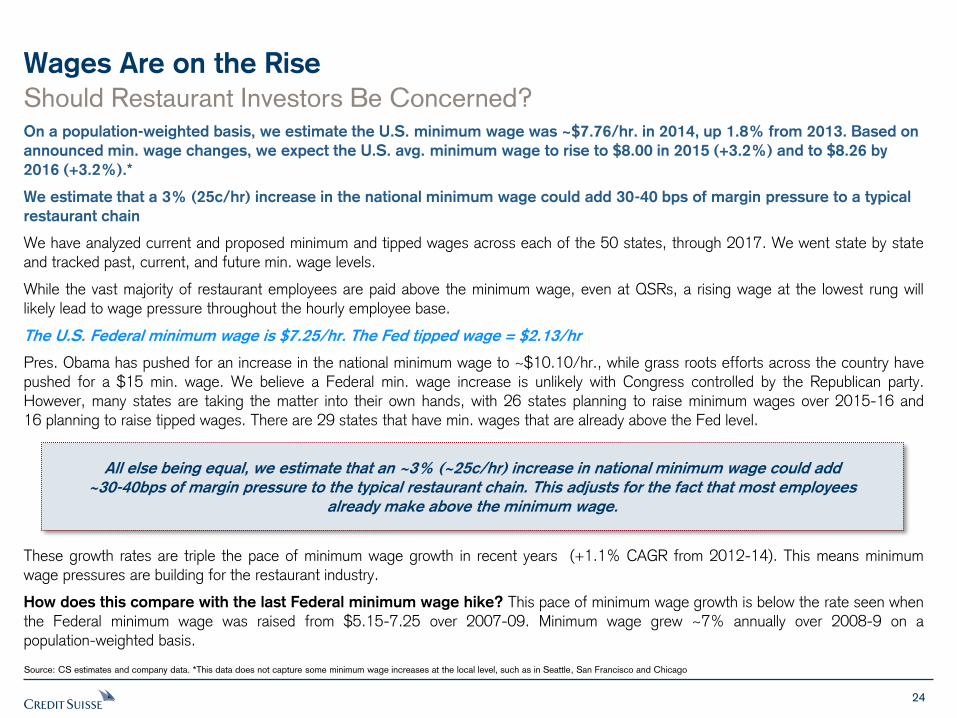
Should Restaurant Investors Be Concerned? On a population-weighted basis, we estimate the U.S. minimum wage was ~$7.76/hr. in 2014, up 1.8% from 2013. Based on
announced min. wage changes, we expect the U.S. avg. minimum wage to rise to $8.00 in 2015 (+3.2%) and to $8.26 by
2016 (+3.2%).*
We estimate that a 3% (25c/hr) increase in the national minimum wage could add 30-40 bps of margin pressure to a typical
restaurant chain
We have analyzed current and proposed minimum and tipped wages across each of the 50 states, through 2017. We went state by state and tracked past, current, and future min. wage levels.
While the vast majority of restaurant employees are paid above the minimum wage, even at QSRs, a rising wage at the lowest rung will likely lead to wage pressure throughout the hourly employee base.
The U.S. Federal minimum wage is $7.25/hr. The Fed tipped wage = $2.13/hr
Pres. Obama has pushed for an increase in the national minimum wage to ~$10.10/hr., while grass roots efforts across the country have
pushed for a $15 min. wage. We believe a Federal min. wage increase is unlikely with Congress controlled by the Republican party. However, many states are taking the matter into their own hands, with 26 states planning to raise minimum wages over 2015-16 and 16 planning to raise tipped wages. There are 29 states that have min. wages that are already above the Fed level.
These growth rates are triple the pace of minimum wage growth in recent years (+1.1% CAGR from 2012-14). This means minimum wage pressures are building for the restaurant industry.
How does this compare with the last Federal minimum wage hike? This pace of minimum wage growth is below the rate seen when
the Federal minimum wage was raised from $5.15-7.25 over 2007-09. Minimum wage grew ~7% annually over 2008-9 on a population-weighted basis.
Source: CS estimates and company data. *This data does not capture some minimum wage increases at the local level, such as in Seattle, San Francisco and Chicago
All else being equal, we estimate that an ~3% (~25c/hr) increase in national minimum wage could add
~30-40bps of margin pressure to the typical restaurant chain. This adjusts for the fact that most employees
already make above the minimum wage.
25
Wages Are on the Rise
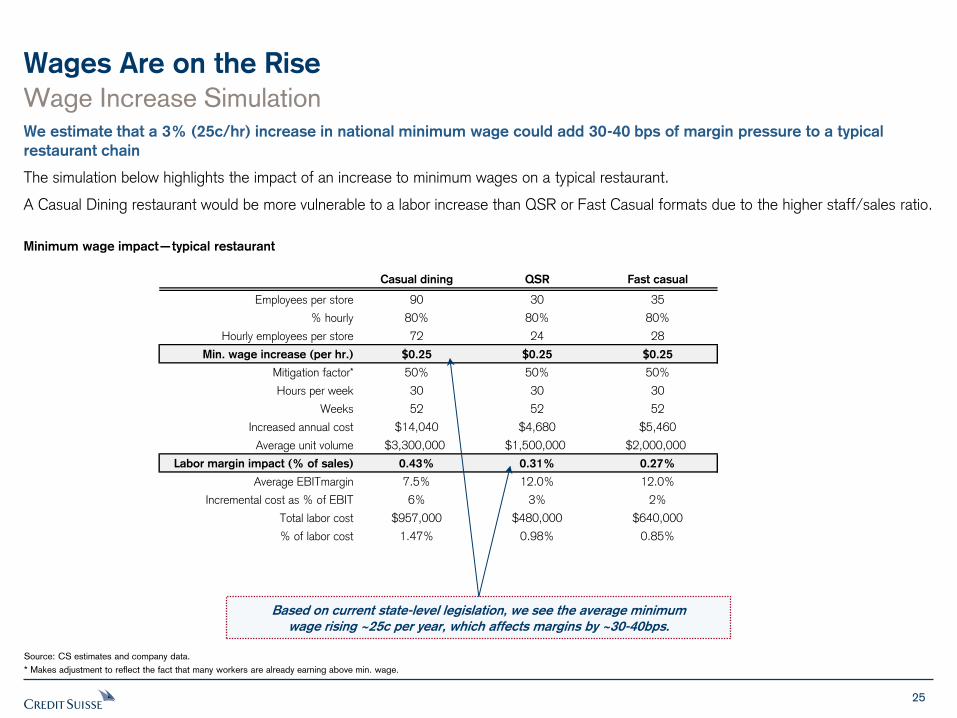
Wage Increase Simulation We estimate that a 3% (25c/hr) increase in national minimum wage could add 30-40 bps of margin pressure to a typical
restaurant chain
The simulation below highlights the impact of an increase to minimum wages on a typical restaurant.
A Casual Dining restaurant would be more vulnerable to a labor increase than QSR or Fast Casual formats due to the higher staff/sales ratio.
Minimum wage impact—typical restaurant
Source: CS estimates and company data.
* Makes adjustment to reflect the fact that many workers are already earning above min. wage.
Casual dining QSR Fast casual
Employees per store 90 30 35
% hourly 80% 80% 80%
Hourly employees per store 72 24 28
Min. wage increase (per hr.) $0.25 $0.25 $0.25
Mitigation factor* 50% 50% 50%
Hours per week 30 30 30
Weeks 52 52 52
Increased annual cost $14,040 $4,680 $5,460
Average unit volume $3,300,000 $1,500,000 $2,000,000
Labor margin impact (% of sales) 0.43% 0.31% 0.27%
Average EBITmargin 7.5% 12.0% 12.0%
Incremental cost as % of EBIT 6% 3% 2%
Total labor cost $957,000 $480,000 $640,000
% of labor cost 1.47% 0.98% 0.85%
Based on current state-level legislation, we see the average minimum
wage rising ~25c per year, which affects margins by ~30-40bps.
26
Wages Are on the Rise
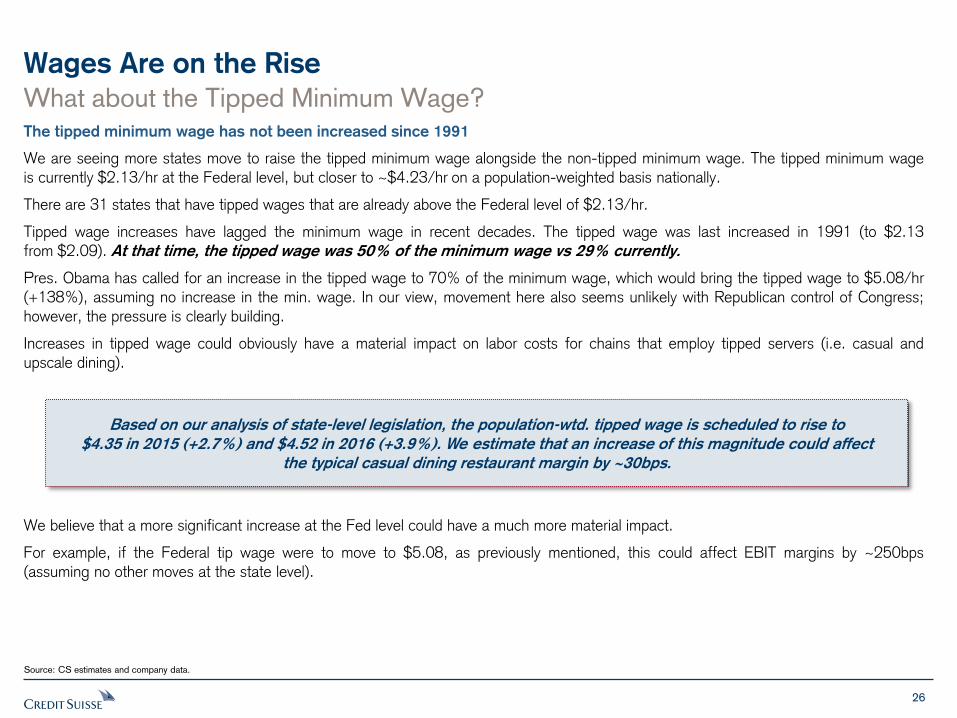
What about the Tipped Minimum Wage? The tipped minimum wage has not been increased since 1991
We are seeing more states move to raise the tipped minimum wage alongside the non-tipped minimum wage. The tipped minimum wage
is currently $2.13/hr at the Federal level, but closer to ~$4.23/hr on a population-weighted basis nationally.
There are 31 states that have tipped wages that are already above the Federal level of $2.13/hr.
Tipped wage increases have lagged the minimum wage in recent decades. The tipped wage was last increased in 1991 (to $2.13 from $2.09). At that time, the tipped wage was 50% of the minimum wage vs 29% currently.
Pres. Obama has called for an increase in the tipped wage to 70% of the minimum wage, which would bring the tipped wage to $5.08/hr
(+138%), assuming no increase in the min. wage. In our view, movement here also seems unlikely with Republican control of Congress; however, the pressure is clearly building.
Increases in tipped wage could obviously have a material impact on labor costs for chains that employ tipped servers (i.e. casual and upscale dining).
We believe that a more significant increase at the Fed level could have a much more material impact.
For example, if the Federal tip wage were to move to $5.08, as previously mentioned, this could affect EBIT margins by ~250bps (assuming no other moves at the state level).
Source: CS estimates and company data.
Based on our analysis of state-level legislation, the population-wtd. tipped wage is scheduled to rise to
$4.35 in 2015 (+2.7%) and $4.52 in 2016 (+3.9%). We estimate that an increase of this magnitude could affect
the typical casual dining restaurant margin by ~30bps.
27
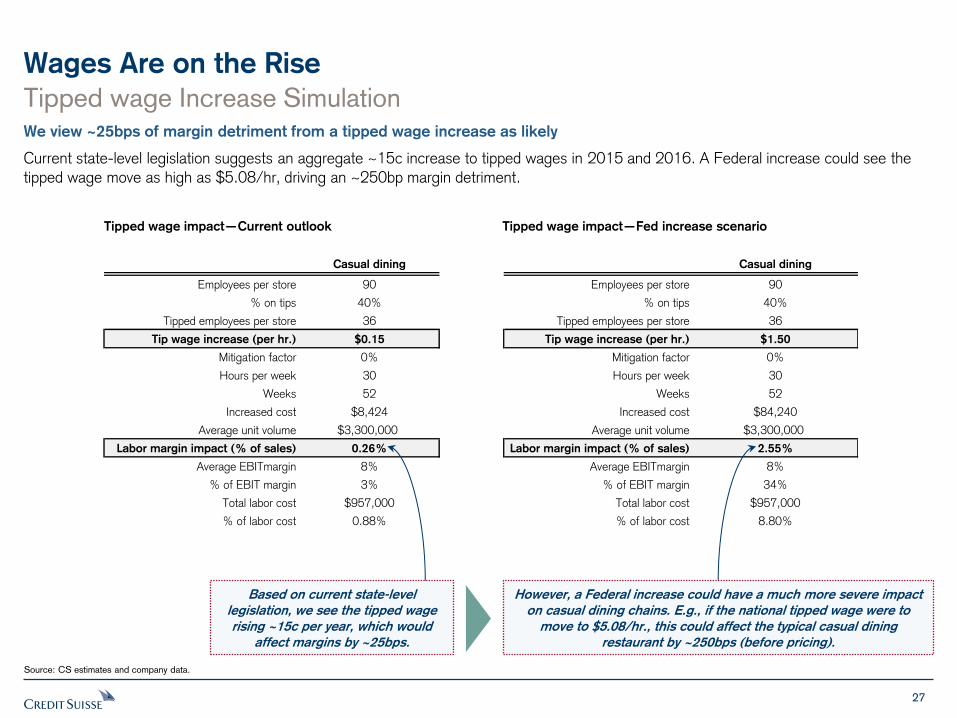
Wages Are on the Rise
Source: CS estimates and company data.
Tipped wage Increase Simulation We view ~25bps of margin detriment from a tipped wage increase as likely
Current state-level legislation suggests an aggregate ~15c increase to tipped wages in 2015 and 2016. A Federal increase could see the
tipped wage move as high as $5.08/hr, driving an ~250bp margin detriment.
Tipped wage impact—Current outlook Tipped wage impact—Fed increase scenario
Casual dining
Employees per store 90
% on tips 40%
Tipped employees per store 36
Tip wage increase (per hr.) $0.15
Mitigation factor 0%
Hours per week 30
Weeks 52
Increased cost $8,424
Average unit volume $3,300,000
Labor margin impact (% of sales) 0.26%
Average EBITmargin 8%
% of EBIT margin 3%
Total labor cost $957,000
% of labor cost 0.88%
Casual dining
Employees per store 90
% on tips 40%
Tipped employees per store 36
Tip wage increase (per hr.) $1.50
Mitigation factor 0%
Hours per week 30
Weeks 52
Increased cost $84,240
Average unit volume $3,300,000
Labor margin impact (% of sales) 2.55%
Average EBITmargin 8%
% of EBIT margin 34%
Total labor cost $957,000
% of labor cost 8.80%
Based on current state-level
legislation, we see the tipped wage
rising ~15c per year, which would
affect margins by ~25bps.
However, a Federal increase could have a much more severe impact
on casual dining chains. E.g., if the national tipped wage were to
move to $5.08/hr., this could affect the typical casual dining
restaurant by ~250bps (before pricing).
28
Wages Are on the Rise
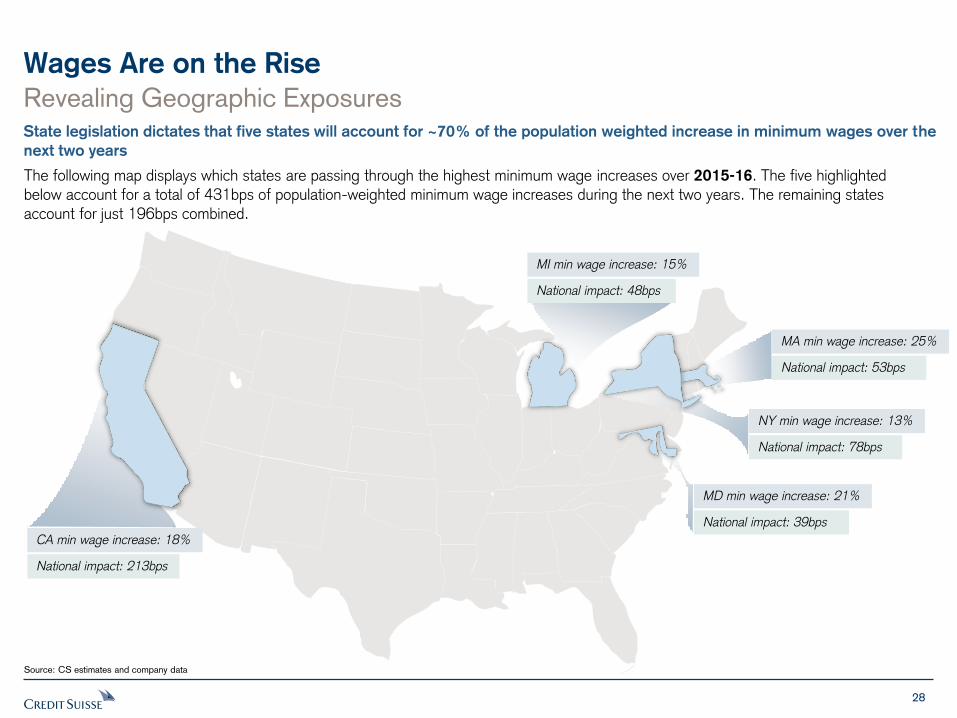
The following map displays which states are passing through the highest minimum wage increases over 2015-16. The five highlighted below account for a total of 431bps of population-weighted minimum wage increases during the next two years. The remaining states account for just 196bps combined.
Revealing Geographic Exposures State legislation dictates that five states will account for ~70% of the population weighted increase in minimum wages over the
next two years
Source: CS estimates and company data
MI min wage increase: 15%
National impact: 48bps
NY min wage increase: 13%
National impact: 78bps
MD min wage increase: 21%
National impact: 39bps
CA min wage increase: 18%
National impact: 213bps
MA min wage increase: 25%
National impact: 53bps
29
Wages Are on the Rise
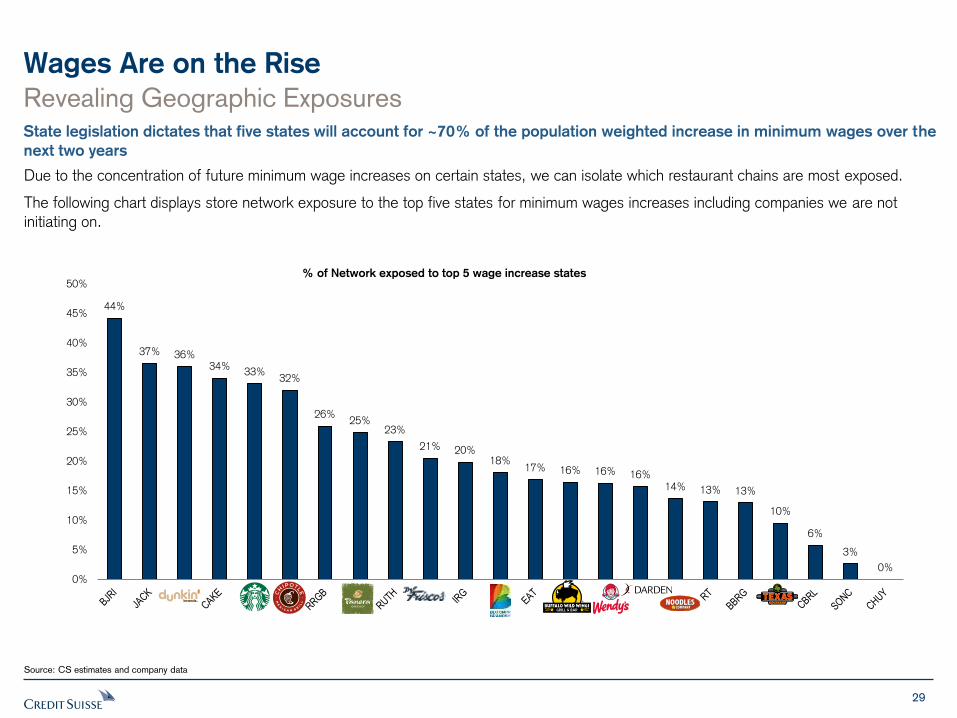
Due to the concentration of future minimum wage increases on certain states, we can isolate which restaurant chains are most exposed.
The following chart displays store network exposure to the top five states for minimum wages increases including companies we are not initiating on.
Revealing Geographic Exposures State legislation dictates that five states will account for ~70% of the population weighted increase in minimum wages over the
next two years
Source: CS estimates and company data
44%
37% 36% 34%
33% 32%
26% 25%
23%
21% 20% 18%
17% 16% 16% 16% 14% 13% 13%
10%
6%
3%
0% 0%
5%
10%
15%
20%
25%
30%
35%
40%
45%
50%% of Network exposed to top 5 wage increase states
30
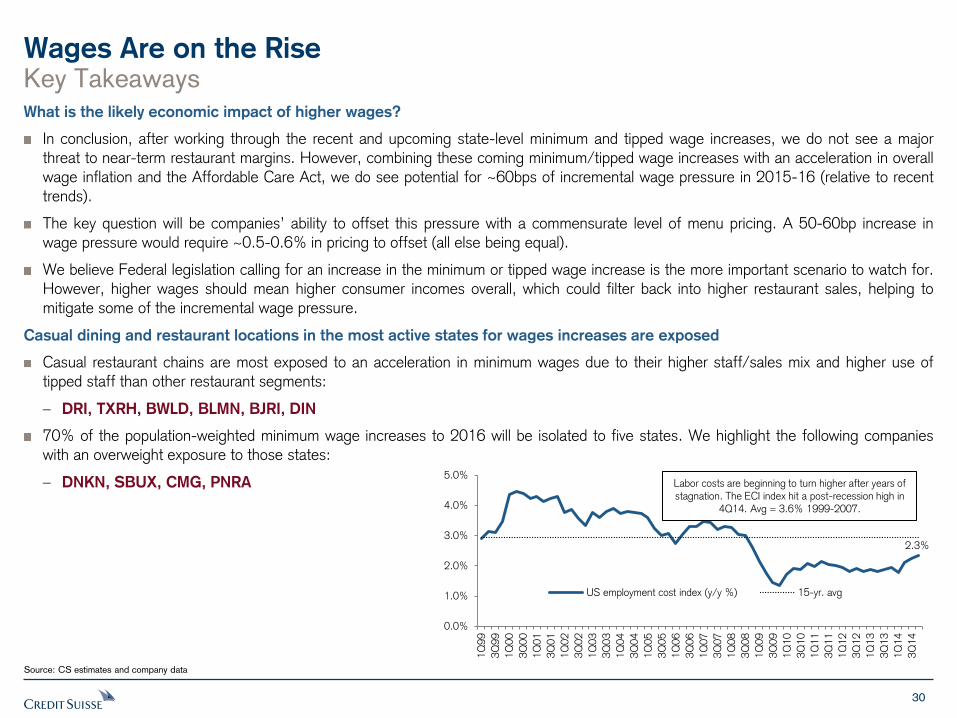
Wages Are on the Rise Key Takeaways What is the likely economic impact of higher wages?
In conclusion, after working through the recent and upcoming state-level minimum and tipped wage increases, we do not see a major threat to near-term restaurant margins. However, combining these coming minimum/tipped wage increases with an acceleration in overall wage inflation and the Affordable Care Act, we do see potential for ~60bps of incremental wage pressure in 2015-16 (relative to recent
trends).
The key question will be companies’ ability to offset this pressure with a commensurate level of menu pricing. A 50-60bp increase in wage pressure would require ~0.5-0.6% in pricing to offset (all else being equal).
We believe Federal legislation calling for an increase in the minimum or tipped wage increase is the more important scenario to watch for.
However, higher wages should mean higher consumer incomes overall, which could filter back into higher restaurant sales, helping to mitigate some of the incremental wage pressure.
Casual dining and restaurant locations in the most active states for wages increases are exposed
Casual restaurant chains are most exposed to an acceleration in minimum wages due to their higher staff/sales mix and higher use of
tipped staff than other restaurant segments:
– DRI, TXRH, BWLD, BLMN, BJRI, DIN
70% of the population-weighted minimum wage increases to 2016 will be isolated to five states. We highlight the following companies
with an overweight exposure to those states:
– DNKN, SBUX, CMG, PNRA
Source: CS estimates and company data
2.3%
0.0%
1.0%
2.0%
3.0%
4.0%
5.0%1Q
99
3Q
99
1Q
00
3Q
00
1Q
01
3Q
01
1Q
02
3Q
02
1Q
03
3Q
03
1Q
04
3Q
04
1Q
05
3Q
05
1Q
06
3Q
06
1Q
07
3Q
07
1Q
08
3Q
08
1Q
09
3Q
09
1Q
10
3Q
10
1Q
11
3Q
11
1Q
12
3Q
12
1Q
13
3Q
13
1Q
14
3Q
14
US employment cost index (y/y %) 15-yr. avg
Labor costs are beginning to turn higher after years of stagnation. The ECI index hit a post-recession high in
4Q14. Avg = 3.6% 1999-2007.
31
The Affordable Care Act
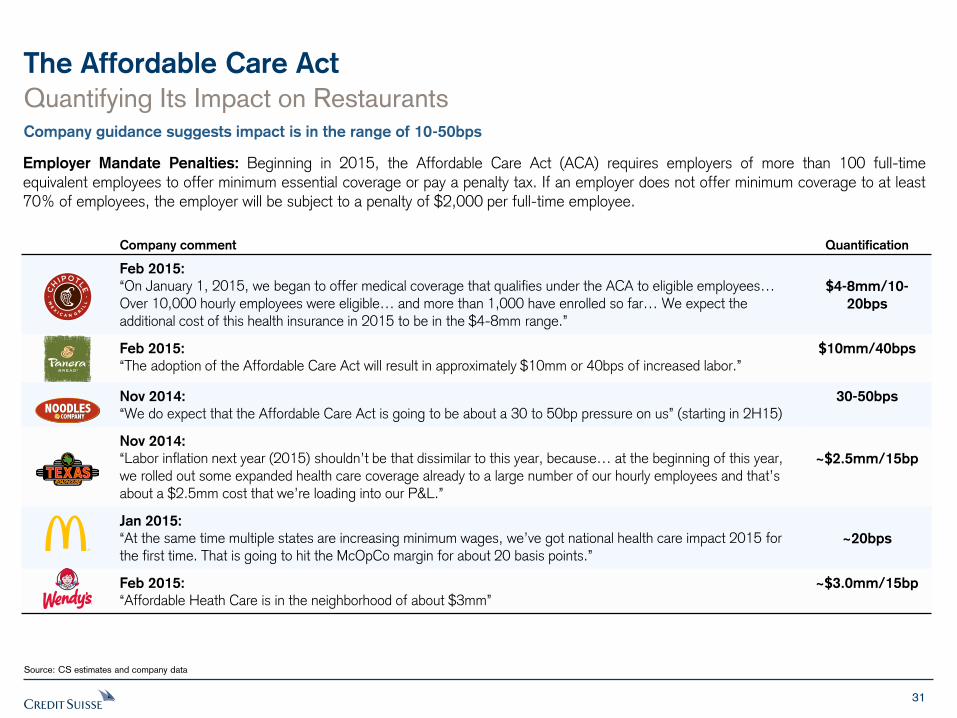
Quantifying Its Impact on Restaurants Company guidance suggests impact is in the range of 10-50bps
Employer Mandate Penalties: Beginning in 2015, the Affordable Care Act (ACA) requires employers of more than 100 full-time equivalent employees to offer minimum essential coverage or pay a penalty tax. If an employer does not offer minimum coverage to at least
70% of employees, the employer will be subject to a penalty of $2,000 per full-time employee.
Source: CS estimates and company data
Company comment Quantification
Feb 2015:
“On January 1, 2015, we began to offer medical coverage that qualifies under the ACA to eligible employees… Over 10,000 hourly employees were eligible… and more than 1,000 have enrolled so far… We expect the additional cost of this health insurance in 2015 to be in the $4-8mm range.”
$4-8mm/10-
20bps
Feb 2015:
“The adoption of the Affordable Care Act will result in approximately $10mm or 40bps of increased labor.” $10mm/40bps
Nov 2014:
“We do expect that the Affordable Care Act is going to be about a 30 to 50bp pressure on us” (starting in 2H15) 30-50bps
Nov 2014:
“Labor inflation next year (2015) shouldn’t be that dissimilar to this year, because… at the beginning of this year, we rolled out some expanded health care coverage already to a large number of our hourly employees and that’s about a $2.5mm cost that we’re loading into our P&L.”
~$2.5mm/15bp
Jan 2015:
“At the same time multiple states are increasing minimum wages, we’ve got national health care impact 2015 for the first time. That is going to hit the McOpCo margin for about 20 basis points.”
~20bps
Feb 2015:
“Affordable Heath Care is in the neighborhood of about $3mm” ~$3.0mm/15bp

FOCUS ISSUE: Gasoline Price Impact
33
Closer Look at Gas Prices & Restaurant Demand
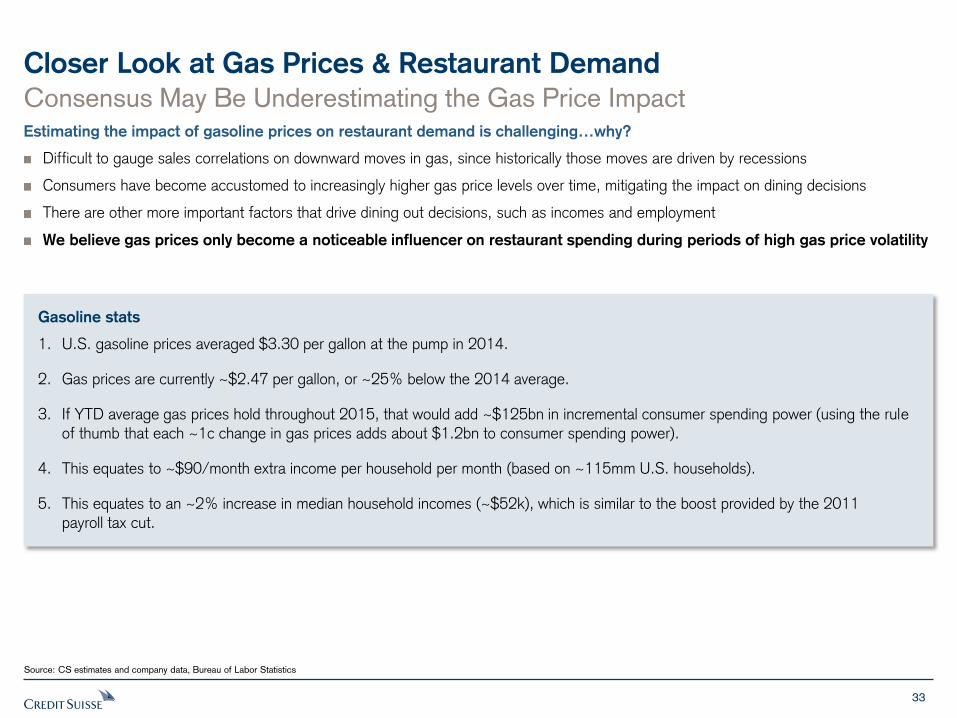
Consensus May Be Underestimating the Gas Price Impact Estimating the impact of gasoline prices on restaurant demand is challenging…why?
Difficult to gauge sales correlations on downward moves in gas, since historically those moves are driven by recessions
Consumers have become accustomed to increasingly higher gas price levels over time, mitigating the impact on dining decisions
There are other more important factors that drive dining out decisions, such as incomes and employment
We believe gas prices only become a noticeable influencer on restaurant spending during periods of high gas price volatility
Source: CS estimates and company data, Bureau of Labor Statistics
Gasoline stats
1. U.S. gasoline prices averaged $3.30 per gallon at the pump in 2014.
2. Gas prices are currently ~$2.47 per gallon, or ~25% below the 2014 average.
3. If YTD average gas prices hold throughout 2015, that would add ~$125bn in incremental consumer spending power (using the rule
of thumb that each ~1c change in gas prices adds about $1.2bn to consumer spending power).
4. This equates to ~$90/month extra income per household per month (based on ~115mm U.S. households).
5. This equates to an ~2% increase in median household incomes (~$52k), which is similar to the boost provided by the 2011 payroll tax cut.
34
Closer Look at Gas Prices & Restaurant Demand
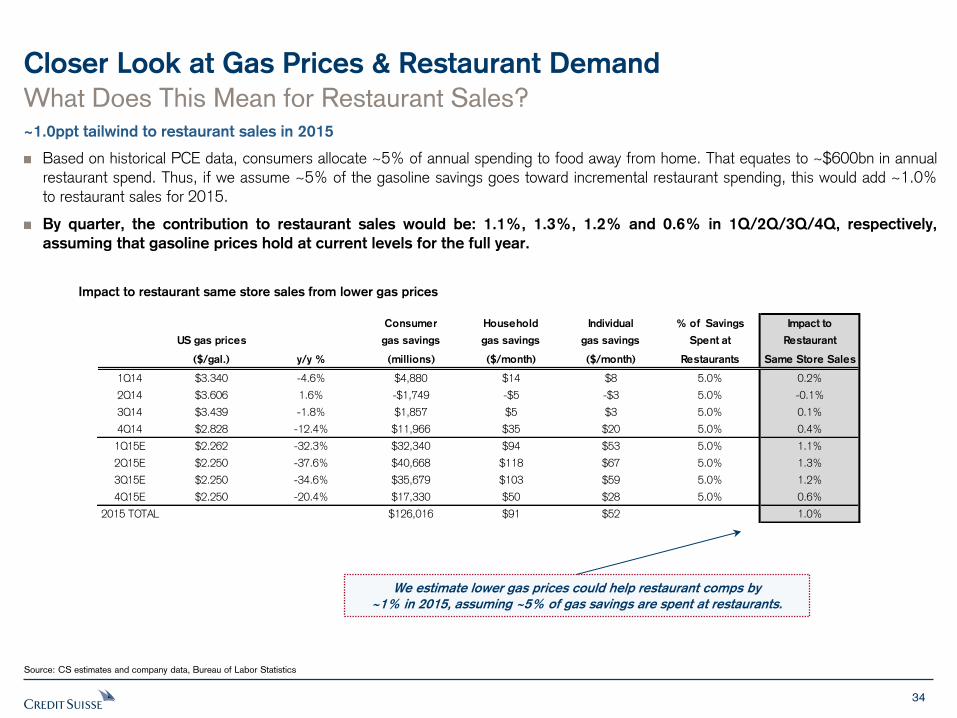
What Does This Mean for Restaurant Sales? ~1.0ppt tailwind to restaurant sales in 2015
Based on historical PCE data, consumers allocate ~5% of annual spending to food away from home. That equates to ~$600bn in annual
restaurant spend. Thus, if we assume ~5% of the gasoline savings goes toward incremental restaurant spending, this would add ~1.0% to restaurant sales for 2015.
By quarter, the contribution to restaurant sales would be: 1.1%, 1.3%, 1.2% and 0.6% in 1Q/2Q/3Q/4Q, respectively,
assuming that gasoline prices hold at current levels for the full year.
Impact to restaurant same store sales from lower gas prices
Source: CS estimates and company data, Bureau of Labor Statistics
We estimate lower gas prices could help restaurant comps by
~1% in 2015, assuming ~5% of gas savings are spent at restaurants.
Consumer Household Individual % of Savings Impact to
US gas prices gas savings gas savings gas savings Spent at Restaurant
($/gal.) y/y % (millions) ($/month) ($/month) Restaurants Same Store Sales
1Q14 $3.340 -4.6% $4,880 $14 $8 5.0% 0.2%
2Q14 $3.606 1.6% -$1,749 -$5 -$3 5.0% -0.1%
3Q14 $3.439 -1.8% $1,857 $5 $3 5.0% 0.1%
4Q14 $2.828 -12.4% $11,966 $35 $20 5.0% 0.4%
1Q15E $2.262 -32.3% $32,340 $94 $53 5.0% 1.1%
2Q15E $2.250 -37.6% $40,668 $118 $67 5.0% 1.3%
3Q15E $2.250 -34.6% $35,679 $103 $59 5.0% 1.2%
4Q15E $2.250 -20.4% $17,330 $50 $28 5.0% 0.6%
2015 TOTAL $126,016 $91 $52 1.0%
35
Closer Look at Gas Prices & Restaurant Demand
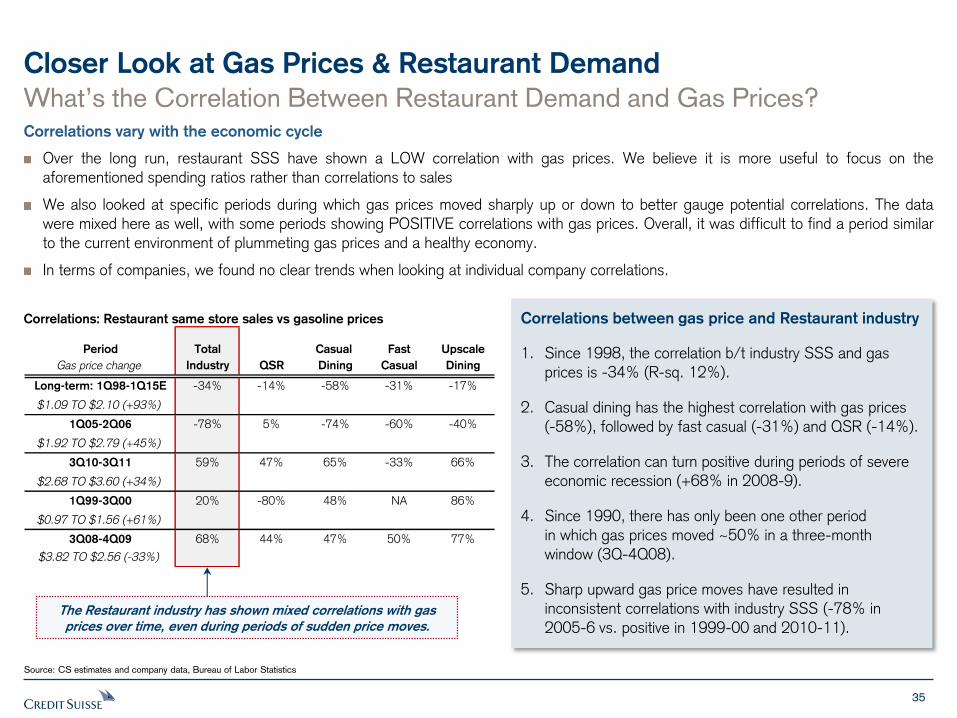
What’s the Correlation Between Restaurant Demand and Gas Prices? Correlations vary with the economic cycle
Over the long run, restaurant SSS have shown a LOW correlation with gas prices. We believe it is more useful to focus on the
aforementioned spending ratios rather than correlations to sales
We also looked at specific periods during which gas prices moved sharply up or down to better gauge potential correlations. The data were mixed here as well, with some periods showing POSITIVE correlations with gas prices. Overall, it was difficult to find a period similar
to the current environment of plummeting gas prices and a healthy economy.
In terms of companies, we found no clear trends when looking at individual company correlations.
Correlations: Restaurant same store sales vs gasoline prices
Source: CS estimates and company data, Bureau of Labor Statistics
Period Total Casual Fast Upscale
Gas price change Industry QSR Dining Casual Dining
Long-term: 1Q98-1Q15E -34% -14% -58% -31% -17%
$1.09 TO $2.10 (+93%)
1Q05-2Q06 -78% 5% -74% -60% -40%
$1.92 TO $2.79 (+45%)
3Q10-3Q11 59% 47% 65% -33% 66%
$2.68 TO $3.60 (+34%)
1Q99-3Q00 20% -80% 48% NA 86%
$0.97 TO $1.56 (+61%)
3Q08-4Q09 68% 44% 47% 50% 77%
$3.82 TO $2.56 (-33%)
Correlations between gas price and Restaurant industry
1. Since 1998, the correlation b/t industry SSS and gas prices is -34% (R-sq. 12%).
2. Casual dining has the highest correlation with gas prices (-58%), followed by fast casual (-31%) and QSR (-14%).
3. The correlation can turn positive during periods of severe economic recession (+68% in 2008-9).
4. Since 1990, there has only been one other period in which gas prices moved ~50% in a three-month window (3Q-4Q08).
5. Sharp upward gas price moves have resulted in inconsistent correlations with industry SSS (-78% in
2005-6 vs. positive in 1999-00 and 2010-11). The Restaurant industry has shown mixed correlations with gas
prices over time, even during periods of sudden price moves.
36
Closer Look at Gas Prices & Restaurant Demand
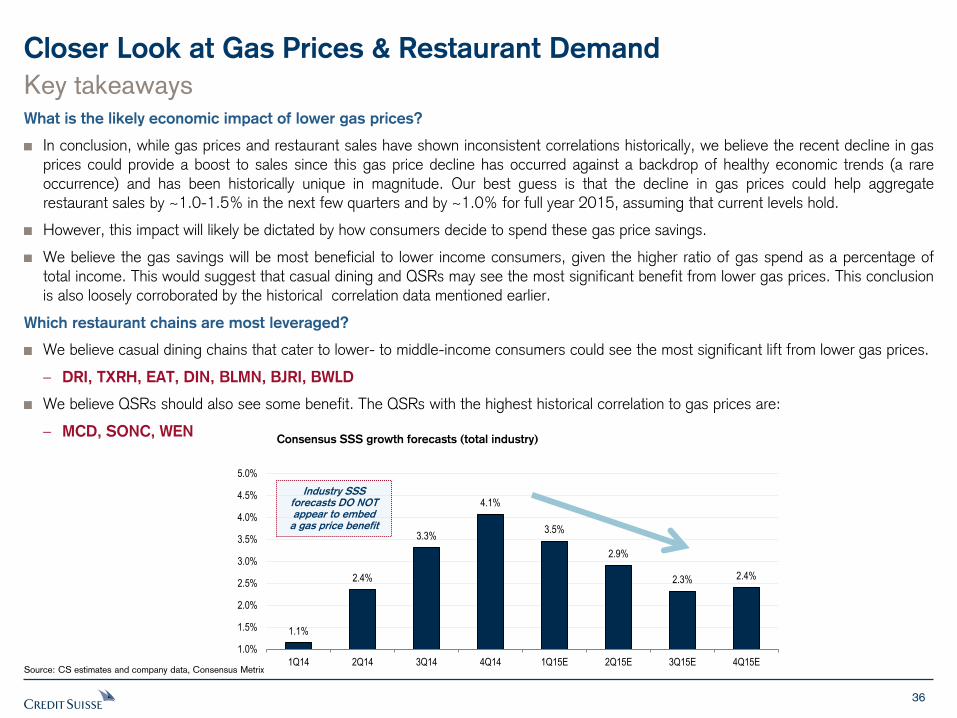
Key takeaways What is the likely economic impact of lower gas prices?
In conclusion, while gas prices and restaurant sales have shown inconsistent correlations historically, we believe the recent decline in gas prices could provide a boost to sales since this gas price decline has occurred against a backdrop of healthy economic trends (a rare occurrence) and has been historically unique in magnitude. Our best guess is that the decline in gas prices could help aggregate
restaurant sales by ~1.0-1.5% in the next few quarters and by ~1.0% for full year 2015, assuming that current levels hold.
However, this impact will likely be dictated by how consumers decide to spend these gas price savings.
We believe the gas savings will be most beneficial to lower income consumers, given the higher ratio of gas spend as a percentage of
total income. This would suggest that casual dining and QSRs may see the most significant benefit from lower gas prices. This conclusion is also loosely corroborated by the historical correlation data mentioned earlier.
Which restaurant chains are most leveraged?
We believe casual dining chains that cater to lower- to middle-income consumers could see the most significant lift from lower gas prices.
– DRI, TXRH, EAT, DIN, BLMN, BJRI, BWLD
We believe QSRs should also see some benefit. The QSRs with the highest historical correlation to gas prices are:
– MCD, SONC, WEN
Source: CS estimates and company data, Consensus Metrix
Consensus SSS growth forecasts (total industry)
1.1%
2.4%
3.3%
4.1%
3.5%
2.9%
2.3% 2.4%
1.0%
1.5%
2.0%
2.5%
3.0%
3.5%
4.0%
4.5%
5.0%
1Q14 2Q14 3Q14 4Q14 1Q15E 2Q15E 3Q15E 4Q15E
Industry SSS forecasts DO NOT appear to embed
a gas price benefit
37
Food Inflation
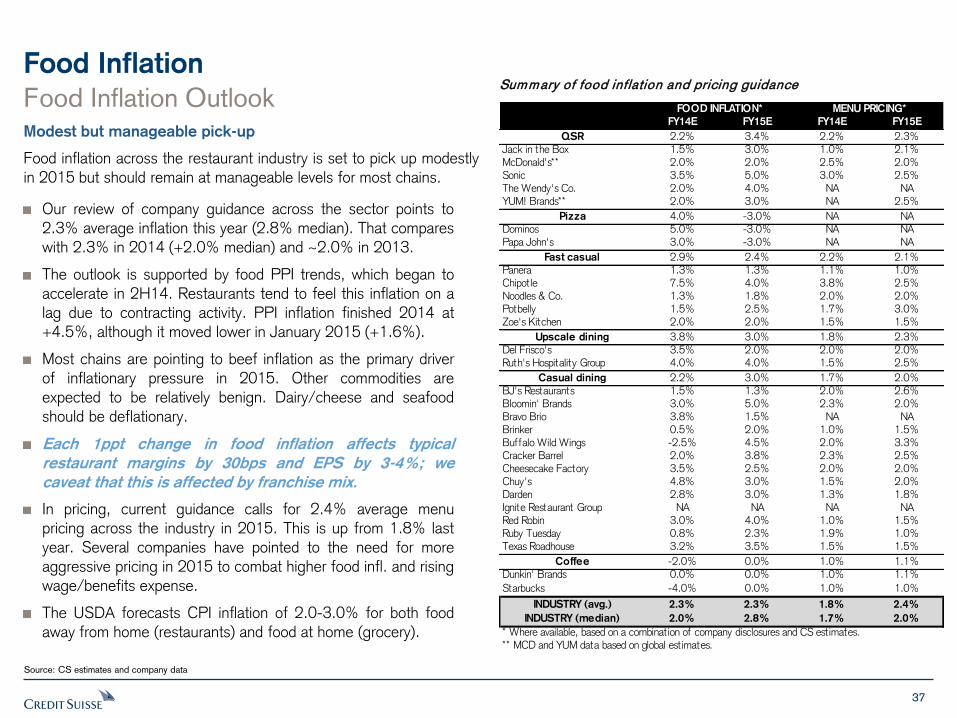
Our review of company guidance across the sector points to 2.3% average inflation this year (2.8% median). That compares with 2.3% in 2014 (+2.0% median) and ~2.0% in 2013.
The outlook is supported by food PPI trends, which began to accelerate in 2H14. Restaurants tend to feel this inflation on a
lag due to contracting activity. PPI inflation finished 2014 at +4.5%, although it moved lower in January 2015 (+1.6%).
Most chains are pointing to beef inflation as the primary driver of inflationary pressure in 2015. Other commodities are
expected to be relatively benign. Dairy/cheese and seafood should be deflationary.
Each 1ppt change in food inflation affects typical
restaurant margins by 30bps and EPS by 3-4%; we
caveat that this is affected by franchise mix.
In pricing, current guidance calls for 2.4% average menu pricing across the industry in 2015. This is up from 1.8% last
year. Several companies have pointed to the need for more aggressive pricing in 2015 to combat higher food infl. and rising
wage/benefits expense.
The USDA forecasts CPI inflation of 2.0-3.0% for both food
away from home (restaurants) and food at home (grocery).
Summary of food inflation and pricing guidance
Food Inflation Outlook Modest but manageable pick-up
Food inflation across the restaurant industry is set to pick up modestly
in 2015 but should remain at manageable levels for most chains.
Source: CS estimates and company data
FOOD INFLATION* MENU PRICING*
FY14E FY15E FY14E FY15E
QSR 2.2% 3.4% 2.2% 2.3%Jack in the Box 1.5% 3.0% 1.0% 2.1%McDonald's** 2.0% 2.0% 2.5% 2.0%Sonic 3.5% 5.0% 3.0% 2.5%The Wendy's Co. 2.0% 4.0% NA NAYUM! Brands** 2.0% 3.0% NA 2.5%
Pizza 4.0% -3.0% NA NADominos 5.0% -3.0% NA NAPapa John's 3.0% -3.0% NA NA
Fast casual 2.9% 2.4% 2.2% 2.1%Panera 1.3% 1.3% 1.1% 1.0%Chipotle 7.5% 4.0% 3.8% 2.5%Noodles & Co. 1.3% 1.8% 2.0% 2.0%Potbelly 1.5% 2.5% 1.7% 3.0%Zoe's Kitchen 2.0% 2.0% 1.5% 1.5%
Upscale dining 3.8% 3.0% 1.8% 2.3%Del Frisco's 3.5% 2.0% 2.0% 2.0%Ruth's Hospitality Group 4.0% 4.0% 1.5% 2.5%
Casual dining 2.2% 3.0% 1.7% 2.0%BJ's Restaurants 1.5% 1.3% 2.0% 2.6%Bloomin' Brands 3.0% 5.0% 2.3% 2.0%Bravo Brio 3.8% 1.5% NA NABrinker 0.5% 2.0% 1.0% 1.5%Buffalo Wild Wings -2.5% 4.5% 2.0% 3.3%Cracker Barrel 2.0% 3.8% 2.3% 2.5%Cheesecake Factory 3.5% 2.5% 2.0% 2.0%Chuy's 4.8% 3.0% 1.5% 2.0%Darden 2.8% 3.0% 1.3% 1.8%Ignite Restaurant Group NA NA NA NARed Robin 3.0% 4.0% 1.0% 1.5%Ruby Tuesday 0.8% 2.3% 1.9% 1.0%Texas Roadhouse 3.2% 3.5% 1.5% 1.5%
Coffee -2.0% 0.0% 1.0% 1.1%Dunkin' Brands 0.0% 0.0% 1.0% 1.1%
Starbucks -4.0% 0.0% 1.0% 1.0%
INDUSTRY (avg.) 2.3% 2.3% 1.8% 2.4%
INDUSTRY (median) 2.0% 2.8% 1.7% 2.0%
* Where available, based on a combinat ion of company disclosures and CS est imates. ** MCD and YUM data based on global est imates.
38
Food Inflation
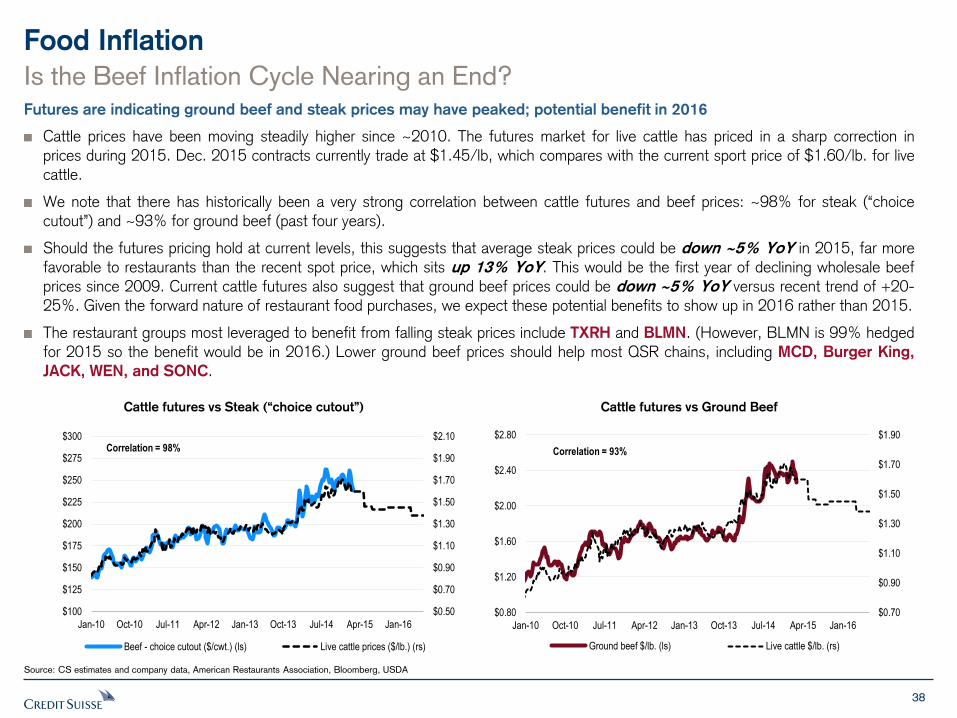
Is the Beef Inflation Cycle Nearing an End? Futures are indicating ground beef and steak prices may have peaked; potential benefit in 2016
Cattle prices have been moving steadily higher since ~2010. The futures market for live cattle has priced in a sharp correction in
prices during 2015. Dec. 2015 contracts currently trade at $1.45/lb, which compares with the current sport price of $1.60/lb. for live cattle.
We note that there has historically been a very strong correlation between cattle futures and beef prices: ~98% for steak (“choice
cutout”) and ~93% for ground beef (past four years).
Should the futures pricing hold at current levels, this suggests that average steak prices could be down ~5% YoY in 2015, far more favorable to restaurants than the recent spot price, which sits up 13% YoY. This would be the first year of declining wholesale beef prices since 2009. Current cattle futures also suggest that ground beef prices could be down ~5% YoY versus recent trend of +20-
25%. Given the forward nature of restaurant food purchases, we expect these potential benefits to show up in 2016 rather than 2015.
The restaurant groups most leveraged to benefit from falling steak prices include TXRH and BLMN. (However, BLMN is 99% hedged for 2015 so the benefit would be in 2016.) Lower ground beef prices should help most QSR chains, including MCD, Burger King,
JACK, WEN, and SONC.
Source: CS estimates and company data, American Restaurants Association, Bloomberg, USDA
$0.50
$0.70
$0.90
$1.10
$1.30
$1.50
$1.70
$1.90
$2.10
$100
$125
$150
$175
$200
$225
$250
$275
$300
Jan-10 Oct-10 Jul-11 Apr-12 Jan-13 Oct-13 Jul-14 Apr-15 Jan-16
Beef - choice cutout ($/cwt.) (ls) Live cattle prices ($/lb.) (rs)
Correlation = 98%
Cattle futures vs Steak (“choice cutout”)
$0.70
$0.90
$1.10
$1.30
$1.50
$1.70
$1.90
$0.80
$1.20
$1.60
$2.00
$2.40
$2.80
Jan-10 Oct-10 Jul-11 Apr-12 Jan-13 Oct-13 Jul-14 Apr-15 Jan-16
Ground beef $/lb. (ls) Live cattle $/lb. (rs)
Correlation = 93%
Cattle futures vs Ground Beef
39
Chicken Legs
Chicken Breasts Chicken Wings
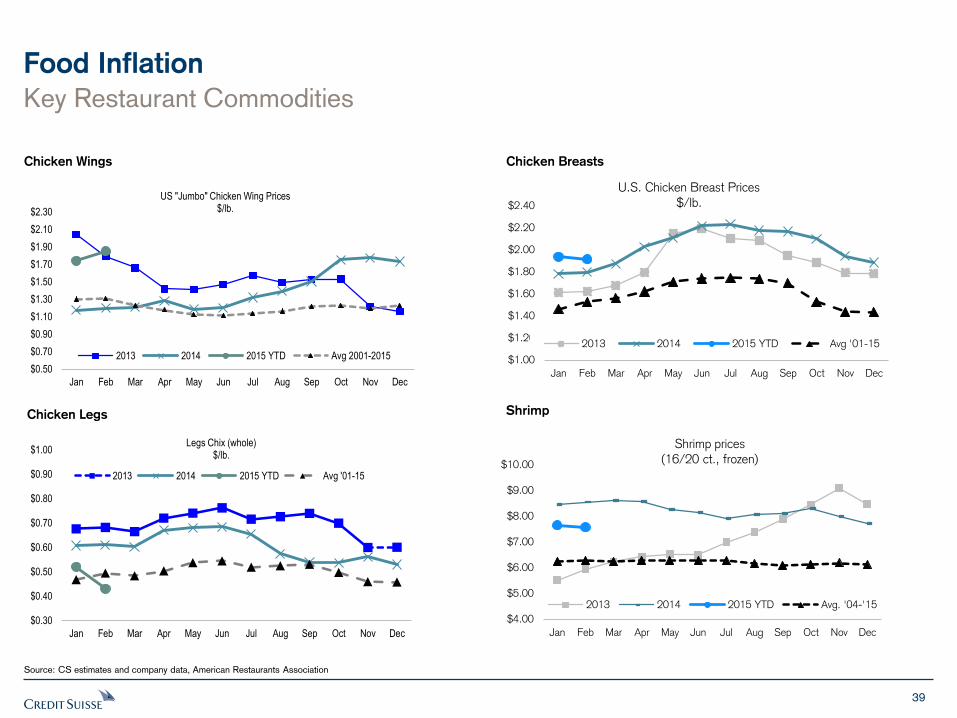
Food Inflation
Shrimp
Key Restaurant Commodities
Source: CS estimates and company data, American Restaurants Association
$1.00
$1.20
$1.40
$1.60
$1.80
$2.00
$2.20
$2.40
Jan Feb Mar Apr May Jun Jul Aug Sep Oct Nov Dec
U.S. Chicken Breast Prices $/lb.
2013 2014 2015 YTD Avg '01-15
$4.00
$5.00
$6.00
$7.00
$8.00
$9.00
$10.00
Jan Feb Mar Apr May Jun Jul Aug Sep Oct Nov Dec
Shrimp prices
(16/20 ct., frozen)
2013 2014 2015 YTD Avg. '04-'15
$0.30
$0.40
$0.50
$0.60
$0.70
$0.80
$0.90
$1.00
Jan Feb Mar Apr May Jun Jul Aug Sep Oct Nov Dec
Legs Chix (whole) $/lb.
2013 2014 2015 YTD Avg '01-15
$0.50
$0.70
$0.90
$1.10
$1.30
$1.50
$1.70
$1.90
$2.10
$2.30
Jan Feb Mar Apr May Jun Jul Aug Sep Oct Nov Dec
US "Jumbo" Chicken Wing Prices $/lb.
2013 2014 2015 YTD Avg 2001-2015
40
Coffee
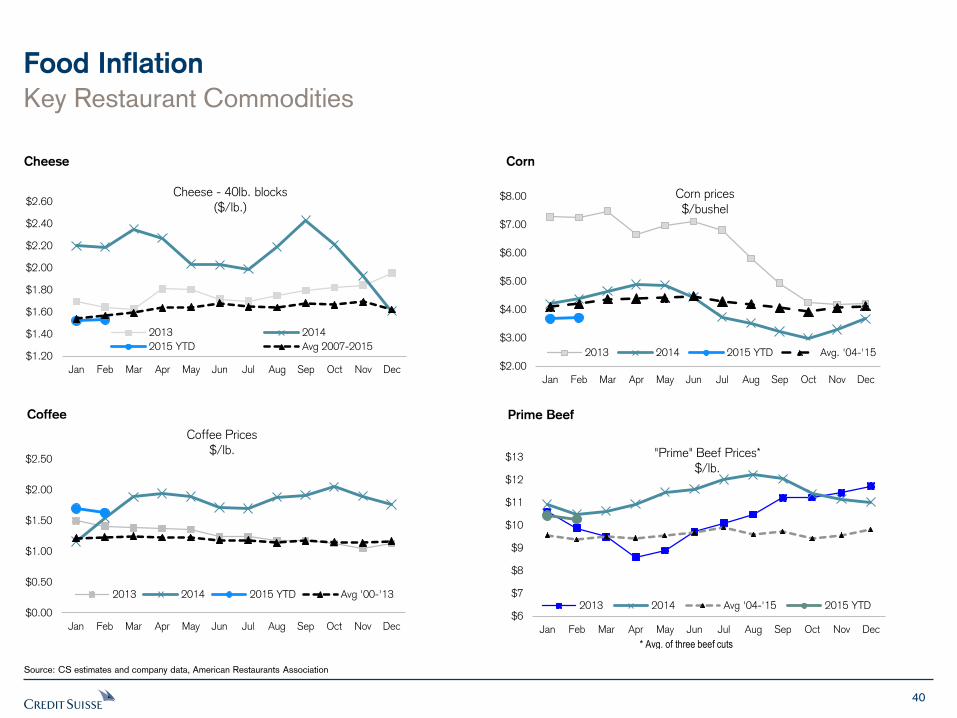
Corn Cheese
Food Inflation
Key Restaurant Commodities
Source: CS estimates and company data, American Restaurants Association
$1.20
$1.40
$1.60
$1.80
$2.00
$2.20
$2.40
$2.60
Jan Feb Mar Apr May Jun Jul Aug Sep Oct Nov Dec
Cheese - 40lb. blocks ($/lb.)
2013 2014
2015 YTD Avg 2007-2015
$2.00
$3.00
$4.00
$5.00
$6.00
$7.00
$8.00
Jan Feb Mar Apr May Jun Jul Aug Sep Oct Nov Dec
Corn prices $/bushel
2013 2014 2015 YTD Avg. '04-'15
$0.00
$0.50
$1.00
$1.50
$2.00
$2.50
Jan Feb Mar Apr May Jun Jul Aug Sep Oct Nov Dec
Coffee Prices
$/lb.
2013 2014 2015 YTD Avg '00-'13
Prime Beef
$6
$7
$8
$9
$10
$11
$12
$13
Jan Feb Mar Apr May Jun Jul Aug Sep Oct Nov Dec
"Prime" Beef Prices*
$/lb.
2013 2014 Avg '04-'15 2015 YTD
* Avg. of three beef cuts
41
-4.0%
-3.0%
-2.0%
-1.0%
0.0%
1.0%
2.0%
3.0%
4.0%
5.0%
6.0%
EA
TM
CD
CA
KE
RU
TH
DIN
DR
IS
BU
XC
BR
LR
TS
ON
CB
LMN
PZ
ZA
YU
MJA
CK
DN
KN
CM
GT
XR
HK
KD
IRG
DP
ZLO
CO
BW
LDQ
SR
PN
RA
PLK
IB
JRI
WE
NC
HU
YP
BP
BR
RG
BZ
OE
SD
FR
GN
DLS
HA
BT
Free cash flow yield (FCF/EV)
Cash Flow
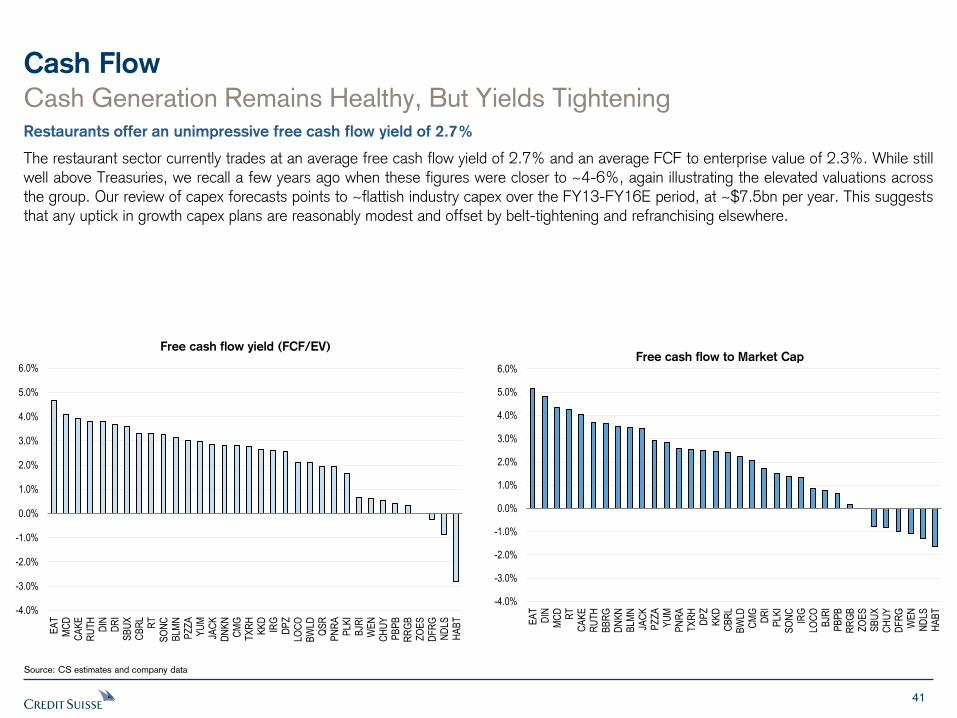
Cash Generation Remains Healthy, But Yields Tightening Restaurants offer an unimpressive free cash flow yield of 2.7%
The restaurant sector currently trades at an average free cash flow yield of 2.7% and an average FCF to enterprise value of 2.3%. While still
well above Treasuries, we recall a few years ago when these figures were closer to ~4-6%, again illustrating the elevated valuations across the group. Our review of capex forecasts points to ~flattish industry capex over the FY13-FY16E period, at ~$7.5bn per year. This suggests that any uptick in growth capex plans are reasonably modest and offset by belt-tightening and refranchising elsewhere.
Source: CS estimates and company data
-4.0%
-3.0%
-2.0%
-1.0%
0.0%
1.0%
2.0%
3.0%
4.0%
5.0%
6.0%
EA
TD
INM
CD
RT
CA
KE
RU
TH
BB
RG
DN
KN
BLM
NJA
CK
PZ
ZA
YU
MP
NR
AT
XR
HD
PZ
KK
DC
BR
LB
WLD
CM
GD
RI
PLK
IS
ON
CIR
GLO
CO
BJR
IP
BP
BR
RG
BZ
OE
SS
BU
XC
HU
YD
FR
GW
EN
ND
LSH
AB
T
Free cash flow to Market Cap
42
Capital Distributions
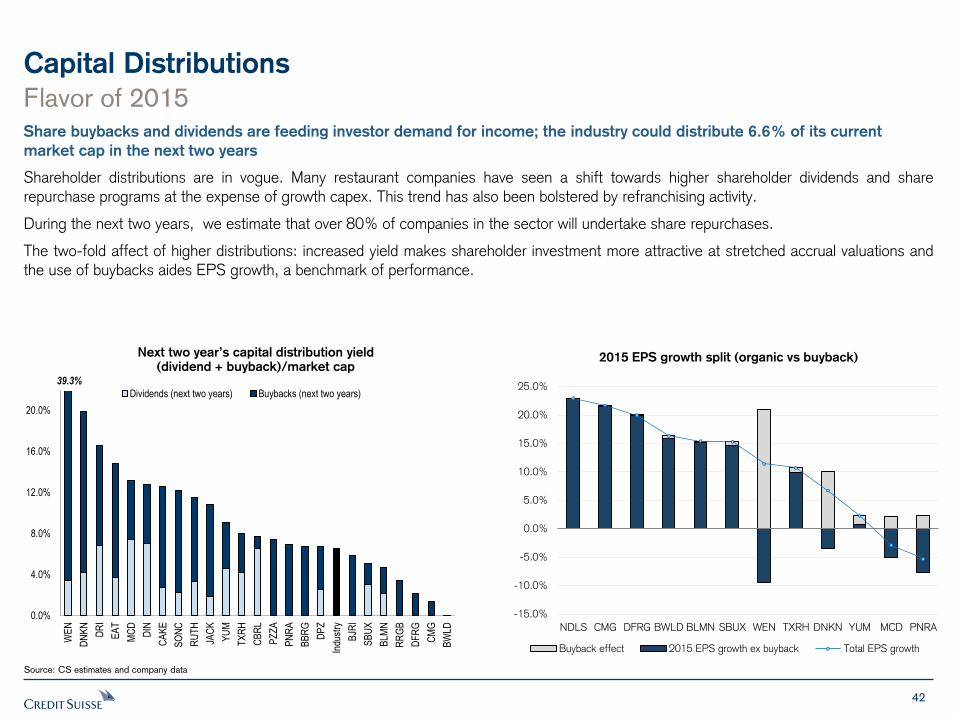
Flavor of 2015 Share buybacks and dividends are feeding investor demand for income; the industry could distribute 6.6% of its current
market cap in the next two years
Shareholder distributions are in vogue. Many restaurant companies have seen a shift towards higher shareholder dividends and share repurchase programs at the expense of growth capex. This trend has also been bolstered by refranchising activity.
During the next two years, we estimate that over 80% of companies in the sector will undertake share repurchases.
The two-fold affect of higher distributions: increased yield makes shareholder investment more attractive at stretched accrual valuations and the use of buybacks aides EPS growth, a benchmark of performance.
Source: CS estimates and company data
Next two year’s capital distribution yield (dividend + buyback)/market cap
-15.0%
-10.0%
-5.0%
0.0%
5.0%
10.0%
15.0%
20.0%
25.0%
NDLS CMG DFRG BWLD BLMN SBUX WEN TXRH DNKN YUM MCD PNRA
Buyback effect 2015 EPS growth ex buyback Total EPS growth
2015 EPS growth split (organic vs buyback)
0.0%
4.0%
8.0%
12.0%
16.0%
20.0%
WE
N
DN
KN
DR
I
EA
T
MC
D
DIN
CA
KE
SO
NC
RU
TH
JAC
K
YU
M
TX
RH
CB
RL
PZ
ZA
PN
RA
BB
RG
DP
Z
Indu
stry
BJR
I
SB
UX
BLM
N
RR
GB
DF
RG
CM
G
BW
LD
Dividends (next two years) Buybacks (next two years)
39.3%
43
HOLT® analysis
Elevated valuations; where to invest?
Source: CS estimates and company data, Credit Suisse HOLT
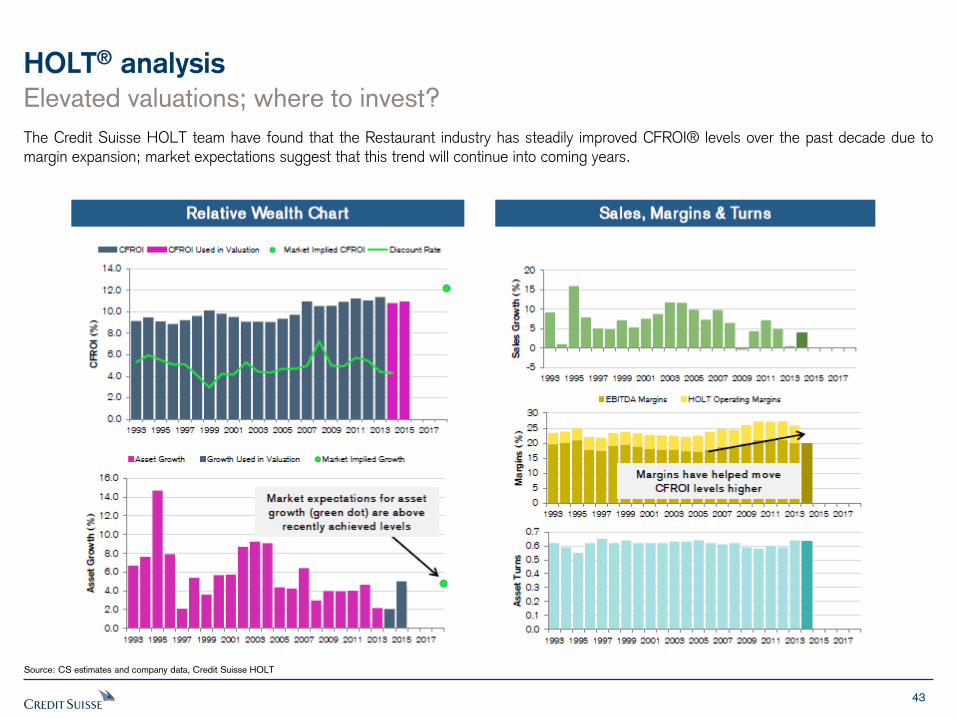
The Credit Suisse HOLT team have found that the Restaurant industry has steadily improved CFROI® levels over the past decade due to margin expansion; market expectations suggest that this trend will continue into coming years.
44
HOLT analysis
Elevated valuations; where to invest?
Source: CS estimates and company data, Credit Suisse HOLT
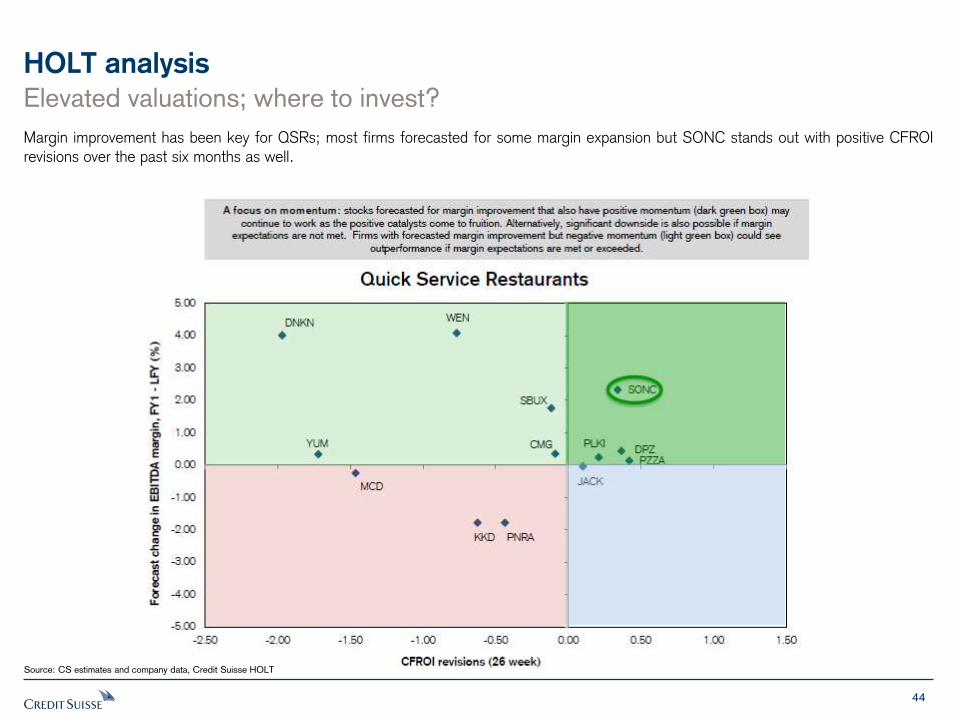
Margin improvement has been key for QSRs; most firms forecasted for some margin expansion but SONC stands out with positive CFROI revisions over the past six months as well.
45
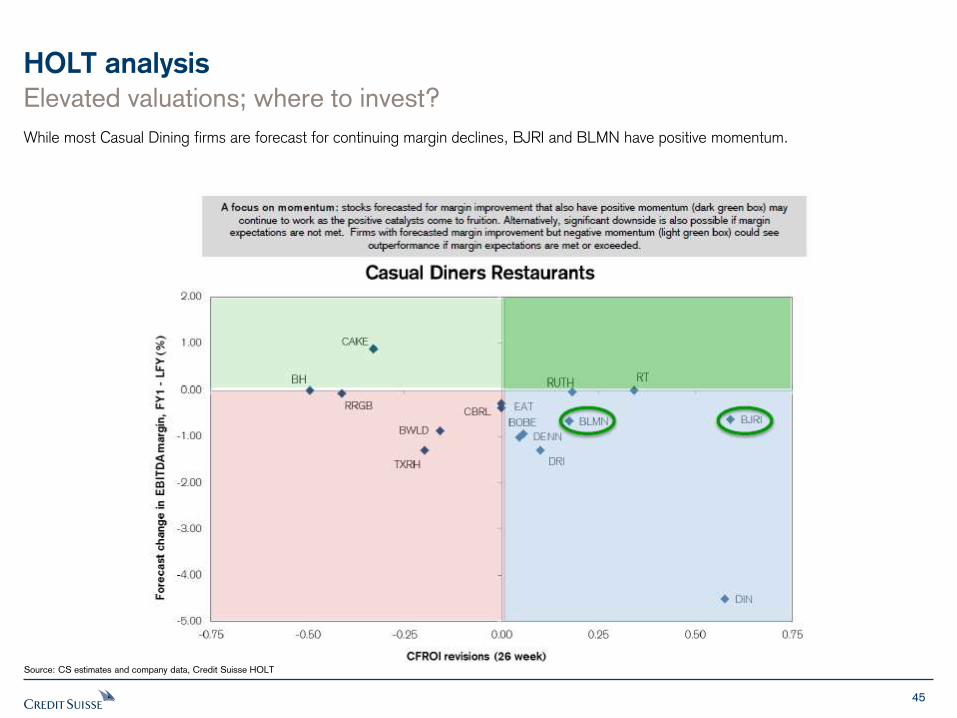
HOLT analysis
Elevated valuations; where to invest?
Source: CS estimates and company data, Credit Suisse HOLT
While most Casual Dining firms are forecast for continuing margin declines, BJRI and BLMN have positive momentum.

Stock Picks / Company Tear Sheets
47
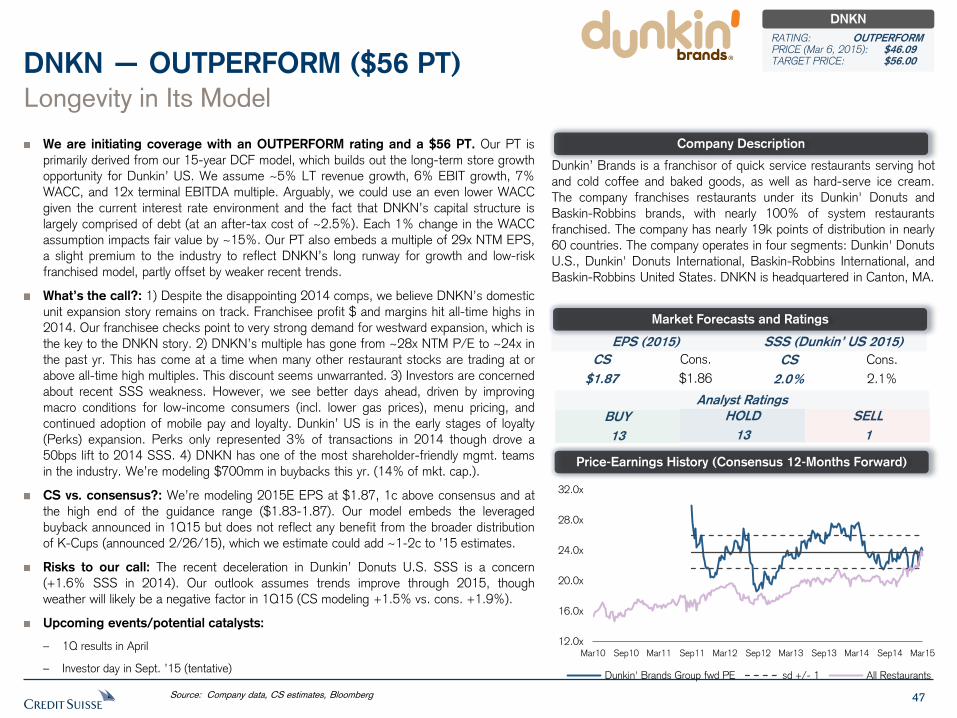
We are initiating coverage with an OUTPERFORM rating and a $56 PT. Our PT is
primarily derived from our 15-year DCF model, which builds out the long-term store growth
opportunity for Dunkin’ US. We assume ~5% LT revenue growth, 6% EBIT growth, 7%
WACC, and 12x terminal EBITDA multiple. Arguably, we could use an even lower WACC
given the current interest rate environment and the fact that DNKN’s capital structure is
largely comprised of debt (at an after-tax cost of ~2.5%). Each 1% change in the WACC
assumption impacts fair value by ~15%. Our PT also embeds a multiple of 29x NTM EPS,
a slight premium to the industry to reflect DNKN’s long runway for growth and low-risk
franchised model, partly offset by weaker recent trends.
What’s the call?: 1) Despite the disappointing 2014 comps, we believe DNKN’s domestic
unit expansion story remains on track. Franchisee profit $ and margins hit all-time highs in
2014. Our franchisee checks point to very strong demand for westward expansion, which is
the key to the DNKN story. 2) DNKN’s multiple has gone from ~28x NTM P/E to ~24x in
the past yr. This has come at a time when many other restaurant stocks are trading at or
above all-time high multiples. This discount seems unwarranted. 3) Investors are concerned
about recent SSS weakness. However, we see better days ahead, driven by improving
macro conditions for low-income consumers (incl. lower gas prices), menu pricing, and
continued adoption of mobile pay and loyalty. Dunkin’ US is in the early stages of loyalty
(Perks) expansion. Perks only represented 3% of transactions in 2014 though drove a
50bps lift to 2014 SSS. 4) DNKN has one of the most shareholder-friendly mgmt. teams
in the industry. We’re modeling $700mm in buybacks this yr. (14% of mkt. cap.).
CS vs. consensus?: We’re modeling 2015E EPS at $1.87, 1c above consensus and at
the high end of the guidance range ($1.83-1.87). Our model embeds the leveraged
buyback announced in 1Q15 but does not reflect any benefit from the broader distribution
of K-Cups (announced 2/26/15), which we estimate could add ~1-2c to ’15 estimates.
Risks to our call: The recent deceleration in Dunkin’ Donuts U.S. SSS is a concern
(+1.6% SSS in 2014). Our outlook assumes trends improve through 2015, though
weather will likely be a negative factor in 1Q15 (CS modeling +1.5% vs. cons. +1.9%).
Upcoming events/potential catalysts:
– 1Q results in April
– Investor day in Sept. ’15 (tentative)
Longevity in Its Model
DNKN — OUTPERFORM ($56 PT)
Dunkin’ Brands is a franchisor of quick service restaurants serving hot
and cold coffee and baked goods, as well as hard-serve ice cream.
The company franchises restaurants under its Dunkin' Donuts and
Baskin-Robbins brands, with nearly 100% of system restaurants
franchised. The company has nearly 19k points of distribution in nearly
60 countries. The company operates in four segments: Dunkin' Donuts
U.S., Dunkin' Donuts International, Baskin-Robbins International, and
Baskin-Robbins United States. DNKN is headquartered in Canton, MA.
Source: Company data, CS estimates, Bloomberg
Company Description
Price-Earnings History (Consensus 12-Months Forward)
EPS (2015) SSS (Dunkin’ US 2015)
CS
$1.87
Cons.
$1.86
CS
2.0%
Cons.
2.1%
Analyst Ratings
BUY
13
SELL
1
HOLD
13
Market Forecasts and Ratings
DNKN
RATING: OUTPERFORM PRICE (Mar 6, 2015): $46.09 TARGET PRICE: $56.00
12.0x
16.0x
20.0x
24.0x
28.0x
32.0x
Mar10 Sep10 Mar11 Sep11 Mar12 Sep12 Mar13 Sep13 Mar14 Sep14 Mar15
Dunkin' Brands Group fwd PE sd +/- 1 All Restaurants
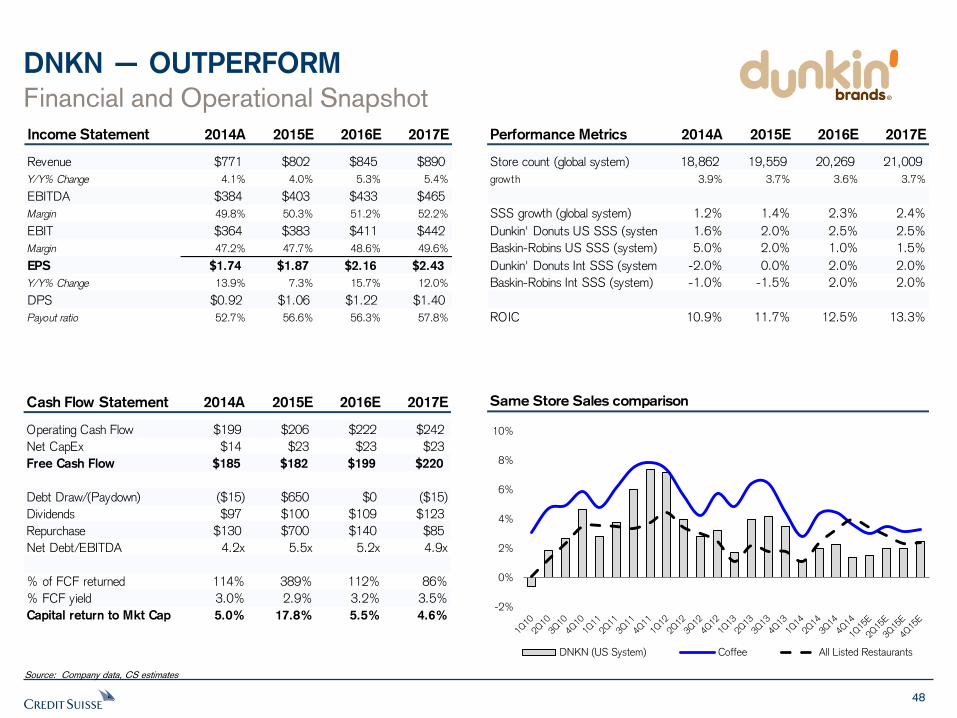
48
DNKN — OUTPERFORM
Financial and Operational Snapshot
Source: Company data, CS estimates
Same Store Sales comparison
Income Statement 2014A 2015E 2016E 2017E
Revenue $771 $802 $845 $890
Y/Y% Change 4.1% 4.0% 5.3% 5.4%
EBITDA $384 $403 $433 $465
Margin 49.8% 50.3% 51.2% 52.2%
EBIT $364 $383 $411 $442
Margin 47.2% 47.7% 48.6% 49.6%
EPS $1.74 $1.87 $2.16 $2.43
Y/Y% Change 13.9% 7.3% 15.7% 12.0%
DPS $0.92 $1.06 $1.22 $1.40
Payout ratio 52.7% 56.6% 56.3% 57.8%
Performance Metrics 2014A 2015E 2016E 2017E
Store count (global system) 18,862 19,559 20,269 21,009
growth 3.9% 3.7% 3.6% 3.7%
SSS growth (global system) 1.2% 1.4% 2.3% 2.4%
Dunkin' Donuts US SSS (system) 1.6% 2.0% 2.5% 2.5%
Baskin-Robins US SSS (system) 5.0% 2.0% 1.0% 1.5%
Dunkin' Donuts Int SSS (system) -2.0% 0.0% 2.0% 2.0%
Baskin-Robins Int SSS (system) -1.0% -1.5% 2.0% 2.0%
ROIC 10.9% 11.7% 12.5% 13.3%
Cash Flow Statement 2014A 2015E 2016E 2017E
Operating Cash Flow $199 $206 $222 $242
Net CapEx $14 $23 $23 $23
Free Cash Flow $185 $182 $199 $220
Debt Draw/(Paydown) ($15) $650 $0 ($15)
Dividends $97 $100 $109 $123
Repurchase $130 $700 $140 $85
Net Debt/EBITDA 4.2x 5.5x 5.2x 4.9x
% of FCF returned 114% 389% 112% 86%
% FCF yield 3.0% 2.9% 3.2% 3.5%
Capital return to Mkt Cap 5.0% 17.8% 5.5% 4.6%-2%
0%
2%
4%
6%
8%
10%
DNKN (US System) Coffee All Listed Restaurants
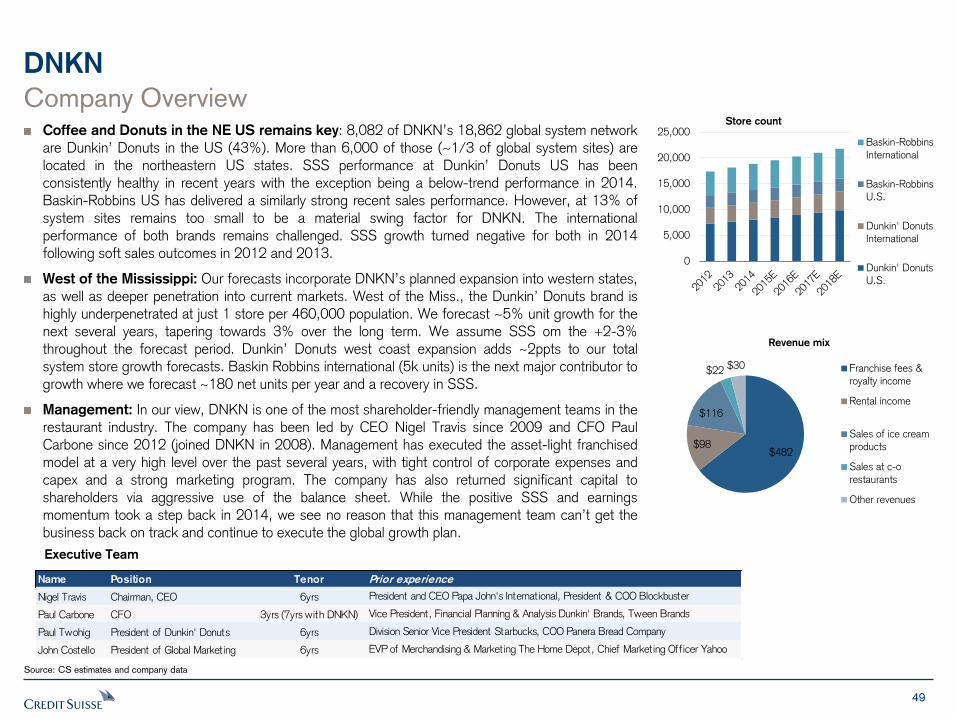
49
DNKN
Company Overview Coffee and Donuts in the NE US remains key: 8,082 of DNKN’s 18,862 global system network are Dunkin’ Donuts in the US (43%). More than 6,000 of those (~1/3 of global system sites) are located in the northeastern US states. SSS performance at Dunkin’ Donuts US has been consistently healthy in recent years with the exception being a below-trend performance in 2014. Baskin-Robbins US has delivered a similarly strong recent sales performance. However, at 13% of system sites remains too small to be a material swing factor for DNKN. The international performance of both brands remains challenged. SSS growth turned negative for both in 2014 following soft sales outcomes in 2012 and 2013.
West of the Mississippi: Our forecasts incorporate DNKN’s planned expansion into western states, as well as deeper penetration into current markets. West of the Miss., the Dunkin’ Donuts brand is highly underpenetrated at just 1 store per 460,000 population. We forecast ~5% unit growth for the next several years, tapering towards 3% over the long term. We assume SSS om the +2-3% throughout the forecast period. Dunkin’ Donuts west coast expansion adds ~2ppts to our total system store growth forecasts. Baskin Robbins international (5k units) is the next major contributor to growth where we forecast ~180 net units per year and a recovery in SSS.
Management: In our view, DNKN is one of the most shareholder-friendly management teams in the restaurant industry. The company has been led by CEO Nigel Travis since 2009 and CFO Paul Carbone since 2012 (joined DNKN in 2008). Management has executed the asset-light franchised model at a very high level over the past several years, with tight control of corporate expenses and capex and a strong marketing program. The company has also returned significant capital to shareholders via aggressive use of the balance sheet. While the positive SSS and earnings momentum took a step back in 2014, we see no reason that this management team can’t get the business back on track and continue to execute the global growth plan.
Source: CS estimates and company data
Executive Team
0
5,000
10,000
15,000
20,000
25,000Store count
Baskin-RobbinsInternational
Baskin-RobbinsU.S.
Dunkin' DonutsInternational
Dunkin' DonutsU.S.
$482 $98
$116
$22 $30
Revenue mix
Franchise fees &royalty income
Rental income
Sales of ice creamproducts
Sales at c-orestaurants
Other revenues
Name Position Tenor Prior experience
Nigel Travis Chairman, CEO 6yrs President and CEO Papa John's International, President & COO Blockbuster
Paul Carbone CFO 3yrs (7yrs with DNKN) Vice President, Financial Planning & Analysis Dunkin' Brands, Tween Brands
Paul Twohig President of Dunkin' Donuts 6yrs Division Senior Vice President Starbucks, COO Panera Bread Company
John Costello President of Global Marketing 6yrs EVP of Merchandising & Marketing The Home Depot, Chief Marketing Officer Yahoo
50
DNKN
Longevity in Its Model DNKN had a difficult 2014…: DNKN’s ~100% franchised, high-margin model (nearly 50% EBIT margins) is highly resistant to top line pressures, but not wholly immune. After generally consistent execution against stated goals since the 2011 IPO, DNKN had to reduce EPS guidance on multiple occasions in the past year. Dunkin’ Donuts US SSS grew 1.6% in 2014, the lowest level since 2009 and below the long-term target of +2-4%. (SSS had averaged +3.8% over the prior 4 years.) DNKN cited weather issues early in the year, as well as increased competitive pressure and an ~30bps drag from weaker K-Cup sales for the year. Nonetheless, adj. EBIT margin grew 110bps in 2014, to 48.7% and free cash flow grew 50% (to $176mm). We believe DNKN is unlikely to return to the +4% SSS run-rate seen in recent years given increased competition in the space and since the company has already launched several new product platforms. We also expect weather and K-Cups to drag on retail comps in 1H15. However, we believe getting back to a +2-3% run-rate is achievable with some menu pricing, effective marketing, loyalty expansion (including mobile), and general macro support. This level of comps should be ample to achieve the company’s financial goals.
…but broader story intact: Despite the disappointing 2014 comps, we believe DNKN’s domestic unit expansion story remains on track. The key to the DNKN investment case is that franchisees will remain bullish on the brand and continue to build stores across the US. DNKN’s store base is currently concentrated in the “Core” and “Established” markets of the Northeast and Florida, where the store penetration rate is 1 store per ~13,500 people. Approx. 82% of Dunkin’ US stores are in these markets. Penetration is much lower in the rest of the country, particularly west of the Mississippi. In the “Emerging” markets (Southeast and Midwest states east of Mississippi), Dunkin’ US has ~1,200 units, with a penetration of ~1 store per 76,000 pop. West of the Mississippi, Dunkin’ US has only 280 units, with a penetration of 1 store per 460,000 in population. DNKN has targeted 17,000 Dunkin’ Donuts units in the US over the long-term, up from ~8k today. This implies a blended penetration rate of 1 store per ~18k in pop., well below the highest penetration levels the company has achieved in its most developed markets. This gives us confidence that the long-term store goals are reasonable. Dunkin’ is currently opening ~400 net new US stores per year. At that pace, it would take ~16 years to achieve full penetration. However, we assume the pace of store openings will move higher as the base grows. The company already has numerous development agreements in place for California and many other markets. We haven’t sensed any weakening of franchisee demand for the brand. From the franchisee perspective, profits matter more than sales. Key metrics around profitability and store-level returns appear to be holding up well, despite the weaker comps. Franchisee profit $ and margins reached all-time highs in 2014 (specifics not disclosed). New unit returns also remain steady, with recent classes of stores generating ~25% cash ROIs (after paying franchise royalties and advertising costs).
Source: CS estimates and company data
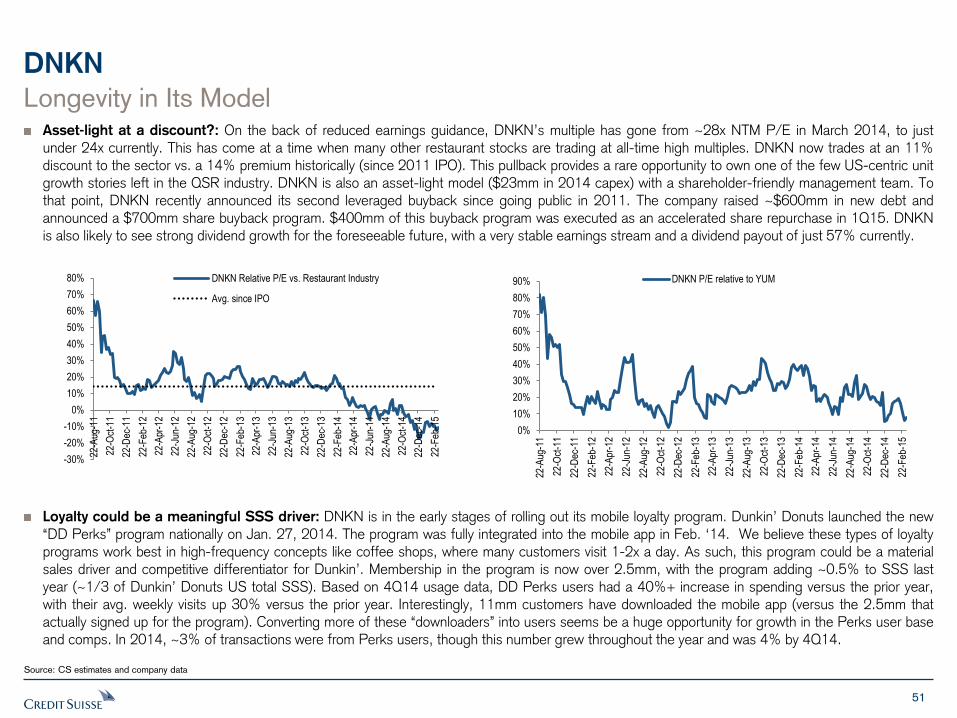
51
DNKN
Longevity in Its Model Asset-light at a discount?: On the back of reduced earnings guidance, DNKN’s multiple has gone from ~28x NTM P/E in March 2014, to just under 24x currently. This has come at a time when many other restaurant stocks are trading at all-time high multiples. DNKN now trades at an 11% discount to the sector vs. a 14% premium historically (since 2011 IPO). This pullback provides a rare opportunity to own one of the few US-centric unit growth stories left in the QSR industry. DNKN is also an asset-light model ($23mm in 2014 capex) with a shareholder-friendly management team. To that point, DNKN recently announced its second leveraged buyback since going public in 2011. The company raised ~$600mm in new debt and announced a $700mm share buyback program. $400mm of this buyback program was executed as an accelerated share repurchase in 1Q15. DNKN is also likely to see strong dividend growth for the foreseeable future, with a very stable earnings stream and a dividend payout of just 57% currently.
Loyalty could be a meaningful SSS driver: DNKN is in the early stages of rolling out its mobile loyalty program. Dunkin’ Donuts launched the new “DD Perks” program nationally on Jan. 27, 2014. The program was fully integrated into the mobile app in Feb. ‘14. We believe these types of loyalty programs work best in high-frequency concepts like coffee shops, where many customers visit 1-2x a day. As such, this program could be a material sales driver and competitive differentiator for Dunkin’. Membership in the program is now over 2.5mm, with the program adding ~0.5% to SSS last year (~1/3 of Dunkin’ Donuts US total SSS). Based on 4Q14 usage data, DD Perks users had a 40%+ increase in spending versus the prior year, with their avg. weekly visits up 30% versus the prior year. Interestingly, 11mm customers have downloaded the mobile app (versus the 2.5mm that actually signed up for the program). Converting more of these “downloaders” into users seems be a huge opportunity for growth in the Perks user base and comps. In 2014, ~3% of transactions were from Perks users, though this number grew throughout the year and was 4% by 4Q14.
Source: CS estimates and company data
0%
10%
20%
30%
40%
50%
60%
70%
80%
90%
22-A
ug-1
1
22-O
ct-1
1
22-D
ec-1
1
22-F
eb-1
2
22-A
pr-1
2
22-J
un-1
2
22-A
ug-1
2
22-O
ct-1
2
22-D
ec-1
2
22-F
eb-1
3
22-A
pr-1
3
22-J
un-1
3
22-A
ug-1
3
22-O
ct-1
3
22-D
ec-1
3
22-F
eb-1
4
22-A
pr-1
4
22-J
un-1
4
22-A
ug-1
4
22-O
ct-1
4
22-D
ec-1
4
22-F
eb-1
5
DNKN P/E relative to YUM
-30%
-20%
-10%
0%
10%
20%
30%
40%
50%
60%
70%
80%
22-A
ug-1
1
22-O
ct-1
1
22-D
ec-1
1
22-F
eb-1
2
22-A
pr-1
2
22-J
un-1
2
22-A
ug-1
2
22-O
ct-1
2
22-D
ec-1
2
22-F
eb-1
3
22-A
pr-1
3
22-J
un-1
3
22-A
ug-1
3
22-O
ct-1
3
22-D
ec-1
3
22-F
eb-1
4
22-A
pr-1
4
22-J
un-1
4
22-A
ug-1
4
22-O
ct-1
4
22-D
ec-1
4
22-F
eb-1
5
DNKN Relative P/E vs. Restaurant Industry
Avg. since IPO
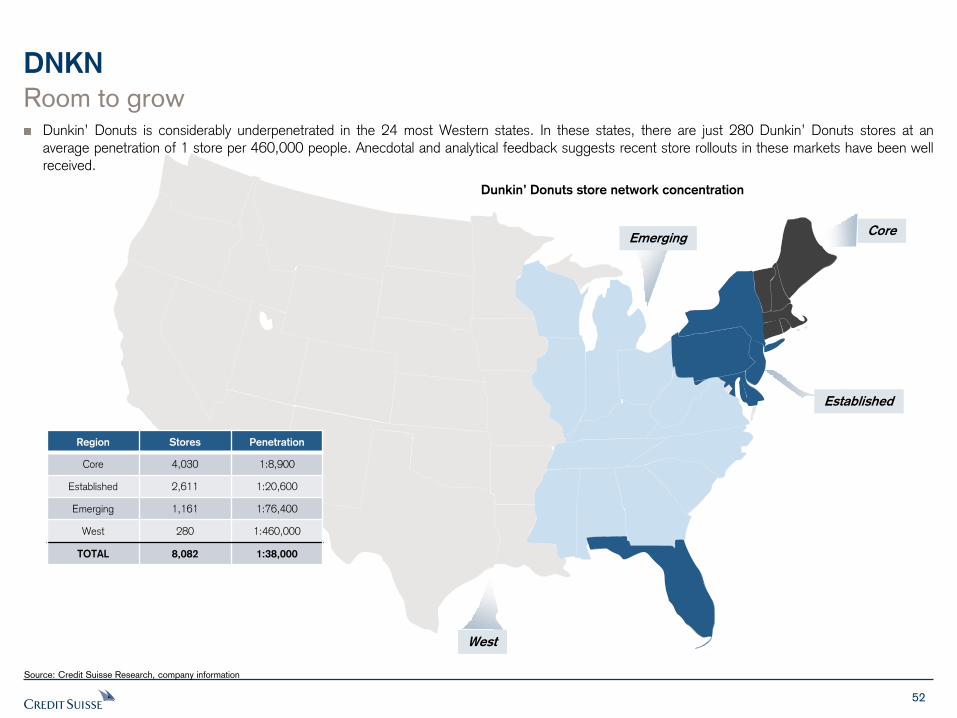
52
DNKN
Source: Credit Suisse Research, company information
Region Stores Penetration
Core 4,030 1:8,900
Established 2,611 1:20,600
Emerging 1,161 1:76,400
West 280 1:460,000
TOTAL 8,082 1:38,000
Room to grow Dunkin’ Donuts is considerably underpenetrated in the 24 most Western states. In these states, there are just 280 Dunkin’ Donuts stores at an average penetration of 1 store per 460,000 people. Anecdotal and analytical feedback suggests recent store rollouts in these markets have been well received.
Dunkin’ Donuts store network concentration
Core
West
Established
Emerging
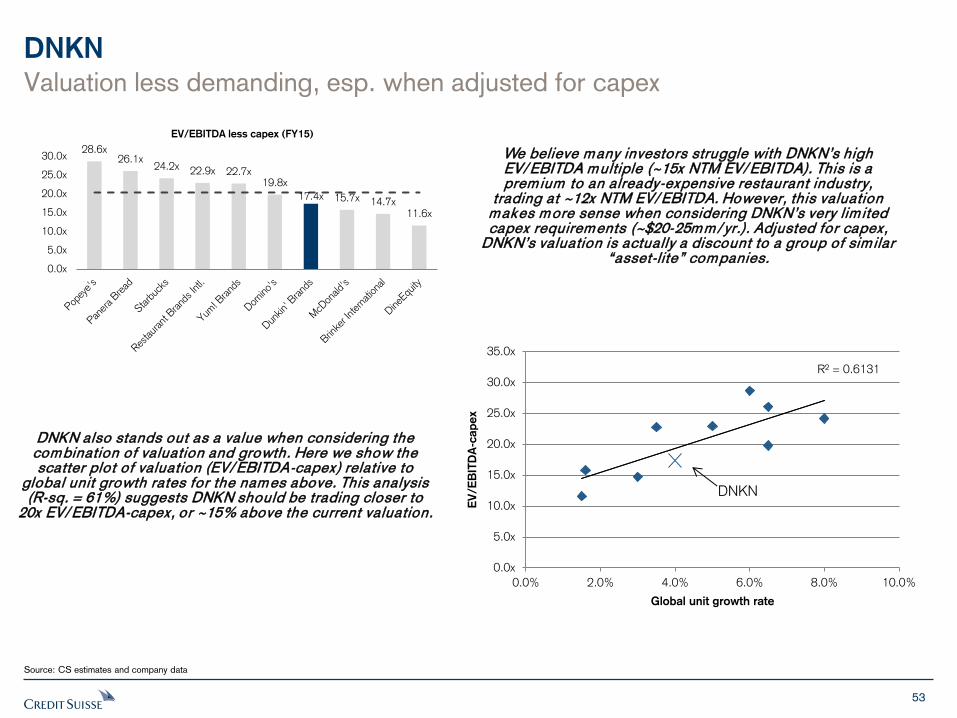
53
DNKN
Source: CS estimates and company data
We believe many investors struggle with DNKN’s high EV/ EBITDA multiple (~15x NTM EV/ EBITDA). This is a premium to an already-expensive restaurant industry,
trading at ~12x NTM EV/ EBITDA. However, this valuation makes more sense when considering DNKN’s very lim ited capex requirements (~$20-25mm/ yr.). Adjusted for capex,
DNKN’s valuation is actually a discount to a group of sim ilar “asset-l ite” companies.
DNKN also stands out as a value when considering the combination of valuation and growth. Here we show the scatter plot of valuation (EV/ EBITDA-capex) relative to
global unit growth rates for the names above. This analysis (R-sq. = 61%) suggests DNKN should be trading closer to
20x EV/ EBITDA-capex, or ~15% above the current valuation.
28.6x 26.1x
24.2x 22.9x 22.7x 19.8x
17.4x 15.7x 14.7x 11.6x
0.0x
5.0x
10.0x
15.0x
20.0x
25.0x
30.0x
EV/EBITDA less capex (FY15)
Valuation less demanding, esp. when adjusted for capex
R² = 0.6131
0.0x
5.0x
10.0x
15.0x
20.0x
25.0x
30.0x
35.0x
0.0% 2.0% 4.0% 6.0% 8.0% 10.0%
EV
/E
BIT
DA
-cap
ex
Global unit growth rate
DNKN
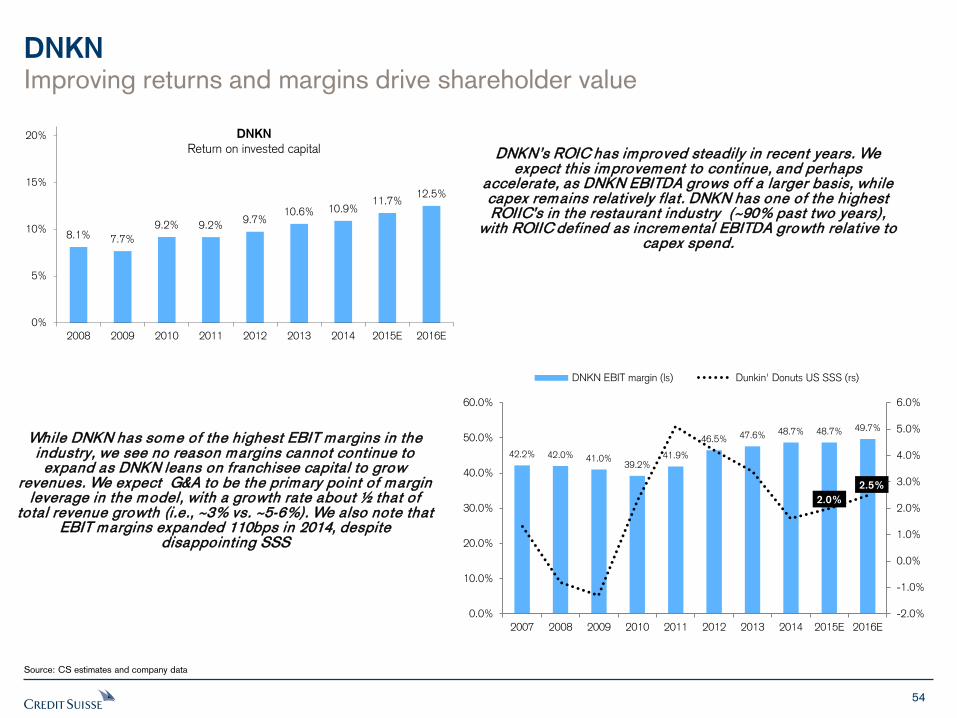
54
DNKN
Source: CS estimates and company data
DNKN’s ROIC has improved steadily in recent years. We expect this improvement to continue, and perhaps
accelerate, as DNKN EBITDA grows off a larger basis, while capex remains relatively flat. DNKN has one of the highest ROIIC’s in the restaurant industry (~90% past two years),
with ROIIC defined as incremental EBITDA growth relative to capex spend.
While DNKN has some of the highest EBIT margins in the industry, we see no reason margins cannot continue to expand as DNKN leans on franchisee capital to grow
revenues. We expect G&A to be the primary point of margin leverage in the model, with a growth rate about ½ that of
total revenue growth (i.e., ~3% vs. ~5-6%). We also note that EBIT margins expanded 110bps in 2014, despite
disappointing SSS
42.2% 42.0% 41.0% 39.2%
41.9%
46.5% 47.6% 48.7% 48.7% 49.7%
2.0%
2.5%
-2.0%
-1.0%
0.0%
1.0%
2.0%
3.0%
4.0%
5.0%
6.0%
0.0%
10.0%
20.0%
30.0%
40.0%
50.0%
60.0%
2007 2008 2009 2010 2011 2012 2013 2014 2015E 2016E
DNKN EBIT margin (ls) Dunkin' Donuts US SSS (rs)
8.1% 7.7%
9.2% 9.2% 9.7%
10.6% 10.9% 11.7%
12.5%
0%
5%
10%
15%
20%
2008 2009 2010 2011 2012 2013 2014 2015E 2016E
DNKN
Return on invested capital
Improving returns and margins drive shareholder value
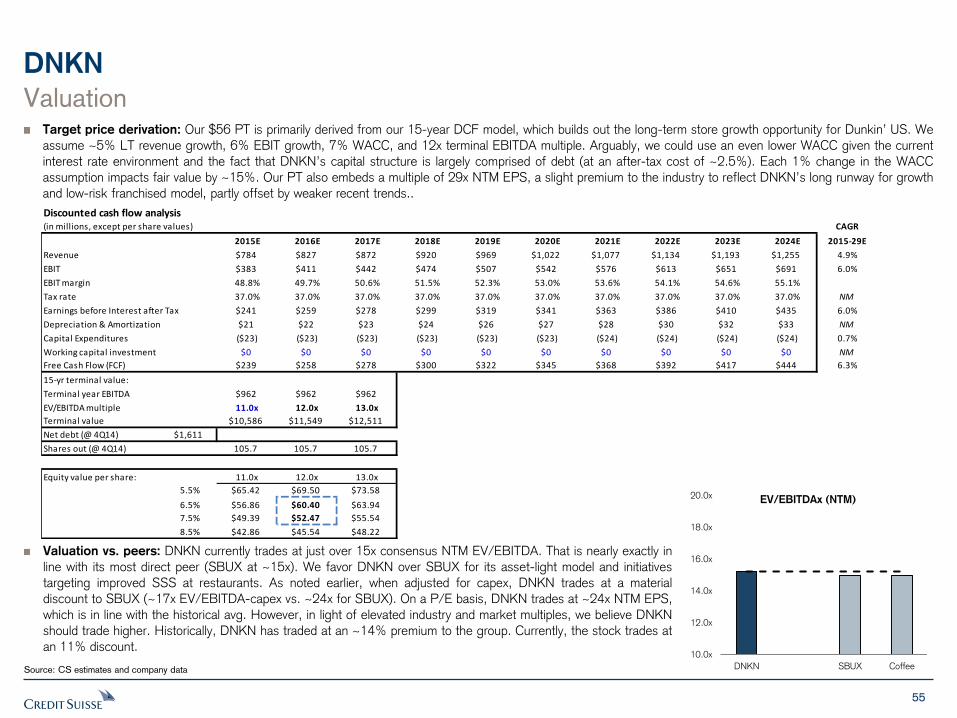
55
Discounted cash flow analysis(in millions, except per share values) CAGR
2015E 2016E 2017E 2018E 2019E 2020E 2021E 2022E 2023E 2024E 2015-29E
Revenue $784 $827 $872 $920 $969 $1,022 $1,077 $1,134 $1,193 $1,255 4.9%
EBIT $383 $411 $442 $474 $507 $542 $576 $613 $651 $691 6.0%
EBIT margin 48.8% 49.7% 50.6% 51.5% 52.3% 53.0% 53.6% 54.1% 54.6% 55.1%
Tax rate 37.0% 37.0% 37.0% 37.0% 37.0% 37.0% 37.0% 37.0% 37.0% 37.0% NM
Earnings before Interest after Tax $241 $259 $278 $299 $319 $341 $363 $386 $410 $435 6.0%
Depreciation & Amortization $21 $22 $23 $24 $26 $27 $28 $30 $32 $33 NM
Capital Expenditures ($23) ($23) ($23) ($23) ($23) ($23) ($24) ($24) ($24) ($24) 0.7%
Working capital investment $0 $0 $0 $0 $0 $0 $0 $0 $0 $0 NM
Free Cash Flow (FCF) $239 $258 $278 $300 $322 $345 $368 $392 $417 $444 6.3%
15-yr terminal value:
Terminal year EBITDA $962 $962 $962
EV/EBITDA multiple 11.0x 12.0x 13.0x
Terminal value $10,586 $11,549 $12,511
Net debt (@ 4Q14) $1,611
Shares out (@ 4Q14) 105.7 105.7 105.7
Equity value per share: 11.0x 12.0x 13.0x
5.5% $65.42 $69.50 $73.58
6.5% $56.86 $60.40 $63.94
7.5% $49.39 $52.47 $55.54
8.5% $42.86 $45.54 $48.22
DNKN
Source: CS estimates and company data
Valuation Target price derivation: Our $56 PT is primarily derived from our 15-year DCF model, which builds out the long-term store growth opportunity for Dunkin’ US. We
assume ~5% LT revenue growth, 6% EBIT growth, 7% WACC, and 12x terminal EBITDA multiple. Arguably, we could use an even lower WACC given the current
interest rate environment and the fact that DNKN’s capital structure is largely comprised of debt (at an after-tax cost of ~2.5%). Each 1% change in the WACC
assumption impacts fair value by ~15%. Our PT also embeds a multiple of 29x NTM EPS, a slight premium to the industry to reflect DNKN’s long runway for growth
and low-risk franchised model, partly offset by weaker recent trends..
Valuation vs. peers: DNKN currently trades at just over 15x consensus NTM EV/EBITDA. That is nearly exactly in
line with its most direct peer (SBUX at ~15x). We favor DNKN over SBUX for its asset-light model and initiatives
targeting improved SSS at restaurants. As noted earlier, when adjusted for capex, DNKN trades at a material
discount to SBUX (~17x EV/EBITDA-capex vs. ~24x for SBUX). On a P/E basis, DNKN trades at ~24x NTM EPS,
which is in line with the historical avg. However, in light of elevated industry and market multiples, we believe DNKN
should trade higher. Historically, DNKN has traded at an ~14% premium to the group. Currently, the stock trades at
an 11% discount.
10.0x
12.0x
14.0x
16.0x
18.0x
20.0x
DNKN SBUX Coffee
EV/EBITDAx (NTM)
56
DNKN
Source: CS estimates and company data
Risks Recent SSS weakness: The recent deceleration in Dunkin’ Donuts U.S. SSS trends is a concern (+1.6% SSS in 2014). Mgmt. has largely chalked this weakness up to weather, competition, a sluggish low/middle income consumer, and K-Cups. However, the company has also expanded the menu in recent years, adding several new platforms around food and beverages and a seemingly endless array of limited-time product offers. Lapping these efforts becomes more difficult each year, and at some point, this menu proliferation may begin to affect speed of service, as has been the case with McDonald’s. However, we haven’t seen clear evidence of this as yet at DNKN. (Also, unlike McDonald’s, DNKN gets 0% of its profits from company-operated restaurants and has much lower international exposure.) Weaker SSS trends (should they persist) could eventually negatively affect the desire of franchisees to build new stores, a key component of the DNKN model.
A catalyst has passed: DNKN recently announced a leveraged stock buyback, which included ~$600mm in net new debt and a $400mm ASR. We also expect additional share repurchases to follow (current share authorization = $700mm). Now that this catalyst has passed, some investors may look to move on to other stories.
International has been weak: DNKN derives ~85% of its profits from the Dunkin’ Donuts U.S. business. However, the company has a meaningful international presence across both the Dunkin’ Donuts and Baskin Robbins brands, as well as 2,500 Baskin-Robbins stores in the U.S. DNKN’s two largest international exposures (Dunkin’ Donuts S. Korea and Baskin-Robbins Japan) have struggled of late, driving an ~11% reduction in total international profits in 2014. We assume that these trends will stabilize in 2015.
Competition: DNKN faces an array of competitive pressures in both the coffee and ice cream businesses, including coffee shops, fast food chains, convenience stores, and at-home options.
Commodity/labor costs: DNKN’s store base is ~100% franchised, insulating the company from cost pressures related to food or wage inflation. However, this pressures will impact franchisee profitability, which could, in turn, impact the store growth rate for DNKN.
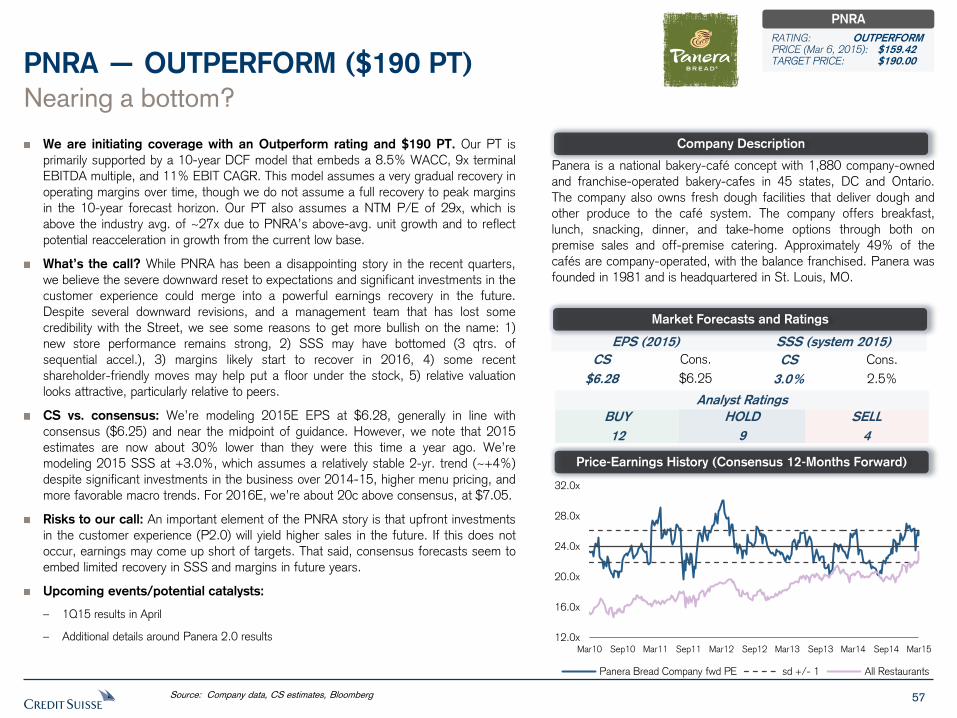
57
We are initiating coverage with an Outperform rating and $190 PT. Our PT is
primarily supported by a 10-year DCF model that embeds a 8.5% WACC, 9x terminal
EBITDA multiple, and 11% EBIT CAGR. This model assumes a very gradual recovery in
operating margins over time, though we do not assume a full recovery to peak margins
in the 10-year forecast horizon. Our PT also assumes a NTM P/E of 29x, which is
above the industry avg. of ~27x due to PNRA’s above-avg. unit growth and to reflect
potential reacceleration in growth from the current low base.
What’s the call? While PNRA has been a disappointing story in the recent quarters,
we believe the severe downward reset to expectations and significant investments in the
customer experience could merge into a powerful earnings recovery in the future.
Despite several downward revisions, and a management team that has lost some
credibility with the Street, we see some reasons to get more bullish on the name: 1)
new store performance remains strong, 2) SSS may have bottomed (3 qtrs. of
sequential accel.), 3) margins likely start to recover in 2016, 4) some recent
shareholder-friendly moves may help put a floor under the stock, 5) relative valuation
looks attractive, particularly relative to peers.
CS vs. consensus: We’re modeling 2015E EPS at $6.28, generally in line with
consensus ($6.25) and near the midpoint of guidance. However, we note that 2015
estimates are now about 30% lower than they were this time a year ago. We’re
modeling 2015 SSS at +3.0%, which assumes a relatively stable 2-yr. trend (~+4%)
despite significant investments in the business over 2014-15, higher menu pricing, and
more favorable macro trends. For 2016E, we’re about 20c above consensus, at $7.05.
Risks to our call: An important element of the PNRA story is that upfront investments
in the customer experience (P2.0) will yield higher sales in the future. If this does not
occur, earnings may come up short of targets. That said, consensus forecasts seem to
embed limited recovery in SSS and margins in future years.
Upcoming events/potential catalysts:
– 1Q15 results in April
– Additional details around Panera 2.0 results
Nearing a bottom?
PNRA — OUTPERFORM ($190 PT)
Panera is a national bakery-café concept with 1,880 company-owned
and franchise-operated bakery-cafes in 45 states, DC and Ontario.
The company also owns fresh dough facilities that deliver dough and
other produce to the café system. The company offers breakfast,
lunch, snacking, dinner, and take-home options through both on
premise sales and off-premise catering. Approximately 49% of the
cafés are company-operated, with the balance franchised. Panera was
founded in 1981 and is headquartered in St. Louis, MO.
Source: Company data, CS estimates, Bloomberg
Company Description
Price-Earnings History (Consensus 12-Months Forward)
EPS (2015) SSS (system 2015)
CS
$6.28
Cons.
$6.25
CS
3.0%
Cons.
2.5%
Analyst Ratings
BUY
12
SELL
4
HOLD
9
Market Forecasts and Ratings
PNRA
RATING: OUTPERFORM PRICE (Mar 6, 2015): $159.42 TARGET PRICE: $190.00
12.0x
16.0x
20.0x
24.0x
28.0x
32.0x
Mar10 Sep10 Mar11 Sep11 Mar12 Sep12 Mar13 Sep13 Mar14 Sep14 Mar15
Panera Bread Company fwd PE sd +/- 1 All Restaurants
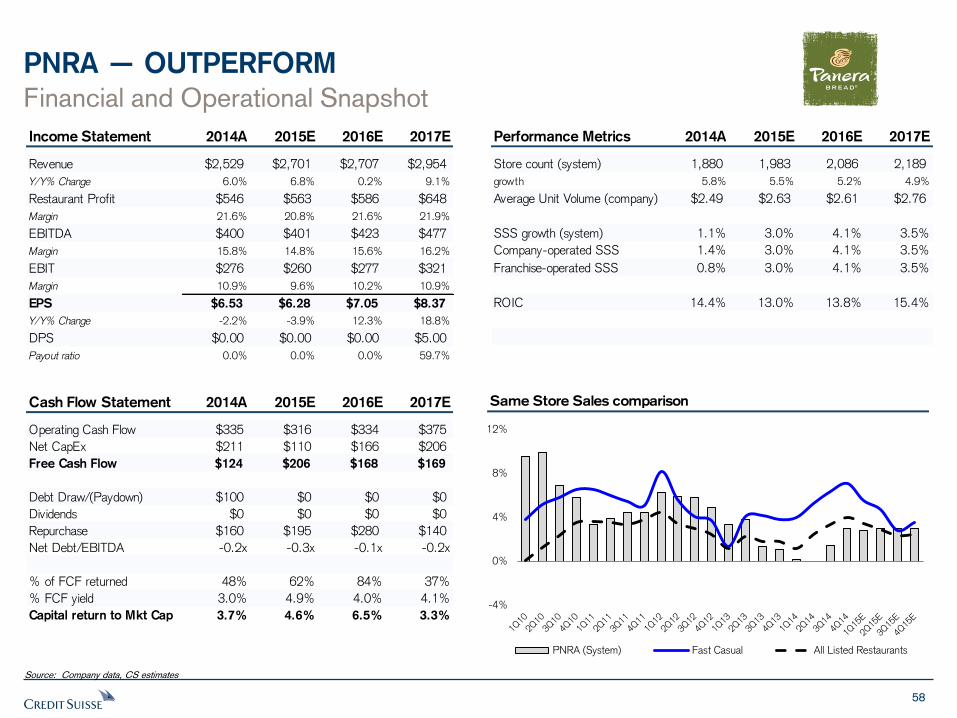
58
PNRA — OUTPERFORM
Financial and Operational Snapshot
Source: Company data, CS estimates
Same Store Sales comparison
Income Statement 2014A 2015E 2016E 2017E
Revenue $2,529 $2,701 $2,707 $2,954
Y/Y% Change 6.0% 6.8% 0.2% 9.1%
Restaurant Profit $546 $563 $586 $648
Margin 21.6% 20.8% 21.6% 21.9%
EBITDA $400 $401 $423 $477
Margin 15.8% 14.8% 15.6% 16.2%
EBIT $276 $260 $277 $321
Margin 10.9% 9.6% 10.2% 10.9%
EPS $6.53 $6.28 $7.05 $8.37
Y/Y% Change -2.2% -3.9% 12.3% 18.8%
DPS $0.00 $0.00 $0.00 $5.00
Payout ratio 0.0% 0.0% 0.0% 59.7%
Performance Metrics 2014A 2015E 2016E 2017E
Store count (system) 1,880 1,983 2,086 2,189
growth 5.8% 5.5% 5.2% 4.9%
Average Unit Volume (company) $2.49 $2.63 $2.61 $2.76
SSS growth (system) 1.1% 3.0% 4.1% 3.5%
Company-operated SSS 1.4% 3.0% 4.1% 3.5%
Franchise-operated SSS 0.8% 3.0% 4.1% 3.5%
ROIC 14.4% 13.0% 13.8% 15.4%
Cash Flow Statement 2014A 2015E 2016E 2017E
Operating Cash Flow $335 $316 $334 $375
Net CapEx $211 $110 $166 $206
Free Cash Flow $124 $206 $168 $169
Debt Draw/(Paydown) $100 $0 $0 $0
Dividends $0 $0 $0 $0
Repurchase $160 $195 $280 $140
Net Debt/EBITDA -0.2x -0.3x -0.1x -0.2x
% of FCF returned 48% 62% 84% 37%
% FCF yield 3.0% 4.9% 4.0% 4.1%
Capital return to Mkt Cap 3.7% 4.6% 6.5% 3.3%-4%
0%
4%
8%
12%
PNRA (System) Fast Casual All Listed Restaurants
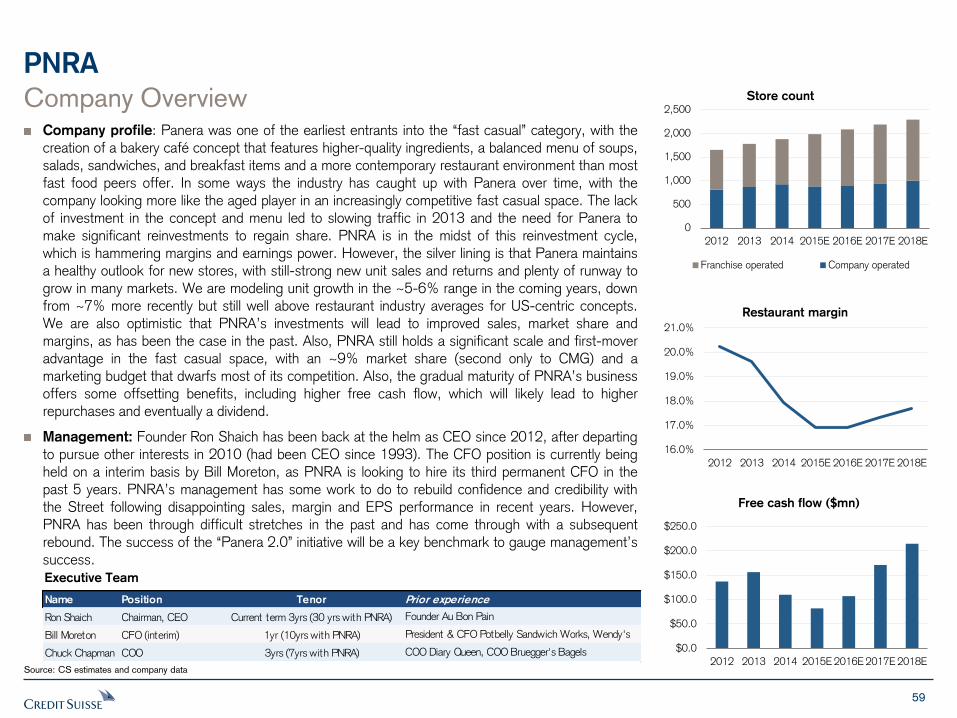
59
PNRA
Company Overview Company profile: Panera was one of the earliest entrants into the “fast casual” category, with the creation of a bakery café concept that features higher-quality ingredients, a balanced menu of soups, salads, sandwiches, and breakfast items and a more contemporary restaurant environment than most fast food peers offer. In some ways the industry has caught up with Panera over time, with the company looking more like the aged player in an increasingly competitive fast casual space. The lack of investment in the concept and menu led to slowing traffic in 2013 and the need for Panera to make significant reinvestments to regain share. PNRA is in the midst of this reinvestment cycle, which is hammering margins and earnings power. However, the silver lining is that Panera maintains a healthy outlook for new stores, with still-strong new unit sales and returns and plenty of runway to grow in many markets. We are modeling unit growth in the ~5-6% range in the coming years, down from ~7% more recently but still well above restaurant industry averages for US-centric concepts. We are also optimistic that PNRA’s investments will lead to improved sales, market share and margins, as has been the case in the past. Also, PNRA still holds a significant scale and first-mover advantage in the fast casual space, with an ~9% market share (second only to CMG) and a marketing budget that dwarfs most of its competition. Also, the gradual maturity of PNRA’s business offers some offsetting benefits, including higher free cash flow, which will likely lead to higher repurchases and eventually a dividend.
Management: Founder Ron Shaich has been back at the helm as CEO since 2012, after departing to pursue other interests in 2010 (had been CEO since 1993). The CFO position is currently being held on a interim basis by Bill Moreton, as PNRA is looking to hire its third permanent CFO in the past 5 years. PNRA’s management has some work to do to rebuild confidence and credibility with the Street following disappointing sales, margin and EPS performance in recent years. However, PNRA has been through difficult stretches in the past and has come through with a subsequent rebound. The success of the “Panera 2.0” initiative will be a key benchmark to gauge management’s success.
Source: CS estimates and company data
Executive Team
0
500
1,000
1,500
2,000
2,500
2012 2013 2014 2015E 2016E 2017E 2018E
Store count
Franchise operated Company operated
16.0%
17.0%
18.0%
19.0%
20.0%
21.0%
2012 2013 2014 2015E 2016E 2017E 2018E
Restaurant margin
Name Position Tenor Prior experience
Ron Shaich Chairman, CEO Current term 3yrs (30 yrs with PNRA) Founder Au Bon Pain
Bill Moreton CFO (interim) 1yr (10yrs with PNRA) President & CFO Potbelly Sandwich Works, Wendy's
Chuck Chapman COO 3yrs (7yrs with PNRA) COO Diary Queen, COO Bruegger's Bagels $0.0
$50.0
$100.0
$150.0
$200.0
$250.0
2012 2013 2014 2015E 2016E 2017E 2018E
Free cash flow ($mn)
60
PNRA
Source: CS estimates and company data
Nearing a bottom? From leader to laggard: PNRA’s ~5-year run (2008-12) of sales outperformance and 25%+ annual EPS growth came to a screeching halt in 2013. Sales began to slow that year, and it became apparent that the company had fallen behind on investments in the customer experience. The company has been in “investment” mode since late 2013, resulting in a painful reset to margins and earnings. While sales have shown some signs of improvement recently, the investment cycle is still in full swing. Margin erosion is slated to continue into 2015 as PNRA invests heavily behind its “Panera 2.0” (P2.0) store upgrade program and deals with labor/benefits inflation. 2015 consensus EPS forecasts are now $6.25, down from $8.56 this time last year (-27%). PNRA has underperformed the market by ~20% since Jan ‘13, a period in which restaurant valuations have inflated to all-time highs.
Despite severe downward revisions, and a management team that has lost some credibility with the Street, we see a few reasons to get
more bullish on the name:
1. New store performance remains strong: While PNRA’s underlying SSS and margins have been weak in recent quarters, a key measure of brand health is the performance of newer stores. We continue to see solid trends on that front, with average weekly sales (AWS) for 2014 traditional company openings up 4.8% versus the prior year and franchisee AWS up 1.9%. New store returns also remain healthy, at ~30% cash-on-cash returns, or ~22% on a lease-adjusted basis. While these returns have come down in recent years (due to lower margins and higher investment costs), we believe these returns are still competitive versus other growth models in the industry and should keep franchisees engaged with the brand.
2. SSS may have bottomed: Same store sales have shown steady recovery in recent quarters, led by improving traffic. 4Q14 SSS were +3.3% for company cafés, the highest level since 2Q13, and up from +0.1% in 1H14. Traffic was +1.3% in 4Q14, the third positive quarter in a row (after 6 negative quarters) and improving on a 2-year basis. Part of this recovery can be chalked up to easing compares. However, PNRA has also made some proactive investments in labor, marketing and menu innovation to bring customers back to the brand. These investments, combined with additional investments this year and low expectations, could result in upside to SSS.
3. Margins likely start to recover in 2016: PNRA has guided to a 100-150bps decline in EBIT margins in 2015, primarily due to investments in the P2.0 remodel initiative, as well as rising health care costs. These declines are on top of a 210bps drop in EBIT margins in 2014 and a 30bps drop in 2013. PNRA is planning to convert ~300 more company cafés to the P2.0 format in 2015. This will leave another ~300-350 company units remaining to convert in 2016. However, by 2016, the earlier conversions should begin to show some sales leverage, and PNRA will be lapping the health care spend from 2015. All in all, we believe margins are likely to begin to rebound by 2016. In contrast, consensus assumes another year of down margins in 2016 (-10bps), as well as modest SSS (+3.3% in 2016). We believe these expectations are very achievable, if not conservative. Our model assumes SSS improve to PNRA +4.1% in 2016 and margins recover by ~60bps, putting our 2016E EPS at $7.05, about 26c above consensus.
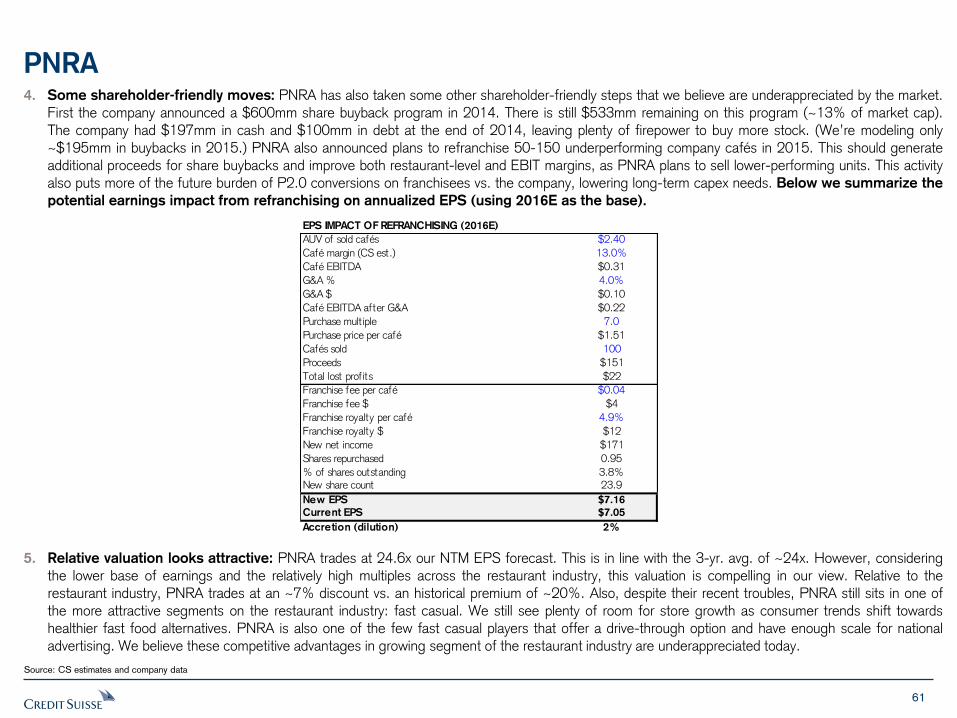
61
PNRA
Source: CS estimates and company data
4. Some shareholder-friendly moves: PNRA has also taken some other shareholder-friendly steps that we believe are underappreciated by the market. First the company announced a $600mm share buyback program in 2014. There is still $533mm remaining on this program (~13% of market cap). The company had $197mm in cash and $100mm in debt at the end of 2014, leaving plenty of firepower to buy more stock. (We’re modeling only ~$195mm in buybacks in 2015.) PNRA also announced plans to refranchise 50-150 underperforming company cafés in 2015. This should generate additional proceeds for share buybacks and improve both restaurant-level and EBIT margins, as PNRA plans to sell lower-performing units. This activity also puts more of the future burden of P2.0 conversions on franchisees vs. the company, lowering long-term capex needs. Below we summarize the
potential earnings impact from refranchising on annualized EPS (using 2016E as the base).
5. Relative valuation looks attractive: PNRA trades at 24.6x our NTM EPS forecast. This is in line with the 3-yr. avg. of ~24x. However, considering the lower base of earnings and the relatively high multiples across the restaurant industry, this valuation is compelling in our view. Relative to the restaurant industry, PNRA trades at an ~7% discount vs. an historical premium of ~20%. Also, despite their recent troubles, PNRA still sits in one of the more attractive segments on the restaurant industry: fast casual. We still see plenty of room for store growth as consumer trends shift towards healthier fast food alternatives. PNRA is also one of the few fast casual players that offer a drive-through option and have enough scale for national advertising. We believe these competitive advantages in growing segment of the restaurant industry are underappreciated today.
EPS IMPACT OF REFRANCHISING (2016E)
AUV of sold cafés $2.40
Café margin (CS est.) 13.0%
Café EBITDA $0.31
G&A % 4.0%
G&A $ $0.10
Café EBITDA after G&A $0.22
Purchase mult iple 7.0
Purchase price per café $1.51
Cafés sold 100
Proceeds $151
Total lost profits $22
Franchise fee per café $0.04
Franchise fee $ $4
Franchise royalty per café 4.9%
Franchise royalty $ $12
New net income $171
Shares repurchased 0.95
% of shares outstanding 3.8%New share count 23.9
New EPS $7.16
Current EPS $7.05
Accretion (dilution) 2%
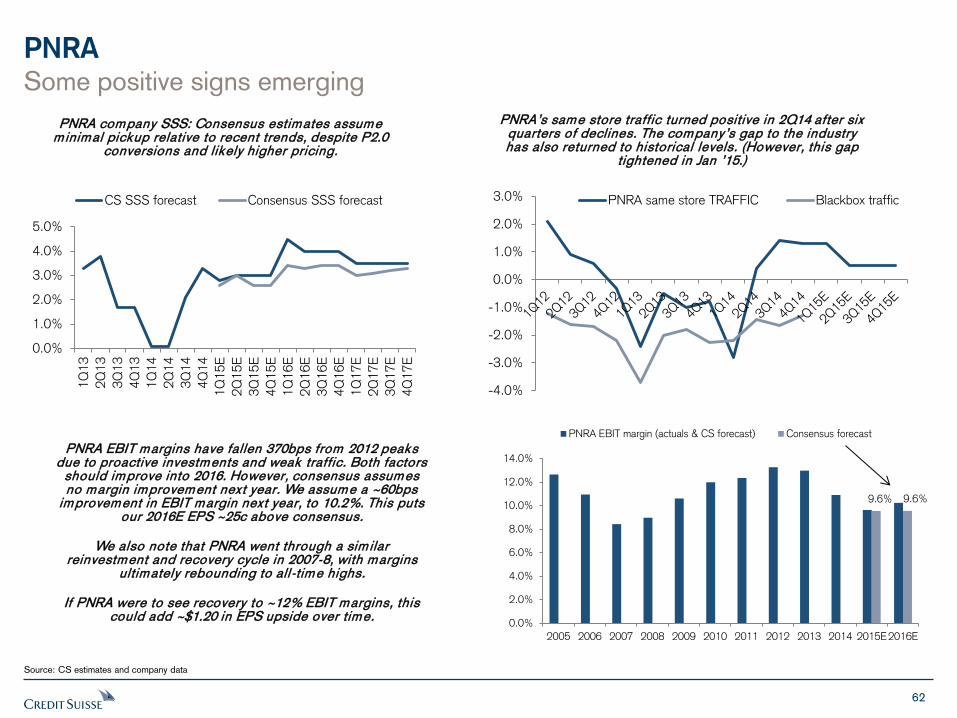
62
PNRA
Source: CS estimates and company data
PNRA company SSS: Consensus estimates assume minimal pickup relative to recent trends, despite P2.0
conversions and likely higher pricing.
0.0%
1.0%
2.0%
3.0%
4.0%
5.0%
1Q
13
2Q
13
3Q
13
4Q
13
1Q
14
2Q
14
3Q
14
4Q
14
1Q
15
E
2Q
15
E
3Q
15
E
4Q
15
E
1Q
16
E
2Q
16
E
3Q
16
E
4Q
16
E
1Q
17
E
2Q
17
E
3Q
17
E
4Q
17
E
CS SSS forecast Consensus SSS forecast
PNRA’s same store traffic turned positive in 2Q14 after six quarters of declines. The company’s gap to the industry has also returned to historical levels. (However, this gap
tightened in Jan ’15.)
-4.0%
-3.0%
-2.0%
-1.0%
0.0%
1.0%
2.0%
3.0% PNRA same store TRAFFIC Blackbox traffic
PNRA EBIT margins have fallen 370bps from 2012 peaks due to proactive investments and weak traffic. Both factors
should improve into 2016. However, consensus assumes no margin improvement next year. We assume a ~60bps
improvement in EBIT margin next year, to 10.2%. This puts our 2016E EPS ~25c above consensus.
We also note that PNRA went through a sim ilar reinvestment and recovery cycle in 2007-8, with margins
ultimately rebounding to all -time highs.
If PNRA were to see recovery to ~12% EBIT margins, this could add ~$1.20 in EPS upside over time.
9.6% 9.6%
0.0%
2.0%
4.0%
6.0%
8.0%
10.0%
12.0%
14.0%
2005 2006 2007 2008 2009 2010 2011 2012 2013 2014 2015E2016E
PNRA EBIT margin (actuals & CS forecast) Consensus forecast
Some positive signs emerging
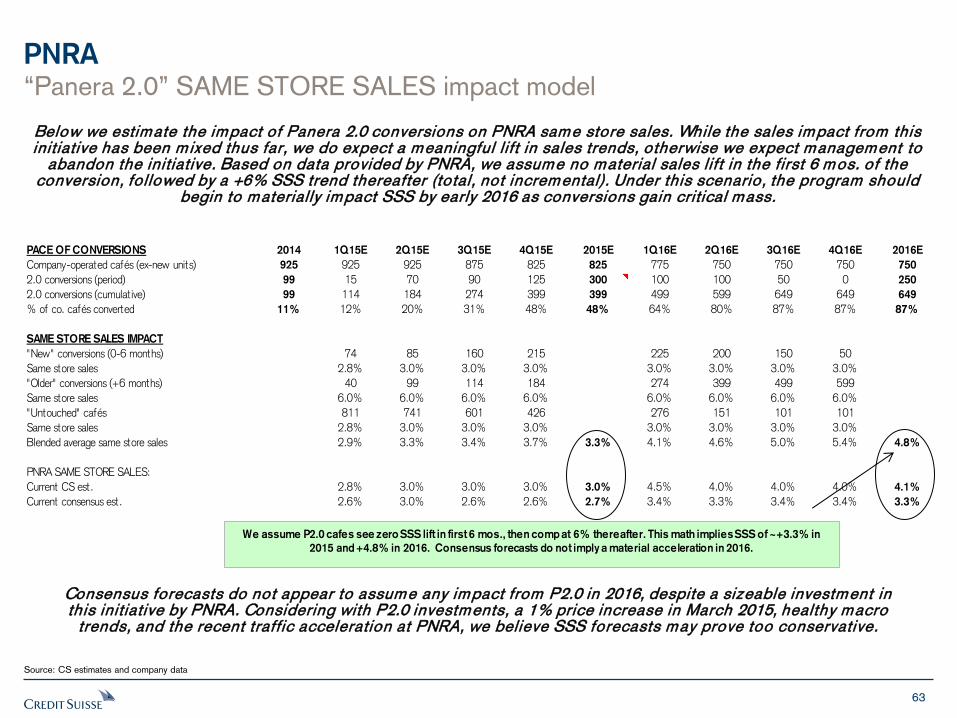
63
PNRA
Source: CS estimates and company data
Below we estimate the impact of Panera 2.0 conversions on PNRA same store sales. While the sales impact from this initiative has been m ixed thus far, we do expect a meaningful l ift in sales trends, otherwise we expect management to
abandon the initiative. Based on data provided by PNRA, we assume no material sales l ift in the first 6 mos. of the conversion, followed by a +6% SSS trend thereafter (total, not incremental). Under this scenario, the program should
begin to materially impact SSS by early 2016 as conversions gain critical mass.
Consensus forecasts do not appear to assume any impact from P2.0 in 2016, despite a sizeable investment in this initiative by PNRA. Considering with P2.0 investments, a 1% price increase in March 2015, healthy macro
trends, and the recent traffic acceleration at PNRA, we believe SSS forecasts may prove too conservative.
PACE OF CONVERSIONS 2014 1Q15E 2Q15E 3Q15E 4Q15E 2015E 1Q16E 2Q16E 3Q16E 4Q16E 2016E
Company-operated cafés (ex-new units) 925 925 925 875 825 825 775 750 750 750 750
2.0 conversions (period) 99 15 70 90 125 300 100 100 50 0 250
2.0 conversions (cumulat ive) 99 114 184 274 399 399 499 599 649 649 649
% of co. cafés converted 11% 12% 20% 31% 48% 48% 64% 80% 87% 87% 87%
SAME STORE SALES IMPACT
"New" conversions (0-6 months) 74 85 160 215 225 200 150 50
Same store sales 2.8% 3.0% 3.0% 3.0% 3.0% 3.0% 3.0% 3.0%
"Older" conversions (+6 months) 40 99 114 184 274 399 499 599
Same store sales 6.0% 6.0% 6.0% 6.0% 6.0% 6.0% 6.0% 6.0%
"Untouched" cafés 811 741 601 426 276 151 101 101
Same store sales 2.8% 3.0% 3.0% 3.0% 3.0% 3.0% 3.0% 3.0%
Blended average same store sales 2.9% 3.3% 3.4% 3.7% 3.3% 4.1% 4.6% 5.0% 5.4% 4.8%
PNRA SAME STORE SALES:
Current CS est. 2.8% 3.0% 3.0% 3.0% 3.0% 4.5% 4.0% 4.0% 4.0% 4.1%
Current consensus est. 2.6% 3.0% 2.6% 2.6% 2.7% 3.4% 3.3% 3.4% 3.4% 3.3%
We assume P2.0 cafes see zero SSS lift in first 6 mos., then comp at 6% thereafter. This math implies SSS of ~+3.3% in
2015 and +4.8% in 2016. Consensus forecasts do not imply a material acceleration in 2016.
“Panera 2.0” SAME STORE SALES impact model
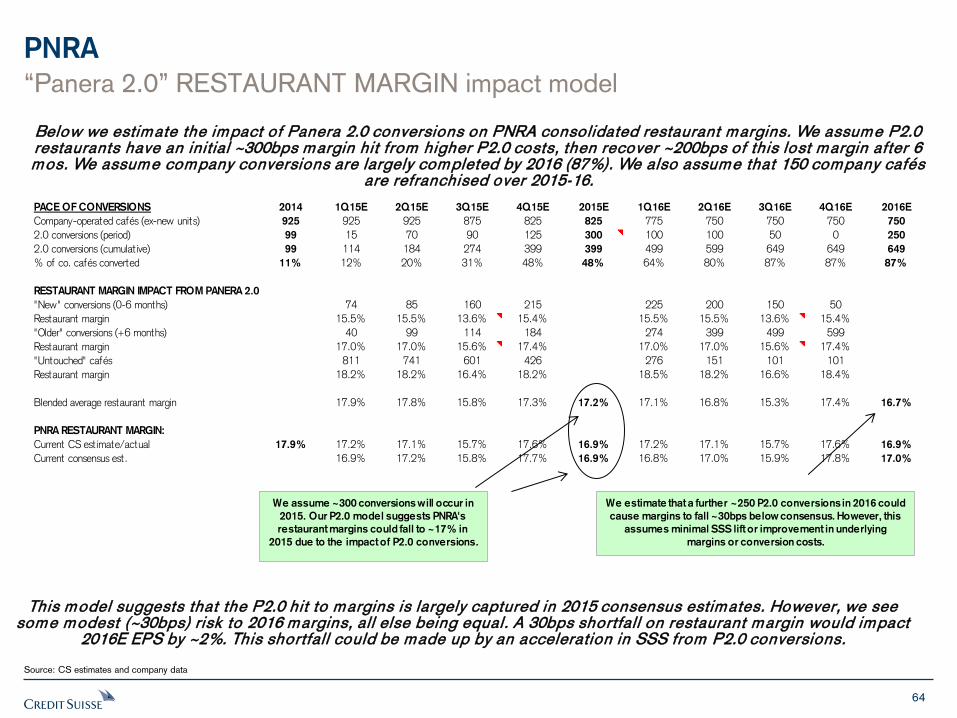
64
PNRA
Source: CS estimates and company data
Below we estimate the impact of Panera 2.0 conversions on PNRA consolidated restaurant margins. We assume P2.0 restaurants have an initial ~300bps margin hit from higher P2.0 costs, then recover ~200bps of this lost margin after 6 mos. We assume company conversions are largely completed by 2016 (87%). We also assume that 150 company cafés
are refranchised over 2015-16.
This model suggests that the P2.0 hit to margins is largely captured in 2015 consensus estimates. However, we see some modest (~30bps) risk to 2016 margins, all else being equal. A 30bps shortfall on restaurant margin would impact
2016E EPS by ~2%. This shortfall could be made up by an acceleration in SSS from P2.0 conversions.
“Panera 2.0” RESTAURANT MARGIN impact model
PACE OF CONVERSIONS 2014 1Q15E 2Q15E 3Q15E 4Q15E 2015E 1Q16E 2Q16E 3Q16E 4Q16E 2016E
Company-operated cafés (ex-new units) 925 925 925 875 825 825 775 750 750 750 750
2.0 conversions (period) 99 15 70 90 125 300 100 100 50 0 250
2.0 conversions (cumulat ive) 99 114 184 274 399 399 499 599 649 649 649
% of co. cafés converted 11% 12% 20% 31% 48% 48% 64% 80% 87% 87% 87%
RESTAURANT MARGIN IMPACT FROM PANERA 2.0
"New" conversions (0-6 months) 74 85 160 215 225 200 150 50
Restaurant margin 15.5% 15.5% 13.6% 15.4% 15.5% 15.5% 13.6% 15.4%
"Older" conversions (+6 months) 40 99 114 184 274 399 499 599
Restaurant margin 17.0% 17.0% 15.6% 17.4% 17.0% 17.0% 15.6% 17.4%
"Untouched" cafés 811 741 601 426 276 151 101 101
Restaurant margin 18.2% 18.2% 16.4% 18.2% 18.5% 18.2% 16.6% 18.4%
Blended average restaurant margin 17.9% 17.8% 15.8% 17.3% 17.2% 17.1% 16.8% 15.3% 17.4% 16.7%
PNRA RESTAURANT MARGIN:
Current CS est imate/actual 17.9% 17.2% 17.1% 15.7% 17.6% 16.9% 17.2% 17.1% 15.7% 17.6% 16.9%
Current consensus est. 16.9% 17.2% 15.8% 17.7% 16.9% 16.8% 17.0% 15.9% 17.8% 17.0%
We assume ~300 conversions will occur in
2015. Our P2.0 model suggests PNRA's
restaurant margins could fall to ~17% in
2015 due to the impact of P2.0 conversions.
We estimate that a further ~250 P2.0 conversions in 2016 could
cause margins to fall ~30bps below consensus. However, this
assumes minimal SSS lift or improvement in underlying
margins or conversion costs.
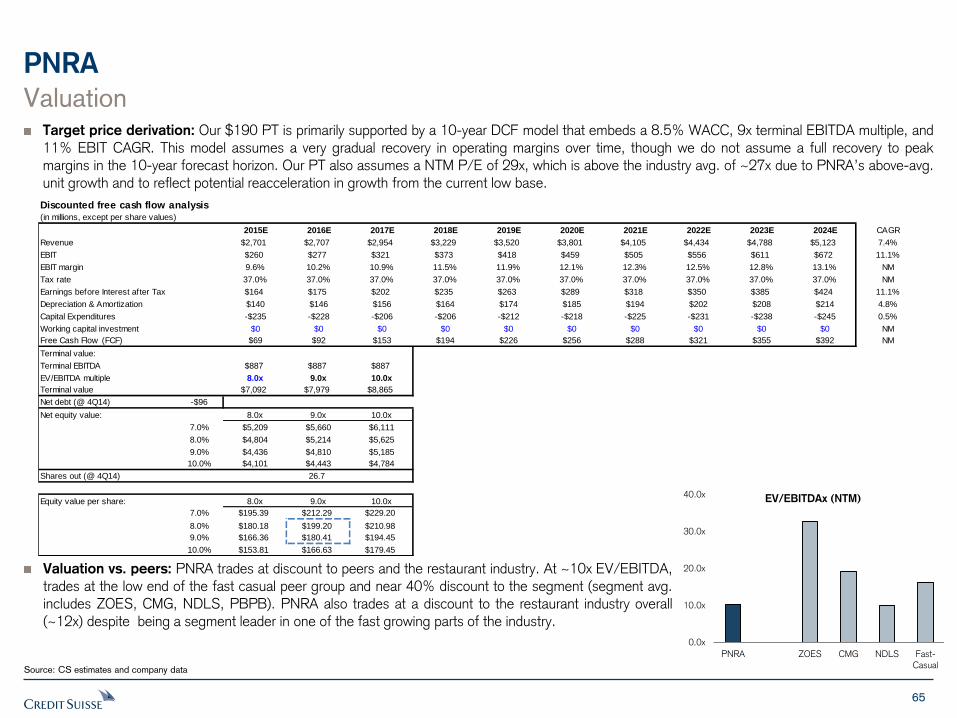
65
Discounted free cash flow analysis(in millions, except per share values)
2015E 2016E 2017E 2018E 2019E 2020E 2021E 2022E 2023E 2024E CAGR
Revenue $2,701 $2,707 $2,954 $3,229 $3,520 $3,801 $4,105 $4,434 $4,788 $5,123 7.4%
EBIT $260 $277 $321 $373 $418 $459 $505 $556 $611 $672 11.1%
EBIT margin 9.6% 10.2% 10.9% 11.5% 11.9% 12.1% 12.3% 12.5% 12.8% 13.1% NM
Tax rate 37.0% 37.0% 37.0% 37.0% 37.0% 37.0% 37.0% 37.0% 37.0% 37.0% NM
Earnings before Interest after Tax $164 $175 $202 $235 $263 $289 $318 $350 $385 $424 11.1%
Depreciation & Amortization $140 $146 $156 $164 $174 $185 $194 $202 $208 $214 4.8%
Capital Expenditures -$235 -$228 -$206 -$206 -$212 -$218 -$225 -$231 -$238 -$245 0.5%
Working capital investment $0 $0 $0 $0 $0 $0 $0 $0 $0 $0 NM
Free Cash Flow (FCF) $69 $92 $153 $194 $226 $256 $288 $321 $355 $392 NM
Terminal value:
Terminal EBITDA $887 $887 $887
EV/EBITDA multiple 8.0x 9.0x 10.0x
Terminal value $7,092 $7,979 $8,865
Net debt (@ 4Q14) -$96
Net equity value: 8.0x 9.0x 10.0x
7.0% $5,209 $5,660 $6,111
8.0% $4,804 $5,214 $5,625
9.0% $4,436 $4,810 $5,185
10.0% $4,101 $4,443 $4,784
Shares out (@ 4Q14) 26.7 26.7 26.7
Equity value per share: 8.0x 9.0x 10.0x
7.0% $195.39 $212.29 $229.20
8.0% $180.18 $199.20 $210.98
9.0% $166.36 $180.41 $194.45
10.0% $153.81 $166.63 $179.45
PNRA
Source: CS estimates and company data
Valuation Target price derivation: Our $190 PT is primarily supported by a 10-year DCF model that embeds a 8.5% WACC, 9x terminal EBITDA multiple, and 11% EBIT CAGR. This model assumes a very gradual recovery in operating margins over time, though we do not assume a full recovery to peak margins in the 10-year forecast horizon. Our PT also assumes a NTM P/E of 29x, which is above the industry avg. of ~27x due to PNRA’s above-avg. unit growth and to reflect potential reacceleration in growth from the current low base.
Valuation vs. peers: PNRA trades at discount to peers and the restaurant industry. At ~10x EV/EBITDA, trades at the low end of the fast casual peer group and near 40% discount to the segment (segment avg. includes ZOES, CMG, NDLS, PBPB). PNRA also trades at a discount to the restaurant industry overall (~12x) despite being a segment leader in one of the fast growing parts of the industry.
0.0x
10.0x
20.0x
30.0x
40.0x
PNRA ZOES CMG NDLS Fast-
Casual
EV/EBITDAx (NTM)
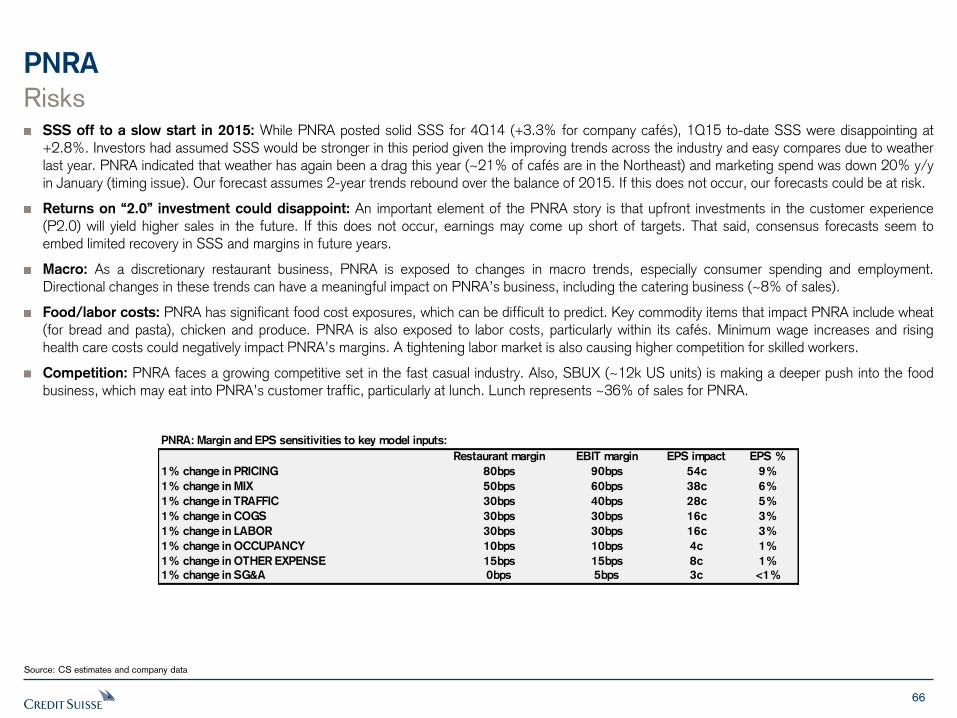
66
PNRA
Source: CS estimates and company data
Risks SSS off to a slow start in 2015: While PNRA posted solid SSS for 4Q14 (+3.3% for company cafés), 1Q15 to-date SSS were disappointing at +2.8%. Investors had assumed SSS would be stronger in this period given the improving trends across the industry and easy compares due to weather last year. PNRA indicated that weather has again been a drag this year (~21% of cafés are in the Northeast) and marketing spend was down 20% y/y in January (timing issue). Our forecast assumes 2-year trends rebound over the balance of 2015. If this does not occur, our forecasts could be at risk.
Returns on “2.0” investment could disappoint: An important element of the PNRA story is that upfront investments in the customer experience (P2.0) will yield higher sales in the future. If this does not occur, earnings may come up short of targets. That said, consensus forecasts seem to embed limited recovery in SSS and margins in future years.
Macro: As a discretionary restaurant business, PNRA is exposed to changes in macro trends, especially consumer spending and employment. Directional changes in these trends can have a meaningful impact on PNRA’s business, including the catering business (~8% of sales).
Food/labor costs: PNRA has significant food cost exposures, which can be difficult to predict. Key commodity items that impact PNRA include wheat (for bread and pasta), chicken and produce. PNRA is also exposed to labor costs, particularly within its cafés. Minimum wage increases and rising health care costs could negatively impact PNRA’s margins. A tightening labor market is also causing higher competition for skilled workers.
Competition: PNRA faces a growing competitive set in the fast casual industry. Also, SBUX (~12k US units) is making a deeper push into the food business, which may eat into PNRA’s customer traffic, particularly at lunch. Lunch represents ~36% of sales for PNRA.
PNRA: Margin and EPS sensitivities to key model inputs:
Restaurant margin EBIT margin EPS impact EPS %
1% change in PRICING 80bps 90bps 54c 9%
1% change in MIX 50bps 60bps 38c 6%
1% change in TRAFFIC 30bps 40bps 28c 5%
1% change in COGS 30bps 30bps 16c 3%
1% change in LABOR 30bps 30bps 16c 3%
1% change in OCCUPANCY 10bps 10bps 4c 1%
1% change in OTHER EXPENSE 15bps 15bps 8c 1%
1% change in SG&A 0bps 5bps 3c <1%
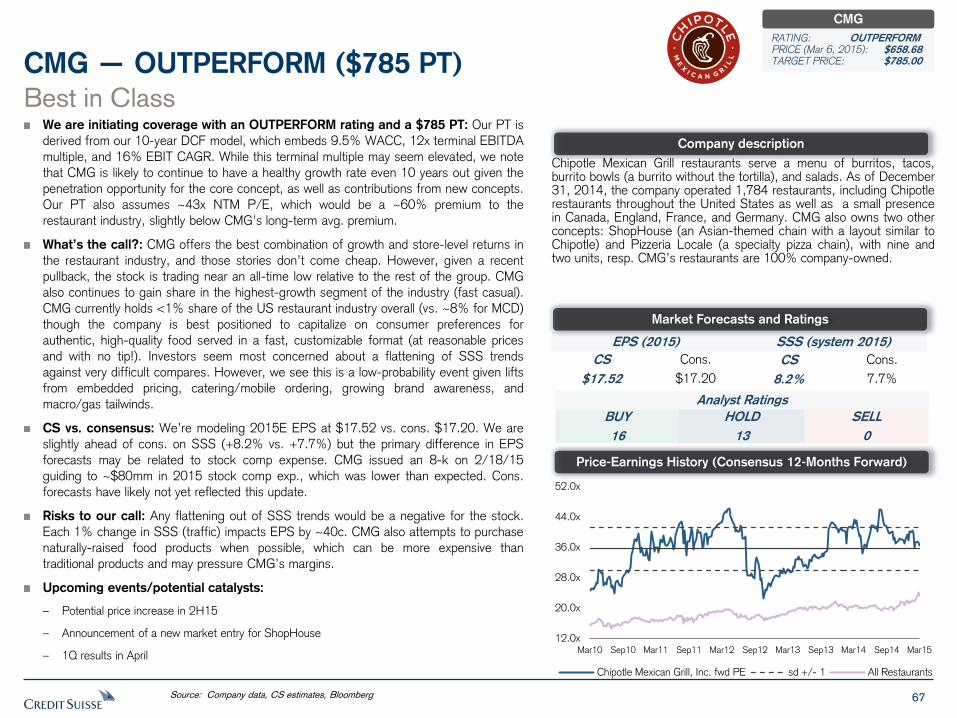
67
We are initiating coverage with an OUTPERFORM rating and a $785 PT: Our PT is
derived from our 10-year DCF model, which embeds 9.5% WACC, 12x terminal EBITDA
multiple, and 16% EBIT CAGR. While this terminal multiple may seem elevated, we note
that CMG is likely to continue to have a healthy growth rate even 10 years out given the
penetration opportunity for the core concept, as well as contributions from new concepts.
Our PT also assumes ~43x NTM P/E, which would be a ~60% premium to the
restaurant industry, slightly below CMG’s long-term avg. premium.
What’s the call?: CMG offers the best combination of growth and store-level returns in
the restaurant industry, and those stories don’t come cheap. However, given a recent
pullback, the stock is trading near an all-time low relative to the rest of the group. CMG
also continues to gain share in the highest-growth segment of the industry (fast casual).
CMG currently holds <1% share of the US restaurant industry overall (vs. ~8% for MCD)
though the company is best positioned to capitalize on consumer preferences for
authentic, high-quality food served in a fast, customizable format (at reasonable prices
and with no tip!). Investors seem most concerned about a flattening of SSS trends
against very difficult compares. However, we see this is a low-probability event given lifts
from embedded pricing, catering/mobile ordering, growing brand awareness, and
macro/gas tailwinds.
CS vs. consensus: We’re modeling 2015E EPS at $17.52 vs. cons. $17.20. We are
slightly ahead of cons. on SSS (+8.2% vs. +7.7%) but the primary difference in EPS
forecasts may be related to stock comp expense. CMG issued an 8-k on 2/18/15
guiding to ~$80mm in 2015 stock comp exp., which was lower than expected. Cons.
forecasts have likely not yet reflected this update.
Risks to our call: Any flattening out of SSS trends would be a negative for the stock.
Each 1% change in SSS (traffic) impacts EPS by ~40c. CMG also attempts to purchase
naturally-raised food products when possible, which can be more expensive than
traditional products and may pressure CMG’s margins.
Upcoming events/potential catalysts:
– Potential price increase in 2H15
– Announcement of a new market entry for ShopHouse
– 1Q results in April
Best in Class
CMG — OUTPERFORM ($785 PT)
Chipotle Mexican Grill restaurants serve a menu of burritos, tacos, burrito bowls (a burrito without the tortilla), and salads. As of December 31, 2014, the company operated 1,784 restaurants, including Chipotle restaurants throughout the United States as well as a small presence in Canada, England, France, and Germany. CMG also owns two other concepts: ShopHouse (an Asian-themed chain with a layout similar to Chipotle) and Pizzeria Locale (a specialty pizza chain), with nine and two units, resp. CMG’s restaurants are 100% company-owned.
Source: Company data, CS estimates, Bloomberg
Company description
Price-Earnings History (Consensus 12-Months Forward)
EPS (2015) SSS (system 2015)
CS
$17.52
Cons.
$17.20
CS
8.2%
Cons.
7.7%
Analyst Ratings
BUY
16
SELL
0
HOLD
13
Market Forecasts and Ratings
CMG
RATING: OUTPERFORM PRICE (Mar 6, 2015): $658.68 TARGET PRICE: $785.00
12.0x
20.0x
28.0x
36.0x
44.0x
52.0x
Mar10 Sep10 Mar11 Sep11 Mar12 Sep12 Mar13 Sep13 Mar14 Sep14 Mar15
Chipotle Mexican Grill, Inc. fwd PE sd +/- 1 All Restaurants
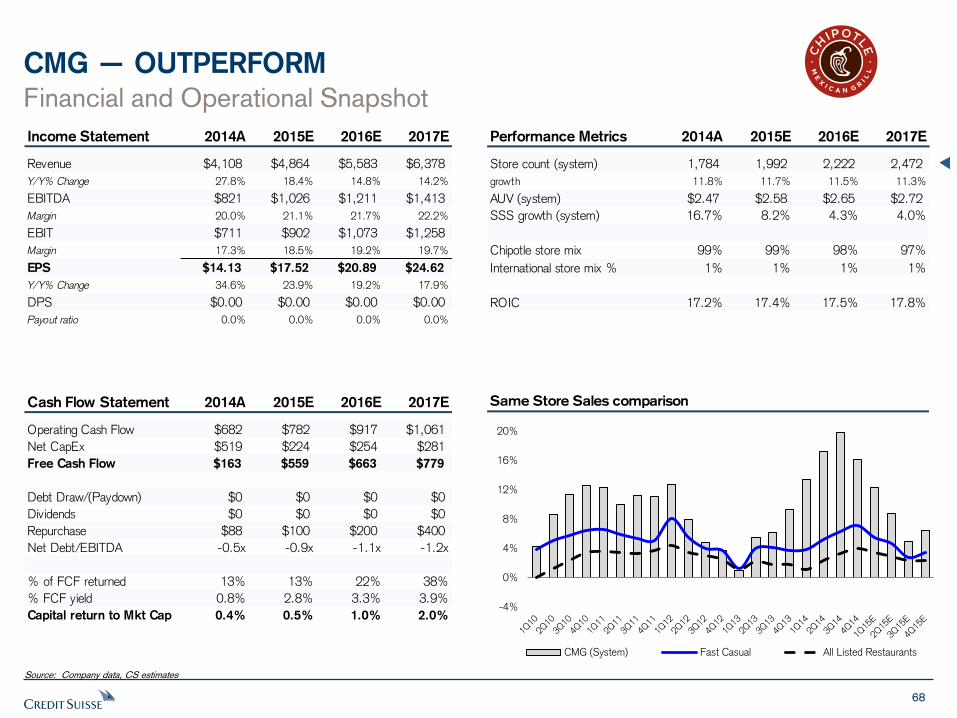
68
CMG — OUTPERFORM
Financial and Operational Snapshot
Source: Company data, CS estimates
Same Store Sales comparison
Income Statement 2014A 2015E 2016E 2017E
Revenue $4,108 $4,864 $5,583 $6,378
Y/Y% Change 27.8% 18.4% 14.8% 14.2%
EBITDA $821 $1,026 $1,211 $1,413
Margin 20.0% 21.1% 21.7% 22.2%
EBIT $711 $902 $1,073 $1,258
Margin 17.3% 18.5% 19.2% 19.7%
EPS $14.13 $17.52 $20.89 $24.62
Y/Y% Change 34.6% 23.9% 19.2% 17.9%
DPS $0.00 $0.00 $0.00 $0.00
Payout ratio 0.0% 0.0% 0.0% 0.0%
Performance Metrics 2014A 2015E 2016E 2017E
Store count (system) 1,784 1,992 2,222 2,472
growth 11.8% 11.7% 11.5% 11.3%
AUV (system) $2.47 $2.58 $2.65 $2.72
SSS growth (system) 16.7% 8.2% 4.3% 4.0%
Chipotle store mix 99% 99% 98% 97%
International store mix % 1% 1% 1% 1%
ROIC 17.2% 17.4% 17.5% 17.8%
Cash Flow Statement 2014A 2015E 2016E 2017E
Operating Cash Flow $682 $782 $917 $1,061
Net CapEx $519 $224 $254 $281
Free Cash Flow $163 $559 $663 $779
Debt Draw/(Paydown) $0 $0 $0 $0
Dividends $0 $0 $0 $0
Repurchase $88 $100 $200 $400
Net Debt/EBITDA -0.5x -0.9x -1.1x -1.2x
% of FCF returned 13% 13% 22% 38%
% FCF yield 0.8% 2.8% 3.3% 3.9%
Capital return to Mkt Cap 0.4% 0.5% 1.0% 2.0%-4%
0%
4%
8%
12%
16%
20%
CMG (System) Fast Casual All Listed Restaurants
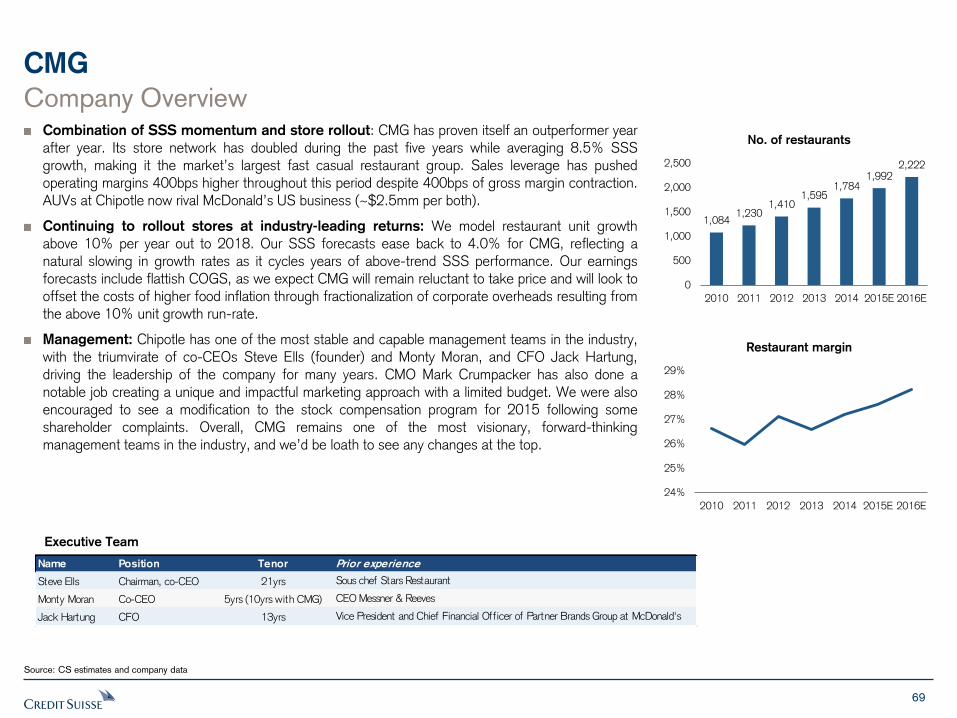
69
CMG
Company Overview Combination of SSS momentum and store rollout: CMG has proven itself an outperformer year after year. Its store network has doubled during the past five years while averaging 8.5% SSS growth, making it the market’s largest fast casual restaurant group. Sales leverage has pushed operating margins 400bps higher throughout this period despite 400bps of gross margin contraction. AUVs at Chipotle now rival McDonald’s US business (~$2.5mm per both).
Continuing to rollout stores at industry-leading returns: We model restaurant unit growth above 10% per year out to 2018. Our SSS forecasts ease back to 4.0% for CMG, reflecting a natural slowing in growth rates as it cycles years of above-trend SSS performance. Our earnings forecasts include flattish COGS, as we expect CMG will remain reluctant to take price and will look to offset the costs of higher food inflation through fractionalization of corporate overheads resulting from the above 10% unit growth run-rate.
Management: Chipotle has one of the most stable and capable management teams in the industry, with the triumvirate of co-CEOs Steve Ells (founder) and Monty Moran, and CFO Jack Hartung, driving the leadership of the company for many years. CMO Mark Crumpacker has also done a notable job creating a unique and impactful marketing approach with a limited budget. We were also encouraged to see a modification to the stock compensation program for 2015 following some shareholder complaints. Overall, CMG remains one of the most visionary, forward-thinking management teams in the industry, and we’d be loath to see any changes at the top.
Source: CS estimates and company data
Executive Team
Name Position Tenor Prior experience
Steve Ells Chairman, co-CEO 21yrs Sous chef Stars Restaurant
Monty Moran Co-CEO 5yrs (10yrs with CMG) CEO Messner & Reeves
Jack Hartung CFO 13yrs Vice President and Chief Financial Officer of Partner Brands Group at McDonald's
1,084 1,230
1,410 1,595
1,784 1,992
2,222
0
500
1,000
1,500
2,000
2,500
2010 2011 2012 2013 2014 2015E 2016E
No. of restaurants
24%
25%
26%
27%
28%
29%
2010 2011 2012 2013 2014 2015E 2016E
Restaurant margin
70
CMG
Best in Class Best-in-class growth: Most investors are aware of the industry-leading metrics that surround the CMG story: 16.7% SSS in 2014, 70% cash ROIs on new restaurants (~40% lease-adj. ROIs), and 17% EBIT margins (vs. industry avg. ~9% and with no franchising). On top of these metrics, CMG is one of the best unit growth stories in the industry, with 12%+ avg. unit growth modeled. CMG is laying the groundwork for future growth by seeding a European business (10 units) and two new concepts: ShopHouse Asian Kitchen (9 units) and Pizzeria Locale (2 units). These opportunities should allow CMG to sustain double-digit unit growth even after the core concept approaches maturity (which we see as at least 10-15 years away), or potentially accelerate unit growth as these seeds gain scale. The company also has a nascent catering business that was launched in 2013 and generates ~2-3% of sales vs. ~8-15% at peers. We believe the sustainability of CMG’s growth model is underappreciated and supports a higher terminal DCF multiple than the market is currently implying.
Thoughts on unit growth potential: CMG currently has ~6 restaurants per 1mm people in the U.S., similar to its largest fast casual competitor Panera. This compares to ~37 restaurants/1mm people for Starbucks and ~44 for McDonald’s. Looking at some of CMG’s most saturated markets, such as Colorado or Virginia, suggests CMG can achieve saturation levels of ~15-18 units/1mm in population. This ratio has even reached ~30 units/1mm in Washington, DC, one of CMG’s most successful market. Applying a ratio of ~15 units/1mm pop. to the U.S. as a whole indicates CMG should be able to build over 5k units over time (before considering population growth, GDP growth, or other concepts). This compares to 1,784 units at YE14. So, the company is currently at ~35% of its future penetration. CMG also has a very flexible real estate model that works in both urban and suburban markets and across a variety of formats (in-line, end cap, standalone, malls, etc.) However, sustaining CMG’s industry-leading margins and returns while building out the store base could be a challenge, but at this time we see no near-term threats to CMG’s return model, and COGS is actually above normalized levels currently.
COGS normalization offers EPS upside: We see potential upside to EPS around a normalization of the COGS line. CMG’s restaurant margins are near all-time highs (27.2% in 2014) despite record-high cost of sales. Normalization in CMG’s food basket could drive outsized margin gains and EPS growth over the next few years. CMG’s COGS currently sits at ~35.0%, up 440bps since 2010. CMG’s COGS has averaged ~32% of sales over the past 9 years. If this margin line reverts to the mean (via pricing and/or less inflation), this could provide built-in EPS growth for CMG. For example, if COGS were to normalize to ~33% of sales, that could add ~$2.25 in EPS power to CMG (~10% upside to 2016E). If COGS were to normalize to ~32%, that could add ~$3.35 in EPS upside (~15% upside to 2016E). Consensus forecasts currently call for very little improvement in COGS, to ~34.6% by 2018 from 35.0% currently. We also believe CMG could be a big beneficiary of a potential pullback in beef prices. (See the food inflation section of this presentation for more details.) We estimate that beef represents ~18% of CMG’s COGS. Each 10% move in beef costs affects margins by ~60bps and EPS by ~50c.
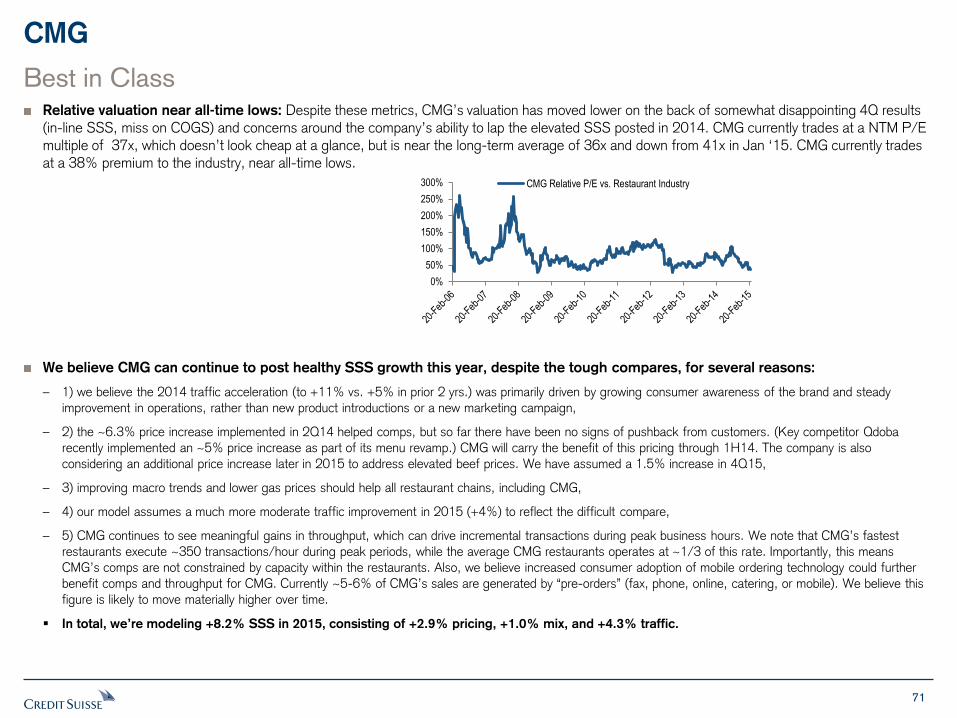
71
CMG
Best in Class Relative valuation near all-time lows: Despite these metrics, CMG’s valuation has moved lower on the back of somewhat disappointing 4Q results (in-line SSS, miss on COGS) and concerns around the company’s ability to lap the elevated SSS posted in 2014. CMG currently trades at a NTM P/E multiple of 37x, which doesn’t look cheap at a glance, but is near the long-term average of 36x and down from 41x in Jan ‘15. CMG currently trades at a 38% premium to the industry, near all-time lows.
We believe CMG can continue to post healthy SSS growth this year, despite the tough compares, for several reasons:
– 1) we believe the 2014 traffic acceleration (to +11% vs. +5% in prior 2 yrs.) was primarily driven by growing consumer awareness of the brand and steady
improvement in operations, rather than new product introductions or a new marketing campaign,
– 2) the ~6.3% price increase implemented in 2Q14 helped comps, but so far there have been no signs of pushback from customers. (Key competitor Qdoba
recently implemented an ~5% price increase as part of its menu revamp.) CMG will carry the benefit of this pricing through 1H14. The company is also
considering an additional price increase later in 2015 to address elevated beef prices. We have assumed a 1.5% increase in 4Q15,
– 3) improving macro trends and lower gas prices should help all restaurant chains, including CMG,
– 4) our model assumes a much more moderate traffic improvement in 2015 (+4%) to reflect the difficult compare,
– 5) CMG continues to see meaningful gains in throughput, which can drive incremental transactions during peak business hours. We note that CMG’s fastest
restaurants execute ~350 transactions/hour during peak periods, while the average CMG restaurants operates at ~1/3 of this rate. Importantly, this means
CMG’s comps are not constrained by capacity within the restaurants. Also, we believe increased consumer adoption of mobile ordering technology could further
benefit comps and throughput for CMG. Currently ~5-6% of CMG’s sales are generated by “pre-orders” (fax, phone, online, catering, or mobile). We believe this
figure is likely to move materially higher over time.
In total, we’re modeling +8.2% SSS in 2015, consisting of +2.9% pricing, +1.0% mix, and +4.3% traffic.
0%
50%
100%
150%
200%
250%
300% CMG Relative P/E vs. Restaurant Industry
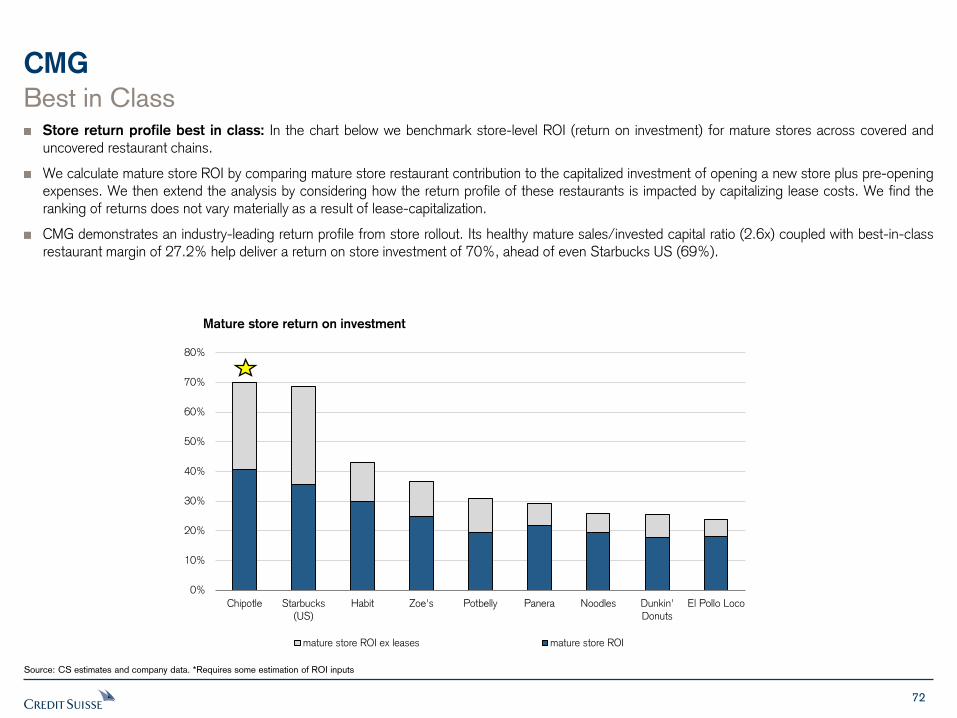
72
0%
10%
20%
30%
40%
50%
60%
70%
80%
Chipotle Starbucks(US)
Habit Zoe's Potbelly Panera Noodles Dunkin'Donuts
El Pollo Loco
mature store ROI ex leases mature store ROI
CMG
Best in Class Store return profile best in class: In the chart below we benchmark store-level ROI (return on investment) for mature stores across covered and uncovered restaurant chains.
We calculate mature store ROI by comparing mature store restaurant contribution to the capitalized investment of opening a new store plus pre-opening expenses. We then extend the analysis by considering how the return profile of these restaurants is impacted by capitalizing lease costs. We find the ranking of returns does not vary materially as a result of lease-capitalization.
CMG demonstrates an industry-leading return profile from store rollout. Its healthy mature sales/invested capital ratio (2.6x) coupled with best-in-class restaurant margin of 27.2% help deliver a return on store investment of 70%, ahead of even Starbucks US (69%).
Source: CS estimates and company data. *Requires some estimation of ROI inputs
Mature store return on investment
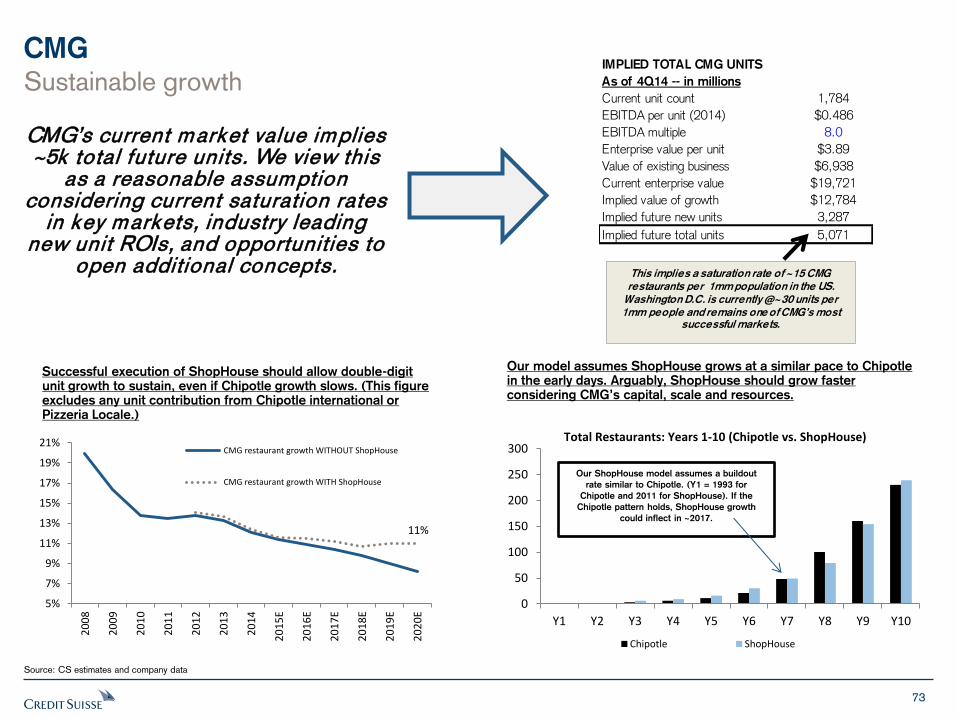
73
CMG
Source: CS estimates and company data
CMG’s current market value implies ~5k total future units. We view this
as a reasonable assumption considering current saturation rates
in key markets, industry leading new unit ROIs, and opportunities to
open additional concepts.
11%
5%
7%
9%
11%
13%
15%
17%
19%
21%
20
08
20
09
20
10
20
11
20
12
20
13
20
14
20
15
E
20
16
E
20
17
E
20
18
E
20
19
E
20
20
E
CMG restaurant growth WITHOUT ShopHouse
CMG restaurant growth WITH ShopHouse
Successful execution of ShopHouse should allow double-digit unit growth to sustain, even if Chipotle growth slows. (This figure excludes any unit contribution from Chipotle international or Pizzeria Locale.)
Our model assumes ShopHouse grows at a similar pace to Chipotle in the early days. Arguably, ShopHouse should grow faster considering CMG’s capital, scale and resources.
IMPLIED TOTAL CMG UNITS
As of 4Q14 -- in millions
Current unit count 1,784
EBITDA per unit (2014) $0.486
EBITDA multiple 8.0
Enterprise value per unit $3.89
Value of existing business $6,938
Current enterprise value $19,721
Implied value of growth $12,784
Implied future new units 3,287
Implied future total units 5,071
This implies a saturation rate of ~15 CMG
restaurants per 1mm population in the US.
Washington D.C. is currently @~30 units per
1mm people and remains one of CMG’s most successful markets.
0
50
100
150
200
250
300
Y1 Y2 Y3 Y4 Y5 Y6 Y7 Y8 Y9 Y10
Total Restaurants: Years 1-10 (Chipotle vs. ShopHouse)
Chipotle ShopHouse
Our ShopHouse model assumes a buildout
rate similar to Chipotle. (Y1 = 1993 for
Chipotle and 2011 for ShopHouse). If the
Chipotle pattern holds, ShopHouse growth
could inflect in ~2017.
Sustainable growth
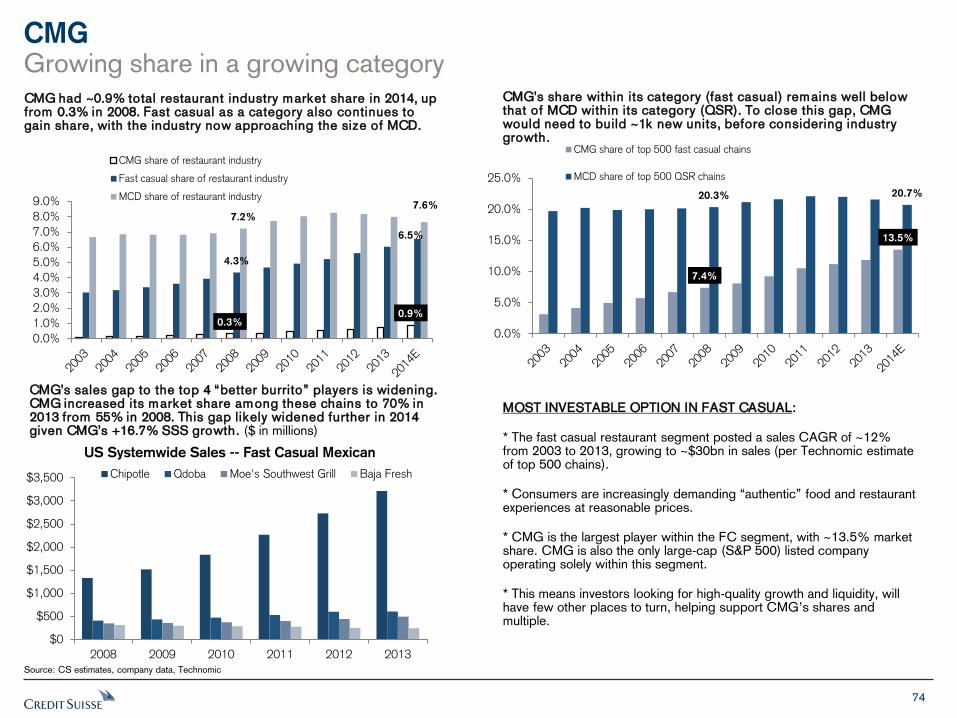
74
CMG
Source: CS estimates, company data, Technomic
CMG had ~0.9% total restaurant industry market share in 2014, up from 0.3% in 2008. Fast casual as a category also continues to gain share, with the industry now approaching the size of MCD.
7.4%
13.5%
20.3% 20.7%
0.0%
5.0%
10.0%
15.0%
20.0%
25.0%
CMG share of top 500 fast casual chains
MCD share of top 500 QSR chains
CMG’s share within its category (fast casual) remains well below that of MCD within its category (QSR). To close this gap, CMG would need to build ~1k new units, before considering industry growth.
0.3% 0.9%
4.3%
6.5%
7.2%
7.6%
0.0%
1.0%
2.0%
3.0%
4.0%
5.0%
6.0%
7.0%
8.0%
9.0%
CMG share of restaurant industry
Fast casual share of restaurant industry
MCD share of restaurant industry
CMG’s sales gap to the top 4 “better burrito” players is widening. CMG increased its market share among these chains to 70% in 2013 from 55% in 2008. This gap likely widened further in 2014 given CMG’s +16.7% SSS growth. ($ in millions)
$0
$500
$1,000
$1,500
$2,000
$2,500
$3,000
$3,500
2008 2009 2010 2011 2012 2013
US Systemwide Sales -- Fast Casual Mexican
Chipotle Qdoba Moe's Southwest Grill Baja Fresh
MOST INVESTABLE OPTION IN FAST CASUAL:
* The fast casual restaurant segment posted a sales CAGR of ~12% from 2003 to 2013, growing to ~$30bn in sales (per Technomic estimate of top 500 chains).
* Consumers are increasingly demanding “authentic” food and restaurant experiences at reasonable prices.
* CMG is the largest player within the FC segment, with ~13.5% market share. CMG is also the only large-cap (S&P 500) listed company operating solely within this segment.
* This means investors looking for high-quality growth and liquidity, will have few other places to turn, helping support CMG’s shares and multiple.
Growing share in a growing category
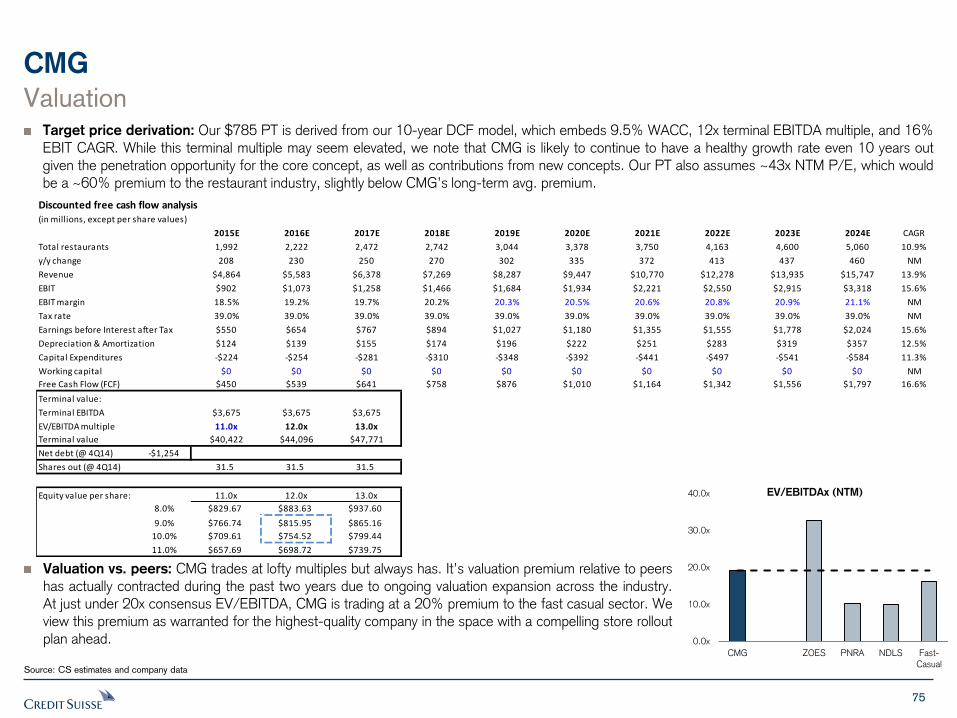
75
Discounted free cash flow analysis(in millions, except per share values)
2015E 2016E 2017E 2018E 2019E 2020E 2021E 2022E 2023E 2024E CAGR
Total restaurants 1,992 2,222 2,472 2,742 3,044 3,378 3,750 4,163 4,600 5,060 10.9%
y/y change 208 230 250 270 302 335 372 413 437 460 NM
Revenue $4,864 $5,583 $6,378 $7,269 $8,287 $9,447 $10,770 $12,278 $13,935 $15,747 13.9%
EBIT $902 $1,073 $1,258 $1,466 $1,684 $1,934 $2,221 $2,550 $2,915 $3,318 15.6%
EBIT margin 18.5% 19.2% 19.7% 20.2% 20.3% 20.5% 20.6% 20.8% 20.9% 21.1% NM
Tax rate 39.0% 39.0% 39.0% 39.0% 39.0% 39.0% 39.0% 39.0% 39.0% 39.0% NM
Earnings before Interest after Tax $550 $654 $767 $894 $1,027 $1,180 $1,355 $1,555 $1,778 $2,024 15.6%
Depreciation & Amortization $124 $139 $155 $174 $196 $222 $251 $283 $319 $357 12.5%
Capital Expenditures -$224 -$254 -$281 -$310 -$348 -$392 -$441 -$497 -$541 -$584 11.3%
Working capital $0 $0 $0 $0 $0 $0 $0 $0 $0 $0 NM
Free Cash Flow (FCF) $450 $539 $641 $758 $876 $1,010 $1,164 $1,342 $1,556 $1,797 16.6%
Terminal value:
Terminal EBITDA $3,675 $3,675 $3,675
EV/EBITDA multiple 11.0x 12.0x 13.0x
Terminal value $40,422 $44,096 $47,771
Net debt (@ 4Q14) -$1,254
Shares out (@ 4Q14) 31.5 31.5 31.5
Equity value per share: 11.0x 12.0x 13.0x
8.0% $829.67 $883.63 $937.60
9.0% $766.74 $815.95 $865.16
10.0% $709.61 $754.52 $799.44
11.0% $657.69 $698.72 $739.75
CMG
Source: CS estimates and company data
Valuation Target price derivation: Our $785 PT is derived from our 10-year DCF model, which embeds 9.5% WACC, 12x terminal EBITDA multiple, and 16% EBIT CAGR. While this terminal multiple may seem elevated, we note that CMG is likely to continue to have a healthy growth rate even 10 years out given the penetration opportunity for the core concept, as well as contributions from new concepts. Our PT also assumes ~43x NTM P/E, which would be a ~60% premium to the restaurant industry, slightly below CMG’s long-term avg. premium.
Valuation vs. peers: CMG trades at lofty multiples but always has. It’s valuation premium relative to peers has actually contracted during the past two years due to ongoing valuation expansion across the industry. At just under 20x consensus EV/EBITDA, CMG is trading at a 20% premium to the fast casual sector. We view this premium as warranted for the highest-quality company in the space with a compelling store rollout plan ahead.
0.0x
10.0x
20.0x
30.0x
40.0x
CMG ZOES PNRA NDLS Fast-
Casual
EV/EBITDAx (NTM)
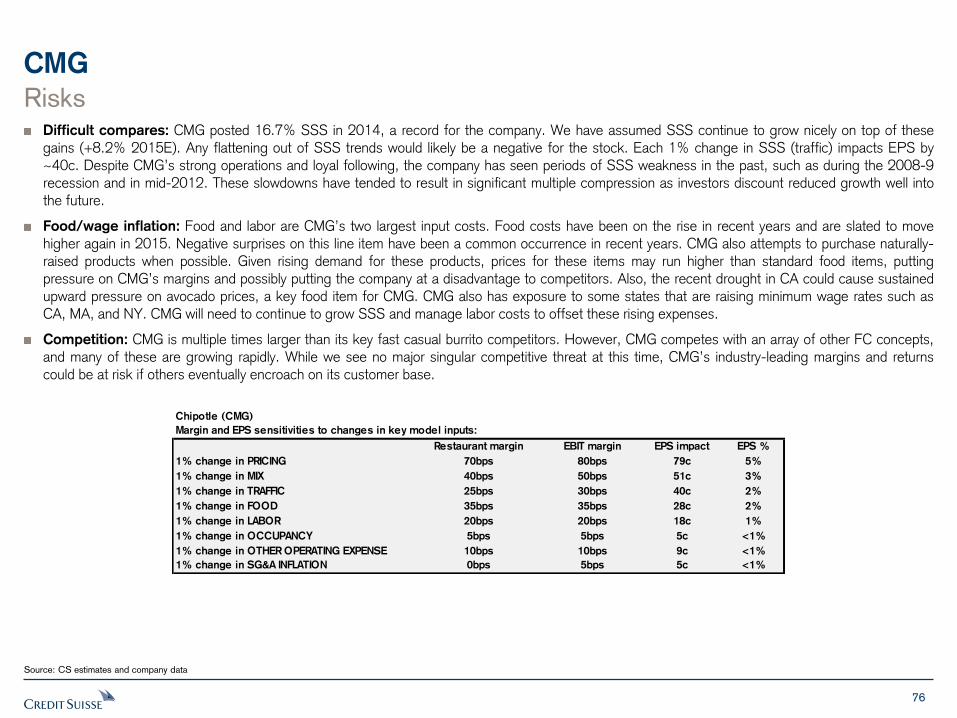
76
CMG
Risks Difficult compares: CMG posted 16.7% SSS in 2014, a record for the company. We have assumed SSS continue to grow nicely on top of these gains (+8.2% 2015E). Any flattening out of SSS trends would likely be a negative for the stock. Each 1% change in SSS (traffic) impacts EPS by ~40c. Despite CMG’s strong operations and loyal following, the company has seen periods of SSS weakness in the past, such as during the 2008-9 recession and in mid-2012. These slowdowns have tended to result in significant multiple compression as investors discount reduced growth well into the future.
Food/wage inflation: Food and labor are CMG’s two largest input costs. Food costs have been on the rise in recent years and are slated to move higher again in 2015. Negative surprises on this line item have been a common occurrence in recent years. CMG also attempts to purchase naturally-raised products when possible. Given rising demand for these products, prices for these items may run higher than standard food items, putting pressure on CMG’s margins and possibly putting the company at a disadvantage to competitors. Also, the recent drought in CA could cause sustained upward pressure on avocado prices, a key food item for CMG. CMG also has exposure to some states that are raising minimum wage rates such as CA, MA, and NY. CMG will need to continue to grow SSS and manage labor costs to offset these rising expenses.
Competition: CMG is multiple times larger than its key fast casual burrito competitors. However, CMG competes with an array of other FC concepts, and many of these are growing rapidly. While we see no major singular competitive threat at this time, CMG’s industry-leading margins and returns could be at risk if others eventually encroach on its customer base.
Source: CS estimates and company data
Chipotle (CMG)
Margin and EPS sensitivities to changes in key model inputs:
Restaurant margin EBIT margin EPS impact EPS %
1% change in PRICING 70bps 80bps 79c 5%
1% change in MIX 40bps 50bps 51c 3%
1% change in TRAFFIC 25bps 30bps 40c 2%
1% change in FOOD 35bps 35bps 28c 2%
1% change in LABOR 20bps 20bps 18c 1%
1% change in OCCUPANCY 5bps 5bps 5c <1%
1% change in OTHER OPERATING EXPENSE 10bps 10bps 9c <1%
1% change in SG&A INFLATION 0bps 5bps 5c <1%
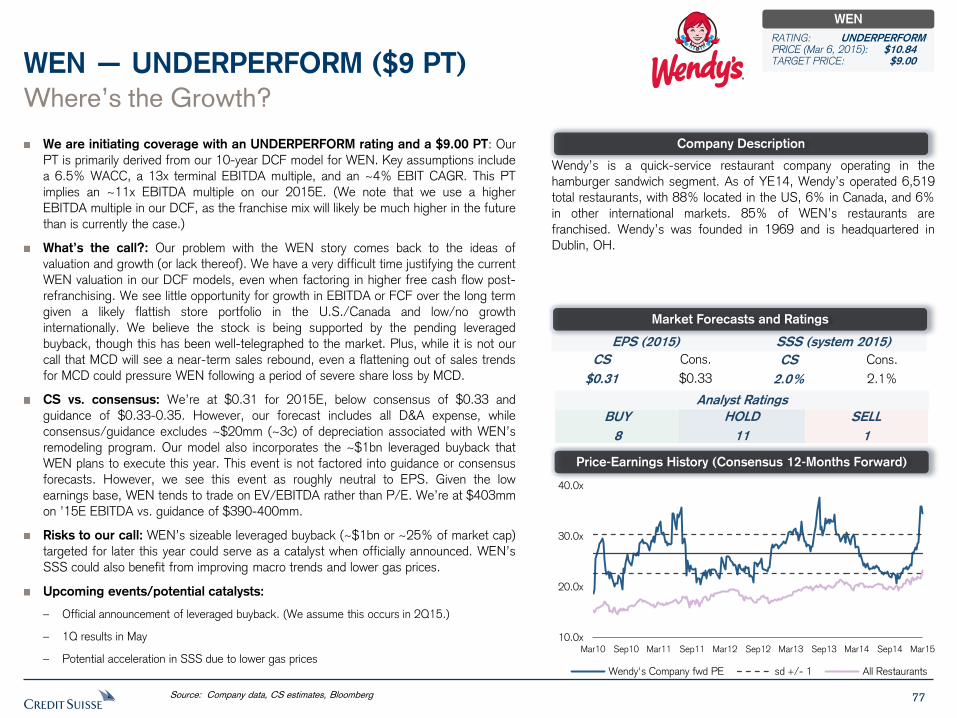
77
We are initiating coverage with an UNDERPERFORM rating and a $9.00 PT: Our
PT is primarily derived from our 10-year DCF model for WEN. Key assumptions include
a 6.5% WACC, a 13x terminal EBITDA multiple, and an ~4% EBIT CAGR. This PT
implies an ~11x EBITDA multiple on our 2015E. (We note that we use a higher
EBITDA multiple in our DCF, as the franchise mix will likely be much higher in the future
than is currently the case.)
What’s the call?: Our problem with the WEN story comes back to the ideas of
valuation and growth (or lack thereof). We have a very difficult time justifying the current
WEN valuation in our DCF models, even when factoring in higher free cash flow post-
refranchising. We see little opportunity for growth in EBITDA or FCF over the long term
given a likely flattish store portfolio in the U.S./Canada and low/no growth
internationally. We believe the stock is being supported by the pending leveraged
buyback, though this has been well-telegraphed to the market. Plus, while it is not our
call that MCD will see a near-term sales rebound, even a flattening out of sales trends
for MCD could pressure WEN following a period of severe share loss by MCD.
CS vs. consensus: We’re at $0.31 for 2015E, below consensus of $0.33 and
guidance of $0.33-0.35. However, our forecast includes all D&A expense, while
consensus/guidance excludes ~$20mm (~3c) of depreciation associated with WEN’s
remodeling program. Our model also incorporates the ~$1bn leveraged buyback that
WEN plans to execute this year. This event is not factored into guidance or consensus
forecasts. However, we see this event as roughly neutral to EPS. Given the low
earnings base, WEN tends to trade on EV/EBITDA rather than P/E. We’re at $403mm
on ’15E EBITDA vs. guidance of $390-400mm.
Risks to our call: WEN’s sizeable leveraged buyback (~$1bn or ~25% of market cap)
targeted for later this year could serve as a catalyst when officially announced. WEN’s
SSS could also benefit from improving macro trends and lower gas prices.
Upcoming events/potential catalysts:
– Official announcement of leveraged buyback. (We assume this occurs in 2Q15.)
– 1Q results in May
– Potential acceleration in SSS due to lower gas prices
Where’s the Growth?
WEN — UNDERPERFORM ($9 PT)
Wendy’s is a quick-service restaurant company operating in the
hamburger sandwich segment. As of YE14, Wendy’s operated 6,519
total restaurants, with 88% located in the US, 6% in Canada, and 6%
in other international markets. 85% of WEN’s restaurants are
franchised. Wendy’s was founded in 1969 and is headquartered in
Dublin, OH.
Source: Company data, CS estimates, Bloomberg
Company Description
Price-Earnings History (Consensus 12-Months Forward)
EPS (2015) SSS (system 2015)
CS
$0.31
Cons.
$0.33
CS
2.0%
Cons.
2.1%
Analyst Ratings
BUY
8
SELL
1
HOLD
11
Market Forecasts and Ratings
WEN
RATING: UNDERPERFORM PRICE (Mar 6, 2015): $10.84 TARGET PRICE: $9.00
10.0x
20.0x
30.0x
40.0x
Mar10 Sep10 Mar11 Sep11 Mar12 Sep12 Mar13 Sep13 Mar14 Sep14 Mar15
Wendy's Company fwd PE sd +/- 1 All Restaurants
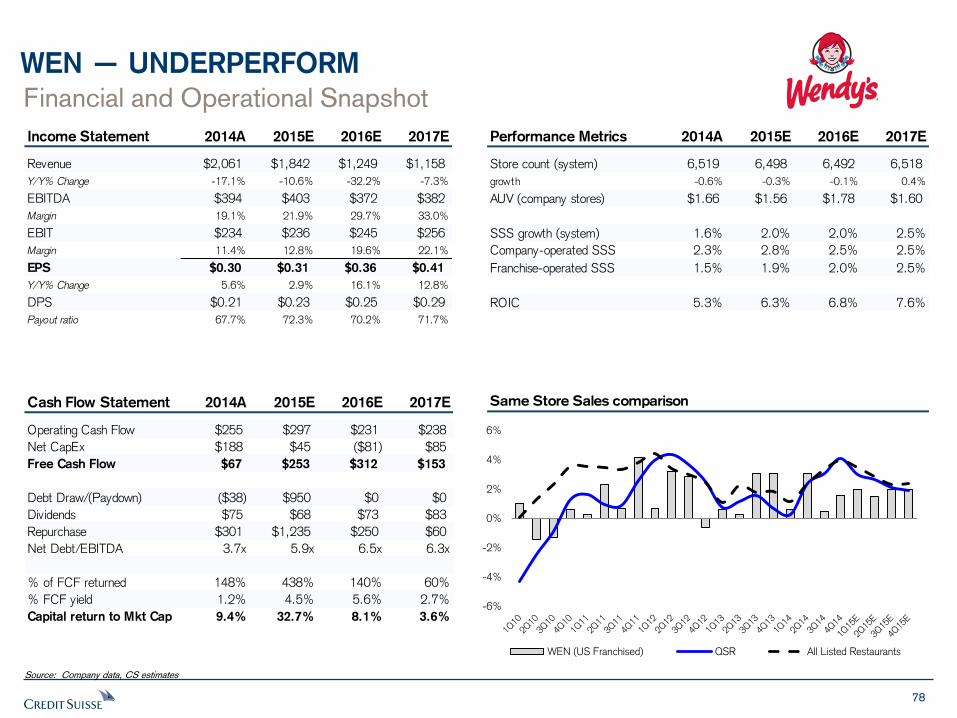
78
WEN — UNDERPERFORM
Financial and Operational Snapshot
Source: Company data, CS estimates
Same Store Sales comparison
Income Statement 2014A 2015E 2016E 2017E
Revenue $2,061 $1,842 $1,249 $1,158
Y/Y% Change -17.1% -10.6% -32.2% -7.3%
EBITDA $394 $403 $372 $382
Margin 19.1% 21.9% 29.7% 33.0%
EBIT $234 $236 $245 $256
Margin 11.4% 12.8% 19.6% 22.1%
EPS $0.30 $0.31 $0.36 $0.41
Y/Y% Change 5.6% 2.9% 16.1% 12.8%
DPS $0.21 $0.23 $0.25 $0.29
Payout ratio 67.7% 72.3% 70.2% 71.7%
Performance Metrics 2014A 2015E 2016E 2017E
Store count (system) 6,519 6,498 6,492 6,518
growth -0.6% -0.3% -0.1% 0.4%
AUV (company stores) $1.66 $1.56 $1.78 $1.60
SSS growth (system) 1.6% 2.0% 2.0% 2.5%
Company-operated SSS 2.3% 2.8% 2.5% 2.5%
Franchise-operated SSS 1.5% 1.9% 2.0% 2.5%
ROIC 5.3% 6.3% 6.8% 7.6%
Cash Flow Statement 2014A 2015E 2016E 2017E
Operating Cash Flow $255 $297 $231 $238
Net CapEx $188 $45 ($81) $85
Free Cash Flow $67 $253 $312 $153
Debt Draw/(Paydown) ($38) $950 $0 $0
Dividends $75 $68 $73 $83
Repurchase $301 $1,235 $250 $60
Net Debt/EBITDA 3.7x 5.9x 6.5x 6.3x
% of FCF returned 148% 438% 140% 60%
% FCF yield 1.2% 4.5% 5.6% 2.7%
Capital return to Mkt Cap 9.4% 32.7% 8.1% 3.6%-6%
-4%
-2%
0%
2%
4%
6%
WEN (US Franchised) QSR All Listed Restaurants
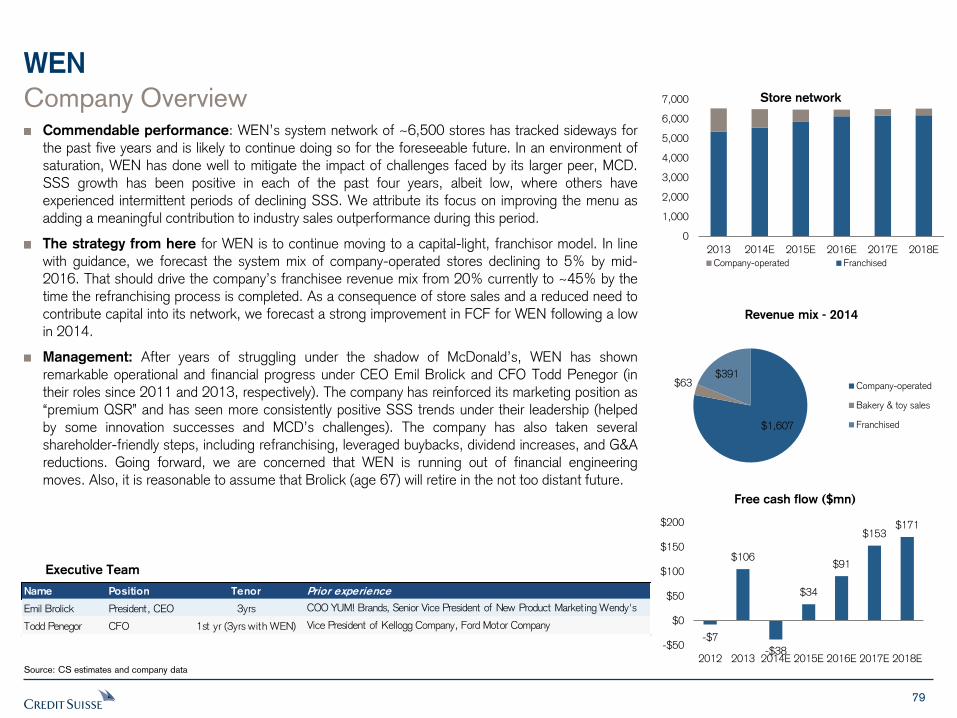
79
WEN
Company Overview Commendable performance: WEN’s system network of ~6,500 stores has tracked sideways for the past five years and is likely to continue doing so for the foreseeable future. In an environment of saturation, WEN has done well to mitigate the impact of challenges faced by its larger peer, MCD. SSS growth has been positive in each of the past four years, albeit low, where others have experienced intermittent periods of declining SSS. We attribute its focus on improving the menu as adding a meaningful contribution to industry sales outperformance during this period.
The strategy from here for WEN is to continue moving to a capital-light, franchisor model. In line with guidance, we forecast the system mix of company-operated stores declining to 5% by mid-2016. That should drive the company’s franchisee revenue mix from 20% currently to ~45% by the time the refranchising process is completed. As a consequence of store sales and a reduced need to contribute capital into its network, we forecast a strong improvement in FCF for WEN following a low in 2014.
Management: After years of struggling under the shadow of McDonald’s, WEN has shown remarkable operational and financial progress under CEO Emil Brolick and CFO Todd Penegor (in their roles since 2011 and 2013, respectively). The company has reinforced its marketing position as “premium QSR” and has seen more consistently positive SSS trends under their leadership (helped by some innovation successes and MCD’s challenges). The company has also taken several shareholder-friendly steps, including refranchising, leveraged buybacks, dividend increases, and G&A reductions. Going forward, we are concerned that WEN is running out of financial engineering moves. Also, it is reasonable to assume that Brolick (age 67) will retire in the not too distant future.
Source: CS estimates and company data
Executive Team
Name Position Tenor Prior experience
Emil Brolick President, CEO 3yrs COO YUM! Brands, Senior Vice President of New Product Marketing Wendy's
Todd Penegor CFO 1st yr (3yrs with WEN) Vice President of Kellogg Company, Ford Motor Company
0
1,000
2,000
3,000
4,000
5,000
6,000
7,000
2013 2014E 2015E 2016E 2017E 2018E
Store network
Company-operated Franchised
$1,607
$63 $391
Revenue mix - 2014
Company-operated
Bakery & toy sales
Franchised
-$7
$106
-$38
$34
$91
$153 $171
-$50
$0
$50
$100
$150
$200
2012 2013 2014E 2015E 2016E 2017E 2018E
Free cash flow ($mn)
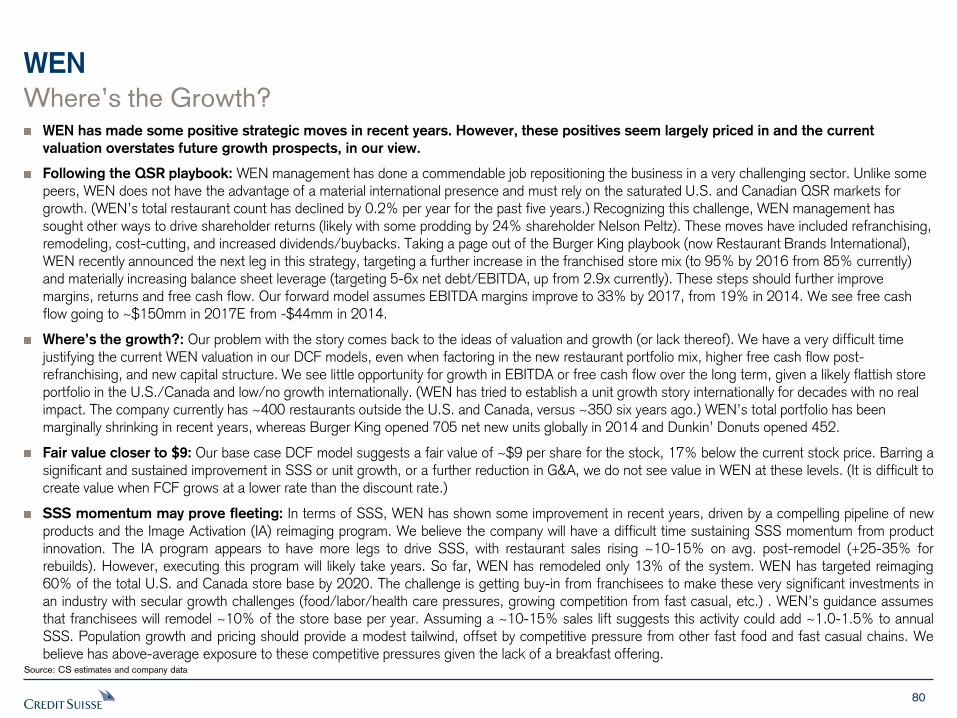
80
WEN
Where’s the Growth? WEN has made some positive strategic moves in recent years. However, these positives seem largely priced in and the current
valuation overstates future growth prospects, in our view.
Following the QSR playbook: WEN management has done a commendable job repositioning the business in a very challenging sector. Unlike some peers, WEN does not have the advantage of a material international presence and must rely on the saturated U.S. and Canadian QSR markets for growth. (WEN’s total restaurant count has declined by 0.2% per year for the past five years.) Recognizing this challenge, WEN management has sought other ways to drive shareholder returns (likely with some prodding by 24% shareholder Nelson Peltz). These moves have included refranchising, remodeling, cost-cutting, and increased dividends/buybacks. Taking a page out of the Burger King playbook (now Restaurant Brands International), WEN recently announced the next leg in this strategy, targeting a further increase in the franchised store mix (to 95% by 2016 from 85% currently) and materially increasing balance sheet leverage (targeting 5-6x net debt/EBITDA, up from 2.9x currently). These steps should further improve margins, returns and free cash flow. Our forward model assumes EBITDA margins improve to 33% by 2017, from 19% in 2014. We see free cash flow going to ~$150mm in 2017E from -$44mm in 2014.
Where’s the growth?: Our problem with the story comes back to the ideas of valuation and growth (or lack thereof). We have a very difficult time justifying the current WEN valuation in our DCF models, even when factoring in the new restaurant portfolio mix, higher free cash flow post-refranchising, and new capital structure. We see little opportunity for growth in EBITDA or free cash flow over the long term, given a likely flattish store portfolio in the U.S./Canada and low/no growth internationally. (WEN has tried to establish a unit growth story internationally for decades with no real impact. The company currently has ~400 restaurants outside the U.S. and Canada, versus ~350 six years ago.) WEN’s total portfolio has been marginally shrinking in recent years, whereas Burger King opened 705 net new units globally in 2014 and Dunkin’ Donuts opened 452.
Fair value closer to $9: Our base case DCF model suggests a fair value of ~$9 per share for the stock, 17% below the current stock price. Barring a significant and sustained improvement in SSS or unit growth, or a further reduction in G&A, we do not see value in WEN at these levels. (It is difficult to create value when FCF grows at a lower rate than the discount rate.)
SSS momentum may prove fleeting: In terms of SSS, WEN has shown some improvement in recent years, driven by a compelling pipeline of new products and the Image Activation (IA) reimaging program. We believe the company will have a difficult time sustaining SSS momentum from product innovation. The IA program appears to have more legs to drive SSS, with restaurant sales rising ~10-15% on avg. post-remodel (+25-35% for rebuilds). However, executing this program will likely take years. So far, WEN has remodeled only 13% of the system. WEN has targeted reimaging 60% of the total U.S. and Canada store base by 2020. The challenge is getting buy-in from franchisees to make these very significant investments in an industry with secular growth challenges (food/labor/health care pressures, growing competition from fast casual, etc.) . WEN’s guidance assumes that franchisees will remodel ~10% of the store base per year. Assuming a ~10-15% sales lift suggests this activity could add ~1.0-1.5% to annual SSS. Population growth and pricing should provide a modest tailwind, offset by competitive pressure from other fast food and fast casual chains. We believe has above-average exposure to these competitive pressures given the lack of a breakfast offering.
Source: CS estimates and company data
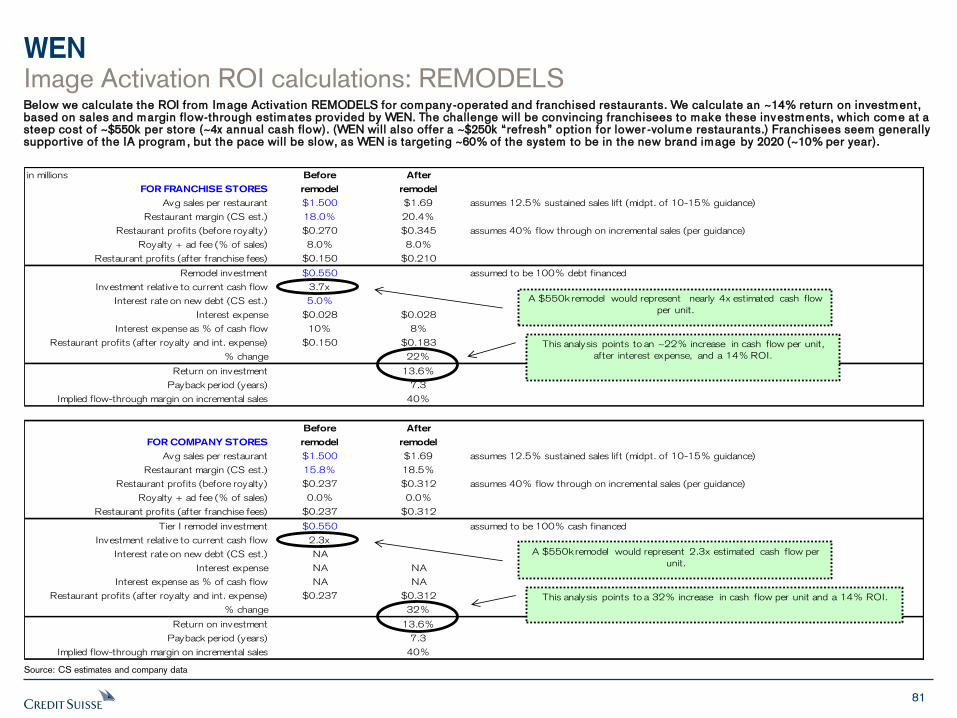
81
WEN
Source: CS estimates and company data
Below we calculate the ROI from Image Activation REMODELS for company-operated and franchised restaurants. We calculate an ~14% return on investment, based on sales and margin flow-through estimates provided by WEN. The challenge wil l be convincing franchisees to make these investments, which come at a steep cost of ~$550k per store (~4x annual cash flow). (WEN will also offer a ~$250k “refresh” option for lower -volume restaurants.) Franchisees seem generally supportive of the IA program, but the pace wil l be slow, as WEN is targeting ~60% of the system to be in the new brand image by 2020 (~10% per year).
in millions Before After
FOR FRANCHISE STORES remodel remodel
Avg sales per restaurant $1.500 $1.69 assumes 12.5% sustained sales lift (midpt. of 10-15% guidance)
Restaurant margin (CS est.) 18.0% 20.4%
Restaurant profits (before royalty) $0.270 $0.345 assumes 40% flow through on incremental sales (per guidance)
Royalty + ad fee (% of sales) 8.0% 8.0%
Restaurant profits (after franchise fees) $0.150 $0.210
Remodel investment $0.550 assumed to be 100% debt financed
Investment relative to current cash flow 3.7x
Interest rate on new debt (CS est.) 5.0%
Interest expense $0.028 $0.028
Interest expense as % of cash flow 10% 8%
Restaurant profits (after royalty and int. expense) $0.150 $0.183
% change 22%
Return on investment 13.6%
Payback period (years) 7.3
Implied flow-through margin on incremental sales 40%
Before After
FOR COMPANY STORES remodel remodel
Avg sales per restaurant $1.500 $1.69 assumes 12.5% sustained sales lift (midpt. of 10-15% guidance)
Restaurant margin (CS est.) 15.8% 18.5%
Restaurant profits (before royalty) $0.237 $0.312 assumes 40% flow through on incremental sales (per guidance)
Royalty + ad fee (% of sales) 0.0% 0.0%
Restaurant profits (after franchise fees) $0.237 $0.312
Tier I remodel investment $0.550 assumed to be 100% cash financed
Investment relative to current cash flow 2.3x
Interest rate on new debt (CS est.) NA
Interest expense NA NA
Interest expense as % of cash flow NA NA
Restaurant profits (after royalty and int. expense) $0.237 $0.312
% change 32%
Return on investment 13.6%
Payback period (years) 7.3
Implied flow-through margin on incremental sales 40%
A $550kremodel would represent nearly 4x estimated cash flow
per unit.
This analysis points to an ~22% increase in cash flow per unit,
after interest expense, and a 14% ROI.
A $550kremodel would represent 2.3x estimated cash flow per
unit.
This analysis points to a 32% increase in cash flow per unit and a 14% ROI.
Image Activation ROI calculations: REMODELS
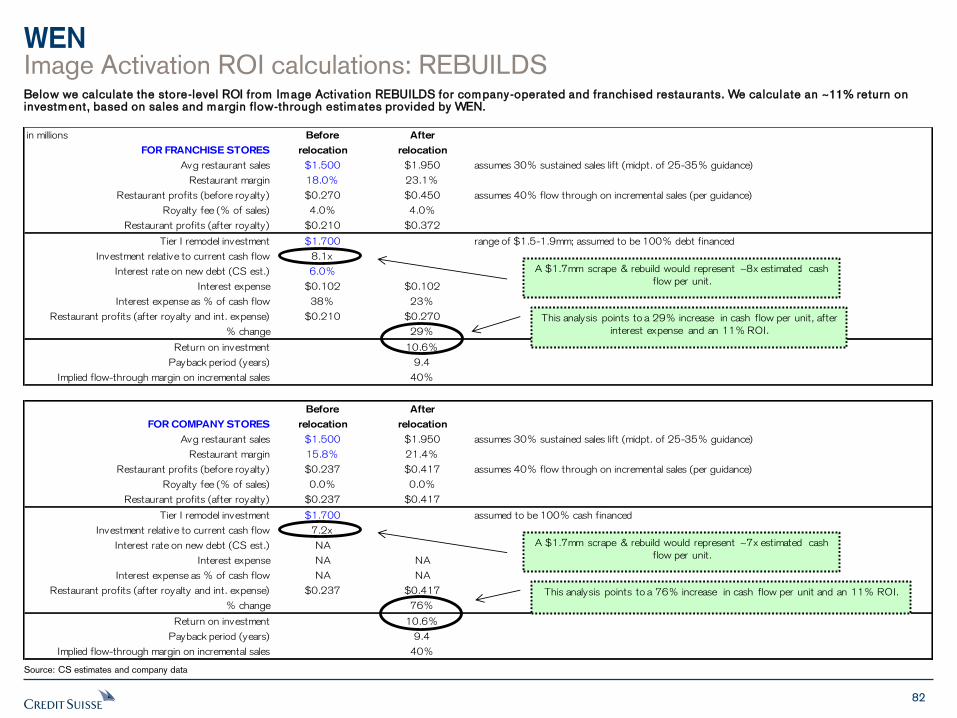
82
WEN
Source: CS estimates and company data
Below we calculate the store-level ROI from Image Activation REBUILDS for company-operated and franchised restaurants. We calculate an ~11% return on investment, based on sales and margin flow-through estimates provided by WEN.
in millions Before After
FOR FRANCHISE STORES relocation relocation
Avg restaurant sales $1.500 $1.950 assumes 30% sustained sales lift (midpt. of 25-35% guidance)
Restaurant margin 18.0% 23.1%
Restaurant profits (before royalty) $0.270 $0.450 assumes 40% flow through on incremental sales (per guidance)
Royalty fee (% of sales) 4.0% 4.0%
Restaurant profits (after royalty) $0.210 $0.372
Tier I remodel investment $1.700 range of $1.5-1.9mm; assumed to be 100% debt financed
Investment relative to current cash flow 8.1x
Interest rate on new debt (CS est.) 6.0%
Interest expense $0.102 $0.102
Interest expense as % of cash flow 38% 23%
Restaurant profits (after royalty and int. expense) $0.210 $0.270
% change 29%
Return on investment 10.6%
Payback period (years) 9.4
Implied flow-through margin on incremental sales 40%
Before After
FOR COMPANY STORES relocation relocation
Avg restaurant sales $1.500 $1.950 assumes 30% sustained sales lift (midpt. of 25-35% guidance)
Restaurant margin 15.8% 21.4%
Restaurant profits (before royalty) $0.237 $0.417 assumes 40% flow through on incremental sales (per guidance)
Royalty fee (% of sales) 0.0% 0.0%
Restaurant profits (after royalty) $0.237 $0.417
Tier I remodel investment $1.700 assumed to be 100% cash financed
Investment relative to current cash flow 7.2x
Interest rate on new debt (CS est.) NA
Interest expense NA NA
Interest expense as % of cash flow NA NA
Restaurant profits (after royalty and int. expense) $0.237 $0.417
% change 76%
Return on investment 10.6%
Payback period (years) 9.4
Implied flow-through margin on incremental sales 40%
A $1.7mm scrape & rebuild would represent ~8x estimated cash
flow per unit.
This analysis points to a 29% increase in cash flow per unit, after
interest expense and an 11% ROI.
A $1.7mm scrape & rebuild would represent ~7x estimated cash
flow per unit.
This analysis points to a 76% increase in cash flow per unit and an 11% ROI.
Image Activation ROI calculations: REBUILDS
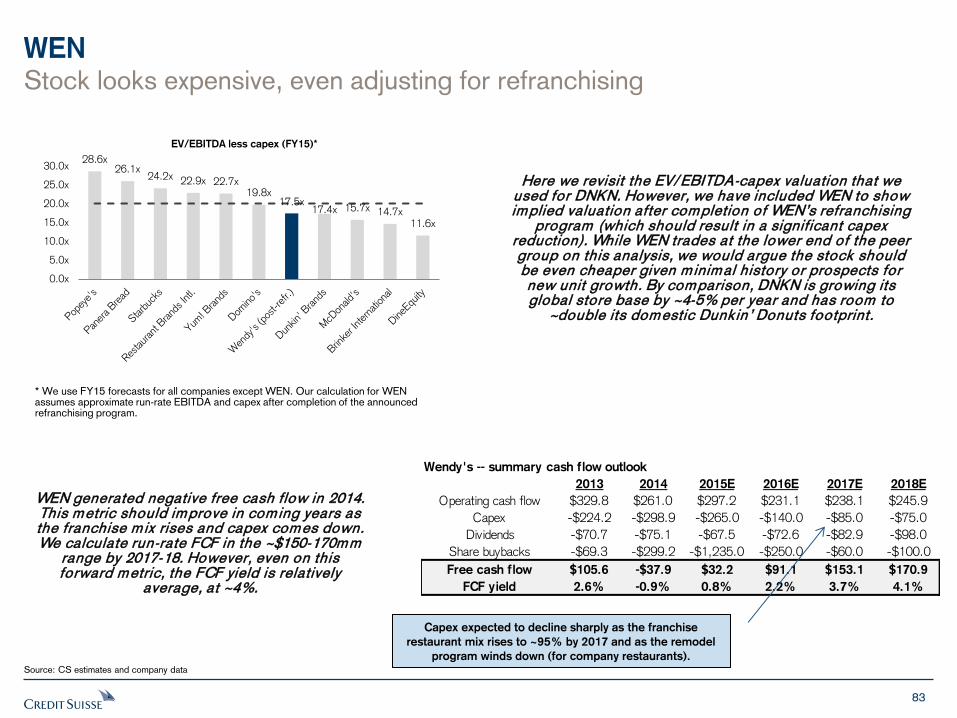
83
WEN
Source: CS estimates and company data
Here we revisit the EV/ EBITDA-capex valuation that we used for DNKN. However, we have included WEN to show implied valuation after completion of WEN’s refranchising
program (which should result in a significant capex reduction). While WEN trades at the lower end of the peer group on this analysis, we would argue the stock should be even cheaper given m inimal history or prospects for new unit growth. By comparison, DNKN is growing its global store base by ~4-5% per year and has room to
~double its domestic Dunkin’ Donuts footprint.
Wendy's -- summary cash flow outlook
2013 2014 2015E 2016E 2017E 2018E
Operating cash flow $329.8 $261.0 $297.2 $231.1 $238.1 $245.9
Capex -$224.2 -$298.9 -$265.0 -$140.0 -$85.0 -$75.0
Dividends -$70.7 -$75.1 -$67.5 -$72.6 -$82.9 -$98.0
Share buybacks -$69.3 -$299.2 -$1,235.0 -$250.0 -$60.0 -$100.0
Free cash flow $105.6 -$37.9 $32.2 $91.1 $153.1 $170.9
FCF yield 2.6% -0.9% 0.8% 2.2% 3.7% 4.1%
* We use FY15 forecasts for all companies except WEN. Our calculation for WEN assumes approximate run-rate EBITDA and capex after completion of the announced refranchising program.
28.6x 26.1x
24.2x 22.9x 22.7x 19.8x
17.5x 17.4x 15.7x 14.7x
11.6x
0.0x
5.0x
10.0x
15.0x
20.0x
25.0x
30.0x
EV/EBITDA less capex (FY15)*
WEN generated negative free cash flow in 2014. This metric should improve in coming years as the franchise m ix rises and capex comes down. We calculate run-rate FCF in the ~$150-170mm
range by 2017-18. However, even on this forward metric, the FCF yield is relatively
average, at ~4%.
Capex expected to decline sharply as the franchise
restaurant mix rises to ~95% by 2017 and as the remodel
program winds down (for company restaurants).
Stock looks expensive, even adjusting for refranchising
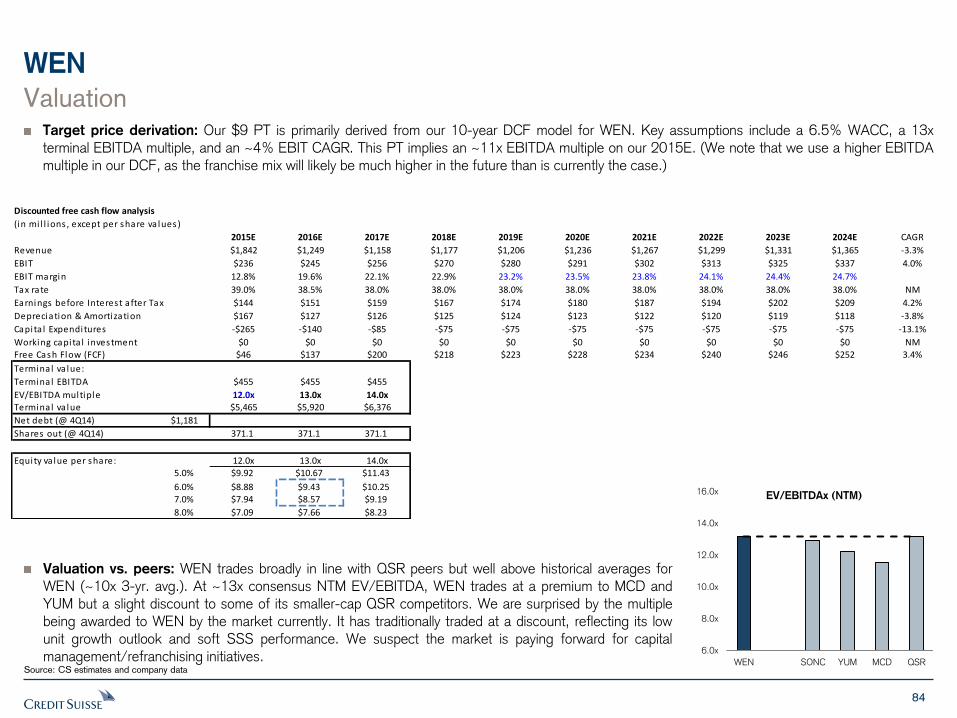
84
WEN
Source: CS estimates and company data
Valuation Target price derivation: Our $9 PT is primarily derived from our 10-year DCF model for WEN. Key assumptions include a 6.5% WACC, a 13x terminal EBITDA multiple, and an ~4% EBIT CAGR. This PT implies an ~11x EBITDA multiple on our 2015E. (We note that we use a higher EBITDA multiple in our DCF, as the franchise mix will likely be much higher in the future than is currently the case.)
Valuation vs. peers: WEN trades broadly in line with QSR peers but well above historical averages for WEN (~10x 3-yr. avg.). At ~13x consensus NTM EV/EBITDA, WEN trades at a premium to MCD and YUM but a slight discount to some of its smaller-cap QSR competitors. We are surprised by the multiple being awarded to WEN by the market currently. It has traditionally traded at a discount, reflecting its low unit growth outlook and soft SSS performance. We suspect the market is paying forward for capital management/refranchising initiatives.
Discounted free cash flow analysis
(in mi l l ions , except per share va lues)
2015E 2016E 2017E 2018E 2019E 2020E 2021E 2022E 2023E 2024E CAGR
Revenue $1,842 $1,249 $1,158 $1,177 $1,206 $1,236 $1,267 $1,299 $1,331 $1,365 -3.3%
EBIT $236 $245 $256 $270 $280 $291 $302 $313 $325 $337 4.0%
EBIT margin 12.8% 19.6% 22.1% 22.9% 23.2% 23.5% 23.8% 24.1% 24.4% 24.7%
Tax rate 39.0% 38.5% 38.0% 38.0% 38.0% 38.0% 38.0% 38.0% 38.0% 38.0% NM
Earnings before Interest after Tax $144 $151 $159 $167 $174 $180 $187 $194 $202 $209 4.2%
Depreciation & Amortization $167 $127 $126 $125 $124 $123 $122 $120 $119 $118 -3.8%
Capita l Expenditures -$265 -$140 -$85 -$75 -$75 -$75 -$75 -$75 -$75 -$75 -13.1%
Working capita l investment $0 $0 $0 $0 $0 $0 $0 $0 $0 $0 NM
Free Cash Flow (FCF) $46 $137 $200 $218 $223 $228 $234 $240 $246 $252 3.4%
Terminal va lue:
Terminal EBITDA $455 $455 $455
EV/EBITDA multiple 12.0x 13.0x 14.0x
Terminal va lue $5,465 $5,920 $6,376
Net debt (@ 4Q14) $1,181
Shares out (@ 4Q14) 371.1 371.1 371.1
Equity va lue per share: 12.0x 13.0x 14.0x
5.0% $9.92 $10.67 $11.43
6.0% $8.88 $9.43 $10.25
7.0% $7.94 $8.57 $9.19
8.0% $7.09 $7.66 $8.23
6.0x
8.0x
10.0x
12.0x
14.0x
16.0x
WEN SONC YUM MCD QSR
EV/EBITDAx (NTM)
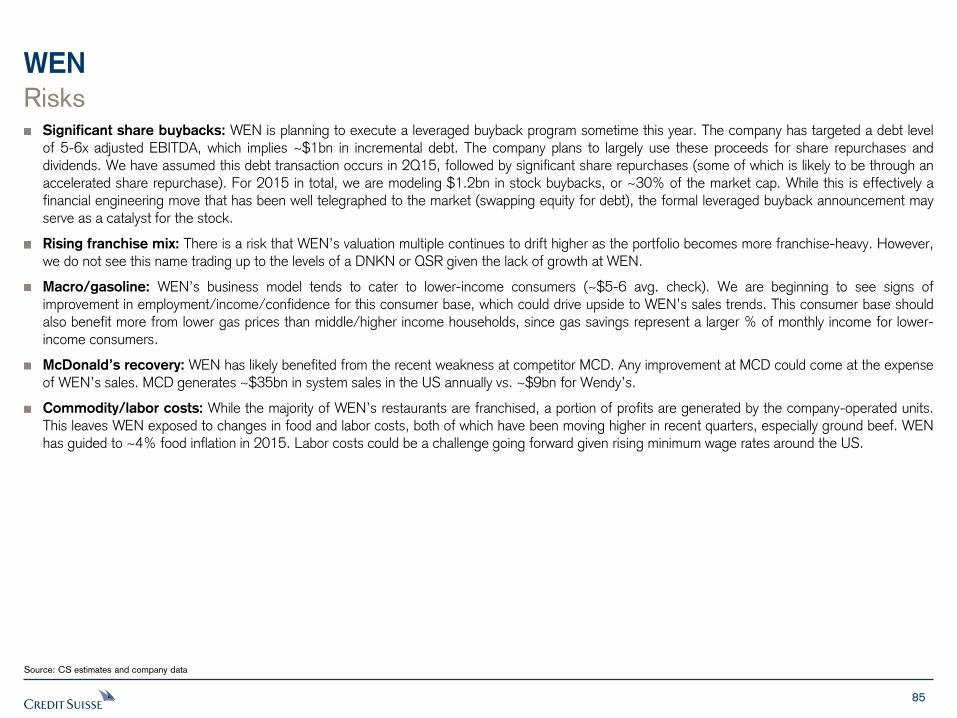
85
WEN
Source: CS estimates and company data
Risks Significant share buybacks: WEN is planning to execute a leveraged buyback program sometime this year. The company has targeted a debt level of 5-6x adjusted EBITDA, which implies ~$1bn in incremental debt. The company plans to largely use these proceeds for share repurchases and dividends. We have assumed this debt transaction occurs in 2Q15, followed by significant share repurchases (some of which is likely to be through an accelerated share repurchase). For 2015 in total, we are modeling $1.2bn in stock buybacks, or ~30% of the market cap. While this is effectively a financial engineering move that has been well telegraphed to the market (swapping equity for debt), the formal leveraged buyback announcement may serve as a catalyst for the stock.
Rising franchise mix: There is a risk that WEN’s valuation multiple continues to drift higher as the portfolio becomes more franchise-heavy. However, we do not see this name trading up to the levels of a DNKN or QSR given the lack of growth at WEN.
Macro/gasoline: WEN’s business model tends to cater to lower-income consumers (~$5-6 avg. check). We are beginning to see signs of improvement in employment/income/confidence for this consumer base, which could drive upside to WEN’s sales trends. This consumer base should also benefit more from lower gas prices than middle/higher income households, since gas savings represent a larger % of monthly income for lower-income consumers.
McDonald’s recovery: WEN has likely benefited from the recent weakness at competitor MCD. Any improvement at MCD could come at the expense of WEN’s sales. MCD generates ~$35bn in system sales in the US annually vs. ~$9bn for Wendy’s.
Commodity/labor costs: While the majority of WEN’s restaurants are franchised, a portion of profits are generated by the company-operated units. This leaves WEN exposed to changes in food and labor costs, both of which have been moving higher in recent quarters, especially ground beef. WEN has guided to ~4% food inflation in 2015. Labor costs could be a challenge going forward given rising minimum wage rates around the US.
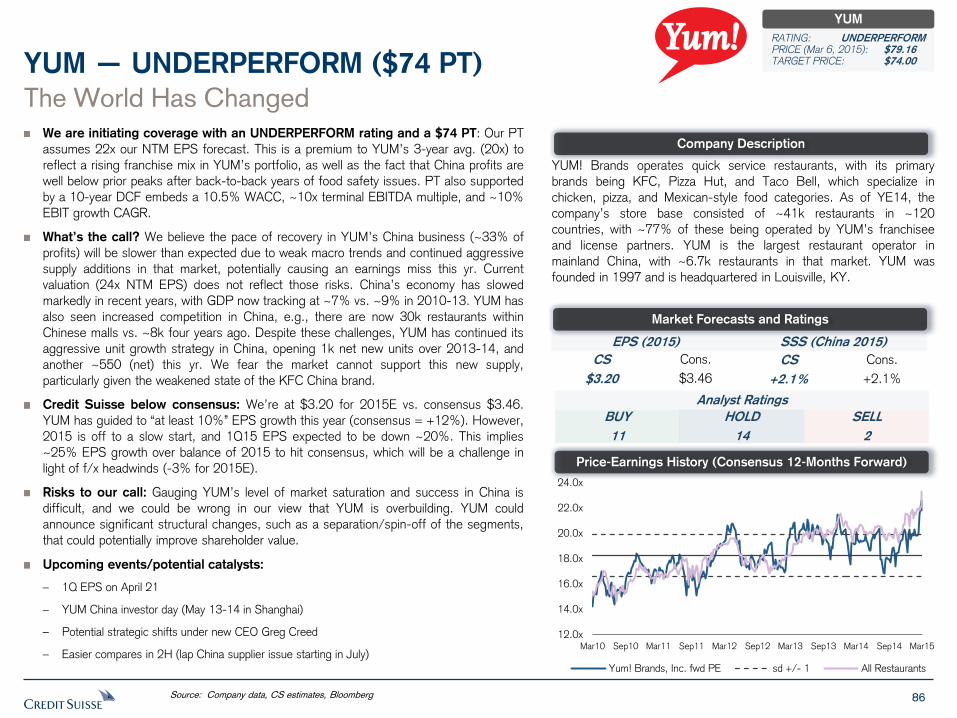
86
We are initiating coverage with an UNDERPERFORM rating and a $74 PT: Our PT
assumes 22x our NTM EPS forecast. This is a premium to YUM’s 3-year avg. (20x) to
reflect a rising franchise mix in YUM’s portfolio, as well as the fact that China profits are
well below prior peaks after back-to-back years of food safety issues. PT also supported
by a 10-year DCF embeds a 10.5% WACC, ~10x terminal EBITDA multiple, and ~10%
EBIT growth CAGR.
What’s the call? We believe the pace of recovery in YUM’s China business (~33% of
profits) will be slower than expected due to weak macro trends and continued aggressive
supply additions in that market, potentially causing an earnings miss this yr. Current
valuation (24x NTM EPS) does not reflect those risks. China’s economy has slowed
markedly in recent years, with GDP now tracking at ~7% vs. ~9% in 2010-13. YUM has
also seen increased competition in China, e.g., there are now 30k restaurants within
Chinese malls vs. ~8k four years ago. Despite these challenges, YUM has continued its
aggressive unit growth strategy in China, opening 1k net new units over 2013-14, and
another ~550 (net) this yr. We fear the market cannot support this new supply,
particularly given the weakened state of the KFC China brand.
Credit Suisse below consensus: We’re at $3.20 for 2015E vs. consensus $3.46.
YUM has guided to “at least 10%” EPS growth this year (consensus = +12%). However,
2015 is off to a slow start, and 1Q15 EPS expected to be down ~20%. This implies
~25% EPS growth over balance of 2015 to hit consensus, which will be a challenge in
light of f/x headwinds (-3% for 2015E).
Risks to our call: Gauging YUM’s level of market saturation and success in China is
difficult, and we could be wrong in our view that YUM is overbuilding. YUM could
announce significant structural changes, such as a separation/spin-off of the segments,
that could potentially improve shareholder value.
Upcoming events/potential catalysts:
– 1Q EPS on April 21
– YUM China investor day (May 13-14 in Shanghai)
– Potential strategic shifts under new CEO Greg Creed
– Easier compares in 2H (lap China supplier issue starting in July)
The World Has Changed
YUM — UNDERPERFORM ($74 PT)
YUM! Brands operates quick service restaurants, with its primary
brands being KFC, Pizza Hut, and Taco Bell, which specialize in
chicken, pizza, and Mexican-style food categories. As of YE14, the
company’s store base consisted of ~41k restaurants in ~120
countries, with ~77% of these being operated by YUM’s franchisee
and license partners. YUM is the largest restaurant operator in
mainland China, with ~6.7k restaurants in that market. YUM was
founded in 1997 and is headquartered in Louisville, KY.
Source: Company data, CS estimates, Bloomberg
Company Description
Price-Earnings History (Consensus 12-Months Forward)
EPS (2015) SSS (China 2015)
CS
$3.20
Cons.
$3.46
CS
+2.1%
Cons.
+2.1%
Analyst Ratings
BUY
11
SELL
2
HOLD
14
Market Forecasts and Ratings
YUM
RATING: UNDERPERFORM PRICE (Mar 6, 2015): $79.16 TARGET PRICE: $74.00
12.0x
14.0x
16.0x
18.0x
20.0x
22.0x
24.0x
Mar10 Sep10 Mar11 Sep11 Mar12 Sep12 Mar13 Sep13 Mar14 Sep14 Mar15
Yum! Brands, Inc. fwd PE sd +/- 1 All Restaurants
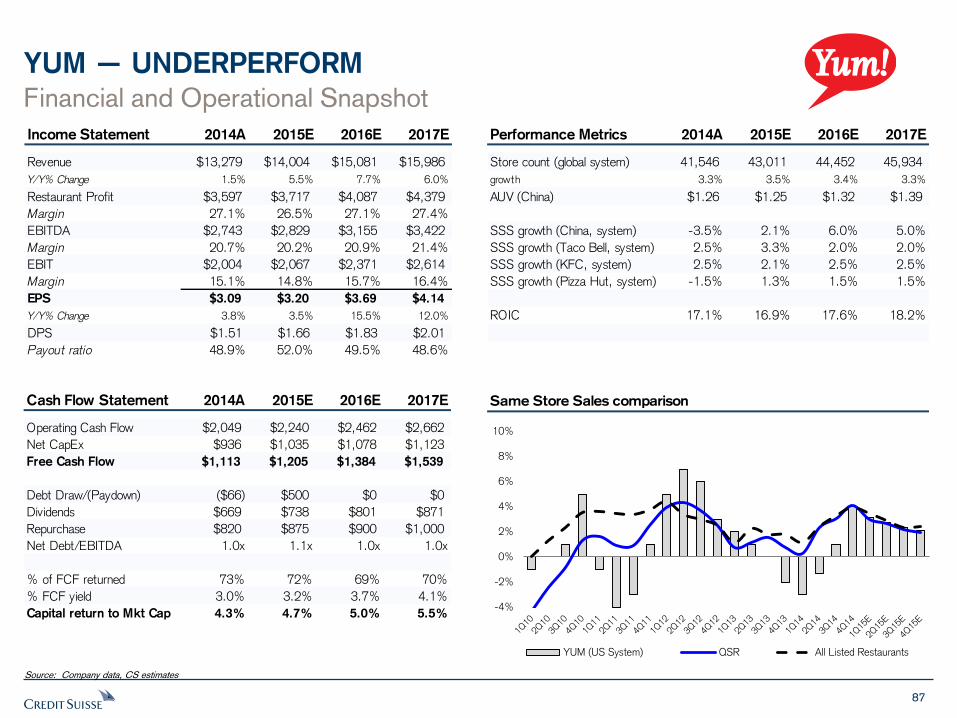
87
YUM — UNDERPERFORM
Financial and Operational Snapshot
Source: Company data, CS estimates
Same Store Sales comparison
Income Statement 2014A 2015E 2016E 2017E
Revenue $13,279 $14,004 $15,081 $15,986
Y/Y% Change 1.5% 5.5% 7.7% 6.0%
Restaurant Profit $3,597 $3,717 $4,087 $4,379
Margin 27.1% 26.5% 27.1% 27.4%
EBITDA $2,743 $2,829 $3,155 $3,422
Margin 20.7% 20.2% 20.9% 21.4%
EBIT $2,004 $2,067 $2,371 $2,614
Margin 15.1% 14.8% 15.7% 16.4%
EPS $3.09 $3.20 $3.69 $4.14
Y/Y% Change 3.8% 3.5% 15.5% 12.0%
DPS $1.51 $1.66 $1.83 $2.01
Payout ratio 48.9% 52.0% 49.5% 48.6%
Performance Metrics 2014A 2015E 2016E 2017E
Store count (global system) 41,546 43,011 44,452 45,934
growth 3.3% 3.5% 3.4% 3.3%
AUV (China) $1.26 $1.25 $1.32 $1.39
SSS growth (China, system) -3.5% 2.1% 6.0% 5.0%
SSS growth (Taco Bell, system) 2.5% 3.3% 2.0% 2.0%
SSS growth (KFC, system) 2.5% 2.1% 2.5% 2.5%
SSS growth (Pizza Hut, system) -1.5% 1.3% 1.5% 1.5%
ROIC 17.1% 16.9% 17.6% 18.2%
Cash Flow Statement 2014A 2015E 2016E 2017E
Operating Cash Flow $2,049 $2,240 $2,462 $2,662
Net CapEx $936 $1,035 $1,078 $1,123
Free Cash Flow $1,113 $1,205 $1,384 $1,539
Debt Draw/(Paydown) ($66) $500 $0 $0
Dividends $669 $738 $801 $871
Repurchase $820 $875 $900 $1,000
Net Debt/EBITDA 1.0x 1.1x 1.0x 1.0x
% of FCF returned 73% 72% 69% 70%
% FCF yield 3.0% 3.2% 3.7% 4.1%
Capital return to Mkt Cap 4.3% 4.7% 5.0% 5.5%-4%
-2%
0%
2%
4%
6%
8%
10%
YUM (US System) QSR All Listed Restaurants
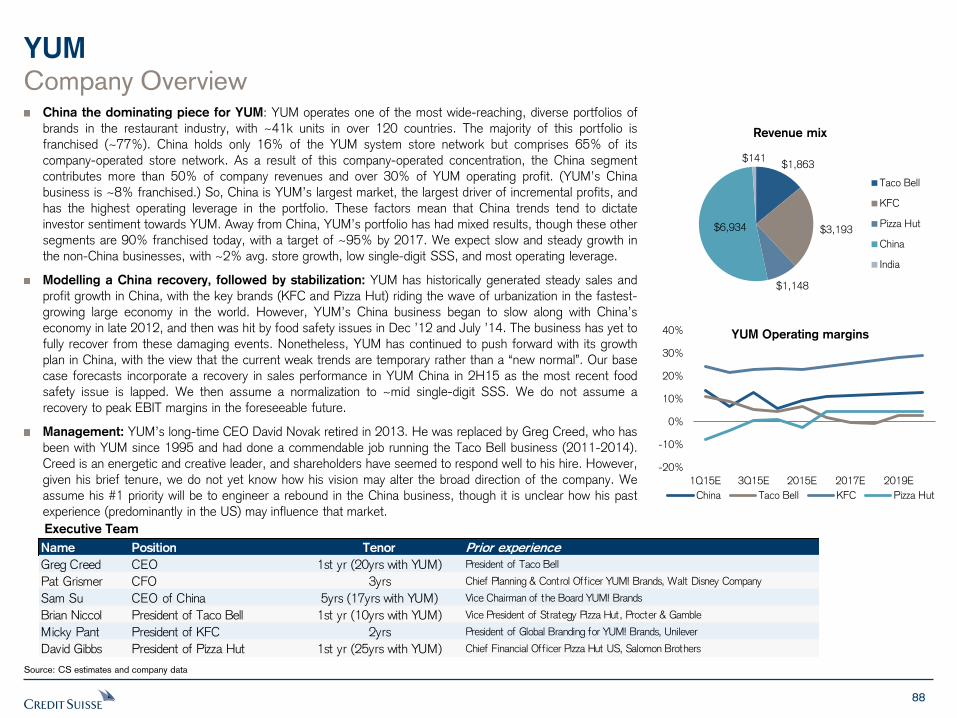
88
YUM Company Overview
China the dominating piece for YUM: YUM operates one of the most wide-reaching, diverse portfolios of
brands in the restaurant industry, with ~41k units in over 120 countries. The majority of this portfolio is
franchised (~77%). China holds only 16% of the YUM system store network but comprises 65% of its
company-operated store network. As a result of this company-operated concentration, the China segment
contributes more than 50% of company revenues and over 30% of YUM operating profit. (YUM’s China
business is ~8% franchised.) So, China is YUM’s largest market, the largest driver of incremental profits, and
has the highest operating leverage in the portfolio. These factors mean that China trends tend to dictate
investor sentiment towards YUM. Away from China, YUM’s portfolio has had mixed results, though these other
segments are 90% franchised today, with a target of ~95% by 2017. We expect slow and steady growth in
the non-China businesses, with ~2% avg. store growth, low single-digit SSS, and most operating leverage.
Modelling a China recovery, followed by stabilization: YUM has historically generated steady sales and
profit growth in China, with the key brands (KFC and Pizza Hut) riding the wave of urbanization in the fastest-
growing large economy in the world. However, YUM’s China business began to slow along with China’s
economy in late 2012, and then was hit by food safety issues in Dec ’12 and July ’14. The business has yet to
fully recover from these damaging events. Nonetheless, YUM has continued to push forward with its growth
plan in China, with the view that the current weak trends are temporary rather than a “new normal”. Our base
case forecasts incorporate a recovery in sales performance in YUM China in 2H15 as the most recent food
safety issue is lapped. We then assume a normalization to ~mid single-digit SSS. We do not assume a
recovery to peak EBIT margins in the foreseeable future.
Management: YUM’s long-time CEO David Novak retired in 2013. He was replaced by Greg Creed, who has
been with YUM since 1995 and had done a commendable job running the Taco Bell business (2011-2014).
Creed is an energetic and creative leader, and shareholders have seemed to respond well to his hire. However,
given his brief tenure, we do not yet know how his vision may alter the broad direction of the company. We
assume his #1 priority will be to engineer a rebound in the China business, though it is unclear how his past
experience (predominantly in the US) may influence that market.
Source: CS estimates and company data
Executive Team
Name Position Tenor Prior experience
Greg Creed CEO 1st yr (20yrs with YUM) President of Taco Bell
Pat Grismer CFO 3yrs Chief Planning & Control Officer YUM! Brands, Walt Disney Company
Sam Su CEO of China 5yrs (17yrs with YUM) Vice Chairman of the Board YUM! Brands
Brian Niccol President of Taco Bell 1st yr (10yrs with YUM) Vice President of Strategy Pizza Hut, Procter & Gamble
Micky Pant President of KFC 2yrs President of Global Branding for YUM! Brands, Unilever
David Gibbs President of Pizza Hut 1st yr (25yrs with YUM) Chief Financial Officer Pizza Hut US, Salomon Brothers
$1,863
$3,193
$1,148
$6,934
$141
Revenue mix
Taco Bell
KFC
Pizza Hut
China
India
-20%
-10%
0%
10%
20%
30%
40%
1Q15E 3Q15E 2015E 2017E 2019E
YUM Operating margins
China Taco Bell KFC Pizza Hut
89
YUM
Source: CS estimates and company data
The World Has Changed The world has changed: YUM has historically been one of the most consistent performers in the restaurant industry, with steady low double-digit EPS growth year after year. This streak was broken in 2013 (EPS down 8%) due to the chicken supplier issue in China. (China represents ~50% of YUM’s revenue and ~33% of profits.) The China business was hit again in 2014 due to another supplier issue (in July), leading to another year of disappointing earnings last year (2014 EPS $3.09, +4% y/y, vs. original guidance +20%). Exacerbating these food safety issues is the fact that China’s economy has slowed markedly in recent years, with GDP now tracking in the ~7% range vs. ~9% in 2010-13. Chinese retail sales growth is now in the +11-12% range vs. +15% in 2012. YUM has also seen increased competition in China, as local and regional operators have moved aggressively into the restaurant space, particularly in larger cities. For example, there are now 30k restaurants within Chinese malls vs. ~7,900 four years ago. China has also been an important growth market for MCD, with the company adding ~1k net new units in China since 2009 (to 2,100 at YE14). Further, YUM’s China business has yet to recover from the 2014 supplier issue, with 4Q14 China SSS down 16% and 1Q15 down “mid-teens” to-date (as of the Feb. 4 conf. call). While YUM’s other non-China businesses have performed reasonably well (esp. KFC and Taco Bell), this has not been enough to offset the China woes.
Eventual mea culpa on China growth?: Despite these challenges, YUM has continued to plow ahead with aggressive unit growth in China, opening ~1,000 net new units over 2013-14. The company plans to open another 700 (gross; ~550 net) new units in the market this year. We fear the market cannot support this new supply, particularly given the weakened state of the KFC brand and the Chinese economy. YUM China cash-on-cash returns on new units have fallen into the low 30% range more recently, down from 50-60% two years ago. These returns could continue to fall. We believe the company will ultimately have to reduce growth targets for China, leading to further investor disappointment and likely multiple compression.
Credit Suisse below consensus: We’re modeling 2015 EPS at $3.20, which is ~$0.26 below consensus. Our model assumes 4% EPS growth this year, below guidance of “at least 10%”. Consensus forecasts call for 12% growth. Like consensus, our model assumes a sharp recovery in the China business in 2H15 (2H SSS +11%). However, we are not as aggressive in our margin recovery assumptions, resulting in an ~$100mm China EBIT difference for the year vs. consensus. (Credit Suisse 2015E China EBIT = $712mm vs. consensus $814mm, per Consensus Metrix). Our model implies 14.2% China restaurant margins for 2015 (down 60bps y/y) vs. the consensus of 15.2%. We note that margins will likely be down sharply in 1Q due to a slow start to the year. This further accentuates the 2H recovery needed to reach consensus/guidance. Our model also reflects an ~$0.09 per share currency headwind for the year.
90
YUM
Source: CS estimates and company data
The World Has Changed Full valuation considering recent trends and lingering risks:
– YUM currently trades at a NTM P/E multiple of 24x on our forecasts (or ~22x on consensus forecasts). This compares to the 3-year average of 20x and the long-term average of 18.5x. Unlike MCD, YUM’s dividend yield of 2.1% does not provide material downside support to the stock. Given the challenges in China, we are surprised the market is giving the company this premium.
– YUM also has the highest non-U.S. business exposure in the group (~70-75% of profits from outside the U.S.). As investors position for higher relative US economic growth, YUM’s relative multiple may suffer.
– We are also surprised the market isn’t more concerned about a potential recurrence of China supply chain/food safety issues. We point to MCD’s recent experience in Japan, where a weak market became dramatically worse on the back of a string of food safety concerns. MCD’s Japan comps fell 40% in January 2015, after falling 11% in 2014 and 6% in 2013. YUM cannot afford any more such missteps in China.
– We also note that YUM China’s business had been struggling before the supplier issues first emerged in late 2012. The root cause of these core SSS problems (oversupply? competition?) have never been fully addressed. Adding another 700 stores into that market this year may only make those problems worse.
– Overall, YUM’s business in China seems to be building toward a more significant reset in growth expectations. We’d prefer to get involved after that event rather than before.
– Away from China, YUM’s portfolio is ~90% franchised and much more stable. However, this portfolio has exhibited mixed results over the years, especially in the U.S. YUM is also in the process of increasing the franchise mix to the mid-90% range for these brands. While this should help overall margins and returns, it could pressure absolute earnings growth in the near term.
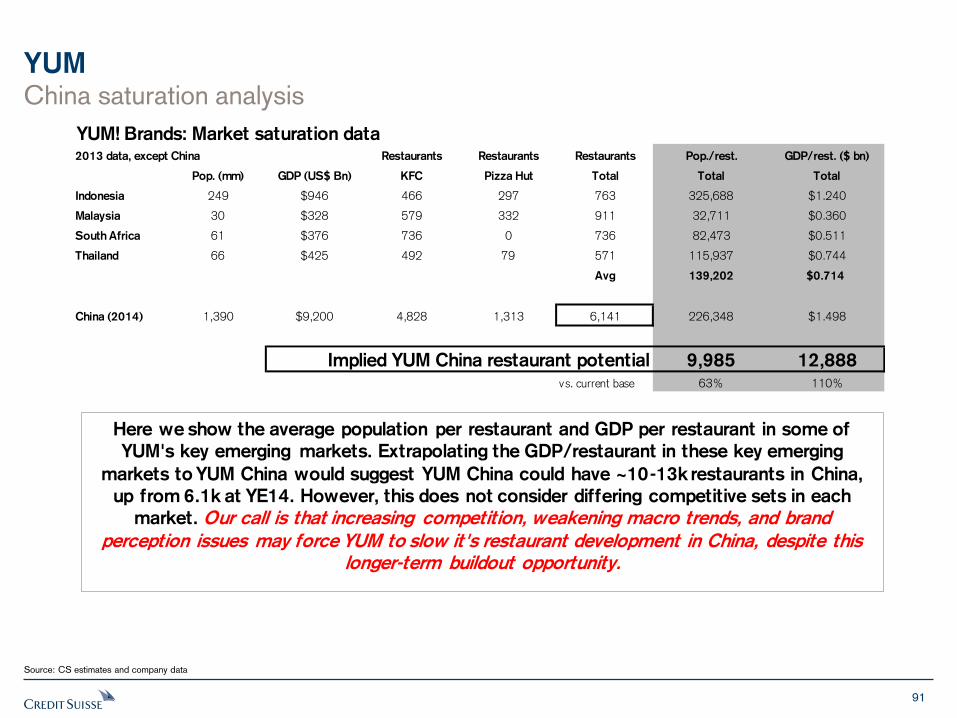
91
YUM
Source: CS estimates and company data
YUM! Brands: Market saturation data2013 data, except China Restaurants Restaurants Restaurants Pop./rest. GDP/rest. ($ bn)
Pop. (mm) GDP (US$ Bn) KFC Pizza Hut Total Total Total
Indonesia 249 $946 466 297 763 325,688 $1.240
Malaysia 30 $328 579 332 911 32,711 $0.360
South Africa 61 $376 736 0 736 82,473 $0.511
Thailand 66 $425 492 79 571 115,937 $0.744
Avg 139,202 $0.714
China (2014) 1,390 $9,200 4,828 1,313 6,141 226,348 $1.498
Implied YUM China restaurant potential 9,985 12,888
vs. current base 63% 110%
Here we show the average population per restaurant and GDP per restaurant in some of
YUM's key emerging markets. Extrapolating the GDP/restaurant in these key emerging
markets to YUM China would suggest YUM China could have ~10-13k restaurants in China,
up from 6.1k at YE14. However, this does not consider differing competitive sets in each
market. Our call is that increasing competition, weakening macro trends, and brand
perception issues may force YUM to slow it's restaurant development in China, despite this
longer-term buildout opportunity.
China saturation analysis
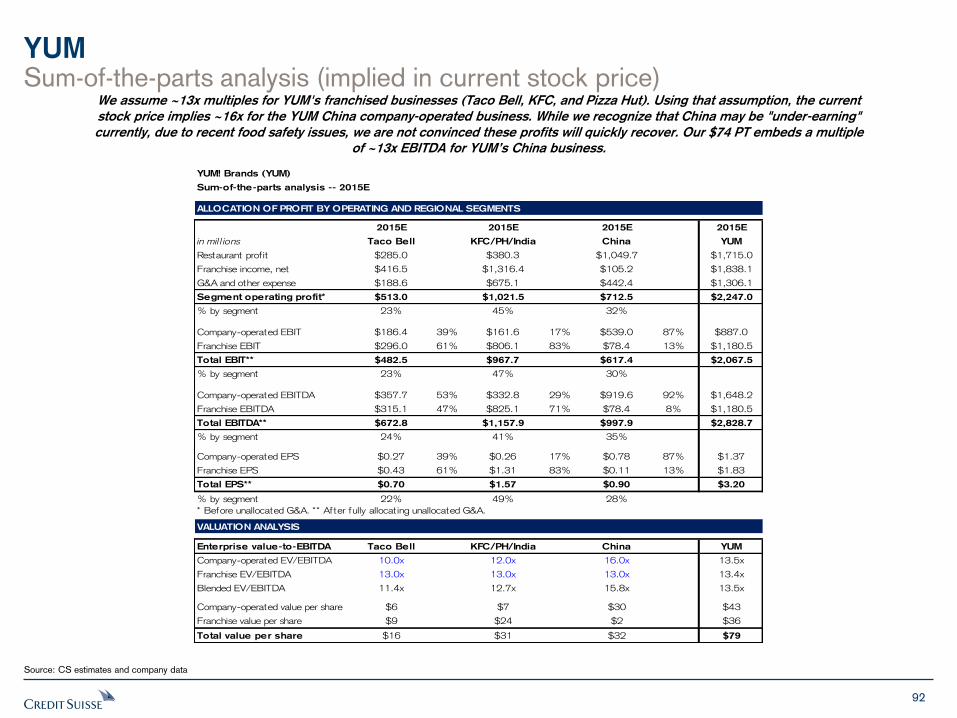
92
YUM
Source: CS estimates and company data
Sum-of-the-parts analysis (implied in current stock price) We assume ~13x multiples for YUM's franchised businesses (Taco Bell, KFC, and Pizza Hut). Using that assumption, the current
stock price implies ~16x for the YUM China company-operated business. While we recognize that China may be "under-earning"
currently, due to recent food safety issues, we are not convinced these profits will quickly recover. Our $74 PT embeds a multiple
of ~13x EBITDA for YUM’s China business.
YUM! Brands (YUM)
Sum-of-the-parts analysis -- 2015E
ALLOCATION OF PROFIT BY OPERATING AND REGIONAL SEGMENTS
2015E 2015E 2015E 2015E
in mil l ions Taco Bell KFC/PH/India China YUM
Restaurant profit $285.0 $380.3 $1,049.7 $1,715.0
Franchise income, net $416.5 $1,316.4 $105.2 $1,838.1
G&A and other expense $188.6 $675.1 $442.4 $1,306.1
Segment operating profit* $513.0 $1,021.5 $712.5 $2,247.0
% by segment 23% 45% 32%
Company-operated EBIT $186.4 39% $161.6 17% $539.0 87% $887.0
Franchise EBIT $296.0 61% $806.1 83% $78.4 13% $1,180.5
Total EBIT** $482.5 $967.7 $617.4 $2,067.5
% by segment 23% 47% 30%
Company-operated EBITDA $357.7 53% $332.8 29% $919.6 92% $1,648.2
Franchise EBITDA $315.1 47% $825.1 71% $78.4 8% $1,180.5
Total EBITDA** $672.8 $1,157.9 $997.9 $2,828.7
% by segment 24% 41% 35%
Company-operated EPS $0.27 39% $0.26 17% $0.78 87% $1.37
Franchise EPS $0.43 61% $1.31 83% $0.11 13% $1.83
Total EPS** $0.70 $1.57 $0.90 $3.20
% by segment 22% 49% 28%
* Before unallocated G&A. ** After fully allocat ing unallocated G&A.
VALUATION ANALYSIS
Enterprise value-to-EBITDA Taco Bell KFC/PH/India China YUM
Company-operated EV/EBITDA 10.0x 12.0x 16.0x 13.5x
Franchise EV/EBITDA 13.0x 13.0x 13.0x 13.4x
Blended EV/EBITDA 11.4x 12.7x 15.8x 13.5x
Company-operated value per share $6 $7 $30 $43
Franchise value per share $9 $24 $2 $36
Total value per share $16 $31 $32 $79
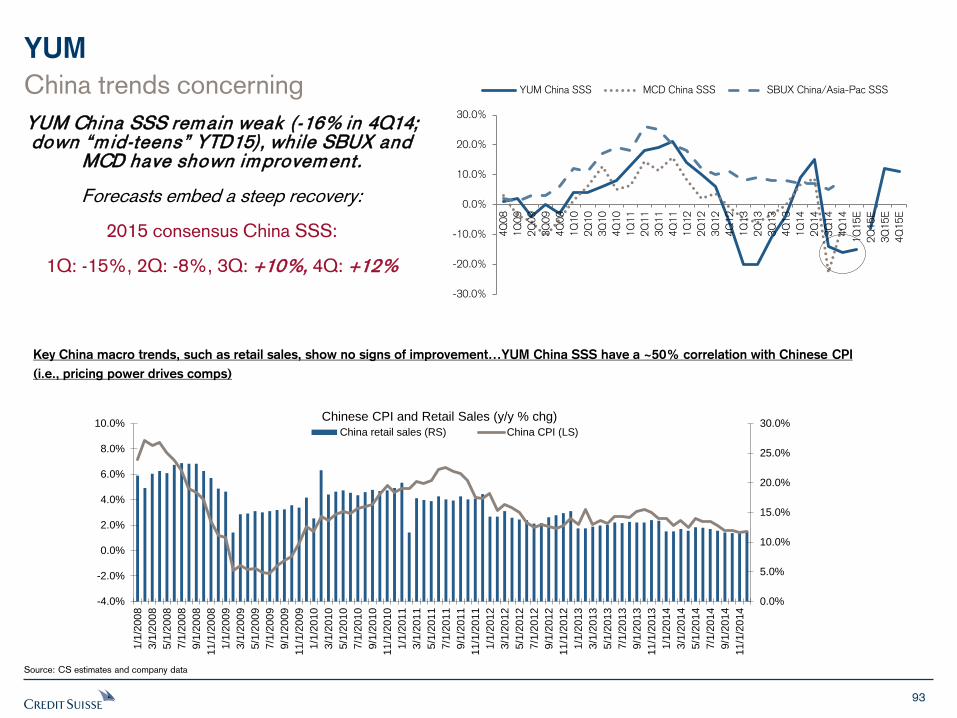
93
YUM
Source: CS estimates and company data
YUM China SSS remain weak (-16% in 4Q14; down “m id-teens” YTD15), while SBUX and
MCD have shown improvement.
Forecasts embed a steep recovery:
2015 consensus China SSS:
1Q: -15%, 2Q: -8%, 3Q: +10%, 4Q: +12%
Key China macro trends, such as retail sales, show no signs of improvement…YUM China SSS have a ~50% correlation with Chinese CPI
(i.e., pricing power drives comps)
-30.0%
-20.0%
-10.0%
0.0%
10.0%
20.0%
30.0%
4Q
08
1Q
09
2Q
09
3Q
09
4Q
09
1Q
10
2Q
10
3Q
10
4Q
10
1Q
11
2Q
11
3Q
11
4Q
11
1Q
12
2Q
12
3Q
12
4Q
12
1Q
13
2Q
13
3Q
13
4Q
13
1Q
14
2Q
14
3Q
14
4Q
14
1Q
15E
2Q
15E
3Q
15E
4Q
15E
YUM China SSS MCD China SSS SBUX China/Asia-Pac SSSChina trends concerning
0.0%
5.0%
10.0%
15.0%
20.0%
25.0%
30.0%
-4.0%
-2.0%
0.0%
2.0%
4.0%
6.0%
8.0%
10.0%
1/1
/200
8
3/1
/200
8
5/1
/200
8
7/1
/200
8
9/1
/200
8
11/1
/20
08
1/1
/200
9
3/1
/200
9
5/1
/200
9
7/1
/200
9
9/1
/200
9
11/1
/20
09
1/1
/201
0
3/1
/201
0
5/1
/201
0
7/1
/201
0
9/1
/201
0
11/1
/20
10
1/1
/201
1
3/1
/201
1
5/1
/201
1
7/1
/201
1
9/1
/201
1
11/1
/20
11
1/1
/201
2
3/1
/201
2
5/1
/201
2
7/1
/201
2
9/1
/201
2
11/1
/20
12
1/1
/201
3
3/1
/201
3
5/1
/201
3
7/1
/201
3
9/1
/201
3
11/1
/20
13
1/1
/201
4
3/1
/201
4
5/1
/201
4
7/1
/201
4
9/1
/201
4
11/1
/20
14
Chinese CPI and Retail Sales (y/y % chg)
China retail sales (RS) China CPI (LS)
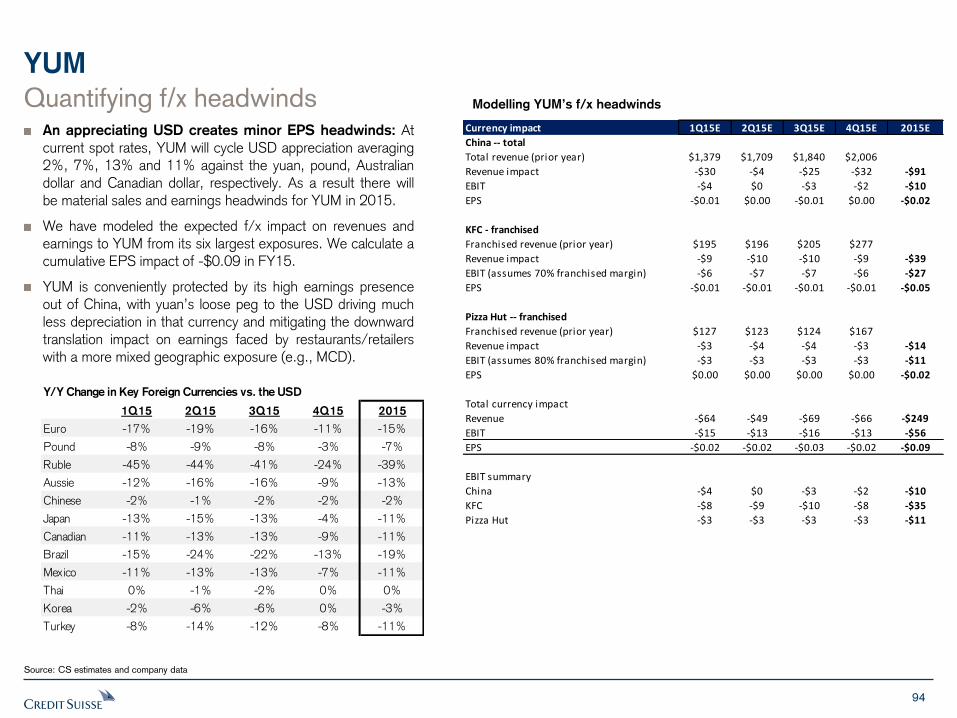
94
YUM
Quantifying f/x headwinds An appreciating USD creates minor EPS headwinds: At current spot rates, YUM will cycle USD appreciation averaging 2%, 7%, 13% and 11% against the yuan, pound, Australian dollar and Canadian dollar, respectively. As a result there will be material sales and earnings headwinds for YUM in 2015.
We have modeled the expected f/x impact on revenues and earnings to YUM from its six largest exposures. We calculate a cumulative EPS impact of -$0.09 in FY15.
YUM is conveniently protected by its high earnings presence out of China, with yuan’s loose peg to the USD driving much less depreciation in that currency and mitigating the downward translation impact on earnings faced by restaurants/retailers with a more mixed geographic exposure (e.g., MCD).
Source: CS estimates and company data
Modelling YUM’s f/x headwinds
Currency impact 1Q15E 2Q15E 3Q15E 4Q15E 2015E
China -- total
Total revenue (prior year) $1,379 $1,709 $1,840 $2,006
Revenue impact -$30 -$4 -$25 -$32 -$91
EBIT -$4 $0 -$3 -$2 -$10
EPS -$0.01 $0.00 -$0.01 $0.00 -$0.02
KFC - franchised
Franchised revenue (prior year) $195 $196 $205 $277
Revenue impact -$9 -$10 -$10 -$9 -$39
EBIT (assumes 70% franchised margin) -$6 -$7 -$7 -$6 -$27
EPS -$0.01 -$0.01 -$0.01 -$0.01 -$0.05
Pizza Hut -- franchised
Franchised revenue (prior year) $127 $123 $124 $167
Revenue impact -$3 -$4 -$4 -$3 -$14
EBIT (assumes 80% franchised margin) -$3 -$3 -$3 -$3 -$11
EPS $0.00 $0.00 $0.00 $0.00 -$0.02
Total currency impact
Revenue -$64 -$49 -$69 -$66 -$249
EBIT -$15 -$13 -$16 -$13 -$56
EPS -$0.02 -$0.02 -$0.03 -$0.02 -$0.09
EBIT summary
China -$4 $0 -$3 -$2 -$10
KFC -$8 -$9 -$10 -$8 -$35
Pizza Hut -$3 -$3 -$3 -$3 -$11
Y/Y Change in Key Foreign Currencies vs. the USD
1Q15 2Q15 3Q15 4Q15 2015
Euro -17% -19% -16% -11% -15%
Pound -8% -9% -8% -3% -7%
Ruble -45% -44% -41% -24% -39%
Aussie -12% -16% -16% -9% -13%
Chinese -2% -1% -2% -2% -2%
Japan -13% -15% -13% -4% -11%
Canadian -11% -13% -13% -9% -11%
Brazil -15% -24% -22% -13% -19%
Mexico -11% -13% -13% -7% -11%
Thai 0% -1% -2% 0% 0%
Korea -2% -6% -6% 0% -3%
Turkey -8% -14% -12% -8% -11%
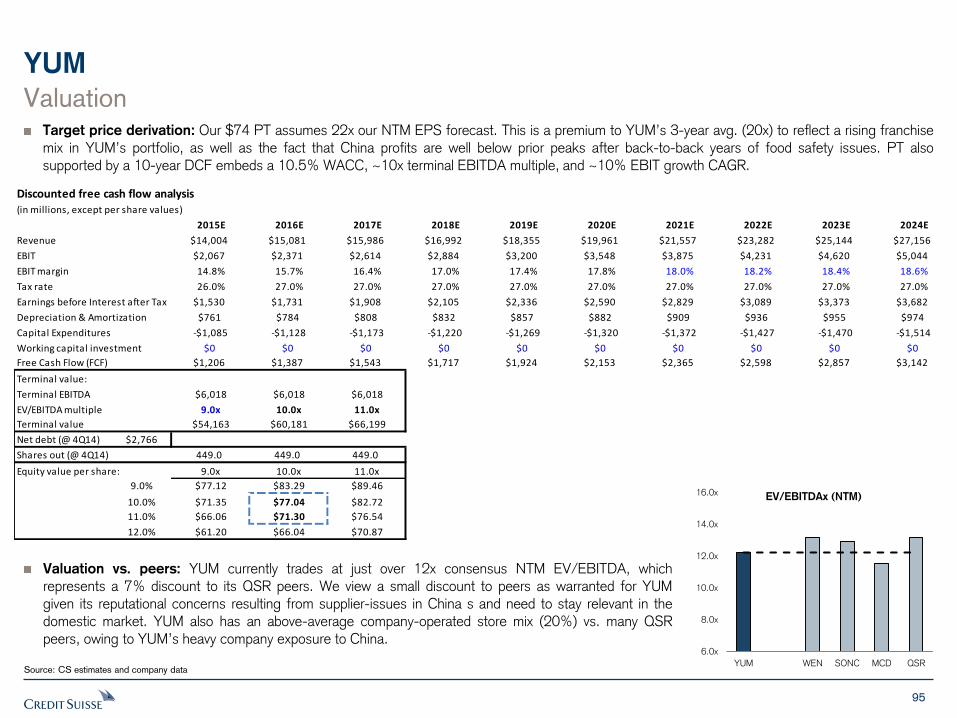
95
Discounted free cash flow analysis(in millions, except per share values)
2015E 2016E 2017E 2018E 2019E 2020E 2021E 2022E 2023E 2024E
Revenue $14,004 $15,081 $15,986 $16,992 $18,355 $19,961 $21,557 $23,282 $25,144 $27,156
EBIT $2,067 $2,371 $2,614 $2,884 $3,200 $3,548 $3,875 $4,231 $4,620 $5,044
EBIT margin 14.8% 15.7% 16.4% 17.0% 17.4% 17.8% 18.0% 18.2% 18.4% 18.6%
Tax rate 26.0% 27.0% 27.0% 27.0% 27.0% 27.0% 27.0% 27.0% 27.0% 27.0%
Earnings before Interest after Tax $1,530 $1,731 $1,908 $2,105 $2,336 $2,590 $2,829 $3,089 $3,373 $3,682
Depreciation & Amortization $761 $784 $808 $832 $857 $882 $909 $936 $955 $974
Capital Expenditures -$1,085 -$1,128 -$1,173 -$1,220 -$1,269 -$1,320 -$1,372 -$1,427 -$1,470 -$1,514
Working capital investment $0 $0 $0 $0 $0 $0 $0 $0 $0 $0
Free Cash Flow (FCF) $1,206 $1,387 $1,543 $1,717 $1,924 $2,153 $2,365 $2,598 $2,857 $3,142
Terminal value:
Terminal EBITDA $6,018 $6,018 $6,018
EV/EBITDA multiple 9.0x 10.0x 11.0x
Terminal value $54,163 $60,181 $66,199
Net debt (@ 4Q14) $2,766
Shares out (@ 4Q14) 449.0 449.0 449.0
Equity value per share: 9.0x 10.0x 11.0x
9.0% $77.12 $83.29 $89.46
10.0% $71.35 $77.04 $82.72
11.0% $66.06 $71.30 $76.54
12.0% $61.20 $66.04 $70.87
YUM
Source: CS estimates and company data
Valuation Target price derivation: Our $74 PT assumes 22x our NTM EPS forecast. This is a premium to YUM’s 3-year avg. (20x) to reflect a rising franchise mix in YUM’s portfolio, as well as the fact that China profits are well below prior peaks after back-to-back years of food safety issues. PT also supported by a 10-year DCF embeds a 10.5% WACC, ~10x terminal EBITDA multiple, and ~10% EBIT growth CAGR.
Valuation vs. peers: YUM currently trades at just over 12x consensus NTM EV/EBITDA, which represents a 7% discount to its QSR peers. We view a small discount to peers as warranted for YUM given its reputational concerns resulting from supplier-issues in China s and need to stay relevant in the domestic market. YUM also has an above-average company-operated store mix (20%) vs. many QSR peers, owing to YUM’s heavy company exposure to China.
6.0x
8.0x
10.0x
12.0x
14.0x
16.0x
YUM WEN SONC MCD QSR
EV/EBITDAx (NTM)
96
YUM
Source: CS estimates and company data
Risks China saturation: Our call is that YUM is growing too quickly in China and will ultimately slow this pace of growth. However, gauging YUM’s level of market saturation and long-term success in China is challenging, and we could be wrong in our view that YUM is overbuilding. YUM’s China business has been generally resilient in the past. If this business shows a full recovery this time around, our forecasts could prove to be too low. On the other hand, if competition and/or cannibalization are more severe than we have estimated, our forecasts could move lower.
Potential strategic/structural changes under new CEO: One risk of being negative on YUM is that management (led by new CEO Greg Creed) could announce significant structural changes in the business, such as a separation/spin-off of the segments or a leveraged stock buyback. Both outcomes seem unlikely in the near-to-intermediate term, given management’s recent commentary, but cannot be ruled out.
Global macros: YUM has material business exposures in many countries around the world, most notably China, the US, Japan, Thailand, and the UK. Changes in macro conditions in these markets can have a meaningful impact on YUM’s earnings power.
Food/labor inflation: The majority of YUM’s restaurants are franchised, which helps mitigate the company from fluctuations and food and labor costs. However, ~20% of restaurants are company owned, with the majority of those in China. Changes in food and labor inflation rates can have a material impact on YUM’s margins.
Food safety issues: YUM’s has had several instances of food safety concerns in the past, mostly recently in China. Our YUM outlook assumes a gradual recovery in the China business following the food safety issues that hurt sales last year. Should the company face another such issue, our forecasts would likely prove too high.
Forex: YUM is exposed to significant currency risk, given that 70-75% of profits come from outside the U.S. YUM’s most significant currency exposure is to the Chinese yuan.
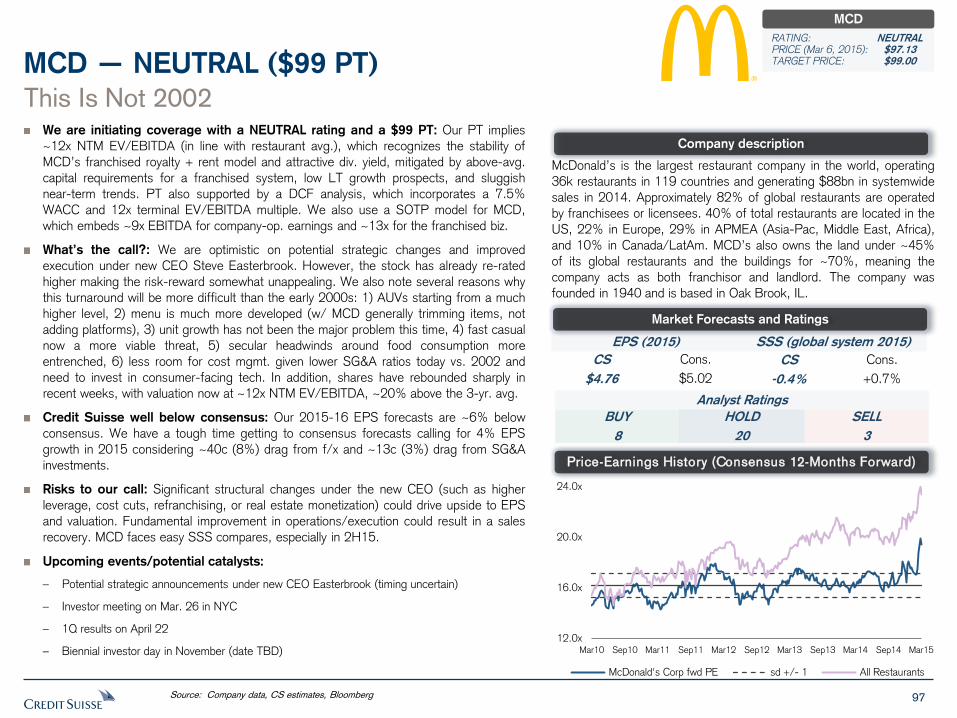
97
We are initiating coverage with a NEUTRAL rating and a $99 PT: Our PT implies
~12x NTM EV/EBITDA (in line with restaurant avg.), which recognizes the stability of
MCD’s franchised royalty + rent model and attractive div. yield, mitigated by above-avg.
capital requirements for a franchised system, low LT growth prospects, and sluggish
near-term trends. PT also supported by a DCF analysis, which incorporates a 7.5%
WACC and 12x terminal EV/EBITDA multiple. We also use a SOTP model for MCD,
which embeds ~9x EBITDA for company-op. earnings and ~13x for the franchised biz.
What’s the call?: We are optimistic on potential strategic changes and improved
execution under new CEO Steve Easterbrook. However, the stock has already re-rated
higher making the risk-reward somewhat unappealing. We also note several reasons why
this turnaround will be more difficult than the early 2000s: 1) AUVs starting from a much
higher level, 2) menu is much more developed (w/ MCD generally trimming items, not
adding platforms), 3) unit growth has not been the major problem this time, 4) fast casual
now a more viable threat, 5) secular headwinds around food consumption more
entrenched, 6) less room for cost mgmt. given lower SG&A ratios today vs. 2002 and
need to invest in consumer-facing tech. In addition, shares have rebounded sharply in
recent weeks, with valuation now at ~12x NTM EV/EBITDA, ~20% above the 3-yr. avg.
Credit Suisse well below consensus: Our 2015-16 EPS forecasts are ~6% below
consensus. We have a tough time getting to consensus forecasts calling for 4% EPS
growth in 2015 considering ~40c (8%) drag from f/x and ~13c (3%) drag from SG&A
investments.
Risks to our call: Significant structural changes under the new CEO (such as higher
leverage, cost cuts, refranchising, or real estate monetization) could drive upside to EPS
and valuation. Fundamental improvement in operations/execution could result in a sales
recovery. MCD faces easy SSS compares, especially in 2H15.
Upcoming events/potential catalysts:
– Potential strategic announcements under new CEO Easterbrook (timing uncertain)
– Investor meeting on Mar. 26 in NYC
– 1Q results on April 22
– Biennial investor day in November (date TBD)
This Is Not 2002
MCD — NEUTRAL ($99 PT)
McDonald’s is the largest restaurant company in the world, operating
36k restaurants in 119 countries and generating $88bn in systemwide
sales in 2014. Approximately 82% of global restaurants are operated
by franchisees or licensees. 40% of total restaurants are located in the
US, 22% in Europe, 29% in APMEA (Asia-Pac, Middle East, Africa),
and 10% in Canada/LatAm. MCD’s also owns the land under ~45%
of its global restaurants and the buildings for ~70%, meaning the
company acts as both franchisor and landlord. The company was
founded in 1940 and is based in Oak Brook, IL.
Source: Company data, CS estimates, Bloomberg
Company description
Price-Earnings History (Consensus 12-Months Forward)
EPS (2015) SSS (global system 2015)
CS
$4.76
Cons.
$5.02
CS
-0.4%
Cons.
+0.7%
Analyst Ratings
BUY
8
SELL
3
HOLD
20
Market Forecasts and Ratings
MCD
RATING: NEUTRAL PRICE (Mar 6, 2015): $97.13 TARGET PRICE: $99.00
12.0x
16.0x
20.0x
24.0x
Mar10 Sep10 Mar11 Sep11 Mar12 Sep12 Mar13 Sep13 Mar14 Sep14 Mar15
McDonald's Corp fwd PE sd +/- 1 All Restaurants
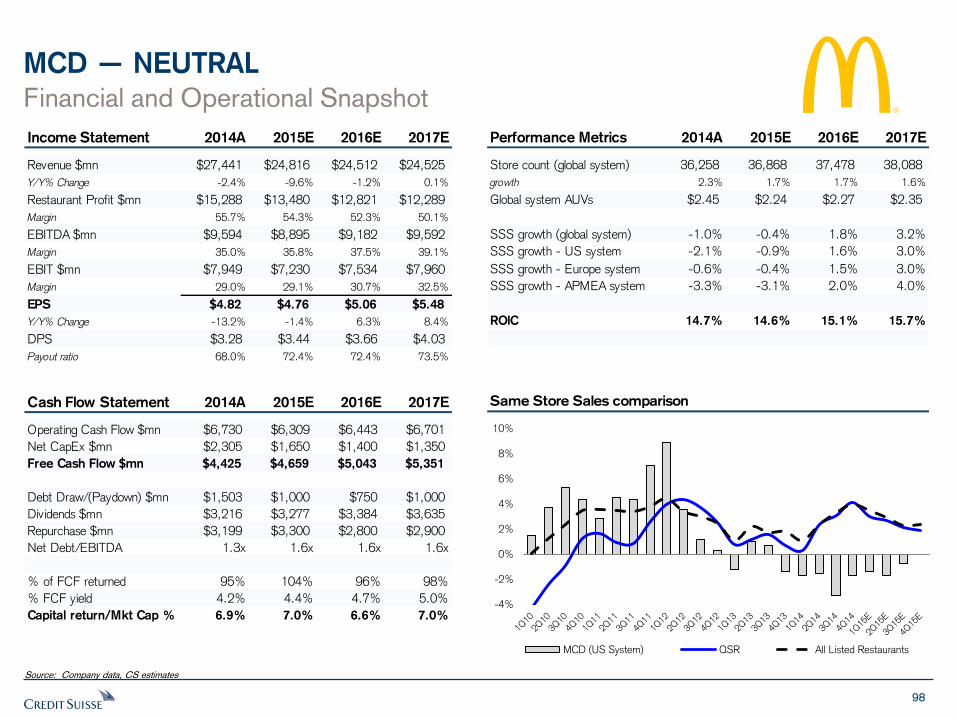
98
MCD — NEUTRAL
Financial and Operational Snapshot
Source: Company data, CS estimates
Same Store Sales comparison
Income Statement 2014A 2015E 2016E 2017E
Revenue $mn $27,441 $24,816 $24,512 $24,525
Y/Y% Change -2.4% -9.6% -1.2% 0.1%
Restaurant Profit $mn $15,288 $13,480 $12,821 $12,289
Margin 55.7% 54.3% 52.3% 50.1%
EBITDA $mn $9,594 $8,895 $9,182 $9,592
Margin 35.0% 35.8% 37.5% 39.1%
EBIT $mn $7,949 $7,230 $7,534 $7,960
Margin 29.0% 29.1% 30.7% 32.5%
EPS $4.82 $4.76 $5.06 $5.48
Y/Y% Change -13.2% -1.4% 6.3% 8.4%
DPS $3.28 $3.44 $3.66 $4.03
Payout ratio 68.0% 72.4% 72.4% 73.5%
Cash Flow Statement 2014A 2015E 2016E 2017E
Operating Cash Flow $mn $6,730 $6,309 $6,443 $6,701
Net CapEx $mn $2,305 $1,650 $1,400 $1,350
Free Cash Flow $mn $4,425 $4,659 $5,043 $5,351
Debt Draw/(Paydown) $mn $1,503 $1,000 $750 $1,000
Dividends $mn $3,216 $3,277 $3,384 $3,635
Repurchase $mn $3,199 $3,300 $2,800 $2,900
Net Debt/EBITDA 1.3x 1.6x 1.6x 1.6x
% of FCF returned 95% 104% 96% 98%
% FCF yield 4.2% 4.4% 4.7% 5.0%
Capital return/Mkt Cap % 6.9% 7.0% 6.6% 7.0%
Performance Metrics 2014A 2015E 2016E 2017E
Store count (global system) 36,258 36,868 37,478 38,088
growth 2.3% 1.7% 1.7% 1.6%
Global system AUVs $2.45 $2.24 $2.27 $2.35
SSS growth (global system) -1.0% -0.4% 1.8% 3.2%
SSS growth - US system -2.1% -0.9% 1.6% 3.0%
SSS growth - Europe system -0.6% -0.4% 1.5% 3.0%
SSS growth - APMEA system -3.3% -3.1% 2.0% 4.0%
ROIC 14.7% 14.6% 15.1% 15.7%
-4%
-2%
0%
2%
4%
6%
8%
10%
MCD (US System) QSR All Listed Restaurants
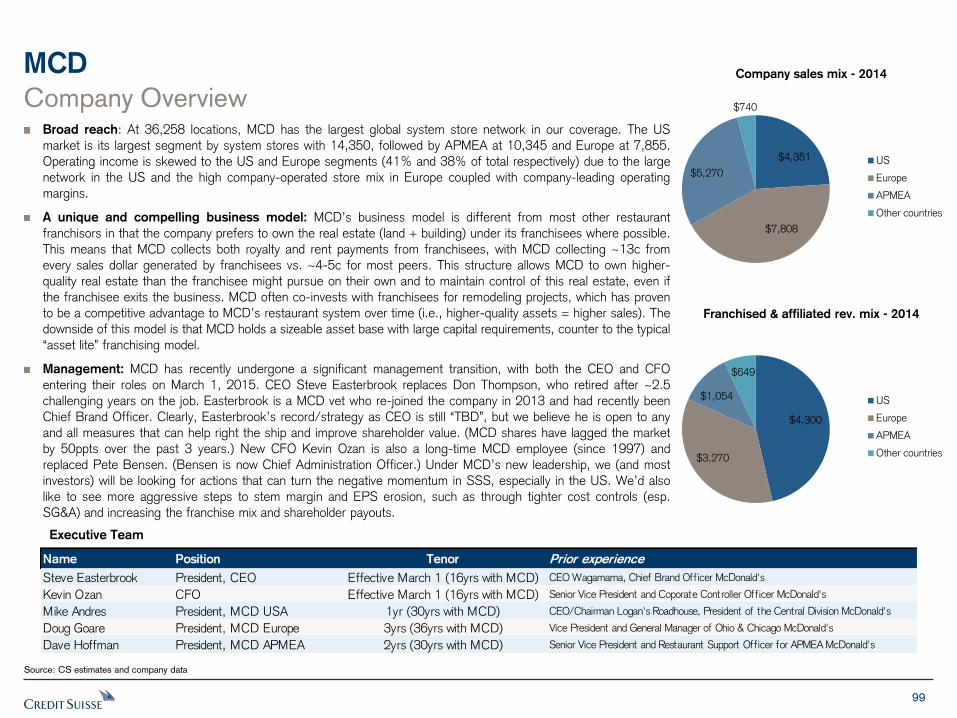
99
MCD
Company Overview Broad reach: At 36,258 locations, MCD has the largest global system store network in our coverage. The US
market is its largest segment by system stores with 14,350, followed by APMEA at 10,345 and Europe at 7,855.
Operating income is skewed to the US and Europe segments (41% and 38% of total respectively) due to the large
network in the US and the high company-operated store mix in Europe coupled with company-leading operating
margins.
A unique and compelling business model: MCD’s business model is different from most other restaurant
franchisors in that the company prefers to own the real estate (land + building) under its franchisees where possible.
This means that MCD collects both royalty and rent payments from franchisees, with MCD collecting ~13c from
every sales dollar generated by franchisees vs. ~4-5c for most peers. This structure allows MCD to own higher-
quality real estate than the franchisee might pursue on their own and to maintain control of this real estate, even if
the franchisee exits the business. MCD often co-invests with franchisees for remodeling projects, which has proven
to be a competitive advantage to MCD’s restaurant system over time (i.e., higher-quality assets = higher sales). The
downside of this model is that MCD holds a sizeable asset base with large capital requirements, counter to the typical
“asset lite” franchising model.
Management: MCD has recently undergone a significant management transition, with both the CEO and CFO
entering their roles on March 1, 2015. CEO Steve Easterbrook replaces Don Thompson, who retired after ~2.5
challenging years on the job. Easterbrook is a MCD vet who re-joined the company in 2013 and had recently been
Chief Brand Officer. Clearly, Easterbrook’s record/strategy as CEO is still “TBD”, but we believe he is open to any
and all measures that can help right the ship and improve shareholder value. (MCD shares have lagged the market
by 50ppts over the past 3 years.) New CFO Kevin Ozan is also a long-time MCD employee (since 1997) and
replaced Pete Bensen. (Bensen is now Chief Administration Officer.) Under MCD’s new leadership, we (and most
investors) will be looking for actions that can turn the negative momentum in SSS, especially in the US. We’d also
like to see more aggressive steps to stem margin and EPS erosion, such as through tighter cost controls (esp.
SG&A) and increasing the franchise mix and shareholder payouts.
Source: CS estimates and company data
Name Position Tenor Prior experience
Steve Easterbrook President, CEO Effective March 1 (16yrs with MCD) CEO Wagamama, Chief Brand Officer McDonald's
Kevin Ozan CFO Effective March 1 (16yrs with MCD) Senior Vice President and Coporate Controller Officer McDonald's
Mike Andres President, MCD USA 1yr (30yrs with MCD) CEO/Chairman Logan's Roadhouse, President of the Central Division McDonald's
Doug Goare President, MCD Europe 3yrs (36yrs with MCD) Vice President and General Manager of Ohio & Chicago McDonald's
Dave Hoffman President, MCD APMEA 2yrs (30yrs with MCD) Senior Vice President and Restaurant Support Officer for APMEA McDonald's
Executive Team
$4,351
$7,808
$5,270
$740
Company sales mix - 2014
US
Europe
APMEA
Other countries
$4,300
$3,270
$1,054
$649
Franchised & affiliated rev. mix - 2014
US
Europe
APMEA
Other countries
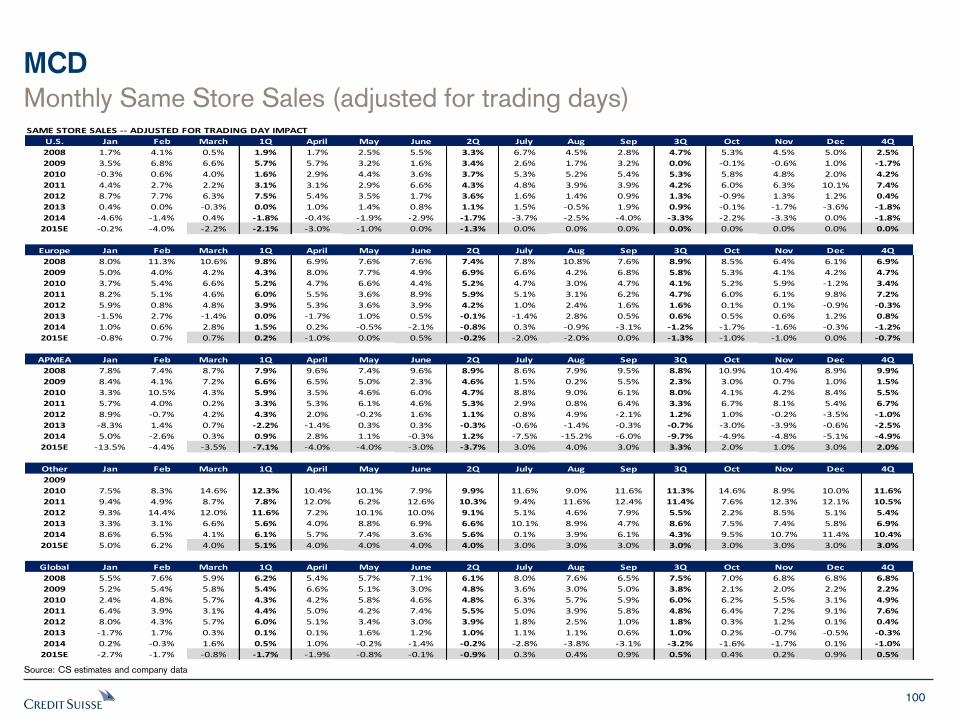
100
MCD
Monthly Same Store Sales (adjusted for trading days)
Source: CS estimates and company data
SAME STORE SALES -- ADJUSTED FOR TRADING DAY IMPACT
U.S. Jan Feb March 1Q April May June 2Q July Aug Sep 3Q Oct Nov Dec 4Q
2008 1.7% 4.1% 0.5% 1.9% 1.7% 2.5% 5.5% 3.3% 6.7% 4.5% 2.8% 4.7% 5.3% 4.5% 5.0% 2.5%
2009 3.5% 6.8% 6.6% 5.7% 5.7% 3.2% 1.6% 3.4% 2.6% 1.7% 3.2% 0.0% -0.1% -0.6% 1.0% -1.7%
2010 -0.3% 0.6% 4.0% 1.6% 2.9% 4.4% 3.6% 3.7% 5.3% 5.2% 5.4% 5.3% 5.8% 4.8% 2.0% 4.2%
2011 4.4% 2.7% 2.2% 3.1% 3.1% 2.9% 6.6% 4.3% 4.8% 3.9% 3.9% 4.2% 6.0% 6.3% 10.1% 7.4%
2012 8.7% 7.7% 6.3% 7.5% 5.4% 3.5% 1.7% 3.6% 1.6% 1.4% 0.9% 1.3% -0.9% 1.3% 1.2% 0.4%
2013 0.4% 0.0% -0.3% 0.0% 1.0% 1.4% 0.8% 1.1% 1.5% -0.5% 1.9% 0.9% -0.1% -1.7% -3.6% -1.8%
2014 -4.6% -1.4% 0.4% -1.8% -0.4% -1.9% -2.9% -1.7% -3.7% -2.5% -4.0% -3.3% -2.2% -3.3% 0.0% -1.8%
2015E -0.2% -4.0% -2.2% -2.1% -3.0% -1.0% 0.0% -1.3% 0.0% 0.0% 0.0% 0.0% 0.0% 0.0% 0.0% 0.0%
Europe Jan Feb March 1Q April May June 2Q July Aug Sep 3Q Oct Nov Dec 4Q
2008 8.0% 11.3% 10.6% 9.8% 6.9% 7.6% 7.6% 7.4% 7.8% 10.8% 7.6% 8.9% 8.5% 6.4% 6.1% 6.9%
2009 5.0% 4.0% 4.2% 4.3% 8.0% 7.7% 4.9% 6.9% 6.6% 4.2% 6.8% 5.8% 5.3% 4.1% 4.2% 4.7%
2010 3.7% 5.4% 6.6% 5.2% 4.7% 6.6% 4.4% 5.2% 4.7% 3.0% 4.7% 4.1% 5.2% 5.9% -1.2% 3.4%
2011 8.2% 5.1% 4.6% 6.0% 5.5% 3.6% 8.9% 5.9% 5.1% 3.1% 6.2% 4.7% 6.0% 6.1% 9.8% 7.2%
2012 5.9% 0.8% 4.8% 3.9% 5.3% 3.6% 3.9% 4.2% 1.0% 2.4% 1.6% 1.6% 0.1% 0.1% -0.9% -0.3%
2013 -1.5% 2.7% -1.4% 0.0% -1.7% 1.0% 0.5% -0.1% -1.4% 2.8% 0.5% 0.6% 0.5% 0.6% 1.2% 0.8%
2014 1.0% 0.6% 2.8% 1.5% 0.2% -0.5% -2.1% -0.8% 0.3% -0.9% -3.1% -1.2% -1.7% -1.6% -0.3% -1.2%
2015E -0.8% 0.7% 0.7% 0.2% -1.0% 0.0% 0.5% -0.2% -2.0% -2.0% 0.0% -1.3% -1.0% -1.0% 0.0% -0.7%
APMEA Jan Feb March 1Q April May June 2Q July Aug Sep 3Q Oct Nov Dec 4Q
2008 7.8% 7.4% 8.7% 7.9% 9.6% 7.4% 9.6% 8.9% 8.6% 7.9% 9.5% 8.8% 10.9% 10.4% 8.9% 9.9%
2009 8.4% 4.1% 7.2% 6.6% 6.5% 5.0% 2.3% 4.6% 1.5% 0.2% 5.5% 2.3% 3.0% 0.7% 1.0% 1.5%
2010 3.3% 10.5% 4.3% 5.9% 3.5% 4.6% 6.0% 4.7% 8.8% 9.0% 6.1% 8.0% 4.1% 4.2% 8.4% 5.5%
2011 5.7% 4.0% 0.2% 3.3% 5.3% 6.1% 4.6% 5.3% 2.9% 0.8% 6.4% 3.3% 6.7% 8.1% 5.4% 6.7%
2012 8.9% -0.7% 4.2% 4.3% 2.0% -0.2% 1.6% 1.1% 0.8% 4.9% -2.1% 1.2% 1.0% -0.2% -3.5% -1.0%
2013 -8.3% 1.4% 0.7% -2.2% -1.4% 0.3% 0.3% -0.3% -0.6% -1.4% -0.3% -0.7% -3.0% -3.9% -0.6% -2.5%
2014 5.0% -2.6% 0.3% 0.9% 2.8% 1.1% -0.3% 1.2% -7.5% -15.2% -6.0% -9.7% -4.9% -4.8% -5.1% -4.9%
2015E -13.5% -4.4% -3.5% -7.1% -4.0% -4.0% -3.0% -3.7% 3.0% 4.0% 3.0% 3.3% 2.0% 1.0% 3.0% 2.0%
Other Jan Feb March 1Q April May June 2Q July Aug Sep 3Q Oct Nov Dec 4Q
2009
2010 7.5% 8.3% 14.6% 12.3% 10.4% 10.1% 7.9% 9.9% 11.6% 9.0% 11.6% 11.3% 14.6% 8.9% 10.0% 11.6%
2011 9.4% 4.9% 8.7% 7.8% 12.0% 6.2% 12.6% 10.3% 9.4% 11.6% 12.4% 11.4% 7.6% 12.3% 12.1% 10.5%
2012 9.3% 14.4% 12.0% 11.6% 7.2% 10.1% 10.0% 9.1% 5.1% 4.6% 7.9% 5.5% 2.2% 8.5% 5.1% 5.4%
2013 3.3% 3.1% 6.6% 5.6% 4.0% 8.8% 6.9% 6.6% 10.1% 8.9% 4.7% 8.6% 7.5% 7.4% 5.8% 6.9%
2014 8.6% 6.5% 4.1% 6.1% 5.7% 7.4% 3.6% 5.6% 0.1% 3.9% 6.1% 4.3% 9.5% 10.7% 11.4% 10.4%
2015E 5.0% 6.2% 4.0% 5.1% 4.0% 4.0% 4.0% 4.0% 3.0% 3.0% 3.0% 3.0% 3.0% 3.0% 3.0% 3.0%
Global Jan Feb March 1Q April May June 2Q July Aug Sep 3Q Oct Nov Dec 4Q
2008 5.5% 7.6% 5.9% 6.2% 5.4% 5.7% 7.1% 6.1% 8.0% 7.6% 6.5% 7.5% 7.0% 6.8% 6.8% 6.8%
2009 5.2% 5.4% 5.8% 5.4% 6.6% 5.1% 3.0% 4.8% 3.6% 3.0% 5.0% 3.8% 2.1% 2.0% 2.2% 2.2%
2010 2.4% 4.8% 5.7% 4.3% 4.2% 5.8% 4.6% 4.8% 6.3% 5.7% 5.9% 6.0% 6.2% 5.5% 3.1% 4.9%
2011 6.4% 3.9% 3.1% 4.4% 5.0% 4.2% 7.4% 5.5% 5.0% 3.9% 5.8% 4.8% 6.4% 7.2% 9.1% 7.6%
2012 8.0% 4.3% 5.7% 6.0% 5.1% 3.4% 3.0% 3.9% 1.8% 2.5% 1.0% 1.8% 0.3% 1.2% 0.1% 0.4%
2013 -1.7% 1.7% 0.3% 0.1% 0.1% 1.6% 1.2% 1.0% 1.1% 1.1% 0.6% 1.0% 0.2% -0.7% -0.5% -0.3%
2014 0.2% -0.3% 1.6% 0.5% 1.0% -0.2% -1.4% -0.2% -2.8% -3.8% -3.1% -3.2% -1.6% -1.7% 0.1% -1.0%
2015E -2.7% -1.7% -0.8% -1.7% -1.9% -0.8% -0.1% -0.9% 0.3% 0.4% 0.9% 0.5% 0.4% 0.2% 0.9% 0.5%
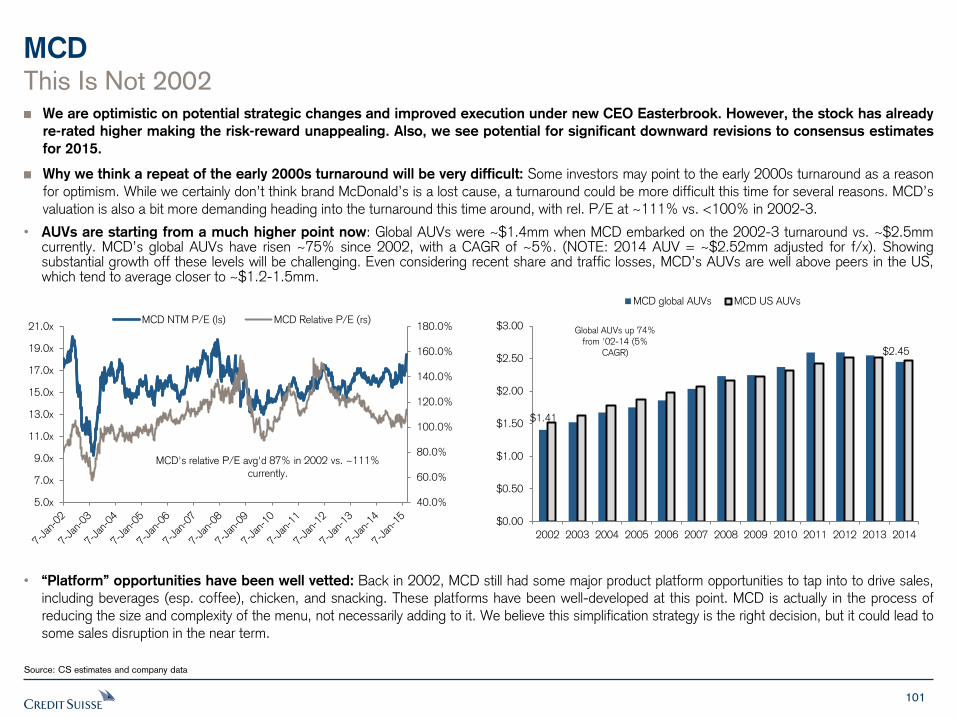
101
MCD This Is Not 2002
We are optimistic on potential strategic changes and improved execution under new CEO Easterbrook. However, the stock has already
re-rated higher making the risk-reward unappealing. Also, we see potential for significant downward revisions to consensus estimates
for 2015.
Why we think a repeat of the early 2000s turnaround will be very difficult: Some investors may point to the early 2000s turnaround as a reason for optimism. While we certainly don’t think brand McDonald’s is a lost cause, a turnaround could be more difficult this time for several reasons. MCD’s valuation is also a bit more demanding heading into the turnaround this time around, with rel. P/E at ~111% vs. <100% in 2002-3.
• AUVs are starting from a much higher point now: Global AUVs were ~$1.4mm when MCD embarked on the 2002-3 turnaround vs. ~$2.5mm currently. MCD’s global AUVs have risen ~75% since 2002, with a CAGR of ~5%. (NOTE: 2014 AUV = ~$2.52mm adjusted for f/x). Showing substantial growth off these levels will be challenging. Even considering recent share and traffic losses, MCD’s AUVs are well above peers in the US, which tend to average closer to ~$1.2-1.5mm.
• “Platform” opportunities have been well vetted: Back in 2002, MCD still had some major product platform opportunities to tap into to drive sales, including beverages (esp. coffee), chicken, and snacking. These platforms have been well-developed at this point. MCD is actually in the process of reducing the size and complexity of the menu, not necessarily adding to it. We believe this simplification strategy is the right decision, but it could lead to some sales disruption in the near term.
Source: CS estimates and company data
$1.41
$2.45
$0.00
$0.50
$1.00
$1.50
$2.00
$2.50
$3.00
2002 2003 2004 2005 2006 2007 2008 2009 2010 2011 2012 2013 2014
MCD global AUVs MCD US AUVs
Global AUVs up 74%
from '02-14 (5%
CAGR)
40.0%
60.0%
80.0%
100.0%
120.0%
140.0%
160.0%
180.0%
5.0x
7.0x
9.0x
11.0x
13.0x
15.0x
17.0x
19.0x
21.0xMCD NTM P/E (ls) MCD Relative P/E (rs)
MCD's relative P/E avg'd 87% in 2002 vs. ~111% currently.
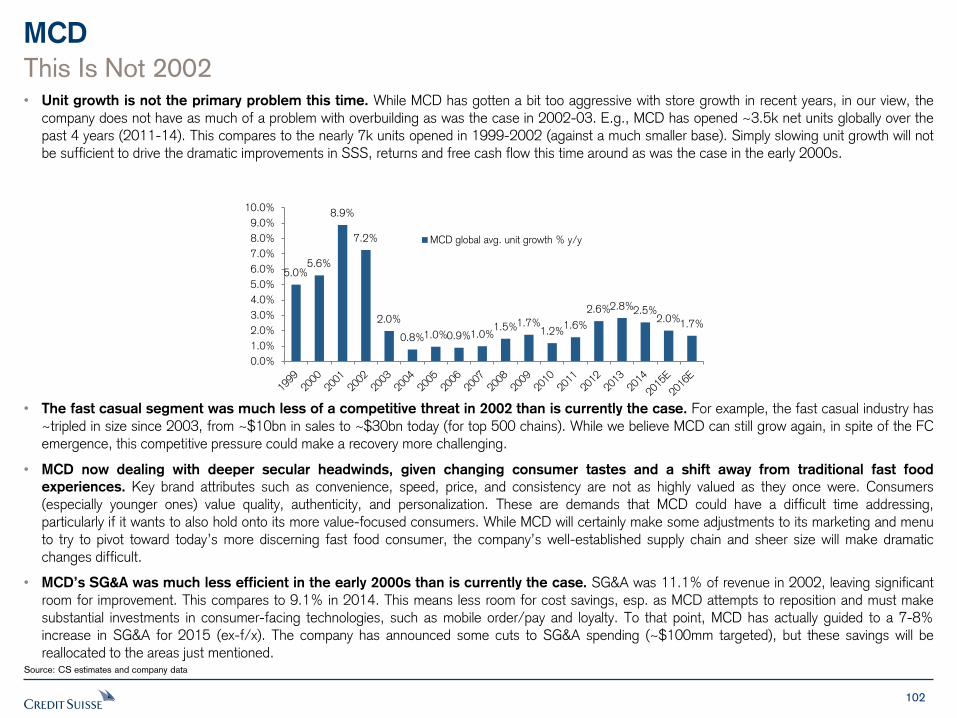
102
MCD
Source: CS estimates and company data
This Is Not 2002 • Unit growth is not the primary problem this time. While MCD has gotten a bit too aggressive with store growth in recent years, in our view, the
company does not have as much of a problem with overbuilding as was the case in 2002-03. E.g., MCD has opened ~3.5k net units globally over the past 4 years (2011-14). This compares to the nearly 7k units opened in 1999-2002 (against a much smaller base). Simply slowing unit growth will not be sufficient to drive the dramatic improvements in SSS, returns and free cash flow this time around as was the case in the early 2000s.
• The fast casual segment was much less of a competitive threat in 2002 than is currently the case. For example, the fast casual industry has ~tripled in size since 2003, from ~$10bn in sales to ~$30bn today (for top 500 chains). While we believe MCD can still grow again, in spite of the FC emergence, this competitive pressure could make a recovery more challenging.
• MCD now dealing with deeper secular headwinds, given changing consumer tastes and a shift away from traditional fast food
experiences. Key brand attributes such as convenience, speed, price, and consistency are not as highly valued as they once were. Consumers (especially younger ones) value quality, authenticity, and personalization. These are demands that MCD could have a difficult time addressing, particularly if it wants to also hold onto its more value-focused consumers. While MCD will certainly make some adjustments to its marketing and menu to try to pivot toward today’s more discerning fast food consumer, the company’s well-established supply chain and sheer size will make dramatic changes difficult.
• MCD’s SG&A was much less efficient in the early 2000s than is currently the case. SG&A was 11.1% of revenue in 2002, leaving significant room for improvement. This compares to 9.1% in 2014. This means less room for cost savings, esp. as MCD attempts to reposition and must make substantial investments in consumer-facing technologies, such as mobile order/pay and loyalty. To that point, MCD has actually guided to a 7-8% increase in SG&A for 2015 (ex-f/x). The company has announced some cuts to SG&A spending (~$100mm targeted), but these savings will be reallocated to the areas just mentioned.
5.0% 5.6%
8.9%
7.2%
2.0%
0.8% 1.0% 0.9% 1.0% 1.5% 1.7%
1.2% 1.6%
2.6% 2.8% 2.5% 2.0%
1.7%
0.0%
1.0%
2.0%
3.0%
4.0%
5.0%
6.0%
7.0%
8.0%
9.0%
10.0%
MCD global avg. unit growth % y/y
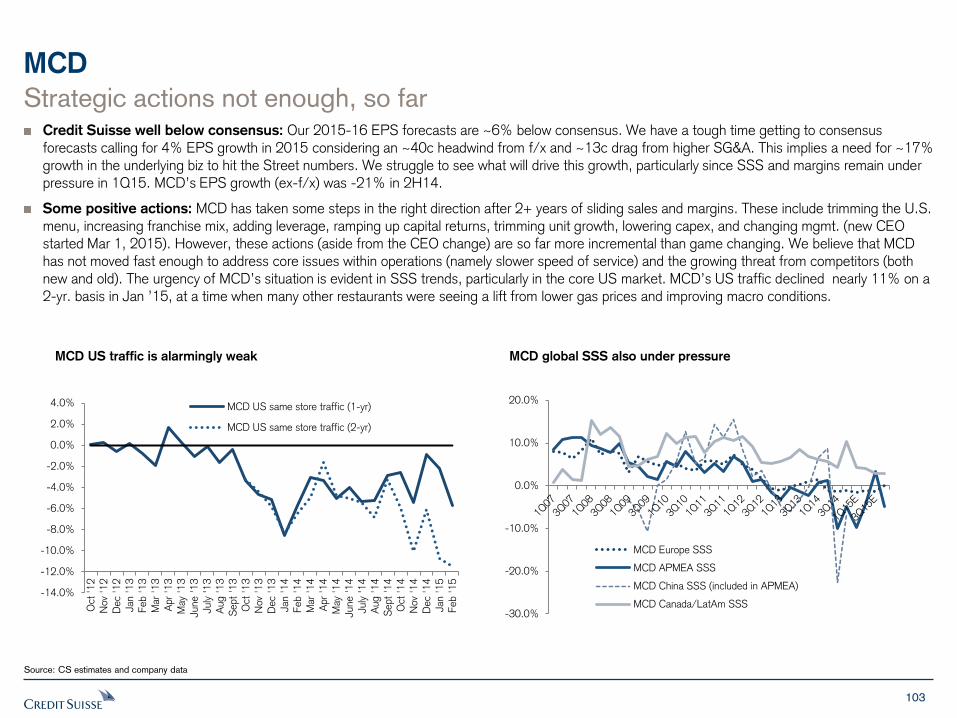
103
MCD
Strategic actions not enough, so far Credit Suisse well below consensus: Our 2015-16 EPS forecasts are ~6% below consensus. We have a tough time getting to consensus forecasts calling for 4% EPS growth in 2015 considering an ~40c headwind from f/x and ~13c drag from higher SG&A. This implies a need for ~17% growth in the underlying biz to hit the Street numbers. We struggle to see what will drive this growth, particularly since SSS and margins remain under pressure in 1Q15. MCD’s EPS growth (ex-f/x) was -21% in 2H14.
Some positive actions: MCD has taken some steps in the right direction after 2+ years of sliding sales and margins. These include trimming the U.S. menu, increasing franchise mix, adding leverage, ramping up capital returns, trimming unit growth, lowering capex, and changing mgmt. (new CEO started Mar 1, 2015). However, these actions (aside from the CEO change) are so far more incremental than game changing. We believe that MCD has not moved fast enough to address core issues within operations (namely slower speed of service) and the growing threat from competitors (both new and old). The urgency of MCD’s situation is evident in SSS trends, particularly in the core US market. MCD’s US traffic declined nearly 11% on a 2-yr. basis in Jan ’15, at a time when many other restaurants were seeing a lift from lower gas prices and improving macro conditions.
Source: CS estimates and company data
MCD US traffic is alarmingly weak MCD global SSS also under pressure
-30.0%
-20.0%
-10.0%
0.0%
10.0%
20.0%
MCD Europe SSS
MCD APMEA SSS
MCD China SSS (included in APMEA)
MCD Canada/LatAm SSS-14.0%
-12.0%
-10.0%
-8.0%
-6.0%
-4.0%
-2.0%
0.0%
2.0%
4.0%
Oct
'1
2
Nov
'12
Dec
'12
Jan '13
Feb '13
Mar
'13
Apr
'13
May
'1
3
June '13
July
'13
Aug '13
Sept
'13
Oct
'1
3
Nov
'13
Dec
'13
Jan '14
Feb '14
Mar
'14
Apr
'14
May
'1
4
June '14
July
'14
Aug '14
Sept
'14
Oct
'1
4
Nov
'14
Dec
'14
Jan '15
Feb '15
MCD US same store traffic (1-yr)
MCD US same store traffic (2-yr)
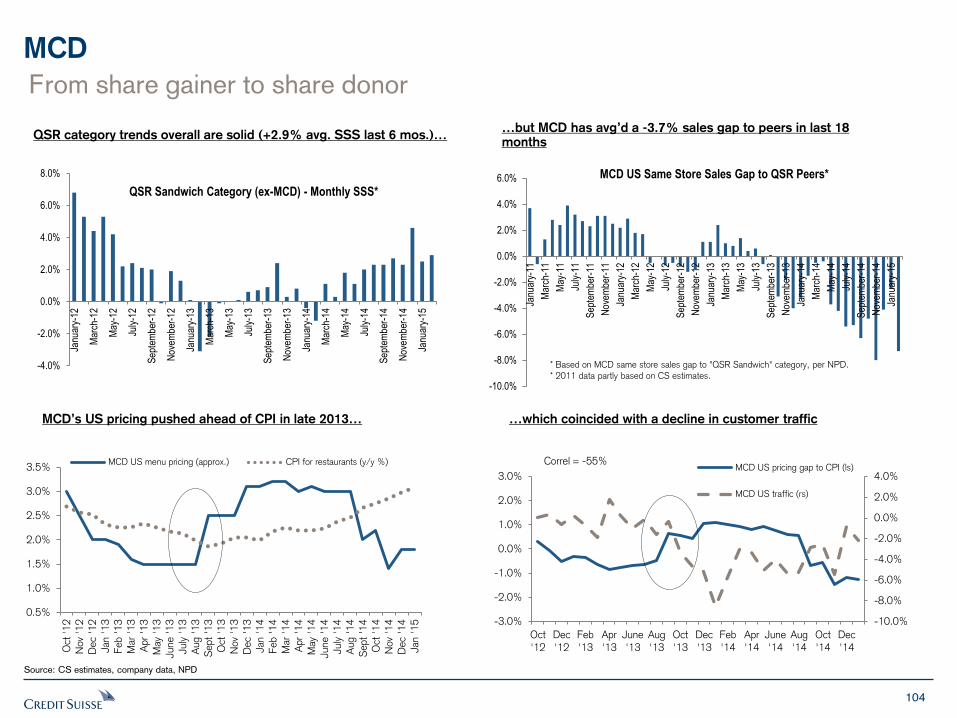
104
MCD
From share gainer to share donor
Source: CS estimates, company data, NPD
MCD’s US pricing pushed ahead of CPI in late 2013… …which coincided with a decline in customer traffic
QSR category trends overall are solid (+2.9% avg. SSS last 6 mos.)… …but MCD has avg’d a -3.7% sales gap to peers in last 18 months
0.5%
1.0%
1.5%
2.0%
2.5%
3.0%
3.5%
Oct
'1
2
Nov
'12
Dec
'12
Jan '13
Feb '13
Mar
'13
Apr
'13
May
'1
3
June '13
July
'13
Aug '13
Sept
'13
Oct
'1
3
Nov
'13
Dec
'13
Jan '14
Feb '14
Mar
'14
Apr
'14
May
'1
4
June '14
July
'14
Aug '14
Sept
'14
Oct
'1
4
Nov
'14
Dec
'14
Jan '15
MCD US menu pricing (approx.) CPI for restaurants (y/y %)
-10.0%
-8.0%
-6.0%
-4.0%
-2.0%
0.0%
2.0%
4.0%
-3.0%
-2.0%
-1.0%
0.0%
1.0%
2.0%
3.0%
Oct'12
Dec'12
Feb'13
Apr'13
June'13
Aug'13
Oct'13
Dec'13
Feb'14
Apr'14
June'14
Aug'14
Oct'14
Dec'14
MCD US pricing gap to CPI (ls)
MCD US traffic (rs)
Correl = -55%
-10.0%
-8.0%
-6.0%
-4.0%
-2.0%
0.0%
2.0%
4.0%
6.0%
Janu
ary-
11
Mar
ch-1
1
May
-11
July
-11
Sep
tem
ber-
11
Nov
embe
r-11
Janu
ary-
12
Mar
ch-1
2
May
-12
July
-12
Sep
tem
ber-
12
Nov
embe
r-12
Janu
ary-
13
Mar
ch-1
3
May
-13
July
-13
Sep
tem
ber-
13
Nov
embe
r-13
Janu
ary-
14
Mar
ch-1
4
May
-14
July
-14
Sep
tem
ber-
14
Nov
embe
r-14
Janu
ary-
15
MCD US Same Store Sales Gap to QSR Peers*
* Based on MCD same store sales gap to "QSR Sandwich" category, per NPD.
* 2011 data partly based on CS estimates. -4.0%
-2.0%
0.0%
2.0%
4.0%
6.0%
8.0%
Janu
ary-
12
Mar
ch-1
2
May
-12
July
-12
Sep
tem
ber-
12
Nov
embe
r-12
Janu
ary-
13
Mar
ch-1
3
May
-13
July
-13
Sep
tem
ber-
13
Nov
embe
r-13
Janu
ary-
14
Mar
ch-1
4
May
-14
July
-14
Sep
tem
ber-
14
Nov
embe
r-14
Janu
ary-
15
QSR Sandwich Category (ex-MCD) - Monthly SSS*
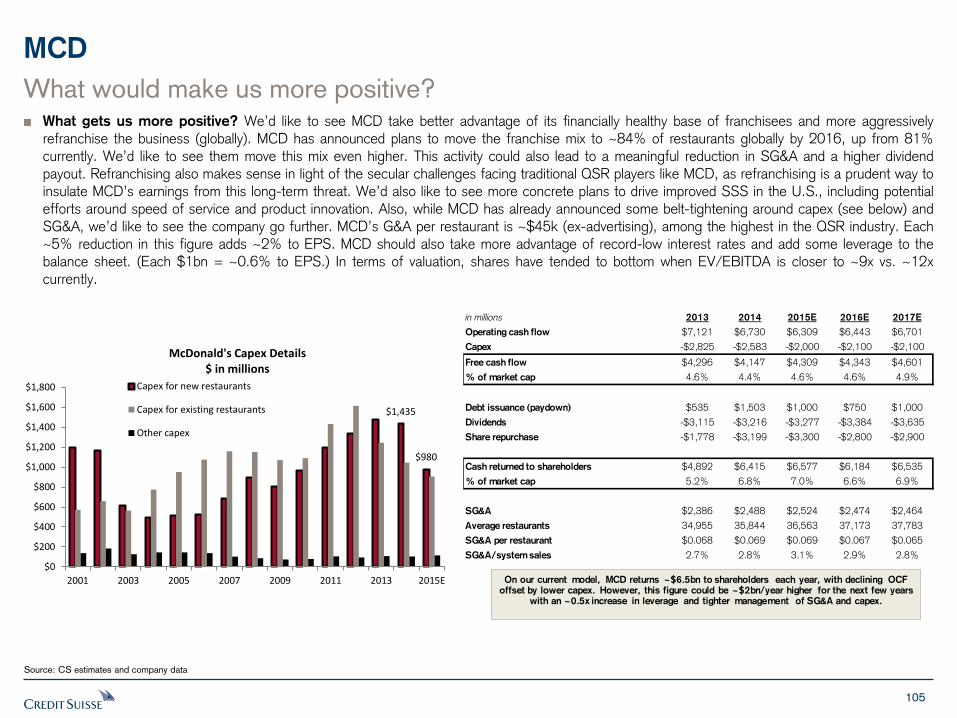
105
MCD
What would make us more positive? What gets us more positive? We’d like to see MCD take better advantage of its financially healthy base of franchisees and more aggressively refranchise the business (globally). MCD has announced plans to move the franchise mix to ~84% of restaurants globally by 2016, up from 81% currently. We’d like to see them move this mix even higher. This activity could also lead to a meaningful reduction in SG&A and a higher dividend payout. Refranchising also makes sense in light of the secular challenges facing traditional QSR players like MCD, as refranchising is a prudent way to insulate MCD’s earnings from this long-term threat. We’d also like to see more concrete plans to drive improved SSS in the U.S., including potential efforts around speed of service and product innovation. Also, while MCD has already announced some belt-tightening around capex (see below) and SG&A, we’d like to see the company go further. MCD’s G&A per restaurant is ~$45k (ex-advertising), among the highest in the QSR industry. Each ~5% reduction in this figure adds ~2% to EPS. MCD should also take more advantage of record-low interest rates and add some leverage to the balance sheet. (Each $1bn = ~0.6% to EPS.) In terms of valuation, shares have tended to bottom when EV/EBITDA is closer to ~9x vs. ~12x currently.
Source: CS estimates and company data
$1,435
$980
$0
$200
$400
$600
$800
$1,000
$1,200
$1,400
$1,600
$1,800
2001 2003 2005 2007 2009 2011 2013 2015E
McDonald's Capex Details $ in millions
Capex for new restaurants
Capex for existing restaurants
Other capex
in millions 2013 2014 2015E 2016E 2017E
Operating cash flow $7,121 $6,730 $6,309 $6,443 $6,701
Capex -$2,825 -$2,583 -$2,000 -$2,100 -$2,100
Free cash flow $4,296 $4,147 $4,309 $4,343 $4,601
% of market cap 4.6% 4.4% 4.6% 4.6% 4.9%
Debt issuance (paydown) $535 $1,503 $1,000 $750 $1,000
Dividends -$3,115 -$3,216 -$3,277 -$3,384 -$3,635
Share repurchase -$1,778 -$3,199 -$3,300 -$2,800 -$2,900
Cash returned to shareholders $4,892 $6,415 $6,577 $6,184 $6,535
% of market cap 5.2% 6.8% 7.0% 6.6% 6.9%
SG&A $2,386 $2,488 $2,524 $2,474 $2,464
Average restaurants 34,955 35,844 36,563 37,173 37,783
SG&A per restaurant $0.068 $0.069 $0.069 $0.067 $0.065
SG&A/system sales 2.7% 2.8% 3.1% 2.9% 2.8%
On our current model, MCD returns ~$6.5bn to shareholders each year, with declining OCF offset by lower capex. However, this figure could be ~$2bn/year higher for the next few years
with an ~0.5x increase in leverage and tighter management of SG&A and capex.
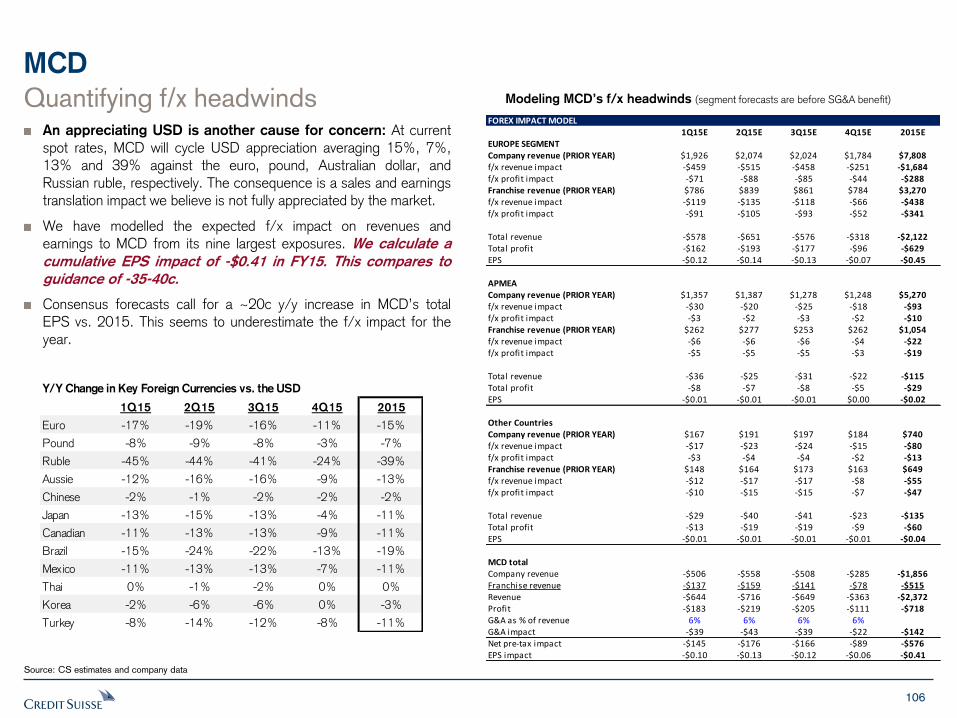
106
MCD
Quantifying f/x headwinds An appreciating USD is another cause for concern: At current spot rates, MCD will cycle USD appreciation averaging 15%, 7%, 13% and 39% against the euro, pound, Australian dollar, and Russian ruble, respectively. The consequence is a sales and earnings translation impact we believe is not fully appreciated by the market.
We have modelled the expected f/x impact on revenues and earnings to MCD from its nine largest exposures. We calculate a
cumulative EPS impact of -$0.41 in FY15. This compares to
guidance of -35-40c.
Consensus forecasts call for a ~20c y/y increase in MCD’s total EPS vs. 2015. This seems to underestimate the f/x impact for the year.
Source: CS estimates and company data
Modeling MCD’s f/x headwinds (segment forecasts are before SG&A benefit)
FOREX IMPACT MODEL1Q15E 2Q15E 3Q15E 4Q15E 2015E
EUROPE SEGMENTCompany revenue (PRIOR YEAR) $1,926 $2,074 $2,024 $1,784 $7,808f/x revenue impact -$459 -$515 -$458 -$251 -$1,684f/x profit impact -$71 -$88 -$85 -$44 -$288Franchise revenue (PRIOR YEAR) $786 $839 $861 $784 $3,270f/x revenue impact -$119 -$135 -$118 -$66 -$438f/x profit impact -$91 -$105 -$93 -$52 -$341
Total revenue -$578 -$651 -$576 -$318 -$2,122Total profit -$162 -$193 -$177 -$96 -$629EPS -$0.12 -$0.14 -$0.13 -$0.07 -$0.45
APMEACompany revenue (PRIOR YEAR) $1,357 $1,387 $1,278 $1,248 $5,270f/x revenue impact -$30 -$20 -$25 -$18 -$93f/x profit impact -$3 -$2 -$3 -$2 -$10Franchise revenue (PRIOR YEAR) $262 $277 $253 $262 $1,054f/x revenue impact -$6 -$6 -$6 -$4 -$22f/x profit impact -$5 -$5 -$5 -$3 -$19
Total revenue -$36 -$25 -$31 -$22 -$115Total profit -$8 -$7 -$8 -$5 -$29EPS -$0.01 -$0.01 -$0.01 $0.00 -$0.02
Other CountriesCompany revenue (PRIOR YEAR) $167 $191 $197 $184 $740f/x revenue impact -$17 -$23 -$24 -$15 -$80f/x profit impact -$3 -$4 -$4 -$2 -$13Franchise revenue (PRIOR YEAR) $148 $164 $173 $163 $649f/x revenue impact -$12 -$17 -$17 -$8 -$55f/x profit impact -$10 -$15 -$15 -$7 -$47
Total revenue -$29 -$40 -$41 -$23 -$135Total profit -$13 -$19 -$19 -$9 -$60EPS -$0.01 -$0.01 -$0.01 -$0.01 -$0.04
MCD totalCompany revenue -$506 -$558 -$508 -$285 -$1,856Franchise revenue -$137 -$159 -$141 -$78 -$515Revenue -$644 -$716 -$649 -$363 -$2,372Profit -$183 -$219 -$205 -$111 -$718G&A as % of revenue 6% 6% 6% 6%G&A impact -$39 -$43 -$39 -$22 -$142Net pre-tax impact -$145 -$176 -$166 -$89 -$576EPS impact -$0.10 -$0.13 -$0.12 -$0.06 -$0.41
Y/Y Change in Key Foreign Currencies vs. the USD
1Q15 2Q15 3Q15 4Q15 2015
Euro -17% -19% -16% -11% -15%
Pound -8% -9% -8% -3% -7%
Ruble -45% -44% -41% -24% -39%
Aussie -12% -16% -16% -9% -13%
Chinese -2% -1% -2% -2% -2%
Japan -13% -15% -13% -4% -11%
Canadian -11% -13% -13% -9% -11%
Brazil -15% -24% -22% -13% -19%
Mexico -11% -13% -13% -7% -11%
Thai 0% -1% -2% 0% 0%
Korea -2% -6% -6% 0% -3%
Turkey -8% -14% -12% -8% -11%
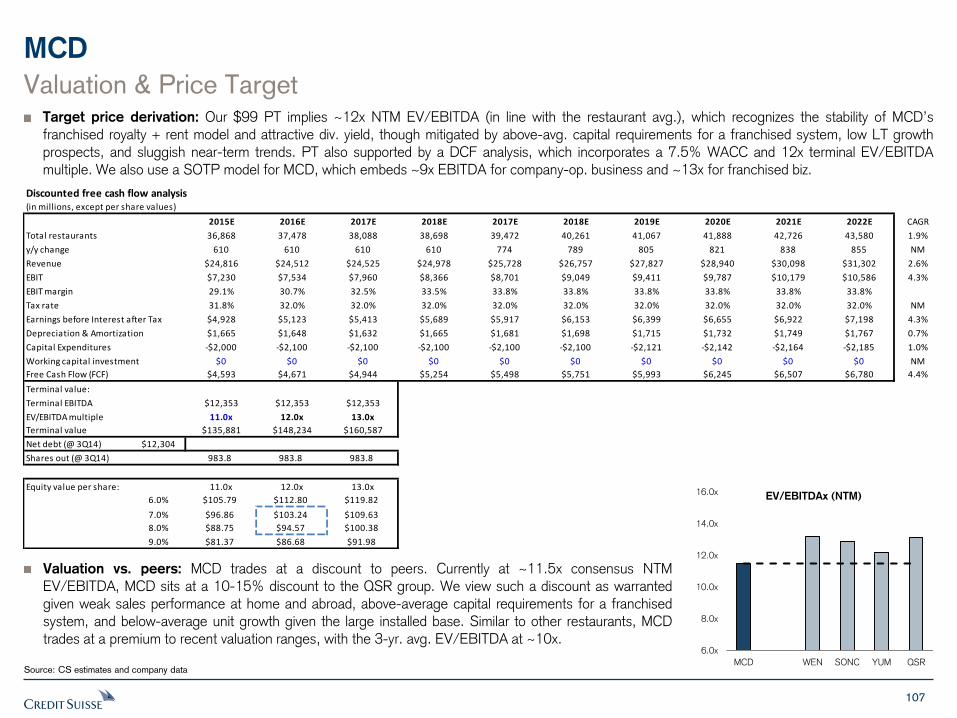
107
Discounted free cash flow analysis(in millions, except per share values)
2015E 2016E 2017E 2018E 2017E 2018E 2019E 2020E 2021E 2022E CAGR
Total restaurants 36,868 37,478 38,088 38,698 39,472 40,261 41,067 41,888 42,726 43,580 1.9%
y/y change 610 610 610 610 774 789 805 821 838 855 NM
Revenue $24,816 $24,512 $24,525 $24,978 $25,728 $26,757 $27,827 $28,940 $30,098 $31,302 2.6%
EBIT $7,230 $7,534 $7,960 $8,366 $8,701 $9,049 $9,411 $9,787 $10,179 $10,586 4.3%
EBIT margin 29.1% 30.7% 32.5% 33.5% 33.8% 33.8% 33.8% 33.8% 33.8% 33.8%
Tax rate 31.8% 32.0% 32.0% 32.0% 32.0% 32.0% 32.0% 32.0% 32.0% 32.0% NM
Earnings before Interest after Tax $4,928 $5,123 $5,413 $5,689 $5,917 $6,153 $6,399 $6,655 $6,922 $7,198 4.3%
Depreciation & Amortization $1,665 $1,648 $1,632 $1,665 $1,681 $1,698 $1,715 $1,732 $1,749 $1,767 0.7%
Capital Expenditures -$2,000 -$2,100 -$2,100 -$2,100 -$2,100 -$2,100 -$2,121 -$2,142 -$2,164 -$2,185 1.0%
Working capital investment $0 $0 $0 $0 $0 $0 $0 $0 $0 $0 NM
Free Cash Flow (FCF) $4,593 $4,671 $4,944 $5,254 $5,498 $5,751 $5,993 $6,245 $6,507 $6,780 4.4%
Terminal value:
Terminal EBITDA $12,353 $12,353 $12,353
EV/EBITDA multiple 11.0x 12.0x 13.0x
Terminal value $135,881 $148,234 $160,587
Net debt (@ 3Q14) $12,304
Shares out (@ 3Q14) 983.8 983.8 983.8
Equity value per share: 11.0x 12.0x 13.0x
6.0% $105.79 $112.80 $119.82
7.0% $96.86 $103.24 $109.63
8.0% $88.75 $94.57 $100.38
9.0% $81.37 $86.68 $91.98
MCD
Source: CS estimates and company data
Valuation & Price Target Target price derivation: Our $99 PT implies ~12x NTM EV/EBITDA (in line with the restaurant avg.), which recognizes the stability of MCD’s franchised royalty + rent model and attractive div. yield, though mitigated by above-avg. capital requirements for a franchised system, low LT growth prospects, and sluggish near-term trends. PT also supported by a DCF analysis, which incorporates a 7.5% WACC and 12x terminal EV/EBITDA multiple. We also use a SOTP model for MCD, which embeds ~9x EBITDA for company-op. business and ~13x for franchised biz.
Valuation vs. peers: MCD trades at a discount to peers. Currently at ~11.5x consensus NTM EV/EBITDA, MCD sits at a 10-15% discount to the QSR group. We view such a discount as warranted given weak sales performance at home and abroad, above-average capital requirements for a franchised system, and below-average unit growth given the large installed base. Similar to other restaurants, MCD trades at a premium to recent valuation ranges, with the 3-yr. avg. EV/EBITDA at ~10x.
6.0x
8.0x
10.0x
12.0x
14.0x
16.0x
MCD WEN SONC YUM QSR
EV/EBITDAx (NTM)
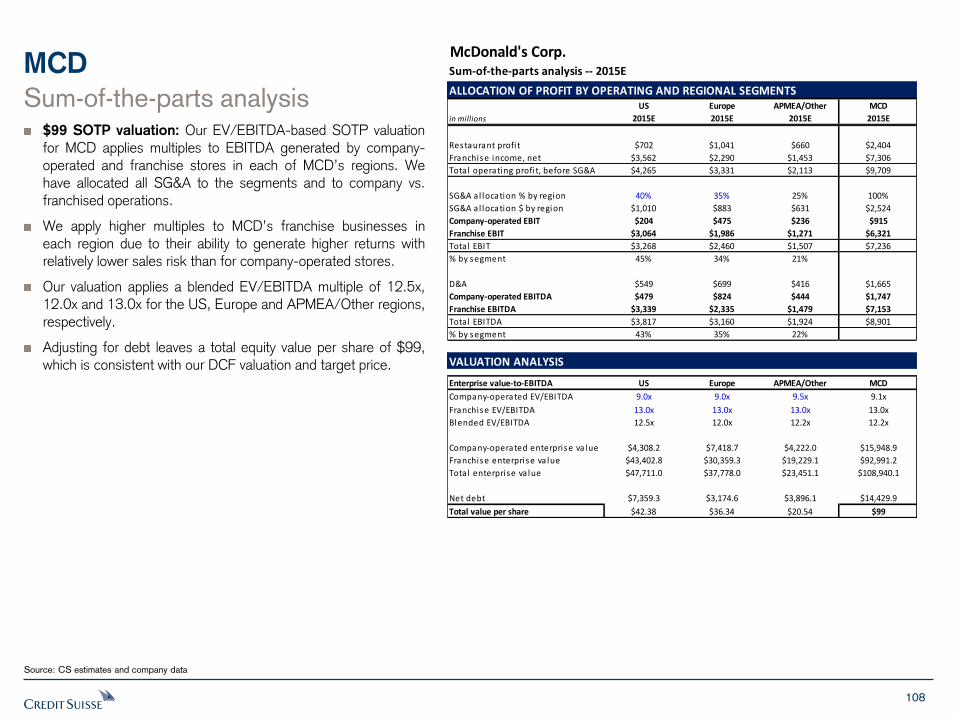
108
MCD
Source: CS estimates and company data
Sum-of-the-parts analysis $99 SOTP valuation: Our EV/EBITDA-based SOTP valuation for MCD applies multiples to EBITDA generated by company-operated and franchise stores in each of MCD’s regions. We have allocated all SG&A to the segments and to company vs. franchised operations.
We apply higher multiples to MCD’s franchise businesses in each region due to their ability to generate higher returns with relatively lower sales risk than for company-operated stores.
Our valuation applies a blended EV/EBITDA multiple of 12.5x, 12.0x and 13.0x for the US, Europe and APMEA/Other regions, respectively.
Adjusting for debt leaves a total equity value per share of $99, which is consistent with our DCF valuation and target price.
McDonald's Corp.Sum-of-the-parts analysis -- 2015E
ALLOCATION OF PROFIT BY OPERATING AND REGIONAL SEGMENTSUS Europe APMEA/Other MCD
in millions 2015E 2015E 2015E 2015E
Restaurant profi t $702 $1,041 $660 $2,404
Franchise income, net $3,562 $2,290 $1,453 $7,306
Total operating profi t, before SG&A $4,265 $3,331 $2,113 $9,709
SG&A a l location % by region 40% 35% 25% 100%
SG&A a l location $ by region $1,010 $883 $631 $2,524
Company-operated EBIT $204 $475 $236 $915
Franchise EBIT $3,064 $1,986 $1,271 $6,321
Total EBIT $3,268 $2,460 $1,507 $7,236
% by segment 45% 34% 21%
D&A $549 $699 $416 $1,665
Company-operated EBITDA $479 $824 $444 $1,747
Franchise EBITDA $3,339 $2,335 $1,479 $7,153
Total EBITDA $3,817 $3,160 $1,924 $8,901
% by segment 43% 35% 22%
VALUATION ANALYSIS
Enterprise value-to-EBITDA US Europe APMEA/Other MCD
Company-operated EV/EBITDA 9.0x 9.0x 9.5x 9.1x
Franchise EV/EBITDA 13.0x 13.0x 13.0x 13.0x
Blended EV/EBITDA 12.5x 12.0x 12.2x 12.2x
Company-operated enterprise va lue $4,308.2 $7,418.7 $4,222.0 $15,948.9
Franchise enterprise va lue $43,402.8 $30,359.3 $19,229.1 $92,991.2
Total enterprise va lue $47,711.0 $37,778.0 $23,451.1 $108,940.1
Net debt $7,359.3 $3,174.6 $3,896.1 $14,429.9
Total value per share $42.38 $36.34 $20.54 $99
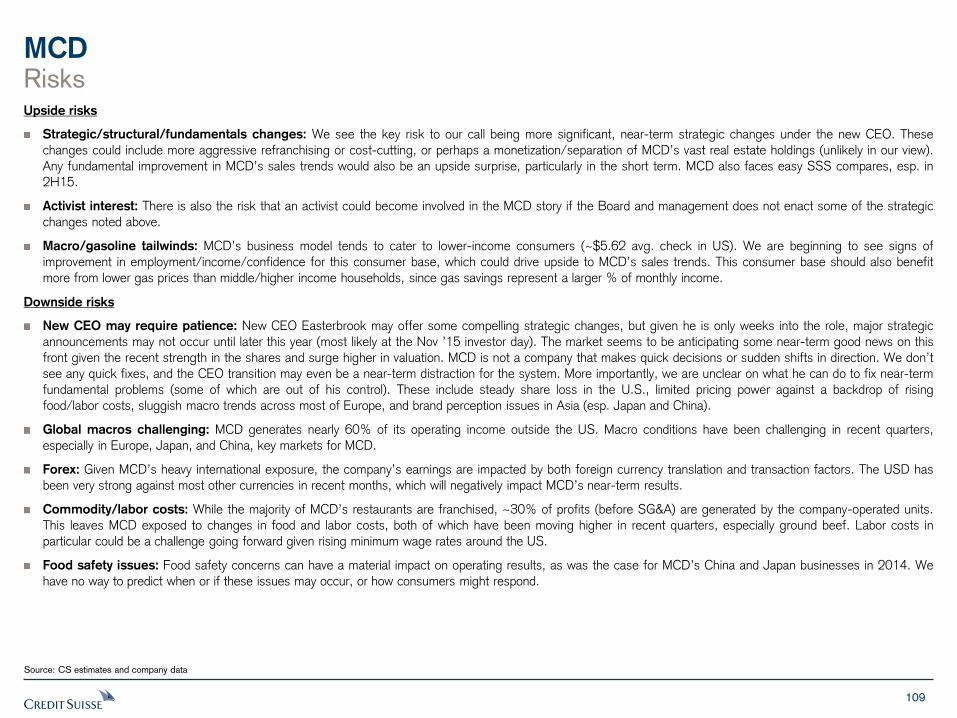
109
MCD Risks Upside risks
Strategic/structural/fundamentals changes: We see the key risk to our call being more significant, near-term strategic changes under the new CEO. These
changes could include more aggressive refranchising or cost-cutting, or perhaps a monetization/separation of MCD’s vast real estate holdings (unlikely in our view).
Any fundamental improvement in MCD’s sales trends would also be an upside surprise, particularly in the short term. MCD also faces easy SSS compares, esp. in
2H15.
Activist interest: There is also the risk that an activist could become involved in the MCD story if the Board and management does not enact some of the strategic
changes noted above.
Macro/gasoline tailwinds: MCD’s business model tends to cater to lower-income consumers (~$5.62 avg. check in US). We are beginning to see signs of
improvement in employment/income/confidence for this consumer base, which could drive upside to MCD’s sales trends. This consumer base should also benefit
more from lower gas prices than middle/higher income households, since gas savings represent a larger % of monthly income.
Downside risks
New CEO may require patience: New CEO Easterbrook may offer some compelling strategic changes, but given he is only weeks into the role, major strategic
announcements may not occur until later this year (most likely at the Nov ’15 investor day). The market seems to be anticipating some near-term good news on this
front given the recent strength in the shares and surge higher in valuation. MCD is not a company that makes quick decisions or sudden shifts in direction. We don’t
see any quick fixes, and the CEO transition may even be a near-term distraction for the system. More importantly, we are unclear on what he can do to fix near-term
fundamental problems (some of which are out of his control). These include steady share loss in the U.S., limited pricing power against a backdrop of rising
food/labor costs, sluggish macro trends across most of Europe, and brand perception issues in Asia (esp. Japan and China).
Global macros challenging: MCD generates nearly 60% of its operating income outside the US. Macro conditions have been challenging in recent quarters,
especially in Europe, Japan, and China, key markets for MCD.
Forex: Given MCD’s heavy international exposure, the company’s earnings are impacted by both foreign currency translation and transaction factors. The USD has
been very strong against most other currencies in recent months, which will negatively impact MCD’s near-term results.
Commodity/labor costs: While the majority of MCD’s restaurants are franchised, ~30% of profits (before SG&A) are generated by the company-operated units.
This leaves MCD exposed to changes in food and labor costs, both of which have been moving higher in recent quarters, especially ground beef. Labor costs in
particular could be a challenge going forward given rising minimum wage rates around the US.
Food safety issues: Food safety concerns can have a material impact on operating results, as was the case for MCD’s China and Japan businesses in 2014. We
have no way to predict when or if these issues may occur, or how consumers might respond.
Source: CS estimates and company data
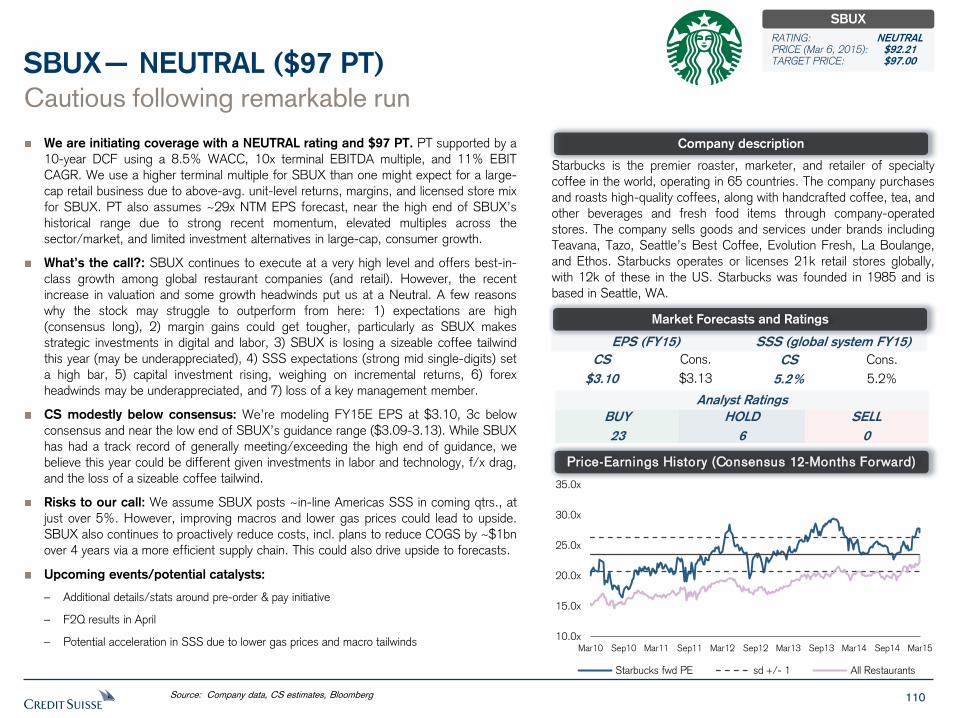
110
We are initiating coverage with a NEUTRAL rating and $97 PT. PT supported by a
10-year DCF using a 8.5% WACC, 10x terminal EBITDA multiple, and 11% EBIT
CAGR. We use a higher terminal multiple for SBUX than one might expect for a large-
cap retail business due to above-avg. unit-level returns, margins, and licensed store mix
for SBUX. PT also assumes ~29x NTM EPS forecast, near the high end of SBUX’s
historical range due to strong recent momentum, elevated multiples across the
sector/market, and limited investment alternatives in large-cap, consumer growth.
What’s the call?: SBUX continues to execute at a very high level and offers best-in-
class growth among global restaurant companies (and retail). However, the recent
increase in valuation and some growth headwinds put us at a Neutral. A few reasons
why the stock may struggle to outperform from here: 1) expectations are high
(consensus long), 2) margin gains could get tougher, particularly as SBUX makes
strategic investments in digital and labor, 3) SBUX is losing a sizeable coffee tailwind
this year (may be underappreciated), 4) SSS expectations (strong mid single-digits) set
a high bar, 5) capital investment rising, weighing on incremental returns, 6) forex
headwinds may be underappreciated, and 7) loss of a key management member.
CS modestly below consensus: We’re modeling FY15E EPS at $3.10, 3c below
consensus and near the low end of SBUX’s guidance range ($3.09-3.13). While SBUX
has had a track record of generally meeting/exceeding the high end of guidance, we
believe this year could be different given investments in labor and technology, f/x drag,
and the loss of a sizeable coffee tailwind.
Risks to our call: We assume SBUX posts ~in-line Americas SSS in coming qtrs., at
just over 5%. However, improving macros and lower gas prices could lead to upside.
SBUX also continues to proactively reduce costs, incl. plans to reduce COGS by ~$1bn
over 4 years via a more efficient supply chain. This could also drive upside to forecasts.
Upcoming events/potential catalysts:
– Additional details/stats around pre-order & pay initiative
– F2Q results in April
– Potential acceleration in SSS due to lower gas prices and macro tailwinds
Cautious following remarkable run
SBUX— NEUTRAL ($97 PT)
Starbucks is the premier roaster, marketer, and retailer of specialty
coffee in the world, operating in 65 countries. The company purchases
and roasts high-quality coffees, along with handcrafted coffee, tea, and
other beverages and fresh food items through company-operated
stores. The company sells goods and services under brands including
Teavana, Tazo, Seattle’s Best Coffee, Evolution Fresh, La Boulange,
and Ethos. Starbucks operates or licenses 21k retail stores globally,
with 12k of these in the US. Starbucks was founded in 1985 and is
based in Seattle, WA.
Source: Company data, CS estimates, Bloomberg
Company description
Price-Earnings History (Consensus 12-Months Forward)
EPS (FY15) SSS (global system FY15)
CS
$3.10
Cons.
$3.13
CS
5.2%
Cons.
5.2%
Analyst Ratings
BUY
23
SELL
0
HOLD
6
Market Forecasts and Ratings
SBUX
RATING: NEUTRAL PRICE (Mar 6, 2015): $92.21 TARGET PRICE: $97.00
10.0x
15.0x
20.0x
25.0x
30.0x
35.0x
Mar10 Sep10 Mar11 Sep11 Mar12 Sep12 Mar13 Sep13 Mar14 Sep14 Mar15
Starbucks fwd PE sd +/- 1 All Restaurants
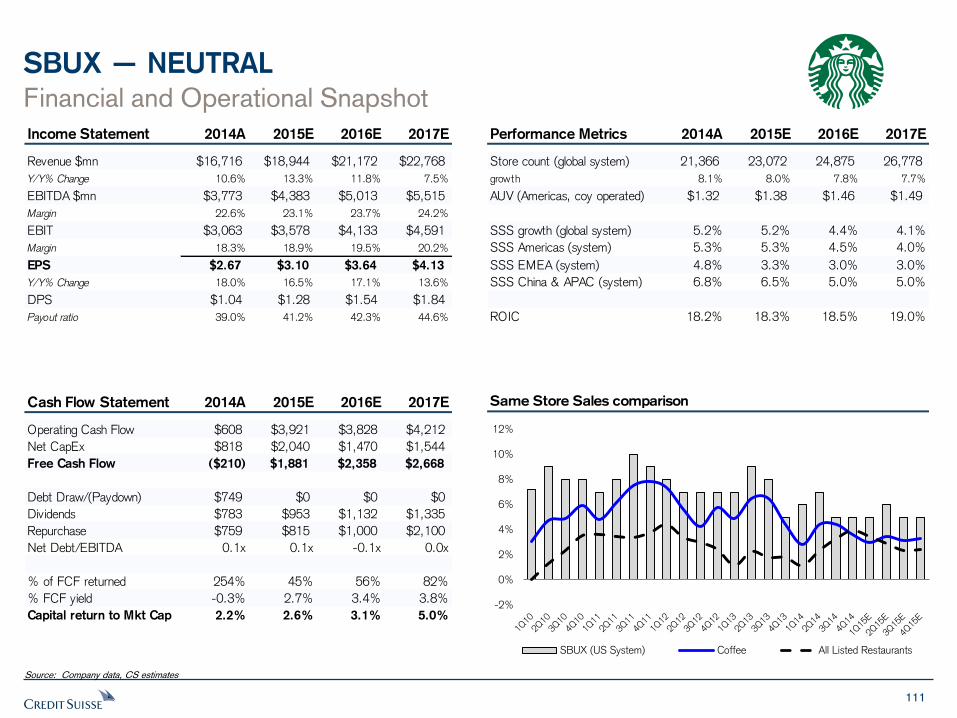
111
SBUX — NEUTRAL
Financial and Operational Snapshot
Source: Company data, CS estimates
Same Store Sales comparison
Income Statement 2014A 2015E 2016E 2017E
Revenue $mn $16,716 $18,944 $21,172 $22,768
Y/Y% Change 10.6% 13.3% 11.8% 7.5%
EBITDA $mn $3,773 $4,383 $5,013 $5,515
Margin 22.6% 23.1% 23.7% 24.2%
EBIT $3,063 $3,578 $4,133 $4,591
Margin 18.3% 18.9% 19.5% 20.2%
EPS $2.67 $3.10 $3.64 $4.13
Y/Y% Change 18.0% 16.5% 17.1% 13.6%
DPS $1.04 $1.28 $1.54 $1.84
Payout ratio 39.0% 41.2% 42.3% 44.6%
Performance Metrics 2014A 2015E 2016E 2017E
Store count (global system) 21,366 23,072 24,875 26,778
growth 8.1% 8.0% 7.8% 7.7%
AUV (Americas, coy operated) $1.32 $1.38 $1.46 $1.49
SSS growth (global system) 5.2% 5.2% 4.4% 4.1%
SSS Americas (system) 5.3% 5.3% 4.5% 4.0%
SSS EMEA (system) 4.8% 3.3% 3.0% 3.0%
SSS China & APAC (system) 6.8% 6.5% 5.0% 5.0%
ROIC 18.2% 18.3% 18.5% 19.0%
Cash Flow Statement 2014A 2015E 2016E 2017E
Operating Cash Flow $608 $3,921 $3,828 $4,212
Net CapEx $818 $2,040 $1,470 $1,544
Free Cash Flow ($210) $1,881 $2,358 $2,668
Debt Draw/(Paydown) $749 $0 $0 $0
Dividends $783 $953 $1,132 $1,335
Repurchase $759 $815 $1,000 $2,100
Net Debt/EBITDA 0.1x 0.1x -0.1x 0.0x
% of FCF returned 254% 45% 56% 82%
% FCF yield -0.3% 2.7% 3.4% 3.8%
Capital return to Mkt Cap 2.2% 2.6% 3.1% 5.0%-2%
0%
2%
4%
6%
8%
10%
12%
SBUX (US System) Coffee All Listed Restaurants
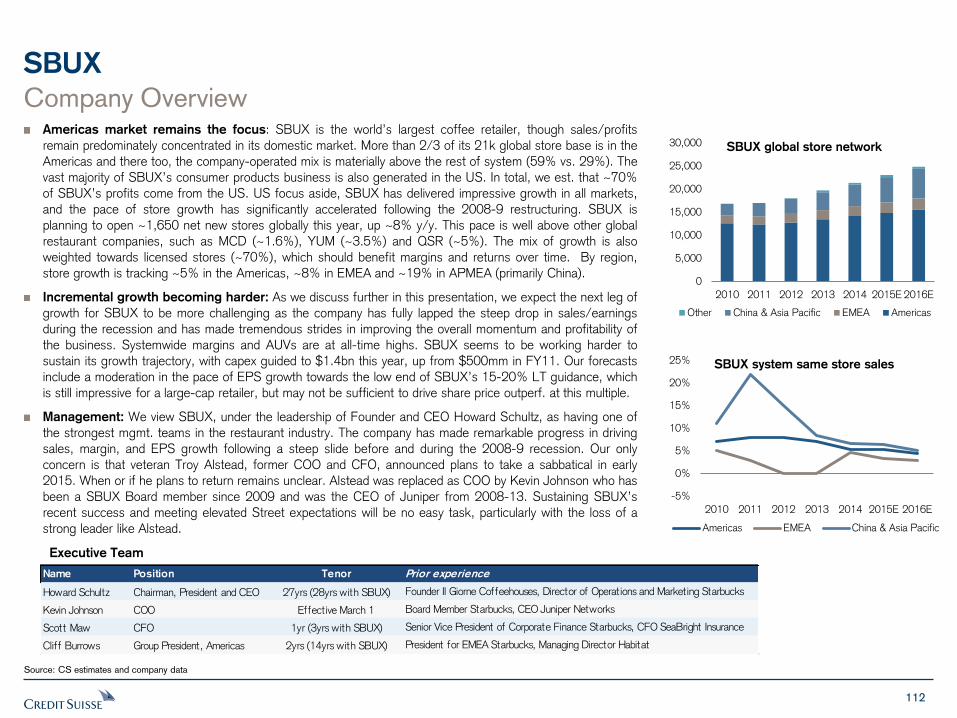
112
SBUX
Company Overview Americas market remains the focus: SBUX is the world’s largest coffee retailer, though sales/profits
remain predominately concentrated in its domestic market. More than 2/3 of its 21k global store base is in the
Americas and there too, the company-operated mix is materially above the rest of system (59% vs. 29%). The
vast majority of SBUX’s consumer products business is also generated in the US. In total, we est. that ~70%
of SBUX’s profits come from the US. US focus aside, SBUX has delivered impressive growth in all markets,
and the pace of store growth has significantly accelerated following the 2008-9 restructuring. SBUX is
planning to open ~1,650 net new stores globally this year, up ~8% y/y. This pace is well above other global
restaurant companies, such as MCD (~1.6%), YUM (~3.5%) and QSR (~5%). The mix of growth is also
weighted towards licensed stores (~70%), which should benefit margins and returns over time. By region,
store growth is tracking ~5% in the Americas, ~8% in EMEA and ~19% in APMEA (primarily China).
Incremental growth becoming harder: As we discuss further in this presentation, we expect the next leg of
growth for SBUX to be more challenging as the company has fully lapped the steep drop in sales/earnings
during the recession and has made tremendous strides in improving the overall momentum and profitability of
the business. Systemwide margins and AUVs are at all-time highs. SBUX seems to be working harder to
sustain its growth trajectory, with capex guided to $1.4bn this year, up from $500mm in FY11. Our forecasts
include a moderation in the pace of EPS growth towards the low end of SBUX’s 15-20% LT guidance, which
is still impressive for a large-cap retailer, but may not be sufficient to drive share price outperf. at this multiple.
Management: We view SBUX, under the leadership of Founder and CEO Howard Schultz, as having one of
the strongest mgmt. teams in the restaurant industry. The company has made remarkable progress in driving
sales, margin, and EPS growth following a steep slide before and during the 2008-9 recession. Our only
concern is that veteran Troy Alstead, former COO and CFO, announced plans to take a sabbatical in early
2015. When or if he plans to return remains unclear. Alstead was replaced as COO by Kevin Johnson who has
been a SBUX Board member since 2009 and was the CEO of Juniper from 2008-13. Sustaining SBUX’s
recent success and meeting elevated Street expectations will be no easy task, particularly with the loss of a
strong leader like Alstead.
Source: CS estimates and company data
Executive Team
Name Position Tenor Prior experience
Howard Schultz Chairman, President and CEO 27yrs (28yrs with SBUX) Founder Il Giorne Coffeehouses, Director of Operations and Marketing Starbucks
Kevin Johnson COO Effective March 1 Board Member Starbucks, CEO Juniper Networks
Scott Maw CFO 1yr (3yrs with SBUX) Senior Vice President of Corporate Finance Starbucks, CFO SeaBright Insurance
Cliff Burrows Group President, Americas 2yrs (14yrs with SBUX) President for EMEA Starbucks, Managing Director Habitat
0
5,000
10,000
15,000
20,000
25,000
30,000
2010 2011 2012 2013 2014 2015E 2016E
SBUX global store network
Other China & Asia Pacific EMEA Americas
-5%
0%
5%
10%
15%
20%
25%
2010 2011 2012 2013 2014 2015E 2016E
SBUX system same store sales
Americas EMEA China & Asia Pacific
113
SBUX
Source: CS estimates and company data
Cautious following remarkable run Why we’re more cautious going forward? SBUX continues to click on all cylinders. However, we see a few reasons why the stock may struggle to outperform from here:
1. Expectations are high (consensus long): Investors have flocked to the SBUX story as a best-in-class retail/consumer name, with a rock solid business model and visible growth. The stock has been a consensus long for some time and just “in line” results are likely not good enough to carry the shares materially higher. SBUX enjoys 23 Buy-equivalent ratings out of 29 sell side analysts, with 0 Sells. The stock trades at 27x NTM P/E, above the 3-year avg. of 25x and near the 3-year high. Street estimates call for 17% EPS growth in FY15 (high end of guidance range) and ~15% in FY16 (excluding extra week). However, with SBUX at peak AUVs and margins, growing at this pace will be a challenge.
2. Margin gains could get tougher: SBUX’s outlook call for ~10% organic revenue growth each year. (FY14 will reported revenue growth will be higher due to the Japan acquisition.) This means organic margins need to improve ~80bps per year to meet Street expectations on EPS growth. Clearly, SBUX’s mid single-digit SSS can go a long way to driving margin expansion. The company also works to continue to improve its cost efficiency, especially in the areas of supply chain and G&A. However, the company is also making significant investments in the retail labor base (beginning with a bump to wages and benefits in Jan ’15), mobile/digital, international, and other areas. Additionally, SBUX has high exposure to states with rising minimum wage rates, such as CA and NY. With margins already at all-time highs (18.6% EBIT margin in FY14; ~600bps
above pre-recession peak), we are concerned that achieving substantial further growth will be difficult.
3. Losing a sizeable coffee tailwind this year: SBUX cited a $115mm (70bps) tailwind to FY14 EBIT due to lower coffee prices last year. However, this figure is net of offsetting investments. We believe the actual coffee benefit was closer to ~$240mm (~150bps) pre-tax. This means that lower coffee prices benefited FY14 EPS by ~20c (+8%), rather than the ~10c discussed by mgmt. SBUX expects coffee prices to be approximately neutral in FY15, meaning SBUX will need to find other avenues of growth to replace the 8% coffee benefit from last year.
4. SSS expectations leave no room for error: SBUX’s core Americas segment (~73% of profits) continues to generate remarkably strong SSS in light of the size and maturity of this business (~14k restaurants, with 12k in the US). We see no reason that SBUX cannot sustain similar strength in the coming quarters, especially with a healthy macro backdrop and lower gas prices. However, hitting CS/consensus targets of ~+5-6% SSS will not be easy given difficult multi-year comparisons, and just meeting expectations may not be sufficient to carry the stock higher at these multiples. We also feel that investors are eagerly awaiting a sales lift from the pre-order and pre-pay (PREOP) functionality that SBUX is testing in Portland. We believe
the expectations around the PREOP initiative should be tempered since the functionality will not likely roll out until late calendar 2015
and since this functionality only works with the SBUX smartphone app. Currently, only 15% of orders are placed on the mobile app
and most of the PREOP orders will be from customers that were coming anyway. So, the incremental sales lift from this initiative is likely to be limited until later in calendar 2016 or 2017, as mobile app usage grows.
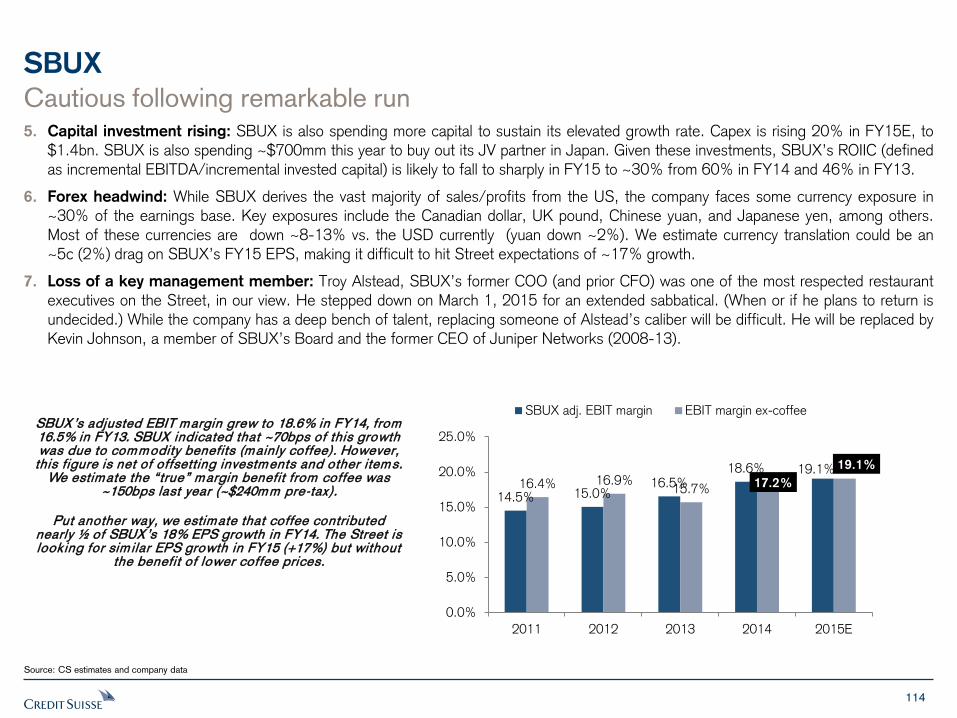
114
SBUX
Source: CS estimates and company data
Cautious following remarkable run 5. Capital investment rising: SBUX is also spending more capital to sustain its elevated growth rate. Capex is rising 20% in FY15E, to
$1.4bn. SBUX is also spending ~$700mm this year to buy out its JV partner in Japan. Given these investments, SBUX’s ROIIC (defined
as incremental EBITDA/incremental invested capital) is likely to fall to sharply in FY15 to ~30% from 60% in FY14 and 46% in FY13.
6. Forex headwind: While SBUX derives the vast majority of sales/profits from the US, the company faces some currency exposure in ~30% of the earnings base. Key exposures include the Canadian dollar, UK pound, Chinese yuan, and Japanese yen, among others.
Most of these currencies are down ~8-13% vs. the USD currently (yuan down ~2%). We estimate currency translation could be an ~5c (2%) drag on SBUX’s FY15 EPS, making it difficult to hit Street expectations of ~17% growth.
7. Loss of a key management member: Troy Alstead, SBUX’s former COO (and prior CFO) was one of the most respected restaurant executives on the Street, in our view. He stepped down on March 1, 2015 for an extended sabbatical. (When or if he plans to return is undecided.) While the company has a deep bench of talent, replacing someone of Alstead’s caliber will be difficult. He will be replaced by Kevin Johnson, a member of SBUX’s Board and the former CEO of Juniper Networks (2008-13).
14.5% 15.0% 16.5%
18.6% 19.1% 16.4% 16.9%
15.7% 17.2%
19.1%
0.0%
5.0%
10.0%
15.0%
20.0%
25.0%
2011 2012 2013 2014 2015E
SBUX adj. EBIT margin EBIT margin ex-coffeeSBUX’s adjusted EBIT margin grew to 18.6% in FY14, from 16.5% in FY13. SBUX indicated that ~70bps of this growth was due to commodity benefits (mainly coffee). However, this figure is net of offsetting investments and other items.
We estimate the “true” margin benefit from coffee was ~150bps last year (~$240mm pre-tax).
Put another way, we estimate that coffee contributed nearly ½ of SBUX’s 18% EPS growth in FY14. The Street is looking for sim ilar EPS growth in FY15 (+17%) but without
the benefit of lower coffee prices.
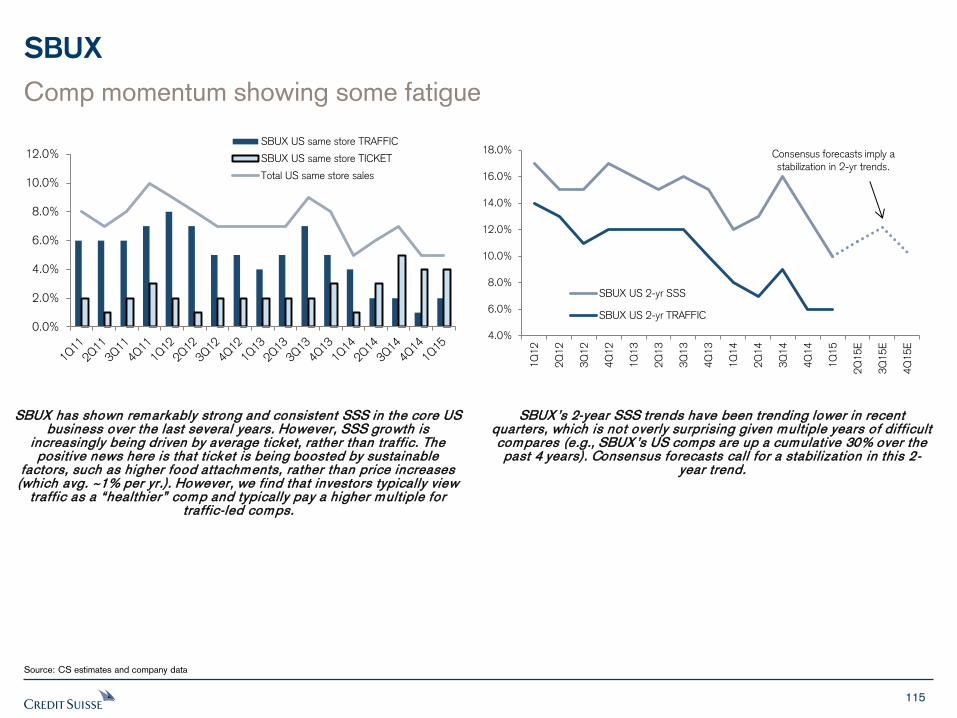
115
SBUX
Source: CS estimates and company data
SBUX has shown remarkably strong and consistent SSS in the core US business over the last several years. However, SSS growth is
increasingly being driven by average ticket, rather than traffic. The positive news here is that ticket is being boosted by sustainable
factors, such as higher food attachments, rather than price increases (which avg. ~1% per yr.). However, we find that investors typically view
traffic as a “healthier” comp and typically pay a higher multiple for traffic-led comps.
0.0%
2.0%
4.0%
6.0%
8.0%
10.0%
12.0%SBUX US same store TRAFFIC
SBUX US same store TICKET
Total US same store sales
4.0%
6.0%
8.0%
10.0%
12.0%
14.0%
16.0%
18.0%
1Q
12
2Q
12
3Q
12
4Q
12
1Q
13
2Q
13
3Q
13
4Q
13
1Q
14
2Q
14
3Q
14
4Q
14
1Q
15
2Q
15E
3Q
15E
4Q
15E
SBUX US 2-yr SSS
SBUX US 2-yr TRAFFIC
Consensus forecasts imply a stabilization in 2-yr trends.
SBUX’s 2-year SSS trends have been trending lower in recent quarters, which is not overly surprising given multiple years of difficult compares (e.g., SBUX’s US comps are up a cumulative 30% over the past 4 years). Consensus forecasts call for a stabilization in this 2-
year trend.
Comp momentum showing some fatigue
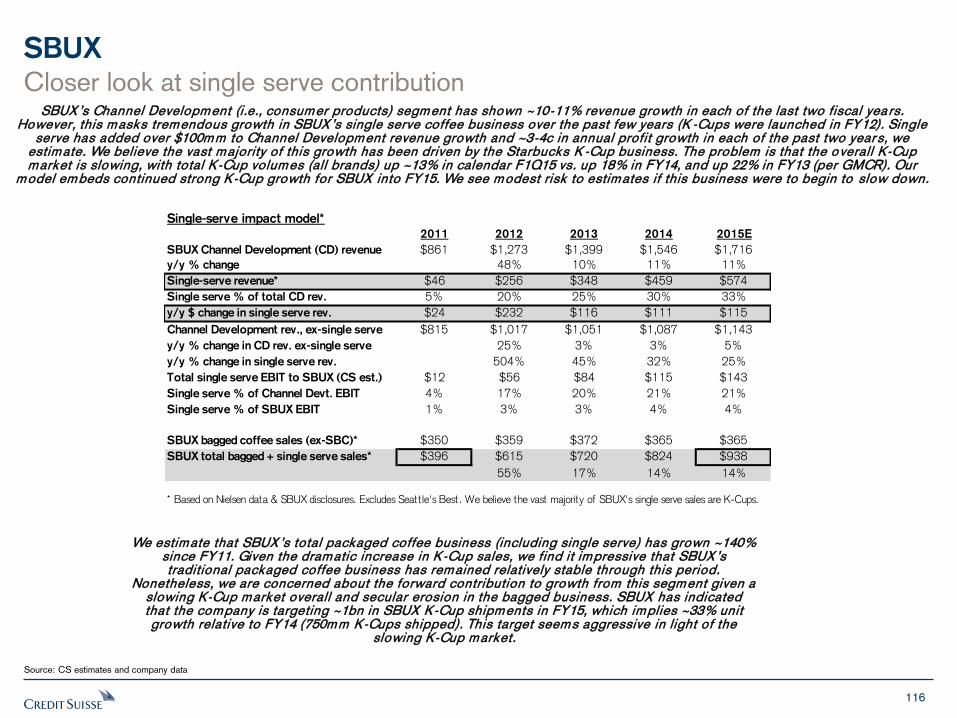
116
SBUX
Source: CS estimates and company data
SBUX’s Channel Development (i.e., consumer products) segment has shown ~10-11% revenue growth in each of the last two fiscal yea rs. However, this masks tremendous growth in SBUX’s single serve coffee business over the past few years (K -Cups were launched in FY12). Single
serve has added over $100mm to Channel Development revenue growth and ~3-4c in annual profit growth in each of the past two years, we estimate. We believe the vast majority of this growth has been driven by the Starbucks K -Cup business. The problem is that the overall K-Cup market is slowing, with total K-Cup volumes (all brands) up ~13% in calendar F1Q15 vs. up 18% in FY14, and up 22% in FY13 (per GMCR). Our
model embeds continued strong K-Cup growth for SBUX into FY15. We see modest risk to estimates if this business were to begin to slow down.
We estimate that SBUX’s total packaged coffee business (including single serve) has grown ~140% since FY11. Given the dramatic increase in K-Cup sales, we find it impressive that SBUX’s traditional packaged coffee business has remained relatively stable through this period.
Nonetheless, we are concerned about the forward contribution to growth from this segment given a slowing K-Cup market overall and secular erosion in the bagged business. SBUX has indicated that the company is targeting ~1bn in SBUX K-Cup shipments in FY15, which implies ~33% unit growth relative to FY14 (750mm K-Cups shipped). This target seems aggressive in light of the
slowing K-Cup market.
Closer look at single serve contribution
Single-serve impact model*
2011 2012 2013 2014 2015E
SBUX Channel Development (CD) revenue $861 $1,273 $1,399 $1,546 $1,716
y/y % change 48% 10% 11% 11%
Single-serve revenue* $46 $256 $348 $459 $574
Single serve % of total CD rev. 5% 20% 25% 30% 33%
y/y $ change in single serve rev. $24 $232 $116 $111 $115
Channel Development rev., ex-single serve $815 $1,017 $1,051 $1,087 $1,143
y/y % change in CD rev. ex-single serve 25% 3% 3% 5%
y/y % change in single serve rev. 504% 45% 32% 25%
Total single serve EBIT to SBUX (CS est.) $12 $56 $84 $115 $143
Single serve % of Channel Devt. EBIT 4% 17% 20% 21% 21%
Single serve % of SBUX EBIT 1% 3% 3% 4% 4%
SBUX bagged coffee sales (ex-SBC)* $350 $359 $372 $365 $365
SBUX total bagged + single serve sales* $396 $615 $720 $824 $938
55% 17% 14% 14%
* Based on Nielsen data & SBUX disclosures. Excludes Seatt le's Best. We believe the vast majority of SBUX's single serve sales are K-Cups.
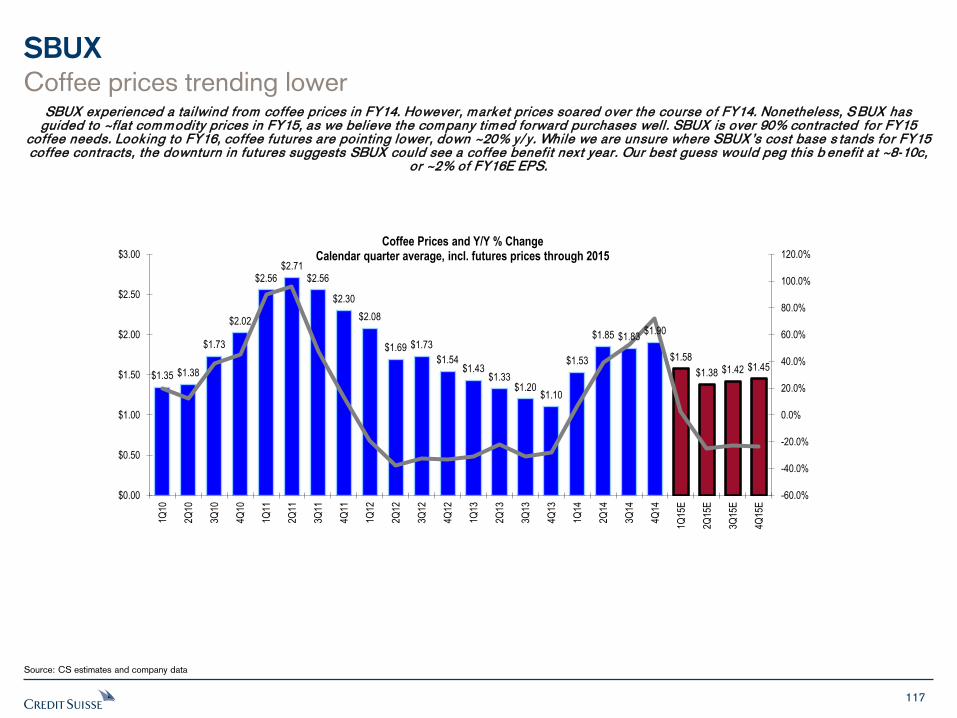
117
SBUX
Source: CS estimates and company data
Coffee prices trending lower SBUX experienced a tailwind from coffee prices in FY14. However, market prices soared over the course of FY14. Nonetheless, S BUX has
guided to ~flat commodity prices in FY15, as we believe the company timed forward purchases well. SBUX is over 90% contracted for FY15 coffee needs. Looking to FY16, coffee futures are pointing lower, down ~20% y/ y. While we are unsure where SBUX’s cost base s tands for FY15 coffee contracts, the downturn in futures suggests SBUX could see a coffee benefit next year. Our best guess would peg this b enefit at ~8-10c,
or ~2% of FY16E EPS.
$1.35 $1.38
$1.73
$2.02
$2.56 $2.71
$2.56
$2.30
$2.08
$1.69 $1.73
$1.54 $1.43
$1.33 $1.20
$1.10
$1.53
$1.85 $1.83 $1.90
$1.58
$1.38 $1.42 $1.45
-60.0%
-40.0%
-20.0%
0.0%
20.0%
40.0%
60.0%
80.0%
100.0%
120.0%
$0.00
$0.50
$1.00
$1.50
$2.00
$2.50
$3.00
1Q10
2Q10
3Q10
4Q10
1Q11
2Q11
3Q11
4Q11
1Q12
2Q12
3Q12
4Q12
1Q13
2Q13
3Q13
4Q13
1Q14
2Q14
3Q14
4Q14
1Q15
E
2Q15
E
3Q15
E
4Q15
E
Coffee Prices and Y/Y % Change Calendar quarter average, incl. futures prices through 2015
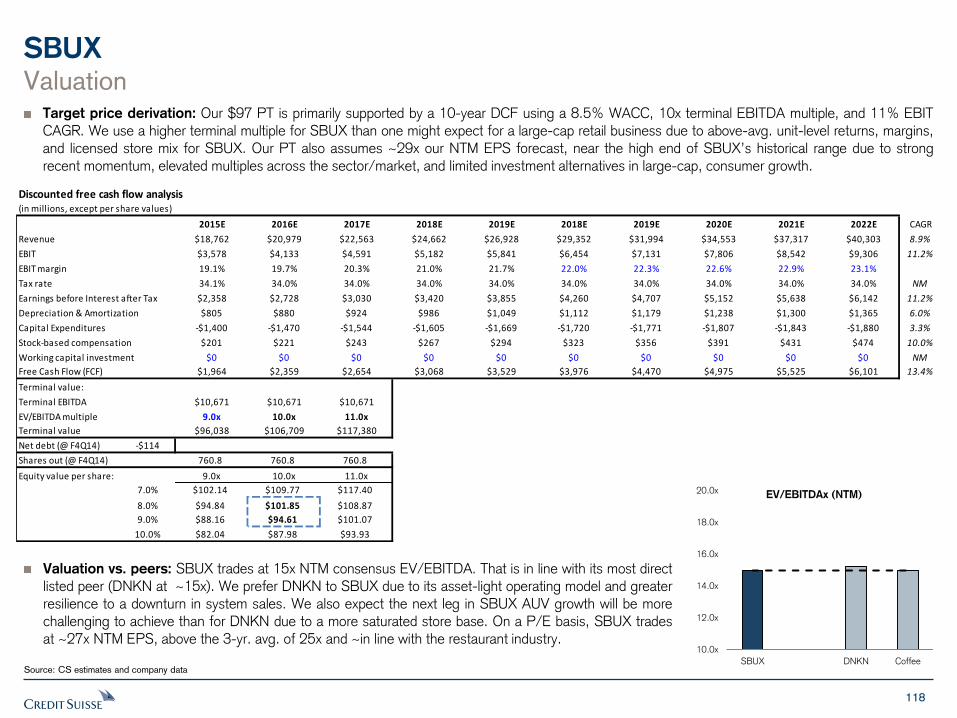
118
Discounted free cash flow analysis(in millions, except per share values)
2015E 2016E 2017E 2018E 2019E 2018E 2019E 2020E 2021E 2022E CAGR
Revenue $18,762 $20,979 $22,563 $24,662 $26,928 $29,352 $31,994 $34,553 $37,317 $40,303 8.9%
EBIT $3,578 $4,133 $4,591 $5,182 $5,841 $6,454 $7,131 $7,806 $8,542 $9,306 11.2%
EBIT margin 19.1% 19.7% 20.3% 21.0% 21.7% 22.0% 22.3% 22.6% 22.9% 23.1%
Tax rate 34.1% 34.0% 34.0% 34.0% 34.0% 34.0% 34.0% 34.0% 34.0% 34.0% NM
Earnings before Interest after Tax $2,358 $2,728 $3,030 $3,420 $3,855 $4,260 $4,707 $5,152 $5,638 $6,142 11.2%
Depreciation & Amortization $805 $880 $924 $986 $1,049 $1,112 $1,179 $1,238 $1,300 $1,365 6.0%
Capital Expenditures -$1,400 -$1,470 -$1,544 -$1,605 -$1,669 -$1,720 -$1,771 -$1,807 -$1,843 -$1,880 3.3%
Stock-based compensation $201 $221 $243 $267 $294 $323 $356 $391 $431 $474 10.0%
Working capital investment $0 $0 $0 $0 $0 $0 $0 $0 $0 $0 NM
Free Cash Flow (FCF) $1,964 $2,359 $2,654 $3,068 $3,529 $3,976 $4,470 $4,975 $5,525 $6,101 13.4%
Terminal value:
Terminal EBITDA $10,671 $10,671 $10,671
EV/EBITDA multiple 9.0x 10.0x 11.0x
Terminal value $96,038 $106,709 $117,380
Net debt (@ F4Q14) -$114
Shares out (@ F4Q14) 760.8 760.8 760.8
Equity value per share: 9.0x 10.0x 11.0x
7.0% $102.14 $109.77 $117.40
8.0% $94.84 $101.85 $108.87
9.0% $88.16 $94.61 $101.07
10.0% $82.04 $87.98 $93.93
SBUX
Source: CS estimates and company data
Valuation Target price derivation: Our $97 PT is primarily supported by a 10-year DCF using a 8.5% WACC, 10x terminal EBITDA multiple, and 11% EBIT CAGR. We use a higher terminal multiple for SBUX than one might expect for a large-cap retail business due to above-avg. unit-level returns, margins, and licensed store mix for SBUX. Our PT also assumes ~29x our NTM EPS forecast, near the high end of SBUX’s historical range due to strong recent momentum, elevated multiples across the sector/market, and limited investment alternatives in large-cap, consumer growth.
Valuation vs. peers: SBUX trades at 15x NTM consensus EV/EBITDA. That is in line with its most direct listed peer (DNKN at ~15x). We prefer DNKN to SBUX due to its asset-light operating model and greater resilience to a downturn in system sales. We also expect the next leg in SBUX AUV growth will be more challenging to achieve than for DNKN due to a more saturated store base. On a P/E basis, SBUX trades at ~27x NTM EPS, above the 3-yr. avg. of 25x and ~in line with the restaurant industry.
10.0x
12.0x
14.0x
16.0x
18.0x
20.0x
SBUX DNKN Coffee
EV/EBITDAx (NTM)
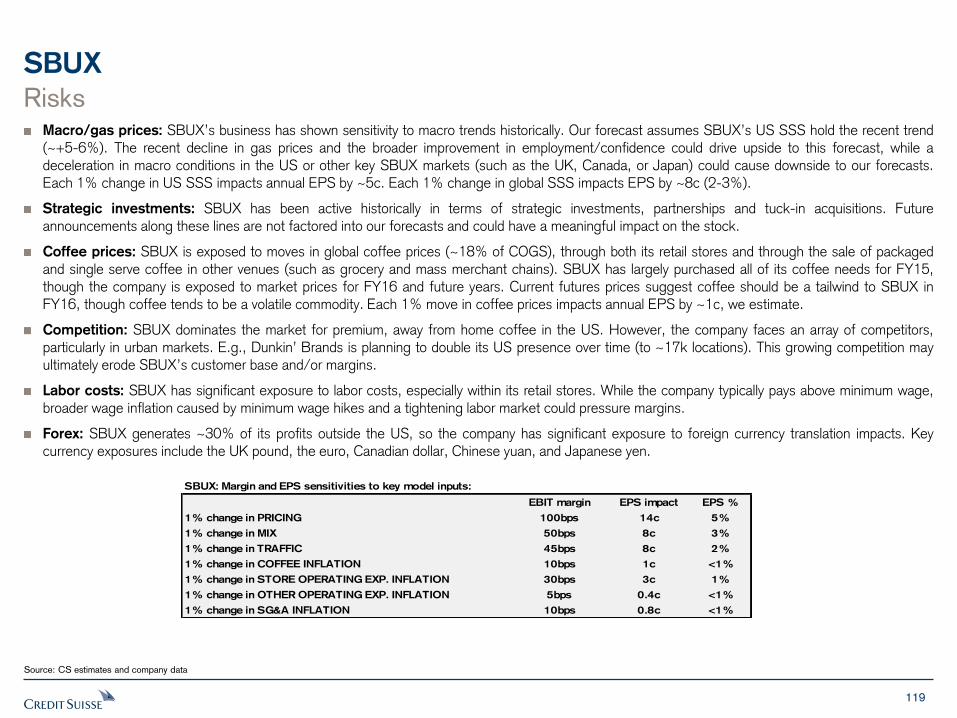
119
SBUX
Source: CS estimates and company data
Risks Macro/gas prices: SBUX’s business has shown sensitivity to macro trends historically. Our forecast assumes SBUX’s US SSS hold the recent trend (~+5-6%). The recent decline in gas prices and the broader improvement in employment/confidence could drive upside to this forecast, while a deceleration in macro conditions in the US or other key SBUX markets (such as the UK, Canada, or Japan) could cause downside to our forecasts. Each 1% change in US SSS impacts annual EPS by ~5c. Each 1% change in global SSS impacts EPS by ~8c (2-3%).
Strategic investments: SBUX has been active historically in terms of strategic investments, partnerships and tuck-in acquisitions. Future announcements along these lines are not factored into our forecasts and could have a meaningful impact on the stock.
Coffee prices: SBUX is exposed to moves in global coffee prices (~18% of COGS), through both its retail stores and through the sale of packaged and single serve coffee in other venues (such as grocery and mass merchant chains). SBUX has largely purchased all of its coffee needs for FY15, though the company is exposed to market prices for FY16 and future years. Current futures prices suggest coffee should be a tailwind to SBUX in FY16, though coffee tends to be a volatile commodity. Each 1% move in coffee prices impacts annual EPS by ~1c, we estimate.
Competition: SBUX dominates the market for premium, away from home coffee in the US. However, the company faces an array of competitors, particularly in urban markets. E.g., Dunkin’ Brands is planning to double its US presence over time (to ~17k locations). This growing competition may ultimately erode SBUX’s customer base and/or margins.
Labor costs: SBUX has significant exposure to labor costs, especially within its retail stores. While the company typically pays above minimum wage, broader wage inflation caused by minimum wage hikes and a tightening labor market could pressure margins.
Forex: SBUX generates ~30% of its profits outside the US, so the company has significant exposure to foreign currency translation impacts. Key currency exposures include the UK pound, the euro, Canadian dollar, Chinese yuan, and Japanese yen.
SBUX: Margin and EPS sensitivities to key model inputs:
EBIT margin EPS impact EPS %
1% change in PRICING 100bps 14c 5%
1% change in MIX 50bps 8c 3%
1% change in TRAFFIC 45bps 8c 2%
1% change in COFFEE INFLATION 10bps 1c <1%
1% change in STORE OPERATING EXP. INFLATION 30bps 3c 1%
1% change in OTHER OPERATING EXP. INFLATION 5bps 0.4c <1%
1% change in SG&A INFLATION 10bps 0.8c <1%
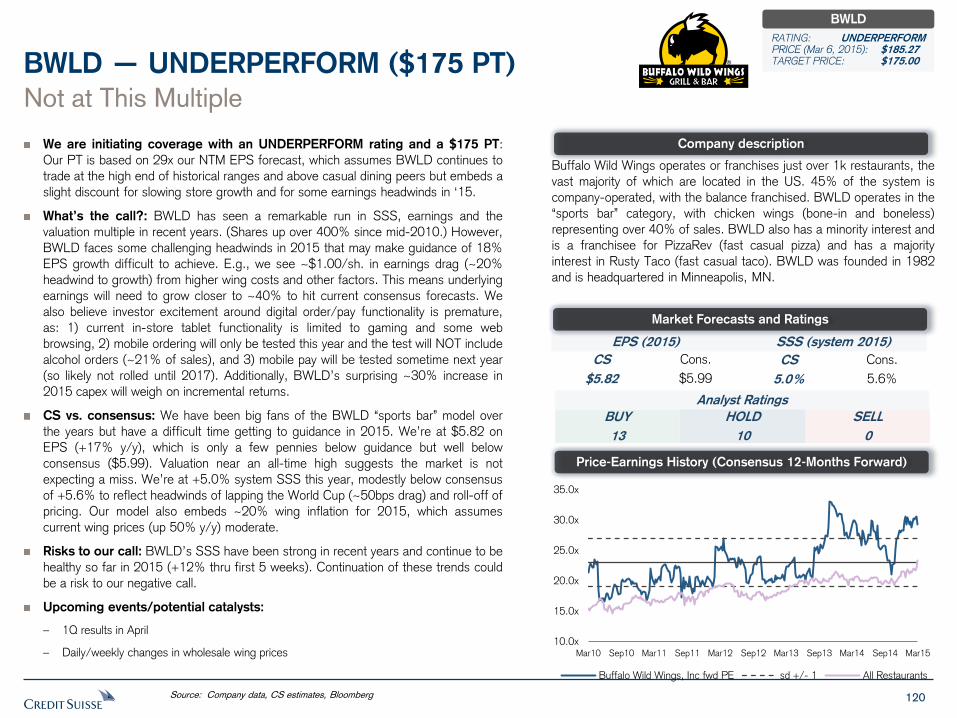
120
We are initiating coverage with an UNDERPERFORM rating and a $175 PT:
Our PT is based on 29x our NTM EPS forecast, which assumes BWLD continues to
trade at the high end of historical ranges and above casual dining peers but embeds a
slight discount for slowing store growth and for some earnings headwinds in ‘15.
What’s the call?: BWLD has seen a remarkable run in SSS, earnings and the
valuation multiple in recent years. (Shares up over 400% since mid-2010.) However,
BWLD faces some challenging headwinds in 2015 that may make guidance of 18%
EPS growth difficult to achieve. E.g., we see ~$1.00/sh. in earnings drag (~20%
headwind to growth) from higher wing costs and other factors. This means underlying
earnings will need to grow closer to ~40% to hit current consensus forecasts. We
also believe investor excitement around digital order/pay functionality is premature,
as: 1) current in-store tablet functionality is limited to gaming and some web
browsing, 2) mobile ordering will only be tested this year and the test will NOT include
alcohol orders (~21% of sales), and 3) mobile pay will be tested sometime next year
(so likely not rolled until 2017). Additionally, BWLD’s surprising ~30% increase in
2015 capex will weigh on incremental returns.
CS vs. consensus: We have been big fans of the BWLD “sports bar” model over
the years but have a difficult time getting to guidance in 2015. We’re at $5.82 on
EPS (+17% y/y), which is only a few pennies below guidance but well below
consensus ($5.99). Valuation near an all-time high suggests the market is not
expecting a miss. We’re at +5.0% system SSS this year, modestly below consensus
of +5.6% to reflect headwinds of lapping the World Cup (~50bps drag) and roll-off of
pricing. Our model also embeds ~20% wing inflation for 2015, which assumes
current wing prices (up 50% y/y) moderate.
Risks to our call: BWLD’s SSS have been strong in recent years and continue to be
healthy so far in 2015 (+12% thru first 5 weeks). Continuation of these trends could
be a risk to our negative call.
Upcoming events/potential catalysts:
– 1Q results in April
– Daily/weekly changes in wholesale wing prices
Not at This Multiple
BWLD — UNDERPERFORM ($175 PT)
Buffalo Wild Wings operates or franchises just over 1k restaurants, the
vast majority of which are located in the US. 45% of the system is
company-operated, with the balance franchised. BWLD operates in the
“sports bar” category, with chicken wings (bone-in and boneless)
representing over 40% of sales. BWLD also has a minority interest and
is a franchisee for PizzaRev (fast casual pizza) and has a majority
interest in Rusty Taco (fast casual taco). BWLD was founded in 1982
and is headquartered in Minneapolis, MN.
Source: Company data, CS estimates, Bloomberg
Company description
Price-Earnings History (Consensus 12-Months Forward)
EPS (2015) SSS (system 2015)
CS
$5.82
Cons.
$5.99
CS
5.0%
Cons.
5.6%
Analyst Ratings
BUY
13
SELL
0
HOLD
10
Market Forecasts and Ratings
BWLD
RATING: UNDERPERFORM PRICE (Mar 6, 2015): $185.27 TARGET PRICE: $175.00
10.0x
15.0x
20.0x
25.0x
30.0x
35.0x
Mar10 Sep10 Mar11 Sep11 Mar12 Sep12 Mar13 Sep13 Mar14 Sep14 Mar15
Buffalo Wild Wings, Inc fwd PE sd +/- 1 All Restaurants
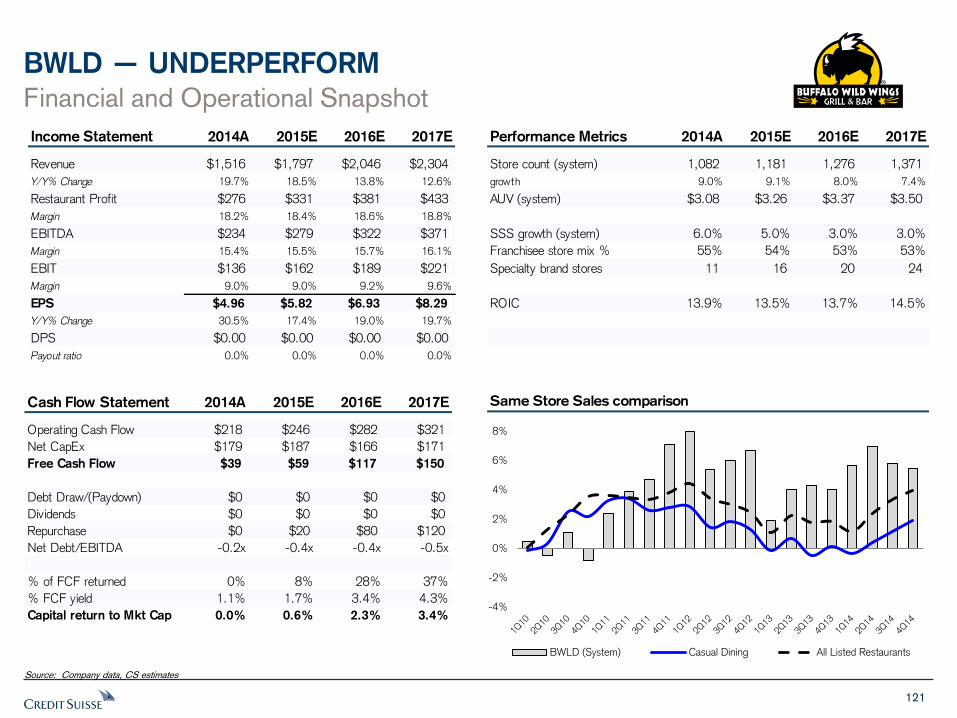
121
BWLD — UNDERPERFORM
Financial and Operational Snapshot
Source: Company data, CS estimates
Same Store Sales comparison
Income Statement 2014A 2015E 2016E 2017E
Revenue $1,516 $1,797 $2,046 $2,304
Y/Y% Change 19.7% 18.5% 13.8% 12.6%
Restaurant Profit $276 $331 $381 $433
Margin 18.2% 18.4% 18.6% 18.8%
EBITDA $234 $279 $322 $371
Margin 15.4% 15.5% 15.7% 16.1%
EBIT $136 $162 $189 $221
Margin 9.0% 9.0% 9.2% 9.6%
EPS $4.96 $5.82 $6.93 $8.29
Y/Y% Change 30.5% 17.4% 19.0% 19.7%
DPS $0.00 $0.00 $0.00 $0.00
Payout ratio 0.0% 0.0% 0.0% 0.0%
Performance Metrics 2014A 2015E 2016E 2017E
Store count (system) 1,082 1,181 1,276 1,371
growth 9.0% 9.1% 8.0% 7.4%
AUV (system) $3.08 $3.26 $3.37 $3.50
SSS growth (system) 6.0% 5.0% 3.0% 3.0%
Franchisee store mix % 55% 54% 53% 53%
Specialty brand stores 11 16 20 24
ROIC 13.9% 13.5% 13.7% 14.5%
Cash Flow Statement 2014A 2015E 2016E 2017E
Operating Cash Flow $218 $246 $282 $321
Net CapEx $179 $187 $166 $171
Free Cash Flow $39 $59 $117 $150
Debt Draw/(Paydown) $0 $0 $0 $0
Dividends $0 $0 $0 $0
Repurchase $0 $20 $80 $120
Net Debt/EBITDA -0.2x -0.4x -0.4x -0.5x
% of FCF returned 0% 8% 28% 37%
% FCF yield 1.1% 1.7% 3.4% 4.3%
Capital return to Mkt Cap 0.0% 0.6% 2.3% 3.4%-4%
-2%
0%
2%
4%
6%
8%
BWLD (System) Casual Dining All Listed Restaurants
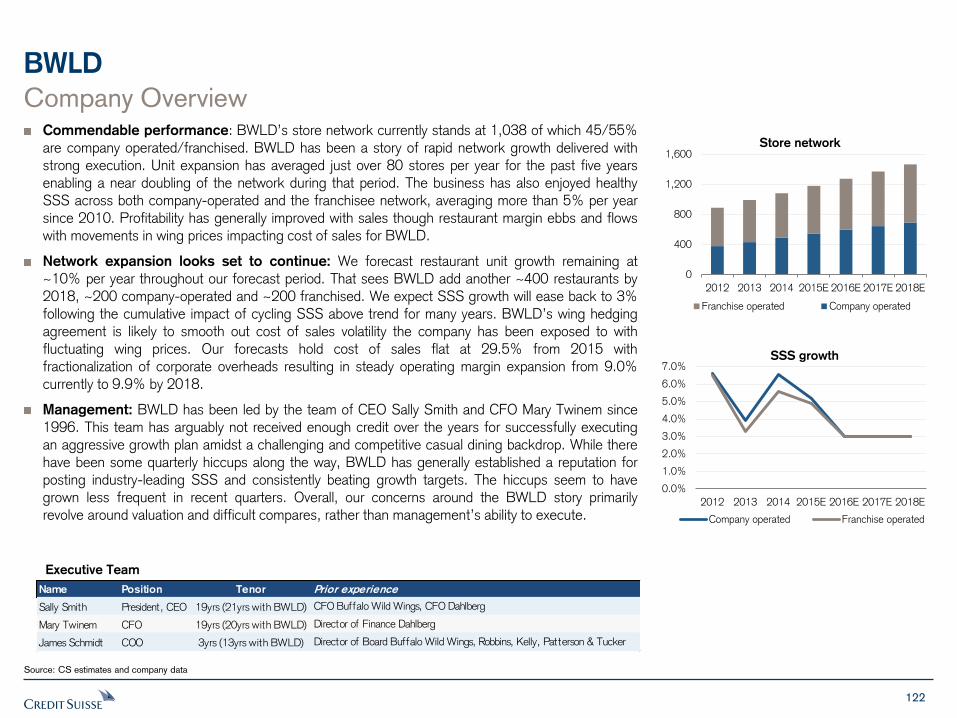
122
BWLD
Company Overview Commendable performance: BWLD’s store network currently stands at 1,038 of which 45/55% are company operated/franchised. BWLD has been a story of rapid network growth delivered with strong execution. Unit expansion has averaged just over 80 stores per year for the past five years enabling a near doubling of the network during that period. The business has also enjoyed healthy SSS across both company-operated and the franchisee network, averaging more than 5% per year since 2010. Profitability has generally improved with sales though restaurant margin ebbs and flows with movements in wing prices impacting cost of sales for BWLD.
Network expansion looks set to continue: We forecast restaurant unit growth remaining at ~10% per year throughout our forecast period. That sees BWLD add another ~400 restaurants by 2018, ~200 company-operated and ~200 franchised. We expect SSS growth will ease back to 3% following the cumulative impact of cycling SSS above trend for many years. BWLD’s wing hedging agreement is likely to smooth out cost of sales volatility the company has been exposed to with fluctuating wing prices. Our forecasts hold cost of sales flat at 29.5% from 2015 with fractionalization of corporate overheads resulting in steady operating margin expansion from 9.0% currently to 9.9% by 2018.
Management: BWLD has been led by the team of CEO Sally Smith and CFO Mary Twinem since 1996. This team has arguably not received enough credit over the years for successfully executing an aggressive growth plan amidst a challenging and competitive casual dining backdrop. While there have been some quarterly hiccups along the way, BWLD has generally established a reputation for posting industry-leading SSS and consistently beating growth targets. The hiccups seem to have grown less frequent in recent quarters. Overall, our concerns around the BWLD story primarily revolve around valuation and difficult compares, rather than management’s ability to execute.
Source: CS estimates and company data
Executive Team
Name Position Tenor Prior experience
Sally Smith President, CEO 19yrs (21yrs with BWLD) CFO Buffalo Wild Wings, CFO Dahlberg
Mary Twinem CFO 19yrs (20yrs with BWLD) Director of Finance Dahlberg
James Schmidt COO 3yrs (13yrs with BWLD) Director of Board Buffalo Wild Wings, Robbins, Kelly, Patterson & Tucker
0
400
800
1,200
1,600
2012 2013 2014 2015E 2016E 2017E 2018E
Store network
Franchise operated Company operated
0.0%
1.0%
2.0%
3.0%
4.0%
5.0%
6.0%
7.0%
2012 2013 2014 2015E 2016E 2017E 2018E
SSS growth
Company operated Franchise operated
123
BWLD
Not at This Multiple Solid execution but valuation is stretched: BWLD shares have increased over 400% since mid-2010, as the co. has been a big beneficiary of the growing popularity of sports in the U.S., particularly football. SSS have averaged +5.2% over the past 4 years, 510bps above the Knapp-Track casual dining average. EPS growth has averaged 24% over that time. BWLD has executed well and has taken advantage of a favorable consumer dynamics. However, we have a hard time getting excited at these valuations. Valuation sits near an all-time high, with BWLD trading at 30x our NTM EPS estimate, above the 3-yr. avg. of ~25x and the LT avg. of ~23x. (The all-time high = ~33x.) This valuation seems to embed further EPS upside potential in coming quarters. However, we are concerned that BWLD may have a difficult time just meeting consensus expectations this year, and we note that overall top-line growth is likely to slow as the core concept approaches maturity.
Over $1.00/share (-20%) earnings headwinds in 2015: BWLD faces some challenging headwinds in 2015 that may make guidance of 18% EPS growth difficult to achieve. These drags include: ~-$0.70 from higher wing costs (based on a Credit Suisse forecast of ~$1.84/lb. wing cost for the yr., up 19%), ~-$0.15 from lapping the World Cup SSS benefit (2Q/3Q), and ~-$0.22 from a higher tax rate (assuming Federal tax credits are not renewed for 2015). Combined, these factors add up to just over $1.00 in earnings drag, or ~20% of 2014 EPS. This means underlying earnings will need to grow closer to ~40% to hit current consensus forecasts, calling for 21% EPS growth this year (guidance = +18%). BWLD’s menu price increase of ~3.4% for the year should go a long way toward offsetting these headwinds. However, BWLD may have a difficult time sustaining its beat & raise track record, which is part of the reason the stock trades at such an elevated multiple. In other words, the market is likely already embedding some EPS upside potential this year, although this seems less likely to occur than in prior years. We are modeling 2015 EPS at $5.82, up ~17% y/y.
Unit growth is slowing: The law of large numbers is beginning to catch up with BWLD as the base of assets gets larger. There are now just over 1k BWLD units in the U.S. & Canada. This makes BWLD the 3rd largest casual dining chain in North America, behind Applebee’s and Chili’s. Very few casual dining chains show much growth beyond the 1k store footprint. BWLD has targeted ~1,700 units in the U.S. & Canada over the long term. At the current pace of ~90 net new units/yr., the company is likely to approach this target in the next ~7 yrs. While BWLD is beginning to establish an international franchise pipeline and has dabbled in some start-up brands (Rusty Taco and PizzaRev), it remains unclear what will carry the growth story once BWLD hits saturation. These two start-up brands are also a significant departure from BWLD’s core competency (sports bars), leaving us less confident in management’s ability to turn these into national chains.
Source: CS estimates and company data
124
BWLD
Not at This Multiple Unit-economics are good, not great – we prefer CMG over BWLD: BWLD’s new unit economics are not particularly compelling. For example, the typical cash ROI on a new unit is ~23%. This compares to ~70% for CMG. On a rent-adjusted basis, BWLD’s new unit ROIs are ~20% (vs. ~41% for CMG). CMG is also growing faster (~12% annual unit growth vs. ~9% for BWLD) and has a longer runway to grow. However, the valuations on the two stocks are relatively similar, with CMG trading at a NTM P/E multiple of ~36x vs. BWLD at ~30x. BWLD’s ROIC is also likely to take a material step back in 2015 due to a surprising 30% increase in planned capex spend (due to slightly higher store openings and a significant increase in remodel spending). We are modeling BWLD’s ROIC to fall to 13.2% in 2015 vs. 14.0% in 2014. Declining ROIC often leads to multiple compression.
SSS remain strong, but it gets tougher from here: BWLD’s 1Q15 SSS are off to a very strong start, at +11.9%/+11.1% for company/franchised restaurants for the first 5 weeks of the qtr. However, we believe there was an ~190bps timing benefit in those figures related to NCAA bowl games. Comparisons also get ~300bps tougher over the rest of the qtr and BWLD will be lapping some major sporting events from 2014, incl. the Winter Olympics and World Cup. We believe the World Cup helped both 2Q and 3Q14 SSS by ~100bps each.
Tablet opportunity may be overblown in the near term: Digital technologies, such as mobile ordering and tabletop tablets, are currently an important theme in the restaurant space. BWLD may be in a better position than most casual dining chains to utilize these technologies, given the interactive nature of the BWLD experience and the heavy mix of apps/alcohol (add-ons are easier with tablets). However, investors may be getting prematurely excited about this opportunity for BWLD. While the company has now rolled out tabletop tablets to most company locations and ~70% of system wide locations, the functionality is currently limited to games and some web browsing (no order or pay capabilities). The company is testing tablet ordering in certain markets this year, but this will not allow for alcohol ordering due to regulatory restrictions. Tablet payment will not be available this year and is unlikely to be tested until late in the year or 2016. Thus, without ordering or payment functions, we don’t expect to see much benefit from tablets before the 2H of 2016.
Source: CS estimates and company data
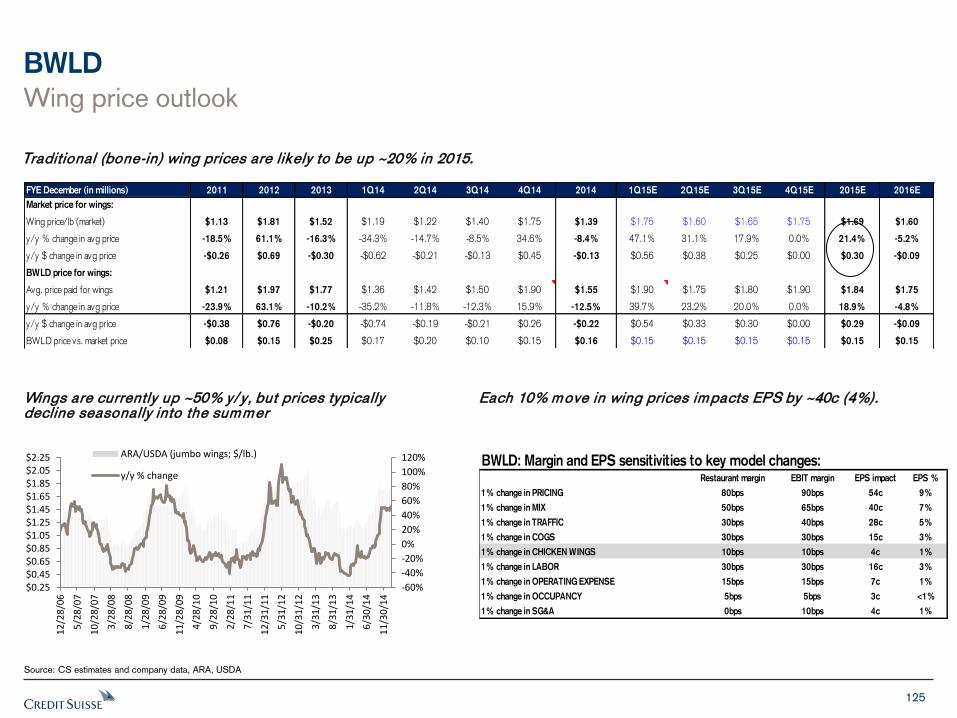
125
BWLD
Source: CS estimates and company data, ARA, USDA
Wing price outlook
FYE December (in millions) 2011 2012 2013 1Q14 2Q14 3Q14 4Q14 2014 1Q15E 2Q15E 3Q15E 4Q15E 2015E 2016E
Market price for wings:
Wing price/lb (market) $1.13 $1.81 $1.52 $1.19 $1.22 $1.40 $1.75 $1.39 $1.75 $1.60 $1.65 $1.75 $1.69 $1.60
y/y % change in avg price -18.5% 61.1% -16.3% -34.3% -14.7% -8.5% 34.6% -8.4% 47.1% 31.1% 17.9% 0.0% 21.4% -5.2%
y/y $ change in avg price -$0.26 $0.69 -$0.30 -$0.62 -$0.21 -$0.13 $0.45 -$0.13 $0.56 $0.38 $0.25 $0.00 $0.30 -$0.09
BWLD price for wings:
Avg. price paid for wings $1.21 $1.97 $1.77 $1.36 $1.42 $1.50 $1.90 $1.55 $1.90 $1.75 $1.80 $1.90 $1.84 $1.75
y/y % change in avg price -23.9% 63.1% -10.2% -35.2% -11.8% -12.3% 15.9% -12.5% 39.7% 23.2% 20.0% 0.0% 18.9% -4.8%
y/y $ change in avg price -$0.38 $0.76 -$0.20 -$0.74 -$0.19 -$0.21 $0.26 -$0.22 $0.54 $0.33 $0.30 $0.00 $0.29 -$0.09
BWLD price vs. market price $0.08 $0.15 $0.25 $0.17 $0.20 $0.10 $0.15 $0.16 $0.15 $0.15 $0.15 $0.15 $0.15 $0.15
BWLD: Margin and EPS sensitivities to key model changes:Restaurant margin EBIT margin EPS impact EPS %
1% change in PRICING 80bps 90bps 54c 9%
1% change in MIX 50bps 65bps 40c 7%
1% change in TRAFFIC 30bps 40bps 28c 5%
1% change in COGS 30bps 30bps 15c 3%
1% change in CHICKEN WINGS 10bps 10bps 4c 1%
1% change in LABOR 30bps 30bps 16c 3%
1% change in OPERATING EXPENSE 15bps 15bps 7c 1%
1% change in OCCUPANCY 5bps 5bps 3c <1%
1% change in SG&A 0bps 10bps 4c 1%
Each 10% move in wing prices impacts EPS by ~40c (4%). Wings are currently up ~50% y/ y, but prices typically decline seasonally into the summer
Traditional (bone-in) wing prices are likely to be up ~20% in 2015.
-60%
-40%
-20%
0%
20%
40%
60%
80%
100%
120%
$0.25$0.45$0.65$0.85$1.05$1.25$1.45$1.65$1.85$2.05$2.25
12
/28
/06
5/2
8/0
7
10
/28
/07
3/2
8/0
8
8/2
8/0
8
1/2
8/0
9
6/2
8/0
9
11
/28
/09
4/2
8/1
0
9/2
8/1
0
2/2
8/1
1
7/3
1/1
1
12
/31
/11
5/3
1/1
2
10
/31
/12
3/3
1/1
3
8/3
1/1
3
1/3
1/1
4
6/3
0/1
4
11
/30
/14
ARA/USDA (jumbo wings; $/lb.)
y/y % change
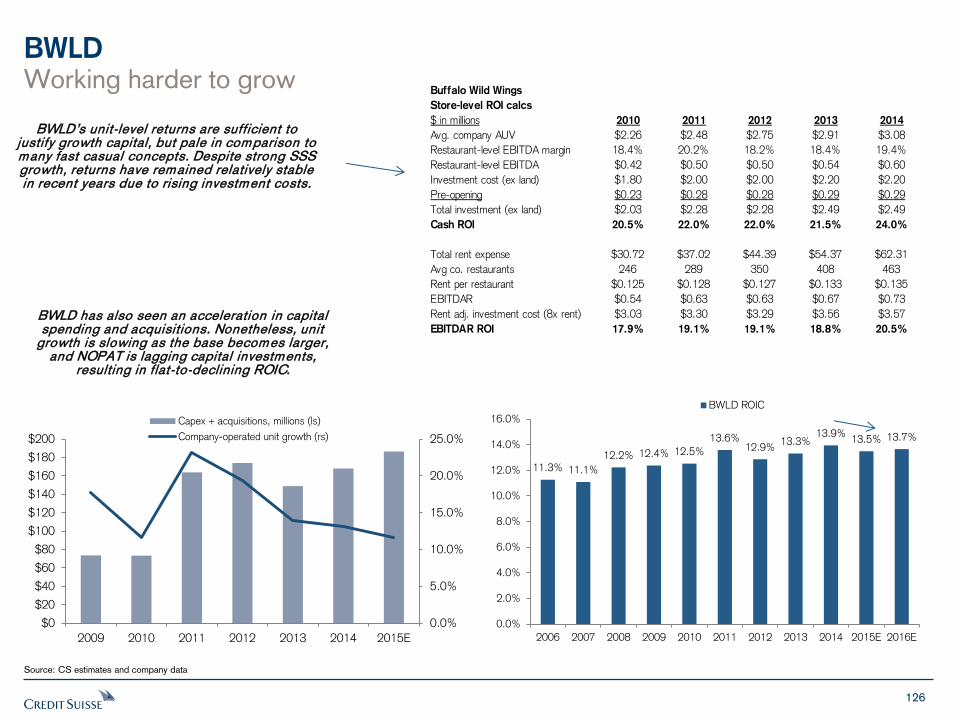
126
BWLD
Source: CS estimates and company data
BWLD’s unit-level returns are sufficient to justify growth capital, but pale in comparison to many fast casual concepts. Despite strong SSS growth, returns have remained relatively stable in recent years due to rising investment costs.
Buffalo Wild Wings
Store-level ROI calcs
$ in millions 2010 2011 2012 2013 2014
Avg. company AUV $2.26 $2.48 $2.75 $2.91 $3.08
Restaurant-level EBITDA margin 18.4% 20.2% 18.2% 18.4% 19.4%
Restaurant-level EBITDA $0.42 $0.50 $0.50 $0.54 $0.60
Investment cost (ex land) $1.80 $2.00 $2.00 $2.20 $2.20
Pre-opening $0.23 $0.28 $0.28 $0.29 $0.29
Total investment (ex land) $2.03 $2.28 $2.28 $2.49 $2.49
Cash ROI 20.5% 22.0% 22.0% 21.5% 24.0%
Total rent expense $30.72 $37.02 $44.39 $54.37 $62.31
Avg co. restaurants 246 289 350 408 463
Rent per restaurant $0.125 $0.128 $0.127 $0.133 $0.135
EBITDAR $0.54 $0.63 $0.63 $0.67 $0.73
Rent adj. investment cost (8x rent) $3.03 $3.30 $3.29 $3.56 $3.57
EBITDAR ROI 17.9% 19.1% 19.1% 18.8% 20.5%
11.3% 11.1%
12.2% 12.4% 12.5%
13.6% 12.9%
13.3% 13.9%
13.5% 13.7%
0.0%
2.0%
4.0%
6.0%
8.0%
10.0%
12.0%
14.0%
16.0%
2006 2007 2008 2009 2010 2011 2012 2013 2014 2015E 2016E
BWLD ROIC
0.0%
5.0%
10.0%
15.0%
20.0%
25.0%
$0
$20
$40
$60
$80
$100
$120
$140
$160
$180
$200
2009 2010 2011 2012 2013 2014 2015E
Capex + acquisitions, millions (ls)
Company-operated unit growth (rs)
BWLD has also seen an acceleration in capital spending and acquisitions. Nonetheless, unit
growth is slowing as the base becomes larger, and NOPAT is lagging capital investments,
resulting in flat-to-declining ROIC.
Working harder to grow
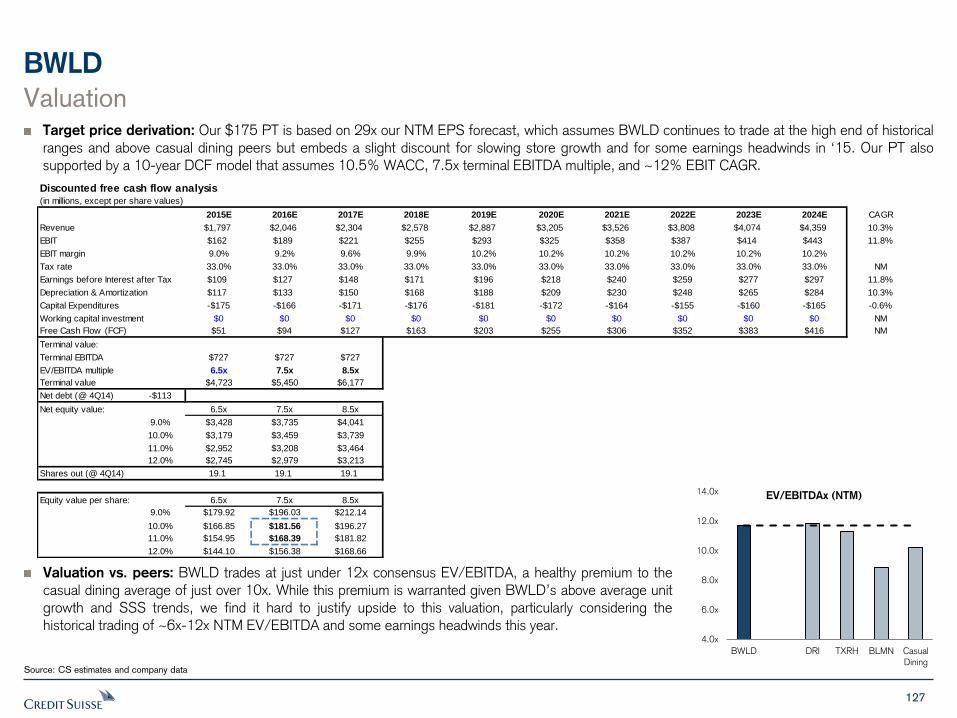
127
Discounted free cash flow analysis(in millions, except per share values)
2015E 2016E 2017E 2018E 2019E 2020E 2021E 2022E 2023E 2024E CAGR
Revenue $1,797 $2,046 $2,304 $2,578 $2,887 $3,205 $3,526 $3,808 $4,074 $4,359 10.3%
EBIT $162 $189 $221 $255 $293 $325 $358 $387 $414 $443 11.8%
EBIT margin 9.0% 9.2% 9.6% 9.9% 10.2% 10.2% 10.2% 10.2% 10.2% 10.2%
Tax rate 33.0% 33.0% 33.0% 33.0% 33.0% 33.0% 33.0% 33.0% 33.0% 33.0% NM
Earnings before Interest after Tax $109 $127 $148 $171 $196 $218 $240 $259 $277 $297 11.8%
Depreciation & Amortization $117 $133 $150 $168 $188 $209 $230 $248 $265 $284 10.3%
Capital Expenditures -$175 -$166 -$171 -$176 -$181 -$172 -$164 -$155 -$160 -$165 -0.6%
Working capital investment $0 $0 $0 $0 $0 $0 $0 $0 $0 $0 NM
Free Cash Flow (FCF) $51 $94 $127 $163 $203 $255 $306 $352 $383 $416 NM
Terminal value:
Terminal EBITDA $727 $727 $727
EV/EBITDA multiple 6.5x 7.5x 8.5x
Terminal value $4,723 $5,450 $6,177
Net debt (@ 4Q14) -$113
Net equity value: 6.5x 7.5x 8.5x
9.0% $3,428 $3,735 $4,041
10.0% $3,179 $3,459 $3,739
11.0% $2,952 $3,208 $3,464
12.0% $2,745 $2,979 $3,213
Shares out (@ 4Q14) 19.1 19.1 19.1
Equity value per share: 6.5x 7.5x 8.5x
9.0% $179.92 $196.03 $212.14
10.0% $166.85 $181.56 $196.27
11.0% $154.95 $168.39 $181.82
12.0% $144.10 $156.38 $168.66
BWLD
Source: CS estimates and company data
Valuation Target price derivation: Our $175 PT is based on 29x our NTM EPS forecast, which assumes BWLD continues to trade at the high end of historical ranges and above casual dining peers but embeds a slight discount for slowing store growth and for some earnings headwinds in ‘15. Our PT also supported by a 10-year DCF model that assumes 10.5% WACC, 7.5x terminal EBITDA multiple, and ~12% EBIT CAGR.
Valuation vs. peers: BWLD trades at just under 12x consensus EV/EBITDA, a healthy premium to the casual dining average of just over 10x. While this premium is warranted given BWLD’s above average unit growth and SSS trends, we find it hard to justify upside to this valuation, particularly considering the historical trading of ~6x-12x NTM EV/EBITDA and some earnings headwinds this year.
4.0x
6.0x
8.0x
10.0x
12.0x
14.0x
BWLD DRI TXRH BLMN Casual
Dining
EV/EBITDAx (NTM)
128
BWLD
Source: CS estimates and company data
Risks SSS momentum: As noted earlier, BWLD’s SSS have been strong in recent years and continue to be healthy so far in 2015. Continuation of these trends could be a risk to our negative call. The BWLD concept has had a steady track record of market share gains driven by: 1) favorable demographic/cultural trends around sports viewership, 2) limited competition in the branded sports bar space, 3) newer assets than many casual dining peers, and 4) solid execution. That said, the company faces difficult compares, so sustaining recent trends will be a challenge.
Macro/gasoline: BWLD has significant leverage to improvement in consumer spending, particularly for low- to middle-income consumers. Continued acceleration in macro trends, coupled with low gas prices, could result in upside to our forecasts.
Wing prices can be friend or foe: Wing prices are a key variable in the BWLD model and can be difficult to predict. Chicken in total represents over 40% of BWLD’s food cost basket, with bone-in wing purchases representing ~23% of COGS. BWLD has historically not hedged or contracted bone-in wing purchases, although it has put a collar in place for 2015 (which protects extreme highs and lows). Our outlook assumes some moderation in wing prices from recent levels but still averaging about 20% higher y/y in 2015. Each 10% move in this wing assumption affects annual EPS by nearly $0.40. BWLD is also exposed to other commodities, including ground beef, beer, and cheese.
Wage/benefits inflation: Wage and health care costs are generally on the rise. BWLD is likely to see increased pressure in these areas in the coming quarters, which may be difficult to pass on via pricing.
New unit sales & returns: The BWLD growth model is contingent upon significant new store openings for the foreseeable future. Any deterioration in new store metrics (such as sales, costs, or margins) could negatively impact the BWLD growth trajectory and valuation. BWLD must also be cognizant of cannibalization of existing stores as the new store openings proliferate.
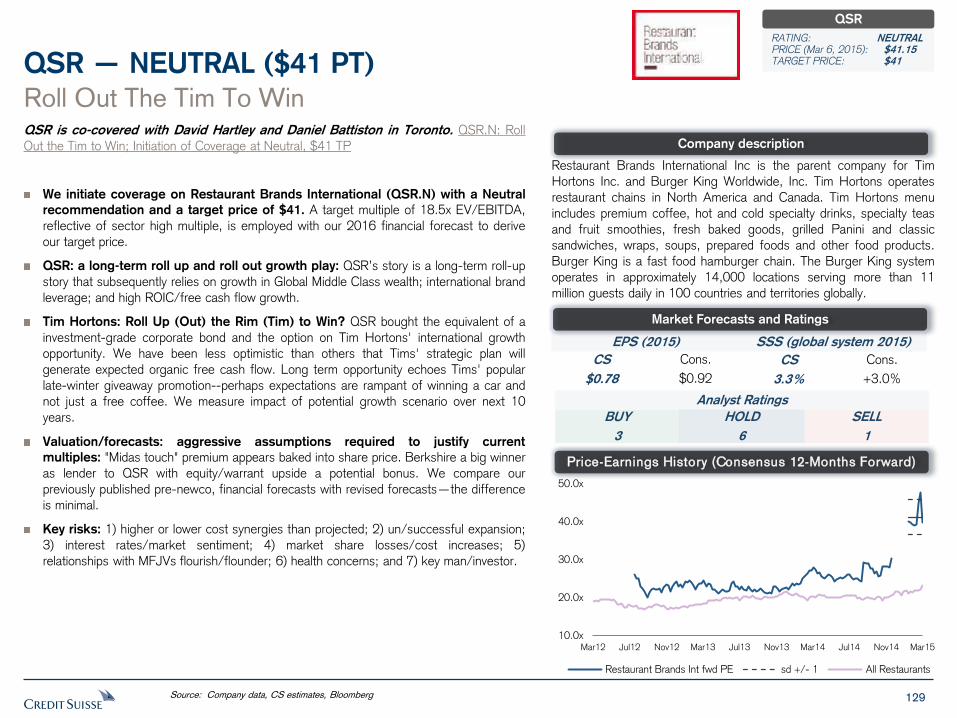
129
QSR is co-covered with David Hartley and Daniel Battiston in Toronto. QSR.N: Roll
Out the Tim to Win; Initiation of Coverage at Neutral, $41 TP
We initiate coverage on Restaurant Brands International (QSR.N) with a Neutral
recommendation and a target price of $41. A target multiple of 18.5x EV/EBITDA,
reflective of sector high multiple, is employed with our 2016 financial forecast to derive
our target price.
QSR: a long-term roll up and roll out growth play: QSR’s story is a long-term roll-up
story that subsequently relies on growth in Global Middle Class wealth; international brand
leverage; and high ROIC/free cash flow growth.
Tim Hortons: Roll Up (Out) the Rim (Tim) to Win? QSR bought the equivalent of a
investment-grade corporate bond and the option on Tim Hortons' international growth
opportunity. We have been less optimistic than others that Tims' strategic plan will
generate expected organic free cash flow. Long term opportunity echoes Tims' popular
late-winter giveaway promotion--perhaps expectations are rampant of winning a car and
not just a free coffee. We measure impact of potential growth scenario over next 10
years.
Valuation/forecasts: aggressive assumptions required to justify current
multiples: "Midas touch" premium appears baked into share price. Berkshire a big winner
as lender to QSR with equity/warrant upside a potential bonus. We compare our
previously published pre-newco, financial forecasts with revised forecasts—the difference
is minimal.
Key risks: 1) higher or lower cost synergies than projected; 2) un/successful expansion;
3) interest rates/market sentiment; 4) market share losses/cost increases; 5)
relationships with MFJVs flourish/flounder; 6) health concerns; and 7) key man/investor.
Roll Out The Tim To Win
QSR — NEUTRAL ($41 PT)
Restaurant Brands International Inc is the parent company for Tim
Hortons Inc. and Burger King Worldwide, Inc. Tim Hortons operates
restaurant chains in North America and Canada. Tim Hortons menu
includes premium coffee, hot and cold specialty drinks, specialty teas
and fruit smoothies, fresh baked goods, grilled Panini and classic
sandwiches, wraps, soups, prepared foods and other food products.
Burger King is a fast food hamburger chain. The Burger King system
operates in approximately 14,000 locations serving more than 11
million guests daily in 100 countries and territories globally.
Source: Company data, CS estimates, Bloomberg
Company description
Price-Earnings History (Consensus 12-Months Forward)
EPS (2015) SSS (global system 2015)
CS
$0.78
Cons.
$0.92
CS
3.3%
Cons.
+3.0%
Analyst Ratings
BUY
3
SELL
1
HOLD
6
Market Forecasts and Ratings
QSR
RATING: NEUTRAL PRICE (Mar 6, 2015): $41.15 TARGET PRICE: $41
10.0x
20.0x
30.0x
40.0x
50.0x
Mar12 Jul12 Nov12 Mar13 Jul13 Nov13 Mar14 Jul14 Nov14 Mar15
Restaurant Brands Int fwd PE sd +/- 1 All Restaurants
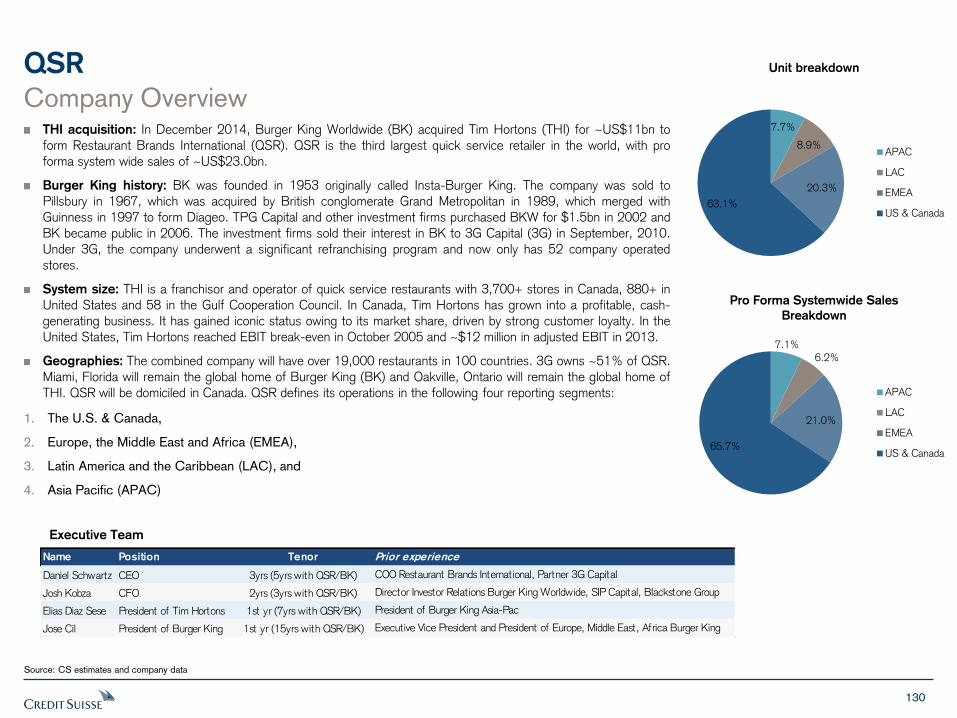
130
QSR
Company Overview THI acquisition: In December 2014, Burger King Worldwide (BK) acquired Tim Hortons (THI) for ~US$11bn to
form Restaurant Brands International (QSR). QSR is the third largest quick service retailer in the world, with pro
forma system wide sales of ~US$23.0bn.
Burger King history: BK was founded in 1953 originally called Insta-Burger King. The company was sold to
Pillsbury in 1967, which was acquired by British conglomerate Grand Metropolitan in 1989, which merged with
Guinness in 1997 to form Diageo. TPG Capital and other investment firms purchased BKW for $1.5bn in 2002 and
BK became public in 2006. The investment firms sold their interest in BK to 3G Capital (3G) in September, 2010.
Under 3G, the company underwent a significant refranchising program and now only has 52 company operated
stores.
System size: THI is a franchisor and operator of quick service restaurants with 3,700+ stores in Canada, 880+ in
United States and 58 in the Gulf Cooperation Council. In Canada, Tim Hortons has grown into a profitable, cash-
generating business. It has gained iconic status owing to its market share, driven by strong customer loyalty. In the
United States, Tim Hortons reached EBIT break-even in October 2005 and ~$12 million in adjusted EBIT in 2013.
Geographies: The combined company will have over 19,000 restaurants in 100 countries. 3G owns ~51% of QSR.
Miami, Florida will remain the global home of Burger King (BK) and Oakville, Ontario will remain the global home of
THI. QSR will be domiciled in Canada. QSR defines its operations in the following four reporting segments:
1. The U.S. & Canada,
2. Europe, the Middle East and Africa (EMEA),
3. Latin America and the Caribbean (LAC), and
4. Asia Pacific (APAC)
Source: CS estimates and company data
Executive Team
7.7%
8.9%
20.3%
63.1%
Unit breakdown
APAC
LAC
EMEA
US & Canada
7.1%
6.2%
21.0%
65.7%
Pro Forma Systemwide Sales
Breakdown
APAC
LAC
EMEA
US & Canada
Name Position Tenor Prior experience
Daniel Schwartz CEO 3yrs (5yrs with QSR/BK) COO Restaurant Brands International, Partner 3G Capital
Josh Kobza CFO 2yrs (3yrs with QSR/BK) Director Investor Relations Burger King Worldwide, SIP Capital, Blackstone Group
Elias Diaz Sese President of Tim Hortons 1st yr (7yrs with QSR/BK) President of Burger King Asia-Pac
Jose Cil President of Burger King 1st yr (15yrs with QSR/BK) Executive Vice President and President of Europe, Middle East, Africa Burger King
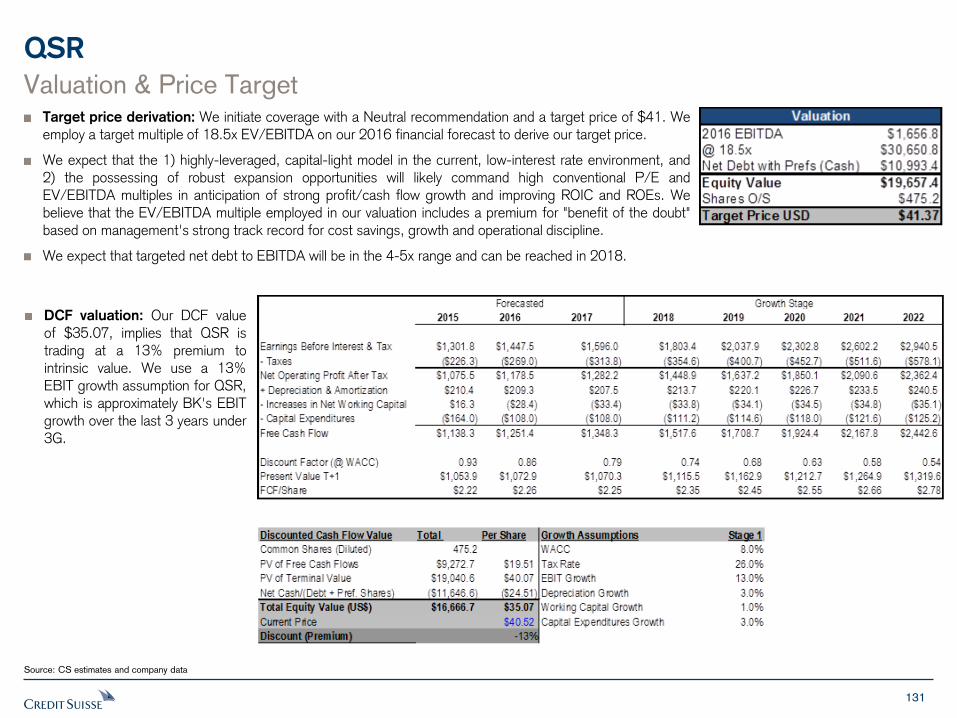
131
QSR
Source: CS estimates and company data
Valuation & Price Target Target price derivation: We initiate coverage with a Neutral recommendation and a target price of $41. We employ a target multiple of 18.5x EV/EBITDA on our 2016 financial forecast to derive our target price.
We expect that the 1) highly-leveraged, capital-light model in the current, low-interest rate environment, and 2) the possessing of robust expansion opportunities will likely command high conventional P/E and EV/EBITDA multiples in anticipation of strong profit/cash flow growth and improving ROIC and ROEs. We believe that the EV/EBITDA multiple employed in our valuation includes a premium for "benefit of the doubt" based on management's strong track record for cost savings, growth and operational discipline.
We expect that targeted net debt to EBITDA will be in the 4-5x range and can be reached in 2018.
DCF valuation: Our DCF value of $35.07, implies that QSR is trading at a 13% premium to intrinsic value. We use a 13% EBIT growth assumption for QSR, which is approximately BK's EBIT growth over the last 3 years under 3G.
132
QSR Risks
Upside/downside: growth of BK and Tims continues successfully/ unsuccessfully: The expansion of Tims successfully into the US and international markets is being bet on, but there are no assurances of success. Furthermore, expectations for average sales per unit are difficult to gauge for Tims based strength in Canada sales per unit vs. much weaker figures outside Canada. We believe that QSR management is also interested in acquiring other foodservice brands over time to franchise around the world. The opportunity could represent upside for QSR shareholders from a growth perspective, or it could be problematic if an acquisition adds too much debt and/or the corporation becomes too focused on one brand at the expense of another. We do not believe that QSR is in a position at this time to buy a meaningful foodservice brand that can be franchised globally, owing largely to debt capacity restrictions.
Interest rates/market environment sentiment: The market appears to favor high ROIC stories in such a low interest rate environment. Furthermore, fund flows is driving interest in consumer staples and discretionary stocks. A change in sentiment could be detrimental to the valuation of a stock like QSR. Also, should interest rates rise, financing costs would increase affecting earnings growth, and potentially capital decisions for those investing in QSR's brand growth.
Market share losses, cost increases: Losses of market share, particularly in large established markets for the company like the US and Canada, could be detrimental to the market's view of the stock. However, the company can mitigate some of this risk with increased diversification.
Relationships with MFJV flourish/flounder: The ability of the company to grow the brand relies in good part on its ability to convince partners to invest capital to grow the brand, and to drive growth and strong businesses at store level on an ongoing basis.
Health concerns: There have been health scares owing to tainted food products, such as that of Yum! Brands' experience with tainted chicken in China. The impact on the brand and sales can be very damaging.
Key man/investor: 3G has developed a reputation as successful investors. Should the company reduce its equity position or influence in managing QSR, it could create uncertainty for QSR's share price. Warren Buffett/Berkshire Hathaway's financial backing of the company via $3 billion in preferred shares and equity warrants (since converted to more than 8mm QSR shares) has, in our view, increased the confidence of investors for investing in QSR. Should Berkshire reduce or increase its position in the stock, it could affect the confidence of investors and therefore the share price.
Source: CS estimates and company data
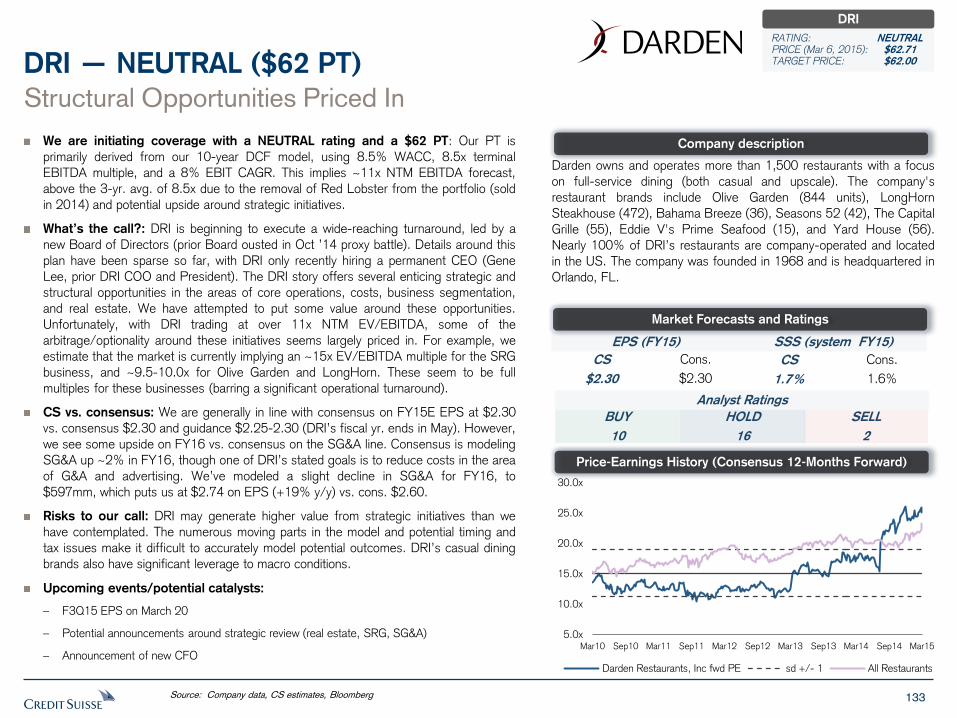
133
We are initiating coverage with a NEUTRAL rating and a $62 PT: Our PT is
primarily derived from our 10-year DCF model, using 8.5% WACC, 8.5x terminal
EBITDA multiple, and a 8% EBIT CAGR. This implies ~11x NTM EBITDA forecast,
above the 3-yr. avg. of 8.5x due to the removal of Red Lobster from the portfolio (sold
in 2014) and potential upside around strategic initiatives.
What’s the call?: DRI is beginning to execute a wide-reaching turnaround, led by a
new Board of Directors (prior Board ousted in Oct ’14 proxy battle). Details around this
plan have been sparse so far, with DRI only recently hiring a permanent CEO (Gene
Lee, prior DRI COO and President). The DRI story offers several enticing strategic and
structural opportunities in the areas of core operations, costs, business segmentation,
and real estate. We have attempted to put some value around these opportunities.
Unfortunately, with DRI trading at over 11x NTM EV/EBITDA, some of the
arbitrage/optionality around these initiatives seems largely priced in. For example, we
estimate that the market is currently implying an ~15x EV/EBITDA multiple for the SRG
business, and ~9.5-10.0x for Olive Garden and LongHorn. These seem to be full
multiples for these businesses (barring a significant operational turnaround).
CS vs. consensus: We are generally in line with consensus on FY15E EPS at $2.30
vs. consensus $2.30 and guidance $2.25-2.30 (DRI’s fiscal yr. ends in May). However,
we see some upside on FY16 vs. consensus on the SG&A line. Consensus is modeling
SG&A up ~2% in FY16, though one of DRI’s stated goals is to reduce costs in the area
of G&A and advertising. We’ve modeled a slight decline in SG&A for FY16, to
$597mm, which puts us at $2.74 on EPS (+19% y/y) vs. cons. $2.60.
Risks to our call: DRI may generate higher value from strategic initiatives than we
have contemplated. The numerous moving parts in the model and potential timing and
tax issues make it difficult to accurately model potential outcomes. DRI’s casual dining
brands also have significant leverage to macro conditions.
Upcoming events/potential catalysts:
– F3Q15 EPS on March 20
– Potential announcements around strategic review (real estate, SRG, SG&A)
– Announcement of new CFO
Structural Opportunities Priced In
DRI — NEUTRAL ($62 PT)
Darden owns and operates more than 1,500 restaurants with a focus
on full-service dining (both casual and upscale). The company's
restaurant brands include Olive Garden (844 units), LongHorn
Steakhouse (472), Bahama Breeze (36), Seasons 52 (42), The Capital
Grille (55), Eddie V's Prime Seafood (15), and Yard House (56).
Nearly 100% of DRI’s restaurants are company-operated and located
in the US. The company was founded in 1968 and is headquartered in
Orlando, FL.
Source: Company data, CS estimates, Bloomberg
Company description
Price-Earnings History (Consensus 12-Months Forward)
EPS (FY15) SSS (system FY15)
CS
$2.30
Cons.
$2.30
CS
1.7%
Cons.
1.6%
Analyst Ratings
BUY
10
SELL
2
HOLD
16
Market Forecasts and Ratings
DRI
RATING: NEUTRAL PRICE (Mar 6, 2015): $62.71 TARGET PRICE: $62.00
5.0x
10.0x
15.0x
20.0x
25.0x
30.0x
Mar10 Sep10 Mar11 Sep11 Mar12 Sep12 Mar13 Sep13 Mar14 Sep14 Mar15
Darden Restaurants, Inc fwd PE sd +/- 1 All Restaurants
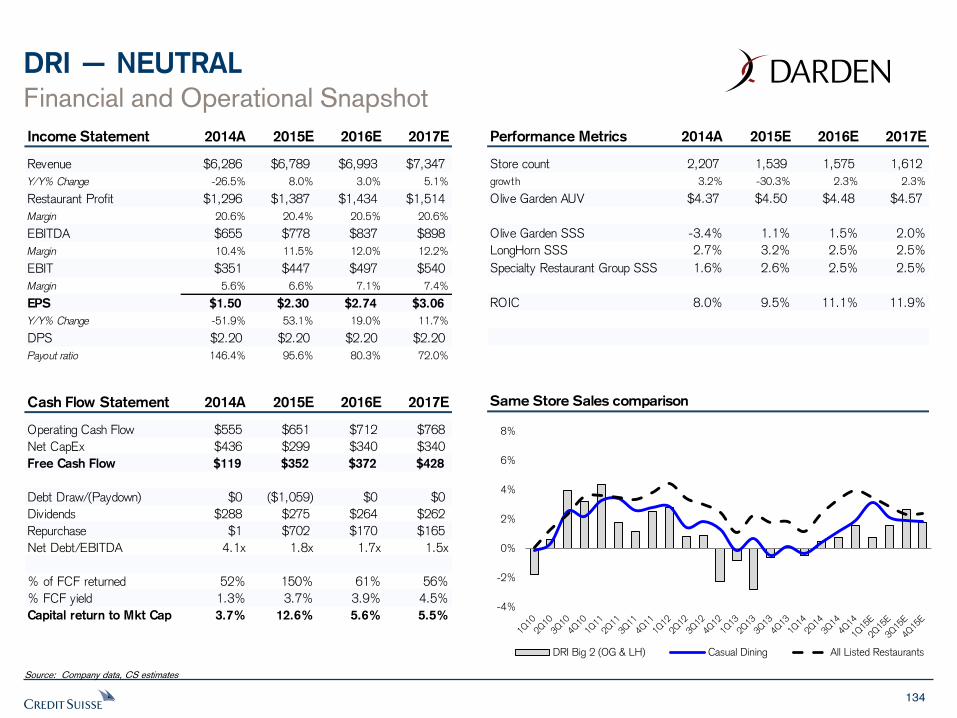
134
DRI — NEUTRAL
Financial and Operational Snapshot
Source: Company data, CS estimates
Same Store Sales comparison
Income Statement 2014A 2015E 2016E 2017E
Revenue $6,286 $6,789 $6,993 $7,347
Y/Y% Change -26.5% 8.0% 3.0% 5.1%
Restaurant Profit $1,296 $1,387 $1,434 $1,514
Margin 20.6% 20.4% 20.5% 20.6%
EBITDA $655 $778 $837 $898
Margin 10.4% 11.5% 12.0% 12.2%
EBIT $351 $447 $497 $540
Margin 5.6% 6.6% 7.1% 7.4%
EPS $1.50 $2.30 $2.74 $3.06
Y/Y% Change -51.9% 53.1% 19.0% 11.7%
DPS $2.20 $2.20 $2.20 $2.20
Payout ratio 146.4% 95.6% 80.3% 72.0%
Cash Flow Statement 2014A 2015E 2016E 2017E
Operating Cash Flow $555 $651 $712 $768
Net CapEx $436 $299 $340 $340
Free Cash Flow $119 $352 $372 $428
Debt Draw/(Paydown) $0 ($1,059) $0 $0
Dividends $288 $275 $264 $262
Repurchase $1 $702 $170 $165
Net Debt/EBITDA 4.1x 1.8x 1.7x 1.5x
% of FCF returned 52% 150% 61% 56%
% FCF yield 1.3% 3.7% 3.9% 4.5%
Capital return to Mkt Cap 3.7% 12.6% 5.6% 5.5%-4%
-2%
0%
2%
4%
6%
8%
DRI Big 2 (OG & LH) Casual Dining All Listed Restaurants
Performance Metrics 2014A 2015E 2016E 2017E
Store count 2,207 1,539 1,575 1,612
growth 3.2% -30.3% 2.3% 2.3%
Olive Garden AUV $4.37 $4.50 $4.48 $4.57
Olive Garden SSS -3.4% 1.1% 1.5% 2.0%
LongHorn SSS 2.7% 3.2% 2.5% 2.5%
Specialty Restaurant Group SSS 1.6% 2.6% 2.5% 2.5%
ROIC 8.0% 9.5% 11.1% 11.9%
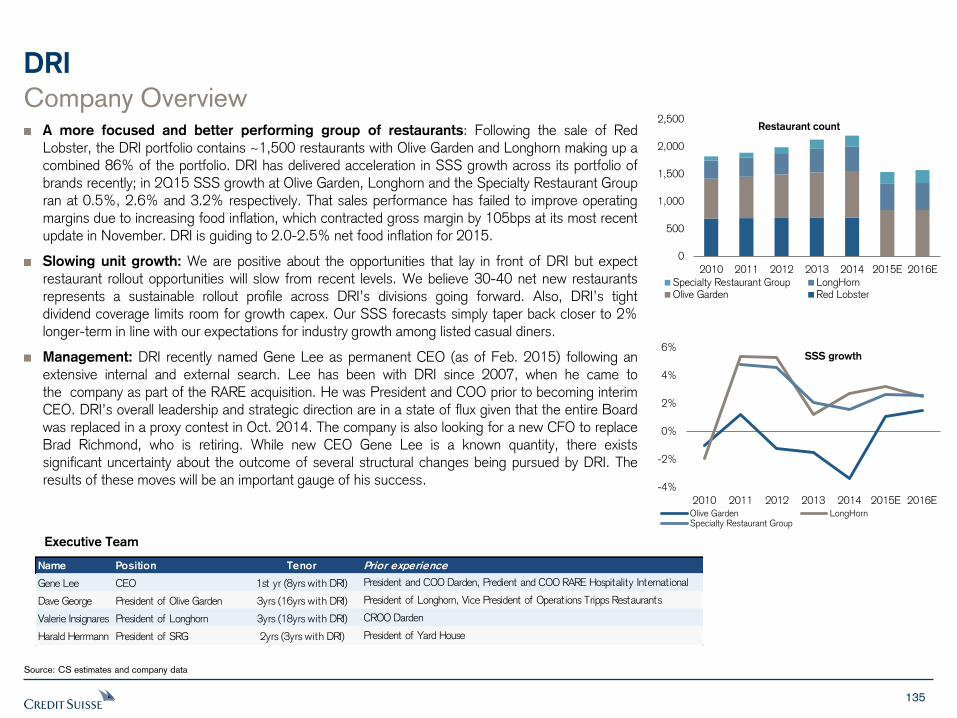
135
DRI
Company Overview A more focused and better performing group of restaurants: Following the sale of Red Lobster, the DRI portfolio contains ~1,500 restaurants with Olive Garden and Longhorn making up a combined 86% of the portfolio. DRI has delivered acceleration in SSS growth across its portfolio of brands recently; in 2Q15 SSS growth at Olive Garden, Longhorn and the Specialty Restaurant Group ran at 0.5%, 2.6% and 3.2% respectively. That sales performance has failed to improve operating margins due to increasing food inflation, which contracted gross margin by 105bps at its most recent update in November. DRI is guiding to 2.0-2.5% net food inflation for 2015.
Slowing unit growth: We are positive about the opportunities that lay in front of DRI but expect restaurant rollout opportunities will slow from recent levels. We believe 30-40 net new restaurants represents a sustainable rollout profile across DRI’s divisions going forward. Also, DRI’s tight dividend coverage limits room for growth capex. Our SSS forecasts simply taper back closer to 2% longer-term in line with our expectations for industry growth among listed casual diners.
Management: DRI recently named Gene Lee as permanent CEO (as of Feb. 2015) following an extensive internal and external search. Lee has been with DRI since 2007, when he came to the company as part of the RARE acquisition. He was President and COO prior to becoming interim CEO. DRI’s overall leadership and strategic direction are in a state of flux given that the entire Board was replaced in a proxy contest in Oct. 2014. The company is also looking for a new CFO to replace Brad Richmond, who is retiring. While new CEO Gene Lee is a known quantity, there exists significant uncertainty about the outcome of several structural changes being pursued by DRI. The results of these moves will be an important gauge of his success.
Source: CS estimates and company data
Executive Team
Name Position Tenor Prior experience
Gene Lee CEO 1st yr (8yrs with DRI) President and COO Darden, Predient and COO RARE Hospitality International
Dave George President of Olive Garden 3yrs (16yrs with DRI) President of Longhorn, Vice President of Operations Tripps Restaurants
Valerie Insignares President of Longhorn 3yrs (18yrs with DRI) CROO Darden
Harald Herrmann President of SRG 2yrs (3yrs with DRI) President of Yard House
0
500
1,000
1,500
2,000
2,500
2010 2011 2012 2013 2014 2015E 2016E
Restaurant count
Specialty Restaurant Group LongHornOlive Garden Red Lobster
-4%
-2%
0%
2%
4%
6%
2010 2011 2012 2013 2014 2015E 2016E
SSS growth
Olive Garden LongHornSpecialty Restaurant Group
136
DRI
Structural Opportunities Abound, But Priced In A catalyst-rich story: DRI’s board was ousted in Oct. ‘14, after losing a proxy battle with activist investor Starboard Value. The current board was hand picked by Starboard, and its Chairman is the activist fund’s CEO, Jeff Smith. DRI is beginning to execute parts of the turnaround plan proposed by Starboard prior to the proxy fight. This plan has several key steps:
1. Hiring a new CEO (done) and CFO: DRI’s former CEO, Clarence Otis, resigned in July 2014. The firm announced on Feb. 23, 2015 that the interim CEO Gene Lee (53) will become permanent CEO. He has been with the company since 2007 and had served as DRI President and COO since Sept. ‘13. DRI looked at both internal and external candidates for the position. We believe Mr. Lee is well liked by investors, and an internal hire should help ease the transition occurring at the company. The company is also looking for a replacement for CFO Brad Richmond, who is retiring.
2. Real estate review: Commensurate with the CEO search, DRI is also reviewing options for its significant real estate holdings, which include 586 owned restaurant sites and 668 owned buildings. Several options are on the table, including a sale-leaseback of all or part of the real estate or the formation of a separate REIT company. Our rough estimates peg the value of DRI’s real estate at ~$3bn, or ~40% of DRI’s current market cap. However, when adjusting for the lost rent benefit, monetizing this real estate seems largely priced into DRI’s valuation. (see following pages for details)
3. SG&A review: DRI is also reviewing its SG&A spend, which is annualizing at ~$600mm currently. This spend includes an ~$250mm advertising budget. This may be one of the biggest opportunities in the DRI story, as our model (nor consensus) assumes a material reduction in SG&A going forward. Each 5% reduction in SG&A could add ~20c to ongoing EPS.
4. Potential SRG spin: DRI is also reviewing options for its Specialty Restaurant Group, which comprises ~200 restaurants across 5 brands. These businesses generate ~$1.3bn in revenue (20% of DRI total). DRI does not disclose margins/profitability for the SRG segment, although we estimate the unit generates ~25-30% of DRI’s EBITDA, or ~$235-240mm after SG&A. Given DRI currently trades at over 11x forward EBITDA, we do not see a significant multiple arbitrage opportunity from separating the SRG business (particularly if there is a material tax hit on the transaction). (see following pages for details)
5. Olive Garden turnaround: DRI is also working to improve the fundamentals at the flagship Olive Garden chain, which represents ~55% of DRI’s revenue and profits, we estimate. The chain has struggled with weak SSS and share loss for years. Prior to winning the proxy fight, Starboard put forth a nearly 300-page presentation outlining its turnaround plan for DRI, with a focus on Olive Garden. Recommendations included improving the food quality at Olive Garden, reducing wait times, and increasing alcohol sales. Mgmt. is also evaluating a remodeling program for Olive Garden units. However, Starboard has only been in control since Oct ’14, and the company has only reported one quarter of results in that period, so we have yet to see the full scale of DRI’s Olive Garden turnaround plans. (DRI reports F3Q15 results on March 20th.) Olive Garden has shown some early signs of progress, with SSS positive in each of the last 4 months (though still <1.0% each month).
Source: CS estimates and company data
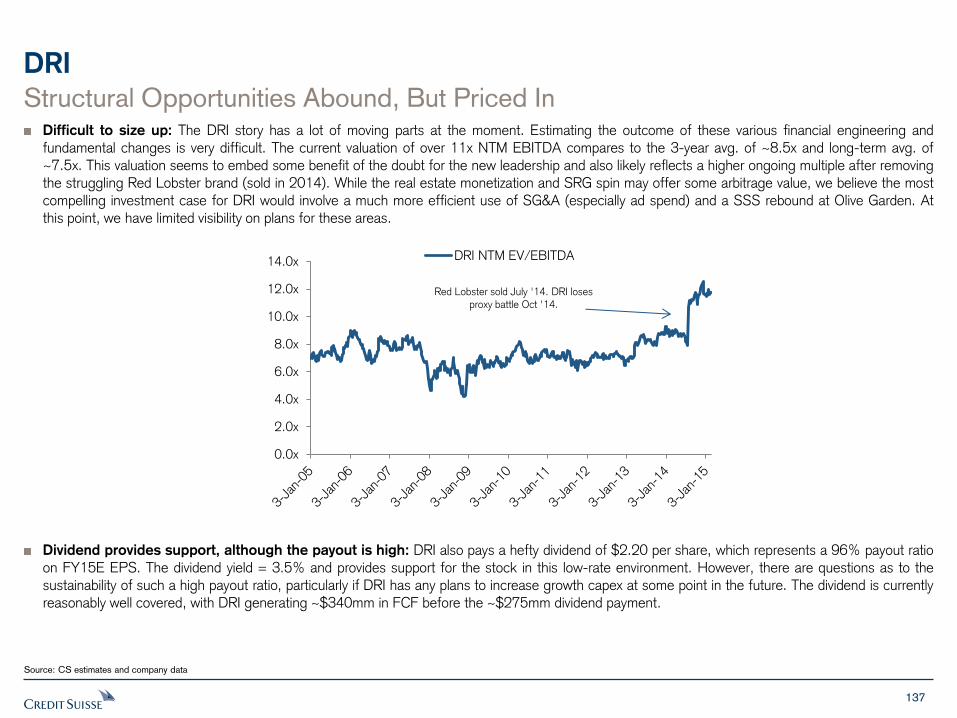
137
DRI
Structural Opportunities Abound, But Priced In Difficult to size up: The DRI story has a lot of moving parts at the moment. Estimating the outcome of these various financial engineering and fundamental changes is very difficult. The current valuation of over 11x NTM EBITDA compares to the 3-year avg. of ~8.5x and long-term avg. of ~7.5x. This valuation seems to embed some benefit of the doubt for the new leadership and also likely reflects a higher ongoing multiple after removing the struggling Red Lobster brand (sold in 2014). While the real estate monetization and SRG spin may offer some arbitrage value, we believe the most compelling investment case for DRI would involve a much more efficient use of SG&A (especially ad spend) and a SSS rebound at Olive Garden. At this point, we have limited visibility on plans for these areas.
Dividend provides support, although the payout is high: DRI also pays a hefty dividend of $2.20 per share, which represents a 96% payout ratio on FY15E EPS. The dividend yield = 3.5% and provides support for the stock in this low-rate environment. However, there are questions as to the sustainability of such a high payout ratio, particularly if DRI has any plans to increase growth capex at some point in the future. The dividend is currently reasonably well covered, with DRI generating ~$340mm in FCF before the ~$275mm dividend payment.
Source: CS estimates and company data
0.0x
2.0x
4.0x
6.0x
8.0x
10.0x
12.0x
14.0x DRI NTM EV/EBITDA
Red Lobster sold July '14. DRI loses proxy battle Oct '14.
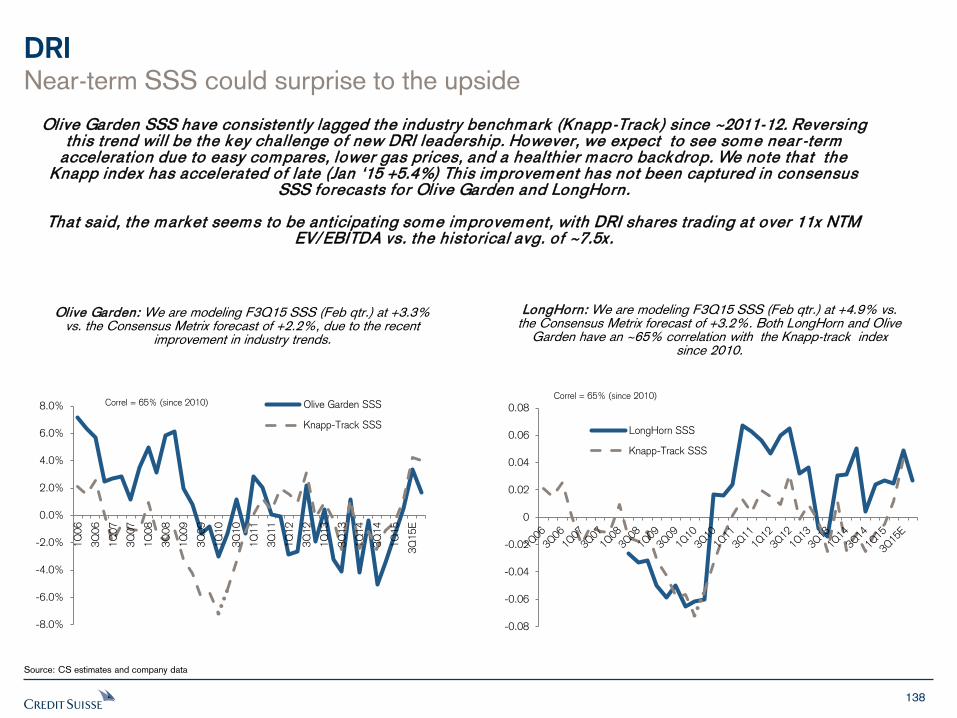
138
DRI
Source: CS estimates and company data
Olive Garden SSS have consistently lagged the industry benchmark (Knapp-Track) since ~2011-12. Reversing this trend wil l be the key challenge of new DRI leadership. However, we expect to see some near -term
acceleration due to easy compares, lower gas prices, and a healthier macro backdrop. We note that the Knapp index has accelerated of late (Jan ‘15 +5.4%) This improvement has not been captured in consensus
SSS forecasts for Olive Garden and LongHorn.
That said, the market seems to be anticipating some improvement, with DRI shares trading at over 11x NTM EV/EBITDA vs. the historical avg. of ~7.5x.
-8.0%
-6.0%
-4.0%
-2.0%
0.0%
2.0%
4.0%
6.0%
8.0%
1Q
06
3Q
06
1Q
07
3Q
07
1Q
08
3Q
08
1Q
09
3Q
09
1Q
10
3Q
10
1Q
11
3Q
11
1Q
12
3Q
12
1Q
13
3Q
13
1Q
14
3Q
14
1Q
15
3Q
15E
Olive Garden SSS
Knapp-Track SSS
Correl = 65% (since 2010)
-0.08
-0.06
-0.04
-0.02
0
0.02
0.04
0.06
0.08
LongHorn SSS
Knapp-Track SSS
Correl = 65% (since 2010)
Olive Garden: We are modeling F3Q15 SSS (Feb qtr.) at +3.3% vs. the Consensus Metrix forecast of +2.2%, due to the recent
improvement in industry trends.
LongHorn: We are modeling F3Q15 SSS (Feb qtr.) at +4.9% vs. the Consensus Metrix forecast of +3.2%. Both LongHorn and Olive
Garden have an ~65% correlation with the Knapp-track index since 2010.
Near-term SSS could surprise to the upside
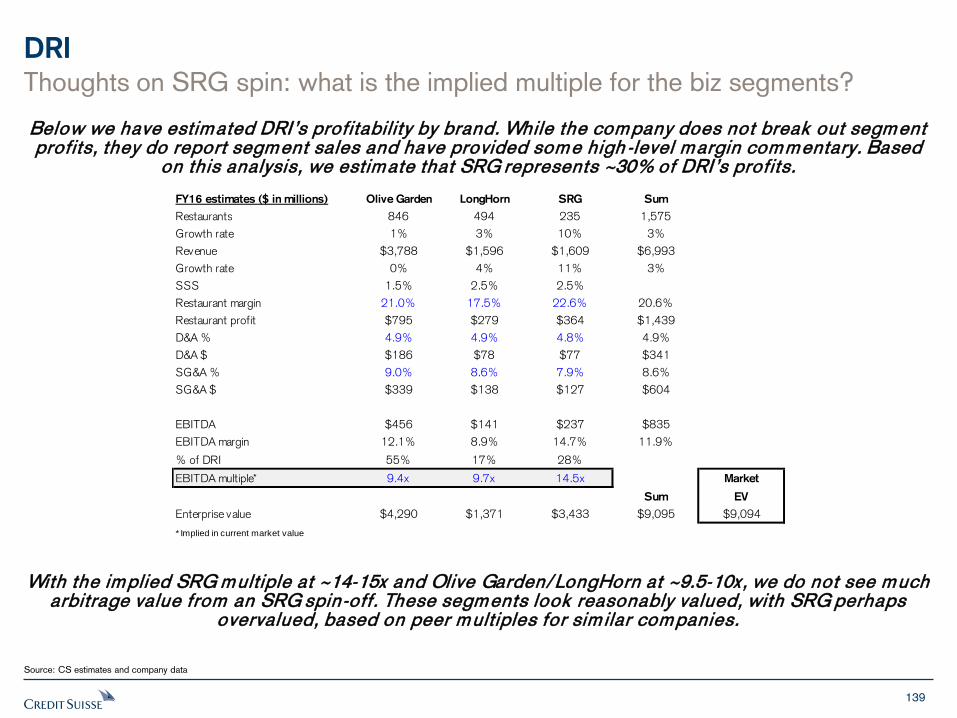
139
DRI
Source: CS estimates and company data
Below we have estimated DRI’s profitability by brand. While the company does not break out segment profits, they do report segment sales and have provided some high -level margin commentary. Based
on this analysis, we estimate that SRG represents ~30% of DRI’s profits.
With the implied SRG multiple at ~14-15x and Olive Garden/LongHorn at ~9.5-10x, we do not see much arbitrage value from an SRG spin-off. These segments look reasonably valued, with SRG perhaps
overvalued, based on peer multiples for sim ilar companies.
Thoughts on SRG spin: what is the implied multiple for the biz segments?
FY16 estimates ($ in millions) Olive Garden LongHorn SRG Sum
Restaurants 846 494 235 1,575
Growth rate 1% 3% 10% 3%
Revenue $3,788 $1,596 $1,609 $6,993
Growth rate 0% 4% 11% 3%
SSS 1.5% 2.5% 2.5%
Restaurant margin 21.0% 17.5% 22.6% 20.6%
Restaurant profit $795 $279 $364 $1,439
D&A % 4.9% 4.9% 4.8% 4.9%
D&A $ $186 $78 $77 $341
SG&A % 9.0% 8.6% 7.9% 8.6%
SG&A $ $339 $138 $127 $604
EBITDA $456 $141 $237 $835
EBITDA margin 12.1% 8.9% 14.7% 11.9%
% of DRI 55% 17% 28%
EBITDA multiple* 9.4x 9.7x 14.5x Market
Sum EV
Enterprise value $4,290 $1,371 $3,433 $9,095 $9,094
* Implied in current market value
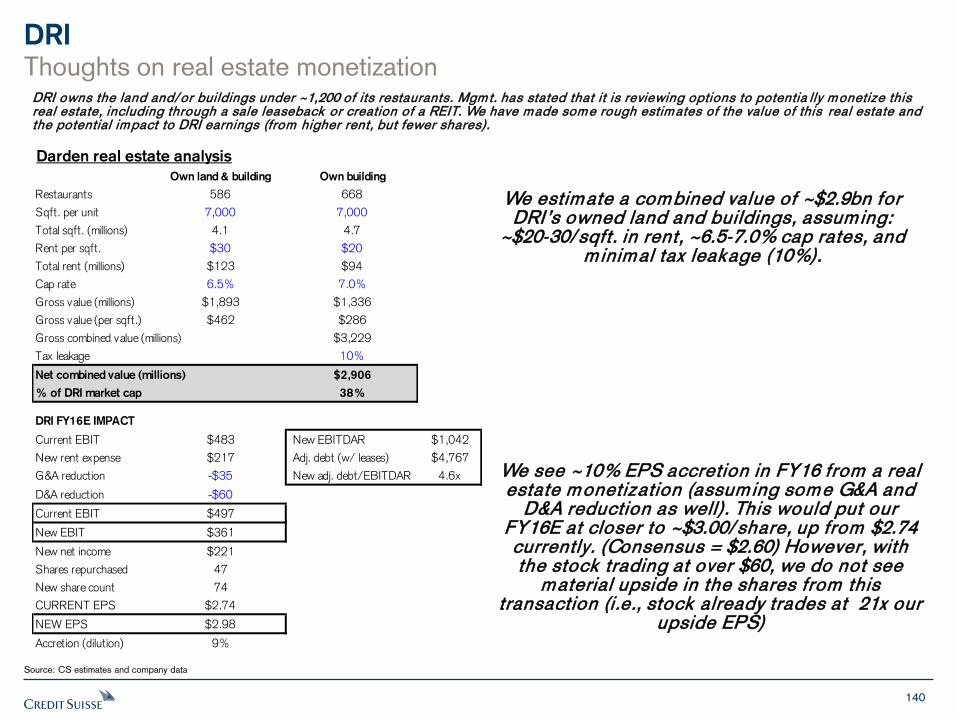
140
DRI
Source: CS estimates and company data
We estimate a combined value of ~$2.9bn for DRI’s owned land and buildings, assum ing:
~$20-30/sqft. in rent, ~6.5-7.0% cap rates, and m inimal tax leakage (10%).
We see ~10% EPS accretion in FY16 from a real estate monetization (assum ing some G&A and
D&A reduction as well). This would put our FY16E at closer to ~$3.00/ share, up from $2.74 currently. (Consensus = $2.60) However, with the stock trading at over $60, we do not see
material upside in the shares from this transaction (i.e., stock already trades at 21x our
upside EPS)
DRI owns the land and/or buildings under ~1,200 of its restaurants. Mgmt. has stated that it is reviewing options to potentia lly monetize this real estate, including through a sale leaseback or creation of a REIT. We have made some rough estimates of the value of this real estate and the potential impact to DRI earnings (from higher rent, but fewer shares).
Thoughts on real estate monetization
Darden real estate analysis
Own land & building Own building
Restaurants 586 668
Sqft. per unit 7,000 7,000
Total sqft. (millions) 4.1 4.7
Rent per sqft. $30 $20
Total rent (millions) $123 $94
Cap rate 6.5% 7.0%
Gross value (millions) $1,893 $1,336
Gross value (per sqft.) $462 $286
Gross combined value (millions) $3,229
Tax leakage 10%
Net combined value (millions) $2,906
% of DRI market cap 38%
DRI FY16E IMPACT
Current EBIT $483 New EBITDAR $1,042
New rent expense $217 Adj. debt (w/ leases) $4,767
G&A reduction -$35 New adj. debt/EBITDAR 4.6x
D&A reduction -$60
Current EBIT $497
New EBIT $361
New net income $221
Shares repurchased 47
New share count 74
CURRENT EPS $2.74
NEW EPS $2.98
Accretion (dilution) 9%
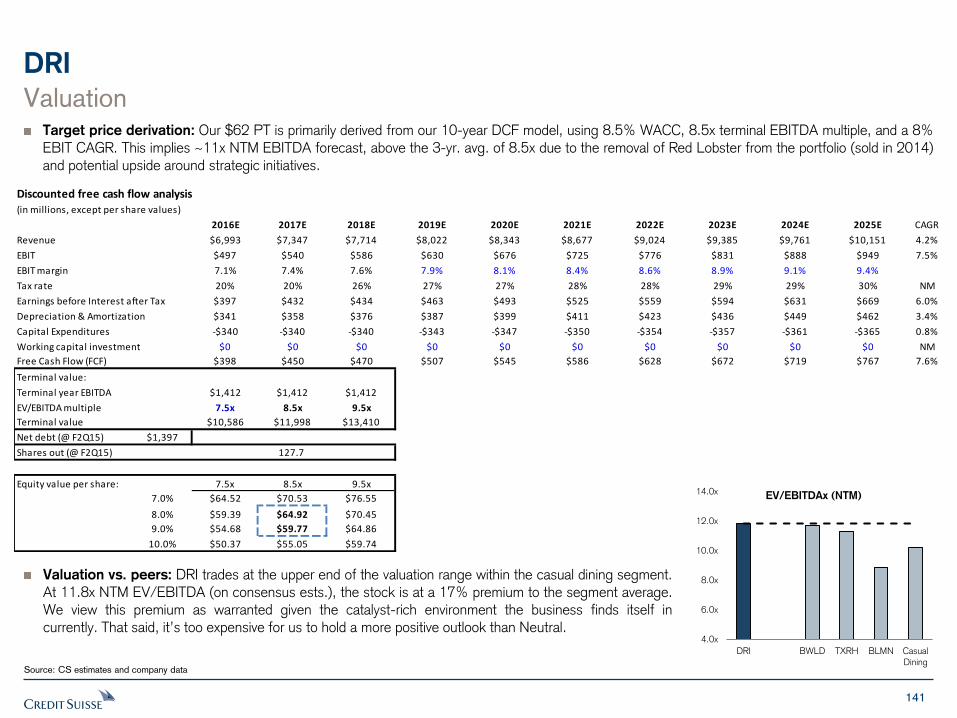
141
Discounted free cash flow analysis(in millions, except per share values)
2016E 2017E 2018E 2019E 2020E 2021E 2022E 2023E 2024E 2025E CAGR
Revenue $6,993 $7,347 $7,714 $8,022 $8,343 $8,677 $9,024 $9,385 $9,761 $10,151 4.2%
EBIT $497 $540 $586 $630 $676 $725 $776 $831 $888 $949 7.5%
EBIT margin 7.1% 7.4% 7.6% 7.9% 8.1% 8.4% 8.6% 8.9% 9.1% 9.4%
Tax rate 20% 20% 26% 27% 27% 28% 28% 29% 29% 30% NM
Earnings before Interest after Tax $397 $432 $434 $463 $493 $525 $559 $594 $631 $669 6.0%
Depreciation & Amortization $341 $358 $376 $387 $399 $411 $423 $436 $449 $462 3.4%
Capital Expenditures -$340 -$340 -$340 -$343 -$347 -$350 -$354 -$357 -$361 -$365 0.8%
Working capital investment $0 $0 $0 $0 $0 $0 $0 $0 $0 $0 NM
Free Cash Flow (FCF) $398 $450 $470 $507 $545 $586 $628 $672 $719 $767 7.6%
Terminal value:
Terminal year EBITDA $1,412 $1,412 $1,412
EV/EBITDA multiple 7.5x 8.5x 9.5x
Terminal value $10,586 $11,998 $13,410
Net debt (@ F2Q15) $1,397
Shares out (@ F2Q15) 127.7 127.7 127.7
Equity value per share: 7.5x 8.5x 9.5x
7.0% $64.52 $70.53 $76.55
8.0% $59.39 $64.92 $70.45
9.0% $54.68 $59.77 $64.86
10.0% $50.37 $55.05 $59.74
DRI
Source: CS estimates and company data
Valuation Target price derivation: Our $62 PT is primarily derived from our 10-year DCF model, using 8.5% WACC, 8.5x terminal EBITDA multiple, and a 8% EBIT CAGR. This implies ~11x NTM EBITDA forecast, above the 3-yr. avg. of 8.5x due to the removal of Red Lobster from the portfolio (sold in 2014) and potential upside around strategic initiatives.
Valuation vs. peers: DRI trades at the upper end of the valuation range within the casual dining segment. At 11.8x NTM EV/EBITDA (on consensus ests.), the stock is at a 17% premium to the segment average. We view this premium as warranted given the catalyst-rich environment the business finds itself in currently. That said, it’s too expensive for us to hold a more positive outlook than Neutral.
4.0x
6.0x
8.0x
10.0x
12.0x
14.0x
DRI BWLD TXRH BLMN Casual
Dining
EV/EBITDAx (NTM)
142
DRI
Source: CS estimates and company data
Risks Structural changes: DRI’s new mgmt. may generate higher value from strategic initiatives than we have contemplated. The numerous moving parts in the model and potential timing and tax issues make it difficult to accurately model the potential outcomes of DRI’s strategic review. DRI may also determine that a spin or monetization of its real estate or SRG segments may not be feasible or economically accretive. We believe this outcome could be a disappointment to investors. DRI is also reviewing its current SG&A spend as part of the strategic review, including advertising. Any material changes in DRI’s advertising spend levels or go to market strategies could have an impact on sales.
Macro/gas: DRI has significant leverage to improvement in consumer spending, particularly for low- to middle-income consumers. We believe that continued acceleration in macro trends, coupled with low gas prices, could result in upside to our forecasts.
Tight dividend coverage: DRI’s dividend payout ratio is ~96% based on our FY15 EPS forecasts. Companies with DRI’s earnings and risk profile typically have payout ratios of less than 50%. This elevated payout ratio leaves limited room for error. We believe any reduction in the dividend would be negatively received by the market.
Food/labor costs: DRI faces significant cost exposures around food and labor. Key commodity exposures for DRI include beef, chicken, seafood, dairy, and wheat. Inflation in these categories can negatively impact margins and may be difficult for DRI to pass on to customers through pricing. DRI also faces significant exposure to rising wage rates and rising health care costs.
Competition: The restaurant industry is intensely competitive. DRI faces competition from large national chains, as well as smaller regional players and mom & pop operators. Changes in promotional/marketing activities or store openings by competitors can meaningfully impact DRI’s business. We note that the casual dining industry has historically experienced negative customer traffic on a per store basis, partly due to rising supply in the industry.
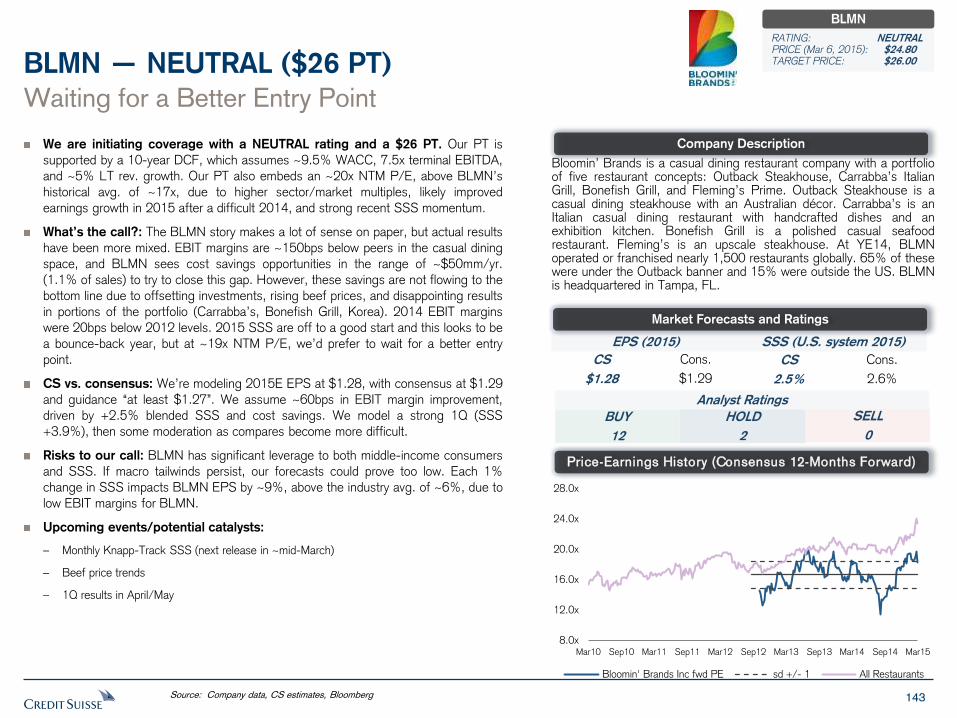
143
We are initiating coverage with a NEUTRAL rating and a $26 PT. Our PT is
supported by a 10-year DCF, which assumes ~9.5% WACC, 7.5x terminal EBITDA,
and ~5% LT rev. growth. Our PT also embeds an ~20x NTM P/E, above BLMN’s
historical avg. of ~17x, due to higher sector/market multiples, likely improved
earnings growth in 2015 after a difficult 2014, and strong recent SSS momentum.
What’s the call?: The BLMN story makes a lot of sense on paper, but actual results
have been more mixed. EBIT margins are ~150bps below peers in the casual dining
space, and BLMN sees cost savings opportunities in the range of ~$50mm/yr.
(1.1% of sales) to try to close this gap. However, these savings are not flowing to the
bottom line due to offsetting investments, rising beef prices, and disappointing results
in portions of the portfolio (Carrabba’s, Bonefish Grill, Korea). 2014 EBIT margins
were 20bps below 2012 levels. 2015 SSS are off to a good start and this looks to be
a bounce-back year, but at ~19x NTM P/E, we’d prefer to wait for a better entry
point.
CS vs. consensus: We’re modeling 2015E EPS at $1.28, with consensus at $1.29
and guidance “at least $1.27”. We assume ~60bps in EBIT margin improvement,
driven by +2.5% blended SSS and cost savings. We model a strong 1Q (SSS
+3.9%), then some moderation as compares become more difficult.
Risks to our call: BLMN has significant leverage to both middle-income consumers
and SSS. If macro tailwinds persist, our forecasts could prove too low. Each 1%
change in SSS impacts BLMN EPS by ~9%, above the industry avg. of ~6%, due to
low EBIT margins for BLMN.
Upcoming events/potential catalysts:
– Monthly Knapp-Track SSS (next release in ~mid-March)
– Beef price trends
– 1Q results in April/May
Waiting for a Better Entry Point
BLMN — NEUTRAL ($26 PT)
Bloomin’ Brands is a casual dining restaurant company with a portfolio of five restaurant concepts: Outback Steakhouse, Carrabba’s Italian Grill, Bonefish Grill, and Fleming’s Prime. Outback Steakhouse is a casual dining steakhouse with an Australian décor. Carrabba’s is an Italian casual dining restaurant with handcrafted dishes and an exhibition kitchen. Bonefish Grill is a polished casual seafood restaurant. Fleming’s is an upscale steakhouse. At YE14, BLMN operated or franchised nearly 1,500 restaurants globally. 65% of these were under the Outback banner and 15% were outside the US. BLMN is headquartered in Tampa, FL.
Source: Company data, CS estimates, Bloomberg
Company Description
Price-Earnings History (Consensus 12-Months Forward)
EPS (2015) SSS (U.S. system 2015)
CS
$1.28
Cons.
$1.29
CS
2.5%
Cons.
2.6%
Analyst Ratings
BUY
12
SELL
0
HOLD
2
Market Forecasts and Ratings
BLMN
RATING: NEUTRAL PRICE (Mar 6, 2015): $24.80 TARGET PRICE: $26.00
8.0x
12.0x
16.0x
20.0x
24.0x
28.0x
Mar10 Sep10 Mar11 Sep11 Mar12 Sep12 Mar13 Sep13 Mar14 Sep14 Mar15
Bloomin' Brands Inc fwd PE sd +/- 1 All Restaurants
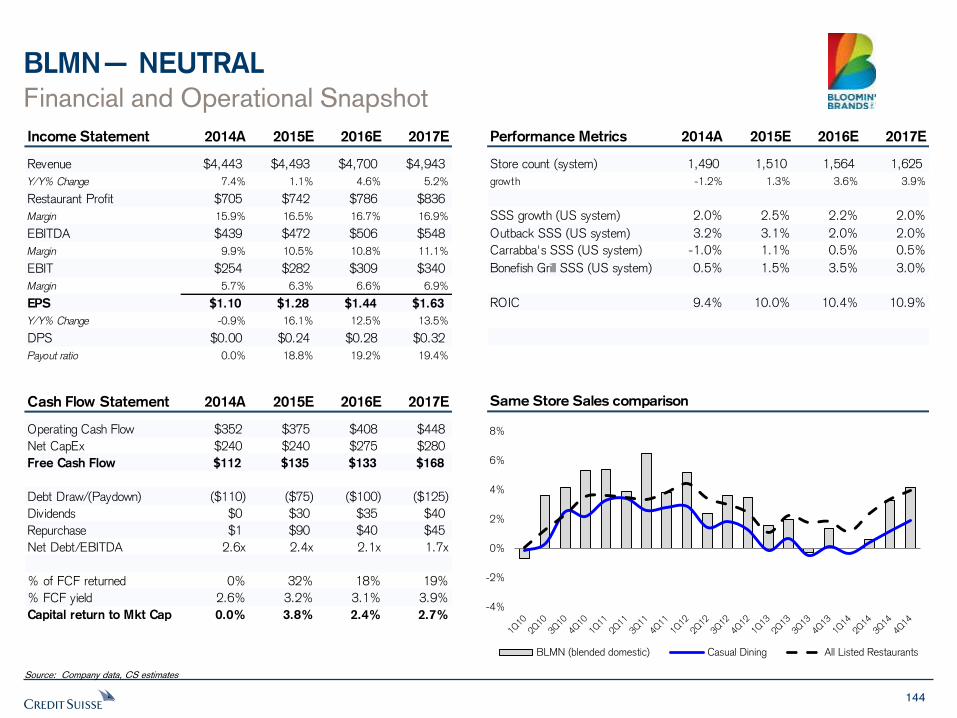
144
BLMN— NEUTRAL
Financial and Operational Snapshot
Source: Company data, CS estimates
Same Store Sales comparison
Income Statement 2014A 2015E 2016E 2017E
Revenue $4,443 $4,493 $4,700 $4,943
Y/Y% Change 7.4% 1.1% 4.6% 5.2%
Restaurant Profit $705 $742 $786 $836
Margin 15.9% 16.5% 16.7% 16.9%
EBITDA $439 $472 $506 $548
Margin 9.9% 10.5% 10.8% 11.1%
EBIT $254 $282 $309 $340
Margin 5.7% 6.3% 6.6% 6.9%
EPS $1.10 $1.28 $1.44 $1.63
Y/Y% Change -0.9% 16.1% 12.5% 13.5%
DPS $0.00 $0.24 $0.28 $0.32
Payout ratio 0.0% 18.8% 19.2% 19.4%
Performance Metrics 2014A 2015E 2016E 2017E
Store count (system) 1,490 1,510 1,564 1,625
growth -1.2% 1.3% 3.6% 3.9%
SSS growth (US system) 2.0% 2.5% 2.2% 2.0%
Outback SSS (US system) 3.2% 3.1% 2.0% 2.0%
Carrabba's SSS (US system) -1.0% 1.1% 0.5% 0.5%
Bonefish Grill SSS (US system) 0.5% 1.5% 3.5% 3.0%
ROIC 9.4% 10.0% 10.4% 10.9%
Cash Flow Statement 2014A 2015E 2016E 2017E
Operating Cash Flow $352 $375 $408 $448
Net CapEx $240 $240 $275 $280
Free Cash Flow $112 $135 $133 $168
Debt Draw/(Paydown) ($110) ($75) ($100) ($125)
Dividends $0 $30 $35 $40
Repurchase $1 $90 $40 $45
Net Debt/EBITDA 2.6x 2.4x 2.1x 1.7x
% of FCF returned 0% 32% 18% 19%
% FCF yield 2.6% 3.2% 3.1% 3.9%
Capital return to Mkt Cap 0.0% 3.8% 2.4% 2.7%-4%
-2%
0%
2%
4%
6%
8%
BLMN (blended domestic) Casual Dining All Listed Restaurants
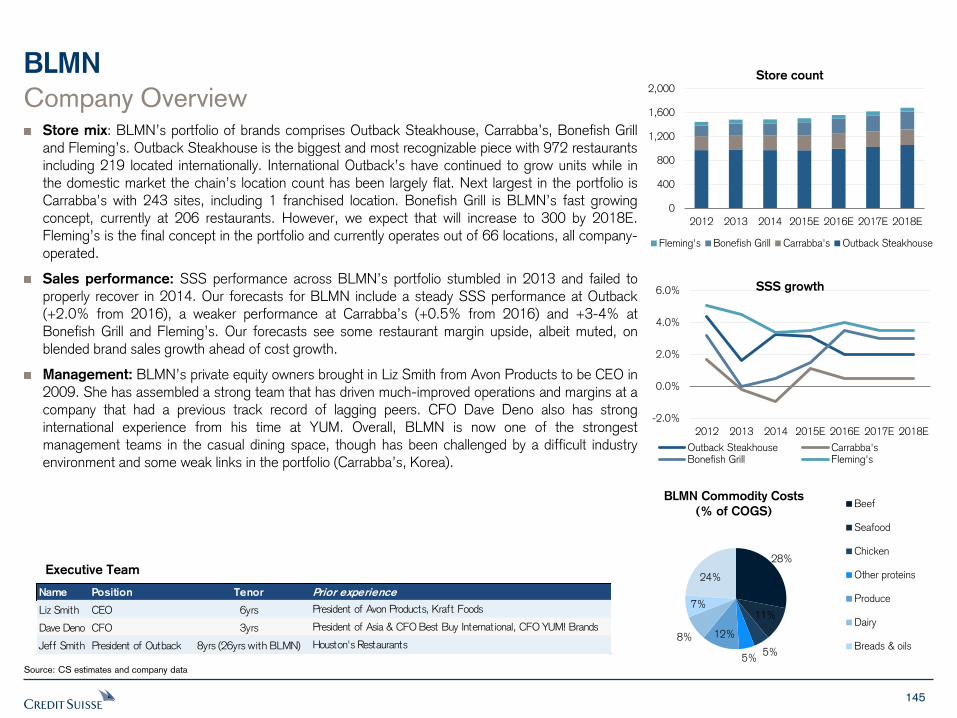
145
BLMN
Company Overview Store mix: BLMN’s portfolio of brands comprises Outback Steakhouse, Carrabba’s, Bonefish Grill and Fleming’s. Outback Steakhouse is the biggest and most recognizable piece with 972 restaurants including 219 located internationally. International Outback’s have continued to grow units while in the domestic market the chain’s location count has been largely flat. Next largest in the portfolio is Carrabba’s with 243 sites, including 1 franchised location. Bonefish Grill is BLMN’s fast growing concept, currently at 206 restaurants. However, we expect that will increase to 300 by 2018E. Fleming’s is the final concept in the portfolio and currently operates out of 66 locations, all company-operated.
Sales performance: SSS performance across BLMN’s portfolio stumbled in 2013 and failed to properly recover in 2014. Our forecasts for BLMN include a steady SSS performance at Outback (+2.0% from 2016), a weaker performance at Carrabba’s (+0.5% from 2016) and +3-4% at Bonefish Grill and Fleming’s. Our forecasts see some restaurant margin upside, albeit muted, on blended brand sales growth ahead of cost growth.
Management: BLMN’s private equity owners brought in Liz Smith from Avon Products to be CEO in 2009. She has assembled a strong team that has driven much-improved operations and margins at a company that had a previous track record of lagging peers. CFO Dave Deno also has strong international experience from his time at YUM. Overall, BLMN is now one of the strongest management teams in the casual dining space, though has been challenged by a difficult industry environment and some weak links in the portfolio (Carrabba’s, Korea).
Source: CS estimates and company data
Executive Team
Name Position Tenor Prior experience
Liz Smith CEO 6yrs President of Avon Products, Kraft Foods
Dave Deno CFO 3yrs President of Asia & CFO Best Buy International, CFO YUM! Brands
Jeff Smith President of Outback 8yrs (26yrs with BLMN) Houston's Restaurants
28%
11%
5% 5%
12% 8%
7%
24%
BLMN Commodity Costs
(% of COGS) Beef
Seafood
Chicken
Other proteins
Produce
Dairy
Breads & oils
0
400
800
1,200
1,600
2,000
2012 2013 2014 2015E 2016E 2017E 2018E
Store count
Fleming's Bonefish Grill Carrabba's Outback Steakhouse
-2.0%
0.0%
2.0%
4.0%
6.0%
2012 2013 2014 2015E 2016E 2017E 2018E
SSS growth
Outback Steakhouse Carrabba'sBonefish Grill Fleming's
146
BLMN Waiting for a Better Entry Point
Waiting for a better entry point: BLMN had a difficult 2014, as weak 1H14 SSS and a sharp decline in the S. Korean business led to an ~11% EPS guide-down at midyear. Trends improved in 2H14, and BLMN ultimately finished the year at the high end of the new guidance range (2014A = $1.10 EPS). However, earnings were down 1% for the year. Restaurant margins were also flat for the second year in a row, counter to mgmt.’s goal of growing margins via productivity savings. Despite the disappointing 2014 result, the stock has largely recovered from the mid-2014 swoon and valuation has bounced back to ~19x our NTM EPS estimate, not far from the all-time peak of 21x. This seems full for a company that has limited store growth and an earnings growth model in the low-teens (and that has had some earnings missteps in the past). Consensus also already assumes robust EPS and SSS growth this year, with consensus EPS at $1.29 (vs. guidance of “at least $1.27”) and SSS at +2.5% (vs. guidance of “at least 1.5%”). Consensus also assumes ~70bps improvement in restaurant margins this year (to 16.7%), which may be a challenge in light of ~10% beef inflation and the fact that margins have been flat for the past 3 years.
Some key positives (and negatives):
1. EBIT margins have structural room to grow, but haven’t lately: BLMN’s consolidated EBIT margins are ~150bps below peers due to general inefficiencies throughout the P&L (in areas such as supply chain, labor scheduling, waste management, back-of-house technology, etc.). BLMN has made steady progress on addressing these inefficiencies, with annual productivity savings of at least $50mm (gross) for each of the last 6 years. BLMN is targeting another year of at least $50mm in savings in 2015, led by the implementation of better food cost mgmt. tools in 1Q (“actual vs. theoretical”). However, these savings have historically not fully flowed to the bottom line due to offsetting investments, cost pressures (such as beef inflation), and pockets of sales weakness. Thus, while BLMN has a compelling margin improvement story, we have not seen steady margin expansion come through in recent years (e.g., 2014 EBIT margins were 5.7%, 20bps below 2012).
2. Core comps tracking above peers at Outback; balance of portfolio mixed: BLMN’s core Outback brand (~50% of profits) has consistently outperformed peers in recent years due to improved operations, better innovation, better analytics, improved marketing, remodels/relocations, and the addition of lunch. Outback SSS have averaged an 180bps spread to peers since 2011. This outperformance continued in 2014, with Outback SSS at +3.2% vs. casual dining peers at +0.6% (for major listed chains). However, performance has been much more mixed throughout the other half of BLMN’s business, with Carrabba’s and Bonefish (each ~15-20% of profits) posting weak SSS for the past 2 years. BLMN’s second-largest international business, S. Korea (~8% of profits, prior to 2014), had a disastrous 2014, wiping out ~70bps of consolidated EBIT margin. Struggles at these segments, combined with portfolio restructuring, have led to material store closures in recent years. As such, net restaurant growth has averaged ~1% over the past few years, well short of BLMN’s long-term goal of ~5%.
3. Free cash flow offers a floor: Free cash flow is an important piece of the BLMN story. We are modeling ~$135mm in annual FCF, with a large portion of this going to pay down debt. (BLMN is targeting ~3.0x adj. net debt/ EBITDAR vs ~4.0x currently.) BLMN also recently initiated its first dividend (6c per qtr.; ~1% yield) and buyback program ($100mm authorized). However, given the recent recovery in the stock, the FCF yield is now ~4%, about in-line with industry averages. Also, FCF has been steadily declining in recent years as capex ramps higher.
Source: CS estimates and company data
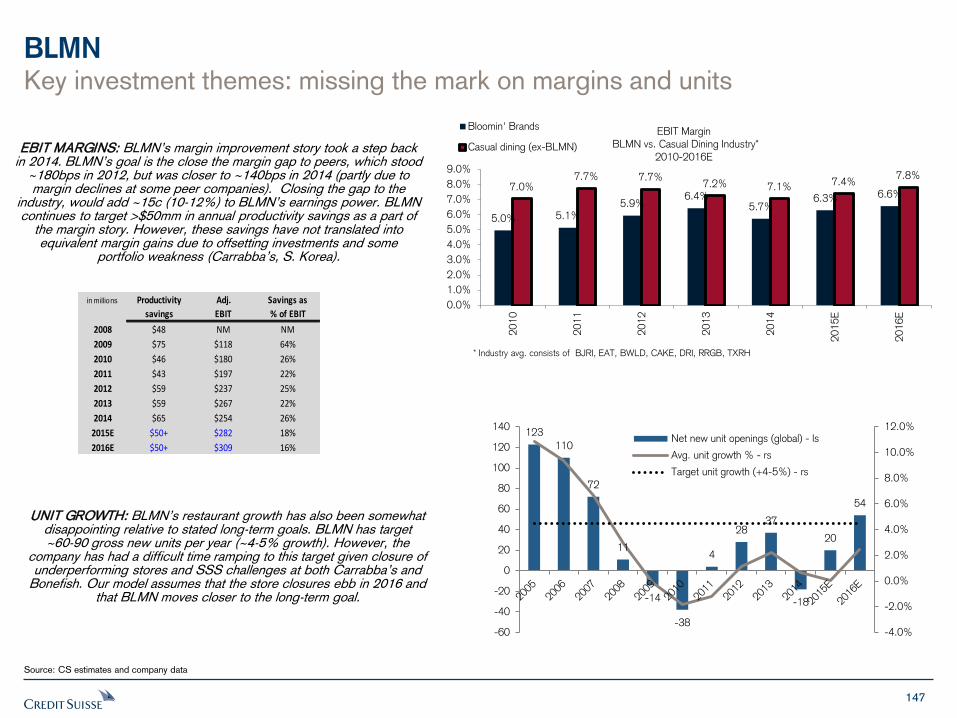
147
BLMN
Source: CS estimates and company data
EBIT MARGINS: BLMN’s margin improvement story took a step back in 2014. BLMN’s goal is the close the margin gap to peers, which stood
~180bps in 2012, but was closer to ~140bps in 2014 (partly due to margin declines at some peer companies). Closing the gap to the
industry, would add ~15c (10-12%) to BLMN’s earnings power. BLMN continues to target >$50mm in annual productivity savings as a part of
the margin story. However, these savings have not translated into equivalent margin gains due to offsetting investments and some
portfolio weakness (Carrabba’s, S. Korea).
5.0% 5.1% 5.9%
6.4% 5.7%
6.3% 6.6% 7.0%
7.7% 7.7% 7.2% 7.1% 7.4%
7.8%
0.0%
1.0%
2.0%
3.0%
4.0%
5.0%
6.0%
7.0%
8.0%
9.0%
2010
2011
2012
2013
2014
2015E
2016E
EBIT Margin BLMN vs. Casual Dining Industry*
2010-2016E
Bloomin' Brands
Casual dining (ex-BLMN)
* Industry avg. consists of BJRI, EAT, BWLD, CAKE, DRI, RRGB, TXRH
123
110
72
11
-14
-38
4
28 37
-18
20
54
-4.0%
-2.0%
0.0%
2.0%
4.0%
6.0%
8.0%
10.0%
12.0%
-60
-40
-20
0
20
40
60
80
100
120
140Net new unit openings (global) - ls
Avg. unit growth % - rs
Target unit growth (+4-5%) - rs
in millions Productivity Adj. Savings as
savings EBIT % of EBIT
2008 $48 NM NM
2009 $75 $118 64%
2010 $46 $180 26%
2011 $43 $197 22%
2012 $59 $237 25%
2013 $59 $267 22%
2014 $65 $254 26%
2015E $50+ $282 18%
2016E $50+ $309 16%
UNIT GROWTH: BLMN’s restaurant growth has also been somewhat disappointing relative to stated long-term goals. BLMN has target ~60-90 gross new units per year (~4-5% growth). However, the
company has had a difficult time ramping to this target given closure of underperforming stores and SSS challenges at both Carrabba’s and
Bonefish. Our model assumes that the store closures ebb in 2016 and that BLMN moves closer to the long-term goal.
Key investment themes: missing the mark on margins and units
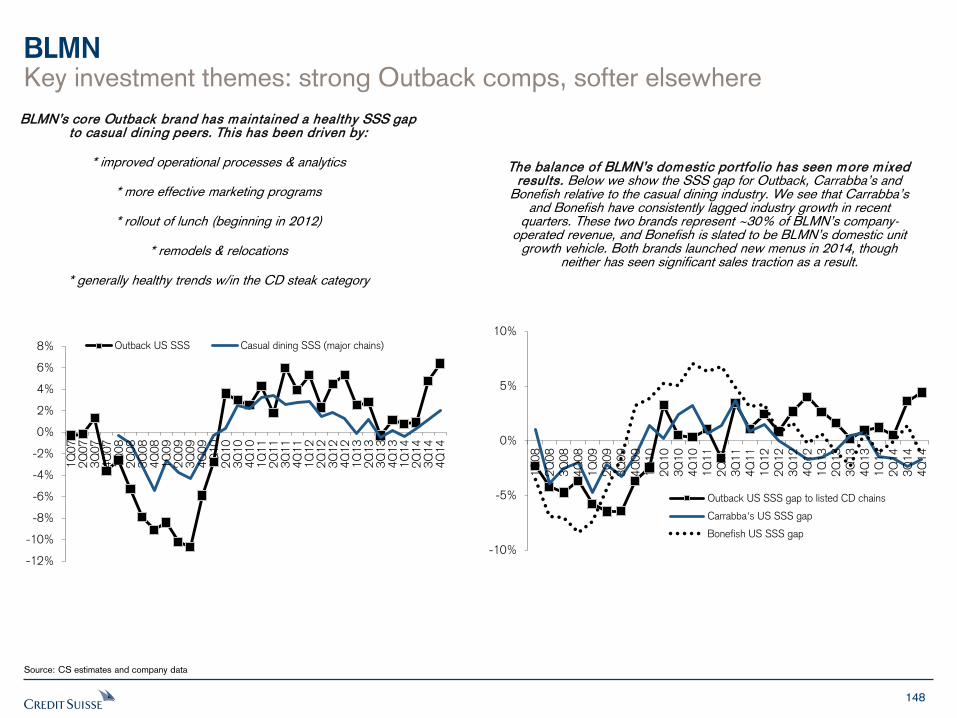
148
BLMN
Source: CS estimates and company data
BLMN’s core Outback brand has maintained a healthy SSS gap to casual dining peers. This has been driven by:
* improved operational processes & analytics
* more effective marketing programs
* rollout of lunch (beginning in 2012)
* remodels & relocations
* generally healthy trends w/in the CD steak category
The balance of BLMN’s domestic portfolio has seen more m ixed results. Below we show the SSS gap for Outback, Carrabba’s and
Bonefish relative to the casual dining industry. We see that Carrabba’s and Bonefish have consistently lagged industry growth in recent
quarters. These two brands represent ~30% of BLMN’s company-operated revenue, and Bonefish is slated to be BLMN’s domestic unit
growth vehicle. Both brands launched new menus in 2014, though neither has seen significant sales traction as a result.
-10%
-5%
0%
5%
10%
1Q
08
2Q
08
3Q
08
4Q
08
1Q
09
2Q
09
3Q
09
4Q
09
1Q
10
2Q
10
3Q
10
4Q
10
1Q
11
2Q
11
3Q
11
4Q
11
1Q
12
2Q
12
3Q
12
4Q
12
1Q
13
2Q
13
3Q
13
4Q
13
1Q
14
2Q
14
3Q
14
4Q
14
Outback US SSS gap to listed CD chains
Carrabba's US SSS gap
Bonefish US SSS gap
-12%
-10%
-8%
-6%
-4%
-2%
0%
2%
4%
6%
8%
1Q
07
2Q
07
3Q
07
4Q
07
1Q
08
2Q
08
3Q
08
4Q
08
1Q
09
2Q
09
3Q
09
4Q
09
1Q
10
2Q
10
3Q
10
4Q
10
1Q
11
2Q
11
3Q
11
4Q
11
1Q
12
2Q
12
3Q
12
4Q
12
1Q
13
2Q
13
3Q
13
4Q
13
1Q
14
2Q
14
3Q
14
4Q
14
Outback US SSS Casual dining SSS (major chains)
Key investment themes: strong Outback comps, softer elsewhere
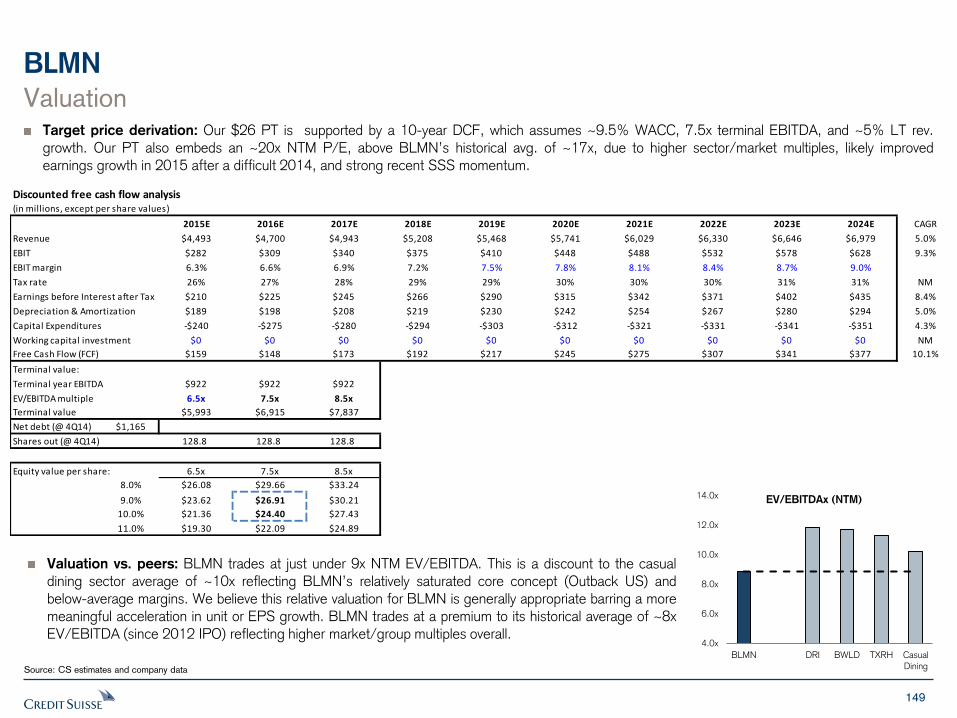
149
Discounted free cash flow analysis(in millions, except per share values)
2015E 2016E 2017E 2018E 2019E 2020E 2021E 2022E 2023E 2024E CAGR
Revenue $4,493 $4,700 $4,943 $5,208 $5,468 $5,741 $6,029 $6,330 $6,646 $6,979 5.0%
EBIT $282 $309 $340 $375 $410 $448 $488 $532 $578 $628 9.3%
EBIT margin 6.3% 6.6% 6.9% 7.2% 7.5% 7.8% 8.1% 8.4% 8.7% 9.0%
Tax rate 26% 27% 28% 29% 29% 30% 30% 30% 31% 31% NM
Earnings before Interest after Tax $210 $225 $245 $266 $290 $315 $342 $371 $402 $435 8.4%
Depreciation & Amortization $189 $198 $208 $219 $230 $242 $254 $267 $280 $294 5.0%
Capital Expenditures -$240 -$275 -$280 -$294 -$303 -$312 -$321 -$331 -$341 -$351 4.3%
Working capital investment $0 $0 $0 $0 $0 $0 $0 $0 $0 $0 NM
Free Cash Flow (FCF) $159 $148 $173 $192 $217 $245 $275 $307 $341 $377 10.1%
Terminal value:
Terminal year EBITDA $922 $922 $922
EV/EBITDA multiple 6.5x 7.5x 8.5x
Terminal value $5,993 $6,915 $7,837
Net debt (@ 4Q14) $1,165
Shares out (@ 4Q14) 128.8 128.8 128.8
Equity value per share: 6.5x 7.5x 8.5x
8.0% $26.08 $29.66 $33.24
9.0% $23.62 $26.91 $30.21
10.0% $21.36 $24.40 $27.43
11.0% $19.30 $22.09 $24.89
BLMN
Source: CS estimates and company data
Valuation Target price derivation: Our $26 PT is supported by a 10-year DCF, which assumes ~9.5% WACC, 7.5x terminal EBITDA, and ~5% LT rev. growth. Our PT also embeds an ~20x NTM P/E, above BLMN’s historical avg. of ~17x, due to higher sector/market multiples, likely improved earnings growth in 2015 after a difficult 2014, and strong recent SSS momentum.
Valuation vs. peers: BLMN trades at just under 9x NTM EV/EBITDA. This is a discount to the casual dining sector average of ~10x reflecting BLMN’s relatively saturated core concept (Outback US) and below-average margins. We believe this relative valuation for BLMN is generally appropriate barring a more meaningful acceleration in unit or EPS growth. BLMN trades at a premium to its historical average of ~8x EV/EBITDA (since 2012 IPO) reflecting higher market/group multiples overall.
4.0x
6.0x
8.0x
10.0x
12.0x
14.0x
BLMN DRI BWLD TXRH Casual
Dining
EV/EBITDAx (NTM)
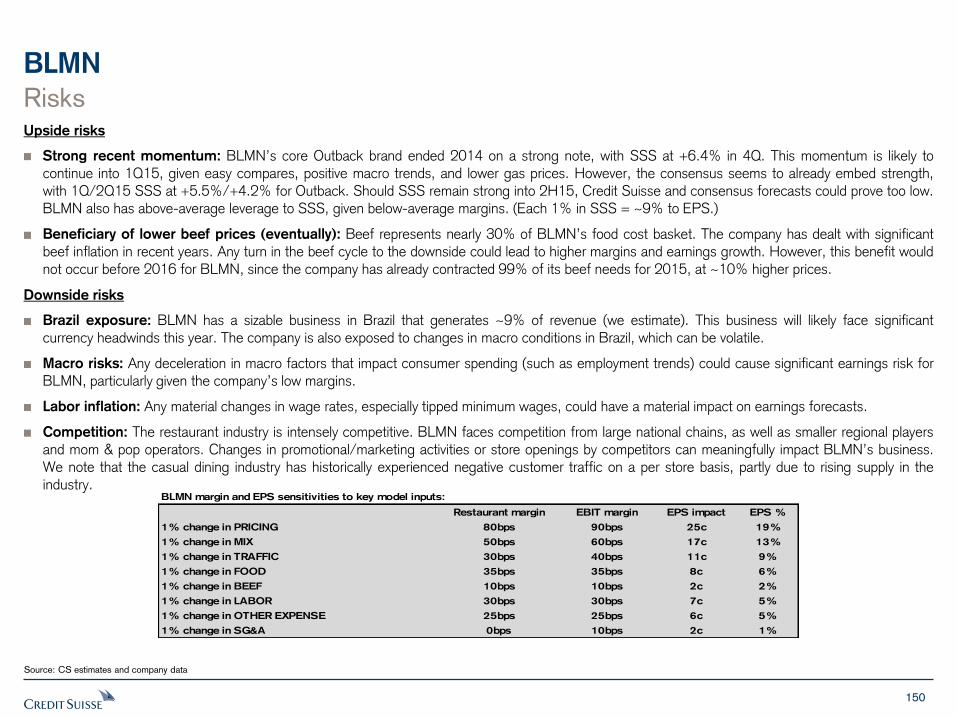
150
BLMN
Source: CS estimates and company data
Risks Upside risks
Strong recent momentum: BLMN’s core Outback brand ended 2014 on a strong note, with SSS at +6.4% in 4Q. This momentum is likely to continue into 1Q15, given easy compares, positive macro trends, and lower gas prices. However, the consensus seems to already embed strength, with 1Q/2Q15 SSS at +5.5%/+4.2% for Outback. Should SSS remain strong into 2H15, Credit Suisse and consensus forecasts could prove too low. BLMN also has above-average leverage to SSS, given below-average margins. (Each 1% in SSS = ~9% to EPS.)
Beneficiary of lower beef prices (eventually): Beef represents nearly 30% of BLMN’s food cost basket. The company has dealt with significant beef inflation in recent years. Any turn in the beef cycle to the downside could lead to higher margins and earnings growth. However, this benefit would not occur before 2016 for BLMN, since the company has already contracted 99% of its beef needs for 2015, at ~10% higher prices.
Downside risks
Brazil exposure: BLMN has a sizable business in Brazil that generates ~9% of revenue (we estimate). This business will likely face significant currency headwinds this year. The company is also exposed to changes in macro conditions in Brazil, which can be volatile.
Macro risks: Any deceleration in macro factors that impact consumer spending (such as employment trends) could cause significant earnings risk for BLMN, particularly given the company’s low margins.
Labor inflation: Any material changes in wage rates, especially tipped minimum wages, could have a material impact on earnings forecasts.
Competition: The restaurant industry is intensely competitive. BLMN faces competition from large national chains, as well as smaller regional players and mom & pop operators. Changes in promotional/marketing activities or store openings by competitors can meaningfully impact BLMN’s business. We note that the casual dining industry has historically experienced negative customer traffic on a per store basis, partly due to rising supply in the industry.
BLMN margin and EPS sensitivities to key model inputs:
Restaurant margin EBIT margin EPS impact EPS %
1% change in PRICING 80bps 90bps 25c 19%
1% change in MIX 50bps 60bps 17c 13%
1% change in TRAFFIC 30bps 40bps 11c 9%
1% change in FOOD 35bps 35bps 8c 6%
1% change in BEEF 10bps 10bps 2c 2%
1% change in LABOR 30bps 30bps 7c 5%
1% change in OTHER EXPENSE 25bps 25bps 6c 5%
1% change in SG&A 0bps 10bps 2c 1%
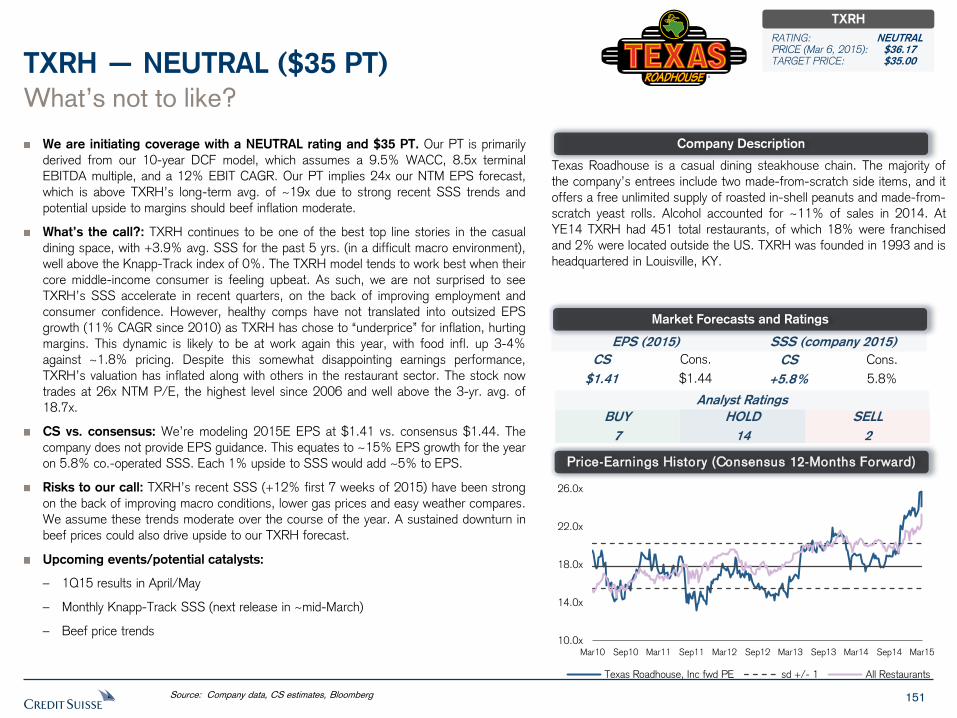
151
We are initiating coverage with a NEUTRAL rating and $35 PT. Our PT is primarily
derived from our 10-year DCF model, which assumes a 9.5% WACC, 8.5x terminal
EBITDA multiple, and a 12% EBIT CAGR. Our PT implies 24x our NTM EPS forecast,
which is above TXRH’s long-term avg. of ~19x due to strong recent SSS trends and
potential upside to margins should beef inflation moderate.
What’s the call?: TXRH continues to be one of the best top line stories in the casual
dining space, with +3.9% avg. SSS for the past 5 yrs. (in a difficult macro environment),
well above the Knapp-Track index of 0%. The TXRH model tends to work best when their
core middle-income consumer is feeling upbeat. As such, we are not surprised to see
TXRH’s SSS accelerate in recent quarters, on the back of improving employment and
consumer confidence. However, healthy comps have not translated into outsized EPS
growth (11% CAGR since 2010) as TXRH has chose to “underprice” for inflation, hurting
margins. This dynamic is likely to be at work again this year, with food infl. up 3-4%
against ~1.8% pricing. Despite this somewhat disappointing earnings performance,
TXRH’s valuation has inflated along with others in the restaurant sector. The stock now
trades at 26x NTM P/E, the highest level since 2006 and well above the 3-yr. avg. of
18.7x.
CS vs. consensus: We’re modeling 2015E EPS at $1.41 vs. consensus $1.44. The
company does not provide EPS guidance. This equates to ~15% EPS growth for the year
on 5.8% co.-operated SSS. Each 1% upside to SSS would add ~5% to EPS.
Risks to our call: TXRH’s recent SSS (+12% first 7 weeks of 2015) have been strong
on the back of improving macro conditions, lower gas prices and easy weather compares.
We assume these trends moderate over the course of the year. A sustained downturn in
beef prices could also drive upside to our TXRH forecast.
Upcoming events/potential catalysts:
– 1Q15 results in April/May
– Monthly Knapp-Track SSS (next release in ~mid-March)
– Beef price trends
What’s not to like?
TXRH — NEUTRAL ($35 PT)
Texas Roadhouse is a casual dining steakhouse chain. The majority of
the company’s entrees include two made-from-scratch side items, and it
offers a free unlimited supply of roasted in-shell peanuts and made-from-
scratch yeast rolls. Alcohol accounted for ~11% of sales in 2014. At
YE14 TXRH had 451 total restaurants, of which 18% were franchised
and 2% were located outside the US. TXRH was founded in 1993 and is
headquartered in Louisville, KY.
Source: Company data, CS estimates, Bloomberg
Company Description
Price-Earnings History (Consensus 12-Months Forward)
EPS (2015) SSS (company 2015)
CS
$1.41
Cons.
$1.44
CS
+5.8%
Cons.
5.8%
Analyst Ratings
BUY
7
SELL
2
HOLD
14
Market Forecasts and Ratings
TXRH
RATING: NEUTRAL PRICE (Mar 6, 2015): $36.17 TARGET PRICE: $35.00
10.0x
14.0x
18.0x
22.0x
26.0x
Mar10 Sep10 Mar11 Sep11 Mar12 Sep12 Mar13 Sep13 Mar14 Sep14 Mar15
Texas Roadhouse, Inc fwd PE sd +/- 1 All Restaurants
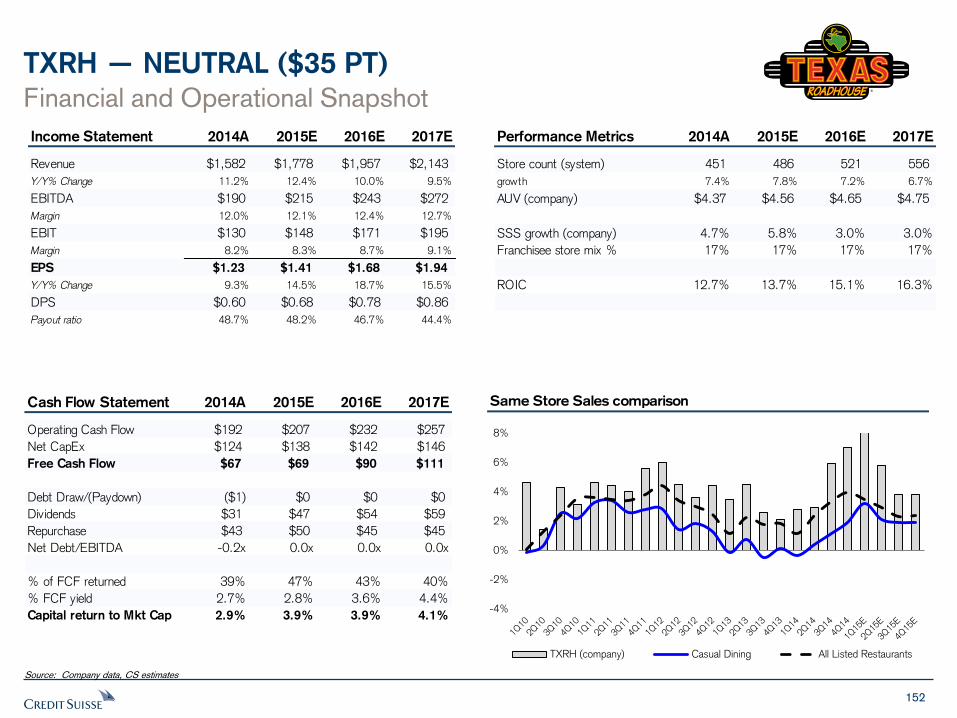
152
TXRH — NEUTRAL ($35 PT)
Financial and Operational Snapshot
Source: Company data, CS estimates
Same Store Sales comparison
Income Statement 2014A 2015E 2016E 2017E
Revenue $1,582 $1,778 $1,957 $2,143
Y/Y% Change 11.2% 12.4% 10.0% 9.5%
EBITDA $190 $215 $243 $272
Margin 12.0% 12.1% 12.4% 12.7%
EBIT $130 $148 $171 $195
Margin 8.2% 8.3% 8.7% 9.1%
EPS $1.23 $1.41 $1.68 $1.94
Y/Y% Change 9.3% 14.5% 18.7% 15.5%
DPS $0.60 $0.68 $0.78 $0.86
Payout ratio 48.7% 48.2% 46.7% 44.4%
Performance Metrics 2014A 2015E 2016E 2017E
Store count (system) 451 486 521 556
growth 7.4% 7.8% 7.2% 6.7%
AUV (company) $4.37 $4.56 $4.65 $4.75
SSS growth (company) 4.7% 5.8% 3.0% 3.0%
Franchisee store mix % 17% 17% 17% 17%
ROIC 12.7% 13.7% 15.1% 16.3%
Cash Flow Statement 2014A 2015E 2016E 2017E
Operating Cash Flow $192 $207 $232 $257
Net CapEx $124 $138 $142 $146
Free Cash Flow $67 $69 $90 $111
Debt Draw/(Paydown) ($1) $0 $0 $0
Dividends $31 $47 $54 $59
Repurchase $43 $50 $45 $45
Net Debt/EBITDA -0.2x 0.0x 0.0x 0.0x
% of FCF returned 39% 47% 43% 40%
% FCF yield 2.7% 2.8% 3.6% 4.4%
Capital return to Mkt Cap 2.9% 3.9% 3.9% 4.1%-4%
-2%
0%
2%
4%
6%
8%
TXRH (company) Casual Dining All Listed Restaurants
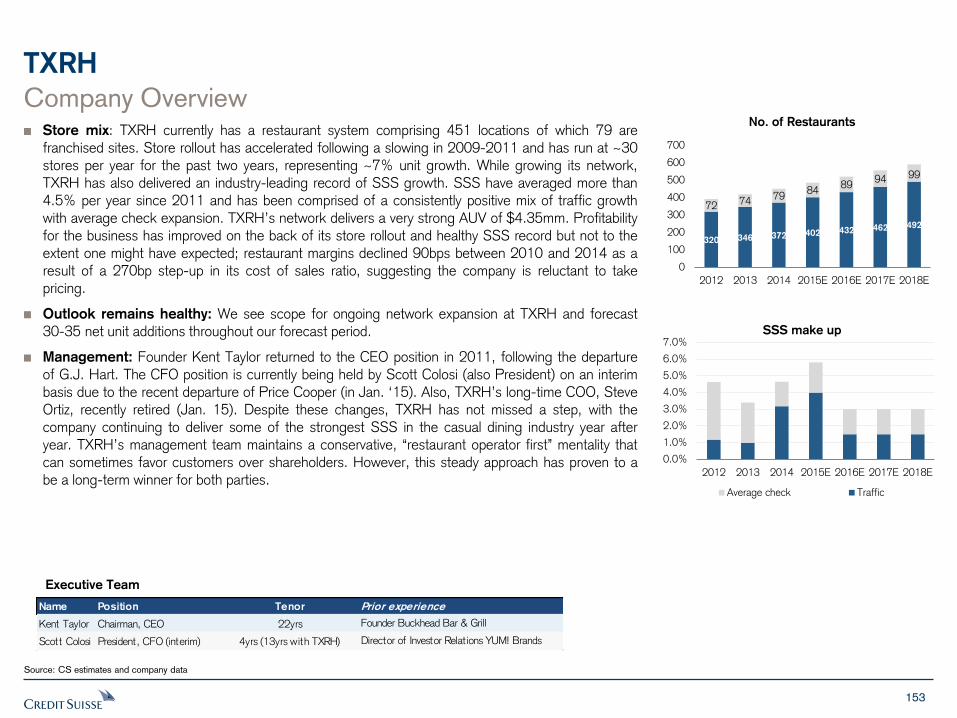
153
TXRH
Company Overview Store mix: TXRH currently has a restaurant system comprising 451 locations of which 79 are franchised sites. Store rollout has accelerated following a slowing in 2009-2011 and has run at ~30 stores per year for the past two years, representing ~7% unit growth. While growing its network, TXRH has also delivered an industry-leading record of SSS growth. SSS have averaged more than 4.5% per year since 2011 and has been comprised of a consistently positive mix of traffic growth with average check expansion. TXRH’s network delivers a very strong AUV of $4.35mm. Profitability for the business has improved on the back of its store rollout and healthy SSS record but not to the extent one might have expected; restaurant margins declined 90bps between 2010 and 2014 as a result of a 270bp step-up in its cost of sales ratio, suggesting the company is reluctant to take pricing.
Outlook remains healthy: We see scope for ongoing network expansion at TXRH and forecast 30-35 net unit additions throughout our forecast period.
Management: Founder Kent Taylor returned to the CEO position in 2011, following the departure of G.J. Hart. The CFO position is currently being held by Scott Colosi (also President) on an interim basis due to the recent departure of Price Cooper (in Jan. ‘15). Also, TXRH’s long-time COO, Steve Ortiz, recently retired (Jan. 15). Despite these changes, TXRH has not missed a step, with the company continuing to deliver some of the strongest SSS in the casual dining industry year after year. TXRH’s management team maintains a conservative, “restaurant operator first” mentality that can sometimes favor customers over shareholders. However, this steady approach has proven to a be a long-term winner for both parties.
Source: CS estimates and company data
Executive Team
320 346 372 402 432 462 492
72 74 79 84
89 94 99
0
100
200
300
400
500
600
700
2012 2013 2014 2015E 2016E 2017E 2018E
No. of Restaurants
0.0%
1.0%
2.0%
3.0%
4.0%
5.0%
6.0%
7.0%
2012 2013 2014 2015E 2016E 2017E 2018E
SSS make up
Average check Traffic
Name Position Tenor Prior experience
Kent Taylor Chairman, CEO 22yrs Founder Buckhead Bar & Grill
Scott Colosi President, CFO (interim) 4yrs (13yrs with TXRH) Director of Investor Relat ions YUM! Brands

154
TXRH What’s not to like?
Well-positioned for current environment: TXRH continues to be one of the best top line stories in the casual dining space, with +3.9% avg. SSS for the past 5 yrs. (in a difficult macro environment), well above the Knapp-Track index of 0%. Traffic has been even more impressive, averaging +2.2% over this 5-year period vs. Knapp-Track -1.9%. TXRH is also one of the best unit growth stories in casual dining, with consistent annual store growth in the ~7% range, helped by TXRH’s relatively small base of stores (451 at YE14: 372 company and 79 franchised). TXRH also hits on many of the attributes we like to see in the restaurant space: a simple menu with intense focus on quality ingredients and preparation, limited reliance on marketing/promos/innovation to drive sales, and an employee base that is fully engaged and properly incentivized. The TXRH model tends to work best when their core middle-income consumer is feeling upbeat. As such, we are not surprised to see TXRH’s SSS accelerate in recent quarters on the back of improving employment and consumer confidence. Also, TXRH’s restaurants tend to skew towards suburban/residential areas, meaning that lower gas prices should encourage additional visits. This appears to be the case, as SSS accelerated to +12% in the first 7 weeks of 1Q15, up from +7.0% in 4Q14 and +5.9% in 3Q14.
Improving cash return story: This disciplined approach to growth also generates healthy free cash flow (~$60-70mm per yr.). The company currently pays out ~50% of earnings via dividend (68c, 1.8% yield). The dividend has grown at a 21% CAGR since being introduced in 2011. TXRH repurchased $43mm in stock last year (1.6% of market cap), up from $13mm in 2013. The company has zero net debt.
What’s not to like?: Overall, this model of ~7% unit growth, low-to-mid single digit SSS and ~1% share buybacks, should generate ~mid-teens annual EPS growth. However, this has not been the case in recent years (EPS CAGR +11% since 2010) due to margin pressures. TXRH has the highest exposure to beef in our coverage universe, with this item representing just over 40% of COGS. Beef prices have been on the rise in recent years, and TXRH has had a tendency to “underprice” for this inflation, resulting in COGS pressure. TXRH’s COGS has risen to 35.3% of sales in 2014, up from 32.6% in 2010. The company has also not seen much leverage on labor or G&A expenses over the past several years, due to rising wage/benefit costs. Overall, TXRH has done a better job of protecting the customer value proposition (via minimal pricing) versus protecting the bottom line.
Valuation inflation: Despite this somewhat disappointing earnings performance, TXRH’s valuation has inflated along with others in the restaurant sector. The stock now trades at 24.5x NTM P/E, the highest level since 2006 and well above the 3-yr. avg. of 18.7x. We have a difficult time arguing for a much higher multiple for a company with a mid-teens growth model. Plus, 2015 is expected to be another year of above-avg. cost inflation and limited menu pricing (~+1.8%), which will mitigate potential EPS upside from higher SSS. TXRH has guided to 3-4% food inflation, led by beef, and elevated wage inflation due to higher mgmt. incentive comp, higher health care costs, and minimum/tipped wage increases in certain states.
Source: CS estimates and company data
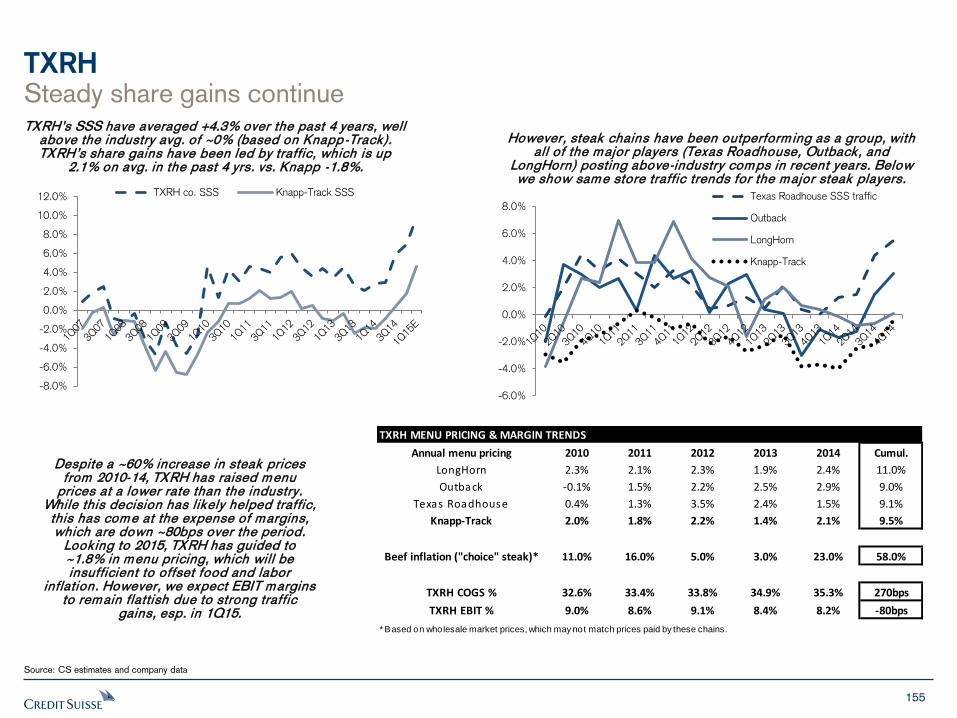
155
TXRH
Source: CS estimates and company data
TXRH’s SSS have averaged +4.3% over the past 4 years, well above the industry avg. of ~0% (based on Knapp-Track). TXRH’s share gains have been led by traffic, which is up
2.1% on avg. in the past 4 yrs. vs. Knapp -1.8%.
-6.0%
-4.0%
-2.0%
0.0%
2.0%
4.0%
6.0%
8.0%Texas Roadhouse SSS traffic
Outback
LongHorn
Knapp-Track
-8.0%
-6.0%
-4.0%
-2.0%
0.0%
2.0%
4.0%
6.0%
8.0%
10.0%
12.0% TXRH co. SSS Knapp-Track SSS
However, steak chains have been outperform ing as a group, with all of the major players (Texas Roadhouse, Outback, and
LongHorn) posting above-industry comps in recent years. Below we show same store traffic trends for the major steak players.
Despite a ~60% increase in steak prices from 2010-14, TXRH has raised menu
prices at a lower rate than the industry. While this decision has likely helped traffic, this has come at the expense of margins, which are down ~80bps over the period.
Looking to 2015, TXRH has guided to ~1.8% in menu pricing, which will be insufficient to offset food and labor
inflation. However, we expect EBIT margins to remain flattish due to strong traffic
gains, esp. in 1Q15.
TXRH MENU PRICING & MARGIN TRENDS
Annual menu pricing 2010 2011 2012 2013 2014 Cumul.
LongHorn 2.3% 2.1% 2.3% 1.9% 2.4% 11.0%
Outback -0.1% 1.5% 2.2% 2.5% 2.9% 9.0%
Texas Roadhouse 0.4% 1.3% 3.5% 2.4% 1.5% 9.1%
Knapp-Track 2.0% 1.8% 2.2% 1.4% 2.1% 9.5%
Beef inflation ("choice" steak)* 11.0% 16.0% 5.0% 3.0% 23.0% 58.0%
TXRH COGS % 32.6% 33.4% 33.8% 34.9% 35.3% 270bps
TXRH EBIT % 9.0% 8.6% 9.1% 8.4% 8.2% -80bps
* Based on wholesale market prices, which may not match prices paid by these chains.
Steady share gains continue
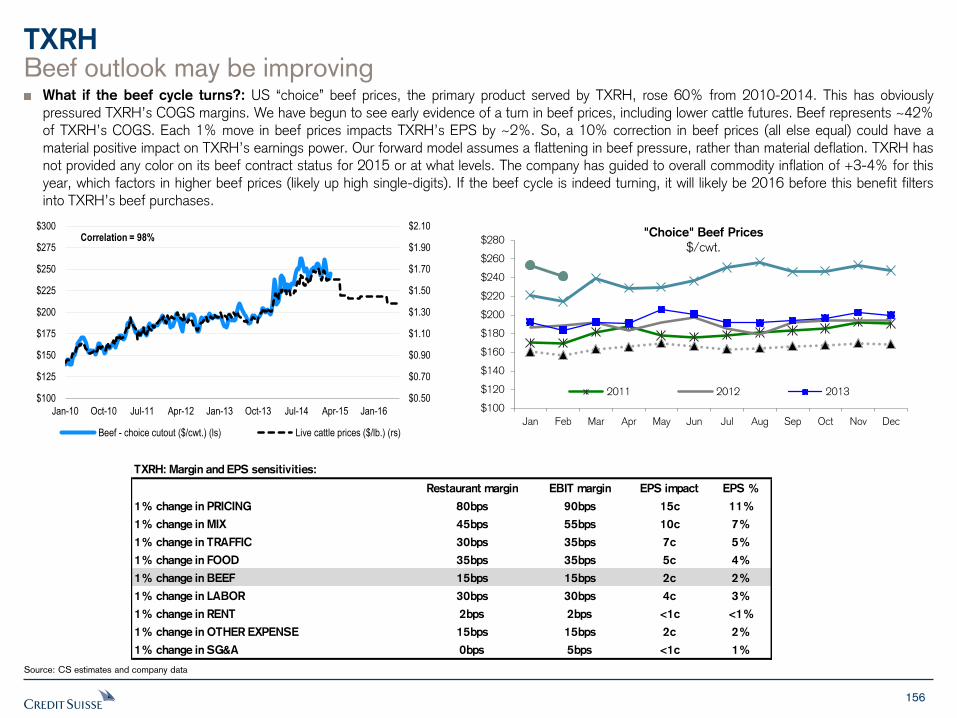
156
TXRH
Source: CS estimates and company data
What if the beef cycle turns?: US “choice” beef prices, the primary product served by TXRH, rose 60% from 2010-2014. This has obviously pressured TXRH’s COGS margins. We have begun to see early evidence of a turn in beef prices, including lower cattle futures. Beef represents ~42% of TXRH’s COGS. Each 1% move in beef prices impacts TXRH’s EPS by ~2%. So, a 10% correction in beef prices (all else equal) could have a material positive impact on TXRH’s earnings power. Our forward model assumes a flattening in beef pressure, rather than material deflation. TXRH has not provided any color on its beef contract status for 2015 or at what levels. The company has guided to overall commodity inflation of +3-4% for this year, which factors in higher beef prices (likely up high single-digits). If the beef cycle is indeed turning, it will likely be 2016 before this benefit filters into TXRH’s beef purchases.
$100
$120
$140
$160
$180
$200
$220
$240
$260
$280
Jan Feb Mar Apr May Jun Jul Aug Sep Oct Nov Dec
"Choice" Beef Prices
$/cwt.
2011 2012 2013$0.50
$0.70
$0.90
$1.10
$1.30
$1.50
$1.70
$1.90
$2.10
$100
$125
$150
$175
$200
$225
$250
$275
$300
Jan-10 Oct-10 Jul-11 Apr-12 Jan-13 Oct-13 Jul-14 Apr-15 Jan-16
Beef - choice cutout ($/cwt.) (ls) Live cattle prices ($/lb.) (rs)
Correlation = 98%
TXRH: Margin and EPS sensitivities:
Restaurant margin EBIT margin EPS impact EPS %
1% change in PRICING 80bps 90bps 15c 11%
1% change in MIX 45bps 55bps 10c 7%
1% change in TRAFFIC 30bps 35bps 7c 5%
1% change in FOOD 35bps 35bps 5c 4%
1% change in BEEF 15bps 15bps 2c 2%
1% change in LABOR 30bps 30bps 4c 3%
1% change in RENT 2bps 2bps <1c <1%
1% change in OTHER EXPENSE 15bps 15bps 2c 2%
1% change in SG&A 0bps 5bps <1c 1%
Beef outlook may be improving
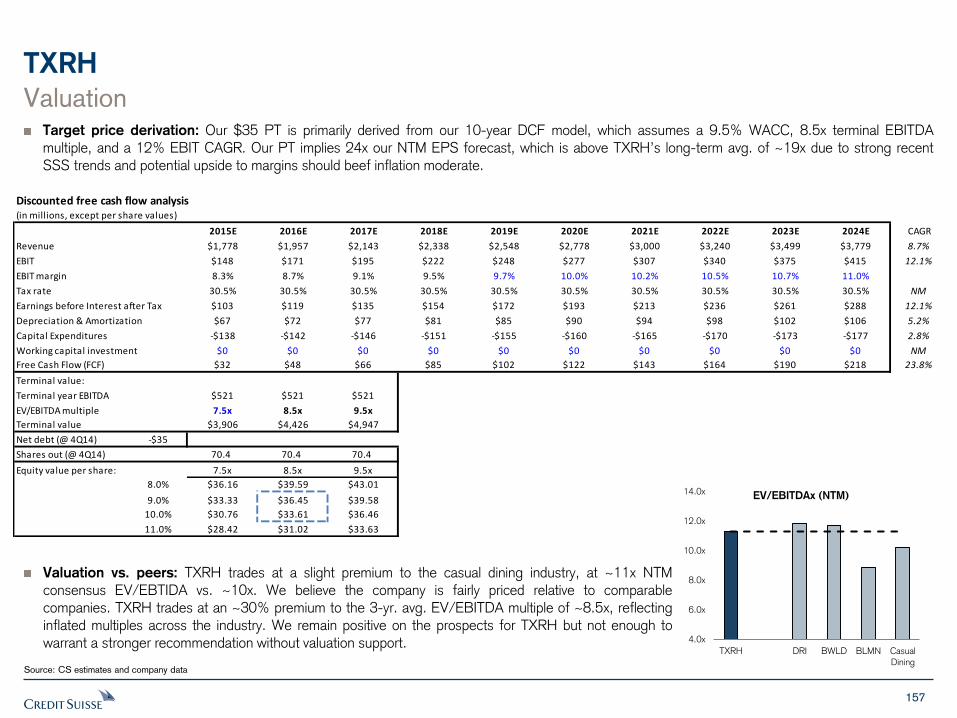
157
Discounted free cash flow analysis(in millions, except per share values)
2015E 2016E 2017E 2018E 2019E 2020E 2021E 2022E 2023E 2024E CAGR
Revenue $1,778 $1,957 $2,143 $2,338 $2,548 $2,778 $3,000 $3,240 $3,499 $3,779 8.7%
EBIT $148 $171 $195 $222 $248 $277 $307 $340 $375 $415 12.1%
EBIT margin 8.3% 8.7% 9.1% 9.5% 9.7% 10.0% 10.2% 10.5% 10.7% 11.0%
Tax rate 30.5% 30.5% 30.5% 30.5% 30.5% 30.5% 30.5% 30.5% 30.5% 30.5% NM
Earnings before Interest after Tax $103 $119 $135 $154 $172 $193 $213 $236 $261 $288 12.1%
Depreciation & Amortization $67 $72 $77 $81 $85 $90 $94 $98 $102 $106 5.2%
Capital Expenditures -$138 -$142 -$146 -$151 -$155 -$160 -$165 -$170 -$173 -$177 2.8%
Working capital investment $0 $0 $0 $0 $0 $0 $0 $0 $0 $0 NM
Free Cash Flow (FCF) $32 $48 $66 $85 $102 $122 $143 $164 $190 $218 23.8%
Terminal value:
Terminal year EBITDA $521 $521 $521
EV/EBITDA multiple 7.5x 8.5x 9.5x
Terminal value $3,906 $4,426 $4,947
Net debt (@ 4Q14) -$35
Shares out (@ 4Q14) 70.4 70.4 70.4
Equity value per share: 7.5x 8.5x 9.5x
8.0% $36.16 $39.59 $43.01
9.0% $33.33 $36.45 $39.58
10.0% $30.76 $33.61 $36.46
11.0% $28.42 $31.02 $33.63
TXRH
Source: CS estimates and company data
Valuation Target price derivation: Our $35 PT is primarily derived from our 10-year DCF model, which assumes a 9.5% WACC, 8.5x terminal EBITDA multiple, and a 12% EBIT CAGR. Our PT implies 24x our NTM EPS forecast, which is above TXRH’s long-term avg. of ~19x due to strong recent SSS trends and potential upside to margins should beef inflation moderate.
Valuation vs. peers: TXRH trades at a slight premium to the casual dining industry, at ~11x NTM consensus EV/EBTIDA vs. ~10x. We believe the company is fairly priced relative to comparable companies. TXRH trades at an ~30% premium to the 3-yr. avg. EV/EBITDA multiple of ~8.5x, reflecting inflated multiples across the industry. We remain positive on the prospects for TXRH but not enough to warrant a stronger recommendation without valuation support.
4.0x
6.0x
8.0x
10.0x
12.0x
14.0x
TXRH DRI BWLD BLMN Casual
Dining
EV/EBITDAx (NTM)
158
TXRH
Source: CS estimates and company data
Risks “Negative” exposure to gas prices?: TXRH has above-avg. exposure to the state of TX, with this market representing ~16% of company-operated restaurants (vs. industry avg. of ~9%). The recent decline in oil/gas prices could negatively impact the TX economy, potentially hurting restaurant traffic for TXRH. However, we have seen no evidence of this dynamic thus far, with TXRH’s SSS strong in 4Q14 and 1Q15 to-date.
Beef inflation: TXRH has among the highest beef exposure in the restaurant industry, at over 40% of COGS. Beef prices have been rising faster than overall food prices in recent years due to tight cattle supplies. If this dynamic continues, then TXRH’s margins could be further at risk.
Macro/consumer: TXRH operates in the discretionary casual dining category. Changes in consumer spending patterns are significant drivers of the business model. These patterns can be impacted by factors outside of the company’s control, including employment levels, income growth and general consumer confidence.
Labor inflation: Any material changes in wage rates, especially tipped minimum wages, could have a material impact on earnings forecasts.
Competition: The restaurant industry is intensely competitive. TXRH faces competition from large national chains, as well as smaller regional players and mom & pop operators. Changes in promotional/marketing activities or store openings by competitors can meaningfully impact TXRH’s business. We note that the casual dining industry has historically experienced negative customer traffic on a per store basis, partly due to rising supply in the industry.
New unit sales & returns: The TXRH model is contingent upon significant new store openings for the foreseeable future. Any deterioration in new store metrics (such as sales, costs, or margins) could negatively impact the TXRH growth trajectory and valuation. TXRH must also be cognizant of cannibalization of existing stores as the new store openings proliferate.
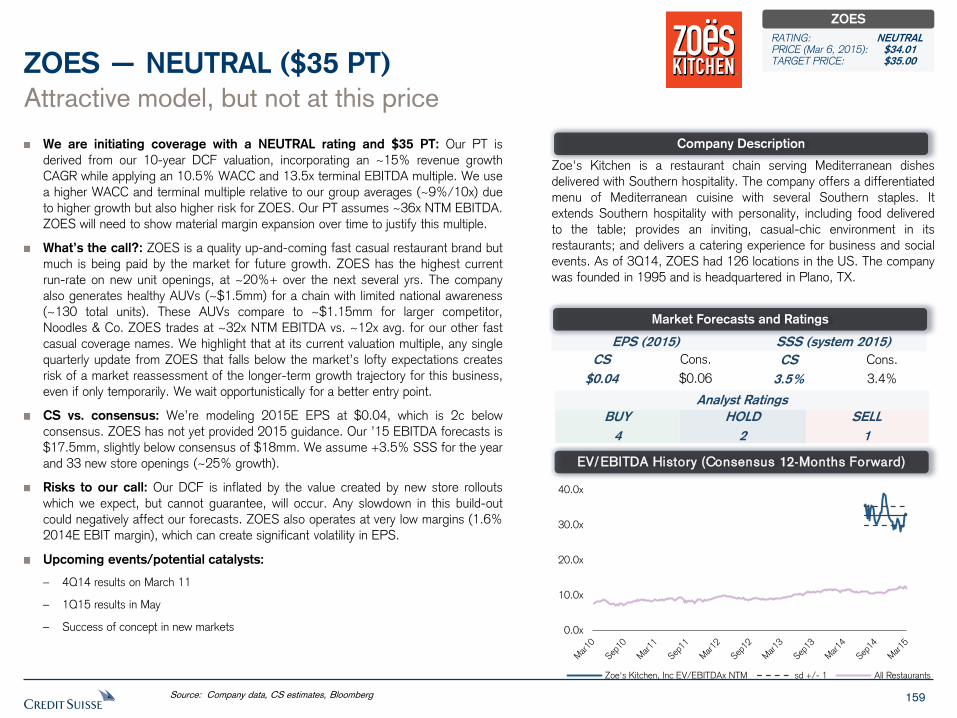
159
We are initiating coverage with a NEUTRAL rating and $35 PT: Our PT is
derived from our 10-year DCF valuation, incorporating an ~15% revenue growth
CAGR while applying an 10.5% WACC and 13.5x terminal EBITDA multiple. We use
a higher WACC and terminal multiple relative to our group averages (~9%/10x) due
to higher growth but also higher risk for ZOES. Our PT assumes ~36x NTM EBITDA.
ZOES will need to show material margin expansion over time to justify this multiple.
What’s the call?: ZOES is a quality up-and-coming fast casual restaurant brand but
much is being paid by the market for future growth. ZOES has the highest current
run-rate on new unit openings, at ~20%+ over the next several yrs. The company
also generates healthy AUVs (~$1.5mm) for a chain with limited national awareness
(~130 total units). These AUVs compare to ~$1.15mm for larger competitor,
Noodles & Co. ZOES trades at ~32x NTM EBITDA vs. ~12x avg. for our other fast
casual coverage names. We highlight that at its current valuation multiple, any single
quarterly update from ZOES that falls below the market’s lofty expectations creates
risk of a market reassessment of the longer-term growth trajectory for this business,
even if only temporarily. We wait opportunistically for a better entry point.
CS vs. consensus: We’re modeling 2015E EPS at $0.04, which is 2c below
consensus. ZOES has not yet provided 2015 guidance. Our ’15 EBITDA forecasts is
$17.5mm, slightly below consensus of $18mm. We assume +3.5% SSS for the year
and 33 new store openings (~25% growth).
Risks to our call: Our DCF is inflated by the value created by new store rollouts
which we expect, but cannot guarantee, will occur. Any slowdown in this build-out
could negatively affect our forecasts. ZOES also operates at very low margins (1.6%
2014E EBIT margin), which can create significant volatility in EPS.
Upcoming events/potential catalysts:
– 4Q14 results on March 11
– 1Q15 results in May
– Success of concept in new markets
Attractive model, but not at this price
ZOES — NEUTRAL ($35 PT)
Zoe's Kitchen is a restaurant chain serving Mediterranean dishes
delivered with Southern hospitality. The company offers a differentiated
menu of Mediterranean cuisine with several Southern staples. It
extends Southern hospitality with personality, including food delivered
to the table; provides an inviting, casual-chic environment in its
restaurants; and delivers a catering experience for business and social
events. As of 3Q14, ZOES had 126 locations in the US. The company
was founded in 1995 and is headquartered in Plano, TX.
Source: Company data, CS estimates, Bloomberg
Company Description
EV/EBITDA History (Consensus 12-Months Forward)
EPS (2015) SSS (system 2015)
CS
$0.04
Cons.
$0.06
CS
3.5%
Cons.
3.4%
Analyst Ratings
BUY
4
SELL
1
HOLD
2
Market Forecasts and Ratings
ZOES
RATING: NEUTRAL PRICE (Mar 6, 2015): $34.01 TARGET PRICE: $35.00
0.0x
10.0x
20.0x
30.0x
40.0x
Zoe's Kitchen, Inc EV/EBITDAx NTM sd +/- 1 All Restaurants
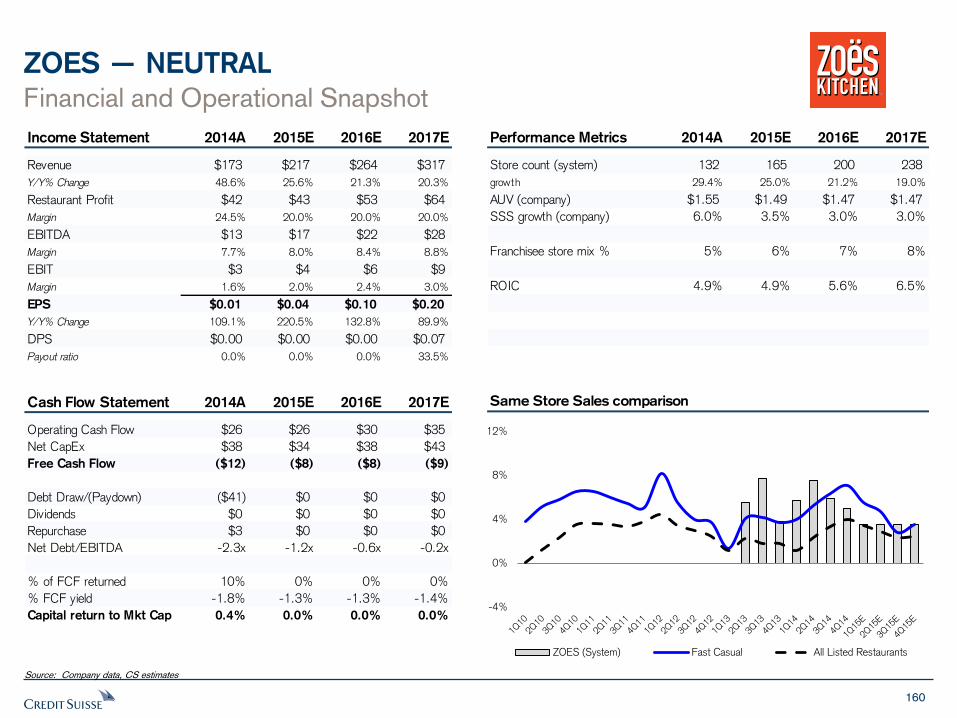
160
ZOES — NEUTRAL
Financial and Operational Snapshot
Source: Company data, CS estimates
Same Store Sales comparison
Income Statement 2014A 2015E 2016E 2017E
Revenue $173 $217 $264 $317
Y/Y% Change 48.6% 25.6% 21.3% 20.3%
Restaurant Profit $42 $43 $53 $64
Margin 24.5% 20.0% 20.0% 20.0%
EBITDA $13 $17 $22 $28
Margin 7.7% 8.0% 8.4% 8.8%
EBIT $3 $4 $6 $9
Margin 1.6% 2.0% 2.4% 3.0%
EPS $0.01 $0.04 $0.10 $0.20
Y/Y% Change 109.1% 220.5% 132.8% 89.9%
DPS $0.00 $0.00 $0.00 $0.07
Payout ratio 0.0% 0.0% 0.0% 33.5%
Performance Metrics 2014A 2015E 2016E 2017E
Store count (system) 132 165 200 238
growth 29.4% 25.0% 21.2% 19.0%
AUV (company) $1.55 $1.49 $1.47 $1.47
SSS growth (company) 6.0% 3.5% 3.0% 3.0%
Franchisee store mix % 5% 6% 7% 8%
ROIC 4.9% 4.9% 5.6% 6.5%
Cash Flow Statement 2014A 2015E 2016E 2017E
Operating Cash Flow $26 $26 $30 $35
Net CapEx $38 $34 $38 $43
Free Cash Flow ($12) ($8) ($8) ($9)
Debt Draw/(Paydown) ($41) $0 $0 $0
Dividends $0 $0 $0 $0
Repurchase $3 $0 $0 $0
Net Debt/EBITDA -2.3x -1.2x -0.6x -0.2x
% of FCF returned 10% 0% 0% 0%
% FCF yield -1.8% -1.3% -1.3% -1.4%
Capital return to Mkt Cap 0.4% 0.0% 0.0% 0.0%-4%
0%
4%
8%
12%
ZOES (System) Fast Casual All Listed Restaurants
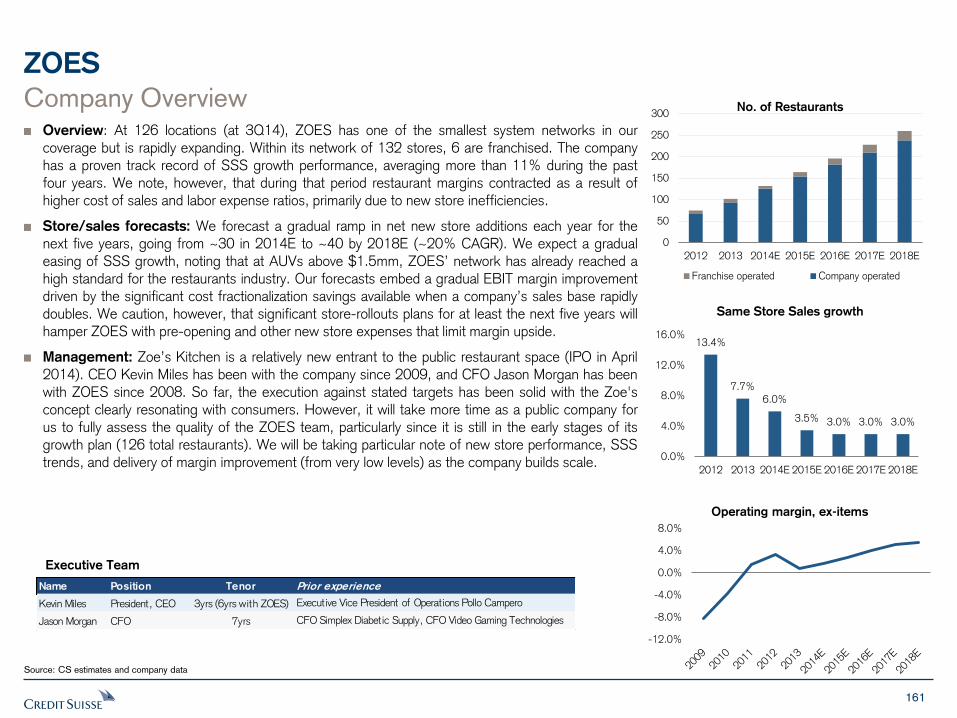
161
ZOES
Company Overview Overview: At 126 locations (at 3Q14), ZOES has one of the smallest system networks in our coverage but is rapidly expanding. Within its network of 132 stores, 6 are franchised. The company has a proven track record of SSS growth performance, averaging more than 11% during the past four years. We note, however, that during that period restaurant margins contracted as a result of higher cost of sales and labor expense ratios, primarily due to new store inefficiencies.
Store/sales forecasts: We forecast a gradual ramp in net new store additions each year for the next five years, going from ~30 in 2014E to ~40 by 2018E (~20% CAGR). We expect a gradual easing of SSS growth, noting that at AUVs above $1.5mm, ZOES’ network has already reached a high standard for the restaurants industry. Our forecasts embed a gradual EBIT margin improvement driven by the significant cost fractionalization savings available when a company’s sales base rapidly doubles. We caution, however, that significant store-rollouts plans for at least the next five years will hamper ZOES with pre-opening and other new store expenses that limit margin upside.
Management: Zoe’s Kitchen is a relatively new entrant to the public restaurant space (IPO in April 2014). CEO Kevin Miles has been with the company since 2009, and CFO Jason Morgan has been with ZOES since 2008. So far, the execution against stated targets has been solid with the Zoe's concept clearly resonating with consumers. However, it will take more time as a public company for us to fully assess the quality of the ZOES team, particularly since it is still in the early stages of its growth plan (126 total restaurants). We will be taking particular note of new store performance, SSS trends, and delivery of margin improvement (from very low levels) as the company builds scale.
Source: CS estimates and company data
Executive Team
0
50
100
150
200
250
300
2012 2013 2014E 2015E 2016E 2017E 2018E
No. of Restaurants
Franchise operated Company operated
Name Position Tenor Prior experience
Kevin Miles President, CEO 3yrs (6yrs with ZOES) Executive Vice President of Operations Pollo Campero
Jason Morgan CFO 7yrs CFO Simplex Diabetic Supply, CFO Video Gaming Technologies
13.4%
7.7% 6.0%
3.5% 3.0% 3.0% 3.0%
0.0%
4.0%
8.0%
12.0%
16.0%
2012 2013 2014E 2015E 2016E 2017E 2018E
Same Store Sales growth
-12.0%
-8.0%
-4.0%
0.0%
4.0%
8.0%
Operating margin, ex-items
162
ZOES
Source: CS estimates and company data
We choose to wait ZOES is a quality up-and-coming fast-casual restaurant brand but much is being paid by the market before being proven. We wait opportunistically for a better entry point.
Right idea…: The ZOES concept has merit; it’s unique, well-managed and effective at drawing footfall from a highly sought after affluent demographic. We are impressed by the menu and image, which appeals to a discerning fast casual customer. ZOES is among the best positioned in our coverage to benefit from a pipeline of unit growth.
… not the right price: What inhibits an investment in ZOES is that the good news is very comfortably captured by the market’s valuation. At 29x 2016 EBITDA, this is the most expensive name in our coverage. We therefore need conviction that the market is materially underestimating the near-term sales/earnings outlook for this business. However, to the contrary, generally in-line SSS run-rates coupled with scope for margin dilution from new store openings tempers our optimism. The real risk here, as we see it, is that an unexpected sales/earnings miss drives a market reassessment of the longer-term growth trajectory for the business (as was the case for NDLS). At the current valuation, we note the ZOES’ multiple has a long way to fall before hitting the fast casual average of ~12x EV/EBITDA, ex-ZOES (based on average multiples for CMG, PNRA, NDLS, PBPB). The silver lining on that outlook is that any event driving a sudden market correction could present an attractive buying opportunity. Until then, we prefer to wait on the sidelines or play the theme through PNRA.
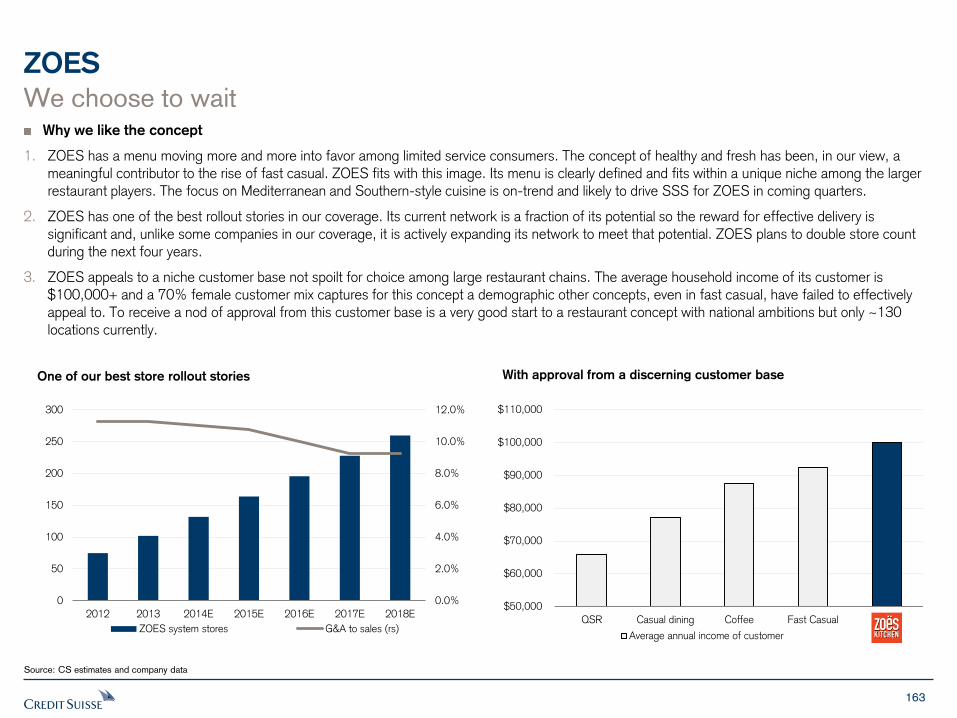
163
ZOES
Source: CS estimates and company data
We choose to wait Why we like the concept
1. ZOES has a menu moving more and more into favor among limited service consumers. The concept of healthy and fresh has been, in our view, a meaningful contributor to the rise of fast casual. ZOES fits with this image. Its menu is clearly defined and fits within a unique niche among the larger restaurant players. The focus on Mediterranean and Southern-style cuisine is on-trend and likely to drive SSS for ZOES in coming quarters.
2. ZOES has one of the best rollout stories in our coverage. Its current network is a fraction of its potential so the reward for effective delivery is significant and, unlike some companies in our coverage, it is actively expanding its network to meet that potential. ZOES plans to double store count during the next four years.
3. ZOES appeals to a niche customer base not spoilt for choice among large restaurant chains. The average household income of its customer is $100,000+ and a 70% female customer mix captures for this concept a demographic other concepts, even in fast casual, have failed to effectively appeal to. To receive a nod of approval from this customer base is a very good start to a restaurant concept with national ambitions but only ~130 locations currently.
One of our best store rollout stories
0.0%
2.0%
4.0%
6.0%
8.0%
10.0%
12.0%
0
50
100
150
200
250
300
2012 2013 2014E 2015E 2016E 2017E 2018E
ZOES system stores G&A to sales (rs)
$50,000
$60,000
$70,000
$80,000
$90,000
$100,000
$110,000
QSR Casual dining Coffee Fast Casual ZOES
Average annual income of customer
With approval from a discerning customer base
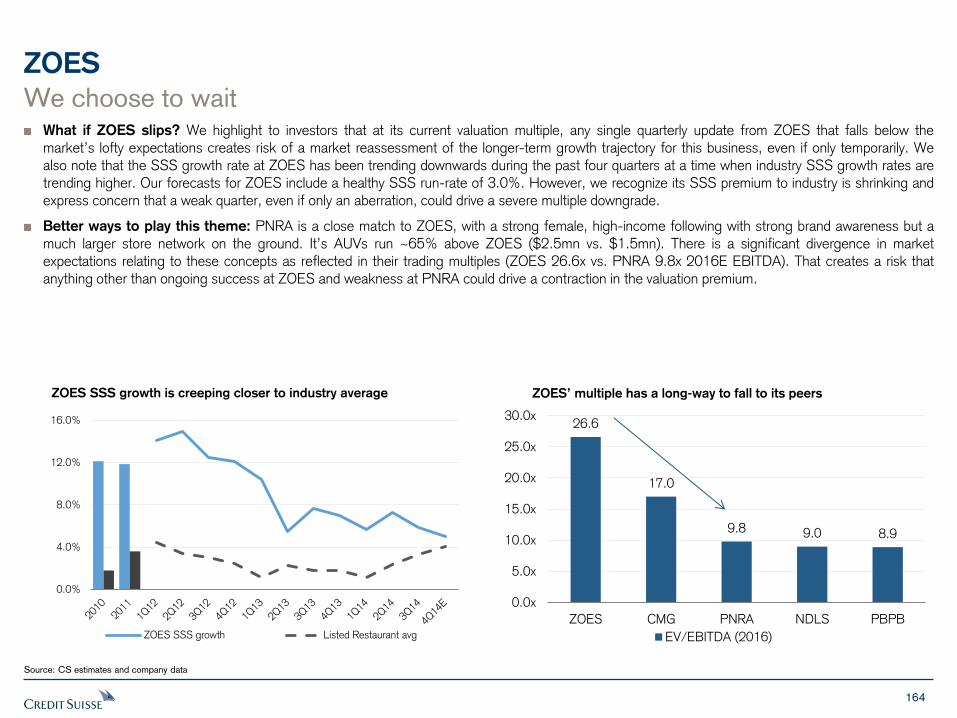
164
ZOES
Source: CS estimates and company data
We choose to wait What if ZOES slips? We highlight to investors that at its current valuation multiple, any single quarterly update from ZOES that falls below the market’s lofty expectations creates risk of a market reassessment of the longer-term growth trajectory for this business, even if only temporarily. We also note that the SSS growth rate at ZOES has been trending downwards during the past four quarters at a time when industry SSS growth rates are trending higher. Our forecasts for ZOES include a healthy SSS run-rate of 3.0%. However, we recognize its SSS premium to industry is shrinking and express concern that a weak quarter, even if only an aberration, could drive a severe multiple downgrade.
Better ways to play this theme: PNRA is a close match to ZOES, with a strong female, high-income following with strong brand awareness but a much larger store network on the ground. It’s AUVs run ~65% above ZOES ($2.5mn vs. $1.5mn). There is a significant divergence in market expectations relating to these concepts as reflected in their trading multiples (ZOES 26.6x vs. PNRA 9.8x 2016E EBITDA). That creates a risk that anything other than ongoing success at ZOES and weakness at PNRA could drive a contraction in the valuation premium.
ZOES’ multiple has a long-way to fall to its peers
26.6
17.0
9.8 9.0 8.9
0.0x
5.0x
10.0x
15.0x
20.0x
25.0x
30.0x
ZOES CMG PNRA NDLS PBPB
EV/EBITDA (2016)
ZOES SSS growth is creeping closer to industry average
0.0%
4.0%
8.0%
12.0%
16.0%
ZOES SSS growth Listed Restaurant avg
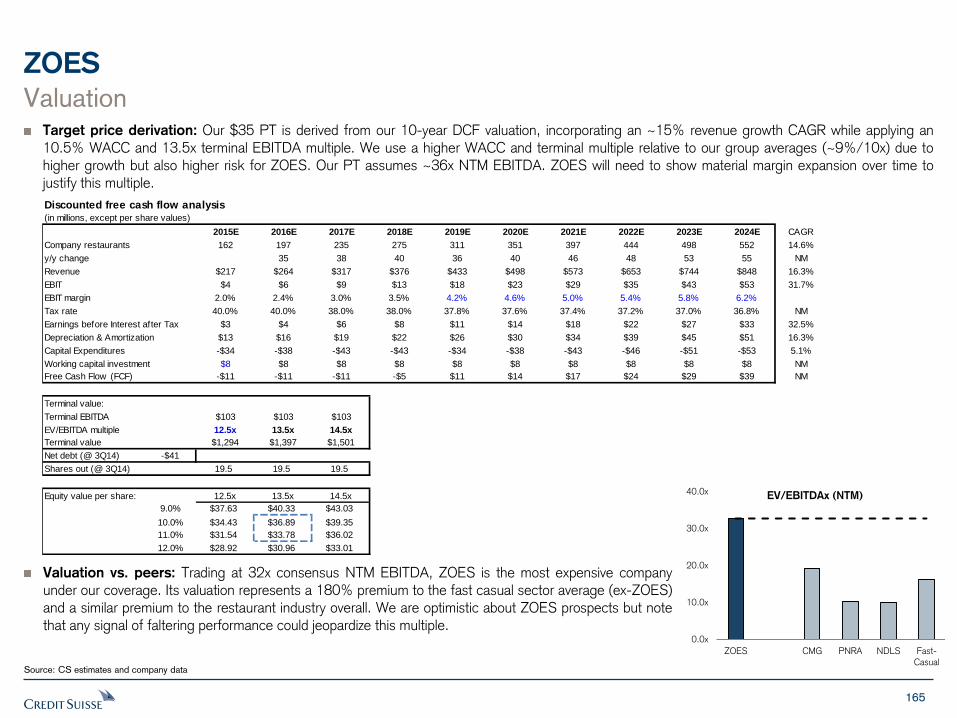
165
Discounted free cash flow analysis(in millions, except per share values)
2015E 2016E 2017E 2018E 2019E 2020E 2021E 2022E 2023E 2024E CAGR
Company restaurants 162 197 235 275 311 351 397 444 498 552 14.6%
y/y change 35 38 40 36 40 46 48 53 55 NM
Revenue $217 $264 $317 $376 $433 $498 $573 $653 $744 $848 16.3%
EBIT $4 $6 $9 $13 $18 $23 $29 $35 $43 $53 31.7%
EBIT margin 2.0% 2.4% 3.0% 3.5% 4.2% 4.6% 5.0% 5.4% 5.8% 6.2%
Tax rate 40.0% 40.0% 38.0% 38.0% 37.8% 37.6% 37.4% 37.2% 37.0% 36.8% NM
Earnings before Interest after Tax $3 $4 $6 $8 $11 $14 $18 $22 $27 $33 32.5%
Depreciation & Amortization $13 $16 $19 $22 $26 $30 $34 $39 $45 $51 16.3%
Capital Expenditures -$34 -$38 -$43 -$43 -$34 -$38 -$43 -$46 -$51 -$53 5.1%
Working capital investment $8 $8 $8 $8 $8 $8 $8 $8 $8 $8 NM
Free Cash Flow (FCF) -$11 -$11 -$11 -$5 $11 $14 $17 $24 $29 $39 NM
Terminal value:
Terminal EBITDA $103 $103 $103
EV/EBITDA multiple 12.5x 13.5x 14.5x
Terminal value $1,294 $1,397 $1,501
Net debt (@ 3Q14) -$41
Shares out (@ 3Q14) 19.5 19.5 19.5
Equity value per share: 12.5x 13.5x 14.5x
9.0% $37.63 $40.33 $43.03
10.0% $34.43 $36.89 $39.35
11.0% $31.54 $33.78 $36.02
12.0% $28.92 $30.96 $33.01
ZOES
Source: CS estimates and company data
Valuation Target price derivation: Our $35 PT is derived from our 10-year DCF valuation, incorporating an ~15% revenue growth CAGR while applying an 10.5% WACC and 13.5x terminal EBITDA multiple. We use a higher WACC and terminal multiple relative to our group averages (~9%/10x) due to higher growth but also higher risk for ZOES. Our PT assumes ~36x NTM EBITDA. ZOES will need to show material margin expansion over time to justify this multiple.
Valuation vs. peers: Trading at 32x consensus NTM EBITDA, ZOES is the most expensive company under our coverage. Its valuation represents a 180% premium to the fast casual sector average (ex-ZOES) and a similar premium to the restaurant industry overall. We are optimistic about ZOES prospects but note that any signal of faltering performance could jeopardize this multiple.
0.0x
10.0x
20.0x
30.0x
40.0x
ZOES CMG PNRA NDLS Fast-
Casual
EV/EBITDAx (NTM)
166
ZOES
Source: CS estimates and company data
Risks Store rollout program: Our outlook for ZOES is highly dependent on execution of the store build-out program. Our DCF is inflated by the value created by new store rollouts which we expect, but cannot guarantee, will occur. Any slowdown in this build-out could negatively affect our forecasts.
SSS trends: As mentioned earlier, ZOES trades at a significant premium to the market, partly because it has a history of delivering above-industry SSS growth rates. We note that SSS growth rates have been trending lower and highlight the risk that a weak quarter could see SSS growth at ZOES fall below industry levels and may drive a downward re-rating of the stock.
Shifts in consumer food preferences: ZOES offers a unique menu of Mediterranean and Southern-style cuisine. Both styles are currently in favor with consumers but there is a risk that these styles move off-trend, which could see traffic into ZOES fall and as a result impact sales and earnings.
Macroeconomic conditions: Any deterioration in macroeconomic conditions, especially income and job growth, could have a negative impact on our ZOES forecasts. Sales performances at restaurants are highly correlated to economic conditions because they remain a discretionary purchase.
Food/labor costs: ZOES has significant food cost exposures, which can be difficult to predict. Key commodity items that impact NDLS include produce, chicken and beef. ZOES is also exposed to labor costs, particularly within its restaurants. Minimum wage increases and rising health care costs could negatively impact ZOES margins. A tightening labor market is also causing higher competition for skilled workers.
Competition: ZOES faces a growing competitive set in the fast casual industry. Increased competition could negatively impact ZOES’s SSS and margins and could cause increases in investment costs, especially for real estate.
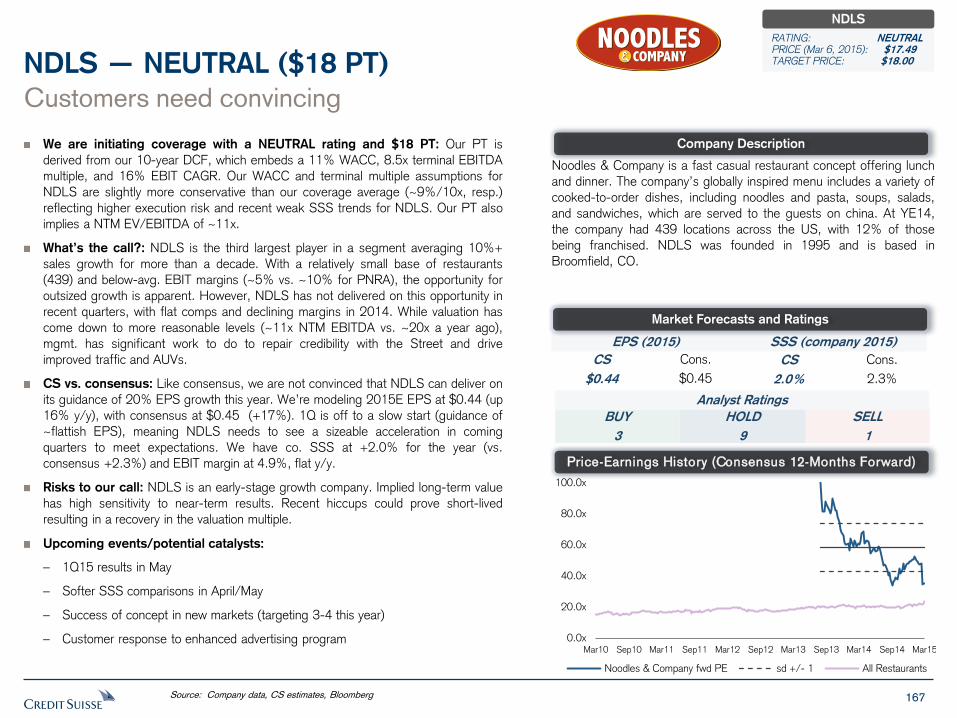
167
We are initiating coverage with a NEUTRAL rating and $18 PT: Our PT is
derived from our 10-year DCF, which embeds a 11% WACC, 8.5x terminal EBITDA
multiple, and 16% EBIT CAGR. Our WACC and terminal multiple assumptions for
NDLS are slightly more conservative than our coverage average (~9%/10x, resp.)
reflecting higher execution risk and recent weak SSS trends for NDLS. Our PT also
implies a NTM EV/EBITDA of ~11x.
What’s the call?: NDLS is the third largest player in a segment averaging 10%+
sales growth for more than a decade. With a relatively small base of restaurants
(439) and below-avg. EBIT margins (~5% vs. ~10% for PNRA), the opportunity for
outsized growth is apparent. However, NDLS has not delivered on this opportunity in
recent quarters, with flat comps and declining margins in 2014. While valuation has
come down to more reasonable levels (~11x NTM EBITDA vs. ~20x a year ago),
mgmt. has significant work to do to repair credibility with the Street and drive
improved traffic and AUVs.
CS vs. consensus: Like consensus, we are not convinced that NDLS can deliver on
its guidance of 20% EPS growth this year. We’re modeling 2015E EPS at $0.44 (up
16% y/y), with consensus at $0.45 (+17%). 1Q is off to a slow start (guidance of
~flattish EPS), meaning NDLS needs to see a sizeable acceleration in coming
quarters to meet expectations. We have co. SSS at +2.0% for the year (vs.
consensus +2.3%) and EBIT margin at 4.9%, flat y/y.
Risks to our call: NDLS is an early-stage growth company. Implied long-term value
has high sensitivity to near-term results. Recent hiccups could prove short-lived
resulting in a recovery in the valuation multiple.
Upcoming events/potential catalysts:
– 1Q15 results in May
– Softer SSS comparisons in April/May
– Success of concept in new markets (targeting 3-4 this year)
– Customer response to enhanced advertising program
Customers need convincing
NDLS — NEUTRAL ($18 PT)
Noodles & Company is a fast casual restaurant concept offering lunch
and dinner. The company’s globally inspired menu includes a variety of
cooked-to-order dishes, including noodles and pasta, soups, salads,
and sandwiches, which are served to the guests on china. At YE14,
the company had 439 locations across the US, with 12% of those
being franchised. NDLS was founded in 1995 and is based in
Broomfield, CO.
Source: Company data, CS estimates, Bloomberg
Company Description
Price-Earnings History (Consensus 12-Months Forward)
EPS (2015) SSS (company 2015)
CS
$0.44
Cons.
$0.45
CS
2.0%
Cons.
2.3%
Analyst Ratings
BUY
3
SELL
1
HOLD
9
Market Forecasts and Ratings
NDLS
RATING: NEUTRAL PRICE (Mar 6, 2015): $17.49 TARGET PRICE: $18.00
0.0x
20.0x
40.0x
60.0x
80.0x
100.0x
Mar10 Sep10 Mar11 Sep11 Mar12 Sep12 Mar13 Sep13 Mar14 Sep14 Mar15
Noodles & Company fwd PE sd +/- 1 All Restaurants
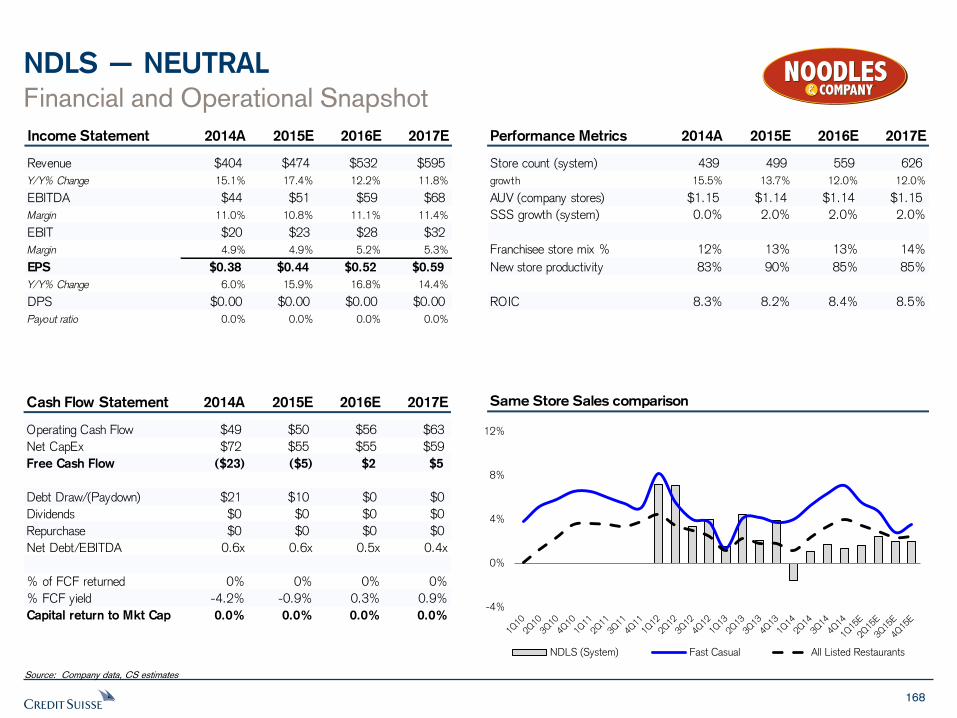
168
NDLS — NEUTRAL
Financial and Operational Snapshot
Source: Company data, CS estimates
Same Store Sales comparison
Income Statement 2014A 2015E 2016E 2017E
Revenue $404 $474 $532 $595
Y/Y% Change 15.1% 17.4% 12.2% 11.8%
EBITDA $44 $51 $59 $68
Margin 11.0% 10.8% 11.1% 11.4%
EBIT $20 $23 $28 $32
Margin 4.9% 4.9% 5.2% 5.3%
EPS $0.38 $0.44 $0.52 $0.59
Y/Y% Change 6.0% 15.9% 16.8% 14.4%
DPS $0.00 $0.00 $0.00 $0.00
Payout ratio 0.0% 0.0% 0.0% 0.0%
Performance Metrics 2014A 2015E 2016E 2017E
Store count (system) 439 499 559 626
growth 15.5% 13.7% 12.0% 12.0%
AUV (company stores) $1.15 $1.14 $1.14 $1.15
SSS growth (system) 0.0% 2.0% 2.0% 2.0%
Franchisee store mix % 12% 13% 13% 14%
New store productivity 83% 90% 85% 85%
ROIC 8.3% 8.2% 8.4% 8.5%
Cash Flow Statement 2014A 2015E 2016E 2017E
Operating Cash Flow $49 $50 $56 $63
Net CapEx $72 $55 $55 $59
Free Cash Flow ($23) ($5) $2 $5
Debt Draw/(Paydown) $21 $10 $0 $0
Dividends $0 $0 $0 $0
Repurchase $0 $0 $0 $0
Net Debt/EBITDA 0.6x 0.6x 0.5x 0.4x
% of FCF returned 0% 0% 0% 0%
% FCF yield -4.2% -0.9% 0.3% 0.9%
Capital return to Mkt Cap 0.0% 0.0% 0.0% 0.0%-4%
0%
4%
8%
12%
NDLS (System) Fast Casual All Listed Restaurants
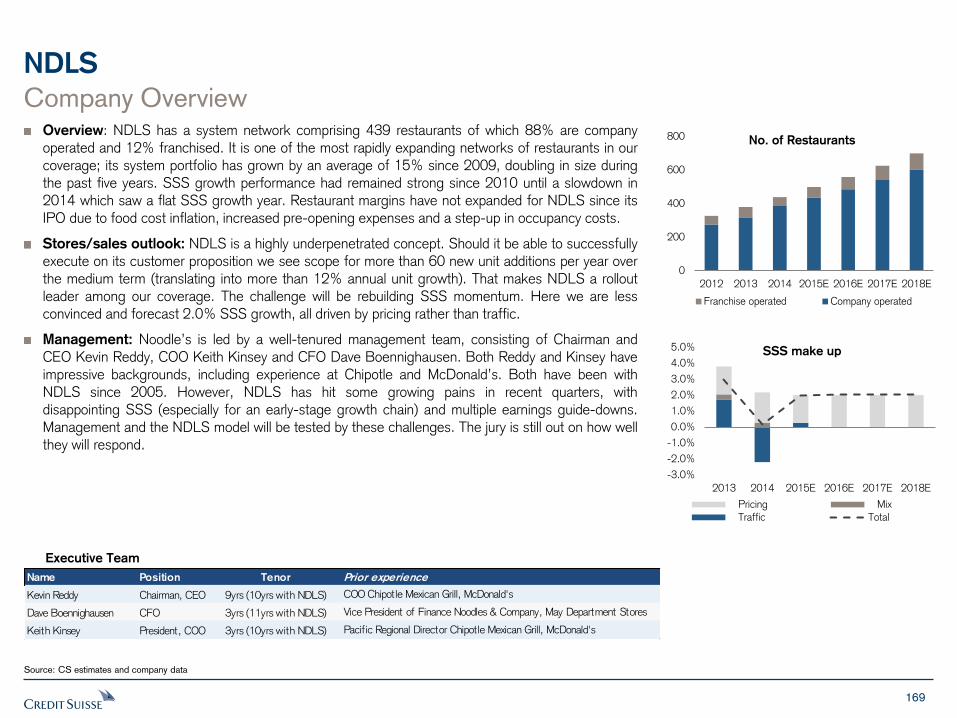
169
NDLS
Company Overview Overview: NDLS has a system network comprising 439 restaurants of which 88% are company operated and 12% franchised. It is one of the most rapidly expanding networks of restaurants in our coverage; its system portfolio has grown by an average of 15% since 2009, doubling in size during the past five years. SSS growth performance had remained strong since 2010 until a slowdown in 2014 which saw a flat SSS growth year. Restaurant margins have not expanded for NDLS since its IPO due to food cost inflation, increased pre-opening expenses and a step-up in occupancy costs.
Stores/sales outlook: NDLS is a highly underpenetrated concept. Should it be able to successfully execute on its customer proposition we see scope for more than 60 new unit additions per year over the medium term (translating into more than 12% annual unit growth). That makes NDLS a rollout leader among our coverage. The challenge will be rebuilding SSS momentum. Here we are less convinced and forecast 2.0% SSS growth, all driven by pricing rather than traffic.
Management: Noodle’s is led by a well-tenured management team, consisting of Chairman and CEO Kevin Reddy, COO Keith Kinsey and CFO Dave Boennighausen. Both Reddy and Kinsey have impressive backgrounds, including experience at Chipotle and McDonald’s. Both have been with NDLS since 2005. However, NDLS has hit some growing pains in recent quarters, with disappointing SSS (especially for an early-stage growth chain) and multiple earnings guide-downs. Management and the NDLS model will be tested by these challenges. The jury is still out on how well they will respond.
Source: CS estimates and company data
Executive Team
Name Position Tenor Prior experience
Kevin Reddy Chairman, CEO 9yrs (10yrs with NDLS) COO Chipotle Mexican Grill, McDonald's
Dave Boennighausen CFO 3yrs (11yrs with NDLS) Vice President of Finance Noodles & Company, May Department Stores
Keith Kinsey President, COO 3yrs (10yrs with NDLS) Pacific Regional Director Chipotle Mexican Grill, McDonald's
0
200
400
600
800
2012 2013 2014 2015E 2016E 2017E 2018E
No. of Restaurants
Franchise operated Company operated
-3.0%
-2.0%
-1.0%
0.0%
1.0%
2.0%
3.0%
4.0%
5.0%
2013 2014 2015E 2016E 2017E 2018E
SSS make up
Pricing Mix
Traffic Total
170
NDLS
Source: CS estimates and company data
Customers need convincing NDLS AUV is $30k below levels at the time of its IPO and without momentum. During that period, CMG’s AUV has increased $300k. We view the issue as simply one of failing to grow/retain customer interest. There is no quick fix here, just the persistent efforts of management to improve its appeal to customers increasingly spoilt for choice. Macro tailwinds will aid in 2015 but seem unlikely to generate the level of uplift needed to get us more excited by the story, especially considering the slow start to 2015 (+1.0% company SSS through Feb 18).
NDLS faces challenges unique to our coverage:
1. Its proposition is the least clear among listed restaurants due to its high menu item count spanning different cuisine styles.
2. Its network is relatively sparsely spread (top 20 restaurants in 13 markets). That can make marketing less effective and impede brand awareness, an area in which it will naturally be less effective due its diverse cuisine range.
The prize is large if they can get it right: NDLS is the third largest player in a segment averaging 10%+ sales growth for more than a decade. A disproportionate share of the incremental sales has moved to peers who have demonstrated a superior marketing and execution strategy. That said, NDLS has a high quality, differentiated product in the right segment with a strong store rollout story. If it can prove up its product to a consumer base flooded with choice, the opportunity is profound.
NDLS is not a CMG, don’t expect it to trade like one: Initial market valuations for NDLS baked in certainty of success. 20x EBITDA is not the right multiple for a business underperforming peers and the broader industry. 10x EBITDA is closer to the mark. We will continue to value NDLS on what its delivered, not what it could one day be. Our DCF valuation of $18 represents a NTM EV/EBITDA multiple of ~11x.
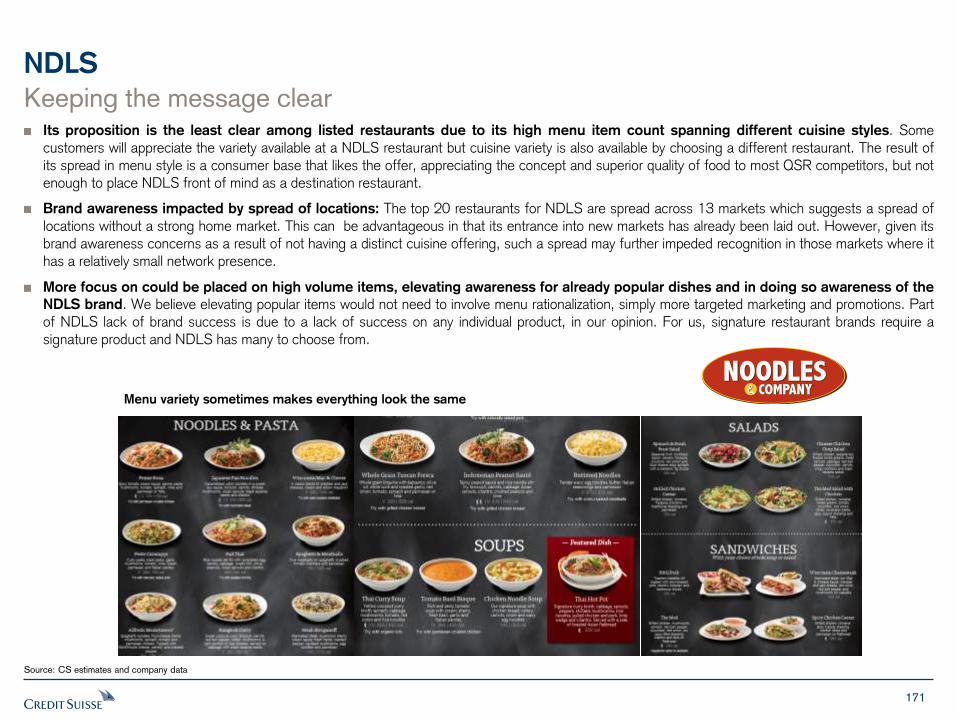
171
NDLS
Source: CS estimates and company data
Keeping the message clear Its proposition is the least clear among listed restaurants due to its high menu item count spanning different cuisine styles. Some customers will appreciate the variety available at a NDLS restaurant but cuisine variety is also available by choosing a different restaurant. The result of its spread in menu style is a consumer base that likes the offer, appreciating the concept and superior quality of food to most QSR competitors, but not enough to place NDLS front of mind as a destination restaurant.
Brand awareness impacted by spread of locations: The top 20 restaurants for NDLS are spread across 13 markets which suggests a spread of locations without a strong home market. This can be advantageous in that its entrance into new markets has already been laid out. However, given its brand awareness concerns as a result of not having a distinct cuisine offering, such a spread may further impeded recognition in those markets where it has a relatively small network presence.
More focus on could be placed on high volume items, elevating awareness for already popular dishes and in doing so awareness of the
NDLS brand. We believe elevating popular items would not need to involve menu rationalization, simply more targeted marketing and promotions. Part of NDLS lack of brand success is due to a lack of success on any individual product, in our opinion. For us, signature restaurant brands require a signature product and NDLS has many to choose from.
Menu variety sometimes makes everything look the same
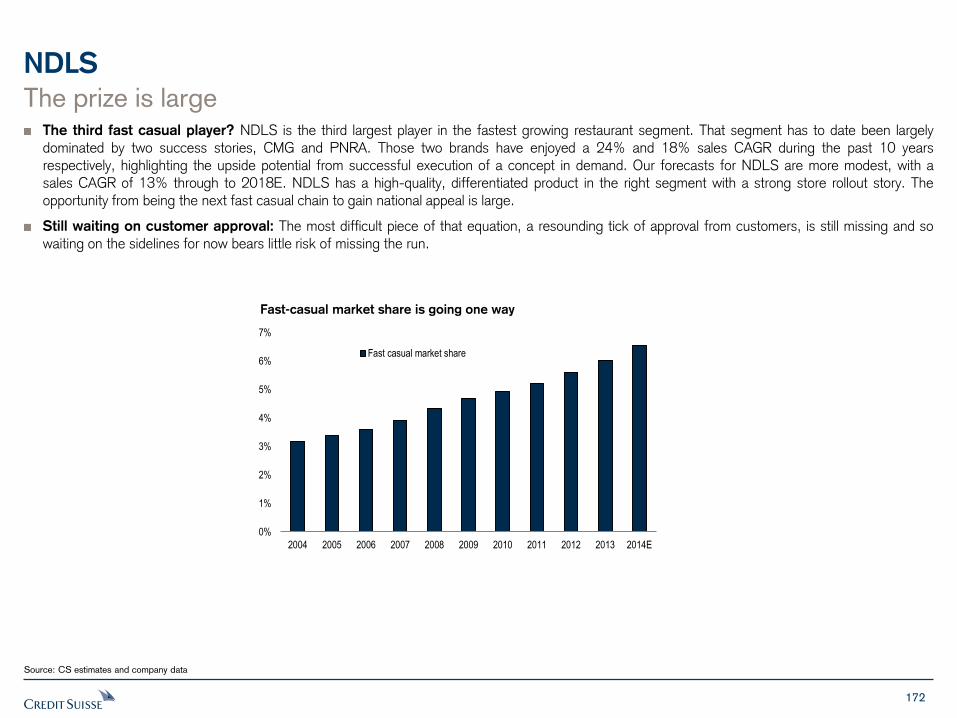
172
NDLS
Source: CS estimates and company data
The prize is large The third fast casual player? NDLS is the third largest player in the fastest growing restaurant segment. That segment has to date been largely dominated by two success stories, CMG and PNRA. Those two brands have enjoyed a 24% and 18% sales CAGR during the past 10 years respectively, highlighting the upside potential from successful execution of a concept in demand. Our forecasts for NDLS are more modest, with a sales CAGR of 13% through to 2018E. NDLS has a high-quality, differentiated product in the right segment with a strong store rollout story. The opportunity from being the next fast casual chain to gain national appeal is large.
Still waiting on customer approval: The most difficult piece of that equation, a resounding tick of approval from customers, is still missing and so waiting on the sidelines for now bears little risk of missing the run.
Fast-casual market share is going one way
0%
1%
2%
3%
4%
5%
6%
7%
2004 2005 2006 2007 2008 2009 2010 2011 2012 2013 2014E
Fast casual market share
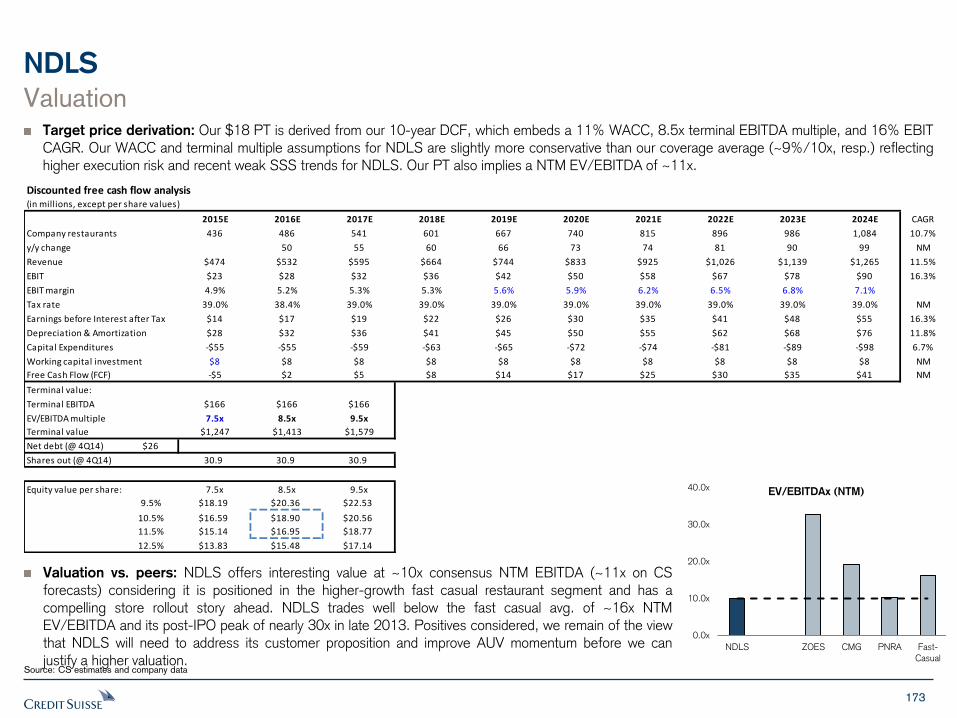
173
Discounted free cash flow analysis(in millions, except per share values)
2015E 2016E 2017E 2018E 2019E 2020E 2021E 2022E 2023E 2024E CAGR
Company restaurants 436 486 541 601 667 740 815 896 986 1,084 10.7%
y/y change 50 55 60 66 73 74 81 90 99 NM
Revenue $474 $532 $595 $664 $744 $833 $925 $1,026 $1,139 $1,265 11.5%
EBIT $23 $28 $32 $36 $42 $50 $58 $67 $78 $90 16.3%
EBIT margin 4.9% 5.2% 5.3% 5.3% 5.6% 5.9% 6.2% 6.5% 6.8% 7.1%
Tax rate 39.0% 38.4% 39.0% 39.0% 39.0% 39.0% 39.0% 39.0% 39.0% 39.0% NM
Earnings before Interest after Tax $14 $17 $19 $22 $26 $30 $35 $41 $48 $55 16.3%
Depreciation & Amortization $28 $32 $36 $41 $45 $50 $55 $62 $68 $76 11.8%
Capital Expenditures -$55 -$55 -$59 -$63 -$65 -$72 -$74 -$81 -$89 -$98 6.7%
Working capital investment $8 $8 $8 $8 $8 $8 $8 $8 $8 $8 NM
Free Cash Flow (FCF) -$5 $2 $5 $8 $14 $17 $25 $30 $35 $41 NM
Terminal value:
Terminal EBITDA $166 $166 $166
EV/EBITDA multiple 7.5x 8.5x 9.5x
Terminal value $1,247 $1,413 $1,579
Net debt (@ 4Q14) $26
Shares out (@ 4Q14) 30.9 30.9 30.9
Equity value per share: 7.5x 8.5x 9.5x
9.5% $18.19 $20.36 $22.53
10.5% $16.59 $18.90 $20.56
11.5% $15.14 $16.95 $18.77
12.5% $13.83 $15.48 $17.14
NDLS
Source: CS estimates and company data
Valuation Target price derivation: Our $18 PT is derived from our 10-year DCF, which embeds a 11% WACC, 8.5x terminal EBITDA multiple, and 16% EBIT CAGR. Our WACC and terminal multiple assumptions for NDLS are slightly more conservative than our coverage average (~9%/10x, resp.) reflecting higher execution risk and recent weak SSS trends for NDLS. Our PT also implies a NTM EV/EBITDA of ~11x.
Valuation vs. peers: NDLS offers interesting value at ~10x consensus NTM EBITDA (~11x on CS forecasts) considering it is positioned in the higher-growth fast casual restaurant segment and has a compelling store rollout story ahead. NDLS trades well below the fast casual avg. of ~16x NTM EV/EBITDA and its post-IPO peak of nearly 30x in late 2013. Positives considered, we remain of the view that NDLS will need to address its customer proposition and improve AUV momentum before we can justify a higher valuation.
0.0x
10.0x
20.0x
30.0x
40.0x
NDLS ZOES CMG PNRA Fast-
Casual
EV/EBITDAx (NTM)
174
NDLS
Source: CS estimates and company data
Risks Store rollout program: Our outlook for NDLS is highly dependent on execution of the store build-out program. Our DCF is inflated by the value created by new store rollouts which we expect, but cannot guarantee, will occur. Any slowdown in this build-out could negatively affect our forecasts.
Advertising: NDLS is likely to embark on a process of adjusting its advertising program to feature popular products more prominently. This would likely be one of its first such initiatives looking to promote isolated products rather than the brand more generally. Such programs require more expenditure and are designed to increase per store sales. However, there is a risk that consumers do not respond positively and increased marketing expenditure fails to drive stronger sales, which would be detrimental to earnings.
Shifts in consumer food preferences: NDLS is positioned as a fast casual offering. However, its carbohydrate-heavy menu is slightly out of step with a recent trend among consumers looking for more protein-heavy diets. There is a risk that a preference for lower carbohydrate intake among consumers spreads and leaves the NDLS menu further out of alignment with trending dietary preferences.
Macroeconomic conditions: Any deterioration in macroeconomic conditions, especially income and job growth, could have a negative impact on our NDLS forecasts. Sales performances at restaurants are highly correlated to economic conditions because they remain a discretionary purchase. NDLS, being positioned as a fast casual offering is leveraged to discretionary income changes for consumers.
Food/labor costs: NDLS has significant food cost exposures, which can be difficult to predict. Key commodity items that impact NDLS include wheat (mainly for pasta), chicken and produce. NDLS is also exposed to labor costs, particularly within its restaurants. Minimum wage increases and rising health care costs could negatively impact NDLS’s margins. A tightening labor market is also causing higher competition for skilled workers.
Competition: NDLS faces a growing competitive set in the fast casual industry. Increased competition could further exacerbate NDLS’s recent SSS pressures.
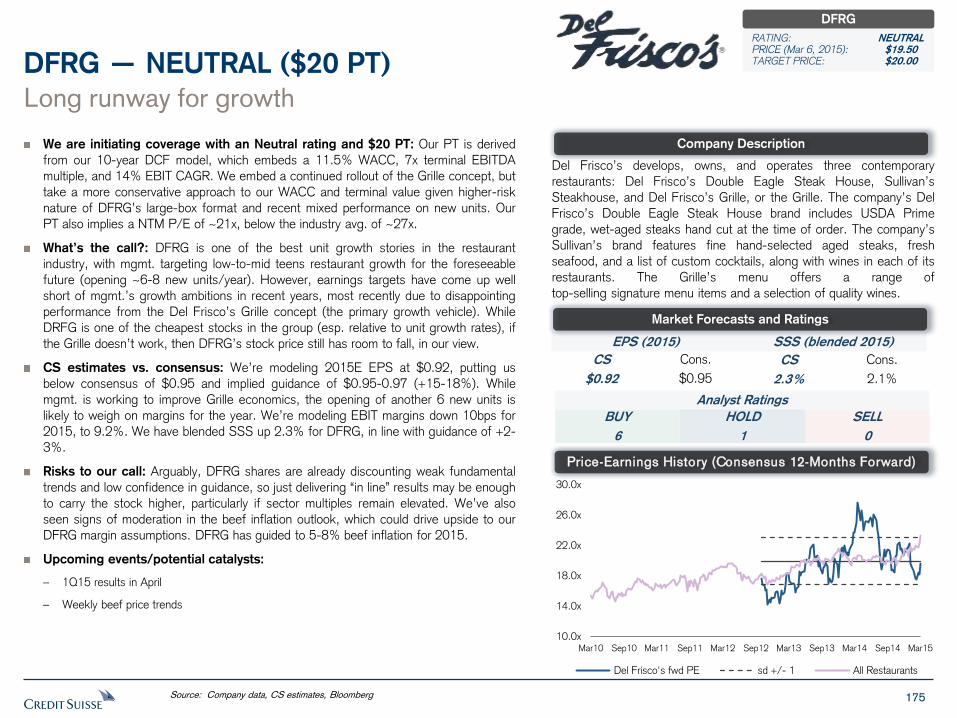
175
We are initiating coverage with an Neutral rating and $20 PT: Our PT is derived
from our 10-year DCF model, which embeds a 11.5% WACC, 7x terminal EBITDA
multiple, and 14% EBIT CAGR. We embed a continued rollout of the Grille concept, but
take a more conservative approach to our WACC and terminal value given higher-risk
nature of DFRG’s large-box format and recent mixed performance on new units. Our
PT also implies a NTM P/E of ~21x, below the industry avg. of ~27x.
What’s the call?: DFRG is one of the best unit growth stories in the restaurant
industry, with mgmt. targeting low-to-mid teens restaurant growth for the foreseeable
future (opening ~6-8 new units/year). However, earnings targets have come up well
short of mgmt.’s growth ambitions in recent years, most recently due to disappointing
performance from the Del Frisco’s Grille concept (the primary growth vehicle). While
DRFG is one of the cheapest stocks in the group (esp. relative to unit growth rates), if
the Grille doesn’t work, then DFRG’s stock price still has room to fall, in our view.
CS estimates vs. consensus: We’re modeling 2015E EPS at $0.92, putting us
below consensus of $0.95 and implied guidance of $0.95-0.97 (+15-18%). While
mgmt. is working to improve Grille economics, the opening of another 6 new units is
likely to weigh on margins for the year. We’re modeling EBIT margins down 10bps for
2015, to 9.2%. We have blended SSS up 2.3% for DFRG, in line with guidance of +2-
3%.
Risks to our call: Arguably, DFRG shares are already discounting weak fundamental
trends and low confidence in guidance, so just delivering “in line” results may be enough
to carry the stock higher, particularly if sector multiples remain elevated. We’ve also
seen signs of moderation in the beef inflation outlook, which could drive upside to our
DFRG margin assumptions. DFRG has guided to 5-8% beef inflation for 2015.
Upcoming events/potential catalysts:
– 1Q15 results in April
– Weekly beef price trends
Long runway for growth
DFRG — NEUTRAL ($20 PT)
Del Frisco’s develops, owns, and operates three contemporary
restaurants: Del Frisco’s Double Eagle Steak House, Sullivan’s
Steakhouse, and Del Frisco’s Grille, or the Grille. The company’s Del
Frisco’s Double Eagle Steak House brand includes USDA Prime
grade, wet-aged steaks hand cut at the time of order. The company’s
Sullivan’s brand features fine hand-selected aged steaks, fresh
seafood, and a list of custom cocktails, along with wines in each of its
restaurants. The Grille’s menu offers a range of
top-selling signature menu items and a selection of quality wines.
Source: Company data, CS estimates, Bloomberg
Company Description
Price-Earnings History (Consensus 12-Months Forward)
EPS (2015) SSS (blended 2015)
CS
$0.92
Cons.
$0.95
CS
2.3%
Cons.
2.1%
Analyst Ratings
BUY
6
SELL
0
HOLD
1
Market Forecasts and Ratings
DFRG
RATING: NEUTRAL PRICE (Mar 6, 2015): $19.50 TARGET PRICE: $20.00
10.0x
14.0x
18.0x
22.0x
26.0x
30.0x
Mar10 Sep10 Mar11 Sep11 Mar12 Sep12 Mar13 Sep13 Mar14 Sep14 Mar15
Del Frisco's fwd PE sd +/- 1 All Restaurants
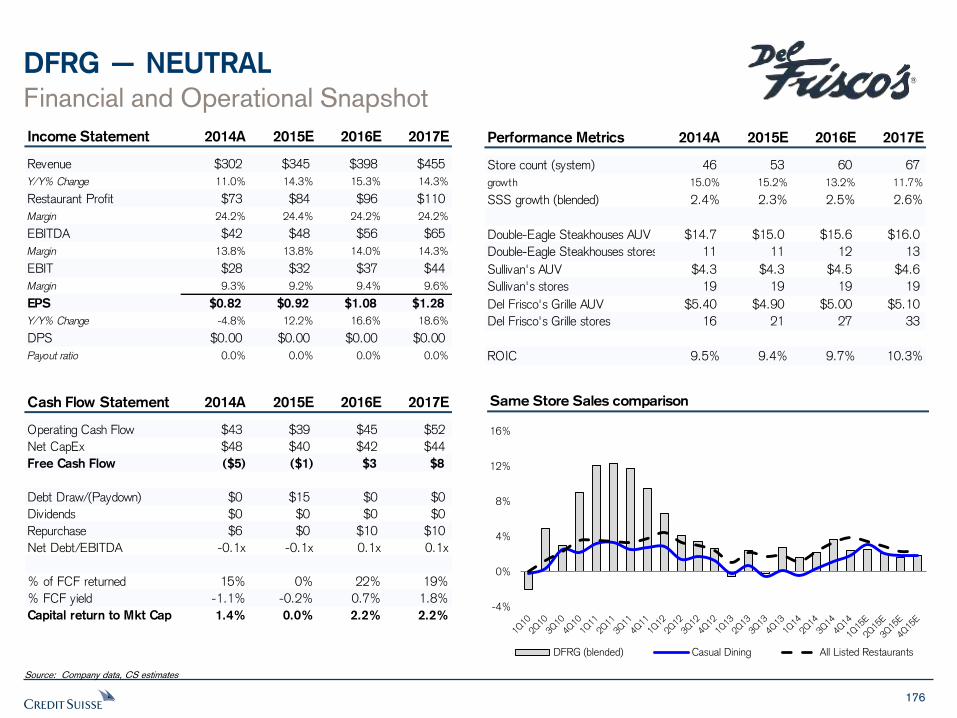
176
DFRG — NEUTRAL
Financial and Operational Snapshot
Source: Company data, CS estimates
Same Store Sales comparison
Income Statement 2014A 2015E 2016E 2017E
Revenue $302 $345 $398 $455
Y/Y% Change 11.0% 14.3% 15.3% 14.3%
Restaurant Profit $73 $84 $96 $110
Margin 24.2% 24.4% 24.2% 24.2%
EBITDA $42 $48 $56 $65
Margin 13.8% 13.8% 14.0% 14.3%
EBIT $28 $32 $37 $44
Margin 9.3% 9.2% 9.4% 9.6%
EPS $0.82 $0.92 $1.08 $1.28
Y/Y% Change -4.8% 12.2% 16.6% 18.6%
DPS $0.00 $0.00 $0.00 $0.00
Payout ratio 0.0% 0.0% 0.0% 0.0%
Performance Metrics 2014A 2015E 2016E 2017E
Store count (system) 46 53 60 67
growth 15.0% 15.2% 13.2% 11.7%
SSS growth (blended) 2.4% 2.3% 2.5% 2.6%
Double-Eagle Steakhouses AUV $14.7 $15.0 $15.6 $16.0
Double-Eagle Steakhouses stores 11 11 12 13
Sullivan's AUV $4.3 $4.3 $4.5 $4.6
Sullivan's stores 19 19 19 19
Del Frisco's Grille AUV $5.40 $4.90 $5.00 $5.10
Del Frisco's Grille stores 16 21 27 33
ROIC 9.5% 9.4% 9.7% 10.3%
Cash Flow Statement 2014A 2015E 2016E 2017E
Operating Cash Flow $43 $39 $45 $52
Net CapEx $48 $40 $42 $44
Free Cash Flow ($5) ($1) $3 $8
Debt Draw/(Paydown) $0 $15 $0 $0
Dividends $0 $0 $0 $0
Repurchase $6 $0 $10 $10
Net Debt/EBITDA -0.1x -0.1x 0.1x 0.1x
% of FCF returned 15% 0% 22% 19%
% FCF yield -1.1% -0.2% 0.7% 1.8%
Capital return to Mkt Cap 1.4% 0.0% 2.2% 2.2%-4%
0%
4%
8%
12%
16%
DFRG (blended) Casual Dining All Listed Restaurants
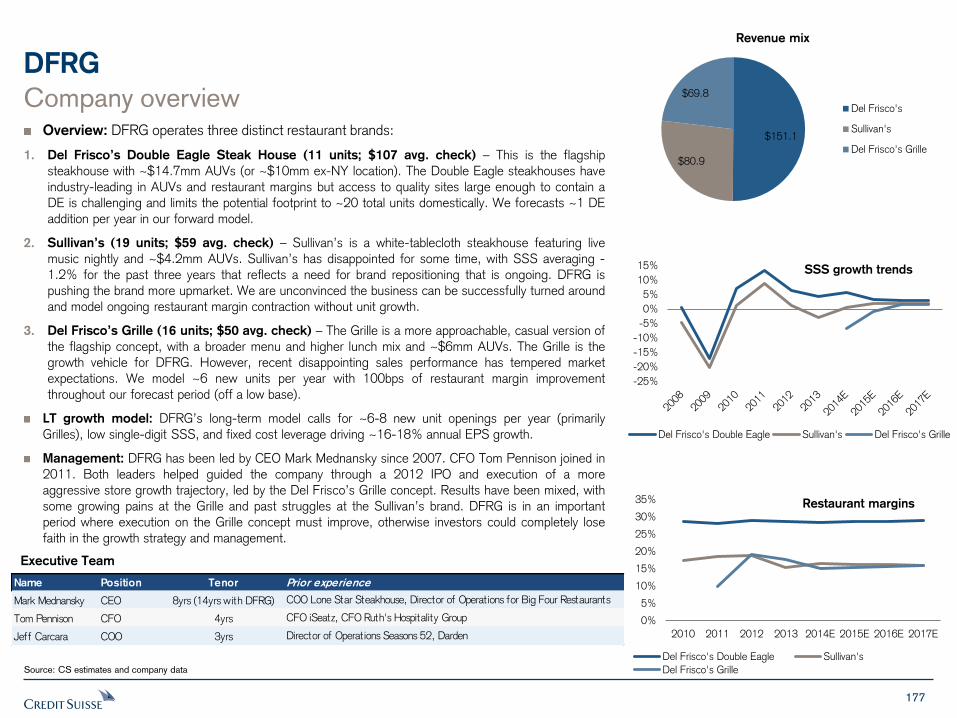
177
DFRG
Source: CS estimates and company data
Company overview Overview: DFRG operates three distinct restaurant brands:
1. Del Frisco’s Double Eagle Steak House (11 units; $107 avg. check) – This is the flagship
steakhouse with ~$14.7mm AUVs (or ~$10mm ex-NY location). The Double Eagle steakhouses have
industry-leading in AUVs and restaurant margins but access to quality sites large enough to contain a
DE is challenging and limits the potential footprint to ~20 total units domestically. We forecasts ~1 DE
addition per year in our forward model.
2. Sullivan’s (19 units; $59 avg. check) – Sullivan’s is a white-tablecloth steakhouse featuring live
music nightly and ~$4.2mm AUVs. Sullivan’s has disappointed for some time, with SSS averaging -
1.2% for the past three years that reflects a need for brand repositioning that is ongoing. DFRG is
pushing the brand more upmarket. We are unconvinced the business can be successfully turned around
and model ongoing restaurant margin contraction without unit growth.
3. Del Frisco’s Grille (16 units; $50 avg. check) – The Grille is a more approachable, casual version of
the flagship concept, with a broader menu and higher lunch mix and ~$6mm AUVs. The Grille is the
growth vehicle for DFRG. However, recent disappointing sales performance has tempered market
expectations. We model ~6 new units per year with 100bps of restaurant margin improvement
throughout our forecast period (off a low base).
LT growth model: DFRG’s long-term model calls for ~6-8 new unit openings per year (primarily
Grilles), low single-digit SSS, and fixed cost leverage driving ~16-18% annual EPS growth.
Management: DFRG has been led by CEO Mark Mednansky since 2007. CFO Tom Pennison joined in
2011. Both leaders helped guided the company through a 2012 IPO and execution of a more
aggressive store growth trajectory, led by the Del Frisco’s Grille concept. Results have been mixed, with
some growing pains at the Grille and past struggles at the Sullivan’s brand. DFRG is in an important
period where execution on the Grille concept must improve, otherwise investors could completely lose
faith in the growth strategy and management.
Executive Team
$151.1
$80.9
$69.8
Revenue mix
Del Frisco's
Sullivan's
Del Frisco's Grille
Name Position Tenor Prior experience
Mark Mednansky CEO 8yrs (14yrs with DFRG) COO Lone Star Steakhouse, Director of Operations for Big Four Restaurants
Tom Pennison CFO 4yrs CFO iSeatz, CFO Ruth's Hospitality Group
Jeff Carcara COO 3yrs Director of Operations Seasons 52, Darden
-25%
-20%
-15%
-10%
-5%
0%
5%
10%
15% SSS growth trends
Del Frisco's Double Eagle Sullivan's Del Frisco's Grille
0%
5%
10%
15%
20%
25%
30%
35%
2010 2011 2012 2013 2014E 2015E 2016E 2017E
Restaurant margins
Del Frisco's Double Eagle Sullivan's
Del Frisco's Grille
178
DFRG
Source: CS estimates and company data
Long runway for growth…but execution is lacking Long runway for growth…: On paper, DFRG is one of the best unit growth stories in the restaurant industry. Management is targeting low-to-mid teens restaurant growth for foreseeable future (opening ~6-8 new units/year). This growth outlook is partly the function of having a small base of stores, with DFRG at 46 units as of YE14 (all US). DFRG sees a long runway for growth, with ~170+ potential Del Frisco’s Grille locations targeted over the long-term, as well as ~10 additional Double Eagle’s. Achieving these targets would put the total store base at ~225 units domestically over time, or 5x the size of the current footprint. Few restaurant chains offer this level of store growth potential. The company is also reviewing international opportunities though nothing has been announced so far. DFRG has also historically been known for strong operations (particularly at the Double Eagle), with historic consolidated restaurant margins in the ~26% range (vs. ~19% for the industry) and EBIT margins in the ~13% range (vs. the industry at ~9-10%).
…if they can execute: However, these margins have eroded in recent years, with restaurant margins falling to 24.2% in 2014 from 26.3% in 2012. Similarly, EBIT margins have fallen to 9.3% in 2014 vs. 13.1% in 2012. Key reasons for these declines include: public co. costs (IPO in 2012), higher beef costs, management additions and other costs related to accelerating store growth, and weaker-than-expected margins on new stores. The Grille concept is expected to be the primary vehicle for growth. However, new store performance from this concept has been mixed and margins have fallen short of targets. Top line trends have been adequate, as the Grille units generated $70mm in sales in 2014, for an AUV of $5.6mm, generally in line with plan. However, restaurant margins were 15.1% in 2014, below the target of ~20-25% for this concept. Some of these margin woes can be tied to a handful of weaker units in the base (e.g., Phoenix, Palm Beach). However, the sales volumes for the Grille overall have shown a downward trend post-opening. The Grille units tend to generate a lot of interest on the initial opening, with a large “honeymoon” period of elevated early sales. These sales volumes have then fallen sharply in years 2-3, leading to concerns around repeat visits and the overall health of the model.
One of the few “cheap” stocks in the group: These disappointing Grille trends have led to a significant underperformance in the stock price of late and a discounted valuation for DFRG. E.g., DFRG trades at under 9x NTM EV/EBITDA, down from a peak of ~12x in March 2014. The current multiple is a ~35% discount to the restaurant industry vs. the historical discount of ~10%. On a NTM P/E, the stock trades at 17.6x, below the historical avg. of 20x (since the 2012 IPO) and down from ~28x in March 2014. The stock trades at a 30% discount to the industry vs. the historical avg. of ~9% discount. At these levels, the stock seems to be pricing in a reasonably high risk of failure on the Grille concept. We believe this outlook may be too punitive, particularly since the Grille has seen success in many locations and given the continued health of the Del Frisco’s Double Eagle brand (+5.6% SSS in 2014). Also, the macro environment is in their favor, with healthy housing and stock markets, as well as a strong labor market supporting SSS momentum. Finally, DFRG could be a beneficiary of any moderation in beef prices (which we discuss elsewhere in this presentation).
Not cheap enough: However, valuation is not cheap enough for us to take on the risk of a failed growth model. If the company does not show vast improvement in current and future Grille openings, then we see further room for earnings and the multiple to fall. DFRG has guided to 15-18% EPS growth in 2015, which is contingent on improved results at the Grille.
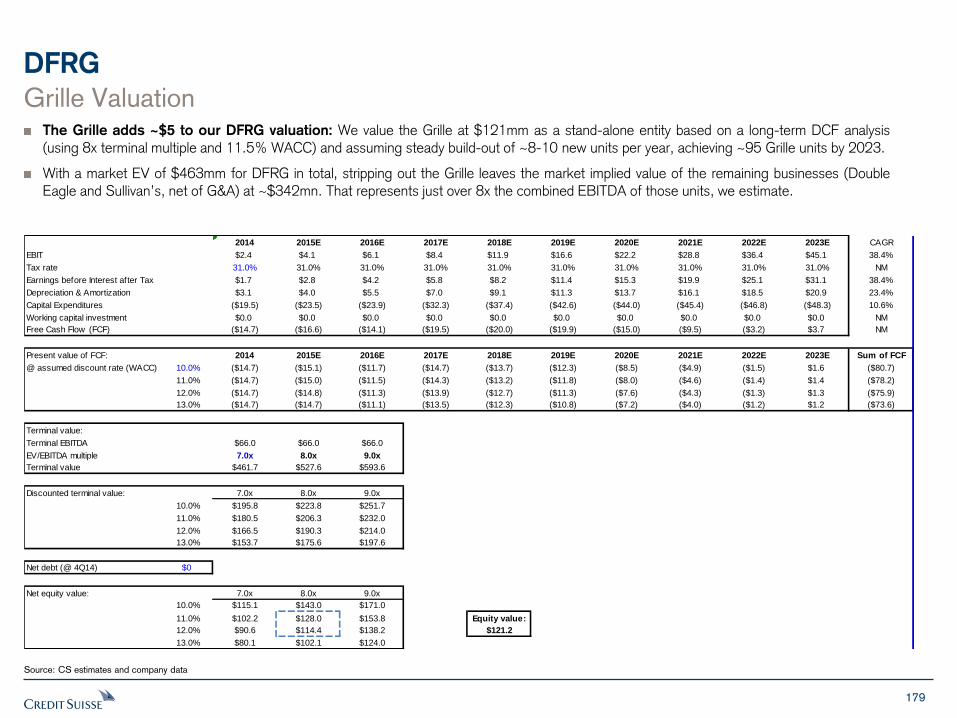
179
DFRG
Source: CS estimates and company data
Grille Valuation The Grille adds ~$5 to our DFRG valuation: We value the Grille at $121mm as a stand-alone entity based on a long-term DCF analysis (using 8x terminal multiple and 11.5% WACC) and assuming steady build-out of ~8-10 new units per year, achieving ~95 Grille units by 2023.
With a market EV of $463mm for DFRG in total, stripping out the Grille leaves the market implied value of the remaining businesses (Double Eagle and Sullivan’s, net of G&A) at ~$342mn. That represents just over 8x the combined EBITDA of those units, we estimate.
2014 2015E 2016E 2017E 2018E 2019E 2020E 2021E 2022E 2023E CAGR
EBIT $2.4 $4.1 $6.1 $8.4 $11.9 $16.6 $22.2 $28.8 $36.4 $45.1 38.4%
Tax rate 31.0% 31.0% 31.0% 31.0% 31.0% 31.0% 31.0% 31.0% 31.0% 31.0% NM
Earnings before Interest after Tax $1.7 $2.8 $4.2 $5.8 $8.2 $11.4 $15.3 $19.9 $25.1 $31.1 38.4%
Depreciation & Amortization $3.1 $4.0 $5.5 $7.0 $9.1 $11.3 $13.7 $16.1 $18.5 $20.9 23.4%
Capital Expenditures ($19.5) ($23.5) ($23.9) ($32.3) ($37.4) ($42.6) ($44.0) ($45.4) ($46.8) ($48.3) 10.6%
Working capital investment $0.0 $0.0 $0.0 $0.0 $0.0 $0.0 $0.0 $0.0 $0.0 $0.0 NM
Free Cash Flow (FCF) ($14.7) ($16.6) ($14.1) ($19.5) ($20.0) ($19.9) ($15.0) ($9.5) ($3.2) $3.7 NM
Present value of FCF: 2014 2015E 2016E 2017E 2018E 2019E 2020E 2021E 2022E 2023E Sum of FCF
@ assumed discount rate (WACC) 10.0% ($14.7) ($15.1) ($11.7) ($14.7) ($13.7) ($12.3) ($8.5) ($4.9) ($1.5) $1.6 ($80.7)
11.0% ($14.7) ($15.0) ($11.5) ($14.3) ($13.2) ($11.8) ($8.0) ($4.6) ($1.4) $1.4 ($78.2)
12.0% ($14.7) ($14.8) ($11.3) ($13.9) ($12.7) ($11.3) ($7.6) ($4.3) ($1.3) $1.3 ($75.9)
13.0% ($14.7) ($14.7) ($11.1) ($13.5) ($12.3) ($10.8) ($7.2) ($4.0) ($1.2) $1.2 ($73.6)
Terminal value:
Terminal EBITDA $66.0 $66.0 $66.0
EV/EBITDA multiple 7.0x 8.0x 9.0x
Terminal value $461.7 $527.6 $593.6
Discounted terminal value: 7.0x 8.0x 9.0x
10.0% $195.8 $223.8 $251.7
11.0% $180.5 $206.3 $232.0
12.0% $166.5 $190.3 $214.0
13.0% $153.7 $175.6 $197.6
Net debt (@ 4Q14) $0
Net equity value: 7.0x 8.0x 9.0x
10.0% $115.1 $143.0 $171.0
11.0% $102.2 $128.0 $153.8 Equity value:
12.0% $90.6 $114.4 $138.2 $121.2
13.0% $80.1 $102.1 $124.0
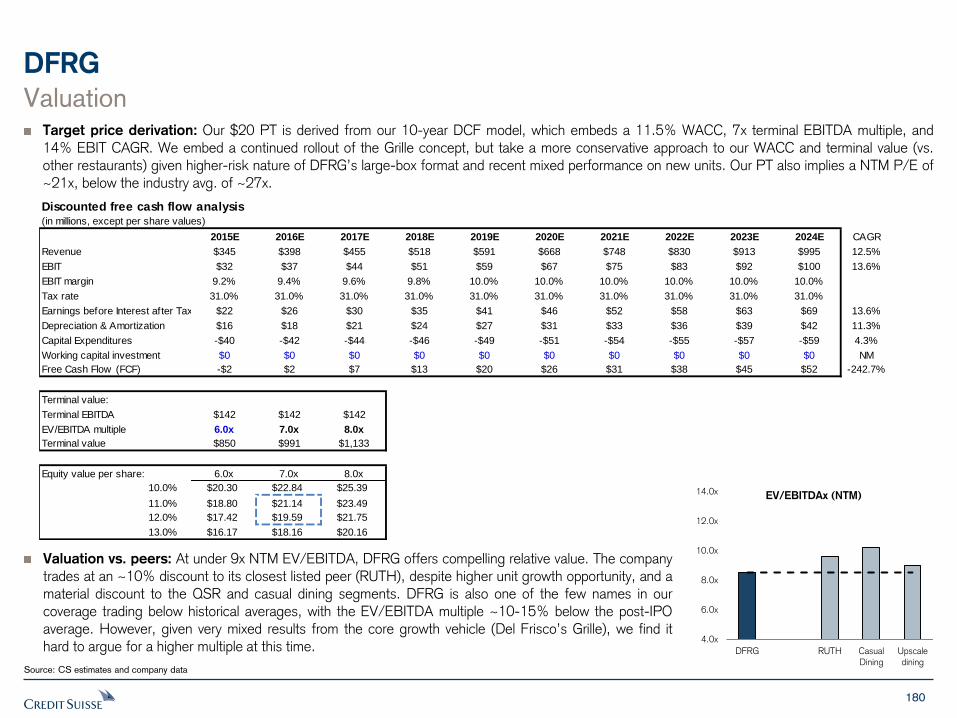
180
Discounted free cash flow analysis(in millions, except per share values)
2015E 2016E 2017E 2018E 2019E 2020E 2021E 2022E 2023E 2024E CAGR
Revenue $345 $398 $455 $518 $591 $668 $748 $830 $913 $995 12.5%
EBIT $32 $37 $44 $51 $59 $67 $75 $83 $92 $100 13.6%
EBIT margin 9.2% 9.4% 9.6% 9.8% 10.0% 10.0% 10.0% 10.0% 10.0% 10.0%
Tax rate 31.0% 31.0% 31.0% 31.0% 31.0% 31.0% 31.0% 31.0% 31.0% 31.0%
Earnings before Interest after Tax $22 $26 $30 $35 $41 $46 $52 $58 $63 $69 13.6%
Depreciation & Amortization $16 $18 $21 $24 $27 $31 $33 $36 $39 $42 11.3%
Capital Expenditures -$40 -$42 -$44 -$46 -$49 -$51 -$54 -$55 -$57 -$59 4.3%
Working capital investment $0 $0 $0 $0 $0 $0 $0 $0 $0 $0 NM
Free Cash Flow (FCF) -$2 $2 $7 $13 $20 $26 $31 $38 $45 $52 -242.7%
Terminal value:
Terminal EBITDA $142 $142 $142
EV/EBITDA multiple 6.0x 7.0x 8.0x
Terminal value $850 $991 $1,133
Equity value per share: 6.0x 7.0x 8.0x
10.0% $20.30 $22.84 $25.39
11.0% $18.80 $21.14 $23.49
12.0% $17.42 $19.59 $21.75
13.0% $16.17 $18.16 $20.16
DFRG
Source: CS estimates and company data
Valuation Target price derivation: Our $20 PT is derived from our 10-year DCF model, which embeds a 11.5% WACC, 7x terminal EBITDA multiple, and 14% EBIT CAGR. We embed a continued rollout of the Grille concept, but take a more conservative approach to our WACC and terminal value (vs. other restaurants) given higher-risk nature of DFRG’s large-box format and recent mixed performance on new units. Our PT also implies a NTM P/E of ~21x, below the industry avg. of ~27x.
Valuation vs. peers: At under 9x NTM EV/EBITDA, DFRG offers compelling relative value. The company trades at an ~10% discount to its closest listed peer (RUTH), despite higher unit growth opportunity, and a material discount to the QSR and casual dining segments. DFRG is also one of the few names in our coverage trading below historical averages, with the EV/EBITDA multiple ~10-15% below the post-IPO average. However, given very mixed results from the core growth vehicle (Del Frisco’s Grille), we find it hard to argue for a higher multiple at this time.
4.0x
6.0x
8.0x
10.0x
12.0x
14.0x
DFRG RUTH Casual
Dining
Upscale
dining
EV/EBITDAx (NTM)
181
DFRG
Source: CS estimates and company data
Risks Beef prices: Beef represents ~34% of DFRG’s food basket. This commodity has been inflationary in recent years. Continuation of this trend could negatively impact our forecasts, while a correction in beef prices could offer upside. Each 10% move in beef prices = ~9% to DFRG earnings.
Consumer & business spending: With an average check per person ranging from ~$50-100, DFRG’s concepts are very discretionary. Any changes in consumer confidence could materially impact customer traffic. Historically, high-end steakhouse chains have seen above-average sales declines during recessions. These concepts also have above-average exposure to business spending and special occasion visits.
Del Frisco’s Grille growth: The key to DFRG’s growth model is building out the Grille concept around the US. So far, results on this concept have been mixed. If DFRG ultimately decides to slow or cease the Grille rollout, our estimates would be negatively impacted. DFRG also operates a relatively small base of large-format restaurants, so weakness in even a small number of units can negatively impact consolidated results.
Concentrated geographic exposure: DFRG has significant exposure to one market, NYC, which represents ~16% of sales. Any disruptions to that market, related to weather, competition, or other factors, can have a material impact on DFRG’s consolidated results.
Appendix
Coverage Introduction
Stock Picks/ Co. Tearsheats
FOCUS ISSUE: Gasoline
Price Impact
Appendix
FOCUS ISSUE: Minimum Wage Analysis
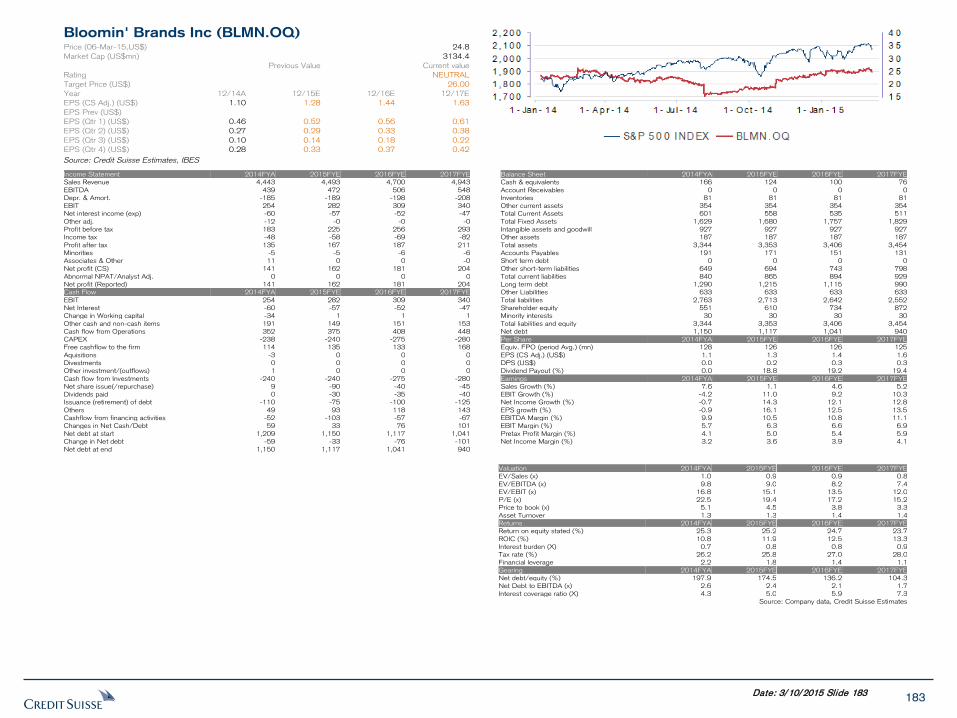
183 Date: 3/10/2015 Slide 183
Bloomin' Brands Inc (BLMN.OQ)
Price (06-Mar-15,US$) 24.8
Market Cap (US$mn) 3134.4
Previous Value
Current value
Rating
NEUTRAL
Target Price (US$)
26.00
Year 12/14A 12/15E 12/16E 12/17E
EPS (CS Adj.) (US$) 1.10 1.28 1.44 1.63
EPS Prev (US$)
EPS (Qtr 1) (US$) 0.46 0.52 0.56 0.61
EPS (Qtr 2) (US$) 0.27 0.29 0.33 0.38
EPS (Qtr 3) (US$) 0.10 0.14 0.18 0.22
EPS (Qtr 4) (US$) 0.28 0.33 0.37 0.42
Source: Credit Suisse Estimates, IBES
Income Statement 2014FYA 2015FYE 2016FYE 2017FYE
Sales Revenue 4,443 4,493 4,700 4,943
EBITDA 439 472 506 548
Depr. & Amort. -185 -189 -198 -208
EBIT 254 282 309 340
Net interest income (exp) -60 -57 -52 -47
Other adj. -12 -0 -0 -0
Profit before tax 183 225 256 293
Income tax -48 -58 -69 -82
Profit after tax 135 167 187 211
Minorities -5 -5 -6 -6
Associates & Other 11 0 0 -0
Net profit (CS) 141 162 181 204
Abnormal NPAT/Analyst Adj. 0 0 0 0
Net profit (Reported) 141 162 181 204
Cash Flow 2014FYA 2015FYE 2016FYE 2017FYE
EBIT 254 282 309 340
Net Interest -60 -57 -52 -47
Change in Working capital -34 1 1 1
Other cash and non-cash items 191 149 151 153
Cash flow from Operations 352 375 408 448
CAPEX -238 -240 -275 -280
Free cashflow to the firm 114 135 133 168
Aquisitions -3 0 0 0
Divestments 0 0 0 0
Other investment/(outflows) 1 0 0 0
Cash flow from Investments -240 -240 -275 -280
Net share issue(/repurchase) 9 -90 -40 -45
Dividends paid 0 -30 -35 -40
Issuance (retirement) of debt -110 -75 -100 -125
Others 49 93 118 143
Cashflow from financing activities -52 -103 -57 -67
Changes in Net Cash/Debt 59 33 76 101
Net debt at start 1,209 1,150 1,117 1,041
Change in Net debt -59 -33 -76 -101
Net debt at end 1,150 1,117 1,041 940
Balance Sheet 2014FYA 2015FYE 2016FYE 2017FYE
Cash & equivalents 166 124 100 76
Account Receivables 0 0 0 0
Inventories 81 81 81 81
Other current assets 354 354 354 354
Total Current Assets 601 558 535 511
Total Fixed Assets 1,629 1,680 1,757 1,829
Intangible assets and goodwill 927 927 927 927
Other assets 187 187 187 187
Total assets 3,344 3,353 3,406 3,454
Accounts Payables 191 171 151 131
Short term debt 0 0 0 0
Other short-term liabilities 649 694 743 798
Total current liabilities 840 865 894 929
Long term debt 1,290 1,215 1,115 990
Other Liabilities 633 633 633 633
Total liabilities 2,763 2,713 2,642 2,552
Shareholder equity 551 610 734 872
Minority interests 30 30 30 30
Total liabilities and equity 3,344 3,353 3,406 3,454
Net debt 1,150 1,117 1,041 940
Per Share 2014FYA 2015FYE 2016FYE 2017FYE
Equiv. FPO (period Avg.) (mn) 128 126 126 125
EPS (CS Adj.) (US$) 1.1 1.3 1.4 1.6
DPS (US$) 0.0 0.2 0.3 0.3
Dividend Payout (%) 0.0 18.8 19.2 19.4
Earnings 2014FYA 2015FYE 2016FYE 2017FYE
Sales Growth (%) 7.6 1.1 4.6 5.2
EBIT Growth (%) -4.2 11.0 9.2 10.3
Net Income Growth (%) -0.7 14.3 12.1 12.8
EPS growth (%) -0.9 16.1 12.5 13.5
EBITDA Margin (%) 9.9 10.5 10.8 11.1
EBIT Margin (%) 5.7 6.3 6.6 6.9
Pretax Profit Margin (%) 4.1 5.0 5.4 5.9
Net Income Margin (%) 3.2 3.6 3.9 4.1
Valuation 2014FYA 2015FYE 2016FYE 2017FYE
EV/Sales (x) 1.0 0.9 0.9 0.8
EV/EBITDA (x) 9.8 9.0 8.2 7.4
EV/EBIT (x) 16.8 15.1 13.5 12.0
P/E (x) 22.5 19.4 17.2 15.2
Price to book (x) 5.1 4.5 3.8 3.3
Asset Turnover 1.3 1.3 1.4 1.4
Returns 2014FYA 2015FYE 2016FYE 2017FYE
Return on equity stated (%) 25.3 25.2 24.7 23.7
ROIC (%) 10.8 11.9 12.5 13.3
Interest burden (X) 0.7 0.8 0.8 0.9
Tax rate (%) 26.2 25.8 27.0 28.0
Financial leverage 2.2 1.8 1.4 1.1
Gearing 2014FYA 2015FYE 2016FYE 2017FYE
Net debt/equity (%) 197.9 174.5 136.2 104.3
Net Debt to EBITDA (x) 2.6 2.4 2.1 1.7
Interest coverage ratio (X) 4.3 5.0 5.9 7.3
Source: Company data, Credit Suisse Estimates
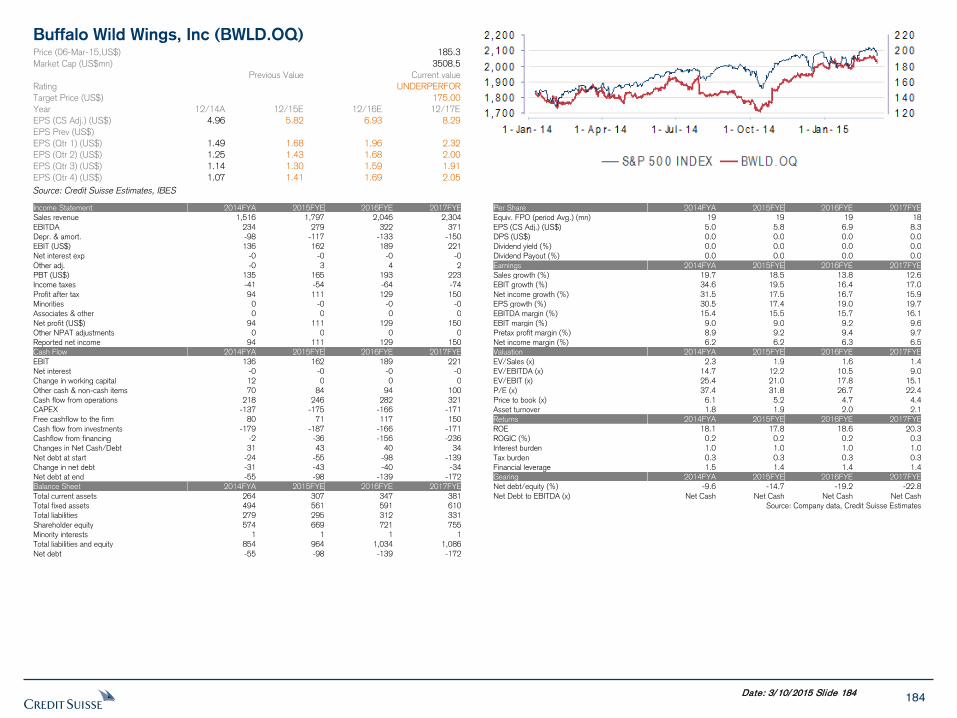
184 Date: 3/10/2015 Slide 184
Buffalo Wild Wings, Inc (BWLD.OQ)
Price (06-Mar-15,US$) 185.3
Market Cap (US$mn) 3508.5
Previous Value
Current value
Rating
UNDERPERFORM Target Price (US$)
175.00
Year 12/14A 12/15E 12/16E 12/17E
EPS (CS Adj.) (US$) 4.96 5.82 6.93 8.29
EPS Prev (US$)
EPS (Qtr 1) (US$) 1.49 1.68 1.96 2.32
EPS (Qtr 2) (US$) 1.25 1.43 1.68 2.00
EPS (Qtr 3) (US$) 1.14 1.30 1.59 1.91
EPS (Qtr 4) (US$) 1.07 1.41 1.69 2.05
Source: Credit Suisse Estimates, IBES
Income Statement 2014FYA 2015FYE 2016FYE 2017FYE
Sales revenue 1,516 1,797 2,046 2,304
EBITDA 234 279 322 371
Depr. & amort. -98 -117 -133 -150
EBIT (US$) 136 162 189 221
Net interest exp -0 -0 -0 -0
Other adj. -0 3 4 2
PBT (US$) 135 165 193 223
Income taxes -41 -54 -64 -74
Profit after tax 94 111 129 150
Minorities 0 -0 -0 -0
Associates & other 0 0 0 0
Net profit (US$) 94 111 129 150
Other NPAT adjustments 0 0 0 0
Reported net income 94 111 129 150
Cash Flow 2014FYA 2015FYE 2016FYE 2017FYE
EBIT 136 162 189 221
Net interest -0 -0 -0 -0
Change in working capital 12 0 0 0
Other cash & non-cash items 70 84 94 100
Cash flow from operations 218 246 282 321
CAPEX -137 -175 -166 -171
Free cashflow to the firm 80 71 117 150
Cash flow from investments -179 -187 -166 -171
Cashflow from financing -2 -36 -156 -236
Changes in Net Cash/Debt 31 43 40 34
Net debt at start -24 -55 -98 -139
Change in net debt -31 -43 -40 -34
Net debt at end -55 -98 -139 -172
Balance Sheet 2014FYA 2015FYE 2016FYE 2017FYE
Total current assets 264 307 347 381
Total fixed assets 494 561 591 610
Total liabilities 279 295 312 331
Shareholder equity 574 669 721 755
Minority interests 1 1 1 1
Total liabilities and equity 854 964 1,034 1,086
Net debt -55 -98 -139 -172
Per Share 2014FYA 2015FYE 2016FYE 2017FYE
Equiv. FPO (period Avg.) (mn) 19 19 19 18
EPS (CS Adj.) (US$) 5.0 5.8 6.9 8.3
DPS (US$) 0.0 0.0 0.0 0.0
Dividend yield (%) 0.0 0.0 0.0 0.0
Dividend Payout (%) 0.0 0.0 0.0 0.0
Earnings 2014FYA 2015FYE 2016FYE 2017FYE
Sales growth (%) 19.7 18.5 13.8 12.6
EBIT growth (%) 34.6 19.5 16.4 17.0
Net income growth (%) 31.5 17.5 16.7 15.9
EPS growth (%) 30.5 17.4 19.0 19.7
EBITDA margin (%) 15.4 15.5 15.7 16.1
EBIT margin (%) 9.0 9.0 9.2 9.6
Pretax profit margin (%) 8.9 9.2 9.4 9.7
Net income margin (%) 6.2 6.2 6.3 6.5
Valuation 2014FYA 2015FYE 2016FYE 2017FYE
EV/Sales (x) 2.3 1.9 1.6 1.4
EV/EBITDA (x) 14.7 12.2 10.5 9.0
EV/EBIT (x) 25.4 21.0 17.8 15.1
P/E (x) 37.4 31.8 26.7 22.4
Price to book (x) 6.1 5.2 4.7 4.4
Asset turnover 1.8 1.9 2.0 2.1
Returns 2014FYA 2015FYE 2016FYE 2017FYE
ROE 18.1 17.8 18.6 20.3
ROGIC (%) 0.2 0.2 0.2 0.3
Interest burden 1.0 1.0 1.0 1.0
Tax burden 0.3 0.3 0.3 0.3
Financial leverage 1.5 1.4 1.4 1.4
Gearing 2014FYA 2015FYE 2016FYE 2017FYE
Net debt/equity (%) -9.6 -14.7 -19.2 -22.8
Net Debt to EBITDA (x) Net Cash Net Cash Net Cash Net Cash
Source: Company data, Credit Suisse Estimates
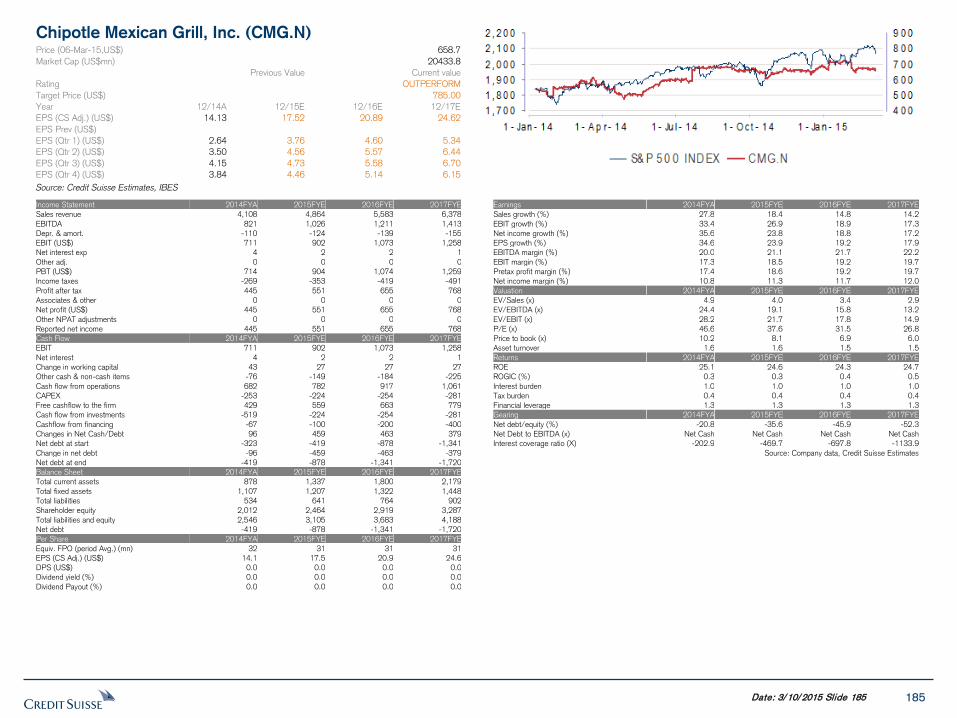
185 Date: 3/10/2015 Slide 185
Chipotle Mexican Grill, Inc. (CMG.N)
Price (06-Mar-15,US$) 658.7
Market Cap (US$mn) 20433.8
Previous Value
Current value
Rating
OUTPERFORM
Target Price (US$)
785.00
Year 12/14A 12/15E 12/16E 12/17E
EPS (CS Adj.) (US$) 14.13 17.52 20.89 24.62
EPS Prev (US$)
EPS (Qtr 1) (US$) 2.64 3.76 4.60 5.34
EPS (Qtr 2) (US$) 3.50 4.56 5.57 6.44
EPS (Qtr 3) (US$) 4.15 4.73 5.58 6.70
EPS (Qtr 4) (US$) 3.84 4.46 5.14 6.15
Source: Credit Suisse Estimates, IBES
Income Statement 2014FYA 2015FYE 2016FYE 2017FYE
Sales revenue 4,108 4,864 5,583 6,378
EBITDA 821 1,026 1,211 1,413
Depr. & amort. -110 -124 -139 -155
EBIT (US$) 711 902 1,073 1,258
Net interest exp 4 2 2 1
Other adj. 0 0 0 0
PBT (US$) 714 904 1,074 1,259
Income taxes -269 -353 -419 -491
Profit after tax 445 551 655 768
Associates & other 0 0 0 0
Net profit (US$) 445 551 655 768
Other NPAT adjustments 0 0 0 0
Reported net income 445 551 655 768
Cash Flow 2014FYA 2015FYE 2016FYE 2017FYE
EBIT 711 902 1,073 1,258
Net interest 4 2 2 1
Change in working capital 43 27 27 27
Other cash & non-cash items -76 -149 -184 -225
Cash flow from operations 682 782 917 1,061
CAPEX -253 -224 -254 -281
Free cashflow to the firm 429 559 663 779
Cash flow from investments -519 -224 -254 -281
Cashflow from financing -67 -100 -200 -400
Changes in Net Cash/Debt 96 459 463 379
Net debt at start -323 -419 -878 -1,341
Change in net debt -96 -459 -463 -379
Net debt at end -419 -878 -1,341 -1,720
Balance Sheet 2014FYA 2015FYE 2016FYE 2017FYE
Total current assets 878 1,337 1,800 2,179
Total fixed assets 1,107 1,207 1,322 1,448
Total liabilities 534 641 764 902
Shareholder equity 2,012 2,464 2,919 3,287
Total liabilities and equity 2,546 3,105 3,683 4,188
Net debt -419 -878 -1,341 -1,720
Per Share 2014FYA 2015FYE 2016FYE 2017FYE
Equiv. FPO (period Avg.) (mn) 32 31 31 31
EPS (CS Adj.) (US$) 14.1 17.5 20.9 24.6
DPS (US$) 0.0 0.0 0.0 0.0
Dividend yield (%) 0.0 0.0 0.0 0.0
Dividend Payout (%) 0.0 0.0 0.0 0.0
Earnings 2014FYA 2015FYE 2016FYE 2017FYE
Sales growth (%) 27.8 18.4 14.8 14.2
EBIT growth (%) 33.4 26.9 18.9 17.3
Net income growth (%) 35.6 23.8 18.8 17.2
EPS growth (%) 34.6 23.9 19.2 17.9
EBITDA margin (%) 20.0 21.1 21.7 22.2
EBIT margin (%) 17.3 18.5 19.2 19.7
Pretax profit margin (%) 17.4 18.6 19.2 19.7
Net income margin (%) 10.8 11.3 11.7 12.0
Valuation 2014FYA 2015FYE 2016FYE 2017FYE
EV/Sales (x) 4.9 4.0 3.4 2.9
EV/EBITDA (x) 24.4 19.1 15.8 13.2
EV/EBIT (x) 28.2 21.7 17.8 14.9
P/E (x) 46.6 37.6 31.5 26.8
Price to book (x) 10.2 8.1 6.9 6.0
Asset turnover 1.6 1.6 1.5 1.5
Returns 2014FYA 2015FYE 2016FYE 2017FYE
ROE 25.1 24.6 24.3 24.7
ROGIC (%) 0.3 0.3 0.4 0.5
Interest burden 1.0 1.0 1.0 1.0
Tax burden 0.4 0.4 0.4 0.4
Financial leverage 1.3 1.3 1.3 1.3
Gearing 2014FYA 2015FYE 2016FYE 2017FYE
Net debt/equity (%) -20.8 -35.6 -45.9 -52.3
Net Debt to EBITDA (x) Net Cash Net Cash Net Cash Net Cash
Interest coverage ratio (X) -202.9 -469.7 -697.8 -1133.9
Source: Company data, Credit Suisse Estimates
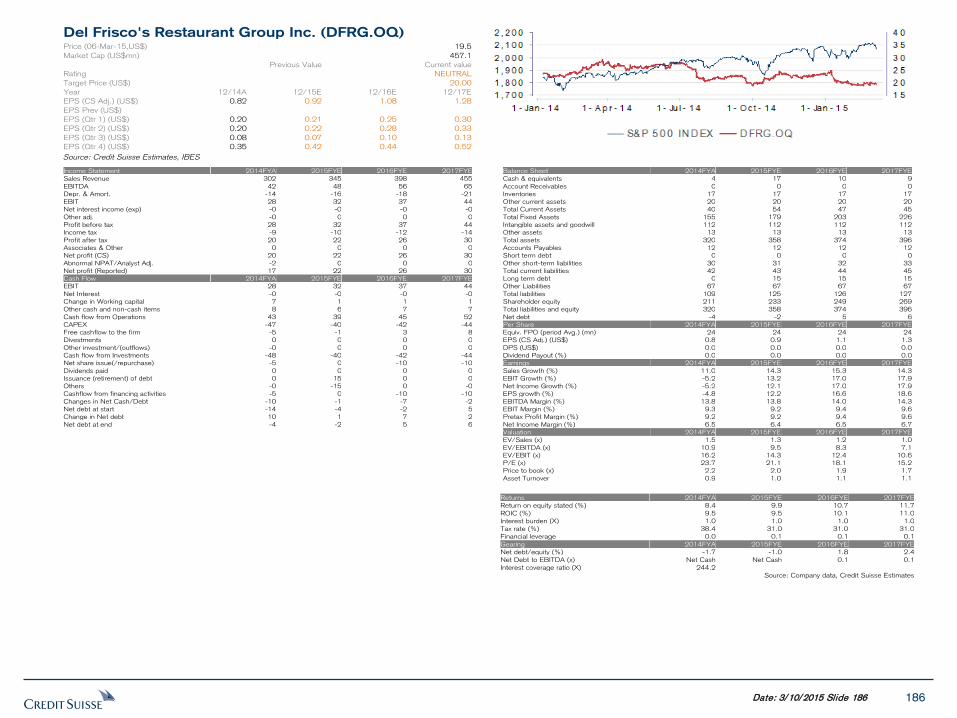
186 Date: 3/10/2015 Slide 186
Del Frisco's Restaurant Group Inc. (DFRG.OQ)
Price (06-Mar-15,US$) 19.5
Market Cap (US$mn) 457.1
Previous Value
Current value
Rating
NEUTRAL
Target Price (US$)
20.00
Year 12/14A 12/15E 12/16E 12/17E
EPS (CS Adj.) (US$) 0.82 0.92 1.08 1.28
EPS Prev (US$)
EPS (Qtr 1) (US$) 0.20 0.21 0.25 0.30
EPS (Qtr 2) (US$) 0.20 0.22 0.28 0.33
EPS (Qtr 3) (US$) 0.08 0.07 0.10 0.13
EPS (Qtr 4) (US$) 0.35 0.42 0.44 0.52
Source: Credit Suisse Estimates, IBES
Income Statement 2014FYA 2015FYE 2016FYE 2017FYE
Sales Revenue 302 345 398 455
EBITDA 42 48 56 65
Depr. & Amort. -14 -16 -18 -21
EBIT 28 32 37 44
Net interest income (exp) -0 -0 -0 -0
Other adj. -0 0 0 0
Profit before tax 28 32 37 44
Income tax -9 -10 -12 -14
Profit after tax 20 22 26 30
Associates & Other 0 0 0 0
Net profit (CS) 20 22 26 30
Abnormal NPAT/Analyst Adj. -2 0 0 0
Net profit (Reported) 17 22 26 30
Cash Flow 2014FYA 2015FYE 2016FYE 2017FYE
EBIT 28 32 37 44
Net Interest -0 -0 -0 -0
Change in Working capital 7 1 1 1
Other cash and non-cash items 8 6 7 7
Cash flow from Operations 43 39 45 52
CAPEX -47 -40 -42 -44
Free cashflow to the firm -5 -1 3 8
Divestments 0 0 0 0
Other investment/(outflows) -0 0 0 0
Cash flow from Investments -48 -40 -42 -44
Net share issue(/repurchase) -5 0 -10 -10
Dividends paid 0 0 0 0
Issuance (retirement) of debt 0 15 0 0
Others -0 -15 0 -0
Cashflow from financing activities -5 0 -10 -10
Changes in Net Cash/Debt -10 -1 -7 -2
Net debt at start -14 -4 -2 5
Change in Net debt 10 1 7 2
Net debt at end -4 -2 5 6
Balance Sheet 2014FYA 2015FYE 2016FYE 2017FYE
Cash & equivalents 4 17 10 9
Account Receivables 0 0 0 0
Inventories 17 17 17 17
Other current assets 20 20 20 20
Total Current Assets 40 54 47 45
Total Fixed Assets 155 179 203 226
Intangible assets and goodwill 112 112 112 112
Other assets 13 13 13 13
Total assets 320 358 374 396
Accounts Payables 12 12 12 12
Short term debt 0 0 0 0
Other short-term liabilities 30 31 32 33
Total current liabilities 42 43 44 45
Long term debt 0 15 15 15
Other Liabilities 67 67 67 67
Total liabilities 109 125 126 127
Shareholder equity 211 233 249 269
Total liabilities and equity 320 358 374 396
Net debt -4 -2 5 6
Per Share 2014FYA 2015FYE 2016FYE 2017FYE
Equiv. FPO (period Avg.) (mn) 24 24 24 24
EPS (CS Adj.) (US$) 0.8 0.9 1.1 1.3
DPS (US$) 0.0 0.0 0.0 0.0
Dividend Payout (%) 0.0 0.0 0.0 0.0
Earnings 2014FYA 2015FYE 2016FYE 2017FYE
Sales Growth (%) 11.0 14.3 15.3 14.3
EBIT Growth (%) -5.2 13.2 17.0 17.9
Net Income Growth (%) -5.2 12.1 17.0 17.9
EPS growth (%) -4.8 12.2 16.6 18.6
EBITDA Margin (%) 13.8 13.8 14.0 14.3
EBIT Margin (%) 9.3 9.2 9.4 9.6
Pretax Profit Margin (%) 9.2 9.2 9.4 9.6
Net Income Margin (%) 6.5 6.4 6.5 6.7
Valuation 2014FYA 2015FYE 2016FYE 2017FYE
EV/Sales (x) 1.5 1.3 1.2 1.0
EV/EBITDA (x) 10.9 9.5 8.3 7.1
EV/EBIT (x) 16.2 14.3 12.4 10.6
P/E (x) 23.7 21.1 18.1 15.2
Price to book (x) 2.2 2.0 1.9 1.7
Asset Turnover 0.9 1.0 1.1 1.1
Returns 2014FYA 2015FYE 2016FYE 2017FYE
Return on equity stated (%) 8.4 9.9 10.7 11.7
ROIC (%) 9.5 9.5 10.1 11.0
Interest burden (X) 1.0 1.0 1.0 1.0
Tax rate (%) 38.4 31.0 31.0 31.0
Financial leverage 0.0 0.1 0.1 0.1
Gearing 2014FYA 2015FYE 2016FYE 2017FYE
Net debt/equity (%) -1.7 -1.0 1.8 2.4
Net Debt to EBITDA (x) Net Cash Net Cash 0.1 0.1
Interest coverage ratio (X) 244.2
Source: Company data, Credit Suisse Estimates
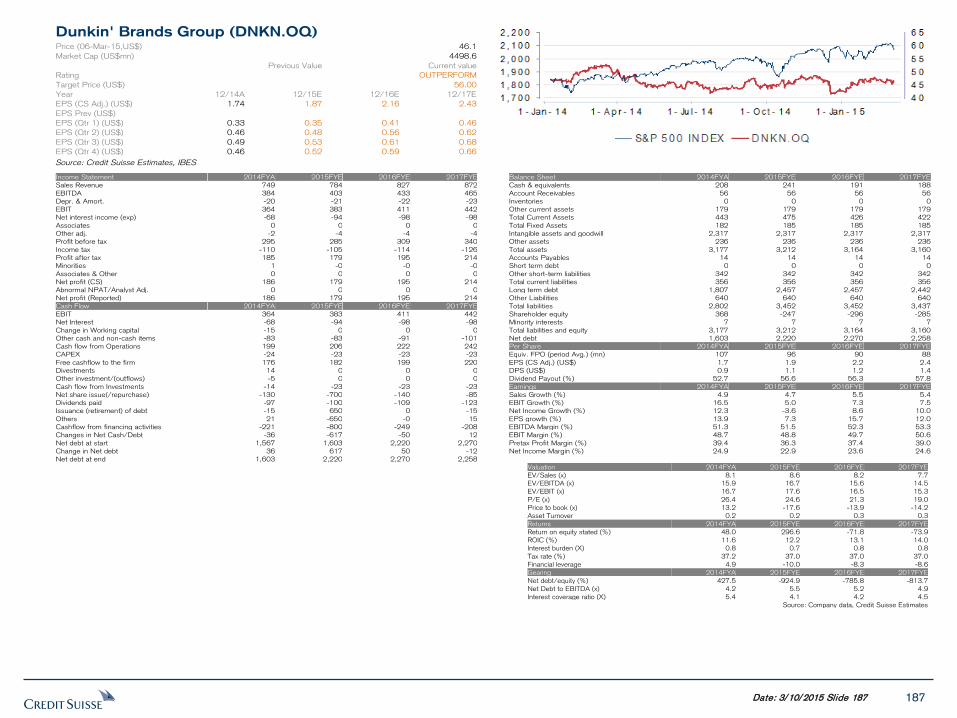
187 Date: 3/10/2015 Slide 187
Dunkin' Brands Group (DNKN.OQ)
Price (06-Mar-15,US$) 46.1
Market Cap (US$mn) 4498.6
Previous Value
Current value
Rating
OUTPERFORM
Target Price (US$)
56.00
Year 12/14A 12/15E 12/16E 12/17E
EPS (CS Adj.) (US$) 1.74 1.87 2.16 2.43
EPS Prev (US$)
EPS (Qtr 1) (US$) 0.33 0.35 0.41 0.46
EPS (Qtr 2) (US$) 0.46 0.48 0.56 0.62
EPS (Qtr 3) (US$) 0.49 0.53 0.61 0.68
EPS (Qtr 4) (US$) 0.46 0.52 0.59 0.66
Source: Credit Suisse Estimates, IBES
Income Statement 2014FYA 2015FYE 2016FYE 2017FYE
Sales Revenue 749 784 827 872
EBITDA 384 403 433 465
Depr. & Amort. -20 -21 -22 -23
EBIT 364 383 411 442
Net interest income (exp) -68 -94 -98 -98
Associates 0 0 0 0
Other adj. -2 -4 -4 -4
Profit before tax 295 285 309 340
Income tax -110 -105 -114 -126
Profit after tax 185 179 195 214
Minorities 1 -0 -0 -0
Associates & Other 0 0 0 0
Net profit (CS) 186 179 195 214
Abnormal NPAT/Analyst Adj. 0 0 0 0
Net profit (Reported) 186 179 195 214
Cash Flow 2014FYA 2015FYE 2016FYE 2017FYE
EBIT 364 383 411 442
Net Interest -68 -94 -98 -98
Change in Working capital -15 0 0 0
Other cash and non-cash items -83 -83 -91 -101
Cash flow from Operations 199 206 222 242
CAPEX -24 -23 -23 -23
Free cashflow to the firm 176 182 199 220
Divestments 14 0 0 0
Other investment/(outflows) -5 0 0 0
Cash flow from Investments -14 -23 -23 -23
Net share issue(/repurchase) -130 -700 -140 -85
Dividends paid -97 -100 -109 -123
Issuance (retirement) of debt -15 650 0 -15
Others 21 -650 -0 15
Cashflow from financing activities -221 -800 -249 -208
Changes in Net Cash/Debt -36 -617 -50 12
Net debt at start 1,567 1,603 2,220 2,270
Change in Net debt 36 617 50 -12
Net debt at end 1,603 2,220 2,270 2,258
Balance Sheet 2014FYA 2015FYE 2016FYE 2017FYE
Cash & equivalents 208 241 191 188
Account Receivables 56 56 56 56
Inventories 0 0 0 0
Other current assets 179 179 179 179
Total Current Assets 443 475 426 422
Total Fixed Assets 182 185 185 185
Intangible assets and goodwill 2,317 2,317 2,317 2,317
Other assets 236 236 236 236
Total assets 3,177 3,212 3,164 3,160
Accounts Payables 14 14 14 14
Short term debt 0 0 0 0
Other short-term liabilities 342 342 342 342
Total current liabilities 356 356 356 356
Long term debt 1,807 2,457 2,457 2,442
Other Liabilities 640 640 640 640
Total liabilities 2,802 3,452 3,452 3,437
Shareholder equity 368 -247 -296 -285
Minority interests 7 7 7 7
Total liabilities and equity 3,177 3,212 3,164 3,160
Net debt 1,603 2,220 2,270 2,258
Per Share 2014FYA 2015FYE 2016FYE 2017FYE
Equiv. FPO (period Avg.) (mn) 107 96 90 88
EPS (CS Adj.) (US$) 1.7 1.9 2.2 2.4
DPS (US$) 0.9 1.1 1.2 1.4
Dividend Payout (%) 52.7 56.6 56.3 57.8
Earnings 2014FYA 2015FYE 2016FYE 2017FYE
Sales Growth (%) 4.9 4.7 5.5 5.4
EBIT Growth (%) 16.5 5.0 7.3 7.5
Net Income Growth (%) 12.3 -3.6 8.6 10.0
EPS growth (%) 13.9 7.3 15.7 12.0
EBITDA Margin (%) 51.3 51.5 52.3 53.3
EBIT Margin (%) 48.7 48.8 49.7 50.6
Pretax Profit Margin (%) 39.4 36.3 37.4 39.0
Net Income Margin (%) 24.9 22.9 23.6 24.6
Valuation 2014FYA 2015FYE 2016FYE 2017FYE
EV/Sales (x) 8.1 8.6 8.2 7.7
EV/EBITDA (x) 15.9 16.7 15.6 14.5
EV/EBIT (x) 16.7 17.6 16.5 15.3
P/E (x) 26.4 24.6 21.3 19.0
Price to book (x) 13.2 -17.6 -13.9 -14.2
Asset Turnover 0.2 0.2 0.3 0.3
Returns 2014FYA 2015FYE 2016FYE 2017FYE
Return on equity stated (%) 48.0 296.6 -71.8 -73.9
ROIC (%) 11.6 12.2 13.1 14.0
Interest burden (X) 0.8 0.7 0.8 0.8
Tax rate (%) 37.2 37.0 37.0 37.0
Financial leverage 4.9 -10.0 -8.3 -8.6
Gearing 2014FYA 2015FYE 2016FYE 2017FYE
Net debt/equity (%) 427.5 -924.9 -785.8 -813.7
Net Debt to EBITDA (x) 4.2 5.5 5.2 4.9
Interest coverage ratio (X) 5.4 4.1 4.2 4.5
Source: Company data, Credit Suisse Estimates
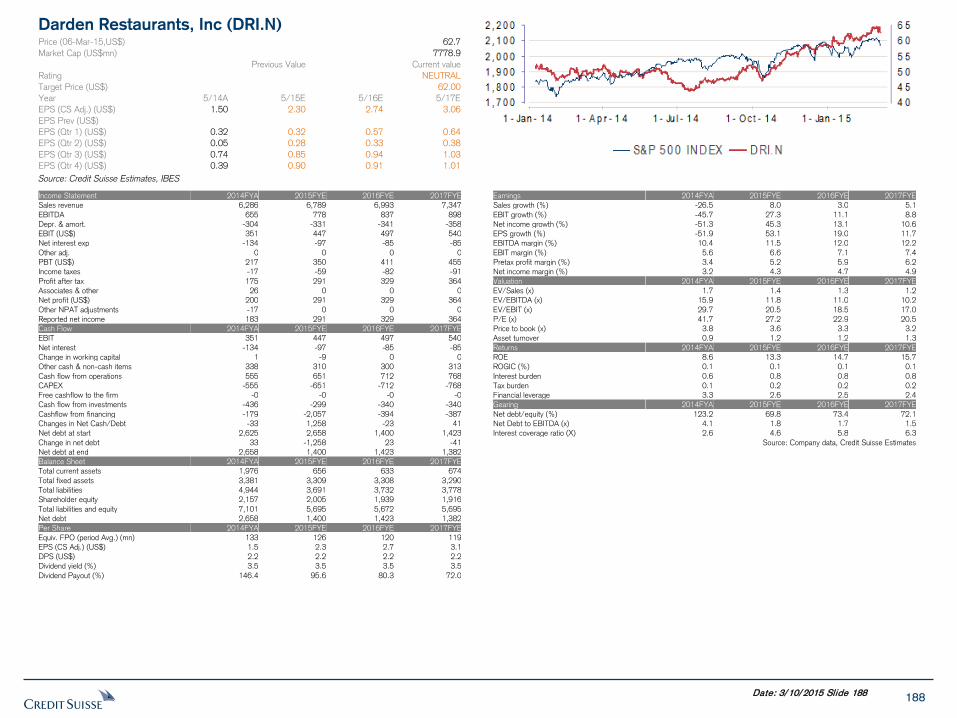
188 Date: 3/10/2015 Slide 188
Darden Restaurants, Inc (DRI.N)
Price (06-Mar-15,US$) 62.7
Market Cap (US$mn) 7778.9
Previous Value
Current value
Rating
NEUTRAL
Target Price (US$)
62.00
Year 5/14A 5/15E 5/16E 5/17E
EPS (CS Adj.) (US$) 1.50 2.30 2.74 3.06
EPS Prev (US$)
EPS (Qtr 1) (US$) 0.32 0.32 0.57 0.64
EPS (Qtr 2) (US$) 0.05 0.28 0.33 0.38
EPS (Qtr 3) (US$) 0.74 0.85 0.94 1.03
EPS (Qtr 4) (US$) 0.39 0.90 0.91 1.01
Source: Credit Suisse Estimates, IBES
Income Statement 2014FYA 2015FYE 2016FYE 2017FYE
Sales revenue 6,286 6,789 6,993 7,347
EBITDA 655 778 837 898
Depr. & amort. -304 -331 -341 -358
EBIT (US$) 351 447 497 540
Net interest exp -134 -97 -85 -85
Other adj. 0 0 0 0
PBT (US$) 217 350 411 455
Income taxes -17 -59 -82 -91
Profit after tax 175 291 329 364
Associates & other 26 0 0 0
Net profit (US$) 200 291 329 364
Other NPAT adjustments -17 0 0 0
Reported net income 183 291 329 364
Cash Flow 2014FYA 2015FYE 2016FYE 2017FYE
EBIT 351 447 497 540
Net interest -134 -97 -85 -85
Change in working capital 1 -9 0 0
Other cash & non-cash items 338 310 300 313
Cash flow from operations 555 651 712 768
CAPEX -555 -651 -712 -768
Free cashflow to the firm -0 -0 -0 -0
Cash flow from investments -436 -299 -340 -340
Cashflow from financing -179 -2,057 -394 -387
Changes in Net Cash/Debt -33 1,258 -23 41
Net debt at start 2,625 2,658 1,400 1,423
Change in net debt 33 -1,258 23 -41
Net debt at end 2,658 1,400 1,423 1,382
Balance Sheet 2014FYA 2015FYE 2016FYE 2017FYE
Total current assets 1,976 656 633 674
Total fixed assets 3,381 3,309 3,308 3,290
Total liabilities 4,944 3,691 3,732 3,778
Shareholder equity 2,157 2,005 1,939 1,916
Total liabilities and equity 7,101 5,695 5,672 5,695
Net debt 2,658 1,400 1,423 1,382
Per Share 2014FYA 2015FYE 2016FYE 2017FYE
Equiv. FPO (period Avg.) (mn) 133 126 120 119
EPS (CS Adj.) (US$) 1.5 2.3 2.7 3.1
DPS (US$) 2.2 2.2 2.2 2.2
Dividend yield (%) 3.5 3.5 3.5 3.5
Dividend Payout (%) 146.4 95.6 80.3 72.0
Earnings 2014FYA 2015FYE 2016FYE 2017FYE
Sales growth (%) -26.5 8.0 3.0 5.1
EBIT growth (%) -45.7 27.3 11.1 8.8
Net income growth (%) -51.3 45.3 13.1 10.6
EPS growth (%) -51.9 53.1 19.0 11.7
EBITDA margin (%) 10.4 11.5 12.0 12.2
EBIT margin (%) 5.6 6.6 7.1 7.4
Pretax profit margin (%) 3.4 5.2 5.9 6.2
Net income margin (%) 3.2 4.3 4.7 4.9
Valuation 2014FYA 2015FYE 2016FYE 2017FYE
EV/Sales (x) 1.7 1.4 1.3 1.2
EV/EBITDA (x) 15.9 11.8 11.0 10.2
EV/EBIT (x) 29.7 20.5 18.5 17.0
P/E (x) 41.7 27.2 22.9 20.5
Price to book (x) 3.8 3.6 3.3 3.2
Asset turnover 0.9 1.2 1.2 1.3
Returns 2014FYA 2015FYE 2016FYE 2017FYE
ROE 8.6 13.3 14.7 15.7
ROGIC (%) 0.1 0.1 0.1 0.1
Interest burden 0.6 0.8 0.8 0.8
Tax burden 0.1 0.2 0.2 0.2
Financial leverage 3.3 2.6 2.5 2.4
Gearing 2014FYA 2015FYE 2016FYE 2017FYE
Net debt/equity (%) 123.2 69.8 73.4 72.1
Net Debt to EBITDA (x) 4.1 1.8 1.7 1.5
Interest coverage ratio (X) 2.6 4.6 5.8 6.3
Source: Company data, Credit Suisse Estimates
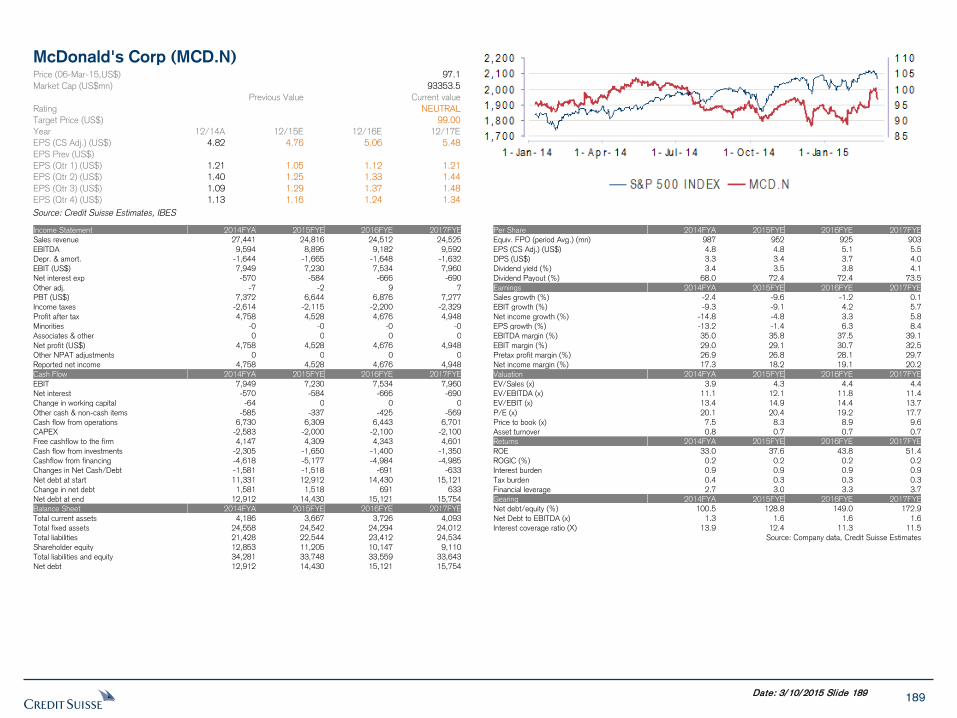
189 Date: 3/10/2015 Slide 189
McDonald's Corp (MCD.N)
Price (06-Mar-15,US$) 97.1
Market Cap (US$mn) 93353.5
Previous Value
Current value
Rating
NEUTRAL
Target Price (US$)
99.00
Year 12/14A 12/15E 12/16E 12/17E
EPS (CS Adj.) (US$) 4.82 4.76 5.06 5.48
EPS Prev (US$)
EPS (Qtr 1) (US$) 1.21 1.05 1.12 1.21
EPS (Qtr 2) (US$) 1.40 1.25 1.33 1.44
EPS (Qtr 3) (US$) 1.09 1.29 1.37 1.48
EPS (Qtr 4) (US$) 1.13 1.16 1.24 1.34
Source: Credit Suisse Estimates, IBES
Income Statement 2014FYA 2015FYE 2016FYE 2017FYE
Sales revenue 27,441 24,816 24,512 24,525
EBITDA 9,594 8,895 9,182 9,592
Depr. & amort. -1,644 -1,665 -1,648 -1,632
EBIT (US$) 7,949 7,230 7,534 7,960
Net interest exp -570 -584 -666 -690
Other adj. -7 -2 9 7
PBT (US$) 7,372 6,644 6,876 7,277
Income taxes -2,614 -2,115 -2,200 -2,329
Profit after tax 4,758 4,528 4,676 4,948
Minorities -0 -0 -0 -0
Associates & other 0 0 0 0
Net profit (US$) 4,758 4,528 4,676 4,948
Other NPAT adjustments 0 0 0 0
Reported net income 4,758 4,528 4,676 4,948
Cash Flow 2014FYA 2015FYE 2016FYE 2017FYE
EBIT 7,949 7,230 7,534 7,960
Net interest -570 -584 -666 -690
Change in working capital -64 0 0 0
Other cash & non-cash items -585 -337 -425 -569
Cash flow from operations 6,730 6,309 6,443 6,701
CAPEX -2,583 -2,000 -2,100 -2,100
Free cashflow to the firm 4,147 4,309 4,343 4,601
Cash flow from investments -2,305 -1,650 -1,400 -1,350
Cashflow from financing -4,618 -5,177 -4,984 -4,985
Changes in Net Cash/Debt -1,581 -1,518 -691 -633
Net debt at start 11,331 12,912 14,430 15,121
Change in net debt 1,581 1,518 691 633
Net debt at end 12,912 14,430 15,121 15,754
Balance Sheet 2014FYA 2015FYE 2016FYE 2017FYE
Total current assets 4,186 3,667 3,726 4,093
Total fixed assets 24,558 24,542 24,294 24,012
Total liabilities 21,428 22,544 23,412 24,534
Shareholder equity 12,853 11,205 10,147 9,110
Total liabilities and equity 34,281 33,748 33,559 33,643
Net debt 12,912 14,430 15,121 15,754
Per Share 2014FYA 2015FYE 2016FYE 2017FYE
Equiv. FPO (period Avg.) (mn) 987 952 925 903
EPS (CS Adj.) (US$) 4.8 4.8 5.1 5.5
DPS (US$) 3.3 3.4 3.7 4.0
Dividend yield (%) 3.4 3.5 3.8 4.1
Dividend Payout (%) 68.0 72.4 72.4 73.5
Earnings 2014FYA 2015FYE 2016FYE 2017FYE
Sales growth (%) -2.4 -9.6 -1.2 0.1
EBIT growth (%) -9.3 -9.1 4.2 5.7
Net income growth (%) -14.8 -4.8 3.3 5.8
EPS growth (%) -13.2 -1.4 6.3 8.4
EBITDA margin (%) 35.0 35.8 37.5 39.1
EBIT margin (%) 29.0 29.1 30.7 32.5
Pretax profit margin (%) 26.9 26.8 28.1 29.7
Net income margin (%) 17.3 18.2 19.1 20.2
Valuation 2014FYA 2015FYE 2016FYE 2017FYE
EV/Sales (x) 3.9 4.3 4.4 4.4
EV/EBITDA (x) 11.1 12.1 11.8 11.4
EV/EBIT (x) 13.4 14.9 14.4 13.7
P/E (x) 20.1 20.4 19.2 17.7
Price to book (x) 7.5 8.3 8.9 9.6
Asset turnover 0.8 0.7 0.7 0.7
Returns 2014FYA 2015FYE 2016FYE 2017FYE
ROE 33.0 37.6 43.8 51.4
ROGIC (%) 0.2 0.2 0.2 0.2
Interest burden 0.9 0.9 0.9 0.9
Tax burden 0.4 0.3 0.3 0.3
Financial leverage 2.7 3.0 3.3 3.7
Gearing 2014FYA 2015FYE 2016FYE 2017FYE
Net debt/equity (%) 100.5 128.8 149.0 172.9
Net Debt to EBITDA (x) 1.3 1.6 1.6 1.6
Interest coverage ratio (X) 13.9 12.4 11.3 11.5
Source: Company data, Credit Suisse Estimates
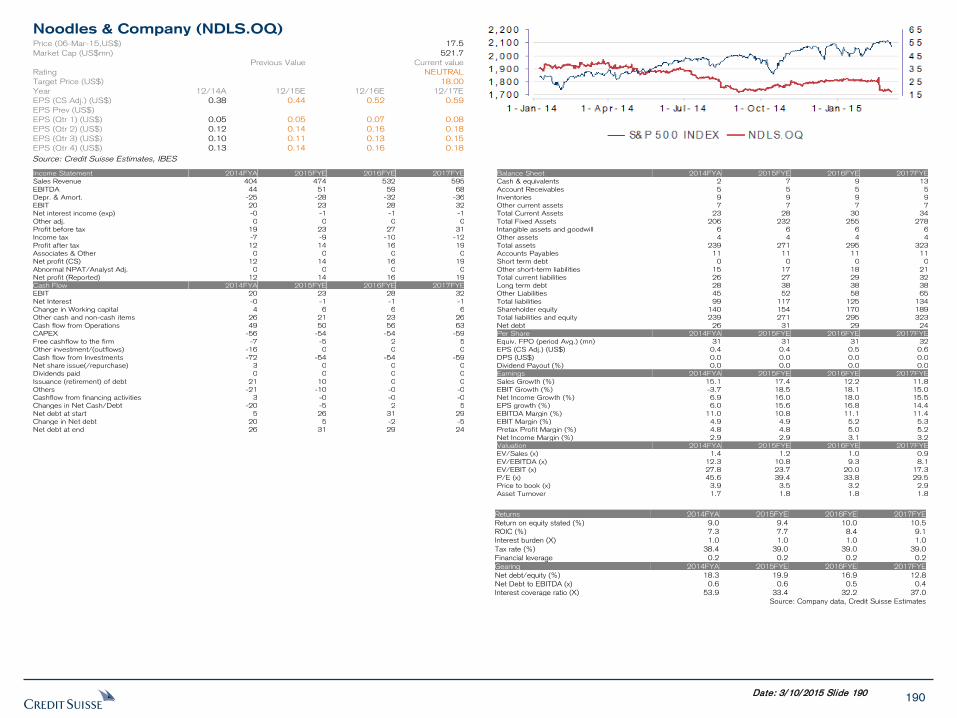
190 Date: 3/10/2015 Slide 190
Noodles & Company (NDLS.OQ)
Price (06-Mar-15,US$) 17.5
Market Cap (US$mn) 521.7
Previous Value
Current value
Rating
NEUTRAL
Target Price (US$)
18.00
Year 12/14A 12/15E 12/16E 12/17E
EPS (CS Adj.) (US$) 0.38 0.44 0.52 0.59
EPS Prev (US$)
EPS (Qtr 1) (US$) 0.05 0.05 0.07 0.08
EPS (Qtr 2) (US$) 0.12 0.14 0.16 0.18
EPS (Qtr 3) (US$) 0.10 0.11 0.13 0.15
EPS (Qtr 4) (US$) 0.13 0.14 0.16 0.18
Source: Credit Suisse Estimates, IBES
Income Statement 2014FYA 2015FYE 2016FYE 2017FYE
Sales Revenue 404 474 532 595
EBITDA 44 51 59 68
Depr. & Amort. -25 -28 -32 -36
EBIT 20 23 28 32
Net interest income (exp) -0 -1 -1 -1
Other adj. 0 0 0 0
Profit before tax 19 23 27 31
Income tax -7 -9 -10 -12
Profit after tax 12 14 16 19
Associates & Other 0 0 0 0
Net profit (CS) 12 14 16 19
Abnormal NPAT/Analyst Adj. 0 0 0 0
Net profit (Reported) 12 14 16 19
Cash Flow 2014FYA 2015FYE 2016FYE 2017FYE
EBIT 20 23 28 32
Net Interest -0 -1 -1 -1
Change in Working capital 4 6 6 6
Other cash and non-cash items 26 21 23 26
Cash flow from Operations 49 50 56 63
CAPEX -56 -54 -54 -59
Free cashflow to the firm -7 -5 2 5
Other investment/(outflows) -16 0 0 0
Cash flow from Investments -72 -54 -54 -59
Net share issue(/repurchase) 3 0 0 0
Dividends paid 0 0 0 0
Issuance (retirement) of debt 21 10 0 0
Others -21 -10 -0 -0
Cashflow from financing activities 3 -0 -0 -0
Changes in Net Cash/Debt -20 -5 2 5
Net debt at start 5 26 31 29
Change in Net debt 20 5 -2 -5
Net debt at end 26 31 29 24
Balance Sheet 2014FYA 2015FYE 2016FYE 2017FYE
Cash & equivalents 2 7 9 13
Account Receivables 5 5 5 5
Inventories 9 9 9 9
Other current assets 7 7 7 7
Total Current Assets 23 28 30 34
Total Fixed Assets 206 232 255 278
Intangible assets and goodwill 6 6 6 6
Other assets 4 4 4 4
Total assets 239 271 295 323
Accounts Payables 11 11 11 11
Short term debt 0 0 0 0
Other short-term liabilities 15 17 18 21
Total current liabilities 26 27 29 32
Long term debt 28 38 38 38
Other Liabilities 45 52 58 65
Total liabilities 99 117 125 134
Shareholder equity 140 154 170 189
Total liabilities and equity 239 271 295 323
Net debt 26 31 29 24
Per Share 2014FYA 2015FYE 2016FYE 2017FYE
Equiv. FPO (period Avg.) (mn) 31 31 31 32
EPS (CS Adj.) (US$) 0.4 0.4 0.5 0.6
DPS (US$) 0.0 0.0 0.0 0.0
Dividend Payout (%) 0.0 0.0 0.0 0.0
Earnings 2014FYA 2015FYE 2016FYE 2017FYE
Sales Growth (%) 15.1 17.4 12.2 11.8
EBIT Growth (%) -3.7 18.5 18.1 15.0
Net Income Growth (%) 6.9 16.0 18.0 15.5
EPS growth (%) 6.0 15.6 16.8 14.4
EBITDA Margin (%) 11.0 10.8 11.1 11.4
EBIT Margin (%) 4.9 4.9 5.2 5.3
Pretax Profit Margin (%) 4.8 4.8 5.0 5.2
Net Income Margin (%) 2.9 2.9 3.1 3.2
Valuation 2014FYA 2015FYE 2016FYE 2017FYE
EV/Sales (x) 1.4 1.2 1.0 0.9
EV/EBITDA (x) 12.3 10.8 9.3 8.1
EV/EBIT (x) 27.8 23.7 20.0 17.3
P/E (x) 45.6 39.4 33.8 29.5
Price to book (x) 3.9 3.5 3.2 2.9
Asset Turnover 1.7 1.8 1.8 1.8
Returns 2014FYA 2015FYE 2016FYE 2017FYE
Return on equity stated (%) 9.0 9.4 10.0 10.5
ROIC (%) 7.3 7.7 8.4 9.1
Interest burden (X) 1.0 1.0 1.0 1.0
Tax rate (%) 38.4 39.0 39.0 39.0
Financial leverage 0.2 0.2 0.2 0.2
Gearing 2014FYA 2015FYE 2016FYE 2017FYE
Net debt/equity (%) 18.3 19.9 16.9 12.8
Net Debt to EBITDA (x) 0.6 0.6 0.5 0.4
Interest coverage ratio (X) 53.9 33.4 32.2 37.0
Source: Company data, Credit Suisse Estimates
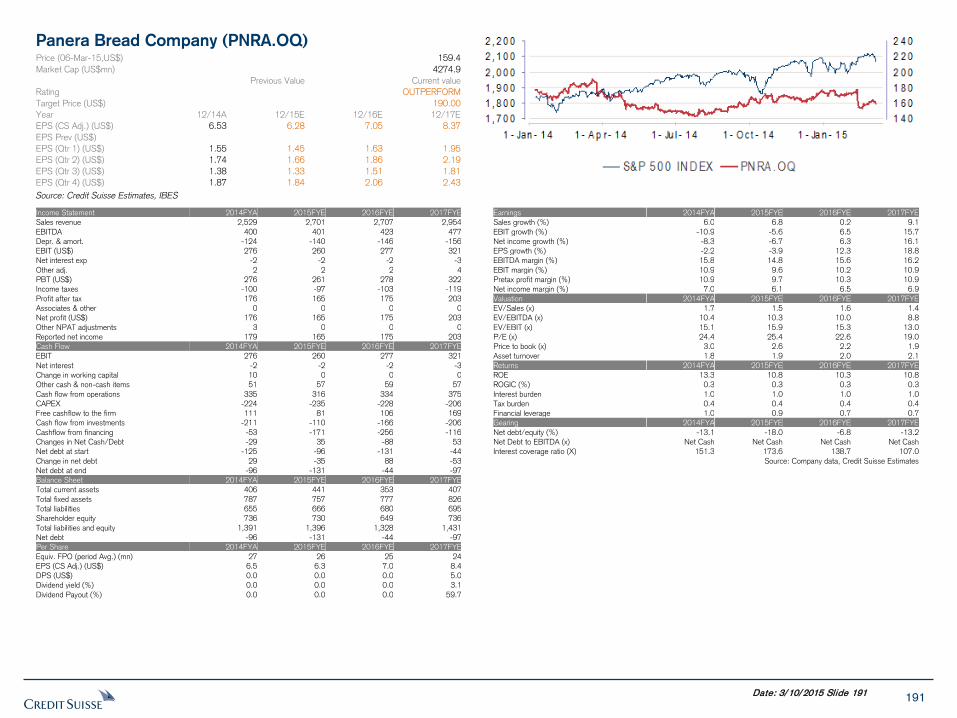
191 Date: 3/10/2015 Slide 191
Panera Bread Company (PNRA.OQ)
Price (06-Mar-15,US$) 159.4
Market Cap (US$mn) 4274.9
Previous Value
Current value
Rating
OUTPERFORM
Target Price (US$)
190.00
Year 12/14A 12/15E 12/16E 12/17E
EPS (CS Adj.) (US$) 6.53 6.28 7.05 8.37
EPS Prev (US$)
EPS (Qtr 1) (US$) 1.55 1.45 1.63 1.95
EPS (Qtr 2) (US$) 1.74 1.66 1.86 2.19
EPS (Qtr 3) (US$) 1.38 1.33 1.51 1.81
EPS (Qtr 4) (US$) 1.87 1.84 2.06 2.43
Source: Credit Suisse Estimates, IBES
Income Statement 2014FYA 2015FYE 2016FYE 2017FYE
Sales revenue 2,529 2,701 2,707 2,954
EBITDA 400 401 423 477
Depr. & amort. -124 -140 -146 -156
EBIT (US$) 276 260 277 321
Net interest exp -2 -2 -2 -3
Other adj. 2 2 2 4
PBT (US$) 276 261 278 322
Income taxes -100 -97 -103 -119
Profit after tax 176 165 175 203
Associates & other 0 0 0 0
Net profit (US$) 176 165 175 203
Other NPAT adjustments 3 0 0 0
Reported net income 179 165 175 203
Cash Flow 2014FYA 2015FYE 2016FYE 2017FYE
EBIT 276 260 277 321
Net interest -2 -2 -2 -3
Change in working capital 10 0 0 0
Other cash & non-cash items 51 57 59 57
Cash flow from operations 335 316 334 375
CAPEX -224 -235 -228 -206
Free cashflow to the firm 111 81 106 169
Cash flow from investments -211 -110 -166 -206
Cashflow from financing -53 -171 -256 -116
Changes in Net Cash/Debt -29 35 -88 53
Net debt at start -125 -96 -131 -44
Change in net debt 29 -35 88 -53
Net debt at end -96 -131 -44 -97
Balance Sheet 2014FYA 2015FYE 2016FYE 2017FYE
Total current assets 406 441 353 407
Total fixed assets 787 757 777 826
Total liabilities 655 666 680 695
Shareholder equity 736 730 649 736
Total liabilities and equity 1,391 1,396 1,328 1,431
Net debt -96 -131 -44 -97
Per Share 2014FYA 2015FYE 2016FYE 2017FYE
Equiv. FPO (period Avg.) (mn) 27 26 25 24
EPS (CS Adj.) (US$) 6.5 6.3 7.0 8.4
DPS (US$) 0.0 0.0 0.0 5.0
Dividend yield (%) 0.0 0.0 0.0 3.1
Dividend Payout (%) 0.0 0.0 0.0 59.7
Earnings 2014FYA 2015FYE 2016FYE 2017FYE
Sales growth (%) 6.0 6.8 0.2 9.1
EBIT growth (%) -10.9 -5.6 6.5 15.7
Net income growth (%) -8.3 -6.7 6.3 16.1
EPS growth (%) -2.2 -3.9 12.3 18.8
EBITDA margin (%) 15.8 14.8 15.6 16.2
EBIT margin (%) 10.9 9.6 10.2 10.9
Pretax profit margin (%) 10.9 9.7 10.3 10.9
Net income margin (%) 7.0 6.1 6.5 6.9
Valuation 2014FYA 2015FYE 2016FYE 2017FYE
EV/Sales (x) 1.7 1.5 1.6 1.4
EV/EBITDA (x) 10.4 10.3 10.0 8.8
EV/EBIT (x) 15.1 15.9 15.3 13.0
P/E (x) 24.4 25.4 22.6 19.0
Price to book (x) 3.0 2.6 2.2 1.9
Asset turnover 1.8 1.9 2.0 2.1
Returns 2014FYA 2015FYE 2016FYE 2017FYE
ROE 13.3 10.8 10.3 10.8
ROGIC (%) 0.3 0.3 0.3 0.3
Interest burden 1.0 1.0 1.0 1.0
Tax burden 0.4 0.4 0.4 0.4
Financial leverage 1.0 0.9 0.7 0.7
Gearing 2014FYA 2015FYE 2016FYE 2017FYE
Net debt/equity (%) -13.1 -18.0 -6.8 -13.2
Net Debt to EBITDA (x) Net Cash Net Cash Net Cash Net Cash
Interest coverage ratio (X) 151.3 173.6 138.7 107.0
Source: Company data, Credit Suisse Estimates
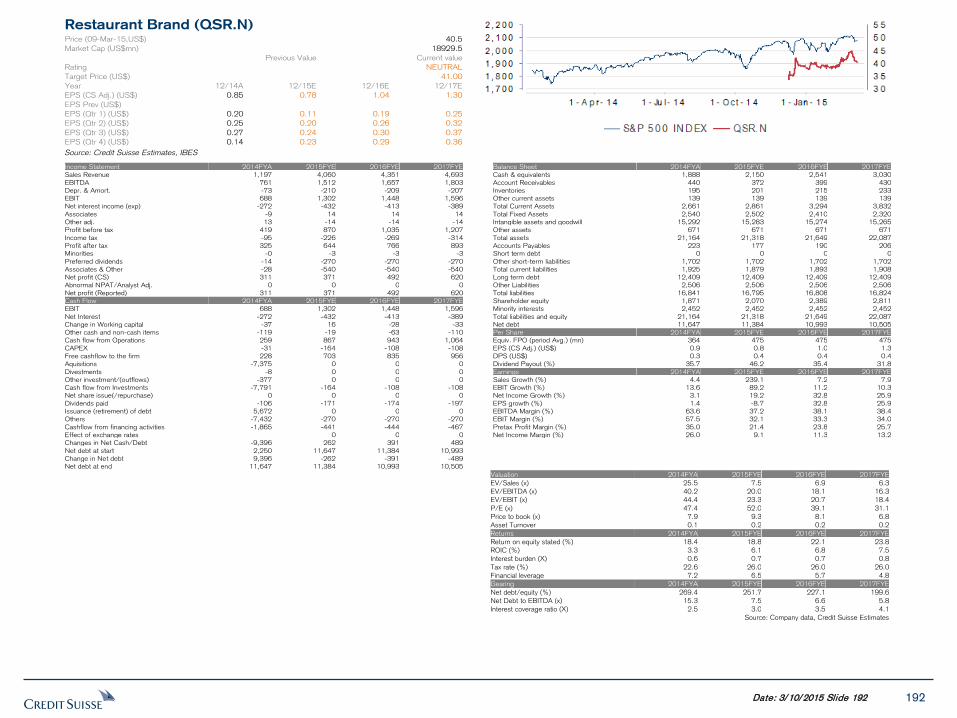
192
Date: 3/10/2015 Slide 192
Restaurant Brand (QSR.N)
Price (09-Mar-15,US$) 40.5
Market Cap (US$mn) 18929.5
Previous Value Current value
Rating NEUTRAL
Target Price (US$) 41.00
Year 12/14A 12/15E 12/16E 12/17E
EPS (CS Adj.) (US$) 0.85 0.78 1.04 1.30
EPS Prev (US$)
EPS (Qtr 1) (US$) 0.20 0.11 0.19 0.25
EPS (Qtr 2) (US$) 0.25 0.20 0.26 0.32
EPS (Qtr 3) (US$) 0.27 0.24 0.30 0.37
EPS (Qtr 4) (US$) 0.14 0.23 0.29 0.36
Source: Credit Suisse Estimates, IBES
Income Statement 2014FYA 2015FYE 2016FYE 2017FYE
Sales Revenue 1,197 4,060 4,351 4,693
EBITDA 761 1,512 1,657 1,803
Depr. & Amort. -73 -210 -209 -207
EBIT 688 1,302 1,448 1,596
Net interest income (exp) -272 -432 -413 -389
Associates -9 14 14 14
Other adj. 13 -14 -14 -14
Profit before tax 419 870 1,035 1,207
Income tax -95 -226 -269 -314
Profit after tax 325 644 766 893
Minorities -0 -3 -3 -3
Preferred dividends -14 -270 -270 -270
Associates & Other -28 -540 -540 -540
Net profit (CS) 311 371 492 620
Abnormal NPAT/Analyst Adj. 0 0 0 0
Net profit (Reported) 311 371 492 620
Cash Flow 2014FYA 2015FYE 2016FYE 2017FYE
EBIT 688 1,302 1,448 1,596
Net Interest -272 -432 -413 -389
Change in Working capital -37 16 -28 -33
Other cash and non-cash items -119 -19 -63 -110
Cash flow from Operations 259 867 943 1,064
CAPEX -31 -164 -108 -108
Free cashflow to the firm 228 703 835 956
Aquisitions -7,375 0 0 0
Divestments -8 0 0 0
Other investment/(outflows) -377 0 0 0
Cash flow from Investments -7,791 -164 -108 -108
Net share issue(/repurchase) 0 0 0 0
Dividends paid -106 -171 -174 -197
Issuance (retirement) of debt 5,672 0 0 0
Others -7,432 -270 -270 -270
Cashflow from financing activities -1,865 -441 -444 -467
Effect of exchange rates 0 0 0
Changes in Net Cash/Debt -9,396 262 391 489
Net debt at start 2,250 11,647 11,384 10,993
Change in Net debt 9,396 -262 -391 -489
Net debt at end 11,647 11,384 10,993 10,505
Balance Sheet 2014FYA 2015FYE 2016FYE 2017FYE
Cash & equivalents 1,888 2,150 2,541 3,030
Account Receivables 440 372 399 430
Inventories 195 201 215 233
Other current assets 139 139 139 139
Total Current Assets 2,661 2,861 3,294 3,832
Total Fixed Assets 2,540 2,502 2,410 2,320
Intangible assets and goodwill 15,292 15,283 15,274 15,265
Other assets 671 671 671 671
Total assets 21,164 21,318 21,649 22,087
Accounts Payables 223 177 190 206
Short term debt 0 0 0 0
Other short-term liabilities 1,702 1,702 1,702 1,702
Total current liabilities 1,925 1,879 1,893 1,908
Long term debt 12,409 12,409 12,409 12,409
Other Liabilities 2,506 2,506 2,506 2,506
Total liabilities 16,841 16,795 16,808 16,824
Shareholder equity 1,871 2,070 2,389 2,811
Minority interests 2,452 2,452 2,452 2,452
Total liabilities and equity 21,164 21,318 21,649 22,087
Net debt 11,647 11,384 10,993 10,505
Per Share 2014FYA 2015FYE 2016FYE 2017FYE
Equiv. FPO (period Avg.) (mn) 364 475 475 475
EPS (CS Adj.) (US$) 0.9 0.8 1.0 1.3
DPS (US$) 0.3 0.4 0.4 0.4
Dividend Payout (%) 35.7 46.2 35.4 31.8
Earnings 2014FYA 2015FYE 2016FYE 2017FYE
Sales Growth (%) 4.4 239.1 7.2 7.9
EBIT Growth (%) 13.6 89.2 11.2 10.3
Net Income Growth (%) 3.1 19.2 32.8 25.9
EPS growth (%) 1.4 -8.7 32.8 25.9
EBITDA Margin (%) 63.6 37.2 38.1 38.4
EBIT Margin (%) 57.5 32.1 33.3 34.0
Pretax Profit Margin (%) 35.0 21.4 23.8 25.7
Net Income Margin (%) 26.0 9.1 11.3 13.2
Valuation 2014FYA 2015FYE 2016FYE 2017FYE
EV/Sales (x) 25.5 7.5 6.9 6.3
EV/EBITDA (x) 40.2 20.0 18.1 16.3
EV/EBIT (x) 44.4 23.3 20.7 18.4
P/E (x) 47.4 52.0 39.1 31.1
Price to book (x) 7.9 9.3 8.1 6.8
Asset Turnover 0.1 0.2 0.2 0.2
Returns 2014FYA 2015FYE 2016FYE 2017FYE
Return on equity stated (%) 18.4 18.8 22.1 23.8
ROIC (%) 3.3 6.1 6.8 7.5
Interest burden (X) 0.6 0.7 0.7 0.8
Tax rate (%) 22.6 26.0 26.0 26.0
Financial leverage 7.2 6.5 5.7 4.8
Gearing 2014FYA 2015FYE 2016FYE 2017FYE
Net debt/equity (%) 269.4 251.7 227.1 199.6
Net Debt to EBITDA (x) 15.3 7.5 6.6 5.8
Interest coverage ratio (X) 2.5 3.0 3.5 4.1
Source: Company data, Credit Suisse Estimates
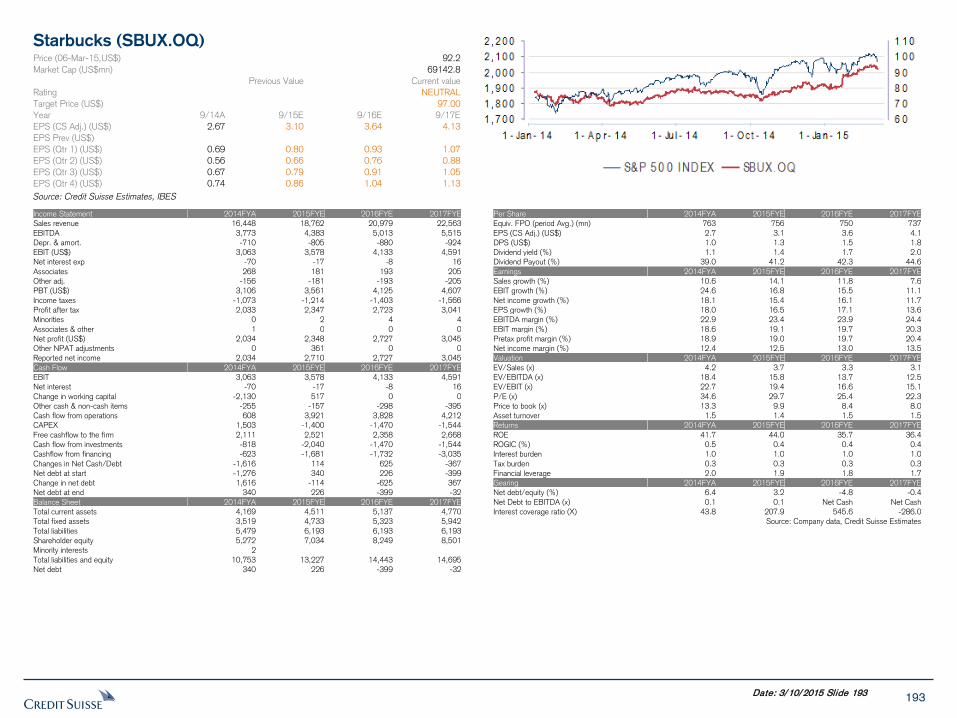
193 Date: 3/10/2015 Slide 193
Starbucks (SBUX.OQ)
Price (06-Mar-15,US$) 92.2
Market Cap (US$mn) 69142.8
Previous Value
Current value
Rating
NEUTRAL
Target Price (US$)
97.00
Year 9/14A 9/15E 9/16E 9/17E
EPS (CS Adj.) (US$) 2.67 3.10 3.64 4.13
EPS Prev (US$)
EPS (Qtr 1) (US$) 0.69 0.80 0.93 1.07
EPS (Qtr 2) (US$) 0.56 0.66 0.76 0.88
EPS (Qtr 3) (US$) 0.67 0.79 0.91 1.05
EPS (Qtr 4) (US$) 0.74 0.86 1.04 1.13
Source: Credit Suisse Estimates, IBES
Income Statement 2014FYA 2015FYE 2016FYE 2017FYE
Sales revenue 16,448 18,762 20,979 22,563
EBITDA 3,773 4,383 5,013 5,515
Depr. & amort. -710 -805 -880 -924
EBIT (US$) 3,063 3,578 4,133 4,591
Net interest exp -70 -17 -8 16
Associates 268 181 193 205
Other adj. -156 -181 -193 -205
PBT (US$) 3,106 3,561 4,125 4,607
Income taxes -1,073 -1,214 -1,403 -1,566
Profit after tax 2,033 2,347 2,723 3,041
Minorities 0 2 4 4
Associates & other 1 0 0 0
Net profit (US$) 2,034 2,348 2,727 3,045
Other NPAT adjustments 0 361 0 0
Reported net income 2,034 2,710 2,727 3,045
Cash Flow 2014FYA 2015FYE 2016FYE 2017FYE
EBIT 3,063 3,578 4,133 4,591
Net interest -70 -17 -8 16
Change in working capital -2,130 517 0 0
Other cash & non-cash items -255 -157 -298 -395
Cash flow from operations 608 3,921 3,828 4,212
CAPEX 1,503 -1,400 -1,470 -1,544
Free cashflow to the firm 2,111 2,521 2,358 2,668
Cash flow from investments -818 -2,040 -1,470 -1,544
Cashflow from financing -623 -1,681 -1,732 -3,035
Changes in Net Cash/Debt -1,616 114 625 -367
Net debt at start -1,276 340 226 -399
Change in net debt 1,616 -114 -625 367
Net debt at end 340 226 -399 -32
Balance Sheet 2014FYA 2015FYE 2016FYE 2017FYE
Total current assets 4,169 4,511 5,137 4,770
Total fixed assets 3,519 4,733 5,323 5,942
Total liabilities 5,479 6,193 6,193 6,193
Shareholder equity 5,272 7,034 8,249 8,501
Minority interests 2
Total liabilities and equity 10,753 13,227 14,443 14,695
Net debt 340 226 -399 -32
Per Share 2014FYA 2015FYE 2016FYE 2017FYE
Equiv. FPO (period Avg.) (mn) 763 756 750 737
EPS (CS Adj.) (US$) 2.7 3.1 3.6 4.1
DPS (US$) 1.0 1.3 1.5 1.8
Dividend yield (%) 1.1 1.4 1.7 2.0
Dividend Payout (%) 39.0 41.2 42.3 44.6
Earnings 2014FYA 2015FYE 2016FYE 2017FYE
Sales growth (%) 10.6 14.1 11.8 7.6
EBIT growth (%) 24.6 16.8 15.5 11.1
Net income growth (%) 18.1 15.4 16.1 11.7
EPS growth (%) 18.0 16.5 17.1 13.6
EBITDA margin (%) 22.9 23.4 23.9 24.4
EBIT margin (%) 18.6 19.1 19.7 20.3
Pretax profit margin (%) 18.9 19.0 19.7 20.4
Net income margin (%) 12.4 12.5 13.0 13.5
Valuation 2014FYA 2015FYE 2016FYE 2017FYE
EV/Sales (x) 4.2 3.7 3.3 3.1
EV/EBITDA (x) 18.4 15.8 13.7 12.5
EV/EBIT (x) 22.7 19.4 16.6 15.1
P/E (x) 34.6 29.7 25.4 22.3
Price to book (x) 13.3 9.9 8.4 8.0
Asset turnover 1.5 1.4 1.5 1.5
Returns 2014FYA 2015FYE 2016FYE 2017FYE
ROE 41.7 44.0 35.7 36.4
ROGIC (%) 0.5 0.4 0.4 0.4
Interest burden 1.0 1.0 1.0 1.0
Tax burden 0.3 0.3 0.3 0.3
Financial leverage 2.0 1.9 1.8 1.7
Gearing 2014FYA 2015FYE 2016FYE 2017FYE
Net debt/equity (%) 6.4 3.2 -4.8 -0.4
Net Debt to EBITDA (x) 0.1 0.1 Net Cash Net Cash
Interest coverage ratio (X) 43.8 207.9 545.6 -286.0
Source: Company data, Credit Suisse Estimates
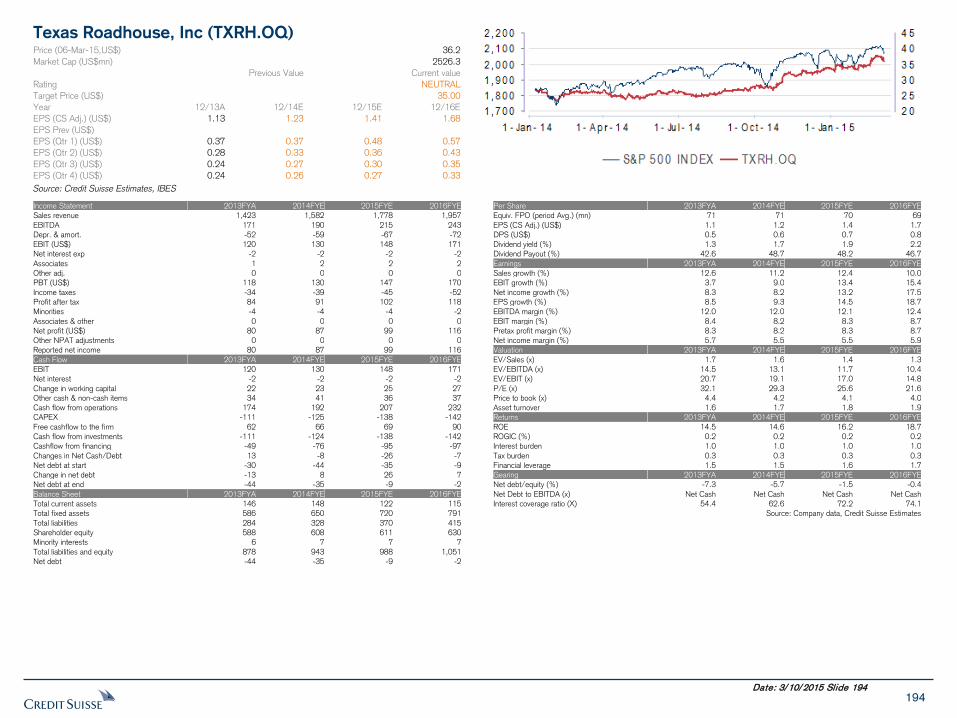
194 Date: 3/10/2015 Slide 194
Texas Roadhouse, Inc (TXRH.OQ)
Price (06-Mar-15,US$) 36.2
Market Cap (US$mn) 2526.3
Previous Value
Current value
Rating
NEUTRAL
Target Price (US$)
35.00
Year 12/13A 12/14E 12/15E 12/16E
EPS (CS Adj.) (US$) 1.13 1.23 1.41 1.68
EPS Prev (US$)
EPS (Qtr 1) (US$) 0.37 0.37 0.48 0.57
EPS (Qtr 2) (US$) 0.28 0.33 0.36 0.43
EPS (Qtr 3) (US$) 0.24 0.27 0.30 0.35
EPS (Qtr 4) (US$) 0.24 0.26 0.27 0.33
Source: Credit Suisse Estimates, IBES
Income Statement 2013FYA 2014FYE 2015FYE 2016FYE
Sales revenue 1,423 1,582 1,778 1,957
EBITDA 171 190 215 243
Depr. & amort. -52 -59 -67 -72
EBIT (US$) 120 130 148 171
Net interest exp -2 -2 -2 -2
Associates 1 2 2 2
Other adj. 0 0 0 0
PBT (US$) 118 130 147 170
Income taxes -34 -39 -45 -52
Profit after tax 84 91 102 118
Minorities -4 -4 -4 -2
Associates & other 0 0 0 0
Net profit (US$) 80 87 99 116
Other NPAT adjustments 0 0 0 0
Reported net income 80 87 99 116
Cash Flow 2013FYA 2014FYE 2015FYE 2016FYE
EBIT 120 130 148 171
Net interest -2 -2 -2 -2
Change in working capital 22 23 25 27
Other cash & non-cash items 34 41 36 37
Cash flow from operations 174 192 207 232
CAPEX -111 -125 -138 -142
Free cashflow to the firm 62 66 69 90
Cash flow from investments -111 -124 -138 -142
Cashflow from financing -49 -76 -95 -97
Changes in Net Cash/Debt 13 -8 -26 -7
Net debt at start -30 -44 -35 -9
Change in net debt -13 8 26 7
Net debt at end -44 -35 -9 -2
Balance Sheet 2013FYA 2014FYE 2015FYE 2016FYE
Total current assets 146 148 122 115
Total fixed assets 586 650 720 791
Total liabilities 284 328 370 415
Shareholder equity 588 608 611 630
Minority interests 6 7 7 7
Total liabilities and equity 878 943 988 1,051
Net debt -44 -35 -9 -2
Per Share 2013FYA 2014FYE 2015FYE 2016FYE
Equiv. FPO (period Avg.) (mn) 71 71 70 69
EPS (CS Adj.) (US$) 1.1 1.2 1.4 1.7
DPS (US$) 0.5 0.6 0.7 0.8
Dividend yield (%) 1.3 1.7 1.9 2.2
Dividend Payout (%) 42.6 48.7 48.2 46.7
Earnings 2013FYA 2014FYE 2015FYE 2016FYE
Sales growth (%) 12.6 11.2 12.4 10.0
EBIT growth (%) 3.7 9.0 13.4 15.4
Net income growth (%) 8.3 8.2 13.2 17.5
EPS growth (%) 8.5 9.3 14.5 18.7
EBITDA margin (%) 12.0 12.0 12.1 12.4
EBIT margin (%) 8.4 8.2 8.3 8.7
Pretax profit margin (%) 8.3 8.2 8.3 8.7
Net income margin (%) 5.7 5.5 5.5 5.9
Valuation 2013FYA 2014FYE 2015FYE 2016FYE
EV/Sales (x) 1.7 1.6 1.4 1.3
EV/EBITDA (x) 14.5 13.1 11.7 10.4
EV/EBIT (x) 20.7 19.1 17.0 14.8
P/E (x) 32.1 29.3 25.6 21.6
Price to book (x) 4.4 4.2 4.1 4.0
Asset turnover 1.6 1.7 1.8 1.9
Returns 2013FYA 2014FYE 2015FYE 2016FYE
ROE 14.5 14.6 16.2 18.7
ROGIC (%) 0.2 0.2 0.2 0.2
Interest burden 1.0 1.0 1.0 1.0
Tax burden 0.3 0.3 0.3 0.3
Financial leverage 1.5 1.5 1.6 1.7
Gearing 2013FYA 2014FYE 2015FYE 2016FYE
Net debt/equity (%) -7.3 -5.7 -1.5 -0.4
Net Debt to EBITDA (x) Net Cash Net Cash Net Cash Net Cash
Interest coverage ratio (X) 54.4 62.6 72.2 74.1
Source: Company data, Credit Suisse Estimates
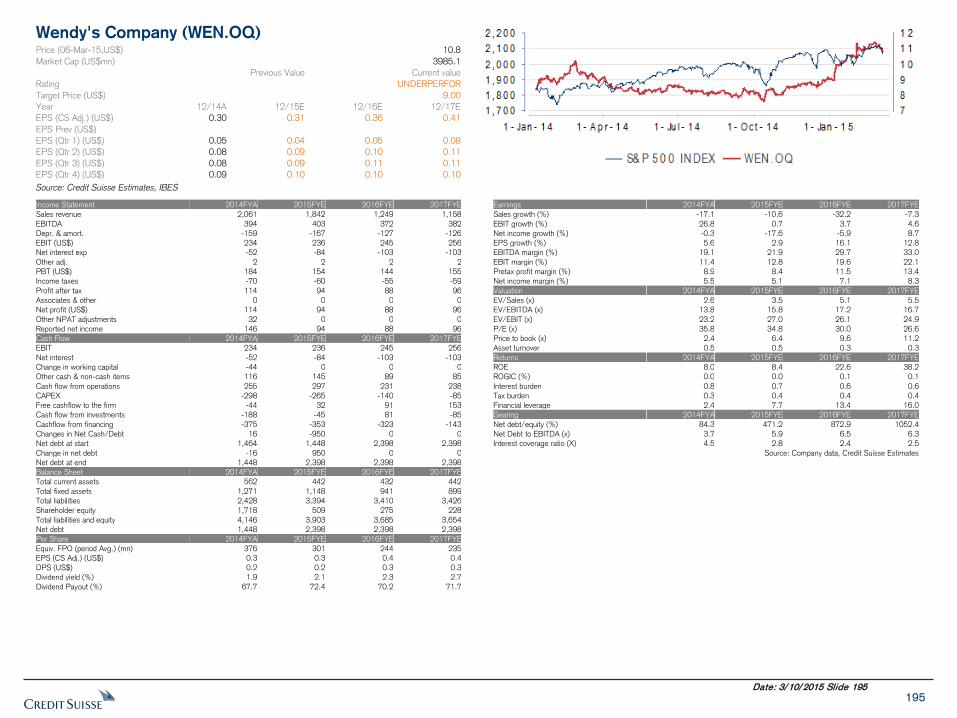
195 Date: 3/10/2015 Slide 195
Wendy's Company (WEN.OQ)
Price (06-Mar-15,US$) 10.8
Market Cap (US$mn) 3985.1
Previous Value
Current value
Rating
UNDERPERFORM Target Price (US$)
9.00
Year 12/14A 12/15E 12/16E 12/17E
EPS (CS Adj.) (US$) 0.30 0.31 0.36 0.41
EPS Prev (US$)
EPS (Qtr 1) (US$) 0.05 0.04 0.05 0.08
EPS (Qtr 2) (US$) 0.08 0.09 0.10 0.11
EPS (Qtr 3) (US$) 0.08 0.09 0.11 0.11
EPS (Qtr 4) (US$) 0.09 0.10 0.10 0.10
Source: Credit Suisse Estimates, IBES
Income Statement 2014FYA 2015FYE 2016FYE 2017FYE
Sales revenue 2,061 1,842 1,249 1,158
EBITDA 394 403 372 382
Depr. & amort. -159 -167 -127 -126
EBIT (US$) 234 236 245 256
Net interest exp -52 -84 -103 -103
Other adj. 2 2 2 2
PBT (US$) 184 154 144 155
Income taxes -70 -60 -55 -59
Profit after tax 114 94 88 96
Associates & other 0 0 0 0
Net profit (US$) 114 94 88 96
Other NPAT adjustments 32 0 0 0
Reported net income 146 94 88 96
Cash Flow 2014FYA 2015FYE 2016FYE 2017FYE
EBIT 234 236 245 256
Net interest -52 -84 -103 -103
Change in working capital -44 0 0 0
Other cash & non-cash items 116 145 89 85
Cash flow from operations 255 297 231 238
CAPEX -298 -265 -140 -85
Free cashflow to the firm -44 32 91 153
Cash flow from investments -188 -45 81 -85
Cashflow from financing -375 -353 -323 -143
Changes in Net Cash/Debt 16 -950 0 0
Net debt at start 1,464 1,448 2,398 2,398
Change in net debt -16 950 0 0
Net debt at end 1,448 2,398 2,398 2,398
Balance Sheet 2014FYA 2015FYE 2016FYE 2017FYE
Total current assets 562 442 432 442
Total fixed assets 1,271 1,148 941 899
Total liabilities 2,428 3,394 3,410 3,426
Shareholder equity 1,718 509 275 228
Total liabilities and equity 4,146 3,903 3,685 3,654
Net debt 1,448 2,398 2,398 2,398
Per Share 2014FYA 2015FYE 2016FYE 2017FYE
Equiv. FPO (period Avg.) (mn) 376 301 244 235
EPS (CS Adj.) (US$) 0.3 0.3 0.4 0.4
DPS (US$) 0.2 0.2 0.3 0.3
Dividend yield (%) 1.9 2.1 2.3 2.7
Dividend Payout (%) 67.7 72.4 70.2 71.7
Earnings 2014FYA 2015FYE 2016FYE 2017FYE
Sales growth (%) -17.1 -10.6 -32.2 -7.3
EBIT growth (%) 26.8 0.7 3.7 4.6
Net income growth (%) -0.3 -17.6 -5.9 8.7
EPS growth (%) 5.6 2.9 16.1 12.8
EBITDA margin (%) 19.1 21.9 29.7 33.0
EBIT margin (%) 11.4 12.8 19.6 22.1
Pretax profit margin (%) 8.9 8.4 11.5 13.4
Net income margin (%) 5.5 5.1 7.1 8.3
Valuation 2014FYA 2015FYE 2016FYE 2017FYE
EV/Sales (x) 2.6 3.5 5.1 5.5
EV/EBITDA (x) 13.8 15.8 17.2 16.7
EV/EBIT (x) 23.2 27.0 26.1 24.9
P/E (x) 35.8 34.8 30.0 26.6
Price to book (x) 2.4 6.4 9.6 11.2
Asset turnover 0.5 0.5 0.3 0.3
Returns 2014FYA 2015FYE 2016FYE 2017FYE
ROE 8.0 8.4 22.6 38.2
ROGIC (%) 0.0 0.0 0.1 0.1
Interest burden 0.8 0.7 0.6 0.6
Tax burden 0.3 0.4 0.4 0.4
Financial leverage 2.4 7.7 13.4 16.0
Gearing 2014FYA 2015FYE 2016FYE 2017FYE
Net debt/equity (%) 84.3 471.2 872.9 1052.4
Net Debt to EBITDA (x) 3.7 5.9 6.5 6.3
Interest coverage ratio (X) 4.5 2.8 2.4 2.5
Source: Company data, Credit Suisse Estimates
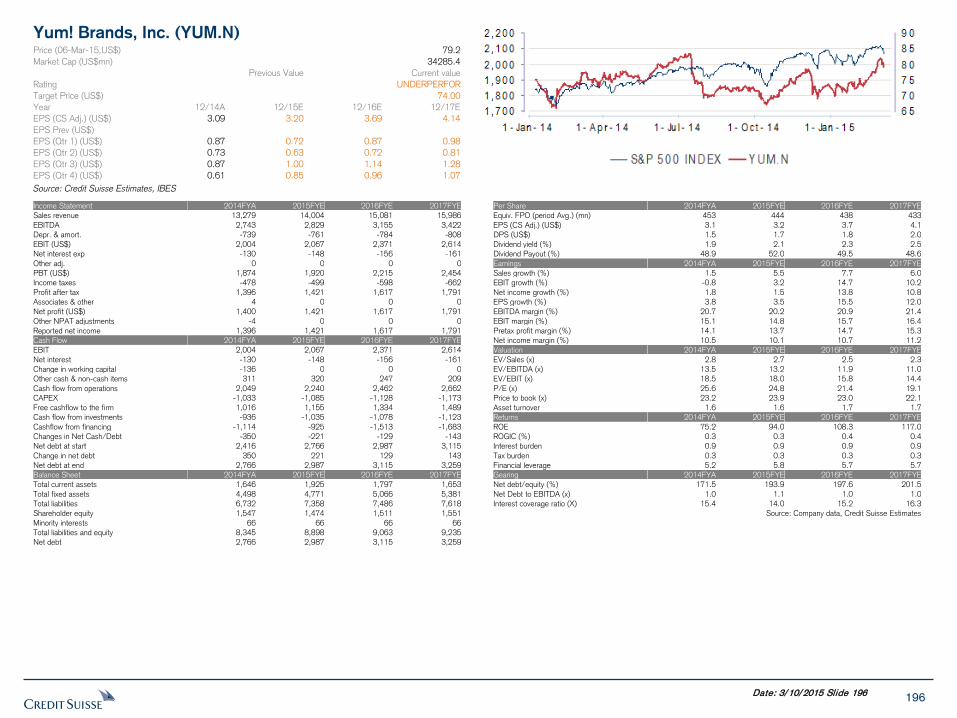
196 Date: 3/10/2015 Slide 196
Yum! Brands, Inc. (YUM.N)
Price (06-Mar-15,US$) 79.2
Market Cap (US$mn) 34285.4
Previous Value
Current value
Rating
UNDERPERFORM Target Price (US$)
74.00
Year 12/14A 12/15E 12/16E 12/17E
EPS (CS Adj.) (US$) 3.09 3.20 3.69 4.14
EPS Prev (US$)
EPS (Qtr 1) (US$) 0.87 0.72 0.87 0.98
EPS (Qtr 2) (US$) 0.73 0.63 0.72 0.81
EPS (Qtr 3) (US$) 0.87 1.00 1.14 1.28
EPS (Qtr 4) (US$) 0.61 0.85 0.96 1.07
Source: Credit Suisse Estimates, IBES
Income Statement 2014FYA 2015FYE 2016FYE 2017FYE
Sales revenue 13,279 14,004 15,081 15,986
EBITDA 2,743 2,829 3,155 3,422
Depr. & amort. -739 -761 -784 -808
EBIT (US$) 2,004 2,067 2,371 2,614
Net interest exp -130 -148 -156 -161
Other adj. 0 0 0 0
PBT (US$) 1,874 1,920 2,215 2,454
Income taxes -478 -499 -598 -662
Profit after tax 1,396 1,421 1,617 1,791
Associates & other 4 0 0 0
Net profit (US$) 1,400 1,421 1,617 1,791
Other NPAT adjustments -4 0 0 0
Reported net income 1,396 1,421 1,617 1,791
Cash Flow 2014FYA 2015FYE 2016FYE 2017FYE
EBIT 2,004 2,067 2,371 2,614
Net interest -130 -148 -156 -161
Change in working capital -136 0 0 0
Other cash & non-cash items 311 320 247 209
Cash flow from operations 2,049 2,240 2,462 2,662
CAPEX -1,033 -1,085 -1,128 -1,173
Free cashflow to the firm 1,016 1,155 1,334 1,489
Cash flow from investments -936 -1,035 -1,078 -1,123
Cashflow from financing -1,114 -925 -1,513 -1,683
Changes in Net Cash/Debt -350 -221 -129 -143
Net debt at start 2,416 2,766 2,987 3,115
Change in net debt 350 221 129 143
Net debt at end 2,766 2,987 3,115 3,259
Balance Sheet 2014FYA 2015FYE 2016FYE 2017FYE
Total current assets 1,646 1,925 1,797 1,653
Total fixed assets 4,498 4,771 5,066 5,381
Total liabilities 6,732 7,358 7,486 7,618
Shareholder equity 1,547 1,474 1,511 1,551
Minority interests 66 66 66 66
Total liabilities and equity 8,345 8,898 9,063 9,235
Net debt 2,766 2,987 3,115 3,259
Per Share 2014FYA 2015FYE 2016FYE 2017FYE
Equiv. FPO (period Avg.) (mn) 453 444 438 433
EPS (CS Adj.) (US$) 3.1 3.2 3.7 4.1
DPS (US$) 1.5 1.7 1.8 2.0
Dividend yield (%) 1.9 2.1 2.3 2.5
Dividend Payout (%) 48.9 52.0 49.5 48.6
Earnings 2014FYA 2015FYE 2016FYE 2017FYE
Sales growth (%) 1.5 5.5 7.7 6.0
EBIT growth (%) -0.8 3.2 14.7 10.2
Net income growth (%) 1.8 1.5 13.8 10.8
EPS growth (%) 3.8 3.5 15.5 12.0
EBITDA margin (%) 20.7 20.2 20.9 21.4
EBIT margin (%) 15.1 14.8 15.7 16.4
Pretax profit margin (%) 14.1 13.7 14.7 15.3
Net income margin (%) 10.5 10.1 10.7 11.2
Valuation 2014FYA 2015FYE 2016FYE 2017FYE
EV/Sales (x) 2.8 2.7 2.5 2.3
EV/EBITDA (x) 13.5 13.2 11.9 11.0
EV/EBIT (x) 18.5 18.0 15.8 14.4
P/E (x) 25.6 24.8 21.4 19.1
Price to book (x) 23.2 23.9 23.0 22.1
Asset turnover 1.6 1.6 1.7 1.7
Returns 2014FYA 2015FYE 2016FYE 2017FYE
ROE 75.2 94.0 108.3 117.0
ROGIC (%) 0.3 0.3 0.4 0.4
Interest burden 0.9 0.9 0.9 0.9
Tax burden 0.3 0.3 0.3 0.3
Financial leverage 5.2 5.8 5.7 5.7
Gearing 2014FYA 2015FYE 2016FYE 2017FYE
Net debt/equity (%) 171.5 193.9 197.6 201.5
Net Debt to EBITDA (x) 1.0 1.1 1.0 1.0
Interest coverage ratio (X) 15.4 14.0 15.2 16.3
Source: Company data, Credit Suisse Estimates
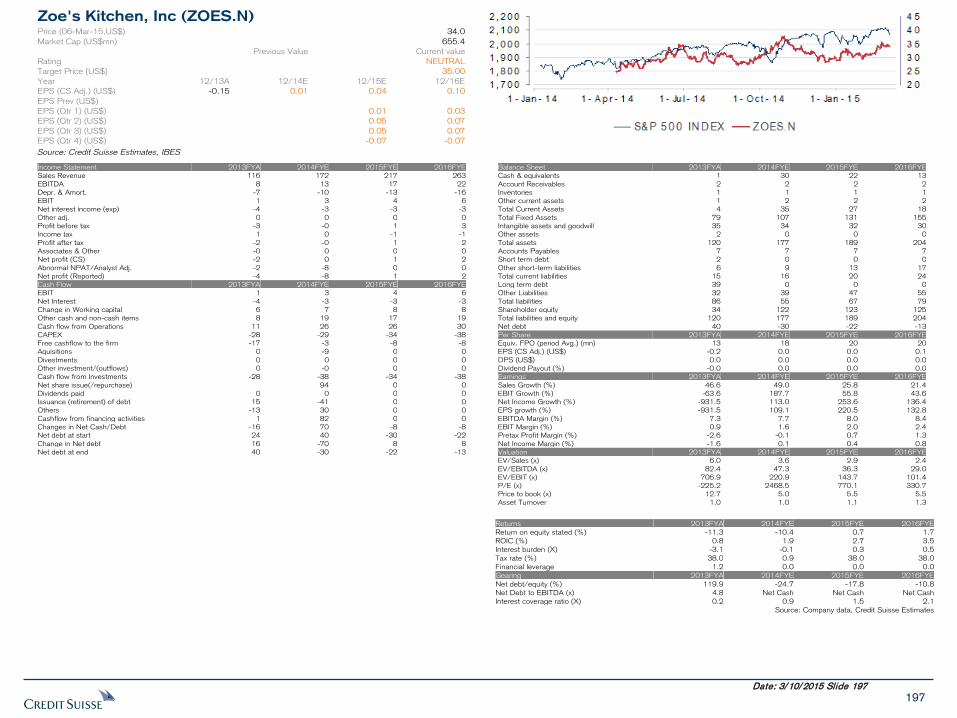
197 Date: 3/10/2015 Slide 197
Zoe's Kitchen, Inc (ZOES.N)
Price (06-Mar-15,US$) 34.0
Market Cap (US$mn) 655.4
Previous Value
Current value
Rating
NEUTRAL
Target Price (US$)
35.00
Year 12/13A 12/14E 12/15E 12/16E
EPS (CS Adj.) (US$) -0.15 0.01 0.04 0.10
EPS Prev (US$)
EPS (Qtr 1) (US$) 0.01 0.03
EPS (Qtr 2) (US$) 0.05 0.07
EPS (Qtr 3) (US$) 0.05 0.07
EPS (Qtr 4) (US$) -0.07 -0.07
Source: Credit Suisse Estimates, IBES
Income Statement 2013FYA 2014FYE 2015FYE 2016FYE
Sales Revenue 116 172 217 263
EBITDA 8 13 17 22
Depr. & Amort. -7 -10 -13 -16
EBIT 1 3 4 6
Net interest income (exp) -4 -3 -3 -3
Other adj. 0 0 0 0
Profit before tax -3 -0 1 3
Income tax 1 0 -1 -1
Profit after tax -2 -0 1 2
Associates & Other -0 0 0 0
Net profit (CS) -2 0 1 2
Abnormal NPAT/Analyst Adj. -2 -8 0 0
Net profit (Reported) -4 -8 1 2
Cash Flow 2013FYA 2014FYE 2015FYE 2016FYE
EBIT 1 3 4 6
Net Interest -4 -3 -3 -3
Change in Working capital 6 7 8 8
Other cash and non-cash items 8 19 17 19
Cash flow from Operations 11 26 26 30
CAPEX -28 -29 -34 -38
Free cashflow to the firm -17 -3 -8 -8
Aquisitions 0 -9 0 0
Divestments 0 0 0 0
Other investment/(outflows) 0 -0 0 0
Cash flow from Investments -28 -38 -34 -38
Net share issue(/repurchase) 94 0 0
Dividends paid 0 0 0 0
Issuance (retirement) of debt 15 -41 0 0
Others -13 30 0 0
Cashflow from financing activities 1 82 0 0
Changes in Net Cash/Debt -16 70 -8 -8
Net debt at start 24 40 -30 -22
Change in Net debt 16 -70 8 8
Net debt at end 40 -30 -22 -13
Balance Sheet 2013FYA 2014FYE 2015FYE 2016FYE
Cash & equivalents 1 30 22 13
Account Receivables 2 2 2 2
Inventories 1 1 1 1
Other current assets 1 2 2 2
Total Current Assets 4 35 27 18
Total Fixed Assets 79 107 131 155
Intangible assets and goodwill 35 34 32 30
Other assets 2 0 0 0
Total assets 120 177 189 204
Accounts Payables 7 7 7 7
Short term debt 2 0 0 0
Other short-term liabilities 6 9 13 17
Total current liabilities 15 16 20 24
Long term debt 39 0 0 0
Other Liabilities 32 39 47 55
Total liabilities 86 55 67 79
Shareholder equity 34 122 123 125
Total liabilities and equity 120 177 189 204
Net debt 40 -30 -22 -13
Per Share 2013FYA 2014FYE 2015FYE 2016FYE
Equiv. FPO (period Avg.) (mn) 13 18 20 20
EPS (CS Adj.) (US$) -0.2 0.0 0.0 0.1
DPS (US$) 0.0 0.0 0.0 0.0
Dividend Payout (%) -0.0 0.0 0.0 0.0
Earnings 2013FYA 2014FYE 2015FYE 2016FYE
Sales Growth (%) 46.6 49.0 25.8 21.4
EBIT Growth (%) -63.6 187.7 55.8 43.6
Net Income Growth (%) -931.5 113.0 253.6 136.4
EPS growth (%) -931.5 109.1 220.5 132.8
EBITDA Margin (%) 7.3 7.7 8.0 8.4
EBIT Margin (%) 0.9 1.6 2.0 2.4
Pretax Profit Margin (%) -2.6 -0.1 0.7 1.3
Net Income Margin (%) -1.6 0.1 0.4 0.8
Valuation 2013FYA 2014FYE 2015FYE 2016FYE
EV/Sales (x) 6.0 3.6 2.9 2.4
EV/EBITDA (x) 82.4 47.3 36.3 29.0
EV/EBIT (x) 706.9 220.9 143.7 101.4
P/E (x) -225.2 2468.5 770.1 330.7
Price to book (x) 12.7 5.0 5.5 5.5
Asset Turnover 1.0 1.0 1.1 1.3
Returns 2013FYA 2014FYE 2015FYE 2016FYE
Return on equity stated (%) -11.3 -10.4 0.7 1.7
ROIC (%) 0.8 1.9 2.7 3.5
Interest burden (X) -3.1 -0.1 0.3 0.5
Tax rate (%) 38.0 0.9 38.0 38.0
Financial leverage 1.2 0.0 0.0 0.0
Gearing 2013FYA 2014FYE 2015FYE 2016FYE
Net debt/equity (%) 119.9 -24.7 -17.8 -10.8
Net Debt to EBITDA (x) 4.8 Net Cash Net Cash Net Cash
Interest coverage ratio (X) 0.2 0.9 1.5 2.1
Source: Company data, Credit Suisse Estimates
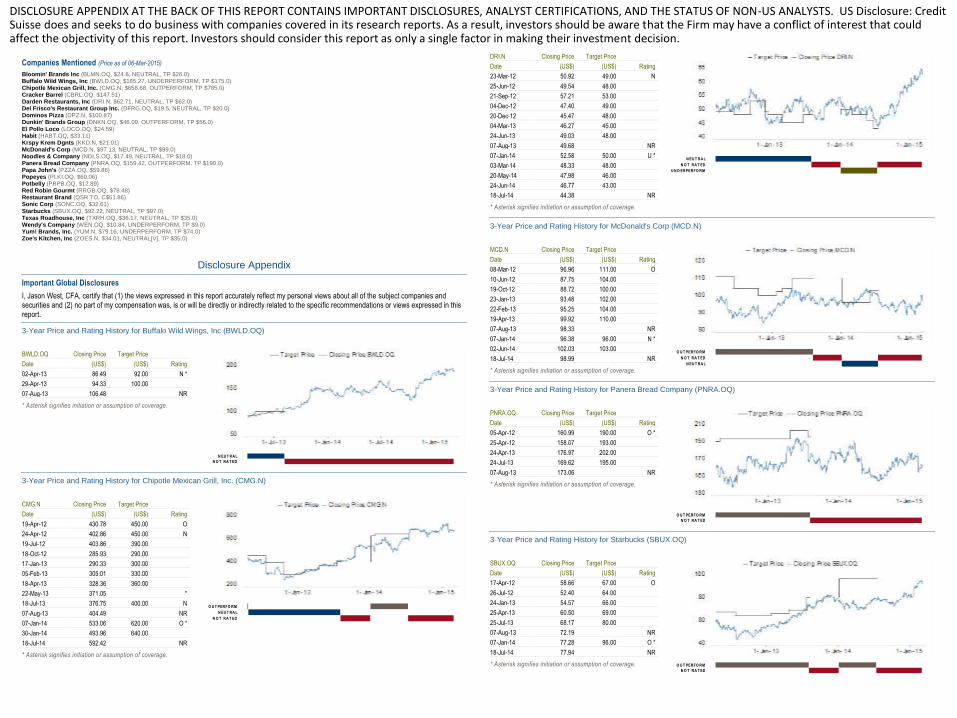
Companies Mentioned (Price as of 06-Mar-2015)
Bloomin' Brands Inc (BLMN.OQ, $24.8, NEUTRAL, TP $26.0) Buffalo Wild Wings, Inc (BWLD.OQ, $185.27, UNDERPERFORM, TP $175.0) Chipotle Mexican Grill, Inc. (CMG.N, $658.68, OUTPERFORM, TP $785.0) Cracker Barrel (CBRL.OQ, $147.51) Darden Restaurants, Inc (DRI.N, $62.71, NEUTRAL, TP $62.0) Del Frisco's Restaurant Group Inc. (DFRG.OQ, $19.5, NEUTRAL, TP $20.0) Dominos Pizza (DPZ.N, $100.87) Dunkin' Brands Group (DNKN.OQ, $46.09, OUTPERFORM, TP $56.0) El Pollo Loco (LOCO.OQ, $24.59) Habit (HABT.OQ, $33.11) Krspy Krem Dgnts (KKD.N, $21.01) McDonald's Corp (MCD.N, $97.13, NEUTRAL, TP $99.0) Noodles & Company (NDLS.OQ, $17.49, NEUTRAL, TP $18.0) Panera Bread Company (PNRA.OQ, $159.42, OUTPERFORM, TP $190.0) Papa John's (PZZA.OQ, $59.86) Popeyes (PLKI.OQ, $60.06) Potbelly (PBPB.OQ, $12.89) Red Robin Gourmt (RRGB.OQ, $78.48) Restaurant Brand (QSR.TO, C$51.86) Sonic Corp (SONC.OQ, $32.61) Starbucks (SBUX.OQ, $92.22, NEUTRAL, TP $97.0) Texas Roadhouse, Inc (TXRH.OQ, $36.17, NEUTRAL, TP $35.0) Wendy's Company (WEN.OQ, $10.84, UNDERPERFORM, TP $9.0) Yum! Brands, Inc. (YUM.N, $79.16, UNDERPERFORM, TP $74.0) Zoe's Kitchen, Inc (ZOES.N, $34.01, NEUTRAL[V], TP $35.0)
Disclosure Appendix
Important Global Disclosures
I, Jason West, CFA, certify that (1) the views expressed in this report accurately reflect my personal views about all of the subject companies and securities and (2) no part of my compensation was, is or will be directly or indirectly related to the specific recommendations or views expressed in this report.
3-Year Price and Rating History for Buffalo Wild Wings, Inc (BWLD.OQ)
BWLD.OQ Closing Price Target Price
Date (US$) (US$) Rating
02-Apr-13 86.49 92.00 N *
29-Apr-13 94.33 100.00
07-Aug-13 106.48 NR
* Asterisk signifies initiation or assumption of coverage.
N EU T RA L
N O T RA T ED
3-Year Price and Rating History for Chipotle Mexican Grill, Inc. (CMG.N)
CMG.N Closing Price Target Price
Date (US$) (US$) Rating
19-Apr-12 430.78 450.00 O
24-Apr-12 402.86 450.00 N
19-Jul-12 403.86 390.00
18-Oct-12 285.93 290.00
17-Jan-13 290.33 300.00
05-Feb-13 305.01 330.00
18-Apr-13 328.36 360.00
22-May-13 371.05 *
18-Jul-13 376.75 400.00 N
07-Aug-13 404.49 NR
07-Jan-14 533.06 620.00 O *
30-Jan-14 493.96 640.00
18-Jul-14 592.42 NR
* Asterisk signifies initiation or assumption of coverage.
O U T PERFO RM
N EU T RA L
N O T RA T ED
3-Year Price and Rating History for Darden Restaurants, Inc (DRI.N)
DRI.N Closing Price Target Price
Date (US$) (US$) Rating
23-Mar-12 50.92 49.00 N
25-Jun-12 49.54 48.00
21-Sep-12 57.21 53.00
04-Dec-12 47.40 49.00
20-Dec-12 45.47 48.00
04-Mar-13 46.27 45.00
24-Jun-13 49.03 48.00
07-Aug-13 49.68 NR
07-Jan-14 52.58 50.00 U *
03-Mar-14 48.33 48.00
20-May-14 47.98 46.00
24-Jun-14 46.77 43.00
18-Jul-14 44.38 NR
* Asterisk signifies initiation or assumption of coverage.
N EU T RA L
N O T RA T ED
U N D ERPERFO RM
3-Year Price and Rating History for McDonald's Corp (MCD.N)
MCD.N Closing Price Target Price
Date (US$) (US$) Rating
08-Mar-12 96.96 111.00 O
10-Jun-12 87.75 104.00
19-Oct-12 88.72 100.00
23-Jan-13 93.48 102.00
22-Feb-13 95.25 104.00
19-Apr-13 99.92 110.00
07-Aug-13 98.33 NR
07-Jan-14 96.38 96.00 N *
02-Jun-14 102.03 103.00
18-Jul-14 98.99 NR
* Asterisk signifies initiation or assumption of coverage.
O U T PERFO RM
N O T RA T ED
N EU T RA L
3-Year Price and Rating History for Panera Bread Company (PNRA.OQ)
PNRA.OQ Closing Price Target Price
Date (US$) (US$) Rating
05-Apr-12 160.99 190.00 O *
25-Apr-12 158.07 193.00
24-Apr-13 176.97 202.00
24-Jul-13 169.62 195.00
07-Aug-13 173.06 NR
* Asterisk signifies initiation or assumption of coverage.
O U T PERFO RM
N O T RA T ED
3-Year Price and Rating History for Starbucks (SBUX.OQ)
SBUX.OQ Closing Price Target Price
Date (US$) (US$) Rating
17-Apr-12 58.66 67.00 O
26-Jul-12 52.40 64.00
24-Jan-13 54.57 66.00
25-Apr-13 60.50 69.00
25-Jul-13 68.17 80.00
07-Aug-13 72.19 NR
07-Jan-14 77.28 96.00 O *
18-Jul-14 77.94 NR
* Asterisk signifies initiation or assumption of coverage.
O U T PERFO RM
N O T RA T ED
DISCLOSURE APPENDIX AT THE BACK OF THIS REPORT CONTAINS IMPORTANT DISCLOSURES, ANALYST CERTIFICATIONS, AND THE STATUS OF NON-US ANALYSTS. US Disclosure: Credit Suisse does and seeks to do business with companies covered in its research reports. As a result, investors should be aware that the Firm may have a conflict of interest that could affect the objectivity of this report. Investors should consider this report as only a single factor in making their investment decision.
3-Year Price and Rating History for Texas Roadhouse, Inc (TXRH.OQ)
TXRH.OQ Closing Price Target Price
Date (US$) (US$) Rating
30-Apr-12 17.25 19.00 N
30-Jul-12 17.95 20.00
29-Apr-13 21.32 22.00
29-Jul-13 24.07 23.00
07-Aug-13 24.70 NR
* Asterisk signifies initiation or assumption of coverage.
N EU T RA L
N O T RA T ED
3-Year Price and Rating History for Wendy's Company (WEN.OQ)
WEN.OQ Closing Price Target Price
Date (US$) (US$) Rating
22-Oct-12 4.17 4.50 N *
16-Jan-13 5.08 5.00
22-Feb-13 5.49 5.00 U
23-Jul-13 7.23 6.50
07-Aug-13 7.80 NR
* Asterisk signifies initiation or assumption of coverage.
N EU T RA L
U N D ERPERFO RM
N O T RA T ED
3-Year Price and Rating History for Yum! Brands, Inc. (YUM.N)
YUM.N Closing Price Target Price
Date (US$) (US$) Rating
19-Apr-12 71.41 80.00 O
10-Oct-12 70.99 82.00
07-Jan-13 67.89 77.00
05-Feb-13 62.08 67.00
12-Mar-13 68.73 70.00
25-Apr-13 67.20 72.00
12-Jul-13 70.64 77.00
07-Aug-13 73.88 NR
07-Jan-14 76.56 79.00 N *
04-Feb-14 72.06 81.00
18-Jul-14 77.42 NR
* Asterisk signifies initiation or assumption of coverage.
O U T PERFO RM
N O T RA T ED
N EU T RA L
The analyst(s) responsible for preparing this research report received Compensation that is based upon various factors including Credit Suisse's total revenues, a portion of which are generated by Credit Suisse's investment banking activities
As of December 10, 2012 Analysts’ stock rating are defined as follows:
Outperform (O) : The stock’s total return is expected to outperform the relevant benchmark*over the next 12 months.
Neutral (N) : The stock’s total return is expected to be in line with the relevant benchmark* over the next 12 months.
Underperform (U) : The stock’s total return is expected to underperform the relevant benchmark* over the next 12 months.
*Relevant benchmark by region: As of 10th December 2012, Japanese ratings are based on a stock’s total return relative to the analyst's coverage universe which consists of all companies covered by the analyst within the relevant sector, with Outperforms representing the most attractiv e, Neutrals the less attractive, and Underperforms the least attractive investment opportunities. As of 2nd October 2012, U.S. and Canadian as well as European ratings are based on a stock’s to tal return relative to the analyst's coverage universe which consists of all companies covered by the analyst within the relevant s ector, with Outperforms representing the most attractive, Neutrals the less attractive, and Underperforms the least attractive investment opportunities. For Latin American and non-Japan Asia stocks, ratings are based on a stock’s total return relative to the average total return of the relevant country or regional benchmark; prior to 2nd October 2012 U.S. and Canadian ratings were based on (1) a stock’s absolute total return potential to its current share price and (2) the relative attractiveness of a stock’s total return potential within an analyst’s coverage universe. For Australian and New Zealand stocks, 12-month rolling yield is incorporated in the absolute total return calculation and a 15% and a 7.5% threshold replace the 10-15% level in the Outperform and Underperform stock rating definitions, respectively. The 15% and 7.5% thresholds replace the +10-15% and -10-15% levels in the Neutral stock rating definition, respectively. Prior to 10th December 2012, Japanese ratings were based on a stock’s total return relative to the average total return of the relevant country or regional benchmark.
Restricted (R) : In certain circumstances, Credit Suisse policy and/or applicable law and regulations preclude certain types of communications, including an investment recommendation, during the course of Credit Suisse's engagement in an investment banking transaction and in certain other circumstances.
Volatility Indicator [V] : A stock is defined as volatile if the stock price has moved up or down by 20% or more in a month in at least 8 of the past 24 months or the analyst expects significant volatility going forward.
Analysts’ sector weightings are distinct from analysts’ stock ratings and are based on the analyst’s expectations for the fundamentals and/or valuation of the sector* relative to the group’s historic fundamentals and/or valuation:
Overweight : The analyst’s expectation for the sector’s fundamentals and/or valuation is favorable over the next 12 months.
Market Weight : The analyst’s expectation for the sector’s fundamentals and/or valuation is neutral over the next 12 months.
Underweight : The analyst’s expectation for the sector’s fundamentals and/or valuation is cautious over the next 12 months.
*An analyst’s coverage sector consists of all companies covered by the analyst within the relevant sector. An analyst may cover multiple sectors.
Credit Suisse's distribution of stock ratings (and banking clients) is:
Global Ratings Distribution
Rating Versus universe (%) Of which banking clients (%)
Outperform/Buy* 44% (53% banking clients)
Neutral/Hold* 38% (49% banking clients)
Underperform/Sell* 15% (43% banking clients)
Restricted 3%
*For purposes of the NYSE and NASD ratings distribution disclosure requirements, our stock ratings of Outperform, Neutral, an d Underperform most closely correspond to Buy, Hold, and Sell, respectively; however, the meanings are not the same, as our stock ratings are determined on a relative basis. (Please refer to definitions above.) An investor's decision to buy or sell a security should be based on investment objectives, current holdings, and other individual factors.
Credit Suisse’s policy is to update research reports as it deems appropriate, based on developments with the subject company, the sector or the market that may have a material impact on the research views or opinions stated herein.
Credit Suisse's policy is only to publish investment research that is impartial, independent, clear, fair and not misleading. For more detail please refer to Credit Suisse's Policies for Managing Conflicts of Interest in connection with Investment Research: http://www.csfb.com/research-and-analytics/disclaimer/managing_conflicts_disclaimer.html
Credit Suisse does not provide any tax advice. Any statement herein regarding any US federal tax is not intended or written to be used, and cannot be used, by any taxpayer for the purposes of avoiding any penalties.
Price Target: (12 months) for Bloomin' Brands Inc (BLMN.OQ)
Method: Our $26.00 TP for BLMN is primarily supported by a 10-year DCF model, which assumes 9.5% WACC, 7.5x terminal EBITDA, and ~5% LT
revenue growth. Our TP also embeds an ~20x P/E ratio, above BLMN’s historical avg. of ~17x, due to higher sector/market multiples, likely
improved earnings growth in 2015 after a difficult 2014, and strong recent SSS momentum.
Risk: Risks to our $26.00 TP for BLMN include any deceleration in consumer spending could cause significant earnings risk for BLMN, particularly given the company’s low margins. BLMN also has a sizable business in Brazil that generates ~9% of revenue (we estimate). This business will likely face significant currency headwinds this year. Further real depreciation would exaccerbate those headwinds and impact our valuation
Price Target: (12 months) for Buffalo Wild Wings, Inc (BWLD.OQ)
Method: Our $175 TP for BWLD assumes 30x our NTM EPS forecast. This assumes BWLD continues to trade at the high end of historical ranges and above casual dining peers, but embeds a slight discount for slowing store growth and for some of the earnings headwinds noted above. Our PT is also supported by a DCF analysis, using a 10.5% WACC, 10x terminal EBITDA multiple and ~12% LT EBIT growth rate.
Risk: Risks to our $175 TP for BWLD incldue include same store sales declining and an increase in wing commodity prices. Both would hurt sales and margin and therefore be negative for BWLD earnings.
Price Target: (12 months) for Chipotle Mexican Grill, Inc. (CMG.N)
Method: Our $785 TP for CMG is primarily derived from our 10-yr. DCF model and assumes low-double-digit unit growth, an 9.5% WACC, and a 12x
terminal EBITDA multiple. While this terminal multiple may seem elevated, we note that CMG currently trades at ~20x ‘15E EBITDA, and
the company is likely to continue to have a healthy growth rate even 10 yrs out, given the penetration opportunity for the core concept as well as contributions from new concepts. Our TP also assumes a NTM P/E multiple of ~45x, which would be a 70% premium to the restaurant
industry, in-line with CMG’s long-term avg. premium.
Risk: Risks to our $785 TP for CMG include that we have assumed SSS continue to grow nicely on top of these gains (+8.2% 2015E). Any flattening out of SSS trends would likely be a negative for the stock. Each 1% change in SSS (traffic) would affect EPS by ~40c. Despite CMG’s strong operations and loyal following, the company has also seen periods of SSS weakness in the past, such as during the 2008-9 recession and in mid-2012. These slowdowns have tended to result in significant multiple compression as investors discount reduced growth well into the future.
Price Target: (12 months) for Del Frisco's Restaurant Group Inc. (DFRG.OQ)
Method: We set our $20 for DFRG to our DCF valuation which incorporates a 11.5% WACC and applies an 7x EV/EBITDA terminal multiple. That is slightly more punitive than for most of our coverage, reflecting the relatively higher risk profile of this business.
Risk: Risks to our $20 TP for DFRG include that our outlook for DFRG is highly dependent on execution of the store build-out program. Any slowdown in this build-out could negatively impact our forecasts. Also, any deterioration in macro fundamentals, especially income and job growth, could have a negative impact on our DFRG forecasts.
Price Target: (12 months) for Dunkin' Brands Group (DNKN.OQ)
Method: Our $56 TP for DNKN is primarily derived from our 10-year DCF model, which embeds a 7% WACC, a 12x terminal EBITDA multiple, and an 11% EBIT CAGR. Our TP implies a P/E valuation of 29x our NTM EPS forecast. This is above the 3-year avg. of ~24x, as we believe DNKN could see an above-average earnings trajectory in coming years as recent margin investments bear fruit.
Risk: Risks to our $56 TP for DNKN include any deterioration in macro fundamentals, especially income and job growth, could have a negative impact on our DNKN forecasts. DNKN is also highly exposed to the north-eastern states which creates downside risk from severe weather systems in the region.
Price Target: (12 months) for Darden Restaurants, Inc (DRI.N)
Method: Our $62 PT for DRI is primarily derived from our 10-year DCF model, which assumes an 8.5% WACC, 8.5x terminal EBITDA multiple, and 8% EBIT CAGR. This implies an ~11x multiple on our NTM EBITDA forecast, above the 3-yr. avg. of 8.5x due to the removal of the Red Lobster business from the portfolio (sold in 2014) and potential upside around strategic initiatives.
Risk: Downside risks to our $62 TP for DRIcome from a material slowing in sales which would be detrimental to earnings. DRI's restaurant brands have a high level of exposure to consumer sentiment and so can be adversely impacted by negative macro trends.
Price Target: (12 months) for McDonald's Corp (MCD.N)
Method: Our MCD target price is based on our $99 DCF valuation for MCD which incorporates a 7.5% WACC and 12x EV/EBITDA terminal value multiple. Those parameters are consistent with the rest of our coverage
Risk: We see the key risk to our $99 TP for MCD call being more significant, near-term strategic changes under the new CEO. These changes could include more aggressive refranchising or cost-cutting, or perhaps a monetization/separation of MCD’s vast real estate holdings (unlikely in our view). Any fundamental improvement in MCD’s sales trends would also be an upside surprise, particularly in the short term. MCD also faces easy SSS compares, esp. in 2H15.
Price Target: (12 months) for Noodles & Company (NDLS.OQ)
Method: Our $18 TP for NDLS is primarily supported by our 10-year DCF model, which embeds a 11% WACC, 12x terminal EBITDA multiple, and 11% EBIT CAGR. Our PT also assumes 11.5x our NTM EBITDA forecast.
Risk: Our $18 TP for NDLS is highly dependent on execution of the store build-out program. Any slowdown in this build-out could negatively impact our forecasts. Also, any deterioration in macro fundamentals, especially income and job growth, could have a negative impact on our NDLS forecasts.
Price Target: (12 months) for Panera Bread Company (PNRA.OQ)
Method: Our $190 TP for PNRA is primarily derived from our 10-year DCF model, which embeds a 8.5% WACC, 9x terminal EBITDA multiple, and an 11% EBIT CAGR. Our PT implies a P/E valuation of 28x our NTM EPS forecast. This is above the 3-year avg. of ~24x as we believe PNRA could see an above-average earnings trajectory in coming years as recent margin investments bear fruit.
Risk: Risks tou our $190 TP for PNRA include any deterioration in macro fundamentals, especially income and job growth, could have a negative impact on our PNRA forecasts. PNRA is also exposed to food costs, especially wheat, which can be volatile. Rising wage rates could also pressure margins.
Price Target: (12 months) for Starbucks (SBUX.OQ)
Method: Our $97 TP for SBUX is primarily derived from our 10-year DCF model, which embeds an 8.5% WACC, 10x terminal EBITDA multiple, and an 11% EBIT CAGR. Our PT implies a P/E valuation of 30x our NTM EPS forecast.
Risk: Risks to our $97 TP for SBUX include any deterioration in macro fundamentals, especially income and job growth, could have a negative impact on our SBUX forecasts. SBUX is also exposed to food costs, especially coffee, which can be volatile. Rising wage rates could also pressure margins.
Price Target: (12 months) for Texas Roadhouse, Inc (TXRH.OQ)
Method: Our $35 TP for TXRH is primarily supported by our 10-year DCF model, which embeds a 9.5% WACC, 8.5x terminal EBITDA multiple, and 12% EBIT CAGR. Our PT also assumes 24x our NTM EPS forecast.
Risk: Risks to our $35 TP for TXRH include any deterioration in macro fundamentals, especially income and job growth, could have a negative impact on our TXRH forecasts. TXRH is also exposed to food costs, especially beef, which has been elevated in recent years. Rising wage rates could also pressure margins.
Price Target: (12 months) for Wendy's Company (WEN.OQ)
Method: Our $9 TP for WEN is primarily derived from our 10-year DCF model for WEN. Key assumptions include a 6.5% WACC, a 13x terminal EBITDA multiple, and an ~4% EBIT CAGR. This TP implies an ~11x EBITDA multiple on our 2015E.
Risk: Risks to our $9 TP for WEN include that it has likely benefited from the recent weakness at competitor MCD. Any improvement at MCD could come at the expense of WEN’s sales. WEN also has significant exposure to both food and labor costs within its company-operated stores.
Price Target: (12 months) for Yum! Brands, Inc. (YUM.N)
Method: Our $74 YUM TP assumes 22x our NTM EPS forecast. This is a premium to YUM’s 3-year avg. (20x) to reflect a rising franchise mix in
YUM’s portfolio, as well as the fact that China AUVs and margins are well below prior peaks following two back-to-back years of
safety issues. Our TP is also supported by a 10-year DCF analysis that embeds a 10.5% WACC, an ~10x terminal EBITDA multiple, and an ~10% EBIT growth CAGR.
Risk: Risks to our $74 TP for YUM include that our outlook assumes a gradual recovery in the China business following the food safety issues that hurt sales last year. Should the company face another such issue, our forecasts would likely prove too high. YUM is also exposed to significant currency risk, given 70-75% of profits come from outside the U.S.
Price Target: (12 months) for Zoe's Kitchen, Inc (ZOES.N)
Method: Our $35 TP for ZOES is primarily supported by our 10-year DCF model, which embeds a 10.5% WACC, 12x terminal EBITDA multiple, and 31% EBIT CAGR. We use an unusually high terminal multiple for ZOES since the company will still be relatively early in its store build-out program 10 years from now.
Risk: Risks to our $35 TP for ZOES include that our outlook for ZOES is highly dependent on execution of the store build-out program. Any slowdown in this build-out could negatively impact our forecasts. Also, any deterioration in macro fundamentals, especially income and job growth, could have a negative impact on our ZOES forecasts.
Please refer to the firm's disclosure website at https://rave.credit-suisse.com/disclosures for the definitions of abbreviations typically used in the target price method and risk sections.
See the Companies Mentioned section for full company names
The subject company (BLMN.OQ, CMG.N, DFRG.OQ, DRI.N, MCD.N, SBUX.OQ) currently is, or was during the 12-month period preceding the date of distribution of this report, a client of Credit Suisse.
Credit Suisse provided investment banking services to the subject company (BLMN.OQ, CMG.N, DFRG.OQ, MCD.N, SBUX.OQ) within the past 12 months.
Credit Suisse has received investment banking related compensation from the subject company (BLMN.OQ, CMG.N, DFRG.OQ, MCD.N, SBUX.OQ) within the past 12 months
Credit Suisse expects to receive or intends to seek investment banking related compensation from the subject company (BLMN.OQ, CMG.N, DFRG.OQ, DNKN.OQ, DRI.N, MCD.N, PNRA.OQ, SBUX.OQ, TXRH.OQ, YUM.N) within the next 3 months.
As of the date of this report, Credit Suisse makes a market in the following subject companies (BLMN.OQ, BWLD.OQ, CMG.N, DFRG.OQ, DNKN.OQ, DRI.N, MCD.N, NDLS.OQ, PNRA.OQ, SBUX.OQ, TXRH.OQ, WEN.OQ, YUM.N, ZOES.N).
Important Regional Disclosures
Singapore recipients should contact Credit Suisse AG, Singapore Branch for any matters arising from this research report.
The analyst(s) involved in the preparation of this report have not visited the material operations of the subject company (BLMN.OQ, BWLD.OQ, CMG.N, DFRG.OQ, DNKN.OQ, DRI.N, MCD.N, NDLS.OQ, PNRA.OQ, SBUX.OQ, TXRH.OQ, WEN.OQ, YUM.N, ZOES.N) within the past 12 months
Restrictions on certain Canadian securities are indicated by the following abbreviations: NVS--Non-Voting shares; RVS--Restricted Voting Shares; SVS--Subordinate Voting Shares.
Individuals receiving this report from a Canadian investment dealer that is not affiliated with Credit Suisse should be advised that this report may not contain regulatory disclosures the non-affiliated Canadian investment dealer would be required to make if this were its own report.
For Credit Suisse Securities (Canada), Inc.'s policies and procedures regarding the dissemination of equity research, please visit http://www.csfb.com/legal_terms/canada_research_policy.shtml.
Credit Suisse has acted as lead manager or syndicate member in a public offering of securities for the subject company (MCD.N) within the past 3 years.
As of the date of this report, Credit Suisse acts as a market maker or liquidity provider in the equities securities that are the subject of this report.
Principal is not guaranteed in the case of equities because equity prices are variable.
Commission is the commission rate or the amount agreed with a customer when setting up an account or at any time after that.
Important Credit Suisse HOLT Disclosures
With respect to the analysis in this report based on the Credit Suisse HOLT methodology, Credit Suisse certifies that (1) the views expressed in this report accurately reflect the Credit Suisse HOLT methodology and (2) no part of the Firm’s compensation was, is, or will be directly related to the specific views disclosed in this report.
The Credit Suisse HOLT methodology does not assign ratings to a security. It is an analytical tool that involves use of a set of proprietary quantitative algorithms and warranted value calculations, collectively called the Credit Suisse HOLT valuation model, that are consistently applied to all the companies included in its database. Third-party data (including consensus earnings estimates) are systematically translated into a number of default algorithms available in the Credit Suisse HOLT valuation model. The source financial statement, pricing, and earnings data provided by outside data vendors are subject to quality control and may also be adjusted to more closely measure the underlying economics of firm performance. The adjustments provide consistency when analyzing a single company across time, or analyzing multiple companies across industries or national borders. The default scenario that is produced by the Credit Suisse HOLT valuation model establishes the baseline valuation for a security, and a user then may adjust the default variables to produce alternative scenarios, any of which could occur.
Additional information about the Credit Suisse HOLT methodology is available on request.
The Credit Suisse HOLT methodology does not assign a price target to a security. The default scenario that is produced by the Credit Suisse HOLT valuation model establishes a warranted price for a security, and as the third-party data are updated, the warranted price may also change. The default variable may also be adjusted to produce alternative warranted prices, any of which could occur.
CFROI®, HOLT, HOLTfolio, ValueSearch, AggreGator, Signal Flag and “Powered by HOLT” are trademarks or service marks or registered trademarks or registered service marks of Credit Suisse or its affiliates in the United States and other countries. HOLT is a corporate performance and valuation advisory service of Credit Suisse.
For Credit Suisse disclosure information on other companies mentioned in this report, please visit the website at https://rave.credit-suisse.com/disclosures or call +1 (877) 291-2683.
References in this report to Credit Suisse include all of the subsidiaries and affiliates of Credit Suisse operating under its investment banking division. For more information on our structure, please use the following link: https://www.credit-suisse.com/who_we_are/en/This report may contain material that is not directed to, or intended for distribution to or use by, any person or entity who is a citizen or resident of or located in any locality, state, country or other jurisdiction where such distribution, publication, availability or use would be contrary to law or regulation or which would subject Credit Suisse AG or its affiliates ("CS") to any registration or licensing requirement within such jurisdiction. All material presented in this report, unless specifically indicated otherwise, is under copyright to CS. None of the material, nor its content, nor any copy of it, may be altered in any way, transmitted to, copied or distributed to any other party, without the prior express written permission of CS. All trademarks, service marks and logos used in this report are trademarks or service marks or registered trademarks or service marks of CS or its affiliates. The information, tools and material presented in this report are provided to you for information purposes only and are not to be used or considered as an offer or the solicitation of an offer to sell or to buy or subscribe for securities or other financial instruments. CS may not have taken any steps to ensure that the securities referred to in this report are suitable for any particular investor. CS will not treat recipients of this report as its customers by virtue of their receiving this report. The investments and services contained or referred to in this report may not be suitable for you and it is recommended that you consult an independent investment advisor if you are in doubt about such investments or investment services. Nothing in this report constitutes investment, legal, accounting or tax advice, or a representation that any investment or strategy is suitable or appropriate to your individual circumstances, or otherwise constitutes a personal recommendation to you. CS does not advise on the tax consequences of investments and you are advised to contact an independent tax adviser. Please note in particular that the bases and levels of taxation may change. Information and opinions presented in this report have been obtained or derived from sources believed by CS to be reliable, but CS makes no representation as to their accuracy or completeness. CS accepts no liability for loss arising from the use of the material presented in this report, except that this exclusion of liability does not apply to the extent that such liability arises under specific statutes or regulations applicable to CS. This report is not to be relied upon in substitution for the exercise of independent judgment. CS may have issued, and may in the future issue, other communications that are inconsistent with, and reach different conclusions from, the information presented in this report. Those communications reflect the different assumptions, views and analytical methods of the analysts who prepared them and CS is under no obligation to ensure that such other communications are brought to the attention of any recipient of this report. Some investments referred to in this report will be offered solely by a single entity and in the case of some investments solely by CS, or an associate of CS or CS may be the only market maker in such investments. Past performance should not be taken as an indication or guarantee of future performance, and no representation or warranty, express or implied, is made regarding future performance. Information, opinions and estimates contained in this report reflect a judgment at its original date of publication by CS and are subject to change without notice. The price, value of and income from any of the securities or financial instruments mentioned in this report can fall as well as rise. The value of securities and financial instruments is subject to exchange rate fluctuation that may have a positive or adverse effect on the price or income of such securities or financial instruments. Investors in securities such as ADR's, the values of which are influenced by currency volatility, effectively assume this risk. Structured securities are complex instruments, typically involve a high degree of risk and are intended for sale only to sophisticated investors who are capable of understanding and assuming the risks involved. The market value of any structured security may be affected by changes in economic, financial and political factors (including, but not limited to, spot and forward interest and exchange rates), time to maturity, market conditions and volatility, and the credit quality of any issuer or reference issuer. Any investor interested in purchasing a structured product should conduct their own investigation and analysis of the product and consult with their own professional advisers as to the risks involved in making such a purchase. Some investments discussed in this report may have a high level of volatility. High volatility investments may experience sudden and large falls in their value causing losses when that investment is realised. Those losses may equal your original investment. Indeed, in the case of some investments the potential losses may exceed the amount of initial investment and, in such circumstances, you may be required to pay more money to support those losses. Income yields from investments may fluctuate and, in consequence, initial capital paid to make the investment may be used as part of that income yield. Some investments may not be readily realisable and it may be difficult to sell or realise those investments, similarly it may prove difficult for you to obtain reliable information about the value, or risks, to which such an investment is exposed. This report may provide the addresses of, or contain hyperlinks to, websites. Except to the extent to which the report refers to website material of CS, CS has not reviewed any such site and takes no responsibility for the content contained therein. Such address or hyperlink (including addresses or hyperlinks to CS's own website material) is provided solely for your convenience and information and the content of any such website does not in any way form part of this document. Accessing such website or following such link through this report or CS's website shall be at your own risk. This report is issued and distributed in Europe (except Switzerland) by Credit Suisse Securities (Europe) Limited, One Cabot Square, London E14 4QJ, England, which is authorised by the Prudential Regulation Authority and regulated by the Financial Conduct Authority and the Prudential Regulation Authority. This report is being distributed in Germany by Credit Suisse Securities (Europe) Limited Niederlassung Frankfurt am Main regulated by the Bundesanstalt fuer Finanzdienstleistungsaufsicht ("BaFin"). This report is being distributed in the United States and Canada by Credit Suisse Securities (USA) LLC; in Switzerland by Credit Suisse AG; in Brazil by Banco de Investimentos Credit Suisse (Brasil) S.A or its affiliates; in Mexico by Banco Credit Suisse (México), S.A. (transactions related to the securities mentioned in this report will only be effected in compliance with applicable regulation); in Japan by Credit Suisse Securities (Japan) Limited, Financial Instruments Firm, Director-General of Kanto Local Finance Bureau (Kinsho) No. 66, a member of Japan Securities Dealers Association, The Financial Futures Association of Japan, Japan Investment Advisers Association, Type II Financial Instruments Firms Association; elsewhere in Asia/ Pacific by whichever of the following is the appropriately authorised entity in the relevant jurisdiction: Credit Suisse (Hong Kong) Limited, Credit Suisse Equities (Australia) Limited, Credit Suisse Securities (Thailand) Limited, regulated by the Office of the Securities and Exchange Commission, Thailand, having registered address at 990 Abdulrahim Place, 27th Floor, Unit 2701, Rama IV Road, Silom, Bangrak, Bangkok 10500, Thailand, Tel. +66 2614 6000, Credit Suisse Securities (Malaysia) Sdn Bhd, Credit Suisse AG, Singapore Branch, Credit Suisse Securities (India) Private Limited (CIN no. U67120MH1996PTC104392) regulated by the Securities and Exchange Board of India (registration Nos. INB230970637; INF230970637; INB010970631; INF010970631), having registered address at 9th Floor, Ceejay House, Dr.A.B. Road, Worli, Mumbai - 18, India, T- +91-22 6777 3777, Credit Suisse Securities (Europe) Limited, Seoul Branch, Credit Suisse AG, Taipei Securities Branch, PT Credit Suisse Securities Indonesia, Credit Suisse Securities (Philippines ) Inc., and elsewhere in the world by the relevant authorised affiliate of the above. Research on Taiwanese securities produced by Credit Suisse AG, Taipei Securities Branch has been prepared by a registered Senior Business Person. Research provided to residents of Malaysia is authorised by the Head of Research for Credit Suisse Securities (Malaysia) Sdn Bhd, to whom they should direct any queries on +603 2723 2020. This report has been prepared and issued for distribution in Singapore to institutional investors, accredited investors and expert investors (each as defined under the Financial Advisers Regulations) only, and is also distributed by Credit Suisse AG, Singapore branch to overseas investors (as defined under the Financial Advisers Regulations). By virtue of your status as an institutional investor, accredited investor, expert investor or overseas investor, Credit Suisse AG, Singapore branch is exempted from complying with certain compliance requirements under the Financial Advisers Act, Chapter 110 of Singapore (the "FAA"), the Financial Advisers Regulations and the relevant Notices and Guidelines issued thereunder, in respect of any financial advisory service which Credit Suisse AG, Singapore branch may provide to you. This information is being distributed by Credit Suisse AG, Dubai Branch, duly licensed and regulated by the Dubai Financial Services Authority (DFSA), and is directed at Professional Clients or Market Counterparties only, as defined by the DFSA. The financial products or financial services to which the information relates will only be made available to a client who meets the regulatory criteria to be a Professional Client or Market Counterparty only, as defined by the DFSA, and is not intended for any other person. This research may not conform to Canadian disclosure requirements. In jurisdictions where CS is not already registered or licensed to trade in securities, transactions will only be effected in accordance with applicable securities legislation, which will vary from jurisdiction to jurisdiction and may require that the trade be made in accordance with applicable exemptions from registration or licensing requirements. Non-U.S. customers wishing to effect a transaction should contact a CS entity in their local jurisdiction unless governing law permits otherwise. U.S. customers wishing to effect a transaction should do so only by contacting a representative at Credit Suisse Securities (USA) LLC in the U.S. Please note that this research was originally prepared and issued by CS for distribution to their market professional and institutional investor customers. Recipients who are not market professional or institutional investor customers of CS should seek the advice of their independent financial advisor prior to taking any investment decision based on this report or for any necessary explanation of its contents. This research may relate to investments or services of a person outside of the UK or to other matters which are not authorised by the Prudential Regulation Authority and regulated by the Financial Conduct Authority and the Prudential Regulation Authority or in respect of which the protections of the Prudential Regulation Authority and Financial Conduct Authority for private customers and/or the UK compensation scheme may not be available, and further details as to where this may be the case are available upon request in respect of this report. CS may provide various services to US municipal entities or obligated persons ("municipalities"), including suggesting individual transactions or trades and entering into such transactions. Any services CS provides to municipalities are not viewed as "advice" within the meaning of Section 975 of the Dodd-Frank Wall Street Reform and Consumer Protection Act. CS is providing any such services and related information solely on an arm's length basis and not as an advisor or fiduciary to the municipality. In connection with the provision of the any such services, there is no agreement, direct or indirect, between any municipality (including the officials, management, employees or agents thereof) and CS for CS to provide advice to the municipality. Municipalities should consult with their financial, accounting and legal advisors regarding any such services provided by CS. In addition, CS is not acting for direct or indirect compensation to solicit the municipality on behalf of an unaffiliated broker, dealer, municipal securities dealer, municipal advisor, or investment adviser for the purpose of obtaining or retaining an engagement by the municipality for or in connection with Municipal Financial Products, the issuance of municipal securities, or of an investment adviser to provide investment advisory services to or on behalf of the municipality. If this report is being distributed by a financial institution other than Credit Suisse AG, or its affiliates, that financial institution is solely responsible for distribution. Clients of that institution should contact that institution to effect a transaction in the securities mentioned in this report or require further information. This report does not constitute investment advice by Credit Suisse to the clients of the distributing financial institution, and neither Credit Suisse AG, its affiliates, and their respective officers, directors and employees accept any liability whatsoever for any direct or consequential loss arising from their use of this report or its content. Principal is not guaranteed. Commission is the commission rate or the amount agreed with a customer when setting up an account or at any time after that.
Copyright © 2015 CREDIT SUISSE AG and/or its affiliates. All rights reserved.
Investment principal on bonds can be eroded depending on sale price or market price. In addition, there are bonds on which investment principal can be eroded due to changes in redemption amounts. Care is required when investing in such instruments. When you purchase non-listed Japanese fixed income securities (Japanese government bonds, Japanese municipal bonds, Japanese government guaranteed bonds, Japanese corporate bonds) from CS as a seller, you will be requested to pay the purchase price only