response of bulb yield and yield components of onion (allium cepa l) for deficit irrigation in...
TRANSCRIPT

Mekelle University
College of Dry land Agriculture and Natural Resources
Department of Dry land Crop and Horticultural
Science
Response of bulb yield and yield components of onion (Allium cepa
L) for deficit irrigation in Antsokia Gemza Woreda, Eastern
Amhara
By
Teshome Nega Shumye
A thesis
Submitted in Partial Fulfillment of the Requirements for the
Master of Science Degree

in
Dry Land Agronomy
Advisor: Solomon Habtu
(PhD)
January, 2011
ii

ABSTRACT
In arid and semiarid areas where agricultural development is severely constrained by
water scarcity and its mismanagement, the need to use the available water efficiently
is unquestionable. The purpose of this study was to investigate the response of onion
for deficit irrigation. The field experiment was conducted at Antsokia Gemza woreda,
eastern Amhara. The treatments consisted of four irrigation levels (25%, 50%, 75% and
100%ETc) that each were applied at four developmental (establishment, vegetative
development, bulbification and ripening) stages and throughout the developmental
stages. It was laid out in RCB design with three replications. Variation in amount of
applied irrigation water either at specific or throughout the crop developmental
stage/s/ had very high significant (P< 0.001) effect on yield and yield components of
onion. Plant height, leaf number, fresh biomass, total bulb yield, unmarketable bulb
yield, average bulb weight, bulb diameter, number of bigger and medium bulbs and
percentage of bolting were increased linearly with increasing irrigation amount. The
highest total bulb yield (26t ha-1) was obtained from treatment 100%IIII and the
highest marketable yield (23.5t ha -1) was obtained from treatment 75%III0. Treatment
75%0III, 75%III0 and 50%III0 gave none significantly different total and marketable
yields from 100%IIII. The severe yield reduction was obtained in treatment 25%IIII
(3.8t ha-1) and 25%II0I (6.9t ha-1). Bulbification stage was the most sensitive stage for
water deficit. On the other hand, water deficit during establishment or ripening stage
iii

had a limited effect on yield. Water productivity of onion was increased from 2.16% in
treatment 75%0III to 6.47% in treatment 75%IIII compared to 100IIII. Hence,
application of deficit irrigation either at establishment or ripening stage is good
option to save water without significant bulb yield reduction. Application of 75%IIII
can be a good option in water scarce areas to increase the irrigated area as a result of
its high crop water productivity.
Key words: onion, developmental stages, deficit irrigation, crop water productivity
iv

Acknowledgement
I would like to express my sincere and profound gratitude to my
advisor Dr. Solomon Habtu for his invaluable guidance,
encouragement, unreserved support and constructive comments
throughout the thesis work.
I would like to extend my sincere gratitude to Antsokia Gemza
Woreda Agricultural and Rural Development Office giving me the
chance to upgrade my education level. I am also grateful for
Rural Capacity Building Project for covering all the financial
expenses of the research and without which, the completion of
this research work would have been impossible. I also extend my
gratitude for Ethiopian National Meteorology Agency, Kombolcha
sub branch for providing Class ‘A’ pan and weather data of the
research area.
I wish to extend my special thanks to Dr. Fetein A., Mr. Dejenie
K. and, Mr Samuel T, Lecturers in Mekelle University for their
assistance and critical comments in the manuscript.
v

I would like to express my special thanks to my colleague
Teshome Mulugeta for his unexpressive support by giving his PC
for writing this thesis. The generous support and encouragement
of Mr. Getnet A., Ms. Aynalem K., Mr. Birhan B. and Arega Z, and
all my colleagues, friends, families and relatives are deeply
acknowledged and emphasized in all cases of my future life.
Finally, I would like to extend my sincere thanks to my beloved
wife Genet Mengist who had great participation and overall care
and support during my study.
Dedication
vi

To my candle of hope and light when
blindness and darkness
overwhelmed the atmosphere around me,
to my fallen angel, to my mother Asnakech
Abera.
vii

Acronyms
OM Organic Matter
OC Organic Carbon
pH Potential of Hydrogen
FC Field capacity
Av.P Available Phosphorus
CEC Cathion Exchange Capacity
EC Electrical conductivity
CSA Central Statistic Authority
ANOVA Analysis of Variance
CV Coefficient of Variation
TAW Total available water
RAW Readily available water
WVE World Vision Ethiopia
FAO Food and Agriculture Organization of the
United Nations
WUA Water users association
CWP Crop water productivity
GDP Gross domestic product
ETo Evapotranspiration from a reference crop
ETc Evapotranspiration from the crop
Kc Crop coefficient
Estabt Establishment stage
viii

Veg. devt Vegetative development stage
Bulfn Bulbification stage
Ripen Ripening stage
Av. Average
Wt Weight
t ha-1 Tons per hectare
AGWARDO Antsokia Gemza Woreda Agricultural and Rural Development Office
ix

Table of Contents
DECLARATION. ......................................................II
ABSTRACT.........................................................III
ACKNOWLEDGEMENT................................................IV
DEDICATION......................................................V
ACRONYMS.......................................................VI
LIST OF TABLES.................................................IX
LIST OF FIGURES.................................................X
CHAPTER ONE: INTRODUCTION......................................1
1.1. BACKGROUND AND RATIONALE.....................................1
1.2. STATEMENT OF THE PROBLEM.....................................4
1.3. OBJECTIVES OF THE STUDY......................................6
1.4. HYPOTHESIS.................................................6
CHAPTER TWO: LITERATURE REVIEW.................................7
2.1. ONION PRODUCTION OVERVIEW....................................7
2.1.1. Agronomic characteristics of onion..............................7
2.1.2. Economic significance of onion production........................8
2.1.3. Onion production in Ethiopia..................................9
2.1.4. Optimum growth environments of onion.........................10
2.2. IRRIGATION DEVELOPMENT AND MANAGEMENT.........................11
2.2.1. Irrigation development......................................11
2.2.2. Irrigation scheduling: the tool for water management...............13
2.2.3. Farmers experience on irrigation scheduling and water management in the
study area...............................................16
x

2.2.4. Concepts of deficit irrigation..................................18
2.2.4.1. Influence of deficit irrigation on yield and yield components.......20
2.2.4.2. Influence of deficit irrigation on crop water productivity..........23
CHAPTER THREE: MATERIALS AND METHODS.........................26
3.1. DESCRIPTION OF THE STUDY AREA...............................26
3.1.1. Location................................................26
3.1.2. Climate.................................................27
3.1.3. Soil ....................................................27
3.1.4. Farming system ...........................................28
3.2. TREATMENTS, DESIGN AND AGRONOMIC PRACTICES OF THE EXPERIMENT.....30
3.3. DATA COLLECTION AND ANALYSIS................................32
3.3.1. Analysis of soil chemical and physical properties..................32
3.3.2. Reference evapotranspiration, crop water requirement and applied
irrigation depth................................................34
3.3.3. Crop parameters..........................................40
3.3.4. Statistical analysis.........................................41
CHAPTER FOUR: RESULTS AND DISCUSSION.........................42
4.1. PLANT HEIGHT..............................................42
4.2. LEAF NUMBER...............................................43
4.3. FRESH BIOMASS YIELD........................................44
4.4. TOTAL BULB YIELD..........................................46
4.5. MARKETABLE AND UNMARKETABLE BULB YIELDS.......................49
4.6. AVERAGE BULB WEIGHT........................................51
4.7. BULB DIAMETER.............................................53
4.8. WEIGHT AND NUMBER OF BULBS FOR BULB SIZE CLASSES..............54
4.9. BOLTING.................................................58
4.10. HARVEST INDEX............................................59
xi

4.11. CROP WATER PRODUCTIVITY....................................60
CHAPTER FIVE: CONCLUSION AND RECOMMENDATIONS..................64
5.1 CONCLUSION.................................................64
5.2 RECOMMENDATIONS.............................................66
REFERENCES.....................................................68
APPENDICES.....................................................78
APPENDIX A: METEOROLOGICAL DATA..................................78
APPENDIX B: IRRIGATION RELATED DATA...............................84
APPENDIX C: MEAN SQUARE TABLES FOR ANALYZED PARAMETERS...............87
BIOGRAPHICAL SKETCH............................................89
List of Tables
xii

2.1. Irrigation frequencies in some assessed kebeles.............18
3.1. Average yields and area coverage for the major irrigated crops.
..............................................................29
3.2. Types of irrigation scheme and their respective irrigated area
in 2008 & 09..................................................29
3.3. Treatment combinations for irrigation amount and crop
development stages............................................30
3.4. Properties of soil analyzed and methods used................33
3.5. Some soil chemical properties of the experimental site......33
3.6. Some soil physical properties of the experimental site......33
3.7. Reference evapotranspiration and crop water requirement of
onion per decade..............................................36
3.8. Break down of total applied irrigation water to developmental
stages of onion...............................................40
4.1. Amount of water, developmental stages and their interaction
effects on fresh biomass, total bulb yield, marketable and
unmarketable bulb yield of onion..............................50
4.2. Amount of water, developmental stages and their interaction
effects on
mean bulb weight of onion....................................52
xiii

4.3. Amount of water,crop developmental stages and their interaction
effects on mean diameter of onion bulbs.......................54
4.4. Weight of each bulb size classes and their corresponding
numbers as affected by irrigation amount, developmental stage of
the crop and their interaction................................57
4.5. The actual yield loss, calculated yield that can be obtained
from the saved water and net yield gain or loss compared to full
irrigation....................................................61
4.6. Water productivity of onion interms of total bulb yield and
marketable bulb yield.........................................63
List of Figures
xiv

2.1. Accumulated water over the surface of farmers field due to
over irrigation of onion......................................17
3.1. Location of the experimental site........................26
3.2. Mean monthly rainfall, maximum and minimum temperature and
relative humidity of the study area...........................27
3.3. Experimental field with onion plants at the end of
establishment stage of onion...................................32
3.4. Onion developmental stages, its duration days and the
corresponding Kc value........................................35
3.5. Refernce evapotranspiration of the experimental area by
using pan evaporation method and Penman-Montheith model.......37
4.1. Plant height measurement taken at the end of each
developmental stages..........................................43
4.2. Relation ship between applied water and fresh biomass....45
4.3. Weight of bigger and small size bulb classes per treatment
..............................................................56
4.4. Bulb size classes classified as small, medium, and bigger
size..........................................................56
4.5. Percentage of bolted onion plants per treatment..........59
4.6. Yield loss due to water deficit and yield gain from the
saved water...................................................62
xv

Chapter 1. Introduction
1.1. Background and Rationale
While on global scale water resources are still ample, water
scarcity and fragility, unequal distribution in space and time
and its mismanagement are an increasingly important issue in
many parts of the world (Farre and Faci, 2006). These problems
are mainly due to population pressure and fast urbanization as
xvi

well as industrial and agricultural development. Since the last
decades, the competition among water sectors is going to
increase also with the on-going climatic change and variability,
and land degradation and desertification processes. Despite,
Ethiopia is blessed with ample water resources in central,
western and south western parts; most of north eastern and
eastern parts of the country are relatively dry. In those parts
of the country, the distribution and availability of water is
erratic both in space and time. Furthermore, Ethiopia will
become a physically water scarce country by the year 2020
(Sileshi et al., 2005).
At the same time, the success of sustained agricultural
production largely depends on water availability. It is clear
that, irrigation water has increased food security and improved
living standards in many parts of the world; it has been
instrumental in feeding the populations of developing countries
in the last 50 years. However, water resources are not
distributed evenly around the globe; arid and semi arid regions
will continue to have conflicts over water supplies (FAO, 2002).
In addition to the decreasing supply of water, larger
xvii

populations in developing countries are expected to increase
total demand for food in the coming century. Those in developing
countries are eating more meat products, which require cereal
crops as food for livestock. Estimates by International Food
Policy Research Institute (IFPRI) showed that to meet demand for
consumption and livestock feed in 2020 world production will
have to increase 40% over 1995 levels (Zilberman and Schoengold,
(nd)). The great challenge for the coming decades will therefore
be the task of increasing food production with less water
particularly in areas with limited water, land resources and
inefficient water use (FAO, 2002).
The Ethiopian agriculture plays a dominant role in the overall
economic performance of the country, not only in terms of its
contribution to GDP, but also as a major source of foreign
exchange earnings, and in providing employment to a large
segment of the population. However, it is heavily dependent on
rainfall which is highly variable, both spatially and
temporally. It is hampered by recurrent droughts. The
variability of rainfall distribution, frequent dry spells and
droughts exacerbate the incidence of crop failure and hence food
xviii

insecurity and poverty. The erratic weather pattern is the major
factor for the variability and unpredictability of food
production in Ethiopia. There seems to be clear evidence that,
there has been below average rainfall in Ethiopia since mid
1970s (Warren and Khogali, 1992). According to Von Braun (1991)
a 10% decline in rainfall below the Ethiopian national long-term
average reduces national food production by 4.4%. Therefore,
better management of existing water systems along with the use
of more efficient irrigation technologies will be essential in
upcoming decades.
The current agricultural policy of Ethiopia is within a strategy
towards a more market-oriented agriculture at national and/or
international level. Horticultural crops play an important role
in this strategy as well contributing to the household food
security. The vegetable being cash crop with nutritional value
generate income for the poor households. Further, it provides
employment opportunities as their management being labor
intensive. However, higher profits can be achieved by increasing
the production of a particular vegetable throughout the year
when efficient irrigation system is used. Ethiopia has enormous
xix

potential to cultivate vegetables like onion on small scale as
well as commercial scale. Onion (Allium cepa L.) is the most
important cultivated crops in the country. It is an integral
part of Ethiopian dish. It plays a key role in the economies of
many households. Due to its high economic value, it is rapidly
becoming popular and the major vegetable produced in the farming
community of Ethiopia as a cash crop. It is popular among
producers because of the advantage of high yield potential,
availability of desired cultivars for various uses, ease of
propagation by seed, high domestic (bulb and seed) and export
(bulb and cut flower) markets in fresh and processed forms
(Lemma and Shimelis, 2003). The Ethiopian Central Statistics
Agency (CSA) report of the production year 2007/08 of meher
season indicated that the status of root crops produced and the
area under root crops production in the country was about 1.53
million tones and 184329 hectares respectively. Out of this
production, onion takes the share of 175106.1 tones and 18013
hectares (CSA, 2009). In Antsokia Gemza woreda, which is the
study area, onion is the major vegetable crop followed by
tomato. The area covered by onion in the years 2006, 2007, 2008
and 2009 were 675 (22.21%), 796.4 (24.87%), 1086.9 (30.55%), and
xx

1251.9 (32.5%) ha, respectively. Both onion and tomato are
exclusively produced under furrow irrigation. In the last few
years, the demand for onion production has shown a significant
increase in the woreda. However, the limited irrigation water
availability along with unwise use of the available resource
limits the area allotted for onion production.
To utilize the advantages of irrigation development, Ethiopia is
increasingly investing in this sector. In the past 20 years
various efforts have been made by the current government to
expand irrigation in the country. The country’s Agricultural
Development Led Industrialization (ADLI) Strategy considers
irrigation development as a key input for increasing
agricultural production. Despite the efforts of the government
to expand irrigation, the country has still not achieved
sufficient irrigated agriculture to overcome the problem of
endemic food insecurity and poverty. The total area under
irrigation in 2006 was reported to be 603,359 hectares (less
than 5% of its total irrigation potential) which is very small
per capita irrigated area (of about 30 m2) compared to 450 m2
globally (Sileshi et al. 2005). The same author indicated that
xxi

the per capita irrigated area only reaches 45 m2 per head by the
year 2015. This figure does not move the sector significantly.
Therefore, given extreme meteorological and hydrological
variability in the country, it is important that significant
attention to be given to enhance management of the water
resources and water productivity for better agricultural
production.
In the context of improving water use efficiency, there is a
growing interest in deficit irrigation, an irrigation practice
whereby water supply is reduced below maximum levels (FAO,
2002). The crop is exposed to a certain level of water stress
either during a particular period or through the whole growing
season (Kirda, 2000). The expectation is that any yield
reduction will be insignificant compared with the benefits
gained through diverting the saved water to irrigate other crops
(Eck et al., 1987). It can maximize water productivity for higher
yields per unit of irrigation water applied (Kirda, 2000).
However, this approach requires precise knowledge of crop
response to water as drought tolerance varies considerably by
species, cultivar and stage of growth.
xxii

1.2. Statement of the problem
Though the study area is endowed with high potential for
production of onion, irrigation water application efficiency is
still undermined. The concept of ‘more crop per drop’ seemed to
be forsaken. Just like the observation made by Mintesinot (2002)
in Tigray, farmers around the study area do not use proper
irrigation scheduling. Ofcourse, farmers in the woreda have
established irrigation frequencies for their crop when
irrigation water is in surplus and in scarce. However, the
frequencies are adjusted regardless of the crop developmental
stages; depending only on the availability of irrigation water.
Though, the water stress during certain growth stages may have
more effect on bulb yield than similar stress at other growth
stages. When water deficit occurs during a specific crop
development period, the yield response can vary depending on the
sensitivity of the crop development stage (Mountannet, 2000).
Moreover, the amount of irrigation water application is
unquantified. It depends on the farmers’ judgment. Once the
xxiii

irrigation is on they stop irrigation when the field is too wet,
an approach that runs counter to conservation of limited
resources. Farmers especially at the upper stream apply as much
water and stop irrigating when they believe the field is well
watered. It is said that the field is well watered when there is
accumulated water over the surface (Fig.2.1). On the other hand,
when water is scares, the limited supply of water along with
large demand of farmers to produce more crops on new irrigable
land even becomes source of dispute. In this case, farmers
usually limit the area allotted for onion production due to the
decreased supply of irrigation water. In addition, the increase
in population in the area is expected to increase total demand
for crop production under irrigation in the coming years.
Increasing crop production and productivity with limited water
and low water use efficiency will be a great challenge.
Improving the available water productivity is therefore the most
important issue needing to be actively addressed for now
(Mintesinot et al, 2004).
Use of deficit irrigation is one of water management approaches
which can save water and at the same time maintain crop yield
xxiv

(Kirda, 2000). Such technique can help these farmers to increase
crop (onion) production per unit of irrigation water. It can
lead to considerable water savings and to a more rational
planning of water distribution (FAO, 2002). The saved water can
bring new areas under irrigation. The increase in additional
irrigated land insures food security due to the increase in
sustainable food production. At the same time, the wise use of
this finite, vulnerable resource will enable us to respond
effectively to new emerging challenges such as climate change
and assure that future generations have enough water. However,
there is a gap of knowledge on how much water at what stage to
irrigate and which stage is more sensitive for water stress.
Enough research was not conducted on this aspect in the area.
This research was then initiated to study the response of bulb
yield of onion to deficit irrigation scheduling, and the
susceptible stage of the crop for the water deficit. The
experiment would have its own share in investigating the
productivity of water in relation to deficit irrigation with
particular emphasis to onion.
xxv

xxvi

1.3. Objectives of the study
General objective
The general objective of the research was to investigate
the response of onion to different amounts of irrigation
water application under furrow irrigation in Antsokia Gemza
Woreda.
Specific objectives
The specific objectives of the research were:
to identify the susceptible developmental stages of onion
for water stress,
to estimate the crop water productivity of onion under
deficit irrigation practice and
to examine the interaction between irrigation amount and
growth stages of onion.
1.4. Hypothesis
xxvii

Use of deficit irrigation scheduling for onion can increase
the productivity of water without substantial yield
reduction.
xxviii

Chapter 2. Literature Review
2.1.Onion production overview
2.1.1. Agronomic characteristics of onion
Onion (Allium cepa L.) (2n=16) is a biennial herb belongs to the
order Amaryllidales, family Alliacae, subfamily Allilideae and the tribe
Allieae (Currah and Proctor, 1990). The cultivated species of
Allium are native to central and south western Asia, including
Iran, Afghanistan and southwest China (Muhammad, 2004). It is
believed to be one of the first vegetables domesticated by
humans for food and medicine that its seeds have been found in
Egyptian tombs dated to 3200 BC (Rademaker, 2009).
Onion is naturally packaged vegetable consisting of fleshy,
concentric scales that are enclosed in paper like wrapping
leaves, connected at the base by flatted stem disc. The green
leaves above the bulbs are hallowed and rise at the base of the
bulb (Currah and Proctor, 1990). The pseudo-stem which is below
xxix

soil level is flattened to form a disc at the base of the plant.
At the top centre of the stem disc is the shoot apex, from which
leaves are initiated oppositely and alternately so that the
leaves emerge in to ranks at 180 degrees to each other. The
onion root system is fibrous; spreading just beneath the soil
surface with few laterals and total root growth is spare and not
especially aggressive (AVRDC, 2001). It can be propagated by
seeds and bulbs. However, the former is the most widely used by
farmers.
There are more than 750 species within the genus Allium
(Rabinowitch and Currah, 2002). It includes various economically
important cultivated species including the bulb onion (A. cepa),
chive (A. schoenoprasum), garlic (A. sativum), and leek (A. orrum).
They differ in skin color (white, brown, yellow, red, or
purple), size (2.5-15.2cm in diameter), shape (glob-shaped,
flattened or spindle-shaped), pungency and sweetness (Currah and
Proctor, 1990). The most common way of classifying onion
cultivars is by their day length sensitivity as short day (12 to
13 hours threshold), intermediate day (13.5 to 14.5 hours
threshold) and long day (over 14.5 hours threshold) onions
xxx

(Boyhan et al., 2001). However, the bulb onion (A. cepa) is the
most economically valuable species (David et al, 2006). Its
production cycle is quit complex involving vegetative growth,
bulb formation, bulb dormancy and sprouting, flowering and seed
production. Rates of development and growth within each phase
are strongly influenced by environmental conditions and cultural
practices (Brewster, 2008).
2.1.2. Economic significance of onion production
Onion (Allium cepa L.) is an important bulbous crop widely
cultivated throughout the world for its edible bulb and leaves
and plays a key role in the economies of many developing
countries (Boyan et al., 2001). As a staple, onions, including
shallots, garlic and leek, contribute to the food security of
millions of people in most of the developing world (Boyhan, et al.,
2001), and when traded in local markets, they provide income and
employment to rural populations. As an export commodity, onions
are key contributors to the economies of many low-income
countries like Ethiopia. In Ethiopia onion is widely produced
by small scale farmers and commercial growers for local use and
xxxi

export market. Per capita consumption for shallot and onion
together is said to be 1.7 kg in rural areas and 5 kg in towns
as both crops are found mixed in production, marketing and
consumption in Ethiopia (Currah and Proctor, 1990). In the last
few years, the demand for onion has increased due to its high
dry bulb, seed and flower production potential. Dry bulb and
cut flower production for local and export market have shown a
significant increase (Lemma and Shimelis, 2003). According to
World Bank (2004) report in the year 2001 the crop shared one
fourth of the vegetable export quantities and stood third
following green beans and peas contributing about 20% of the
total vegetable export value which was about 244,000 US dollar
of export earnings. In addition to dry bulb, onion cut flower
also constitutes significant proportion of foreign export values
(World Bank, 2004). In between the years 1999-2001 alone, about
1.75 million birr worth cut flower stems were exported. This
indicates that Ethiopia has high potential to benefit from onion
production. In recent years the demand for onion increased for
its high bulb yield, seed and flower production potential. The
establishment of state owned enterprises contributed
xxxii

substantially to the increase in the production and expansion of
area under onion in the country (Lemma and Shimelis, 2003).
Onion, shallot and garlic are major crops in many tropical
countries being valued for their flavor, nutritive and medicinal
value. The demand for them is world-wide. Onions are grown for a
variety of purposes, as fresh shoots for green 'salad' onions,
and as bulbs for: flavoring varieties of dishes, saucers, soup,
sandwiches, pickling and used as flavoring compounds in food
processing industries. It is characterized by the remarkable
sulfur-containing volatile oil (allyl propyl disulphide)
compounds they contain, which give them their distinctive smell
and pungency (Brewster, 2008). These substances has been
extensively used as precursor of the flavor compounds in food
processing industries and used as a medicine to cure a wide
range of aliments. In a traditional medicine garlic and onion
have been used in the prevention and treatment of
atherosclerosis, coronary heart disease, in reducing blood
cholesterol level, in the treatments of diabetes, cancer and
asthma (Brewster, 2008). The mature bulb contains some starch,
appreciable quantities of sugars, some protein, and vitamins A,
B and C (Decoteau, 2000).
xxxiii

2.1.3. Onion production in Ethiopia
As a result of the increase in both the surface area cultivated
and the yield obtained, the world production of onions is now
above 57884000 Mt per year which is by far higher than the
14,164,000 Mt per year obtained in 1960 (FAO, 2007). The average
world yields increased from 12 t ha−1 in the early 1960s to 18 t
ha−1 in 2005, while the productivity of tropical onion is around
9.6 t ha,-1 which is very low (FAO, 2007). Tropical countries,
having about 45% of the world’s arable land, grow about 35% of
the world’s onions (Pathak, 1994). The African average bulb
yield were 12.3 t ha-1. This figure is still very far from the 54
t ha−1 yielded on average in Korea Republic, USA and the EU
countries.
Onion is a recently introduced bulb crop in agricultural
community of Ethiopia and is rapidly becoming popular among
producers and consumers (Geremew et al., 2010). Currently, onion
production is rapidly expanding in all administrative regions of
Ethiopia where there are favorable climate and soil types either
in small pockets or large commercial farms (MARC, 2003). Onion
xxxiv

is becoming one of the most important vegetable crops grown in
the country, where the bulk is produced in traditional
agricultural system. It has comparative advantage over its close
alley shallot in that it is high yielder, can easily be
propagated through seed and both its bulbs and flowers have got
export values (Lemma and Shimelis, 2003).
Onions are produced in the country on an estimated area of about
18,000 hectares of which 3 % was in the state sector and the
rest under traditional farming system (MARC, 2003). In Amhara
region, root and bulb crops covered about 0.7 % of the regional
crop area and 4.3% of the production volume. Onion shared 11 %
(3684 ha) of the regional root and bulb crops area and added
about 14% (40848.4 tones) to the regional volume of root and
bulb crops production (CSA, 2009). The most popular onion
cultivars include Adama red, Bombay red, Melkam, and Red creole.
The first two cultivars are widely popularized and extensively
produced in many regions of the country (MARC, 2003). The
average yield in Ethiopia is approximately 10.2 ton ha-1 compare
to over 30 ton ha-1 in other countries (Korean Republic, 62.5t
ha-1), (USA, 51.1t ha-1), (Ireland, 55.9 t ha-1) (FAO, 2007).
xxxv

However, experimental yields obtained from Bombey red variety so
far ranged from 30 to 40 t ha-1 in the Awash valley (Lemma and
Herath, 1994; Lemma and Shimels, 2003).
2.1.4. Optimum growth environments of onion
Depending on the season of the year and type of cultivar, it can
grow well all year round at 500m to 2400 meter above sea level
with optimum range of 700-1800 meters above sea level. It was
reported that onion grows in all types of soils from sandy loam
to heavy clay. Highest yield was attained from freely drained
friable loam soil with pH of 6.5 to 7 (Lemma and Shimelis, 2003;
Tindall, 1983). According to Tindall (1983) relatively high
levels of organic mater are required for optimum growth and
development. In addition, adequate reserves of the major
elements, particularly nitrogen and potash, should be available
throughout the growing period. Temperature is also an important
environmental factor that affects onion bulb development and
production. Optimum temperature for plant development is between
13 and 24 0C, although the range for seedling growth is narrow,
20-25 0C. High temperature favors bulbing and curing.
xxxvi

Temperature of 18.3-240C day and 10-12 0C nights are ideal for
bulb production in Ethiopia (MARC, 2003).
Moisture is one of the most vital environmental factors that
affect onion production. Its growth rate can be inhibited well
before the leaves wilt visibly even when the roots seem
adequately supplied with water (Drinkwater and Janes, 1955).
Ronald et al. (1999) indicated that onion plant’s rate of
transpiration, photosynthesis and growth are reduced even by
mild water stress. Unlike many plants, onions show little
capacity to reduce their leaf water potential by osmotic
adjustment to compensate for reduced availability of water at
the root whether caused by salinity or by drying of the soil
(Ronald et al., 1999). The shallow root depth of onion makes it to
be particularly sensitive for moisture stress at the time of
bulbing (Brewster, 2008). According to Drinkwater and Janes
(1955), 100% of the water uptake occurs in the first 30 to 50 cm
soil depth. Under an evaporation rate of 5 to 6 mm day-1 the rate
of water uptake starts to reduce when about 25 percent of the
total available soil water (P = 0.25) has been depleted
(Doorenbos et al., 1979). Both shallot and garlic are produced
xxxvii

under rain-fed whereas, onion is produced mainly under
irrigation. Otherwise, incidence of disease may cause a
considerable reduction in rainy season (Jackson et al., 1985).
2.2.Irrigation development and management
2.2.1. Irrigation development
There is indisputable evidence that irrigating land leads to
increased productivity. Irrigation was a necessary input into
the high yield varieties developed during the Green Revolution.
One acre of irrigated cropland is worth multiple acres of rain-
fed cropland. Between 1962 and 1996, the irrigated area in
developing countries increased at about 2% a year, leading to a
near doubling in irrigated land (Zilberman and Schoengold(nd)).
For example, in 1950 India had an irrigation potential of 22.6
mha. By 1993-94 this had grown to 86 million ha (Saleth, 1996).
Between 1949 and 1998, the amount of land in China under
irrigation increased from 16 mha to 52.3 mha. This represented a
change from 16% to 40% of China’s total farmland (Zilberman and
Schoengold(nd) cited Guangzhi and Hansong, (1999)). Irrigation
has increased not only the amount of land under cultivation, but
xxxviii

also the yields on existing cropland. For instance, in Asia
yields from most crops have increased 100-400% after irrigation
(FAO, 1996). It allows farmers to apply water at the most
beneficial times for the crop, instead of being subject to the
timing of rainfall. FAO (1997) estimate indicated that irrigated
agriculture produces nearly 40 % of food and agriculture
commodities on 17% of agricultural land, in which 75% of all
irrigated land is in developing countries. In Africa about 12.2
million hectares benefit from irrigation which is equal to only
about 8.5% of the cultivated land and in sub-Saharan Africa only
about 10% of the agricultural production comes from irrigated
land (FAO, 1997).
Irrigation is practiced in Ethiopia since ancient times
producing subsistence food crops. Traditional irrigation has
been practiced for more than a century in North Shewa, Gojam,
and Harar, too (ARARI, 2008). However, modern irrigation systems
were started in the 1960s with the objective of producing
industrial crops in Awash Valley (Sileshi et al., 2007). Private
concessionaires who operated farms for growing commercial crops
such as cotton, sugarcane and horticultural crops started the
xxxix

first formal irrigation schemes in the late 1950s in the upper
and lower Awash Valley. In the 1960s, irrigated agriculture was
expanded in all parts of the Awash Valley and in the Lower Rift
Valley due to the water regulation afforded by the construction
of the Koka dam and reservoir that regulated flows with benefits
of flood control, hydropower and assured irrigation water supply
(Sileshi et al., 2007). However, it is only in the after math of
the 1984 drought which has had a devastating effect on the lives
of thousands of people that the government was induced to turn
its attention towards irrigation as a possible solution to help
victimized farmers (Getaneh, 2002). In the 1980s with the
recurring cycle of drought and environmental hazards, the need
for small scale irrigation development expanded to other parts
of the country to address drought and food shortages, and the
need for more food for the internal market.
Currently, the government is giving more emphasis to the sub-
sector as a means of enhancing the food security situation in
the country. The total area under irrigation in 2006 was
reported to be 603,359 hectares, of which traditional irrigation
accounts for 479,049 hectares while 124,569 hectares of land was
xl

developed through medium and large scale irrigation schemes
(MoFED, 2007). Amhara region is one of the regional states of
the country that emphasizing on developing irrigation-based
agriculture to attain food security at household and state
level. It has more than 700,000 ha of potentially irrigable
land. Despite this huge potential of irrigable land only 90,000
ha of land or about 12 % of the irrigable land is currently
under irrigation (Sileshi et al., 2007), out of which traditional
irrigation accounts 70,000 hectares (85%) of the total irrigable
land (Enyew, 2007). Although few irrigation schemes were
established recently, most traditional schemes in North Shewa
Zone (in which Antsokia Gemza woreda is found) were established
long ago that farmers were observed to have difficulties
remembering when they were operational (Yonas et al, 2008).
In Antsokia Gemza woreda most traditional schemes are
constructed based on run-of-river diversion of streams and
springs. These schemes are built under sprout from farmers own
initiative with government technical and material support. It is
managed and controlled by the users. Traditional water
committees, locally known as ‘water fathers’, administer the
xli

water distribution and coordinate the maintenance activities of
the schemes. The modern small-scale irrigation schemes were
built from 1995 – 2003 (WVE, 2009) by World Vision Ethiopia
(WVE) Antsokia Gemza area development program with direct farmer
participation. (The irrigation schemes constructed by WVE
Antsokia Gemza area development program are presented in
appendix B, Table B.4.). In such schemes, efforts are being made
to involve farmers progressively in various aspects of
management of small-scale irrigation systems starting from
planning, implementation and management aspects, particularly in
water distribution and operation and maintenance. There are also
water user associations which handle water allocation,
operation, and other maintenance functions. This can pave the
way to introduce new water management techniques like deficit
irrigation in the woreda.
2.2.2. Irrigation scheduling: the tool for water
management
Irrigation scheduling is the process of determining when to
irrigate and how much water to apply per irrigation. It has been
described as the primary tool to improve water use efficiency,
xlii

increase crop yields, increase the availability of water
resources, and provoke a positive effect on the quality of soil
and ground water (FAO, 1996). Timing and depth criteria for
irrigation scheduling can be established by using several
approaches based on soil water measurements, soil water balance
estimates and plant stress indicators, in combination with
simple rules or very sophisticated models. Since crops
irrigation need is decided by the evaporative demand of the
ambient atmosphere, soil water status and plant characteristics,
a thorough understanding of the soil-plant-atmosphere
relationship is essential for proper irrigation scheduling
(Majumdar, 2000). The author indicated that the criteria for
scheduling irrigation as attempted from time to time may be
grouped in to three categories, namely plant criteria, criteria
based on soil water status and meteorological criteria. The
water status of the plant in terms of leaf water potential may
serve as a sound basis for irrigation scheduling. There are also
a wide range of commercially available instruments to measure
soil moisture for irrigation scheduling. These include neutron
probes, tensiometer, and Time Domain Reflectrometer (TDR). The
role of climate in governing the water needs of crops was
xliii

recognized and criteria based on evapotranspiration were
utilized for scheduling irrigation. A range of empirical methods
was developed to estimate potential crop evapotranspiration from
readily available climatic parameters. The water requirement of
a given crop was derived through a crop coefficient that
integrated the combined effects of crop transpiration and soil
evaporation into a single crop coefficient as in eq.1.
Where: ETo is reference crop
evapotranspiration
Kc is crop coefficient
ETc is the crop
evapotranspiration.
ETc is defined as the evapotranspiration from a disease-free,
well fertilized crop, grown in large fields, under optimum soil
water conditions, and achieving full production under the given
ecological environment (Kassam and Smith, 2001; Allen et al., 1998;
Doorenbos et al., 1979). Whereas, ETo is the evapotranspiration
from a reference crop with the specific characteristics of
xliv

grass, fully covering the soil and not short of water and
represents the evaporative demand of the atmosphere at a
specific location and the time of the year independently of crop
type, crop development and management practices, and soil
factors (Doorenbos et al., 1979; Allen et al 1998). The only
factors affecting ETo are climatic parameters. Consequently, ETo
is a climatic parameter and can be computed from weather data.
Crop transpiration is determined by the typical crop
physiological and morphological characteristics and increases
over the growing season with the growth of the canopy surface.
Soil evaporation decreases proportionally over the growing
season as the ground surface is increasingly shaded by the crop
canopy.
The net irrigation requirement is calculated as the depth of
water required to replenish the soil water content to field
capacity in the irrigated crop root zone. Depth of irrigation
application is the depth of water that can be stored within the
root zone between field capacity and the allowable level the
soil water can be depleted for a given crop, soil and climate.
It is equal to the readily available soil water (RAW) over the
xlv

root zone. According to Doorenbos et al. (1979), the total
available water (TAW) for plant use in the root zone is commonly
defined as the range of soil moisture held at a negative
apparent pressure of 0.1 to 0.33 bar (a soil moisture level
(called 'field capacity') and 15 bars (called the 'permanent
wilting point'). The TAW will vary from 250 mm/m for silty loams
to as low as 60 mm/m for sandy soils. Irrigation water is added
to the water balance when the available soil water storage
reduced to RAW (Doorenbos et al., 1979). Readily available water
(RAW) is the fraction of stored water that a crop can extract
from the root zone without suffering stress and is expressed as
the product of stored water and allowable soil water depletion.
Shock et al. (2010) indicated that irrigation scheduling is
directly related to profitable onion production and sustainable
agricultural practices. They demonstrated that onion yield and
grade are very closely related to irrigation practices. Careful
attention to irrigation scheduling can help assure high onion
yields, better bulb storability, and better internal quality.
Small errors in irrigation can result in large losses in yield,
especially in marketable yield of the larger size class bulbs
xlvi

(Shock et al., 2010). The seasonal water requirement of onion
varied according to the climate conditions. Variability in the
water requirements for onions is also a function of location and
irrigation method. According to Lemma and Shimelis (2003), the
crop demands about 400-800 mm per growing season for the
formation of large bulb size and high yield. Whereas, FAO (2002)
reported that its demand vary with climate and 350 to 550mm
water is optimum for bulb production. Depending on climatic and
soil condition Doorenbos et al. (1979) reported that the water
requirements for optimum yield (35 to 45t ha−1) might vary from
35 to 55 cm of water using furrow irrigation. Whereas, Ells et al.
(1993) reported that furrow-irrigated onions required 104 cm of
water to obtain a yield of 59t ha−1.
2.2.2. Farmers experience on irrigation scheduling and
water management in the study area
Traditional small-scale irrigation schemes are the dominant
irrigation water sources in the study area. They are managed by
local water administration body known as ‘Yewuha abat’ which means
‘’father of water’’. Yewuha abat is an elected member of the
xlvii

community whom the farmers agree up on to be in charge of all
water issues. It is well recognized by the kebele’s leaders and
‘limat budin’. Water dispute and other water distribution issues
are solved by the ‘Yewuha abat’. If things get out of the capacity
of this body the kebele administration and elders will join to
solve the problem. Most of the cases however, are handled by the
‘yewuha abat’. While, most of the recently constructed modern
irrigation schemes are managed by water users associations.
There are more than five water users associations in the woreda
which encompass more than 500 beneficiaries in each. Members of
the WUA have annual financial fee for operation and maintenance
of the scheme. In some WUAs, specially when water is scarce,
water is allocated to their members in hour. While in some WUAs,
two or three months before members inform their association
about the type of irrigated crop they plan to grow. Thus, crops
are grown as per the potential of the irrigation scheme and
water is distributed to each member in rotation.
Flood irrigation is widely used method of water application for
crops other than vegetables. Furrow irrigation is used for row
cropped onion and other vegetables. According to the interview,
xlviii

farmers selected these methods due to lower labor requirement
and lack of knowledge about other irrigation methods.
Traditionally water is measured by the size of secondary and
tertiary canals/boy/ which are judged by the size of water it
carries. These measurements are applied to distribute
irrigation water to each farmer. For instance, it was observed
and pointed out by farmers that irrigation water is measured by
’boy wuha’. One ‘boy wuha’ is the same as saying water amount which
satisfy optimum flow in a furrow. Although volumetric discharge
measurement is unknown in the area, proportioning of water gives
an entry point in introducing formal water measurement systems
for economizing the use of the resource.
xlix

Figure 2.1. Accumulated water over the surface of farmers field
due to over irrigation of onion
Farmers in the woreda have established irrigation frequencies
for their crops when water is in surplus and in scares (Table
2.1). Based on the availability of water these frequencies are
adjusted. However, the amount of water application depends on
the farmers’ judgment. They apply to the extent that water is
accumulated over the surface. Farms were observed to be over
irrigated once the supply is on (Fig.2.1). This is related to
the farmers believe that application of more water can bring
more yield.
According to the assessments made on those farmers who have the
experience in irrigation agriculture, commercial fertilizer was
rarely applied for other crops except onion. Even, the use of
fertilizer for onion is below the recommended level (1qt Urea
ha-1). They do not use DAP for vegetable production. This is
mainly because of fertilizer prices and for fear of water
shortages which might result in crop burns by fertilizer. This
indicates that there is a need to improve the traditional
schemes in terms of water productivity.
l

li

Table 2.1. Irrigation frequencies in some of the assessed
kebeles
Kebele Scheme
Name
Irrigate
d crop
Frequency of irrigation
During
sufficient
water
During scarce
water
Agla
Majatte
Lay Jara Onion 4-5 days 8-9days
Tomato 2-3
times/season
2-3
times/season
teff Twice/season Once/season
Agla
Majette
Tach
Jara
Onion 6 days 9 days
Tomato 15days 20 days
teff 3-4
times/season
Twice/season
Mekoy 03 Gudaber Onion 8 days days
interval
13 days
Sweet
potato
Once a month Once a season
teff 7 days
interval
15-30 days
Fruit
trees
10 days >20days
Kobekob Sirinka Pepper 15days 25 days
interval
Onion 4-5days 8days
interval
Maize 9 days 11-15days
lii

Tomato 8days 15days
2.2.3. Concepts of deficit irrigation
Rapid increases in the world's population have made the
efficient use of irrigation water vitally important,
particularly in poorer countries, where the greatest potential
for increasing food production and rural incomes is often to be
found in irrigated areas. There is increased need to maximize
the productivity of both land and water. ’Inputs’ to land may
improve land productivity but inputs to water may not change the
productive capacity of water. Improving ‘water security’ and
‘crop water productivity (CWP)’ can, however, result in higher
productivity (Mintesinot et al., 2004). Water security, in this
context is used to signify the all year round availability of
water for production purposes. CWP is a term commonly used to
describe the relationship between water and agricultural
product. Therefore, CWP can be defined as the relationship
between units produced and volume of irrigation water applied
and is estimated by dividing crop yield by total applied water
liii

(Samson and Ketema, 2003; Yenesew and Tilahun, 2009; Heping,
2003; Biswas et al., 2003; Urea et al., 2003; Steduto, 1996).
In Ethiopia, the issue of ‘water security’ is being addressed
through the implementations of water harvesting projects. Under
these projects many efforts have been done to construct and
develop river diversion, ponds, earth dams, flood spreading and
spring development. The issue of CWP, however, is little
considered. Promoting productivity, therefore, is an urgent
necessity. One of the strategies to increases CWP is the use of
deficit irrigation (Zwart and Bastiaanssen, 2004).
Deficit irrigation was developed to control vegetative vigor in
high density orchards in order to optimize fruit size, fruit
fullness and fruit quality (Goodwin and Boland, 2000). It is the
practice of using irrigation to maintain plant water status
within the prescribed limits of deficit with respect to maximum
water potential with a prescribed part or parts of the seasonal
cycle of plant development (Shaozong, 2004). Similarly, Shock
and Feibert (2006) stated that deficit irrigation is a strategy
liv

that allows a crop to sustain some degree of water deficit in
order to reduce irrigation costs and potentially increase
revenue. Its objective is to save water by subjecting crops to
periods of moisture stress with minimal effect of yields (Smith
et al., 2000).
According to Shaozong (2004) the potential benefits of deficit
irrigation derive from three factors: increasing irrigation
efficiency, reducing cost of irrigation and opportunity costs of
water, and improving quality and/or yield. Therefore, it is
important to mitigate drastic yield reductions (Bazza and Tayya,
1999) and can maximize water productivity for higher yields per
unit of irrigation water applied (Kirda, 2000). However, when
the water stress is sever or occurs at the critical growth
stages of crops, deficit irrigation may only lead to drastic
reduction in crop yield and a negative impact on productivity of
water and economic return (Henry et al., 2004).
Oweis et al. (1999) suggested that economically reasonable yields
could be obtained with deficit irrigation when the dose and
interval of irrigation are well monitored. They noted that
lv

deficit irrigation requires more control over the amount and
timing of water application than full irrigation. They conclude
that with established crop water production functions and
sensitive stages of crop growth to water stress, optimal deficit
irrigation could be scheduled with minimum yield reduction
compared with full irrigation.
On the other hand, properly practiced deficit irrigation may
increase crop quality. For instance, the protein content and
baking quality of wheat, the length and strength of cotton
fibers, and the sucrose concentration of sugar beet and grape
have been reported by the above author to increase under deficit
irrigation. In addition, the established crop production
functions made it possible to solve the problem of allocation of
limited water resources between crops where there is competition
for limited available water in dry areas. It is practiced in
many arid areas of the world, and increase demand on water
supplied worldwide suggested the practice must be increase
(Shani and Dudley, 2001).
lvi

2.2.4.1. Influence of deficit irrigation on yield and
yield components
Water is essential for plant growth, and it is needed in much
larger quantities than are the nutrients (Teixeira et al., 2003).
The author mentioned that water is essential and as an
inevitable consequence of opening their stomata to ensure
gaseous exchange during photosynthesis. During the period of
water stress they react by closing their stomata to minimize
water loss through transpiration. This has an impact on gas
exchange with in the leaf and results to slow down
photosynthesis and growth (Allen et al., 1998; Brewster, 2008).
The stress will be aggravated and the effect of closure of
stomata is more impose an effect when there is salinity problem
(Brewster and Rabinowitch, 1990).
Sadeghipour (2008) indicated that vaying timing of irrigation
had significant effect on yield and yield conponenets of
Mungbean (Vigna radiate L. Wilczek) varieties. Stress that occurred
at the reproductive stages affect seed yield more sevierly than
its occurrence on other stages. The author obtained that stress
lvii

at flowering stage reduce number of pods per plant, number of
seed per pod and seed yield, while, withholding irrigation at
pod filling stage decreased 1000 seed weight. Another study on
soybean by Stegman et al. (1990) showed that although short term
stress during early flowering resulted in flower and pod drop in
the lower canopy, increased pod set in the upper nods compensate
for this where is a resumption of normal irrigation.
In two years study on wheat, increasing irrigation resulted in
progressively higher leaf area index, increased crop growth
rate, and increased above ground biomass (Pandy et al., 2001). The
same author explained that deficit water supply in the earlier
growth stage of wheat can result in sufficient above ground
biomass to support an economically acceptable yield. However,
the adverse effects of water stress on crop growth rate can lead
to reduced biomass yield. Asseng et al. (1998) indicated that root
growth of wheat slowed in the upper layers, but compensatory
growth occurred in deeper layers during drying. Root growth was
greatest in the upper layers, immediately after rewetting, water
uptake rate increased quickly after rewetting, and exceeded the
uptake rate of the non stressed treatment about 2-3 weeks after
lviii

the deficit is released. Rosenthal et al. (1987) also indicated
that the effect of pre and post anthesis water deficit on
transpiration of wheat were not significantly different (p <
0.05). The same author studied on cotton and sorghum and found
that water deficits below 20% to 30% plant available water
reduced transpiration and enhanced leaf senescence.
Yenesew and Tilahun (2009) indicated the significant impact of
variation in level (amount) of irrigation water application on
grain yield of maize. They explained that, in the case of stress
by 75% deficit at a specific stage, the effect of stress was
severe during the mid season stage. On the other hand, water
deficit during the early and maturity stage had a limited effect
on yield. Stressing the crop by 75% deficit throughout the
growing season resulted in the highest yield reduction.
Smith et al. (2000) reported that water stress imposed during
establishment, flowering and tuber formation developmental
stages of potato has caused yield reduction compared to full
irrigation. The measured yield reductions and the simulation
lix

results revealed particular sensitivity to moisture stress
during establishment and flowering stages.
Several studies have been conducted on limited irrigation water
application and its effect on bulb yield of onion by imposing
soil water stress at some phonological stages during the growing
period (Kadayifcia et al., 2005 cited Shock et al., 1998; Shock et
al., 2000; Singh and Alderfer, 1996; Van Eeden and Myburgh, 1971;
Mart´ın de Santa Olalla et al., 2004). These studies gave clear
proof that the bulb and dry matter production were highly
dependent on appropriate water supply. Singh and Alderfer (1996)
reported that soil water stress at any developmental stage of
onion can leads to reduction in marketable yield. They further
observed that with regard to yield reduction, onions are more
sensitive to water stress during bulb formation and enlargement
than during the vegetative stage. Dragland (1974) also reported
that three weeks long water stressed onion in the early
development stage reduce onion yield more than when the imposed
near the end of the growing season. In line with this, Van Eeden
and Myburgh (1971) reported that water stress imposed late in
the season reduced onion total yield by 15% when compared to the
lx

yield with no water stress. Onion is considered a shallow rooted
crop and is comparatively sensitive to water stress. Drinkwater
and Janes (1955) noted that the growth of onion can be inhibited
well before the leaves wilt visibly even when the roots seem
adequately supplied with water.
According to Lemma and Shimelis (2003), dry bulb yield decline
from 20.4 to 11t ha-1 as irrigation interval increased from three
to twelve days, while yield increment was observed from 12.9 to
17t ha-1 as the amount of water applied increased from 3-7cm
depth. The same author obtained in sandy loam soil that, 5cm
water applied at 3-6 days interval gave the highest yield of 17-
20.4t ha-1.
Shock et al. (2003) reported that water stress at the four-leaf
and at the six-leaf stages of onion resulted in fewer single-
centered onions than the unstressed check. Water stress at the
later stages did not affect onion single-centeredness. Water
stress did not affect translucent scale. In contrast to Hegde
(1986), the short-duration water stress in this trial did not
affect onion yield or grade. Another experiment on the effect of
lxi

irrigation regime on growth and yield of onion showed an
improvement on plant growth with increasing the amounts of
irrigation water. Increasing total water application from 762 to
2381 and 857 to 2095 mm resulted in total yield increases of 70%
and 37.6% in the first and second seasons, respectively. Average
bulb weight, length and diameter were significantly increased at
higher levels of irrigation water (Al-Harbi, 2002). These
results seemed to be in a close agreement with those reported by
Shock et al. (2003). He reported that total yield and marketable
yields increased with increasing irrigation threshold. The
improvements of total yield response to high amounts of total
water application could be attributed to the enhancing effects
of water to crop’s biological functions and growth in addition
to the improving effects of water on nutrients availability.
Kumar et al. (2007), Orta and Ener (2001) and Faten et al. (2010)
reported the significant effect of irrigation amount on growth
parameters and yield of onion. There have been also several
reports on the effects of irrigation on onion bulb yield and
their subsequent storage life (Gomie et al., 2000). According to
Kumar et al. (2007) the best yield was recorded from the highest
lxii

irrigation amount (1.2% of cumulative pan evaporation)
associated with the higher percentage of bulbs having diameter
greater than 45 mm. In line with this Biswas et al. (2010) also
indicated that bulb yield of onion showed significant variation
among treatments. The yield of bulb increased almost linearly
with increasing number of irrigation. Faten et al. (2010) found
reduction of onion plant growth by both medium and longer
irrigation intervals. Whereas, the superiority of onion plants
which were irrigated at the short interval, i.e. 14 days might
be attributed to that, water is one of the main raw materials
for photosynthesis and required for translocation of nutrients
from roots media to different plant organs.
2.2.4.2. Influence of deficit irrigation on crop water
productivity
Water is the major constitute of living plant tissues which
accounts for about 90% and many physiological processes depend
on it. However, only a very small part about 1% of water needed
by a plant is used in metabolic process and the rest is lost
through transpiration (Kumar et al., 2007). In most areas water
resources are being over exploited for full irrigation, while
lxiii

sustainable water use can be obtained only by producing more
crops from less water. Crop water productivity can be maximized
when water is conserved and maximal crop growth is promoted. The
former requires minimizing loses through run off, seepage and
evaporation. The later task includes improved agronomic
practices and use of high yielding varieties. English and Raja
(1996) reported that deficit irrigation averaging 64% of full
irrigation was found to be economically equivalent to full
irrigation when water was the limiting factor. According to
Henry et al. (2004), irrigation scheduling protocol which entails
a 14 day irrigation interval at crop vegetative developmental
stage gave the best productivity of water in terms of water
applied being 0.5 kg/m3 than regular irrigation carried out at
7 day interval (0.44kg/m3). The crop yield based on such
scheduling was not significantly different. Another study showed
that two third of full irrigation increased productivity of
total applied water by 19-28% for maize. The risk with deficit
irrigation was low because the response curve of crop yield to
water supply often has a wide plateau; considerable amount of
water can be saved without a significant yield reduction
compared with full irrigation (Heping, 2003).
lxiv

Harmoniously with the above result, Yenesew and Tilahun (2009)
indicated that the water productivity of maize was the lowest
(1.72 kg/m3) at optimum irrigation water application and the
highest (2.96 kg/m3) at stress of 75% deficit throughout the
growth season. They noted that, although at individual farmer’s
level, maximum yield is obtained when the entire crop water
requirement is fulfilled, practicing deficit irrigation could
increase the irrigated area as a result of high crop water
productivity. The same author concluded that strategy of
stressing maize by one-half at the beginning and end of season
and using the water to irrigate a greater area, results in
higher aggregate production than providing optimum irrigation
throughout the season for a smaller area.
In contrast to Yenesew and Tilahun (2009), Payero et al. ( 2006)
suggest that increase crop water productivity by imposing
deficit irrigation for maize might not be a beneficial strategy
as the CWP linearly increased with evapotranspiration (R2 =
0.75). However, it is recognized that there could be other good
justifications for deficit irrigation other than increasing CWP.
lxv

For instance, Zwart and Bastiaanssen (2004) reviewed measured
CWP for several crops around the world and concluded that the
CWP could be significantly increased if irrigation was reduced
and crop water deficit was intentionally induced.
Salkini and Oweis (1993) found that supplementing only 50% of
the rain fed crop irrigation requirements reduce crop yield by
only 10-20% relative to full irrigation. Using the saved 50 % to
irrigate an equal area gives a much greater return in the total
production. Irrigation scheduling to manage supplemental water
for maximum net profit of winter wheat in the Northern china
showed that a single irrigation in wet years, two irrigations in
normal years and three in dry years produce maximum profit
(Heping, 2003). In comparison to productivity of water in fully
irrigated areas (when rainfall effect is negligible), the
productivity is higher with supplemental irrigation. In full
irrigated areas with good management, wheat grain yield is about
6t ha-1 using 800mm of water. Thus, the water productivity is
about 0.75kg m-3, one third of that under supplemental irrigation
with similar management (Salkini and Oweis, 1993).
lxvi

Experiment during the rainy season done on onion in Bangladesh
showed that the highest crop water productivity (36.44kg/mm) was
obtained in the treatments with four irrigations at 15 days
interval with a total water use of 239mm. However; the total
water use of onion (two years average) during the rainy season
was the highest (279.5mm) in treatment with six irrigations at
10 days interval (Biswas et al., 2003). Al-Harbi (2002) noticed
that water productivity of onion was increased with increasing
the amounts of applied water. Urrea et al. (2003) found the
greatest water productivity in garlic by application of deficit
irrigation at the bulbification stage. Oda et al. (2010) found the
highest CWP under irrigation with 80% of full irrigation for
three growing seasons. Similar results were obtained by Samson
and Ketema (2007) who stated that deficit irrigation application
for onion increased CWP. In line with this Kumar et al. (2007)
indicated that CWP of onion was the highest in application of
irrigation water amount equivalent to 0.8% of the cumulative pan
evaporation and then declined with the increase in irrigation
water amount.
lxvii

Samson and Ketema (2007) reported that all deficit irrigation
water applications increased the CWP of onion from a minimum of
6% (application of 25% of Etc at initial stage) to a maximum of
13% by applying irrigation water 75% of Etc throughout the whole
growing season compared to the optimum application. They
concluded that increasing the irrigated area with the saved
water would compensate for any yield loss. The average water
utilization efficiency for harvested yield of bulb, that
containing 85 to 90% moisture is 8-10 kgm-3 (FAO, 2002).
Chapter 3. Materials and methods
3.1. Description of the study area
3.1.1. Location
The experiment was conducted in Antsokia Gemza Woreda in North
Eastern part of Ethiopia at a distance of 350kms NE of Addis
Ababa (Fig.3.1). It is one of the rural woreda of Eastern Amhara
in the Amhara National regional state located at 10o37’ N
latitude and 39o52’ longitude, at an altitude of 1400-2800
meters above sea level. The woreda has a total area of
lxviii

386.10km2 (CSA, 1999) and lies on the watershed of Borkena river.
Regarding topography of the woreda 46% is mountainous, 11% is
terrain and 43% is plateaus (AGWARDO, 2010).
Figure 3.1. Location of the experimental site
lxix
Ants
okia
Gem
za
wore
daAmha
ra r
egio
n
Ethi
opi
aNo
rth
shoa
zo
ne
Experimental siteMajettie (town)Area of land irrigated by Jara river schemeMekoy (town)
0 5 10

3.1.2. Climate
The area has three agro ecological zones of low, mid, and
highlands, out of which 45% is lowland, 44% is midland and 11%
is highland (AGWARDO, 2010). Its mean annual temperature is
20.1oC with a mean annual maximum and minimum temperature of
28.62oC and 14oC, respectively. The mean annual rainfall at the
study area is 1074mm with a bimodal precipitation of 800-1200mm
rainfall in which more than 60% of the rainfall is obtained in
July, August and September (Fig.3.2). The long term climatic
data of the area is presented in appendix A.
lxx
Ave
rage
RF
(mm)
&
RH (
%)

Figure 3.2 Mean monthly rainfalls (mm), maximum and minimum
temperature (oC) and relative humidity (%) of the study area.
3.1.3. Soil
There is little information about biological and physico-
chemical properties of the soil around the area. However, the
extensive plain of the woreda that is lying below the highland
is rich in alluvial soil (Tibebe and Siobhan, 2000) typically
used for vegetable and other crop production. According to
AGWARDO (2010), the dominant soil around the woreda is sandy
loam soil. The lab result of some physico-chemical properties
of the soil is presented in section 3.3.1.
lxxi

3.1.4. Farming system
About 90% of the people practice mixed agriculture as a means of
livelihood. According to AGWARDO (2010), the land use pattern of
the woreda is 47% cultivated, 20% uncultivated and less than 3%
is grazing land. About 30% of the land is covered with bush
grassland and wasteland too. The major crops cultivated in the
area are cereals: sorghum, teff, maize, barley and wheat; pulses:
beans and peas; fruits: citrus, mango, avocado and papaya;
vegetables: onion, tomato, cabbages, and potato. The crops
cultivated in irrigation in 2009 cropping season in the order of
area coverage are maize (34.84%), onion (28.22%) and teff (4.6%)
and their respective total yield was 5106.2, 37848.3 and 331.6
tons (Table 3.1). People also have domestic animals like cattle,
sheep, goat, and pack animals. Planting date varies according to
the crop type and availability of moisture. If there is enough
moisture, starting from half June crops like wheat barely and
beans have been sown, while sorghum and maize have been sown in
April. In the woreda onion crop production as rain fed crop is
not common because of high disease incidence in rainy season. It
is extensively produced in irrigation during the off season.
lxxii

Recently, cropping pattern in traditional irrigating areas of
the woreda is changing. For example, long season sorghum planted
in late April is replaced by irrigated onion and other vegetable
crops. These changes are mainly due the increased need of
farmers to irrigated agriculture along with the introduction of
high valued crops like onion, driven by the market.
Irrigated agriculture has been practiced for a long time in the
woreda using different irrigation schemes like river diversions,
springs, hand dug wells etc. The majority of farmers grow
vegetables and crops twice a year; one during the dry season
(from January to May) with irrigation and the second during the
main rainy season (from July to September) with or without
supplemental irrigation. There are also farmers who are
producing crops twice in the dry season using irrigation and
once in the wet season. According to AGWARDO (2010) annual
report, the number of these farmers is increasing from time to
time. It rose from 73 in 2006 to 14203 in 2009. The cultivated
area also rose from 16.39 ha in 2006 to 2915 ha in 2009. These
farmers produce their first crop from the beginning of October
to February and the second crop has been planted at the end of
lxxiii

February and reaches to harvest before the beginning of the main
rainy season. In the main rainy season early maturing crops like
teff, mung bean, early maturing variety of maize and some
vegetables are grown. The total area irrigated by each
irrigation scheme during 2008 and 2009 is presented in table
3.2.
Table 3.1 Average yields (t) and area coverage (ha) for the major irrigated crops (AGWARDO, 2010).
Type of Cultivated area (ha) Yield per cultivated area
(ton)
Crops
grown
2006 2007 2008 2009 2006 2007 2008 2009
Teff 40.75 110.9 223 178.6 52.3 105.4 162.5 331.6
Maize 1037.
6
1275 1355.
2
1342 2751.
7
3071.
5
3132.
5
5106.
2
Onion 675 796.4 1086.
9
1251.
9
3314.
2
6512.
5
19275
.4
37848
.3
Tomato 146.9 78.8 46.88 132.4 2209.
8
2942.
7
2809.
1
5012.
6
Cabbage 12.76 17.5 23.3 40.2 624.9 525.0 1009.
8
1952.
5
lxxiv

S/potato 63.6 28.9 74.5 140.1 902.8 352.8 1080.
7
2509.
3
.
.
.
.
.
.
.
.
.
.
.
.
.
.
.
.
.
.
.
.
.
.
.
.
.
.
.Total 3038.
5
3202.
5
3557.
7
3851.
8
10463
.9
16608
.1
42619
.3
72171
.9
Table 3.2. Types of irrigation scheme and their respective
irrigated area (ha) in 2008 and 2009 cropping seasons (AGWARDO,
2010)
Product
ion
Year
Types of irrigation scheme
Earth
dam
Modern
diversi
on
Traditio
nal
diversio
n
Pumped
water
Spring
developme
nt
Hand
dug
well
Farm
pond
2008 1009.
1
418.1 1155.5 25.6 131 8.4
2009 2002.
2
571.01 1642.1 50 520.1 5.73 6
lxxv

3.2. Treatments, design and agronomic practices of the
experiment
There were a total of sixteen treatments made by varying the
amount of irrigation water throughout the developmental stages
(three treatments); and with possible combination of specific
developmental stages of the crop (12 treatments) (Table 3.5).
The irrigation levels were full irrigation which is 100% of Etc,
75% of Etc (25% deficit), 50% of Etc (50% deficit) and 25% of
Etc (75% deficit). The crop developmental stages were divided in
to four major periods: establishment, vegetative development,
bulbification and ripening stage. According to Allen et al. (1998)
the establishment stage runs from transplanting until
approximately 10% of ground cover (02 – 21 Feb, 2010). The
vegetative development stage run from 10% of ground cover up to
effective full cover (22 Feb - 23 Mar, 2010). The bulbification
stage runs from effective full cover to start of maturity (24
Mar - 22 Apr, 2010) and the ripening stage (23 Apr - 7 May,
2010) runs from start of maturity to harvest. Each four levels
of irrigation water were applied throughout the crop growth
stages and each the three limited irrigation amounts were
lxxvi

applied at specific growth stages of the crop. Full irrigation
was used as standard check and replicated for each treatment.
Table 3.3. Treatment combinations of the amount of irrigation
water throughout the growing season and at specific
developmental stage of onion.
Limited irrigation application at specific developmental stages
Irrigation
amount
Establishm
ent
Veg.
development
Bulbificat
ion
Ripening
75%ETc 75%0III 75%I0II 75%II0I 75%III0
50%ETc 50%0III 50%I0II 50%II0I 50%III0
25%ETc 25%0III 25%I0II 25%II0I 25%III0
75%IIII 25 % deficit throughout the crop stages
50%IIII 50 % deficit throughout the crop stages
25%IIII 75 % deficit throughout the crop stages
100%IIII Full irrigation (standard check)
I indicates full irrigation or the throughout deficit amount of water,0 indicates the deficit amount of water and its position indicates thestage in which the treatment applied.
The experimental plots were laid out using randomized complete
block design. Each treatment were replicated three times and
distributed randomly in each block. Each plot had an area of
lxxvii

5.4m2 with a one meter wide pathway between each plot and 2m
wide pathway between each block. Three furrows of 40cm wide each
were laid through each plot that onion seedlings were planted at
the two sides of each furrow. Each row had 30 plants and each
plot had a total of 180 plants. Totally, 60 plots, each of a
1.8m width and 3m length plots were arranged in three blocks.
The field was plowed four times (twice using tractor and twice
using oxen). It was prepared again by human labor to break the
clods, while leveling and furrow preparation was done using hand
tools. Row orientation for furrow was north to south having
three rows per plot. The commonly used onion variety in the
area, Bombey Red was nursed and seedlings were transplanted to
the main field 45 days after emergency on 2 Feb, 2010. According
to the recommended practice of Sirinka Agricultural Research
Center (SARC, 2003) seedlings were planted at the two sides of
ridges of the furrow at 10cm spacing between plants, 20cm
between rows and 40cm between furrows ridges. DAP ((NH4)2HPO4)
and Urea ((COCNH2)2) were applied at the recommended rate of
100kg/ha DAP at time of planting and 100kg Urea with split
application 50kg at time of planting and 50kg six weeks after
lxxviii

planting. All other cultural practices were followed as per the
requirement of onion crop. Prior to the application of
treatments equal amount of irrigation was applied two times for
all experimental plots to favor uniform establishment of the
seedlings.
Fig. 3.3. Experimental field with onion plants (at the end of
its establishment stage)
lxxix

3.3. Data collection and analysis
3.3.1. Analysis of soil chemical and physical
properties
The physical and chemical properties of the soil at the study
site were analyzed up to 60cm depth at the Ethiopian National
Soil Testing Center. The soil samples were collected from
different soil sampling points using an auger and combined in a
plate and mixed thoroughly to form a composite soil sample. Ten
undisturbed soil samples were taken by core sampler from
representative pits of 60cm depth, five from 0-30cm and five
from 30-60cm depths and analyzed to determine field capacity and
permanent wilting point for each horizon. Thus, the available
volumetric soil moisture (%) for each soil depth was determined
by taking the difference between soil moisture content at -
0.3bar FC and -15bar PWP suction by pressure plate apparatus
method (Table 3.7). The method of analysis of the soil chemical
and physical properties is described in table 3.4.
Table 3.4. Properties of soil analyzed and methods used
lxxx

The results of analysis of the some soil chemical and physical
properties of the experimental site are provided in tables 3.5
and 3.6, respectively.
Table 3.5. Some soil chemical properties of the experimental
site
Soil
Dept
h
pH ECe
(ds/
m)
ECw
(ds/
m)
OM
(%
)
OC
(%
)
CEC
(cmo
le
Exchangeable
Cathion
(cmole/kg)
Av.P
(ppm
)
Base
satn
(%)
Soil property Method of analysis
Electrical
conductivity
Conducto metric analysis by
conductivity meter
CEC & Exchangeable
bases
Ammonium acetate extraction method
at pH 7
Organic meter Walkely and Black method
pH H2O Potentiometric analysis by pH meter
Available Phosphorous Olsen method
Texture Bouyoucos method by hydrometer
Bulk density and
Particle density
Measurement of volume and mass by
Blake & Hartage (1986)
Total Nitrogen Kjeldahal method
Available K Morgan extraction method
FC & PWP Pressure plate apparatus by Cassel
and Nielsen (1986)
lxxxi

(cm) kg-1) K Na Ca Mg
0-30 7.
6
0.10
8
0.12
1
0.
13
1.
33
32.1
8
2.
11
0.
95
18.
6
8.
55
20.7
2
94
30-
60
7.
4
0.06
1
0.
09
0.
59
28.5
4
0.
9
0.
95
16.
06
2.
14
13.1
2
70
Table 3.6. Some soil physical properties of the experimental
site
Soil
Depth
(cm)
Particle size
(%)
Textural
class
FC
(%wt.
)
PWP
(%wt
)
Bulk
density
(g/cc)
Particle
Density
(g/cc) Sand si
lt
cl
ay
0-30 38 38 24 Loam 13.88 13.8
8
1.334 2.47
30-60 46 26 28 Sandy
clay
loam
13.19 13.1
9
1.294 2.51
Based on USDA soil texture classification the soil is found as
loam at the upper profile and sandy clay loam in the lower soil
profile with the average bulk density of 1.334 g/cc and 1.294
g/cc, respectively. The pH of the study soil is 7.5. According
to SARC (2003), the desirable soil pH for onion production
ranges from 6.5-7.5. However, onion performs well on soils with
lxxxii

pH of 7.5-7.8, provided high organic matter, nutrients of
nitrogen, phosphorus and available water (Nonnecke, 1989). In
line with this Ayas and Cigdem (2009) obtained maximum yield of
55t ha-1 with soil pH of 8.04. The electrical conductivity of the
soil extract (ECe) indicated that the soil is non-saline. There
is no soil salinity problem in the irrigable areas where the
experimental site was located as the source of irrigation water
is Jarra stream with EC value of 0.121ds/m (Flip, 2003). The
measured average available phosphorus for the experimental site
is 16.92 ppm which is responsive for onion production
(Amarasiri, 1990). The organic matter content of the area is
0.11% which is said to be low and it was supplemented with
artificial fertilizer.
3.3.2. Reference evapotranspiration, crop water
requirement and applied irrigation depth
The reference evapotranspiration (ETo) was calculated based on
the FAO Penman Monteith method (Allen et al., 1998) and estimated
using Cropwat version 8.0 software. For the computation of ETo
lxxxiii

full information of metrological data for the study area were
collected from National Metrological Agency, Kombolcha sub
branch. The climate data were temperature (minimum & maximum),
relative humidity, sunshine hours, wind speed and precipitation
from long serious of data (Appendix A). The crop water
requirement (ETc) over the growing season was estimated from ETo
and estimates of crop evaporation rates expressed as crop
coefficients (Kc) (Allen et al., 1998). It was calculated by
multiplying the reference evapotranspiration value with the
small vegetables crop coefficients given by the Cropwat software
as 0.7 for the initial stage, 0.7<Kc<1.03 for the crop
development stage, 1.03 for the mid season stage and
1.03>Kc>0.96 for the late season stage (eq.1).
The software also demands crop information on crops that is
relevant for irrigation scheduling. The average length of the
growing period of onion crop was taken as 95 days. The length of
establishment stage, vegetative development stage, bulbification
stage and ripening stage were 20, 30, 30, and 15 days (Fig 3.4).
Transplanted date was recorded and average maximum rooting depth
was taken as 45cm. The critical soil moisture level where first
lxxxiv

drought stress occurs affecting crop evapotranspiration and crop
production (critical water depletion fraction (P)) was taken
from Allen et al., (1998) (commonly known as FAO Irrigation and
Drainage paper 56) as 0.3, 0.45 and 0.5 for establishment, bulb
enlargement and ripening stages. As well, crop yield factor
(Ky), factors for the crop sensitivity to water stress was based
on information from the FAO Irrigation and Drainage paper 33 as
0.8, 0.4, 1.2 and 1 for establishment, vegetative development,
bulbification and ripening stages, respectively. Reference
evapotranspiration and crop water requirement of onion is
presented in table 3.8.
Fig. 3.4. Onion developmental stages, its duration days and the
corresponding Kc value.
lxxxv
0.7 0.7<Kc<1.03 1.03 1.03 >Kc>0.96

Allen et al., (1998) indicated the successful estimate of ETo by
observing the water loss from the pan and using empirical
coefficients to relate pan evaporation to ETo. Elliades (1988)
also reported the worldwide realization of pan evaporation based
irrigation scheduling because of its simple and easy
application. Steduto et al. (1996) cited in Maldonado et al. (2006)
explained the overestimating behavior of the Penman-Monteith
model when compared to the lysimeter data in conditions of low
evaporative demand and underestimating in conditions of high
evaporative demand. In consideration of this idea and to obtain
the evaporation rate of the area in particular, class ‘A’ pan
was taken from the Ethiopian Meteorological Agency, Kombolcha
sub branch and set near the experimental site. The evaporation
data was recorded simply by observing the daily water loss from
the pan. In the absence of rain, the amount of water evaporated
during a period (mm/day) corresponds with the decrease in water
depth in that period. When there is rain the amount of
evaporated water was calculated in consideration of the amount
of rainfall added to the pan. The pan evaporation data during
the experiment was described in appendix A, Table A.9.
lxxxvi

Table 3.7. Reference evapotranspiration and crop water
requirement (mm) of onion
Month Decad
e
Sta
ge
Kc ETo ETc ETo ETc Net Irr.
Req.
coef
f
mm/day mm/
day
mm/
dec
mm/dec mm/dec
Feb 1 Ini
t
0.7 3.79 2.65 34.14 23.9 23.9
Feb 2 Ini
t
0.7 4.06 2.84 40.57 28.4 28.4
Feb 3 Dev
e
0.74 4.15 3.07 33.11 24.5 24.5
Mar 1 Dev
e
0.84 4.24 3.56 42.38 35.6 35.6
Mar 2 Dev
e
0.95 4.33 4.11 43.26 41.1 41.1
Mar 3 Mid 1.03 4.36 4.49 47.96 49.4 49.4
Apr 1 Mid 1.03 4.40 4.53 43.98 45.3 45.3
Apr 2 Mid 1.03 4.43 4.56 44.27 45.6 45.6
Apr 3 Lat
e
1.01 4.69 4.74 46.93 47.4 47.4
May 1 Lat
e
0.96 4.95 4.75 34.69 33.3 33.3
Total 374.6 374.6
lxxxvii

For the purpose of calculation of net irrigation water amount
(ETc) obtained from the pan evaporation equation 2, whose
fundamentals are given in Allen et al. (1998) was used. By
considering the local climatic condition (wind speed and
relative humidity) the pan coefficient was taken simply as 0.75
(Allen et al., 1998).
Where: - ETc is the amount of net irrigation water (mm)
Epan is the cumulative evaporation in the
irrigation interval (mm)
Kp is the pan coefficient
Kc is the plant coefficient
The pan evaporation method indicated that ETo and ETc were 1.3%
to 8.4% under estimated by the pan evaporation method from
February to first decade of April and over estimated in the
later periods (Fig. 3.5). Thus, the calculated ETo data (Cropwat
software output) was used for the whole irrigation purposes
lxxxviii

during experimentation. Even though the software output ETc was
used for irrigating the experiment, according to the result
obtained from both methods the total evapotranspiration estimate
over the growing seasons of the crop was 376.2mm and 374.5mm
(Appendex B, Table B.1). Both methods are highly and positively
correlated (R2=0.9148). The pan evaporation method estimated the
value only 0.45% over the Penman-Monteith method which is
insignificant. Therefore, the pan evaporation method estimated
the reference evapotranspiration of the area and can be used
adequately for onion irrigation scheduling.
Figure 3.5. Correlation of reference evapotranspiration (mm/dec)
of the experimental area by using pan evaporation method and
Penman-Montheith model.
During the study period unexpected precipitation were occurred
at different stages of the crop. However, it was well recorded
lxxxix

by using standard rain gauge. Thus, each amount of rainfall was
recorded and the effective precipitation was considered in the
gross irrigation amount during each irrigation water application
(Appendix A, Table A.8). The effective rainfall was calculated
by FAO empirical formula. The total effective rainfall from
beginning to the end of the experiment was 3.6mm. This amount
can be considered as minimum compared to the total water
requirement of onion. The development of the crop can,
therefore, be considered to have depended essentially on the
application of irrigation water. The optimal or ‘no stress’
irrigation was computed by deducting the effective rainfall (if
rainfall available) from the net irrigation requirement of the
crop and then, the depth of water applied to other treatments is
taken simply as percentage of the optimal irrigation at specific
developmental stage or throughout the growing season.
The gross irrigation requirement was computed by adopting a
field application efficiency of 60%. Furrow irrigation
application efficiencies normally vary from 45-60% (Bakker et al.,
1999). Brouwer and Prins (1989) also indicated 60% as irrigation
application efficiency for furrow irrigation. In this
xc

experimental setup, water was applied with accurate measurement;
furrows were short and end-diked. As a result, there was no run-
off and the only loss would be deep percolation which is
expected to be not much in a deficit irrigation practice.
Therefore, a higher value of application efficiency (60%) was
adopted. Then, the overall discharge measurement was done at the
inlet of the supply channel always at the time of irrigation
using bucket method by using eq.3.
Where: - Q is farm channel discharge in l/s.
v is known volume of the bucket.
s is average time taken to fill the bucket.
The amount of water delivered to each treatment was estimated by
the time duration of application irrigation water (eq.4). The
duration of water application for each furrow was calculated
as:-
Where: - t is the water application time (min)
xci

Dap is gross water application depth (mm)
l is furrow length (m)
w is furrow width (m) and
Q is discharge (l/s)
Therefore, according to the required amount of water to be
applied the duration of irrigation at different treatment was
different. The result of time duration per single furrow of full
irrigation condition is indicated in appendix B, table B.2. The
depth of irrigation amounts that were applied for each treatment
per irrigation time is presented in appendix B, table B.3.
Based on the typical practice of the local farmer to irrigate
onion a fixed irrigation interval, six days was selected. Six
days irrigation interval resulted in better yield in the region
(Samson and Ketema, 2007; ARARI, 2008). For one week after
transplanting the irrigation depth of 13.1mm was applied twice
uniformly to all the treatments to favor uniform seedling
establishment. The irrigation treatment was started on 7 Feb,
2010. The total amount of water applied starting from 7 Feb,
2010 to the end of the growing period of the crop (7 May, 2010)
xcii

was 584.2mm. The lowest was applied in treatment level of
25%IIII. Table 3.8 shows the seasonal total water applied for
each treatment at each developmental stage. The table showed
that the highest amount of water was applied during mid season
stage. This is because of the highest crop water need (the
larger Kc value) and relatively longer number of days during
this growing period.
xciii

Table 3.8. Break down of total applied irrigation water (mm) to each
development stages of onion
Treatments
Establishment stage
Veg.development stage
Bulbificationstage
Ripening stage
Totalapplied Water (mm)
100%IIII 82 181 226.4 94.8 584.2
75%IIII 61.5 135.8 169.8 71.1 438.2
50%IIII 41 90.5 113.2 47.4 292.1
25%IIII 20.5 45.3 56.6 23.7 146.3
75%0III 61.5 181 226.4 94.8 563.7
50%0III 41 181 226.4 94.8 543.2
25%0III 20.5 181 226.4 94.8 522.7
75%I0II 82 135.8 226.4 94.8 538.95
50%I0II 82 90.5 226.4 94.8 493.7
25%I0II 82 45.3 226.4 94.8 448.4
75%II0I 82 181 169.8 94.8 527.6
50%II0I 82 181 113.2 94.8 471
25%II0I 82 181 56.6 94.8 414.4
75%III0 82 181 226.4 71.1 560.5
50%III0 82 181 226.4 47.4 536.8
25%IIII 82 181 226.4 23.7 513.1
I indicates full irrigation or the throughout deficit amount of water, 0 indicates the deficit amount of water, and its position indicates the stage in which the treatment applied.
3.3.3. Crop parameters
Plant height, leaf number and bolting
xciv

The height of the plant at the end of each stage was measured
from randomly selected five representative plants. The first,
the second and the third height measurement was taken at the end
of the establishment stage (21-02-2010), vegetative development
stage (23-03-2010), and bulbification stage (30-04-2010). For
all measurements representative plants from the middle ridge of
each treatment was taken. The last height measurement was taken
just before harvest and subjected to statistical analysis. The
number of leaves of representative sample plants of the onion
was counted from randomly selected five plants per plot.
Flowered onion plants in each plot were counted and percentage
of bolting was calculated as number of bolted onions per total
number of onion plants per hectare times hundred.
Fresh biomass, total bulb yield, marketable and unmarketable
bulb yields
Fresh biomass and total bulb yields per plot were measured at
harvest using sensitive balance. Unmarketable yield of onion
bulbs were selected from the total bulb and weight of both
marketable and unmarketable bulb yields were measured for each
plot. (Unmarketable yield here refers to the bulb yield with
xcv

physiological and disease problems including under sized,
splitted, and white colored.)
Average bulb weight bulb diameter and bulb size classification
Just after harvest average bulb weight and bulb diameter of five
representative bulbs were measured randomly from each plot using
sensitive balance and caliper, respectively. The local farmers
were requested for bulb size classification in to small, medium
and big classes. The size of onion bulbs in each plot were
categorized in to big, medium, and small sizes by them and their
respective weight and number of bulbs was recorded.
Harvest index and irrigation water productivity
Harvest index was calculated as the ratio of bulb yield to
biomass yield per hectare and crop water use efficiency was
calculated as the ratio of average bulb yield (Kg ha-1) to total
amount of water used (m3 ha-1).
3.3.4. Statistical analysis
xcvi

Analysis of variance (ANOVA) was made to determine crop
parameter response to irrigation using Genstat and JMP 5
statistical softwares. Means among treatments were compared
using Duncan’s multiple range test. Correlation and regression
analysis were carried out to estimate the relationship between
yield and yield components as affected by the amount of
irrigation water.
Chapter 4. Results and Discussion
4.1. Plant height
The analysis of variance indicated that application of different
irrigation water amount and its application to the different
developmental stages had very high significant (P < 0.001) effect on
plant height of onion. (The mean square table for plant height
is indicated in appendix C, table C.1). The highest mean plant
height was observed from 100%IIII (51.73cm) and the lowest mean
plant height was recorded from treatment 25%IIII (32.6cm).
Compared to 100%IIII treatment, it resulted in 36.9 % height
reduction. The result agreed with the findings of Khan et al.
xcvii

(2005) and Biswas et al. (2003) who reported higher plant height
of onion at shorter irrigation intervals. The effect of
application of deficit irrigation at the vegetative
developmental stage was higher than any other stages. Next to
treatment 25%IIII the second severe height reduction was
observed from treatment 25%I0II (35.07cm). It resulted in 32.2%
height reduction. This might be due to the effect on plant
growth which is associated with its effect on the cell division,
expansion and cell wall synthesis (Mumns, et al., 1998). As the
amount of irrigation water decreases there will be less amount
of RAW for the root and plants exert more energy to absorb
water. Hence, the division and expansion of cell will be lower
which might have resulted in shorter plant height (Mumns, et al.,
1998).
The height measurement taken at the end of developmental stages
of the crop indicated that, application of 25%, 50% and 75%
deficit irrigation at vegetative developmental stage reduce the
height increment by 14.7, 28.3 and 38.6% compared to the
100%IIII, respectively (Fig.4.1). On the other hand, application
of deficit irrigation at the crop establishment stage and
xcviii

ripening stage had little effect. Particularly, application of
deficit irrigation at the ripening stage had no effect on the
height of onion compared to other stages. Plant height was
positively and very highly significantly (P < 0.001) correlated
to fresh biomass (r=0.814) and total bulb yield (r=0.836) of
onion.
Figure 4.1. Plant height (cm) differences in treatments with
time (measurement taken at the end of each developmental stage).
4.2. Leaf number
xcix

Variation in number of leaves indicates the vigorousity of the
crop which is directly related to the potential yield of onion.
Leaf number per plant was very highly significantly (P < 0.001)
different among treatments due to application of deficit
irrigation and its application to the different developmental
stages of the crop and also significant (P < 0.05) due to its
interaction. (The mean square table for leaf number is indicated
in appendix C, table C.1). The highest mean (11.8) leaf number
per plant was obtained from treatment 100%IIII. Treatments that
were irrigated with 50% and 75% of the full irrigation at
establishment, bulbification, and ripening stages, didn’t show
significant difference in their mean leaf number. However, the
leaf numbers in treatment 50%II0I and 75%II0I were slightly
higher than treatment 50%0III and 75%0III. This might be due to
the time difference in application of treatments in which leaf
initiation might cease when bulbing starts (Sinclair, 1982).
Application of deficit irrigation at the ripening stage didn’t
affect mean number of leaves. This result agreed with Mohammed
(2004) who reported that mean leaf number per plant increased
with increasing days after transplanting reaching a maximum at
75 days after transplanting. However, water deficit at any stage
c

might have negative effect on leaf life. The slight leaf number
difference in between treatment 100%IIII and deficit water
treated treatments at the ripening stage might be due to loss of
leaves because of senescence. A decrease in root zone water
potential would result in partial or complete closure of stomata
(Allen et al, 1998; Brewster, 2008)). Continued stomatal closure
triggers photo-oxidative reactions, generating free radicals,
destabilizing membranes that become leaky, releasing cell
contents to the apoplast (Rajasekaran and Blake, 1999)
triggering a sequence of senescence reactions resulting in
desiccation. The lowest leaf number was observed from treatment
25%IIII which was 37% lower than treatment 100%IIII. The reason
for decreased number of leaves per plant with increased in water
deficit could be due to the influence of moisture on the rate of
leaf initiation and the leaf life. This result agrees with the
results of Khan et al. (2005) and Biswas et al. (2003) who reported
significant increment in leaf number per plant with decreased %
TAW depletion. The reduced number of leaves in these treatments
might be the reason for their low amount of bulb yield with high
number of small bulbs. Because, leaf number was positively and
ci

very highly significantly (P < 0.001) correlated to fresh biomass
(r=0.752) and total bulb yield (r=0.760) of onion.
4.3. Fresh biomass yield
Application of different amount of irrigation water either
throughout the developmental stages or at the specific
development stages of onion had a significant effect (P < 0.001) on
fresh biomass of onion (Appendix C, table C.2). The fresh
biomass of treatment 100%IIII was the highest (31.5t ha-1) (Table
4.1). However, it was not statistically different from treatment
of 75%0III (28.9t ha-1), 75%III0 (28.1t ha-1), 75%I0II (25.1t ha-
1) and 50%III0 (24.4t ha-1). Next to these treatments, the fresh
biomass obtained from treatment 75%IIII (24.0t ha-1) was higher
than the rest irrigation treatments. The lowest fresh biomass
was obtained from treatment 25%IIII (7.2t ha-1) followed by
treatment 25%II0I (9.6t ha-1). The result indicated that as the
amount of irrigation water increased from 75% deficit to full
irrigation, the fresh biomass yield also increased linearly
(Fig.4.2). The result is in line with Ayas and Cigdem (2009) and
Pandy et al. (2001) who reported the linear relationship between
cii

amount of irrigation water and biomass production. Even if the
linear relationship was true the additional fresh biomass due to
the additional water used in fully irrigated treatment was
insignificant compared to the amount of water saved by
treatments 75%0III, 75%III0, 75%I0II and 50%III0.
EMBED Excel.Sheet.8
y = 0.233x -104.0R² = 0.973
0
5
10
15
20
25
30
35
510 520 530 540 550 560 570 580 590
ciii
Fres
h bi
omas
s yi
eld
(t/h
a)
Fres
h bi
omas
s yi
eld
(t/h
a)
Fres
h bi
omas
s yi
eld
(t/h
a)
Fres
h bi
omas
s yi
eld
(t/h
a)
applied irrigation depth (mm) throughout the crop stages

EMBED Excel.Sheet.8
y = 0.116x -36.93R² = 0.973
0
5
10
15
20
25
30
35
400 450 500 550 600
Water deficit during establishment and ripening stages had
insignificant effect on the fresh biomass of the crop. It
resulted in a yield reduction of 8.2% and 10.8% in treatment
civ
applied irrigation depth (mm) at ripeningstage
applied irrigation depth (mm) at veg. development stage applied irrigation depth (mm) at bulbification stage
Fres
h bi
omas
s yi
eld
(t/h
a)
Fig. 4.2. Relation between fresh biomass (t ha-1) yield and thecorresponding applied irrigation depth (mm) throughout and at

75%0III and 75%III0, respectively. The lower the yield reduction
at establishment stage might be attributing to its ability to
partially recover from the effect of early water stress. Pandy et
al. (2001) obtained sufficient above ground biomass in wheat when
it was imposed for water deficit at the earlier growth stage.
The lower the yield reduction at the ripening stages might be
attributed to low water requirement of the crop late in the
ripening stage.
The result revealed that vegetative developmental and bulb
enlargement stage is the most susceptible stages for moisture
stress that water deficit at these stages significantly reduce
fresh biomass of onion. As compared to 100%IIII, treatment
25%I0II and 25%II0I encountered 69.5% and 53.01% fresh biomass
reduction, respectively. Even, treatment 75%II0I and 75%I0II
encountered yield reduction of 31.4% and 20.3%, respectively
which is by far higher than the yield reduction caused by the
water deficit at establishment and ripening stages of onion.
This is similar to Bazza and Tayya (1999) who reported stressing
the crop during bulbification stage reduces the yield
significantly than stressing the crop during establishment and
cv

ripening stages. Fresh biomass weight was positively and very
highly significantly (P < 0.001) correlated to total bulb yield
(r=0.970) of onion.
4.4. Total bulb yield
Total bulb yields were very highly significantly affected by
deficit irrigation water applications (P < 0.001) either
throughout the crop development stages or application at the
specific development stage of onion. Interaction effect of water
deficit and crop developmental stages was also very highly
significant (P < 0.001) for the reduction of total onion bulb
yield (Table 4.1). The mean square value for total bulb yield is
presented in appendix C, table C.2. Application of full
irrigation increased total bulb yield to 26.2t ha-1. However, it
was statistically the same with treatment 75%0III, 75%III0 and
treatment 50%III0 with a total bulb yield of 25.8, 26 and 23.9t
ha-1, respectively. This means, the additional irrigation water
(205, 237, 474m3 ha-1, respectively) consumed by this treatment
didn’t bring significant additional bulb yield. Treatment
75%IIII resulted in 20.09% bulb yield reduction. However, it had
cvi

9.4%, 17.4%, and 53.68% bulb yield increment over treatment
50%0III, 75%II0I and 50%IIII, respectively. In terms of water
productivity 20.09% yield reduction was insignificant that the
saved water from this treatment can produce 7.97% bulb yield
over treatment 100IIII. Even though, the water saved in
treatment 25%IIII was the highest, its impact on yield was more
severe. The yield loss in this treatment was 85.44% which was
hard to compensate with the saved water.
The finding revealed that the total bulb yield loss due to
moisture stress was linear. Similarly, linear relationship was
observed between irrigation water with yield (R2=0.97) in green
house experiment (Ayas and Sigdem, 2009). Lemma and Shimelis
(2003) also observed yield increment from 12.9 to 17t ha-1 as the
amount of water applied increased from 3 to 7cm depth. The
significant effect of irrigation water application was reported
by many researchers (Biswas et al., 2010; Faten et al., 2010; Orta
and Ener, 2001; Kumar, et al., 2007; Ayas and Sigdem, 2009; Lemma
and Shimelis, 2003). The improvement of total yield response to
high amount of total water application could be attributed to
the enhancing effects of water to crops biological functions and
cvii

growth in addition to the improving effects of water on nutrient
availability.
The results of analysis of variance for total bulb yield also
showed that there was highly significant (P < 0.001) difference
among the sensitivity of crop developmental stages to moisture
stress. In contrast to Urrea et al. (2003), in which the highest
garlic bulb yield was obtained from no water restriction during
the ripening period, water deficit at the establishment and
ripening stages of onion brought the highest bulb yield than the
other crop stages. Water deficit imposed during bulbification
stage and vegetative development stage resulted in highly
significant yield reduction. A yield reduction of 37.8% and
32.5% were recorded for these stages, respectively. While 17.1%
and 12.8% yield reduction were associated with water deficit
applied during the establishment and ripening stages of onion,
respectively. The result is in agreement with Van Eeden and
Mybungh (1971) which showed that water stress imposed late in
the season reduced onion total bulb yield by 15%. From deficit
irrigation experiments on vegetables and cereals, it was found
that lowest yield is obtained during 75% deficit throughout the
cviii

growing season; however, stressing the crops during
establishment and ripening stage of the growing season does not
affect the crop yield significantly (Bazza and Tayaa, 1999).
Irrigation water deficit applied at different developmental
stages had different effect on bulb yield of onion (Table 4.1).
Severe yield reduction was brought by treatment 25%II0I (6.9t
ha-1). It caused about 73.5% yield reduction compared to
100%IIII. This indicates that bulbification stage is the most
sensitive stage for moisture deficit. The highest the yield
reduction at this stage is in agreement with many authors
(Samson and Ketema, 2007; Yenesew and Tilahun, 2009; Singh and
Aldefer, 1996). This period coincides with the highest water
requirement and the crop cannot withstand water deficit without
substantial reduction on yield. Dragland (1974) also reported
that three weeks long water stressed onion in early
developmental stage reduced onion yield more than when imposed
near the end of the growing season. The higher the total bulb
yield reduction at vegetative developmental stage might be
associated with reduction of leaf expansion which can result in
poor net photosynthetic capacity of plants. On the other hand,
cix

water deficit during establishment and ripening stage had a
limited effect on yield. The less sensitivity of onion at the
initial stage might be attributed to its fast compensation
capability for the early water stress. Asseng et al. (1998)
indicated that water uptake rate increased quickly after
rewetting and exceeded the uptake rate of the non stressed
treatment at about 2-3 weeks after the deficit is released.
The yield reduction from treatment 75%0III and 75%III0 was
insignificant compared to the yield obtained from 100%IIII. The
yield reduction caused by treatment 75%III0 was almost nil,
which is only about 0.8% reduction. But the amount of irrigation
water consumed by this treatment is 4% less than the water
consumed by 100%IIII. While greater than 25% deficit irrigation
at the mid and vegetative developmental stages caused a yield
reduction that was equivalent with 50% and less irrigation water
application throughout the crop growth stages.
cx

4.5. Marketable and unmarketable bulb Yields
The ANOVA on marketable yield of the treatments indicated the
very high significant effect (P<0.001) of variation in irrigation
water amount either throughout the whole growing season or at
specific phenological stage of the crop (Appendix C, Table C.2).
Unlike the yield components, the increase in irrigation water
amount didn’t increase marketable yield of onion proportionally
(Table 4.1). Even though, the highest (21.5t ha-1) marketable
bulb yield was obtained from treatment 100%IIII, it accounted
marketable bulb yield loss of 17.9%. This value was greater
compared to 9.6%, and 12.9% yield loss of treatment 75%III0 and
treatment 50%III0, respectively. Compared to its total bulb
yield the highest marketable yield loss was occurred from
treatment 25%II0I (59.9%) and 25%IIII (47.3%). Even though, the
water saved in these treatments was the highest, its impact on
marketable bulb yield was more severe. Compared to 100%IIII, the
loss recorded in these treatments was 66.5% and 62.9%,
respectively. This might be due to the large number of small and
immature bulbs introduced due to the water stress.
cxi

Interaction effect of water deficit and crop development stages
was also very highly significant (P < 0.001) for the variation of
marketable yield. Application of 25% deficit irrigation at the
ripening stage of the crop increased marketable bulb yield of
onion by 9.3% over the control. The marketable bulb yield
obtained from 100%IIII was not statistically significantly
different from treatment 75%0III (20.6t ha-1), 75%III0 (23.5t ha-
1), and 50%III0 (20.8t ha-1). This result disagreed with the work
of Singh and Aldefer (1996) that soil water stress at any
developmental stages leads to reduction of marketable yield. But
it is in line with ARARI (2008) that as the amount of applied
irrigation water increases, the amount of marketable yield will
decrease due to the increase in unmarketable yield components
like split, decay and bolt. Therefore, application of full
irrigation water at the ripening stage of onion doesn’t
necessarily increase marketable bulb yield.
cxii

Table 4.1. Amount of water, developmental stages and their
interaction effects on fresh biomass, total bulb yield,
marketable and unmarketable bulb yield of onion.
Treatments
Fresh
biomass
Total bulb
Yld Mrk Yld Unmrk Yld
100%Irr 31.5a 26.17a 21.52a 4.78b
75%Irr 24.89b 21.6b 18.45b 3.65ab
50%Irr 20.35c 17.28c 13.99c 3.55a
25%Irr 12.75d 10.21d 7.77d 3.15a
LSD0.05 11.897 1.319 1.376 0.853Throught 20.07b 16.13b 12.77a 3.37
Establish 25.48a 21.57a 17.11b 4.23
Veg.dev. 21.72b 17.54b 15.23b 3.88
Bulbifn 20.17b 16.17b 12.12a 3.8
Ripening 25.03a 22.67a 19.93c 3.64
LSD0.05 2.121 1.474 1.538 NSInteraction effect of irrigation amount and
growth stage of the crop
100%IIII 31.5a 26.2a 21.5ab 4.8a
75%0III 28.9ab 25.8a 20.6abc 5.2a
75%III0 28.1ab 26a 23.5a 2.5ef
75%I0II 25.1abc 20.2cd 17.5bcd 2.8cdef
50%III0 24.4abcd 23.9ab 20.8abc 3.1bcde
75%IIII 24.0bcd 20.9bc 16.7cde 4.2abcd
50%0III 23.3cd 19.1cde 15.1def 3.7abcd
50%I0II 22.3cd 17.7def 12.8efg 4.7a
75%II0I 21.6cde 17.8def 13.9ef 3.8abcd
cxiii

25%III0 19.4de 18.6cdef 14.2ef 4.4abc
50%II0I 17.9de 13.9fg 10.4gh 3.6abcde
25%0III 17.4def 15.2efg 11.8efg 3.17abcde
50%IIII 16.8ef 13.6fgh 10.9fgh 2.7def
25%I0II 14.8fg 11.1hi 7.9hi 3.2abcde
25%II0I 9.6gh 6.9ij 2.9ij 4.0abcde
25%IIII 7.2h 3.8j 2j 1.8f
LSD0.05 4.243 2.948 3.077 1.05CV (%) 11.1 9.2 12.1 30.4
Mrk = Marketable, Unmrk = Unmarketable, Yld = Yield, NS = Non significant, Means in the same column followed by the same letter are not significantly different at P < 0.05, I indicates full irrigation or the throughout deficit amount of water, 0 indicates the deficit amountof water, and its position indicates the stage in which the treatment applied.
The effect of the amount of irrigation water applied was highly
significant (P < 0.01) for unmarketable yield. But, there was no
statistically significant effect among its application to the
specific developmental stages of the crop and its interaction.
However, there was slight difference among them. Deficit
irrigation water application at the initial stage recorded the
highest unmarketable bulb yield than the other crop stages. In
contrast, application of deficit irrigation at the ripening
stage reduce unmarketable bulb yield.
Application of full irrigation at the ripening stages resulted
in the highest unmarketable bulb yield than the rest irrigation
cxiv

amounts (100%IIII (18.3%) and 75%0III (19.3%)). Similarly,
ARARI (2008) found that irrigating 30mm per four and seven days
irrigation interval gave high unmarketable bulb yield than ten
and thirteen days irrigation interval. This is because as the
amount of applied irrigation water increases the amount of
unmarketable yield components, like split, decay and bolt
increases.
4.6. Average bulb weight
The results of analysis of variance showed that there was very
highly significant (P < 0.001) different effect among the
different irrigation water applications, its application to
specific developmental stages and their interaction (P < 0.01) on
average bulb weight per plant (Appendix C, table C.3 and table
4.2). The average bulb weight of onion increased from 51.3%
(treatment 25%IIII) to 84.2% (treatment 75%IIII) as the amount
of water used by the plant increased from 25% to 75% of the full
irrigation. In between these, 35% of bulb weight reduction
occurred due to half of the full irrigation water application
(treatment 50%IIII). Unit bulb weight increased linearly with
cxv

increasing applied water (Hanson et al., 2003). In line with this
Al-Harbi (2002) also indicated the increase in average bulb
weight at higher level of irrigation water. Application of 25%
deficit irrigation throughout the plant growth stages (treatment
75%IIII) resulted in 15.8% bulb weight reduction compared to the
control which was better than 75% water deficit at any stage as
well as 50% and 75% water deficit throughout the crop
phenological stages. Water deficit at the bulbification stage of
the crop resulted in less average bulb weight than the other
stages (51.05g in treatment 25%II0I, 62.07g in treatment
50%II0I, and 69.8g in treatment II0I). The highest average bulb
weight was obtained from treatment 100%IIII. However, it was
statistically the same with treatment 75%I0II (94.3g), 75%III0
(89.6g), 75%0III (96.9g) and 50%0III (91g). This result
disagreed with the finding of Urrea et al. (2003). The authors
found a significant effect on bulb size of garlic when the
amount of water varied at the ripening stage. Application of 25%
deficit irrigation at the initial stage of onion had only 3.7%
bulb weight reduction, while 49% bulb weight reduction was
observed in application of 75% deficit at the bulbification
stage (treatment 25%II0I). The finding indicated that
cxvi

application of deficit irrigation at the initial stage has less
effect on bulb weight of onion than other stages. Average bulb
weight was very highly significantly (p < 0.001) and positively
correlated with leaf number(r=0.692) and plant height (r=0.750).
Table 4.2. Amount of water, developmental stages and their interaction effects on mean bulb weight of onion
Irrigatio
ns
Av.bulb wt.
(gm) Plant sages
Av.bulb wt.
(gm)
25% irr 58.28d Establishment 87.38b
50%irr 75.51c Veg. develop 83.66b
75% irr 86.86b Bulbification 70.73a
100% irr 101.2a Ripening 85.82b
Throughout 74.75a
LSD0.05 4.46 LSD0.05 4.99
Interaction effect of plant stage
and water amount
Plant stages
Veg.dev
t Estabt Ripen Bulbfn Throughout
25%irr 57.9fg 62.3efg
69.1def
g 51.0g 51g
50%irr 80.3cde 91abc 79.3cde 62.1efg 64.8efg
75%irr 94.3abc 96.93abc 89.6abc 69.8def 83.7bcd
Full irr 102.07a 99.27a 101.2a 100a 99.5a
LSD0.05 9.98
CV(%) 7.5
cxvii

Means in the same column followed by the same letter are notsignificantly different at p < 0.05, LSD = Least significant difference, CV = coefficient of variation
4.7. Bulb diameter
Differences in mean bulb diameter per plant due to differences
in amount of irrigation water application were very highly
significant (P < 0.001) (Appendix C, Table C.3). It resulted in
maximum and minimum bulb diameter of 6.6cm in treatment 100%IIII
and 3.5cm in treatment 25%IIII, respectively (Table 4.3). A
significant bulb diameter increment with increasing of
irrigation water also mentioned in Al-Harbi (2002), Orta and
Sener (2001) and Kumar et al. (2007). The best yields were
recorded from the highest irrigation amount associated with the
higher percentage of bulbs having diameter greater than 45 mm
(Kumar et al., 2007). Application of 25% deficit irrigation
throughout the crop stages resulted in only 8.1% bulb diameter
reduction compared to the other amounts. Severe reduction (47%
bulb diameter reduction) was occurred in treatment 25%IIII.
Bulbing involves the swelling of leaf sheaths and thickening of
cxviii

leaf sheaths occurs as a result of lateral expansion of cells.
High water deficit might have decreased the expansion of leaf
sheath cells. Average bulb diameter was very highly
significantly (P < 0.001) and positively correlated with leaf
number (r=0.678). Thus, the larger bulb diameter with increased
irrigation amount could also be attributed to the higher amount
of light intercepted by leaves which result in higher assimilate
production as the result of high number of leaves and the
partitioning of this assimilate to bulb.
There was also high significant difference (P < 0.01) in average
bulb diameter with plant growth stages in response to the amount
of irrigation water. Water stress created at bulbification stage
caused the highest bulb diameter reduction compared to other
crop stages. Particularly, 50% and less amount of irrigation
water application at the bulbification stage strongly affect
bulb diameter of onion (24.5%) compared to 14.4%, 17.6% and
16.8% bulb diameter reduction by the same amount of irrigation
at establishment, ripening and vegetative developmental stages,
respectively.
cxix

Table 4.3. Amount of water, developmental stages and their
interaction effects on mean bulb diameter of onion bulbs
Irrigatio
ns
Av. bulb
diameter (cm) Plant sages
Av. bulb
diameter (cm)
25% irr 6.56a Establishment 5.9b
50%irr 5.87b Veg. develop 5.62ab
75% irr 5.34c Bulbification 5.31a
100% irr 4.6d Ripening 5.74ab
Throughout 5.37a
LSD0.05 0.301 LSD0.05 0.337
Interaction effect of plant stages and
irrigation amount
Plant stages
Veg.devt Estabt Ripen Bulbfn Throughout
25%irr 4.6def 5.6abcd 5.1cde 4.2ef 3.5f
50%irr 5.4abcd 5.6abcd 5.5abcd 4.9cde 5.3bcde
75%irr 5.8abcd 5.9abc 5.8abcd 5.6abcd 6.1abc
Full irr 6.4a 6.5a 6.4a 6.6a 6.5a
LSD0.050.674
CV (%) 7.3
Means in the same column followed by the same letter are notsignificantly different at p < 0.05, LSD = Least significantdifference, CV = coefficient of variation
cxx

4.8. Weight and Number of Bulbs for Bulb Size Classes
The ANOVA on weight of different bulb size classes indicated
that there was very highly significant difference (P < 0.001) for
bigger and medium size bulbs among treatments (Appendix C, Table
C.4). Figure 4.4 shows the picture for each graded bulb size
classes. The analysis of variance indicated that as the amount
of irrigation water increased the weight of bigger bulb class
also increased (Table 4.4). The highest bigger bulb yield was
obtained from treatment 100%IIII and the least was from
treatment 25%IIII. The bulb yield of bigger class obtained from
treatment 75%IIII was 7.07t ha-1. Its rank was best next to
treatment 75%0III (11.2t ha-1), 75%III0 (12.6t ha-1), 50%III0
(9.2t ha-1) and 100%IIII (12.4t ha-1). Treatment 100%IIII and
75%III0 were significantly higher than any other treatments. The
lowest bigger bulb size in terms of weight and number was found
from treatment 25%IIII (0.6t ha-1). Compared to the check
(100%IIII), the reduction for this bulb class in this treatment
was almost 95% followed by 86.3% big size bulb yield reduction
from treatment 25%II0I. Since bulb size classification was done
by the local farmers, the number of bigger class onion bulbs per
cxxi

unit weight was not significantly different for all treatments.
Therefore, weight of the bulb yield obtained from each treatment
was proportional to its number.
The weight of medium bulb size obtained from the experiment
followed the same trend as the weight of the big size class. The
highest medium size bulb yield weight was obtained from 100%IIII
(10.63t ha-1) and the least was from treatment 25%IIII (1.97t ha-
1). Big and medium size bulb yields were also significantly high
as the control in treatments 75%IIII (7.9t ha-1), 75%0III (8.4t
ha-1), 50%0III (7t ha-1), 75%III0 (9.7t ha-1), 50%III0 (8.2t ha-1),
and 25%III0 (7.1t ha-1). From these treatments, treatment
75%IIII consumed 25% less water than treatment 100%IIII and gave
reasonable amount of big and medium size bulbs. The amount of
saved water as well as the reasonable amount of bigger and
medium bulbs of this treatment made it one of the best
alternatives. Most of the treatments that were subjected for 50%
and 25% water deficit either at the establishment stage or at
the ripening stage respond well for medium size bulb. Mart´ın
de Santa Olalla et al. (2004) indicated the significant weight
percentage increment of 75 to 90 mm sizes as the water dose
cxxii

increases at ripening stages. In contrast, this finding
indicated water deficit at the establishment and ripening stage
of the crop had less effect on bulb sizes relative to the effect
of water deficit created on the other two stages. The evidence
from the experiment is that 25% deficit irrigation water
application throughout the whole growing season, 50% and 25%
deficit water application either at the establishment period or
at the time of ripening of onion gave reasonable amount of
desirable bulb sizes.
The ANOVA result on small size bulbs indicated that there was
very highly significant difference (P < 0.001) between small size
bulbs among treatments (Appendix C, table C.4 and table 4.9).
Figure 4.3 indicates the weight of bigger and small size bulb
classes for each treatment. The effect of the treatment on mean
bulb weight of onion was statistically not different. However,
the corresponding numbers of small bulbs obtained in 25%IIII and
25%II0I treatment were 214.9% and 213.2% greater than small
bulbs obtained in full irrigation application, respectively. The
number of small bulbs obtained from the throughout water deficit
was significantly higher than the full irrigation. This means
cxxiii

that full stress throughout the crop phenological stages can
increase the number of small bulbs at the expense of big and
medium size bulbs. The deficit irrigation water application at
vegetative development and bulbification stages also highly
increase the number of small bulbs than the other two stages.
Figure 4.3. Weight of bigger and small size bulb classes per
treatment
cxxiv

Small size bulb Medium size
bulb Bigger size bulb
Figure 4.4. Bulb sizes classified as small, medium, and bigger
size.
Table 4.4. Weight of each bulb size classes and their
corresponding numbers as affected by irrigation amount,
developmental stage of the crop and their interaction.
Treatments Big size bulbs Med. size bulbs
Small size
bulbs
Irrigation
s
Weight
(t ha-
1) No*1000
Weight
(t ha-
1) No*1000
Weigh
t (t
ha-1)
No*100
0
100% 12.47a 114.6d 10.63d 138.3c 3.29a 73.7a
75% 9.05b 72.84c 7.95c 115.9b 5.34ab 139.4b
50% 6.11c 72.84b 6.09b 99.6b 5.61c 171.6c
25% 3.5d 72.84a 3.97a 69.3a 4.09ab 216.4d
cxxv
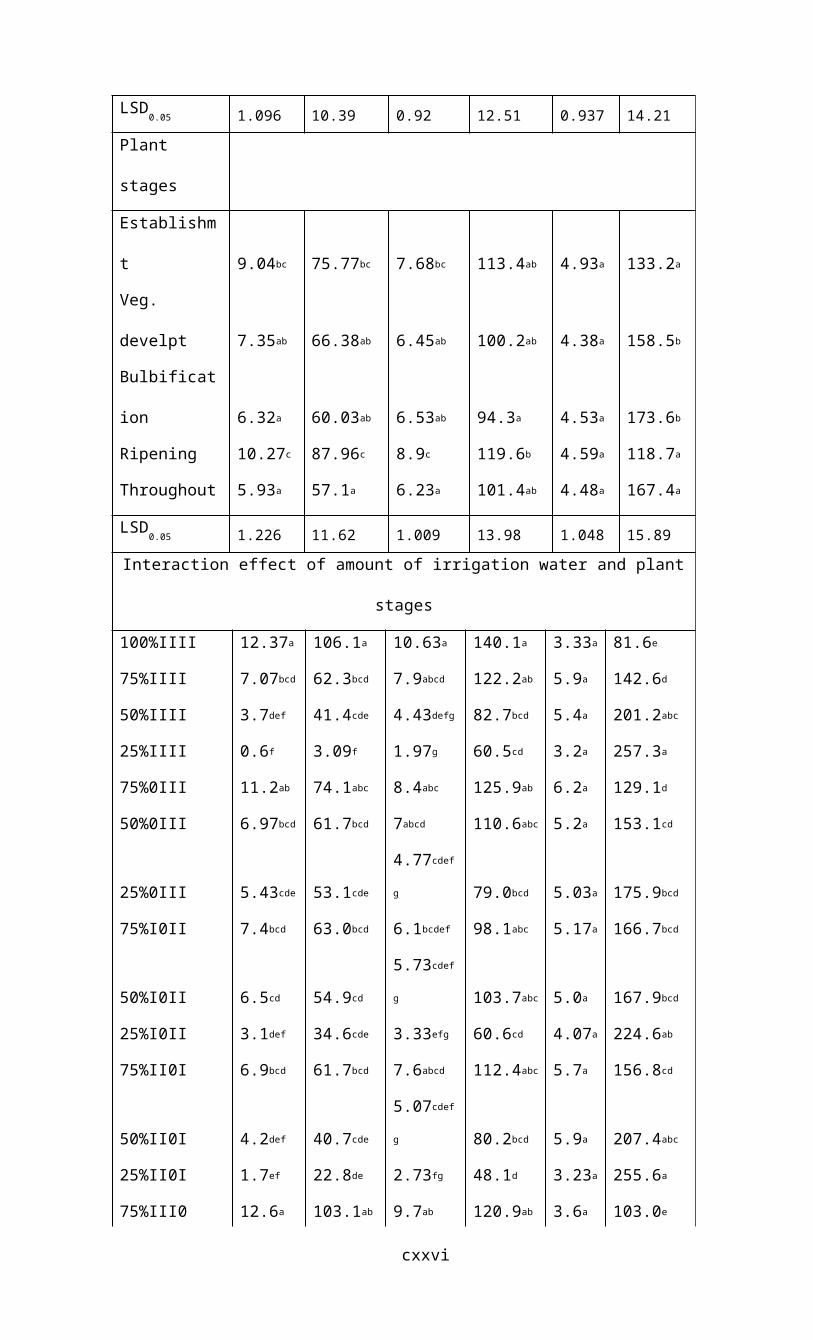
LSD0.05 1.096 10.39 0.92 12.51 0.937 14.21
Plant
stages
Establishm
t 9.04bc 75.77bc 7.68bc 113.4ab 4.93a 133.2a
Veg.
develpt 7.35ab 66.38ab 6.45ab 100.2ab 4.38a 158.5b
Bulbificat
ion 6.32a 60.03ab 6.53ab 94.3a 4.53a 173.6b
Ripening 10.27c 87.96c 8.9c 119.6b 4.59a 118.7a
Throughout 5.93a 57.1a 6.23a 101.4ab 4.48a 167.4a
LSD0.05 1.226 11.62 1.009 13.98 1.048 15.89
Interaction effect of amount of irrigation water and plant
stages
100%IIII 12.37a 106.1a 10.63a 140.1a 3.33a 81.6e
75%IIII 7.07bcd 62.3bcd 7.9abcd 122.2ab 5.9a 142.6d
50%IIII 3.7def 41.4cde 4.43defg 82.7bcd 5.4a 201.2abc
25%IIII 0.6f 3.09f 1.97g 60.5cd 3.2a 257.3a
75%0III 11.2ab 74.1abc 8.4abc 125.9ab 6.2a 129.1d
50%0III 6.97bcd 61.7bcd 7abcd 110.6abc 5.2a 153.1cd
25%0III 5.43cde 53.1cde
4.77cdef
g 79.0bcd 5.03a 175.9bcd
75%I0II 7.4bcd 63.0bcd 6.1bcdef 98.1abc 5.17a 166.7bcd
50%I0II 6.5cd 54.9cd
5.73cdef
g 103.7abc 5.0a 167.9bcd
25%I0II 3.1def 34.6cde 3.33efg 60.6cd 4.07a 224.6ab
75%II0I 6.9bcd 61.7bcd 7.6abcd 112.4abc 5.7a 156.8cd
50%II0I 4.2def 40.7cde
5.07cdef
g 80.2bcd 5.9a 207.4abc
25%II0I 1.7ef 22.8de 2.73fg 48.1d 3.23a 255.6a
75%III0 12.6a 103.1ab 9.7ab 120.9ab 3.6a 103.0e
cxxvi

50%III0 9.2abc 77.2abc 8.2abcd 120.9ab 6.5a 128.4de
25%III0 6.7bcd 55.6cd 7.1abcde 98.1abcd 4.93a 171.6bcd
LSD0.05
2.451 23.24 2.018 27.97 2.096 31.78
CV (%) 19.1 20.2 17 16 27.7 12.8
Means in the same column followed by the same letter are notsignificantly different at p < 0.05 I indicates full irrigation or thethroughout deficit amount of water, 0 indicates the deficit amount ofwater, and its position indicates the stage in which the treatmentapplied.
The number of small bulbs in treatment 75%IIII were reduced by
44.5% and 29.1% compared to the 75% and 50% deficit water
application, respectively. Particularly, treatment 25%II0I
resulted in 213%, 79.2%, 95.3% and 142% increment in number of
small bulbs over treatments 100%IIII, 75%IIII, 75%0III and
75%III0, respectively. While treatment 25%I0II resulted in
192.4%, 57.1%, 71.1%, and 112.1% increase in number of small
bulbs over treatments 100%IIII, 75%IIII, 75%0III and 75III0,
respectively. This indicates water stress applied at
bulbification stage of the crop could increases number of small
bulbs than any other stages of the crop followed by stress at
vegetative stages. In line with this Mart´ın de Santa Olalla et
al. (2004) found that water restrictions at the development and
bulbification stages increase the weight percentage of small
bulbs (< 60mm sizes).
cxxvii

4.9.Bolting
Bolt development in onion needs low temperature (9-17oC) with an
adequate moisture supply. In Upper Awash region of Ethiopia,
September to February supplemented with low humidity is good
condition for flower stalk emergency (Lemma and Herath, 1994).
The experimental period might be the reason that the number of
bolted onion in the experiment was low in general. However, the
maximum number of bolted onion was obtained from treatment
100%IIII (6132 bolts ha-1) and the lowest was from treatment
25%IIII (647 bolts ha-1). In the order of percentage of bolting
1.8%, 0.75%, 0.38% and 0.2% of the onion plants got bolting in
treatment 100%IIII, 75%IIII, 50%IIII, and 25%IIII. Treatment
25%IIII reduced bolting problem 80% over treatment 100%IIII.
Application of deficit irrigation late in the season also
significantly reduce bolting problem. Almost for all the
treatments the trend of bolting was linear with the amount of
irrigation water (Fig.4.5). As the amount of irrigation water
increased bolting was also increased. This finding is in
agreement with ARARI (2008) that as the irrigation frequency
increased bolting also increased. This indicates that by
cxxviii

applying deficit irrigation it is possible to control bolting
problem. On the other hand, for the purpose of seed production
full irrigation at ripening stage of the crop might increase
flowering of onion that deficit irrigation late in the ripening
stage decrease percentage of bolting.
Figure 4.5. Percentage of bolted onion plants per treatment
4.10. Harvest Index
As harvest index is the ratio of bulb yield to biomass yield, it
signify physiological ability of a crop to convert proportion of
cxxix

dry mater into economic yield, thus the higher the harvest index
the more productive efficiency of a crop (Evans, 1993). The
results of analysis of variance showed that there was very
highly significant (P < 0.001) difference among the different
irrigation water applications, its application to each
developmental stages and their interaction (P < 0.01) on the
harvest index of the crop. The highest harvest index was
obtained from treatment 50%III0 (97.7%). This value is much
higher than the average harvest index of onion which is 70-80%
(Brewster, 2008). This might be due to the senescence of plant
parts other than the bulb. Brewster (2008) indicated that the
percentage of total weight in the bulb continue to increase
after the optimum time for harvest (80% of plants have soft neck
and 80% of the shoot weight is in the bulb). The finding
indicated that application of 25% deficit irrigation throughout
the crop phonological stages increase the harvest index of onion
by 7.07% over the throughout full irrigation. The minimum
harvest index (52%) was obtained from the treatment 25%IIII. The
water stress in this treatment reduced the harvest index by
36.5%. Application of deficit irrigation at the ripening stage
of the crop increased the harvest index of onion from 12.8 %
cxxx

(treatment 75%III0) to 19.4% (treatment 50%III0) over 100%IIII.
On the other hand water deficit greater than 25% of the full
irrigation at bulbification stage of onion significantly reduces
its harvest index.
4.11. Crop water productivity
Crop water productivity (CWP) in terms of total fresh bulb yield
and marketable yield was estimated by dividing total fresh tuber
yield to the total irrigation water applied, and marketable
yield to the total irrigation water applied, respectively. The
highest CWP in terms of total bulb yield was obtained from
treatment 75%IIII (4.77 kg/m3) followed by treatment 50%IIII
(4.66kg/m3), 75%III0 (4.64kg/m3) and 75%0III (4.58kg/m3) (Table
4.6). Deficit irrigation water applications increased the CWP of
onion by 6.47% in treatment 75%IIII, 3.92% in treatment 50%IIII,
2.16% in treatment 75%0III and 3.54% in treatment 75%III0. This
indicates that more water was saved by producing more bulb yield
per m3 of applied water in relative to the 100%IIII irrigation
water application. This finding agreed with Samson and Ketema
cxxxi

(2007), Heping (2003), Salkini and Oweis (1993), Ouda et al.
(2010), Yenesew and Tilahun (2009).
Treatment 75%IIII consumed 25% less water as compared to
100%IIII, though; yield was reduced by 20.5% (5.3t ha-1). If the
saved water is used to produce onion at the same irrigation
scheduling, it will produce bulb yield of 6.97t ha-1. And this
exceeds the loss of onion bulbs occurred due to deficit
irrigation by 1.67t ha-1. This implies that it can bring 7.97%
area of land in to production and increasing the irrigated area
with the saved water would compensate for any yield loss.
Table 4.5. Actual yield loss, saved water and net yield
gain/loss as compared to the calculated yield.
Totalbulbyield
Yieldloss
Waterused
Savedwater
Calculatedyieldfromthesavedwater
Netyieldgain/loss
Extralandthatcan beirrigated fromthe
cxxxii

savedwater
Treatment
s t ha-1
t ha-
1 m3/ha m3/ha t ha-1 t ha-1 %
100%IIII 26.2 5842 0
75%IIII 20.9 5.3 4381.5 1460.5 6.97 1.67 7.97
50%IIII 13.6 12.6 2921 2921 13.60 1.00 7.35
25%IIII 3.8 22.4 1463 4379 11.37 -11.03
75%0III 25.8 0.4 5637 205 0.94 0.54 2.09
50%0III 19.1 7.1 5432 410 1.44 -5.66
25%0III 15.2 11 5227 615 1.79 -9.21
75%I0II 20.2 6 5389.5 452.5 1.70 -4.30
50%I0II 17.7 8.5 4937 905 3.24 -5.26
25%I0II 11.1 15.1 4484.5 1357.5 3.36 -11.74
75%II0I 17.8 8.4 5276 566 1.91 -6.49
50%II0I 13.9 12.3 4710 1132 3.34 -8.96
25%II0I 6.9 19.3 4144 1698 2.83 -16.47
75%III0 26 0.2 5605 237 1.10 0.90 3.46
50%III0 23.9 2.3 5368 474 2.11 -0.19
25%III0 18.6 7.6 5131 711 2.58 -5.02
I indicates full irrigation or the throughout deficit amount of water,0 indicates the deficit amount of water, and its position indicates the stage in which the treatment applied
Salkini and Oweis (1993) found that supplementing only 50% of
the rain fed crop irrigation requirement reduce crop yield only
by 10-20% relative to full irrigation. Using the saved 50% to
irrigate an equal area gives a much greater return in the total
production. Treatment 50%IIII, 75%0III, and 75%III0 consumed
50%, 3.5% and 4.1% less water as compared to the check. Though
cxxxiii

yield was reduced by 47.9 % (12.6t ha-1), 1.8% (0.4t ha-1), and
1.1% (0.2t ha-1), respectively (Table 4.5). If the saved water
from these treatments is used to produce onion, it will produce
13.6, 0.94, and 1.1t ha-1 of bulbs and would have brought a net
yield of 1.0, 0.54 and 0.9 t ha-1, respectively. This suggests
that increasing the irrigated area with the saved water would
have brought 7.35, 2.09 and 3.46% area of irrigated land. These
verify that following such deficit irrigation scheduling under
limited water supply will have a paramount importance in
bringing more land under cultivation and so more beneficiaries.
cxxxiv

Figure 4.6. Yield loss due to water deficit and yield gain from
the saved water
The least CWP was recorded from treatment 25%II0I (1.67kg/m3)
followed by treatment 25%I0II (2.3kg/m3). This can be attributed
to the higher water demand at these onion stages for bulb
formation and vegetative development. Mondal et al. (1986)
reported that once bulbing starts the onion plant will cease to
produce new leaves. Therefore, every agronomic operation can
influence bulbing rate via its effect on foliage growth and leaf
area index prior to bulbing.
Crop water productivity obtained in terms of marketable bulb
yield (CWPm), excluding the unmarketable one, was lower than the
CWP of the total bulb yield (CWPt). The highest value is
obtained from treatment 75%III0 (4.19kg/m3) followed by 50%III0
(3.87kg/m3) and 75%IIII (3.81kg/m3) (Table 4.6). This result is
different from the result obtained for CWP in terms of total
bulb yield. The finding revealed that reducing the amount of
irrigation water late in the ripening stage improves the water
productivity for marketable bulb yield from 5.2% to 13.1%. This
cxxxv

can be due to the contribution of moisture deficit for the crop
quality character like color, firmness and texture. ARARI (2008)
indicated that as the amount of applied irrigation water
increases the amount of unmarketable yield components, split,
decay and bolt increases. Therefore, application of full
irrigation water at the ripening stage of onion will reduce the
productivity of water for marketable yield.
Table 4.6. Crop water productivity (kg m-3) of onion in terms of
total bulb yield (CWPt) and marketable bulb yield (CWPm).
Total
bulb
yield
Marketa
ble
yield
Appli
ed
water CWPt Rank CWPm Rank
Treatmen
ts
t ha-
1 t ha-1 m3 ha-1 Kg m-3 Kg m-3
100%IIII 26.2 21.5 5842 4.48 5 3.68 5
75%IIII 20.9 16.7
4381.
5 4.77 1 3.81 3
50%IIII 13.6 10.9 2921 4.66 2 3.73 4
25%IIII 3.8 2 1463 2.60 14 1.37 15
75%0III 25.8 20.6 5637 4.58 4 3.65 6
50%0III 19.1 15.1 5432 3.52 10 2.78 8
25%0III 15.2 11.8 5227 2.91 13 2.26 12
75%I0II 20.2 17.55389.
5 3.75 7 3.25 7
cxxxvi

50%I0II 17.7 12.8 4937 3.59 9 2.59 11
25%I0II 11.1 7.9
4484.
5 2.48 15 1.76 14
75%II0I 17.8 13.9 5276 3.37 11 2.63 10
50%II0I 13.9 10.4 4710 2.95 12 2.21 13
25%II0I 6.9 2.9 4144 1.67 16 0.70 16
75%III0 26 23.5 5605 4.64 3 4.19 1
50%III0 23.9 20.8 5368 4.45 6 3.87 2
25%III0 18.6 14.2 5131 3.63 8 2.77 9
CWPt = crop water productivity of onion interms of total bulbyield, CWPm = crop water productivity of onion interms ofmarketable yield; I indicates full irrigation or the throughoutdeficit amount of water, 0 indicates the deficit amount of water, andits position indicates the stage in which the treatment applied.
cxxxvii

Chapter 5. Conclusion and
Recommendations
5.1. Conclusion
Scarcity of water is the most severe constraint for the
development of agriculture in arid and semi-arid areas. Under
these conditions along with the construction and development of
irrigation dams, different water harvesting structures, springs
and diversions, the need to use the available water economically
and efficiently using appropriate irrigation systems and
management is unquestionable. Based on the actual crop need, the
irrigation management has to be improved so that the water
supply to the crop can be reduced while still achieving high
yield. Therefore, this study was aimed to investigate whether
there is an option to conserve and economize the limited
available water through application of deficit irrigation as one
of water management alternative approaches and also to
cxxxviii

investigate the sensitive onion developmental stage for the
water deficit and come up with the following conclusions.
The very high significant effect (P < 0.001) of amount of
irrigation water application either throughout the developmental
stages or at specific developmental stage of onion on its bulb
yield and yield components implies that the crop is sensitive
enough to detect the moisture stress. In all cases application
of full irrigation throughout the crop developmental stages
resulted in the highest yield and yield components. However, 25%
water deficit application throughout the crop developmental
stages or only at establishment or ripening stages can be an
option, because, the yield increment in full irrigation is less
compared to the amount of yield that can be produced by the
saved water obtained from imposing the crop for 25% deficit
irrigation at the establishment or ripening stage as well as
throughout the crop phenological stages. When water stress is
imposed at the establishment stage; high yields of onion could
easily be sustained provided adequate watering conditions take
place during the rest of the growing season. It has also been
observed that, limited effect on yield resulted from water
cxxxix

deficit applied during the ripening stage. Water deficit at the
establishment and ripening stage of the crop also has less
effect on bulb diameter and bulb sizes relative to the effect of
water deficit created on the other two stages. Meeting the full
water requirement during the two extreme /establishment and
ripening/ stages is not advisable. Moreover, withholding 50% to
25% irrigation water application at the maturity/ripening stage
increase marketability of onion through its effect on decreasing
unmarketable yield components like decay, bolt, and split.
The most critical period for irrigation was the bulbification
stage. This period coincides with the highest water requirement
and the crop cannot withstand water deficit without substantial
reduction on yield. Next to the bulbification stage, water
stress at the vegetative development stage also highly affects
bulb yield and yield components of onion. This period is the
most critical period for the growth of yield contributing plant
components like plant height and leaf number. The height and
leaf number of onion strongly affected when deficit water is
applied at the vegetative development of the crop. This in turn
has significant effect on bulb yield of onion. 75% deficit
cxl

irrigation throughout the growing season or only at the
bulbification stage results the highest yield and yield
component reduction per unit of water deficit. It increases
number of small bulbs per hectare and unmarketable bulbs, too.
From the results of this experiment it is possible to conclude
that application of not more than 50% deficit irrigation at the
ripening stage can increase harvest index of onion. As compared
to the full irrigation water application, 75% irrigation water
application throughout the crop developmental stages increase
the harvest index of the crop by 7.07%. Whereas, the minimum
harvest index (52%) was obtained from the treatment that has got
only 25% of the full irrigation. The increased harvest index due
to reducing the amount of irrigation water application late in
ripening stage of onion might be due to accelerated movement of
photosyntates from the neck and leaves of onion to the loading
sites/bulbs/.
Deficit irrigation applications increased crop water
productivity from a minimum of 2.2% to a maximum of 6.5%
compared with the optimum application. But incase of application
cxli

of 75% deficit at bulbification stage, development stage or
throughout the crop growth stages the crop water productivity
value was the lowest, which showed that the amount of saved
water did not, compensate the amount of the yield loss. The
highest crop water productivity in terms of total bulb yield was
obtained from the 25% deficit irrigation water application (4.77
kg/m3). The saved water from such irrigation scheduling can
produce more bulb yield than the loss. This leads to the idea
that increasing the irrigated area with the saved water would
compensate for any yield loss. Therefore, proper application of
deficit irrigation practices can generate significant savings in
irrigation water allocation. Application of 50% to 25% deficit
irrigation late in the ripening stage would increase the water
productivity for marketable yield over the full irrigation. This
might be through the increasing of quality characters and or
through reducing unmarketable bulb yield components.
5.2 Recommendations
According to the finding from one season study the following
recommendations can be made:
cxlii

The most critical period for irrigation is the
bulbification stage followed by vegetative development
stage. Stressing onion at these stages should be avoided.
However, if water stress is unavoidable at these stages, it
is better to stress the crop 25% of the full irrigation
than 75% of the full irrigation. Application of deficit
irrigation either at the establishment or ripening stage is
good option to save water without significant bulb yield
reduction. Particularly, 50% to 25% deficit irrigation late
in the ripening stage can increases marketable bulb yield.
Either at specific growth stages or throughout the crop
growth stages the amount of irrigation water should not go
below 50% of the full irrigation water application.
In water scarcity areas application of 25% deficit
irrigation is a good option to increase productivity of
water and/or to introduce additional irrigable land with
the saved water.
This research was conducted on onion, which is one of the
sensitive crops to water stress. However, it showed
cxliii

promising upshot to save water without significant yield
reduction. Therefore, further research should be conducted
on such deficit irrigation practice to save even more water
from other crops with insignificant yield reduction.
When there is lack of long term climatic data of the area
and ETo calculator software to estimate the amount of
irrigation water, pan evaporation method can be used as the
best option for irrigation scheduling.
However, the result is limited to one season and location.
Hence, research should be done over season and location to
establish the optimum irrigation amount for optimum bulb
yield and the sensitive developmental stage of onion so as
to improve the productivity of water in the study area.
Moreover, future researches should comprise the effect of
irrigation amounts to onion dry matter weight, shelf life
and quality aspects like nutrition content and pungency.
cxliv

Farmers and extension workers in the study area have little
knowledge on deficit irrigation practices. Therefore,
creating and enhancing awareness should be done. Every
concerned body should give due attention for the water
management aspect along with the started effort for
construction and development of irrigation water sources.
cxlv

References
AGWARDO. 2010. Antsokia Gemza Woreda Agricultural and Rural
Development Office, Annual report [Unpublished], Mekoy.
Al-Harbi, R. 2002. Effect of Irrigation Regimes on Growth and
Yield of Onion (Allium cepa L.) Plant Production Department,
College of Agriculture, King Saud University, Riyadh, Saudi
Arabia. J. King Saud Univ. Agric. Sci. (1), pp. 1-11.
Allen, R., Pereira, L., Raes, D. and Smith, M. 1998. Crop
Evapotranspiration Guidelines for Computing Crop Water
Requirements. Irrigation,and Drainage Paper No. 56, Food,
Agricultural Organization, United Nations, Rome, Italy.
Amarasiri, S. 1990. Phosphorus management in intensive vegetable
cultivetion, International Rice Research Institute, Manila,
Philippine.
ARARI (Amhara Region Agricultural Research Institute). 2008.
Determination of optimum irrigation scheduling. In: Yihenew
G/Selassie (ed). Proceedings of the 2nd Annual Regional Conference on
Complete Natural Resource Management Research Activities (18-19 Sep2007)
Amhara Regional Agricultural Research Institute, Bahr Dar.
cxlvi

Asseng, S., Ritch, T., Sucker, T., and Robertson,J. 1998. Root
growth and water uptake during water deficit and recovering
in wheat. Plant and soil 201:265-273.
AVRDC (Asian Vegetable Research and Development Center). 2001.
Onion cultivation and seed production guidline, Shanhua,
Taiwan. Pp.151.
Ayas, S. and Cigdem, D. 2009. Deficit irrigation effects on
onion(Allium cepa L.E.T.Grano 502) yield in untreated green
house condition. Journal of Food, Agriculture and Environment, 7(3&4)
Pp. 239-243.
Bakker, M., Raine, R., and Robertson, M. 1999. A Preliminary
Investigation of Alternate Furrow Irrigation for Sugar Cane
Production. [online] http://www.usq.edu.au/users/raine/index
fiels/ASSCT /pdf. [accessed on 24,May,2009].
Bazza, M., and Tayaa, M. 1999. Contribution to improve sugar
beet deficit-irrigation. In: C. Kirda,P. Moutonnet, C. Hera &
D.R. Nielsen, (eds). Crop yield response to deficit irrigation,
Dordrecht, The Netherlands, Kluwer Academic Publishers.
Biswas K., Sarker, K., Mazharul, A., Islam, M., Bhuiyan, K. and
Kundu, B. 2003. Effect of Irrigation on Onion Production.
Irrigation and Water Management Division, Bangladesh
cxlvii

Agricultural Research Institute, Joydebpur, Gazipur 1701,
Bangladesh. Pakistan Journal of Biological Sciences 6 (20): 1725-1728.
Biswas, K., Khair, A., Sarker, P. and Alom, M. 2010. Yield and
Storability of Onion (Allium cepa L.) as Affected by
Varying Levels of Irrigation. Bangladesh J. Agril. Res. 35(2):
247-255.
Boyhan, G., Grandberry, D. and Kelley, T. 2001. Onion Production
Guide. Cooprative Extention Service. The University of
Georgia, Collage of Agricultural & Environmental Sciences.
Brewster, J. 2008. Onions and other vegetable Alliums. 2nd ed. CAB
International, Wallingford, UK. [onlone]
http://books.google.com.et/books?id [accessed on 05 Nov,
2010]
Brewster, L. and Rabinowitch, D. 1990. Onions and Allied Crops:
Botany, Physiology and Genetics. CRS Press. USA. p 320.
Brouwer, C and Prins K. 1989. Irrigation water management:
Irrigation scheduling. Training manual No. 4. Food and
Agricultural Organization of the United Nation, Rome,
Itally.
cxlviii

CSA (Ethiopian National Central Statistics). 1999. Statistical
Abstract, Addis Ababa, Ethiopia.
CSA (Ethiopian National Central Statistics). 2009. Agricultural
sample survey, Report on area and Production of crops (Peasant
holdings, Meher season), Addis Ababa, Ethiopia.
Currah, L. and Proctor, F. 1990. Onion in Tropical Regions. Natural
Resources Institute Bulletin No. 35.
David, G., Tolt, F., Scott, K., Mohan, H., Pappu, R. and
Schwartz, F. 2006. Iris yellow spot virus: An emerging
threat to onion bulb and seed production. The American
Phytopathological Society. 90:12.
Decoteau, R. 2000. Vegetable crops practice, Hall INC, New Jersy. Pp
326-327.
Doorenbos, J., Kassam, A., Bentvelsen, C., and Uittenbogaard,
G. 1979. Yield response to water. FAO Irrigation and Drainage
Paper No. 33, FAO, Rome, Italy. P 193.
Dragland, S. 1974. Nitrogen and water requirements in onions.
Forsk Frs. Landbrkt. pp. 26-93.
Drinkwater, W. and Janes, B. 1955. Effect of Irrigation and Soil
water on Maturity, Yield and Storage of two Onion hybrids.
American Society of Horticultural Sciences, 66: 267-279.
cxlix

Eck, V., Mathers, C., Musick, T., 1987. Plant water stress at
various growth stages and growth and yield of soybean. Field
Crop Res. 17, 1–16.
Elliades, G., 1988. Irrigation of greenhouse-grown cucumbers. J.
Hort. Sci. 63 2, pp. 235–239.
Ells, E., McSay, E., Soltanpour, N., Schweissing, C., Bartolo,
E. and Kruse, G. 1993. Onion irrigation and Nitrogen
leaching in the Arkansas Valley of Colorado. Hort. Tech. 32,
pp. 184–187.
Englsih, J., Music, T., Murty, N. 1990. Deficit irrigation. In:
Hoffman, J., Howell, A., Solomon, H. (Eds.), Management of
Farm Irrigation Systems. ASAE Monograph, Michigan, pp. 631–663.
Enyew, A., Lakachew, M and Abedin, M. 2007. Farmers Innovations
in Agricultural Water Management: Traditional irrigation
practices in Amhara Region, Amhara Region Agricultural
Institute, Ethiopia. In: Yihenew G/Selassie(ed). 2008.
Proceeding of the 2nd Annual Regional Conference on Compeleted Natural
Resource Management Research Activities (18-19 Sept, 2007). Amhara
Regional Agricultural Research Institute, Sep 2008. Bahir
Dar, Ethiopia.
cl

Evans, T. 1993. Crop Evolution, Adaptation and Yield, Cambridge
University Press Cambridge. p 500.
FAO (Food and Agricultural Organization of the United Nations).
2002. Deficit irrigation practice, Water Reports 22, Rome.
FAO (Food and Agricultural Organization of the United Nations).
1996. Agriculture and Food Security, World Food Summit,
November 1996, Rome.
FAO (Food and Agricultural Organization of the United Nations).
1997. Irrigation Potential in Africa: A Basin Approach, FAO
Land and Water bulletin 4. Rome, Italy.
FAO (United Nations Food and Agriculture Organization). 2007.
Statistical database, FAOStat [online]
http://faostat.fao.org/site/340/default.aspx [Date accessed
19, Oct, 2010].
Farre, I., Faci J. 2006. Comparative response of maize (Zea mays
L.) and sorghum (Sorghum bicolor L. Moench) to deficit
irrigation in a Mediterranean environment, Zaragoza, Spain.
Agricultural water management, (83) Pp.135 – 143.[online]
www.sciencedirect.com [accessed on 23, May,2009].
Faten, A., Shaheen , M., Fatma, R and. Magda, H. 2010.
Influence of Irrigation Intervals and Potassium
cli

Fertilization on Productivity and Quality of Onion Plant,
NRC, Dokki, Cairo, EGYPT. International Journal of Academic Research.
2 (1).
Flip, G. 2003. Irrigation water quality standards and salinity
management strategies, The Texas A&M University stream.
Geremew, A., Teshome A., Kasaye T. and Amenti C. 2010. Effect
of intra-row spacing on yield of three onion (Allium cepa
l.) varieties at Adami Tulu agricultural research center
(mid rift valley of Ethiopia) Adami Tulu Agricultural
Research Center, Ethiopia. Journal of Horticulture and Forestry. 2(1)
pp. 007-011 [online] http://www.academicjournals.org/jhf
(accessed on 25 Oct,2010)
Getaneh, Y. 2002. Constraint analysis of small scale irrigation
schemes in Amhara and Tigray Regions. FAO’s Special
Programme for Food and Production (SPFP), Addis Ababa,
Ethiopia.
Gomie, A., Mohamed,K., El- Aref, O. and Massoud, M. 2000.
Studies on Some Egyptian Onion varieties under Upper Egypt
conditions: Effect of Soil Moisture Content on Storability
of Some Egyptian Onion Genotypes, Assiut Journal of Agricultural
Sciences. 31(5) Pp.129-136.
clii

Goodwin, I. and Boland, M. 2000. Scheduling deficit irrigation
of fruit trees for optimizing water use efficiency,
Department of Natural Resources and Environment, Institute
of Sustainable Irrigated Agriculture, Tatura, Australia.
In:Deficit irrigation practice, Water Reports 22, Rome.
Hanson B., May D., Voss R., Cantwell M., and Rice R. 2003.
Response of garlic to irrigation water. Agricultural water
management 58 Pp. 29-43.
Hegde, M. 1986. Effect of irrigation regimes on dry matter
production, yield, nutrient uptake and water use of onion.
Indian J. Agronomy, 31 Pp. 343-348.
Henry, E., Igbadun, Mahoo, H., Andrew, R., and Baadar A. 2004.
Productivity of water and economic benefit associated with
deficit irrigation scheduling in maize. Sokoin University of
Agriculture, Morogo Tanzania. [online]
www.iwmi.cgiar.org/Africa/files (Accessed on 12 Sep, 2009).
Heping, Z. 2003. Water Productivity. [online]
www.iwmi.cgiar.org//pubs/book/CA-CBI-series/ (Accessed on 12
Feb, 2010).
Jackson, T., Agegnehu, H., Brunco, W., Haussler, S., Proctor F.
and Semungus, H. and Zimmermann, A. 1985. A practical guide
cliii

to Horticulture in Ethiopia. Ministry of state Farm
Development, Horticultural Department A.A, Ethiopia. p59.
Kadayifcia, A., Tuylua, G., Ucarb, Y., Cakmakc, B. 2005. Crop
water use of onion (Allium cepa L.) in Turkey, Agricultural
Water Management, 2005 (72) Pp. 59–68. [online]
www.sciencedirect.com [accessed on 17Apr, 2009]
Kassam, A., and Smith, M. 2001. FAO Methodologies on Crop Water
Use and Crop Water Productivity, Paper no. CWP-M07, ROME.
Khan H., Imran, M and Chattha, T. 2005. Effect of Irrigation
Intervals on Growth and Yield of Onion Varieties Swat–1 and
Phulkara. Journal of Applied Sciences Research.1(2) Pp. 112-116.
Kirda, C. 2000. Deficit irrigation scheduling based on plant
growth stages showing water stress tolerance. Cukuroya
University Adana, Turkey. In: Deficit irrigation practice. Water
reports No 22. Food and Agricultural Organization of the
United Nations, Rome, Italy.
Kumar, S., Imtiyaz, M., Kumar, A. and Singh, R. 2007. Response
of onion (Allium cepa L.) to different levels of irrigation
water, India. Agricultural Water Management 89, (1-2), Pp 161-
166. [Online]
cliv

http://www.sciencedirect.com/science/journal/037883774
[accessed on Oct, 2010].
Lemma, D. and Herath, E. 1994. Agronomic Studies on Allium. In:
Lemma, D. and E. Herath(eds).1994. Proceedings of the second
National Horticultural Workshop of Ethiopia. pp139-146
Lemma, D., and Shimelis, A. 2003. Research Experience in Onion
Production, EARO, Report No. 55. Addis Ababa. Ethiopia.
Majumdar, K. 2000. Irrigation water management principles and
practice, Printice Hal of India Private Limited, New Delhi,
India.
Maldonado, I., Quezada, C., León L. and Márquez, L. 2006.
Irrigation scheduling in the sugar beet by pan evaporation
and the Penman-Monteith equation. Cien. Inv. Agr. 33(3), Pp.201-
210.
MARC (Melkasa Agricultural Research Center). 2003. Progress
report for 1995-2003. Ethiopian Agricultural Research
Organization, Ethiopia.
Mart´ın de Santa Olalla, J., Lopez, R., Dom´ınguez, A. 2004.
Production and quality of the onion crop (Allium cepa L.)
cultivated under controlled deficit irrigation conditions in
a semi-arid climate, Agricultural Water Management 68, Pp. 77–89.
clv

Mintesinot B., Verplancke H., Van Ranst E., and Mitiku H. 2004.
Examining traditional irrigation methods, irrigation
scheduling and alternative furrow irrigation on vertisols in
Northern Ethiopia. Agricultural water management. 64 Pp.17-24
Mintesnot, B. 2002. Assesment and optimization of traditional
irrigation of vertisols in Northen Ethiopia. A case study at
Gumselasa microdam using maize as indicator crop. Ph.D
Thesis. Ghent University Belgium.
MoFED(Ministry of Finance and Economic Development). 2007.
Annual Report on Macroeconomic Developments for 2006/07,
Addis Abeba, Ethiopia.
Mohammed, S.J. 2004. Studies on management strategies for bulb
and seed production of different varieties of onion (Allium
cepa L.) Faculty of Agriculture, Gomal University, Dera
Ismail Khan.
Mondal, M., Brewster, J., Morris J. and Butter, A. 1986. Bulb
development in onion - Effect of plant density and sowing
date in field conditions. Annals of Botany, 58:187-195.
Moutonet, P. 2000. Yield response factors of field crops to
deficit irrigation. In: Deficit irrigation practice. Water reports.No.
22. IAEA Division/joint FAO, Vienna Austria.
clvi

Mumns, R., John, L., Peter, C., Ping-Hua, H., Schuppler, U.
1998. Effect of water Stress on cell division and Cdc2-Like
cell cycle kinase activity in Wheat leaves. Plant Physiol. 117
Pp. 667-678.
Nonnecke, I. 1989. Vegetables Production. Van Nostrand Reinhold
Library of Congress. New York, USA.
Orta, A.H. and Şener, M. 2001. A study on irrigation scheduling
of onion (Allium cepa L.) in Turkey. Journal of Biological
Sciences, 1 (8): 735-736.
Orta, A. H. and Ener, M. 2001. Irrigation scheduling of onion in
Tekirdag province of Turkey. Jour. Appl. Hort. 3(2)75-77.
Ouda, A.S, Rashad A.E., and Mouhamed A. S. 2010. Using Yield-
Stress Model to Predict the Impact of Deficit Irrigation on
Onion Yield. Agricultural Research Center, 14th
International Water Technology Conference, Cairo, Egypt.
Oweis, T., Hachum, A., and Kilne, J. 1999. Water Harvesting and
Supplemental Irrigation for Improved Water use Efficiency in
Dry Areas. SWIM Paper No. 7. International Water Management
Institute,
Pandey, K., Maranville, W. and Chetima, M. 2001.Tropical wheat
response to irrigation and Nitrogen in Sahelian environment:
clvii

Biomass accumulation, nitrogen uptake and water extraction,
European Journal of Agronomy 15 Pp. 107-118.
Pathak, S. 1994. Allium for the tropics: Problems and AVRDC
strategy. International Symposium on Allium for Tropics. ISHS Acta
Horticulture No 358.
Payero, O., Steven, R., Suat, I. and David, T. 2006. Yield
response of corn to deficit irrigation in a semiarid
climate, University of Nebraska Agricultural Research
Division, Lincoln. Agricultural water management 84 Pp. 101-112
[online] www.sciencedirect.com (Accessed on 12Sep, 2010)
Rabinowitch, D. and Currah, L. 2002. Allium Crop Science: Recent
Advances. CABI Publishing. United Kingdom. p 585.
Rademaker, M. 2009. Onions. [online]
http://dermnetnz.org/dermatitis/plants/onion.html (accessed
on 23 Oct, 2010)
Rajasekaran, R. and Blake, J. 1999. New plant growth regulators
protect photosynthesis and enhance growth under drought of
Jack Pine seedlings. Plant Growth Regul. 38, Pp.1-7
Ronald, V., Mike, M., Kent, B., Keith, S and Evan, M. 1999.
Onion Seed production in California. University of
clviii

California, Division of Agriculture and Natural Resources.
Rosenthal, F., Arkin, F., Shouse, J., and Jordan, R. 1987.
Water deficit effects on transpiration and leaf growth.
Agronomy Journal 79, Pp 156-169.
Sadeghipour, O. 2008. Effect of withholding irrigation at
different growth stages on yield and yield conponents of
Mungbean (Vigna radiate L. Wilczek) Varieties. American-Eurasian J.
Agric.& Environ.Scie., 4(5) Pp 590-594.
Salkini, B., and Oweis, T. 1993. Optimizing ground water use for
supplemental irrigation of wheat production in Syria. Farm
resource management programme, Annual report ICARDA, In:
ICARDA(International Center for Agricultural Research in Dry
land Areas) and ESCWA (Economics and Social Commission for
Western Asia).2003. Enhancing agricultural productivity through on –farm
water use efficiency: An empirical case study of wheat production in Iraq. New
York, pp. 6-9.
Saleth, M. 1996. Water Institutions in India: Economics, Law and
Policy, Common wealth Publishers, New Delhi.
Samson B, and Ketema T. 2007. Regulated deficit irrigation
scheduling of onion in semiarid region of Ethiopia.
Agricultural water management, 89 Pp 148 – 152.
clix

Shani, U. and Dudley, M. 2001. Field studies of crop response to
water and salt stress. Soil Sci.Soc. AM.J., 56. Pp 263-285.
Shaozhang, K. 2004. Regulated deficit irrigation and alternate
partial root zone irrigation. Concepts, principles,
progresses and applications. Efficient irrigation technology
and management. International TCDC training courses on
efficient irrigation technology and management. Beijing.
SARC(Sirinka Agricultural Research Center). 2003. Research
outputs, Recommended and Released Technologies of Sirinka
Agricultural Research Center, Sirinka.P 38.
Shock ,C., Feibert, E. and Lamont S. 2003. Effect of short-
duration water stress on onion single centerdness and
translucent scale, Malheur Experiment Station Oregon State
University Ontario.
Shock, C., Feibert, G. and Saunders, L. 2000. Irrigation
criteria for drip-irrigated onions, Hortic. Sci. 35, Pp. 63–66.
Shock, C., and Feibert, E. 2006. Onion yield and quality
affected by soil water potential as irrigation threshold.
HortScience, 33,(7) Pp. 1188-1191.
Shock, C., Feibert,E., Klauzer, J. and Jensen, L. 2010.
Successful onion irrigation scheduling, Oregon State
clx

University Extension Service, Ontario.
Signh, R. and Aldefer, R. 1996. Effect of soil moisture stress
at different periods of some vegetable crops. Soil Science
journal, 101(1) Pp. 69-80.
Sileshi, B., Merrey, J., Kamara, B., Van Koppen, B., Penning de
Vries, F., Boelee, E., Makombe, G. 2005. Experiences and
opportunities for promoting small–scale/micro irrigation and
rainwater harvesting for food security in Ethiopia. Colombo,
Sri Lanka: International Water Management Institute. P. 43.
Sileshi, B., Aster, D., Mekonen,L., Loiskandl, M., Mekonene, A.,
Tena, A. 2007. Water Resources and Irrigation Development in Ethiopia.
Colombo, Sri Lanka: International Water Management
Institute. Pp. 6-38.
Sinclaire, P. 1982. Onion varieties for late sowing NSW Dept. of
Agric.,Yanco Agric. Institute Belletin, Yanco 3 Pp 16-18
In: International Symposium on Allium for the Tropics. Acta
Horticulture, 350:Pp. 253-357
Smith, M., Kivumbi, D. and Heng, L. 2000. Use of the FAO CROPWAT
Model in deficit irrigation studies, Vienna, Austria.
Deficit Irrigation Practice Water Reports No 22.
clxi

Steduto, P. 1996. Water use efficiency. In: Pereira, L.S.,
Feddes, R.A., Gilley, J.R., Lesaffre, B. (Eds.) Sustainability
of Irrigated Agriculture, NATA ASI Series E: Applied Sciences, vol.
312. Kluwer Academic Publishers, London, UK . In: Mart´ın de
Santa Olalla, J., Lopez, R., Dom´ınguez, A. 2004.
Production and quality of the onion crop (Allium cepa L.)
cultivated under controlled deficit irrigation conditions in
a semi-arid climate, Agricultural Water Management 68, Pp. 77–89.
Stegman, C., Schatz, G., and Gardner, C. 1990. Yield
sensitivities of short season soybeans to irrigation
management. Irrigation Science. 11, Pp 111-119.
Teixeira, G., Sinclair, F., Huwe, B., and Schroth, G. 2003.
Soil water. In: Schroth, G. and F.L Sinclair (eds.), Trees,
Crops and Soil Fertility Concepts and Research Methods. Cabi Publishing,
UK.
Tibebe, E. and Siobhan, O. 2000. Silent Revolution: The role of
Community Development in Reducing the Demand for Small Arms,
Working No.3. World Vision Publications, Monrovia, USA.
Tindal, H.D. 1983. Vegetable in the tropics. The Macmillan Press
Limited. London and Basingstoke.
clxii

Urrea, R., Cortes, C., Mart´ın de Santa Olalla, F. 2003.
Production of garlic (Allium sativum L.) under controlled
deficit irrigation in a semiarid climate. Agricultural Water
Management, 59 Pp. 155-163.
Van Eeden, F. and Myburgh, J. 1971. Irrigation trials with onions.
Agroplantae, 3. Pp.57-62.
Von Braun, J. 1991. A Policy Agenda for Famine Prevention in
Africa. Food Policy Technology and Research in Irrigation
and Drainage (IPTRID). Rome: Food and Agricultural
Organization of the United Nations. Statement No. 13,
International Food Policy Research Institutes.
Waren, A. and M, Khogali. 1992. Assessment of Desertification
and Drought in the Sudano-Sahellan Region 1985-1991, UNSO,
New York.
World Bank. 2004. Opportunities and Challenges for Development
of High Value Agricultural Exports in Ethiopia [online]
http://lnweb18.worldbank.org/ESSD/ardext.nsf. [Date of
accessed Dec, 2009]
WVE (World Vision Ethiopia). 2009. World Vision Ethiopia
Antsokia Gemza Area Development Programme unpublished
clxiii

documented on developed and constructed irrigation schemes
by WVE, Mekoy, Ethiopia.
Yenesew, M. and Ketema, T. 2009. Yield and Water Use Efficiency
of Deficit Irrigated Maize in a Semi arid region of
Ethiopia. African Journal of food Agriculture nutrition and Development,
9(8)
Yonas, G., Zainul, A., Gizaw, D., Tegenu,A., and Enyew, A. 2007.
Documentation of successful traditional farmers’ practices
and innovations in agricultural water management in Amhara
Region. In:Yihenew G/Selassie(ed). 2008. Proceeding of the 2nd
Annual Regional Conference on Compeleted Natural Resource Management
Research Activities (18-19 Sept, 2007). Amhara Regional
Agricultural Research Institute, Sep 2008. Bahir Dar,
Ethiopia.
Zilberman D. and Schoengold K. (nd). Water and development: the
importance of irrigation in developing countries [online]
pdf. [Accessed on 18 Oct, 2010].
Zwart, S. and Bastiaanssen, W. 2004. Review of Measured Crop
Water Productivity Values for Irrigated Wheat, Rice, Cotton
and Maize. Agricultural Water Management. 6(9). Pp. 115–133.
clxiv

Appendices
Appendix A: Meteorological data
Table A.1: Monthly annual rainfall (mm) of the experimental area
(Majettie) from 1980-2008. (Source: National Meteorological Agency,
Kombolcha Sub branch, 2009)
Year Jan Feb Mar Apr May Jun Jul Aug Sep Oct Nov Dec Annu
al
1980 33.2 69.2 16.2 83.
0
8.8 15.
7
202
.9
302
.3
58.
0
38.
8
36.
2
0.0 864.
3
1981 0.0 10.8 199.
6
79.
2
3.2 0.0 307
.4
314
.0
132
.7
49.
8
0.0 2.5 1099
.2
1982 17.6 43.1 51.3 36.
5
83.
1
0.0 102
.7
200
.6
124
.3
109
.1
96.
8
40.
1
905.
2
1983 40.2 61.0 39.1 85.
0
65.
0
20.
1
191
.0
238
.1
22.
0
69.
6
0.0 2.5 833.
6
1984 0.0 0.0 47.8 53.
5
163
.2
29.
2
113
.2
18.
7
109
.4
0.0 2.3 96.
5
633.
8
1985 11.2 0.0 37.5 120
.6
124
.2
0.0 223
.9
384
.5
100
.6
2.5 0.0 13.
7
1018
.7
1986 0.0 59.0 85.5 96.
0
31.
6
75.
3
129
.8
249
.9
153
.3
8.4 0.0 11.
0
899.
8
1987 0.0 16.0 55.0 121
.5
87.
0
0.0 24.
7
397
.2
47.
5
45.
6
0.0 38.
7
833.
2
clxv

1988 33.7 142.
0
36.8 88.
0
9.2 10.
8
199
.8
472
.5
117
.8
14.
6
0.0 0.0 1125
.2
1989 11.8 71.8 54.0 120
.2
20.
1
25.
1
158
.7
270
.6
160
.8
37.
8
0.0 88.
5
1019
.4
1990 48.3 144.
9
134.
1
141
.3
0.0 0.0 203
.7
182
.0
157
.9
6.3 0.0 0.0 1018
.5
1991 8.6 114.
1
67.0 36.
2
15.
5
8.1 224
.4
169
.1
123
.1
35.
8
0.0 18.
5
820.
4
1992 96.4 39.9 35.7 67.
8
30.
2
51.
4
163
.8
234
.6
88.
7
173
.1
101
.7
26.
2
1109
.5
1993 126.
5
48.6 8.0 86.
0
189
.7
5.2 205
.3
166
.1
99.
7
66.
7
0.0 0.0 1001
.8
1994 0.0 4.6 43.8 40.
6
12.
3
23.
6
240
.7
412
.9
160
.7
7.1 50.
7
2.2 999.
2
1995 0.0 88.3 46.8 150
.7
71.
5
54.
0
354
.6
355
.6
130
.8
26.
1
0.0 74.
9
1353
.3
1996 41.2 0.0 163.
3
120
.8
120
.4
57.
0
299
.3
379
.0
101
.9
8.9 53.
1
0.0 1344
.9
1997 41.0 0.0 129.
7
69.
4
7.9 53.
6
222
.2
266
.6
61.
7
270
.3
143
.9
0.0 1266
.3
1998 108.
0
91.8 59.7 121
.6
74.
3
9.0 464
.8
373
.8
127
.2
62.
7
2.3 0.0 1495
.2
1999 94.9 0.3 35.6 91.
3
22.
9
10.
0
438
.5
504
.5
148
.5
261
.1
5.6 0.3 1613
.5
2000 0.0 0.0 1.2 85.
1
77.
5
12.
2
318
.0
401
.0
131
.1
51.
3
103
.3
27.
5
1208
.2
2001 7.6 2.1 45.0 14.
4
96.
6
11.
0
450
.8
240
.3
105
.9
11.
2
8.0 1.8 994.
7
2002 106.
4
6.8 60.4 74.
0
31.
4
26.
8
247
.5
311
.2
99.
4
7.4 2.6 163
.1
1137
.0
2003 63.2 44.1 82.7 98.
8
3.1 20.
8
254
.1
250
.2
186
.1
3.0 3.9 61.
1
1071
.1
2004 0.0 69.9 0.0 97.
6
5.9 47.
5
199
.9
259
.4
118
.9
40.
4
59.
1
29.
2
927.
8
2005 53.3 0.0 144. 98. 113 40. 208 228 191 9.5 62. 0.0 1150
clxvi

4 0 .9 3 .6 .4 .9 4 .7
2006 56.3 10.7 55.4 15.
0
9.0 36.
4
340
.0
508
.3
107
.3
34.
9
0.0 38.
0
1211
.3
2007 20.9 20.1 72.9 86.
6
79.
4
31.
4
302
.9
438
.1
156
.9
22.
6
12.
0
0.0 1243
.8
2008 50.0 0.0 0.0 59.
6
28.
3
27.
9
225
.8
254
.5
96.
7
59.
7
153
.0
0.0 955.
5
Averag
e
36.9 40.0 62.4 84.
1
54.
7
24.
2
242
.0
302
.9
118
.0
52.
9
30.
9
25.
4
1074
.3
Table A.2. Monthly average maximum temperature (oC) of Majettie
(1999-2008) (Source: National Meteorological Agency, Kombolcha Sub
branch, 2009)
Ja
n Feb
Ma
r
Ap
r May
Ju
n
Ju
l
Au
g
Se
p Oct
No
v Dec
1999
25
.8
29.
1
27
.0
31
.3
32.
0
33
.2
28
.5
28
.4
28
.2
26.
7
26
.3
25.
3
2000
27
.0
28.
3
29
.5
29
.7
31.
1
33
.4
30
.1
27
.9
28
.0
27.
2
25
.8
25.
2
2001
23
.7
27.
5
26
.6
30
.3
31.
3
33
.2
29
.6
28
.1
28
.3
28.
7
26
.7
26.
7
2002
24
.7
27.
7
28
.6
29
.5
32.
5
33
.4
32
.1
29
.2
28
.5
29.
4
28
.1
24.
7
2003
24
.9
28.
2
29
.0
29
.1
32.
6
33
.2
30
.3
28
.2
29
.0
28.
7
27
.8
25.
7
2004
25
.1
26.
2
28
.4
28
.8
33.
0
32
.7
31
.2
29
.7
29
.0
27.
5
27
.3
25.
5
200525
.3
29.
7
28
.7
29
.1
29.
8
32
.2
29
.3
29
.0
28
.6
28.
0
27
.2
26.
5
clxvii

2006
26
.8
27.
3
28
.6
27
.8
31.
1
33
.1
29
.4
28
.0
28
.2
28.
0
27
.6
25.
3
2007
23
.9
26.
9
29
.2
29
.4
31.
8
31
.8
28
.8
28
.3
28
.5
27.
6
26
.8
26.
4
2008
26
.5
26.
6
30
.2
30
.3
31.
9
33
.1
30
.6
28
.8
28
.4
28.
1
25
.4
25.
1
Avera
ge
25
.4
27.
7
28
.6
29
.5
31.
7
32
.9
30
.0
28
.6
28
.5
28.
0
26
.9
25.
7
Table A.3. Monthly average minimum temperature (oC) of Majettie
(1999-2008) (Source: National Meteorological Agency Kombolcha Sub
branch, 2009)
Jan Feb Mar Apr May Jun Jul Aug Sep Oct Nov Dec
1999
11.
3
10.
4
14.
1
14.
6
16.
0
17.
1
15.
9
15.
4
14.
8
14.
2 9.9 9.8
2000
10.
3
10.
3
12.
5
14.
8
16.
2
17.
3
16.
5
16.
2
15.
6
13.
8
11.
7
11.
1
2001
11.
4
11.
8
15.
1
14.
9
16.
5
18.
5
16.
7
16.
6
15.
2
14.
4
11.
4
10.
6
2002
13.
6
12.
2
15.
7
15.
6
16.
1
18.
2
18.
1
16.
8
15.
9
13.
3
11.
3
15.
2
2003
12.
7
13.
8
14.
8
16.
1
16.
4
18.
1
17.
3
16.
6
16.
1
12.
4
12.
1
10.
4
2004
12.
1
12.
8
13.
7
16.
0
15.
2
17.
5
17.
0
16.
4
15.
2
12.
6
12.
0
12.
3
200512.
9
12.
7
15.
7
16.
0
17.
0
17.
2
17.
0
17.
1
15.
9
13.
1
11.
6 9.2
clxviii

2006
12.
3
14.
3
14.
9
15.
7
16.
3
17.
8
17.
5
16.
6
15.
7
14.
7
13.
2
14.
2
2007
13.
7
15.
0
14.
5
16.
4
17.
0
18.
2
16.
8
16.
5
15.
7
12.
7
11.
9 9.8
2008
12.
2
11.
7
11.
1
15.
8 18
18.
4
17.
7
16.
6
15.
5 14
11.
8
12.
4
Av.
12.
2
12.
5
14.
2
15.
6
16.
5
17.
8
17.
0
16.
5
15.
6
13.
5
11.
7
11.
5
Table A: 4. Monthly average winds speed (m/s) of the
experimental area from 2003-2007. (Source: National Meteorological
Agency Kombolcha Sub branch, 2009)
Jan Feb Mar Apr May Jun Jul Aug Sep Oct Nov Dec
2003
0.7
9 1.08 1.06 0.83
1.0
2
8.1
5
3.4
6
2.6
9
0.6
8
0.7
7
1.2
5
0.9
1
2004
0.8
0 0.95 1.08 0.93
1.2
0
1.1
8
1.1
3
0.9
6
0.6
7
0.7
7
0.8
6
0.9
4
2005
0.8
9 1.41 1.19 1.10
1.0
2
1.3
0
1.0
3
0.9
9
0.7
8
0.8
9
1.0
7
1.1
4
2006
1.0
7 1.26 1.23 1.00
1.0
9
1.2
1
0.8
6
0.8
7
0.7
8
0.8
1
1.0
5
0.9
3
2007
0.9
5 1.11 1.25 1.03
2.0
4
1.0
5
1.0
0
0.9
2
0.7
6
0.9
8
1.0
2
1.0
7
Avera 0.9 1.16 1.16 0.98 1.2 2.5 1.5 1.2 0.7 0.8 1.0 1.0
clxix

ge 0 8 8 0 9 4 5 5 0
Table A: 5. Monthly average sunshine hours in the experimental
area from 2003-2007 (Source: National Meteorological Agency,
Kombolcha Sub branch, 2009)
Jan Feb Mar Apr May Jun Jul Aug Sep Oct Nov Dec
2003 6.8 8.5 7.4 7.1
10.
3 7.4 6.1 7.0 5.4 9.5 8.9 8.3
2004 6.5 7.0 7.6 7.0
10.
0 6.9 5.0 7.3 6.0 8.6 9.4 6.7
2005 5.2 9.6 6.4 7.2 8.1 7.7 6.0 6.8 6.3 8.7 9.4
10.
2
2006 8.4 6.9 6.6 6.9 8.9 7.8 7.2 6.3 8.1 8.2 8.9 6.7
2007 5.9 6.8 8.0 8.2 9.0 7.3 6.4 7.4 8.2 9.7 8.9 9.2
Averag
e 6.5 7.8 7.2 7.3 9.3 7.4 6.1 7.0 6.8 9.0 9.1 8.2
Table A: 6. Monthly average relative humidity (%) of Majettie
from 2004-2007 (Source: National Meteorological
Agency, Kombolcha Sub branch, 2009)
Jan Feb Mar Apr May Jun
Ju
l Aug Sep Oct Nov Dec
2004 61 57 54 56 47 42 59 65 62 54 51 59
2005 64 45 58 55 57 40 60 62 63 52 50 45
2006 55 60 55 59 42 35 59 68 62 53 48 63
2007 65 59 49 54 42 43 67 67 63 50 51 50
clxx

Averag
e 61 55 54 56 47 40 61 66 63 52 50 54
clxxi

Table A.7. Summary of weather data and monthly ETo of Majettie
area
Country
Ethio
pia
Station
Majet
tie
Altitud
e 1652
Longitu
de
39.83o
E
Latitud
e
10.73o
N
Month
Min
Temp
Max
Temp
Humidi
ty Wind Sun Rad ETo
°C °C %
km/
day hours
MJ/m2/
day
mm/
day
January 12.2 25.4 61 78 6.5 16.9 3.24
Februar
y 12.5 27.7 55 100 7.8 20 4.06
March 14.2 28.6 54 100 7.2 20.2 4.33
April 15.6 29.5 56 85 7.3 20.8 4.41
May 16.5 31.7 47 111 9.3 23.4 5.24
June 17.8 32.9 40 223 7.4 20.2 6.2
July 17 30 61 130 6.1 18.4 4.45
August 16.5 28.6 66 111 7 20 4.37
Septemb
er 15.6 28.5 63 64 6.8 19.6 4.05
October 13.5 28 52 73 9 22 4.3
Novembe 11.7 26.9 50 91 9.1 20.7 4.02
clxxii

r
Decembe
r 11.5 25.6 54 86 8.2 18.7 3.53
Average 14.6 28.6 55 104 7.6 20.1 4.35
Table A.8. Rainfall amount (mm) during the experimentation from
Nov, 2009-May, 2010.
Months
Nov Dec Jan Feb Mar Apr May
1 0 0 3.2 0 0 0 0
2 0 0 9.2 0 3.6 0 0
3 0 0 0 0 0 0 0
clxxiii

4 0 0 0 0 0 0 0
5 0 0 0 0 6.6 3.5 0
6 0 0 0 4.2 4.6 0 0
7 0 0 0 0 0 9.5 0
8 0 0 0 0 0 0 2
9 0 0 0 0 0 0 2.8
10 0 2.5 0 0 0 0 3.1
11 0 12.4 0 7.8 0 4.6 0
12 0 0 0 0 0 2.4 0
13 0 13.5 0 0 0 0 9.7
14 0 0 0 1.2 0 0 0
15 0 0 0 0 0 0
16 0 0 0 0 0 0
17 0 0 0 0 0 12.2
18 0 0 0 0 0 0
19 0 1.7 0 0 0 0
20 0 10.8 0 0 0 0
21 0 0 0 0 0 0
22 0 0 0 0 0 4.4
23 0 2 0 0 0 0
24 0 4.1 0 0 0 0
25 0 0 0 0 0 6.4
26 0 0 0 4.2 0 0
27 0 2.2 0 1.5 0 0
28 2.7 0 0 0 0 0
29 1.7 0 0 0 0
30 7 0 0 0 0
31 0 0 0
Sum 11.4 49.2 12.4 18.9 14.8 43
clxxiv

Table A.9. Measured pan evaporation data (mm) during the
experimentation (Dec 2009-May, 2010)
Months
Dec Jan Feb Mar Apr May
1 9085.92 84.6 84.7 75.6 84.88 57.8
2 81.1 89.1 80 73.74 78.9 53.990
3 75.52 83.87 74.7 68.76 72.98 83.5
4 70 79.18 68.6 63.4 64.63 78
5 65.46 73.44 64.81 58.7 69.28 72.45
6 59.38 71.64 63.6 54.0890 62.93 67.8
7 53.83 65.64 59.47 85.2 66.38 62.5
8 49.6390 59.76 54.94 80.62 59.75 58.4
9 84.8 55.26 49.3490 74.84 54.390 55.590
10 83.3 50.0690 85.1 68.34 85.2 85.3
11 91.1 83.34 87.4 63.96 83.8 79.98
12 86.2 78.54 81.72 57.96 79.27 75.6
13 95.8 74.54 76.02 52.72 74.06 69.4
14 90 69.04 72.94 47.8990 69.14 65.4
15 84.5 64.04 66.16 89.6 64.57 58.3
16 79.6 58.54 60.55 83.46 58
17 74.990 51.28 55.44 77.02 68.87
18 85.79 46.890 50.6490 71.04 61.990
19 82.47 83.14 86.11 65.54 84.2
20 87.08 77.14 81.33 61.78 77.7
21 82.10 71.42 76.09 57.67 71.3
22 78.00 67.33 71 53.38 68.9
23 72.70 60.94 66.13 48.690 62.52
clxxv

24 72.82 54.06 60.26 84.84 55.52
25 65.18 47.1690 54.13 79.58 56.690
26 62.00 83.38 52.9690 74.94 84.8
27 62.9 76.38 85.8 70.05 78.4
28 57.87 71.3 81.5 64.94 74.76
29 52.5 65.65 63.28 68.72
30 47.690 61.91 57.73 62.91
31 85.48 56.2290 51.790
Superscript 90 indicates refilling of the pan to 90 mm
Appendix B: Irrigation related data
Table B.1. Comparison of the reference evapotranspiration ETo
by FAO Penman –Montheith model and Pan evaporation method.
Month Dec Stag
e
Kc K
pan
Pan
Evapn
Eto
Pan
Eto
PM
Etc
PM
Etc
Pan
Diff.
(PM-
Pan)
Coe
ff
Coe
f
mm/de mm/de mm/de mm/de mm/de
Feb 1 Init 0.7 0.7
5
44.46 33.35 34.14 23.90 23.34 0.56
Feb 2 Init 0.7 0.7
5
52.13 39.10 40.57 28.40 27.37 1.03
Feb 3 Deve 0.7
4
0.7
5
42.57 31.93 33.11 24.50 23.63 0.87
Mar 1 Deve 0.8
4
0.7
5
54.7 41.03 42.38 35.60 34.46 1.14
Mar 2 Deve 0.9
5
0.7
5
56.96 42.72 43.26 41.10 40.58 0.52
clxxvi

Mar 3 Mid 1.0
3
0.7
5
54.58 43.94 47.96 49.40 45.25 4.15
Apr 1 Mid 1.0
3
0.7
5
56.5 42.38 43.98 45.30 43.65 1.65
Apr 2 Mid 1.0
3
0.7
5
63.3 47.48 44.27 45.60 48.90 -3.30
Apr 3 Late 1.0
1
0.7
5
65.49 49.12 46.93 47.40 49.61 -2.21
May 1 Late 0.9
6
0.7
5
54.7 41.03 34.67 33.30 39.38 -6.08
Tota
l
545.3
9
412.0
8
411.2
7 374.5
376.1
7 -1.67
Evapn -evaporation, PM -Penman-Monteith method, Dec –decade, Diff -
difference.
Table B.2. Measured discharge and application time for single
(1.2m2) furrow of full irrigation
Date of irrigation Stage
Gr. Irr(mm)
Dischargel/s
Application duration per furrow (s)
7-Feb, 2010 Estabt 26.1 1.6 19.8
13-Feb, 2010 Estabt 27.5 1.5 22
19-Feb, 2010 Estabt 28.4 1.7 20.4
25-Feb, 2010
Veg.de
v 30.3 1.3 27.9
3-Mar, 2010
Veg.de
v 33.1 1.3 31.8
9-Mar, 2010
Veg.de
v 35.6 1.3 34.2
clxxvii

15-Mar, 2010
Veg.de
v 40.2 1.7 28.9
21-Mar, 2010
Veg.de
v 41.8 1.4 36.8
27-Mar, 2010 Bulbfn 44.9 1.7 32.3
2-Apr, 2010 Bulbfn 45.1 1.5 36.1
8-Apr, 2010 Bulbfn 45.3 1.5 36.2
14-Apr,
2010 Bulbfn 45.5 1.7 32.8
20-Apr, 2010 Bulbfn 45.6 1.4 40.1
26-Apr,2010 Ripen 47.4 1.5 37.9
2-May, 2010 Ripen 47.4 1.4 41.7
Table B.3. Date of irrigation and gross irrigation water amount
for each treatment in mm
Date of irrigation water application and stage of the crop
7-Feb
13-
Feb
19-Feb
25-Feb
3-Mar
9-Mar
15-Mar
21-Mar
27-Mar
2-Apr
8-Apr
14-Apr
20-Apr
26-Apr
2-May
7-May
Est
Est Est Dev Dev Dev Dev Dev
Bulb
Bulb
Bulb Bulb
Bulb Rip Rip End
Etc (mm)
15.7
16.5
17.1
18.2
19.9
21.3
24.1
25.1
26.9
27.0
27.2 27.3
27.4
28.4
28.5
Rf (mm)
4.2
7.8 1.2 0.0 9.3
11.2 0.0 0.0 0.0 0.0
13.0 7.0
12.2
10.8 0.0
Pe (mm)
0.0
0.0 0.0 0.0 0.0 0.6 0.0 0.0 0.0 0.0 1.5 0.0 1.1 0.4 0.0
Net.Irr (mm)
15.7
16.5
17.1
18.2
19.9
20.7
24.1
25.1
26.9
27.0
25.7 27.3
26.3
28.0
28.5
Trts Gross Irrigation 100%IIII
26.1
27.5
28.4
30.3
33.1
35.6
40.2
41.8
44.9
45.1
45.3
45.5
45.6
47.4
47.4
75%IIII
19.6
20.6
21.3
22.7
24.8
26.7
30.2
31.4
33.7
33.8
34.0
34.1
34.2
35.6
35.6
50%IIII
13.1
13.8
14.2
15.2
16.6
17.8
20.1
20.9
22.5
22.6
22.7
22.8
22.8
23.7
23.7
25% 6. 6.9 7.1 7.6 8.3 8.9 10. 10. 11. 11. 11. 11. 11. 11. 11.
clxxviii

IIII 5 1 5 2 3 3 4 4 9 975%0III
19.6
20.6
21.3
30.3
33.1
35.6
40.2
41.8
44.9
45.1
45.3
45.5
45.6
47.4
47.4
50%0III
13.1
13.8
14.2
30.3
33.1
35.6
40.2
41.8
44.9
45.1
45.3
45.5
45.6
47.4
47.4
25%0III
6.5 6.9 7.1
30.3
33.1
35.6
40.2
41.8
44.9
45.1
45.3
45.5
45.6
47.4
47.4
75%I0II
26.1
27.5
28.4
22.7
24.8
26.7
30.2
31.4
44.9
45.1
45.3
45.5
45.6
47.4
47.4
50%I0II
26.1
27.5
28.4
15.2
16.6
17.8
20.1
20.9
44.9
45.1
45.3
45.5
45.6
47.4
47.4
25%I0II
26.1
27.5
28.4 7.6 8.3 8.9
10.1
10.5
44.9
45.1
45.3
45.5
45.6
47.4
47.4
75%II0I
26.1
27.5
28.4
30.3
33.1
35.6
40.2
41.8
33.7
33.8
34.0
34.1
34.2
47.4
47.4
50%II0I
26.1
27.5
28.4
30.3
33.1
35.6
40.2
41.8
22.5
22.6
22.7
22.8
22.8
47.4
47.4
25%II0I
26.1
27.5
28.4
30.3
33.1
35.6
40.2
41.8
11.2
11.3
11.3
11.4
11.4
47.4
47.4
75%III0
26.1
27.5
28.4
30.3
33.1
35.6
40.2
41.8
44.9
45.1
45.3
45.5
45.6
35.6
35.6
50%III0
26.1
27.5
28.4
30.3
33.1
35.6
40.2
41.8
44.9
45.1
45.3
45.5
45.6
23.7
23.7
25%III0
26.1
27.5
28.4
30.3
33.1
35.6
40.2
41.8
44.9
45.1
45.3
45.5
45.6
11.9
11.9
Net.Ir- net irrigation, Rf- Rainfall, Pe- effective rainfall, Trts-
treatments
Table B.4. Irrigation development projects constructed by World
Vision Ethiopia at Antsokia Gemza Woreda (WVE, 2009).
clxxix

Irrigati
on
scheme
Year of
construc
tion
Command
Area in
ha
No of
beneficiary
households
Scheme status
Dariga
river
2000-
2003
125 416 Functional with
little canal damage
Sal
river
right
2000-
2003
115 328 Semi functional with
intake canal damage
problem
Sal
river
left
2000-
2003
276 1112 Semi functional with
intake and
underground canal
damage problem
Gudaber
river
1995-
1996
120 364 Semi functional with
intake canal damage
problem
Sirinka
spring
2000-
2002
80 232 Functional
Agodo
river
2001 85 425 Semi functional with
intake and half
section canal damage
problem
Chancho
river
1996-
1997
60 188 Functional with
little problem
Lay 2000- 80 216 Semi functional
clxxx

Jara
river
2002
clxxxi
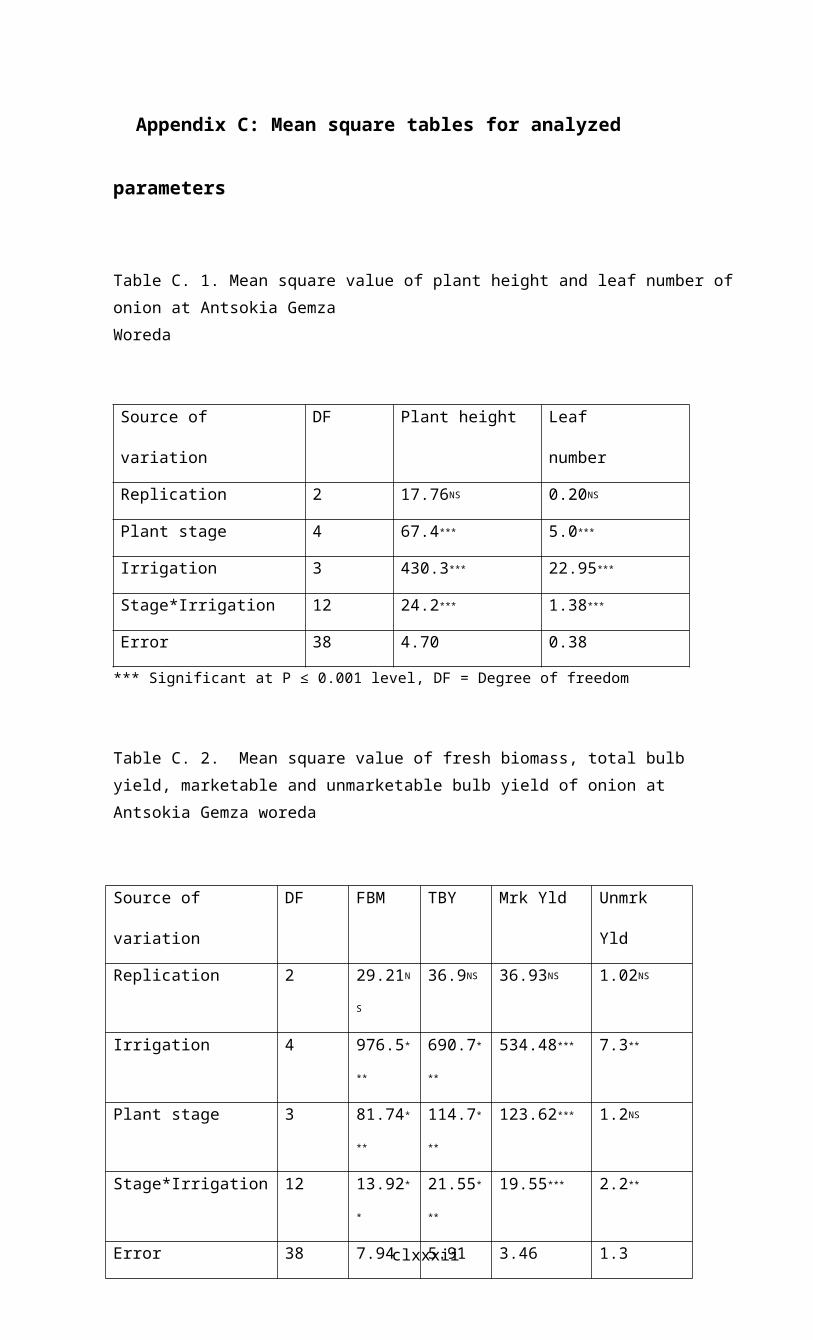
Appendix C: Mean square tables for analyzed
parameters
Table C. 1. Mean square value of plant height and leaf number ofonion at Antsokia Gemza Woreda
Source of
variation
DF Plant height Leaf
number
Replication 2 17.76NS 0.20NS
Plant stage 4 67.4*** 5.0***
Irrigation 3 430.3*** 22.95***
Stage*Irrigation 12 24.2*** 1.38***
Error 38 4.70 0.38
*** Significant at P ≤ 0.001 level, DF = Degree of freedom
Table C. 2. Mean square value of fresh biomass, total bulb yield, marketable and unmarketable bulb yield of onion at Antsokia Gemza woreda
Source of
variation
DF FBM TBY Mrk Yld Unmrk
Yld
Replication 2 29.21N
S
36.9NS 36.93NS 1.02NS
Irrigation 4 976.5*
**
690.7*
**
534.48*** 7.3**
Plant stage 3 81.74*
**
114.7*
**
123.62*** 1.2NS
Stage*Irrigation 12 13.92*
*
21.55*
**
19.55*** 2.2**
Error 38 7.94 5.91 3.46 1.3clxxxii

*** Significant at P ≤ 0.001 level, ** Significant at P ≤ 0.01 level, NS = Non significant, DF = Degrees of freedom, FBM = Fresh biomass, TBY = Total biomass, Mrk= Marketable, Unmrk = Unmarketable, Yld = Yield
clxxxiii

Table C. 3. Mean square value of average bulb weight and bulb diameter of onion
Source of
variation
DF Average bulb
weight
Average bulb
diameter
Replication 2 4.22NS 0.56NS
Plant stage 4 642.69*** 0.7**
Irrigation 3 4940.41*** 10.3***
Stage*Irrigation 12 111.62** 0.48**
Error 38 36.46 0.16
* Significant at P ≤ 0.001 level ** Significant at P ≤ 0.01 level, DF = Degrees of freedom
Table C. 4. Mean square value of weight and number of big, medium and small bulb of onion
Source
of
variatio
n
DF Wt. BSB No. BSB Wt. MSB No. MSB Wt.
SSB
No. SSB
Replicat
ion
2 4.2NS 2477.4*
*
3.32NS 3821.4*
*
2.3NS 3529.3*
Plant
stage
3 40.46*** 1900.6*
**
15.17*** 1297.1*
*
0.52NS 6592.7*
**
Irrigati
on
4 223.41*
**
17123.4***
119.77*
**
12651.2***
17.52*
**
54059.5***
clxxxiv

Stage*
Irrigati
on
12 5.1NS 293.2NS 3.05* 388.3** 2.06* 1190.6*
*
Error 38 3.45 197.6 1.49 286.3 1.7 369.7
*Significant at P ≤ 0.001 level **Significant at P ≤ 0.01 level; * significant at P ≤ 0.05 level, DF = Degrees of freedom, Wt. = Weight, No. = Number, BSB = Big size bulb, MSB = Medium size bulb, SSB = Smallsize bulb
Fig. A. Evaporation measurement by using class ‘A’ pan at the
research site.
Fig. B. Bulb yield measurement by using sensitive balance.
clxxxv

Biographical Sketch
The author was born on 26 July 1982 G.C in Majettie Town of
Eastern Amhara Region. He attended his elementary and secondary
school at Majettie elementary school and at Hotie Senior
Secondary School, Dessie. After passing the Ethiopian School
Leaving Certificate Examination in 2001, he joined the former
Debub, and now Hawassa University and graduated with a B.Sc.
degree in the field of Plant Production and Dryland Farming on
July 2, 2005. He was then employed as crop production and
protection expert for two years and then vice head of
Agricultural and Rural Development office in Antsokia Gemza
Woreda of Eastern Amhara region till he joined Mekelle
University in 2009 to pursue his post graduate study in the
field of Dryland Agronomy.
E-mail- [email protected]
Tel.- +251913282228
clxxxvi

clxxxvii