effect of naa on the yield and yield contributing characters of
TRANSCRIPT
1
EFFECT OF NAPHTHALENEACETIC ACID ON ROOT AND PLANT GROWTH, AND YIELD
OF TEN IRRIGATED WHEAT GENOTYPES
M.A.H.S. JAHAN1, AKBAR HOSSAIN2* JAIME A. TEIXEIRA DA SILVA3; AYMAN EL SABAGH4* AND
M.H. RASHID1, C. BARUTÇULAR5
1 Bangladesh Agricultural Research Institute (BARI), Joydebpur, Gazipur, Dhaka, Bangladesh
2 Wheat Research Centre, BARI, Nashipur, Dinajpur-5200, Bangladesh 3 P.O. Box 7, Miki-cho post office, Ikenobe 3011-2, Kagawa-ken, 761-0799, Japan4
4 Department of Agronomy, Faculty of Agriculture, Kafrelsheikh University, 33156 Kafrelsheikh, Egypt; 5 Department of Field Crops, Faculty of Agriculture, Cukurova University,Turkey
*Corresponding authors’ email: [email protected] (A. El Sabagh) &
[email protected] (A. Hossain)
Abstract
The use of plant growth regulators (PGRs), namely 1-naphthaleneacetic acid (NAA), gibberellins, cytokinins,
abscisic acid, and ethylene in the field of agriculture has become commercialized in some countries, not only for
high-value horticultural crops but also to increase field crop yield directly, either by increasing total biological yield
or the harvest index. However, in Bangladesh very limited research has been conducted on root growth, plant
biomass and yield of wheat using NAA. In this context, an experiment was conducted over two consecutive seasons,
from November to April, in the research field of the Wheat Research Center (WRC) (under Old Himalayan
Piedmont Plain), Dinajpur-Bangladesh. Treatments consisted of the application of 25 mg/l NAA in five temporal
regimes: 1) NAA applied at 20, 35 and 50 days after emergence (DAS); 2) NAA applied at 20 and 35 DAS; 3) NAA
applied at 20 and 50 DAS; 4) NAA applied at 35 and 50 DAS; 5) a control (without NAA). These treatments were
applied to 10 irrigated spring wheat genotypes i.e., ‘Kanchan’, ‘Protiva’, ‘Surov’, ‘Gourov’, ‘BAW 944’, ‘BAW
953’, ‘BAW 994’, ‘Akbar’, ‘Agrhani’ and ‘Sonalika’, and arranged in a split-plot design (i.e., five NAA treatments
as the main plots and 10 wheat genotypes as the sub-plots). In both seasons, data on root fresh and dry weight, root
length, total plant dry biomass (TDM), grain yield (GY) and yield attributes of wheat were significantly (p≤0.05)
influenced by the NAA application regime and genotypes. However, the maximum root fresh and dry weight and
longest roots were recorded in treatment 2 in ‘Gourav’. Maximum TDM was recorded at 40 and 50 DAS in ‘BAW
944’ in treatment 3. Significantly similar and maximum TDM at 60 DAS was found in ‘Kanchan’ and ‘Sourav’ in
treatment 1 and at 70 DAS in ‘Sourav’ in treatment 2. ‘BAW 994’, ‘BAW 953’ and ‘Agrahani’ produced
2
significantly similar and maximum number of spikelets spike-1 in treatment 2. ‘BAW 944’ and ‘BAW 953’ showed
significantly similar 1000-grain weight in treatment 3 while smallest grain size was obtained in ‘BAW 953’ in the
control treatment. ‘BAW 953’ produced highest GY in treatment 1, which was statistically similar to ‘BAW 994’
and ‘Protiva’ after the application of treatments 2 and 4. Therefore, application of NAA at 20, 35 and 50 DAS in all
genotypes was more effective (i.e., better root growth and yield) than the control plot. Among the 10 tested
genotypes, ‘BAW 953’ and ‘BAW 994’ responded most to NAA.
Key words: naphthalene acetic acid, wheat, growth, yield and yield attributes
Introduction
Wheat (Triticum aestivum L.) is the most widely grown leading cereal crop in the world (FAO &WFP,
2015) and its demand is increasing as a result of a rise in global population. The International Food Policy Research
Institute projected that the world demand for wheat will rise from 552 million tons in 1993 to 775 million tons by
2020, and by a total of 60% by 2050 (Rosegrant & Agcaoili, 2010; Singh et al., 2016).
Wheat is the second most important cereal after rice in Bangladesh, (Timsina et al., 2016),
occupies about 4% of the total cropped area and 11% of the area cropped in the Rabi season, and contributes
7% to the total output of food cereals (BBS, 2016). In 2015-16, 1.36 million tons of wheat was harvested from 0.49
million ha of land, according to the BBS (2016). The current demand of wheat in Bangladesh is 5.9 million tons
with demand increasing by 10% per year (BBS, 2016). Therefore, to meet the demand of wheat for an increasing
population, greater efforts are needed to develop new wheat varieties with higher grain yield (GY) potential and to
develop and adopt improved crop management practices (Timsina et al., 1998, 2010).
There is little scope to increase agricultural lands suitable for cultivation (Reynolds et al., 2009; Long &
Ort, 2010; Li et al., 2016). Therefore, intensive farming or agriculture is the best way to meet future food security
using a small piece of land. Such systems are characterized by a low fallow ratio, higher use of inputs such
as capital and labour, and higher crop yields per unit land area (Tilman et al., 2002; Henkel, 2015), in contrasts
with traditional agriculture. Most commercial agriculture is intensive, including planting multiple crops per year,
reducing the frequency of fallow years, and improving cultivars to achieve greater GY (Tilman et al., 2002). This
also involves increased use of fertilizers, plant growth regulators (PGRs), pesticides and mechanized agriculture,
3
controlled by increased and more detailed analysis of growing conditions, including weather, soil, water, weeds and
pests (Henkel, 2015).
PGRs have been use to increase the GY of major cereal crops, including wheat, and have already become
commercialized in the EU, USA and Japan (Bakhsh et al., 2011a; Adam & Jahan, 2011; Basuchaudhuri, 2016).
Although plant growth regulators have been used in agriculture for as long as crop cultivation, their impact up to
now has been relatively little detected and their application is limited to some specific objectives for example quality
and quantity improvement (Pandey et al., 2001). 1-Naphthaleneacetic acid (NAA) is a synthetic aromatic acid,
belongs to synthetic forms of Auxins. Auxins play key role in RNA synthesis, membrane permeability and water
uptake involved in many physiological processes like cell elongation, cell division, vascular tissue, differentiation,
root initiation, apical dominance, leaf senescence, leaf and fruit abscission, fruit setting and flowering (Alabadí et
al., 2009; Basuchaudhuri, 2016). Exogenous application of naturally occurring or synthetic PGRs affects the
endogenous hormonal pattern of a plant either by supplementation of sub-optimal levels or by interaction with their
synthesis, translocation or inactivation of existing hormone levels (Bakhsh et al., 2011a; Adam & Jahan, 2011;
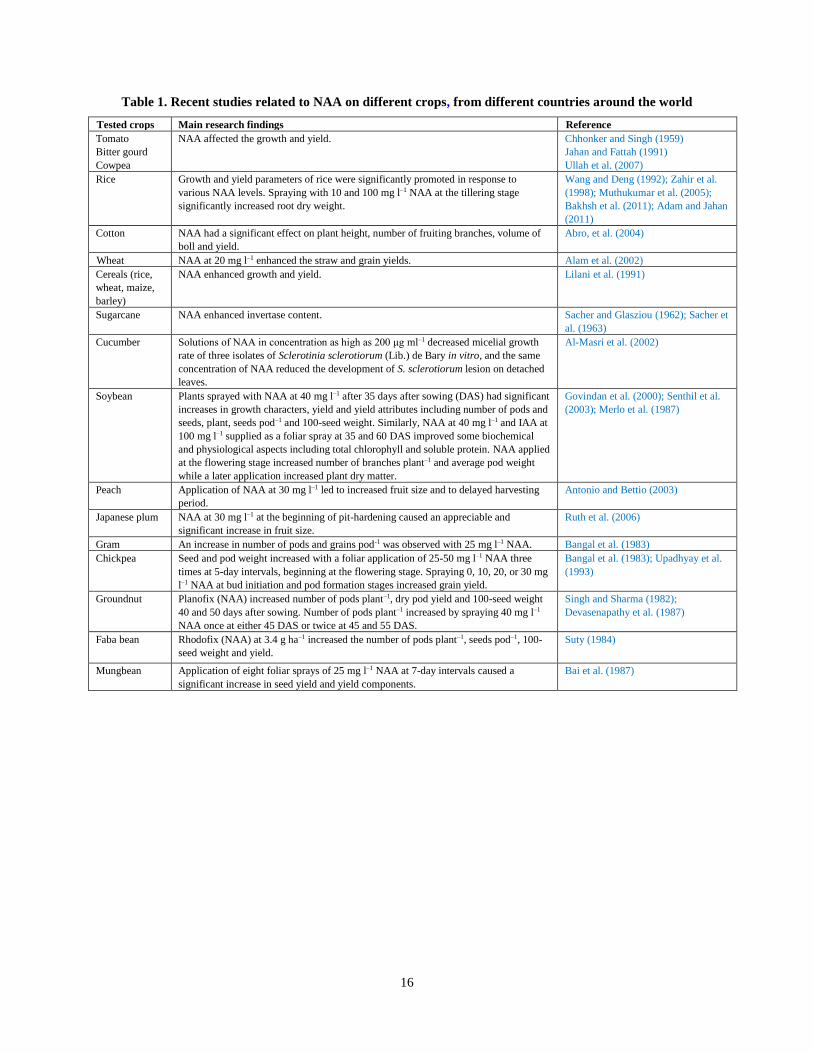
Basuchaudhuri, 2016). An appropriate concentration of NAA affects the growth and yield of a number of plants
(Table 1). However, in Bangladesh very limited research has been found on root growth, plant biomass and yield of
wheat genotypes with NAA. Therefore, the present investigation was undertaken to study the effect of NAA on root
growth, plant biomass and yield of 10 irrigated spring wheat genotypes.
Materials and Methods
Location of the experiment: The experiment was conducted in a research field of Wheat Research Center (WRC),
BARI, Nashipur, Dinajpur over two consecutive years during the wheat season (November to April). The Agro
Ecological Zone (AEZ) of the area is the Old Himalayan Piedmont Plain (AEZ-1). The geographical position of the
area is between N 25º 44.574" and E 88º 40.344", and 40 m above sea level.
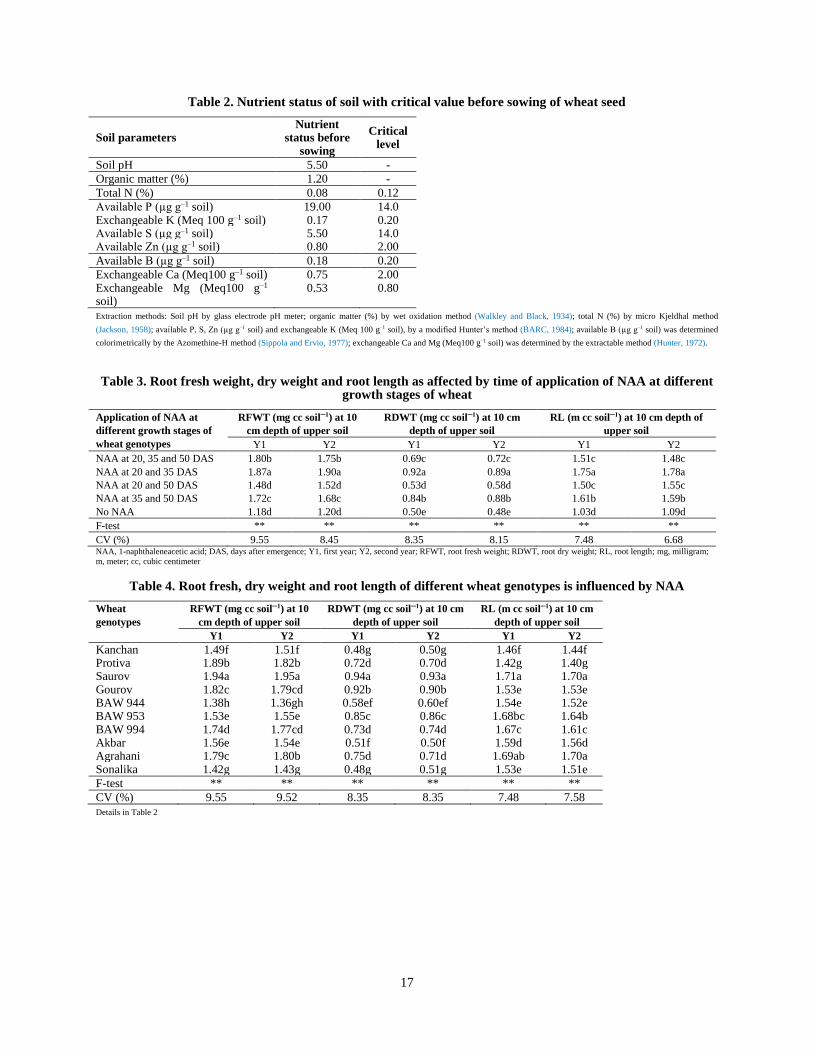
Nutrient status in the experimental soil: Soils of the experimental sites were analyzed before sowing wheat (Table
2). The pre-seeding total soil N was 0.08%, indicating a deficiency in soil N (nitrogen). Soil available K (potassium)
was 0.21 meq 100 g─1 soil, and available P (phosphorus), S (sulphur), Zn (zinc) and B (boron) were 17.5, 4.8, 0.72
and 0.12 µg g–1 soil, respectively. Based on the critical level of these plant nutrients, K, S, Zn and B were low, but P
was high. Soil pH was 5.5 and organic matter was 1.15% (Table 2).
4
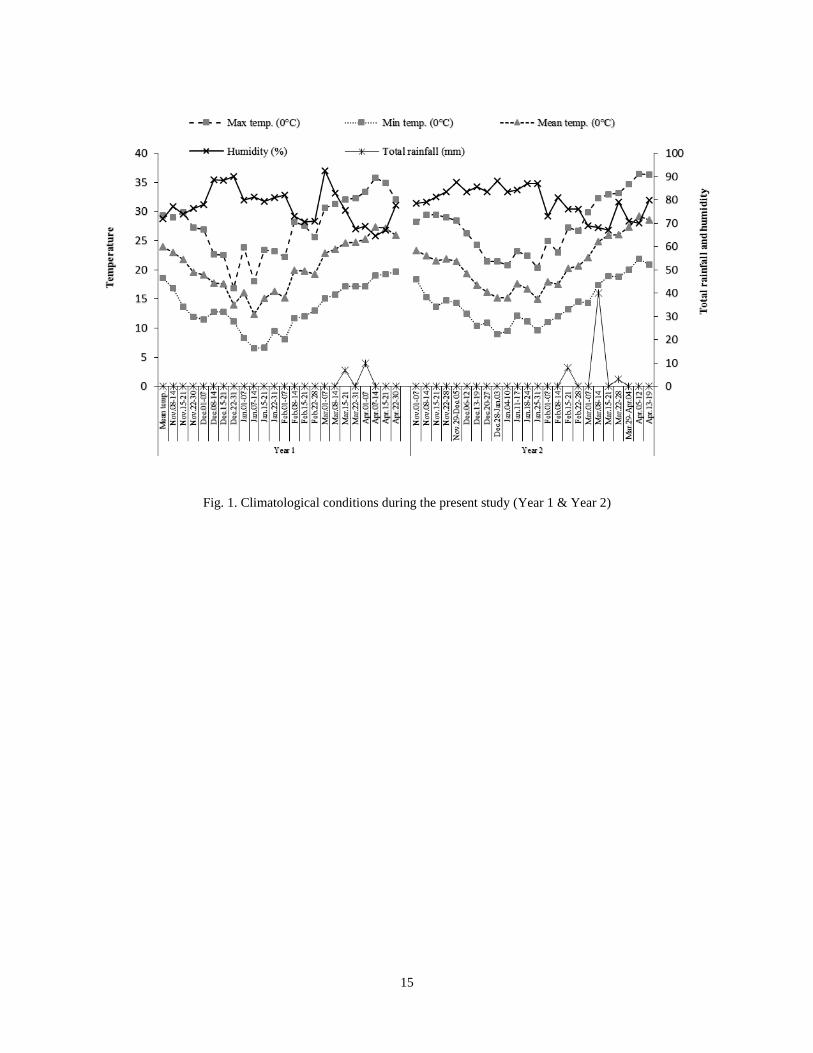
Temperature, humidity and rainfall in both years: Weather data on weekly average temperature, humidity and
rainfall in both experimental seasons were recorded regularly from the meteorological station of Wheat Research
Center, Nashipur, Dinajpur and are presented in Fig. 1.
Experimental design and treatments: Treatments were five application times of NAA (1-naphthaleneacetic acid,
25 mg/l): 1. NAA applied at 20, 35 and 50 days after sowing (DAS), 2. NAA applied at 20 and 35 DAS, 3. NAA
applied at 20 and 50 DAS, 4. NAA applied at 35 and 50 DAS, and a control (without NAA), and 10 irrigated spring
wheat genotypes i.e., ‘Kanchan’, ‘Protiva’, ‘Surov’, ‘Gourov’, ‘BAW 944’, ‘BAW 953’, ‘BAW 994’, ‘Akbar’,
‘Agrhani’ and ‘Sonalika’, arranged in a split-plot design (i.e., five spray application times of NAA were placed as
the main plots and the 10 wheat genotypes as the sub-plots). According to the treatments (application at different
DAS), 30 ml of NAA per 10 liter of water was applied with a Knapsack sprayer as a foliar spray. The unit plot size
(6×3 m) consisted of 30 rows, each 3 m long, and a row-to-row distance of 20 cm and a block-to-block distance of
1.0 m.
Variety, seeding rate, sowing time, seed treatment and insecticide: Ten wheat genotypes (‘Kanchan’, ‘Protiva’,
‘Surov’, ‘Gourov’, ‘BAW 944’, ‘BAW 953’, ‘BAW 994’, ‘Akbar’, ‘Agrhani’ and ‘Sonalika’) were used as
experimental material, collected from the WRC, BARI, Nashipur, Dinajpur. In both wheat seasons, all genotypes
were sown in lines by hand on November 20. Seeding rate was 120 kg ha─1 treatment. Before sowing, seeds of all
genotypes were treated with a fungicide, Vitavax-200 (37.5% Carboxin + 37.5% Thiram) (marketed by Hossain
Enterprise CC Bangladesh Ltd.).
Land preparation, fertilizer, irrigation, mulching and weeding: Land was thoroughly prepared and leveled by
ploughing and laddering. Weeds and stubble were removed from the field at the time of final land preparation.
Fertilizer (N, P, K, S and B) was applied at 100, 27, 40, 20, 1 kg ha─1, respectively, as recommended by the WRC-
BARI. Before sowing seeds, and during final land preparation, two-thirds of N and a full amount of the other
fertilizers were applied as basal (see as Akhter et al., 2016). The remaining N fertilizer was applied immediately
after the first irrigation (20 DAS) while second and third irrigations were applied at 52 and 73 DAS.
Data collection: Root growth per cubic centimeter of soil was studied at 90 days after sowing (DAS) (at the early
grain-filling stage). Roots with soil were collected from randomly selected hills of each treatment and also from
between the two lines of adjacent hills by vertically penetrating a core sampler to a depth of 0-10 cm. Root samples
were watered individual in a polyethylene bag and kept for 12 h to allow the soil to swell and loosen. Samples were
5
then washed in pond water using a cloth net over the plastic net tray. Root fresh weight (RFWT; mg cc soil─1) was
taken immediately. To measure root dry weight (RDWT; mg cc soil─1), samples were dried in an oven at 70 °C for
72 h. Root length (RL; cm cc soil─1) was measured manually using calibrated paper.
Total biomass dry weight (TDM; g m-2) at different DAS was recorded from each treatment, starting from
40 DAS with a 10-day interval up until 100 DAS. TDM was assessed immediately after sampling each treatment. To
determine TDM, samples were dried in an oven at 70°C for 72 h, and weighed on an electric balance to two decimal
places.
The crop was harvested on April 4 in the first year, and on April 3 in the second year. Grain yield (GY),
biomass yield (BY) at harvest, and yield-related attributes were recorded from a 2 × 2 m (2 m long; 10 rows) area
from the center of each plot. Samples from each plot were bundled separately, tagged and threshed manually on a
threshing floor. Bundles were thoroughly dried in bright sunshine before their weights were recorded. Data on plant
height (cm), spikes m−2, spikelets spike−1, 1000-grain weight (g; TGW), and GY (kg ha−1) were recorded. GY and
TGW were recorded at 12% moisture content (Hellevang, 1995).
Y (M2) = )(100
1001
2
1 MYM
M
where Y (M2) = grain weight at 12% moisture; Y (M1) = grain weight at actual moisture %; M1 = actual
moisture %; M2 = expected moisture %.
Data analysis: Data were statistically analyzed using MSTAT-C statistical package of Michigan State
University, USA (Russell, 1986). Mean separation test was done by Duncan’s new multiple range test
(DNMRT) at a 5% probability level (Steel and Torrie, 1984).
Results
Root growth recorded at early grain filling stage of wheat genotypes
Effect of timing of NAA application on root fresh weight, dry weight and root length: Root fresh weight
(RFWT), dry weight (RDWT) and length (RL) at the early grain-filling stage were significantly (p≤0.05) influenced
by the timing of NAA application at different growth stages of wheat in both years (Table 3). Maximum RFWT,
RDWT and RL were recorded in treatments where NAA was applied at 20 and 35 DAS, followed by NAA applied
at 35 and 50 DAS, and the worst performance was when no NAA was applied (control plot) (Table 3).
6
Root fresh weight, dry weight and length varied due to genotypic variation: RFWT, RDWT and RL also varied
significantly (p≤0.05) for different genotypes in both years (Table 4). The highest RFWT was recorded for ‘Sourav’,
followed by ‘Protiva’, ‘Agrahani’ and the highest RDWT was found in ‘Gourav’ and longest roots for ‘Agrahani’.
Lowest RFWT and RDWT was recorded for ‘Sonalika’ and shortest roots for ‘Protiva’ (Table 4).
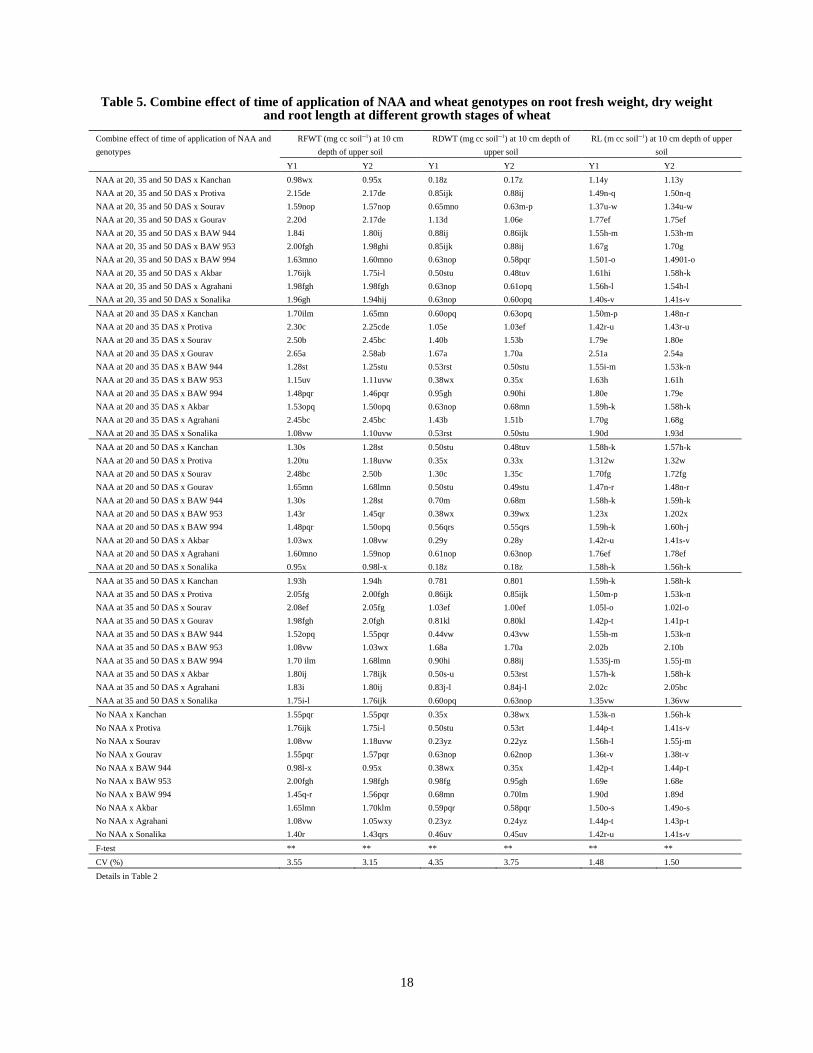
Combined effect of timing of application of NAA and genotypes on root fresh weight, dry weight and root
length: RFWT, RDWT and RL in both years were significantly (p≤0.05) influenced by the combined effect of
timing of application of NAA and genotypes (Table 5). In both years, maximum RFWT was recorded in the
treatment in which NAA was applied to ‘Gourav’ at 20 and 35 DAS, followed by NAA applied at the same DAS to
‘Sourav’ and ‘Agrahani’. Lowest values were observed in the control plot. However, maximum RDWT (similarly
significant values) was also recorded in ‘Gourav’ (when NAA was applied at 20 and 35 DAS) and ‘BAW 953’
(when NAA was applied at 35 and 50 DAS), followed by NAA applied at 20 and 35 DAS in ‘Sourav’ and
‘Agrahani’, while the lowest values were observed in the control plot. Longest roots were observed in ‘Gourav’
when NAA was applied at 20 and 35 DAS, followed by ‘BAW 953’ when NAA was applied at 35 and 50 DAS
while shortest roots formed in the control plot in both years (Table 5).
Total biomass dry weight recorded at different DAS
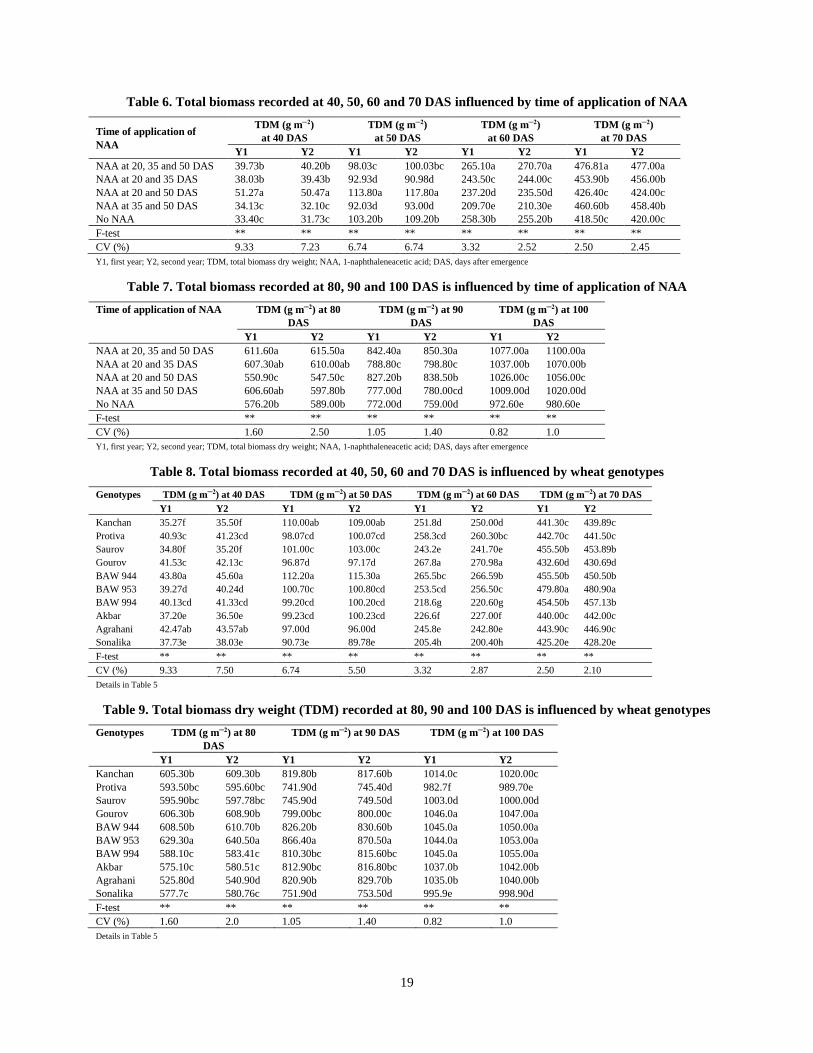
Time of application of NAA on TDM: Total biomass dry weight (TDM) recorded at different DAS (started from
40 DAS and continued up to 100 DAS with10 days interval) influenced significantly (p≤0.05) with time of
application of NAA at different DAS (Table 6, 7). The maximum TDM at 40 and 50 DAS was recorded in the
treatment where NAA was applied at 20 and 50 DAS. However, TDM at 60, 70, 80, 90 and 100 DAS, the maximum
TDM was found in the treatment where NAA was applied at 20, 35 and 50 DAS, and the worst TDM was in control
plots in both years (Table 6, 7).
Genotypic variation for TDM recorded at different DAS: The TDM of the 10 tested wheat genotypes varied
significantly (p≤0.05) at different DAS (Table 8, 9). Among all genotypes, ‘BAW 944’ had maximum TDM at 40
and 50 DAS, which was statistically similar with ‘Agrahani’ at 40 DAS and ‘Kanchan’ at 50 DAS. At 60 DAS,
highest TDM was recorded in ‘Gourav’. However, maximum and significantly similar TDM at 70, 80, 90 and 100
DAS was recorded in ‘BAW 953’ while worst values were recorded for ‘Agrahani’ at 40 DAS and ‘Protiva’ at 90
and 100 DAS (Table 8, 9).
7
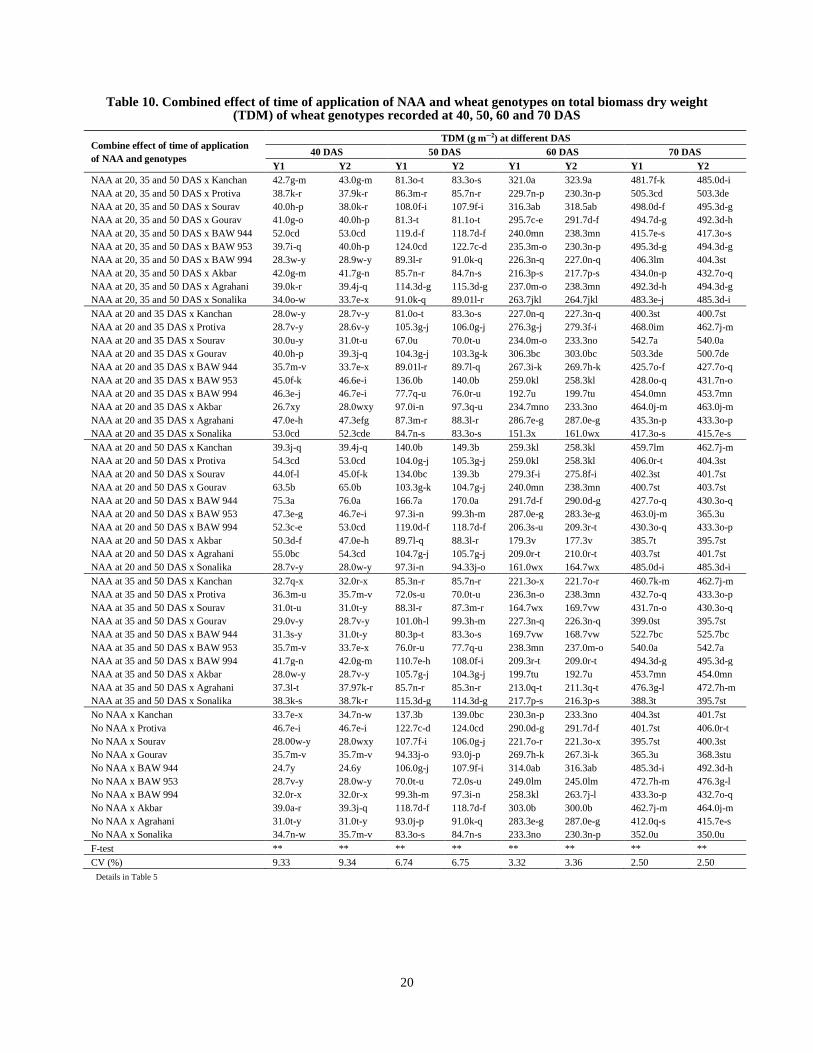
Combined effect of time of application of NAA and genotypes on TDM: The TDM of wheat genotypes recorded
at 40, 50, 60, 70, 80, 90 and 100 DAS were significantly (p≤0.05) influenced by the combined effect of timing of
NAA application and genotypes (Table 10, 11). Maximum TDM at 40 and 50 DAS was observed in ‘BAW 944’
when NAA was applied at 20 and 50 DAS. However, significantly similar and maximum TDM at 60 DAS was
observed in ‘Kanchan’ and ‘Sourav’ when NAA was applied at 20, 35 and 50 DAS, as well as at 70 DAS in
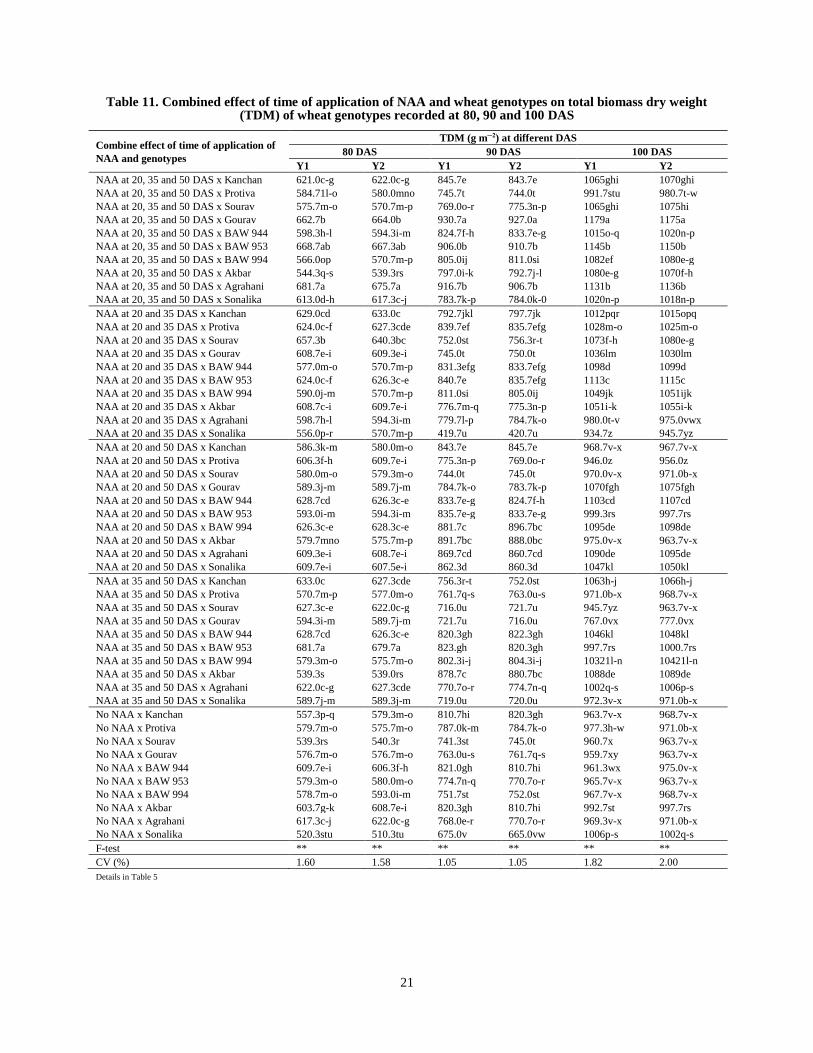
‘Sourav’ when NAA was applied at 20 and 35 DAS (Table 10). In contrast, maximum and statistically similar TDM
was recorded at 80, 90 and 100 DAS in ‘BAW 994’, ‘Gourav’ and ‘Agrahani’ with when NAA was applied at 20,
35 and 50 DAS while lowest TDM was observed in ‘Sonalika’ in the absence of NAA (control plot) (Table 11).
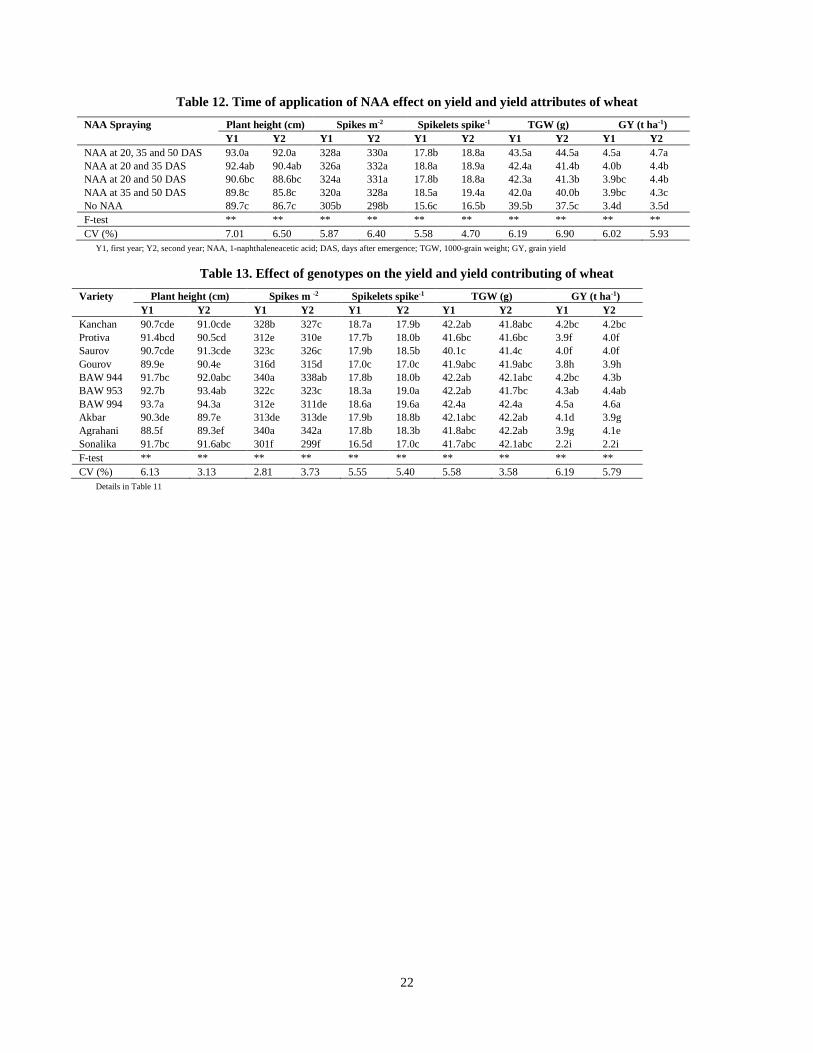
Yield and yield-related attributes: Yield and yield-related attributes of the 10 wheat genotypes varied significantly
(p≤0.05) depending on the timing of application of NAA at different DAS (Table 12). At harvest, tallest plants were
observed in the treatment where NAA was applied at 20, 35 and 50 DAS, which was statistically similar with NAA
applied at 20 and 35 DAS while shortest plants were observed in the control plot in both years. For spikes m–2 and
spikelets spike−1, no significant difference were found between NAA applications at different DAS. Maximum TGW
was found in plots where NAA was applied at 20, 35 and 50 DAS in both years and lowest values in the control plot
for all genotypes. Maximum GY was recorded when NAA was applied at 20, 35 and 50 DAS, followed by NAA
applied at 20 and 35 DAS in both years while lowest GY was observed in the control plot (Table 12).
Yield and yield-related attributes of different wheat genotypes varied significantly (p≤0.05) in both years
(Table 13). Tallest plants at harvest formed in ‘BAW 994’, followed by ‘BAW 953’, ‘BAW 944’ and ‘Sonalika’,
while shortest plants formed in ‘Agrahani’ in both years. Significantly similar and maximum spikes m–2 were
recorded in ‘Agrahani’ and ‘BAW 944’ and least spikes m–2 in ‘Sonalika’. In contrast, ‘Kanchan’, ‘BAW 953’ and
‘BAW 994’ produced significantly similar and maximum number of spikelets spike–1 in both years. The maximum
TGW was recorded in ‘BAW 994’, followed by ‘Agrahani’, ‘Akbar’, ‘Sonalika’, ‘BAW 944’, ‘Gourav’ and
‘Kanchan’ in both years whereas the lowest TGW was found in ‘Sourav’. The highest GY was found in ‘BAW 994’
followed by ‘BAW 953’ and ‘BAW 944’, and the lowest GY was recorded in ‘Sonalika’ (Table 13).
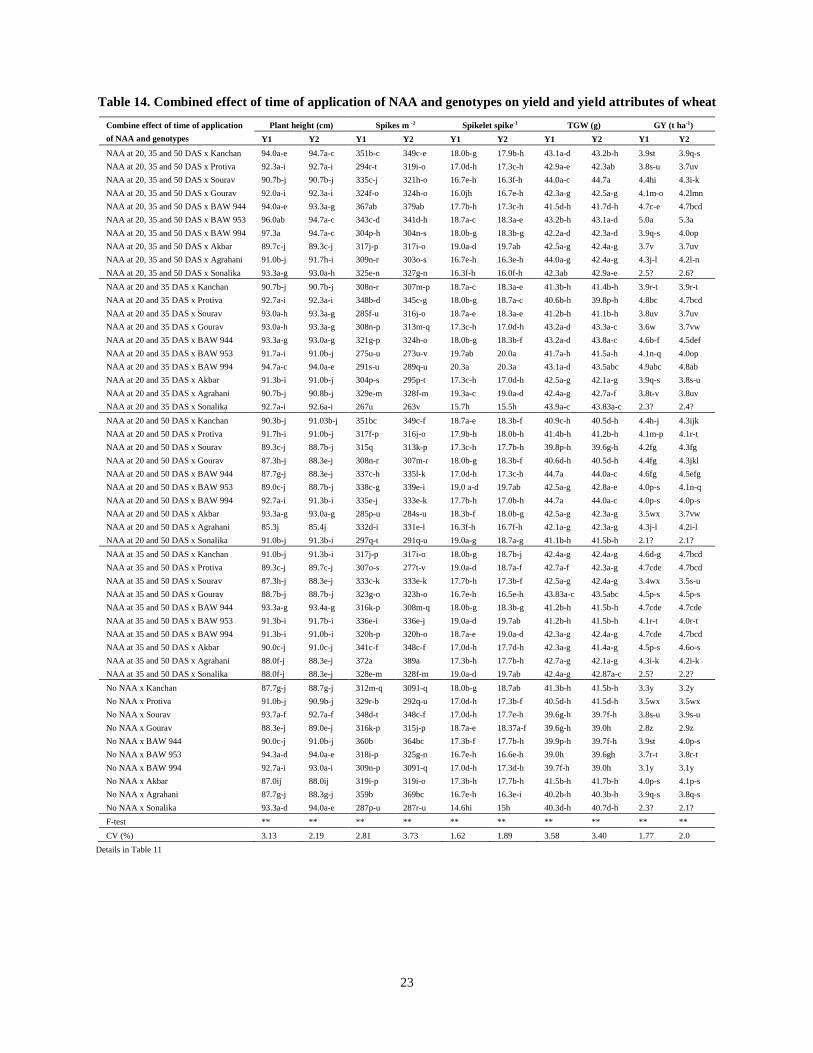
The combined effect of timing of NAA application and genotypes also significantly (p≤0.05) influenced
GY and yield attributes (Table 14). Tallest plants formed when NAA was applied at 20, 35 and 50 DAS in ‘BAW
994’ followed by ‘BAW 953’ and ‘BAW 994’ while shortest plants formed in ‘Agrahani’ when NAA was applied at
20 and 50 DAS. ‘Agrahani’ produced highest number of spikes m–2 after the application of NAA at 35 and 50 DAS,

8
which was statistically similar to ‘BAW 944’ when NAA was applied at 20, 35 and 50 DAS. Fewest spikes m–2
formed in ‘Sonalika’ with application of NAA at 20 and 35 DAS (Table 14).
The application of NAA at 20 and 35 DAS to ‘BAW 994’, ‘BAW 953’ and ‘Agrahani’ produced the
significantly similar and maximum number of spikelets spike–1 in both years, followed by the application of NAA at
20 and 50 DAS to ‘BAW 953’ and ‘Sonalika’. The fewest number of spikelets spike−1 were obtained in ‘Sonalika’ in
the NAA-free treatment (Table 14).
‘BAW 944’ and ‘BAW 953’ showed significantly similar TGW when NAA was applied at 20 and 50 DAS,
followed by ‘Agrahani’ exposed to NAA at 20, 35 and 50 DAS. Smaller grain size was found in ‘BAW 953’ in the
NAA-free treatment (Table 14).
‘BAW 953’ produced the highest GY when NAA was applied at 20, 35 and 50 DAS, which was statistically
similar with the application of NAA at 20 and 35 DAS, and at 35 and 50 DAS in both ‘BAW 994’ and ‘Protiva’.
However, ‘Sonalika’ produced significantly lowest GY in all NAA treatments as well as in the control (Table 14).
Discussion
Soil nutrient status and climatological conditions during the experiment: The soil nutrient status before sowing
wheat in the experimental soils is defined in Table 2. Soil pH was 5.3 and organic matter was 1.2%. The pre-sowing
total soil nitrogen (N) status was 0.08%, indicating that soil was deficient in soil N. Available K was 0.17 meq
100g─1 soil, and available P, S, Zn and B were 19.0, 5.5, 0.80 and 0.18 µg g–1 soil, respectively. Based on the critical
level of these plant nutrients, K, S, Zn and B were low, but P was high.
Temperature (maximum and minimum) fluctuations, rainfall, sunshine hours and relative humidity are the
most important climatic factors for phenology, growth, and yield of wheat (Hossain et al., 2013; Uddin et al., 2016).
The optimum temperature required for wheat is 20-25°C and the maximum temperature is 35°C (Tewolde et al.,
2006; Hossain and Teixeira da Silva, 2012, 2013). Relative to those findings, the weather conditions in our
experimental period were suitable for good wheat GY (Fig. 1).
NAA: effect on root growth, plant biomass and yield of wheat: PGRs are one of the most important
factors used to induce a higher yield of field crops. They regulate physiological processes and synthetic PGRs may
enhance the growth and development of field crops thereby increasing total dry mass of field crops, but the timing of
application of NAA is important to increase crop yield (Cho et al., 2008; Aslam et al., 2010; Adam & Jahan, 2011;
9
El-ghit, 2015; Islam & Jahan, 2016). In the present study, data on RFWT, RDWT, RL, TDM, GY and yield
attributes of wheat genotypes were significantly (p≤0.05) influenced by the timing of application of NAA in both
years (Tables 3 to 14). These results indicate that the application of NAA at different growth stages of wheat are
more effective than the control.
Jahan & Adam (2013), who conducted a field experiment at the Department of Botany, University of
Dhaka, to investigate the effect of various concentrations of NAA (0, 25, 50, 75, 100 mg l–1) on the growth and yield
components of BARI Gom-26, also noticed that the application of NAA at different concentrations effectively
increased growth parameters and yield while plant height, number of tillers plant–1 and number of leaves plant–1
performed negatively in most cases with a few exceptions (7 and 14 DAS with 25 and 50 mg l–1 NAA). However, 50
mg l–1 NAA produced the highest TDM at all the stages of growth except at 21 and 28 DAS. In contrast, spike
length, number of grains spike–1 and 1000‐ seed weight increased following the application of any concentration of
NAA. The number of spikes m-2 and maximum yield (g plant–1 and t ha–1) increased significantly only after the
application of 50 mg l–1 NAA, 9.09% and 12.24% higher than the control, respectively. Their results indicated that
the application of NAA at different growth stages of wheat were more effective for RFWT, RDWT, RL and TDM of
wheat genotypes than the control. Similarly, Islam & Jahan (2016) also conducted a field experiment at the
Department of Botany, University of Dhaka to determine the growth and yield responses of BARI Gom-26
following the application of three concentrations of NAA, i.e., no NAA, 25 mg l–1 NAA and 50 mg l–1 NAA, and
four levels of N-fertilizer, namely without any N-fertilizer (F0), 50% of the recommended dose, 75% of the
recommended dose and full recommended dose of urea and reported that the maximum number of tillers, TDM
plant–1 were obtained with 25 mg l–1 NAA in combination with 50% N-fertilizer recorded at different days after
spray. They also noticed that number of effective tillers plant–1, 1000-seed weight and yield (g plant–1 and t ha–1)
increased significantly with 25 mg l–1 NAA in combination with 75% N-fertilizer.
The positive effect of NAA on the growth or yield of different crops was confirmed by earlier studies.
Bengal et al. (1983) noted that Cicer arietinum (chickpea) seed and pod weight increased with foliar application of
25–30 mg l–1 NAA three times at 5-day intervals, beginning at the flowering stage. NAA increased the number of
pods plant–1, dry pod yield and 100-seed weight in Arachis hypogaea (peanut) (40 and 50 DAS) (Singh & Sharma,
1982). Bai et al. (1987) found that the application of eight foliar sprays of 25 mg l–1 NAA at 7-day intervals
significantly increased seed yield and yield components of Vigna radiata (groundnut). The number of pods plant–1
10
increased by spraying 40 mg l–1 NAA on groundnut once at either 45 DAS or twice at 45 and 55 DAS
(Devasenapathy et al., 1987). Deotale et al. (1998) studied the effect of gibberellic acid and NAA on growth
parameters of Glycine max (soybean) and obtained tallest plants, highest number of leaves plant–1, number of
branches plant–1, leaf area, dry matter, days to maturity and seed yield with 100–400 mg l–1 NAA. Application of
NAA (4.5% a.i.) applied at 200 ml ha–1 in three split doses at 45, 90 and 135 DAS increased number of pods plant–1,
seeds pod–1, 100-seed weight, biological yield and seed yield of chickpea by 12.50, 6.98, 9.59, 2.61 and 13.98%,
respectively more than the control (Aslam et al., 2010). The application of 100 and 200 mg l–1 NAA to Oryza sativa
(rice) increased GY plant–1 by 27.67 and 6.85%, respectively in ‘BRRI dhan-29’, although the difference was not
statistically significant. However, in ‘BRRI dhan-50’, GY plant–1 decreased by 26.54% at 100 mg l–1 and by 27.67%
at 200 mg l–1. Among both concentrations, 100 mg l–1 NAA stimulated growth best (Adam & Jahan, 2011). Alam et
al. (2002) conducted a field research in Pakistan with different levels of NAA and noticed that NAA at 20 mg l–1
enhanced the straw and grain yields of wheat cultivars ‘Sarsabz’, ‘Soghat’ and ‘S-232’. NAA has been used to
enhance the growth and yield of cereals (Bakhsh et al., 2011b; Yan et al., 2014; Basuchaudhuri, 2016), by
producing significant effects in promoting development of pointed ends in the root system, resulting in more,
straighter and thicker roots. PGRs also significantly increased root growth (RDWT) and promoted new roots in rice
sprayed with 10 or 100 mg l–1 NAA at the tillering stage (Raoofi et al., 2014; Basuchaudhuri, 2016). El-ghit (2015)
noticed that foliar application of NAA reduced the harmful effects of salinity to Rosmarinus officinalis (rosemary)
and improved growth by increasing the concentration of NAA up to 200 mg l–1 but decreased growth at a higher
concentration (300 mg l–1).
Conclusions
The results of a two-year study reveal that the application of NAA (25 mg l–1) at 20, 35 and 50 DAS were
effective for growth, yield and yield attributes of 10 wheat genotypes. Maximum TDM at 40 and 50 DAS was
obtained in ‘BAW 944’ when NAA was applied at 20 and 50 DAS, but highest TDM at 60 DAS was observed in
‘Kanchan’ and ‘Sourav’ when NAA was applied at 20, 35 and 50 DAS. TDM at 70 DAS was observed in ‘Sourav’
with the application of NAA at 20 and 35 DAS. When considering yield and yield attributes, ‘BAW 994’ and ‘BAW
953’ produced significantly similar and maximum GY when NAA was applied at 20, 35 and 50 DAS. Therefore, the
11
application of NAA at 20, 35 and 50 DAS in all genotypes was more effective (i.e., better growth and yield) than the
control plot. Among the 10 tested genotypes, ‘BAW 953’ and ‘BAW 994’ responded best to NAA.
Conflicts of interest
The authors declare no conflicts of interest.
Financial support
This research was under taken as part of a national research program of the Wheat Research Centre, BARI,
Dinajpur, with the financial support of BARI from the annual research budgets.
Acknowledgements
We are very grateful to Director General of BARI and Director of WRC, BARI to provide fund and uninterrupted
support during the research trial.
References
Adam, A.G. and Jahan, N. 2011. Effects of naphthalene acetic acid on yield attributes and yield of two varieties of
rice (Oryza sativa L.). Bangladesh J. Bot., 40(1): 97-100.
Akhter, M.M., Hossain, A., Timsina, J., da Silva, J.A.T. and Islam, M.S. 2016. Chlorophyll meter–a decision-
making tool for nitrogen application in wheat under light soils. Intl. J. Plant Prod., 10(3): 289-302
Alabadí, D., Blázquez, M.A., Carbonell, J., Ferrándiz, C. and Pérez-Amador, M.A., 2009. Instructive roles for
hormones in plant development. Intl. J. Develop. Biol., 53(8), p.1597.
Alam SM, Shereen A, Khan M. 2002. Growth response of wheat cultivars to naphthalene acetic acid (NAA) and
ethrel. Pak. J. Bot., 34(2): 135-137.
Aslam, M., E. Ahmad, A.G.Saguu, K. Hussain, M. Ayaz, Inayat Ullah, A. Hussain and Himayatullah. 2010. Effect
of plant growth regular (NAA) and available soil moisture depletions on yield and yield components of
chickpea. Sarhad J. Agric., 26(4): 325-335.
Bai, D. I. S., Abraham, A. T. and Mercy, S. T., 1987. Hormonal influence in green gram. Legume Res., 10: 49–52.
12
Bakhsh, I., Awan, I., Sadiq, M., Niamatullah, M., Zaman, K.U. and Aftab, M., 2011a. Effect of plant growth
regulator application at different growth stages on the economical yield potential of coarse rice (Oryza
sativa L.). J. Anim. Plant Sci., 21: 612-616.
Bakhsh, I., H.U. Khan, M.Q. Khan and S. Javaria. 2011b. Effect of naphthalene acetic acid and phosphorus levels on
the yield potential of transplanted coarse rice. Sarhad J. Agric., 27(2): 161-165.
Bangal, D.B., Deshmukh, S.N. and Patil, V.A., 1983. Contribution of pod wall in grain development of chickpea
(Cicer arietinum L.) as influenced by foliar application of growth regulators and urea. Indian J. Plant
Physiol., 1983: 26, 292–295.
Basuchaudhuri, P. 2016. 1-Naphthaleneacetic acid in rice cultivation. Current Sci., 110(1): 52-56.
BBS (Bangladesh Bureau of Statistics). 2016. Statistical year book of Bangladesh. Statistics Division, Ministry of
Finance and Planning, Government of Peoples Republic of Bangladesh, Dhaka.
Cho MH, No HK, Prinyawiwatkul W. 2008. Chitosan treatments affect growth and selected quality of sunflower
sprouts. J. Food Sci., 73: 570-577.
Devasenapathy, P., Jagannathan, N. T. and Subbiah, K. 1987. Effect of naphthalene acetic acid on groundnut. Indian
J. Agron. 32, 176–177.
Deotale, R. D., Maske, V. G., Sorte, N. V., Chimurkar, B. S. and Yeme, A. Z. 1998. Effect of GA and NAA on
morphological parameter of soybean. J. Soil Crops., 1: 323–325.
El-ghit, H.M.A. 2015. Effect of naphthalene acetic acid (NAA) on growth and yield of rosemary (Rosemarinus
officinalis L.) under salinity stress. Egypt. J. Bot., 56 (2): 303-317.
FAO I, WFP. 2015. The state of food insecurity in the world: meeting the 2015 international hunger targets: taking
stock of uneven progress. FAO Rome; 2015.
Hellevang, K.J. 1995. Grain moisture content effects and management. Department of Agricultural and Biosystems
Engineering, North Dakota State University. Retrieved from
<http://www.ag.ndsu.edu/pubs/plantsci/crops/ae905w.htm> (Accessed on January 27 2018)
Henkel, M., 2015. 21st Century Homestead: Sustainable Agriculture I. Lulu. Com, 2015. Pp. 394.
Hossain, A., Teixeira da Silva, J.A., 2012. Phenology, growth and yield of three wheat (Triticum aestivum L.)
varieties as affected by high temperature stress. Not. Sci. Biol., 4(3): 97–106.
13
Hossain, A., Teixeira da Silva, J.A., 2013. Wheat production in Bangladesh: its future in the light of global
warming. AoB Plants, 5: pls042. doi: 10.1093/aobpla/pls042
Hossain, A., Sarker, M.A.Z., Saifuzzaman, M., Teixeira da Silva, J.A., Lozovskaya, M.V., Akhter, M.M. 2013.
Evaluation of growth, yield, relative performance and heat susceptibility of eight wheat (Triticum aestivum
L.) genotypes grown under heat stress. Int. J. Plant Prod., 7(3): 615–636.
Islam, S., Jahan, N. 2016. Growth and yield responses of BARI Gom-26 (Triticum aestivum L.) following
application of naphthalene acetic acid at varying nitrogen levels. Bangladesh J. Bot., 45(2): 411-418.
Jahan, N. and Adam, A.G., 2013. Growth and yield responses of BARI Gom-26 (Triticum aestivum L.) to
naphthalene acetic acid. Dhaka Univ. J. Biol. Sci., 22(2):119-125.
Li, Y., Cui, Z., Ni, Y., Zheng, M., Yang, D., Jin, M., Chen, J., Wang, Z. & Yin, Y. 2016. Plant density effect on
grain number and weight of two winter wheat cultivars at different spikelet and grain positions. PloS
ONE, 11(5), p.e0155351. doi: 10.1371/journal.pone.0155351
Long, S.P., Ort, D.R. 2010. More than taking the heat: crops and global change. Current Opinion Plant Biol., 13:
241-248.
Pandey, A. K., R. S. Tripathi and R. S. Yadav. 2001. Effect of certain growth regulators on growth yield and quality
of rice (Oryza sativa L.). Indian J. Agric. Res., 35(2): 118-120.
Raoofi, M.M., Dehghan, S., Keighobadi, M. and Poodineh, O., 2014. Effact of naphthalene acetic acid in agriculture
and the role of increase yield. Intl J. Agric. Crop Sci., 7(14): 1378-1380.
Reynolds, M., Foulkes, M. J., Slafer, G. A., Berry, P., Parry, M. A., Snape, J. W. & Angus, W. J. (2009). Raising
yield potential in wheat. J. Expt. Bot.,, 60(7): 1899–1918. doi:10.1093/jxb/erp016
Rosegrant, M.W., Agcaoili, M. 2010. Global food demand, supply, and price prospects to 2010.
International Food Policy Research Institute, Washington, DC, USA, pp. 69-71.
Russell, F. 1986. MSTAT Micro-Computer Statistical Programme. Michigan State. East Lansing, Michigan, USA.
Ruth B. A., Stern, R.A., Flaishman, M., Galilee, M. 2006. Synthetic auxin promotes fruit development and
climacteric in Prunus salicina Technology Center, P.O. Box 831, Kiryat-Shmona 11016, Institute of
Horticulture, ARO, The Volcani Center, P.O. Box 6, Bet-Dagan 50250.
Singh, G. S. and Sharma, B., 1982. Effect of plant growth regulators on groundnut productivity. Indian J. Ecol., 12:
267–272.
14
Singh, J., Kaur, S., Majithia, H. 2016. Emerging genetic technologies for improving the security of food crops. In:
Woodhead Publishing Series in Food Science, Technology and Nutrition, edited by Chandra Madramootoo,
Woodhead Publishing, Oxford, 2016, pp. 23-41, Emerging Technologies for Promoting Food Security.
doi.org/10.1016/B978-1-78242-335-5.00002-0.
Steel, R.G.D., Torrie, J.H. 1984. Principles and Procedures of Statistics: A Biometrical Approach, (pp. 172-177),
2nd Ed., McGraw Hill Book Co. Inc., Singapore.
Tewolde, H., C. J. Fernandez and C. A. Erickson. 2006. Wheat cultivars adapted to post-heading high temperature
stress. J. Agron. Crop Sci., 192: 111–120.
Tilman, D., Cassman, K.G., Matson, P.A., Naylor, R. and Polasky, S., 2002. Agricultural sustainability and
intensive production practices. Nature, 418 (6898): 671-677. doi:10.1038/nature01014
Timsina, J., Wolf, J., Guilpart, N., van Bussel, L.G.J., Grassini, P., van Wart, J., Hossain, A., Rashid, H., Islam, S.,
van Ittersum, M.K., 2016. Can Bangladesh produce enough cereals to meet future demand? Agric. Syst.,
Doi: 10.1016/j.agsy.2016.11.003.
Timsina, J., Singh, U., Badaruddin, M. & Meisner, C., 1998. Cultivar, nitrogen, and moisture effects on a rice-wheat
sequence: experimentation and simulation. Agron. J., 90: 119-130.
Timsina, J., Jat, M.L., Majumdar, K., 2010. Rice-maize systems of South Asia: current status, future prospects and
research priorities for nutrient management. Plant and Soil. 335: 65–82.
Uddin, R., Islam, M.S., Ullah, M.J., Hore, P.K. and Paul, S.K. 2016. Grain growth and yield of wheat as influenced
by variety and sowing date. Bangladesh Agronomy Journal, 18(2), 97-104. doi: 10.3329/baj.v18i2.28911
Yan Y-H, Li J-L, Zhang X-Q, Yang W-Y, Wan Y, Ma Y-M, Zhu Y-Q, Peng Y, Huang L-K. 2014. Effect of
naphthalene acetic acid on adventitious root development and associated physiological changes in stem
cutting of Hemarthria compressa. PLoS ONE 9(3): e90700. Doi: 10.1371/journal.pone.0090700
15
Fig. 1. Climatological conditions during the present study (Year 1 & Year 2)
16
Table 1. Recent studies related to NAA on different crops, from different countries around the world
Tested crops Main research findings Reference
Tomato
Bitter gourd
Cowpea
NAA affected the growth and yield. Chhonker and Singh (1959)
Jahan and Fattah (1991)
Ullah et al. (2007)
Rice Growth and yield parameters of rice were significantly promoted in response to
various NAA levels. Spraying with 10 and 100 mg l–1 NAA at the tillering stage
significantly increased root dry weight.
Wang and Deng (1992); Zahir et al.
(1998); Muthukumar et al. (2005);
Bakhsh et al. (2011); Adam and Jahan
(2011)
Cotton NAA had a significant effect on plant height, number of fruiting branches, volume of
boll and yield.
Abro, et al. (2004)
Wheat NAA at 20 mg l–1 enhanced the straw and grain yields. Alam et al. (2002)
Cereals (rice,
wheat, maize,
barley)
NAA enhanced growth and yield. Lilani et al. (1991)
Sugarcane NAA enhanced invertase content. Sacher and Glasziou (1962); Sacher et
al. (1963)
Cucumber Solutions of NAA in concentration as high as 200 μg ml–1 decreased micelial growth
rate of three isolates of Sclerotinia sclerotiorum (Lib.) de Bary in vitro, and the same
concentration of NAA reduced the development of S. sclerotiorum lesion on detached
leaves.
Al-Masri et al. (2002)
Soybean Plants sprayed with NAA at 40 mg l–1 after 35 days after sowing (DAS) had significant
increases in growth characters, yield and yield attributes including number of pods and
seeds, plant, seeds pod–1 and 100-seed weight. Similarly, NAA at 40 mg l–1 and IAA at
100 mg l–1 supplied as a foliar spray at 35 and 60 DAS improved some biochemical
and physiological aspects including total chlorophyll and soluble protein. NAA applied
at the flowering stage increased number of branches plant–1 and average pod weight
while a later application increased plant dry matter.
Govindan et al. (2000); Senthil et al.
(2003); Merlo et al. (1987)
Peach Application of NAA at 30 mg l–1 led to increased fruit size and to delayed harvesting
period.
Antonio and Bettio (2003)
Japanese plum NAA at 30 mg l–1 at the beginning of pit-hardening caused an appreciable and
significant increase in fruit size.
Ruth et al. (2006)
Gram An increase in number of pods and grains pod-1 was observed with 25 mg l–1 NAA. Bangal et al. (1983)
Chickpea Seed and pod weight increased with a foliar application of 25-50 mg l–1 NAA three
times at 5-day intervals, beginning at the flowering stage. Spraying 0, 10, 20, or 30 mg
l–1 NAA at bud initiation and pod formation stages increased grain yield.
Bangal et al. (1983); Upadhyay et al.
(1993)
Groundnut Planofix (NAA) increased number of pods plant–1, dry pod yield and 100-seed weight
40 and 50 days after sowing. Number of pods plant–1 increased by spraying 40 mg l–1
NAA once at either 45 DAS or twice at 45 and 55 DAS.
Singh and Sharma (1982);
Devasenapathy et al. (1987)
Faba bean Rhodofix (NAA) at 3.4 g ha–1 increased the number of pods plant–1, seeds pod–1, 100-
seed weight and yield.
Suty (1984)
Mungbean Application of eight foliar sprays of 25 mg l–1 NAA at 7-day intervals caused a
significant increase in seed yield and yield components.
Bai et al. (1987)
17
Table 2. Nutrient status of soil with critical value before sowing of wheat seed
Soil parameters Nutrient
status before sowing
Critical
level
Soil pH 5.50 -
Organic matter (%) 1.20 -
Total N (%) 0.08 0.12
Available P (µg g–1 soil) 19.00 14.0 Exchangeable K (Meq 100 g–1 soil) 0.17 0.20 Available S (µg g–1 soil) 5.50 14.0 Available Zn (µg g–1 soil) 0.80 2.00
Available B (µg g–1 soil) 0.18 0.20
Exchangeable Ca (Meq100 g–1 soil) 0.75 2.00 Exchangeable Mg (Meq100 g–1 soil)
0.53 0.80
Extraction methods: Soil pH by glass electrode pH meter; organic matter (%) by wet oxidation method (Walkley and Black, 1934); total N (%) by micro Kjeldhal method
(Jackson, 1958); available P, S, Zn (µg g–1 soil) and exchangeable K (Meq 100 g–1 soil), by a modified Hunter’s method (BARC, 1984); available B (µg g–1 soil) was determined
colorimetrically by the Azomethine-H method (Sippola and Ervio, 1977); exchangeable Ca and Mg (Meq100 g–1 soil) was determined by the extractable method (Hunter, 1972).
Table 3. Root fresh weight, dry weight and root length as affected by time of application of NAA at different growth stages of wheat
Application of NAA at
different growth stages of
wheat genotypes
RFWT (mg cc soil─1) at 10
cm depth of upper soil
RDWT (mg cc soil─1) at 10 cm
depth of upper soil
RL (m cc soil─1) at 10 cm depth of
upper soil
Y1 Y2 Y1 Y2 Y1 Y2
NAA at 20, 35 and 50 DAS 1.80b 1.75b 0.69c 0.72c 1.51c 1.48c
NAA at 20 and 35 DAS 1.87a 1.90a 0.92a 0.89a 1.75a 1.78a
NAA at 20 and 50 DAS 1.48d 1.52d 0.53d 0.58d 1.50c 1.55c
NAA at 35 and 50 DAS 1.72c 1.68c 0.84b 0.88b 1.61b 1.59b
No NAA 1.18d 1.20d 0.50e 0.48e 1.03d 1.09d
F-test ** ** ** ** ** **
CV (%) 9.55 8.45 8.35 8.15 7.48 6.68 NAA, 1-naphthaleneacetic acid; DAS, days after emergence; Y1, first year; Y2, second year; RFWT, root fresh weight; RDWT, root dry weight; RL, root length; mg, milligram;
m, meter; cc, cubic centimeter
Table 4. Root fresh, dry weight and root length of different wheat genotypes is influenced by NAA
Wheat
genotypes
RFWT (mg cc soil─1) at 10
cm depth of upper soil
RDWT (mg cc soil─1) at 10 cm
depth of upper soil
RL (m cc soil─1) at 10 cm
depth of upper soil
Y1 Y2 Y1 Y2 Y1 Y2
Kanchan 1.49f 1.51f 0.48g 0.50g 1.46f 1.44f Protiva 1.89b 1.82b 0.72d 0.70d 1.42g 1.40g Saurov 1.94a 1.95a 0.94a 0.93a 1.71a 1.70a Gourov 1.82c 1.79cd 0.92b 0.90b 1.53e 1.53e BAW 944 1.38h 1.36gh 0.58ef 0.60ef 1.54e 1.52e BAW 953 1.53e 1.55e 0.85c 0.86c 1.68bc 1.64b BAW 994 1.74d 1.77cd 0.73d 0.74d 1.67c 1.61c Akbar 1.56e 1.54e 0.51f 0.50f 1.59d 1.56d Agrahani 1.79c 1.80b 0.75d 0.71d 1.69ab 1.70a Sonalika 1.42g 1.43g 0.48g 0.51g 1.53e 1.51e
F-test ** ** ** ** ** **
CV (%) 9.55 9.52 8.35 8.35 7.48 7.58
Details in Table 2
18
Table 5. Combine effect of time of application of NAA and wheat genotypes on root fresh weight, dry weight and root length at different growth stages of wheat
Combine effect of time of application of NAA and
genotypes
RFWT (mg cc soil─1) at 10 cm
depth of upper soil
RDWT (mg cc soil─1) at 10 cm depth of
upper soil
RL (m cc soil─1) at 10 cm depth of upper
soil
Y1 Y2 Y1 Y2 Y1 Y2
NAA at 20, 35 and 50 DAS x Kanchan 0.98wx 0.95x 0.18z 0.17z 1.14y 1.13y
NAA at 20, 35 and 50 DAS x Protiva 2.15de 2.17de 0.85ijk 0.88ij 1.49n-q 1.50n-q
NAA at 20, 35 and 50 DAS x Sourav 1.59nop 1.57nop 0.65mno 0.63m-p 1.37u-w 1.34u-w
NAA at 20, 35 and 50 DAS x Gourav 2.20d 2.17de 1.13d 1.06e 1.77ef 1.75ef
NAA at 20, 35 and 50 DAS x BAW 944 1.84i 1.80ij 0.88ij 0.86ijk 1.55h-m 1.53h-m
NAA at 20, 35 and 50 DAS x BAW 953 2.00fgh 1.98ghi 0.85ijk 0.88ij 1.67g 1.70g
NAA at 20, 35 and 50 DAS x BAW 994 1.63mno 1.60mno 0.63nop 0.58pqr 1.501-o 1.4901-o
NAA at 20, 35 and 50 DAS x Akbar 1.76ijk 1.75i-l 0.50stu 0.48tuv 1.61hi 1.58h-k
NAA at 20, 35 and 50 DAS x Agrahani 1.98fgh 1.98fgh 0.63nop 0.61opq 1.56h-l 1.54h-l
NAA at 20, 35 and 50 DAS x Sonalika 1.96gh 1.94hij 0.63nop 0.60opq 1.40s-v 1.41s-v
NAA at 20 and 35 DAS x Kanchan 1.70ilm 1.65mn 0.60opq 0.63opq 1.50m-p 1.48n-r
NAA at 20 and 35 DAS x Protiva 2.30c 2.25cde 1.05e 1.03ef 1.42r-u 1.43r-u
NAA at 20 and 35 DAS x Sourav 2.50b 2.45bc 1.40b 1.53b 1.79e 1.80e
NAA at 20 and 35 DAS x Gourav 2.65a 2.58ab 1.67a 1.70a 2.51a 2.54a
NAA at 20 and 35 DAS x BAW 944 1.28st 1.25stu 0.53rst 0.50stu 1.55i-m 1.53k-n
NAA at 20 and 35 DAS x BAW 953 1.15uv 1.11uvw 0.38wx 0.35x 1.63h 1.61h
NAA at 20 and 35 DAS x BAW 994 1.48pqr 1.46pqr 0.95gh 0.90hi 1.80e 1.79e
NAA at 20 and 35 DAS x Akbar 1.53opq 1.50opq 0.63nop 0.68mn 1.59h-k 1.58h-k
NAA at 20 and 35 DAS x Agrahani 2.45bc 2.45bc 1.43b 1.51b 1.70g 1.68g
NAA at 20 and 35 DAS x Sonalika 1.08vw 1.10uvw 0.53rst 0.50stu 1.90d 1.93d
NAA at 20 and 50 DAS x Kanchan 1.30s 1.28st 0.50stu 0.48tuv 1.58h-k 1.57h-k
NAA at 20 and 50 DAS x Protiva 1.20tu 1.18uvw 0.35x 0.33x 1.312w 1.32w
NAA at 20 and 50 DAS x Sourav 2.48bc 2.50b 1.30c 1.35c 1.70fg 1.72fg
NAA at 20 and 50 DAS x Gourav 1.65mn 1.68lmn 0.50stu 0.49stu 1.47n-r 1.48n-r
NAA at 20 and 50 DAS x BAW 944 1.30s 1.28st 0.70m 0.68m 1.58h-k 1.59h-k
NAA at 20 and 50 DAS x BAW 953 1.43r 1.45qr 0.38wx 0.39wx 1.23x 1.202x
NAA at 20 and 50 DAS x BAW 994 1.48pqr 1.50opq 0.56qrs 0.55qrs 1.59h-k 1.60h-j
NAA at 20 and 50 DAS x Akbar 1.03wx 1.08vw 0.29y 0.28y 1.42r-u 1.41s-v
NAA at 20 and 50 DAS x Agrahani 1.60mno 1.59nop 0.61nop 0.63nop 1.76ef 1.78ef
NAA at 20 and 50 DAS x Sonalika 0.95x 0.98l-x 0.18z 0.18z 1.58h-k 1.56h-k
NAA at 35 and 50 DAS x Kanchan 1.93h 1.94h 0.781 0.801 1.59h-k 1.58h-k
NAA at 35 and 50 DAS x Protiva 2.05fg 2.00fgh 0.86ijk 0.85ijk 1.50m-p 1.53k-n
NAA at 35 and 50 DAS x Sourav 2.08ef 2.05fg 1.03ef 1.00ef 1.05l-o 1.02l-o
NAA at 35 and 50 DAS x Gourav 1.98fgh 2.0fgh 0.81kl 0.80kl 1.42p-t 1.41p-t
NAA at 35 and 50 DAS x BAW 944 1.52opq 1.55pqr 0.44vw 0.43vw 1.55h-m 1.53k-n
NAA at 35 and 50 DAS x BAW 953 1.08vw 1.03wx 1.68a 1.70a 2.02b 2.10b
NAA at 35 and 50 DAS x BAW 994 1.70 ilm 1.68lmn 0.90hi 0.88ij 1.535j-m 1.55j-m
NAA at 35 and 50 DAS x Akbar 1.80ij 1.78ijk 0.50s-u 0.53rst 1.57h-k 1.58h-k
NAA at 35 and 50 DAS x Agrahani 1.83i 1.80ij 0.83j-l 0.84j-l 2.02c 2.05bc
NAA at 35 and 50 DAS x Sonalika 1.75i-l 1.76ijk 0.60opq 0.63nop 1.35vw 1.36vw
No NAA x Kanchan 1.55pqr 1.55pqr 0.35x 0.38wx 1.53k-n 1.56h-k
No NAA x Protiva 1.76ijk 1.75i-l 0.50stu 0.53rt 1.44p-t 1.41s-v
No NAA x Sourav 1.08vw 1.18uvw 0.23yz 0.22yz 1.56h-l 1.55j-m
No NAA x Gourav 1.55pqr 1.57pqr 0.63nop 0.62nop 1.36t-v 1.38t-v
No NAA x BAW 944 0.98l-x 0.95x 0.38wx 0.35x 1.42p-t 1.44p-t
No NAA x BAW 953 2.00fgh 1.98fgh 0.98fg 0.95gh 1.69e 1.68e
No NAA x BAW 994 1.45q-r 1.56pqr 0.68mn 0.70lm 1.90d 1.89d
No NAA x Akbar 1.65lmn 1.70klm 0.59pqr 0.58pqr 1.50o-s 1.49o-s
No NAA x Agrahani 1.08vw 1.05wxy 0.23yz 0.24yz 1.44p-t 1.43p-t
No NAA x Sonalika 1.40r 1.43qrs 0.46uv 0.45uv 1.42r-u 1.41s-v
F-test ** ** ** ** ** **
CV (%) 3.55 3.15 4.35 3.75 1.48 1.50
Details in Table 2
19
Table 6. Total biomass recorded at 40, 50, 60 and 70 DAS influenced by time of application of NAA
Time of application of
NAA
TDM (g m─2)
at 40 DAS
TDM (g m─2)
at 50 DAS
TDM (g m─2)
at 60 DAS
TDM (g m─2)
at 70 DAS
Y1 Y2 Y1 Y2 Y1 Y2 Y1 Y2
NAA at 20, 35 and 50 DAS 39.73b 40.20b 98.03c 100.03bc 265.10a 270.70a 476.81a 477.00a
NAA at 20 and 35 DAS 38.03b 39.43b 92.93d 90.98d 243.50c 244.00c 453.90b 456.00b
NAA at 20 and 50 DAS 51.27a 50.47a 113.80a 117.80a 237.20d 235.50d 426.40c 424.00c
NAA at 35 and 50 DAS 34.13c 32.10c 92.03d 93.00d 209.70e 210.30e 460.60b 458.40b
No NAA 33.40c 31.73c 103.20b 109.20b 258.30b 255.20b 418.50c 420.00c
F-test ** ** ** ** ** ** ** **
CV (%) 9.33 7.23 6.74 6.74 3.32 2.52 2.50 2.45
Y1, first year; Y2, second year; TDM, total biomass dry weight; NAA, 1-naphthaleneacetic acid; DAS, days after emergence
Table 7. Total biomass recorded at 80, 90 and 100 DAS is influenced by time of application of NAA
Time of application of NAA TDM (g m─2) at 80
DAS
TDM (g m─2) at 90
DAS
TDM (g m─2) at 100
DAS
Y1 Y2 Y1 Y2 Y1 Y2
NAA at 20, 35 and 50 DAS 611.60a 615.50a 842.40a 850.30a 1077.00a 1100.00a
NAA at 20 and 35 DAS 607.30ab 610.00ab 788.80c 798.80c 1037.00b 1070.00b
NAA at 20 and 50 DAS 550.90c 547.50c 827.20b 838.50b 1026.00c 1056.00c
NAA at 35 and 50 DAS 606.60ab 597.80b 777.00d 780.00cd 1009.00d 1020.00d
No NAA 576.20b 589.00b 772.00d 759.00d 972.60e 980.60e
F-test ** ** ** ** ** **
CV (%) 1.60 2.50 1.05 1.40 0.82 1.0
Y1, first year; Y2, second year; TDM, total biomass dry weight; NAA, 1-naphthaleneacetic acid; DAS, days after emergence
Table 8. Total biomass recorded at 40, 50, 60 and 70 DAS is influenced by wheat genotypes
Genotypes TDM (g m─2) at 40 DAS TDM (g m─2) at 50 DAS TDM (g m─2) at 60 DAS TDM (g m─2) at 70 DAS
Y1 Y2 Y1 Y2 Y1 Y2 Y1 Y2
Kanchan 35.27f 35.50f 110.00ab 109.00ab 251.8d 250.00d 441.30c 439.89c
Protiva 40.93c 41.23cd 98.07cd 100.07cd 258.3cd 260.30bc 442.70c 441.50c
Saurov 34.80f 35.20f 101.00c 103.00c 243.2e 241.70e 455.50b 453.89b
Gourov 41.53c 42.13c 96.87d 97.17d 267.8a 270.98a 432.60d 430.69d
BAW 944 43.80a 45.60a 112.20a 115.30a 265.5bc 266.59b 455.50b 450.50b
BAW 953 39.27d 40.24d 100.70c 100.80cd 253.5cd 256.50c 479.80a 480.90a
BAW 994 40.13cd 41.33cd 99.20cd 100.20cd 218.6g 220.60g 454.50b 457.13b
Akbar 37.20e 36.50e 99.23cd 100.23cd 226.6f 227.00f 440.00c 442.00c
Agrahani 42.47ab 43.57ab 97.00d 96.00d 245.8e 242.80e 443.90c 446.90c
Sonalika 37.73e 38.03e 90.73e 89.78e 205.4h 200.40h 425.20e 428.20e
F-test ** ** ** ** ** ** ** **
CV (%) 9.33 7.50 6.74 5.50 3.32 2.87 2.50 2.10
Details in Table 5
Table 9. Total biomass dry weight (TDM) recorded at 80, 90 and 100 DAS is influenced by wheat genotypes
Genotypes TDM (g m─2) at 80
DAS
TDM (g m─2) at 90 DAS TDM (g m─2) at 100 DAS
Y1 Y2 Y1 Y2 Y1 Y2
Kanchan 605.30b 609.30b 819.80b 817.60b 1014.0c 1020.00c
Protiva 593.50bc 595.60bc 741.90d 745.40d 982.7f 989.70e
Saurov 595.90bc 597.78bc 745.90d 749.50d 1003.0d 1000.00d
Gourov 606.30b 608.90b 799.00bc 800.00c 1046.0a 1047.00a
BAW 944 608.50b 610.70b 826.20b 830.60b 1045.0a 1050.00a
BAW 953 629.30a 640.50a 866.40a 870.50a 1044.0a 1053.00a
BAW 994 588.10c 583.41c 810.30bc 815.60bc 1045.0a 1055.00a
Akbar 575.10c 580.51c 812.90bc 816.80bc 1037.0b 1042.00b
Agrahani 525.80d 540.90d 820.90b 829.70b 1035.0b 1040.00b
Sonalika 577.7c 580.76c 751.90d 753.50d 995.9e 998.90d
F-test ** ** ** ** ** **
CV (%) 1.60 2.0 1.05 1.40 0.82 1.0
Details in Table 5
20
Table 10. Combined effect of time of application of NAA and wheat genotypes on total biomass dry weight (TDM) of wheat genotypes recorded at 40, 50, 60 and 70 DAS
Combine effect of time of application
of NAA and genotypes
TDM (g m─2) at different DAS
40 DAS 50 DAS 60 DAS 70 DAS
Y1 Y2 Y1 Y2 Y1 Y2 Y1 Y2
NAA at 20, 35 and 50 DAS x Kanchan 42.7g-m 43.0g-m 81.3o-t 83.3o-s 321.0a 323.9a 481.7f-k 485.0d-i
NAA at 20, 35 and 50 DAS x Protiva 38.7k-r 37.9k-r 86.3m-r 85.7n-r 229.7n-p 230.3n-p 505.3cd 503.3de
NAA at 20, 35 and 50 DAS x Sourav 40.0h-p 38.0k-r 108.0f-i 107.9f-i 316.3ab 318.5ab 498.0d-f 495.3d-g
NAA at 20, 35 and 50 DAS x Gourav 41.0g-o 40.0h-p 81.3-t 81.1o-t 295.7c-e 291.7d-f 494.7d-g 492.3d-h
NAA at 20, 35 and 50 DAS x BAW 944 52.0cd 53.0cd 119.d-f 118.7d-f 240.0mn 238.3mn 415.7e-s 417.3o-s
NAA at 20, 35 and 50 DAS x BAW 953 39.7i-q 40.0h-p 124.0cd 122.7c-d 235.3m-o 230.3n-p 495.3d-g 494.3d-g
NAA at 20, 35 and 50 DAS x BAW 994 28.3w-y 28.9w-y 89.3l-r 91.0k-q 226.3n-q 227.0n-q 406.3lm 404.3st
NAA at 20, 35 and 50 DAS x Akbar 42.0g-m 41.7g-n 85.7n-r 84.7n-s 216.3p-s 217.7p-s 434.0n-p 432.7o-q
NAA at 20, 35 and 50 DAS x Agrahani 39.0k-r 39.4j-q 114.3d-g 115.3d-g 237.0m-o 238.3mn 492.3d-h 494.3d-g
NAA at 20, 35 and 50 DAS x Sonalika 34.0o-w 33.7e-x 91.0k-q 89.01l-r 263.7jkl 264.7jkl 483.3e-j 485.3d-i
NAA at 20 and 35 DAS x Kanchan 28.0w-y 28.7v-y 81.0o-t 83.3o-s 227.0n-q 227.3n-q 400.3st 400.7st
NAA at 20 and 35 DAS x Protiva 28.7v-y 28.6v-y 105.3g-j 106.0g-j 276.3g-j 279.3f-i 468.0im 462.7j-m
NAA at 20 and 35 DAS x Sourav 30.0u-y 31.0t-u 67.0u 70.0t-u 234.0m-o 233.3no 542.7a 540.0a
NAA at 20 and 35 DAS x Gourav 40.0h-p 39.3j-q 104.3g-j 103.3g-k 306.3bc 303.0bc 503.3de 500.7de
NAA at 20 and 35 DAS x BAW 944 35.7m-v 33.7e-x 89.01l-r 89.7l-q 267.3i-k 269.7h-k 425.7o-f 427.7o-q
NAA at 20 and 35 DAS x BAW 953 45.0f-k 46.6e-i 136.0b 140.0b 259.0kl 258.3kl 428.0o-q 431.7n-o
NAA at 20 and 35 DAS x BAW 994 46.3e-j 46.7e-i 77.7q-u 76.0r-u 192.7u 199.7tu 454.0mn 453.7mn
NAA at 20 and 35 DAS x Akbar 26.7xy 28.0wxy 97.0i-n 97.3q-u 234.7mno 233.3no 464.0j-m 463.0j-m
NAA at 20 and 35 DAS x Agrahani 47.0e-h 47.3efg 87.3m-r 88.3l-r 286.7e-g 287.0e-g 435.3n-p 433.3o-p
NAA at 20 and 35 DAS x Sonalika 53.0cd 52.3cde 84.7n-s 83.3o-s 151.3x 161.0wx 417.3o-s 415.7e-s
NAA at 20 and 50 DAS x Kanchan 39.3j-q 39.4j-q 140.0b 149.3b 259.3kl 258.3kl 459.7lm 462.7j-m
NAA at 20 and 50 DAS x Protiva 54.3cd 53.0cd 104.0g-j 105.3g-j 259.0kl 258.3kl 406.0r-t 404.3st
NAA at 20 and 50 DAS x Sourav 44.0f-l 45.0f-k 134.0bc 139.3b 279.3f-i 275.8f-i 402.3st 401.7st
NAA at 20 and 50 DAS x Gourav 63.5b 65.0b 103.3g-k 104.7g-j 240.0mn 238.3mn 400.7st 403.7st
NAA at 20 and 50 DAS x BAW 944 75.3a 76.0a 166.7a 170.0a 291.7d-f 290.0d-g 427.7o-q 430.3o-q
NAA at 20 and 50 DAS x BAW 953 47.3e-g 46.7e-i 97.3i-n 99.3h-m 287.0e-g 283.3e-g 463.0j-m 365.3u
NAA at 20 and 50 DAS x BAW 994 52.3c-e 53.0cd 119.0d-f 118.7d-f 206.3s-u 209.3r-t 430.3o-q 433.3o-p
NAA at 20 and 50 DAS x Akbar 50.3d-f 47.0e-h 89.7l-q 88.3l-r 179.3v 177.3v 385.7t 395.7st
NAA at 20 and 50 DAS x Agrahani 55.0bc 54.3cd 104.7g-j 105.7g-j 209.0r-t 210.0r-t 403.7st 401.7st
NAA at 20 and 50 DAS x Sonalika 28.7v-y 28.0w-y 97.3i-n 94.33j-o 161.0wx 164.7wx 485.0d-i 485.3d-i
NAA at 35 and 50 DAS x Kanchan 32.7q-x 32.0r-x 85.3n-r 85.7n-r 221.3o-x 221.7o-r 460.7k-m 462.7j-m
NAA at 35 and 50 DAS x Protiva 36.3m-u 35.7m-v 72.0s-u 70.0t-u 236.3n-o 238.3mn 432.7o-q 433.3o-p
NAA at 35 and 50 DAS x Sourav 31.0t-u 31.0t-y 88.3l-r 87.3m-r 164.7wx 169.7vw 431.7n-o 430.3o-q
NAA at 35 and 50 DAS x Gourav 29.0v-y 28.7v-y 101.0h-l 99.3h-m 227.3n-q 226.3n-q 399.0st 395.7st
NAA at 35 and 50 DAS x BAW 944 31.3s-y 31.0t-y 80.3p-t 83.3o-s 169.7vw 168.7vw 522.7bc 525.7bc
NAA at 35 and 50 DAS x BAW 953 35.7m-v 33.7e-x 76.0r-u 77.7q-u 238.3mn 237.0m-o 540.0a 542.7a
NAA at 35 and 50 DAS x BAW 994 41.7g-n 42.0g-m 110.7e-h 108.0f-i 209.3r-t 209.0r-t 494.3d-g 495.3d-g
NAA at 35 and 50 DAS x Akbar 28.0w-y 28.7v-y 105.7g-j 104.3g-j 199.7tu 192.7u 453.7mn 454.0mn
NAA at 35 and 50 DAS x Agrahani 37.3l-t 37.97k-r 85.7n-r 85.3n-r 213.0q-t 211.3q-t 476.3g-l 472.7h-m
NAA at 35 and 50 DAS x Sonalika 38.3k-s 38.7k-r 115.3d-g 114.3d-g 217.7p-s 216.3p-s 388.3t 395.7st
No NAA x Kanchan 33.7e-x 34.7n-w 137.3b 139.0bc 230.3n-p 233.3no 404.3st 401.7st
No NAA x Protiva 46.7e-i 46.7e-i 122.7c-d 124.0cd 290.0d-g 291.7d-f 401.7st 406.0r-t
No NAA x Sourav 28.00w-y 28.0wxy 107.7f-i 106.0g-j 221.7o-r 221.3o-x 395.7st 400.3st
No NAA x Gourav 35.7m-v 35.7m-v 94.33j-o 93.0j-p 269.7h-k 267.3i-k 365.3u 368.3stu
No NAA x BAW 944 24.7y 24.6y 106.0g-j 107.9f-i 314.0ab 316.3ab 485.3d-i 492.3d-h
No NAA x BAW 953 28.7v-y 28.0w-y 70.0t-u 72.0s-u 249.0lm 245.0lm 472.7h-m 476.3g-l
No NAA x BAW 994 32.0r-x 32.0r-x 99.3h-m 97.3i-n 258.3kl 263.7j-l 433.3o-p 432.7o-q
No NAA x Akbar 39.0a-r 39.3j-q 118.7d-f 118.7d-f 303.0b 300.0b 462.7j-m 464.0j-m
No NAA x Agrahani 31.0t-y 31.0t-y 93.0j-p 91.0k-q 283.3e-g 287.0e-g 412.0q-s 415.7e-s
No NAA x Sonalika 34.7n-w 35.7m-v 83.3o-s 84.7n-s 233.3no 230.3n-p 352.0u 350.0u
F-test ** ** ** ** ** ** ** **
CV (%) 9.33 9.34 6.74 6.75 3.32 3.36 2.50 2.50
Details in Table 5
21
Table 11. Combined effect of time of application of NAA and wheat genotypes on total biomass dry weight (TDM) of wheat genotypes recorded at 80, 90 and 100 DAS
Combine effect of time of application of
NAA and genotypes
TDM (g m─2) at different DAS
80 DAS 90 DAS 100 DAS
Y1 Y2 Y1 Y2 Y1 Y2
NAA at 20, 35 and 50 DAS x Kanchan 621.0c-g 622.0c-g 845.7e 843.7e 1065ghi 1070ghi
NAA at 20, 35 and 50 DAS x Protiva 584.71l-o 580.0mno 745.7t 744.0t 991.7stu 980.7t-w
NAA at 20, 35 and 50 DAS x Sourav 575.7m-o 570.7m-p 769.0o-r 775.3n-p 1065ghi 1075hi
NAA at 20, 35 and 50 DAS x Gourav 662.7b 664.0b 930.7a 927.0a 1179a 1175a
NAA at 20, 35 and 50 DAS x BAW 944 598.3h-l 594.3i-m 824.7f-h 833.7e-g 1015o-q 1020n-p
NAA at 20, 35 and 50 DAS x BAW 953 668.7ab 667.3ab 906.0b 910.7b 1145b 1150b
NAA at 20, 35 and 50 DAS x BAW 994 566.0op 570.7m-p 805.0ij 811.0si 1082ef 1080e-g
NAA at 20, 35 and 50 DAS x Akbar 544.3q-s 539.3rs 797.0i-k 792.7j-l 1080e-g 1070f-h
NAA at 20, 35 and 50 DAS x Agrahani 681.7a 675.7a 916.7b 906.7b 1131b 1136b
NAA at 20, 35 and 50 DAS x Sonalika 613.0d-h 617.3c-j 783.7k-p 784.0k-0 1020n-p 1018n-p
NAA at 20 and 35 DAS x Kanchan 629.0cd 633.0c 792.7jkl 797.7jk 1012pqr 1015opq
NAA at 20 and 35 DAS x Protiva 624.0c-f 627.3cde 839.7ef 835.7efg 1028m-o 1025m-o
NAA at 20 and 35 DAS x Sourav 657.3b 640.3bc 752.0st 756.3r-t 1073f-h 1080e-g
NAA at 20 and 35 DAS x Gourav 608.7e-i 609.3e-i 745.0t 750.0t 1036lm 1030lm
NAA at 20 and 35 DAS x BAW 944 577.0m-o 570.7m-p 831.3efg 833.7efg 1098d 1099d
NAA at 20 and 35 DAS x BAW 953 624.0c-f 626.3c-e 840.7e 835.7efg 1113c 1115c
NAA at 20 and 35 DAS x BAW 994 590.0j-m 570.7m-p 811.0si 805.0ij 1049jk 1051ijk
NAA at 20 and 35 DAS x Akbar 608.7c-i 609.7e-i 776.7m-q 775.3n-p 1051i-k 1055i-k
NAA at 20 and 35 DAS x Agrahani 598.7h-l 594.3i-m 779.7l-p 784.7k-o 980.0t-v 975.0vwx
NAA at 20 and 35 DAS x Sonalika 556.0p-r 570.7m-p 419.7u 420.7u 934.7z 945.7yz
NAA at 20 and 50 DAS x Kanchan 586.3k-m 580.0m-o 843.7e 845.7e 968.7v-x 967.7v-x
NAA at 20 and 50 DAS x Protiva 606.3f-h 609.7e-i 775.3n-p 769.0o-r 946.0z 956.0z
NAA at 20 and 50 DAS x Sourav 580.0m-o 579.3m-o 744.0t 745.0t 970.0v-x 971.0b-x
NAA at 20 and 50 DAS x Gourav 589.3j-m 589.7j-m 784.7k-o 783.7k-p 1070fgh 1075fgh
NAA at 20 and 50 DAS x BAW 944 628.7cd 626.3c-e 833.7e-g 824.7f-h 1103cd 1107cd
NAA at 20 and 50 DAS x BAW 953 593.0i-m 594.3i-m 835.7e-g 833.7e-g 999.3rs 997.7rs
NAA at 20 and 50 DAS x BAW 994 626.3c-e 628.3c-e 881.7c 896.7bc 1095de 1098de
NAA at 20 and 50 DAS x Akbar 579.7mno 575.7m-p 891.7bc 888.0bc 975.0v-x 963.7v-x
NAA at 20 and 50 DAS x Agrahani 609.3e-i 608.7e-i 869.7cd 860.7cd 1090de 1095de
NAA at 20 and 50 DAS x Sonalika 609.7e-i 607.5e-i 862.3d 860.3d 1047kl 1050kl
NAA at 35 and 50 DAS x Kanchan 633.0c 627.3cde 756.3r-t 752.0st 1063h-j 1066h-j
NAA at 35 and 50 DAS x Protiva 570.7m-p 577.0m-o 761.7q-s 763.0u-s 971.0b-x 968.7v-x
NAA at 35 and 50 DAS x Sourav 627.3c-e 622.0c-g 716.0u 721.7u 945.7yz 963.7v-x
NAA at 35 and 50 DAS x Gourav 594.3i-m 589.7j-m 721.7u 716.0u 767.0vx 777.0vx
NAA at 35 and 50 DAS x BAW 944 628.7cd 626.3c-e 820.3gh 822.3gh 1046kl 1048kl
NAA at 35 and 50 DAS x BAW 953 681.7a 679.7a 823.gh 820.3gh 997.7rs 1000.7rs
NAA at 35 and 50 DAS x BAW 994 579.3m-o 575.7m-o 802.3i-j 804.3i-j 10321l-n 10421l-n
NAA at 35 and 50 DAS x Akbar 539.3s 539.0rs 878.7c 880.7bc 1088de 1089de
NAA at 35 and 50 DAS x Agrahani 622.0c-g 627.3cde 770.7o-r 774.7n-q 1002q-s 1006p-s
NAA at 35 and 50 DAS x Sonalika 589.7j-m 589.3j-m 719.0u 720.0u 972.3v-x 971.0b-x
No NAA x Kanchan 557.3p-q 579.3m-o 810.7hi 820.3gh 963.7v-x 968.7v-x
No NAA x Protiva 579.7m-o 575.7m-o 787.0k-m 784.7k-o 977.3h-w 971.0b-x
No NAA x Sourav 539.3rs 540.3r 741.3st 745.0t 960.7x 963.7v-x
No NAA x Gourav 576.7m-o 576.7m-o 763.0u-s 761.7q-s 959.7xy 963.7v-x
No NAA x BAW 944 609.7e-i 606.3f-h 821.0gh 810.7hi 961.3wx 975.0v-x
No NAA x BAW 953 579.3m-o 580.0m-o 774.7n-q 770.7o-r 965.7v-x 963.7v-x
No NAA x BAW 994 578.7m-o 593.0i-m 751.7st 752.0st 967.7v-x 968.7v-x
No NAA x Akbar 603.7g-k 608.7e-i 820.3gh 810.7hi 992.7st 997.7rs
No NAA x Agrahani 617.3c-j 622.0c-g 768.0e-r 770.7o-r 969.3v-x 971.0b-x
No NAA x Sonalika 520.3stu 510.3tu 675.0v 665.0vw 1006p-s 1002q-s
F-test ** ** ** ** ** **
CV (%) 1.60 1.58 1.05 1.05 1.82 2.00
Details in Table 5
22
Table 12. Time of application of NAA effect on yield and yield attributes of wheat
NAA Spraying Plant height (cm) Spikes m-2 Spikelets spike-1 TGW (g) GY (t ha-1)
Y1 Y2 Y1 Y2 Y1 Y2 Y1 Y2 Y1 Y2
NAA at 20, 35 and 50 DAS 93.0a 92.0a 328a 330a 17.8b 18.8a 43.5a 44.5a 4.5a 4.7a
NAA at 20 and 35 DAS 92.4ab 90.4ab 326a 332a 18.8a 18.9a 42.4a 41.4b 4.0b 4.4b
NAA at 20 and 50 DAS 90.6bc 88.6bc 324a 331a 17.8b 18.8a 42.3a 41.3b 3.9bc 4.4b
NAA at 35 and 50 DAS 89.8c 85.8c 320a 328a 18.5a 19.4a 42.0a 40.0b 3.9bc 4.3c
No NAA 89.7c 86.7c 305b 298b 15.6c 16.5b 39.5b 37.5c 3.4d 3.5d
F-test ** ** ** ** ** ** ** ** ** **
CV (%) 7.01 6.50 5.87 6.40 5.58 4.70 6.19 6.90 6.02 5.93
Y1, first year; Y2, second year; NAA, 1-naphthaleneacetic acid; DAS, days after emergence; TGW, 1000-grain weight; GY, grain yield
Table 13. Effect of genotypes on the yield and yield contributing of wheat
Variety Plant height (cm) Spikes m -2 Spikelets spike-1 TGW (g) GY (t ha-1)
Y1 Y2 Y1 Y2 Y1 Y2 Y1 Y2 Y1 Y2
Kanchan 90.7cde 91.0cde 328b 327c 18.7a 17.9b 42.2ab 41.8abc 4.2bc 4.2bc
Protiva 91.4bcd 90.5cd 312e 310e 17.7b 18.0b 41.6bc 41.6bc 3.9f 4.0f
Saurov 90.7cde 91.3cde 323c 326c 17.9b 18.5b 40.1c 41.4c 4.0f 4.0f
Gourov 89.9e 90.4e 316d 315d 17.0c 17.0c 41.9abc 41.9abc 3.8h 3.9h
BAW 944 91.7bc 92.0abc 340a 338ab 17.8b 18.0b 42.2ab 42.1abc 4.2bc 4.3b
BAW 953 92.7b 93.4ab 322c 323c 18.3a 19.0a 42.2ab 41.7bc 4.3ab 4.4ab
BAW 994 93.7a 94.3a 312e 311de 18.6a 19.6a 42.4a 42.4a 4.5a 4.6a
Akbar 90.3de 89.7e 313de 313de 17.9b 18.8b 42.1abc 42.2ab 4.1d 3.9g
Agrahani 88.5f 89.3ef 340a 342a 17.8b 18.3b 41.8abc 42.2ab 3.9g 4.1e
Sonalika 91.7bc 91.6abc 301f 299f 16.5d 17.0c 41.7abc 42.1abc 2.2i 2.2i
F-test ** ** ** ** ** ** ** ** ** **
CV (%) 6.13 3.13 2.81 3.73 5.55 5.40 5.58 3.58 6.19 5.79
Details in Table 11
23
Table 14. Combined effect of time of application of NAA and genotypes on yield and yield attributes of wheat
Combine effect of time of application
of NAA and genotypes
Plant height (cm) Spikes m -2 Spikelet spike-1 TGW (g) GY (t ha-1)
Y1 Y2 Y1 Y2 Y1 Y2 Y1 Y2 Y1 Y2
NAA at 20, 35 and 50 DAS x Kanchan 94.0a-e 94.7a-c 351b-c 349c-e 18.0b-g 17.9b-h 43.1a-d 43.2b-h 3.9st 3.9q-s
NAA at 20, 35 and 50 DAS x Protiva 92.3a-i 92.7a-i 294r-t 319i-o 17.0d-h 17.3c-h 42.9a-e 42.3ab 3.8s-u 3.7uv
NAA at 20, 35 and 50 DAS x Sourav 90.7b-j 90.7b-j 335c-j 321h-o 16.7e-h 16.3f-h 44.0a-c 44.7a 4.4hi 4.3i-k
NAA at 20, 35 and 50 DAS x Gourav 92.0a-i 92.3a-i 324f-o 324h-o 16.0jh 16.7e-h 42.3a-g 42.5a-g 4.1m-o 4.2lmn
NAA at 20, 35 and 50 DAS x BAW 944 94.0a-e 93.3a-g 367ab 379ab 17.7b-h 17.3c-h 41.5d-h 41.7d-h 4.7c-e 4.7bcd
NAA at 20, 35 and 50 DAS x BAW 953 96.0ab 94.7a-c 343c-d 341d-h 18.7a-c 18.3a-e 43.2b-h 43.1a-d 5.0a 5.3a
NAA at 20, 35 and 50 DAS x BAW 994 97.3a 94.7a-c 304p-h 304n-s 18.0b-g 18.3b-g 42.2a-d 42.3a-d 3.9q-s 4.0op
NAA at 20, 35 and 50 DAS x Akbar 89.7c-j 89.3c-j 317j-p 317i-o 19.0a-d 19.7ab 42.5a-g 42.4a-g 3.7v 3.7uv
NAA at 20, 35 and 50 DAS x Agrahani 91.0b-j 91.7h-i 309n-r 303o-s 16.7e-h 16.3e-h 44.0a-g 42.4a-g 4.3j-l 4.2l-n
NAA at 20, 35 and 50 DAS x Sonalika 93.3a-g 93.0a-h 325e-n 327g-n 16.3f-h 16.0f-h 42.3ab 42.9a-e 2.5? 2.6?
NAA at 20 and 35 DAS x Kanchan 90.7b-j 90.7b-j 308n-r 307m-p 18.7a-c 18.3a-e 41.3b-h 41.4b-h 3.9r-t 3.9r-t
NAA at 20 and 35 DAS x Protiva 92.7a-i 92.3a-i 348b-d 345c-g 18.0b-g 18.7a-c 40.6b-h 39.8p-h 4.8bc 4.7bcd
NAA at 20 and 35 DAS x Sourav 93.0a-h 93.3a-g 285f-u 316j-o 18.7a-e 18.3a-e 41.2b-h 41.1b-h 3.8uv 3.7uv
NAA at 20 and 35 DAS x Gourav 93.0a-h 93.3a-g 308n-p 313m-q 17.3c-h 17.0d-h 43.2a-d 43.3a-c 3.6w 3.7vw
NAA at 20 and 35 DAS x BAW 944 93.3a-g 93.0a-g 321g-p 324h-o 18.0b-g 18.3b-f 43.2a-d 43.8a-c 4.6b-f 4.5def
NAA at 20 and 35 DAS x BAW 953 91.7a-i 91.0b-j 275u-u 273u-v 19.7ab 20.0a 41.7a-h 41.5a-h 4.1n-q 4.0op
NAA at 20 and 35 DAS x BAW 994 94.7a-c 94.0a-e 291s-u 289q-u 20.3a 20.3a 43.1a-d 43.5abc 4.9abc 4.8ab
NAA at 20 and 35 DAS x Akbar 91.3b-i 91.0b-j 304p-s 295p-t 17.3c-h 17.0d-h 42.5a-g 42.1a-g 3.9q-s 3.8s-u
NAA at 20 and 35 DAS x Agrahani 90.7b-j 90.8b-j 329e-m 328f-m 19.3a-c 19.0a-d 42.4a-g 42.7a-f 3.8t-v 3.8uv
NAA at 20 and 35 DAS x Sonalika 92.7a-i 92.6a-i 267u 263v 15.7h 15.5h 43.9a-c 43.83a-c 2.3? 2.4?
NAA at 20 and 50 DAS x Kanchan 90.3b-j 91.03b-j 351bc 349c-f 18.7a-e 18.3b-f 40.9c-h 40.5d-h 4.4h-j 4.3ijk
NAA at 20 and 50 DAS x Protiva 91.7h-i 91.0b-j 317f-p 316j-o 17.9b-h 18.0b-h 41.4b-h 41.2b-h 4.1m-p 4.1r-t
NAA at 20 and 50 DAS x Sourav 89.3c-j 88.7b-j 315q 313k-p 17.3c-h 17.7b-h 39.8p-h 39.6g-h 4.2fg 4.3fg
NAA at 20 and 50 DAS x Gourav 87.3h-j 88.3e-j 308n-r 307m-r 18.0b-g 18.3b-f 40.6d-h 40.5d-h 4.4fg 4.3jkl
NAA at 20 and 50 DAS x BAW 944 87.7g-j 88.3e-j 337c-h 335l-k 17.0d-h 17.3c-h 44.7a 44.0a-c 4.6fg 4.5efg
NAA at 20 and 50 DAS x BAW 953 89.0c-j 88.7b-j 338c-g 339e-i 19.0 a-d 19.7ab 42.5a-g 42.8a-e 4.0p-s 4.1n-q
NAA at 20 and 50 DAS x BAW 994 92.7a-i 91.3b-i 335e-j 333e-k 17.7b-h 17.0b-h 44.7a 44.0a-c 4.0p-s 4.0p-s
NAA at 20 and 50 DAS x Akbar 93.3a-g 93.0a-g 285p-u 284s-u 18.3b-f 18.0b-g 42.5a-g 42.3a-g 3.5wx 3.7vw
NAA at 20 and 50 DAS x Agrahani 85.3j 85.4j 332d-i 331e-l 16.3f-h 16.7f-h 42.1a-g 42.3a-g 4.3j-l 4.2i-l
NAA at 20 and 50 DAS x Sonalika 91.0b-j 91.3b-i 297q-t 291q-u 19.0a-g 18.7a-g 41.1b-h 41.5b-h 2.1? 2.1?
NAA at 35 and 50 DAS x Kanchan 91.0b-j 91.3b-i 317j-p 317i-o 18.0b-g 18.7b-j 42.4a-g 42.4a-g 4.6d-g 4.7bcd
NAA at 35 and 50 DAS x Protiva 89.3c-j 89.7c-j 307o-s 277t-v 19.0a-d 18.7a-f 42.7a-f 42.3a-g 4.7cde 4.7bcd
NAA at 35 and 50 DAS x Sourav 87.3h-j 88.3e-j 333c-k 333e-k 17.7b-h 17.3b-f 42.5a-g 42.4a-g 3.4wx 3.5s-u
NAA at 35 and 50 DAS x Gourav 88.7b-j 88.7b-j 323g-o 323h-o 16.7e-h 16.5e-h 43.83a-c 43.5abc 4.5p-s 4.5p-s
NAA at 35 and 50 DAS x BAW 944 93.3a-g 93.4a-g 316k-p 308m-q 18.0b-g 18.3b-g 41.2b-h 41.5b-h 4.7cde 4.7cde
NAA at 35 and 50 DAS x BAW 953 91.3b-i 91.7b-i 336e-i 336e-j 19.0a-d 19.7ab 41.2b-h 41.5b-h 4.1r-t 4.0r-t
NAA at 35 and 50 DAS x BAW 994 91.3b-i 91.0b-i 320h-p 320h-o 18.7a-e 19.0a-d 42.3a-g 42.4a-g 4.7cde 4.7bcd
NAA at 35 and 50 DAS x Akbar 90.0c-j 91.0c-j 341c-f 348c-f 17.0d-h 17.7d-h 42.3a-g 41.4a-g 4.5p-s 4.6o-s
NAA at 35 and 50 DAS x Agrahani 88.0f-j 88.3e-j 372a 389a 17.3b-h 17.7b-h 42.7a-g 42.1a-g 4.3i-k 4.2i-k
NAA at 35 and 50 DAS x Sonalika 88.0f-j 88.3e-j 328e-m 328f-m 19.0a-d 19.7ab 42.4a-g 42.87a-c 2.5? 2.2?
No NAA x Kanchan 87.7g-j 88.7g-j 312m-q 3091-q 18.0b-g 18.7ab 41.3b-h 41.5b-h 3.3y 3.2y
No NAA x Protiva 91.0b-j 90.9b-j 329r-b 292q-u 17.0d-h 17.3b-f 40.5d-h 41.5d-h 3.5wx 3.5wx
No NAA x Sourav 93.7a-f 92.7a-f 348d-t 348c-f 17.0d-h 17.7e-h 39.6g-h 39.7f-h 3.8s-u 3.9s-u
No NAA x Gourav 88.3e-j 89.0e-j 316k-p 315j-p 18.7a-e 18.37a-f 39.6g-h 39.0h 2.8z 2.9z
No NAA x BAW 944 90.0c-j 91.0b-j 360b 364bc 17.3b-f 17.7b-h 39.9p-h 39.7f-h 3.9st 4.0p-s
No NAA x BAW 953 94.3a-d 94.0a-e 318i-p 325g-n 16.7e-h 16.6e-h 39.0h 39.6gh 3.7r-t 3.8r-t
No NAA x BAW 994 92.7a-i 93.0a-i 309n-p 3091-q 17.0d-h 17.3d-h 39.7f-h 39.0h 3.1y 3.1y
No NAA x Akbar 87.0ij 88.0ij 319i-p 319i-o 17.3b-h 17.7b-h 41.5b-h 41.7b-h 4.0p-s 4.1p-s
No NAA x Agrahani 87.7g-j 88.3g-j 359b 369bc 16.7e-h 16.3e-i 40.2b-h 40.3b-h 3.9q-s 3.8q-s
No NAA x Sonalika 93.3a-d 94.0a-e 287p-u 287r-u 14.6hi 15h 40.3d-h 40.7d-h 2.3? 2.1?
F-test ** ** ** ** ** ** ** ** ** **
CV (%) 3.13 2.19 2.81 3.73 1.62 1.89 3.58 3.40 1.77 2.0
Details in Table 11