growth and yield of sweet corn
TRANSCRIPT
1(.:ULIUKt KL)JMe. O F 2
Soil M
TECHNICAL BULLETIN 53 SEPTEMBER 1960
oisture, Nitrogen, andStand Density Effects on
Growth and Yield of Sweet Corn
D. D. Evans
H. J. Mack
D. S. Stevenson
J. W. Wolfe
Agricultural Experiment StationOregon State College
Corvallis
r
u
1611
5
al
Table of ContentsPage
Introduction --------------- ---------------------------------- -------------------------- 3
Review of Literature - ------------------------------------------------------------ 3
Procedures-1954 and 1955 4
Procedures-1957 12
Results -------------------------------------------------------------------------------------------------- 14
Discussion -------------------------------------------------------------------------------------------- 26
Summary and Conclusions ---------------------------------------------------------------- 29
References ------------------------------------------------------------------------------------------ 30
Appendix -------------------------------------------------------------------------------------------- 31
AUTHORS : D. D. Evans, Associate Soil Scientist; H. J. Mack,Assistant Horticulturist; D. S. Stevenson, Junior Soil Scientist; andJ. W. Wolfe, Associate Agricultural Engineer, Oregon State College.
ACKNOWLEDGMENTS: The authors acknowledge the assistance of thefollowing researchers who cooperated in this project: S B Apple, Jr., Horti-culturist, Oregon State College; A. W. Marsh, formerly Soil Scientist, andJ P. Riley, `formerly Assistant Agricultural Engineer, Oregon State College.
were selected as variables for study in field experiments.A second objective was to determine usefulness of certain soil
moisture measuring instruments for estimating soil moisture tension,calculating consumptive use and scheduling irrigations. The instru-ment studied was the gypsum stake unit.
Work on this project was done jointly by the Departments ofSoils, Horticulture, and Agricultural Engineering. Field experimentswere begun in 1953 and concluded in 1957 and were on Chehalis loamsoil near Corvallis, Oregon. Due to unusually high precipitation dur-ing the growing season of 1953, the moisture treatment variation wassmall and results showed little of significance so are not reported.Experiments in 1954 and 1955 were identical so procedure and resultsfor these two years are presented together. Design of the experimentin 1957 was altered from previous years based on the earlier findings
3
1x1
Soil Moisture, Nitrogen, and Stand Density Effects on
Growth and Yield of Sweet Corn
IntroductionSweet corn is an important crop in Oregon. According to the
1959 estimates, about 19,100 acres are grown, with about three quar-ters of the acreage in the Willamette Valley where the climate andgrowing season are suitable for sweet corn production. Some of thecorn is marketed fresh but most of it is processed and sold either asfrozen or as canned corn. In Oregon where summer rainfall is lightand infrequent, irrigation is essential for profitable production ofsweet corn. Management practices vary among sweet corn growersand, consequently, yields vary considerably.
Primary objective of this research was (1) to define more spe-cifically the management practices necessary for the highest economi-cal benefits to the grower and (2) to define best practices for produc-ing improved qualities of corn.
The-three practices considered most influential were irrigationscheduling, rates of fertilization, particularly nitrogen applications,and number of plants per acre of stand density. These three practices
and it is presented separately.
Review of LiteratureMany studies have been made on the effects of fertility and
moisture levels on sweet corn yields. Several have included fertilityand moisture in the same experiment. Few studies have included
(4) in Oklahoma found that increasing irrigation frequency from 3 to4 to 7 irrigations per season progressively increased corn yield underuniform fertility, MacGillivray and Doneen ( 7) and MIacGillivray6) in California also found increased height and yield when the
number of irrigations was increased. None of these workers included
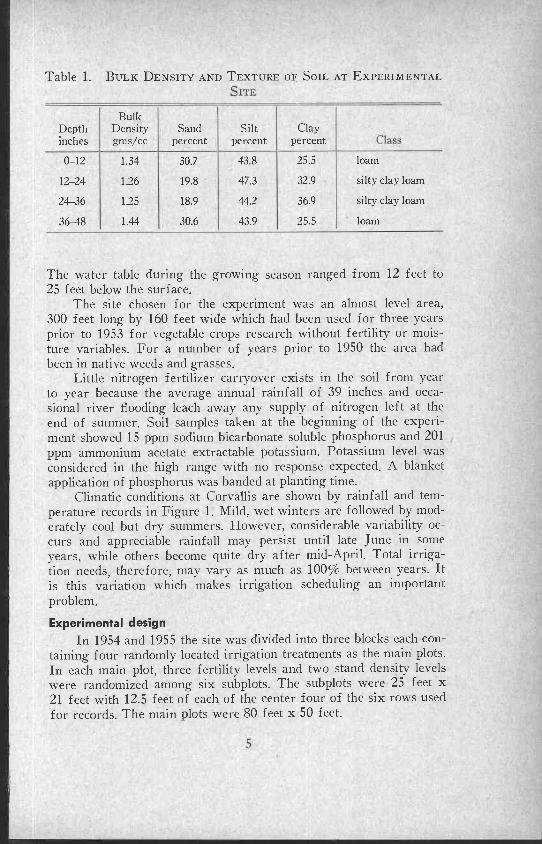
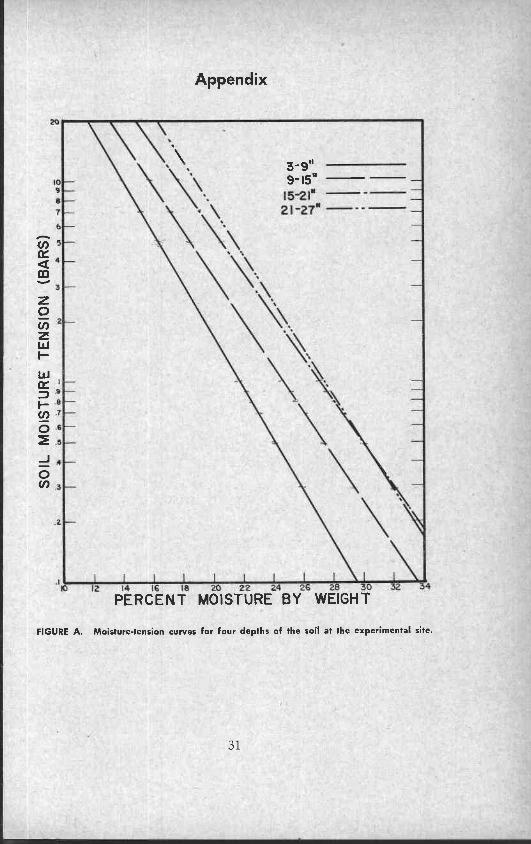
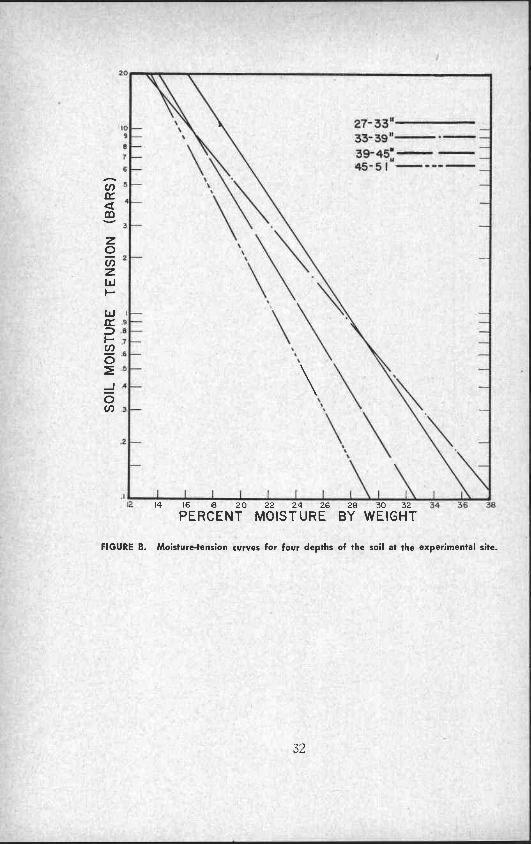
mapped Chehalis loam (5 ), a brown, medium textured, young soilhaving no well defined horizons but generally grading into somewhatfiner textured material in the second font, becoming slightly lightercolored and coarser textured in the fourth foot. It is underlaid bysand at various depths of 4 feet to 6 feet and ultimately by gravel.Percent of sand, silt, and clay along with bulk density for differentdepths are given in Table 1. The soils are further characterized bythe moisture-tension curves shown in the Appendix, Figures A and B.
-J
density of stand along with fertility and moisture. It is expected thatresponse to all three of these variables would depend on soil and en-vironmental conditions, so results obtained in other regions may notnecessarily apply directly to the Willamette Valley but are of generalinterest.
Carolus and Schleusener (3) in Michigan conducted an experi-ment with fertility, moisture, and stand density as variables, but be-cause of a wet summer they obtained a yield response only from thefertilizer. Peterson and Ballard (8) in Utah found a definite inter-action between moisture and fertility on yield of sweet corn and con-cluded that if corn is irrigated for maximum yields, it should also befertilized for maximum yields. High nitrogen and moisture producedthe highest yields, the most uniform, the earliest maturing, the larg-est and the fullest ears. Richardson and Minges (9) in Californiafound that nitrogen improved husk color and market appeal. Cordner
stand density in their experiments.
Procedures-1954 and 1955Since the three practices under study may be interrelated, field
experiments were carried out in such a manner that main effects andinteractions could be evaluated. Variables were moisture, stand, andnitrogen. Phosphorus and potassium were not varied and were at asufficiently high level not to limit growth.
Experimental site and conditionsExperiments were conducted on the vegetable crops research
farm about one mile east of Corvallis on an alluvial flood plain ofthe Willamette River. This plain consists mainly of soils of the Che-halis and Newberg series on which the major proportion of the sweetcorn acreage in western Oregon occurs. The experimental site was
R
SITE
Class
11
n
m
a
5N
r
Table 1. BULK DENSITY AND TEXTURE OF SOIL AT EXPERIMENTAL
Depthinches
BulkDensitygms/cc
Sandpercent
Siltpercent
Claypercent
0-12 1.34 30.7 43.8 25.5
12-24 1.26 19.8 47.3 32.9
24-36 1.25 18.9 44.2 36.9
36-48 1.44 30.6 43.9 25.5
loam
silty clay loam
silty clay loam
loam
The water table during the growing season ranged from 12 feet to25 feet below the surface.
The site chosen for the experiment was an almost level area,300 feet long by 160 feet wide which had been used for three yearsprior to 1953 for vegetable crops research without fertility or mois-ture variables. For a number of years prior to 1950 the area hadbeen in native weeds and grasses.
Little nitrogen fertilizer carryover exists in the soil from yearto year because the average annual rainfall of 39 inches and occa-sional river flooding leach away any supply of nitrogen left at theend of summer. Soil samples taken at the beginning of the experi-ment showed 15 ppm sodium bicarbonate soluble phosphorus and 201ppm ammonium acetate extractable potassium. Potassium level wasconsidered in the high range with no response expected. A blanketapplication of phosphorus was banded at planting time.
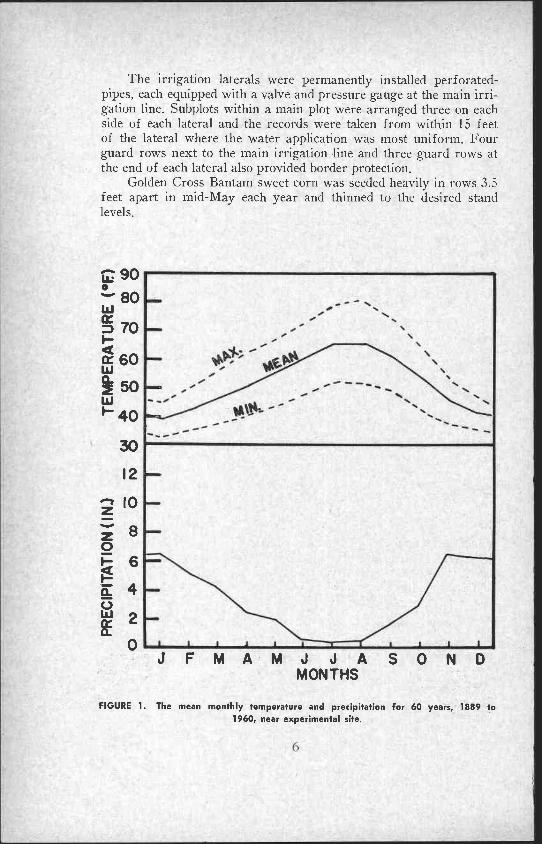
Climatic conditions at Corvallis are shown by rainfall and tem-perature records in Figure 1. Mild, wet winters are followed by mod-erately cool but dry summers. However, considerable variability oc-curs and appreciable rainfall may persist until late June in someyears, while others become quite dry after mid-April. Total irriga-tion needs, therefore, may vary as much as 100% between years. Itis this variation which makes irrigation scheduling an importantproblem.
Experimental designIn 1954 and 1955 the site was divided into three blocks each con-
taining four randomly located irrigation treatments as the main plots.In each main plot, three fertility levels and two stand density levelswere randomized among six subplots. The subplots were 25 feet x21 feet with 12.5 feet of each of the center four of the six rows usedfor records. The main plots were 80 feet x 50 feet.
6
The irrigation laterals were permanently installed perforated-pipes, each equipped with a valve and pressure gauge at the main irri-gation line. Subplots within a main plot were arranged three on eachside of each lateral and the records were taken from within 15 feetof the lateral where the water application was most uniform. Fourguard rows next to the main irrigation -line and three guard rows atthe end of each lateral also provided border protection.
Golden Cross Bantam sweet corn was seeded heavily in rows 3.5feet apart in mid-May each year and thinned to the desired standlevels.
0 900
80W
70
60W
2 50W
40
30
12
z 10
J F M A M J J A S 0 N DMONTHS
FIGURE 1. The mean monthly temperature and precipitation for 60 years, 1889 to1960, near experimental site.
The three nitrogen treatments were combinations of rate andtime of application. The seasonal nitrogen rates were 50, 100, and200 pounds of NI per acre. All plots received 50 pounds of N per acrein the form of 1148-0 at planting time. Plots designated as N, re-ceived no additional nitrogen. N. and Na plots received an additional50 pounds per acre in the form of side dressed ammonium nitratebetween 54 days and 59 days after planting. The N:; plots received
a further sidedressing of 50 pounds per acre at 177 days to 79 days
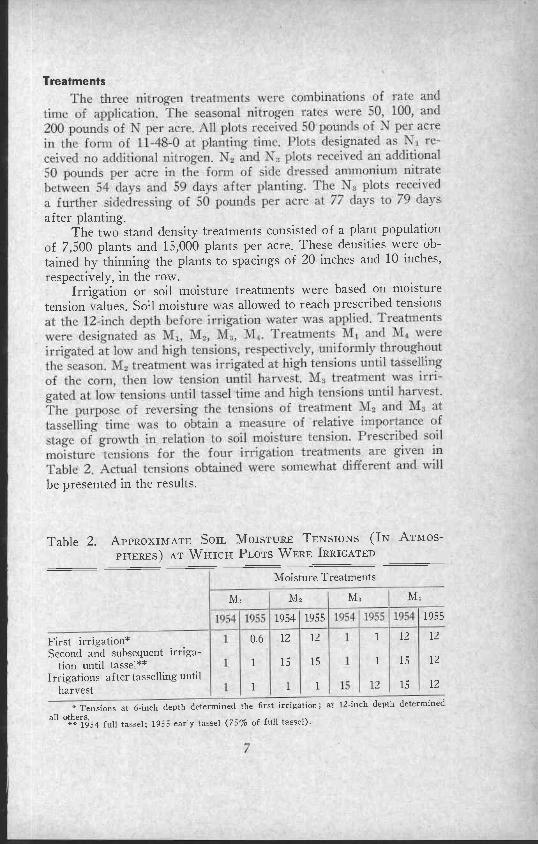
at the 12-inch depth before irrigation water was applied. Treatmentswere designated as Mt41. M2, AT,, Al, ,Treatments M, and M., wereirrigated at low and high tensions, respectively, uniformly throughoutthe season. 142 treatment was irrigated at high tensions until tassellingof the corn, then low tension until harvest. M. treatment was irri-gated at. low tensions until tassel time and high tensions until harvest.The purpose of reversing the tensions of treatment M2 and M., attasselling time was to obtain a measure of relative importance of
stage of growth in relation to soil moisture tension. Prescribed soilmoisture tensions for the four irrigation treatments are given inTable 2. Actual tensions obtained were somewhat different and will
]Q741954 195
li
1955 1054
r
Treatments
after planting.The two stand density treatments consisted of a plant population
of 7,500 plants and 15,000 plants per acre. These densities were ob-tained by thinning the plants to spacings of 20 inches and 10 inches,respectively, in the row.
Irrigation or soil moisture treatments were based on moisturetension values. Soil moisture was allowed to reach prescribed tensions
be presented in the results.
Table 2. APPROXIMATE SOIL MOISTURE TENSIONS (IN ATMOS-
PHERES) AT WHICH PLOTS WERE IRRIGATED
Moisture Treatments
M, M2 M, M4
1954 11955 1955
First irrigation* 0.6 12 12 1 12 12
Second and subsequent irriga-tion until tassel** 1 15 15 1 15 12
Irrigations after tasselling untilharvest 1 1 1 12 15 12
* Tensions at 6-inch depth determined the first irrigation; at 12-inch depth determinedall others.
* 1954 full tassel; 1955 early tassel (75% of full tassel).
Soil moisture measurements
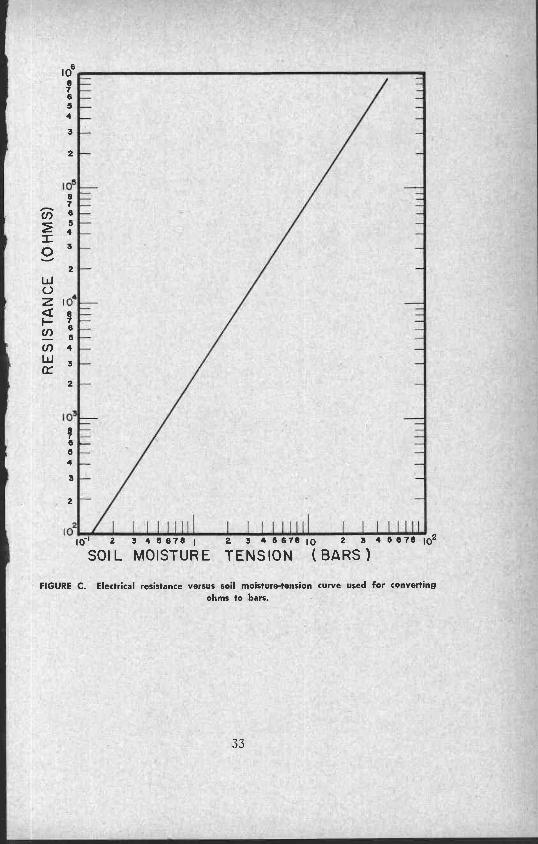
One method of measuring soil moisture was a modification ofthe Bouyoucos (2) gypsum electrical resistance block in which fourgypsum units are combined in a single stake as developed by Samieand Marsh (1). This instrument is a tapered stake 2 feet long andhas a pair of electrodes embedded in gypsum at 6-inch intervals alongthe stake. A measurement of electrical resistance between two elec-trodes at one depth is a measure of soil moisture condition at thatdepth. Proper calibration is necessary for conversion of resistancereadings to soil moisture tension or content.
When a stake was installed the units were at depths of 6, 12, 18,and 24 inches. Resistance of the units was read with a meter equippedwith a selector switch. The meter was calibrated against standardresistances and the calibration curves obtained used to convert fieldreadings into ohms resistance. Resistance readings made by thismethod were converted to tension as described later, and used to de-termine the need for irrigation. They were also used to determine thetotal moisture deficit in the root zone so that the proper amount ofirrigation water could be applied.
The other method of measuring soil moisture was that of takingsoil moisture samples with a soil tube and calculating moisture per-centages on an oven-dried basis. This method was used to measureconsumptive use and to calibrate gypsum stakes.
Installation of gypsum stakesTwo gypsum stakes were installed in each subplot. They were
placed in the row using the second and fifth rows, which were theoutside record rows, the first and sixth being guard rows. In 1954 onestake in each subplot was placed 5 feet from the irrigation lateral, theother 15 feet from the lateral. Analysis of variance showed no signifi-cant difference between the two locations, so in 1955 both stakes wereplaced 10 feet from the lateral. Leads from the stakes extended acrossto the guard row so that foot traffic was between guard rows andnot adjacent to a record row. In the high tension plots a second stakewas inserted to measure moisture at depths of 24 inches to 48 inches.
The gypsum stake installation was reatively simple. For a 2-foot installation, a 1-inch core to a depth of 2 feet was removed witha soil tube. Water was poured down the hole and allowed to soak 10minutes. The hole was then reamed out to stake shape using a taperedauger and the stake pushed in for a firm fit. Good contact, which isvery important, is assured by this technique in all except quite sandysoils. For installation to the 4-foot depth, a 4-inch diameter augerhole was first made to a depth of 2 feet. This was followed by the1-inch core removal with a soil tube to the 4-foot depth and subse-
r
samples was determined by the oven drying method. By samplingnear several stakes and reading them at the sampling times, numerouspoints within the available moisture range were obtained with which
to prepare a resistance versus moisture content graph. For conven-
ience the log of resistance was plotted against moisture content.To convert resistance to soil moisture tension, the moisture con-
Readings from the gypsum stakes were taken every three days,
an interval which provided a close enough check on water removalto stay below the prescribed tensions. Maintaining a strict three-dayschedule also simplified computation of seasonal average tensions. Allreadings were taken early in the morning to minimize effects of tem-perature changes. Average tensions were computed and the need forirrigation determined the same day. In this way, if readings taken inthe morning showed that a moisture treatment was ready to be irri-gated, water was applied that evening.
Need for irrigation was based on the average soil moisture ten-sion at the 12-inch depth within a given moisture treatment and allreplications were irrigated alike. With three replications of mainplots, six subplots in each main plot and two stakes in each subplot,the average of readings from 36 stakes was used for scheduling theirrigations of each moisture treatment. When the mean tension
9
quent operations as described above except that the tapered augerhad a 2-foot extension handle. Longer leads were employed and the4-inch auger hole was carefully backfilled and tamped.
Calibration of moisture instrumentsInstruments for indicating moisture content and tensions gave
the electrical resistance between two electrodes embedded in gypsum.In order to make use of the resistance readings they had to be con-verted to either moisture content or tension. Therefore, at selectedtimes, samples of soil were taken at the depths of the electrodes unitsand within a 6-inch radius of the gypsum stake at the same time theresistance measurements were made. The moisture content of these
tent of the samples described above was converted to moisture tensionby the use of a moisture-tension curve for the soil. Data for themoisture-tension curve were obtained with pressure extraction appa-ratus (11, 12). In practice the log of tension was plotted againstmoisture content and the mathematical function of the best fit straightline was determined by regression analysis. This function was used toconvert moisture content to tension. The log of tension was thenplotted against the log of resistance which gave nearly a straight line.The best fit straight line was again determined by regression analysis.
Irrigations based on readings
reached the predetermined level as shown in Table 2, irrigation waterwas applied.
Consumptive use measurements
Soil moisture samples for consumptive use measurements weretaken in both 1954 and 1955 but on a different schedule. In 1954,samples were taken before and after each irrigation with additionalsamples obtained at some intermediate times between irrigations forthe treatments. The treatments selected for sampling were M4 allseason, MZ prior to tassel, and M3 following tassel. In 1955, sampleswere taken from the Ml treatment every three days, that is, on thesame days the stakes were read. Other treatments were sampled asin 1954. Two samples were taken from each replication or six pertreatment. They were taken in the record rows, by 1-foot incrementsto a depth of 4 feet. The samples were oven dried and weight percent-ages of moisture calculated and converted to volume percentages,using bulk density values obtained from numerous cores taken with a2-inch Pomona sampler.
Measurements of irrigation amountsIn order to apply water at a constant rate to each plot, pressure
in each lateral was carefully maintained at a fixed value. At an opera-ting pressure of 30 p.s.i. the system applied water at an average rateof approximately 4 inch per hour. Each lateral was equipped with apressure gauge and valve. The gauge was checked at regular intervalsduring an irrigation. The system was operated for the calculated timenecessary to apply required amounts of water. If puddling within therows became excessive during irrigation, the system was shut downfor a short period to allow water to enter the soil.
An estimate of the actual amount of water applied to a givenplot during a particular irrigation was obtained from both can catch-ment data and from a measurement of total gallonage applied to theplot. Forty-eight-ounce cans were placed in the guard rows at dis-tances of 4 feet and 11 feet on either side of the lateral with a total of60 cans per 80-foot lateral. Early in the season, cans were placeddirectly on the ground surface but when the corn foliage developedto the stage where it interferred with the water distribution betweenrows, cans were mounted on stakes 6 feet and 7 feet above the ground,depending on height of the corn. Amount of precipitation was esti-mated by measuring volume of water caught in each can and averag-ing the results. Diameter of the cans was such that a constant factorof 226 cubic centimeters was equivalent to 1 inch of precipitation.Because of the apparent wide variation between can measurements,the number of cans per lateral was doubled for the latter part ofthe 1955 season.
10
Total gallonage applied to the plots irrigated at any one time in
1954 and 1955 was measured by means of a flow meter placed in the'main line to the plots. Application rate was estimated from the totalgallonage reading for a given irrigation by considering the total areato which water was applied Dimensions of the area irrigated from asingle 80-foot lateral were indistinct because of tapering at the edges,but were considered to be 80 feet by about 38 feet. Since all three
replications within a moisture treatment were irrigated simulta-neously, the total area to which water was applied during any oneirrigation was 9,120 square feet. The estimate from total gallonagereadings was compared with that from the can measurements. Thedata indicated that about 88% of the water applied was accounted
acre.
Each subplot was harvested when corn reached acceptable ma-
turity as determined by visual inspection of kernel color and fullness
of the ears. Purpose of harvesting on an individual plot basis was to
obtain, as nearly as possible, corn which would be at or near thesame stage of maturity. Variation in maturity, and therefore yieldvariation, caused by treatment and location in the experimental areawould be minimized, Acceptable stage of maturity of sweet corn in
this study was at a slightly later stage of maturity than the com-monly used 72% moisture content for processing. Preliminary inves-tigation indicated that the sweet corn could be harvested at a later
stage of maturity without seriously reducing quality and also couldhave less variation from plot to plot. TI. common commercial prac-
September 9 through SeptemberCorn from individual plots was weighed in the husk, then graded
into acceptable (graded) and unacceptable (cull) can and husked.Weights and numbers of ears were recorded. Data obtained fromeach plot included total, graded, and unacceptable weights of un-husked and husked corn; total, graded, and unacceptable number of
ears; and average weight of unhusked and husked graded ears. Thesedata were converted to an acre basis. Since exact stands of plants
4
14.
for by can measurements. The remainder probably was lost by evap-oration from the can and while in the air, or was due to error of
measurement.
Yield measurementsYield data of individual subplots were obtained by harvesting
four rows, each 12.5 feet long, for a total of 50 feet of row. Theharvested area of each of the subplots was 175 square feet or 0.00403
tice of only one harvest was made for each plot.In 1954, harvest of individual plots began on September 20 and
continued through October 4. The harvest period in 1955 was from
11
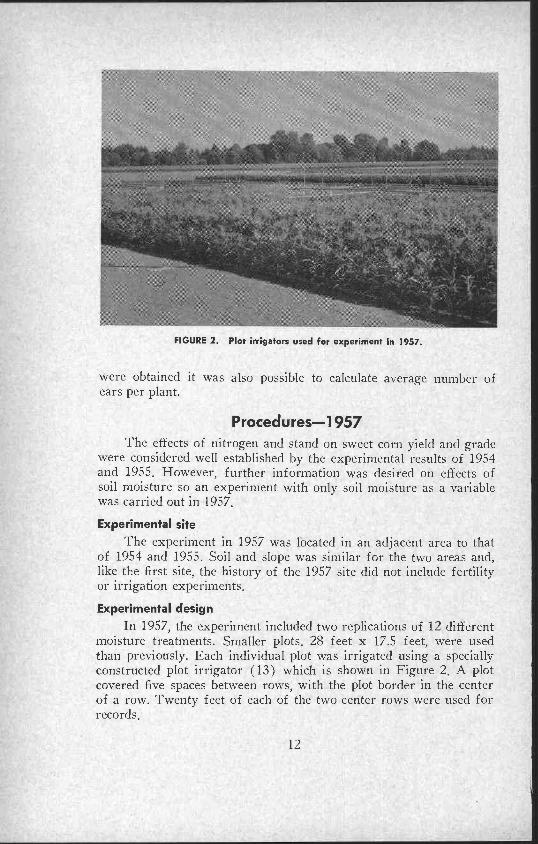
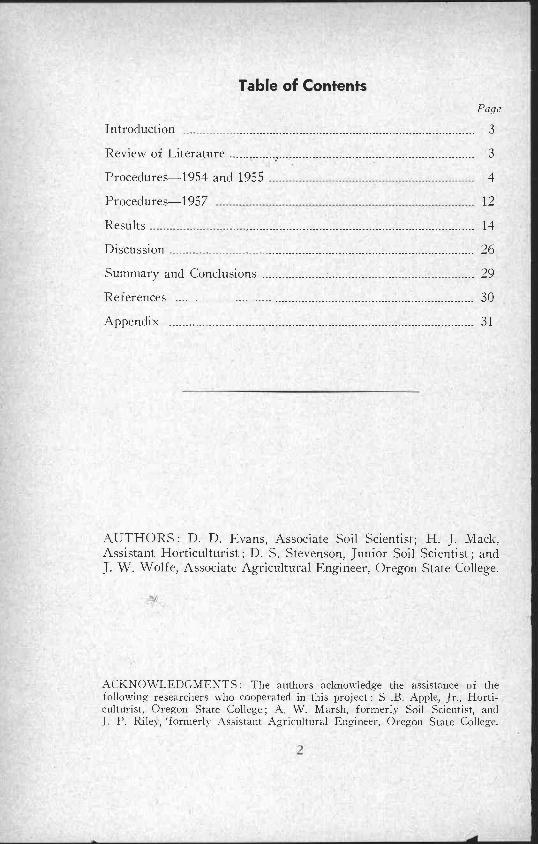
FIGURE 2. Plot irrigators used for experiment in 1957.
were obtained it was also possible to calculate average number ofears per plant.
Procedures-1957The effects of nitrogen and stand on sweet corn yield and grade
were considered well established by the experimental results of 1954and 1955. However, further information was desired on effects ofsoil moisture so an experiment with only soil moisture as a variablewas carried out in 1957.
Experimental siteThe experiment in 1957 was located in an adjacent area to that
of 1954 and 1955. Soil and slope was similar for the two areas and,like the first site, the history of the 1957 site did not include fertilityor irrigation experiments.
Experimental designIn 1957, the experiment included two replications of 12 different
moisture treatments. Smaller plots, 28 feet x 17.5 feet, were usedthan previously. Each individual plot was irrigated using a speciallyconstructed plot irrigator (13) which is shown in Figure 2. A plotcovered five spaces between rows, with the plot border in the centerof a row. Twenty feet of each of the two center rows were used forrecords.
12
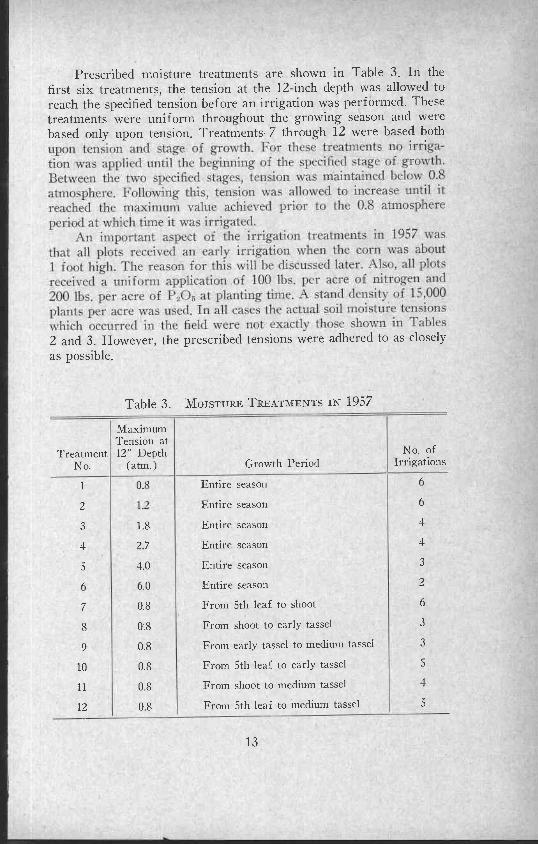
upon tension and stage of growth. For these treatments no irriga-tion was applied until the beginning of the specified stage of growth.Between the two specified stages, tension was maintained below 0.8atmosphere. Following this, tension was allowed to increase until itreached the maximum value achieved prior to the 0.8 atmosphereperiod at which lime it was irrigated.
An important aspect of the irrigation treatments in 1957 wasthat all plots received an early irrigation when the corn was about1 tool high. The reason for this will be discussed later. Also, all plotsreceived a uniform application of 100 lbs. per acre of nitrogen and200 lbs. per acre of R.O, at planting time. A stand density of 15,000plants per acre wad used. In all cases the actual soil moisture tensionswhich occurred in the lull were not exactly those shown ill Tables
1?
Prescribed moisture treatments are shown in Table 3. In thefirst six treatments, the tension at the 12-inch depth was allowed toreach the specified tension before an irrigation was performed. Thesetreatments were uniform throughout the growing season and werebased only upon tension. Treatments 7 through 12 were based both
2 and 3. However, the prescribed tensions were adhered to as closelyas possible.
Table 3. MOISTURE TREATMENTS IN 1957
MaximumTension at
Treatment 12" DepthNo. (atm.) Growth Period
No. ofIrrigations
1 0.8 Entire season 6
2 Entire season 6
3 18 Entire season 4
4 2.7 Entire season 4
5 4.0 Entire season 3
6 6.0 Entire season 2
7 0.8 From 5th leaf to shoot 6
8 0.8 From shoot to early tassel 3
9 0.8 From early tassel to medium tassel 3
10 0.8 From 5th leaf to early tassel 5
11 0.8 From shoot to medium tassel 4
12 0.8 From 5th leaf to medium tassel 5
13
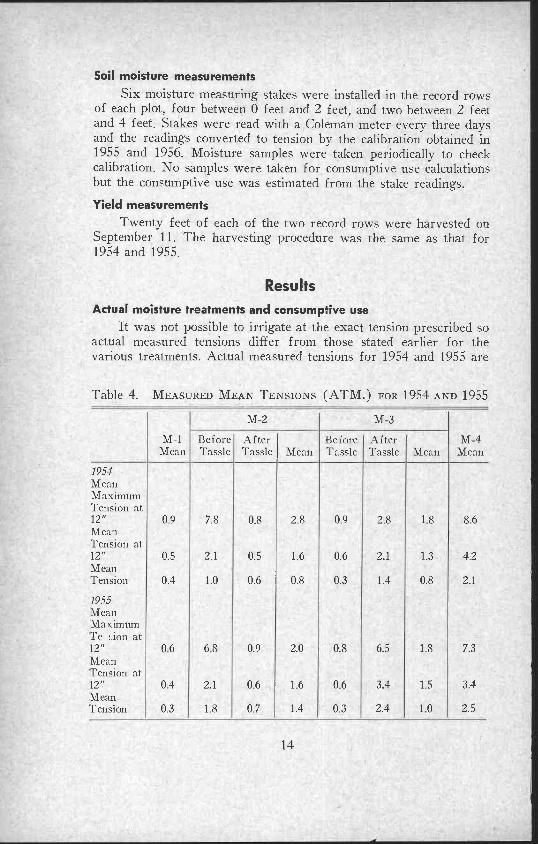
Soil moisture measurements
Six moisture measuring stakes were installed in the record rowsof each plot, four between 0 feet and 2 feet, and two between 2 feetand 4 feet. Stakes were read with a Coleman meter every three daysand the readings converted to tension by the calibration obtained in1955 and 1956. Moisture samples were taken periodically to checkcalibration. No samples were taken for consumptive use calculationsbut the consumptive use was estimated from the stake readings.
Yield measurements
Twenty feet of each of the two record rows were harvested onSeptember 11. The harvesting procedure was the same as that for1954 and 1955.
Resu Its
Actual moisture treatments and consumptive useIt was not possible to irrigate at the exact tension prescribed so
actual measured tensions differ from those stated earlier for thevarious treatments. Actual measured tensions for 1954 and 1955 are
Table 4. MEASURED MEAN TENSIONS (ATM.) FOR 1954 AND 1955
M-1Mean
BeforeTassle
M-2
AfterTassle Mean
BeforeTassle
M-3
AfterTassle Mean
M-4Mean
1954MeanMaximumTension at12" .9 .8 .8 2.8 .9 .8 .8 6
MeanTension at12" 0.5 2.1 0.5 1.6 0.6 2.1 1.3 4.2MeanTension 0.4 1.0 0.6 0.8 0.3 1.4 0.8 2.1
1955MeanMaximumTe on at12" 6 8 .9 2.0 .8 .5 .8 .3
MeanTension at12" 04 2.1 0.6 1.6 0.6 3.4 1.5 34MeanTension 0.3 1.8 0.7 1.4 0.3 2.4 10 2.5
14
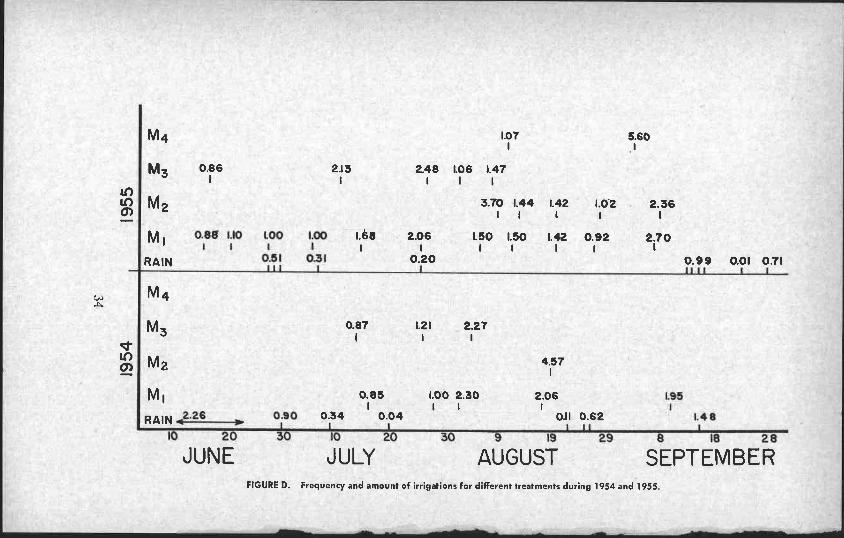
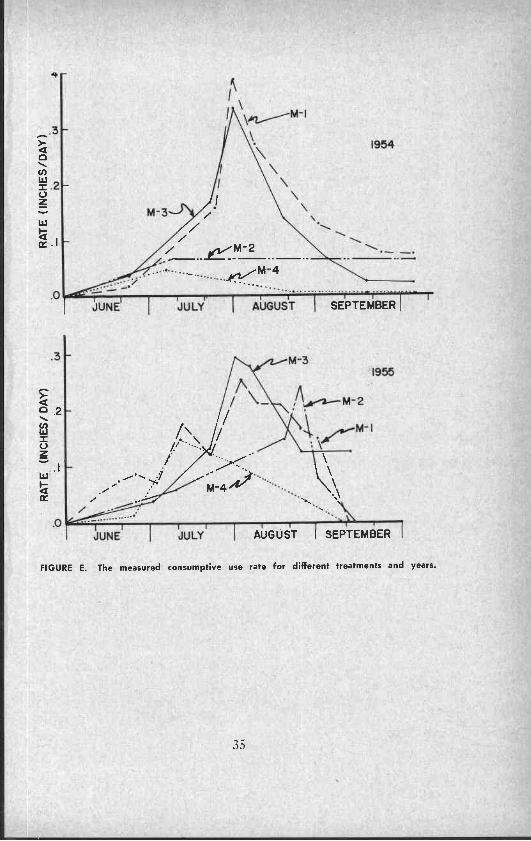
Ail,, M2, and M, (1955) contained 1.0, 1.3, and Lib inches, respec-tively, more water at the end of the experiment than at the beginWing. The distribution and magnitude of irrigations are given in theAppendix, Figure D. The measured consumptive use rate for eachtreatment is plotted for different dates in the Appendix, Figure E.
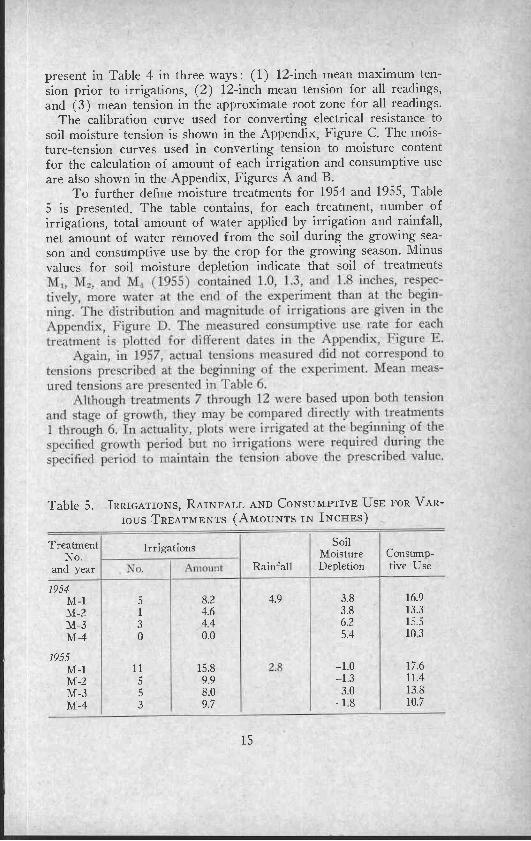
Again, in 1957, actual tensions measured (lid not correspond totensions prescribed at the beginning of the experiment. Mean meas-ured tensions are presented in 'fable 6.
Although treatments 7 through 12 were based upon both tensionand stage of growth, they may be compared directly with treatmentsI through 6. Tn actuality, plots were irrigated at the beginning (if thespecified growth period but no irrigations were required during thespecified period to maintain the tension above the prescribed value.
\O. Amount
Z.8
present in Table 4 in three ways : (1) 12-inch mean maximum ten-sion prior to irrigations, (2) 12-inch mean tension for all readings,and (3) mean tension in the approximate root zone for all readings.
The calibration curve used for converting electrical resistance tosoil moisture tension is shown in the Appendix, Figure C. The mois-ture-tension curves used in converting tension to moisture contentfor the calculation of amount of each irrigation and consumptive useare also shown in the Appendix, Figures A and B.
To further define moisture treatments for 1954 and 1955, Table5 is presented. The table contains, for each treatment, number ofirrigations, total amount of water applied by irrigation and rainfall,net amount of water removed from the soil during the growing sea-son and consumptive use by the crop for the growing season. Minusvalues for soil moisture depletion indicate that soil of treatments
Table 5. IRRIGATIONS, RAINFALL AND CONSUMPTIVE USE FOR VAR-IOUS TREATMENTS (AMOUNTS IN INCHES)
TreatmentNo.
and year
Irrigations
Rainfall
SoilMoistureDepletion
Consump-tive Use
1954M-1 5 8.2 4.9 3.8 16.9
M-2 1 4.6 3.8 13.3
M-3 3 4.4 6.2 15.5
M-4 0 0.0 5.4 103
1955M-1 11 15.8 -1.0 17.6
M-2 5 9.9 -1.3 11.4
M-3 5 8.0 3.0 13.8
M-4 3 9.7 -1 8 10.7
15
ti
II
c o-l ti
li l
I I
a
I
are
R,;tj
Irrigation
Rainfall
= I n I `i1
AT
n
I
I
11
T
,i
ry
Table 6. MEASURED MEAN TENSIONS FOR 1957
TreatmentNo.
Mean Max.at 12 inches
Tension (Atm)Mean
at 12 inches
Meanin Surface
4 feet
1 1.6 0.7 0.5
2 1.8 0.7 0.5
3 3.2 1.0 0.6
4 4.2 1.3 0.7
5 5.6 2.1 1.2
6 7.1 2.8 1.8
7 1.7 0.7 0.4
8 4.4 1.5 0.9
9 7.0 2.0 1.9
10 2.6 1.0 0.6
11 4.0 1.3 0.7
12 2.6 0.9 0.6
Table 7. IRRIGATIONS, RAINFALL, AND CONSUMPTIVE USE FORVARIOUS TREATMENTS IN 1957
Treatment No. I Amount
SoilMoistureDepletion
Consump-tive Use
1 6 125 1.2 2.5 162
2 6 13.4 1.2 13 15.9
3 4 11.3 1.2 2.7 15.2
4 4 12.7 1.2 1.5 15.4
5 3 9.7 1.2 5.1 160
6 2 6.3 12 7.2 14:7
7 6 12 7 1.2 2.3 16.2
8 3 10.5 1.2 4.0 15.7
9 3 11.6 1.2 0.8 136
10 5 13.7 1.2 0.4 15.3
11 4 12.4 1.2 2.0 15.6
12 5 14.0 1.2 24 17.6
16
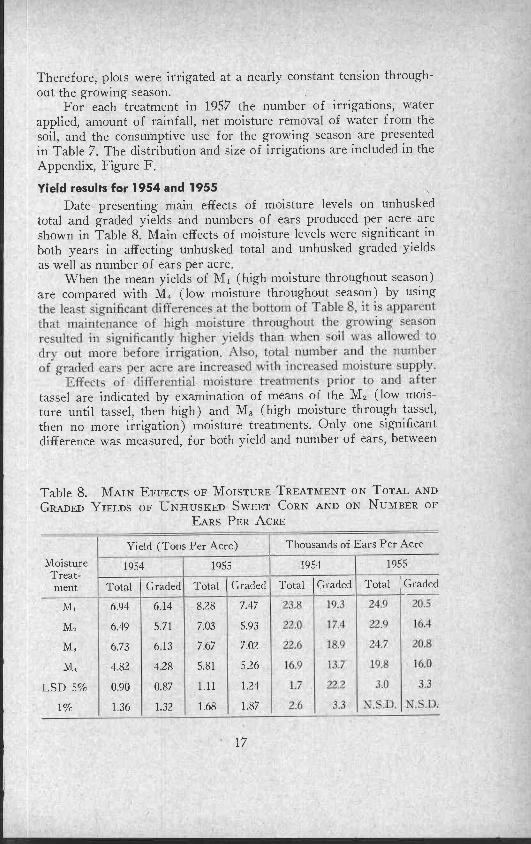
the least significant differences at the bottom of Table 8, it is apparentthat maintenance of high moisture throughout the growing seasonresulted in significantly higher yields than when soil was allowed todry out more before irrigation. Also, total number and the numberof graded ears per acre are increased with increased moisture supply.
Effects of differential moisture treatments prior to and alter
23.8 19.3 24.9 20.
22.0 17.4 22.9 16.4
22.6 18.! ) 24.7 20.8
16.9 13.7 19,8 16.0
1.7 22.2 3.0 3.3
2.6 3.3 N.S.D. N.S.F),
Therefore, plots were irrigated at a nearly constant tension through-out the growing season.
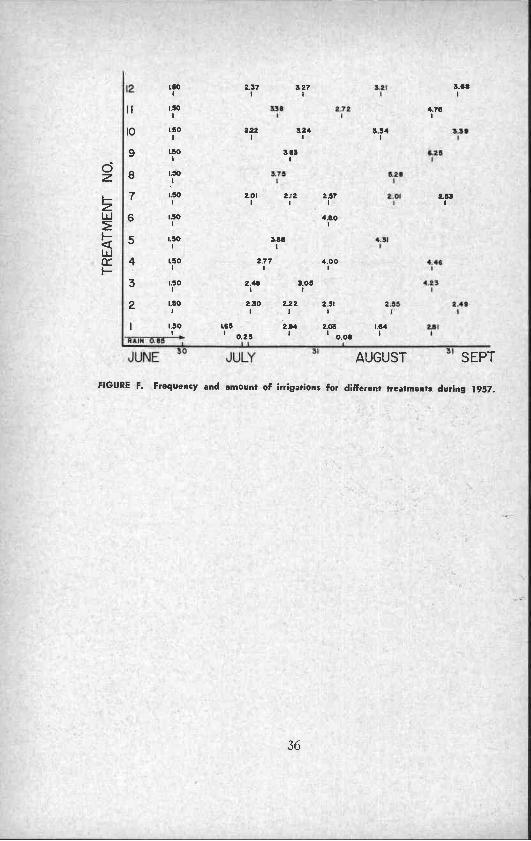
For each treatment in 1957 the number of irrigations, waterapplied, amount of rainfall, net moisture removal of water from thesoil, and the consumptive use for the growing season are presentedin Table 7. The distribution and size of irrigations are included in theAppendix, Figure F.
Yield results for 1954 and 1955Date presenting main effects of moisture levels on unhusked
total and graded yields and numbers of ears produced per acre areshown in Table 8. Main effects of moisture levels were significant inboth years in affecting unhusked total and unhusked graded yieldsas well as number of ears per acre.
When the mean yields of M1 (high moisture throughout season)are compared with M4 (low moisture throughout season) by using
tassel are indicated by examination of means of the M2 (low mois-ture until tassel, then high) and M3 (high moisture through tassel,then no more irrigation) moisture treatments. Only one significantdifference was measured, for both yield and number of ears, between
Table 8. MAIN EFFECTS OF MOISTURE TREATMENT ON TOTAL ANDGRADED YIELDS OF UNHUSKED SWEET CORN AND ON NUMBER OF
EARS PER ACRE
Yield (Tons Per Acre) Thousands of Ears Per Acre
MoistureT t-
1954 1955 1954 1955rea
ment Total I Graded Total I Graded Total I Graded Total I Graded
M, 6.94 6.14 8.28 7.47
M, 6.49 5.71 7.03 5.93
M, 6.73 6 13 7 67 7.02
M, 4 82 4 28 5.81 5.26
LSD 5% 0.90 0.87 1.11 1.24
1% 136 1.32 1.68 1.87
17
IQ 41 1955 1 Unhusked I Husked
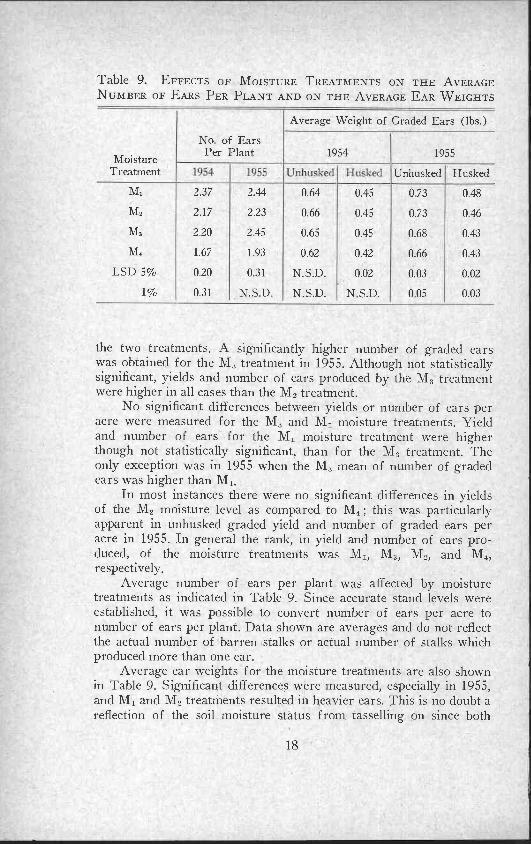
Table 9. EFFECTS OF MOISTURE TREATMENTS ON THE AVERAGENUMBER OF EARS PER PLANT AND ON THE AVERAGE EAR WEIGHTS
Average Weight of Graded Ears (lbs.)
No. of EarsPer Plant 1954 1955Moisture
Treatment Unhusked Husked
M, 2.37 2.44 0.64 0.45 0 73 0.48
M, 2.17 2.23 0.66 0.45 0.73 0.46
M, 2.20 2.45 0.65 0.45 0.68 0.43
M4 1.67 1.93 0.62 0.42 0.66 0 43
LSD 5% 0.20 0.31 N.S.D. 0.02 0.03 0.02
1% 0.31 N.S.D N.S.D. N S.D. 005 0.03
the two treatments. A significantly higher number of graded earswas obtained for the M3 treatment in 1955. Although not statisticallysignificant, yields and number of ears produced by the M3 treatmentwere higher in all cases than the M2 treatment.
No significant differences between yields or number of ears peracre were measured for the M3 and M1 moisture treatments. Yieldand number of ears for the M1 moisture treatment were higherthough not statistically significant, than for the M3 treatment. Theonly exception was in 1955 when the M3 mean of number of gradedears was higher than M1.
In most instances there were no significant differences in yieldsof the M2 moisture level as compared to M4i this was particularlyapparent in unhusked graded yield and number of graded ears peracre in 1955. In general the rank, in yield and number of ears pro-duced, of the moisture treatments was M1, M3, M2, and M4,respectively.
Average number of ears per plant was affected by moisturetreatments as indicated in Table 9. Since accurate stand levels wereestablished, it was possible to convert number of ears per acre tonumber of ears per plant. Data shown are averages and do not reflectthe actual number of barren stalks or actual number of stalks whichproduced more than one ear.
Average ear weights for the moisture treatments are also shownin Table 9. Significant differences were measured, especially in 1955,and M1 and M2 treatments resulted in heavier ears. This is no doubt areflection of the soil moisture status from tasselling on since both
18
19 i4
Total l ;raiied Total traded
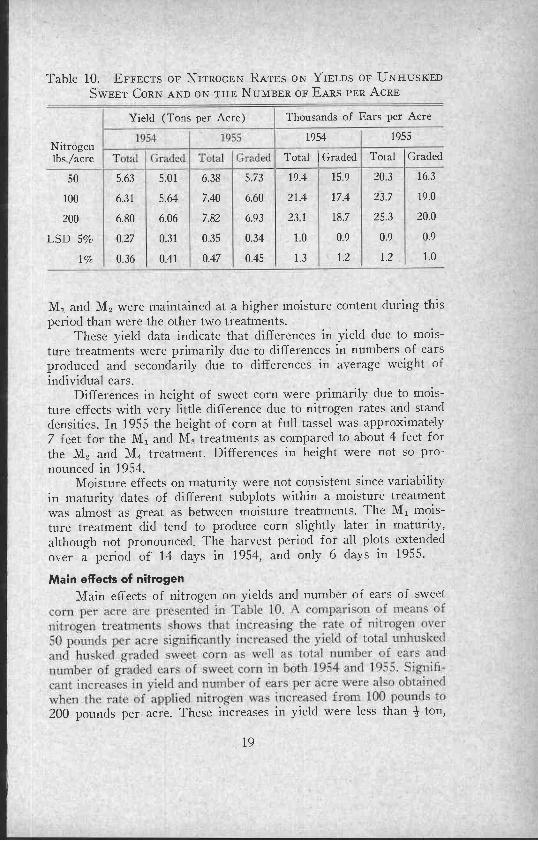
corn per acre are presented in Table 10. A comparison of means ofnitrogen treatments shows that increasing the rate of nitrogen over50 pounds per acre significantly increased the yield of total unhuskedand husked graded sweet corn as well as total number of cars andnumber of graded ears of sweet corn in both 1954 and 1955. Si ni f;.:-
cant increases in yield and number of ears per acre were also obtainedwhen the rate of applied nitrogen was increased from 100 pounds to
4
1955
Table 10. EFFECTS OF NITROGEN RATES ON YIELDS OF UNHUSKEDSWEET CORN AND ON THE NUMBER OF EARS PER ACRE
Yield (Tons per Acre) Thousands of Ears per Acre
1954 1955Nitrogenlbs /acre Total I Graded Total Graded
50 5.63 5.01 6.38 5.73 19.4 15.9 20.3 16.3
100 6.31 5.64 7.40 6.60 21.4 17.4 23 7 19.0
200 6.80 6.06 7.82 6.93 23.1 18.7 25.3 20.0
LSD 5% 0.27 0.31 0.35 0.34 1.0 0.9 0.9 0.9
1% 0.36 0.41 0.47 0.45 1.3 1.2 1.2 1.0
M1 and MZ were maintained at a higher moisture content during thisperiod than were the other two treatments.
These yield data indicate that differences in yield due to mois-ture treatments were primarily due to differences in numbers of earsproduced and secondarily due to differences in average weight ofindividual ears.
Differences in height of sweet corn were primarily due to mois-ture effects with very little difference due to nitrogen rates and standdensities. In 1955 the height of corn at full tassel was approximately7 feet for the M1 and M3 treatments as compared to about 4 feet forthe M2 and M4 treatment. Differences in height were not so pro-nounced in 1954.
Moisture effects on maturity were not consistent since variabilityin maturity dates of different subplots within a moisture treatmentwas almost as great as between moisture treatments. The M1 mois-ture treatment did tend to produce corn slightly later in maturity,although not pronounced. The harvest period for all plots extendedover a period of 14 days in 1954, and only 6 days in 1955.
Main effects of nitrogenMain effects of nitrogen on yields and number of ears of sweet
200 pounds per acre. These increases in yield were less than I ton,
19
10
9
8
7
6
5
I-
OL50 1000 200/0 50 100
treatments.
100 150
2(_I
200
200
H
'1954
44M'2
M:3 195_.'
-NITROGEN (LBS./ACRE)
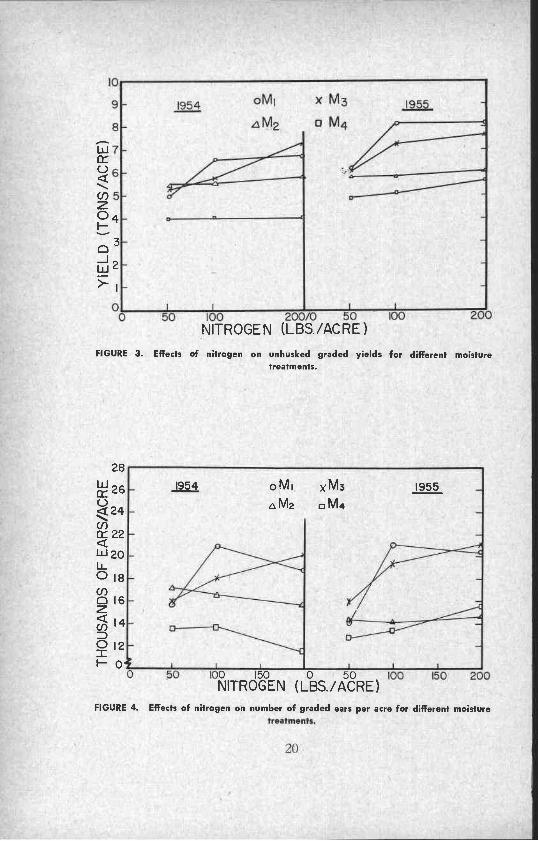
FIGURE 3. Effects of nitrogen on unhusked graded yields for different moisturetreatments.
28
ILLI 260
24Cf)
22
W 20LL0 18Co0 16Z
14
0 12
0.
1954 0M1 XM3 1955
AM2 r.3 M4
10 150 0 50NITROGEN (LBS./ACRE)
FIGURE 4. Effects of nitrogen on number of graded ears per acre for different moisture
I
yields and number of ears of sweet corn, certain moisture x nitrogeninteractions were also significant as shown in Figures 3 and 4. Differ-ences in yields due to moisture treatments were not so great at the
50 pound per acre nitrogen rates as at the 100 pound and 200 poundrates of nitrogen. These data indicate that increased rates of nitrogenover 50 pounds per acre were more effective in increasing yields andnumbers of ears at the Al, and M, moisture levels as compared to
ranging from 54 days to 79 days after planting.Rainfall or irrigation was necessary for this nitrogen to be in-
corporated into the root zone. In 1954, for the M, and M, moisturetreatments, no irrigation was provided prior to tassel, whereas forthe Al, and AT, moisture levels, regular irrigation mould insure thatthe nitrogen would be incorporated into the root zone. If all moisturelevels were compared, the validity of moisture x nitrogen interactionscould be questioned because of the delay of incorporation of the ni-trogen for M, and AM,. To alleviate this situation in 1955, the M2and M4 treatments were given an irrigation of approximately oneinch to incorporate the nitrogen, when it was applied, into the root
t
Y.
however, and economic consideration should be given to this smallincrease in yield as compared to the cost of an additional 100 poundsof nitrogen fertilizer.
There were no significant effects from the nitrogen rates onaverage ear weights of unhusked graded or husked graded ears.
In addition to the main effects of moisture and nitrogen levels
the MZ and M4 levels. It should, however, be remembered that for thenitrogen fertilizer rates of 100 and 200 pounds per acre, the excessover 50 pounds per acre, was applied as a sidedress prior to tassel,
zone.
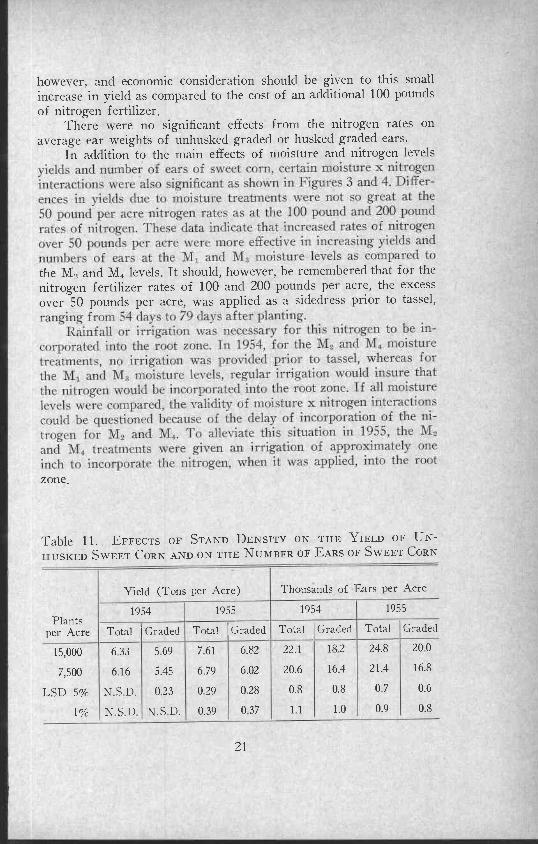
Table 11. EFFECTS OF STAND DENSITY ON THE YIELD OF UN-HUSKED SWEET CORN AND ON THE NUMBER OF EARS OF SWEET CORN
Yield (Tons per Acre) Thousands of Ears per Acre
1954 1955 1954 1955
Plantsper Acre Total I Graded Total I Graded Total I Graded Total Graded
15,000 6 33 5 69 7.61 6.82 22.1 182 24.8 200
7,500 6.16 5.45 6.79 6.02 20.6 16.4 21.4 16.8
LSD 5% N.S D. 0 23 0 29 0 28 0.8 0.8 0 7 0.6
1% NSD N.SD. 0.39 037 1.1 1.0 0.9 0.8
21
When lT, and 1M14 moisture treatments are compared, no signiti-cant moisture x nitrogen interactions occurred in 1954. Tn 1955.however, yields and number of ears produced at M., more nearlyapproached those of At. at the 100-pound and 200-pound nitrogenrates than at the 50-pound per acre rate of nitrogen. Both yields andthe number of ears were consistently higher for the M_ moisture
9
X- 19550-1954
x
x
0
0x
fi
4 0
0MEAN TENSION (BARS )2
2.5
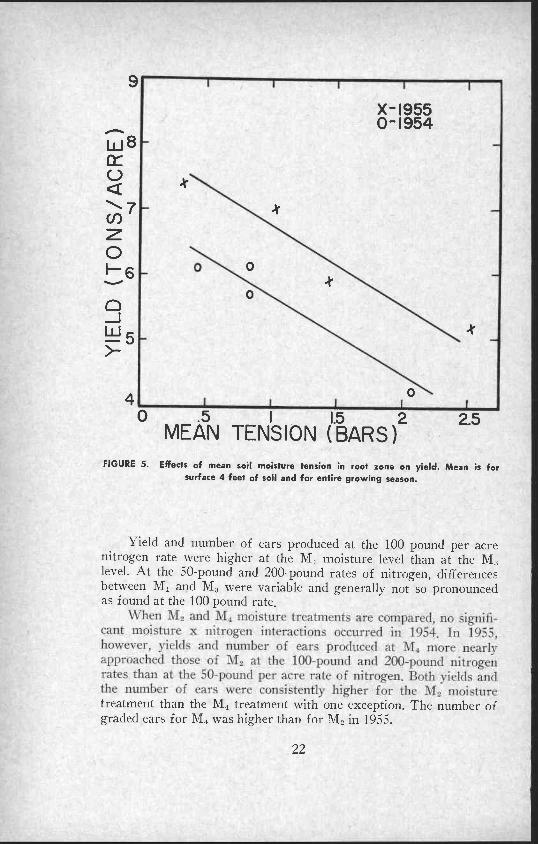
FIGURE 5. Effects of mean soil moisture tension in root zone on yield. Mean is forsurface 4 feet of soil and for entire growing season.
Yield and number of ears produced at the 100 pound per acrenitrogen rate were higher at the M, moisture level than at the M3level. At the 50-pound and 200-pound rates of nitrogen, differencesbetween Ml and M3 were variable and generally not so pronouncedas found at the 100 pound rate.
treatment than the M4 treatment with one exception. The number ofgraded ears for M4 was higher than for MZ in 1955.
22
7.75
4.2510 II 12 13 14 15 6 17 18
CONSUMPTIVE USE (INCHES)
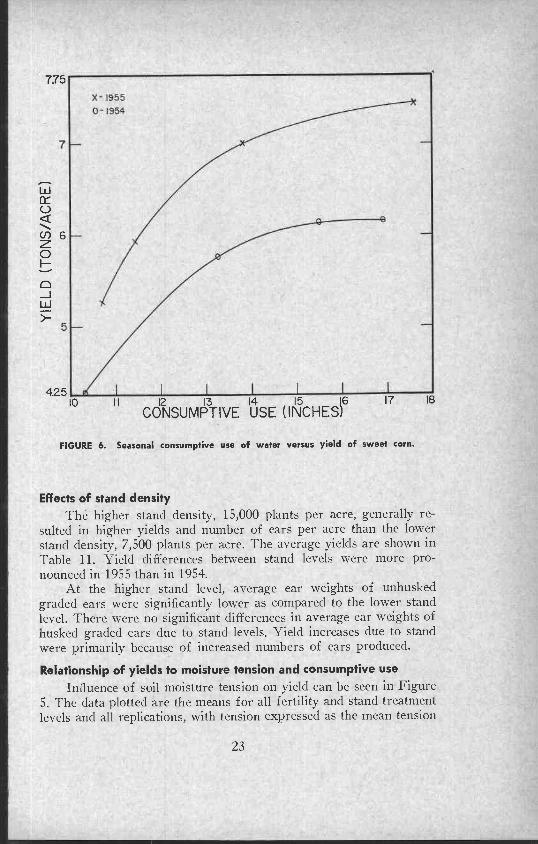
FIGURE 6. Seasonal consumptive use of water versus yield of sweet corn.
Effects of stand densityThe higher stand density, 15,000 plants per acre, generally re-
sulted in higher yields and number of ears per acre than the lowerstand density, 7,500 plants per acre. The average yields are shown inTable 11. Yield differences between stand levels were more pro-nounced in 1955 than in 1954.
At the higher stand level, average ear weights of unhuskedgraded ears were significantly lower as compared to the lower standlevel. There were no significant differences in average ear weights ofhusked graded ears due to stand levels. Yield increases due to standwere primarily because of increased numbers of ears produced.
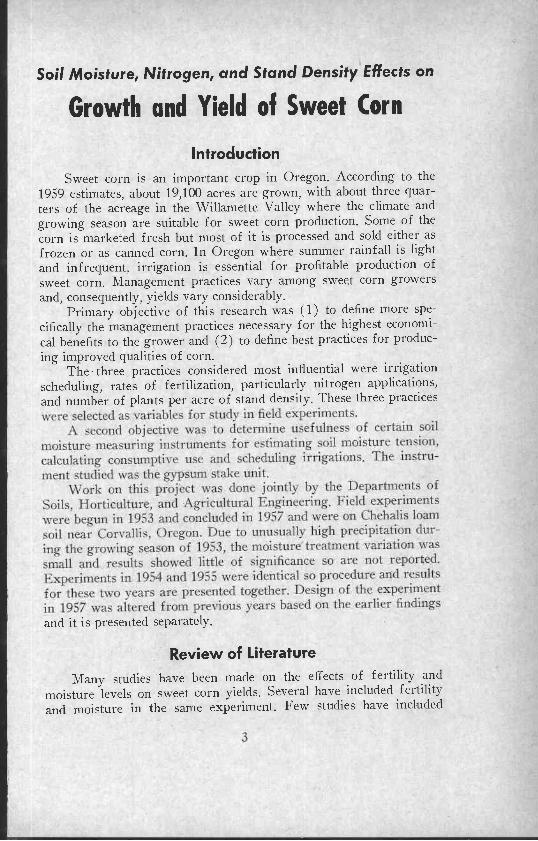
Relationship of yields to moisture tension and consumptive useInfluence of soil moisture tension on yield can be seen in Figure
5. The data plotted are the means for all fertility and stand treatmentlevels and all replications, with tension expressed as the mean tension
23
18
10
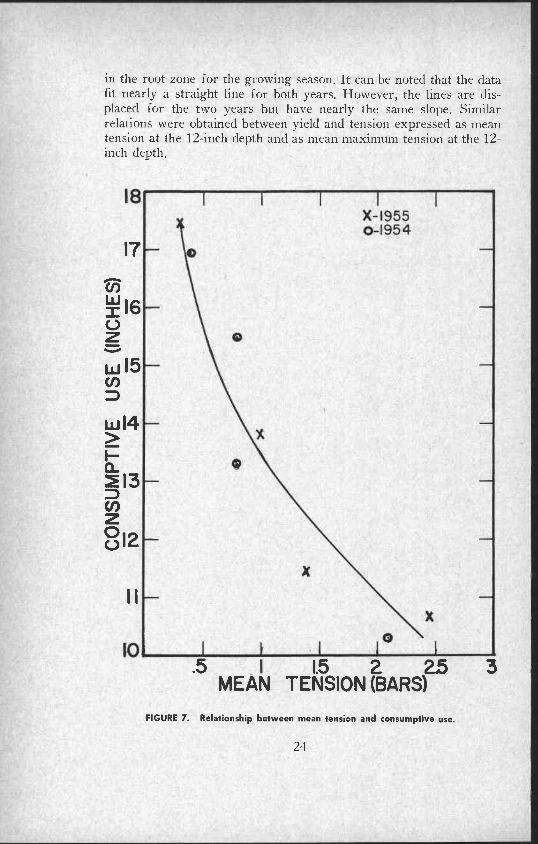
in the root zone for the growing season. It can be noted that the datafit nearly a straight line for both years. However, the lines are dis-placed for the two years but have nearly the same slope. Similarrelations were obtained between yield and tension expressed as meantension at the 12-inch depth and as mean maximum tension at the 12-inch depth.
17
Cn
=16UZvW15CnD
w14
F-a213Dz0012
II
3.5MEAN TENSION
(2 2,5BARS)
FIGURE 7. Relationship between mean tension and consumptive use.
74
0
6L104
16
I
TEN
of
u
0
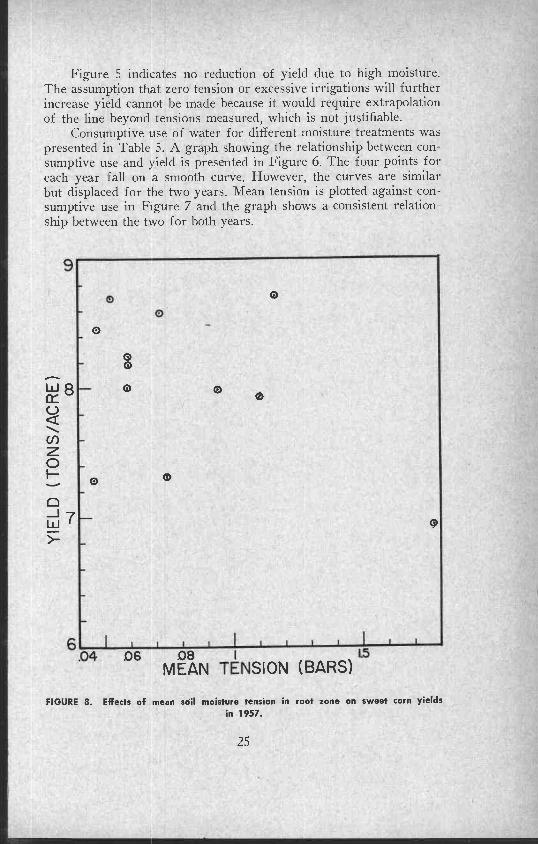
Figure 5 indicates no reduction of yield due to high moisture.The assumption that zero tension or excessive irrigations will furtherincrease yield cannot be made because it would require extrapolationof the line beyond tensions measured, which is not justifiable.
Consumptive use of water for different moisture treatments waspresented in Table 5. A graph showing the relationship between con-sumptive use and yield is presented in Figure 6. The four points foreach year fall on a smooth curve. However, the curves are similarbut displaced for the two years. Mean tension is plotted against con-sumptive use in Figure 7 and the graph shows a consistent relation-ship between the two for both years.
O
0
0
OO
0 0 0
0
AsMEAN SION (BARS)
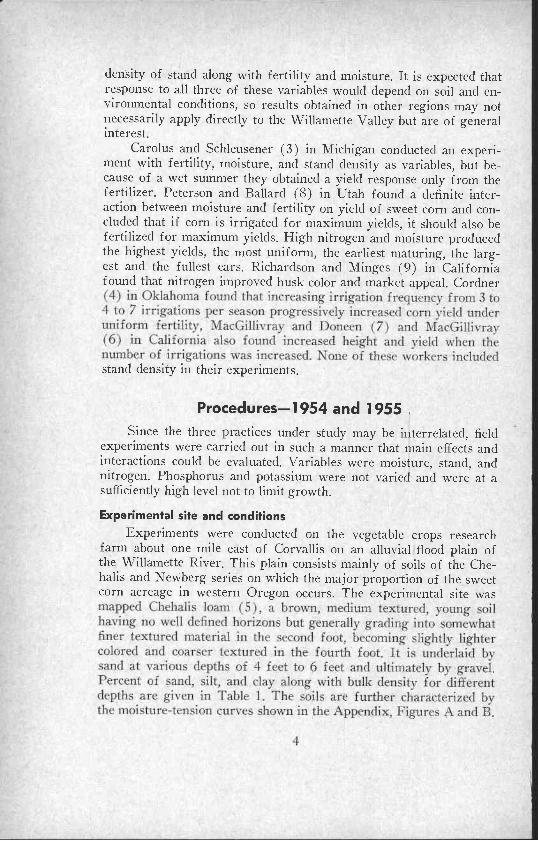
FIGURE 8. Effects of mean soil moisture tension in root zone on sweet corn yieldsin 1957.
25
Yield (T/A)Treatment Total Graded Treatment Total (traded
1 9.36 8.45 7 8.41 726
9.45 8.68 8 8.81 7.98
3 9.44 822 9 8.76 7.91
4 9.25 8.58 10 9.33 8.16
5 9.72 8.70 11 8.4f0 7.30
6 7.60 6.tt3 I? 9.30 i98
2
r
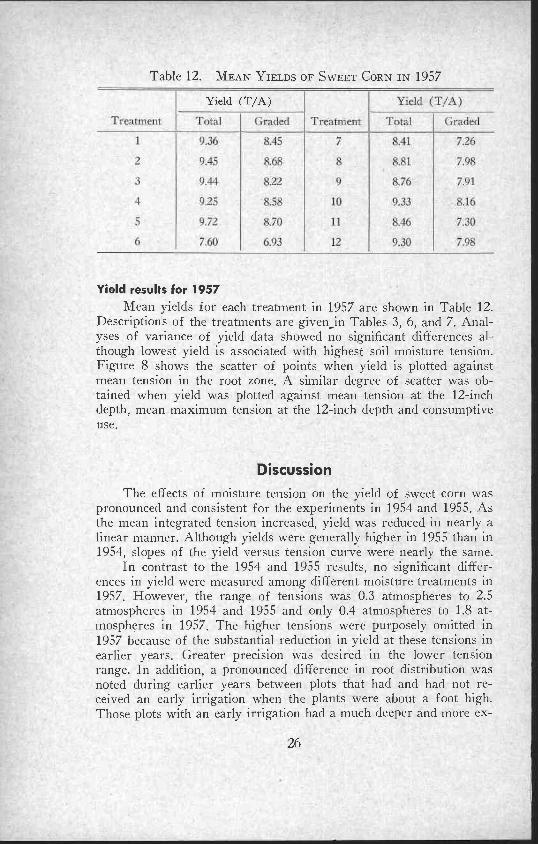
Table 12. MEAN YIELDS OF SWEET CORN IN 1957
Yield (T/A)
Yield results for 1957Mean yields for each treatment in 1957 are shown in Table 12.
Descriptions of the treatments are given-in Tables 3, 6, and 7. Anal-yses of variance of yield data showed no significant differences al-though lowest yield is associated with highest soil moisture tension.Figure 8 shows the scatter of points when yield is plotted againstmean tension in the root zone. A similar degree of scatter was ob-tained when yield was plotted against mean tension at the 12-inchdepth, mean maximum tension at the 12-inch depth and consumptiveuse.
Discussion
The effects of moisture tension on the yield of sweet corn waspronounced and consistent for the experiments in 1954 and 1955. Asthe mean integrated tension increased, yield was reduced in nearlylinear manner. Although yields were generally higher in 1955 than in1954, slopes of the yield versus tension curve were nearly the same.
In contrast to the 1954 and 1955 results, no significant differ-ences in yield were measured among different moisture treatments in1957. However, the range of tensions was 0.3 atmospheres to 2.5atmospheres in 1954 and 1955 and only 0.4 atmospheres to 1.8 at-mospheres in 1957. The higher tensions were purposely omitted in1957 because of the substantial reduction in yield at these tensions inearlier years. Greater precision was desired in the lower tensionrange. In addition, a pronounced difference in root distribution wasnoted during earlier years between plots that had and had not re-ceived an early irrigation when the plants were about a foot high.Those plots with an early irrigation had a much deeper and more ex-
26
tensive root distribution than those that did not receive the irrigation.Roots in the latter plots were mainly confined in the top foot of soilabove an apparent restricting layer. Irrigation experiments with sweetcorn at Davis, California, have also shown the importance of an earlyirrigation.
Based on these observations, all plots in 1957 received an irriga-tion when the corn was about 1 foot tall. Applications of an earlyirrigation also gave a more uniform incorporation of the added ni-trogen than was perhaps obtained in 1954 and 1955. Combination ofthese two factors tended to reduce influence of different moisturetreatments. It should be noted that yields from all plots in 1957 weregenerally higher than the highest yields during 1954 and 1955.
Yield increase from moisture treatments resulted mainly fromproduction of more ears of corn per acre rather than larger ears.However, treatments which resulted in high levels of moisture fol-lowing tasselling tended to give somewhat larger ears than thoseplots that were drier after tasselling.
Sweet corn responded well to application of a certain amount ofnitrogen. Significant yield increases were obtained between 50 poundsand 100 pounds per acre but the yield increase between 100 poundsand 200 pounds per acre was not sufficiently great to warrant appli-cation of the heavier rate based on 1958 economy. Again, as withmoisture, the yield increase due to nitrogen was from increased num-ber of ears per acre.
The significant interaction between moisture and nitrogen em-phasizes that for maximum efficiency of water and nitrogen bothmust be at a high level. That is, when nitrogen was applied at a highrate the effect of added moisture was most pronounced. Conversely,when moisture was maintained at a high level, the effects of nitrogenwere most pronounced.
The small increase in yield from 15,000 plants over 7,500 plantsper acre is of some practical significance. The extra cost of seed isrelatively small, even though the yield increase is small, and the 15,000plants per acre appears to be the better rate to use.
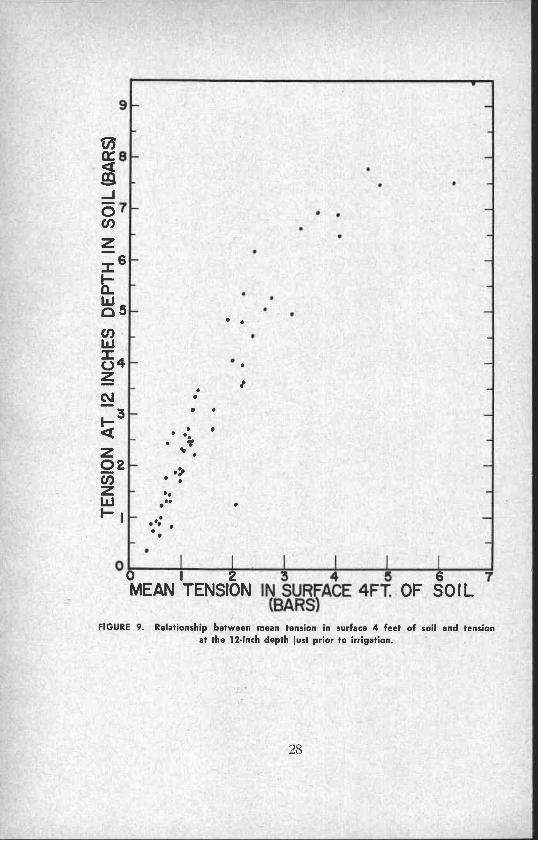
The good correlation between mean integrated tension in thesurface 4 feet of soil and the maximum tension at the 12-inch depthshown in Figure 9 is of interest since one can predict one from theother. However, it must be kept in mind that the relationship maychange for soils sufficiently different from Chehalis loam. But withsuch a relationship justification exists for using the tension at onedepth for predicting irrigation needs. At the present time it is notpractical for a grower to measure mean integrated tension, but it isrelatively simple to measure the tension at the 12-inch depth and pre-dict irrigation needs.
27
3 4 5 TIN SURFACE 4FT.
(BARS)
1
"7!
r
a .
. .
...
o 1 2MEAN TENSION
sOF SOIL
FIGURE 9. Relationship between mean tension in surface 4 feet of soil and tensionat the 12-inch depth just prior to irrigation.
.
28
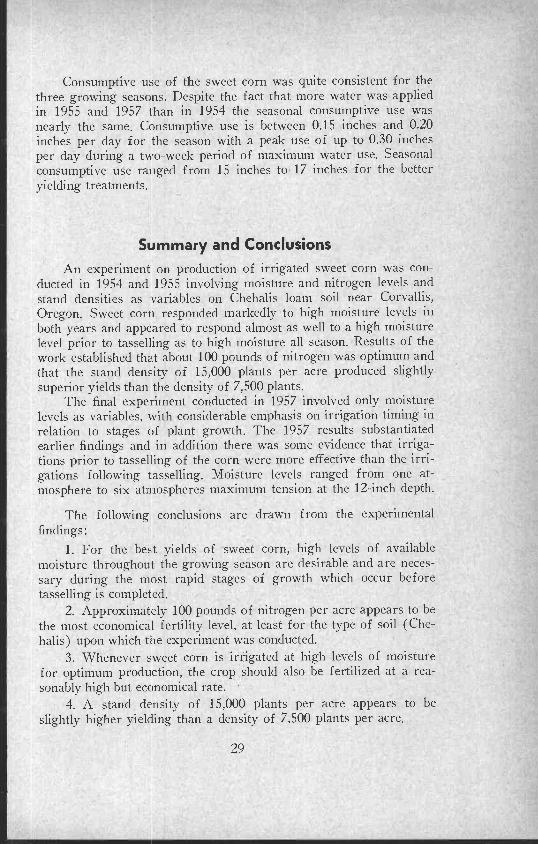
Consumptive use of the sweet corn was quite consistent for thethree growing seasons. Despite the fact that more water was appliedin 1955 and 1957 than in 1954 the seasonal consumptive use wasnearly the same. Consumptive use is between 0.15 inches and 0.20inches per day for the season with a peak use of up to 0.30 inchesper day during a two-week period of maximum water use. Seasonalconsumptive use ranged from 15 inches to 17 inches for the betteryielding treatments.
Summary and ConclusionsAn experiment on production of irrigated sweet corn was con-
ducted in 1954 and 1955 involving moisture and nitrogen levels andstand densities as variables on Chehalis loam soil near Corvallis,Oregon. Sweet corn responded markedly to high moisture levels inboth years and appeared to respond almost as well to a high moisturelevel prior to tasselling as to high moisture all season. Results of thework established that about 100 pounds of nitrogen was optimum andthat the stand density of 15,000 plants per acre produced slightlysuperior yields than the density of 7,500 plants.
The final experiment conducted in 1957 involved only moisturelevels as variables, with considerable emphasis on irrigation timing inrelation to stages of plant growth. The 1957 results substantiatedearlier findings and in addition there was some evidence that irriga-tions prior to tasselling of the corn were more effective than the irri-gations following tasselling. Moisture levels ranged from one at-mosphere to six atmospheres maximum tension at the 12-inch depth.
The following conclusions are drawn from the experimentalfindings:
1. For the best yields of sweet corn, high levels of availablemoisture throughout the growing season are desirable and are neces-sary during the most rapid stages of growth which occur beforetasselling is completed.
2. Approximately 100 pounds of nitrogen per acre appears to bethe most economical fertility level, at least for the type of soil (Che-halis) upon which the experiment was conducted.
3. Whenever sweet corn is irrigated at high levels of moisturefor optimum production, the crop should also be fertilized at a rea-sonably high but economical rate.
4. A stand density of 15,000 plants per acre appears to beslightly higher yielding than a density of 7,500 plants per acre.
29
5. The consumptive use of water by sweet corn on the loam orsilty clay loam soils, such as Chehalis, in the Willamette Valley isbetween 0.15 inches and 0.20 inches per day for the season with apeak use of up to 0.30 inches per day during a two-week period ofmaximum water use. Annual consumptive use ranged from 15 inchesto 17 inches for the better yielding treatments during three seasons.
6. Although this series of experiments was not designed tomeasure the effect of an irrigation when corn is about 1-foot high, theresults strongly indicate that one is desirable at that time. Beneficialeffects probably result from softening the plow pan to permit rootpenetration, and incorporation of the fertilizer down into the rootzone.
References1. Abd-El-Samie, Ahmed G. and Albert W. Marsh. A tube containing gyp-
sum blocks for following moisture changes is undisturbed soil. Soil Sci.Soc. Amer. Proc. 19:404-406, 1955.
2. Bouyoucos, G. J. and Mick, A. H. Improvements in the plaster of parisabsorption block electrical resistance method of measuring soil moistureunder field conditions. Soil Sci. 63 :455-465, 1947.Carolus, R. L. and Schleusener, P. E Effect of irrigation on the yield ofsnap beans, sweet corn, and tomatoes as influenced by certain cultural prac-tices in 1949 Mich. Agr. Expt. Sta. Q. B. 32:465-478, May 1950.
4. Cordner, H. B The influence of irrigation water on the yield and qualityof sweet corn and tomatoes with special reference to the time and numberof applications. Proc. Am Soc. Hort. Sci. 40:475-481, 1942.
5. Kocher, A. E. Soil Survey of Linn County. 1924.6. MacGillivray, J. H. Effect of irrigation on the growth and yield of sweet
corn. Amer. Soc Hort. Sci. Proc 54:330-338, 1949.7. MacGillivray, J. H. and Doneen, L D. Irrigation studies with truck crops.
Calif. Agr. Expt. Sta. Mimeo. No. 40. Davis, California, 1947.8. Peterson, H. B. and Ballard, J. C. Effect of fertilizer and moisture on the
growth and yield of sweet corn. Utah Agr. Expt. Sta. Bulletin 360, 1953.9. Richardson, H. B. and Minges, P. A. Effects of nitrogen on early sweet
corn. Calif. Cult. 91:662, 1944.10. Powers, W. L. Climate and its relation to-'agriculture. Oregon Sta. Cir. of
Information. 1950.11 Richards, L A A pressure membrane extraction apparatus for soil solu-
tion. Soil Science 51 :377-386. 1940.12. Richards, L. A. Porous plate apparatus for measuring moisture retention
and transmission by soil. Soil Science 66:105-110. 1948.13. Riley, J. P. and J. W. Wolfe A field plot sprinkler irrigator. Oregon Agr.
Expt. Sta. Misc. Paper No. 57. 1958.
30
20
3
2
4
3
12 14 16 18 20 22 24 26 28 30 32---3-4
Appendix
3-9n
9-15°
PERCENT MOISTURE BY WEIGHT
FIGURE A. Moisture-tension curves for four depths of the soil at the experimental site.
31
027_33u —
%\ \ 33-39" —
2 —
I
.2
I I I I
z0Cl)zwI-
14 16 18 20 22 24 26 28 30 32
PERCENT MOISTURE BY WEIGHT
FIGURE B. Moisture-tension curves for four depths of the soil at the experimental site
37
U)
O
878s
4
3
10-, 2 3 4 8 878 1 2. 3 4 8 878 10 2 3 j--5 878 102
SOIL MOISTURE TENSION (BARS)
FIGURE C. Electrical resistance versus soil moisture-tension curve used for convertingohms to bars.
33
9z81Q6Z616OfOZorO£OZof
61r 106109z*zQ61
Ito,coIIII
00.1001011 solo
M4
11)
0)
M3
M2
M,
RAIN
M311,
0)) M2
M,
RAIN
1.07 5.60I I
0.86 2.13 2.48 1.06 L47I 1 I I I
3.70 1.44 1.42 1.02 2.361 1 1 I 1
1.68 2.06 L50 1.50 1.42 0.92 2.701 1 I I 1 I 1
0.20 0.99 0.01 0.71
0.87 1.21 2.271 I 1
4.571
0.85 1.00 2.30 2.06I I I I
0.34 0.04 0.11 0.62
JUNE JULY AUGUST SEPTEMBERFIGURE D. Frequency and amount of irrigations for different treatments during 1954 and 1955
M4
4
.3
.2
.3
JUNE JULY AUGUST
JUNE JULY1
i
SEPTEMBER
xt)z \/ fIILI
a M_4ac
AUGUST I SEPTEMBER
FIGURE E. The measured consumptive use rate for different treatments and years.
35
12
RA-1-H-WO
JUNE 30 JULY
121
33 2. 72
3.3.
4.25
3.75I
4.31
4.44
4.E3
:.DD 2.4.
ElI
31 31
.9h
wv zar azi1 1
160
1.50 2.22 2.24 3.341 1 I
L50 2.631
1.60
1.50 201 2.12 2.571 I 1
1.30 4.60
1.50 See1
L50 2.77 4.001 1
1.50 2.46 3.051 1
1.50 2.30 222 2 31 Z
1 I
1.50 L65 224 2.03 1.641 0.23 1 0.06 1
4.751
2.53
AUGUST SEPT
FIGURE F. Frequency and amount of irrigations for different treatments during 1957
.F,