research on passengers' preference for high-speed ... - mdpi
TRANSCRIPT
�����������������
Citation: Wu, D.; Martín, J.C.
Research on Passengers’ Preference
for High-Speed Railways (HSRs) and
High-Speed Trains (HSTs).
Sustainability 2022, 14, 1473.
https://doi.org/10.3390/
su14031473
Academic Editor: Marinella Giunta
Received: 23 December 2021
Accepted: 19 January 2022
Published: 27 January 2022
Publisher’s Note: MDPI stays neutral
with regard to jurisdictional claims in
published maps and institutional affil-
iations.
Copyright: © 2022 by the authors.
Licensee MDPI, Basel, Switzerland.
This article is an open access article
distributed under the terms and
conditions of the Creative Commons
Attribution (CC BY) license (https://
creativecommons.org/licenses/by/
4.0/).
sustainability
Article
Research on Passengers’ Preference for High-Speed Railways(HSRs) and High-Speed Trains (HSTs)Di Wu and Juan Carlos Martín *
Department of Applied Economic Analysis, Faculty of Economics, University of Las Palmas de Gran,35017 Las Palmas de Gran Canaria, Spain; [email protected]* Correspondence: [email protected]; Tel.: +34-928-458189
Abstract: This paper aims to study passengers’ preference for High-Speed Railways (HSRs) andHigh-Speed Trains (HSTs) through a systematic literature review. The existing relevant literaturewas examined by using the Scopus application, and the Latent Dirichlet Allocation (LDA) method isapplied to extract the topics of the selected documents. By comparing the contents of the relevantliterature, the general overview of research in this field can be further understood, and the key factorsthat have been studied so far that affect passengers’ preference can be analyzed. As a green, safe, andsustainable transport mode, HSRs do not only play an essential role in serving passengers but couldalso be a novel option for freight transport as long as HSRs are able to adjust their technology to therequirements of the rapid growth of the modern logistics industry. The evaluation of passengers’preference for HSRs/HSTs presents some gaps that need to be addressed in future studies: (1) thespeed of the HST line ought to be introduced clearly; (2) more competing alternatives, such as maglev,autonomous vehicles, and other access–egress transport modes to terminals, such as subways andaero taxis, need to be included; (3) the analysis of passengers’ preferences needs to be extended tothe new role that HSRs can play in the logistics industry as new cargo services have been developedwith the participation of HSRs; and (4) some attributes related to environmental costs and carbonemissions for the transport modes, as well as segmentation variables that are proxies for differentpassengers’ attitudes towards climate change concerns, need to be included in the design of thechoice experiment.
Keywords: passengers’ preference; high-speed rail; high-speed train; systematic literature review;LDA model; high-speed express train; logistics industry; sustainability
1. Introduction
The term “transportation” can be interpreted with two different meanings accordingto the Cambridge English Dictionary: vehicles and people vs. vehicles and goods. Thesetwo different meanings are the origin of passenger and goods transport. Governments,experts, policymakers, and researchers need to study both transport markets in order to:(1) provide efficient transportation services; (2) develop more effective transportationpolicies; and (3) estimate the demand of consumers accurately. However, most of theexisting and relevant research on High-Speed Railways (HSRs) has been mainly focused onpassenger transport, and the analysis of goods transport is practically negligible.
It is well known that after their introduction, HSRs have mainly substituted fortraditional or conventional railway services on developed routes as passengers’ preferencesfor reducing the travel time are aligned with the railway service’s improvement [1]. It isthe safest transport system that has been developed in the world [2]. The transport mode isalso seen as green, safe, and sustainable, and the network also has important economic andsocial effects at the regional level [3]. The fast development of HSRs has brought about anovel option for freight transport, but this has not gained researchers’ attention. It is timeto analyze whether HSRs can be used to move express freight transport goods. Thus, the
Sustainability 2022, 14, 1473. https://doi.org/10.3390/su14031473 https://www.mdpi.com/journal/sustainability
Sustainability 2022, 14, 1473 2 of 20
HSR capacity could be used more intensively, and the rapid growth of the modern logisticsindustry will be better serviced [4].
The HSR industry can be considered a remarkable exception to the obsolescence oftransport technologies as railways have evolved during the last few decades from being aVictorian anachronism destined to a secondary role in interurban transport to one of thebasic transport technologies of the twenty-first century [5]. Since the first HST launched onthe Tokaido line in Japan between the cities of Tokyo and Osaka, the HST network has beenexpanded worldwide [1]. The emphasis on building new HST systems is a consequence ofdealing with the relationships between climate change, transport, and space, in which thelogic of speeding up and increasing efficiency through new road construction and expansionis losing support [6]. In addition, HSRs present a number of comparative advantageswith respect to other interurban transport modes, such as being more environmentallyfriendly [7]. HSRs can contribute to environmental protection, have a low price, andprovide a speedy transportation service for the express transportation market, which hasextensive benefits both in the economy and society [8]. The environmental costs, trafficcongestion, and carbon emissions have dramatically increased in most of the countries ofthe world [9].
The paper aims to: (1) analyze through a systematic literature review passengers’ pref-erence for HSRs and HSTs; (2) examine the existing literature using the Scopus application;(3) understand the main alternatives and attributes that have been used; (4) obtain the mainsegmentation variables that have been used to analyze the heterogeneity in passengers’preferences; and (5) summarize the main findings that could expand future research.
To this end, first, the data were extracted from Scopus with the following keyords:TITLE-ABS-KEY (hst AND preferenc*) OR TITLE-ABS-KEY (hsr AND preferenc*). Con-sequently, a database that contains 143 related articles was obtained. Second, the LatentDirichlet Allocation (LDA) method was applied to elicit the topics of the selected documents.Then, by summarizing the alphabetic abbreviations “HSR” and “HST”, 65 documents werefiltered in which “HSR” and “HST” mean “high-speed railway” and “high-speed train”, re-spectively. Third, after reading the abstracts of the selected documents, a further refinementwas made to select 24 articles that applied a Stated Preference method.
2. Bibliometric Analysis2.1. Scopus Database
The information database about passengers’ preference for HSRs and HSTs was ob-tained from Scopus, a citation platform launched by Elsevier Science in 2004 [10]. It isa navigation tool that provides the world’s largest curated, peer-reviewed abstract andindexing database with over 24,000 active titles indexed in August 2020. Scopus offersnew refining and sorting features for researchers with bibliometrics tools that can track,analyze, and visualize research, covering the fields of Sciences, Social Sciences, Medicine,Technology, and Arts and Humanities [11].
A total of 143 documents were obtained by using TITLE-ABS-KEY (hst AND prefer-enc*) OR TITLE-ABS-KEY (hsr AND preferenc*) as the search keywords on Scopus. Thisstrategy guaranteed that all the 143 documents contained those terms, in either the title(TITLE), abstract (ABS), or keywords (KEY). In addition, the following information foreach study was also extracted: author, author(s) ID, title, year of publication, source title,volume, issue, page start, page end, page count, abstract, keywords, and document type.
To further filter the 143 documents, each abstract was read carefully, and the meaningof the acronyms in each article was summarized. Thus, 65 documents that dealt with high-speed railways or high-speed trains were further filtered to make an additional selection.The selection was based on whether the study conducted or did not conduct a “StatedPreference” (SP) experiment. Thus, 24 papers were specified as the target references of thispaper for further analysis.
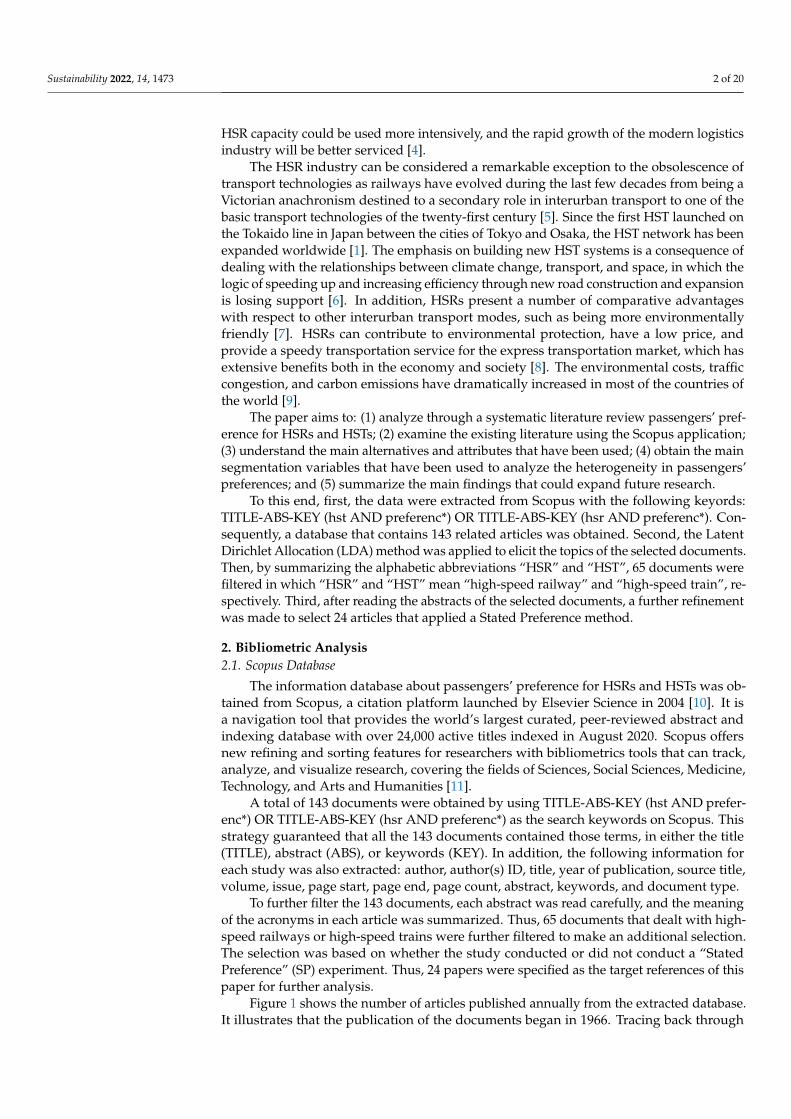
Figure 1 shows the number of articles published annually from the extracted database.It illustrates that the publication of the documents began in 1966. Tracing back through
Sustainability 2022, 14, 1473 3 of 20
history, the world’s first high-speed railway was the Tokaido Shinkansen from Tokyo,Japan, which opened for regular service in 1964 [12]. Thus, if the subject of the only articlepublished in 1966 is about a high-speed railway, then it can be assumed that the studyreferred to the Japanese Shinkansen.
Figure 1. The total number of published documents.
Figure 1 shows that from the year 1966 until the year 1991, there were only fourpublished documents. From 1986 to 2001, there were some slight fluctuations in the curvewith some ups and downs. In 2001, no papers were published. Then, an increasing trendof the curve occurs from 2008, in which the highest peak point for the period is observedin 2020.
2.2. Latent Dirichlet Allocation (LDA) Model
To determine the main topics studied by the selected papers, the Latent Dirichletallocation (LDA) model was applied. The LDA model has been applied successfully withinthe computer sciences for information retrieval and text mining [13]. The LDA modelwas the first probabilistic topic model and was presented by Blei et al. in 2003 [14]. Moreinformation can be obtained in other articles (e.g., Blei and Lafferty [15] and Griffiths andSteyvers [16]). The fundaments of the model are based on the assumption that a documentcan be considered a collection of words, with no order or sequential relationship betweenwords. A document can contain random mixtures of latent topics, and each word in thedocument is generated by one of the topics. For reducing each document in a given corpus,the LDA method can be used to extract a topic from the topic distribution of each documentand a word from the word distribution corresponding to the extracted topic [17].
Thus, the 143 abstracts were pre-processed by executing the Python programminglanguage code on Google Colaboratory (Colab), which is a free-of-charge cloud service fordisseminating data analysis, machine learning, and education [18]. Colab is an easy-to-useChrome-browser-based collaboration tool that has two cell types (text cells and code cells),and the output appears below each cell directly [19].
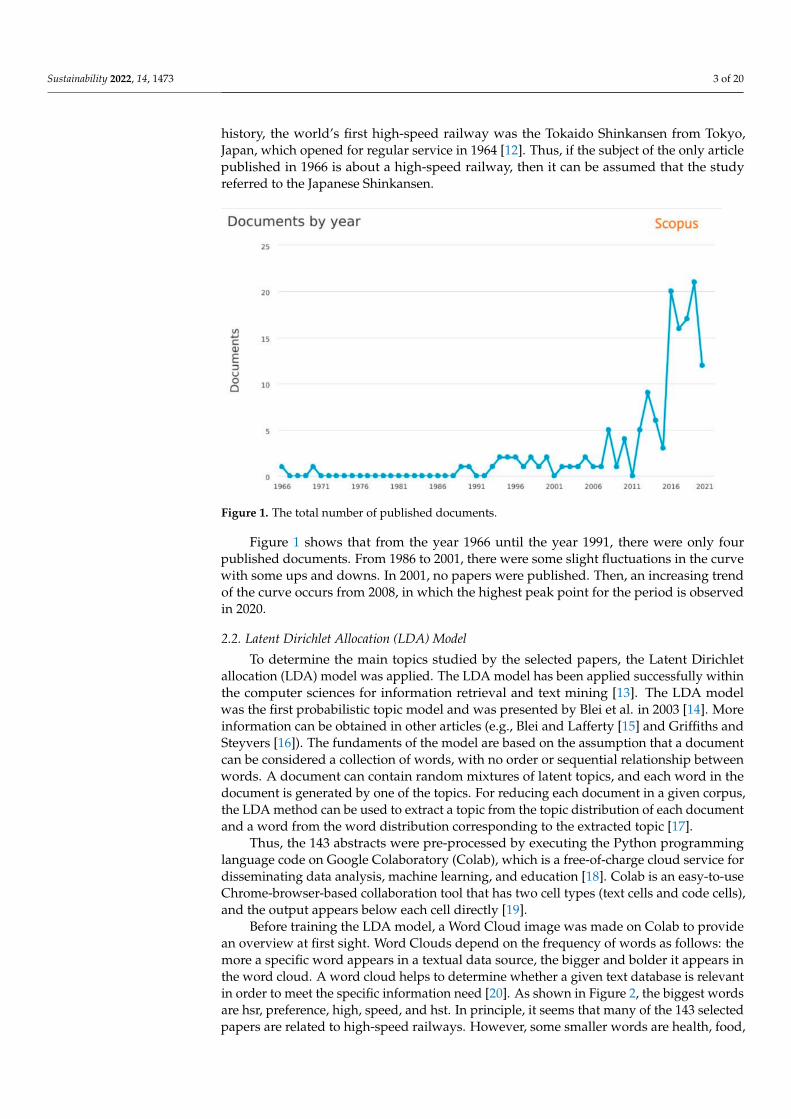
Before training the LDA model, a Word Cloud image was made on Colab to providean overview at first sight. Word Clouds depend on the frequency of words as follows: themore a specific word appears in a textual data source, the bigger and bolder it appears inthe word cloud. A word cloud helps to determine whether a given text database is relevantin order to meet the specific information need [20]. As shown in Figure 2, the biggest wordsare hsr, preference, high, speed, and hst. In principle, it seems that many of the 143 selectedpapers are related to high-speed railways. However, some smaller words are health, food,
Sustainability 2022, 14, 1473 4 of 20
nutrient, and star. These words were unexpected and made the researchers cautious asother fields could have been part of the selected database; thus, the selected papers couldhave needed a further refinement.
Figure 2. Word cloud image of the 143 abstracts.
3. Results3.1. Results of the Database
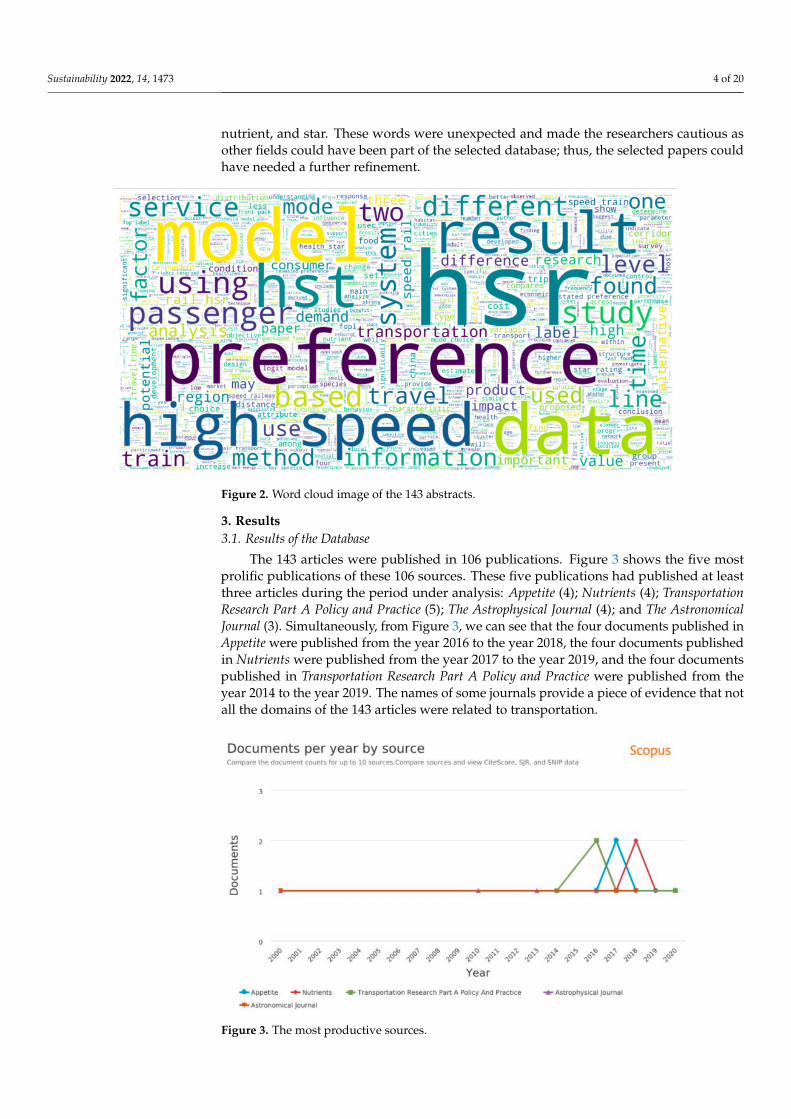
The 143 articles were published in 106 publications. Figure 3 shows the five mostprolific publications of these 106 sources. These five publications had published at leastthree articles during the period under analysis: Appetite (4); Nutrients (4); TransportationResearch Part A Policy and Practice (5); The Astrophysical Journal (4); and The AstronomicalJournal (3). Simultaneously, from Figure 3, we can see that the four documents published inAppetite were published from the year 2016 to the year 2018, the four documents publishedin Nutrients were published from the year 2017 to the year 2019, and the four documentspublished in Transportation Research Part A Policy and Practice were published from theyear 2014 to the year 2019. The names of some journals provide a piece of evidence that notall the domains of the 143 articles were related to transportation.
Figure 3. The most productive sources.
Sustainability 2022, 14, 1473 5 of 20
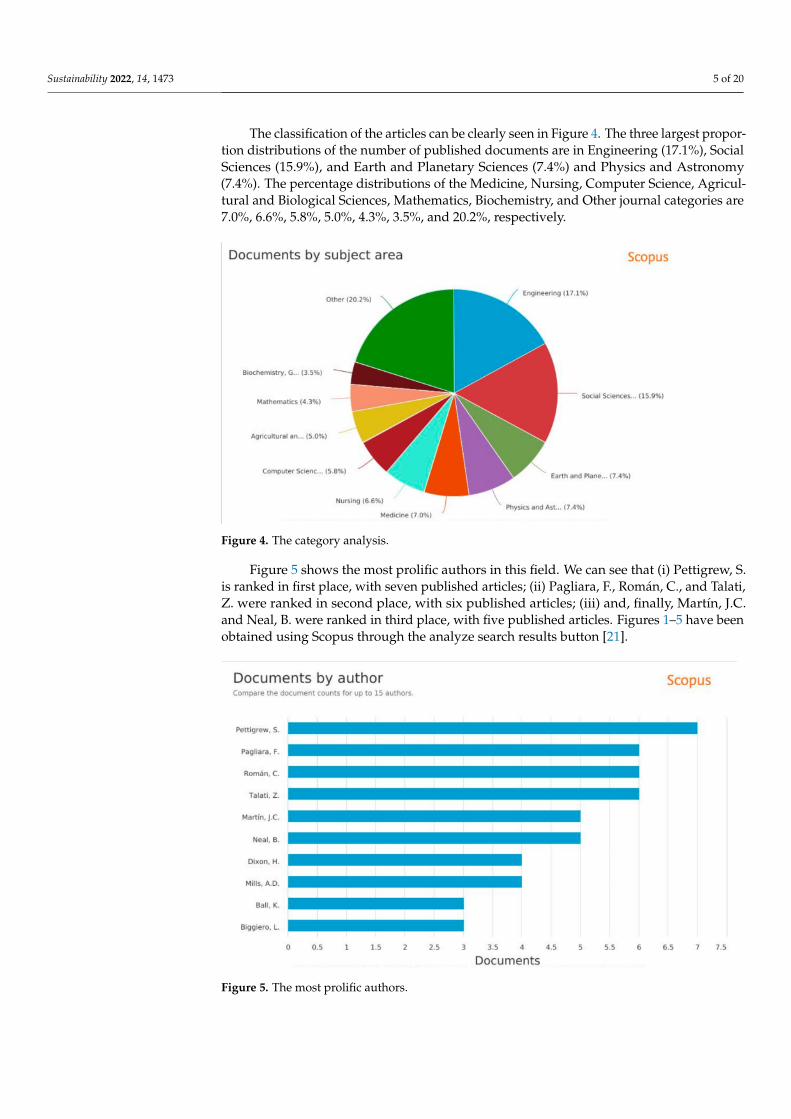
The classification of the articles can be clearly seen in Figure 4. The three largest propor-tion distributions of the number of published documents are in Engineering (17.1%), SocialSciences (15.9%), and Earth and Planetary Sciences (7.4%) and Physics and Astronomy(7.4%). The percentage distributions of the Medicine, Nursing, Computer Science, Agricul-tural and Biological Sciences, Mathematics, Biochemistry, and Other journal categories are7.0%, 6.6%, 5.8%, 5.0%, 4.3%, 3.5%, and 20.2%, respectively.
Figure 4. The category analysis.
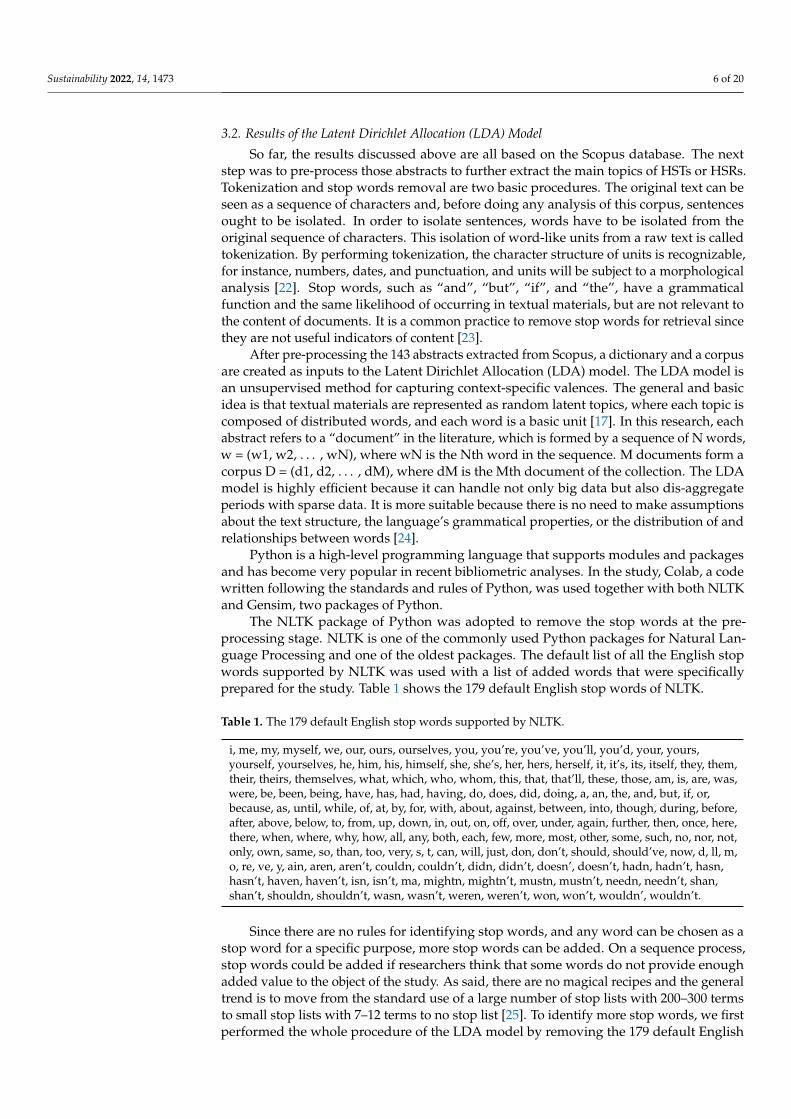
Figure 5 shows the most prolific authors in this field. We can see that (i) Pettigrew, S.is ranked in first place, with seven published articles; (ii) Pagliara, F., Román, C., and Talati,Z. were ranked in second place, with six published articles; (iii) and, finally, Martín, J.C.and Neal, B. were ranked in third place, with five published articles. Figures 1–5 have beenobtained using Scopus through the analyze search results button [21].
Figure 5. The most prolific authors.
Sustainability 2022, 14, 1473 6 of 20
3.2. Results of the Latent Dirichlet Allocation (LDA) Model
So far, the results discussed above are all based on the Scopus database. The nextstep was to pre-process those abstracts to further extract the main topics of HSTs or HSRs.Tokenization and stop words removal are two basic procedures. The original text can beseen as a sequence of characters and, before doing any analysis of this corpus, sentencesought to be isolated. In order to isolate sentences, words have to be isolated from theoriginal sequence of characters. This isolation of word-like units from a raw text is calledtokenization. By performing tokenization, the character structure of units is recognizable,for instance, numbers, dates, and punctuation, and units will be subject to a morphologicalanalysis [22]. Stop words, such as “and”, “but”, “if”, and “the”, have a grammaticalfunction and the same likelihood of occurring in textual materials, but are not relevant tothe content of documents. It is a common practice to remove stop words for retrieval sincethey are not useful indicators of content [23].
After pre-processing the 143 abstracts extracted from Scopus, a dictionary and a corpusare created as inputs to the Latent Dirichlet Allocation (LDA) model. The LDA model isan unsupervised method for capturing context-specific valences. The general and basicidea is that textual materials are represented as random latent topics, where each topic iscomposed of distributed words, and each word is a basic unit [17]. In this research, eachabstract refers to a “document” in the literature, which is formed by a sequence of N words,w = (w1, w2, . . . , wN), where wN is the Nth word in the sequence. M documents form acorpus D = (d1, d2, . . . , dM), where dM is the Mth document of the collection. The LDAmodel is highly efficient because it can handle not only big data but also dis-aggregateperiods with sparse data. It is more suitable because there is no need to make assumptionsabout the text structure, the language’s grammatical properties, or the distribution of andrelationships between words [24].
Python is a high-level programming language that supports modules and packagesand has become very popular in recent bibliometric analyses. In the study, Colab, a codewritten following the standards and rules of Python, was used together with both NLTKand Gensim, two packages of Python.
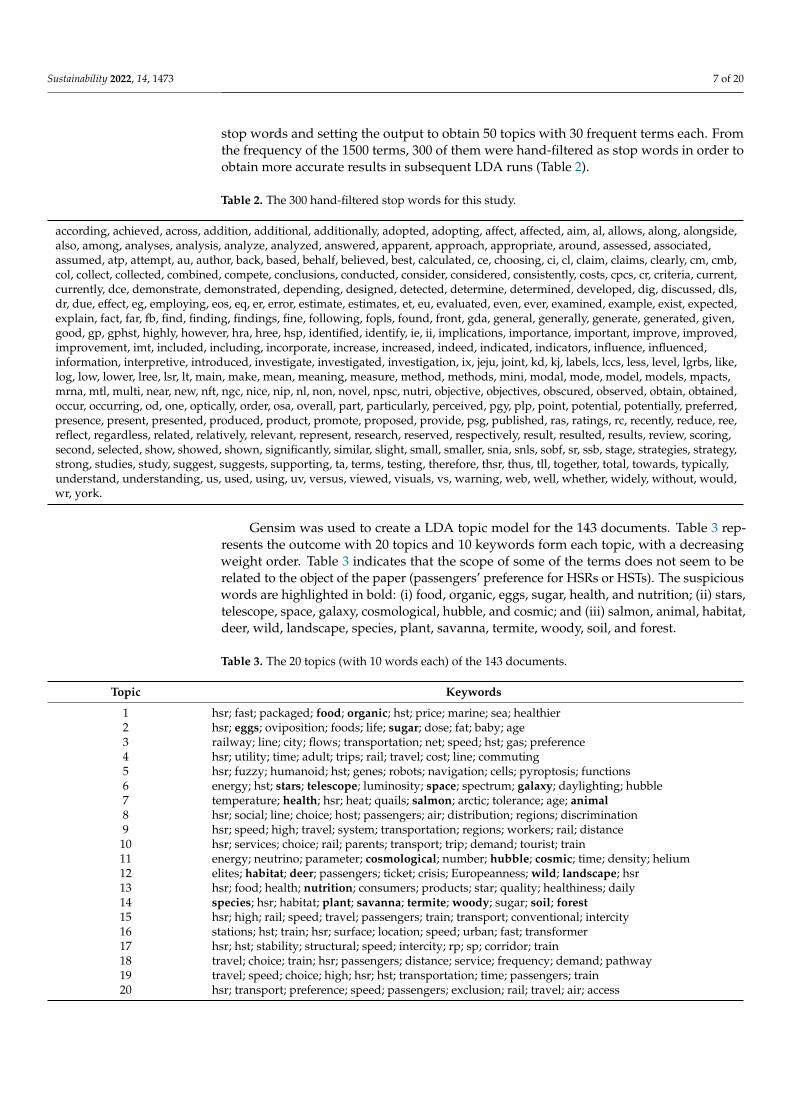
The NLTK package of Python was adopted to remove the stop words at the pre-processing stage. NLTK is one of the commonly used Python packages for Natural Lan-guage Processing and one of the oldest packages. The default list of all the English stopwords supported by NLTK was used with a list of added words that were specificallyprepared for the study. Table 1 shows the 179 default English stop words of NLTK.
Table 1. The 179 default English stop words supported by NLTK.
i, me, my, myself, we, our, ours, ourselves, you, you’re, you’ve, you’ll, you’d, your, yours,yourself, yourselves, he, him, his, himself, she, she’s, her, hers, herself, it, it’s, its, itself, they, them,their, theirs, themselves, what, which, who, whom, this, that, that’ll, these, those, am, is, are, was,were, be, been, being, have, has, had, having, do, does, did, doing, a, an, the, and, but, if, or,because, as, until, while, of, at, by, for, with, about, against, between, into, though, during, before,after, above, below, to, from, up, down, in, out, on, off, over, under, again, further, then, once, here,there, when, where, why, how, all, any, both, each, few, more, most, other, some, such, no, nor, not,only, own, same, so, than, too, very, s, t, can, will, just, don, don’t, should, should’ve, now, d, ll, m,o, re, ve, y, ain, aren, aren’t, couldn, couldn’t, didn, didn’t, doesn’, doesn’t, hadn, hadn’t, hasn,hasn’t, haven, haven’t, isn, isn’t, ma, mightn, mightn’t, mustn, mustn’t, needn, needn’t, shan,shan’t, shouldn, shouldn’t, wasn, wasn’t, weren, weren’t, won, won’t, wouldn’, wouldn’t.
Since there are no rules for identifying stop words, and any word can be chosen as astop word for a specific purpose, more stop words can be added. On a sequence process,stop words could be added if researchers think that some words do not provide enoughadded value to the object of the study. As said, there are no magical recipes and the generaltrend is to move from the standard use of a large number of stop lists with 200–300 termsto small stop lists with 7–12 terms to no stop list [25]. To identify more stop words, we firstperformed the whole procedure of the LDA model by removing the 179 default English
Sustainability 2022, 14, 1473 7 of 20
stop words and setting the output to obtain 50 topics with 30 frequent terms each. Fromthe frequency of the 1500 terms, 300 of them were hand-filtered as stop words in order toobtain more accurate results in subsequent LDA runs (Table 2).
Table 2. The 300 hand-filtered stop words for this study.
according, achieved, across, addition, additional, additionally, adopted, adopting, affect, affected, aim, al, allows, along, alongside,also, among, analyses, analysis, analyze, analyzed, answered, apparent, approach, appropriate, around, assessed, associated,assumed, atp, attempt, au, author, back, based, behalf, believed, best, calculated, ce, choosing, ci, cl, claim, claims, clearly, cm, cmb,col, collect, collected, combined, compete, conclusions, conducted, consider, considered, consistently, costs, cpcs, cr, criteria, current,currently, dce, demonstrate, demonstrated, depending, designed, detected, determine, determined, developed, dig, discussed, dls,dr, due, effect, eg, employing, eos, eq, er, error, estimate, estimates, et, eu, evaluated, even, ever, examined, example, exist, expected,explain, fact, far, fb, find, finding, findings, fine, following, fopls, found, front, gda, general, generally, generate, generated, given,good, gp, gphst, highly, however, hra, hree, hsp, identified, identify, ie, ii, implications, importance, important, improve, improved,improvement, imt, included, including, incorporate, increase, increased, indeed, indicated, indicators, influence, influenced,information, interpretive, introduced, investigate, investigated, investigation, ix, jeju, joint, kd, kj, labels, lccs, less, level, lgrbs, like,log, low, lower, lree, lsr, lt, main, make, mean, meaning, measure, method, methods, mini, modal, mode, model, models, mpacts,mrna, mtl, multi, near, new, nft, ngc, nice, nip, nl, non, novel, npsc, nutri, objective, objectives, obscured, observed, obtain, obtained,occur, occurring, od, one, optically, order, osa, overall, part, particularly, perceived, pgy, plp, point, potential, potentially, preferred,presence, present, presented, produced, product, promote, proposed, provide, psg, published, ras, ratings, rc, recently, reduce, ree,reflect, regardless, related, relatively, relevant, represent, research, reserved, respectively, result, resulted, results, review, scoring,second, selected, show, showed, shown, significantly, similar, slight, small, smaller, snia, snls, sobf, sr, ssb, stage, strategies, strategy,strong, studies, study, suggest, suggests, supporting, ta, terms, testing, therefore, thsr, thus, tll, together, total, towards, typically,understand, understanding, us, used, using, uv, versus, viewed, visuals, vs, warning, web, well, whether, widely, without, would,wr, york.
Gensim was used to create a LDA topic model for the 143 documents. Table 3 rep-resents the outcome with 20 topics and 10 keywords form each topic, with a decreasingweight order. Table 3 indicates that the scope of some of the terms does not seem to berelated to the object of the paper (passengers’ preference for HSRs or HSTs). The suspiciouswords are highlighted in bold: (i) food, organic, eggs, sugar, health, and nutrition; (ii) stars,telescope, space, galaxy, cosmological, hubble, and cosmic; and (iii) salmon, animal, habitat,deer, wild, landscape, species, plant, savanna, termite, woody, soil, and forest.
Table 3. The 20 topics (with 10 words each) of the 143 documents.
Topic Keywords
1 hsr; fast; packaged; food; organic; hst; price; marine; sea; healthier2 hsr; eggs; oviposition; foods; life; sugar; dose; fat; baby; age3 railway; line; city; flows; transportation; net; speed; hst; gas; preference4 hsr; utility; time; adult; trips; rail; travel; cost; line; commuting5 hsr; fuzzy; humanoid; hst; genes; robots; navigation; cells; pyroptosis; functions6 energy; hst; stars; telescope; luminosity; space; spectrum; galaxy; daylighting; hubble7 temperature; health; hsr; heat; quails; salmon; arctic; tolerance; age; animal8 hsr; social; line; choice; host; passengers; air; distribution; regions; discrimination9 hsr; speed; high; travel; system; transportation; regions; workers; rail; distance
10 hsr; services; choice; rail; parents; transport; trip; demand; tourist; train11 energy; neutrino; parameter; cosmological; number; hubble; cosmic; time; density; helium12 elites; habitat; deer; passengers; ticket; crisis; Europeanness; wild; landscape; hsr13 hsr; food; health; nutrition; consumers; products; star; quality; healthiness; daily14 species; hsr; habitat; plant; savanna; termite; woody; sugar; soil; forest15 hsr; high; rail; speed; travel; passengers; train; transport; conventional; intercity16 stations; hst; train; hsr; surface; location; speed; urban; fast; transformer17 hsr; hst; stability; structural; speed; intercity; rp; sp; corridor; train18 travel; choice; train; hsr; passengers; distance; service; frequency; demand; pathway19 travel; speed; choice; high; hsr; hst; transportation; time; passengers; train20 hsr; transport; preference; speed; passengers; exclusion; rail; travel; air; access
Sustainability 2022, 14, 1473 8 of 20
3.3. A further Refinement of the Topics
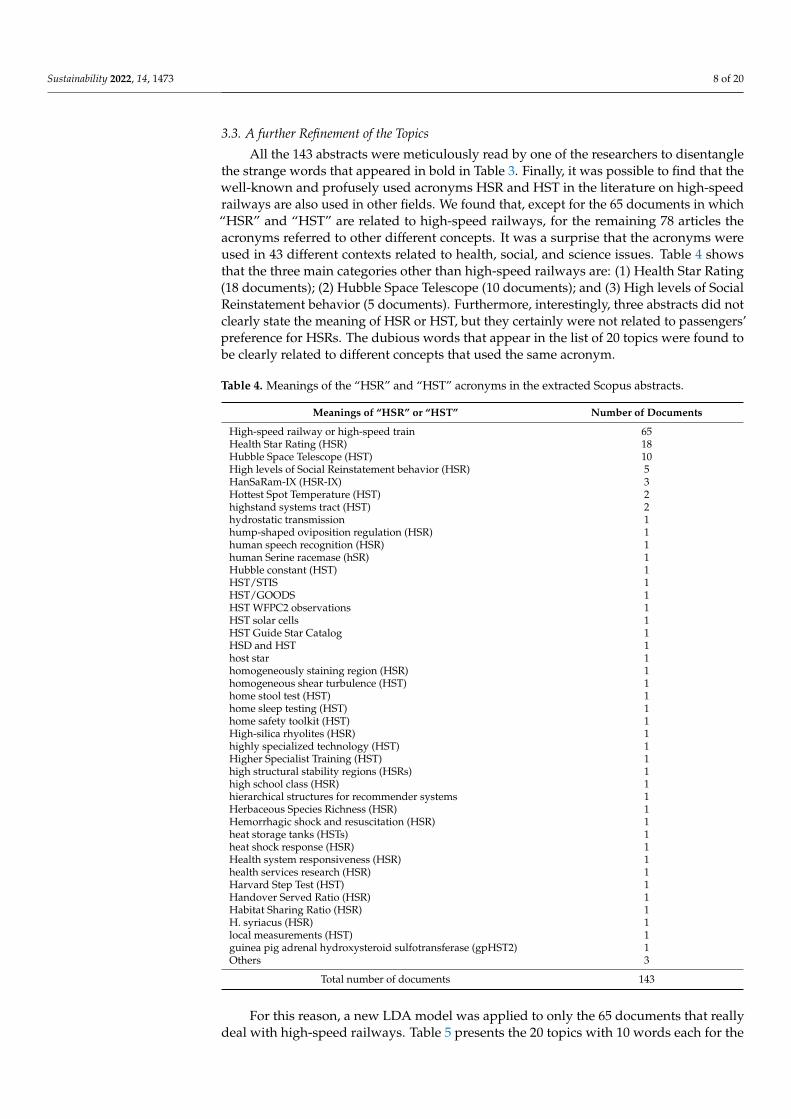
All the 143 abstracts were meticulously read by one of the researchers to disentanglethe strange words that appeared in bold in Table 3. Finally, it was possible to find that thewell-known and profusely used acronyms HSR and HST in the literature on high-speedrailways are also used in other fields. We found that, except for the 65 documents in which“HSR” and “HST” are related to high-speed railways, for the remaining 78 articles theacronyms referred to other different concepts. It was a surprise that the acronyms wereused in 43 different contexts related to health, social, and science issues. Table 4 showsthat the three main categories other than high-speed railways are: (1) Health Star Rating(18 documents); (2) Hubble Space Telescope (10 documents); and (3) High levels of SocialReinstatement behavior (5 documents). Furthermore, interestingly, three abstracts did notclearly state the meaning of HSR or HST, but they certainly were not related to passengers’preference for HSRs. The dubious words that appear in the list of 20 topics were found tobe clearly related to different concepts that used the same acronym.
Table 4. Meanings of the “HSR” and “HST” acronyms in the extracted Scopus abstracts.
Meanings of “HSR” or “HST” Number of Documents
High-speed railway or high-speed train 65Health Star Rating (HSR) 18Hubble Space Telescope (HST) 10High levels of Social Reinstatement behavior (HSR) 5HanSaRam-IX (HSR-IX) 3Hottest Spot Temperature (HST) 2highstand systems tract (HST) 2hydrostatic transmission 1hump-shaped oviposition regulation (HSR) 1human speech recognition (HSR) 1human Serine racemase (hSR) 1Hubble constant (HST) 1HST/STIS 1HST/GOODS 1HST WFPC2 observations 1HST solar cells 1HST Guide Star Catalog 1HSD and HST 1host star 1homogeneously staining region (HSR) 1homogeneous shear turbulence (HST) 1home stool test (HST) 1home sleep testing (HST) 1home safety toolkit (HST) 1High-silica rhyolites (HSR) 1highly specialized technology (HST) 1Higher Specialist Training (HST) 1high structural stability regions (HSRs) 1high school class (HSR) 1hierarchical structures for recommender systems 1Herbaceous Species Richness (HSR) 1Hemorrhagic shock and resuscitation (HSR) 1heat storage tanks (HSTs) 1heat shock response (HSR) 1Health system responsiveness (HSR) 1health services research (HSR) 1Harvard Step Test (HST) 1Handover Served Ratio (HSR) 1Habitat Sharing Ratio (HSR) 1H. syriacus (HSR) 1local measurements (HST) 1guinea pig adrenal hydroxysteroid sulfotransferase (gpHST2) 1Others 3
Total number of documents 143
For this reason, a new LDA model was applied to only the 65 documents that reallydeal with high-speed railways. Table 5 presents the 20 topics with 10 words each for the
Sustainability 2022, 14, 1473 9 of 20
new dataset. It shows that the suspicious words do not appear anymore, and that this listcan now be used to provide interesting insights for the rest of the study.
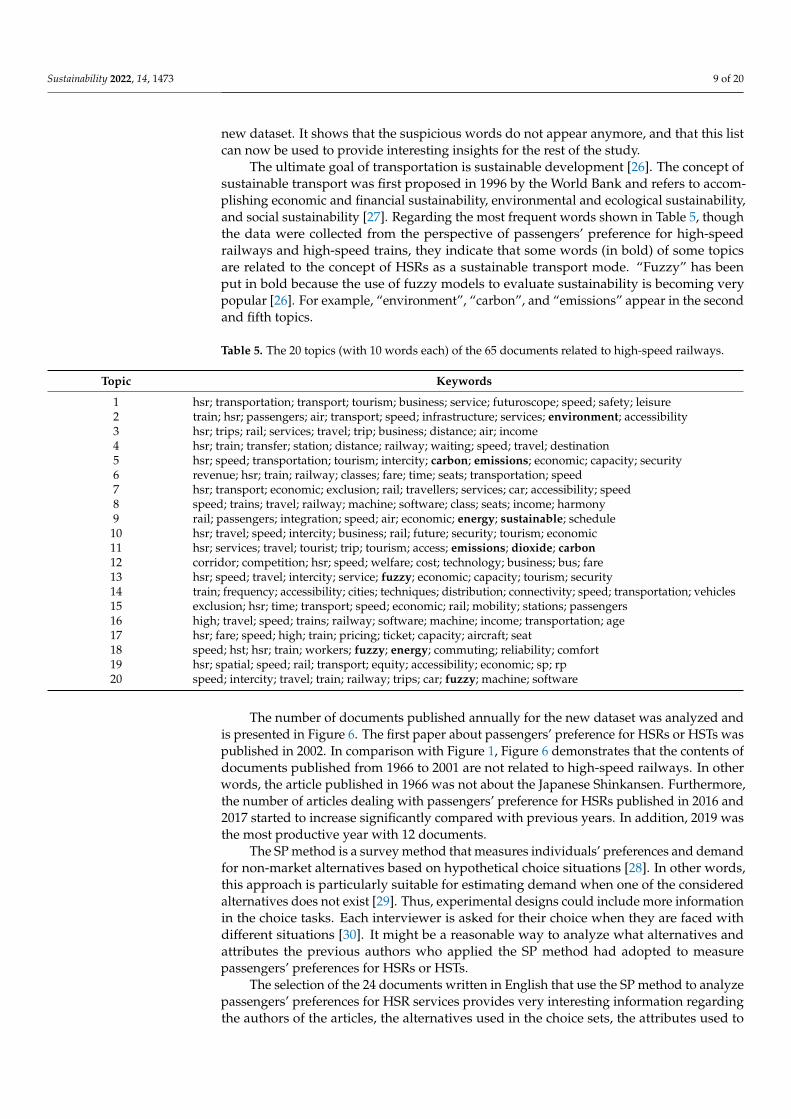
The ultimate goal of transportation is sustainable development [26]. The concept ofsustainable transport was first proposed in 1996 by the World Bank and refers to accom-plishing economic and financial sustainability, environmental and ecological sustainability,and social sustainability [27]. Regarding the most frequent words shown in Table 5, thoughthe data were collected from the perspective of passengers’ preference for high-speedrailways and high-speed trains, they indicate that some words (in bold) of some topicsare related to the concept of HSRs as a sustainable transport mode. “Fuzzy” has beenput in bold because the use of fuzzy models to evaluate sustainability is becoming verypopular [26]. For example, “environment”, “carbon”, and “emissions” appear in the secondand fifth topics.
Table 5. The 20 topics (with 10 words each) of the 65 documents related to high-speed railways.
Topic Keywords
1 hsr; transportation; transport; tourism; business; service; futuroscope; speed; safety; leisure2 train; hsr; passengers; air; transport; speed; infrastructure; services; environment; accessibility3 hsr; trips; rail; services; travel; trip; business; distance; air; income4 hsr; train; transfer; station; distance; railway; waiting; speed; travel; destination5 hsr; speed; transportation; tourism; intercity; carbon; emissions; economic; capacity; security6 revenue; hsr; train; railway; classes; fare; time; seats; transportation; speed7 hsr; transport; economic; exclusion; rail; travellers; services; car; accessibility; speed8 speed; trains; travel; railway; machine; software; class; seats; income; harmony9 rail; passengers; integration; speed; air; economic; energy; sustainable; schedule
10 hsr; travel; speed; intercity; business; rail; future; security; tourism; economic11 hsr; services; travel; tourist; trip; tourism; access; emissions; dioxide; carbon12 corridor; competition; hsr; speed; welfare; cost; technology; business; bus; fare13 hsr; speed; travel; intercity; service; fuzzy; economic; capacity; tourism; security14 train; frequency; accessibility; cities; techniques; distribution; connectivity; speed; transportation; vehicles15 exclusion; hsr; time; transport; speed; economic; rail; mobility; stations; passengers16 high; travel; speed; trains; railway; software; machine; income; transportation; age17 hsr; fare; speed; high; train; pricing; ticket; capacity; aircraft; seat18 speed; hst; hsr; train; workers; fuzzy; energy; commuting; reliability; comfort19 hsr; spatial; speed; rail; transport; equity; accessibility; economic; sp; rp20 speed; intercity; travel; train; railway; trips; car; fuzzy; machine; software
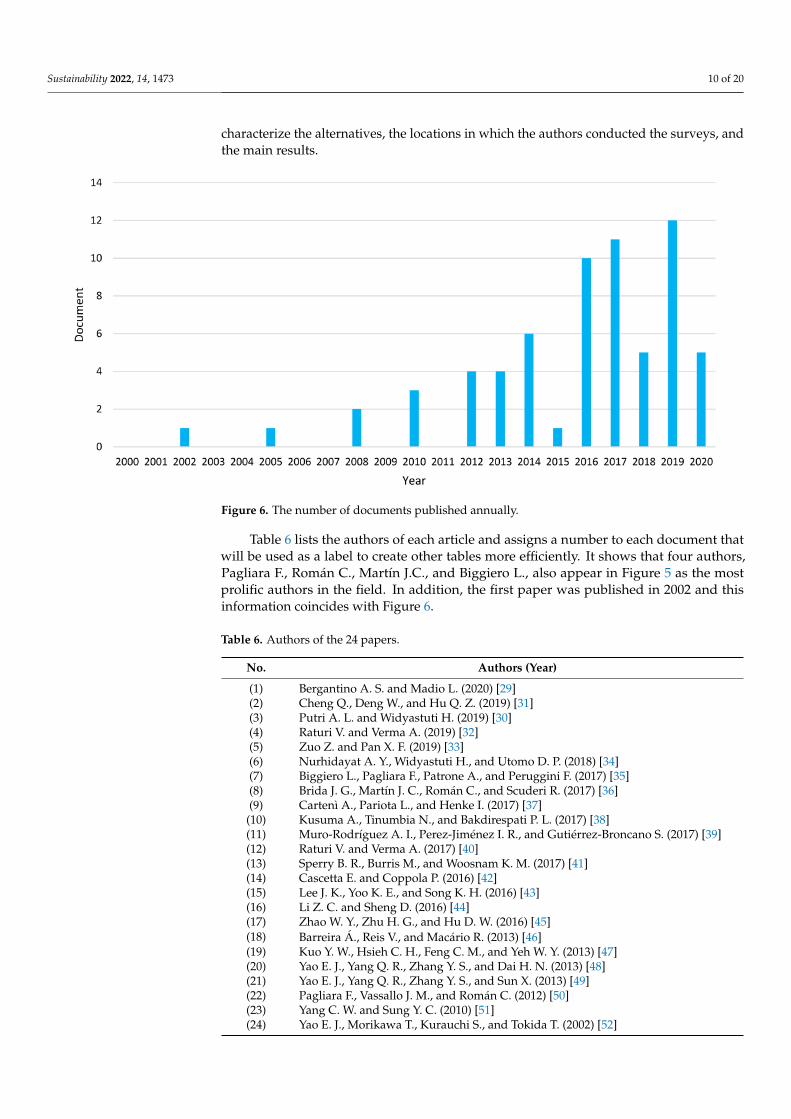
The number of documents published annually for the new dataset was analyzed andis presented in Figure 6. The first paper about passengers’ preference for HSRs or HSTs waspublished in 2002. In comparison with Figure 1, Figure 6 demonstrates that the contents ofdocuments published from 1966 to 2001 are not related to high-speed railways. In otherwords, the article published in 1966 was not about the Japanese Shinkansen. Furthermore,the number of articles dealing with passengers’ preference for HSRs published in 2016 and2017 started to increase significantly compared with previous years. In addition, 2019 wasthe most productive year with 12 documents.
The SP method is a survey method that measures individuals’ preferences and demandfor non-market alternatives based on hypothetical choice situations [28]. In other words,this approach is particularly suitable for estimating demand when one of the consideredalternatives does not exist [29]. Thus, experimental designs could include more informationin the choice tasks. Each interviewer is asked for their choice when they are faced withdifferent situations [30]. It might be a reasonable way to analyze what alternatives andattributes the previous authors who applied the SP method had adopted to measurepassengers’ preferences for HSRs or HSTs.
The selection of the 24 documents written in English that use the SP method to analyzepassengers’ preferences for HSR services provides very interesting information regardingthe authors of the articles, the alternatives used in the choice sets, the attributes used to
Sustainability 2022, 14, 1473 10 of 20
characterize the alternatives, the locations in which the authors conducted the surveys, andthe main results.
Figure 6. The number of documents published annually.
Table 6 lists the authors of each article and assigns a number to each document thatwill be used as a label to create other tables more efficiently. It shows that four authors,Pagliara F., Román C., Martín J.C., and Biggiero L., also appear in Figure 5 as the mostprolific authors in the field. In addition, the first paper was published in 2002 and thisinformation coincides with Figure 6.
Table 6. Authors of the 24 papers.
No. Authors (Year)
(1) Bergantino A. S. and Madio L. (2020) [29](2) Cheng Q., Deng W., and Hu Q. Z. (2019) [31](3) Putri A. L. and Widyastuti H. (2019) [30](4) Raturi V. and Verma A. (2019) [32](5) Zuo Z. and Pan X. F. (2019) [33](6) Nurhidayat A. Y., Widyastuti H., and Utomo D. P. (2018) [34](7) Biggiero L., Pagliara F., Patrone A., and Peruggini F. (2017) [35](8) Brida J. G., Martín J. C., Román C., and Scuderi R. (2017) [36](9) Cartenì A., Pariota L., and Henke I. (2017) [37]
(10) Kusuma A., Tinumbia N., and Bakdirespati P. L. (2017) [38](11) Muro-Rodríguez A. I., Perez-Jiménez I. R., and Gutiérrez-Broncano S. (2017) [39](12) Raturi V. and Verma A. (2017) [40](13) Sperry B. R., Burris M., and Woosnam K. M. (2017) [41](14) Cascetta E. and Coppola P. (2016) [42](15) Lee J. K., Yoo K. E., and Song K. H. (2016) [43](16) Li Z. C. and Sheng D. (2016) [44](17) Zhao W. Y., Zhu H. G., and Hu D. W. (2016) [45](18) Barreira Á., Reis V., and Macário R. (2013) [46](19) Kuo Y. W., Hsieh C. H., Feng C. M., and Yeh W. Y. (2013) [47](20) Yao E. J., Yang Q. R., Zhang Y. S., and Dai H. N. (2013) [48](21) Yao E. J., Yang Q. R., Zhang Y. S., and Sun X. (2013) [49](22) Pagliara F., Vassallo J. M., and Román C. (2012) [50](23) Yang C. W. and Sung Y. C. (2010) [51](24) Yao E. J., Morikawa T., Kurauchi S., and Tokida T. (2002) [52]
Sustainability 2022, 14, 1473 11 of 20
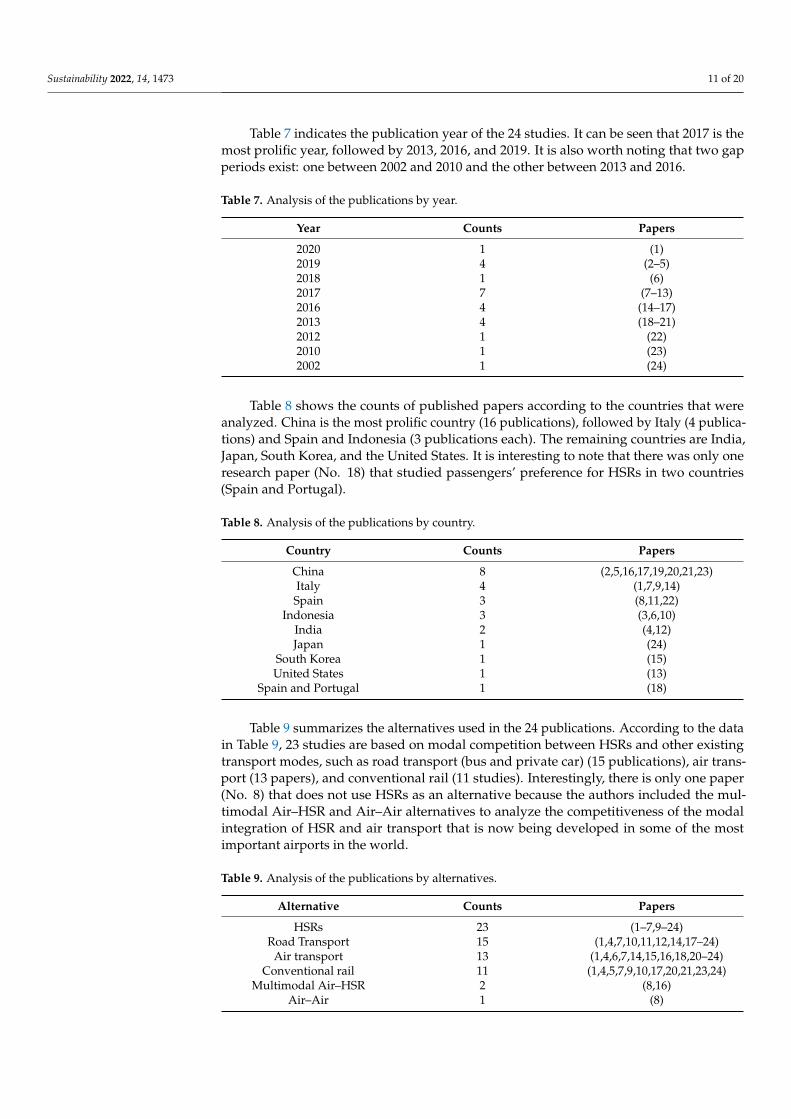
Table 7 indicates the publication year of the 24 studies. It can be seen that 2017 is themost prolific year, followed by 2013, 2016, and 2019. It is also worth noting that two gapperiods exist: one between 2002 and 2010 and the other between 2013 and 2016.
Table 7. Analysis of the publications by year.
Year Counts Papers
2020 1 (1)2019 4 (2–5)2018 1 (6)2017 7 (7–13)2016 4 (14–17)2013 4 (18–21)2012 1 (22)2010 1 (23)2002 1 (24)
Table 8 shows the counts of published papers according to the countries that wereanalyzed. China is the most prolific country (16 publications), followed by Italy (4 publica-tions) and Spain and Indonesia (3 publications each). The remaining countries are India,Japan, South Korea, and the United States. It is interesting to note that there was only oneresearch paper (No. 18) that studied passengers’ preference for HSRs in two countries(Spain and Portugal).
Table 8. Analysis of the publications by country.
Country Counts Papers
China 8 (2,5,16,17,19,20,21,23)Italy 4 (1,7,9,14)Spain 3 (8,11,22)
Indonesia 3 (3,6,10)India 2 (4,12)Japan 1 (24)
South Korea 1 (15)United States 1 (13)
Spain and Portugal 1 (18)
Table 9 summarizes the alternatives used in the 24 publications. According to the datain Table 9, 23 studies are based on modal competition between HSRs and other existingtransport modes, such as road transport (bus and private car) (15 publications), air trans-port (13 papers), and conventional rail (11 studies). Interestingly, there is only one paper(No. 8) that does not use HSRs as an alternative because the authors included the mul-timodal Air–HSR and Air–Air alternatives to analyze the competitiveness of the modalintegration of HSR and air transport that is now being developed in some of the mostimportant airports in the world.
Table 9. Analysis of the publications by alternatives.
Alternative Counts Papers
HSRs 23 (1–7,9–24)Road Transport 15 (1,4,7,10,11,12,14,17–24)
Air transport 13 (1,4,6,7,14,15,16,18,20–24)Conventional rail 11 (1,4,5,7,9,10,17,20,21,23,24)
Multimodal Air–HSR 2 (8,16)Air–Air 1 (8)
Sustainability 2022, 14, 1473 12 of 20
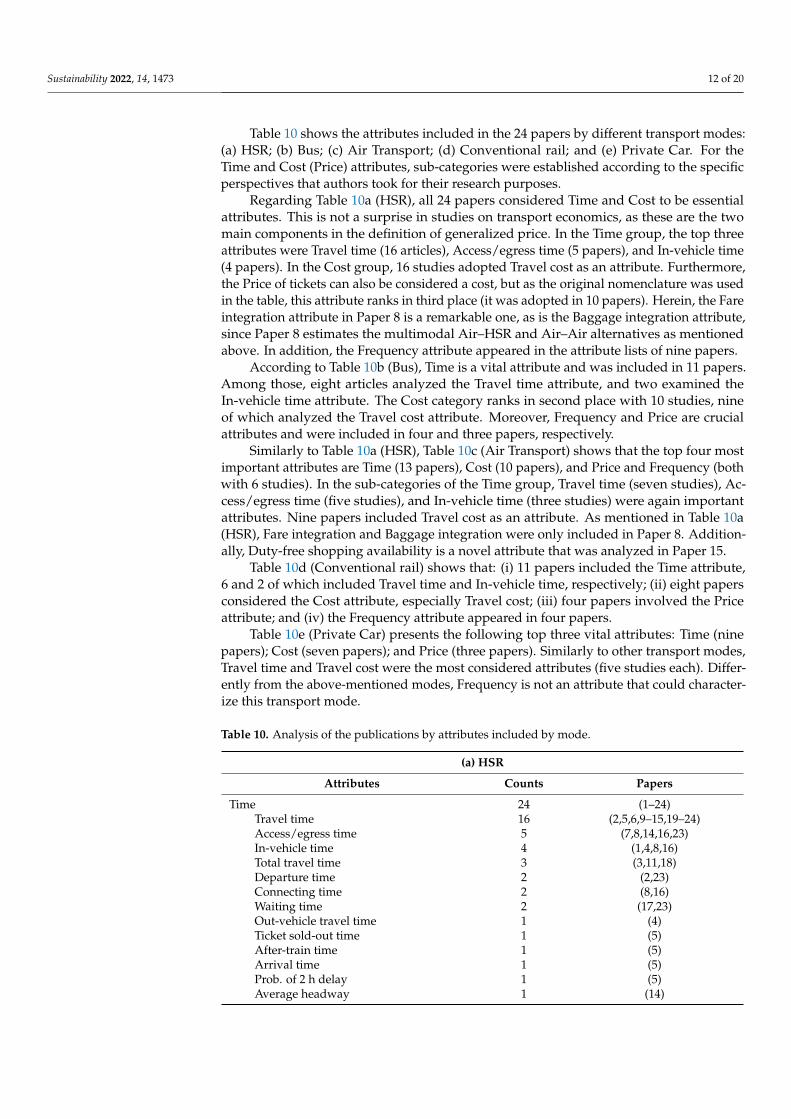
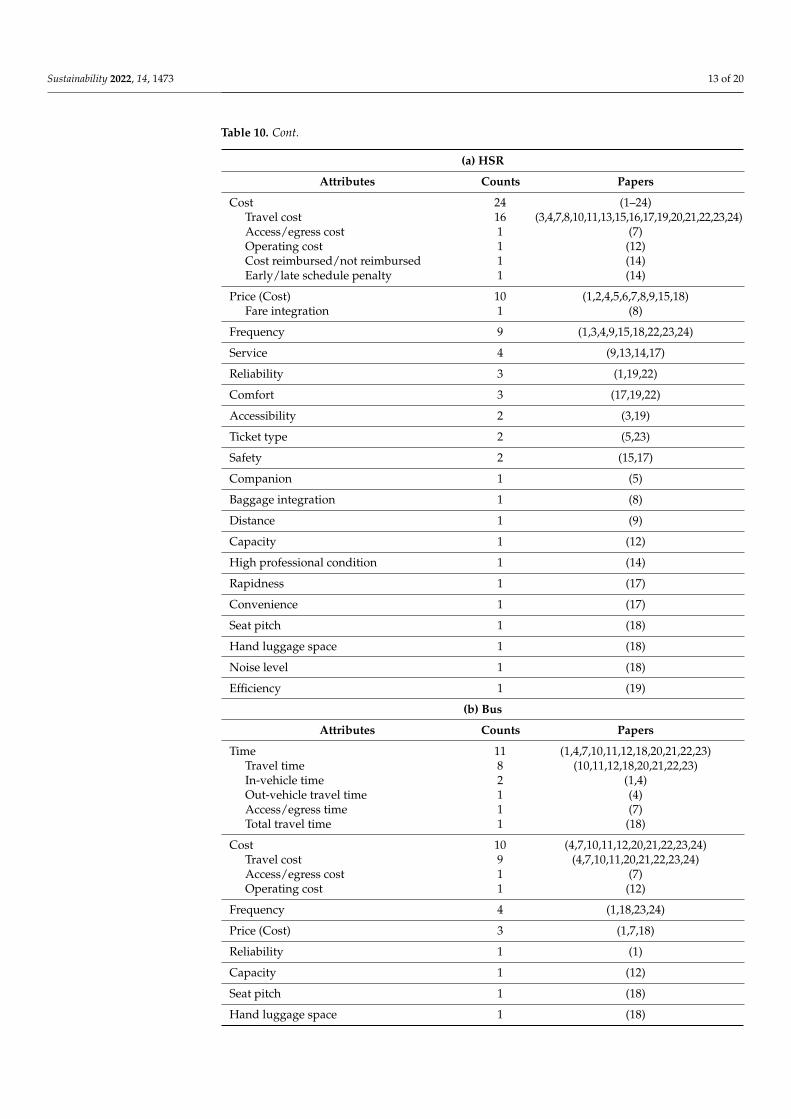
Table 10 shows the attributes included in the 24 papers by different transport modes:(a) HSR; (b) Bus; (c) Air Transport; (d) Conventional rail; and (e) Private Car. For theTime and Cost (Price) attributes, sub-categories were established according to the specificperspectives that authors took for their research purposes.
Regarding Table 10a (HSR), all 24 papers considered Time and Cost to be essentialattributes. This is not a surprise in studies on transport economics, as these are the twomain components in the definition of generalized price. In the Time group, the top threeattributes were Travel time (16 articles), Access/egress time (5 papers), and In-vehicle time(4 papers). In the Cost group, 16 studies adopted Travel cost as an attribute. Furthermore,the Price of tickets can also be considered a cost, but as the original nomenclature was usedin the table, this attribute ranks in third place (it was adopted in 10 papers). Herein, the Fareintegration attribute in Paper 8 is a remarkable one, as is the Baggage integration attribute,since Paper 8 estimates the multimodal Air–HSR and Air–Air alternatives as mentionedabove. In addition, the Frequency attribute appeared in the attribute lists of nine papers.
According to Table 10b (Bus), Time is a vital attribute and was included in 11 papers.Among those, eight articles analyzed the Travel time attribute, and two examined theIn-vehicle time attribute. The Cost category ranks in second place with 10 studies, nineof which analyzed the Travel cost attribute. Moreover, Frequency and Price are crucialattributes and were included in four and three papers, respectively.
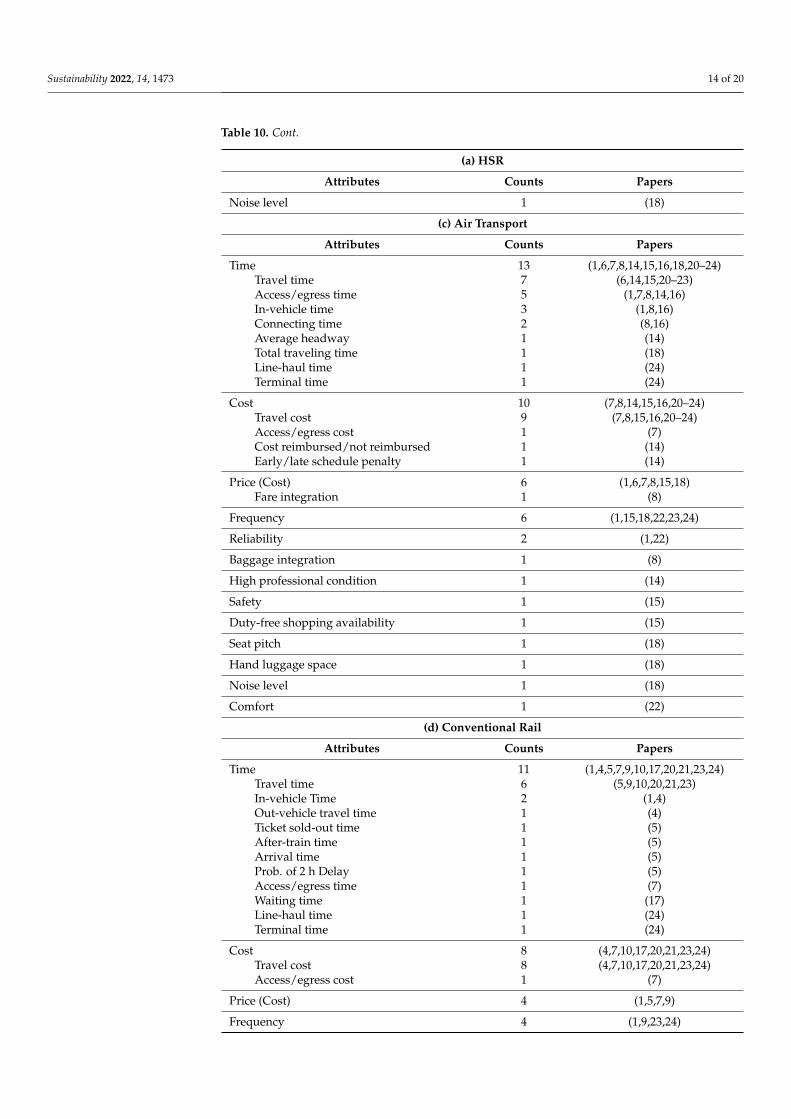
Similarly to Table 10a (HSR), Table 10c (Air Transport) shows that the top four mostimportant attributes are Time (13 papers), Cost (10 papers), and Price and Frequency (bothwith 6 studies). In the sub-categories of the Time group, Travel time (seven studies), Ac-cess/egress time (five studies), and In-vehicle time (three studies) were again importantattributes. Nine papers included Travel cost as an attribute. As mentioned in Table 10a(HSR), Fare integration and Baggage integration were only included in Paper 8. Addition-ally, Duty-free shopping availability is a novel attribute that was analyzed in Paper 15.
Table 10d (Conventional rail) shows that: (i) 11 papers included the Time attribute,6 and 2 of which included Travel time and In-vehicle time, respectively; (ii) eight papersconsidered the Cost attribute, especially Travel cost; (iii) four papers involved the Priceattribute; and (iv) the Frequency attribute appeared in four papers.
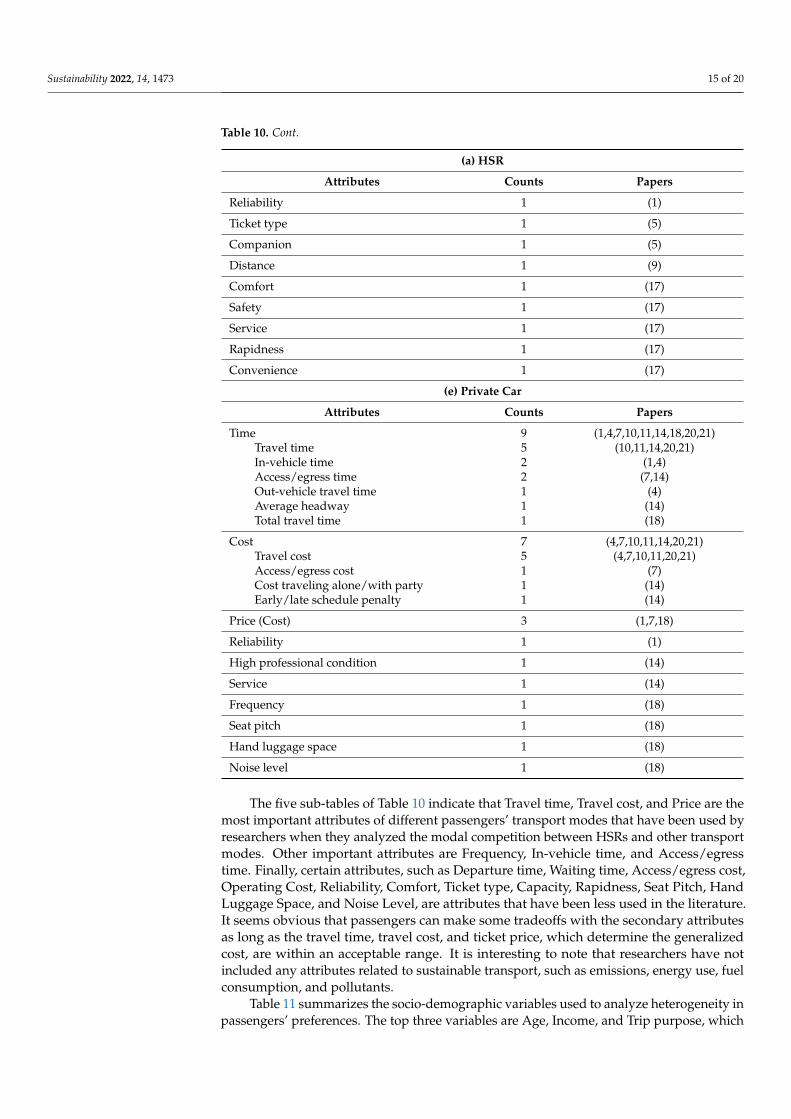
Table 10e (Private Car) presents the following top three vital attributes: Time (ninepapers); Cost (seven papers); and Price (three papers). Similarly to other transport modes,Travel time and Travel cost were the most considered attributes (five studies each). Differ-ently from the above-mentioned modes, Frequency is not an attribute that could character-ize this transport mode.
Table 10. Analysis of the publications by attributes included by mode.
(a) HSR
Attributes Counts Papers
Time 24 (1–24)Travel time 16 (2,5,6,9–15,19–24)Access/egress time 5 (7,8,14,16,23)In-vehicle time 4 (1,4,8,16)Total travel time 3 (3,11,18)Departure time 2 (2,23)Connecting time 2 (8,16)Waiting time 2 (17,23)Out-vehicle travel time 1 (4)Ticket sold-out time 1 (5)After-train time 1 (5)Arrival time 1 (5)Prob. of 2 h delay 1 (5)Average headway 1 (14)
Sustainability 2022, 14, 1473 13 of 20
Table 10. Cont.
(a) HSR
Attributes Counts Papers
Cost 24 (1–24)Travel cost 16 (3,4,7,8,10,11,13,15,16,17,19,20,21,22,23,24)Access/egress cost 1 (7)Operating cost 1 (12)Cost reimbursed/not reimbursed 1 (14)Early/late schedule penalty 1 (14)
Price (Cost) 10 (1,2,4,5,6,7,8,9,15,18)Fare integration 1 (8)
Frequency 9 (1,3,4,9,15,18,22,23,24)
Service 4 (9,13,14,17)
Reliability 3 (1,19,22)
Comfort 3 (17,19,22)
Accessibility 2 (3,19)
Ticket type 2 (5,23)
Safety 2 (15,17)
Companion 1 (5)
Baggage integration 1 (8)
Distance 1 (9)
Capacity 1 (12)
High professional condition 1 (14)
Rapidness 1 (17)
Convenience 1 (17)
Seat pitch 1 (18)
Hand luggage space 1 (18)
Noise level 1 (18)
Efficiency 1 (19)
(b) Bus
Attributes Counts Papers
Time 11 (1,4,7,10,11,12,18,20,21,22,23)Travel time 8 (10,11,12,18,20,21,22,23)In-vehicle time 2 (1,4)Out-vehicle travel time 1 (4)Access/egress time 1 (7)Total travel time 1 (18)
Cost 10 (4,7,10,11,12,20,21,22,23,24)Travel cost 9 (4,7,10,11,20,21,22,23,24)Access/egress cost 1 (7)Operating cost 1 (12)
Frequency 4 (1,18,23,24)
Price (Cost) 3 (1,7,18)
Reliability 1 (1)
Capacity 1 (12)
Seat pitch 1 (18)
Hand luggage space 1 (18)
Sustainability 2022, 14, 1473 14 of 20
Table 10. Cont.
(a) HSR
Attributes Counts Papers
Noise level 1 (18)
(c) Air Transport
Attributes Counts Papers
Time 13 (1,6,7,8,14,15,16,18,20–24)Travel time 7 (6,14,15,20–23)Access/egress time 5 (1,7,8,14,16)In-vehicle time 3 (1,8,16)Connecting time 2 (8,16)Average headway 1 (14)Total traveling time 1 (18)Line-haul time 1 (24)Terminal time 1 (24)
Cost 10 (7,8,14,15,16,20–24)Travel cost 9 (7,8,15,16,20–24)Access/egress cost 1 (7)Cost reimbursed/not reimbursed 1 (14)Early/late schedule penalty 1 (14)
Price (Cost) 6 (1,6,7,8,15,18)Fare integration 1 (8)
Frequency 6 (1,15,18,22,23,24)
Reliability 2 (1,22)
Baggage integration 1 (8)
High professional condition 1 (14)
Safety 1 (15)
Duty-free shopping availability 1 (15)
Seat pitch 1 (18)
Hand luggage space 1 (18)
Noise level 1 (18)
Comfort 1 (22)
(d) Conventional Rail
Attributes Counts Papers
Time 11 (1,4,5,7,9,10,17,20,21,23,24)Travel time 6 (5,9,10,20,21,23)In-vehicle Time 2 (1,4)Out-vehicle travel time 1 (4)Ticket sold-out time 1 (5)After-train time 1 (5)Arrival time 1 (5)Prob. of 2 h Delay 1 (5)Access/egress time 1 (7)Waiting time 1 (17)Line-haul time 1 (24)Terminal time 1 (24)
Cost 8 (4,7,10,17,20,21,23,24)Travel cost 8 (4,7,10,17,20,21,23,24)Access/egress cost 1 (7)
Price (Cost) 4 (1,5,7,9)
Frequency 4 (1,9,23,24)
Sustainability 2022, 14, 1473 15 of 20
Table 10. Cont.
(a) HSR
Attributes Counts Papers
Reliability 1 (1)
Ticket type 1 (5)
Companion 1 (5)
Distance 1 (9)
Comfort 1 (17)
Safety 1 (17)
Service 1 (17)
Rapidness 1 (17)
Convenience 1 (17)
(e) Private Car
Attributes Counts Papers
Time 9 (1,4,7,10,11,14,18,20,21)Travel time 5 (10,11,14,20,21)In-vehicle time 2 (1,4)Access/egress time 2 (7,14)Out-vehicle travel time 1 (4)Average headway 1 (14)Total travel time 1 (18)
Cost 7 (4,7,10,11,14,20,21)Travel cost 5 (4,7,10,11,20,21)Access/egress cost 1 (7)Cost traveling alone/with party 1 (14)Early/late schedule penalty 1 (14)
Price (Cost) 3 (1,7,18)
Reliability 1 (1)
High professional condition 1 (14)
Service 1 (14)
Frequency 1 (18)
Seat pitch 1 (18)
Hand luggage space 1 (18)
Noise level 1 (18)
The five sub-tables of Table 10 indicate that Travel time, Travel cost, and Price are themost important attributes of different passengers’ transport modes that have been used byresearchers when they analyzed the modal competition between HSRs and other transportmodes. Other important attributes are Frequency, In-vehicle time, and Access/egresstime. Finally, certain attributes, such as Departure time, Waiting time, Access/egress cost,Operating Cost, Reliability, Comfort, Ticket type, Capacity, Rapidness, Seat Pitch, HandLuggage Space, and Noise Level, are attributes that have been less used in the literature.It seems obvious that passengers can make some tradeoffs with the secondary attributesas long as the travel time, travel cost, and ticket price, which determine the generalizedcost, are within an acceptable range. It is interesting to note that researchers have notincluded any attributes related to sustainable transport, such as emissions, energy use, fuelconsumption, and pollutants.
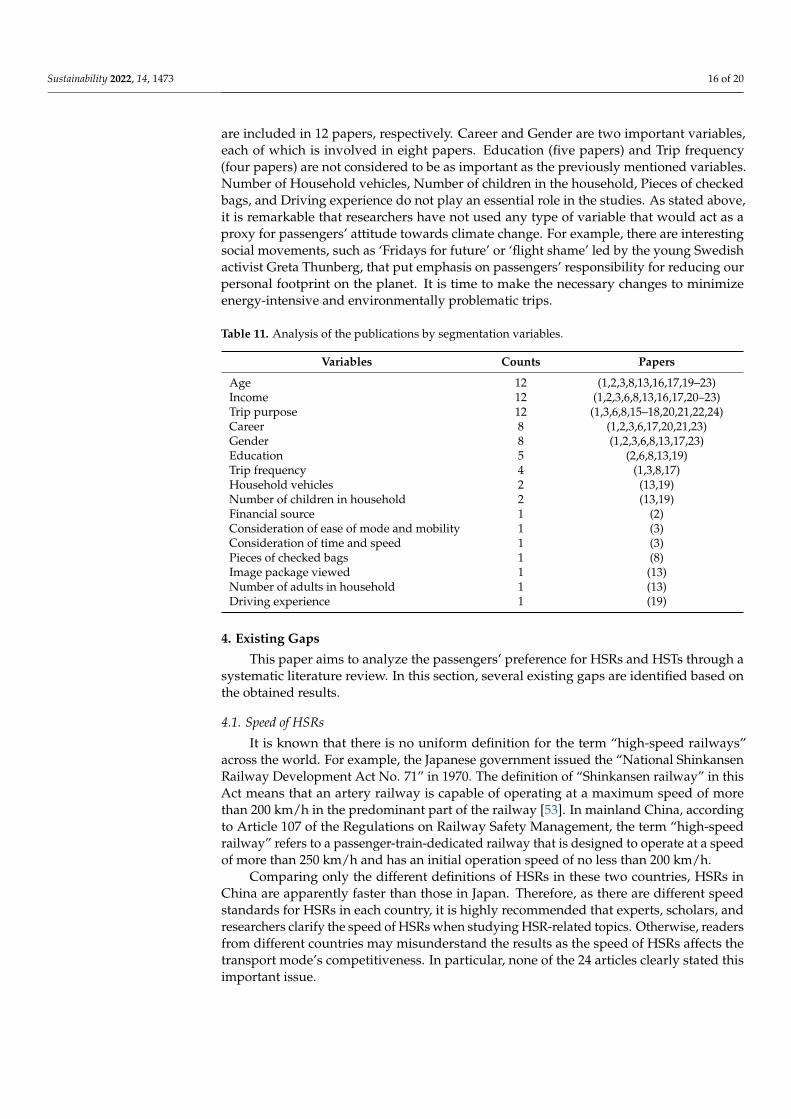
Table 11 summarizes the socio-demographic variables used to analyze heterogeneity inpassengers’ preferences. The top three variables are Age, Income, and Trip purpose, which
Sustainability 2022, 14, 1473 16 of 20
are included in 12 papers, respectively. Career and Gender are two important variables,each of which is involved in eight papers. Education (five papers) and Trip frequency(four papers) are not considered to be as important as the previously mentioned variables.Number of Household vehicles, Number of children in the household, Pieces of checkedbags, and Driving experience do not play an essential role in the studies. As stated above,it is remarkable that researchers have not used any type of variable that would act as aproxy for passengers’ attitude towards climate change. For example, there are interestingsocial movements, such as ‘Fridays for future’ or ‘flight shame’ led by the young Swedishactivist Greta Thunberg, that put emphasis on passengers’ responsibility for reducing ourpersonal footprint on the planet. It is time to make the necessary changes to minimizeenergy-intensive and environmentally problematic trips.
Table 11. Analysis of the publications by segmentation variables.
Variables Counts Papers
Age 12 (1,2,3,8,13,16,17,19–23)Income 12 (1,2,3,6,8,13,16,17,20–23)Trip purpose 12 (1,3,6,8,15–18,20,21,22,24)Career 8 (1,2,3,6,17,20,21,23)Gender 8 (1,2,3,6,8,13,17,23)Education 5 (2,6,8,13,19)Trip frequency 4 (1,3,8,17)Household vehicles 2 (13,19)Number of children in household 2 (13,19)Financial source 1 (2)Consideration of ease of mode and mobility 1 (3)Consideration of time and speed 1 (3)Pieces of checked bags 1 (8)Image package viewed 1 (13)Number of adults in household 1 (13)Driving experience 1 (19)
4. Existing Gaps
This paper aims to analyze the passengers’ preference for HSRs and HSTs through asystematic literature review. In this section, several existing gaps are identified based onthe obtained results.
4.1. Speed of HSRs
It is known that there is no uniform definition for the term “high-speed railways”across the world. For example, the Japanese government issued the “National ShinkansenRailway Development Act No. 71” in 1970. The definition of “Shinkansen railway” in thisAct means that an artery railway is capable of operating at a maximum speed of morethan 200 km/h in the predominant part of the railway [53]. In mainland China, accordingto Article 107 of the Regulations on Railway Safety Management, the term “high-speedrailway” refers to a passenger-train-dedicated railway that is designed to operate at a speedof more than 250 km/h and has an initial operation speed of no less than 200 km/h.
Comparing only the different definitions of HSRs in these two countries, HSRs inChina are apparently faster than those in Japan. Therefore, as there are different speedstandards for HSRs in each country, it is highly recommended that experts, scholars, andresearchers clarify the speed of HSRs when studying HSR-related topics. Otherwise, readersfrom different countries may misunderstand the results as the speed of HSRs affects thetransport mode’s competitiveness. In particular, none of the 24 articles clearly stated thisimportant issue.
Sustainability 2022, 14, 1473 17 of 20
4.2. Competing Alternatives and Access to Terminals
Table 9 presents the commonly used transport alternatives. It can be seen that roadtransport (buses and private cars), air transport, and conventional rail have been, sofar, the most used alternatives. However, in the future, there will be more competitivetransportation modes, such as maglev, autonomous vehicles, and even ships or ferries; forexample, China’s first cross-sea high-speed railway with a speed of 350 km/h will beginoperation in 2022.
Another interesting area in which further research is required is associated with theaccess and egress transport modes to terminals. In this sense, currently, subways arebooming in developing countries [54]. For instance, traffic congestion and emissionshave increased because of the rapidly growing motorization, which has encouraged manyChinese metropolitan areas to invest in subway developments [55]. After the 2008 OlympicGames in China, many cities began developing and improving urban rail transit systems,including tram, light rail, metro, and monorail systems. At present, 31 cities in Chinahave subways, with a total of 133 lines [56]. In addition to avoiding serious traffic jamson the road, subways are more convenient, faster, cheaper, and, to a certain extent, theoptimal option for the low-income and middle-income classes. However, this issue hasbeen neglected in the current literature.
4.3. Attributes for the Development of HSRs in Logistics
HSRs do not only play an essential role in serving passengers among other transportmodes, but also bring about a novel option for freight transport. HSRs are adjusting to therequirements of the rapid growth of the modern logistics industry. As shown in Table 10a(HSR), Travel time, Travel cost, Ticket price, Frequency, and Access/egress time are themost-used attributes. Indeed, people prefer to use time rationally and efficiently, but thisissue has not been deeply studied in logistics, and it may be relevant, especially in an erawhen more sustainable transport modes are a necessity to mitigate negative externalities.
High-speed freight trains have been launched in many countries, such as Germany,France, Denmark [57], and China. Since 2014, China Railway Corporation has launched thehigh-speed railway express delivery (HSReD) system, cooperated with express transportcompanies and e-commerce platforms, initially focusing on time-sensitive and valuableitems, and launched services such as “Same-Day Delivery” and “Next-Day Delivery”.According to the Statistical Office of the People’s Republic of China (2017), in 2016, thevolume of express delivery parcels reached 31.35 billion pieces, increasing by 51.67%over 2015. China’s example indicates that the HSReD system is feasible and has beenoperating for several years. Thus, questions need to be considered, for instance: Whatis the impact of HSReD on passengers’ demand and preferences? Will some attributes(e.g., number of carriages carrying parcels, delivery time, and delivery frequency) of HSReDaffect passengers’ choices? In addition, Bi et al. [57] claim that the HSReD parcel volumeon China’s HSR network will reach the transportation capacity limit in 2021. Will thisprediction be true? Will this affect the travel demand of passengers and the sustainabledevelopment of HSRs? These are worthy lines of future research.
4.4. Attributes Related to Environmental Costs and Passengers’ Attitudes towards Climate Change
This fourth gap probably represents the most promising line of future research. It wascertainly a surprise to find that none of the 24 SP studies included any attributes relatedto environmental costs in order to characterize the transport modes. In this respect, thecomparative advantages of HSRs over other transport modes could have not been properlyanalyzed in previous studies. Similarly, the more or less pro-environmentalist or greenbehavior associated with each passenger could also have an effect on mode choices, so it ishighly possible that there is a latent heterogeneity in passengers’ preferences that has notbeen analyzed. Air travel can be affected by the interference of ‘flight shame’ supporterswho obtain the media’s attention in order to change social norms, and, apparently, thesechanges have more or less been accepted by some nationalities. Gössling et al. [57] assessed
Sustainability 2022, 14, 1473 18 of 20
the effect of ‘flight shame’ on policy support for the decarbonization of the transportsystem for 16 different measures, and found that a majority of respondents consideredthe following three measures as the most effective: (1) an annual reduction in the aviationindustry’s total CO2 emissions by 5%; (2) a reduction in specific emissions by 5% per yearand a total of km flown; and (3) a decline in the cost of train travel to make this transportmode relatively more cost-competitive. Interestingly, the authors studied these issues froma conceptual point of view, and it is time to include these segmentation variables in thediscrete choice approach.
5. Conclusions
This paper provided a critical overview of the evolution of passengers’ preference forHSRs in the last 20 years. An initial database containing 143 related articles, obtained fromScopus by using the keywords TITLE-ABS-KEY (hst AND preferenc*) OR TITLE-ABS-KEY(hsr AND preferenc*), was filtered because it was found that the use of abbreviations wasnot appropriate for selecting a particular field of study. The bibliometric analysis withthe refinements showed that the first paper about passengers’ preference for HSRs waspublished in 2002.
The Latent Dirichlet Allocation (LDA) method was applied to elicit the topics of the65 selected documents that deal with high-speed railways. The meanings of the abbre-viations “HSR” and “HST” other than “high-speed railway” and “high-speed train”, re-spectively, are shown in Table 4. The other three main categories are: (1) “HSR”, whichstands for “Health Star Rating”; (2) “HST”, which means “Hubble Space Telescope”; and(3) “HSR”, which means “High levels of Social Reinstatement behavior”.
The 24 studies that conducted a SP experiment were selected to provide more insightsinto passengers’ preferences for HSRs. The in-depth analysis of the selected papers demon-strates that: (1) the SP surveys were implemented for measuring the passengers’ preferencefor HSRs in different countries: China, Italy, Spain, Indonesia, India, Japan, South Korea,the United States, and Portugal (Table 8); (2) the most frequently used transport alternativesare Road Transport, Air transport, and Conventional rail (Table 9); (3) the top five mostused attributes are Travel time, Travel cost, Price, Frequency, and In-vehicle time (Table 10);and (4) the top five segmentation variables are Age, Income, Trip purpose, Career, andGender (Table 11).
We found four important gaps that need to be addressed as future lines of research:(1) the definition of HSRs according to the speed needs to be mentioned; (2) more competingalternatives need to be included as well as other transport modes for accessing and egressingto/from terminals; (3) the role of HSRs as an alternative in logistics needs to be studied toanalyze what effects HSRs could have on passengers’ demand; and (4) environmental andsustainability issues need to be included in the choice experiment to determine whetherHSRs could be more competitive, as well as other variables that could act as proxies forpassengers’ attitudes toward mitigating transport externalities.
This study is also subject to some shortcomings. First, the information was extractedfrom only a single platform (Scopus), and the results may be biased by this issue. Second,using the abbreviations HSR and HST as search keywords is inappropriate when researcherswant to study a specific field. Third, only the SP method was considered when filteringout the 24 papers written in English in order to analyze the passengers’ preferences. Othermethods or topics need to be used in the future and, for that, the list of the topics presentedin this study will be valuable.
Author Contributions: D.W. was involved in data collection, methodology application, resultsanalysis, and the writing of the paper. J.C.M. was involved in methodology application, resultsanalysis, supervision, and the editing of the draft. All authors have read and agreed to the publishedversion of the manuscript.
Funding: This research received no external funding.
Institutional Review Board Statement: Not applicable.
Sustainability 2022, 14, 1473 19 of 20
Informed Consent Statement: Not applicable.
Data Availability Statement: The data presented in the study are available in SCOPUS.
Conflicts of Interest: The authors declare no conflict of interest.
References1. Givoni, M. Development and Impact of the Modern High-speed Train: A Review. Transp. Rev. 2006, 26, 593–611. [CrossRef]2. Evazzadeh, E.; Kheirkhah, A.; Shakeri, M. An Investigation of the Advantages and Disadvantages of Parallelism of the High-Speed
Intercity Passenger Rail with Freeway. Int. J. Technol. Res. Eng. 2020, 8, 108–114.3. Cascetta, E.; Cartenì, A.; Henke, I.; Pagliara, F. Economic Growth, Transport Accessibility and Regional Equity Impacts of
High-Speed Railways in Italy: Ten Years Ex Post Evaluation and Future Perspectives. Transp. Res. Part Policy Pract. 2020, 139,412–428. [CrossRef]
4. Shao, L.H.; Zhao, Y. Research of High-Speed Rail Express Delivery Market Demand Prediction Problem in China. Appl. Mech.Mater. 2016, 851, 899–903. [CrossRef]
5. Banister, D.; Hall, P. The Second Railway Age. Built Environ. 1993, 19, 157.6. Schwanen, T. Transport Geography, Climate Change and Space: Opportunity for New Thinking. J. Transp. Geogr. 2019, 81, 102530.
[CrossRef]7. Chen, F.; Shen, X.; Wang, Z.; Yang, Y. An Evaluation of the Low-Carbon Effects of Urban Rail Based on Mode Shifts. Sustainability
2017, 9, 401. [CrossRef]8. Yu, X.; Lang, M.; Gao, Y.; Wang, K.; Su, C.-H.; Tsai, S.-B.; Huo, M.; Yu, X.; Li, S. An Empirical Study on the Design of China
High-Speed Rail Express Train Operation Plan—From a Sustainable Transport Perspective. Sustainability 2018, 10, 2478. [CrossRef]9. Armah, F.; Yawson, D.; Pappoe, A.A.N.M. A Systems Dynamics Approach to Explore Traffic Congestion and Air Pollution Link
in the City of Accra, Ghana. Sustainability 2010, 2, 252–265. [CrossRef]10. Vieira, E.S.; Gomes, J.A.N.F. A Comparison of Scopus and Web of Science for a Typical University. Scientometrics 2009, 81, 587–600.
[CrossRef]11. Boyle, F.; Sherman, D. ScopusTM: The Product and Its Development. Ser. Libr. 2006, 49, 147–153. [CrossRef]12. Kawakami, T. Electrical Features of the New Tokaido Line. IEEE Spectr. 1966, 3, 57–63. [CrossRef]13. Ponweiser, M. Latent Dirichlet Allocation in R. Diploma Thesis, Vienna University of Business and Economics, Vienna, Austria, 2012.14. Blei, D.M.; Ng, A.Y.; Jordan, M.I. Latent Dirichlet Allocation. J. Mach. Learn. Res. 2003, 3, 993–1022.15. Blei, D.M.; Lafferty, J.D. Visualizing Topics with Multi-Word Expressions. arXiv 2009, arXiv:0907.1013.16. Griffiths, T.L.; Steyvers, M. Finding Scientific Topics. Proc. Natl. Acad. Sci. USA 2004, 101, 5228–5235. [CrossRef]17. Campbell, J.C.; Hindle, A.; Stroulia, E. Latent Dirichlet Allocation: Extracting Topics from Software Engineering Data. In The Art
and Science of Analyzing Software Data; Elsevier: Amsterdam, The Netherlands, 2015; pp. 139–159, ISBN 978-0-12-411519-4.18. Carneiro, T.; Medeiros Da Nobrega, R.V.; Nepomuceno, T.; Bian, G.-B.; De Albuquerque, V.H.C.; Filho, P.P.R. Performance
Analysis of Google Colaboratory as a Tool for Accelerating Deep Learning Applications. IEEE Access 2018, 6, 61677–61685.[CrossRef]
19. Tock, K. Google CoLaboratory as a Platform for Python Coding with Students. RTSRE Proc. 2019, 2, 1–13.20. Heimerl, F.; Lohmann, S.; Lange, S.; Ertl, T. Word Cloud Explorer: Text Analytics Based on Word Clouds. In Proceedings of the
2014 47th Hawaii International Conference on System Sciences, Waikoloa, HI, 6–9 January 2014; pp. 1833–1842.21. Elsevier Scopus Search API. Available online: https://www.scopus.com/search/ (accessed on 1 November 2021).22. Grefenstette, G.; Tapanainen, P. What Is a Word, What Is a Sentence? Problems of Tokenization. In Proceedings of the 3rd
International Conference on Computational Lexicography, Budapest, Hungary, 7–10 July 1994.23. Wilbur, W.J.; Sirotkin, K. The Automatic Identification of Stop Words. J. Inf. Sci. 1992, 18, 45–55. [CrossRef]24. Tirunillai, S.; Tellis, G.J. Mining Marketing Meaning from Online Chatter: Strategic Brand Analysis of Big Data Using Latent
Dirichlet Allocation. J. Mark. Res. 2014, 51, 463–479. [CrossRef]25. Manning, C.D.; Raghavan, P.; Schutze, H. Introduction to Information Retrieval; Cambridge University Press: Cambridge, UK, 2008.26. Chang, Y.; Yang, Y.; Dong, S. Comprehensive Sustainability Evaluation of High-Speed Railway (HSR) Construction Projects Based
on Unascertained Measure and Analytic Hierarchy Process. Sustainability 2018, 10, 408. [CrossRef]27. Sustainable Transport: Priorities for Policy Reform Development in Practice; World Bank: Washington, DC, USA, 1996; ISBN 0-8213-3598-7.28. Aizaki, H.; Nakatani, T.; Sato, K. Stated Preference Methods Using R; The R Series; CRC Press: Boca Raton, FL, USA, 2014;
ISBN 978-1-4398-9048-6.29. Bergantino, A.S.; Madio, L. Intermodal Competition and Substitution. HSR versus Air Transport: Understanding the Socio-
Economic Determinants of Modal Choice. Res. Transp. Econ. 2020, 79, 100823. [CrossRef]30. Putri, A.L.; Widyastuti, H. Study of Willingness to Pay the Jakarta-Bandung Highspeed Train: A Case Study of Argo Parahyangan
Train Passangers. IOP Conf. Ser. Mater. Sci. Eng. 2019, 650, 012048. [CrossRef]31. Cheng, Q.; Deng, W.; Hu, Q. Modeling Passengers’ Preference on High-Speed Trains: Mixed Logit Model Development. In
Proceedings of the CICTP 2019, Nanjing, China, 6–8 July 2019; pp. 5925–5936.32. Raturi, V.; Verma, A. Competition between High Speed Rail and Conventional Transport Modes: Market Entry Game Analysis on
Indian Corridors. Netw. Spat. Econ. 2019, 19, 763–790. [CrossRef]
Sustainability 2022, 14, 1473 20 of 20
33. Zuo, Z.; Pan, X.-F. Determinants of College Students Choosing Railway during the Spring Festival Travel Rush in China:Preliminary Results Using Stated Preference Approach. In Proceedings of the CICTP 2019, Nanjing, China, 6–8 July 2019;pp. 5913–5924.
34. Nurhidayat, A.Y.; Widyastuti, H.; Utomo, D.P. Model of Transportation Mode Choice between Aircraft and High Speed Train ofJakarta-Surabaya Route. IOP Conf. Ser. Earth Environ. Sci. 2018, 202, 012002. [CrossRef]
35. Biggiero, L.; Pagliara, F.; Patrone, A.; Peruggini, F. Spatial Equity and High-Speed Rail Systems. Int. J. Transp. Dev. Integr. 2017, 1,194–202. [CrossRef]
36. Brida, J.G.; Martín, J.C.; Román, C.; Scuderi, R. Air and HST Multimodal Products. A Segmentation Analysis for Policy Makers.Netw. Spat. Econ. 2017, 17, 911–934. [CrossRef]
37. Cartenì, A.; Pariota, L.; Henke, I. Hedonic Value of High-Speed Rail Services: Quantitative Analysis of the Students’ DomesticTourist Attractiveness of the Main Italian Cities. Transp. Res. Part Policy Pract. 2017, 100, 348–365. [CrossRef]
38. Kusuma, A.; Tinumbia, N.; Leksono, P. The Characteristics of Potential Passengers of an Indonesian High-Speed Train (CaseStudy: Jakarta–Bandung). Int. J. Technol. 2017, 8, 1150. [CrossRef]
39. Muro-Rodríguez, A.I.; Perez-Jiménez, I.R.; Gutiérrez-Broncano, S. Consumer Behavior in the Choice of Mode of Transport: ACase Study in the Toledo-Madrid Corridor. Front. Psychol. 2017, 8, 1011. [CrossRef]
40. Raturi, V.; Verma, A. Analyzing Competition between High Speed Rail and Bus Mode Using Market Entry Game Analysis. Transp.Res. Procedia 2017, 25, 2373–2384. [CrossRef]
41. Sperry, B.R.; Burris, M.; Woosnam, K.M. Investigating the Impact of High-Speed Rail Equipment Visualization on Mode ChoiceModels: Case Study in Central Texas. Case Stud. Transp. Policy 2017, 5, 560–572. [CrossRef]
42. Cascetta, E.; Coppola, P. Assessment of Schedule-Based and Frequency-Based Assignment Models for Strategic and OperationalPlanning of High-Speed Rail Services. Transp. Res. Part Policy Pract. 2016, 84, 93–108. [CrossRef]
43. Lee, J.-K.; Yoo, K.-E.; Song, K.-H. A Study on Travelers’ Transport Mode Choice Behavior Using the Mixed Logit Model: A CaseStudy of the Seoul-Jeju Route. J. Air Transp. Manag. 2016, 56, 131–137. [CrossRef]
44. Li, Z.-C.; Sheng, D. Forecasting Passenger Travel Demand for Air and High-Speed Rail Integration Service: A Case Study ofBeijing-Guangzhou Corridor, China. Transp. Res. Part Policy Pract. 2016, 94, 397–410. [CrossRef]
45. Zhao, W.; Zhu, H.; Hu, D. High-Speed Rail Competitiveness Analysis in the Guangzhou-Zhaoqing Transport Corridor withMixed RP/SP Data. In Proceedings of the CICTP 2016, Shanghai, China, 6–9 July 2016; pp. 478–490.
46. Barreira, Á.; Reis, V.; Macário, R. Competitiveness of High-Speed Rail: Analysis for Corridor Between Lisbon, Portugal, andMadrid, Spain, Based on Discrete Choice Models. Transp. Res. Rec. J. Transp. Res. Board 2013, 2374, 9–16. [CrossRef]
47. Kuo, Y.-W.; Hsieh, C.-H.; Feng, C.-M.; Yeh, W.-Y. Effects of Price Promotions on Potential Consumers of High-Speed Rail. Transp.Plan. Technol. 2013, 36, 722–738. [CrossRef]
48. Yao, E.J.; Yang, Q.R.; Zhang, Y.S.; Dai, H.N. A Study on Travel Demand for High-Speed Train Based on Nested Logit Model. Appl.Mech. Mater. 2013, 361–363, 2096–2099. [CrossRef]
49. Yao, E.; Yang, Q.; Zhang, Y.; Sun, X. A Study on High-Speed Rail Pricing Strategy in the Context of Modes Competition. DiscreteDyn. Nat. Soc. 2013, 2013, 1–6. [CrossRef]
50. Pagliara, F.; Vassallo, J.M.; Román, C. High-Speed Rail versus Air Transportation: Case Study of Madrid–Barcelona, Spain. Transp.Res. Rec. J. Transp. Res. Board 2012, 2289, 10–17. [CrossRef]
51. Yang, C.-W.; Sung, Y.-C. Constructing a Mixed-Logit Model with Market Positioning to Analyze the Effects of New ModeIntroduction. J. Transp. Geogr. 2010, 18, 175–182. [CrossRef]
52. Yao, E.; Morikawa, T.; Kurauchi, S.; Tokida, T. A Study on Nested Logit Mode Choice Model for Intercity High-Speed Rail Systemwith Combined RP/SP Data. In Proceedings of the Traffic And Transportation Studies (2002), Guilin, China, 23–25 July 2002;pp. 612–619.
53. Nationwide Shinkansen Railway Development Act; 1970; pp. 1–19. Available online: https://www.mlit.go.jp/english/2006/h_railway_bureau/Laws_concerning/05.pdf (accessed on 22 December 2021).
54. Xiao, C.; Yang, Y.; Chi, G. Subway Development and Obesity: Evidence from China. J. Transp. Health 2021, 21, 101065. [CrossRef]55. de Jong, M.; Mu, R.; Stead, D.; Ma, Y.; Xi, B. Introducing Public–Private Partnerships for Metropolitan Subways in China: What Is
the Evidence? J. Transp. Geogr. 2010, 18, 301–313. [CrossRef]56. Lu, K.; Han, B.; Lu, F.; Wang, Z. Urban Rail Transit in China: Progress Report and Analysis (2008–2015). Urban Rail Transit 2016, 2,
93–105. [CrossRef]57. Bi, M.; He, S.; Xu, W. (Ato) Express Delivery with High-Speed Railway: Definitely Feasible or Just a Publicity Stunt. Transp. Res.
Part Policy Pract. 2019, 120, 165–187. [CrossRef]