república de kenya evaluación de la estrategia y el
TRANSCRIPT
Nota para los representantes en la Junta Ejecutiva
Funcionarios de contacto:
Preguntas técnicas: Envío de documentación:
Oscar A. Garcia Director Oficina de Evaluación Independiente del FIDA Tel.: (+39) 06 5459 2274 Correo electrónico: [email protected]
Deirdre McGrenra Jefa Oficina de Gobernanza Institucional y Relaciones con los Estados Miembros Tel.: (+39) 06 5459 2374 Correo electrónico: [email protected]
Johanna Pennarz Oficial Principal de Evaluación Tel.: (+39) 06 5459 2558 Correo electrónico: [email protected]
Junta Ejecutiva — 128.º período de sesiones Roma, 10 a 12 de diciembre de 2019
Para examen
Signatura: EB 2019/128/R.12
S
Tema: 6 c)
Fecha: 15 de noviembre de 2019
Distribución: Pública
Original: Inglés
República de Kenya
Evaluación de la estrategia y el programa en el país
EB 2019/128/R.12
i
Índice
Agradecimientos ii Resumen iii
Apéndice
I. Main report: Kenya Country Strategy and Programme Evaluation 1
EB 2019/128/R.12
ii
Agradecimientos
La presente evaluación de la estrategia y el programa en el país estuvo encabezada por Johanna Pennarz, Oficial Principal de Evaluación de la Oficina de Evaluación Independiente (IOE) del FIDA. La preparación del proyecto de informe estuvo a cargo de Nicholas Chapman, consultor superior de la IOE, con aportes de Hansdeep Khaira, Oficial de Evaluación de la IOE, las consultoras Violet Matiru (gestión de recursos naturales) y Rose Mwaniki (financiación rural), el experto Hesbourne Mangera (datos) y Nicholas Bourguignon, Analista de Evaluación de la IOE. Shaun Ryan, Asistente de Evaluación de la IOE, prestó un valioso apoyo administrativo.
Para la evaluación se tuvieron en cuenta las observaciones formuladas por varios funcionarios de la IOE, quienes examinaron el proyecto del documento conceptual y el proyecto del informe final.
La IOE agradece a la División de África Oriental y Meridional del FIDA las útiles observaciones aportadas sobre el proyecto de informe. Se extiende un especial agradecimiento a la Oficina del FIDA en Kenya por el apoyo recibido durante las misiones y el taller nacional de cierre.
Se agradece también al Gobierno de la República de Kenya el respaldo brindado en todas las fases de la evaluación. Merece asimismo una mención especial el departamento de Tesorería Nacional y Planificación, que colaboró con la organización del taller nacional. La IOE desea también dar las gracias a los coordinadores y el personal del Proyecto para la Gestión de los Recursos Naturales de la Cuenca Alta del Río Tana, el Programa de Comercialización de Productos Lácteos de Pequeños Productores, el Programa de Difusión Rural de Innovaciones y Tecnologías Financieras y el Programa de Mejora de la Producción de Cereales en Kenya – Modalidad de Fomento de Medios de Vida Agrícolas Resistentes al Cambio Climático, por incorporarse a las misiones y aportar datos valiosos que hicieron posible la presente evaluación. En particular, se agradece a la coordinadora del Proyecto para la Gestión de los Recursos Naturales de la Cuenca Alta del Río Tana y al personal a su cargo por organizar las visitas sobre el terreno durante el taller nacional.
EB 2019/128/R.12
iii
Resumen
I. Antecedentes 1. De conformidad con la Política de Evaluación del FIDA tal cual fue aprobada
durante el 116.º período de sesiones de la Junta Ejecutiva del FIDA, la Oficina de Evaluación Independiente del FIDA (IOE) llevó a cabo una evaluación de la estrategia y el programa en el país (EEPP) en la República de Kenya. Es la segunda evaluación del programa que la IOE realiza en Kenya; la primera concluyó en 2011.
2. Los principales objetivos de la evaluación eran valorar los resultados y la ejecución del Programa sobre Oportunidades Estratégicas Nacionales (COSOP) de Kenya, vigente desde 2011, así como obtener datos y generar conclusiones y recomendaciones que sirvieran para elaborar el próximo COSOP basado en los resultados en 2019.
3. La presente EEPP se aplica a las actividades respaldadas por el FIDA que se ejecutan desde 2011, momento en que se presentó el actual COSOP a la Junta Ejecutiva. Abarca las actividades tanto crediticias como no crediticias (gestión de los conocimientos, creación de asociaciones y actuación en materia de políticas a nivel nacional), incluidas las donaciones, así como los procesos de gestión vinculados al programa en el país y el COSOP.
4. Se aprovecharon también otras evaluaciones de la IOE relativas a Kenya, en particular, las validaciones de los informes finales de cuatro proyectos terminados y la evaluación del impacto del Programa de Comercialización para Pequeños Productores Hortícolas, de 2018. Se utilizaron, en la medida de lo posible, datos aportados por estudios del impacto que estaban disponibles. Para complementar dichos datos, el equipo encargado de la EEPP condujo también una verificación de los activos y una encuesta telefónica de una muestra de 118 grupos de productores lácteos.
5. La misión de evaluación principal se realizó del 4 al 25 de junio de 2018. Se enviaron tres equipos a los condados de Nakuru, Kisii, Nyamira, Embu y Kitui para realizar visitas sobre el terreno. Asimismo, se organizaron grupos de discusión sobre tres áreas temáticas: cadenas de valor, gestión de los recursos naturales y los jóvenes en la agricultura.
II. Cartera 6. Desde 1979, el FIDA ha destinado a Kenya USD 376 millones en préstamos en
condiciones muy favorables para apoyar la reducción de la pobreza rural y el desarrollo agrícola. El Fondo ha invertido en 18 programas y proyectos de desarrollo agrícola y rural, financiados por 20 préstamos.
7. El monto de la cartera de préstamos durante el período analizado por la EEPP (2011-2018) ascendió a USD 542,2 millones; la financiación aportada por el FIDA fue de USD 283,1 millones. En la cartera se incluyen nueve operaciones en diferentes etapas del ciclo de proyectos: cuatro terminadas, cuatro en curso y una que entraría en vigor en junio de 2018.
8. La gama de actividades y sectores de la cartera es variada pero se centra principalmente en la comercialización y las cadenas de valor (25 % de todos los compromisos), los servicios financieros y el crédito rurales (19 %), la acuicultura (13 %), la gestión de los recursos naturales (8 %), el fomento de capacidad y la transferencia de tecnología (7 %) y la infraestructura (5 %). Las actividades de gestión y seguimiento y evaluación (SyE) representaron el 11 % de la cartera mientras que se destinó el 4 % al desarrollo comunitario y el fomento de capacidad institucional. El 9 % restante se asignó a ámbitos como el cambio climático, el riego, la salud y la nutrición.
EB 2019/128/R.12
iv
9. En el mismo período se concedieron 59 donaciones a nivel mundial y regional por un valor de USD 115 millones a organizaciones con base en Kenya. Solo seis de esas donaciones fueron financiadas a través del Fondo para el Medio Ambiente Mundial, cuyos fondos se destinan específicamente a países, y otros mecanismos. Las principales esferas temáticas apoyadas por medio de las donaciones fueron la comercialización y la gestión de los conocimientos, el diálogo sobre políticas, la gestión de los recursos naturales, las mujeres y los jóvenes, las tecnologías agrícolas y el respaldo a organizaciones de agricultores y productores. Entre los principales receptores de las donaciones se cuentan los centros del Grupo Consultivo sobre Investigaciones Agrícolas Internacionales, organizaciones sin fines de lucro y ONG.
10. Contexto. En los últimos siete años, Kenya ha debido enfrentar grandes desafíos políticos, económicos y ambientales: elecciones que suscitaron tensiones, complejos procesos de transferencia de competencias y desastres naturales. Aunque el país tiene una economía en crecimiento, la pobreza continúa siendo alta y la riqueza se distribuye de manera desigual. Si bien la agricultura ha seguido siendo el eje estratégico para el Gobierno, los compromisos presupuestarios de este no han logrado alcanzar las metas fijadas en el Programa General para el Desarrollo de la Agricultura en África. Se prevé que el sector privado tendrá un papel cada vez más importante como motor de la economía rural; se lo percibe como un elemento clave en el programa de “cuatro grandes prioridades” del Gobierno, conocido como Big Four Agenda.
11. Una de las premisas fundamentales de este programa es alcanzar la seguridad alimentaria mediante el aumento de los ingresos y una mayor resiliencia alimentaria y nutricional. En el marco de este programa se dará impulso a la producción en pequeña escala por medio de la incorporación de mejoras al suministro de insumos, el crédito, el almacenamiento, la concesión de licencias y el apoyo a las pequeñas y medianas empresas, además de mejoras a los sistemas de regadío y la explotación pesquera. En vista de la atención renovada que el programa pone en el sector agrícola, el FIDA está bien posicionado para apoyar el imperativo de mejorar la seguridad alimentaria sobre la base de un enfoque más competitivo, más empresarial e impulsado por el mercado, con el respaldo de una reforma gubernamental de las políticas y reglamentaciones pertinentes.
12. La actuación del FIDA en Kenya ha crecido desde la última evaluación del programa en el país, que tuvo lugar en 2011. La presencia del Fondo en Kenya data de 2008; ese mismo año el FIDA comenzó a ejercer la supervisión directa y el apoyo a la ejecución, tras la apertura de su oficina en Nairobi. El Gerente del Programa en el País está basado en Nairobi desde 2011. A lo largo de este período, la mira estratégica del FIDA ha pasado del desarrollo comunitario general a centrarse en cadenas de valor seleccionadas, a invertir en las zonas semiáridas, a mejorar el acceso a la financiación rural y a combatir la degradación ambiental y el cambio climático.
III. Principales constataciones 13. Pertinencia. Se observa una buena correspondencia entre la cartera y las
estrategias del Gobierno desde el punto de vista de la orientación temática. No obstante, en lo que concierne a la selección de los grupos objetivo y la prestación de servicios, la transferencia de competencias solo se tuvo en cuenta parcialmente en el diseño de los proyectos. Solo los proyectos más recientes han logrado armonizarse con la exigencia cada vez más mayor, en el ámbito de los condados, de gestionar sus propios fondos y su planificación. Desde el punto de vista geográfico, se seleccionaron los grupos objetivo de manera bastante específica para alcanzar ciertos grupos, en especial las mujeres y, en menor grado, los jóvenes. Los pastores de las zonas áridas no fueron seleccionados como grupo objetivo.
EB 2019/128/R.12
v
14. Los proyectos más recientes se centraron en un subsector particular, lo cual contribuyó a que el diseño fuera menos complejo. Sin embargo, la complejidad de colaborar con una multiplicidad de asociados a lo largo de la cadena de valor resultó un cometido demasiado ambicioso y no se realizaron suficientes diagnósticos de las cadenas en la fase de diseño. También fue demasiado ambiciosa la meta en materia de financiación rural: pasar de proyectos con subcomponentes de financiación rural relativamente menores a una inversión considerable en financiación rural a través de un proyecto único representa un cambio significativo en el enfoque. La complejidad y el alto grado de riesgo de este enfoque expusieron a la unidad de coordinación del proyecto y sus proveedores de servicios a grandes dificultades y ocasionaron graves retrasos.
15. Eficacia. La ejecución de la cartera de préstamos arrojó en general buenos resultados en cuanto a los productos y efectos directos obtenidos. La utilización de personal de extensión, salud y servicios sociales más capacitado permitió mejorar la prestación de servicios. En general, en toda la cartera se alcanzaron o excedieron las metas fijadas en materia de formación de grupos y fomento de la capacidad. Las metas medioambientales se alcanzaron principalmente en ámbitos como la reducción de la contaminación, la protección de los bosques y la conservación de suelos. No obstante, no fueron satisfactorios los resultados de la cartera en lo que respecta a estudios o diagnósticos y a la transición a grupos comerciales. Estos efectos directos a menudo se obtuvieron solamente tras un período de puesta en marcha lento, al cual le sucedieron resultados rápidos y robustos entre las etapas media y final del proyecto.
16. Con respecto al número de beneficiarios alcanzados, se cumplieron o excedieron las metas fijadas en tres de los cuatro proyectos terminados. El número total de beneficiarios fue de 2,3 millones contra una meta fijada de 2,6 millones. Los proyectos permitieron establecer grupos de beneficiarios en varios sectores (salud, carreteras, agua, bosques, sector lácteo y hortícola) y facilitaron el apoyo y la capacitación a estos grupos. Más de 2 000 hectáreas de zonas de regadío fueron objeto de mejoras y se mejoró también el manejo de suelos y la gestión hídrica y forestal. Los proyectos iniciales fueron en gran medida eficaces en lo que respecta al logro de las metas materiales, que se alcanzaron utilizando enfoques y planes de acción de base comunitaria dirigidos por grupos.
17. Los proyectos centrados en la gestión de los recursos naturales permitieron mejorar el acceso a estos recursos y empoderar a las comunidades para que hagan un manejo sostenible de los mismos. El Proyecto Piloto de Ordenación de los Recursos Naturales en la Ladera Oriental del Monte Kenya permitió apoyar la rehabilitación de los recursos naturales dentro del bosque protegido y asistir en tareas de conservación y rehabilitación en cinco cuencas hidrográficas fuera de la zona protegida. Algunas de estas actividades prosiguieron durante la ejecución del Proyecto para la Gestión de los Recursos Naturales de la Cuenca Alta del Río Tana, por medio del cual se rehabilitaron 28 cuencas hidrográficas.
18. Las actividades en materia de cadenas de valor contribuyeron a aumentar la productividad de la producción agropecuaria, pero las vinculadas a la comercialización y los procesos de transformación obtuvieron menos resultados. No lograron concretarse las sinergias previstas entre los proyectos centrados en la financiación rural y los basados en cadenas de valor. En los proyectos de financiación rural, la demora de los resultados, la baja calidad de la cartera de préstamos y el alcance limitado respecto del grupo objetivo fueron aspectos que suscitaron preocupación. Toda la cartera ha centrado especial atención en las mujeres y ha dado prioridad sistemática a las personas que viven con el VIH/sida. En cambio, las actividades no consiguieron beneficiar suficientemente a los jóvenes y pastores.
EB 2019/128/R.12
vi
19. Eficiencia. La lentitud en los desembolsos limitó la eficiencia general de la cartera. La demora en conferir autorización para efectuar gastos fue un aspecto señalado como motivo de preocupación en la última evaluación del programa. Esto se relaciona con el hecho de que las unidades de gestión de los proyectos no pueden gastar los fondos hasta que la autoridad gubernamental supervisora delegue a esas unidades el permiso para hacerlo (generalmente, al gerente del proyecto). Fue un problema que afectó a todos los proyectos y tardó mucho tiempo en solucionarse debido a los cambios constantes de funciones y responsabilidades institucionales. Además, el alto grado de rotación y la escasa dotación de personal de las unidades de gestión de proyectos no permitieron contar con las capacidades necesarias.
20. Los costos reales de gestión excedieron los previstos en todos los proyectos, si bien se redujo la proporción de fondos destinados a solventar los costos de gestión de proyectos, de un máximo del 35 % registrado en el primer proyecto analizado (Proyecto de Desarrollo de Pequeños Agricultores y Servicios Comunitarios en las Zonas Secas de la Provincia Central de Kenya) a menos del 20 % en el proyecto hortícola, de reciente conclusión. En los proyectos terminados, los costos de gestión más altos de lo previsto pueden atribuirse a la duplicación de las estructuras de coordinación, la necesidad de equiparar las prestaciones con las existentes en el Gobierno, el aumento del precio de los combustibles y las deficiencias en los planes operacionales anuales y la planificación de las prórrogas de los proyectos. Los proyectos de cadenas de valor registraron el costo por beneficiario más alto debido al número relativamente bajo de beneficiarios alcanzados. En cambio, el costo por beneficiario de los primeros proyectos de desarrollo comunitario fue el que se mantuvo más cerca del estimado.
21. Impacto en la pobreza rural. De acuerdo con los estudios del impacto disponibles, todos los proyectos trajeron cambios económicos positivos para los beneficiarios. Según estos estudios, los ingresos de los hogares aumentaron en un rango que va del 70 % en el primer proyecto ejecutado (el Proyecto de Desarrollo de Pequeños Agricultores y Servicios Comunitarios en las Zonas Secas de la Provincia Central de Kenya) al 14 % en el Proyecto para la Gestión de los Recursos Naturales de la Cuenca Alta del Río Tana, actualmente en ejecución. También se constató una mejora en las condiciones de vivienda. El aumento de la producción agrícola fue una premisa fundamental en todos los proyectos de la cartera y la causa más importante del incremento de los ingresos y activos de los hogares. Una serie de razones explican los cambios en la productividad, entre otros: la capacitación, las demostraciones sobre el terreno, el uso de variedades de cultivos y razas ganaderas mejoradas, y la introducción de nuevas tecnologías como el cultivo de tejidos de banano. Al acceder los beneficiarios a canastas alimentarias más diversas, con contenidos más altos de proteínas animales y vegetales y un menor consumo de tubérculos y frutas, mejoró en general la seguridad alimentaria.
22. Los estudios permitieron constatar mejoras considerables en la productividad, la seguridad alimentaria y los ingresos atribuibles al Programa de Comercialización de la Producción de los Pequeños Agricultores y al Programa de Comercialización de Productos Lácteos de Pequeños Productores. Los inferiores costos de transporte, los mejores precios y una demanda local más fuerte (en el caso de la leche) llevaron al aumento de los ingresos. En todos los proyectos, los cambios positivos como el aumento de la productividad fueron producto de intervenciones del lado de la producción únicamente. Los resultados positivos derivados de intervenciones del lado del mercado fueron mucho menos evidentes.
23. La capacitación en dinámica de grupos permitió obtener resultados positivos, entre otros, una reducción de los conflictos. Sin embargo, fueron desparejos los resultados en lo que concierne a la cohesión grupal. En algunos casos, la duración del proyecto fue demasiado corta para que se alcanzara el nivel deseado de cohesión social. Una dinámica de grupos negativa y la desconfianza entre los grupos comerciales recientemente constituidos fueron factores difíciles de superar
EB 2019/128/R.12
vii
y hubo problemas a raíz de la debilidad en la gobernanza y el liderazgo. Los grupos que funcionaron mejor fueron los de más antigüedad (sector lácteo) así como los constituidos y regidos por la constitución nacional (grupos de gestión de los recursos naturales). En general, los proyectos permitieron fortalecer las capacidades del personal de las instituciones gubernamentales. Sin embargo, la mayoría no preveía intervenciones destinadas específicamente a influir en las políticas nacionales. Las organizaciones de base que se formaron o a las que el FIDA brindó apoyo no siempre evolucionaron hacia estructuras de carácter permanente.
24. Sostenibilidad. La formación de grupos y el fomento del sentido de apropiación dentro de estos han sido rasgos característicos de las intervenciones del FIDA en toda la cartera. La sostenibilidad de los activos de los proyectos se ha mantenido gracias al compromiso, la participación y el sentido de apropiación de las comunidades locales y organizaciones de base. Las asociaciones de usuarios consagradas en la legislación fueron eficaces y muchas de ellas se financian ahora con fondos propios.
25. Algunas obras de infraestructura de los proyectos (los ambulatorios, por ejemplo) han pasado a la órbita y gestión de los departamentos de salud de los condados. Sin embargo, los condados aún no han asumido la propiedad íntegra de los activos de los proyectos, ni garantizado los fondos para sostenerlos: por ejemplo, los mercados financiados en el marco del Programa de Comercialización para Pequeños Productores Hortícolas. En ocasiones, el proceso de cambio de las responsabilidades institucionales provocó demoras y llevó a la inacción en el mantenimiento de los activos en el plano local.
26. Los modelos de financiación rural han demostrado solo una sostenibilidad parcial. Tan solo unas pocas asociaciones de financiación comunitarias establecidas en los primeros proyectos continúan operando en estos días. Su supervivencia se ha visto afectada por la dotación insuficiente de personal, la escasa seguridad en sitios remotos, el incumplimiento de los préstamos, la competencia por el acceso a los fondos y la falta de un estatus jurídico claro. La sostenibilidad de los proyectos piloto de graduación financiera actualmente en curso depende de la posibilidad de formalizar el estatus de los grupos de ahorro y sus vínculos con servicios financieros formales mediante la microfinanciación y los bancos.
27. La participación del sector privado es también un elemento fundamental de la sostenibilidad. Los vínculos forjados con los actores del sector privado para permitir el crecimiento comercial continuado de las actividades productivas han sido valiosos, por ejemplo, la vinculación de los grupos del sector lácteo con las organizaciones cooperativas de ahorro y crédito, y de los compradores de productos a granel con las grandes empresas lácteas. Sin embargo, la falta de vínculos con proveedores de servicios financieros en los proyectos de cadenas de valor quizás dificulte la sostenibilidad de beneficios que dependan del acceso continuo a financiación para mantener y ampliar los activos del proyecto.
28. Innovación. La innovación ha sido un aspecto que se ha tenido muy en cuenta en la cartera en Kenya, un país al que se reconoce como líder en la innovación. En el ámbito de la financiación rural, el FIDA introdujo enfoques innovadores tales como la financiación de cadenas de valor, las modalidades de microfondos de capital de riesgo y los seguros indexados contra las inclemencias climáticas. En la esfera de la gestión de los recursos naturales, se promovieron prácticas como los programas ecológicos para las escuelas, el uso de los conocimientos indígenas, los cultivos hidropónicos y los cercos eléctricos alimentados a energía solar. La introducción de un enfoque de cadenas de valor en tierras áridas y semiáridas impulsó la innovación de combinar diferentes estrategias de producción y comercialización, por ejemplo, la agricultura de conservación, un fondo para el cambio climático en un condado, servicios de información climática, instalaciones de almacenamiento y nuevas asociaciones con el sector privado e instituciones de investigación.
EB 2019/128/R.12
viii
29. Ampliación de escala. La prórroga de la duración de algunos proyectos y la adopción por parte del Gobierno y otros actores son algunos ejemplos que demuestran la reproducción y la ampliación de escala. Un caso de reproducción es el uso de tecnologías hortícolas por empresarios del sector privado y gobiernos de los condados vecinos. No obstante, se desaprovecharon oportunidades para ampliar los resultados a nivel nacional y hubo posibilidades de ampliación de escala que no se exploraron adecuadamente. El proyecto en la cuenca alta del río Tana brindó la posibilidad de ampliar la labor del FIDA en la esfera de la gestión de los recursos naturales al aplicar prácticas como la rehabilitación forestal y la protección de las cuencas hidrográficas que habían sido probadas de manera piloto en el proyecto del Monte Kenya en una zona de mayor extensión.
30. Igualdad de género y empoderamiento de la mujer. La cartera registra buenos resultados en la esfera de las cuestiones de género. La promoción de la igualdad de género y empoderamiento de la mujer trajo aparejados logros importantes como la mejora del acceso de las mujeres a los recursos, los activos y los servicios, y de su influencia en los procesos decisorios en el hogar, los grupos y la comunidad. De esta manera, la ejecución de la cartera ha contribuido a abordar las causas profundas de la desigualdad de género en las zonas rurales de Kenya y a cuestionar las normas y los papeles tradicionales relativos al género. Se puso menos atención en promover un reparto equitativo de la carga de trabajo entre hombres y mujeres que permitiera reducir la “pobreza de tiempo” que padecen las mujeres. La aplicación de las metodologías basadas en los hogares seguramente contribuirá a aumentar el potencial de la cartera para facilitar un impacto capaz de transformar las relaciones de género. Las intervenciones de los proyectos han beneficiado a los hogares encabezados por mujeres, si bien en menor medida que a aquellos encabezados por hombres.
31. Los jóvenes. La atención centrada en los jóvenes fue poco sistemática y los resultados en el alcance de la cartera respecto de este grupo objetivo fueron desparejos. Para citar un caso, el 60 % de los miembros de los grupos de ahorro en los proyectos piloto de graduación financiera en el condado de Kitui fueron jóvenes, pero estos solo representaron el 20 % de los grupos del sector lácteo respaldados por el proyecto correspondiente. La transferencia de vacas y otros activos, un mejor acceso a servicios de ahorro y préstamo, y las oportunidades de empleo en el comercio de leche en motocicleta fueron algunos de los beneficios que los jóvenes obtuvieron de las intervenciones del FIDA.
32. Gestión de los recursos naturales. La gestión de los recursos naturales es una esfera de desempeño sólido y eficaz dentro de la cartera. En efecto, los dos proyectos centrados en los recursos naturales, el medio ambiente y el cambio climático registraron muy buenos resultados y trajeron como consecuencia la mejora del acceso a los recursos naturales y el empoderamiento creciente de las comunidades para que hicieran un manejo sostenible de los mismos. Otros proyectos del FIDA contribuyeron a la consecución de efectos directos en este ámbito, por ejemplo, mediante el establecimiento de tres viveros agroforestales y la rehabilitación de zonas degradadas, y mediante la promoción de prácticas de conservación de suelos y el agua.
33. Cambio climático. Los efectos del cambio climático no recibieron un reconocimiento constante en la cartera, ni fueron mitigados de manera sistemática. En los primeros proyectos prácticamente no se tuvieron en cuenta los riesgos climáticos ni se incluyeron indicadores al respecto. Sin embargo, las actividades de los proyectos incluían medidas tales como el uso de cultivos resistentes a las sequías, plantas de biogás, cocinas eficientes y viveros forestales. Las estrategias de adaptación al cambio climático (por ejemplo, relativas a la agricultura de conservación, el riego, la promoción de cultivos tolerantes a las sequías y la gestión integrada de plagas) estuvieron relativamente bien integradas en los proyectos.
EB 2019/128/R.12
ix
34. Gestión de los conocimientos. La gestión de los conocimientos no recibió la atención adecuada en los proyectos. Aunque se produjeron materiales de conocimiento en el marco de algunos proyectos, su utilización por el FIDA u otros actores no fue exhaustiva. El análisis del contexto nacional fue mínimo: por ejemplo, entre 2013 y 2018 no se hizo ningún examen del COSOP vigente. Además, el FIDA prácticamente no prestó atención a fortalecer el papel del Gobierno en la gestión de los conocimientos ni su responsabilidad en esta esfera, cosa que podría haber hecho vinculando el SyE de los proyectos con el sistema nacional de SyE y los sistemas equivalentes en los condados.
35. Creación de asociaciones. El FIDA ha mantenido buenas relaciones con los organismos nacionales y locales encargados de la ejecución. La percepción general es que los proyectos del FIDA lograron responder a las necesidades locales. En los COSOP de 2007 y 2013 se reconoció la necesidad de fortalecer la capacidad de las autoridades y comunidades locales para gestionar su propio desarrollo como parte del proceso en curso de transferencia de competencias. Pero aunque el apoyo general del FIDA fue positivo, no se adoptaron ni financiaron medidas específicas para ayudar a los asociados en la ejecución a ajustarse a los cambios institucionales que se estaban produciendo.
36. El sector privado debería haber tenido un papel más importante en las asociaciones. Al diseñar los proyectos se desestimó el papel de asociado que este sector podía cumplir en las cadenas de valor hortícola, láctea y cerealista; se consideró que su función de apoyo era complementaria, aunque secundaria. Algunos actores del sector privado —en particular, bancos, comerciantes y distribuidores de productos agrícolas y ONG— han asumido un papel más activo en las operaciones más recientes.
37. La cofinanciación no ha sido un rasgo importante en la cartera pero ha ido recibiendo cada vez más atención en los últimos proyectos. Los dos proyectos centrados en la gestión de los recursos naturales (Proyecto Piloto de Ordenación de los Recursos Naturales en la Ladera Oriental del Monte Kenya y Proyecto para la Gestión de los Recursos Naturales de la Cuenca Alta del Río Tana) contaron con financiación del Fondo para el Medio Ambiente Mundial y el Fondo Fiduciario de España para el Mecanismo de Cofinanciación de la Seguridad Alimentaria, respectivamente. Los proyectos de cadenas de valor en curso (Programa de Mejora de la Producción de Cereales en Kenya – Modalidad de Fomento de Medios de Vida Agrícolas Resistentes al Cambio Climático y Programa de Desarrollo de Empresas de Acuicultura) están cofinanciados por la Unión Europea y la Organización de las Naciones Unidas para la Alimentación y la Agricultura (FAO), respectivamente.
38. La interacción con los organismos con sede en Roma ha ido mejorando con el tiempo, y sus funciones complementarias se han ajustado y valorizado. En particular, la FAO ha estado estrechamente implicada en la asistencia y la capacitación técnica de los proyectos del FIDA en las esferas de la acuicultura, las cadenas de valor cerealista, las tierras áridas y semiáridas y el sector lácteo.
39. Actuación en materia de políticas. La lista de prioridades del COSOP de 2013 era tan ambiciosa como la de COSOP anteriores. Pero aun así, aunque en el ínterin se estableció una oficina en el país, los recursos proporcionados fueron limitados y no se definieron mecanismos claros para llevar la labor en el ámbito de las políticas al próximo nivel. La elevada rotación de los gerentes del programa en el país fue un factor coadyuvante de la escasa actuación en esta esfera. Sin embargo, el FIDA mantuvo una participación activa en los grupos de trabajo sectoriales y se considera que en los últimos cinco años su contribución ha sido particularmente sólida.
40. La actuación en materia de políticas fue una esfera a la que se prestó atención especial en las donaciones del FIDA, con algunos resultados positivos. Por ejemplo, la donación destinada a apoyar el Foro para una Revolución Verde en África
EB 2019/128/R.12
x
contribuyó a que el Presidente de Kenya anunciara el establecimiento de un fondo para agricultores y empresarios agrícolas jóvenes. Otro ejemplo positivo de actuación en esta esfera es la donación para el Programa de Recompensas a favor de la Población Pobre por la Prestación de Servicios Ambientales en África, el cual llevó a que se instituyeran recompensas por la prestación de servicios ambientales en la política de agua de Kenya con arreglo a la Constitución de 2010.
41. Donaciones. La cartera de donaciones para Kenya ha sido en gran medida pertinente a las estrategias del FIDA y coherente con ellas. Las donaciones sirvieron para apoyar esferas que eran de importancia fundamental para la estrategia del país y contribuyeron a lograr los objetivos del COSOP. Aunque las donaciones se destinaron a financiar esferas temáticas pertinentes, hay pocos ejemplos documentales que demuestren la adopción de los resultados de dichas actividades, como el apoyo al fomento de la capacidad de los grupos comunitarios con el objeto de mejorar su producción e ingresos. La escala de las actividades desarrolladas a menudo fue pequeña proporcional al tamaño de las cuencas, lo cual limitó su pertinencia para los encargados de formular políticas.
42. La porción más grande de la cartera correspondió a las donaciones a nivel regional. En las donaciones centradas en la gestión de los conocimientos faltó un marco claro para la interacción con el programa en el país. Esto hizo que los conocimientos se difundieran trámite los talleres regionales de África Oriental y no mediante los talleres nacionales, lo cual habría resultado más eficaz. Habría sido más beneficioso si en la composición de la cartera se hubieran incluido más donaciones por países.
43. Desempeño del FIDA como asociado. El FIDA ha logrado interactuar más y de manera más eficaz con el Gobierno, sus asociados y los proyectos, especialmente tras haber comenzado la supervisión directa en 2008. El Fondo ha participado activamente en grupos de coordinación de donantes como el Grupo de Donantes para el Desarrollo Agrícola y Rural, si bien todavía no ha presidido ninguno de ellos. La imagen del FIDA es la de un asociado valioso con sólidos conocimientos del terreno y una rica experiencia para compartir. La significativa presencia de donantes supone una carga considerable para la oficina del FIDA en Nairobi en lo que concierne a la coordinación. Su papel de centro regional implica que deba desempeñar una tarea adicional para el equipo del FIDA. En estos momentos la oficina cuenta con cinco miembros del personal que se encargan de estrategia y actuación en materia de políticas. Sin embargo, tres de ellos (que se ocupan de cuestiones de género y jóvenes, medio ambiente y operaciones de la Unión Europea) tienen también responsabilidades regionales.
44. Desempeño del Gobierno como asociado. El Gobierno ha hecho varios cambios a su estructura ministerial que han afectado la relación de trabajo con el FIDA. Al tiempo que el proceso de transferencia de competencias tendrá seguramente resultados positivos en el largo plazo, en el corto plazo ha restado eficiencia a los proyectos. Cuando entró en vigor la política de transferencia de competencias a principios de 2013, la responsabilidad de la ejecución de los proyectos comenzó a trasladarse cada vez más de los ministerios competentes a los gobiernos de los condados. En los distritos y condados se utilizaron equipos de facilitación como mecanismo para asegurar la coordinación con las estructuras gubernamentales locales.
45. En general, el Gobierno cumplió o excedió las contribuciones previstas. El modelo basado en la unidad de coordinación o gestión del proyecto ha sido eficaz para los proyectos desde el punto de vista de las tareas financieras y de adquisiciones y contrataciones, especialmente a partir de 2013 cuando se estaban transfiriendo las competencias. Desde 2016 se ha debido poner más empeño en integrar los proyectos con las modalidades de los condados. Tan solo en una de las intervenciones más recientes (el Programa de Desarrollo de Empresas de
EB 2019/128/R.12
xi
Acuicultura) se ha establecido con más precisión la nueva relación entre el Gobierno nacional y las autoridades de los condados mediante la creación de cuentas exclusivas para los proyectos tanto a nivel de los condados como a nivel nacional.
IV. Conclusiones 46. La adaptación al proceso de transferencia de competencias ha supuesto un desafío
singular para el FIDA y afectado el desempeño del programa y su sostenibilidad durante el período de vigencia del COSOP. De alguna manera, se tardó en adaptar los procedimientos del FIDA a la situación imperante. La necesidad de trabajar eficazmente tanto con asociados nacionales como en los condados ejerció una presión adicional sobre los recursos limitados de la oficina del FIDA en el país. La transferencia de competencias, la reorganización ministerial del Gobierno y la lentitud de los procesos de reforma de las políticas redujeron también el impacto de las elevadas inversiones que se destinaron a fortalecer las capacidades de los funcionarios gubernamentales y otros proveedores de servicios en esferas como la extensión agrícola, la concesión de créditos, la comercialización y la incorporación de la perspectiva de género. Solo en los últimos tiempos se ha logrado armonizar los proyectos nuevos con la exigencia cada vez mayor que tienen los condados de gestionar sus propios fondos y su planificación.
47. La lentitud de los desembolsos y los plazos demasiado ambiciosos para la puesta en marcha de los proyectos afectaron negativamente el desempeño de la cartera de préstamos. La ejecución de las actividades de los proyectos recayó totalmente en las unidades de gestión de los proyectos, las cuales también debieron ajustarse a la nueva función de los gobiernos de los condados. Estas unidades han seguido sufriendo demoras en la contratación de personal y la constitución de asociaciones, y resultado más costosas de lo previsto. La prórroga de algunos proyectos o la utilización en otros de una infraestructura de gestión ya establecida permitió evitar estas demoras en la puesta en marcha.
48. No obstante estas dificultades, los resultados de la cartera fueron en general moderadamente satisfactorios. La continuidad de la ejecución de los proyectos y, en otros casos, la ampliación de la financiación, permitió que en las intervenciones se aprovecharan instituciones existentes y enseñanzas extraídas, lo cual contribuyó a aumentar su eficacia. El FIDA ha intentado introducir enfoques nuevos en su cartera y ha prestado más atención a la financiación rural y la colaboración del sector privado. Sin embargo, ello hizo aumentar la complejidad del diseño y la ejecución de los proyectos, lo cual provocó demoras en los desembolsos y dificultades para desarrollar la capacidad de personal necesaria y finalizar los acuerdos de asociación. Aunque la atención que puso el FIDA en supervisar la gestión de los proyectos insumió recursos considerables, trajo también resultados positivos para la cartera de préstamos, especialmente en lo que concierne a la capacidad de llegar a los grupos objetivo más pobres, la integración de cuestiones transversales y la supervisión fiduciaria.
49. El FIDA se ha lanzado de lleno a la ardua tarea de establecer enfoques más comerciales entre los agricultores pobres y con difícil acceso a recursos, especialmente en las zonas áridas y semiáridas. Los enfoques de reparto de riesgos dentro de grupos funcionaron bien y el FIDA ha sido innovador en materia de soluciones relacionadas con la concesión de créditos, la transformación de productos agrícolas y la gestión medioambiental. Dicho esto, aunque los modelos de graduación ofrecen una vía lógica para que los hogares produzcan a una escala más comercial, en ocasiones han sido demasiado ambiciosos, especialmente cuando los riesgos climáticos eran altos o cuando los vínculos con elaboradores a gran escala planteaban dificultades.
EB 2019/128/R.12
xii
50. Los mejores resultados se alcanzaron en la esfera de la gestión de los recursos naturales; el FIDA también obtuvo buenos resultados con las cadenas de valor y la financiación rural. La labor con los enfoques grupales de gestión de los recursos naturales ha sido eficaz y sostenible debido a que en Kenya existe un entorno jurídico e institucional favorable. Por consiguiente, el FIDA ha podido aprovechar su ventaja comparativa en materia de desarrollo comunitario. Los mejores resultados se obtuvieron en cadenas de valor relativamente más establecidas e integradas (por ejemplo, del sector lácteo), mientras que en las cadenas más nuevas y menos integradas (por ejemplo, hortícola) el FIDA no pudo alcanzar sus objetivos debido al plazo limitado previsto para el proyecto en particular. Se logró aumentar la productividad de los productores lácteos, hortícolas y cerealistas, pero todavía deben materializarse los vínculos con los aspectos de la cadena de valor relacionados con la elaboración y la comercialización. En el ámbito de la financiación rural, el FIDA ha logrado concitar un interés inmenso en sus esfuerzos por abogar por que los bancos e instituciones de microfinanciación de Kenya ofrecieran préstamos a los productores en pequeña escala y por preparar a los agricultores pobres para acceder al crédito mediante el apoyo a la graduación financiera. Existen buenas posibilidades de ampliar estas actividades mientras se hace un seguimiento más riguroso de sus beneficios. Sin embargo, todavía no han logrado concretarse las sinergias previstas entre los proyectos centrados en la financiación rural y los basados en cadenas de valor.
51. La atención prioritaria concedida a las personas pobres dio buenos resultados en los proyectos centrados en cadenas de valor y en la gestión de los recursos naturales, y también en lo que respecta al componente de graduación financiera del proyecto centrado en la financiación rural. Se ha dado especial atención a la perspectiva de género y la aplicación de un enfoque cada vez más transformador. En cambio, no se dio suficiente prioridad a los jóvenes. El FIDA podría haber hecho mayores esfuerzos para centrar la labor en los jóvenes, habida cuenta de que la tasa nacional de desempleo juvenil es dos veces más alta que la de los adultos. Aunque en la última evaluación del programa se había recomendado que se prestara especial atención a las zonas áridas y semiáridas, hasta el momento solo se ha centrado en las zonas semiáridas. Considerando que la labor del FIDA se centra en las cadenas de valor y que todavía no ha podido llegar a los pastores, quizás resulte difícil centrar la labor en las zonas áridas en el marco del objetivo del COSOP de acceso a los mercados. La intervención más reciente (Programa de Desarrollo de Empresas de Acuicultura) sí se centra claramente en las zonas áridas y semiáridas.
52. La gran escala de las operaciones, la complejidad de los proyectos y su amplia cobertura geográfica han consumido los recursos limitados de la oficina del FIDA en el país y dejado poco tiempo para dedicar a las actividades no crediticias. El diálogo sobre políticas se hizo de manera ad hoc, sin un enfoque coherente que saque partido de la cartera de préstamos en su conjunto, manteniendo una cartera de donaciones, de alguna manera, por separado. La labor del FIDA en la esfera de las políticas se ha restringido hasta ahora a la participación activa en grupos de trabajo de donantes y gubernamentales. Existe sin embargo un gran potencial para que el FIDA, a partir de su experiencia sobre el terreno, influya para definir las prioridades de política a escala nacional, así como en sus propias operaciones y las de otros asociados para el desarrollo. La gestión de los conocimientos ha recibido poca atención, el SyE no ha sido lo suficientemente sólido para recopilar información útil y la oficina del FIDA en el país no tiene la capacidad suficiente para combinar los datos de toda la cartera y difundirlos.
53. La elevada rotación de los gerentes del programa en el país y la falta de un seguimiento sistemático de los resultados del COSOP dificultaron la tarea de extracción de enseñanzas. La creación de asociaciones fue más eficaz pero se concentró alrededor de la prestación de servicios para los proyectos; se obtuvieron
EB 2019/128/R.12
xiii
menos resultados con los actores del sector privado. La cofinanciación internacional aumentó en los proyectos más nuevos y existe margen para que siga creciendo en el futuro. Aunque las asociaciones con los organismos con sede en Roma son de creación relativamente reciente, sus posibilidades son prometedoras. Persisten las dificultades para coordinar las actividades sobre el terreno.
V. Recomendaciones 54. Recomendación 1. En vista de la importancia y el volumen de la cartera en
Kenya, asignar la capacidad y los recursos necesarios a las actividades no crediticias. Como se había recomendado en la anterior evaluación del programa, en esta EEPP se destaca la necesidad de una actuación que vaya más allá de las actividades crediticias, en reconocimiento de: i) el papel de Kenya como centro nodal para los asociados internacionales para el desarrollo, y ii) el volumen de las inversiones del FIDA en el país. En el próximo COSOP deberán definirse esferas específicas para la actuación en materia de políticas junto con una estrategia viable y recursos financieros y humanos destinados a tal efecto. Se requiere por tanto contratar personal adicional con las competencias técnicas necesarias para la oficina del FIDA en el país. Las esferas de actuación en materia de políticas deberán basarse en la ventaja comparativa del FIDA en el sector rural y en su prolongada experiencia sobre el terreno. Se prevé que los conocimientos especializados de que dispone el nuevo Centro de África Oriental y el Océano Índico del FIDA, con sede en Nairobi, servirán para apoyar dicha actuación. Se necesitan más inversiones de donaciones y préstamos para inventariar experiencias y análisis de modelos eficaces que puedan servir de base para las operaciones de préstamo. Además, como parte del examen anual de la cartera, se deberán adoptar mecanismos para facilitar el traspaso de enseñanzas entre los proyectos y las actividades no crediticias. Se deberá procurar hacer un mayor uso de las plataformas de intercambio de conocimientos (dentro del FIDA y con otros asociados para el desarrollo) y contribuir de manera más activa a sus contenidos; el FIDA deberá tratar de integrar mejor sus sistemas de SyE con los sistemas de Kenya (tanto el nacional como el de los condados) y trabajar más estrechamente con asociados como la FAO.
55. Recomendación 2. Aprovechar la ventaja comparativa del FIDA y mantener la atención en esferas y zonas geográficas determinadas. Todavía quedan tareas pendientes en las esferas donde la labor del FIDA ha tenido resultados positivos en el pasado. Las esferas centrales de la cartera del FIDA deberán seguir siendo la gestión de los recursos naturales, el cambio climático, las cadenas de valor y la financiación rural. El Fondo deberá concentrarse en consolidar sus logros (por ejemplo, afianzar el acceso a los mercados), definir y fortalecer los vínculos (por ejemplo, entre la financiación rural y las cadenas de valor) y aumentar el alcance inclusivo (por ejemplo, con los jóvenes). Deberá reducir la cobertura geográfica y centrarse más en determinados condados de las zonas semiáridas. Tendrá asimismo que seguir trabajando en los sitios donde ha forjado buenas relaciones y donde sus actividades puedan asimilarse en los planes de desarrollo integrado de los condados. Para garantizar una selección rigurosa, el FIDA deberá dialogar con el Gobierno para que este armonice sus exigencias con la ventaja comparativa del FIDA en Kenya.
56. Recomendación 3. Dar respuesta a problemas institucionales y relativos al diseño que ocurren con frecuencia y socavan la eficiencia del programa en el contexto del proceso de transferencia de competencias en curso. Se deberán extraer enseñanzas de la experiencia con diseños de proyectos demasiado ambiciosos y complejos. Es preciso que los diseños sean realistas y viables y estén apoyados en un análisis profundo de los aspectos técnicos e institucionales. Habida cuenta de la complejidad de la cartera y de los limitados recursos de que dispone la oficina del FIDA en el país, los aspectos que causan ineficiencia en la gestión de los proyectos deberán abordarse por medio de marcos temporales más realistas y una
EB 2019/128/R.12
xiv
secuencia más apropiada de las actividades. Ello permitirá el tiempo suficiente para concertar asociaciones, contratar personal y realizar estudios de referencia. En lo que cabe al FIDA, deberá tratar de reducir las demoras en los desembolsos de los préstamos; el Gobierno, por su parte, deberá contratar personal de proyectos y ser más expeditivo a la hora de conferir autorización para efectuar gastos. Los controles fiduciarios deberán mantenerse en unidades de gestión de proyectos pequeñas pero dotadas de las capacidades necesarias; al mismo tiempo, se deberá lograr una mayor integración con los sistemas gubernamentales transferidos (financiero, de planificación, de adquisiciones y contrataciones y de SyE). Sería oportuno que los condados mostraran un mayor sentido de apropiación; este podría fomentarse mediante la participación desde el momento mismo en que se diseña y pone en marcha el proyecto (por ejemplo, hacer más inclusivas las instancias de puesta en marcha). Se deberá velar por que los proyectos respaldados por el FIDA se incluyan en los planes de desarrollo integrado de los condados y por que se adopte un nivel adecuado de cofinanciación en los presupuestos de los gobiernos de los condados. El FIDA y el Gobierno de Kenya deberán evaluar el rendimiento económico y el uso óptimo de los recursos de forma más rigurosa, particularmente en el caso de los proyectos centrados en cadenas de valor.
57. Recomendación 4. En consonancia con la planificación estratégica del Gobierno de Kenya, crear espacio y oportunidades para fomentar la participación del sector privado. El éxito de los proyectos centrados en cadenas de valor y en la financiación rural dependerá en gran medida de la participación de actores del sector privado. La estrategia del Gobierno nacional (Big Four Agenda) prevé que el sector privado aporte un volumen importante de financiación para impulsar la economía rural. En los proyectos de cadenas de valor, la introducción de mejoras en el suministro de insumos, crédito e infraestructura relacionada con los mercados (por ejemplo, almacenes) puede contribuir a potenciar el papel del sector privado. El FIDA tendrá que asumir un papel de intermediario más activo entre los grupos de agricultores y los asociados del sector privado. Las asociaciones entre el sector público, el sector privado y los productores necesitarán estrategias donde se definan y dispongan medidas para mitigar los riesgos y costos de transacción para todas las partes interesadas.
Appendix I EB 2019/128/R.12
1
Appendix
I
EC 2
019/1
04/W
.P.5
/Rev.1
Agreement at Completion Point
Introduction
1. In line with the International Fund for Agricultural Development (IFAD) Evaluation
Policy and as approved by the 116th Session of the IFAD Executive Board, the
Independent Office of Evaluation (IOE) undertook a country strategy and
programme evaluation (CSPE) in Kenya. This is the second country programme
evaluation (CPE) conducted by IOE in Kenya; the first CPE was finalised in 2011.
2. The main purpose of this evaluation is to assess the results and performance of the
country strategic opportunity programmes (COSOPs) since 2011 and to generate
findings, conclusions and recommendations for the upcoming COSOP to be
prepared in 2019.
3. The scope of this CSPE covers the IFAD-supported activities conducted since 2011,
when the current COSOP was presented to the Executive Board. The CSPE covers
the lending and non-lending activities (knowledge management, partnership-
building, and country-level policy engagement), including grants, as well as country
programme and COSOP management processes.
4. The main mission took place from 4 to 25 June 2018. Field visits were undertaken
by three teams to five counties (Nakuru, Kisii, Nyamira, Embu and Kitui). Focus
group discussions were held on three thematic areas: value chains, natural
resource management and youth in agriculture.
5. The CSPE concluded with a National Workshop on 5 December in Nairobi, where
findings, conclusions and recommendations were discussed with a larger group of
stakeholders, including Government representatives, implementing partners, civil
society organizations and international development partners.
6. The Agreement at Completion Point (ACP) reflects commitment of the Government
of Kenya and IFAD Management of the main CSPE to adopt and implement the
CSPE recommendations within specific timeframes. The implementation of the
agreed actions will be tracked through the Presidents Report of the Implementation
Status of Evaluation Recommendations and Management Actions (PRISMA), which
is presented to the IFAD Executive Board on an annual basis by the Fund's
Management.
7. The ACP is signed by the Government of Kenya (represented by the Cabinet
Secretary of the National Treasury and Planning) and IFAD Management
(represented by the Associate Vice President of the Programme Management
Department. The signed ACP will be submitted to the Executive Board of IFAD as
an annex to the new COSOP for Kenya.
Recommendations
8. Recommendation 1. Consistent with the importance and size of the Kenya
portfolio, commit sufficient effort and resources to non-lending activities.
In line with the recommendations from the last CPE, this CSPE highlights the need
for engagement beyond lending, recognising the significance of Kenya as a hub for
international development partners and the size of IFAD's investment in the
country. The next COSOP should define specific areas for policy engagement
together with an actionable strategy and dedicated (financial and human)
resources. This means that additional staff with relevant technical skills will need to
be added to the IFAD country office. Areas for policy engagement need to build on
IFAD's comparative advantage in the rural sector and its long-standing experiences
on the ground. It is expected that policy engagement will also benefit from the
expertise available within the new Eastern Africa and Indian Ocean Hub of IFAD,
based in Nairobi. Greater investment from loans and grants is needed to take stock
of experiences and analysis of successful models that can effectively inform the
Appendix I EB 2019/128/R.12
2
Appendix
I
EC 2
019/1
04/W
.P.5
/Rev.1
lending operations. In addition, mechanisms for cross-learning between projects
and non-lending activities should be adopted as part of the annual portfolio review.
More active contribution to and use of knowledge sharing platforms (within IFAD
and with other development partners) should be pursued, and IFAD should work to
better integrate its M&E systems with national systems (NIMES, CIMES) as well
with close partners such as FAO.
9. Recommendation 2. Build on IFAD's comparative advantage and retain
focus on selected themes and geographic areas. There is still "unfinished
business" in the areas where IFAD has successfully worked in the past. IFAD's
portfolio should continue its focus on NRM, value chains and rural finance. It should
concentrate on consolidating its achievements (e.g. by strengthening market
access), identify and strengthen linkages (e.g. between rural finance and value
chains), and deepen inclusive outreach (e.g. to youth). Geographic stretch should
be reduced through greater focus on selected counties in semi-arid areas. IFAD
should build on places where it has established good relations and the County
Integrated Development Plans can integrate IFAD activities. To ensure stringency in
its selectivity, IFAD should dialogue with the Government on aligning its requests
with IFAD's comparative advantage in Kenya.
10. Recommendation 3. Address recurrent design and institutional issues
undermining programme efficiency within the context of the ongoing
devolution process. Lessons from overambitious and overly complex project
designs have yet to be learned. Designs need to be realistic and implementable,
supported by sound technical and institutional analysis. Given the complexity of the
portfolio and the limited resources of IFAD’s country office, inefficiencies in project
management should be addressed by more realistic timeframes and better
sequencing of activities. This would allow sufficient time to establish partnerships,
recruit staff and conduct baselines. From IFAD’s side, it should aim to reduce loan
disbursement delays; from the Government’s side, it should recruit project staff
and set up Authority to Incur Expenditures in a more timely manner. Fiduciary
controls should be retained in small but capable Project Management Units while at
the same time seeking greater integration with devolved government planning,
financial procurement and M&E systems. Greater ownership at county level is
desirable and could be fostered through participation right from project design and
start-up (e.g. inclusive project launches). IFAD-supported projects should make
sure that they are included in the County Integrated Development Plans and that
county government budgets assume an appropriate level of co-financing. IFAD and
the Government should assess economic return and value for money more
rigorously particularly for value chain projects.
11. Recommendation 4. In line with the Government's strategic planning,
create space and opportunities for engaging the private sector. The success
of the value chain and rural finance projects will depend to a large extent on the
involvement of private sector players. Within the Government’s strategy (Big Four)
the private sector is expected to contribute significant financing to drive the rural
economy. In the value chain projects, the role of the private sector could be
enhanced through improved supply of inputs, credit and market-related
infrastructure (e.g. warehouses). IFAD will need to play a stronger brokering role
between farmer groups and private sector partners. The public-private-producer
partnerships will require strategies to identify and mitigate the risks and
transaction costs for all stakeholders.
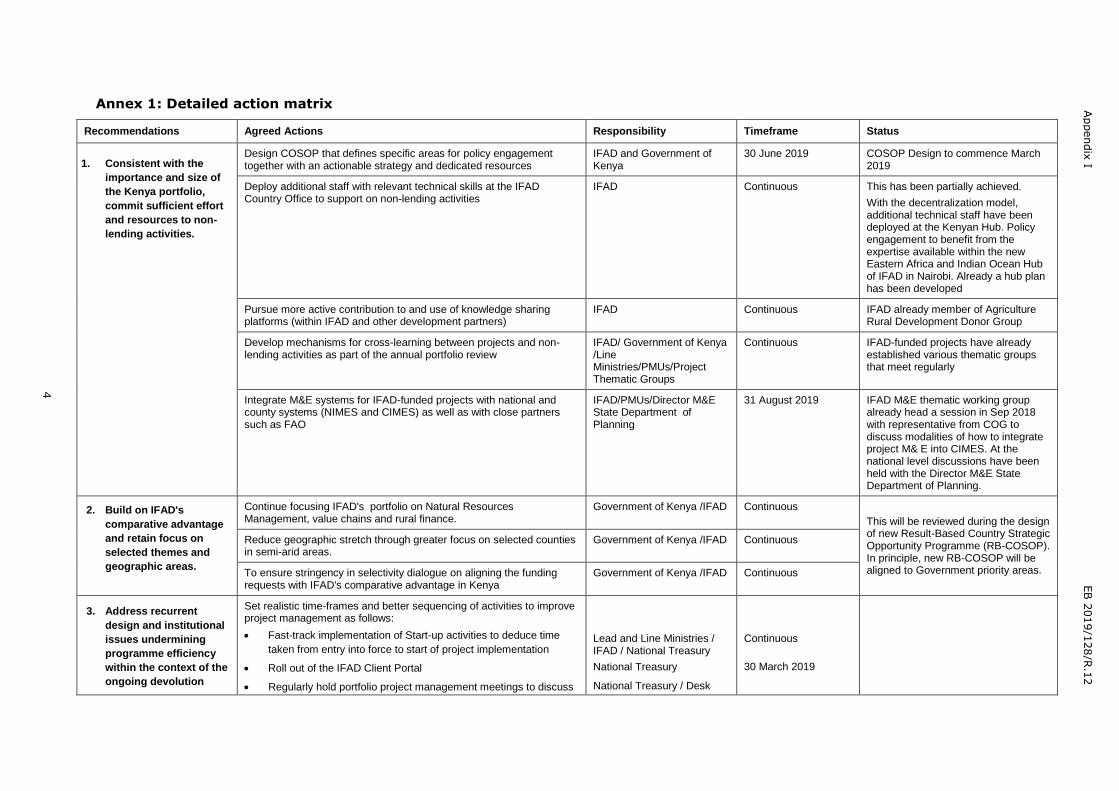
12. Refer to annex 1: Detailed Action Matrix for agreed actions, responsible
partners and timeline.
Appendix I EB 2019/128/R.12
3
Appendix
I
EC 2
019/1
04/W
.P.5
/Rev.1
Signed by:
4
Appendix
I
EB 2
019/1
28/R
.12
Annex 1: Detailed action matrix
Recommendations Agreed Actions Responsibility Timeframe Status
1.
1. Consistent with the
importance and size of
the Kenya portfolio,
commit sufficient effort
and resources to non-
lending activities.
Design COSOP that defines specific areas for policy engagement together with an actionable strategy and dedicated resources
IFAD and Government of Kenya
30 June 2019 COSOP Design to commence March 2019
Deploy additional staff with relevant technical skills at the IFAD Country Office to support on non-lending activities
IFAD Continuous This has been partially achieved.
With the decentralization model, additional technical staff have been deployed at the Kenyan Hub. Policy engagement to benefit from the expertise available within the new Eastern Africa and Indian Ocean Hub of IFAD in Nairobi. Already a hub plan has been developed
Pursue more active contribution to and use of knowledge sharing platforms (within IFAD and other development partners)
IFAD Continuous IFAD already member of Agriculture Rural Development Donor Group
Develop mechanisms for cross-learning between projects and non-lending activities as part of the annual portfolio review
IFAD/ Government of Kenya /Line Ministries/PMUs/Project Thematic Groups
Continuous IFAD-funded projects have already established various thematic groups that meet regularly
Integrate M&E systems for IFAD-funded projects with national and county systems (NIMES and CIMES) as well as with close partners such as FAO
IFAD/PMUs/Director M&E State Department of Planning
31 August 2019 IFAD M&E thematic working group already head a session in Sep 2018 with representative from COG to discuss modalities of how to integrate project M& E into CIMES. At the national level discussions have been held with the Director M&E State Department of Planning.
2. Build on IFAD's
comparative advantage
and retain focus on
selected themes and
geographic areas.
Continue focusing IFAD's portfolio on Natural Resources Management, value chains and rural finance.
Government of Kenya /IFAD Continuous
This will be reviewed during the design of new Result-Based Country Strategic Opportunity Programme (RB-COSOP). In principle, new RB-COSOP will be aligned to Government priority areas.
Reduce geographic stretch through greater focus on selected counties in semi-arid areas.
Government of Kenya /IFAD Continuous
To ensure stringency in selectivity dialogue on aligning the funding requests with IFAD's comparative advantage in Kenya
Government of Kenya /IFAD Continuous
3. Address recurrent
design and institutional
issues undermining
programme efficiency
within the context of the
ongoing devolution
Set realistic time-frames and better sequencing of activities to improve project management as follows:
Fast-track implementation of Start-up activities to deduce time
taken from entry into force to start of project implementation
Roll out of the IFAD Client Portal
Regularly hold portfolio project management meetings to discuss
Lead and Line Ministries / IFAD / National Treasury
National Treasury
National Treasury / Desk
Continuous
30 March 2019
Appendix
I
EB 2
019/1
28/R
.12
5
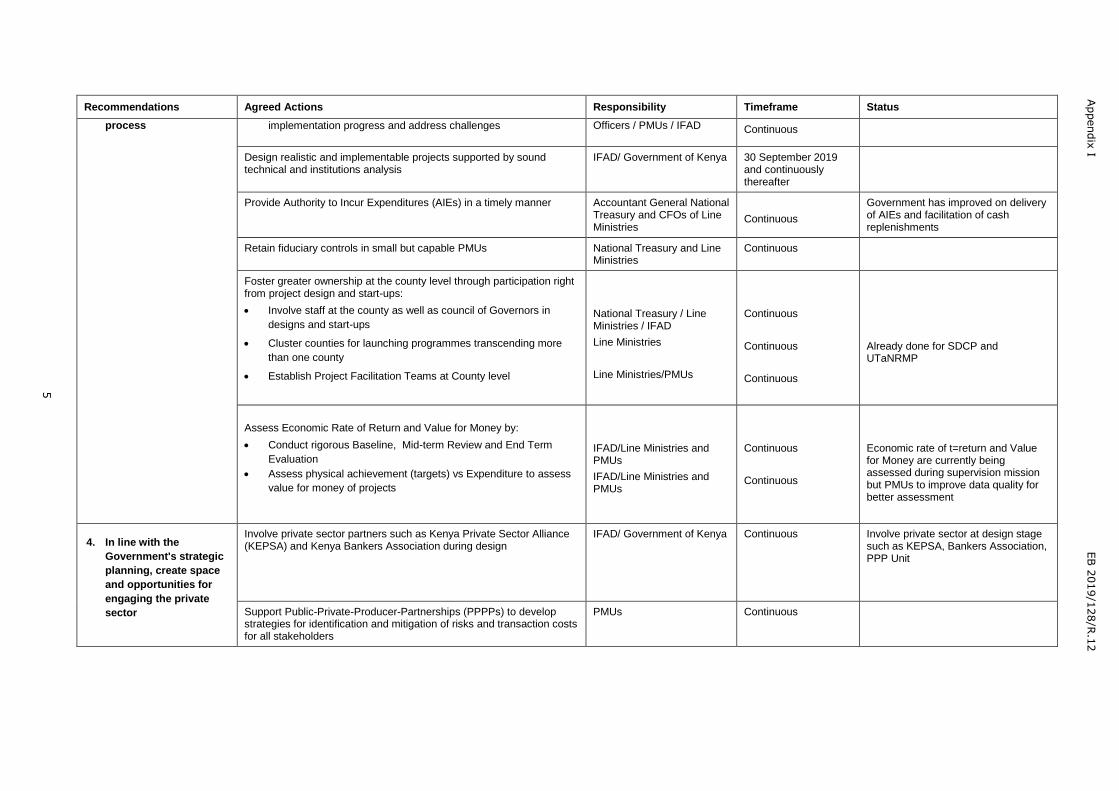
Recommendations Agreed Actions Responsibility Timeframe Status
process
implementation progress and address challenges Officers / PMUs / IFAD Continuous
Design realistic and implementable projects supported by sound technical and institutions analysis
IFAD/ Government of Kenya 30 September 2019 and continuously thereafter
Provide Authority to Incur Expenditures (AIEs) in a timely manner Accountant General National Treasury and CFOs of Line Ministries
Continuous
Government has improved on delivery of AIEs and facilitation of cash replenishments
Retain fiduciary controls in small but capable PMUs National Treasury and Line Ministries
Continuous
Foster greater ownership at the county level through participation right from project design and start-ups:
Involve staff at the county as well as council of Governors in
designs and start-ups
Cluster counties for launching programmes transcending more
than one county
Establish Project Facilitation Teams at County level
National Treasury / Line Ministries / IFAD
Line Ministries
Line Ministries/PMUs
Continuous
Continuous
Continuous
Already done for SDCP and UTaNRMP
Assess Economic Rate of Return and Value for Money by:
Conduct rigorous Baseline, Mid-term Review and End Term
Evaluation
Assess physical achievement (targets) vs Expenditure to assess
value for money of projects
IFAD/Line Ministries and PMUs
IFAD/Line Ministries and PMUs
Continuous
Continuous
Economic rate of t=return and Value for Money are currently being assessed during supervision mission but PMUs to improve data quality for better assessment
4. In line with the
Government's strategic
planning, create space
and opportunities for
engaging the private
sector
Involve private sector partners such as Kenya Private Sector Alliance (KEPSA) and Kenya Bankers Association during design
IFAD/ Government of Kenya Continuous
Involve private sector at design stage such as KEPSA, Bankers Association, PPP Unit
Support Public-Private-Producer-Partnerships (PPPPs) to develop strategies for identification and mitigation of risks and transaction costs for all stakeholders
PMUs Continuous
Appendix II EB 2019/128/R.12
6
Republic of Kenya Country strategy and programme evaluation
Contents
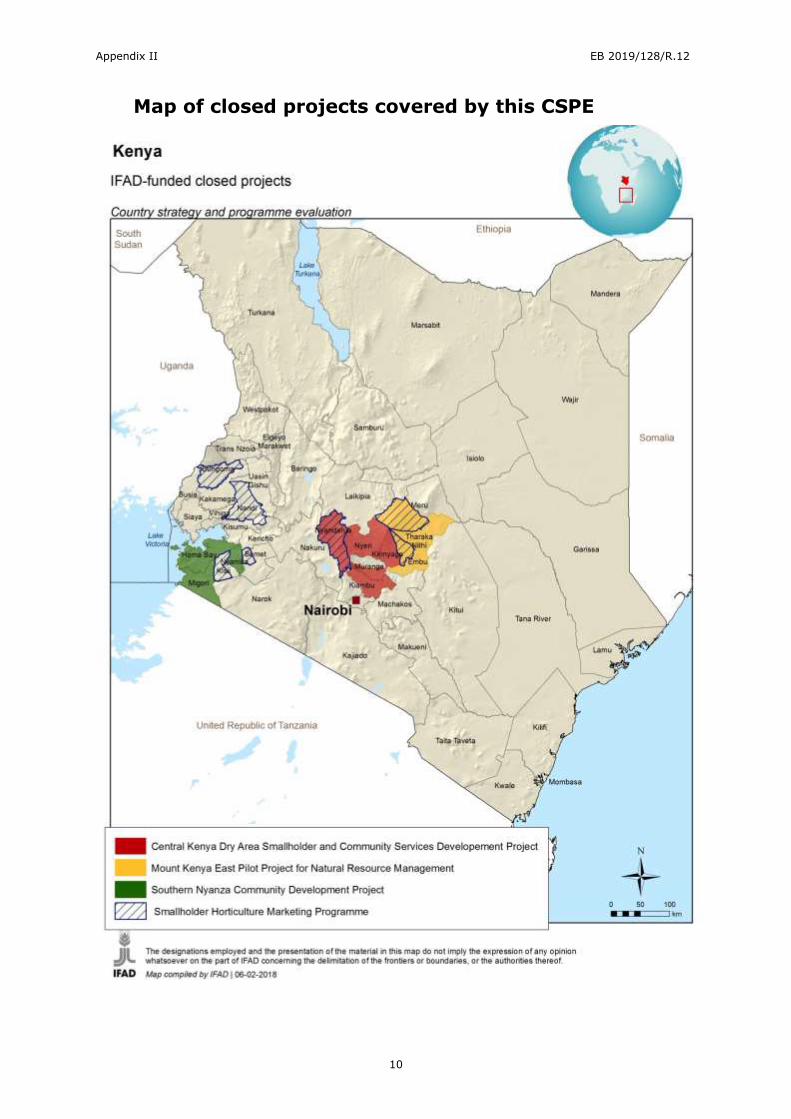
Map of closed projects covered by this CSPE 10
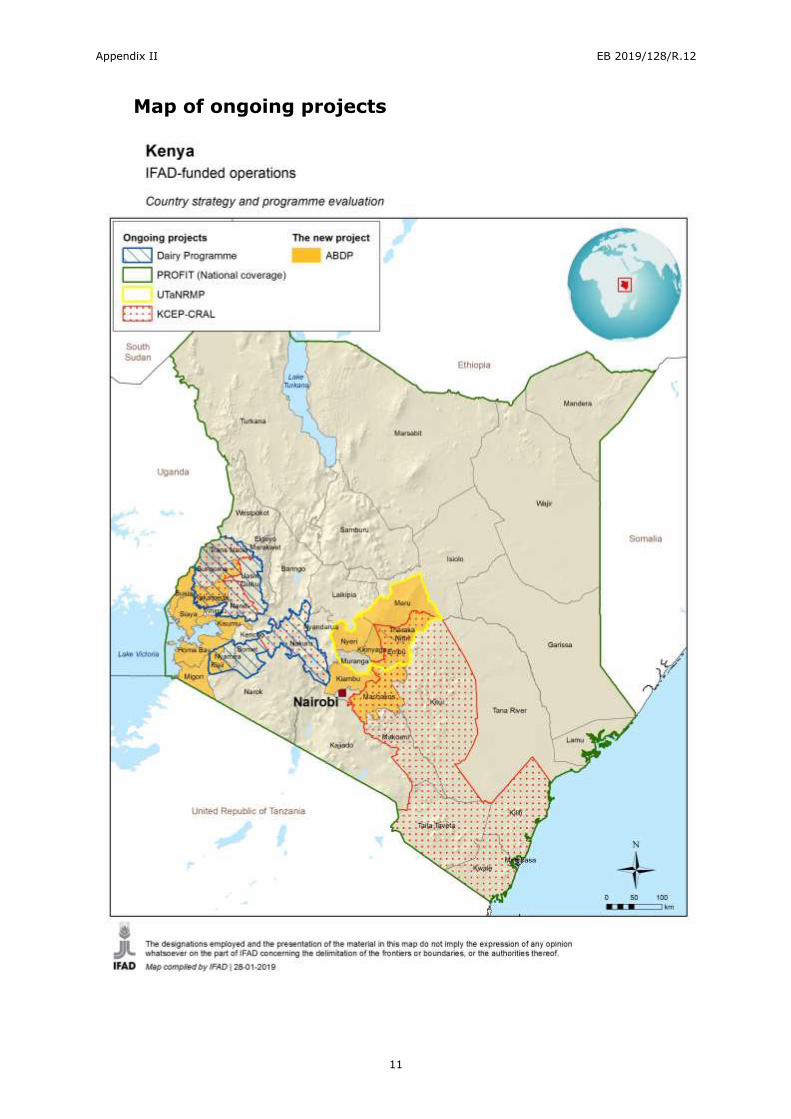
Map of ongoing projects 11
I. Background 12 A. Introduction 12 B. Objectives, scope and methodology 12
II. Country context and IFAD's strategy and operations for the CSPE period 17 A. Country context 17 B. IFAD's strategy and operations for the CSPE period 25
III. Lending portfolio 30 A. Performance and impact 30 B. Other performance criteria 58 C. Overall portfolio performance 65
IV. Non-lending activities 67 A. Knowledge management 67 B. Partnership-building 68 C. Policy engagement 70 D. Grants 71
V. Performance of partners 76 A. IFAD 76 B. Government 77
VI. Country programme and strategy performance 81 A. Relevance 81 B. Effectiveness 83
VII. Conclusions and recommendations 87 A. Conclusions 87 B. Recommendations 89
Annexes
I. Definition of the evaluation criteria used by IOE 91 II. Ratings of IFAD lending portfolio in Kenyaa 93 III. Final ratings of the country strategy and programme in Kenya 94 IV. IFAD-financed projects in Kenya 95 V. Sampled IFAD-funded grants in Kenya 98 VI. List of key people met 100 VII. Supporting Tables and Figures 106 VIII. Evaluation framework – lending portfolio 116 IX. Evaluation framework – non-lending activities 127 X. Smallholder Dairy Commercialization Programme: mini survey 132 XI. Asset verification results 134 XII. Effectiveness – analysis of project outcomes and results 135 XIII. Theory of change 152 XIV. COSOP Recommendations Follow Up. 153 XV. List of Partners in IFAD Kenya Projects 155 XVI. Bibliography 157
Appendix II EB 2019/128/R.12
7
Working paper
Report on mini survey of the Smallholder Dairy Commercialization Programme (available
on request from IOE).
Appendix II EB 2019/128/R.12
8
Currency equivalent
Currency unit = Kenyan Shilling (KES)
US$1.00 = KES 100.81 (1 April 2018)
Abbreviations and acronyms ABDP Aquaculture Business Development Programme
AfDB African Development Bank
AGRA Alliance for a Green Revolution in Africa
AIE authority to incur expenditure
AFC Agricultural Finance Corporation
ASALs arid and semi-arid lands
ASDS Agricultural Sector Development Strategy
AWPB Annual Workplan and Budget
BSS business service support
CAADP Comprehensive Africa Agriculture Development Programme
CAP community action plan
CDD Community-driven development
CETRAD Centre for Training and Integrated Research in ASAL Development
CFA community forest association
CFSA community financial service association
CGIAR Consultative Group for International Agricultural Research
CIDP County Integrated Development Plan
CIG community interest group
CIMES County Integrated Monitoring and Evaluation System
CKDAP Central Kenya Dry Area Smallholder and Community Services
Development Project
COSOP country strategic opportunities programme
CPE country programme evaluation
CPM country programme manager
CPMT country programme management team
CSPE country strategy and programme evaluation
DTM deposit-taking micro-bank
EU European Union
FAO Food and Agriculture Organization of the United Nations
FDA focal development area
FDAC focal development area committee
GEF Global Environment Facility
GRIPS Grants and Investment Projects System
IA impact assessment
ICO IFAD country office
IE impact evaluation
IOE Independent Office of Evaluation of IFAD
KCEP-CRAL Kenya Cereal Enhancement Programme – Climate Resilient
Agricultural Livelihoods Window
KDB Kenya Dairy Board
KFS Kenya Forestry Service
KMD Kenya Meteorology Department
KWFT Kenya Women’s’ Financial Trust
KWS Kenya Wildlife Service
M&E monitoring and evaluation
MFB microfinance bank
MFI microfinance institution
MKEPP Mount Kenya East Pilot Project for Natural Resource Management
MTP medium term plan
MTR mid-term review
Appendix II EB 2019/128/R.12
9
NDMA National Drought Management Authority
NGO non-governmental organization
NIMES National Integrated Monitoring and Evaluation System
NRM natural resources management
NPSDNKAL National Policy for the Sustainable Development of Northern Kenya
and other Arid Lands
ODA official development assistance
OECD Organisation for Economic Co-operation and Development
PCRV project completion report validation
PCU project coordination unit
PFI private financial institution
PMU project management unit
PRESA Pro-poor Rewards for Environmental Services in Africa
PROFIT Programme for Rural Outreach of Financial Innovations and
Technologies
REACTS Regional East African Community Trade in Staples Project
RIMS Results and Impact Management System
RSF risk-sharing facility
SACCO savings and credit cooperative organization
SDCP Smallholder Dairy Commercialization Programme
SHoMAP Smallholder Horticulture Marketing Programme
SME small and medium enterprise
SNCDP Southern Nyanza Community Development Project
USAID United States Agency for International Development
UTaNRMP Upper Tana Catchment Natural Resource Management Project
UTNWF Upper Tana Nairobi Water Fund
WFP World Food Programme
WRMA Water Resources Management Authority
WRUA water resource users’ association
WUA water user association
Appendix II EB 2019/128/R.12
10
Map of closed projects covered by this CSPE
Appendix II EB 2019/128/R.12
11
Map of ongoing projects
Appendix II EB 2019/128/R.12
12
Republic of Kenya Country strategy and programme evaluation
I. Background
A. Introduction
1. In line with the International Fund for Agricultural Development (IFAD) Evaluation
Policy1 and as approved by the 116th Session of the IFAD Executive Board, the
Independent Office of Evaluation (IOE) undertook a country strategy and
programme evaluation (CSPE) in Kenya. This is the second country programme
evaluation (CPE) conducted by IOE in Kenya; the first CPE was finalized in 2011.
2. This report presents the findings of the CSPE. It contains a summary of background
information on the country and IFAD-supported portfolio that was evaluated. The
next section outlines the evaluation objectives, methodology, process and time
frame.
3. The CSPE benefited from other IOE evaluations that have covered Kenya. This
includes the project completion review validations (PCRVs) for the four closed
projects and the impact evaluation of a recently closed project, as well as a country
study as part of the 2016 corporate-level evaluation on decentralization.
Table 1 A snapshot of IFAD operations in Kenya since 1979
First IFAD-funded project 1979
Number of approved loans 18
Ongoing projects 4
Total amount of IFAD lending
US$376.3 million
Counterpart funding (Government and beneficiaries)
US$205.7 million
Domestic partner funding US$51.9 million
Co-/parallel financing amount
US$185.4 million
Total portfolio cost US$819.3 million
Lending terms Highly concessional
Main co-financiers World Bank International Development Association (IDA), Spanish Trust Fund, African Development Bank (AfDB). European Union (EU) and Global Environment Fund (GEF) in most recent projects
COSOPs 2002, 2007, 2013
Past cooperating institutions
World Bank; United Nations Office for Project Services (UNOPS)
Country office in Kenya Country office since 2008
Country programme managers
Mutandi Robson (2007-2010); Samuel Wariboko Eremie (2010-2013); Nadine Gbossa (2014-2015); Henrik Franklin (2015-2016); Hani Abdelkader Elsadani Salem (2016-2018); Esther Kasalu-Coffin (2018-present)
Main government partners National Treasury and Planning; Ministry of Agriculture, Livestock, Fisheries and Irrigation; Ministry of Water and Sanitation; Ministry of Environment and Forestry
B. Objectives, scope and methodology
4. Objective. The main objective of this evaluation is to assess the results and
performance of the country strategic opportunities programmes (COSOPs) since
2011 and to generate findings and recommendations for the upcoming results-
Appendix II EB 2019/128/R.12
13
based COSOP to be prepared in 2019. The CSPE identifies the factors that
contributed to the achievement of strategic objectives (SOs) and results, including
the management of project activities by IFAD and the Government.
5. Scope. The CSPE assesses the outcomes, impact and performance of the activities
conducted since 2011, when the current COSOP was presented to the Executive
Board. The CSPE covers the full range of IFAD support to Kenya, including lending
and non-lending activities (knowledge management, partnership-building,
implementation arrangements, and country-level policy engagement), including
grants, as well as country programme and COSOP management processes.
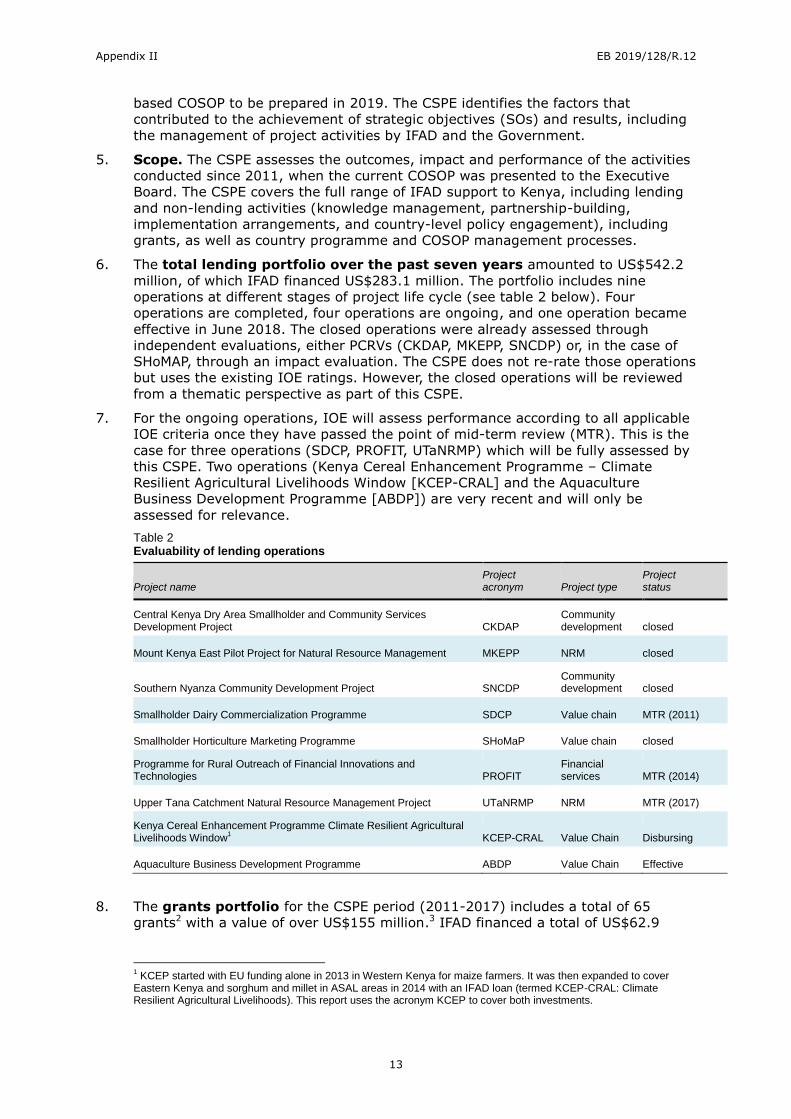
6. The total lending portfolio over the past seven years amounted to US$542.2
million, of which IFAD financed US$283.1 million. The portfolio includes nine
operations at different stages of project life cycle (see table 2 below). Four
operations are completed, four operations are ongoing, and one operation became
effective in June 2018. The closed operations were already assessed through
independent evaluations, either PCRVs (CKDAP, MKEPP, SNCDP) or, in the case of
SHoMAP, through an impact evaluation. The CSPE does not re-rate those operations
but uses the existing IOE ratings. However, the closed operations will be reviewed
from a thematic perspective as part of this CSPE.
7. For the ongoing operations, IOE will assess performance according to all applicable
IOE criteria once they have passed the point of mid-term review (MTR). This is the
case for three operations (SDCP, PROFIT, UTaNRMP) which will be fully assessed by
this CSPE. Two operations (Kenya Cereal Enhancement Programme – Climate
Resilient Agricultural Livelihoods Window [KCEP-CRAL] and the Aquaculture
Business Development Programme [ABDP]) are very recent and will only be
assessed for relevance.
Table 2 Evaluability of lending operations
Project name Project acronym Project type
Project status
Central Kenya Dry Area Smallholder and Community Services Development Project CKDAP
Community development closed
Mount Kenya East Pilot Project for Natural Resource Management MKEPP NRM closed
Southern Nyanza Community Development Project SNCDP Community development closed
Smallholder Dairy Commercialization Programme SDCP Value chain MTR (2011)
Smallholder Horticulture Marketing Programme SHoMaP Value chain closed
Programme for Rural Outreach of Financial Innovations and Technologies PROFIT
Financial services MTR (2014)
Upper Tana Catchment Natural Resource Management Project UTaNRMP NRM MTR (2017)
Kenya Cereal Enhancement Programme Climate Resilient Agricultural Livelihoods Window
1 KCEP-CRAL Value Chain Disbursing
Aquaculture Business Development Programme ABDP Value Chain Effective
8. The grants portfolio for the CSPE period (2011-2017) includes a total of 65
grants2 with a value of over US$155 million.3 IFAD financed a total of US$62.9
1 KCEP started with EU funding alone in 2013 in Western Kenya for maize farmers. It was then expanded to cover
Eastern Kenya and sorghum and millet in ASAL areas in 2014 with an IFAD loan (termed KCEP-CRAL: Climate Resilient Agricultural Livelihoods). This report uses the acronym KCEP to cover both investments.
Appendix II EB 2019/128/R.12
14
million, or 41 per cent. Twenty-six grants were co-financed. Partners such as the
European Union (EU), centres of the Consultative Group for International
Agricultural Research (CGIAR), United Nations (UN) agencies, non-governmental
organizations (NGOs) and national development agencies contributed a total of
US$92.3 million, or 59 per cent, to the grants portfolio.
9. Three grants only were country-specific and two under the GEF window. The largest
country grant in terms of financing was the 2000001524 (Integrated Approach
Programme: Establishment of the Upper Tana Nairobi Water Fund - UTNWF) under
the GEF window, with an overall budget of over US$33 million, including IFAD
financing of US$7.2 million and co-financing by several partners of US$26.4
million.4
10. Thematic issues and CSPE focus. Four thematic areas have been assessed as
part of this CSPE (See box 1 below).
Box 1 Thematic issues
Value chain development. Under the 2013 COSOP, IFAD moved towards adopting a full value chain approach. These covered five projects (SHoMAP, SDCP, KCEP, ABDP and PROFIT). The CSPE reviews whether the adoption of a value-chain approach facilitated more effective use of various support instruments, better private sector involvement, participation of the poor, particularly women and youth. The CSPE findings will also provide input to the ongoing corporate-level evaluation on value chains.
Rural finance. The Kenya country programme has pursued a number of different
approaches to rural finance, with varying levels of success. These covered community financial services associations (CFSAs), through banking intermediaries such as Equity Bank, and leveraged commercial funds for small-scale producers and agro-dealers. The CSPE reviews the relevance and effectiveness of the different intervention models.
PROFIT provides an interesting case on how to address challenges within the institutional and policy frameworks which will also inform the ongoing IOE evaluation synthesis on
inclusive rural services.
Natural resources management and climate change. The CSPE reviews to what extent the synergies between the MKEPP and UTaNRMP were realized and led to a more sustainable management of land and water resources. Climate change in Kenya has resulted in increasing occurrence of extreme weather effects of drought, erratic rainfall, and floods. IFAD supported various activities to mitigate the effects of climate change, and the CSPE will review the extent to which IFAD-supported interventions have
contributed to greater resilience in agricultural livelihoods. Recently, Adaptation for Smallholder Agriculture Programme (ASAP) financing has been included in the KCEP-CRAL.
Implementation arrangements. Issues around multi-tier and multisector implementation arrangements were highlighted by the 2011 CPE. Since then, devolution
has fundamentally transformed the relationship between central government and counties. The CSPE explores under Efficiency how these and other factors have led to
serious start-up delays for most projects in the portfolio and what solutions may be found.
11. Methodology. The CSPE followed the IFAD Evaluation Policy5 and the IFAD IOE
Evaluation Manual (second edition 2015).6 The approach paper for this CSPE,
2 Grants covered are: (i) those whose date of completion is after 1 January 2011 and date effectiveness is by December
2017; and (ii) those having Kenya among focus countries (this implies that grants having the recipient based in Kenya but not being implemented in the country were not taken into account). Also, grants contributing to finance investment projects were not included. 3 For grants in EUR, amounts were converted in US$ using the exchange rate at 10/01/2018.
4 Financiers include: The Nature Conservancy, beneficiaries, the private sector and local NGOs.
5 http://www.ifad.org/pub/policy/oe.pdf.
Appendix II EB 2019/128/R.12
15
including the evaluation framework and key issues for focus, served as a further
and specific guidance for the exercise. The evaluation was multi-level, examining
individual operations, the portfolio as a whole (lending and non-lending) and the
broader country strategy in terms of adherence to the last COSOP and pursuit of
IFAD’s corporate goals.
12. An evaluation framework was prepared (annexes VII and VIII) in order to guide
the collection of evidence from documents, interviews, focus groups and
observation. The framework includes the common IOE evaluation criteria, and
covered three areas: lending, non-lending and COSOP. The loan projects are
assessed using the common IOE evaluation criteria.7 For the non-lending activities,
performance on policy engagement, partnerships and knowledge management are
assessed and rated separately and an overall rating given. Performance of partners
(IFAD, Government) is assessed and rated. Finally, the findings from the three
building blocks are synthesised as country strategy and programme performance
and overall ratings for relevance and effectiveness are awarded.
13. Sampling grants. The CSPE identified a sample of 21 grants for close review (see
annex V for the list of grants considered for the analysis). The selection criteria for
inclusion were: (i) thematic focus (coverage of main themes, relevance for the
COSOP or IFAD’s strategies); (ii) linkages with the investment portfolio; and (iii)
implementation period (recent, ongoing and closed grants, or grants covering more
than one phase). Criteria for exclusion were: (i) implementation period (too old or
too recent grants); (ii) financing (non-IFAD-financed grants); and (iii) availability of
information.
14. Field assessments. During the field visits, the CSPE team collected data through
interviews, group discussions and site checks. In addition the CSPE used
standardized data collection tools covering a wider sample of communities. The
asset verification exercise involved recording the condition of assets and the
level of use and ownership by the beneficiaries using a standard format. A total of
25 assets were assessed across six projects by the team (annex XI). A telephone
survey was conducted of a sample of dairy groups supported by SDCP to collect
contemporary data on group membership and finances, milk production, herd
statistics and assets. A total of 118 groups were interviewed across nine counties.
Annex X contains the results. These tools enabled triangulation and generalization
of findings.
15. Process. The CSPE started with a preparatory mission in March 2018 and the
development of an approach paper based on document review. Annex XIV contains
a list of selected documents. The main mission then took place from 4 to 25 June.
A kick-off meeting with staff of the project coordination unit (PCU) was held on 6
June. Field visits were undertaken by three teams to five counties.8 In each county,
the team interacted with key stakeholders, including county and IFAD project staff,
farmer organizations and individual farmers. Three focus group discussions were
held on three thematic areas: value chains, natural resources management (NRM)
and youth in agriculture. Annex VI presents a list of people met. The team
presented emerging findings at a wrap-up meeting on 25 June, chaired by the
National Treasury and attended by representatives of relevant agencies and IFAD
staff.
6 http://www.ifad.org/evaluation/process_methodology/doc/manual.pdf.
7 The 2017 Agreement between IFAD Management and IOE on the Harmonization of IFAD’s independent evaluation
and self-evaluation methods and systems establishes the most up-to-date set of evaluation criteria. IFAD. 2017. Annex I p. 5. 8 Nakuru, Kisii, Nyamira, Embu and Kitui – covering both closed (SNCDP, MKEPP) and ongoing projects (UTaNRMP,
SDCP and KCEP).
Appendix II EB 2019/128/R.12
16
16. Following internal review, this draft CSPE report was presented at a national
workshop in Kenya in December 2018. Key points emerging from the discussion are
included in the Agreement at Completion Point (ACP). The ACP will be attached to
the forthcoming Kenya COSOP that will run from 2019 to 2022. IOE presented the
final CSPE report, which incorporated comments from the Government and IFAD, to
the Evaluation Committee in 2019. The entire CSPE process was conducted in close
consultation with stakeholders in Kenya and IFAD’s Programme Management
Department.
17. Limitations. During field visits, county coverage was reasonable based on
purposive sampling of both medium- to high-potential and ASAL areas, but greater
time would have allowed more comprehensive coverage of areas supported by
CKDAP, KCEP-CRAL and MKEPP.
18. There were challenges in accessing reliable data from project monitoring and
evaluation (M&E) systems and the COSOP review process. For example, while sex-
disaggregated data are often reported by project completion, they are not always
captured early on in progress reporting. Comparable financial data from the banks
and credit agencies under PROFIT contained major gaps. The quality of reporting
on gender issues in IFAD missions has been mixed.9 This limits the analysis of data
and the timely visibility of gender issues in implementation.
Key points
This is the second CSPE for Kenya covering two COSOPs (2007 and 2013). The first CPE was completed in 2011
The portfolio reviewed includes four completed operations, four ongoing operations and one operation recently effective, as well as 65 grants. Four themes were
examined: value chains, rural finance, NRM and climate change, and implementation.
The CSPE field mission took place in June and five counties were visited.
There were a number of limitations to the evaluation, including limited field time and access to reliable data.
9 When a gender and social inclusion expert is present on the missions, reporting is exemplary. However, most
missions have not included an expert, and reporting on gender has been incomplete. A gender and social inclusion expert was present on only 4 of the 15 missions for SDCP, 2 or the 14 missions for SHoMAP and 3 of the 14 missions for PROFIT. UTaNRMP is the notable exception, with a gender and social inclusion specialist on 5 of the 7 missions and high-quality reporting on gender issues.
Appendix II EB 2019/128/R.12
17
II. Country context and IFAD's strategy and operations
for the CSPE period
A. Country context
19. Kenya is an equatorial country in East Africa with a geography that varies from
snow-capped Mount Kenya to fertile farmland, lakes, flat arid plains and desert.
The Rift Valley bisects the country into east and west. Dryland areas, known as the
ASALs, are characterized by low and erratic rainfall. They stretch from the north-
west of Kenya across to the east, making up more than 84 per cent of the country's
total land mass of 571,416km. The remaining land mass is of high and medium
agricultural potential, with adequate and reliable rainfall.
20. Between 2000 and 2016, the Kenyan population steadily increased by around
2.5 per cent, or 1 million annually, from 31.5 million to 48.5 million people.10 The
majority of people live in the central and western regions of medium to high
agricultural potential, while 36 per cent reside in the ASALs.11 Although the
prevalence of poverty is higher in the ASALs, the absolute number of people living
in poverty is higher in the central and western regions.12 In 2016, 36 million
people, representing 74 per cent of the population, inhabited rural areas.13
Although this proportion is decreasing each year, the absolute number of rural
dwellers is increasing.
21. Political risks in Kenya remain ever-present. The country became a multiparty
democracy in December 1991, but it was not until March 2013 that the country
saw a peaceful election. The widely reported 2008 post-election violence saw over
1,000 people die and hundreds of thousands become displaced. Since then,
political elections have been less violent but still surrounded by turmoil. The
current President, Uhuru Kenyatta, was sworn in for a second term at the end of
2017 after initial results were annulled. The repeat elections were boycotted by the
main opposition party and set amid sporadic violence and ethnic tensions. The
growing youth population coupled with its high rate of unemployment represent a
significant risk to socio-political stability. Terrorism has also surfaced with the
Somalia-based Al Shabaab group responsible for the 2013 attack in Westgate in
Nairobi, and the 2015 Garissa University massacre in north-eastern Kenya. Internal
security issues driven by ethnic and political differences as well as prolonged
periods of drought (2008-2011 and 2014-2018) and land tenure insecurity14 led to
the forced displacement of an estimated 138,000 Kenyans at the end of 2016, with
25,000 new internally displaced persons in 2017.15
Economic, agricultural, and rural development processes
22. Kenya became a low middle-income country in September 2014 and is now the
sixth largest economy in sub-Saharan Africa.16 It is a key regional player in East
Africa and a major communications and logistics hub in sub-Saharan Africa. In
2017, gross domestic product (GDP) per capita was US$2,926.17
23. Recent annual economic growth from 2011 to 2016 of between 4.5 and 6 per cent
has made Kenya one of the fastest-growing economies in sub-Saharan Africa.
Growth rates have been volatile, however, ranging between 0.2 per cent in 2008 to
8.4 per cent in 2010.18 The reasons are mainly internal: political instability, which
10
World Bank 2018. 11
Ministry of Devolution and Planning 2016. 12
Kenya National Bureau of Statistics. 2018. 13
World Bank 2018. 14
ODI 2017. 15
Internal Displacement Monitoring Centre 2018. 16
World Bank 2018. 17
World Bank 2018. GDP per capita, purchasing power parity (constant US$2,011). 18
World Bank 2018.
Appendix II EB 2019/128/R.12
18
has affected the tourism sector, and declining private sector access to credit have
limited economic activity; and drought has hindered agricultural output (the single
highest contributor to GDP) and hydropower generation, increased inflation and
reduced household consumption. External factors also play a role, to a lesser
extent: declining agricultural exports and rising capital goods imports (linked to oil
exploration); and food and fuel price rises.19
24. Over the last decade, growth has mainly been driven by services (accounting for 72
per cent of the increase in GDP from 2006 to 201320), namely telecommunications,
finance and tourism.21 However, economic growth has not translated into improved
livelihoods for most Kenyans. Services account for only 29.5 per cent of
employment among those of working age, compared to agriculture and industry,
where growth has slowed, that account for 61.9 per cent and 8.6 per cent of
employment, respectively.22 Other reasons for economic expansion include low oil
prices, strong remittance inflows (2 per cent of GDP, amounting to US$1.7 billion in
201623), and government-led infrastructure development initiatives.24
25. In 2017, over half of the population was of working age and 11 per cent of them
were unemployed.25 Unemployment is decreasing at a slow rate (from 12 per cent
in 2009) and levels remain high. Youth unemployment, at 22 per cent, is double
the overall rate for adults, in part because of a skills gap26 as well as a general lack
of new employment opportunities. The share of the working-age population is
expected to increase to two-thirds by 2050,27 making young women and men an
important cohort in the economy. The majority of youth who are employed work in
the informal sector, which is characterized by job insecurity as well as under-
employment.28 The consequences of youth unemployment, underemployment and
inactivity are migration from rural to urban areas and increased rates of crime,
drug use and general social unrest.29,30 Unemployment, poverty and political
marginalization are also reported to contribute to the radicalization of some of
Kenya's youth.31
26. Most of private sector GDP and employment come from the agriculture sector,
although this is declining relative to the service sector. Private sector exports are
mostly a handful of globally competitive agricultural products (tea, cut flowers and
leguminous vegetables), with limited value addition. Informal small businesses
dominate the sector, employing the majority of workers compared to formal larger
businesses that employ fewer people but generate a much larger output. Persistent
challenges constraining private sector growth include infrastructure, regulation,
security and politics.32 Important reforms have been made in starting a business,
dealing with construction permits, obtaining electricity, accessing credit, paying
taxes and trading across borders.33
27. Agriculture remains the backbone of the economy, employing nearly two-thirds of
the working-age population and providing a livelihood to 70 per cent of rural
inhabitants.34 Despite good growth in some subsectors such as horticulture, overall
19
World Bank 2016; World Bank 2017d. 20
World Bank 2016. 21
ODI 2017. 22
World Bank 2018. 23
World Bank 2018. 24
World Bank 2017c. 25
World Bank 2018. 26
AFDB, UNDP, OECD 2017. 27
World Bank 2012. 28
Brookings 2014. 29
Youth policy 2014 30
Muiya 2018. 31
IRIN 2013. 32
AfDB 2013. 33
World Bank 2017b. 34
ODI 2017; FAO 2018.
Appendix II EB 2019/128/R.12
19
agriculture saw its share of GDP decline from 26.5 per cent in 2006 to 22 per cent
in 2014.35 The crop, livestock, and fishery subsectors contribute 78 per cent, 20
per cent, and 2 per cent to the agricultural GDP, respectively.36 The sector accounts
for 65 per cent of export earnings mainly through tea but also depends on imports,
including wheat, maize and rice.37 Mobile pastoralism dominates the economy in
arid areas, while a more mixed economy is found in the better-watered and better-
serviced semi-arid areas.
28. Kenya has not met either of the Comprehensive Africa Agriculture Development
Programme (CAADP)38 targets: annual growth in agricultural GDP was 4.8 per cent
in 2017 compared to the target of 6 per cent; and the budget allocated to
agriculture has been declining in relative terms since the financial year 2012/13
and is currently set to remain at a low 2 per cent of the national budget (see figure
1 annex VII) compared to the target of 10 per cent set by the Maputo declaration
in 2003.39
29. Farming systems are mainly rain-fed and small scale, with an average of 0.2 to 3
hectares (ha) of land and characterized by mixed crop-livestock systems and
partial commercial production.40 Various challenges, persistent and emerging,
hinder agricultural production and restrict food and nutrition security. Long-lasting
and recurring drought has a devastating effect on the mainly rain-dependent
sector. On the 20 per cent of land that is arable, maximum yields have not been
reached, owing to poor access to basic and improved inputs, modern production
practices, such as irrigation, and financial and extension services.41 The population
increase of over one million people a year has resulted in shrinking land parcels in
high agricultural potential areas, adversely affecting food production. This has also
led to farmers who rely on rain-fed systems being pushed into drier, more marginal
areas that are increasingly vulnerable to drought.42 In 2016, the Fall Army Worm
infestation in major growing regions destroyed thousands of hectares of planted
maize.43
30. Reports suggest that 70 per cent of the livestock herd are found in the ASALs,
providing an important source of livelihood for 90 per cent of the inhabitants of
those areas. Although pastoralists produce the bulk of meat consumed in Kenya,
poor access to inputs such as land, water and veterinary services reduces herd
quality and productivity. The dairy industry is the largest subsector in agriculture,
growing at an estimated 3 to 4 per cent annually and contributing 40 per cent of
agricultural GDP and 4 per cent of national GDP.44 Between 70 and 80 per cent of
the milk is produced by around one million smallholder farmers with mixed crop-
livestock systems.45 Pastoralists produce about 15 per cent of cattle milk, which is
mainly consumed at home. Twenty per cent of milk is produced by a growing group
of medium- to large-scale dairy farms.46
31. Environmental degradation and climate change pose major threats to Kenya's
ecosystems, economic growth and sustainable development. The natural resources
base is under stress from population growth, deforestation, coastal development
and degradation of ecosystems from unsustainable use and poor governance of
35
World Bank 2016. 36
World Bank and Centre for Tropical Agriculture 2015. 37
World Bank and Centre for Tropical Agriculture 2015; FAO 2018. 38
Kenya signed the New Partnership for Africa's Development CAADP Compact on 24 July 2010. 39
This analysis does not consider the proportion of budget allocations to agriculture at individual county levels following devolution. 40
World Bank and Centre for Tropical Agriculture 2015. 41
United States Government 2013. Feed the Future fact sheet. World Bank and Centre for Tropical Agriculture 2015. 42
FAO 2018. 43
World Bank 2017a. 44
(Kenya) Ministry of Livestock Development 2010. 45
(Kenya) Ministry of Livestock Development 2010; FAO 2011b; SNV 2013. 46
SNV 2013.
Appendix II EB 2019/128/R.12
20
resources. The key climate change impacts in the country are drought and water
scarcity, flooding and sea-level rise.47 Increases in temperatures, the frequency of
hot days, precipitation (particularly in the highlands and coastal areas) and dry
spells (in the ASALs) are forecast to continue.48 Resulting adverse impacts affect
hydro-energy generation, agricultural production and food security, forestry, wildlife
and tourism, among others. The negative effects of climate change and rapid
increases in population and the ensuing loss of pasture in pastoral areas have
resulted in conflict over land and water resources. A growing number of pastoralists
have dropped out of nomadic livelihoods and turned to settled communities, where
they are largely dependent on food aid.49
32. The Kenyan financial sector is the most developed in the region, reflected in the
remarkable statistics on financial inclusion. Between 2006 and 2016, adults with
access to formal financial services increased from 26.7 per cent to 75.3 per cent.50
Mobile money services have proved key to furthering financial inclusion, with usage
expanded to 71.4 per cent of the adult population by 2016.51 However, the supply
of formal financial services in the agriculture sector remains low. Indeed, the
remaining 17.4 per cent of people financially excluded are mainly: rural, female
and informally employed or dependent.52 Since 2010, a number of sectoral changes
have occurred that affect the sustainability of financial services. Key among them is
the interest-capping law, which became operational in 2016 and has shifted lending
away from smaller borrowers.53
Poverty characteristics
33. Between 1990 and 2015, Kenya’s Human Development Index value increased by
17.3 per cent to 0.555, positioning it at 146 out of 188 countries and territories.
The Index shows improvements in life expectancy at birth (by 3.4 years) and mean
and expected years of schooling (by 2.6 and 2 years, respectively). Gross national
income per capita increased by about 26 per cent over the same period.54 The
prevalence of adults living with HIV/AIDS also decreased from 10.2 per cent in
2000 to 5.4 per cent in 2016, mainly attributed to the rapid scaling up of HIV
treatment.55 Despite these achievements and good economic growth, poverty still
remains high. Overall poverty at the national level and in rural areas decreased
between 2005/6 and 2015/16 from almost 50 per cent to 36 per cent and 40.1 per
cent of the population, respectively. Given the rapid increase in population over this
period, the decrease in the number of rural people living in poverty was limited to
2.4 million, from 14.1 million to 11.7 million. Importantly, the proportion of rural
people living in extreme poverty halved from 22.3 per cent in 2005/6 to 11.2 per
cent in 2015/16. However, the incidence of poverty varies considerably between
counties.56 Income inequality also remains a major issue. Between 2000 and 2017,
the Gini coefficient steadily increased from 45 to 59.57
34. The Global Hunger Index58 shows that although Kenya made great strides between
1992 and 2017 to improve levels of food security and nutrition, they remain a
serious concern.59 The Government's National Nutrition Action Plan (2012-2017),
47
Kenya's National Climate Change Action Plan (2013). 48
Government of Kenya 2013b. 49
FAO 2018. 50
Central Bank of Kenya, Kenya National Bureau of Statistics and FSD Kenya 2016. 51
AFDB, UNDP, OECD 2017. 52
CGAP 2017. 53
Impact of Interest Rate Capping on Kenya Economy, CBK, March 2018. 54
UNDP 2016. 55
World Bank 2016; AFDB, UNDP, OECD 2017. 56
Kenya National Bureau of Statistics. 2018. 2015/16 Kenya Integrated Household Budget Survey Reports. March 2018. 57
UNDP 2018. 58
The Global Hunger Index is based on the measurement of four indicators - prevalence of undernourishment, child wasting, child stunting and child mortality. 59
UNDP 2016.
Appendix II EB 2019/128/R.12
21
complemented by investments in agriculture, disaster-resilience, food fortification
and other areas, has helped to reduce stunting in under-fives from 35.2 per cent to
26 per cent over that period.60 But with still one quarter of under-fives, mostly in
rural areas, stunted, Kenya has a way to go to reach its nutrition target of 18.1 per
cent by 2025.61 Malnutrition and obesity in adults, from the consumption of foods
low in fibre and high in fats and sugars, are also a concern.62 The current drought
from 2014 to 2018 has worsened the food-security situation in large parts of the
country, particularly in the ASALs, with harvest, livestock and food prices adversely
affected.63 In the first quarter of 2017, 2.7 million people were classified as
severely food-insecure.64
35. Kenya has developed a comprehensive legal, policy and institutional framework to
promote gender equality and women's empowerment.65 66 However, tangible
benefits for most women are yet to be felt, particularly in rural areas. The 2017
Global Gender Gap Index shows that although performance has varied over the last
decade, in the end, Kenya has maintained relatively good levels of equality in
educational attainment and health and survival but made little progress in reducing
inequalities in economic participation and political empowerment.67
36. In smallholder farming, rural women are heavily involved in agricultural production,
processing and marketing, yet they continue to lack access to crucial natural and
productive resources (including land, credit, inputs and markets) compared to men.
For example, they provide 80 per cent of farm labour and manage 40 per cent of
the farms but own roughly 1 per cent of agricultural land and receive 10 per cent of
available credit.68 In addition, the patriarchal culture in some of the communities
perpetuates harmful practices such as gender-based violence, widow inheritance,69
early marriage for girls and female genital-cutting.70
37. Evidence suggests that youth engagement in agriculture is declining despite
rising youth unemployment. Although youth are mainly present in production, they
have lower access than their older counterparts to improved inputs, productive
assets, such as land and credit, extension services, farmer organizations and
markets. Other barriers to youth engagement in agriculture include: their negative
perception of agriculture-based livelihoods; a skills and knowledge gap; limited
participation in agricultural innovations and research; and inadequate support for
youth agri-preneurship.71
38. Long-running security risks in neighbouring countries contribute to the continuing
influx of refugees into Kenya. As of end January 2018, Kenya had 486,460 refugees
and asylum seekers, mainly from Somalia (59 per cent), followed by South Sudan
(23 per cent), the Democratic Republic of Congo (7 per cent) and Ethiopia (5 per
cent). They reside in Dadaab refugee complex (49 per cent), Kakuma camp (38 per
cent) and in urban areas, mainly Nairobi (13 per cent).72 By now they resemble
60
IFPRI 2018; Scaling Up Nutrition 2015; Scaling Up Nutrition 2018. 61
Scaling Up Nutrition 2015. 62
Ministry of Public Health and Sanitation n.d. 63
IFPRI 2018. 64
FAO 2017. 65
Legal ratification of international and regional conventions on gender equality, such as the Convention on the Elimination of all forms of Discrimination against Women and the African Union Solemn Declaration on Gender Equality, the 2010 Constitution of Kenya and the National Policy on Gender and Development (2000). 66
NGEC 2017. 67
World Economic Forum 2017. 68
USAID 2015. 69
Whereby the widow is "inherited" by one of her late husband's relatives (e.g. brother). 70
Katothya 2017. 71
Ministry of Agriculture Livestock and Fisheries 2017. 72
UNHCR 2018a.
Appendix II EB 2019/128/R.12
22
naturally grown towns and have developed into commercial hubs connecting north-
eastern Kenya and southern Somalia.73
Rural governance and rural development policies
39. Kenya became a multiparty democracy in December 1991,74 following internal
and external pressures for greater democratic space. In 2010, a new constitution
came into force that involved: reducing the President's power; abolishing the post
of Prime Minister; expanding the National Assembly (to 350 seats, including special
seats reserved for women); creating a Senate with 68 members; significantly
devolving power to new county authorities; recognizing faith courts; establishing a
bill of rights; and creating a supreme court, a new anti-corruption agency, and an
independent land commission to promote land reform.75
40. Set out by the new constitution, the devolution process to create a two-tier
government has markedly changed political and economic governance in Kenya.
Decision-making power and financial resources for many public services and some
aspects of the business environment have been transferred to 47 county
authorities. The process formally started after the March 2013 elections and aims
to: overcome regional disparities; give more autonomy and power to different
counties and groups; and improve governance (more public participation by, as
well as responsiveness and accountability to, citizens).76 A five-year County
Integrated Development Plan (CIDP) was developed for each county to inform
annual budget priorities. Although counties are reported to have successfully
continued agricultural projects previously funded by the national government,
several shortcomings are reported. These include: low budget allocations to the
sector in general; poor coordination between the national government and the
counties and between the counties themselves; slow legislation of county laws;
human resource constraints; and reduced support services and early warning
systems for farmers.77
41. The Ibrahim Index of African Governance reports that from 2007 to 2016, overall
governance has improved in Kenya, ranking it 13 out of 54 countries in Africa,
with a score of 59.3 out of 100.78 Improvements have been recorded across the
board in safety and rule of law, participation and human rights, sustainable
economic opportunity and human development. Yet, despite efforts by the new
constitution to counter corruption,79 it remains a long-standing and widespread
concern. The 2017 Corruption Perceptions Index80 shows that Kenya's score over
the past five years has been relatively static and still stands at 28, ranking Kenya
143 out of 180 countries.81
42. Civil society comprises a vast number of domestic and international NGOs. It has
historically played an important role in poverty reduction, but its relationship with
the Government has not always been straightforward. Important apex farmer
organizations include the Kenya National Farmers’ Federation, representing 2
million farming families, the Kenya Livestock Producers Association, representing
1.5 million farmers, and the Cereal Growers Associations, representing medium- to
large-scale maize, wheat and barley producers.
Rural development policies
73
UNHCR 2018b. 74
Commonwealth Secretariat 2018. 75
Commonwealth Secretariat 2018. 76
World Bank 2015. 77
Africa Research Institute 2017; Tegemeo Institute of Agricultural Policy and Development 2016; World Bank 2015. 78
Mo Ibrahim Foundation 2017. 79
Transparency International 2017. 80
The Corruption Perceptions Index by Transparency International ranks 180 countries and territories by their perceived levels of public sector corruption according to experts and businesspeople, using a scale of 0 to 100, where 0 is highly corrupt and 100 is very clean. 81
Transparency International 2018.
Appendix II EB 2019/128/R.12
23
43. Vision 2030 provides the long-term development framework from 2008 to 2030.
It aspires to transform Kenya into an industrialized middle-income country where
its citizens can enjoy a high quality of life. There are three pillars of the vision –
economic, social and political governance. The economic pillar aims to achieve and
sustain an economic growth rate of 10 per cent per annum from 2012. Agriculture
is one of the key sectors therein. The social pillar aims to build a just and cohesive
society with social equity, identifying gender, youth and vulnerable groups as
priority issues. The political pillar focuses on public sector reform, including
constitutional reform.82
44. Medium Term Plans (MTPs) operationalize Vision 2030 with key policy actions,
reforms, programmes and projects that the Government will implement. So far,
they include the first MTP (2008 to 2012), the second (2013 to 2017) and now the
third (2018 to 2022), which is currently under development. Under agriculture and
livestock, top priority was given to increasing acreage under irrigation to reduce
dependence on rain-fed agriculture. Other priorities included mechanizing
agricultural production, reviving cooperatives and farmers unions, and subsidizing
farm inputs to raise productivity.83
45. The Agricultural Sector Development Strategy (ASDS), from 2010 to 2020, is
the overall national policy document for the sector. The overall goal is to achieve an
average growth rate of 7 per cent per year over the first five years. The overall
development of the sector is anchored in two strategic thrusts: increasing
productivity, commercialization and competitiveness of agricultural commodities
and enterprises; and developing and managing key factors of production.84 The
ASDS is the umbrella document for many other national strategies, policies and
legislation in the sector.85 The ASDS is currently under review, with the intention of
being renamed the Agricultural Sector Transformation and Growth Strategy
(ASTGS) 2018-2028.86
46. Kenya signed the CAADP Compact87 in July 2010. CAADP initiatives have been
primarily concerned with public sector investments and sector-wide growth trends,
along with work around the programme’s four pillars: sustainable land
management and water control systems; rural infrastructure and trade-related
capacities for improved market access; food security and nutrition; and research
and dissemination support. CAADP efforts, for example, have supported the
development of Kenya’s Medium-Term Investment Plan for Kenya’s
Agricultural Sector: 2010-2015,88 which comes directly from the ASDS and
describes public agricultural spending strategies and identifies the approach to
meet CAADP’s targets.
47. The main actor in the sector is the Ministry of Agriculture, Livestock, Fisheries and
Irrigation, divided into the State Departments of crops, livestock, research,
irrigation and fisheries. The Joint Agriculture Sector Consultation and
Cooperation Mechanism was established in November 2016. The rationale was
to set up a formal mechanism for the national and county governments to jointly
pursue the development of the agriculture sector in line with national and
international commitments.
48. The National Policy for the Sustainable Development of ASALs, from 2006 to 2015,
was followed by the draft National Policy for the Sustainable Development of
82
Government of Kenya 2007. 83
Government of Kenya 2013a. 84
Government of Kenya 2010. 85
Such as: National Food and Nutrition Security Policy; National Agricultural Sector Extension Policy Sessional Paper; National Agricultural Research System Policy 2012; and National Agribusiness Strategy. 86
Towards Agricultural Transformation and 100% Food Security in Kenya, ASTGS Overview, (Draft) 19 April 2018. 87
Pan-African policy framework for agricultural transformation, wealth creation, food security and nutrition, economic growth and prosperity for all. 88
Government of Kenya n.d.
Appendix II EB 2019/128/R.12
24
Northern Kenya and other Arid Lands (NPSDNKAL) in 2015/16. Three distinct
but interconnected terms are covered – the ASALs, pastoralism and Northern
Kenya – to enable a more nuanced policy response. This is because the arid
counties are located in Northern Kenya and pastoralism is the dominant production
system in the arid counties and in some semi-arid counties. However, not everyone
in the north is a pastoralist.89
49. Other important policies that attempt to take account of climate change in the
development of the agriculture sector include: the National Climate Change
Response Strategy in 2010; the National Climate Change Action Plan, 2013-2017;
and more recently the Kenya National Adaptation Plan, 2015–2030. Other key sub-
sector policies and plans are: the National Nutrition Action Plan, 2012–2017; the
National Dairy Master Plan, 2010; the National Policy on Gender and Development,
2000; and the National AIDS Strategic Framework.
50. Since the 2017 elections, the President has launched a new national initiative
termed the Big Four Agenda to guide the development agenda from 2018 to
2022.90 This includes agriculture and food security, which has three thrusts:
increasing incomes; increasing value-added production; and improving household
food resilience (for ASAL areas). The Big Four Agenda explicitly includes devolved
government in the implementation of nine “flagship” targets.
International Development Assistance
51. Between 2011 and 2017, Kenya received US$16.8 billion (constant 2015 US$
prices) in Country Programmable Aid.91 Flows peaked in 2013 and fell by US$500
million the following year. The largest bilateral donors between 2011 and 201592
were the United States of America (USA), the United Kingdom (UK) and Japan,
while the largest multilateral donors were the World Bank, the African Development
Fund and the EU. While the USA has remained the top donor throughout the
period, it has recently reduced funding (from US$725 million in 2013 to US$575
million in 2015), while the World Bank has substantially increased funding (from
US$237 million in 2011 to US$471 million in 2015).93
52. Figure 2 annex VII shows that remittance inflows play an increasingly important
role in the Kenyan economy. Both official development assistance (ODA)
commitments and remittance inflows have generally increased since 2004, but as
GDP has grown, the proportion of ODA to GDP has generally declined, while the
proportion of remittance inflows to GDP has slightly increased.
53. Bilateral ODA commitments by purpose to Kenya between 2011 and 2016 have
been dominated by social infrastructure and services, which received nearly US$8
billion (58 per cent of ODA commitments). The production sector accounts for 6.3
per cent of ODA commitments in the same period, whereas the agriculture, forestry
and fishing subsector represents 70 per cent (US$610 million) of ODA
commitments dedicated to production.94
54. According to the Kenyan Agriculture and Rural Development Donor Group, the main
multilateral donors supporting the development of the agriculture sector between
2011 and 2017 were the World Bank, AfDB and the EU. The main bilateral donors
over the same period were the USA, Japan, Germany and the UK. Other important
89
Ministry of Devolution and Planning 2016. 90
Policy Monitor, Issue 9 No 3, Jan0Marhc 2018 Realizing the Big Four Agenda. Kenya Institute for Public Policy Research and Analysis (KIPPRA). The “Big Four” agenda covers affordable and decent housing, affordable healthcare, food and nutritional security, and employment creation through manufacturing. 91
Country Programmable Assistance is the proportion of aid that is subjected to multi-year programming at country level. It excludes spending which is unpredictable, entails no flows to recipient countries, aid that is not discussed between donors and governments, and does not net out loan repayments (OECD 2018). 92
The latest OECD DAC data provides individual donor data up to 2015 93
OECD 2018 94
OECD 2018
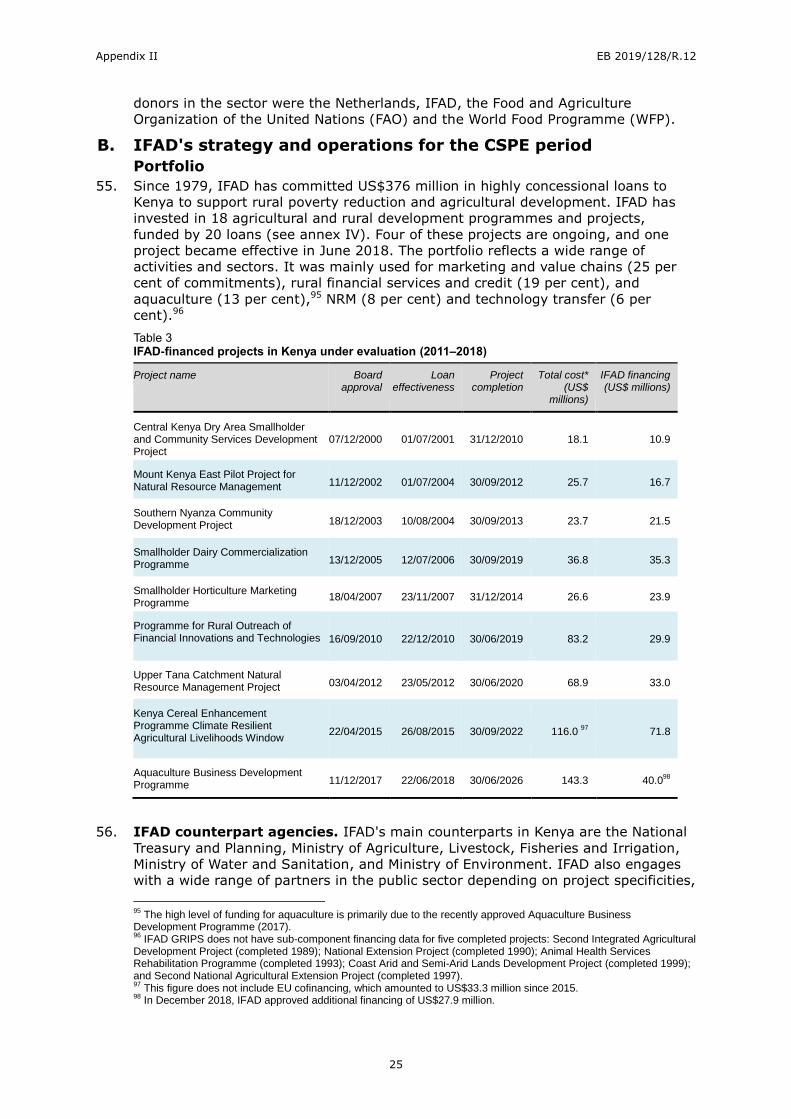
Appendix II EB 2019/128/R.12
25
donors in the sector were the Netherlands, IFAD, the Food and Agriculture
Organization of the United Nations (FAO) and the World Food Programme (WFP).
B. IFAD's strategy and operations for the CSPE period
Portfolio
55. Since 1979, IFAD has committed US$376 million in highly concessional loans to
Kenya to support rural poverty reduction and agricultural development. IFAD has
invested in 18 agricultural and rural development programmes and projects,
funded by 20 loans (see annex IV). Four of these projects are ongoing, and one
project became effective in June 2018. The portfolio reflects a wide range of
activities and sectors. It was mainly used for marketing and value chains (25 per
cent of commitments), rural financial services and credit (19 per cent), and
aquaculture (13 per cent),95 NRM (8 per cent) and technology transfer (6 per
cent).96
Table 3 IFAD-financed projects in Kenya under evaluation (2011–2018)
Project name Board approval
Loan effectiveness
Project completion
Total cost* (US$
millions)
IFAD financing (US$ millions)
Central Kenya Dry Area Smallholder and Community Services Development Project
07/12/2000 01/07/2001 31/12/2010 18.1 10.9
Mount Kenya East Pilot Project for Natural Resource Management 11/12/2002 01/07/2004 30/09/2012 25.7 16.7
Southern Nyanza Community Development Project 18/12/2003 10/08/2004 30/09/2013 23.7 21.5
Smallholder Dairy Commercialization Programme 13/12/2005 12/07/2006 30/09/2019 36.8 35.3
Smallholder Horticulture Marketing Programme
18/04/2007 23/11/2007 31/12/2014 26.6 23.9
Programme for Rural Outreach of Financial Innovations and Technologies 16/09/2010 22/12/2010 30/06/2019 83.2 29.9
Upper Tana Catchment Natural Resource Management Project 03/04/2012 23/05/2012 30/06/2020 68.9 33.0
Kenya Cereal Enhancement Programme Climate Resilient Agricultural Livelihoods Window
22/04/2015 26/08/2015 30/09/2022 116.0 97
71.8
Aquaculture Business Development Programme 11/12/2017 22/06/2018 30/06/2026 143.3 40.0
98
56. IFAD counterpart agencies. IFAD's main counterparts in Kenya are the National
Treasury and Planning, Ministry of Agriculture, Livestock, Fisheries and Irrigation,
Ministry of Water and Sanitation, and Ministry of Environment. IFAD also engages
with a wide range of partners in the public sector depending on project specificities,
95
The high level of funding for aquaculture is primarily due to the recently approved Aquaculture Business Development Programme (2017). 96
IFAD GRIPS does not have sub-component financing data for five completed projects: Second Integrated Agricultural Development Project (completed 1989); National Extension Project (completed 1990); Animal Health Services Rehabilitation Programme (completed 1993); Coast Arid and Semi-Arid Lands Development Project (completed 1999); and Second National Agricultural Extension Project (completed 1997). 97
This figure does not include EU cofinancing, which amounted to US$33.3 million since 2015. 98
In December 2018, IFAD approved additional financing of US$27.9 million.
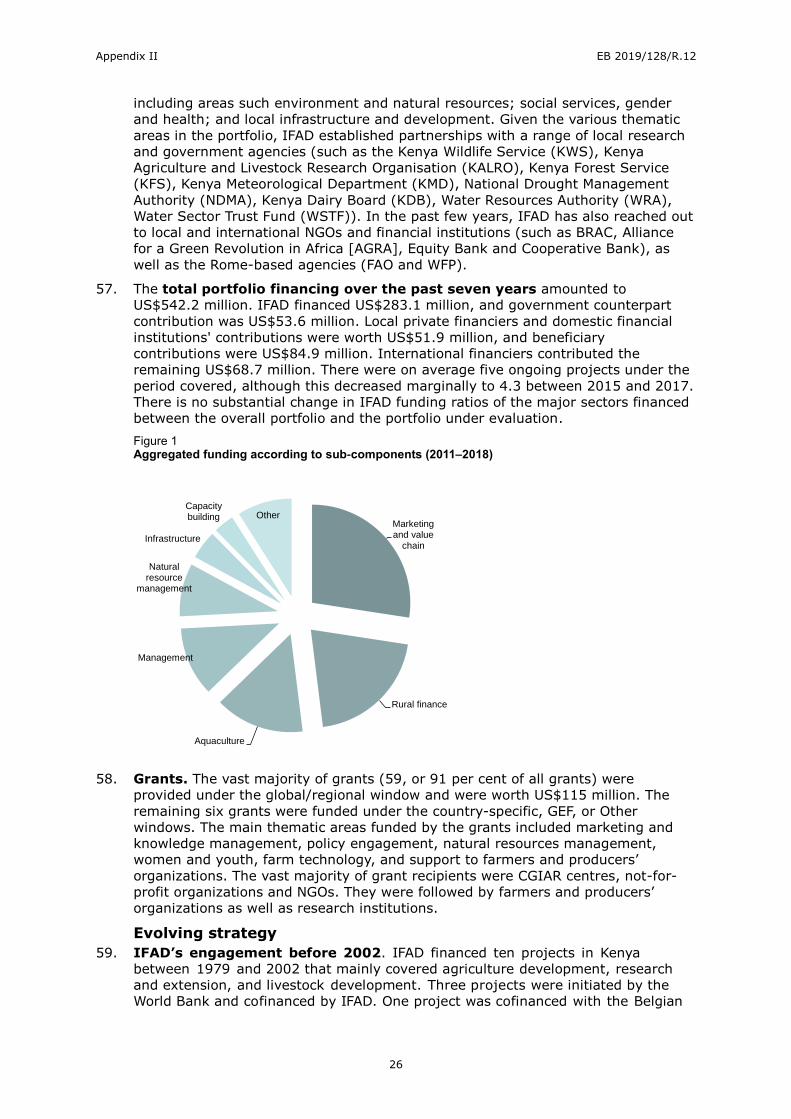
Appendix II EB 2019/128/R.12
26
including areas such environment and natural resources; social services, gender
and health; and local infrastructure and development. Given the various thematic
areas in the portfolio, IFAD established partnerships with a range of local research
and government agencies (such as the Kenya Wildlife Service (KWS), Kenya
Agriculture and Livestock Research Organisation (KALRO), Kenya Forest Service
(KFS), Kenya Meteorological Department (KMD), National Drought Management
Authority (NDMA), Kenya Dairy Board (KDB), Water Resources Authority (WRA),
Water Sector Trust Fund (WSTF)). In the past few years, IFAD has also reached out
to local and international NGOs and financial institutions (such as BRAC, Alliance
for a Green Revolution in Africa [AGRA], Equity Bank and Cooperative Bank), as
well as the Rome-based agencies (FAO and WFP).
57. The total portfolio financing over the past seven years amounted to
US$542.2 million. IFAD financed US$283.1 million, and government counterpart
contribution was US$53.6 million. Local private financiers and domestic financial
institutions' contributions were worth US$51.9 million, and beneficiary
contributions were US$84.9 million. International financiers contributed the
remaining US$68.7 million. There were on average five ongoing projects under the
period covered, although this decreased marginally to 4.3 between 2015 and 2017.
There is no substantial change in IFAD funding ratios of the major sectors financed
between the overall portfolio and the portfolio under evaluation.
Figure 1 Aggregated funding according to sub-components (2011–2018)
58. Grants. The vast majority of grants (59, or 91 per cent of all grants) were
provided under the global/regional window and were worth US$115 million. The
remaining six grants were funded under the country-specific, GEF, or Other
windows. The main thematic areas funded by the grants included marketing and
knowledge management, policy engagement, natural resources management,
women and youth, farm technology, and support to farmers and producers’
organizations. The vast majority of grant recipients were CGIAR centres, not-for-
profit organizations and NGOs. They were followed by farmers and producers’
organizations as well as research institutions.
Evolving strategy
59. IFAD’s engagement before 2002. IFAD financed ten projects in Kenya
between 1979 and 2002 that mainly covered agriculture development, research
and extension, and livestock development. Three projects were initiated by the
World Bank and cofinanced by IFAD. One project was cofinanced with the Belgian
Marketing and value
chain
Rural finance
Aquaculture
Management
Natural resource
management
Infrastructure
Capacity building Other
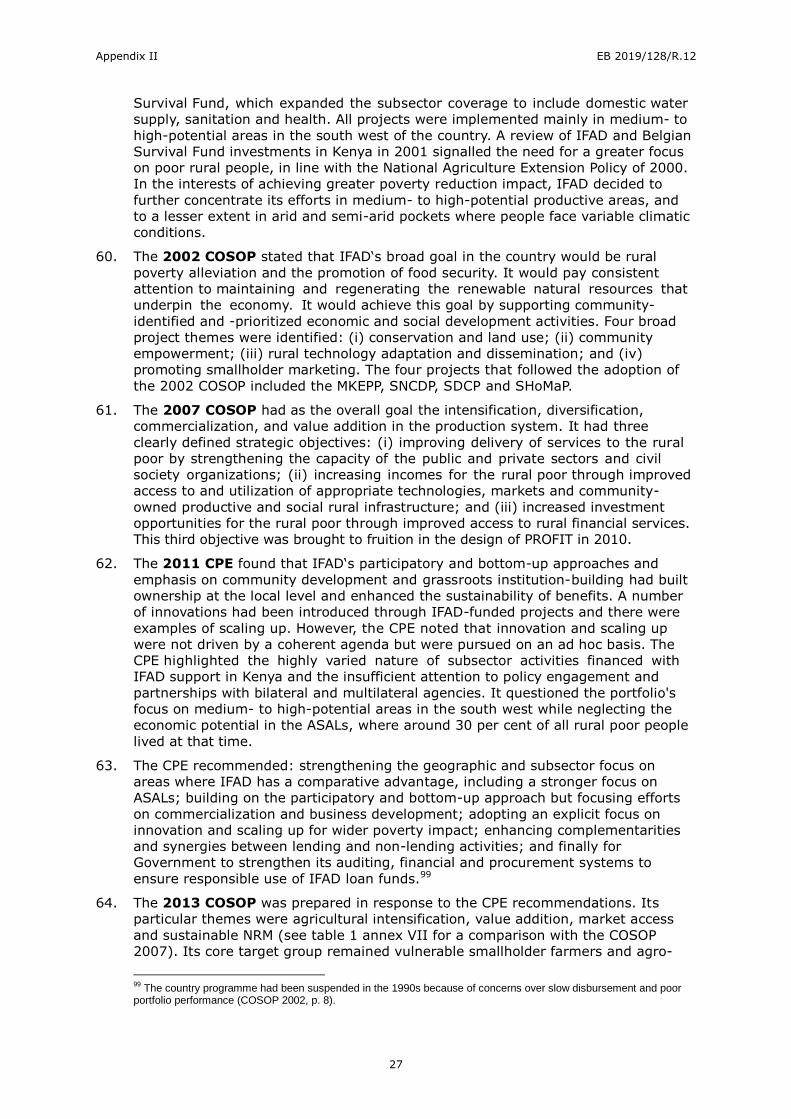
Appendix II EB 2019/128/R.12
27
Survival Fund, which expanded the subsector coverage to include domestic water
supply, sanitation and health. All projects were implemented mainly in medium- to
high-potential areas in the south west of the country. A review of IFAD and Belgian
Survival Fund investments in Kenya in 2001 signalled the need for a greater focus
on poor rural people, in line with the National Agriculture Extension Policy of 2000.
In the interests of achieving greater poverty reduction impact, IFAD decided to
further concentrate its efforts in medium- to high-potential productive areas, and
to a lesser extent in arid and semi-arid pockets where people face variable climatic
conditions.
60. The 2002 COSOP stated that IFAD‘s broad goal in the country would be rural
poverty alleviation and the promotion of food security. It would pay consistent
attention to maintaining and regenerating the renewable natural resources that
underpin the economy. It would achieve this goal by supporting community-
identified and -prioritized economic and social development activities. Four broad
project themes were identified: (i) conservation and land use; (ii) community
empowerment; (iii) rural technology adaptation and dissemination; and (iv)
promoting smallholder marketing. The four projects that followed the adoption of
the 2002 COSOP included the MKEPP, SNCDP, SDCP and SHoMaP.
61. The 2007 COSOP had as the overall goal the intensification, diversification,
commercialization, and value addition in the production system. It had three
clearly defined strategic objectives: (i) improving delivery of services to the rural
poor by strengthening the capacity of the public and private sectors and civil
society organizations; (ii) increasing incomes for the rural poor through improved
access to and utilization of appropriate technologies, markets and community-
owned productive and social rural infrastructure; and (iii) increased investment
opportunities for the rural poor through improved access to rural financial services.
This third objective was brought to fruition in the design of PROFIT in 2010.
62. The 2011 CPE found that IFAD‘s participatory and bottom-up approaches and
emphasis on community development and grassroots institution-building had built
ownership at the local level and enhanced the sustainability of benefits. A number
of innovations had been introduced through IFAD-funded projects and there were
examples of scaling up. However, the CPE noted that innovation and scaling up
were not driven by a coherent agenda but were pursued on an ad hoc basis. The
CPE highlighted the highly varied nature of subsector activities financed with
IFAD support in Kenya and the insufficient attention to policy engagement and
partnerships with bilateral and multilateral agencies. It questioned the portfolio's
focus on medium- to high-potential areas in the south west while neglecting the
economic potential in the ASALs, where around 30 per cent of all rural poor people
lived at that time.
63. The CPE recommended: strengthening the geographic and subsector focus on
areas where IFAD has a comparative advantage, including a stronger focus on
ASALs; building on the participatory and bottom-up approach but focusing efforts
on commercialization and business development; adopting an explicit focus on
innovation and scaling up for wider poverty impact; enhancing complementarities
and synergies between lending and non-lending activities; and finally for
Government to strengthen its auditing, financial and procurement systems to
ensure responsible use of IFAD loan funds.99
64. The 2013 COSOP was prepared in response to the CPE recommendations. Its
particular themes were agricultural intensification, value addition, market access
and sustainable NRM (see table 1 annex VII for a comparison with the COSOP
2007). Its core target group remained vulnerable smallholder farmers and agro-
99
The country programme had been suspended in the 1990s because of concerns over slow disbursement and poor portfolio performance (COSOP 2002, p. 8).
Appendix II EB 2019/128/R.12
28
pastoralists, including young people and woman-headed households. The three SOs
were: (i) gender-responsive, climate-resilient and sustainable community-based
NRM; (ii) access to productivity-enhancing assets, technologies and services; and
(iii) access to improved post-production technologies and markets. The first
strategic objective specifically targeted ASALs. The COSOP envisaged innovations
for scaling up, in particular NRM and climate change adaptation, but also linking
pastoralists to markets and public-private partnerships along the agricultural value
chain. Figure 2 presents a timeline of COSOP periods, projects, main national
policies and key external factors.
65. The CSPE has developed a theory of change (annex XIII) that describes the
intervention pathways for each of the SOs from the 2007 and 2013 COSOPs
through programme outputs to outcomes and impact, including lending and non-
lending operations, against the COSOP objectives. Three impact pathways were
defined that relate to three thematic areas of IFAD's operations in Kenya:
NRM/climate change, value chains and rural finance. This evaluation assesses the
results achieved within these thematic areas in terms of achieving the SOs.
Figure 2 Timeline of major policies and events over the three COSOP periods
Economic Recovery Strategy Vision 2030
CKDAP
2014 201520132012201120102008200620042002 2016
MKEPPSNCDP
PROFIT
KCEP-CRAL
COSOP 1 COSOP 2
2000
Eve
nts
Drought
Garissa University massacre
Westgate shopping centre attack
General ElectionGeneral ElectionGeneral Election General Election
Pro
gram
me
s
2001 2003 2005 2007
ABDP
20092017
Drought
Global Food Price Crisis
High food prices
High food prices
New constitution
ASCU est.
ASDS 2010-2020
MTP 2008 - 2012 MTP 2013 - 2017
ASDS MTIP 2010 - 2015
Devolution process
National ASALS policy 2006 - 2015 Draft Northern Kenya and other Arid lands policy
COSOP 3
2014 201520132012201120102008200620042002 201620002001 2003 2005 2007 2009
2017
Po
licie
s
SDCPSHoMAP
UTaNRMP
National Poverty Eradication Plan 1999-2015 CAADP Compact
signed
IFAD Country Office established
IFAD CPM out-posted
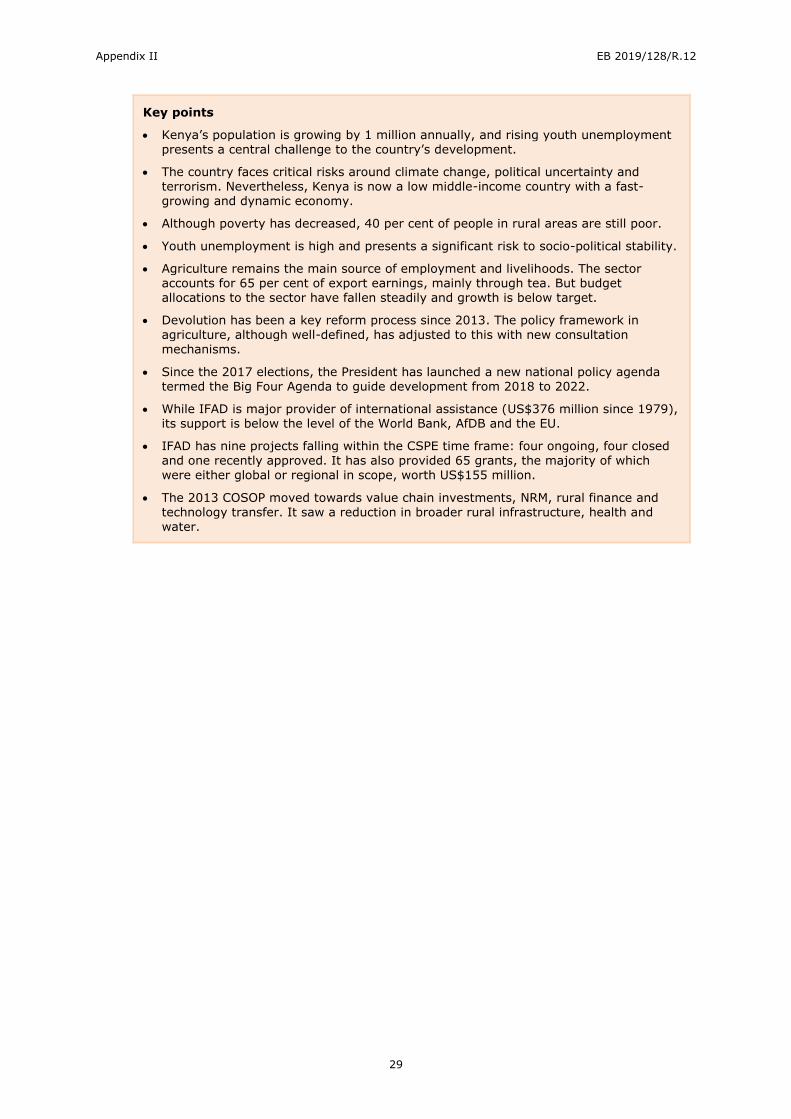
Appendix II EB 2019/128/R.12
29
Key points
Kenya’s population is growing by 1 million annually, and rising youth unemployment presents a central challenge to the country’s development.
The country faces critical risks around climate change, political uncertainty and terrorism. Nevertheless, Kenya is now a low middle-income country with a fast- growing and dynamic economy.
Although poverty has decreased, 40 per cent of people in rural areas are still poor.
Youth unemployment is high and presents a significant risk to socio-political stability.
Agriculture remains the main source of employment and livelihoods. The sector accounts for 65 per cent of export earnings, mainly through tea. But budget allocations to the sector have fallen steadily and growth is below target.
Devolution has been a key reform process since 2013. The policy framework in
agriculture, although well-defined, has adjusted to this with new consultation mechanisms.
Since the 2017 elections, the President has launched a new national policy agenda termed the Big Four Agenda to guide development from 2018 to 2022.
While IFAD is major provider of international assistance (US$376 million since 1979), its support is below the level of the World Bank, AfDB and the EU.
IFAD has nine projects falling within the CSPE time frame: four ongoing, four closed and one recently approved. It has also provided 65 grants, the majority of which were either global or regional in scope, worth US$155 million.
The 2013 COSOP moved towards value chain investments, NRM, rural finance and technology transfer. It saw a reduction in broader rural infrastructure, health and water.
Appendix II EB 2019/128/R.12
30
III. Lending portfolio
A. Performance and impact
Relevance
(i) Policy relevance
66. Strategic alignment. In broad terms, the IFAD projects covered by this CSPE
reflect the Government policy agenda as it evolved during the period, as guided by
the Vision 2030, the associated MTPs and the ASDS. The IFAD portfolio
incorporates the centrality of the commercialization of agriculture but also reflects
the greater focus on ASALs.
67. Individual projects were in general well aligned with specific subsector government
strategies. The earlier projects in the period, such as CKDAP and SNDCP, were in
tune with national poverty reduction plans, and in the emphasis on local-level
participation and integrated development. In the later projects, the value chain
interventions sought to build more commercial agriculture while still targeting
poverty. For example, SDCP was developed within the contemporary livestock and
dairy policies, while SHoMAP followed the MTP 2008-12, which aimed to “promote
horticultural marketing models that respond to the needs of the industry”. A
strong community-led focus is a significant aspect of the earlier projects (CKDAP,
SNCDP), reflecting IFAD’s strength in participatory methods, while the
commercialization of farmer groups is a strong feature of the later projects.
68. Geographic focus. More recent project designs have put a greater focus on the
semi-arid counties (those with 30 to 84 per cent aridity) in the ASALs (figure 4
annex VII).100 This is in line with the recommendations of the 2011 CPE and the
2013 COSOP, which targets agro-pastoralists located in these areas. It is also
aligned with the Government's Vision 2030 Development Strategy for Northern
Kenya and other Arid Lands (2012) and the recent NPSDNKAL (2018), which are
based on the premise that the ASALs have enormous untapped resources that can
be harnessed to sustain resident communities and contribute to national
development. However, the portfolio does not focus on the arid counties as per the
2013 COSOP, except for Kitui and Samburu in PROFIT, which was designed prior to
the 2011 CPE. Nor does the pastoralist community receive the attention
anticipated in the 2013 COSOP.
69. Although the geographic focus of the portfolio has changed since 2012, the level of
funding (total and per county) allocated to high- and medium-potential agricultural
areas and semi-arid lands (with 10 to 29 per cent aridity) is higher, owing to the
increased size of projects designed since the 2011 CPE. Furthermore, the most
recently designed project, ABDP, does not have an explicit ASAL although it covers
eight ASAL counties with a high aquaculture potential.
70. Sector focus. The evaluation period entailed an important shift from area-based
community-led projects (SNDCP, CKAPD) to sector-focused projects (in horticulture
(SHoMAP), cereals (KCEP-CRAL), dairy (SDCP) and aquaculture (ADBP)). This
move followed the CPE 2011 and COSOP 2013, which promoted a switch in
emphasis to a commodity-driven, value chain approach with stronger private sector
engagement. This reflects IFAD’s own growing emphasis on value chains, although
emphasis on working with private sector actors had not been a strong feature in
project design hitherto. The emphasis on NRM for the poor was also sustained
throughout the period with MKEPP and then UTaNRMP.
100
The Government has recently reclassified ASALs, resulting in total of 29 counties being labelled ASALs: http://www.devolutionasals.go.ke/county-information/.
Appendix II EB 2019/128/R.12
31
71. Rural finance. PROFIT’s main investment was to meet the low level of penetration
of financial services101 by providing an incentive to banks to increase their
agricultural lending and to diversify their services to rural areas. PROFIT also
provides limited funds to be used as a line of credit by deposit-taking micro-banks
(DTMs) facing liquidity problems. PROFIT also funds business support services and
pilots a financial graduation programme for the most vulnerable farmers.
72. PROFIT has found itself somewhat misaligned due to timing. It was a response to
the 2007 COSOP objectives but due to delays in start-up and implementation, it
has found itself operating mainly under the COSOP 2013, where rural finance is no
longer an explicit priority. Nevertheless, its adherence to a value chain approach
through its support for the financing of different stages of agricultural production
can be said to appropriately underpin the value chain projects (by attracting
commercial banks and micro-lending institutions to increase their agricultural
lending portfolios).
73. Financial services have been strongly aligned with IFAD and government policies
for the subsector. The thinking of the IFAD 2001 and revised 2009 Rural Finance
Policy, with their focus on the development of diverse, viable financial service
providers that increase the long-term access of poor rural people to a wide range of
financial services, is well reflected in the portfolio. At the micro level, too, projects
have directed finance towards the productive potential of poor people and their
organizations, while for the poorest, financial graduation and targeted savings have
been followed.102 The Government's priorities are also clearly reflected, particularly
in expanding rural finance outreach through a value chain approach. Regarding
smallholder priorities and needs, these are also reflected.
74. For value chains, there was a close fit with both the Government and IFAD
strategy. The Government’s ASDS (2010-20) highlights the value chain approach
as underpinning its subsector strategic focus related to market information,
sustainable and competitive crop productivity, and access to markets. IFAD has
placed value chains at the centre of its rural development strategy, and in the
Strategic Frameworks (2011-15 and 2016-25), value chains are seen as generating
opportunities for increased incomes and employment both on-farm and off-farm.
Its application to Kenya matched the strong market-led business-minded nature of
the country’s economy very well.
75. Natural resources management. The leading projects, MKEPP and UTNMRP,
directly addressed sustainable management of water, forest and land resources and
had high relevance to national and beneficiary needs in terms of reducing poverty
by improving access to resources though community-based plans. UTaNRMP built
on MKEPP’s pilot work and matched well the Government’s policy reforms to reduce
environmental degradation.103
76. CKDAP and SNDCP built in water and agro-forest management and soil
conservation measures, and KCEP-CRAL stresses these aspects. SDCP inculcated
NRM issues to some extent (through tree nurseries and biogas), but less attention
was paid to the potential for water pollution, and for negative impacts from milk
disposal and effluents, as well as zero-grazing practices.104
101
By commercial banks, microfinance institutions (MFIs), NGOs and savings and credit cooperative organizations (SACCOs). 102
SNCDP aimed to build group capacity for deposit collection through CFSAs, although sustainability and exit strategies were not considered. SHoMAP, too, aimed to increase incomes of the rural poor through improved access to and utilization of appropriate technologies, markets, and community-owned productive and social infrastructure. 103
Including the Forest Act (2005), the Environmental Management and Coordination Act (2012) and the new Constitution, which provided an enhanced framework for NRM, including the provision that the “State shall work to achieve and maintain a tree cover of at least 10 per cent of the land area of Kenya”. 104
SDCP MTR.
Appendix II EB 2019/128/R.12
32
77. Alignment with ongoing devolution. Project designs were not always well
aligned to the emerging devolution processes, and they have had to be adjusted
during implementation to reflect political realities, and in particular the growing
influence of county governors and their administrations. Over the evaluation
period, the IFAD portfolio has been faced with a major change in the role of central
and local government following the 2010 Constitution. On paper the direction has
been clear, but the practical problems of implementing the newly devolved
government arrangements have been considerable. As detailed in the 2016 Policy
document, there are a large number of actions to take place over the 2017-2020
period.105
78. Devolution has been accompanied by the creation of new counties and sub-
counties.106 This was accompanied by the need to incorporate project activities into
emerging CIDPs, and to align IFAD project priorities within the growing capacity of
county budgets and staffing.
79. The ongoing devolution processes have at times made county-level coherence
more difficult. Plans for county staffing support and coordination mechanisms have
subsequently been disrupted by changes in county boundaries and personnel.
However, based on CSPE interviews with county government staff, efforts to
integrate project activities into CIDPs have been improving, for example with SDCP
and KCEP-CRAL.
(ii) Targeting strategies
80. The portfolio used clear geographic targeting criteria to identify project target
areas, and each project included at least one criterion on poverty. The community-
driven development (CDD) projects of CKDAP and SNCDP included more poverty
criteria, including levels of food security, malnutrition, access to water and
sanitation and health facilities, health status, and prevalence of HIV/AIDS. The
prevalence of HIV/AIDS was a highly relevant criterion at the time when the
incidence of HIV/AIDS was growing. Of the two NRM projects, UTaNRMP used a
two-pronged approach mixing poverty criteria with criteria on the extent and risk of
natural resource degradation. MKEPP focused more on poverty criteria that
reflected the collapse of the coffee market, in an area with decreasing smallholder
land sizes and productivity.
81. Geographic targeting criteria used in value-chain projects include poverty but
logically put significant focus on existing and potential production levels and the
availability of infrastructure for processing, market access and research. SHoMAP
and SDCP stand out as value chain projects that give the highest weighting to
poverty when ranking locations among other geographic targeting criteria. The
finance project, PROFIT, is national and rural in scope, given that the bulk of rural
men and women across the country do not have access to formal financial services,
with priority given to areas with agricultural potential and a high incidence of
poverty. The wide geographical coverage of SHoMAP spread resources too thinly,
and a smaller and more concentrated coverage would still have provided lessons
for scaling up.107 KCEP-CRAL included a detailed set of targeting criteria, including
poverty incidence, gender inclusiveness, climate vulnerability and specific criteria
for subsistence farmers and farmers ready to graduate to commercial operation.108
82. There has been tension between the objectives of commercialization and poverty
targeting in IFAD’s value chain approach. For instance, the geographic targeting of
SDCP was based on selection of districts with a poverty incidence of 46 per cent
105
Policy on Devolved System of Government, Ministry of Devolution and Planning, October 2016. 106
For example, under SNDCP six new districts were created within the project area, and for SDCP, by 2011, 22 new counties had been created out of the original nine in 2006. 107
IFAD 2012, Supervision April 2012 and MTR 2012 108
PDR, 2013, para. 30.
Appendix II EB 2019/128/R.12
33
and more. However, this brought areas with high poverty levels into the
programme, which proved not to be very conducive for dairy commercialization.
Adoption of commercial dairy production technologies requires some level of
investment from the dairy farmers, which for many “resource-poor” farmers is a
challenge.109 In the case of SHoMAP no such challenge was observed, given that
the project did not presuppose substantial increases in investment by farmers.
83. Gender targeting has varied in quality compared to the IFAD instruments to
mainstream gender in its projects over the years,110 but generally improved over
time. The earlier projects of CKDAP, MKEPP, SDCP and to a lesser extent SNCDP
relied to a certain extent on an inherent gender focus in development activities111
rather than specific targeting mechanisms and operational measures to reach
women. Although weaknesses in gender strategies were in most cases addressed
during implementation, opportunities to promote gender equality to the full extent
possible were missed. Gender strategies in the design of later projects (SHoMAP,
PROFIT, UTaNRMP, KCEP-CRAL and ABDP) are comprehensive, covering the critical
areas of gender analysis, gender-responsive targeting mechanisms and operational
measures, and gender-sensitive M&E.
84. The loan portfolio has largely followed (implicitly or explicitly) IFAD's three-pronged
approach to promote the economic empowerment of women and men, their equal
voice and influence in rural institutions, and an equitable workload balance
between women and men. The latter objective was not integrated into the design
of SHoMAP despite the longer working hours of women compared to men being
identified as a gender issue.112
85. In line with IFAD's more recent move from gender mainstreaming to gender-
transformative approaches,113 KCEP-CRAL, ABDP, SDCP and UTaNRMP include the
implementation of Household Methodologies in beneficiary groups. This
methodology aims to tackle the root causes of inequalities – social norms, attitudes
and behaviours – to improve gender relations and promote equal social and
economic opportunities between men and women.114
86. Targeting of youth. The quality of targeting mechanisms to reach youth has
improved over time from very low to satisfactory. The targeting of youth was
notably absent in the design of SHoMAP in 2007 following the identification of
youth as a target group in the 2007 COSOP. Although PROFIT aimed to target
youth, the design did not include targeting mechanisms to reach them, other than
a quota for youth representation among beneficiaries. The design also lacked
specific operational measures or data collection and reporting on youth. The
subsequent five projects (including the updated design of SDCP) have targeted
youth better, using quotas (SDCP, KCEP-CRAL) and support to youth groups (SDCP,
UTNMRP, ABDP).115
87. Poverty targeting. Beneficiary targeting and poverty focus have become more
comprehensive. Earlier project designs primarily relied upon participatory
approaches and geographic targeting to reach the project target group, including
poorer and more vulnerable subgroups. It was also assumed that the demand-
109
SDCP PCR. 110
The main instruments concern the IFAD Gender Plan of Action (2003-2006), Framework for gender mainstreaming in IFAD's operations (2008) and the Policy on Gender Equality and Women’s Empowerment (2012). 111
Such as primary health care, drinking water and sanitation and income-generating activities from agricultural and livestock development. 112
The design expected that the increase in employment opportunities would enable more women to be employed, in piece-work, with flexible working hours, which would fit in with family duties. Activities to reduce their workload, at home or on-farm, would have enhanced the project's promotion of gender equality and women's empowerment. 113
IFAD (2016) Gender mainstreaming in IFAD10 https://www.ifad.org/web/knowledge/publication/asset/39614616. 114
IFAD (2014) Toolkit on Household Methodologies https://www.ifad.org/web/knowledge/publication/asset/39409831. 115
In line with the 2007 and 2013 COSOPs as well as the national ASDS and the subsequent Youth in Agribusiness Strategy (2016) that highlights the need to address youth migration from rural areas through interventions in agriculture.
Appendix II EB 2019/128/R.12
34
responsive nature of project activities, such as primary health care, water and
sanitation and small livestock production, would reach and benefit the whole target
group. However, it became clear from CKDAP, MKEPP and SNCDP that better
targeting mechanisms were required to reach the poorer and more vulnerable
households and to avoid elite capture.116 Since then, more comprehensive targeting
strategies have been designed in projects, with a mix of measures to reach
different sub-target groups. On the whole, the relevance of these measures has
been satisfactory to reach the core target group, but more mixed in reaching the
poorer and more vulnerable groups.
88. For example, in addition to directly targeting dairy farmers' groups, SDCP aimed to
reach poorer smallholders, in particular women, through a dairy goat scheme. It
was appropriate, owing to the minimal capital investment, feed and land required
to look after the goats as well as the nutritional benefits and potential for income
generation. However, the updated design of SDCP discontinued the dairy goat
scheme and focused solely on better-off dairy farmers already producing a surplus
for market. Although this move was relevant to achieve the commercialization
objective, it significantly reduced the poverty focus of the project.
89. PROFIT included relevant targeting mechanisms to reach poor men and women,
including establishing partnerships with organizations already operating in target
areas and targeting vulnerable groups, linking social protection to microfinance
and, supporting rural savings and credit cooperative organizations (SACCOs) to
improve their governance systems to enable more equitable access to financial
services among members. The programme includes a financial graduation
subcomponent that solely focuses on the poor, women and youth. PROFIT’s design
was not very clear in terms of how commercial banks under the risk-sharing
modality would have the capacity and incentives to be able to reach the poor.117
90. KCEP-CRAL has relevant eligibility criteria to identify poor smallholders to
participate in step 1 of its graduation strategy, but the criteria of subsequent steps
are overly ambitious and risk excluding the poorer and more vulnerable farmers.118
SHoMaP’s primary focus was on smallholder horticultural farmers, but it did not
include specific measures to also target poorer groups in communities, besides
through employment-intensive, labour-based infrastructure rehabilitation and
construction.
91. The designs of UTaNRMP and ABDP include comprehensive targeting mechanisms
to reach their respective target groups. Learning from MKEPP, specific measures
were designed in UTaNRMP to reach the most vulnerable, for example, by waiving
or varying contributions to access small grants and by using wealth-ranking during
beneficiary selection. Similarly, the design of ABDP includes targeting measures to
improve the inclusion of vulnerable groups such as unemployed youth, the elderly,
widows/orphans and the disabled. These include providing economic opportunities,
mainly in processing, to attract both men and women, as well as the vulnerable,
and affirmative action to include vulnerable groups (including quotas for example).
92. Participatory and bottom-up approaches have been well integrated into the
portfolio's project designs and have been instrumental in initiating dialogue with
communities, understanding people's needs and identifying beneficiaries and
empowering them to participate in and influence development planning and
implementation. Consistent attention was placed on the participatory mobilization
116
IFAD 2007 COSOP. 117
On implementation, design of the Business Support Services (BSS) sub-component was revised to include capacity-building for the participating financial institutions to develop appropriate financial products for reaching smallholder farmers. 118
To graduate between steps, farmers must significantly increase the size of land under cultivation, yields and financial contributions, which seems unrealistic in the allocated time, especially considering the risk, and recent occurrence, of drought.
Appendix II EB 2019/128/R.12
35
and sensitization of communities and rural stakeholders by local authorities and
project staff to communicate project objectives and potential activities.119
93. To ensure the effective implementation of these approaches, capacity building of
local government staff was also included in design. In the NRM projects,
participatory development planning spanned different intervention areas. For
example, in UTaNRMP, the water resources users’ association (WRUA) at the river
basin level would be assisted to develop their sub-catchment management plans in
consultation with communities dependent on the natural resources of the
catchment, and community forest associations (CFAs) would be empowered to
consult communities living along the margins of forest reserves to develop forest
management plans.
94. Importantly, the designs of value chain projects continue to promote open and
participatory approaches during: the selection of value-chain commodities; the
community-based selection of beneficiaries and farmers' groups; and the
preparation of group or community action plans. Lastly, participatory market
research was designed in PROFIT to develop pro-poor and gender-sensitive
financial services and products that meet the priority needs of the target group.
95. Nutrition. The country portfolio has put an increasing focus on designing nutrition-
sensitive projects, in line with Kenya's national policy and action plan on nutrition
and the latest policy developments in IFAD.120 In ABDP, nutrition is included in the
overall goal, development objective and at the outcome and output levels of the
logframe, with corresponding indicators, including on dietary diversity for
households and women. Community nutrition initiatives aim to improve the diet
quality of the target group through support to fish and nutrition knowledge,
provision of curriculum and training materials, and the promotion of improved
nutrition through fish fairs and a school fish-feeding programme.
96. KCEP, SDCP and UTaNRMP include indicators to measure nutrition at impact level in
the logframe as well as nutrition-sensitive activities. However, the project
objectives do not explicitly refer to nutrition, nor do the logframes include other
indicators to monitor progress on nutrition. The design of KCEP in 2015 updated
the 2013 design of KCEP into a nutrition-sensitive project. IFAD’s partner, WFP,
aims to support food-insecure farmers to adopt diversified livelihood coping
measures. In addition, nutrition activities would involve how to plan a diversified
and balanced diet and how to improve household food management.
97. In the updated design of SDCP, nutrition activities include linking the increased
availability of manure through increased livestock production to the establishment
of kitchen gardens, promoting increased dietary diversity to address micronutrient
deficiency, and improving nutrition knowledge, attitude and practice. The design of
UTaNRMP includes nutrition in the community participatory planning process, the
possibility of implementing kitchen gardens, improving household access to safe
drinking water, the diversification of income-generating activities and several NRM
activities that have the potential to improve nutrition (through soil fertility
enhancement, improved crop varieties for soil fertility, and erosion prevention).
(iii) Complexity of project designs
98. The need to reduce complexity of design was an important message from the last
CPE and COSOP. This arose from the delays and difficulties encountered in earlier
119
The earlier CDD projects (CKDAP and SNCDP) and the NRM projects (MKEPP and UTaNRMP) planned poverty rural appraisals to prioritize community needs and help communities and local authorities to develop feasible community action plans (CAPs) at the focal development area (FDA) to be implemented by the project. 120
IFAD10 (2016-2018) commitments are that 100 per cent of COSOPs and 33 per cent of projects will be nutrition-sensitive by 2018. The IFAD (2015) Action Plan for Mainstreaming Nutrition states that a nutrition-sensitive project has explicit nutrition objectives, activities and indicators. It will also have considered the impact pathway through which it can maximize its contribution to improving nutrition. https://webapps.ifad.org/members/eb/116/docs/EB-2015-116-INF-5.pdf.
Appendix II EB 2019/128/R.12
36
IFAD projects in establishing and managing multiple partnerships and in working
across multiple sectors (from health, water and roads to agriculture and rural
finance). Three of the value chain projects have been responsive to this issue by
focusing on single subsectors (dairy, horticulture and most recently aquaculture).
However, the approach taken in KCEP has been different, with a much more
complex design in several aspects (see box 2 below). Similarly, PROFIT has a
relatively complex and ambitious design involving different credit mechanisms,
nationwide coverage, and a varied range of implementing partners including NGOs,
microfinance and commercial banks, and technical service providers.
Box 2 KCEP design complexity
KCEP began in 2013 as an EU-financed IFAD-managed programme targeting the maize
value chain in Western Kenya. A second phase (KCEP-CRAL) in 2015 expanded the
project to cover two additional value chains (millet and sorghum with associated pulses) in the more demanding ASAL areas. Three Rome-based agencies are involved (WFP providing food aid to subsistence farmers, IFAD then providing support to farmers who have potential for crop surpluses, and FAO providing technical support and training). Nine further partners were designated in the design to cover support for inputs, credit,
marketing, extension, research and crop insurance.121
The project introduced a credit-in-kind system using e-vouchers run by Equity Bank through agro-dealers to help farmers obtain seeds and inputs. The system follows a graduation model – for sorghum and millet, this foresees farmers contributing 10 per cent, 40 per cent, then 70 per cent of the package costs over three seasons. The project also follows conservation agriculture principles, building farmer organizations as value chain actors, introducing a warehousing receipts system to aggregate production, as well
as road spot repairs to ease access to markets. Yields were expected to double (based on the Kenya Agricultural & Livestock Research Organization research figures) in three years.
KCEP-CRAL therefore draws together several important strands that taken together arguably present a major implementation challenge – these strands include climate- smart agriculture, climate monitoring, addressing climate vulnerability, financial service provision, third-party supported inputs and research, and farmer mobilization and
extension by county governments.
Funds were designated to flow through the project coordination unit (PCU) and then to the service providers and county staff directly involved in implementation. To manage the programme, a large PCU staff consisted of 25 technical staff in the Nairobi head office and three regional sub-units.122
According to the PCU team, several of the above design issues have caused delays
including: appointing the full PCU staffing, signing Memoranda of Understanding (MoUs) with partners, and achieving the transition rate of the graduating farmers (only 40 per cent of farmers in Eastern areas have succeeded in graduating as expected). In addition,
yield responses are lower than expected partly due to drought, validated quality seed has not always been available, and a warehouse receipts bill has not been passed by parliament. The graduation of farmers receiving WFP food aid to becoming IFAD-supported farmers has not been as expected – one issue being that the location of WFP
food aid farmers does not often overlap with the areas targeted for IFAD support.123
The most recent mission report (Dec 2017) notes that while progress is being made in terms of outreach, there are major concerns over productivity, transition rates and low disbursement, thus resulting in an overall effectiveness rating of 3. The required multiple partnerships are being gradually established.
121
An additional five partners were identified under the CRAL window. 122
PDR Volume 2, p. 77. 123
FAO verbal communication.
Appendix II EB 2019/128/R.12
37
99. There were three weak elements in the approach taken to value chain design: the
lack of diagnostic analyses; over-ambitious targets; and weak links to private
sector actors. In terms of analysis, either a value chain diagnosis was missing or it
was deferred to implementation and then performed in a poor or incomplete
way.124.
100. In terms of over-ambition, KCEP-CRAL crop models appear particularly ambitious,
expecting yield responses of 100 per cent in three to four years and a rapid
transition to non-subsidized packages under risky semi-arid conditions. The plans
to transition from WFP-graduated food-insecure farmers to farmers with
commercial potential within three years appear unrealistic. Moreover, the
complexity of engaging with multiple partners along the value chain was over-
ambitious.
101. Ambitions were also high in rural finance. The shift from relatively minor rural
finance subcomponents in projects to a major new investment in rural finance with
PROFIT represents a dramatic change in IFAD’s approach from 2010. The design
required substantial leveraging from private banks (US$50 million), timely
coordination of support services, and strong management from IFAD’s new partner
in the National Treasury, if the matching investments were to occur and the level of
planned outreach achieved. The complexity and high risk of this approach placed
immense challenges on the very lean PCU and its service providers, and led to
serious delays and the project being put in IFAD’s “at risk” category in 2015.125 In
particular, the expectation that commercial banks would have the capacity and
incentives to reach the poor seemed unrealistic.126
(iv) Coherence of project designs
102. A good measure of coherence is whether project logframes have a sound internal
logic and also reflect the most pertinent external conditions affecting delivery of
outcomes. In general, the balance of funding between components in projects has
been sound. There are examples of components that were cancelled due to
implementation problems, with funds then reallocated, but these changes have
been made in pursuit of the overall objectives.127
103. Project logframes generally reflect the strategic objectives of the COSOP, such as
addressing food security, enabling the poor to have better access to markets, and
emphasizing market-oriented production as a key avenue out of poverty while
highlighting value addition and reductions in market inefficiencies. For NRM, too,
MKEPP and UTaNRMP were in line with the COSOP emphasis on sustainable access
to and the maintenance and rehabilitation of natural resources.
104. Use of group approaches was a common and coherent method adopted in all
project designs for channelling project support (training, credit, grants). Groups
enabled poorer farmers to aggregate produce and share risk as they moved to
more commercial production models. Graduation models also assisted coherent
delivery so that as beneficiaries transitioned they would receive relevant levels of
support. There remain major challenges, especially in higher-risk environments
124
SDCP design (2005) stated that a value chain analysis was conducted as part of preparation, but there is no documentation to this effect; the first supervision mission in 2007 calls for further analysis of market linkages between the key actors and the roles of private sector actors. For SHoMAP, diagnostic crop-specific analyses were to be undertaken at district level. However, the value chain analyses were undertaken by inexperienced consultants, and considered intra-district physical and value flows only, rather than a comprehensive picture of horticultural trade in Kenya. 125
The level of effort to coordinate a complex programme like PROFIT was underestimated at design. After the lifting of the suspension and recruitment of nine project staff in August 2016, the programme was able to roll out all programme components. 126
The MTR in 2014 found that external guarantees, such as the risk-sharing facility (RSF), had encouraged banks to engage in more lending. The “anchor” model of risk-sharing to large commercial actors expects that these would then include clients within IFAD’s target group. 127
For example, the Poverty Alleviation Initiative in CKDAP and the Innovation Fund in PROFIT.
Appendix II EB 2019/128/R.12
38
such as in ASALs, to find ways to lift poorer beneficiaries to a more commercially
focused approach.
105. Coherence with other development initiatives has been mixed. Projects such as
SHoMAP complemented the Japan International Cooperation Agency UN Women
and United States Agency for International Development (USAID) initiatives.
However, they did not always use the analytical work e.g. from USAID to inform
their design.128 Under KCEP, design brought together a range of ASAL-related
initiatives – for example, FAO’s research on ASAL, WFP’s experience, EU funding,
Swedish International Development Cooperation Agency’s work with NDMA, and
Equity Bank’s experience on input vouchers.
106. The designs were not always coherent in terms of their methods to engage with
relevant traders or suppliers. In SHoMAP, for example, the project chose to invest
in expensive market structures that absorbed 61 per cent of project costs; some of
them were not adopted or used due to an overemphasis on product supply rather
than on how operators would run the markets or on how traders and processors
would use them. The role of private sector actors in the dairy value chain was also
given less attention compared to the supply side.
107. There has been less success in linking across the IFAD portfolio itself.129 In
particular, PROFIT was to be linked to ongoing IFAD value chain projects, which
made good sense, especially as these projects did not have their own credit
provision nor had a limited credit programme that needed support. In general,
there has been only limited follow-up since mechanisms for these links were not
established.130 However, some projects have provided financial literacy training
(SDCP, UTNMRP, KCEP) to equip groups of farmers to make sound use of financial
services provided by others, including banks supported under PROFIT. KCEP-CRAL
also envisages including subsistence farmers in rural finance mechanisms through
its e-vouchers and insurance.
Summary – relevance
108. The portfolio has been well aligned with government strategies for agriculture and
the environment. It had an evolving focus that sought to track the move by IFAD
from CDD to value chain approaches. Devolution processes have been partly
reflected in design in terms of targeting and service provision, although only
recently have newer projects been able to align with the growing county-level
mandate to manage their own funding and planning. Targeting has been sound
geographically and with sufficient specificity to reach certain groups, in particular
women and to a lesser degree youth. Pastoralists in arid areas were not targeted.
Some recent projects appear over-ambitious, and there were gaps in terms of a
lack of value chain diagnosis and climate change. Overall relevance is rated as
satisfactory (5).
Effectiveness
(i) Results
109. Overall there has been a good level of output and outcome delivery in the lending
portfolio. Service provision has strengthened in the form of better trained
extension, health and social officers. Group formation and capacity-building
generally met or exceeded targets across the portfolio, as did the preparation of
action plans. Environmental targets were mostly achieved in areas such as reduced
128
PCRV SHoMAP 129
A KCEP supervision mission noted that “there seems to be no systematic arrangement to building synergies and complementarities” between IFAD projects such as PROFIT, UTaNRMP, SCDP (KCEP supervision mission November 2016). 130
A promising value chain based integrated model is being developed around Highland Creameries, involving other financial institutions (SACCOs,) for access to financial services by smallholder farmers, and building on synergies between BSS Technical Service Providers and SDCP.
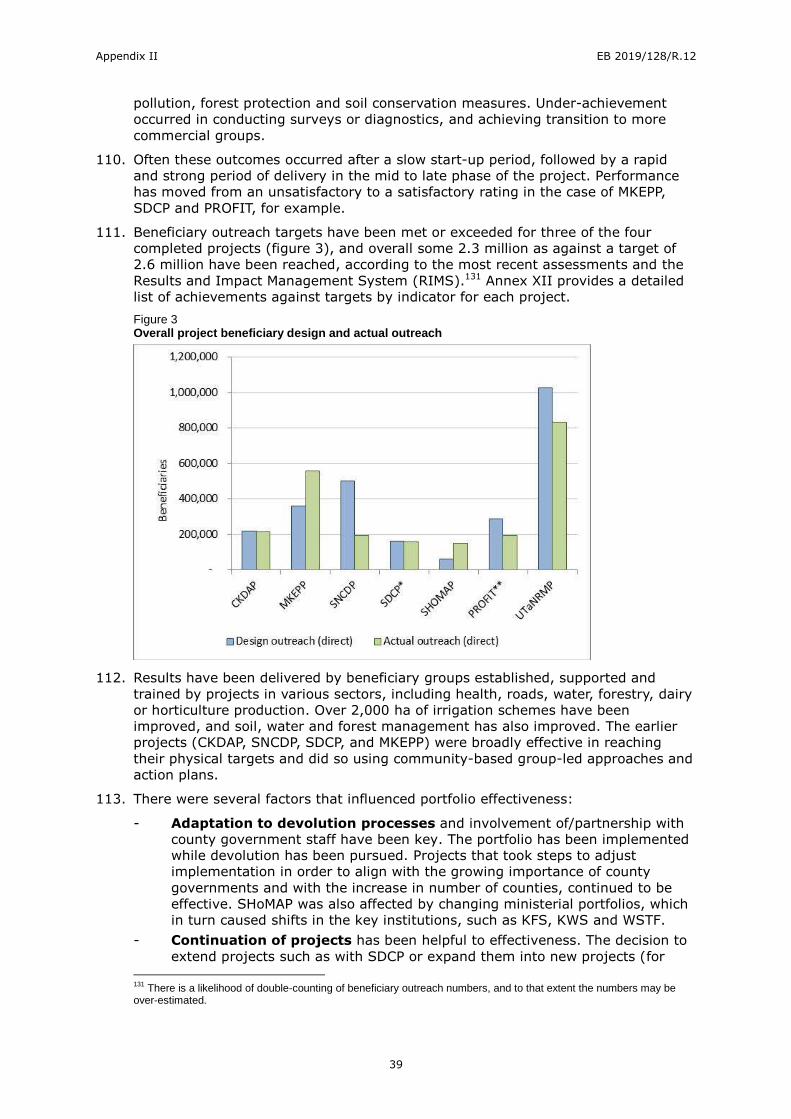
Appendix II EB 2019/128/R.12
39
pollution, forest protection and soil conservation measures. Under-achievement
occurred in conducting surveys or diagnostics, and achieving transition to more
commercial groups.
110. Often these outcomes occurred after a slow start-up period, followed by a rapid
and strong period of delivery in the mid to late phase of the project. Performance
has moved from an unsatisfactory to a satisfactory rating in the case of MKEPP,
SDCP and PROFIT, for example.
111. Beneficiary outreach targets have been met or exceeded for three of the four
completed projects (figure 3), and overall some 2.3 million as against a target of
2.6 million have been reached, according to the most recent assessments and the
Results and Impact Management System (RIMS).131 Annex XII provides a detailed
list of achievements against targets by indicator for each project.
Figure 3 Overall project beneficiary design and actual outreach
112. Results have been delivered by beneficiary groups established, supported and
trained by projects in various sectors, including health, roads, water, forestry, dairy
or horticulture production. Over 2,000 ha of irrigation schemes have been
improved, and soil, water and forest management has also improved. The earlier
projects (CKDAP, SNCDP, SDCP, and MKEPP) were broadly effective in reaching
their physical targets and did so using community-based group-led approaches and
action plans.
113. There were several factors that influenced portfolio effectiveness:
- Adaptation to devolution processes and involvement of/partnership with
county government staff have been key. The portfolio has been implemented
while devolution has been pursued. Projects that took steps to adjust
implementation in order to align with the growing importance of county
governments and with the increase in number of counties, continued to be
effective. SHoMAP was also affected by changing ministerial portfolios, which
in turn caused shifts in the key institutions, such as KFS, KWS and WSTF.
- Continuation of projects has been helpful to effectiveness. The decision to
extend projects such as with SDCP or expand them into new projects (for
131
There is a likelihood of double-counting of beneficiary outreach numbers, and to that extent the numbers may be over-estimated.
Appendix II EB 2019/128/R.12
40
example, from MKEPP to UTaNRMP) has allowed success to be built on and
modalities and technologies that proved effective to be expanded or scaled
up. In contrast, new projects have faced varying levels of delay that have
affected delivery of results (see Efficiency).
- Group mobilization and training have been a viable method to deliver
results, provided that sensitization was done well, and groups were supported
to be strong and viable institutions. Supporting registration for groups such
as WRUAs and CFAs has also encouraged stability and expansion. On the
other hand, the graduation or transition of groups has had mixed results, as
access to credit to move to more commercial operation has not proved so
easy (SDCP, PROFIT), and the early signs for KCEP-CRAL indicate as well that
it is not easy to move rapidly to unsubsidized production.
- Unfavourable weather, especially drought, has affected project
performance. CKDAP efforts were dampened by the failure of the long rains
between 2007 and 2010 and the resulting drought. The 2011-2012 drought
also had an impact, being described as the worst in 60 years and affecting
3.75 million people, causing crop failure and loss of livestock.132 The eastern
region farmers, including those under KCEP-CRAL, have been seriously
affected by the most recent drought in 2016-17, and this has affected yields
and subsequent transition rates.133
- Appropriate technology has had key benefits in boosting results across the
portfolio, whether from saving energy, boosting production or preventing crop
losses. These range from the solar electric fence in UTaNRMP that reduced
the incidences of human-wildlife conflict by 96 per cent, to the introduction of
biogas to boost returns to dairy farmers, e-vouchers to enable cash-
constrained cereal farmers under KCEP, micro-irrigation (CKDAP), labour-
saving equipment (chaff cutters), and financial products (crop insurance,
warehouse receipts).
(ii) Targeting
114. The portfolio has successfully achieved a good gender balance in its beneficiary
outreach. From initial gender-sensitive community sensitization, participatory rural
appraisal exercises and beneficiary and group selection, projects have invariably
continued to raise awareness on gender issues and use gender-sensitive
approaches during implementation. Six projects (CKDAP, MKEPP, SNCDP, SDCP,
SHoMAP and PROFIT) have demonstrably mainstreamed gender equality and
women's empowerment and succeeded in ensuring that women represent at least
50 per cent of beneficiaries.134
115. Interestingly, achieving a gender balance in groups in CKDAP and SNCDP often
meant promoting men's participation. Before CKDAP, group activities were
dominated by women, but the project managed to increase their involvement
through continuous sensitization on the importance of gender equality as well as
the economic opportunities afforded by group membership.
116. In PROFIT, women have mainly been reached through the financial graduation
programme implemented by the NGOs CARE and BOMA and through the
specialized microfinance institution, Kenya Women’s’ Financial Trust (KWFT).
However, PROFIT has yet to develop gender and pro-poor targeting mechanisms as
expected in design. Traditional financial institutions continue to use existing
132
PCRV, MKEPP. 133
KCEP Annual Progress Report, 2017-18. 134
Women represented: 50 per cent of 213,578 beneficiaries accessing improved primary health care services in CKDAP; 55 per cent of 196,639 beneficiaries in SNCDP; and 51 per cent of 558,145 beneficiaries in MKEPP. Women represented 50 per cent of dairy farmers and horticultural farmers and value chain players in SDCP and SHoMAP, surpassing the quotas set at design of 30 and 36 per cent, respectively. PROFIT has also surpassed its 50 per cent quota for women's participation, with women making up 79 per cent of beneficiaries to date.
Appendix II EB 2019/128/R.12
41
approaches that do not reach the entire target group, namely poorer women and
youth.135 Therefore the programme is also piloting innovative approaches, such as
bringing SACCOs on board.
117. Pastoralists have been reached to a limited extent and only through PROFIT via the
financial graduation pilot.136 The earlier projects were not designed to support this
target group, and subsequently KCEP-CRAL, while targeting ASAL areas, has so far
focused on cereal producers.
118. In terms of numbers alone, the portfolio has demonstrated varied outreach to
youth. This is compounded by inadequate reporting on the participation of youth.137
On the one hand, in SDCP, youth represent 20 per cent of the members of
participating dairy groups, surpassing the quota of 10 per cent.138 Sixty per cent of
members of the savings groups participating in PROFIT’s financial graduation
programme in Kitui County are youth. Youth were also targeted directly in CKDAP
and indirectly in MKEPP and SNCDP, although there were no specific needs-oriented
measures – except for the School Greening Programme in MKEPP. In SNCDP, 47 per
cent of members in beneficiary groups were youth. Outreach was low in CKDAP (18
youth groups trained in entrepreneurship compared to 300 planned) and in
UTaNRMP.139
119. The portfolio has consistently aimed to target people living with HIV/AIDS.
HIV/AIDS considerations were mainstreamed in earlier projects, in line with the
2002 and 2007 COSOPs. Although the 2013 COSOP does not include HIV/AIDS, the
portfolio through KCEP-CRAL and ABDP continues to target people living with
HIV/AIDS among its core and secondary target groups as well as provides
HIV/AIDS awareness-raising activities. The strongest focus on HIV/AIDS was in
SNCDP because at the time of design the Southern Nyanza region had some of the
highest HIV/AIDS prevalence figures in the country. Therefore, the project
mainstreamed HIV/AIDS awareness and supported activities specifically to
contribute to reversing the spread of the disease.140 Evidence suggests that the
activities were effective and contributed to improved awareness and increased
testing.141
(iii) Natural resources management
120. Results have been positive in relation to NRM. The two main projects in the area of
natural resources, the environment and climate change performed very well
(MKEPP, UTaNRMP). They have resulted in improved access to natural resources
and a growing empowerment of communities to manage these resources in a
sustainable way.
121. MKEPP built successfully upon earlier GEF projects that sought to protect the Mt.
Kenya ecosystem. Complementary GEF funding under MKEPP supported the
rehabilitation of natural resources within the protected forest (National Park and
135
For instance, 95 per cent of Agricultural Finance Corporation’s (AFC) credit goes to men. 136
Implemented by BOMA, in Samburu county and via the technical service provider SNV operating in Isiolo and Meru counties. 137
In PROFIT and UTaNRMP, youth participation is not reported beyond the financial graduation programme and community empowerment component, respectively. In SHoMAP, the poor reporting of sex- and youth-disaggregated data was repeatedly raised in supervision mission reports and the MTR, and the issue remained unresolved until completion, when results were disaggregated by sex, but still not by youth. 138
They are mainly involved in milking, milk collection, testing, the transportation of milk and inputs, commercial pasture production as well as employment in the milk bars and milk-cooling centres, and less so in dairy cattle management activities. 139
Just 2 per cent of beneficiaries in barazas (or meetings) to develop community action plans (CAPs) and 7 per cent of CIGs submitted proposals for grants compared to the quota of 30 per cent. However, the project is going to commendable lengths to address this, and the latest data on youth participation show marked improvements. 140
For example, through home-based care providers who provide services to people affected and participatory educational theatre and local livelihood forums that sensitize communities on social and health-related issues. 141
SNCDP PCR.
Appendix II EB 2019/128/R.12
42
Forest Reserve), while IFAD funding assisted conservation and rehabilitation along
five river basins outside the protected areas.
122. UTaNRMP is a scaling-up of MKEPP and is supporting the rehabilitation of 28 river
basins. UTaNRMP has also continued some activities in the protected areas through
support to CFAs. It has facilitated 94,550 households to have access to safe water,
while 75,000 school children have safer water in schools. A total of 1,576 ha had
been put under irrigation benefiting 39,400 people, while 77 water sources had
been rehabilitated or developed. Environmental vulnerability has been reduced
through irrigation, provision of safe water for domestic use, and installation of a
solar electric fence that reduced the incidences of human-wildlife conflict by 96 per
cent.
123. In both projects, there was a high level of community participation, which was
mobilized through FDAs, CFAs, WRUAs, water user associations (WUAs), schools
and common interest groups (CIGs). By 2017, 236 action plans had been prepared
by UTaNRMP’s mid-term compared to a target of 150, and this has led to improved
irrigation and soil management, better access to clean water, and decreasing
chemical and microbial pollution levels in waterways.
(iv) Value chain activities
124. With respect to production,142 activities were mostly related to training on best
practices and facilitating the use of improved inputs, crop varieties and livestock
breeds. Activities related to markets were more diverse – training on group
marketing and market scouting, infrastructure development and provision of
market information.
125. The outcome of trainings on production was largely successful and led to improved
supply. For instance, SDCP households were more likely than control households to
have received information on all the practices being promoted by SDCP, and they
were also more likely to have adopted those practices. Milk production increased as
a consequence.143 Similarly, productivity increases for some horticultural crops,
such as bananas, were registered for the SHoMAP beneficiaries as a result of
trainings on input use and use of improved crop varieties. A total of 873 dairy
groups improved their milk productivity and efficiency, while 600 horticulture
groups raised their production of marketable produce (bananas, roots, salad
vegetables).
126. The effectiveness of market-related training was found to be low. In the case of
SDCP, the share of households receiving information on market-related topics (59
per cent) was in general lower than for production-related and farm management
topics (79 per cent). Entering the market and understanding how to expand their
dairy business was still a challenge for many farmers.144 In the case of SHoMAP,
beneficiaries adopted improved production methods, but adoption of market-
related skills (such as market scouting) was much lower. Most farmers continued to
sell to the same market intermediaries at similar terms of trade as before. Most
producer groups in both projects did not enter into contractual agreements with
buyers.145
127. In terms of improvement in infrastructure to support market-related activities,
SHoMaP’s activities included improvement of roads and culverts and construction of
market structures to facilitate trade. The former led to successful outcomes in
terms of reduced transportation costs and increased access of traders to the farm
gate. However, market structures were less successful due to unfavourable
142
Findings draw mainly on the two impact evaluation studies for SHoMAP and SDCP. 143
SDCP 3iE impact evaluation 2017 144
Only some 20 per cent of SDCP groups facilitated links between members and input suppliers, and just 24 per cent facilitated linking members to milk purchasers – similar to the percentages observed in control groups. 145
Although some examples in the case of SDCP were noted where dairy groups arranged contracts with SACCOs
Appendix II EB 2019/128/R.12
43
location, devolution to counties, and lack of enforcement, among other factors. The
milk bars organized under SDCP as a marketing channel to sell dairy products such
as fresh milk and yoghurt were more successful.
(v) Rural finance
128. Provision of rural financial services was relatively effective when delivered as
components under two projects: SHoMAP and SNCDP. For the former, rural finance
support reached over 46,000 borrowers in the form of competitive grants and loans
through Equity Bank.146 Whether this credit line was continued is not clear.147
SHoMAP also supported 80 pilot initiatives to access competitive grants that were
to be replicated through loans from microfinance institutions.
129. SNCDP supported the establishment of 15 CFSAs with 22,294 shareholders, which
led to more than KES 328 million of savings being mobilized, and loans amounting
to KES 256 million disbursed. These loans supported the expansion of businesses,
asset acquisition, improved standards of living and social status for youth, women
and the productive poor in the project area. A total of 67 per cent of the population
had access to financial services at project completion as compared to 45 per cent
at midterm and 18 per cent at baseline. The levels of savings were also noted to
have increased from 48 per cent at baseline to 56 per cent by completion. Overall,
the introduction of the CFSAs led to an improved saving culture among community
members, who were initially not used to saving.
130. For the major rural finance initiative (PROFIT), delays have meant that targets
have yet to be reached, although recent progress has been more promising, in
particular with regard to outreach to enterprises and very poor farmers.148 PROFIT
aimed to reach 287,750 smallholder farmers, fishers, pastoralists, women, landless
labourers and youth through a risk-sharing fund, credit facility, business support
services and financial graduation. By March 2018, the private financial institutions
under the RSF had disbursed KES 1.1 billion, reaching 67,862 beneficiaries (58 per
cent of target for this component). For business support, 23,489 smallholder
farmers and 641 small and medium enterprises (SMEs) were recruited and capacity
building is underway, representing a 71 per cent and 183 per cent achievement,
respectively. As of June 2017, the credit facility had a total of 20,273 beneficiaries,
representing only a 15 per cent achievement. Finally, the financial graduation
component has already reached its target of providing 2,600 ultra-poor with
consumption stipends and investment grants.
131. The assumption of PROFIT was that commercial banks have excess liquidity which
can be leverage into agriculture. The revised target for IFAD funds (2016) under
the RSF component to leverage commercial lending is 6.1, which means that the
project intends to facilitate commercial lending of US$41.4 million supported by the
project’s partial credit guarantee of US$6.9 million. Of the two banks using the RSF
to date, AFC has achieved a ratio of 5:1, while Barclay's leverage ratio is currently
only 1:1.149 This does appear to confound the assumption made by PROFIT that the
main issue was on the demand side, when in fact it was the supply side that
needed considerable attention since banks were not experienced or willing to lend
in the sector.150
146
According to the MTR in 2012, a guarantee risk-sharing fund of KES 2.5 million was deposited with Equity Bank under Kilimo Biashara (a national Agribusiness initiative). 147
The PCRV did not confirm these results or whether any outstanding balance was refunded to the Treasury by Equity Bank with approval by IFAD. 148
Severe delays caused PROFIT to be rated a problem project for nearly three years (from June 2014 to March 2017), and low disbursement caused the cancellation of the Innovation Facility post-MTR. Implementation of value chain activities only started in 2017, through two financial institutions (Barclays and AFC) rather than the four originally planned. 149
AGRA Combined IPPT BSS & RSF Report, March 2018. 150
According to interviews with AGRA, the PROFIT service provider for RSF and BSS,
Appendix II EB 2019/128/R.12
44
132. The second PROFIT credit line component has also shown weak performance.
Portfolio at Risk (PAR) rates for the four microfinance banks (MFBs) are alarmingly
high, and deteriorating in the case of SMEP.151 Table 2 annex VII provides a
summary of the available data. The evidence indicates poor performance of the
agriculture loan product and deteriorating loan portfolio quality.152 The MFBs
reported a variety of weak practices that affected performance.153
133. A loss of critical sequencing effectively led to MFBs lending to clients outside the
target group.154 It was expected that the Business Service Support (BSS)
subcomponent would help participating banks in the RSF and MFBs in the Credit
Facility subcomponents to provide tailored products to the PROFIT target group and
increase access to finance. Yet BSS only effectively started in 2017, while the credit
facility had already on-lent all resources to the MFBs as of April 2013.155 This
emphasizes the need for capacity-building inputs to either precede or accompany
the delivery of either RSF or CF, to ensure that the partner financial institutions
have the correct strategies and product offerings in response to the needs of the
identified agricultural value chains.
(vi) Institution building
134. Group formation has been the strongest area of institution-building success. Across
all projects, there has been effective delivery of services and increased production
and conservation outcomes through groups. This is particularly the case when
existing groups are supported – for example, dairy groups that started as bee-
keepers in SDCP, vegetable producers in SHoMAP, and conservation groups, CFAs
or WUAs in UTaNRMP. Ownership has been strong where community planning
methods have been used. Building on local knowledge has also encouraged more
ready adoption of technologies – for example, dairy farmers upgrading existing
local breeds with artificial insemination (SDCP), and modern hives replacing
traditional ones in beekeeping and upgrading of local goats and poultry through
cross-breeding, as opposed to the direct introduction of new and expensive breeds
(CKDAP).
135. Group registration (such as with local cooperative offices) has been a critical step
to ensure that groups have recognition, work in a more disciplined and collective
manner, and can receive better market prices, especially when they obtain Bureau
of Standards certificates.
136. Adjustment to devolution processes during implementation meant that projects
moved to increasingly support devolved structures. For example, in CKDAP, the
PCU was relocated from Nairobi to Nyeri and new structures were created at the
divisional and area levels to facilitate integrated development of different sectoral
activities and to improve participation of the target group in project planning,
budgeting, implementation and evaluation.156 Nevertheless, as noted in the review
151
The MFBs have all repaid the first two tranches of instalments on the credit line loans. However, FAULU, SMEP and KWFT still report utilisation of PROFIT funds outside the set targeting criteria, and, according to available data, FAULU, Rafiki and SMEP are not fully using the credit facility for PROFIT targets. PROFIT Supervision Mission Report, October 2017. Para. 30. 152
Only KWFT was able to build its agriculture loan portfolio and maintain a healthy portfolio; FAULU and SMEP performed poorly both in agriculture loan portfolio build-up as well as in its quality. SMEP confirmed a write-off of KES 21 million in bad debts under its agriculture loan portfolio. RAFIKI disbursements and loan portfolio size were impressive in 2016, but the PAR at 76 per cent wipes out any gains made. 153
SMEP disbursed loans without a clear focus of target client and agribusiness product; its classification of these loans and reporting were also not done properly. FAULU loans under PROFIT were disbursed to village groups, classification of loans was not done, and its current shift in institutional focus from productive to consumer lending adversely affected accurate reporting of the agribusiness loan portfolio. RAFIKI’s poor loan performance is directly related to a collapsed business anchor model with New KCC and Mobi Pay. 154
PROFIT Supervision Mission Report, October 2017. Para. 38 155
According to one KWFT project officer, PROFIT barely provided guidance on targeting issues, leaving the activity up to the discretion of individual MFBs. 156
PCRV, CKDAP.
Appendix II EB 2019/128/R.12
45
of the earlier COSOP 2007, capacity-building results were affected by the transfer
of many staff as a result of devolution.157
Summary – effectiveness
137. Overall, effectiveness is very mixed, with strong group development and production
increases. NRM projects have resulted in improved access to natural resources and
a growing empowerment of communities to manage these resources in a
sustainable way. Value chain-related activities have contributed to increased
productivity of crops and livestock, but the activities related to marketing and
processing were less successful. Expected synergies between PROFIT and value
chain projects have so far been limited. Rural finance results have been delayed
and though now rapidly progressing, the quality of the lending portfolio has been of
concern and success in reaching the IFAD target group mainly undocumented.
Outreach to women was good throughout the portfolio and HIV/AIDS was
mainstreamed. Youth and pastoralists were not targeted and outreach was limited
as a result. Effectiveness is therefore rated as moderately satisfactory (4).
Efficiency
138. This section examines three areas of efficiency: project management, fund
disbursement, and economic rate of return.
139. Management costs. Actual management costs have exceeded the planned
allocations for all projects, although the proportion of funds spent on project
management costs has fallen from a high of 35 per cent in the earliest project
reviewed (CKDAP) to less than 20 per cent for the recently closed horticultural
project (See figure 7, annex VII). For the closed projects, higher-than-expected
management costs were attributed to duplication of coordination structures in
CKDAP, the need to match allowances prevailing in the Government, and increased
fuel prices (MKEPP), and poor planning of annual workplan and budget (AWPB)
activities and project extension (SNCDP). In SHoMAP, while there was not a huge
increase in management costs vis-á-vis total project costs, the project did spend
137 per cent of its allocated project management cost on this category. This
increase is attributed to conceptual challenges on value chains necessitating
outsourcing, under-staffing, weak contract management, and long distances for
supervision.
140. Ongoing projects with PCU headquarters outside of Nairobi (SDCP and UTaNRMP)
are overall progressing well, with management costs not exceeding more than 6
per cent of allocated costs.158 PROFIT has a much lower allocation of management
costs at (re)design vis-à-vis other projects – 4 per cent compared to all others,
which range between 10 and 22 per cent – due to its location in Nairobi, and
limited need for extensive infrastructure. However, its actual management costs
have been relatively high, largely due to slow implementation.
141. Staffing issues. Two specific issues affected project staffing: high staff turnover
and under-staffing. Factors contributing to staff turnover included the terms of
service in MKEPP and no top-up allowances in PROFIT. Under-staffing was acute in
early periods of projects such as SNCDP, or found in implementing agencies in
SDCP, conceptual challenges for the PMU to understand value chains in SHoMAP,
and overlapping staff duties due to the PROFIT's embeddedness in the National
Treasury.
142. Disbursements. Many projects accelerate their disbursements in the second half
of the project life cycle, which is a poor indicator of efficiency. Overall disbursement
157
COSOP 2013, Previous COSOP results framework comments, Appendix IV. 158
In the case of SDCP, increased management costs relative to actual programme costs are still only 66 per cent of re-allocated costs in Project Year 11 of 13. UTaNRMP is also well within its allocated management costs, with half of its allocated expenses used in Project Year 6 of 8.
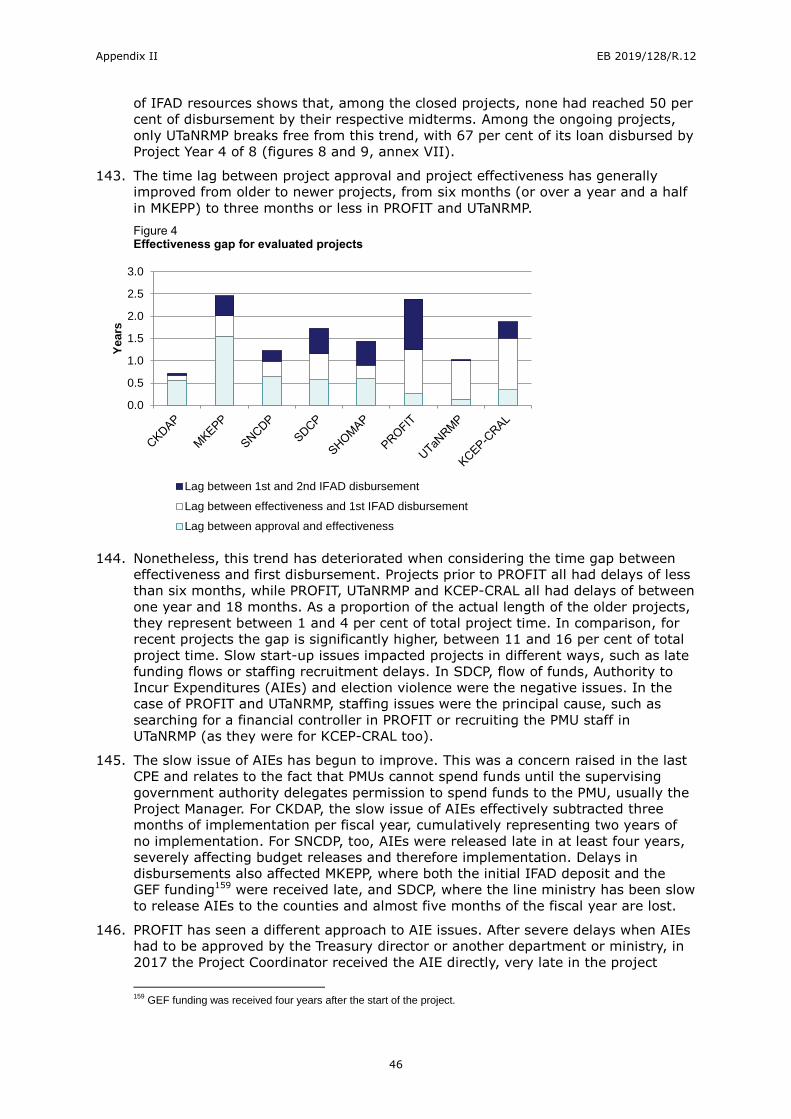
Appendix II EB 2019/128/R.12
46
of IFAD resources shows that, among the closed projects, none had reached 50 per
cent of disbursement by their respective midterms. Among the ongoing projects,
only UTaNRMP breaks free from this trend, with 67 per cent of its loan disbursed by
Project Year 4 of 8 (figures 8 and 9, annex VII).
143. The time lag between project approval and project effectiveness has generally
improved from older to newer projects, from six months (or over a year and a half
in MKEPP) to three months or less in PROFIT and UTaNRMP.
Figure 4 Effectiveness gap for evaluated projects
144. Nonetheless, this trend has deteriorated when considering the time gap between
effectiveness and first disbursement. Projects prior to PROFIT all had delays of less
than six months, while PROFIT, UTaNRMP and KCEP-CRAL all had delays of between
one year and 18 months. As a proportion of the actual length of the older projects,
they represent between 1 and 4 per cent of total project time. In comparison, for
recent projects the gap is significantly higher, between 11 and 16 per cent of total
project time. Slow start-up issues impacted projects in different ways, such as late
funding flows or staffing recruitment delays. In SDCP, flow of funds, Authority to
Incur Expenditures (AIEs) and election violence were the negative issues. In the
case of PROFIT and UTaNRMP, staffing issues were the principal cause, such as
searching for a financial controller in PROFIT or recruiting the PMU staff in
UTaNRMP (as they were for KCEP-CRAL too).
145. The slow issue of AIEs has begun to improve. This was a concern raised in the last
CPE and relates to the fact that PMUs cannot spend funds until the supervising
government authority delegates permission to spend funds to the PMU, usually the
Project Manager. For CKDAP, the slow issue of AIEs effectively subtracted three
months of implementation per fiscal year, cumulatively representing two years of
no implementation. For SNCDP, too, AIEs were released late in at least four years,
severely affecting budget releases and therefore implementation. Delays in
disbursements also affected MKEPP, where both the initial IFAD deposit and the
GEF funding159 were received late, and SDCP, where the line ministry has been slow
to release AIEs to the counties and almost five months of the fiscal year are lost.
146. PROFIT has seen a different approach to AIE issues. After severe delays when AIEs
had to be approved by the Treasury director or another department or ministry, in
2017 the Project Coordinator received the AIE directly, very late in the project
159
GEF funding was received four years after the start of the project.
0.0
0.5
1.0
1.5
2.0
2.5
3.0
Years
Lag between 1st and 2nd IFAD disbursement
Lag between effectiveness and 1st IFAD disbursement
Lag between approval and effectiveness

Appendix II EB 2019/128/R.12
47
cycle. By October 2017 this AIE designation had seen positive results, with
increased expenditure. UTaNRMP (and KCEP) have also learned from previous AIE
issues, and have modified procedures to allow for a more effective flow of funds.
To date, AIEs have not been reported to be a cause for problems.
147. Economic rate of return (ERR). While all projects aside from CKDAP did an ex
ante ERR analysis, no projects assessed their ERR at completion. This is a
significant gap given the importance of such an analysis for value chain projects.
While in most cases beneficiary outreach was higher than planned, spreading
potential economic gains, the near-universal extension of projects by an average of
1.8 years also reduces the economic impact of the projects. It is also noteworthy
that projects from SDCP onwards had ERRs of 20 to 22 per cent compared to
CKDAP and MKEPP ERRs of 8 to 10 per cent.
148. Cost per beneficiary. Value chain projects present the highest cost per
beneficiary (between US$132 and US$211) due to the relatively smaller number of
beneficiaries reached in comparison to the rest of the portfolio.160 The project with
the highest cost per beneficiary compared to design was SNCDP, fueled by its low
outreach figures against targeted beneficiaries. PROFIT presents a low cost per
beneficiary mainly due to the implementation delays of project subcomponents that
would have leveraged a high amount of domestic financing for the project. The
projects that kept closest to their estimated cost per beneficiary at design were the
early CKDAP and MKEPP (table 3, annex VII).
Summary – efficiency
149. The portfolio has seen some improvements in efficiency, such as recent efforts to
tackle the structural limitations that AIEs imposed on projects, or reduced time lags
between approval and entry into force. Exogenous factors that impacted project
efficiency, such as devolution or rising prices, were outside of project control. Yet
because of the time lags between effectiveness and disbursement, the generally
high management costs and the staffing issues, efficiency is rated as moderately
unsatisfactory (3).
Rural poverty impact
150. The rural poverty impact criterion is assessed for MKEPP, UTaNRMP, SDCP, SHoMAP,
CKDAP and SNCDP. These projects have conducted both quantitative (household
survey) and qualitative (focus group discussions and interviews) studies as part of
the impact assessment (IA).161 However, only two had used a comparison group
(counterfactual) – the SDCP IA, which was commissioned by IFAD's Programme
Management Department and the Government; and the SHoMAP impact
evaluation, which was commissioned and conducted by IOE. The other IAs have
assessed only the contribution of the projects to the economic changes in the lives
of their beneficiaries; therefore, it cannot be stated with certainty that observed
changes were a result of IFAD-supported projects alone.
(i) Household income and assets
151. Overall, the economic impact of the portfolio on the beneficiaries has been positive.
The IA studies used a mix of income, expenditure and assets as variables to assess
the economic impact of projects on their beneficiaries.
152. Household incomes. The effect of the projects' interventions on beneficiary
household incomes was found to be positive. As shown in table 4 below, income
changes ranged from 14 per cent in the case of UTaNRMP to 30 per cent in the case
160
It should be noted that the SHoMAP impact evaluation did not calculate cost per beneficiary due to double-counting of beneficiaries. 161
CKDAP PCR, June 2011; MKEPP Impact Assessment Final Report, May 2012; SNDCP Impact Assessment Report, July 2013; Impact evaluation of the smallholder dairy commercialization programme in Kenya, October 2017; SHoMAP Impact Evaluation draft report, July 2018, IFAD IOE; UTaNRMP Impact Assessment Survey Final Report, April 2017.
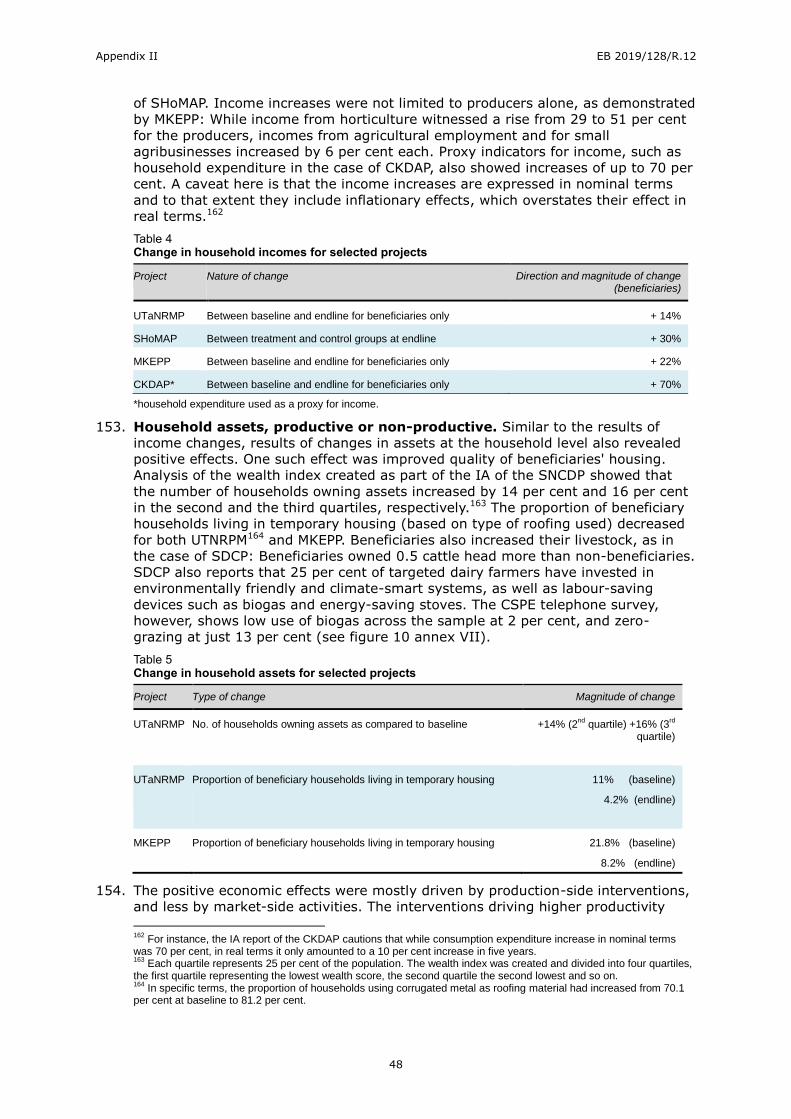
Appendix II EB 2019/128/R.12
48
of SHoMAP. Income increases were not limited to producers alone, as demonstrated
by MKEPP: While income from horticulture witnessed a rise from 29 to 51 per cent
for the producers, incomes from agricultural employment and for small
agribusinesses increased by 6 per cent each. Proxy indicators for income, such as
household expenditure in the case of CKDAP, also showed increases of up to 70 per
cent. A caveat here is that the income increases are expressed in nominal terms
and to that extent they include inflationary effects, which overstates their effect in
real terms.162
Table 4 Change in household incomes for selected projects
Project Nature of change Direction and magnitude of change (beneficiaries)
UTaNRMP Between baseline and endline for beneficiaries only + 14%
SHoMAP Between treatment and control groups at endline + 30%
MKEPP Between baseline and endline for beneficiaries only + 22%
CKDAP* Between baseline and endline for beneficiaries only + 70%
*household expenditure used as a proxy for income.
153. Household assets, productive or non-productive. Similar to the results of
income changes, results of changes in assets at the household level also revealed
positive effects. One such effect was improved quality of beneficiaries' housing.
Analysis of the wealth index created as part of the IA of the SNCDP showed that
the number of households owning assets increased by 14 per cent and 16 per cent
in the second and the third quartiles, respectively.163 The proportion of beneficiary
households living in temporary housing (based on type of roofing used) decreased
for both UTNRPM164 and MKEPP. Beneficiaries also increased their livestock, as in
the case of SDCP: Beneficiaries owned 0.5 cattle head more than non-beneficiaries.
SDCP also reports that 25 per cent of targeted dairy farmers have invested in
environmentally friendly and climate-smart systems, as well as labour-saving
devices such as biogas and energy-saving stoves. The CSPE telephone survey,
however, shows low use of biogas across the sample at 2 per cent, and zero-
grazing at just 13 per cent (see figure 10 annex VII).
Table 5 Change in household assets for selected projects
Project Type of change Magnitude of change
UTaNRMP No. of households owning assets as compared to baseline +14% (2nd
quartile) +16% (3rd
quartile)
UTaNRMP
Proportion of beneficiary households living in temporary housing 11% (baseline)
4.2% (endline)
MKEPP Proportion of beneficiary households living in temporary housing 21.8% (baseline)
8.2% (endline)
154. The positive economic effects were mostly driven by production-side interventions,
and less by market-side activities. The interventions driving higher productivity
162
For instance, the IA report of the CKDAP cautions that while consumption expenditure increase in nominal terms was 70 per cent, in real terms it only amounted to a 10 per cent increase in five years. 163
Each quartile represents 25 per cent of the population. The wealth index was created and divided into four quartiles, the first quartile representing the lowest wealth score, the second quartile the second lowest and so on. 164
In specific terms, the proportion of households using corrugated metal as roofing material had increased from 70.1 per cent at baseline to 81.2 per cent.
Appendix II EB 2019/128/R.12
49
included training provided by projects and the adoption of improved crop varieties
and livestock breeds. In the case of SNDCP, inputs for crop and livestock
production deriving from improved availability and access to extension services
were one of the reasons for increased incomes. For projects with a prominent value
chain focus, i.e. SHoMAP and SDCP, besides increased production, economic
changes were also attributed to market-side interventions: lower transportation
costs and higher prices, respectively.
(ii) Human and social capital and empowerment
155. This includes an assessment of the extent to which individuals were empowered
through improved access to information and to services, for example inclusive
financial services. It also looks at the empowerment of grassroots organizations
and institutions and changes with regard to social cohesion and conflict
management.
156. Community empowerment. The outcomes with respect to group cohesion and
empowerment were mixed. All projects had some element of training in improving
group dynamics. UTaNRMP successfully built capacities of grassroot organizations
such as the WUAs, CFAs and CIGs on governance and management of grants.
Groups visited by the CSPE team were functioning satisfactorily.
157. While capacity-building activities were generally viewed as positive by beneficiaries,
there was limited time to make these activities sustainable. Yet time was important
to help people see the importance of collective action through mutual cooperation.
The MKEPP IA report states that the capacity-building of WRUAs had been
successful, and their ability to carry out their roles in water catchment,
management and conservation was well demonstrated, but more time was required
to enable the WRUAs to grow and to carry out their mandate. For the groups that
were formed last, MKEPP could not provide the interventions the communities had
demanded since their period of engagement with the project was too short.165
158. Group cohesion. Improved group cohesion has led to a reduction in social
conflicts. One reason was the training imparted on leadership skills and conflict
resolution mechanisms, which consequently enhanced the cohesiveness of the
groups and reduced conflicts. For instance, the IA of UTaNRMP showed that 60 per
cent of the respondents did not experience water conflicts in their area after WRUA
formation and interventions. In areas where conflicts emerged, they were mainly
resolved through leaders and the WRUAs. In the case of SNCDP, 62 per cent of the
respondents were satisfied with conflict resolution mechanisms.166
159. In other cases, creating understanding among users of natural resources of their
varying needs helped reduce conflicts. The MKEPP, through exchange visits and
learning between upstream and downstream users of rivers along the river course,
helped build cooperation and reduced conflicts between the communities.167 The IA
study showed that the majority of the respondents did not experience water
conflicts in their area.
160. In some cases, group cohesion had been undermined by negative group dynamics.
For example, in SNCDP, insufficient support from the community leadership and
negative attitudes towards the cooperative model have limited the impact of
community groups established for water management and maintenance of the
irrigation facilities.168 In the case of CKDAP, local opinion leaders provided
conflicting information to communities on the level of financial and material
support, leading to mistrust and low community participation.169
165
MKEPP, IA, p.83. 166
SNDCP, PCR, p. 57. 167
MKEPP, PCR, p. 58. 168
SNCDP, PCR Digest. 169
CKDAP, PCR, p. VIII appendices.
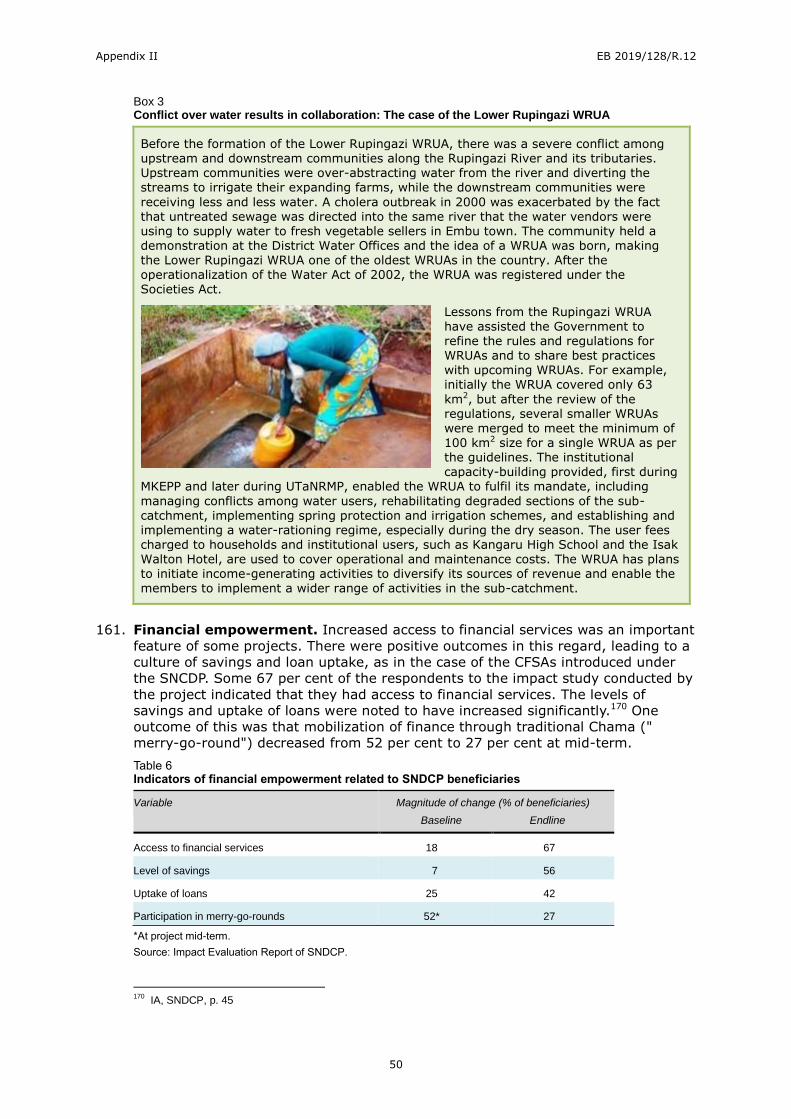
Appendix II EB 2019/128/R.12
50
Box 3 Conflict over water results in collaboration: The case of the Lower Rupingazi WRUA
Before the formation of the Lower Rupingazi WRUA, there was a severe conflict among upstream and downstream communities along the Rupingazi River and its tributaries. Upstream communities were over-abstracting water from the river and diverting the streams to irrigate their expanding farms, while the downstream communities were
receiving less and less water. A cholera outbreak in 2000 was exacerbated by the fact that untreated sewage was directed into the same river that the water vendors were using to supply water to fresh vegetable sellers in Embu town. The community held a demonstration at the District Water Offices and the idea of a WRUA was born, making the Lower Rupingazi WRUA one of the oldest WRUAs in the country. After the operationalization of the Water Act of 2002, the WRUA was registered under the Societies Act.
Lessons from the Rupingazi WRUA
have assisted the Government to refine the rules and regulations for WRUAs and to share best practices with upcoming WRUAs. For example, initially the WRUA covered only 63
km2, but after the review of the regulations, several smaller WRUAs were merged to meet the minimum of 100 km2 size for a single WRUA as per the guidelines. The institutional capacity-building provided, first during
MKEPP and later during UTaNRMP, enabled the WRUA to fulfil its mandate, including
managing conflicts among water users, rehabilitating degraded sections of the sub-catchment, implementing spring protection and irrigation schemes, and establishing and implementing a water-rationing regime, especially during the dry season. The user fees
charged to households and institutional users, such as Kangaru High School and the Isak Walton Hotel, are used to cover operational and maintenance costs. The WRUA has plans to initiate income-generating activities to diversify its sources of revenue and enable the members to implement a wider range of activities in the sub-catchment.
161. Financial empowerment. Increased access to financial services was an important
feature of some projects. There were positive outcomes in this regard, leading to a
culture of savings and loan uptake, as in the case of the CFSAs introduced under
the SNCDP. Some 67 per cent of the respondents to the impact study conducted by
the project indicated that they had access to financial services. The levels of
savings and uptake of loans were noted to have increased significantly.170 One
outcome of this was that mobilization of finance through traditional Chama ("
merry-go-round") decreased from 52 per cent to 27 per cent at mid-term.
Table 6 Indicators of financial empowerment related to SNDCP beneficiaries
Variable Magnitude of change (% of beneficiaries)
Baseline Endline
Access to financial services 18 67
Level of savings 7 56
Uptake of loans 25 42
Participation in merry-go-rounds 52* 27
*At project mid-term.
Source: Impact Evaluation Report of SNDCP.
170
IA, SNDCP, p. 45
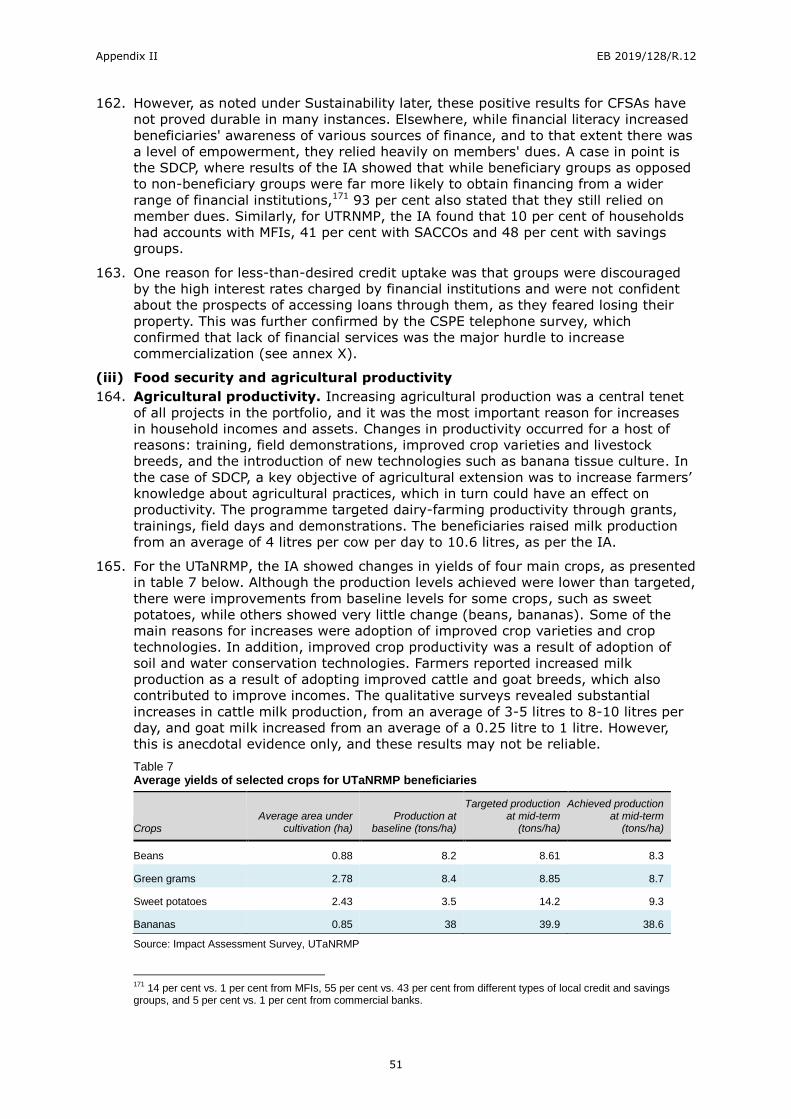
Appendix II EB 2019/128/R.12
51
162. However, as noted under Sustainability later, these positive results for CFSAs have
not proved durable in many instances. Elsewhere, while financial literacy increased
beneficiaries' awareness of various sources of finance, and to that extent there was
a level of empowerment, they relied heavily on members' dues. A case in point is
the SDCP, where results of the IA showed that while beneficiary groups as opposed
to non-beneficiary groups were far more likely to obtain financing from a wider
range of financial institutions,171 93 per cent also stated that they still relied on
member dues. Similarly, for UTRNMP, the IA found that 10 per cent of households
had accounts with MFIs, 41 per cent with SACCOs and 48 per cent with savings
groups.
163. One reason for less-than-desired credit uptake was that groups were discouraged
by the high interest rates charged by financial institutions and were not confident
about the prospects of accessing loans through them, as they feared losing their
property. This was further confirmed by the CSPE telephone survey, which
confirmed that lack of financial services was the major hurdle to increase
commercialization (see annex X).
(iii) Food security and agricultural productivity
164. Agricultural productivity. Increasing agricultural production was a central tenet
of all projects in the portfolio, and it was the most important reason for increases
in household incomes and assets. Changes in productivity occurred for a host of
reasons: training, field demonstrations, improved crop varieties and livestock
breeds, and the introduction of new technologies such as banana tissue culture. In
the case of SDCP, a key objective of agricultural extension was to increase farmers’
knowledge about agricultural practices, which in turn could have an effect on
productivity. The programme targeted dairy-farming productivity through grants,
trainings, field days and demonstrations. The beneficiaries raised milk production
from an average of 4 litres per cow per day to 10.6 litres, as per the IA.
165. For the UTaNRMP, the IA showed changes in yields of four main crops, as presented
in table 7 below. Although the production levels achieved were lower than targeted,
there were improvements from baseline levels for some crops, such as sweet
potatoes, while others showed very little change (beans, bananas). Some of the
main reasons for increases were adoption of improved crop varieties and crop
technologies. In addition, improved crop productivity was a result of adoption of
soil and water conservation technologies. Farmers reported increased milk
production as a result of adopting improved cattle and goat breeds, which also
contributed to improve incomes. The qualitative surveys revealed substantial
increases in cattle milk production, from an average of 3-5 litres to 8-10 litres per
day, and goat milk increased from an average of a 0.25 litre to 1 litre. However,
this is anecdotal evidence only, and these results may not be reliable.
Table 7 Average yields of selected crops for UTaNRMP beneficiaries
Crops Average area under
cultivation (ha) Production at
baseline (tons/ha)
Targeted production at mid-term
(tons/ha)
Achieved production at mid-term
(tons/ha)
Beans 0.88 8.2 8.61 8.3
Green grams 2.78 8.4 8.85 8.7
Sweet potatoes 2.43 3.5 14.2 9.3
Bananas 0.85 38 39.9 38.6
Source: Impact Assessment Survey, UTaNRMP
171
14 per cent vs. 1 per cent from MFIs, 55 per cent vs. 43 per cent from different types of local credit and savings groups, and 5 per cent vs. 1 per cent from commercial banks.
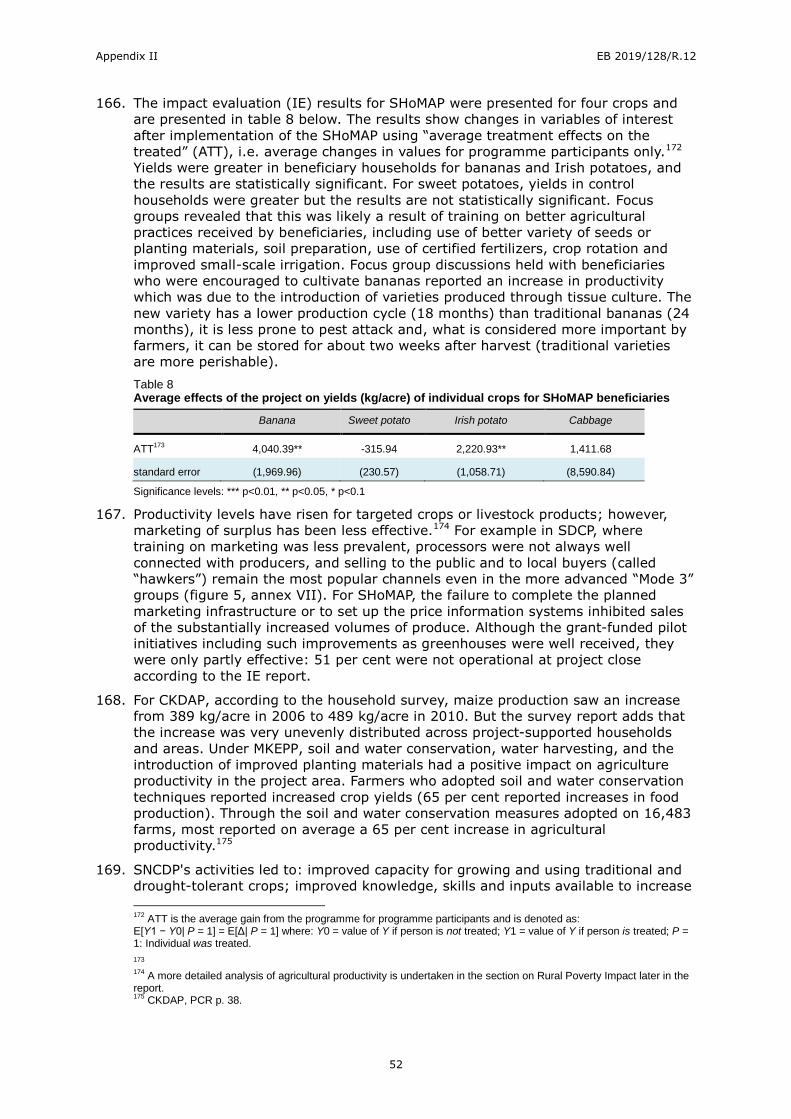
Appendix II EB 2019/128/R.12
52
166. The impact evaluation (IE) results for SHoMAP were presented for four crops and
are presented in table 8 below. The results show changes in variables of interest
after implementation of the SHoMAP using “average treatment effects on the
treated” (ATT), i.e. average changes in values for programme participants only.172
Yields were greater in beneficiary households for bananas and Irish potatoes, and
the results are statistically significant. For sweet potatoes, yields in control
households were greater but the results are not statistically significant. Focus
groups revealed that this was likely a result of training on better agricultural
practices received by beneficiaries, including use of better variety of seeds or
planting materials, soil preparation, use of certified fertilizers, crop rotation and
improved small-scale irrigation. Focus group discussions held with beneficiaries
who were encouraged to cultivate bananas reported an increase in productivity
which was due to the introduction of varieties produced through tissue culture. The
new variety has a lower production cycle (18 months) than traditional bananas (24
months), it is less prone to pest attack and, what is considered more important by
farmers, it can be stored for about two weeks after harvest (traditional varieties
are more perishable).
Table 8 Average effects of the project on yields (kg/acre) of individual crops for SHoMAP beneficiaries
Banana Sweet potato Irish potato Cabbage
ATT173
4,040.39** -315.94 2,220.93** 1,411.68
standard error (1,969.96) (230.57) (1,058.71) (8,590.84)
Significance levels: *** p<0.01, ** p<0.05, * p<0.1
167. Productivity levels have risen for targeted crops or livestock products; however,
marketing of surplus has been less effective.174 For example in SDCP, where
training on marketing was less prevalent, processors were not always well
connected with producers, and selling to the public and to local buyers (called
“hawkers”) remain the most popular channels even in the more advanced “Mode 3”
groups (figure 5, annex VII). For SHoMAP, the failure to complete the planned
marketing infrastructure or to set up the price information systems inhibited sales
of the substantially increased volumes of produce. Although the grant-funded pilot
initiatives including such improvements as greenhouses were well received, they
were only partly effective: 51 per cent were not operational at project close
according to the IE report.
168. For CKDAP, according to the household survey, maize production saw an increase
from 389 kg/acre in 2006 to 489 kg/acre in 2010. But the survey report adds that
the increase was very unevenly distributed across project-supported households
and areas. Under MKEPP, soil and water conservation, water harvesting, and the
introduction of improved planting materials had a positive impact on agriculture
productivity in the project area. Farmers who adopted soil and water conservation
techniques reported increased crop yields (65 per cent reported increases in food
production). Through the soil and water conservation measures adopted on 16,483
farms, most reported on average a 65 per cent increase in agricultural
productivity.175
169. SNCDP's activities led to: improved capacity for growing and using traditional and
drought-tolerant crops; improved knowledge, skills and inputs available to increase
172
ATT is the average gain from the programme for programme participants and is denoted as: E[Y1 − Y0| P = 1] = E[Δ| P = 1] where: Y0 = value of Y if person is not treated; Y1 = value of Y if person is treated; P = 1: Individual was treated. 173
174
A more detailed analysis of agricultural productivity is undertaken in the section on Rural Poverty Impact later in the report. 175
CKDAP, PCR p. 38.
Appendix II EB 2019/128/R.12
53
livestock productivity; and increased production of high-value crops. The average
number of households engaged in crop farming was 94.6 per cent and 92.5 per
cent during benchmark and completion, respectively, a slight decrease only. The
main reasons for not engaging in crop farming identified by respondents were lack
of access to land, followed by land not being arable. On lands that were farmed,
yield increases were mixed. Production increase in the case of livestock was more
pronounced – growth was prevalent in the case of indigenous cattle, exotic/cross
goats, chickens, indigenous sheep and goats, and exotic crossbreed cattle,
although beef cattle and exotic/cross sheep showed a decline in production.176
170. Food security generally improved as a result.177 Beneficiaries had access to more
diverse dietary sources, as in the case of both SDCP and SHoMAP, where
beneficiary households were more likely to have a more diverse food basket,
especially foods with higher levels of animal and vegetable proteins, and lower
levels of tuber and fruit consumption.
171. Nutrition. The effect of food security on improved nutrition was a clear outcome.
For example, increased production and improved access to water also led to
improved household nutrition, as beneficiaries increased consumption of the foods
that were obtained from their farms/own produce. In the case of UTaNRMP, farmers
reported improved nutrition as a result of taking goat milk, which is more nutritious
and easier to digest (especially by children), has higher calcium content and low
iron content and is also rich in vitamins. For MKEPP, improved access to water led
to the large majority of the households reporting positive results in nutrition/
household diet (64 per cent), availability of food (68 per cent) and affordability of
food (56 per cent) as compared to the period before the project.
172. On the other hand, there are notable exceptions to improvements in food security.
For CKDAP, as per the household impact survey, the number of households
experiencing at least one hungry season had actually increased in 2010 compared
to 2006. The PCR noted that the intervention in food security concerning drought-
resistant crops was unsuccessful in producing the intended benefits during the
persistent drought in 2008 and 2009. As a supervision report in 2010 noted, the
project had not been able to develop a comprehensive intervention strategy aimed
at crop diversification to ensure food security in the ASALs, thus reducing the
effectiveness of the food security intervention. Similarly, for SNCDP, a comparative
analysis showed a negligible increase in the average number of households
consuming three meals a day, from 63.1 per cent at benchmark to 64.2 per cent at
completion.
(iv) Institutions and policies
173. Impact on policies. The majority of evaluated projects did not have specific
activities to influence policy. In the case of SDCP and SHoMAP though, activities to
contribute to policies were part of the project components. For example, one of the
activities undertaken by SHoMAP was to support the development of an improved
horticultural subsector policy and legislation framework. Accordingly, the project
provided for a grant of US$500,000 towards these envisaged support functions to
the ASCU and a draft “National Horticultural Policy” document was developed
through a participatory process involving a wide range of stakeholders. The Policy,
which provides a framework for the horticultural subsector and improved regulation
of the sector, has been promulgated.
174. SDCP had support to policy and institutions as one of its components. The major
impact of the component was creation of awareness among the stakeholders of the
need for conducive policy and legal frameworks for the dairy subsector. This was
176
SNDCP, PCR, p. 62. 177
The IAs used a variety of methods to assess changes in the food security of beneficiaries as a result of project interventions, using indicators such as levels of nourishment, diversity of sources, and access to food.
Appendix II EB 2019/128/R.12
54
achieved through the following: (i) Dairy Industry Policy and Bill, both of which
were approved by the Cabinet; a draft Livestock Feedstuff Policy and Bill, which is
with the Attorney General for submission to parliament; Strategic Plan for Central
Artificial Insemination Station; and Animal Breeding Policy and Bill, with the policy
finalized while the bill is being prepared; (ii) strengthening and upgrading the Dairy
Training Institute; (iii) support to the Kenya Dairy Board in terms of stakeholder
needs analysis, branding of milk bar premises and upgrading of the Board’s
website; and (iv) support to the Department of Veterinary Services.178
175. Impact on institutions. The results on institution-building were mixed. Although
capacities of government institutions were built through staff training, the paucity
of staff (especially after the devolution process) coupled with their transfer to
newly formed counties resulted in less-than-desired outcomes. In the case of
grassroots organizations, while their capacities were built, there is mixed evidence
of the extent to which they were transformed into more permanent formal
structures. M&E records capture the delivery of training in terms of type, coverage,
recipients, etc. However, there is limited assessment available of the results
achieved. For example, impact studies often provide the results of farmer or group
training,179 but there is little evidence on the effects of training on the performance
of public officials or private sector actors.
176. Lack of formal recognition or status of the community-based organizations was one
of the most important reasons for their failure. SHoMAP helped develop market
management committees to manage the day-to-day functioning of the market
structures constructed or rehabilitated by the project. However, these committees
did not have the desired authority to manage the markets, largely because the
counties formed under the devolution process had not yet delegated any power to
these committees. Similarly, the focal development area committee (FDAC)
structure conceptualized under CKDAP as an informal institution at the grassroots
level elected democratically by the beneficiaries themselves for delivery of project
planning, implementation and maintenance did not have any formal recognition,
thus making it weak.180 Even in the case of SNCDP, which aimed to improve access
to financial services for those with low income, the absence of clear laws to guide
CFSAs led to weak governance structures and incidents of fraud within the
committees.181
177. The local institutions targeted were often not able to deliver the expected outcomes
due to staff-related issues. For instance, SHoMAP facilitated training of county
government staff on effective agricultural practices, agri-business, value chains,
business management and entrepreneurship. However, while the trainings were
useful in building capacities, in interviews with the CSPE team beneficiary farmer
groups reported the lack of adequate and timely support from the local extension
offices. CKDAP helped build capacities of local government institutions such as the
district water offices under the Domestic Water Supply & Technical Services
component. However, the PCR notes that the legislation – Water Act 2002 –
hindered the capacity-building of district water offices by transferring the officials of
the district water offices to other water boards, thus negating the benefits of their
improved capacity.
178. Projects that worked with well-entrenched grassroots organizations were more
successful. MKEPP, which made important contributions to strengthening local-level
institutions such as FDACs, CFAs, WUAs, and other community-based
178
MTR, p. 45. 179
UTaNRMP data did show that 50 to 60 per cent of trainees adopted new technology or capacities for recordkeeping, leadership and other skills, while under SHoMAP there is evidence that productivity rose due partly to training on crop practices, and in SDCP’s improved cattle husbandry and productivity relate to the range of capacity-building provided. 180
CKADP, PCR, p. 68. 181
SNDCP PCR.
Appendix II EB 2019/128/R.12
55
organizations, was able to generate benefits at the district level with improved river
basin management capacity at community and district levels. This was done
through, for example, the deployment of district project coordinators who improved
their management skills at all levels and revitalized government support, and at
national level with the enhanced technical and management capacity of the KWS
and KFS.
Summary – impact
179. Evidence from impact studies shows that positive economic changes occurred for
beneficiaries of all projects. But only for SHoMAP and SDCP can the positive and
significant changes (particularly with regard to productivity, food security and
incomes) be attributed to the project. In all cases, the positive changes, such as
increases in productivity for both crops and livestock, were mainly the result of
production-side interventions. In SHoMAP and SDCP, lower transportation costs,
better prices and stronger local demand (in the case of milk) did lead to increased
incomes. However, positive results emanating from the market-side interventions
were far less visible.
180. Improvements in food security were found for all evaluated projects, except CKDAP
in the ASALs. Training in group dynamics led to positive outcomes such as reduced
conflicts. Results in terms of group cohesion were mixed. In some instances,
project duration was too short and more time was needed to reach a level of
cohesion. Negative group dynamics and mistrust among newly formed groups were
difficult to overcome and there were issues of weak governance and leadership,
also related to the devolution process. The more successful groups were those that
were more mature (dairy) and those that were formed and governed by the
national constitution (NRM groups). The projects successfully built capacities of
staff of government institutions. However, most projects did not have explicit
interventions to influence national policy. Similarly, the grassroots organizations
formed or supported by the projects did not always transform into permanent
structures. The rating given to rural the impact criterion is moderately
satisfactory (4).
Sustainability
181. The CSPE assesses sustainability for seven projects: CKDAP, SNCDP, SHoMAP,
SDCP, PROFIT, MKEPP and UTaNRMP. A range of external factors have hindered or
supported sustainability. Natural events such as those related to climate change
and drought have affected the sustainability of yields in the recent seasons, and
pest outbreaks, notably the fall army worm, were a critical limitation on production
levels in 2017 in UTANRMP and KCEP.182
182. Community groups and associations. The sustainability of project assets has
benefited from the engagement, participation and ownership of local communities,
grassroots organizations and the rural poor. Where groups across the portfolio have
continued to flourish by retaining membership and assets, sustainability has been
positive. The CSPE’s field verification183 of 20 groups and their assets found that 45
per cent of groups met in the field were functioning well and with an active
membership, while 50 per cent were functioning to a moderate level with some
active members. In terms of assets, 48 per cent of the groups had assets that were
in full working order and maintained, while 43 per cent had assets that were in
moderate condition (see results in annex XI). Further examples are given in box 3.
182
KCEP with FAO support is taking measures to tackle this serious African pest https://www.bbc.com/news/science-environment-38859851. 183
Covering field visits to SNDCP, SDCP, SHoMAP, PROFIT, KCEP, UTaNRMP
Appendix II EB 2019/128/R.12
56
Box 4 Evidence of sustainability through various forms of group association
MKEPP UTaNRMP
UTNMRP
SDCP
SHoMAP
The 301 FDAs that were set up under MKEPP and UTaNRMP were instrumental in the development of CAPs and later formed the building blocks for the WRUAs that were formed for the sub-catchments. WRUAs and WUAs were enshrined in law (i.e. registered) as legal associations with
the WRMA. In MKEPP, strong community ownership was reflected by the higher-than-expected contribution to the project (138 per cent).
By June 2018, UTANRMP had supported 30 CFAs and 43 WRUAs. Sustainability is enhanced by the formulation of the Development Cycle for both CFAs and WRUAs, which makes it possible to receive funding through the Water Services Trust Fund. The irrigation groups also demonstrated a high level of cohesion and were effectively organized and trained to ensure
the continued maintenance of the infrastructure. (An example is given in
box 3.)
SDCP groups have generally been sustainable. They were based on existing groups and have focused on raising animal quality and milk production standards with growing assets and incomes. Milk demand is high and groups can receive better income when selling as a group.
Groups have moved from Mode 1 to mostly Mode 2, and 13 per cent at Mode 3184 in 2018, although this is below the targets set for the original and additional financing (table 4, annex VII).
Ownership is reported to be high even after SDCP support ends, with bank assets, sales and improved income. The CSPE telephone survey showed that 93 per cent of 113 groups contacted have a bank account and have maintained group registration. But the groups are still short of finance to
commercialize production with processing and bulking, with 61 per cent identifying this as the most important need (annex X). The takeover of
support by county staff has yet to be assured after the project closes in 2019 and will depend on incorporation into CIDP activities along with county budgets and oversight roles.
Under SHoMAP, the survival of enterprise-based commercial groups was assessed as uncertain in the IE due to underlying governance issues and
weak county government follow-up.
183. Infrastructure and assets. Some project infrastructure such as health clinics
have been taken over successfully and run by county health departments (CKDAPP,
SNCDP). An example in Kerobo, Nyamera County visited by the mission – although
understaffed and without reliable electricity – nevertheless continues to attend to
50 patients per day and a community of 8,700 people nine years after its
construction under SNCDP (figure 5 below). Under SHoMAP, too, there was a
continuing funding arrangement from the county governments and Constituency
Development Fund for the maintenance of the 547 km of roads and bridges
rehabilitated under the spot-improvements activity.
184
Mode category reflects the level of commercialisation and group capacity of the dairy groups under SDCP.
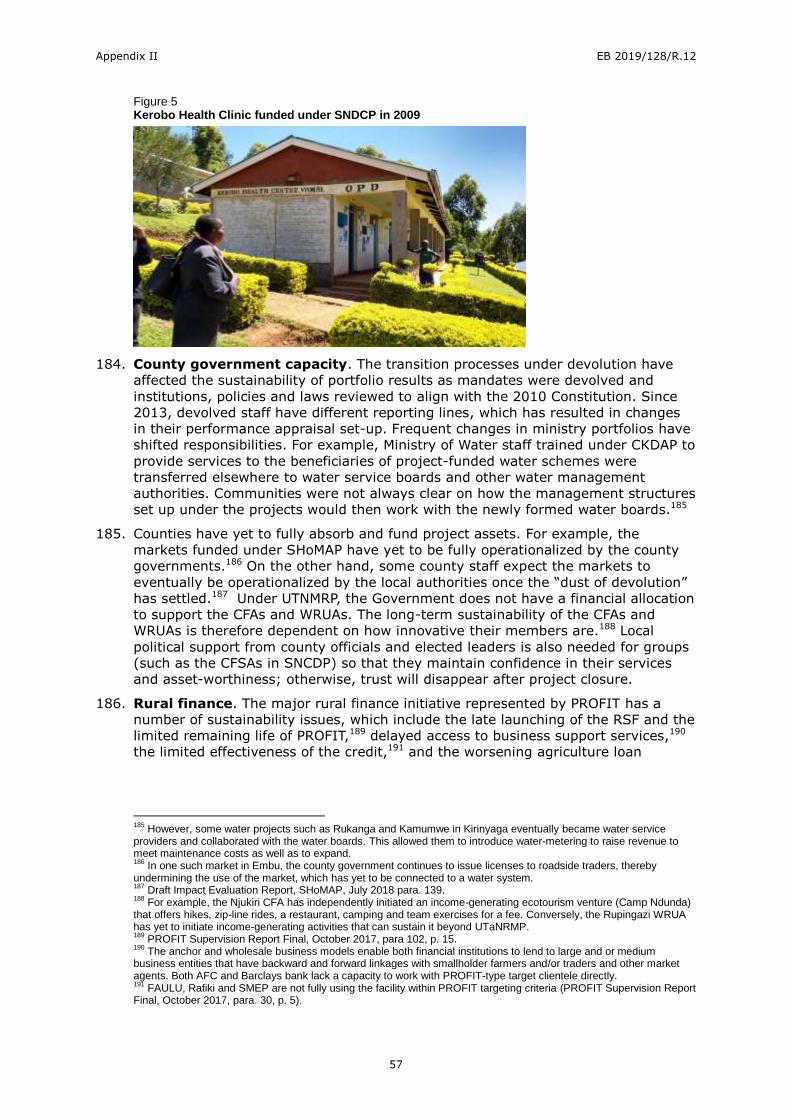
Appendix II EB 2019/128/R.12
57
Figure 5 Kerobo Health Clinic funded under SNDCP in 2009
184. County government capacity. The transition processes under devolution have
affected the sustainability of portfolio results as mandates were devolved and
institutions, policies and laws reviewed to align with the 2010 Constitution. Since
2013, devolved staff have different reporting lines, which has resulted in changes
in their performance appraisal set-up. Frequent changes in ministry portfolios have
shifted responsibilities. For example, Ministry of Water staff trained under CKDAP to
provide services to the beneficiaries of project-funded water schemes were
transferred elsewhere to water service boards and other water management
authorities. Communities were not always clear on how the management structures
set up under the projects would then work with the newly formed water boards.185
185. Counties have yet to fully absorb and fund project assets. For example, the
markets funded under SHoMAP have yet to be fully operationalized by the county
governments.186 On the other hand, some county staff expect the markets to
eventually be operationalized by the local authorities once the “dust of devolution”
has settled.187 Under UTNMRP, the Government does not have a financial allocation
to support the CFAs and WRUAs. The long-term sustainability of the CFAs and
WRUAs is therefore dependent on how innovative their members are.188 Local
political support from county officials and elected leaders is also needed for groups
(such as the CFSAs in SNCDP) so that they maintain confidence in their services
and asset-worthiness; otherwise, trust will disappear after project closure.
186. Rural finance. The major rural finance initiative represented by PROFIT has a
number of sustainability issues, which include the late launching of the RSF and the
limited remaining life of PROFIT,189 delayed access to business support services,190
the limited effectiveness of the credit,191 and the worsening agriculture loan
185
However, some water projects such as Rukanga and Kamumwe in Kirinyaga eventually became water service providers and collaborated with the water boards. This allowed them to introduce water-metering to raise revenue to meet maintenance costs as well as to expand. 186
In one such market in Embu, the county government continues to issue licenses to roadside traders, thereby undermining the use of the market, which has yet to be connected to a water system. 187
Draft Impact Evaluation Report, SHoMAP, July 2018 para. 139. 188
For example, the Njukiri CFA has independently initiated an income-generating ecotourism venture (Camp Ndunda) that offers hikes, zip-line rides, a restaurant, camping and team exercises for a fee. Conversely, the Rupingazi WRUA has yet to initiate income-generating activities that can sustain it beyond UTaNRMP. 189
PROFIT Supervision Report Final, October 2017, para 102, p. 15. 190
The anchor and wholesale business models enable both financial institutions to lend to large and or medium business entities that have backward and forward linkages with smallholder farmers and/or traders and other market agents. Both AFC and Barclays bank lack a capacity to work with PROFIT-type target clientele directly. 191
FAULU, Rafiki and SMEP are not fully using the facility within PROFIT targeting criteria (PROFIT Supervision Report Final, October 2017, para. 30, p. 5).
Appendix II EB 2019/128/R.12
58
portfolio at risk of FAULU, SMEP and RAFIKI microfinance banks.192 The poor
performance of the portfolio will certainly inhibit sustainability. For the Financial
Graduation component, sustainability will depend on the speed with which the
Government builds on the PROFIT pilots.193 The sustainability of financial inclusion
will depend on the formalization of the savings groups and their linkage to formal
financial services through microfinance and banks.194
187. Financial literacy training has been a useful way to equip groups to handle their
own funds and access external credit. Evidence that this training has led to greater
capacity to handle funds and access external finance, and therefore sustainability,
has been seen in PROFIT, UTANRMP, SHoMAP and SDCP.
188. Elsewhere in the portfolio, rural finance models have shown only partial
sustainability. Although CFSAs under SNDCP are the oldest community-level
financial services in the portfolio, they have shown mixed but generally weak
sustainability.195 Only 7 of the 16 CFSAs established under SNDCP are still
operating today.196 Inadequate staffing, poor security in remote locations, loan
default and competition have all affected their survival, as well as their lack of clear
legal status.197 For SDCP, access to financial services and resources through
linkages with financial service providers and private sector actors has been limited.
Only 83 dairy groups have been able to access credit from local banks and MFIs.
189. Private sector. The involvement of the private sector is a key element of
sustainability. Where links have been made with private sector actors to enable
continued commercial growth of production activities, this has been valuable.
Examples include dairy goats in CKDAPP, dairy group links to SACCOs and in some
cases links to bulk buyers such as Brookside in SDCP, and links to traders for
horticultural producers under SHoMAP. On the other hand, lack of linkages with
financial service providers under SHoMAP and SDCP may hinder the sustainability
of benefits that depend on continued access to finance to maintain and expand
project assets.
Summary – sustainability
190. Across the portfolio, group formation and ownership have been a strong feature of
IFAD interventions. Physical assets have been maintained where local authorities
have taken them over. Where enshrined in law, user associations have continued to
be effective and many have become self-financing. However, the targets for
numbers of fully sustainable groups have not always been met, and subsequent
county government support has been mixed. Moreover, it is somewhat early to
assess sustainability of financial services under PROFIT. A rating of moderately
satisfactory (4) is given.
B. Other performance criteria
Innovation
191. In the context of IFAD’s innovation strategy (2007), it is expected that operations
will seek to mainstream innovation and include strategies, processes, partnerships
192
SMEP PAR deteriorated (from 49 per cent in the first quarter 2017 to 57 per cent in the second quarter), FAULU PAR dropped from 16 per cent to 19 per cent in the same period, while RAFIKI PAR in the fourth quarter 2016 was at 76 per cent (PROFIT Quarterly Progress Report, March 2018, p.16). 193
Both CARE and BOMA, the two implementing partners, are exploring linkages with SNV and KCEP in Samburu and Kitui to ensure that participants engaged in the livestock and grains trade have formal access to markets. PROFIT Supervision Report Final, October 2017, para. 100, p. 14. 194
PROFIT Graduation Progress Report, January 2018 p.13. 195
Indeed, the SNDCP completion report noted that weak governance and risk management could affect sustainability after project closure. 196
Interview with ex-Chair of Hoima Bay CFSA umbrella. 197
There is one example of a successful CFSA (Neutral Point in Nyamusi County) that has graduated to a SACCO with 4,000 members and capital of KES 24.5 million. The involvement of local administration (chiefs, assistant chiefs and village elders) and use of government officers to provide credibility to the CFSAs and the contractual engagement of K-Rep development agency to support operationalization were key to their sustainability.
Appendix II EB 2019/128/R.12
59
and sharing of experiences to encourage it.198 In short, IFAD should be a catalyst
for innovation. This commitment takes place furthermore in a country which is
acknowledged as a leader in innovation by the World Bank.199
192. The portfolio has taken innovation seriously in design and implementation. The last
CPE called for a more coherent agenda to address the topic and expected the 2013
COSOP to highlight how it would be pursued. In response, the COSOP specified
that innovation would be sought under each of the three SOs, and specified,
bringing in new ways to tackle production and marketing and to include climate-
friendly technologies into ASAL areas.
193. A good range of technologies, community approaches and financing tools have
been designed and pursued across the portfolio. The key areas where innovation
has been most prolific in design are with financial services (under PROFIT but also
SNDCP and KCEP), under NRM (with MKEPP, UTNMRP and the Upper Tana Nairobi
Water Fund (UTNWF), and in value chains, particularly in the more recent KCEP-
CRAL and ABDP. The introduction of agro-technology, partly supported by IFAD, has
been critical at a time when resources for traditional extension services decline.200
“Agri-tec” solutions are also an appropriate way to involve youth.
PROFIT’s design expected to foster innovation in several ways: by
contributing to the development of a new Kenyan rural finance policy;
developing a range of innovative financial products such as value chain
financing, micro-venture capital modalities and weather index-based
insurance; using technology to provide critical financial services to a widely
dispersed population201; and scaling up of cutting-edge biometric point of sale
devices by Jamii Bora202 to help monitoring in the micro-finance sector. So far,
because of the cancellation of the innovation facility, innovative practices
have been introduced through DTMs' own processes.203 There is no mention
of a rural finance policy being designed.
MKEPP was innovative because of its introduction of school greening and its
use of business planning and use of indigenous knowledge. The innovations
have been extended under UNTRMP, including hydroponics and solar-powered
electric fencing.
SDCP presents a model of smallholder success in the deployment of breeding,
feeding and health technologies.204 The deployment of community extension
persons has also proved effective.
In SNCDP the introduction of CFSAs was innovative in the sense of
introducing an intermediate level of community banking to be linked with
established banks or MFIs. Also innovative was the formation of community-
elected planning area development committees as coordination structures at
community level (PCR Digest).
For SHoMAP, the IE identified a number of noteworthy innovations to promote
best practices and to ensure effective programme implementation were found
noteworthy. On the other hand, some were not implemented (two nation-
198
Innovation Strategy, IFAD, 2007. 199
Kenya Country Economic Memorandum, World Bank, March 2016. 200
In Nakuru County, the Minister of Agriculture referred to the potential with “agri-tec” call-centres and weather and market information systems. http://aims.fao.org/activity/blog/25-27-april-2018-east-africa-digital-farmers-conference-exhibition. 201
such as the M-PESA facility for transferring funds through the use of mobile technology. 202
An MFI that targets landless farm workers, pastoralists, women and other vulnerable groups. 203
Such as the case of KWFT's dairy cow loans and dairy cow insurance, or via the help of the BSS technical service providers (such as the development of innovative commercial bank services and products); under the RSF the design and adoption of anchor (SMEs) and wholesale lending (SACCOs) business models and adoption of mobile technology for credit delivery both by the RSF and credit facility partners. 204
IFAD Rural Development Report, Chapter 8, Agricultural Technology Innovation, Box 8.1, 2016.
Appendix II EB 2019/128/R.12
60
wide studies), were of low quality (value chain analysis studies) or had mixed
results (commercial villages and pilot initiatives).
KCEP-CRAL has introduced several innovative elements, including the use of
e-vouchers to improve access to inputs and crop insurance. The introduction
of a value chain approach in ASAL areas has also led to the innovative inter-
weaving of different production and marketing elements such as conservation
agriculture, a county climate change fund, climate information services,
warehousing, and new partnerships with private sector and research
agencies.
ABDP also plans to follow a Public-Private-Producer Partnership (4P) approach
to value chains. This involves establishing innovative 4Ps, and draws on
business models from other sectors in order to institute mutually beneficial
contracts for production and marketing.
194. In summary, innovation is rated as satisfactory (5). This reflects the strong
design elements for this criterion and the generally good implementation record in
the majority of projects across the portfolio.
Scaling up
195. Across the portfolio various notable examples of scaling up have been identified,
although mostly within the project locality, yet opportunities were missed to reach
a wider, more regional or national audience.
196. For SHoMAP, 56 pilot initiatives were replicated by individual entrepreneurs and
groups in and around the project area, and the Kilimo Biashara initiative by Equity
Bank.205 The value chain approach was also adopted by nearby county
governments.206 In terms of technologies, there is some evidence that these have
spread beyond the target groups. Under SNCDP, farmers replicated the use of
improved cassava and sweet potato varieties, especially in Nyamira North, Kuria
West and Suba. However, the PCRV notes that there is no evidence that the
approaches and successful innovations introduced by the project were being widely
scaled up by the Government, private sector or other development partners in their
policies, institutions and operations. Nor is there any evidence that IFAD made
proactive efforts to identify the pathways for scaling up, or invested specific
resources (e.g. in documenting good practices for policy engagement) that could
help scaling-up.
197. A stronger example of broader scaling-up is in IFAD’s work in NRM. MKEPP was a
pilot and several features were intentionally scaled up by UTANRMP such as forest
rehabilitation and river basin protection covering a much larger area. For example,
MKEPP introduced the School Greening Programme in which 1,177 schools
participated. Subsequently, school greening has been adopted by the national and
county governments as an approach to increase forest cover in the country.
198. Where projects have been extended, results in terms of scaling up of tested
approaches have been positive. SDCP’s additional financing deliberately aimed for
initial achievements to be scaled up within already targeted sub-counties and also
to new counties. For example, in Nakuru County, IFAD-trained staff had been
working in new sub-counties to create 29 dairy commercialization areas and
introducing commercial fodder production. Field days, demonstrations and study
tours have all supported replication. Extending the initial KCEP design into KCEP-
CRAL has allowed key elements such as the e-voucher system to be extended from
Western Kenya to areas in the ASALs.
205
Interview with Equity Bank agribusiness manager. 206
In Bungoma, Nyandarua and Kericho counties, according to the PCR.
Appendix II EB 2019/128/R.12
61
199. PROFIT’s financial leveraging – a form of scaling up financing beyond the initial
IFAD investment – has already occurred to some extent in the cases of AFC and
KWFT. The National Treasury plans to replicate the RSF and CF, and AGRA is also
supporting training on these approaches at the Kenya Monetary Institute.207 The
PROFIT approach (particularly the RSF and financial graduation) is being followed
with interest by other development partners and some African countries as an
innovative model that could be replicated in other regions.208
200. Finally, ABDP has taken on board earlier lessons from the 2011 CPE on the need to
define scaling-up pathways early on in design. The design document (Appendix 6)
specifies scaling-up pathways, spaces and drivers in its planning and knowledge
management.
201. In summary, there are several examples of solid scaling-up both through
extending the duration of projects (SDCP, KCEP to KCEP-CRAL, MKEPP to
UTANRMP) and adoption by government and other actors. However, opportunities
were missed to expand to a national level (SNCDP, SHoMAP) and in other cases are
planned but have yet to occur (PROFIT). Accordingly, a rating of moderately
satisfactory (4) is given.
Gender equality and women’s empowerment
202. A good practice across the portfolio to reach women and youth has been the use of
participatory approaches for community sensitization and mobilization, needs
analysis, beneficiary/group/commodity selection and action plan development.
Several projects have also consistently applied the good practice of on-site, rather
than residential, trainings to promote the participation of women restricted by
mobility constraints and care responsibilities (MKEPP, SDCP, SHoMAP, UTaNRMP).
203. Quotas for the participation of women and youth in project activities and groups
have also provided useful targets to guide outreach activities. They have also
increased over time from 10 and 30 per cent up to 50 per cent, reflecting the
portfolio’s increasing importance placed on gender equality and on youth
engagement for rural development.
204. Access to services and assets. The portfolio has improved women's access to
livestock, finance, training, and income-generating activities. Women were the
main participants and beneficiaries of MKEPP support to poultry production, and
dairy goats have been effective in SDCP and CKDAP. Women have demonstrably
gained better access to financial services in SNCDP, SDCP and PROFIT. In SNDCP,
women represented the majority of members (59 per cent), although men held
majority shares in the CFSAs, giving them greater say in decision-making. Women
showed a preference for savings compared to men. Women and youth have also
gained access to financial services in PROFIT through the financial graduation
component and with loans from KWFT.209
205. Women have benefited with men from the extensive gender-sensitive training and
capacity-building in projects, covering topics from CDD to making business plans
and improving production and marketing.
206. The IAs show that women have greater access to and control over assets than at
baseline, including assets that were traditionally the domain of men only. In MKEPP,
207
Knowledge Management Forum for IFAD Follow-up and Implementation Support Mission, Workshop Report, Kenya School of Monetary Studies, 24 April 2018. 208
PROFIT has hosted a mission from Ghana, which was interested in learning more from the programme, and AGRA has proposed to develop a similar risk-sharing model in Ghana. Ghana Incentive-Based Risk-Sharing System for Agriculture Lending (GIRSAL), Technical Assistance Facility, Kick-start for Initial SME pipeline development. AGRA, 2018. 209
In the former case, women have started saving in Samburu county, where savings groups have not yet been established, to cover the National Health Insurance Fund premium after the project subsidy expires. In the latter, KWFT supports different value chains, and provides loans with insurance to vulnerable women to afford them some security.
Appendix II EB 2019/128/R.12
62
women had better access to beehives, goats and cash crops. In UTaNRMP, more
assets (land, large stock animals, small stock animals, motorcycles, food crops,
cash crops, farm tools, and household items) were co-owned by men and women
by midterm review (MTR) than at baseline.
207. Empowerment. There is evidence that women and men have a more equal voice
at home, indicating that community sensitization and group training on gender
issues have been effective. At the end of MKEPP, reportedly 74 per cent of
households interviewed indicated that gender disparity had been reduced. In SDCP,
participating households were more likely to have women managing cash from the
sale of milk compared to non-participating households.210 For SHoMAP, the IE found
that participating households were 5 per cent more likely to have a woman
managing the cash from both crop and livestock activities compared to non-
participating households. The Gender-Action Learning System211 is also
strengthening women’s influence in design-making at home and in groups.
However, it is still too early in implementation to see results.
208. The portfolio has made a concerted effort to promote women’s participation in
leadership roles to increase their influence in decision-making. In CKDAP, 9 out of
47 FDA committees included women in senior management committees; while in
SDCP, women are important members of the Dairy Commercialisation Area
Committees. In 2016, women represented 37 per cent of the 784 members.
209. There is little evidence of the portfolio’s positive impact on gender relations. This
may be because the information was not collected rather than because of a lack of
results. However, some negative impacts were reported. SNCDP’s PCR raised the
issue that women’s absence from the home to participate in project activities led to
increased family quarrels. Under PROFIT, some husbands of women beneficiaries
were reluctant to let their wives spend too much time on their businesses, and in
Kitui, gender-based violence against some women had increased.
210. Workloads. Achieving a more equitable balance in workloads between men and
women has proved only moderately successful:
Investments in a range of domestic water infrastructures in CKDAP, SNCDP,
MKEPP and UTaNRMP have decreased the distance women, and in some cases
children, have to travel to fetch water, freeing up time for productive
activities, other domestic chores and rest.
Biogas digesters have been promoted to reduce firewood collection and the
cutting down of trees. Although demonstrations were undertaken in CKDAP
and SDCP, there is little evidence of their replication, and although the
UTaNRMP project sought to scale up the MKEPP initiative of supporting biogas
generators, there is no evidence of their uptake by beneficiaries.
Energy-saving stoves to reduce firewood collection and cooking time were
successfully adopted in MKEPP and SDCP, although the effects on women’s
workload are not clear.212 The stoves are also reported to be user-friendly for
even elderly women to use. However, overall the uptake is still low, requiring
continued effort to increase rates of adoption.
211. Women's health and nutritional levels have improved. The focus of earlier
projects on improving access to water, sanitation and hygiene and primary health
care led to better health of the project beneficiaries. In SNCDP, the proportion of
mothers going to formal health facilities rather than traditional birth attendants and
210
This was also found to be true for decisions relating to the use of services such as artificial insemination, anthelmintic drugs, tick control, vaccination and curative treatments, which are tasks traditionally undertaken by men. 211
A household methodology, in SDCP, UTaNRMP, KCEP and soon in ABDP. 212
In UTaNRMP, however, 546 energy-saving jikos have been adopted, with 50 per cent time savings when cooking, thus reducing women’s workload.
Appendix II EB 2019/128/R.12
63
traditional healers increased from 18 per cent at baseline to 35 per cent by
completion. Support to poultry and dairy goat production for vulnerable women in
MKEPP and SDCP led to increased consumption of eggs and milk, respectively,
improving household nutrition. The financial graduation programme in PROFIT has
started the promotion of improved health-seeking behaviour and access to
healthcare. All 2,600 of the women and youth participating in the programme are
enrolled in the National Hospital Insurance Fund, which provides them with free
access to care.
212. Institutional changes. The improvement in gender equality and women's
empowerment in project structures is mixed. Capacity-building of project and
implementation staff on gender mainstreaming has been carried out across the
portfolio, apart from in PROFIT. Responsibility for the implementation of gender
strategies and social inclusion in general has been allocated to appropriate
incumbents in the PMUs in CKDAP, MKEPP and SDCP.213 The design of UTaNRMP
includes responsibility for gender and social inclusion in all the terms of reference
of PMU staff and implementing teams, but in practice the Community
Empowerment Officer covers gender and social inclusion issues. In SHoMAP and
SNCDP, responsibility for gender and social inclusion was assumed by the M&E
Officer. In SNCDP, the focus was on enabling gender-sensitive M&E rather than
mainstreaming gender throughout the project, although this was largely achieved
through gender-sensitive community empowerment in the project.
213. In PROFIT, the promotion of gender equality and youth engagement is the general
responsibility of the PCU, rather than an individual. Consequently, little has
happened, outside of the financial graduation programme. It was not until three
years after the MTR that recommendations were made to improve implementation
arrangements.214
214. The expert on supervision missions is in most cases the Regional Gender and Youth
Coordinator, who covers the entire East and Southern Africa division for IFAD. To
increase the frequency of gender and social inclusion experts on missions, other
experts need to participate in the missions as well.
215. Youth. The outcomes of youth participation go largely unreported, making it
difficult to understand how they benefited from projects.215 From the evidence that
is available, youth have benefitted from: cows and other asset transfers in PROFIT,
enabling them to generate an income; improved access to savings and loans
through CFSAs in SNCDP and KWFT in PROFIT; increasing their standard of living
and resilience against shocks; and employment through SDCP by marketing milk
on motorbikes.
216. In summary, the promotion of gender equality and women's empowerment in the
portfolio has resulted in significant achievements, improving women's access to
resources, assets and services and their influence in decision-making at home, in
groups and in the community. In this way, the portfolio has contributed to
addressing some of the root causes of gender inequality in rural Kenya and to
challenging some traditional gender norms and roles. Less attention has been given
to reducing women’s “time poverty” by promoting an equitable workload balance
between women and men, and this is reflected in the results achieved. The
potential of the portfolio to enable gender-transformative impact is set to increase
with the the implementation of household methodologies in SDCP, UTaNRMP, KCEP-
CRAL and ABDP. Weaknesses in reporting on gender issues in project reports may
213
For example, responsibility for gender and social inclusion is included in the terms of reference of the Group Development Officer in SDCP. 214
These included allocating responsibility for their implementation to an appropriate officer in the PCU – the M&E Officer – and staff in implementing partners, and sensitizing and building the capacity of implementing partners to mainstream gender. 215
One of the main issues being limited collection of age-disaggregated data.
Appendix II EB 2019/128/R.12
64
mean that the achievements are underestimated. Overall this criterion is rated as
satisfactory (5).
Environment and natural resources management, and adaptation to climate change
217. NRM has been well addressed in MKEPP and UTaNRMP (see Effectiveness). Other
IFAD projects contributed to NRM outcomes through, for example, the
establishment of tree nurseries for agro-forestry and the rehabilitation of degraded
areas (CKDAP, SDCP) and the promotion of soil and water conservation (SNCDP,
CKDAP). KCEP-CRAL is now also addressing conservation agriculture and
community resilience through county climate change funds in ASAL areas. Output
targets were largely achieved in a range of water and soil conservation activities
such as rain-water harvesting and tree nurseries. Working through groups often led
to high adoption rates in the community-based projects (CKDAP, SNDCP), while
synergies were realized between agricultural and environmental objectives,
especially with agro-forestry and composting, and terracing and conservation
tillage.
218. Some negative effects on the environment could be observed due to the increased
use of farm chemicals. For example, there is a proliferation of aquatic weeds in the
Ithatha Dam as a result of an increase in fertilizer use in the adjacent farms. Also,
increases in intensive dairy systems have the potential to affect public health, while
zero-grazing systems may also have some environmental impact, particularly with
regard to temperature, humidity and noxious gases such as methane. In addition,
there is likely to be pollution of the water system.216 On the other hand, recent
research suggests that improved feeding systems and breed quality can reduce
greenhouse gas emissions per litre of milk.217
219. In summary, NRM has been well addressed in MKEPP and UTaNRMP, and while
other projects had elements that addressed this criterion, there are also some
concerns about the results of intensification and the limited attention to this area in
financial services. A rating of satisfactory (5) is given.
220. Climate change. The portfolio can be assessed as having mixed quality in terms
of recognizing and addressing climate change adaptation and mitigation measures.
In the older projects (SNDCP, CKAPP, SDCP) recognition of climate risks was
minimal and indicators not included. Nevertheless, actions such as supporting
drought-resistant crops, biogas plants, energy-saving stoves and tree nurseries
appeared as part of the activities.
221. MKEPP and UTaNRMP were more relevant from a climate change perspective as
they included activities to rehabilitate forests, which are important for carbon
sequestration, biogas technologies for climate change mitigation and support for
drought-tolerant crops for climate change adaptation. Indeed, MKEPP was
recognized as a best practice in IFAD’s Climate Change Policy approved by the
Executive Board in 2010. KCEP-CRAL, with its focus on ASALs, more directly
addresses climate change aspects compared to its predecessor KCEP.218 In PROFIT
there was an overall lack of integration of climate change-related activities,
although the financial graduation component targets vulnerable farmers in ASAL
counties (Turkana, Marsabit, Mandera and Wajir) and includes crop and livestock
insurance.
216
SDCP MTR 2010. 217
Options for low-emission development in the Kenya Dairy Sector, FAO, 2017. 218
It provides innovative measures such as crop insurance, climate-smart conservation agriculture, promoting partnerships with the Centre for Training and Integrated Research in ASAL Development (CETRAD) and KMD to support climate change and resilience-related activities and by building in dedicated climate change expertise in the PCU.
Appendix II EB 2019/128/R.12
65
222. Climate change adaptation strategies were relatively well incorporated into
projects, including conservation agriculture, irrigation, promotion of drought-
tolerant crops and integrated pest management. The main climate change
mitigation practices were biogas, which was promoted with varying degrees of
uptake by CKDAP, SDCP, MKEPP, UTaNRMP, and energy-saving stoves at the
domestic and institutional levels, which were promoted by MKEPP, SDCP and
UTaNRMP. Disaster preparedness measures were not effectively incorporated into
many projects due to limited expertise and lack of data.
223. After lengthy negotiation, the inclusion of the NDMA219
as a partner in the KCEP-
CRAL project is about to be concluded, with IFAD funds supporting adaptation
investments (such as dams, agroforestry and storm-water control structures).
Partnerships with Sweden and the UK have also been promoted through KCEP-
CRAL for the development of a County Climate Change Fund framework. Use of
IFAD’s ASAP is also expected to support investments for improved NRM and
resilience to climate change, including crop insurance.
224. In summary, climate change is rated as moderately satisfactory (4).
C. Overall portfolio performance
225. The portfolio has aligned with government strategies for agriculture and the
environment. It has evolved successfully to track IFAD’s shift from CDD to value
chain approaches.
226. The IFAD-supported interventions have been effective in the area of NRM, but
performance has been mixed in the two value chain projects and in the central
rural finance project. The portfolio has been affected by delays in disbursement and
high management overheads for older projects, while staffing has faced both high
levels of turnover and under-staffed PCUs.
227. Rural finance outreach has improved access to credit for group members. Food
security impacts have been mixed, with negligible changes in three projects but
improved dietary diversity and food availability in three others. Impacts on policy
can be described as moderately successful, with several pieces of legislation
drafted and awaiting final parliamentary approval.
228. Group formation has strengthened empowerment, but lasting impacts have often
been undermined by lack of subsequent support from local leaders, lack of formal
recognition and the effects of devolution. There is also a gap in the extent to which
private sector actors, particularly in credit provision and marketing, are being
encouraged to support the continued growth of community producer groups.
229. Gender has been a successful theme in IFAD’s Kenya portfolio. This has led to
improvements in women’s access to assets and services, and their role as decision-
makers.
230. Overall portfolio performance is rated as moderately satisfactory (4).
Table 9 Ratings for non-lending activities
Criteria CSPE Rating/1
Rural poverty impact 4
Project performance
219
Established by the National Drought Management Authority Act in 2016, NDMA provides a platform for long-term planning and action, as well as a mechanism for coordination across the Government and with other stakeholders. NDMA has established offices in 23 ASAL counties considered vulnerable to drought.
Appendix II EB 2019/128/R.12
66
Relevance
Effectiveness
Efficiency
Sustainability of benefits
5
4
3
4
Other performance criteria
Gender equality and women's empowerment
Innovation
Scaling up
Environment and natural resources management
Adaptation to climate change
5
5
4
5
4
Overall portfolio achievement 4
/1 Rating scale: 1 = highly unsatisfactory; 2 = unsatisfactory; 3 = moderately unsatisfactory;
4 = moderately satisfactory; 5 = satisfactory; 6 = highly satisfactory.
Key points
The IFAD lending portfolio is well aligned with Government of Kenya policies and
IFAD’s evolving strategies.
Effectiveness has been strong in terms of outreach and group development. Value chain projects have been mixed in performance, but the NRM investments have achieved expected results.
Targeting has been sound geographically and with sufficient specificity to reach specific groups with potential as well as women and youth, with the exception of
pastoralists.
Available evidence suggests that impact has been positive in terms of incomes, productivity and group cohesion. Somewhat less impact has been seen in terms of policy reform.
Sustainability at community level has been generally adequate, although devolution processes have affected how well local authorities have taken over project assets, and private sector actors have not yet come in with the expected support needed.
Innovation has been notable in several projects, and scaling-up has taken place in
new regions or through extensions.
Women have been successfully targeted. Youth have also benefited, although reporting on this is thin.
NRM and climate change have been reasonably well addressed, although some opportunities have also been missed.
Appendix II EB 2019/128/R.12
67
IV. Non-lending activities 231. IFAD undertakes a range of non-lending activities to support the objectives of the
COSOP. These include knowledge management, partnership-building and policy
engagement. This chapter provides an assessment and rating of the achievements
of IFAD in each of these areas. In addition, the chapter discusses IFAD grant-
funded activities in Kenya.
A. Knowledge management
232. Attention to knowledge management in projects has been insufficient. Although
knowledge management products have been produced by some projects, such as
the PROFIT workshop in 2018,220 they have not been well harnessed by IFAD or
others. Country-level analysis has been limited: no review of the current COSOP
has taken place from 2013 until this year, when an MTR was only recently
conducted221 even though this is the final year of the COSOP. Prior to this, the last
COSOP review took place in 2012 and covered the previous COSOP.
233. IFAD has also paid less attention to strengthening the Government’s role in and
ownership of knowledge management. The IFAD country office (ICO) has had
limited resources for this work. In particular, the integration of IFAD results into
emerging national systems such as National Integrated Monitoring and Evaluation
System (NIMES) as well as the county-level equivalent (CIMES)222 has not been
strong.223
234. Exchange visits between projects have taken place and a range of learning events
have been held at key stages in the project cycle. Regional Implementation
Workshops have also been useful in sharing experiences and building coordination
across the East and Southern Africa region (e.g. Ethiopia in 2012 and Zambia in
2014).
235. Supervisions have been well staffed, with comprehensive if often very long reports
and these have contributed to sharing of experiences and lessons. On the other
hand, the COSOP’s expectation that additional resources would be provided for
knowledge management/M&E functions has not been fulfilled – there is no budget
line for this activity. The ICO does not have a dedicated communications officer,
which has led to poor sharing of IFAD’s operations and results.224
236. Communication on rural finance between projects and other agencies has been
limited. There is little evidence from SDCP and SHoMAP that PCUs communicate
with each other on rural finance and that they seek coordination with sector actors,
apex bodies and agencies. Due to the delayed start of PROFIT, coordination of rural
finance matters among PCUs and other apex bodies was also affected. However,
the situation is improving somewhat with a recently more active rural finance
thematic group.225
237. Knowledge generation and sharing was also a theme of the selected IFAD-
supported grants (e.g. through the integration of knowledge management among
project objectives or strategies). Three of them were regional initiatives that aimed
to support staff of IFAD-supported projects to improve project management
processes and results by fully integrating knowledge management into all aspects
220
Knowledge Management Forum for PROFIT, Kenya School of Monetary Studies, April 2018. 221
Draft COSOP Results Review MTR, May 2018. 222
Guidelines for the Development of County Integrated Monitoring and Evaluation System (CIMES), Ministry of Devolution and Planning, Government, 2016. 223
Interviews with ICO team. 224
For example, the IFAD data on the joint donor project database (https://www.arddashboard.com) were found to be very incomplete at the time of the mission. 225
The PROFIT PCU has convened and will be chairing the Rural Finance Thematic Group, which brings together all IFAD-supported projects in Kenya. The first meeting took place in mid-2018. However, the PCU has been participating and making presentations on rural finance in a number of forums (such as Africa Finance Investment Forum and the National Credit Guarantee Scheme policy development process).
Appendix II EB 2019/128/R.12
68
of project management, including M&E, financial management, supervision and
reporting.226 As a result, material such as flyers, videos and other related
documents were prepared. However, this evaluation did not find tangible evidence
that strongly supports the influence of grants on IFAD's knowledge management
activities in the country.
238. In summary, while projects did produce a range of reports summarizing results
and lessons, the lack of resources available at country level, as well as the
moderate use of grants to consolidate and share learning (see next section on
Grants) was a missed opportunity. Gaps in the COSOP reviews and the lack of
learning and analysis from a diverse and relatively successful portfolio
accompanied by weak M&E means that the CSPE rates knowledge management as
moderately unsatisfactory (3).
B. Partnership-building
239. Involving a range of partners in project design has had mixed success, even
though the 2011 CPE called for greater engagement with bilateral and multilateral
development partners.
240. Cofinancing has been successfully mobilized in some projects, although this has
not been a prominent feature in the portfolio. Of the nine projects considered in
this evaluation, less than 50 per cent (four) have had co-financing from
international partners. Further, projects approved after 2002 and before 2010 did
not have cofinancing. These include SNCDP, SHoMAP, SDCP and PROFIT. For
projects that were cofinanced, between 15 to 25 per cent of the total project
financing came from cofinancing. KCEP had productive co-funding partnerships with
the EU and ASAP, the latter building on the UK Department for International
Development’s DFID’s County Adaptation Fund. IFAD initiated the first phase of
KCEP using purely EU funding, and then complemented this by expanding into
KCEP-CRAL with IFAD resources and additional funds from the EU. Another strong
partnership example is the complementary GEF support that also occurred under
MKEPP. UTaNRMP has then continued to build effective working relationships with
KWS, KFS, Rhino Ark Foundation and Mt Kenya Trust. Other partnerships have not
been realized as expected in the last COSOP, e.g. with the World Bank, USAID and
AfDB. Evidence suggests that this has occurred because of two factors227: (i) the
country relies on its resources for a significant proportion of its budget and is
therefore less aid-dependent than many other countries in the region; and (ii)
government coordination of donor activities in the agriculture sector is weak, and
many donors do not feel pressed to harmonize their activities better. ADBP has
some cofinancing from FAO, but the anticipated co-funding from Kreditanstalt für
Wiederaufbau Development Bank has proved problematic to date.228
241. Rome-based agencies. Good interaction has occurred with the Rome-based
agencies under KCEP, and their complementary roles have been focused and
valuable. FAO in particular has been closely involved in technical and training work
around IFAD’s investments in aquaculture, ASAL and dairy farming.229 FAO also has
a large technical presence in Kenya, with over 200 staff, which complements IFAD’s
stronger financial footprint.
242. IFAD and the Government continue to have a mutually strong relationship, and
interviews with a range of ministry staff reiterate the high value placed on IFAD’s
role in the country. At county level, too, IFAD has maintained good relations with
226 These include: (i) Regional Knowledge Management Learning Process in ESA (2010-2012), implemented by AFRACA; (ii) Technical Support to Ex Post Impact Evaluations of Rural Development Projects Using Mixed Method Approaches (2015-2017), implemented by 3ie; and (iii) Using Mixed Method Approaches Strengthening Capacities and Tools to Scale Up and Disseminate Innovations (2015-2019) implemented by PROCASUR. 227
Country Programme Issues Sheet (2012) and interviews with IFAD CPMs. 228
Interview with PCU. 229
For example, FAO designed the Dairy Training Institute that IFAD then funded under SDCP.
Appendix II EB 2019/128/R.12
69
implementation partners, and IFAD projects are seen as being responsive to local
needs. In terms of service provision, a wide range of partners have been identified
across projects. The main partnership has been with county government staff, who
have provided on-the-ground services to help target beneficiaries and implement
activities. Supplementing these staff have been a wide range of other service
providers.230
243. Local government partners. The need to strengthen local authorities and
communities to manage their own development was captured in the 2007 and
2013 COSOPs and in project designs. The 2013 COSOP also recognized the
emerging importance of devolution processes as a risk. However, specific measures
to help projects adjust to these changes were not sufficiently identified or funded.
The newer projects (KCEP-CRAL and UTaNRMP) have been strongly affected by the
transition process and have increasingly adjusted their implementation
arrangements in order to cope.231 The design of the most recent project, ABDP, has
proposed giving a leading role to county governments by transferring
responsibilities and providing support.
244. Private sector partnerships have continued to be modest, despite CPE 2011
recommendations, and most projects have been led and implemented by the
Government. While tackling poverty reduction through commercialization was a
strong feature in the later projects, the role of the private sector was not so
effectively built in at design for the horticulture, dairy and cereal value chain
projects, and private sector actors were seen to have complementary though
secondary supporting roles. How private actors were to engage was less clear, as a
result of the limited use of value chain diagnostic analysis at design.232 Projects
tended to be government-led through their strong representation on steering
committees and in terms of staffing, using personnel recruited or seconded from
the Government.
245. This has evolved somewhat in the recent operations, and certain private sector
actors, particularly banks, agro-dealers, traders and NGOs, have taken a more
active role, for example with Boma and CARE under PROFIT. Their involvement is
likely to expand further under the most recent projects, such as ABDP with the
planned private-producer investments (using the 4P model)233 and through the
financial leveraging under PROFIT. Key financial intermediaries such as Equity
Bank, KWFT and AFC have increased their role in smallholder lending, stimulated
by IFAD’s risk-sharing and credit support.
246. Nevertheless, the private sector could have been involved much more, for example
as an active partner rather than just as a service provider or target for leveraging.
Private sector actors could have played a greater role in project design and
supervision missions, taken part in the country programme management team
(CPMT), and brought in their experiences in major IFAD reviews, workshops and
training forums.234
247. IFAD has continued an active partnership with AGRA around PROFIT, although this
has gone through some hurdles as the role of AGRA has changed from co-investor
to service provider. AGRA is now drawing on the PROFIT model in its other
operations in Africa.
230
Such as the K-rep NGO in SNCDP (contracted to establish and develop 15 CFSAs, KDB (for standards), KALRO (research), NDMA (drought assessment and training), Kenya Institute of Business Training (training). 231
The challenge of building county ownership of the KCEP-CRAL approach took intense efforts, using the Council of Governors forum before county governors signed an MoU regarding the way KCEP-CRAL would operate (interview with KCEP PCU). 232
Such studies being deferred to implementation in the case of SHoMAP and SDCP, for example. 233
4P: Public, Private, Producer Partnership 234
For example, of the 34 attendees at the recent COSOP review workshop in April 2018, none were from the profit-oriented private sector (COSOP 2018 Review, Appendix V, Attendance list).
Appendix II EB 2019/128/R.12
70
248. Grants. Partnership-building was also a key element of IFAD-supported grants in
Kenya, in line with the 2007 and 2013 COSOPs’ focus on strengthening partnership
with a large number of stakeholders (including NGOs, community-based
organizations, the private sector and universities). For instance, the UTNWF grant
has been established as a multisector platform with a shared governance structure
by the public and private sector. It has already institutionalized collaboration with
national and county governments, lead agencies in water, forest and wetlands,
businesses and local NGOs in Kenya. Pro-poor Rewards for Environmental Services
in Africa (PRESA) too has been working on a multi-stakeholder platform involving
ministries and agencies, many of which are also involved in IFAD's operations in
Kenya.235 However, the influence of such partnerships on IFAD's lending or non-
lending operations in Kenya cannot be established with certainty.
249. Overall, IFAD has been quite effective in partnership-building but mainly through
its lending portfolio. Its achievements with the Rome-based agencies and
government agencies have been offset by a weaker partnership achievement with
the private sector. A rating of moderately satisfactory (4) is given.
C. Policy engagement
250. The 2013 COSOP noted that IFAD’s policy engagement work had been weak and
that its capacity would be strengthened in this respect.236 A number of actions were
specified: building capacity of the Government and communities to engage in policy
development; participating in sector working groups; and operationalizing national
policy at local level. These reflect an ambitious agenda, especially given the
experience reported in the CPE of 2011 that policy work had underperformed
against a backdrop of over-ambitious intentions in the 2002 and 2007 COSOPs.
251. The establishment of an in-country presence has been a valuable step in building
IFAD’s profile and strengthening implementation support. But the lack of resources
to deliver on the non-lending activities and the limited linkages between the IFAD
grants and the ICO team’s needs and priorities have hampered their delivery. The
relatively high turnover of CPMs (five CPMs over the last ten years) has also
contributed to the inefficiency of engagement. Opportunities have therefore been
missed to leverage IFAD’s on-the-ground experiences and lessons to inform
national policy processes.
252. IFAD’s efforts in the policy sphere have been further hampered by the complex and
changing government framework. Devolution in particular has changed the focus of
policy work and has also brought some uncertainty, as the processes required to
establish county government capacity have taken time to emerge.
253. Nevertheless, IFAD has been active in the sector working groups, and its
contribution has been seen as particularly strong in the past five years. Based on
interviews with government and selected partners, we judge that IFAD has been
perceived as bringing important field validation of policy issues. However, based on
interviews with the ICO team, there has been little reporting or stocktaking of IFAD
experiences in a form that could provide more influential input into these forums.
The ICO has not had the budget or manpower to tackle such work, especially since
some of the staff also have regional responsibilities, and to this extent its policy
contribution is less than could be expected.
235
These stakeholders include: Ministry of Water and Irrigation; Water Resource Management Authority; Water Services Trust Fund; World Wide Fund; Jomo Kenyatta University of Agriculture and Technology; Nairobi City Water and Sewerage Company; Sasumua Water Resources Users Association; CARE Kenya; The Nature Conservancy Kenya; Kenya Electricity Generating Company Limited; National Environment Management Authority; Kenya Forestry Service; Ministry of Agriculture; and Kenya Agricultural Productivity and Sustainable Land Management Project in the Ministry of Environment and Mineral Resources. 236
COSOP 2013, p. 4.
Appendix II EB 2019/128/R.12
71
254. As noted under Impact, a number of policy documents have been drafted with IFAD
assistance (for example, on example horticulture, dairy and animal feed), but
according to our interviews with Ministry of Agriculture officials some of these have
not yet been enacted by Parliament. This is partly due to the disruption of the
recent elections, but it is disappointing that the good work at local and subsector
levels has yet to bear fruit.
255. IFAD’s rural finance initiative has been influencing policy thinking in the sector, with
other partners and government taking up the PROFIT leveraging model. While
there has not yet been a contribution to the formulation of a broad rural finance
policy, a Kenya Credit Guarantee Policy and Bill has been drafted. The e-voucher
modality promoted under KCEP-CRAL has been taken up by the Agricultural Sector
Strategy and is reflected in the Big Four Agenda.
256. Grants. Policy engagement was one of the focus areas of IFAD grants, with some
positive results. For example, the grant in support of the African Green Revolution
Forum237 led to the President of Kenya announcing his government’s commitment
to invest US$200 million so that at least 150,000 young farmers and young
agriculture entrepreneurs could gain access to markets, finance and insurance.
Another example is the grant for PRESA, which contributed to the adoption of
rewards for environmental services in the Kenya Water Policy under the new
Constitution of 2010 by informing a land restoration mechanism based on a case
study developed in Sasuma.
257. One issue related to policy engagement is the difficulty of directly linking grant
interventions at country or regional level to policy reform, since to a large extent
such changes result from a multitude of stakeholders. However, it can be argued
that grants have been able to indirectly influence the policy environment by
building the capacity of of the benefitting organisations through seminars,
workshops, exchange tours and focused studies, thus enabling them to lobby from
an informed point of view.
258. In conclusion, policy engagement is rated as moderately unsatisfactory (3).
The 2013 COSOP agenda remained as ambitious as the earlier COSOPs, yet while a
country office was established in the interim, and good engagement has occurred
within sector forums, limited resources were provided and no clear mechanisms
were defined to really take policy work forward to a new level. Most policy
engagement occurred around the lending operations, and results have been
hindered by slow policy-approval processes.
D. Grants 238
259. Grants portfolio. The grants portfolio in the period covered by the CSPE consisted
of 65 grants239 with a value of approximately US$155 million.240 A large number of
these IFAD-funded and/or -managed grants were provided under the
global/regional window that included some activities in Kenya (59 grants, or 91 per
cent of all grants, worth US$115 million). Of the remaining six, three were funded
under the country-specific window and the other three under the GEF and other
237
A multi-stakeholder initiative that aims to discuss and develop concrete investment and development plans and policy support strategies for agriculture value-chain development in Africa. The AGRF partners, which includes the Government of Kenya, pledged to pursue a political, policy and business agenda intended to accelerate smallholder-inclusive agricultural transformation in at least 20 countries. 238
The objectives of IFAD grant financing are to: (i) promote innovative, pro-poor approaches and technologies with the potential to be scaled up for greater impact; (ii) strengthen partners’ institutional and policy capacities; (iii) enhance advocacy and policy engagement; and (iv) generate and share knowledge for development impact (source: IFAD Policy for Grant Financing 2015, EB 2015/114/R.2/Rev.1). 239
Grants covered are: (i) those whose date of completion is after 1 January 2011 and date effectiveness is by December 2017; (ii) those having Kenya among focus countries (this implies that grants having the recipient based in Kenya but not being implemented in the country were not taken into account). Also, grants contributing to finance investment projects were not included. 240
For grants in EUR, amounts were converted in US$, using the exchange rate on 10/01/2018.
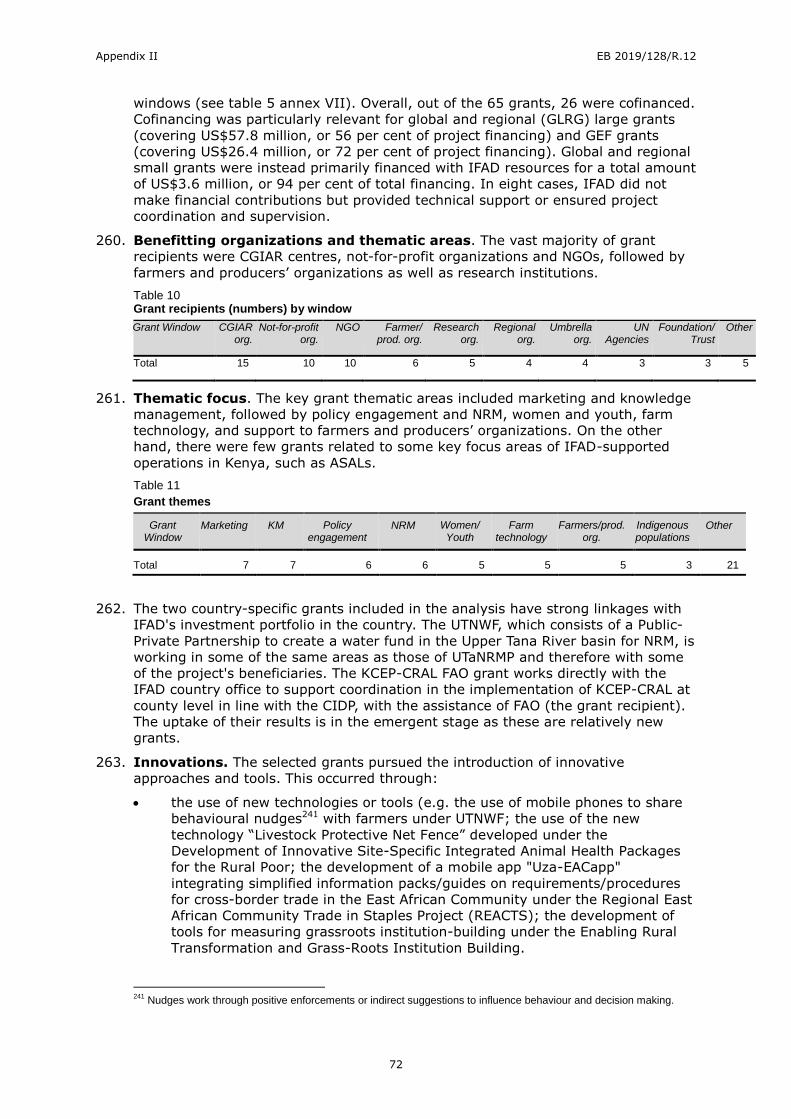
Appendix II EB 2019/128/R.12
72
windows (see table 5 annex VII). Overall, out of the 65 grants, 26 were cofinanced.
Cofinancing was particularly relevant for global and regional (GLRG) large grants
(covering US$57.8 million, or 56 per cent of project financing) and GEF grants
(covering US$26.4 million, or 72 per cent of project financing). Global and regional
small grants were instead primarily financed with IFAD resources for a total amount
of US$3.6 million, or 94 per cent of total financing. In eight cases, IFAD did not
make financial contributions but provided technical support or ensured project
coordination and supervision.
260. Benefitting organizations and thematic areas. The vast majority of grant
recipients were CGIAR centres, not-for-profit organizations and NGOs, followed by
farmers and producers’ organizations as well as research institutions.
Table 10 Grant recipients (numbers) by window
Grant Window CGIAR org.
Not-for-profit org.
NGO Farmer/ prod. org.
Research org.
Regional org.
Umbrella org.
UN Agencies
Foundation/ Trust
Other
Total 15 10 10 6 5 4 4 3 3 5
261. Thematic focus. The key grant thematic areas included marketing and knowledge
management, followed by policy engagement and NRM, women and youth, farm
technology, and support to farmers and producers’ organizations. On the other
hand, there were few grants related to some key focus areas of IFAD-supported
operations in Kenya, such as ASALs.
Table 11
Grant themes
Grant Window
Marketing KM Policy engagement
NRM Women/ Youth
Farm technology
Farmers/prod. org.
Indigenous populations
Other
Total 7 7 6 6 5 5 5 3 21
262. The two country-specific grants included in the analysis have strong linkages with
IFAD's investment portfolio in the country. The UTNWF, which consists of a Public-
Private Partnership to create a water fund in the Upper Tana River basin for NRM, is
working in some of the same areas as those of UTaNRMP and therefore with some
of the project's beneficiaries. The KCEP-CRAL FAO grant works directly with the
IFAD country office to support coordination in the implementation of KCEP-CRAL at
county level in line with the CIDP, with the assistance of FAO (the grant recipient).
The uptake of their results is in the emergent stage as these are relatively new
grants.
263. Innovations. The selected grants pursued the introduction of innovative
approaches and tools. This occurred through:
the use of new technologies or tools (e.g. the use of mobile phones to share
behavioural nudges241 with farmers under UTNWF; the use of the new
technology “Livestock Protective Net Fence” developed under the
Development of Innovative Site-Specific Integrated Animal Health Packages
for the Rural Poor; the development of a mobile app "Uza-EACapp"
integrating simplified information packs/guides on requirements/procedures
for cross-border trade in the East African Community under the Regional East
African Community Trade in Staples Project (REACTS); the development of
tools for measuring grassroots institution-building under the Enabling Rural
Transformation and Grass-Roots Institution Building.
241
Nudges work through positive enforcements or indirect suggestions to influence behaviour and decision making.
Appendix II EB 2019/128/R.12
73
the adoption of innovative learning systems (e.g. the service desk developed
under the Knowledge Management Partnership (KMP), which takes requests
from IFAD projects in the field of rural finance and provides responses in real
time; the promotion of South-South cooperation through the learning route
methodology and the design of innovation plans under the PROCASUR grant;
and the organization of annual innovation competitions under the
Strengthening Capacity of EAFF Through Knowledge Management and
Institutional Development).
the rewards for environmental services under PRESA, a novel approach for
linking ecosystem stewardship with the interest of ecosystem service
beneficiaries in African contexts.
The UTNWF, an innovative NRM project which is the first water fund of its
kind in Africa.
264. However, there are no concrete examples of the innovations been used in the
Kenya lending portfolio.
265. Synergies. An effort was made to ensure synergies across loan and grant
operations. Some of the grants analysed have had linkages with four IFAD-
supported projects that are part of this CSPE: SDCP, MKEPP, UTaNRMP and PROFIT.
The linkages were devised, and in some cases achieved, in ways that can be
categorized as follows:
Focusing on the same targeted populations of IFAD investment projects or on
populations living in zones covered by IFAD investment projects (e.g. Scaling
up Bee-keeping targeted poor rural people in MKEPP and UTaNRMP project
areas; REACTS focused on smallholder producers targeted by SDCP and
UTaNRMP).
Providing input, assistance, support and/or coaching. The KMP III participated
in the design mission of UTaNRMP and in technical implementation missions
for PROFIT. However, there is no evidence of the recommendations being
adopted.
Implementing activities in collaboration with IFAD-supported projects. This
was the case for REACTS, where a consortium was initiated linking seven
SDCP dairy cooperatives (with 6,200 members) to a dairy processor (New
Kenya Cooperative Creameries) to fill the daily deficit of 90,000 litres of milk.
Developing and adapting tools to assist IFAD-supported projects. For
example, through the Tenure Security Learning Initiative for Eastern and
Southern Africa the UTaNRMP used the Social Tenure Domain Model for its
NRM objective. Also, a manual offering a set of guidelines for sustainable land
management technologies, water and carbon benefits was developed for
MKEPP. The Development of Innovative Site-Specific Integrated Animal
Health Packages for the Rural Poor grant supported SDCP to incorporate the
animal health package into its activities.
266. Results. The outcomes related to adoption of grant activities in the lending and
non-lending portfolios are moderately positive. Some concrete examples include
the capacity-building for community groups to improve their production and
incomes as well as the promotion of tree-planting under PRESA that was taken up
by UTaNRMP. At the policy level, PRESA contributed to the mention of rewards for
environmental services in the Kenya Water Policy under the new Constitution of
2010. Other documentary evidence of uptake of grants at the policy level is very
limited.
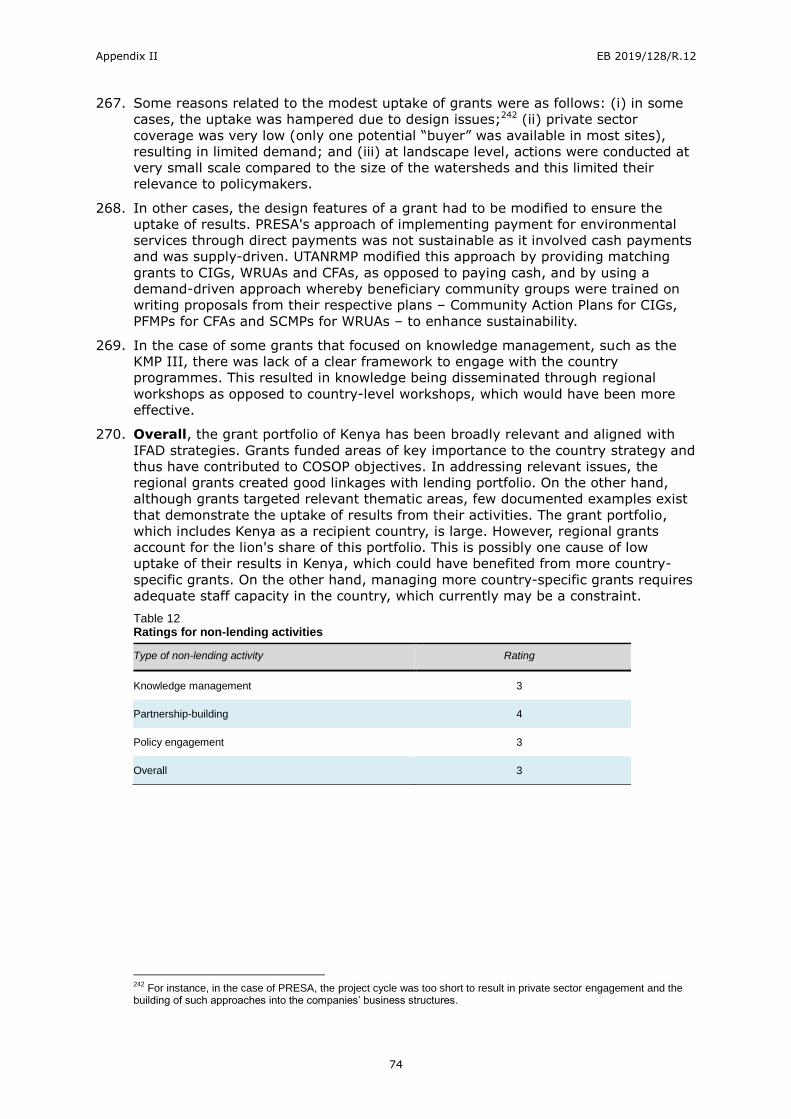
Appendix II EB 2019/128/R.12
74
267. Some reasons related to the modest uptake of grants were as follows: (i) in some
cases, the uptake was hampered due to design issues;242 (ii) private sector
coverage was very low (only one potential “buyer” was available in most sites),
resulting in limited demand; and (iii) at landscape level, actions were conducted at
very small scale compared to the size of the watersheds and this limited their
relevance to policymakers.
268. In other cases, the design features of a grant had to be modified to ensure the
uptake of results. PRESA's approach of implementing payment for environmental
services through direct payments was not sustainable as it involved cash payments
and was supply-driven. UTANRMP modified this approach by providing matching
grants to CIGs, WRUAs and CFAs, as opposed to paying cash, and by using a
demand-driven approach whereby beneficiary community groups were trained on
writing proposals from their respective plans – Community Action Plans for CIGs,
PFMPs for CFAs and SCMPs for WRUAs – to enhance sustainability.
269. In the case of some grants that focused on knowledge management, such as the
KMP III, there was lack of a clear framework to engage with the country
programmes. This resulted in knowledge being disseminated through regional
workshops as opposed to country-level workshops, which would have been more
effective.
270. Overall, the grant portfolio of Kenya has been broadly relevant and aligned with
IFAD strategies. Grants funded areas of key importance to the country strategy and
thus have contributed to COSOP objectives. In addressing relevant issues, the
regional grants created good linkages with lending portfolio. On the other hand,
although grants targeted relevant thematic areas, few documented examples exist
that demonstrate the uptake of results from their activities. The grant portfolio,
which includes Kenya as a recipient country, is large. However, regional grants
account for the lion's share of this portfolio. This is possibly one cause of low
uptake of their results in Kenya, which could have benefited from more country-
specific grants. On the other hand, managing more country-specific grants requires
adequate staff capacity in the country, which currently may be a constraint.
Table 12 Ratings for non-lending activities
Type of non-lending activity Rating
Knowledge management 3
Partnership-building 4
Policy engagement 3
Overall 3
242
For instance, in the case of PRESA, the project cycle was too short to result in private sector engagement and the building of such approaches into the companies’ business structures.
Appendix II EB 2019/128/R.12
75
Key points
Policy engagement has been restricted to sector working groups. Projects have supported the drafting of various policy documents although none have been fully adopted.
Partnership-building has also delivered mainly through project mechanisms, particularly with the Rome-based agencies and the EU. Anticipated partnerships with the World Bank, USAID and AfDB have not occurred. Private sector partnerships have
been modest, although there are some notable examples.
Knowledge management has shown disappointing performance, and the ICO has not had sufficient resources to fulfil COSOP expectations.
Grants have been aligned with IFAD strategies and contributed to COSOP objectives. While there were linkages with the lending portfolio, there were limited examples of uptake because most grants were regional in nature.
Appendix II EB 2019/128/R.12
76
V. Performance of partners
A. IFAD
271. The last CPE (2011) found IFAD‘s engagement in Kenya significantly strengthened.
It had reactivated a suspended portfolio in the 1990s, and since 2000 prepared two
COSOPs for Kenya and financed six new loans. Later IFAD established a country
presence (2008), shifted to direct supervision and implementation support (2012)
and adopted a fully staffed IFAD Regional Office in Nairobi (2011).243
272. In the following period the CPM was out-posted (2012), a new COSOP was
prepared (2013), and three new projects initiated (UTNMRP 2012, KCEP 2014 and
ABDP 2018).
273. The IFAD office in Nairobi has been strengthened with the out-posting of the
CPM. Yet the office faces a high burden with regard to coordination because of the
large donor presence in Kenya and the dual country-regional role of the ICO. There
are currently five staff contributing to strategy and policy engagement. However,
three of these (covering Gender and Youth, Environment, and European Union
operations) also have a regional role. The regional hub role of the office provides
access to much needed technical expertise, but it also places an additional layer of
complexity on the IFAD team. The relatively rapid turnover of IFAD CPMs has also
been an issue in Kenya, affecting continuity of engagement.244
274. Country programming and review has shown varied effectiveness. The CPMT
was very active in the past, especially around the formulation of the last COSOP. It
consisted of a wide group of stakeholders, including the ICO team, other donors,
IFAD project staff and the private sector. Indeed the 2013 COSOP foresaw the
CPMT as an important mechanism to review and share progress. But in the past
five years its role has diminished and there is little reference to its activities in the
recent past.245 Equally, the COSOP reviews have not been a regular feature since
2013, although a review took place in early 2018 (see COSOP performance).
275. Project designs were innovative in several areas, including in NRM, rural finance
and ASAL interventions. On the other hand, design processes did not focus on
reducing complexity (in the case of KCEP-CRAL and PROFIT), as recommended by
the last CPE (2011). They also did not propose ways to overcome the
implementation delays common at start-up for new projects, and which affected all
projects consistently (see Efficiency). Sensible scaling-up was also achieved, for
example from MKEPP to UTaNRMP, with SDCP and its extension, as well as
expansion of KCEP to KCEP-CRAL. The extension of SNCDP and MKEPP for two
years was sensible too, to allow for completion of activities (SNCDP) and design of
scaling up (MKEPP).
276. Direct supervision has been a turning point in the portfolio. Project PCRs lauded
the better support provided, and found the approval process easier than when the
United Nations Office for Project Services was administering the portfolio (MKEPP,
SNCDP). IFAD supervision has been effective and timely. Missions have mostly
taken place every six months and for the purposes of supervision or
implementation support. They were well staffed and appreciated by stakeholders.
Mobilization of technical expertise and timely follow-up were instrumental in
turning around underperforming projects.246 Some missions deployed very large
teams of 10 to 20 personnel; others were narrowly focused on technical aspects
243
The previous CPE (2011) comments extensively on the transition of the Nairobi Office from a regional hub supervised by a portfolio advisor (2007) to a fully staffed regional office. 244
There have been four CPMs since 2010, each serving around two years (Table1). 245
According to IFAD’s records (GRIPS), it last met in 2015. 246
Strong supervision as well as support accounted for the turnaround in the performance of PROFIT. It was rated unsatisfactory in 2016 and a project at risk, but with intensive support from the ICO and the help of supplementary technical assistance, it has rapidly improved its disbursement rate and quality of PCU staffing.
Appendix II EB 2019/128/R.12
77
and had critical expertise missing, for example on gender and social inclusion.247
Supervision reports have been extremely comprehensive, but often very long
(sometimes well over 100 pages). They have had good involvement from
Government personnel and thus often provided an opportunity for policy
engagement.
277. Policy engagement. Since it established its country presence in 2008, IFAD has
had higher and more effective interaction with the Government, partners and
projects. IFAD has been active in the donor coordination groups such as the
Agricultural and Rural Development Donor Group and the ASAL Donor Sector
Working Group, although it has not taken a chairing role so far. It is seen as a
valuable partner with strong field knowledge and valuable experiences to share.248
278. The Government feels positive about IFAD’s role. It finds IFAD’s country team
engaged, responsive and easy to work with compared to other partners.249 Though
other donors have adjusted and supported devolution more effectively,250 IFAD
projects have been flexible to engage with county departments and adjust to the
creation of new counties and sub-counties. The Nakuru County Agriculture Minister,
for example, noted that IFAD funding had been key in ensuring that farmers’ voices
were heard in planning processes, and IFAD’s support for value chains in dairy and cereals had been influential in policy-making and in the CIDP. 251
279. In sum, IFAD’s performance was positive in terms of project design and
supervision aspects, but more mixed in its country portfolio management and
partnerships. A rating of moderately satisfactory (4) is given.
B. Government
280. The Government remained committed to the agriculture sector and demonstrated a
high degree of ownership, although frequent changes in the roles and
responsibilities of ministries, particularly in the agriculture sector, and other
agencies over the CSPE period have proved difficult for projects to adjust to.
281. Commitment and ownership. Government's commitment to IFAD-supported
projects is reflected in its contribution, which has usually exceeded the amount
pledged at design. The data presented in figure 6 below illustrates this aspect. This
is particularly the case with SHoMAP, to which the Government contributed
additional funds for completing the market structures. The contribution has ranged
from some 3 per cent, as in the case of PROFIT, to approximately 22 per cent, as in
the case of SHoMAP.
247
A gender and social inclusion expert was present on only 4 out of 15 missions for SDCP, 2 out of 14 missions for SHoMAP and 3 out of 14 missions for PROFIT. UTaNRMP is the notable exception, with a gender and social inclusion specialist on 5 out of 7 missions and high-quality reporting on gender issues. 248
Based on interviews with representatives from FAO, Swedish Embassy and USAID and the secretary of the ARD . 249
Based on CSPE interviews with senior Ministry of Agriculture and Livestock staff. 250
For example, the World Bank has a dedicated project to support decentralization. 251
KIIs with KCEP regional coordinators and Minister of Agriculture, Nakuru County.
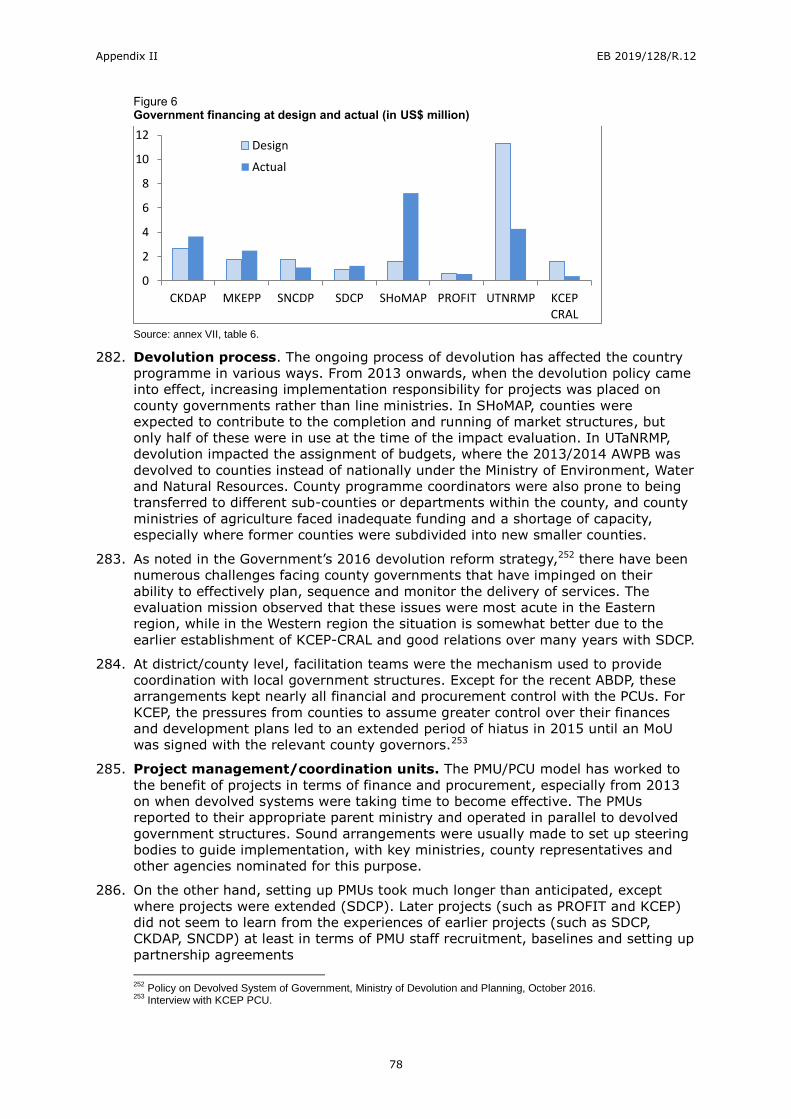
Appendix II EB 2019/128/R.12
78
Figure 6 Government financing at design and actual (in US$ million)
Source: annex VII, table 6.
282. Devolution process. The ongoing process of devolution has affected the country
programme in various ways. From 2013 onwards, when the devolution policy came
into effect, increasing implementation responsibility for projects was placed on
county governments rather than line ministries. In SHoMAP, counties were
expected to contribute to the completion and running of market structures, but
only half of these were in use at the time of the impact evaluation. In UTaNRMP,
devolution impacted the assignment of budgets, where the 2013/2014 AWPB was
devolved to counties instead of nationally under the Ministry of Environment, Water
and Natural Resources. County programme coordinators were also prone to being
transferred to different sub-counties or departments within the county, and county
ministries of agriculture faced inadequate funding and a shortage of capacity,
especially where former counties were subdivided into new smaller counties.
283. As noted in the Government’s 2016 devolution reform strategy,252 there have been
numerous challenges facing county governments that have impinged on their
ability to effectively plan, sequence and monitor the delivery of services. The
evaluation mission observed that these issues were most acute in the Eastern
region, while in the Western region the situation is somewhat better due to the
earlier establishment of KCEP-CRAL and good relations over many years with SDCP.
284. At district/county level, facilitation teams were the mechanism used to provide
coordination with local government structures. Except for the recent ABDP, these
arrangements kept nearly all financial and procurement control with the PCUs. For
KCEP, the pressures from counties to assume greater control over their finances
and development plans led to an extended period of hiatus in 2015 until an MoU
was signed with the relevant county governors.253
285. Project management/coordination units. The PMU/PCU model has worked to
the benefit of projects in terms of finance and procurement, especially from 2013
on when devolved systems were taking time to become effective. The PMUs
reported to their appropriate parent ministry and operated in parallel to devolved
government structures. Sound arrangements were usually made to set up steering
bodies to guide implementation, with key ministries, county representatives and
other agencies nominated for this purpose.
286. On the other hand, setting up PMUs took much longer than anticipated, except
where projects were extended (SDCP). Later projects (such as PROFIT and KCEP)
did not seem to learn from the experiences of earlier projects (such as SDCP,
CKDAP, SNCDP) at least in terms of PMU staff recruitment, baselines and setting up
partnership agreements
252
Policy on Devolved System of Government, Ministry of Devolution and Planning, October 2016. 253
Interview with KCEP PCU.
0
2
4
6
8
10
12
CKDAP MKEPP SNCDP SDCP SHoMAP PROFIT UTNRMP KCEPCRAL
Design
Actual
Appendix II EB 2019/128/R.12
79
287. On the whole the PMU approach was appropriate in terms of meeting fiduciary and
monitoring needs. On the other hand, M&E has been on the whole an area of
weakness, according to supervisions and reviews, with the average project status
report rating across the portfolio of 3.8 and showing a declining trend (figure 11,
annex VII).
288. Since 2016, projects have had to work harder to integrate with county-level
arrangements, and the KCEP design was the first to strongly reflect the county-led
responsibilities for executing the project, while at the same time retaining most
financial controls in the PCU.254 The most recent project, ABDP, has been able to
reflect more clearly the new relationship between national and county government
by setting up dedicated project accounts at county level alongside the national
account.
289. In the case of PROFIT, an embedded PMU design was proposed to work within the
Micro Finance Unit in the National Treasury to oversee implementation, with the
idea that this would allow strong linkages to other initiatives.255 Other components
were to be outsourced to a range of service providers, particularly AGRA, which
would manage the risk-sharing facility. However, the Government did not focus
enough attention on these arrangements. The staffing and procurement needs
were relatively small compared to other major programmes run by the Treasury.
This led to delays in PCU staff recruitment and in setting up MoUs with partners.
290. Compliance with loan agreements and loan conditions by the Government has
been overall very good. In general, the anticipated government contributions have
been met or exceeded. For MKEPP, for example, the PCRV noted that the
Government participated in all aspects of project design, negotiation, loan
agreement, implementation, supervision and in offering implementation support
and undertaking specific studies, reviews, auditing and reporting. The Government
adhered to all the loan covenants, including the provision of counterpart funding,
with its contributions amounting to 140 per cent of the expected amount.256
According to the final supervision mission, SNCDP had complied with all loan
covenants.257 There were some issues with procurement, however, namely slow
completion of infrastructure projects.258 In general, despite the wider issues of
corruption in Kenya, the portfolio did not experience misuse of funds.
291. Overall, Government performance is rated as moderately satisfactory (4),
based on its providing continuing policy emphasis to the sector, complying with
loan agreements and improving fund flow, but offset by the continuing
underfunding of the sector, and delays in building capacity at local government
level to support implementation.
254
To overcome the gaps in county-level capacity, FAO was to provide training support to county staff, and the KCEP PCU set up three regional offices (in Nakuru, Kitui and Mombasa) to ensure closer liaison with counties while also reflecting different agro-ecological demands. 255
Such as the World Bank Financial Sector Deepening Trust and the Micro-Finance Sector Support Credit project funded by the Agence Française de Development. 256
MKEPP PCRV 2014. Paragraph 83. 257
SNCDP Supervision Mission July 2013. Paragraph 40. 258
SNCDP Supervision Mission report July 2013. Paragraph 43.
Appendix II EB 2019/128/R.12
80
Key points
IFAD as a partner has performed well in terms of strategic direction, project design and supervision, but with less success in terms of programme management, ICO stability and partnerships.
The Government of Kenya has shown continuing commitment to the agriculture sector from a policy perspective, although not from a budget allocation point of view. Loan compliance has been good, but disbursements have sometimes been slow,
reducing efficiency and project delivery. PMU staffing has been problematic.
Devolution processes have had an effect on all projects in the portfolio except PROFIT, which is implemented at national level. Implementation units have developed various mechanisms to adjust to the growing role of county governments.
Appendix II EB 2019/128/R.12
81
VI. Country programme and strategy performance 292. This chapter assesses the relevance and effectiveness of the evolving country
strategy pursued in Kenya by IFAD and the Government since 2011. The
assessment draws on the analysis in Chapter III on portfolio performance, Chapter
IV on the assessment of non-lending activities and Chapter V on performance of
partners.
A. Relevance
293. Strategic alignment. The 2013 COSOP covered a period of transition from
external to in-country management of IFAD’s portfolio and presence, and
introduced a major shift away from area-based rural development projects to value
chains and ASAL areas, as well as working more closely with the private sector.
The focus on ASAL areas remains a key theme presenting major technical
challenges in a period when climate change is occurring. As the private sector
continues to grow strongly in Kenya and the emphasis on the role of private
investment in agriculture expands (for example in the new Big Four Agenda),259
IFAD has had to reposition itself to incorporate these priorities. Yet it has not found
the task easy.
294. There is a significant and predictable issue of strategy-to-execution time lag (i.e.
the difference between the COSOP time frame and the design and execution of
projects).260 Projects that were designed under the earlier 2007 COSOP are being
implemented under the 2013 version. The identification of rural finance as a key
objective was clear in 2007; however, the 2013 COSOP makes relatively little
mention of this sector.261 This downgrading is surprising given the substantial
investment that was to be provided through PROFIT.
295. Equally, the two projects that are most clearly aligned to the COSOP 2013-18
framework are only now beginning to deliver results (KCEP) or due to begin shortly
(ABDP). These will therefore run over into the next COSOP phase. This strategy-to-
execution time lag seems to reflect the marked contrast between the rather rapid
pace of policy evolution in IFAD and the much slower ability to deliver on the
ground.
296. Value chains. The importance of pro-poor value chains has been progressively
acknowledged in IFAD's corporate Strategic Frameworks. According to the Strategic
Framework 2007-2010, value chain analysis was one of the key elements that
should underpin the efforts to address the lack of markets for poor producers.
Similarly, in the Strategic Framework 2011-2015, value chains were to be at the
centre of IFAD’s rural development strategy to generate opportunities for increased
incomes and employment both on-farm and off-farm. The current Strategic
Framework 2016-2025 considers value chains as major features of IFAD’s
operations and 4Ps as one of the mechanisms to be developed around value
chains. Value chain thinking also forms part of IFAD's other strategies.262
297. The COSOP 2013 has identified agricultural value chains as one of the comparative
advantages of IFAD in Kenya. It also called for innovation when working with value
chains – under SO1 it calls for use of low-carbon technologies for value chain
development and under SO3 it argues for innovative public/private partnerships
along the agricultural value chain. In response, IFAD has taken on a large number
of very different value chains with varying technical, marketing, financing and
259
Policy on Devolved System of Government, Ministry of Devolution and Planning, October 2016. 260
An issue noted in the recent COSOP Results Review draft, April 2018, version 11. 261
It appears only as an Output under SO1. 262
For instance, the Private Sector Engagement Strategy 2012 makes extensive reference to value chains and underlines the central role of farmers’ organizations to increase farm-gate prices and improving incomes of small farmers within value chains. The 2009 IFAD Rural Finance Strategy also envisages innovative products that could target actors throughout agricultural value chains.
Appendix II EB 2019/128/R.12
82
targeting demands. This complexity has led to a range of implementation
challenges, and as such the choices could have been more selective or rather less
ambitious.
298. Targeting. The 2013 COSOP showed an increasingly comprehensive
understanding of IFAD’s target groups, in terms of the subgroups therein and their
respective levels of poverty and economic activities on-farm, off-farm and along
value chains. Following in the footsteps of the 2007 COSOP and in line with IFAD
(2008) Policy on Targeting, the core target group of the country strategy was the
poor and semi-subsistence smallholders and agro-pastoralists with the potential to
produce, or already producing, a marketable surplus. In addition, the broader
target group included the poorest smallholders and pastoralists, which was a
relevant approach in the context of rising income inequality.
299. As noted in Chapter II, Kenya has a progressive national legal, policy and
institutional framework to promote gender equality and women's empowerment.
However, the benefits have yet to be fully felt by rural women, whose lives are
governed by informal customary laws and social norms that perpetuate gender
inequality and limit poverty reduction and economic growth. In response, the
portfolio has clearly identified women and female-headed households as important
target groups of programme interventions and strived to promote gender equality
and women's empowerment in all project designs. The inclusion of women and
female-headed households in project target groups is in line with the IFAD COSOPs
(2002, 2007, and 2013) and the IFAD Policy on Targeting, which affirms IFAD’s
special focus on rural women for reasons of equity, effectiveness and impact.
300. Grants. Overall, the interventions and support funded by grants were broadly
aligned with IFAD strategies, including the 2007-2012 and 2013-2018 COSOPs and
with IFAD Strategic Frameworks.263 For instance, the grant seeking to improve
IFAD’s role as a knowledge broker on rural finance (KMP) was relevant and in line
with SO3 of COSOP 2007 and the IFAD strategic frameworks’ focus on enhancing
the access of poor rural women and men to a broad range of financial services, and
enabling them to develop the skills and organizations they require to take
advantage of such services. SO1 of COSOP 2013 (gender-responsive, climate-
resilient and sustainable community-based NRM is improved) was reflected in
PRESA. This grant sought to generate evidence and facilitate mechanisms that
enable recognition and appropriate rewarding of land management practices that
generate ecosystem services.
301. SO2 of COSOP 2007 and SO3 of COSOP 2013, which aimed to increase incomes of
the rural poor through the utilization of technologies, market-oriented production
and increased market access, were to be achieved through developing efficient
linkages of smallholders to regional markets (REACTS) and generating livelihood
options for greater incomes through enhanced productivity and organic certification
(Scaling up Bee-keeping and other Livelihood Options). Similarly, the grant
Enabling Rural Transformation and Grass-Roots Institution Building aimed to
provide support to smallholder organizations in the context of organizational
development, as per IFAD’s objective to support poor rural people’s organizations
and with the 2007 COSOP objective of ensuring that poor rural people have better
access to, and the skills and organization they need to take advantage of, policy
and programming processes at the local and national levels.
302. The mix of instruments deployed during the COSOP has not been so optimal.
While both the lending portfolio and the grants have generally been well devised
and effective in accordance with the SOs, the synergies between lending and non-
lending could have been stronger. This is largely due to the weaker performance of
263 The Strategic Frameworks taken into account are the following: 2007-2010; 2011-2015; and 2016-2025.
Appendix II EB 2019/128/R.12
83
policy engagement and knowledge management and the often distinct and
separate role of grants (other than those embedded as part of lending operations).
This gap is especially striking given the CPE recommendations in 2011
(paragraph 62).
303. Given the strong relevance of the thematic focus and the targeting approach, yet
the insufficient focus on non-lending activities within the strategy, the rating for
COSOP relevance is moderately satisfactory (4).
B. Effectiveness
304. The 2013 COSOP includes three SOs: SO1 on NRM; SO2 on agricultural
productivity (yield increases, improved services, stronger production groups); and
SO3 on value addition and markets. Findings on performance are hindered by the
lack of alignment of RIMS indicators at project level with the COSOP results
framework. The draft COSOP review report from April 2018 provides a positive view
of overall achievements, but in our view provides little critical assessment of actual
gaps.
305. The theory of change set out in the CSPE approach paper (and following in annex
XIII) elucidates how each of the SOs from the 2007 and 2013 COSOPs will be
achieved through programme outputs to outcomes and impact, i.e. the results of
lending and non-lending operations against the COSOP objectives. The evaluation
identified three impact pathways through which the SOs would be achieved. These
pathways are embedded in three thematic areas of IFAD's operations in Kenya:
NRM/climate change, value chains and rural finance. As noted above, the third
pathway on rural finance is a 2007 objective and has not been highlighted to the
same extent in the 2013 COSOP, yet it has been important in terms of financial
investments (through PROFIT). This evaluation assesses the results in these
thematic areas as pathways to achieving the SOs.
306. The intervention pathway for NRM/climate change activities, which corresponds
to SO1 of the COSOP 2013, wherein NRM/climate change activities lead to
improved soil and water conservation and then to more sustainable production
systems as well as greater institutional capacity and social cohesion, has been
shown to be viable and successful. This is confirmed by a range of evidence from
impact studies, supervision missions and our interviews in the field.
307. The pathway for value chains relates to SO3 of COSOP 2013 (access to improved
post-production technologies and markets enhanced), SO2 of COSOP 2007 (access
to and use of appropriate technologies, markets and community-owned rural
infrastructure) and to an extent SO2 of COSOP 2007 (capacity of public, private
sector and civil society organizations in delivering pro-poor and demand-oriented
services strengthened). Here, there is a reasonably good performance, particularly
in the dairy sector, which shows that the pathway based around value chains is
valid, although achievements have been affected by gaps in market access. The
horticulture value chain, on the other hand, improved access to technology but
market access-related results were mixed.
308. Finally, the pathway which aims to improve access to financial services and
corresponds to SO3 of COSOP 2007 (access of rural poor to financial services and
investment opportunities is improved) has shown that financial leveraging of new
actors with IFAD funds in the rural finance sector is possible with the right support.
Yet the expected scale of leveraging in terms of number of banks (two rather than
four) and the scale of response from the private sector to date have not matched
the ambitions of the PROFIT model. Delays in implementation have also delayed
creating a clear pathway to the outcome of reaching the target smallholder
farmers, but the graduation of the very poor to becoming credit-ready has been
demonstrated.
Appendix II EB 2019/128/R.12
84
309. The achievements of SO1 are rated as high. The lending side has generally
delivered well on the required indicators around improved NRM and strengthening
gender-responsiveness. Some aspects of policy have been effective (Forestry,
Water Rights), and community groups have played a strong role in delivering
benefits on the ground through CAPs or dairy groups. Women have led a third of
these groups. Key achievements include the success and affordability of the wildlife
fencing and also the improved quality of water and soil in the target areas from
conservation measures.
310. The non-lending portfolio has achieved more limited results, although a notable
success has been UTNWF, which has demonstrated valuable multisector and
partnership links.
311. For SO2, achievement is rated as moderate. Projects are improving the access
of poor rural women, men and youth in the target areas to sustainable and
productivity-enhancing assets, technologies and services. Adoption rates for
technologies are reportedly fairly good, and access to services has risen for both
men and women producers. Ownership of productive assets has risen although
there are still gaps in terms of achieving full intensification of dairy production with
biogas digesters, chaff-cutters and concrete floors, or marketing structures and
processing equipment for horticultural groups. Access to credit remains relatively
poor for producers, despite the steps taken to improve rural finance outreach.
312. Production and income changes are mixed – productivity responses show good
results for dairy but are more varied for horticulture, and the early signs for ASAL
crops such as millet and sorghum are below expectations.
313. Significant benefits from the use of new forms of technology are occurring, such as
with the e-voucher system, mobile payments, improved cooking stoves and
drought-forecasting and crop insurance.
314. For SO3, overall achievement is moderate. Processing improvements are
evident at the local level, for example in the dairy sector (with milk bars or biogas)
and among producer groups in different value chains, which increased the level of
contract production. Access roads have proven successful while storage facilities
(such as warehouses) have not been so effective.
315. As groups become more commercialized, there is a concern that the poorest
producers will drop out of the groups as they will not be able to mobilize the labour
or capital required to improve quality. Interventions such as dairy goats were not
pursued to overcome this. The role of youth has seen some success in terms of
their involvement in marketing, but there is potential for much more to be
achieved.
316. Overall, the performance across the three SOs (see table 13 below) from COSOP
2013 is judged by the CSPE as follows. For SO1 (NRM), the two lead projects have
been generally successful while the other projects have incorporated NRM/climate
change approaches to varied levels. Significant improvements in soil and water
management have occurred, forest and wildlife resources have been protected, and
grassroots organizations have been strengthened. For SO2 (yield increases,
improved services, stronger production groups), results have been good as well but
they have also been affected by devolution, over-ambitious targets and drought
and pest problems. SO3 (value addition and markets) has had mixed performance,
with some success on infrastructure delivery and productivity rises, although
access to markets has still to be effective, so that increases in production are only
partially matched by increases in sales. Private sector links have improved although
there are still gaps in absorbing the increased production.
317. From the information available, effectiveness is rated as moderately satisfactory
(4).
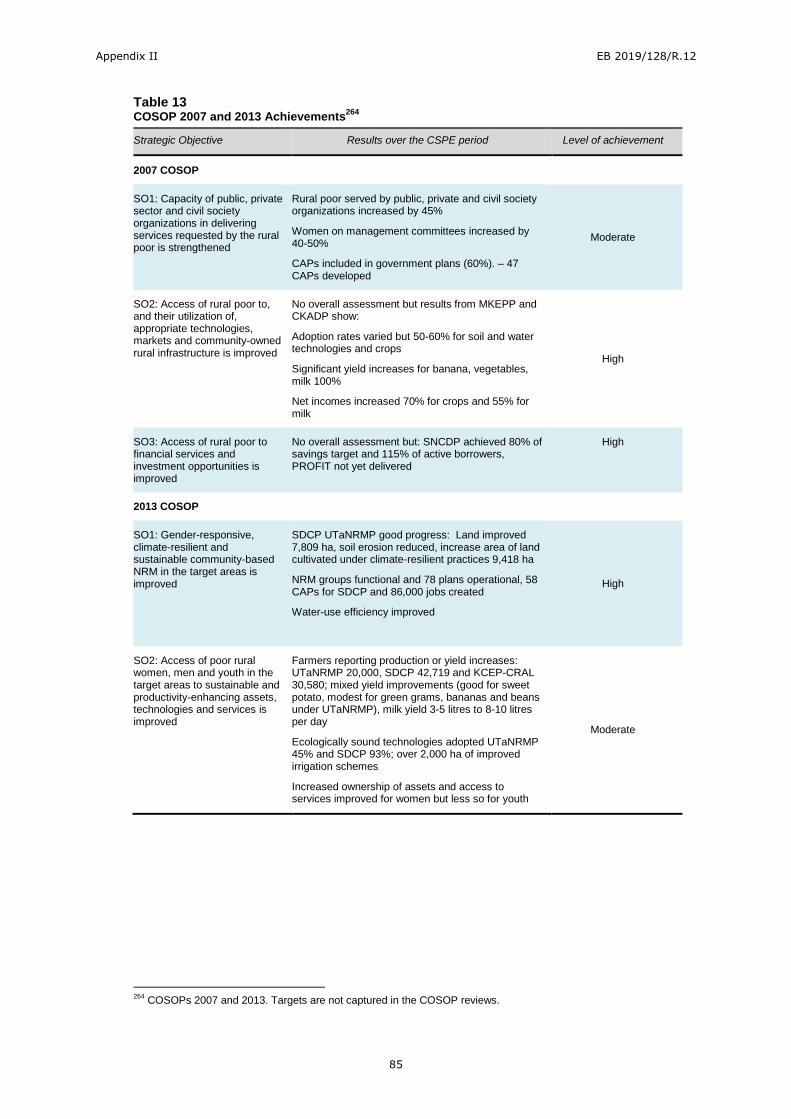
Appendix II EB 2019/128/R.12
85
Table 13 COSOP 2007 and 2013 Achievements
264
Strategic Objective Results over the CSPE period Level of achievement
2007 COSOP
SO1: Capacity of public, private sector and civil society organizations in delivering services requested by the rural poor is strengthened
Rural poor served by public, private and civil society organizations increased by 45%
Women on management committees increased by 40-50%
CAPs included in government plans (60%). – 47 CAPs developed
Moderate
SO2: Access of rural poor to, and their utilization of, appropriate technologies, markets and community-owned rural infrastructure is improved
No overall assessment but results from MKEPP and CKADP show:
Adoption rates varied but 50-60% for soil and water technologies and crops
Significant yield increases for banana, vegetables, milk 100%
Net incomes increased 70% for crops and 55% for milk
High
SO3: Access of rural poor to financial services and investment opportunities is improved
No overall assessment but: SNCDP achieved 80% of savings target and 115% of active borrowers, PROFIT not yet delivered
High
2013 COSOP
SO1: Gender-responsive, climate-resilient and sustainable community-based NRM in the target areas is improved
SDCP UTaNRMP good progress: Land improved 7,809 ha, soil erosion reduced, increase area of land cultivated under climate-resilient practices 9,418 ha
NRM groups functional and 78 plans operational, 58 CAPs for SDCP and 86,000 jobs created
Water-use efficiency improved
High
SO2: Access of poor rural women, men and youth in the target areas to sustainable and productivity-enhancing assets, technologies and services is improved
Farmers reporting production or yield increases: UTaNRMP 20,000, SDCP 42,719 and KCEP-CRAL 30,580; mixed yield improvements (good for sweet potato, modest for green grams, bananas and beans under UTaNRMP), milk yield 3-5 litres to 8-10 litres per day
Ecologically sound technologies adopted UTaNRMP 45% and SDCP 93%; over 2,000 ha of improved irrigation schemes
Increased ownership of assets and access to services improved for women but less so for youth
Moderate
264
COSOPs 2007 and 2013. Targets are not captured in the COSOP reviews.
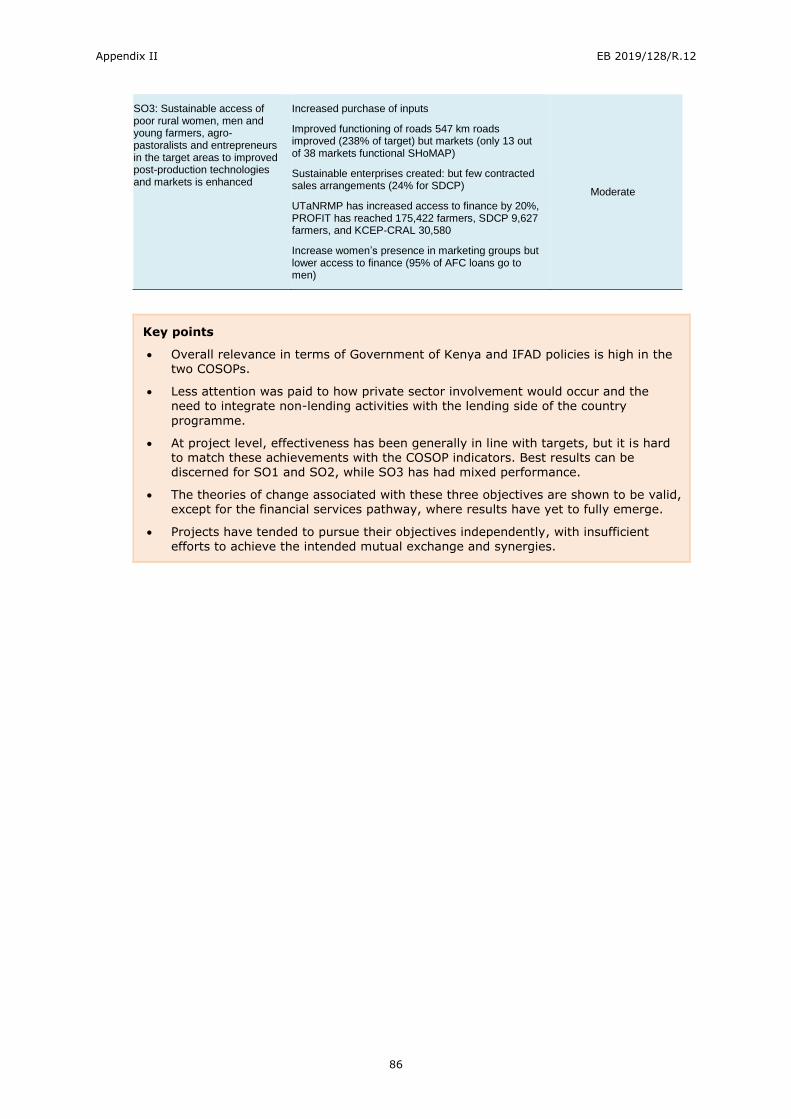
Appendix II EB 2019/128/R.12
86
SO3: Sustainable access of poor rural women, men and young farmers, agro-pastoralists and entrepreneurs in the target areas to improved post-production technologies and markets is enhanced
Increased purchase of inputs
Improved functioning of roads 547 km roads improved (238% of target) but markets (only 13 out of 38 markets functional SHoMAP)
Sustainable enterprises created: but few contracted sales arrangements (24% for SDCP)
UTaNRMP has increased access to finance by 20%, PROFIT has reached 175,422 farmers, SDCP 9,627 farmers, and KCEP-CRAL 30,580
Increase women’s presence in marketing groups but lower access to finance (95% of AFC loans go to men)
Moderate
Key points
Overall relevance in terms of Government of Kenya and IFAD policies is high in the two COSOPs.
Less attention was paid to how private sector involvement would occur and the need to integrate non-lending activities with the lending side of the country
programme.
At project level, effectiveness has been generally in line with targets, but it is hard to match these achievements with the COSOP indicators. Best results can be discerned for SO1 and SO2, while SO3 has had mixed performance.
The theories of change associated with these three objectives are shown to be valid, except for the financial services pathway, where results have yet to fully emerge.
Projects have tended to pursue their objectives independently, with insufficient
efforts to achieve the intended mutual exchange and synergies.
Appendix II EB 2019/128/R.12
87
VII. Conclusions and recommendations
A. Conclusions
318. Context. The past seven years in Kenya have seen considerable political, economic
and environmental challenges. Tension around elections, complex devolution
processes and severe drought in particular affected the context in which
development activities occurred. While Kenya is a strongly growing economy,
corruption and a rapidly growing youth population have contributed to unequal
wealth-sharing. The Government has maintained a strategic emphasis on
agriculture, although its budget commitments have not met CAADP targets. Part of
the reasons for this is that the private sector is expected to adopt an increasingly
vital role in driving the rural economy forward and is seen as a key element in the
Government’s new Big Four Agenda. Achieving food security through higher
incomes and greater food resilience are central tenets of the new Big Four Agenda.
It expects that smallholder production will be boosted by improved feed supply,
credit, warehousing, licensing and supporting small and medium enterprises, better
irrigation and fish farming. This agenda is bringing a renewed impetus to the
agriculture sector, and IFAD is well placed to align with the imperatives of
improving food security alongside a more competitive, market-led enterprise-driven
approach backed by government policy and regulatory reform.265
319. Within this setting, IFAD has adopted broadly sound strategic objectives over
the period covered by this CSPE. Its shift from broad community development
towards selected value chains, investing more in semi-arid areas, improving access
to rural finance and continuing to address environmental degradation and climate
change has been highly appropriate. While the focus on ASALs has recognized the
priorities of the Government, there has been less attention paid to arid lands and
pastoralists within that domain.
320. Adapting to the process of devolution has been a defining challenge for
IFAD and affected the programme's performance and sustainability over
the COSOP period. IFAD's procedures were somewhat slow to adapt. Only
recently have newer projects been able to align with the growing county-level
mandate to manage their own funding and planning. The need to engage
effectively with both national and county-level partners has added pressure on the
limited ICO resources. Devolution, government ministry reorganization, and slow
policy reform processes have also limited the impact of the substantial investments
into building the capacities of government staff and other service providers in areas
such as agricultural extension, credit delivery, marketing and gender
mainstreaming until now.
321. The lending portfolio has been affected by slow disbursement and over-
ambitious start up time frames. Project delivery has relied on PMUs, which also
had to adjust to the growing role of county governments. The PMUs have continued
to suffer delays around staff recruitment and partnership-building, and have proved
costlier than planned. Projects that have been extended, or have been able to use
established management infrastructure, were able to avoid those start-up delays.
322. Despite these challenges, the portfolio has overall achieved a moderately
satisfactory performance, mainly due to the following reasons. The continuity of
and extended financing for project implementation has enabled interventions to
build upon existing institutions and lessons learned, and it has deepened
effectiveness. While IFAD has tried to introduce new approaches to its portfolio and
given more attention to rural finance and to private sector engagement, this has
increased the complexity of designs and implementation, leading to delays in
265
Recent evidence suggests that Kenya performs comparatively well in terms of enabling the business of agriculture, particularly as regards its regulatory environment for finance, water and ICT, but it needs to do more in terms of supporting effective markets. Enabling the Business of Agriculture, Kenya Snapshot, World Bank, 2017.
Appendix II EB 2019/128/R.12
88
disbursement, and difficulties in achieving sufficient staff capacity and in finalizing
partnership agreements. IFAD's focus on supervising project management has
absorbed considerable resources, but has yielded positive results within the lending
portfolio, in particular with regard to fiduciary oversight, outreach to poorer groups
and integration of cross-cutting issues.
323. IFAD has met head-on the difficult task of building more commercial
approaches amidst the poor and resource-challenged farmers, especially in
ASAL areas. Group approaches have worked here to provide risk-sharing, and IFAD
has also been innovative in bringing in solutions around credit delivery, processing
and environmental management. But graduation models, while offering a logical
pathway for households to produce at a more commercial level, have sometimes
been over-ambitious, especially where climate risks are acute or where links to
large processors remain a challenge.
324. IFAD has achieved most success in the area of NRM, while value chains
and rural finance have also performed well. Working with group-based
approaches to NRM has been successful and sustainable because of the favourable
legal and institutional framework in Kenya, and IFAD has thus been able to
leverage its comparative advantage in community development. For value chains,
IFAD has been successful with relatively mature and better integrated value chains
such as dairy, while in the more nascent and less integrated value chains such as
horticulture it has been unable to achieve the stated objectives within the limited
span of a project. Progress has been made on raising the productivity of dairy,
horticulture and cereal producers, but linkages with the processing and marketing
parts of the value chain have not yet been fully realized. With rural finance, IFAD
has stimulated immense interest in its drive to leverage Kenya’s banks and MFIs to
lend to smallholder producers as well as in preparing poorer farmers for access to
credit through financial graduation. There is good potential now to expand, while
more carefully monitoring who benefits. Expected synergies between rural finance
and value chain projects have yet to be realized.
325. Targeting of the poor has been more successful in the NRM and value
chain projects and also in the financial graduation component of the rural
finance project. Targeting has been strong in terms of gender, with an
increasingly transformative approach. On the other hand, youth have been less
well addressed, and IFAD could have done more to focus on this constituency given
that nationally, youth unemployment is double that of adults. The move toward the
ASALs, recommended by the last CPE, has been limited to semi-arid areas so far.
Given that IFAD has a focus on value chains and to date has not been able to reach
out to pastoralists, targeting the arid areas may be hard to realize within the
COSOP objective of market access. The newest project ABDP reflects again a move
away from arid areas.
326. The large scale of operations, the complexity of projects and their
geographic spread have absorbed the limited ICO resources and left little
time to engage in non-lending activities. Policy dialogue has been ad hoc and
without a coherent approach that builds on the lending portfolio as a whole, and
with a somewhat detached grant portfolio. So far, IFAD’s policy work has been
through active engagement in donor and government working groups. However,
there is considerable potential for drawing on IFAD’s field experiences to inform the
wider national policy agenda in Kenya as well as to inform IFAD and its other
development partners. Knowledge management has received insufficient attention,
M&E has not been robust enough to drive the capture of useful findings, and the
ICO has not had capacity to aggregate and share evidence across the portfolio.
Learning lessons has not been helped by the high turnover of IFAD CPMs and the
failure to monitor COSOP performance punctually. Partnership-building has been
more effective but mainly built around project service provision, and with
somewhat less success with private sector actors. International cofinancing has
Appendix II EB 2019/128/R.12
89
been increasing in the newer projects and there is scope for further growth.
Partnerships with the Rome-based agencies have been relatively new, but they are
showing promising signs of success. Challenges remain with regard to the
coordination of activities on the ground.
B. Recommendations
327. Recommendation 1. Consistent with the importance and size of the Kenya
portfolio, commit sufficient effort and resources to non-lending activities.
In line with the recommendations from the last CPE, this CSPE highlights the need
for engagement beyond lending, recognizing the significance of Kenya as a hub for
international development partners and the size of IFAD's investment in the
country. The next COSOP should define specific areas for policy engagement
together with an actionable strategy and dedicated (financial and human)
resources. This means that additional staff with relevant technical skills will need to
be added to the ICO. Areas for policy engagement need to build on IFAD's
comparative advantage in the rural sector and its long-standing experiences on the
ground. It is expected that policy engagement will also benefit from the expertise
available within the new Eastern Africa and Indian Ocean Hub of IFAD, based in
Nairobi. Greater investment from loans and grants is needed in carrying out stock-
taking of experiences and analysis of successful models that can effectively inform
the lending operations. In addition, mechanisms for cross-learning between
projects and non-lending activities should be adopted as part of the annual
portfolio review. More active contribution to and use of knowledge-sharing
platforms (within IFAD and with other development partners) should be pursued,
and IFAD should work to better integrate its M&E systems with national systems
(NIMES, CIMES) as well with close partners such as FAO.
328. Recommendation 2. Build on IFAD's comparative advantage and retain
focus on selected themes and geographic areas. There is still "unfinished
business" in the areas where IFAD has successfully worked in the past. IFAD's
programme should continue its focus on NRM and climate change, value chains and
rural finance. It should concentrate on consolidating its achievements (e.g. by
strengthening market access), identify and strengthen linkages (e.g. between rural
finance and value chains), and deepen inclusive outreach (e.g. to youth).
Geographic stretch should be reduced through greater focus on selected counties in
semi-arid areas. IFAD should build on places where it has established good
relations and the CIDPs can integrate IFAD activities. To ensure stringency in its
selectivity, IFAD should dialogue with the Government on aligning its requests with
IFAD's comparative advantage in Kenya.
329. Recommendation 3. Address recurrent design and institutional issues
undermining programme efficiency within the context of the ongoing
devolution process. Lessons from over-ambitious and overly complex project
designs have yet to be learned. Designs need to be realistic and implementable,
supported by sound technical and institutional analysis. Given the complexity of the
portfolio and the limited resources of IFAD’s country office, inefficiencies in project
management should be addressed by more realistic time frames and better
sequencing of activities. This would allow sufficient time to establish partnerships,
recruit staff and conduct baselines. From IFAD’s side, it should aim to reduce loan
disbursement delays; from the Government’s side, it should recruit project staff
and set up AIEs in a more timely manner. Fiduciary controls should be retained in
small but capable PMUs while at the same time seeking greater integration with
devolved government planning, financial procurement and M&E systems. Greater
ownership at county level is desirable and could be fostered through participation
right from project design and start-up (e.g. inclusive project launches). IFAD-
supported projects should make sure that they are included in the CIDPs and that
county government budgets assume an appropriate level of cofinancing. IFAD and
Appendix II EB 2019/128/R.12
90
the Government should assess economic return and value for money more
rigorously, particularly for value chain projects.
330. Recommendation 4. In line with the Government's strategic planning,
create space and opportunities for engaging the private sector. The success
of the value chain and rural finance projects will to a large extent depend on the
involvement of private sector players. Within the Government strategy (Big Four
Agenda), the private sector is expected to contribute significant financing to drive
the rural economy. In the value chain projects, the role of the private sector could
be enhanced through improved supply of inputs, credit and market-related
infrastructure (e.g. warehouses). IFAD will have to play a stronger brokering role
between farmer groups and private sector partners. The public-private-producer
partnerships will require strategies to identify and mitigate the risks and
transaction costs for all stakeholders.
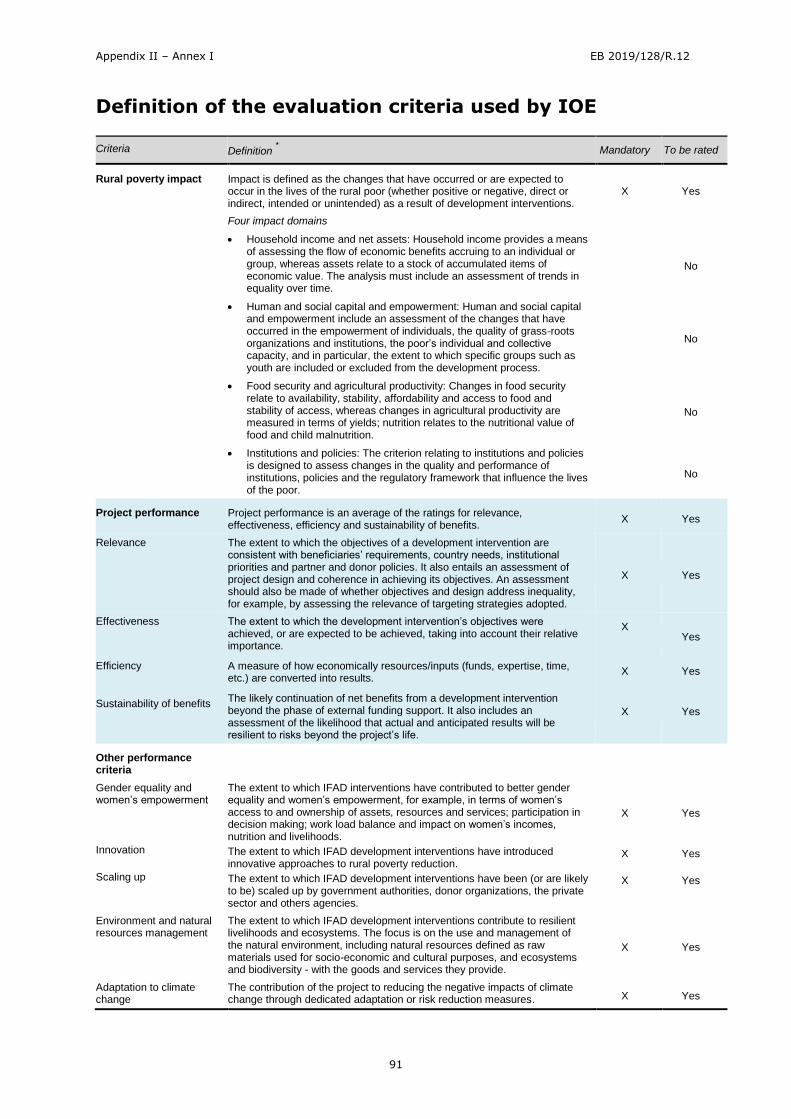
Appendix II – Annex I EB 2019/128/R.12
91
Definition of the evaluation criteria used by IOE
Criteria Definition * Mandatory To be rated
Rural poverty impact Impact is defined as the changes that have occurred or are expected to occur in the lives of the rural poor (whether positive or negative, direct or indirect, intended or unintended) as a result of development interventions.
X Yes
Four impact domains
Household income and net assets: Household income provides a means of assessing the flow of economic benefits accruing to an individual or group, whereas assets relate to a stock of accumulated items of economic value. The analysis must include an assessment of trends in equality over time.
No
Human and social capital and empowerment: Human and social capital and empowerment include an assessment of the changes that have occurred in the empowerment of individuals, the quality of grass-roots organizations and institutions, the poor’s individual and collective capacity, and in particular, the extent to which specific groups such as youth are included or excluded from the development process.
No
Food security and agricultural productivity: Changes in food security relate to availability, stability, affordability and access to food and stability of access, whereas changes in agricultural productivity are measured in terms of yields; nutrition relates to the nutritional value of food and child malnutrition.
No
Institutions and policies: The criterion relating to institutions and policies is designed to assess changes in the quality and performance of institutions, policies and the regulatory framework that influence the lives of the poor.
No
Project performance Project performance is an average of the ratings for relevance, effectiveness, efficiency and sustainability of benefits.
X Yes
Relevance The extent to which the objectives of a development intervention are consistent with beneficiaries’ requirements, country needs, institutional priorities and partner and donor policies. It also entails an assessment of project design and coherence in achieving its objectives. An assessment should also be made of whether objectives and design address inequality, for example, by assessing the relevance of targeting strategies adopted.
X Yes
Effectiveness The extent to which the development intervention’s objectives were achieved, or are expected to be achieved, taking into account their relative importance.
X
Yes
Efficiency
Sustainability of benefits
A measure of how economically resources/inputs (funds, expertise, time, etc.) are converted into results.
The likely continuation of net benefits from a development intervention beyond the phase of external funding support. It also includes an assessment of the likelihood that actual and anticipated results will be resilient to risks beyond the project’s life.
X
X
Yes
Yes
Other performance criteria
Gender equality and women’s empowerment
Innovation
Scaling up
The extent to which IFAD interventions have contributed to better gender equality and women’s empowerment, for example, in terms of women’s access to and ownership of assets, resources and services; participation in decision making; work load balance and impact on women’s incomes, nutrition and livelihoods.
The extent to which IFAD development interventions have introduced innovative approaches to rural poverty reduction.
The extent to which IFAD development interventions have been (or are likely to be) scaled up by government authorities, donor organizations, the private sector and others agencies.
X
X
X
Yes
Yes
Yes
Environment and natural resources management
The extent to which IFAD development interventions contribute to resilient livelihoods and ecosystems. The focus is on the use and management of the natural environment, including natural resources defined as raw materials used for socio-economic and cultural purposes, and ecosystems and biodiversity - with the goods and services they provide.
X Yes
Adaptation to climate change
The contribution of the project to reducing the negative impacts of climate change through dedicated adaptation or risk reduction measures. X Yes
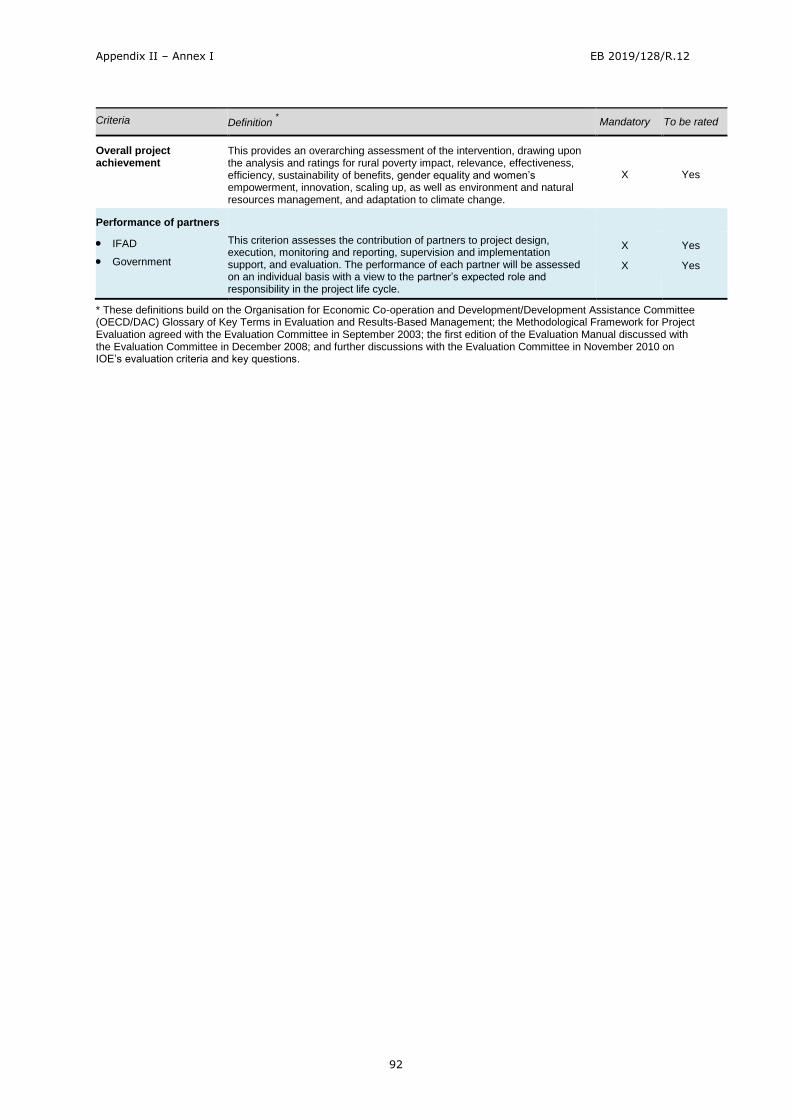
Appendix II – Annex I EB 2019/128/R.12
92
Criteria Definition * Mandatory To be rated
Overall project achievement
This provides an overarching assessment of the intervention, drawing upon the analysis and ratings for rural poverty impact, relevance, effectiveness, efficiency, sustainability of benefits, gender equality and women’s empowerment, innovation, scaling up, as well as environment and natural resources management, and adaptation to climate change.
X Yes
Performance of partners
IFAD
Government
This criterion assesses the contribution of partners to project design, execution, monitoring and reporting, supervision and implementation support, and evaluation. The performance of each partner will be assessed on an individual basis with a view to the partner’s expected role and responsibility in the project life cycle.
X
X
Yes
Yes
* These definitions build on the Organisation for Economic Co-operation and Development/Development Assistance Committee (OECD/DAC) Glossary of Key Terms in Evaluation and Results-Based Management; the Methodological Framework for Project Evaluation agreed with the Evaluation Committee in September 2003; the first edition of the Evaluation Manual discussed with the Evaluation Committee in December 2008; and further discussions with the Evaluation Committee in November 2010 on IOE’s evaluation criteria and key questions.
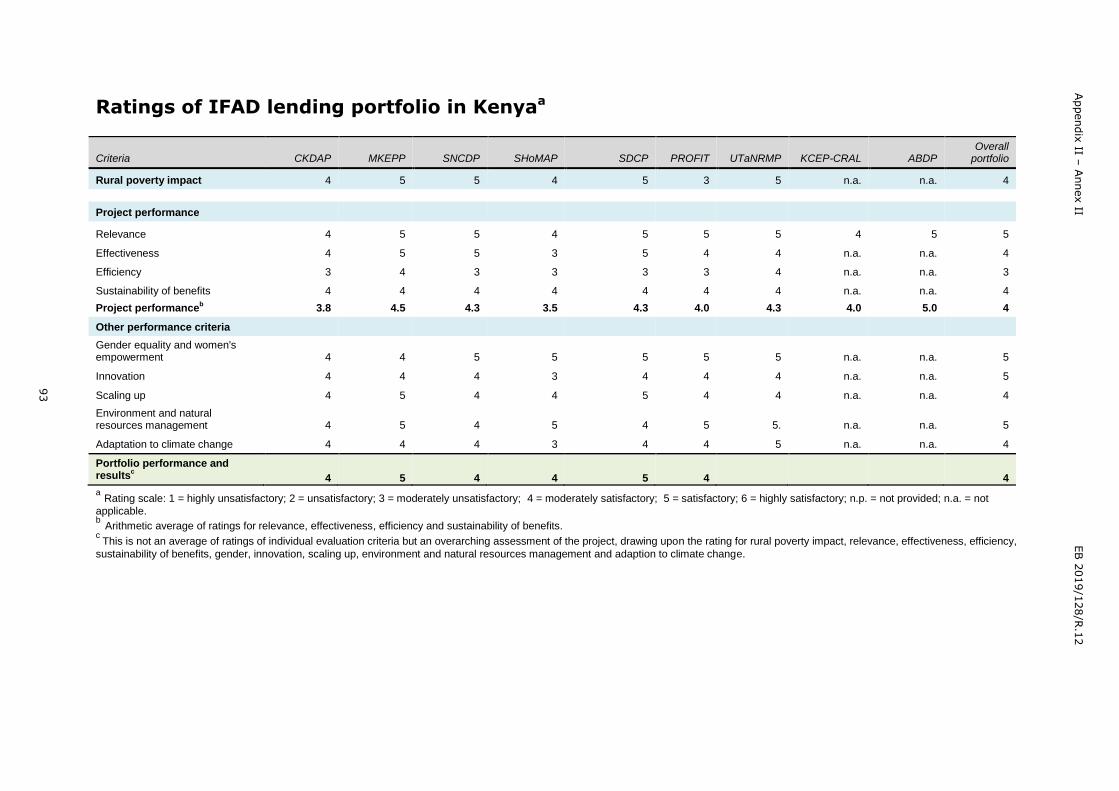
93
Appendix
II – A
nnex II
EB 2
019/1
28/R
.12
Ratings of IFAD lending portfolio in Kenyaa
Criteria CKDAP MKEPP SNCDP SHoMAP SDCP PROFIT UTaNRMP KCEP-CRAL ABDP Overall
portfolio
Rural poverty impact 4 5 5 4 5 3 5 n.a. n.a. 4
Project performance
Relevance 4 5 5 4 5 5 5 4 5 5
Effectiveness 4 5 5 3 5 4 4 n.a. n.a. 4
Efficiency 3 4 3 3 3 3 4 n.a. n.a. 3
Sustainability of benefits 4 4 4 4 4 4 4 n.a. n.a. 4
Project performanceb 3.8 4.5 4.3 3.5 4.3 4.0 4.3 4.0 5.0 4
Other performance criteria
Gender equality and women's empowerment 4 4 5 5 5 5 5 n.a. n.a. 5
Innovation 4 4 4 3 4 4 4 n.a. n.a. 5
Scaling up 4 5 4 4 5 4 4 n.a. n.a. 4
Environment and natural resources management 4 5 4 5 4 5 5. n.a. n.a. 5
Adaptation to climate change 4 4 4 3 4 4 5 n.a. n.a. 4
Portfolio performance and results
c 4 5 4 4 5 4 4
a Rating scale: 1 = highly unsatisfactory; 2 = unsatisfactory; 3 = moderately unsatisfactory; 4 = moderately satisfactory; 5 = satisfactory; 6 = highly satisfactory; n.p. = not provided; n.a. = not
applicable. b Arithmetic average of ratings for relevance, effectiveness, efficiency and sustainability of benefits. c
This is not an average of ratings of individual evaluation criteria but an overarching assessment of the project, drawing upon the rating for rural poverty impact, relevance, effectiveness, efficiency,
sustainability of benefits, gender, innovation, scaling up, environment and natural resources management and adaption to climate change.
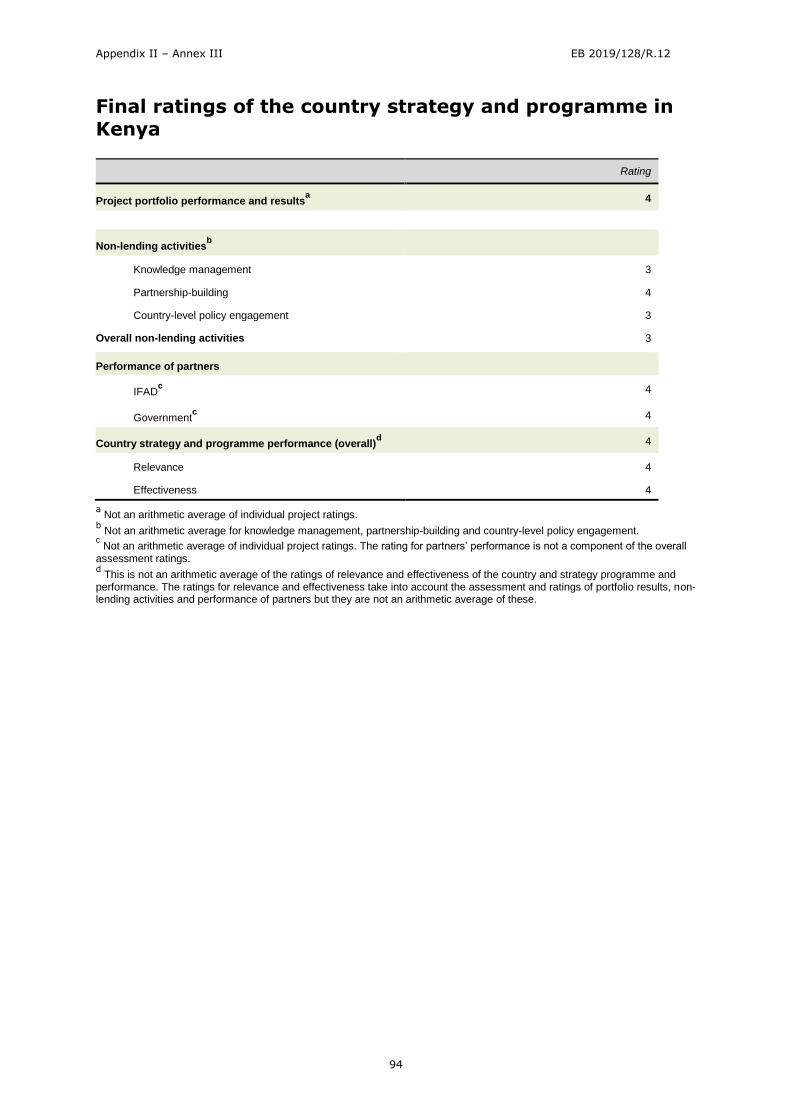
Appendix II – Annex III EB 2019/128/R.12
94
Final ratings of the country strategy and programme in Kenya
Rating
Project portfolio performance and resultsa 4
Non-lending activitiesb
Knowledge management 3
Partnership-building 4
Country-level policy engagement 3
Overall non-lending activities 3
Performance of partners
IFADc 4
Governmentc 4
Country strategy and programme performance (overall)d 4
Relevance 4
Effectiveness 4
a Not an arithmetic average of individual project ratings.
b Not an arithmetic average for knowledge management, partnership-building and country-level policy engagement.
c Not an arithmetic average of individual project ratings. The rating for partners’ performance is not a component of the overall
assessment ratings. d
This is not an arithmetic average of the ratings of relevance and effectiveness of the country and strategy programme and performance. The ratings for relevance and effectiveness take into account the assessment and ratings of portfolio results, non-lending activities and performance of partners but they are not an arithmetic average of these.
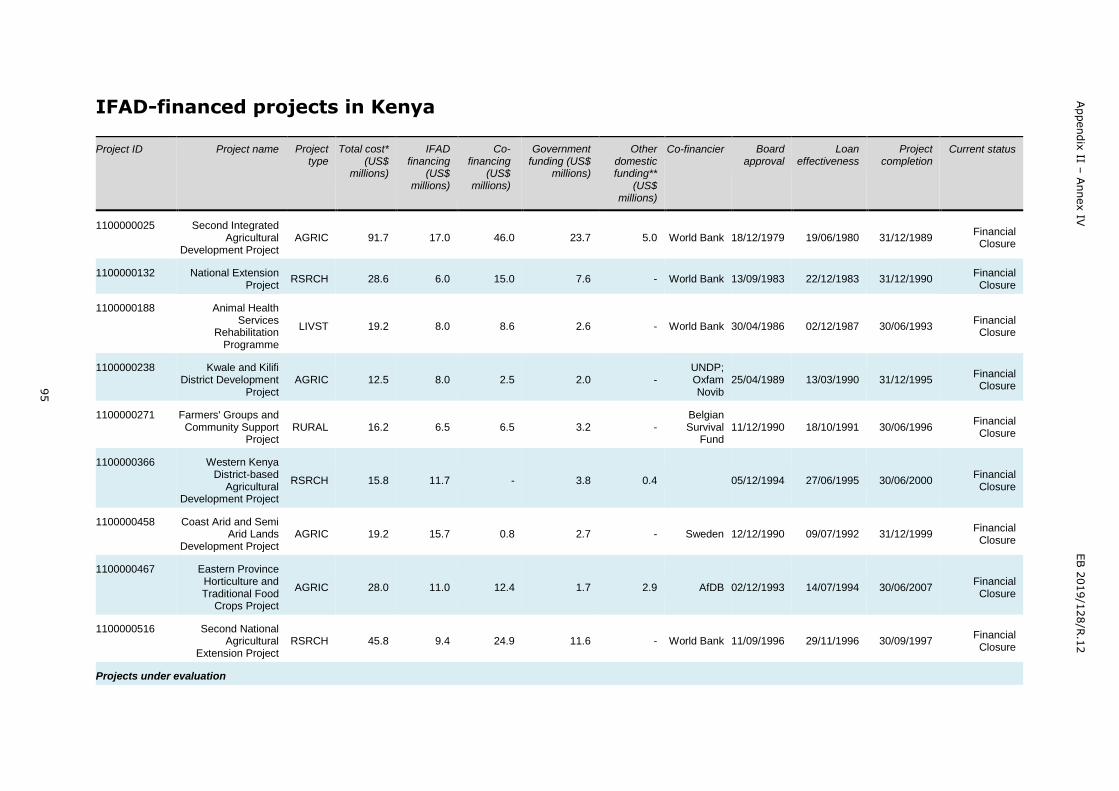
95
Appendix
II – A
nnex IV
EB 2
019/1
28/R
.12
IFAD-financed projects in Kenya
Project ID Project name Project type
Total cost* (US$
millions)
IFAD financing
(US$ millions)
Co-financing
(US$ millions)
Government funding (US$
millions)
Other domestic funding**
(US$ millions)
Co-financier Board approval
Loan effectiveness
Project completion
Current status
1100000025 Second Integrated Agricultural
Development Project AGRIC 91.7 17.0 46.0 23.7 5.0 World Bank 18/12/1979 19/06/1980 31/12/1989
Financial Closure
1100000132 National Extension Project
RSRCH 28.6 6.0 15.0 7.6 - World Bank 13/09/1983 22/12/1983 31/12/1990 Financial Closure
1100000188 Animal Health Services
Rehabilitation Programme
LIVST 19.2 8.0 8.6 2.6 - World Bank 30/04/1986 02/12/1987 30/06/1993 Financial Closure
1100000238 Kwale and Kilifi District Development
Project AGRIC 12.5 8.0 2.5 2.0 -
UNDP; Oxfam Novib
25/04/1989 13/03/1990 31/12/1995 Financial Closure
1100000271 Farmers' Groups and Community Support
Project RURAL 16.2 6.5 6.5 3.2 -
Belgian Survival
Fund 11/12/1990 18/10/1991 30/06/1996
Financial Closure
1100000366 Western Kenya District-based
Agricultural Development Project
RSRCH 15.8 11.7 - 3.8 0.4 05/12/1994 27/06/1995 30/06/2000 Financial Closure
1100000458 Coast Arid and Semi Arid Lands
Development Project AGRIC 19.2 15.7 0.8 2.7 - Sweden 12/12/1990 09/07/1992 31/12/1999
Financial Closure
1100000467 Eastern Province Horticulture and Traditional Food
Crops Project
AGRIC 28.0 11.0 12.4 1.7 2.9 AfDB 02/12/1993 14/07/1994 30/06/2007 Financial Closure
1100000516 Second National Agricultural
Extension Project RSRCH 45.8 9.4 24.9 11.6 - World Bank 11/09/1996 29/11/1996 30/09/1997
Financial Closure
Projects under evaluation
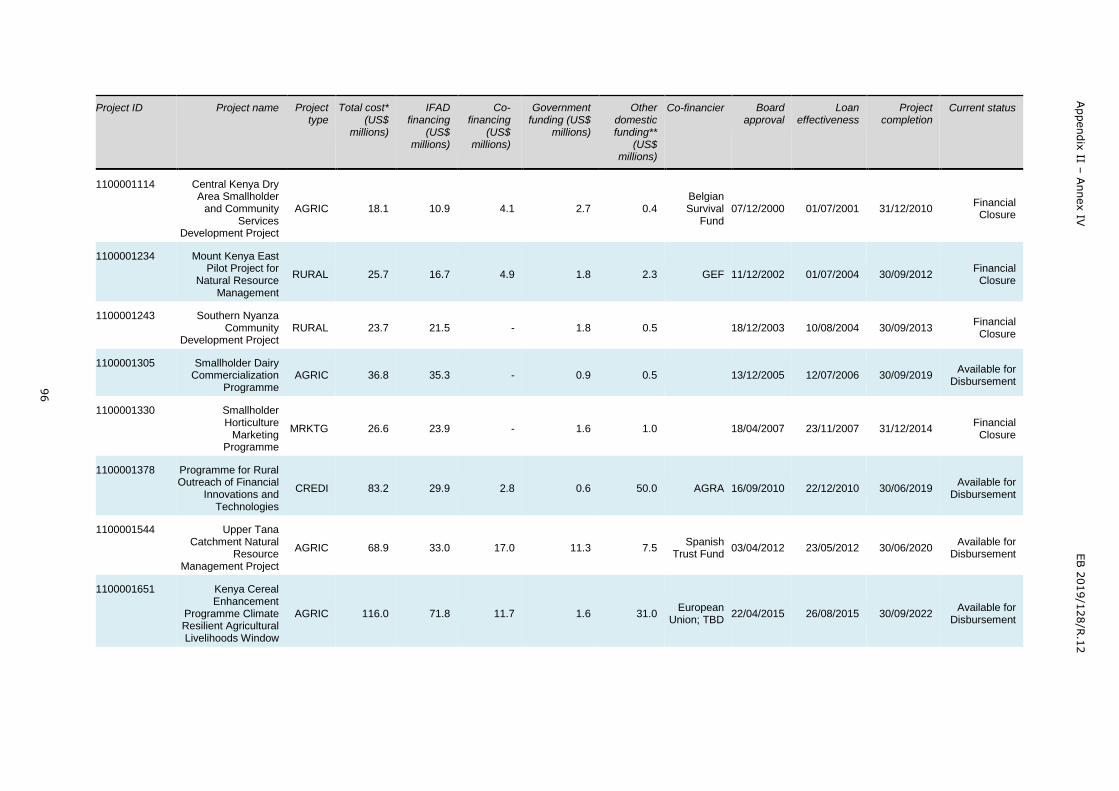
96
Appendix
II – A
nnex IV
EB 2
019/1
28/R
.12
Project ID Project name Project type
Total cost* (US$
millions)
IFAD financing
(US$ millions)
Co-financing
(US$ millions)
Government funding (US$
millions)
Other domestic funding**
(US$ millions)
Co-financier Board approval
Loan effectiveness
Project completion
Current status
1100001114 Central Kenya Dry Area Smallholder
and Community Services
Development Project
AGRIC 18.1 10.9 4.1 2.7 0.4 Belgian Survival
Fund 07/12/2000 01/07/2001 31/12/2010
Financial Closure
1100001234 Mount Kenya East Pilot Project for
Natural Resource Management
RURAL 25.7 16.7 4.9 1.8 2.3 GEF 11/12/2002 01/07/2004 30/09/2012 Financial Closure
1100001243 Southern Nyanza Community
Development Project RURAL 23.7 21.5 - 1.8 0.5 18/12/2003 10/08/2004 30/09/2013
Financial Closure
1100001305 Smallholder Dairy Commercialization
Programme AGRIC 36.8 35.3 - 0.9 0.5 13/12/2005 12/07/2006 30/09/2019
Available for Disbursement
1100001330 Smallholder Horticulture
Marketing Programme
MRKTG 26.6 23.9 - 1.6 1.0 18/04/2007 23/11/2007 31/12/2014 Financial Closure
1100001378 Programme for Rural Outreach of Financial
Innovations and Technologies
CREDI 83.2 29.9 2.8 0.6 50.0 AGRA 16/09/2010 22/12/2010 30/06/2019 Available for
Disbursement
1100001544 Upper Tana Catchment Natural
Resource Management Project
AGRIC 68.9 33.0 17.0 11.3 7.5 Spanish
Trust Fund 03/04/2012 23/05/2012 30/06/2020
Available for Disbursement
1100001651 Kenya Cereal Enhancement
Programme Climate Resilient Agricultural Livelihoods Window
AGRIC 116.0 71.8 11.7 1.6 31.0 European
Union; TBD 22/04/2015 26/08/2015 30/09/2022
Available for Disbursement
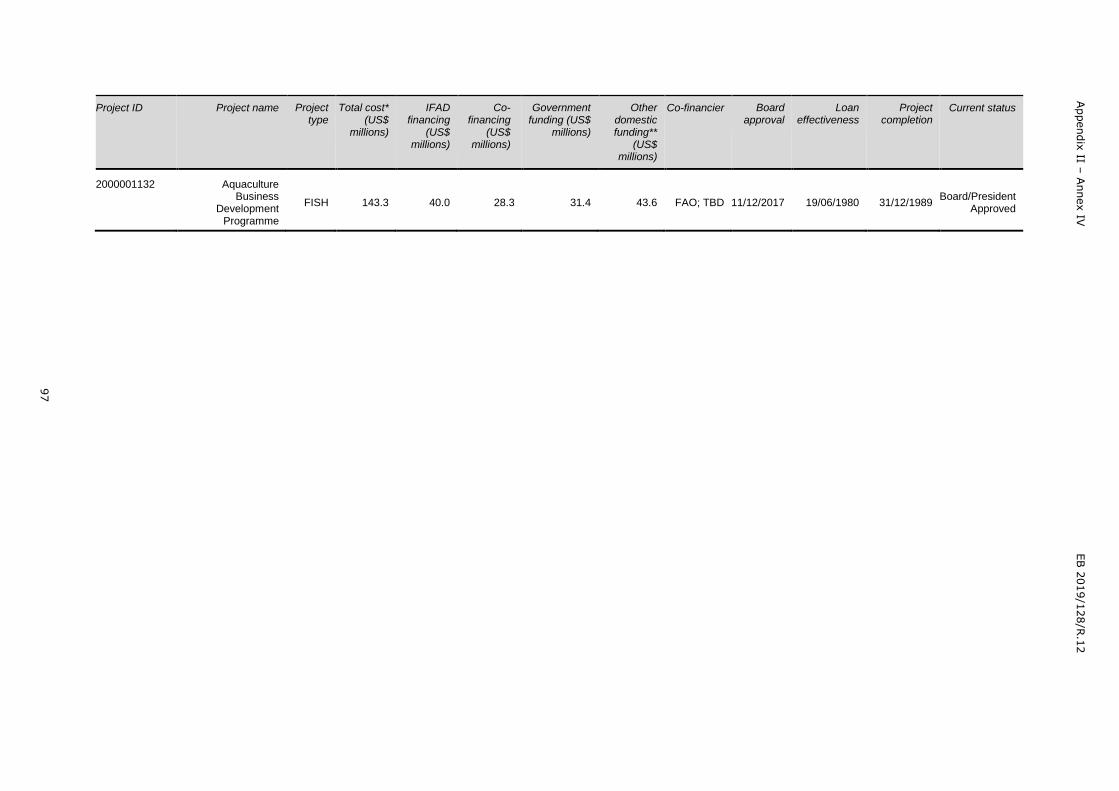
97
Appendix
II – A
nnex IV
EB 2
019/1
28/R
.12
Project ID Project name Project type
Total cost* (US$
millions)
IFAD financing
(US$ millions)
Co-financing
(US$ millions)
Government funding (US$
millions)
Other domestic funding**
(US$ millions)
Co-financier Board approval
Loan effectiveness
Project completion
Current status
2000001132 Aquaculture Business
Development Programme
FISH 143.3 40.0 28.3 31.4 43.6 FAO; TBD 11/12/2017 19/06/1980 31/12/1989 Board/President
Approved
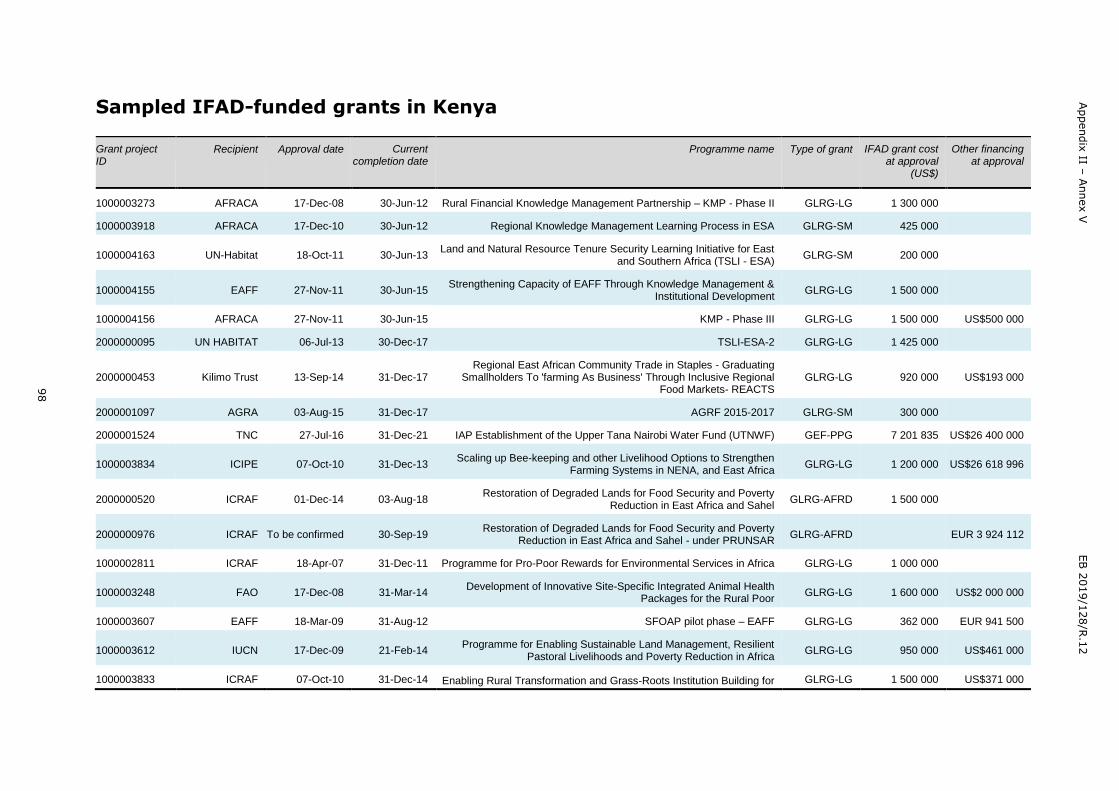
98
Appendix
II – A
nnex V
EB 2
019/1
28/R
.12
Sampled IFAD-funded grants in Kenya
Grant project ID
Recipient Approval date Current completion date
Programme name Type of grant IFAD grant cost at approval
(US$)
Other financing at approval
1000003273 AFRACA 17-Dec-08 30-Jun-12 Rural Financial Knowledge Management Partnership – KMP - Phase II GLRG-LG 1 300 000
1000003918 AFRACA 17-Dec-10 30-Jun-12 Regional Knowledge Management Learning Process in ESA GLRG-SM 425 000
1000004163 UN-Habitat 18-Oct-11 30-Jun-13 Land and Natural Resource Tenure Security Learning Initiative for East
and Southern Africa (TSLI - ESA) GLRG-SM 200 000
1000004155 EAFF 27-Nov-11 30-Jun-15 Strengthening Capacity of EAFF Through Knowledge Management &
Institutional Development GLRG-LG 1 500 000
1000004156 AFRACA 27-Nov-11 30-Jun-15 KMP - Phase III GLRG-LG 1 500 000 US$500 000
2000000095 UN HABITAT 06-Jul-13 30-Dec-17 TSLI-ESA-2 GLRG-LG 1 425 000
2000000453 Kilimo Trust 13-Sep-14 31-Dec-17 Regional East African Community Trade in Staples - Graduating
Smallholders To 'farming As Business' Through Inclusive Regional Food Markets- REACTS
GLRG-LG 920 000 US$193 000
2000001097 AGRA 03-Aug-15 31-Dec-17 AGRF 2015-2017 GLRG-SM 300 000
2000001524 TNC 27-Jul-16 31-Dec-21 IAP Establishment of the Upper Tana Nairobi Water Fund (UTNWF) GEF-PPG 7 201 835 US$26 400 000
1000003834 ICIPE 07-Oct-10 31-Dec-13 Scaling up Bee-keeping and other Livelihood Options to Strengthen
Farming Systems in NENA, and East Africa GLRG-LG 1 200 000 US$26 618 996
2000000520 ICRAF 01-Dec-14 03-Aug-18 Restoration of Degraded Lands for Food Security and Poverty
Reduction in East Africa and Sahel GLRG-AFRD 1 500 000
2000000976 ICRAF To be confirmed 30-Sep-19 Restoration of Degraded Lands for Food Security and Poverty
Reduction in East Africa and Sahel - under PRUNSAR GLRG-AFRD EUR 3 924 112
1000002811 ICRAF 18-Apr-07 31-Dec-11 Programme for Pro-Poor Rewards for Environmental Services in Africa GLRG-LG 1 000 000
1000003248 FAO 17-Dec-08 31-Mar-14 Development of Innovative Site-Specific Integrated Animal Health
Packages for the Rural Poor GLRG-LG 1 600 000 US$2 000 000
1000003607 EAFF 18-Mar-09 31-Aug-12 SFOAP pilot phase – EAFF GLRG-LG 362 000 EUR 941 500
1000003612 IUCN 17-Dec-09 21-Feb-14 Programme for Enabling Sustainable Land Management, Resilient
Pastoral Livelihoods and Poverty Reduction in Africa GLRG-LG 950 000 US$461 000
1000003833 ICRAF 07-Oct-10 31-Dec-14 Enabling Rural Transformation and Grass-Roots Institution Building for GLRG-LG 1 500 000 US$371 000
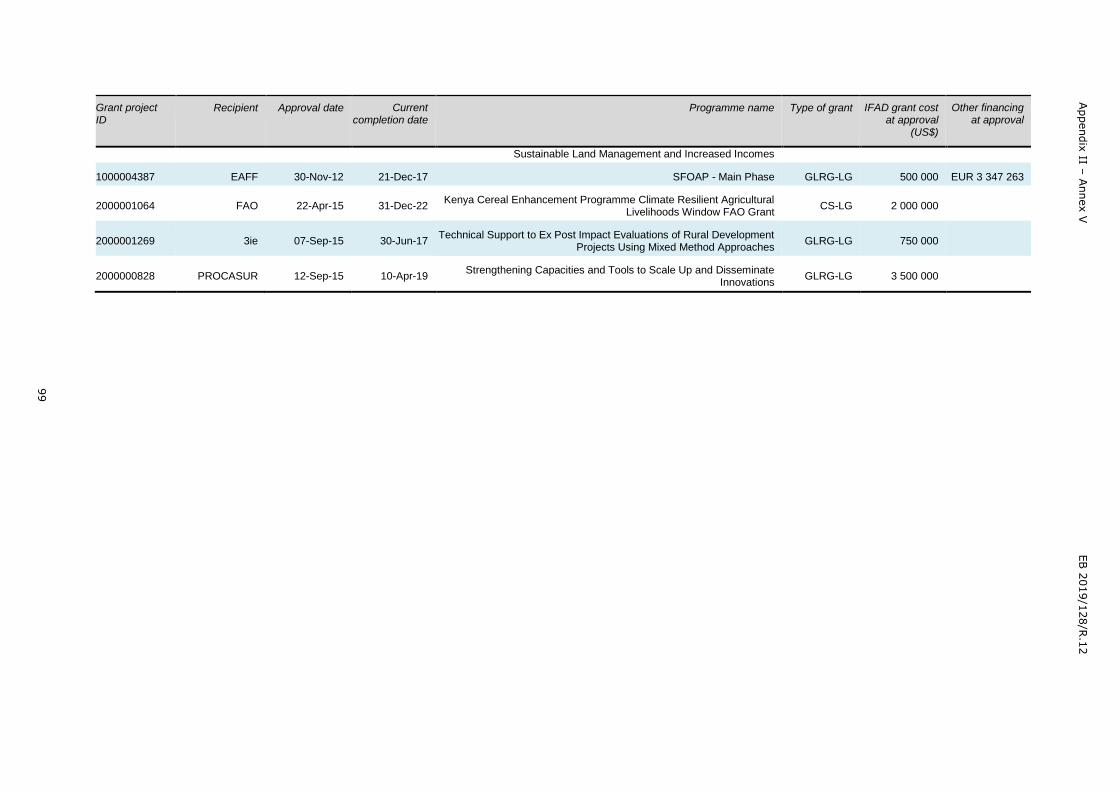
99
Appendix
II – A
nnex V
EB 2
019/1
28/R
.12
Grant project ID
Recipient Approval date Current completion date
Programme name Type of grant IFAD grant cost at approval
(US$)
Other financing at approval
Sustainable Land Management and Increased Incomes
1000004387 EAFF 30-Nov-12 21-Dec-17 SFOAP - Main Phase GLRG-LG 500 000 EUR 3 347 263
2000001064 FAO 22-Apr-15 31-Dec-22 Kenya Cereal Enhancement Programme Climate Resilient Agricultural
Livelihoods Window FAO Grant CS-LG 2 000 000
2000001269 3ie 07-Sep-15 30-Jun-17 Technical Support to Ex Post Impact Evaluations of Rural Development
Projects Using Mixed Method Approaches GLRG-LG 750 000
2000000828 PROCASUR 12-Sep-15 10-Apr-19 Strengthening Capacities and Tools to Scale Up and Disseminate
Innovations GLRG-LG 3 500 000
Appendix II – Annex VI EB 2019/128/R.12
100
List of key people met
Government
National Treasury and Planning
Kennedy Tegeret Senior Economist National Treasury and Min. of Planning
Lawrence M. Nzioka Director Planning and Economic Affairs, Embu County National
Treasury and Min. of Planning
Erick Nandwa Economist National Treasury and Min. of Planning
Peter Wachira D/A National Treasury
Geoffrey Nyaga R.I.A. National Treasury
Emma Mturi IFAD Desk Officer National Treasury
Elizabeth Chepkemboi IFAD Desk/TNT National Treasury
Ministry of Agriculture, Livestock, Irrigation and Fisheries
Jacqueline Wanjala CPFT – Agriculture
Paul Busiemeu SCPIT – Kuresoi South
Paul Njagi CALP
Teresa Kiplagat SALPO
Slyvester Mwai SALHO
Mutisya Benson SCLPO – NJORO
Felistus Kamau SCLPO – SUBUKIA
Margaret Mburu SALPO – BAHATI MOALF
Francis Njunge SALPO – BAHATI MOALF
Irene Kipchumba SCLPO – RONGAI
Veronica Nandasaba WLEO – NAKURU WEST
Simon Kiniu WLEO – LANET UMOJA
Samwel Ndirango WLEO – KIPTALUCH
Francis Kagumo WLEO – RONGAI MOALF
Njora Mwaniki WLEO – DUNDORI
Hannah Kamau SCLPO – NAKURU WEST
Jihana Opiyo SCLPO – NAKURU EAST
Grace Chichir Dep Director, Agribusiness State Dept. of Agriculture,
Anne Onyango Agriculture Secretary State Dept Crops Development,
Samuel Matoke Dep Director Livestock Production (Dairy),
Bernard Ondanje Snr Asst Director of Agriculture
Henry Ngeno Dep. Director, Planning Monitoring and Evaluation Livetock Dept.,
Moses Kamau Senior Assistant – Director of Africa Livestock & Fisheries
Ministry of Water and Sanitation
Thomas Milewa IFAD Desk Officer
Kenya Agriculture and Livestock Research Organization
Susan Wanderi Research Officer, Seeds
Catherine Muriithi Research Officer, Soils
Rahab Magoti Research Officer, On-farm trials
Kenya Wildlife Services
Jane Francisca Wamboi Forest Officer
James Mathenge, Research Scientist
The National Environment Management Authority
Esther Mugure Principal Environmental Planning Officer
Maurice Nyunja Otieno Chief Env. Planning Officer, CC unit
Haron Wanjohi Env. Planning Officer
Elizabeth Ngotho Chief Environment Officer
Appendix II – Annex VI EB 2019/128/R.12
101
National Drought Management Authority
Masinde Lindah Monitoring Officer, Drought Resilience
Paul Kimeu , Drought Resilience Manager
Kenya Forest Service
Benedict Omondi, Head, Watershed Management
Rose Njiri, Senior Forest Officer
Water Resources Authority
Boniface Mwaniki Technical Coordination Manager
Geoffrey Wachira Deputy Technical Manager
Other Government agencies
Rose Nyikuri Manager, Water Resources Water Sector Trust Fund
Eng. Richard Njiru Mbogo Chief Officer, Water and Irrigation Embu County
Eng. Waganagwa County Executive Committee (CEC) Ministry of Water & Irrigation
Embu County
International and donor institutions
Andrea Ferrero Agriculture Counsellor Delegation of EU, Kenya
Joan Sang Progamme Officer Environment Embassy of Sweden
Duncan Marigi Progamme Officer Agriculture Embassy of Sweden
Tito Arunga Agribusiness Officer FAO
Gabriel Rugalema Country Representative FAO
Barrack Okoba Climate Smart Agriculture FAO
Bob Creswell Chief Financial Mgt Officer IFAD
Hani Abdelkader Elsadani CPM, ICO IFAD
Moses Abukari Regional Programme Manager, ICO IFAD
James Mbwika Programme Officer, ICO IFAD
Judy Maina Youth Program Officer FAO
Non-governmental organizations and associations
AGRA
Valentine Miheso Program Officer Partnerships
Ronald Ajengo Program Officer Innovative Finance
Ezra Anyango Senior Program Officer, inclusive Finance
John Macharia Country Manager Kenya
David Ojwang Director - Programmes Heifer International
Leah W. Mwangi Acting Executive Director Kijabe Ecovolunteers (KENVO)
Anthony Kariuki Project Manager-Upper Tana Nairobi Water Fund The Nature
Conservancy
Private sector
Josephat Chege Team Leader Biogas International Limited
Philip Kariuki Senior Consultant Blue Ribbon Concepts Limited
Alice Ngone Advisory – Strategy & Operations Deloitte
Nicholas Kamonye Head - CCIA CCIA
Esther Muiruri General Manager –Agribusiness Equity Bank
Cyrus Kariuki Proprietor Horticultural Nursery Limited
Appendix II – Annex VI EB 2019/128/R.12
102
Laura Chao Donor Coordination Specialist Africa Lead Africa Lead
George Owono Manager Brookside Milk Processor, Nakuru
Simon Kinuthia Head of Agri-Business Barclays bank
James Nyambok Business Devt Manager. Agri-business Barclays bank
Patrick Ngige Manager-Agribusiness Equity Bank
Sandeep Khapre CEO BDO
IFAD-supported projects
UTaNRMP
Faith Mutoni Livingstone Project Coordinator
Grace N. Mwangi M&E Officer
Joyce W. Mathenge Community Empowerment
Paul Njuguna Land and Environment Coordinator
Boniface Kisuvi Rural Livelihood Coordinator
Samuel Obwocha Procurement Officer
Simon Mumbere Knowledge Management and Learning Officer
Veronicah Chgege Project Procurement Assistant
Rodgers Musyoka Project Accountant
Florence Osebe Assistant Project Accountant
Samuel Onyango Project Financial Controller
Grace N Mwangi UTaNRMP M&E Officer
KCEP-CRAL
Ms. Pamela Kimkung Community Mobilization, Training and Gender Officer
Esther Magambo Senior Programme Coordinator
Maryann Njogu Programme Coordinator
Nyakundi Mogere Finance and Admin Manager
Nyakundi Mogeni FAM
SDCP
Moses Kembe PC
Bernard N Kimoro Director of Production
Ochieng Geoffrey M&E Officer
Christopher Kingi FC
Michael Kibieoyo, MO
Bernard Kimoro, DPO
Humphrey Khakula ACPD –
Winfred Olubai GDO
Lorna Mbatia DRDO
Adija Bwiaza CNS
Virginiah Ngunjiri CPC
Geoffrey Ochieng PCU – Assistant M&E
SNDCP
Minde Michael ex Chair of CFSAs
Bakari Masoud M&E Officer
Alfred Mokaya Former Rural Finance Officer
PROFIT
John Kabutha PC
Phillip K Musyoka M&E Officer
KCEP-CRAL
Pamela Kimkung CMTHO
Appendix II – Annex VI EB 2019/128/R.12
103
Antony Njoroge Farmer Nakuru – Cereals -
Jemima Kawira Agro-Dealer Kitui -
Chomboi Kiprotich VCDS
Jacob Muriungi Trader Tharaka Nithi -
Beneficiaries / farmer organizations
Ithatha Self Help Group
Trufas Nyaga Vice Chairman
Patrick Gicovi Secretary, Table Banking
Gerrison Muringi Committee Member
Joseph Ireri Member
Elizabeth Namu Secretary
Dancan Kathuogi Member
Green Paradise Irrigation Group
Esteria Nginya Member
Margaret Muthoni Member
Doreen Marigu Member
Laulenzia Wanjiru Member
Tilas Njagi Member
John Mwaniki Member
Joseph Nyaga Nguagi Chairman
Joseph N. Njagi Secretary
Pauline Mbura Treasurer
Ondrata Igoki Nyaga Vice Treasurer
Harriet Ngithi Vice Chairman
Richard Nyaga Member
Josheph Muchiri Member
Esbon Njagi Manager
Joyce Muthoni Member
Doras Kaura Member
Vivian Wanjiru Munyi Member
Lucia Tharaka Gitonga Member
Iveche Banana Group
Mary W. Nyaga Treasurer
Crispin Gicovi Vice Chairperson
Karen Rwamba Member
Micaheal Ireri Member
Johnson Nyaga Chairman
Junius Njagi Member
Ephys M. Muriithi Member
Benson Mguu Member
James Njoka Member
Daniel Gichuki Member
Nellyruth Wawira Member
Esther Kariuki Member
Kagumori Dairy Cow CIG
Zakaria Ireri Treasurer
Joseph Muturi Secretary
Josephine Njura Member
Dorothy Wawira Member
Mercy Wambeti Member
Lucy Wanyaga Member
Appendix II – Annex VI EB 2019/128/R.12
104
Bwoca farmer group
Emmanuel Ogetii Group member
David Ngoge Chairperson
Joan Musungu Treasurer
Davis Makario Secretary
Mangu Tomato Dairy Group
Elisipha Njugi Member
Mary Moroge Member
Mary Wainaina Chairperson
Christine Nderitu Secretary
Lower Rupingazi WRUA
Beatrice N. Mawia Treasurer
Esther W. Kariuki Procurement Member
Kamiu Kavanga Irrigation Group
Fredrick N. Njiru Secretary
Jane Kanyi Njiru Vice Chairperson
Kamiu Kavanga Irrigation Group
Peter Njeru Executive Committee Member
Tumaini Dairy Farmers Cooperative Society
Peter Muriithi Mugoit Treasurer
Leonard Nyaga Kanake Chairman
Peter Robert Nyaga Supervisory Chairman
Community forest association members
Jeremiah Kinya Chairman Njukiri CFA, Embu
Francis Murugari Wachira Committee Member Njukiri CFA, Embu
Elias Njue Secretary Njukiri CFA, Embu
Catherine Gicovi Treasurer Njukiri CFA, Embu
Suikanos wa Njeru Vice Secretary Njukiri CFA, Embu
James Mugo Ndwiga Youth Representative Njukiri CFA, Embu
Irenia Wanja Member Njukiri CFA, Embu
Kariuki Kariji Vice Chairperson Njukiri CFA, Embu
George K. Gachaga Manager, Camp Ndunda Njukiri CFA, Embu
Jeremia Kinyua Chairman Njukiri CFA, Embu
Naomi Wamuyu Njeru Executive Committee Member Njukiri CFA, Embu
Simon K. Wambua Coordinator Njukiri CFA, Embu
James Mwaniki Member IRACOFA CFA
John N. Njue Treasurer IRACOFA CFA
Virginia Gicuku Vice Chairperson IRACOFA CFA
Juliet M. Njagi Member IRACOFA CFA
Other resource people
Lincoln M. Kiura Chairman Lower Rupingazi WRUA
Erick Ogallo Project Officer RUBICOM
Moses Abukari Regional Programme Manager IFAD
John N. Njeru SAAO, Water and Irrigation, Embu County
Agnes N. Muchira CPC, Water and Sanitation Embu County
Bridget Wanjiru Chief Livestock Production Officer Embu County
Charles Mugo Soil Conservation and Agricultural Officer Embu County
Justin I. Nyaga ADF, Fisheries Embu County
Appendix II – Annex VI EB 2019/128/R.12
105
Isaac Miano Social Development Officer Embu County
Nancy Gacheri Forester, Irangi KFS
Samuel Machiara Ag. PC ABDP
John Ndege Director Livestock Kisii County
Immacualte Maina Minister of Agriculture Nakuru County
Enock Onyambu Clinical Officer Kerobo Health Facility
Zablon Mogambi K Chairman Neutral Point Sacco
Nemwel Monari Treasurer Neutral Point Sacco
Dickson Mamboleo Sacco Manager Neutral Point Sacco
Alice Boyioka County Coordinator, Social Development Department of Social
Development, Nyamira
Priscah Mabeya DSDA, Nyamusi MoE
Moffat Ogendo Livestock Extension Officer Kisii South
Daniel Keter IFAD Desk Officer SDL
Kennedy Kago Research and Policy officer KLPA
Kelvin Keya Project officer CARE
Stephen Njenga Youth rep KHYG-IITA
Deceber Mogoi Youth entrepreneur -
Dr. Dave Nyongesa Scientist Kenya Agriculture and Livestock Research Organisation
Antony Wanyoike GM-Mavuno Enterprises ARM CEMENT
Patrick Ekwam Value Chain-Finance Officer MESPT
Fred Simon Otieno Program Officer-Structured Trading System EAGC
Nelvin Obiero Program Officer -Trade Analysis and MIS Eastern Africa Grain
Council
Michael Mugwe Agribusiness GM SMEP MFB LTD
Lawrence Maina EABL-EAML EABL-EAM
Dominic Menjo Managing Director Association of Milk Processors
James Echoka Head of Risk AFC
Rose Asewe Relationship Officer RAFIKI MFB
Michael Mugweru Head - Agri-business SMEP MFB
Johnson Kithendu Consultant BDO
Albertina Muema Access to Finance Advisor SNV
Dr. Rhoda Kigotho Managing Director LIASON
Nazia Moqueet Technical Specialist BRAC USA
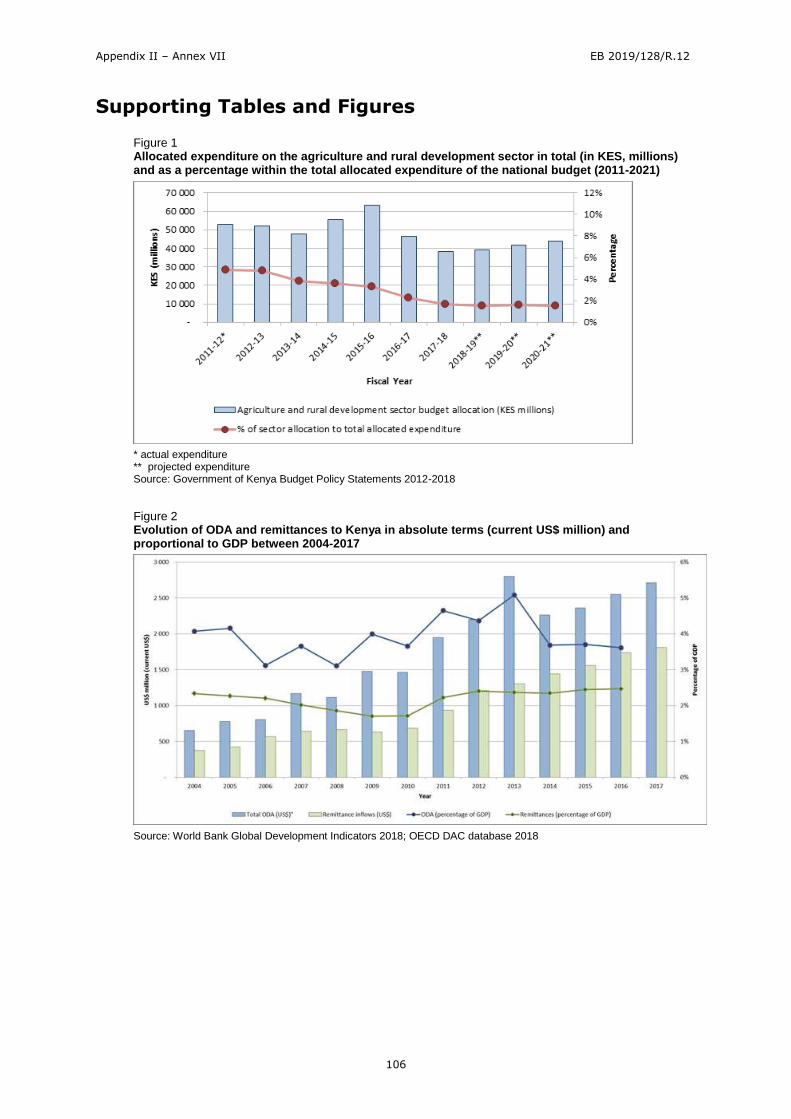
Appendix II – Annex VII EB 2019/128/R.12
106
Supporting Tables and Figures
Figure 1 Allocated expenditure on the agriculture and rural development sector in total (in KES, millions) and as a percentage within the total allocated expenditure of the national budget (2011-2021)
* actual expenditure ** projected expenditure Source: Government of Kenya Budget Policy Statements 2012-2018
Figure 2 Evolution of ODA and remittances to Kenya in absolute terms (current US$ million) and proportional to GDP between 2004-2017
Source: World Bank Global Development Indicators 2018; OECD DAC database 2018
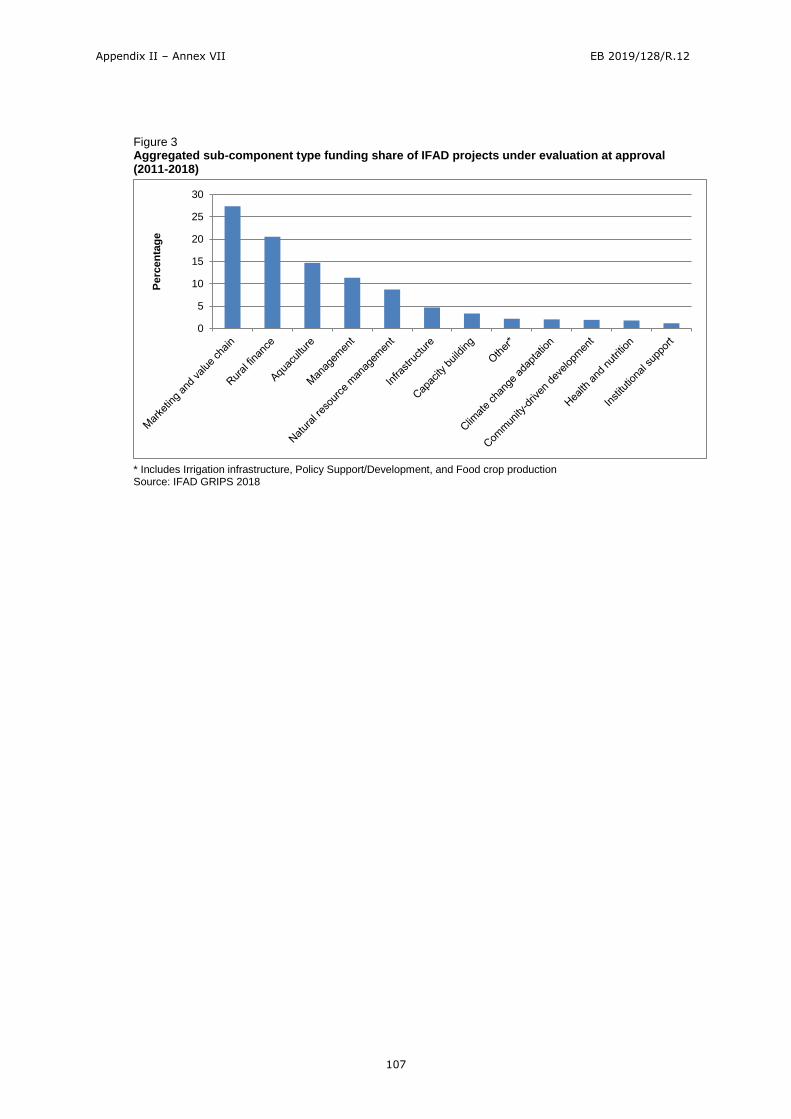
Appendix II – Annex VII EB 2019/128/R.12
107
Figure 3 Aggregated sub-component type funding share of IFAD projects under evaluation at approval (2011-2018)
* Includes Irrigation infrastructure, Policy Support/Development, and Food crop production Source: IFAD GRIPS 2018
0
5
10
15
20
25
30
Perc
en
tag
e
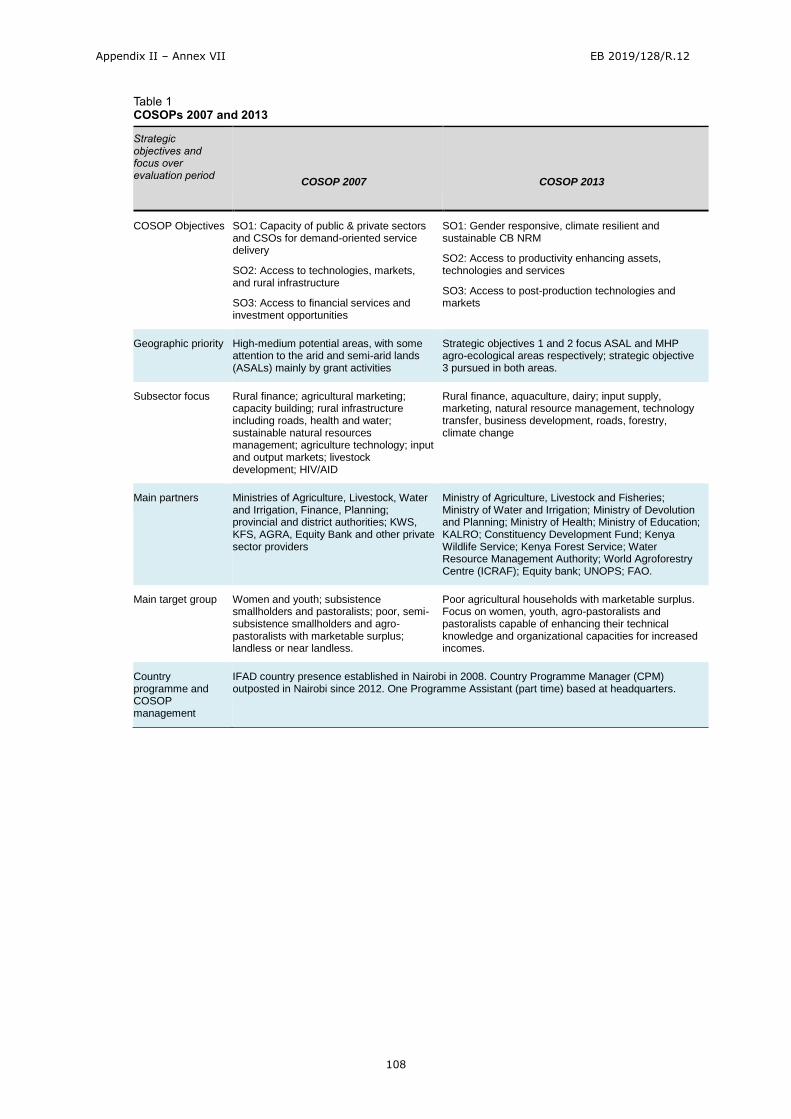
Appendix II – Annex VII EB 2019/128/R.12
108
Table 1 COSOPs 2007 and 2013
Strategic objectives and focus over evaluation period
COSOP 2007
COSOP 2013
COSOP Objectives SO1: Capacity of public & private sectors and CSOs for demand-oriented service delivery
SO2: Access to technologies, markets, and rural infrastructure
SO3: Access to financial services and investment opportunities
SO1: Gender responsive, climate resilient and sustainable CB NRM
SO2: Access to productivity enhancing assets, technologies and services
SO3: Access to post-production technologies and markets
Geographic priority High-medium potential areas, with some attention to the arid and semi-arid lands (ASALs) mainly by grant activities
Strategic objectives 1 and 2 focus ASAL and MHP agro-ecological areas respectively; strategic objective 3 pursued in both areas.
Subsector focus Rural finance; agricultural marketing; capacity building; rural infrastructure including roads, health and water; sustainable natural resources management; agriculture technology; input and output markets; livestock development; HIV/AID
Rural finance, aquaculture, dairy; input supply, marketing, natural resource management, technology transfer, business development, roads, forestry, climate change
Main partners Ministries of Agriculture, Livestock, Water and Irrigation, Finance, Planning; provincial and district authorities; KWS, KFS, AGRA, Equity Bank and other private sector providers
Ministry of Agriculture, Livestock and Fisheries; Ministry of Water and Irrigation; Ministry of Devolution and Planning; Ministry of Health; Ministry of Education; KALRO; Constituency Development Fund; Kenya Wildlife Service; Kenya Forest Service; Water Resource Management Authority; World Agroforestry Centre (ICRAF); Equity bank; UNOPS; FAO.
Main target group Women and youth; subsistence smallholders and pastoralists; poor, semi-subsistence smallholders and agro-pastoralists with marketable surplus; landless or near landless.
Poor agricultural households with marketable surplus. Focus on women, youth, agro-pastoralists and pastoralists capable of enhancing their technical knowledge and organizational capacities for increased incomes.
Country programme and COSOP management
IFAD country presence established in Nairobi in 2008. Country Programme Manager (CPM) outposted in Nairobi since 2012. One Programme Assistant (part time) based at headquarters.
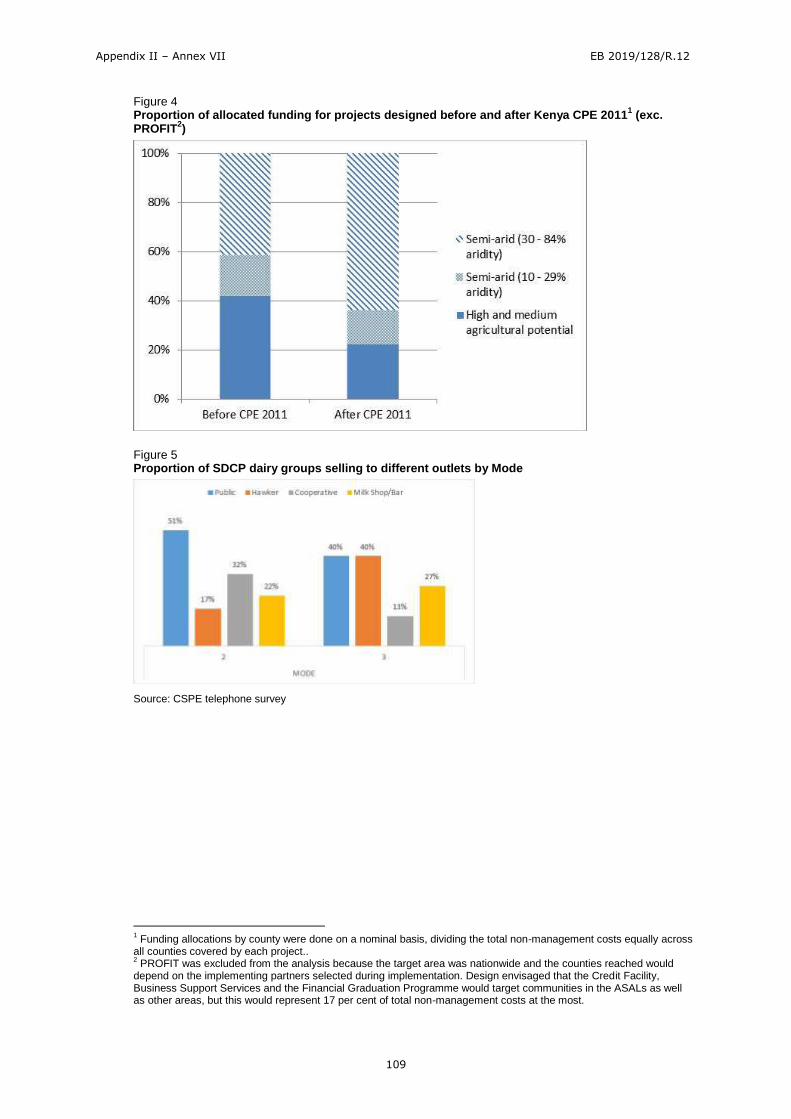
Appendix II – Annex VII EB 2019/128/R.12
109
Figure 4 Proportion of allocated funding for projects designed before and after Kenya CPE 2011
1 (exc.
PROFIT2)
Figure 5 Proportion of SDCP dairy groups selling to different outlets by Mode
Source: CSPE telephone survey
1 Funding allocations by county were done on a nominal basis, dividing the total non-management costs equally across
all counties covered by each project.. 2 PROFIT was excluded from the analysis because the target area was nationwide and the counties reached would
depend on the implementing partners selected during implementation. Design envisaged that the Credit Facility, Business Support Services and the Financial Graduation Programme would target communities in the ASALs as well as other areas, but this would represent 17 per cent of total non-management costs at the most.
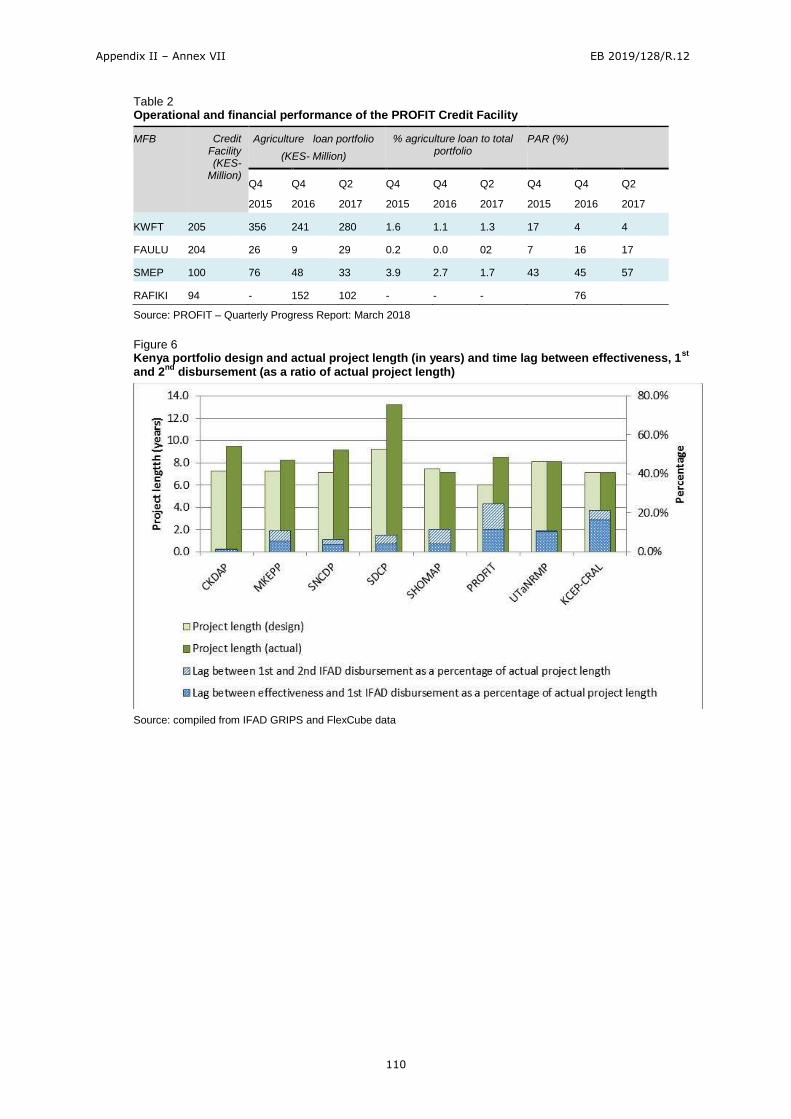
Appendix II – Annex VII EB 2019/128/R.12
110
Table 2 Operational and financial performance of the PROFIT Credit Facility
MFB Credit Facility (KES-
Million)
Agriculture loan portfolio
(KES- Million)
% agriculture loan to total portfolio
PAR (%)
Q4
2015
Q4
2016
Q2
2017
Q4
2015
Q4
2016
Q2
2017
Q4
2015
Q4
2016
Q2
2017
KWFT 205 356 241 280 1.6 1.1 1.3 17 4 4
FAULU 204 26 9 29 0.2 0.0 02 7 16 17
SMEP 100 76 48 33 3.9 2.7 1.7 43 45 57
RAFIKI 94 - 152 102 - - - 76
Source: PROFIT – Quarterly Progress Report: March 2018
Figure 6 Kenya portfolio design and actual project length (in years) and time lag between effectiveness, 1
st
and 2nd
disbursement (as a ratio of actual project length)
Source: compiled from IFAD GRIPS and FlexCube data
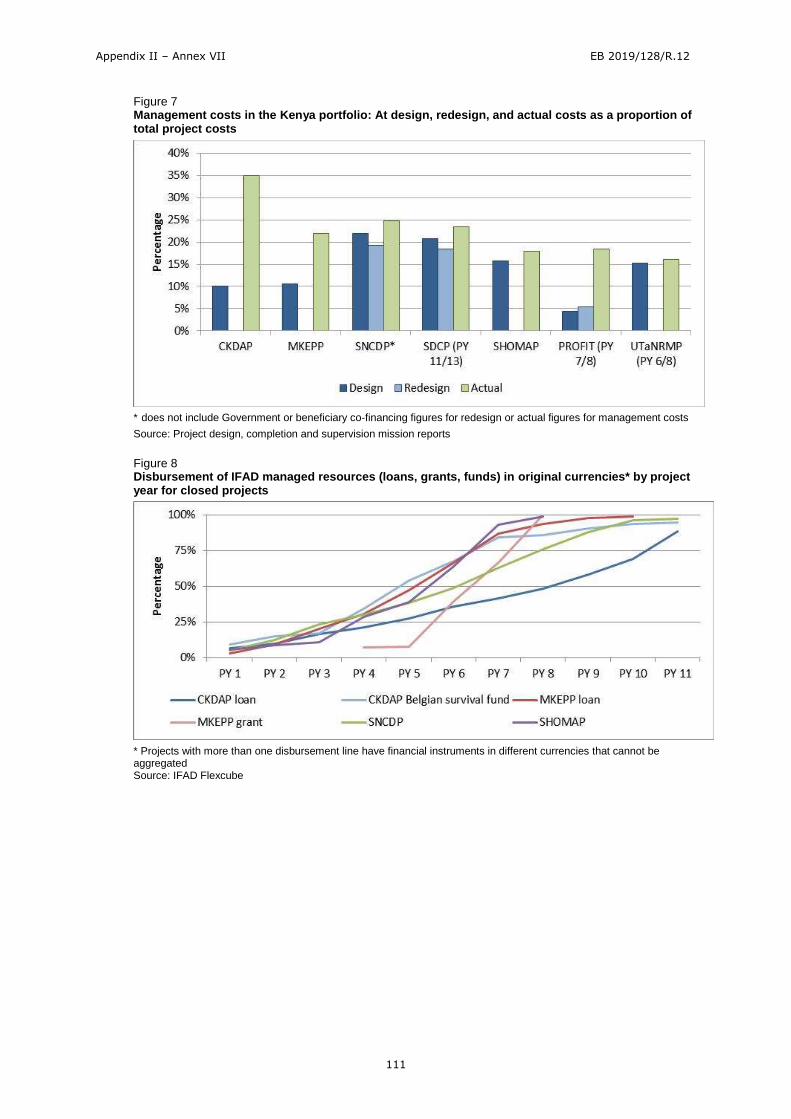
Appendix II – Annex VII EB 2019/128/R.12
111
Figure 7 Management costs in the Kenya portfolio: At design, redesign, and actual costs as a proportion of total project costs
* does not include Government or beneficiary co-financing figures for redesign or actual figures for management costs
Source: Project design, completion and supervision mission reports
Figure 8 Disbursement of IFAD managed resources (loans, grants, funds) in original currencies* by project year for closed projects
* Projects with more than one disbursement line have financial instruments in different currencies that cannot be aggregated Source: IFAD Flexcube
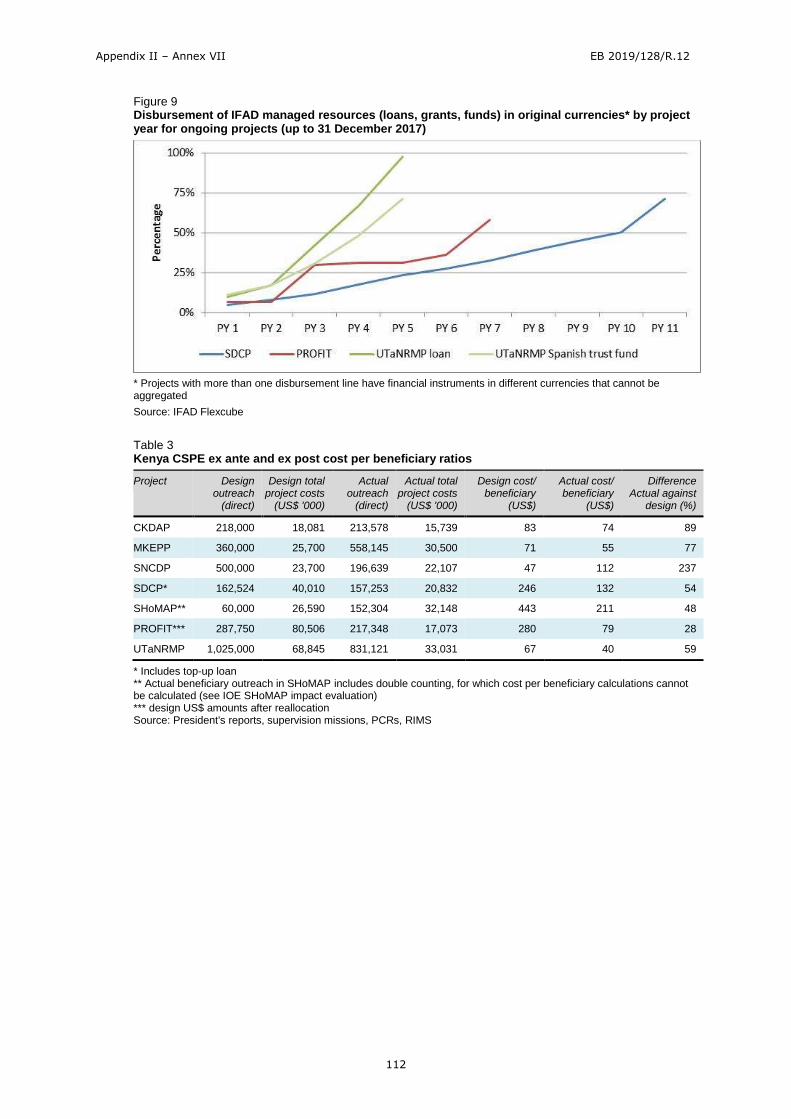
Appendix II – Annex VII EB 2019/128/R.12
112
Figure 9 Disbursement of IFAD managed resources (loans, grants, funds) in original currencies* by project year for ongoing projects (up to 31 December 2017)
* Projects with more than one disbursement line have financial instruments in different currencies that cannot be aggregated
Source: IFAD Flexcube
Table 3 Kenya CSPE ex ante and ex post cost per beneficiary ratios
Project Design outreach
(direct)
Design total project costs
(US$ '000)
Actual outreach
(direct)
Actual total project costs
(US$ '000)
Design cost/ beneficiary
(US$)
Actual cost/ beneficiary
(US$)
Difference Actual against
design (%)
CKDAP 218,000 18,081 213,578 15,739 83 74 89
MKEPP 360,000 25,700 558,145 30,500 71 55 77
SNCDP 500,000 23,700 196,639 22,107 47 112 237
SDCP* 162,524 40,010 157,253 20,832 246 132 54
SHoMAP** 60,000 26,590 152,304 32,148 443 211 48
PROFIT*** 287,750 80,506 217,348 17,073 280 79 28
UTaNRMP 1,025,000 68,845 831,121 33,031 67 40 59
* Includes top-up loan ** Actual beneficiary outreach in SHoMAP includes double counting, for which cost per beneficiary calculations cannot be calculated (see IOE SHoMAP impact evaluation) *** design US$ amounts after reallocation Source: President's reports, supervision missions, PCRs, RIMS
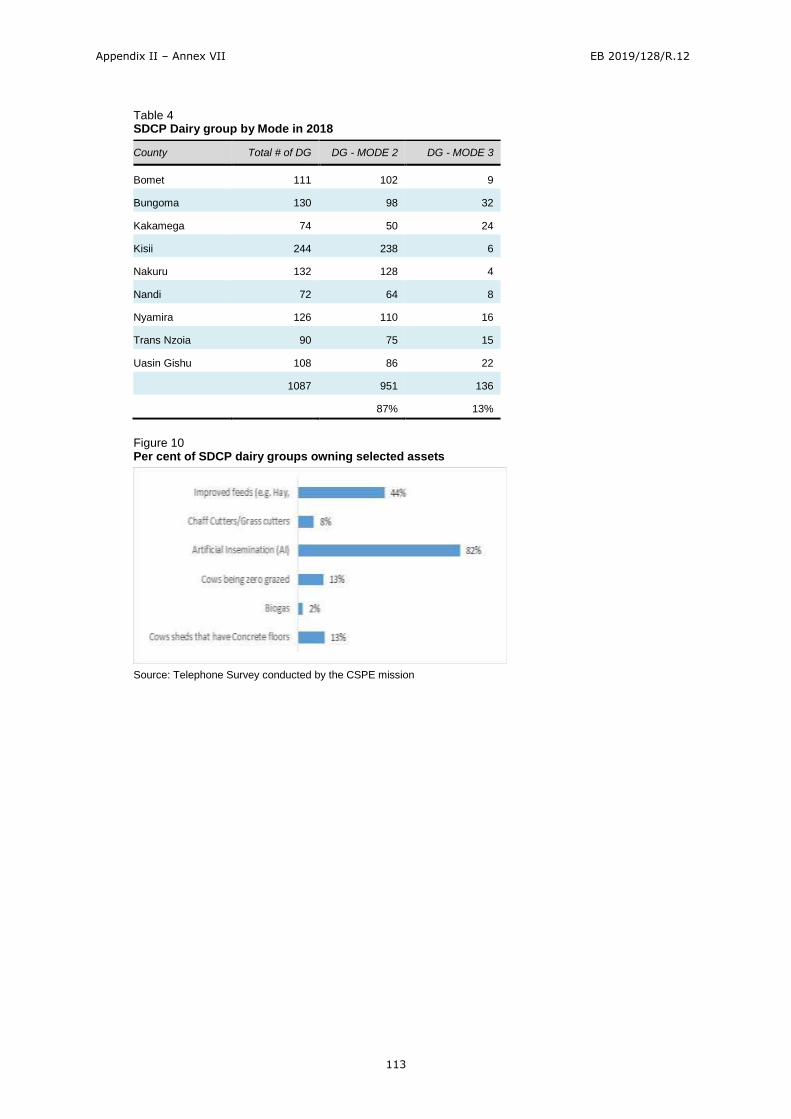
Appendix II – Annex VII EB 2019/128/R.12
113
Table 4 SDCP Dairy group by Mode in 2018
County Total # of DG DG - MODE 2 DG - MODE 3
Bomet 111 102 9
Bungoma 130 98 32
Kakamega 74 50 24
Kisii 244 238 6
Nakuru 132 128 4
Nandi 72 64 8
Nyamira 126 110 16
Trans Nzoia 90 75 15
Uasin Gishu 108 86 22
1087 951 136
87% 13%
Figure 10 Per cent of SDCP dairy groups owning selected assets
Source: Telephone Survey conducted by the CSPE mission
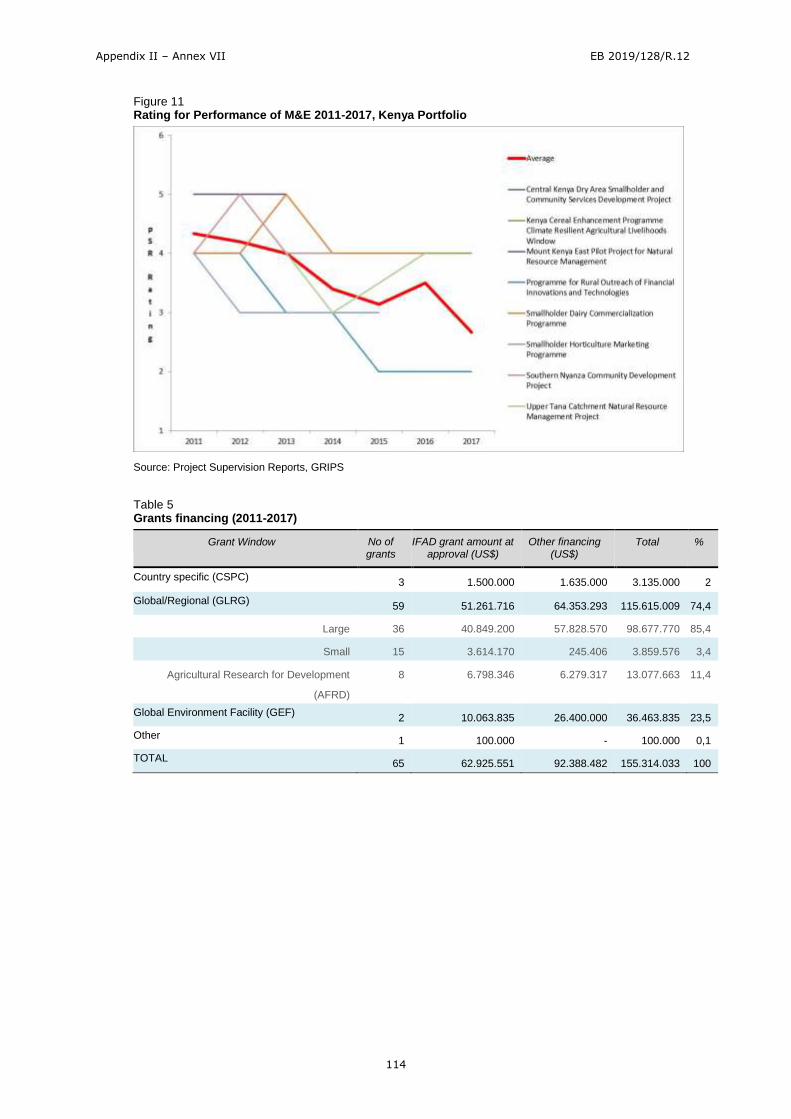
Appendix II – Annex VII EB 2019/128/R.12
114
Figure 11 Rating for Performance of M&E 2011-2017, Kenya Portfolio
Source: Project Supervision Reports, GRIPS
Table 5 Grants financing (2011-2017)
Grant Window No of grants
IFAD grant amount at approval (US$)
Other financing (US$)
Total %
Country specific (CSPC) 3 1.500.000 1.635.000 3.135.000 2
Global/Regional (GLRG) 59 51.261.716 64.353.293 115.615.009 74,4
Large 36 40.849.200 57.828.570 98.677.770 85,4
Small 15 3.614.170 245.406 3.859.576 3,4
Agricultural Research for Development
(AFRD)
8 6.798.346 6.279.317 13.077.663 11,4
Global Environment Facility (GEF) 2 10.063.835 26.400.000 36.463.835 23,5
Other 1 100.000 - 100.000 0,1
TOTAL 65 62.925.551 92.388.482 155.314.033 100
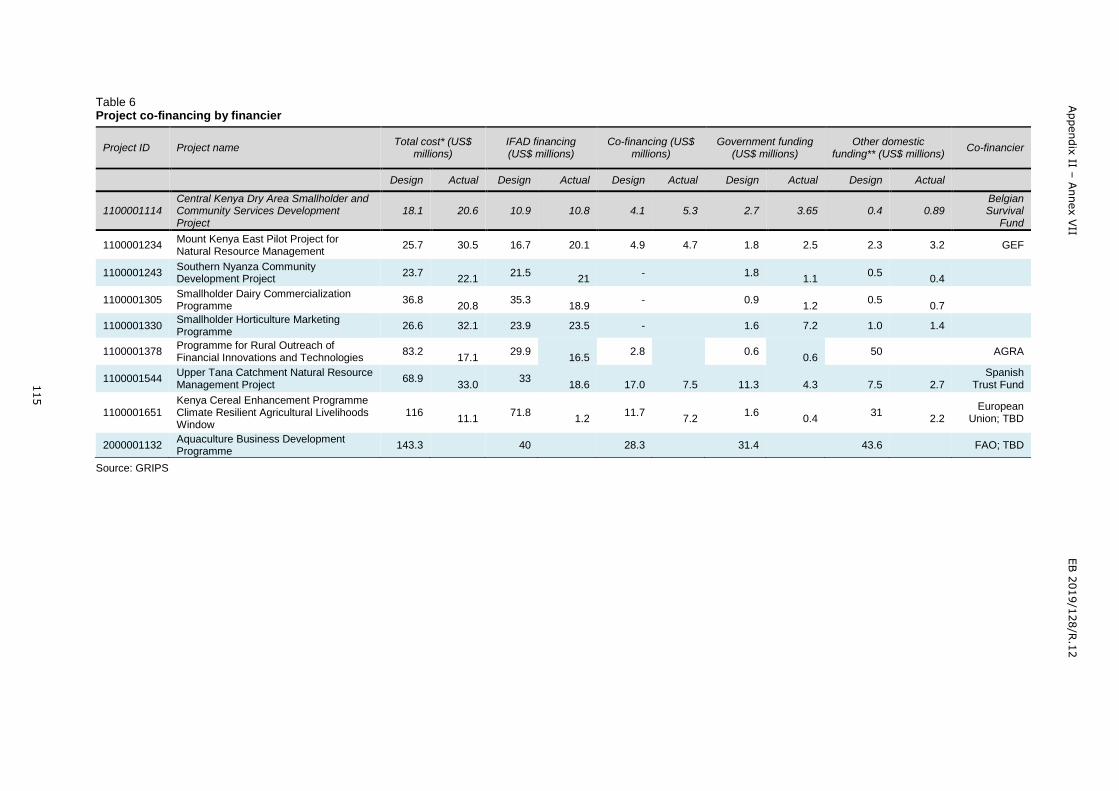
115
Appendix
II – A
nnex V
II
EB 2
019/1
28/R
.12
115
Table 6 Project co-financing by financier
Project ID Project name Total cost* (US$
millions) IFAD financing (US$ millions)
Co-financing (US$ millions)
Government funding (US$ millions)
Other domestic funding** (US$ millions)
Co-financier
Design Actual Design Actual Design Actual Design Actual Design Actual
1100001114 Central Kenya Dry Area Smallholder and Community Services Development Project
18.1 20.6 10.9 10.8 4.1 5.3 2.7 3.65 0.4 0.89 Belgian Survival
Fund
1100001234 Mount Kenya East Pilot Project for Natural Resource Management
25.7 30.5 16.7 20.1 4.9 4.7 1.8 2.5 2.3 3.2 GEF
1100001243 Southern Nyanza Community Development Project
23.7
22.1 21.5
21
- 1.8
1.1 0.5
0.4
1100001305 Smallholder Dairy Commercialization Programme
36.8
20.8 35.3
18.9
-
0.9
1.2 0.5
0.7
1100001330 Smallholder Horticulture Marketing Programme
26.6 32.1 23.9 23.5 - 1.6 7.2 1.0 1.4
1100001378 Programme for Rural Outreach of Financial Innovations and Technologies
83.2
17.1 29.9
16.5
2.8 0.6
0.6 50
AGRA
1100001544 Upper Tana Catchment Natural Resource Management Project
68.9
33.0 33
18.6
17.0
7.5
11.3
4.3
7.5
2.7
Spanish Trust Fund
1100001651 Kenya Cereal Enhancement Programme Climate Resilient Agricultural Livelihoods Window
116
11.1 71.8
1.2
11.7
7.2 1.6
0.4
31
2.2 European
Union; TBD
2000001132 Aquaculture Business Development Programme
143.3 40 28.3 31.4 43.6 FAO; TBD
Source: GRIPS
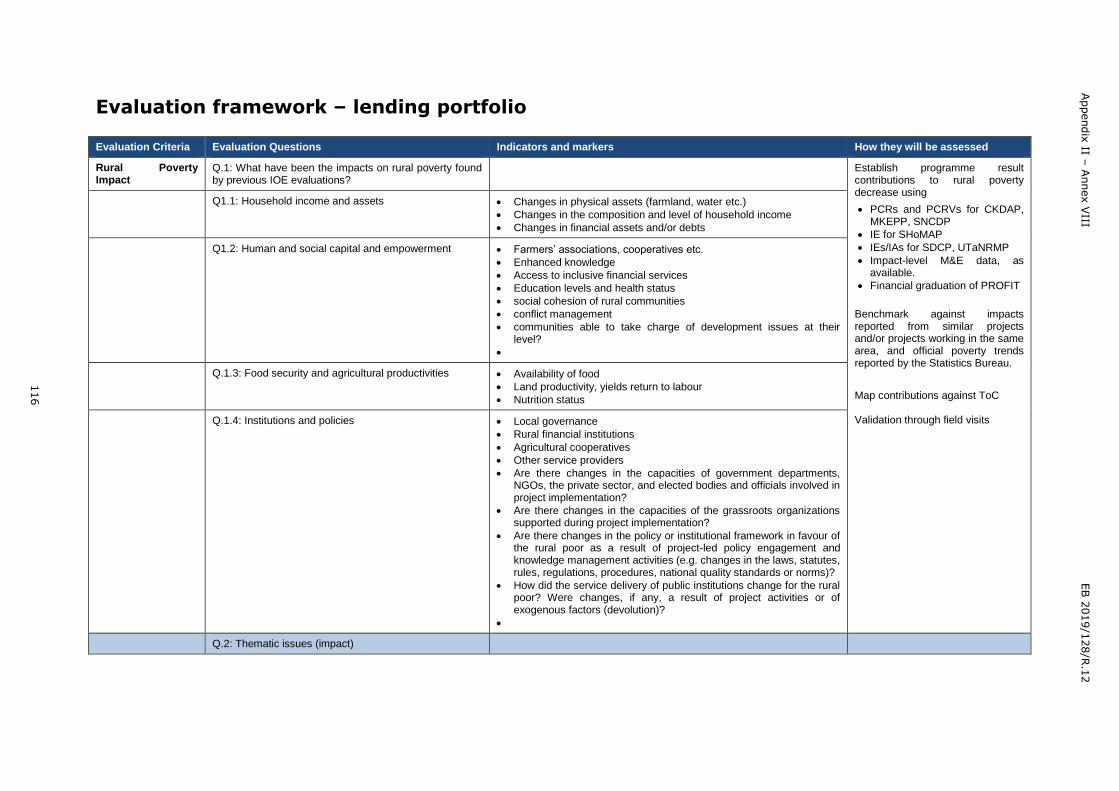
116
Appendix
II – A
nnex V
III
EB 2
019/1
28/R
.12
Evaluation framework – lending portfolio
Evaluation Criteria Evaluation Questions Indicators and markers How they will be assessed
Rural Poverty Impact
Q.1: What have been the impacts on rural poverty found by previous IOE evaluations?
Establish programme result contributions to rural poverty decrease using
PCRs and PCRVs for CKDAP, MKEPP, SNCDP
IE for SHoMAP
IEs/IAs for SDCP, UTaNRMP
Impact-level M&E data, as available.
Financial graduation of PROFIT
Benchmark against impacts reported from similar projects and/or projects working in the same area, and official poverty trends reported by the Statistics Bureau.
Map contributions against ToC Validation through field visits
Q1.1: Household income and assets Changes in physical assets (farmland, water etc.)
Changes in the composition and level of household income
Changes in financial assets and/or debts
Q1.2: Human and social capital and empowerment Farmers’ associations, cooperatives etc.
Enhanced knowledge
Access to inclusive financial services
Education levels and health status
social cohesion of rural communities
conflict management
communities able to take charge of development issues at their level?
Q.1.3: Food security and agricultural productivities Availability of food
Land productivity, yields return to labour
Nutrition status
Q.1.4: Institutions and policies Local governance
Rural financial institutions
Agricultural cooperatives
Other service providers
Are there changes in the capacities of government departments, NGOs, the private sector, and elected bodies and officials involved in project implementation?
Are there changes in the capacities of the grassroots organizations supported during project implementation?
Are there changes in the policy or institutional framework in favour of the rural poor as a result of project-led policy engagement and knowledge management activities (e.g. changes in the laws, statutes, rules, regulations, procedures, national quality standards or norms)?
How did the service delivery of public institutions change for the rural poor? Were changes, if any, a result of project activities or of exogenous factors (devolution)?
Q.2: Thematic issues (impact)
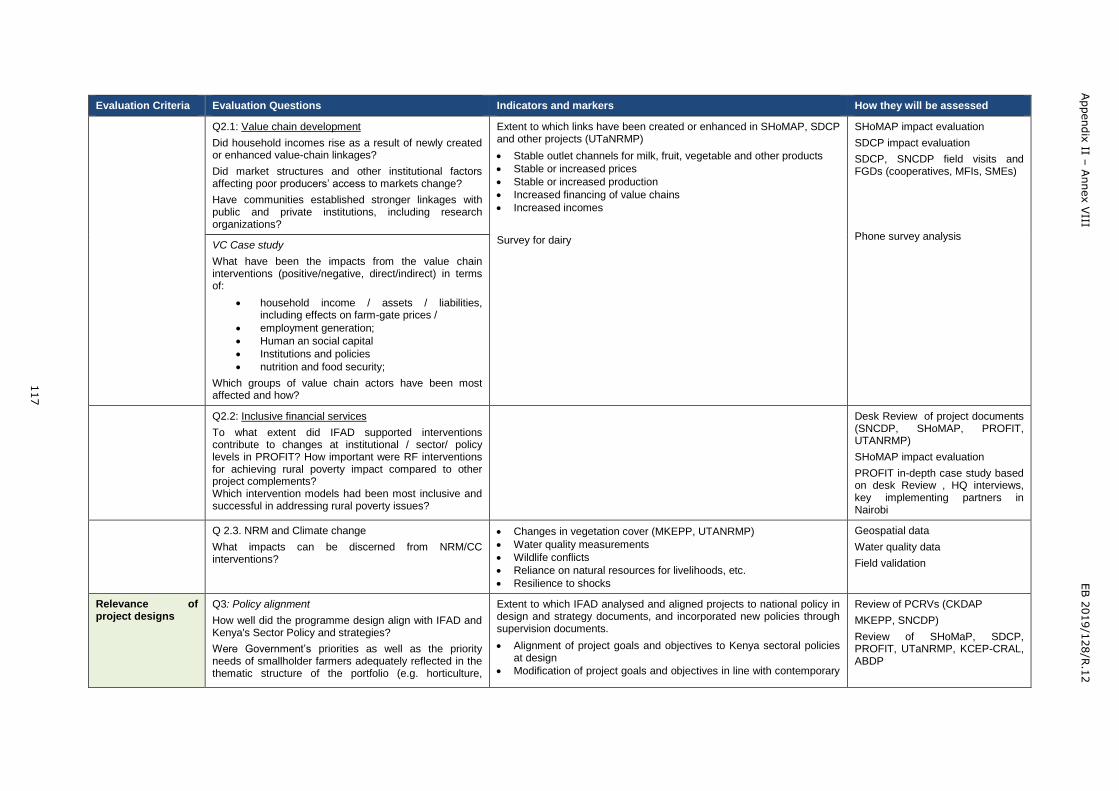
117
Appendix
II – A
nnex V
III
EB 2
019/1
28/R
.12
Evaluation Criteria Evaluation Questions Indicators and markers How they will be assessed
Q2.1: Value chain development
Did household incomes rise as a result of newly created or enhanced value-chain linkages?
Did market structures and other institutional factors affecting poor producers’ access to markets change?
Have communities established stronger linkages with public and private institutions, including research organizations?
Extent to which links have been created or enhanced in SHoMAP, SDCP and other projects (UTaNRMP)
Stable outlet channels for milk, fruit, vegetable and other products
Stable or increased prices
Stable or increased production
Increased financing of value chains
Increased incomes
Survey for dairy
SHoMAP impact evaluation
SDCP impact evaluation
SDCP, SNCDP field visits and FGDs (cooperatives, MFIs, SMEs)
Phone survey analysis VC Case study
What have been the impacts from the value chain interventions (positive/negative, direct/indirect) in terms of:
household income / assets / liabilities, including effects on farm-gate prices /
employment generation;
Human an social capital
Institutions and policies
nutrition and food security;
Which groups of value chain actors have been most affected and how?
Q2.2: Inclusive financial services
To what extent did IFAD supported interventions contribute to changes at institutional / sector/ policy levels in PROFIT? How important were RF interventions for achieving rural poverty impact compared to other project complements? Which intervention models had been most inclusive and successful in addressing rural poverty issues?
Desk Review of project documents (SNCDP, SHoMAP, PROFIT, UTANRMP)
SHoMAP impact evaluation
PROFIT in-depth case study based on desk Review , HQ interviews, key implementing partners in Nairobi
Q 2.3. NRM and Climate change
What impacts can be discerned from NRM/CC interventions?
Changes in vegetation cover (MKEPP, UTANRMP)
Water quality measurements
Wildlife conflicts
Reliance on natural resources for livelihoods, etc.
Resilience to shocks
Geospatial data
Water quality data
Field validation
Relevance of project designs
Q3: Policy alignment
How well did the programme design align with IFAD and Kenya's Sector Policy and strategies?
Were Government’s priorities as well as the priority needs of smallholder farmers adequately reflected in the thematic structure of the portfolio (e.g. horticulture,
Extent to which IFAD analysed and aligned projects to national policy in design and strategy documents, and incorporated new policies through supervision documents.
Alignment of project goals and objectives to Kenya sectoral policies at design
Modification of project goals and objectives in line with contemporary
Review of PCRVs (CKDAP
MKEPP, SNCDP)
Review of SHoMaP, SDCP, PROFIT, UTaNRMP, KCEP-CRAL, ABDP
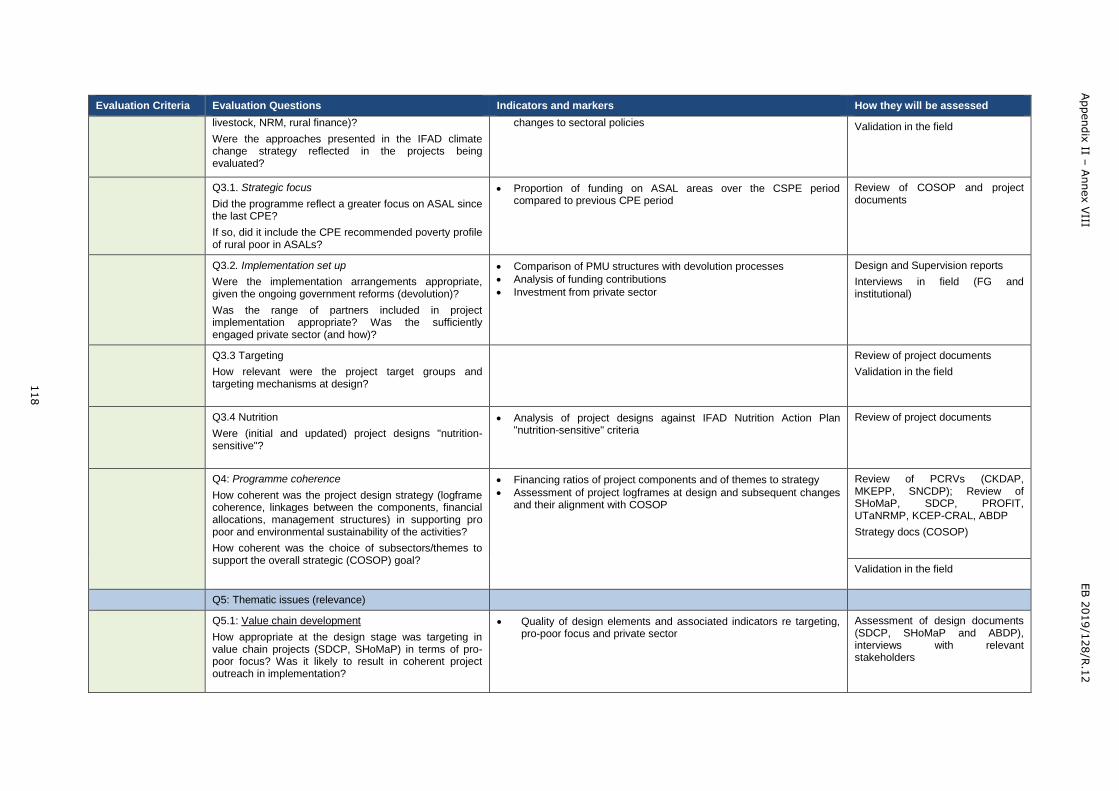
118
Appendix
II – A
nnex V
III
EB 2
019/1
28/R
.12
Evaluation Criteria Evaluation Questions Indicators and markers How they will be assessed
livestock, NRM, rural finance)?
Were the approaches presented in the IFAD climate change strategy reflected in the projects being evaluated?
changes to sectoral policies
Validation in the field
Q3.1. Strategic focus
Did the programme reflect a greater focus on ASAL since the last CPE?
If so, did it include the CPE recommended poverty profile of rural poor in ASALs?
Proportion of funding on ASAL areas over the CSPE period compared to previous CPE period
Review of COSOP and project documents
Q3.2. Implementation set up
Were the implementation arrangements appropriate, given the ongoing government reforms (devolution)?
Was the range of partners included in project implementation appropriate? Was the sufficiently engaged private sector (and how)?
Comparison of PMU structures with devolution processes
Analysis of funding contributions
Investment from private sector
Design and Supervision reports
Interviews in field (FG and institutional)
Q3.3 Targeting
How relevant were the project target groups and targeting mechanisms at design?
Review of project documents
Validation in the field
Q3.4 Nutrition
Were (initial and updated) project designs "nutrition-sensitive"?
Analysis of project designs against IFAD Nutrition Action Plan "nutrition-sensitive" criteria
Review of project documents
Q4: Programme coherence
How coherent was the project design strategy (logframe coherence, linkages between the components, financial allocations, management structures) in supporting pro poor and environmental sustainability of the activities?
How coherent was the choice of subsectors/themes to support the overall strategic (COSOP) goal?
Financing ratios of project components and of themes to strategy
Assessment of project logframes at design and subsequent changes and their alignment with COSOP
Review of PCRVs (CKDAP, MKEPP, SNCDP); Review of SHoMaP, SDCP, PROFIT, UTaNRMP, KCEP-CRAL, ABDP
Strategy docs (COSOP)
Validation in the field
Q5: Thematic issues (relevance)
Q5.1: Value chain development
How appropriate at the design stage was targeting in value chain projects (SDCP, SHoMaP) in terms of pro-poor focus? Was it likely to result in coherent project outreach in implementation?
Quality of design elements and associated indicators re targeting, pro-poor focus and private sector
Assessment of design documents (SDCP, SHoMaP and ABDP), interviews with relevant stakeholders
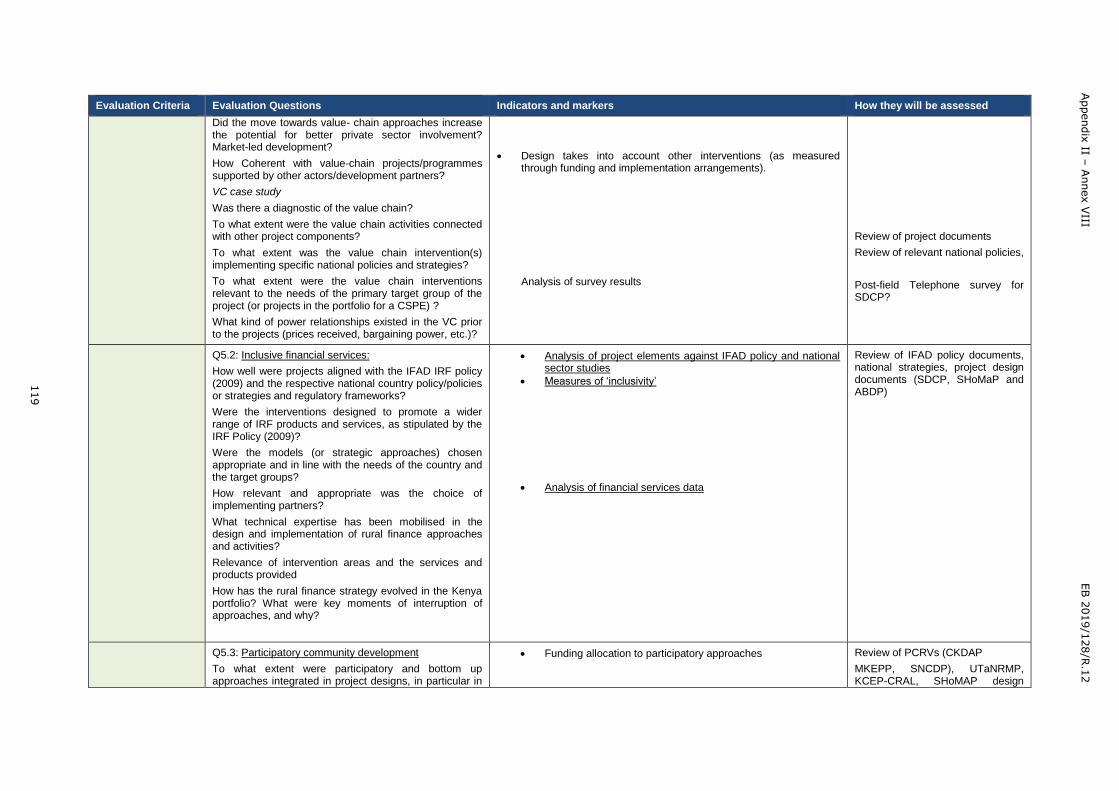
119
Appendix
II – A
nnex V
III
EB 2
019/1
28/R
.12
Evaluation Criteria Evaluation Questions Indicators and markers How they will be assessed
Did the move towards value- chain approaches increase the potential for better private sector involvement? Market-led development?
How Coherent with value-chain projects/programmes supported by other actors/development partners?
VC case study
Was there a diagnostic of the value chain?
To what extent were the value chain activities connected with other project components?
To what extent was the value chain intervention(s) implementing specific national policies and strategies?
To what extent were the value chain interventions relevant to the needs of the primary target group of the project (or projects in the portfolio for a CSPE) ?
What kind of power relationships existed in the VC prior to the projects (prices received, bargaining power, etc.)?
Design takes into account other interventions (as measured through funding and implementation arrangements).
Analysis of survey results
Review of project documents
Review of relevant national policies,
Post-field Telephone survey for SDCP?
Q5.2: Inclusive financial services:
How well were projects aligned with the IFAD IRF policy (2009) and the respective national country policy/policies or strategies and regulatory frameworks?
Were the interventions designed to promote a wider range of IRF products and services, as stipulated by the IRF Policy (2009)?
Were the models (or strategic approaches) chosen appropriate and in line with the needs of the country and the target groups?
How relevant and appropriate was the choice of implementing partners?
What technical expertise has been mobilised in the design and implementation of rural finance approaches and activities?
Relevance of intervention areas and the services and products provided
How has the rural finance strategy evolved in the Kenya portfolio? What were key moments of interruption of approaches, and why?
Analysis of project elements against IFAD policy and national sector studies
Measures of ‘inclusivity’
Analysis of financial services data
Review of IFAD policy documents, national strategies, project design documents (SDCP, SHoMaP and ABDP)
Q5.3: Participatory community development
To what extent were participatory and bottom up approaches integrated in project designs, in particular in
Funding allocation to participatory approaches Review of PCRVs (CKDAP
MKEPP, SNCDP), UTaNRMP, KCEP-CRAL, SHoMAP design
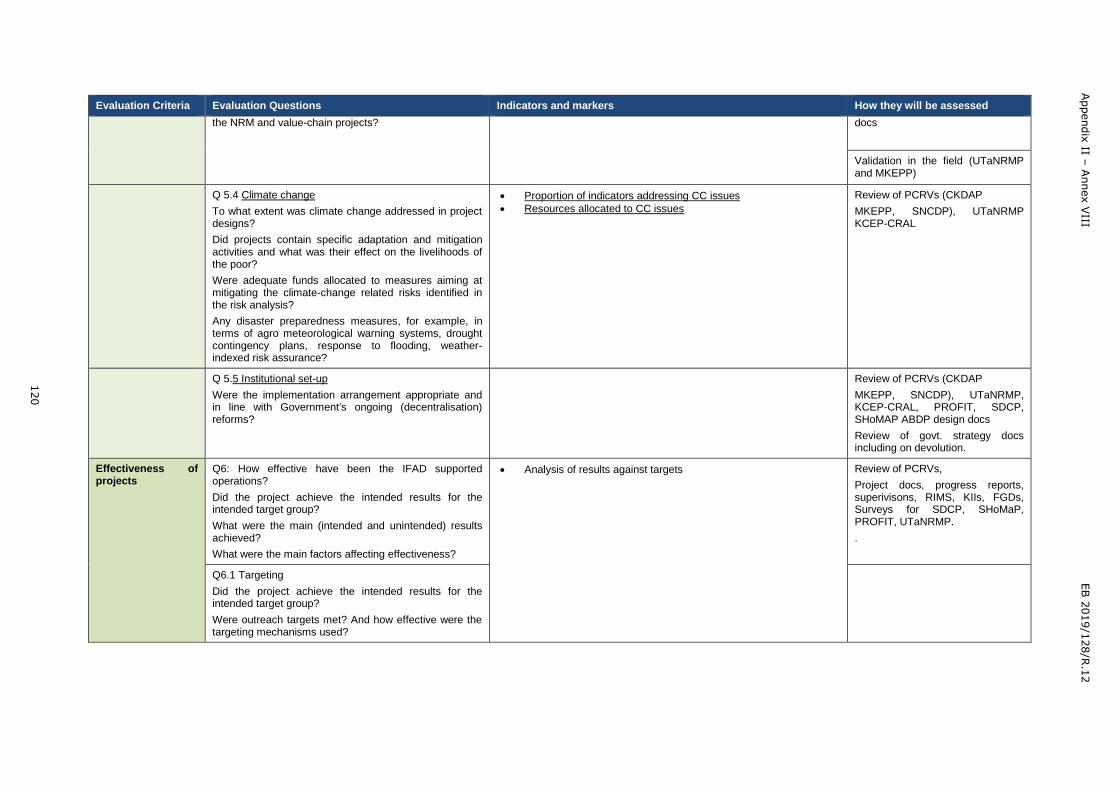
120
Appendix
II – A
nnex V
III
EB 2
019/1
28/R
.12
Evaluation Criteria Evaluation Questions Indicators and markers How they will be assessed
the NRM and value-chain projects? docs
Validation in the field (UTaNRMP and MKEPP)
Q 5.4 Climate change
To what extent was climate change addressed in project designs?
Did projects contain specific adaptation and mitigation activities and what was their effect on the livelihoods of the poor?
Were adequate funds allocated to measures aiming at mitigating the climate-change related risks identified in the risk analysis?
Any disaster preparedness measures, for example, in terms of agro meteorological warning systems, drought contingency plans, response to flooding, weather-indexed risk assurance?
Proportion of indicators addressing CC issues
Resources allocated to CC issues
Review of PCRVs (CKDAP
MKEPP, SNCDP), UTaNRMP KCEP-CRAL
Q 5.5 Institutional set-up
Were the implementation arrangement appropriate and in line with Government's ongoing (decentralisation) reforms?
Review of PCRVs (CKDAP
MKEPP, SNCDP), UTaNRMP, KCEP-CRAL, PROFIT, SDCP, SHoMAP ABDP design docs
Review of govt. strategy docs including on devolution.
Effectiveness of projects
Q6: How effective have been the IFAD supported operations?
Did the project achieve the intended results for the intended target group?
What were the main (intended and unintended) results achieved?
What were the main factors affecting effectiveness?
Analysis of results against targets
Review of PCRVs,
Project docs, progress reports, superivisons, RIMS, KIIs, FGDs, Surveys for SDCP, SHoMaP, PROFIT, UTaNRMP.
.
Q6.1 Targeting
Did the project achieve the intended results for the intended target group?
Were outreach targets met? And how effective were the targeting mechanisms used?
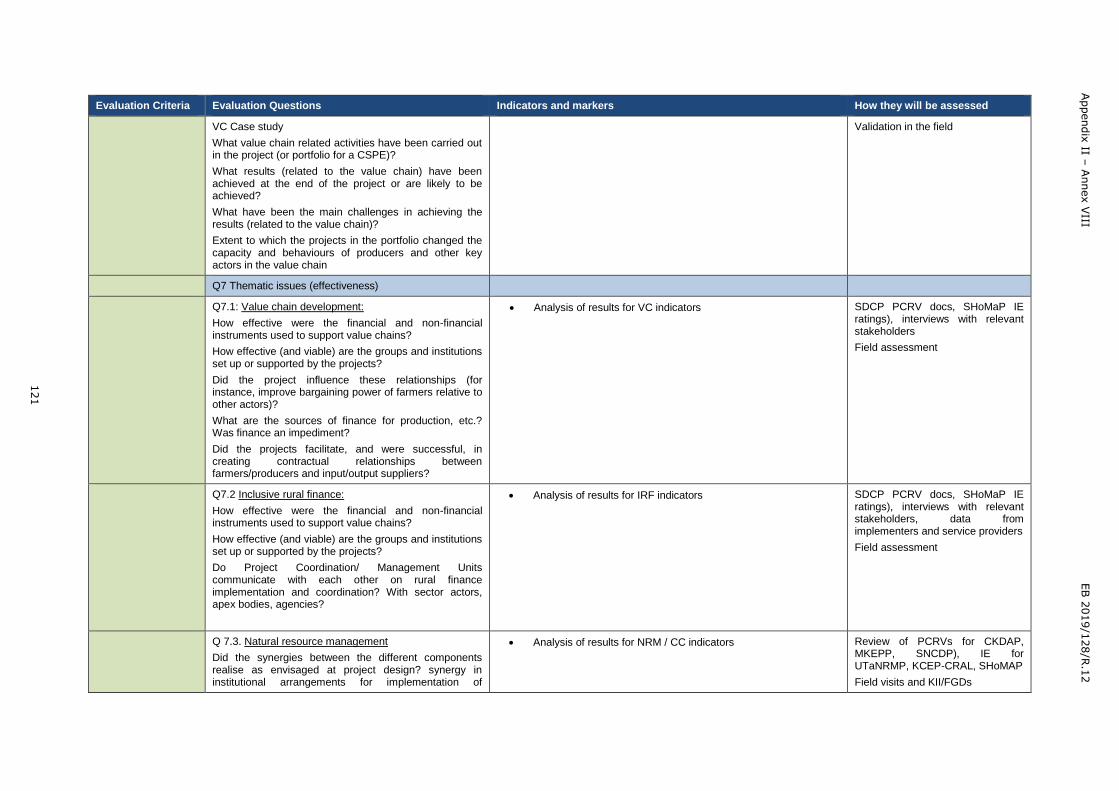
121
Appendix
II – A
nnex V
III
EB 2
019/1
28/R
.12
Evaluation Criteria Evaluation Questions Indicators and markers How they will be assessed
VC Case study
What value chain related activities have been carried out in the project (or portfolio for a CSPE)?
What results (related to the value chain) have been achieved at the end of the project or are likely to be achieved?
What have been the main challenges in achieving the results (related to the value chain)?
Extent to which the projects in the portfolio changed the capacity and behaviours of producers and other key actors in the value chain
Validation in the field
Q7 Thematic issues (effectiveness)
Q7.1: Value chain development:
How effective were the financial and non-financial instruments used to support value chains?
How effective (and viable) are the groups and institutions set up or supported by the projects?
Did the project influence these relationships (for instance, improve bargaining power of farmers relative to other actors)?
What are the sources of finance for production, etc.? Was finance an impediment?
Did the projects facilitate, and were successful, in creating contractual relationships between farmers/producers and input/output suppliers?
Analysis of results for VC indicators SDCP PCRV docs, SHoMaP IE ratings), interviews with relevant stakeholders
Field assessment
Q7.2 Inclusive rural finance:
How effective were the financial and non-financial instruments used to support value chains?
How effective (and viable) are the groups and institutions set up or supported by the projects?
Do Project Coordination/ Management Units communicate with each other on rural finance implementation and coordination? With sector actors, apex bodies, agencies?
Analysis of results for IRF indicators SDCP PCRV docs, SHoMaP IE ratings), interviews with relevant stakeholders, data from implementers and service providers
Field assessment
Q 7.3. Natural resource management
Did the synergies between the different components realise as envisaged at project design? synergy in institutional arrangements for implementation of
Analysis of results for NRM / CC indicators Review of PCRVs for CKDAP, MKEPP, SNCDP), IE for UTaNRMP, KCEP-CRAL, SHoMAP
Field visits and KII/FGDs
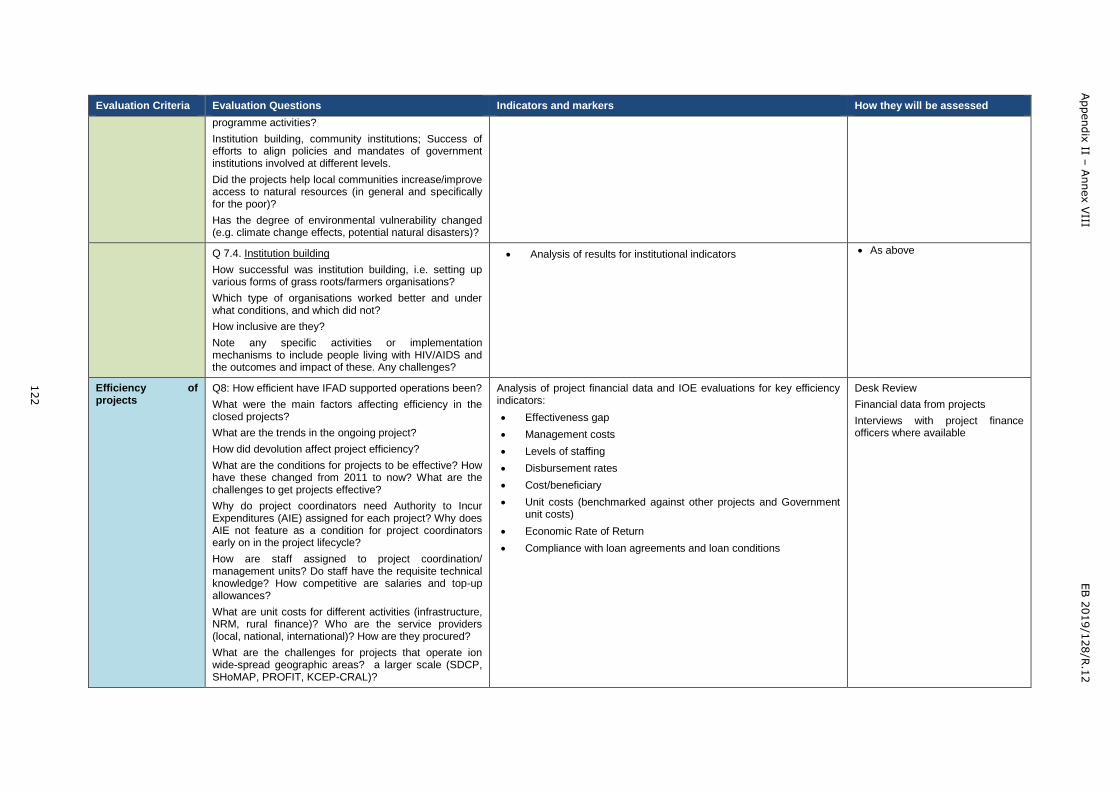
122
Appendix
II – A
nnex V
III
EB 2
019/1
28/R
.12
Evaluation Criteria Evaluation Questions Indicators and markers How they will be assessed
programme activities?
Institution building, community institutions; Success of efforts to align policies and mandates of government institutions involved at different levels.
Did the projects help local communities increase/improve access to natural resources (in general and specifically for the poor)?
Has the degree of environmental vulnerability changed (e.g. climate change effects, potential natural disasters)?
Q 7.4. Institution building
How successful was institution building, i.e. setting up various forms of grass roots/farmers organisations?
Which type of organisations worked better and under what conditions, and which did not?
How inclusive are they?
Note any specific activities or implementation mechanisms to include people living with HIV/AIDS and the outcomes and impact of these. Any challenges?
Analysis of results for institutional indicators As above
Efficiency of projects
Q8: How efficient have IFAD supported operations been?
What were the main factors affecting efficiency in the closed projects?
What are the trends in the ongoing project?
How did devolution affect project efficiency?
What are the conditions for projects to be effective? How have these changed from 2011 to now? What are the challenges to get projects effective?
Why do project coordinators need Authority to Incur Expenditures (AIE) assigned for each project? Why does AIE not feature as a condition for project coordinators early on in the project lifecycle?
How are staff assigned to project coordination/ management units? Do staff have the requisite technical knowledge? How competitive are salaries and top-up allowances?
What are unit costs for different activities (infrastructure, NRM, rural finance)? Who are the service providers (local, national, international)? How are they procured?
What are the challenges for projects that operate ion wide-spread geographic areas? a larger scale (SDCP, SHoMAP, PROFIT, KCEP-CRAL)?
Analysis of project financial data and IOE evaluations for key efficiency indicators:
Effectiveness gap
Management costs
Levels of staffing
Disbursement rates
Cost/beneficiary
Unit costs (benchmarked against other projects and Government unit costs)
Economic Rate of Return
Compliance with loan agreements and loan conditions
Desk Review
Financial data from projects
Interviews with project finance officers where available
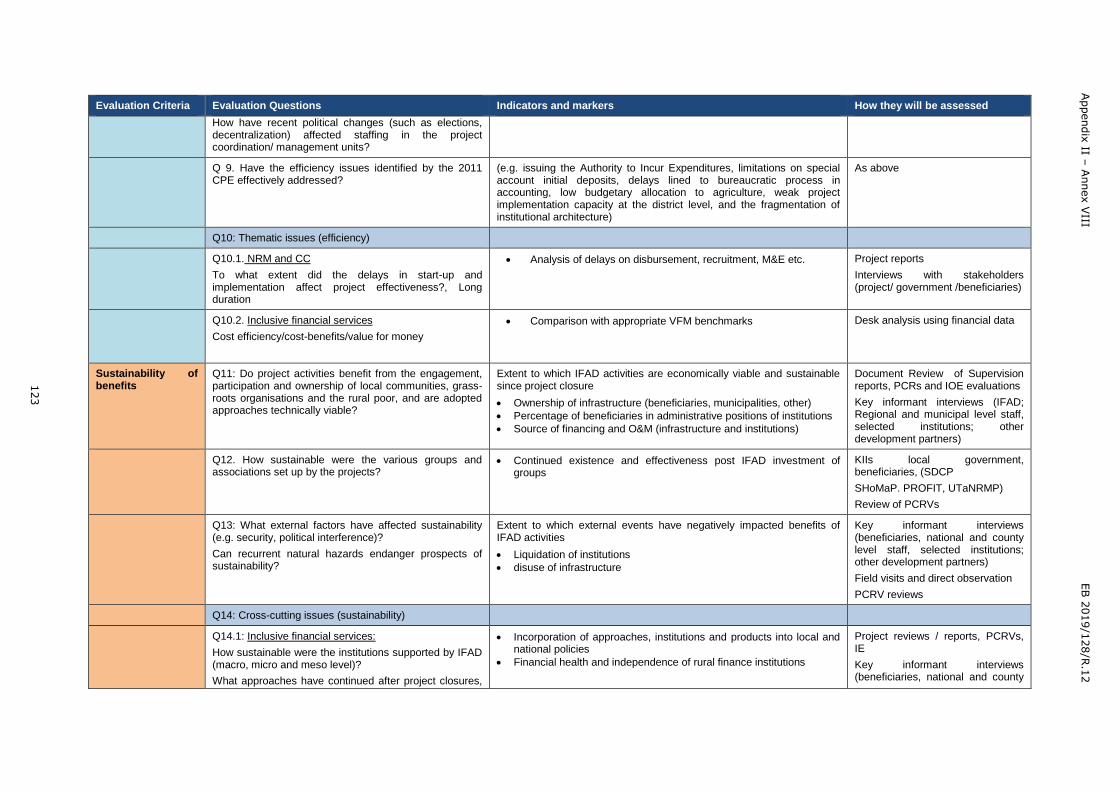
123
Appendix
II – A
nnex V
III
EB 2
019/1
28/R
.12
Evaluation Criteria Evaluation Questions Indicators and markers How they will be assessed
How have recent political changes (such as elections, decentralization) affected staffing in the project coordination/ management units?
Q 9. Have the efficiency issues identified by the 2011 CPE effectively addressed?
(e.g. issuing the Authority to Incur Expenditures, limitations on special account initial deposits, delays lined to bureaucratic process in accounting, low budgetary allocation to agriculture, weak project implementation capacity at the district level, and the fragmentation of institutional architecture)
As above
Q10: Thematic issues (efficiency)
Q10.1. NRM and CC
To what extent did the delays in start-up and implementation affect project effectiveness?, Long duration
Analysis of delays on disbursement, recruitment, M&E etc. Project reports
Interviews with stakeholders (project/ government /beneficiaries)
Q10.2. Inclusive financial services
Cost efficiency/cost-benefits/value for money
Comparison with appropriate VFM benchmarks Desk analysis using financial data
Sustainability of benefits
Q11: Do project activities benefit from the engagement, participation and ownership of local communities, grass-roots organisations and the rural poor, and are adopted approaches technically viable?
Extent to which IFAD activities are economically viable and sustainable since project closure
Ownership of infrastructure (beneficiaries, municipalities, other)
Percentage of beneficiaries in administrative positions of institutions
Source of financing and O&M (infrastructure and institutions)
Document Review of Supervision reports, PCRs and IOE evaluations
Key informant interviews (IFAD; Regional and municipal level staff, selected institutions; other development partners)
Q12. How sustainable were the various groups and associations set up by the projects?
Continued existence and effectiveness post IFAD investment of groups
KIIs local government, beneficiaries, (SDCP
SHoMaP. PROFIT, UTaNRMP)
Review of PCRVs
Q13: What external factors have affected sustainability (e.g. security, political interference)?
Can recurrent natural hazards endanger prospects of sustainability?
Extent to which external events have negatively impacted benefits of IFAD activities
Liquidation of institutions
disuse of infrastructure
Key informant interviews (beneficiaries, national and county level staff, selected institutions; other development partners)
Field visits and direct observation
PCRV reviews
Q14: Cross-cutting issues (sustainability)
Q14.1: Inclusive financial services:
How sustainable were the institutions supported by IFAD (macro, micro and meso level)?
What approaches have continued after project closures,
Incorporation of approaches, institutions and products into local and national policies
Financial health and independence of rural finance institutions
Project reviews / reports, PCRVs, IE
Key informant interviews (beneficiaries, national and county
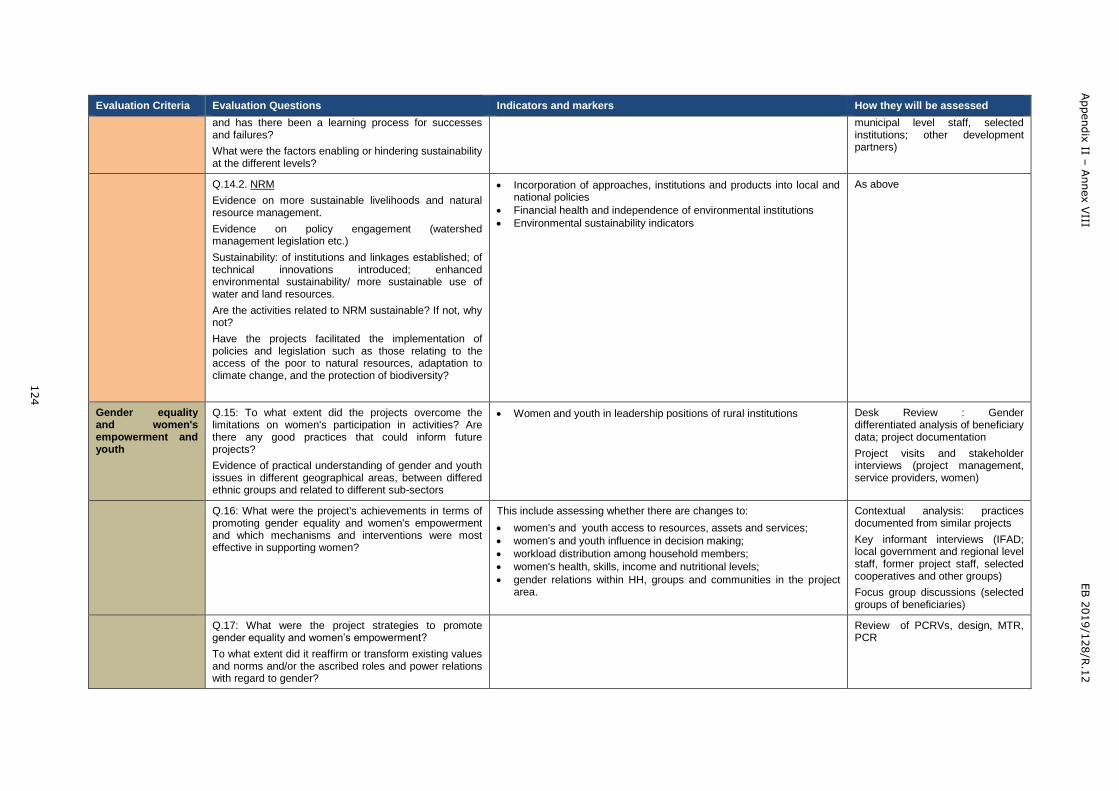
124
Appendix
II – A
nnex V
III
EB 2
019/1
28/R
.12
Evaluation Criteria Evaluation Questions Indicators and markers How they will be assessed
and has there been a learning process for successes and failures?
What were the factors enabling or hindering sustainability at the different levels?
municipal level staff, selected institutions; other development partners)
Q.14.2. NRM
Evidence on more sustainable livelihoods and natural resource management.
Evidence on policy engagement (watershed management legislation etc.)
Sustainability: of institutions and linkages established; of technical innovations introduced; enhanced environmental sustainability/ more sustainable use of water and land resources.
Are the activities related to NRM sustainable? If not, why not?
Have the projects facilitated the implementation of policies and legislation such as those relating to the access of the poor to natural resources, adaptation to climate change, and the protection of biodiversity?
Incorporation of approaches, institutions and products into local and national policies
Financial health and independence of environmental institutions
Environmental sustainability indicators
As above
Gender equality and women's empowerment and youth
Q.15: To what extent did the projects overcome the limitations on women's participation in activities? Are there any good practices that could inform future projects?
Evidence of practical understanding of gender and youth issues in different geographical areas, between differed ethnic groups and related to different sub-sectors
Women and youth in leadership positions of rural institutions Desk Review : Gender differentiated analysis of beneficiary data; project documentation
Project visits and stakeholder interviews (project management, service providers, women)
Q.16: What were the project's achievements in terms of promoting gender equality and women's empowerment and which mechanisms and interventions were most effective in supporting women?
This include assessing whether there are changes to:
women's and youth access to resources, assets and services;
women's and youth influence in decision making;
workload distribution among household members;
women's health, skills, income and nutritional levels;
gender relations within HH, groups and communities in the project area.
Contextual analysis: practices documented from similar projects
Key informant interviews (IFAD; local government and regional level staff, former project staff, selected cooperatives and other groups)
Focus group discussions (selected groups of beneficiaries)
Q.17: What were the project strategies to promote gender equality and women’s empowerment?
To what extent did it reaffirm or transform existing values and norms and/or the ascribed roles and power relations with regard to gender?
Review of PCRVs, design, MTR, PCR
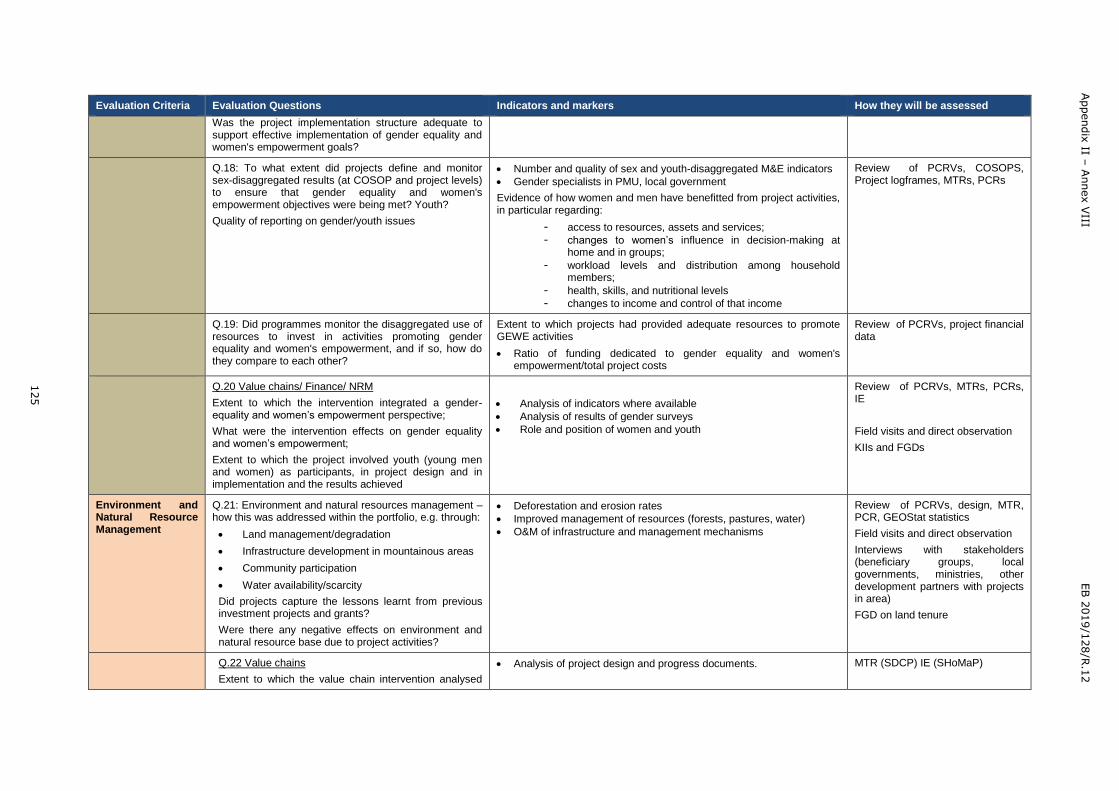
125
Appendix
II – A
nnex V
III
EB 2
019/1
28/R
.12
Evaluation Criteria Evaluation Questions Indicators and markers How they will be assessed
Was the project implementation structure adequate to support effective implementation of gender equality and women's empowerment goals?
Q.18: To what extent did projects define and monitor sex-disaggregated results (at COSOP and project levels) to ensure that gender equality and women's empowerment objectives were being met? Youth?
Quality of reporting on gender/youth issues
Number and quality of sex and youth-disaggregated M&E indicators
Gender specialists in PMU, local government
Evidence of how women and men have benefitted from project activities, in particular regarding:
- access to resources, assets and services;
- changes to women’s influence in decision-making at home and in groups;
- workload levels and distribution among household members;
- health, skills, and nutritional levels
- changes to income and control of that income
Review of PCRVs, COSOPS, Project logframes, MTRs, PCRs
Q.19: Did programmes monitor the disaggregated use of resources to invest in activities promoting gender equality and women's empowerment, and if so, how do they compare to each other?
Extent to which projects had provided adequate resources to promote GEWE activities
Ratio of funding dedicated to gender equality and women's empowerment/total project costs
Review of PCRVs, project financial data
Q.20 Value chains/ Finance/ NRM
Extent to which the intervention integrated a gender-equality and women’s empowerment perspective;
What were the intervention effects on gender equality and women’s empowerment;
Extent to which the project involved youth (young men and women) as participants, in project design and in implementation and the results achieved
Analysis of indicators where available
Analysis of results of gender surveys
Role and position of women and youth
Review of PCRVs, MTRs, PCRs, IE
Field visits and direct observation
KIIs and FGDs
Environment and Natural Resource Management
Q.21: Environment and natural resources management – how this was addressed within the portfolio, e.g. through:
Land management/degradation
Infrastructure development in mountainous areas
Community participation
Water availability/scarcity
Did projects capture the lessons learnt from previous investment projects and grants?
Were there any negative effects on environment and natural resource base due to project activities?
Deforestation and erosion rates
Improved management of resources (forests, pastures, water)
O&M of infrastructure and management mechanisms
Review of PCRVs, design, MTR, PCR, GEOStat statistics
Field visits and direct observation
Interviews with stakeholders (beneficiary groups, local governments, ministries, other development partners with projects in area)
FGD on land tenure
Q.22 Value chains
Extent to which the value chain intervention analysed
Analysis of project design and progress documents. MTR (SDCP) IE (SHoMaP)
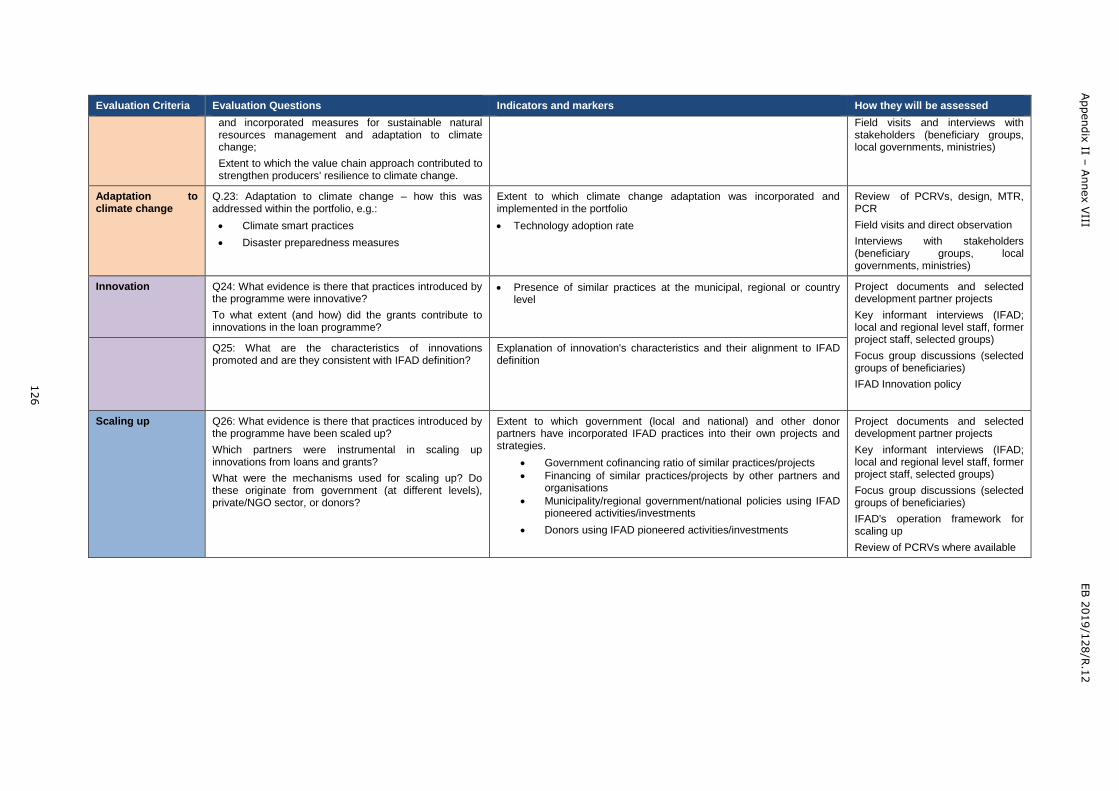
126
Appendix
II – A
nnex V
III
EB 2
019/1
28/R
.12
Evaluation Criteria Evaluation Questions Indicators and markers How they will be assessed
and incorporated measures for sustainable natural resources management and adaptation to climate change;
Extent to which the value chain approach contributed to strengthen producers' resilience to climate change.
Field visits and interviews with stakeholders (beneficiary groups, local governments, ministries)
Adaptation to climate change
Q.23: Adaptation to climate change – how this was addressed within the portfolio, e.g.:
Climate smart practices
Disaster preparedness measures
Extent to which climate change adaptation was incorporated and implemented in the portfolio
Technology adoption rate
Review of PCRVs, design, MTR, PCR
Field visits and direct observation
Interviews with stakeholders (beneficiary groups, local governments, ministries)
Innovation Q24: What evidence is there that practices introduced by the programme were innovative?
To what extent (and how) did the grants contribute to innovations in the loan programme?
Presence of similar practices at the municipal, regional or country level
Project documents and selected development partner projects
Key informant interviews (IFAD; local and regional level staff, former project staff, selected groups)
Focus group discussions (selected groups of beneficiaries)
IFAD Innovation policy
Q25: What are the characteristics of innovations promoted and are they consistent with IFAD definition?
Explanation of innovation's characteristics and their alignment to IFAD definition
Scaling up Q26: What evidence is there that practices introduced by the programme have been scaled up?
Which partners were instrumental in scaling up innovations from loans and grants?
What were the mechanisms used for scaling up? Do these originate from government (at different levels), private/NGO sector, or donors?
Extent to which government (local and national) and other donor partners have incorporated IFAD practices into their own projects and strategies.
Government cofinancing ratio of similar practices/projects
Financing of similar practices/projects by other partners and organisations
Municipality/regional government/national policies using IFAD pioneered activities/investments
Donors using IFAD pioneered activities/investments
Project documents and selected development partner projects
Key informant interviews (IFAD; local and regional level staff, former project staff, selected groups)
Focus group discussions (selected groups of beneficiaries)
IFAD's operation framework for scaling up
Review of PCRVs where available
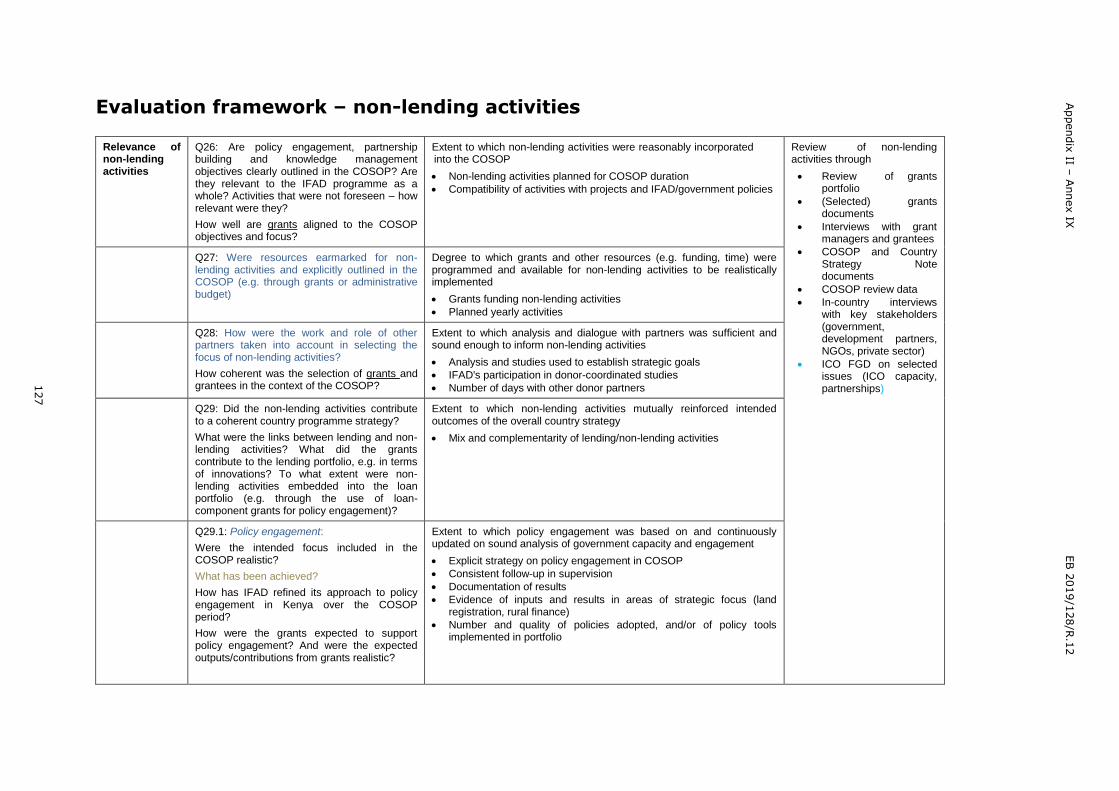
Appendix
II – A
nnex IX
EB 2
019/1
28/R
.12
127
Evaluation framework – non-lending activities
Relevance of non-lending activities
Q26: Are policy engagement, partnership building and knowledge management objectives clearly outlined in the COSOP? Are they relevant to the IFAD programme as a whole? Activities that were not foreseen – how relevant were they?
How well are grants aligned to the COSOP objectives and focus?
Extent to which non-lending activities were reasonably incorporated into the COSOP
Non-lending activities planned for COSOP duration
Compatibility of activities with projects and IFAD/government policies
Review of non-lending activities through
Review of grants portfolio
(Selected) grants documents
Interviews with grant managers and grantees
COSOP and Country Strategy Note documents
COSOP review data
In-country interviews with key stakeholders (government, development partners, NGOs, private sector)
ICO FGD on selected issues (ICO capacity, partnerships)
Q27: Were resources earmarked for non-lending activities and explicitly outlined in the COSOP (e.g. through grants or administrative budget)
Degree to which grants and other resources (e.g. funding, time) were programmed and available for non-lending activities to be realistically implemented
Grants funding non-lending activities
Planned yearly activities
Q28: How were the work and role of other partners taken into account in selecting the focus of non-lending activities?
How coherent was the selection of grants and grantees in the context of the COSOP?
Extent to which analysis and dialogue with partners was sufficient and sound enough to inform non-lending activities
Analysis and studies used to establish strategic goals
IFAD's participation in donor-coordinated studies
Number of days with other donor partners
Q29: Did the non-lending activities contribute to a coherent country programme strategy?
What were the links between lending and non-lending activities? What did the grants contribute to the lending portfolio, e.g. in terms of innovations? To what extent were non-lending activities embedded into the loan portfolio (e.g. through the use of loan-component grants for policy engagement)?
Extent to which non-lending activities mutually reinforced intended outcomes of the overall country strategy
Mix and complementarity of lending/non-lending activities
Q29.1: Policy engagement:
Were the intended focus included in the COSOP realistic?
What has been achieved?
How has IFAD refined its approach to policy engagement in Kenya over the COSOP period?
How were the grants expected to support policy engagement? And were the expected outputs/contributions from grants realistic?
Extent to which policy engagement was based on and continuously updated on sound analysis of government capacity and engagement
Explicit strategy on policy engagement in COSOP
Consistent follow-up in supervision
Documentation of results
Evidence of inputs and results in areas of strategic focus (land registration, rural finance)
Number and quality of policies adopted, and/or of policy tools implemented in portfolio
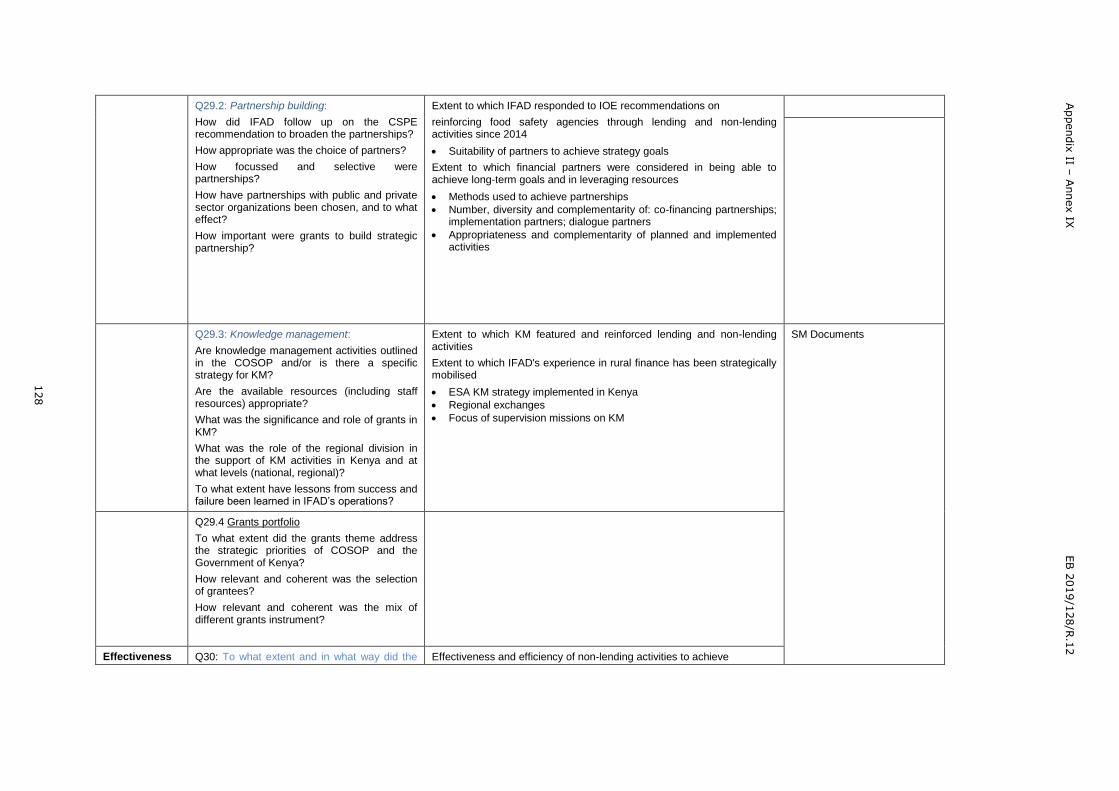
Appendix
II – A
nnex IX
EB 2
019/1
28/R
.12
128
Q29.2: Partnership building:
How did IFAD follow up on the CSPE recommendation to broaden the partnerships?
How appropriate was the choice of partners?
How focussed and selective were partnerships?
How have partnerships with public and private sector organizations been chosen, and to what effect?
How important were grants to build strategic partnership?
Extent to which IFAD responded to IOE recommendations on
reinforcing food safety agencies through lending and non-lending activities since 2014
Suitability of partners to achieve strategy goals
Extent to which financial partners were considered in being able to achieve long-term goals and in leveraging resources
Methods used to achieve partnerships
Number, diversity and complementarity of: co-financing partnerships; implementation partners; dialogue partners
Appropriateness and complementarity of planned and implemented activities
Q29.3: Knowledge management:
Are knowledge management activities outlined in the COSOP and/or is there a specific strategy for KM?
Are the available resources (including staff resources) appropriate?
What was the significance and role of grants in KM?
What was the role of the regional division in the support of KM activities in Kenya and at what levels (national, regional)?
To what extent have lessons from success and failure been learned in IFAD’s operations?
Extent to which KM featured and reinforced lending and non-lending activities
Extent to which IFAD's experience in rural finance has been strategically mobilised
ESA KM strategy implemented in Kenya
Regional exchanges
Focus of supervision missions on KM
SM Documents
Q29.4 Grants portfolio
To what extent did the grants theme address the strategic priorities of COSOP and the Government of Kenya?
How relevant and coherent was the selection of grantees?
How relevant and coherent was the mix of different grants instrument?
Effectiveness Q30: To what extent and in what way did the Effectiveness and efficiency of non-lending activities to achieve
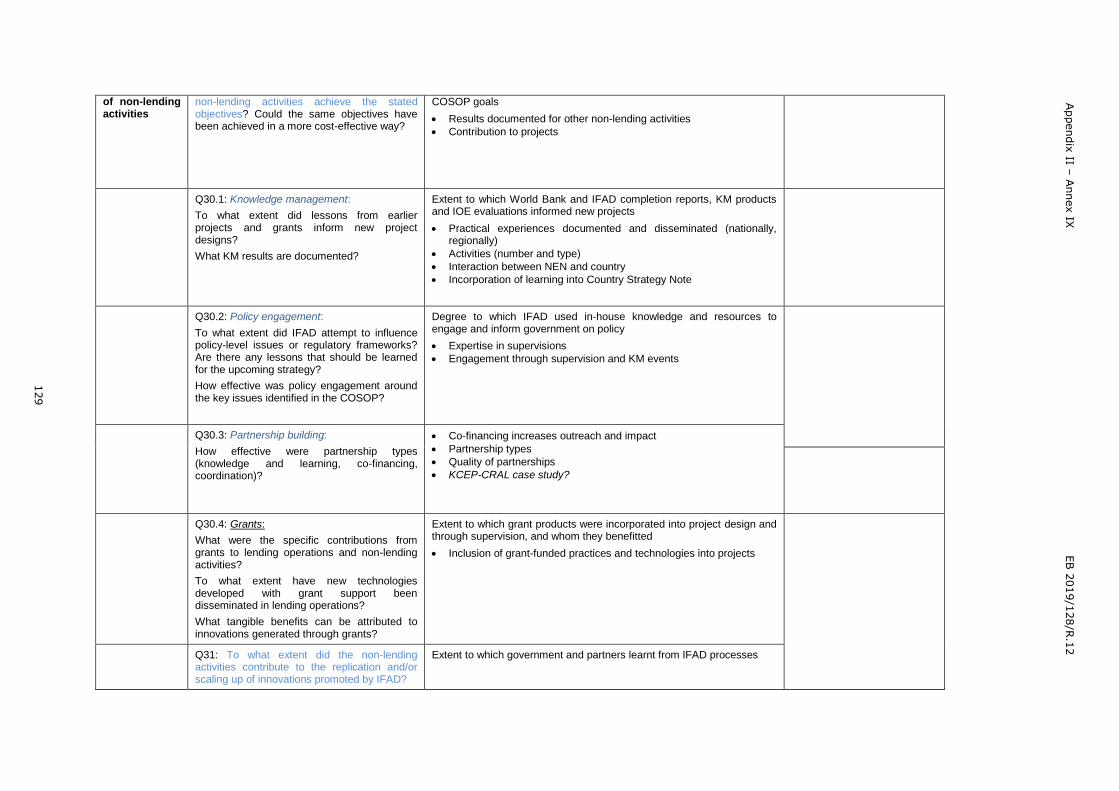
Appendix
II – A
nnex IX
EB 2
019/1
28/R
.12
129
of non-lending activities
non-lending activities achieve the stated objectives? Could the same objectives have been achieved in a more cost-effective way?
COSOP goals
Results documented for other non-lending activities
Contribution to projects
Q30.1: Knowledge management:
To what extent did lessons from earlier projects and grants inform new project designs?
What KM results are documented?
Extent to which World Bank and IFAD completion reports, KM products and IOE evaluations informed new projects
Practical experiences documented and disseminated (nationally, regionally)
Activities (number and type)
Interaction between NEN and country
Incorporation of learning into Country Strategy Note
Q30.2: Policy engagement:
To what extent did IFAD attempt to influence policy-level issues or regulatory frameworks? Are there any lessons that should be learned for the upcoming strategy?
How effective was policy engagement around the key issues identified in the COSOP?
Degree to which IFAD used in-house knowledge and resources to engage and inform government on policy
Expertise in supervisions
Engagement through supervision and KM events
Q30.3: Partnership building:
How effective were partnership types (knowledge and learning, co-financing, coordination)?
Co-financing increases outreach and impact
Partnership types
Quality of partnerships
KCEP-CRAL case study?
Q30.4: Grants:
What were the specific contributions from grants to lending operations and non-lending activities?
To what extent have new technologies developed with grant support been disseminated in lending operations?
What tangible benefits can be attributed to innovations generated through grants?
Extent to which grant products were incorporated into project design and through supervision, and whom they benefitted
Inclusion of grant-funded practices and technologies into projects
Q31: To what extent did the non-lending activities contribute to the replication and/or scaling up of innovations promoted by IFAD?
Extent to which government and partners learnt from IFAD processes
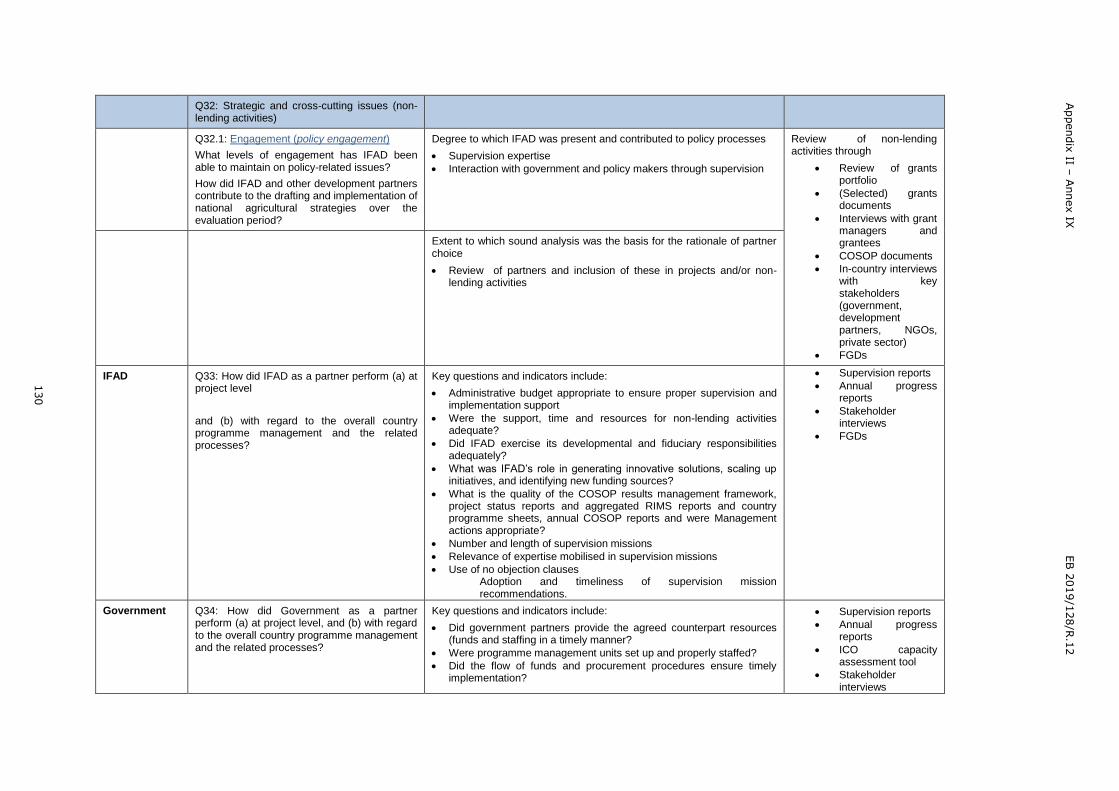
Appendix
II – A
nnex IX
EB 2
019/1
28/R
.12
130
Q32: Strategic and cross-cutting issues (non-lending activities)
Q32.1: Engagement (policy engagement)
What levels of engagement has IFAD been able to maintain on policy-related issues?
How did IFAD and other development partners contribute to the drafting and implementation of national agricultural strategies over the evaluation period?
Degree to which IFAD was present and contributed to policy processes
Supervision expertise
Interaction with government and policy makers through supervision
Review of non-lending activities through
Review of grants portfolio
(Selected) grants documents
Interviews with grant managers and grantees
COSOP documents
In-country interviews with key stakeholders (government, development partners, NGOs, private sector)
FGDs
Extent to which sound analysis was the basis for the rationale of partner choice
Review of partners and inclusion of these in projects and/or non-lending activities
IFAD
Q33: How did IFAD as a partner perform (a) at project level
and (b) with regard to the overall country programme management and the related processes?
Key questions and indicators include:
Administrative budget appropriate to ensure proper supervision and implementation support
Were the support, time and resources for non-lending activities adequate?
Did IFAD exercise its developmental and fiduciary responsibilities adequately?
What was IFAD’s role in generating innovative solutions, scaling up initiatives, and identifying new funding sources?
What is the quality of the COSOP results management framework, project status reports and aggregated RIMS reports and country programme sheets, annual COSOP reports and were Management actions appropriate?
Number and length of supervision missions
Relevance of expertise mobilised in supervision missions
Use of no objection clauses Adoption and timeliness of supervision mission recommendations.
Supervision reports
Annual progress reports
Stakeholder interviews
FGDs
Government
Q34: How did Government as a partner perform (a) at project level, and (b) with regard to the overall country programme management and the related processes?
Key questions and indicators include:
Did government partners provide the agreed counterpart resources (funds and staffing in a timely manner?
Were programme management units set up and properly staffed?
Did the flow of funds and procurement procedures ensure timely implementation?
Supervision reports
Annual progress reports
ICO capacity assessment tool
Stakeholder interviews
Appendix
II – A
nnex IX
EB 2
019/1
28/R
.12
131
Were the programme coordinating mechanisms functioning and effective?
What mechanisms were there to ensure effective coordination and communication between relevant actors working in the same sector?
Did government fulfil all the fiduciary obligations as agreed? Were audit reports done and submitted as needed?
Did Government put into place any mechanisms for scaling up innovative practices?
Q35: Were the M&E systems set up properly and did they provide timely and accurate information?
Extent to which M&E systems were effective in providing management with appropriate and high quality data to maintain a proper M&E and management function
Quality and appropriateness of indicators
Key functions (baseline, implementation surveys, impact assessments) conducted on a timely and effective manner
Review of M&E data, supervision missions, MTR, IOE evaluations
Key stakeholder interviews (MoA M&E staff, project managers)
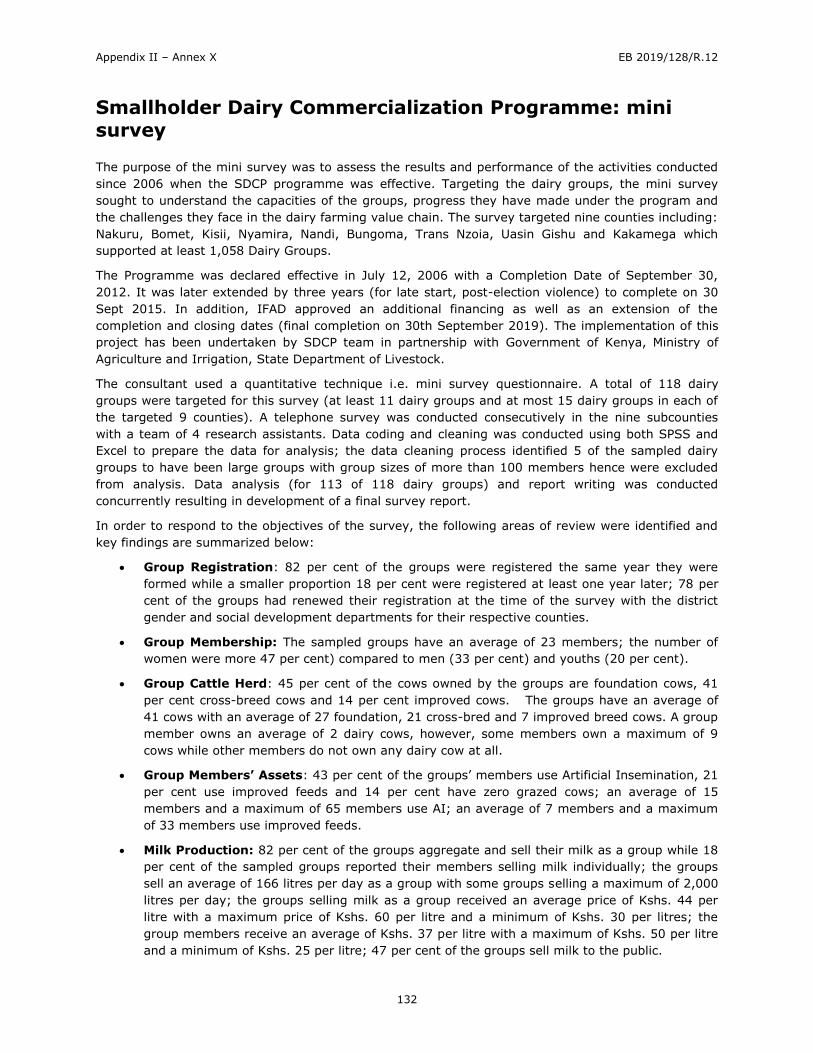
Appendix II – Annex X EB 2019/128/R.12
132
Smallholder Dairy Commercialization Programme: mini survey
The purpose of the mini survey was to assess the results and performance of the activities conducted
since 2006 when the SDCP programme was effective. Targeting the dairy groups, the mini survey
sought to understand the capacities of the groups, progress they have made under the program and
the challenges they face in the dairy farming value chain. The survey targeted nine counties including:
Nakuru, Bomet, Kisii, Nyamira, Nandi, Bungoma, Trans Nzoia, Uasin Gishu and Kakamega which
supported at least 1,058 Dairy Groups.
The Programme was declared effective in July 12, 2006 with a Completion Date of September 30,
2012. It was later extended by three years (for late start, post-election violence) to complete on 30
Sept 2015. In addition, IFAD approved an additional financing as well as an extension of the
completion and closing dates (final completion on 30th September 2019). The implementation of this
project has been undertaken by SDCP team in partnership with Government of Kenya, Ministry of
Agriculture and Irrigation, State Department of Livestock.
The consultant used a quantitative technique i.e. mini survey questionnaire. A total of 118 dairy
groups were targeted for this survey (at least 11 dairy groups and at most 15 dairy groups in each of
the targeted 9 counties). A telephone survey was conducted consecutively in the nine subcounties
with a team of 4 research assistants. Data coding and cleaning was conducted using both SPSS and
Excel to prepare the data for analysis; the data cleaning process identified 5 of the sampled dairy
groups to have been large groups with group sizes of more than 100 members hence were excluded
from analysis. Data analysis (for 113 of 118 dairy groups) and report writing was conducted
concurrently resulting in development of a final survey report.
In order to respond to the objectives of the survey, the following areas of review were identified and
key findings are summarized below:
Group Registration: 82 per cent of the groups were registered the same year they were
formed while a smaller proportion 18 per cent were registered at least one year later; 78 per
cent of the groups had renewed their registration at the time of the survey with the district
gender and social development departments for their respective counties.
Group Membership: The sampled groups have an average of 23 members; the number of
women were more 47 per cent) compared to men (33 per cent) and youths (20 per cent).
Group Cattle Herd: 45 per cent of the cows owned by the groups are foundation cows, 41
per cent cross-breed cows and 14 per cent improved cows. The groups have an average of
41 cows with an average of 27 foundation, 21 cross-bred and 7 improved breed cows. A group
member owns an average of 2 dairy cows, however, some members own a maximum of 9
cows while other members do not own any dairy cow at all.
Group Members’ Assets: 43 per cent of the groups’ members use Artificial Insemination, 21
per cent use improved feeds and 14 per cent have zero grazed cows; an average of 15
members and a maximum of 65 members use AI; an average of 7 members and a maximum
of 33 members use improved feeds.
Milk Production: 82 per cent of the groups aggregate and sell their milk as a group while 18
per cent of the sampled groups reported their members selling milk individually; the groups
sell an average of 166 litres per day as a group with some groups selling a maximum of 2,000
litres per day; the groups selling milk as a group received an average price of Kshs. 44 per
litre with a maximum price of Kshs. 60 per litre and a minimum of Kshs. 30 per litres; the
group members receive an average of Kshs. 37 per litre with a maximum of Kshs. 50 per litre
and a minimum of Kshs. 25 per litre; 47 per cent of the groups sell milk to the public.
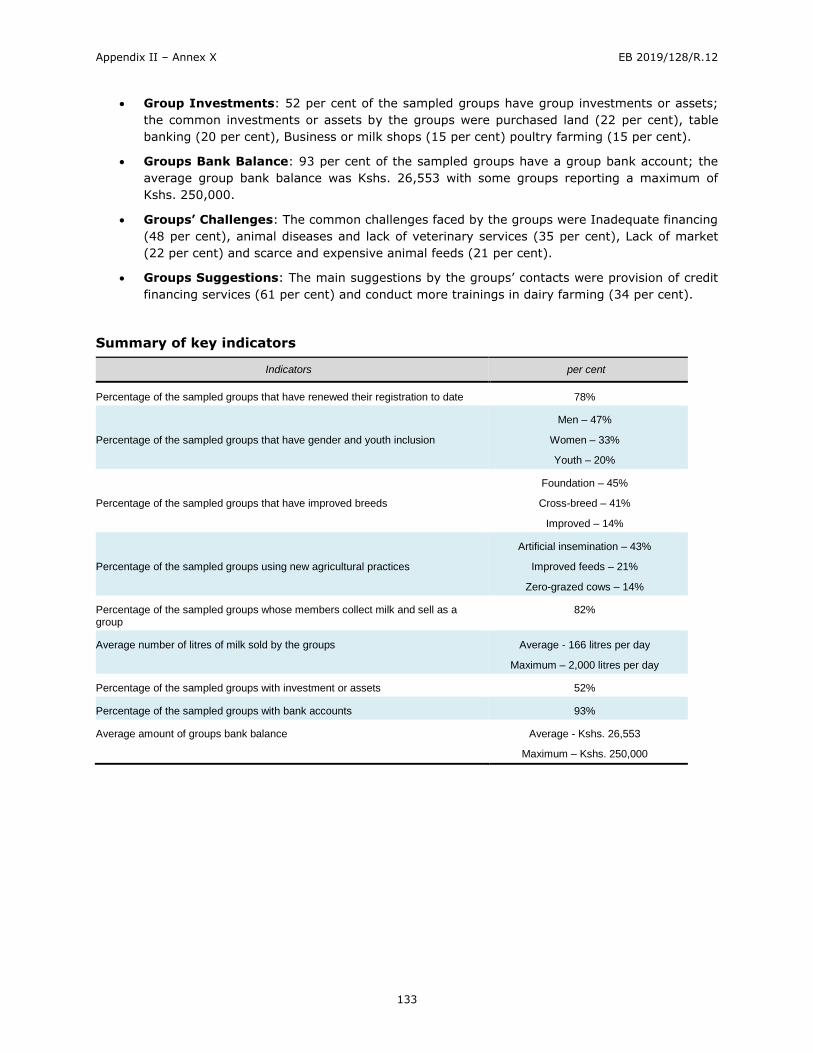
Appendix II – Annex X EB 2019/128/R.12
133
Group Investments: 52 per cent of the sampled groups have group investments or assets;
the common investments or assets by the groups were purchased land (22 per cent), table
banking (20 per cent), Business or milk shops (15 per cent) poultry farming (15 per cent).
Groups Bank Balance: 93 per cent of the sampled groups have a group bank account; the
average group bank balance was Kshs. 26,553 with some groups reporting a maximum of
Kshs. 250,000.
Groups’ Challenges: The common challenges faced by the groups were Inadequate financing
(48 per cent), animal diseases and lack of veterinary services (35 per cent), Lack of market
(22 per cent) and scarce and expensive animal feeds (21 per cent).
Groups Suggestions: The main suggestions by the groups’ contacts were provision of credit
financing services (61 per cent) and conduct more trainings in dairy farming (34 per cent).
Summary of key indicators
Indicators per cent
Percentage of the sampled groups that have renewed their registration to date 78%
Percentage of the sampled groups that have gender and youth inclusion
Men – 47%
Women – 33%
Youth – 20%
Percentage of the sampled groups that have improved breeds
Foundation – 45%
Cross-breed – 41%
Improved – 14%
Percentage of the sampled groups using new agricultural practices
Artificial insemination – 43%
Improved feeds – 21%
Zero-grazed cows – 14%
Percentage of the sampled groups whose members collect milk and sell as a group
82%
Average number of litres of milk sold by the groups Average - 166 litres per day
Maximum – 2,000 litres per day
Percentage of the sampled groups with investment or assets 52%
Percentage of the sampled groups with bank accounts 93%
Average amount of groups bank balance Average - Kshs. 26,553
Maximum – Kshs. 250,000
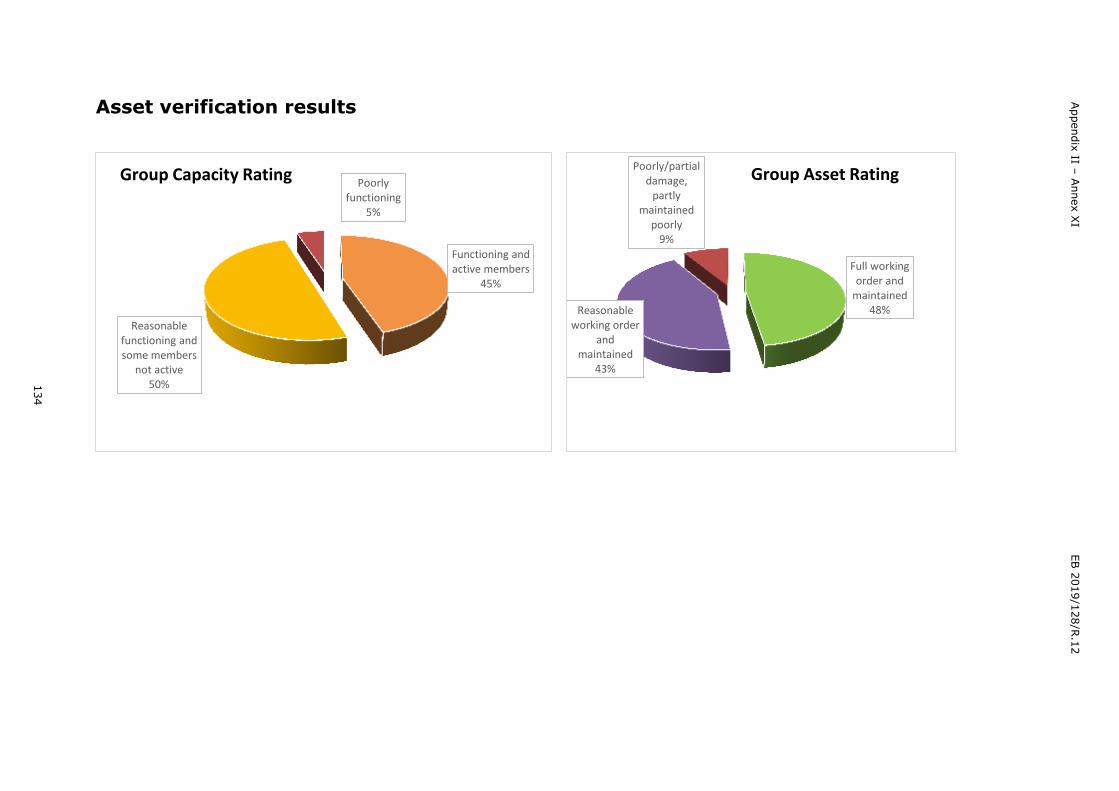
134
Appendix
II – A
nnex X
I
EB 2
019/1
28/R
.12
Asset verification results
Functioning and active members
45%
Reasonable functioning and some members
not active 50%
Poorly functioning
5%
Group Capacity Rating
Full working order and
maintained 48% Reasonable
working order and
maintained 43%
Poorly/partial damage,
partly maintained
poorly 9%
Group Asset Rating
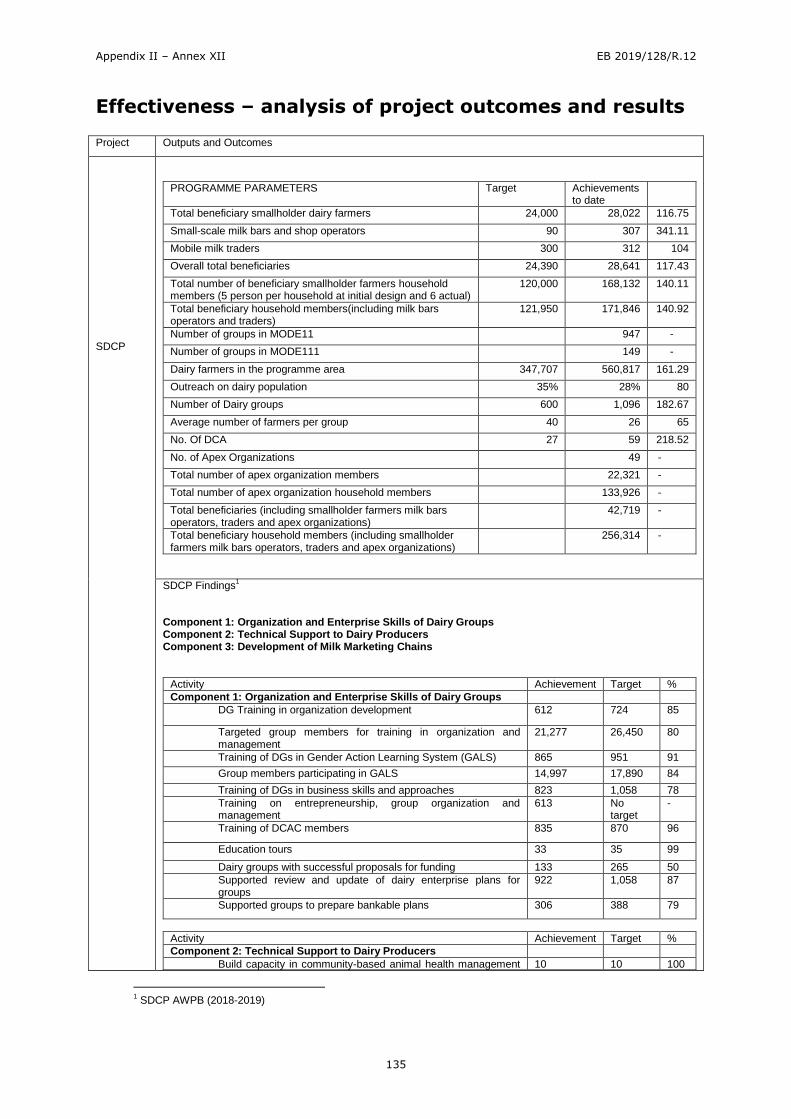
Appendix II – Annex XII EB 2019/128/R.12
135
Effectiveness – analysis of project outcomes and results
Project Outputs and Outcomes
SDCP
PROGRAMME PARAMETERS Target Achievements to date
Total beneficiary smallholder dairy farmers 24,000 28,022 116.75
Small-scale milk bars and shop operators 90 307 341.11
Mobile milk traders 300 312 104
Overall total beneficiaries 24,390 28,641 117.43
Total number of beneficiary smallholder farmers household members (5 person per household at initial design and 6 actual)
120,000 168,132 140.11
Total beneficiary household members(including milk bars operators and traders)
121,950 171,846 140.92
Number of groups in MODE11 947 -
Number of groups in MODE111 149 -
Dairy farmers in the programme area 347,707 560,817 161.29
Outreach on dairy population 35% 28% 80
Number of Dairy groups 600 1,096 182.67
Average number of farmers per group 40 26 65
No. Of DCA 27 59 218.52
No. of Apex Organizations 49 -
Total number of apex organization members 22,321 -
Total number of apex organization household members 133,926 -
Total beneficiaries (including smallholder farmers milk bars operators, traders and apex organizations)
42,719 -
Total beneficiary household members (including smallholder farmers milk bars operators, traders and apex organizations)
256,314 -
SDCP Findings1
Component 1: Organization and Enterprise Skills of Dairy Groups Component 2: Technical Support to Dairy Producers Component 3: Development of Milk Marketing Chains
Activity Achievement Target %
Component 1: Organization and Enterprise Skills of Dairy Groups
DG Training in organization development 612 724 85
Targeted group members for training in organization and management
21,277 26,450 80
Training of DGs in Gender Action Learning System (GALS) 865 951 91
Group members participating in GALS 14,997 17,890 84
Training of DGs in business skills and approaches 823 1,058 78
Training on entrepreneurship, group organization and management
613 No target
-
Training of DCAC members 835 870 96
Education tours 33 35 99
Dairy groups with successful proposals for funding 133 265 50
Supported review and update of dairy enterprise plans for groups
922 1,058 87
Supported groups to prepare bankable plans 306 388 79
Activity Achievement Target %
Component 2: Technical Support to Dairy Producers
Build capacity in community-based animal health management 10 10 100
1 SDCP AWPB (2018-2019)
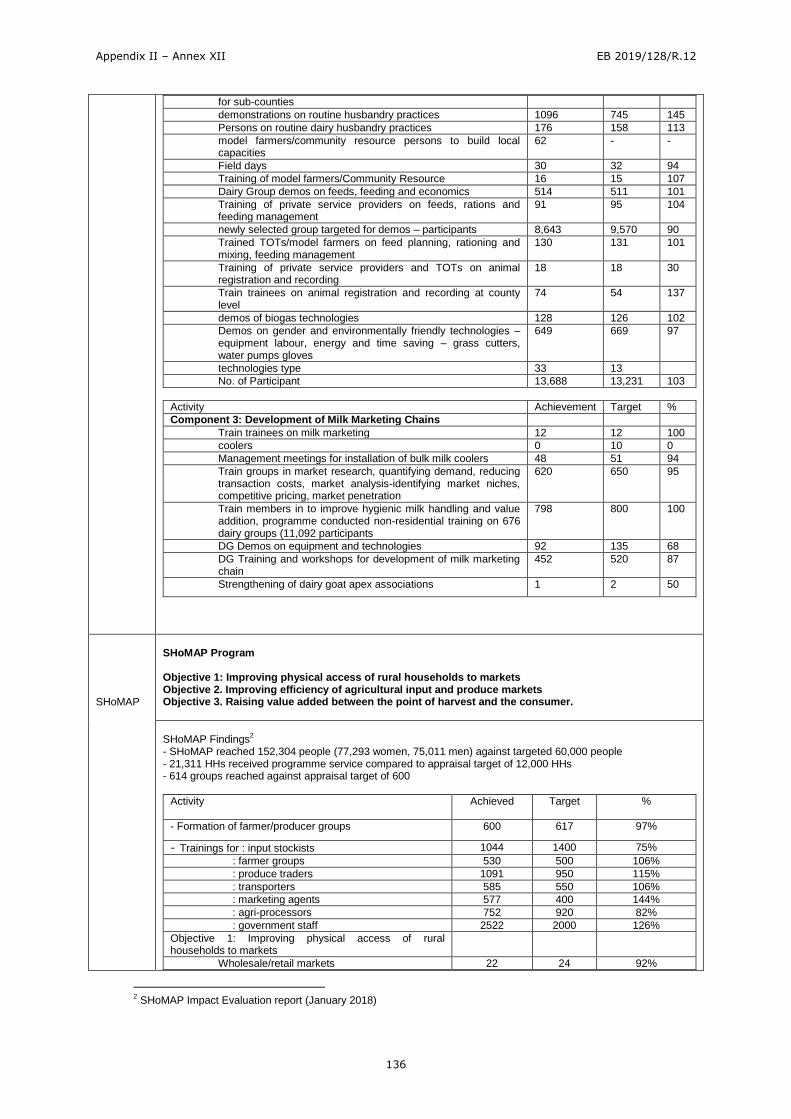
Appendix II – Annex XII EB 2019/128/R.12
136
for sub-counties
demonstrations on routine husbandry practices 1096 745 145
Persons on routine dairy husbandry practices 176 158 113
model farmers/community resource persons to build local capacities
62 - -
Field days 30 32 94
Training of model farmers/Community Resource 16 15 107
Dairy Group demos on feeds, feeding and economics 514 511 101
Training of private service providers on feeds, rations and feeding management
91 95 104
newly selected group targeted for demos – participants 8,643 9,570 90
Trained TOTs/model farmers on feed planning, rationing and mixing, feeding management
130 131 101
Training of private service providers and TOTs on animal registration and recording
18 18 30
Train trainees on animal registration and recording at county level
74 54 137
demos of biogas technologies 128 126 102
Demos on gender and environmentally friendly technologies – equipment labour, energy and time saving – grass cutters, water pumps gloves
649 669 97
technologies type 33 13
No. of Participant 13,688 13,231 103
Activity Achievement Target %
Component 3: Development of Milk Marketing Chains
Train trainees on milk marketing 12 12 100
coolers 0 10 0
Management meetings for installation of bulk milk coolers 48 51 94
Train groups in market research, quantifying demand, reducing transaction costs, market analysis-identifying market niches, competitive pricing, market penetration
620 650 95
Train members in to improve hygienic milk handling and value addition, programme conducted non-residential training on 676 dairy groups (11,092 participants
798 800 100
DG Demos on equipment and technologies 92 135 68
DG Training and workshops for development of milk marketing chain
452 520 87
Strengthening of dairy goat apex associations 1 2 50
SHoMAP
SHoMAP Program Objective 1: Improving physical access of rural households to markets Objective 2. Improving efficiency of agricultural input and produce markets Objective 3. Raising value added between the point of harvest and the consumer.
SHoMAP Findings
2
- SHoMAP reached 152,304 people (77,293 women, 75,011 men) against targeted 60,000 people - 21,311 HHs received programme service compared to appraisal target of 12,000 HHs - 614 groups reached against appraisal target of 600
Activity Achieved
Target %
- Formation of farmer/producer groups 600 617 97%
- Trainings for : input stockists 1044 1400 75%
: farmer groups 530 500 106%
: produce traders 1091 950 115%
: transporters 585 550 106%
: marketing agents 577 400 144%
: agri-processors 752 920 82%
: government staff 2522 2000 126%
Objective 1: Improving physical access of rural households to markets
Wholesale/retail markets 22 24 92%
2 SHoMAP Impact Evaluation report (January 2018)
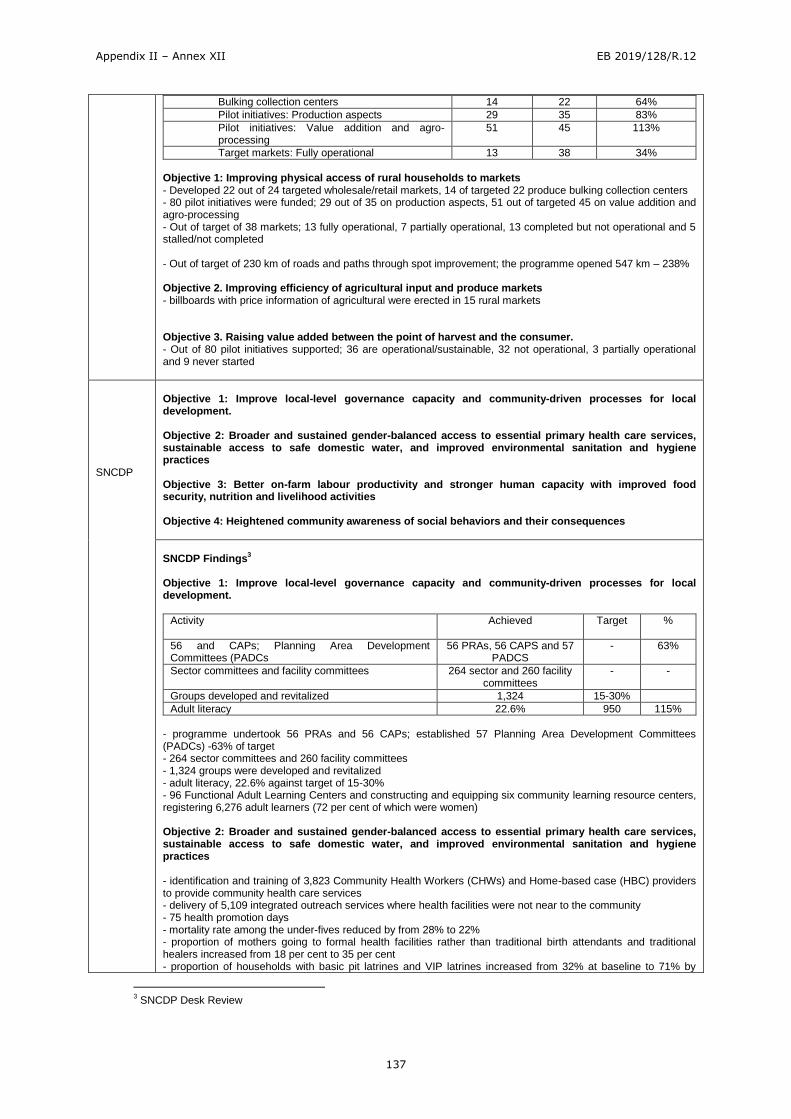
Appendix II – Annex XII EB 2019/128/R.12
137
Bulking collection centers 14 22 64%
Pilot initiatives: Production aspects 29 35 83%
Pilot initiatives: Value addition and agro-processing
51 45 113%
Target markets: Fully operational 13 38 34%
Objective 1: Improving physical access of rural households to markets - Developed 22 out of 24 targeted wholesale/retail markets, 14 of targeted 22 produce bulking collection centers - 80 pilot initiatives were funded; 29 out of 35 on production aspects, 51 out of targeted 45 on value addition and agro-processing - Out of target of 38 markets; 13 fully operational, 7 partially operational, 13 completed but not operational and 5 stalled/not completed - Out of target of 230 km of roads and paths through spot improvement; the programme opened 547 km – 238% Objective 2. Improving efficiency of agricultural input and produce markets - billboards with price information of agricultural were erected in 15 rural markets Objective 3. Raising value added between the point of harvest and the consumer. - Out of 80 pilot initiatives supported; 36 are operational/sustainable, 32 not operational, 3 partially operational and 9 never started
SNCDP
Objective 1: Improve local-level governance capacity and community-driven processes for local development. Objective 2: Broader and sustained gender-balanced access to essential primary health care services, sustainable access to safe domestic water, and improved environmental sanitation and hygiene practices Objective 3: Better on-farm labour productivity and stronger human capacity with improved food security, nutrition and livelihood activities Objective 4: Heightened community awareness of social behaviors and their consequences
SNCDP Findings
3
Objective 1: Improve local-level governance capacity and community-driven processes for local development.
Activity Achieved
Target %
56 and CAPs; Planning Area Development Committees (PADCs
56 PRAs, 56 CAPS and 57 PADCS
- 63%
Sector committees and facility committees 264 sector and 260 facility committees
- -
Groups developed and revitalized 1,324 15-30%
Adult literacy 22.6% 950 115%
- programme undertook 56 PRAs and 56 CAPs; established 57 Planning Area Development Committees (PADCs) -63% of target - 264 sector committees and 260 facility committees - 1,324 groups were developed and revitalized - adult literacy, 22.6% against target of 15-30% - 96 Functional Adult Learning Centers and constructing and equipping six community learning resource centers, registering 6,276 adult learners (72 per cent of which were women) Objective 2: Broader and sustained gender-balanced access to essential primary health care services, sustainable access to safe domestic water, and improved environmental sanitation and hygiene practices - identification and training of 3,823 Community Health Workers (CHWs) and Home-based case (HBC) providers to provide community health care services - delivery of 5,109 integrated outreach services where health facilities were not near to the community - 75 health promotion days - mortality rate among the under-fives reduced by from 28% to 22% - proportion of mothers going to formal health facilities rather than traditional birth attendants and traditional healers increased from 18 per cent to 35 per cent - proportion of households with basic pit latrines and VIP latrines increased from 32% at baseline to 71% by
3 SNCDP Desk Review
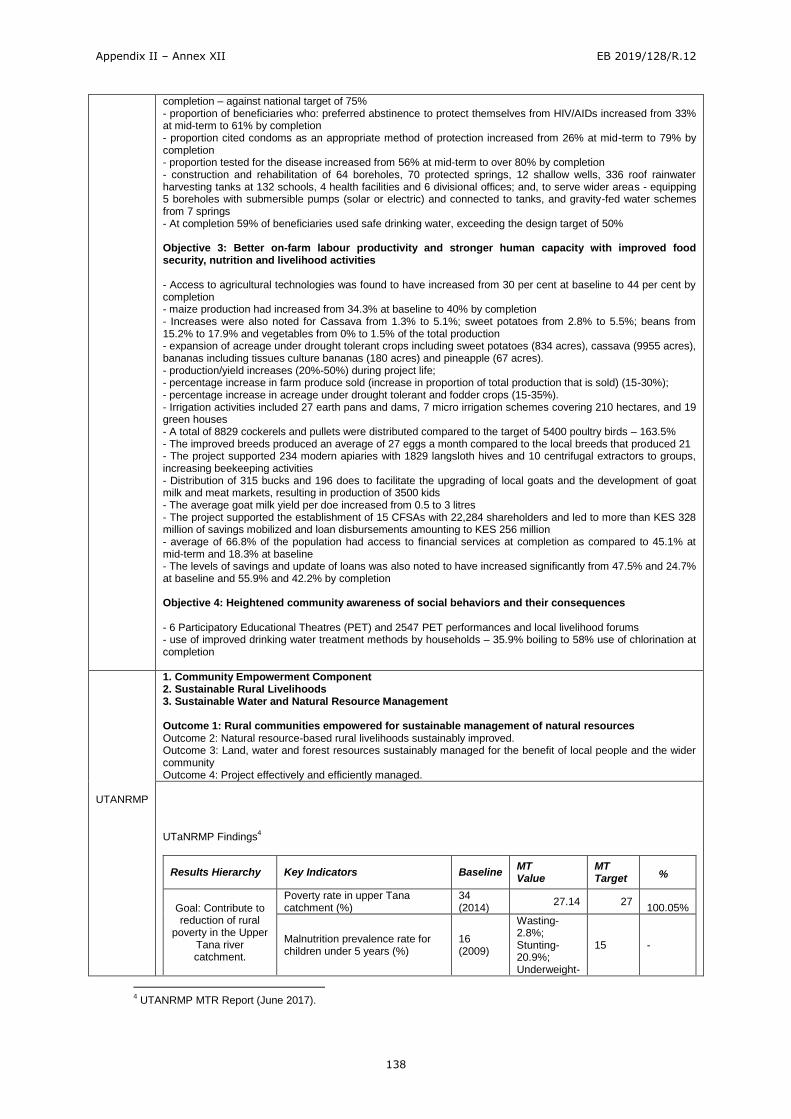
Appendix II – Annex XII EB 2019/128/R.12
138
completion – against national target of 75% - proportion of beneficiaries who: preferred abstinence to protect themselves from HIV/AIDs increased from 33% at mid-term to 61% by completion - proportion cited condoms as an appropriate method of protection increased from 26% at mid-term to 79% by completion - proportion tested for the disease increased from 56% at mid-term to over 80% by completion - construction and rehabilitation of 64 boreholes, 70 protected springs, 12 shallow wells, 336 roof rainwater harvesting tanks at 132 schools, 4 health facilities and 6 divisional offices; and, to serve wider areas - equipping 5 boreholes with submersible pumps (solar or electric) and connected to tanks, and gravity-fed water schemes from 7 springs - At completion 59% of beneficiaries used safe drinking water, exceeding the design target of 50% Objective 3: Better on-farm labour productivity and stronger human capacity with improved food security, nutrition and livelihood activities - Access to agricultural technologies was found to have increased from 30 per cent at baseline to 44 per cent by completion - maize production had increased from 34.3% at baseline to 40% by completion - Increases were also noted for Cassava from 1.3% to 5.1%; sweet potatoes from 2.8% to 5.5%; beans from 15.2% to 17.9% and vegetables from 0% to 1.5% of the total production - expansion of acreage under drought tolerant crops including sweet potatoes (834 acres), cassava (9955 acres), bananas including tissues culture bananas (180 acres) and pineapple (67 acres). - production/yield increases (20%-50%) during project life; - percentage increase in farm produce sold (increase in proportion of total production that is sold) (15-30%); - percentage increase in acreage under drought tolerant and fodder crops (15-35%). - Irrigation activities included 27 earth pans and dams, 7 micro irrigation schemes covering 210 hectares, and 19 green houses - A total of 8829 cockerels and pullets were distributed compared to the target of 5400 poultry birds – 163.5% - The improved breeds produced an average of 27 eggs a month compared to the local breeds that produced 21 - The project supported 234 modern apiaries with 1829 langsloth hives and 10 centrifugal extractors to groups, increasing beekeeping activities - Distribution of 315 bucks and 196 does to facilitate the upgrading of local goats and the development of goat milk and meat markets, resulting in production of 3500 kids - The average goat milk yield per doe increased from 0.5 to 3 litres - The project supported the establishment of 15 CFSAs with 22,284 shareholders and led to more than KES 328 million of savings mobilized and loan disbursements amounting to KES 256 million - average of 66.8% of the population had access to financial services at completion as compared to 45.1% at mid-term and 18.3% at baseline - The levels of savings and update of loans was also noted to have increased significantly from 47.5% and 24.7% at baseline and 55.9% and 42.2% by completion Objective 4: Heightened community awareness of social behaviors and their consequences - 6 Participatory Educational Theatres (PET) and 2547 PET performances and local livelihood forums - use of improved drinking water treatment methods by households – 35.9% boiling to 58% use of chlorination at completion
UTANRMP
1. Community Empowerment Component 2. Sustainable Rural Livelihoods 3. Sustainable Water and Natural Resource Management Outcome 1: Rural communities empowered for sustainable management of natural resources Outcome 2: Natural resource-based rural livelihoods sustainably improved. Outcome 3: Land, water and forest resources sustainably managed for the benefit of local people and the wider community Outcome 4: Project effectively and efficiently managed.
UTaNRMP Findings
4
Results Hierarchy Key Indicators Baseline MT Value
MT Target
%
Goal: Contribute to reduction of rural
poverty in the Upper Tana river catchment.
Poverty rate in upper Tana catchment (%)
34 (2014)
27.14 27
100.05%
Malnutrition prevalence rate for children under 5 years (%)
16 (2009)
Wasting-2.8%; Stunting-20.9%; Underweight-
15
-
4 UTANRMP MTR Report (June 2017).
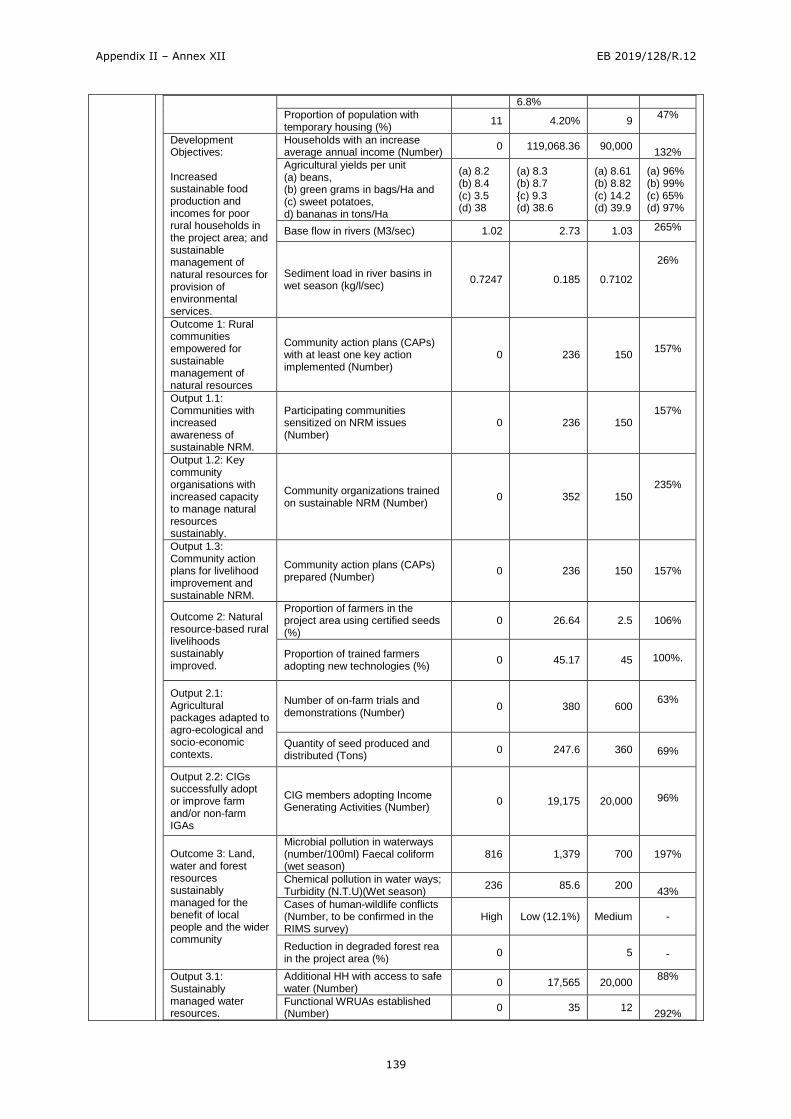
Appendix II – Annex XII EB 2019/128/R.12
139
6.8%
Proportion of population with temporary housing (%)
11 4.20% 9 47%
Development Objectives: Increased sustainable food production and incomes for poor rural households in the project area; and sustainable management of natural resources for provision of environmental services.
Households with an increase average annual income (Number)
0 119,068.36 90,000
132%
Agricultural yields per unit (a) beans, (b) green grams in bags/Ha and (c) sweet potatoes, d) bananas in tons/Ha
(a) 8.2 (b) 8.4 (c) 3.5 (d) 38
(a) 8.3 (b) 8.7 {c) 9.3 (d) 38.6
(a) 8.61 (b) 8.82 (c) 14.2 (d) 39.9
(a) 96% (b) 99% (c) 65% (d) 97%
Base flow in rivers (M3/sec) 1.02 2.73 1.03 265%
Sediment load in river basins in wet season (kg/l/sec)
0.7247 0.185 0.7102
26%
Outcome 1: Rural communities empowered for sustainable management of natural resources
Community action plans (CAPs) with at least one key action implemented (Number)
0 236 150
157%
Output 1.1: Communities with increased awareness of sustainable NRM.
Participating communities sensitized on NRM issues (Number)
0 236 150
157%
Output 1.2: Key community organisations with increased capacity to manage natural resources sustainably.
Community organizations trained on sustainable NRM (Number)
0 352 150
235%
Output 1.3: Community action plans for livelihood improvement and sustainable NRM.
Community action plans (CAPs) prepared (Number)
0 236 150
157%
Outcome 2: Natural resource-based rural livelihoods sustainably improved.
Proportion of farmers in the project area using certified seeds (%)
0 26.64 2.5
106%
Proportion of trained farmers adopting new technologies (%)
0 45.17 45
100%.
Output 2.1: Agricultural packages adapted to agro-ecological and socio-economic contexts.
Number of on-farm trials and demonstrations (Number)
0 380 600
63%
Quantity of seed produced and distributed (Tons)
0 247.6 360
69%
Output 2.2: CIGs successfully adopt or improve farm and/or non-farm IGAs
CIG members adopting Income Generating Activities (Number)
0 19,175 20,000
96%
Outcome 3: Land, water and forest resources sustainably managed for the benefit of local people and the wider community
Microbial pollution in waterways (number/100ml) Faecal coliform (wet season)
816 1,379 700
197%
Chemical pollution in water ways; Turbidity (N.T.U)(Wet season)
236 85.6 200
43%
Cases of human-wildlife conflicts (Number, to be confirmed in the RIMS survey)
High Low (12.1%) Medium
-
Reduction in degraded forest rea in the project area (%)
0
5
-
Output 3.1: Sustainably managed water resources.
Additional HH with access to safe water (Number)
0 17,565 20,000 88%
Functional WRUAs established (Number)
0 35 12
292%
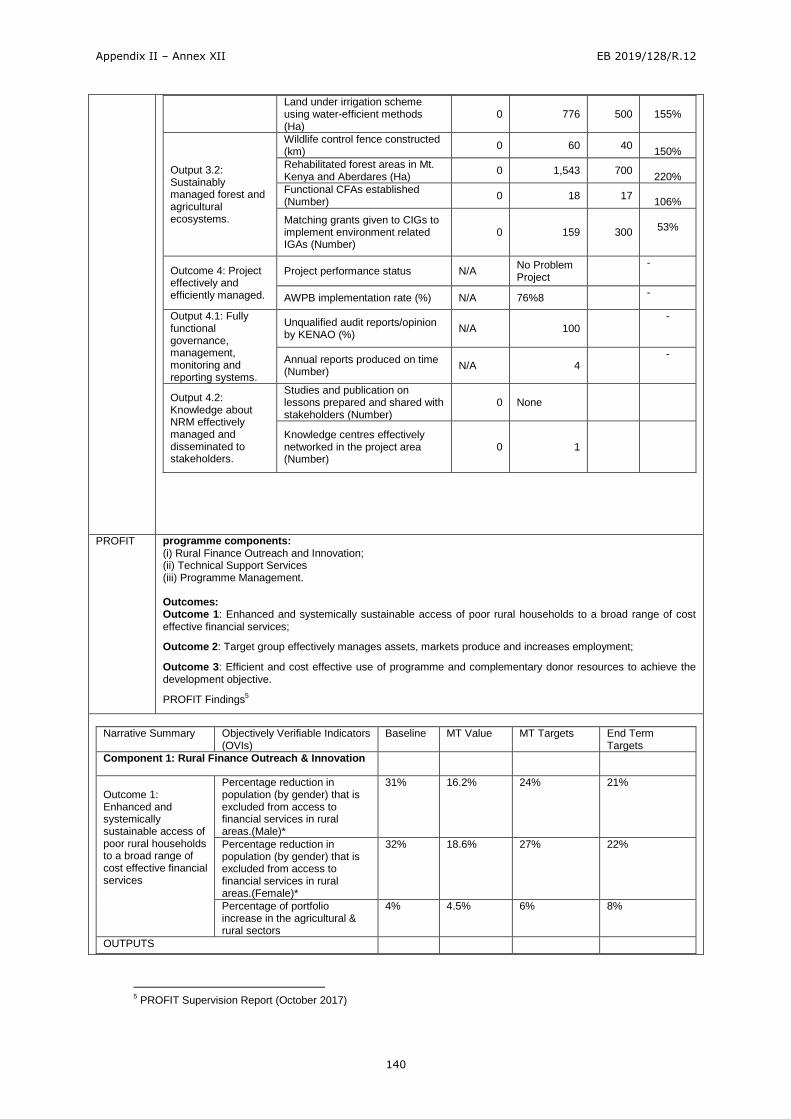
Appendix II – Annex XII EB 2019/128/R.12
140
Land under irrigation scheme using water-efficient methods (Ha)
0 776 500
155%
Output 3.2: Sustainably managed forest and agricultural ecosystems.
Wildlife control fence constructed (km)
0 60 40
150%
Rehabilitated forest areas in Mt. Kenya and Aberdares (Ha)
0 1,543 700
220%
Functional CFAs established (Number)
0 18 17
106%
Matching grants given to CIGs to implement environment related IGAs (Number)
0 159 300
53%
Outcome 4: Project effectively and efficiently managed.
Project performance status N/A No Problem Project
-
AWPB implementation rate (%) N/A 76%8 -
Output 4.1: Fully functional governance, management, monitoring and reporting systems.
Unqualified audit reports/opinion by KENAO (%)
N/A 100 -
Annual reports produced on time (Number)
N/A 4 -
Output 4.2: Knowledge about NRM effectively managed and disseminated to stakeholders.
Studies and publication on lessons prepared and shared with stakeholders (Number)
0 None
Knowledge centres effectively networked in the project area (Number)
0 1
PROFIT programme components: (i) Rural Finance Outreach and Innovation; (ii) Technical Support Services (iii) Programme Management.
Outcomes: Outcome 1: Enhanced and systemically sustainable access of poor rural households to a broad range of cost effective financial services;
Outcome 2: Target group effectively manages assets, markets produce and increases employment;
Outcome 3: Efficient and cost effective use of programme and complementary donor resources to achieve the development objective.
PROFIT Findings5
Narrative Summary Objectively Verifiable Indicators (OVIs)
Baseline MT Value MT Targets End Term Targets
Component 1: Rural Finance Outreach & Innovation
Outcome 1: Enhanced and systemically sustainable access of poor rural households to a broad range of cost effective financial services
Percentage reduction in population (by gender) that is excluded from access to financial services in rural areas.(Male)*
31% 16.2% 24% 21%
Percentage reduction in population (by gender) that is excluded from access to financial services in rural areas.(Female)*
32% 18.6% 27% 22%
Percentage of portfolio increase in the agricultural & rural sectors
4% 4.5% 6% 8%
OUTPUTS
5 PROFIT Supervision Report (October 2017)
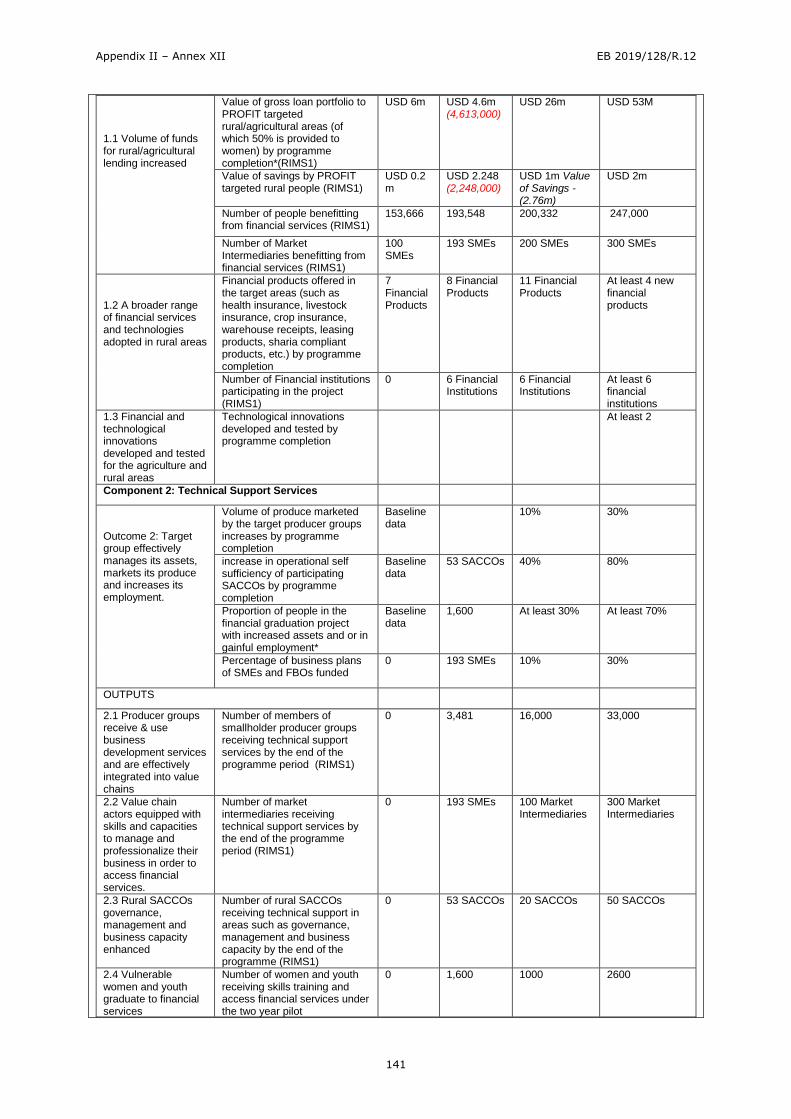
Appendix II – Annex XII EB 2019/128/R.12
141
1.1 Volume of funds for rural/agricultural lending increased
Value of gross loan portfolio to PROFIT targeted rural/agricultural areas (of which 50% is provided to women) by programme completion*(RIMS1)
USD 6m USD 4.6m (4,613,000)
USD 26m USD 53M
Value of savings by PROFIT targeted rural people (RIMS1)
USD 0.2 m
USD 2.248 (2,248,000)
USD 1m Value of Savings - (2.76m)
USD 2m
Number of people benefitting from financial services (RIMS1)
153,666 193,548 200,332
247,000
Number of Market Intermediaries benefitting from financial services (RIMS1)
100 SMEs
193 SMEs 200 SMEs 300 SMEs
1.2 A broader range of financial services and technologies adopted in rural areas
Financial products offered in the target areas (such as health insurance, livestock insurance, crop insurance, warehouse receipts, leasing products, sharia compliant products, etc.) by programme completion
7 Financial Products
8 Financial Products
11 Financial Products
At least 4 new financial products
Number of Financial institutions participating in the project (RIMS1)
0 6 Financial Institutions
6 Financial Institutions
At least 6 financial institutions
1.3 Financial and technological innovations developed and tested for the agriculture and rural areas
Technological innovations developed and tested by programme completion
At least 2
Component 2: Technical Support Services
Outcome 2: Target group effectively manages its assets, markets its produce and increases its employment.
Volume of produce marketed by the target producer groups increases by programme completion
Baseline data
10% 30%
increase in operational self sufficiency of participating SACCOs by programme completion
Baseline data
53 SACCOs 40%
80%
Proportion of people in the financial graduation project with increased assets and or in gainful employment*
Baseline data
1,600 At least 30% At least 70%
Percentage of business plans of SMEs and FBOs funded
0 193 SMEs 10%
30%
OUTPUTS
2.1 Producer groups receive & use business development services and are effectively integrated into value chains
Number of members of smallholder producer groups receiving technical support services by the end of the programme period (RIMS1)
0 3,481 16,000
33,000
2.2 Value chain actors equipped with skills and capacities to manage and professionalize their business in order to access financial services.
Number of market intermediaries receiving technical support services by the end of the programme period (RIMS1)
0 193 SMEs 100 Market Intermediaries
300 Market Intermediaries
2.3 Rural SACCOs governance, management and business capacity enhanced
Number of rural SACCOs receiving technical support in areas such as governance, management and business capacity by the end of the programme (RIMS1)
0 53 SACCOs 20 SACCOs
50 SACCOs
2.4 Vulnerable women and youth graduate to financial services
Number of women and youth receiving skills training and access financial services under the two year pilot
0 1,600 1000 2600
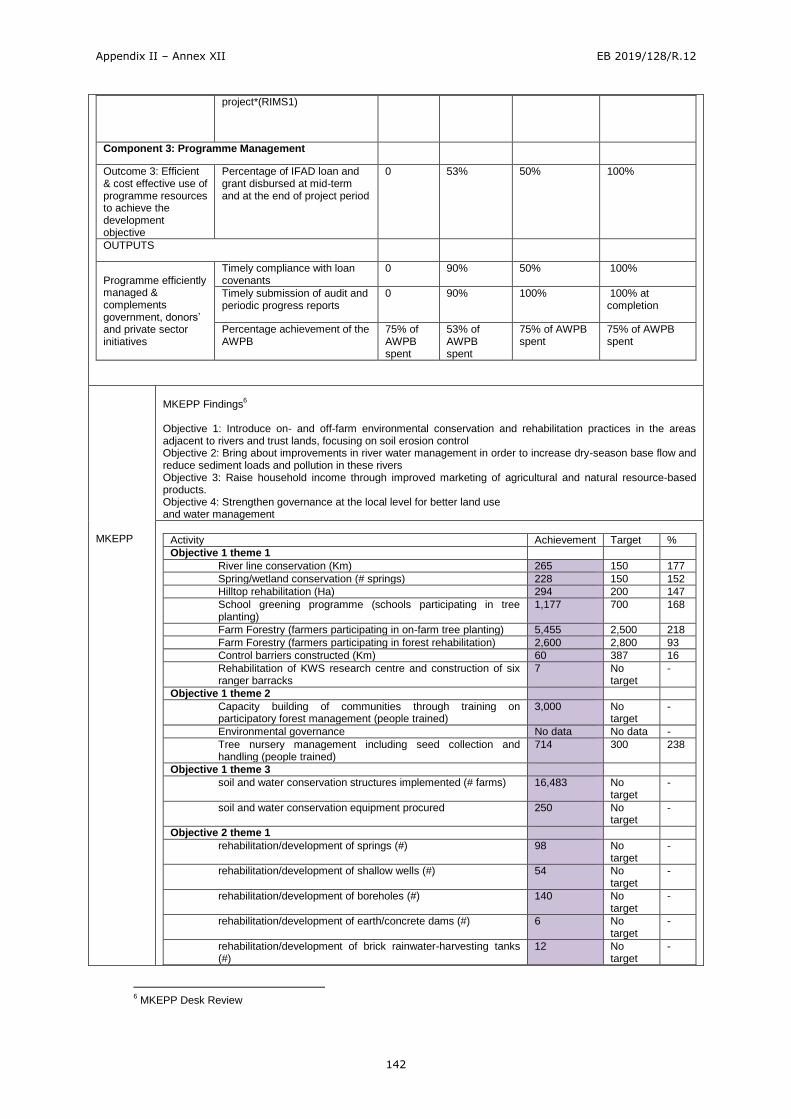
Appendix II – Annex XII EB 2019/128/R.12
142
project*(RIMS1)
Component 3: Programme Management
Outcome 3: Efficient & cost effective use of programme resources to achieve the development objective
Percentage of IFAD loan and grant disbursed at mid-term and at the end of project period
0 53% 50%
100%
OUTPUTS
Programme efficiently managed & complements government, donors’ and private sector initiatives
Timely compliance with loan covenants
0 90% 50%
100%
Timely submission of audit and periodic progress reports
0 90% 100%
100% at completion
Percentage achievement of the AWPB
75% of AWPB spent
53% of AWPB spent
75% of AWPB spent
75% of AWPB spent
MKEPP
MKEPP Findings
6
Objective 1: Introduce on- and off-farm environmental conservation and rehabilitation practices in the areas adjacent to rivers and trust lands, focusing on soil erosion control Objective 2: Bring about improvements in river water management in order to increase dry-season base flow and reduce sediment loads and pollution in these rivers Objective 3: Raise household income through improved marketing of agricultural and natural resource-based products. Objective 4: Strengthen governance at the local level for better land use and water management
Activity Achievement Target %
Objective 1 theme 1
River line conservation (Km) 265 150 177
Spring/wetland conservation (# springs) 228 150 152
Hilltop rehabilitation (Ha) 294 200 147
School greening programme (schools participating in tree planting)
1,177 700 168
Farm Forestry (farmers participating in on-farm tree planting) 5,455 2,500 218
Farm Forestry (farmers participating in forest rehabilitation) 2,600 2,800 93
Control barriers constructed (Km) 60 387 16
Rehabilitation of KWS research centre and construction of six ranger barracks
7 No target
-
Objective 1 theme 2
Capacity building of communities through training on participatory forest management (people trained)
3,000 No target
-
Environmental governance No data No data -
Tree nursery management including seed collection and handling (people trained)
714 300 238
Objective 1 theme 3
soil and water conservation structures implemented (# farms) 16,483 No target
-
soil and water conservation equipment procured 250 No target
-
Objective 2 theme 1
rehabilitation/development of springs (#) 98 No target
-
rehabilitation/development of shallow wells (#) 54 No target
-
rehabilitation/development of boreholes (#) 140 No target
-
rehabilitation/development of earth/concrete dams (#) 6 No target
-
rehabilitation/development of brick rainwater-harvesting tanks (#)
12 No target
-
6 MKEPP Desk Review
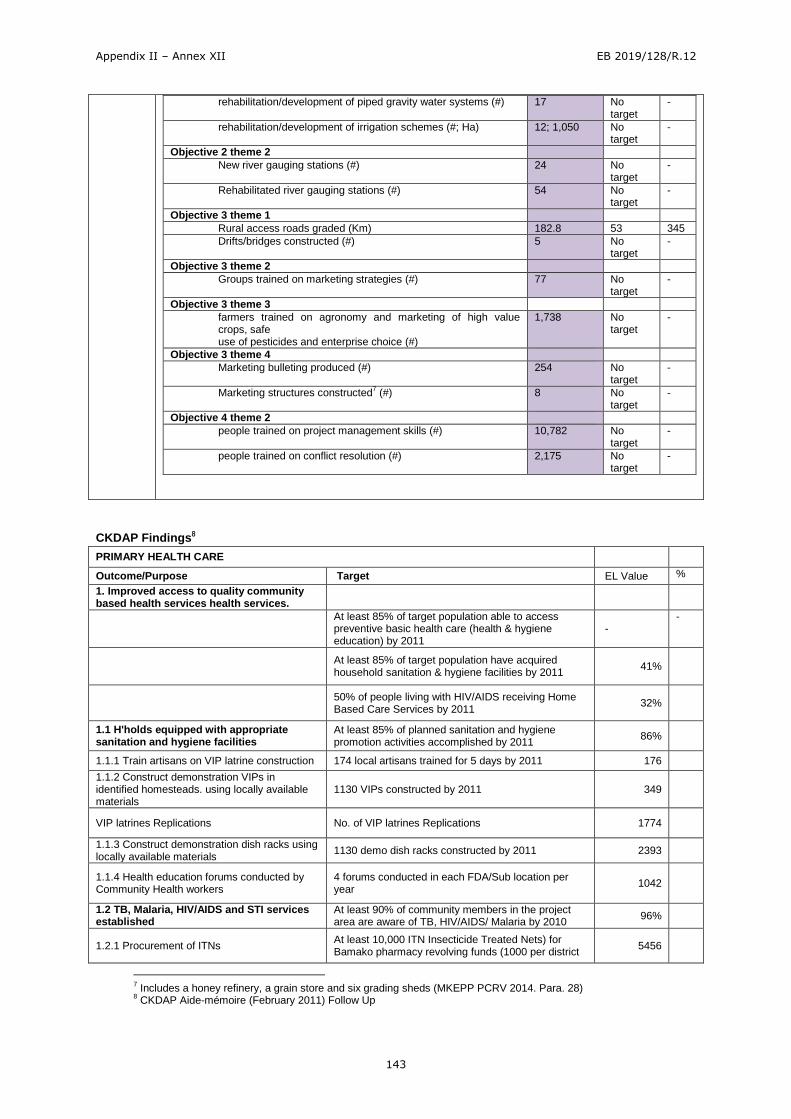
Appendix II – Annex XII EB 2019/128/R.12
143
rehabilitation/development of piped gravity water systems (#) 17 No target
-
rehabilitation/development of irrigation schemes (#; Ha) 12; 1,050 No target
-
Objective 2 theme 2
New river gauging stations (#) 24 No target
-
Rehabilitated river gauging stations (#) 54 No target
-
Objective 3 theme 1
Rural access roads graded (Km) 182.8 53 345
Drifts/bridges constructed (#) 5 No target
-
Objective 3 theme 2
Groups trained on marketing strategies (#) 77 No target
-
Objective 3 theme 3
farmers trained on agronomy and marketing of high value crops, safe use of pesticides and enterprise choice (#)
1,738 No target
-
Objective 3 theme 4
Marketing bulleting produced (#) 254 No target
-
Marketing structures constructed7 (#) 8 No
target -
Objective 4 theme 2
people trained on project management skills (#) 10,782 No target
-
people trained on conflict resolution (#) 2,175 No target
-
CKDAP Findings8
PRIMARY HEALTH CARE
Outcome/Purpose Target EL Value %
1. Improved access to quality community based health services health services.
At least 85% of target population able to access preventive basic health care (health & hygiene education) by 2011
- -
At least 85% of target population have acquired household sanitation & hygiene facilities by 2011
41%
50% of people living with HIV/AIDS receiving Home Based Care Services by 2011
32%
1.1 H'holds equipped with appropriate sanitation and hygiene facilities
At least 85% of planned sanitation and hygiene promotion activities accomplished by 2011
86%
1.1.1 Train artisans on VIP latrine construction 174 local artisans trained for 5 days by 2011 176
1.1.2 Construct demonstration VIPs in identified homesteads. using locally available materials
1130 VIPs constructed by 2011 349
VIP latrines Replications No. of VIP latrines Replications 1774
1.1.3 Construct demonstration dish racks using locally available materials
1130 demo dish racks constructed by 2011 2393
1.1.4 Health education forums conducted by Community Health workers
4 forums conducted in each FDA/Sub location per year
1042
1.2 TB, Malaria, HIV/AIDS and STI services established
At least 90% of community members in the project area are aware of TB, HIV/AIDS/ Malaria by 2010
96%
1.2.1 Procurement of ITNs At least 10,000 ITN Insecticide Treated Nets) for Bamako pharmacy revolving funds (1000 per district
5456
7 Includes a honey refinery, a grain store and six grading sheds (MKEPP PCRV 2014. Para. 28)
8 CKDAP Aide-mémoire (February 2011) Follow Up
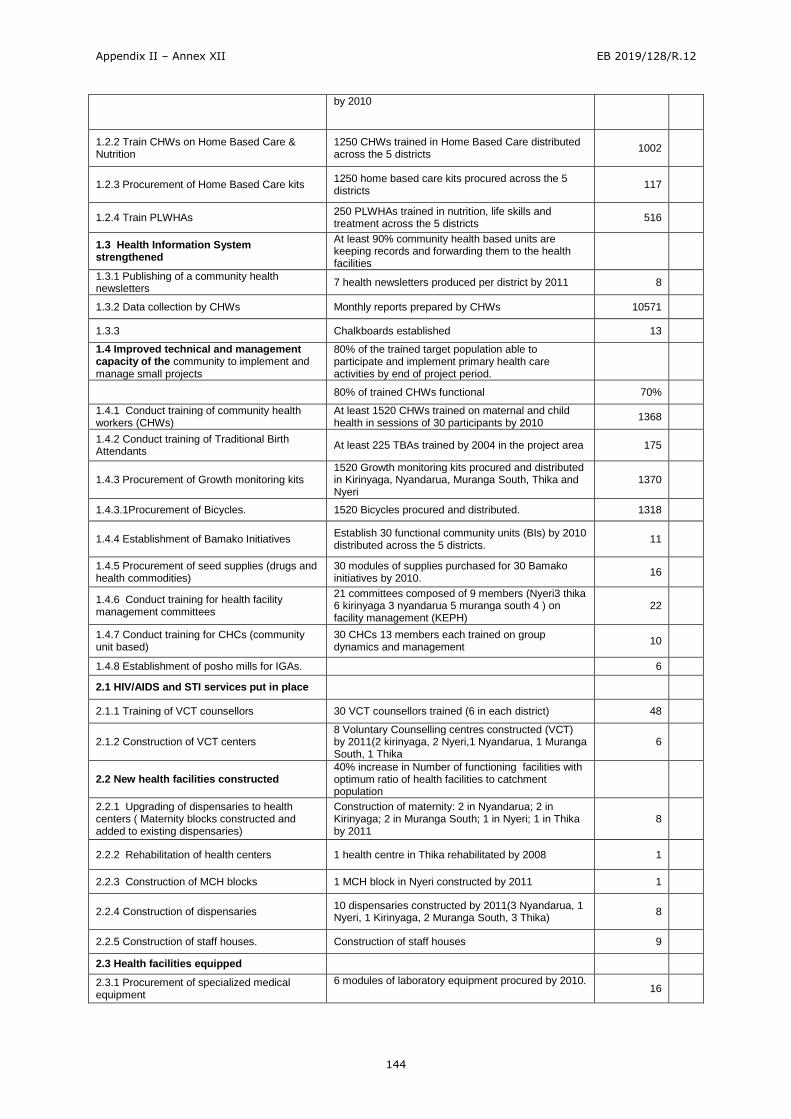
Appendix II – Annex XII EB 2019/128/R.12
144
by 2010
1.2.2 Train CHWs on Home Based Care & Nutrition
1250 CHWs trained in Home Based Care distributed across the 5 districts
1002
1.2.3 Procurement of Home Based Care kits 1250 home based care kits procured across the 5 districts
117
1.2.4 Train PLWHAs 250 PLWHAs trained in nutrition, life skills and treatment across the 5 districts
516
1.3 Health Information System strengthened
At least 90% community health based units are keeping records and forwarding them to the health facilities
1.3.1 Publishing of a community health newsletters
7 health newsletters produced per district by 2011 8
1.3.2 Data collection by CHWs Monthly reports prepared by CHWs 10571
1.3.3 Chalkboards established 13
1.4 Improved technical and management capacity of the community to implement and manage small projects
80% of the trained target population able to participate and implement primary health care activities by end of project period.
80% of trained CHWs functional 70%
1.4.1 Conduct training of community health workers (CHWs)
At least 1520 CHWs trained on maternal and child health in sessions of 30 participants by 2010
1368
1.4.2 Conduct training of Traditional Birth Attendants
At least 225 TBAs trained by 2004 in the project area 175
1.4.3 Procurement of Growth monitoring kits 1520 Growth monitoring kits procured and distributed in Kirinyaga, Nyandarua, Muranga South, Thika and Nyeri
1370
1.4.3.1Procurement of Bicycles. 1520 Bicycles procured and distributed. 1318
1.4.4 Establishment of Bamako Initiatives Establish 30 functional community units (BIs) by 2010 distributed across the 5 districts.
11
1.4.5 Procurement of seed supplies (drugs and health commodities)
30 modules of supplies purchased for 30 Bamako initiatives by 2010.
16
1.4.6 Conduct training for health facility management committees
21 committees composed of 9 members (Nyeri3 thika 6 kirinyaga 3 nyandarua 5 muranga south 4 ) on facility management (KEPH)
22
1.4.7 Conduct training for CHCs (community unit based)
30 CHCs 13 members each trained on group dynamics and management
10
1.4.8 Establishment of posho mills for IGAs. 6
2.1 HIV/AIDS and STI services put in place
2.1.1 Training of VCT counsellors 30 VCT counsellors trained (6 in each district) 48
2.1.2 Construction of VCT centers 8 Voluntary Counselling centres constructed (VCT) by 2011(2 kirinyaga, 2 Nyeri,1 Nyandarua, 1 Muranga South, 1 Thika
6
2.2 New health facilities constructed 40% increase in Number of functioning facilities with optimum ratio of health facilities to catchment population
2.2.1 Upgrading of dispensaries to health centers ( Maternity blocks constructed and added to existing dispensaries)
Construction of maternity: 2 in Nyandarua; 2 in Kirinyaga; 2 in Muranga South; 1 in Nyeri; 1 in Thika by 2011
8
2.2.2 Rehabilitation of health centers 1 health centre in Thika rehabilitated by 2008 1
2.2.3 Construction of MCH blocks 1 MCH block in Nyeri constructed by 2011 1
2.2.4 Construction of dispensaries 10 dispensaries constructed by 2011(3 Nyandarua, 1 Nyeri, 1 Kirinyaga, 2 Muranga South, 3 Thika)
8
2.2.5 Construction of staff houses. Construction of staff houses 9
2.3 Health facilities equipped
2.3.1 Procurement of specialized medical equipment
6 modules of laboratory equipment procured by 2010. 16
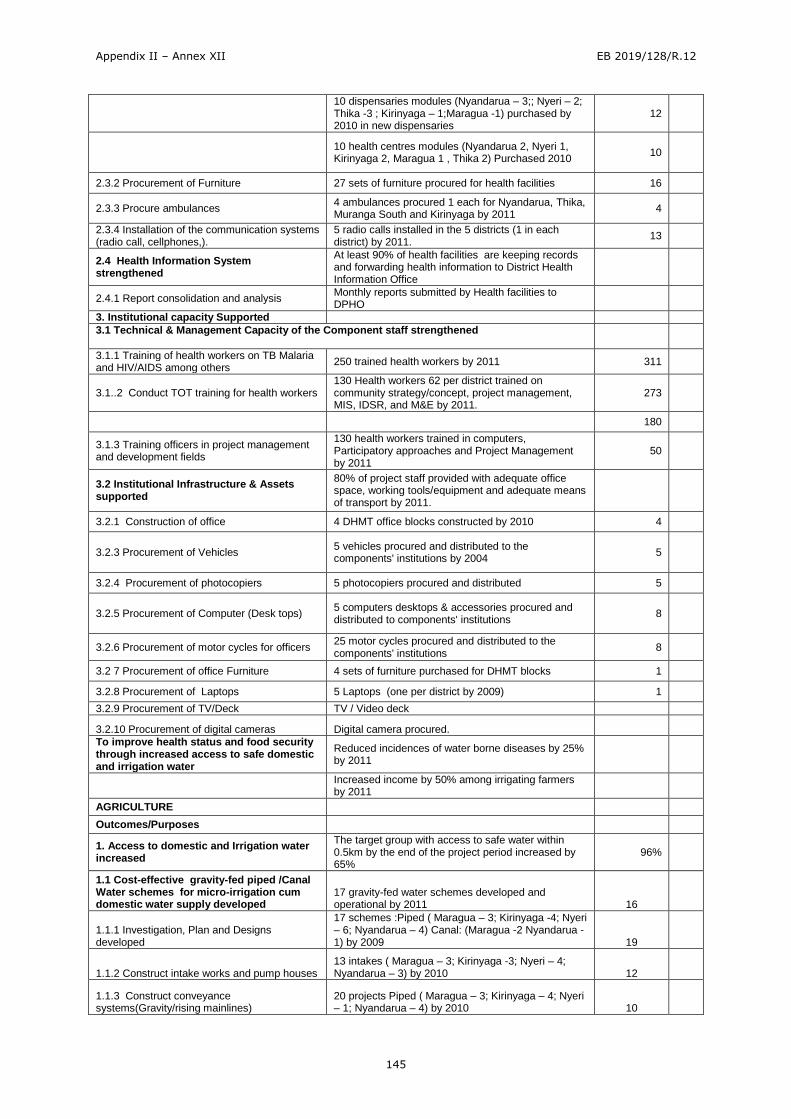
Appendix II – Annex XII EB 2019/128/R.12
145
10 dispensaries modules (Nyandarua – 3;; Nyeri – 2; Thika -3 ; Kirinyaga – 1;Maragua -1) purchased by 2010 in new dispensaries
12
10 health centres modules (Nyandarua 2, Nyeri 1, Kirinyaga 2, Maragua 1 , Thika 2) Purchased 2010
10
2.3.2 Procurement of Furniture 27 sets of furniture procured for health facilities 16
2.3.3 Procure ambulances 4 ambulances procured 1 each for Nyandarua, Thika, Muranga South and Kirinyaga by 2011
4
2.3.4 Installation of the communication systems (radio call, cellphones,).
5 radio calls installed in the 5 districts (1 in each district) by 2011.
13
2.4 Health Information System strengthened
At least 90% of health facilities are keeping records and forwarding health information to District Health Information Office
2.4.1 Report consolidation and analysis Monthly reports submitted by Health facilities to DPHO
3. Institutional capacity Supported
3.1 Technical & Management Capacity of the Component staff strengthened
3.1.1 Training of health workers on TB Malaria and HIV/AIDS among others
250 trained health workers by 2011 311
3.1..2 Conduct TOT training for health workers 130 Health workers 62 per district trained on community strategy/concept, project management, MIS, IDSR, and M&E by 2011.
273
180
3.1.3 Training officers in project management and development fields
130 health workers trained in computers, Participatory approaches and Project Management by 2011
50
3.2 Institutional Infrastructure & Assets supported
80% of project staff provided with adequate office space, working tools/equipment and adequate means of transport by 2011.
3.2.1 Construction of office 4 DHMT office blocks constructed by 2010 4
3.2.3 Procurement of Vehicles 5 vehicles procured and distributed to the components' institutions by 2004
5
3.2.4 Procurement of photocopiers 5 photocopiers procured and distributed 5
3.2.5 Procurement of Computer (Desk tops) 5 computers desktops & accessories procured and distributed to components' institutions
8
3.2.6 Procurement of motor cycles for officers 25 motor cycles procured and distributed to the components' institutions
8
3.2 7 Procurement of office Furniture 4 sets of furniture purchased for DHMT blocks 1
3.2.8 Procurement of Laptops 5 Laptops (one per district by 2009) 1
3.2.9 Procurement of TV/Deck TV / Video deck
3.2.10 Procurement of digital cameras Digital camera procured.
To improve health status and food security through increased access to safe domestic and irrigation water
Reduced incidences of water borne diseases by 25% by 2011
Increased income by 50% among irrigating farmers by 2011
AGRICULTURE
Outcomes/Purposes
1. Access to domestic and Irrigation water increased
The target group with access to safe water within 0.5km by the end of the project period increased by 65%
96%
1.1 Cost-effective gravity-fed piped /Canal Water schemes for micro-irrigation cum domestic water supply developed
17 gravity-fed water schemes developed and operational by 2011 16
1.1.1 Investigation, Plan and Designs developed
17 schemes :Piped ( Maragua – 3; Kirinyaga -4; Nyeri – 6; Nyandarua – 4) Canal: (Maragua -2 Nyandarua -1) by 2009 19
1.1.2 Construct intake works and pump houses 13 intakes ( Maragua – 3; Kirinyaga -3; Nyeri – 4; Nyandarua – 3) by 2010 12
1.1.3 Construct conveyance systems(Gravity/rising mainlines)
20 projects Piped ( Maragua – 3; Kirinyaga – 4; Nyeri – 1; Nyandarua – 4) by 2010 10
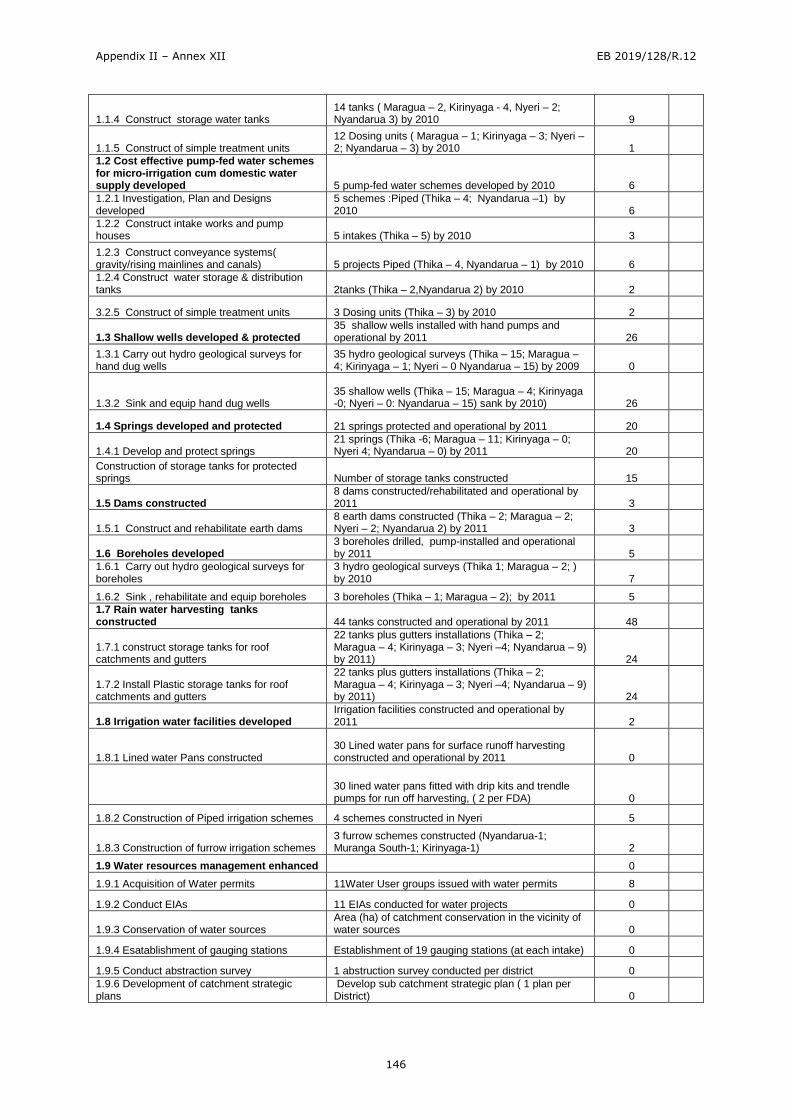
Appendix II – Annex XII EB 2019/128/R.12
146
1.1.4 Construct storage water tanks 14 tanks ( Maragua – 2, Kirinyaga - 4, Nyeri – 2; Nyandarua 3) by 2010 9
1.1.5 Construct of simple treatment units 12 Dosing units ( Maragua – 1; Kirinyaga – 3; Nyeri – 2; Nyandarua – 3) by 2010 1
1.2 Cost effective pump-fed water schemes for micro-irrigation cum domestic water supply developed 5 pump-fed water schemes developed by 2010 6
1.2.1 Investigation, Plan and Designs developed
5 schemes :Piped (Thika – 4; Nyandarua –1) by 2010 6
1.2.2 Construct intake works and pump houses 5 intakes (Thika – 5) by 2010 3
1.2.3 Construct conveyance systems( gravity/rising mainlines and canals) 5 projects Piped (Thika – 4, Nyandarua – 1) by 2010 6
1.2.4 Construct water storage & distribution tanks 2tanks (Thika – 2,Nyandarua 2) by 2010 2
3.2.5 Construct of simple treatment units 3 Dosing units (Thika – 3) by 2010 2
1.3 Shallow wells developed & protected 35 shallow wells installed with hand pumps and operational by 2011 26
1.3.1 Carry out hydro geological surveys for hand dug wells
35 hydro geological surveys (Thika – 15; Maragua – 4; Kirinyaga – 1; Nyeri – 0 Nyandarua – 15) by 2009 0
1.3.2 Sink and equip hand dug wells 35 shallow wells (Thika – 15; Maragua – 4; Kirinyaga -0; Nyeri – 0: Nyandarua – 15) sank by 2010) 26
1.4 Springs developed and protected 21 springs protected and operational by 2011 20
1.4.1 Develop and protect springs 21 springs (Thika -6; Maragua – 11; Kirinyaga – 0; Nyeri 4; Nyandarua – 0) by 2011 20
Construction of storage tanks for protected springs Number of storage tanks constructed 15
1.5 Dams constructed 8 dams constructed/rehabilitated and operational by 2011 3
1.5.1 Construct and rehabilitate earth dams 8 earth dams constructed (Thika – 2; Maragua – 2; Nyeri – 2; Nyandarua 2) by 2011 3
1.6 Boreholes developed 3 boreholes drilled, pump-installed and operational by 2011 5
1.6.1 Carry out hydro geological surveys for boreholes
3 hydro geological surveys (Thika 1; Maragua – 2; ) by 2010 7
1.6.2 Sink , rehabilitate and equip boreholes 3 boreholes (Thika – 1; Maragua – 2); by 2011 5
1.7 Rain water harvesting tanks constructed 44 tanks constructed and operational by 2011 48
1.7.1 construct storage tanks for roof catchments and gutters
22 tanks plus gutters installations (Thika – 2; Maragua – 4; Kirinyaga – 3; Nyeri –4; Nyandarua – 9) by 2011) 24
1.7.2 Install Plastic storage tanks for roof catchments and gutters
22 tanks plus gutters installations (Thika – 2; Maragua – 4; Kirinyaga – 3; Nyeri –4; Nyandarua – 9) by 2011) 24
1.8 Irrigation water facilities developed Irrigation facilities constructed and operational by 2011 2
1.8.1 Lined water Pans constructed 30 Lined water pans for surface runoff harvesting constructed and operational by 2011 0
30 lined water pans fitted with drip kits and trendle pumps for run off harvesting, ( 2 per FDA) 0
1.8.2 Construction of Piped irrigation schemes 4 schemes constructed in Nyeri 5
1.8.3 Construction of furrow irrigation schemes 3 furrow schemes constructed (Nyandarua-1; Muranga South-1; Kirinyaga-1) 2
1.9 Water resources management enhanced 0
1.9.1 Acquisition of Water permits 11Water User groups issued with water permits 8
1.9.2 Conduct EIAs 11 EIAs conducted for water projects 0
1.9.3 Conservation of water sources Area (ha) of catchment conservation in the vicinity of water sources 0
1.9.4 Esatablishment of gauging stations Establishment of 19 gauging stations (at each intake) 0
1.9.5 Conduct abstraction survey 1 abstruction survey conducted per district 0
1.9.6 Development of catchment strategic plans
Develop sub catchment strategic plan ( 1 plan per District) 0
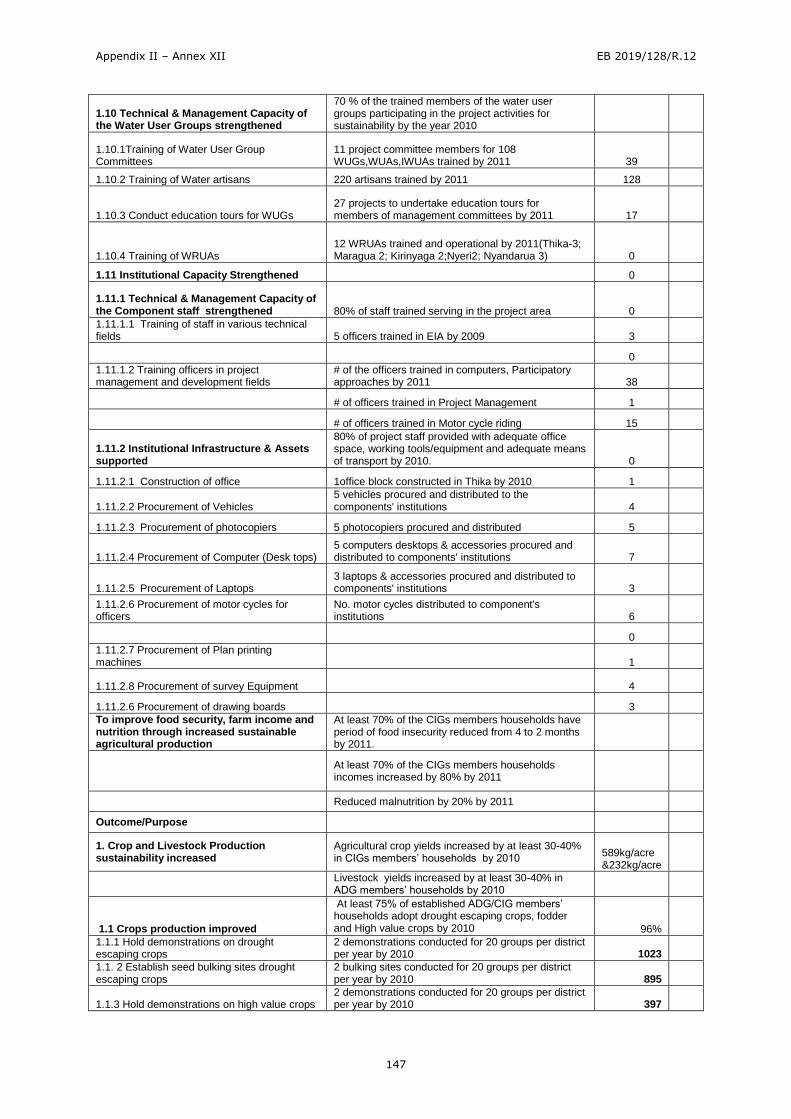
Appendix II – Annex XII EB 2019/128/R.12
147
1.10 Technical & Management Capacity of the Water User Groups strengthened
70 % of the trained members of the water user groups participating in the project activities for sustainability by the year 2010
1.10.1Training of Water User Group Committees
11 project committee members for 108 WUGs,WUAs,IWUAs trained by 2011 39
1.10.2 Training of Water artisans 220 artisans trained by 2011 128
1.10.3 Conduct education tours for WUGs 27 projects to undertake education tours for members of management committees by 2011 17
1.10.4 Training of WRUAs 12 WRUAs trained and operational by 2011(Thika-3; Maragua 2; Kirinyaga 2;Nyeri2; Nyandarua 3) 0
1.11 Institutional Capacity Strengthened 0
1.11.1 Technical & Management Capacity of the Component staff strengthened 80% of staff trained serving in the project area 0
1.11.1.1 Training of staff in various technical fields 5 officers trained in EIA by 2009 3
0
1.11.1.2 Training officers in project management and development fields
# of the officers trained in computers, Participatory approaches by 2011 38
# of officers trained in Project Management 1
# of officers trained in Motor cycle riding 15
1.11.2 Institutional Infrastructure & Assets supported
80% of project staff provided with adequate office space, working tools/equipment and adequate means of transport by 2010. 0
1.11.2.1 Construction of office 1office block constructed in Thika by 2010 1
1.11.2.2 Procurement of Vehicles 5 vehicles procured and distributed to the components' institutions 4
1.11.2.3 Procurement of photocopiers 5 photocopiers procured and distributed 5
1.11.2.4 Procurement of Computer (Desk tops) 5 computers desktops & accessories procured and distributed to components' institutions 7
1.11.2.5 Procurement of Laptops 3 laptops & accessories procured and distributed to components' institutions 3
1.11.2.6 Procurement of motor cycles for officers
No. motor cycles distributed to component's institutions 6
0
1.11.2.7 Procurement of Plan printing machines 1
1.11.2.8 Procurement of survey Equipment 4
1.11.2.6 Procurement of drawing boards 3
To improve food security, farm income and nutrition through increased sustainable agricultural production
At least 70% of the CIGs members households have period of food insecurity reduced from 4 to 2 months by 2011.
At least 70% of the CIGs members households incomes increased by 80% by 2011
Reduced malnutrition by 20% by 2011
Outcome/Purpose
1. Crop and Livestock Production sustainability increased
Agricultural crop yields increased by at least 30-40% in CIGs members’ households by 2010
589kg/acre &232kg/acre
Livestock yields increased by at least 30-40% in ADG members’ households by 2010
1.1 Crops production improved
At least 75% of established ADG/CIG members’ households adopt drought escaping crops, fodder and High value crops by 2010 96%
1.1.1 Hold demonstrations on drought escaping crops
2 demonstrations conducted for 20 groups per district per year by 2010 1023
1.1. 2 Establish seed bulking sites drought escaping crops
2 bulking sites conducted for 20 groups per district per year by 2010 895
1.1.3 Hold demonstrations on high value crops 2 demonstrations conducted for 20 groups per district per year by 2010 397
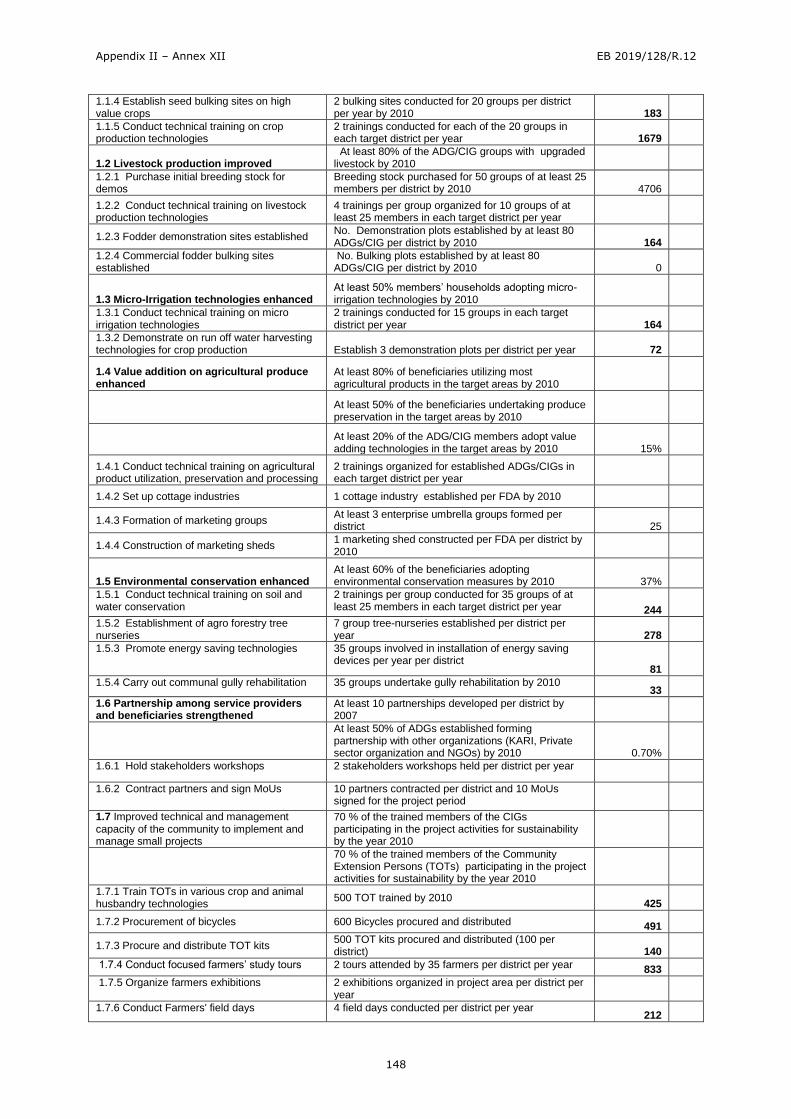
Appendix II – Annex XII EB 2019/128/R.12
148
1.1.4 Establish seed bulking sites on high value crops
2 bulking sites conducted for 20 groups per district per year by 2010 183
1.1.5 Conduct technical training on crop production technologies
2 trainings conducted for each of the 20 groups in each target district per year 1679
1.2 Livestock production improved At least 80% of the ADG/CIG groups with upgraded livestock by 2010
1.2.1 Purchase initial breeding stock for demos
Breeding stock purchased for 50 groups of at least 25 members per district by 2010 4706
1.2.2 Conduct technical training on livestock production technologies
4 trainings per group organized for 10 groups of at least 25 members in each target district per year
1.2.3 Fodder demonstration sites established No. Demonstration plots established by at least 80 ADGs/CIG per district by 2010 164
1.2.4 Commercial fodder bulking sites established
No. Bulking plots established by at least 80 ADGs/CIG per district by 2010 0
1.3 Micro-Irrigation technologies enhanced At least 50% members’ households adopting micro-irrigation technologies by 2010
1.3.1 Conduct technical training on micro irrigation technologies
2 trainings conducted for 15 groups in each target district per year 164
1.3.2 Demonstrate on run off water harvesting technologies for crop production Establish 3 demonstration plots per district per year 72
1.4 Value addition on agricultural produce enhanced
At least 80% of beneficiaries utilizing most agricultural products in the target areas by 2010
At least 50% of the beneficiaries undertaking produce preservation in the target areas by 2010
At least 20% of the ADG/CIG members adopt value adding technologies in the target areas by 2010 15%
1.4.1 Conduct technical training on agricultural product utilization, preservation and processing
2 trainings organized for established ADGs/CIGs in each target district per year
1.4.2 Set up cottage industries 1 cottage industry established per FDA by 2010
1.4.3 Formation of marketing groups At least 3 enterprise umbrella groups formed per district 25
1.4.4 Construction of marketing sheds 1 marketing shed constructed per FDA per district by 2010
1.5 Environmental conservation enhanced At least 60% of the beneficiaries adopting environmental conservation measures by 2010 37%
1.5.1 Conduct technical training on soil and water conservation
2 trainings per group conducted for 35 groups of at least 25 members in each target district per year 244
1.5.2 Establishment of agro forestry tree nurseries
7 group tree-nurseries established per district per year 278
1.5.3 Promote energy saving technologies 35 groups involved in installation of energy saving devices per year per district
81
1.5.4 Carry out communal gully rehabilitation 35 groups undertake gully rehabilitation by 2010 33
1.6 Partnership among service providers and beneficiaries strengthened
At least 10 partnerships developed per district by 2007
At least 50% of ADGs established forming partnership with other organizations (KARI, Private sector organization and NGOs) by 2010 0.70%
1.6.1 Hold stakeholders workshops 2 stakeholders workshops held per district per year
1.6.2 Contract partners and sign MoUs 10 partners contracted per district and 10 MoUs signed for the project period
1.7 Improved technical and management capacity of the community to implement and manage small projects
70 % of the trained members of the CIGs participating in the project activities for sustainability by the year 2010
70 % of the trained members of the Community Extension Persons (TOTs) participating in the project activities for sustainability by the year 2010
1.7.1 Train TOTs in various crop and animal husbandry technologies
500 TOT trained by 2010 425
1.7.2 Procurement of bicycles 600 Bicycles procured and distributed 491
1.7.3 Procure and distribute TOT kits 500 TOT kits procured and distributed (100 per district) 140
1.7.4 Conduct focused farmers’ study tours 2 tours attended by 35 farmers per district per year 833
1.7.5 Organize farmers exhibitions 2 exhibitions organized in project area per district per year
1.7.6 Conduct Farmers' field days 4 field days conducted per district per year 212
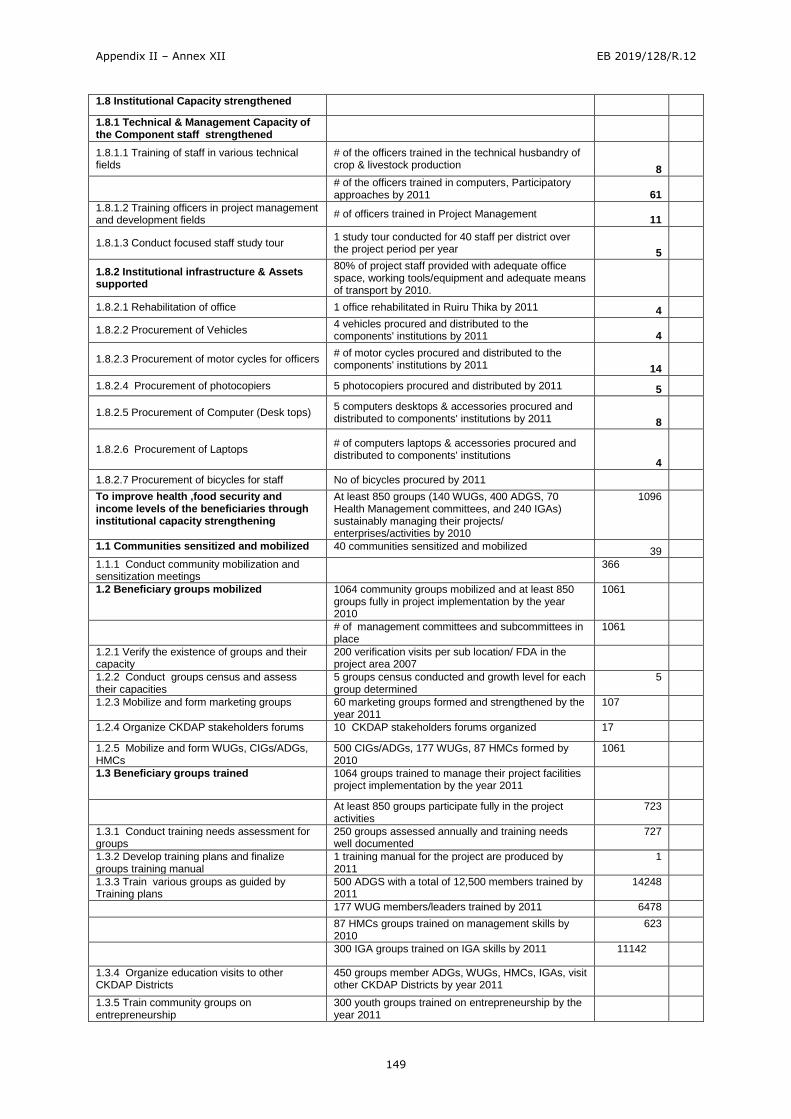
Appendix II – Annex XII EB 2019/128/R.12
149
1.8 Institutional Capacity strengthened
1.8.1 Technical & Management Capacity of the Component staff strengthened
1.8.1.1 Training of staff in various technical fields
# of the officers trained in the technical husbandry of crop & livestock production 8
# of the officers trained in computers, Participatory approaches by 2011 61
1.8.1.2 Training officers in project management and development fields
# of officers trained in Project Management 11
1.8.1.3 Conduct focused staff study tour 1 study tour conducted for 40 staff per district over the project period per year 5
1.8.2 Institutional infrastructure & Assets supported
80% of project staff provided with adequate office space, working tools/equipment and adequate means of transport by 2010.
1.8.2.1 Rehabilitation of office 1 office rehabilitated in Ruiru Thika by 2011 4
1.8.2.2 Procurement of Vehicles 4 vehicles procured and distributed to the components' institutions by 2011 4
1.8.2.3 Procurement of motor cycles for officers # of motor cycles procured and distributed to the components' institutions by 2011 14
1.8.2.4 Procurement of photocopiers 5 photocopiers procured and distributed by 2011 5
1.8.2.5 Procurement of Computer (Desk tops) 5 computers desktops & accessories procured and distributed to components' institutions by 2011 8
1.8.2.6 Procurement of Laptops # of computers laptops & accessories procured and distributed to components' institutions
4
1.8.2.7 Procurement of bicycles for staff No of bicycles procured by 2011
To improve health ,food security and income levels of the beneficiaries through institutional capacity strengthening
At least 850 groups (140 WUGs, 400 ADGS, 70 Health Management committees, and 240 IGAs) sustainably managing their projects/ enterprises/activities by 2010
1096
1.1 Communities sensitized and mobilized 40 communities sensitized and mobilized 39
1.1.1 Conduct community mobilization and sensitization meetings
366
1.2 Beneficiary groups mobilized 1064 community groups mobilized and at least 850 groups fully in project implementation by the year 2010
1061
# of management committees and subcommittees in place
1061
1.2.1 Verify the existence of groups and their capacity
200 verification visits per sub location/ FDA in the project area 2007
1.2.2 Conduct groups census and assess their capacities
5 groups census conducted and growth level for each group determined
5
1.2.3 Mobilize and form marketing groups 60 marketing groups formed and strengthened by the year 2011
107
1.2.4 Organize CKDAP stakeholders forums 10 CKDAP stakeholders forums organized 17
1.2.5 Mobilize and form WUGs, CIGs/ADGs, HMCs
500 CIGs/ADGs, 177 WUGs, 87 HMCs formed by 2010
1061
1.3 Beneficiary groups trained 1064 groups trained to manage their project facilities project implementation by the year 2011
At least 850 groups participate fully in the project activities
723
1.3.1 Conduct training needs assessment for groups
250 groups assessed annually and training needs well documented
727
1.3.2 Develop training plans and finalize groups training manual
1 training manual for the project are produced by 2011
1
1.3.3 Train various groups as guided by Training plans
500 ADGS with a total of 12,500 members trained by 2011
14248
177 WUG members/leaders trained by 2011 6478
87 HMCs groups trained on management skills by 2010
623
300 IGA groups trained on IGA skills by 2011 11142
1.3.4 Organize education visits to other CKDAP Districts
450 groups member ADGs, WUGs, HMCs, IGAs, visit other CKDAP Districts by year 2011
1.3.5 Train community groups on entrepreneurship
300 youth groups trained on entrepreneurship by the year 2011
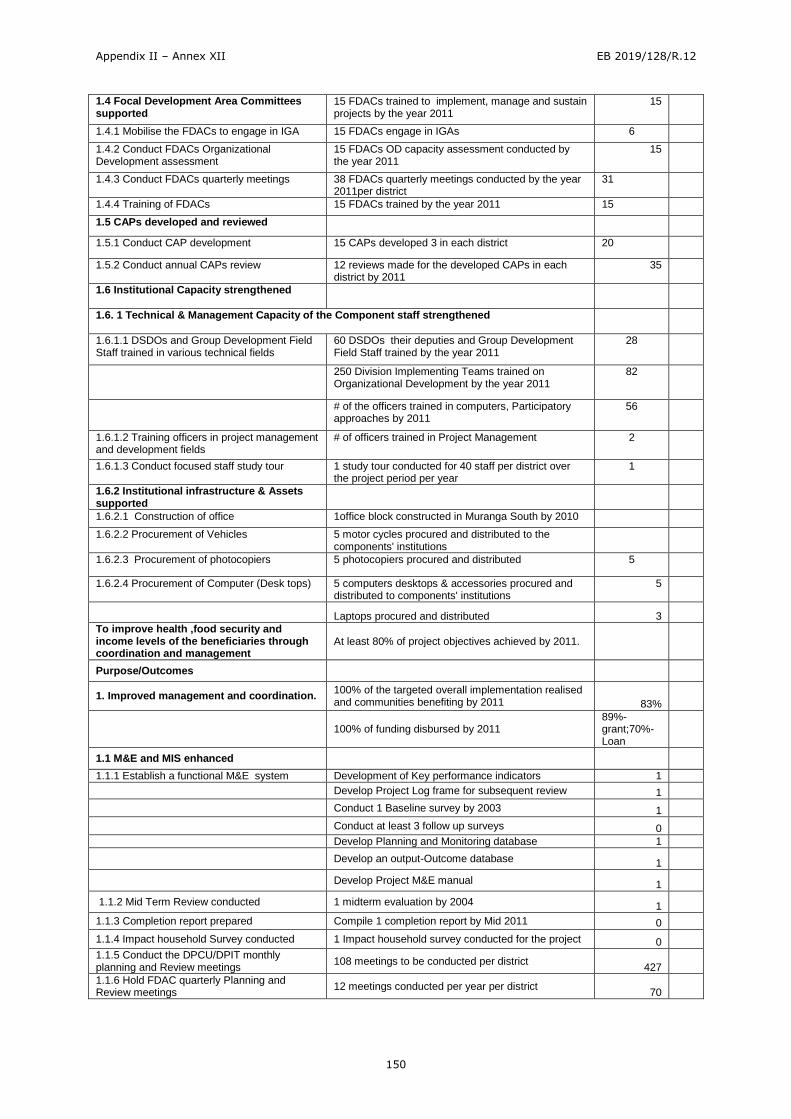
Appendix II – Annex XII EB 2019/128/R.12
150
1.4 Focal Development Area Committees supported
15 FDACs trained to implement, manage and sustain projects by the year 2011
15
1.4.1 Mobilise the FDACs to engage in IGA 15 FDACs engage in IGAs 6
1.4.2 Conduct FDACs Organizational Development assessment
15 FDACs OD capacity assessment conducted by the year 2011
15
1.4.3 Conduct FDACs quarterly meetings 38 FDACs quarterly meetings conducted by the year 2011per district
31
1.4.4 Training of FDACs 15 FDACs trained by the year 2011 15
1.5 CAPs developed and reviewed
1.5.1 Conduct CAP development 15 CAPs developed 3 in each district 20
1.5.2 Conduct annual CAPs review 12 reviews made for the developed CAPs in each district by 2011
35
1.6 Institutional Capacity strengthened
1.6. 1 Technical & Management Capacity of the Component staff strengthened
1.6.1.1 DSDOs and Group Development Field Staff trained in various technical fields
60 DSDOs their deputies and Group Development Field Staff trained by the year 2011
28
250 Division Implementing Teams trained on Organizational Development by the year 2011
82
# of the officers trained in computers, Participatory approaches by 2011
56
1.6.1.2 Training officers in project management and development fields
# of officers trained in Project Management 2
1.6.1.3 Conduct focused staff study tour 1 study tour conducted for 40 staff per district over the project period per year
1
1.6.2 Institutional infrastructure & Assets supported
1.6.2.1 Construction of office 1office block constructed in Muranga South by 2010
1.6.2.2 Procurement of Vehicles 5 motor cycles procured and distributed to the components' institutions
1.6.2.3 Procurement of photocopiers 5 photocopiers procured and distributed 5
1.6.2.4 Procurement of Computer (Desk tops) 5 computers desktops & accessories procured and distributed to components' institutions
5
Laptops procured and distributed 3
To improve health ,food security and income levels of the beneficiaries through coordination and management
At least 80% of project objectives achieved by 2011.
Purpose/Outcomes
1. Improved management and coordination. 100% of the targeted overall implementation realised and communities benefiting by 2011 83%
100% of funding disbursed by 2011 89%-grant;70%-Loan
1.1 M&E and MIS enhanced
1.1.1 Establish a functional M&E system Development of Key performance indicators 1
Develop Project Log frame for subsequent review 1
Conduct 1 Baseline survey by 2003 1
Conduct at least 3 follow up surveys 0
Develop Planning and Monitoring database 1
Develop an output-Outcome database 1
Develop Project M&E manual 1
1.1.2 Mid Term Review conducted 1 midterm evaluation by 2004 1
1.1.3 Completion report prepared Compile 1 completion report by Mid 2011 0
1.1.4 Impact household Survey conducted 1 Impact household survey conducted for the project 0
1.1.5 Conduct the DPCU/DPIT monthly planning and Review meetings
108 meetings to be conducted per district 427
1.1.6 Hold FDAC quarterly Planning and Review meetings
12 meetings conducted per year per district 70
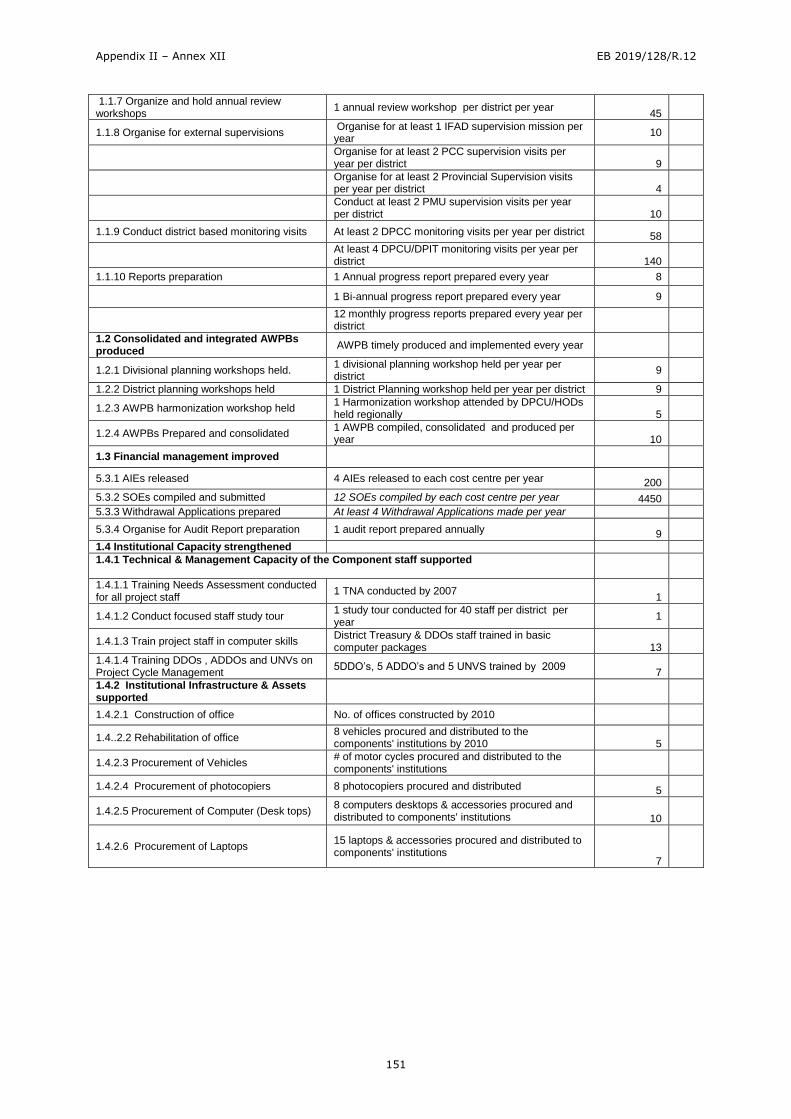
Appendix II – Annex XII EB 2019/128/R.12
151
1.1.7 Organize and hold annual review workshops
1 annual review workshop per district per year 45
1.1.8 Organise for external supervisions Organise for at least 1 IFAD supervision mission per year
10
Organise for at least 2 PCC supervision visits per year per district 9
Organise for at least 2 Provincial Supervision visits per year per district 4
Conduct at least 2 PMU supervision visits per year per district 10
1.1.9 Conduct district based monitoring visits At least 2 DPCC monitoring visits per year per district 58
At least 4 DPCU/DPIT monitoring visits per year per district 140
1.1.10 Reports preparation 1 Annual progress report prepared every year 8
1 Bi-annual progress report prepared every year 9
12 monthly progress reports prepared every year per district
1.2 Consolidated and integrated AWPBs produced
AWPB timely produced and implemented every year
1.2.1 Divisional planning workshops held. 1 divisional planning workshop held per year per district
9
1.2.2 District planning workshops held 1 District Planning workshop held per year per district 9
1.2.3 AWPB harmonization workshop held 1 Harmonization workshop attended by DPCU/HODs held regionally 5
1.2.4 AWPBs Prepared and consolidated 1 AWPB compiled, consolidated and produced per year 10
1.3 Financial management improved
5.3.1 AIEs released 4 AIEs released to each cost centre per year 200
5.3.2 SOEs compiled and submitted 12 SOEs compiled by each cost centre per year 4450
5.3.3 Withdrawal Applications prepared At least 4 Withdrawal Applications made per year
5.3.4 Organise for Audit Report preparation 1 audit report prepared annually 9
1.4 Institutional Capacity strengthened
1.4.1 Technical & Management Capacity of the Component staff supported
1.4.1.1 Training Needs Assessment conducted for all project staff
1 TNA conducted by 2007 1
1.4.1.2 Conduct focused staff study tour 1 study tour conducted for 40 staff per district per year
1
1.4.1.3 Train project staff in computer skills District Treasury & DDOs staff trained in basic computer packages 13
1.4.1.4 Training DDOs , ADDOs and UNVs on Project Cycle Management
5DDO’s, 5 ADDO’s and 5 UNVS trained by 2009 7
1.4.2 Institutional Infrastructure & Assets supported
1.4.2.1 Construction of office No. of offices constructed by 2010
1.4..2.2 Rehabilitation of office 8 vehicles procured and distributed to the components' institutions by 2010 5
1.4.2.3 Procurement of Vehicles # of motor cycles procured and distributed to the components' institutions
1.4.2.4 Procurement of photocopiers 8 photocopiers procured and distributed 5
1.4.2.5 Procurement of Computer (Desk tops) 8 computers desktops & accessories procured and distributed to components' institutions 10
1.4.2.6 Procurement of Laptops 15 laptops & accessories procured and distributed to components' institutions
7
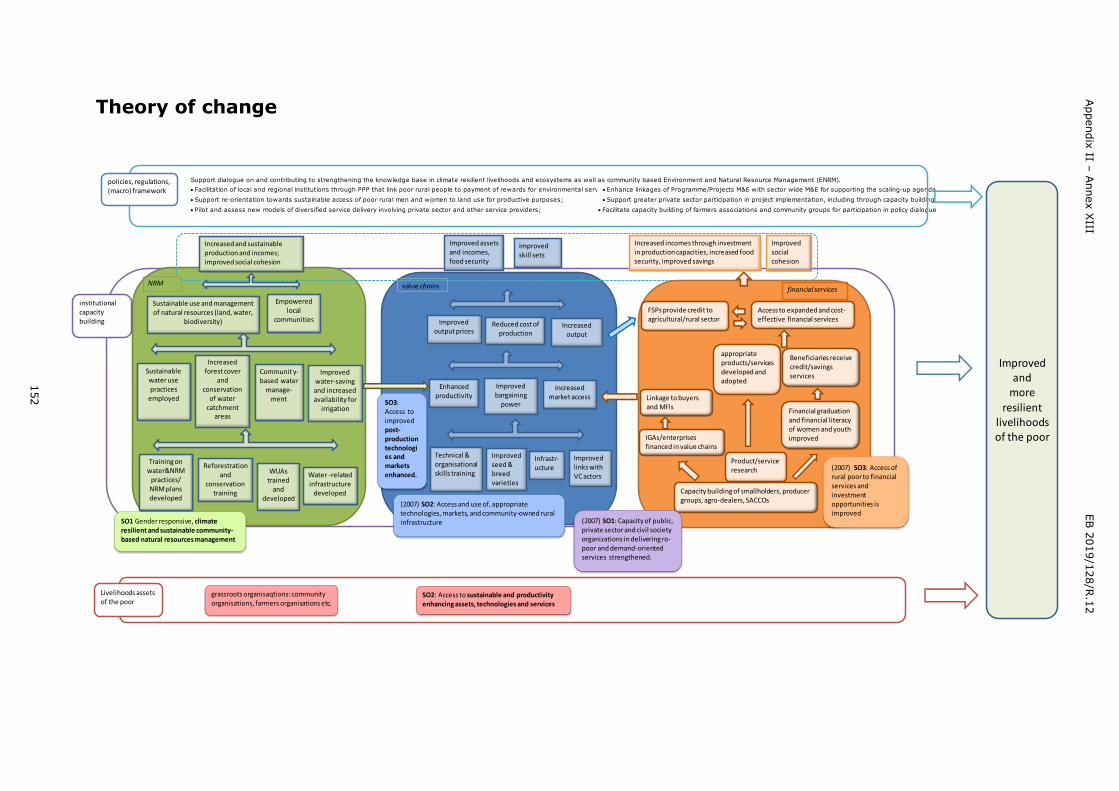
152
Appendix
II – A
nnex X
III
EB 2
019/1
28/R
.12
Theory of change
Support dialogue on and contributing to strengthening the knowledge base in climate resilient livelihoods and ecosystems as well as community based Environment and Natural Resource Management (ENRM).
Facilitation of local and regional institutions through PPP that link poor rural people to payment of rewards for environmental services Enhance linkages of Programme/Projects M&E with sector wide M&E for supporting the scaling-up agenda.
Support re-orientation towards sustainable access of poor rural men and women to land use for productive purposes; Support greater private sector participation in project implementation, including through capacity building
Pilot and assess new models of diversified service delivery involving private sector and other service providers; Facilitate capacity building of farmers associations and community groups for participation in policy dialogue
NRM
SO1 Gender responsive, climate resilient and sustainable community-based natural resources management
institutional capacity building
policies, regulations,(macro) framework
SO2: Access to sustainable and productivity enhancing assets, technologies and services
Livelihoods assets of the poor
grassroots organisaqtions: community organisations, farmers organisations etc.
Improved and
more
resilient livelihoods of the poor
value chains
(2007) SO2: Access and use of, appropriate technologies, markets, and community-owned rural infrastructure
SO3: Access to improved post-production technologies and markets enhanced.
Improved assets and incomes, food security
Improvedskill sets
Increased output
Reduced cost of production
Improvedoutput prices
Enhanced productivity
Improvedbargaining
power
Increased market access
Technical & organisational skills training
Infrastr-ucture
Improvedlinks with VC actors
Improved seed & breedvarieties
Increased incomes through investmentin production capacities, increased food security, improved savings
Improvedsocial cohesion
Access to expanded and cost-effective financial services
FSPs provide credit to agricultural/rural sector
Linkage to buyers and MFIs
appropriate products/services developed and adopted
IGAs/enterprisesfinanced in value chains
Financial graduation and financial literacy of women and youthimproved
Capacity building of smallholders, producer groups, agro-dealers, SACCOs
Product/serviceresearch
Beneficiaries receive credit/savings services
(2007) SO1: Capacity of public, private sector and civil society organizations in delivering ro-poor and demand-oriented services strengthened.
(2007) SO3: Access of rural poor to financial services and investment opportunities is improved
financial services
Training on water&NRM
practices/ NRM plans developed
Water -relatedinfrastructure
developed
WUAs trained
and developed
Reforestrationand
conservation training
Improvedwater-saving and increased availability for
irrigation
Increased forest cover
and conservation
of water catchment
areas
Communit y-based water
manage-ment
Sustainablewater use practices
employed
Empoweredlocal
communities
Sustainable use and management of natural resources (land, water,
biodiversity)
Increased and sustainable production and incomes; improved social cohesion
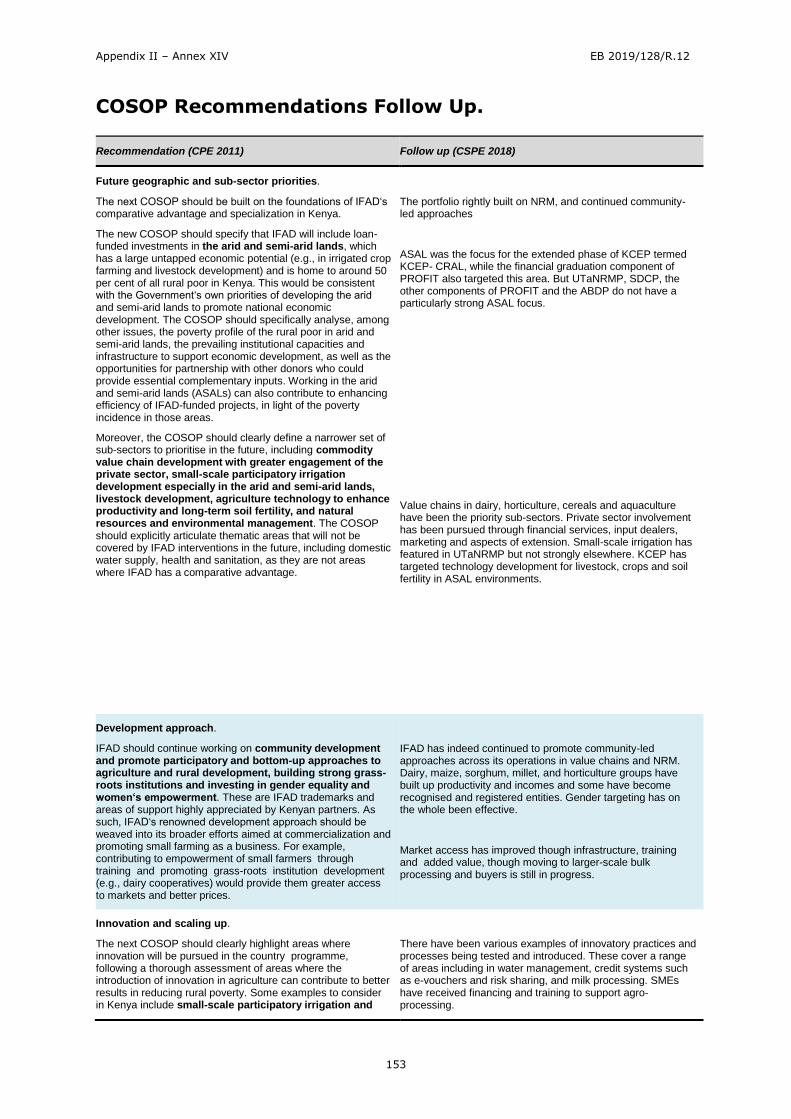
Appendix II – Annex XIV EB 2019/128/R.12
153
COSOP Recommendations Follow Up.
Recommendation (CPE 2011) Follow up (CSPE 2018)
Future geographic and sub-sector priorities.
The next COSOP should be built on the foundations of IFAD‘s comparative advantage and specialization in Kenya.
The new COSOP should specify that IFAD will include loan-funded investments in the arid and semi-arid lands, which has a large untapped economic potential (e.g., in irrigated crop farming and livestock development) and is home to around 50 per cent of all rural poor in Kenya. This would be consistent with the Government‘s own priorities of developing the arid and semi-arid lands to promote national economic development. The COSOP should specifically analyse, among other issues, the poverty profile of the rural poor in arid and semi-arid lands, the prevailing institutional capacities and infrastructure to support economic development, as well as the opportunities for partnership with other donors who could provide essential complementary inputs. Working in the arid and semi-arid lands (ASALs) can also contribute to enhancing efficiency of IFAD-funded projects, in light of the poverty incidence in those areas.
Moreover, the COSOP should clearly define a narrower set of sub-sectors to prioritise in the future, including commodity value chain development with greater engagement of the private sector, small-scale participatory irrigation development especially in the arid and semi-arid lands, livestock development, agriculture technology to enhance productivity and long-term soil fertility, and natural resources and environmental management. The COSOP should explicitly articulate thematic areas that will not be covered by IFAD interventions in the future, including domestic water supply, health and sanitation, as they are not areas where IFAD has a comparative advantage.
The portfolio rightly built on NRM, and continued community-led approaches
ASAL was the focus for the extended phase of KCEP termed KCEP- CRAL, while the financial graduation component of PROFIT also targeted this area. But UTaNRMP, SDCP, the other components of PROFIT and the ABDP do not have a particularly strong ASAL focus.
Value chains in dairy, horticulture, cereals and aquaculture have been the priority sub-sectors. Private sector involvement has been pursued through financial services, input dealers, marketing and aspects of extension. Small-scale irrigation has featured in UTaNRMP but not strongly elsewhere. KCEP has targeted technology development for livestock, crops and soil fertility in ASAL environments.
Development approach.
IFAD should continue working on community development and promote participatory and bottom-up approaches to agriculture and rural development, building strong grass-roots institutions and investing in gender equality and women‘s empowerment. These are IFAD trademarks and areas of support highly appreciated by Kenyan partners. As such, IFAD‘s renowned development approach should be weaved into its broader efforts aimed at commercialization and promoting small farming as a business. For example, contributing to empowerment of small farmers through training and promoting grass-roots institution development (e.g., dairy cooperatives) would provide them greater access to markets and better prices.
IFAD has indeed continued to promote community-led approaches across its operations in value chains and NRM. Dairy, maize, sorghum, millet, and horticulture groups have built up productivity and incomes and some have become recognised and registered entities. Gender targeting has on the whole been effective.
Market access has improved though infrastructure, training and added value, though moving to larger-scale bulk processing and buyers is still in progress.
Innovation and scaling up.
The next COSOP should clearly highlight areas where innovation will be pursued in the country programme, following a thorough assessment of areas where the introduction of innovation in agriculture can contribute to better results in reducing rural poverty. Some examples to consider in Kenya include small-scale participatory irrigation and
There have been various examples of innovatory practices and processes being tested and introduced. These cover a range of areas including in water management, credit systems such as e-vouchers and risk sharing, and milk processing. SMEs have received financing and training to support agro-processing.
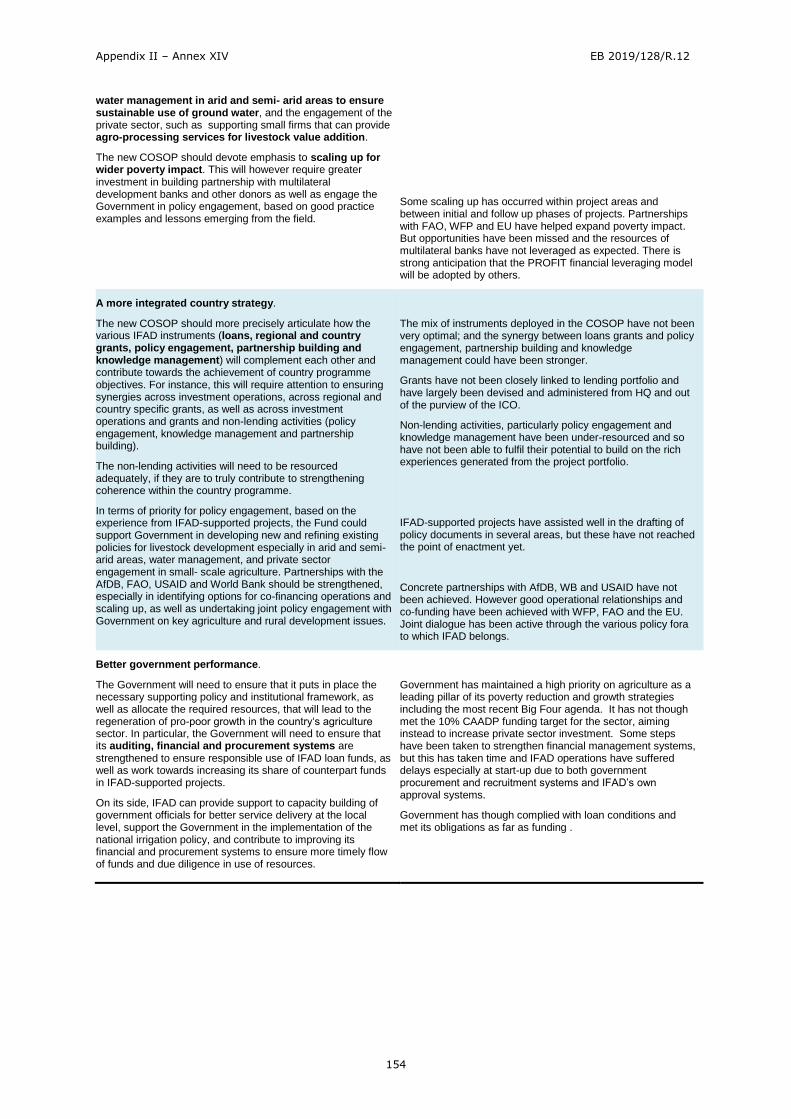
Appendix II – Annex XIV EB 2019/128/R.12
154
water management in arid and semi- arid areas to ensure sustainable use of ground water, and the engagement of the private sector, such as supporting small firms that can provide agro-processing services for livestock value addition.
The new COSOP should devote emphasis to scaling up for wider poverty impact. This will however require greater investment in building partnership with multilateral development banks and other donors as well as engage the Government in policy engagement, based on good practice examples and lessons emerging from the field.
Some scaling up has occurred within project areas and between initial and follow up phases of projects. Partnerships with FAO, WFP and EU have helped expand poverty impact. But opportunities have been missed and the resources of multilateral banks have not leveraged as expected. There is strong anticipation that the PROFIT financial leveraging model will be adopted by others.
A more integrated country strategy.
The new COSOP should more precisely articulate how the various IFAD instruments (loans, regional and country grants, policy engagement, partnership building and knowledge management) will complement each other and contribute towards the achievement of country programme objectives. For instance, this will require attention to ensuring synergies across investment operations, across regional and country specific grants, as well as across investment operations and grants and non-lending activities (policy engagement, knowledge management and partnership building).
The non-lending activities will need to be resourced adequately, if they are to truly contribute to strengthening coherence within the country programme.
In terms of priority for policy engagement, based on the experience from IFAD-supported projects, the Fund could support Government in developing new and refining existing policies for livestock development especially in arid and semi-arid areas, water management, and private sector engagement in small- scale agriculture. Partnerships with the AfDB, FAO, USAID and World Bank should be strengthened, especially in identifying options for co-financing operations and scaling up, as well as undertaking joint policy engagement with Government on key agriculture and rural development issues.
The mix of instruments deployed in the COSOP have not been very optimal; and the synergy between loans grants and policy engagement, partnership building and knowledge management could have been stronger.
Grants have not been closely linked to lending portfolio and have largely been devised and administered from HQ and out of the purview of the ICO.
Non-lending activities, particularly policy engagement and knowledge management have been under-resourced and so have not been able to fulfil their potential to build on the rich experiences generated from the project portfolio.
IFAD-supported projects have assisted well in the drafting of policy documents in several areas, but these have not reached the point of enactment yet.
Concrete partnerships with AfDB, WB and USAID have not been achieved. However good operational relationships and co-funding have been achieved with WFP, FAO and the EU. Joint dialogue has been active through the various policy fora to which IFAD belongs.
Better government performance.
The Government will need to ensure that it puts in place the necessary supporting policy and institutional framework, as well as allocate the required resources, that will lead to the regeneration of pro-poor growth in the country‘s agriculture sector. In particular, the Government will need to ensure that its auditing, financial and procurement systems are strengthened to ensure responsible use of IFAD loan funds, as well as work towards increasing its share of counterpart funds in IFAD-supported projects.
On its side, IFAD can provide support to capacity building of government officials for better service delivery at the local level, support the Government in the implementation of the national irrigation policy, and contribute to improving its financial and procurement systems to ensure more timely flow of funds and due diligence in use of resources.
Government has maintained a high priority on agriculture as a leading pillar of its poverty reduction and growth strategies including the most recent Big Four agenda. It has not though met the 10% CAADP funding target for the sector, aiming instead to increase private sector investment. Some steps have been taken to strengthen financial management systems, but this has taken time and IFAD operations have suffered delays especially at start-up due to both government procurement and recruitment systems and IFAD’s own approval systems.
Government has though complied with loan conditions and met its obligations as far as funding .
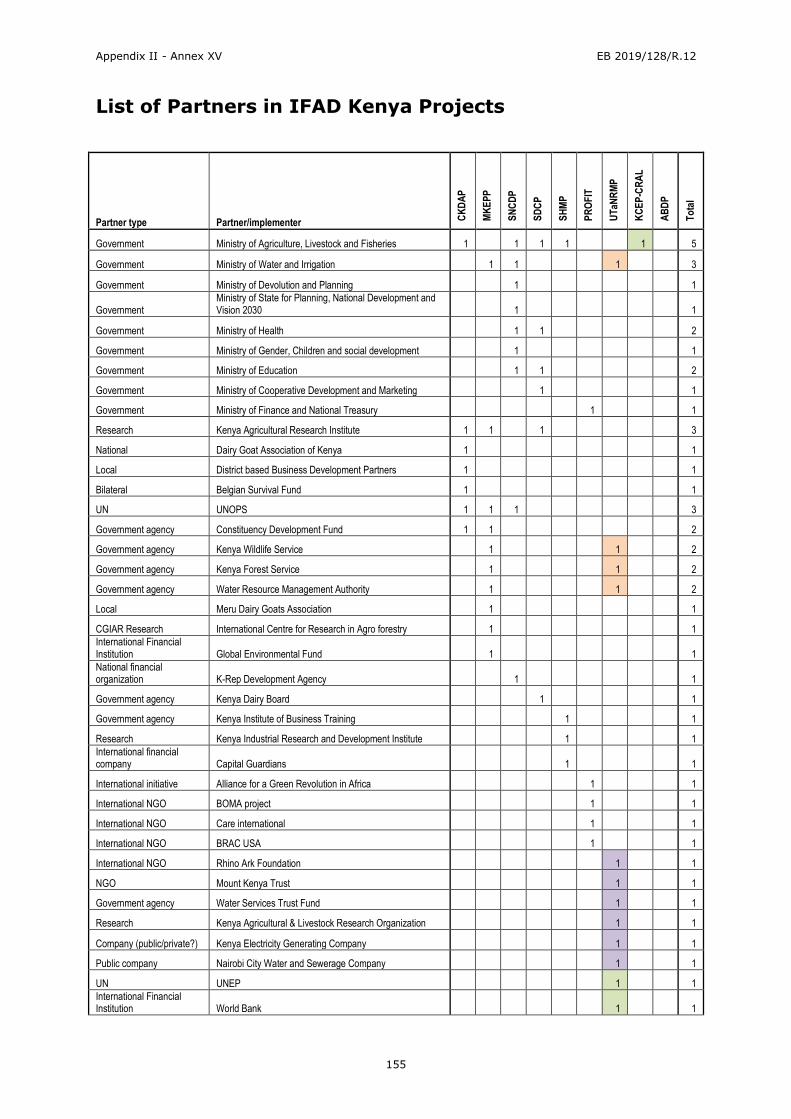
Appendix II - Annex XV EB 2019/128/R.12
155
List of Partners in IFAD Kenya Projects
Partner type Partner/implementer CK
DA
P
MK
EP
P
SN
CD
P
SD
CP
SH
MP
PR
OF
IT
UT
aNR
MP
KC
EP
-CR
AL
AB
DP
To
tal
Government Ministry of Agriculture, Livestock and Fisheries 1 1 1 1 1 5
Government Ministry of Water and Irrigation 1 1 1 3
Government Ministry of Devolution and Planning 1 1
Government Ministry of State for Planning, National Development and Vision 2030 1 1
Government Ministry of Health 1 1 2
Government Ministry of Gender, Children and social development 1 1
Government Ministry of Education 1 1 2
Government Ministry of Cooperative Development and Marketing 1 1
Government Ministry of Finance and National Treasury 1 1
Research Kenya Agricultural Research Institute 1 1 1 3
National Dairy Goat Association of Kenya 1 1
Local District based Business Development Partners 1 1
Bilateral Belgian Survival Fund 1 1
UN UNOPS 1 1 1 3
Government agency Constituency Development Fund 1 1 2
Government agency Kenya Wildlife Service 1 1 2
Government agency Kenya Forest Service 1 1 2
Government agency Water Resource Management Authority 1 1 2
Local Meru Dairy Goats Association 1 1
CGIAR Research International Centre for Research in Agro forestry 1 1
International Financial Institution Global Environmental Fund 1 1
National financial organization K-Rep Development Agency 1 1
Government agency Kenya Dairy Board 1 1
Government agency Kenya Institute of Business Training 1 1
Research Kenya Industrial Research and Development Institute 1 1
International financial company Capital Guardians 1 1
International initiative Alliance for a Green Revolution in Africa 1 1
International NGO BOMA project 1 1
International NGO Care international 1 1
International NGO BRAC USA 1 1
International NGO Rhino Ark Foundation 1 1
NGO Mount Kenya Trust 1 1
Government agency Water Services Trust Fund 1 1
Research Kenya Agricultural & Livestock Research Organization 1 1
Company (public/private?) Kenya Electricity Generating Company 1 1
Public company Nairobi City Water and Sewerage Company 1 1
UN UNEP 1 1
International Financial Institution World Bank 1 1
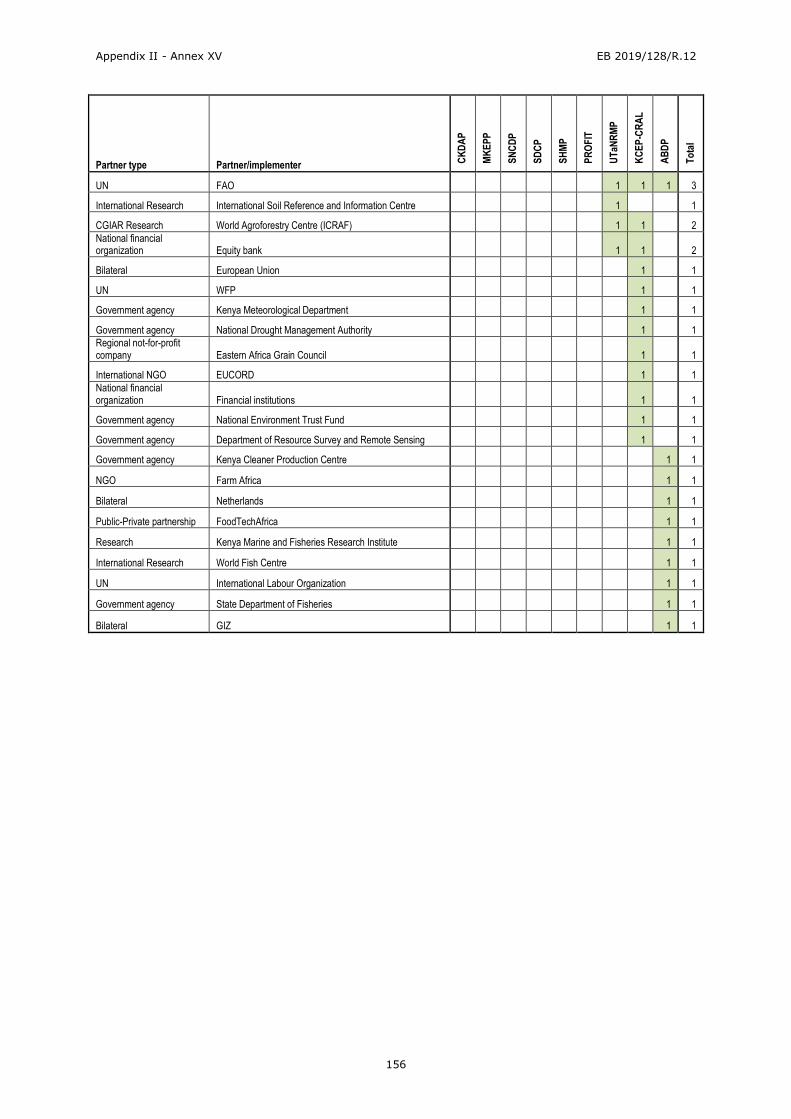
Appendix II - Annex XV EB 2019/128/R.12
156
Partner type Partner/implementer CK
DA
P
MK
EP
P
SN
CD
P
SD
CP
SH
MP
PR
OF
IT
UT
aNR
MP
KC
EP
-CR
AL
AB
DP
To
tal
UN FAO 1 1 1 3
International Research International Soil Reference and Information Centre 1 1
CGIAR Research World Agroforestry Centre (ICRAF) 1 1 2
National financial organization Equity bank 1 1 2
Bilateral European Union 1 1
UN WFP 1 1
Government agency Kenya Meteorological Department 1 1
Government agency National Drought Management Authority 1 1
Regional not-for-profit company Eastern Africa Grain Council 1 1
International NGO EUCORD 1 1
National financial organization Financial institutions 1 1
Government agency National Environment Trust Fund 1 1
Government agency Department of Resource Survey and Remote Sensing 1 1
Government agency Kenya Cleaner Production Centre 1 1
NGO Farm Africa 1 1
Bilateral Netherlands 1 1
Public-Private partnership FoodTechAfrica 1 1
Research Kenya Marine and Fisheries Research Institute 1 1
International Research World Fish Centre 1 1
UN International Labour Organization 1 1
Government agency State Department of Fisheries 1 1
Bilateral GIZ 1 1
Appendix II – Annex XVI EB 2019/128/R.12
157
Bibliography
Government and inter-governmental documents
Agricultural Sector Development Support Programme. n.d.. Current Agricultural sector
strategies, policies and legislation.
Government of Kenya. 2007. Kenya Vision 2030. The popular version.
____. 2010. Agricultural Sector Development Strategy 2010 – 2020.
____. 2013a. Second Medium Term Plan, 2013 – 2017. Transforming Kenya: pathway to
devolution, social-economic development, equity and national unity.
____. 2013b. National Climate Change Action Plan 2013 – 2017.
____. n.d.. Agricultural Sector Development Strategy, Medium-Term Investment Plan:
2010–2015.
Kenya National Bureau of Statistics. 2018. Highlights of the 2015/16 Kenya Integrated
Household Budget Survey Reports. KNBS, March 2018.
Ministry of Agriculture Livestock and Fisheries. 2017. Kenya Youth Agribusiness Strategy
2017 – 2021.
Ministry of Devolution and Planning. 2016. Draft National Policy for the Sustainable
Development of Northern Kenya and other Arid Lands: Unlocking Our Full Potential for
Realization of the Kenya Vision 2030.
Ministry of Livestock Development. 2010. Kenya National Dairy Master Plan.
Ministry of Public Health and Sanitation. n.d.. National Nutrition Action Plan 2012 –
2017.
National Gender and Equality Commission (NGEC). 2017. Gender equality challenges in
Kenya and Africa. Key note address by Commissioner Winfred Lichuma EBS, Chairperson
NGEC Kenya during the event: Gender equality: International challenges and strategies
for success, organized by Australian Federal Police at the Australian High Commission in
London offices on 28 June 2017.
New Partnership for Africa’s Development (NEPAD) Planning and Coordinating Agency.
2016. Overview of the policy, legislative and institutional frameworks for sustainable land
management in the public sector in Kenya. Kenya country report. February 2016
IFAD Documents
Development Partner documents
European Commission (EC). 2014. EU – Kenya Cooperation.11th European Development
Fund. National Indicative Programme, 2014 - 2020
USAID. 2014. Kenya Country Development Cooperation Strategy, 2014 – 2018.
____. 2017. Kenya agriculture and food security fact sheet.
World Bank. 2014. Kenya Country Partnership Strategy, 2014 – 2018.
Non-IFAD documents
African Development Bank (AfDB). 2013. The State of Kenya’s Private Sector:
recommendations for government, development partners and the private sector.
AfDB, Organisation for Economic Cooperation and Development (OECD) and United
Nations Development Programme (UNDP). 2017. African economic outlook: Kenya 2017.
Brookings. n.d.. CAADP at 10: Progress Toward Agricultural Prosperity. Policy paper.
Appendix II – Annex XVI EB 2019/128/R.12
158
Central Bank of Kenya, Kenya National Bureau of Statistics & FSD Kenya. 2016. The
2016 FinAccess Household Survey on financial inclusion. Nairobi, Kenya: FSD Kenya.
Food and Agriculture Organization (FAO). 2011a. Dairy development institutions in East
Africa, by Kurwijila, L. & Bennett, A. FAO Rome.
____. 2011b. Dairy development in Kenya, by Muriuki H.G.. FAO Rome.
____. 2017. Kenya and FAO Partnering to build resilience and food and nutrition security.
Global Partnership for Effective Development Cooperation. 2014. Kenya. Country policy
brief.
Kassie M. 2014. Food security as a gender issue: Why are female-headed households
worse off compared to similar male-headed counterparts? Socioeconomics program,
policy brief no. 1, January 2014. CIMMYT – International maize and wheat improvement
centre
Katothya G. 2017. Gender assessment of dairy value chains: evidence from Kenya. FAO
Rome
Mo Ibrahim Foundation. 2017. 2017 Ibrahim Index of African Governance. Index report.
Muiya B.M. 2018. The Nature, Challenges and Consequences of Urban Youth
Unemployment: A Case of Nairobi City, Kenya. Universal Journal of Educational Research
Vol. 2(7), pp. 495 – 503. Department of Sociology, Kenyatta University, Kenya.
Accessed 4 May 2018 http://www.hrpub.org/journals/article_info.php?aid=1722
Scaling Up Nutrition. 2015. Scaling Up Nutrition movement annual progress report:
Kenya.
Swedish International Development Cooperation Agency (SIDA). 2014. Environmental
and climate change policy brief, Kenya.
SNV Netherlands Development Organisation. 2013. Study on the Kenyan animal feed
and fodder sub-sectors: sub-report II; Dairy Sector Structure. Nairobi.
Transparency International. 2018. Corruption Perceptions Index 2017. Results brochure
United Nations Development Programme (UNDP). 2016. Human Development Report
2016. Briefing note on Kenya.
United States Government. 2013. Kenya Fact sheet. Feed the Future Initiative.
USAID. 2015. Support for Gender Equality in Kenya. Kenya and East Africa. July 2015.
World Bank. 2012. Kenya Economic Update, December 2012: Kenya at Work, Energizing
the Economy and Creating Jobs. World Bank, Nairobi.
____. 2016. Kenya country economic memorandum: from economic growth to jobs and
shared prosperity. World Bank Group, March 2016.
____. 2017a. Kenya Economic Update. December 2017, edition number 16.
____. 2017b. Doing business 2018: reforming to create jobs.
World Bank & Centre for Tropical Agriculture. 2015. Climate-Smart Agriculture in Kenya.
CSA Country Profiles for Africa, Asia, and Latin America and the Caribbean Series.
Washington D.C.: The World Bank Group. October 2015.
World Bank. 2015. Kenya Devolution. Kenya School of Government, Centre for Devolution
Studies, Working Paper Series 1-6. February 2015
World Economic Forum. 2017. The Global Gender Gap Report 2017. Insight report. World
Economic Forum.
Appendix II – Annex XVI EB 2019/128/R.12
159
Consulted websites
AfDB. 2013. The Drought Resilience and Sustainable Livelihoods Program. Accessed 3
March 2018 https://www.afdb.org/en/news-and-events/the-drought-resilience-and-
sustainable-livelihoods-program-10235/
____. 2015. AfDB supports small-scale irrigation in Kenya’s rural communities. Accessed
3 March 2018 https://www.afdb.org/en/news-and-events/afdb-supports-small-scale-
irrigation-in-kenyas-rural-communities-15043/
Africa Lead. 2017. Kenya Seizing the moment – Developing a national agricultural sector
strategy and investment plan. Posted 14 February 2017.
Africa Research Institute. 2017. Is agriculture being neglected under devolution? Written
by Anzetse Were. Posted on 19 July 2017. Accessed 20 March 2018
https://www.africaresearchinstitute.org/newsite/blog/is-agriculture-being-neglected-
under-devolution/
Brookings. 2014. State of youth unemployment in Kenya. By Boaz Munga and Eldah
Onsomu. Posted 21 August 2014. Accessed 4 May 2018
https://www.brookings.edu/blog/africa-in-focus/2014/08/21/state-of-youth-
unemployment-in-kenya/
Central Intelligence Agency (CIA). 2018. The World Factbook.
Africa/Kenya/Population/Ethnic groups. Page last updated 24 April 2018. Accessed 3 May
2018 https://www.cia.gov/library/publications/the-world-factbook/geos/ke.html
Commonwealth Secretariat. 2018. Kenya: constitution and politics. Accessed 23
February 2018. http://thecommonwealth.org/our-member-countries/kenya/constitution-
politics
Consultative Group to Assist the Poor (CGAP). 2017. Who are Kenya’s financially
excluded? 9 November 2017. Accessed 27 February 2018
http://www.cgap.org/blog/who-are-kenya%E2%80%99s-financially-excluded
Embassy of the Federal Republic of Germany, GIZ and KfW. 2017. Agriculture and Rural
Development, German Development Cooperation in Kenya. Accessed 3 March 2018
http://www.nairobi.diplo.de/contentblob/4310970/Daten/7451220/Factsheet_Agriculture
FAO. 2018.FAO Kenya at a glance. Accessed 21 February 2018.
http://www.fao.org/kenya/fao-in-kenya/kenya-at-a-glance/en/
Internal Displacement Monitoring Centre 2018. Kenya. Accessed 20 February 2018.
http://www.internal-displacement.org/countries/kenya/
International Food Policy Research Institute (IFPRI). 2018. 2017 Global Hunger Index
Results. Accessed 23 February 2018 http://www.globalhungerindex.org/results-2017/
IRIN. 2013. Countering the radicalization of Kenya's youth. Posted 6 May 2013. Accessed
4 May 2018. http://www.irinnews.org/report/97982/countering-radicalization-kenyas-
youth
OECD. 2018. OECD.Stat. Accessed 15 February 2018 http://stats.oecd.org/
Overseas Development Institute (ODI). 2017. The climate, economic and political shifts
that shaped Kenya’s 2017 election. Comment, by Elizabeth Carabine. 11 August 2017.
Accessed 20 February 2018 https://www.odi.org/comment/10539-climate-economic-
and-political-shifts-shaped-kenya-s-2017-election
Scaling up nutrition. 2018. Kenya. Accessed 26 March 2018
http://scalingupnutrition.org/sun-countries/kenya/
Tegemeo Institute of Agricultural Policy and Development. 2016. How has devolution
affected service delivery in the agriculture sector in Kenya? Tegemeo Institute, Egerton
University. Posted on 26 May 2016. Accessed 20 March 2018
Appendix II – Annex XVI EB 2019/128/R.12
160
http://tegemeo.org/index.php/component/easyblog/entry/how-has-devolution-affected-
service-delivery-in-the-agriculture-sector-in-kenya.html
Transparency International. 2017. Sub-Saharan Africa: Corruption is a big issue in 2016
African elections. 25 January 2017. Accessed 26 February 2018
https://www.transparency.org/news/feature/africa_corruption_is_a_big_issue_in_2016_
african_elections
UNDP. 2018. Human Development Report; data. Accessed 10 October 2018
http://hdr.undp.org/en/data#
United Nations High Commissioner for Refugees (UNHCR). 2018a. Kenya: figures at a
glance. Accessed 22 February 2018 http://www.unhcr.org/ke/figures-at-a-glance
____. 2018b. Kenya: Dadaab refugee complex. Accessed 22 February 2018
http://www.unhcr.org/ke/dadaab-refugee-complex
World Bank. 2014a. Kenya: A Bigger, Better Economy. FEATURE STORY September 30,
2014. Accessed 20 February 2018
http://www.worldbank.org/en/news/feature/2014/09/30/kenya-a-bigger-better-
economy
____. 2017c. The World Bank in Kenya. Overview. Context. Last updated October 10
2017. Accessed 21 February 2018
http://www.worldbank.org/en/country/kenya/overview
____. 2017d. Kenya’s GDP Growth Slumps in 2017, but can Rebound over the Medium-
Term. PRESS RELEASE 6 December 2017. Accessed 21 February 2018
http://www.worldbank.org/en/news/press-release/2017/12/06/kenyas-gdp-growth-
slumps-in-2017-but-can-rebound-over-the-medium-term
____. 2018. World Development Indicators. Accessed 19 February 2018
http://databank.worldbank.org/data/reports.aspx?source=world-development-indicators
Youth policy 2014. Kenya factsheet. Last updated 28 April 2014. Accessed 4 May 2018
http://www.youthpolicy.org/factsheets/country/kenya/