report reference guide - veritas
TRANSCRIPT
Report Reference Guide
Contents 3
Chapter 1Introduction to APTARE IT AnalyticsAPTARE IT Analytics Licensed Modules . . . . . . . . . . . . . . . . . . . . . . . . . . . . . . . . . . . . . . . . . . . . . . . . . . . . . . . . . . . 17IT Analytics Components . . . . . . . . . . . . . . . . . . . . . . . . . . . . . . . . . . . . . . . . . . . . . . . . . . . . . . . . . . . . . . . . . . . . . . . 18
Portal Server Software. . . . . . . . . . . . . . . . . . . . . . . . . . . . . . . . . . . . . . . . . . . . . . . . . . . . . . . . . . . . . . . . . . . . . . . 18Reporting Database. . . . . . . . . . . . . . . . . . . . . . . . . . . . . . . . . . . . . . . . . . . . . . . . . . . . . . . . . . . . . . . . . . . . . . . . . 18Data Collectors . . . . . . . . . . . . . . . . . . . . . . . . . . . . . . . . . . . . . . . . . . . . . . . . . . . . . . . . . . . . . . . . . . . . . . . . . . . . 19
Chapter 2Alert ReportsAlert Delivery Failure . . . . . . . . . . . . . . . . . . . . . . . . . . . . . . . . . . . . . . . . . . . . . . . . . . . . . . . . . . . . . . . . . . . . . . . . . . 20Alert Detail . . . . . . . . . . . . . . . . . . . . . . . . . . . . . . . . . . . . . . . . . . . . . . . . . . . . . . . . . . . . . . . . . . . . . . . . . . . . . . . . . . 22Alert Detail History . . . . . . . . . . . . . . . . . . . . . . . . . . . . . . . . . . . . . . . . . . . . . . . . . . . . . . . . . . . . . . . . . . . . . . . . . . . . 22
Chapter 3Risk Mitigation Solution ReportsRisk Mitigation Reports. . . . . . . . . . . . . . . . . . . . . . . . . . . . . . . . . . . . . . . . . . . . . . . . . . . . . . . . . . . . . . . . . . . . . . . . . 24Risk Mitigation Analysis . . . . . . . . . . . . . . . . . . . . . . . . . . . . . . . . . . . . . . . . . . . . . . . . . . . . . . . . . . . . . . . . . . . . . . . . 24Risk Mitigation Trend . . . . . . . . . . . . . . . . . . . . . . . . . . . . . . . . . . . . . . . . . . . . . . . . . . . . . . . . . . . . . . . . . . . . . . . . . . 26Risk Mitigation Detail Reports. . . . . . . . . . . . . . . . . . . . . . . . . . . . . . . . . . . . . . . . . . . . . . . . . . . . . . . . . . . . . . . . . . . . 27
Backup Job Size Variance . . . . . . . . . . . . . . . . . . . . . . . . . . . . . . . . . . . . . . . . . . . . . . . . . . . . . . . . . . . . . . . . . . . . 27Source Consecutive Failure. . . . . . . . . . . . . . . . . . . . . . . . . . . . . . . . . . . . . . . . . . . . . . . . . . . . . . . . . . . . . . . . . . . 28Source Overall Status Summary . . . . . . . . . . . . . . . . . . . . . . . . . . . . . . . . . . . . . . . . . . . . . . . . . . . . . . . . . . . . . . . 29Compliance RTO RPO. . . . . . . . . . . . . . . . . . . . . . . . . . . . . . . . . . . . . . . . . . . . . . . . . . . . . . . . . . . . . . . . . . . . . . . 30Host Multi-Pathing Exposure . . . . . . . . . . . . . . . . . . . . . . . . . . . . . . . . . . . . . . . . . . . . . . . . . . . . . . . . . . . . . . . . . . 31Sources with No Recent Backups . . . . . . . . . . . . . . . . . . . . . . . . . . . . . . . . . . . . . . . . . . . . . . . . . . . . . . . . . . . . . . 32Hot Array Ports . . . . . . . . . . . . . . . . . . . . . . . . . . . . . . . . . . . . . . . . . . . . . . . . . . . . . . . . . . . . . . . . . . . . . . . . . . . . 32Hot LUNs by Read IO . . . . . . . . . . . . . . . . . . . . . . . . . . . . . . . . . . . . . . . . . . . . . . . . . . . . . . . . . . . . . . . . . . . . . . . 34Hot LUNs by Read Response . . . . . . . . . . . . . . . . . . . . . . . . . . . . . . . . . . . . . . . . . . . . . . . . . . . . . . . . . . . . . . . . . 35Hot LUNs by Write IO . . . . . . . . . . . . . . . . . . . . . . . . . . . . . . . . . . . . . . . . . . . . . . . . . . . . . . . . . . . . . . . . . . . . . . . 36Hot LUNs by Write Response . . . . . . . . . . . . . . . . . . . . . . . . . . . . . . . . . . . . . . . . . . . . . . . . . . . . . . . . . . . . . . . . . 37NetBackup Disk Pool Forecast . . . . . . . . . . . . . . . . . . . . . . . . . . . . . . . . . . . . . . . . . . . . . . . . . . . . . . . . . . . . . . . . 38Thin Pool Forecast. . . . . . . . . . . . . . . . . . . . . . . . . . . . . . . . . . . . . . . . . . . . . . . . . . . . . . . . . . . . . . . . . . . . . . . . . . 39VM Datastore Forecast . . . . . . . . . . . . . . . . . . . . . . . . . . . . . . . . . . . . . . . . . . . . . . . . . . . . . . . . . . . . . . . . . . . . . . 39VM Guest Disk Forecast . . . . . . . . . . . . . . . . . . . . . . . . . . . . . . . . . . . . . . . . . . . . . . . . . . . . . . . . . . . . . . . . . . . . . 40
Chapter 4Storage Optimization Solution ReportsStorage Optimization Overview . . . . . . . . . . . . . . . . . . . . . . . . . . . . . . . . . . . . . . . . . . . . . . . . . . . . . . . . . . . . . . . . . . 43Storage Optimization Analysis . . . . . . . . . . . . . . . . . . . . . . . . . . . . . . . . . . . . . . . . . . . . . . . . . . . . . . . . . . . . . . . . . . . 44Storage Optimization by Tier . . . . . . . . . . . . . . . . . . . . . . . . . . . . . . . . . . . . . . . . . . . . . . . . . . . . . . . . . . . . . . . . . . . . 45Storage Optimization Trend . . . . . . . . . . . . . . . . . . . . . . . . . . . . . . . . . . . . . . . . . . . . . . . . . . . . . . . . . . . . . . . . . . . . . 45Storage Optimization Detail Reports . . . . . . . . . . . . . . . . . . . . . . . . . . . . . . . . . . . . . . . . . . . . . . . . . . . . . . . . . . . . . . 46
Unallocated LUNs by Array . . . . . . . . . . . . . . . . . . . . . . . . . . . . . . . . . . . . . . . . . . . . . . . . . . . . . . . . . . . . . . . . . . . 48Unallocated LUNs . . . . . . . . . . . . . . . . . . . . . . . . . . . . . . . . . . . . . . . . . . . . . . . . . . . . . . . . . . . . . . . . . . . . . . . . . . 48Undiscovered LUNs by Array. . . . . . . . . . . . . . . . . . . . . . . . . . . . . . . . . . . . . . . . . . . . . . . . . . . . . . . . . . . . . . . . . . 49Undiscovered LUNs. . . . . . . . . . . . . . . . . . . . . . . . . . . . . . . . . . . . . . . . . . . . . . . . . . . . . . . . . . . . . . . . . . . . . . . . . 49Unused LUNs by Array . . . . . . . . . . . . . . . . . . . . . . . . . . . . . . . . . . . . . . . . . . . . . . . . . . . . . . . . . . . . . . . . . . . . . . 50Unused LUNs . . . . . . . . . . . . . . . . . . . . . . . . . . . . . . . . . . . . . . . . . . . . . . . . . . . . . . . . . . . . . . . . . . . . . . . . . . . . . 50Overprovisioned Hosts Summary . . . . . . . . . . . . . . . . . . . . . . . . . . . . . . . . . . . . . . . . . . . . . . . . . . . . . . . . . . . . . . 51Overprovisioned Hosts . . . . . . . . . . . . . . . . . . . . . . . . . . . . . . . . . . . . . . . . . . . . . . . . . . . . . . . . . . . . . . . . . . . . . . 52Inactive LUNS by Array . . . . . . . . . . . . . . . . . . . . . . . . . . . . . . . . . . . . . . . . . . . . . . . . . . . . . . . . . . . . . . . . . . . . . . 53
Contents
Contents 4
Inactive LUNS . . . . . . . . . . . . . . . . . . . . . . . . . . . . . . . . . . . . . . . . . . . . . . . . . . . . . . . . . . . . . . . . . . . . . . . . . . . . . .53VM Aged Snapshots by Datastore . . . . . . . . . . . . . . . . . . . . . . . . . . . . . . . . . . . . . . . . . . . . . . . . . . . . . . . . . . . . . .54VM Aged Snapshots . . . . . . . . . . . . . . . . . . . . . . . . . . . . . . . . . . . . . . . . . . . . . . . . . . . . . . . . . . . . . . . . . . . . . . . . .54VMs Powered Off by VM Server . . . . . . . . . . . . . . . . . . . . . . . . . . . . . . . . . . . . . . . . . . . . . . . . . . . . . . . . . . . . . . . .55VMs Powered Off . . . . . . . . . . . . . . . . . . . . . . . . . . . . . . . . . . . . . . . . . . . . . . . . . . . . . . . . . . . . . . . . . . . . . . . . . . .55VMs Low CPU by VM Server . . . . . . . . . . . . . . . . . . . . . . . . . . . . . . . . . . . . . . . . . . . . . . . . . . . . . . . . . . . . . . . . . .56VMs Low CPU. . . . . . . . . . . . . . . . . . . . . . . . . . . . . . . . . . . . . . . . . . . . . . . . . . . . . . . . . . . . . . . . . . . . . . . . . . . . . .56VMs Undiscovered Disks by VM Server . . . . . . . . . . . . . . . . . . . . . . . . . . . . . . . . . . . . . . . . . . . . . . . . . . . . . . . . . .57VMs Undiscovered Disks . . . . . . . . . . . . . . . . . . . . . . . . . . . . . . . . . . . . . . . . . . . . . . . . . . . . . . . . . . . . . . . . . . . . .57VMs Not in VM Inventory by Datastore. . . . . . . . . . . . . . . . . . . . . . . . . . . . . . . . . . . . . . . . . . . . . . . . . . . . . . . . . . .58VMs Not in Inventory. . . . . . . . . . . . . . . . . . . . . . . . . . . . . . . . . . . . . . . . . . . . . . . . . . . . . . . . . . . . . . . . . . . . . . . . .58Non-VM Files by Datastore. . . . . . . . . . . . . . . . . . . . . . . . . . . . . . . . . . . . . . . . . . . . . . . . . . . . . . . . . . . . . . . . . . . .60Non-VM Files . . . . . . . . . . . . . . . . . . . . . . . . . . . . . . . . . . . . . . . . . . . . . . . . . . . . . . . . . . . . . . . . . . . . . . . . . . . . . .60Data Domain File Compression by Host . . . . . . . . . . . . . . . . . . . . . . . . . . . . . . . . . . . . . . . . . . . . . . . . . . . . . . . . . .61High Backup Retention Jobs by Sources . . . . . . . . . . . . . . . . . . . . . . . . . . . . . . . . . . . . . . . . . . . . . . . . . . . . . . . . .61Sources Backed Up by Multiple Servers. . . . . . . . . . . . . . . . . . . . . . . . . . . . . . . . . . . . . . . . . . . . . . . . . . . . . . . . . .62Inactive Large Files by Host . . . . . . . . . . . . . . . . . . . . . . . . . . . . . . . . . . . . . . . . . . . . . . . . . . . . . . . . . . . . . . . . . . .62Inactive Large Files. . . . . . . . . . . . . . . . . . . . . . . . . . . . . . . . . . . . . . . . . . . . . . . . . . . . . . . . . . . . . . . . . . . . . . . . . .63File Type Usage by Host . . . . . . . . . . . . . . . . . . . . . . . . . . . . . . . . . . . . . . . . . . . . . . . . . . . . . . . . . . . . . . . . . . . . . .63File Type Usage . . . . . . . . . . . . . . . . . . . . . . . . . . . . . . . . . . . . . . . . . . . . . . . . . . . . . . . . . . . . . . . . . . . . . . . . . . . .64AWS Orphan Snapshots . . . . . . . . . . . . . . . . . . . . . . . . . . . . . . . . . . . . . . . . . . . . . . . . . . . . . . . . . . . . . . . . . . . . . .65AWS Orphan Volumes by Account . . . . . . . . . . . . . . . . . . . . . . . . . . . . . . . . . . . . . . . . . . . . . . . . . . . . . . . . . . . . . .65AWS Orphan Volumes . . . . . . . . . . . . . . . . . . . . . . . . . . . . . . . . . . . . . . . . . . . . . . . . . . . . . . . . . . . . . . . . . . . . . . .67
Chapter 5System Administration ReportsData Collection Message Summary. . . . . . . . . . . . . . . . . . . . . . . . . . . . . . . . . . . . . . . . . . . . . . . . . . . . . . . . . . . . . . . .70
Data Collection Message Summary . . . . . . . . . . . . . . . . . . . . . . . . . . . . . . . . . . . . . . . . . . . . . . . . . . . . . . . . . . . . .70Data Collection Message Detail . . . . . . . . . . . . . . . . . . . . . . . . . . . . . . . . . . . . . . . . . . . . . . . . . . . . . . . . . . . . . . . .71
Data Collection Activity Detail . . . . . . . . . . . . . . . . . . . . . . . . . . . . . . . . . . . . . . . . . . . . . . . . . . . . . . . . . . . . . . . . . . . .72Data Collection Hourly Activity . . . . . . . . . . . . . . . . . . . . . . . . . . . . . . . . . . . . . . . . . . . . . . . . . . . . . . . . . . . . . . . . . . . .73Data Collection Performance Detail. . . . . . . . . . . . . . . . . . . . . . . . . . . . . . . . . . . . . . . . . . . . . . . . . . . . . . . . . . . . . . . .74Data Collection Performance Summary. . . . . . . . . . . . . . . . . . . . . . . . . . . . . . . . . . . . . . . . . . . . . . . . . . . . . . . . . . . . .75Data Collection Schedule Summary . . . . . . . . . . . . . . . . . . . . . . . . . . . . . . . . . . . . . . . . . . . . . . . . . . . . . . . . . . . . . . .76
Cases Not Represented in the Data Collection Schedule Summary . . . . . . . . . . . . . . . . . . . . . . . . . . . . . . . . . . . .77Example of a Data Collector Log Request . . . . . . . . . . . . . . . . . . . . . . . . . . . . . . . . . . . . . . . . . . . . . . . . . . . . . . . .78
Data Collection Status Details . . . . . . . . . . . . . . . . . . . . . . . . . . . . . . . . . . . . . . . . . . . . . . . . . . . . . . . . . . . . . . . . . . . .79Data Collector Status Summary. . . . . . . . . . . . . . . . . . . . . . . . . . . . . . . . . . . . . . . . . . . . . . . . . . . . . . . . . . . . . . . . . . .81Database Error Aggregation . . . . . . . . . . . . . . . . . . . . . . . . . . . . . . . . . . . . . . . . . . . . . . . . . . . . . . . . . . . . . . . . . . . . .82Database Error Summary . . . . . . . . . . . . . . . . . . . . . . . . . . . . . . . . . . . . . . . . . . . . . . . . . . . . . . . . . . . . . . . . . . . . . . .83File Analytics Collection Status . . . . . . . . . . . . . . . . . . . . . . . . . . . . . . . . . . . . . . . . . . . . . . . . . . . . . . . . . . . . . . . . . . .84
NetApp Volume Status . . . . . . . . . . . . . . . . . . . . . . . . . . . . . . . . . . . . . . . . . . . . . . . . . . . . . . . . . . . . . . . . . . . . . . .85License Summary . . . . . . . . . . . . . . . . . . . . . . . . . . . . . . . . . . . . . . . . . . . . . . . . . . . . . . . . . . . . . . . . . . . . . . . . . . . . .86
Capacity License Usage Details . . . . . . . . . . . . . . . . . . . . . . . . . . . . . . . . . . . . . . . . . . . . . . . . . . . . . . . . . . . . . . . .87File Analytics License Usage Details . . . . . . . . . . . . . . . . . . . . . . . . . . . . . . . . . . . . . . . . . . . . . . . . . . . . . . . . . . . .87Virtual Server License Usage Details . . . . . . . . . . . . . . . . . . . . . . . . . . . . . . . . . . . . . . . . . . . . . . . . . . . . . . . . . . . .88Fabric Manager License Usage Details . . . . . . . . . . . . . . . . . . . . . . . . . . . . . . . . . . . . . . . . . . . . . . . . . . . . . . . . . .88Backup License Usage Details . . . . . . . . . . . . . . . . . . . . . . . . . . . . . . . . . . . . . . . . . . . . . . . . . . . . . . . . . . . . . . . . .89Replication License Usage Details . . . . . . . . . . . . . . . . . . . . . . . . . . . . . . . . . . . . . . . . . . . . . . . . . . . . . . . . . . . . . .90License Overage Detail. . . . . . . . . . . . . . . . . . . . . . . . . . . . . . . . . . . . . . . . . . . . . . . . . . . . . . . . . . . . . . . . . . . . . . .90
Report Activity Summary . . . . . . . . . . . . . . . . . . . . . . . . . . . . . . . . . . . . . . . . . . . . . . . . . . . . . . . . . . . . . . . . . . . . . . . .92Report Activity Detail . . . . . . . . . . . . . . . . . . . . . . . . . . . . . . . . . . . . . . . . . . . . . . . . . . . . . . . . . . . . . . . . . . . . . . . . . . .93Scheduled Reports Summary . . . . . . . . . . . . . . . . . . . . . . . . . . . . . . . . . . . . . . . . . . . . . . . . . . . . . . . . . . . . . . . . . . . .93
Disable or Delete a Scheduled Report . . . . . . . . . . . . . . . . . . . . . . . . . . . . . . . . . . . . . . . . . . . . . . . . . . . . . . . . . . .94Modify a Schedule . . . . . . . . . . . . . . . . . . . . . . . . . . . . . . . . . . . . . . . . . . . . . . . . . . . . . . . . . . . . . . . . . . . . . . . . . .95
System Health Check . . . . . . . . . . . . . . . . . . . . . . . . . . . . . . . . . . . . . . . . . . . . . . . . . . . . . . . . . . . . . . . . . . . . . . . . . .95Top Running Reports . . . . . . . . . . . . . . . . . . . . . . . . . . . . . . . . . . . . . . . . . . . . . . . . . . . . . . . . . . . . . . . . . . . . . . . . . . .97
Dashboard Considerations . . . . . . . . . . . . . . . . . . . . . . . . . . . . . . . . . . . . . . . . . . . . . . . . . . . . . . . . . . . . . . . . . . . .97
Contents 5
Top Running Report Details . . . . . . . . . . . . . . . . . . . . . . . . . . . . . . . . . . . . . . . . . . . . . . . . . . . . . . . . . . . . . . . . . . .98Version History. . . . . . . . . . . . . . . . . . . . . . . . . . . . . . . . . . . . . . . . . . . . . . . . . . . . . . . . . . . . . . . . . . . . . . . . . . . . . . . .99WMI Proxy Servers . . . . . . . . . . . . . . . . . . . . . . . . . . . . . . . . . . . . . . . . . . . . . . . . . . . . . . . . . . . . . . . . . . . . . . . . . . .100
Chapter 6Array Capacity Utilization ReportsManaging Capacity Quick-Start List. . . . . . . . . . . . . . . . . . . . . . . . . . . . . . . . . . . . . . . . . . . . . . . . . . . . . . . . . . . . . . .105Array Capacity and Utilization . . . . . . . . . . . . . . . . . . . . . . . . . . . . . . . . . . . . . . . . . . . . . . . . . . . . . . . . . . . . . . . . . . .106Array Capacity & Utilization (Generic Data). . . . . . . . . . . . . . . . . . . . . . . . . . . . . . . . . . . . . . . . . . . . . . . . . . . . . . . . .107Array Capacity & Utilization - (Dell Compellent View) . . . . . . . . . . . . . . . . . . . . . . . . . . . . . . . . . . . . . . . . . . . . . . . . . 111Array Capacity & Utilization - (EMC Data Domain Storage View) . . . . . . . . . . . . . . . . . . . . . . . . . . . . . . . . . . . . . . . . 113Array Capacity & Utilization - (EMC VNX Celerra View) . . . . . . . . . . . . . . . . . . . . . . . . . . . . . . . . . . . . . . . . . . . . . . . 115Array Capacity & Utilization - (EMC VNX CLARiiON View) . . . . . . . . . . . . . . . . . . . . . . . . . . . . . . . . . . . . . . . . . . . . . 118Array Capacity & Utilization - (EMC VPLEX) . . . . . . . . . . . . . . . . . . . . . . . . . . . . . . . . . . . . . . . . . . . . . . . . . . . . . . . .121Array Capacity & Utilization - (EMC Isilon View) . . . . . . . . . . . . . . . . . . . . . . . . . . . . . . . . . . . . . . . . . . . . . . . . . . . . .123Array Capacity & Utilization - (EMC Symmetrix View) . . . . . . . . . . . . . . . . . . . . . . . . . . . . . . . . . . . . . . . . . . . . . . . . .125Array Capacity & Utilization (Hitachi Content Platform) . . . . . . . . . . . . . . . . . . . . . . . . . . . . . . . . . . . . . . . . . . . . . . . .128Array Capacity & Utilization (Hitachi Arrays & HDP View) . . . . . . . . . . . . . . . . . . . . . . . . . . . . . . . . . . . . . . . . . . . . . .129Array Capacity & Utilization (Hitachi NAS Arrays) . . . . . . . . . . . . . . . . . . . . . . . . . . . . . . . . . . . . . . . . . . . . . . . . . . . .132HP 3PAR Overview . . . . . . . . . . . . . . . . . . . . . . . . . . . . . . . . . . . . . . . . . . . . . . . . . . . . . . . . . . . . . . . . . . . . . . . . . . .134Array Capacity & Utilization (HP 3PAR View) . . . . . . . . . . . . . . . . . . . . . . . . . . . . . . . . . . . . . . . . . . . . . . . . . . . . . . .134
Array Summary . . . . . . . . . . . . . . . . . . . . . . . . . . . . . . . . . . . . . . . . . . . . . . . . . . . . . . . . . . . . . . . . . . . . . . . . . . . .134Physical Summary . . . . . . . . . . . . . . . . . . . . . . . . . . . . . . . . . . . . . . . . . . . . . . . . . . . . . . . . . . . . . . . . . . . . . . . . .135Chunklets . . . . . . . . . . . . . . . . . . . . . . . . . . . . . . . . . . . . . . . . . . . . . . . . . . . . . . . . . . . . . . . . . . . . . . . . . . . . . . . .135Logical (LD) Summary . . . . . . . . . . . . . . . . . . . . . . . . . . . . . . . . . . . . . . . . . . . . . . . . . . . . . . . . . . . . . . . . . . . . . .136Common Provisioning Groups (CPG). . . . . . . . . . . . . . . . . . . . . . . . . . . . . . . . . . . . . . . . . . . . . . . . . . . . . . . . . . .137VV Summary. . . . . . . . . . . . . . . . . . . . . . . . . . . . . . . . . . . . . . . . . . . . . . . . . . . . . . . . . . . . . . . . . . . . . . . . . . . . . .137
Array Capacity & Utilization (IBM Enterprise Array View) . . . . . . . . . . . . . . . . . . . . . . . . . . . . . . . . . . . . . . . . . . . . . .138Array Capacity & Utilization (IBM Modular Array View) . . . . . . . . . . . . . . . . . . . . . . . . . . . . . . . . . . . . . . . . . . . . . . . .138Array Capacity & Utilization (IBM SVC View) . . . . . . . . . . . . . . . . . . . . . . . . . . . . . . . . . . . . . . . . . . . . . . . . . . . . . . .139Array Capacity and Utilization (IBM XIV View) . . . . . . . . . . . . . . . . . . . . . . . . . . . . . . . . . . . . . . . . . . . . . . . . . . . . . .142Array Capacity and Utilization (NetApp View) . . . . . . . . . . . . . . . . . . . . . . . . . . . . . . . . . . . . . . . . . . . . . . . . . . . . . . .145Array Capacity and Utilization (NetApp Cluster) . . . . . . . . . . . . . . . . . . . . . . . . . . . . . . . . . . . . . . . . . . . . . . . . . . . . .149NetApp Storage System Detail . . . . . . . . . . . . . . . . . . . . . . . . . . . . . . . . . . . . . . . . . . . . . . . . . . . . . . . . . . . . . . . . . .153Array iSCSI Port Utilization . . . . . . . . . . . . . . . . . . . . . . . . . . . . . . . . . . . . . . . . . . . . . . . . . . . . . . . . . . . . . . . . . . . . .156NetApp Cluster-Mode Array iSCSI Port Utilization. . . . . . . . . . . . . . . . . . . . . . . . . . . . . . . . . . . . . . . . . . . . . . . . . . . .158Array Capacity and Utilization (OpenStack Swift) . . . . . . . . . . . . . . . . . . . . . . . . . . . . . . . . . . . . . . . . . . . . . . . . . . . .161Disk Summary . . . . . . . . . . . . . . . . . . . . . . . . . . . . . . . . . . . . . . . . . . . . . . . . . . . . . . . . . . . . . . . . . . . . . . . . . . . . . . .162RA Summary . . . . . . . . . . . . . . . . . . . . . . . . . . . . . . . . . . . . . . . . . . . . . . . . . . . . . . . . . . . . . . . . . . . . . . . . . . . . . . . .165Array Executive Summary . . . . . . . . . . . . . . . . . . . . . . . . . . . . . . . . . . . . . . . . . . . . . . . . . . . . . . . . . . . . . . . . . . . . . .166List Array Groups . . . . . . . . . . . . . . . . . . . . . . . . . . . . . . . . . . . . . . . . . . . . . . . . . . . . . . . . . . . . . . . . . . . . . . . . . . . . .167HP EVA Physical Disks . . . . . . . . . . . . . . . . . . . . . . . . . . . . . . . . . . . . . . . . . . . . . . . . . . . . . . . . . . . . . . . . . . . . . . . .168Array FC Port Utilization . . . . . . . . . . . . . . . . . . . . . . . . . . . . . . . . . . . . . . . . . . . . . . . . . . . . . . . . . . . . . . . . . . . . . . .169AWS S3 Bucket Summary . . . . . . . . . . . . . . . . . . . . . . . . . . . . . . . . . . . . . . . . . . . . . . . . . . . . . . . . . . . . . . . . . . . . . .171Data Domain Filesystem Compression . . . . . . . . . . . . . . . . . . . . . . . . . . . . . . . . . . . . . . . . . . . . . . . . . . . . . . . . . . . .173Data Domain System Summary - Storage. . . . . . . . . . . . . . . . . . . . . . . . . . . . . . . . . . . . . . . . . . . . . . . . . . . . . . . . . .174Data Domain System Details . . . . . . . . . . . . . . . . . . . . . . . . . . . . . . . . . . . . . . . . . . . . . . . . . . . . . . . . . . . . . . . . . . . .175Data Domain MTree Summary . . . . . . . . . . . . . . . . . . . . . . . . . . . . . . . . . . . . . . . . . . . . . . . . . . . . . . . . . . . . . . . . . .177Data Domain Replication History . . . . . . . . . . . . . . . . . . . . . . . . . . . . . . . . . . . . . . . . . . . . . . . . . . . . . . . . . . . . . . . . .178Data Domain Snapshot History . . . . . . . . . . . . . . . . . . . . . . . . . . . . . . . . . . . . . . . . . . . . . . . . . . . . . . . . . . . . . . . . . .179EMC Isilon Disks . . . . . . . . . . . . . . . . . . . . . . . . . . . . . . . . . . . . . . . . . . . . . . . . . . . . . . . . . . . . . . . . . . . . . . . . . . . . .180EMC Isilon HDFS Racks . . . . . . . . . . . . . . . . . . . . . . . . . . . . . . . . . . . . . . . . . . . . . . . . . . . . . . . . . . . . . . . . . . . . . . .181EMC Isilon HDFS Roots . . . . . . . . . . . . . . . . . . . . . . . . . . . . . . . . . . . . . . . . . . . . . . . . . . . . . . . . . . . . . . . . . . . . . . .182EMC Isilon License Detail . . . . . . . . . . . . . . . . . . . . . . . . . . . . . . . . . . . . . . . . . . . . . . . . . . . . . . . . . . . . . . . . . . . . . .183EMC Isilon NFS Exports . . . . . . . . . . . . . . . . . . . . . . . . . . . . . . . . . . . . . . . . . . . . . . . . . . . . . . . . . . . . . . . . . . . . . . .183EMC Isilon Nodes . . . . . . . . . . . . . . . . . . . . . . . . . . . . . . . . . . . . . . . . . . . . . . . . . . . . . . . . . . . . . . . . . . . . . . . . . . . .185EMC Isilon Quota Summary . . . . . . . . . . . . . . . . . . . . . . . . . . . . . . . . . . . . . . . . . . . . . . . . . . . . . . . . . . . . . . . . . . . .186EMC Isilon SMB Share Summary . . . . . . . . . . . . . . . . . . . . . . . . . . . . . . . . . . . . . . . . . . . . . . . . . . . . . . . . . . . . . . . .187
Contents 6
EMC Isilon Snapshot Summary. . . . . . . . . . . . . . . . . . . . . . . . . . . . . . . . . . . . . . . . . . . . . . . . . . . . . . . . . . . . . . . . . .189EMC Isilon Zones. . . . . . . . . . . . . . . . . . . . . . . . . . . . . . . . . . . . . . . . . . . . . . . . . . . . . . . . . . . . . . . . . . . . . . . . . . . . .190EMC VNX (Celerra) Data Mover Summary . . . . . . . . . . . . . . . . . . . . . . . . . . . . . . . . . . . . . . . . . . . . . . . . . . . . . . . . .190EMC VNX (Celerra) Virtual Data Mover Summary . . . . . . . . . . . . . . . . . . . . . . . . . . . . . . . . . . . . . . . . . . . . . . . . . . .192EMC VNX (Celerra) File System Summary . . . . . . . . . . . . . . . . . . . . . . . . . . . . . . . . . . . . . . . . . . . . . . . . . . . . . . . . .193EMC VNX (Celerra) SnapSure Summary . . . . . . . . . . . . . . . . . . . . . . . . . . . . . . . . . . . . . . . . . . . . . . . . . . . . . . . . . .195EMC VNX (Celerra) Storage Pools Summary . . . . . . . . . . . . . . . . . . . . . . . . . . . . . . . . . . . . . . . . . . . . . . . . . . . . . . .197EMC VNX (Celerra) Storage Pools Detail . . . . . . . . . . . . . . . . . . . . . . . . . . . . . . . . . . . . . . . . . . . . . . . . . . . . . . . . . .199EMC VNX (Celerra) Tree Summary. . . . . . . . . . . . . . . . . . . . . . . . . . . . . . . . . . . . . . . . . . . . . . . . . . . . . . . . . . . . . . .201EMC VNX (Celerra) Volume Summary . . . . . . . . . . . . . . . . . . . . . . . . . . . . . . . . . . . . . . . . . . . . . . . . . . . . . . . . . . . .202EMC VNX (Celerra) Volume Detail . . . . . . . . . . . . . . . . . . . . . . . . . . . . . . . . . . . . . . . . . . . . . . . . . . . . . . . . . . . . . . .203EMC VNX (Celerra) Disk Summary . . . . . . . . . . . . . . . . . . . . . . . . . . . . . . . . . . . . . . . . . . . . . . . . . . . . . . . . . . . . . . .204EMC VNX (Celerra) Storage System Detail. . . . . . . . . . . . . . . . . . . . . . . . . . . . . . . . . . . . . . . . . . . . . . . . . . . . . . . . .204EMC VPLEX Backend Array Summary . . . . . . . . . . . . . . . . . . . . . . . . . . . . . . . . . . . . . . . . . . . . . . . . . . . . . . . . . . . .205EMC VPLEX Device Summary . . . . . . . . . . . . . . . . . . . . . . . . . . . . . . . . . . . . . . . . . . . . . . . . . . . . . . . . . . . . . . . . . .207EMC VPLEX Extent Summary. . . . . . . . . . . . . . . . . . . . . . . . . . . . . . . . . . . . . . . . . . . . . . . . . . . . . . . . . . . . . . . . . . .208EMC VPLEX Port Summary . . . . . . . . . . . . . . . . . . . . . . . . . . . . . . . . . . . . . . . . . . . . . . . . . . . . . . . . . . . . . . . . . . . .209EMC VPLEX Storage View Summary . . . . . . . . . . . . . . . . . . . . . . . . . . . . . . . . . . . . . . . . . . . . . . . . . . . . . . . . . . . . .210EMC VPLEX Storage Volume Summary . . . . . . . . . . . . . . . . . . . . . . . . . . . . . . . . . . . . . . . . . . . . . . . . . . . . . . . . . . . 211Object Store Namespace Summary . . . . . . . . . . . . . . . . . . . . . . . . . . . . . . . . . . . . . . . . . . . . . . . . . . . . . . . . . . . . . .213Node Summary . . . . . . . . . . . . . . . . . . . . . . . . . . . . . . . . . . . . . . . . . . . . . . . . . . . . . . . . . . . . . . . . . . . . . . . . . . . . . .214Object Store Tenant Summary. . . . . . . . . . . . . . . . . . . . . . . . . . . . . . . . . . . . . . . . . . . . . . . . . . . . . . . . . . . . . . . . . . .215Hitachi NAS CIFS Share Summary . . . . . . . . . . . . . . . . . . . . . . . . . . . . . . . . . . . . . . . . . . . . . . . . . . . . . . . . . . . . . . .216Hitachi NAS Disk Summary . . . . . . . . . . . . . . . . . . . . . . . . . . . . . . . . . . . . . . . . . . . . . . . . . . . . . . . . . . . . . . . . . . . . .217Hitachi NAS EVS Summary. . . . . . . . . . . . . . . . . . . . . . . . . . . . . . . . . . . . . . . . . . . . . . . . . . . . . . . . . . . . . . . . . . . . .218Hitachi NAS Ethernet Port Summary. . . . . . . . . . . . . . . . . . . . . . . . . . . . . . . . . . . . . . . . . . . . . . . . . . . . . . . . . . . . . .218Hitachi NAS File System Summary . . . . . . . . . . . . . . . . . . . . . . . . . . . . . . . . . . . . . . . . . . . . . . . . . . . . . . . . . . . . . . .220Hitachi NAS NFS Export Summary . . . . . . . . . . . . . . . . . . . . . . . . . . . . . . . . . . . . . . . . . . . . . . . . . . . . . . . . . . . . . . .222Hitachi NAS Snapshot Summary. . . . . . . . . . . . . . . . . . . . . . . . . . . . . . . . . . . . . . . . . . . . . . . . . . . . . . . . . . . . . . . . .223Hitachi NAS Storage Pool Summary . . . . . . . . . . . . . . . . . . . . . . . . . . . . . . . . . . . . . . . . . . . . . . . . . . . . . . . . . . . . . .224Hitachi NAS Storage Server Summary . . . . . . . . . . . . . . . . . . . . . . . . . . . . . . . . . . . . . . . . . . . . . . . . . . . . . . . . . . . .225Hitachi NAS System Drive Summary. . . . . . . . . . . . . . . . . . . . . . . . . . . . . . . . . . . . . . . . . . . . . . . . . . . . . . . . . . . . . .225Hitachi NAS Tier Summary . . . . . . . . . . . . . . . . . . . . . . . . . . . . . . . . . . . . . . . . . . . . . . . . . . . . . . . . . . . . . . . . . . . . .227Hitachi NAS Virtual Volume Summary . . . . . . . . . . . . . . . . . . . . . . . . . . . . . . . . . . . . . . . . . . . . . . . . . . . . . . . . . . . . .228Overview of IBM Array Support . . . . . . . . . . . . . . . . . . . . . . . . . . . . . . . . . . . . . . . . . . . . . . . . . . . . . . . . . . . . . . . . . .229IBM Array Site Summary . . . . . . . . . . . . . . . . . . . . . . . . . . . . . . . . . . . . . . . . . . . . . . . . . . . . . . . . . . . . . . . . . . . . . . .230IBM Array Summary. . . . . . . . . . . . . . . . . . . . . . . . . . . . . . . . . . . . . . . . . . . . . . . . . . . . . . . . . . . . . . . . . . . . . . . . . . .230IBM Array Detail . . . . . . . . . . . . . . . . . . . . . . . . . . . . . . . . . . . . . . . . . . . . . . . . . . . . . . . . . . . . . . . . . . . . . . . . . . . . . .232IBM Extent Pool Summary. . . . . . . . . . . . . . . . . . . . . . . . . . . . . . . . . . . . . . . . . . . . . . . . . . . . . . . . . . . . . . . . . . . . . .237IBM Rank Summary. . . . . . . . . . . . . . . . . . . . . . . . . . . . . . . . . . . . . . . . . . . . . . . . . . . . . . . . . . . . . . . . . . . . . . . . . . .238IBM Disk Summary . . . . . . . . . . . . . . . . . . . . . . . . . . . . . . . . . . . . . . . . . . . . . . . . . . . . . . . . . . . . . . . . . . . . . . . . . . .240IBM SAN Volume Controller Overview. . . . . . . . . . . . . . . . . . . . . . . . . . . . . . . . . . . . . . . . . . . . . . . . . . . . . . . . . . . . .241
Space-efficient VDisks . . . . . . . . . . . . . . . . . . . . . . . . . . . . . . . . . . . . . . . . . . . . . . . . . . . . . . . . . . . . . . . . . . . . . .242IBM SVC VDisk Summary . . . . . . . . . . . . . . . . . . . . . . . . . . . . . . . . . . . . . . . . . . . . . . . . . . . . . . . . . . . . . . . . . . . . . .243IBM SVC MDisk Groups . . . . . . . . . . . . . . . . . . . . . . . . . . . . . . . . . . . . . . . . . . . . . . . . . . . . . . . . . . . . . . . . . . . . . . .245IBM SVC MDisk Group Details . . . . . . . . . . . . . . . . . . . . . . . . . . . . . . . . . . . . . . . . . . . . . . . . . . . . . . . . . . . . . . . . . .245IBM SVC MDisk Summary. . . . . . . . . . . . . . . . . . . . . . . . . . . . . . . . . . . . . . . . . . . . . . . . . . . . . . . . . . . . . . . . . . . . . .248How Capacity Values are Represented in XIV Reports . . . . . . . . . . . . . . . . . . . . . . . . . . . . . . . . . . . . . . . . . . . . . . . .248IBM XIV Consistency Groups Summary . . . . . . . . . . . . . . . . . . . . . . . . . . . . . . . . . . . . . . . . . . . . . . . . . . . . . . . . . . .249IBM XIV Consistency Group Detail . . . . . . . . . . . . . . . . . . . . . . . . . . . . . . . . . . . . . . . . . . . . . . . . . . . . . . . . . . . . . . .249XIV Physical Disks. . . . . . . . . . . . . . . . . . . . . . . . . . . . . . . . . . . . . . . . . . . . . . . . . . . . . . . . . . . . . . . . . . . . . . . . . . . .250XIV Snapshot Details . . . . . . . . . . . . . . . . . . . . . . . . . . . . . . . . . . . . . . . . . . . . . . . . . . . . . . . . . . . . . . . . . . . . . . . . . .251IBM XIV Storage Pools Summary . . . . . . . . . . . . . . . . . . . . . . . . . . . . . . . . . . . . . . . . . . . . . . . . . . . . . . . . . . . . . . . .252IBM XIV Storage Pool Details . . . . . . . . . . . . . . . . . . . . . . . . . . . . . . . . . . . . . . . . . . . . . . . . . . . . . . . . . . . . . . . . . . .253LUN Utilization Summary . . . . . . . . . . . . . . . . . . . . . . . . . . . . . . . . . . . . . . . . . . . . . . . . . . . . . . . . . . . . . . . . . . . . . .256LUN Utilization Summary for EMC VPLEX Arrays. . . . . . . . . . . . . . . . . . . . . . . . . . . . . . . . . . . . . . . . . . . . . . . . . . . .259LUN Utilization Summary for IBM XIV Arrays . . . . . . . . . . . . . . . . . . . . . . . . . . . . . . . . . . . . . . . . . . . . . . . . . . . . . . .261LUN Utilization Summary for NetApp 7-Mode . . . . . . . . . . . . . . . . . . . . . . . . . . . . . . . . . . . . . . . . . . . . . . . . . . . . . . .263LUN Utilization Summary for NetApp Cluster-Mode . . . . . . . . . . . . . . . . . . . . . . . . . . . . . . . . . . . . . . . . . . . . . . . . . .264
Contents 7
LUN Utilization Summary for HP3PAR . . . . . . . . . . . . . . . . . . . . . . . . . . . . . . . . . . . . . . . . . . . . . . . . . . . . . . . . . . . .265Array Group Details . . . . . . . . . . . . . . . . . . . . . . . . . . . . . . . . . . . . . . . . . . . . . . . . . . . . . . . . . . . . . . . . . . . . . . . . . . .266
EMC CLARiiON Storage Array Group Specifics . . . . . . . . . . . . . . . . . . . . . . . . . . . . . . . . . . . . . . . . . . . . . . . . . . .267Microsoft Azure Endpoint Summary. . . . . . . . . . . . . . . . . . . . . . . . . . . . . . . . . . . . . . . . . . . . . . . . . . . . . . . . . . . . . . .268Microsoft Azure Storage Account Summary . . . . . . . . . . . . . . . . . . . . . . . . . . . . . . . . . . . . . . . . . . . . . . . . . . . . . . . .269NetApp Aggregate Summary . . . . . . . . . . . . . . . . . . . . . . . . . . . . . . . . . . . . . . . . . . . . . . . . . . . . . . . . . . . . . . . . . . . .270NetApp Cluster-Mode Aggregate Summary. . . . . . . . . . . . . . . . . . . . . . . . . . . . . . . . . . . . . . . . . . . . . . . . . . . . . . . . .271NetApp Aggregate Detail . . . . . . . . . . . . . . . . . . . . . . . . . . . . . . . . . . . . . . . . . . . . . . . . . . . . . . . . . . . . . . . . . . . . . . .272NetApp Cluster-Mode Aggregate Detail. . . . . . . . . . . . . . . . . . . . . . . . . . . . . . . . . . . . . . . . . . . . . . . . . . . . . . . . . . . .274NetApp Plex Details . . . . . . . . . . . . . . . . . . . . . . . . . . . . . . . . . . . . . . . . . . . . . . . . . . . . . . . . . . . . . . . . . . . . . . . . . . .276NetApp CIFS Summary . . . . . . . . . . . . . . . . . . . . . . . . . . . . . . . . . . . . . . . . . . . . . . . . . . . . . . . . . . . . . . . . . . . . . . . .277NetApp Cluster-Mode CIFS Summary. . . . . . . . . . . . . . . . . . . . . . . . . . . . . . . . . . . . . . . . . . . . . . . . . . . . . . . . . . . . .278NetApp Disk Summary. . . . . . . . . . . . . . . . . . . . . . . . . . . . . . . . . . . . . . . . . . . . . . . . . . . . . . . . . . . . . . . . . . . . . . . . .280NetApp Cluster-Mode Disk Summary . . . . . . . . . . . . . . . . . . . . . . . . . . . . . . . . . . . . . . . . . . . . . . . . . . . . . . . . . . . . .281NetApp Cluster-Mode FC Array Port Utilization . . . . . . . . . . . . . . . . . . . . . . . . . . . . . . . . . . . . . . . . . . . . . . . . . . . . . .282NetApp NFS Summary . . . . . . . . . . . . . . . . . . . . . . . . . . . . . . . . . . . . . . . . . . . . . . . . . . . . . . . . . . . . . . . . . . . . . . . .283NetApp Cluster-Mode NFS Summary . . . . . . . . . . . . . . . . . . . . . . . . . . . . . . . . . . . . . . . . . . . . . . . . . . . . . . . . . . . . .285NetApp Cluster-Mode Node Summary . . . . . . . . . . . . . . . . . . . . . . . . . . . . . . . . . . . . . . . . . . . . . . . . . . . . . . . . . . . .285NetApp QTree Summary . . . . . . . . . . . . . . . . . . . . . . . . . . . . . . . . . . . . . . . . . . . . . . . . . . . . . . . . . . . . . . . . . . . . . . .287NetApp Cluster-Mode QTree Summary. . . . . . . . . . . . . . . . . . . . . . . . . . . . . . . . . . . . . . . . . . . . . . . . . . . . . . . . . . . .289NetApp Snapshot Summary . . . . . . . . . . . . . . . . . . . . . . . . . . . . . . . . . . . . . . . . . . . . . . . . . . . . . . . . . . . . . . . . . . . .289NetApp Cluster-Mode Snapshot Summary . . . . . . . . . . . . . . . . . . . . . . . . . . . . . . . . . . . . . . . . . . . . . . . . . . . . . . . . .291NetApp Volume Summary . . . . . . . . . . . . . . . . . . . . . . . . . . . . . . . . . . . . . . . . . . . . . . . . . . . . . . . . . . . . . . . . . . . . . .292NetApp Cluster-Mode Volume Summary. . . . . . . . . . . . . . . . . . . . . . . . . . . . . . . . . . . . . . . . . . . . . . . . . . . . . . . . . . .293NetApp Volume Details . . . . . . . . . . . . . . . . . . . . . . . . . . . . . . . . . . . . . . . . . . . . . . . . . . . . . . . . . . . . . . . . . . . . . . . .294NetApp Cluster-Mode Volume Detail . . . . . . . . . . . . . . . . . . . . . . . . . . . . . . . . . . . . . . . . . . . . . . . . . . . . . . . . . . . . . .297NetApp Cluster-Mode Summary . . . . . . . . . . . . . . . . . . . . . . . . . . . . . . . . . . . . . . . . . . . . . . . . . . . . . . . . . . . . . . . . .299NetApp Cluster-Mode Thin Provisioning Summary . . . . . . . . . . . . . . . . . . . . . . . . . . . . . . . . . . . . . . . . . . . . . . . . . . .303NetApp Cluster-Mode Vserver Summary. . . . . . . . . . . . . . . . . . . . . . . . . . . . . . . . . . . . . . . . . . . . . . . . . . . . . . . . . . .304OpenStack Swift Container Summary . . . . . . . . . . . . . . . . . . . . . . . . . . . . . . . . . . . . . . . . . . . . . . . . . . . . . . . . . . . . .306OpenStack Swift Policy Summary . . . . . . . . . . . . . . . . . . . . . . . . . . . . . . . . . . . . . . . . . . . . . . . . . . . . . . . . . . . . . . . .307OpenStack Swift Storage Utilization by Account . . . . . . . . . . . . . . . . . . . . . . . . . . . . . . . . . . . . . . . . . . . . . . . . . . . . .308OpenStack Swift Storage Utilization by Zone . . . . . . . . . . . . . . . . . . . . . . . . . . . . . . . . . . . . . . . . . . . . . . . . . . . . . . .309OpenStack Swift Storage Device Summary . . . . . . . . . . . . . . . . . . . . . . . . . . . . . . . . . . . . . . . . . . . . . . . . . . . . . . . .310OpenStack Swift Storage Utilization by Node . . . . . . . . . . . . . . . . . . . . . . . . . . . . . . . . . . . . . . . . . . . . . . . . . . . . . . . 311
Chapter 7Host Capacity Utilization ReportsHost Capacity & Utilization . . . . . . . . . . . . . . . . . . . . . . . . . . . . . . . . . . . . . . . . . . . . . . . . . . . . . . . . . . . . . . . . . . . . .313Host Utilization Detail. . . . . . . . . . . . . . . . . . . . . . . . . . . . . . . . . . . . . . . . . . . . . . . . . . . . . . . . . . . . . . . . . . . . . . . . . .316
Host Utilization Detail (ASM Example) . . . . . . . . . . . . . . . . . . . . . . . . . . . . . . . . . . . . . . . . . . . . . . . . . . . . . . . . . .323Veritas Volume Details . . . . . . . . . . . . . . . . . . . . . . . . . . . . . . . . . . . . . . . . . . . . . . . . . . . . . . . . . . . . . . . . . . . . . . . . .325Host Executive Summary. . . . . . . . . . . . . . . . . . . . . . . . . . . . . . . . . . . . . . . . . . . . . . . . . . . . . . . . . . . . . . . . . . . . . . .326Host HBA Summary. . . . . . . . . . . . . . . . . . . . . . . . . . . . . . . . . . . . . . . . . . . . . . . . . . . . . . . . . . . . . . . . . . . . . . . . . . .328
Chapter 8Thin Provisioning ReportsThin Provisioning Overview . . . . . . . . . . . . . . . . . . . . . . . . . . . . . . . . . . . . . . . . . . . . . . . . . . . . . . . . . . . . . . . . . . . . .329EMC Symmetrix Compression Ratio Summary . . . . . . . . . . . . . . . . . . . . . . . . . . . . . . . . . . . . . . . . . . . . . . . . . . . . . .329EMC Symmetrix SRP Summary . . . . . . . . . . . . . . . . . . . . . . . . . . . . . . . . . . . . . . . . . . . . . . . . . . . . . . . . . . . . . . . . .331EMC Symmetrix Thin Pool Summary . . . . . . . . . . . . . . . . . . . . . . . . . . . . . . . . . . . . . . . . . . . . . . . . . . . . . . . . . . . . .332EMC Symmetrix Thin Pool Detail. . . . . . . . . . . . . . . . . . . . . . . . . . . . . . . . . . . . . . . . . . . . . . . . . . . . . . . . . . . . . . . . .333EMC VNX (CLARiiON) Thin Pool Summary . . . . . . . . . . . . . . . . . . . . . . . . . . . . . . . . . . . . . . . . . . . . . . . . . . . . . . . .335EMC VNX (CLARiiON) Thin Pool Details . . . . . . . . . . . . . . . . . . . . . . . . . . . . . . . . . . . . . . . . . . . . . . . . . . . . . . . . . .336Hitachi Disk Summary . . . . . . . . . . . . . . . . . . . . . . . . . . . . . . . . . . . . . . . . . . . . . . . . . . . . . . . . . . . . . . . . . . . . . . . . .338Hitachi Dynamic Provisioning Pool Summary . . . . . . . . . . . . . . . . . . . . . . . . . . . . . . . . . . . . . . . . . . . . . . . . . . . . . . .339Hitachi Dynamic Provisioning Pool Utilization . . . . . . . . . . . . . . . . . . . . . . . . . . . . . . . . . . . . . . . . . . . . . . . . . . . . . . .342HP 3PAR Common Provisioning Group (CPG) Summary . . . . . . . . . . . . . . . . . . . . . . . . . . . . . . . . . . . . . . . . . . . . . .343
Contents 8
HP 3PAR Common Provisioning Group (CPG) Detail . . . . . . . . . . . . . . . . . . . . . . . . . . . . . . . . . . . . . . . . . . . . . .345Storage Pool Summary . . . . . . . . . . . . . . . . . . . . . . . . . . . . . . . . . . . . . . . . . . . . . . . . . . . . . . . . . . . . . . . . . . . . . . . .346
Chapter 9Capacity Forecasting ReportsArray Capacity Forecast . . . . . . . . . . . . . . . . . . . . . . . . . . . . . . . . . . . . . . . . . . . . . . . . . . . . . . . . . . . . . . . . . . . . . . .347Data Domain Filesystem Capacity & Forecast . . . . . . . . . . . . . . . . . . . . . . . . . . . . . . . . . . . . . . . . . . . . . . . . . . . . . .349Data Domain Filesystem Status. . . . . . . . . . . . . . . . . . . . . . . . . . . . . . . . . . . . . . . . . . . . . . . . . . . . . . . . . . . . . . . . . .350EMC Symmetrix Thin Pool Capacity Forecast. . . . . . . . . . . . . . . . . . . . . . . . . . . . . . . . . . . . . . . . . . . . . . . . . . . . . . .351EMC VNX (CLARiiON) Thin Pool Capacity Forecast . . . . . . . . . . . . . . . . . . . . . . . . . . . . . . . . . . . . . . . . . . . . . . . . .352Object Store Usage Over Time . . . . . . . . . . . . . . . . . . . . . . . . . . . . . . . . . . . . . . . . . . . . . . . . . . . . . . . . . . . . . . . . . .353Hitachi NAS Storage Pool Capacity Over Time . . . . . . . . . . . . . . . . . . . . . . . . . . . . . . . . . . . . . . . . . . . . . . . . . . . . . .354Host Capacity Forecast . . . . . . . . . . . . . . . . . . . . . . . . . . . . . . . . . . . . . . . . . . . . . . . . . . . . . . . . . . . . . . . . . . . . . . . .355Host Volume Growth and Forecast . . . . . . . . . . . . . . . . . . . . . . . . . . . . . . . . . . . . . . . . . . . . . . . . . . . . . . . . . . . . . . .356Host Storage Usage Over Time. . . . . . . . . . . . . . . . . . . . . . . . . . . . . . . . . . . . . . . . . . . . . . . . . . . . . . . . . . . . . . . . . .357Storage Capacity Over Time . . . . . . . . . . . . . . . . . . . . . . . . . . . . . . . . . . . . . . . . . . . . . . . . . . . . . . . . . . . . . . . . . . . .358
Chapter 10Available/Reclaimable Capacity ReportsAllocated but Undiscovered LUNs . . . . . . . . . . . . . . . . . . . . . . . . . . . . . . . . . . . . . . . . . . . . . . . . . . . . . . . . . . . . . . . .360Allocated but Unused LUNs. . . . . . . . . . . . . . . . . . . . . . . . . . . . . . . . . . . . . . . . . . . . . . . . . . . . . . . . . . . . . . . . . . . . .361Array Utilization Dashboard . . . . . . . . . . . . . . . . . . . . . . . . . . . . . . . . . . . . . . . . . . . . . . . . . . . . . . . . . . . . . . . . . . . . .363Array Utilization Summary . . . . . . . . . . . . . . . . . . . . . . . . . . . . . . . . . . . . . . . . . . . . . . . . . . . . . . . . . . . . . . . . . . . . . .365Reclamation Summary. . . . . . . . . . . . . . . . . . . . . . . . . . . . . . . . . . . . . . . . . . . . . . . . . . . . . . . . . . . . . . . . . . . . . . . . .369
Reclaimable Space by Host Group. . . . . . . . . . . . . . . . . . . . . . . . . . . . . . . . . . . . . . . . . . . . . . . . . . . . . . . . . . . . .369Reclaimable Space by Host Group Details . . . . . . . . . . . . . . . . . . . . . . . . . . . . . . . . . . . . . . . . . . . . . . . . . . . . . . .370Reclaimable Space by Host . . . . . . . . . . . . . . . . . . . . . . . . . . . . . . . . . . . . . . . . . . . . . . . . . . . . . . . . . . . . . . . . . .370LUNS Added to Volume Group but Unused . . . . . . . . . . . . . . . . . . . . . . . . . . . . . . . . . . . . . . . . . . . . . . . . . . . . . .371
Suspected De-provisioned Hosts. . . . . . . . . . . . . . . . . . . . . . . . . . . . . . . . . . . . . . . . . . . . . . . . . . . . . . . . . . . . . . . . .371Unallocated LUNs . . . . . . . . . . . . . . . . . . . . . . . . . . . . . . . . . . . . . . . . . . . . . . . . . . . . . . . . . . . . . . . . . . . . . . . . . . . .372Unused Disks/Volume Groups. . . . . . . . . . . . . . . . . . . . . . . . . . . . . . . . . . . . . . . . . . . . . . . . . . . . . . . . . . . . . . . . . . .373Unused Partitions/Logical Volumes . . . . . . . . . . . . . . . . . . . . . . . . . . . . . . . . . . . . . . . . . . . . . . . . . . . . . . . . . . . . . . .374
Chapter 11Storage Performance ReportsPerformance Profiles Overview . . . . . . . . . . . . . . . . . . . . . . . . . . . . . . . . . . . . . . . . . . . . . . . . . . . . . . . . . . . . . . . . . .378Capacity Manager Array/LUN Performance Data Collection . . . . . . . . . . . . . . . . . . . . . . . . . . . . . . . . . . . . . . . . . . . .378
Port Performance Metrics . . . . . . . . . . . . . . . . . . . . . . . . . . . . . . . . . . . . . . . . . . . . . . . . . . . . . . . . . . . . . . . . . . . .379EMC Isilon Metrics . . . . . . . . . . . . . . . . . . . . . . . . . . . . . . . . . . . . . . . . . . . . . . . . . . . . . . . . . . . . . . . . . . . . . . . . .380NetApp Cluster-Mode Metrics . . . . . . . . . . . . . . . . . . . . . . . . . . . . . . . . . . . . . . . . . . . . . . . . . . . . . . . . . . . . . . . . .380EMC Symmetrix Enhanced Performance Metrics. . . . . . . . . . . . . . . . . . . . . . . . . . . . . . . . . . . . . . . . . . . . . . . . . .380
Determining Performance States. . . . . . . . . . . . . . . . . . . . . . . . . . . . . . . . . . . . . . . . . . . . . . . . . . . . . . . . . . . . . . . . .380Populating Performance States . . . . . . . . . . . . . . . . . . . . . . . . . . . . . . . . . . . . . . . . . . . . . . . . . . . . . . . . . . . . . . . . . .380Updating Performance Profiles . . . . . . . . . . . . . . . . . . . . . . . . . . . . . . . . . . . . . . . . . . . . . . . . . . . . . . . . . . . . . . . . . .380Community Performance Profiling . . . . . . . . . . . . . . . . . . . . . . . . . . . . . . . . . . . . . . . . . . . . . . . . . . . . . . . . . . . . . . . .382
Configure Community Performance Profiling . . . . . . . . . . . . . . . . . . . . . . . . . . . . . . . . . . . . . . . . . . . . . . . . . . . . .382Aggregated Profiles . . . . . . . . . . . . . . . . . . . . . . . . . . . . . . . . . . . . . . . . . . . . . . . . . . . . . . . . . . . . . . . . . . . . . . . .383
Array Performance by RAID Group . . . . . . . . . . . . . . . . . . . . . . . . . . . . . . . . . . . . . . . . . . . . . . . . . . . . . . . . . . . . . . .384Array Performance by LUN . . . . . . . . . . . . . . . . . . . . . . . . . . . . . . . . . . . . . . . . . . . . . . . . . . . . . . . . . . . . . . . . . . . . .386
LUN Performance . . . . . . . . . . . . . . . . . . . . . . . . . . . . . . . . . . . . . . . . . . . . . . . . . . . . . . . . . . . . . . . . . . . . . . . . . .387LUN Details . . . . . . . . . . . . . . . . . . . . . . . . . . . . . . . . . . . . . . . . . . . . . . . . . . . . . . . . . . . . . . . . . . . . . . . . . . . . . .388
Data Domain Disk Performance . . . . . . . . . . . . . . . . . . . . . . . . . . . . . . . . . . . . . . . . . . . . . . . . . . . . . . . . . . . . . . . . .389Data Domain System Performance . . . . . . . . . . . . . . . . . . . . . . . . . . . . . . . . . . . . . . . . . . . . . . . . . . . . . . . . . . . . . . .390EMC Isilon CPU Performance by Cluster . . . . . . . . . . . . . . . . . . . . . . . . . . . . . . . . . . . . . . . . . . . . . . . . . . . . . . . . . .391EMC Isilon CPU Performance by Node. . . . . . . . . . . . . . . . . . . . . . . . . . . . . . . . . . . . . . . . . . . . . . . . . . . . . . . . . . . .392EMC Isilon Disk Performance by Cluster. . . . . . . . . . . . . . . . . . . . . . . . . . . . . . . . . . . . . . . . . . . . . . . . . . . . . . . . . . .393EMC Isilon Disk Performance by Node . . . . . . . . . . . . . . . . . . . . . . . . . . . . . . . . . . . . . . . . . . . . . . . . . . . . . . . . . . . .393
Contents 9
EMC Isilon File System Performance by Protocol . . . . . . . . . . . . . . . . . . . . . . . . . . . . . . . . . . . . . . . . . . . . . . . . . . . .393EMC Symmetrix Array Performance . . . . . . . . . . . . . . . . . . . . . . . . . . . . . . . . . . . . . . . . . . . . . . . . . . . . . . . . . . . . . .395EMC Symmetrix Device Group Performance . . . . . . . . . . . . . . . . . . . . . . . . . . . . . . . . . . . . . . . . . . . . . . . . . . . . . . .396EMC Symmetrix Disk Performance . . . . . . . . . . . . . . . . . . . . . . . . . . . . . . . . . . . . . . . . . . . . . . . . . . . . . . . . . . . . . . .397EMC Symmetrix FE Director Performance . . . . . . . . . . . . . . . . . . . . . . . . . . . . . . . . . . . . . . . . . . . . . . . . . . . . . . . . .399EMC Symmetrix Storage Group Performance. . . . . . . . . . . . . . . . . . . . . . . . . . . . . . . . . . . . . . . . . . . . . . . . . . . . . . .400EMC Symmetrix Thin Tier Performance . . . . . . . . . . . . . . . . . . . . . . . . . . . . . . . . . . . . . . . . . . . . . . . . . . . . . . . . . . .401EMC VNX (Celerra) Data Mover Performance . . . . . . . . . . . . . . . . . . . . . . . . . . . . . . . . . . . . . . . . . . . . . . . . . . . . . .402LUN Performance . . . . . . . . . . . . . . . . . . . . . . . . . . . . . . . . . . . . . . . . . . . . . . . . . . . . . . . . . . . . . . . . . . . . . . . . . . . .403Mission Control for Performance Analysis . . . . . . . . . . . . . . . . . . . . . . . . . . . . . . . . . . . . . . . . . . . . . . . . . . . . . . . . . .404NetApp Cluster-Mode Aggregate Performance by Cluster . . . . . . . . . . . . . . . . . . . . . . . . . . . . . . . . . . . . . . . . . . . . .405NetApp Cluster-Mode Aggregate Performance by Node. . . . . . . . . . . . . . . . . . . . . . . . . . . . . . . . . . . . . . . . . . . . . . .406NetApp Cluster-Mode CIFS Performance by Cluster . . . . . . . . . . . . . . . . . . . . . . . . . . . . . . . . . . . . . . . . . . . . . . . . .407NetApp Cluster-Mode CIFS Performance by Vserver . . . . . . . . . . . . . . . . . . . . . . . . . . . . . . . . . . . . . . . . . . . . . . . . .408NetApp Cluster-Mode Disk Performance by Cluster . . . . . . . . . . . . . . . . . . . . . . . . . . . . . . . . . . . . . . . . . . . . . . . . . .409NetApp Cluster-Mode Disk Performance by Node . . . . . . . . . . . . . . . . . . . . . . . . . . . . . . . . . . . . . . . . . . . . . . . . . . .410NetApp Cluster-Mode NFS Performance by Cluster . . . . . . . . . . . . . . . . . . . . . . . . . . . . . . . . . . . . . . . . . . . . . . . . . . 411NetApp Cluster-Mode NFS Performance by Vserver . . . . . . . . . . . . . . . . . . . . . . . . . . . . . . . . . . . . . . . . . . . . . . . . .412NetApp Cluster-Mode Volume Performance by Cluster. . . . . . . . . . . . . . . . . . . . . . . . . . . . . . . . . . . . . . . . . . . . . . . .413NetApp Cluster-Mode Volume Performance by Vserver . . . . . . . . . . . . . . . . . . . . . . . . . . . . . . . . . . . . . . . . . . . . . . .414NetApp Cluster-Mode Performance by Cluster . . . . . . . . . . . . . . . . . . . . . . . . . . . . . . . . . . . . . . . . . . . . . . . . . . . . . .415NetApp Cluster-Mode Performance by Node . . . . . . . . . . . . . . . . . . . . . . . . . . . . . . . . . . . . . . . . . . . . . . . . . . . . . . .416Performance Profiles . . . . . . . . . . . . . . . . . . . . . . . . . . . . . . . . . . . . . . . . . . . . . . . . . . . . . . . . . . . . . . . . . . . . . . . . . .417Port Throughput by Array. . . . . . . . . . . . . . . . . . . . . . . . . . . . . . . . . . . . . . . . . . . . . . . . . . . . . . . . . . . . . . . . . . . . . . .419
Chapter 12Application Capacity ReportsApplication Storage Dashboard . . . . . . . . . . . . . . . . . . . . . . . . . . . . . . . . . . . . . . . . . . . . . . . . . . . . . . . . . . . . . . . . .420
Application Sub-Level of the Application Storage Dashboard. . . . . . . . . . . . . . . . . . . . . . . . . . . . . . . . . . . . . . . . .422Applications at Risk . . . . . . . . . . . . . . . . . . . . . . . . . . . . . . . . . . . . . . . . . . . . . . . . . . . . . . . . . . . . . . . . . . . . . . . . . . .423Over-Provisioned Applications. . . . . . . . . . . . . . . . . . . . . . . . . . . . . . . . . . . . . . . . . . . . . . . . . . . . . . . . . . . . . . . . . . .423
Chapter 13Capacity at Risk ReportsException Summary. . . . . . . . . . . . . . . . . . . . . . . . . . . . . . . . . . . . . . . . . . . . . . . . . . . . . . . . . . . . . . . . . . . . . . . . . . .425
Advanced Options. . . . . . . . . . . . . . . . . . . . . . . . . . . . . . . . . . . . . . . . . . . . . . . . . . . . . . . . . . . . . . . . . . . . . . . . . .426Hosts at Risk . . . . . . . . . . . . . . . . . . . . . . . . . . . . . . . . . . . . . . . . . . . . . . . . . . . . . . . . . . . . . . . . . . . . . . . . . . . . . . . .428LUNs at Risk . . . . . . . . . . . . . . . . . . . . . . . . . . . . . . . . . . . . . . . . . . . . . . . . . . . . . . . . . . . . . . . . . . . . . . . . . . . . . . . .428NetApp Aggregates at Risk . . . . . . . . . . . . . . . . . . . . . . . . . . . . . . . . . . . . . . . . . . . . . . . . . . . . . . . . . . . . . . . . . . . . .431NetApp Cluster-Mode Aggregates at Risk . . . . . . . . . . . . . . . . . . . . . . . . . . . . . . . . . . . . . . . . . . . . . . . . . . . . . . . . . .432NetApp Volumes at Risk . . . . . . . . . . . . . . . . . . . . . . . . . . . . . . . . . . . . . . . . . . . . . . . . . . . . . . . . . . . . . . . . . . . . . . .433NetApp Cluster-Mode Volumes at Risk . . . . . . . . . . . . . . . . . . . . . . . . . . . . . . . . . . . . . . . . . . . . . . . . . . . . . . . . . . . .433Over-Provisioned Hosts . . . . . . . . . . . . . . . . . . . . . . . . . . . . . . . . . . . . . . . . . . . . . . . . . . . . . . . . . . . . . . . . . . . . . . . .435Over-Provisioned LUNs . . . . . . . . . . . . . . . . . . . . . . . . . . . . . . . . . . . . . . . . . . . . . . . . . . . . . . . . . . . . . . . . . . . . . . .436
Chapter 14File Analytics ReportsFile Analytics Overview . . . . . . . . . . . . . . . . . . . . . . . . . . . . . . . . . . . . . . . . . . . . . . . . . . . . . . . . . . . . . . . . . . . . . . . .440Capacity Report . . . . . . . . . . . . . . . . . . . . . . . . . . . . . . . . . . . . . . . . . . . . . . . . . . . . . . . . . . . . . . . . . . . . . . . . . . . . . .441Capacity Forecast . . . . . . . . . . . . . . . . . . . . . . . . . . . . . . . . . . . . . . . . . . . . . . . . . . . . . . . . . . . . . . . . . . . . . . . . . . . .442Capacity Forecast by Device . . . . . . . . . . . . . . . . . . . . . . . . . . . . . . . . . . . . . . . . . . . . . . . . . . . . . . . . . . . . . . . . . . . .443Capacity Forecast by Volume/Share . . . . . . . . . . . . . . . . . . . . . . . . . . . . . . . . . . . . . . . . . . . . . . . . . . . . . . . . . . . . . .443Host Summary . . . . . . . . . . . . . . . . . . . . . . . . . . . . . . . . . . . . . . . . . . . . . . . . . . . . . . . . . . . . . . . . . . . . . . . . . . . . . . .444Top Candidates for Duplicates. . . . . . . . . . . . . . . . . . . . . . . . . . . . . . . . . . . . . . . . . . . . . . . . . . . . . . . . . . . . . . . . . . .445Volume Summary Report. . . . . . . . . . . . . . . . . . . . . . . . . . . . . . . . . . . . . . . . . . . . . . . . . . . . . . . . . . . . . . . . . . . . . . .446Share Summary Report . . . . . . . . . . . . . . . . . . . . . . . . . . . . . . . . . . . . . . . . . . . . . . . . . . . . . . . . . . . . . . . . . . . . . . . .447New Files Added . . . . . . . . . . . . . . . . . . . . . . . . . . . . . . . . . . . . . . . . . . . . . . . . . . . . . . . . . . . . . . . . . . . . . . . . . . . . .448
Contents 10
Usage by Owner . . . . . . . . . . . . . . . . . . . . . . . . . . . . . . . . . . . . . . . . . . . . . . . . . . . . . . . . . . . . . . . . . . . . . . . . . . . . .449Usage by Owner Forecast . . . . . . . . . . . . . . . . . . . . . . . . . . . . . . . . . . . . . . . . . . . . . . . . . . . . . . . . . . . . . . . . . . . . . .450Usage by Owner Forecast Details . . . . . . . . . . . . . . . . . . . . . . . . . . . . . . . . . . . . . . . . . . . . . . . . . . . . . . . . . . . . . . . .451Duplicate Files (top 50 in each device) . . . . . . . . . . . . . . . . . . . . . . . . . . . . . . . . . . . . . . . . . . . . . . . . . . . . . . . . . . . .452Deduplication Candidates . . . . . . . . . . . . . . . . . . . . . . . . . . . . . . . . . . . . . . . . . . . . . . . . . . . . . . . . . . . . . . . . . . . . . .453File Categories. . . . . . . . . . . . . . . . . . . . . . . . . . . . . . . . . . . . . . . . . . . . . . . . . . . . . . . . . . . . . . . . . . . . . . . . . . . . . . .454File Sizes . . . . . . . . . . . . . . . . . . . . . . . . . . . . . . . . . . . . . . . . . . . . . . . . . . . . . . . . . . . . . . . . . . . . . . . . . . . . . . . . . . .455File Types. . . . . . . . . . . . . . . . . . . . . . . . . . . . . . . . . . . . . . . . . . . . . . . . . . . . . . . . . . . . . . . . . . . . . . . . . . . . . . . . . . .456Largest Files . . . . . . . . . . . . . . . . . . . . . . . . . . . . . . . . . . . . . . . . . . . . . . . . . . . . . . . . . . . . . . . . . . . . . . . . . . . . . . . .457Access Dates. . . . . . . . . . . . . . . . . . . . . . . . . . . . . . . . . . . . . . . . . . . . . . . . . . . . . . . . . . . . . . . . . . . . . . . . . . . . . . . .458Create Dates . . . . . . . . . . . . . . . . . . . . . . . . . . . . . . . . . . . . . . . . . . . . . . . . . . . . . . . . . . . . . . . . . . . . . . . . . . . . . . . .459Modified Dates. . . . . . . . . . . . . . . . . . . . . . . . . . . . . . . . . . . . . . . . . . . . . . . . . . . . . . . . . . . . . . . . . . . . . . . . . . . . . . .460
Chapter 15Capacity Chargeback ReportsAggregated Chargeback . . . . . . . . . . . . . . . . . . . . . . . . . . . . . . . . . . . . . . . . . . . . . . . . . . . . . . . . . . . . . . . . . . . . . . .464
Aggregated Chargeback by Host Groups . . . . . . . . . . . . . . . . . . . . . . . . . . . . . . . . . . . . . . . . . . . . . . . . . . . . . . . .466Aggregated Chargeback by Attribute . . . . . . . . . . . . . . . . . . . . . . . . . . . . . . . . . . . . . . . . . . . . . . . . . . . . . . . . . . .467Chargeback Detail . . . . . . . . . . . . . . . . . . . . . . . . . . . . . . . . . . . . . . . . . . . . . . . . . . . . . . . . . . . . . . . . . . . . . . . . .467
AWS Account Billing Detail . . . . . . . . . . . . . . . . . . . . . . . . . . . . . . . . . . . . . . . . . . . . . . . . . . . . . . . . . . . . . . . . . . . . .467AWS Account Listing . . . . . . . . . . . . . . . . . . . . . . . . . . . . . . . . . . . . . . . . . . . . . . . . . . . . . . . . . . . . . . . . . . . . . . . . . .469AWS Billing Summary Over Time . . . . . . . . . . . . . . . . . . . . . . . . . . . . . . . . . . . . . . . . . . . . . . . . . . . . . . . . . . . . . . . .471AWS Product Summary . . . . . . . . . . . . . . . . . . . . . . . . . . . . . . . . . . . . . . . . . . . . . . . . . . . . . . . . . . . . . . . . . . . . . . . .472Chargeback Array Capacity . . . . . . . . . . . . . . . . . . . . . . . . . . . . . . . . . . . . . . . . . . . . . . . . . . . . . . . . . . . . . . . . . . . . .473Chargeback By Host . . . . . . . . . . . . . . . . . . . . . . . . . . . . . . . . . . . . . . . . . . . . . . . . . . . . . . . . . . . . . . . . . . . . . . . . . .475
Chargeback Detail . . . . . . . . . . . . . . . . . . . . . . . . . . . . . . . . . . . . . . . . . . . . . . . . . . . . . . . . . . . . . . . . . . . . . . . . .475Chargeback Policy Capacity . . . . . . . . . . . . . . . . . . . . . . . . . . . . . . . . . . . . . . . . . . . . . . . . . . . . . . . . . . . . . . . . . . . .477
Policy Detail . . . . . . . . . . . . . . . . . . . . . . . . . . . . . . . . . . . . . . . . . . . . . . . . . . . . . . . . . . . . . . . . . . . . . . . . . . . . . .478Microsoft Azure Billing Summary . . . . . . . . . . . . . . . . . . . . . . . . . . . . . . . . . . . . . . . . . . . . . . . . . . . . . . . . . . . . . . . . .479Microsoft Azure Resource Group Summary . . . . . . . . . . . . . . . . . . . . . . . . . . . . . . . . . . . . . . . . . . . . . . . . . . . . . . . .480Microsoft Azure Subscription Summary . . . . . . . . . . . . . . . . . . . . . . . . . . . . . . . . . . . . . . . . . . . . . . . . . . . . . . . . . . . .481Object Store Chargeback. . . . . . . . . . . . . . . . . . . . . . . . . . . . . . . . . . . . . . . . . . . . . . . . . . . . . . . . . . . . . . . . . . . . . . .482Object Store Chargeback Detail . . . . . . . . . . . . . . . . . . . . . . . . . . . . . . . . . . . . . . . . . . . . . . . . . . . . . . . . . . . . . . . . .484
Chapter 16Virtualization Manager ReportsVirtualization Terminology . . . . . . . . . . . . . . . . . . . . . . . . . . . . . . . . . . . . . . . . . . . . . . . . . . . . . . . . . . . . . . . . . . . . . .488Virtualization Manager Overview . . . . . . . . . . . . . . . . . . . . . . . . . . . . . . . . . . . . . . . . . . . . . . . . . . . . . . . . . . . . . . . . .490
Understanding the Datastore . . . . . . . . . . . . . . . . . . . . . . . . . . . . . . . . . . . . . . . . . . . . . . . . . . . . . . . . . . . . . . . . .490Using Virtualization Manager for Planning and Monitoring . . . . . . . . . . . . . . . . . . . . . . . . . . . . . . . . . . . . . . . . . . .491
AWS EC2 Instance Summary . . . . . . . . . . . . . . . . . . . . . . . . . . . . . . . . . . . . . . . . . . . . . . . . . . . . . . . . . . . . . . . . . . .492Microsoft Azure Virtual Machine Summary . . . . . . . . . . . . . . . . . . . . . . . . . . . . . . . . . . . . . . . . . . . . . . . . . . . . . . . . .494Microsoft Azure Virtual Machine Detail . . . . . . . . . . . . . . . . . . . . . . . . . . . . . . . . . . . . . . . . . . . . . . . . . . . . . . . . . . . .495VM Cluster Summary. . . . . . . . . . . . . . . . . . . . . . . . . . . . . . . . . . . . . . . . . . . . . . . . . . . . . . . . . . . . . . . . . . . . . . . . . .496VM Files Summary. . . . . . . . . . . . . . . . . . . . . . . . . . . . . . . . . . . . . . . . . . . . . . . . . . . . . . . . . . . . . . . . . . . . . . . . . . . .498VM Server Summary . . . . . . . . . . . . . . . . . . . . . . . . . . . . . . . . . . . . . . . . . . . . . . . . . . . . . . . . . . . . . . . . . . . . . . . . . .500VM Server Detail . . . . . . . . . . . . . . . . . . . . . . . . . . . . . . . . . . . . . . . . . . . . . . . . . . . . . . . . . . . . . . . . . . . . . . . . . . . . .502Microsoft Hyper-V Server Summary . . . . . . . . . . . . . . . . . . . . . . . . . . . . . . . . . . . . . . . . . . . . . . . . . . . . . . . . . . . . . .505VM Snapshot Summary. . . . . . . . . . . . . . . . . . . . . . . . . . . . . . . . . . . . . . . . . . . . . . . . . . . . . . . . . . . . . . . . . . . . . . . .507VM Storage Mapping Summary. . . . . . . . . . . . . . . . . . . . . . . . . . . . . . . . . . . . . . . . . . . . . . . . . . . . . . . . . . . . . . . . . .508VM Summary . . . . . . . . . . . . . . . . . . . . . . . . . . . . . . . . . . . . . . . . . . . . . . . . . . . . . . . . . . . . . . . . . . . . . . . . . . . . . . . .509VM Detail . . . . . . . . . . . . . . . . . . . . . . . . . . . . . . . . . . . . . . . . . . . . . . . . . . . . . . . . . . . . . . . . . . . . . . . . . . . . . . . . . . . 511Microsoft Hyper-V VM Summary . . . . . . . . . . . . . . . . . . . . . . . . . . . . . . . . . . . . . . . . . . . . . . . . . . . . . . . . . . . . . . . . .514VM Detail (Hyper-V). . . . . . . . . . . . . . . . . . . . . . . . . . . . . . . . . . . . . . . . . . . . . . . . . . . . . . . . . . . . . . . . . . . . . . . . . . .516VMs Over Time . . . . . . . . . . . . . . . . . . . . . . . . . . . . . . . . . . . . . . . . . . . . . . . . . . . . . . . . . . . . . . . . . . . . . . . . . . . . . .518Logical Disk Utilization. . . . . . . . . . . . . . . . . . . . . . . . . . . . . . . . . . . . . . . . . . . . . . . . . . . . . . . . . . . . . . . . . . . . . . . . .519Datastore Usage Breakdown. . . . . . . . . . . . . . . . . . . . . . . . . . . . . . . . . . . . . . . . . . . . . . . . . . . . . . . . . . . . . . . . . . . .520VM Datastore Overview. . . . . . . . . . . . . . . . . . . . . . . . . . . . . . . . . . . . . . . . . . . . . . . . . . . . . . . . . . . . . . . . . . . . . . . .521
Contents 11
Datastore Usage History and Performance . . . . . . . . . . . . . . . . . . . . . . . . . . . . . . . . . . . . . . . . . . . . . . . . . . . . . . . . .522Datastore Usage History . . . . . . . . . . . . . . . . . . . . . . . . . . . . . . . . . . . . . . . . . . . . . . . . . . . . . . . . . . . . . . . . . . . . .522Datastore Disk Read/Write Performance . . . . . . . . . . . . . . . . . . . . . . . . . . . . . . . . . . . . . . . . . . . . . . . . . . . . . . . .523Datastore Disk Latency Performance . . . . . . . . . . . . . . . . . . . . . . . . . . . . . . . . . . . . . . . . . . . . . . . . . . . . . . . . . . .524
Datastore Utilization Summary . . . . . . . . . . . . . . . . . . . . . . . . . . . . . . . . . . . . . . . . . . . . . . . . . . . . . . . . . . . . . . . . . .525Datastore Detail . . . . . . . . . . . . . . . . . . . . . . . . . . . . . . . . . . . . . . . . . . . . . . . . . . . . . . . . . . . . . . . . . . . . . . . . . . . . . .526Physical Disk Utilization. . . . . . . . . . . . . . . . . . . . . . . . . . . . . . . . . . . . . . . . . . . . . . . . . . . . . . . . . . . . . . . . . . . . . . . .530Physical Disk Detail . . . . . . . . . . . . . . . . . . . . . . . . . . . . . . . . . . . . . . . . . . . . . . . . . . . . . . . . . . . . . . . . . . . . . . . . . . .531Datastore Performance Summary . . . . . . . . . . . . . . . . . . . . . . . . . . . . . . . . . . . . . . . . . . . . . . . . . . . . . . . . . . . . . . . .533Physical Disk Performance Over Time . . . . . . . . . . . . . . . . . . . . . . . . . . . . . . . . . . . . . . . . . . . . . . . . . . . . . . . . . . . .535Physical Disk Performance Summary . . . . . . . . . . . . . . . . . . . . . . . . . . . . . . . . . . . . . . . . . . . . . . . . . . . . . . . . . . . . .536VM Guest to LUN Performance . . . . . . . . . . . . . . . . . . . . . . . . . . . . . . . . . . . . . . . . . . . . . . . . . . . . . . . . . . . . . . . . . .537VM Performance Over Time . . . . . . . . . . . . . . . . . . . . . . . . . . . . . . . . . . . . . . . . . . . . . . . . . . . . . . . . . . . . . . . . . . . .538VM Performance Summary . . . . . . . . . . . . . . . . . . . . . . . . . . . . . . . . . . . . . . . . . . . . . . . . . . . . . . . . . . . . . . . . . . . . .540
vCenter Statistics Configuration . . . . . . . . . . . . . . . . . . . . . . . . . . . . . . . . . . . . . . . . . . . . . . . . . . . . . . . . . . . . . . .541Focusing on Specific I/O Statistics . . . . . . . . . . . . . . . . . . . . . . . . . . . . . . . . . . . . . . . . . . . . . . . . . . . . . . . . . . . . .541Show Chart Parameter . . . . . . . . . . . . . . . . . . . . . . . . . . . . . . . . . . . . . . . . . . . . . . . . . . . . . . . . . . . . . . . . . . . . . .543
Datastore Capacity Forecast . . . . . . . . . . . . . . . . . . . . . . . . . . . . . . . . . . . . . . . . . . . . . . . . . . . . . . . . . . . . . . . . . . . .544VM Size Forecast. . . . . . . . . . . . . . . . . . . . . . . . . . . . . . . . . . . . . . . . . . . . . . . . . . . . . . . . . . . . . . . . . . . . . . . . . . . . .545
Chapter 17Fabric Manager ReportsHost to Storage Dashboard . . . . . . . . . . . . . . . . . . . . . . . . . . . . . . . . . . . . . . . . . . . . . . . . . . . . . . . . . . . . . . . . . . . . .551
Paths Portlet . . . . . . . . . . . . . . . . . . . . . . . . . . . . . . . . . . . . . . . . . . . . . . . . . . . . . . . . . . . . . . . . . . . . . . . . . . . . . .551Paths in the Host to Array Connectivity Portlet . . . . . . . . . . . . . . . . . . . . . . . . . . . . . . . . . . . . . . . . . . . . . . . . . . . .552Zones in the Host to Array Connectivity Portlet. . . . . . . . . . . . . . . . . . . . . . . . . . . . . . . . . . . . . . . . . . . . . . . . . . . .552
Port Summary . . . . . . . . . . . . . . . . . . . . . . . . . . . . . . . . . . . . . . . . . . . . . . . . . . . . . . . . . . . . . . . . . . . . . . . . . . . . . . .552Port Details . . . . . . . . . . . . . . . . . . . . . . . . . . . . . . . . . . . . . . . . . . . . . . . . . . . . . . . . . . . . . . . . . . . . . . . . . . . . . . . . .554SAN Fabric Summary . . . . . . . . . . . . . . . . . . . . . . . . . . . . . . . . . . . . . . . . . . . . . . . . . . . . . . . . . . . . . . . . . . . . . . . . .556SAN Fabric Details. . . . . . . . . . . . . . . . . . . . . . . . . . . . . . . . . . . . . . . . . . . . . . . . . . . . . . . . . . . . . . . . . . . . . . . . . . . .557Switch Summary . . . . . . . . . . . . . . . . . . . . . . . . . . . . . . . . . . . . . . . . . . . . . . . . . . . . . . . . . . . . . . . . . . . . . . . . . . . . .558Switch Details . . . . . . . . . . . . . . . . . . . . . . . . . . . . . . . . . . . . . . . . . . . . . . . . . . . . . . . . . . . . . . . . . . . . . . . . . . . . . . .559Node Port Summary . . . . . . . . . . . . . . . . . . . . . . . . . . . . . . . . . . . . . . . . . . . . . . . . . . . . . . . . . . . . . . . . . . . . . . . . . .561Zone Summary . . . . . . . . . . . . . . . . . . . . . . . . . . . . . . . . . . . . . . . . . . . . . . . . . . . . . . . . . . . . . . . . . . . . . . . . . . . . . .561Zone Details. . . . . . . . . . . . . . . . . . . . . . . . . . . . . . . . . . . . . . . . . . . . . . . . . . . . . . . . . . . . . . . . . . . . . . . . . . . . . . . . .563Zone Set Summary . . . . . . . . . . . . . . . . . . . . . . . . . . . . . . . . . . . . . . . . . . . . . . . . . . . . . . . . . . . . . . . . . . . . . . . . . . .565Zone Members. . . . . . . . . . . . . . . . . . . . . . . . . . . . . . . . . . . . . . . . . . . . . . . . . . . . . . . . . . . . . . . . . . . . . . . . . . . . . . .566Bottom Ranking . . . . . . . . . . . . . . . . . . . . . . . . . . . . . . . . . . . . . . . . . . . . . . . . . . . . . . . . . . . . . . . . . . . . . . . . . . . . . .567Port Distribution . . . . . . . . . . . . . . . . . . . . . . . . . . . . . . . . . . . . . . . . . . . . . . . . . . . . . . . . . . . . . . . . . . . . . . . . . . . . . .568SAN Resource Utilization. . . . . . . . . . . . . . . . . . . . . . . . . . . . . . . . . . . . . . . . . . . . . . . . . . . . . . . . . . . . . . . . . . . . . . .569Top Ranking. . . . . . . . . . . . . . . . . . . . . . . . . . . . . . . . . . . . . . . . . . . . . . . . . . . . . . . . . . . . . . . . . . . . . . . . . . . . . . . . .570SAN Fabric Change Status Summary . . . . . . . . . . . . . . . . . . . . . . . . . . . . . . . . . . . . . . . . . . . . . . . . . . . . . . . . . . . . .571SAN Fabric Change Summary. . . . . . . . . . . . . . . . . . . . . . . . . . . . . . . . . . . . . . . . . . . . . . . . . . . . . . . . . . . . . . . . . . .572Port Performance Dashboard . . . . . . . . . . . . . . . . . . . . . . . . . . . . . . . . . . . . . . . . . . . . . . . . . . . . . . . . . . . . . . . . . . .572
Ports Portlet . . . . . . . . . . . . . . . . . . . . . . . . . . . . . . . . . . . . . . . . . . . . . . . . . . . . . . . . . . . . . . . . . . . . . . . . . . . . . .573Port Details Portlet . . . . . . . . . . . . . . . . . . . . . . . . . . . . . . . . . . . . . . . . . . . . . . . . . . . . . . . . . . . . . . . . . . . . . . . . .573
Port Performance Summary . . . . . . . . . . . . . . . . . . . . . . . . . . . . . . . . . . . . . . . . . . . . . . . . . . . . . . . . . . . . . . . . . . . .574Port Performance Details. . . . . . . . . . . . . . . . . . . . . . . . . . . . . . . . . . . . . . . . . . . . . . . . . . . . . . . . . . . . . . . . . . . . . . .575SAN Fabric Usage . . . . . . . . . . . . . . . . . . . . . . . . . . . . . . . . . . . . . . . . . . . . . . . . . . . . . . . . . . . . . . . . . . . . . . . . . . . .577Port Error Rate Forecast . . . . . . . . . . . . . . . . . . . . . . . . . . . . . . . . . . . . . . . . . . . . . . . . . . . . . . . . . . . . . . . . . . . . . . .577Port Utilization Forecast. . . . . . . . . . . . . . . . . . . . . . . . . . . . . . . . . . . . . . . . . . . . . . . . . . . . . . . . . . . . . . . . . . . . . . . .579
Chapter 18Backup Manager Management ReportsUsing Backup Manager Reports for Analysis. . . . . . . . . . . . . . . . . . . . . . . . . . . . . . . . . . . . . . . . . . . . . . . . . . . . . . . .581Backup Executive Summary . . . . . . . . . . . . . . . . . . . . . . . . . . . . . . . . . . . . . . . . . . . . . . . . . . . . . . . . . . . . . . . . . . . .583Failed Backup Sources . . . . . . . . . . . . . . . . . . . . . . . . . . . . . . . . . . . . . . . . . . . . . . . . . . . . . . . . . . . . . . . . . . . . . . . .584Consecutive Errors . . . . . . . . . . . . . . . . . . . . . . . . . . . . . . . . . . . . . . . . . . . . . . . . . . . . . . . . . . . . . . . . . . . . . . . . . . .585
Contents 12
Data Domain Backup Summary. . . . . . . . . . . . . . . . . . . . . . . . . . . . . . . . . . . . . . . . . . . . . . . . . . . . . . . . . . . . . . . . . .586Data Domain File Compression Detail. . . . . . . . . . . . . . . . . . . . . . . . . . . . . . . . . . . . . . . . . . . . . . . . . . . . . . . . . . . . .587Data Domain File Compression Summary. . . . . . . . . . . . . . . . . . . . . . . . . . . . . . . . . . . . . . . . . . . . . . . . . . . . . . . . . .589Error Log Summary . . . . . . . . . . . . . . . . . . . . . . . . . . . . . . . . . . . . . . . . . . . . . . . . . . . . . . . . . . . . . . . . . . . . . . . . . . .590HP Data Protector Session Summary . . . . . . . . . . . . . . . . . . . . . . . . . . . . . . . . . . . . . . . . . . . . . . . . . . . . . . . . . . . . .593HP Data Protector Session Details . . . . . . . . . . . . . . . . . . . . . . . . . . . . . . . . . . . . . . . . . . . . . . . . . . . . . . . . . . . . . . .594Job Duration Report. . . . . . . . . . . . . . . . . . . . . . . . . . . . . . . . . . . . . . . . . . . . . . . . . . . . . . . . . . . . . . . . . . . . . . . . . . .596Job Error Code . . . . . . . . . . . . . . . . . . . . . . . . . . . . . . . . . . . . . . . . . . . . . . . . . . . . . . . . . . . . . . . . . . . . . . . . . . . . . .598Job Status Summary . . . . . . . . . . . . . . . . . . . . . . . . . . . . . . . . . . . . . . . . . . . . . . . . . . . . . . . . . . . . . . . . . . . . . . . . . .599Job Summary Report . . . . . . . . . . . . . . . . . . . . . . . . . . . . . . . . . . . . . . . . . . . . . . . . . . . . . . . . . . . . . . . . . . . . . . . . . .601
Job Summary - Heterogeneous Backup Products . . . . . . . . . . . . . . . . . . . . . . . . . . . . . . . . . . . . . . . . . . . . . . . . .602Avamar Job Summary Report (Homogeneous) . . . . . . . . . . . . . . . . . . . . . . . . . . . . . . . . . . . . . . . . . . . . . . . . . . .602Backup Exec Job Summary Report (Homogeneous) . . . . . . . . . . . . . . . . . . . . . . . . . . . . . . . . . . . . . . . . . . . . . . .603Cohesity Data Protect Job Summary Report (Homogeneous) . . . . . . . . . . . . . . . . . . . . . . . . . . . . . . . . . . . . . . . .604Commvault Simpana Job Summary Report (Homogeneous) . . . . . . . . . . . . . . . . . . . . . . . . . . . . . . . . . . . . . . . . .605Commvault Simpana ESX Backup Summary . . . . . . . . . . . . . . . . . . . . . . . . . . . . . . . . . . . . . . . . . . . . . . . . . . . . .606HP Data Protector Job Summary Report (Homogeneous) . . . . . . . . . . . . . . . . . . . . . . . . . . . . . . . . . . . . . . . . . . .607IBM Spectrum Protect (TSM) Job Summary Report (Homogeneous) . . . . . . . . . . . . . . . . . . . . . . . . . . . . . . . . . .608NetBackup Job Summary Report (Homogeneous). . . . . . . . . . . . . . . . . . . . . . . . . . . . . . . . . . . . . . . . . . . . . . . . .609NetWorker Job Summary Report (Homogeneous) . . . . . . . . . . . . . . . . . . . . . . . . . . . . . . . . . . . . . . . . . . . . . . . . .610Oracle Recovery Manager (RMAN) Job Summary Report (Homogeneous) . . . . . . . . . . . . . . . . . . . . . . . . . . . . .610Veeam Backup & Replication Job Summary Report (Homogeneous) . . . . . . . . . . . . . . . . . . . . . . . . . . . . . . . . . . 611
Job Details Report . . . . . . . . . . . . . . . . . . . . . . . . . . . . . . . . . . . . . . . . . . . . . . . . . . . . . . . . . . . . . . . . . . . . . . . . . . . .612Avamar Job Details . . . . . . . . . . . . . . . . . . . . . . . . . . . . . . . . . . . . . . . . . . . . . . . . . . . . . . . . . . . . . . . . . . . . . . . . .615Commvault Simpana Job Details . . . . . . . . . . . . . . . . . . . . . . . . . . . . . . . . . . . . . . . . . . . . . . . . . . . . . . . . . . . . . .619IBM Spectrum Protect (TSM) Job Details Report . . . . . . . . . . . . . . . . . . . . . . . . . . . . . . . . . . . . . . . . . . . . . . . . . .620Veeam and RMAN Job Details Report . . . . . . . . . . . . . . . . . . . . . . . . . . . . . . . . . . . . . . . . . . . . . . . . . . . . . . . . . .622Adding a Note to a Job . . . . . . . . . . . . . . . . . . . . . . . . . . . . . . . . . . . . . . . . . . . . . . . . . . . . . . . . . . . . . . . . . . . . . .627
Job Summary by Server . . . . . . . . . . . . . . . . . . . . . . . . . . . . . . . . . . . . . . . . . . . . . . . . . . . . . . . . . . . . . . . . . . . . . . .629Job Type Count . . . . . . . . . . . . . . . . . . . . . . . . . . . . . . . . . . . . . . . . . . . . . . . . . . . . . . . . . . . . . . . . . . . . . . . . . . . . . .630Job Volume Summary Report . . . . . . . . . . . . . . . . . . . . . . . . . . . . . . . . . . . . . . . . . . . . . . . . . . . . . . . . . . . . . . . . . . .631Largest Backup Volume. . . . . . . . . . . . . . . . . . . . . . . . . . . . . . . . . . . . . . . . . . . . . . . . . . . . . . . . . . . . . . . . . . . . . . . .632Monthly Backup Summary. . . . . . . . . . . . . . . . . . . . . . . . . . . . . . . . . . . . . . . . . . . . . . . . . . . . . . . . . . . . . . . . . . . . . .633NetBackup SLP Status . . . . . . . . . . . . . . . . . . . . . . . . . . . . . . . . . . . . . . . . . . . . . . . . . . . . . . . . . . . . . . . . . . . . . . . .634NetBackup SLP Details . . . . . . . . . . . . . . . . . . . . . . . . . . . . . . . . . . . . . . . . . . . . . . . . . . . . . . . . . . . . . . . . . . . . . . . .636NetBackup SLP Status by Destination (AIR Activity) . . . . . . . . . . . . . . . . . . . . . . . . . . . . . . . . . . . . . . . . . . . . . . . . . .636NetBackup SLP Status by Client . . . . . . . . . . . . . . . . . . . . . . . . . . . . . . . . . . . . . . . . . . . . . . . . . . . . . . . . . . . . . . . . .639NetBackup SLP Status by Image Copy . . . . . . . . . . . . . . . . . . . . . . . . . . . . . . . . . . . . . . . . . . . . . . . . . . . . . . . . . . . .641NetBackup SLP Status by Image. . . . . . . . . . . . . . . . . . . . . . . . . . . . . . . . . . . . . . . . . . . . . . . . . . . . . . . . . . . . . . . . .643NetBackup SLP Status by SLP . . . . . . . . . . . . . . . . . . . . . . . . . . . . . . . . . . . . . . . . . . . . . . . . . . . . . . . . . . . . . . . . . .645Running and Queued Job Summary . . . . . . . . . . . . . . . . . . . . . . . . . . . . . . . . . . . . . . . . . . . . . . . . . . . . . . . . . . . . . .647
NetBackup Running and Queued Jobs Summary . . . . . . . . . . . . . . . . . . . . . . . . . . . . . . . . . . . . . . . . . . . . . . . . .647NetWorker Running and Queued Jobs Summary. . . . . . . . . . . . . . . . . . . . . . . . . . . . . . . . . . . . . . . . . . . . . . . . . .647
Chapter 19Backup Administration ReportsAvamar Grid Capacity Dashboard . . . . . . . . . . . . . . . . . . . . . . . . . . . . . . . . . . . . . . . . . . . . . . . . . . . . . . . . . . . . . . . .650Job Histogram . . . . . . . . . . . . . . . . . . . . . . . . . . . . . . . . . . . . . . . . . . . . . . . . . . . . . . . . . . . . . . . . . . . . . . . . . . . . . . .650
Job Throughput Histogram . . . . . . . . . . . . . . . . . . . . . . . . . . . . . . . . . . . . . . . . . . . . . . . . . . . . . . . . . . . . . . . . . . .650Job Activity Histogram. . . . . . . . . . . . . . . . . . . . . . . . . . . . . . . . . . . . . . . . . . . . . . . . . . . . . . . . . . . . . . . . . . . . . . .651
Client Protection Summary . . . . . . . . . . . . . . . . . . . . . . . . . . . . . . . . . . . . . . . . . . . . . . . . . . . . . . . . . . . . . . . . . . . . .652Command Center Dashboard . . . . . . . . . . . . . . . . . . . . . . . . . . . . . . . . . . . . . . . . . . . . . . . . . . . . . . . . . . . . . . . . . . .655Data Protection Dashboard . . . . . . . . . . . . . . . . . . . . . . . . . . . . . . . . . . . . . . . . . . . . . . . . . . . . . . . . . . . . . . . . . . . . .658Message of the Day Report . . . . . . . . . . . . . . . . . . . . . . . . . . . . . . . . . . . . . . . . . . . . . . . . . . . . . . . . . . . . . . . . . . . . .659Host Details . . . . . . . . . . . . . . . . . . . . . . . . . . . . . . . . . . . . . . . . . . . . . . . . . . . . . . . . . . . . . . . . . . . . . . . . . . . . . . . .660Host Group . . . . . . . . . . . . . . . . . . . . . . . . . . . . . . . . . . . . . . . . . . . . . . . . . . . . . . . . . . . . . . . . . . . . . . . . . . . . . . . . .664Object Details . . . . . . . . . . . . . . . . . . . . . . . . . . . . . . . . . . . . . . . . . . . . . . . . . . . . . . . . . . . . . . . . . . . . . . . . . . . . . . .664Mission Control - Backup. . . . . . . . . . . . . . . . . . . . . . . . . . . . . . . . . . . . . . . . . . . . . . . . . . . . . . . . . . . . . . . . . . . . . . .666
Contents 13
Tailoring the Report Output by Backup Product . . . . . . . . . . . . . . . . . . . . . . . . . . . . . . . . . . . . . . . . . . . . . . . . . . .668Operations Dashboard. . . . . . . . . . . . . . . . . . . . . . . . . . . . . . . . . . . . . . . . . . . . . . . . . . . . . . . . . . . . . . . . . . . . . . . . .669IBM Spectrum Protect (TSM) Storage Pools Dashboard. . . . . . . . . . . . . . . . . . . . . . . . . . . . . . . . . . . . . . . . . . . . . . .671TSM Process Summary. . . . . . . . . . . . . . . . . . . . . . . . . . . . . . . . . . . . . . . . . . . . . . . . . . . . . . . . . . . . . . . . . . . . . . . .673
Chapter 20Backup Media Management ReportsCurrent Media Summary . . . . . . . . . . . . . . . . . . . . . . . . . . . . . . . . . . . . . . . . . . . . . . . . . . . . . . . . . . . . . . . . . . . . . . .677Data Domain VTL Errors . . . . . . . . . . . . . . . . . . . . . . . . . . . . . . . . . . . . . . . . . . . . . . . . . . . . . . . . . . . . . . . . . . . . . . .679Data Domain VTL Media Summary . . . . . . . . . . . . . . . . . . . . . . . . . . . . . . . . . . . . . . . . . . . . . . . . . . . . . . . . . . . . . . .680Data Domain VTL Performance. . . . . . . . . . . . . . . . . . . . . . . . . . . . . . . . . . . . . . . . . . . . . . . . . . . . . . . . . . . . . . . . . .680Tape Media Summary Report . . . . . . . . . . . . . . . . . . . . . . . . . . . . . . . . . . . . . . . . . . . . . . . . . . . . . . . . . . . . . . . . . . .682Tape Media Detail Report . . . . . . . . . . . . . . . . . . . . . . . . . . . . . . . . . . . . . . . . . . . . . . . . . . . . . . . . . . . . . . . . . . . . . .684
Commvault Simpana Tape Media Detail . . . . . . . . . . . . . . . . . . . . . . . . . . . . . . . . . . . . . . . . . . . . . . . . . . . . . . . . .686HP Data Protector Tape Media Table . . . . . . . . . . . . . . . . . . . . . . . . . . . . . . . . . . . . . . . . . . . . . . . . . . . . . . . . . . .687NetBackup Tape Media Table . . . . . . . . . . . . . . . . . . . . . . . . . . . . . . . . . . . . . . . . . . . . . . . . . . . . . . . . . . . . . . . . .687NetWorker Tape Media Table . . . . . . . . . . . . . . . . . . . . . . . . . . . . . . . . . . . . . . . . . . . . . . . . . . . . . . . . . . . . . . . . .687TSM Tape Media Detail. . . . . . . . . . . . . . . . . . . . . . . . . . . . . . . . . . . . . . . . . . . . . . . . . . . . . . . . . . . . . . . . . . . . . .688TSM Tape Media Detail Table . . . . . . . . . . . . . . . . . . . . . . . . . . . . . . . . . . . . . . . . . . . . . . . . . . . . . . . . . . . . . . . . .688
Chapter 21Backup Service Level Agreement (SLA) ReportsAvailable Service Level Agreement (SLA) Reports . . . . . . . . . . . . . . . . . . . . . . . . . . . . . . . . . . . . . . . . . . . . . . . . . . .691Configure a Backup SLA Policy . . . . . . . . . . . . . . . . . . . . . . . . . . . . . . . . . . . . . . . . . . . . . . . . . . . . . . . . . . . . . . . . . .692Backup Start Time SLA . . . . . . . . . . . . . . . . . . . . . . . . . . . . . . . . . . . . . . . . . . . . . . . . . . . . . . . . . . . . . . . . . . . . . . . .692Determining and Improving Backup Start Time Performance . . . . . . . . . . . . . . . . . . . . . . . . . . . . . . . . . . . . . . . . . . .693Backup Status SLA . . . . . . . . . . . . . . . . . . . . . . . . . . . . . . . . . . . . . . . . . . . . . . . . . . . . . . . . . . . . . . . . . . . . . . . . . . .694
Changing the Success Percentage. . . . . . . . . . . . . . . . . . . . . . . . . . . . . . . . . . . . . . . . . . . . . . . . . . . . . . . . . . . . .694Backup Master Server Overview . . . . . . . . . . . . . . . . . . . . . . . . . . . . . . . . . . . . . . . . . . . . . . . . . . . . . . . . . . . . . . . . .695Determining and Improving Backup Success Performance. . . . . . . . . . . . . . . . . . . . . . . . . . . . . . . . . . . . . . . . . . . . .696Backup Duration SLA. . . . . . . . . . . . . . . . . . . . . . . . . . . . . . . . . . . . . . . . . . . . . . . . . . . . . . . . . . . . . . . . . . . . . . . . . .696Determining and Improving Backup Duration Performance. . . . . . . . . . . . . . . . . . . . . . . . . . . . . . . . . . . . . . . . . . . . .697SLA Job Summary . . . . . . . . . . . . . . . . . . . . . . . . . . . . . . . . . . . . . . . . . . . . . . . . . . . . . . . . . . . . . . . . . . . . . . . . . . . .698
Chapter 22Backup Storage Utilization ReportsUsing Storage Utilization Reports . . . . . . . . . . . . . . . . . . . . . . . . . . . . . . . . . . . . . . . . . . . . . . . . . . . . . . . . . . . . . . . .700Data Domain System Summary - Backup . . . . . . . . . . . . . . . . . . . . . . . . . . . . . . . . . . . . . . . . . . . . . . . . . . . . . . . . . .702Data Domain System Details . . . . . . . . . . . . . . . . . . . . . . . . . . . . . . . . . . . . . . . . . . . . . . . . . . . . . . . . . . . . . . . . . . . .703Data Domain Disk Summary . . . . . . . . . . . . . . . . . . . . . . . . . . . . . . . . . . . . . . . . . . . . . . . . . . . . . . . . . . . . . . . . . . . .705Disk Usage and Performance Report . . . . . . . . . . . . . . . . . . . . . . . . . . . . . . . . . . . . . . . . . . . . . . . . . . . . . . . . . . . . .706Drive Performance Summary Report. . . . . . . . . . . . . . . . . . . . . . . . . . . . . . . . . . . . . . . . . . . . . . . . . . . . . . . . . . . . . .708
NetBackup Drive Performance Summary . . . . . . . . . . . . . . . . . . . . . . . . . . . . . . . . . . . . . . . . . . . . . . . . . . . . . . . .710Drive Performance Detail. . . . . . . . . . . . . . . . . . . . . . . . . . . . . . . . . . . . . . . . . . . . . . . . . . . . . . . . . . . . . . . . . . . . . . .710Drive Utilization & Performance Report . . . . . . . . . . . . . . . . . . . . . . . . . . . . . . . . . . . . . . . . . . . . . . . . . . . . . . . . . . . .712NetBackup Deduplication Effect . . . . . . . . . . . . . . . . . . . . . . . . . . . . . . . . . . . . . . . . . . . . . . . . . . . . . . . . . . . . . . . . .714NetBackup Deduplication Savings. . . . . . . . . . . . . . . . . . . . . . . . . . . . . . . . . . . . . . . . . . . . . . . . . . . . . . . . . . . . . . . .715NetBackup Storage Unit Summary . . . . . . . . . . . . . . . . . . . . . . . . . . . . . . . . . . . . . . . . . . . . . . . . . . . . . . . . . . . . . . .716Real Time Library and Drive Status . . . . . . . . . . . . . . . . . . . . . . . . . . . . . . . . . . . . . . . . . . . . . . . . . . . . . . . . . . . . . . .717Storage Unit Detail Report . . . . . . . . . . . . . . . . . . . . . . . . . . . . . . . . . . . . . . . . . . . . . . . . . . . . . . . . . . . . . . . . . . . . . .718Storage Unit Images . . . . . . . . . . . . . . . . . . . . . . . . . . . . . . . . . . . . . . . . . . . . . . . . . . . . . . . . . . . . . . . . . . . . . . . . . .721Storage Unit Event Details. . . . . . . . . . . . . . . . . . . . . . . . . . . . . . . . . . . . . . . . . . . . . . . . . . . . . . . . . . . . . . . . . . . . . .722Disk Volume Details . . . . . . . . . . . . . . . . . . . . . . . . . . . . . . . . . . . . . . . . . . . . . . . . . . . . . . . . . . . . . . . . . . . . . . . . . . .723Tape Library and Drive Utilization . . . . . . . . . . . . . . . . . . . . . . . . . . . . . . . . . . . . . . . . . . . . . . . . . . . . . . . . . . . . . . . .724IBM Spectrum Protect (TSM) Database Utilization . . . . . . . . . . . . . . . . . . . . . . . . . . . . . . . . . . . . . . . . . . . . . . . . . . .724IBM Spectrum Protect (TSM) Recovery Log Utilization . . . . . . . . . . . . . . . . . . . . . . . . . . . . . . . . . . . . . . . . . . . . . . . .726
Contents 14
Chapter 23Backup Manager Forecasting ReportsForecasting Overview . . . . . . . . . . . . . . . . . . . . . . . . . . . . . . . . . . . . . . . . . . . . . . . . . . . . . . . . . . . . . . . . . . . . . . . . .730NetBackup Library Capacity Forecast . . . . . . . . . . . . . . . . . . . . . . . . . . . . . . . . . . . . . . . . . . . . . . . . . . . . . . . . . . . . .731Media Availability Forecast . . . . . . . . . . . . . . . . . . . . . . . . . . . . . . . . . . . . . . . . . . . . . . . . . . . . . . . . . . . . . . . . . . . . .733Media Consumption Forecast . . . . . . . . . . . . . . . . . . . . . . . . . . . . . . . . . . . . . . . . . . . . . . . . . . . . . . . . . . . . . . . . . . .734Media Usage Details . . . . . . . . . . . . . . . . . . . . . . . . . . . . . . . . . . . . . . . . . . . . . . . . . . . . . . . . . . . . . . . . . . . . . . . . . .735Scratch Pool Forecast Report . . . . . . . . . . . . . . . . . . . . . . . . . . . . . . . . . . . . . . . . . . . . . . . . . . . . . . . . . . . . . . . . . . .736Tape Drive Usage and Forecast Report. . . . . . . . . . . . . . . . . . . . . . . . . . . . . . . . . . . . . . . . . . . . . . . . . . . . . . . . . . . .736
Chapter 24Backup Billing and Usage ReportsAvailable Billing and Usage Reports . . . . . . . . . . . . . . . . . . . . . . . . . . . . . . . . . . . . . . . . . . . . . . . . . . . . . . . . . . . . . .740Determining Media Chargebacks. . . . . . . . . . . . . . . . . . . . . . . . . . . . . . . . . . . . . . . . . . . . . . . . . . . . . . . . . . . . . . . . .740Determining Backup Chargebacks . . . . . . . . . . . . . . . . . . . . . . . . . . . . . . . . . . . . . . . . . . . . . . . . . . . . . . . . . . . . . . .741Billing and Chargeback Summary . . . . . . . . . . . . . . . . . . . . . . . . . . . . . . . . . . . . . . . . . . . . . . . . . . . . . . . . . . . . . . . .742Server Consumption Summary . . . . . . . . . . . . . . . . . . . . . . . . . . . . . . . . . . . . . . . . . . . . . . . . . . . . . . . . . . . . . . . . . .743
Chapter 25Backup Policies ReportsCommvault Simpana Policy Summary Report. . . . . . . . . . . . . . . . . . . . . . . . . . . . . . . . . . . . . . . . . . . . . . . . . . . . . . .748Commvault Simpana Policy Backup Copy Details. . . . . . . . . . . . . . . . . . . . . . . . . . . . . . . . . . . . . . . . . . . . . . . . . . . .750EMC Avamar Groups . . . . . . . . . . . . . . . . . . . . . . . . . . . . . . . . . . . . . . . . . . . . . . . . . . . . . . . . . . . . . . . . . . . . . . . . . .752Avamar Server Detail. . . . . . . . . . . . . . . . . . . . . . . . . . . . . . . . . . . . . . . . . . . . . . . . . . . . . . . . . . . . . . . . . . . . . . . . . .753Avamar Group Detail . . . . . . . . . . . . . . . . . . . . . . . . . . . . . . . . . . . . . . . . . . . . . . . . . . . . . . . . . . . . . . . . . . . . . . . . . .753Clients for Group . . . . . . . . . . . . . . . . . . . . . . . . . . . . . . . . . . . . . . . . . . . . . . . . . . . . . . . . . . . . . . . . . . . . . . . . . . . . .755Avamar Client Detail . . . . . . . . . . . . . . . . . . . . . . . . . . . . . . . . . . . . . . . . . . . . . . . . . . . . . . . . . . . . . . . . . . . . . . . . . .756Avamar Dataset Detail . . . . . . . . . . . . . . . . . . . . . . . . . . . . . . . . . . . . . . . . . . . . . . . . . . . . . . . . . . . . . . . . . . . . . . . . .759Avamar Schedule Detail . . . . . . . . . . . . . . . . . . . . . . . . . . . . . . . . . . . . . . . . . . . . . . . . . . . . . . . . . . . . . . . . . . . . . . .760Avamar Retention Policy Detail . . . . . . . . . . . . . . . . . . . . . . . . . . . . . . . . . . . . . . . . . . . . . . . . . . . . . . . . . . . . . . . . . .762EMC NetWorker Groups . . . . . . . . . . . . . . . . . . . . . . . . . . . . . . . . . . . . . . . . . . . . . . . . . . . . . . . . . . . . . . . . . . . . . . .763
Group Detail . . . . . . . . . . . . . . . . . . . . . . . . . . . . . . . . . . . . . . . . . . . . . . . . . . . . . . . . . . . . . . . . . . . . . . . . . . . . . .763Client Instance Detail . . . . . . . . . . . . . . . . . . . . . . . . . . . . . . . . . . . . . . . . . . . . . . . . . . . . . . . . . . . . . . . . . . . . . . .766
HP Data Protector Backup Specification Summary . . . . . . . . . . . . . . . . . . . . . . . . . . . . . . . . . . . . . . . . . . . . . . . . . . .767HP Data Protector Backup Specification Detail . . . . . . . . . . . . . . . . . . . . . . . . . . . . . . . . . . . . . . . . . . . . . . . . . . .768
IBM Spectrum Protect (TSM) Policy Domains . . . . . . . . . . . . . . . . . . . . . . . . . . . . . . . . . . . . . . . . . . . . . . . . . . . . . . .770Policy Domain Details . . . . . . . . . . . . . . . . . . . . . . . . . . . . . . . . . . . . . . . . . . . . . . . . . . . . . . . . . . . . . . . . . . . . . . .770
Veritas NetBackup Policy. . . . . . . . . . . . . . . . . . . . . . . . . . . . . . . . . . . . . . . . . . . . . . . . . . . . . . . . . . . . . . . . . . . . . . .772Backup Policy Details . . . . . . . . . . . . . . . . . . . . . . . . . . . . . . . . . . . . . . . . . . . . . . . . . . . . . . . . . . . . . . . . . . . . . . .772
Chapter 26Replication Manager ReportsOverview of Replication Manager . . . . . . . . . . . . . . . . . . . . . . . . . . . . . . . . . . . . . . . . . . . . . . . . . . . . . . . . . . . . . . . .776SnapMirror Summary. . . . . . . . . . . . . . . . . . . . . . . . . . . . . . . . . . . . . . . . . . . . . . . . . . . . . . . . . . . . . . . . . . . . . . . . . .777SnapMirror Details . . . . . . . . . . . . . . . . . . . . . . . . . . . . . . . . . . . . . . . . . . . . . . . . . . . . . . . . . . . . . . . . . . . . . . . . . . . .777SnapMirror Schedule . . . . . . . . . . . . . . . . . . . . . . . . . . . . . . . . . . . . . . . . . . . . . . . . . . . . . . . . . . . . . . . . . . . . . . . . . .779SnapMirror Status Summary . . . . . . . . . . . . . . . . . . . . . . . . . . . . . . . . . . . . . . . . . . . . . . . . . . . . . . . . . . . . . . . . . . . .781SnapMirror Data Transfer . . . . . . . . . . . . . . . . . . . . . . . . . . . . . . . . . . . . . . . . . . . . . . . . . . . . . . . . . . . . . . . . . . . . . .782SnapMirror Volumes/QTrees At Risk . . . . . . . . . . . . . . . . . . . . . . . . . . . . . . . . . . . . . . . . . . . . . . . . . . . . . . . . . . . . . .783SnapVault Relationship Summary . . . . . . . . . . . . . . . . . . . . . . . . . . . . . . . . . . . . . . . . . . . . . . . . . . . . . . . . . . . . . . . .784SnapMirror Data Protection Dashboard. . . . . . . . . . . . . . . . . . . . . . . . . . . . . . . . . . . . . . . . . . . . . . . . . . . . . . . . . . . .785FlexClone Summary . . . . . . . . . . . . . . . . . . . . . . . . . . . . . . . . . . . . . . . . . . . . . . . . . . . . . . . . . . . . . . . . . . . . . . . . . .786Aggregate Mirror Summary . . . . . . . . . . . . . . . . . . . . . . . . . . . . . . . . . . . . . . . . . . . . . . . . . . . . . . . . . . . . . . . . . . . . .787SnapVault Secondary Configuration . . . . . . . . . . . . . . . . . . . . . . . . . . . . . . . . . . . . . . . . . . . . . . . . . . . . . . . . . . . . . .788SnapVault Summary . . . . . . . . . . . . . . . . . . . . . . . . . . . . . . . . . . . . . . . . . . . . . . . . . . . . . . . . . . . . . . . . . . . . . . . . . .789SnapVault Detail . . . . . . . . . . . . . . . . . . . . . . . . . . . . . . . . . . . . . . . . . . . . . . . . . . . . . . . . . . . . . . . . . . . . . . . . . . . . .790
Contents 15
SnapVault Schedule. . . . . . . . . . . . . . . . . . . . . . . . . . . . . . . . . . . . . . . . . . . . . . . . . . . . . . . . . . . . . . . . . . . . . . . . . . .791SnapVault Status . . . . . . . . . . . . . . . . . . . . . . . . . . . . . . . . . . . . . . . . . . . . . . . . . . . . . . . . . . . . . . . . . . . . . . . . . . . . .792SnapVault Data Transfer . . . . . . . . . . . . . . . . . . . . . . . . . . . . . . . . . . . . . . . . . . . . . . . . . . . . . . . . . . . . . . . . . . . . . . .793SnapVault Relationship Summary . . . . . . . . . . . . . . . . . . . . . . . . . . . . . . . . . . . . . . . . . . . . . . . . . . . . . . . . . . . . . . . .794SnapVault Data Protection Dashboard . . . . . . . . . . . . . . . . . . . . . . . . . . . . . . . . . . . . . . . . . . . . . . . . . . . . . . . . . . . .795SnapVault QTrees at Risk . . . . . . . . . . . . . . . . . . . . . . . . . . . . . . . . . . . . . . . . . . . . . . . . . . . . . . . . . . . . . . . . . . . . . .796
Copyrights and Trademarks 2
Copyrights and Trademarks
Legal Notice
Copyright (c) 2019 Veritas Technologies LLC. All rights reserved.
Veritas, and the Veritas Logo, are trademarks or registered trademarks of Veritas Technologies LLC or its affiliates in the U.S. and other countries. Other names may be trademarks of their respective owners.
This product may contain third-party software for which Veritas is required to provide attribution to the third party (“Third-party Programs”). Some of the Third-party Programs are available under open source or free software licenses. The License Agreement accompanying the Software does not alter any rights or obligations you may have under those open source or free software licenses. Refer to the Third-party Legal Notices document accompanying this Veritas product or available at: https://www.veritas.com/about/legal/license-agreements
The product described in this document is distributed under licenses restricting its use, copying, distribution, and decompilation/reverse engineering. No part of this document may be reproduced in any form by any means without prior written authorization of Veritas Technologies LLC and its licensors, if any.
THE DOCUMENTATION IS PROVIDED "AS IS" AND ALL EXPRESS OR IMPLIED
CONDITIONS, REPRESENTATIONS AND WARRANTIES, INCLUDING ANY IMPLIED
WARRANTY OF MERCHANTABILITY, FITNESS FOR A PARTICULAR PURPOSE OR
NON-INFRINGEMENT, ARE DISCLAIMED, EXCEPT TO THE EXTENT THAT SUCH
DISCLAIMERS ARE HELD TO BE LEGALLY INVALID. VERITAS TECHNOLOGIES LLC
SHALL NOT BE LIABLE FOR INCIDENTAL OR CONSEQUENTIAL DAMAGES IN
CONNECTION WITH THE FURNISHING, PERFORMANCE, OR USE OF THIS
DOCUMENTATION. THE INFORMATION CONTAINED IN THIS DOCUMENTATION IS
SUBJECT TO CHANGE WITHOUT NOTICE.
The Licensed Software and Documentation are deemed to be commercial computer software as defined in FAR 12.212 and subject to restricted rights as defined in FAR Section 52.227-19 "Commercial Computer Software - Restricted Rights" and DFARS 227.7202, et seq. "Commercial Computer Software and Commercial Computer Software Documentation," as applicable, and any successor regulations, whether delivered by Veritas as on premises or hosted services. Any use, modification, reproduction release, performance, display or disclosure of the Licensed Software and Documentation by the U.S. Government shall be solely in accordance with the terms of this Agreement.
Veritas Technologies LLC
2625 Augustine Drive
Santa Clara, CA 95054
http://www.veritas.com
16
1Chapter 0Introduction to APTARE IT Analytics
APTARE IT Analytics provides storage reporting solutions for consolidated visibility into multi-vendor, complex storage environments, enabling you to increase data reliability and reduce costs with consolidated reporting and automated alerts.
IT Analytics allows you to drill down and identify the root cause of performance issues, identify re-tiering opportunities, and effectively implement chargebacks so business units understand their overall storage environment.
Data collectors send relevant storage component information to the APTARE IT Analytics platform, an integrated Oracle DB that maintains current and historical data on the entire storage environment. From this database, each APTARE IT Analytics product can analyze and correlate relevant information. The result is consistent analysis and reporting, enabling you to manage all aspects of your IT environment.
APTARE IT Analytics Licensed Modules 17
APTARE IT Analytics Licensed Modules
APTARE IT Analytics offers several major licensed modules:
Backup Manager provides a centralized, real-time view of your backup environment. These reports increase the reliability of your data protection environment by providing the most in-depth backup reporting and management available. You can instantly view backup job status across thousands of clients in the enterprise. Benefits include:
• View successful, partial, and failed backups across the entire data protection infrastructure and discover the root cause of problems
• Institute best practices for data protection compliance and internal SLAs
• Increase reliability and performance of the backup/recovery environment
Capacity Manager increases storage utilization by providing a full view of the SAN storage environment from the applications, hosts, and storage arrays. Automated mapping shows the relationship between each host and LUN in your environment to convey how the storage resources are being used. Array utilization shows the amount of allocated storage from each storage array. Application utilization identifies the amount of storage used vs. allocated by application. Benefits include:
• Create chargeback reports by any logical grouping (for example, by department, geography, tiers)
• Optimize efficiency and reclaim hidden storage with allocated and used storage capacity views
• Improve planning with forecasts and trend analysis of future storage capacity
Fabric Manager provides a view of SAN Fabric components—zones, switches, ports, arrays, and hosts—enabling a full view of your resources. A variety of reports offer a quick view of capacity and utilization, along with change management and performance metrics. Benefits include:
• Visualize the SAN from the physical or virtual server to the storage system
• Determine if errors are creating issues
• View I/O response times, throughput, and read/write statistics
File Analytics collects and profiles unstructured data to enable you to identify storage that can be reclaimed. Three types of Data Collectors collect and categorize this data from: CIFS Shares, NetApp storage systems, and from host-attached storage. Benefits include:
• Consolidate and remove duplicate files for faster, optimized data backups
• Move data to specific tiers based on the value of the data
• Enforce corporate retention and unauthorized usage policies
Replication Manager can help you protect mission-critical data by measuring compliance, maximizing resources, controlling costs, and improving overall performance. Identify wasted storage, occupied by obsolete snapshot files, and reclaim space. Plan for growth as replication demands increase. Issue warnings when replication storage capacity becomes dangerously low. Benefits include:
• Measure compliance with business continuity goals and control costs associated with data replication environments
Virtualization Manager enables you to gain insight into how to plan, manage, and optimize storage allocated to virtual systems—improve efficiency and reduce costs. Directly map the storage used by each virtual machine, down to the actual storage array itself. Determine which virtual machines are over- or under-utilizing their allocated storage. Benefits include:
• Maximizing the storage efficiency in virtualized environments
• Improve performance of the virtualized infrastructure
IT Analytics Components 18
• Monitor current usage and forecasting of virtual resource demands
IT Analytics Components
When you install APTARE IT Analytics, you are installing the following components:
• Portal Server. The physical server on which the IT Analytics Portal Server software resides.
• Portal Server Software. The APTARE binaries, SQL scripts, configuration files, and open-source and third-party software products needed to retrieve and render reporting data from the Reporting Database.
• Reporting Database. The Oracle database stores all report data. The Reporting Database is usually installed on the Portal Server, but you can just as easily install it on a separate server, preferably a dedicated database server. These binaries are installed during the first step of the installation procedure.
• Data Collectors. The software that collects report data about your backup servers and storage arrays. The Data Collector is usually installed on a separate server, but you can just as easily install it on the Portal Server, with one exception: if you use Veritas NetBackup you must install it on each Master Server.
Because of the relationship between the Portal Server, the Portal Server software, and the Reporting Database, you need to install these Portal Server components at the same time. However, you can install the Data Collector separately.
Portal Server Software
When you install Portal Server software, you install a compilation of software:
• Open-Source and Third-Party Software provide framework components.
• APTARE binaries to provide APTARE IT Analytics its intelligence and functionality. These binaries include the Portal engine, the Data Receiver, and stored procedures.
• The Portal engine drives the Portal user interface.
• The Data Receiver accepts data from the Data Collector, then saves the data to the Reporting Database.
• The stored procedures retrieve data from the Reporting Database, input data into the Reporting Database, and perform calculations and analysis.
• Database SQL Scripts instruct the Oracle SQL scripts to create IT Analytics’s object module and database schema.
Reporting Database
The Reporting Database stores all report data (as metadata) that it receives from the Data Receiver. You can install the Reporting Database on a standalone server or on the same server as the Portal Server. If you use a Managed Services Provider, the Reporting Database and Portal Server are usually off site and hosted by that third-party provider.
APTARE IT Analytics maintains most of the data in the Reporting Database indefinitely. Some reports are more valuable when they have access to historical data. Because the Reporting Database only stores metadata, the amount of data on the Reporting Database is relatively small (GBs). This report data is essential to retrieving reports, so the Portal Installation Guide walks you through a database backup process.
IT Analytics Components 19
Data Collectors
The Data Collector is a centralized and remotely managed data collection mechanism. This Java application is responsible for gathering metadata from storage arrays, hosts, switches, and backup servers.
The Data Collector continuously collects data and sends this data, using an http or https connection, to another Java application, the Data Receiver. The Data Receiver runs on the Portal Server and stores the data that it receives in the Reporting Database. When you use the Portal to generate a report, the Portal requests this information from the Reporting Database, then returns the results in one of the many available reports that support storage management and data protection.
The Data Collector obtains all of its monitoring rules from a Data Collector Configuration File. This file resides in the Reporting Database in XML format. When the Data Collector first starts, it downloads this file from the Reporting Database. The Data Collector uses this file to determine the list of enterprise objects—such as backup servers, hosts, or storage arrays—that are to be monitored and included in its data collection process.
A single installation of the Data Collector supports any number of servers. The only real limitation is the memory and CPU processing power of the server on which the Data Collector resides. See the Certified Configurations Guide for Data Collector system requirements.
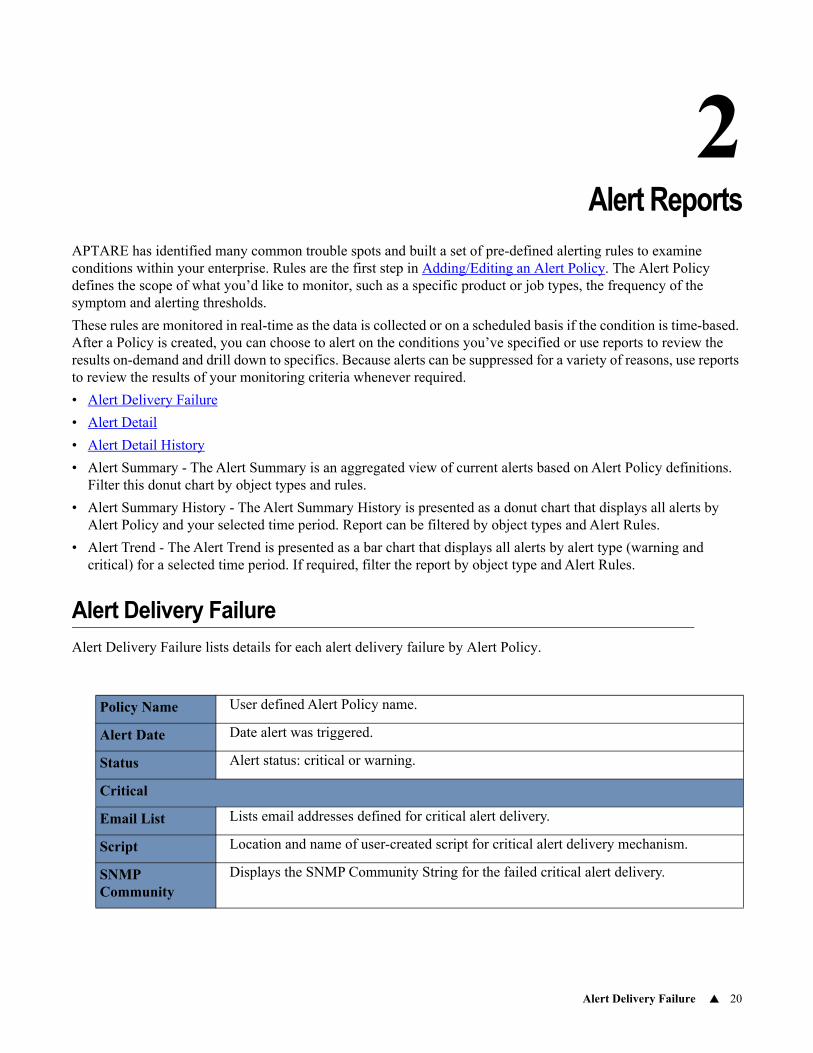
Alert Delivery Failure 20
2Chapter 0Alert Reports
APTARE has identified many common trouble spots and built a set of pre-defined alerting rules to examine conditions within your enterprise. Rules are the first step in Adding/Editing an Alert Policy. The Alert Policy defines the scope of what you’d like to monitor, such as a specific product or job types, the frequency of the symptom and alerting thresholds.
These rules are monitored in real-time as the data is collected or on a scheduled basis if the condition is time-based. After a Policy is created, you can choose to alert on the conditions you’ve specified or use reports to review the results on-demand and drill down to specifics. Because alerts can be suppressed for a variety of reasons, use reports to review the results of your monitoring criteria whenever required.
• Alert Delivery Failure
• Alert Detail
• Alert Detail History
• Alert Summary - The Alert Summary is an aggregated view of current alerts based on Alert Policy definitions. Filter this donut chart by object types and rules.
• Alert Summary History - The Alert Summary History is presented as a donut chart that displays all alerts by Alert Policy and your selected time period. Report can be filtered by object types and Alert Rules.
• Alert Trend - The Alert Trend is presented as a bar chart that displays all alerts by alert type (warning and critical) for a selected time period. If required, filter the report by object type and Alert Rules.
Alert Delivery Failure
Alert Delivery Failure lists details for each alert delivery failure by Alert Policy.
Policy Name User defined Alert Policy name.
Alert Date Date alert was triggered.
Status Alert status: critical or warning.
Critical
Email List Lists email addresses defined for critical alert delivery.
Script Location and name of user-created script for critical alert delivery mechanism.
SNMP Community
Displays the SNMP Community String for the failed critical alert delivery.
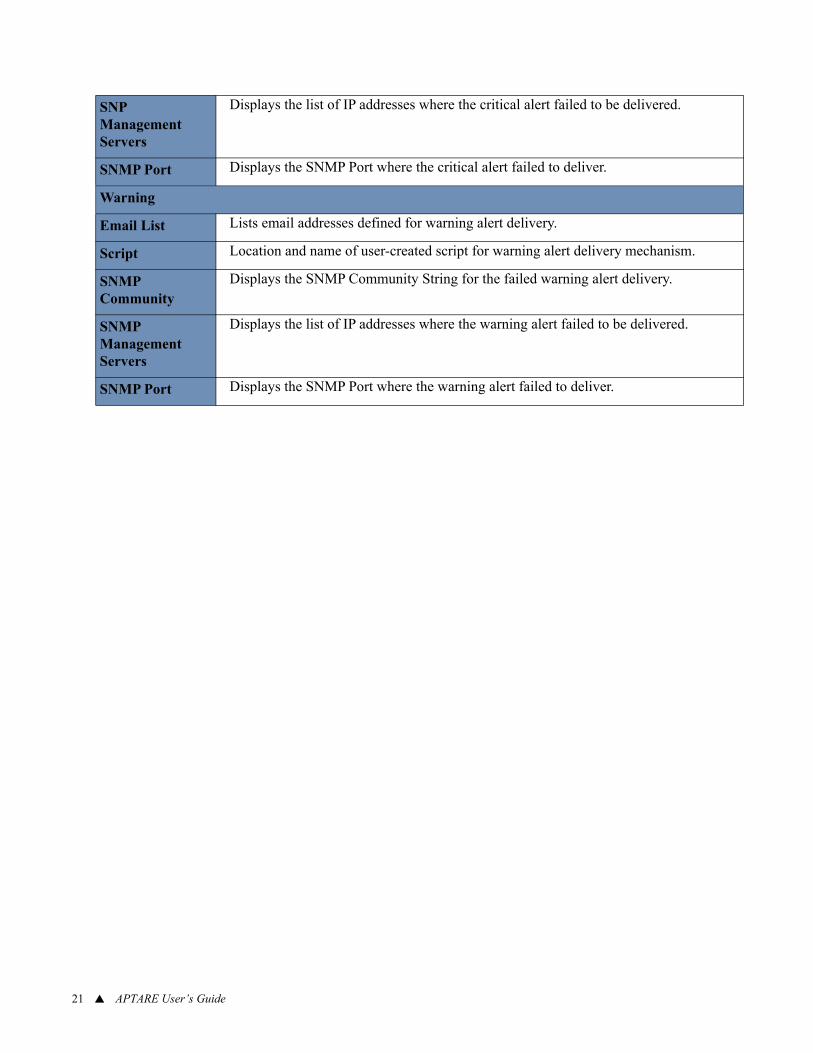
21APTARE User’s Guide
SNP Management Servers
Displays the list of IP addresses where the critical alert failed to be delivered.
SNMP Port Displays the SNMP Port where the critical alert failed to deliver.
Warning
Email List Lists email addresses defined for warning alert delivery.
Script Location and name of user-created script for warning alert delivery mechanism.
SNMP Community
Displays the SNMP Community String for the failed warning alert delivery.
SNMP Management Servers
Displays the list of IP addresses where the warning alert failed to be delivered.
SNMP Port Displays the SNMP Port where the warning alert failed to deliver.
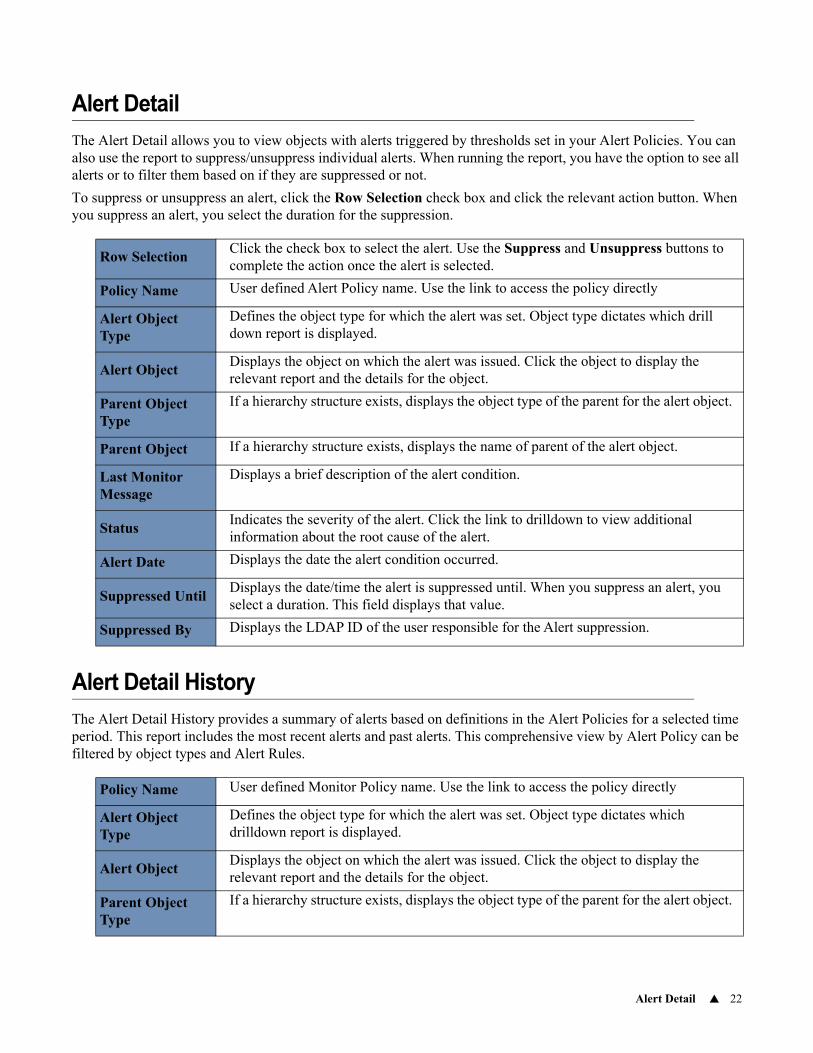
Alert Detail 22
Alert Detail
The Alert Detail allows you to view objects with alerts triggered by thresholds set in your Alert Policies. You can also use the report to suppress/unsuppress individual alerts. When running the report, you have the option to see all alerts or to filter them based on if they are suppressed or not.
To suppress or unsuppress an alert, click the Row Selection check box and click the relevant action button. When you suppress an alert, you select the duration for the suppression.
Alert Detail History
The Alert Detail History provides a summary of alerts based on definitions in the Alert Policies for a selected time period. This report includes the most recent alerts and past alerts. This comprehensive view by Alert Policy can be filtered by object types and Alert Rules.
Row SelectionClick the check box to select the alert. Use the Suppress and Unsuppress buttons to complete the action once the alert is selected.
Policy Name User defined Alert Policy name. Use the link to access the policy directly
Alert Object Type
Defines the object type for which the alert was set. Object type dictates which drill down report is displayed.
Alert ObjectDisplays the object on which the alert was issued. Click the object to display the relevant report and the details for the object.
Parent Object Type
If a hierarchy structure exists, displays the object type of the parent for the alert object.
Parent Object If a hierarchy structure exists, displays the name of parent of the alert object.
Last Monitor Message
Displays a brief description of the alert condition.
StatusIndicates the severity of the alert. Click the link to drilldown to view additional information about the root cause of the alert.
Alert Date Displays the date the alert condition occurred.
Suppressed UntilDisplays the date/time the alert is suppressed until. When you suppress an alert, you select a duration. This field displays that value.
Suppressed By Displays the LDAP ID of the user responsible for the Alert suppression.
Policy Name User defined Monitor Policy name. Use the link to access the policy directly
Alert Object Type
Defines the object type for which the alert was set. Object type dictates which drilldown report is displayed.
Alert ObjectDisplays the object on which the alert was issued. Click the object to display the relevant report and the details for the object.
Parent Object Type
If a hierarchy structure exists, displays the object type of the parent for the alert object.
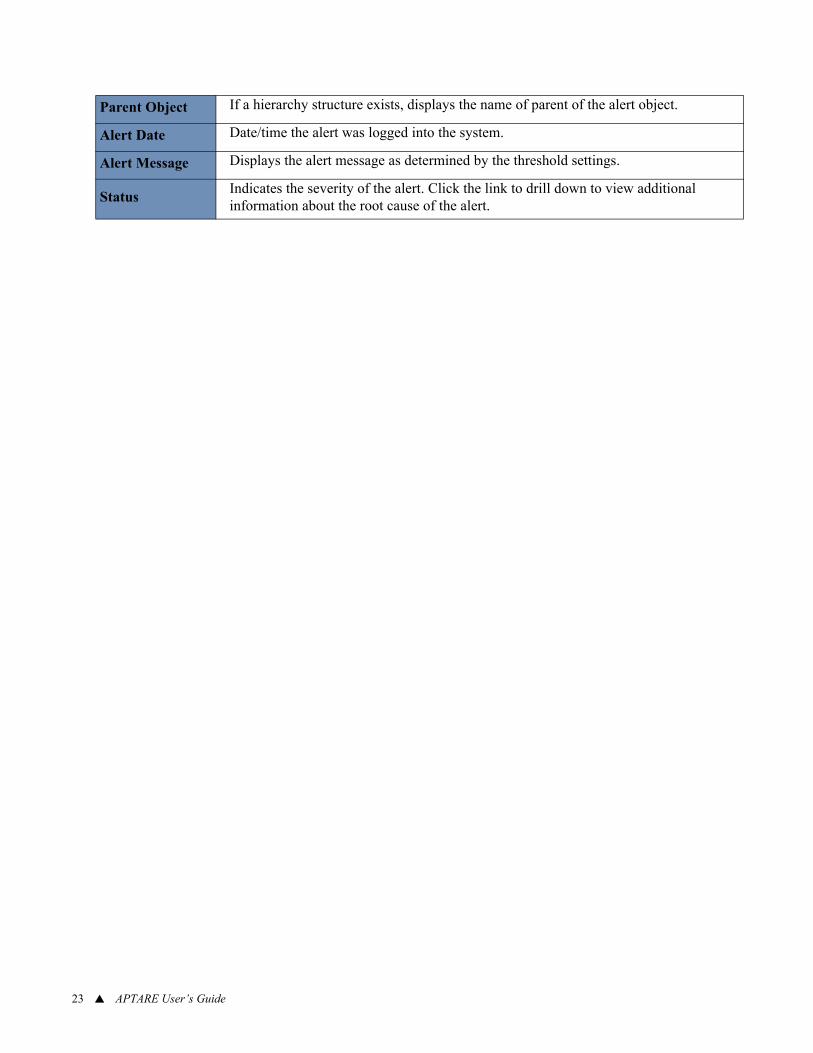
23APTARE User’s Guide
Parent Object If a hierarchy structure exists, displays the name of parent of the alert object.
Alert Date Date/time the alert was logged into the system.
Alert Message Displays the alert message as determined by the threshold settings.
StatusIndicates the severity of the alert. Click the link to drill down to view additional information about the root cause of the alert.
Risk Mitigation Reports 24
3Chapter 0Risk Mitigation Solution Reports
Risk Mitigation Reports
The reports discussed in this section employ Risk Mitigation Rules to assess areas within your enterprise that may require attention to avoid performance issues and outages. These rules include parameters that can be configured to isolate specific conditions relevant for your environment. See also Solutions Administration.
Use the following reports to monitor and optimize data center storage:
• Risk Mitigation Analysis
• Risk Mitigation Trend
• Risk Mitigation Detail Reports
Risk Mitigation Analysis
Explore your data center using APTARE customizable report templates or by using parts of your IT infrastructure as entry points. Use Search to find reports, templates and dashboards across the portal.
Use the Reports tab to examine the catalog of templates, dashboards and reports - organized by products along with user-created, and system folders. This report is located here:
Solutions > Risk Mitigation > Risk Mitigation Analysis
View a chart of infrastructure categories and parameters that may offer opportunities for storage optimization. Click a chart sector to view additional details for each of the relevant risk mitigation rules.
Each chart sector can drill down to increasing levels of detail, which can be used to isolate potential issues. For the types of risk mitigation details that can be accessed via this chart, see Risk Mitigation Detail Reports.
See also Interacting with Reports and Solution Reports Scope Selector Settings.
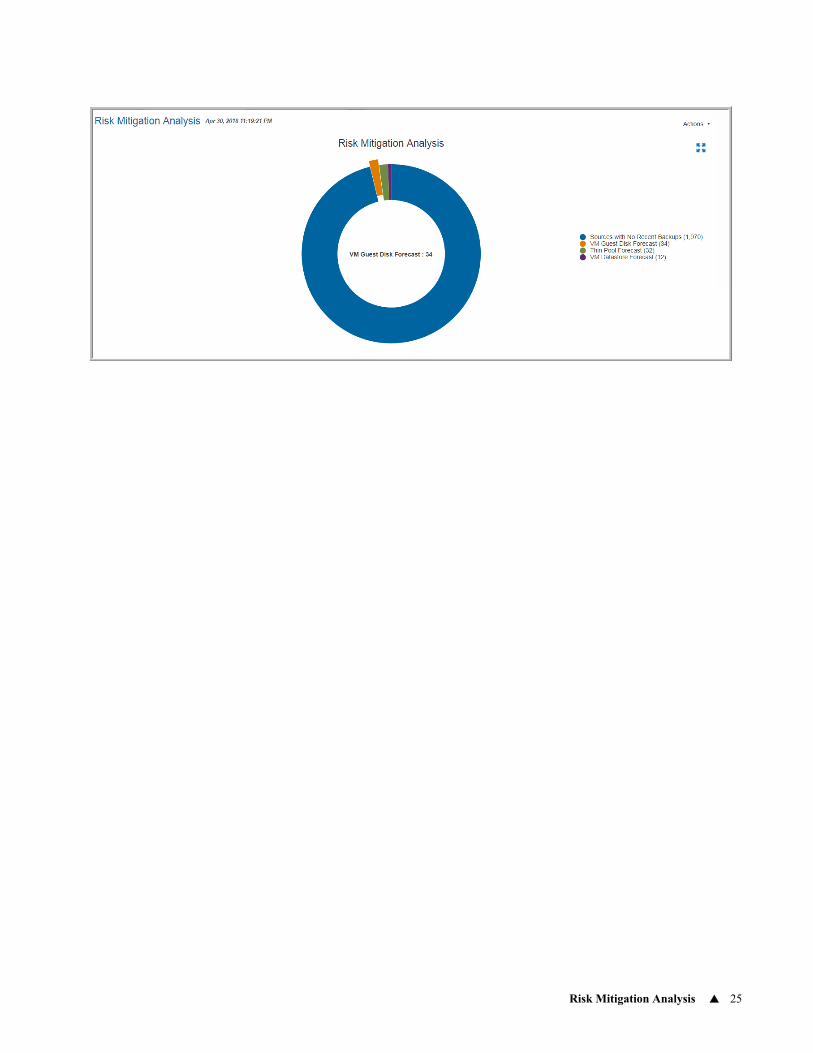
Risk Mitigation Analysis 25
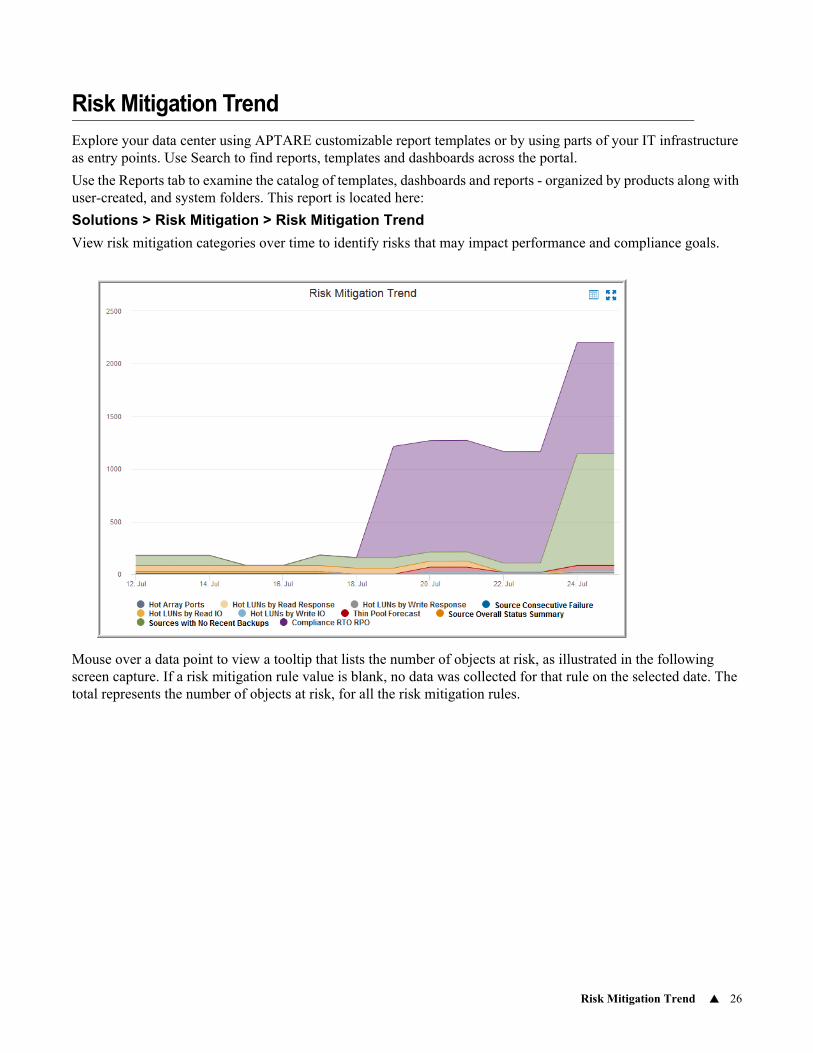
Risk Mitigation Trend 26
Risk Mitigation Trend
Explore your data center using APTARE customizable report templates or by using parts of your IT infrastructure as entry points. Use Search to find reports, templates and dashboards across the portal.
Use the Reports tab to examine the catalog of templates, dashboards and reports - organized by products along with user-created, and system folders. This report is located here:
Solutions > Risk Mitigation > Risk Mitigation Trend
View risk mitigation categories over time to identify risks that may impact performance and compliance goals.
Mouse over a data point to view a tooltip that lists the number of objects at risk, as illustrated in the following screen capture. If a risk mitigation rule value is blank, no data was collected for that rule on the selected date. The total represents the number of objects at risk, for all the risk mitigation rules.
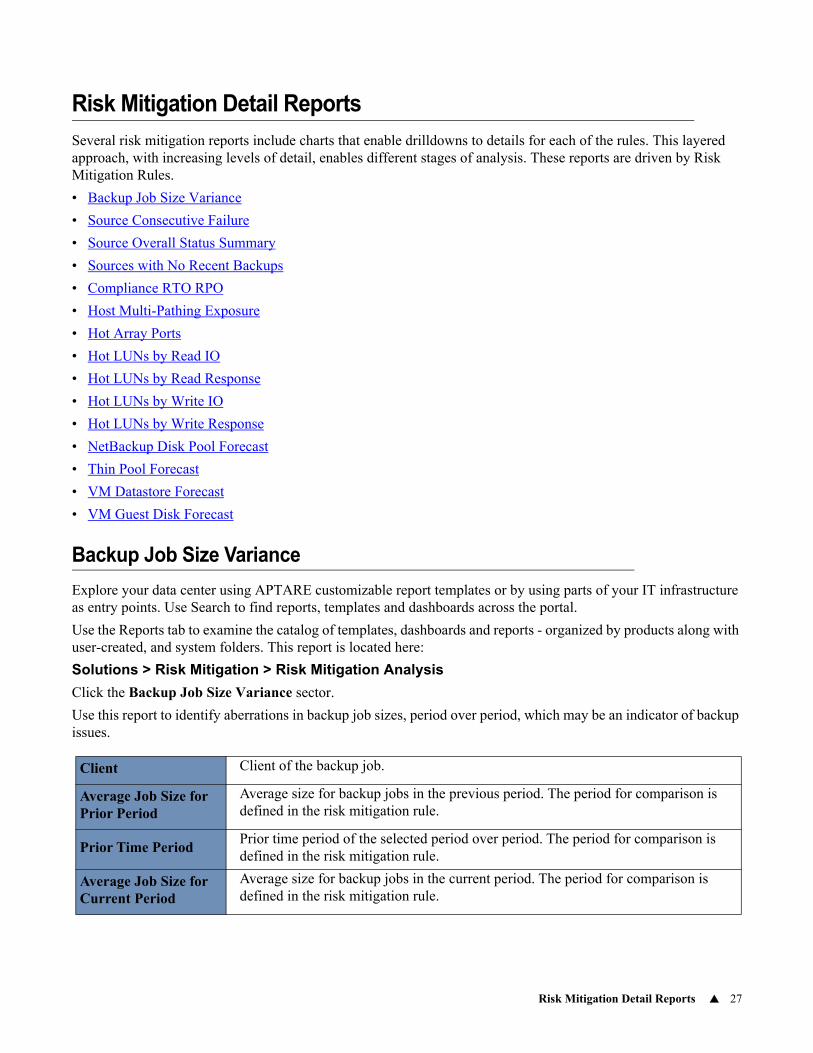
Risk Mitigation Detail Reports 27
Risk Mitigation Detail Reports
Several risk mitigation reports include charts that enable drilldowns to details for each of the rules. This layered approach, with increasing levels of detail, enables different stages of analysis. These reports are driven by Risk Mitigation Rules.
• Backup Job Size Variance
• Source Consecutive Failure
• Source Overall Status Summary
• Sources with No Recent Backups
• Compliance RTO RPO
• Host Multi-Pathing Exposure
• Hot Array Ports
• Hot LUNs by Read IO
• Hot LUNs by Read Response
• Hot LUNs by Write IO
• Hot LUNs by Write Response
• NetBackup Disk Pool Forecast
• Thin Pool Forecast
• VM Datastore Forecast
• VM Guest Disk Forecast
Backup Job Size Variance
Explore your data center using APTARE customizable report templates or by using parts of your IT infrastructure as entry points. Use Search to find reports, templates and dashboards across the portal.
Use the Reports tab to examine the catalog of templates, dashboards and reports - organized by products along with user-created, and system folders. This report is located here:
Solutions > Risk Mitigation > Risk Mitigation Analysis
Click the Backup Job Size Variance sector.
Use this report to identify aberrations in backup job sizes, period over period, which may be an indicator of backup issues.
Client Client of the backup job.
Average Job Size for Prior Period
Average size for backup jobs in the previous period. The period for comparison is defined in the risk mitigation rule.
Prior Time PeriodPrior time period of the selected period over period. The period for comparison is defined in the risk mitigation rule.
Average Job Size for Current Period
Average size for backup jobs in the current period. The period for comparison is defined in the risk mitigation rule.
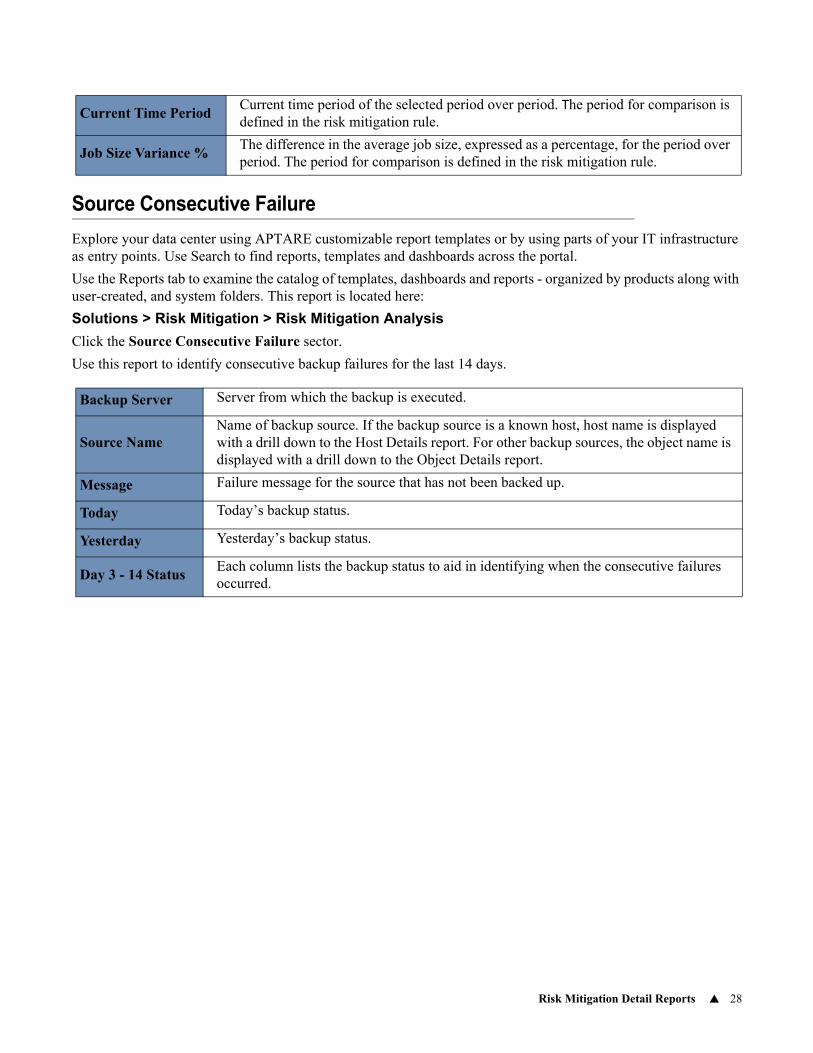
Risk Mitigation Detail Reports 28
Source Consecutive Failure
Explore your data center using APTARE customizable report templates or by using parts of your IT infrastructure as entry points. Use Search to find reports, templates and dashboards across the portal.
Use the Reports tab to examine the catalog of templates, dashboards and reports - organized by products along with user-created, and system folders. This report is located here:
Solutions > Risk Mitigation > Risk Mitigation Analysis
Click the Source Consecutive Failure sector.
Use this report to identify consecutive backup failures for the last 14 days.
Current Time PeriodCurrent time period of the selected period over period. The period for comparison is defined in the risk mitigation rule.
Job Size Variance %The difference in the average job size, expressed as a percentage, for the period over period. The period for comparison is defined in the risk mitigation rule.
Backup Server Server from which the backup is executed.
Source NameName of backup source. If the backup source is a known host, host name is displayed with a drill down to the Host Details report. For other backup sources, the object name is displayed with a drill down to the Object Details report.
Message Failure message for the source that has not been backed up.
Today Today’s backup status.
Yesterday Yesterday’s backup status.
Day 3 - 14 StatusEach column lists the backup status to aid in identifying when the consecutive failures occurred.
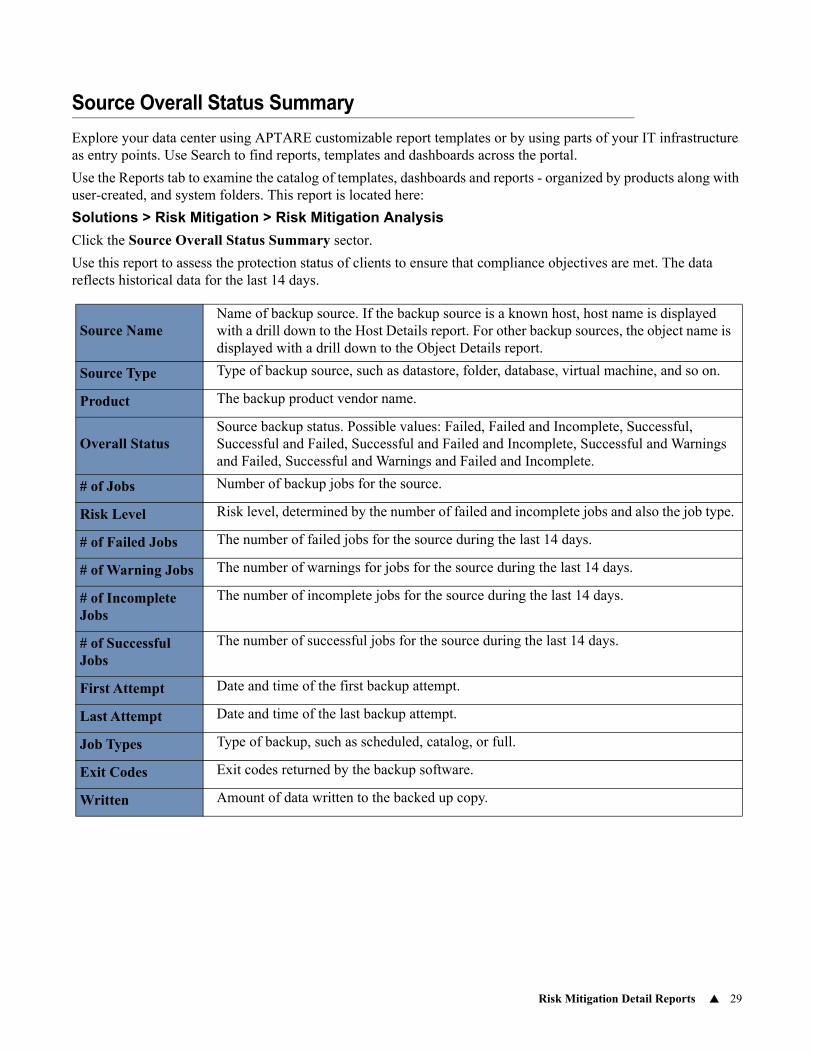
Risk Mitigation Detail Reports 29
Source Overall Status Summary
Explore your data center using APTARE customizable report templates or by using parts of your IT infrastructure as entry points. Use Search to find reports, templates and dashboards across the portal.
Use the Reports tab to examine the catalog of templates, dashboards and reports - organized by products along with user-created, and system folders. This report is located here:
Solutions > Risk Mitigation > Risk Mitigation Analysis
Click the Source Overall Status Summary sector.
Use this report to assess the protection status of clients to ensure that compliance objectives are met. The data reflects historical data for the last 14 days.
Source NameName of backup source. If the backup source is a known host, host name is displayed with a drill down to the Host Details report. For other backup sources, the object name is displayed with a drill down to the Object Details report.
Source Type Type of backup source, such as datastore, folder, database, virtual machine, and so on.
Product The backup product vendor name.
Overall StatusSource backup status. Possible values: Failed, Failed and Incomplete, Successful, Successful and Failed, Successful and Failed and Incomplete, Successful and Warnings and Failed, Successful and Warnings and Failed and Incomplete.
# of Jobs Number of backup jobs for the source.
Risk Level Risk level, determined by the number of failed and incomplete jobs and also the job type.
# of Failed Jobs The number of failed jobs for the source during the last 14 days.
# of Warning Jobs The number of warnings for jobs for the source during the last 14 days.
# of Incomplete Jobs
The number of incomplete jobs for the source during the last 14 days.
# of Successful Jobs
The number of successful jobs for the source during the last 14 days.
First Attempt Date and time of the first backup attempt.
Last Attempt Date and time of the last backup attempt.
Job Types Type of backup, such as scheduled, catalog, or full.
Exit Codes Exit codes returned by the backup software.
Written Amount of data written to the backed up copy.
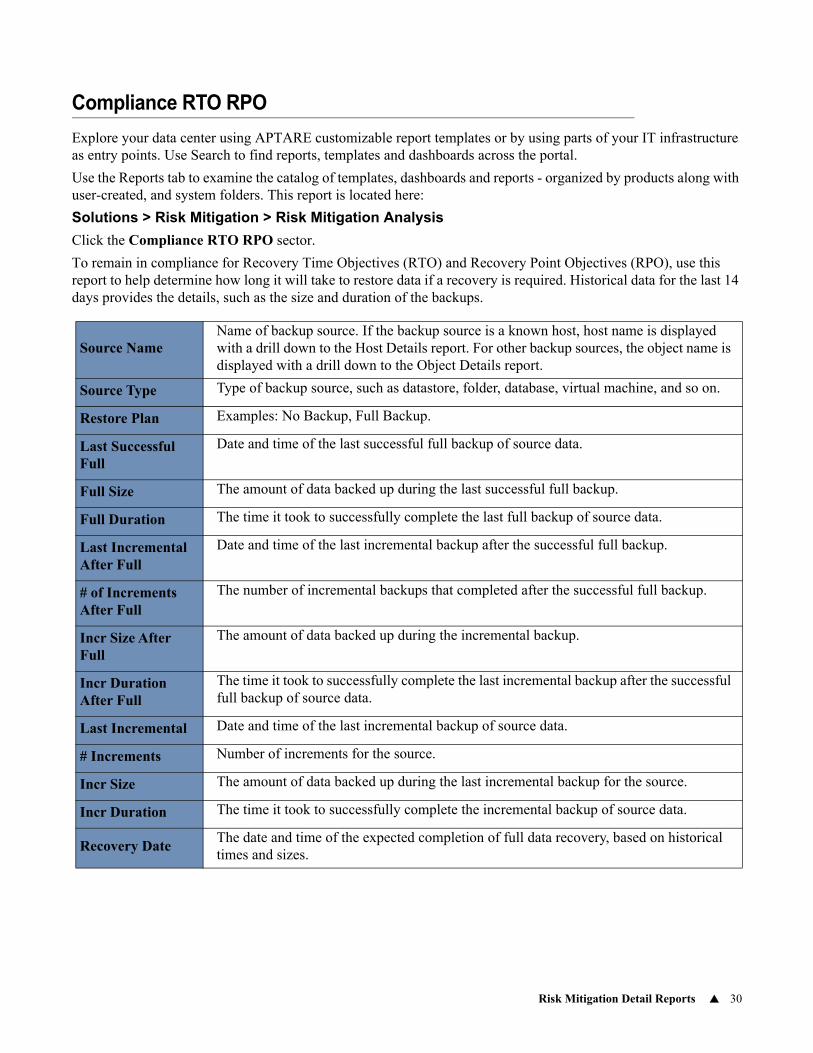
Risk Mitigation Detail Reports 30
Compliance RTO RPO
Explore your data center using APTARE customizable report templates or by using parts of your IT infrastructure as entry points. Use Search to find reports, templates and dashboards across the portal.
Use the Reports tab to examine the catalog of templates, dashboards and reports - organized by products along with user-created, and system folders. This report is located here:
Solutions > Risk Mitigation > Risk Mitigation Analysis
Click the Compliance RTO RPO sector.
To remain in compliance for Recovery Time Objectives (RTO) and Recovery Point Objectives (RPO), use this report to help determine how long it will take to restore data if a recovery is required. Historical data for the last 14 days provides the details, such as the size and duration of the backups.
Source NameName of backup source. If the backup source is a known host, host name is displayed with a drill down to the Host Details report. For other backup sources, the object name is displayed with a drill down to the Object Details report.
Source Type Type of backup source, such as datastore, folder, database, virtual machine, and so on.
Restore Plan Examples: No Backup, Full Backup.
Last Successful Full
Date and time of the last successful full backup of source data.
Full Size The amount of data backed up during the last successful full backup.
Full Duration The time it took to successfully complete the last full backup of source data.
Last Incremental After Full
Date and time of the last incremental backup after the successful full backup.
# of Increments After Full
The number of incremental backups that completed after the successful full backup.
Incr Size After Full
The amount of data backed up during the incremental backup.
Incr Duration After Full
The time it took to successfully complete the last incremental backup after the successful full backup of source data.
Last Incremental Date and time of the last incremental backup of source data.
# Increments Number of increments for the source.
Incr Size The amount of data backed up during the last incremental backup for the source.
Incr Duration The time it took to successfully complete the incremental backup of source data.
Recovery DateThe date and time of the expected completion of full data recovery, based on historical times and sizes.
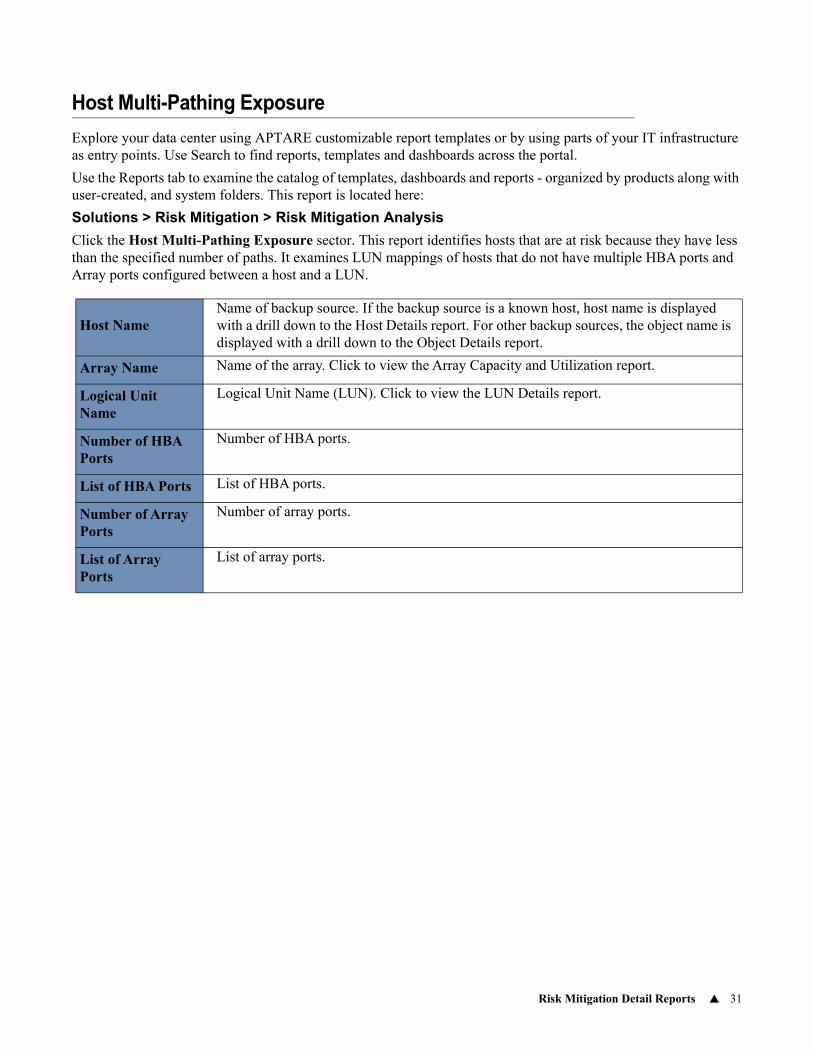
Risk Mitigation Detail Reports 31
Host Multi-Pathing Exposure
Explore your data center using APTARE customizable report templates or by using parts of your IT infrastructure as entry points. Use Search to find reports, templates and dashboards across the portal.
Use the Reports tab to examine the catalog of templates, dashboards and reports - organized by products along with user-created, and system folders. This report is located here:
Solutions > Risk Mitigation > Risk Mitigation Analysis
Click the Host Multi-Pathing Exposure sector. This report identifies hosts that are at risk because they have less than the specified number of paths. It examines LUN mappings of hosts that do not have multiple HBA ports and Array ports configured between a host and a LUN.
Host NameName of backup source. If the backup source is a known host, host name is displayed with a drill down to the Host Details report. For other backup sources, the object name is displayed with a drill down to the Object Details report.
Array Name Name of the array. Click to view the Array Capacity and Utilization report.
Logical Unit Name
Logical Unit Name (LUN). Click to view the LUN Details report.
Number of HBA Ports
Number of HBA ports.
List of HBA Ports List of HBA ports.
Number of Array Ports
Number of array ports.
List of Array Ports
List of array ports.
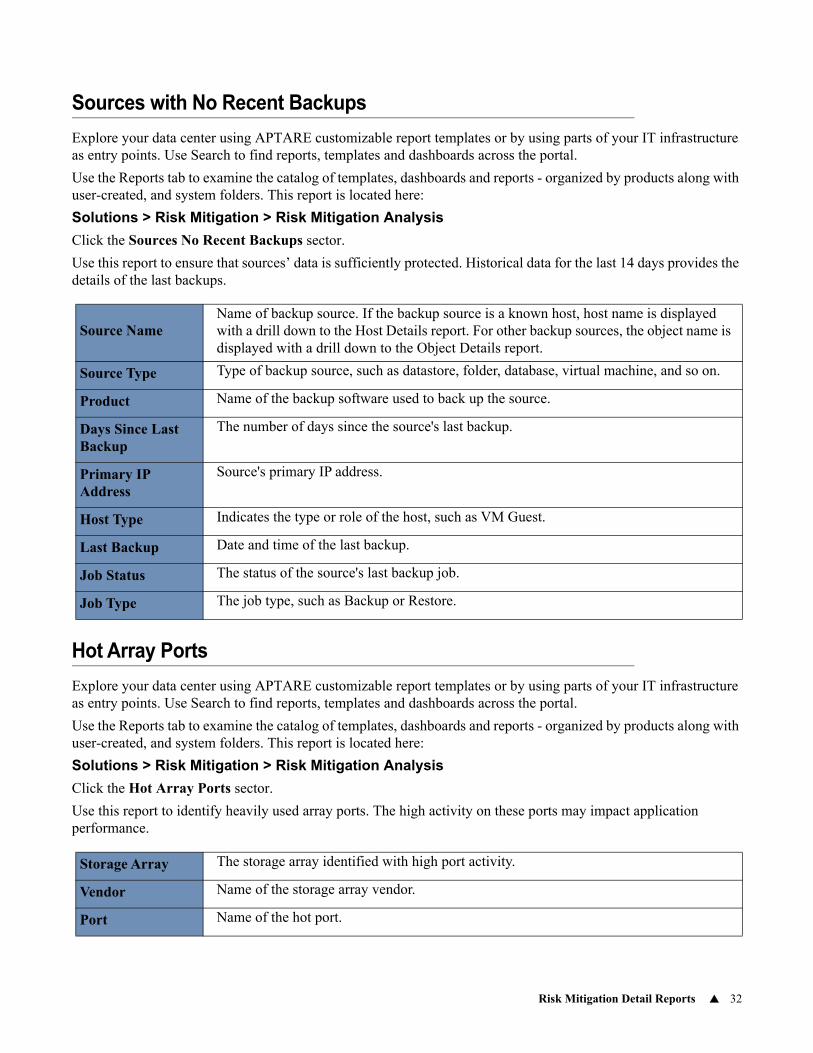
Risk Mitigation Detail Reports 32
Sources with No Recent Backups
Explore your data center using APTARE customizable report templates or by using parts of your IT infrastructure as entry points. Use Search to find reports, templates and dashboards across the portal.
Use the Reports tab to examine the catalog of templates, dashboards and reports - organized by products along with user-created, and system folders. This report is located here:
Solutions > Risk Mitigation > Risk Mitigation Analysis
Click the Sources No Recent Backups sector.
Use this report to ensure that sources’ data is sufficiently protected. Historical data for the last 14 days provides the details of the last backups.
Hot Array Ports
Explore your data center using APTARE customizable report templates or by using parts of your IT infrastructure as entry points. Use Search to find reports, templates and dashboards across the portal.
Use the Reports tab to examine the catalog of templates, dashboards and reports - organized by products along with user-created, and system folders. This report is located here:
Solutions > Risk Mitigation > Risk Mitigation Analysis
Click the Hot Array Ports sector.
Use this report to identify heavily used array ports. The high activity on these ports may impact application performance.
Source NameName of backup source. If the backup source is a known host, host name is displayed with a drill down to the Host Details report. For other backup sources, the object name is displayed with a drill down to the Object Details report.
Source Type Type of backup source, such as datastore, folder, database, virtual machine, and so on.
Product Name of the backup software used to back up the source.
Days Since Last Backup
The number of days since the source's last backup.
Primary IP Address
Source's primary IP address.
Host Type Indicates the type or role of the host, such as VM Guest.
Last Backup Date and time of the last backup.
Job Status The status of the source's last backup job.
Job Type The job type, such as Backup or Restore.
Storage Array The storage array identified with high port activity.
Vendor Name of the storage array vendor.
Port Name of the hot port.
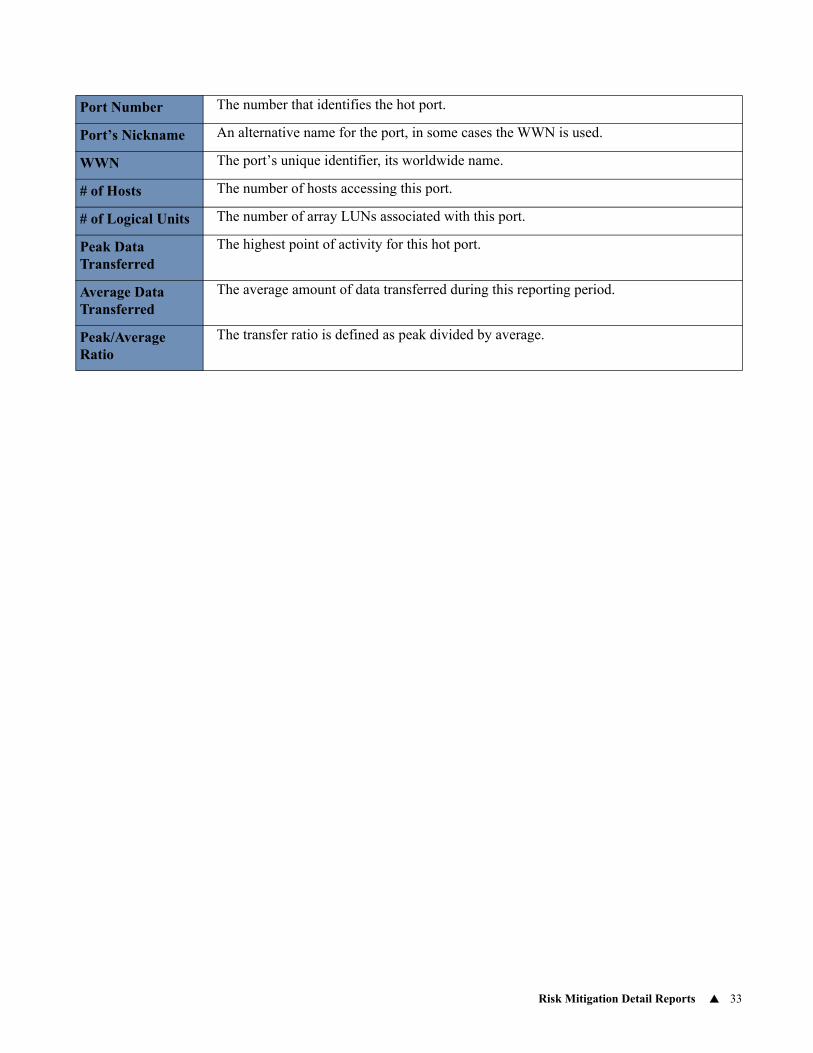
Risk Mitigation Detail Reports 33
Port Number The number that identifies the hot port.
Port’s Nickname An alternative name for the port, in some cases the WWN is used.
WWN The port’s unique identifier, its worldwide name.
# of Hosts The number of hosts accessing this port.
# of Logical Units The number of array LUNs associated with this port.
Peak Data Transferred
The highest point of activity for this hot port.
Average Data Transferred
The average amount of data transferred during this reporting period.
Peak/Average Ratio
The transfer ratio is defined as peak divided by average.
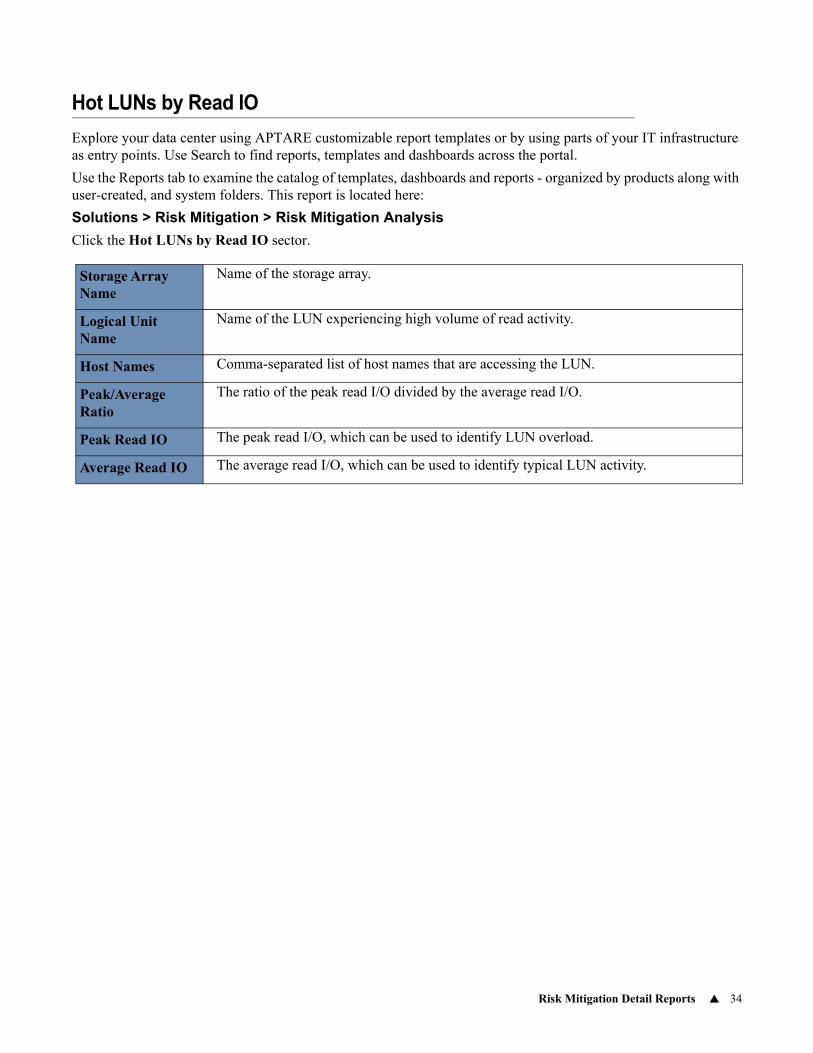
Risk Mitigation Detail Reports 34
Hot LUNs by Read IO
Explore your data center using APTARE customizable report templates or by using parts of your IT infrastructure as entry points. Use Search to find reports, templates and dashboards across the portal.
Use the Reports tab to examine the catalog of templates, dashboards and reports - organized by products along with user-created, and system folders. This report is located here:
Solutions > Risk Mitigation > Risk Mitigation Analysis
Click the Hot LUNs by Read IO sector.
Storage Array Name
Name of the storage array.
Logical Unit Name
Name of the LUN experiencing high volume of read activity.
Host Names Comma-separated list of host names that are accessing the LUN.
Peak/Average Ratio
The ratio of the peak read I/O divided by the average read I/O.
Peak Read IO The peak read I/O, which can be used to identify LUN overload.
Average Read IO The average read I/O, which can be used to identify typical LUN activity.
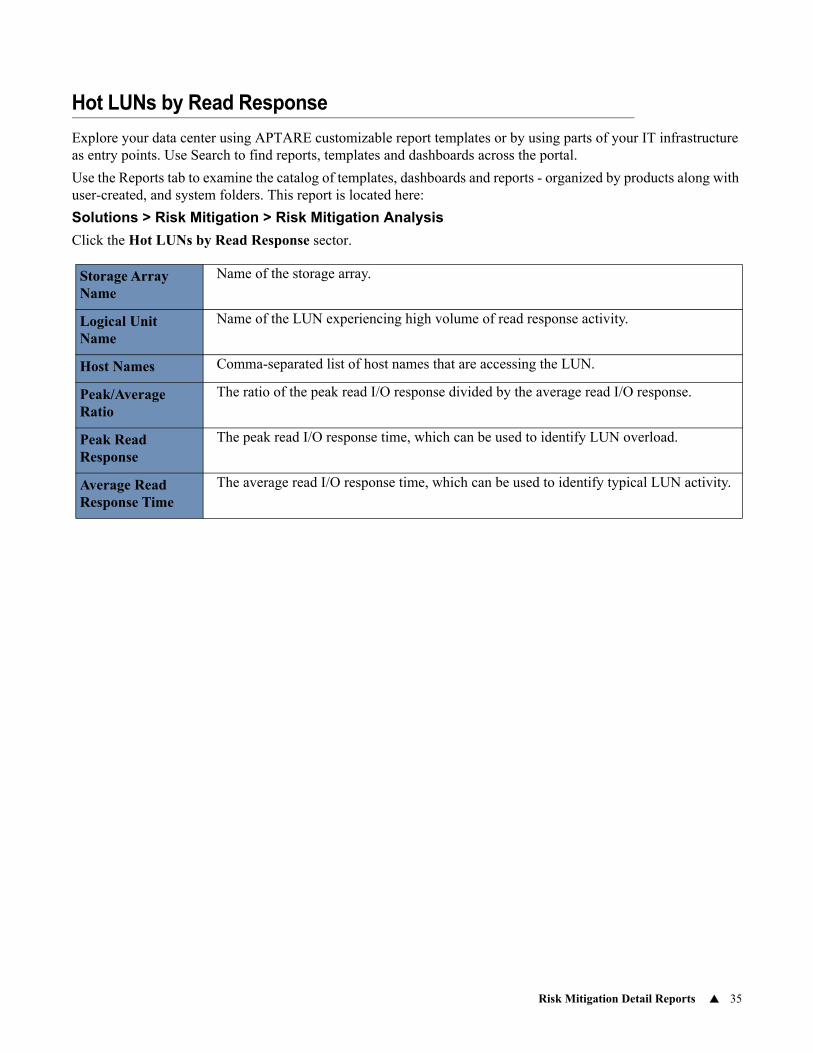
Risk Mitigation Detail Reports 35
Hot LUNs by Read Response
Explore your data center using APTARE customizable report templates or by using parts of your IT infrastructure as entry points. Use Search to find reports, templates and dashboards across the portal.
Use the Reports tab to examine the catalog of templates, dashboards and reports - organized by products along with user-created, and system folders. This report is located here:
Solutions > Risk Mitigation > Risk Mitigation Analysis
Click the Hot LUNs by Read Response sector.
Storage Array Name
Name of the storage array.
Logical Unit Name
Name of the LUN experiencing high volume of read response activity.
Host Names Comma-separated list of host names that are accessing the LUN.
Peak/Average Ratio
The ratio of the peak read I/O response divided by the average read I/O response.
Peak Read Response
The peak read I/O response time, which can be used to identify LUN overload.
Average Read Response Time
The average read I/O response time, which can be used to identify typical LUN activity.

Risk Mitigation Detail Reports 36
Hot LUNs by Write IO
Explore your data center using APTARE customizable report templates or by using parts of your IT infrastructure as entry points. Use Search to find reports, templates and dashboards across the portal.
Use the Reports tab to examine the catalog of templates, dashboards and reports - organized by products along with user-created, and system folders. This report is located here:
Solutions > Risk Mitigation > Risk Mitigation Analysis
Click the Hot LUNs by Write IO sector.
Storage Array Name
Name of the storage array.
Logical Unit Name
Name of the LUN experiencing high volume of write activity.
Host Names Comma-separated list of hosts that are accessing the LUN.
Peak/Average Ratio
The ratio of the peak write I/O divided by the average write I/O.
Peak Write IO The peak write I/O, which can be used to identify LUN overload.
Average Write IO The average write I/O, which can be used to identify typical LUN activity.
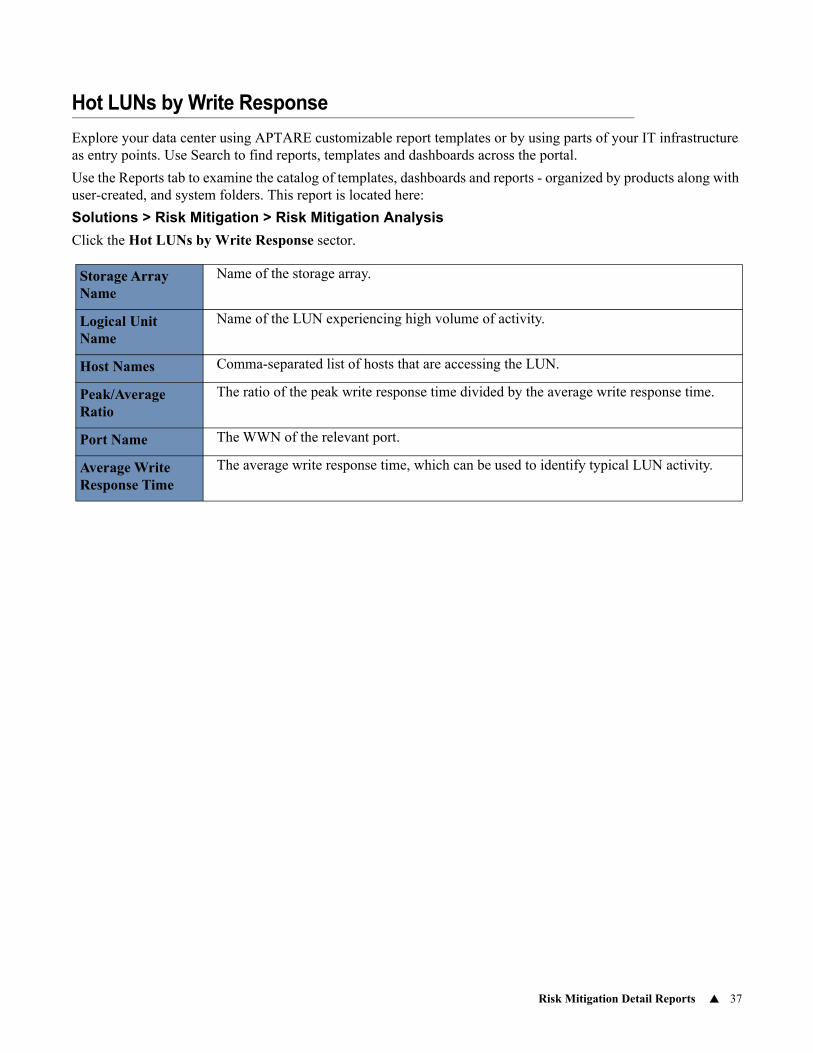
Risk Mitigation Detail Reports 37
Hot LUNs by Write Response
Explore your data center using APTARE customizable report templates or by using parts of your IT infrastructure as entry points. Use Search to find reports, templates and dashboards across the portal.
Use the Reports tab to examine the catalog of templates, dashboards and reports - organized by products along with user-created, and system folders. This report is located here:
Solutions > Risk Mitigation > Risk Mitigation Analysis
Click the Hot LUNs by Write Response sector.
Storage Array Name
Name of the storage array.
Logical Unit Name
Name of the LUN experiencing high volume of activity.
Host Names Comma-separated list of hosts that are accessing the LUN.
Peak/Average Ratio
The ratio of the peak write response time divided by the average write response time.
Port Name The WWN of the relevant port.
Average Write Response Time
The average write response time, which can be used to identify typical LUN activity.
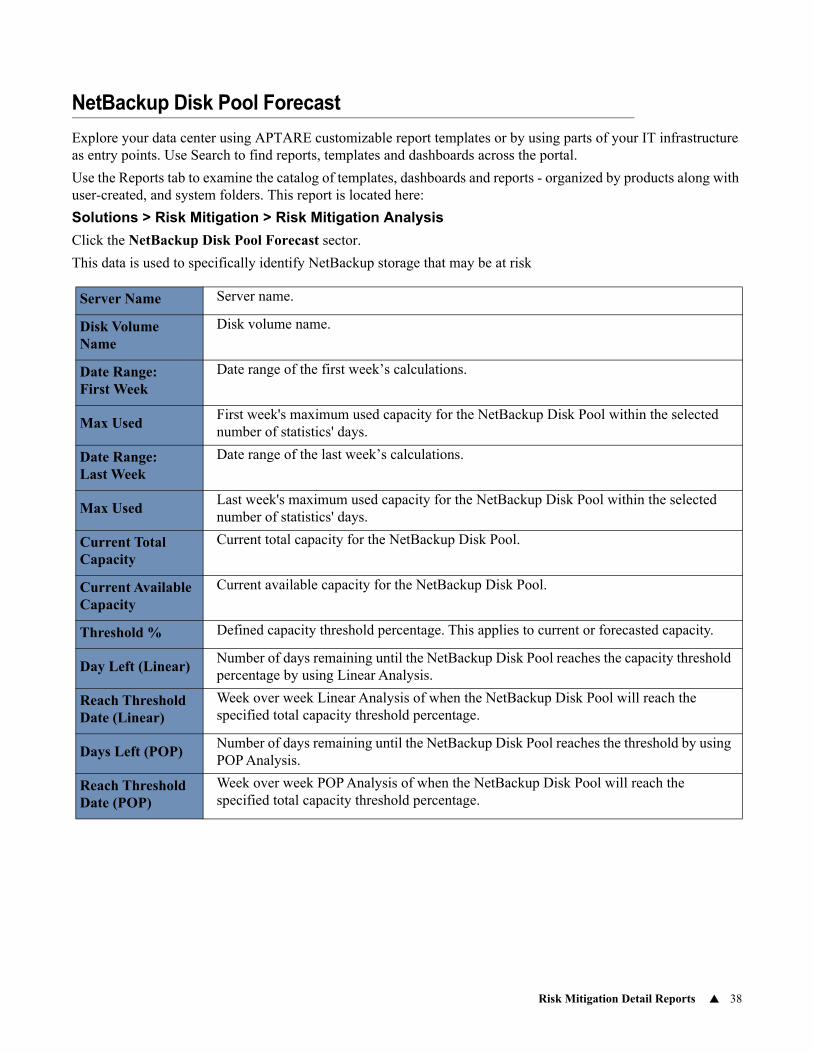
Risk Mitigation Detail Reports 38
NetBackup Disk Pool Forecast
Explore your data center using APTARE customizable report templates or by using parts of your IT infrastructure as entry points. Use Search to find reports, templates and dashboards across the portal.
Use the Reports tab to examine the catalog of templates, dashboards and reports - organized by products along with user-created, and system folders. This report is located here:
Solutions > Risk Mitigation > Risk Mitigation Analysis
Click the NetBackup Disk Pool Forecast sector.
This data is used to specifically identify NetBackup storage that may be at risk
Server Name Server name.
Disk Volume Name
Disk volume name.
Date Range: First Week
Date range of the first week’s calculations.
Max UsedFirst week's maximum used capacity for the NetBackup Disk Pool within the selected number of statistics' days.
Date Range:Last Week
Date range of the last week’s calculations.
Max UsedLast week's maximum used capacity for the NetBackup Disk Pool within the selected number of statistics' days.
Current Total Capacity
Current total capacity for the NetBackup Disk Pool.
Current Available Capacity
Current available capacity for the NetBackup Disk Pool.
Threshold % Defined capacity threshold percentage. This applies to current or forecasted capacity.
Day Left (Linear)Number of days remaining until the NetBackup Disk Pool reaches the capacity threshold percentage by using Linear Analysis.
Reach Threshold Date (Linear)
Week over week Linear Analysis of when the NetBackup Disk Pool will reach the specified total capacity threshold percentage.
Days Left (POP)Number of days remaining until the NetBackup Disk Pool reaches the threshold by using POP Analysis.
Reach Threshold Date (POP)
Week over week POP Analysis of when the NetBackup Disk Pool will reach the specified total capacity threshold percentage.
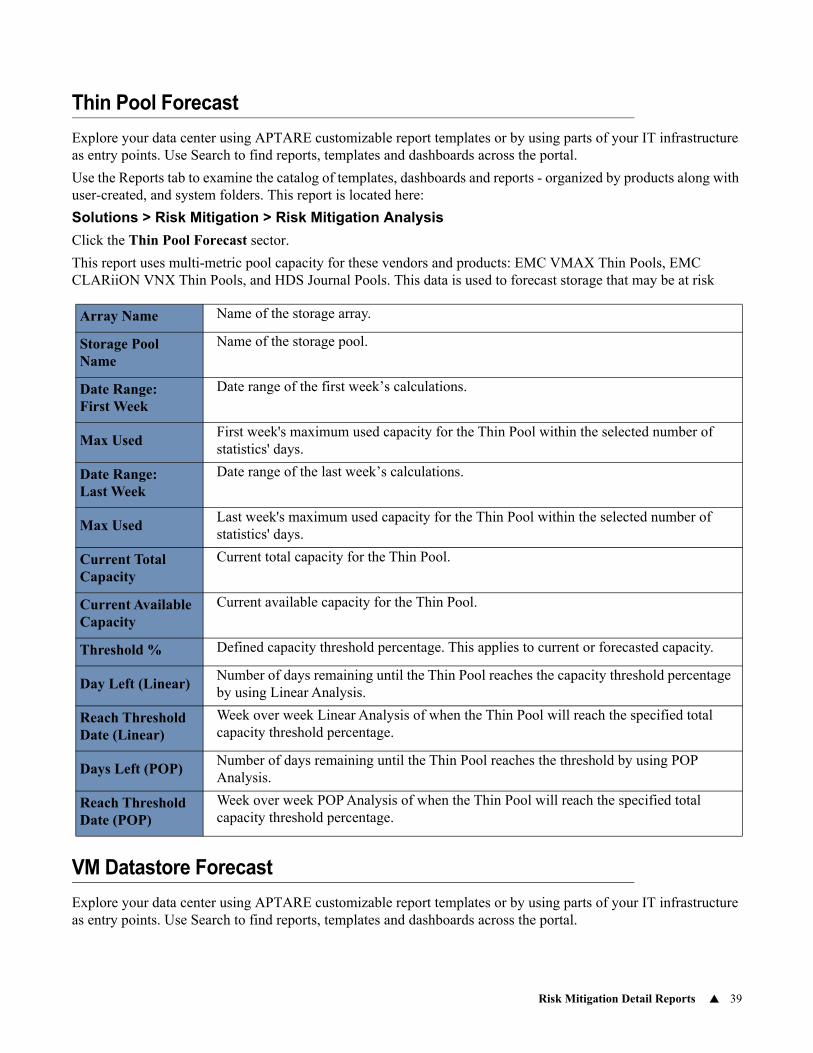
Risk Mitigation Detail Reports 39
Thin Pool Forecast
Explore your data center using APTARE customizable report templates or by using parts of your IT infrastructure as entry points. Use Search to find reports, templates and dashboards across the portal.
Use the Reports tab to examine the catalog of templates, dashboards and reports - organized by products along with user-created, and system folders. This report is located here:
Solutions > Risk Mitigation > Risk Mitigation Analysis
Click the Thin Pool Forecast sector.
This report uses multi-metric pool capacity for these vendors and products: EMC VMAX Thin Pools, EMC CLARiiON VNX Thin Pools, and HDS Journal Pools. This data is used to forecast storage that may be at risk
VM Datastore Forecast
Explore your data center using APTARE customizable report templates or by using parts of your IT infrastructure as entry points. Use Search to find reports, templates and dashboards across the portal.
Array Name Name of the storage array.
Storage Pool Name
Name of the storage pool.
Date Range: First Week
Date range of the first week’s calculations.
Max UsedFirst week's maximum used capacity for the Thin Pool within the selected number of statistics' days.
Date Range:Last Week
Date range of the last week’s calculations.
Max UsedLast week's maximum used capacity for the Thin Pool within the selected number of statistics' days.
Current Total Capacity
Current total capacity for the Thin Pool.
Current Available Capacity
Current available capacity for the Thin Pool.
Threshold % Defined capacity threshold percentage. This applies to current or forecasted capacity.
Day Left (Linear)Number of days remaining until the Thin Pool reaches the capacity threshold percentage by using Linear Analysis.
Reach Threshold Date (Linear)
Week over week Linear Analysis of when the Thin Pool will reach the specified total capacity threshold percentage.
Days Left (POP)Number of days remaining until the Thin Pool reaches the threshold by using POP Analysis.
Reach Threshold Date (POP)
Week over week POP Analysis of when the Thin Pool will reach the specified total capacity threshold percentage.
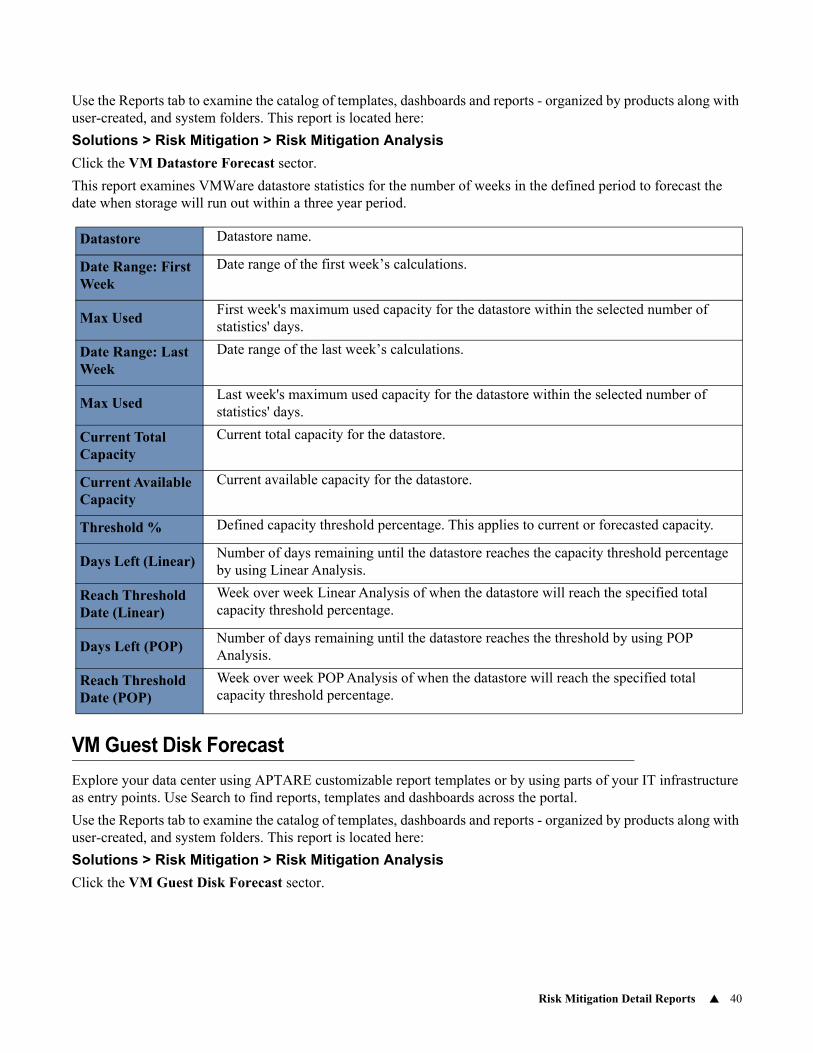
Risk Mitigation Detail Reports 40
Use the Reports tab to examine the catalog of templates, dashboards and reports - organized by products along with user-created, and system folders. This report is located here:
Solutions > Risk Mitigation > Risk Mitigation Analysis
Click the VM Datastore Forecast sector.
This report examines VMWare datastore statistics for the number of weeks in the defined period to forecast the date when storage will run out within a three year period.
VM Guest Disk Forecast
Explore your data center using APTARE customizable report templates or by using parts of your IT infrastructure as entry points. Use Search to find reports, templates and dashboards across the portal.
Use the Reports tab to examine the catalog of templates, dashboards and reports - organized by products along with user-created, and system folders. This report is located here:
Solutions > Risk Mitigation > Risk Mitigation Analysis
Click the VM Guest Disk Forecast sector.
Datastore Datastore name.
Date Range: First Week
Date range of the first week’s calculations.
Max UsedFirst week's maximum used capacity for the datastore within the selected number of statistics' days.
Date Range: Last Week
Date range of the last week’s calculations.
Max UsedLast week's maximum used capacity for the datastore within the selected number of statistics' days.
Current Total Capacity
Current total capacity for the datastore.
Current Available Capacity
Current available capacity for the datastore.
Threshold % Defined capacity threshold percentage. This applies to current or forecasted capacity.
Days Left (Linear)Number of days remaining until the datastore reaches the capacity threshold percentage by using Linear Analysis.
Reach Threshold Date (Linear)
Week over week Linear Analysis of when the datastore will reach the specified total capacity threshold percentage.
Days Left (POP)Number of days remaining until the datastore reaches the threshold by using POP Analysis.
Reach Threshold Date (POP)
Week over week POP Analysis of when the datastore will reach the specified total capacity threshold percentage.
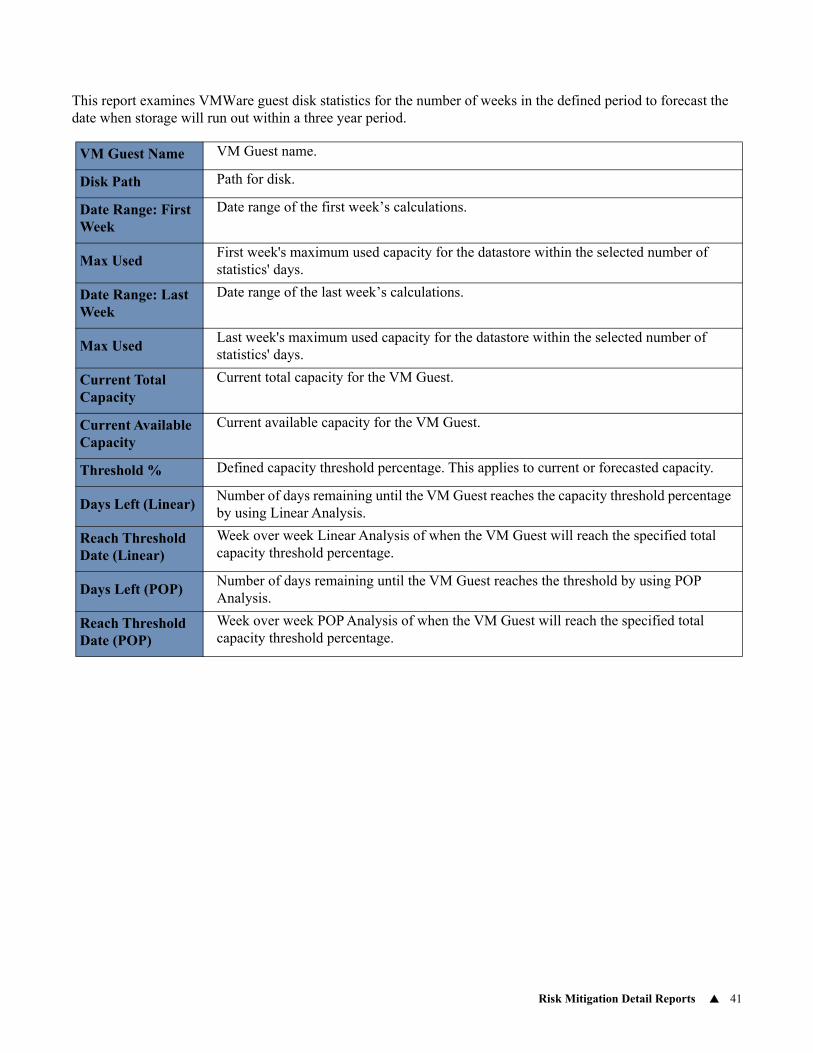
Risk Mitigation Detail Reports 41
This report examines VMWare guest disk statistics for the number of weeks in the defined period to forecast the date when storage will run out within a three year period.
VM Guest Name VM Guest name.
Disk Path Path for disk.
Date Range: First Week
Date range of the first week’s calculations.
Max UsedFirst week's maximum used capacity for the datastore within the selected number of statistics' days.
Date Range: Last Week
Date range of the last week’s calculations.
Max UsedLast week's maximum used capacity for the datastore within the selected number of statistics' days.
Current Total Capacity
Current total capacity for the VM Guest.
Current Available Capacity
Current available capacity for the VM Guest.
Threshold % Defined capacity threshold percentage. This applies to current or forecasted capacity.
Days Left (Linear)Number of days remaining until the VM Guest reaches the capacity threshold percentage by using Linear Analysis.
Reach Threshold Date (Linear)
Week over week Linear Analysis of when the VM Guest will reach the specified total capacity threshold percentage.
Days Left (POP)Number of days remaining until the VM Guest reaches the threshold by using POP Analysis.
Reach Threshold Date (POP)
Week over week POP Analysis of when the VM Guest will reach the specified total capacity threshold percentage.
Storage Optimization Overview 43
4Chapter 0Storage Optimization Solution Reports
Storage Optimization report templates provide actionable analytics, enabling administrators to monitor and manage storage consumption before making unnecessary purchases. Because APTARE has end-to-end visibility, from array storage to host applications, it supplies the data that is necessary to make informed decisions.
The reports discussed in this section employ Storage Optimization Rules to assess areas within your enterprise that offer candidates for optimization. These rules include parameters that can be configured to isolate specific conditions relevant for your environment. See also Solutions Administration.
Use the following reports to monitor and optimize data center storage:
• Storage Optimization Overview
• Storage Optimization Analysis
• Storage Optimization by Tier
• Storage Optimization Trend
• Storage Optimization Detail Reports
Storage Optimization Overview
Explore your data center using APTARE customizable report templates or by using parts of your IT infrastructure as entry points. Use Search to find reports, templates and dashboards across the portal.
Use the Reports tab to examine the catalog of templates, dashboards and reports - organized by products along with user-created, and system folders. This report is located here:
Solutions > Storage Optimization > Storage Optimization Overview
View a chart of potentially reclaimable and non-reclaimable storage.
• Click the reclaimable chart sector to view the Storage Optimization Analysis chart, which provides a more detailed breakdown of scenarios that may offer reclamation opportunities.
• Click the non-reclaimable sector to view the Array Utilization Summary, which lists capacity utilization details.
• Click the reclaimable sector to view the Storage Optimization Analysis report.
For the types of storage optimization details that can be accessed via this chart, see Storage Optimization Detail Reports.
See also Interacting with Reports and Solution Reports Scope Selector Settings.
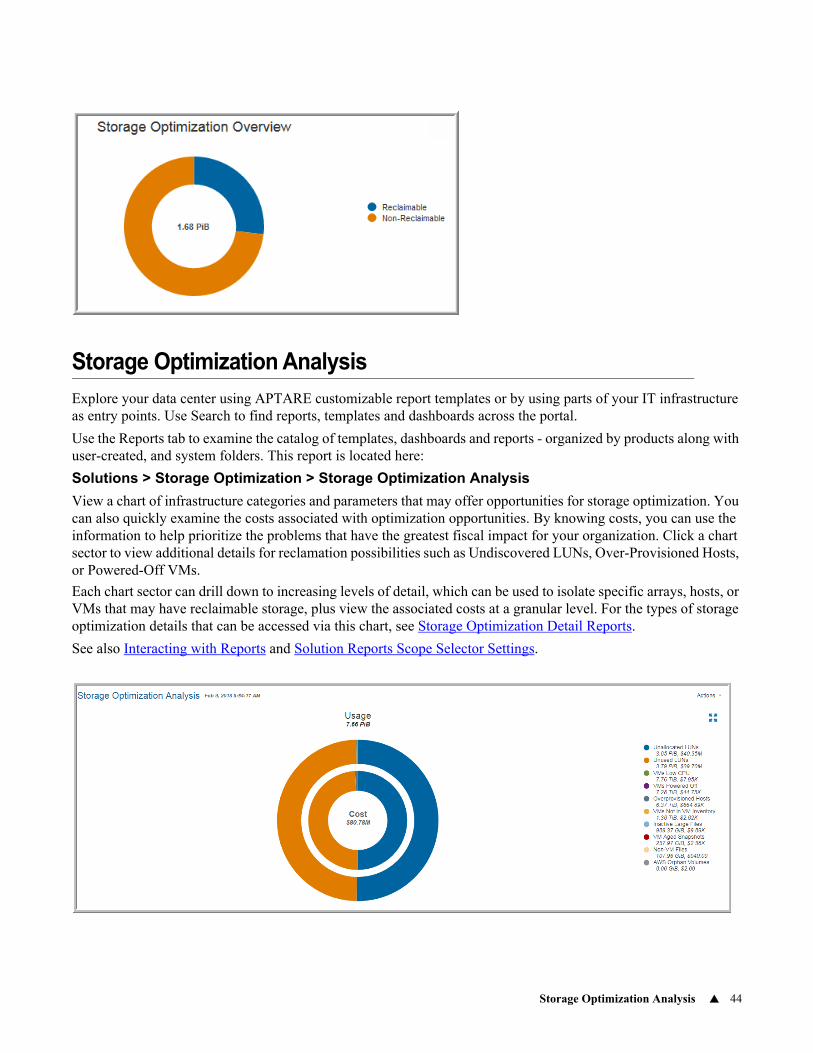
Storage Optimization Analysis 44
Storage Optimization Analysis
Explore your data center using APTARE customizable report templates or by using parts of your IT infrastructure as entry points. Use Search to find reports, templates and dashboards across the portal.
Use the Reports tab to examine the catalog of templates, dashboards and reports - organized by products along with user-created, and system folders. This report is located here:
Solutions > Storage Optimization > Storage Optimization Analysis
View a chart of infrastructure categories and parameters that may offer opportunities for storage optimization. You can also quickly examine the costs associated with optimization opportunities. By knowing costs, you can use the information to help prioritize the problems that have the greatest fiscal impact for your organization. Click a chart sector to view additional details for reclamation possibilities such as Undiscovered LUNs, Over-Provisioned Hosts, or Powered-Off VMs.
Each chart sector can drill down to increasing levels of detail, which can be used to isolate specific arrays, hosts, or VMs that may have reclaimable storage, plus view the associated costs at a granular level. For the types of storage optimization details that can be accessed via this chart, see Storage Optimization Detail Reports.
See also Interacting with Reports and Solution Reports Scope Selector Settings.
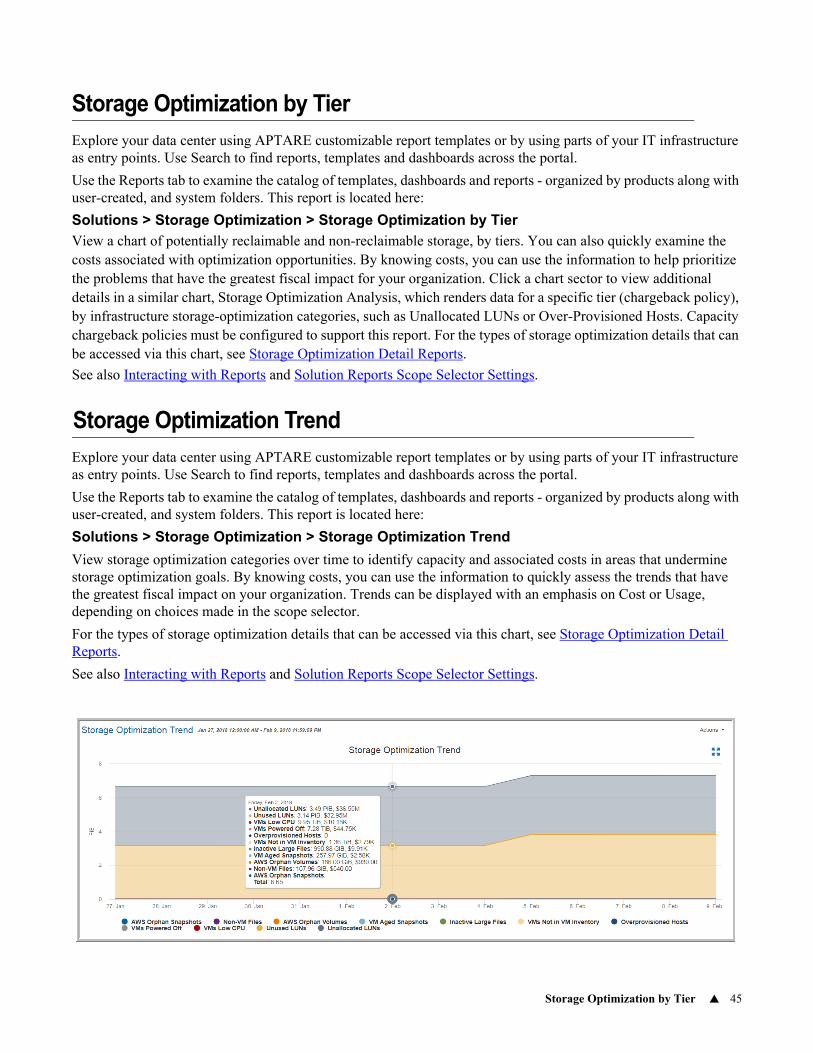
Storage Optimization by Tier 45
Storage Optimization by Tier
Explore your data center using APTARE customizable report templates or by using parts of your IT infrastructure as entry points. Use Search to find reports, templates and dashboards across the portal.
Use the Reports tab to examine the catalog of templates, dashboards and reports - organized by products along with user-created, and system folders. This report is located here:
Solutions > Storage Optimization > Storage Optimization by Tier
View a chart of potentially reclaimable and non-reclaimable storage, by tiers. You can also quickly examine the costs associated with optimization opportunities. By knowing costs, you can use the information to help prioritize the problems that have the greatest fiscal impact for your organization. Click a chart sector to view additional details in a similar chart, Storage Optimization Analysis, which renders data for a specific tier (chargeback policy), by infrastructure storage-optimization categories, such as Unallocated LUNs or Over-Provisioned Hosts. Capacity chargeback policies must be configured to support this report. For the types of storage optimization details that can be accessed via this chart, see Storage Optimization Detail Reports.
See also Interacting with Reports and Solution Reports Scope Selector Settings.
Storage Optimization Trend
Explore your data center using APTARE customizable report templates or by using parts of your IT infrastructure as entry points. Use Search to find reports, templates and dashboards across the portal.
Use the Reports tab to examine the catalog of templates, dashboards and reports - organized by products along with user-created, and system folders. This report is located here:
Solutions > Storage Optimization > Storage Optimization Trend
View storage optimization categories over time to identify capacity and associated costs in areas that undermine storage optimization goals. By knowing costs, you can use the information to quickly assess the trends that have the greatest fiscal impact on your organization. Trends can be displayed with an emphasis on Cost or Usage, depending on choices made in the scope selector.
For the types of storage optimization details that can be accessed via this chart, see Storage Optimization Detail Reports.
See also Interacting with Reports and Solution Reports Scope Selector Settings.
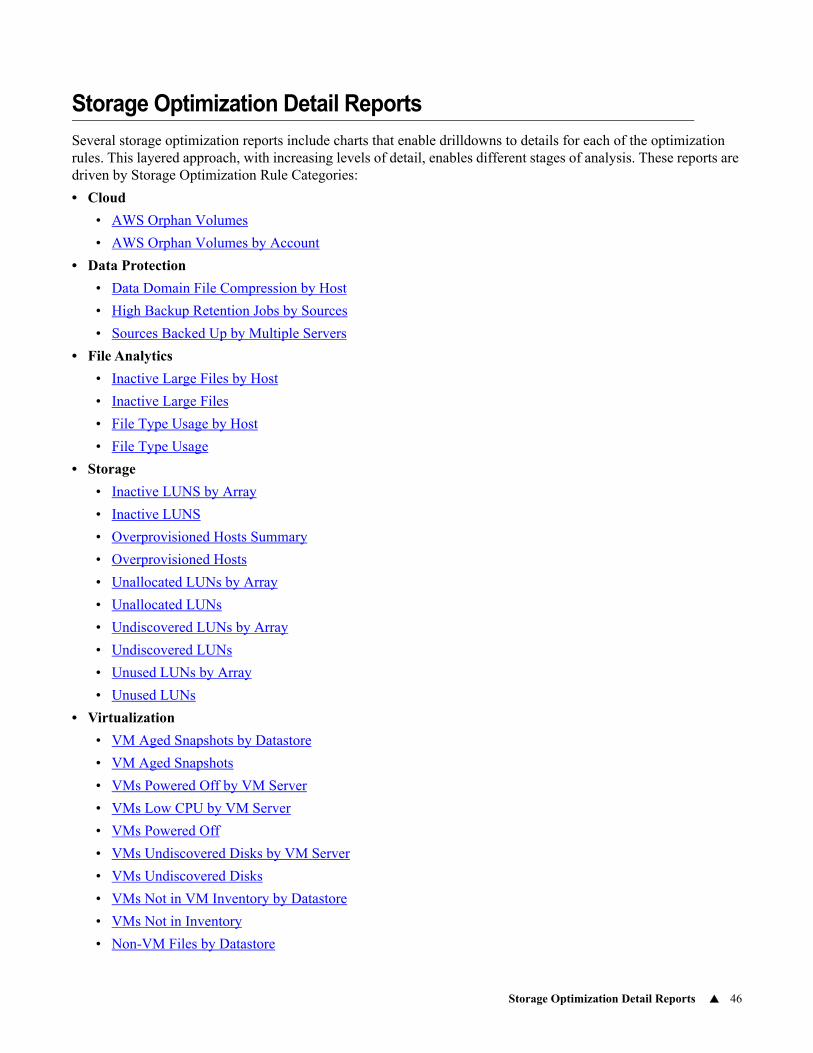
Storage Optimization Detail Reports 46
Storage Optimization Detail Reports
Several storage optimization reports include charts that enable drilldowns to details for each of the optimization rules. This layered approach, with increasing levels of detail, enables different stages of analysis. These reports are driven by Storage Optimization Rule Categories:
• Cloud
• AWS Orphan Volumes
• AWS Orphan Volumes by Account
• Data Protection
• Data Domain File Compression by Host
• High Backup Retention Jobs by Sources
• Sources Backed Up by Multiple Servers
• File Analytics
• Inactive Large Files by Host
• Inactive Large Files
• File Type Usage by Host
• File Type Usage
• Storage
• Inactive LUNS by Array
• Inactive LUNS
• Overprovisioned Hosts Summary
• Overprovisioned Hosts
• Unallocated LUNs by Array
• Unallocated LUNs
• Undiscovered LUNs by Array
• Undiscovered LUNs
• Unused LUNs by Array
• Unused LUNs
• Virtualization
• VM Aged Snapshots by Datastore
• VM Aged Snapshots
• VMs Powered Off by VM Server
• VMs Low CPU by VM Server
• VMs Powered Off
• VMs Undiscovered Disks by VM Server
• VMs Undiscovered Disks
• VMs Not in VM Inventory by Datastore
• VMs Not in Inventory
• Non-VM Files by Datastore

Storage Optimization Detail Reports 47
• Non-VM Files
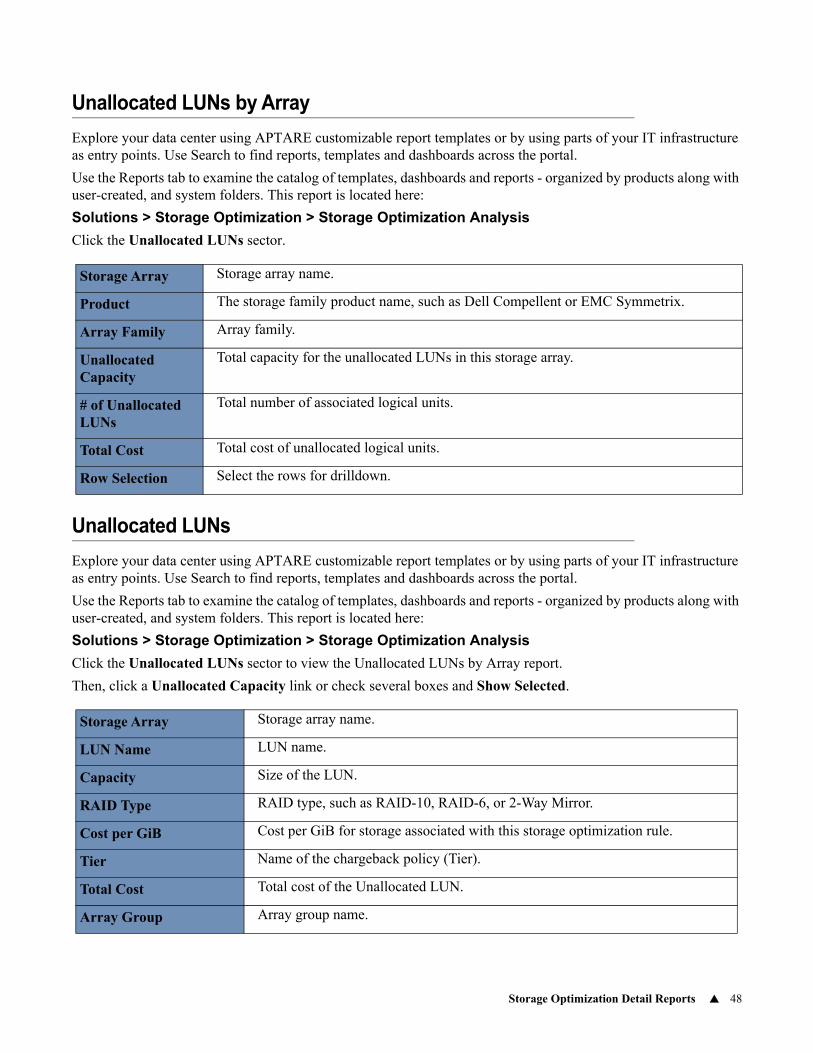
Storage Optimization Detail Reports 48
Unallocated LUNs by Array
Explore your data center using APTARE customizable report templates or by using parts of your IT infrastructure as entry points. Use Search to find reports, templates and dashboards across the portal.
Use the Reports tab to examine the catalog of templates, dashboards and reports - organized by products along with user-created, and system folders. This report is located here:
Solutions > Storage Optimization > Storage Optimization Analysis
Click the Unallocated LUNs sector.
Unallocated LUNs
Explore your data center using APTARE customizable report templates or by using parts of your IT infrastructure as entry points. Use Search to find reports, templates and dashboards across the portal.
Use the Reports tab to examine the catalog of templates, dashboards and reports - organized by products along with user-created, and system folders. This report is located here:
Solutions > Storage Optimization > Storage Optimization Analysis
Click the Unallocated LUNs sector to view the Unallocated LUNs by Array report.
Then, click a Unallocated Capacity link or check several boxes and Show Selected.
Storage Array Storage array name.
Product The storage family product name, such as Dell Compellent or EMC Symmetrix.
Array Family Array family.
Unallocated Capacity
Total capacity for the unallocated LUNs in this storage array.
# of Unallocated LUNs
Total number of associated logical units.
Total Cost Total cost of unallocated logical units.
Row Selection Select the rows for drilldown.
Storage Array Storage array name.
LUN Name LUN name.
Capacity Size of the LUN.
RAID Type RAID type, such as RAID-10, RAID-6, or 2-Way Mirror.
Cost per GiB Cost per GiB for storage associated with this storage optimization rule.
Tier Name of the chargeback policy (Tier).
Total Cost Total cost of the Unallocated LUN.
Array Group Array group name.
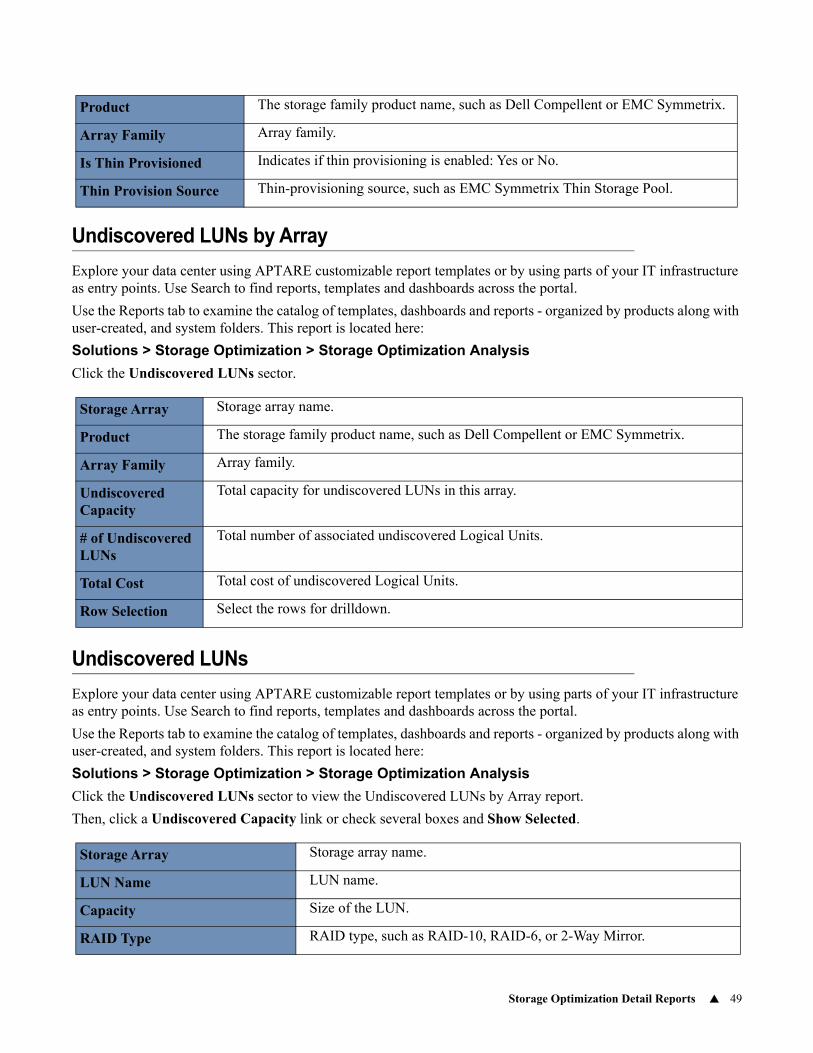
Storage Optimization Detail Reports 49
Undiscovered LUNs by Array
Explore your data center using APTARE customizable report templates or by using parts of your IT infrastructure as entry points. Use Search to find reports, templates and dashboards across the portal.
Use the Reports tab to examine the catalog of templates, dashboards and reports - organized by products along with user-created, and system folders. This report is located here:
Solutions > Storage Optimization > Storage Optimization Analysis
Click the Undiscovered LUNs sector.
Undiscovered LUNs
Explore your data center using APTARE customizable report templates or by using parts of your IT infrastructure as entry points. Use Search to find reports, templates and dashboards across the portal.
Use the Reports tab to examine the catalog of templates, dashboards and reports - organized by products along with user-created, and system folders. This report is located here:
Solutions > Storage Optimization > Storage Optimization Analysis
Click the Undiscovered LUNs sector to view the Undiscovered LUNs by Array report.
Then, click a Undiscovered Capacity link or check several boxes and Show Selected.
Product The storage family product name, such as Dell Compellent or EMC Symmetrix.
Array Family Array family.
Is Thin Provisioned Indicates if thin provisioning is enabled: Yes or No.
Thin Provision Source Thin-provisioning source, such as EMC Symmetrix Thin Storage Pool.
Storage Array Storage array name.
Product The storage family product name, such as Dell Compellent or EMC Symmetrix.
Array Family Array family.
Undiscovered Capacity
Total capacity for undiscovered LUNs in this array.
# of Undiscovered LUNs
Total number of associated undiscovered Logical Units.
Total Cost Total cost of undiscovered Logical Units.
Row Selection Select the rows for drilldown.
Storage Array Storage array name.
LUN Name LUN name.
Capacity Size of the LUN.
RAID Type RAID type, such as RAID-10, RAID-6, or 2-Way Mirror.
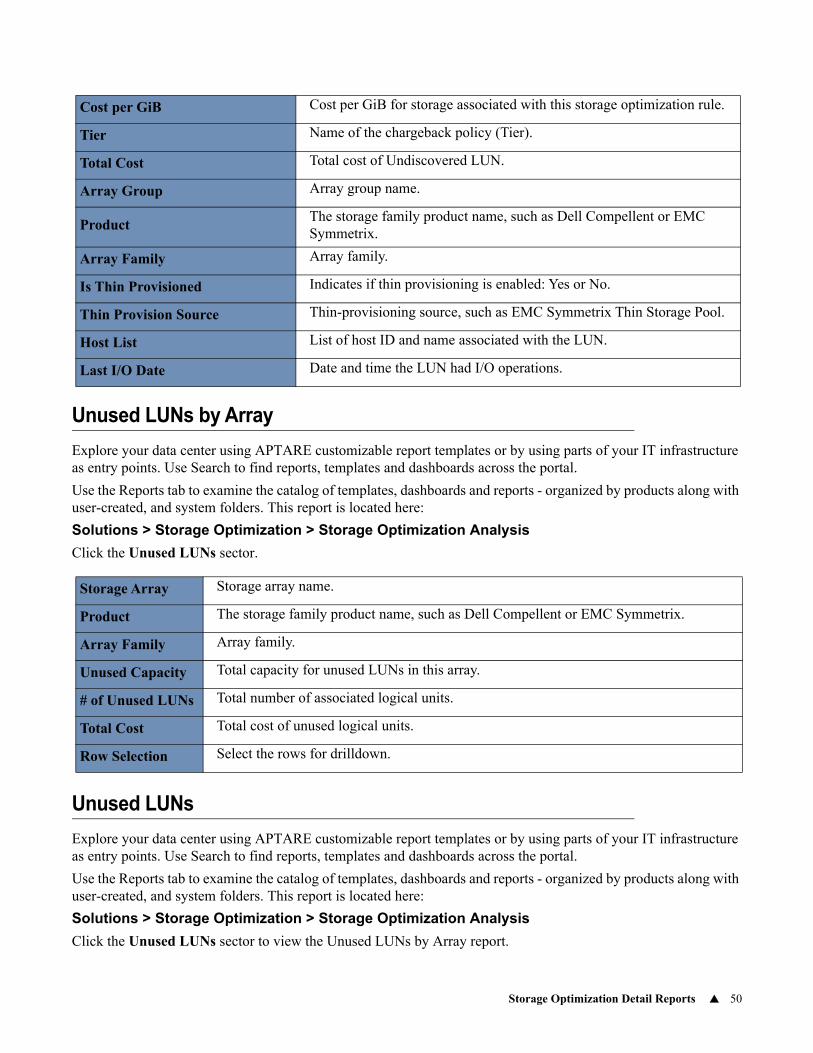
Storage Optimization Detail Reports 50
Unused LUNs by Array
Explore your data center using APTARE customizable report templates or by using parts of your IT infrastructure as entry points. Use Search to find reports, templates and dashboards across the portal.
Use the Reports tab to examine the catalog of templates, dashboards and reports - organized by products along with user-created, and system folders. This report is located here:
Solutions > Storage Optimization > Storage Optimization Analysis
Click the Unused LUNs sector.
Unused LUNs
Explore your data center using APTARE customizable report templates or by using parts of your IT infrastructure as entry points. Use Search to find reports, templates and dashboards across the portal.
Use the Reports tab to examine the catalog of templates, dashboards and reports - organized by products along with user-created, and system folders. This report is located here:
Solutions > Storage Optimization > Storage Optimization Analysis
Click the Unused LUNs sector to view the Unused LUNs by Array report.
Cost per GiB Cost per GiB for storage associated with this storage optimization rule.
Tier Name of the chargeback policy (Tier).
Total Cost Total cost of Undiscovered LUN.
Array Group Array group name.
ProductThe storage family product name, such as Dell Compellent or EMC Symmetrix.
Array Family Array family.
Is Thin Provisioned Indicates if thin provisioning is enabled: Yes or No.
Thin Provision Source Thin-provisioning source, such as EMC Symmetrix Thin Storage Pool.
Host List List of host ID and name associated with the LUN.
Last I/O Date Date and time the LUN had I/O operations.
Storage Array Storage array name.
Product The storage family product name, such as Dell Compellent or EMC Symmetrix.
Array Family Array family.
Unused Capacity Total capacity for unused LUNs in this array.
# of Unused LUNs Total number of associated logical units.
Total Cost Total cost of unused logical units.
Row Selection Select the rows for drilldown.
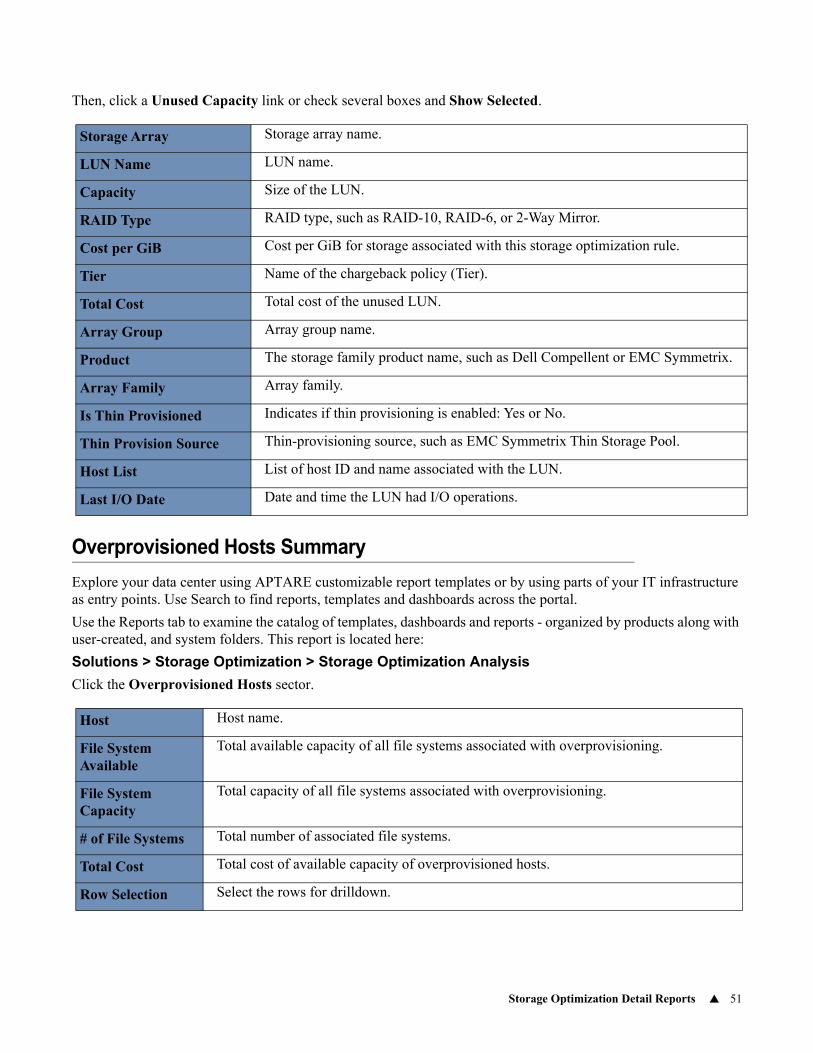
Storage Optimization Detail Reports 51
Then, click a Unused Capacity link or check several boxes and Show Selected.
Overprovisioned Hosts Summary
Explore your data center using APTARE customizable report templates or by using parts of your IT infrastructure as entry points. Use Search to find reports, templates and dashboards across the portal.
Use the Reports tab to examine the catalog of templates, dashboards and reports - organized by products along with user-created, and system folders. This report is located here:
Solutions > Storage Optimization > Storage Optimization Analysis
Click the Overprovisioned Hosts sector.
Storage Array Storage array name.
LUN Name LUN name.
Capacity Size of the LUN.
RAID Type RAID type, such as RAID-10, RAID-6, or 2-Way Mirror.
Cost per GiB Cost per GiB for storage associated with this storage optimization rule.
Tier Name of the chargeback policy (Tier).
Total Cost Total cost of the unused LUN.
Array Group Array group name.
Product The storage family product name, such as Dell Compellent or EMC Symmetrix.
Array Family Array family.
Is Thin Provisioned Indicates if thin provisioning is enabled: Yes or No.
Thin Provision Source Thin-provisioning source, such as EMC Symmetrix Thin Storage Pool.
Host List List of host ID and name associated with the LUN.
Last I/O Date Date and time the LUN had I/O operations.
Host Host name.
File System Available
Total available capacity of all file systems associated with overprovisioning.
File System Capacity
Total capacity of all file systems associated with overprovisioning.
# of File Systems Total number of associated file systems.
Total Cost Total cost of available capacity of overprovisioned hosts.
Row Selection Select the rows for drilldown.
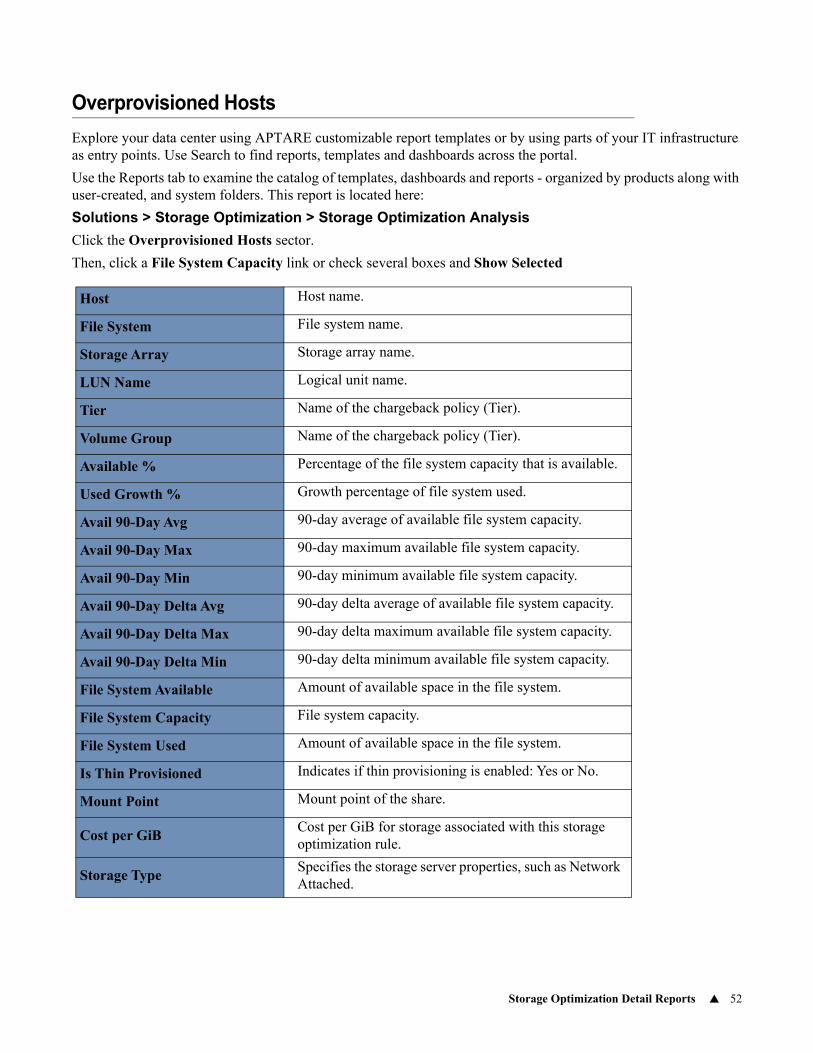
Storage Optimization Detail Reports 52
Overprovisioned Hosts
Explore your data center using APTARE customizable report templates or by using parts of your IT infrastructure as entry points. Use Search to find reports, templates and dashboards across the portal.
Use the Reports tab to examine the catalog of templates, dashboards and reports - organized by products along with user-created, and system folders. This report is located here:
Solutions > Storage Optimization > Storage Optimization Analysis
Click the Overprovisioned Hosts sector.
Then, click a File System Capacity link or check several boxes and Show Selected
Host Host name.
File System File system name.
Storage Array Storage array name.
LUN Name Logical unit name.
Tier Name of the chargeback policy (Tier).
Volume Group Name of the chargeback policy (Tier).
Available % Percentage of the file system capacity that is available.
Used Growth % Growth percentage of file system used.
Avail 90-Day Avg 90-day average of available file system capacity.
Avail 90-Day Max 90-day maximum available file system capacity.
Avail 90-Day Min 90-day minimum available file system capacity.
Avail 90-Day Delta Avg 90-day delta average of available file system capacity.
Avail 90-Day Delta Max 90-day delta maximum available file system capacity.
Avail 90-Day Delta Min 90-day delta minimum available file system capacity.
File System Available Amount of available space in the file system.
File System Capacity File system capacity.
File System Used Amount of available space in the file system.
Is Thin Provisioned Indicates if thin provisioning is enabled: Yes or No.
Mount Point Mount point of the share.
Cost per GiBCost per GiB for storage associated with this storage optimization rule.
Storage TypeSpecifies the storage server properties, such as Network Attached.
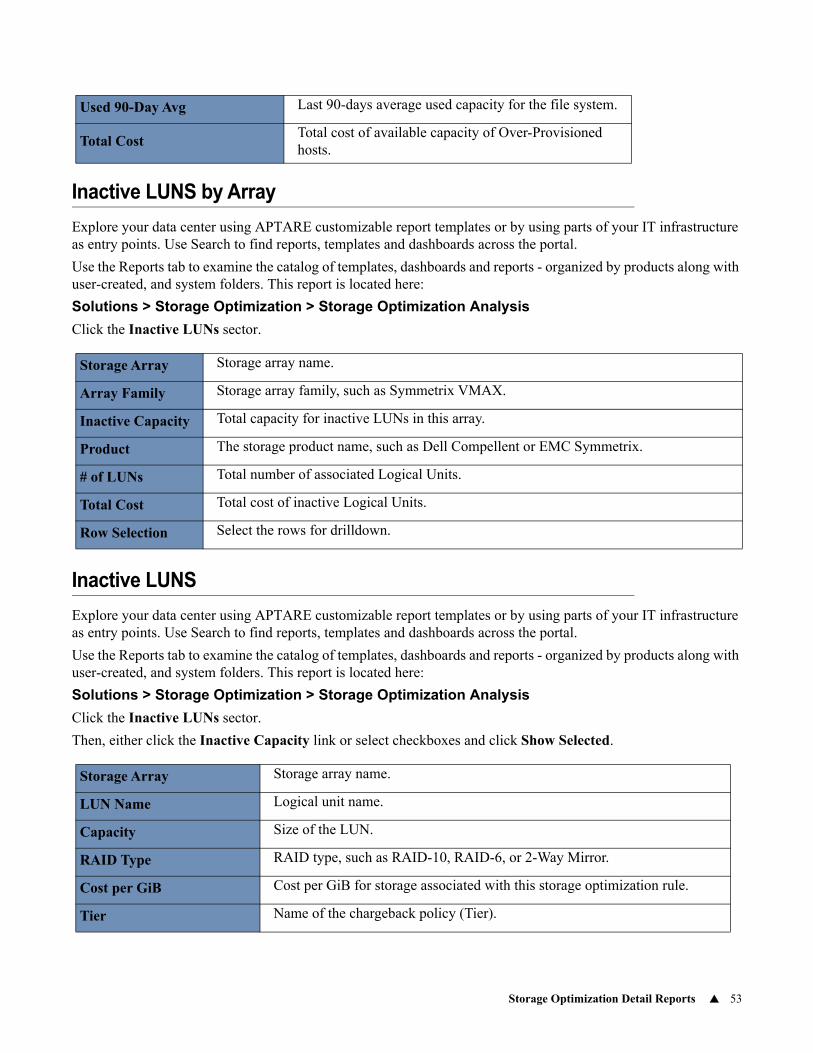
Storage Optimization Detail Reports 53
Inactive LUNS by Array
Explore your data center using APTARE customizable report templates or by using parts of your IT infrastructure as entry points. Use Search to find reports, templates and dashboards across the portal.
Use the Reports tab to examine the catalog of templates, dashboards and reports - organized by products along with user-created, and system folders. This report is located here:
Solutions > Storage Optimization > Storage Optimization Analysis
Click the Inactive LUNs sector.
Inactive LUNS
Explore your data center using APTARE customizable report templates or by using parts of your IT infrastructure as entry points. Use Search to find reports, templates and dashboards across the portal.
Use the Reports tab to examine the catalog of templates, dashboards and reports - organized by products along with user-created, and system folders. This report is located here:
Solutions > Storage Optimization > Storage Optimization Analysis
Click the Inactive LUNs sector.
Then, either click the Inactive Capacity link or select checkboxes and click Show Selected.
Used 90-Day Avg Last 90-days average used capacity for the file system.
Total CostTotal cost of available capacity of Over-Provisioned hosts.
Storage Array Storage array name.
Array Family Storage array family, such as Symmetrix VMAX.
Inactive Capacity Total capacity for inactive LUNs in this array.
Product The storage product name, such as Dell Compellent or EMC Symmetrix.
# of LUNs Total number of associated Logical Units.
Total Cost Total cost of inactive Logical Units.
Row Selection Select the rows for drilldown.
Storage Array Storage array name.
LUN Name Logical unit name.
Capacity Size of the LUN.
RAID Type RAID type, such as RAID-10, RAID-6, or 2-Way Mirror.
Cost per GiB Cost per GiB for storage associated with this storage optimization rule.
Tier Name of the chargeback policy (Tier).
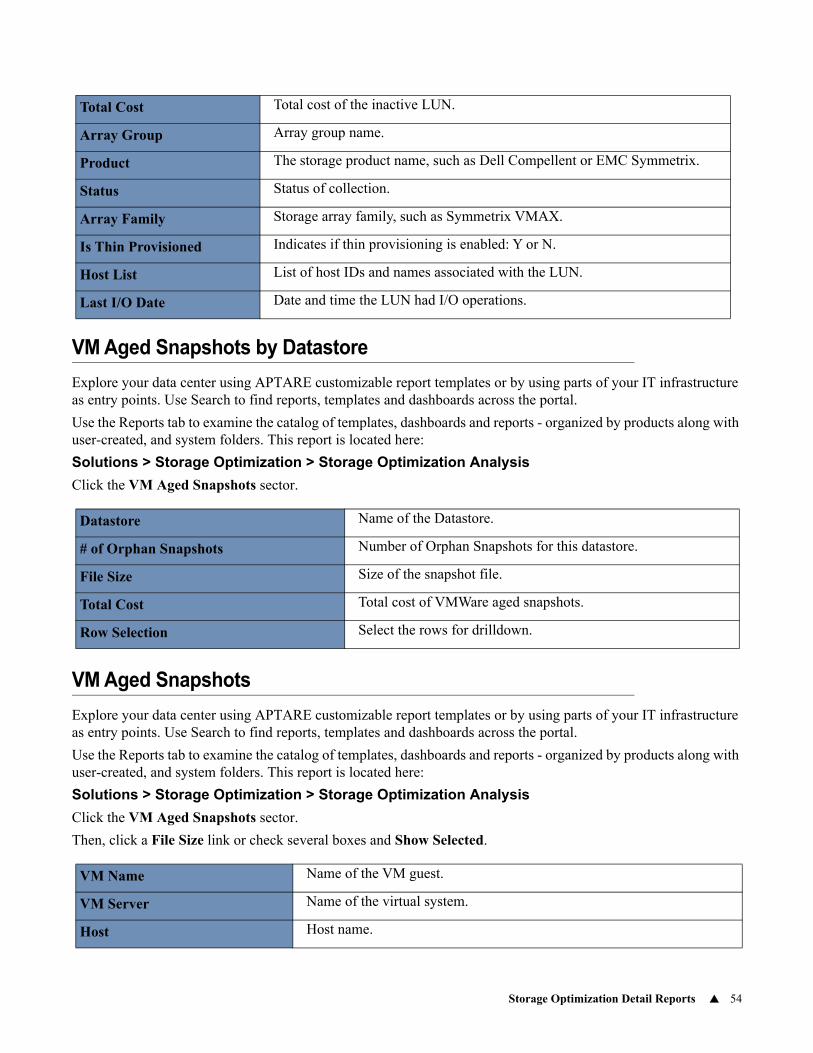
Storage Optimization Detail Reports 54
VM Aged Snapshots by Datastore
Explore your data center using APTARE customizable report templates or by using parts of your IT infrastructure as entry points. Use Search to find reports, templates and dashboards across the portal.
Use the Reports tab to examine the catalog of templates, dashboards and reports - organized by products along with user-created, and system folders. This report is located here:
Solutions > Storage Optimization > Storage Optimization Analysis
Click the VM Aged Snapshots sector.
VM Aged Snapshots
Explore your data center using APTARE customizable report templates or by using parts of your IT infrastructure as entry points. Use Search to find reports, templates and dashboards across the portal.
Use the Reports tab to examine the catalog of templates, dashboards and reports - organized by products along with user-created, and system folders. This report is located here:
Solutions > Storage Optimization > Storage Optimization Analysis
Click the VM Aged Snapshots sector.
Then, click a File Size link or check several boxes and Show Selected.
Total Cost Total cost of the inactive LUN.
Array Group Array group name.
Product The storage product name, such as Dell Compellent or EMC Symmetrix.
Status Status of collection.
Array Family Storage array family, such as Symmetrix VMAX.
Is Thin Provisioned Indicates if thin provisioning is enabled: Y or N.
Host List List of host IDs and names associated with the LUN.
Last I/O Date Date and time the LUN had I/O operations.
Datastore Name of the Datastore.
# of Orphan Snapshots Number of Orphan Snapshots for this datastore.
File Size Size of the snapshot file.
Total Cost Total cost of VMWare aged snapshots.
Row Selection Select the rows for drilldown.
VM Name Name of the VM guest.
VM Server Name of the virtual system.
Host Host name.
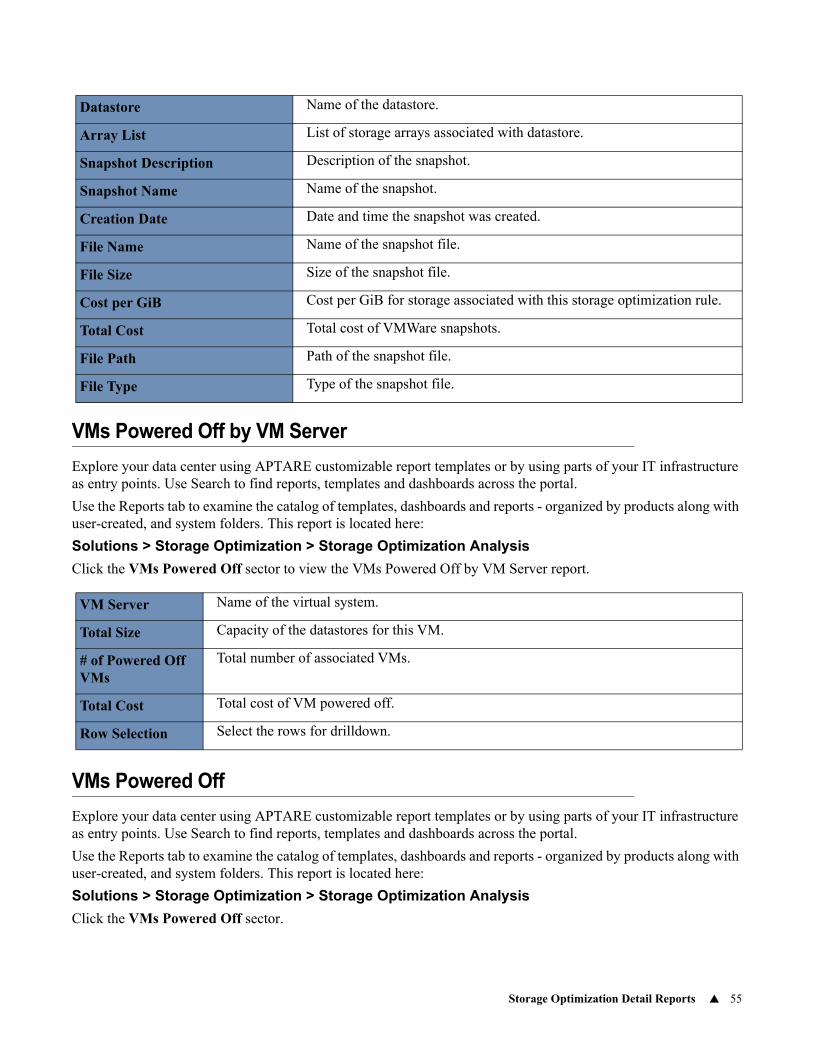
Storage Optimization Detail Reports 55
VMs Powered Off by VM Server
Explore your data center using APTARE customizable report templates or by using parts of your IT infrastructure as entry points. Use Search to find reports, templates and dashboards across the portal.
Use the Reports tab to examine the catalog of templates, dashboards and reports - organized by products along with user-created, and system folders. This report is located here:
Solutions > Storage Optimization > Storage Optimization Analysis
Click the VMs Powered Off sector to view the VMs Powered Off by VM Server report.
VMs Powered Off
Explore your data center using APTARE customizable report templates or by using parts of your IT infrastructure as entry points. Use Search to find reports, templates and dashboards across the portal.
Use the Reports tab to examine the catalog of templates, dashboards and reports - organized by products along with user-created, and system folders. This report is located here:
Solutions > Storage Optimization > Storage Optimization Analysis
Click the VMs Powered Off sector.
Datastore Name of the datastore.
Array List List of storage arrays associated with datastore.
Snapshot Description Description of the snapshot.
Snapshot Name Name of the snapshot.
Creation Date Date and time the snapshot was created.
File Name Name of the snapshot file.
File Size Size of the snapshot file.
Cost per GiB Cost per GiB for storage associated with this storage optimization rule.
Total Cost Total cost of VMWare snapshots.
File Path Path of the snapshot file.
File Type Type of the snapshot file.
VM Server Name of the virtual system.
Total Size Capacity of the datastores for this VM.
# of Powered Off VMs
Total number of associated VMs.
Total Cost Total cost of VM powered off.
Row Selection Select the rows for drilldown.
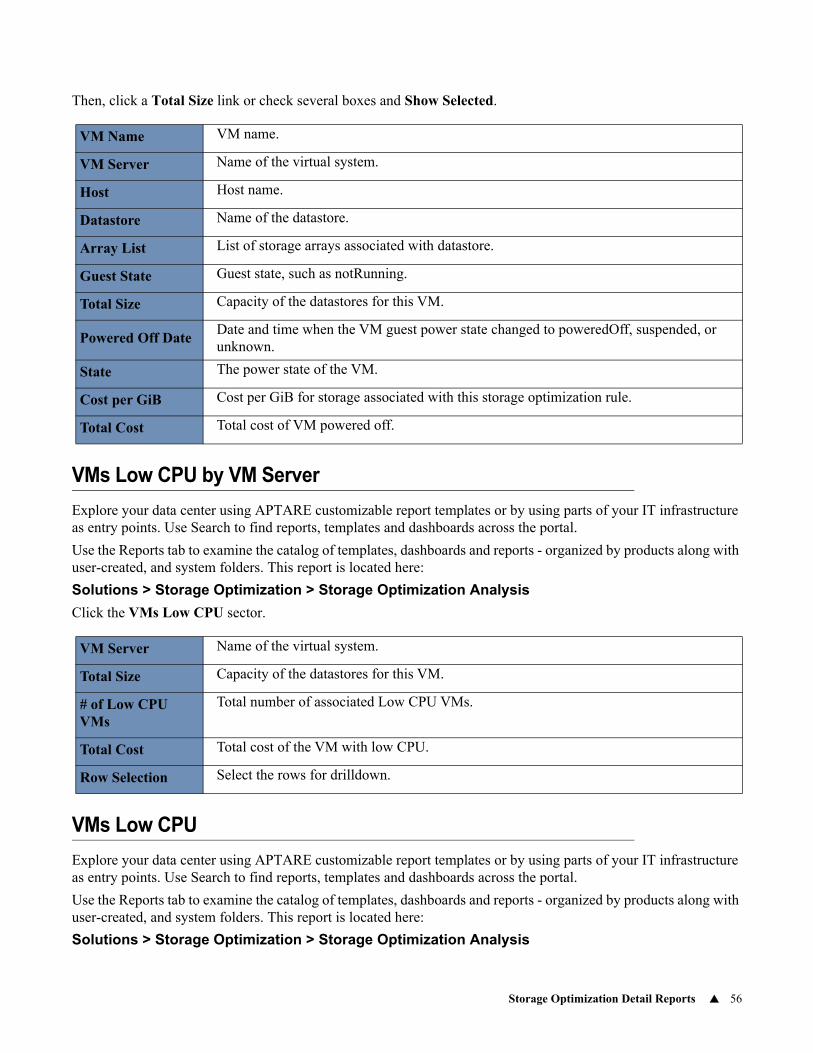
Storage Optimization Detail Reports 56
Then, click a Total Size link or check several boxes and Show Selected.
VMs Low CPU by VM Server
Explore your data center using APTARE customizable report templates or by using parts of your IT infrastructure as entry points. Use Search to find reports, templates and dashboards across the portal.
Use the Reports tab to examine the catalog of templates, dashboards and reports - organized by products along with user-created, and system folders. This report is located here:
Solutions > Storage Optimization > Storage Optimization Analysis
Click the VMs Low CPU sector.
VMs Low CPU
Explore your data center using APTARE customizable report templates or by using parts of your IT infrastructure as entry points. Use Search to find reports, templates and dashboards across the portal.
Use the Reports tab to examine the catalog of templates, dashboards and reports - organized by products along with user-created, and system folders. This report is located here:
Solutions > Storage Optimization > Storage Optimization Analysis
VM Name VM name.
VM Server Name of the virtual system.
Host Host name.
Datastore Name of the datastore.
Array List List of storage arrays associated with datastore.
Guest State Guest state, such as notRunning.
Total Size Capacity of the datastores for this VM.
Powered Off DateDate and time when the VM guest power state changed to poweredOff, suspended, or unknown.
State The power state of the VM.
Cost per GiB Cost per GiB for storage associated with this storage optimization rule.
Total Cost Total cost of VM powered off.
VM Server Name of the virtual system.
Total Size Capacity of the datastores for this VM.
# of Low CPU VMs
Total number of associated Low CPU VMs.
Total Cost Total cost of the VM with low CPU.
Row Selection Select the rows for drilldown.
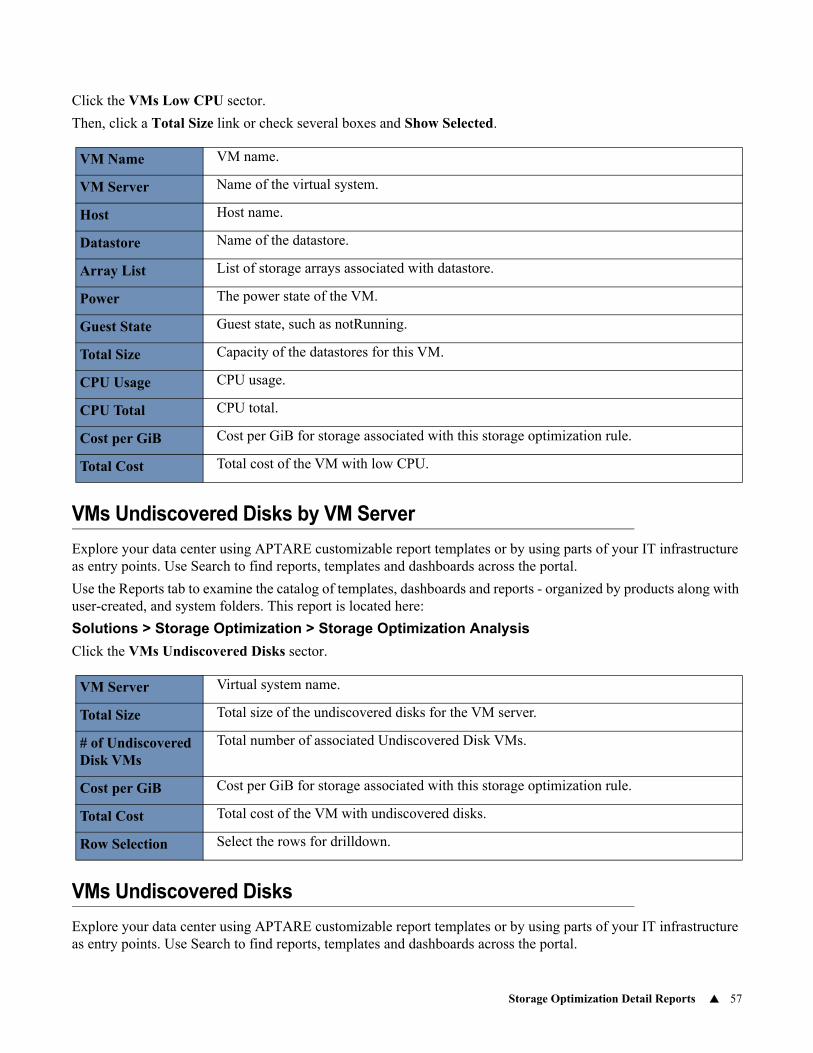
Storage Optimization Detail Reports 57
Click the VMs Low CPU sector.
Then, click a Total Size link or check several boxes and Show Selected.
VMs Undiscovered Disks by VM Server
Explore your data center using APTARE customizable report templates or by using parts of your IT infrastructure as entry points. Use Search to find reports, templates and dashboards across the portal.
Use the Reports tab to examine the catalog of templates, dashboards and reports - organized by products along with user-created, and system folders. This report is located here:
Solutions > Storage Optimization > Storage Optimization Analysis
Click the VMs Undiscovered Disks sector.
VMs Undiscovered Disks
Explore your data center using APTARE customizable report templates or by using parts of your IT infrastructure as entry points. Use Search to find reports, templates and dashboards across the portal.
VM Name VM name.
VM Server Name of the virtual system.
Host Host name.
Datastore Name of the datastore.
Array List List of storage arrays associated with datastore.
Power The power state of the VM.
Guest State Guest state, such as notRunning.
Total Size Capacity of the datastores for this VM.
CPU Usage CPU usage.
CPU Total CPU total.
Cost per GiB Cost per GiB for storage associated with this storage optimization rule.
Total Cost Total cost of the VM with low CPU.
VM Server Virtual system name.
Total Size Total size of the undiscovered disks for the VM server.
# of Undiscovered Disk VMs
Total number of associated Undiscovered Disk VMs.
Cost per GiB Cost per GiB for storage associated with this storage optimization rule.
Total Cost Total cost of the VM with undiscovered disks.
Row Selection Select the rows for drilldown.
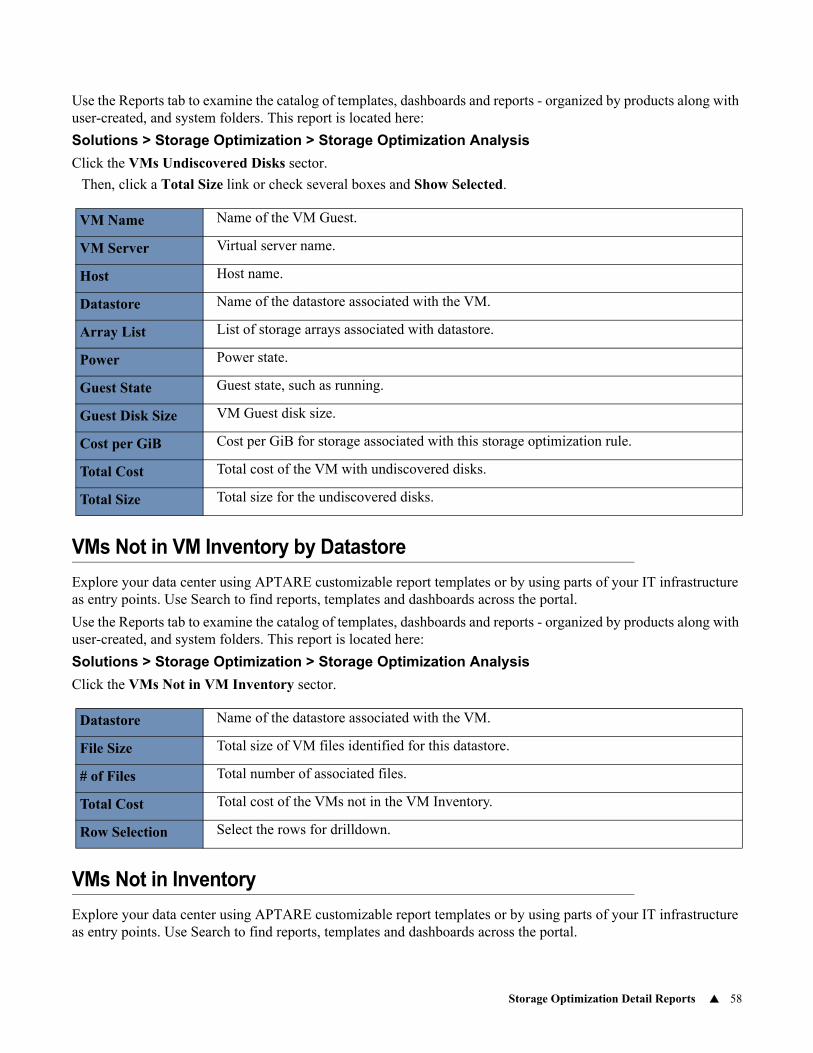
Storage Optimization Detail Reports 58
Use the Reports tab to examine the catalog of templates, dashboards and reports - organized by products along with user-created, and system folders. This report is located here:
Solutions > Storage Optimization > Storage Optimization Analysis
Click the VMs Undiscovered Disks sector.
Then, click a Total Size link or check several boxes and Show Selected.
VMs Not in VM Inventory by Datastore
Explore your data center using APTARE customizable report templates or by using parts of your IT infrastructure as entry points. Use Search to find reports, templates and dashboards across the portal.
Use the Reports tab to examine the catalog of templates, dashboards and reports - organized by products along with user-created, and system folders. This report is located here:
Solutions > Storage Optimization > Storage Optimization Analysis
Click the VMs Not in VM Inventory sector.
VMs Not in Inventory
Explore your data center using APTARE customizable report templates or by using parts of your IT infrastructure as entry points. Use Search to find reports, templates and dashboards across the portal.
VM Name Name of the VM Guest.
VM Server Virtual server name.
Host Host name.
Datastore Name of the datastore associated with the VM.
Array List List of storage arrays associated with datastore.
Power Power state.
Guest State Guest state, such as running.
Guest Disk Size VM Guest disk size.
Cost per GiB Cost per GiB for storage associated with this storage optimization rule.
Total Cost Total cost of the VM with undiscovered disks.
Total Size Total size for the undiscovered disks.
Datastore Name of the datastore associated with the VM.
File Size Total size of VM files identified for this datastore.
# of Files Total number of associated files.
Total Cost Total cost of the VMs not in the VM Inventory.
Row Selection Select the rows for drilldown.
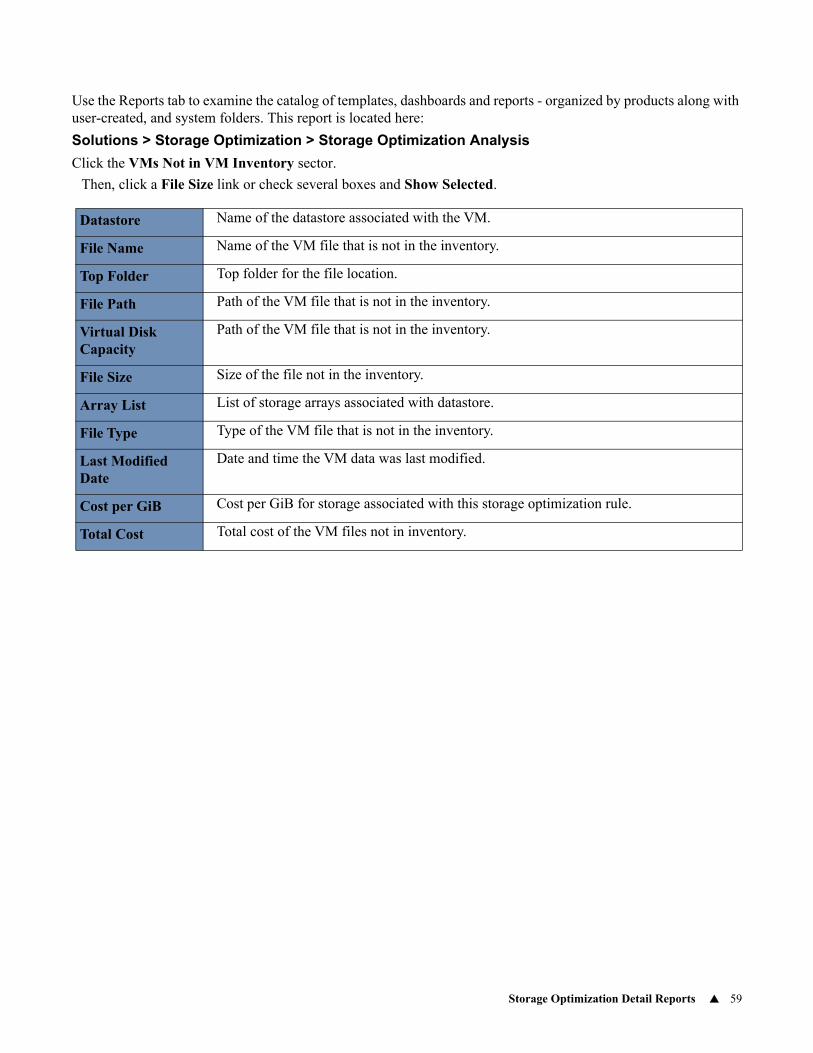
Storage Optimization Detail Reports 59
Use the Reports tab to examine the catalog of templates, dashboards and reports - organized by products along with user-created, and system folders. This report is located here:
Solutions > Storage Optimization > Storage Optimization Analysis
Click the VMs Not in VM Inventory sector.
Then, click a File Size link or check several boxes and Show Selected.
Datastore Name of the datastore associated with the VM.
File Name Name of the VM file that is not in the inventory.
Top Folder Top folder for the file location.
File Path Path of the VM file that is not in the inventory.
Virtual Disk Capacity
Path of the VM file that is not in the inventory.
File Size Size of the file not in the inventory.
Array List List of storage arrays associated with datastore.
File Type Type of the VM file that is not in the inventory.
Last Modified Date
Date and time the VM data was last modified.
Cost per GiB Cost per GiB for storage associated with this storage optimization rule.
Total Cost Total cost of the VM files not in inventory.
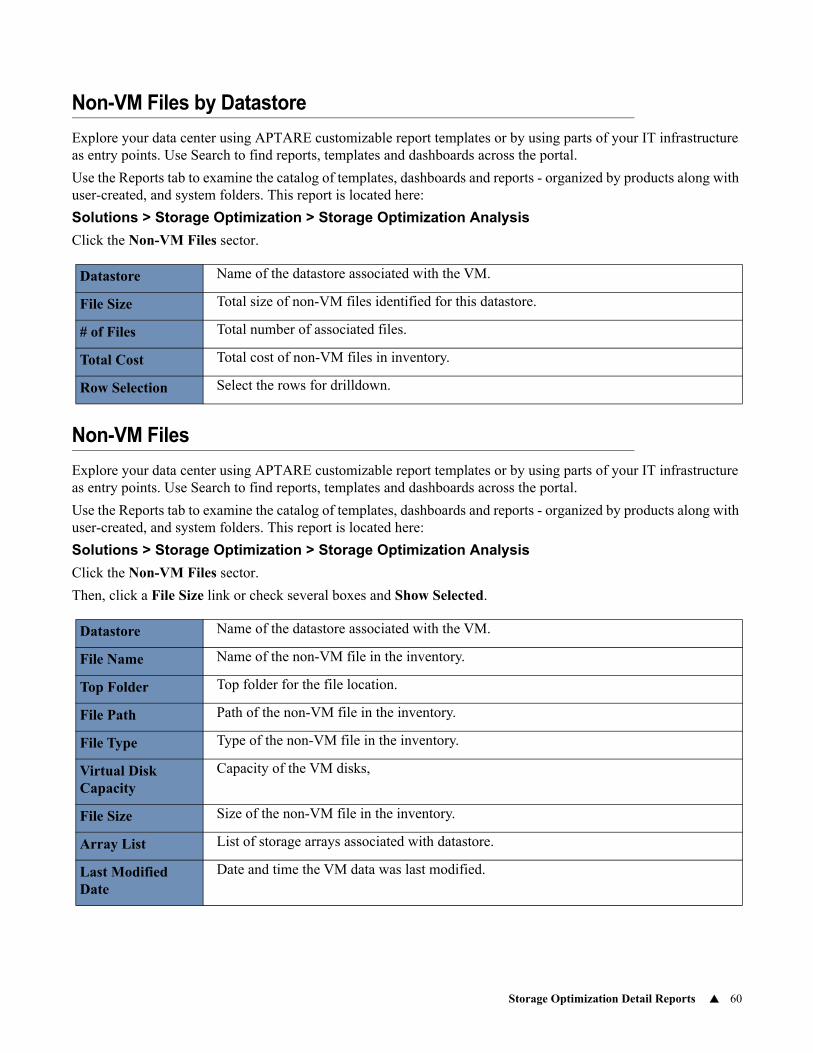
Storage Optimization Detail Reports 60
Non-VM Files by Datastore
Explore your data center using APTARE customizable report templates or by using parts of your IT infrastructure as entry points. Use Search to find reports, templates and dashboards across the portal.
Use the Reports tab to examine the catalog of templates, dashboards and reports - organized by products along with user-created, and system folders. This report is located here:
Solutions > Storage Optimization > Storage Optimization Analysis
Click the Non-VM Files sector.
Non-VM Files
Explore your data center using APTARE customizable report templates or by using parts of your IT infrastructure as entry points. Use Search to find reports, templates and dashboards across the portal.
Use the Reports tab to examine the catalog of templates, dashboards and reports - organized by products along with user-created, and system folders. This report is located here:
Solutions > Storage Optimization > Storage Optimization Analysis
Click the Non-VM Files sector.
Then, click a File Size link or check several boxes and Show Selected.
Datastore Name of the datastore associated with the VM.
File Size Total size of non-VM files identified for this datastore.
# of Files Total number of associated files.
Total Cost Total cost of non-VM files in inventory.
Row Selection Select the rows for drilldown.
Datastore Name of the datastore associated with the VM.
File Name Name of the non-VM file in the inventory.
Top Folder Top folder for the file location.
File Path Path of the non-VM file in the inventory.
File Type Type of the non-VM file in the inventory.
Virtual Disk Capacity
Capacity of the VM disks,
File Size Size of the non-VM file in the inventory.
Array List List of storage arrays associated with datastore.
Last Modified Date
Date and time the VM data was last modified.
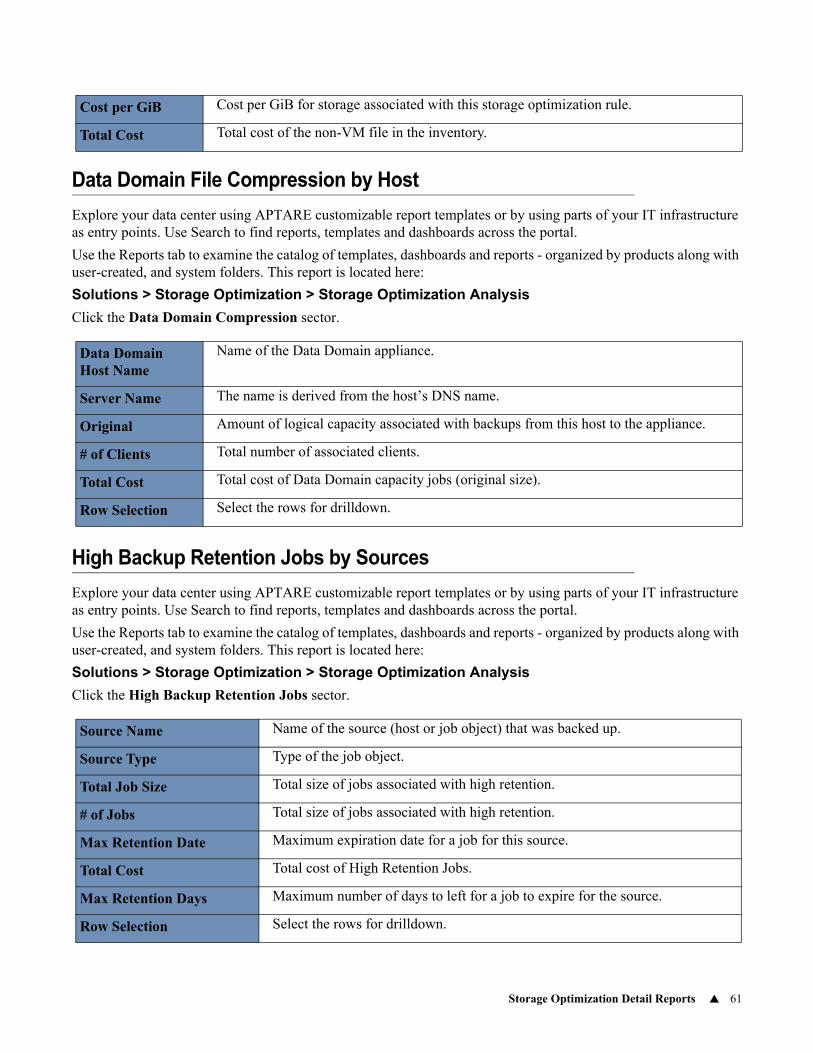
Storage Optimization Detail Reports 61
Data Domain File Compression by Host
Explore your data center using APTARE customizable report templates or by using parts of your IT infrastructure as entry points. Use Search to find reports, templates and dashboards across the portal.
Use the Reports tab to examine the catalog of templates, dashboards and reports - organized by products along with user-created, and system folders. This report is located here:
Solutions > Storage Optimization > Storage Optimization Analysis
Click the Data Domain Compression sector.
High Backup Retention Jobs by Sources
Explore your data center using APTARE customizable report templates or by using parts of your IT infrastructure as entry points. Use Search to find reports, templates and dashboards across the portal.
Use the Reports tab to examine the catalog of templates, dashboards and reports - organized by products along with user-created, and system folders. This report is located here:
Solutions > Storage Optimization > Storage Optimization Analysis
Click the High Backup Retention Jobs sector.
Cost per GiB Cost per GiB for storage associated with this storage optimization rule.
Total Cost Total cost of the non-VM file in the inventory.
Data Domain Host Name
Name of the Data Domain appliance.
Server Name The name is derived from the host’s DNS name.
Original Amount of logical capacity associated with backups from this host to the appliance.
# of Clients Total number of associated clients.
Total Cost Total cost of Data Domain capacity jobs (original size).
Row Selection Select the rows for drilldown.
Source Name Name of the source (host or job object) that was backed up.
Source Type Type of the job object.
Total Job Size Total size of jobs associated with high retention.
# of Jobs Total size of jobs associated with high retention.
Max Retention Date Maximum expiration date for a job for this source.
Total Cost Total cost of High Retention Jobs.
Max Retention Days Maximum number of days to left for a job to expire for the source.
Row Selection Select the rows for drilldown.
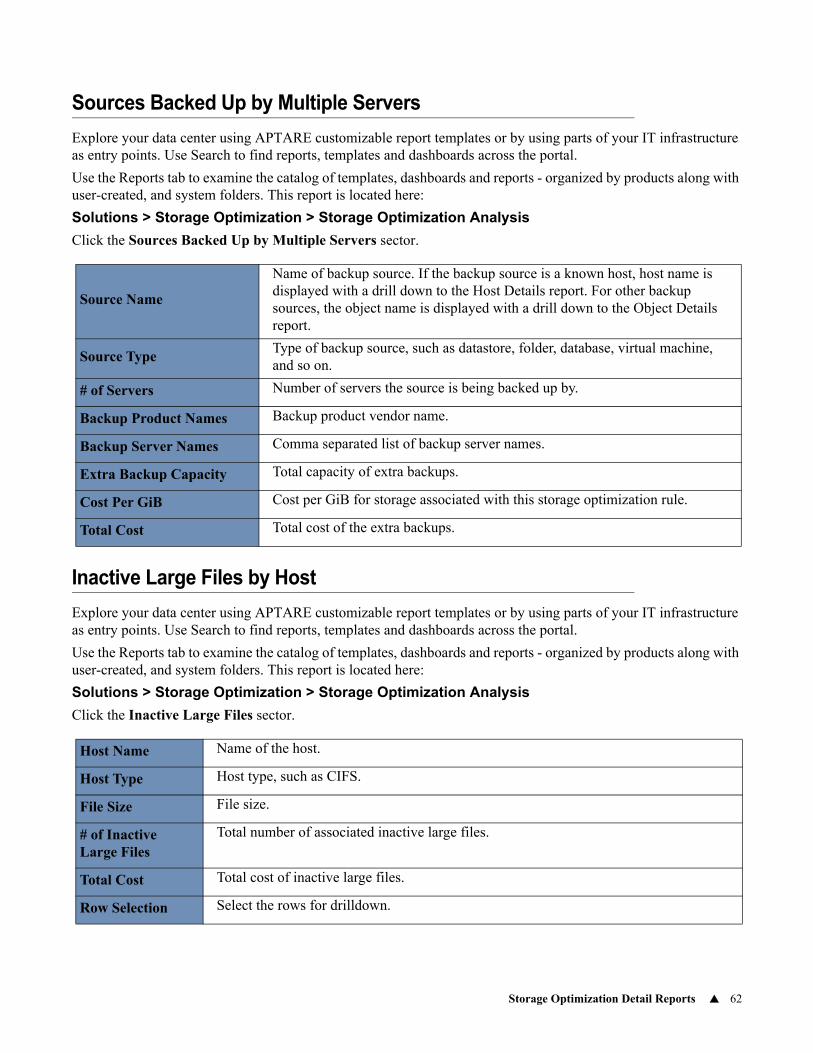
Storage Optimization Detail Reports 62
Sources Backed Up by Multiple Servers
Explore your data center using APTARE customizable report templates or by using parts of your IT infrastructure as entry points. Use Search to find reports, templates and dashboards across the portal.
Use the Reports tab to examine the catalog of templates, dashboards and reports - organized by products along with user-created, and system folders. This report is located here:
Solutions > Storage Optimization > Storage Optimization Analysis
Click the Sources Backed Up by Multiple Servers sector.
Inactive Large Files by Host
Explore your data center using APTARE customizable report templates or by using parts of your IT infrastructure as entry points. Use Search to find reports, templates and dashboards across the portal.
Use the Reports tab to examine the catalog of templates, dashboards and reports - organized by products along with user-created, and system folders. This report is located here:
Solutions > Storage Optimization > Storage Optimization Analysis
Click the Inactive Large Files sector.
Source Name
Name of backup source. If the backup source is a known host, host name is displayed with a drill down to the Host Details report. For other backup sources, the object name is displayed with a drill down to the Object Details report.
Source TypeType of backup source, such as datastore, folder, database, virtual machine, and so on.
# of Servers Number of servers the source is being backed up by.
Backup Product Names Backup product vendor name.
Backup Server Names Comma separated list of backup server names.
Extra Backup Capacity Total capacity of extra backups.
Cost Per GiB Cost per GiB for storage associated with this storage optimization rule.
Total Cost Total cost of the extra backups.
Host Name Name of the host.
Host Type Host type, such as CIFS.
File Size File size.
# of Inactive Large Files
Total number of associated inactive large files.
Total Cost Total cost of inactive large files.
Row Selection Select the rows for drilldown.
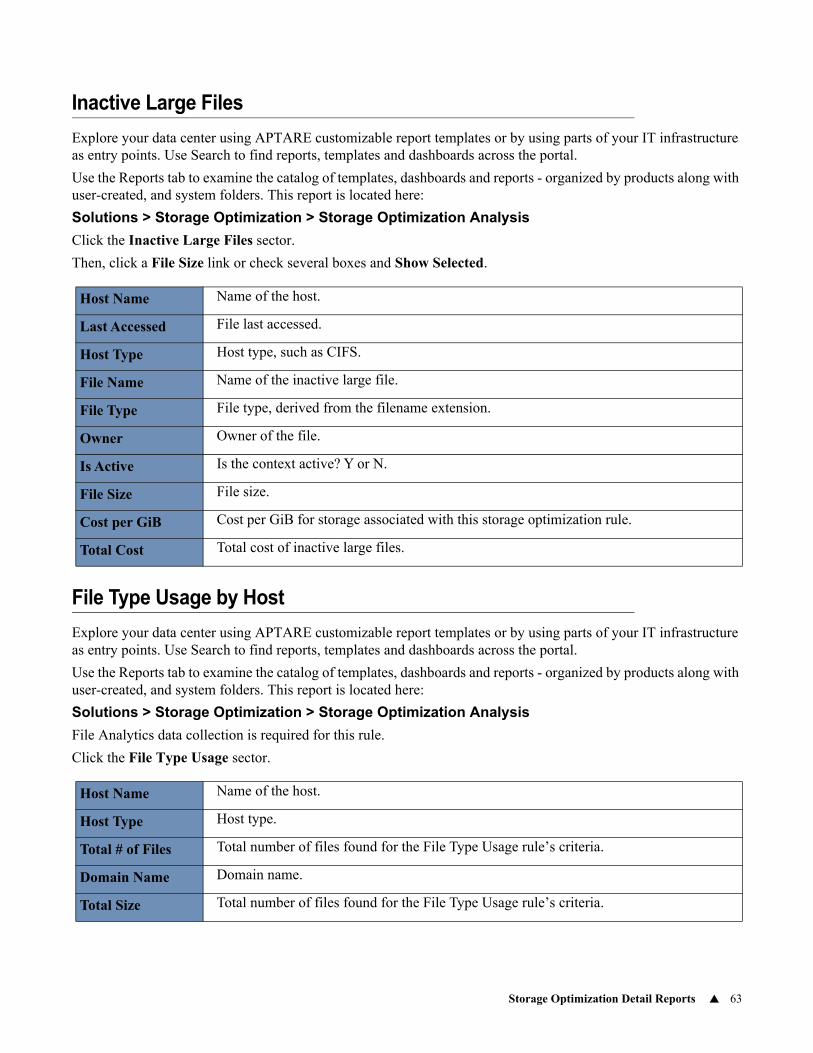
Storage Optimization Detail Reports 63
Inactive Large Files
Explore your data center using APTARE customizable report templates or by using parts of your IT infrastructure as entry points. Use Search to find reports, templates and dashboards across the portal.
Use the Reports tab to examine the catalog of templates, dashboards and reports - organized by products along with user-created, and system folders. This report is located here:
Solutions > Storage Optimization > Storage Optimization Analysis
Click the Inactive Large Files sector.
Then, click a File Size link or check several boxes and Show Selected.
File Type Usage by Host
Explore your data center using APTARE customizable report templates or by using parts of your IT infrastructure as entry points. Use Search to find reports, templates and dashboards across the portal.
Use the Reports tab to examine the catalog of templates, dashboards and reports - organized by products along with user-created, and system folders. This report is located here:
Solutions > Storage Optimization > Storage Optimization Analysis
File Analytics data collection is required for this rule.
Click the File Type Usage sector.
Host Name Name of the host.
Last Accessed File last accessed.
Host Type Host type, such as CIFS.
File Name Name of the inactive large file.
File Type File type, derived from the filename extension.
Owner Owner of the file.
Is Active Is the context active? Y or N.
File Size File size.
Cost per GiB Cost per GiB for storage associated with this storage optimization rule.
Total Cost Total cost of inactive large files.
Host Name Name of the host.
Host Type Host type.
Total # of Files Total number of files found for the File Type Usage rule’s criteria.
Domain Name Domain name.
Total Size Total number of files found for the File Type Usage rule’s criteria.
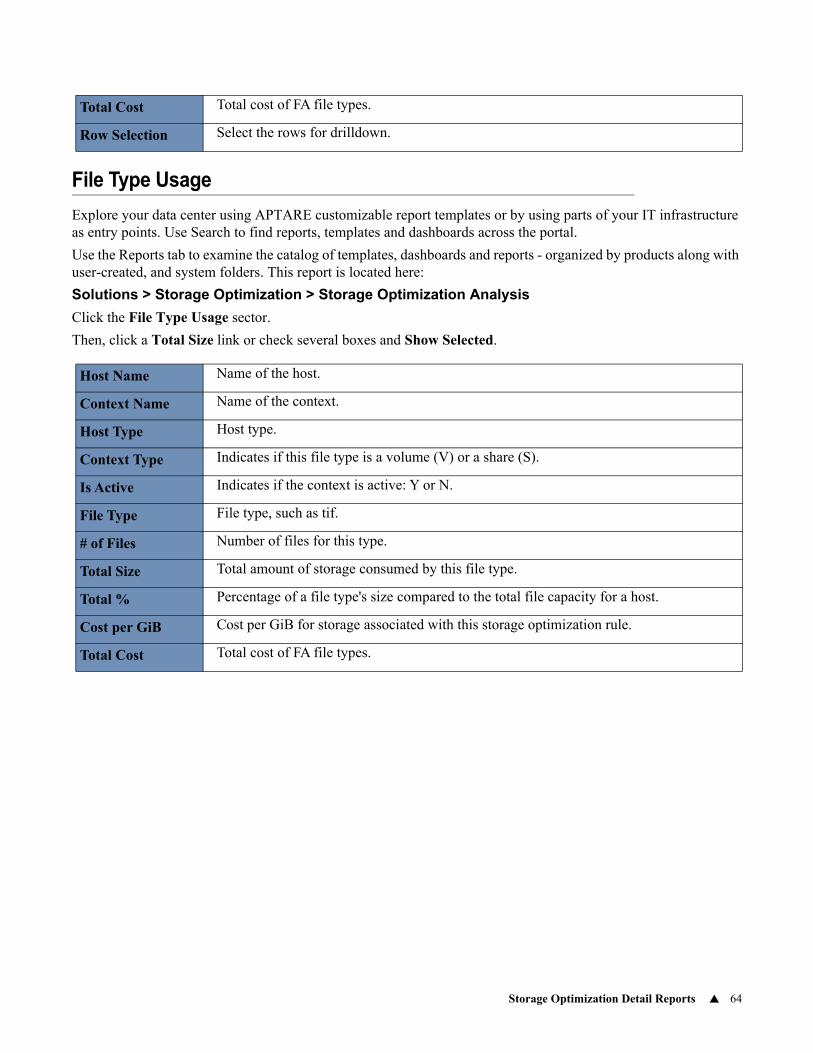
Storage Optimization Detail Reports 64
File Type Usage
Explore your data center using APTARE customizable report templates or by using parts of your IT infrastructure as entry points. Use Search to find reports, templates and dashboards across the portal.
Use the Reports tab to examine the catalog of templates, dashboards and reports - organized by products along with user-created, and system folders. This report is located here:
Solutions > Storage Optimization > Storage Optimization Analysis
Click the File Type Usage sector.
Then, click a Total Size link or check several boxes and Show Selected.
Total Cost Total cost of FA file types.
Row Selection Select the rows for drilldown.
Host Name Name of the host.
Context Name Name of the context.
Host Type Host type.
Context Type Indicates if this file type is a volume (V) or a share (S).
Is Active Indicates if the context is active: Y or N.
File Type File type, such as tif.
# of Files Number of files for this type.
Total Size Total amount of storage consumed by this file type.
Total % Percentage of a file type's size compared to the total file capacity for a host.
Cost per GiB Cost per GiB for storage associated with this storage optimization rule.
Total Cost Total cost of FA file types.
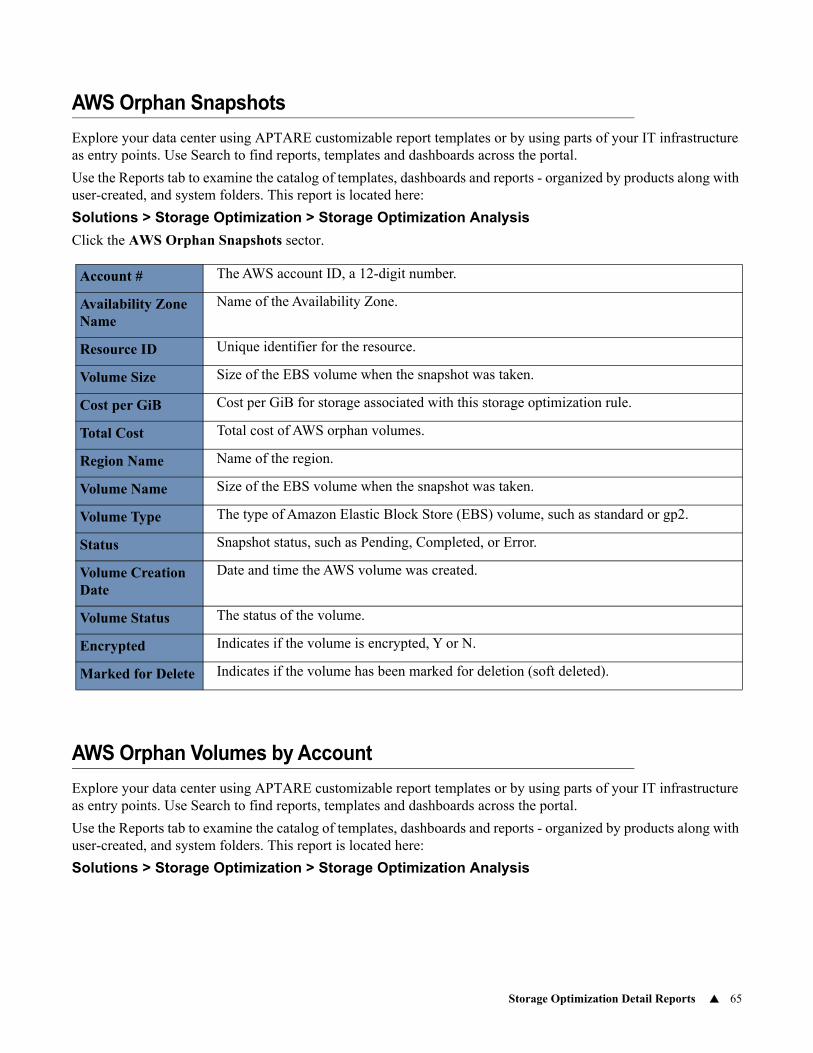
Storage Optimization Detail Reports 65
AWS Orphan Snapshots
Explore your data center using APTARE customizable report templates or by using parts of your IT infrastructure as entry points. Use Search to find reports, templates and dashboards across the portal.
Use the Reports tab to examine the catalog of templates, dashboards and reports - organized by products along with user-created, and system folders. This report is located here:
Solutions > Storage Optimization > Storage Optimization Analysis
Click the AWS Orphan Snapshots sector.
AWS Orphan Volumes by Account
Explore your data center using APTARE customizable report templates or by using parts of your IT infrastructure as entry points. Use Search to find reports, templates and dashboards across the portal.
Use the Reports tab to examine the catalog of templates, dashboards and reports - organized by products along with user-created, and system folders. This report is located here:
Solutions > Storage Optimization > Storage Optimization Analysis
Account # The AWS account ID, a 12-digit number.
Availability Zone Name
Name of the Availability Zone.
Resource ID Unique identifier for the resource.
Volume Size Size of the EBS volume when the snapshot was taken.
Cost per GiB Cost per GiB for storage associated with this storage optimization rule.
Total Cost Total cost of AWS orphan volumes.
Region Name Name of the region.
Volume Name Size of the EBS volume when the snapshot was taken.
Volume Type The type of Amazon Elastic Block Store (EBS) volume, such as standard or gp2.
Status Snapshot status, such as Pending, Completed, or Error.
Volume Creation Date
Date and time the AWS volume was created.
Volume Status The status of the volume.
Encrypted Indicates if the volume is encrypted, Y or N.
Marked for Delete Indicates if the volume has been marked for deletion (soft deleted).
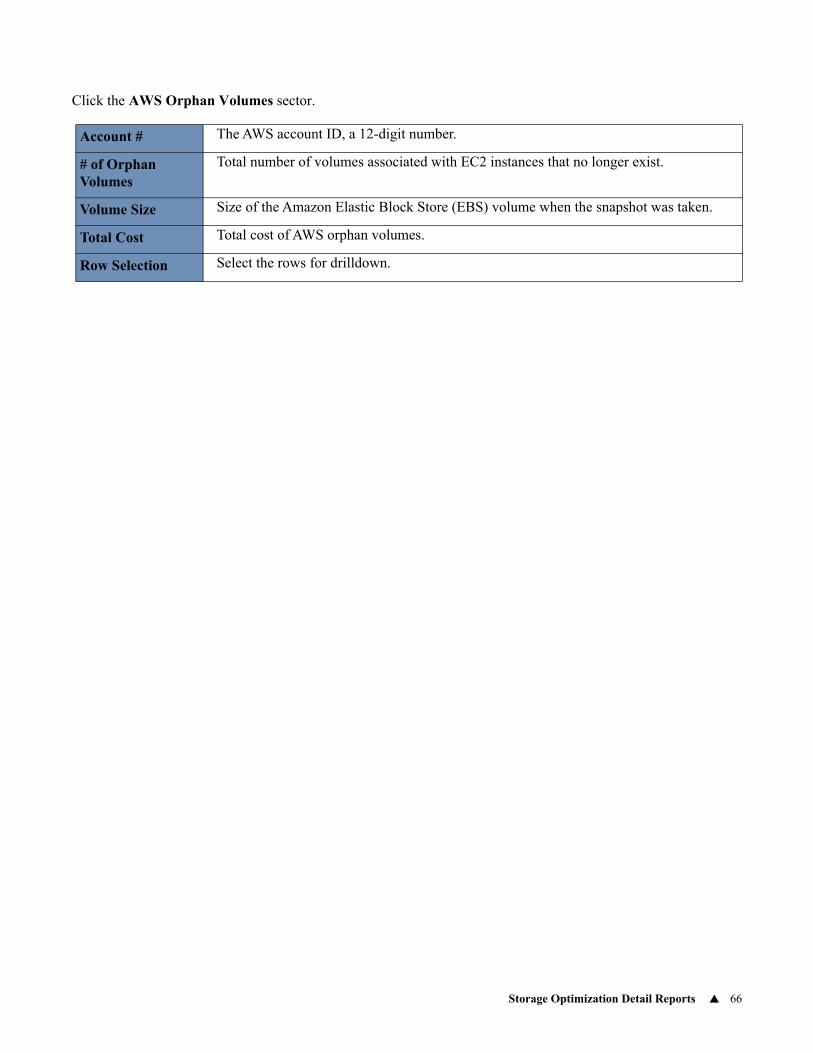
Storage Optimization Detail Reports 66
Click the AWS Orphan Volumes sector.
Account # The AWS account ID, a 12-digit number.
# of Orphan Volumes
Total number of volumes associated with EC2 instances that no longer exist.
Volume Size Size of the Amazon Elastic Block Store (EBS) volume when the snapshot was taken.
Total Cost Total cost of AWS orphan volumes.
Row Selection Select the rows for drilldown.
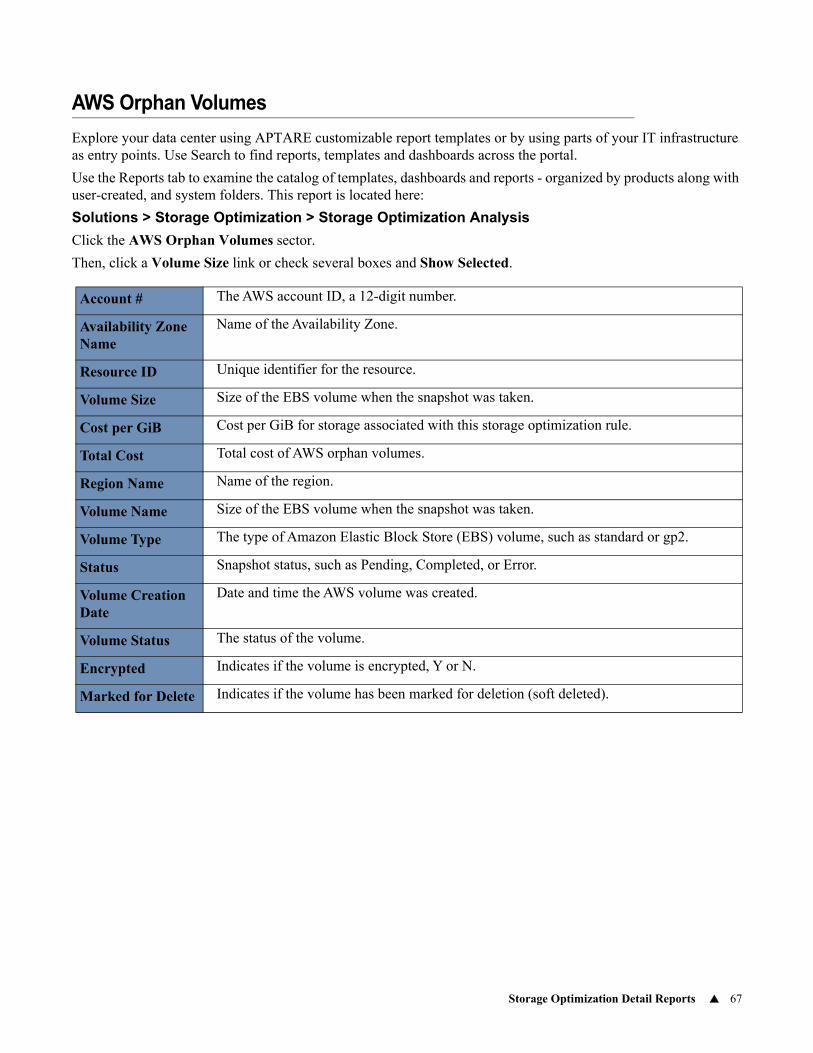
Storage Optimization Detail Reports 67
AWS Orphan Volumes
Explore your data center using APTARE customizable report templates or by using parts of your IT infrastructure as entry points. Use Search to find reports, templates and dashboards across the portal.
Use the Reports tab to examine the catalog of templates, dashboards and reports - organized by products along with user-created, and system folders. This report is located here:
Solutions > Storage Optimization > Storage Optimization Analysis
Click the AWS Orphan Volumes sector.
Then, click a Volume Size link or check several boxes and Show Selected.
Account # The AWS account ID, a 12-digit number.
Availability Zone Name
Name of the Availability Zone.
Resource ID Unique identifier for the resource.
Volume Size Size of the EBS volume when the snapshot was taken.
Cost per GiB Cost per GiB for storage associated with this storage optimization rule.
Total Cost Total cost of AWS orphan volumes.
Region Name Name of the region.
Volume Name Size of the EBS volume when the snapshot was taken.
Volume Type The type of Amazon Elastic Block Store (EBS) volume, such as standard or gp2.
Status Snapshot status, such as Pending, Completed, or Error.
Volume Creation Date
Date and time the AWS volume was created.
Volume Status The status of the volume.
Encrypted Indicates if the volume is encrypted, Y or N.
Marked for Delete Indicates if the volume has been marked for deletion (soft deleted).
69
5Chapter 0System Administration Reports
This section covers the following topics:
• Data Collection Message Summary
• Data Collection Activity Detail
• Data Collection Hourly Activity
• Data Collection Performance Detail
• Data Collection Performance Summary
• Data Collection Schedule Summary
• Data Collection Status Details
• Data Collector Status Summary
• Database Error Aggregation
• Database Error Summary
• File Analytics Collection Status
• License Summary
• Report Activity Summary
• Report Activity Detail
• Scheduled Reports Summary
• System Health Check
• Top Running Reports
• Version History
• WMI Proxy Servers
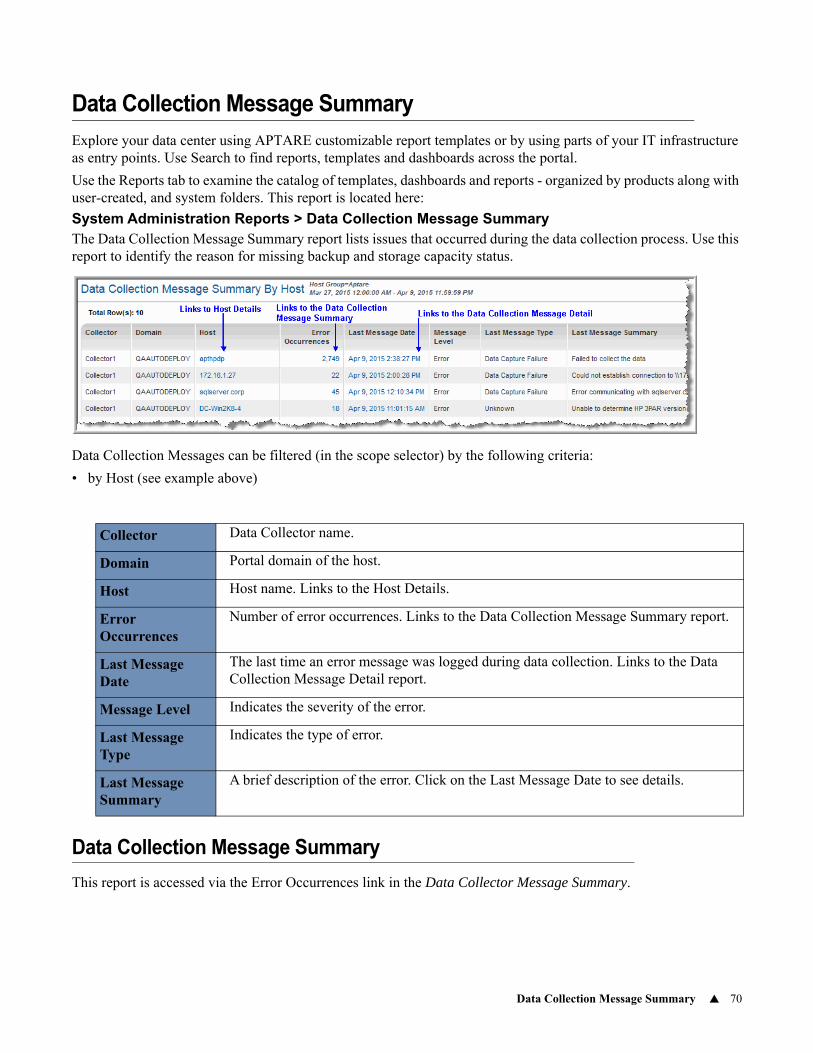
Data Collection Message Summary 70
Data Collection Message Summary
Explore your data center using APTARE customizable report templates or by using parts of your IT infrastructure as entry points. Use Search to find reports, templates and dashboards across the portal.
Use the Reports tab to examine the catalog of templates, dashboards and reports - organized by products along with user-created, and system folders. This report is located here:
System Administration Reports > Data Collection Message SummaryThe Data Collection Message Summary report lists issues that occurred during the data collection process. Use this report to identify the reason for missing backup and storage capacity status.
Data Collection Messages can be filtered (in the scope selector) by the following criteria:
• by Host (see example above)
Data Collection Message Summary
This report is accessed via the Error Occurrences link in the Data Collector Message Summary.
Collector Data Collector name.
Domain Portal domain of the host.
Host Host name. Links to the Host Details.
Error Occurrences
Number of error occurrences. Links to the Data Collection Message Summary report.
Last Message Date
The last time an error message was logged during data collection. Links to the Data Collection Message Detail report.
Message Level Indicates the severity of the error.
Last Message Type
Indicates the type of error.
Last Message Summary
A brief description of the error. Click on the Last Message Date to see details.
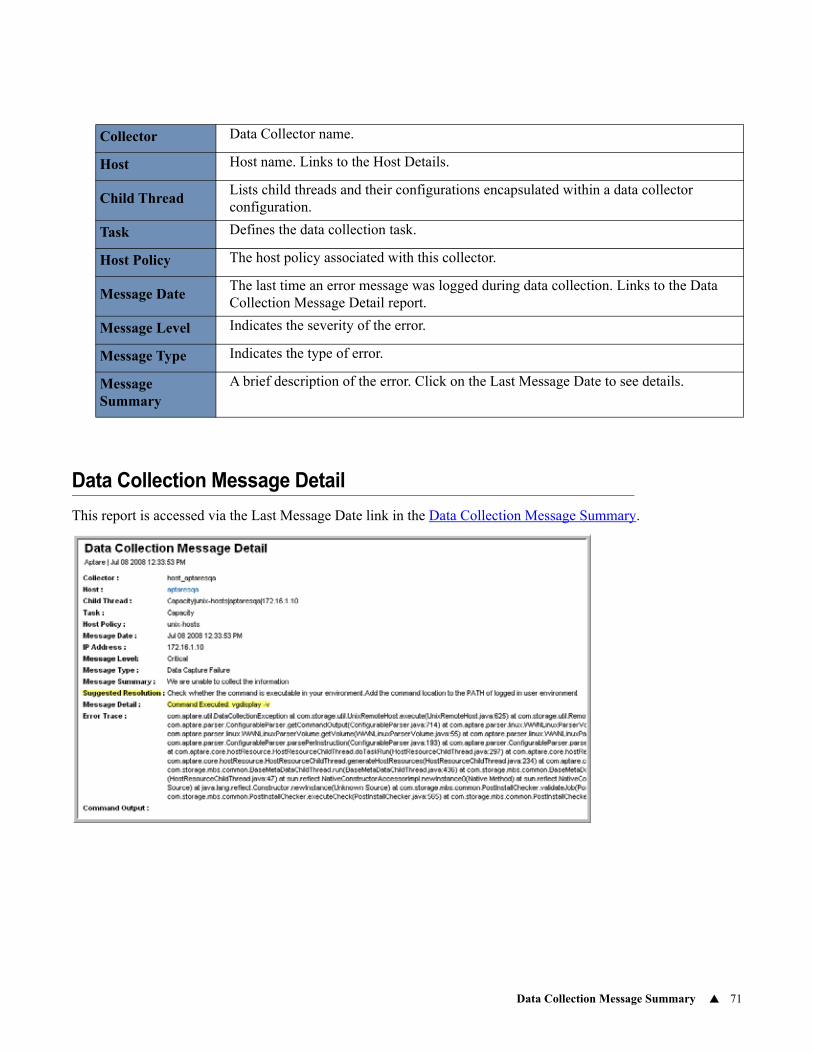
Data Collection Message Summary 71
Data Collection Message Detail
This report is accessed via the Last Message Date link in the Data Collection Message Summary.
Collector Data Collector name.
Host Host name. Links to the Host Details.
Child ThreadLists child threads and their configurations encapsulated within a data collector configuration.
Task Defines the data collection task.
Host Policy The host policy associated with this collector.
Message DateThe last time an error message was logged during data collection. Links to the Data Collection Message Detail report.
Message Level Indicates the severity of the error.
Message Type Indicates the type of error.
Message Summary
A brief description of the error. Click on the Last Message Date to see details.
Data Collection Activity Detail 72
Data Collection Activity Detail
Explore your data center using APTARE customizable report templates or by using parts of your IT infrastructure as entry points. Use Search to find reports, templates and dashboards across the portal.
Use the Reports tab to examine the catalog of templates, dashboards and reports - organized by products along with user-created, and system folders. This report is located here:
System Administration Reports > Data Collection Performance SummaryClick a link within the Data Collection Performance SummaryThis report provides the elapsed time taken by a particular database component and process, when persisting data during a data collection cycle. This list correlates activity with the logged hour to aid in isolating the process that may have impacted performance.
Primarily used to troubleshoot performance issues, this report can aid in determining if a task is taking an unreasonable amount of time or if load-balancing could improve overall performance. When evaluating the data, this report narrows the results to pinpoint specific activity that impacted performance.
Refer to the APTARE User’s Guide for information about Advanced Filtering for Tabular Reports and Alerting.
Note: Data shown in this report may not match the date range selected in the parent report. Only the most recent set of 100 database transactions is retained and reflected in this report.
Component Name
The specific data collection link will render the Data Collection Activity Detail report, which lists details specific to the selected component.
Process GroupThe Process Group aids in isolating the portion of the code that may be causing performance degradation. This field links to the Data Collection Activity Detail report, which lists details specific to the process group.
Process NameThe Process Name links to the Data Collection Activity Detail report, with an even more granular view of the time period and section of code that may have impacted performance.
Total Elapsed Time in Secs
The total time the component required to process the associated number of records.
Number of Records Processed
The number of records processed by the database process.
Average Time Per Record
The average time taken to process each record. The value is displayed in seconds.
Last Updated Date and time the Portal database was last updated with data from a collection cycle.
Data Collection Hourly Activity 73
Data Collection Hourly Activity
Explore your data center using APTARE customizable report templates or by using parts of your IT infrastructure as entry points. Use Search to find reports, templates and dashboards across the portal.
Use the Reports tab to examine the catalog of templates, dashboards and reports - organized by products along with user-created, and system folders. This report is located here:
System Administration Reports > Data Collection Performance SummaryClick a link within the Data Collection Performance SummaryThis report provides the elapsed time taken by a particular database component and process, when persisting data during a data collection cycle. This list correlates activity with the logged hour to aid in isolating the process that may have impacted performance.
Primarily used to troubleshoot performance issues, this report can aid in determining if a task is taking an unreasonable amount of time or if load-balancing could improve overall performance. When evaluating the data, this report narrows the results to pinpoint specific activity that impacted performance.
Refer to the APTARE User’s Guide for information about Advanced Filtering for Tabular Reports and Alerting.
Component Name
The specific data collection link will render the Data Collection Activity Detail report, which lists details specific to the selected component.
Process GroupThe Process Group aids in isolating the portion of the code that may be causing performance degradation. This field links to the Data Collection Activity Detail report, which lists details specific to the process group.
Process NameThe Process Name links to the Data Collection Activity Detail report, with an even more granular view of the time period and section of code that may have impacted performance.
Total Elapsed Time in Secs
The total time the component required to process the associated number of records.
Log Hour The time stamp of the log activity.
Number of Records Processed
The number of records processed by the database process.
Average Time Per Record
The average time taken to process each record. The value is displayed in seconds.
Data Collection Performance Detail 74
Data Collection Performance Detail
Explore your data center using APTARE customizable report templates or by using parts of your IT infrastructure as entry points. Use Search to find reports, templates and dashboards across the portal.
Use the Reports tab to examine the catalog of templates, dashboards and reports - organized by products along with user-created, and system folders. This report is located here:
System Administration Reports > Data Collection Performance DetailThis report provides the elapsed time taken by a particular database component and process, when persisting data during a data collection cycle. This list correlates activity with the logged hour to aid in isolating the process that may have impacted performance.
Primarily used to troubleshoot performance issues, this report can aid in determining if a task is taking an unreasonable amount of time or if load-balancing could improve overall performance. When evaluating the data, this report narrows the results to pinpoint specific activity that impacted performance.
Refer to the APTARE User’s Guide for information about Advanced Filtering for Tabular Reports and Alerting.
Component Name
The specific data collection system link will render the Data Collection Hourly Activity report.
Process GroupThe Process Group aids in isolating the portion of the code that may be causing performance degradation. This field links to the Data Collection Hourly Activity report.
Process NameThe Process Name links to the Data Collection Hourly Activity report, with an even more granular view of the time period and section of code that may have impacted performance.
Total Elapsed Time in Secs
The total time the component required to process the associated number of records.
Number of Records Processed
The number of records processed by the database process.
Average Time Per Record
The average time taken to process each record. The value is displayed in seconds.
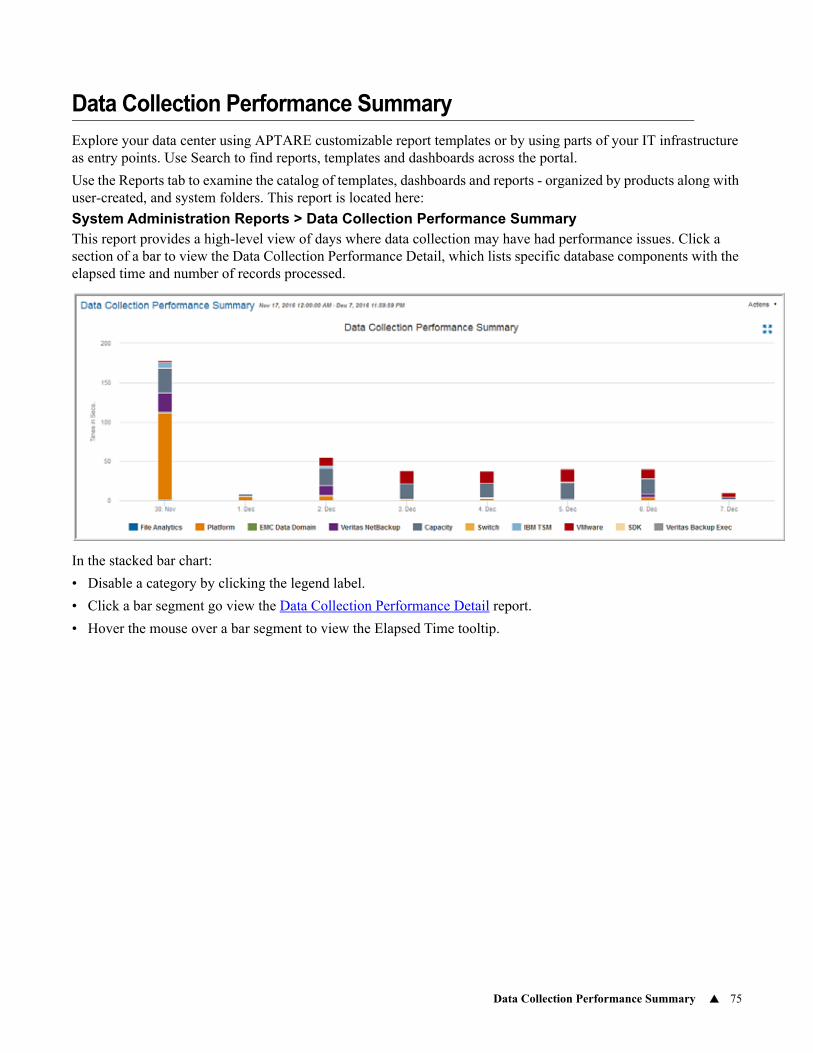
Data Collection Performance Summary 75
Data Collection Performance Summary
Explore your data center using APTARE customizable report templates or by using parts of your IT infrastructure as entry points. Use Search to find reports, templates and dashboards across the portal.
Use the Reports tab to examine the catalog of templates, dashboards and reports - organized by products along with user-created, and system folders. This report is located here:
System Administration Reports > Data Collection Performance SummaryThis report provides a high-level view of days where data collection may have had performance issues. Click a section of a bar to view the Data Collection Performance Detail, which lists specific database components with the elapsed time and number of records processed.
In the stacked bar chart:
• Disable a category by clicking the legend label.
• Click a bar segment go view the Data Collection Performance Detail report.
• Hover the mouse over a bar segment to view the Elapsed Time tooltip.
Data Collection Schedule Summary 76
Data Collection Schedule Summary
Data collection performance may be impacted when multiple policies initiate at the same time. Use this single view of all successful active collection policy schedules to determine scheduling conflicts. Compare the schedule frequency with the start/end times to understand which data collectors may be competing for resources. Note that often long-running collections could be due to database persistence processing. This report can be useful for troubleshooting and implementing database efficiencies. See also, Cases Not Represented in the Data Collection Schedule Summary.
Policy Name
The type of system from which data is being collected, such as EMC VPLEX, Data Domain, or NetApp Cluster. The host name or IP address of the system that is the source of the data is appended to the product name, except for Host Resources collection.
Collector Name Name of the data collector.
Collector Host Name Name of host where data collector is deployed. Drill down to the Host Details.
Probe Type Name The type of data collection probe, such as Capacity, Performance, or Inventory.
ScheduleThe frequency of the data collection, such as Execute at 12:00 PM Daily. All times are relative to the Data Collector server.
Last Start Time The date and time the last successful data collection started.
Last End Time The date and time the last successful data collection ended.
Last Duration
Length of the last successful collection cycle. A color indicator highlights durations that are 50% above the average duration. Note that the duration is calculated from the time the first set of data is persisted in the database until the last data from the collection thread is persisted.
Average DurationThe average duration of all successful executions of this probe, including database persistence processes.
Duration DeltaThe % difference between the last successful duration and the average successful duration, which is an indicator of collection and database persistence performance. If the last duration is unknown, the delta will be unknown.
# of Collections Number of times the probe successfully collected data within the report scope.
Total DurationTotal Duration = (# of Collections) * (Average Duration). This column is useful for sorting purposes, to identify long-running collection and database persistence processes.
Collector Identifier
This metadata collector ID is useful for correlating collection events with the relevant log files. See also, Example of a Data Collector Log Request. For a VM, instead of a metadata ID, the name of the ESX server is listed in this table column.
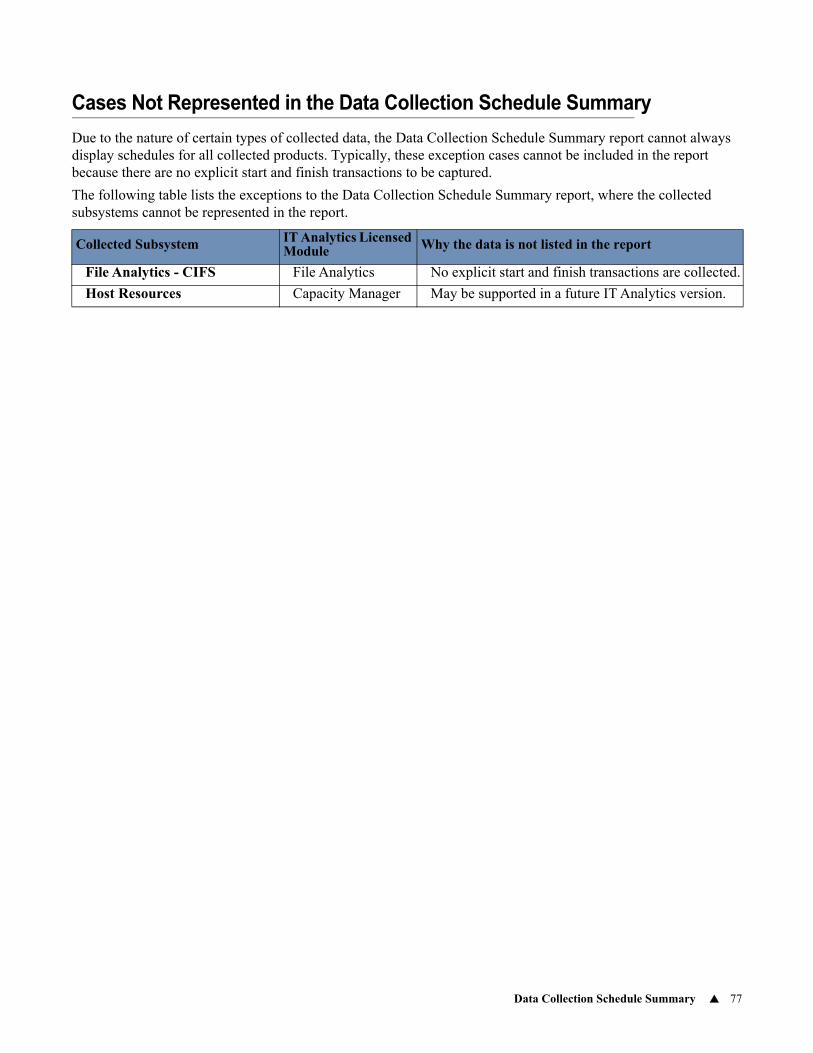
Data Collection Schedule Summary 77
Cases Not Represented in the Data Collection Schedule Summary
Due to the nature of certain types of collected data, the Data Collection Schedule Summary report cannot always display schedules for all collected products. Typically, these exception cases cannot be included in the report because there are no explicit start and finish transactions to be captured.
The following table lists the exceptions to the Data Collection Schedule Summary report, where the collected subsystems cannot be represented in the report.
Collected Subsystem IT Analytics Licensed Module Why the data is not listed in the report
File Analytics - CIFS File Analytics No explicit start and finish transactions are collected.
Host Resources Capacity Manager May be supported in a future IT Analytics version.
Data Collection Schedule Summary 78
Example of a Data Collector Log Request
When troubleshooting data collection issues, you can use the Support Tools feature to create a Support Package Request to download relevant files. When you add a Support Package Request, the Collector Identifier, listed in the Data Collection Schedule Summary, can be entered for the name, to retrieve a specific data collection log.
1. Generate the Data Collection Schedule Summary report.
2. In the Data Collection Schedule Summary, select the Collector Identifier for the data collection thread that needs further investigation.
3. Ctrl-C copy the identifier.
4. Go to the Support Tools: Admin > Advanced > Support Tools
5. Click Add to create a Support Package Request, supply the following details, and click OK.
• Name: Paste the Collector Identifier into this field and also place a wildcard asterisk (*) before and after the identifier.
• Data Collector Server: Select this radio button.
• Data Collector: Select the data collector associated with the collection thread listed in the Data Collection Schedule Summary.
• Path to File/Folder: Enter the path to the log files. For a Linux data collector server, this path typically is/mbs/logs.
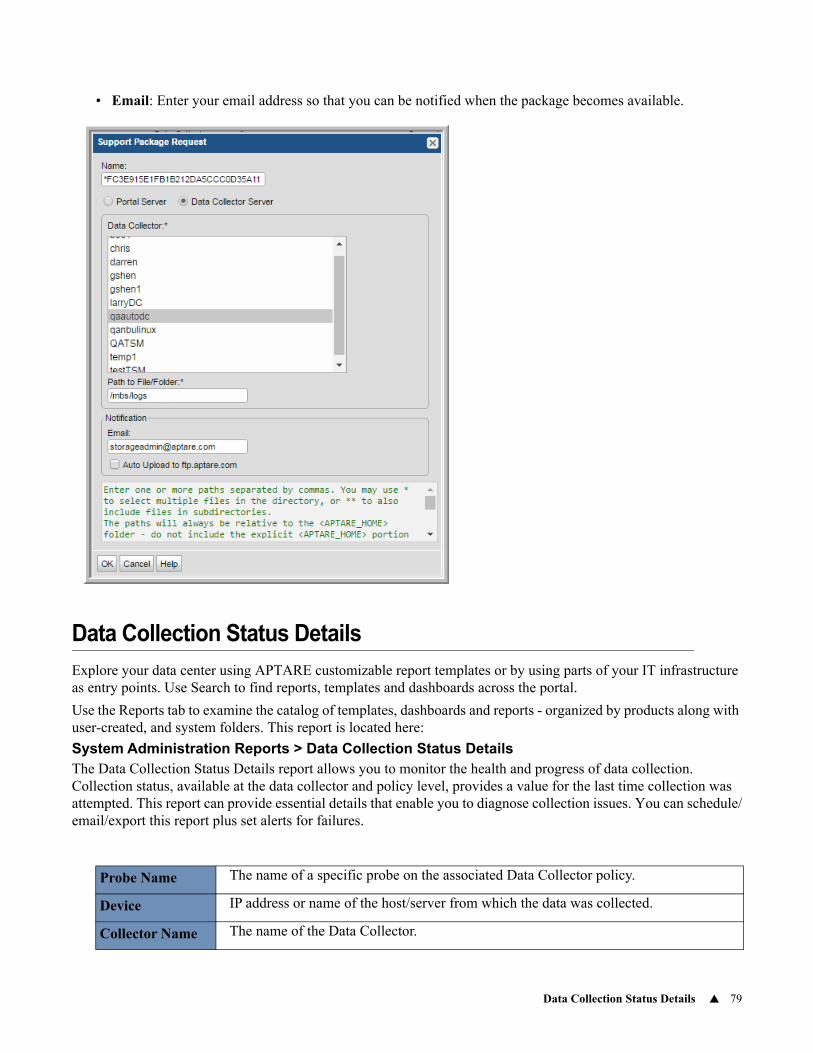
Data Collection Status Details 79
• Email: Enter your email address so that you can be notified when the package becomes available.
Data Collection Status Details
Explore your data center using APTARE customizable report templates or by using parts of your IT infrastructure as entry points. Use Search to find reports, templates and dashboards across the portal.
Use the Reports tab to examine the catalog of templates, dashboards and reports - organized by products along with user-created, and system folders. This report is located here:
System Administration Reports > Data Collection Status DetailsThe Data Collection Status Details report allows you to monitor the health and progress of data collection. Collection status, available at the data collector and policy level, provides a value for the last time collection was attempted. This report can provide essential details that enable you to diagnose collection issues. You can schedule/email/export this report plus set alerts for failures.
Probe Name The name of a specific probe on the associated Data Collector policy.
Device IP address or name of the host/server from which the data was collected.
Collector Name The name of the Data Collector.
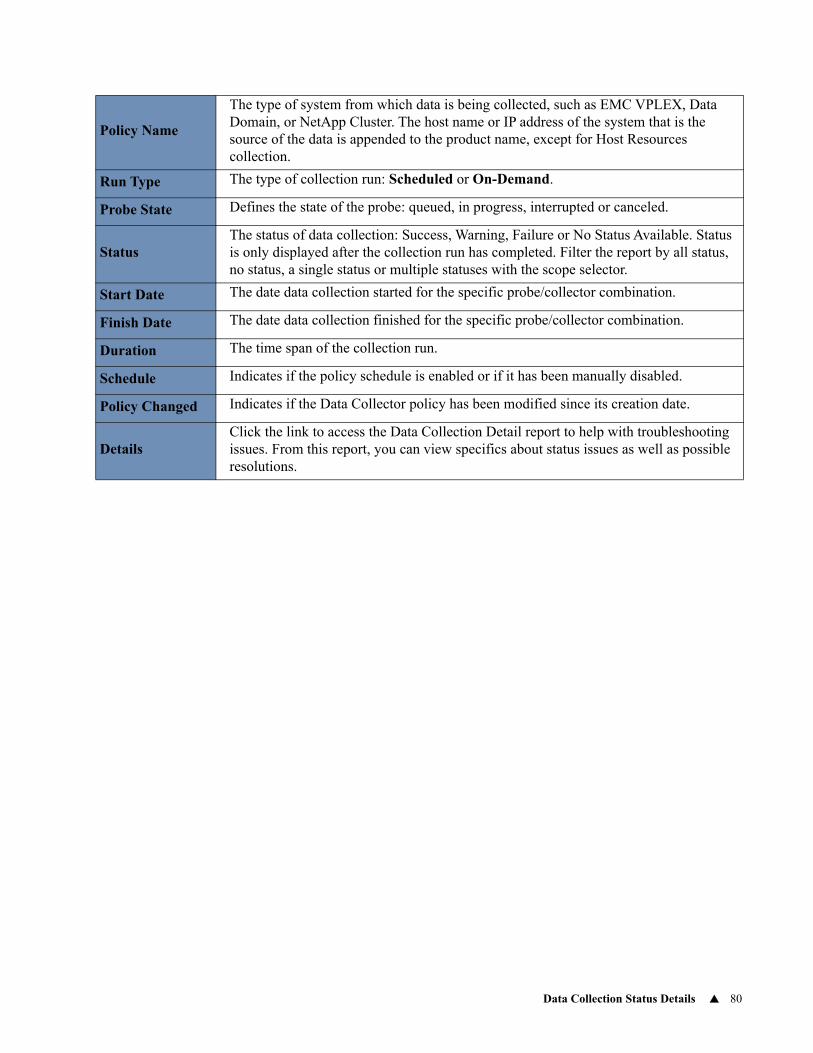
Data Collection Status Details 80
Policy Name
The type of system from which data is being collected, such as EMC VPLEX, Data Domain, or NetApp Cluster. The host name or IP address of the system that is the source of the data is appended to the product name, except for Host Resources collection.
Run Type The type of collection run: Scheduled or On-Demand.
Probe State Defines the state of the probe: queued, in progress, interrupted or canceled.
StatusThe status of data collection: Success, Warning, Failure or No Status Available. Status is only displayed after the collection run has completed. Filter the report by all status, no status, a single status or multiple statuses with the scope selector.
Start Date The date data collection started for the specific probe/collector combination.
Finish Date The date data collection finished for the specific probe/collector combination.
Duration The time span of the collection run.
Schedule Indicates if the policy schedule is enabled or if it has been manually disabled.
Policy Changed Indicates if the Data Collector policy has been modified since its creation date.
DetailsClick the link to access the Data Collection Detail report to help with troubleshooting issues. From this report, you can view specifics about status issues as well as possible resolutions.

Data Collector Status Summary 81
Data Collector Status Summary
Explore your data center using APTARE customizable report templates or by using parts of your IT infrastructure as entry points. Use Search to find reports, templates and dashboards across the portal.
Use the Reports tab to examine the catalog of templates, dashboards and reports - organized by products along with user-created, and system folders. This report is located here:
System Administration Reports > Data Collector Status SummaryThis report provides an at-a-glance view of any issues that may be occurring with your data collectors.
Refer to the APTARE User’s Guide for information about Advanced Filtering for Tabular Reports and Alerting.
Note: The report scope selector includes a Show tasks checkbox. When this is checked, the following columns are displayed. When it is unchecked, only the Name, Product Name, and Status columns are included in the report’s table.
Name The name of the data collector policy.
Product Name Defines the product subsystem that is being collected.
TaskLists the specific data collection task. These are defined in the policy. You can choose to omit this column by un-checking the Show Tasks option in the scope selector.
Status Indicates the status of the collection task, such as warning, failed, or ok.
Last UpdateThe date and time the last collection task was run. You can choose to omit this column by un-checking the Show Tasks option in the scope selector.
CommentsThe comments provide details to help you determine how often the data was accessed. You can choose to omit this column by un-checking the Show Tasks option in the scope selector.
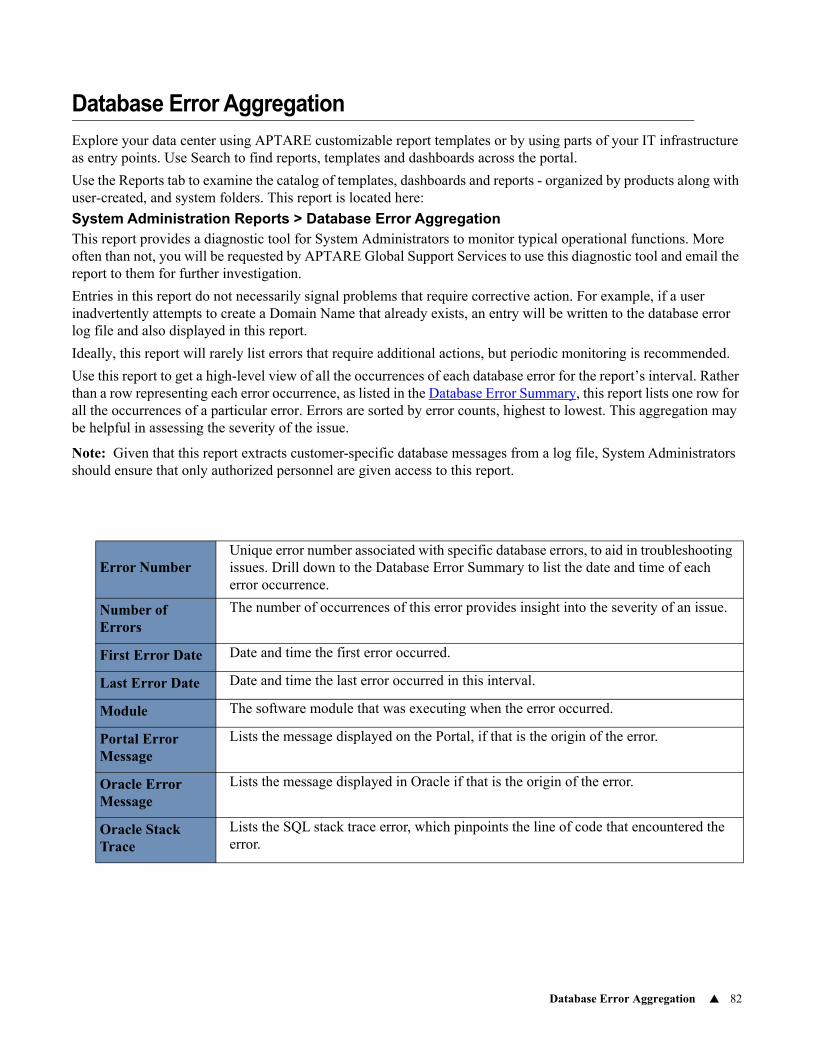
Database Error Aggregation 82
Database Error Aggregation
Explore your data center using APTARE customizable report templates or by using parts of your IT infrastructure as entry points. Use Search to find reports, templates and dashboards across the portal.
Use the Reports tab to examine the catalog of templates, dashboards and reports - organized by products along with user-created, and system folders. This report is located here:
System Administration Reports > Database Error AggregationThis report provides a diagnostic tool for System Administrators to monitor typical operational functions. More often than not, you will be requested by APTARE Global Support Services to use this diagnostic tool and email the report to them for further investigation.
Entries in this report do not necessarily signal problems that require corrective action. For example, if a user inadvertently attempts to create a Domain Name that already exists, an entry will be written to the database error log file and also displayed in this report.
Ideally, this report will rarely list errors that require additional actions, but periodic monitoring is recommended.
Use this report to get a high-level view of all the occurrences of each database error for the report’s interval. Rather than a row representing each error occurrence, as listed in the Database Error Summary, this report lists one row for all the occurrences of a particular error. Errors are sorted by error counts, highest to lowest. This aggregation may be helpful in assessing the severity of the issue.
Note: Given that this report extracts customer-specific database messages from a log file, System Administrators should ensure that only authorized personnel are given access to this report.
Error NumberUnique error number associated with specific database errors, to aid in troubleshooting issues. Drill down to the Database Error Summary to list the date and time of each error occurrence.
Number of Errors
The number of occurrences of this error provides insight into the severity of an issue.
First Error Date Date and time the first error occurred.
Last Error Date Date and time the last error occurred in this interval.
Module The software module that was executing when the error occurred.
Portal Error Message
Lists the message displayed on the Portal, if that is the origin of the error.
Oracle Error Message
Lists the message displayed in Oracle if that is the origin of the error.
Oracle Stack Trace
Lists the SQL stack trace error, which pinpoints the line of code that encountered the error.
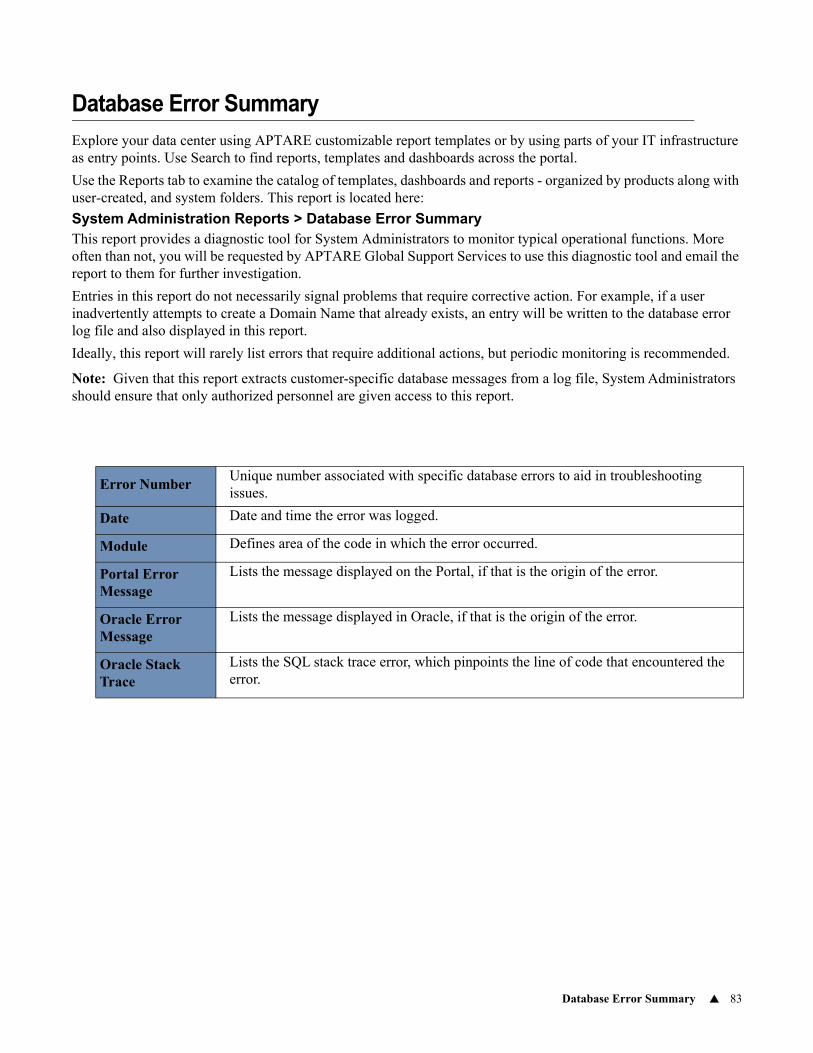
Database Error Summary 83
Database Error Summary
Explore your data center using APTARE customizable report templates or by using parts of your IT infrastructure as entry points. Use Search to find reports, templates and dashboards across the portal.
Use the Reports tab to examine the catalog of templates, dashboards and reports - organized by products along with user-created, and system folders. This report is located here:
System Administration Reports > Database Error SummaryThis report provides a diagnostic tool for System Administrators to monitor typical operational functions. More often than not, you will be requested by APTARE Global Support Services to use this diagnostic tool and email the report to them for further investigation.
Entries in this report do not necessarily signal problems that require corrective action. For example, if a user inadvertently attempts to create a Domain Name that already exists, an entry will be written to the database error log file and also displayed in this report.
Ideally, this report will rarely list errors that require additional actions, but periodic monitoring is recommended.
Note: Given that this report extracts customer-specific database messages from a log file, System Administrators should ensure that only authorized personnel are given access to this report.
Error NumberUnique number associated with specific database errors to aid in troubleshooting issues.
Date Date and time the error was logged.
Module Defines area of the code in which the error occurred.
Portal Error Message
Lists the message displayed on the Portal, if that is the origin of the error.
Oracle Error Message
Lists the message displayed in Oracle, if that is the origin of the error.
Oracle Stack Trace
Lists the SQL stack trace error, which pinpoints the line of code that encountered the error.
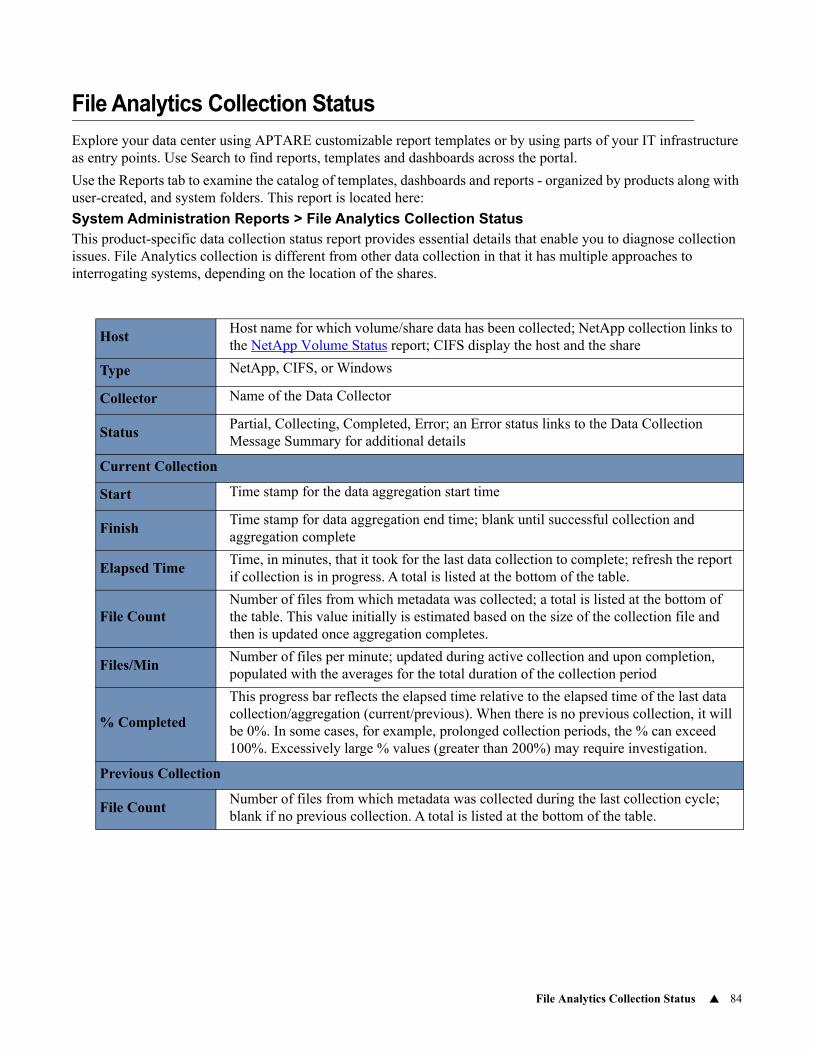
File Analytics Collection Status 84
File Analytics Collection Status
Explore your data center using APTARE customizable report templates or by using parts of your IT infrastructure as entry points. Use Search to find reports, templates and dashboards across the portal.
Use the Reports tab to examine the catalog of templates, dashboards and reports - organized by products along with user-created, and system folders. This report is located here:
System Administration Reports > File Analytics Collection StatusThis product-specific data collection status report provides essential details that enable you to diagnose collection issues. File Analytics collection is different from other data collection in that it has multiple approaches to interrogating systems, depending on the location of the shares.
HostHost name for which volume/share data has been collected; NetApp collection links to the NetApp Volume Status report; CIFS display the host and the share
Type NetApp, CIFS, or Windows
Collector Name of the Data Collector
StatusPartial, Collecting, Completed, Error; an Error status links to the Data Collection Message Summary for additional details
Current Collection
Start Time stamp for the data aggregation start time
FinishTime stamp for data aggregation end time; blank until successful collection and aggregation complete
Elapsed TimeTime, in minutes, that it took for the last data collection to complete; refresh the report if collection is in progress. A total is listed at the bottom of the table.
File CountNumber of files from which metadata was collected; a total is listed at the bottom of the table. This value initially is estimated based on the size of the collection file and then is updated once aggregation completes.
Files/MinNumber of files per minute; updated during active collection and upon completion, populated with the averages for the total duration of the collection period
% Completed
This progress bar reflects the elapsed time relative to the elapsed time of the last data collection/aggregation (current/previous). When there is no previous collection, it will be 0%. In some cases, for example, prolonged collection periods, the % can exceed 100%. Excessively large % values (greater than 200%) may require investigation.
Previous Collection
File CountNumber of files from which metadata was collected during the last collection cycle; blank if no previous collection. A total is listed at the bottom of the table.
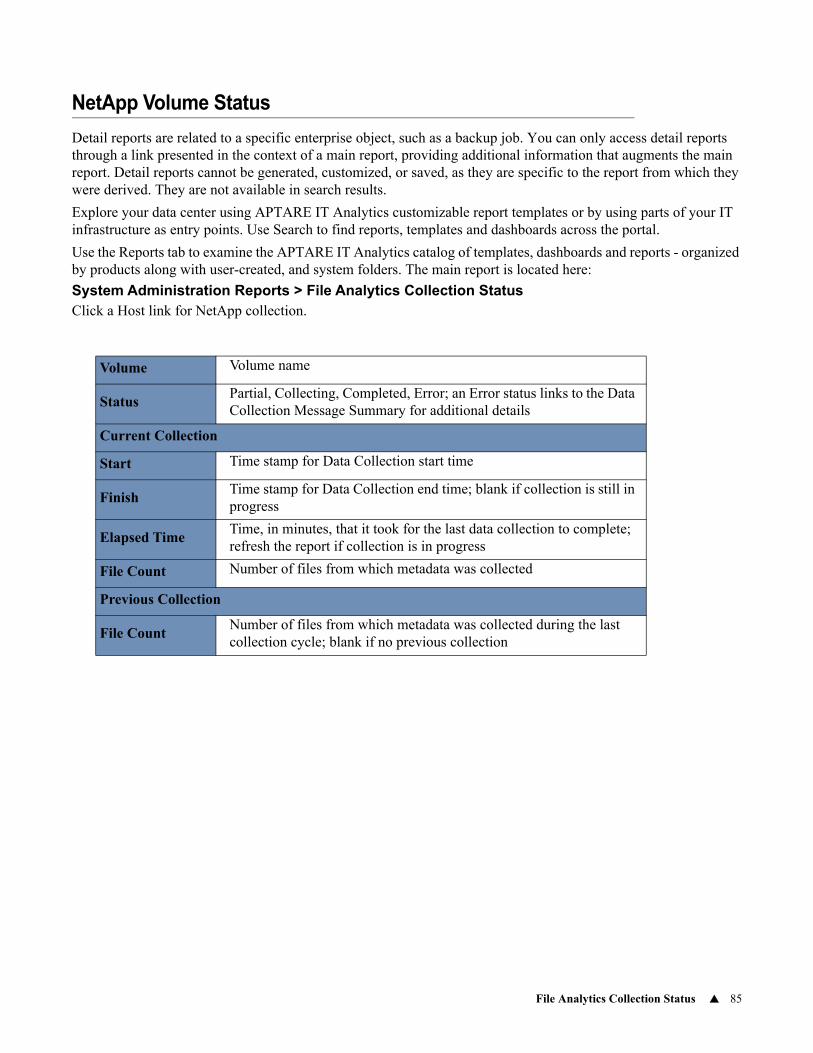
File Analytics Collection Status 85
NetApp Volume Status
Detail reports are related to a specific enterprise object, such as a backup job. You can only access detail reports through a link presented in the context of a main report, providing additional information that augments the main report. Detail reports cannot be generated, customized, or saved, as they are specific to the report from which they were derived. They are not available in search results.
Explore your data center using APTARE IT Analytics customizable report templates or by using parts of your IT infrastructure as entry points. Use Search to find reports, templates and dashboards across the portal.
Use the Reports tab to examine the APTARE IT Analytics catalog of templates, dashboards and reports - organized by products along with user-created, and system folders. The main report is located here:
System Administration Reports > File Analytics Collection StatusClick a Host link for NetApp collection.
Volume Volume name
StatusPartial, Collecting, Completed, Error; an Error status links to the Data Collection Message Summary for additional details
Current Collection
Start Time stamp for Data Collection start time
FinishTime stamp for Data Collection end time; blank if collection is still in progress
Elapsed TimeTime, in minutes, that it took for the last data collection to complete; refresh the report if collection is in progress
File Count Number of files from which metadata was collected
Previous Collection
File CountNumber of files from which metadata was collected during the last collection cycle; blank if no previous collection
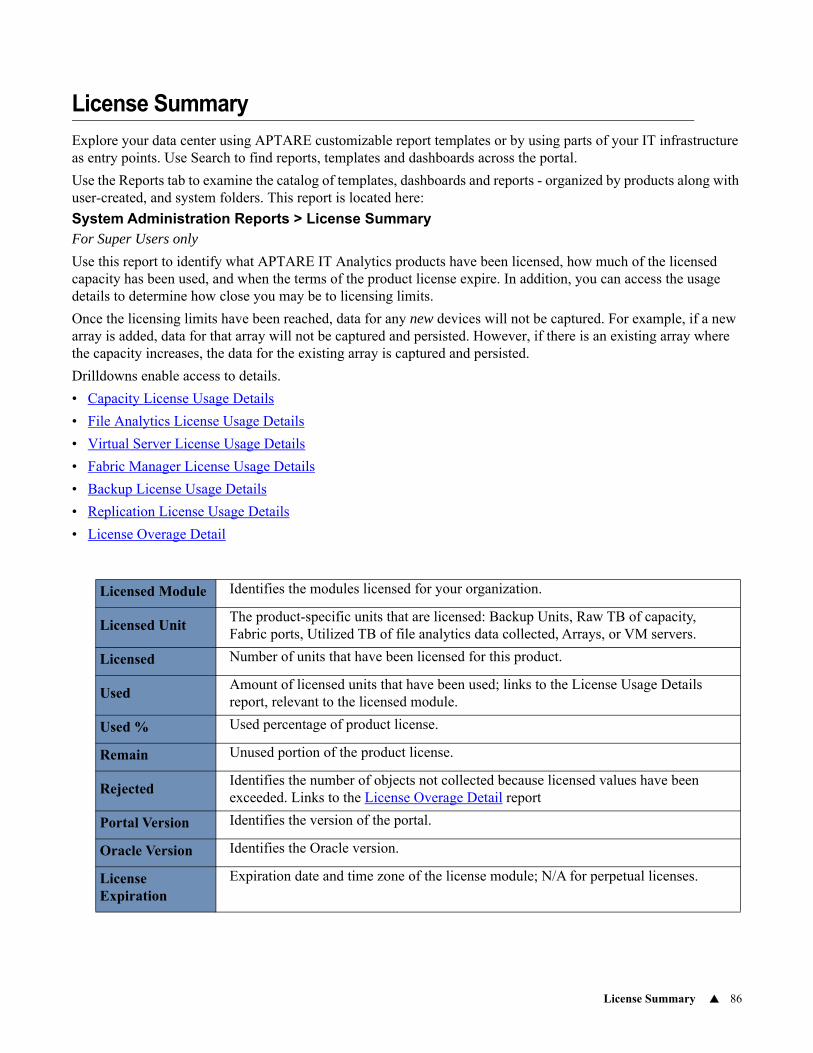
License Summary 86
License Summary
Explore your data center using APTARE customizable report templates or by using parts of your IT infrastructure as entry points. Use Search to find reports, templates and dashboards across the portal.
Use the Reports tab to examine the catalog of templates, dashboards and reports - organized by products along with user-created, and system folders. This report is located here:
System Administration Reports > License SummaryFor Super Users only
Use this report to identify what APTARE IT Analytics products have been licensed, how much of the licensed capacity has been used, and when the terms of the product license expire. In addition, you can access the usage details to determine how close you may be to licensing limits.
Once the licensing limits have been reached, data for any new devices will not be captured. For example, if a new array is added, data for that array will not be captured and persisted. However, if there is an existing array where the capacity increases, the data for the existing array is captured and persisted.
Drilldowns enable access to details.
• Capacity License Usage Details
• File Analytics License Usage Details
• Virtual Server License Usage Details
• Fabric Manager License Usage Details
• Backup License Usage Details
• Replication License Usage Details
• License Overage Detail
Licensed Module Identifies the modules licensed for your organization.
Licensed UnitThe product-specific units that are licensed: Backup Units, Raw TB of capacity, Fabric ports, Utilized TB of file analytics data collected, Arrays, or VM servers.
Licensed Number of units that have been licensed for this product.
UsedAmount of licensed units that have been used; links to the License Usage Details report, relevant to the licensed module.
Used % Used percentage of product license.
Remain Unused portion of the product license.
Rejected Identifies the number of objects not collected because licensed values have been exceeded. Links to the License Overage Detail report
Portal Version Identifies the version of the portal.
Oracle Version Identifies the Oracle version.
License Expiration
Expiration date and time zone of the license module; N/A for perpetual licenses.
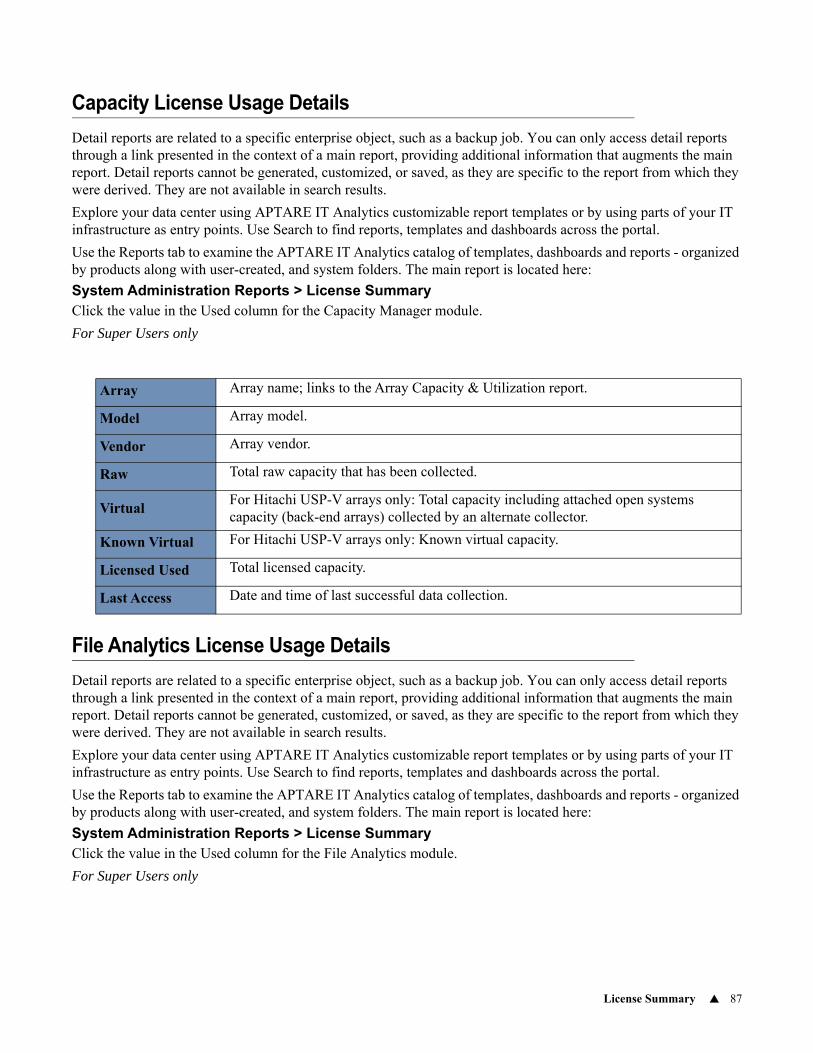
License Summary 87
Capacity License Usage Details
Detail reports are related to a specific enterprise object, such as a backup job. You can only access detail reports through a link presented in the context of a main report, providing additional information that augments the main report. Detail reports cannot be generated, customized, or saved, as they are specific to the report from which they were derived. They are not available in search results.
Explore your data center using APTARE IT Analytics customizable report templates or by using parts of your IT infrastructure as entry points. Use Search to find reports, templates and dashboards across the portal.
Use the Reports tab to examine the APTARE IT Analytics catalog of templates, dashboards and reports - organized by products along with user-created, and system folders. The main report is located here:
System Administration Reports > License SummaryClick the value in the Used column for the Capacity Manager module.
For Super Users only
File Analytics License Usage Details
Detail reports are related to a specific enterprise object, such as a backup job. You can only access detail reports through a link presented in the context of a main report, providing additional information that augments the main report. Detail reports cannot be generated, customized, or saved, as they are specific to the report from which they were derived. They are not available in search results.
Explore your data center using APTARE IT Analytics customizable report templates or by using parts of your IT infrastructure as entry points. Use Search to find reports, templates and dashboards across the portal.
Use the Reports tab to examine the APTARE IT Analytics catalog of templates, dashboards and reports - organized by products along with user-created, and system folders. The main report is located here:
System Administration Reports > License SummaryClick the value in the Used column for the File Analytics module.
For Super Users only
Array Array name; links to the Array Capacity & Utilization report.
Model Array model.
Vendor Array vendor.
Raw Total raw capacity that has been collected.
VirtualFor Hitachi USP-V arrays only: Total capacity including attached open systems capacity (back-end arrays) collected by an alternate collector.
Known Virtual For Hitachi USP-V arrays only: Known virtual capacity.
Licensed Used Total licensed capacity.
Last Access Date and time of last successful data collection.
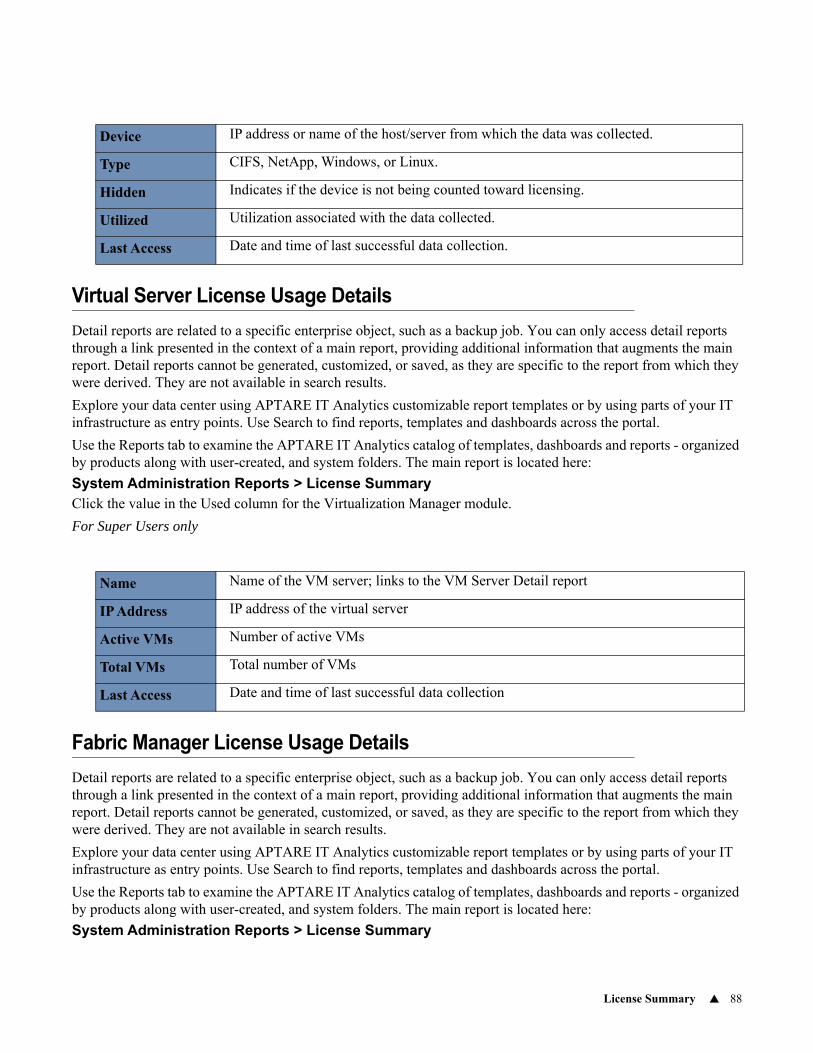
License Summary 88
Virtual Server License Usage Details
Detail reports are related to a specific enterprise object, such as a backup job. You can only access detail reports through a link presented in the context of a main report, providing additional information that augments the main report. Detail reports cannot be generated, customized, or saved, as they are specific to the report from which they were derived. They are not available in search results.
Explore your data center using APTARE IT Analytics customizable report templates or by using parts of your IT infrastructure as entry points. Use Search to find reports, templates and dashboards across the portal.
Use the Reports tab to examine the APTARE IT Analytics catalog of templates, dashboards and reports - organized by products along with user-created, and system folders. The main report is located here:
System Administration Reports > License SummaryClick the value in the Used column for the Virtualization Manager module.
For Super Users only
Fabric Manager License Usage Details
Detail reports are related to a specific enterprise object, such as a backup job. You can only access detail reports through a link presented in the context of a main report, providing additional information that augments the main report. Detail reports cannot be generated, customized, or saved, as they are specific to the report from which they were derived. They are not available in search results.
Explore your data center using APTARE IT Analytics customizable report templates or by using parts of your IT infrastructure as entry points. Use Search to find reports, templates and dashboards across the portal.
Use the Reports tab to examine the APTARE IT Analytics catalog of templates, dashboards and reports - organized by products along with user-created, and system folders. The main report is located here:
System Administration Reports > License Summary
Device IP address or name of the host/server from which the data was collected.
Type CIFS, NetApp, Windows, or Linux.
Hidden Indicates if the device is not being counted toward licensing.
Utilized Utilization associated with the data collected.
Last Access Date and time of last successful data collection.
Name Name of the VM server; links to the VM Server Detail report
IP Address IP address of the virtual server
Active VMs Number of active VMs
Total VMs Total number of VMs
Last Access Date and time of last successful data collection
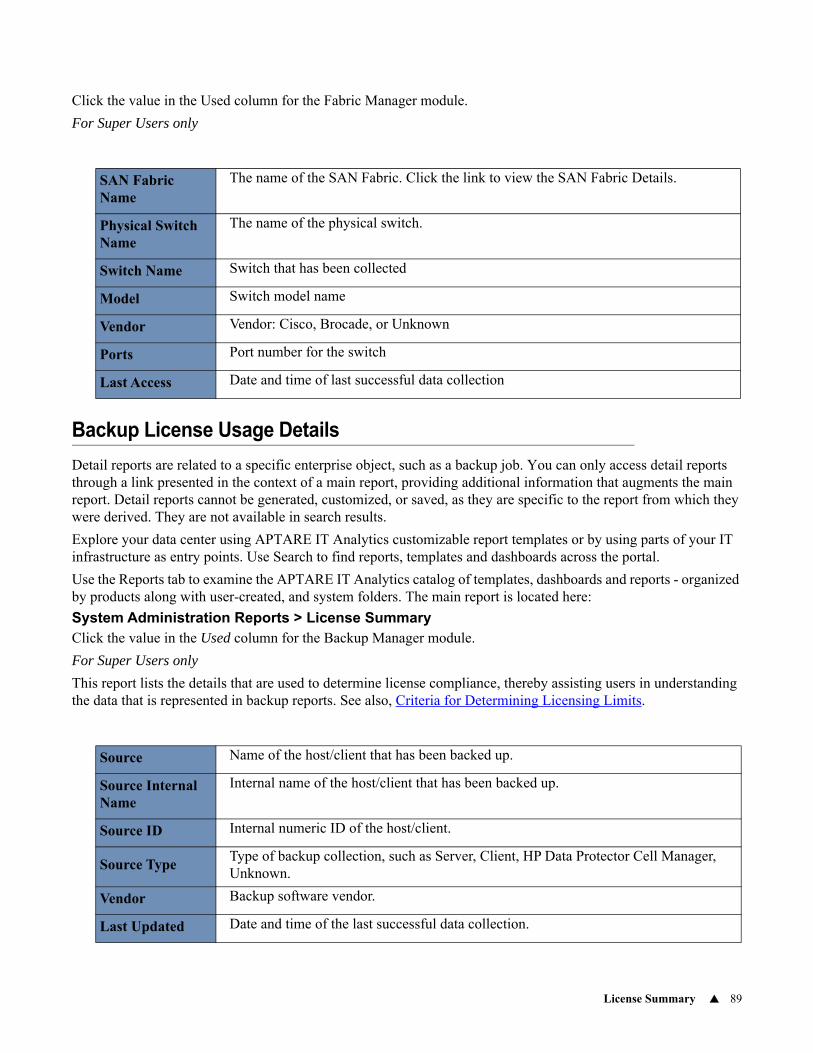
License Summary 89
Click the value in the Used column for the Fabric Manager module.
For Super Users only
Backup License Usage Details
Detail reports are related to a specific enterprise object, such as a backup job. You can only access detail reports through a link presented in the context of a main report, providing additional information that augments the main report. Detail reports cannot be generated, customized, or saved, as they are specific to the report from which they were derived. They are not available in search results.
Explore your data center using APTARE IT Analytics customizable report templates or by using parts of your IT infrastructure as entry points. Use Search to find reports, templates and dashboards across the portal.
Use the Reports tab to examine the APTARE IT Analytics catalog of templates, dashboards and reports - organized by products along with user-created, and system folders. The main report is located here:
System Administration Reports > License SummaryClick the value in the Used column for the Backup Manager module.
For Super Users only
This report lists the details that are used to determine license compliance, thereby assisting users in understanding the data that is represented in backup reports. See also, Criteria for Determining Licensing Limits.
SAN Fabric Name
The name of the SAN Fabric. Click the link to view the SAN Fabric Details.
Physical Switch Name
The name of the physical switch.
Switch Name Switch that has been collected
Model Switch model name
Vendor Vendor: Cisco, Brocade, or Unknown
Ports Port number for the switch
Last Access Date and time of last successful data collection
Source Name of the host/client that has been backed up.
Source Internal Name
Internal name of the host/client that has been backed up.
Source ID Internal numeric ID of the host/client.
Source TypeType of backup collection, such as Server, Client, HP Data Protector Cell Manager, Unknown.
Vendor Backup software vendor.
Last Updated Date and time of the last successful data collection.
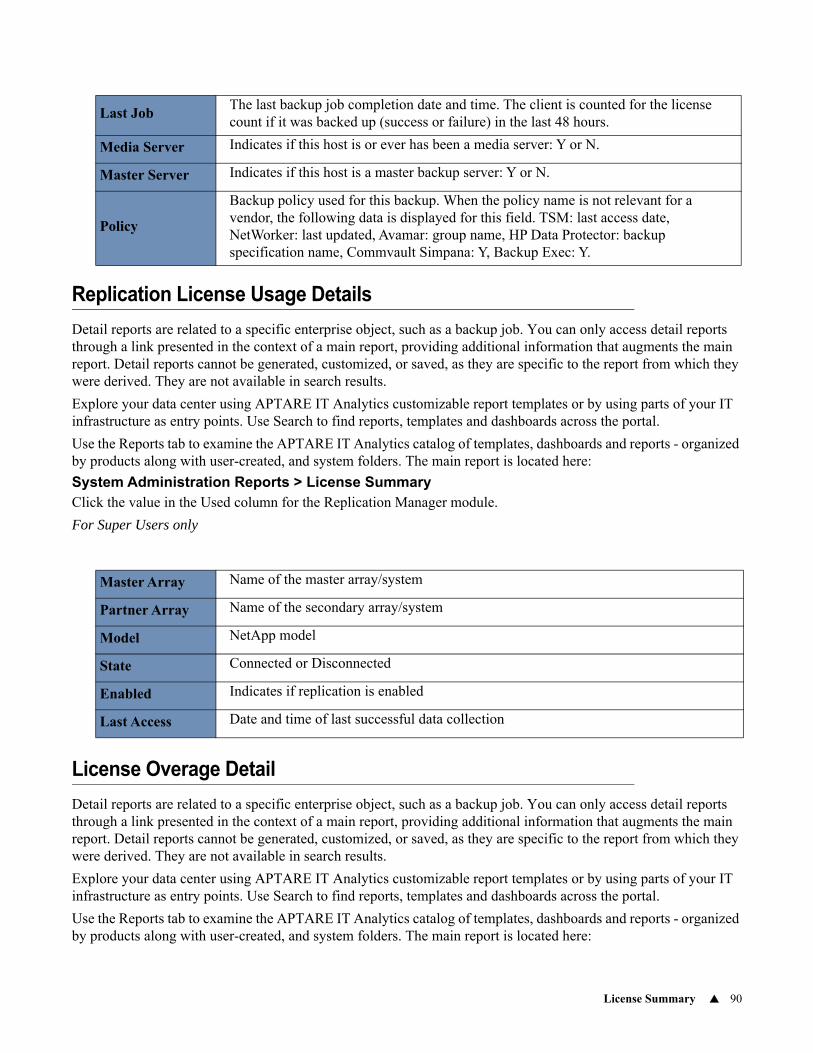
License Summary 90
Replication License Usage Details
Detail reports are related to a specific enterprise object, such as a backup job. You can only access detail reports through a link presented in the context of a main report, providing additional information that augments the main report. Detail reports cannot be generated, customized, or saved, as they are specific to the report from which they were derived. They are not available in search results.
Explore your data center using APTARE IT Analytics customizable report templates or by using parts of your IT infrastructure as entry points. Use Search to find reports, templates and dashboards across the portal.
Use the Reports tab to examine the APTARE IT Analytics catalog of templates, dashboards and reports - organized by products along with user-created, and system folders. The main report is located here:
System Administration Reports > License SummaryClick the value in the Used column for the Replication Manager module.
For Super Users only
License Overage Detail
Detail reports are related to a specific enterprise object, such as a backup job. You can only access detail reports through a link presented in the context of a main report, providing additional information that augments the main report. Detail reports cannot be generated, customized, or saved, as they are specific to the report from which they were derived. They are not available in search results.
Explore your data center using APTARE IT Analytics customizable report templates or by using parts of your IT infrastructure as entry points. Use Search to find reports, templates and dashboards across the portal.
Use the Reports tab to examine the APTARE IT Analytics catalog of templates, dashboards and reports - organized by products along with user-created, and system folders. The main report is located here:
Last JobThe last backup job completion date and time. The client is counted for the license count if it was backed up (success or failure) in the last 48 hours.
Media Server Indicates if this host is or ever has been a media server: Y or N.
Master Server Indicates if this host is a master backup server: Y or N.
Policy
Backup policy used for this backup. When the policy name is not relevant for a vendor, the following data is displayed for this field. TSM: last access date, NetWorker: last updated, Avamar: group name, HP Data Protector: backup specification name, Commvault Simpana: Y, Backup Exec: Y.
Master Array Name of the master array/system
Partner Array Name of the secondary array/system
Model NetApp model
State Connected or Disconnected
Enabled Indicates if replication is enabled
Last Access Date and time of last successful data collection
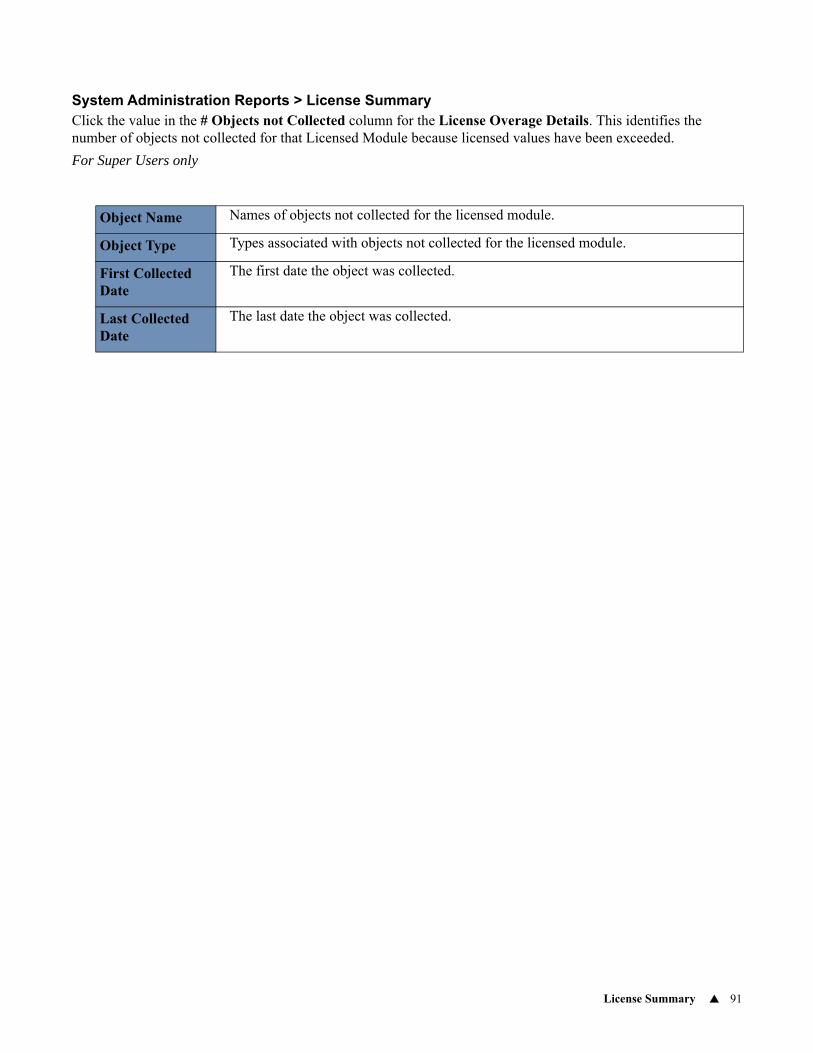
License Summary 91
System Administration Reports > License SummaryClick the value in the # Objects not Collected column for the License Overage Details. This identifies the number of objects not collected for that Licensed Module because licensed values have been exceeded.
For Super Users only
Object Name Names of objects not collected for the licensed module.
Object Type Types associated with objects not collected for the licensed module.
First Collected Date
The first date the object was collected.
Last Collected Date
The last date the object was collected.
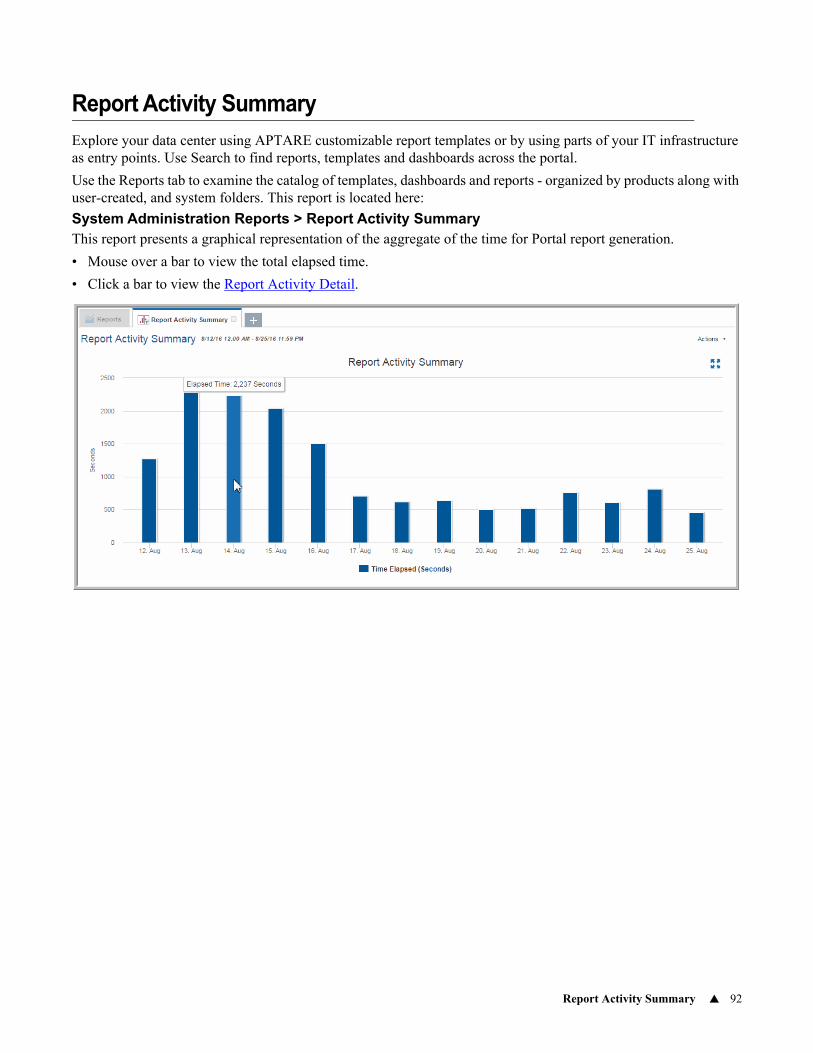
Report Activity Summary 92
Report Activity Summary
Explore your data center using APTARE customizable report templates or by using parts of your IT infrastructure as entry points. Use Search to find reports, templates and dashboards across the portal.
Use the Reports tab to examine the catalog of templates, dashboards and reports - organized by products along with user-created, and system folders. This report is located here:
System Administration Reports > Report Activity SummaryThis report presents a graphical representation of the aggregate of the time for Portal report generation.
• Mouse over a bar to view the total elapsed time.
• Click a bar to view the Report Activity Detail.
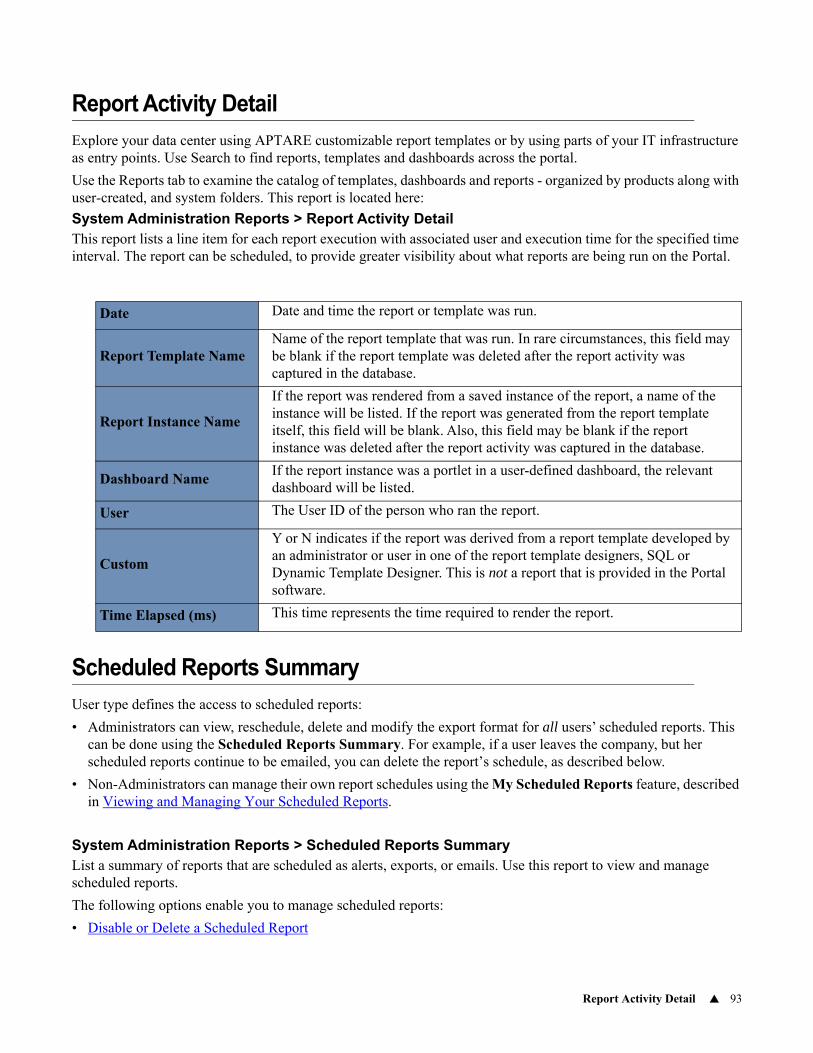
Report Activity Detail 93
Report Activity Detail
Explore your data center using APTARE customizable report templates or by using parts of your IT infrastructure as entry points. Use Search to find reports, templates and dashboards across the portal.
Use the Reports tab to examine the catalog of templates, dashboards and reports - organized by products along with user-created, and system folders. This report is located here:
System Administration Reports > Report Activity DetailThis report lists a line item for each report execution with associated user and execution time for the specified time interval. The report can be scheduled, to provide greater visibility about what reports are being run on the Portal.
Scheduled Reports Summary
User type defines the access to scheduled reports:
• Administrators can view, reschedule, delete and modify the export format for all users’ scheduled reports. This can be done using the Scheduled Reports Summary. For example, if a user leaves the company, but her scheduled reports continue to be emailed, you can delete the report’s schedule, as described below.
• Non-Administrators can manage their own report schedules using the My Scheduled Reports feature, described in Viewing and Managing Your Scheduled Reports.
System Administration Reports > Scheduled Reports SummaryList a summary of reports that are scheduled as alerts, exports, or emails. Use this report to view and manage scheduled reports.
The following options enable you to manage scheduled reports:
• Disable or Delete a Scheduled Report
Date Date and time the report or template was run.
Report Template NameName of the report template that was run. In rare circumstances, this field may be blank if the report template was deleted after the report activity was captured in the database.
Report Instance Name
If the report was rendered from a saved instance of the report, a name of the instance will be listed. If the report was generated from the report template itself, this field will be blank. Also, this field may be blank if the report instance was deleted after the report activity was captured in the database.
Dashboard NameIf the report instance was a portlet in a user-defined dashboard, the relevant dashboard will be listed.
User The User ID of the person who ran the report.
Custom
Y or N indicates if the report was derived from a report template developed by an administrator or user in one of the report template designers, SQL or Dynamic Template Designer. This is not a report that is provided in the Portal software.
Time Elapsed (ms) This time represents the time required to render the report.
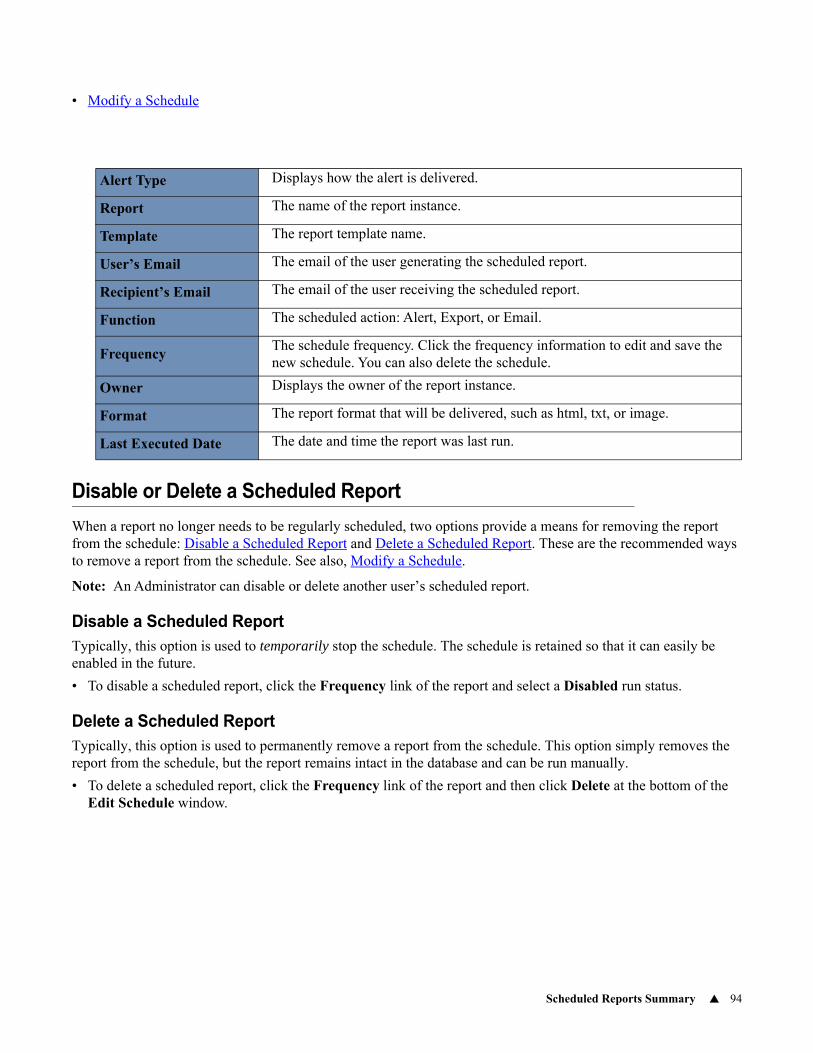
Scheduled Reports Summary 94
• Modify a Schedule
Disable or Delete a Scheduled Report
When a report no longer needs to be regularly scheduled, two options provide a means for removing the report from the schedule: Disable a Scheduled Report and Delete a Scheduled Report. These are the recommended ways to remove a report from the schedule. See also, Modify a Schedule.
Note: An Administrator can disable or delete another user’s scheduled report.
Disable a Scheduled ReportTypically, this option is used to temporarily stop the schedule. The schedule is retained so that it can easily be enabled in the future.
• To disable a scheduled report, click the Frequency link of the report and select a Disabled run status.
Delete a Scheduled ReportTypically, this option is used to permanently remove a report from the schedule. This option simply removes the report from the schedule, but the report remains intact in the database and can be run manually.
• To delete a scheduled report, click the Frequency link of the report and then click Delete at the bottom of the Edit Schedule window.
Alert Type Displays how the alert is delivered.
Report The name of the report instance.
Template The report template name.
User’s Email The email of the user generating the scheduled report.
Recipient’s Email The email of the user receiving the scheduled report.
Function The scheduled action: Alert, Export, or Email.
FrequencyThe schedule frequency. Click the frequency information to edit and save the new schedule. You can also delete the schedule.
Owner Displays the owner of the report instance.
Format The report format that will be delivered, such as html, txt, or image.
Last Executed Date The date and time the report was last run.
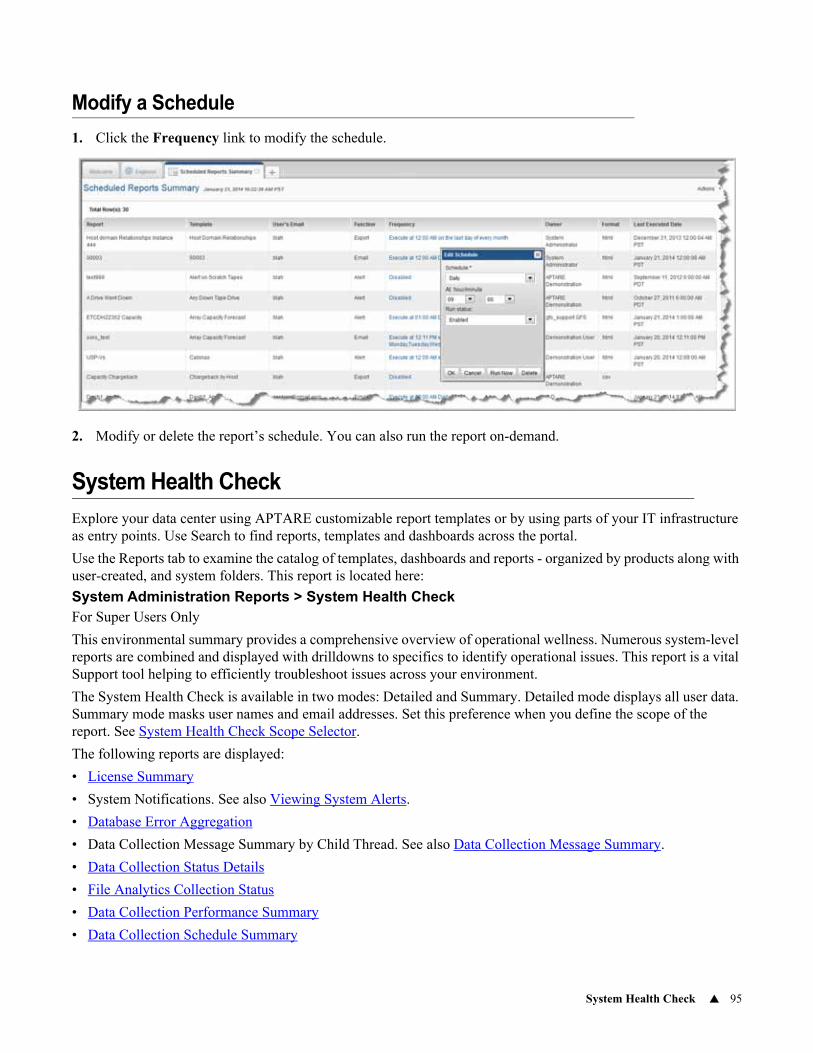
System Health Check 95
Modify a Schedule
1. Click the Frequency link to modify the schedule.
2. Modify or delete the report’s schedule. You can also run the report on-demand.
System Health Check
Explore your data center using APTARE customizable report templates or by using parts of your IT infrastructure as entry points. Use Search to find reports, templates and dashboards across the portal.
Use the Reports tab to examine the catalog of templates, dashboards and reports - organized by products along with user-created, and system folders. This report is located here:
System Administration Reports > System Health CheckFor Super Users Only
This environmental summary provides a comprehensive overview of operational wellness. Numerous system-level reports are combined and displayed with drilldowns to specifics to identify operational issues. This report is a vital Support tool helping to efficiently troubleshoot issues across your environment.
The System Health Check is available in two modes: Detailed and Summary. Detailed mode displays all user data. Summary mode masks user names and email addresses. Set this preference when you define the scope of the report. See System Health Check Scope Selector.
The following reports are displayed:
• License Summary
• System Notifications. See also Viewing System Alerts.
• Database Error Aggregation
• Data Collection Message Summary by Child Thread. See also Data Collection Message Summary.
• Data Collection Status Details
• File Analytics Collection Status
• Data Collection Performance Summary
• Data Collection Schedule Summary
System Health Check 96
• Report Activity Summary
• Top 10 Reports by Resource Consumption. See also Top Running Report Details.
• Top 20 Largest Tables
• Inventory Object Summary
• Top 10 Frequently Run Reports. See also Top Running Reports.
• Last 10 Unique Logins
See also Interacting with Reports.
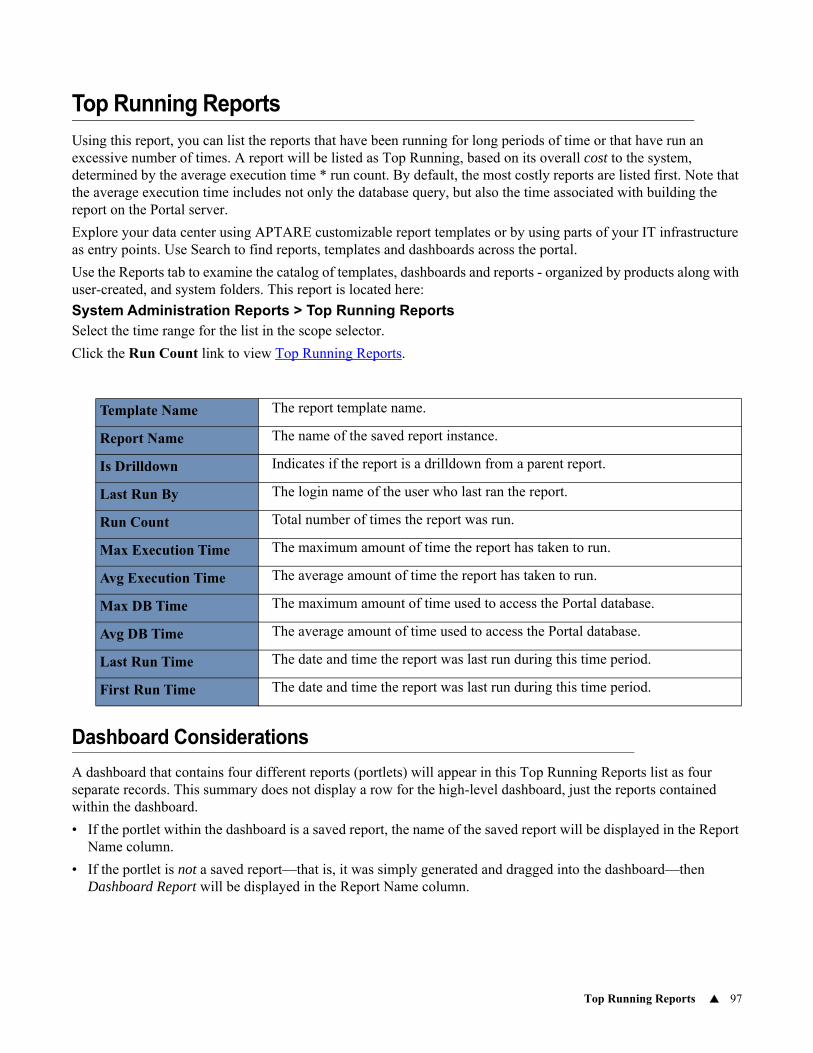
Top Running Reports 97
Top Running Reports
Using this report, you can list the reports that have been running for long periods of time or that have run an excessive number of times. A report will be listed as Top Running, based on its overall cost to the system, determined by the average execution time * run count. By default, the most costly reports are listed first. Note that the average execution time includes not only the database query, but also the time associated with building the report on the Portal server.
Explore your data center using APTARE customizable report templates or by using parts of your IT infrastructure as entry points. Use Search to find reports, templates and dashboards across the portal.
Use the Reports tab to examine the catalog of templates, dashboards and reports - organized by products along with user-created, and system folders. This report is located here:
System Administration Reports > Top Running ReportsSelect the time range for the list in the scope selector.
Click the Run Count link to view Top Running Reports.
Dashboard Considerations
A dashboard that contains four different reports (portlets) will appear in this Top Running Reports list as four separate records. This summary does not display a row for the high-level dashboard, just the reports contained within the dashboard.
• If the portlet within the dashboard is a saved report, the name of the saved report will be displayed in the Report Name column.
• If the portlet is not a saved report—that is, it was simply generated and dragged into the dashboard—then Dashboard Report will be displayed in the Report Name column.
Template Name The report template name.
Report Name The name of the saved report instance.
Is Drilldown Indicates if the report is a drilldown from a parent report.
Last Run By The login name of the user who last ran the report.
Run Count Total number of times the report was run.
Max Execution Time The maximum amount of time the report has taken to run.
Avg Execution Time The average amount of time the report has taken to run.
Max DB Time The maximum amount of time used to access the Portal database.
Avg DB Time The average amount of time used to access the Portal database.
Last Run Time The date and time the report was last run during this time period.
First Run Time The date and time the report was last run during this time period.
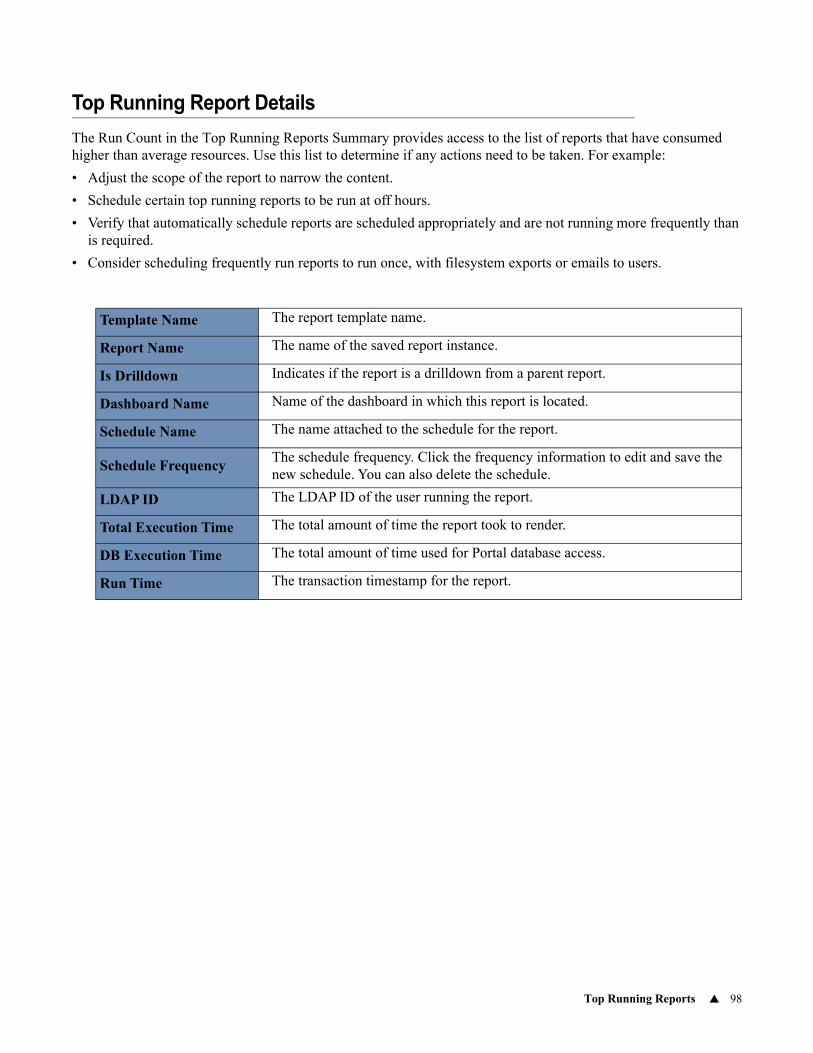
Top Running Reports 98
Top Running Report Details
The Run Count in the Top Running Reports Summary provides access to the list of reports that have consumed higher than average resources. Use this list to determine if any actions need to be taken. For example:
• Adjust the scope of the report to narrow the content.
• Schedule certain top running reports to be run at off hours.
• Verify that automatically schedule reports are scheduled appropriately and are not running more frequently than is required.
• Consider scheduling frequently run reports to run once, with filesystem exports or emails to users.
Template Name The report template name.
Report Name The name of the saved report instance.
Is Drilldown Indicates if the report is a drilldown from a parent report.
Dashboard Name Name of the dashboard in which this report is located.
Schedule Name The name attached to the schedule for the report.
Schedule FrequencyThe schedule frequency. Click the frequency information to edit and save the new schedule. You can also delete the schedule.
LDAP ID The LDAP ID of the user running the report.
Total Execution Time The total amount of time the report took to render.
DB Execution Time The total amount of time used for Portal database access.
Run Time The transaction timestamp for the report.
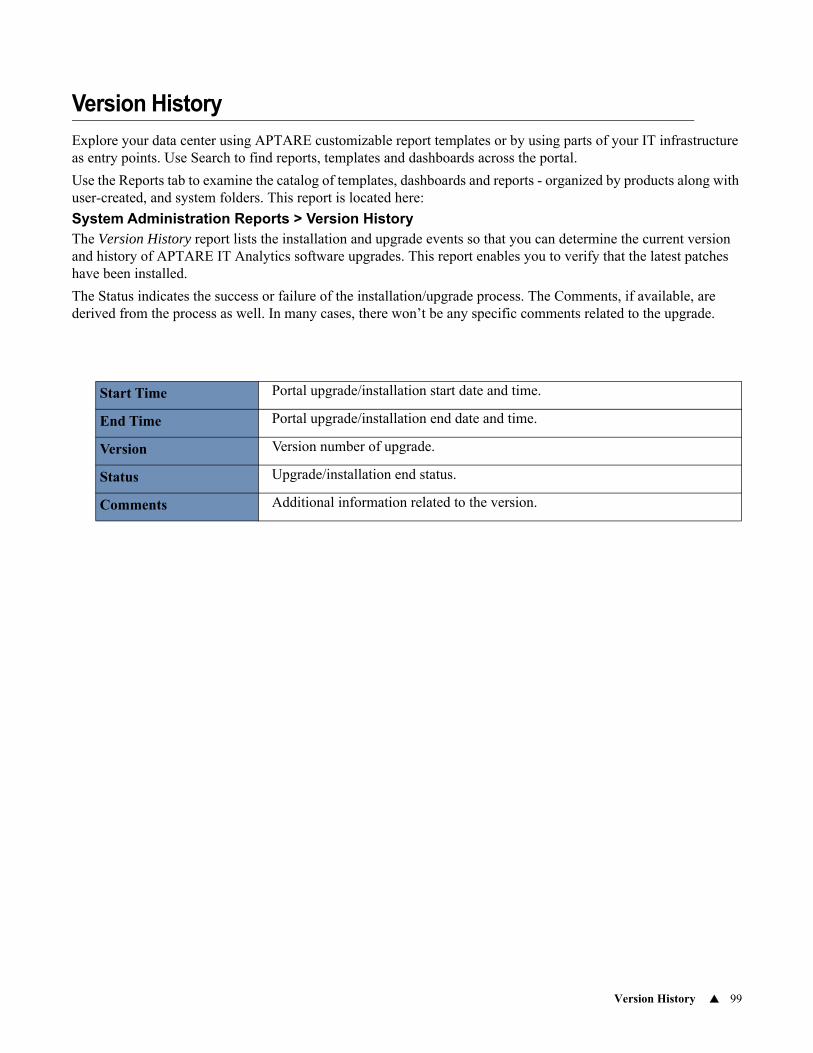
Version History 99
Version History
Explore your data center using APTARE customizable report templates or by using parts of your IT infrastructure as entry points. Use Search to find reports, templates and dashboards across the portal.
Use the Reports tab to examine the catalog of templates, dashboards and reports - organized by products along with user-created, and system folders. This report is located here:
System Administration Reports > Version HistoryThe Version History report lists the installation and upgrade events so that you can determine the current version and history of APTARE IT Analytics software upgrades. This report enables you to verify that the latest patches have been installed.
The Status indicates the success or failure of the installation/upgrade process. The Comments, if available, are derived from the process as well. In many cases, there won’t be any specific comments related to the upgrade.
Start Time Portal upgrade/installation start date and time.
End Time Portal upgrade/installation end date and time.
Version Version number of upgrade.
Status Upgrade/installation end status.
Comments Additional information related to the version.
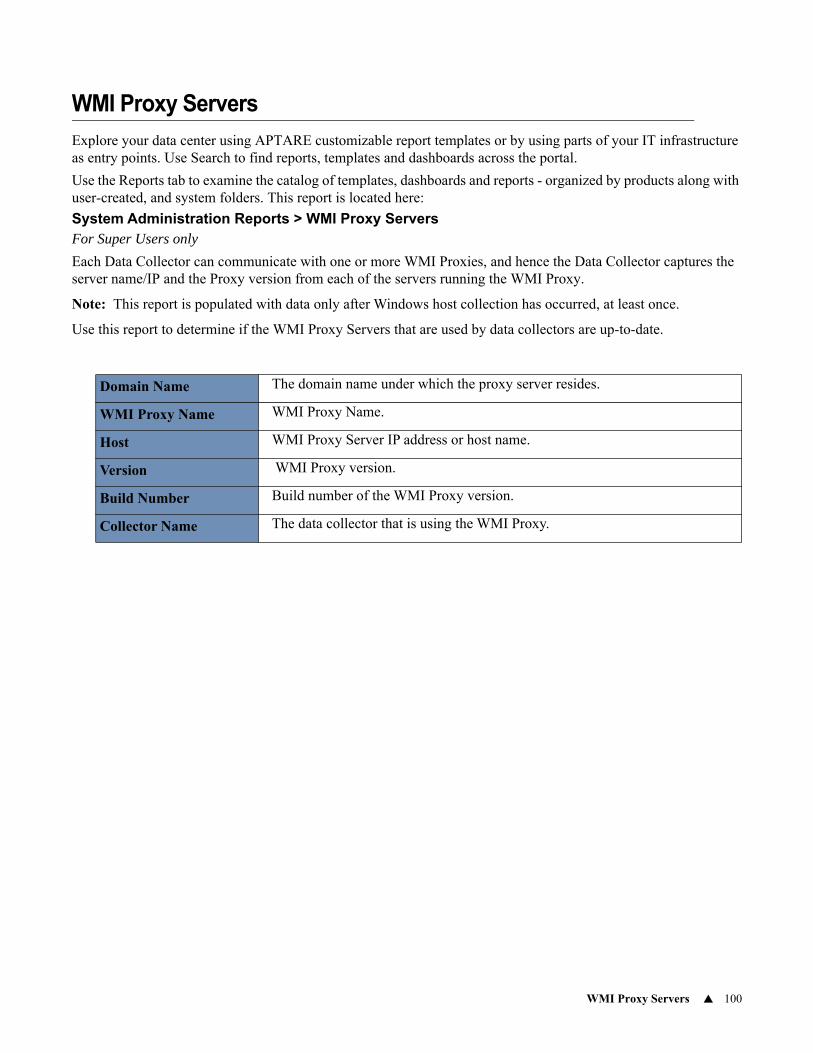
WMI Proxy Servers 100
WMI Proxy Servers
Explore your data center using APTARE customizable report templates or by using parts of your IT infrastructure as entry points. Use Search to find reports, templates and dashboards across the portal.
Use the Reports tab to examine the catalog of templates, dashboards and reports - organized by products along with user-created, and system folders. This report is located here:
System Administration Reports > WMI Proxy ServersFor Super Users only
Each Data Collector can communicate with one or more WMI Proxies, and hence the Data Collector captures the server name/IP and the Proxy version from each of the servers running the WMI Proxy.
Note: This report is populated with data only after Windows host collection has occurred, at least once.
Use this report to determine if the WMI Proxy Servers that are used by data collectors are up-to-date.
Domain Name The domain name under which the proxy server resides.
WMI Proxy Name WMI Proxy Name.
Host WMI Proxy Server IP address or host name.
Version WMI Proxy version.
Build Number Build number of the WMI Proxy version.
Collector Name The data collector that is using the WMI Proxy.
102
6Chapter 0Array Capacity Utilization Reports
This section covers the following topics:
• Managing Capacity Quick-Start List
• Array Capacity and Utilization
• Array Executive Summary
• Array iSCSI Port Utilization
• AWS S3 Bucket Summary
• Data Domain Filesystem Compression
• Data Domain System Summary - Storage
• Data Domain MTree Summary
• Data Domain Replication History
• Data Domain Snapshot History
• List Array Groups
• HP EVA Physical Disks
• Array FC Port Utilization
• EMC Isilon Disks
• EMC Isilon HDFS Racks
• EMC Isilon HDFS Roots
• EMC Isilon License Detail
• EMC Isilon NFS Exports
• EMC Isilon Nodes
• EMC Isilon Quota Summary
• EMC Isilon SMB Share Summary
• EMC Isilon Snapshot Summary
• EMC Isilon Zones
• EMC VNX (Celerra) Virtual Data Mover Summary
• EMC VNX (Celerra) File System Summary
• EMC VNX (Celerra) SnapSure Summary
• EMC VNX (Celerra) Storage Pools Summary
• EMC VNX (Celerra) Tree Summary
• EMC VNX (Celerra) Volume Summary
• EMC VNX (Celerra) Disk Summary
103
• EMC VPLEX Backend Array Summary
• EMC VPLEX Backend Array Summary
• EMC VPLEX Device Summary
• EMC VPLEX Extent Summary
• EMC VPLEX Port Summary
• EMC VPLEX Storage View Summary
• EMC VPLEX Storage Volume Summary
• Object Store Namespace Summary
• Node Summary
• Object Store Tenant Summary
• Hitachi NAS CIFS Share Summary
• Hitachi NAS Disk Summary
• Hitachi NAS EVS Summary
• Hitachi NAS Ethernet Port Summary
• Hitachi NAS File System Summary
• Hitachi NAS NFS Export Summary
• Hitachi NAS Snapshot Summary
• Hitachi NAS Storage Pool Summary
• Hitachi NAS Storage Server Summary
• Hitachi NAS System Drive Summary
• Hitachi NAS Tier Summary
• Hitachi NAS Virtual Volume Summary
• IBM Array Site Summary
• IBM Array Summary
• IBM Disk Summary
• IBM Extent Pool Summary
• IBM Rank Summary
• IBM SVC VDisk Summary
• IBM SVC MDisk Groups
• IBM SVC MDisk Summary
• How Capacity Values are Represented in XIV Reports
• IBM XIV Consistency Groups Summary
• IBM XIV Storage Pool Details
• LUN Utilization Summary
• LUN Utilization Summary for EMC VPLEX Arrays
• LUN Utilization Summary for IBM XIV Arrays
• LUN Utilization Summary for NetApp 7-Mode
• LUN Utilization Summary for NetApp Cluster-Mode
104
• LUN Utilization Summary for HP3PAR
• Array Group Details
• Microsoft Azure Endpoint Summary
• Microsoft Azure Storage Account Summary
• NetApp Aggregate Summary
• NetApp Cluster-Mode Aggregate Summary
• NetApp Aggregate Detail
• NetApp Cluster-Mode Aggregate Detail
• NetApp Plex Details
• NetApp CIFS Summary
• NetApp Cluster-Mode CIFS Summary
• NetApp Disk Summary
• NetApp Cluster-Mode Disk Summary
• NetApp Cluster-Mode FC Array Port Utilization
• NetApp NFS Summary
• NetApp Cluster-Mode NFS Summary
• NetApp Cluster-Mode Node Summary
• NetApp QTree Summary
• NetApp Cluster-Mode QTree Summary
• NetApp Snapshot Summary
• NetApp Cluster-Mode Snapshot Summary
• NetApp Volume Summary
• NetApp Cluster-Mode Volume Summary
• NetApp Volume Details
• NetApp Cluster-Mode Volume Detail
• NetApp Cluster-Mode Summary
• NetApp Cluster-Mode Thin Provisioning Summary
• NetApp Cluster-Mode Vserver Summary
• OpenStack Swift Container Summary
• OpenStack Swift Policy Summary
• OpenStack Swift Storage Utilization by Account
• OpenStack Swift Storage Utilization by Zone
• OpenStack Swift Storage Device Summary
• OpenStack Swift Storage Utilization by Node
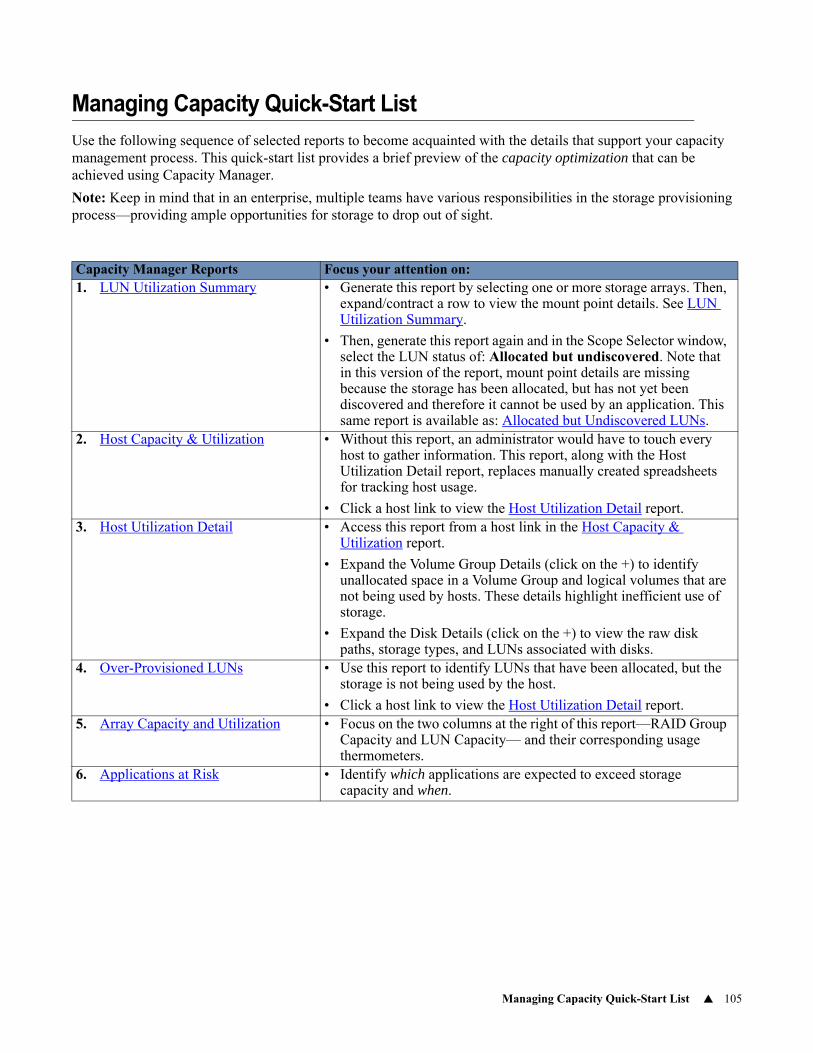
Managing Capacity Quick-Start List 105
Managing Capacity Quick-Start List
Use the following sequence of selected reports to become acquainted with the details that support your capacity management process. This quick-start list provides a brief preview of the capacity optimization that can be achieved using Capacity Manager.
Note: Keep in mind that in an enterprise, multiple teams have various responsibilities in the storage provisioning process—providing ample opportunities for storage to drop out of sight.
Capacity Manager Reports Focus your attention on:1. LUN Utilization Summary • Generate this report by selecting one or more storage arrays. Then,
expand/contract a row to view the mount point details. See LUN Utilization Summary.
• Then, generate this report again and in the Scope Selector window, select the LUN status of: Allocated but undiscovered. Note that in this version of the report, mount point details are missing because the storage has been allocated, but has not yet been discovered and therefore it cannot be used by an application. This same report is available as: Allocated but Undiscovered LUNs.
2. Host Capacity & Utilization • Without this report, an administrator would have to touch every host to gather information. This report, along with the Host Utilization Detail report, replaces manually created spreadsheets for tracking host usage.
• Click a host link to view the Host Utilization Detail report.3. Host Utilization Detail • Access this report from a host link in the Host Capacity &
Utilization report.
• Expand the Volume Group Details (click on the +) to identify unallocated space in a Volume Group and logical volumes that are not being used by hosts. These details highlight inefficient use of storage.
• Expand the Disk Details (click on the +) to view the raw disk paths, storage types, and LUNs associated with disks.
4. Over-Provisioned LUNs • Use this report to identify LUNs that have been allocated, but the storage is not being used by the host.
• Click a host link to view the Host Utilization Detail report.5. Array Capacity and Utilization • Focus on the two columns at the right of this report—RAID Group
Capacity and LUN Capacity— and their corresponding usage thermometers.
6. Applications at Risk • Identify which applications are expected to exceed storage capacity and when.
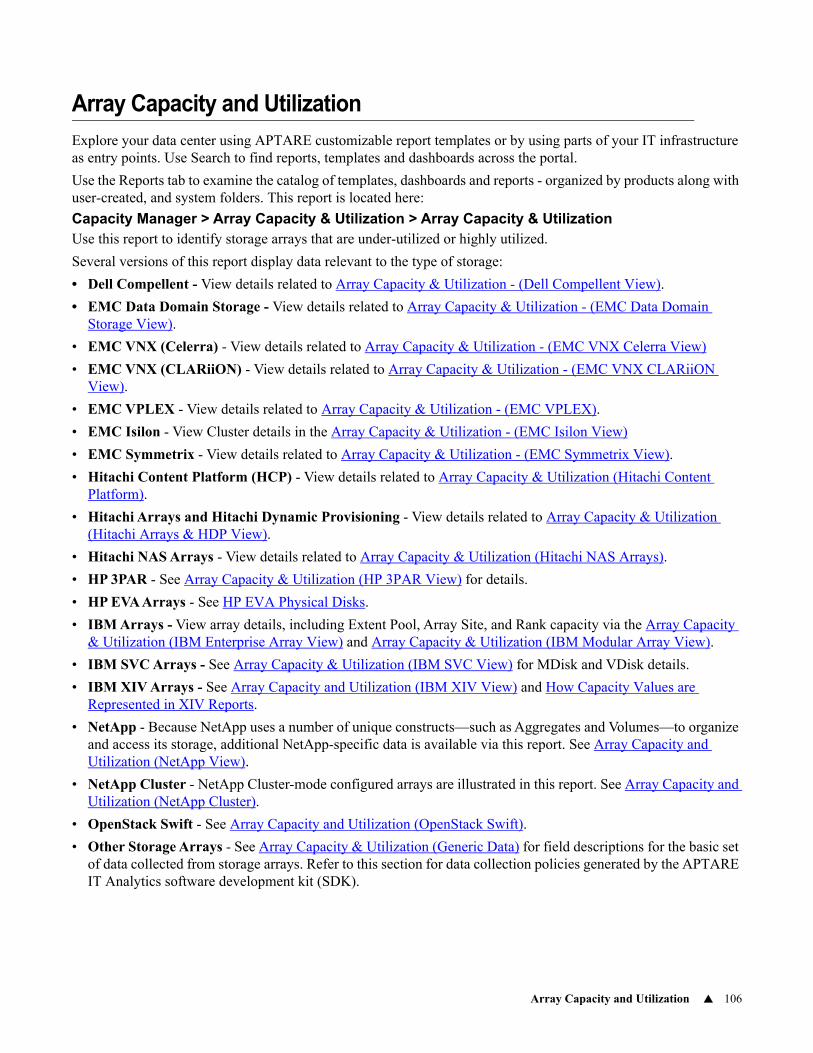
Array Capacity and Utilization 106
Array Capacity and Utilization
Explore your data center using APTARE customizable report templates or by using parts of your IT infrastructure as entry points. Use Search to find reports, templates and dashboards across the portal.
Use the Reports tab to examine the catalog of templates, dashboards and reports - organized by products along with user-created, and system folders. This report is located here:
Capacity Manager > Array Capacity & Utilization > Array Capacity & UtilizationUse this report to identify storage arrays that are under-utilized or highly utilized.
Several versions of this report display data relevant to the type of storage:
• Dell Compellent - View details related to Array Capacity & Utilization - (Dell Compellent View).
• EMC Data Domain Storage - View details related to Array Capacity & Utilization - (EMC Data Domain Storage View).
• EMC VNX (Celerra) - View details related to Array Capacity & Utilization - (EMC VNX Celerra View)
• EMC VNX (CLARiiON) - View details related to Array Capacity & Utilization - (EMC VNX CLARiiON View).
• EMC VPLEX - View details related to Array Capacity & Utilization - (EMC VPLEX).
• EMC Isilon - View Cluster details in the Array Capacity & Utilization - (EMC Isilon View)
• EMC Symmetrix - View details related to Array Capacity & Utilization - (EMC Symmetrix View).
• Hitachi Content Platform (HCP) - View details related to Array Capacity & Utilization (Hitachi Content Platform).
• Hitachi Arrays and Hitachi Dynamic Provisioning - View details related to Array Capacity & Utilization (Hitachi Arrays & HDP View).
• Hitachi NAS Arrays - View details related to Array Capacity & Utilization (Hitachi NAS Arrays).
• HP 3PAR - See Array Capacity & Utilization (HP 3PAR View) for details.
• HP EVA Arrays - See HP EVA Physical Disks.
• IBM Arrays - View array details, including Extent Pool, Array Site, and Rank capacity via the Array Capacity & Utilization (IBM Enterprise Array View) and Array Capacity & Utilization (IBM Modular Array View).
• IBM SVC Arrays - See Array Capacity & Utilization (IBM SVC View) for MDisk and VDisk details.
• IBM XIV Arrays - See Array Capacity and Utilization (IBM XIV View) and How Capacity Values are Represented in XIV Reports.
• NetApp - Because NetApp uses a number of unique constructs—such as Aggregates and Volumes—to organize and access its storage, additional NetApp-specific data is available via this report. See Array Capacity and Utilization (NetApp View).
• NetApp Cluster - NetApp Cluster-mode configured arrays are illustrated in this report. See Array Capacity and Utilization (NetApp Cluster).
• OpenStack Swift - See Array Capacity and Utilization (OpenStack Swift).
• Other Storage Arrays - See Array Capacity & Utilization (Generic Data) for field descriptions for the basic set of data collected from storage arrays. Refer to this section for data collection policies generated by the APTARE IT Analytics software development kit (SDK).
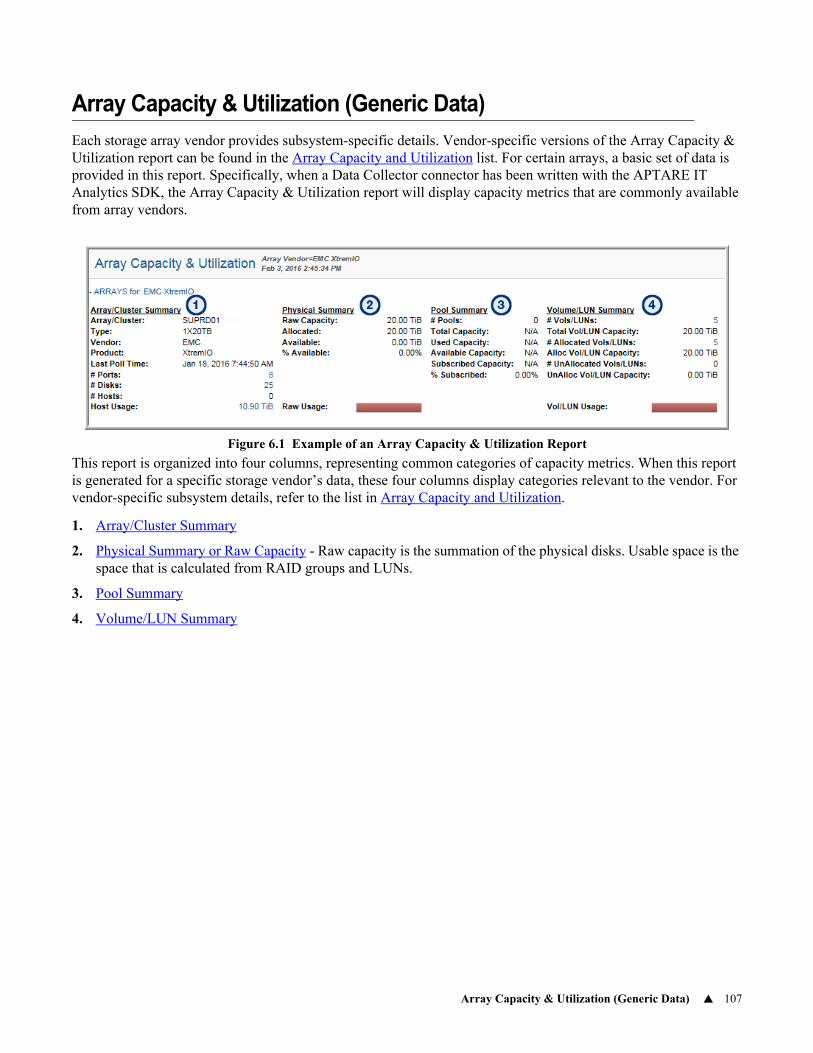
Array Capacity & Utilization (Generic Data) 107
Array Capacity & Utilization (Generic Data)
Each storage array vendor provides subsystem-specific details. Vendor-specific versions of the Array Capacity & Utilization report can be found in the Array Capacity and Utilization list. For certain arrays, a basic set of data is provided in this report. Specifically, when a Data Collector connector has been written with the APTARE IT Analytics SDK, the Array Capacity & Utilization report will display capacity metrics that are commonly available from array vendors.
Figure 6.1 Example of an Array Capacity & Utilization Report
This report is organized into four columns, representing common categories of capacity metrics. When this report is generated for a specific storage vendor’s data, these four columns display categories relevant to the vendor. For vendor-specific subsystem details, refer to the list in Array Capacity and Utilization.
1. Array/Cluster Summary
2. Physical Summary or Raw Capacity - Raw capacity is the summation of the physical disks. Usable space is the space that is calculated from RAID groups and LUNs.
3. Pool Summary
4. Volume/LUN Summary
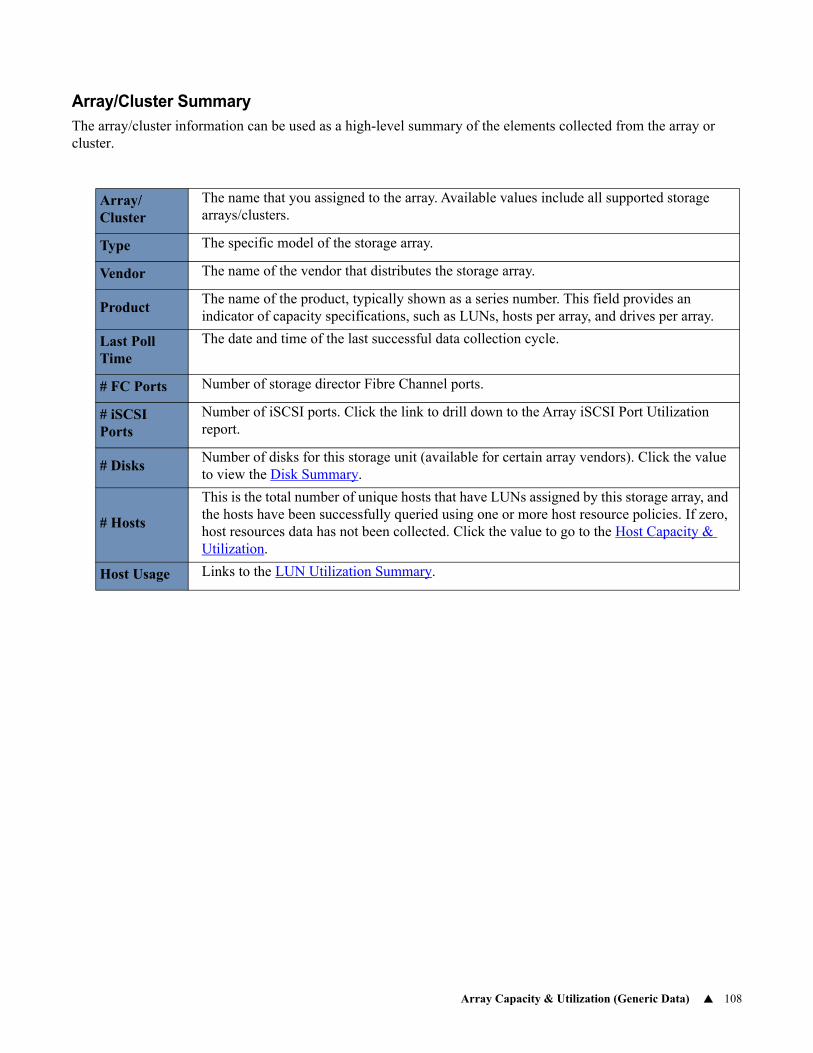
Array Capacity & Utilization (Generic Data) 108
Array/Cluster SummaryThe array/cluster information can be used as a high-level summary of the elements collected from the array or cluster.
Array/Cluster
The name that you assigned to the array. Available values include all supported storage arrays/clusters.
Type The specific model of the storage array.
Vendor The name of the vendor that distributes the storage array.
ProductThe name of the product, typically shown as a series number. This field provides an indicator of capacity specifications, such as LUNs, hosts per array, and drives per array.
Last Poll Time
The date and time of the last successful data collection cycle.
# FC Ports Number of storage director Fibre Channel ports.
# iSCSI Ports
Number of iSCSI ports. Click the link to drill down to the Array iSCSI Port Utilization report.
# DisksNumber of disks for this storage unit (available for certain array vendors). Click the value to view the Disk Summary.
# Hosts
This is the total number of unique hosts that have LUNs assigned by this storage array, and the hosts have been successfully queried using one or more host resource policies. If zero, host resources data has not been collected. Click the value to go to the Host Capacity & Utilization.
Host Usage Links to the LUN Utilization Summary.
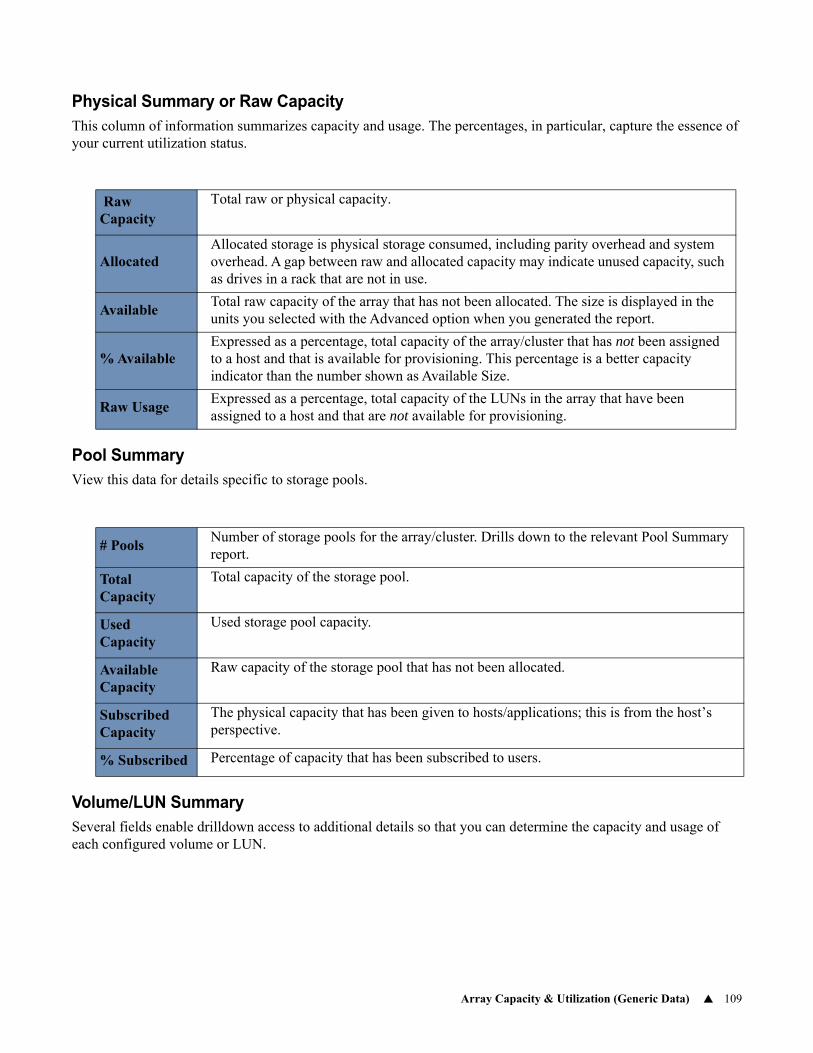
Array Capacity & Utilization (Generic Data) 109
Physical Summary or Raw CapacityThis column of information summarizes capacity and usage. The percentages, in particular, capture the essence of your current utilization status.
Pool SummaryView this data for details specific to storage pools.
Volume/LUN SummarySeveral fields enable drilldown access to additional details so that you can determine the capacity and usage of each configured volume or LUN.
Raw Capacity
Total raw or physical capacity.
AllocatedAllocated storage is physical storage consumed, including parity overhead and system overhead. A gap between raw and allocated capacity may indicate unused capacity, such as drives in a rack that are not in use.
AvailableTotal raw capacity of the array that has not been allocated. The size is displayed in the units you selected with the Advanced option when you generated the report.
% AvailableExpressed as a percentage, total capacity of the array/cluster that has not been assigned to a host and that is available for provisioning. This percentage is a better capacity indicator than the number shown as Available Size.
Raw UsageExpressed as a percentage, total capacity of the LUNs in the array that have been assigned to a host and that are not available for provisioning.
# PoolsNumber of storage pools for the array/cluster. Drills down to the relevant Pool Summary report.
Total Capacity
Total capacity of the storage pool.
Used Capacity
Used storage pool capacity.
Available Capacity
Raw capacity of the storage pool that has not been allocated.
Subscribed Capacity
The physical capacity that has been given to hosts/applications; this is from the host’s perspective.
% Subscribed Percentage of capacity that has been subscribed to users.
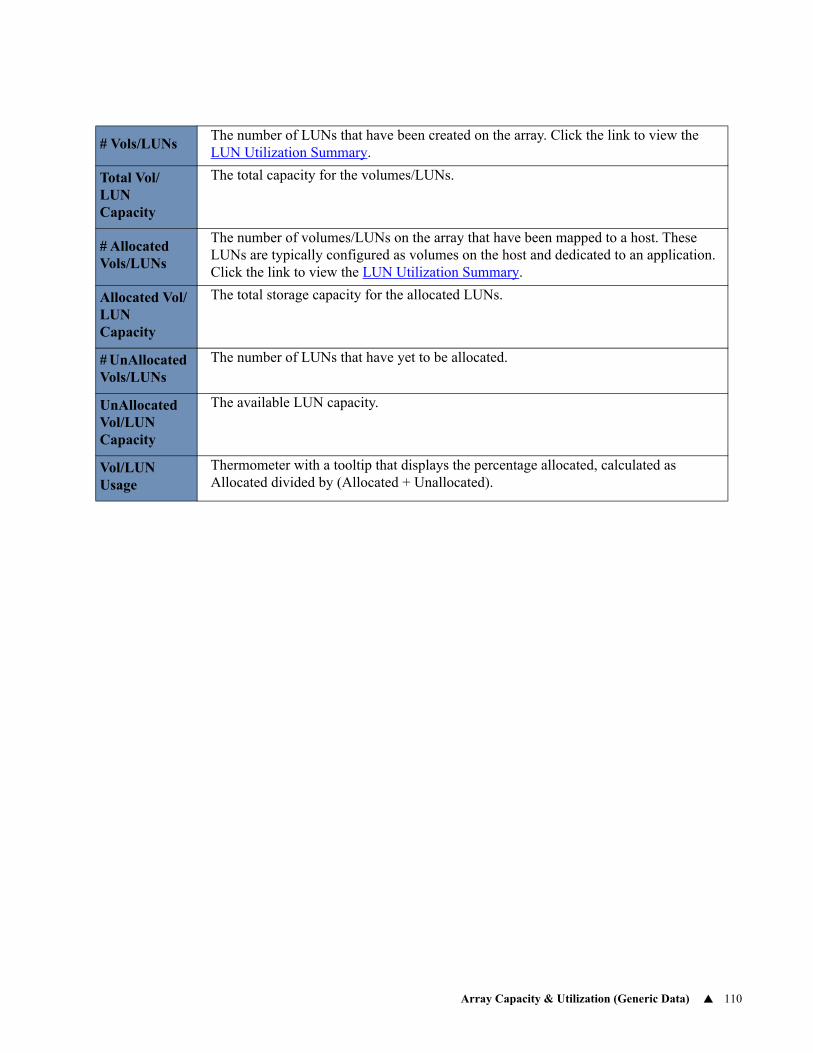
Array Capacity & Utilization (Generic Data) 110
# Vols/LUNsThe number of LUNs that have been created on the array. Click the link to view the LUN Utilization Summary.
Total Vol/LUN Capacity
The total capacity for the volumes/LUNs.
# Allocated Vols/LUNs
The number of volumes/LUNs on the array that have been mapped to a host. These LUNs are typically configured as volumes on the host and dedicated to an application. Click the link to view the LUN Utilization Summary.
Allocated Vol/LUN Capacity
The total storage capacity for the allocated LUNs.
# UnAllocated Vols/LUNs
The number of LUNs that have yet to be allocated.
UnAllocated Vol/LUN Capacity
The available LUN capacity.
Vol/LUN Usage
Thermometer with a tooltip that displays the percentage allocated, calculated as Allocated divided by (Allocated + Unallocated).
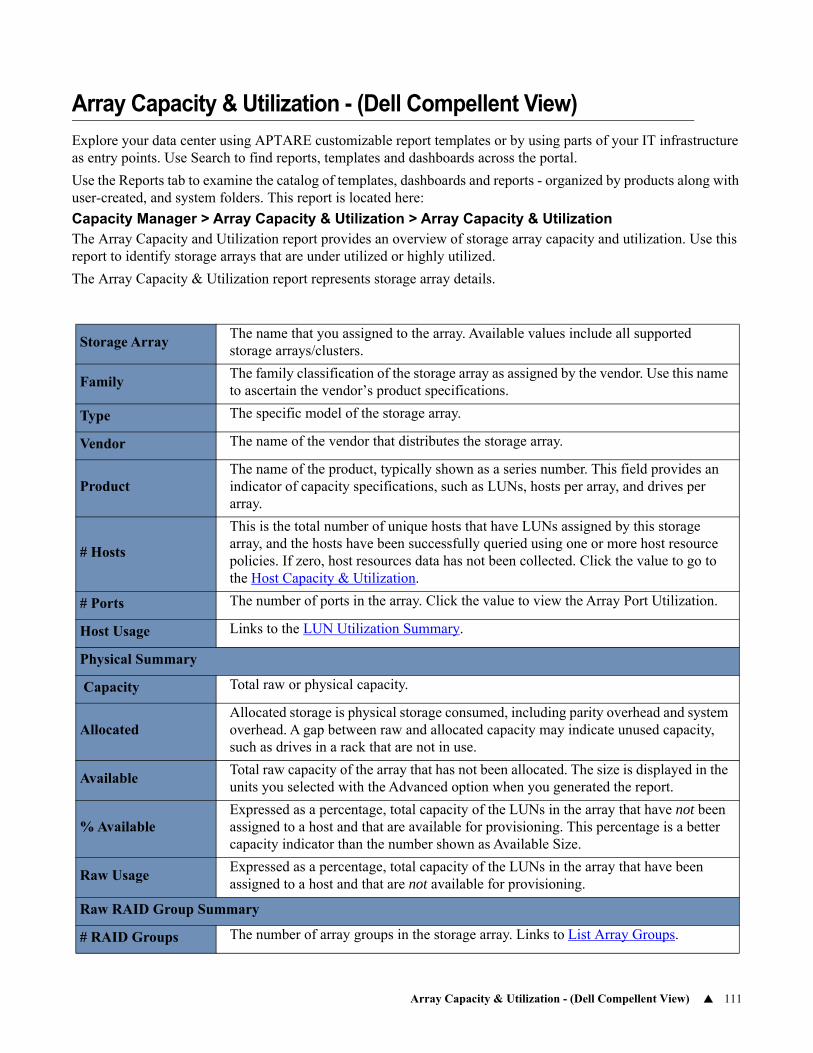
Array Capacity & Utilization - (Dell Compellent View) 111
Array Capacity & Utilization - (Dell Compellent View)
Explore your data center using APTARE customizable report templates or by using parts of your IT infrastructure as entry points. Use Search to find reports, templates and dashboards across the portal.
Use the Reports tab to examine the catalog of templates, dashboards and reports - organized by products along with user-created, and system folders. This report is located here:
Capacity Manager > Array Capacity & Utilization > Array Capacity & UtilizationThe Array Capacity and Utilization report provides an overview of storage array capacity and utilization. Use this report to identify storage arrays that are under utilized or highly utilized.
The Array Capacity & Utilization report represents storage array details.
Storage ArrayThe name that you assigned to the array. Available values include all supported storage arrays/clusters.
FamilyThe family classification of the storage array as assigned by the vendor. Use this name to ascertain the vendor’s product specifications.
Type The specific model of the storage array.
Vendor The name of the vendor that distributes the storage array.
ProductThe name of the product, typically shown as a series number. This field provides an indicator of capacity specifications, such as LUNs, hosts per array, and drives per array.
# Hosts
This is the total number of unique hosts that have LUNs assigned by this storage array, and the hosts have been successfully queried using one or more host resource policies. If zero, host resources data has not been collected. Click the value to go to the Host Capacity & Utilization.
# Ports The number of ports in the array. Click the value to view the Array Port Utilization.
Host Usage Links to the LUN Utilization Summary.
Physical Summary
Capacity Total raw or physical capacity.
AllocatedAllocated storage is physical storage consumed, including parity overhead and system overhead. A gap between raw and allocated capacity may indicate unused capacity, such as drives in a rack that are not in use.
AvailableTotal raw capacity of the array that has not been allocated. The size is displayed in the units you selected with the Advanced option when you generated the report.
% AvailableExpressed as a percentage, total capacity of the LUNs in the array that have not been assigned to a host and that are available for provisioning. This percentage is a better capacity indicator than the number shown as Available Size.
Raw UsageExpressed as a percentage, total capacity of the LUNs in the array that have been assigned to a host and that are not available for provisioning.
Raw RAID Group Summary
# RAID Groups The number of array groups in the storage array. Links to List Array Groups.
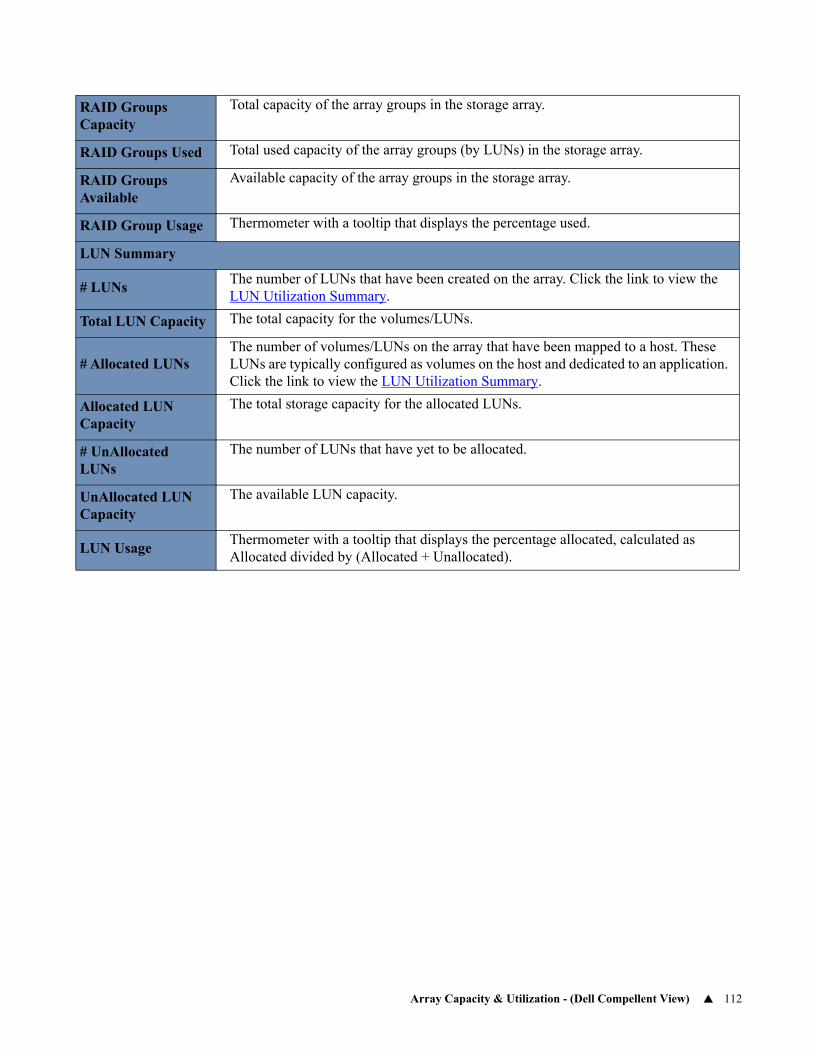
Array Capacity & Utilization - (Dell Compellent View) 112
RAID Groups Capacity
Total capacity of the array groups in the storage array.
RAID Groups Used Total used capacity of the array groups (by LUNs) in the storage array.
RAID Groups Available
Available capacity of the array groups in the storage array.
RAID Group Usage Thermometer with a tooltip that displays the percentage used.
LUN Summary
# LUNsThe number of LUNs that have been created on the array. Click the link to view the LUN Utilization Summary.
Total LUN Capacity The total capacity for the volumes/LUNs.
# Allocated LUNsThe number of volumes/LUNs on the array that have been mapped to a host. These LUNs are typically configured as volumes on the host and dedicated to an application. Click the link to view the LUN Utilization Summary.
Allocated LUN Capacity
The total storage capacity for the allocated LUNs.
# UnAllocated LUNs
The number of LUNs that have yet to be allocated.
UnAllocated LUN Capacity
The available LUN capacity.
LUN UsageThermometer with a tooltip that displays the percentage allocated, calculated as Allocated divided by (Allocated + Unallocated).
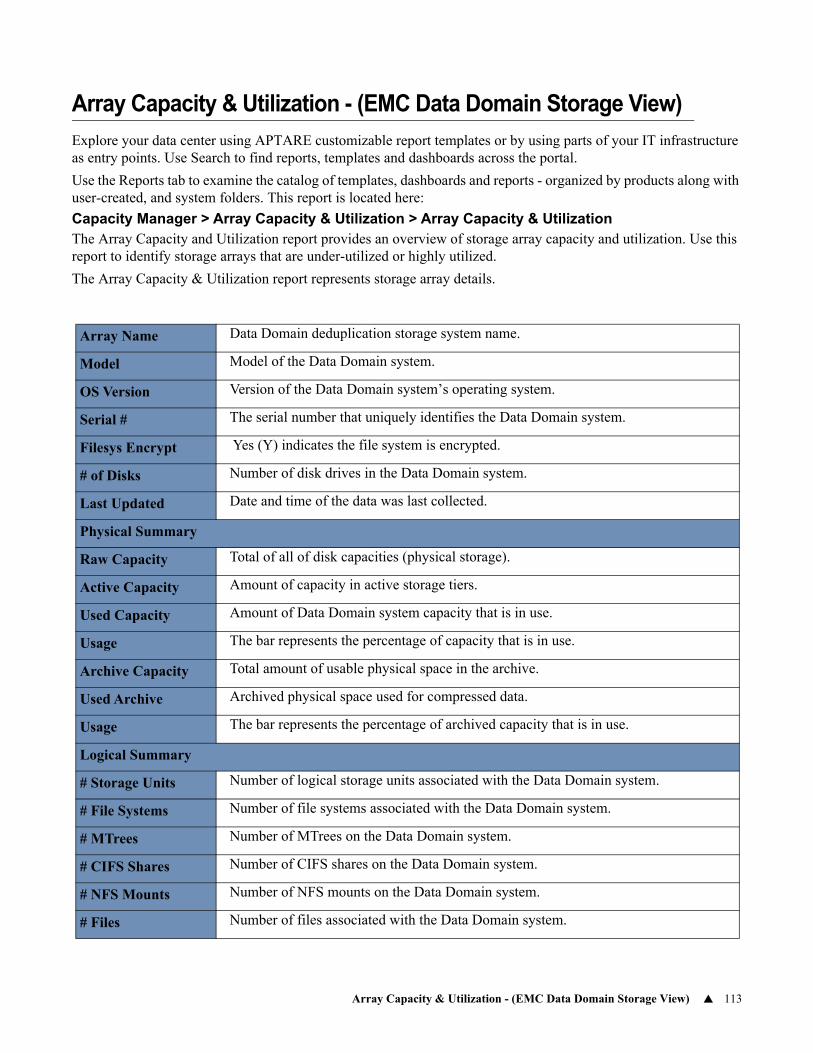
Array Capacity & Utilization - (EMC Data Domain Storage View) 113
Array Capacity & Utilization - (EMC Data Domain Storage View)
Explore your data center using APTARE customizable report templates or by using parts of your IT infrastructure as entry points. Use Search to find reports, templates and dashboards across the portal.
Use the Reports tab to examine the catalog of templates, dashboards and reports - organized by products along with user-created, and system folders. This report is located here:
Capacity Manager > Array Capacity & Utilization > Array Capacity & UtilizationThe Array Capacity and Utilization report provides an overview of storage array capacity and utilization. Use this report to identify storage arrays that are under-utilized or highly utilized.
The Array Capacity & Utilization report represents storage array details.
Array Name Data Domain deduplication storage system name.
Model Model of the Data Domain system.
OS Version Version of the Data Domain system’s operating system.
Serial # The serial number that uniquely identifies the Data Domain system.
Filesys Encrypt Yes (Y) indicates the file system is encrypted.
# of Disks Number of disk drives in the Data Domain system.
Last Updated Date and time of the data was last collected.
Physical Summary
Raw Capacity Total of all of disk capacities (physical storage).
Active Capacity Amount of capacity in active storage tiers.
Used Capacity Amount of Data Domain system capacity that is in use.
Usage The bar represents the percentage of capacity that is in use.
Archive Capacity Total amount of usable physical space in the archive.
Used Archive Archived physical space used for compressed data.
Usage The bar represents the percentage of archived capacity that is in use.
Logical Summary
# Storage Units Number of logical storage units associated with the Data Domain system.
# File Systems Number of file systems associated with the Data Domain system.
# MTrees Number of MTrees on the Data Domain system.
# CIFS Shares Number of CIFS shares on the Data Domain system.
# NFS Mounts Number of NFS mounts on the Data Domain system.
# Files Number of files associated with the Data Domain system.
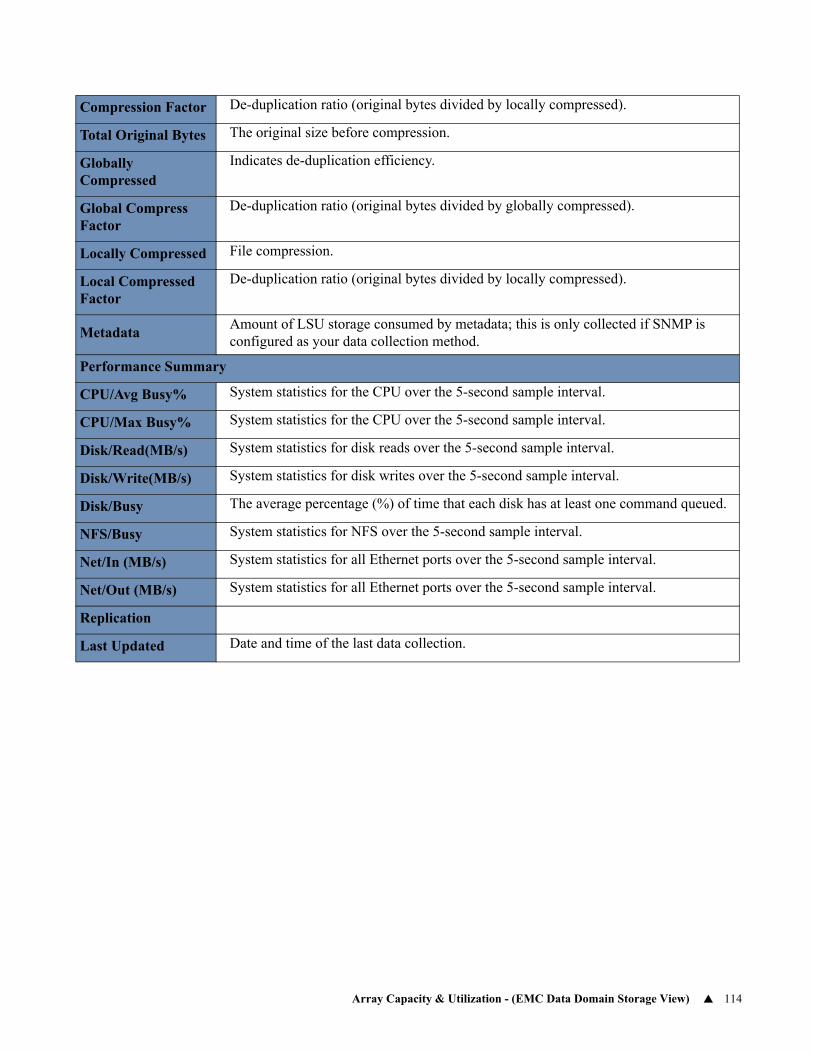
Array Capacity & Utilization - (EMC Data Domain Storage View) 114
Compression Factor De-duplication ratio (original bytes divided by locally compressed).
Total Original Bytes The original size before compression.
Globally Compressed
Indicates de-duplication efficiency.
Global Compress Factor
De-duplication ratio (original bytes divided by globally compressed).
Locally Compressed File compression.
Local Compressed Factor
De-duplication ratio (original bytes divided by locally compressed).
MetadataAmount of LSU storage consumed by metadata; this is only collected if SNMP is configured as your data collection method.
Performance Summary
CPU/Avg Busy% System statistics for the CPU over the 5-second sample interval.
CPU/Max Busy% System statistics for the CPU over the 5-second sample interval.
Disk/Read(MB/s) System statistics for disk reads over the 5-second sample interval.
Disk/Write(MB/s) System statistics for disk writes over the 5-second sample interval.
Disk/Busy The average percentage (%) of time that each disk has at least one command queued.
NFS/Busy System statistics for NFS over the 5-second sample interval.
Net/In (MB/s) System statistics for all Ethernet ports over the 5-second sample interval.
Net/Out (MB/s) System statistics for all Ethernet ports over the 5-second sample interval.
Replication
Last Updated Date and time of the last data collection.
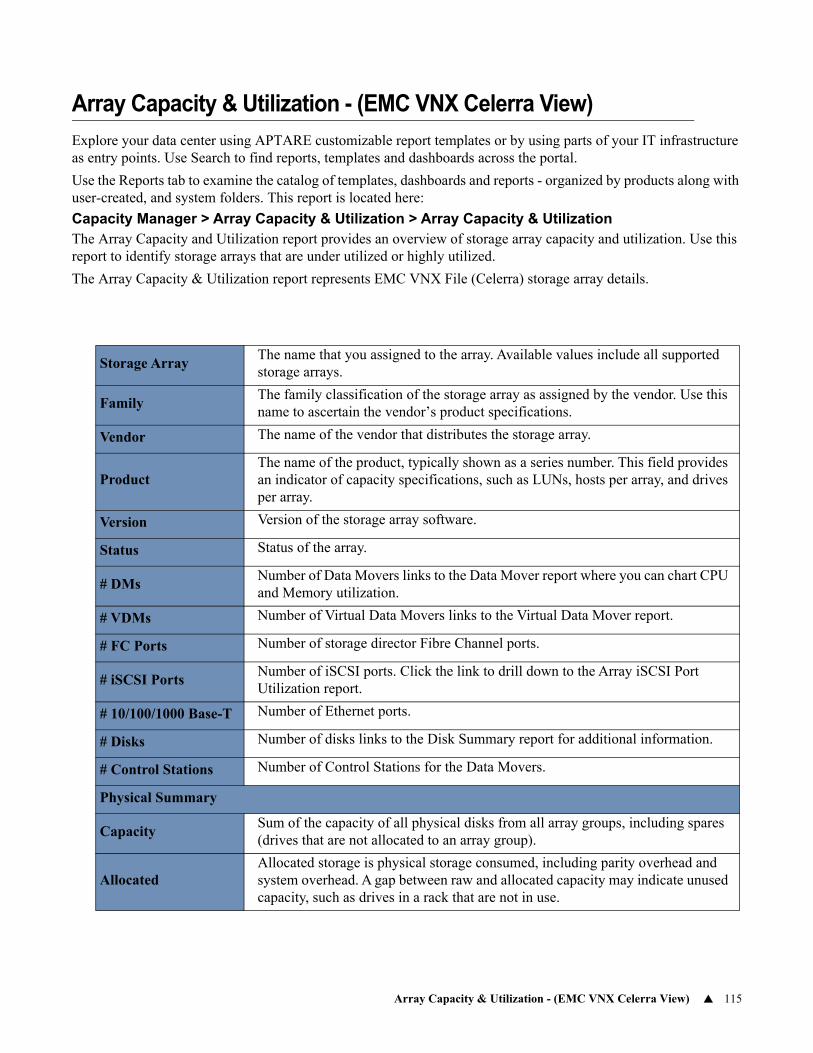
Array Capacity & Utilization - (EMC VNX Celerra View) 115
Array Capacity & Utilization - (EMC VNX Celerra View)
Explore your data center using APTARE customizable report templates or by using parts of your IT infrastructure as entry points. Use Search to find reports, templates and dashboards across the portal.
Use the Reports tab to examine the catalog of templates, dashboards and reports - organized by products along with user-created, and system folders. This report is located here:
Capacity Manager > Array Capacity & Utilization > Array Capacity & UtilizationThe Array Capacity and Utilization report provides an overview of storage array capacity and utilization. Use this report to identify storage arrays that are under utilized or highly utilized.
The Array Capacity & Utilization report represents EMC VNX File (Celerra) storage array details.
Storage ArrayThe name that you assigned to the array. Available values include all supported storage arrays.
FamilyThe family classification of the storage array as assigned by the vendor. Use this name to ascertain the vendor’s product specifications.
Vendor The name of the vendor that distributes the storage array.
ProductThe name of the product, typically shown as a series number. This field provides an indicator of capacity specifications, such as LUNs, hosts per array, and drives per array.
Version Version of the storage array software.
Status Status of the array.
# DMsNumber of Data Movers links to the Data Mover report where you can chart CPU and Memory utilization.
# VDMs Number of Virtual Data Movers links to the Virtual Data Mover report.
# FC Ports Number of storage director Fibre Channel ports.
# iSCSI PortsNumber of iSCSI ports. Click the link to drill down to the Array iSCSI Port Utilization report.
# 10/100/1000 Base-T Number of Ethernet ports.
# Disks Number of disks links to the Disk Summary report for additional information.
# Control Stations Number of Control Stations for the Data Movers.
Physical Summary
CapacitySum of the capacity of all physical disks from all array groups, including spares (drives that are not allocated to an array group).
AllocatedAllocated storage is physical storage consumed, including parity overhead and system overhead. A gap between raw and allocated capacity may indicate unused capacity, such as drives in a rack that are not in use.
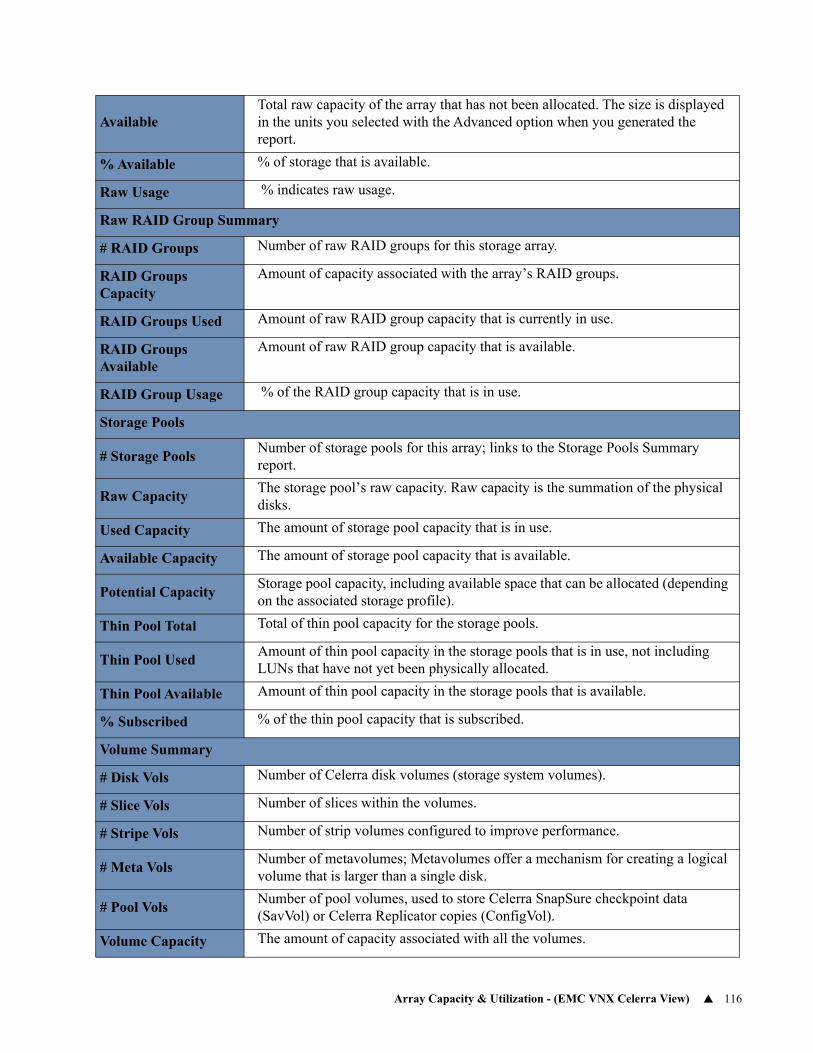
Array Capacity & Utilization - (EMC VNX Celerra View) 116
AvailableTotal raw capacity of the array that has not been allocated. The size is displayed in the units you selected with the Advanced option when you generated the report.
% Available % of storage that is available.
Raw Usage % indicates raw usage.
Raw RAID Group Summary
# RAID Groups Number of raw RAID groups for this storage array.
RAID Groups Capacity
Amount of capacity associated with the array’s RAID groups.
RAID Groups Used Amount of raw RAID group capacity that is currently in use.
RAID Groups Available
Amount of raw RAID group capacity that is available.
RAID Group Usage % of the RAID group capacity that is in use.
Storage Pools
# Storage PoolsNumber of storage pools for this array; links to the Storage Pools Summary report.
Raw CapacityThe storage pool’s raw capacity. Raw capacity is the summation of the physical disks.
Used Capacity The amount of storage pool capacity that is in use.
Available Capacity The amount of storage pool capacity that is available.
Potential CapacityStorage pool capacity, including available space that can be allocated (depending on the associated storage profile).
Thin Pool Total Total of thin pool capacity for the storage pools.
Thin Pool UsedAmount of thin pool capacity in the storage pools that is in use, not including LUNs that have not yet been physically allocated.
Thin Pool Available Amount of thin pool capacity in the storage pools that is available.
% Subscribed % of the thin pool capacity that is subscribed.
Volume Summary
# Disk Vols Number of Celerra disk volumes (storage system volumes).
# Slice Vols Number of slices within the volumes.
# Stripe Vols Number of strip volumes configured to improve performance.
# Meta VolsNumber of metavolumes; Metavolumes offer a mechanism for creating a logical volume that is larger than a single disk.
# Pool VolsNumber of pool volumes, used to store Celerra SnapSure checkpoint data (SavVol) or Celerra Replicator copies (ConfigVol).
Volume Capacity The amount of capacity associated with all the volumes.
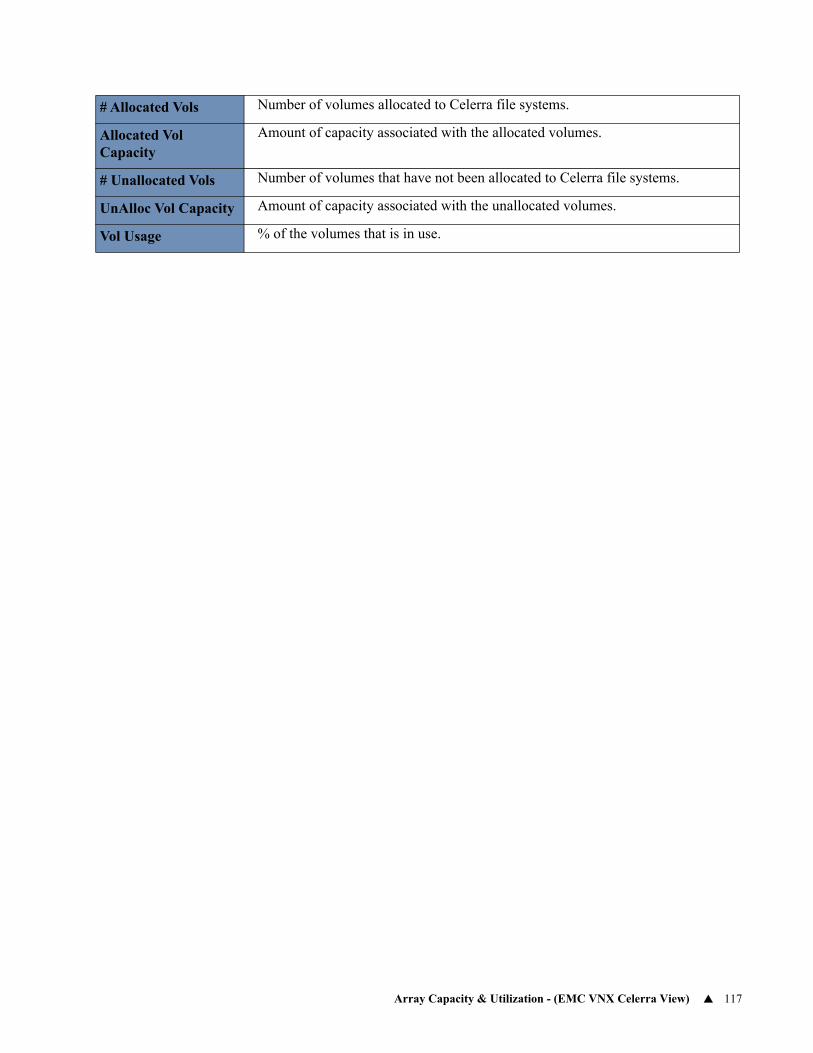
Array Capacity & Utilization - (EMC VNX Celerra View) 117
# Allocated Vols Number of volumes allocated to Celerra file systems.
Allocated Vol Capacity
Amount of capacity associated with the allocated volumes.
# Unallocated Vols Number of volumes that have not been allocated to Celerra file systems.
UnAlloc Vol Capacity Amount of capacity associated with the unallocated volumes.
Vol Usage % of the volumes that is in use.
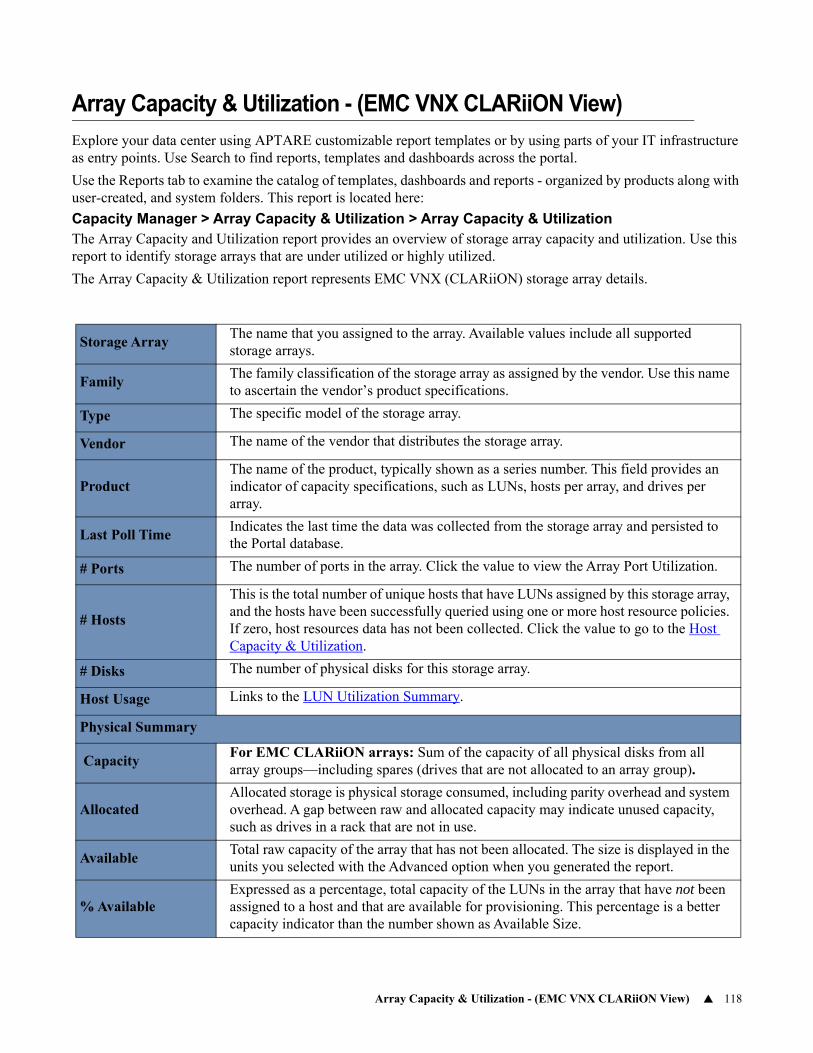
Array Capacity & Utilization - (EMC VNX CLARiiON View) 118
Array Capacity & Utilization - (EMC VNX CLARiiON View)
Explore your data center using APTARE customizable report templates or by using parts of your IT infrastructure as entry points. Use Search to find reports, templates and dashboards across the portal.
Use the Reports tab to examine the catalog of templates, dashboards and reports - organized by products along with user-created, and system folders. This report is located here:
Capacity Manager > Array Capacity & Utilization > Array Capacity & UtilizationThe Array Capacity and Utilization report provides an overview of storage array capacity and utilization. Use this report to identify storage arrays that are under utilized or highly utilized.
The Array Capacity & Utilization report represents EMC VNX (CLARiiON) storage array details.
Storage ArrayThe name that you assigned to the array. Available values include all supported storage arrays.
FamilyThe family classification of the storage array as assigned by the vendor. Use this name to ascertain the vendor’s product specifications.
Type The specific model of the storage array.
Vendor The name of the vendor that distributes the storage array.
ProductThe name of the product, typically shown as a series number. This field provides an indicator of capacity specifications, such as LUNs, hosts per array, and drives per array.
Last Poll TimeIndicates the last time the data was collected from the storage array and persisted to the Portal database.
# Ports The number of ports in the array. Click the value to view the Array Port Utilization.
# Hosts
This is the total number of unique hosts that have LUNs assigned by this storage array, and the hosts have been successfully queried using one or more host resource policies. If zero, host resources data has not been collected. Click the value to go to the Host Capacity & Utilization.
# Disks The number of physical disks for this storage array.
Host Usage Links to the LUN Utilization Summary.
Physical Summary
CapacityFor EMC CLARiiON arrays: Sum of the capacity of all physical disks from all array groups—including spares (drives that are not allocated to an array group).
AllocatedAllocated storage is physical storage consumed, including parity overhead and system overhead. A gap between raw and allocated capacity may indicate unused capacity, such as drives in a rack that are not in use.
AvailableTotal raw capacity of the array that has not been allocated. The size is displayed in the units you selected with the Advanced option when you generated the report.
% AvailableExpressed as a percentage, total capacity of the LUNs in the array that have not been assigned to a host and that are available for provisioning. This percentage is a better capacity indicator than the number shown as Available Size.
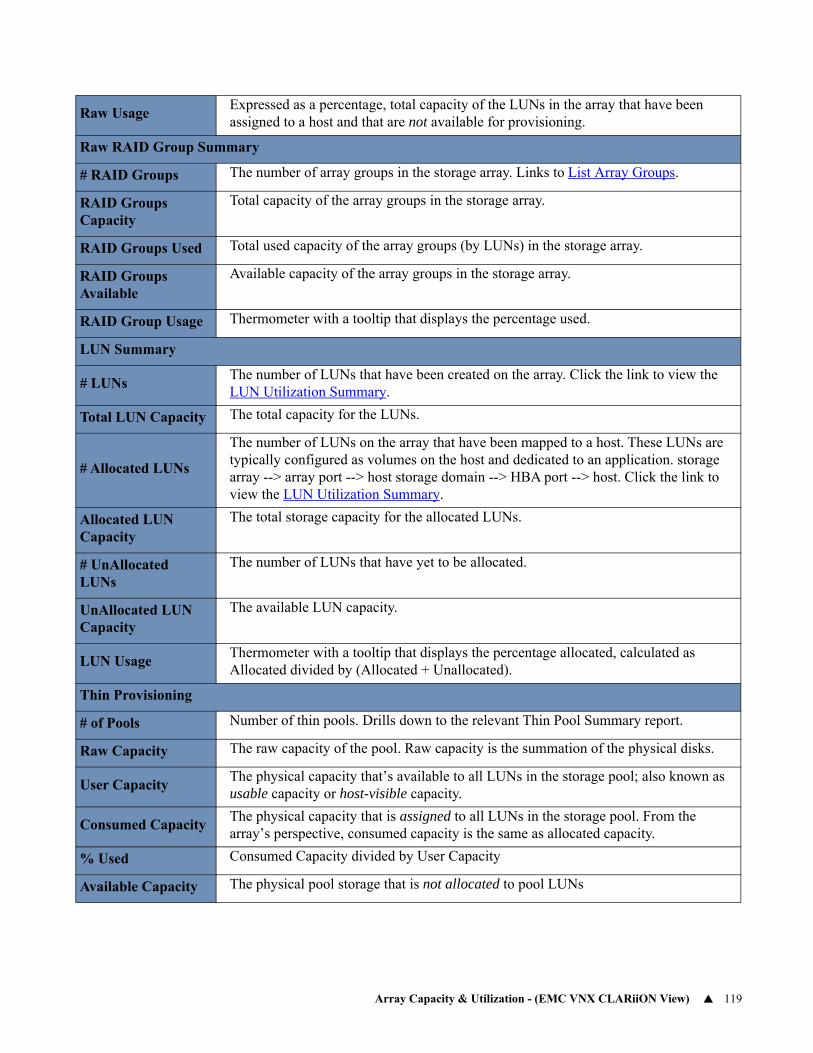
Array Capacity & Utilization - (EMC VNX CLARiiON View) 119
Raw UsageExpressed as a percentage, total capacity of the LUNs in the array that have been assigned to a host and that are not available for provisioning.
Raw RAID Group Summary
# RAID Groups The number of array groups in the storage array. Links to List Array Groups.
RAID Groups Capacity
Total capacity of the array groups in the storage array.
RAID Groups Used Total used capacity of the array groups (by LUNs) in the storage array.
RAID Groups Available
Available capacity of the array groups in the storage array.
RAID Group Usage Thermometer with a tooltip that displays the percentage used.
LUN Summary
# LUNsThe number of LUNs that have been created on the array. Click the link to view the LUN Utilization Summary.
Total LUN Capacity The total capacity for the LUNs.
# Allocated LUNs
The number of LUNs on the array that have been mapped to a host. These LUNs are typically configured as volumes on the host and dedicated to an application. storage array --> array port --> host storage domain --> HBA port --> host. Click the link to view the LUN Utilization Summary.
Allocated LUN Capacity
The total storage capacity for the allocated LUNs.
# UnAllocated LUNs
The number of LUNs that have yet to be allocated.
UnAllocated LUN Capacity
The available LUN capacity.
LUN UsageThermometer with a tooltip that displays the percentage allocated, calculated as Allocated divided by (Allocated + Unallocated).
Thin Provisioning
# of Pools Number of thin pools. Drills down to the relevant Thin Pool Summary report.
Raw Capacity The raw capacity of the pool. Raw capacity is the summation of the physical disks.
User CapacityThe physical capacity that’s available to all LUNs in the storage pool; also known as usable capacity or host-visible capacity.
Consumed CapacityThe physical capacity that is assigned to all LUNs in the storage pool. From the array’s perspective, consumed capacity is the same as allocated capacity.
% Used Consumed Capacity divided by User Capacity
Available Capacity The physical pool storage that is not allocated to pool LUNs
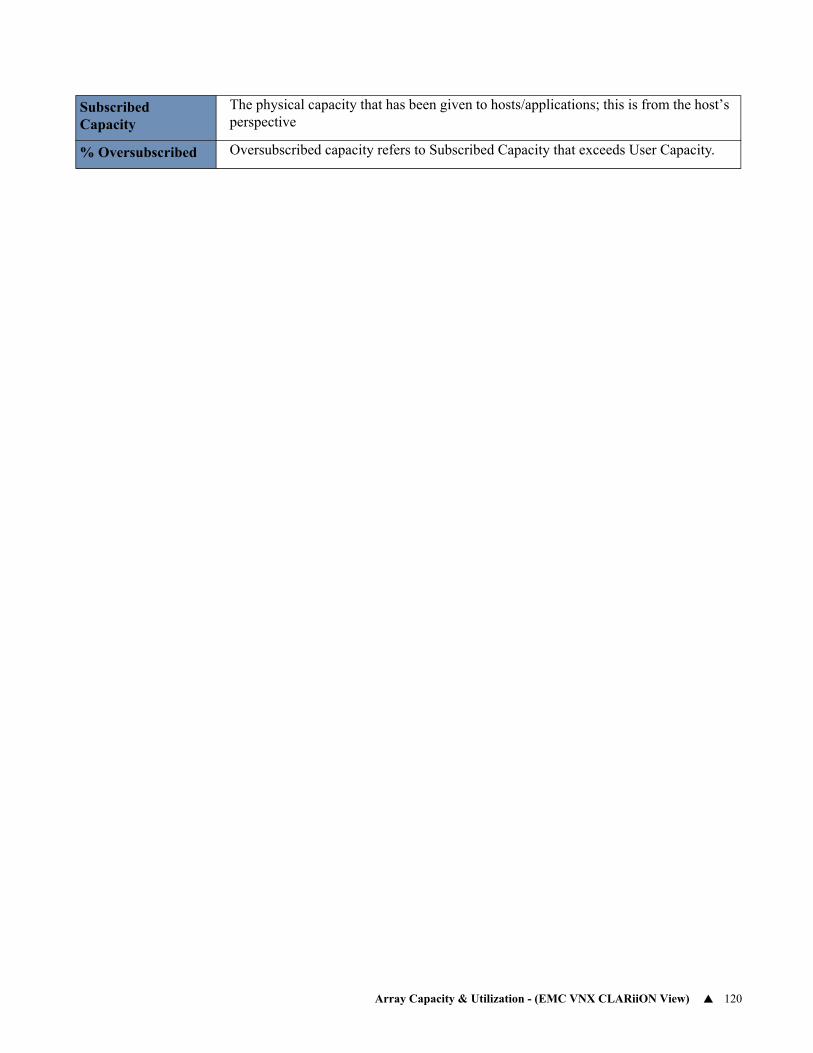
Array Capacity & Utilization - (EMC VNX CLARiiON View) 120
Subscribed Capacity
The physical capacity that has been given to hosts/applications; this is from the host’s perspective
% Oversubscribed Oversubscribed capacity refers to Subscribed Capacity that exceeds User Capacity.
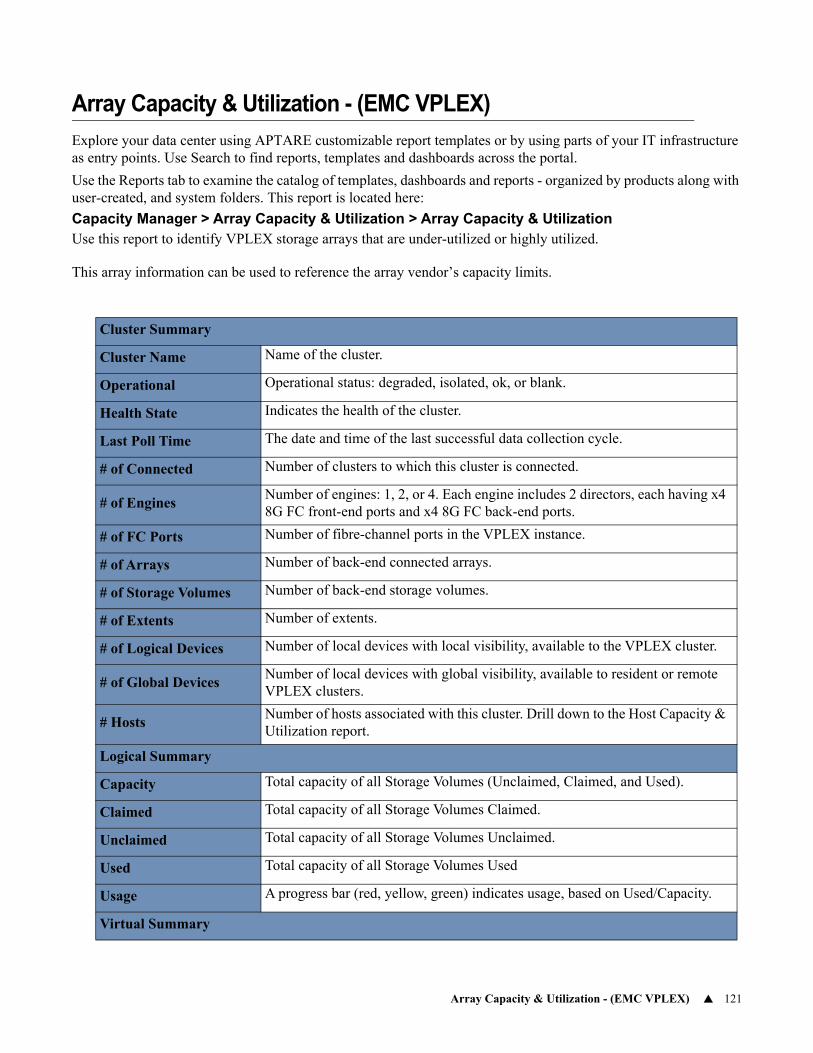
Array Capacity & Utilization - (EMC VPLEX) 121
Array Capacity & Utilization - (EMC VPLEX)
Explore your data center using APTARE customizable report templates or by using parts of your IT infrastructure as entry points. Use Search to find reports, templates and dashboards across the portal.
Use the Reports tab to examine the catalog of templates, dashboards and reports - organized by products along with user-created, and system folders. This report is located here:
Capacity Manager > Array Capacity & Utilization > Array Capacity & UtilizationUse this report to identify VPLEX storage arrays that are under-utilized or highly utilized.
This array information can be used to reference the array vendor’s capacity limits.
Cluster Summary
Cluster Name Name of the cluster.
Operational Operational status: degraded, isolated, ok, or blank.
Health State Indicates the health of the cluster.
Last Poll Time The date and time of the last successful data collection cycle.
# of Connected Number of clusters to which this cluster is connected.
# of EnginesNumber of engines: 1, 2, or 4. Each engine includes 2 directors, each having x4 8G FC front-end ports and x4 8G FC back-end ports.
# of FC Ports Number of fibre-channel ports in the VPLEX instance.
# of Arrays Number of back-end connected arrays.
# of Storage Volumes Number of back-end storage volumes.
# of Extents Number of extents.
# of Logical Devices Number of local devices with local visibility, available to the VPLEX cluster.
# of Global DevicesNumber of local devices with global visibility, available to resident or remote VPLEX clusters.
# HostsNumber of hosts associated with this cluster. Drill down to the Host Capacity & Utilization report.
Logical Summary
Capacity Total capacity of all Storage Volumes (Unclaimed, Claimed, and Used).
Claimed Total capacity of all Storage Volumes Claimed.
Unclaimed Total capacity of all Storage Volumes Unclaimed.
Used Total capacity of all Storage Volumes Used
Usage A progress bar (red, yellow, green) indicates usage, based on Used/Capacity.
Virtual Summary
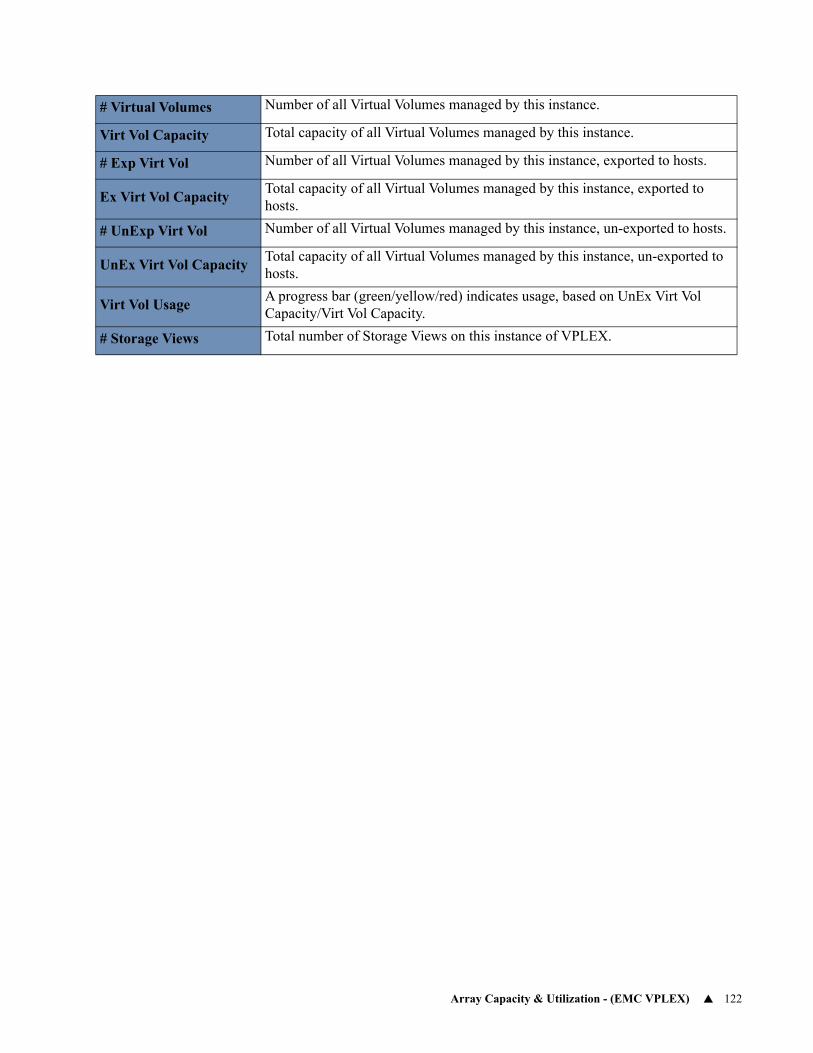
Array Capacity & Utilization - (EMC VPLEX) 122
# Virtual Volumes Number of all Virtual Volumes managed by this instance.
Virt Vol Capacity Total capacity of all Virtual Volumes managed by this instance.
# Exp Virt Vol Number of all Virtual Volumes managed by this instance, exported to hosts.
Ex Virt Vol CapacityTotal capacity of all Virtual Volumes managed by this instance, exported to hosts.
# UnExp Virt Vol Number of all Virtual Volumes managed by this instance, un-exported to hosts.
UnEx Virt Vol CapacityTotal capacity of all Virtual Volumes managed by this instance, un-exported to hosts.
Virt Vol UsageA progress bar (green/yellow/red) indicates usage, based on UnEx Virt Vol Capacity/Virt Vol Capacity.
# Storage Views Total number of Storage Views on this instance of VPLEX.
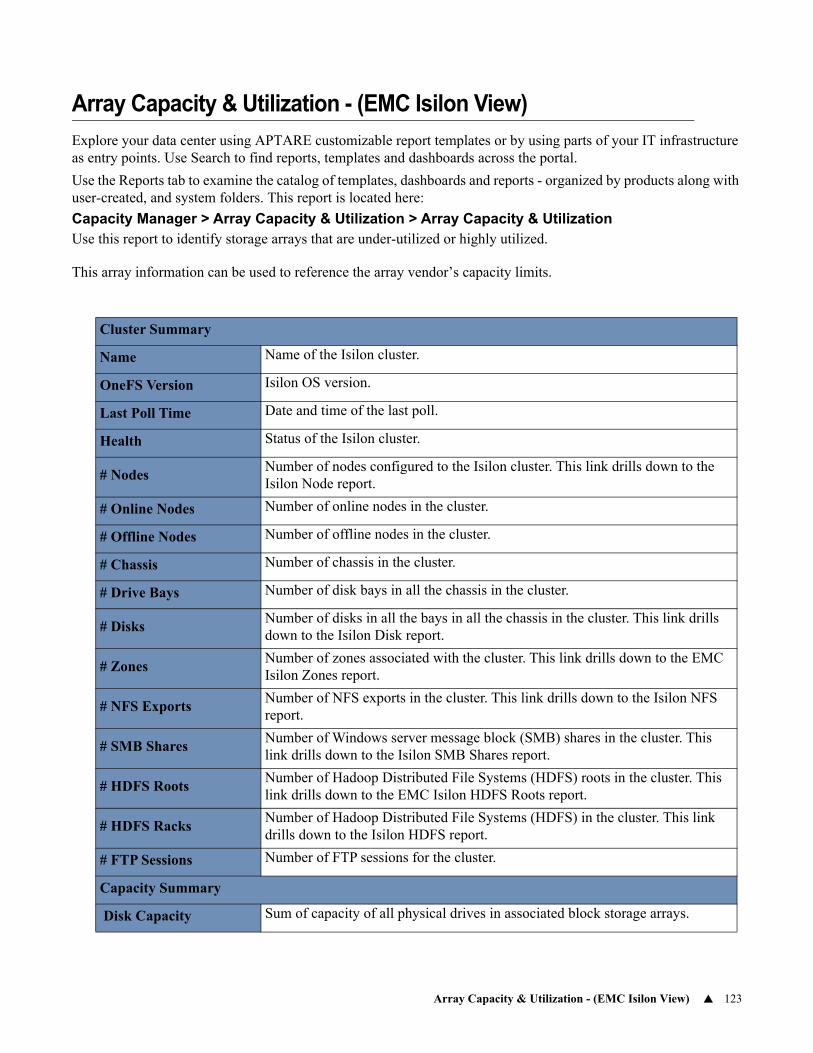
Array Capacity & Utilization - (EMC Isilon View) 123
Array Capacity & Utilization - (EMC Isilon View)
Explore your data center using APTARE customizable report templates or by using parts of your IT infrastructure as entry points. Use Search to find reports, templates and dashboards across the portal.
Use the Reports tab to examine the catalog of templates, dashboards and reports - organized by products along with user-created, and system folders. This report is located here:
Capacity Manager > Array Capacity & Utilization > Array Capacity & UtilizationUse this report to identify storage arrays that are under-utilized or highly utilized.
This array information can be used to reference the array vendor’s capacity limits.
Cluster Summary
Name Name of the Isilon cluster.
OneFS Version Isilon OS version.
Last Poll Time Date and time of the last poll.
Health Status of the Isilon cluster.
# NodesNumber of nodes configured to the Isilon cluster. This link drills down to the Isilon Node report.
# Online Nodes Number of online nodes in the cluster.
# Offline Nodes Number of offline nodes in the cluster.
# Chassis Number of chassis in the cluster.
# Drive Bays Number of disk bays in all the chassis in the cluster.
# DisksNumber of disks in all the bays in all the chassis in the cluster. This link drills down to the Isilon Disk report.
# ZonesNumber of zones associated with the cluster. This link drills down to the EMC Isilon Zones report.
# NFS ExportsNumber of NFS exports in the cluster. This link drills down to the Isilon NFS report.
# SMB SharesNumber of Windows server message block (SMB) shares in the cluster. This link drills down to the Isilon SMB Shares report.
# HDFS RootsNumber of Hadoop Distributed File Systems (HDFS) roots in the cluster. This link drills down to the EMC Isilon HDFS Roots report.
# HDFS RacksNumber of Hadoop Distributed File Systems (HDFS) in the cluster. This link drills down to the Isilon HDFS report.
# FTP Sessions Number of FTP sessions for the cluster.
Capacity Summary
Disk Capacity Sum of capacity of all physical drives in associated block storage arrays.
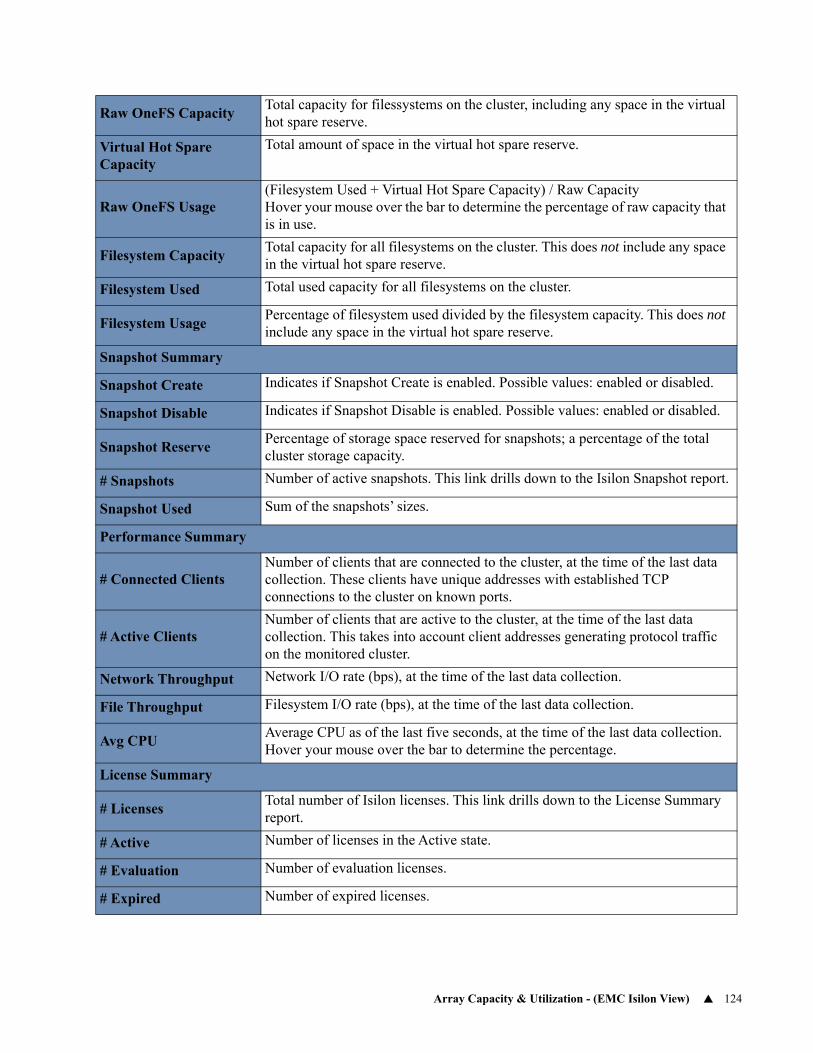
Array Capacity & Utilization - (EMC Isilon View) 124
Raw OneFS CapacityTotal capacity for filessystems on the cluster, including any space in the virtual hot spare reserve.
Virtual Hot Spare Capacity
Total amount of space in the virtual hot spare reserve.
Raw OneFS Usage(Filesystem Used + Virtual Hot Spare Capacity) / Raw CapacityHover your mouse over the bar to determine the percentage of raw capacity that is in use.
Filesystem CapacityTotal capacity for all filesystems on the cluster. This does not include any space in the virtual hot spare reserve.
Filesystem Used Total used capacity for all filesystems on the cluster.
Filesystem UsagePercentage of filesystem used divided by the filesystem capacity. This does not include any space in the virtual hot spare reserve.
Snapshot Summary
Snapshot Create Indicates if Snapshot Create is enabled. Possible values: enabled or disabled.
Snapshot Disable Indicates if Snapshot Disable is enabled. Possible values: enabled or disabled.
Snapshot ReservePercentage of storage space reserved for snapshots; a percentage of the total cluster storage capacity.
# Snapshots Number of active snapshots. This link drills down to the Isilon Snapshot report.
Snapshot Used Sum of the snapshots’ sizes.
Performance Summary
# Connected ClientsNumber of clients that are connected to the cluster, at the time of the last data collection. These clients have unique addresses with established TCP connections to the cluster on known ports.
# Active ClientsNumber of clients that are active to the cluster, at the time of the last data collection. This takes into account client addresses generating protocol traffic on the monitored cluster.
Network Throughput Network I/O rate (bps), at the time of the last data collection.
File Throughput Filesystem I/O rate (bps), at the time of the last data collection.
Avg CPUAverage CPU as of the last five seconds, at the time of the last data collection. Hover your mouse over the bar to determine the percentage.
License Summary
# LicensesTotal number of Isilon licenses. This link drills down to the License Summary report.
# Active Number of licenses in the Active state.
# Evaluation Number of evaluation licenses.
# Expired Number of expired licenses.
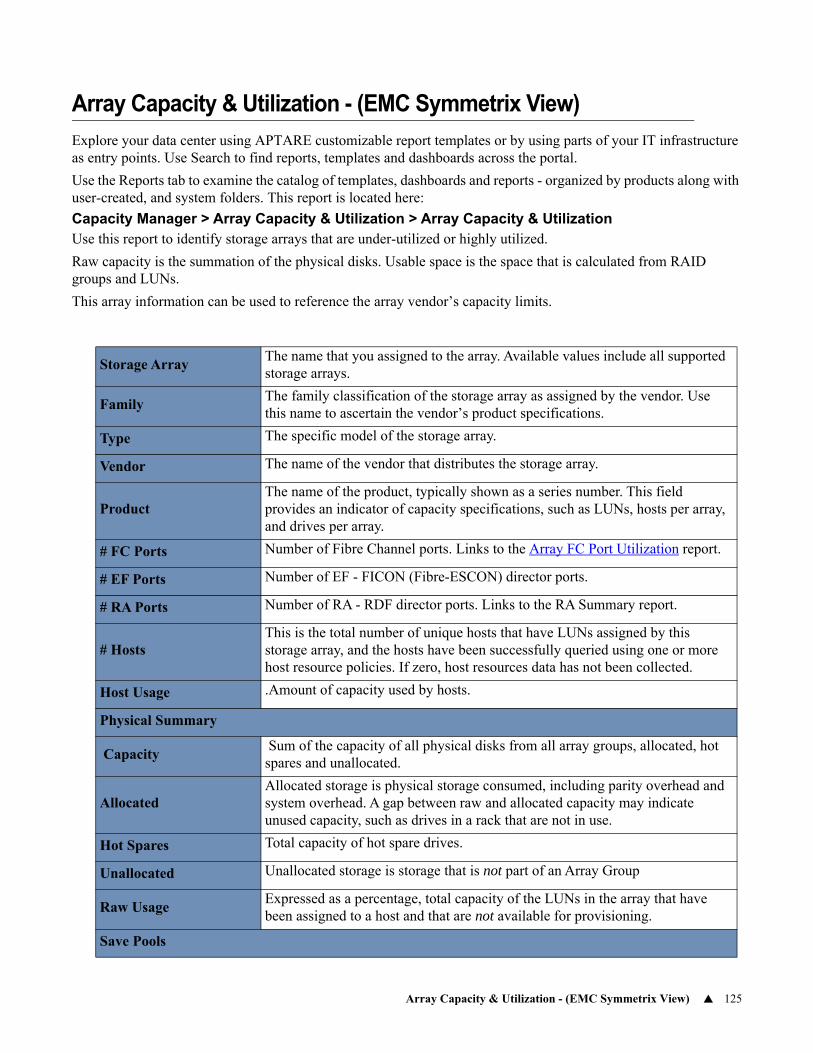
Array Capacity & Utilization - (EMC Symmetrix View) 125
Array Capacity & Utilization - (EMC Symmetrix View)
Explore your data center using APTARE customizable report templates or by using parts of your IT infrastructure as entry points. Use Search to find reports, templates and dashboards across the portal.
Use the Reports tab to examine the catalog of templates, dashboards and reports - organized by products along with user-created, and system folders. This report is located here:
Capacity Manager > Array Capacity & Utilization > Array Capacity & UtilizationUse this report to identify storage arrays that are under-utilized or highly utilized.
Raw capacity is the summation of the physical disks. Usable space is the space that is calculated from RAID groups and LUNs.
This array information can be used to reference the array vendor’s capacity limits.
Storage ArrayThe name that you assigned to the array. Available values include all supported storage arrays.
FamilyThe family classification of the storage array as assigned by the vendor. Use this name to ascertain the vendor’s product specifications.
Type The specific model of the storage array.
Vendor The name of the vendor that distributes the storage array.
ProductThe name of the product, typically shown as a series number. This field provides an indicator of capacity specifications, such as LUNs, hosts per array, and drives per array.
# FC Ports Number of Fibre Channel ports. Links to the Array FC Port Utilization report.
# EF Ports Number of EF - FICON (Fibre-ESCON) director ports.
# RA Ports Number of RA - RDF director ports. Links to the RA Summary report.
# HostsThis is the total number of unique hosts that have LUNs assigned by this storage array, and the hosts have been successfully queried using one or more host resource policies. If zero, host resources data has not been collected.
Host Usage .Amount of capacity used by hosts.
Physical Summary
Capacity Sum of the capacity of all physical disks from all array groups, allocated, hot spares and unallocated.
AllocatedAllocated storage is physical storage consumed, including parity overhead and system overhead. A gap between raw and allocated capacity may indicate unused capacity, such as drives in a rack that are not in use.
Hot Spares Total capacity of hot spare drives.
Unallocated Unallocated storage is storage that is not part of an Array Group
Raw UsageExpressed as a percentage, total capacity of the LUNs in the array that have been assigned to a host and that are not available for provisioning.
Save Pools
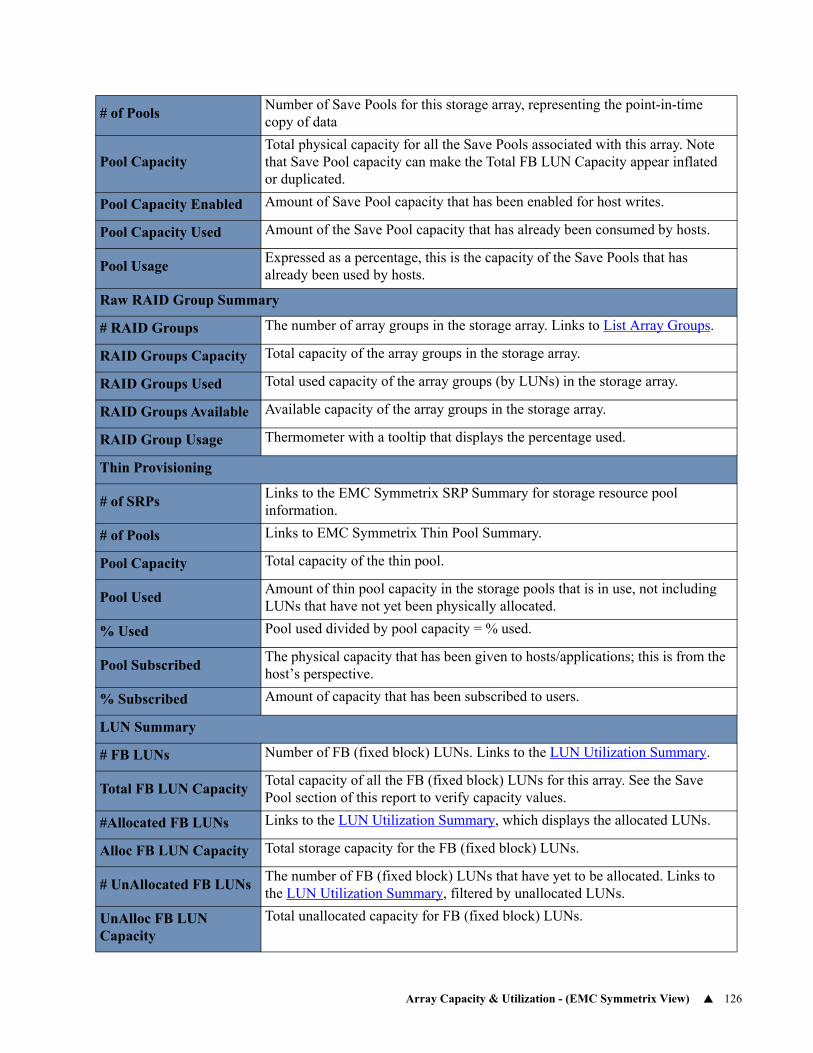
Array Capacity & Utilization - (EMC Symmetrix View) 126
# of PoolsNumber of Save Pools for this storage array, representing the point-in-time copy of data
Pool CapacityTotal physical capacity for all the Save Pools associated with this array. Note that Save Pool capacity can make the Total FB LUN Capacity appear inflated or duplicated.
Pool Capacity Enabled Amount of Save Pool capacity that has been enabled for host writes.
Pool Capacity Used Amount of the Save Pool capacity that has already been consumed by hosts.
Pool UsageExpressed as a percentage, this is the capacity of the Save Pools that has already been used by hosts.
Raw RAID Group Summary
# RAID Groups The number of array groups in the storage array. Links to List Array Groups.
RAID Groups Capacity Total capacity of the array groups in the storage array.
RAID Groups Used Total used capacity of the array groups (by LUNs) in the storage array.
RAID Groups Available Available capacity of the array groups in the storage array.
RAID Group Usage Thermometer with a tooltip that displays the percentage used.
Thin Provisioning
# of SRPsLinks to the EMC Symmetrix SRP Summary for storage resource pool information.
# of Pools Links to EMC Symmetrix Thin Pool Summary.
Pool Capacity Total capacity of the thin pool.
Pool UsedAmount of thin pool capacity in the storage pools that is in use, not including LUNs that have not yet been physically allocated.
% Used Pool used divided by pool capacity = % used.
Pool SubscribedThe physical capacity that has been given to hosts/applications; this is from the host’s perspective.
% Subscribed Amount of capacity that has been subscribed to users.
LUN Summary
# FB LUNs Number of FB (fixed block) LUNs. Links to the LUN Utilization Summary.
Total FB LUN CapacityTotal capacity of all the FB (fixed block) LUNs for this array. See the Save Pool section of this report to verify capacity values.
#Allocated FB LUNs Links to the LUN Utilization Summary, which displays the allocated LUNs.
Alloc FB LUN Capacity Total storage capacity for the FB (fixed block) LUNs.
# UnAllocated FB LUNsThe number of FB (fixed block) LUNs that have yet to be allocated. Links to the LUN Utilization Summary, filtered by unallocated LUNs.
UnAlloc FB LUN Capacity
Total unallocated capacity for FB (fixed block) LUNs.
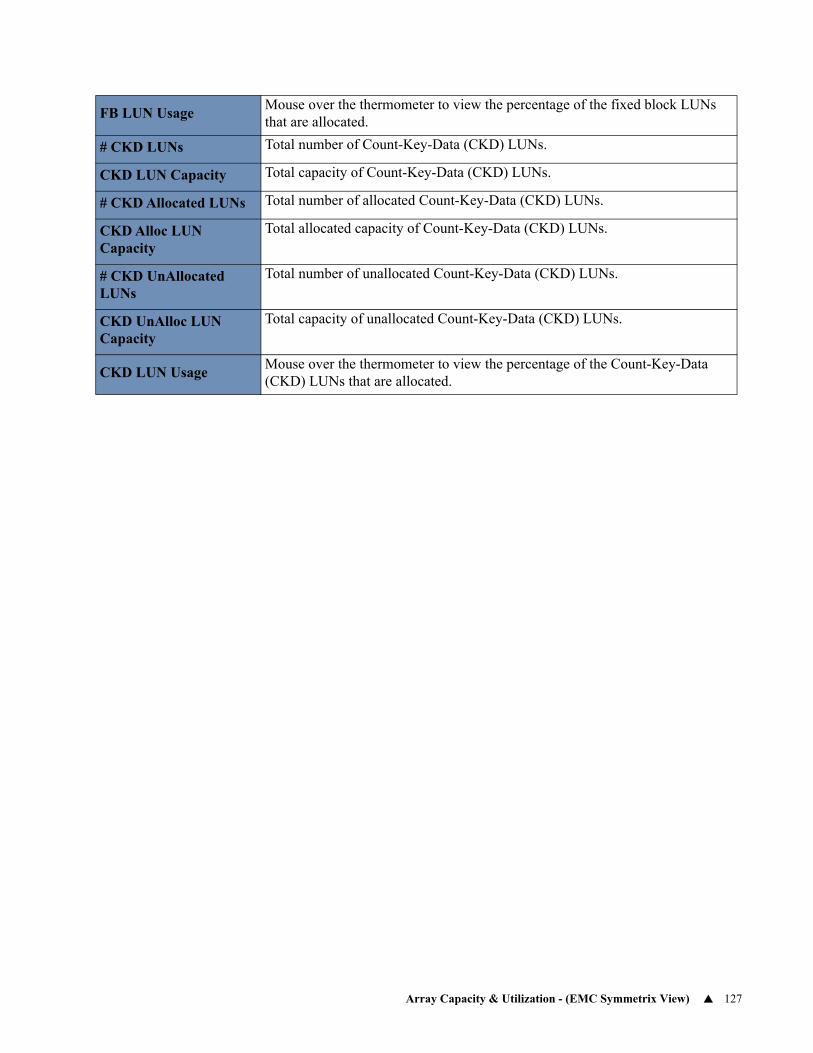
Array Capacity & Utilization - (EMC Symmetrix View) 127
FB LUN UsageMouse over the thermometer to view the percentage of the fixed block LUNs that are allocated.
# CKD LUNs Total number of Count-Key-Data (CKD) LUNs.
CKD LUN Capacity Total capacity of Count-Key-Data (CKD) LUNs.
# CKD Allocated LUNs Total number of allocated Count-Key-Data (CKD) LUNs.
CKD Alloc LUN Capacity
Total allocated capacity of Count-Key-Data (CKD) LUNs.
# CKD UnAllocated LUNs
Total number of unallocated Count-Key-Data (CKD) LUNs.
CKD UnAlloc LUN Capacity
Total capacity of unallocated Count-Key-Data (CKD) LUNs.
CKD LUN UsageMouse over the thermometer to view the percentage of the Count-Key-Data (CKD) LUNs that are allocated.
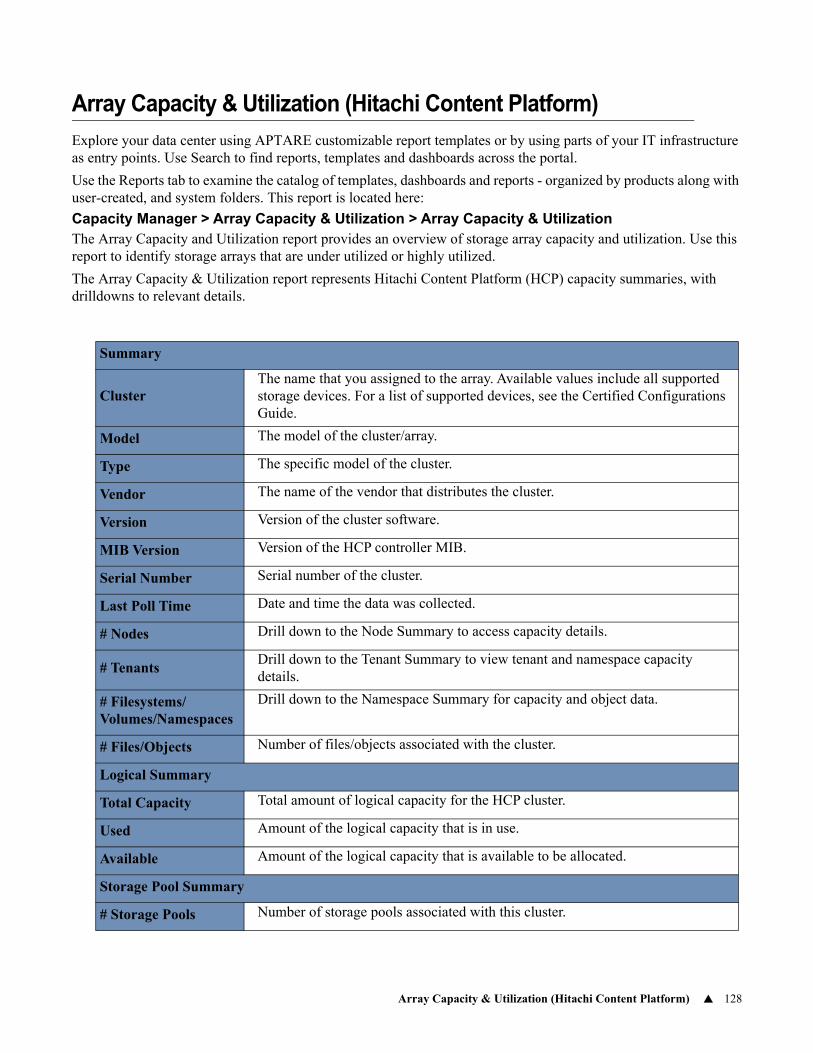
Array Capacity & Utilization (Hitachi Content Platform) 128
Array Capacity & Utilization (Hitachi Content Platform)
Explore your data center using APTARE customizable report templates or by using parts of your IT infrastructure as entry points. Use Search to find reports, templates and dashboards across the portal.
Use the Reports tab to examine the catalog of templates, dashboards and reports - organized by products along with user-created, and system folders. This report is located here:
Capacity Manager > Array Capacity & Utilization > Array Capacity & UtilizationThe Array Capacity and Utilization report provides an overview of storage array capacity and utilization. Use this report to identify storage arrays that are under utilized or highly utilized.
The Array Capacity & Utilization report represents Hitachi Content Platform (HCP) capacity summaries, with drilldowns to relevant details.
Summary
ClusterThe name that you assigned to the array. Available values include all supported storage devices. For a list of supported devices, see the Certified Configurations Guide.
Model The model of the cluster/array.
Type The specific model of the cluster.
Vendor The name of the vendor that distributes the cluster.
Version Version of the cluster software.
MIB Version Version of the HCP controller MIB.
Serial Number Serial number of the cluster.
Last Poll Time Date and time the data was collected.
# Nodes Drill down to the Node Summary to access capacity details.
# TenantsDrill down to the Tenant Summary to view tenant and namespace capacity details.
# Filesystems/Volumes/Namespaces
Drill down to the Namespace Summary for capacity and object data.
# Files/Objects Number of files/objects associated with the cluster.
Logical Summary
Total Capacity Total amount of logical capacity for the HCP cluster.
Used Amount of the logical capacity that is in use.
Available Amount of the logical capacity that is available to be allocated.
Storage Pool Summary
# Storage Pools Number of storage pools associated with this cluster.
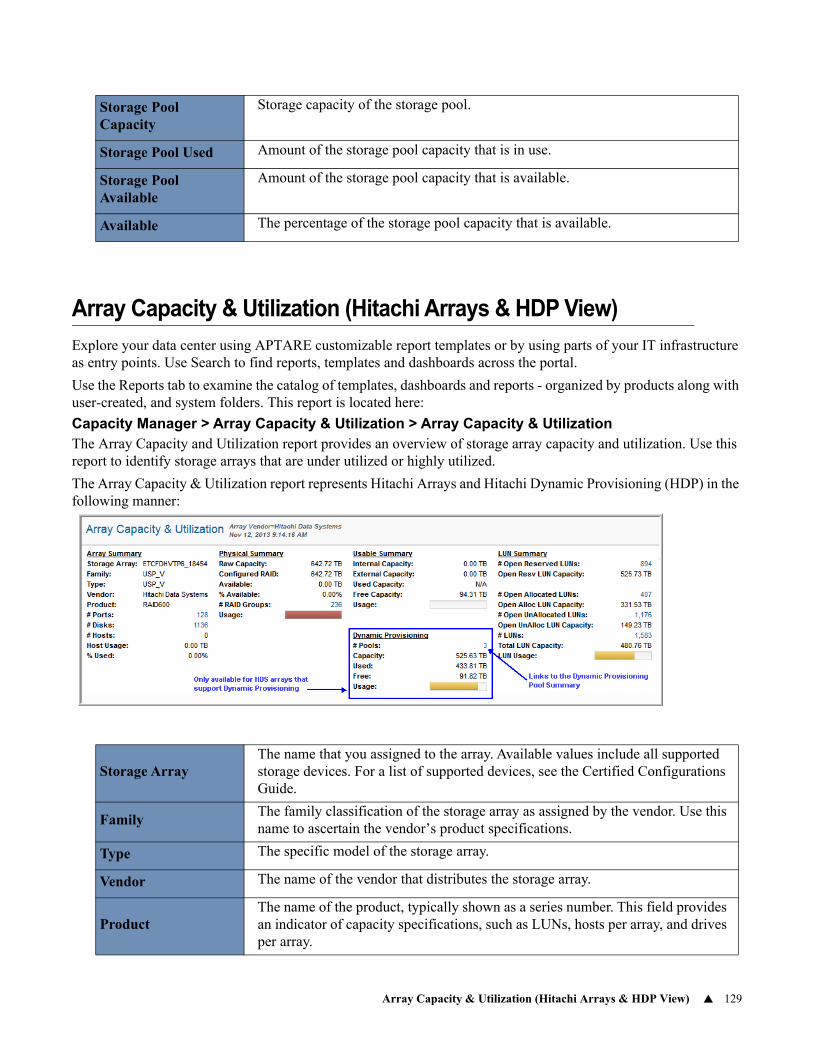
Array Capacity & Utilization (Hitachi Arrays & HDP View) 129
Array Capacity & Utilization (Hitachi Arrays & HDP View)
Explore your data center using APTARE customizable report templates or by using parts of your IT infrastructure as entry points. Use Search to find reports, templates and dashboards across the portal.
Use the Reports tab to examine the catalog of templates, dashboards and reports - organized by products along with user-created, and system folders. This report is located here:
Capacity Manager > Array Capacity & Utilization > Array Capacity & UtilizationThe Array Capacity and Utilization report provides an overview of storage array capacity and utilization. Use this report to identify storage arrays that are under utilized or highly utilized.
The Array Capacity & Utilization report represents Hitachi Arrays and Hitachi Dynamic Provisioning (HDP) in the following manner:
Storage Pool Capacity
Storage capacity of the storage pool.
Storage Pool Used Amount of the storage pool capacity that is in use.
Storage Pool Available
Amount of the storage pool capacity that is available.
Available The percentage of the storage pool capacity that is available.
Storage ArrayThe name that you assigned to the array. Available values include all supported storage devices. For a list of supported devices, see the Certified Configurations Guide.
FamilyThe family classification of the storage array as assigned by the vendor. Use this name to ascertain the vendor’s product specifications.
Type The specific model of the storage array.
Vendor The name of the vendor that distributes the storage array.
ProductThe name of the product, typically shown as a series number. This field provides an indicator of capacity specifications, such as LUNs, hosts per array, and drives per array.
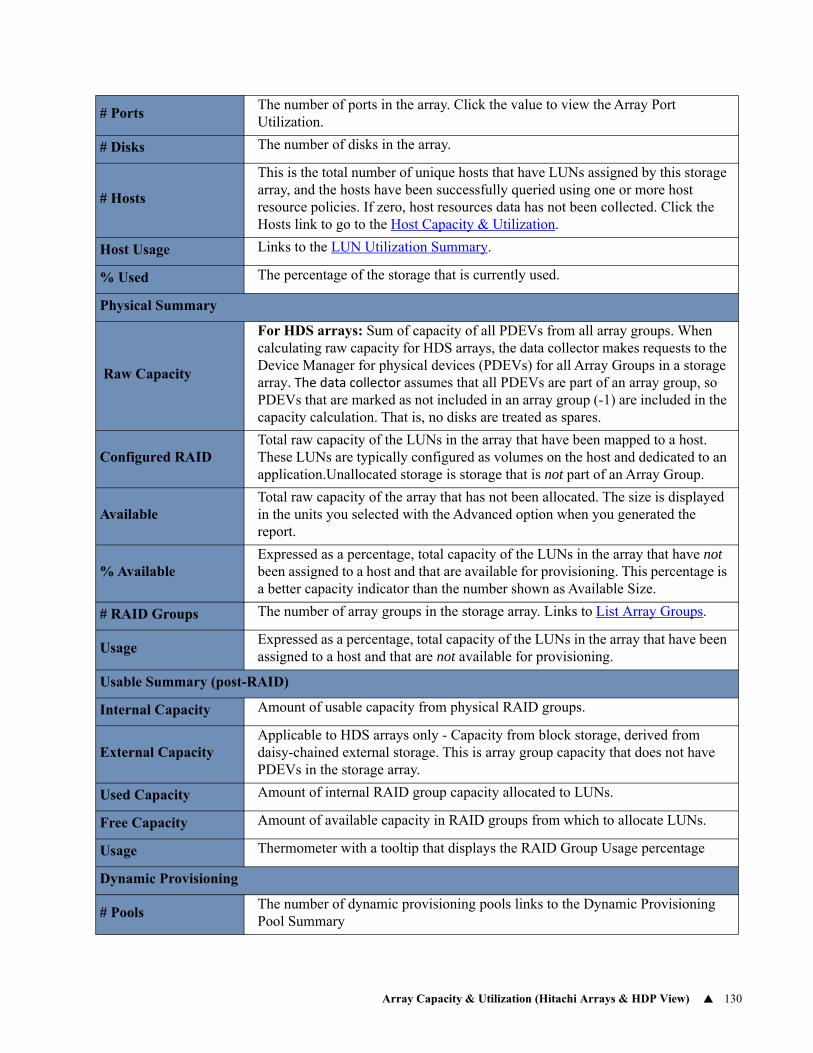
Array Capacity & Utilization (Hitachi Arrays & HDP View) 130
# PortsThe number of ports in the array. Click the value to view the Array Port Utilization.
# Disks The number of disks in the array.
# Hosts
This is the total number of unique hosts that have LUNs assigned by this storage array, and the hosts have been successfully queried using one or more host resource policies. If zero, host resources data has not been collected. Click the Hosts link to go to the Host Capacity & Utilization.
Host Usage Links to the LUN Utilization Summary.
% Used The percentage of the storage that is currently used.
Physical Summary
Raw Capacity
For HDS arrays: Sum of capacity of all PDEVs from all array groups. When calculating raw capacity for HDS arrays, the data collector makes requests to the Device Manager for physical devices (PDEVs) for all Array Groups in a storage array. The data collector assumes that all PDEVs are part of an array group, so PDEVs that are marked as not included in an array group (-1) are included in the capacity calculation. That is, no disks are treated as spares.
Configured RAIDTotal raw capacity of the LUNs in the array that have been mapped to a host. These LUNs are typically configured as volumes on the host and dedicated to an application.Unallocated storage is storage that is not part of an Array Group.
AvailableTotal raw capacity of the array that has not been allocated. The size is displayed in the units you selected with the Advanced option when you generated the report.
% AvailableExpressed as a percentage, total capacity of the LUNs in the array that have not been assigned to a host and that are available for provisioning. This percentage is a better capacity indicator than the number shown as Available Size.
# RAID Groups The number of array groups in the storage array. Links to List Array Groups.
UsageExpressed as a percentage, total capacity of the LUNs in the array that have been assigned to a host and that are not available for provisioning.
Usable Summary (post-RAID)
Internal Capacity Amount of usable capacity from physical RAID groups.
External CapacityApplicable to HDS arrays only - Capacity from block storage, derived from daisy-chained external storage. This is array group capacity that does not have PDEVs in the storage array.
Used Capacity Amount of internal RAID group capacity allocated to LUNs.
Free Capacity Amount of available capacity in RAID groups from which to allocate LUNs.
Usage Thermometer with a tooltip that displays the RAID Group Usage percentage
Dynamic Provisioning
# PoolsThe number of dynamic provisioning pools links to the Dynamic Provisioning Pool Summary
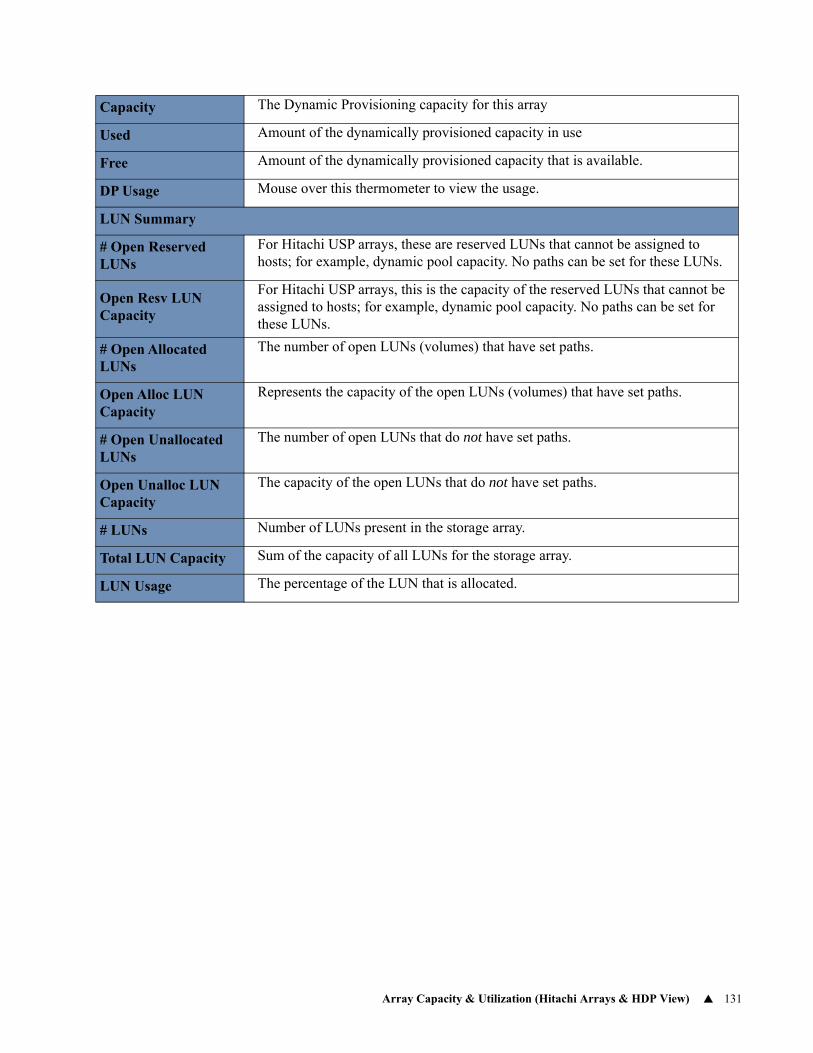
Array Capacity & Utilization (Hitachi Arrays & HDP View) 131
Capacity The Dynamic Provisioning capacity for this array
Used Amount of the dynamically provisioned capacity in use
Free Amount of the dynamically provisioned capacity that is available.
DP Usage Mouse over this thermometer to view the usage.
LUN Summary
# Open Reserved LUNs
For Hitachi USP arrays, these are reserved LUNs that cannot be assigned to hosts; for example, dynamic pool capacity. No paths can be set for these LUNs.
Open Resv LUN Capacity
For Hitachi USP arrays, this is the capacity of the reserved LUNs that cannot be assigned to hosts; for example, dynamic pool capacity. No paths can be set for these LUNs.
# Open Allocated LUNs
The number of open LUNs (volumes) that have set paths.
Open Alloc LUN Capacity
Represents the capacity of the open LUNs (volumes) that have set paths.
# Open Unallocated LUNs
The number of open LUNs that do not have set paths.
Open Unalloc LUN Capacity
The capacity of the open LUNs that do not have set paths.
# LUNs Number of LUNs present in the storage array.
Total LUN Capacity Sum of the capacity of all LUNs for the storage array.
LUN Usage The percentage of the LUN that is allocated.
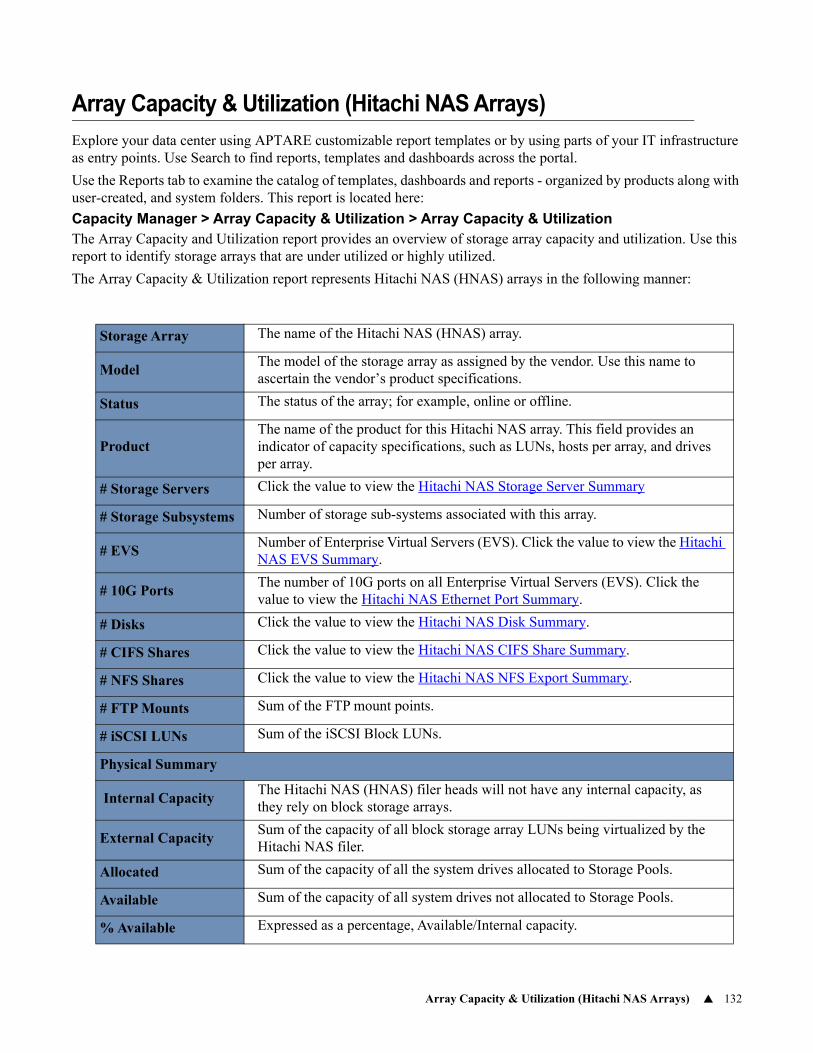
Array Capacity & Utilization (Hitachi NAS Arrays) 132
Array Capacity & Utilization (Hitachi NAS Arrays)
Explore your data center using APTARE customizable report templates or by using parts of your IT infrastructure as entry points. Use Search to find reports, templates and dashboards across the portal.
Use the Reports tab to examine the catalog of templates, dashboards and reports - organized by products along with user-created, and system folders. This report is located here:
Capacity Manager > Array Capacity & Utilization > Array Capacity & UtilizationThe Array Capacity and Utilization report provides an overview of storage array capacity and utilization. Use this report to identify storage arrays that are under utilized or highly utilized.
The Array Capacity & Utilization report represents Hitachi NAS (HNAS) arrays in the following manner:
Storage Array The name of the Hitachi NAS (HNAS) array.
ModelThe model of the storage array as assigned by the vendor. Use this name to ascertain the vendor’s product specifications.
Status The status of the array; for example, online or offline.
ProductThe name of the product for this Hitachi NAS array. This field provides an indicator of capacity specifications, such as LUNs, hosts per array, and drives per array.
# Storage Servers Click the value to view the Hitachi NAS Storage Server Summary
# Storage Subsystems Number of storage sub-systems associated with this array.
# EVSNumber of Enterprise Virtual Servers (EVS). Click the value to view the Hitachi NAS EVS Summary.
# 10G PortsThe number of 10G ports on all Enterprise Virtual Servers (EVS). Click the value to view the Hitachi NAS Ethernet Port Summary.
# Disks Click the value to view the Hitachi NAS Disk Summary.
# CIFS Shares Click the value to view the Hitachi NAS CIFS Share Summary.
# NFS Shares Click the value to view the Hitachi NAS NFS Export Summary.
# FTP Mounts Sum of the FTP mount points.
# iSCSI LUNs Sum of the iSCSI Block LUNs.
Physical Summary
Internal CapacityThe Hitachi NAS (HNAS) filer heads will not have any internal capacity, as they rely on block storage arrays.
External CapacitySum of the capacity of all block storage array LUNs being virtualized by the Hitachi NAS filer.
Allocated Sum of the capacity of all the system drives allocated to Storage Pools.
Available Sum of the capacity of all system drives not allocated to Storage Pools.
% Available Expressed as a percentage, Available/Internal capacity.
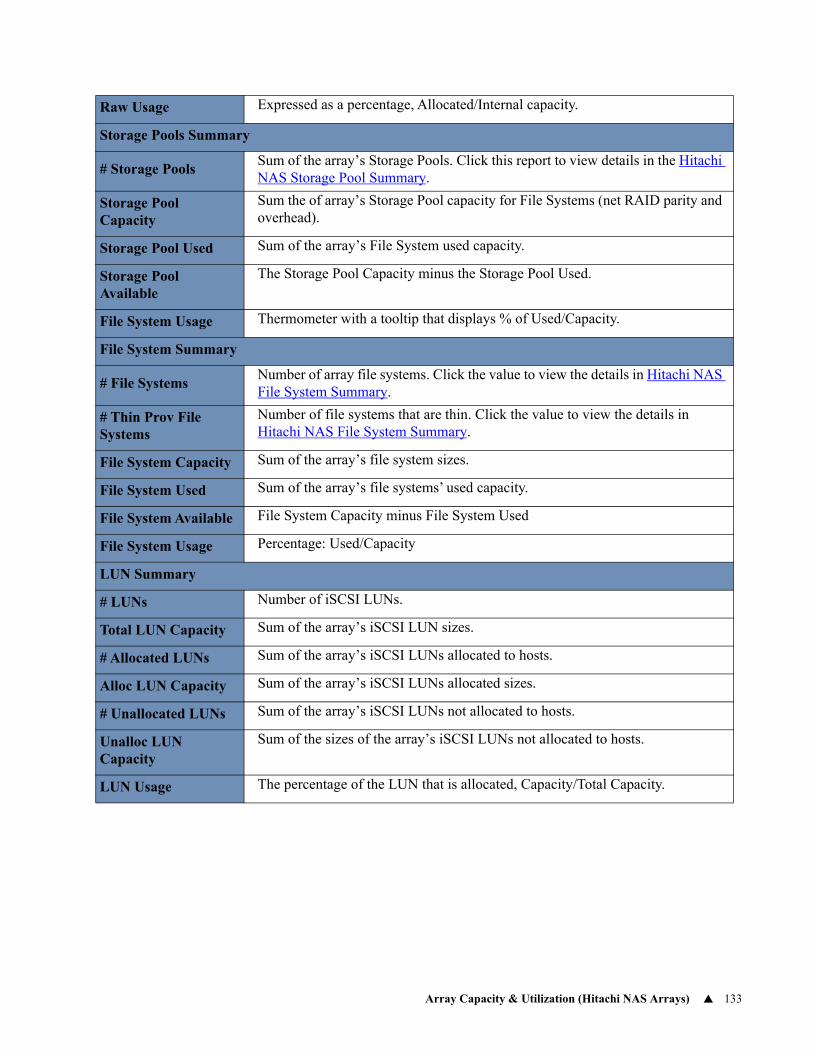
Array Capacity & Utilization (Hitachi NAS Arrays) 133
Raw Usage Expressed as a percentage, Allocated/Internal capacity.
Storage Pools Summary
# Storage PoolsSum of the array’s Storage Pools. Click this report to view details in the Hitachi NAS Storage Pool Summary.
Storage Pool Capacity
Sum the of array’s Storage Pool capacity for File Systems (net RAID parity and overhead).
Storage Pool Used Sum of the array’s File System used capacity.
Storage Pool Available
The Storage Pool Capacity minus the Storage Pool Used.
File System Usage Thermometer with a tooltip that displays % of Used/Capacity.
File System Summary
# File SystemsNumber of array file systems. Click the value to view the details in Hitachi NAS File System Summary.
# Thin Prov File Systems
Number of file systems that are thin. Click the value to view the details in Hitachi NAS File System Summary.
File System Capacity Sum of the array’s file system sizes.
File System Used Sum of the array’s file systems’ used capacity.
File System Available File System Capacity minus File System Used
File System Usage Percentage: Used/Capacity
LUN Summary
# LUNs Number of iSCSI LUNs.
Total LUN Capacity Sum of the array’s iSCSI LUN sizes.
# Allocated LUNs Sum of the array’s iSCSI LUNs allocated to hosts.
Alloc LUN Capacity Sum of the array’s iSCSI LUNs allocated sizes.
# Unallocated LUNs Sum of the array’s iSCSI LUNs not allocated to hosts.
Unalloc LUN Capacity
Sum of the sizes of the array’s iSCSI LUNs not allocated to hosts.
LUN Usage The percentage of the LUN that is allocated, Capacity/Total Capacity.
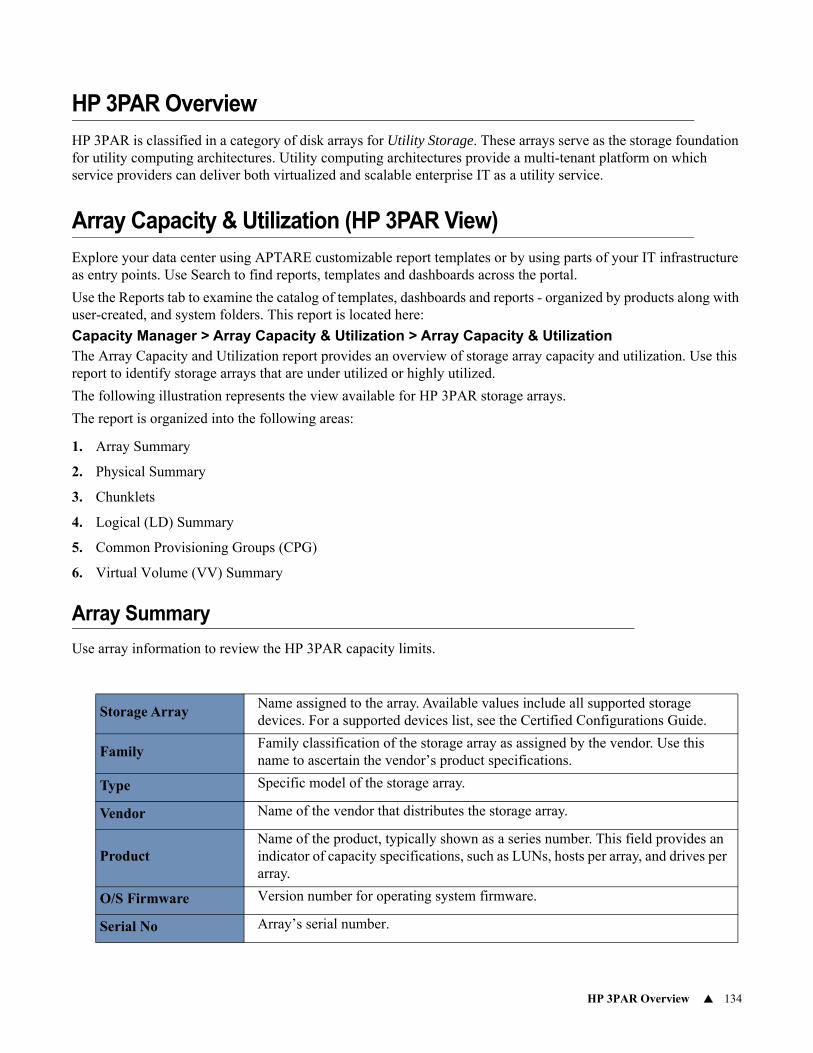
HP 3PAR Overview 134
HP 3PAR Overview
HP 3PAR is classified in a category of disk arrays for Utility Storage. These arrays serve as the storage foundation for utility computing architectures. Utility computing architectures provide a multi-tenant platform on which service providers can deliver both virtualized and scalable enterprise IT as a utility service.
Array Capacity & Utilization (HP 3PAR View)
Explore your data center using APTARE customizable report templates or by using parts of your IT infrastructure as entry points. Use Search to find reports, templates and dashboards across the portal.
Use the Reports tab to examine the catalog of templates, dashboards and reports - organized by products along with user-created, and system folders. This report is located here:
Capacity Manager > Array Capacity & Utilization > Array Capacity & UtilizationThe Array Capacity and Utilization report provides an overview of storage array capacity and utilization. Use this report to identify storage arrays that are under utilized or highly utilized.
The following illustration represents the view available for HP 3PAR storage arrays.
The report is organized into the following areas:
1. Array Summary
2. Physical Summary
3. Chunklets
4. Logical (LD) Summary
5. Common Provisioning Groups (CPG)
6. Virtual Volume (VV) Summary
Array Summary
Use array information to review the HP 3PAR capacity limits.
Storage ArrayName assigned to the array. Available values include all supported storage devices. For a supported devices list, see the Certified Configurations Guide.
FamilyFamily classification of the storage array as assigned by the vendor. Use this name to ascertain the vendor’s product specifications.
Type Specific model of the storage array.
Vendor Name of the vendor that distributes the storage array.
ProductName of the product, typically shown as a series number. This field provides an indicator of capacity specifications, such as LUNs, hosts per array, and drives per array.
O/S Firmware Version number for operating system firmware.
Serial No Array’s serial number.
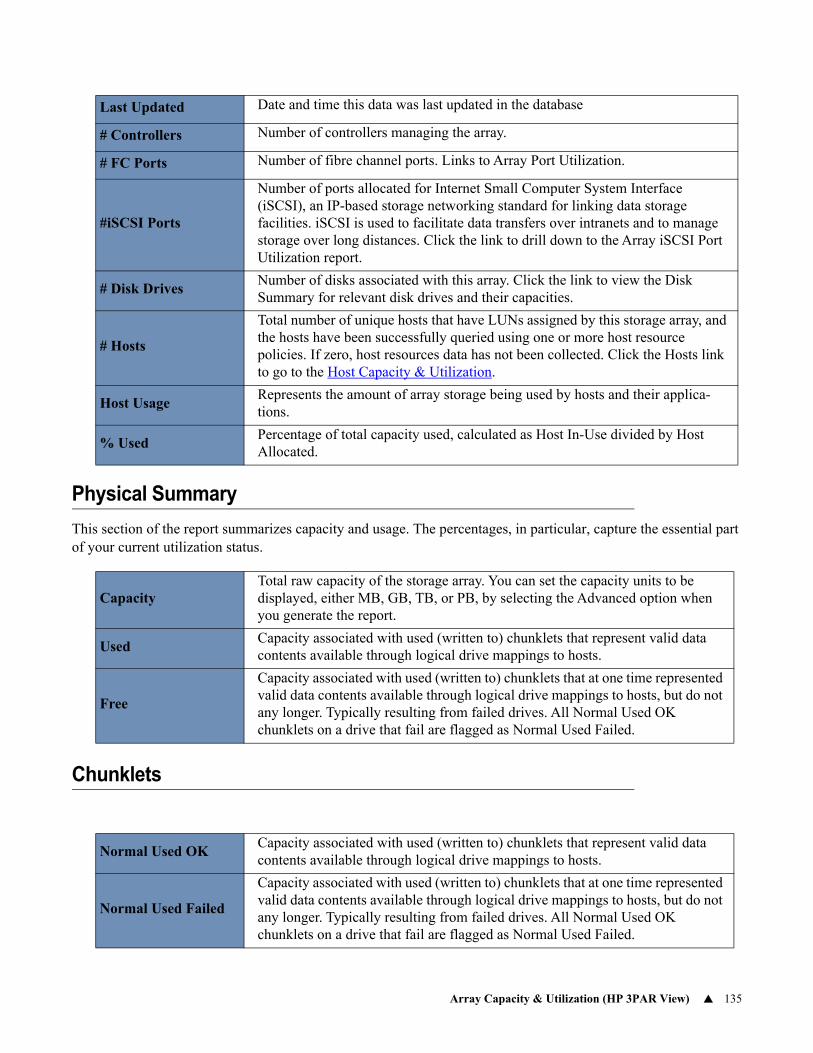
Array Capacity & Utilization (HP 3PAR View) 135
Physical Summary
This section of the report summarizes capacity and usage. The percentages, in particular, capture the essential part of your current utilization status.
Chunklets
Last Updated Date and time this data was last updated in the database
# Controllers Number of controllers managing the array.
# FC Ports Number of fibre channel ports. Links to Array Port Utilization.
#iSCSI Ports
Number of ports allocated for Internet Small Computer System Interface (iSCSI), an IP-based storage networking standard for linking data storage facilities. iSCSI is used to facilitate data transfers over intranets and to manage storage over long distances. Click the link to drill down to the Array iSCSI Port Utilization report.
# Disk DrivesNumber of disks associated with this array. Click the link to view the Disk Summary for relevant disk drives and their capacities.
# Hosts
Total number of unique hosts that have LUNs assigned by this storage array, and the hosts have been successfully queried using one or more host resource policies. If zero, host resources data has not been collected. Click the Hosts link to go to the Host Capacity & Utilization.
Host UsageRepresents the amount of array storage being used by hosts and their applica-tions.
% UsedPercentage of total capacity used, calculated as Host In-Use divided by Host Allocated.
CapacityTotal raw capacity of the storage array. You can set the capacity units to be displayed, either MB, GB, TB, or PB, by selecting the Advanced option when you generate the report.
UsedCapacity associated with used (written to) chunklets that represent valid data contents available through logical drive mappings to hosts.
Free
Capacity associated with used (written to) chunklets that at one time represented valid data contents available through logical drive mappings to hosts, but do not any longer. Typically resulting from failed drives. All Normal Used OK chunklets on a drive that fail are flagged as Normal Used Failed.
Normal Used OKCapacity associated with used (written to) chunklets that represent valid data contents available through logical drive mappings to hosts.
Normal Used Failed
Capacity associated with used (written to) chunklets that at one time represented valid data contents available through logical drive mappings to hosts, but do not any longer. Typically resulting from failed drives. All Normal Used OK chunklets on a drive that fail are flagged as Normal Used Failed.
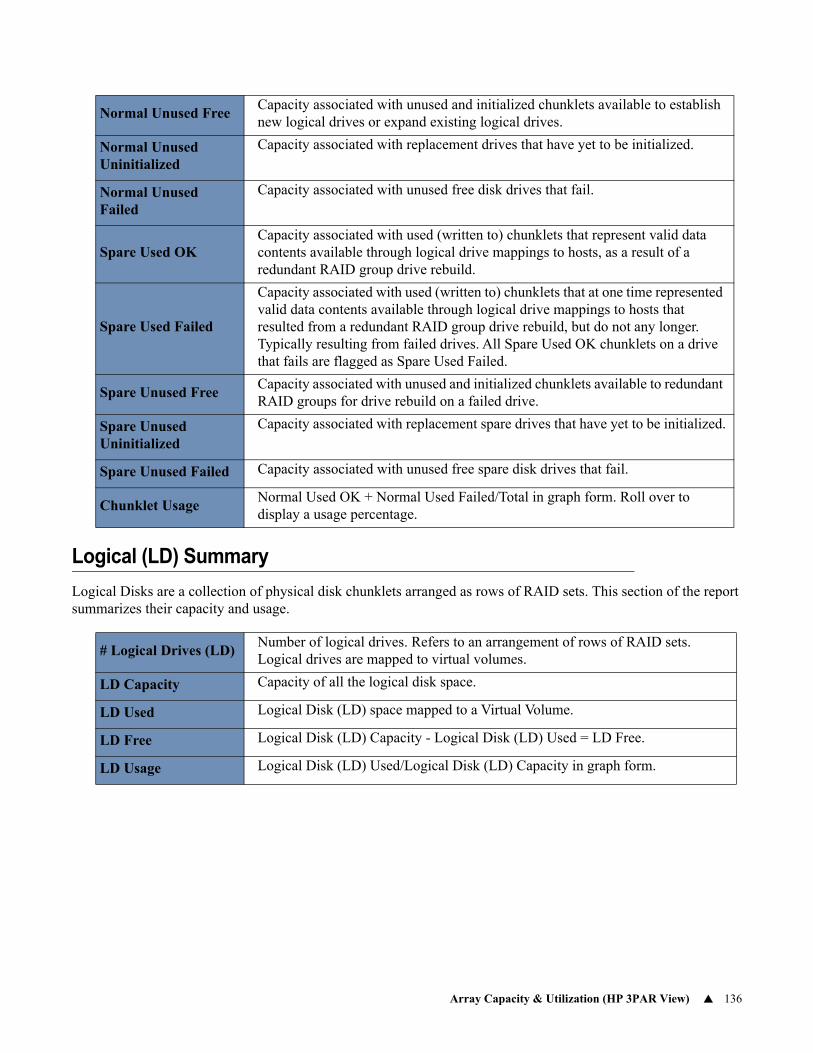
Array Capacity & Utilization (HP 3PAR View) 136
Logical (LD) Summary
Logical Disks are a collection of physical disk chunklets arranged as rows of RAID sets. This section of the report summarizes their capacity and usage.
Normal Unused FreeCapacity associated with unused and initialized chunklets available to establish new logical drives or expand existing logical drives.
Normal Unused Uninitialized
Capacity associated with replacement drives that have yet to be initialized.
Normal Unused Failed
Capacity associated with unused free disk drives that fail.
Spare Used OKCapacity associated with used (written to) chunklets that represent valid data contents available through logical drive mappings to hosts, as a result of a redundant RAID group drive rebuild.
Spare Used Failed
Capacity associated with used (written to) chunklets that at one time represented valid data contents available through logical drive mappings to hosts that resulted from a redundant RAID group drive rebuild, but do not any longer. Typically resulting from failed drives. All Spare Used OK chunklets on a drive that fails are flagged as Spare Used Failed.
Spare Unused FreeCapacity associated with unused and initialized chunklets available to redundant RAID groups for drive rebuild on a failed drive.
Spare Unused Uninitialized
Capacity associated with replacement spare drives that have yet to be initialized.
Spare Unused Failed Capacity associated with unused free spare disk drives that fail.
Chunklet UsageNormal Used OK + Normal Used Failed/Total in graph form. Roll over to display a usage percentage.
# Logical Drives (LD)Number of logical drives. Refers to an arrangement of rows of RAID sets. Logical drives are mapped to virtual volumes.
LD Capacity Capacity of all the logical disk space.
LD Used Logical Disk (LD) space mapped to a Virtual Volume.
LD Free Logical Disk (LD) Capacity - Logical Disk (LD) Used = LD Free.
LD Usage Logical Disk (LD) Used/Logical Disk (LD) Capacity in graph form.
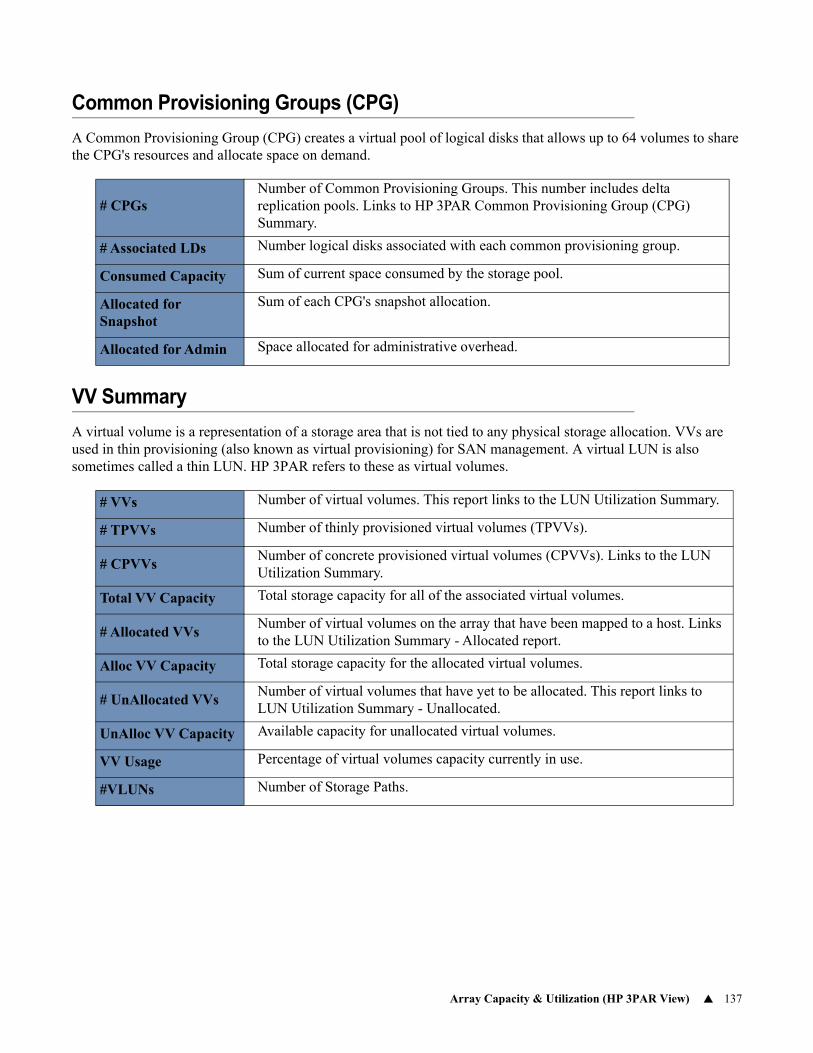
Array Capacity & Utilization (HP 3PAR View) 137
Common Provisioning Groups (CPG)
A Common Provisioning Group (CPG) creates a virtual pool of logical disks that allows up to 64 volumes to share the CPG's resources and allocate space on demand.
VV Summary
A virtual volume is a representation of a storage area that is not tied to any physical storage allocation. VVs are used in thin provisioning (also known as virtual provisioning) for SAN management. A virtual LUN is also sometimes called a thin LUN. HP 3PAR refers to these as virtual volumes.
# CPGsNumber of Common Provisioning Groups. This number includes delta replication pools. Links to HP 3PAR Common Provisioning Group (CPG) Summary.
# Associated LDs Number logical disks associated with each common provisioning group.
Consumed Capacity Sum of current space consumed by the storage pool.
Allocated for Snapshot
Sum of each CPG's snapshot allocation.
Allocated for Admin Space allocated for administrative overhead.
# VVs Number of virtual volumes. This report links to the LUN Utilization Summary.
# TPVVs Number of thinly provisioned virtual volumes (TPVVs).
# CPVVsNumber of concrete provisioned virtual volumes (CPVVs). Links to the LUN Utilization Summary.
Total VV Capacity Total storage capacity for all of the associated virtual volumes.
# Allocated VVsNumber of virtual volumes on the array that have been mapped to a host. Links to the LUN Utilization Summary - Allocated report.
Alloc VV Capacity Total storage capacity for the allocated virtual volumes.
# UnAllocated VVsNumber of virtual volumes that have yet to be allocated. This report links to LUN Utilization Summary - Unallocated.
UnAlloc VV Capacity Available capacity for unallocated virtual volumes.
VV Usage Percentage of virtual volumes capacity currently in use.
#VLUNs Number of Storage Paths.
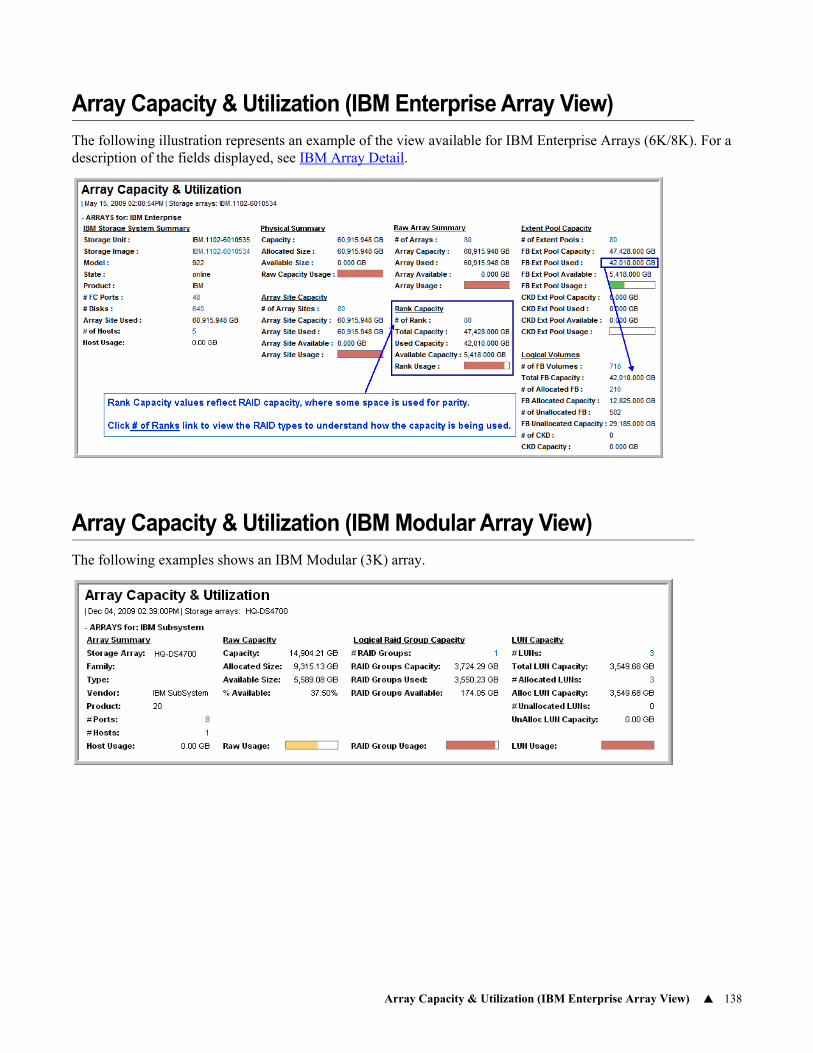
Array Capacity & Utilization (IBM Enterprise Array View) 138
Array Capacity & Utilization (IBM Enterprise Array View)
The following illustration represents an example of the view available for IBM Enterprise Arrays (6K/8K). For a description of the fields displayed, see IBM Array Detail.
Array Capacity & Utilization (IBM Modular Array View)
The following examples shows an IBM Modular (3K) array.
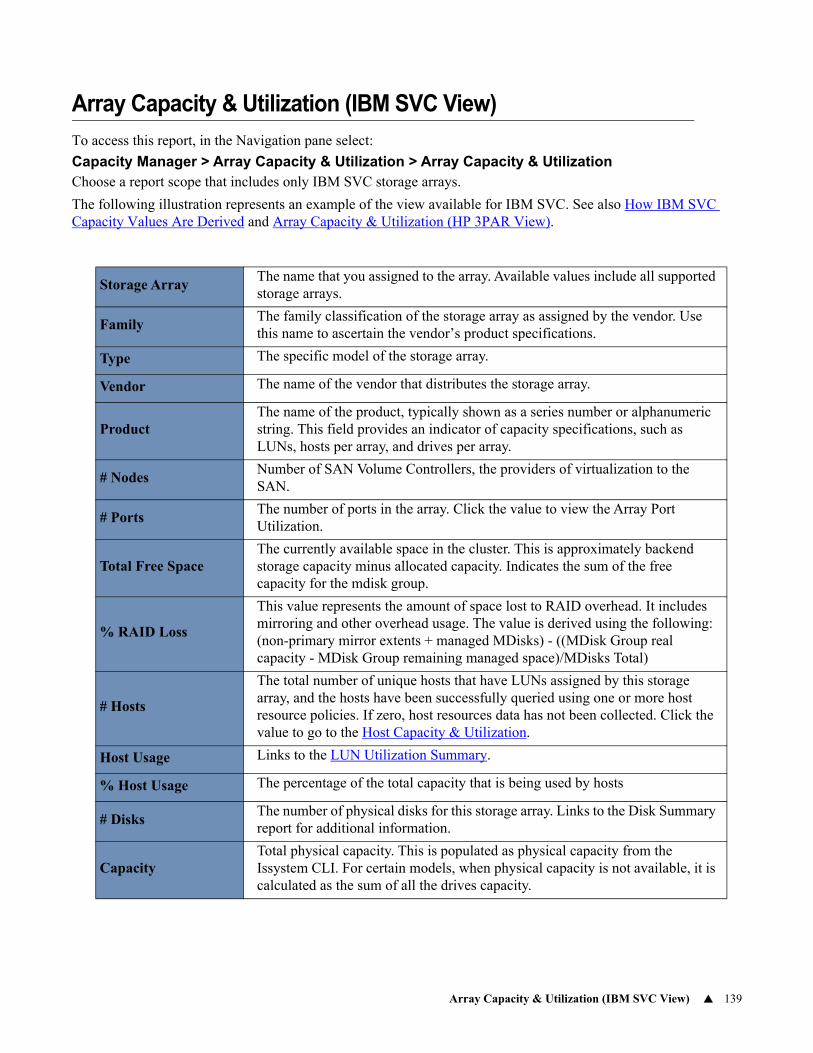
Array Capacity & Utilization (IBM SVC View) 139
Array Capacity & Utilization (IBM SVC View)
To access this report, in the Navigation pane select:
Capacity Manager > Array Capacity & Utilization > Array Capacity & UtilizationChoose a report scope that includes only IBM SVC storage arrays.
The following illustration represents an example of the view available for IBM SVC. See also How IBM SVC Capacity Values Are Derived and Array Capacity & Utilization (HP 3PAR View).
Storage ArrayThe name that you assigned to the array. Available values include all supported storage arrays.
FamilyThe family classification of the storage array as assigned by the vendor. Use this name to ascertain the vendor’s product specifications.
Type The specific model of the storage array.
Vendor The name of the vendor that distributes the storage array.
ProductThe name of the product, typically shown as a series number or alphanumeric string. This field provides an indicator of capacity specifications, such as LUNs, hosts per array, and drives per array.
# NodesNumber of SAN Volume Controllers, the providers of virtualization to the SAN.
# PortsThe number of ports in the array. Click the value to view the Array Port Utilization.
Total Free SpaceThe currently available space in the cluster. This is approximately backend storage capacity minus allocated capacity. Indicates the sum of the free capacity for the mdisk group.
% RAID Loss
This value represents the amount of space lost to RAID overhead. It includes mirroring and other overhead usage. The value is derived using the following: (non-primary mirror extents + managed MDisks) - ((MDisk Group real capacity - MDisk Group remaining managed space)/MDisks Total)
# Hosts
The total number of unique hosts that have LUNs assigned by this storage array, and the hosts have been successfully queried using one or more host resource policies. If zero, host resources data has not been collected. Click the value to go to the Host Capacity & Utilization.
Host Usage Links to the LUN Utilization Summary.
% Host Usage The percentage of the total capacity that is being used by hosts
# DisksThe number of physical disks for this storage array. Links to the Disk Summary report for additional information.
CapacityTotal physical capacity. This is populated as physical capacity from the Issystem CLI. For certain models, when physical capacity is not available, it is calculated as the sum of all the drives capacity.
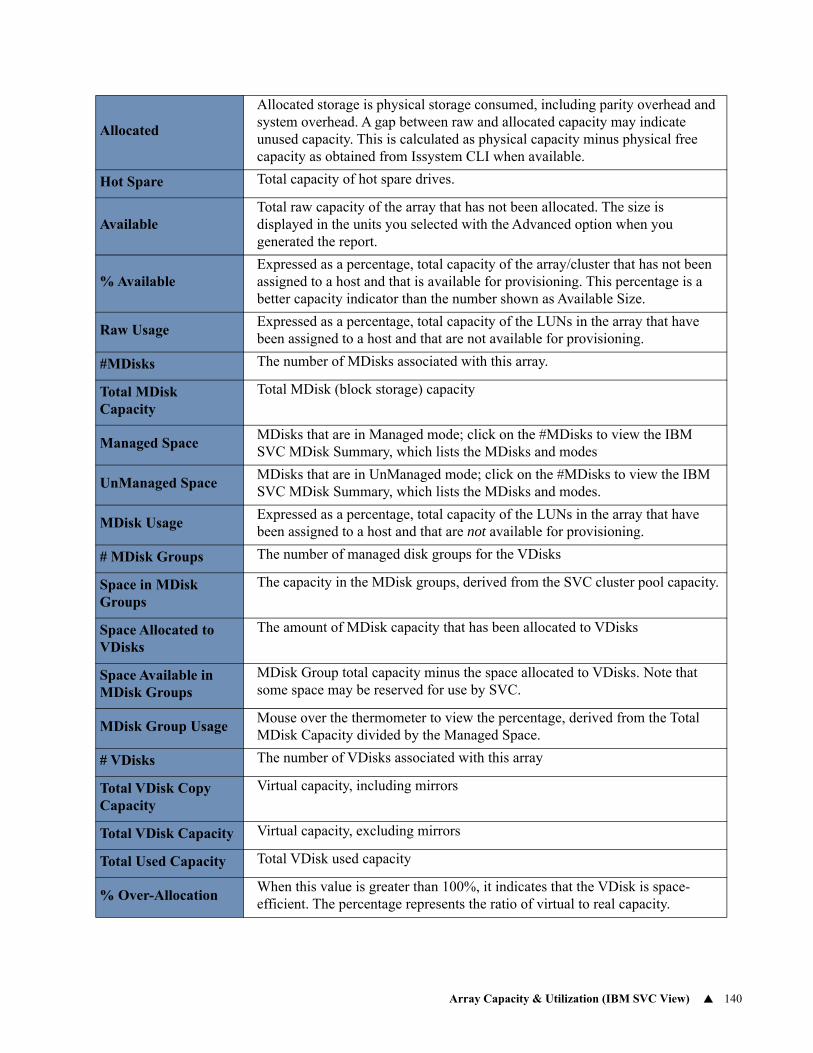
Array Capacity & Utilization (IBM SVC View) 140
Allocated
Allocated storage is physical storage consumed, including parity overhead and system overhead. A gap between raw and allocated capacity may indicate unused capacity. This is calculated as physical capacity minus physical free capacity as obtained from Issystem CLI when available.
Hot Spare Total capacity of hot spare drives.
AvailableTotal raw capacity of the array that has not been allocated. The size is displayed in the units you selected with the Advanced option when you generated the report.
% AvailableExpressed as a percentage, total capacity of the array/cluster that has not been assigned to a host and that is available for provisioning. This percentage is a better capacity indicator than the number shown as Available Size.
Raw UsageExpressed as a percentage, total capacity of the LUNs in the array that have been assigned to a host and that are not available for provisioning.
#MDisks The number of MDisks associated with this array.
Total MDisk Capacity
Total MDisk (block storage) capacity
Managed SpaceMDisks that are in Managed mode; click on the #MDisks to view the IBM SVC MDisk Summary, which lists the MDisks and modes
UnManaged SpaceMDisks that are in UnManaged mode; click on the #MDisks to view the IBM SVC MDisk Summary, which lists the MDisks and modes.
MDisk UsageExpressed as a percentage, total capacity of the LUNs in the array that have been assigned to a host and that are not available for provisioning.
# MDisk Groups The number of managed disk groups for the VDisks
Space in MDisk Groups
The capacity in the MDisk groups, derived from the SVC cluster pool capacity.
Space Allocated to VDisks
The amount of MDisk capacity that has been allocated to VDisks
Space Available in MDisk Groups
MDisk Group total capacity minus the space allocated to VDisks. Note that some space may be reserved for use by SVC.
MDisk Group UsageMouse over the thermometer to view the percentage, derived from the Total MDisk Capacity divided by the Managed Space.
# VDisks The number of VDisks associated with this array
Total VDisk Copy Capacity
Virtual capacity, including mirrors
Total VDisk Capacity Virtual capacity, excluding mirrors
Total Used Capacity Total VDisk used capacity
% Over-AllocationWhen this value is greater than 100%, it indicates that the VDisk is space-efficient. The percentage represents the ratio of virtual to real capacity.
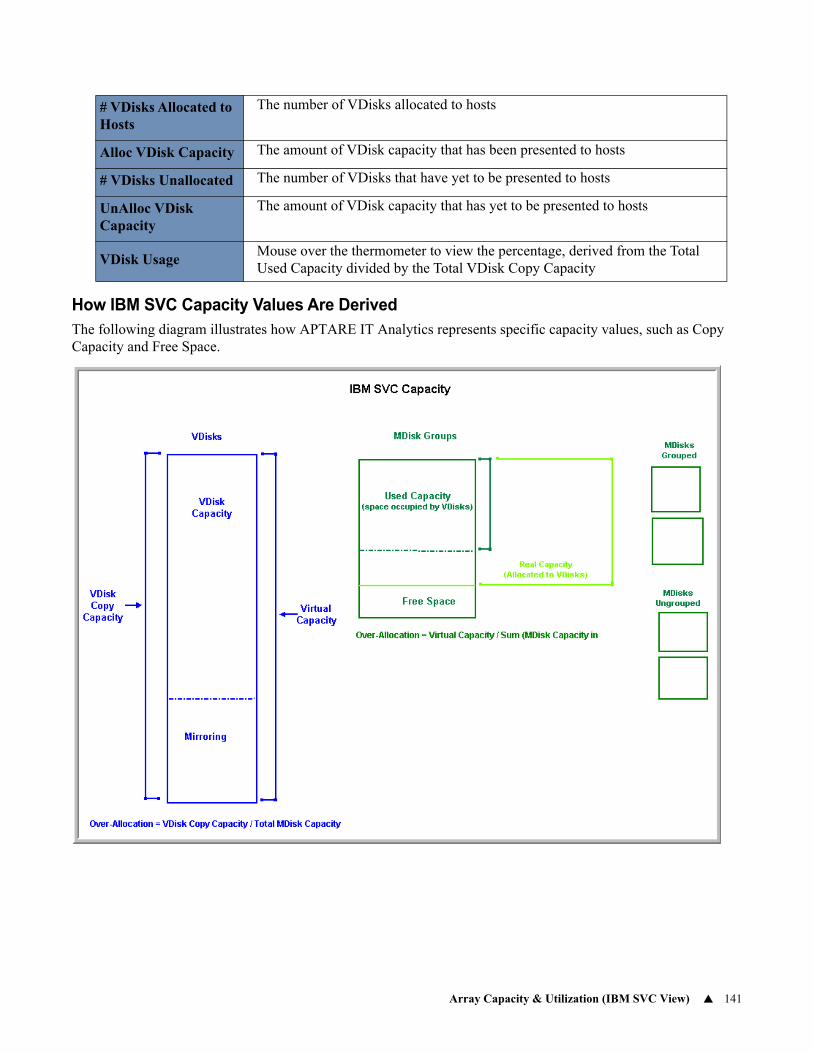
Array Capacity & Utilization (IBM SVC View) 141
How IBM SVC Capacity Values Are DerivedThe following diagram illustrates how APTARE IT Analytics represents specific capacity values, such as Copy Capacity and Free Space.
# VDisks Allocated to Hosts
The number of VDisks allocated to hosts
Alloc VDisk Capacity The amount of VDisk capacity that has been presented to hosts
# VDisks Unallocated The number of VDisks that have yet to be presented to hosts
UnAlloc VDisk Capacity
The amount of VDisk capacity that has yet to be presented to hosts
VDisk UsageMouse over the thermometer to view the percentage, derived from the Total Used Capacity divided by the Total VDisk Copy Capacity
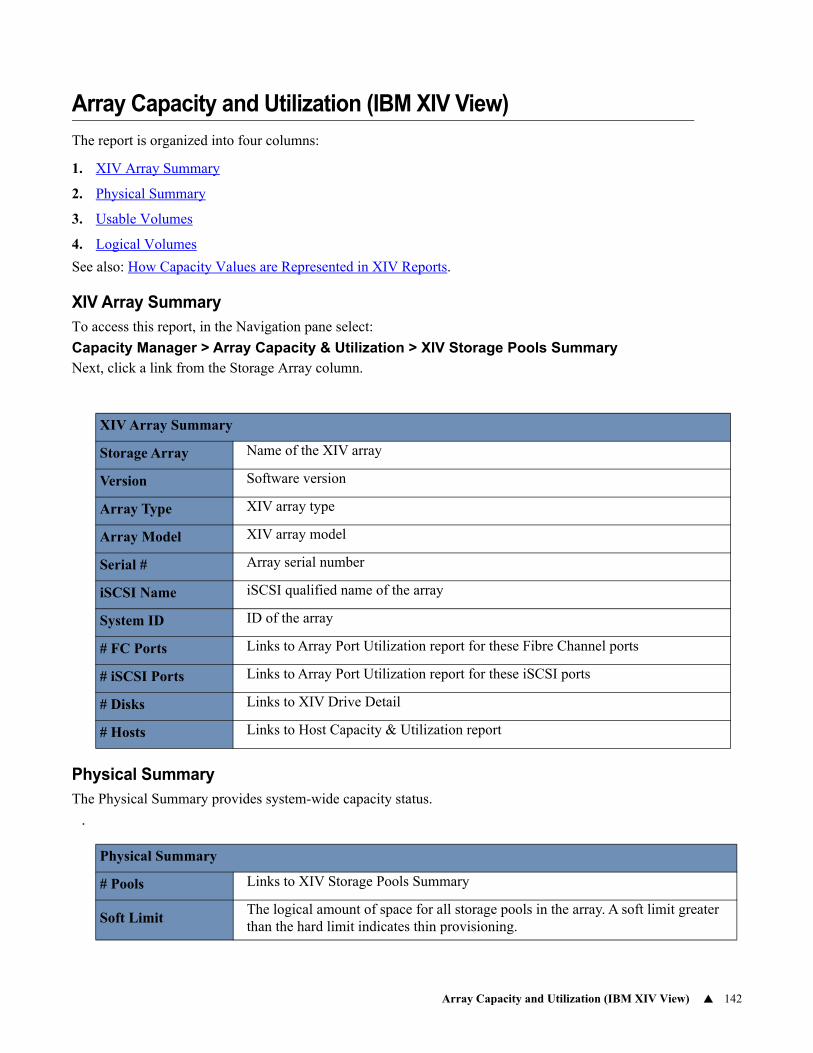
Array Capacity and Utilization (IBM XIV View) 142
Array Capacity and Utilization (IBM XIV View)
The report is organized into four columns:
1. XIV Array Summary
2. Physical Summary
3. Usable Volumes
4. Logical Volumes
See also: How Capacity Values are Represented in XIV Reports.
XIV Array SummaryTo access this report, in the Navigation pane select:
Capacity Manager > Array Capacity & Utilization > XIV Storage Pools SummaryNext, click a link from the Storage Array column.
Physical SummaryThe Physical Summary provides system-wide capacity status.
.
XIV Array Summary
Storage Array Name of the XIV array
Version Software version
Array Type XIV array type
Array Model XIV array model
Serial # Array serial number
iSCSI Name iSCSI qualified name of the array
System ID ID of the array
# FC Ports Links to Array Port Utilization report for these Fibre Channel ports
# iSCSI Ports Links to Array Port Utilization report for these iSCSI ports
# Disks Links to XIV Drive Detail
# Hosts Links to Host Capacity & Utilization report
Physical Summary
# Pools Links to XIV Storage Pools Summary
Soft LimitThe logical amount of space for all storage pools in the array. A soft limit greater than the hard limit indicates thin provisioning.
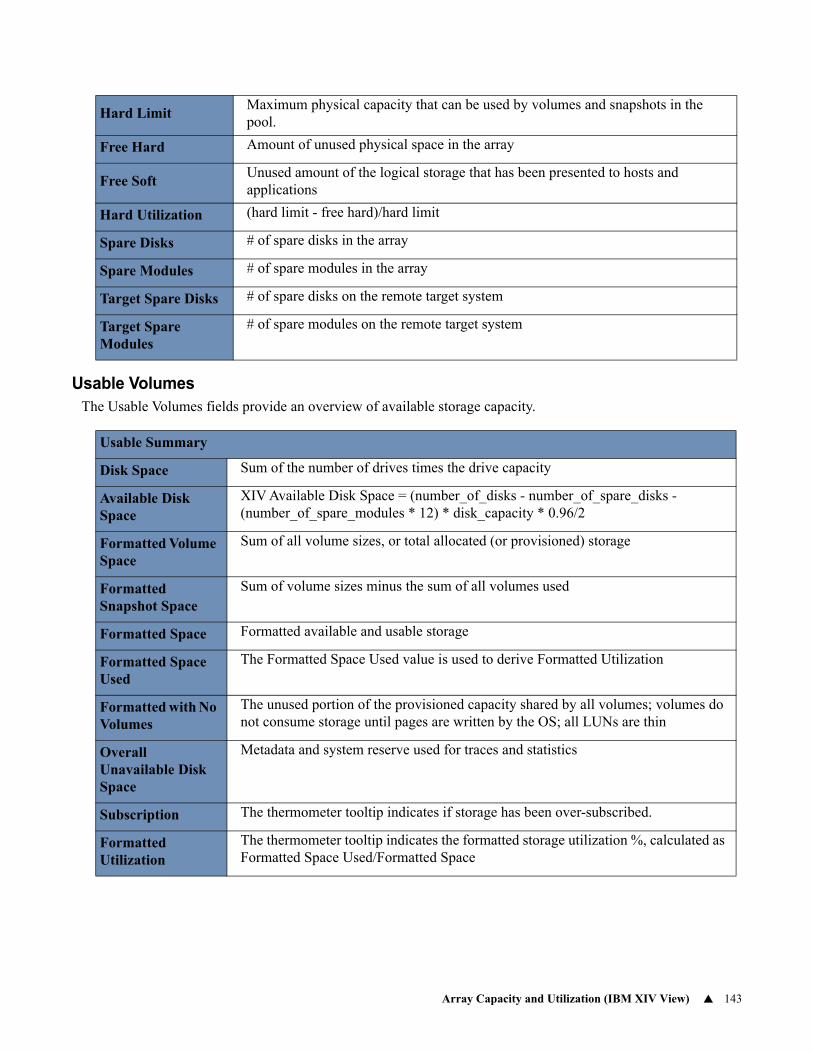
Array Capacity and Utilization (IBM XIV View) 143
Usable VolumesThe Usable Volumes fields provide an overview of available storage capacity.
Hard LimitMaximum physical capacity that can be used by volumes and snapshots in the pool.
Free Hard Amount of unused physical space in the array
Free SoftUnused amount of the logical storage that has been presented to hosts and applications
Hard Utilization (hard limit - free hard)/hard limit
Spare Disks # of spare disks in the array
Spare Modules # of spare modules in the array
Target Spare Disks # of spare disks on the remote target system
Target Spare Modules
# of spare modules on the remote target system
Usable Summary
Disk Space Sum of the number of drives times the drive capacity
Available Disk Space
XIV Available Disk Space = (number_of_disks - number_of_spare_disks - (number_of_spare_modules * 12) * disk_capacity * 0.96/2
Formatted Volume Space
Sum of all volume sizes, or total allocated (or provisioned) storage
Formatted Snapshot Space
Sum of volume sizes minus the sum of all volumes used
Formatted Space Formatted available and usable storage
Formatted Space Used
The Formatted Space Used value is used to derive Formatted Utilization
Formatted with No Volumes
The unused portion of the provisioned capacity shared by all volumes; volumes do not consume storage until pages are written by the OS; all LUNs are thin
Overall Unavailable Disk Space
Metadata and system reserve used for traces and statistics
Subscription The thermometer tooltip indicates if storage has been over-subscribed.
Formatted Utilization
The thermometer tooltip indicates the formatted storage utilization %, calculated as Formatted Space Used/Formatted Space
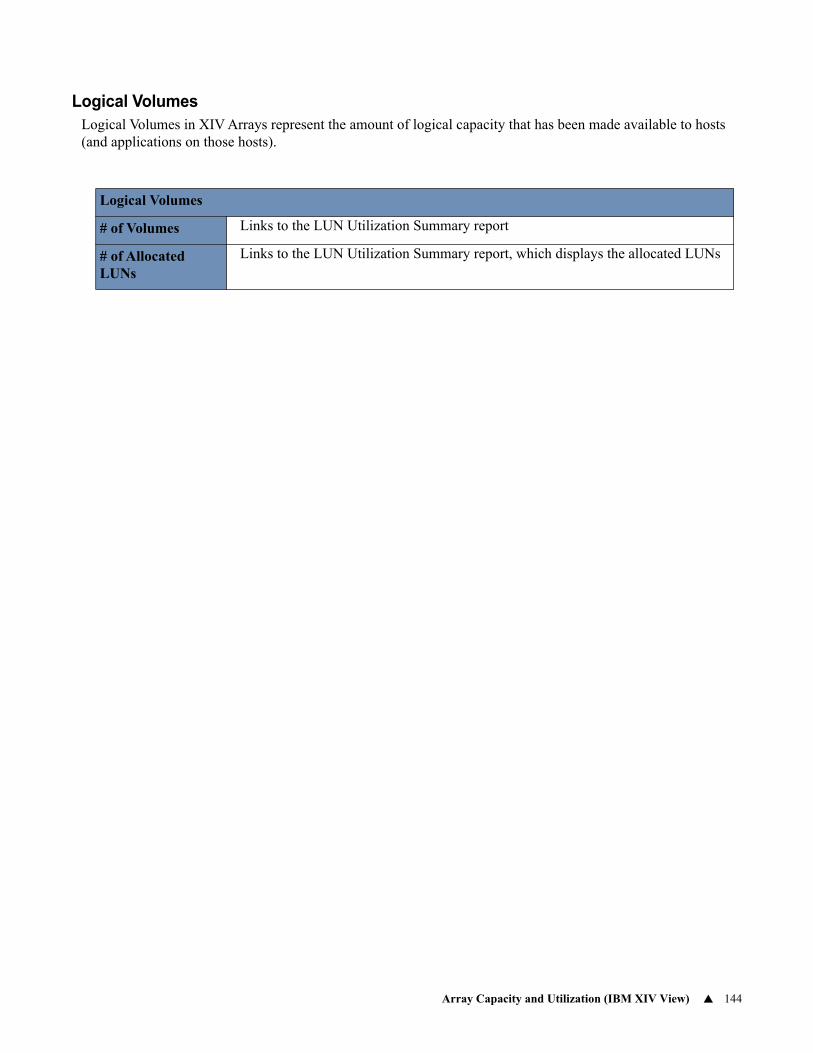
Array Capacity and Utilization (IBM XIV View) 144
Logical VolumesLogical Volumes in XIV Arrays represent the amount of logical capacity that has been made available to hosts (and applications on those hosts).
Logical Volumes
# of Volumes Links to the LUN Utilization Summary report
# of Allocated LUNs
Links to the LUN Utilization Summary report, which displays the allocated LUNs
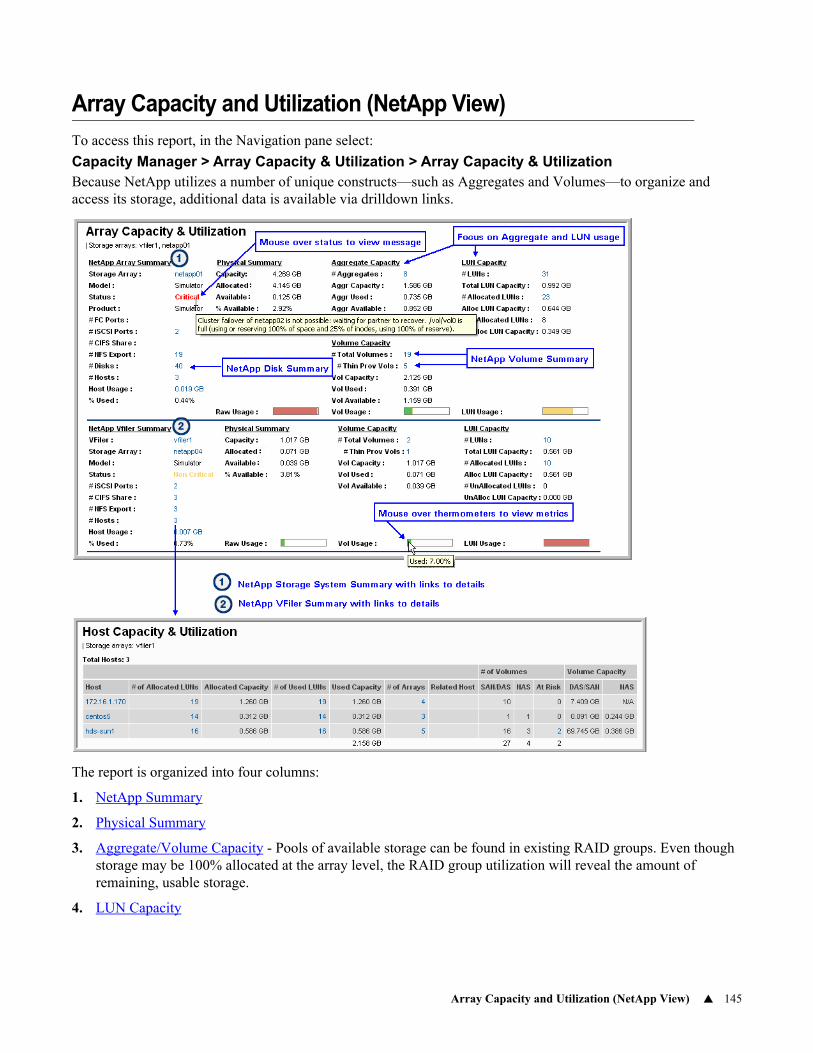
Array Capacity and Utilization (NetApp View) 145
Array Capacity and Utilization (NetApp View)
To access this report, in the Navigation pane select:
Capacity Manager > Array Capacity & Utilization > Array Capacity & UtilizationBecause NetApp utilizes a number of unique constructs—such as Aggregates and Volumes—to organize and access its storage, additional data is available via drilldown links.
The report is organized into four columns:
1. NetApp Summary
2. Physical Summary
3. Aggregate/Volume Capacity - Pools of available storage can be found in existing RAID groups. Even though storage may be 100% allocated at the array level, the RAID group utilization will reveal the amount of remaining, usable storage.
4. LUN Capacity
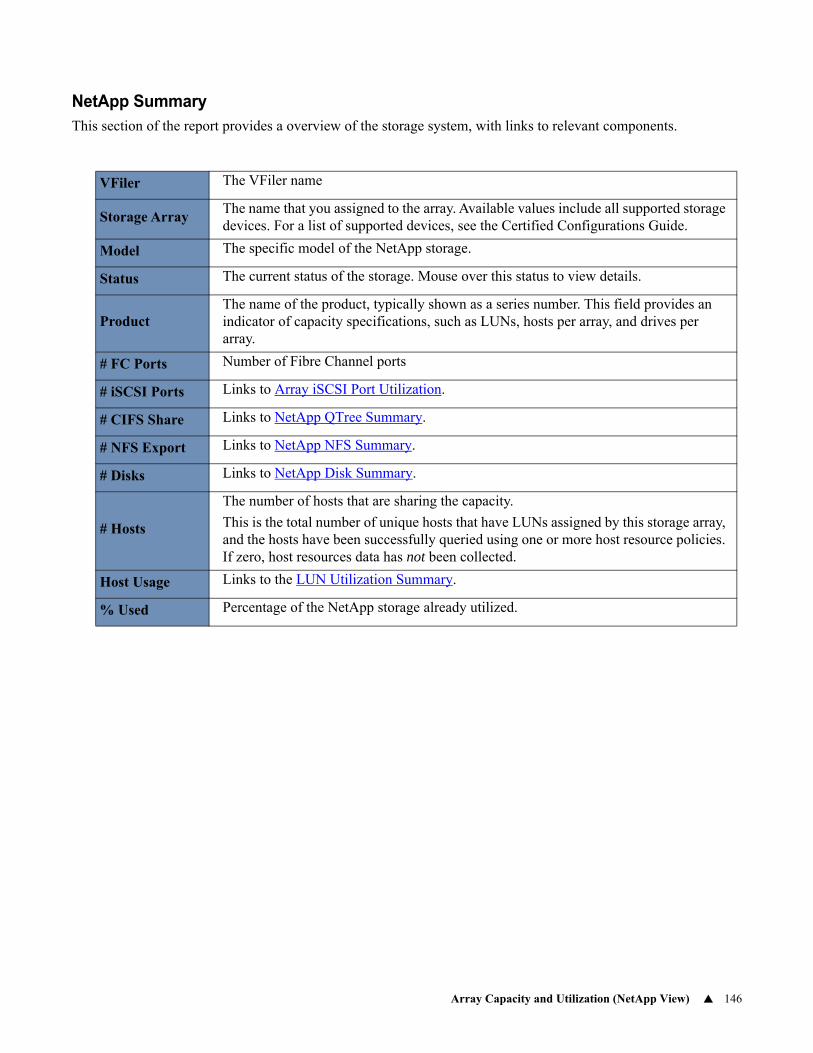
Array Capacity and Utilization (NetApp View) 146
NetApp SummaryThis section of the report provides a overview of the storage system, with links to relevant components.
VFiler The VFiler name
Storage ArrayThe name that you assigned to the array. Available values include all supported storage devices. For a list of supported devices, see the Certified Configurations Guide.
Model The specific model of the NetApp storage.
Status The current status of the storage. Mouse over this status to view details.
ProductThe name of the product, typically shown as a series number. This field provides an indicator of capacity specifications, such as LUNs, hosts per array, and drives per array.
# FC Ports Number of Fibre Channel ports
# iSCSI Ports Links to Array iSCSI Port Utilization.
# CIFS Share Links to NetApp QTree Summary.
# NFS Export Links to NetApp NFS Summary.
# Disks Links to NetApp Disk Summary.
# Hosts
The number of hosts that are sharing the capacity.
This is the total number of unique hosts that have LUNs assigned by this storage array, and the hosts have been successfully queried using one or more host resource policies. If zero, host resources data has not been collected.
Host Usage Links to the LUN Utilization Summary.
% Used Percentage of the NetApp storage already utilized.
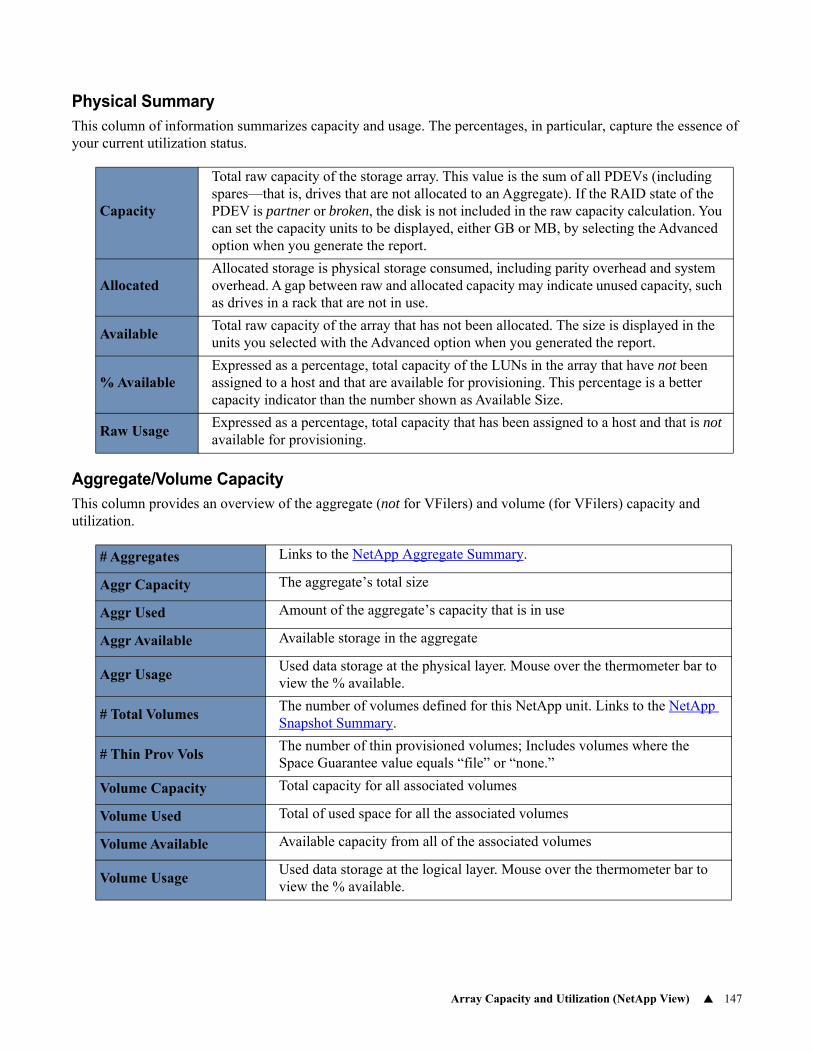
Array Capacity and Utilization (NetApp View) 147
Physical SummaryThis column of information summarizes capacity and usage. The percentages, in particular, capture the essence of your current utilization status.
Aggregate/Volume CapacityThis column provides an overview of the aggregate (not for VFilers) and volume (for VFilers) capacity and utilization.
Capacity
Total raw capacity of the storage array. This value is the sum of all PDEVs (including spares—that is, drives that are not allocated to an Aggregate). If the RAID state of the PDEV is partner or broken, the disk is not included in the raw capacity calculation. You can set the capacity units to be displayed, either GB or MB, by selecting the Advanced option when you generate the report.
AllocatedAllocated storage is physical storage consumed, including parity overhead and system overhead. A gap between raw and allocated capacity may indicate unused capacity, such as drives in a rack that are not in use.
AvailableTotal raw capacity of the array that has not been allocated. The size is displayed in the units you selected with the Advanced option when you generated the report.
% AvailableExpressed as a percentage, total capacity of the LUNs in the array that have not been assigned to a host and that are available for provisioning. This percentage is a better capacity indicator than the number shown as Available Size.
Raw UsageExpressed as a percentage, total capacity that has been assigned to a host and that is not available for provisioning.
# Aggregates Links to the NetApp Aggregate Summary.
Aggr Capacity The aggregate’s total size
Aggr Used Amount of the aggregate’s capacity that is in use
Aggr Available Available storage in the aggregate
Aggr UsageUsed data storage at the physical layer. Mouse over the thermometer bar to view the % available.
# Total VolumesThe number of volumes defined for this NetApp unit. Links to the NetApp Snapshot Summary.
# Thin Prov VolsThe number of thin provisioned volumes; Includes volumes where the Space Guarantee value equals “file” or “none.”
Volume Capacity Total capacity for all associated volumes
Volume Used Total of used space for all the associated volumes
Volume Available Available capacity from all of the associated volumes
Volume UsageUsed data storage at the logical layer. Mouse over the thermometer bar to view the % available.
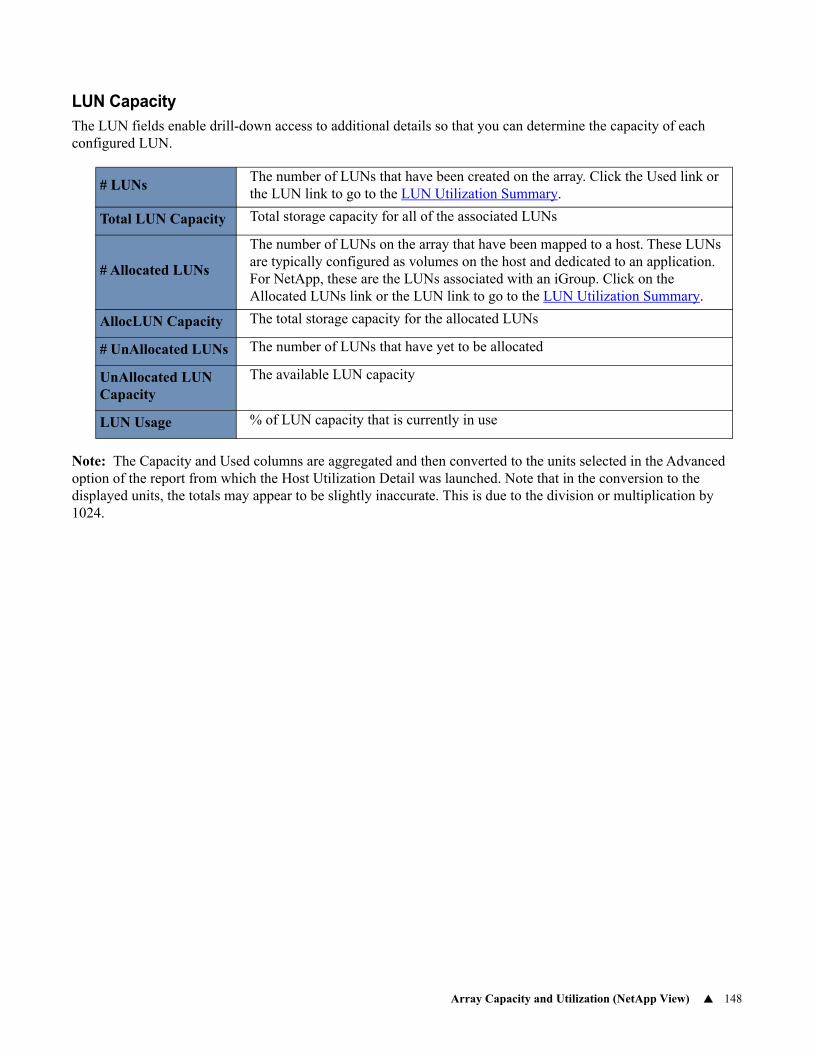
Array Capacity and Utilization (NetApp View) 148
LUN CapacityThe LUN fields enable drill-down access to additional details so that you can determine the capacity of each configured LUN.
Note: The Capacity and Used columns are aggregated and then converted to the units selected in the Advanced option of the report from which the Host Utilization Detail was launched. Note that in the conversion to the displayed units, the totals may appear to be slightly inaccurate. This is due to the division or multiplication by 1024.
# LUNsThe number of LUNs that have been created on the array. Click the Used link or the LUN link to go to the LUN Utilization Summary.
Total LUN Capacity Total storage capacity for all of the associated LUNs
# Allocated LUNs
The number of LUNs on the array that have been mapped to a host. These LUNs are typically configured as volumes on the host and dedicated to an application. For NetApp, these are the LUNs associated with an iGroup. Click on the Allocated LUNs link or the LUN link to go to the LUN Utilization Summary.
AllocLUN Capacity The total storage capacity for the allocated LUNs
# UnAllocated LUNs The number of LUNs that have yet to be allocated
UnAllocated LUN Capacity
The available LUN capacity
LUN Usage % of LUN capacity that is currently in use
Array Capacity and Utilization (NetApp Cluster) 149
Array Capacity and Utilization (NetApp Cluster)
To access this report, in the Navigation pane select:
Capacity Manager > Array Capacity & Utilization > Array Capacity & UtilizationBecause NetApp Cluster mode uses a number of unique constructs—such as Aggregates and Volumes—to organize and access its storage, additional data is available through drilldowns.
The report is organized into four sections:
1. NetApp Cluster Summary
2. Physical Summary
3. Aggregate Summary
4. Volume Capacity
5. LUN Summary
6. Performance
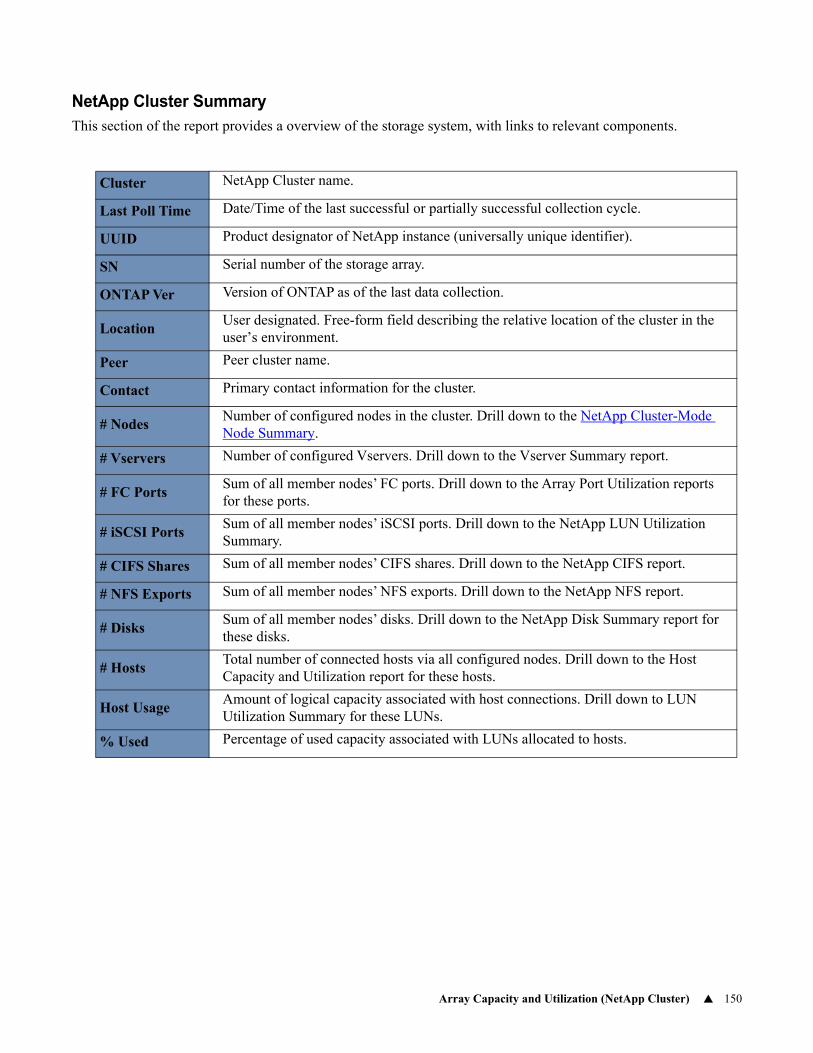
Array Capacity and Utilization (NetApp Cluster) 150
NetApp Cluster SummaryThis section of the report provides a overview of the storage system, with links to relevant components.
Cluster NetApp Cluster name.
Last Poll Time Date/Time of the last successful or partially successful collection cycle.
UUID Product designator of NetApp instance (universally unique identifier).
SN Serial number of the storage array.
ONTAP Ver Version of ONTAP as of the last data collection.
LocationUser designated. Free-form field describing the relative location of the cluster in the user’s environment.
Peer Peer cluster name.
Contact Primary contact information for the cluster.
# NodesNumber of configured nodes in the cluster. Drill down to the NetApp Cluster-Mode Node Summary.
# Vservers Number of configured Vservers. Drill down to the Vserver Summary report.
# FC PortsSum of all member nodes’ FC ports. Drill down to the Array Port Utilization reports for these ports.
# iSCSI PortsSum of all member nodes’ iSCSI ports. Drill down to the NetApp LUN Utilization Summary.
# CIFS Shares Sum of all member nodes’ CIFS shares. Drill down to the NetApp CIFS report.
# NFS Exports Sum of all member nodes’ NFS exports. Drill down to the NetApp NFS report.
# DisksSum of all member nodes’ disks. Drill down to the NetApp Disk Summary report for these disks.
# HostsTotal number of connected hosts via all configured nodes. Drill down to the Host Capacity and Utilization report for these hosts.
Host UsageAmount of logical capacity associated with host connections. Drill down to LUN Utilization Summary for these LUNs.
% Used Percentage of used capacity associated with LUNs allocated to hosts.
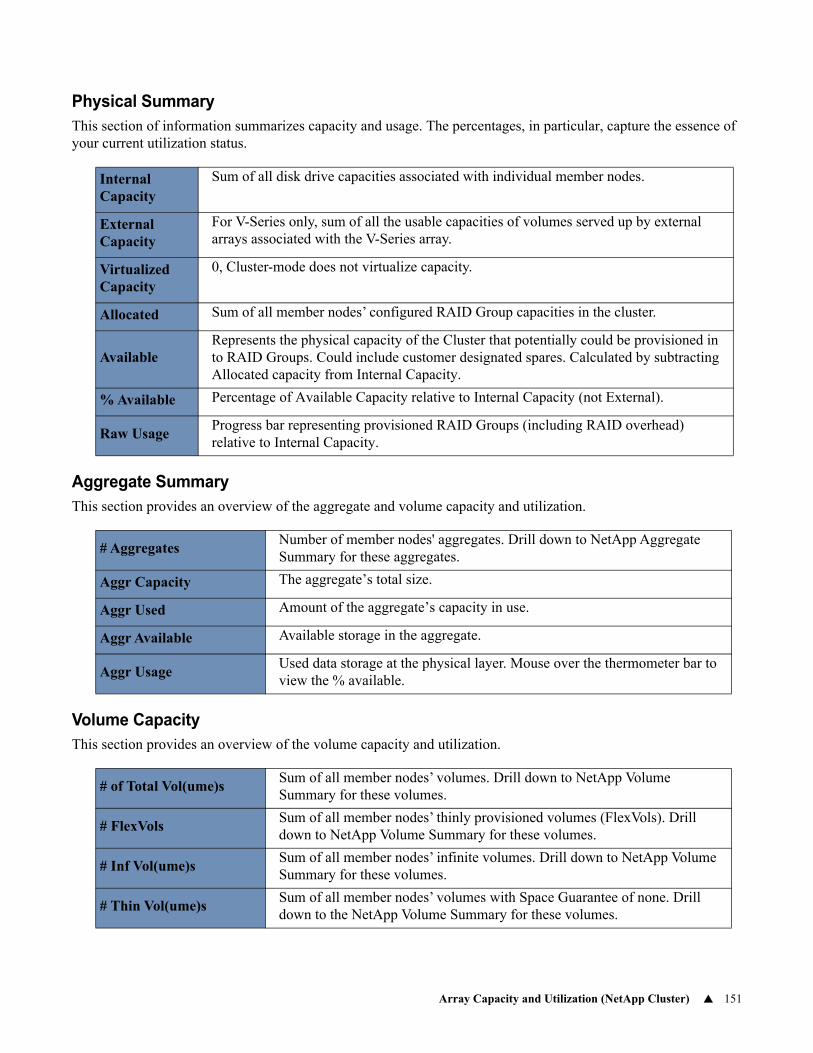
Array Capacity and Utilization (NetApp Cluster) 151
Physical SummaryThis section of information summarizes capacity and usage. The percentages, in particular, capture the essence of your current utilization status.
Aggregate SummaryThis section provides an overview of the aggregate and volume capacity and utilization.
Volume CapacityThis section provides an overview of the volume capacity and utilization.
Internal Capacity
Sum of all disk drive capacities associated with individual member nodes.
External Capacity
For V-Series only, sum of all the usable capacities of volumes served up by external arrays associated with the V-Series array.
Virtualized Capacity
0, Cluster-mode does not virtualize capacity.
Allocated Sum of all member nodes’ configured RAID Group capacities in the cluster.
AvailableRepresents the physical capacity of the Cluster that potentially could be provisioned in to RAID Groups. Could include customer designated spares. Calculated by subtracting Allocated capacity from Internal Capacity.
% Available Percentage of Available Capacity relative to Internal Capacity (not External).
Raw UsageProgress bar representing provisioned RAID Groups (including RAID overhead) relative to Internal Capacity.
# AggregatesNumber of member nodes' aggregates. Drill down to NetApp Aggregate Summary for these aggregates.
Aggr Capacity The aggregate’s total size.
Aggr Used Amount of the aggregate’s capacity in use.
Aggr Available Available storage in the aggregate.
Aggr UsageUsed data storage at the physical layer. Mouse over the thermometer bar to view the % available.
# of Total Vol(ume)sSum of all member nodes’ volumes. Drill down to NetApp Volume Summary for these volumes.
# FlexVolsSum of all member nodes’ thinly provisioned volumes (FlexVols). Drill down to NetApp Volume Summary for these volumes.
# Inf Vol(ume)sSum of all member nodes’ infinite volumes. Drill down to NetApp Volume Summary for these volumes.
# Thin Vol(ume)sSum of all member nodes’ volumes with Space Guarantee of none. Drill down to the NetApp Volume Summary for these volumes.
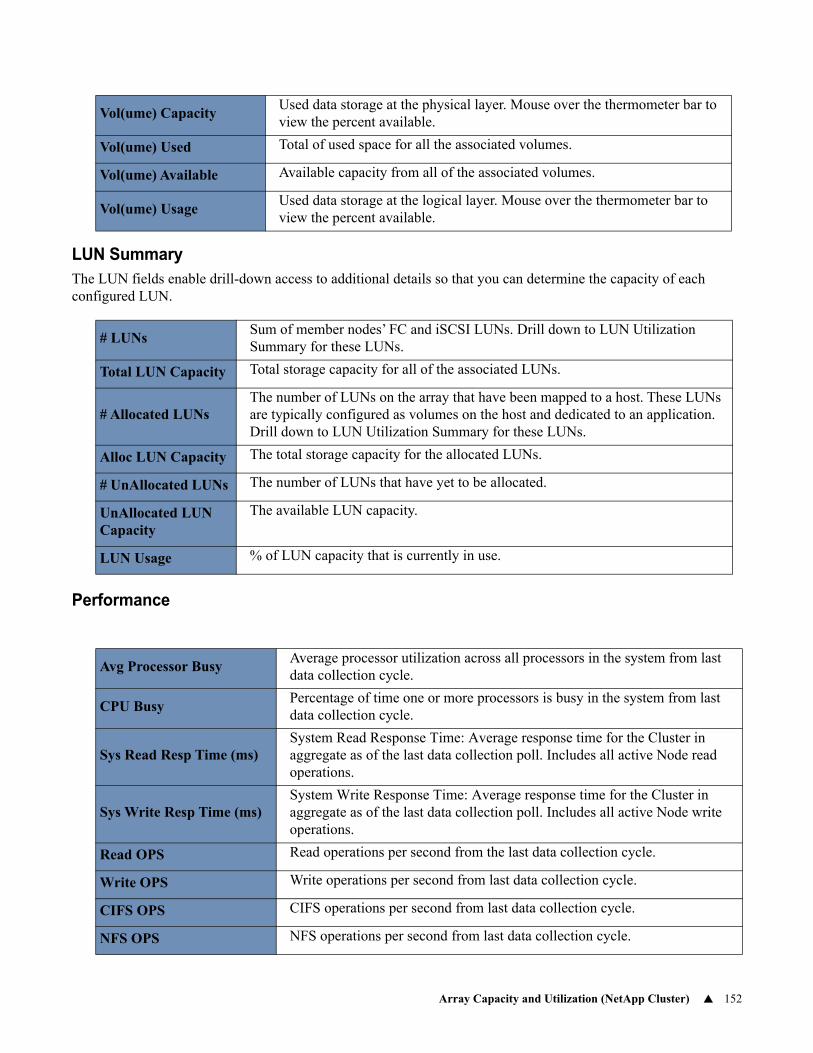
Array Capacity and Utilization (NetApp Cluster) 152
LUN SummaryThe LUN fields enable drill-down access to additional details so that you can determine the capacity of each configured LUN.
Performance
Vol(ume) CapacityUsed data storage at the physical layer. Mouse over the thermometer bar to view the percent available.
Vol(ume) Used Total of used space for all the associated volumes.
Vol(ume) Available Available capacity from all of the associated volumes.
Vol(ume) UsageUsed data storage at the logical layer. Mouse over the thermometer bar to view the percent available.
# LUNsSum of member nodes’ FC and iSCSI LUNs. Drill down to LUN Utilization Summary for these LUNs.
Total LUN Capacity Total storage capacity for all of the associated LUNs.
# Allocated LUNsThe number of LUNs on the array that have been mapped to a host. These LUNs are typically configured as volumes on the host and dedicated to an application. Drill down to LUN Utilization Summary for these LUNs.
Alloc LUN Capacity The total storage capacity for the allocated LUNs.
# UnAllocated LUNs The number of LUNs that have yet to be allocated.
UnAllocated LUN Capacity
The available LUN capacity.
LUN Usage % of LUN capacity that is currently in use.
Avg Processor BusyAverage processor utilization across all processors in the system from last data collection cycle.
CPU BusyPercentage of time one or more processors is busy in the system from last data collection cycle.
Sys Read Resp Time (ms)System Read Response Time: Average response time for the Cluster in aggregate as of the last data collection poll. Includes all active Node read operations.
Sys Write Resp Time (ms)System Write Response Time: Average response time for the Cluster in aggregate as of the last data collection poll. Includes all active Node write operations.
Read OPS Read operations per second from the last data collection cycle.
Write OPS Write operations per second from last data collection cycle.
CIFS OPS CIFS operations per second from last data collection cycle.
NFS OPS NFS operations per second from last data collection cycle.
NetApp Storage System Detail 153
NetApp Storage System Detail
Detail reports are related to a specific enterprise object, such as a backup job. You can only access detail reports through a link presented in the context of a main report, providing additional information that augments the main report. Detail reports cannot be generated, customized, or saved, as they are specific to the report from which they were derived. They are not available in search results.
Explore your data center using APTARE IT Analytics customizable report templates or by using parts of your IT infrastructure as entry points. Use Search to find reports, templates and dashboards across the portal.
Use the Reports tab to examine the APTARE IT Analytics catalog of templates, dashboards and reports - organized by products along with user-created, and system folders. The main report is located here:
Capacity Manager > Array Capacity & Utilization > Array Capacity & UtilizationClick the Array Name link.
FCP OPSFibre channel protocol (FCP) operations per second from the last data collection cycle.
iSCSI OPS iSCSI operations per second from the last data collection cycle.
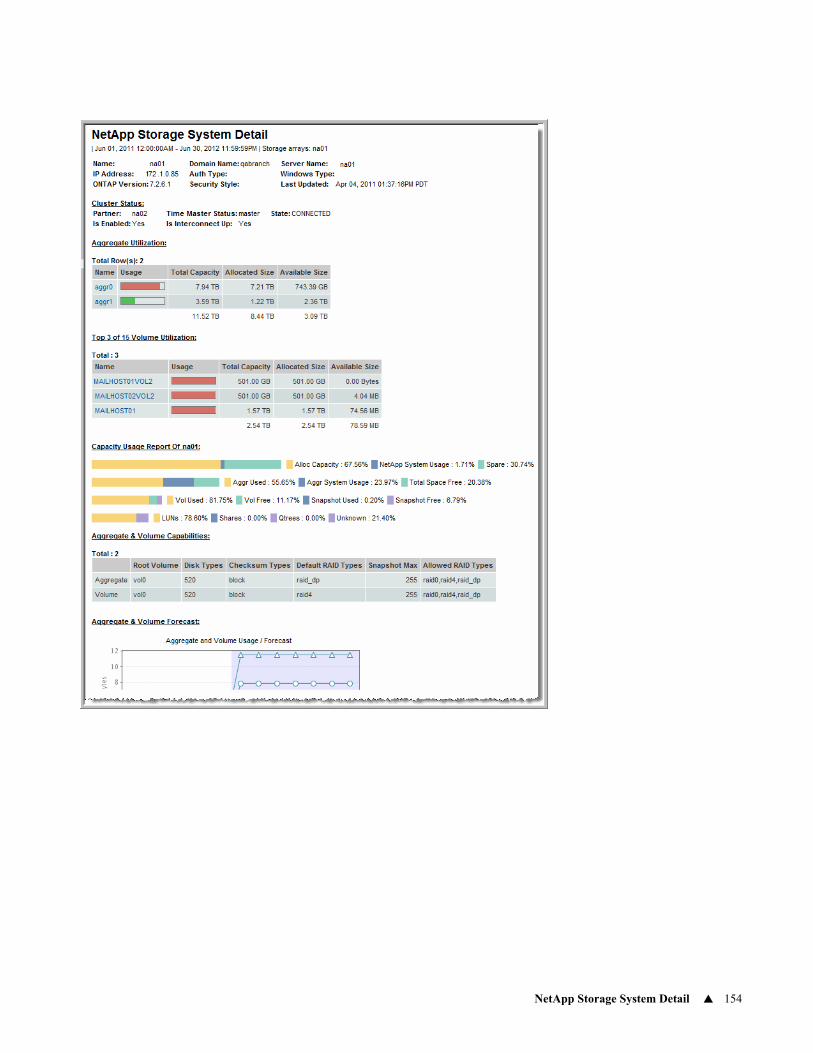
NetApp Storage System Detail 154
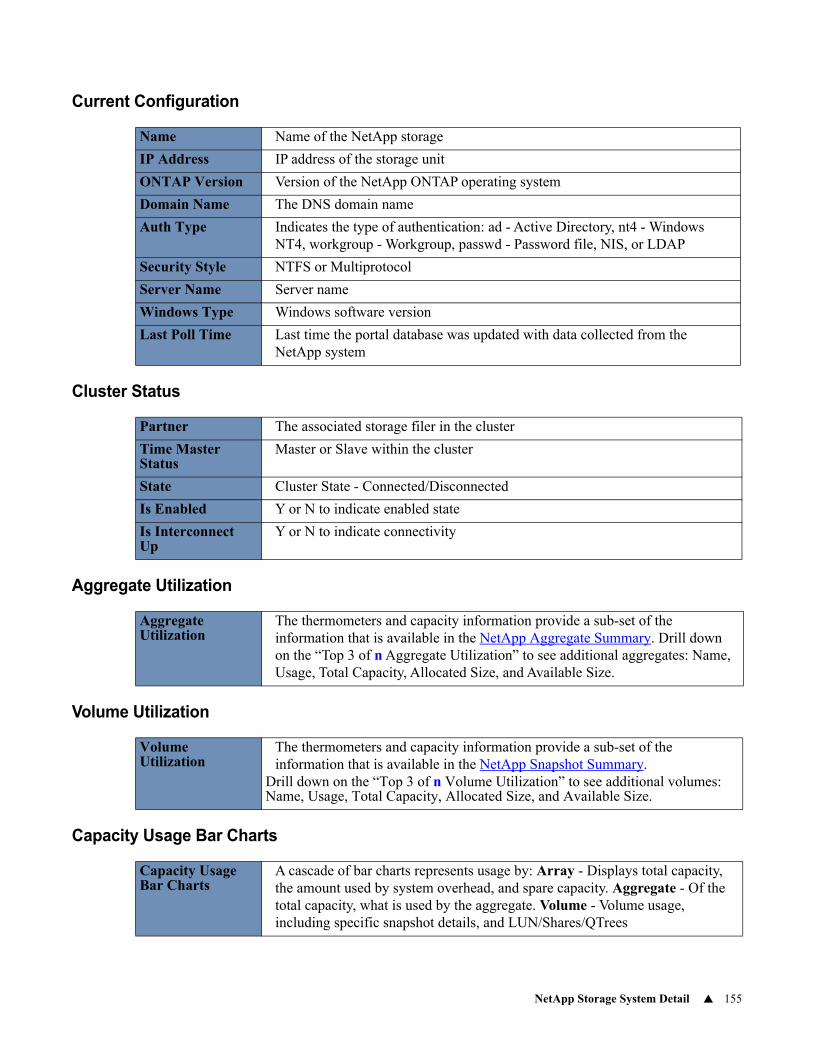
NetApp Storage System Detail 155
Current Configuration
Cluster Status
Aggregate Utilization
Volume Utilization
Capacity Usage Bar Charts
Name Name of the NetApp storage
IP Address IP address of the storage unit
ONTAP Version Version of the NetApp ONTAP operating system
Domain Name The DNS domain name
Auth Type Indicates the type of authentication: ad - Active Directory, nt4 - Windows NT4, workgroup - Workgroup, passwd - Password file, NIS, or LDAP
Security Style NTFS or Multiprotocol
Server Name Server name
Windows Type Windows software version
Last Poll Time Last time the portal database was updated with data collected from the NetApp system
Partner The associated storage filer in the cluster
Time Master Status
Master or Slave within the cluster
State Cluster State - Connected/Disconnected
Is Enabled Y or N to indicate enabled state
Is Interconnect Up
Y or N to indicate connectivity
Aggregate Utilization
The thermometers and capacity information provide a sub-set of the information that is available in the NetApp Aggregate Summary. Drill down on the “Top 3 of n Aggregate Utilization” to see additional aggregates: Name, Usage, Total Capacity, Allocated Size, and Available Size.
Volume Utilization
The thermometers and capacity information provide a sub-set of the information that is available in the NetApp Snapshot Summary.
Drill down on the “Top 3 of n Volume Utilization” to see additional volumes: Name, Usage, Total Capacity, Allocated Size, and Available Size.
Capacity Usage Bar Charts
A cascade of bar charts represents usage by: Array - Displays total capacity, the amount used by system overhead, and spare capacity. Aggregate - Of the total capacity, what is used by the aggregate. Volume - Volume usage, including specific snapshot details, and LUN/Shares/QTrees
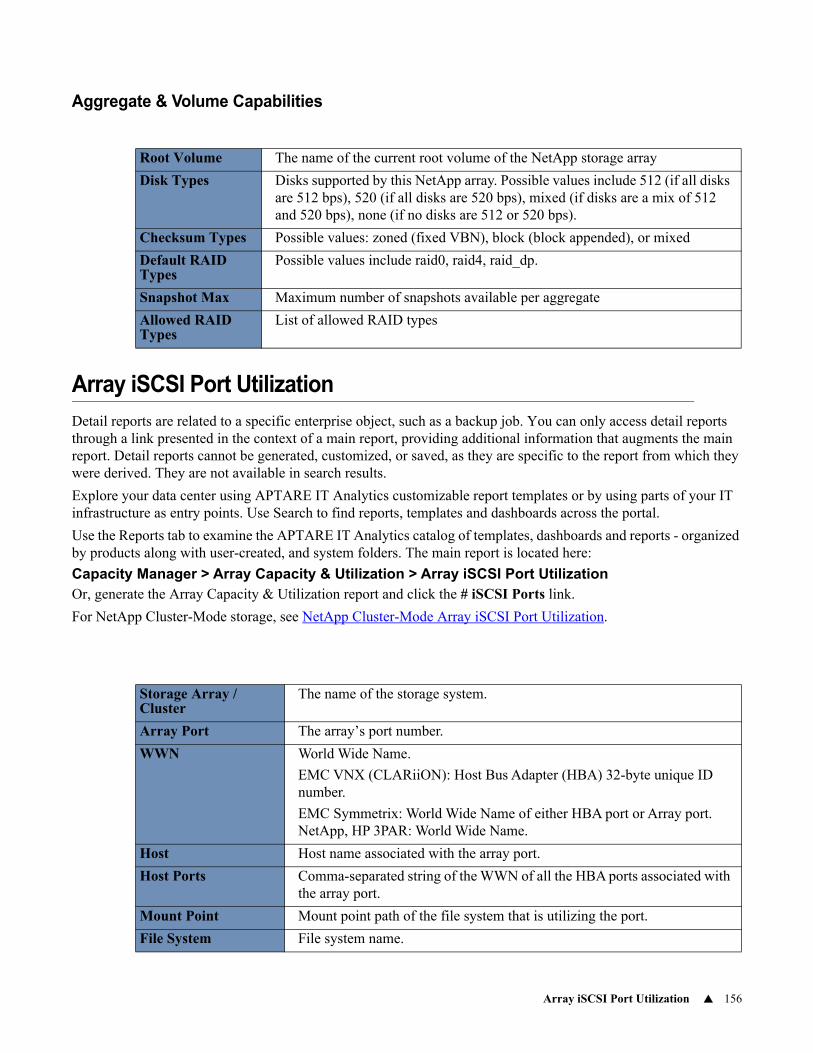
Array iSCSI Port Utilization 156
Aggregate & Volume Capabilities
Array iSCSI Port Utilization
Detail reports are related to a specific enterprise object, such as a backup job. You can only access detail reports through a link presented in the context of a main report, providing additional information that augments the main report. Detail reports cannot be generated, customized, or saved, as they are specific to the report from which they were derived. They are not available in search results.
Explore your data center using APTARE IT Analytics customizable report templates or by using parts of your IT infrastructure as entry points. Use Search to find reports, templates and dashboards across the portal.
Use the Reports tab to examine the APTARE IT Analytics catalog of templates, dashboards and reports - organized by products along with user-created, and system folders. The main report is located here:
Capacity Manager > Array Capacity & Utilization > Array iSCSI Port UtilizationOr, generate the Array Capacity & Utilization report and click the # iSCSI Ports link.
For NetApp Cluster-Mode storage, see NetApp Cluster-Mode Array iSCSI Port Utilization.
Root Volume The name of the current root volume of the NetApp storage array
Disk Types Disks supported by this NetApp array. Possible values include 512 (if all disks are 512 bps), 520 (if all disks are 520 bps), mixed (if disks are a mix of 512 and 520 bps), none (if no disks are 512 or 520 bps).
Checksum Types Possible values: zoned (fixed VBN), block (block appended), or mixed
Default RAID Types
Possible values include raid0, raid4, raid_dp.
Snapshot Max Maximum number of snapshots available per aggregate
Allowed RAID Types
List of allowed RAID types
Storage Array /Cluster
The name of the storage system.
Array Port The array’s port number.
WWN World Wide Name.
EMC VNX (CLARiiON): Host Bus Adapter (HBA) 32-byte unique ID number.
EMC Symmetrix: World Wide Name of either HBA port or Array port. NetApp, HP 3PAR: World Wide Name.
Host Host name associated with the array port.
Host Ports Comma-separated string of the WWN of all the HBA ports associated with the array port.
Mount Point Mount point path of the file system that is utilizing the port.
File System File system name.
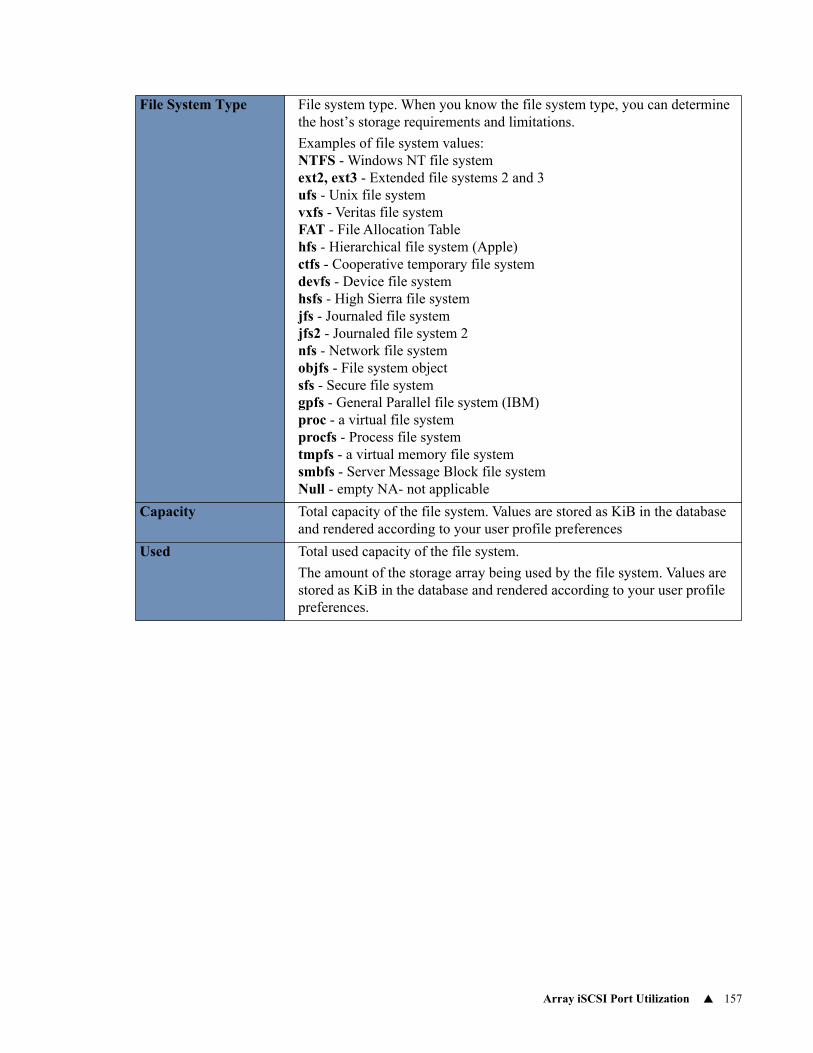
Array iSCSI Port Utilization 157
File System Type File system type. When you know the file system type, you can determine the host’s storage requirements and limitations.
Examples of file system values: NTFS - Windows NT file system ext2, ext3 - Extended file systems 2 and 3 ufs - Unix file system vxfs - Veritas file system FAT - File Allocation Table hfs - Hierarchical file system (Apple) ctfs - Cooperative temporary file system devfs - Device file system hsfs - High Sierra file system jfs - Journaled file system jfs2 - Journaled file system 2 nfs - Network file system objfs - File system object sfs - Secure file system gpfs - General Parallel file system (IBM) proc - a virtual file system procfs - Process file system tmpfs - a virtual memory file system smbfs - Server Message Block file system Null - empty NA- not applicable
Capacity Total capacity of the file system. Values are stored as KiB in the database and rendered according to your user profile preferences
Used Total used capacity of the file system.
The amount of the storage array being used by the file system. Values are stored as KiB in the database and rendered according to your user profile preferences.
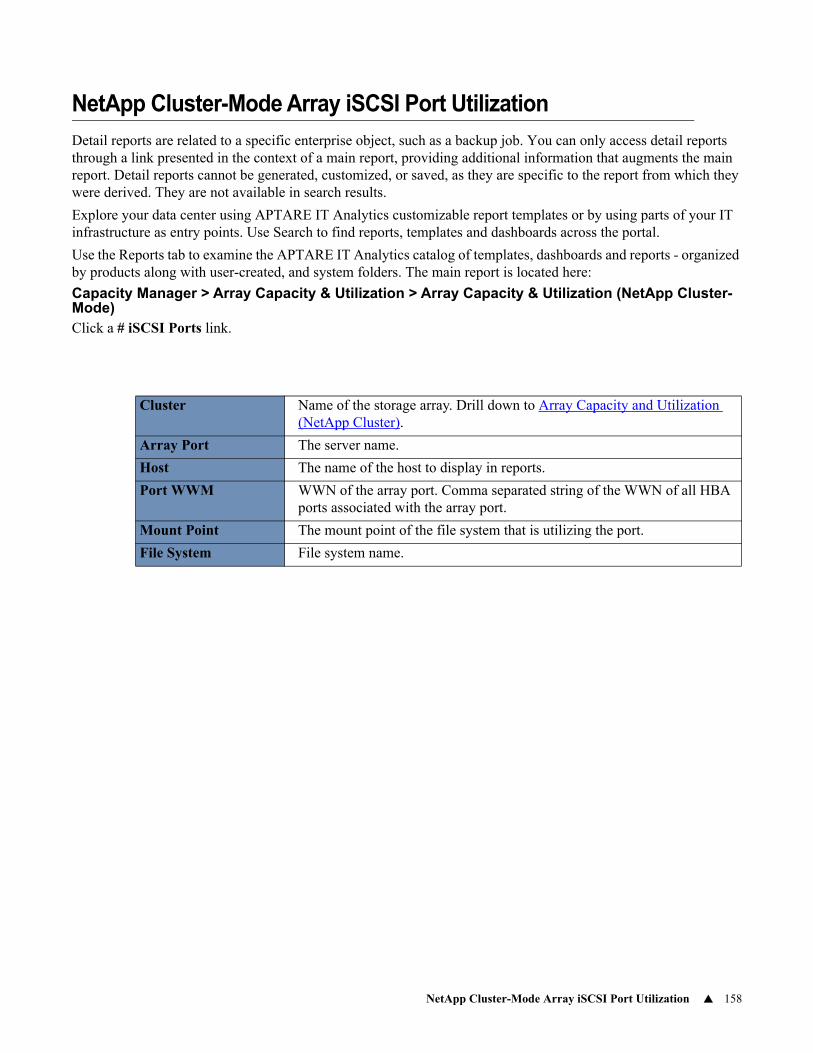
NetApp Cluster-Mode Array iSCSI Port Utilization 158
NetApp Cluster-Mode Array iSCSI Port Utilization
Detail reports are related to a specific enterprise object, such as a backup job. You can only access detail reports through a link presented in the context of a main report, providing additional information that augments the main report. Detail reports cannot be generated, customized, or saved, as they are specific to the report from which they were derived. They are not available in search results.
Explore your data center using APTARE IT Analytics customizable report templates or by using parts of your IT infrastructure as entry points. Use Search to find reports, templates and dashboards across the portal.
Use the Reports tab to examine the APTARE IT Analytics catalog of templates, dashboards and reports - organized by products along with user-created, and system folders. The main report is located here:
Capacity Manager > Array Capacity & Utilization > Array Capacity & Utilization (NetApp Cluster-Mode)Click a # iSCSI Ports link.
Cluster Name of the storage array. Drill down to Array Capacity and Utilization (NetApp Cluster).
Array Port The server name.
Host The name of the host to display in reports.
Port WWM WWN of the array port. Comma separated string of the WWN of all HBA ports associated with the array port.
Mount Point The mount point of the file system that is utilizing the port.
File System File system name.
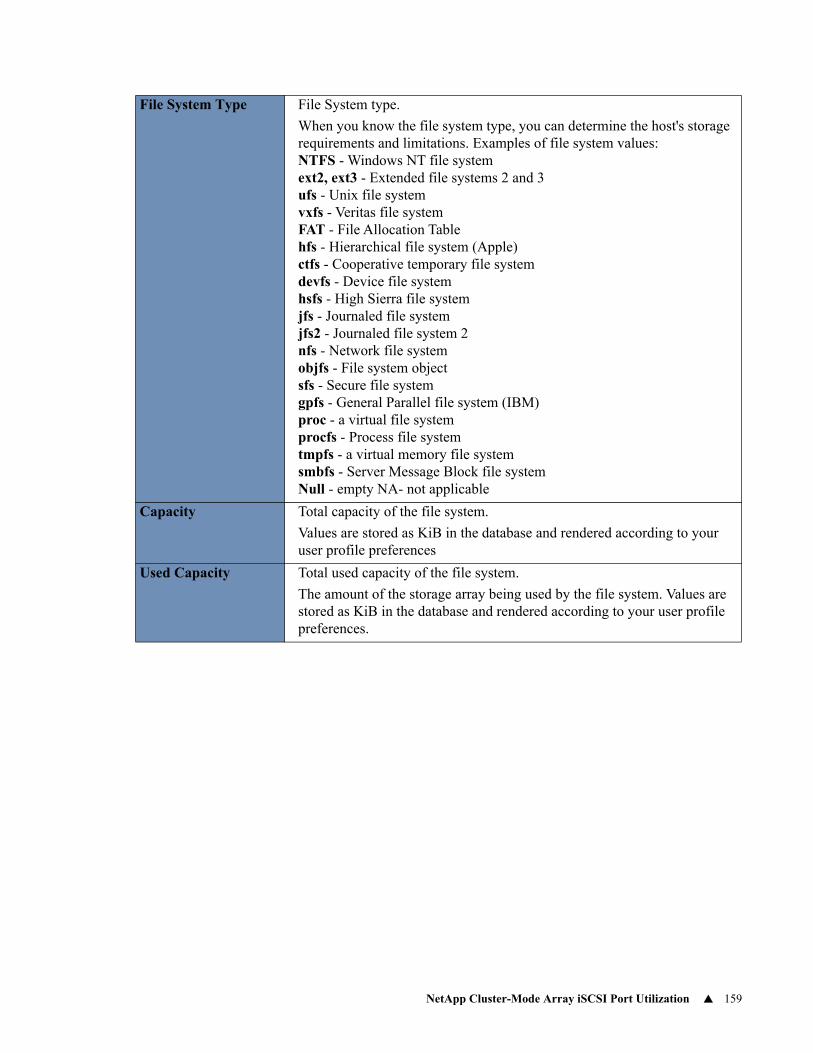
NetApp Cluster-Mode Array iSCSI Port Utilization 159
File System Type File System type.
When you know the file system type, you can determine the host's storage requirements and limitations. Examples of file system values: NTFS - Windows NT file system ext2, ext3 - Extended file systems 2 and 3 ufs - Unix file system vxfs - Veritas file system FAT - File Allocation Table hfs - Hierarchical file system (Apple) ctfs - Cooperative temporary file system devfs - Device file system hsfs - High Sierra file system jfs - Journaled file system jfs2 - Journaled file system 2 nfs - Network file system objfs - File system object sfs - Secure file system gpfs - General Parallel file system (IBM) proc - a virtual file system procfs - Process file system tmpfs - a virtual memory file system smbfs - Server Message Block file system Null - empty NA- not applicable
Capacity Total capacity of the file system.
Values are stored as KiB in the database and rendered according to your user profile preferences
Used Capacity Total used capacity of the file system.
The amount of the storage array being used by the file system. Values are stored as KiB in the database and rendered according to your user profile preferences.
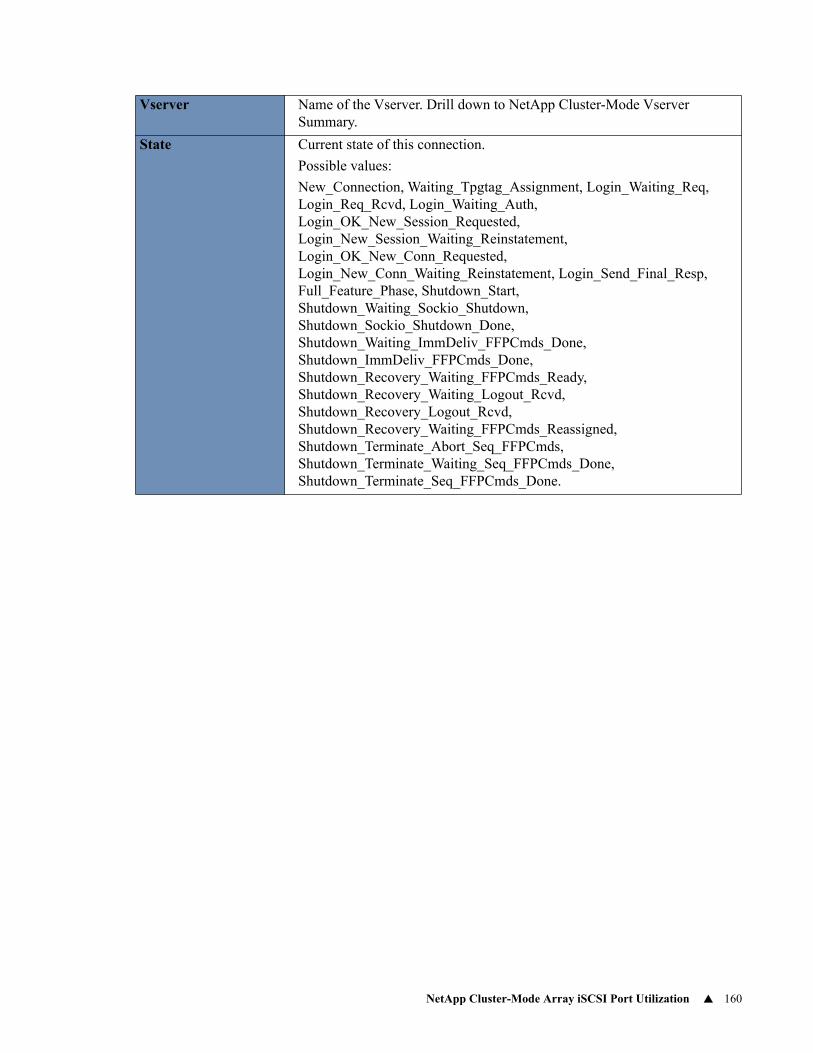
NetApp Cluster-Mode Array iSCSI Port Utilization 160
Vserver Name of the Vserver. Drill down to NetApp Cluster-Mode Vserver Summary.
State Current state of this connection.
Possible values:
New_Connection, Waiting_Tpgtag_Assignment, Login_Waiting_Req, Login_Req_Rcvd, Login_Waiting_Auth, Login_OK_New_Session_Requested, Login_New_Session_Waiting_Reinstatement, Login_OK_New_Conn_Requested, Login_New_Conn_Waiting_Reinstatement, Login_Send_Final_Resp, Full_Feature_Phase, Shutdown_Start, Shutdown_Waiting_Sockio_Shutdown, Shutdown_Sockio_Shutdown_Done, Shutdown_Waiting_ImmDeliv_FFPCmds_Done, Shutdown_ImmDeliv_FFPCmds_Done, Shutdown_Recovery_Waiting_FFPCmds_Ready, Shutdown_Recovery_Waiting_Logout_Rcvd, Shutdown_Recovery_Logout_Rcvd, Shutdown_Recovery_Waiting_FFPCmds_Reassigned, Shutdown_Terminate_Abort_Seq_FFPCmds, Shutdown_Terminate_Waiting_Seq_FFPCmds_Done, Shutdown_Terminate_Seq_FFPCmds_Done.
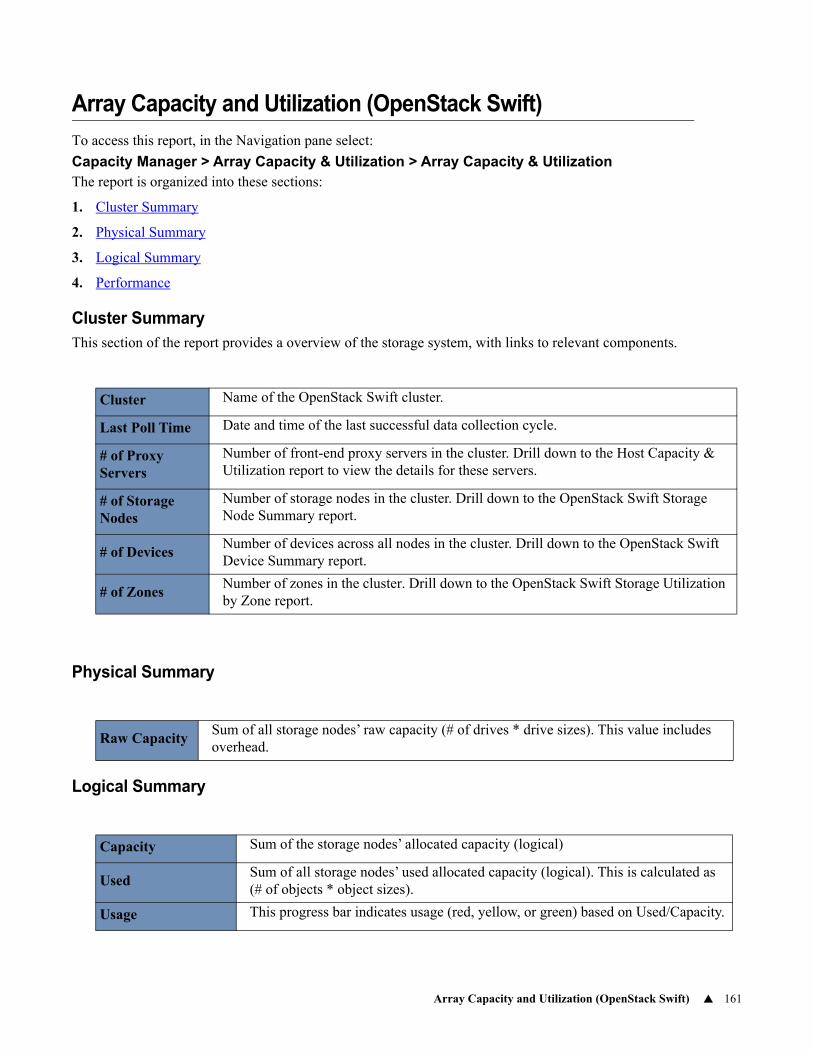
Array Capacity and Utilization (OpenStack Swift) 161
Array Capacity and Utilization (OpenStack Swift)
To access this report, in the Navigation pane select:
Capacity Manager > Array Capacity & Utilization > Array Capacity & UtilizationThe report is organized into these sections:
1. Cluster Summary
2. Physical Summary
3. Logical Summary
4. Performance
Cluster SummaryThis section of the report provides a overview of the storage system, with links to relevant components.
Physical Summary
Logical Summary
Cluster Name of the OpenStack Swift cluster.
Last Poll Time Date and time of the last successful data collection cycle.
# of Proxy Servers
Number of front-end proxy servers in the cluster. Drill down to the Host Capacity & Utilization report to view the details for these servers.
# of Storage Nodes
Number of storage nodes in the cluster. Drill down to the OpenStack Swift Storage Node Summary report.
# of DevicesNumber of devices across all nodes in the cluster. Drill down to the OpenStack Swift Device Summary report.
# of ZonesNumber of zones in the cluster. Drill down to the OpenStack Swift Storage Utilization by Zone report.
Raw CapacitySum of all storage nodes’ raw capacity (# of drives * drive sizes). This value includes overhead.
Capacity Sum of the storage nodes’ allocated capacity (logical)
UsedSum of all storage nodes’ used allocated capacity (logical). This is calculated as (# of objects * object sizes).
Usage This progress bar indicates usage (red, yellow, or green) based on Used/Capacity.
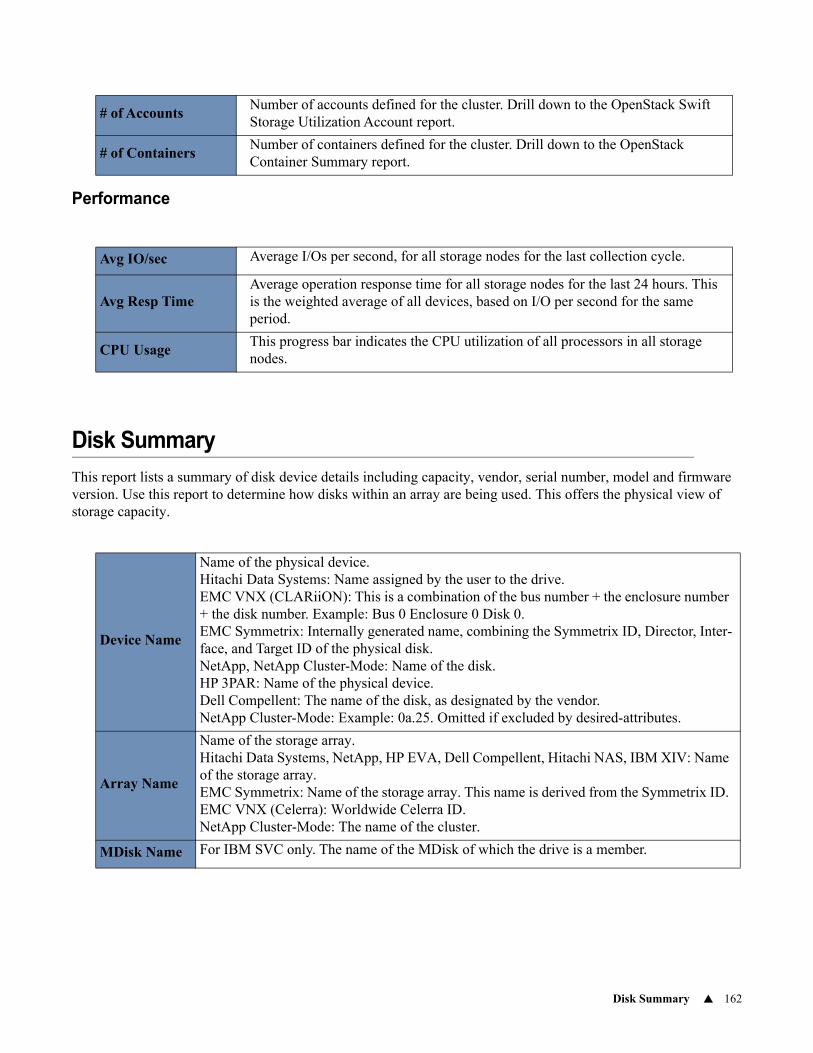
Disk Summary 162
Performance
Disk Summary
This report lists a summary of disk device details including capacity, vendor, serial number, model and firmware version. Use this report to determine how disks within an array are being used. This offers the physical view of storage capacity.
# of AccountsNumber of accounts defined for the cluster. Drill down to the OpenStack Swift Storage Utilization Account report.
# of ContainersNumber of containers defined for the cluster. Drill down to the OpenStack Container Summary report.
Avg IO/sec Average I/Os per second, for all storage nodes for the last collection cycle.
Avg Resp TimeAverage operation response time for all storage nodes for the last 24 hours. This is the weighted average of all devices, based on I/O per second for the same period.
CPU UsageThis progress bar indicates the CPU utilization of all processors in all storage nodes.
Device Name
Name of the physical device. Hitachi Data Systems: Name assigned by the user to the drive. EMC VNX (CLARiiON): This is a combination of the bus number + the enclosure number + the disk number. Example: Bus 0 Enclosure 0 Disk 0. EMC Symmetrix: Internally generated name, combining the Symmetrix ID, Director, Inter-face, and Target ID of the physical disk. NetApp, NetApp Cluster-Mode: Name of the disk. HP 3PAR: Name of the physical device. Dell Compellent: The name of the disk, as designated by the vendor. NetApp Cluster-Mode: Example: 0a.25. Omitted if excluded by desired-attributes.
Array Name
Name of the storage array. Hitachi Data Systems, NetApp, HP EVA, Dell Compellent, Hitachi NAS, IBM XIV: Name of the storage array. EMC Symmetrix: Name of the storage array. This name is derived from the Symmetrix ID. EMC VNX (Celerra): Worldwide Celerra ID. NetApp Cluster-Mode: The name of the cluster.
MDisk Name For IBM SVC only. The name of the MDisk of which the drive is a member.
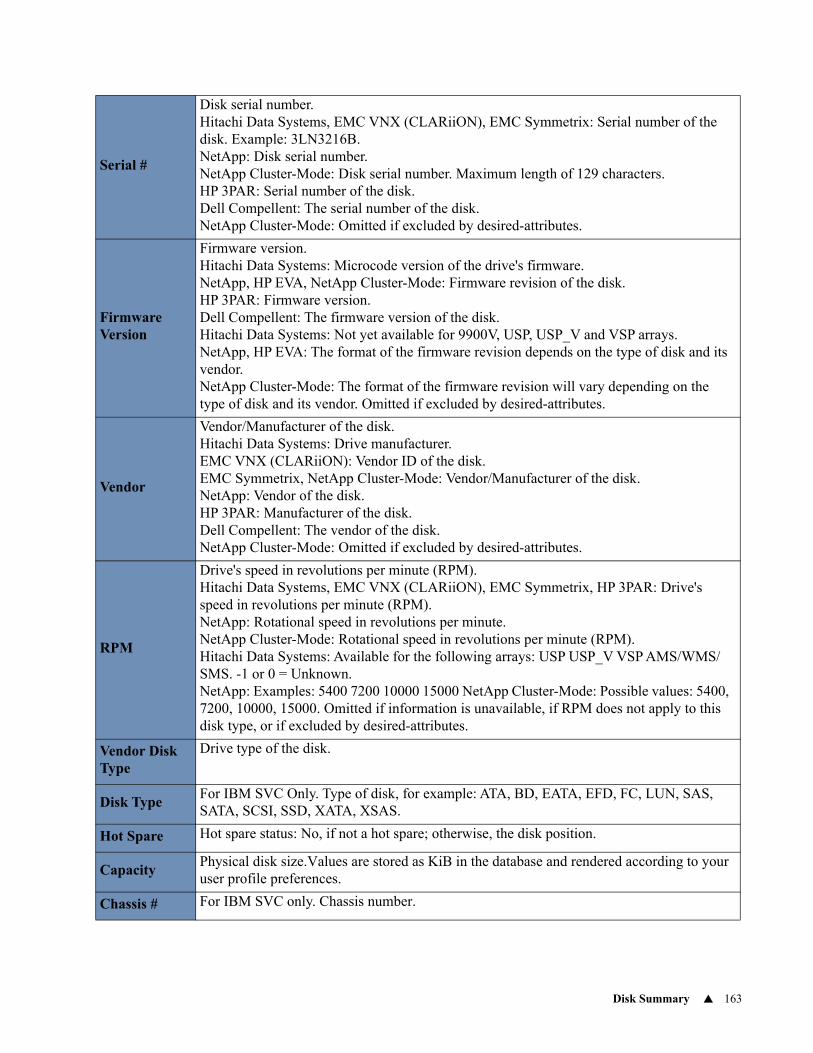
Disk Summary 163
Serial #
Disk serial number. Hitachi Data Systems, EMC VNX (CLARiiON), EMC Symmetrix: Serial number of the disk. Example: 3LN3216B. NetApp: Disk serial number. NetApp Cluster-Mode: Disk serial number. Maximum length of 129 characters. HP 3PAR: Serial number of the disk. Dell Compellent: The serial number of the disk. NetApp Cluster-Mode: Omitted if excluded by desired-attributes.
Firmware Version
Firmware version. Hitachi Data Systems: Microcode version of the drive's firmware. NetApp, HP EVA, NetApp Cluster-Mode: Firmware revision of the disk. HP 3PAR: Firmware version. Dell Compellent: The firmware version of the disk. Hitachi Data Systems: Not yet available for 9900V, USP, USP_V and VSP arrays. NetApp, HP EVA: The format of the firmware revision depends on the type of disk and its vendor. NetApp Cluster-Mode: The format of the firmware revision will vary depending on the type of disk and its vendor. Omitted if excluded by desired-attributes.
Vendor
Vendor/Manufacturer of the disk. Hitachi Data Systems: Drive manufacturer. EMC VNX (CLARiiON): Vendor ID of the disk. EMC Symmetrix, NetApp Cluster-Mode: Vendor/Manufacturer of the disk. NetApp: Vendor of the disk. HP 3PAR: Manufacturer of the disk. Dell Compellent: The vendor of the disk. NetApp Cluster-Mode: Omitted if excluded by desired-attributes.
RPM
Drive's speed in revolutions per minute (RPM). Hitachi Data Systems, EMC VNX (CLARiiON), EMC Symmetrix, HP 3PAR: Drive's speed in revolutions per minute (RPM). NetApp: Rotational speed in revolutions per minute. NetApp Cluster-Mode: Rotational speed in revolutions per minute (RPM). Hitachi Data Systems: Available for the following arrays: USP USP_V VSP AMS/WMS/SMS. -1 or 0 = Unknown. NetApp: Examples: 5400 7200 10000 15000 NetApp Cluster-Mode: Possible values: 5400, 7200, 10000, 15000. Omitted if information is unavailable, if RPM does not apply to this disk type, or if excluded by desired-attributes.
Vendor Disk Type
Drive type of the disk.
Disk TypeFor IBM SVC Only. Type of disk, for example: ATA, BD, EATA, EFD, FC, LUN, SAS, SATA, SCSI, SSD, XATA, XSAS.
Hot Spare Hot spare status: No, if not a hot spare; otherwise, the disk position.
CapacityPhysical disk size.Values are stored as KiB in the database and rendered according to your user profile preferences.
Chassis # For IBM SVC only. Chassis number.

Disk Summary 164
Slot IDFor IBM SVC only. The slot_id of the drive in the enclosure or node. It can be referred to as the drive bay or location. This can be blank.
Model For IBM SVC only. Drive model of the physical device.
Drive Role
For IBM SVC only. The current role of the drive. Possible values: unused: the drive which is not configured to be used by anything candidate: the drive is available to be configured spare: the drive is configured as a spare, to be used if the arrays fail members member: the drive is configured as a member of an array failed: the drive has been rejected, and is no longer available for use.
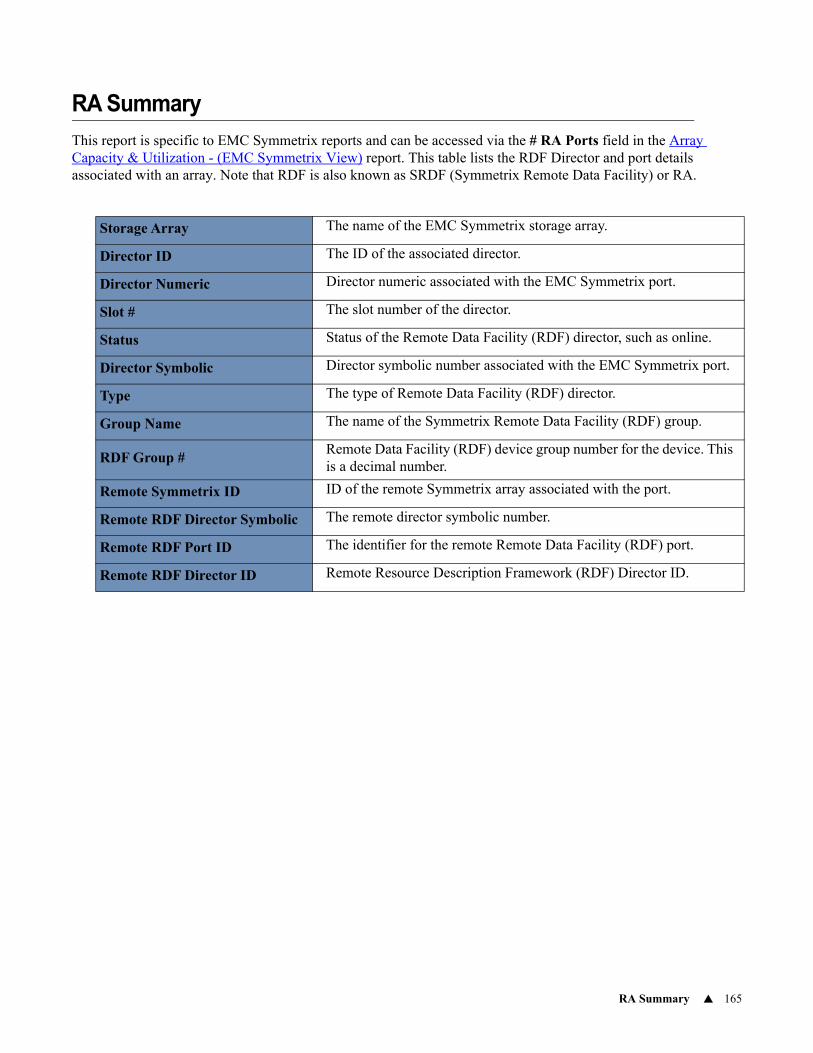
RA Summary 165
RA Summary
This report is specific to EMC Symmetrix reports and can be accessed via the # RA Ports field in the Array Capacity & Utilization - (EMC Symmetrix View) report. This table lists the RDF Director and port details associated with an array. Note that RDF is also known as SRDF (Symmetrix Remote Data Facility) or RA.
Storage Array The name of the EMC Symmetrix storage array.
Director ID The ID of the associated director.
Director Numeric Director numeric associated with the EMC Symmetrix port.
Slot # The slot number of the director.
Status Status of the Remote Data Facility (RDF) director, such as online.
Director Symbolic Director symbolic number associated with the EMC Symmetrix port.
Type The type of Remote Data Facility (RDF) director.
Group Name The name of the Symmetrix Remote Data Facility (RDF) group.
RDF Group #Remote Data Facility (RDF) device group number for the device. This is a decimal number.
Remote Symmetrix ID ID of the remote Symmetrix array associated with the port.
Remote RDF Director Symbolic The remote director symbolic number.
Remote RDF Port ID The identifier for the remote Remote Data Facility (RDF) port.
Remote RDF Director ID Remote Resource Description Framework (RDF) Director ID.
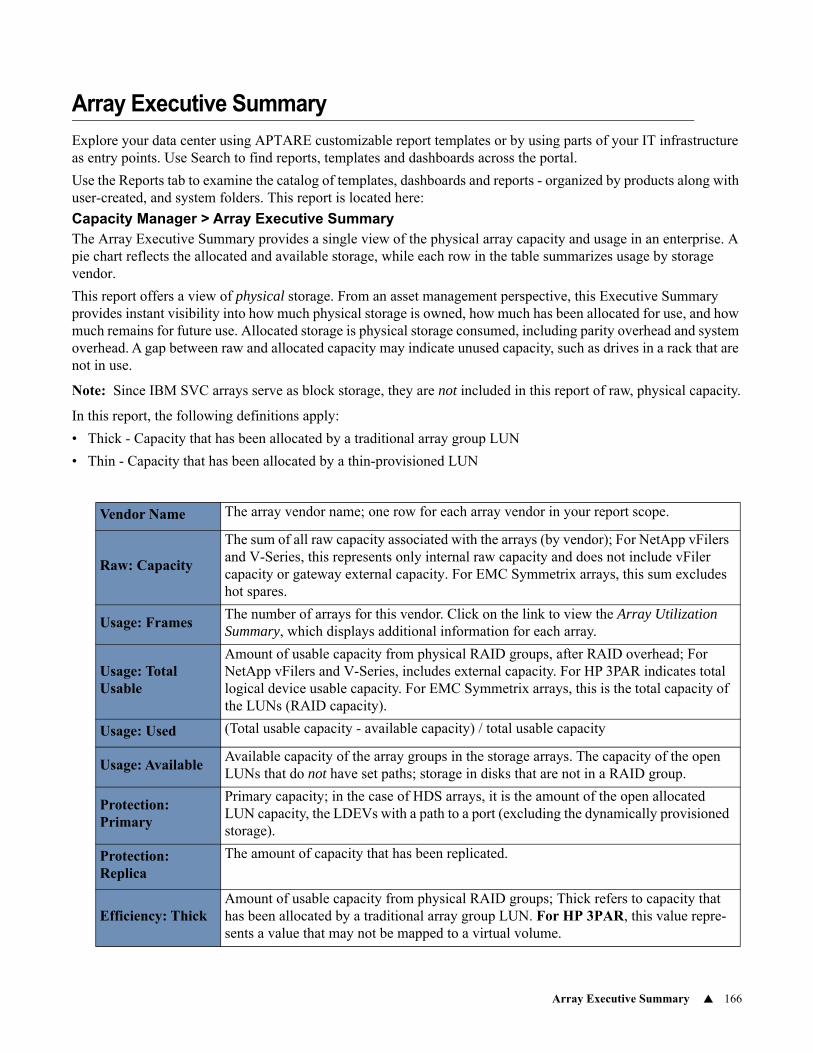
Array Executive Summary 166
Array Executive Summary
Explore your data center using APTARE customizable report templates or by using parts of your IT infrastructure as entry points. Use Search to find reports, templates and dashboards across the portal.
Use the Reports tab to examine the catalog of templates, dashboards and reports - organized by products along with user-created, and system folders. This report is located here:
Capacity Manager > Array Executive SummaryThe Array Executive Summary provides a single view of the physical array capacity and usage in an enterprise. A pie chart reflects the allocated and available storage, while each row in the table summarizes usage by storage vendor.
This report offers a view of physical storage. From an asset management perspective, this Executive Summary provides instant visibility into how much physical storage is owned, how much has been allocated for use, and how much remains for future use. Allocated storage is physical storage consumed, including parity overhead and system overhead. A gap between raw and allocated capacity may indicate unused capacity, such as drives in a rack that are not in use.
Note: Since IBM SVC arrays serve as block storage, they are not included in this report of raw, physical capacity.
In this report, the following definitions apply:
• Thick - Capacity that has been allocated by a traditional array group LUN
• Thin - Capacity that has been allocated by a thin-provisioned LUN
Vendor Name The array vendor name; one row for each array vendor in your report scope.
Raw: Capacity
The sum of all raw capacity associated with the arrays (by vendor); For NetApp vFilers and V-Series, this represents only internal raw capacity and does not include vFiler capacity or gateway external capacity. For EMC Symmetrix arrays, this sum excludes hot spares.
Usage: FramesThe number of arrays for this vendor. Click on the link to view the Array Utilization Summary, which displays additional information for each array.
Usage: Total Usable
Amount of usable capacity from physical RAID groups, after RAID overhead; For NetApp vFilers and V-Series, includes external capacity. For HP 3PAR indicates total logical device usable capacity. For EMC Symmetrix arrays, this is the total capacity of the LUNs (RAID capacity).
Usage: Used (Total usable capacity - available capacity) / total usable capacity
Usage: AvailableAvailable capacity of the array groups in the storage arrays. The capacity of the open LUNs that do not have set paths; storage in disks that are not in a RAID group.
Protection: Primary
Primary capacity; in the case of HDS arrays, it is the amount of the open allocated LUN capacity, the LDEVs with a path to a port (excluding the dynamically provisioned storage).
Protection: Replica
The amount of capacity that has been replicated.
Efficiency: ThickAmount of usable capacity from physical RAID groups; Thick refers to capacity that has been allocated by a traditional array group LUN. For HP 3PAR, this value repre-sents a value that may not be mapped to a virtual volume.
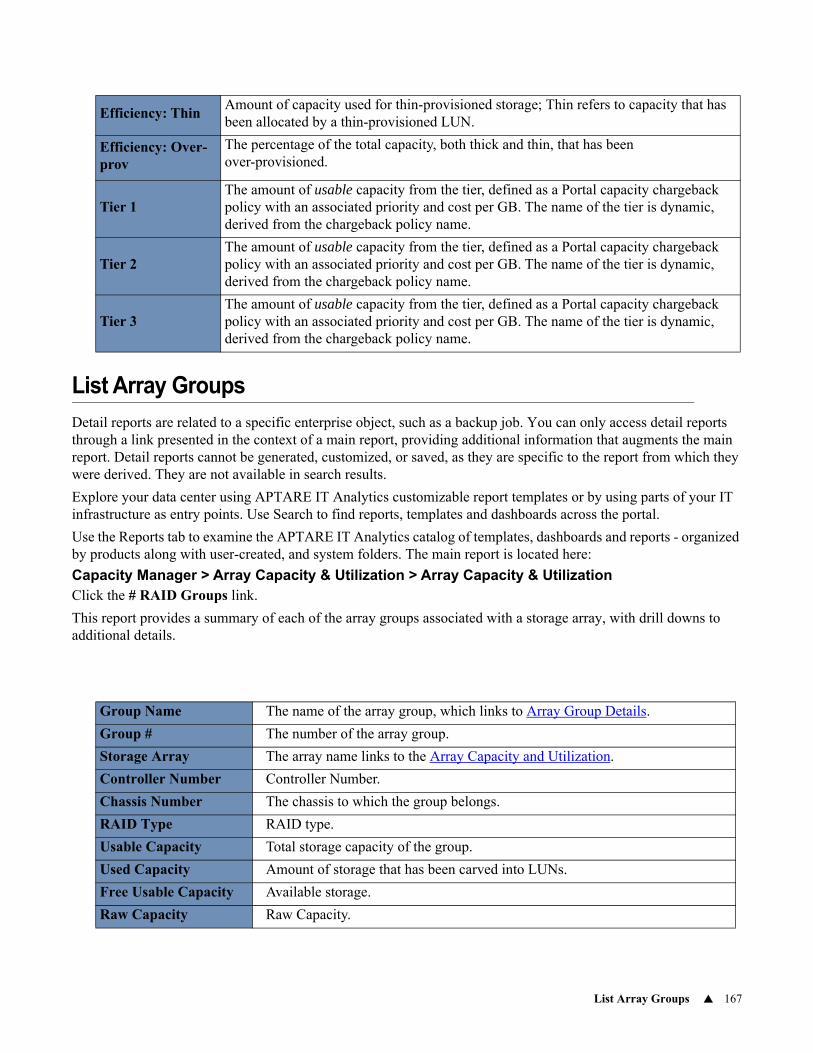
List Array Groups 167
List Array Groups
Detail reports are related to a specific enterprise object, such as a backup job. You can only access detail reports through a link presented in the context of a main report, providing additional information that augments the main report. Detail reports cannot be generated, customized, or saved, as they are specific to the report from which they were derived. They are not available in search results.
Explore your data center using APTARE IT Analytics customizable report templates or by using parts of your IT infrastructure as entry points. Use Search to find reports, templates and dashboards across the portal.
Use the Reports tab to examine the APTARE IT Analytics catalog of templates, dashboards and reports - organized by products along with user-created, and system folders. The main report is located here:
Capacity Manager > Array Capacity & Utilization > Array Capacity & UtilizationClick the # RAID Groups link.
This report provides a summary of each of the array groups associated with a storage array, with drill downs to additional details.
Efficiency: ThinAmount of capacity used for thin-provisioned storage; Thin refers to capacity that has been allocated by a thin-provisioned LUN.
Efficiency: Over-prov
The percentage of the total capacity, both thick and thin, that has been over-provisioned.
Tier 1The amount of usable capacity from the tier, defined as a Portal capacity chargeback policy with an associated priority and cost per GB. The name of the tier is dynamic, derived from the chargeback policy name.
Tier 2The amount of usable capacity from the tier, defined as a Portal capacity chargeback policy with an associated priority and cost per GB. The name of the tier is dynamic, derived from the chargeback policy name.
Tier 3The amount of usable capacity from the tier, defined as a Portal capacity chargeback policy with an associated priority and cost per GB. The name of the tier is dynamic, derived from the chargeback policy name.
Group Name The name of the array group, which links to Array Group Details.
Group # The number of the array group.
Storage Array The array name links to the Array Capacity and Utilization.
Controller Number Controller Number.
Chassis Number The chassis to which the group belongs.
RAID Type RAID type.
Usable Capacity Total storage capacity of the group.
Used Capacity Amount of storage that has been carved into LUNs.
Free Usable Capacity Available storage.
Raw Capacity Raw Capacity.
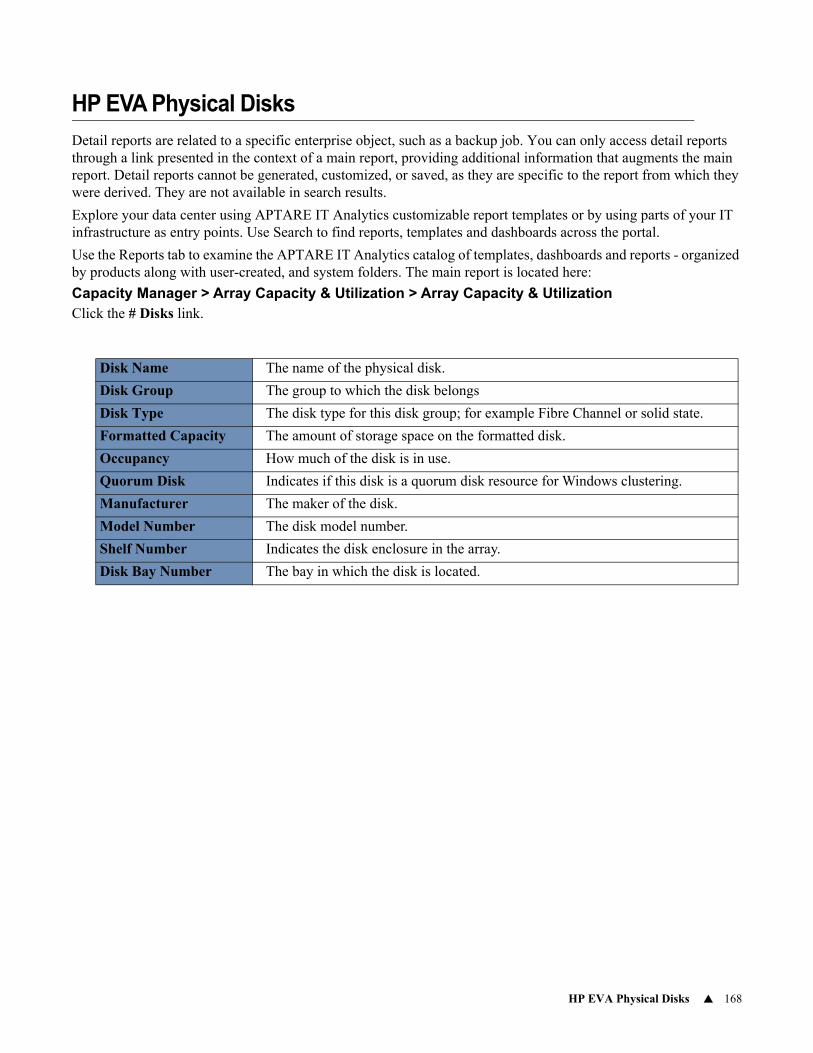
HP EVA Physical Disks 168
HP EVA Physical Disks
Detail reports are related to a specific enterprise object, such as a backup job. You can only access detail reports through a link presented in the context of a main report, providing additional information that augments the main report. Detail reports cannot be generated, customized, or saved, as they are specific to the report from which they were derived. They are not available in search results.
Explore your data center using APTARE IT Analytics customizable report templates or by using parts of your IT infrastructure as entry points. Use Search to find reports, templates and dashboards across the portal.
Use the Reports tab to examine the APTARE IT Analytics catalog of templates, dashboards and reports - organized by products along with user-created, and system folders. The main report is located here:
Capacity Manager > Array Capacity & Utilization > Array Capacity & UtilizationClick the # Disks link.
Disk Name The name of the physical disk.
Disk Group The group to which the disk belongs
Disk Type The disk type for this disk group; for example Fibre Channel or solid state.
Formatted Capacity The amount of storage space on the formatted disk.
Occupancy How much of the disk is in use.
Quorum Disk Indicates if this disk is a quorum disk resource for Windows clustering.
Manufacturer The maker of the disk.
Model Number The disk model number.
Shelf Number Indicates the disk enclosure in the array.
Disk Bay Number The bay in which the disk is located.

Array FC Port Utilization 169
Array FC Port Utilization
Explore your data center using APTARE customizable report templates or by using parts of your IT infrastructure as entry points. Use Search to find reports, templates and dashboards across the portal.
Use the Reports tab to examine the catalog of templates, dashboards and reports - organized by products along with user-created, and system folders. This report is located here:
Capacity Manager > Array Capacity & Utilization > Array FC Port UtilizationThis report provides a list of the physical/logical port connections between the host’s adapter and the storage array. Use this report to troubleshoot connectivity issues and to re-configure when hosts or arrays are taken out of service. In addition, this report provides information you can use to manage load-balancing across array ports.
Storage ArrayThe array links to the Array Capacity and Utilization. You can select multiple storage arrays or a single array when you generate this report.
Array Port The array’s port number.
HostName of the host that owns the HBA (host bus adaptor) port.
Links to the Host Utilization Detail.
Host PortsList of the host ports. Comma-separated string of the WWN of all the HBA ports associated with the array port.
Mount Point The mount point of the filesystem that’s utilizing the port.
Filesystem Name of the filesystem.
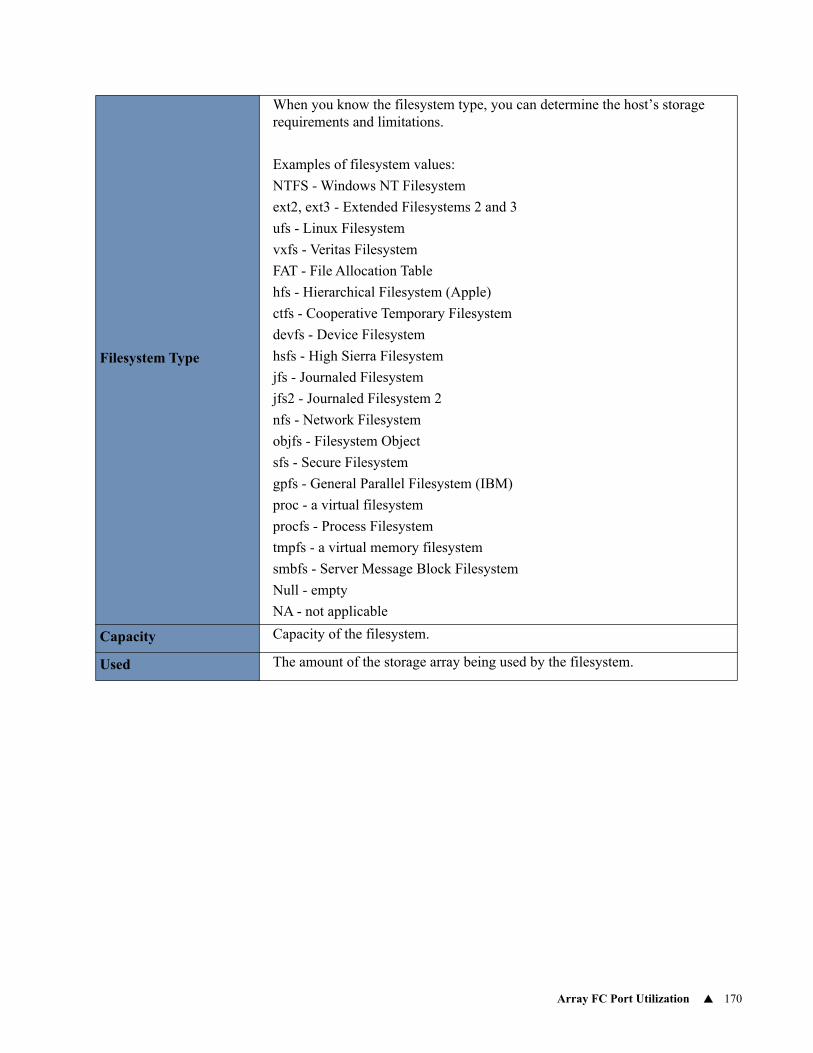
Array FC Port Utilization 170
Filesystem Type
When you know the filesystem type, you can determine the host’s storage requirements and limitations.
Examples of filesystem values:
NTFS - Windows NT Filesystem
ext2, ext3 - Extended Filesystems 2 and 3
ufs - Linux Filesystem
vxfs - Veritas Filesystem
FAT - File Allocation Table
hfs - Hierarchical Filesystem (Apple)
ctfs - Cooperative Temporary Filesystem
devfs - Device Filesystem
hsfs - High Sierra Filesystem
jfs - Journaled Filesystem
jfs2 - Journaled Filesystem 2
nfs - Network Filesystem
objfs - Filesystem Object
sfs - Secure Filesystem
gpfs - General Parallel Filesystem (IBM)
proc - a virtual filesystem
procfs - Process Filesystem
tmpfs - a virtual memory filesystem
smbfs - Server Message Block Filesystem
Null - empty
NA - not applicable
Capacity Capacity of the filesystem.
Used The amount of the storage array being used by the filesystem.
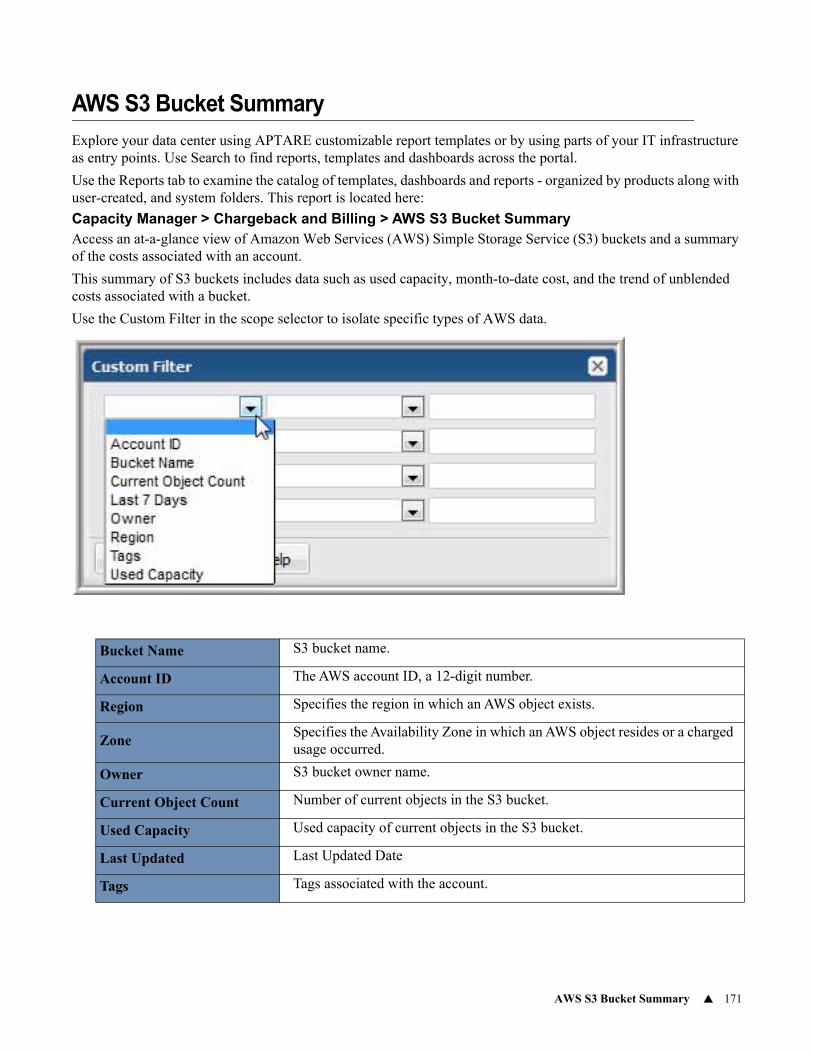
AWS S3 Bucket Summary 171
AWS S3 Bucket Summary
Explore your data center using APTARE customizable report templates or by using parts of your IT infrastructure as entry points. Use Search to find reports, templates and dashboards across the portal.
Use the Reports tab to examine the catalog of templates, dashboards and reports - organized by products along with user-created, and system folders. This report is located here:
Capacity Manager > Chargeback and Billing > AWS S3 Bucket SummaryAccess an at-a-glance view of Amazon Web Services (AWS) Simple Storage Service (S3) buckets and a summary of the costs associated with an account.
This summary of S3 buckets includes data such as used capacity, month-to-date cost, and the trend of unblended costs associated with a bucket.
Use the Custom Filter in the scope selector to isolate specific types of AWS data.
Bucket Name S3 bucket name.
Account ID The AWS account ID, a 12-digit number.
Region Specifies the region in which an AWS object exists.
ZoneSpecifies the Availability Zone in which an AWS object resides or a charged usage occurred.
Owner S3 bucket owner name.
Current Object Count Number of current objects in the S3 bucket.
Used Capacity Used capacity of current objects in the S3 bucket.
Last Updated Last Updated Date
Tags Tags associated with the account.
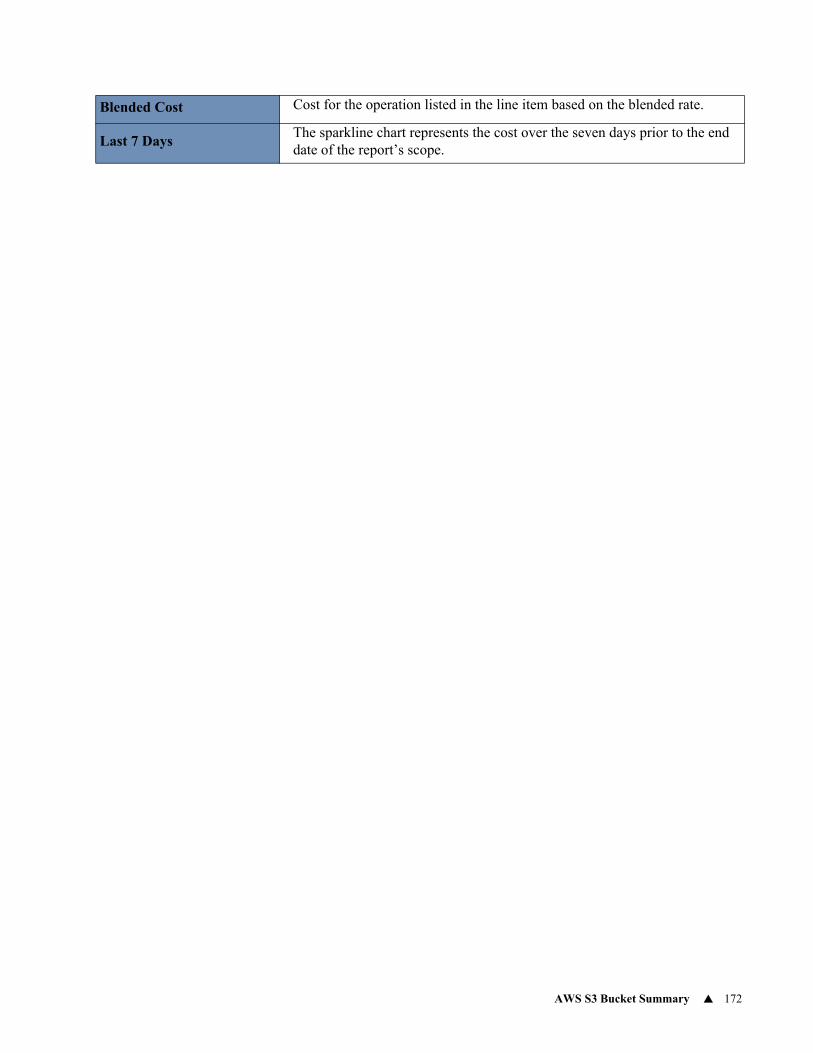
AWS S3 Bucket Summary 172
Blended Cost Cost for the operation listed in the line item based on the blended rate.
Last 7 DaysThe sparkline chart represents the cost over the seven days prior to the end date of the report’s scope.
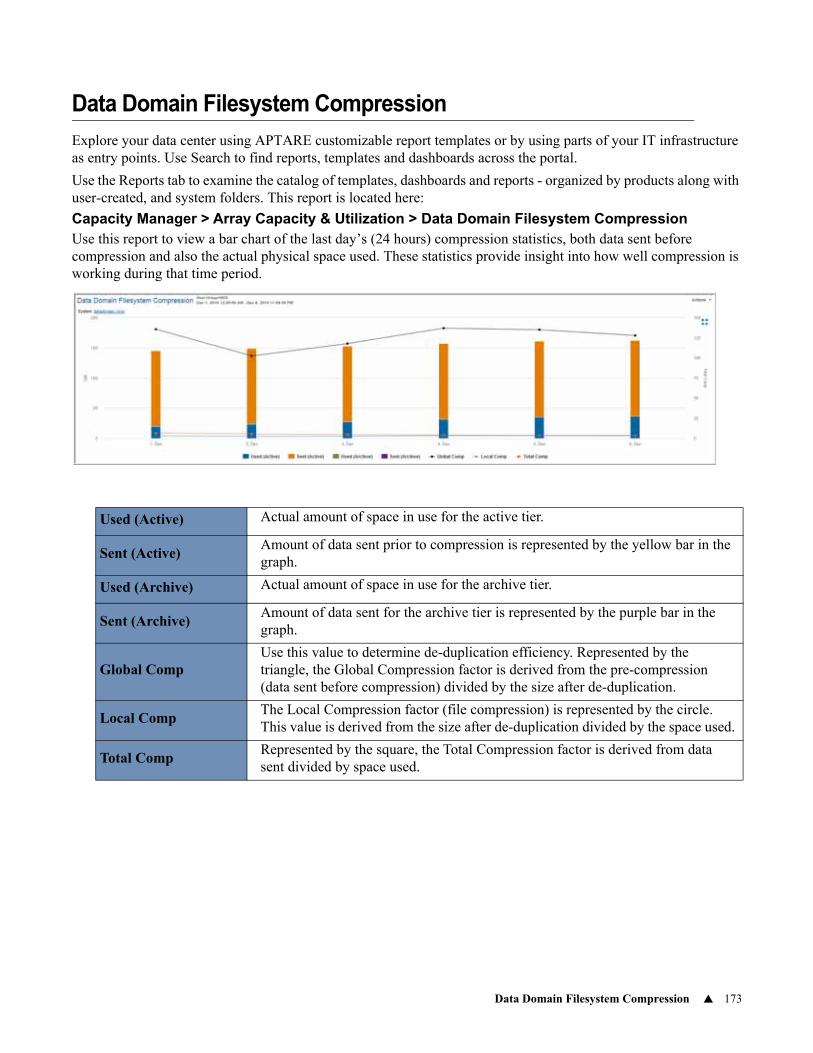
Data Domain Filesystem Compression 173
Data Domain Filesystem Compression
Explore your data center using APTARE customizable report templates or by using parts of your IT infrastructure as entry points. Use Search to find reports, templates and dashboards across the portal.
Use the Reports tab to examine the catalog of templates, dashboards and reports - organized by products along with user-created, and system folders. This report is located here:
Capacity Manager > Array Capacity & Utilization > Data Domain Filesystem CompressionUse this report to view a bar chart of the last day’s (24 hours) compression statistics, both data sent before compression and also the actual physical space used. These statistics provide insight into how well compression is working during that time period.
Used (Active) Actual amount of space in use for the active tier.
Sent (Active)Amount of data sent prior to compression is represented by the yellow bar in the graph.
Used (Archive) Actual amount of space in use for the archive tier.
Sent (Archive)Amount of data sent for the archive tier is represented by the purple bar in the graph.
Global CompUse this value to determine de-duplication efficiency. Represented by the triangle, the Global Compression factor is derived from the pre-compression (data sent before compression) divided by the size after de-duplication.
Local CompThe Local Compression factor (file compression) is represented by the circle. This value is derived from the size after de-duplication divided by the space used.
Total CompRepresented by the square, the Total Compression factor is derived from data sent divided by space used.
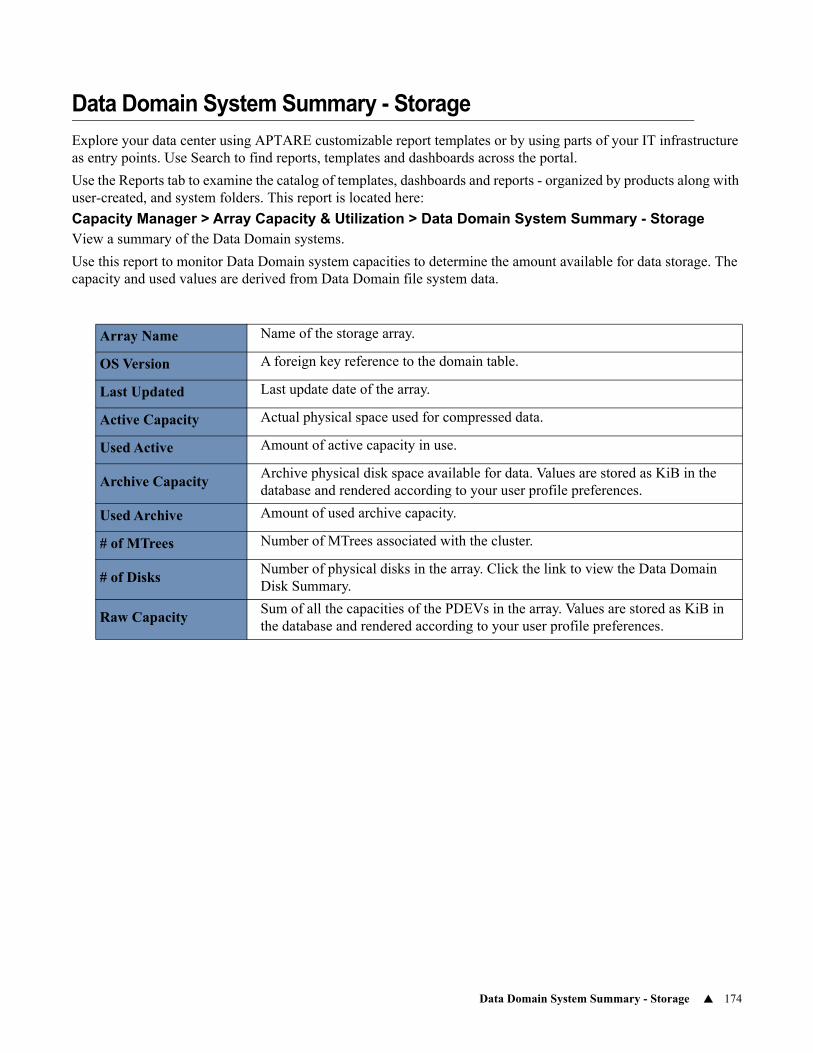
Data Domain System Summary - Storage 174
Data Domain System Summary - Storage
Explore your data center using APTARE customizable report templates or by using parts of your IT infrastructure as entry points. Use Search to find reports, templates and dashboards across the portal.
Use the Reports tab to examine the catalog of templates, dashboards and reports - organized by products along with user-created, and system folders. This report is located here:
Capacity Manager > Array Capacity & Utilization > Data Domain System Summary - StorageView a summary of the Data Domain systems.
Use this report to monitor Data Domain system capacities to determine the amount available for data storage. The capacity and used values are derived from Data Domain file system data.
Array Name Name of the storage array.
OS Version A foreign key reference to the domain table.
Last Updated Last update date of the array.
Active Capacity Actual physical space used for compressed data.
Used Active Amount of active capacity in use.
Archive CapacityArchive physical disk space available for data. Values are stored as KiB in the database and rendered according to your user profile preferences.
Used Archive Amount of used archive capacity.
# of MTrees Number of MTrees associated with the cluster.
# of DisksNumber of physical disks in the array. Click the link to view the Data Domain Disk Summary.
Raw CapacitySum of all the capacities of the PDEVs in the array. Values are stored as KiB in the database and rendered according to your user profile preferences.
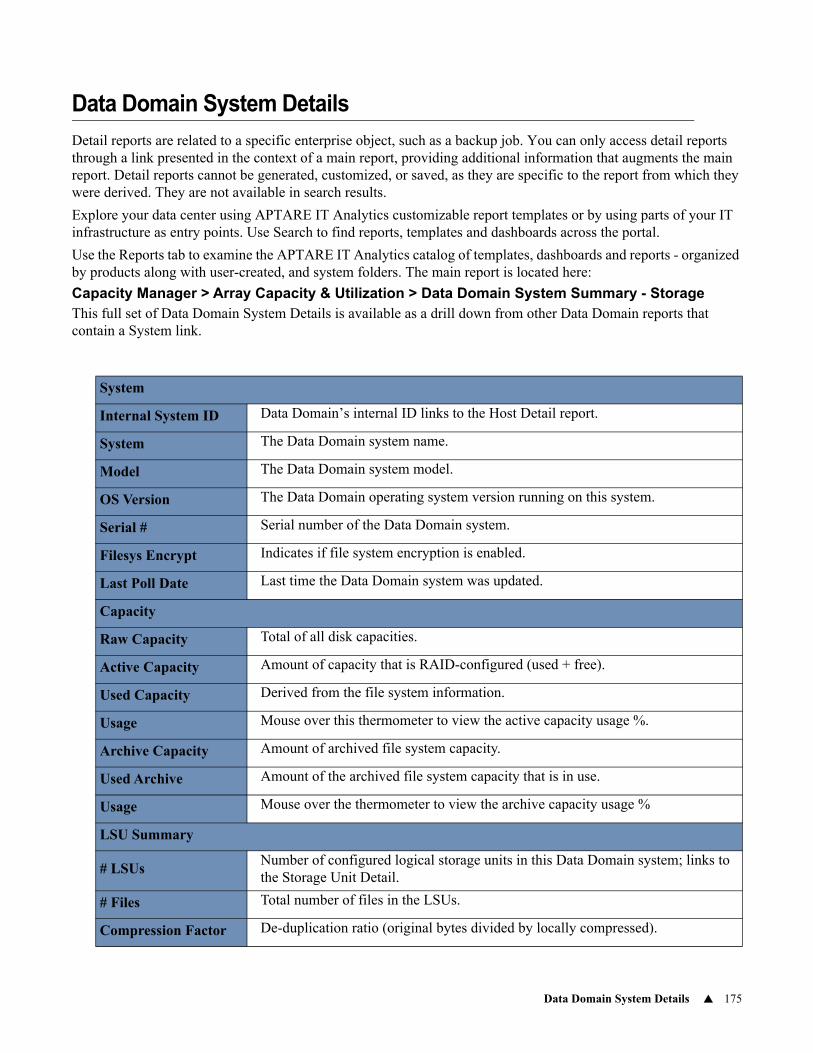
Data Domain System Details 175
Data Domain System Details
Detail reports are related to a specific enterprise object, such as a backup job. You can only access detail reports through a link presented in the context of a main report, providing additional information that augments the main report. Detail reports cannot be generated, customized, or saved, as they are specific to the report from which they were derived. They are not available in search results.
Explore your data center using APTARE IT Analytics customizable report templates or by using parts of your IT infrastructure as entry points. Use Search to find reports, templates and dashboards across the portal.
Use the Reports tab to examine the APTARE IT Analytics catalog of templates, dashboards and reports - organized by products along with user-created, and system folders. The main report is located here:
Capacity Manager > Array Capacity & Utilization > Data Domain System Summary - StorageThis full set of Data Domain System Details is available as a drill down from other Data Domain reports that contain a System link.
System
Internal System ID Data Domain’s internal ID links to the Host Detail report.
System The Data Domain system name.
Model The Data Domain system model.
OS Version The Data Domain operating system version running on this system.
Serial # Serial number of the Data Domain system.
Filesys Encrypt Indicates if file system encryption is enabled.
Last Poll Date Last time the Data Domain system was updated.
Capacity
Raw Capacity Total of all disk capacities.
Active Capacity Amount of capacity that is RAID-configured (used + free).
Used Capacity Derived from the file system information.
Usage Mouse over this thermometer to view the active capacity usage %.
Archive Capacity Amount of archived file system capacity.
Used Archive Amount of the archived file system capacity that is in use.
Usage Mouse over the thermometer to view the archive capacity usage %
LSU Summary
# LSUsNumber of configured logical storage units in this Data Domain system; links to the Storage Unit Detail.
# Files Total number of files in the LSUs.
Compression Factor De-duplication ratio (original bytes divided by locally compressed).
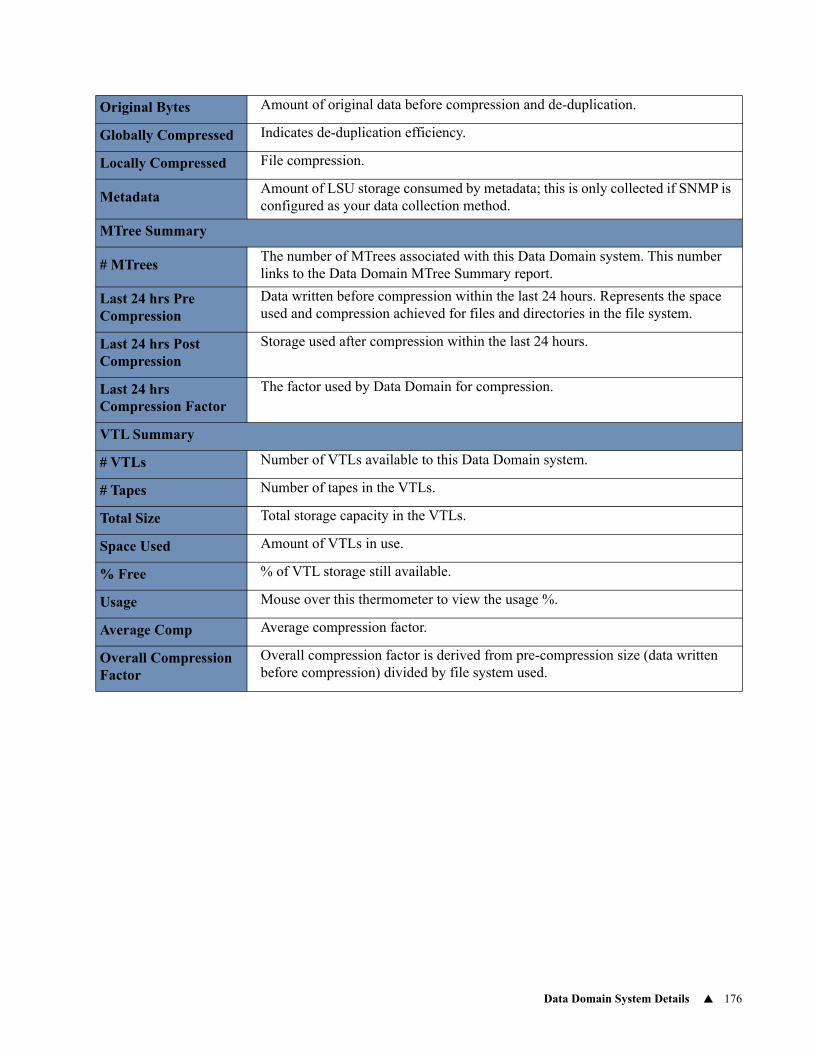
Data Domain System Details 176
Original Bytes Amount of original data before compression and de-duplication.
Globally Compressed Indicates de-duplication efficiency.
Locally Compressed File compression.
MetadataAmount of LSU storage consumed by metadata; this is only collected if SNMP is configured as your data collection method.
MTree Summary
# MTreesThe number of MTrees associated with this Data Domain system. This number links to the Data Domain MTree Summary report.
Last 24 hrs Pre Compression
Data written before compression within the last 24 hours. Represents the space used and compression achieved for files and directories in the file system.
Last 24 hrs Post Compression
Storage used after compression within the last 24 hours.
Last 24 hrs Compression Factor
The factor used by Data Domain for compression.
VTL Summary
# VTLs Number of VTLs available to this Data Domain system.
# Tapes Number of tapes in the VTLs.
Total Size Total storage capacity in the VTLs.
Space Used Amount of VTLs in use.
% Free % of VTL storage still available.
Usage Mouse over this thermometer to view the usage %.
Average Comp Average compression factor.
Overall Compression Factor
Overall compression factor is derived from pre-compression size (data written before compression) divided by file system used.
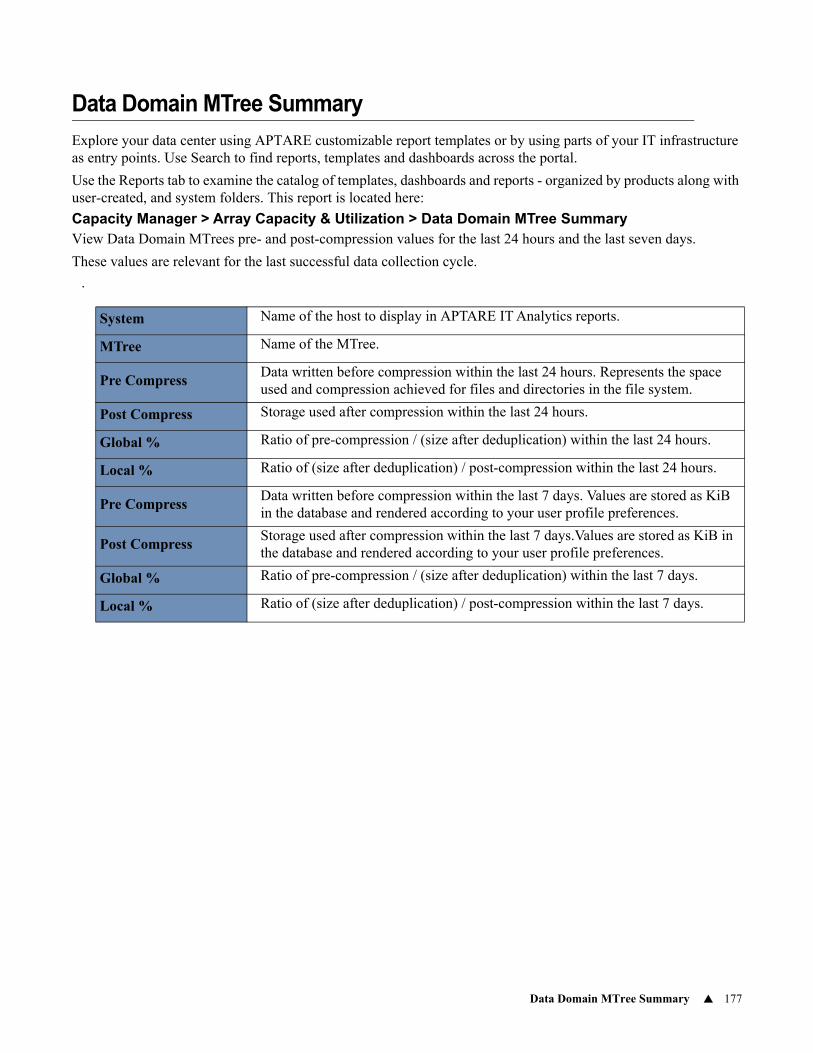
Data Domain MTree Summary 177
Data Domain MTree Summary
Explore your data center using APTARE customizable report templates or by using parts of your IT infrastructure as entry points. Use Search to find reports, templates and dashboards across the portal.
Use the Reports tab to examine the catalog of templates, dashboards and reports - organized by products along with user-created, and system folders. This report is located here:
Capacity Manager > Array Capacity & Utilization > Data Domain MTree SummaryView Data Domain MTrees pre- and post-compression values for the last 24 hours and the last seven days.
These values are relevant for the last successful data collection cycle.
.
System Name of the host to display in APTARE IT Analytics reports.
MTree Name of the MTree.
Pre CompressData written before compression within the last 24 hours. Represents the space used and compression achieved for files and directories in the file system.
Post Compress Storage used after compression within the last 24 hours.
Global % Ratio of pre-compression / (size after deduplication) within the last 24 hours.
Local % Ratio of (size after deduplication) / post-compression within the last 24 hours.
Pre CompressData written before compression within the last 7 days. Values are stored as KiB in the database and rendered according to your user profile preferences.
Post CompressStorage used after compression within the last 7 days.Values are stored as KiB in the database and rendered according to your user profile preferences.
Global % Ratio of pre-compression / (size after deduplication) within the last 7 days.
Local % Ratio of (size after deduplication) / post-compression within the last 7 days.
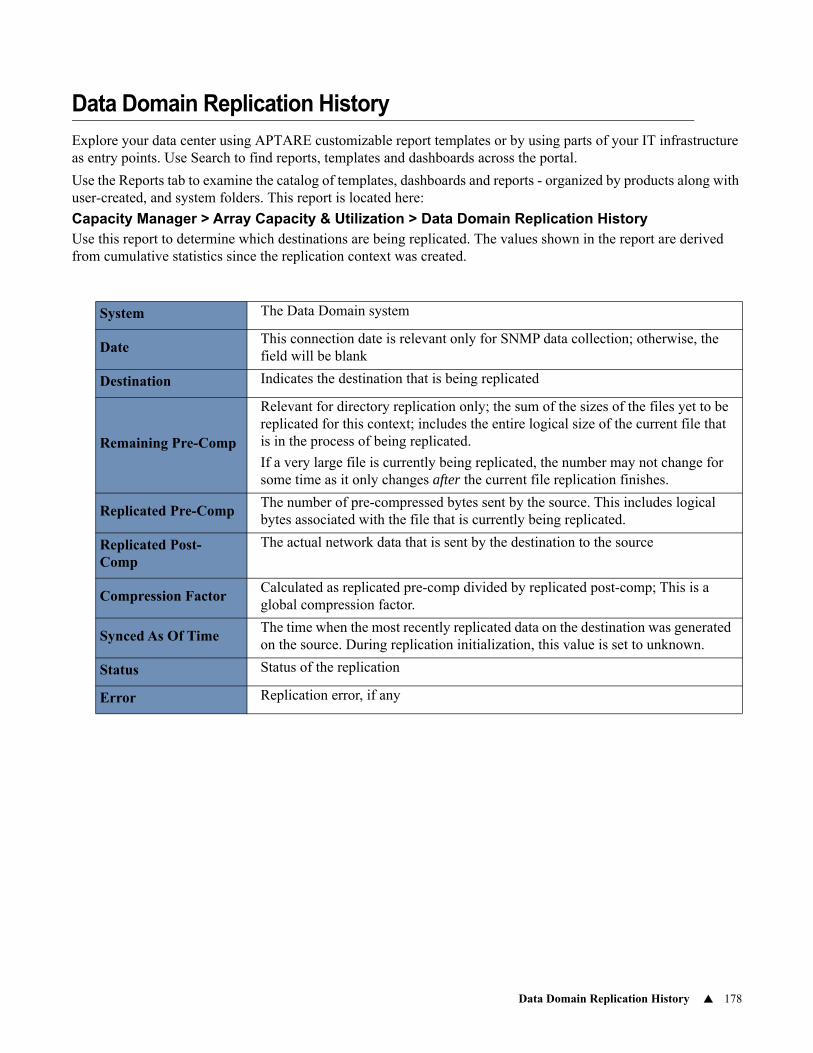
Data Domain Replication History 178
Data Domain Replication History
Explore your data center using APTARE customizable report templates or by using parts of your IT infrastructure as entry points. Use Search to find reports, templates and dashboards across the portal.
Use the Reports tab to examine the catalog of templates, dashboards and reports - organized by products along with user-created, and system folders. This report is located here:
Capacity Manager > Array Capacity & Utilization > Data Domain Replication HistoryUse this report to determine which destinations are being replicated. The values shown in the report are derived from cumulative statistics since the replication context was created.
System The Data Domain system
DateThis connection date is relevant only for SNMP data collection; otherwise, the field will be blank
Destination Indicates the destination that is being replicated
Remaining Pre-Comp
Relevant for directory replication only; the sum of the sizes of the files yet to be replicated for this context; includes the entire logical size of the current file that is in the process of being replicated.
If a very large file is currently being replicated, the number may not change for some time as it only changes after the current file replication finishes.
Replicated Pre-CompThe number of pre-compressed bytes sent by the source. This includes logical bytes associated with the file that is currently being replicated.
Replicated Post-Comp
The actual network data that is sent by the destination to the source
Compression FactorCalculated as replicated pre-comp divided by replicated post-comp; This is a global compression factor.
Synced As Of TimeThe time when the most recently replicated data on the destination was generated on the source. During replication initialization, this value is set to unknown.
Status Status of the replication
Error Replication error, if any
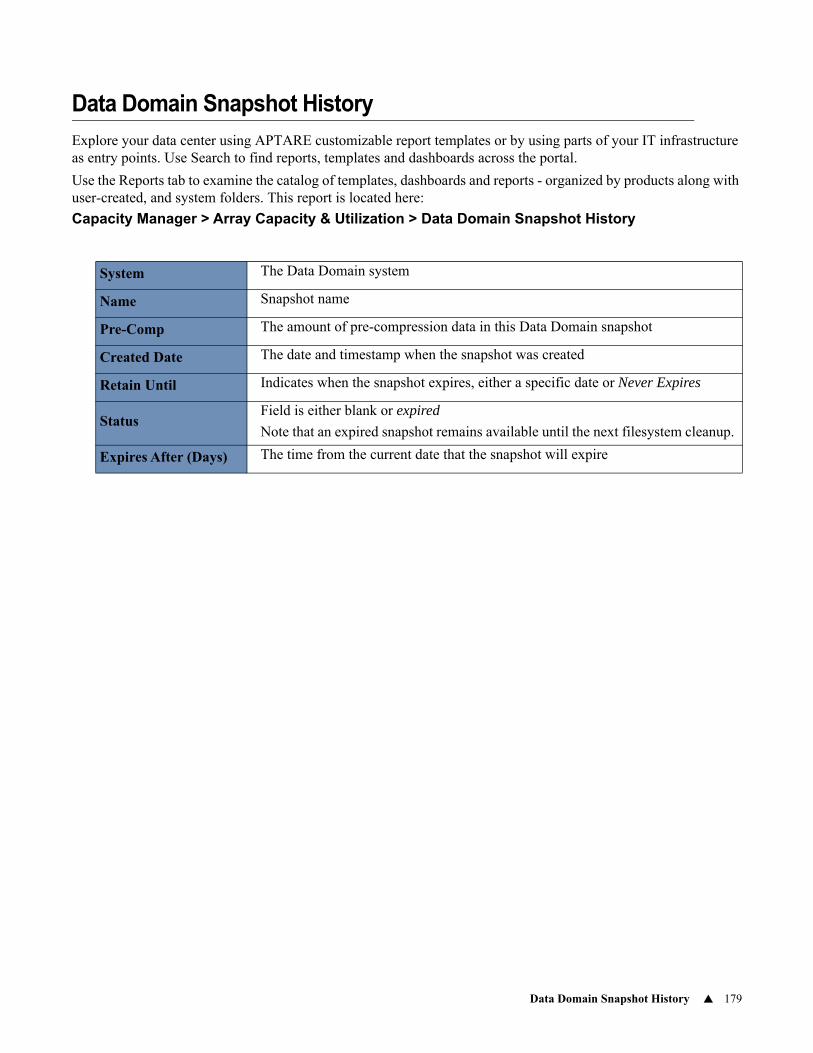
Data Domain Snapshot History 179
Data Domain Snapshot History
Explore your data center using APTARE customizable report templates or by using parts of your IT infrastructure as entry points. Use Search to find reports, templates and dashboards across the portal.
Use the Reports tab to examine the catalog of templates, dashboards and reports - organized by products along with user-created, and system folders. This report is located here:
Capacity Manager > Array Capacity & Utilization > Data Domain Snapshot History
System The Data Domain system
Name Snapshot name
Pre-Comp The amount of pre-compression data in this Data Domain snapshot
Created Date The date and timestamp when the snapshot was created
Retain Until Indicates when the snapshot expires, either a specific date or Never Expires
StatusField is either blank or expired
Note that an expired snapshot remains available until the next filesystem cleanup.
Expires After (Days) The time from the current date that the snapshot will expire
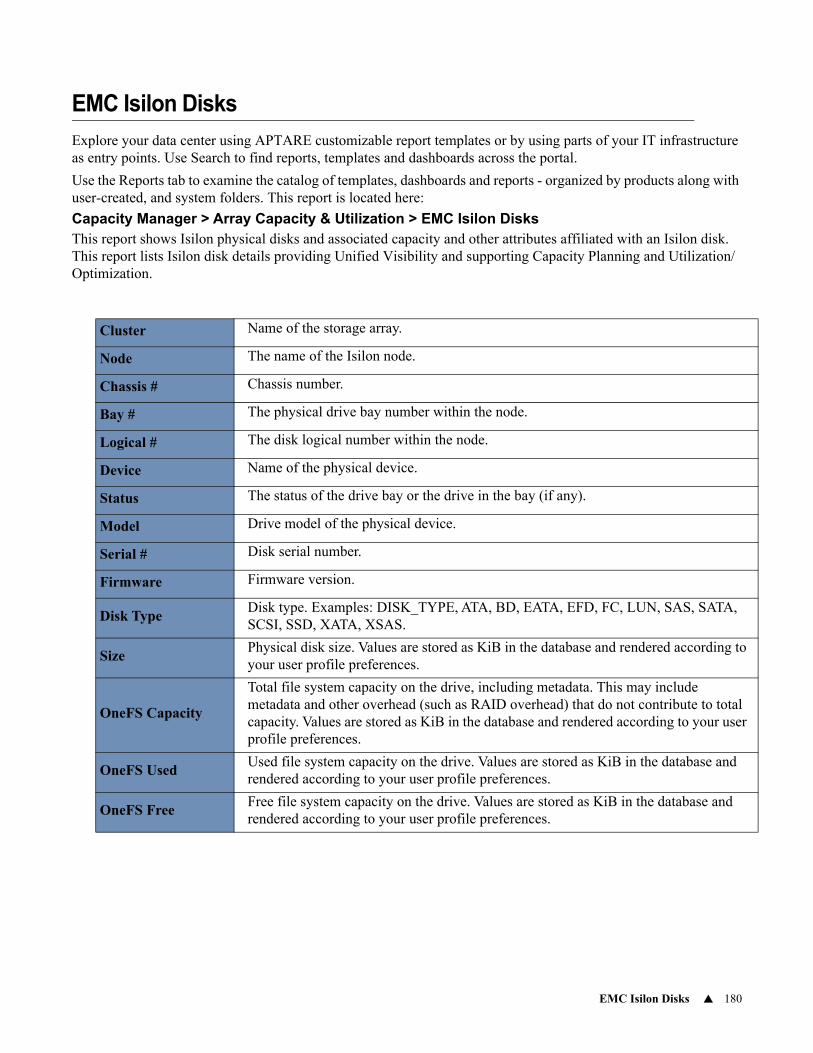
EMC Isilon Disks 180
EMC Isilon Disks
Explore your data center using APTARE customizable report templates or by using parts of your IT infrastructure as entry points. Use Search to find reports, templates and dashboards across the portal.
Use the Reports tab to examine the catalog of templates, dashboards and reports - organized by products along with user-created, and system folders. This report is located here:
Capacity Manager > Array Capacity & Utilization > EMC Isilon DisksThis report shows Isilon physical disks and associated capacity and other attributes affiliated with an Isilon disk. This report lists Isilon disk details providing Unified Visibility and supporting Capacity Planning and Utilization/Optimization.
Cluster Name of the storage array.
Node The name of the Isilon node.
Chassis # Chassis number.
Bay # The physical drive bay number within the node.
Logical # The disk logical number within the node.
Device Name of the physical device.
Status The status of the drive bay or the drive in the bay (if any).
Model Drive model of the physical device.
Serial # Disk serial number.
Firmware Firmware version.
Disk TypeDisk type. Examples: DISK_TYPE, ATA, BD, EATA, EFD, FC, LUN, SAS, SATA, SCSI, SSD, XATA, XSAS.
SizePhysical disk size. Values are stored as KiB in the database and rendered according to your user profile preferences.
OneFS Capacity
Total file system capacity on the drive, including metadata. This may include metadata and other overhead (such as RAID overhead) that do not contribute to total capacity. Values are stored as KiB in the database and rendered according to your user profile preferences.
OneFS UsedUsed file system capacity on the drive. Values are stored as KiB in the database and rendered according to your user profile preferences.
OneFS FreeFree file system capacity on the drive. Values are stored as KiB in the database and rendered according to your user profile preferences.
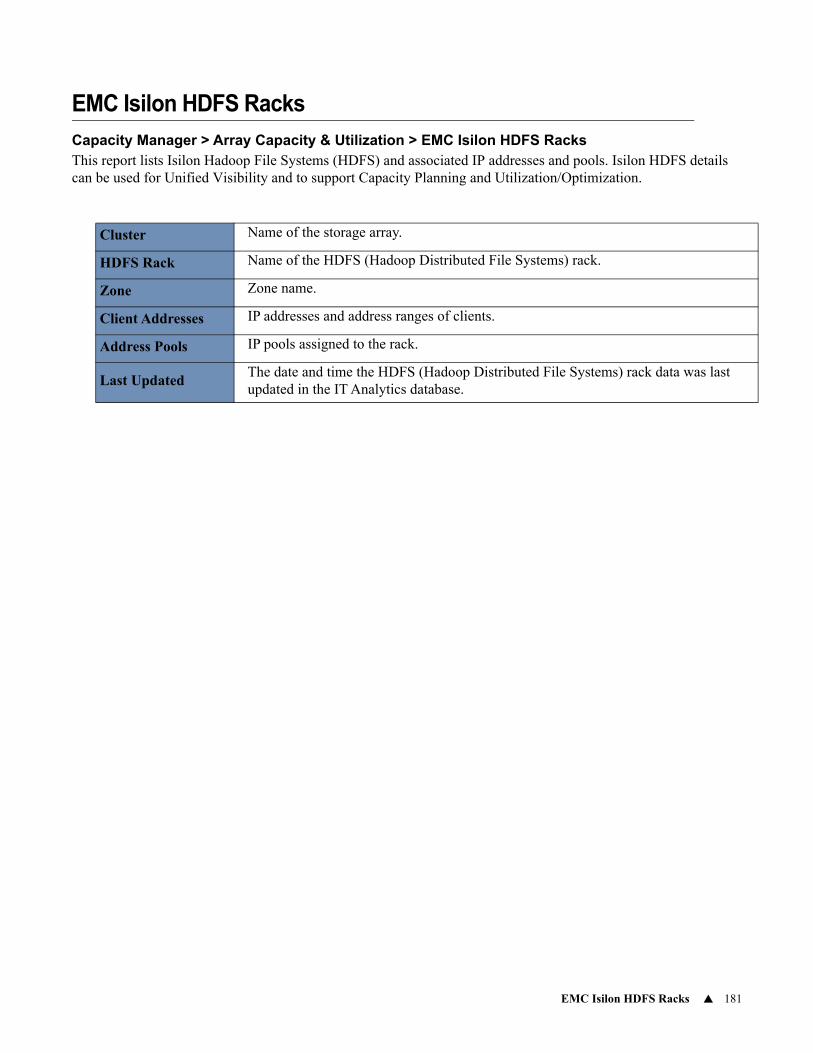
EMC Isilon HDFS Racks 181
EMC Isilon HDFS Racks
Capacity Manager > Array Capacity & Utilization > EMC Isilon HDFS RacksThis report lists Isilon Hadoop File Systems (HDFS) and associated IP addresses and pools. Isilon HDFS details can be used for Unified Visibility and to support Capacity Planning and Utilization/Optimization.
Cluster Name of the storage array.
HDFS Rack Name of the HDFS (Hadoop Distributed File Systems) rack.
Zone Zone name.
Client Addresses IP addresses and address ranges of clients.
Address Pools IP pools assigned to the rack.
Last UpdatedThe date and time the HDFS (Hadoop Distributed File Systems) rack data was last updated in the IT Analytics database.
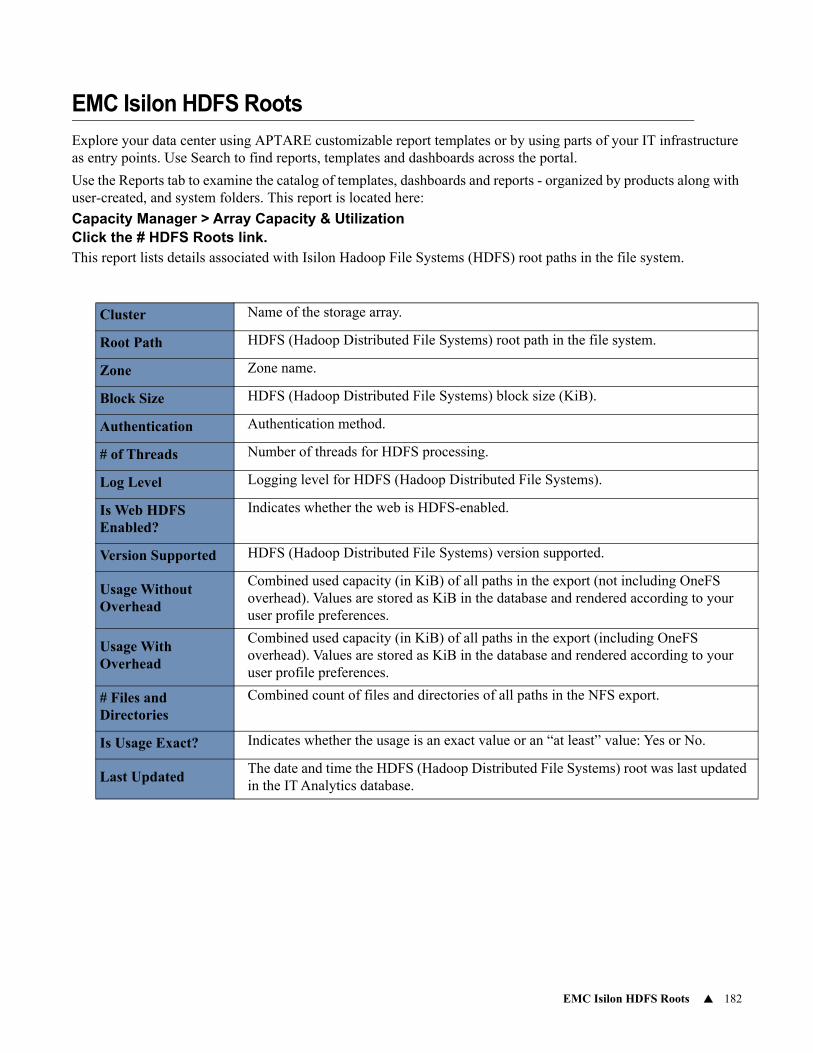
EMC Isilon HDFS Roots 182
EMC Isilon HDFS Roots
Explore your data center using APTARE customizable report templates or by using parts of your IT infrastructure as entry points. Use Search to find reports, templates and dashboards across the portal.
Use the Reports tab to examine the catalog of templates, dashboards and reports - organized by products along with user-created, and system folders. This report is located here:
Capacity Manager > Array Capacity & UtilizationClick the # HDFS Roots link.This report lists details associated with Isilon Hadoop File Systems (HDFS) root paths in the file system.
Cluster Name of the storage array.
Root Path HDFS (Hadoop Distributed File Systems) root path in the file system.
Zone Zone name.
Block Size HDFS (Hadoop Distributed File Systems) block size (KiB).
Authentication Authentication method.
# of Threads Number of threads for HDFS processing.
Log Level Logging level for HDFS (Hadoop Distributed File Systems).
Is Web HDFS Enabled?
Indicates whether the web is HDFS-enabled.
Version Supported HDFS (Hadoop Distributed File Systems) version supported.
Usage Without Overhead
Combined used capacity (in KiB) of all paths in the export (not including OneFS overhead). Values are stored as KiB in the database and rendered according to your user profile preferences.
Usage With Overhead
Combined used capacity (in KiB) of all paths in the export (including OneFS overhead). Values are stored as KiB in the database and rendered according to your user profile preferences.
# Files and Directories
Combined count of files and directories of all paths in the NFS export.
Is Usage Exact? Indicates whether the usage is an exact value or an “at least” value: Yes or No.
Last UpdatedThe date and time the HDFS (Hadoop Distributed File Systems) root was last updated in the IT Analytics database.
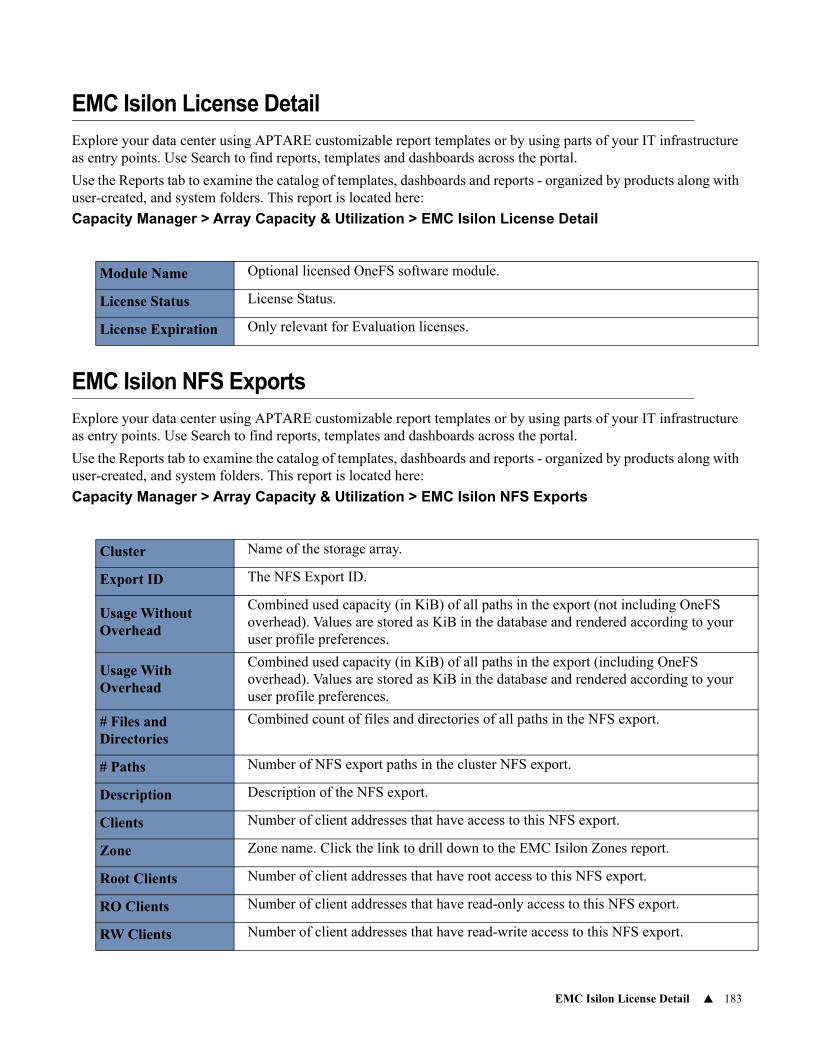
EMC Isilon License Detail 183
EMC Isilon License Detail
Explore your data center using APTARE customizable report templates or by using parts of your IT infrastructure as entry points. Use Search to find reports, templates and dashboards across the portal.
Use the Reports tab to examine the catalog of templates, dashboards and reports - organized by products along with user-created, and system folders. This report is located here:
Capacity Manager > Array Capacity & Utilization > EMC Isilon License Detail
EMC Isilon NFS Exports
Explore your data center using APTARE customizable report templates or by using parts of your IT infrastructure as entry points. Use Search to find reports, templates and dashboards across the portal.
Use the Reports tab to examine the catalog of templates, dashboards and reports - organized by products along with user-created, and system folders. This report is located here:
Capacity Manager > Array Capacity & Utilization > EMC Isilon NFS Exports
Module Name Optional licensed OneFS software module.
License Status License Status.
License Expiration Only relevant for Evaluation licenses.
Cluster Name of the storage array.
Export ID The NFS Export ID.
Usage Without Overhead
Combined used capacity (in KiB) of all paths in the export (not including OneFS overhead). Values are stored as KiB in the database and rendered according to your user profile preferences.
Usage With Overhead
Combined used capacity (in KiB) of all paths in the export (including OneFS overhead). Values are stored as KiB in the database and rendered according to your user profile preferences.
# Files and Directories
Combined count of files and directories of all paths in the NFS export.
# Paths Number of NFS export paths in the cluster NFS export.
Description Description of the NFS export.
Clients Number of client addresses that have access to this NFS export.
Zone Zone name. Click the link to drill down to the EMC Isilon Zones report.
Root Clients Number of client addresses that have root access to this NFS export.
RO Clients Number of client addresses that have read-only access to this NFS export.
RW Clients Number of client addresses that have read-write access to this NFS export.
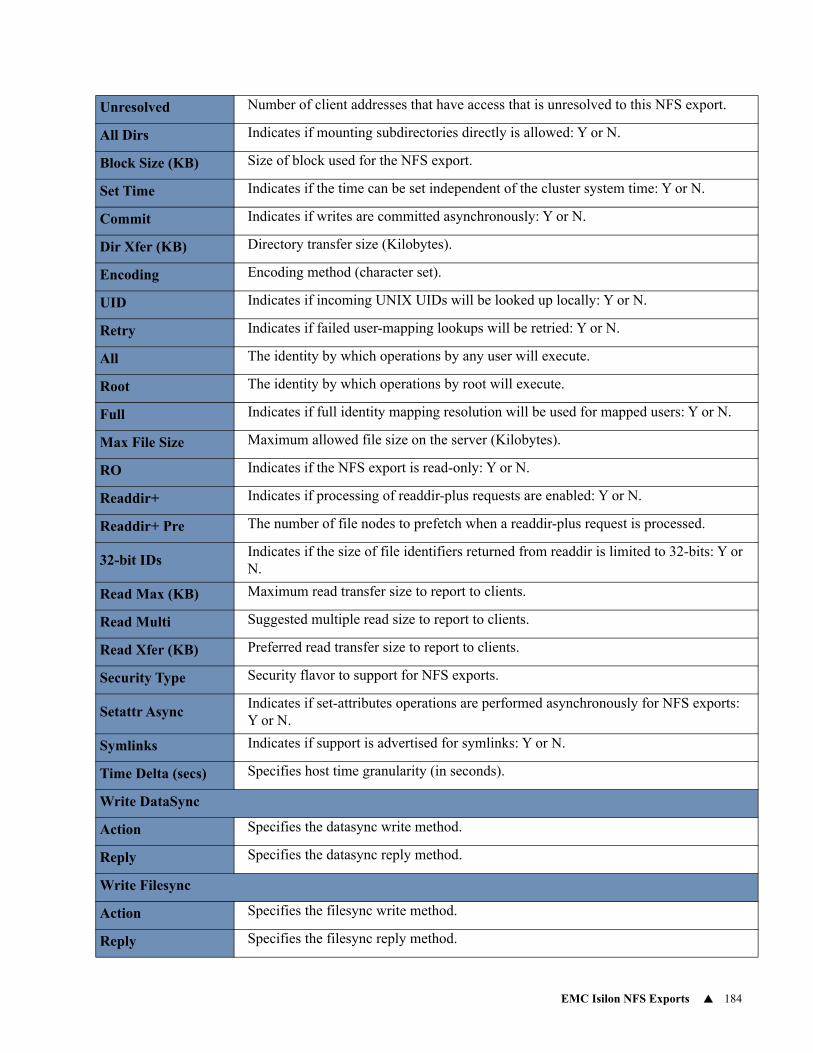
EMC Isilon NFS Exports 184
Unresolved Number of client addresses that have access that is unresolved to this NFS export.
All Dirs Indicates if mounting subdirectories directly is allowed: Y or N.
Block Size (KB) Size of block used for the NFS export.
Set Time Indicates if the time can be set independent of the cluster system time: Y or N.
Commit Indicates if writes are committed asynchronously: Y or N.
Dir Xfer (KB) Directory transfer size (Kilobytes).
Encoding Encoding method (character set).
UID Indicates if incoming UNIX UIDs will be looked up locally: Y or N.
Retry Indicates if failed user-mapping lookups will be retried: Y or N.
All The identity by which operations by any user will execute.
Root The identity by which operations by root will execute.
Full Indicates if full identity mapping resolution will be used for mapped users: Y or N.
Max File Size Maximum allowed file size on the server (Kilobytes).
RO Indicates if the NFS export is read-only: Y or N.
Readdir+ Indicates if processing of readdir-plus requests are enabled: Y or N.
Readdir+ Pre The number of file nodes to prefetch when a readdir-plus request is processed.
32-bit IDsIndicates if the size of file identifiers returned from readdir is limited to 32-bits: Y or N.
Read Max (KB) Maximum read transfer size to report to clients.
Read Multi Suggested multiple read size to report to clients.
Read Xfer (KB) Preferred read transfer size to report to clients.
Security Type Security flavor to support for NFS exports.
Setattr AsyncIndicates if set-attributes operations are performed asynchronously for NFS exports: Y or N.
Symlinks Indicates if support is advertised for symlinks: Y or N.
Time Delta (secs) Specifies host time granularity (in seconds).
Write DataSync
Action Specifies the datasync write method.
Reply Specifies the datasync reply method.
Write Filesync
Action Specifies the filesync write method.
Reply Specifies the filesync reply method.
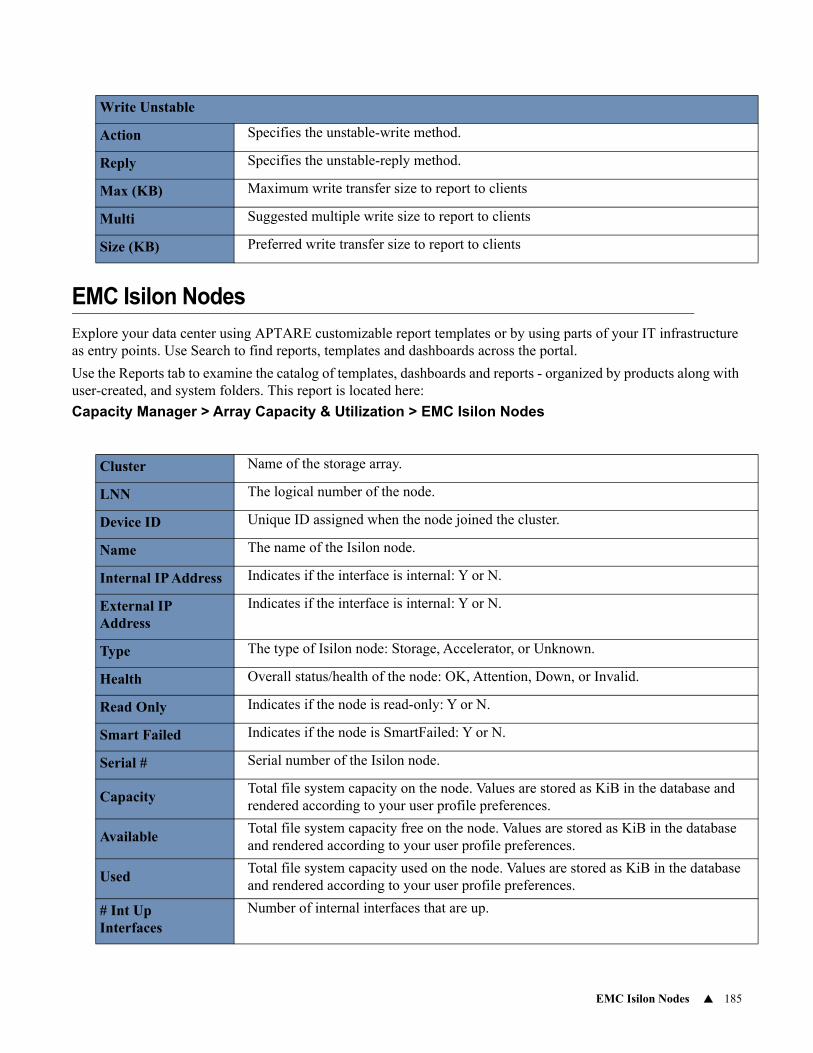
EMC Isilon Nodes 185
EMC Isilon Nodes
Explore your data center using APTARE customizable report templates or by using parts of your IT infrastructure as entry points. Use Search to find reports, templates and dashboards across the portal.
Use the Reports tab to examine the catalog of templates, dashboards and reports - organized by products along with user-created, and system folders. This report is located here:
Capacity Manager > Array Capacity & Utilization > EMC Isilon Nodes
Write Unstable
Action Specifies the unstable-write method.
Reply Specifies the unstable-reply method.
Max (KB) Maximum write transfer size to report to clients
Multi Suggested multiple write size to report to clients
Size (KB) Preferred write transfer size to report to clients
Cluster Name of the storage array.
LNN The logical number of the node.
Device ID Unique ID assigned when the node joined the cluster.
Name The name of the Isilon node.
Internal IP Address Indicates if the interface is internal: Y or N.
External IP Address
Indicates if the interface is internal: Y or N.
Type The type of Isilon node: Storage, Accelerator, or Unknown.
Health Overall status/health of the node: OK, Attention, Down, or Invalid.
Read Only Indicates if the node is read-only: Y or N.
Smart Failed Indicates if the node is SmartFailed: Y or N.
Serial # Serial number of the Isilon node.
CapacityTotal file system capacity on the node. Values are stored as KiB in the database and rendered according to your user profile preferences.
AvailableTotal file system capacity free on the node. Values are stored as KiB in the database and rendered according to your user profile preferences.
UsedTotal file system capacity used on the node. Values are stored as KiB in the database and rendered according to your user profile preferences.
# Int UpInterfaces
Number of internal interfaces that are up.
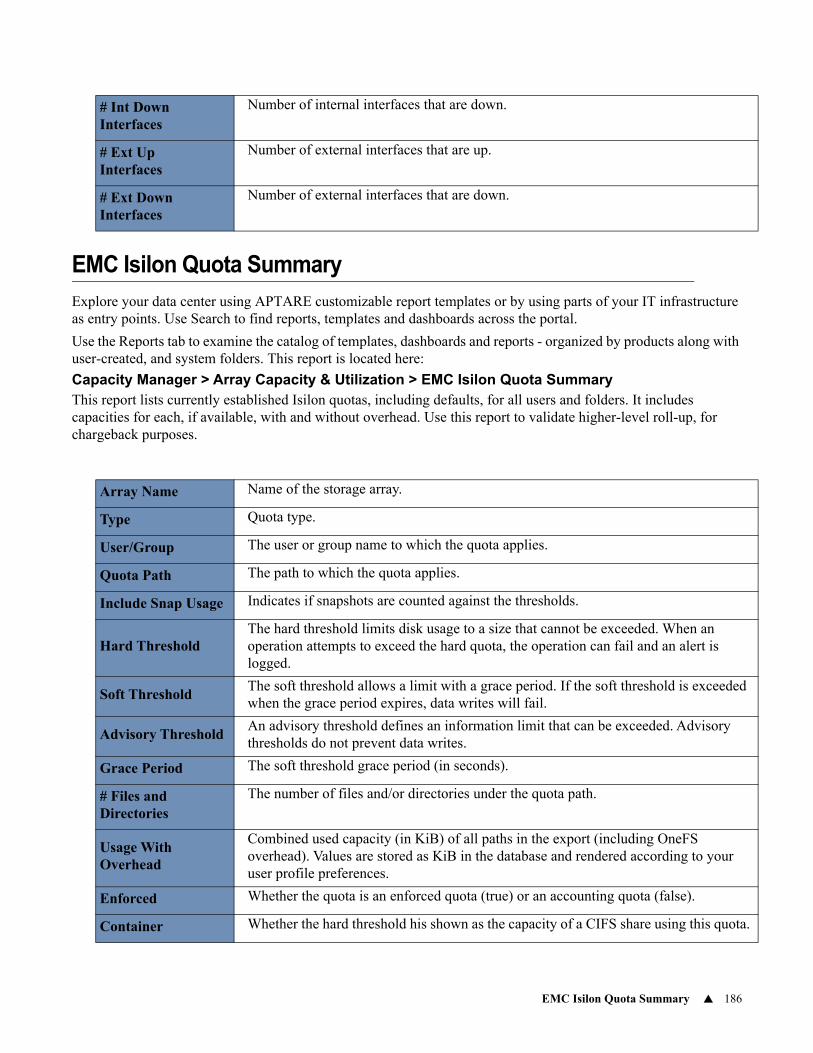
EMC Isilon Quota Summary 186
EMC Isilon Quota Summary
Explore your data center using APTARE customizable report templates or by using parts of your IT infrastructure as entry points. Use Search to find reports, templates and dashboards across the portal.
Use the Reports tab to examine the catalog of templates, dashboards and reports - organized by products along with user-created, and system folders. This report is located here:
Capacity Manager > Array Capacity & Utilization > EMC Isilon Quota SummaryThis report lists currently established Isilon quotas, including defaults, for all users and folders. It includes capacities for each, if available, with and without overhead. Use this report to validate higher-level roll-up, for chargeback purposes.
# Int DownInterfaces
Number of internal interfaces that are down.
# Ext UpInterfaces
Number of external interfaces that are up.
# Ext DownInterfaces
Number of external interfaces that are down.
Array Name Name of the storage array.
Type Quota type.
User/Group The user or group name to which the quota applies.
Quota Path The path to which the quota applies.
Include Snap Usage Indicates if snapshots are counted against the thresholds.
Hard ThresholdThe hard threshold limits disk usage to a size that cannot be exceeded. When an operation attempts to exceed the hard quota, the operation can fail and an alert is logged.
Soft ThresholdThe soft threshold allows a limit with a grace period. If the soft threshold is exceeded when the grace period expires, data writes will fail.
Advisory ThresholdAn advisory threshold defines an information limit that can be exceeded. Advisory thresholds do not prevent data writes.
Grace Period The soft threshold grace period (in seconds).
# Files and Directories
The number of files and/or directories under the quota path.
Usage With Overhead
Combined used capacity (in KiB) of all paths in the export (including OneFS overhead). Values are stored as KiB in the database and rendered according to your user profile preferences.
Enforced Whether the quota is an enforced quota (true) or an accounting quota (false).
Container Whether the hard threshold his shown as the capacity of a CIFS share using this quota.
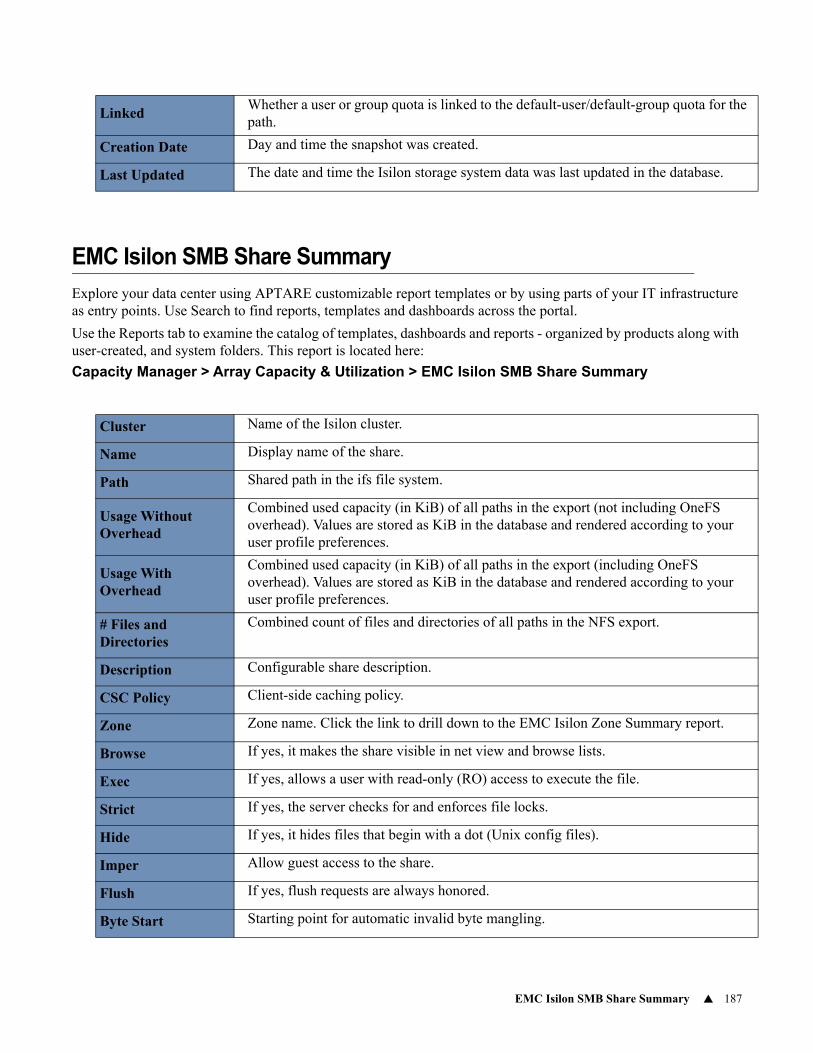
EMC Isilon SMB Share Summary 187
EMC Isilon SMB Share Summary
Explore your data center using APTARE customizable report templates or by using parts of your IT infrastructure as entry points. Use Search to find reports, templates and dashboards across the portal.
Use the Reports tab to examine the catalog of templates, dashboards and reports - organized by products along with user-created, and system folders. This report is located here:
Capacity Manager > Array Capacity & Utilization > EMC Isilon SMB Share Summary
LinkedWhether a user or group quota is linked to the default-user/default-group quota for the path.
Creation Date Day and time the snapshot was created.
Last Updated The date and time the Isilon storage system data was last updated in the database.
Cluster Name of the Isilon cluster.
Name Display name of the share.
Path Shared path in the ifs file system.
Usage Without Overhead
Combined used capacity (in KiB) of all paths in the export (not including OneFS overhead). Values are stored as KiB in the database and rendered according to your user profile preferences.
Usage With Overhead
Combined used capacity (in KiB) of all paths in the export (including OneFS overhead). Values are stored as KiB in the database and rendered according to your user profile preferences.
# Files and Directories
Combined count of files and directories of all paths in the NFS export.
Description Configurable share description.
CSC Policy Client-side caching policy.
Zone Zone name. Click the link to drill down to the EMC Isilon Zone Summary report.
Browse If yes, it makes the share visible in net view and browse lists.
Exec If yes, allows a user with read-only (RO) access to execute the file.
Strict If yes, the server checks for and enforces file locks.
Hide If yes, it hides files that begin with a dot (Unix config files).
Imper Allow guest access to the share.
Flush If yes, flush requests are always honored.
Byte Start Starting point for automatic invalid byte mangling.
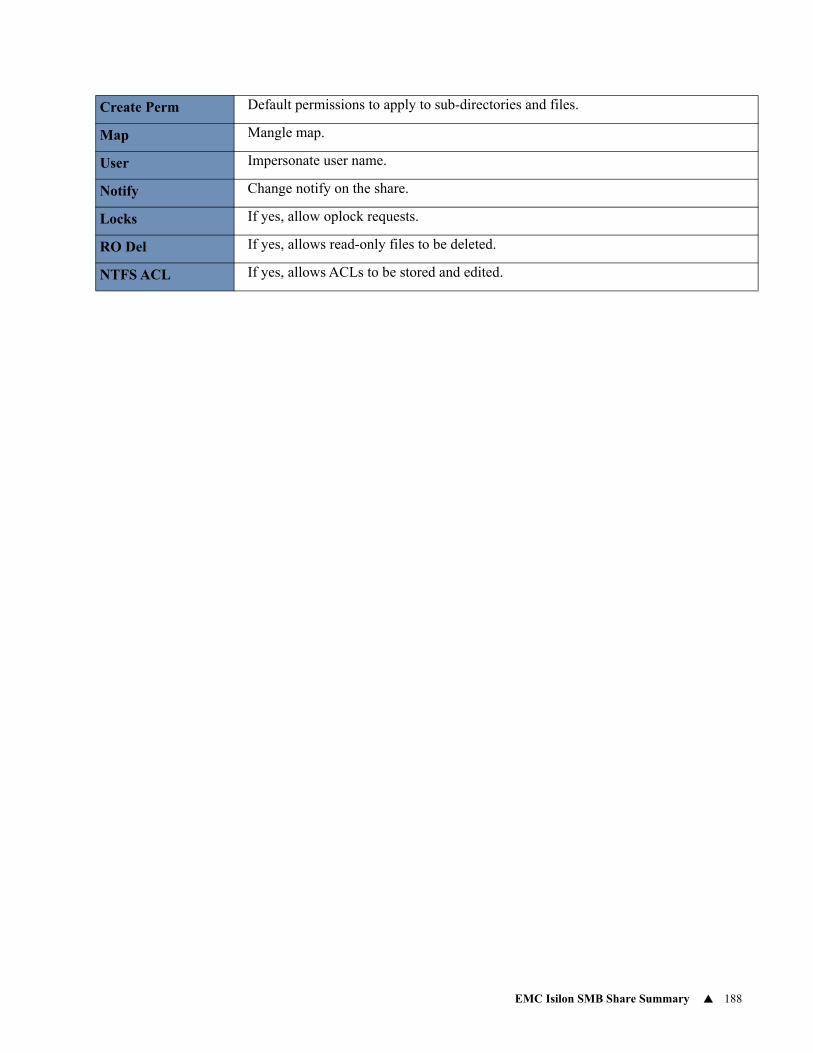
EMC Isilon SMB Share Summary 188
Create Perm Default permissions to apply to sub-directories and files.
Map Mangle map.
User Impersonate user name.
Notify Change notify on the share.
Locks If yes, allow oplock requests.
RO Del If yes, allows read-only files to be deleted.
NTFS ACL If yes, allows ACLs to be stored and edited.
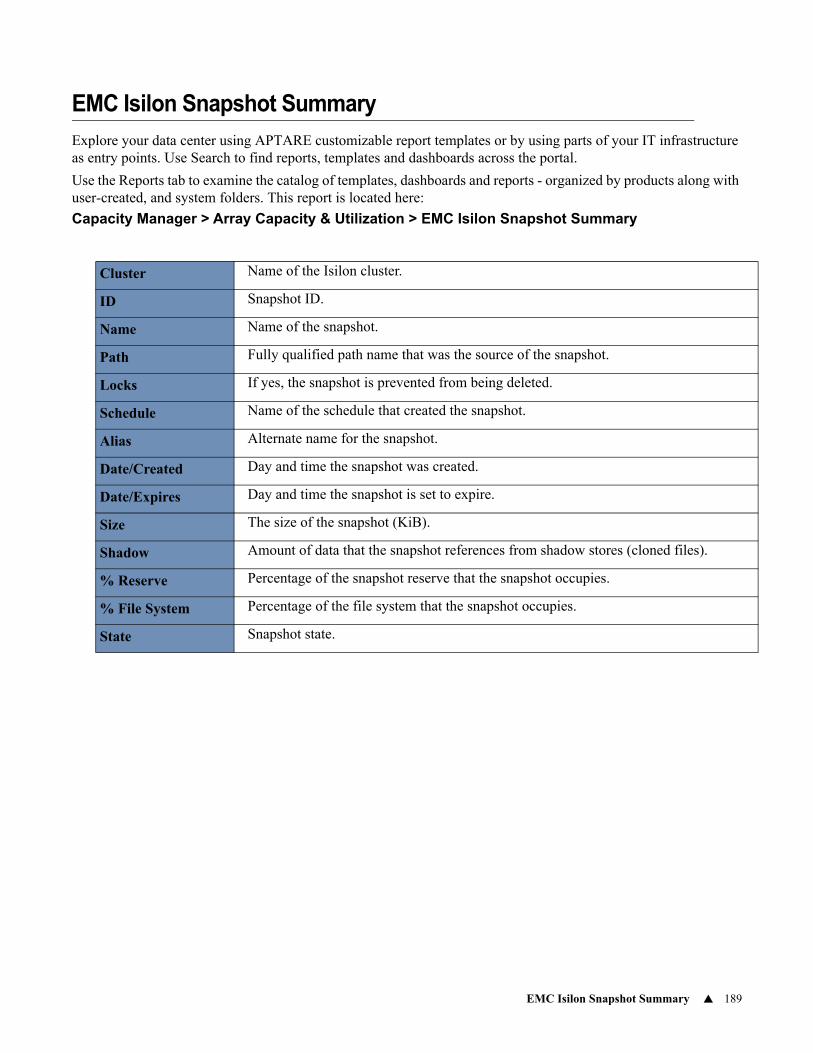
EMC Isilon Snapshot Summary 189
EMC Isilon Snapshot Summary
Explore your data center using APTARE customizable report templates or by using parts of your IT infrastructure as entry points. Use Search to find reports, templates and dashboards across the portal.
Use the Reports tab to examine the catalog of templates, dashboards and reports - organized by products along with user-created, and system folders. This report is located here:
Capacity Manager > Array Capacity & Utilization > EMC Isilon Snapshot Summary
Cluster Name of the Isilon cluster.
ID Snapshot ID.
Name Name of the snapshot.
Path Fully qualified path name that was the source of the snapshot.
Locks If yes, the snapshot is prevented from being deleted.
Schedule Name of the schedule that created the snapshot.
Alias Alternate name for the snapshot.
Date/Created Day and time the snapshot was created.
Date/Expires Day and time the snapshot is set to expire.
Size The size of the snapshot (KiB).
Shadow Amount of data that the snapshot references from shadow stores (cloned files).
% Reserve Percentage of the snapshot reserve that the snapshot occupies.
% File System Percentage of the file system that the snapshot occupies.
State Snapshot state.
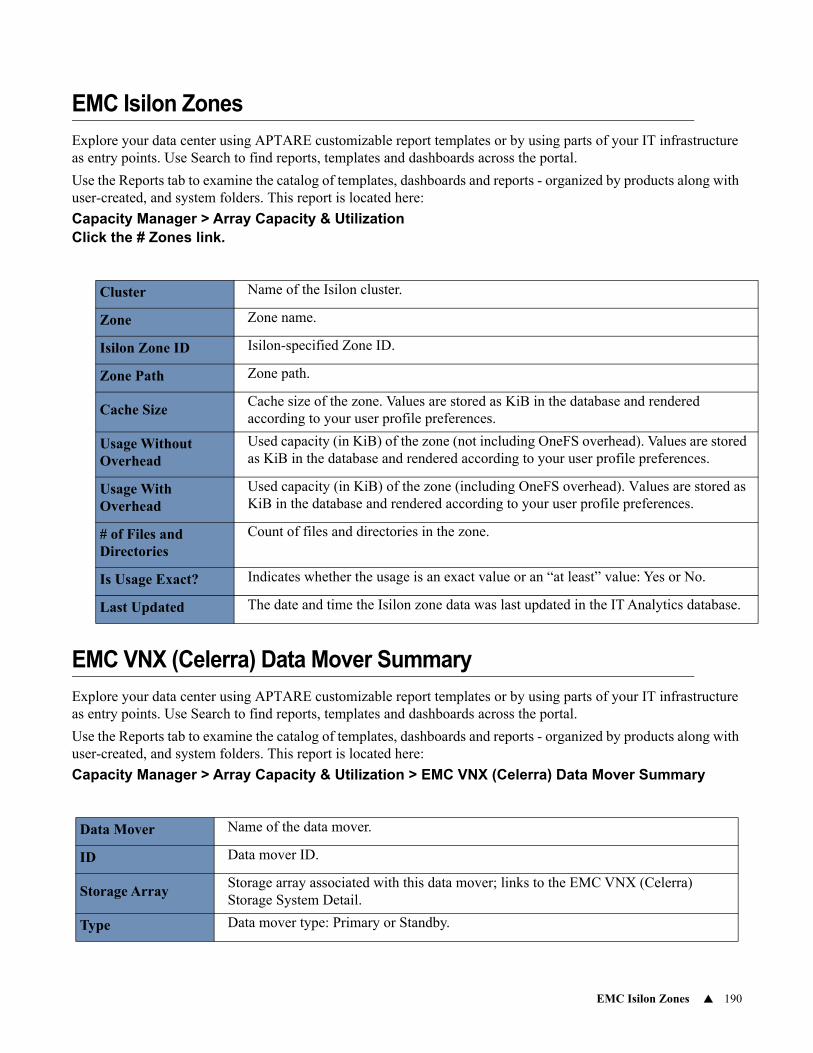
EMC Isilon Zones 190
EMC Isilon Zones
Explore your data center using APTARE customizable report templates or by using parts of your IT infrastructure as entry points. Use Search to find reports, templates and dashboards across the portal.
Use the Reports tab to examine the catalog of templates, dashboards and reports - organized by products along with user-created, and system folders. This report is located here:
Capacity Manager > Array Capacity & UtilizationClick the # Zones link.
EMC VNX (Celerra) Data Mover Summary
Explore your data center using APTARE customizable report templates or by using parts of your IT infrastructure as entry points. Use Search to find reports, templates and dashboards across the portal.
Use the Reports tab to examine the catalog of templates, dashboards and reports - organized by products along with user-created, and system folders. This report is located here:
Capacity Manager > Array Capacity & Utilization > EMC VNX (Celerra) Data Mover Summary
Cluster Name of the Isilon cluster.
Zone Zone name.
Isilon Zone ID Isilon-specified Zone ID.
Zone Path Zone path.
Cache SizeCache size of the zone. Values are stored as KiB in the database and rendered according to your user profile preferences.
Usage Without Overhead
Used capacity (in KiB) of the zone (not including OneFS overhead). Values are stored as KiB in the database and rendered according to your user profile preferences.
Usage With Overhead
Used capacity (in KiB) of the zone (including OneFS overhead). Values are stored as KiB in the database and rendered according to your user profile preferences.
# of Files and Directories
Count of files and directories in the zone.
Is Usage Exact? Indicates whether the usage is an exact value or an “at least” value: Yes or No.
Last Updated The date and time the Isilon zone data was last updated in the IT Analytics database.
Data Mover Name of the data mover.
ID Data mover ID.
Storage ArrayStorage array associated with this data mover; links to the EMC VNX (Celerra) Storage System Detail.
Type Data mover type: Primary or Standby.
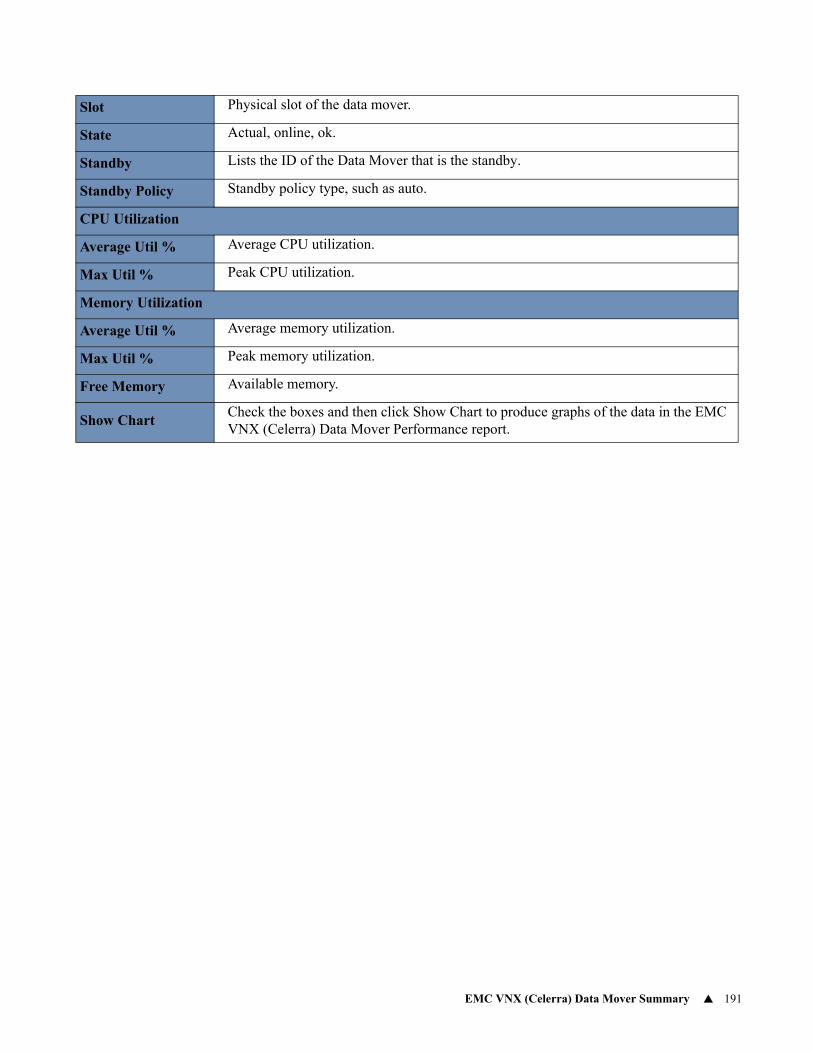
EMC VNX (Celerra) Data Mover Summary 191
Slot Physical slot of the data mover.
State Actual, online, ok.
Standby Lists the ID of the Data Mover that is the standby.
Standby Policy Standby policy type, such as auto.
CPU Utilization
Average Util % Average CPU utilization.
Max Util % Peak CPU utilization.
Memory Utilization
Average Util % Average memory utilization.
Max Util % Peak memory utilization.
Free Memory Available memory.
Show ChartCheck the boxes and then click Show Chart to produce graphs of the data in the EMC VNX (Celerra) Data Mover Performance report.
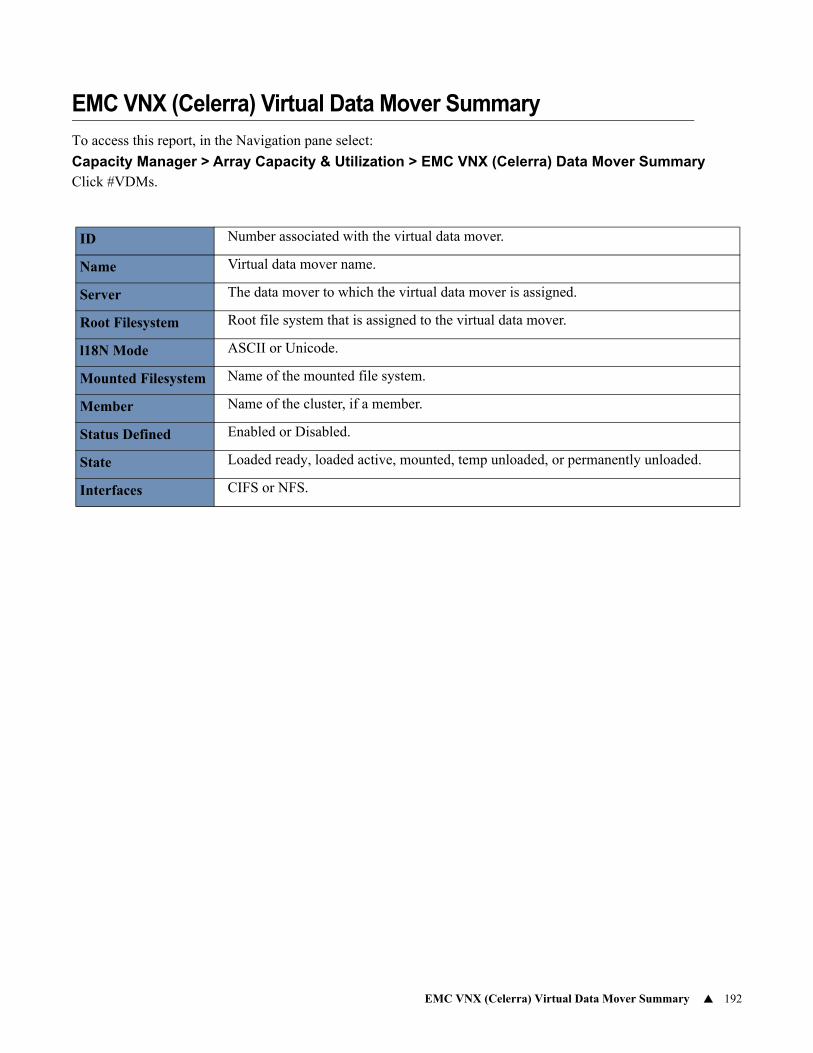
EMC VNX (Celerra) Virtual Data Mover Summary 192
EMC VNX (Celerra) Virtual Data Mover Summary
To access this report, in the Navigation pane select:
Capacity Manager > Array Capacity & Utilization > EMC VNX (Celerra) Data Mover SummaryClick #VDMs.
ID Number associated with the virtual data mover.
Name Virtual data mover name.
Server The data mover to which the virtual data mover is assigned.
Root Filesystem Root file system that is assigned to the virtual data mover.
l18N Mode ASCII or Unicode.
Mounted Filesystem Name of the mounted file system.
Member Name of the cluster, if a member.
Status Defined Enabled or Disabled.
State Loaded ready, loaded active, mounted, temp unloaded, or permanently unloaded.
Interfaces CIFS or NFS.
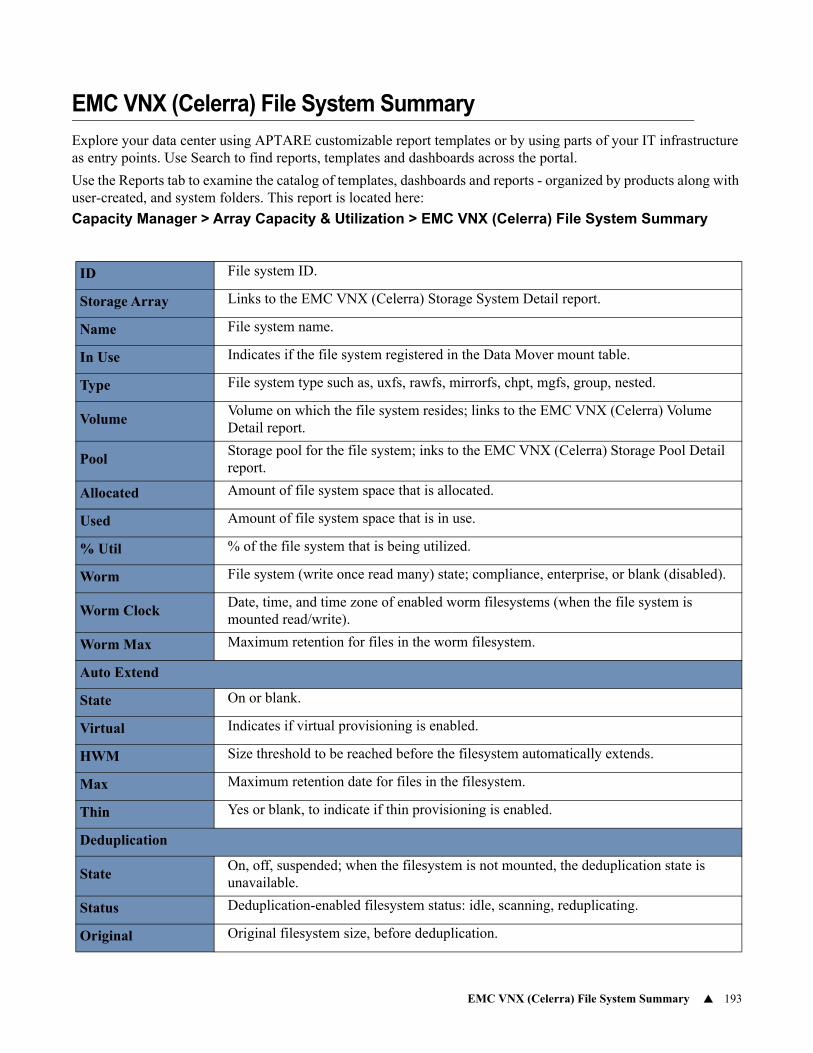
EMC VNX (Celerra) File System Summary 193
EMC VNX (Celerra) File System Summary
Explore your data center using APTARE customizable report templates or by using parts of your IT infrastructure as entry points. Use Search to find reports, templates and dashboards across the portal.
Use the Reports tab to examine the catalog of templates, dashboards and reports - organized by products along with user-created, and system folders. This report is located here:
Capacity Manager > Array Capacity & Utilization > EMC VNX (Celerra) File System Summary
ID File system ID.
Storage Array Links to the EMC VNX (Celerra) Storage System Detail report.
Name File system name.
In Use Indicates if the file system registered in the Data Mover mount table.
Type File system type such as, uxfs, rawfs, mirrorfs, chpt, mgfs, group, nested.
VolumeVolume on which the file system resides; links to the EMC VNX (Celerra) Volume Detail report.
PoolStorage pool for the file system; inks to the EMC VNX (Celerra) Storage Pool Detail report.
Allocated Amount of file system space that is allocated.
Used Amount of file system space that is in use.
% Util % of the file system that is being utilized.
Worm File system (write once read many) state; compliance, enterprise, or blank (disabled).
Worm ClockDate, time, and time zone of enabled worm filesystems (when the file system is mounted read/write).
Worm Max Maximum retention for files in the worm filesystem.
Auto Extend
State On or blank.
Virtual Indicates if virtual provisioning is enabled.
HWM Size threshold to be reached before the filesystem automatically extends.
Max Maximum retention date for files in the filesystem.
Thin Yes or blank, to indicate if thin provisioning is enabled.
Deduplication
StateOn, off, suspended; when the filesystem is not mounted, the deduplication state is unavailable.
Status Deduplication-enabled filesystem status: idle, scanning, reduplicating.
Original Original filesystem size, before deduplication.
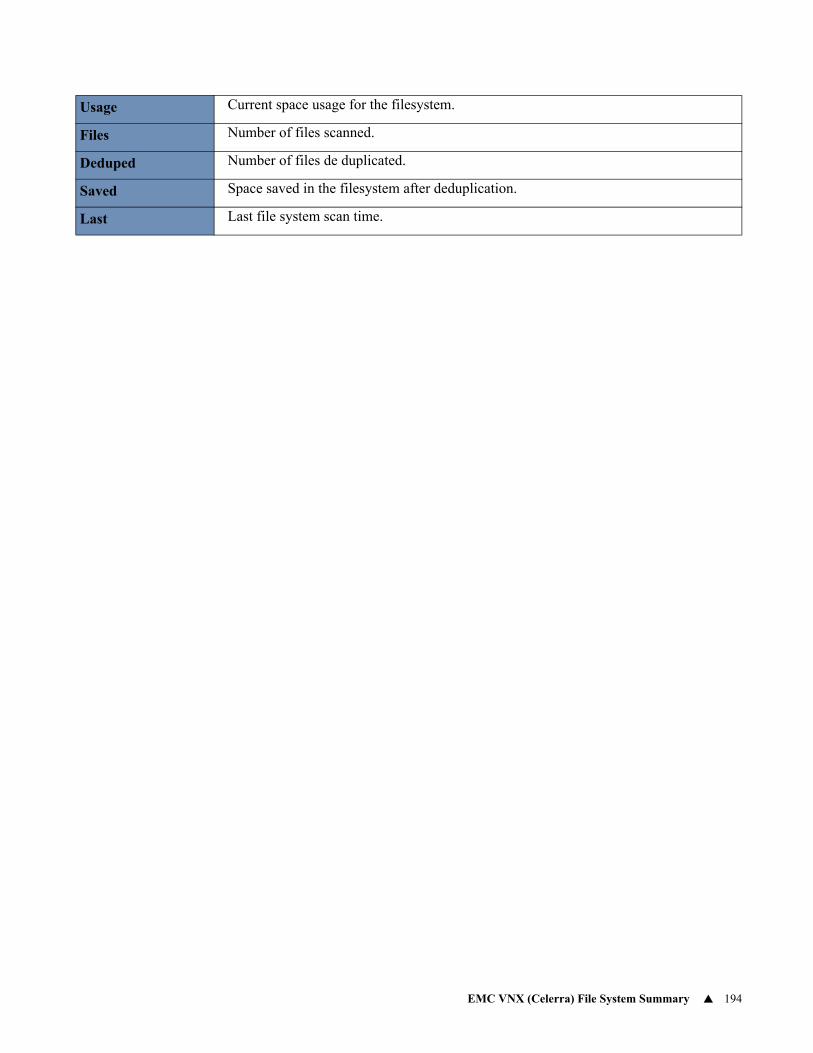
EMC VNX (Celerra) File System Summary 194
Usage Current space usage for the filesystem.
Files Number of files scanned.
Deduped Number of files de duplicated.
Saved Space saved in the filesystem after deduplication.
Last Last file system scan time.

EMC VNX (Celerra) SnapSure Summary 195
EMC VNX (Celerra) SnapSure Summary
Explore your data center using APTARE customizable report templates or by using parts of your IT infrastructure as entry points. Use Search to find reports, templates and dashboards across the portal.
Use the Reports tab to examine the catalog of templates, dashboards and reports - organized by products along with user-created, and system folders. This report is located here:
Capacity Manager > Array Capacity & Utilization > EMC VNX (Celerra) SnapSure SummaryManagement of replication checkpoints, using the SnapSure functionality, provides point-in-time file system images. Use this report to examine related capacity usage.
PFS Production file system; links to the File System Summary report.
Volume Links to the Volume Summary report.
Data Mover List of data mover servers, with their types noted: RO=Read only; RW=Read/Write.
Storage Array Links to the Storage System Detail report.
PoolStorage pool for the checkpoint file system; links to the EMC VNX (Celerra) Storage Pools Summary.
SavVol
Auto Ext Auto-extend: Y or blank.
Virt Prov Virtually provisioned: Y or blank.
Full Mark Usage point that triggers a SavVol auto-extend, if system space is available.
Volume Volume where the checkpoint resides; links to the relevant Volume Summary report.
Max Size Maximum size for auto-extend and virtual provisioning.
Total SavVol total capacity of the volume.
Used Amount of SavVol capacity that is in use.
Avail Available SavVol capacity.
Util % SavVol Used/Available.
Checkpoint
Name Name of the checkpoint.
Total Size of the PFS when the checkpoint was taken.
Used Checkpoint amount of storage used.
Avail Available checkpoint capacity.
Util % Used/Available capacity.
ID Lists the checkpoint IDs.
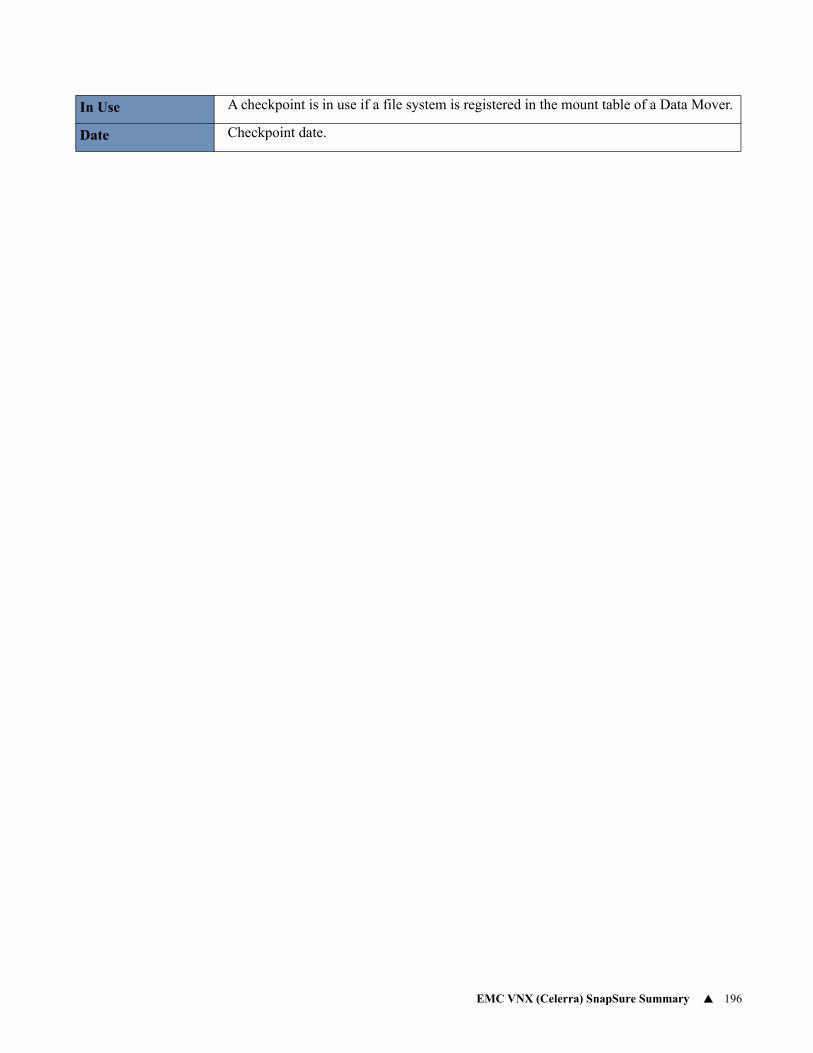
EMC VNX (Celerra) SnapSure Summary 196
In Use A checkpoint is in use if a file system is registered in the mount table of a Data Mover.
Date Checkpoint date.
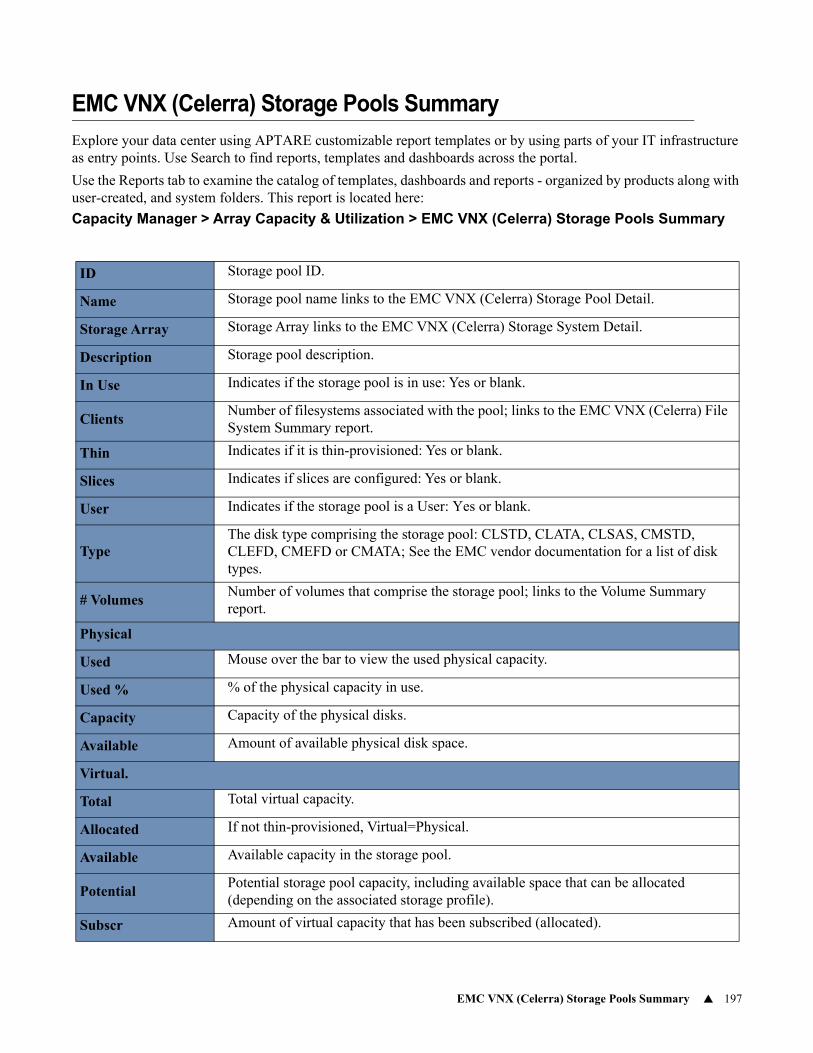
EMC VNX (Celerra) Storage Pools Summary 197
EMC VNX (Celerra) Storage Pools Summary
Explore your data center using APTARE customizable report templates or by using parts of your IT infrastructure as entry points. Use Search to find reports, templates and dashboards across the portal.
Use the Reports tab to examine the catalog of templates, dashboards and reports - organized by products along with user-created, and system folders. This report is located here:
Capacity Manager > Array Capacity & Utilization > EMC VNX (Celerra) Storage Pools Summary
ID Storage pool ID.
Name Storage pool name links to the EMC VNX (Celerra) Storage Pool Detail.
Storage Array Storage Array links to the EMC VNX (Celerra) Storage System Detail.
Description Storage pool description.
In Use Indicates if the storage pool is in use: Yes or blank.
ClientsNumber of filesystems associated with the pool; links to the EMC VNX (Celerra) File System Summary report.
Thin Indicates if it is thin-provisioned: Yes or blank.
Slices Indicates if slices are configured: Yes or blank.
User Indicates if the storage pool is a User: Yes or blank.
TypeThe disk type comprising the storage pool: CLSTD, CLATA, CLSAS, CMSTD, CLEFD, CMEFD or CMATA; See the EMC vendor documentation for a list of disk types.
# VolumesNumber of volumes that comprise the storage pool; links to the Volume Summary report.
Physical
Used Mouse over the bar to view the used physical capacity.
Used % % of the physical capacity in use.
Capacity Capacity of the physical disks.
Available Amount of available physical disk space.
Virtual.
Total Total virtual capacity.
Allocated If not thin-provisioned, Virtual=Physical.
Available Available capacity in the storage pool.
PotentialPotential storage pool capacity, including available space that can be allocated (depending on the associated storage profile).
Subscr Amount of virtual capacity that has been subscribed (allocated).

EMC VNX (Celerra) Storage Pools Summary 198
GreedyIf Yes, the storage pool tries to create new volumes before consuming capacity storage from existing member volumes.
Dynamic If Yes, the storage pool can expand or shrink as needed.
# Data MoversThe number of visible data movers in the storage pool; links to the Data Mover Summary report.
Stripe Members The number of physical drives in the RAID set.
Stripe Size Stripe size of the current storage pool; a multiple of 8 KB, 0=N/A.
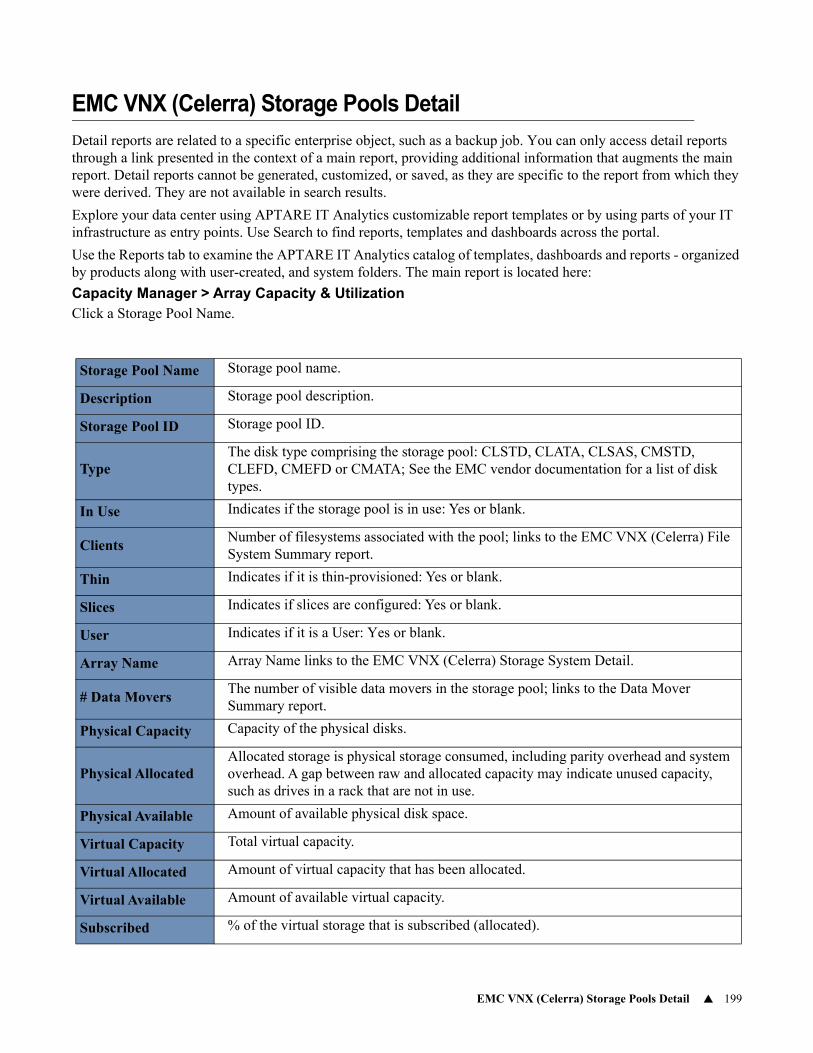
EMC VNX (Celerra) Storage Pools Detail 199
EMC VNX (Celerra) Storage Pools Detail
Detail reports are related to a specific enterprise object, such as a backup job. You can only access detail reports through a link presented in the context of a main report, providing additional information that augments the main report. Detail reports cannot be generated, customized, or saved, as they are specific to the report from which they were derived. They are not available in search results.
Explore your data center using APTARE IT Analytics customizable report templates or by using parts of your IT infrastructure as entry points. Use Search to find reports, templates and dashboards across the portal.
Use the Reports tab to examine the APTARE IT Analytics catalog of templates, dashboards and reports - organized by products along with user-created, and system folders. The main report is located here:
Capacity Manager > Array Capacity & Utilization Click a Storage Pool Name.
Storage Pool Name Storage pool name.
Description Storage pool description.
Storage Pool ID Storage pool ID.
TypeThe disk type comprising the storage pool: CLSTD, CLATA, CLSAS, CMSTD, CLEFD, CMEFD or CMATA; See the EMC vendor documentation for a list of disk types.
In Use Indicates if the storage pool is in use: Yes or blank.
ClientsNumber of filesystems associated with the pool; links to the EMC VNX (Celerra) File System Summary report.
Thin Indicates if it is thin-provisioned: Yes or blank.
Slices Indicates if slices are configured: Yes or blank.
User Indicates if it is a User: Yes or blank.
Array Name Array Name links to the EMC VNX (Celerra) Storage System Detail.
# Data MoversThe number of visible data movers in the storage pool; links to the Data Mover Summary report.
Physical Capacity Capacity of the physical disks.
Physical AllocatedAllocated storage is physical storage consumed, including parity overhead and system overhead. A gap between raw and allocated capacity may indicate unused capacity, such as drives in a rack that are not in use.
Physical Available Amount of available physical disk space.
Virtual Capacity Total virtual capacity.
Virtual Allocated Amount of virtual capacity that has been allocated.
Virtual Available Amount of available virtual capacity.
Subscribed % of the virtual storage that is subscribed (allocated).
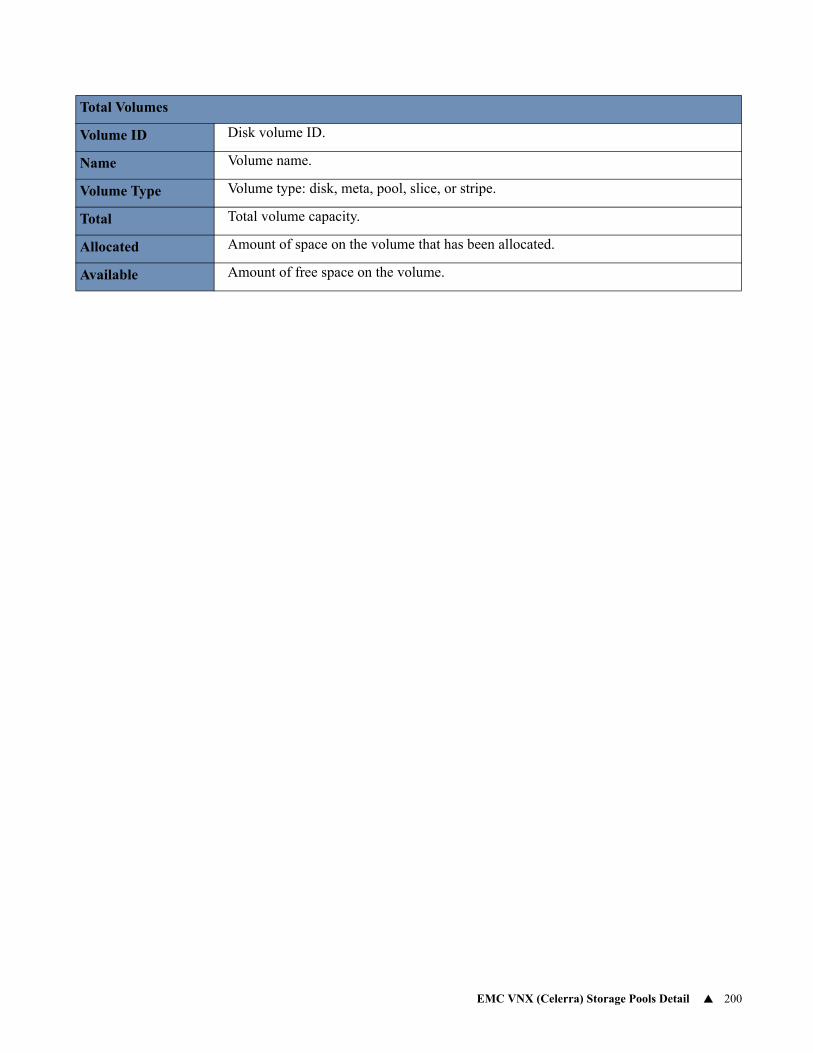
EMC VNX (Celerra) Storage Pools Detail 200
Total Volumes
Volume ID Disk volume ID.
Name Volume name.
Volume Type Volume type: disk, meta, pool, slice, or stripe.
Total Total volume capacity.
Allocated Amount of space on the volume that has been allocated.
Available Amount of free space on the volume.
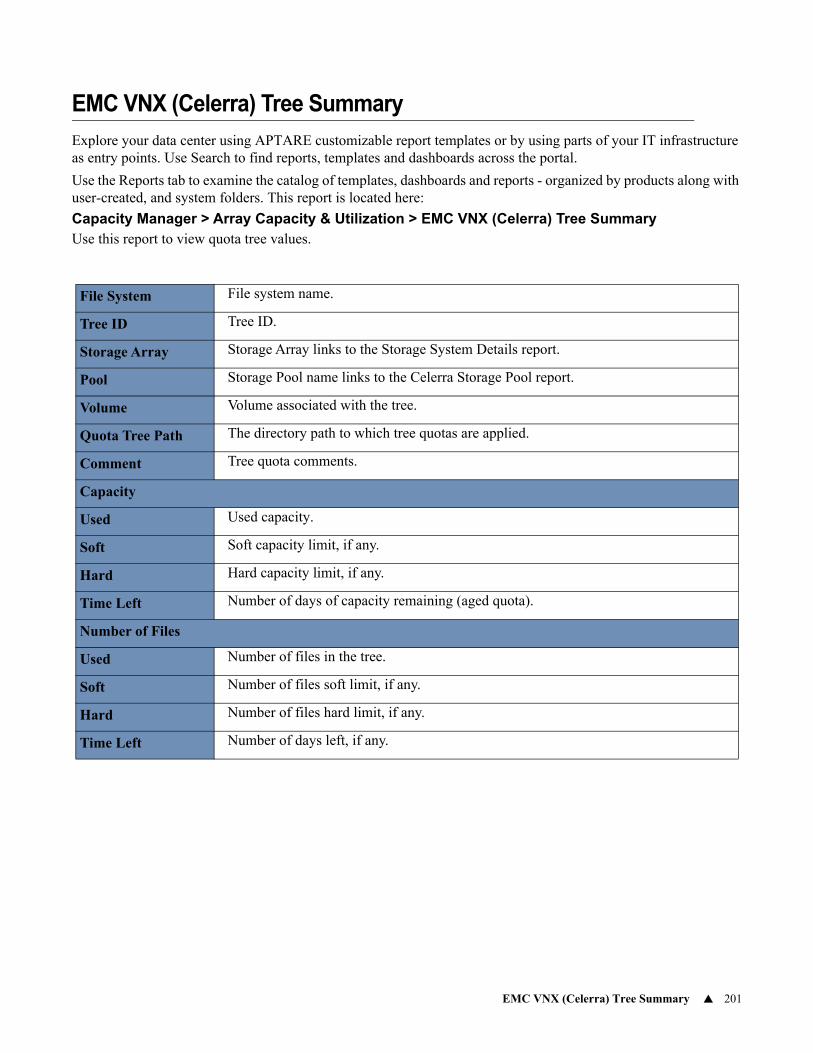
EMC VNX (Celerra) Tree Summary 201
EMC VNX (Celerra) Tree Summary
Explore your data center using APTARE customizable report templates or by using parts of your IT infrastructure as entry points. Use Search to find reports, templates and dashboards across the portal.
Use the Reports tab to examine the catalog of templates, dashboards and reports - organized by products along with user-created, and system folders. This report is located here:
Capacity Manager > Array Capacity & Utilization > EMC VNX (Celerra) Tree SummaryUse this report to view quota tree values.
File System File system name.
Tree ID Tree ID.
Storage Array Storage Array links to the Storage System Details report.
Pool Storage Pool name links to the Celerra Storage Pool report.
Volume Volume associated with the tree.
Quota Tree Path The directory path to which tree quotas are applied.
Comment Tree quota comments.
Capacity
Used Used capacity.
Soft Soft capacity limit, if any.
Hard Hard capacity limit, if any.
Time Left Number of days of capacity remaining (aged quota).
Number of Files
Used Number of files in the tree.
Soft Number of files soft limit, if any.
Hard Number of files hard limit, if any.
Time Left Number of days left, if any.
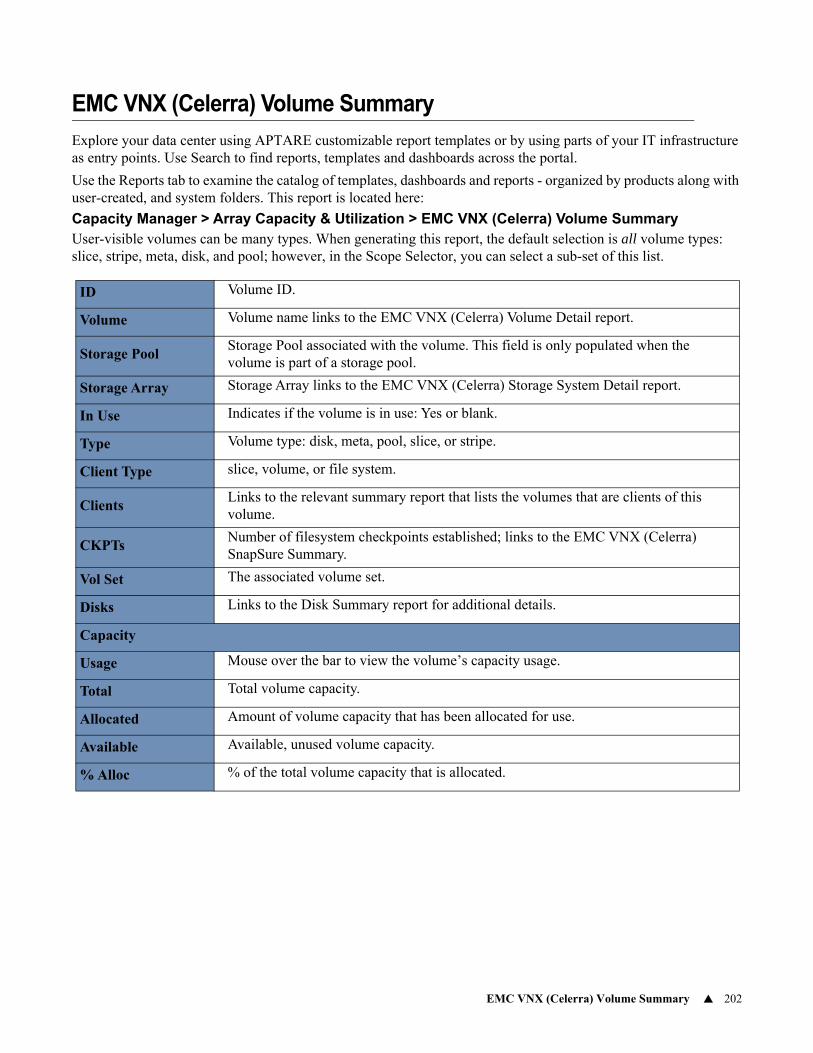
EMC VNX (Celerra) Volume Summary 202
EMC VNX (Celerra) Volume Summary
Explore your data center using APTARE customizable report templates or by using parts of your IT infrastructure as entry points. Use Search to find reports, templates and dashboards across the portal.
Use the Reports tab to examine the catalog of templates, dashboards and reports - organized by products along with user-created, and system folders. This report is located here:
Capacity Manager > Array Capacity & Utilization > EMC VNX (Celerra) Volume SummaryUser-visible volumes can be many types. When generating this report, the default selection is all volume types: slice, stripe, meta, disk, and pool; however, in the Scope Selector, you can select a sub-set of this list.
ID Volume ID.
Volume Volume name links to the EMC VNX (Celerra) Volume Detail report.
Storage PoolStorage Pool associated with the volume. This field is only populated when the volume is part of a storage pool.
Storage Array Storage Array links to the EMC VNX (Celerra) Storage System Detail report.
In Use Indicates if the volume is in use: Yes or blank.
Type Volume type: disk, meta, pool, slice, or stripe.
Client Type slice, volume, or file system.
ClientsLinks to the relevant summary report that lists the volumes that are clients of this volume.
CKPTsNumber of filesystem checkpoints established; links to the EMC VNX (Celerra) SnapSure Summary.
Vol Set The associated volume set.
Disks Links to the Disk Summary report for additional details.
Capacity
Usage Mouse over the bar to view the volume’s capacity usage.
Total Total volume capacity.
Allocated Amount of volume capacity that has been allocated for use.
Available Available, unused volume capacity.
% Alloc % of the total volume capacity that is allocated.
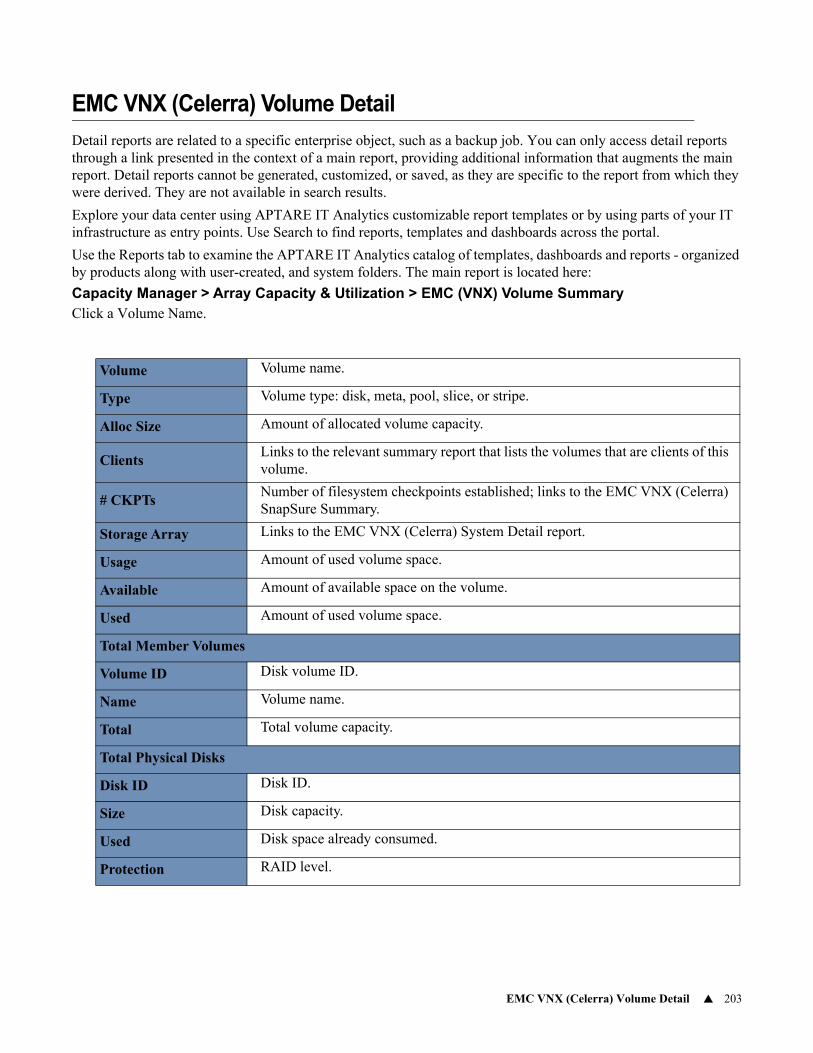
EMC VNX (Celerra) Volume Detail 203
EMC VNX (Celerra) Volume Detail
Detail reports are related to a specific enterprise object, such as a backup job. You can only access detail reports through a link presented in the context of a main report, providing additional information that augments the main report. Detail reports cannot be generated, customized, or saved, as they are specific to the report from which they were derived. They are not available in search results.
Explore your data center using APTARE IT Analytics customizable report templates or by using parts of your IT infrastructure as entry points. Use Search to find reports, templates and dashboards across the portal.
Use the Reports tab to examine the APTARE IT Analytics catalog of templates, dashboards and reports - organized by products along with user-created, and system folders. The main report is located here:
Capacity Manager > Array Capacity & Utilization > EMC (VNX) Volume SummaryClick a Volume Name.
Volume Volume name.
Type Volume type: disk, meta, pool, slice, or stripe.
Alloc Size Amount of allocated volume capacity.
ClientsLinks to the relevant summary report that lists the volumes that are clients of this volume.
# CKPTsNumber of filesystem checkpoints established; links to the EMC VNX (Celerra) SnapSure Summary.
Storage Array Links to the EMC VNX (Celerra) System Detail report.
Usage Amount of used volume space.
Available Amount of available space on the volume.
Used Amount of used volume space.
Total Member Volumes
Volume ID Disk volume ID.
Name Volume name.
Total Total volume capacity.
Total Physical Disks
Disk ID Disk ID.
Size Disk capacity.
Used Disk space already consumed.
Protection RAID level.
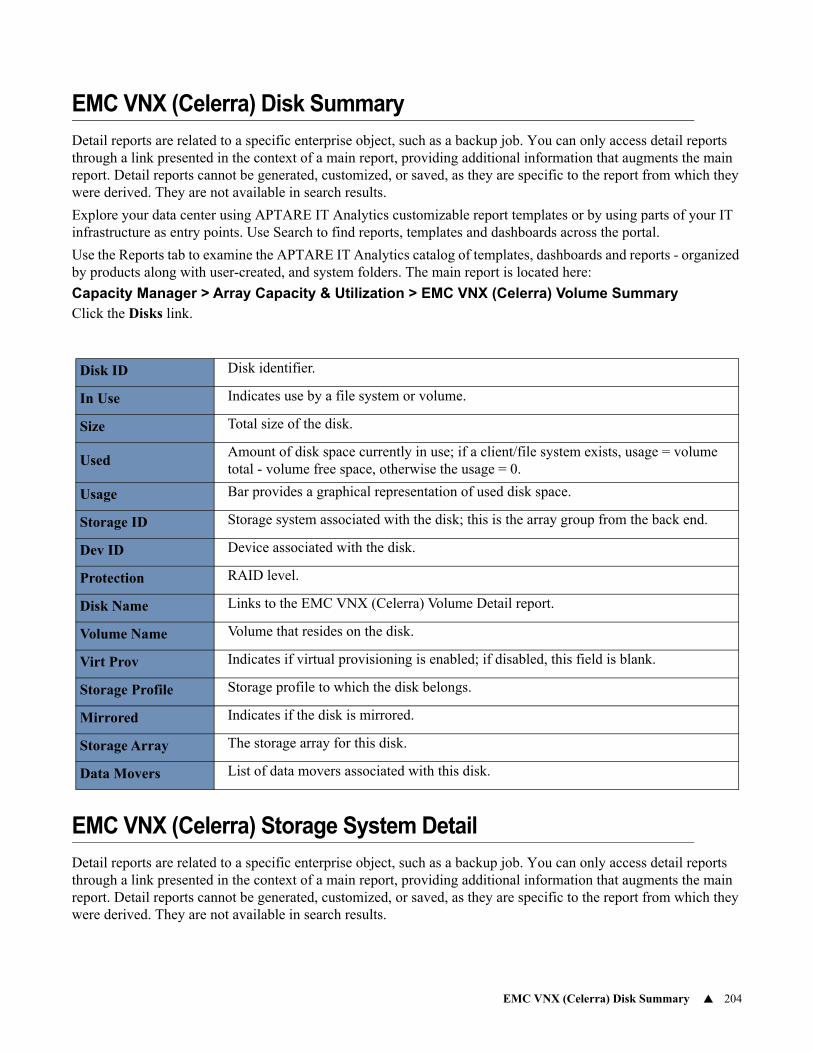
EMC VNX (Celerra) Disk Summary 204
EMC VNX (Celerra) Disk Summary
Detail reports are related to a specific enterprise object, such as a backup job. You can only access detail reports through a link presented in the context of a main report, providing additional information that augments the main report. Detail reports cannot be generated, customized, or saved, as they are specific to the report from which they were derived. They are not available in search results.
Explore your data center using APTARE IT Analytics customizable report templates or by using parts of your IT infrastructure as entry points. Use Search to find reports, templates and dashboards across the portal.
Use the Reports tab to examine the APTARE IT Analytics catalog of templates, dashboards and reports - organized by products along with user-created, and system folders. The main report is located here:
Capacity Manager > Array Capacity & Utilization > EMC VNX (Celerra) Volume SummaryClick the Disks link.
EMC VNX (Celerra) Storage System Detail
Detail reports are related to a specific enterprise object, such as a backup job. You can only access detail reports through a link presented in the context of a main report, providing additional information that augments the main report. Detail reports cannot be generated, customized, or saved, as they are specific to the report from which they were derived. They are not available in search results.
Disk ID Disk identifier.
In Use Indicates use by a file system or volume.
Size Total size of the disk.
UsedAmount of disk space currently in use; if a client/file system exists, usage = volume total - volume free space, otherwise the usage = 0.
Usage Bar provides a graphical representation of used disk space.
Storage ID Storage system associated with the disk; this is the array group from the back end.
Dev ID Device associated with the disk.
Protection RAID level.
Disk Name Links to the EMC VNX (Celerra) Volume Detail report.
Volume Name Volume that resides on the disk.
Virt Prov Indicates if virtual provisioning is enabled; if disabled, this field is blank.
Storage Profile Storage profile to which the disk belongs.
Mirrored Indicates if the disk is mirrored.
Storage Array The storage array for this disk.
Data Movers List of data movers associated with this disk.
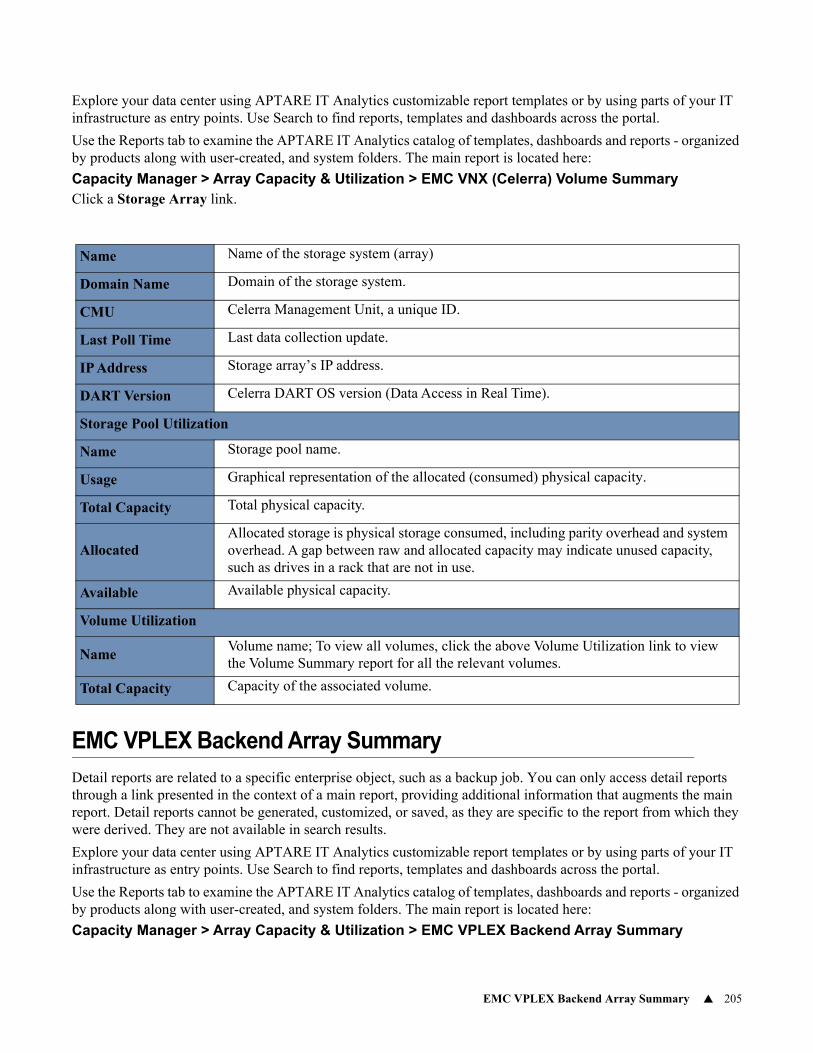
EMC VPLEX Backend Array Summary 205
Explore your data center using APTARE IT Analytics customizable report templates or by using parts of your IT infrastructure as entry points. Use Search to find reports, templates and dashboards across the portal.
Use the Reports tab to examine the APTARE IT Analytics catalog of templates, dashboards and reports - organized by products along with user-created, and system folders. The main report is located here:
Capacity Manager > Array Capacity & Utilization > EMC VNX (Celerra) Volume SummaryClick a Storage Array link.
EMC VPLEX Backend Array Summary
Detail reports are related to a specific enterprise object, such as a backup job. You can only access detail reports through a link presented in the context of a main report, providing additional information that augments the main report. Detail reports cannot be generated, customized, or saved, as they are specific to the report from which they were derived. They are not available in search results.
Explore your data center using APTARE IT Analytics customizable report templates or by using parts of your IT infrastructure as entry points. Use Search to find reports, templates and dashboards across the portal.
Use the Reports tab to examine the APTARE IT Analytics catalog of templates, dashboards and reports - organized by products along with user-created, and system folders. The main report is located here:
Capacity Manager > Array Capacity & Utilization > EMC VPLEX Backend Array Summary
Name Name of the storage system (array)
Domain Name Domain of the storage system.
CMU Celerra Management Unit, a unique ID.
Last Poll Time Last data collection update.
IP Address Storage array’s IP address.
DART Version Celerra DART OS version (Data Access in Real Time).
Storage Pool Utilization
Name Storage pool name.
Usage Graphical representation of the allocated (consumed) physical capacity.
Total Capacity Total physical capacity.
AllocatedAllocated storage is physical storage consumed, including parity overhead and system overhead. A gap between raw and allocated capacity may indicate unused capacity, such as drives in a rack that are not in use.
Available Available physical capacity.
Volume Utilization
NameVolume name; To view all volumes, click the above Volume Utilization link to view the Volume Summary report for all the relevant volumes.
Total Capacity Capacity of the associated volume.
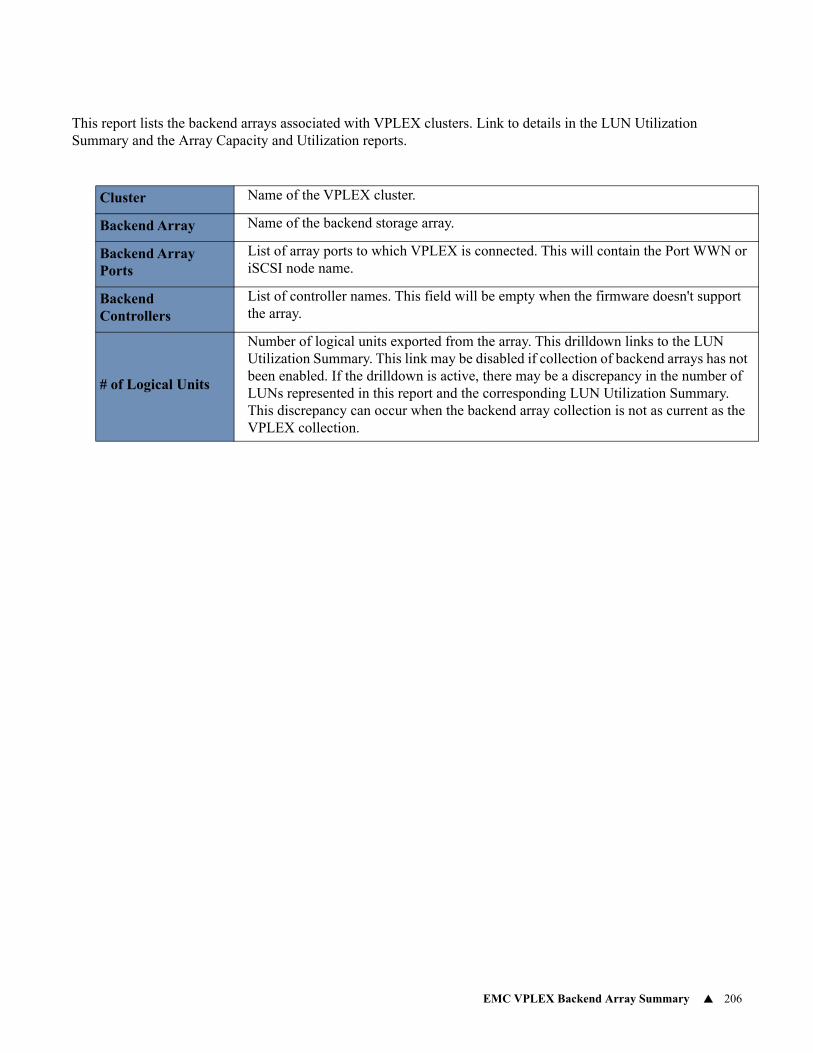
EMC VPLEX Backend Array Summary 206
This report lists the backend arrays associated with VPLEX clusters. Link to details in the LUN Utilization Summary and the Array Capacity and Utilization reports.
Cluster Name of the VPLEX cluster.
Backend Array Name of the backend storage array.
Backend Array Ports
List of array ports to which VPLEX is connected. This will contain the Port WWN or iSCSI node name.
Backend Controllers
List of controller names. This field will be empty when the firmware doesn't support the array.
# of Logical Units
Number of logical units exported from the array. This drilldown links to the LUN Utilization Summary. This link may be disabled if collection of backend arrays has not been enabled. If the drilldown is active, there may be a discrepancy in the number of LUNs represented in this report and the corresponding LUN Utilization Summary. This discrepancy can occur when the backend array collection is not as current as the VPLEX collection.
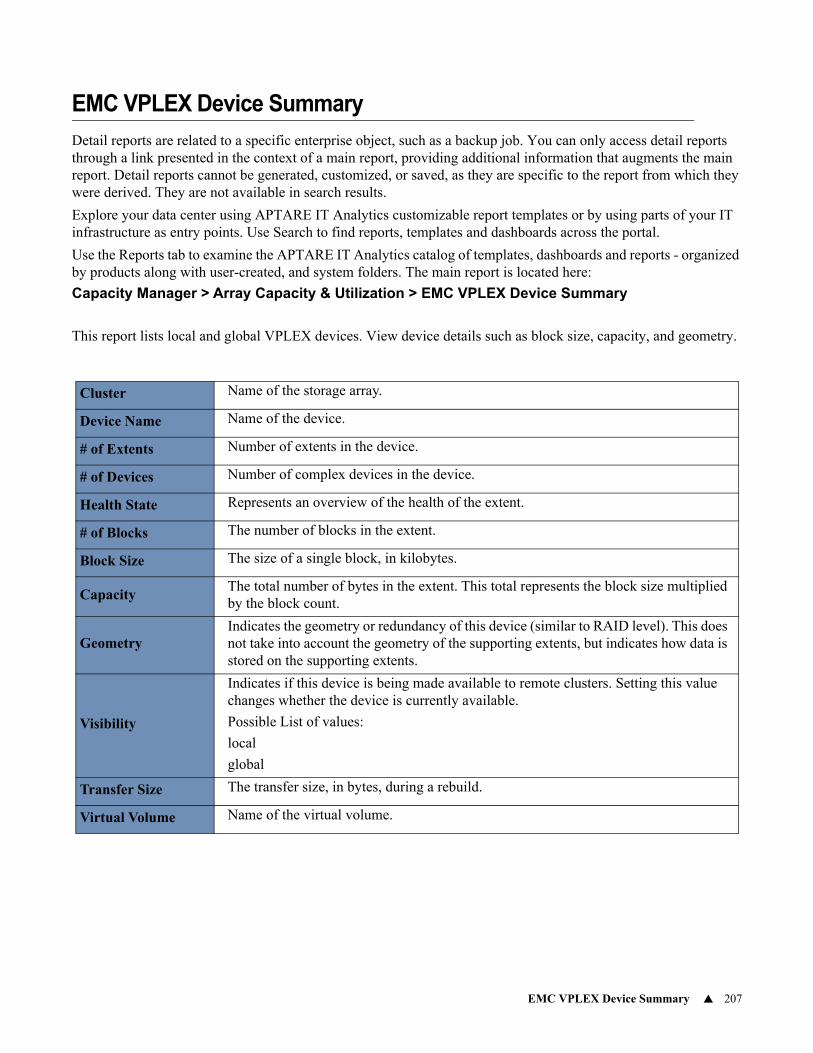
EMC VPLEX Device Summary 207
EMC VPLEX Device Summary
Detail reports are related to a specific enterprise object, such as a backup job. You can only access detail reports through a link presented in the context of a main report, providing additional information that augments the main report. Detail reports cannot be generated, customized, or saved, as they are specific to the report from which they were derived. They are not available in search results.
Explore your data center using APTARE IT Analytics customizable report templates or by using parts of your IT infrastructure as entry points. Use Search to find reports, templates and dashboards across the portal.
Use the Reports tab to examine the APTARE IT Analytics catalog of templates, dashboards and reports - organized by products along with user-created, and system folders. The main report is located here:
Capacity Manager > Array Capacity & Utilization > EMC VPLEX Device Summary
This report lists local and global VPLEX devices. View device details such as block size, capacity, and geometry.
Cluster Name of the storage array.
Device Name Name of the device.
# of Extents Number of extents in the device.
# of Devices Number of complex devices in the device.
Health State Represents an overview of the health of the extent.
# of Blocks The number of blocks in the extent.
Block Size The size of a single block, in kilobytes.
CapacityThe total number of bytes in the extent. This total represents the block size multiplied by the block count.
GeometryIndicates the geometry or redundancy of this device (similar to RAID level). This does not take into account the geometry of the supporting extents, but indicates how data is stored on the supporting extents.
Visibility
Indicates if this device is being made available to remote clusters. Setting this value changes whether the device is currently available.
Possible List of values:
local
global
Transfer Size The transfer size, in bytes, during a rebuild.
Virtual Volume Name of the virtual volume.
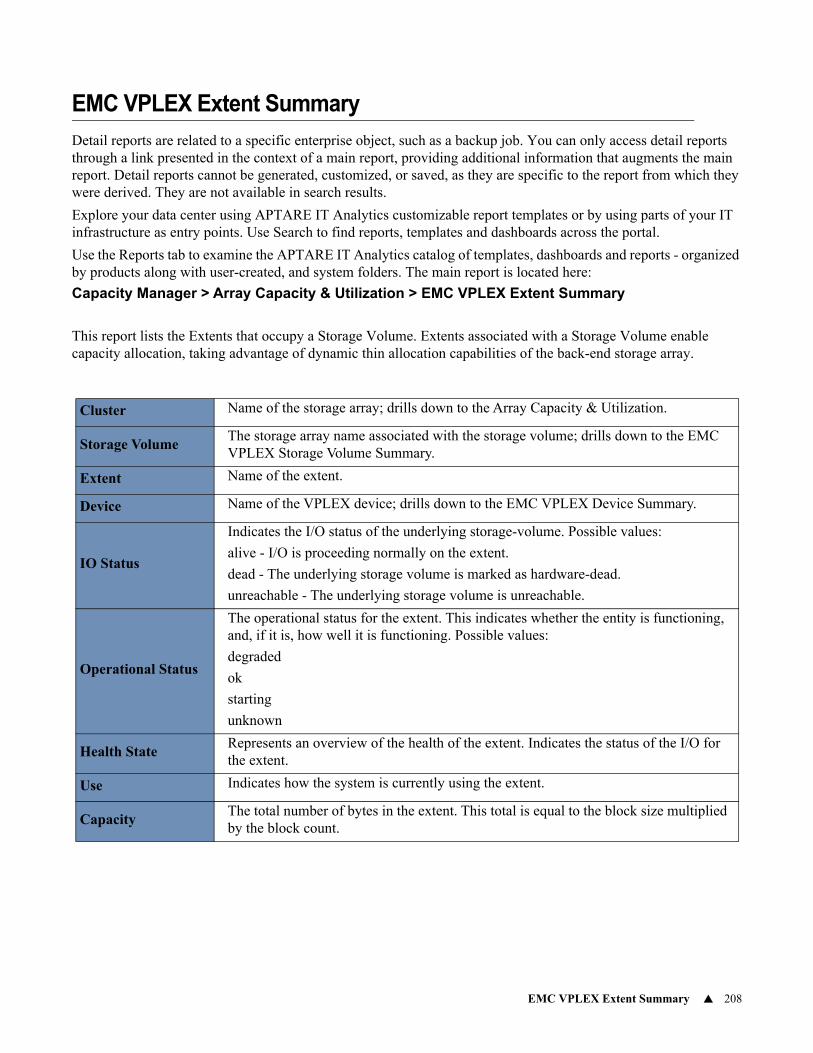
EMC VPLEX Extent Summary 208
EMC VPLEX Extent Summary
Detail reports are related to a specific enterprise object, such as a backup job. You can only access detail reports through a link presented in the context of a main report, providing additional information that augments the main report. Detail reports cannot be generated, customized, or saved, as they are specific to the report from which they were derived. They are not available in search results.
Explore your data center using APTARE IT Analytics customizable report templates or by using parts of your IT infrastructure as entry points. Use Search to find reports, templates and dashboards across the portal.
Use the Reports tab to examine the APTARE IT Analytics catalog of templates, dashboards and reports - organized by products along with user-created, and system folders. The main report is located here:
Capacity Manager > Array Capacity & Utilization > EMC VPLEX Extent Summary
This report lists the Extents that occupy a Storage Volume. Extents associated with a Storage Volume enable capacity allocation, taking advantage of dynamic thin allocation capabilities of the back-end storage array.
Cluster Name of the storage array; drills down to the Array Capacity & Utilization.
Storage VolumeThe storage array name associated with the storage volume; drills down to the EMC VPLEX Storage Volume Summary.
Extent Name of the extent.
Device Name of the VPLEX device; drills down to the EMC VPLEX Device Summary.
IO Status
Indicates the I/O status of the underlying storage-volume. Possible values:
alive - I/O is proceeding normally on the extent.
dead - The underlying storage volume is marked as hardware-dead.
unreachable - The underlying storage volume is unreachable.
Operational Status
The operational status for the extent. This indicates whether the entity is functioning, and, if it is, how well it is functioning. Possible values:
degraded
ok
starting
unknown
Health StateRepresents an overview of the health of the extent. Indicates the status of the I/O for the extent.
Use Indicates how the system is currently using the extent.
CapacityThe total number of bytes in the extent. This total is equal to the block size multiplied by the block count.

EMC VPLEX Port Summary 209
EMC VPLEX Port Summary
Detail reports are related to a specific enterprise object, such as a backup job. You can only access detail reports through a link presented in the context of a main report, providing additional information that augments the main report. Detail reports cannot be generated, customized, or saved, as they are specific to the report from which they were derived. They are not available in search results.
Explore your data center using APTARE IT Analytics customizable report templates or by using parts of your IT infrastructure as entry points. Use Search to find reports, templates and dashboards across the portal.
Use the Reports tab to examine the APTARE IT Analytics catalog of templates, dashboards and reports - organized by products along with user-created, and system folders. The main report is located here:
Capacity Manager > Array Capacity & Utilization > EMC VPLEX Port Summary
This report lists the status of VPLEX ports associated with a cluster. It includes the number of Storage Views and Virtual Volumes exported by a port.
ClusterName of the VPLEX cluster. Click the link to view the Array Capacity & Utilization report.
Port Name Name of the target port.
Export Status This port’s export status.
EnabledIndicates if the port is enabled. The “set” command can be used to enable or disable the port.
# of ViewsNumber of storage views associated with this port. Click the link to view the EMC VPLEX Storage View Summary.
# of Virtual Volumes
Number of virtual volumes associated with this port. Click the link to view the LUN Utilization Summary.

EMC VPLEX Storage View Summary 210
EMC VPLEX Storage View Summary
Detail reports are related to a specific enterprise object, such as a backup job. You can only access detail reports through a link presented in the context of a main report, providing additional information that augments the main report. Detail reports cannot be generated, customized, or saved, as they are specific to the report from which they were derived. They are not available in search results.
Explore your data center using APTARE IT Analytics customizable report templates or by using parts of your IT infrastructure as entry points. Use Search to find reports, templates and dashboards across the portal.
Use the Reports tab to examine the APTARE IT Analytics catalog of templates, dashboards and reports - organized by products along with user-created, and system folders. The main report is located here:
Capacity Manager > Array Capacity & Utilization > EMC VPLEX Storage View Summary
This report lists the logical containers consisting of front end ports, registered host initiator ports, and Virtual Volumes. Storage Views determine host access to virtual volumes from VPLEX.
Cluster Name of the VPLEX cluster.
View Name Name of the storage view.
Target Ports Name of the target port. This is a comma-separated list of the target ports.
Initiator PortsThis list of initiator ports is at the storage view level. This is a comma-separated list of initiator ports.
# of Virtual Volumes
Number of virtual volumes in the storage view.
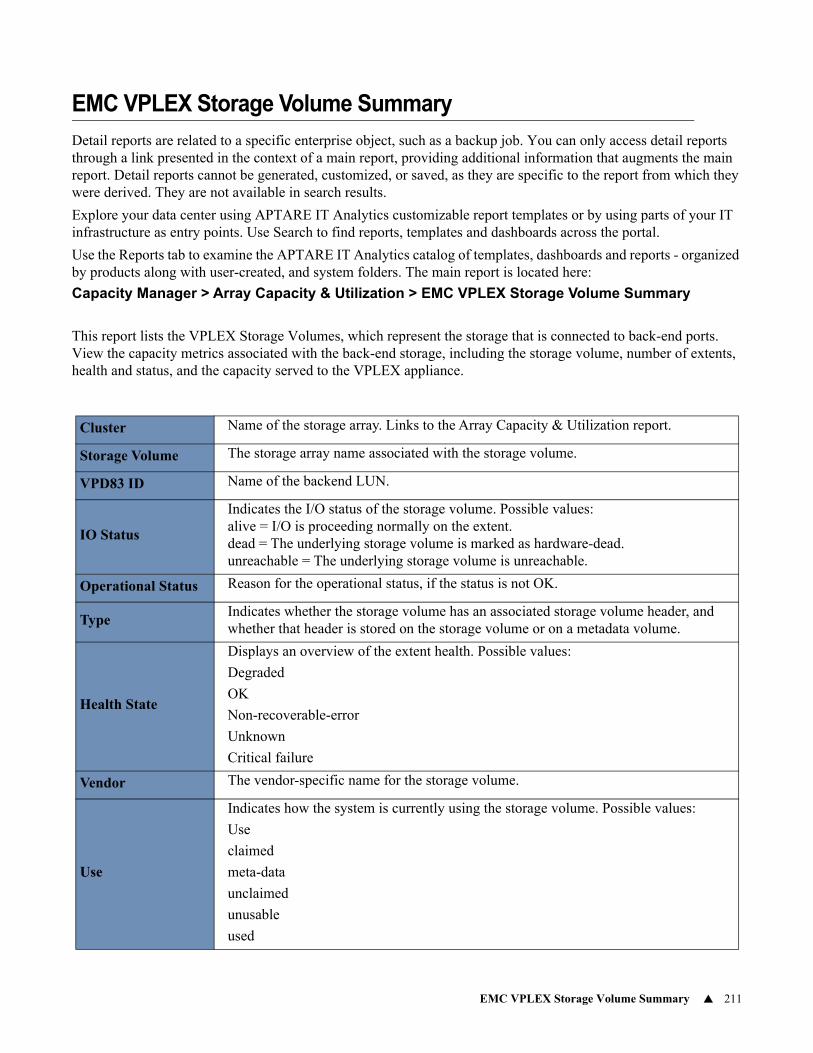
EMC VPLEX Storage Volume Summary 211
EMC VPLEX Storage Volume Summary
Detail reports are related to a specific enterprise object, such as a backup job. You can only access detail reports through a link presented in the context of a main report, providing additional information that augments the main report. Detail reports cannot be generated, customized, or saved, as they are specific to the report from which they were derived. They are not available in search results.
Explore your data center using APTARE IT Analytics customizable report templates or by using parts of your IT infrastructure as entry points. Use Search to find reports, templates and dashboards across the portal.
Use the Reports tab to examine the APTARE IT Analytics catalog of templates, dashboards and reports - organized by products along with user-created, and system folders. The main report is located here:
Capacity Manager > Array Capacity & Utilization > EMC VPLEX Storage Volume Summary
This report lists the VPLEX Storage Volumes, which represent the storage that is connected to back-end ports. View the capacity metrics associated with the back-end storage, including the storage volume, number of extents, health and status, and the capacity served to the VPLEX appliance.
Cluster Name of the storage array. Links to the Array Capacity & Utilization report.
Storage Volume The storage array name associated with the storage volume.
VPD83 ID Name of the backend LUN.
IO Status
Indicates the I/O status of the storage volume. Possible values:alive = I/O is proceeding normally on the extent.dead = The underlying storage volume is marked as hardware-dead.unreachable = The underlying storage volume is unreachable.
Operational Status Reason for the operational status, if the status is not OK.
TypeIndicates whether the storage volume has an associated storage volume header, and whether that header is stored on the storage volume or on a metadata volume.
Health State
Displays an overview of the extent health. Possible values:
Degraded
OK
Non-recoverable-error
Unknown
Critical failure
Vendor The vendor-specific name for the storage volume.
Use
Indicates how the system is currently using the storage volume. Possible values:
Use
claimed
meta-data
unclaimed
unusable
used
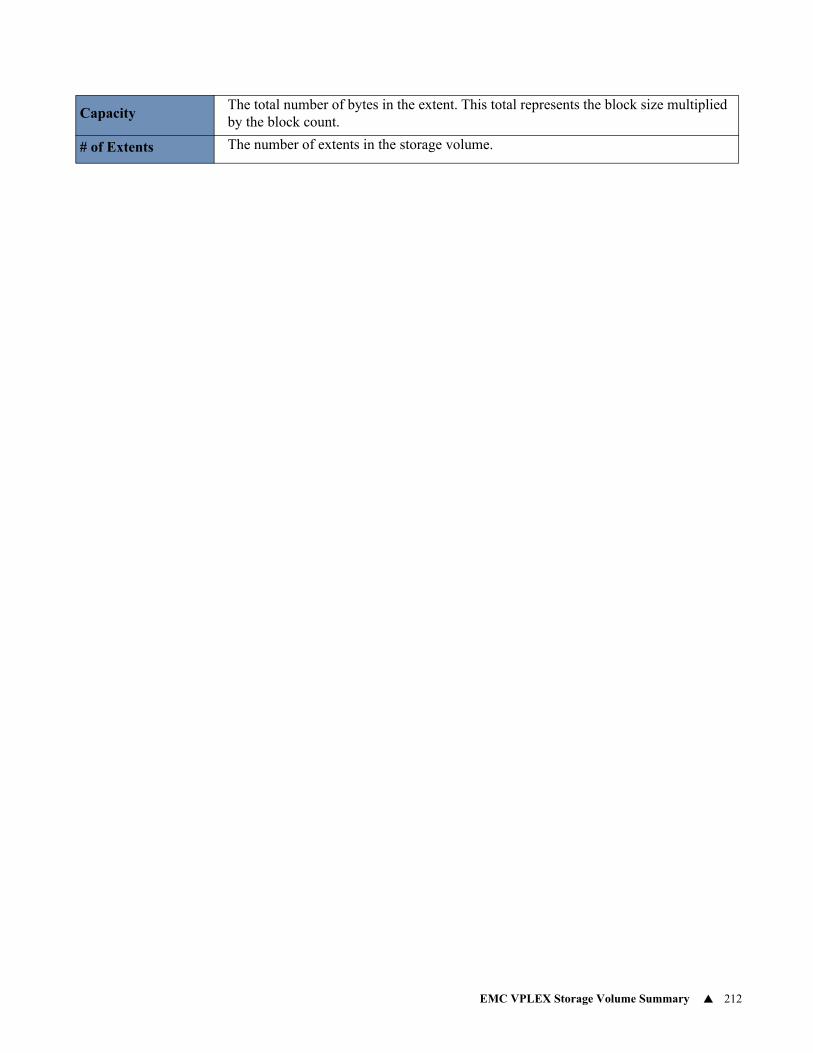
EMC VPLEX Storage Volume Summary 212
CapacityThe total number of bytes in the extent. This total represents the block size multiplied by the block count.
# of Extents The number of extents in the storage volume.
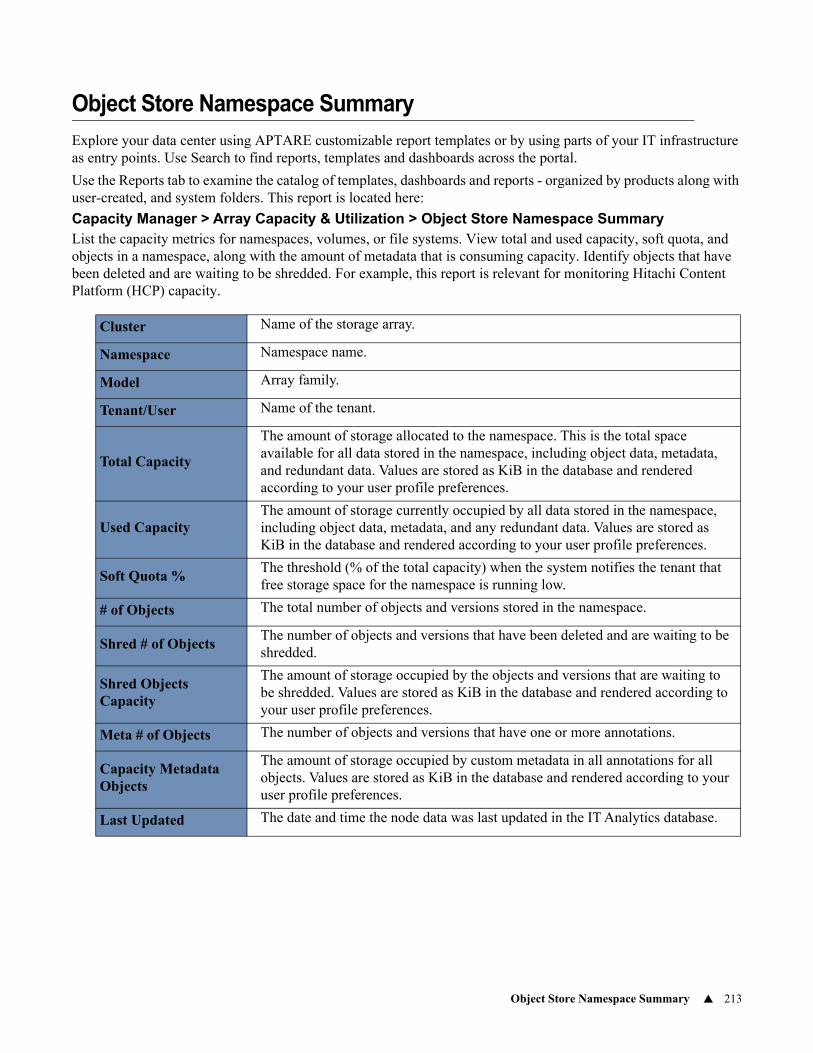
Object Store Namespace Summary 213
Object Store Namespace Summary
Explore your data center using APTARE customizable report templates or by using parts of your IT infrastructure as entry points. Use Search to find reports, templates and dashboards across the portal.
Use the Reports tab to examine the catalog of templates, dashboards and reports - organized by products along with user-created, and system folders. This report is located here:
Capacity Manager > Array Capacity & Utilization > Object Store Namespace SummaryList the capacity metrics for namespaces, volumes, or file systems. View total and used capacity, soft quota, and objects in a namespace, along with the amount of metadata that is consuming capacity. Identify objects that have been deleted and are waiting to be shredded. For example, this report is relevant for monitoring Hitachi Content Platform (HCP) capacity.
Cluster Name of the storage array.
Namespace Namespace name.
Model Array family.
Tenant/User Name of the tenant.
Total Capacity
The amount of storage allocated to the namespace. This is the total space available for all data stored in the namespace, including object data, metadata, and redundant data. Values are stored as KiB in the database and rendered according to your user profile preferences.
Used CapacityThe amount of storage currently occupied by all data stored in the namespace, including object data, metadata, and any redundant data. Values are stored as KiB in the database and rendered according to your user profile preferences.
Soft Quota %The threshold (% of the total capacity) when the system notifies the tenant that free storage space for the namespace is running low.
# of Objects The total number of objects and versions stored in the namespace.
Shred # of ObjectsThe number of objects and versions that have been deleted and are waiting to be shredded.
Shred Objects Capacity
The amount of storage occupied by the objects and versions that are waiting to be shredded. Values are stored as KiB in the database and rendered according to your user profile preferences.
Meta # of Objects The number of objects and versions that have one or more annotations.
Capacity Metadata Objects
The amount of storage occupied by custom metadata in all annotations for all objects. Values are stored as KiB in the database and rendered according to your user profile preferences.
Last Updated The date and time the node data was last updated in the IT Analytics database.
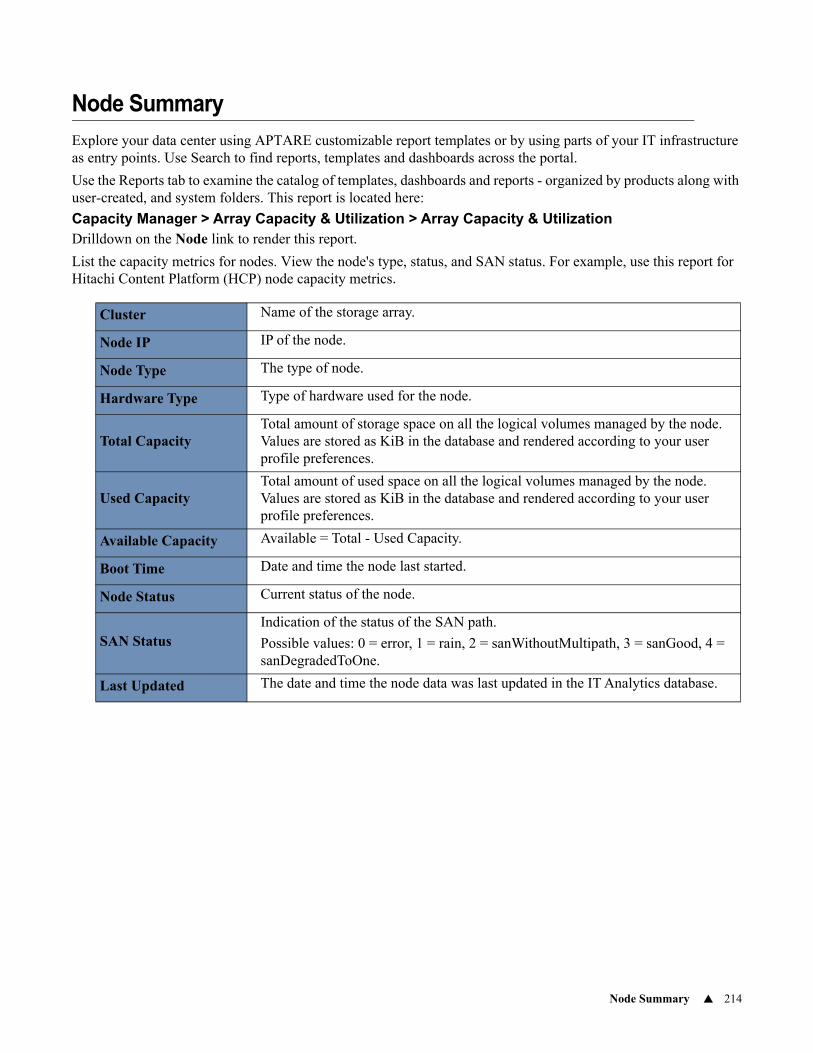
Node Summary 214
Node Summary
Explore your data center using APTARE customizable report templates or by using parts of your IT infrastructure as entry points. Use Search to find reports, templates and dashboards across the portal.
Use the Reports tab to examine the catalog of templates, dashboards and reports - organized by products along with user-created, and system folders. This report is located here:
Capacity Manager > Array Capacity & Utilization > Array Capacity & UtilizationDrilldown on the Node link to render this report.
List the capacity metrics for nodes. View the node's type, status, and SAN status. For example, use this report for Hitachi Content Platform (HCP) node capacity metrics.
Cluster Name of the storage array.
Node IP IP of the node.
Node Type The type of node.
Hardware Type Type of hardware used for the node.
Total CapacityTotal amount of storage space on all the logical volumes managed by the node. Values are stored as KiB in the database and rendered according to your user profile preferences.
Used CapacityTotal amount of used space on all the logical volumes managed by the node. Values are stored as KiB in the database and rendered according to your user profile preferences.
Available Capacity Available = Total - Used Capacity.
Boot Time Date and time the node last started.
Node Status Current status of the node.
SAN StatusIndication of the status of the SAN path.
Possible values: 0 = error, 1 = rain, 2 = sanWithoutMultipath, 3 = sanGood, 4 = sanDegradedToOne.
Last Updated The date and time the node data was last updated in the IT Analytics database.
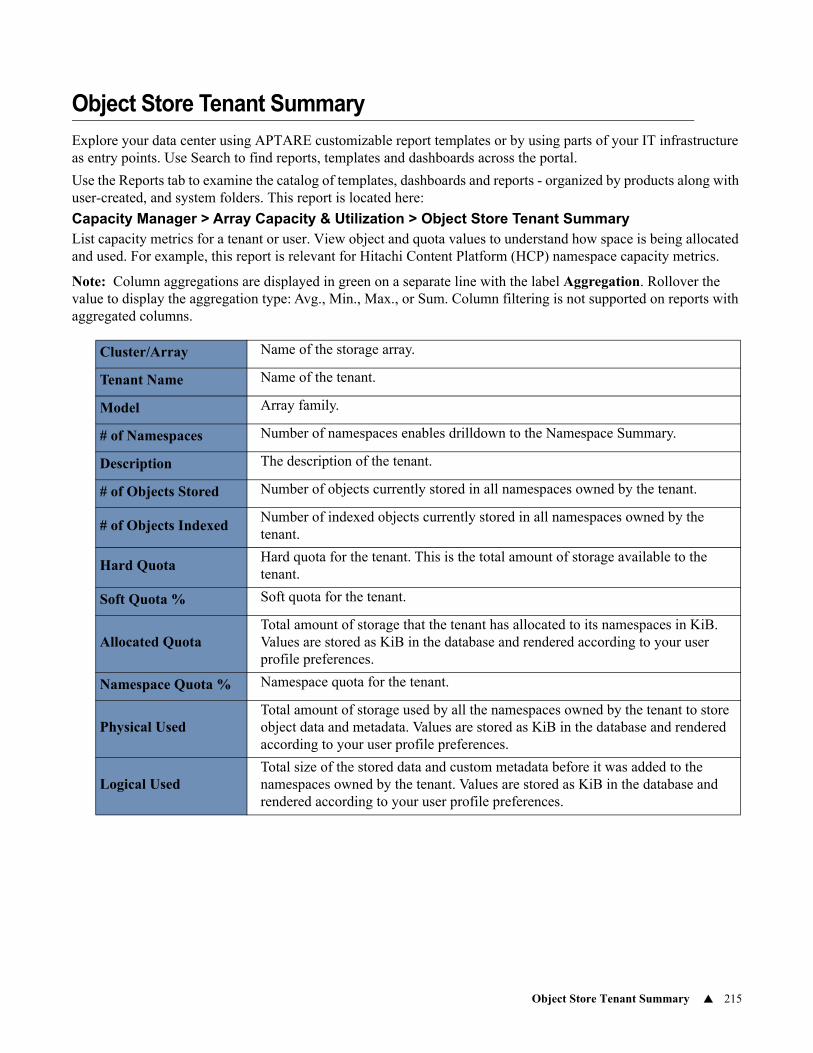
Object Store Tenant Summary 215
Object Store Tenant Summary
Explore your data center using APTARE customizable report templates or by using parts of your IT infrastructure as entry points. Use Search to find reports, templates and dashboards across the portal.
Use the Reports tab to examine the catalog of templates, dashboards and reports - organized by products along with user-created, and system folders. This report is located here:
Capacity Manager > Array Capacity & Utilization > Object Store Tenant SummaryList capacity metrics for a tenant or user. View object and quota values to understand how space is being allocated and used. For example, this report is relevant for Hitachi Content Platform (HCP) namespace capacity metrics.
Note: Column aggregations are displayed in green on a separate line with the label Aggregation. Rollover the value to display the aggregation type: Avg., Min., Max., or Sum. Column filtering is not supported on reports with aggregated columns.
Cluster/Array Name of the storage array.
Tenant Name Name of the tenant.
Model Array family.
# of Namespaces Number of namespaces enables drilldown to the Namespace Summary.
Description The description of the tenant.
# of Objects Stored Number of objects currently stored in all namespaces owned by the tenant.
# of Objects IndexedNumber of indexed objects currently stored in all namespaces owned by the tenant.
Hard QuotaHard quota for the tenant. This is the total amount of storage available to the tenant.
Soft Quota % Soft quota for the tenant.
Allocated QuotaTotal amount of storage that the tenant has allocated to its namespaces in KiB. Values are stored as KiB in the database and rendered according to your user profile preferences.
Namespace Quota % Namespace quota for the tenant.
Physical UsedTotal amount of storage used by all the namespaces owned by the tenant to store object data and metadata. Values are stored as KiB in the database and rendered according to your user profile preferences.
Logical UsedTotal size of the stored data and custom metadata before it was added to the namespaces owned by the tenant. Values are stored as KiB in the database and rendered according to your user profile preferences.
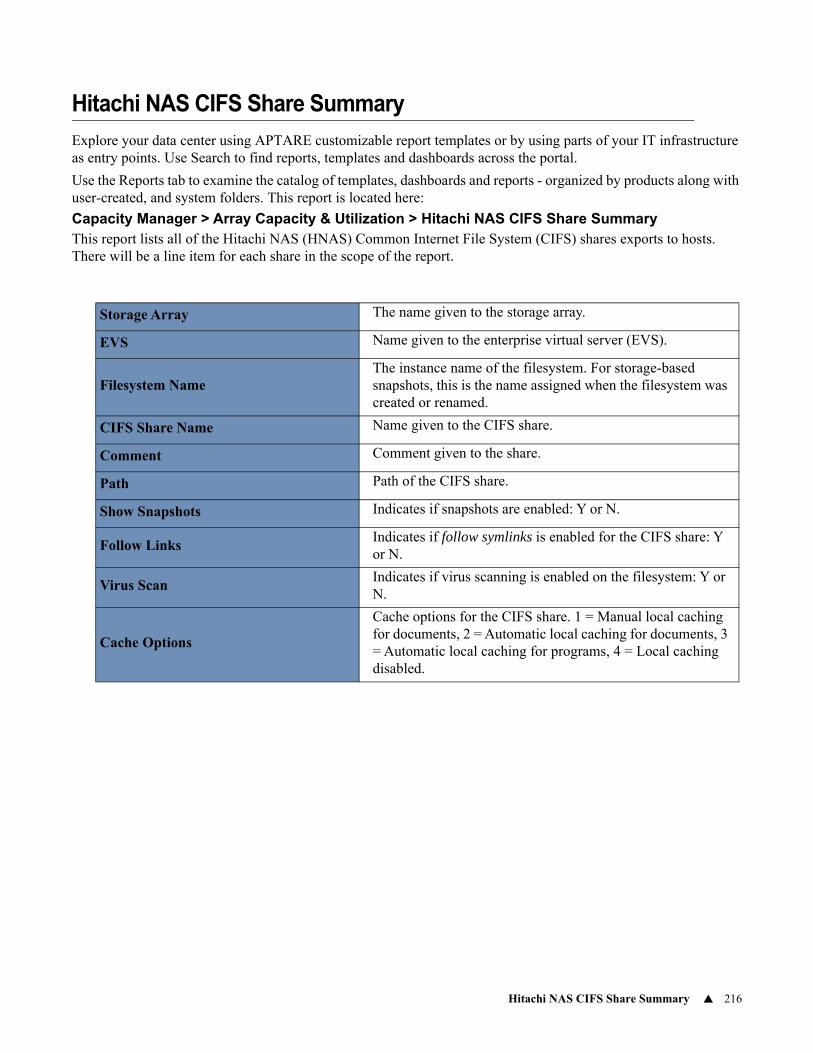
Hitachi NAS CIFS Share Summary 216
Hitachi NAS CIFS Share Summary
Explore your data center using APTARE customizable report templates or by using parts of your IT infrastructure as entry points. Use Search to find reports, templates and dashboards across the portal.
Use the Reports tab to examine the catalog of templates, dashboards and reports - organized by products along with user-created, and system folders. This report is located here:
Capacity Manager > Array Capacity & Utilization > Hitachi NAS CIFS Share SummaryThis report lists all of the Hitachi NAS (HNAS) Common Internet File System (CIFS) shares exports to hosts. There will be a line item for each share in the scope of the report.
Storage Array The name given to the storage array.
EVS Name given to the enterprise virtual server (EVS).
Filesystem NameThe instance name of the filesystem. For storage-based snapshots, this is the name assigned when the filesystem was created or renamed.
CIFS Share Name Name given to the CIFS share.
Comment Comment given to the share.
Path Path of the CIFS share.
Show Snapshots Indicates if snapshots are enabled: Y or N.
Follow Links Indicates if follow symlinks is enabled for the CIFS share: Y or N.
Virus Scan Indicates if virus scanning is enabled on the filesystem: Y or N.
Cache Options
Cache options for the CIFS share. 1 = Manual local caching for documents, 2 = Automatic local caching for documents, 3 = Automatic local caching for programs, 4 = Local caching disabled.
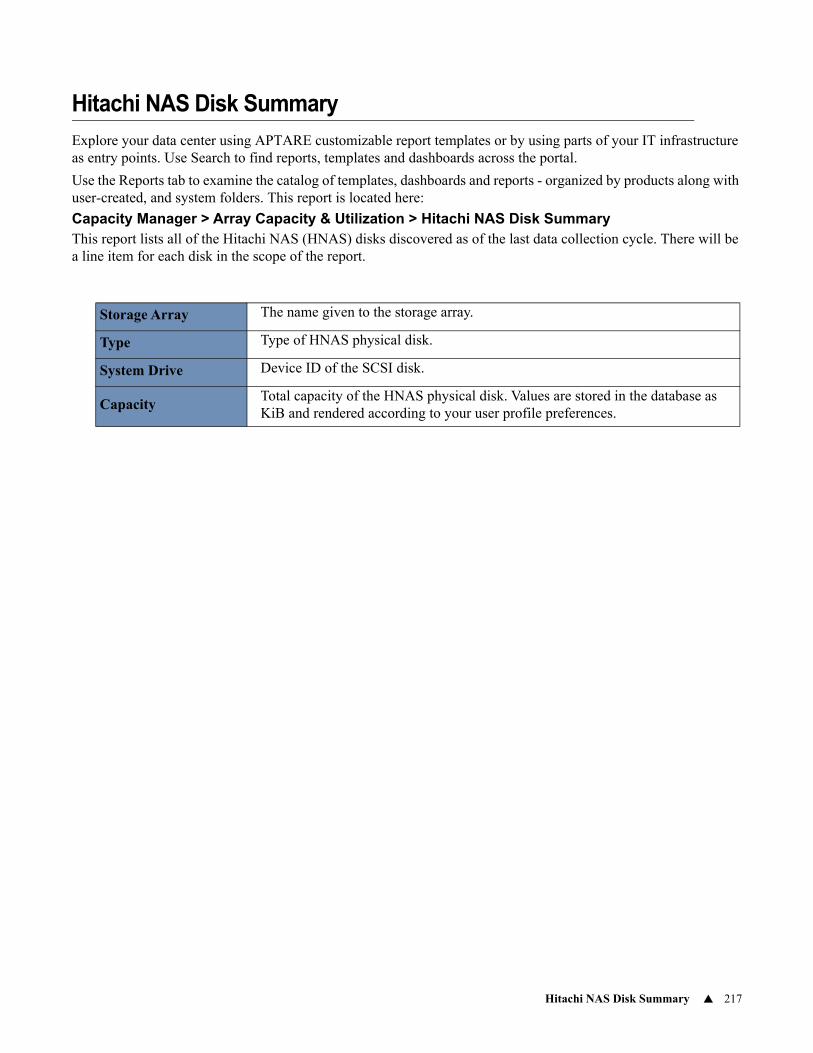
Hitachi NAS Disk Summary 217
Hitachi NAS Disk Summary
Explore your data center using APTARE customizable report templates or by using parts of your IT infrastructure as entry points. Use Search to find reports, templates and dashboards across the portal.
Use the Reports tab to examine the catalog of templates, dashboards and reports - organized by products along with user-created, and system folders. This report is located here:
Capacity Manager > Array Capacity & Utilization > Hitachi NAS Disk SummaryThis report lists all of the Hitachi NAS (HNAS) disks discovered as of the last data collection cycle. There will be a line item for each disk in the scope of the report.
Storage Array The name given to the storage array.
Type Type of HNAS physical disk.
System Drive Device ID of the SCSI disk.
Capacity Total capacity of the HNAS physical disk. Values are stored in the database as KiB and rendered according to your user profile preferences.
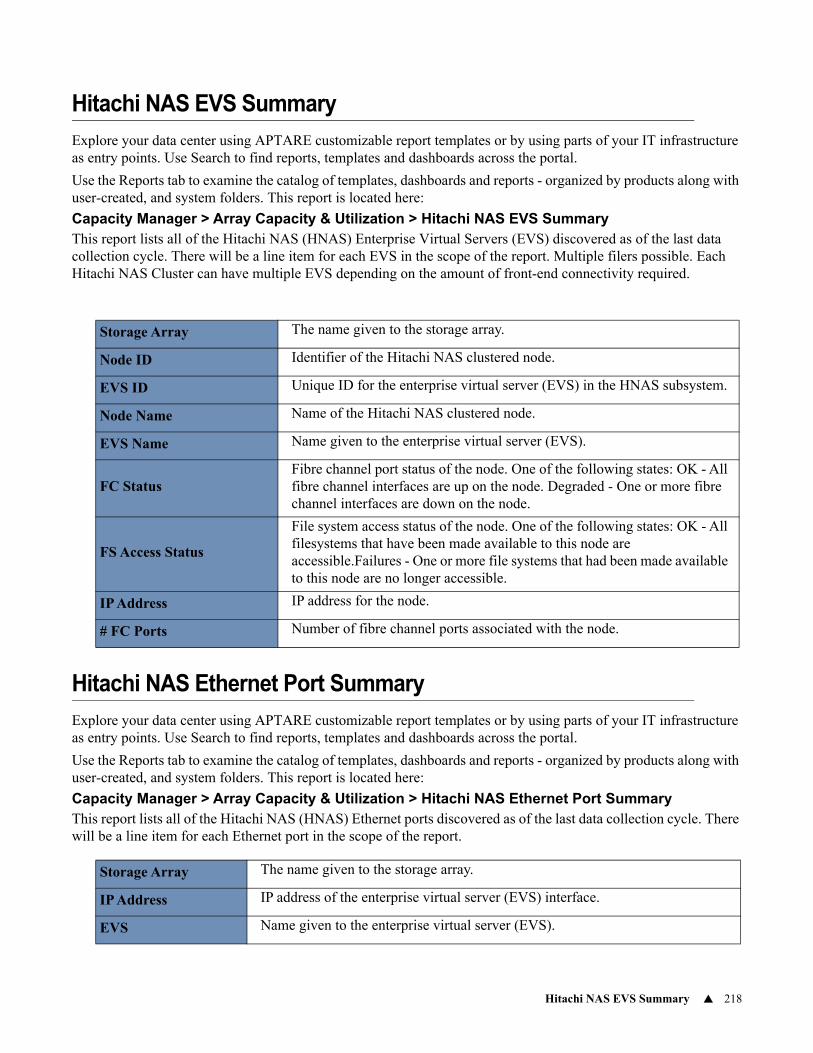
Hitachi NAS EVS Summary 218
Hitachi NAS EVS Summary
Explore your data center using APTARE customizable report templates or by using parts of your IT infrastructure as entry points. Use Search to find reports, templates and dashboards across the portal.
Use the Reports tab to examine the catalog of templates, dashboards and reports - organized by products along with user-created, and system folders. This report is located here:
Capacity Manager > Array Capacity & Utilization > Hitachi NAS EVS SummaryThis report lists all of the Hitachi NAS (HNAS) Enterprise Virtual Servers (EVS) discovered as of the last data collection cycle. There will be a line item for each EVS in the scope of the report. Multiple filers possible. Each Hitachi NAS Cluster can have multiple EVS depending on the amount of front-end connectivity required.
Hitachi NAS Ethernet Port Summary
Explore your data center using APTARE customizable report templates or by using parts of your IT infrastructure as entry points. Use Search to find reports, templates and dashboards across the portal.
Use the Reports tab to examine the catalog of templates, dashboards and reports - organized by products along with user-created, and system folders. This report is located here:
Capacity Manager > Array Capacity & Utilization > Hitachi NAS Ethernet Port SummaryThis report lists all of the Hitachi NAS (HNAS) Ethernet ports discovered as of the last data collection cycle. There will be a line item for each Ethernet port in the scope of the report.
Storage Array The name given to the storage array.
Node ID Identifier of the Hitachi NAS clustered node.
EVS ID Unique ID for the enterprise virtual server (EVS) in the HNAS subsystem.
Node Name Name of the Hitachi NAS clustered node.
EVS Name Name given to the enterprise virtual server (EVS).
FC Status Fibre channel port status of the node. One of the following states: OK - All fibre channel interfaces are up on the node. Degraded - One or more fibre channel interfaces are down on the node.
FS Access Status
File system access status of the node. One of the following states: OK - All filesystems that have been made available to this node are accessible.Failures - One or more file systems that had been made available to this node are no longer accessible.
IP Address IP address for the node.
# FC Ports Number of fibre channel ports associated with the node.
Storage Array The name given to the storage array.
IP Address IP address of the enterprise virtual server (EVS) interface.
EVS Name given to the enterprise virtual server (EVS).

Hitachi NAS Ethernet Port Summary 219
Port Port name of the interface aggregation.
Agg Hitachi NAS interface name.
Status Status of the port: enabled or disabled.
Cluster Node Name of the Hitachi NAS clustered node.
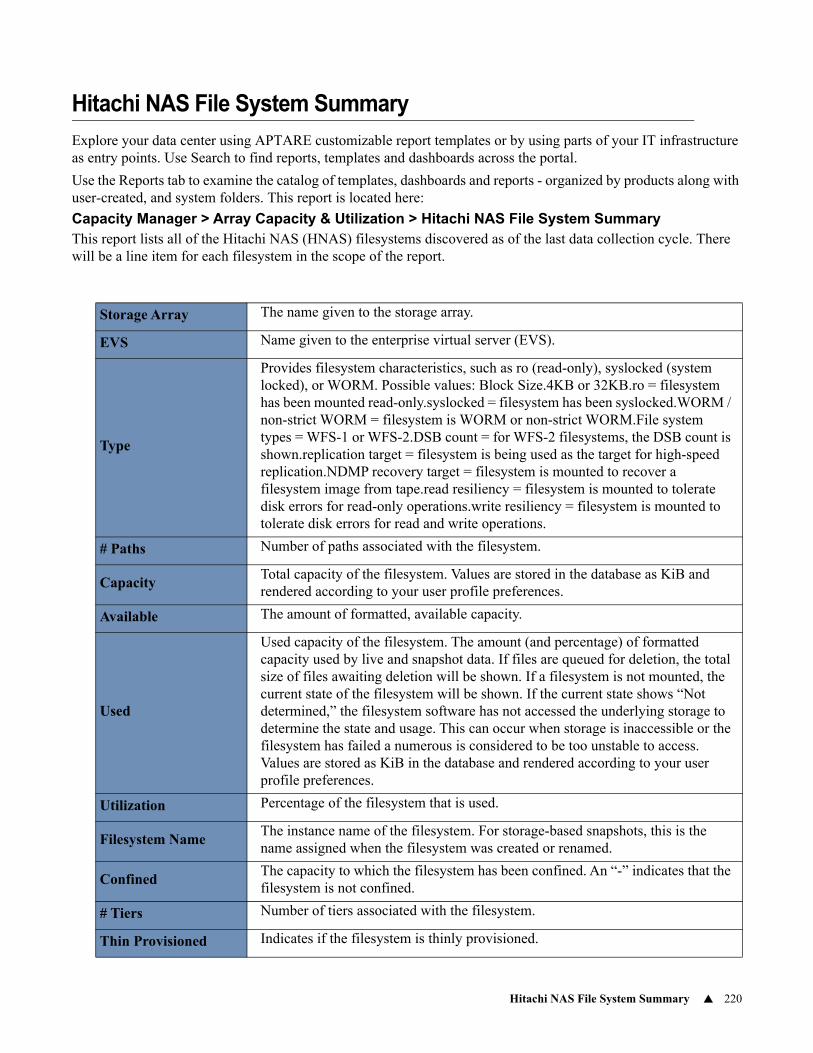
Hitachi NAS File System Summary 220
Hitachi NAS File System Summary
Explore your data center using APTARE customizable report templates or by using parts of your IT infrastructure as entry points. Use Search to find reports, templates and dashboards across the portal.
Use the Reports tab to examine the catalog of templates, dashboards and reports - organized by products along with user-created, and system folders. This report is located here:
Capacity Manager > Array Capacity & Utilization > Hitachi NAS File System SummaryThis report lists all of the Hitachi NAS (HNAS) filesystems discovered as of the last data collection cycle. There will be a line item for each filesystem in the scope of the report.
Storage Array The name given to the storage array.
EVS Name given to the enterprise virtual server (EVS).
Type
Provides filesystem characteristics, such as ro (read-only), syslocked (system locked), or WORM. Possible values: Block Size.4KB or 32KB.ro = filesystem has been mounted read-only.syslocked = filesystem has been syslocked.WORM / non-strict WORM = filesystem is WORM or non-strict WORM.File system types = WFS-1 or WFS-2.DSB count = for WFS-2 filesystems, the DSB count is shown.replication target = filesystem is being used as the target for high-speed replication.NDMP recovery target = filesystem is mounted to recover a filesystem image from tape.read resiliency = filesystem is mounted to tolerate disk errors for read-only operations.write resiliency = filesystem is mounted to tolerate disk errors for read and write operations.
# Paths Number of paths associated with the filesystem.
Capacity Total capacity of the filesystem. Values are stored in the database as KiB and rendered according to your user profile preferences.
Available The amount of formatted, available capacity.
Used
Used capacity of the filesystem. The amount (and percentage) of formatted capacity used by live and snapshot data. If files are queued for deletion, the total size of files awaiting deletion will be shown. If a filesystem is not mounted, the current state of the filesystem will be shown. If the current state shows “Not determined,” the filesystem software has not accessed the underlying storage to determine the state and usage. This can occur when storage is inaccessible or the filesystem has failed a numerous is considered to be too unstable to access. Values are stored as KiB in the database and rendered according to your user profile preferences.
Utilization Percentage of the filesystem that is used.
Filesystem Name The instance name of the filesystem. For storage-based snapshots, this is the name assigned when the filesystem was created or renamed.
Confined The capacity to which the filesystem has been confined. An “-” indicates that the filesystem is not confined.
# Tiers Number of tiers associated with the filesystem.
Thin Provisioned Indicates if the filesystem is thinly provisioned.

Hitachi NAS File System Summary 221
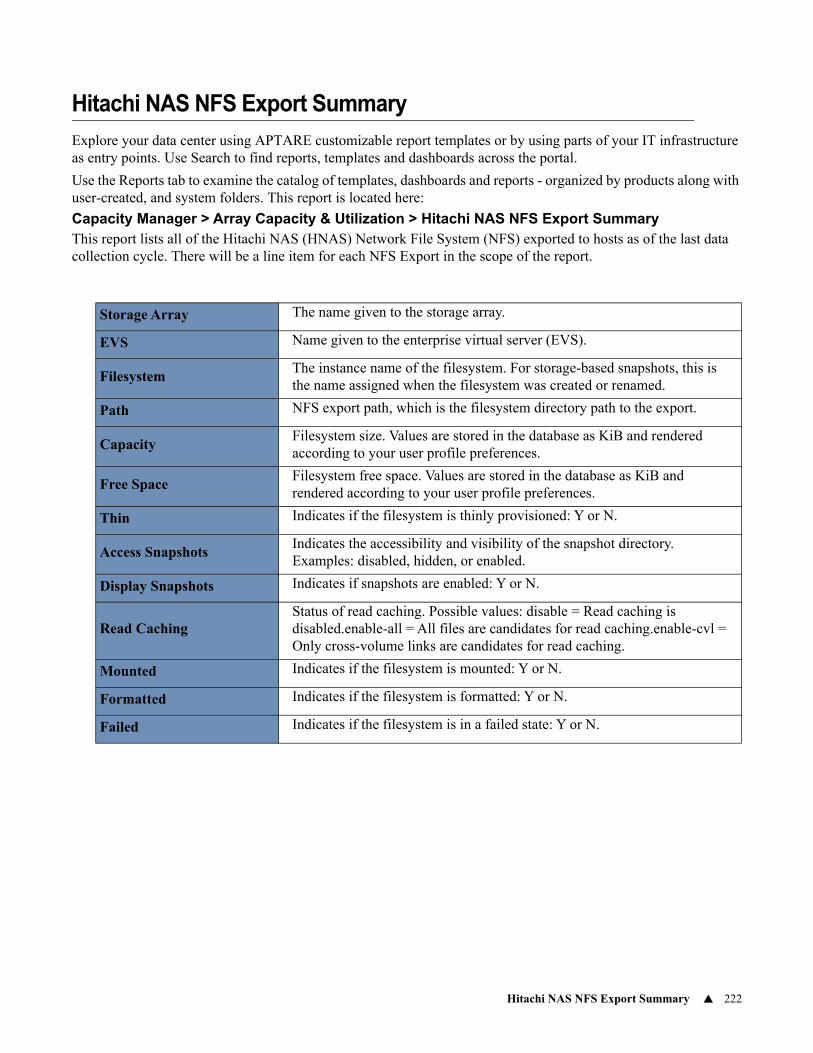
Hitachi NAS NFS Export Summary 222
Hitachi NAS NFS Export Summary
Explore your data center using APTARE customizable report templates or by using parts of your IT infrastructure as entry points. Use Search to find reports, templates and dashboards across the portal.
Use the Reports tab to examine the catalog of templates, dashboards and reports - organized by products along with user-created, and system folders. This report is located here:
Capacity Manager > Array Capacity & Utilization > Hitachi NAS NFS Export SummaryThis report lists all of the Hitachi NAS (HNAS) Network File System (NFS) exported to hosts as of the last data collection cycle. There will be a line item for each NFS Export in the scope of the report.
Storage Array The name given to the storage array.
EVS Name given to the enterprise virtual server (EVS).
Filesystem The instance name of the filesystem. For storage-based snapshots, this is the name assigned when the filesystem was created or renamed.
Path NFS export path, which is the filesystem directory path to the export.
Capacity Filesystem size. Values are stored in the database as KiB and rendered according to your user profile preferences.
Free Space Filesystem free space. Values are stored in the database as KiB and rendered according to your user profile preferences.
Thin Indicates if the filesystem is thinly provisioned: Y or N.
Access Snapshots Indicates the accessibility and visibility of the snapshot directory. Examples: disabled, hidden, or enabled.
Display Snapshots Indicates if snapshots are enabled: Y or N.
Read Caching Status of read caching. Possible values: disable = Read caching is disabled.enable-all = All files are candidates for read caching.enable-cvl = Only cross-volume links are candidates for read caching.
Mounted Indicates if the filesystem is mounted: Y or N.
Formatted Indicates if the filesystem is formatted: Y or N.
Failed Indicates if the filesystem is in a failed state: Y or N.

Hitachi NAS Snapshot Summary 223
Hitachi NAS Snapshot Summary
Explore your data center using APTARE customizable report templates or by using parts of your IT infrastructure as entry points. Use Search to find reports, templates and dashboards across the portal.
Use the Reports tab to examine the catalog of templates, dashboards and reports - organized by products along with user-created, and system folders. This report is located here:
Capacity Manager > Array Capacity & Utilization > Hitachi NAS Snapshot SummaryThis report lists all of the Hitachi NAS (HNAS) snapshots of filesystem as of the last data collection cycle. There will be a line item for each snapshot in the scope of the report relating the snapshot and its capacity to the source file system.
Storage Array The name given to the storage array.
EVS Name Name given to the enterprise virtual server (EVS).
Filesystem Name The instance name of the filesystem. For storage-based snapshots, this is the name assigned when the filesystem was created or renamed.
Snapshot Name Name given to the snapshot.
Snapshot Created Date and time the snapshot was created.
Creation Purpose Reason for creating the snapshot.
Used Capacity Space occupied by the snapshot.
Snapshot Status Status of the snapshot.
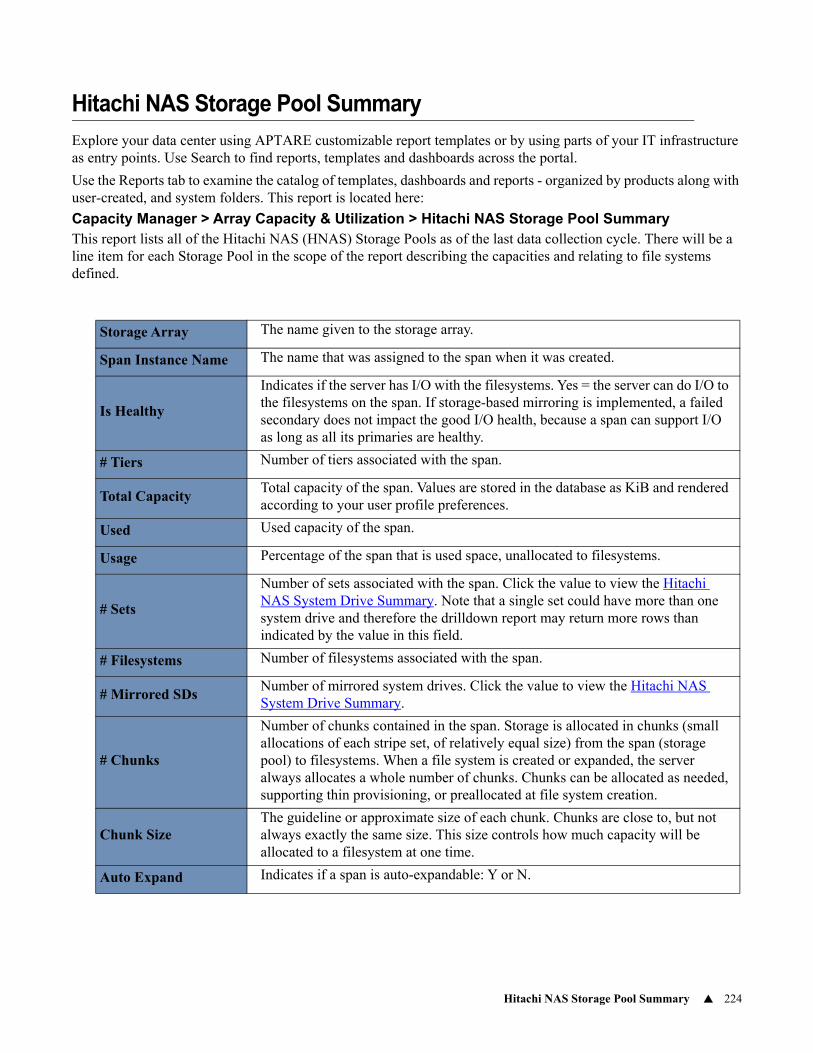
Hitachi NAS Storage Pool Summary 224
Hitachi NAS Storage Pool Summary
Explore your data center using APTARE customizable report templates or by using parts of your IT infrastructure as entry points. Use Search to find reports, templates and dashboards across the portal.
Use the Reports tab to examine the catalog of templates, dashboards and reports - organized by products along with user-created, and system folders. This report is located here:
Capacity Manager > Array Capacity & Utilization > Hitachi NAS Storage Pool SummaryThis report lists all of the Hitachi NAS (HNAS) Storage Pools as of the last data collection cycle. There will be a line item for each Storage Pool in the scope of the report describing the capacities and relating to file systems defined.
Storage Array The name given to the storage array.
Span Instance Name The name that was assigned to the span when it was created.
Is Healthy
Indicates if the server has I/O with the filesystems. Yes = the server can do I/O to the filesystems on the span. If storage-based mirroring is implemented, a failed secondary does not impact the good I/O health, because a span can support I/O as long as all its primaries are healthy.
# Tiers Number of tiers associated with the span.
Total CapacityTotal capacity of the span. Values are stored in the database as KiB and rendered according to your user profile preferences.
Used Used capacity of the span.
Usage Percentage of the span that is used space, unallocated to filesystems.
# Sets
Number of sets associated with the span. Click the value to view the Hitachi NAS System Drive Summary. Note that a single set could have more than one system drive and therefore the drilldown report may return more rows than indicated by the value in this field.
# Filesystems Number of filesystems associated with the span.
# Mirrored SDsNumber of mirrored system drives. Click the value to view the Hitachi NAS System Drive Summary.
# Chunks
Number of chunks contained in the span. Storage is allocated in chunks (small allocations of each stripe set, of relatively equal size) from the span (storage pool) to filesystems. When a file system is created or expanded, the server always allocates a whole number of chunks. Chunks can be allocated as needed, supporting thin provisioning, or preallocated at file system creation.
Chunk Size The guideline or approximate size of each chunk. Chunks are close to, but not always exactly the same size. This size controls how much capacity will be allocated to a filesystem at one time.
Auto Expand Indicates if a span is auto-expandable: Y or N.
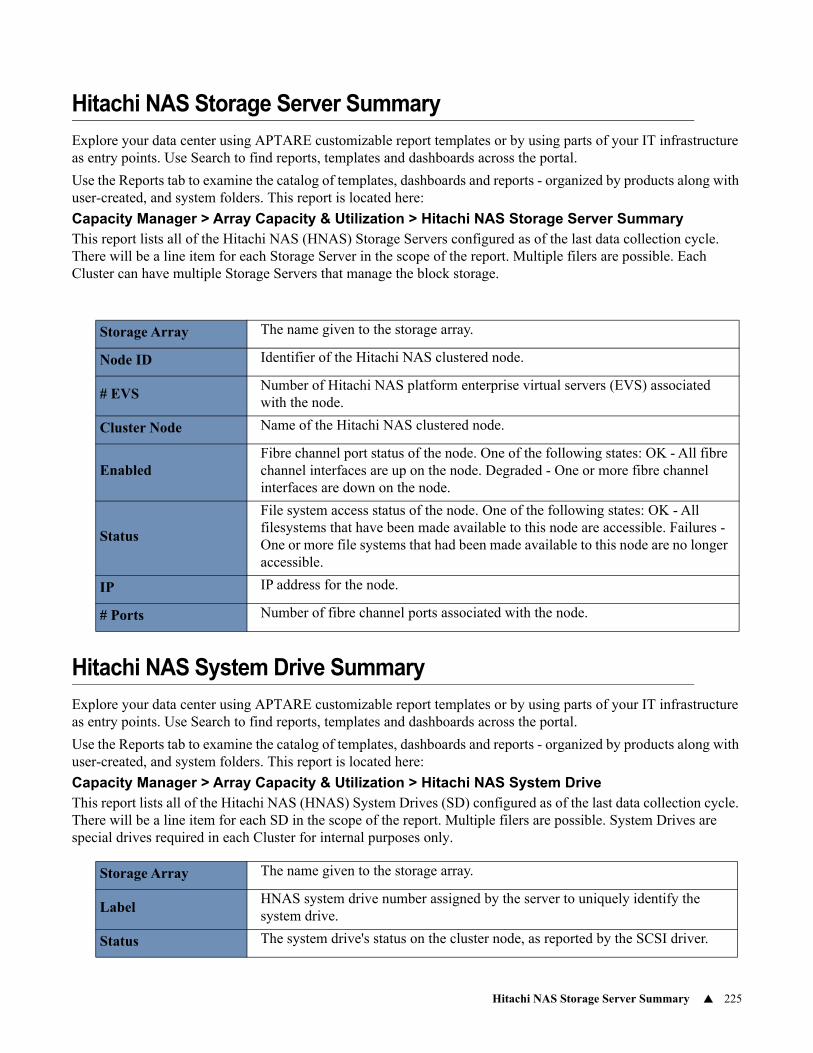
Hitachi NAS Storage Server Summary 225
Hitachi NAS Storage Server Summary
Explore your data center using APTARE customizable report templates or by using parts of your IT infrastructure as entry points. Use Search to find reports, templates and dashboards across the portal.
Use the Reports tab to examine the catalog of templates, dashboards and reports - organized by products along with user-created, and system folders. This report is located here:
Capacity Manager > Array Capacity & Utilization > Hitachi NAS Storage Server SummaryThis report lists all of the Hitachi NAS (HNAS) Storage Servers configured as of the last data collection cycle. There will be a line item for each Storage Server in the scope of the report. Multiple filers are possible. Each Cluster can have multiple Storage Servers that manage the block storage.
Hitachi NAS System Drive Summary
Explore your data center using APTARE customizable report templates or by using parts of your IT infrastructure as entry points. Use Search to find reports, templates and dashboards across the portal.
Use the Reports tab to examine the catalog of templates, dashboards and reports - organized by products along with user-created, and system folders. This report is located here:
Capacity Manager > Array Capacity & Utilization > Hitachi NAS System DriveThis report lists all of the Hitachi NAS (HNAS) System Drives (SD) configured as of the last data collection cycle. There will be a line item for each SD in the scope of the report. Multiple filers are possible. System Drives are special drives required in each Cluster for internal purposes only.
Storage Array The name given to the storage array.
Node ID Identifier of the Hitachi NAS clustered node.
# EVS Number of Hitachi NAS platform enterprise virtual servers (EVS) associated with the node.
Cluster Node Name of the Hitachi NAS clustered node.
Enabled Fibre channel port status of the node. One of the following states: OK - All fibre channel interfaces are up on the node. Degraded - One or more fibre channel interfaces are down on the node.
Status
File system access status of the node. One of the following states: OK - All filesystems that have been made available to this node are accessible. Failures - One or more file systems that had been made available to this node are no longer accessible.
IP IP address for the node.
# Ports Number of fibre channel ports associated with the node.
Storage Array The name given to the storage array.
Label HNAS system drive number assigned by the server to uniquely identify the system drive.
Status The system drive's status on the cluster node, as reported by the SCSI driver.
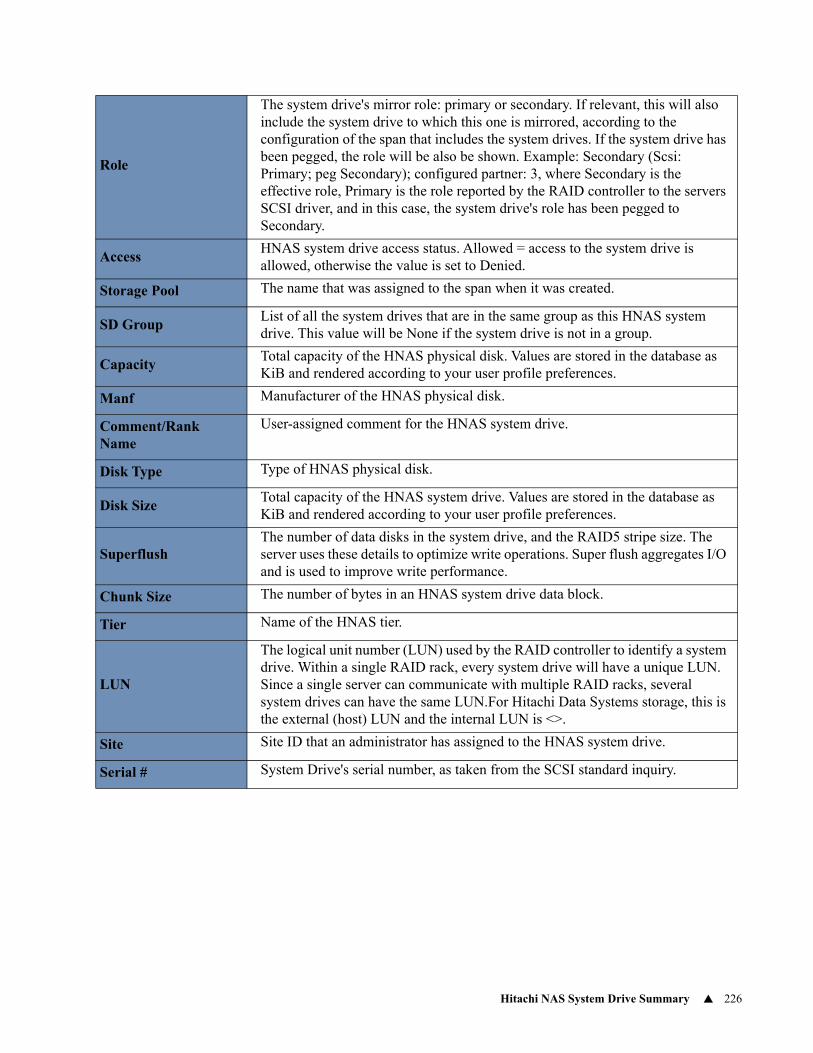
Hitachi NAS System Drive Summary 226
Role
The system drive's mirror role: primary or secondary. If relevant, this will also include the system drive to which this one is mirrored, according to the configuration of the span that includes the system drives. If the system drive has been pegged, the role will be also be shown. Example: Secondary (Scsi: Primary; peg Secondary); configured partner: 3, where Secondary is the effective role, Primary is the role reported by the RAID controller to the servers SCSI driver, and in this case, the system drive's role has been pegged to Secondary.
Access HNAS system drive access status. Allowed = access to the system drive is allowed, otherwise the value is set to Denied.
Storage Pool The name that was assigned to the span when it was created.
SD Group List of all the system drives that are in the same group as this HNAS system drive. This value will be None if the system drive is not in a group.
Capacity Total capacity of the HNAS physical disk. Values are stored in the database as KiB and rendered according to your user profile preferences.
Manf Manufacturer of the HNAS physical disk.
Comment/Rank Name
User-assigned comment for the HNAS system drive.
Disk Type Type of HNAS physical disk.
Disk Size Total capacity of the HNAS system drive. Values are stored in the database as KiB and rendered according to your user profile preferences.
Superflush The number of data disks in the system drive, and the RAID5 stripe size. The server uses these details to optimize write operations. Super flush aggregates I/O and is used to improve write performance.
Chunk Size The number of bytes in an HNAS system drive data block.
Tier Name of the HNAS tier.
LUN
The logical unit number (LUN) used by the RAID controller to identify a system drive. Within a single RAID rack, every system drive will have a unique LUN. Since a single server can communicate with multiple RAID racks, several system drives can have the same LUN.For Hitachi Data Systems storage, this is the external (host) LUN and the internal LUN is <>.
Site Site ID that an administrator has assigned to the HNAS system drive.
Serial # System Drive's serial number, as taken from the SCSI standard inquiry.
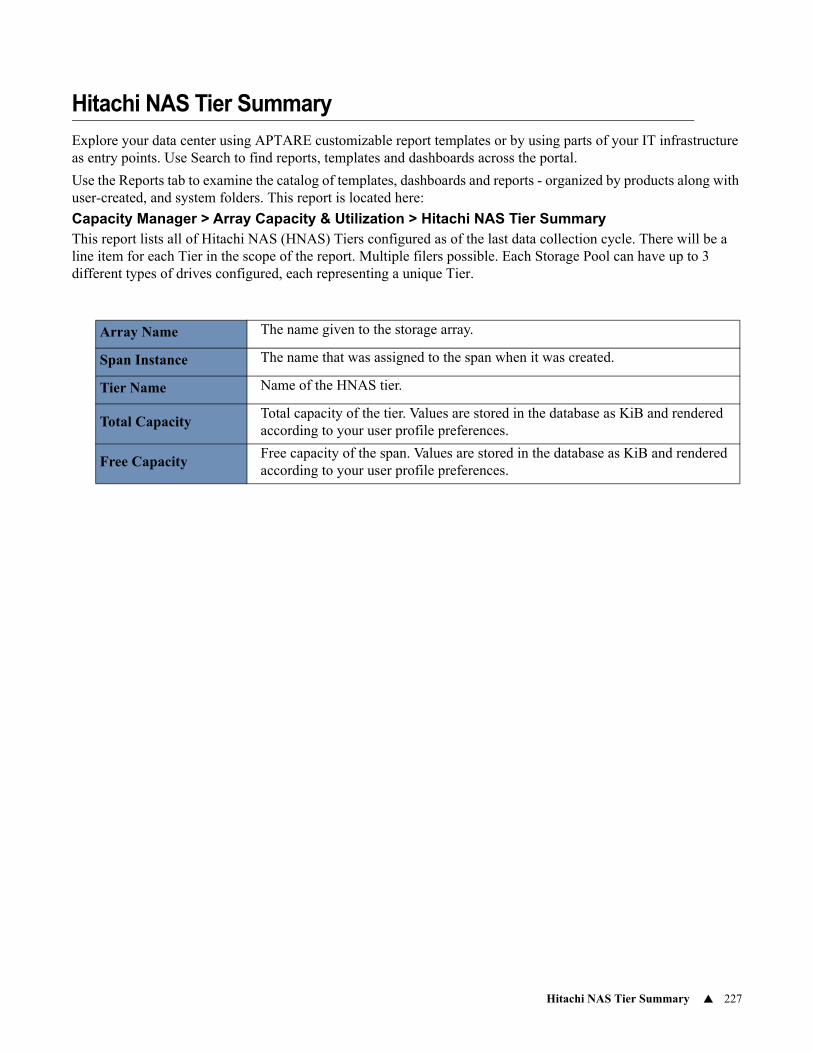
Hitachi NAS Tier Summary 227
Hitachi NAS Tier Summary
Explore your data center using APTARE customizable report templates or by using parts of your IT infrastructure as entry points. Use Search to find reports, templates and dashboards across the portal.
Use the Reports tab to examine the catalog of templates, dashboards and reports - organized by products along with user-created, and system folders. This report is located here:
Capacity Manager > Array Capacity & Utilization > Hitachi NAS Tier SummaryThis report lists all of Hitachi NAS (HNAS) Tiers configured as of the last data collection cycle. There will be a line item for each Tier in the scope of the report. Multiple filers possible. Each Storage Pool can have up to 3 different types of drives configured, each representing a unique Tier.
Array Name The name given to the storage array.
Span Instance The name that was assigned to the span when it was created.
Tier Name Name of the HNAS tier.
Total CapacityTotal capacity of the tier. Values are stored in the database as KiB and rendered according to your user profile preferences.
Free CapacityFree capacity of the span. Values are stored in the database as KiB and rendered according to your user profile preferences.
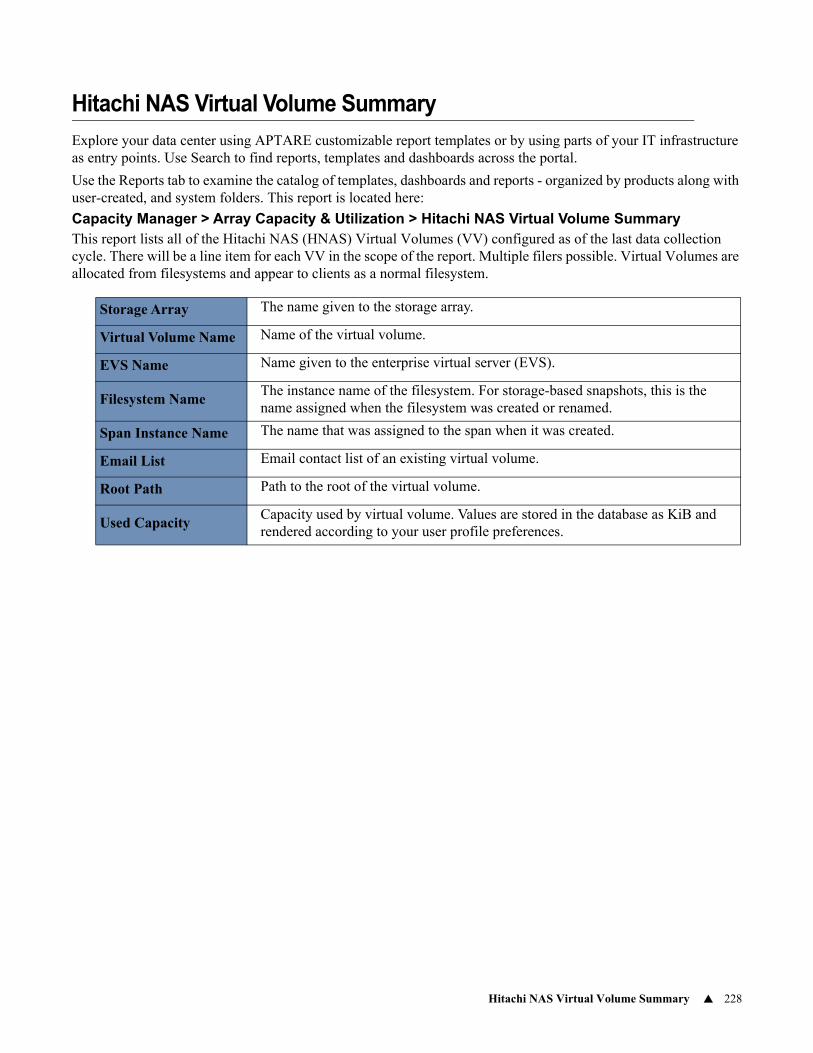
Hitachi NAS Virtual Volume Summary 228
Hitachi NAS Virtual Volume Summary
Explore your data center using APTARE customizable report templates or by using parts of your IT infrastructure as entry points. Use Search to find reports, templates and dashboards across the portal.
Use the Reports tab to examine the catalog of templates, dashboards and reports - organized by products along with user-created, and system folders. This report is located here:
Capacity Manager > Array Capacity & Utilization > Hitachi NAS Virtual Volume SummaryThis report lists all of the Hitachi NAS (HNAS) Virtual Volumes (VV) configured as of the last data collection cycle. There will be a line item for each VV in the scope of the report. Multiple filers possible. Virtual Volumes are allocated from filesystems and appear to clients as a normal filesystem.
Storage Array The name given to the storage array.
Virtual Volume Name Name of the virtual volume.
EVS Name Name given to the enterprise virtual server (EVS).
Filesystem Name The instance name of the filesystem. For storage-based snapshots, this is the name assigned when the filesystem was created or renamed.
Span Instance Name The name that was assigned to the span when it was created.
Email List Email contact list of an existing virtual volume.
Root Path Path to the root of the virtual volume.
Used CapacityCapacity used by virtual volume. Values are stored in the database as KiB and rendered according to your user profile preferences.
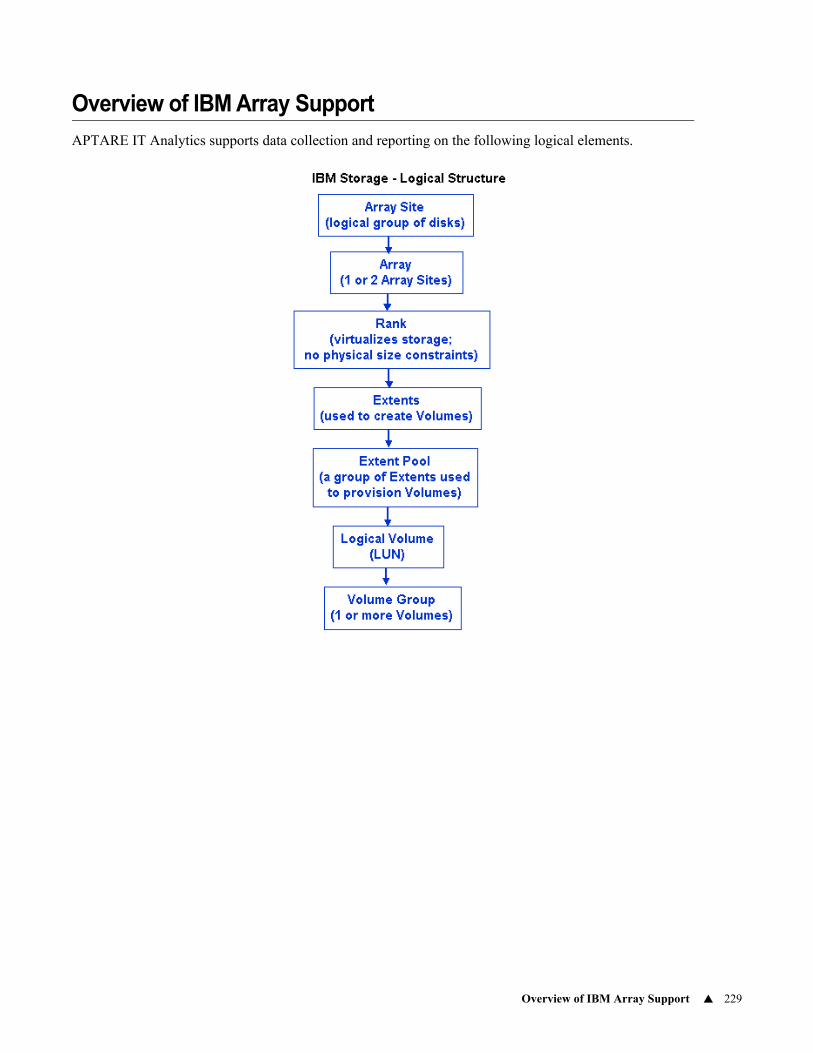
Overview of IBM Array Support 229
Overview of IBM Array Support
APTARE IT Analytics supports data collection and reporting on the following logical elements.
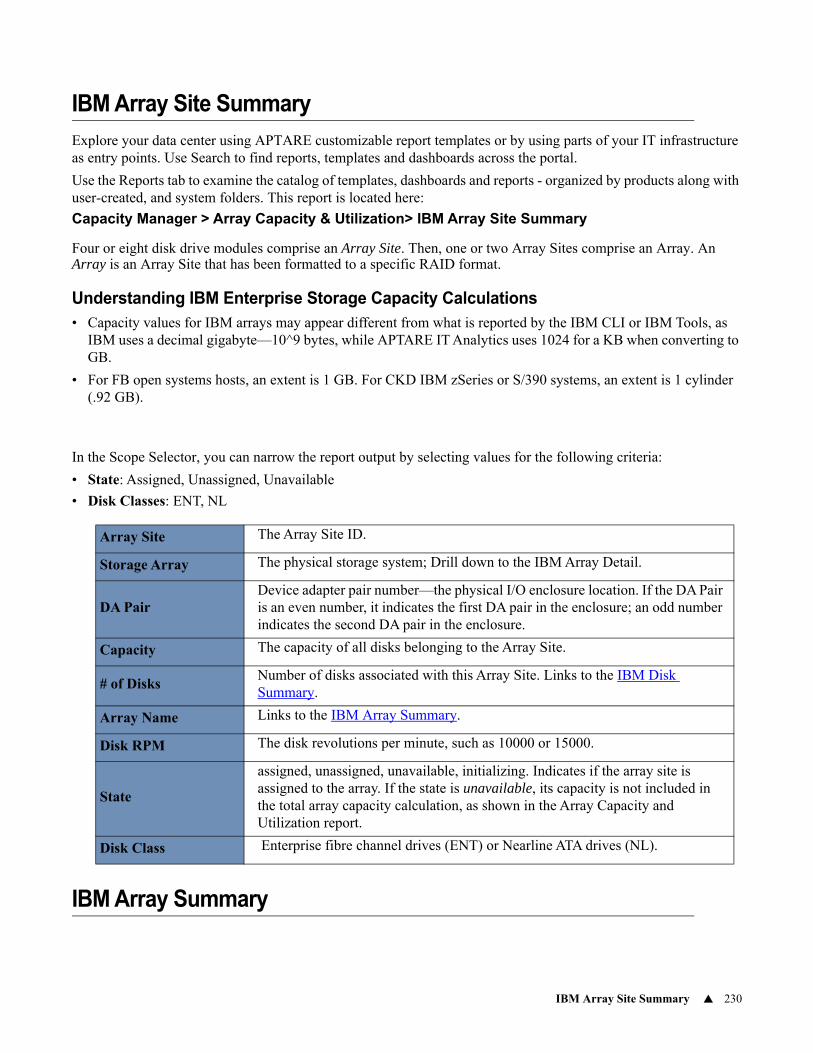
IBM Array Site Summary 230
IBM Array Site Summary
Explore your data center using APTARE customizable report templates or by using parts of your IT infrastructure as entry points. Use Search to find reports, templates and dashboards across the portal.
Use the Reports tab to examine the catalog of templates, dashboards and reports - organized by products along with user-created, and system folders. This report is located here:
Capacity Manager > Array Capacity & Utilization> IBM Array Site Summary
Four or eight disk drive modules comprise an Array Site. Then, one or two Array Sites comprise an Array. An Array is an Array Site that has been formatted to a specific RAID format.
Understanding IBM Enterprise Storage Capacity Calculations• Capacity values for IBM arrays may appear different from what is reported by the IBM CLI or IBM Tools, as
IBM uses a decimal gigabyte—10^9 bytes, while APTARE IT Analytics uses 1024 for a KB when converting to GB.
• For FB open systems hosts, an extent is 1 GB. For CKD IBM zSeries or S/390 systems, an extent is 1 cylinder (.92 GB).
In the Scope Selector, you can narrow the report output by selecting values for the following criteria:
• State: Assigned, Unassigned, Unavailable
• Disk Classes: ENT, NL
IBM Array Summary
Array Site The Array Site ID.
Storage Array The physical storage system; Drill down to the IBM Array Detail.
DA PairDevice adapter pair number—the physical I/O enclosure location. If the DA Pair is an even number, it indicates the first DA pair in the enclosure; an odd number indicates the second DA pair in the enclosure.
Capacity The capacity of all disks belonging to the Array Site.
# of DisksNumber of disks associated with this Array Site. Links to the IBM Disk Summary.
Array Name Links to the IBM Array Summary.
Disk RPM The disk revolutions per minute, such as 10000 or 15000.
State
assigned, unassigned, unavailable, initializing. Indicates if the array site is assigned to the array. If the state is unavailable, its capacity is not included in the total array capacity calculation, as shown in the Array Capacity and Utilization report.
Disk Class Enterprise fibre channel drives (ENT) or Nearline ATA drives (NL).
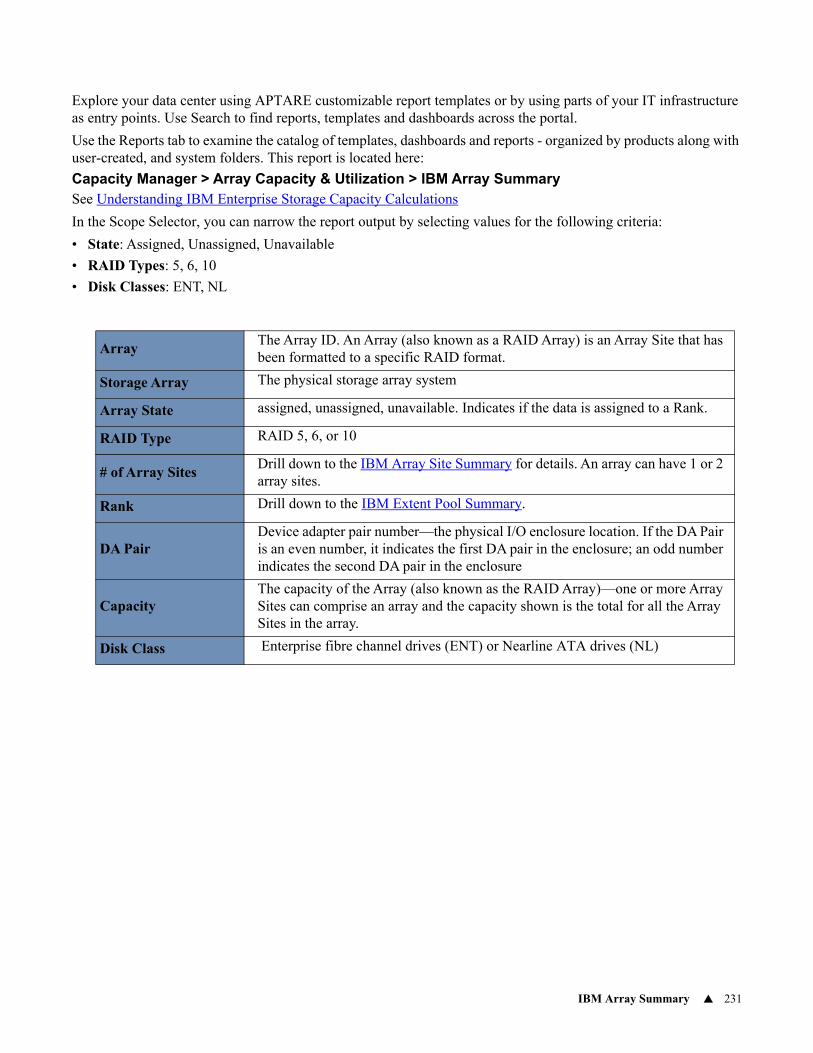
IBM Array Summary 231
Explore your data center using APTARE customizable report templates or by using parts of your IT infrastructure as entry points. Use Search to find reports, templates and dashboards across the portal.
Use the Reports tab to examine the catalog of templates, dashboards and reports - organized by products along with user-created, and system folders. This report is located here:
Capacity Manager > Array Capacity & Utilization > IBM Array SummarySee Understanding IBM Enterprise Storage Capacity Calculations
In the Scope Selector, you can narrow the report output by selecting values for the following criteria:
• State: Assigned, Unassigned, Unavailable
• RAID Types: 5, 6, 10
• Disk Classes: ENT, NL
ArrayThe Array ID. An Array (also known as a RAID Array) is an Array Site that has been formatted to a specific RAID format.
Storage Array The physical storage array system
Array State assigned, unassigned, unavailable. Indicates if the data is assigned to a Rank.
RAID Type RAID 5, 6, or 10
# of Array SitesDrill down to the IBM Array Site Summary for details. An array can have 1 or 2 array sites.
Rank Drill down to the IBM Extent Pool Summary.
DA PairDevice adapter pair number—the physical I/O enclosure location. If the DA Pair is an even number, it indicates the first DA pair in the enclosure; an odd number indicates the second DA pair in the enclosure
CapacityThe capacity of the Array (also known as the RAID Array)—one or more Array Sites can comprise an array and the capacity shown is the total for all the Array Sites in the array.
Disk Class Enterprise fibre channel drives (ENT) or Nearline ATA drives (NL)
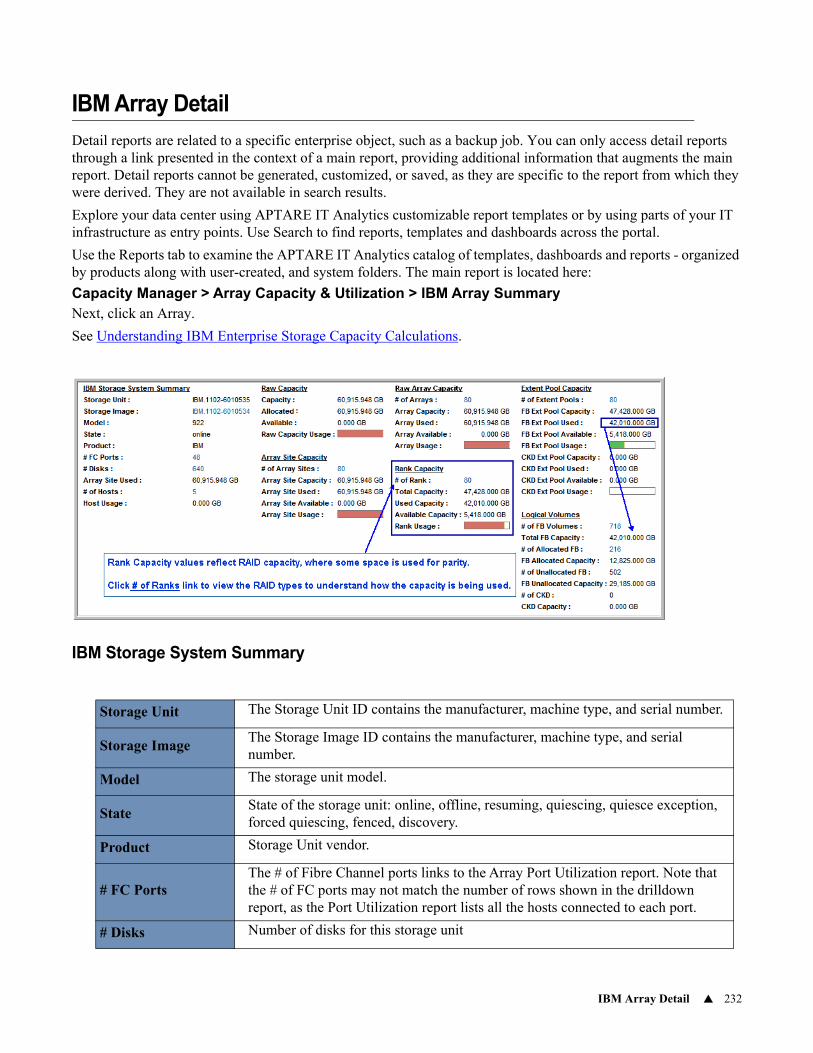
IBM Array Detail 232
IBM Array Detail
Detail reports are related to a specific enterprise object, such as a backup job. You can only access detail reports through a link presented in the context of a main report, providing additional information that augments the main report. Detail reports cannot be generated, customized, or saved, as they are specific to the report from which they were derived. They are not available in search results.
Explore your data center using APTARE IT Analytics customizable report templates or by using parts of your IT infrastructure as entry points. Use Search to find reports, templates and dashboards across the portal.
Use the Reports tab to examine the APTARE IT Analytics catalog of templates, dashboards and reports - organized by products along with user-created, and system folders. The main report is located here:
Capacity Manager > Array Capacity & Utilization > IBM Array SummaryNext, click an Array.
See Understanding IBM Enterprise Storage Capacity Calculations.
IBM Storage System Summary
Storage Unit The Storage Unit ID contains the manufacturer, machine type, and serial number.
Storage ImageThe Storage Image ID contains the manufacturer, machine type, and serial number.
Model The storage unit model.
StateState of the storage unit: online, offline, resuming, quiescing, quiesce exception, forced quiescing, fenced, discovery.
Product Storage Unit vendor.
# FC PortsThe # of Fibre Channel ports links to the Array Port Utilization report. Note that the # of FC ports may not match the number of rows shown in the drilldown report, as the Port Utilization report lists all the hosts connected to each port.
# Disks Number of disks for this storage unit
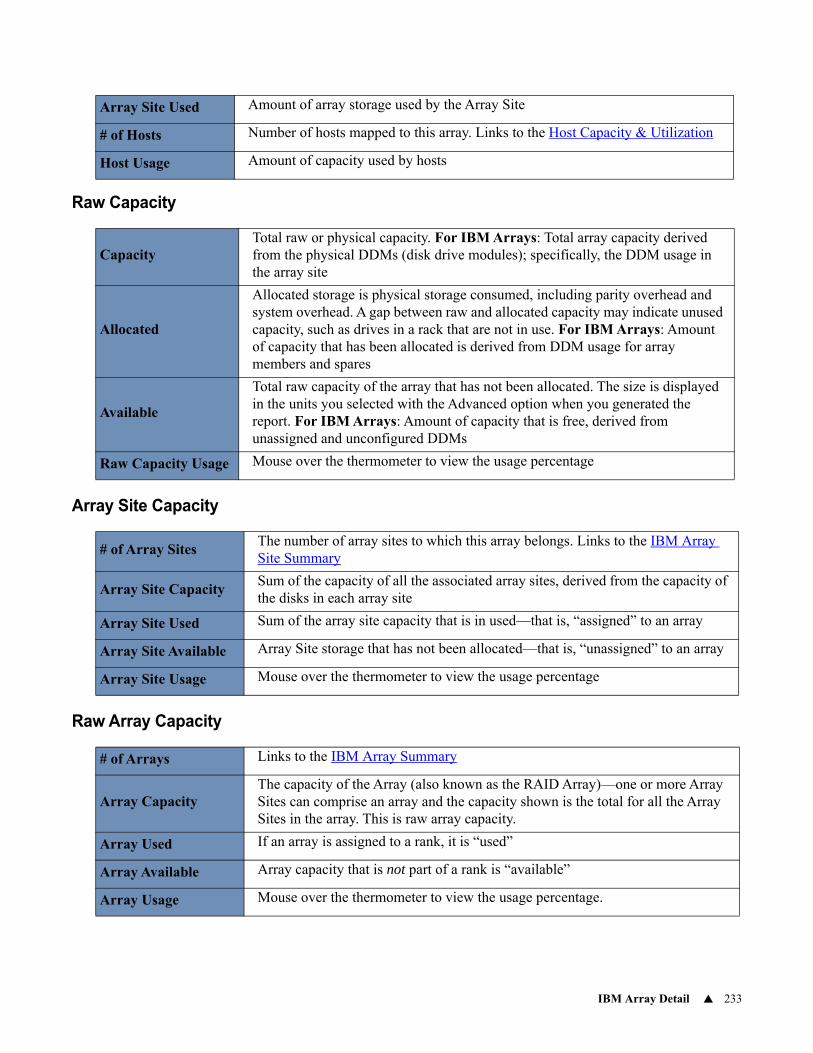
IBM Array Detail 233
Raw Capacity
Array Site Capacity
Raw Array Capacity
Array Site Used Amount of array storage used by the Array Site
# of Hosts Number of hosts mapped to this array. Links to the Host Capacity & Utilization
Host Usage Amount of capacity used by hosts
CapacityTotal raw or physical capacity. For IBM Arrays: Total array capacity derived from the physical DDMs (disk drive modules); specifically, the DDM usage in the array site
Allocated
Allocated storage is physical storage consumed, including parity overhead and system overhead. A gap between raw and allocated capacity may indicate unused capacity, such as drives in a rack that are not in use. For IBM Arrays: Amount of capacity that has been allocated is derived from DDM usage for array members and spares
Available
Total raw capacity of the array that has not been allocated. The size is displayed in the units you selected with the Advanced option when you generated the report. For IBM Arrays: Amount of capacity that is free, derived from unassigned and unconfigured DDMs
Raw Capacity Usage Mouse over the thermometer to view the usage percentage
# of Array SitesThe number of array sites to which this array belongs. Links to the IBM Array Site Summary
Array Site CapacitySum of the capacity of all the associated array sites, derived from the capacity of the disks in each array site
Array Site Used Sum of the array site capacity that is in used—that is, “assigned” to an array
Array Site Available Array Site storage that has not been allocated—that is, “unassigned” to an array
Array Site Usage Mouse over the thermometer to view the usage percentage
# of Arrays Links to the IBM Array Summary
Array CapacityThe capacity of the Array (also known as the RAID Array)—one or more Array Sites can comprise an array and the capacity shown is the total for all the Array Sites in the array. This is raw array capacity.
Array Used If an array is assigned to a rank, it is “used”
Array Available Array capacity that is not part of a rank is “available”
Array Usage Mouse over the thermometer to view the usage percentage.
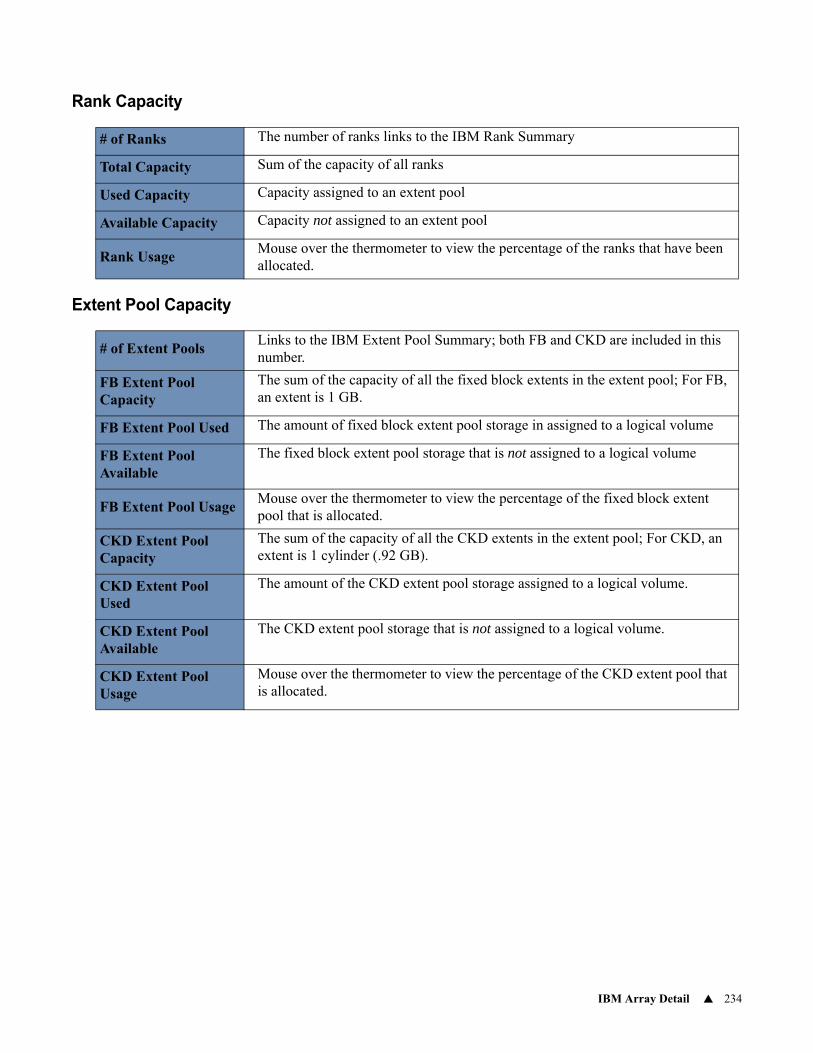
IBM Array Detail 234
Rank Capacity
Extent Pool Capacity
# of Ranks The number of ranks links to the IBM Rank Summary
Total Capacity Sum of the capacity of all ranks
Used Capacity Capacity assigned to an extent pool
Available Capacity Capacity not assigned to an extent pool
Rank UsageMouse over the thermometer to view the percentage of the ranks that have been allocated.
# of Extent PoolsLinks to the IBM Extent Pool Summary; both FB and CKD are included in this number.
FB Extent Pool Capacity
The sum of the capacity of all the fixed block extents in the extent pool; For FB, an extent is 1 GB.
FB Extent Pool Used The amount of fixed block extent pool storage in assigned to a logical volume
FB Extent Pool Available
The fixed block extent pool storage that is not assigned to a logical volume
FB Extent Pool UsageMouse over the thermometer to view the percentage of the fixed block extent pool that is allocated.
CKD Extent Pool Capacity
The sum of the capacity of all the CKD extents in the extent pool; For CKD, an extent is 1 cylinder (.92 GB).
CKD Extent Pool Used
The amount of the CKD extent pool storage assigned to a logical volume.
CKD Extent Pool Available
The CKD extent pool storage that is not assigned to a logical volume.
CKD Extent Pool Usage
Mouse over the thermometer to view the percentage of the CKD extent pool that is allocated.
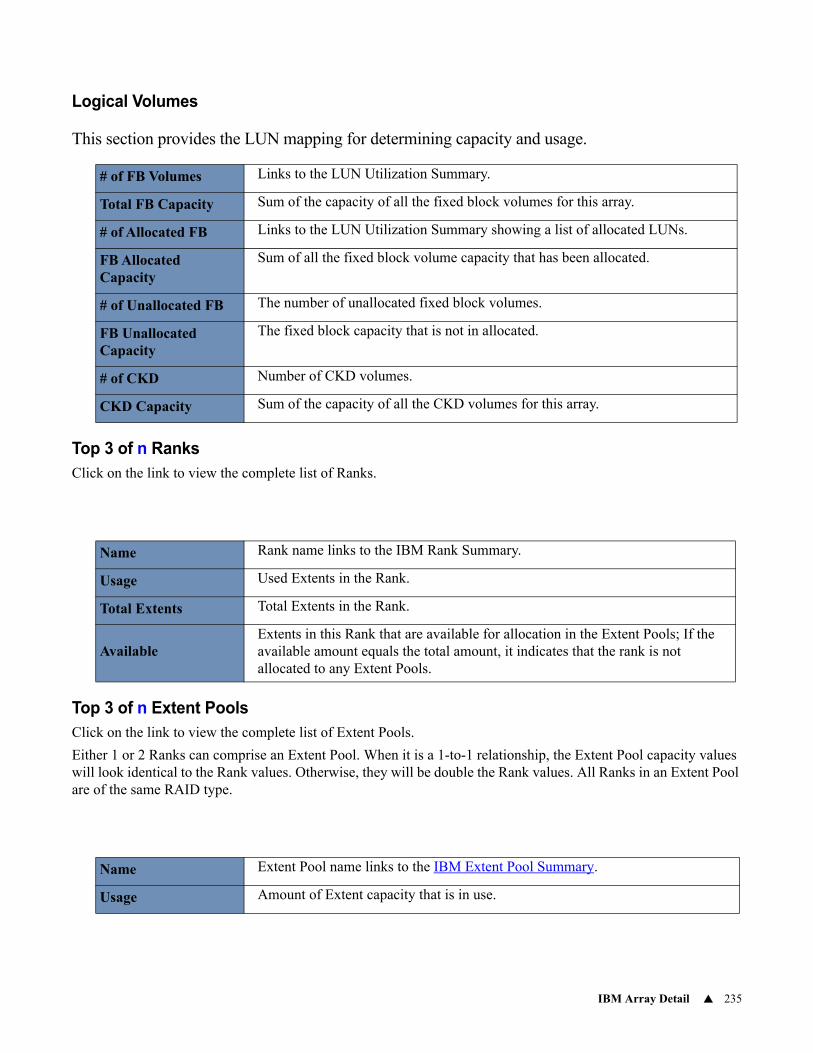
IBM Array Detail 235
Logical Volumes
This section provides the LUN mapping for determining capacity and usage.
Top 3 of n RanksClick on the link to view the complete list of Ranks.
Top 3 of n Extent PoolsClick on the link to view the complete list of Extent Pools.
Either 1 or 2 Ranks can comprise an Extent Pool. When it is a 1-to-1 relationship, the Extent Pool capacity values will look identical to the Rank values. Otherwise, they will be double the Rank values. All Ranks in an Extent Pool are of the same RAID type.
# of FB Volumes Links to the LUN Utilization Summary.
Total FB Capacity Sum of the capacity of all the fixed block volumes for this array.
# of Allocated FB Links to the LUN Utilization Summary showing a list of allocated LUNs.
FB Allocated Capacity
Sum of all the fixed block volume capacity that has been allocated.
# of Unallocated FB The number of unallocated fixed block volumes.
FB Unallocated Capacity
The fixed block capacity that is not in allocated.
# of CKD Number of CKD volumes.
CKD Capacity Sum of the capacity of all the CKD volumes for this array.
Name Rank name links to the IBM Rank Summary.
Usage Used Extents in the Rank.
Total Extents Total Extents in the Rank.
AvailableExtents in this Rank that are available for allocation in the Extent Pools; If the available amount equals the total amount, it indicates that the rank is not allocated to any Extent Pools.
Name Extent Pool name links to the IBM Extent Pool Summary.
Usage Amount of Extent capacity that is in use.
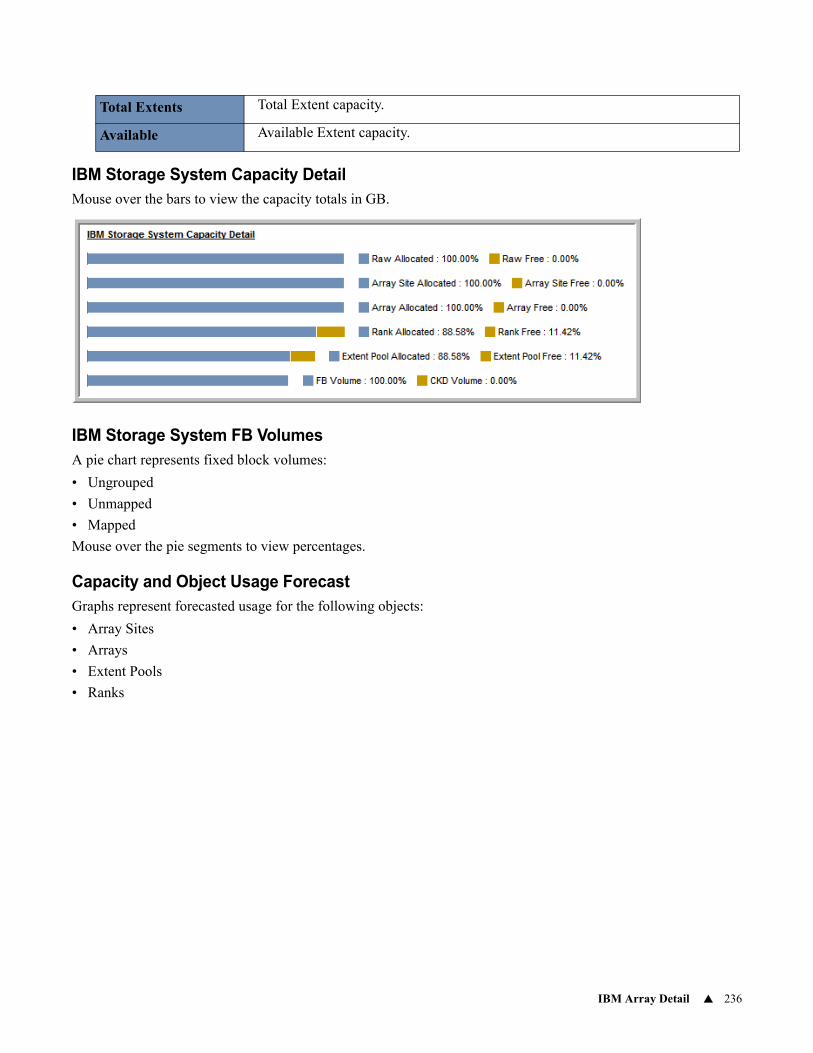
IBM Array Detail 236
IBM Storage System Capacity DetailMouse over the bars to view the capacity totals in GB.
IBM Storage System FB VolumesA pie chart represents fixed block volumes:
• Ungrouped
• Unmapped
• Mapped
Mouse over the pie segments to view percentages.
Capacity and Object Usage ForecastGraphs represent forecasted usage for the following objects:
• Array Sites
• Arrays
• Extent Pools
• Ranks
Total Extents Total Extent capacity.
Available Available Extent capacity.
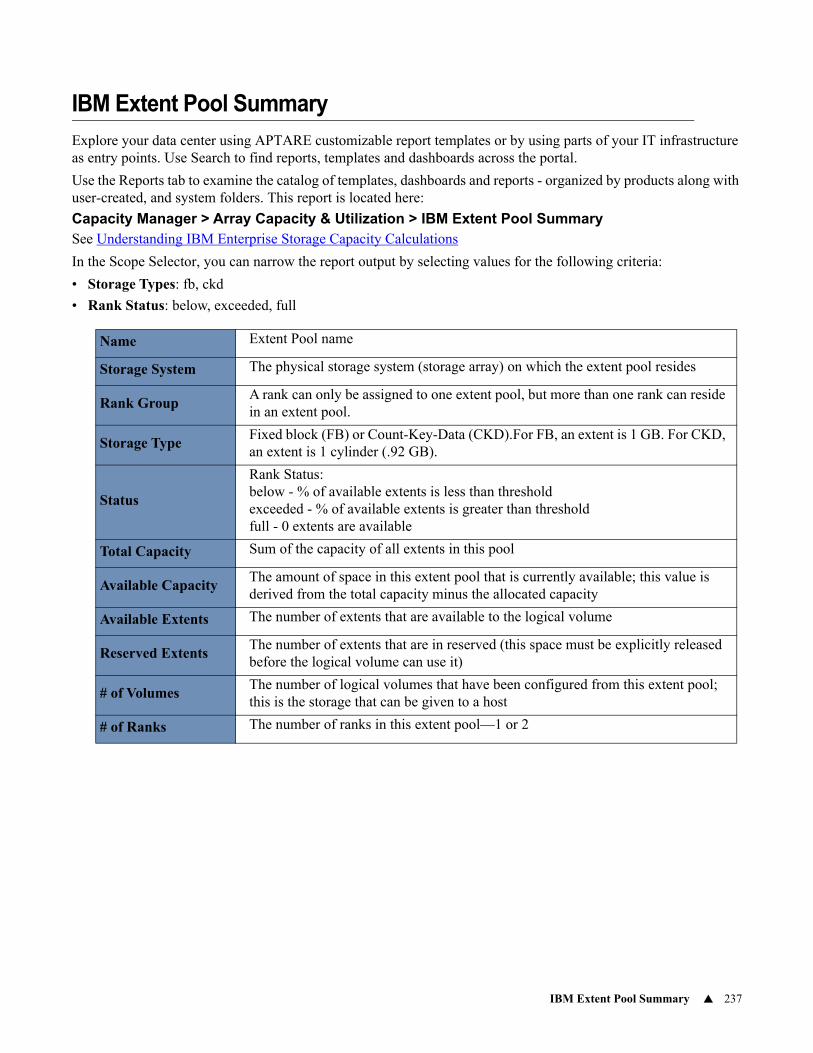
IBM Extent Pool Summary 237
IBM Extent Pool Summary
Explore your data center using APTARE customizable report templates or by using parts of your IT infrastructure as entry points. Use Search to find reports, templates and dashboards across the portal.
Use the Reports tab to examine the catalog of templates, dashboards and reports - organized by products along with user-created, and system folders. This report is located here:
Capacity Manager > Array Capacity & Utilization > IBM Extent Pool SummarySee Understanding IBM Enterprise Storage Capacity Calculations
In the Scope Selector, you can narrow the report output by selecting values for the following criteria:
• Storage Types: fb, ckd
• Rank Status: below, exceeded, full
Name Extent Pool name
Storage System The physical storage system (storage array) on which the extent pool resides
Rank GroupA rank can only be assigned to one extent pool, but more than one rank can reside in an extent pool.
Storage TypeFixed block (FB) or Count-Key-Data (CKD).For FB, an extent is 1 GB. For CKD, an extent is 1 cylinder (.92 GB).
Status
Rank Status: below - % of available extents is less than thresholdexceeded - % of available extents is greater than thresholdfull - 0 extents are available
Total Capacity Sum of the capacity of all extents in this pool
Available CapacityThe amount of space in this extent pool that is currently available; this value is derived from the total capacity minus the allocated capacity
Available Extents The number of extents that are available to the logical volume
Reserved ExtentsThe number of extents that are in reserved (this space must be explicitly released before the logical volume can use it)
# of VolumesThe number of logical volumes that have been configured from this extent pool; this is the storage that can be given to a host
# of Ranks The number of ranks in this extent pool—1 or 2
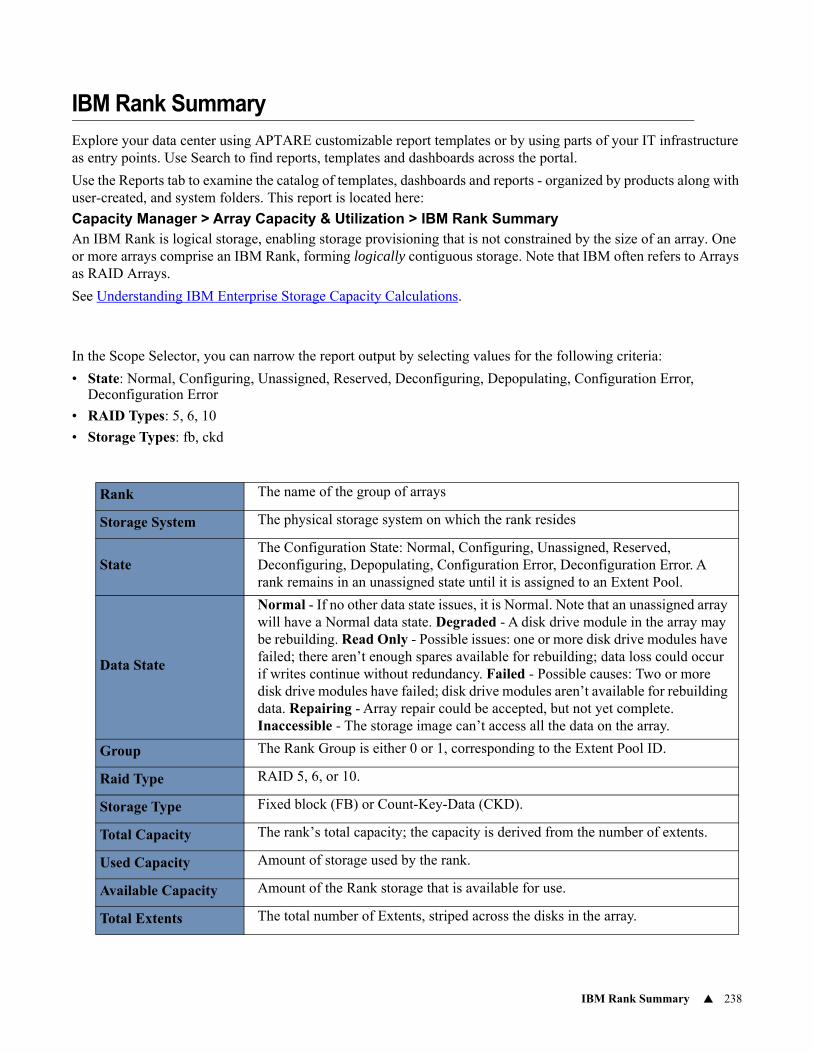
IBM Rank Summary 238
IBM Rank Summary
Explore your data center using APTARE customizable report templates or by using parts of your IT infrastructure as entry points. Use Search to find reports, templates and dashboards across the portal.
Use the Reports tab to examine the catalog of templates, dashboards and reports - organized by products along with user-created, and system folders. This report is located here:
Capacity Manager > Array Capacity & Utilization > IBM Rank SummaryAn IBM Rank is logical storage, enabling storage provisioning that is not constrained by the size of an array. One or more arrays comprise an IBM Rank, forming logically contiguous storage. Note that IBM often refers to Arrays as RAID Arrays.
See Understanding IBM Enterprise Storage Capacity Calculations.
In the Scope Selector, you can narrow the report output by selecting values for the following criteria:
• State: Normal, Configuring, Unassigned, Reserved, Deconfiguring, Depopulating, Configuration Error, Deconfiguration Error
• RAID Types: 5, 6, 10
• Storage Types: fb, ckd
Rank The name of the group of arrays
Storage System The physical storage system on which the rank resides
StateThe Configuration State: Normal, Configuring, Unassigned, Reserved, Deconfiguring, Depopulating, Configuration Error, Deconfiguration Error. A rank remains in an unassigned state until it is assigned to an Extent Pool.
Data State
Normal - If no other data state issues, it is Normal. Note that an unassigned array will have a Normal data state. Degraded - A disk drive module in the array may be rebuilding. Read Only - Possible issues: one or more disk drive modules have failed; there aren’t enough spares available for rebuilding; data loss could occur if writes continue without redundancy. Failed - Possible causes: Two or more disk drive modules have failed; disk drive modules aren’t available for rebuilding data. Repairing - Array repair could be accepted, but not yet complete. Inaccessible - The storage image can’t access all the data on the array.
Group The Rank Group is either 0 or 1, corresponding to the Extent Pool ID.
Raid Type RAID 5, 6, or 10.
Storage Type Fixed block (FB) or Count-Key-Data (CKD).
Total Capacity The rank’s total capacity; the capacity is derived from the number of extents.
Used Capacity Amount of storage used by the rank.
Available Capacity Amount of the Rank storage that is available for use.
Total Extents The total number of Extents, striped across the disks in the array.
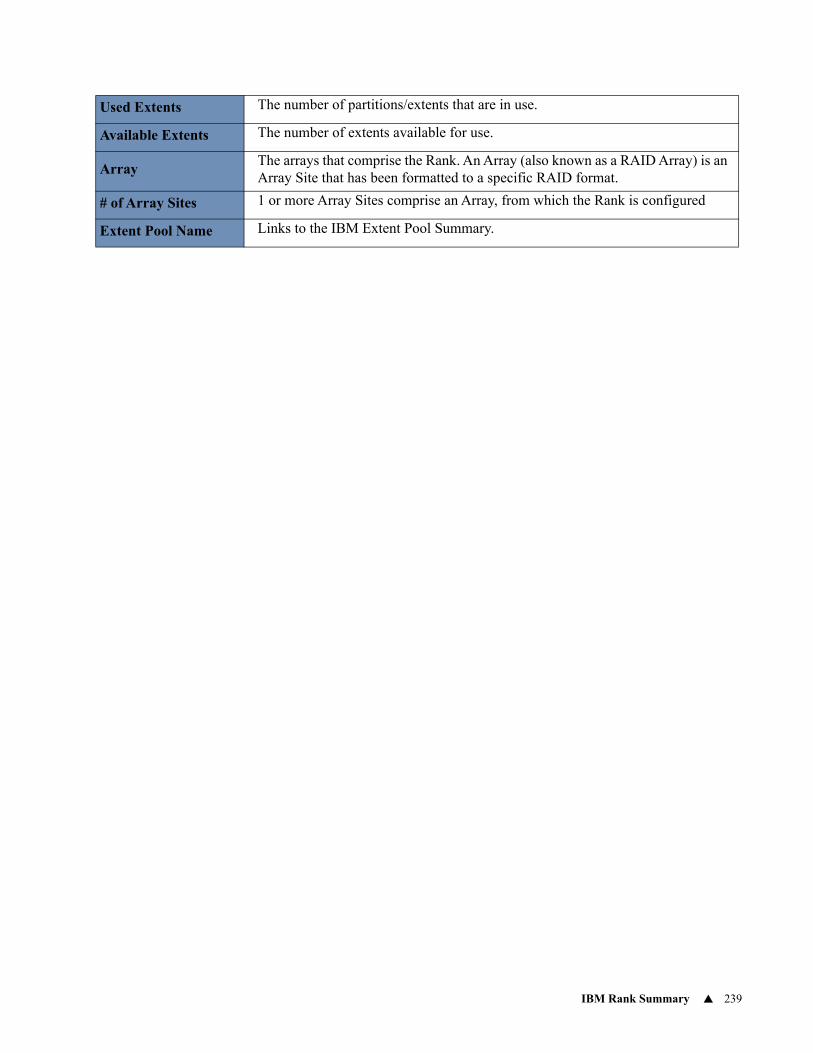
IBM Rank Summary 239
Used Extents The number of partitions/extents that are in use.
Available Extents The number of extents available for use.
ArrayThe arrays that comprise the Rank. An Array (also known as a RAID Array) is an Array Site that has been formatted to a specific RAID format.
# of Array Sites 1 or more Array Sites comprise an Array, from which the Rank is configured
Extent Pool Name Links to the IBM Extent Pool Summary.
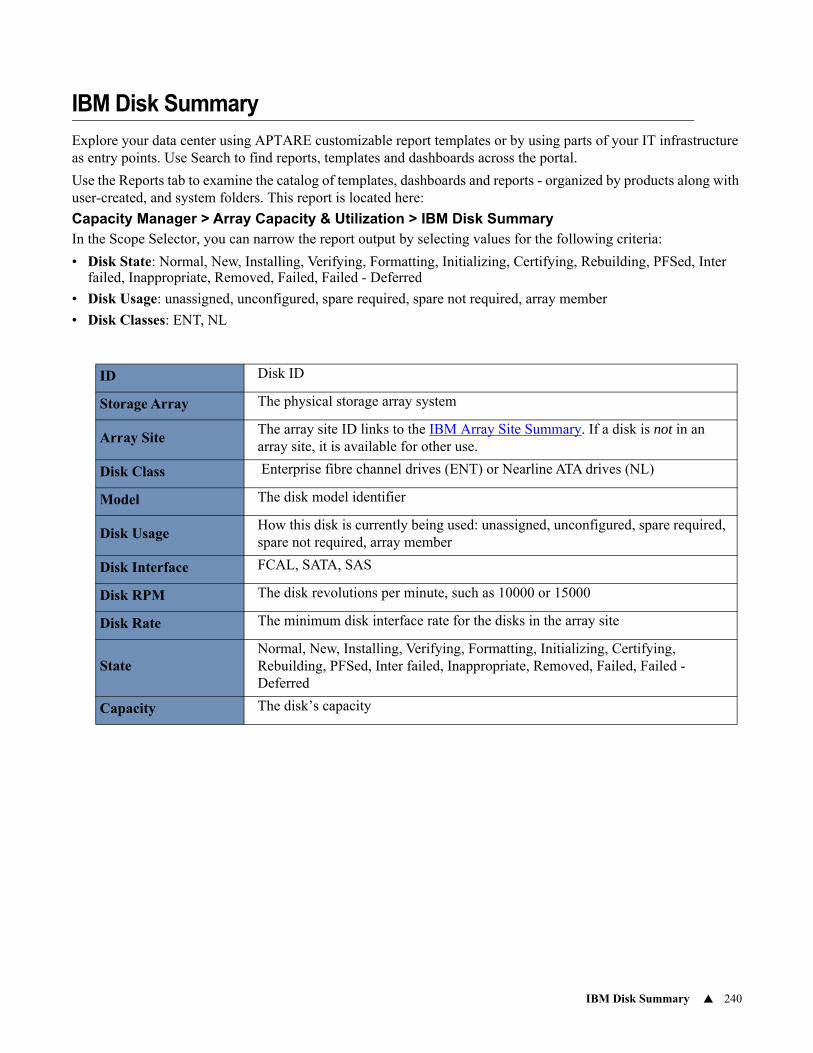
IBM Disk Summary 240
IBM Disk Summary
Explore your data center using APTARE customizable report templates or by using parts of your IT infrastructure as entry points. Use Search to find reports, templates and dashboards across the portal.
Use the Reports tab to examine the catalog of templates, dashboards and reports - organized by products along with user-created, and system folders. This report is located here:
Capacity Manager > Array Capacity & Utilization > IBM Disk SummaryIn the Scope Selector, you can narrow the report output by selecting values for the following criteria:
• Disk State: Normal, New, Installing, Verifying, Formatting, Initializing, Certifying, Rebuilding, PFSed, Inter failed, Inappropriate, Removed, Failed, Failed - Deferred
• Disk Usage: unassigned, unconfigured, spare required, spare not required, array member
• Disk Classes: ENT, NL
ID Disk ID
Storage Array The physical storage array system
Array SiteThe array site ID links to the IBM Array Site Summary. If a disk is not in an array site, it is available for other use.
Disk Class Enterprise fibre channel drives (ENT) or Nearline ATA drives (NL)
Model The disk model identifier
Disk UsageHow this disk is currently being used: unassigned, unconfigured, spare required, spare not required, array member
Disk Interface FCAL, SATA, SAS
Disk RPM The disk revolutions per minute, such as 10000 or 15000
Disk Rate The minimum disk interface rate for the disks in the array site
StateNormal, New, Installing, Verifying, Formatting, Initializing, Certifying, Rebuilding, PFSed, Inter failed, Inappropriate, Removed, Failed, Failed - Deferred
Capacity The disk’s capacity
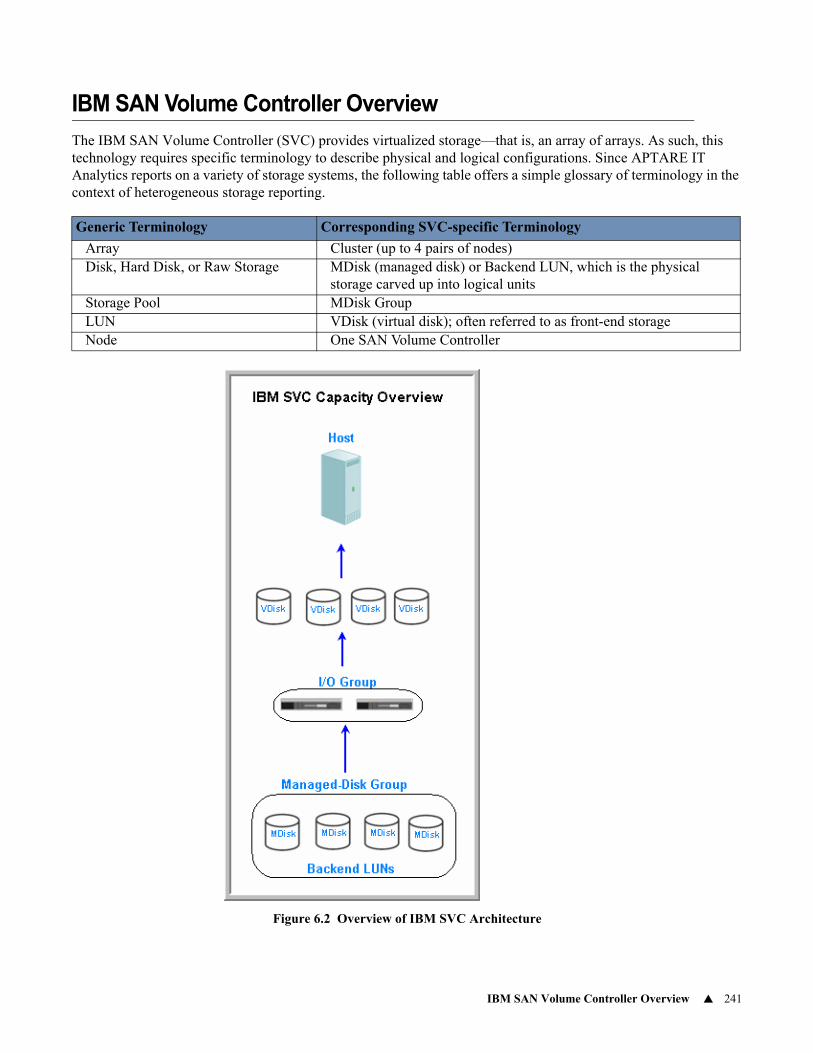
IBM SAN Volume Controller Overview 241
IBM SAN Volume Controller Overview
The IBM SAN Volume Controller (SVC) provides virtualized storage—that is, an array of arrays. As such, this technology requires specific terminology to describe physical and logical configurations. Since APTARE IT Analytics reports on a variety of storage systems, the following table offers a simple glossary of terminology in the context of heterogeneous storage reporting.
Figure 6.2 Overview of IBM SVC Architecture
Generic Terminology Corresponding SVC-specific Terminology
Array Cluster (up to 4 pairs of nodes)Disk, Hard Disk, or Raw Storage MDisk (managed disk) or Backend LUN, which is the physical
storage carved up into logical unitsStorage Pool MDisk GroupLUN VDisk (virtual disk); often referred to as front-end storageNode One SAN Volume Controller
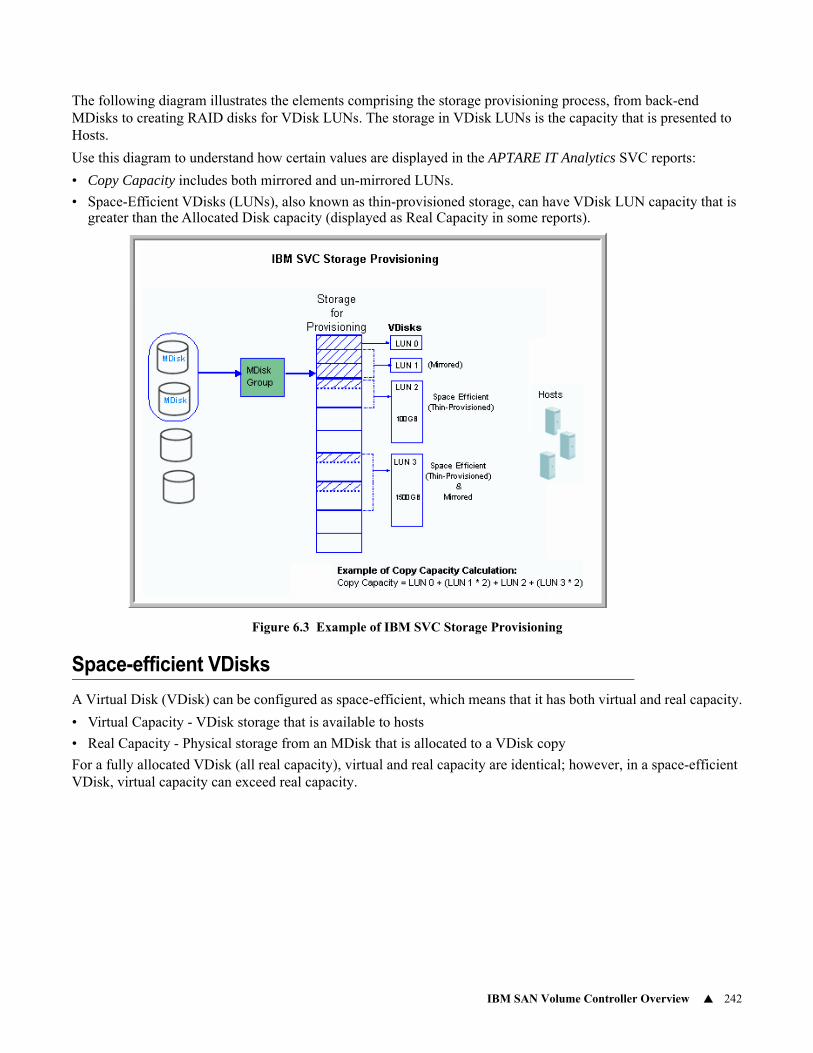
IBM SAN Volume Controller Overview 242
The following diagram illustrates the elements comprising the storage provisioning process, from back-end MDisks to creating RAID disks for VDisk LUNs. The storage in VDisk LUNs is the capacity that is presented to Hosts.
Use this diagram to understand how certain values are displayed in the APTARE IT Analytics SVC reports:
• Copy Capacity includes both mirrored and un-mirrored LUNs.
• Space-Efficient VDisks (LUNs), also known as thin-provisioned storage, can have VDisk LUN capacity that is greater than the Allocated Disk capacity (displayed as Real Capacity in some reports).
Figure 6.3 Example of IBM SVC Storage Provisioning
Space-efficient VDisks
A Virtual Disk (VDisk) can be configured as space-efficient, which means that it has both virtual and real capacity.
• Virtual Capacity - VDisk storage that is available to hosts
• Real Capacity - Physical storage from an MDisk that is allocated to a VDisk copy
For a fully allocated VDisk (all real capacity), virtual and real capacity are identical; however, in a space-efficient VDisk, virtual capacity can exceed real capacity.
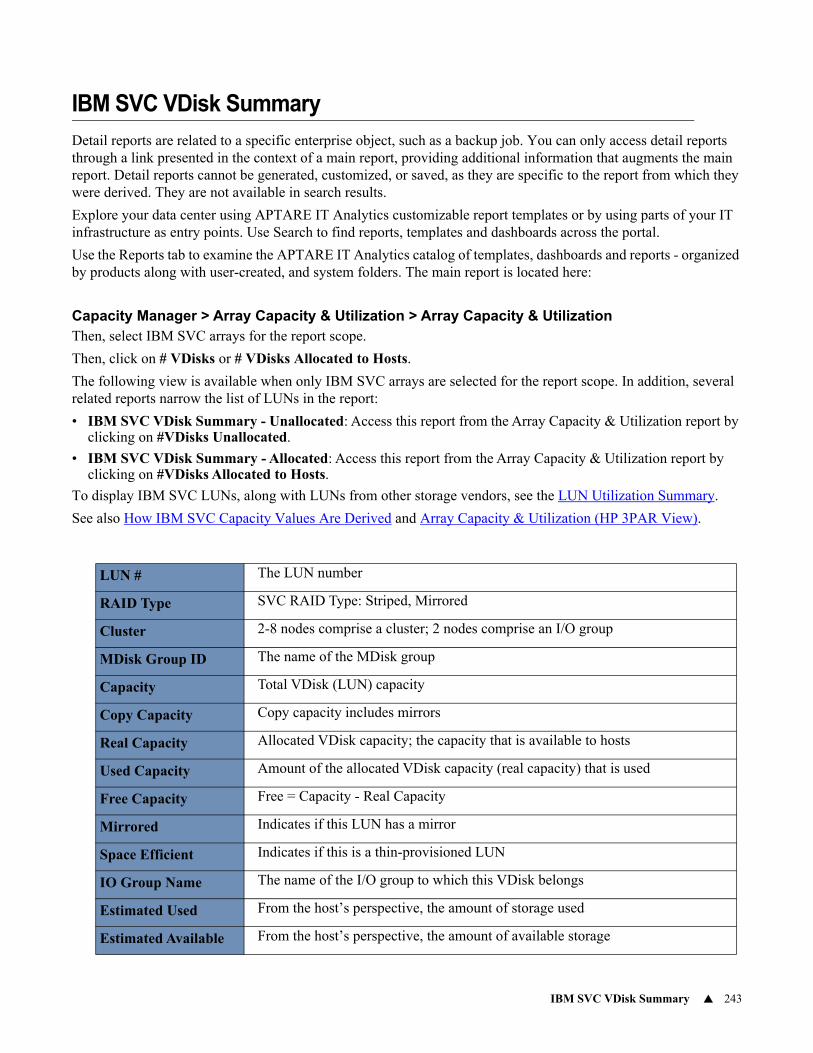
IBM SVC VDisk Summary 243
IBM SVC VDisk Summary
Detail reports are related to a specific enterprise object, such as a backup job. You can only access detail reports through a link presented in the context of a main report, providing additional information that augments the main report. Detail reports cannot be generated, customized, or saved, as they are specific to the report from which they were derived. They are not available in search results.
Explore your data center using APTARE IT Analytics customizable report templates or by using parts of your IT infrastructure as entry points. Use Search to find reports, templates and dashboards across the portal.
Use the Reports tab to examine the APTARE IT Analytics catalog of templates, dashboards and reports - organized by products along with user-created, and system folders. The main report is located here:
Capacity Manager > Array Capacity & Utilization > Array Capacity & UtilizationThen, select IBM SVC arrays for the report scope.
Then, click on # VDisks or # VDisks Allocated to Hosts.
The following view is available when only IBM SVC arrays are selected for the report scope. In addition, several related reports narrow the list of LUNs in the report:
• IBM SVC VDisk Summary - Unallocated: Access this report from the Array Capacity & Utilization report by clicking on #VDisks Unallocated.
• IBM SVC VDisk Summary - Allocated: Access this report from the Array Capacity & Utilization report by clicking on #VDisks Allocated to Hosts.
To display IBM SVC LUNs, along with LUNs from other storage vendors, see the LUN Utilization Summary.
See also How IBM SVC Capacity Values Are Derived and Array Capacity & Utilization (HP 3PAR View).
LUN # The LUN number
RAID Type SVC RAID Type: Striped, Mirrored
Cluster 2-8 nodes comprise a cluster; 2 nodes comprise an I/O group
MDisk Group ID The name of the MDisk group
Capacity Total VDisk (LUN) capacity
Copy Capacity Copy capacity includes mirrors
Real Capacity Allocated VDisk capacity; the capacity that is available to hosts
Used Capacity Amount of the allocated VDisk capacity (real capacity) that is used
Free Capacity Free = Capacity - Real Capacity
Mirrored Indicates if this LUN has a mirror
Space Efficient Indicates if this is a thin-provisioned LUN
IO Group Name The name of the I/O group to which this VDisk belongs
Estimated Used From the host’s perspective, the amount of storage used
Estimated Available From the host’s perspective, the amount of available storage
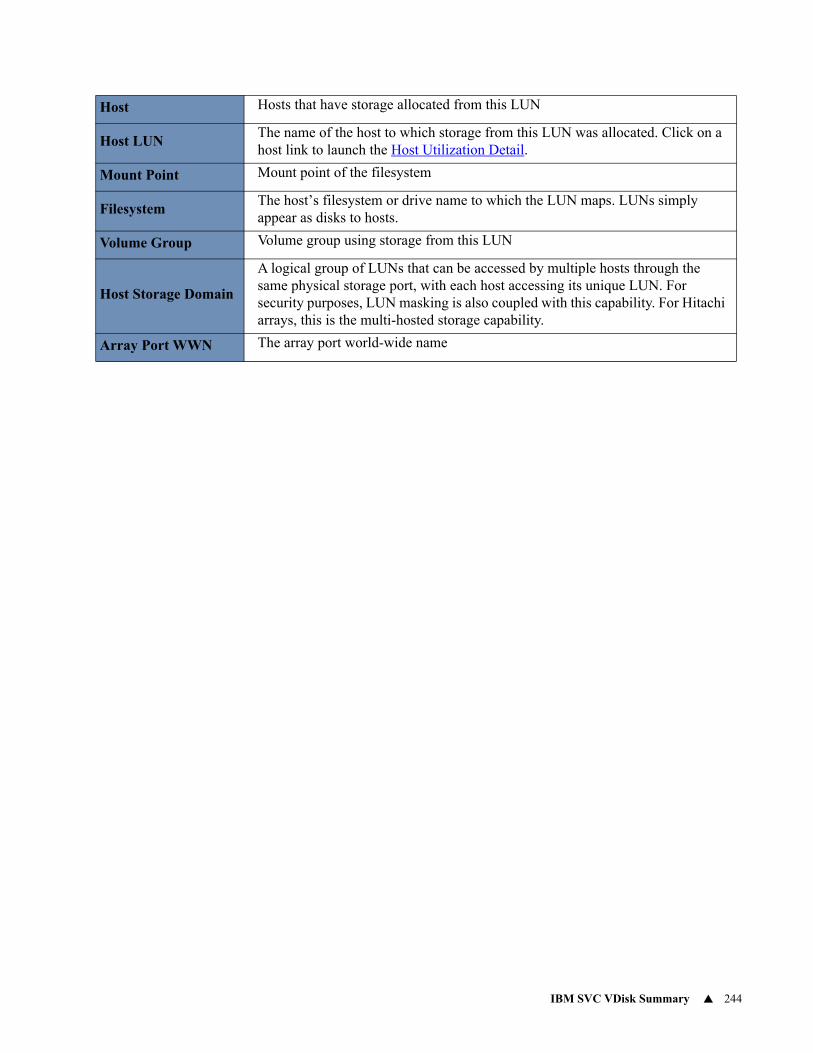
IBM SVC VDisk Summary 244
Host Hosts that have storage allocated from this LUN
Host LUNThe name of the host to which storage from this LUN was allocated. Click on a host link to launch the Host Utilization Detail.
Mount Point Mount point of the filesystem
FilesystemThe host’s filesystem or drive name to which the LUN maps. LUNs simply appear as disks to hosts.
Volume Group Volume group using storage from this LUN
Host Storage Domain
A logical group of LUNs that can be accessed by multiple hosts through the same physical storage port, with each host accessing its unique LUN. For security purposes, LUN masking is also coupled with this capability. For Hitachi arrays, this is the multi-hosted storage capability.
Array Port WWN The array port world-wide name
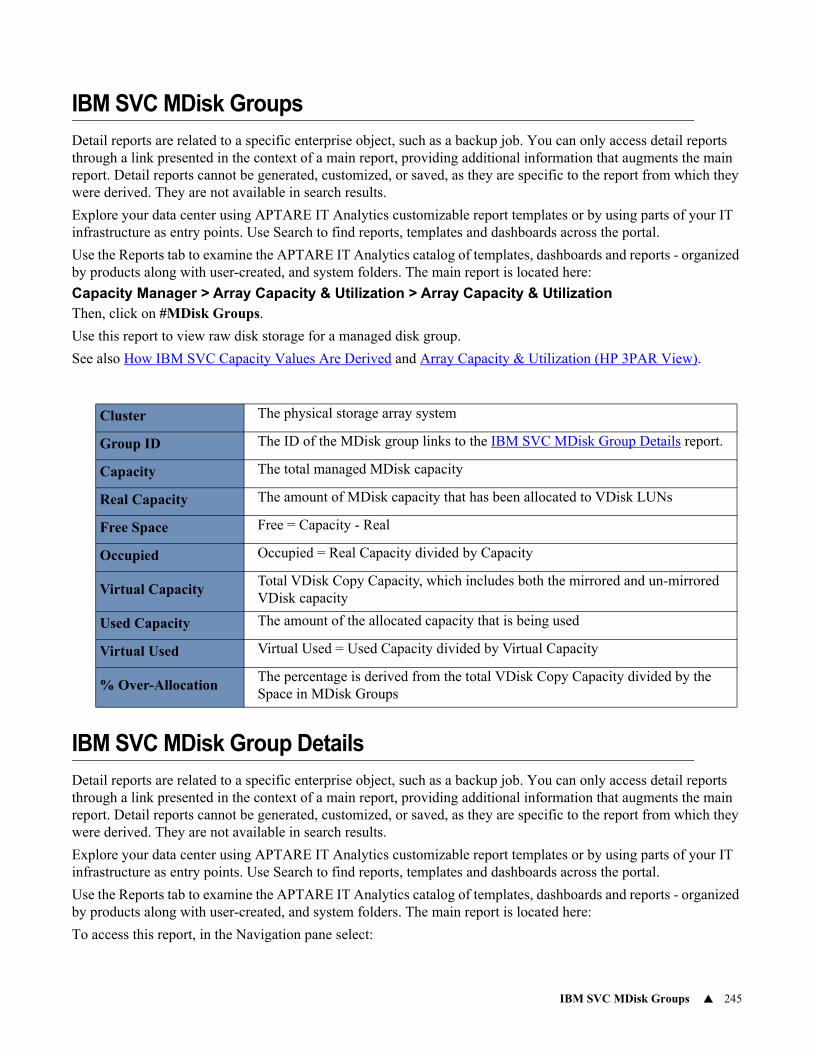
IBM SVC MDisk Groups 245
IBM SVC MDisk Groups
Detail reports are related to a specific enterprise object, such as a backup job. You can only access detail reports through a link presented in the context of a main report, providing additional information that augments the main report. Detail reports cannot be generated, customized, or saved, as they are specific to the report from which they were derived. They are not available in search results.
Explore your data center using APTARE IT Analytics customizable report templates or by using parts of your IT infrastructure as entry points. Use Search to find reports, templates and dashboards across the portal.
Use the Reports tab to examine the APTARE IT Analytics catalog of templates, dashboards and reports - organized by products along with user-created, and system folders. The main report is located here:
Capacity Manager > Array Capacity & Utilization > Array Capacity & UtilizationThen, click on #MDisk Groups.
Use this report to view raw disk storage for a managed disk group.
See also How IBM SVC Capacity Values Are Derived and Array Capacity & Utilization (HP 3PAR View).
IBM SVC MDisk Group Details
Detail reports are related to a specific enterprise object, such as a backup job. You can only access detail reports through a link presented in the context of a main report, providing additional information that augments the main report. Detail reports cannot be generated, customized, or saved, as they are specific to the report from which they were derived. They are not available in search results.
Explore your data center using APTARE IT Analytics customizable report templates or by using parts of your IT infrastructure as entry points. Use Search to find reports, templates and dashboards across the portal.
Use the Reports tab to examine the APTARE IT Analytics catalog of templates, dashboards and reports - organized by products along with user-created, and system folders. The main report is located here:
To access this report, in the Navigation pane select:
Cluster The physical storage array system
Group ID The ID of the MDisk group links to the IBM SVC MDisk Group Details report.
Capacity The total managed MDisk capacity
Real Capacity The amount of MDisk capacity that has been allocated to VDisk LUNs
Free Space Free = Capacity - Real
Occupied Occupied = Real Capacity divided by Capacity
Virtual CapacityTotal VDisk Copy Capacity, which includes both the mirrored and un-mirrored VDisk capacity
Used Capacity The amount of the allocated capacity that is being used
Virtual Used Virtual Used = Used Capacity divided by Virtual Capacity
% Over-AllocationThe percentage is derived from the total VDisk Copy Capacity divided by the Space in MDisk Groups
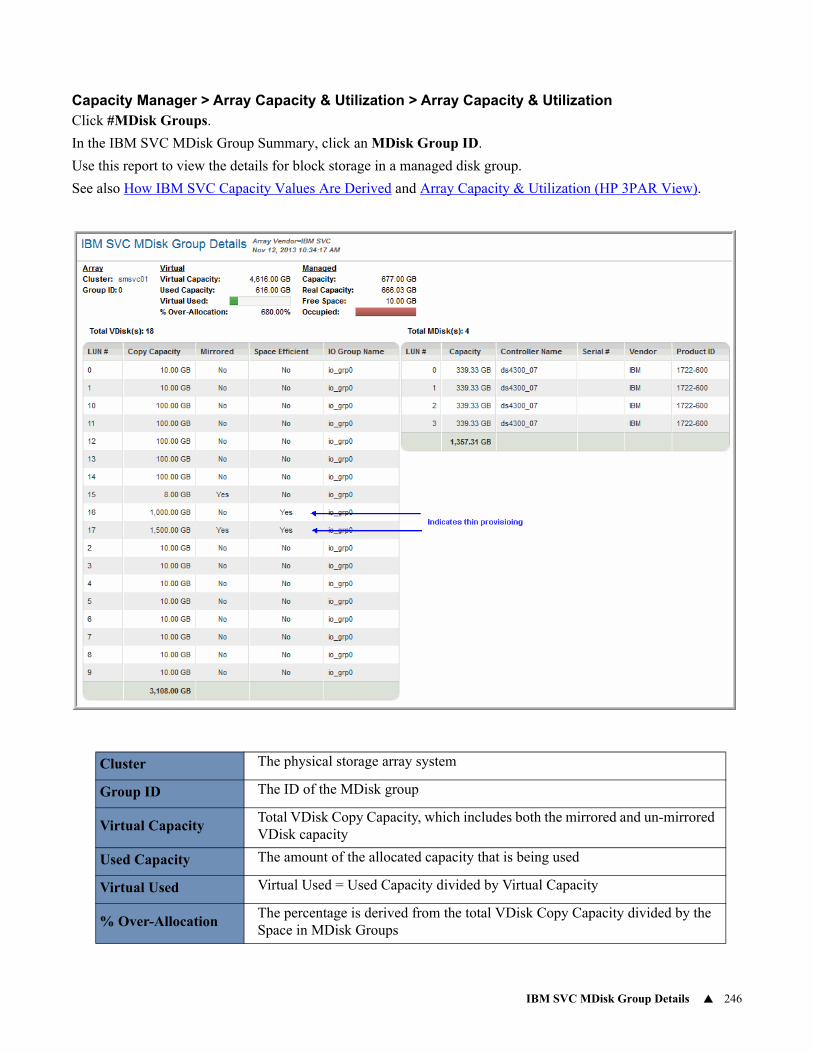
IBM SVC MDisk Group Details 246
Capacity Manager > Array Capacity & Utilization > Array Capacity & UtilizationClick #MDisk Groups.
In the IBM SVC MDisk Group Summary, click an MDisk Group ID.
Use this report to view the details for block storage in a managed disk group.
See also How IBM SVC Capacity Values Are Derived and Array Capacity & Utilization (HP 3PAR View).
Cluster The physical storage array system
Group ID The ID of the MDisk group
Virtual CapacityTotal VDisk Copy Capacity, which includes both the mirrored and un-mirrored VDisk capacity
Used Capacity The amount of the allocated capacity that is being used
Virtual Used Virtual Used = Used Capacity divided by Virtual Capacity
% Over-AllocationThe percentage is derived from the total VDisk Copy Capacity divided by the Space in MDisk Groups
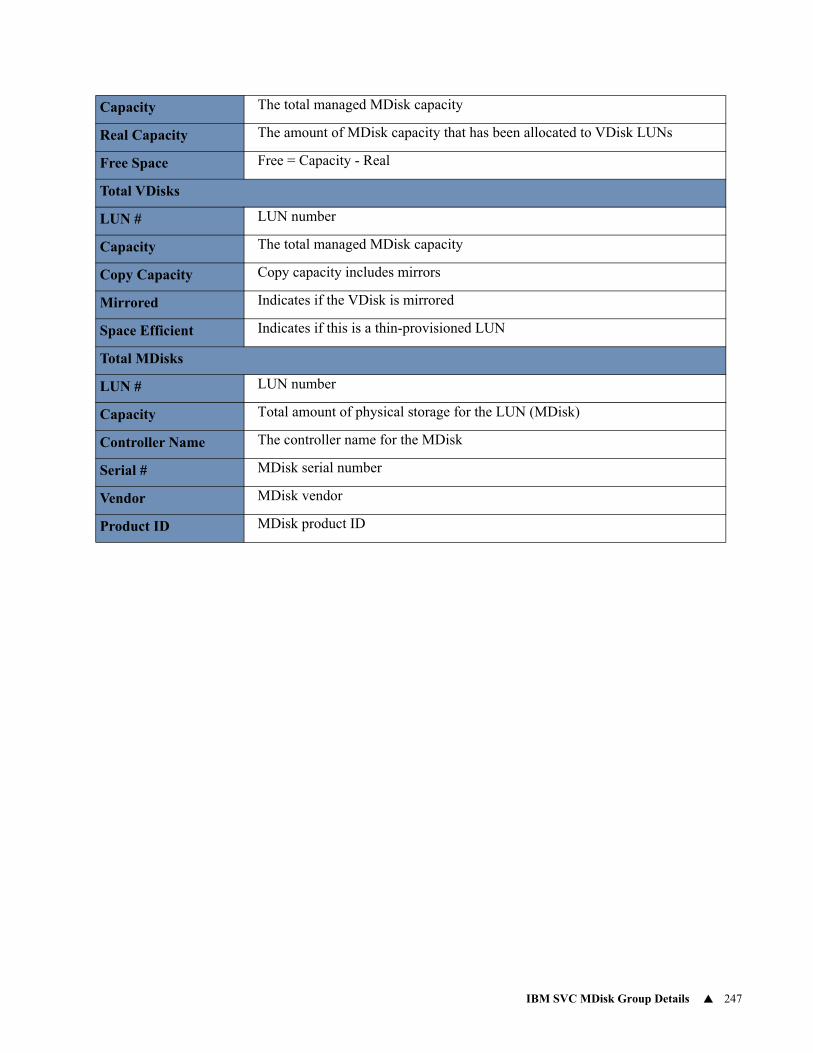
IBM SVC MDisk Group Details 247
Capacity The total managed MDisk capacity
Real Capacity The amount of MDisk capacity that has been allocated to VDisk LUNs
Free Space Free = Capacity - Real
Total VDisks
LUN # LUN number
Capacity The total managed MDisk capacity
Copy Capacity Copy capacity includes mirrors
Mirrored Indicates if the VDisk is mirrored
Space Efficient Indicates if this is a thin-provisioned LUN
Total MDisks
LUN # LUN number
Capacity Total amount of physical storage for the LUN (MDisk)
Controller Name The controller name for the MDisk
Serial # MDisk serial number
Vendor MDisk vendor
Product ID MDisk product ID
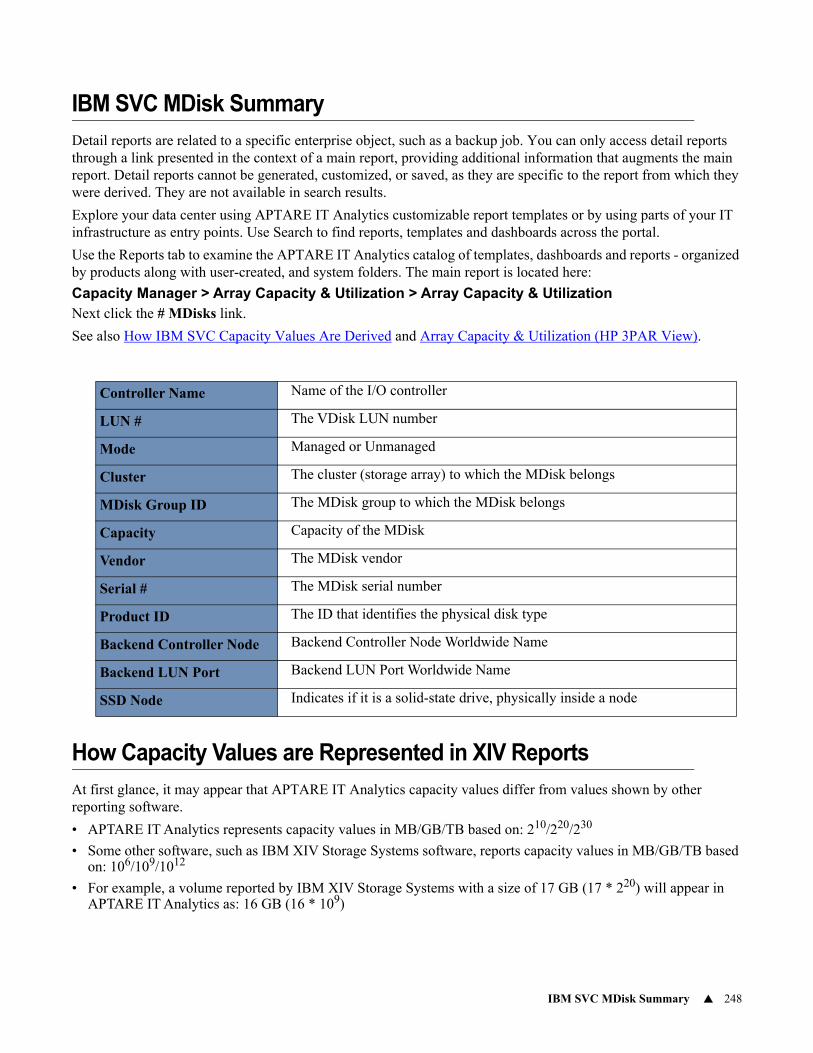
IBM SVC MDisk Summary 248
IBM SVC MDisk Summary
Detail reports are related to a specific enterprise object, such as a backup job. You can only access detail reports through a link presented in the context of a main report, providing additional information that augments the main report. Detail reports cannot be generated, customized, or saved, as they are specific to the report from which they were derived. They are not available in search results.
Explore your data center using APTARE IT Analytics customizable report templates or by using parts of your IT infrastructure as entry points. Use Search to find reports, templates and dashboards across the portal.
Use the Reports tab to examine the APTARE IT Analytics catalog of templates, dashboards and reports - organized by products along with user-created, and system folders. The main report is located here:
Capacity Manager > Array Capacity & Utilization > Array Capacity & UtilizationNext click the # MDisks link.
See also How IBM SVC Capacity Values Are Derived and Array Capacity & Utilization (HP 3PAR View).
How Capacity Values are Represented in XIV Reports
At first glance, it may appear that APTARE IT Analytics capacity values differ from values shown by other reporting software.
• APTARE IT Analytics represents capacity values in MB/GB/TB based on: 210/220/230
• Some other software, such as IBM XIV Storage Systems software, reports capacity values in MB/GB/TB based on: 106/109/1012
• For example, a volume reported by IBM XIV Storage Systems with a size of 17 GB (17 * 220) will appear in APTARE IT Analytics as: 16 GB (16 * 109)
Controller Name Name of the I/O controller
LUN # The VDisk LUN number
Mode Managed or Unmanaged
Cluster The cluster (storage array) to which the MDisk belongs
MDisk Group ID The MDisk group to which the MDisk belongs
Capacity Capacity of the MDisk
Vendor The MDisk vendor
Serial # The MDisk serial number
Product ID The ID that identifies the physical disk type
Backend Controller Node Backend Controller Node Worldwide Name
Backend LUN Port Backend LUN Port Worldwide Name
SSD Node Indicates if it is a solid-state drive, physically inside a node
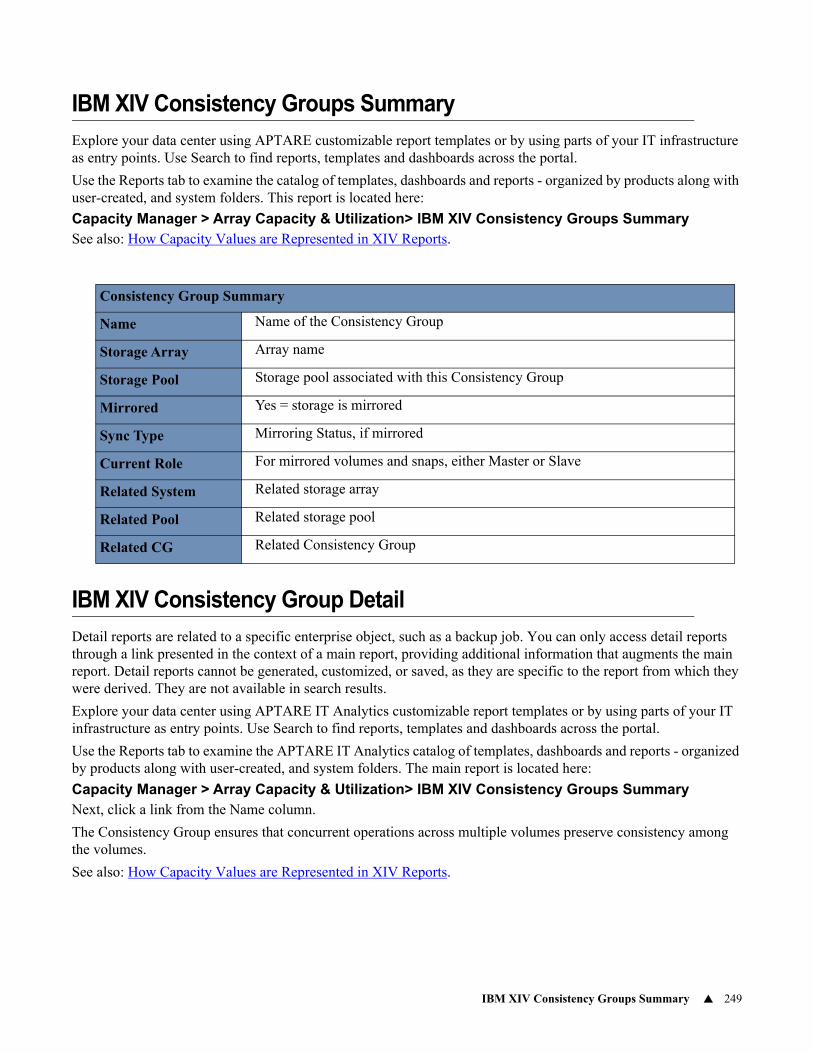
IBM XIV Consistency Groups Summary 249
IBM XIV Consistency Groups Summary
Explore your data center using APTARE customizable report templates or by using parts of your IT infrastructure as entry points. Use Search to find reports, templates and dashboards across the portal.
Use the Reports tab to examine the catalog of templates, dashboards and reports - organized by products along with user-created, and system folders. This report is located here:
Capacity Manager > Array Capacity & Utilization> IBM XIV Consistency Groups SummarySee also: How Capacity Values are Represented in XIV Reports.
IBM XIV Consistency Group Detail
Detail reports are related to a specific enterprise object, such as a backup job. You can only access detail reports through a link presented in the context of a main report, providing additional information that augments the main report. Detail reports cannot be generated, customized, or saved, as they are specific to the report from which they were derived. They are not available in search results.
Explore your data center using APTARE IT Analytics customizable report templates or by using parts of your IT infrastructure as entry points. Use Search to find reports, templates and dashboards across the portal.
Use the Reports tab to examine the APTARE IT Analytics catalog of templates, dashboards and reports - organized by products along with user-created, and system folders. The main report is located here:
Capacity Manager > Array Capacity & Utilization> IBM XIV Consistency Groups SummaryNext, click a link from the Name column.
The Consistency Group ensures that concurrent operations across multiple volumes preserve consistency among the volumes.
See also: How Capacity Values are Represented in XIV Reports.
Consistency Group Summary
Name Name of the Consistency Group
Storage Array Array name
Storage Pool Storage pool associated with this Consistency Group
Mirrored Yes = storage is mirrored
Sync Type Mirroring Status, if mirrored
Current Role For mirrored volumes and snaps, either Master or Slave
Related System Related storage array
Related Pool Related storage pool
Related CG Related Consistency Group
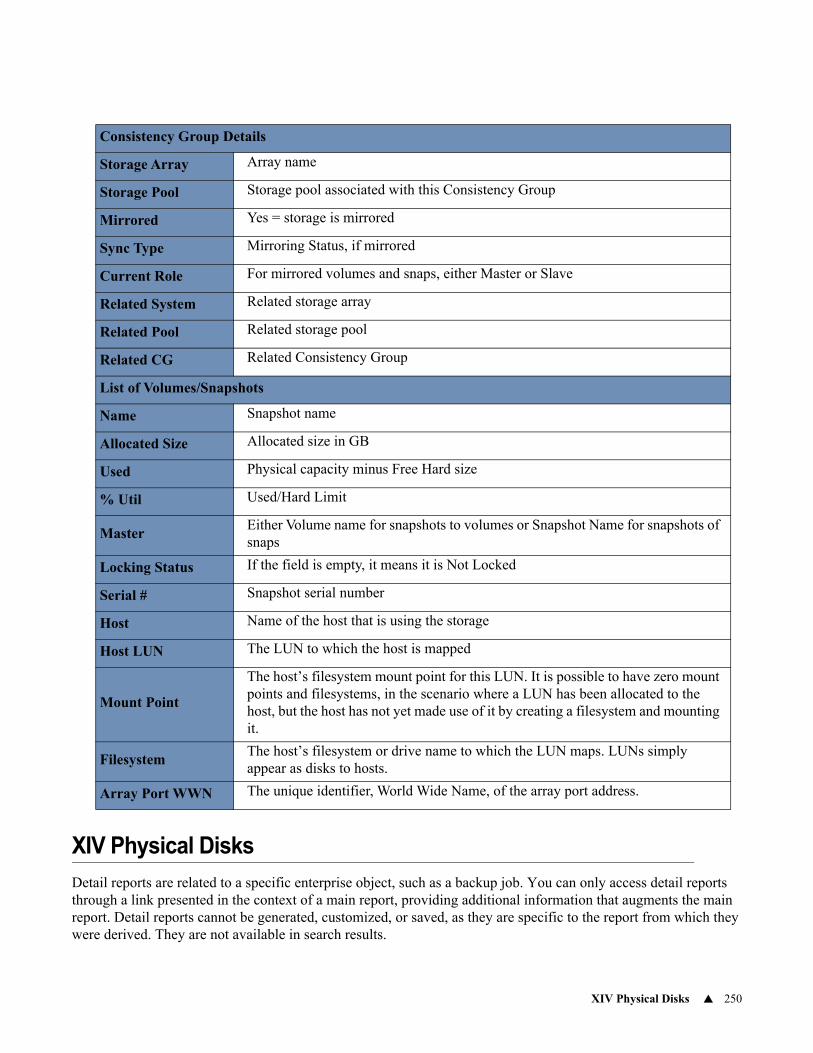
XIV Physical Disks 250
XIV Physical Disks
Detail reports are related to a specific enterprise object, such as a backup job. You can only access detail reports through a link presented in the context of a main report, providing additional information that augments the main report. Detail reports cannot be generated, customized, or saved, as they are specific to the report from which they were derived. They are not available in search results.
Consistency Group Details
Storage Array Array name
Storage Pool Storage pool associated with this Consistency Group
Mirrored Yes = storage is mirrored
Sync Type Mirroring Status, if mirrored
Current Role For mirrored volumes and snaps, either Master or Slave
Related System Related storage array
Related Pool Related storage pool
Related CG Related Consistency Group
List of Volumes/Snapshots
Name Snapshot name
Allocated Size Allocated size in GB
Used Physical capacity minus Free Hard size
% Util Used/Hard Limit
MasterEither Volume name for snapshots to volumes or Snapshot Name for snapshots of snaps
Locking Status If the field is empty, it means it is Not Locked
Serial # Snapshot serial number
Host Name of the host that is using the storage
Host LUN The LUN to which the host is mapped
Mount Point
The host’s filesystem mount point for this LUN. It is possible to have zero mount points and filesystems, in the scenario where a LUN has been allocated to the host, but the host has not yet made use of it by creating a filesystem and mounting it.
FilesystemThe host’s filesystem or drive name to which the LUN maps. LUNs simply appear as disks to hosts.
Array Port WWN The unique identifier, World Wide Name, of the array port address.
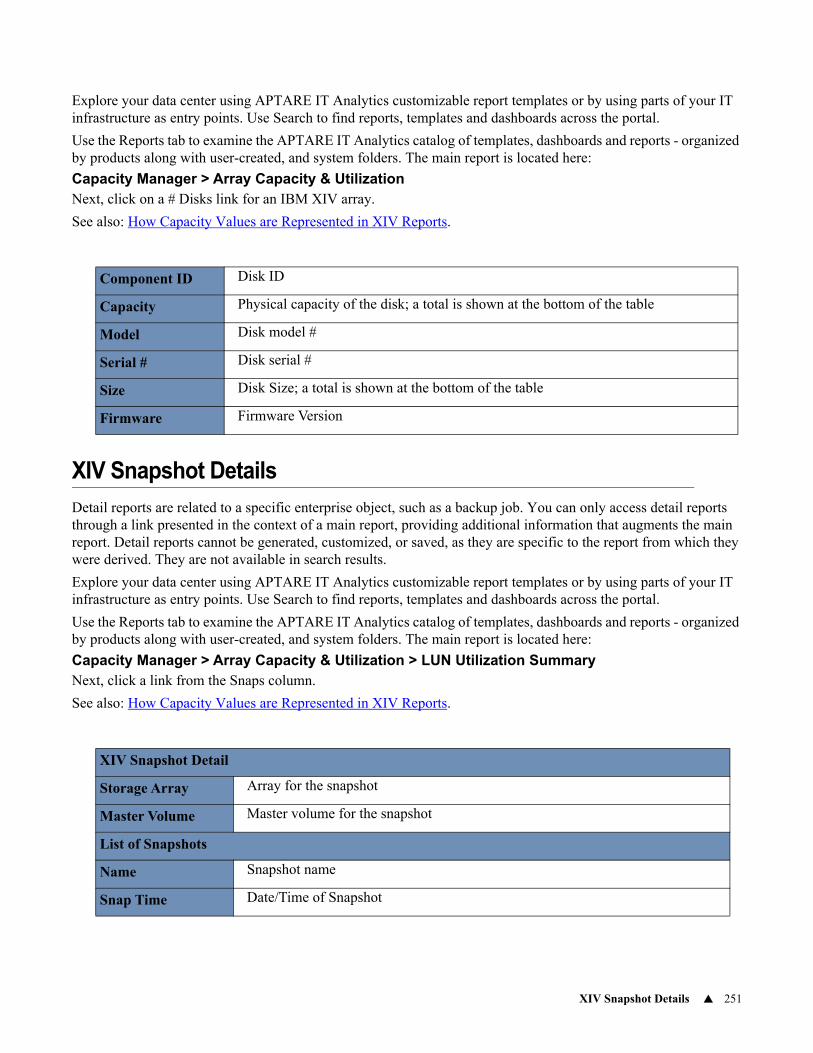
XIV Snapshot Details 251
Explore your data center using APTARE IT Analytics customizable report templates or by using parts of your IT infrastructure as entry points. Use Search to find reports, templates and dashboards across the portal.
Use the Reports tab to examine the APTARE IT Analytics catalog of templates, dashboards and reports - organized by products along with user-created, and system folders. The main report is located here:
Capacity Manager > Array Capacity & UtilizationNext, click on a # Disks link for an IBM XIV array.
See also: How Capacity Values are Represented in XIV Reports.
XIV Snapshot Details
Detail reports are related to a specific enterprise object, such as a backup job. You can only access detail reports through a link presented in the context of a main report, providing additional information that augments the main report. Detail reports cannot be generated, customized, or saved, as they are specific to the report from which they were derived. They are not available in search results.
Explore your data center using APTARE IT Analytics customizable report templates or by using parts of your IT infrastructure as entry points. Use Search to find reports, templates and dashboards across the portal.
Use the Reports tab to examine the APTARE IT Analytics catalog of templates, dashboards and reports - organized by products along with user-created, and system folders. The main report is located here:
Capacity Manager > Array Capacity & Utilization > LUN Utilization SummaryNext, click a link from the Snaps column.
See also: How Capacity Values are Represented in XIV Reports.
Component ID Disk ID
Capacity Physical capacity of the disk; a total is shown at the bottom of the table
Model Disk model #
Serial # Disk serial #
Size Disk Size; a total is shown at the bottom of the table
Firmware Firmware Version
XIV Snapshot Detail
Storage Array Array for the snapshot
Master Volume Master volume for the snapshot
List of Snapshots
Name Snapshot name
Snap Time Date/Time of Snapshot
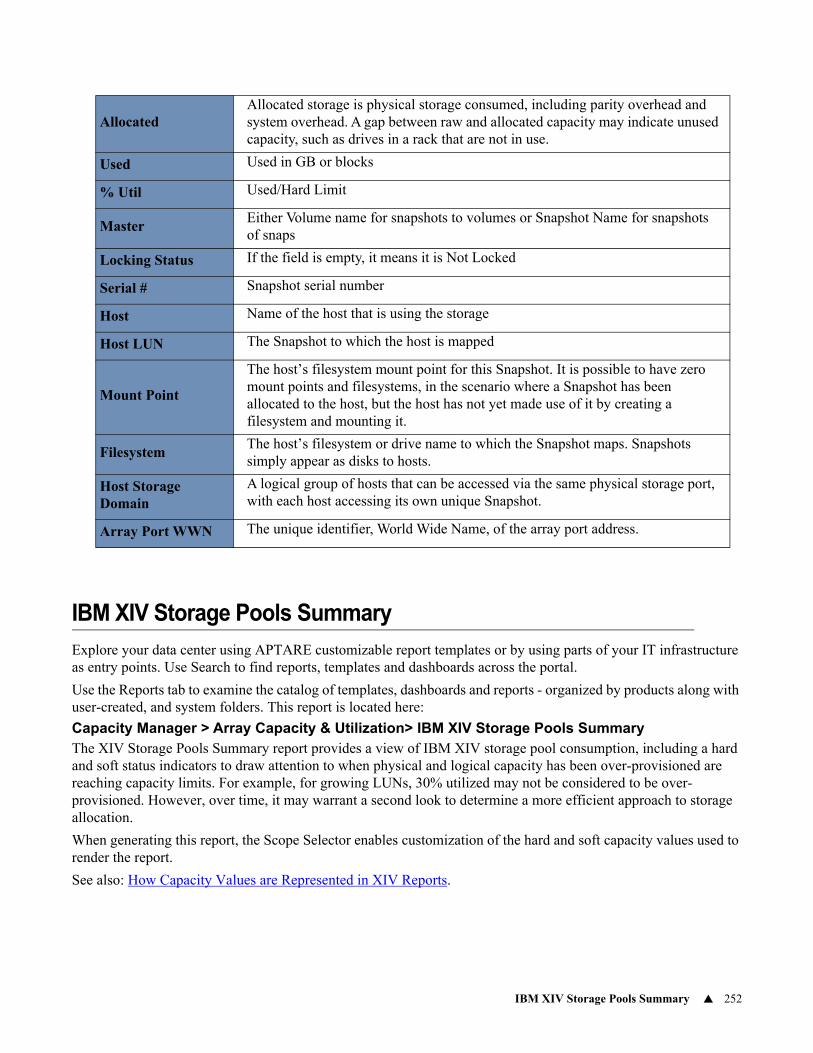
IBM XIV Storage Pools Summary 252
IBM XIV Storage Pools Summary
Explore your data center using APTARE customizable report templates or by using parts of your IT infrastructure as entry points. Use Search to find reports, templates and dashboards across the portal.
Use the Reports tab to examine the catalog of templates, dashboards and reports - organized by products along with user-created, and system folders. This report is located here:
Capacity Manager > Array Capacity & Utilization> IBM XIV Storage Pools SummaryThe XIV Storage Pools Summary report provides a view of IBM XIV storage pool consumption, including a hard and soft status indicators to draw attention to when physical and logical capacity has been over-provisioned are reaching capacity limits. For example, for growing LUNs, 30% utilized may not be considered to be over-provisioned. However, over time, it may warrant a second look to determine a more efficient approach to storage allocation.
When generating this report, the Scope Selector enables customization of the hard and soft capacity values used to render the report.
See also: How Capacity Values are Represented in XIV Reports.
AllocatedAllocated storage is physical storage consumed, including parity overhead and system overhead. A gap between raw and allocated capacity may indicate unused capacity, such as drives in a rack that are not in use.
Used Used in GB or blocks
% Util Used/Hard Limit
MasterEither Volume name for snapshots to volumes or Snapshot Name for snapshots of snaps
Locking Status If the field is empty, it means it is Not Locked
Serial # Snapshot serial number
Host Name of the host that is using the storage
Host LUN The Snapshot to which the host is mapped
Mount Point
The host’s filesystem mount point for this Snapshot. It is possible to have zero mount points and filesystems, in the scenario where a Snapshot has been allocated to the host, but the host has not yet made use of it by creating a filesystem and mounting it.
FilesystemThe host’s filesystem or drive name to which the Snapshot maps. Snapshots simply appear as disks to hosts.
Host Storage Domain
A logical group of hosts that can be accessed via the same physical storage port, with each host accessing its own unique Snapshot.
Array Port WWN The unique identifier, World Wide Name, of the array port address.
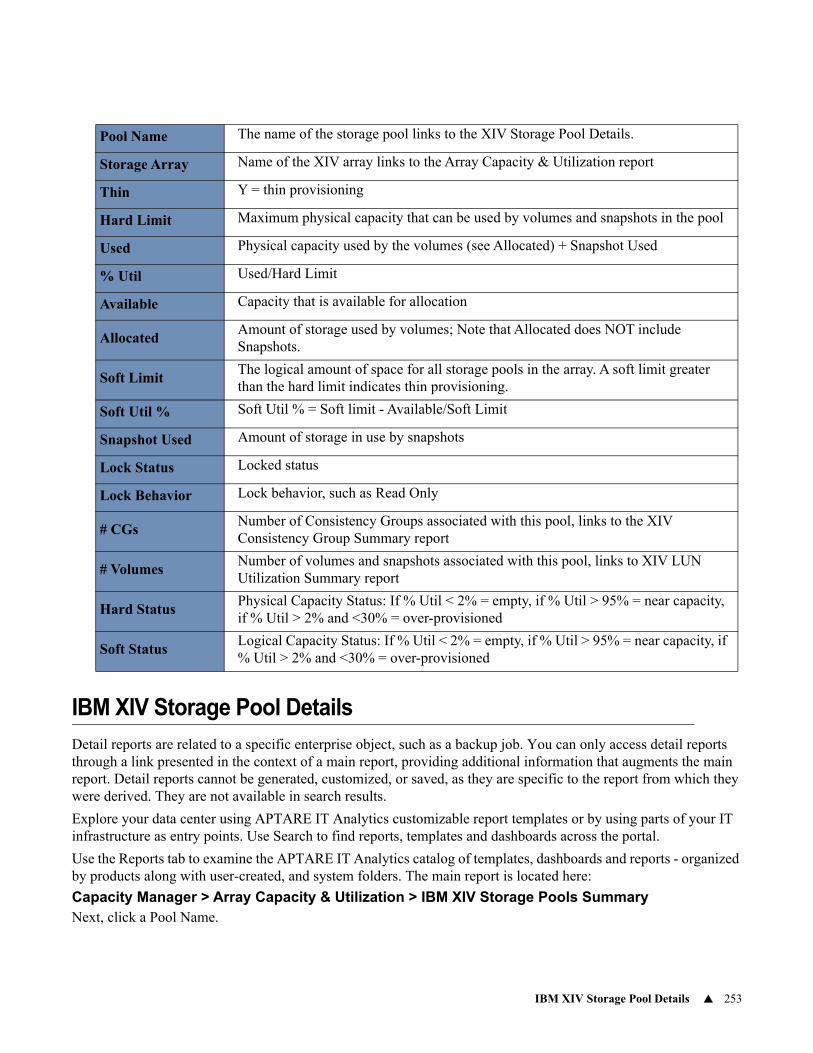
IBM XIV Storage Pool Details 253
IBM XIV Storage Pool Details
Detail reports are related to a specific enterprise object, such as a backup job. You can only access detail reports through a link presented in the context of a main report, providing additional information that augments the main report. Detail reports cannot be generated, customized, or saved, as they are specific to the report from which they were derived. They are not available in search results.
Explore your data center using APTARE IT Analytics customizable report templates or by using parts of your IT infrastructure as entry points. Use Search to find reports, templates and dashboards across the portal.
Use the Reports tab to examine the APTARE IT Analytics catalog of templates, dashboards and reports - organized by products along with user-created, and system folders. The main report is located here:
Capacity Manager > Array Capacity & Utilization > IBM XIV Storage Pools SummaryNext, click a Pool Name.
Pool Name The name of the storage pool links to the XIV Storage Pool Details.
Storage Array Name of the XIV array links to the Array Capacity & Utilization report
Thin Y = thin provisioning
Hard Limit Maximum physical capacity that can be used by volumes and snapshots in the pool
Used Physical capacity used by the volumes (see Allocated) + Snapshot Used
% Util Used/Hard Limit
Available Capacity that is available for allocation
AllocatedAmount of storage used by volumes; Note that Allocated does NOT include Snapshots.
Soft LimitThe logical amount of space for all storage pools in the array. A soft limit greater than the hard limit indicates thin provisioning.
Soft Util % Soft Util % = Soft limit - Available/Soft Limit
Snapshot Used Amount of storage in use by snapshots
Lock Status Locked status
Lock Behavior Lock behavior, such as Read Only
# CGsNumber of Consistency Groups associated with this pool, links to the XIV Consistency Group Summary report
# VolumesNumber of volumes and snapshots associated with this pool, links to XIV LUN Utilization Summary report
Hard StatusPhysical Capacity Status: If % Util < 2% = empty, if % Util > 95% = near capacity, if % Util > 2% and <30% = over-provisioned
Soft StatusLogical Capacity Status: If % Util < 2% = empty, if % Util > 95% = near capacity, if % Util > 2% and <30% = over-provisioned
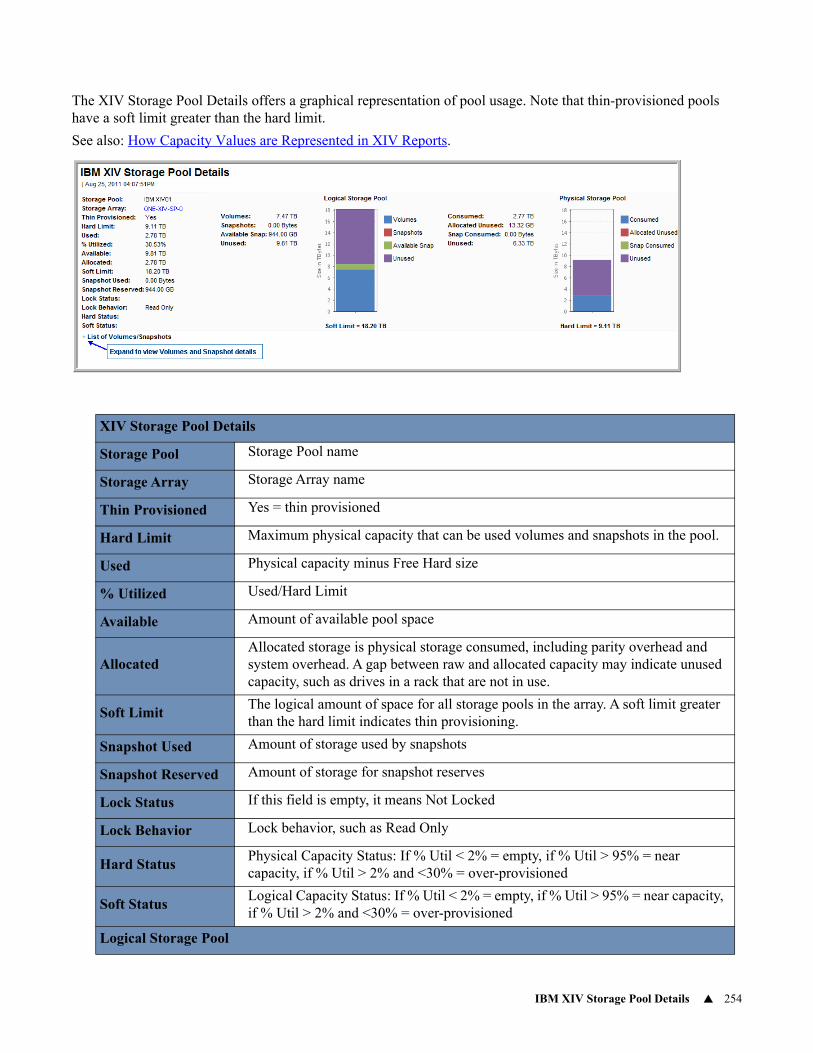
IBM XIV Storage Pool Details 254
The XIV Storage Pool Details offers a graphical representation of pool usage. Note that thin-provisioned pools have a soft limit greater than the hard limit.
See also: How Capacity Values are Represented in XIV Reports.
XIV Storage Pool Details
Storage Pool Storage Pool name
Storage Array Storage Array name
Thin Provisioned Yes = thin provisioned
Hard Limit Maximum physical capacity that can be used volumes and snapshots in the pool.
Used Physical capacity minus Free Hard size
% Utilized Used/Hard Limit
Available Amount of available pool space
AllocatedAllocated storage is physical storage consumed, including parity overhead and system overhead. A gap between raw and allocated capacity may indicate unused capacity, such as drives in a rack that are not in use.
Soft LimitThe logical amount of space for all storage pools in the array. A soft limit greater than the hard limit indicates thin provisioning.
Snapshot Used Amount of storage used by snapshots
Snapshot Reserved Amount of storage for snapshot reserves
Lock Status If this field is empty, it means Not Locked
Lock Behavior Lock behavior, such as Read Only
Hard StatusPhysical Capacity Status: If % Util < 2% = empty, if % Util > 95% = near capacity, if % Util > 2% and <30% = over-provisioned
Soft StatusLogical Capacity Status: If % Util < 2% = empty, if % Util > 95% = near capacity, if % Util > 2% and <30% = over-provisioned
Logical Storage Pool
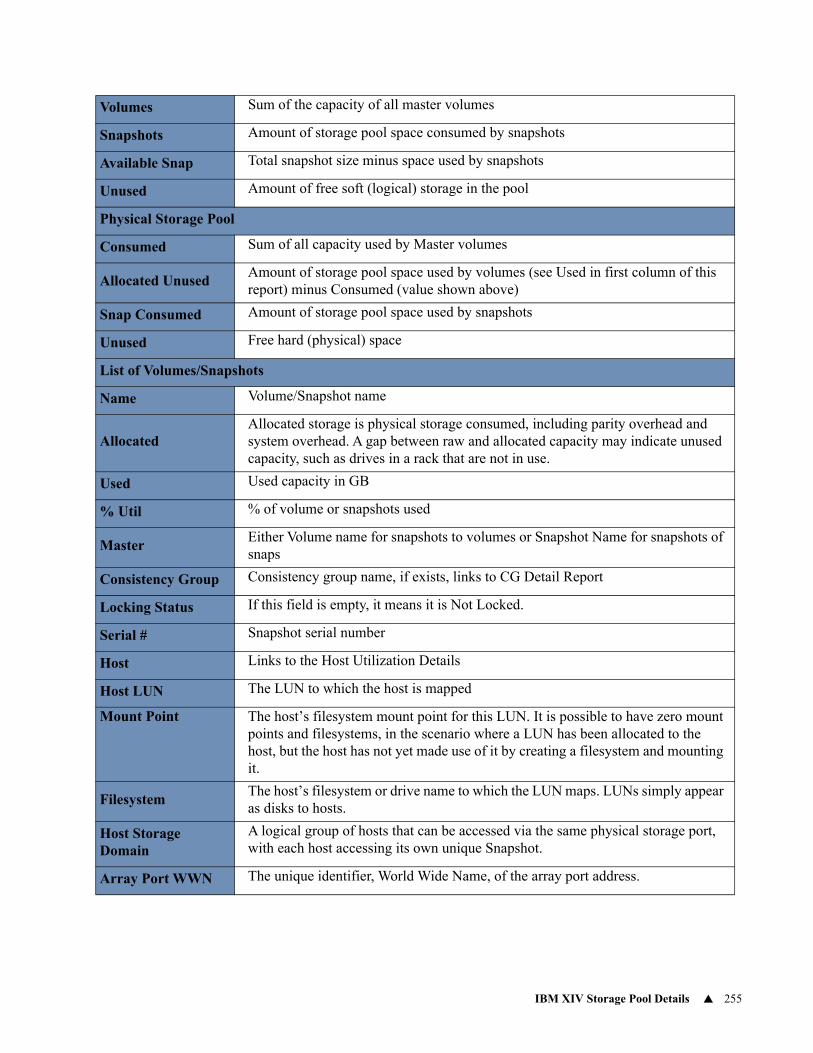
IBM XIV Storage Pool Details 255
Volumes Sum of the capacity of all master volumes
Snapshots Amount of storage pool space consumed by snapshots
Available Snap Total snapshot size minus space used by snapshots
Unused Amount of free soft (logical) storage in the pool
Physical Storage Pool
Consumed Sum of all capacity used by Master volumes
Allocated UnusedAmount of storage pool space used by volumes (see Used in first column of this report) minus Consumed (value shown above)
Snap Consumed Amount of storage pool space used by snapshots
Unused Free hard (physical) space
List of Volumes/Snapshots
Name Volume/Snapshot name
AllocatedAllocated storage is physical storage consumed, including parity overhead and system overhead. A gap between raw and allocated capacity may indicate unused capacity, such as drives in a rack that are not in use.
Used Used capacity in GB
% Util % of volume or snapshots used
MasterEither Volume name for snapshots to volumes or Snapshot Name for snapshots of snaps
Consistency Group Consistency group name, if exists, links to CG Detail Report
Locking Status If this field is empty, it means it is Not Locked.
Serial # Snapshot serial number
Host Links to the Host Utilization Details
Host LUN The LUN to which the host is mapped
Mount Point The host’s filesystem mount point for this LUN. It is possible to have zero mount points and filesystems, in the scenario where a LUN has been allocated to the host, but the host has not yet made use of it by creating a filesystem and mounting it.
FilesystemThe host’s filesystem or drive name to which the LUN maps. LUNs simply appear as disks to hosts.
Host Storage Domain
A logical group of hosts that can be accessed via the same physical storage port, with each host accessing its own unique Snapshot.
Array Port WWN The unique identifier, World Wide Name, of the array port address.
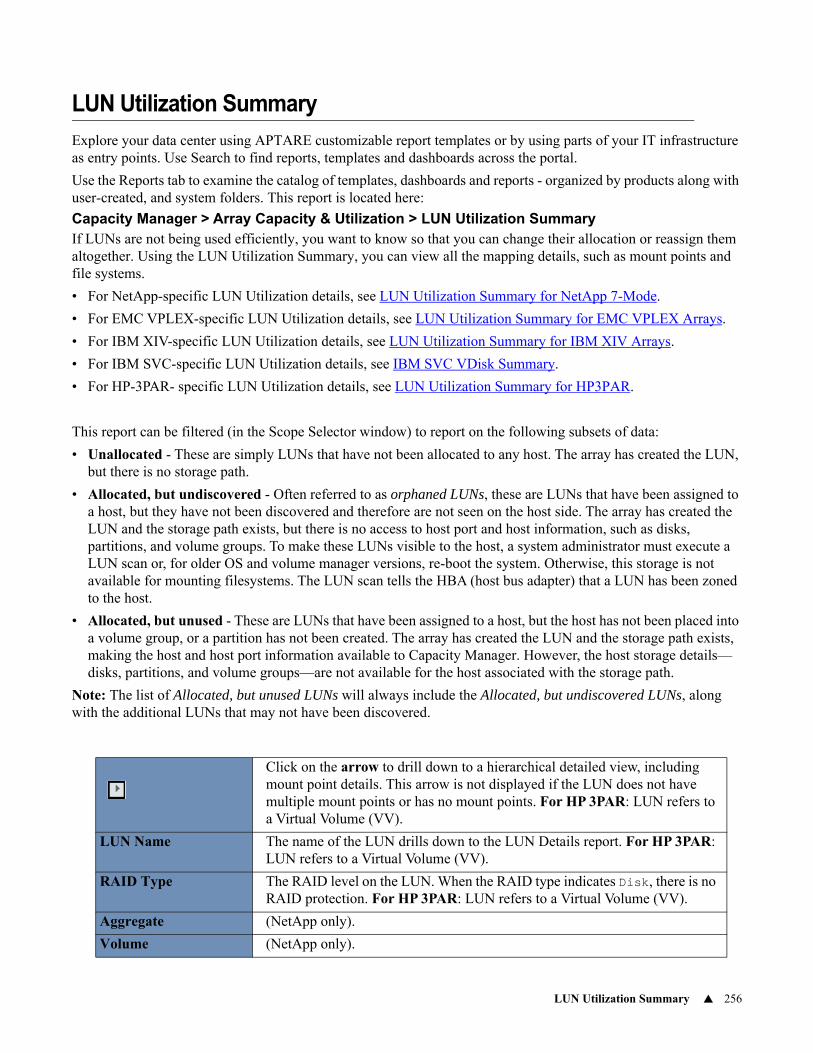
LUN Utilization Summary 256
LUN Utilization Summary
Explore your data center using APTARE customizable report templates or by using parts of your IT infrastructure as entry points. Use Search to find reports, templates and dashboards across the portal.
Use the Reports tab to examine the catalog of templates, dashboards and reports - organized by products along with user-created, and system folders. This report is located here:
Capacity Manager > Array Capacity & Utilization > LUN Utilization SummaryIf LUNs are not being used efficiently, you want to know so that you can change their allocation or reassign them altogether. Using the LUN Utilization Summary, you can view all the mapping details, such as mount points and file systems.
• For NetApp-specific LUN Utilization details, see LUN Utilization Summary for NetApp 7-Mode.
• For EMC VPLEX-specific LUN Utilization details, see LUN Utilization Summary for EMC VPLEX Arrays.
• For IBM XIV-specific LUN Utilization details, see LUN Utilization Summary for IBM XIV Arrays.
• For IBM SVC-specific LUN Utilization details, see IBM SVC VDisk Summary.
• For HP-3PAR- specific LUN Utilization details, see LUN Utilization Summary for HP3PAR.
This report can be filtered (in the Scope Selector window) to report on the following subsets of data:
• Unallocated - These are simply LUNs that have not been allocated to any host. The array has created the LUN, but there is no storage path.
• Allocated, but undiscovered - Often referred to as orphaned LUNs, these are LUNs that have been assigned to a host, but they have not been discovered and therefore are not seen on the host side. The array has created the LUN and the storage path exists, but there is no access to host port and host information, such as disks, partitions, and volume groups. To make these LUNs visible to the host, a system administrator must execute a LUN scan or, for older OS and volume manager versions, re-boot the system. Otherwise, this storage is not available for mounting filesystems. The LUN scan tells the HBA (host bus adapter) that a LUN has been zoned to the host.
• Allocated, but unused - These are LUNs that have been assigned to a host, but the host has not been placed into a volume group, or a partition has not been created. The array has created the LUN and the storage path exists, making the host and host port information available to Capacity Manager. However, the host storage details—disks, partitions, and volume groups—are not available for the host associated with the storage path.
Note: The list of Allocated, but unused LUNs will always include the Allocated, but undiscovered LUNs, along with the additional LUNs that may not have been discovered.
Click on the arrow to drill down to a hierarchical detailed view, including mount point details. This arrow is not displayed if the LUN does not have multiple mount points or has no mount points. For HP 3PAR: LUN refers to a Virtual Volume (VV).
LUN Name The name of the LUN drills down to the LUN Details report. For HP 3PAR: LUN refers to a Virtual Volume (VV).
RAID Type The RAID level on the LUN. When the RAID type indicates Disk, there is no RAID protection. For HP 3PAR: LUN refers to a Virtual Volume (VV).
Aggregate (NetApp only).
Volume (NetApp only).
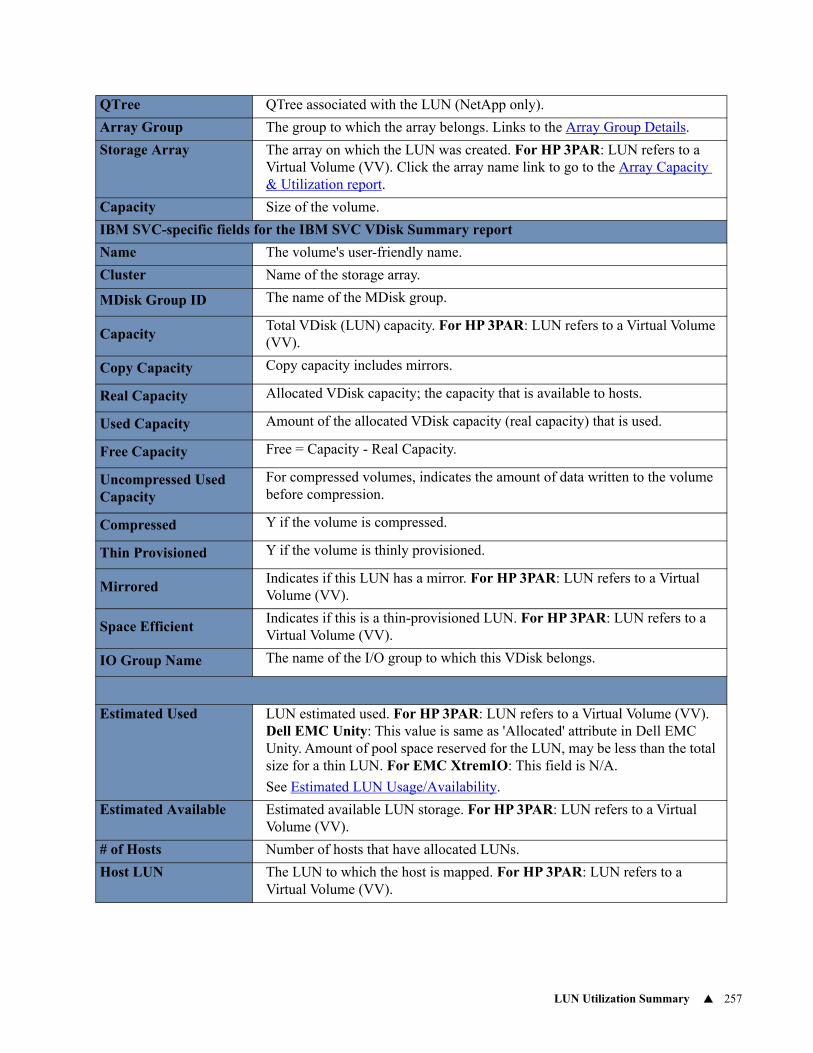
LUN Utilization Summary 257
QTree QTree associated with the LUN (NetApp only).
Array Group The group to which the array belongs. Links to the Array Group Details.
Storage Array The array on which the LUN was created. For HP 3PAR: LUN refers to a Virtual Volume (VV). Click the array name link to go to the Array Capacity & Utilization report.
Capacity Size of the volume.
IBM SVC-specific fields for the IBM SVC VDisk Summary report
Name The volume's user-friendly name.
Cluster Name of the storage array.
MDisk Group ID The name of the MDisk group.
CapacityTotal VDisk (LUN) capacity. For HP 3PAR: LUN refers to a Virtual Volume (VV).
Copy Capacity Copy capacity includes mirrors.
Real Capacity Allocated VDisk capacity; the capacity that is available to hosts.
Used Capacity Amount of the allocated VDisk capacity (real capacity) that is used.
Free Capacity Free = Capacity - Real Capacity.
Uncompressed Used Capacity
For compressed volumes, indicates the amount of data written to the volume before compression.
Compressed Y if the volume is compressed.
Thin Provisioned Y if the volume is thinly provisioned.
MirroredIndicates if this LUN has a mirror. For HP 3PAR: LUN refers to a Virtual Volume (VV).
Space EfficientIndicates if this is a thin-provisioned LUN. For HP 3PAR: LUN refers to a Virtual Volume (VV).
IO Group Name The name of the I/O group to which this VDisk belongs.
Estimated Used LUN estimated used. For HP 3PAR: LUN refers to a Virtual Volume (VV). Dell EMC Unity: This value is same as 'Allocated' attribute in Dell EMC Unity. Amount of pool space reserved for the LUN, may be less than the total size for a thin LUN. For EMC XtremIO: This field is N/A.
See Estimated LUN Usage/Availability.
Estimated Available Estimated available LUN storage. For HP 3PAR: LUN refers to a Virtual Volume (VV).
# of Hosts Number of hosts that have allocated LUNs.
Host LUN The LUN to which the host is mapped. For HP 3PAR: LUN refers to a Virtual Volume (VV).
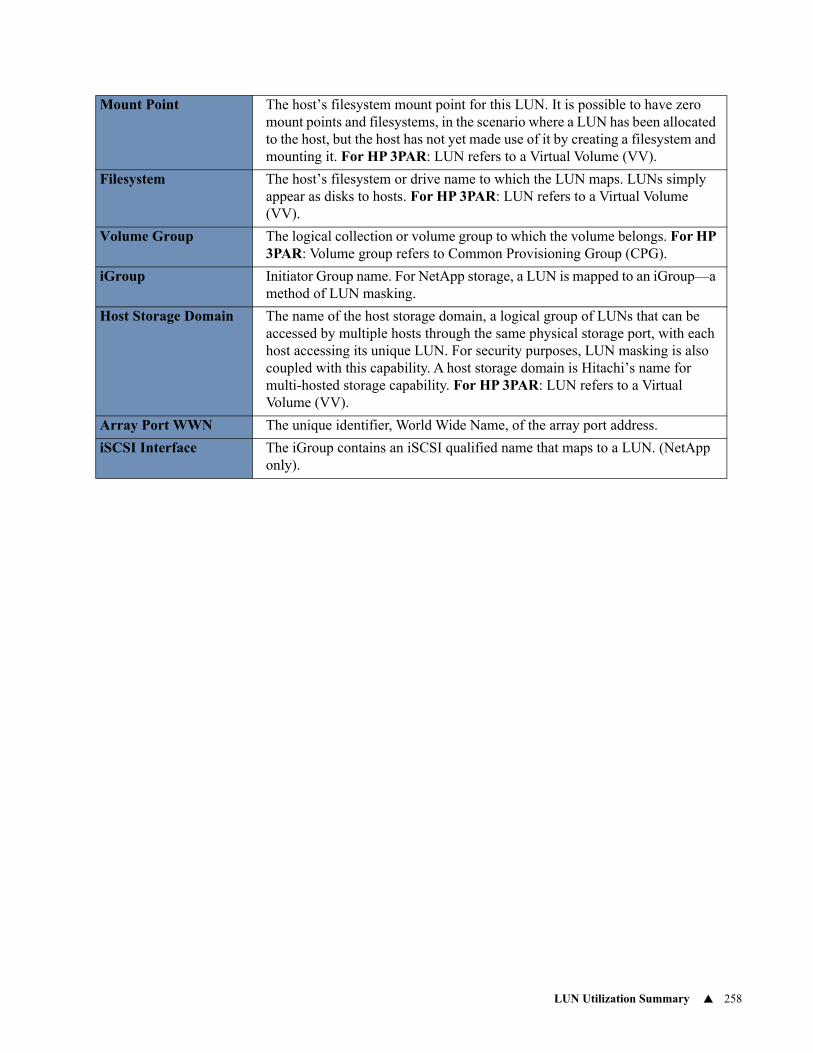
LUN Utilization Summary 258
Mount Point The host’s filesystem mount point for this LUN. It is possible to have zero mount points and filesystems, in the scenario where a LUN has been allocated to the host, but the host has not yet made use of it by creating a filesystem and mounting it. For HP 3PAR: LUN refers to a Virtual Volume (VV).
Filesystem The host’s filesystem or drive name to which the LUN maps. LUNs simply appear as disks to hosts. For HP 3PAR: LUN refers to a Virtual Volume (VV).
Volume Group The logical collection or volume group to which the volume belongs. For HP 3PAR: Volume group refers to Common Provisioning Group (CPG).
iGroup Initiator Group name. For NetApp storage, a LUN is mapped to an iGroup—a method of LUN masking.
Host Storage Domain The name of the host storage domain, a logical group of LUNs that can be accessed by multiple hosts through the same physical storage port, with each host accessing its unique LUN. For security purposes, LUN masking is also coupled with this capability. A host storage domain is Hitachi’s name for multi-hosted storage capability. For HP 3PAR: LUN refers to a Virtual Volume (VV).
Array Port WWN The unique identifier, World Wide Name, of the array port address.
iSCSI Interface The iGroup contains an iSCSI qualified name that maps to a LUN. (NetApp only).
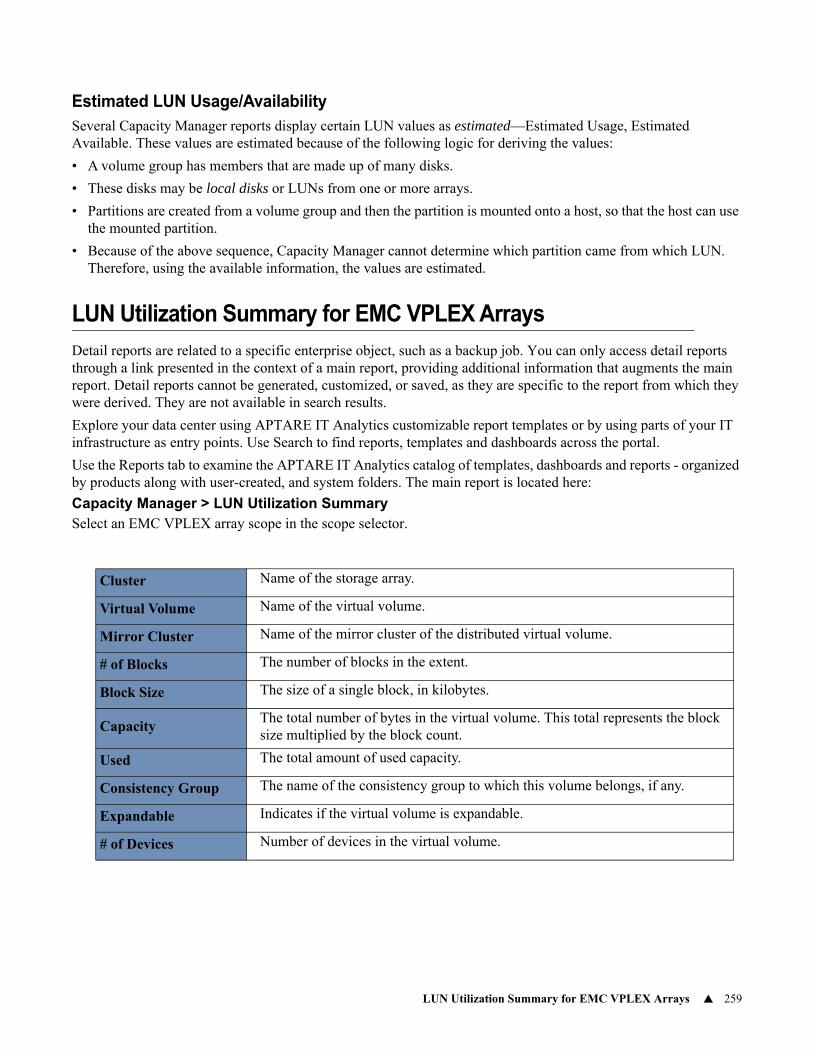
LUN Utilization Summary for EMC VPLEX Arrays 259
Estimated LUN Usage/AvailabilitySeveral Capacity Manager reports display certain LUN values as estimated—Estimated Usage, Estimated Available. These values are estimated because of the following logic for deriving the values:
• A volume group has members that are made up of many disks.
• These disks may be local disks or LUNs from one or more arrays.
• Partitions are created from a volume group and then the partition is mounted onto a host, so that the host can use the mounted partition.
• Because of the above sequence, Capacity Manager cannot determine which partition came from which LUN. Therefore, using the available information, the values are estimated.
LUN Utilization Summary for EMC VPLEX Arrays
Detail reports are related to a specific enterprise object, such as a backup job. You can only access detail reports through a link presented in the context of a main report, providing additional information that augments the main report. Detail reports cannot be generated, customized, or saved, as they are specific to the report from which they were derived. They are not available in search results.
Explore your data center using APTARE IT Analytics customizable report templates or by using parts of your IT infrastructure as entry points. Use Search to find reports, templates and dashboards across the portal.
Use the Reports tab to examine the APTARE IT Analytics catalog of templates, dashboards and reports - organized by products along with user-created, and system folders. The main report is located here:
Capacity Manager > LUN Utilization SummarySelect an EMC VPLEX array scope in the scope selector.
Cluster Name of the storage array.
Virtual Volume Name of the virtual volume.
Mirror Cluster Name of the mirror cluster of the distributed virtual volume.
# of Blocks The number of blocks in the extent.
Block Size The size of a single block, in kilobytes.
CapacityThe total number of bytes in the virtual volume. This total represents the block size multiplied by the block count.
Used The total amount of used capacity.
Consistency Group The name of the consistency group to which this volume belongs, if any.
Expandable Indicates if the virtual volume is expandable.
# of Devices Number of devices in the virtual volume.
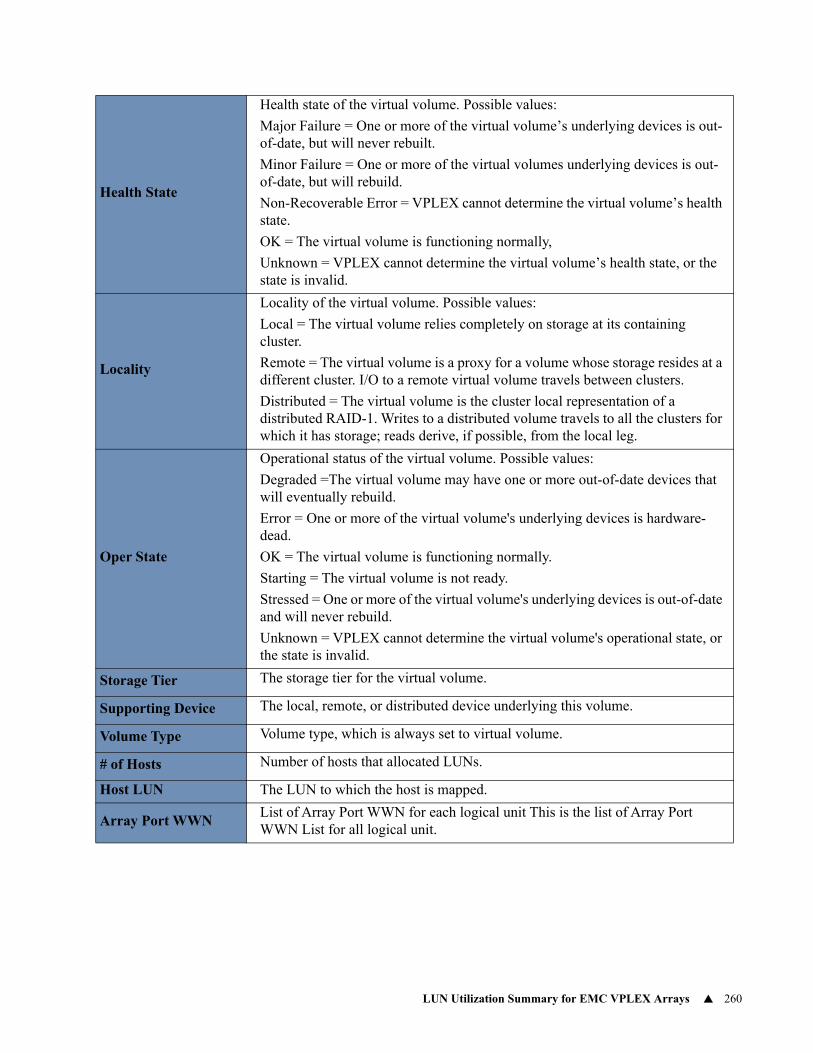
LUN Utilization Summary for EMC VPLEX Arrays 260
Health State
Health state of the virtual volume. Possible values:
Major Failure = One or more of the virtual volume’s underlying devices is out-of-date, but will never rebuilt.
Minor Failure = One or more of the virtual volumes underlying devices is out-of-date, but will rebuild.
Non-Recoverable Error = VPLEX cannot determine the virtual volume’s health state.
OK = The virtual volume is functioning normally,
Unknown = VPLEX cannot determine the virtual volume’s health state, or the state is invalid.
Locality
Locality of the virtual volume. Possible values:
Local = The virtual volume relies completely on storage at its containing cluster.
Remote = The virtual volume is a proxy for a volume whose storage resides at a different cluster. I/O to a remote virtual volume travels between clusters.
Distributed = The virtual volume is the cluster local representation of a distributed RAID-1. Writes to a distributed volume travels to all the clusters for which it has storage; reads derive, if possible, from the local leg.
Oper State
Operational status of the virtual volume. Possible values:
Degraded =The virtual volume may have one or more out-of-date devices that will eventually rebuild.
Error = One or more of the virtual volume's underlying devices is hardware-dead.
OK = The virtual volume is functioning normally.
Starting = The virtual volume is not ready.
Stressed = One or more of the virtual volume's underlying devices is out-of-date and will never rebuild.
Unknown = VPLEX cannot determine the virtual volume's operational state, or the state is invalid.
Storage Tier The storage tier for the virtual volume.
Supporting Device The local, remote, or distributed device underlying this volume.
Volume Type Volume type, which is always set to virtual volume.
# of Hosts Number of hosts that allocated LUNs.
Host LUN The LUN to which the host is mapped.
Array Port WWNList of Array Port WWN for each logical unit This is the list of Array Port WWN List for all logical unit.
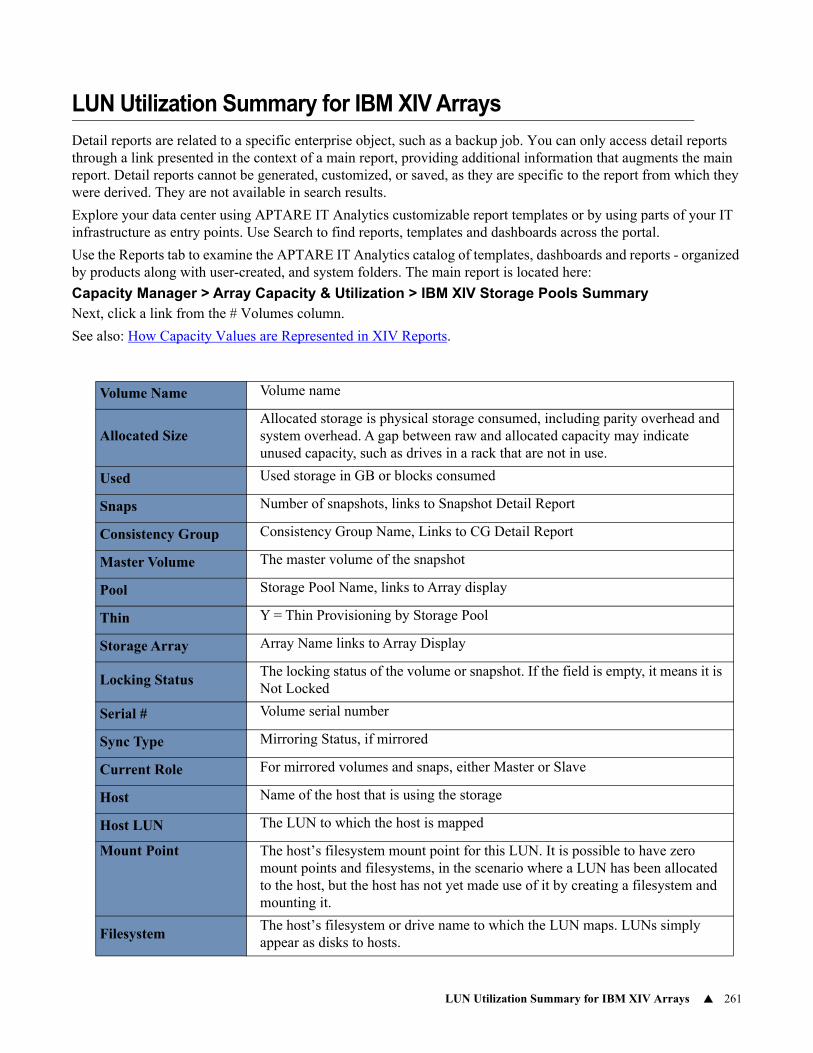
LUN Utilization Summary for IBM XIV Arrays 261
LUN Utilization Summary for IBM XIV Arrays
Detail reports are related to a specific enterprise object, such as a backup job. You can only access detail reports through a link presented in the context of a main report, providing additional information that augments the main report. Detail reports cannot be generated, customized, or saved, as they are specific to the report from which they were derived. They are not available in search results.
Explore your data center using APTARE IT Analytics customizable report templates or by using parts of your IT infrastructure as entry points. Use Search to find reports, templates and dashboards across the portal.
Use the Reports tab to examine the APTARE IT Analytics catalog of templates, dashboards and reports - organized by products along with user-created, and system folders. The main report is located here:
Capacity Manager > Array Capacity & Utilization > IBM XIV Storage Pools SummaryNext, click a link from the # Volumes column.
See also: How Capacity Values are Represented in XIV Reports.
Volume Name Volume name
Allocated SizeAllocated storage is physical storage consumed, including parity overhead and system overhead. A gap between raw and allocated capacity may indicate unused capacity, such as drives in a rack that are not in use.
Used Used storage in GB or blocks consumed
Snaps Number of snapshots, links to Snapshot Detail Report
Consistency Group Consistency Group Name, Links to CG Detail Report
Master Volume The master volume of the snapshot
Pool Storage Pool Name, links to Array display
Thin Y = Thin Provisioning by Storage Pool
Storage Array Array Name links to Array Display
Locking StatusThe locking status of the volume or snapshot. If the field is empty, it means it is Not Locked
Serial # Volume serial number
Sync Type Mirroring Status, if mirrored
Current Role For mirrored volumes and snaps, either Master or Slave
Host Name of the host that is using the storage
Host LUN The LUN to which the host is mapped
Mount Point The host’s filesystem mount point for this LUN. It is possible to have zero mount points and filesystems, in the scenario where a LUN has been allocated to the host, but the host has not yet made use of it by creating a filesystem and mounting it.
FilesystemThe host’s filesystem or drive name to which the LUN maps. LUNs simply appear as disks to hosts.
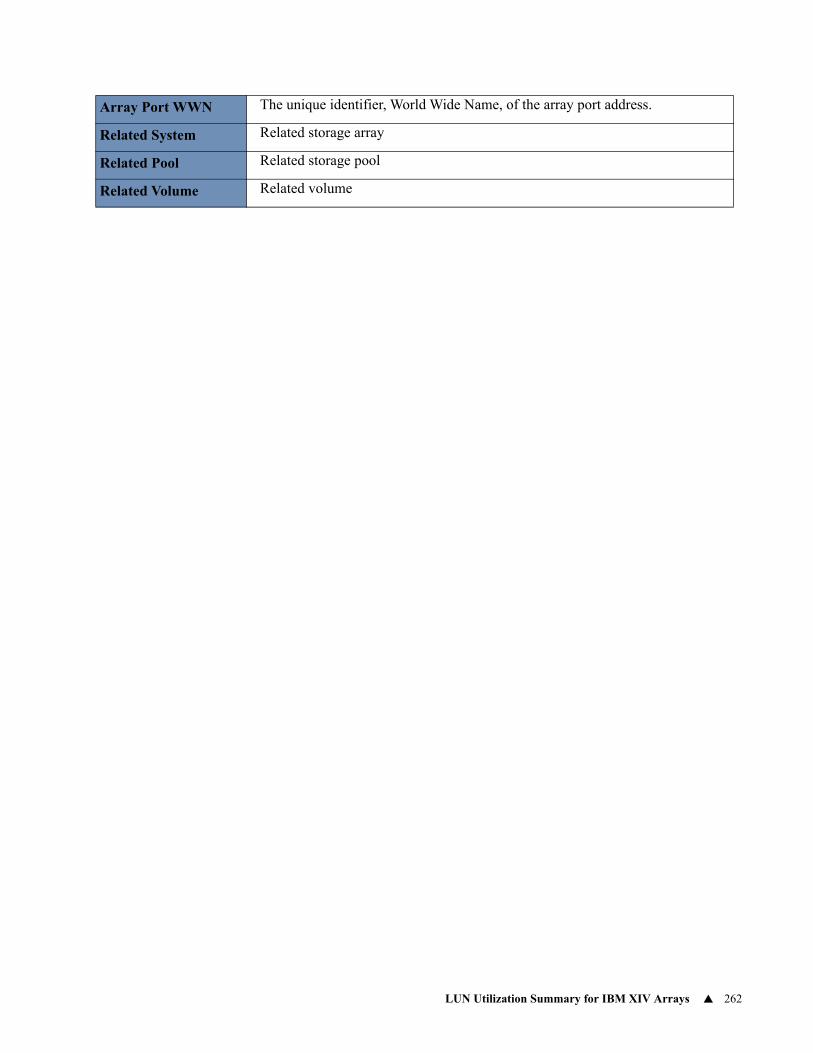
LUN Utilization Summary for IBM XIV Arrays 262
Array Port WWN The unique identifier, World Wide Name, of the array port address.
Related System Related storage array
Related Pool Related storage pool
Related Volume Related volume
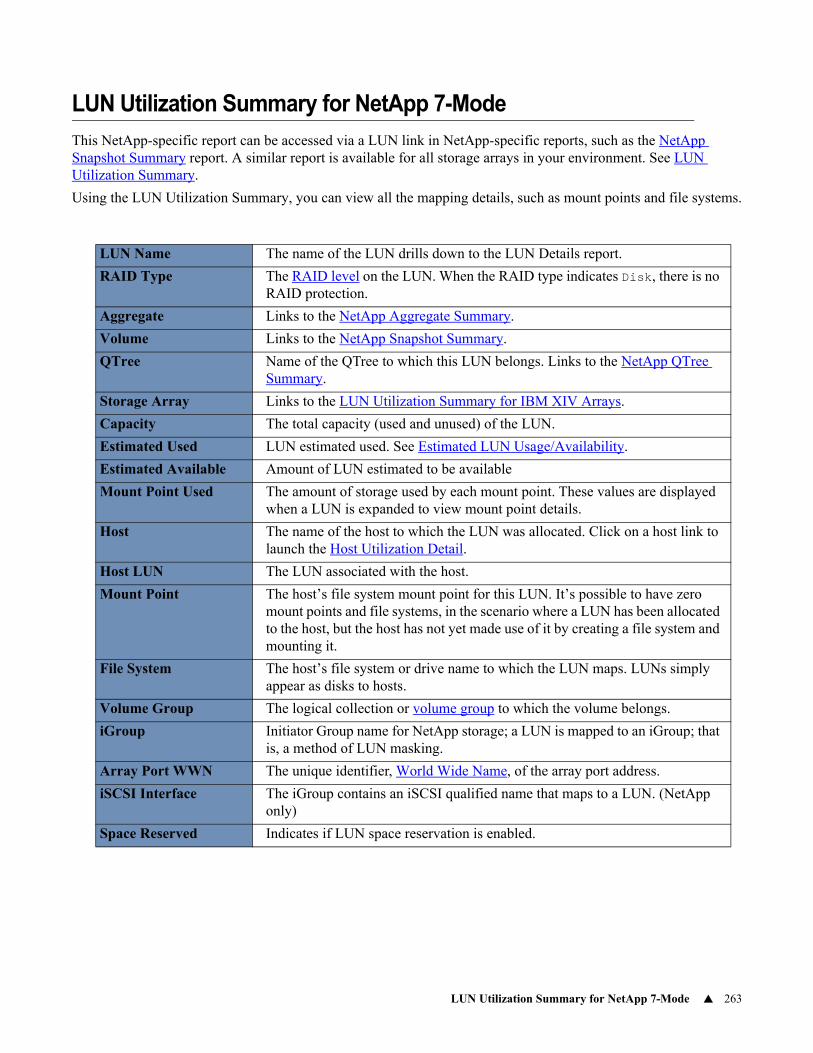
LUN Utilization Summary for NetApp 7-Mode 263
LUN Utilization Summary for NetApp 7-Mode
This NetApp-specific report can be accessed via a LUN link in NetApp-specific reports, such as the NetApp Snapshot Summary report. A similar report is available for all storage arrays in your environment. See LUN Utilization Summary.
Using the LUN Utilization Summary, you can view all the mapping details, such as mount points and file systems.
LUN Name The name of the LUN drills down to the LUN Details report.
RAID Type The RAID level on the LUN. When the RAID type indicates Disk, there is no RAID protection.
Aggregate Links to the NetApp Aggregate Summary.
Volume Links to the NetApp Snapshot Summary.
QTree Name of the QTree to which this LUN belongs. Links to the NetApp QTree Summary.
Storage Array Links to the LUN Utilization Summary for IBM XIV Arrays.
Capacity The total capacity (used and unused) of the LUN.
Estimated Used LUN estimated used. See Estimated LUN Usage/Availability.
Estimated Available Amount of LUN estimated to be available
Mount Point Used The amount of storage used by each mount point. These values are displayed when a LUN is expanded to view mount point details.
Host The name of the host to which the LUN was allocated. Click on a host link to launch the Host Utilization Detail.
Host LUN The LUN associated with the host.
Mount Point The host’s file system mount point for this LUN. It’s possible to have zero mount points and file systems, in the scenario where a LUN has been allocated to the host, but the host has not yet made use of it by creating a file system and mounting it.
File System The host’s file system or drive name to which the LUN maps. LUNs simply appear as disks to hosts.
Volume Group The logical collection or volume group to which the volume belongs.
iGroup Initiator Group name for NetApp storage; a LUN is mapped to an iGroup; that is, a method of LUN masking.
Array Port WWN The unique identifier, World Wide Name, of the array port address.
iSCSI Interface The iGroup contains an iSCSI qualified name that maps to a LUN. (NetApp only)
Space Reserved Indicates if LUN space reservation is enabled.
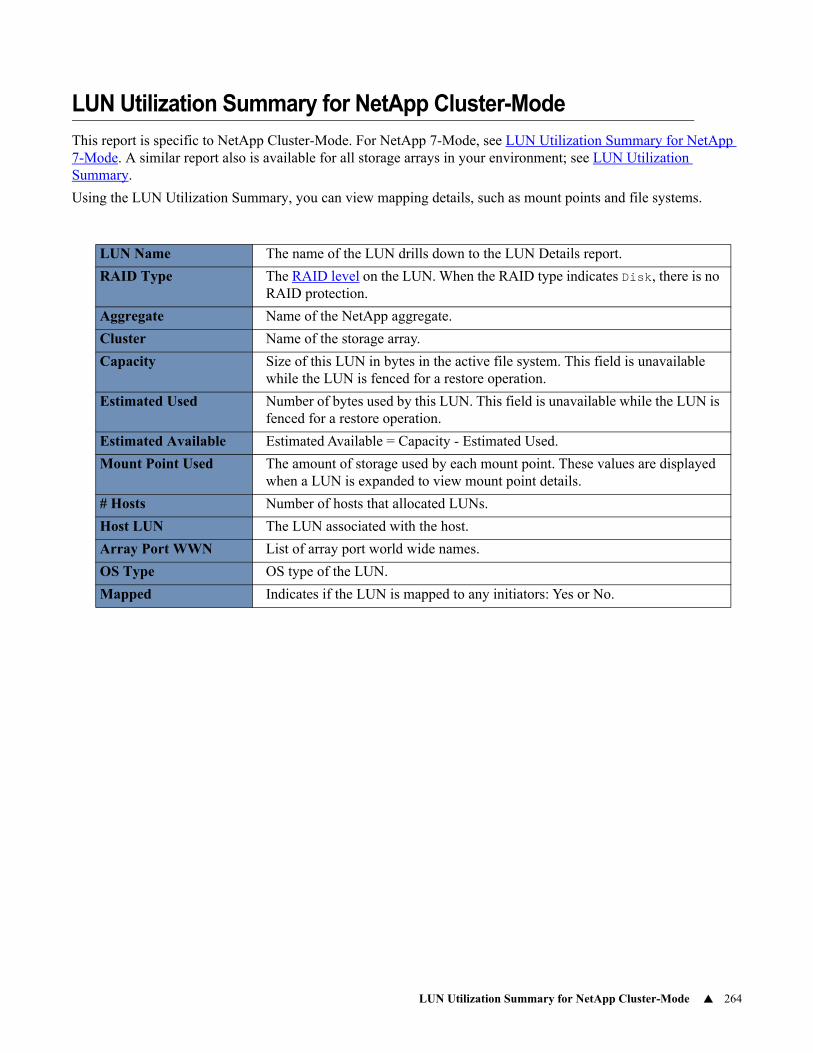
LUN Utilization Summary for NetApp Cluster-Mode 264
LUN Utilization Summary for NetApp Cluster-Mode
This report is specific to NetApp Cluster-Mode. For NetApp 7-Mode, see LUN Utilization Summary for NetApp 7-Mode. A similar report also is available for all storage arrays in your environment; see LUN Utilization Summary.
Using the LUN Utilization Summary, you can view mapping details, such as mount points and file systems.
LUN Name The name of the LUN drills down to the LUN Details report.
RAID Type The RAID level on the LUN. When the RAID type indicates Disk, there is no RAID protection.
Aggregate Name of the NetApp aggregate.
Cluster Name of the storage array.
Capacity Size of this LUN in bytes in the active file system. This field is unavailable while the LUN is fenced for a restore operation.
Estimated Used Number of bytes used by this LUN. This field is unavailable while the LUN is fenced for a restore operation.
Estimated Available Estimated Available = Capacity - Estimated Used.
Mount Point Used The amount of storage used by each mount point. These values are displayed when a LUN is expanded to view mount point details.
# Hosts Number of hosts that allocated LUNs.
Host LUN The LUN associated with the host.
Array Port WWN List of array port world wide names.
OS Type OS type of the LUN.
Mapped Indicates if the LUN is mapped to any initiators: Yes or No.
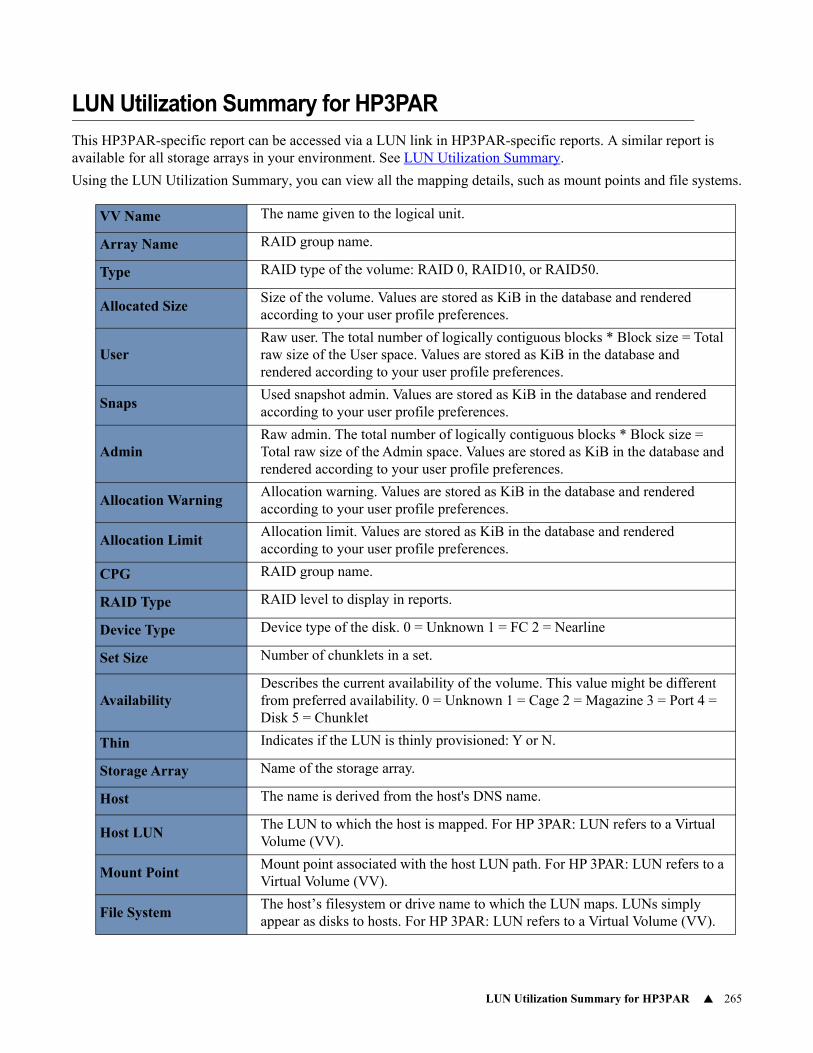
LUN Utilization Summary for HP3PAR 265
LUN Utilization Summary for HP3PAR
This HP3PAR-specific report can be accessed via a LUN link in HP3PAR-specific reports. A similar report is available for all storage arrays in your environment. See LUN Utilization Summary.
Using the LUN Utilization Summary, you can view all the mapping details, such as mount points and file systems.
VV Name The name given to the logical unit.
Array Name RAID group name.
Type RAID type of the volume: RAID 0, RAID10, or RAID50.
Allocated SizeSize of the volume. Values are stored as KiB in the database and rendered according to your user profile preferences.
UserRaw user. The total number of logically contiguous blocks * Block size = Total raw size of the User space. Values are stored as KiB in the database and rendered according to your user profile preferences.
SnapsUsed snapshot admin. Values are stored as KiB in the database and rendered according to your user profile preferences.
AdminRaw admin. The total number of logically contiguous blocks * Block size = Total raw size of the Admin space. Values are stored as KiB in the database and rendered according to your user profile preferences.
Allocation WarningAllocation warning. Values are stored as KiB in the database and rendered according to your user profile preferences.
Allocation LimitAllocation limit. Values are stored as KiB in the database and rendered according to your user profile preferences.
CPG RAID group name.
RAID Type RAID level to display in reports.
Device Type Device type of the disk. 0 = Unknown 1 = FC 2 = Nearline
Set Size Number of chunklets in a set.
AvailabilityDescribes the current availability of the volume. This value might be different from preferred availability. 0 = Unknown 1 = Cage 2 = Magazine 3 = Port 4 = Disk 5 = Chunklet
Thin Indicates if the LUN is thinly provisioned: Y or N.
Storage Array Name of the storage array.
Host The name is derived from the host's DNS name.
Host LUNThe LUN to which the host is mapped. For HP 3PAR: LUN refers to a Virtual Volume (VV).
Mount PointMount point associated with the host LUN path. For HP 3PAR: LUN refers to a Virtual Volume (VV).
File SystemThe host’s filesystem or drive name to which the LUN maps. LUNs simply appear as disks to hosts. For HP 3PAR: LUN refers to a Virtual Volume (VV).
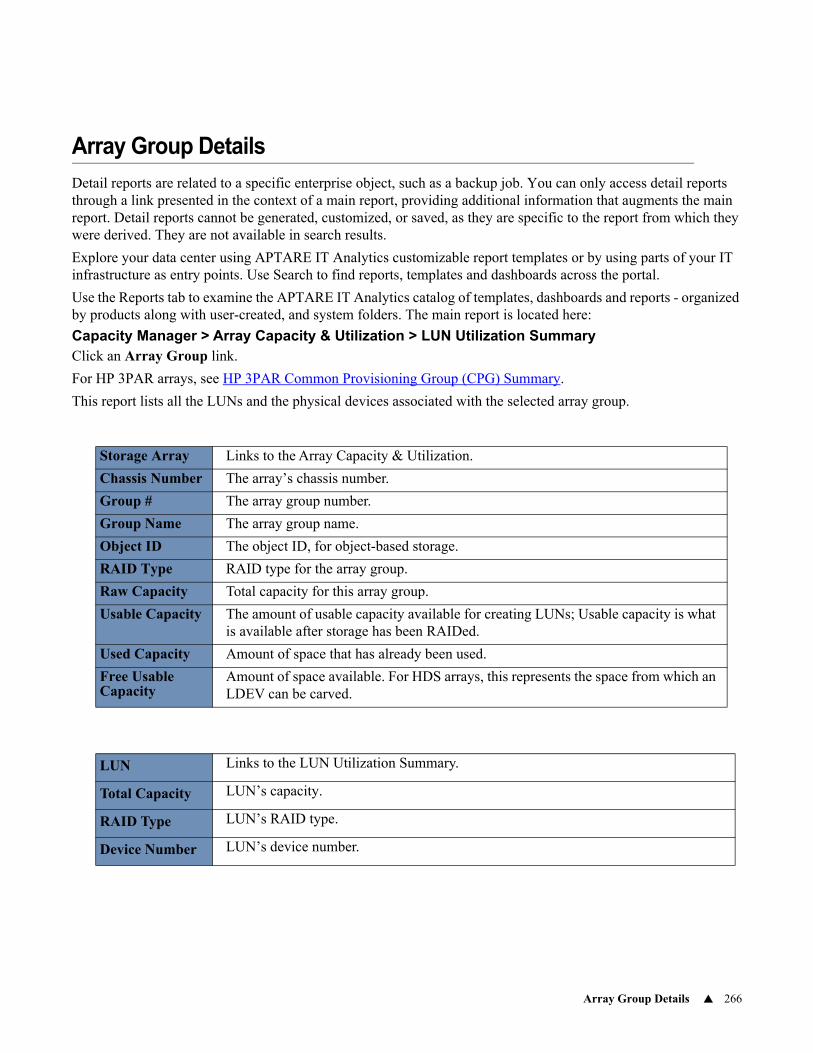
Array Group Details 266
Array Group Details
Detail reports are related to a specific enterprise object, such as a backup job. You can only access detail reports through a link presented in the context of a main report, providing additional information that augments the main report. Detail reports cannot be generated, customized, or saved, as they are specific to the report from which they were derived. They are not available in search results.
Explore your data center using APTARE IT Analytics customizable report templates or by using parts of your IT infrastructure as entry points. Use Search to find reports, templates and dashboards across the portal.
Use the Reports tab to examine the APTARE IT Analytics catalog of templates, dashboards and reports - organized by products along with user-created, and system folders. The main report is located here:
Capacity Manager > Array Capacity & Utilization > LUN Utilization SummaryClick an Array Group link.
For HP 3PAR arrays, see HP 3PAR Common Provisioning Group (CPG) Summary.
This report lists all the LUNs and the physical devices associated with the selected array group.
Storage Array Links to the Array Capacity & Utilization.
Chassis Number The array’s chassis number.
Group # The array group number.
Group Name The array group name.
Object ID The object ID, for object-based storage.
RAID Type RAID type for the array group.
Raw Capacity Total capacity for this array group.
Usable Capacity The amount of usable capacity available for creating LUNs; Usable capacity is what is available after storage has been RAIDed.
Used Capacity Amount of space that has already been used.
Free Usable Capacity
Amount of space available. For HDS arrays, this represents the space from which an LDEV can be carved.
LUN Links to the LUN Utilization Summary.
Total Capacity LUN’s capacity.
RAID Type LUN’s RAID type.
Device Number LUN’s device number.
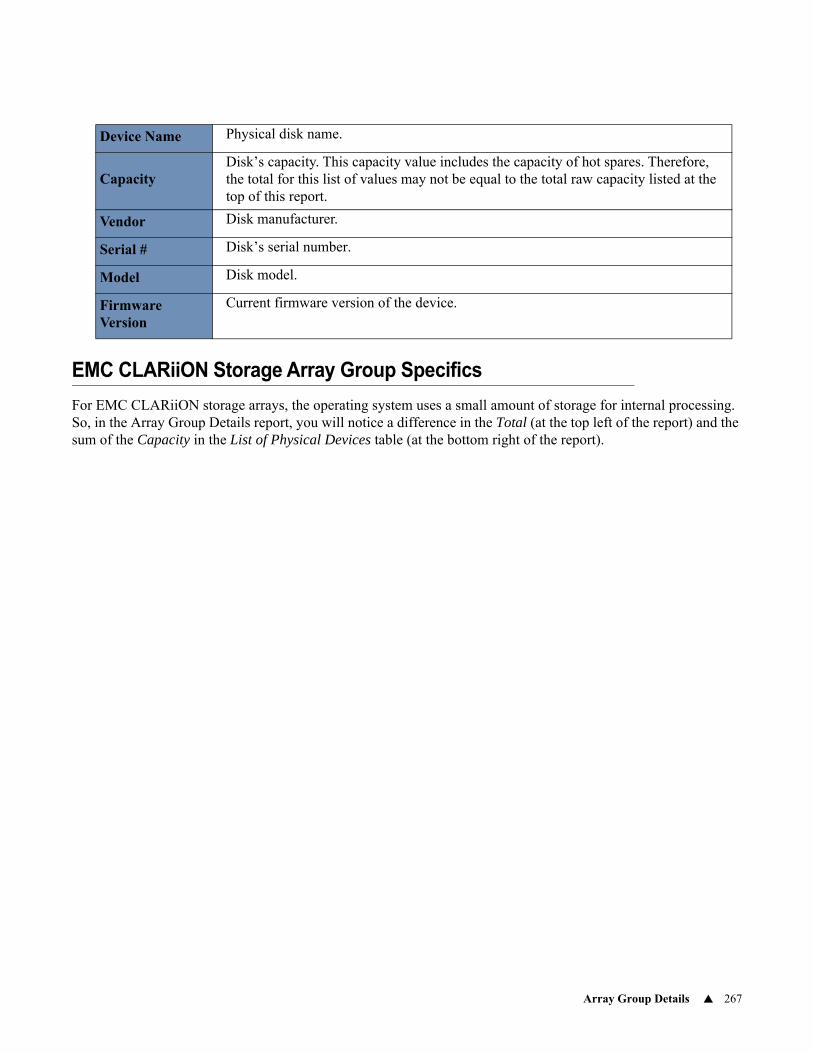
Array Group Details 267
EMC CLARiiON Storage Array Group Specifics
For EMC CLARiiON storage arrays, the operating system uses a small amount of storage for internal processing. So, in the Array Group Details report, you will notice a difference in the Total (at the top left of the report) and the sum of the Capacity in the List of Physical Devices table (at the bottom right of the report).
Device Name Physical disk name.
CapacityDisk’s capacity. This capacity value includes the capacity of hot spares. Therefore, the total for this list of values may not be equal to the total raw capacity listed at the top of this report.
Vendor Disk manufacturer.
Serial # Disk’s serial number.
Model Disk model.
Firmware Version
Current firmware version of the device.
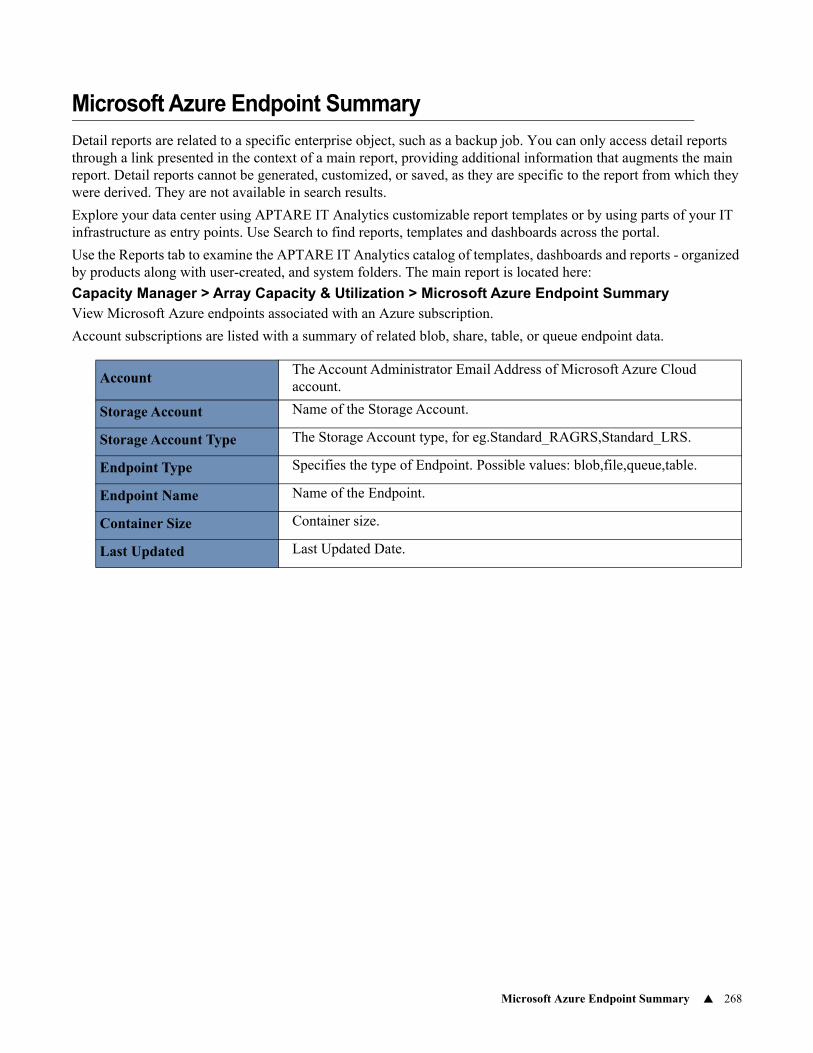
Microsoft Azure Endpoint Summary 268
Microsoft Azure Endpoint Summary
Detail reports are related to a specific enterprise object, such as a backup job. You can only access detail reports through a link presented in the context of a main report, providing additional information that augments the main report. Detail reports cannot be generated, customized, or saved, as they are specific to the report from which they were derived. They are not available in search results.
Explore your data center using APTARE IT Analytics customizable report templates or by using parts of your IT infrastructure as entry points. Use Search to find reports, templates and dashboards across the portal.
Use the Reports tab to examine the APTARE IT Analytics catalog of templates, dashboards and reports - organized by products along with user-created, and system folders. The main report is located here:
Capacity Manager > Array Capacity & Utilization > Microsoft Azure Endpoint SummaryView Microsoft Azure endpoints associated with an Azure subscription.
Account subscriptions are listed with a summary of related blob, share, table, or queue endpoint data.
AccountThe Account Administrator Email Address of Microsoft Azure Cloud account.
Storage Account Name of the Storage Account.
Storage Account Type The Storage Account type, for eg.Standard_RAGRS,Standard_LRS.
Endpoint Type Specifies the type of Endpoint. Possible values: blob,file,queue,table.
Endpoint Name Name of the Endpoint.
Container Size Container size.
Last Updated Last Updated Date.
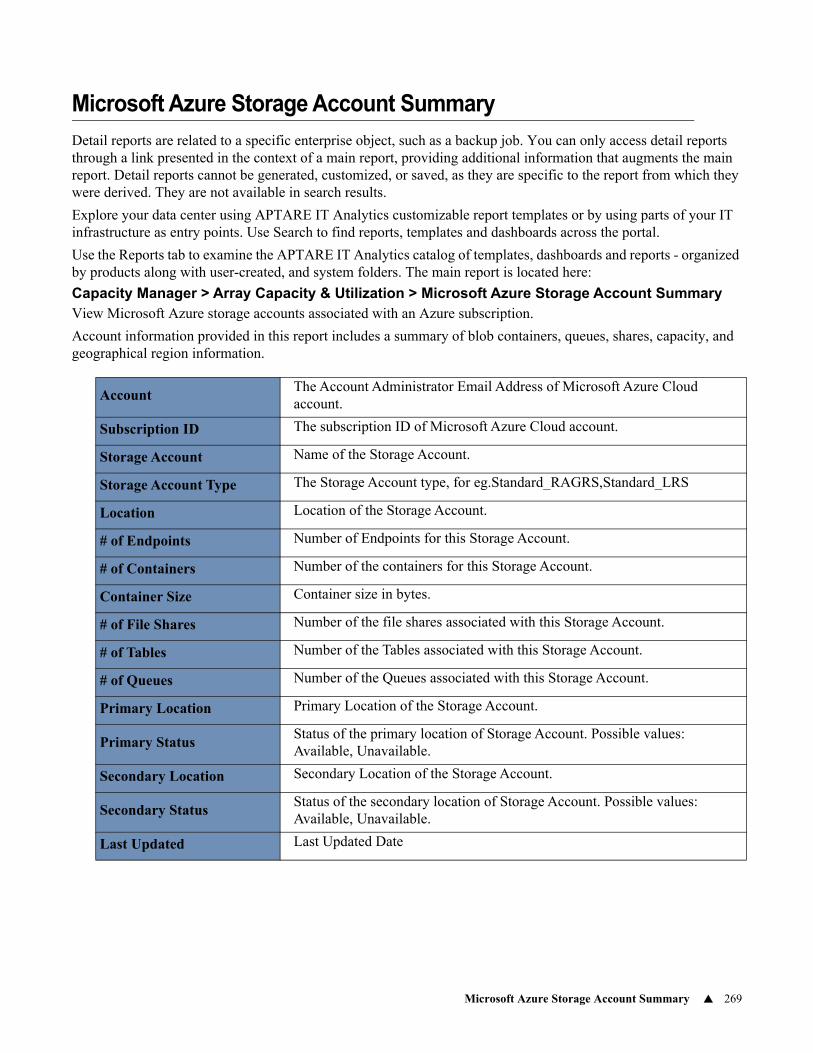
Microsoft Azure Storage Account Summary 269
Microsoft Azure Storage Account Summary
Detail reports are related to a specific enterprise object, such as a backup job. You can only access detail reports through a link presented in the context of a main report, providing additional information that augments the main report. Detail reports cannot be generated, customized, or saved, as they are specific to the report from which they were derived. They are not available in search results.
Explore your data center using APTARE IT Analytics customizable report templates or by using parts of your IT infrastructure as entry points. Use Search to find reports, templates and dashboards across the portal.
Use the Reports tab to examine the APTARE IT Analytics catalog of templates, dashboards and reports - organized by products along with user-created, and system folders. The main report is located here:
Capacity Manager > Array Capacity & Utilization > Microsoft Azure Storage Account SummaryView Microsoft Azure storage accounts associated with an Azure subscription.
Account information provided in this report includes a summary of blob containers, queues, shares, capacity, and geographical region information.
AccountThe Account Administrator Email Address of Microsoft Azure Cloud account.
Subscription ID The subscription ID of Microsoft Azure Cloud account.
Storage Account Name of the Storage Account.
Storage Account Type The Storage Account type, for eg.Standard_RAGRS,Standard_LRS
Location Location of the Storage Account.
# of Endpoints Number of Endpoints for this Storage Account.
# of Containers Number of the containers for this Storage Account.
Container Size Container size in bytes.
# of File Shares Number of the file shares associated with this Storage Account.
# of Tables Number of the Tables associated with this Storage Account.
# of Queues Number of the Queues associated with this Storage Account.
Primary Location Primary Location of the Storage Account.
Primary StatusStatus of the primary location of Storage Account. Possible values: Available, Unavailable.
Secondary Location Secondary Location of the Storage Account.
Secondary StatusStatus of the secondary location of Storage Account. Possible values: Available, Unavailable.
Last Updated Last Updated Date
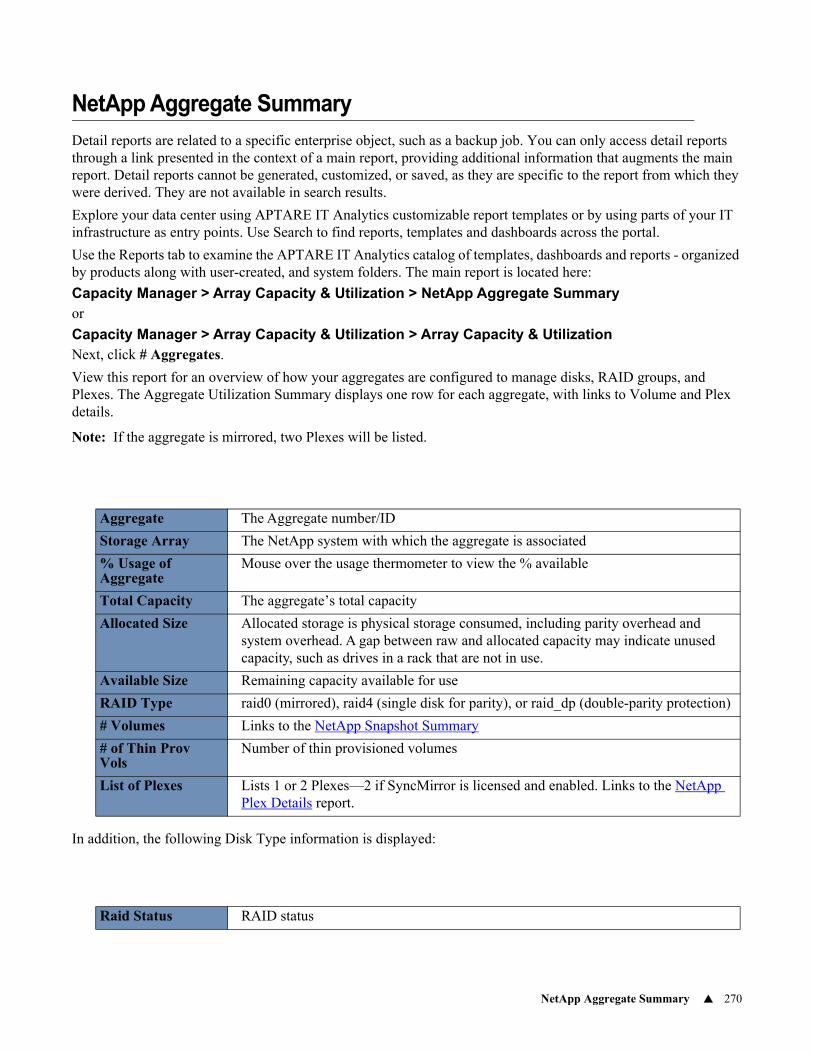
NetApp Aggregate Summary 270
NetApp Aggregate Summary
Detail reports are related to a specific enterprise object, such as a backup job. You can only access detail reports through a link presented in the context of a main report, providing additional information that augments the main report. Detail reports cannot be generated, customized, or saved, as they are specific to the report from which they were derived. They are not available in search results.
Explore your data center using APTARE IT Analytics customizable report templates or by using parts of your IT infrastructure as entry points. Use Search to find reports, templates and dashboards across the portal.
Use the Reports tab to examine the APTARE IT Analytics catalog of templates, dashboards and reports - organized by products along with user-created, and system folders. The main report is located here:
Capacity Manager > Array Capacity & Utilization > NetApp Aggregate Summaryor
Capacity Manager > Array Capacity & Utilization > Array Capacity & UtilizationNext, click # Aggregates.
View this report for an overview of how your aggregates are configured to manage disks, RAID groups, and Plexes. The Aggregate Utilization Summary displays one row for each aggregate, with links to Volume and Plex details.
Note: If the aggregate is mirrored, two Plexes will be listed.
In addition, the following Disk Type information is displayed:
Aggregate The Aggregate number/ID
Storage Array The NetApp system with which the aggregate is associated
% Usage of Aggregate
Mouse over the usage thermometer to view the % available
Total Capacity The aggregate’s total capacity
Allocated Size Allocated storage is physical storage consumed, including parity overhead and system overhead. A gap between raw and allocated capacity may indicate unused capacity, such as drives in a rack that are not in use.
Available Size Remaining capacity available for use
RAID Type raid0 (mirrored), raid4 (single disk for parity), or raid_dp (double-parity protection)
# Volumes Links to the NetApp Snapshot Summary
# of Thin Prov Vols
Number of thin provisioned volumes
List of Plexes Lists 1 or 2 Plexes—2 if SyncMirror is licensed and enabled. Links to the NetApp Plex Details report.
Raid Status RAID status
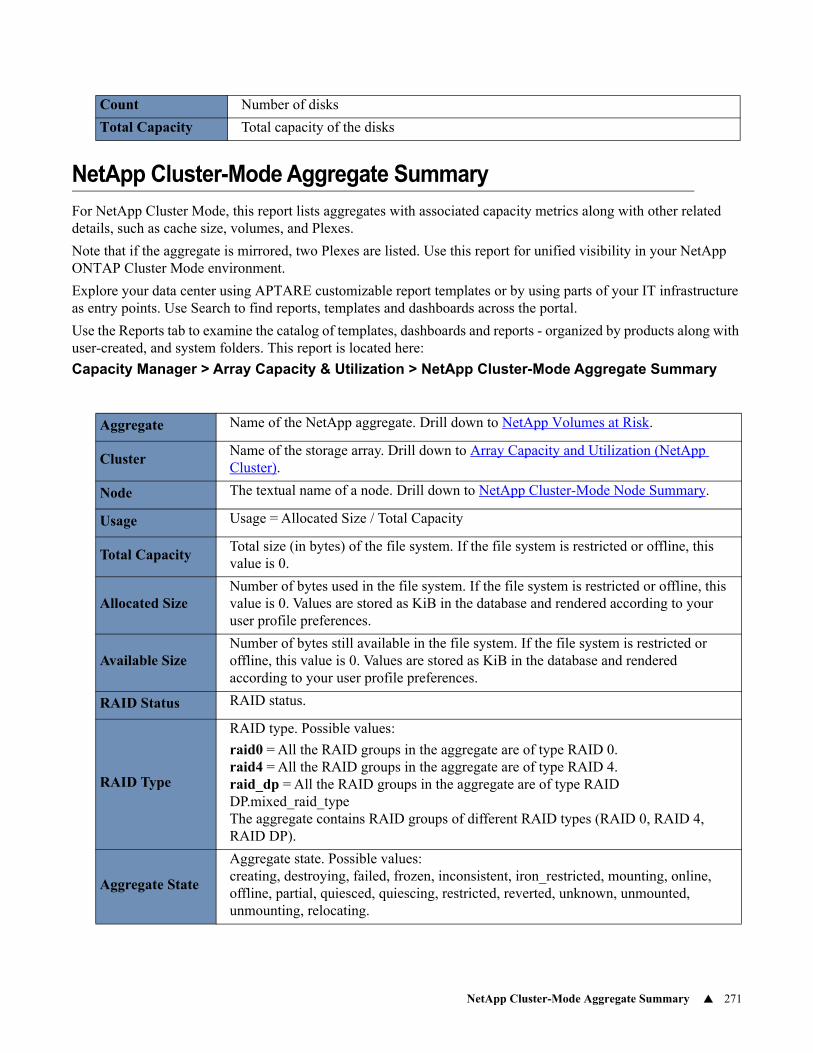
NetApp Cluster-Mode Aggregate Summary 271
NetApp Cluster-Mode Aggregate Summary
For NetApp Cluster Mode, this report lists aggregates with associated capacity metrics along with other related details, such as cache size, volumes, and Plexes.
Note that if the aggregate is mirrored, two Plexes are listed. Use this report for unified visibility in your NetApp ONTAP Cluster Mode environment.
Explore your data center using APTARE customizable report templates or by using parts of your IT infrastructure as entry points. Use Search to find reports, templates and dashboards across the portal.
Use the Reports tab to examine the catalog of templates, dashboards and reports - organized by products along with user-created, and system folders. This report is located here:
Capacity Manager > Array Capacity & Utilization > NetApp Cluster-Mode Aggregate Summary
Count Number of disks
Total Capacity Total capacity of the disks
Aggregate Name of the NetApp aggregate. Drill down to NetApp Volumes at Risk.
ClusterName of the storage array. Drill down to Array Capacity and Utilization (NetApp Cluster).
Node The textual name of a node. Drill down to NetApp Cluster-Mode Node Summary.
Usage Usage = Allocated Size / Total Capacity
Total Capacity Total size (in bytes) of the file system. If the file system is restricted or offline, this value is 0.
Allocated Size Number of bytes used in the file system. If the file system is restricted or offline, this value is 0. Values are stored as KiB in the database and rendered according to your user profile preferences.
Available Size Number of bytes still available in the file system. If the file system is restricted or offline, this value is 0. Values are stored as KiB in the database and rendered according to your user profile preferences.
RAID Status RAID status.
RAID Type
RAID type. Possible values:
raid0 = All the RAID groups in the aggregate are of type RAID 0.raid4 = All the RAID groups in the aggregate are of type RAID 4.raid_dp = All the RAID groups in the aggregate are of type RAID DP.mixed_raid_typeThe aggregate contains RAID groups of different RAID types (RAID 0, RAID 4, RAID DP).
Aggregate State
Aggregate state. Possible values:creating, destroying, failed, frozen, inconsistent, iron_restricted, mounting, online, offline, partial, quiesced, quiescing, restricted, reverted, unknown, unmounted, unmounting, relocating.
NetApp Aggregate Detail 272
NetApp Aggregate Detail
Detail reports are related to a specific enterprise object, such as a backup job. You can only access detail reports through a link presented in the context of a main report, providing additional information that augments the main report. Detail reports cannot be generated, customized, or saved, as they are specific to the report from which they were derived. They are not available in search results.
Explore your data center using APTARE IT Analytics customizable report templates or by using parts of your IT infrastructure as entry points. Use Search to find reports, templates and dashboards across the portal.
Use the Reports tab to examine the APTARE IT Analytics catalog of templates, dashboards and reports - organized by products along with user-created, and system folders. The main report is located here:
Capacity Manager > Array Capacity & Utilization > Array Capacity & UtilizationNext, click # Aggregates.
Click an Aggregate Name link.
The Aggregate Detail forecasts usage, based on historical data. Mouse over the Aggregate and Volume usage symbols to view the historical and projected usage.
# DisksNumber of disks in the aggregate. Drill down to NetApp Cluster-Mode Disk Summary.
# VolumesNumber of volumes in the aggregate. Drill down to NetApp Cluster-Mode Volume Summary.
# Thin VolumesNumber of thin volumes in the aggregate. Drill down to NetApp Cluster-Mode Volume Summary.
List of Plexes List of plex names. If the aggregate is mirrored, two Plexes are listed
Hybrid Cache Size
Total cache size (in bytes) for a hybrid aggregate. If the aggregate is restricted or offline, or if it is not a hybrid aggregate, this value is 0.Values are stored as KiB in the database and rendered according to your user profile preferences.
Cache RAID Group Size
Maximum cache RAID group size of a hybrid aggregate. RAID group size is the maximum number of disks that can be added to a RAID group. Values are stored as KiB in the database and rendered according to your user profile preferences.
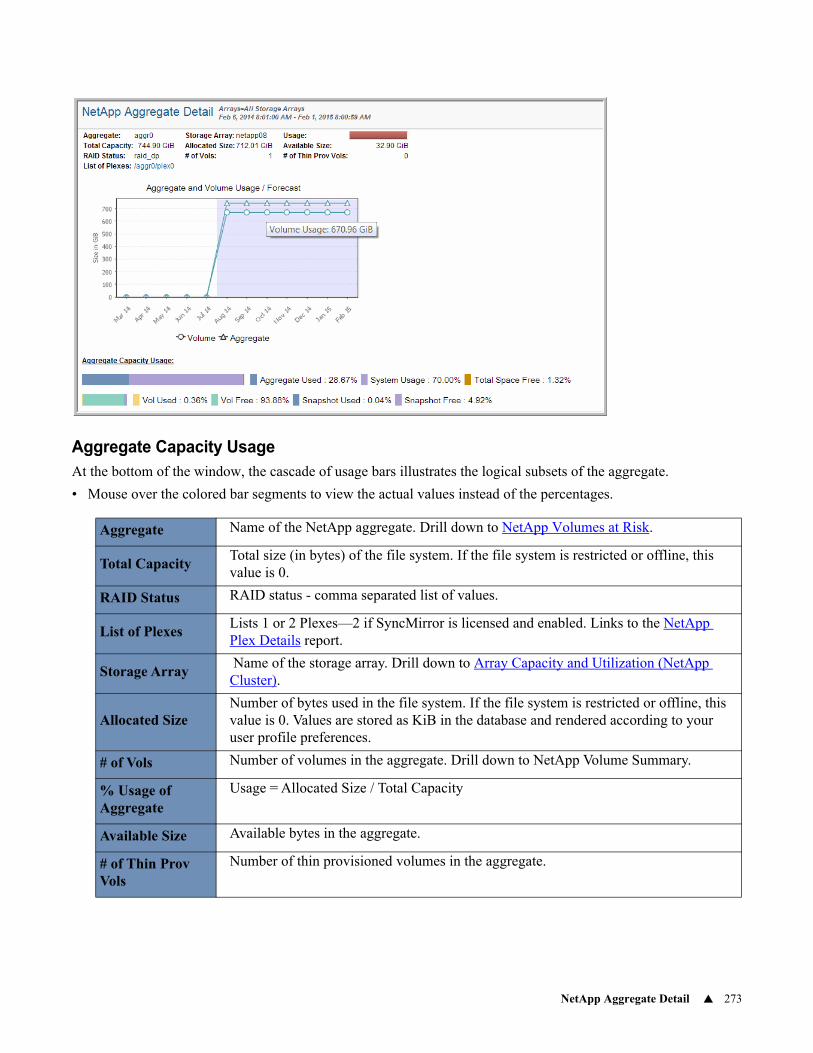
NetApp Aggregate Detail 273
Aggregate Capacity UsageAt the bottom of the window, the cascade of usage bars illustrates the logical subsets of the aggregate.
• Mouse over the colored bar segments to view the actual values instead of the percentages.
Aggregate Name of the NetApp aggregate. Drill down to NetApp Volumes at Risk.
Total Capacity Total size (in bytes) of the file system. If the file system is restricted or offline, this value is 0.
RAID Status RAID status - comma separated list of values.
List of PlexesLists 1 or 2 Plexes—2 if SyncMirror is licensed and enabled. Links to the NetApp Plex Details report.
Storage Array Name of the storage array. Drill down to Array Capacity and Utilization (NetApp Cluster).
Allocated Size Number of bytes used in the file system. If the file system is restricted or offline, this value is 0. Values are stored as KiB in the database and rendered according to your user profile preferences.
# of Vols Number of volumes in the aggregate. Drill down to NetApp Volume Summary.
% Usage of Aggregate
Usage = Allocated Size / Total Capacity
Available Size Available bytes in the aggregate.
# of Thin Prov Vols
Number of thin provisioned volumes in the aggregate.
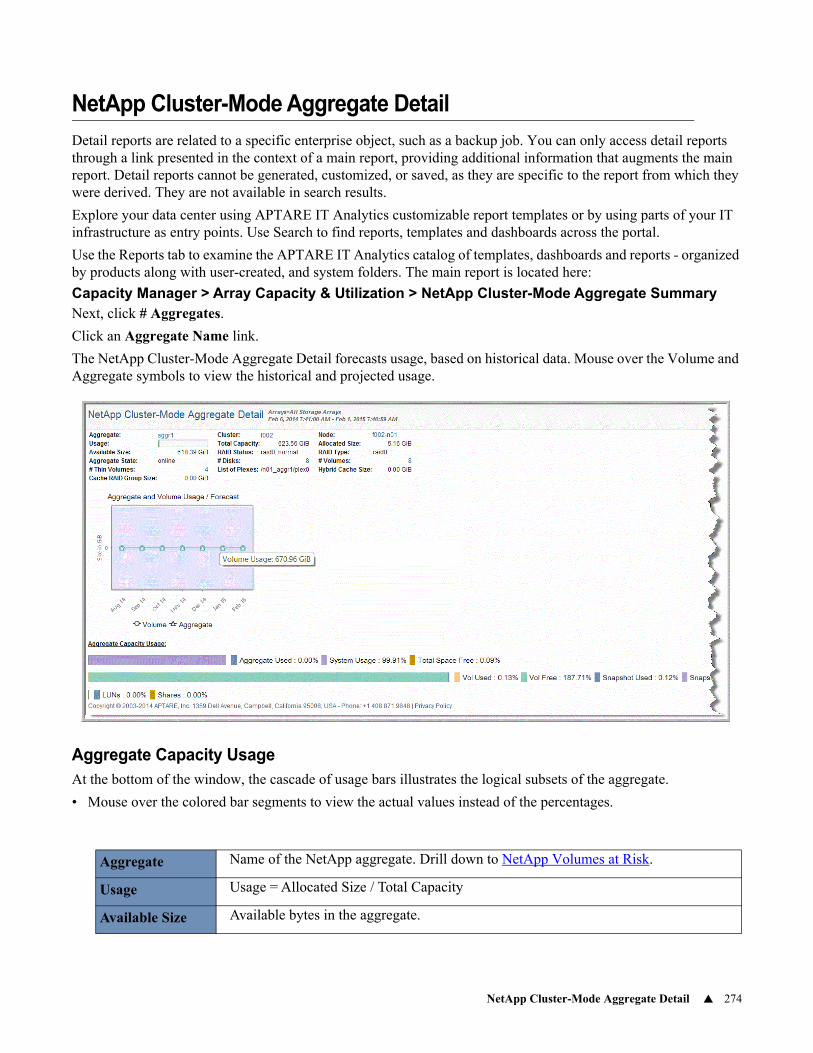
NetApp Cluster-Mode Aggregate Detail 274
NetApp Cluster-Mode Aggregate Detail
Detail reports are related to a specific enterprise object, such as a backup job. You can only access detail reports through a link presented in the context of a main report, providing additional information that augments the main report. Detail reports cannot be generated, customized, or saved, as they are specific to the report from which they were derived. They are not available in search results.
Explore your data center using APTARE IT Analytics customizable report templates or by using parts of your IT infrastructure as entry points. Use Search to find reports, templates and dashboards across the portal.
Use the Reports tab to examine the APTARE IT Analytics catalog of templates, dashboards and reports - organized by products along with user-created, and system folders. The main report is located here:
Capacity Manager > Array Capacity & Utilization > NetApp Cluster-Mode Aggregate SummaryNext, click # Aggregates.
Click an Aggregate Name link.
The NetApp Cluster-Mode Aggregate Detail forecasts usage, based on historical data. Mouse over the Volume and Aggregate symbols to view the historical and projected usage.
Aggregate Capacity UsageAt the bottom of the window, the cascade of usage bars illustrates the logical subsets of the aggregate.
• Mouse over the colored bar segments to view the actual values instead of the percentages.
Aggregate Name of the NetApp aggregate. Drill down to NetApp Volumes at Risk.
Usage Usage = Allocated Size / Total Capacity
Available Size Available bytes in the aggregate.
NetApp Cluster-Mode Aggregate Detail 275
Aggregate State Aggregate state.
# Thin Volumes Number of thin provisioned volumes in the aggregate.
Cache RAID Group Size
Maximum cache RAID group size of a hybrid aggregate. RAID group size is the maximum number of disks that can be added to a RAID group. Values are stored as KiB in the database and rendered according to your user profile preferences.
ClusterName of the storage array. Drill down to Array Capacity and Utilization (NetApp Cluster).
Total Capacity Total size (in bytes) of the file system. If the file system is restricted or offline, this value is 0.
RAID Status RAID status - comma separated list of values.
# Disks Number of disks in the aggregate.
List of PlexesLists 1 or 2 Plexes—2 if SyncMirror is licensed and enabled. Links to the NetApp Plex Details report.
Node The textual name of the node. Drill down to NetApp Cluster-Mode Node Summary.
Allocated Size Number of bytes used in the file system. If the file system is restricted or offline, this value is 0. Values are stored as KiB in the database and rendered according to your user profile preferences.
RAID Type
RAID type. Possible values:
raid0 = All the RAID groups in the aggregate are of type RAID 0.raid4 = All the RAID groups in the aggregate are of type RAID 4.raid_dp = All the RAID groups in the aggregate are of type RAID DP.mixed_raid_typeThe aggregate contains RAID groups of different RAID types (RAID 0, RAID 4, RAID DP).
# Volumes Number of volumes in the aggregate. Drill down to NetApp Volume Summary.
Hybrid Cache Size
Total cache size (in bytes) for a hybrid aggregate. If the aggregate is restricted or offline, or if it is not a hybrid aggregate, this value is 0.Values are stored as KiB in the database and rendered according to your user profile preferences.
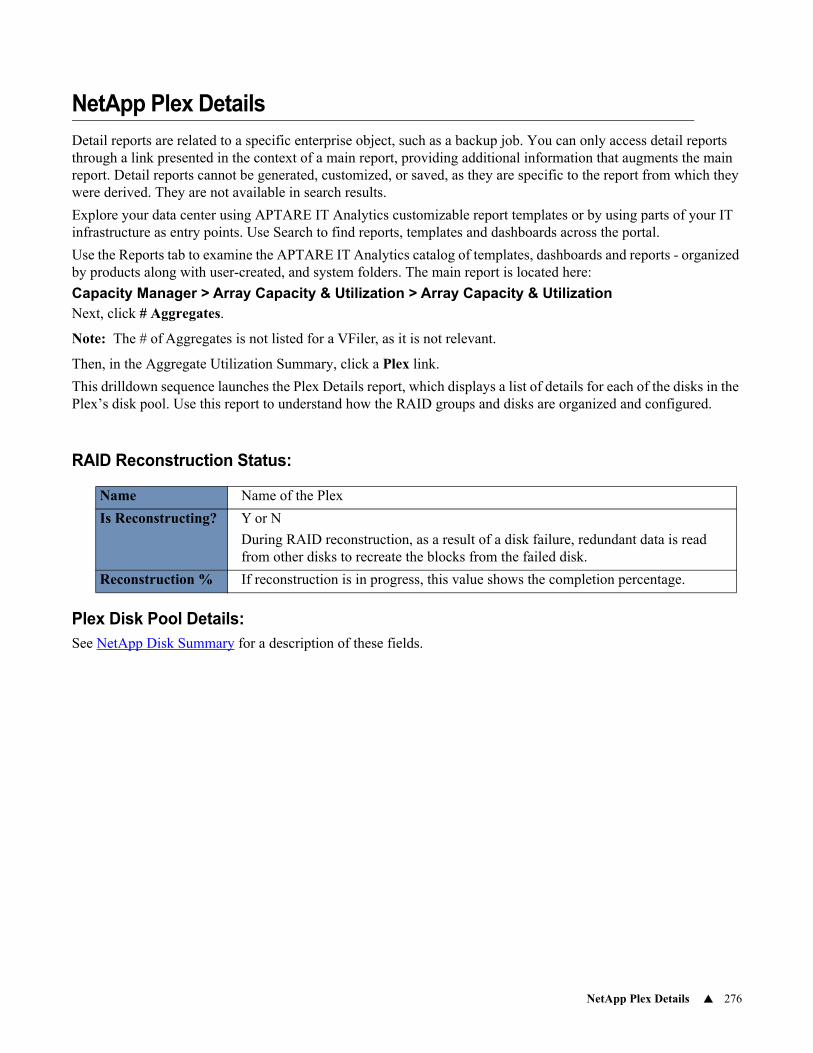
NetApp Plex Details 276
NetApp Plex Details
Detail reports are related to a specific enterprise object, such as a backup job. You can only access detail reports through a link presented in the context of a main report, providing additional information that augments the main report. Detail reports cannot be generated, customized, or saved, as they are specific to the report from which they were derived. They are not available in search results.
Explore your data center using APTARE IT Analytics customizable report templates or by using parts of your IT infrastructure as entry points. Use Search to find reports, templates and dashboards across the portal.
Use the Reports tab to examine the APTARE IT Analytics catalog of templates, dashboards and reports - organized by products along with user-created, and system folders. The main report is located here:
Capacity Manager > Array Capacity & Utilization > Array Capacity & UtilizationNext, click # Aggregates.
Note: The # of Aggregates is not listed for a VFiler, as it is not relevant.
Then, in the Aggregate Utilization Summary, click a Plex link.
This drilldown sequence launches the Plex Details report, which displays a list of details for each of the disks in the Plex’s disk pool. Use this report to understand how the RAID groups and disks are organized and configured.
RAID Reconstruction Status:
Plex Disk Pool Details:See NetApp Disk Summary for a description of these fields.
Name Name of the Plex
Is Reconstructing? Y or N
During RAID reconstruction, as a result of a disk failure, redundant data is read from other disks to recreate the blocks from the failed disk.
Reconstruction % If reconstruction is in progress, this value shows the completion percentage.
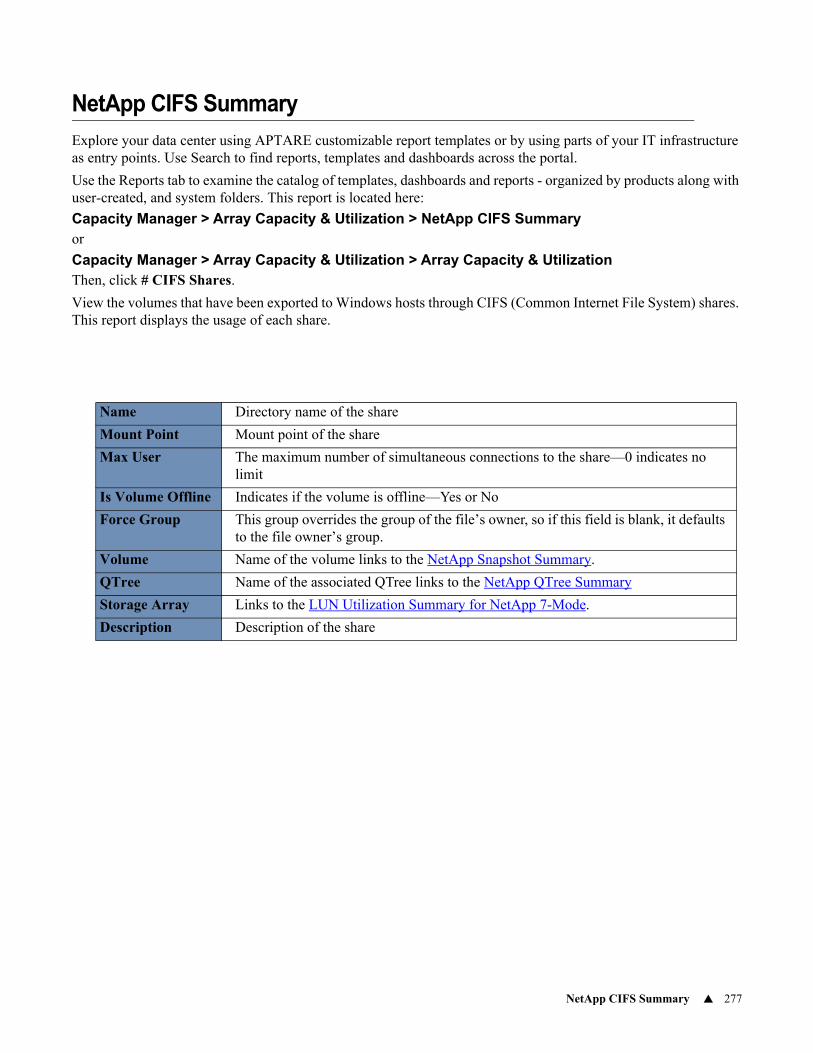
NetApp CIFS Summary 277
NetApp CIFS Summary
Explore your data center using APTARE customizable report templates or by using parts of your IT infrastructure as entry points. Use Search to find reports, templates and dashboards across the portal.
Use the Reports tab to examine the catalog of templates, dashboards and reports - organized by products along with user-created, and system folders. This report is located here:
Capacity Manager > Array Capacity & Utilization > NetApp CIFS Summaryor
Capacity Manager > Array Capacity & Utilization > Array Capacity & UtilizationThen, click # CIFS Shares.
View the volumes that have been exported to Windows hosts through CIFS (Common Internet File System) shares. This report displays the usage of each share.
Name Directory name of the share
Mount Point Mount point of the share
Max User The maximum number of simultaneous connections to the share—0 indicates no limit
Is Volume Offline Indicates if the volume is offline—Yes or No
Force Group This group overrides the group of the file’s owner, so if this field is blank, it defaults to the file owner’s group.
Volume Name of the volume links to the NetApp Snapshot Summary.
QTree Name of the associated QTree links to the NetApp QTree Summary
Storage Array Links to the LUN Utilization Summary for NetApp 7-Mode.
Description Description of the share
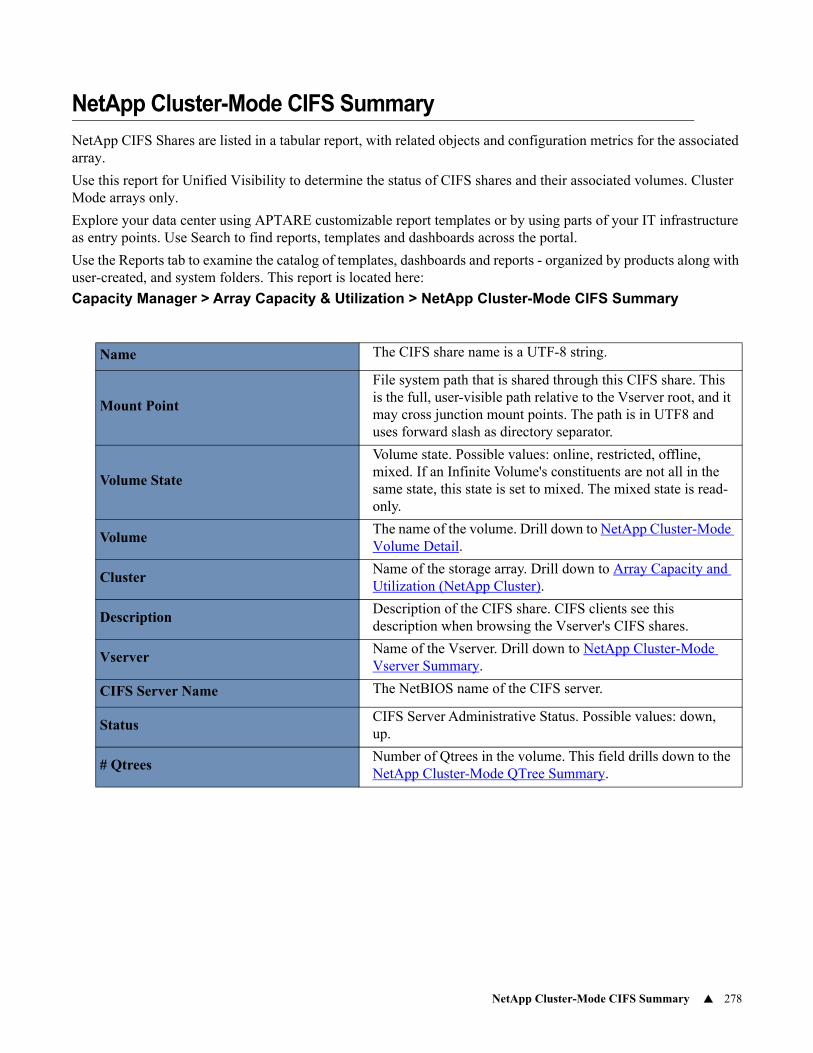
NetApp Cluster-Mode CIFS Summary 278
NetApp Cluster-Mode CIFS Summary
NetApp CIFS Shares are listed in a tabular report, with related objects and configuration metrics for the associated array.
Use this report for Unified Visibility to determine the status of CIFS shares and their associated volumes. Cluster Mode arrays only.
Explore your data center using APTARE customizable report templates or by using parts of your IT infrastructure as entry points. Use Search to find reports, templates and dashboards across the portal.
Use the Reports tab to examine the catalog of templates, dashboards and reports - organized by products along with user-created, and system folders. This report is located here:
Capacity Manager > Array Capacity & Utilization > NetApp Cluster-Mode CIFS Summary
Name The CIFS share name is a UTF-8 string.
Mount Point
File system path that is shared through this CIFS share. This is the full, user-visible path relative to the Vserver root, and it may cross junction mount points. The path is in UTF8 and uses forward slash as directory separator.
Volume State
Volume state. Possible values: online, restricted, offline, mixed. If an Infinite Volume's constituents are not all in the same state, this state is set to mixed. The mixed state is read-only.
VolumeThe name of the volume. Drill down to NetApp Cluster-Mode Volume Detail.
ClusterName of the storage array. Drill down to Array Capacity and Utilization (NetApp Cluster).
DescriptionDescription of the CIFS share. CIFS clients see this description when browsing the Vserver's CIFS shares.
VserverName of the Vserver. Drill down to NetApp Cluster-Mode Vserver Summary.
CIFS Server Name The NetBIOS name of the CIFS server.
StatusCIFS Server Administrative Status. Possible values: down, up.
# QtreesNumber of Qtrees in the volume. This field drills down to the NetApp Cluster-Mode QTree Summary.
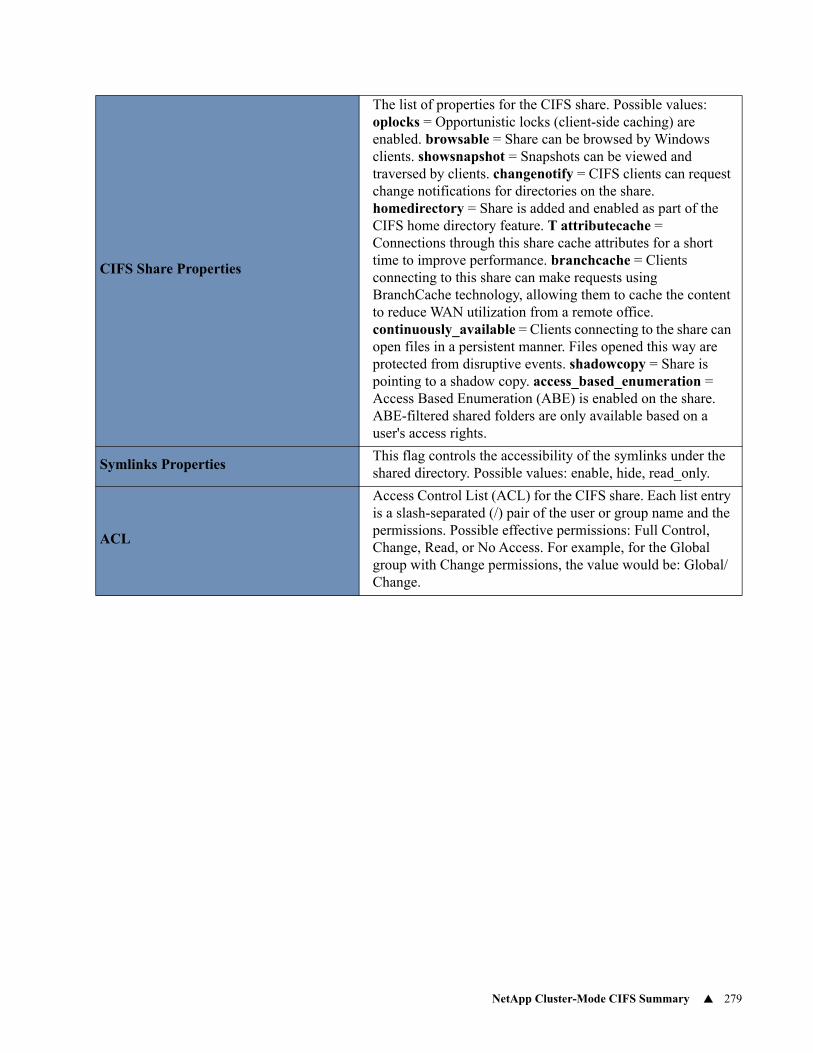
NetApp Cluster-Mode CIFS Summary 279
CIFS Share Properties
The list of properties for the CIFS share. Possible values: oplocks = Opportunistic locks (client-side caching) are enabled. browsable = Share can be browsed by Windows clients. showsnapshot = Snapshots can be viewed and traversed by clients. changenotify = CIFS clients can request change notifications for directories on the share. homedirectory = Share is added and enabled as part of the CIFS home directory feature. T attributecache = Connections through this share cache attributes for a short time to improve performance. branchcache = Clients connecting to this share can make requests using BranchCache technology, allowing them to cache the content to reduce WAN utilization from a remote office. continuously_available = Clients connecting to the share can open files in a persistent manner. Files opened this way are protected from disruptive events. shadowcopy = Share is pointing to a shadow copy. access_based_enumeration = Access Based Enumeration (ABE) is enabled on the share. ABE-filtered shared folders are only available based on a user's access rights.
Symlinks PropertiesThis flag controls the accessibility of the symlinks under the shared directory. Possible values: enable, hide, read_only.
ACL
Access Control List (ACL) for the CIFS share. Each list entry is a slash-separated (/) pair of the user or group name and the permissions. Possible effective permissions: Full Control, Change, Read, or No Access. For example, for the Global group with Change permissions, the value would be: Global/Change.
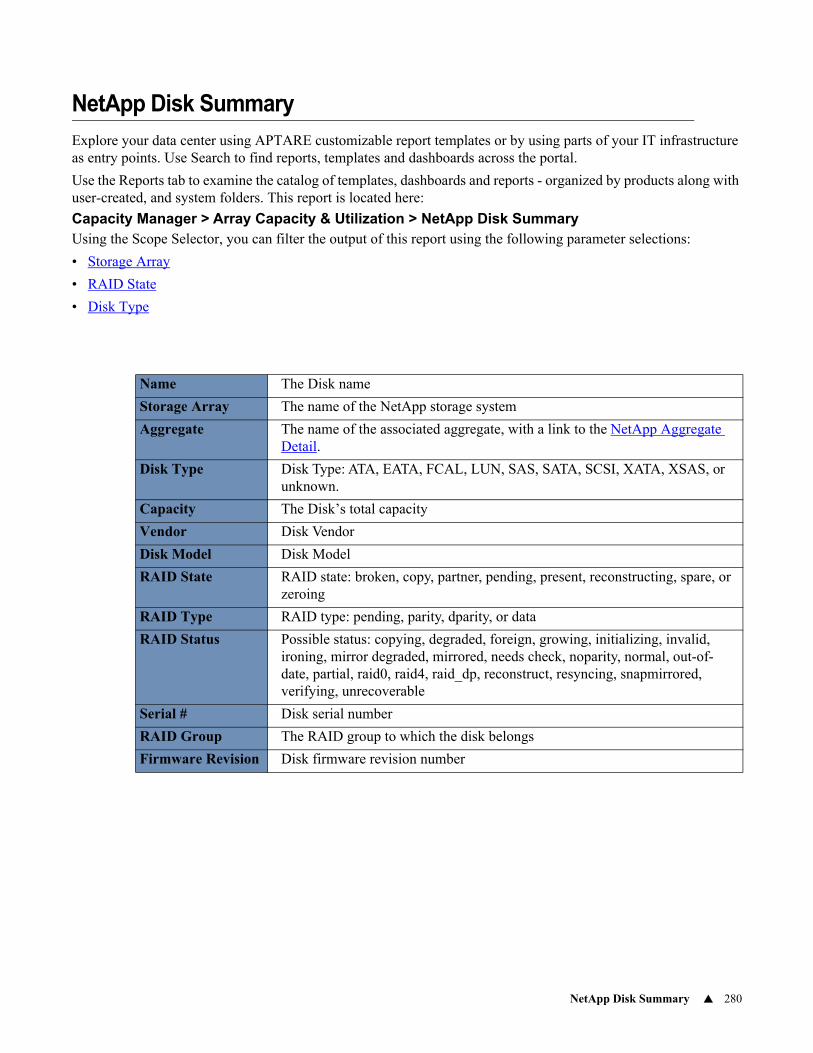
NetApp Disk Summary 280
NetApp Disk Summary
Explore your data center using APTARE customizable report templates or by using parts of your IT infrastructure as entry points. Use Search to find reports, templates and dashboards across the portal.
Use the Reports tab to examine the catalog of templates, dashboards and reports - organized by products along with user-created, and system folders. This report is located here:
Capacity Manager > Array Capacity & Utilization > NetApp Disk SummaryUsing the Scope Selector, you can filter the output of this report using the following parameter selections:
• Storage Array
• RAID State
• Disk Type
Name The Disk name
Storage Array The name of the NetApp storage system
Aggregate The name of the associated aggregate, with a link to the NetApp Aggregate Detail.
Disk Type Disk Type: ATA, EATA, FCAL, LUN, SAS, SATA, SCSI, XATA, XSAS, or unknown.
Capacity The Disk’s total capacity
Vendor Disk Vendor
Disk Model Disk Model
RAID State RAID state: broken, copy, partner, pending, present, reconstructing, spare, or zeroing
RAID Type RAID type: pending, parity, dparity, or data
RAID Status Possible status: copying, degraded, foreign, growing, initializing, invalid, ironing, mirror degraded, mirrored, needs check, noparity, normal, out-of-date, partial, raid0, raid4, raid_dp, reconstruct, resyncing, snapmirrored, verifying, unrecoverable
Serial # Disk serial number
RAID Group The RAID group to which the disk belongs
Firmware Revision Disk firmware revision number
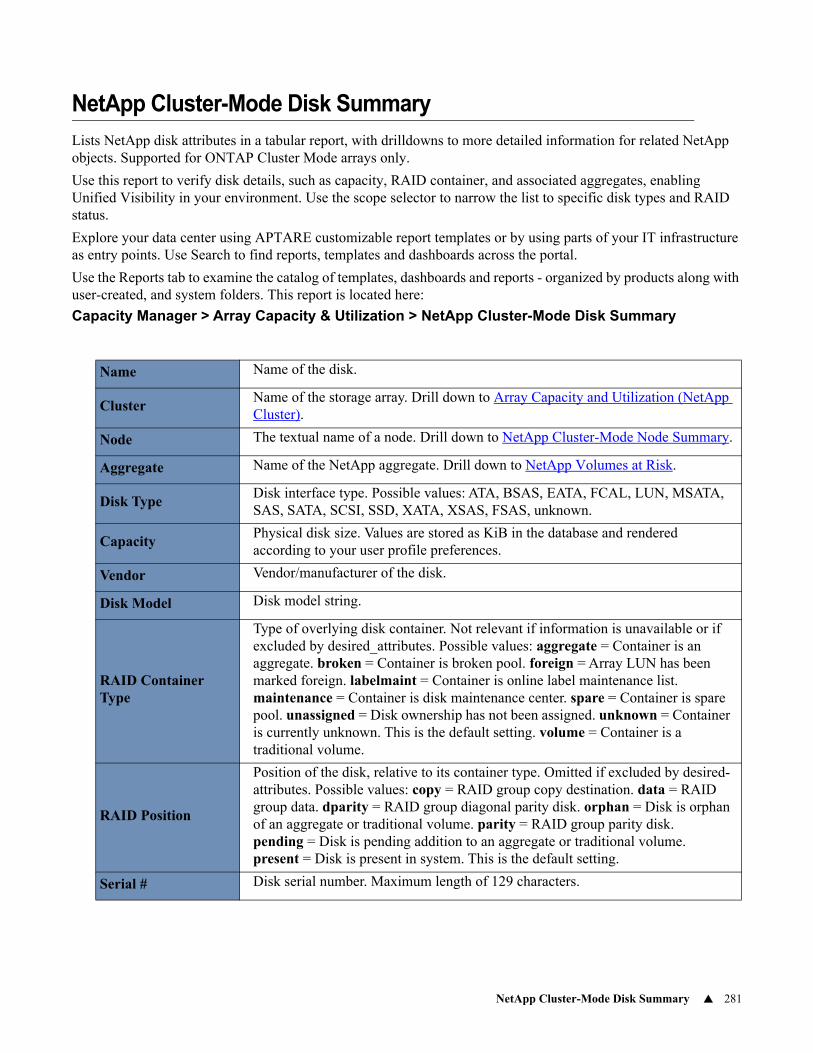
NetApp Cluster-Mode Disk Summary 281
NetApp Cluster-Mode Disk Summary
Lists NetApp disk attributes in a tabular report, with drilldowns to more detailed information for related NetApp objects. Supported for ONTAP Cluster Mode arrays only.
Use this report to verify disk details, such as capacity, RAID container, and associated aggregates, enabling Unified Visibility in your environment. Use the scope selector to narrow the list to specific disk types and RAID status.
Explore your data center using APTARE customizable report templates or by using parts of your IT infrastructure as entry points. Use Search to find reports, templates and dashboards across the portal.
Use the Reports tab to examine the catalog of templates, dashboards and reports - organized by products along with user-created, and system folders. This report is located here:
Capacity Manager > Array Capacity & Utilization > NetApp Cluster-Mode Disk Summary
Name Name of the disk.
ClusterName of the storage array. Drill down to Array Capacity and Utilization (NetApp Cluster).
Node The textual name of a node. Drill down to NetApp Cluster-Mode Node Summary.
Aggregate Name of the NetApp aggregate. Drill down to NetApp Volumes at Risk.
Disk TypeDisk interface type. Possible values: ATA, BSAS, EATA, FCAL, LUN, MSATA, SAS, SATA, SCSI, SSD, XATA, XSAS, FSAS, unknown.
CapacityPhysical disk size. Values are stored as KiB in the database and rendered according to your user profile preferences.
Vendor Vendor/manufacturer of the disk.
Disk Model Disk model string.
RAID Container Type
Type of overlying disk container. Not relevant if information is unavailable or if excluded by desired_attributes. Possible values: aggregate = Container is an aggregate. broken = Container is broken pool. foreign = Array LUN has been marked foreign. labelmaint = Container is online label maintenance list. maintenance = Container is disk maintenance center. spare = Container is spare pool. unassigned = Disk ownership has not been assigned. unknown = Container is currently unknown. This is the default setting. volume = Container is a traditional volume.
RAID Position
Position of the disk, relative to its container type. Omitted if excluded by desired-attributes. Possible values: copy = RAID group copy destination. data = RAID group data. dparity = RAID group diagonal parity disk. orphan = Disk is orphan of an aggregate or traditional volume. parity = RAID group parity disk. pending = Disk is pending addition to an aggregate or traditional volume. present = Disk is present in system. This is the default setting.
Serial # Disk serial number. Maximum length of 129 characters.
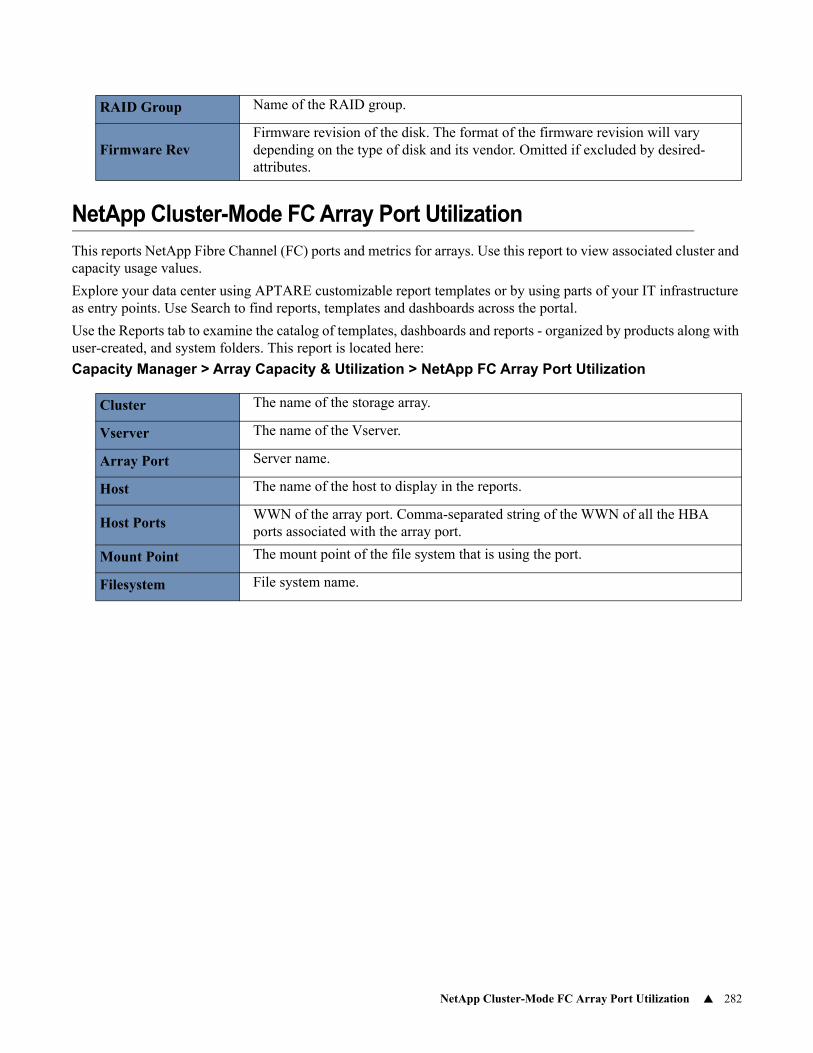
NetApp Cluster-Mode FC Array Port Utilization 282
NetApp Cluster-Mode FC Array Port Utilization
This reports NetApp Fibre Channel (FC) ports and metrics for arrays. Use this report to view associated cluster and capacity usage values.
Explore your data center using APTARE customizable report templates or by using parts of your IT infrastructure as entry points. Use Search to find reports, templates and dashboards across the portal.
Use the Reports tab to examine the catalog of templates, dashboards and reports - organized by products along with user-created, and system folders. This report is located here:
Capacity Manager > Array Capacity & Utilization > NetApp FC Array Port Utilization
RAID Group Name of the RAID group.
Firmware RevFirmware revision of the disk. The format of the firmware revision will vary depending on the type of disk and its vendor. Omitted if excluded by desired-attributes.
Cluster The name of the storage array.
Vserver The name of the Vserver.
Array Port Server name.
Host The name of the host to display in the reports.
Host PortsWWN of the array port. Comma-separated string of the WWN of all the HBA ports associated with the array port.
Mount Point The mount point of the file system that is using the port.
Filesystem File system name.
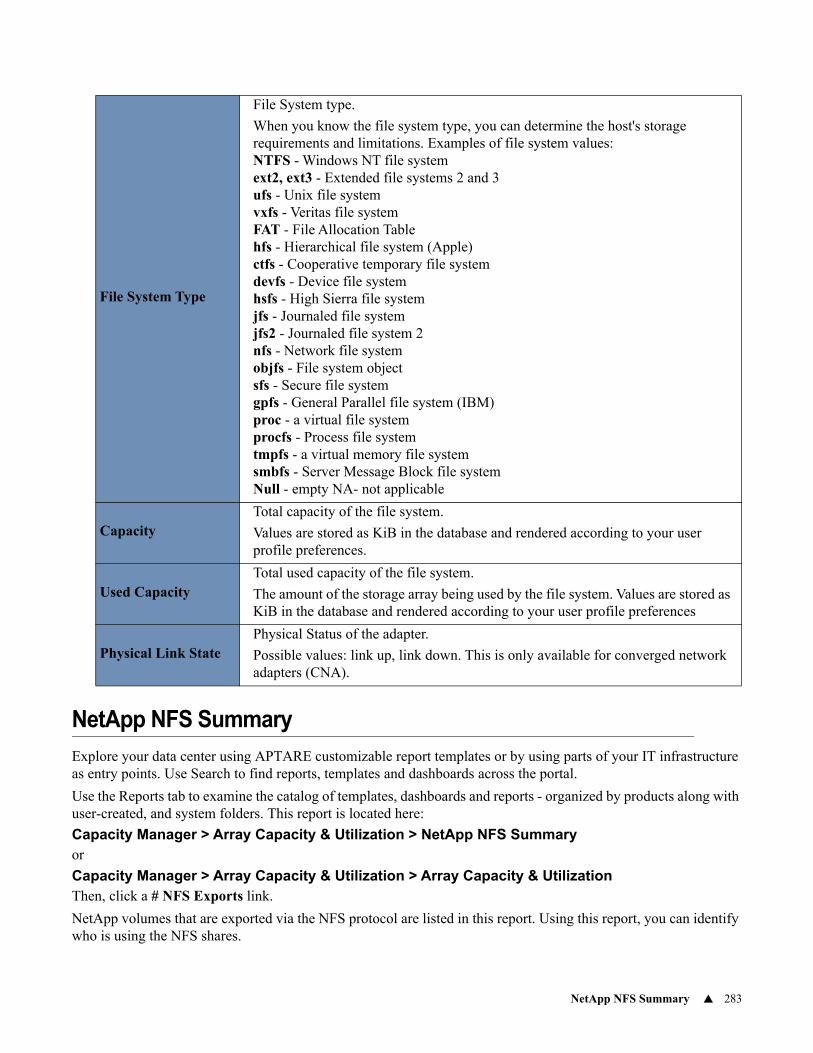
NetApp NFS Summary 283
NetApp NFS Summary
Explore your data center using APTARE customizable report templates or by using parts of your IT infrastructure as entry points. Use Search to find reports, templates and dashboards across the portal.
Use the Reports tab to examine the catalog of templates, dashboards and reports - organized by products along with user-created, and system folders. This report is located here:
Capacity Manager > Array Capacity & Utilization > NetApp NFS Summaryor
Capacity Manager > Array Capacity & Utilization > Array Capacity & UtilizationThen, click a # NFS Exports link.
NetApp volumes that are exported via the NFS protocol are listed in this report. Using this report, you can identify who is using the NFS shares.
File System Type
File System type.
When you know the file system type, you can determine the host's storage requirements and limitations. Examples of file system values: NTFS - Windows NT file system ext2, ext3 - Extended file systems 2 and 3 ufs - Unix file system vxfs - Veritas file system FAT - File Allocation Table hfs - Hierarchical file system (Apple) ctfs - Cooperative temporary file system devfs - Device file system hsfs - High Sierra file system jfs - Journaled file system jfs2 - Journaled file system 2 nfs - Network file system objfs - File system object sfs - Secure file system gpfs - General Parallel file system (IBM) proc - a virtual file system procfs - Process file system tmpfs - a virtual memory file system smbfs - Server Message Block file system Null - empty NA- not applicable
CapacityTotal capacity of the file system.
Values are stored as KiB in the database and rendered according to your user profile preferences.
Used CapacityTotal used capacity of the file system.
The amount of the storage array being used by the file system. Values are stored as KiB in the database and rendered according to your user profile preferences
Physical Link StatePhysical Status of the adapter.
Possible values: link up, link down. This is only available for converged network adapters (CNA).
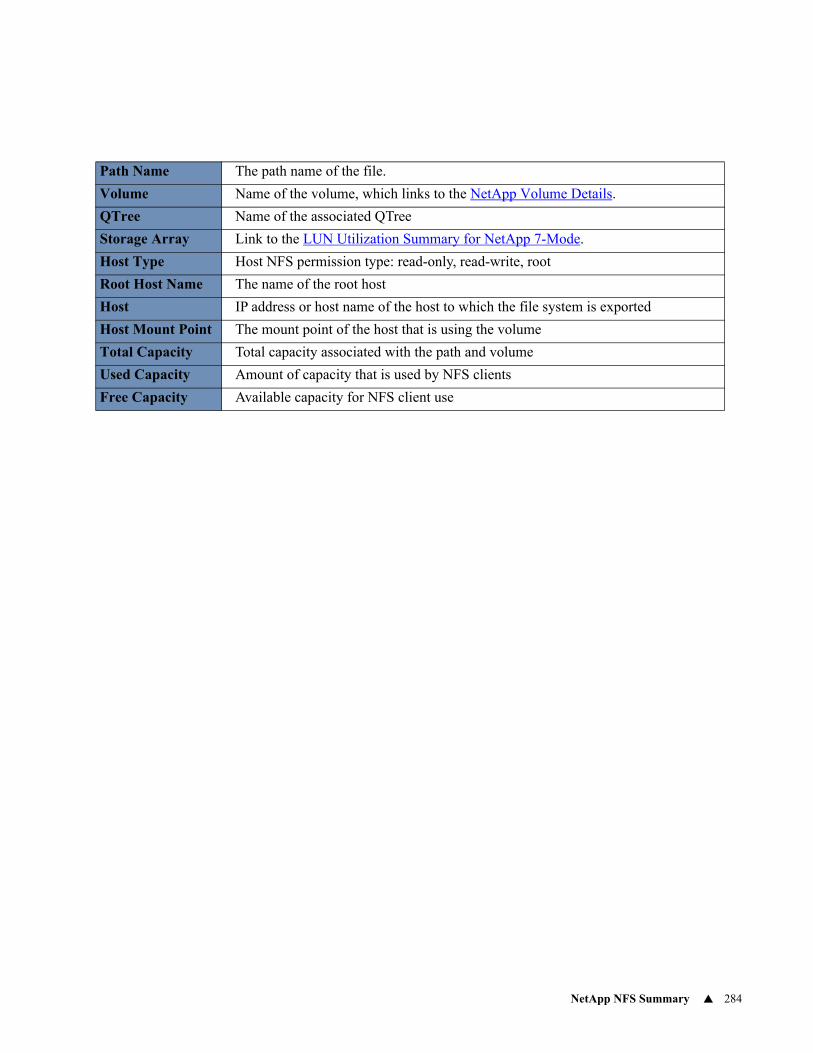
NetApp NFS Summary 284
Path Name The path name of the file.
Volume Name of the volume, which links to the NetApp Volume Details.
QTree Name of the associated QTree
Storage Array Link to the LUN Utilization Summary for NetApp 7-Mode.
Host Type Host NFS permission type: read-only, read-write, root
Root Host Name The name of the root host
Host IP address or host name of the host to which the file system is exported
Host Mount Point The mount point of the host that is using the volume
Total Capacity Total capacity associated with the path and volume
Used Capacity Amount of capacity that is used by NFS clients
Free Capacity Available capacity for NFS client use
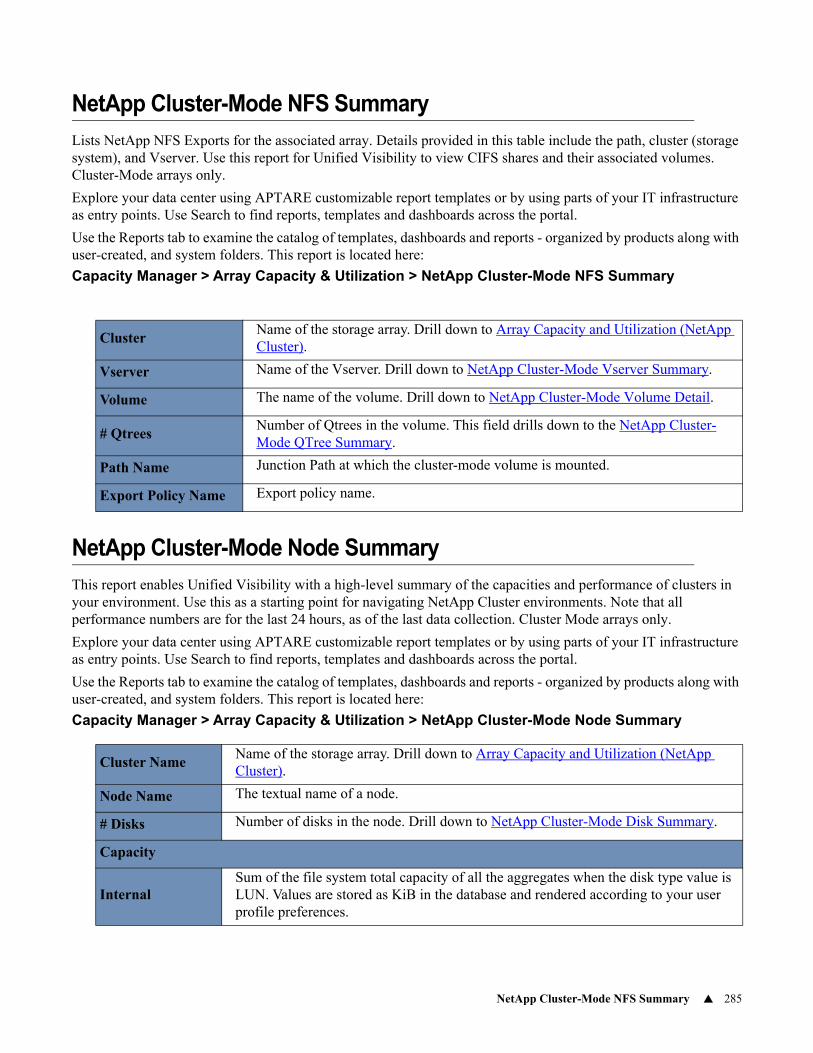
NetApp Cluster-Mode NFS Summary 285
NetApp Cluster-Mode NFS Summary
Lists NetApp NFS Exports for the associated array. Details provided in this table include the path, cluster (storage system), and Vserver. Use this report for Unified Visibility to view CIFS shares and their associated volumes. Cluster-Mode arrays only.
Explore your data center using APTARE customizable report templates or by using parts of your IT infrastructure as entry points. Use Search to find reports, templates and dashboards across the portal.
Use the Reports tab to examine the catalog of templates, dashboards and reports - organized by products along with user-created, and system folders. This report is located here:
Capacity Manager > Array Capacity & Utilization > NetApp Cluster-Mode NFS Summary
NetApp Cluster-Mode Node Summary
This report enables Unified Visibility with a high-level summary of the capacities and performance of clusters in your environment. Use this as a starting point for navigating NetApp Cluster environments. Note that all performance numbers are for the last 24 hours, as of the last data collection. Cluster Mode arrays only.
Explore your data center using APTARE customizable report templates or by using parts of your IT infrastructure as entry points. Use Search to find reports, templates and dashboards across the portal.
Use the Reports tab to examine the catalog of templates, dashboards and reports - organized by products along with user-created, and system folders. This report is located here:
Capacity Manager > Array Capacity & Utilization > NetApp Cluster-Mode Node Summary
ClusterName of the storage array. Drill down to Array Capacity and Utilization (NetApp Cluster).
Vserver Name of the Vserver. Drill down to NetApp Cluster-Mode Vserver Summary.
Volume The name of the volume. Drill down to NetApp Cluster-Mode Volume Detail.
# QtreesNumber of Qtrees in the volume. This field drills down to the NetApp Cluster-Mode QTree Summary.
Path Name Junction Path at which the cluster-mode volume is mounted.
Export Policy Name Export policy name.
Cluster NameName of the storage array. Drill down to Array Capacity and Utilization (NetApp Cluster).
Node Name The textual name of a node.
# Disks Number of disks in the node. Drill down to NetApp Cluster-Mode Disk Summary.
Capacity
InternalSum of the file system total capacity of all the aggregates when the disk type value is LUN. Values are stored as KiB in the database and rendered according to your user profile preferences.
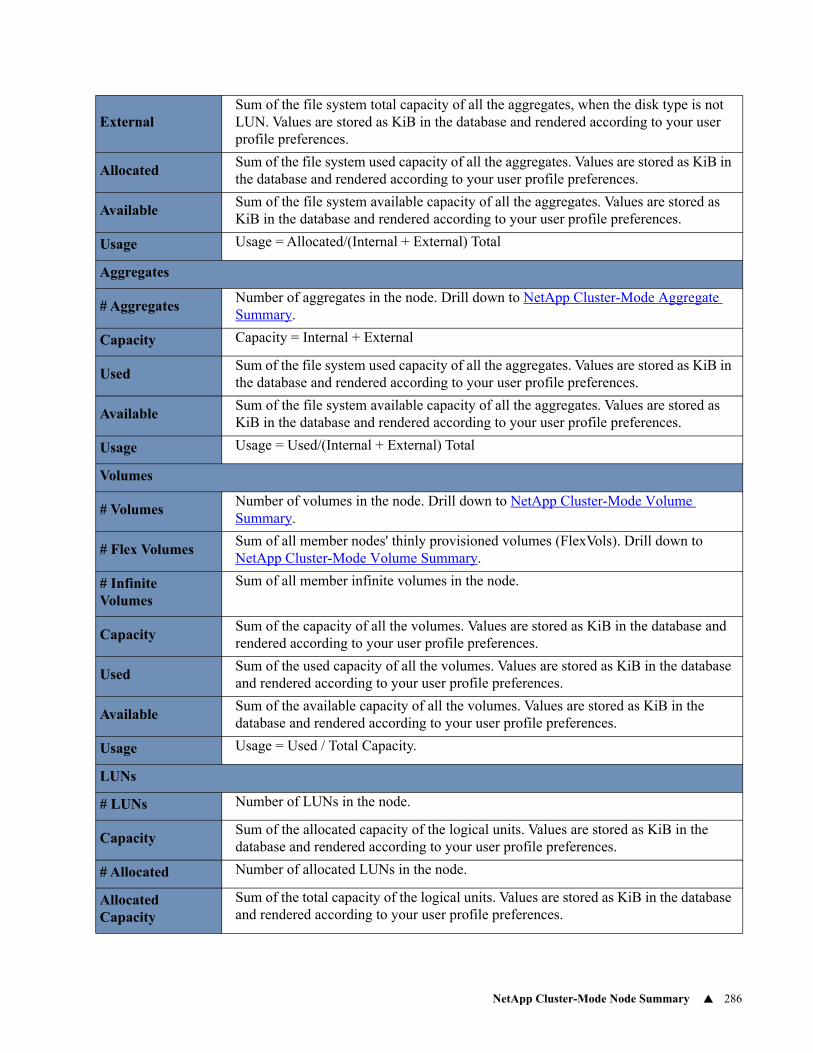
NetApp Cluster-Mode Node Summary 286
ExternalSum of the file system total capacity of all the aggregates, when the disk type is not LUN. Values are stored as KiB in the database and rendered according to your user profile preferences.
AllocatedSum of the file system used capacity of all the aggregates. Values are stored as KiB in the database and rendered according to your user profile preferences.
AvailableSum of the file system available capacity of all the aggregates. Values are stored as KiB in the database and rendered according to your user profile preferences.
Usage Usage = Allocated/(Internal + External) Total
Aggregates
# AggregatesNumber of aggregates in the node. Drill down to NetApp Cluster-Mode Aggregate Summary.
Capacity Capacity = Internal + External
UsedSum of the file system used capacity of all the aggregates. Values are stored as KiB in the database and rendered according to your user profile preferences.
AvailableSum of the file system available capacity of all the aggregates. Values are stored as KiB in the database and rendered according to your user profile preferences.
Usage Usage = Used/(Internal + External) Total
Volumes
# VolumesNumber of volumes in the node. Drill down to NetApp Cluster-Mode Volume Summary.
# Flex VolumesSum of all member nodes' thinly provisioned volumes (FlexVols). Drill down to NetApp Cluster-Mode Volume Summary.
# Infinite Volumes
Sum of all member infinite volumes in the node.
CapacitySum of the capacity of all the volumes. Values are stored as KiB in the database and rendered according to your user profile preferences.
UsedSum of the used capacity of all the volumes. Values are stored as KiB in the database and rendered according to your user profile preferences.
AvailableSum of the available capacity of all the volumes. Values are stored as KiB in the database and rendered according to your user profile preferences.
Usage Usage = Used / Total Capacity.
LUNs
# LUNs Number of LUNs in the node.
CapacitySum of the allocated capacity of the logical units. Values are stored as KiB in the database and rendered according to your user profile preferences.
# Allocated Number of allocated LUNs in the node.
Allocated Capacity
Sum of the total capacity of the logical units. Values are stored as KiB in the database and rendered according to your user profile preferences.
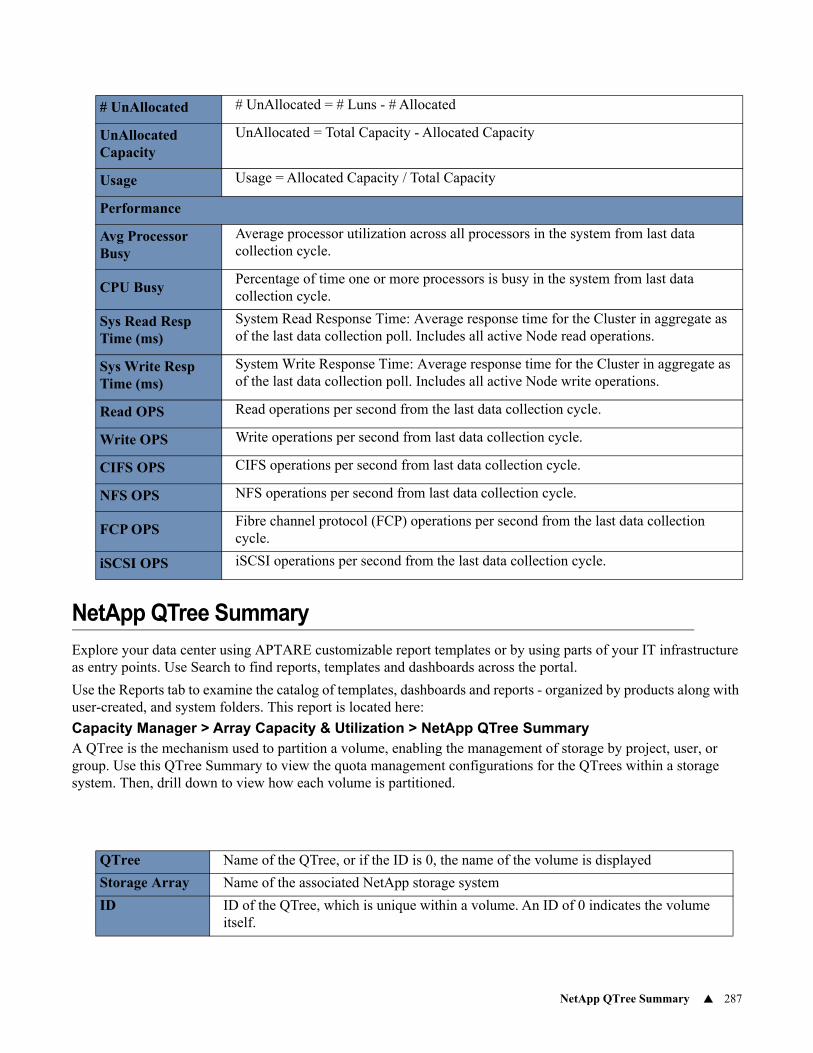
NetApp QTree Summary 287
NetApp QTree Summary
Explore your data center using APTARE customizable report templates or by using parts of your IT infrastructure as entry points. Use Search to find reports, templates and dashboards across the portal.
Use the Reports tab to examine the catalog of templates, dashboards and reports - organized by products along with user-created, and system folders. This report is located here:
Capacity Manager > Array Capacity & Utilization > NetApp QTree SummaryA QTree is the mechanism used to partition a volume, enabling the management of storage by project, user, or group. Use this QTree Summary to view the quota management configurations for the QTrees within a storage system. Then, drill down to view how each volume is partitioned.
# UnAllocated # UnAllocated = # Luns - # Allocated
UnAllocated Capacity
UnAllocated = Total Capacity - Allocated Capacity
Usage Usage = Allocated Capacity / Total Capacity
Performance
Avg Processor Busy
Average processor utilization across all processors in the system from last data collection cycle.
CPU BusyPercentage of time one or more processors is busy in the system from last data collection cycle.
Sys Read Resp Time (ms)
System Read Response Time: Average response time for the Cluster in aggregate as of the last data collection poll. Includes all active Node read operations.
Sys Write Resp Time (ms)
System Write Response Time: Average response time for the Cluster in aggregate as of the last data collection poll. Includes all active Node write operations.
Read OPS Read operations per second from the last data collection cycle.
Write OPS Write operations per second from last data collection cycle.
CIFS OPS CIFS operations per second from last data collection cycle.
NFS OPS NFS operations per second from last data collection cycle.
FCP OPSFibre channel protocol (FCP) operations per second from the last data collection cycle.
iSCSI OPS iSCSI operations per second from the last data collection cycle.
QTree Name of the QTree, or if the ID is 0, the name of the volume is displayed
Storage Array Name of the associated NetApp storage system
ID ID of the QTree, which is unique within a volume. An ID of 0 indicates the volume itself.
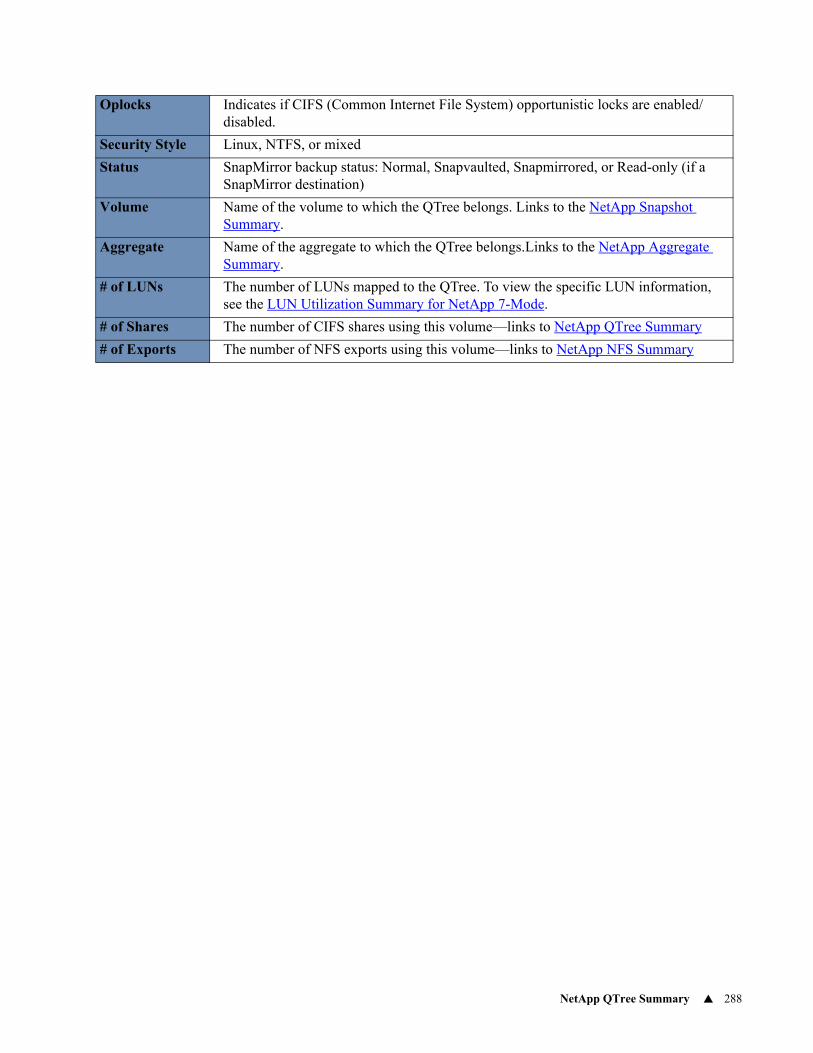
NetApp QTree Summary 288
Oplocks Indicates if CIFS (Common Internet File System) opportunistic locks are enabled/disabled.
Security Style Linux, NTFS, or mixed
Status SnapMirror backup status: Normal, Snapvaulted, Snapmirrored, or Read-only (if a SnapMirror destination)
Volume Name of the volume to which the QTree belongs. Links to the NetApp Snapshot Summary.
Aggregate Name of the aggregate to which the QTree belongs.Links to the NetApp Aggregate Summary.
# of LUNs The number of LUNs mapped to the QTree. To view the specific LUN information, see the LUN Utilization Summary for NetApp 7-Mode.
# of Shares The number of CIFS shares using this volume—links to NetApp QTree Summary
# of Exports The number of NFS exports using this volume—links to NetApp NFS Summary
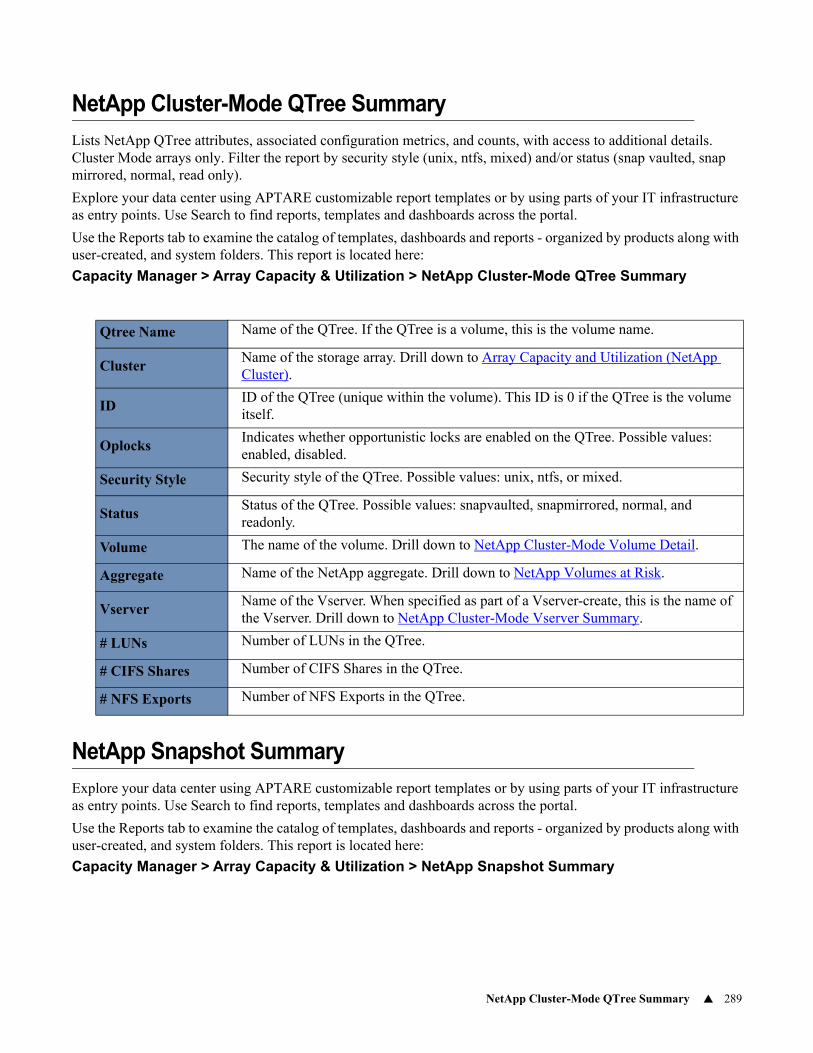
NetApp Cluster-Mode QTree Summary 289
NetApp Cluster-Mode QTree Summary
Lists NetApp QTree attributes, associated configuration metrics, and counts, with access to additional details. Cluster Mode arrays only. Filter the report by security style (unix, ntfs, mixed) and/or status (snap vaulted, snap mirrored, normal, read only).
Explore your data center using APTARE customizable report templates or by using parts of your IT infrastructure as entry points. Use Search to find reports, templates and dashboards across the portal.
Use the Reports tab to examine the catalog of templates, dashboards and reports - organized by products along with user-created, and system folders. This report is located here:
Capacity Manager > Array Capacity & Utilization > NetApp Cluster-Mode QTree Summary
NetApp Snapshot Summary
Explore your data center using APTARE customizable report templates or by using parts of your IT infrastructure as entry points. Use Search to find reports, templates and dashboards across the portal.
Use the Reports tab to examine the catalog of templates, dashboards and reports - organized by products along with user-created, and system folders. This report is located here:
Capacity Manager > Array Capacity & Utilization > NetApp Snapshot Summary
Qtree Name Name of the QTree. If the QTree is a volume, this is the volume name.
ClusterName of the storage array. Drill down to Array Capacity and Utilization (NetApp Cluster).
IDID of the QTree (unique within the volume). This ID is 0 if the QTree is the volume itself.
OplocksIndicates whether opportunistic locks are enabled on the QTree. Possible values: enabled, disabled.
Security Style Security style of the QTree. Possible values: unix, ntfs, or mixed.
StatusStatus of the QTree. Possible values: snapvaulted, snapmirrored, normal, and readonly.
Volume The name of the volume. Drill down to NetApp Cluster-Mode Volume Detail.
Aggregate Name of the NetApp aggregate. Drill down to NetApp Volumes at Risk.
VserverName of the Vserver. When specified as part of a Vserver-create, this is the name of the Vserver. Drill down to NetApp Cluster-Mode Vserver Summary.
# LUNs Number of LUNs in the QTree.
# CIFS Shares Number of CIFS Shares in the QTree.
# NFS Exports Number of NFS Exports in the QTree.
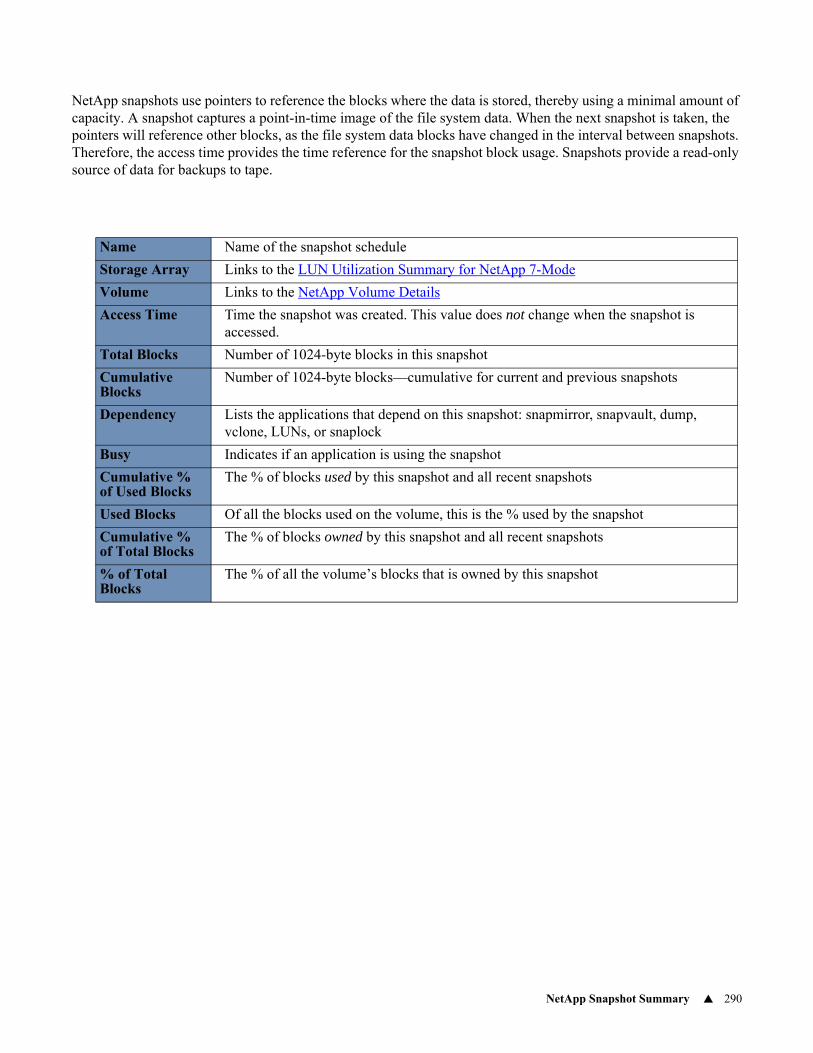
NetApp Snapshot Summary 290
NetApp snapshots use pointers to reference the blocks where the data is stored, thereby using a minimal amount of capacity. A snapshot captures a point-in-time image of the file system data. When the next snapshot is taken, the pointers will reference other blocks, as the file system data blocks have changed in the interval between snapshots. Therefore, the access time provides the time reference for the snapshot block usage. Snapshots provide a read-only source of data for backups to tape.
Name Name of the snapshot schedule
Storage Array Links to the LUN Utilization Summary for NetApp 7-Mode
Volume Links to the NetApp Volume Details
Access Time Time the snapshot was created. This value does not change when the snapshot is accessed.
Total Blocks Number of 1024-byte blocks in this snapshot
Cumulative Blocks
Number of 1024-byte blocks—cumulative for current and previous snapshots
Dependency Lists the applications that depend on this snapshot: snapmirror, snapvault, dump, vclone, LUNs, or snaplock
Busy Indicates if an application is using the snapshot
Cumulative % of Used Blocks
The % of blocks used by this snapshot and all recent snapshots
Used Blocks Of all the blocks used on the volume, this is the % used by the snapshot
Cumulative % of Total Blocks
The % of blocks owned by this snapshot and all recent snapshots
% of Total Blocks
The % of all the volume’s blocks that is owned by this snapshot
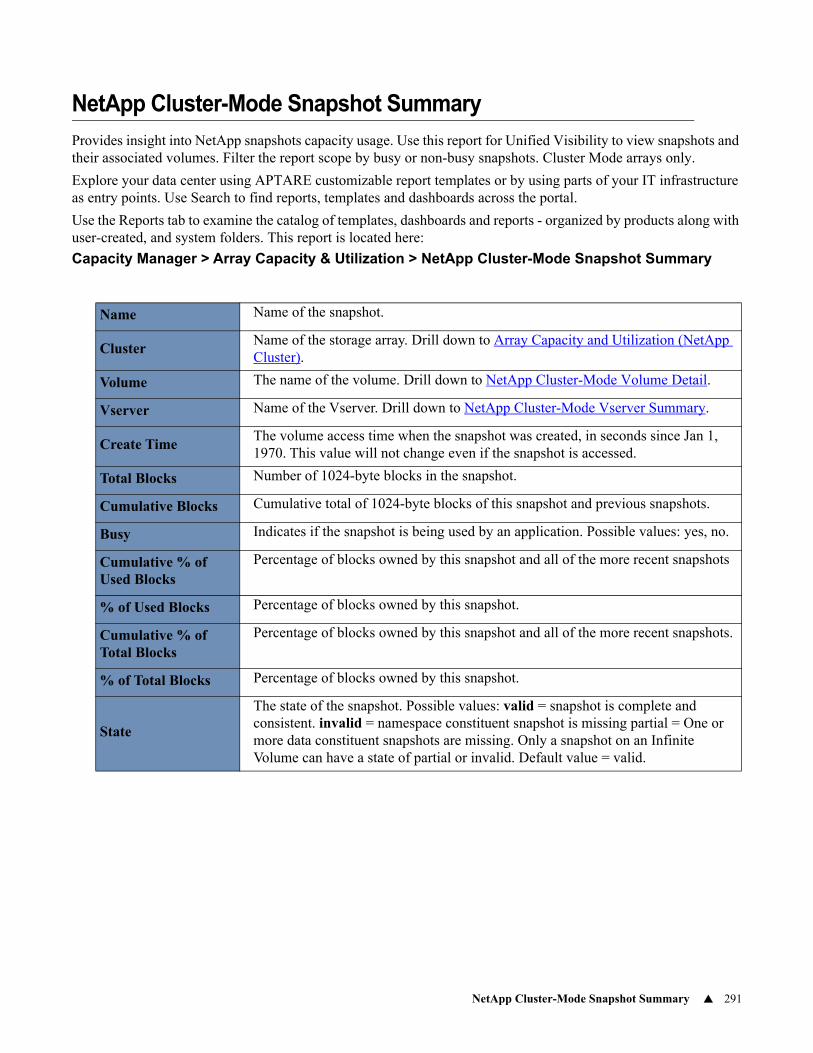
NetApp Cluster-Mode Snapshot Summary 291
NetApp Cluster-Mode Snapshot Summary
Provides insight into NetApp snapshots capacity usage. Use this report for Unified Visibility to view snapshots and their associated volumes. Filter the report scope by busy or non-busy snapshots. Cluster Mode arrays only.
Explore your data center using APTARE customizable report templates or by using parts of your IT infrastructure as entry points. Use Search to find reports, templates and dashboards across the portal.
Use the Reports tab to examine the catalog of templates, dashboards and reports - organized by products along with user-created, and system folders. This report is located here:
Capacity Manager > Array Capacity & Utilization > NetApp Cluster-Mode Snapshot Summary
Name Name of the snapshot.
ClusterName of the storage array. Drill down to Array Capacity and Utilization (NetApp Cluster).
Volume The name of the volume. Drill down to NetApp Cluster-Mode Volume Detail.
Vserver Name of the Vserver. Drill down to NetApp Cluster-Mode Vserver Summary.
Create TimeThe volume access time when the snapshot was created, in seconds since Jan 1, 1970. This value will not change even if the snapshot is accessed.
Total Blocks Number of 1024-byte blocks in the snapshot.
Cumulative Blocks Cumulative total of 1024-byte blocks of this snapshot and previous snapshots.
Busy Indicates if the snapshot is being used by an application. Possible values: yes, no.
Cumulative % of Used Blocks
Percentage of blocks owned by this snapshot and all of the more recent snapshots
% of Used Blocks Percentage of blocks owned by this snapshot.
Cumulative % of Total Blocks
Percentage of blocks owned by this snapshot and all of the more recent snapshots.
% of Total Blocks Percentage of blocks owned by this snapshot.
State
The state of the snapshot. Possible values: valid = snapshot is complete and consistent. invalid = namespace constituent snapshot is missing partial = One or more data constituent snapshots are missing. Only a snapshot on an Infinite Volume can have a state of partial or invalid. Default value = valid.
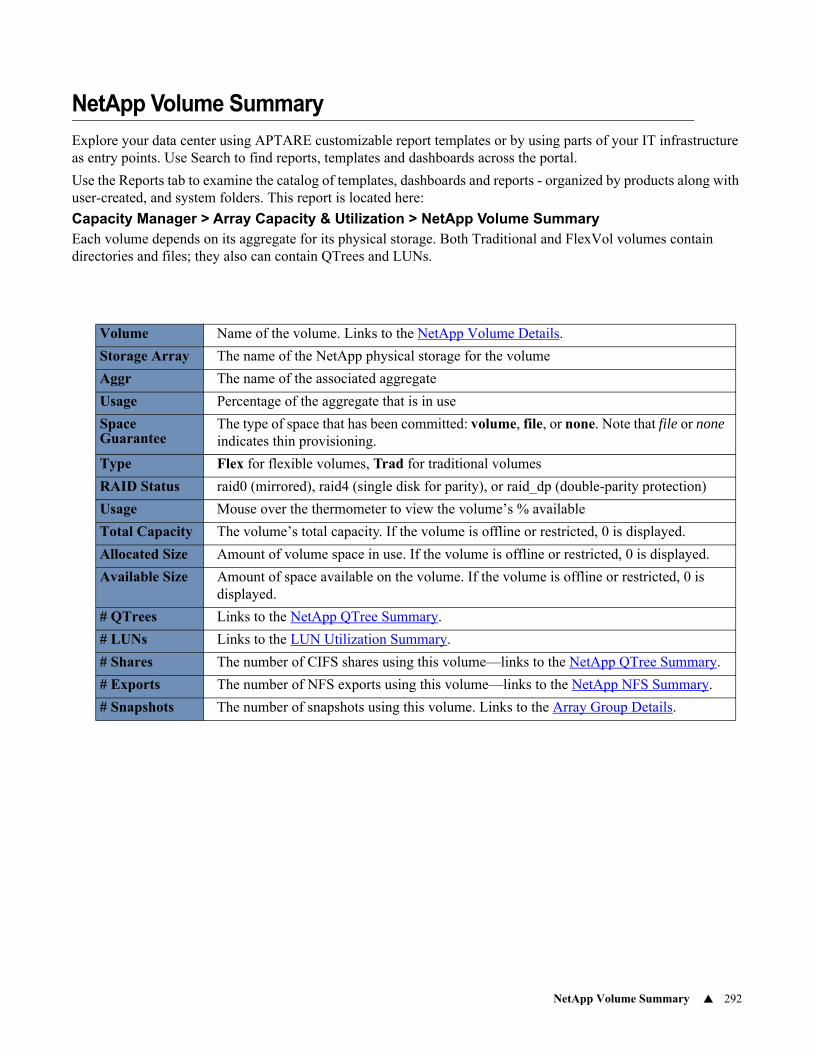
NetApp Volume Summary 292
NetApp Volume Summary
Explore your data center using APTARE customizable report templates or by using parts of your IT infrastructure as entry points. Use Search to find reports, templates and dashboards across the portal.
Use the Reports tab to examine the catalog of templates, dashboards and reports - organized by products along with user-created, and system folders. This report is located here:
Capacity Manager > Array Capacity & Utilization > NetApp Volume SummaryEach volume depends on its aggregate for its physical storage. Both Traditional and FlexVol volumes contain directories and files; they also can contain QTrees and LUNs.
Volume Name of the volume. Links to the NetApp Volume Details.
Storage Array The name of the NetApp physical storage for the volume
Aggr The name of the associated aggregate
Usage Percentage of the aggregate that is in use
Space Guarantee
The type of space that has been committed: volume, file, or none. Note that file or none indicates thin provisioning.
Type Flex for flexible volumes, Trad for traditional volumes
RAID Status raid0 (mirrored), raid4 (single disk for parity), or raid_dp (double-parity protection)
Usage Mouse over the thermometer to view the volume’s % available
Total Capacity The volume’s total capacity. If the volume is offline or restricted, 0 is displayed.
Allocated Size Amount of volume space in use. If the volume is offline or restricted, 0 is displayed.
Available Size Amount of space available on the volume. If the volume is offline or restricted, 0 is displayed.
# QTrees Links to the NetApp QTree Summary.
# LUNs Links to the LUN Utilization Summary.
# Shares The number of CIFS shares using this volume—links to the NetApp QTree Summary.
# Exports The number of NFS exports using this volume—links to the NetApp NFS Summary.
# Snapshots The number of snapshots using this volume. Links to the Array Group Details.
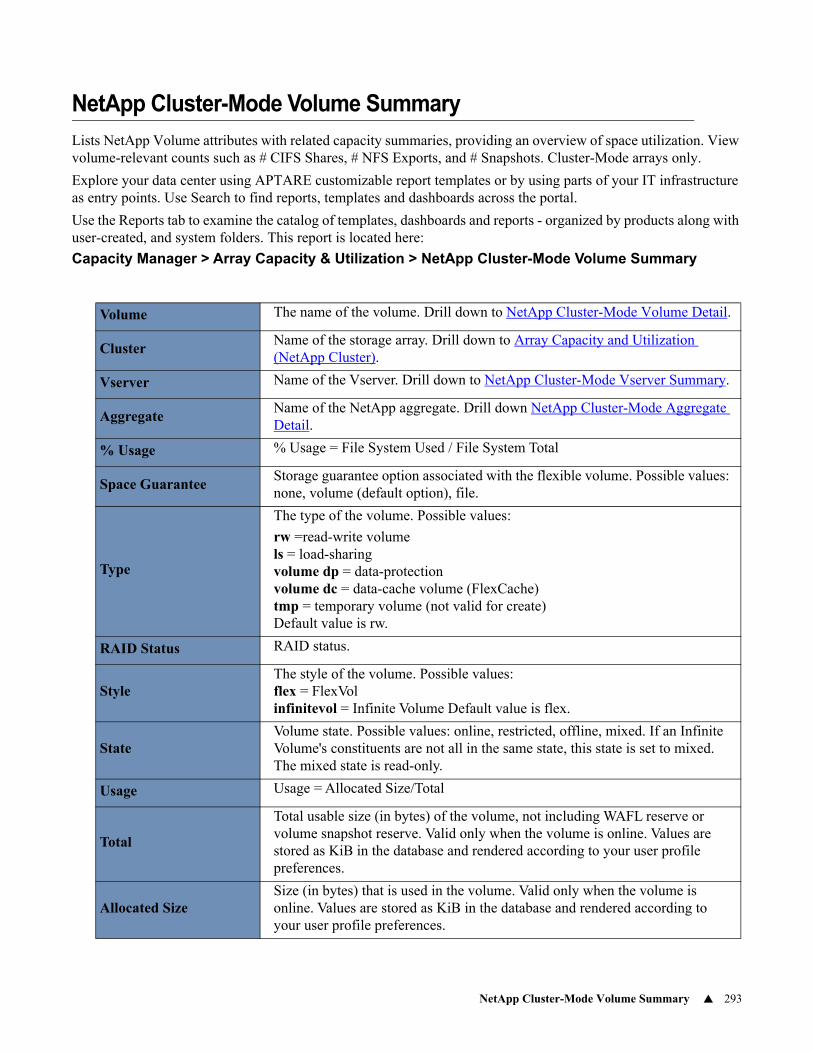
NetApp Cluster-Mode Volume Summary 293
NetApp Cluster-Mode Volume Summary
Lists NetApp Volume attributes with related capacity summaries, providing an overview of space utilization. View volume-relevant counts such as # CIFS Shares, # NFS Exports, and # Snapshots. Cluster-Mode arrays only.
Explore your data center using APTARE customizable report templates or by using parts of your IT infrastructure as entry points. Use Search to find reports, templates and dashboards across the portal.
Use the Reports tab to examine the catalog of templates, dashboards and reports - organized by products along with user-created, and system folders. This report is located here:
Capacity Manager > Array Capacity & Utilization > NetApp Cluster-Mode Volume Summary
Volume The name of the volume. Drill down to NetApp Cluster-Mode Volume Detail.
ClusterName of the storage array. Drill down to Array Capacity and Utilization (NetApp Cluster).
Vserver Name of the Vserver. Drill down to NetApp Cluster-Mode Vserver Summary.
AggregateName of the NetApp aggregate. Drill down NetApp Cluster-Mode Aggregate Detail.
% Usage % Usage = File System Used / File System Total
Space GuaranteeStorage guarantee option associated with the flexible volume. Possible values: none, volume (default option), file.
Type
The type of the volume. Possible values:
rw =read-write volume ls = load-sharing volume dp = data-protection volume dc = data-cache volume (FlexCache) tmp = temporary volume (not valid for create) Default value is rw.
RAID Status RAID status.
StyleThe style of the volume. Possible values: flex = FlexVol infinitevol = Infinite Volume Default value is flex.
StateVolume state. Possible values: online, restricted, offline, mixed. If an Infinite Volume's constituents are not all in the same state, this state is set to mixed. The mixed state is read-only.
Usage Usage = Allocated Size/Total
Total
Total usable size (in bytes) of the volume, not including WAFL reserve or volume snapshot reserve. Valid only when the volume is online. Values are stored as KiB in the database and rendered according to your user profile preferences.
Allocated SizeSize (in bytes) that is used in the volume. Valid only when the volume is online. Values are stored as KiB in the database and rendered according to your user profile preferences.
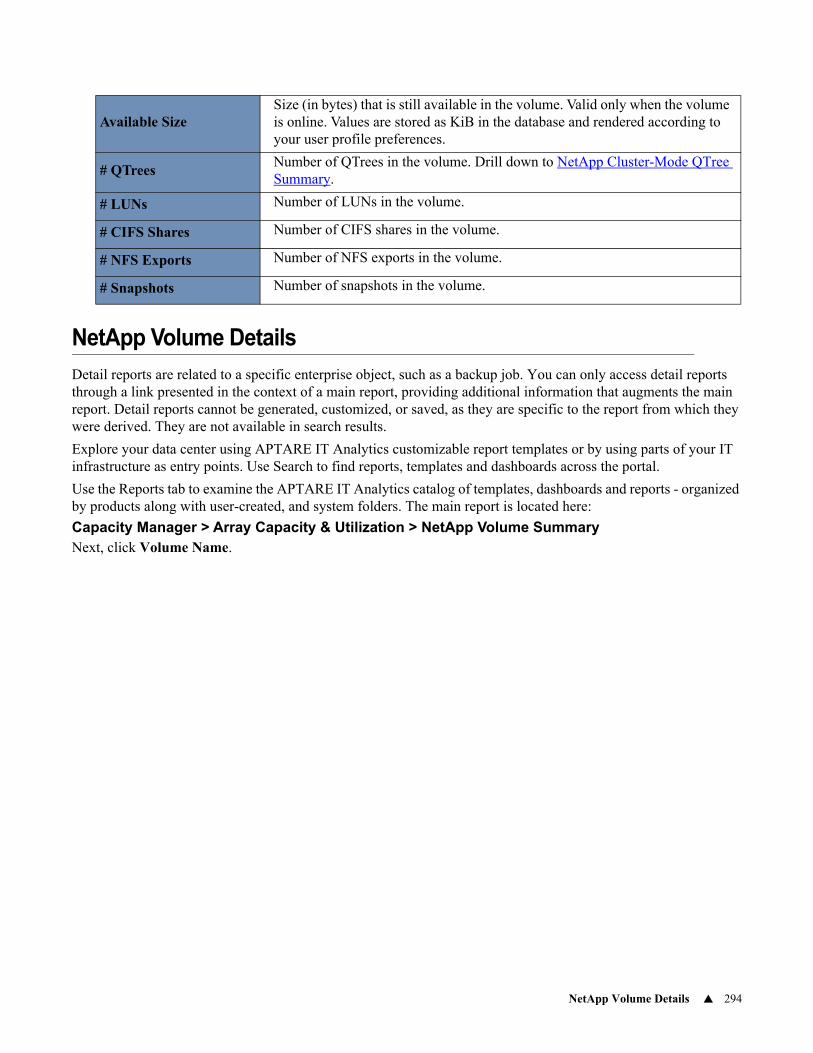
NetApp Volume Details 294
NetApp Volume Details
Detail reports are related to a specific enterprise object, such as a backup job. You can only access detail reports through a link presented in the context of a main report, providing additional information that augments the main report. Detail reports cannot be generated, customized, or saved, as they are specific to the report from which they were derived. They are not available in search results.
Explore your data center using APTARE IT Analytics customizable report templates or by using parts of your IT infrastructure as entry points. Use Search to find reports, templates and dashboards across the portal.
Use the Reports tab to examine the APTARE IT Analytics catalog of templates, dashboards and reports - organized by products along with user-created, and system folders. The main report is located here:
Capacity Manager > Array Capacity & Utilization > NetApp Volume SummaryNext, click Volume Name.
Available SizeSize (in bytes) that is still available in the volume. Valid only when the volume is online. Values are stored as KiB in the database and rendered according to your user profile preferences.
# QTreesNumber of QTrees in the volume. Drill down to NetApp Cluster-Mode QTree Summary.
# LUNs Number of LUNs in the volume.
# CIFS Shares Number of CIFS shares in the volume.
# NFS Exports Number of NFS exports in the volume.
# Snapshots Number of snapshots in the volume.
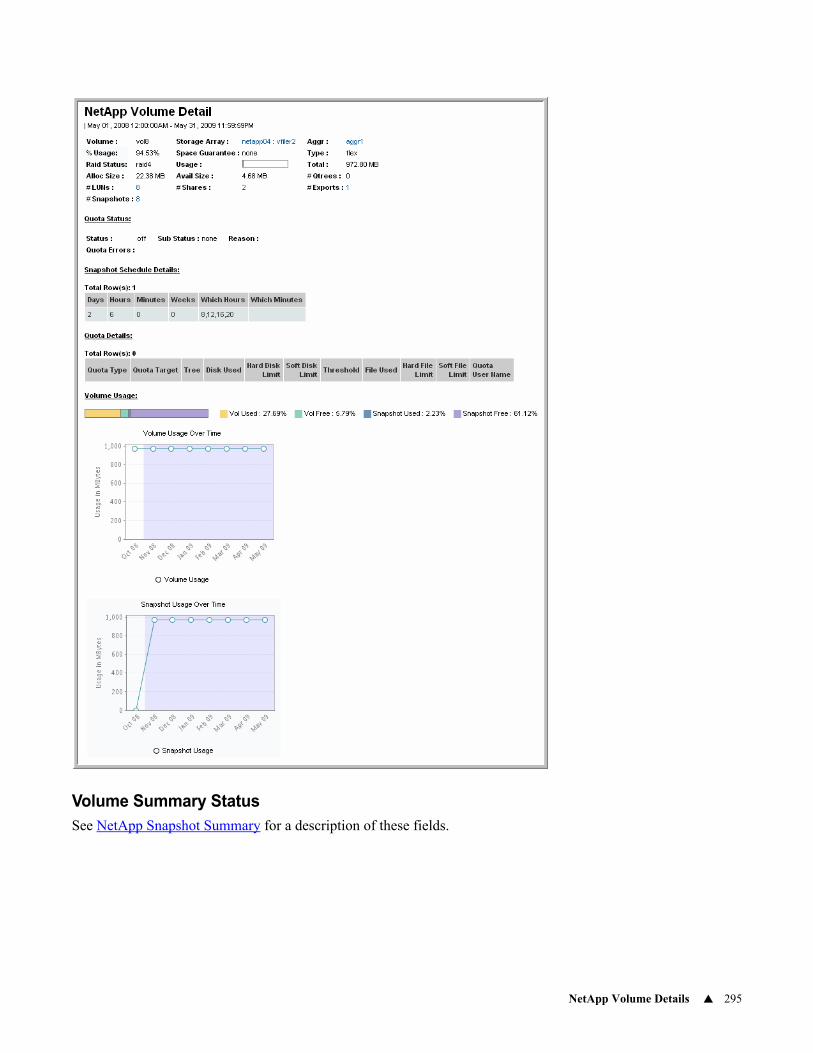
NetApp Volume Details 295
Volume Summary StatusSee NetApp Snapshot Summary for a description of these fields.
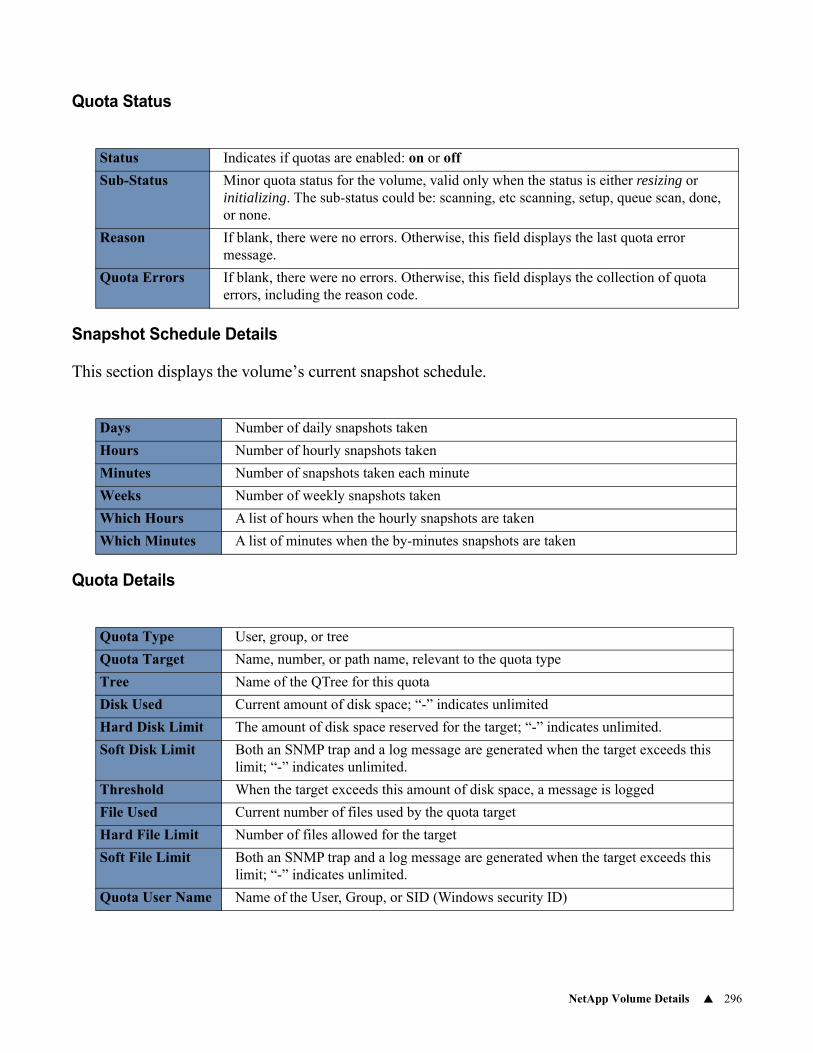
NetApp Volume Details 296
Quota Status
Snapshot Schedule Details
This section displays the volume’s current snapshot schedule.
Quota Details
Status Indicates if quotas are enabled: on or off
Sub-Status Minor quota status for the volume, valid only when the status is either resizing or initializing. The sub-status could be: scanning, etc scanning, setup, queue scan, done, or none.
Reason If blank, there were no errors. Otherwise, this field displays the last quota error message.
Quota Errors If blank, there were no errors. Otherwise, this field displays the collection of quota errors, including the reason code.
Days Number of daily snapshots taken
Hours Number of hourly snapshots taken
Minutes Number of snapshots taken each minute
Weeks Number of weekly snapshots taken
Which Hours A list of hours when the hourly snapshots are taken
Which Minutes A list of minutes when the by-minutes snapshots are taken
Quota Type User, group, or tree
Quota Target Name, number, or path name, relevant to the quota type
Tree Name of the QTree for this quota
Disk Used Current amount of disk space; “-” indicates unlimited
Hard Disk Limit The amount of disk space reserved for the target; “-” indicates unlimited.
Soft Disk Limit Both an SNMP trap and a log message are generated when the target exceeds this limit; “-” indicates unlimited.
Threshold When the target exceeds this amount of disk space, a message is logged
File Used Current number of files used by the quota target
Hard File Limit Number of files allowed for the target
Soft File Limit Both an SNMP trap and a log message are generated when the target exceeds this limit; “-” indicates unlimited.
Quota User Name Name of the User, Group, or SID (Windows security ID)
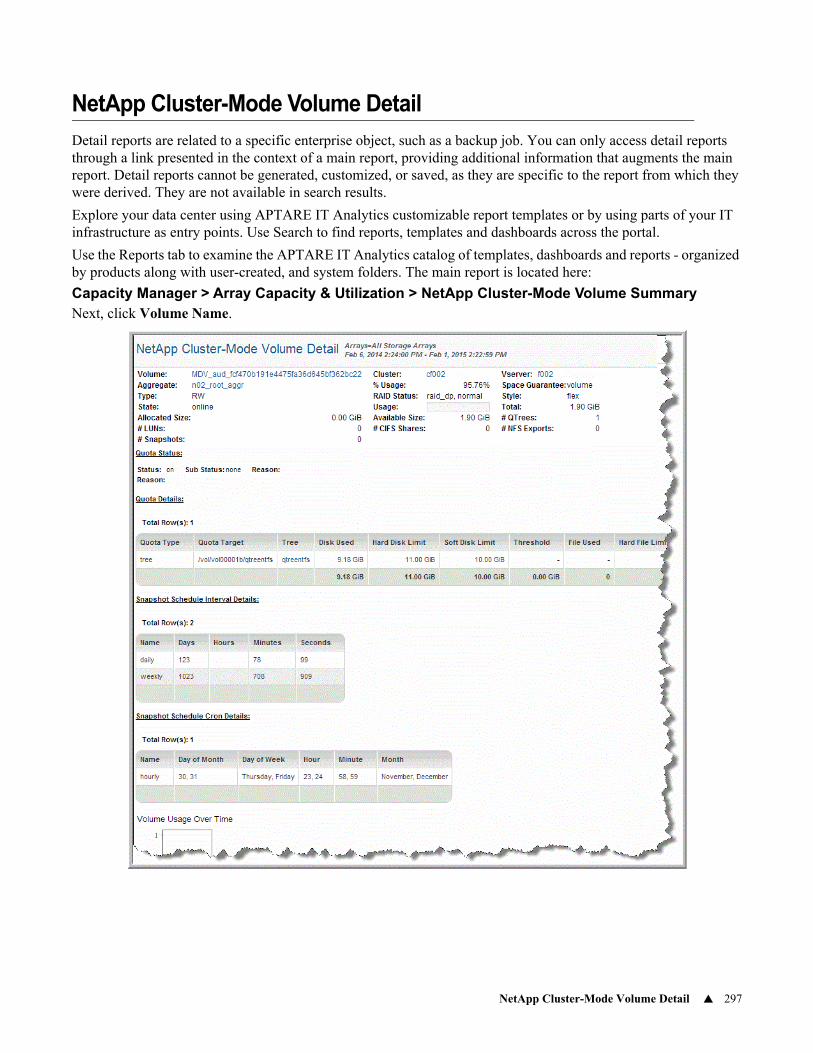
NetApp Cluster-Mode Volume Detail 297
NetApp Cluster-Mode Volume Detail
Detail reports are related to a specific enterprise object, such as a backup job. You can only access detail reports through a link presented in the context of a main report, providing additional information that augments the main report. Detail reports cannot be generated, customized, or saved, as they are specific to the report from which they were derived. They are not available in search results.
Explore your data center using APTARE IT Analytics customizable report templates or by using parts of your IT infrastructure as entry points. Use Search to find reports, templates and dashboards across the portal.
Use the Reports tab to examine the APTARE IT Analytics catalog of templates, dashboards and reports - organized by products along with user-created, and system folders. The main report is located here:
Capacity Manager > Array Capacity & Utilization > NetApp Cluster-Mode Volume SummaryNext, click Volume Name.
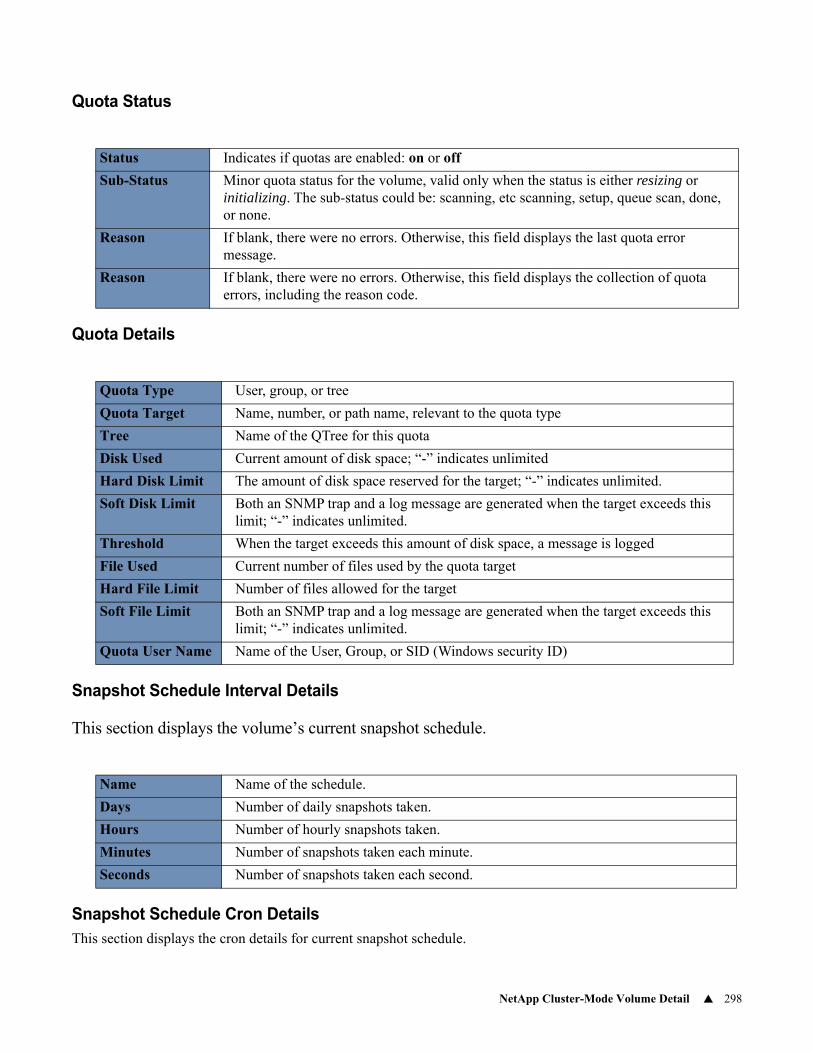
NetApp Cluster-Mode Volume Detail 298
Quota Status
Quota Details
Snapshot Schedule Interval Details
This section displays the volume’s current snapshot schedule.
Snapshot Schedule Cron DetailsThis section displays the cron details for current snapshot schedule.
Status Indicates if quotas are enabled: on or off
Sub-Status Minor quota status for the volume, valid only when the status is either resizing or initializing. The sub-status could be: scanning, etc scanning, setup, queue scan, done, or none.
Reason If blank, there were no errors. Otherwise, this field displays the last quota error message.
Reason If blank, there were no errors. Otherwise, this field displays the collection of quota errors, including the reason code.
Quota Type User, group, or tree
Quota Target Name, number, or path name, relevant to the quota type
Tree Name of the QTree for this quota
Disk Used Current amount of disk space; “-” indicates unlimited
Hard Disk Limit The amount of disk space reserved for the target; “-” indicates unlimited.
Soft Disk Limit Both an SNMP trap and a log message are generated when the target exceeds this limit; “-” indicates unlimited.
Threshold When the target exceeds this amount of disk space, a message is logged
File Used Current number of files used by the quota target
Hard File Limit Number of files allowed for the target
Soft File Limit Both an SNMP trap and a log message are generated when the target exceeds this limit; “-” indicates unlimited.
Quota User Name Name of the User, Group, or SID (Windows security ID)
Name Name of the schedule.
Days Number of daily snapshots taken.
Hours Number of hourly snapshots taken.
Minutes Number of snapshots taken each minute.
Seconds Number of snapshots taken each second.
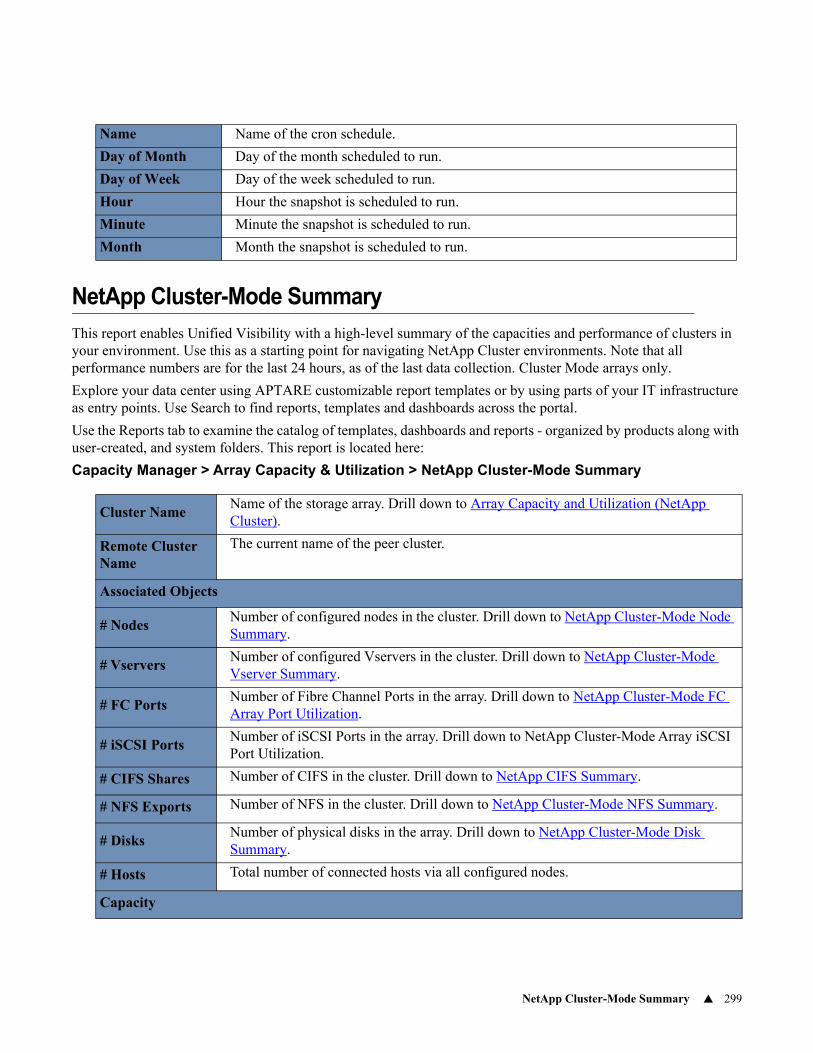
NetApp Cluster-Mode Summary 299
NetApp Cluster-Mode Summary
This report enables Unified Visibility with a high-level summary of the capacities and performance of clusters in your environment. Use this as a starting point for navigating NetApp Cluster environments. Note that all performance numbers are for the last 24 hours, as of the last data collection. Cluster Mode arrays only.
Explore your data center using APTARE customizable report templates or by using parts of your IT infrastructure as entry points. Use Search to find reports, templates and dashboards across the portal.
Use the Reports tab to examine the catalog of templates, dashboards and reports - organized by products along with user-created, and system folders. This report is located here:
Capacity Manager > Array Capacity & Utilization > NetApp Cluster-Mode Summary
Name Name of the cron schedule.
Day of Month Day of the month scheduled to run.
Day of Week Day of the week scheduled to run.
Hour Hour the snapshot is scheduled to run.
Minute Minute the snapshot is scheduled to run.
Month Month the snapshot is scheduled to run.
Cluster NameName of the storage array. Drill down to Array Capacity and Utilization (NetApp Cluster).
Remote Cluster Name
The current name of the peer cluster.
Associated Objects
# NodesNumber of configured nodes in the cluster. Drill down to NetApp Cluster-Mode Node Summary.
# VserversNumber of configured Vservers in the cluster. Drill down to NetApp Cluster-Mode Vserver Summary.
# FC PortsNumber of Fibre Channel Ports in the array. Drill down to NetApp Cluster-Mode FC Array Port Utilization.
# iSCSI PortsNumber of iSCSI Ports in the array. Drill down to NetApp Cluster-Mode Array iSCSI Port Utilization.
# CIFS Shares Number of CIFS in the cluster. Drill down to NetApp CIFS Summary.
# NFS Exports Number of NFS in the cluster. Drill down to NetApp Cluster-Mode NFS Summary.
# DisksNumber of physical disks in the array. Drill down to NetApp Cluster-Mode Disk Summary.
# Hosts Total number of connected hosts via all configured nodes.
Capacity
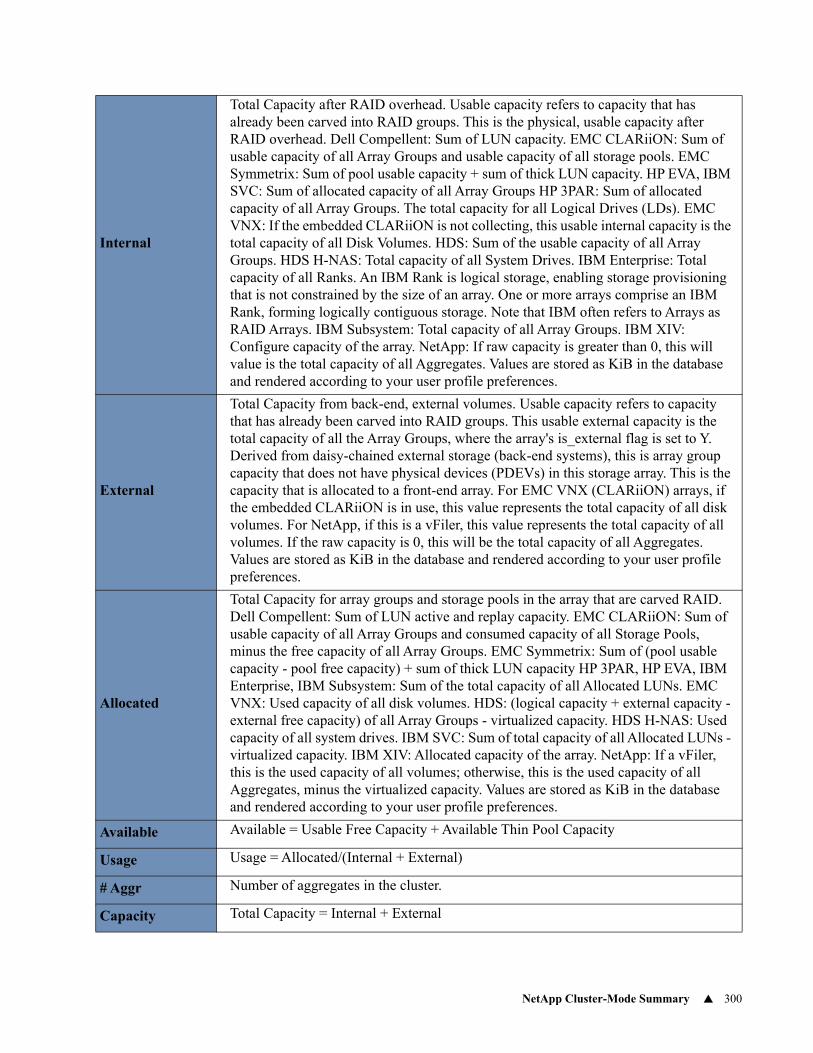
NetApp Cluster-Mode Summary 300
Internal
Total Capacity after RAID overhead. Usable capacity refers to capacity that has already been carved into RAID groups. This is the physical, usable capacity after RAID overhead. Dell Compellent: Sum of LUN capacity. EMC CLARiiON: Sum of usable capacity of all Array Groups and usable capacity of all storage pools. EMC Symmetrix: Sum of pool usable capacity + sum of thick LUN capacity. HP EVA, IBM SVC: Sum of allocated capacity of all Array Groups HP 3PAR: Sum of allocated capacity of all Array Groups. The total capacity for all Logical Drives (LDs). EMC VNX: If the embedded CLARiiON is not collecting, this usable internal capacity is the total capacity of all Disk Volumes. HDS: Sum of the usable capacity of all Array Groups. HDS H-NAS: Total capacity of all System Drives. IBM Enterprise: Total capacity of all Ranks. An IBM Rank is logical storage, enabling storage provisioning that is not constrained by the size of an array. One or more arrays comprise an IBM Rank, forming logically contiguous storage. Note that IBM often refers to Arrays as RAID Arrays. IBM Subsystem: Total capacity of all Array Groups. IBM XIV: Configure capacity of the array. NetApp: If raw capacity is greater than 0, this will value is the total capacity of all Aggregates. Values are stored as KiB in the database and rendered according to your user profile preferences.
External
Total Capacity from back-end, external volumes. Usable capacity refers to capacity that has already been carved into RAID groups. This usable external capacity is the total capacity of all the Array Groups, where the array's is_external flag is set to Y. Derived from daisy-chained external storage (back-end systems), this is array group capacity that does not have physical devices (PDEVs) in this storage array. This is the capacity that is allocated to a front-end array. For EMC VNX (CLARiiON) arrays, if the embedded CLARiiON is in use, this value represents the total capacity of all disk volumes. For NetApp, if this is a vFiler, this value represents the total capacity of all volumes. If the raw capacity is 0, this will be the total capacity of all Aggregates. Values are stored as KiB in the database and rendered according to your user profile preferences.
Allocated
Total Capacity for array groups and storage pools in the array that are carved RAID. Dell Compellent: Sum of LUN active and replay capacity. EMC CLARiiON: Sum of usable capacity of all Array Groups and consumed capacity of all Storage Pools, minus the free capacity of all Array Groups. EMC Symmetrix: Sum of (pool usable capacity - pool free capacity) + sum of thick LUN capacity HP 3PAR, HP EVA, IBM Enterprise, IBM Subsystem: Sum of the total capacity of all Allocated LUNs. EMC VNX: Used capacity of all disk volumes. HDS: (logical capacity + external capacity - external free capacity) of all Array Groups - virtualized capacity. HDS H-NAS: Used capacity of all system drives. IBM SVC: Sum of total capacity of all Allocated LUNs - virtualized capacity. IBM XIV: Allocated capacity of the array. NetApp: If a vFiler, this is the used capacity of all volumes; otherwise, this is the used capacity of all Aggregates, minus the virtualized capacity. Values are stored as KiB in the database and rendered according to your user profile preferences.
Available Available = Usable Free Capacity + Available Thin Pool Capacity
Usage Usage = Allocated/(Internal + External)
# Aggr Number of aggregates in the cluster.
Capacity Total Capacity = Internal + External
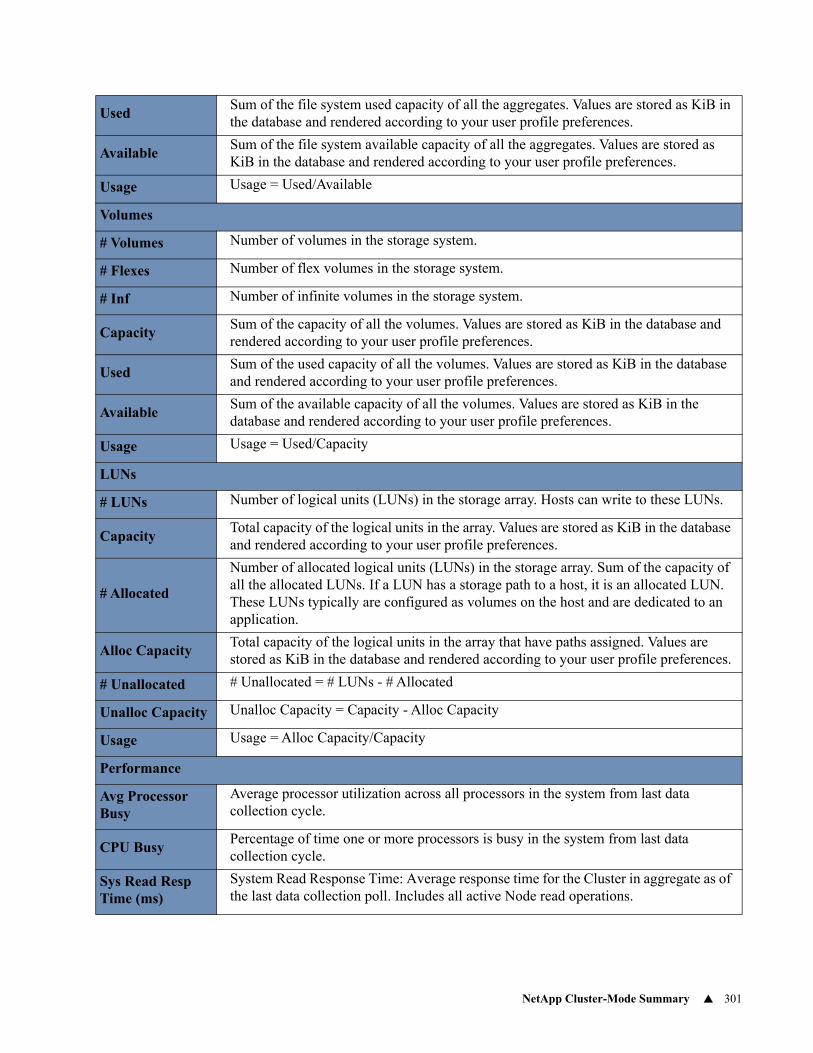
NetApp Cluster-Mode Summary 301
UsedSum of the file system used capacity of all the aggregates. Values are stored as KiB in the database and rendered according to your user profile preferences.
AvailableSum of the file system available capacity of all the aggregates. Values are stored as KiB in the database and rendered according to your user profile preferences.
Usage Usage = Used/Available
Volumes
# Volumes Number of volumes in the storage system.
# Flexes Number of flex volumes in the storage system.
# Inf Number of infinite volumes in the storage system.
CapacitySum of the capacity of all the volumes. Values are stored as KiB in the database and rendered according to your user profile preferences.
UsedSum of the used capacity of all the volumes. Values are stored as KiB in the database and rendered according to your user profile preferences.
AvailableSum of the available capacity of all the volumes. Values are stored as KiB in the database and rendered according to your user profile preferences.
Usage Usage = Used/Capacity
LUNs
# LUNs Number of logical units (LUNs) in the storage array. Hosts can write to these LUNs.
CapacityTotal capacity of the logical units in the array. Values are stored as KiB in the database and rendered according to your user profile preferences.
# Allocated
Number of allocated logical units (LUNs) in the storage array. Sum of the capacity of all the allocated LUNs. If a LUN has a storage path to a host, it is an allocated LUN. These LUNs typically are configured as volumes on the host and are dedicated to an application.
Alloc CapacityTotal capacity of the logical units in the array that have paths assigned. Values are stored as KiB in the database and rendered according to your user profile preferences.
# Unallocated # Unallocated = # LUNs - # Allocated
Unalloc Capacity Unalloc Capacity = Capacity - Alloc Capacity
Usage Usage = Alloc Capacity/Capacity
Performance
Avg Processor Busy
Average processor utilization across all processors in the system from last data collection cycle.
CPU BusyPercentage of time one or more processors is busy in the system from last data collection cycle.
Sys Read Resp Time (ms)
System Read Response Time: Average response time for the Cluster in aggregate as of the last data collection poll. Includes all active Node read operations.
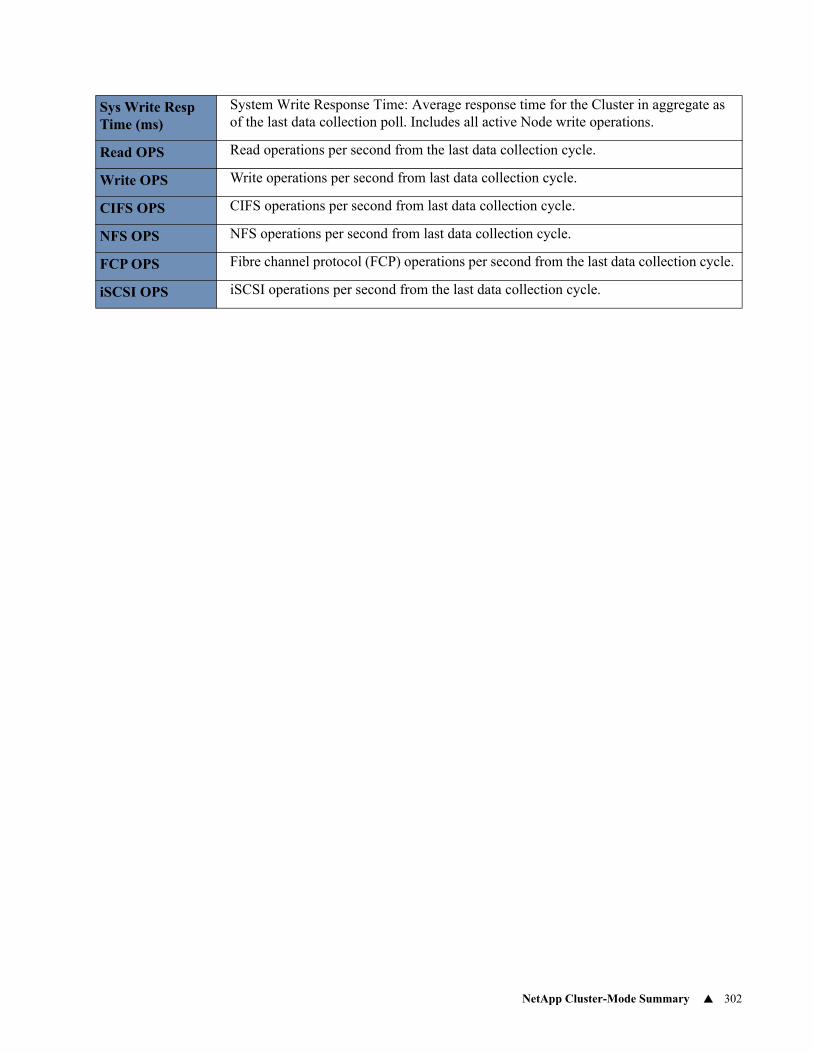
NetApp Cluster-Mode Summary 302
Sys Write Resp Time (ms)
System Write Response Time: Average response time for the Cluster in aggregate as of the last data collection poll. Includes all active Node write operations.
Read OPS Read operations per second from the last data collection cycle.
Write OPS Write operations per second from last data collection cycle.
CIFS OPS CIFS operations per second from last data collection cycle.
NFS OPS NFS operations per second from last data collection cycle.
FCP OPS Fibre channel protocol (FCP) operations per second from the last data collection cycle.
iSCSI OPS iSCSI operations per second from the last data collection cycle.
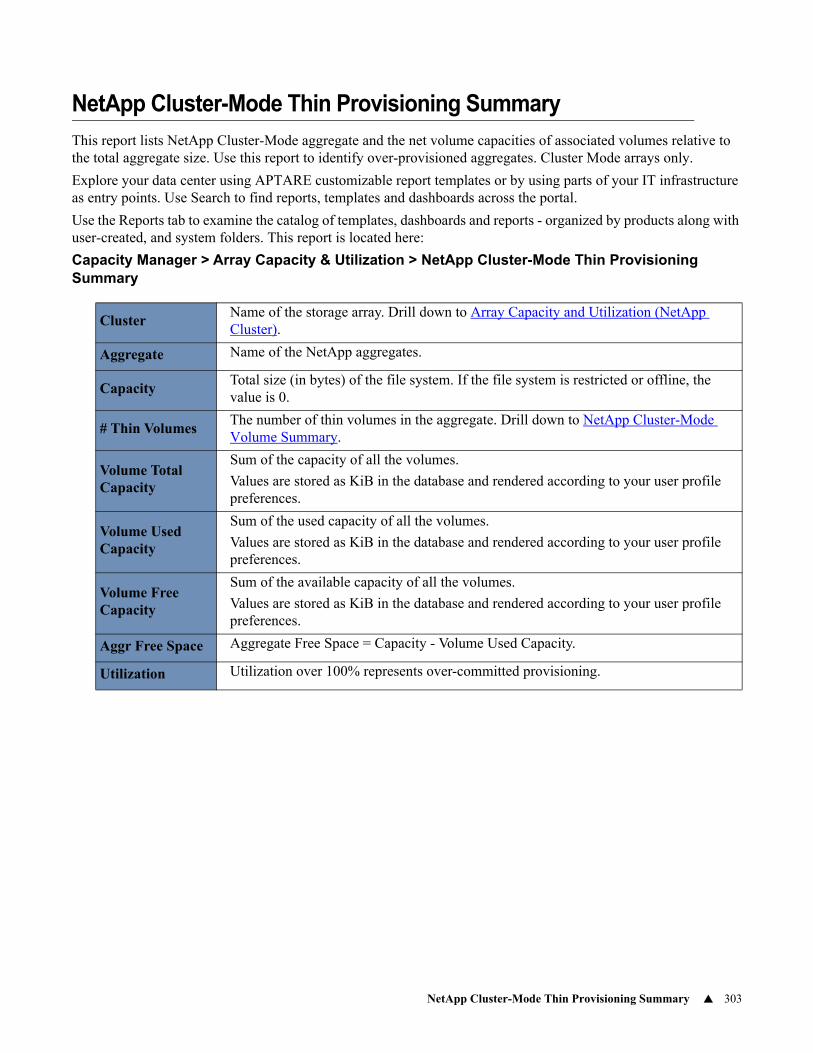
NetApp Cluster-Mode Thin Provisioning Summary 303
NetApp Cluster-Mode Thin Provisioning Summary
This report lists NetApp Cluster-Mode aggregate and the net volume capacities of associated volumes relative to the total aggregate size. Use this report to identify over-provisioned aggregates. Cluster Mode arrays only.
Explore your data center using APTARE customizable report templates or by using parts of your IT infrastructure as entry points. Use Search to find reports, templates and dashboards across the portal.
Use the Reports tab to examine the catalog of templates, dashboards and reports - organized by products along with user-created, and system folders. This report is located here:
Capacity Manager > Array Capacity & Utilization > NetApp Cluster-Mode Thin Provisioning Summary
Cluster Name of the storage array. Drill down to Array Capacity and Utilization (NetApp Cluster).
Aggregate Name of the NetApp aggregates.
CapacityTotal size (in bytes) of the file system. If the file system is restricted or offline, the value is 0.
# Thin VolumesThe number of thin volumes in the aggregate. Drill down to NetApp Cluster-Mode Volume Summary.
Volume Total Capacity
Sum of the capacity of all the volumes.
Values are stored as KiB in the database and rendered according to your user profile preferences.
Volume Used Capacity
Sum of the used capacity of all the volumes.
Values are stored as KiB in the database and rendered according to your user profile preferences.
Volume Free Capacity
Sum of the available capacity of all the volumes.
Values are stored as KiB in the database and rendered according to your user profile preferences.
Aggr Free Space Aggregate Free Space = Capacity - Volume Used Capacity.
Utilization Utilization over 100% represents over-committed provisioning.
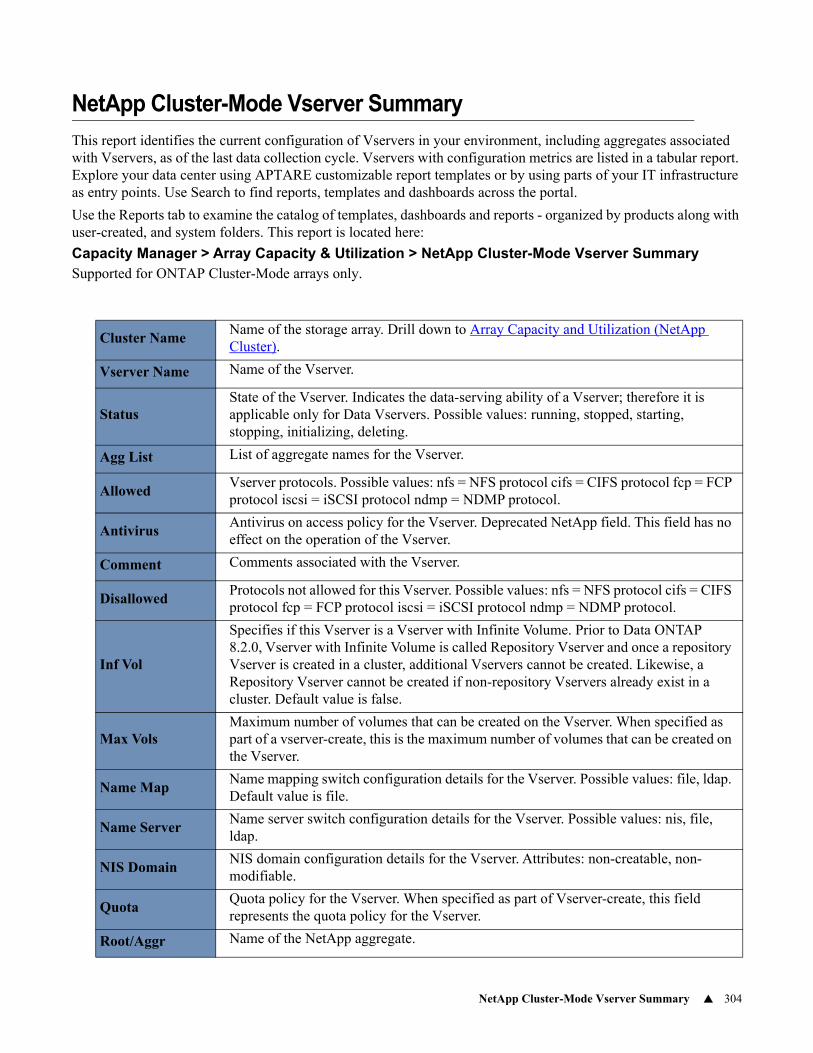
NetApp Cluster-Mode Vserver Summary 304
NetApp Cluster-Mode Vserver Summary
This report identifies the current configuration of Vservers in your environment, including aggregates associated with Vservers, as of the last data collection cycle. Vservers with configuration metrics are listed in a tabular report. Explore your data center using APTARE customizable report templates or by using parts of your IT infrastructure as entry points. Use Search to find reports, templates and dashboards across the portal.
Use the Reports tab to examine the catalog of templates, dashboards and reports - organized by products along with user-created, and system folders. This report is located here:
Capacity Manager > Array Capacity & Utilization > NetApp Cluster-Mode Vserver SummarySupported for ONTAP Cluster-Mode arrays only.
Cluster NameName of the storage array. Drill down to Array Capacity and Utilization (NetApp Cluster).
Vserver Name Name of the Vserver.
StatusState of the Vserver. Indicates the data-serving ability of a Vserver; therefore it is applicable only for Data Vservers. Possible values: running, stopped, starting, stopping, initializing, deleting.
Agg List List of aggregate names for the Vserver.
AllowedVserver protocols. Possible values: nfs = NFS protocol cifs = CIFS protocol fcp = FCP protocol iscsi = iSCSI protocol ndmp = NDMP protocol.
AntivirusAntivirus on access policy for the Vserver. Deprecated NetApp field. This field has no effect on the operation of the Vserver.
Comment Comments associated with the Vserver.
DisallowedProtocols not allowed for this Vserver. Possible values: nfs = NFS protocol cifs = CIFS protocol fcp = FCP protocol iscsi = iSCSI protocol ndmp = NDMP protocol.
Inf Vol
Specifies if this Vserver is a Vserver with Infinite Volume. Prior to Data ONTAP 8.2.0, Vserver with Infinite Volume is called Repository Vserver and once a repository Vserver is created in a cluster, additional Vservers cannot be created. Likewise, a Repository Vserver cannot be created if non-repository Vservers already exist in a cluster. Default value is false.
Max VolsMaximum number of volumes that can be created on the Vserver. When specified as part of a vserver-create, this is the maximum number of volumes that can be created on the Vserver.
Name MapName mapping switch configuration details for the Vserver. Possible values: file, ldap. Default value is file.
Name ServerName server switch configuration details for the Vserver. Possible values: nis, file, ldap.
NIS DomainNIS domain configuration details for the Vserver. Attributes: non-creatable, non-modifiable.
QuotaQuota policy for the Vserver. When specified as part of Vserver-create, this field represents the quota policy for the Vserver.
Root/Aggr Name of the NetApp aggregate.
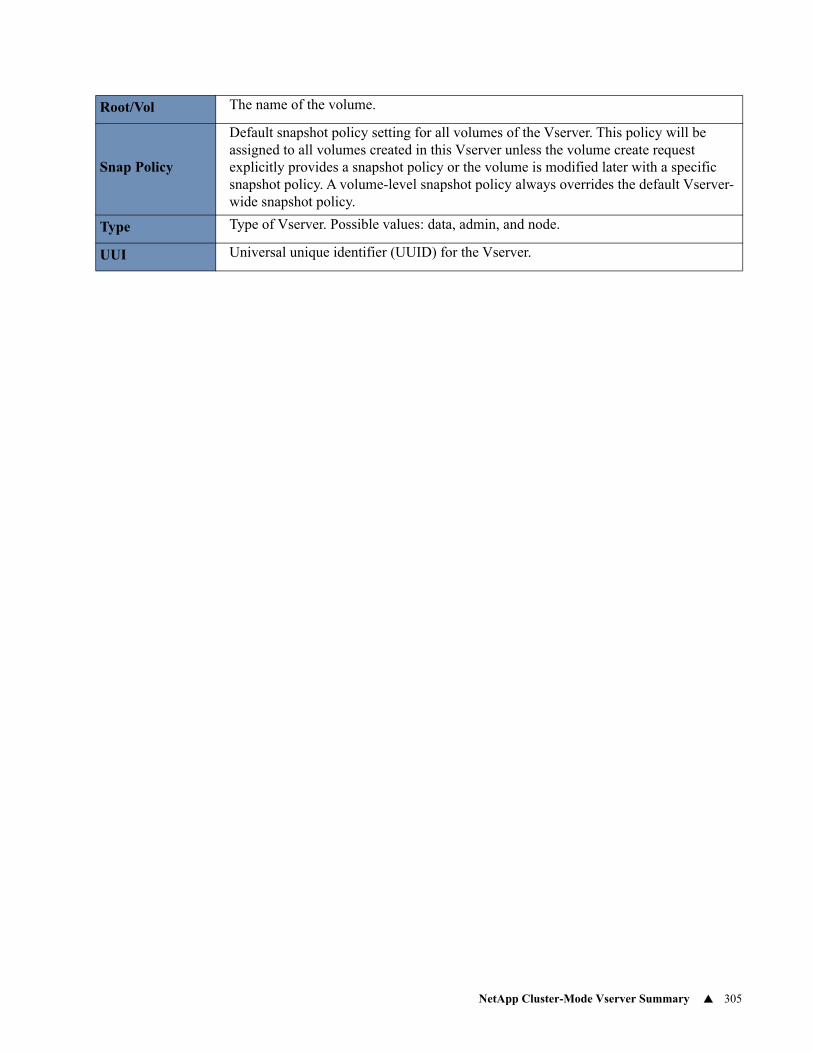
NetApp Cluster-Mode Vserver Summary 305
Root/Vol The name of the volume.
Snap Policy
Default snapshot policy setting for all volumes of the Vserver. This policy will be assigned to all volumes created in this Vserver unless the volume create request explicitly provides a snapshot policy or the volume is modified later with a specific snapshot policy. A volume-level snapshot policy always overrides the default Vserver-wide snapshot policy.
Type Type of Vserver. Possible values: data, admin, and node.
UUI Universal unique identifier (UUID) for the Vserver.
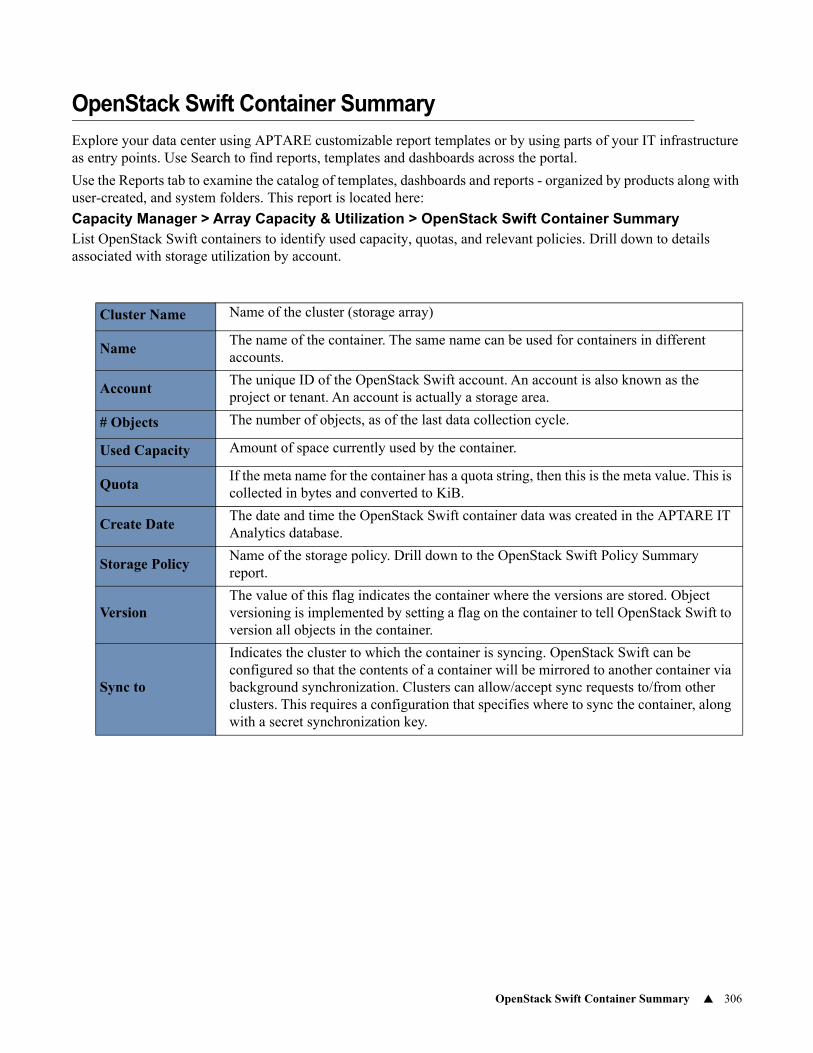
OpenStack Swift Container Summary 306
OpenStack Swift Container Summary
Explore your data center using APTARE customizable report templates or by using parts of your IT infrastructure as entry points. Use Search to find reports, templates and dashboards across the portal.
Use the Reports tab to examine the catalog of templates, dashboards and reports - organized by products along with user-created, and system folders. This report is located here:
Capacity Manager > Array Capacity & Utilization > OpenStack Swift Container SummaryList OpenStack Swift containers to identify used capacity, quotas, and relevant policies. Drill down to details associated with storage utilization by account.
Cluster Name Name of the cluster (storage array)
NameThe name of the container. The same name can be used for containers in different accounts.
AccountThe unique ID of the OpenStack Swift account. An account is also known as the project or tenant. An account is actually a storage area.
# Objects The number of objects, as of the last data collection cycle.
Used Capacity Amount of space currently used by the container.
QuotaIf the meta name for the container has a quota string, then this is the meta value. This is collected in bytes and converted to KiB.
Create DateThe date and time the OpenStack Swift container data was created in the APTARE IT Analytics database.
Storage PolicyName of the storage policy. Drill down to the OpenStack Swift Policy Summary report.
VersionThe value of this flag indicates the container where the versions are stored. Object versioning is implemented by setting a flag on the container to tell OpenStack Swift to version all objects in the container.
Sync to
Indicates the cluster to which the container is syncing. OpenStack Swift can be configured so that the contents of a container will be mirrored to another container via background synchronization. Clusters can allow/accept sync requests to/from other clusters. This requires a configuration that specifies where to sync the container, along with a secret synchronization key.
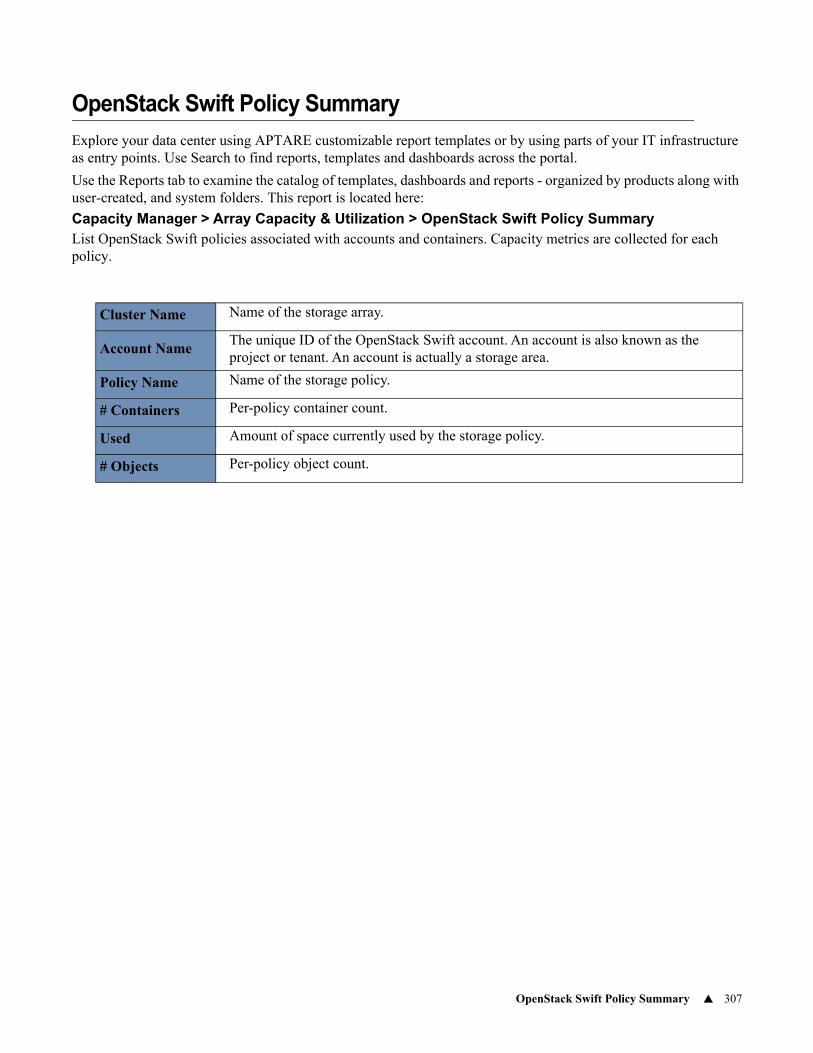
OpenStack Swift Policy Summary 307
OpenStack Swift Policy Summary
Explore your data center using APTARE customizable report templates or by using parts of your IT infrastructure as entry points. Use Search to find reports, templates and dashboards across the portal.
Use the Reports tab to examine the catalog of templates, dashboards and reports - organized by products along with user-created, and system folders. This report is located here:
Capacity Manager > Array Capacity & Utilization > OpenStack Swift Policy SummaryList OpenStack Swift policies associated with accounts and containers. Capacity metrics are collected for each policy.
Cluster Name Name of the storage array.
Account NameThe unique ID of the OpenStack Swift account. An account is also known as the project or tenant. An account is actually a storage area.
Policy Name Name of the storage policy.
# Containers Per-policy container count.
Used Amount of space currently used by the storage policy.
# Objects Per-policy object count.
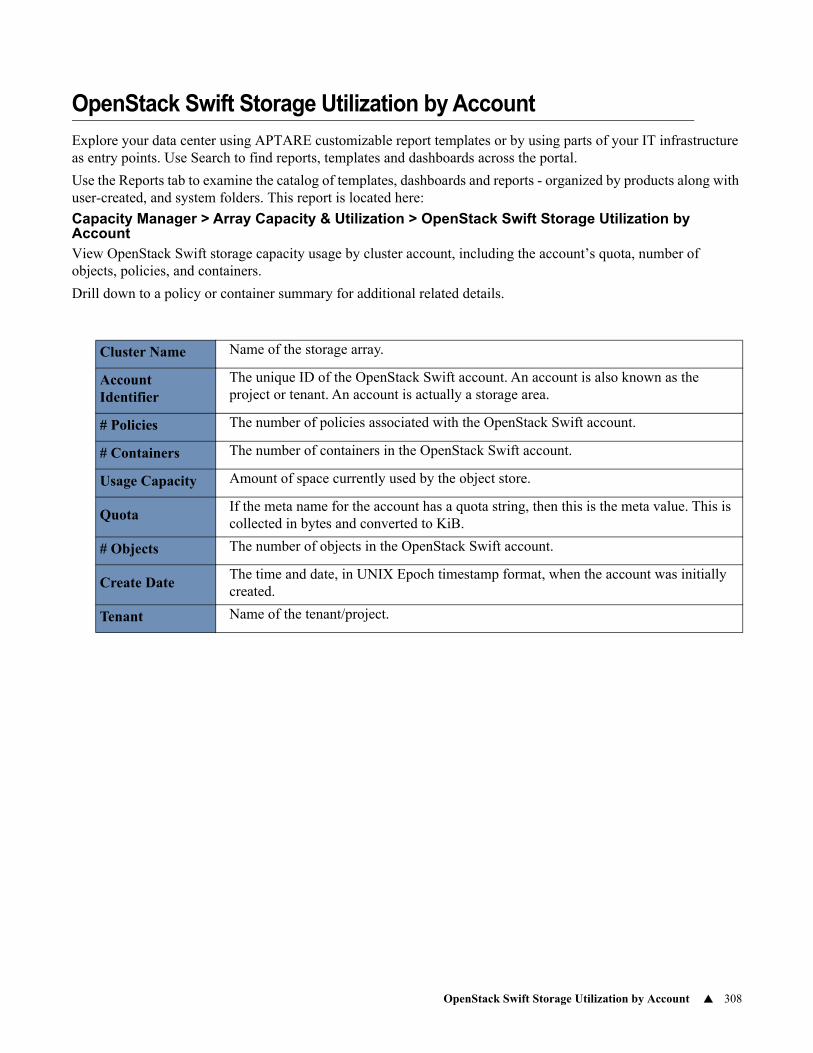
OpenStack Swift Storage Utilization by Account 308
OpenStack Swift Storage Utilization by Account
Explore your data center using APTARE customizable report templates or by using parts of your IT infrastructure as entry points. Use Search to find reports, templates and dashboards across the portal.
Use the Reports tab to examine the catalog of templates, dashboards and reports - organized by products along with user-created, and system folders. This report is located here:
Capacity Manager > Array Capacity & Utilization > OpenStack Swift Storage Utilization by AccountView OpenStack Swift storage capacity usage by cluster account, including the account’s quota, number of objects, policies, and containers.
Drill down to a policy or container summary for additional related details.
Cluster Name Name of the storage array.
Account Identifier
The unique ID of the OpenStack Swift account. An account is also known as the project or tenant. An account is actually a storage area.
# Policies The number of policies associated with the OpenStack Swift account.
# Containers The number of containers in the OpenStack Swift account.
Usage Capacity Amount of space currently used by the object store.
QuotaIf the meta name for the account has a quota string, then this is the meta value. This is collected in bytes and converted to KiB.
# Objects The number of objects in the OpenStack Swift account.
Create DateThe time and date, in UNIX Epoch timestamp format, when the account was initially created.
Tenant Name of the tenant/project.
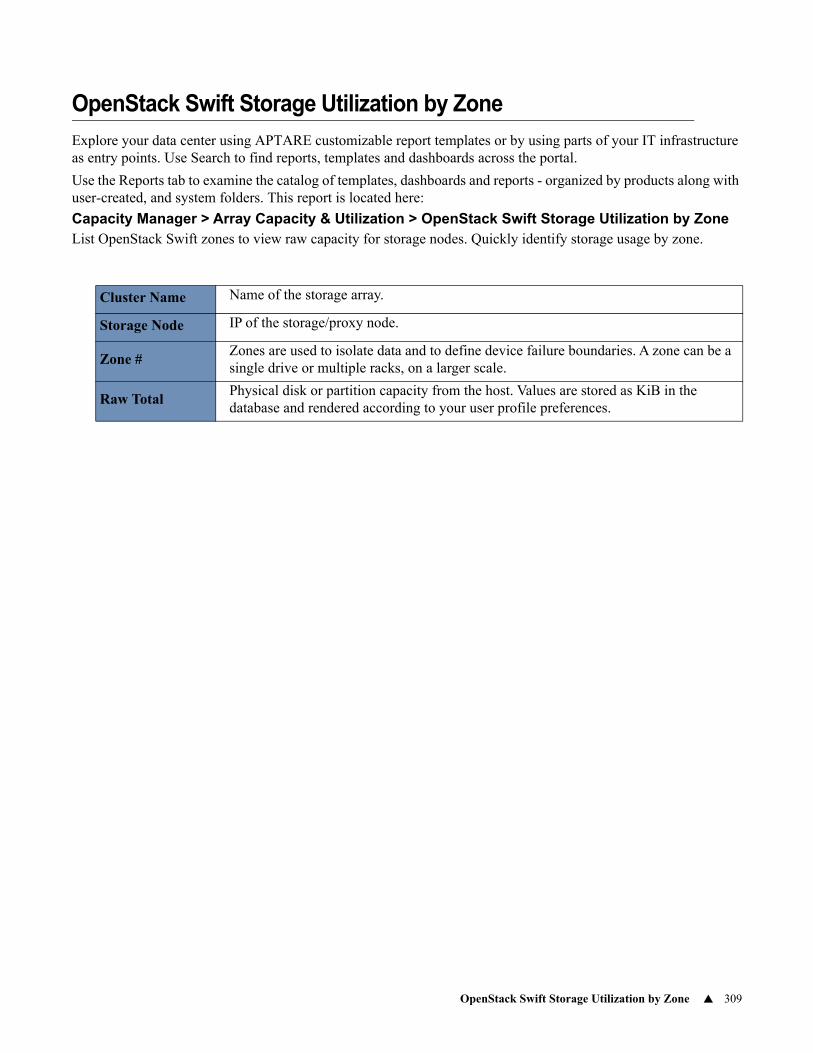
OpenStack Swift Storage Utilization by Zone 309
OpenStack Swift Storage Utilization by Zone
Explore your data center using APTARE customizable report templates or by using parts of your IT infrastructure as entry points. Use Search to find reports, templates and dashboards across the portal.
Use the Reports tab to examine the catalog of templates, dashboards and reports - organized by products along with user-created, and system folders. This report is located here:
Capacity Manager > Array Capacity & Utilization > OpenStack Swift Storage Utilization by ZoneList OpenStack Swift zones to view raw capacity for storage nodes. Quickly identify storage usage by zone.
Cluster Name Name of the storage array.
Storage Node IP of the storage/proxy node.
Zone #Zones are used to isolate data and to define device failure boundaries. A zone can be a single drive or multiple racks, on a larger scale.
Raw TotalPhysical disk or partition capacity from the host. Values are stored as KiB in the database and rendered according to your user profile preferences.
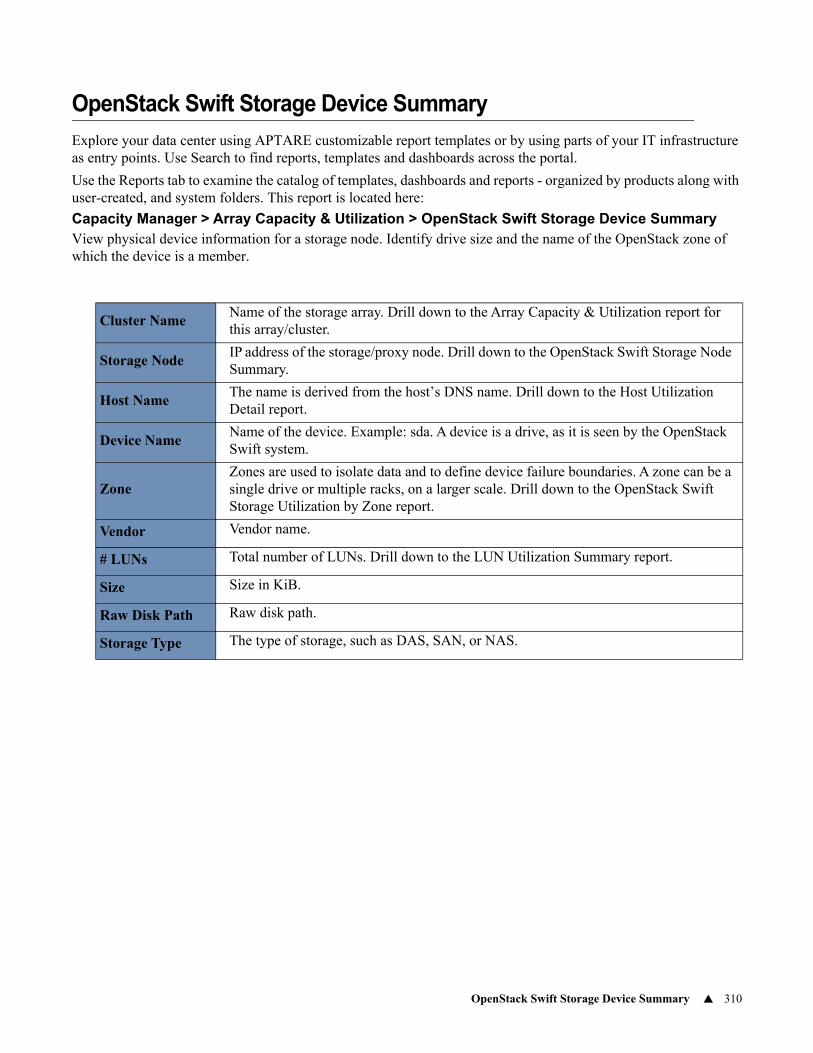
OpenStack Swift Storage Device Summary 310
OpenStack Swift Storage Device Summary
Explore your data center using APTARE customizable report templates or by using parts of your IT infrastructure as entry points. Use Search to find reports, templates and dashboards across the portal.
Use the Reports tab to examine the catalog of templates, dashboards and reports - organized by products along with user-created, and system folders. This report is located here:
Capacity Manager > Array Capacity & Utilization > OpenStack Swift Storage Device SummaryView physical device information for a storage node. Identify drive size and the name of the OpenStack zone of which the device is a member.
Cluster NameName of the storage array. Drill down to the Array Capacity & Utilization report for this array/cluster.
Storage NodeIP address of the storage/proxy node. Drill down to the OpenStack Swift Storage Node Summary.
Host NameThe name is derived from the host’s DNS name. Drill down to the Host Utilization Detail report.
Device NameName of the device. Example: sda. A device is a drive, as it is seen by the OpenStack Swift system.
ZoneZones are used to isolate data and to define device failure boundaries. A zone can be a single drive or multiple racks, on a larger scale. Drill down to the OpenStack Swift Storage Utilization by Zone report.
Vendor Vendor name.
# LUNs Total number of LUNs. Drill down to the LUN Utilization Summary report.
Size Size in KiB.
Raw Disk Path Raw disk path.
Storage Type The type of storage, such as DAS, SAN, or NAS.
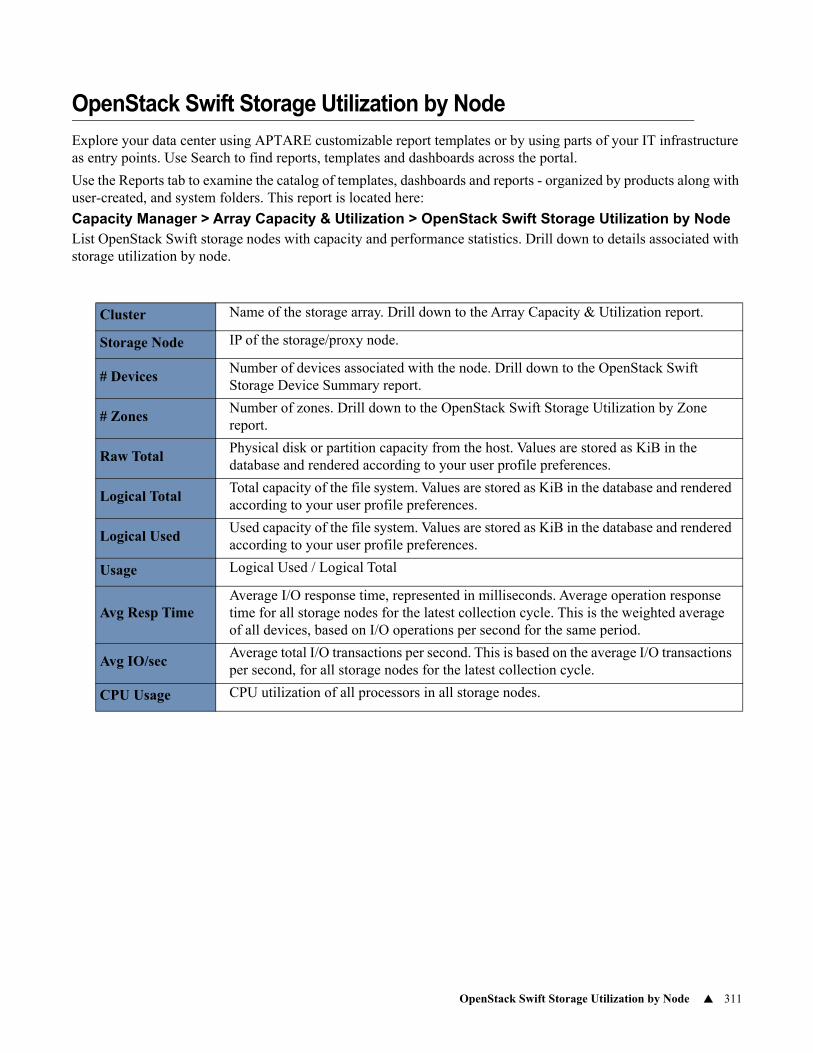
OpenStack Swift Storage Utilization by Node 311
OpenStack Swift Storage Utilization by Node
Explore your data center using APTARE customizable report templates or by using parts of your IT infrastructure as entry points. Use Search to find reports, templates and dashboards across the portal.
Use the Reports tab to examine the catalog of templates, dashboards and reports - organized by products along with user-created, and system folders. This report is located here:
Capacity Manager > Array Capacity & Utilization > OpenStack Swift Storage Utilization by NodeList OpenStack Swift storage nodes with capacity and performance statistics. Drill down to details associated with storage utilization by node.
Cluster Name of the storage array. Drill down to the Array Capacity & Utilization report.
Storage Node IP of the storage/proxy node.
# DevicesNumber of devices associated with the node. Drill down to the OpenStack Swift Storage Device Summary report.
# ZonesNumber of zones. Drill down to the OpenStack Swift Storage Utilization by Zone report.
Raw TotalPhysical disk or partition capacity from the host. Values are stored as KiB in the database and rendered according to your user profile preferences.
Logical TotalTotal capacity of the file system. Values are stored as KiB in the database and rendered according to your user profile preferences.
Logical UsedUsed capacity of the file system. Values are stored as KiB in the database and rendered according to your user profile preferences.
Usage Logical Used / Logical Total
Avg Resp TimeAverage I/O response time, represented in milliseconds. Average operation response time for all storage nodes for the latest collection cycle. This is the weighted average of all devices, based on I/O operations per second for the same period.
Avg IO/secAverage total I/O transactions per second. This is based on the average I/O transactions per second, for all storage nodes for the latest collection cycle.
CPU Usage CPU utilization of all processors in all storage nodes.

OpenStack Swift Storage Utilization by Node 312

OpenStack Swift Storage Utilization by Node 313
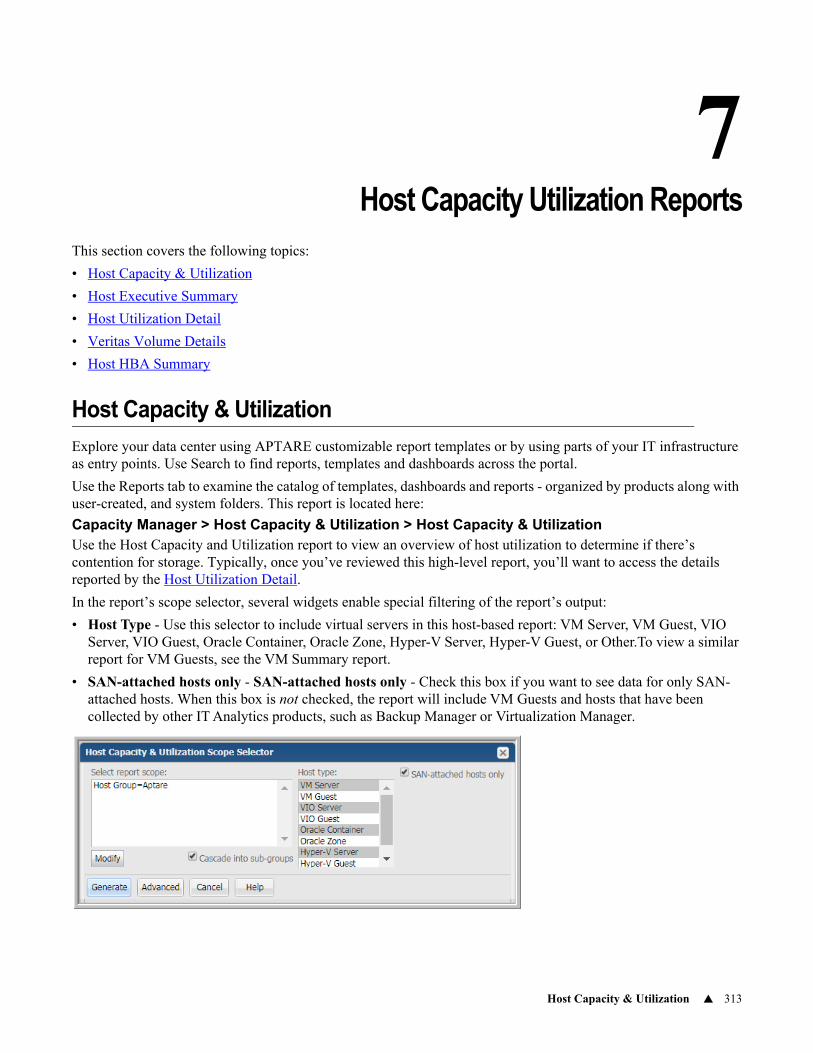
Host Capacity & Utilization 313
7Chapter 6Host Capacity Utilization Reports
This section covers the following topics:
• Host Capacity & Utilization
• Host Executive Summary
• Host Utilization Detail
• Veritas Volume Details
• Host HBA Summary
Host Capacity & Utilization
Explore your data center using APTARE customizable report templates or by using parts of your IT infrastructure as entry points. Use Search to find reports, templates and dashboards across the portal.
Use the Reports tab to examine the catalog of templates, dashboards and reports - organized by products along with user-created, and system folders. This report is located here:
Capacity Manager > Host Capacity & Utilization > Host Capacity & UtilizationUse the Host Capacity and Utilization report to view an overview of host utilization to determine if there’s contention for storage. Typically, once you’ve reviewed this high-level report, you’ll want to access the details reported by the Host Utilization Detail.
In the report’s scope selector, several widgets enable special filtering of the report’s output:
• Host Type - Use this selector to include virtual servers in this host-based report: VM Server, VM Guest, VIO Server, VIO Guest, Oracle Container, Oracle Zone, Hyper-V Server, Hyper-V Guest, or Other.To view a similar report for VM Guests, see the VM Summary report.
• SAN-attached hosts only - SAN-attached hosts only - Check this box if you want to see data for only SAN-attached hosts. When this box is not checked, the report will include VM Guests and hosts that have been collected by other IT Analytics products, such as Backup Manager or Virtualization Manager.
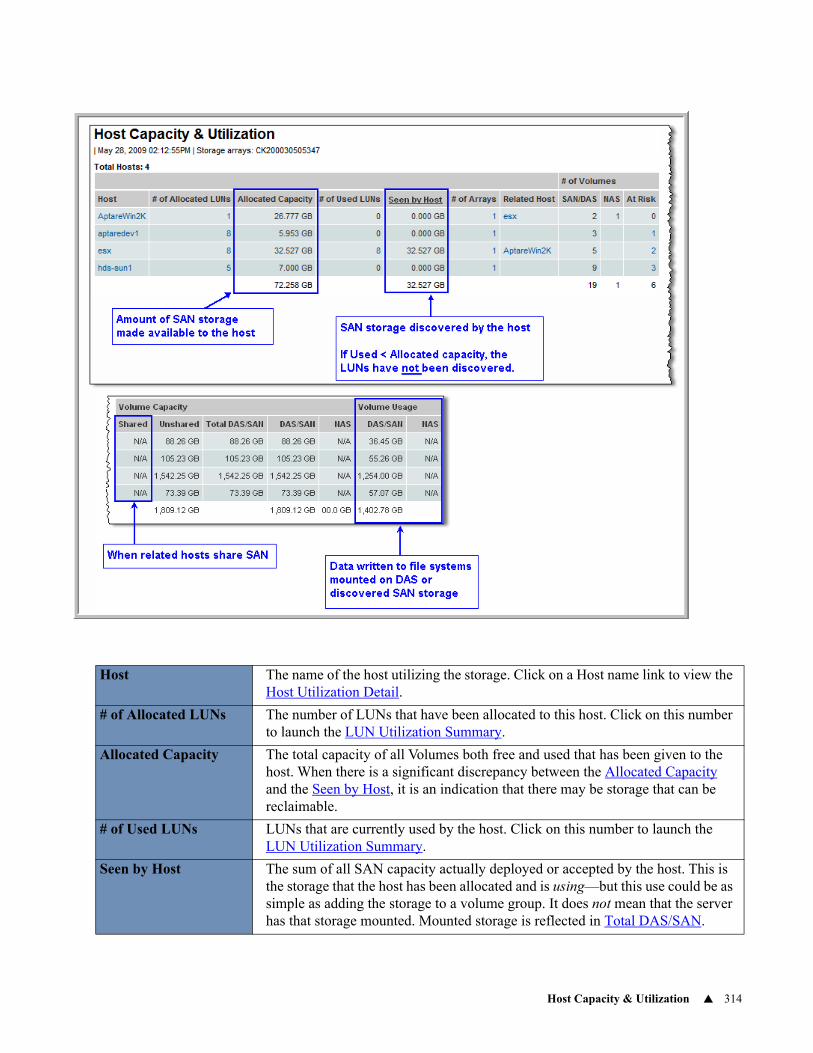
Host Capacity & Utilization 314
Host The name of the host utilizing the storage. Click on a Host name link to view the Host Utilization Detail.
# of Allocated LUNs The number of LUNs that have been allocated to this host. Click on this number to launch the LUN Utilization Summary.
Allocated Capacity The total capacity of all Volumes both free and used that has been given to the host. When there is a significant discrepancy between the Allocated Capacity and the Seen by Host, it is an indication that there may be storage that can be reclaimable.
# of Used LUNs LUNs that are currently used by the host. Click on this number to launch the LUN Utilization Summary.
Seen by Host The sum of all SAN capacity actually deployed or accepted by the host. This is the storage that the host has been allocated and is using—but this use could be as simple as adding the storage to a volume group. It does not mean that the server has that storage mounted. Mounted storage is reflected in Total DAS/SAN.
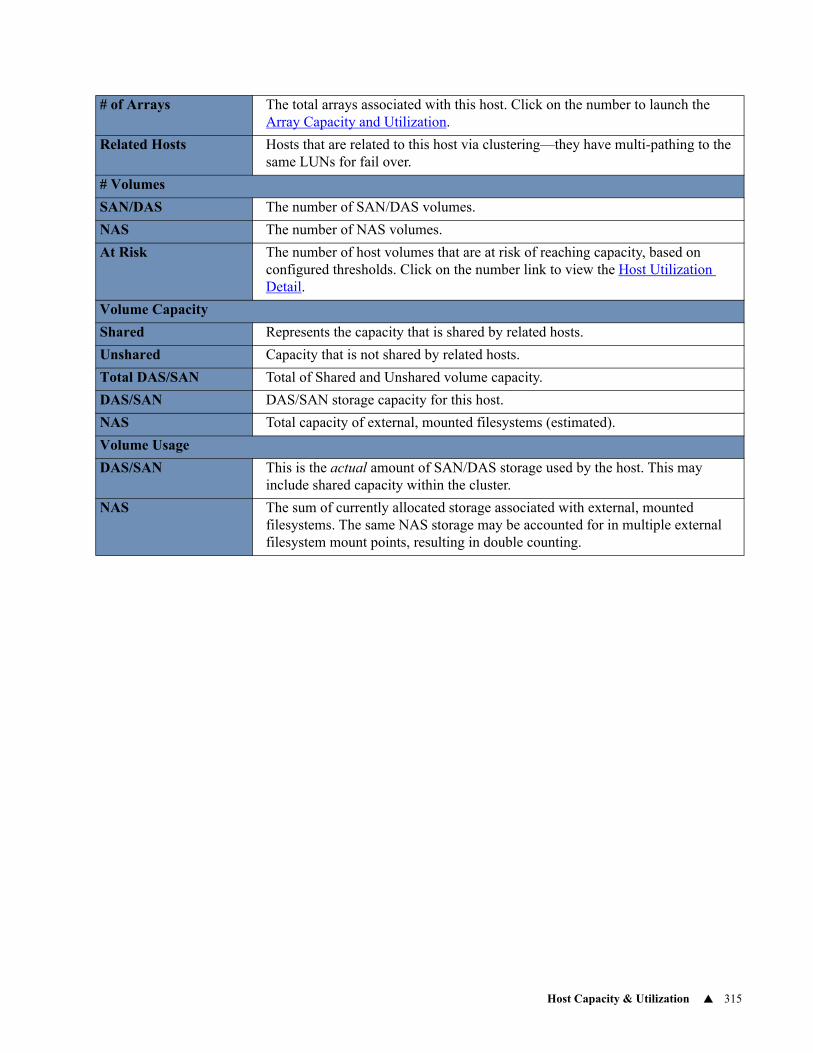
Host Capacity & Utilization 315
# of Arrays The total arrays associated with this host. Click on the number to launch the Array Capacity and Utilization.
Related Hosts Hosts that are related to this host via clustering—they have multi-pathing to the same LUNs for fail over.
# Volumes
SAN/DAS The number of SAN/DAS volumes.
NAS The number of NAS volumes.
At Risk The number of host volumes that are at risk of reaching capacity, based on configured thresholds. Click on the number link to view the Host Utilization Detail.
Volume Capacity
Shared Represents the capacity that is shared by related hosts.
Unshared Capacity that is not shared by related hosts.
Total DAS/SAN Total of Shared and Unshared volume capacity.
DAS/SAN DAS/SAN storage capacity for this host.
NAS Total capacity of external, mounted filesystems (estimated).
Volume Usage
DAS/SAN This is the actual amount of SAN/DAS storage used by the host. This may include shared capacity within the cluster.
NAS The sum of currently allocated storage associated with external, mounted filesystems. The same NAS storage may be accounted for in multiple external filesystem mount points, resulting in double counting.
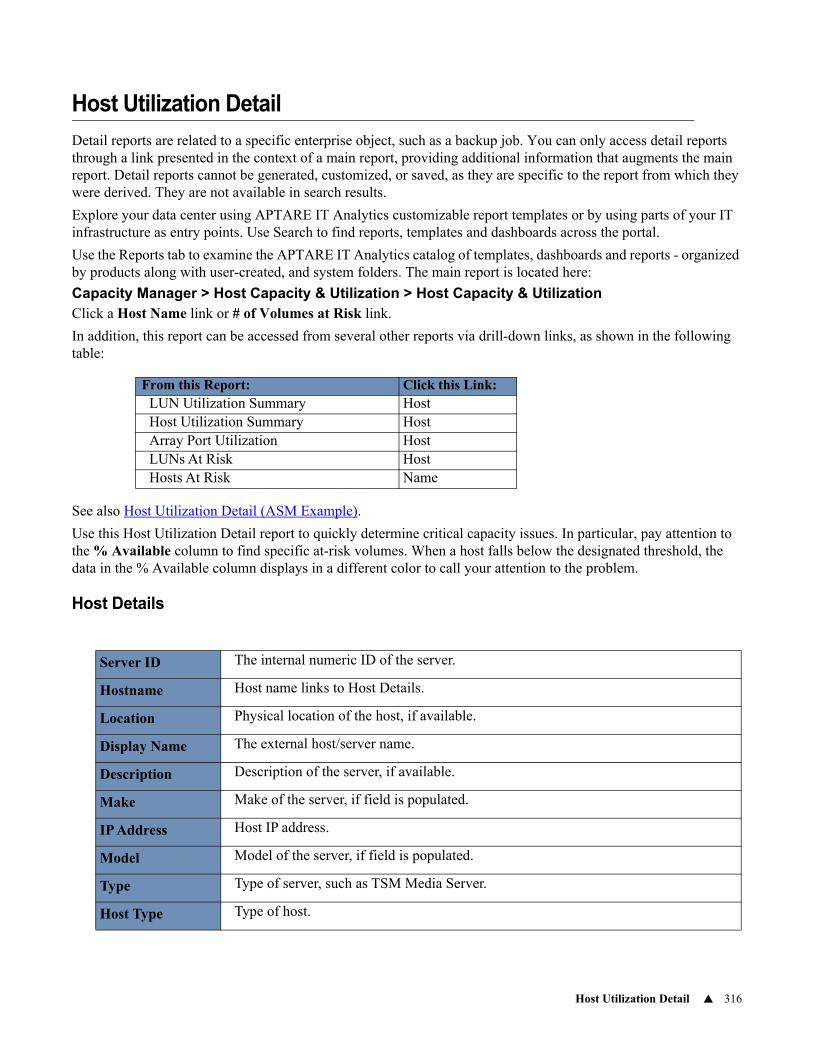
Host Utilization Detail 316
Host Utilization Detail
Detail reports are related to a specific enterprise object, such as a backup job. You can only access detail reports through a link presented in the context of a main report, providing additional information that augments the main report. Detail reports cannot be generated, customized, or saved, as they are specific to the report from which they were derived. They are not available in search results.
Explore your data center using APTARE IT Analytics customizable report templates or by using parts of your IT infrastructure as entry points. Use Search to find reports, templates and dashboards across the portal.
Use the Reports tab to examine the APTARE IT Analytics catalog of templates, dashboards and reports - organized by products along with user-created, and system folders. The main report is located here:
Capacity Manager > Host Capacity & Utilization > Host Capacity & UtilizationClick a Host Name link or # of Volumes at Risk link.
In addition, this report can be accessed from several other reports via drill-down links, as shown in the following table:
See also Host Utilization Detail (ASM Example).
Use this Host Utilization Detail report to quickly determine critical capacity issues. In particular, pay attention to the % Available column to find specific at-risk volumes. When a host falls below the designated threshold, the data in the % Available column displays in a different color to call your attention to the problem.
Host Details
From this Report: Click this Link:LUN Utilization Summary HostHost Utilization Summary HostArray Port Utilization HostLUNs At Risk HostHosts At Risk Name
Server ID The internal numeric ID of the server.
Hostname Host name links to Host Details.
Location Physical location of the host, if available.
Display Name The external host/server name.
Description Description of the server, if available.
Make Make of the server, if field is populated.
IP Address Host IP address.
Model Model of the server, if field is populated.
Type Type of server, such as TSM Media Server.
Host Type Type of host.
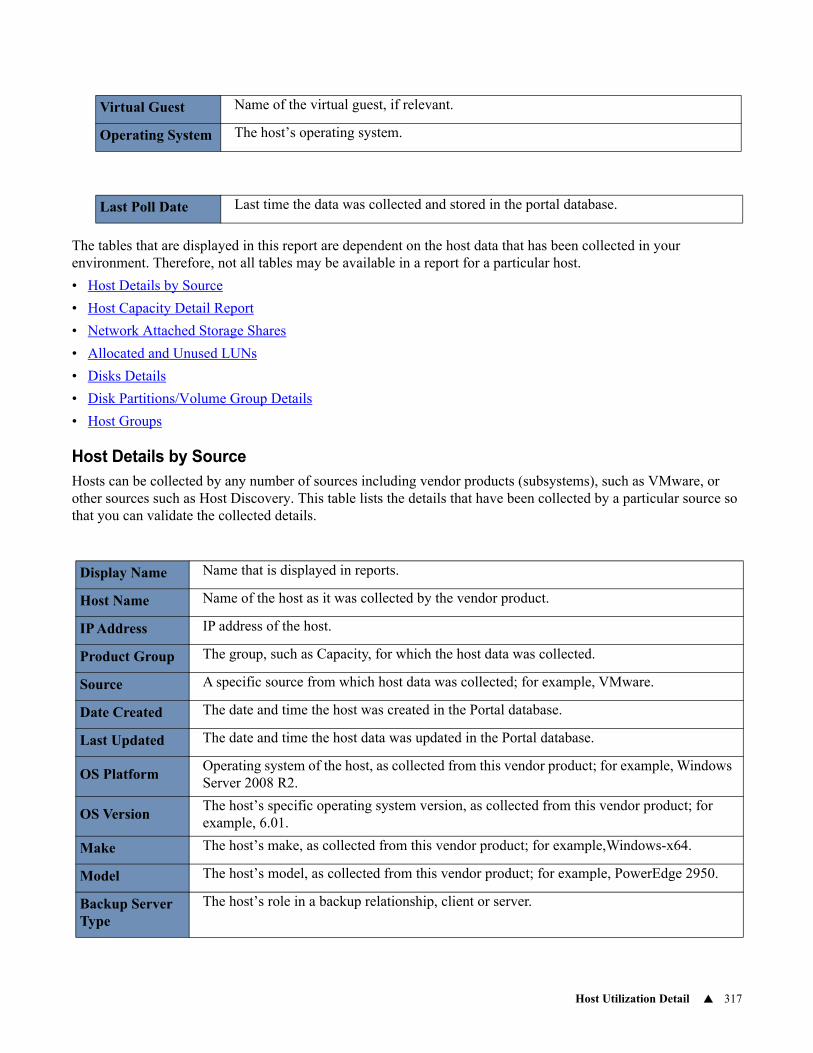
Host Utilization Detail 317
The tables that are displayed in this report are dependent on the host data that has been collected in your environment. Therefore, not all tables may be available in a report for a particular host.
• Host Details by Source
• Host Capacity Detail Report
• Network Attached Storage Shares
• Allocated and Unused LUNs
• Disks Details
• Disk Partitions/Volume Group Details
• Host Groups
Host Details by SourceHosts can be collected by any number of sources including vendor products (subsystems), such as VMware, or other sources such as Host Discovery. This table lists the details that have been collected by a particular source so that you can validate the collected details.
Virtual Guest Name of the virtual guest, if relevant.
Operating System The host’s operating system.
Last Poll Date Last time the data was collected and stored in the portal database.
Display Name Name that is displayed in reports.
Host Name Name of the host as it was collected by the vendor product.
IP Address IP address of the host.
Product Group The group, such as Capacity, for which the host data was collected.
Source A specific source from which host data was collected; for example, VMware.
Date Created The date and time the host was created in the Portal database.
Last Updated The date and time the host data was updated in the Portal database.
OS PlatformOperating system of the host, as collected from this vendor product; for example, Windows Server 2008 R2.
OS VersionThe host’s specific operating system version, as collected from this vendor product; for example, 6.01.
Make The host’s make, as collected from this vendor product; for example,Windows-x64.
Model The host’s model, as collected from this vendor product; for example, PowerEdge 2950.
Backup Server Type
The host’s role in a backup relationship, client or server.
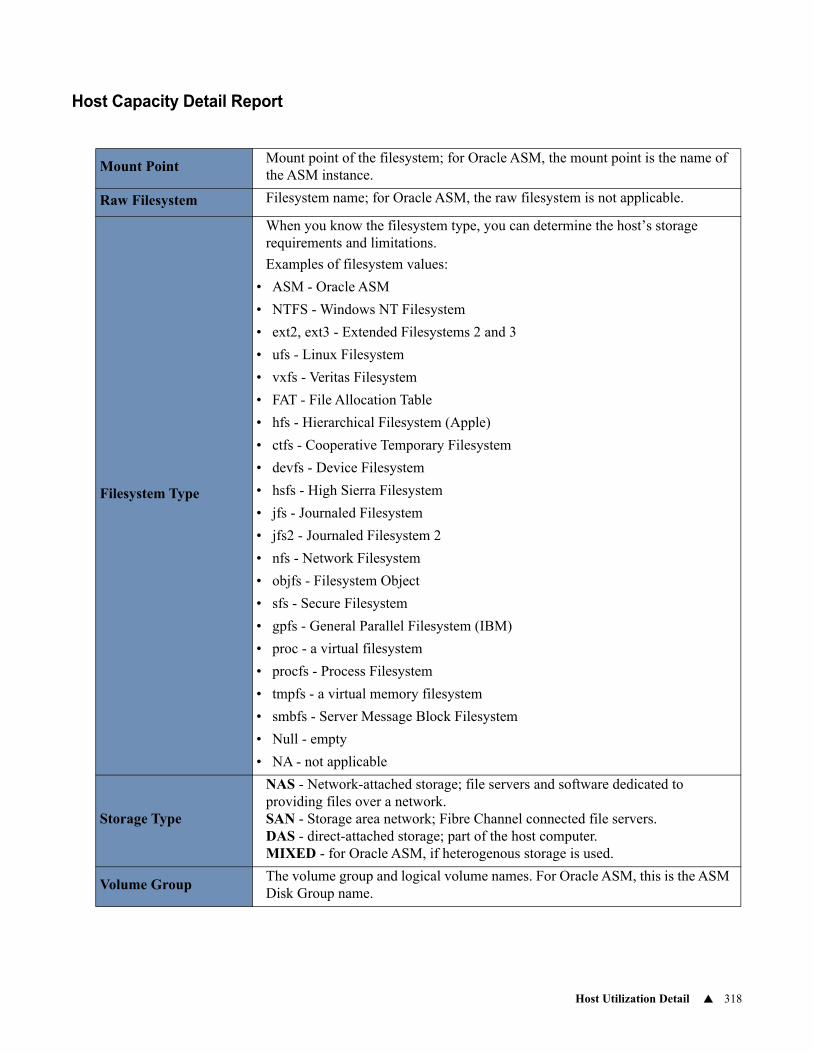
Host Utilization Detail 318
Host Capacity Detail Report
Mount PointMount point of the filesystem; for Oracle ASM, the mount point is the name of the ASM instance.
Raw Filesystem Filesystem name; for Oracle ASM, the raw filesystem is not applicable.
Filesystem Type
When you know the filesystem type, you can determine the host’s storage requirements and limitations.
Examples of filesystem values:
• ASM - Oracle ASM
• NTFS - Windows NT Filesystem
• ext2, ext3 - Extended Filesystems 2 and 3
• ufs - Linux Filesystem
• vxfs - Veritas Filesystem
• FAT - File Allocation Table
• hfs - Hierarchical Filesystem (Apple)
• ctfs - Cooperative Temporary Filesystem
• devfs - Device Filesystem
• hsfs - High Sierra Filesystem
• jfs - Journaled Filesystem
• jfs2 - Journaled Filesystem 2
• nfs - Network Filesystem
• objfs - Filesystem Object
• sfs - Secure Filesystem
• gpfs - General Parallel Filesystem (IBM)
• proc - a virtual filesystem
• procfs - Process Filesystem
• tmpfs - a virtual memory filesystem
• smbfs - Server Message Block Filesystem
• Null - empty
• NA - not applicable
Storage Type
NAS - Network-attached storage; file servers and software dedicated to providing files over a network.SAN - Storage area network; Fibre Channel connected file servers.DAS - direct-attached storage; part of the host computer.MIXED - for Oracle ASM, if heterogenous storage is used.
Volume GroupThe volume group and logical volume names. For Oracle ASM, this is the ASM Disk Group name.
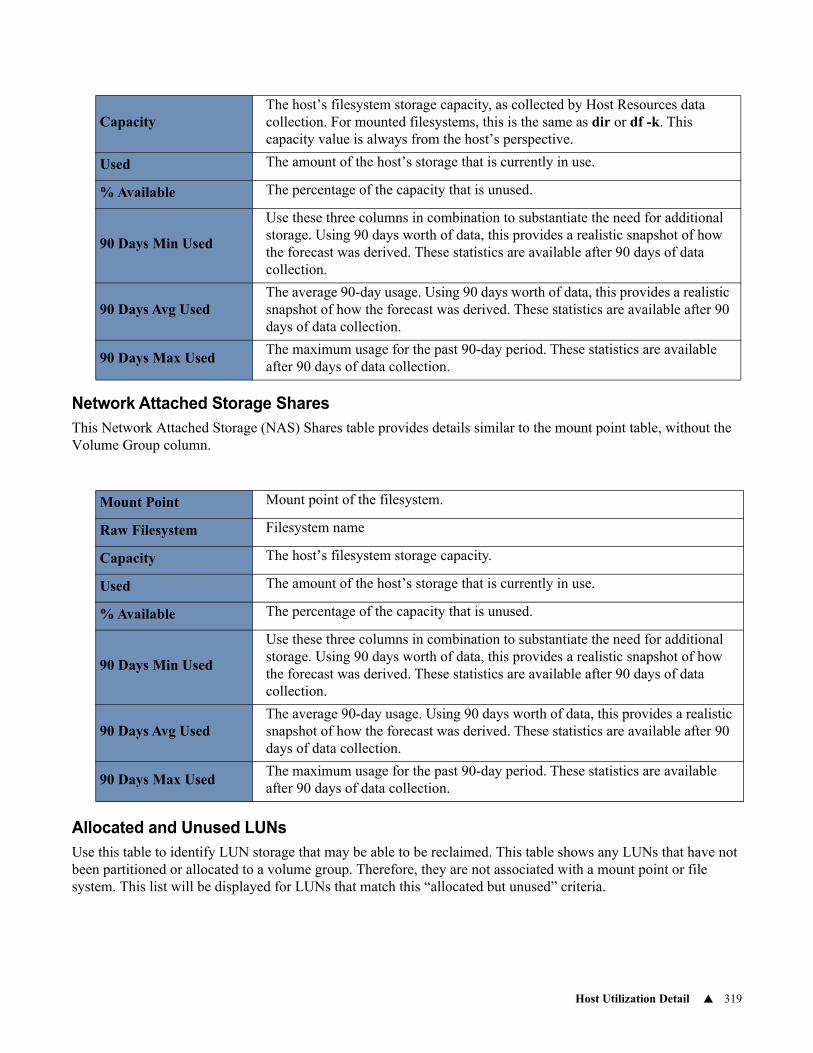
Host Utilization Detail 319
Network Attached Storage SharesThis Network Attached Storage (NAS) Shares table provides details similar to the mount point table, without the Volume Group column.
Allocated and Unused LUNsUse this table to identify LUN storage that may be able to be reclaimed. This table shows any LUNs that have not been partitioned or allocated to a volume group. Therefore, they are not associated with a mount point or file system. This list will be displayed for LUNs that match this “allocated but unused” criteria.
CapacityThe host’s filesystem storage capacity, as collected by Host Resources data collection. For mounted filesystems, this is the same as dir or df -k. This capacity value is always from the host’s perspective.
Used The amount of the host’s storage that is currently in use.
% Available The percentage of the capacity that is unused.
90 Days Min Used
Use these three columns in combination to substantiate the need for additional storage. Using 90 days worth of data, this provides a realistic snapshot of how the forecast was derived. These statistics are available after 90 days of data collection.
90 Days Avg UsedThe average 90-day usage. Using 90 days worth of data, this provides a realistic snapshot of how the forecast was derived. These statistics are available after 90 days of data collection.
90 Days Max UsedThe maximum usage for the past 90-day period. These statistics are available after 90 days of data collection.
Mount Point Mount point of the filesystem.
Raw Filesystem Filesystem name
Capacity The host’s filesystem storage capacity.
Used The amount of the host’s storage that is currently in use.
% Available The percentage of the capacity that is unused.
90 Days Min Used
Use these three columns in combination to substantiate the need for additional storage. Using 90 days worth of data, this provides a realistic snapshot of how the forecast was derived. These statistics are available after 90 days of data collection.
90 Days Avg UsedThe average 90-day usage. Using 90 days worth of data, this provides a realistic snapshot of how the forecast was derived. These statistics are available after 90 days of data collection.
90 Days Max UsedThe maximum usage for the past 90-day period. These statistics are available after 90 days of data collection.
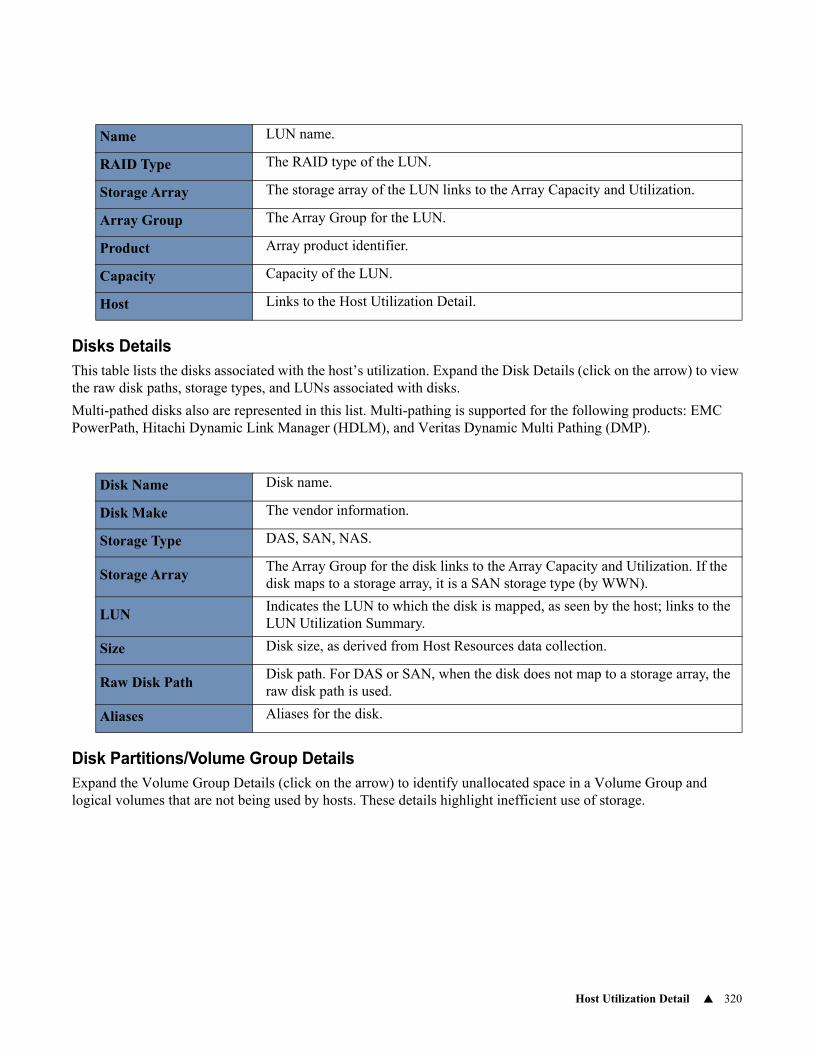
Host Utilization Detail 320
Disks DetailsThis table lists the disks associated with the host’s utilization. Expand the Disk Details (click on the arrow) to view the raw disk paths, storage types, and LUNs associated with disks.
Multi-pathed disks also are represented in this list. Multi-pathing is supported for the following products: EMC PowerPath, Hitachi Dynamic Link Manager (HDLM), and Veritas Dynamic Multi Pathing (DMP).
Disk Partitions/Volume Group DetailsExpand the Volume Group Details (click on the arrow) to identify unallocated space in a Volume Group and logical volumes that are not being used by hosts. These details highlight inefficient use of storage.
Name LUN name.
RAID Type The RAID type of the LUN.
Storage Array The storage array of the LUN links to the Array Capacity and Utilization.
Array Group The Array Group for the LUN.
Product Array product identifier.
Capacity Capacity of the LUN.
Host Links to the Host Utilization Detail.
Disk Name Disk name.
Disk Make The vendor information.
Storage Type DAS, SAN, NAS.
Storage ArrayThe Array Group for the disk links to the Array Capacity and Utilization. If the disk maps to a storage array, it is a SAN storage type (by WWN).
LUNIndicates the LUN to which the disk is mapped, as seen by the host; links to the LUN Utilization Summary.
Size Disk size, as derived from Host Resources data collection.
Raw Disk PathDisk path. For DAS or SAN, when the disk does not map to a storage array, the raw disk path is used.
Aliases Aliases for the disk.
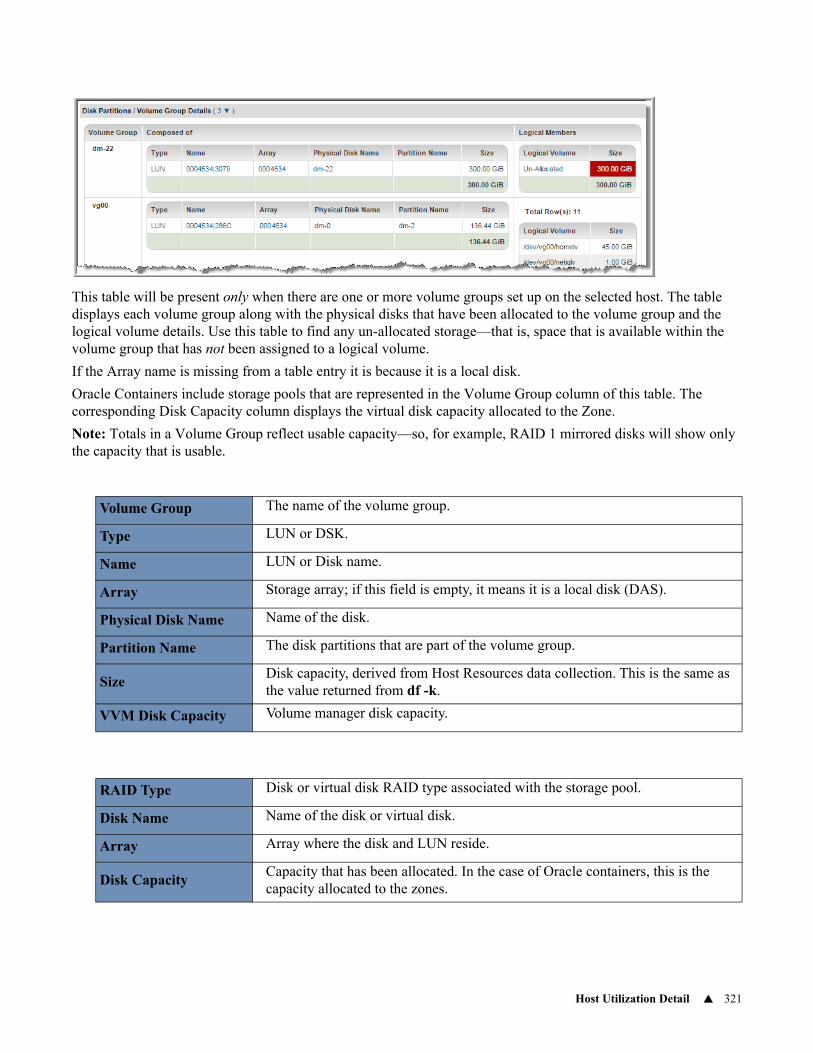
Host Utilization Detail 321
This table will be present only when there are one or more volume groups set up on the selected host. The table displays each volume group along with the physical disks that have been allocated to the volume group and the logical volume details. Use this table to find any un-allocated storage—that is, space that is available within the volume group that has not been assigned to a logical volume.
If the Array name is missing from a table entry it is because it is a local disk.
Oracle Containers include storage pools that are represented in the Volume Group column of this table. The corresponding Disk Capacity column displays the virtual disk capacity allocated to the Zone.
Note: Totals in a Volume Group reflect usable capacity—so, for example, RAID 1 mirrored disks will show only the capacity that is usable.
Volume Group The name of the volume group.
Type LUN or DSK.
Name LUN or Disk name.
Array Storage array; if this field is empty, it means it is a local disk (DAS).
Physical Disk Name Name of the disk.
Partition Name The disk partitions that are part of the volume group.
SizeDisk capacity, derived from Host Resources data collection. This is the same as the value returned from df -k.
VVM Disk Capacity Volume manager disk capacity.
RAID Type Disk or virtual disk RAID type associated with the storage pool.
Disk Name Name of the disk or virtual disk.
Array Array where the disk and LUN reside.
Disk CapacityCapacity that has been allocated. In the case of Oracle containers, this is the capacity allocated to the zones.
Host Utilization Detail 322
Note: The Capacity and Used columns are aggregated and then converted to the units selected in the Advanced option of the report from which the Host Utilization Detail was launched. Note that in the conversion to the displayed units, the totals may appear to be slightly inaccurate. This is due to the division or multiplication by 1024.
Zone Oracle VM (OS instance)
VolumeIf the volume value is blank, the Used value represents the data set used capacity. If there is a value listed for the volume, this means it is for a file system.
Used Represents the capacity “written to” the file system.
Logical Volume Logical volume name. If listed as Un-allocated, it is not mounted.
Size Usable volume space.
Physical Size Physical size of logical member.
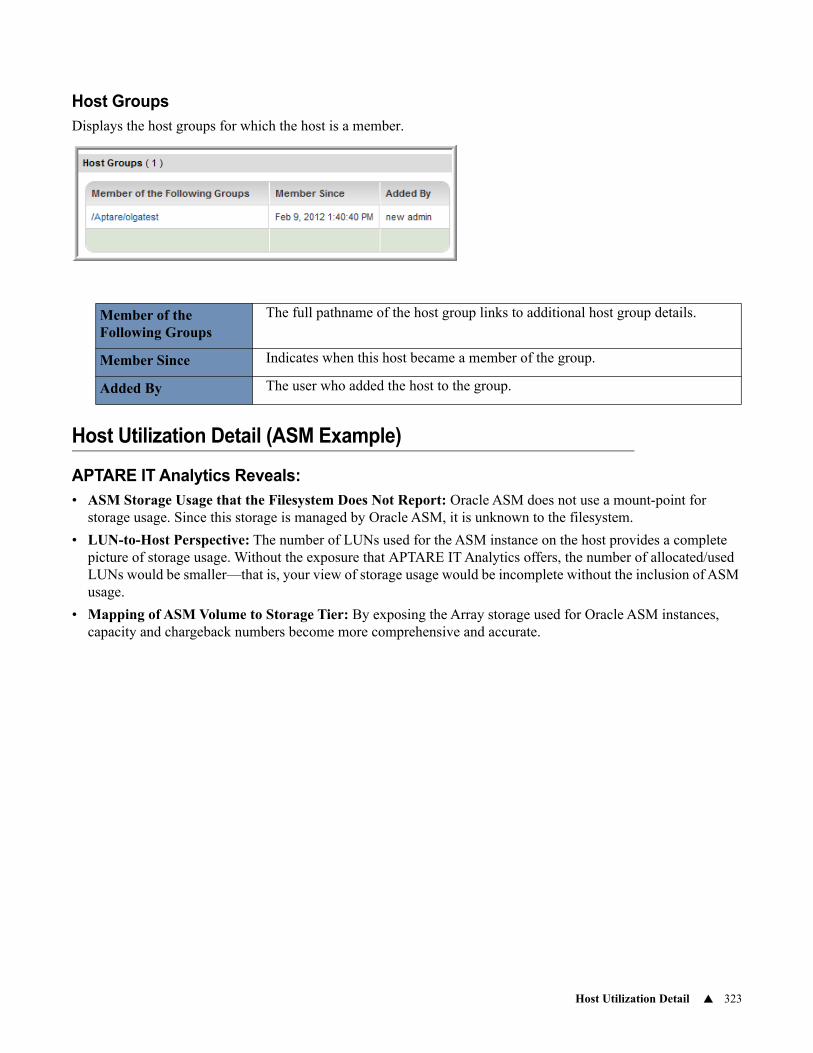
Host Utilization Detail 323
Host GroupsDisplays the host groups for which the host is a member.
Host Utilization Detail (ASM Example)
APTARE IT Analytics Reveals:• ASM Storage Usage that the Filesystem Does Not Report: Oracle ASM does not use a mount-point for
storage usage. Since this storage is managed by Oracle ASM, it is unknown to the filesystem.
• LUN-to-Host Perspective: The number of LUNs used for the ASM instance on the host provides a complete picture of storage usage. Without the exposure that APTARE IT Analytics offers, the number of allocated/used LUNs would be smaller—that is, your view of storage usage would be incomplete without the inclusion of ASM usage.
• Mapping of ASM Volume to Storage Tier: By exposing the Array storage used for Oracle ASM instances, capacity and chargeback numbers become more comprehensive and accurate.
Member of the Following Groups
The full pathname of the host group links to additional host group details.
Member Since Indicates when this host became a member of the group.
Added By The user who added the host to the group.
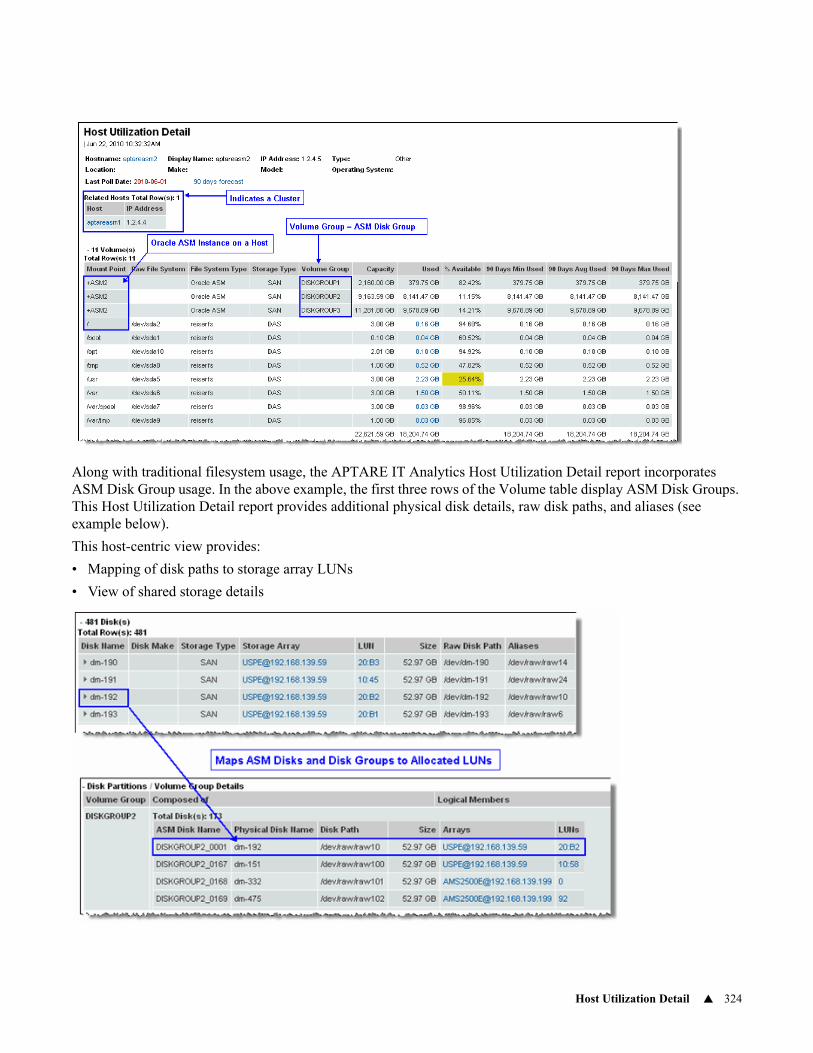
Host Utilization Detail 324
Along with traditional filesystem usage, the APTARE IT Analytics Host Utilization Detail report incorporates ASM Disk Group usage. In the above example, the first three rows of the Volume table display ASM Disk Groups. This Host Utilization Detail report provides additional physical disk details, raw disk paths, and aliases (see example below).
This host-centric view provides:
• Mapping of disk paths to storage array LUNs
• View of shared storage details
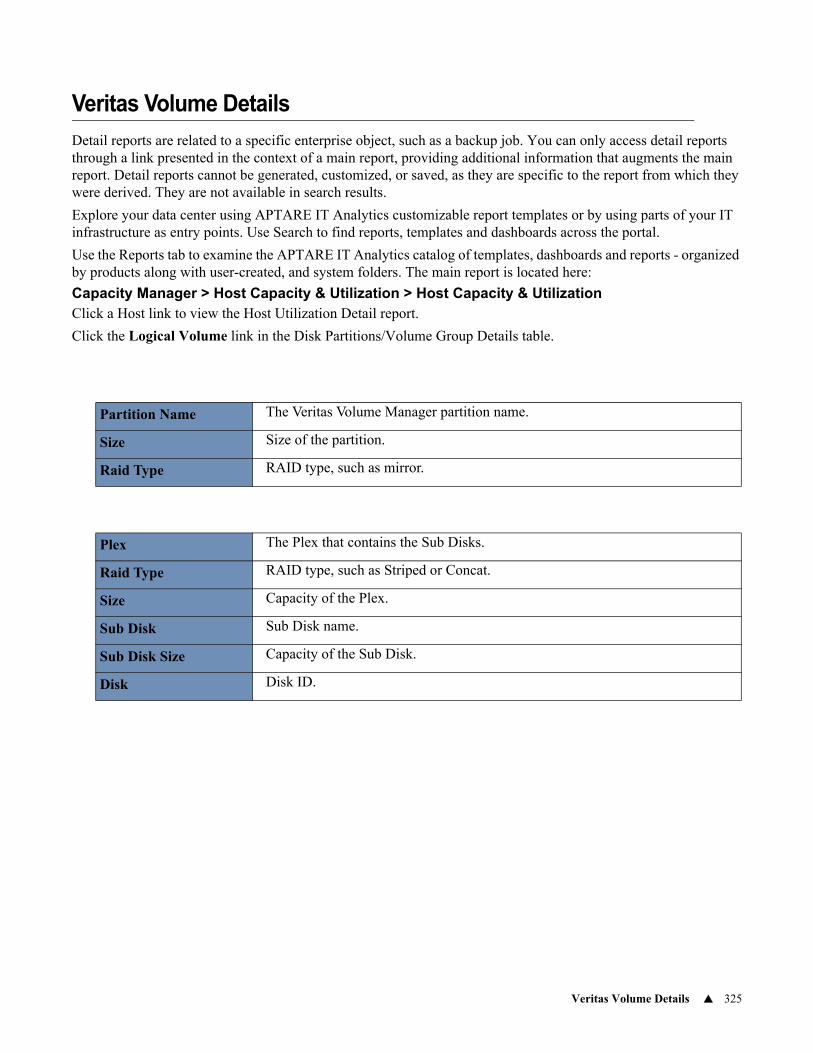
Veritas Volume Details 325
Veritas Volume Details
Detail reports are related to a specific enterprise object, such as a backup job. You can only access detail reports through a link presented in the context of a main report, providing additional information that augments the main report. Detail reports cannot be generated, customized, or saved, as they are specific to the report from which they were derived. They are not available in search results.
Explore your data center using APTARE IT Analytics customizable report templates or by using parts of your IT infrastructure as entry points. Use Search to find reports, templates and dashboards across the portal.
Use the Reports tab to examine the APTARE IT Analytics catalog of templates, dashboards and reports - organized by products along with user-created, and system folders. The main report is located here:
Capacity Manager > Host Capacity & Utilization > Host Capacity & UtilizationClick a Host link to view the Host Utilization Detail report.
Click the Logical Volume link in the Disk Partitions/Volume Group Details table.
Partition Name The Veritas Volume Manager partition name.
Size Size of the partition.
Raid Type RAID type, such as mirror.
Plex The Plex that contains the Sub Disks.
Raid Type RAID type, such as Striped or Concat.
Size Capacity of the Plex.
Sub Disk Sub Disk name.
Sub Disk Size Capacity of the Sub Disk.
Disk Disk ID.
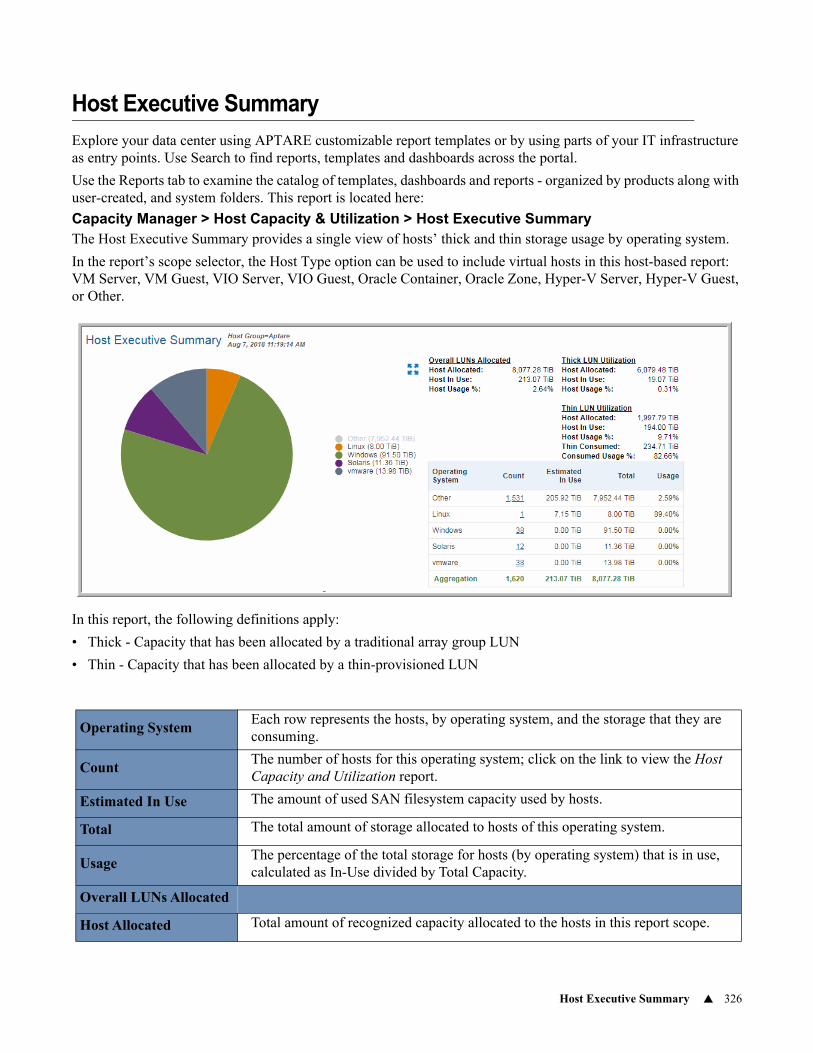
Host Executive Summary 326
Host Executive Summary
Explore your data center using APTARE customizable report templates or by using parts of your IT infrastructure as entry points. Use Search to find reports, templates and dashboards across the portal.
Use the Reports tab to examine the catalog of templates, dashboards and reports - organized by products along with user-created, and system folders. This report is located here:
Capacity Manager > Host Capacity & Utilization > Host Executive SummaryThe Host Executive Summary provides a single view of hosts’ thick and thin storage usage by operating system.
In the report’s scope selector, the Host Type option can be used to include virtual hosts in this host-based report: VM Server, VM Guest, VIO Server, VIO Guest, Oracle Container, Oracle Zone, Hyper-V Server, Hyper-V Guest, or Other.
In this report, the following definitions apply:
• Thick - Capacity that has been allocated by a traditional array group LUN
• Thin - Capacity that has been allocated by a thin-provisioned LUN
Operating SystemEach row represents the hosts, by operating system, and the storage that they are consuming.
CountThe number of hosts for this operating system; click on the link to view the Host Capacity and Utilization report.
Estimated In Use The amount of used SAN filesystem capacity used by hosts.
Total The total amount of storage allocated to hosts of this operating system.
UsageThe percentage of the total storage for hosts (by operating system) that is in use, calculated as In-Use divided by Total Capacity.
Overall LUNs Allocated
Host Allocated Total amount of recognized capacity allocated to the hosts in this report scope.
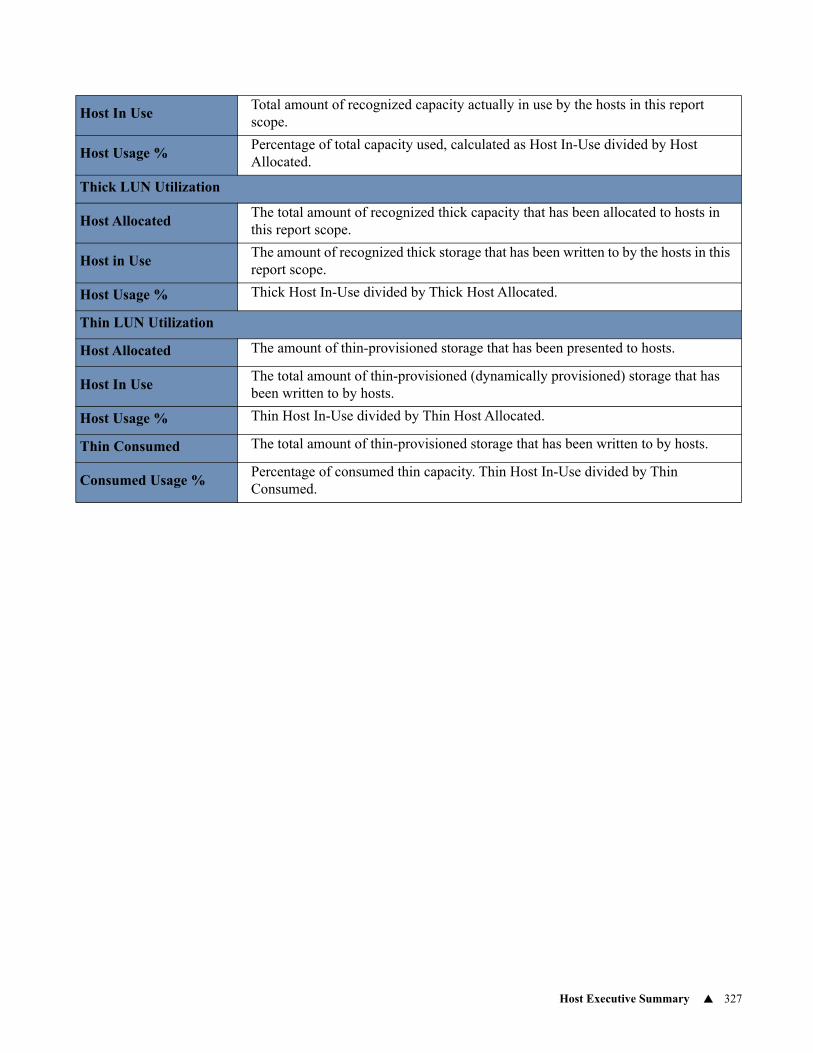
Host Executive Summary 327
Host In UseTotal amount of recognized capacity actually in use by the hosts in this report scope.
Host Usage %Percentage of total capacity used, calculated as Host In-Use divided by Host Allocated.
Thick LUN Utilization
Host Allocated The total amount of recognized thick capacity that has been allocated to hosts in this report scope.
Host in Use The amount of recognized thick storage that has been written to by the hosts in this report scope.
Host Usage % Thick Host In-Use divided by Thick Host Allocated.
Thin LUN Utilization
Host Allocated The amount of thin-provisioned storage that has been presented to hosts.
Host In UseThe total amount of thin-provisioned (dynamically provisioned) storage that has been written to by hosts.
Host Usage % Thin Host In-Use divided by Thin Host Allocated.
Thin Consumed The total amount of thin-provisioned storage that has been written to by hosts.
Consumed Usage %Percentage of consumed thin capacity. Thin Host In-Use divided by Thin Consumed.
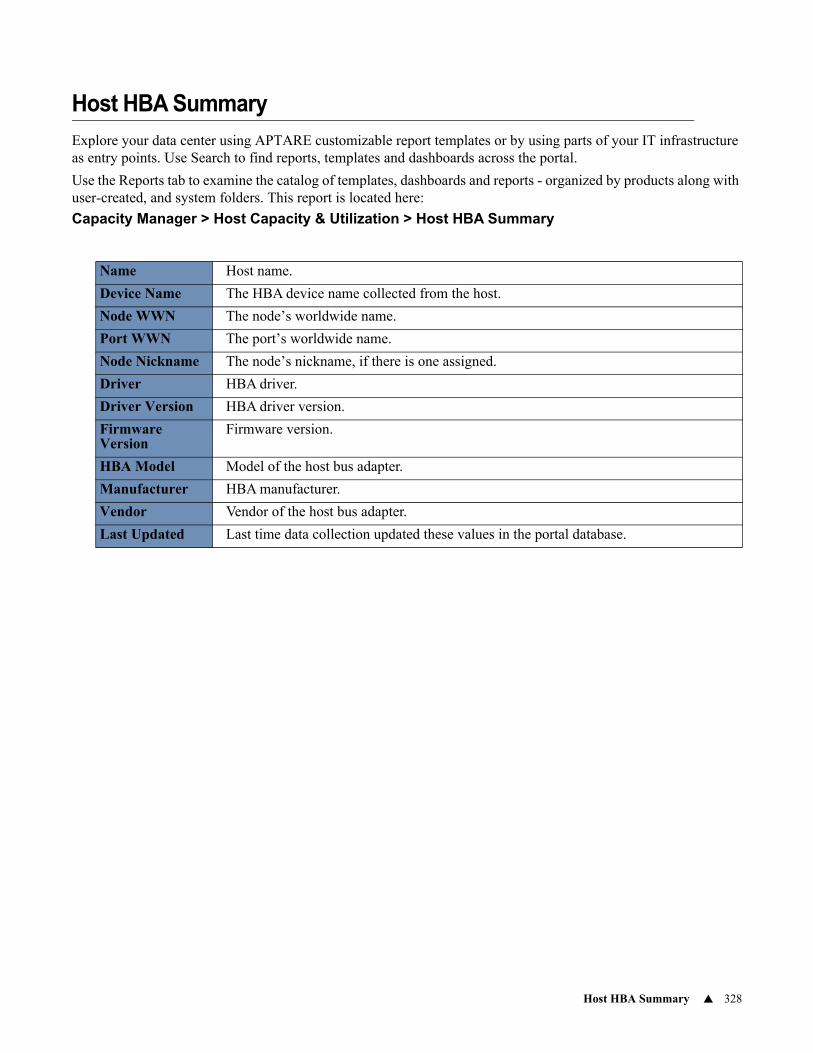
Host HBA Summary 328
Host HBA Summary
Explore your data center using APTARE customizable report templates or by using parts of your IT infrastructure as entry points. Use Search to find reports, templates and dashboards across the portal.
Use the Reports tab to examine the catalog of templates, dashboards and reports - organized by products along with user-created, and system folders. This report is located here:
Capacity Manager > Host Capacity & Utilization > Host HBA Summary
Name Host name.
Device Name The HBA device name collected from the host.
Node WWN The node’s worldwide name.
Port WWN The port’s worldwide name.
Node Nickname The node’s nickname, if there is one assigned.
Driver HBA driver.
Driver Version HBA driver version.
Firmware Version
Firmware version.
HBA Model Model of the host bus adapter.
Manufacturer HBA manufacturer.
Vendor Vendor of the host bus adapter.
Last Updated Last time data collection updated these values in the portal database.
Thin Provisioning Overview 329
8Chapter 6Thin Provisioning Reports
This section covers the following topics:
• Thin Provisioning Overview
• EMC Symmetrix Compression Ratio Summary
• EMC Symmetrix SRP Summary
• EMC Symmetrix Thin Pool Summary
• EMC VNX (CLARiiON) Thin Pool Summary
• Hitachi Disk Summary
• Hitachi Dynamic Provisioning Pool Utilization
• HP 3PAR Common Provisioning Group (CPG) Summary
• Storage Pool Summary
Thin Provisioning Overview
By using an over-subscription strategy, thin provisioning technology addresses the issue of inefficient storage utilization. Applications are given physical space from a storage pool when data is written to the application, avoiding the pre-allocation commitment required by traditional storage provisioning approaches. In this way, an application can appear to have more storage than is actually reserved for it. As the application’s data grows, it can be given more storage from the storage pool, with minimal management intervention. With thin provisioning, existing capacity can be more efficiently used, eliminating the need for over-provisioning and often delaying the acquisition of additional storage.
Often storage is over-promised and then actually dealt out as needed, making it incumbent upon the Storage Administrator to monitor storage usage so that an application’s write requests can be fulfilled without failures.
APTARE IT Analytics provides the following key capacity-at-risk reports to facilitate this monitoring process:
• Exception Summary
• Hosts at Risk
• LUNs at Risk
• NetApp Aggregates at Risk
• NetApp Volumes at Risk
• Over-Provisioned Hosts
EMC Symmetrix Compression Ratio Summary
Explore your data center using APTARE customizable report templates or by using parts of your IT infrastructure as entry points. Use Search to find reports, templates and dashboards across the portal.
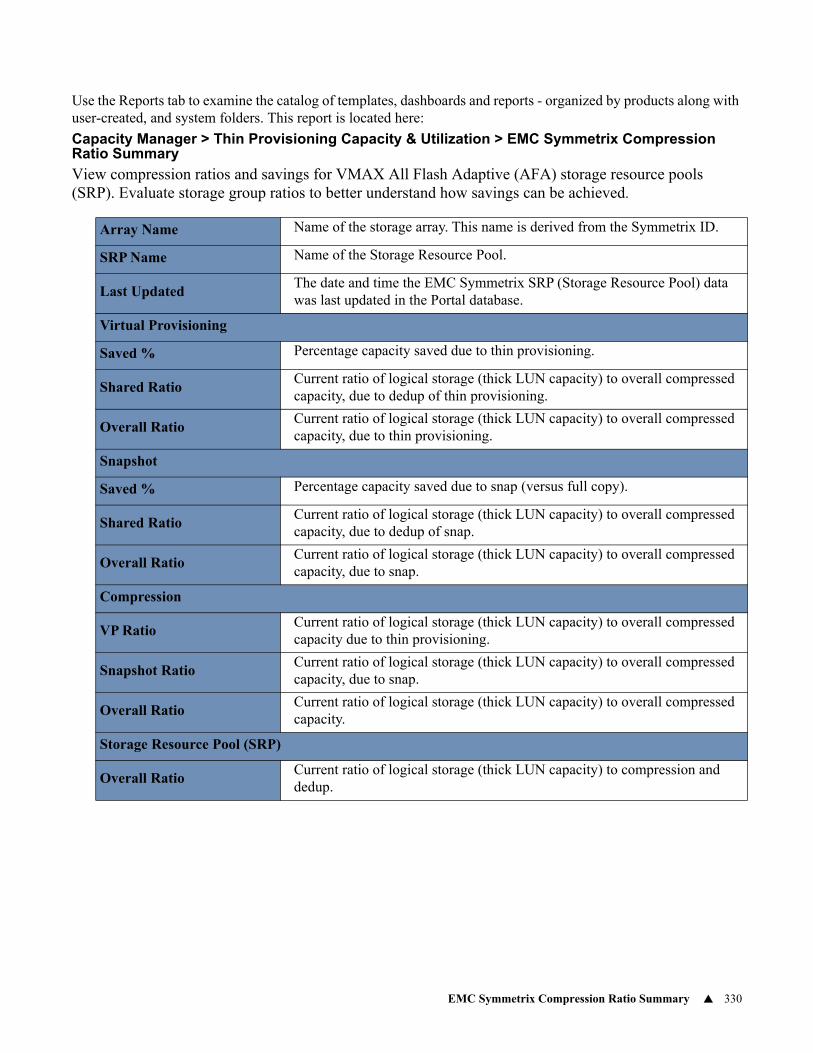
EMC Symmetrix Compression Ratio Summary 330
Use the Reports tab to examine the catalog of templates, dashboards and reports - organized by products along with user-created, and system folders. This report is located here:
Capacity Manager > Thin Provisioning Capacity & Utilization > EMC Symmetrix Compression Ratio Summary
View compression ratios and savings for VMAX All Flash Adaptive (AFA) storage resource pools (SRP). Evaluate storage group ratios to better understand how savings can be achieved.
Array Name Name of the storage array. This name is derived from the Symmetrix ID.
SRP Name Name of the Storage Resource Pool.
Last UpdatedThe date and time the EMC Symmetrix SRP (Storage Resource Pool) data was last updated in the Portal database.
Virtual Provisioning
Saved % Percentage capacity saved due to thin provisioning.
Shared RatioCurrent ratio of logical storage (thick LUN capacity) to overall compressed capacity, due to dedup of thin provisioning.
Overall RatioCurrent ratio of logical storage (thick LUN capacity) to overall compressed capacity, due to thin provisioning.
Snapshot
Saved % Percentage capacity saved due to snap (versus full copy).
Shared RatioCurrent ratio of logical storage (thick LUN capacity) to overall compressed capacity, due to dedup of snap.
Overall RatioCurrent ratio of logical storage (thick LUN capacity) to overall compressed capacity, due to snap.
Compression
VP RatioCurrent ratio of logical storage (thick LUN capacity) to overall compressed capacity due to thin provisioning.
Snapshot RatioCurrent ratio of logical storage (thick LUN capacity) to overall compressed capacity, due to snap.
Overall RatioCurrent ratio of logical storage (thick LUN capacity) to overall compressed capacity.
Storage Resource Pool (SRP)
Overall RatioCurrent ratio of logical storage (thick LUN capacity) to compression and dedup.
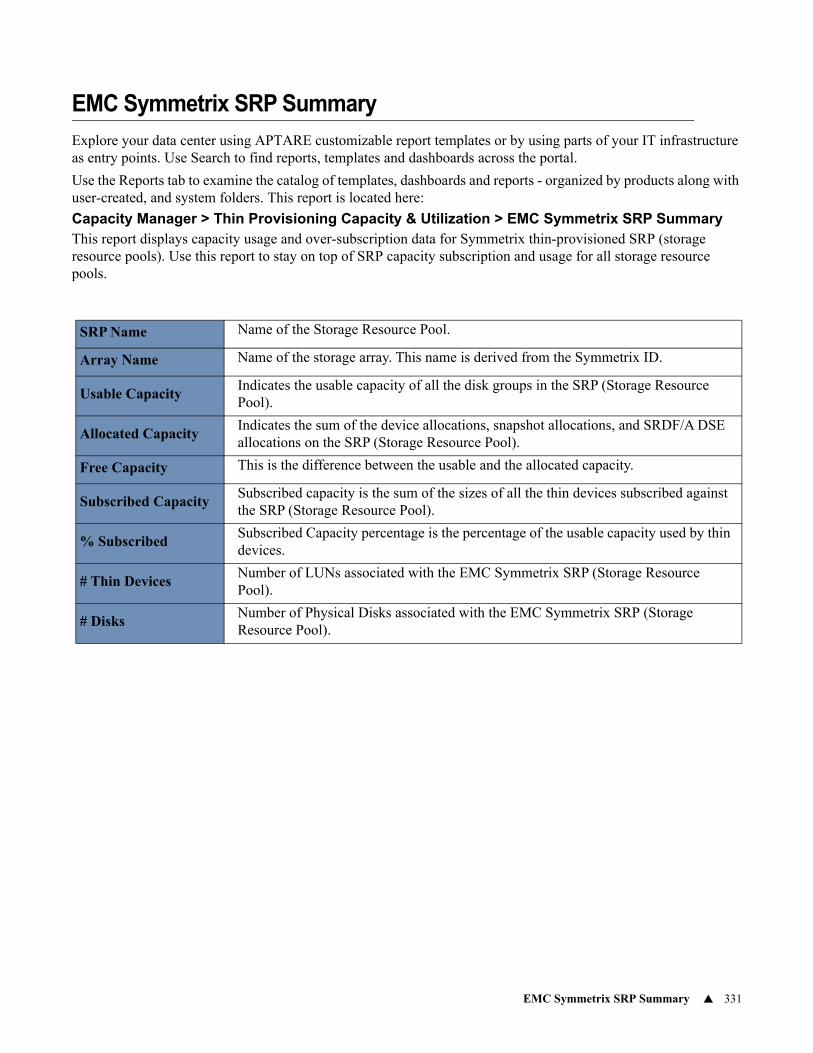
EMC Symmetrix SRP Summary 331
EMC Symmetrix SRP Summary
Explore your data center using APTARE customizable report templates or by using parts of your IT infrastructure as entry points. Use Search to find reports, templates and dashboards across the portal.
Use the Reports tab to examine the catalog of templates, dashboards and reports - organized by products along with user-created, and system folders. This report is located here:
Capacity Manager > Thin Provisioning Capacity & Utilization > EMC Symmetrix SRP SummaryThis report displays capacity usage and over-subscription data for Symmetrix thin-provisioned SRP (storage resource pools). Use this report to stay on top of SRP capacity subscription and usage for all storage resource pools.
SRP Name Name of the Storage Resource Pool.
Array Name Name of the storage array. This name is derived from the Symmetrix ID.
Usable CapacityIndicates the usable capacity of all the disk groups in the SRP (Storage Resource Pool).
Allocated CapacityIndicates the sum of the device allocations, snapshot allocations, and SRDF/A DSE allocations on the SRP (Storage Resource Pool).
Free Capacity This is the difference between the usable and the allocated capacity.
Subscribed CapacitySubscribed capacity is the sum of the sizes of all the thin devices subscribed against the SRP (Storage Resource Pool).
% SubscribedSubscribed Capacity percentage is the percentage of the usable capacity used by thin devices.
# Thin DevicesNumber of LUNs associated with the EMC Symmetrix SRP (Storage Resource Pool).
# DisksNumber of Physical Disks associated with the EMC Symmetrix SRP (Storage Resource Pool).
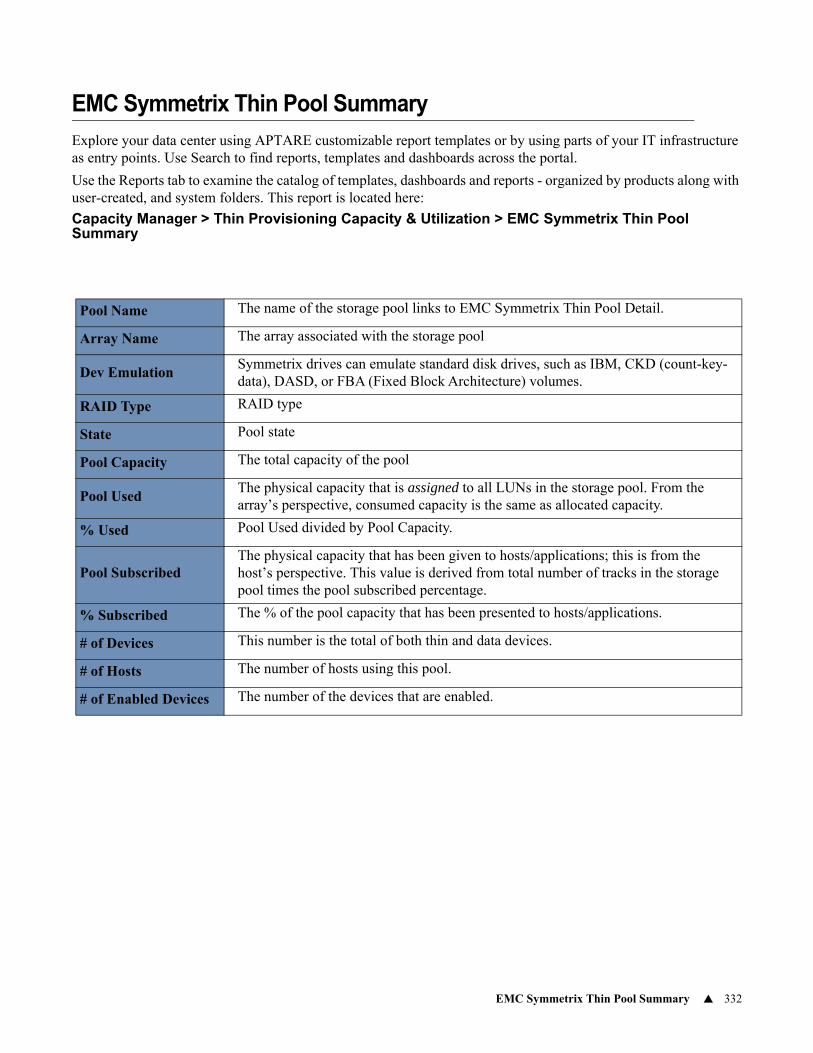
EMC Symmetrix Thin Pool Summary 332
EMC Symmetrix Thin Pool Summary
Explore your data center using APTARE customizable report templates or by using parts of your IT infrastructure as entry points. Use Search to find reports, templates and dashboards across the portal.
Use the Reports tab to examine the catalog of templates, dashboards and reports - organized by products along with user-created, and system folders. This report is located here:
Capacity Manager > Thin Provisioning Capacity & Utilization > EMC Symmetrix Thin Pool Summary
Pool Name The name of the storage pool links to EMC Symmetrix Thin Pool Detail.
Array Name The array associated with the storage pool
Dev EmulationSymmetrix drives can emulate standard disk drives, such as IBM, CKD (count-key-data), DASD, or FBA (Fixed Block Architecture) volumes.
RAID Type RAID type
State Pool state
Pool Capacity The total capacity of the pool
Pool UsedThe physical capacity that is assigned to all LUNs in the storage pool. From the array’s perspective, consumed capacity is the same as allocated capacity.
% Used Pool Used divided by Pool Capacity.
Pool SubscribedThe physical capacity that has been given to hosts/applications; this is from the host’s perspective. This value is derived from total number of tracks in the storage pool times the pool subscribed percentage.
% Subscribed The % of the pool capacity that has been presented to hosts/applications.
# of Devices This number is the total of both thin and data devices.
# of Hosts The number of hosts using this pool.
# of Enabled Devices The number of the devices that are enabled.
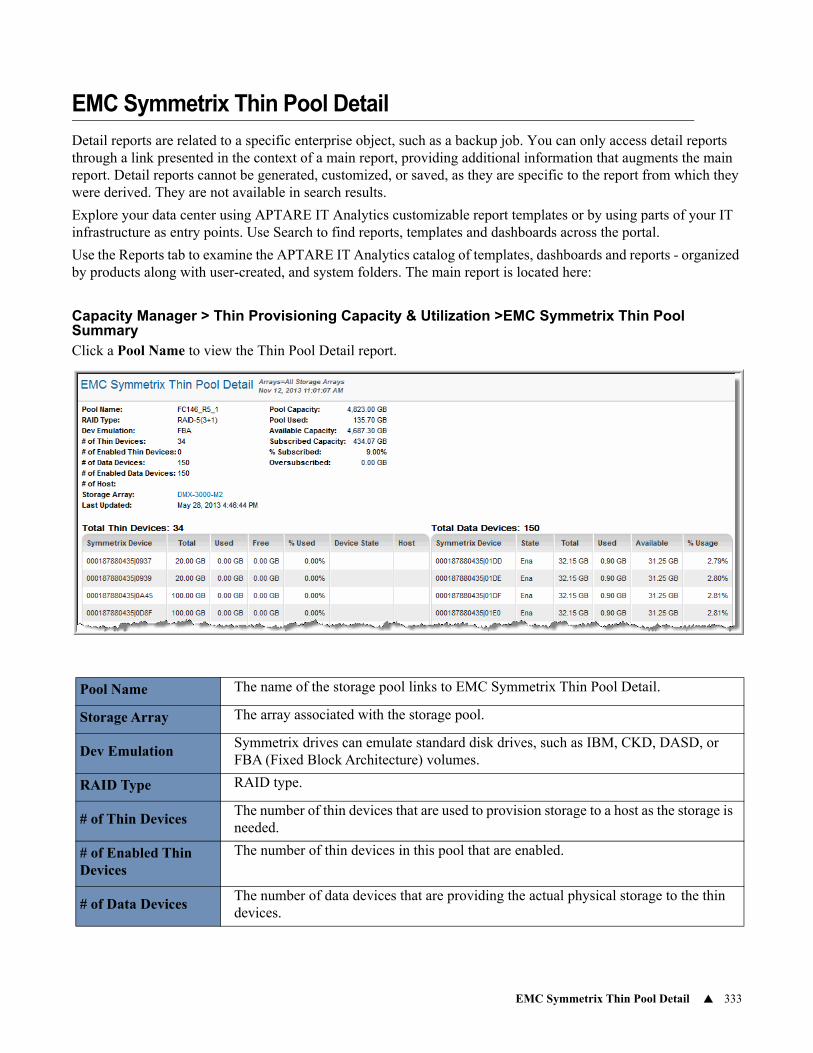
EMC Symmetrix Thin Pool Detail 333
EMC Symmetrix Thin Pool Detail
Detail reports are related to a specific enterprise object, such as a backup job. You can only access detail reports through a link presented in the context of a main report, providing additional information that augments the main report. Detail reports cannot be generated, customized, or saved, as they are specific to the report from which they were derived. They are not available in search results.
Explore your data center using APTARE IT Analytics customizable report templates or by using parts of your IT infrastructure as entry points. Use Search to find reports, templates and dashboards across the portal.
Use the Reports tab to examine the APTARE IT Analytics catalog of templates, dashboards and reports - organized by products along with user-created, and system folders. The main report is located here:
Capacity Manager > Thin Provisioning Capacity & Utilization >EMC Symmetrix Thin Pool SummaryClick a Pool Name to view the Thin Pool Detail report.
Pool Name The name of the storage pool links to EMC Symmetrix Thin Pool Detail.
Storage Array The array associated with the storage pool.
Dev EmulationSymmetrix drives can emulate standard disk drives, such as IBM, CKD, DASD, or FBA (Fixed Block Architecture) volumes.
RAID Type RAID type.
# of Thin DevicesThe number of thin devices that are used to provision storage to a host as the storage is needed.
# of Enabled Thin Devices
The number of thin devices in this pool that are enabled.
# of Data DevicesThe number of data devices that are providing the actual physical storage to the thin devices.
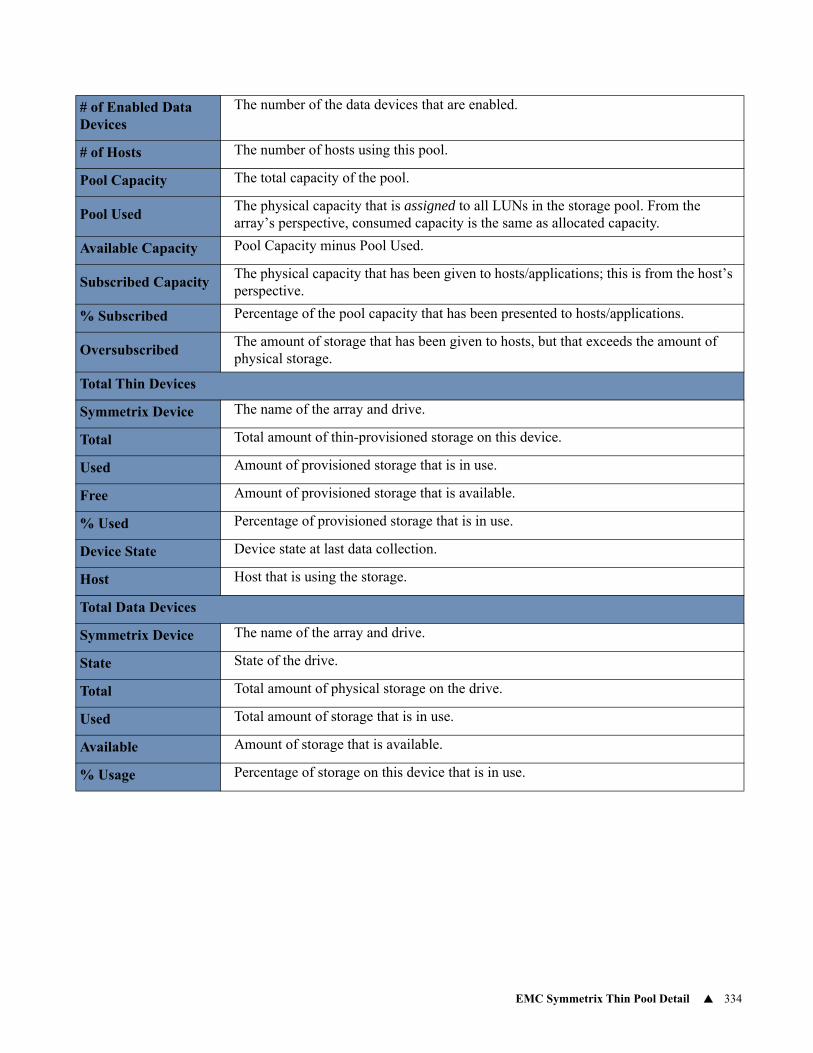
EMC Symmetrix Thin Pool Detail 334
# of Enabled Data Devices
The number of the data devices that are enabled.
# of Hosts The number of hosts using this pool.
Pool Capacity The total capacity of the pool.
Pool UsedThe physical capacity that is assigned to all LUNs in the storage pool. From the array’s perspective, consumed capacity is the same as allocated capacity.
Available Capacity Pool Capacity minus Pool Used.
Subscribed CapacityThe physical capacity that has been given to hosts/applications; this is from the host’s perspective.
% Subscribed Percentage of the pool capacity that has been presented to hosts/applications.
OversubscribedThe amount of storage that has been given to hosts, but that exceeds the amount of physical storage.
Total Thin Devices
Symmetrix Device The name of the array and drive.
Total Total amount of thin-provisioned storage on this device.
Used Amount of provisioned storage that is in use.
Free Amount of provisioned storage that is available.
% Used Percentage of provisioned storage that is in use.
Device State Device state at last data collection.
Host Host that is using the storage.
Total Data Devices
Symmetrix Device The name of the array and drive.
State State of the drive.
Total Total amount of physical storage on the drive.
Used Total amount of storage that is in use.
Available Amount of storage that is available.
% Usage Percentage of storage on this device that is in use.
EMC VNX (CLARiiON) Thin Pool Summary 335
EMC VNX (CLARiiON) Thin Pool Summary
Explore your data center using APTARE customizable report templates or by using parts of your IT infrastructure as entry points. Use Search to find reports, templates and dashboards across the portal.
Use the Reports tab to examine the catalog of templates, dashboards and reports - organized by products along with user-created, and system folders. This report is located here:
Capacity Manager > Thin Provisioning Capacity and Utilization > EMC VNX (CLARiiON) Thin Pool Summary
Pool Name The name of the storage pool links to EMC CLARiiON Thin Pool Details.
Array Name The array associated with the storage pool
RAID Type RAID type
Raw Capacity The raw capacity of the pool
User CapacityThe physical capacity that’s available to all LUNs in the storage pool; also known as usable capacity or host-visible capacity.
Consumed CapacityThe physical capacity that is assigned to all LUNs in the storage pool. From the array’s perspective, consumed capacity is the same as allocated capacity.
% Used Consumed Capacity divided by User Capacity
Available Capacity The physical pool storage that is not allocated to pool LUNs
Pool SubscribedThe physical capacity that has been given to hosts/applications; this is from the host’s perspective
% Oversubscribed Oversubscribed capacity refers to Subscribed Capacity that exceeds User Capacity.
# of Thin LUNsThin LUNs contain the capacity that is visible to hosts (applications); this capacity typically is greater than the actual because it is from the host’s perspective and is the subscribed capacity total. Drill down to the LUN Utilization Summary for details.
# of HostsThe number of hosts using this pool. Drill down to the Host Capacity & Utilization report.
OversubscribedOversubscribed capacity refers to User Capacity that exceeds the physical capacity of the pool.
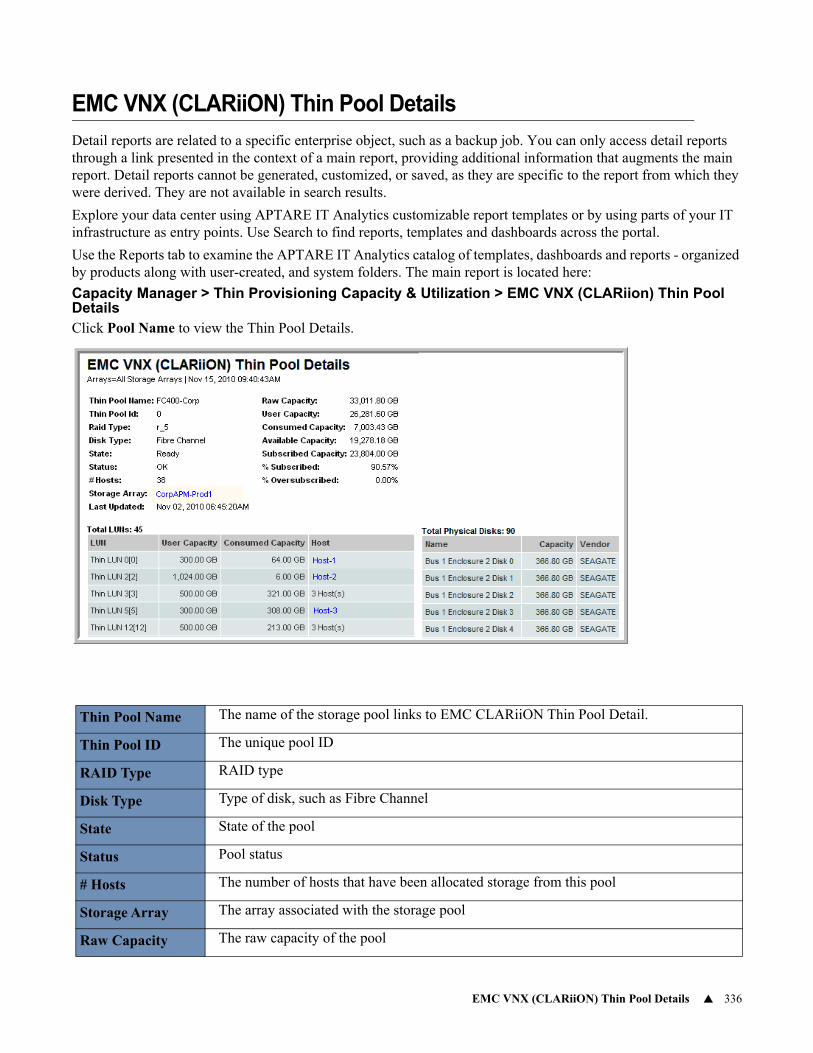
EMC VNX (CLARiiON) Thin Pool Details 336
EMC VNX (CLARiiON) Thin Pool Details
Detail reports are related to a specific enterprise object, such as a backup job. You can only access detail reports through a link presented in the context of a main report, providing additional information that augments the main report. Detail reports cannot be generated, customized, or saved, as they are specific to the report from which they were derived. They are not available in search results.
Explore your data center using APTARE IT Analytics customizable report templates or by using parts of your IT infrastructure as entry points. Use Search to find reports, templates and dashboards across the portal.
Use the Reports tab to examine the APTARE IT Analytics catalog of templates, dashboards and reports - organized by products along with user-created, and system folders. The main report is located here:
Capacity Manager > Thin Provisioning Capacity & Utilization > EMC VNX (CLARiion) Thin Pool Details Click Pool Name to view the Thin Pool Details.
Thin Pool Name The name of the storage pool links to EMC CLARiiON Thin Pool Detail.
Thin Pool ID The unique pool ID
RAID Type RAID type
Disk Type Type of disk, such as Fibre Channel
State State of the pool
Status Pool status
# Hosts The number of hosts that have been allocated storage from this pool
Storage Array The array associated with the storage pool
Raw Capacity The raw capacity of the pool
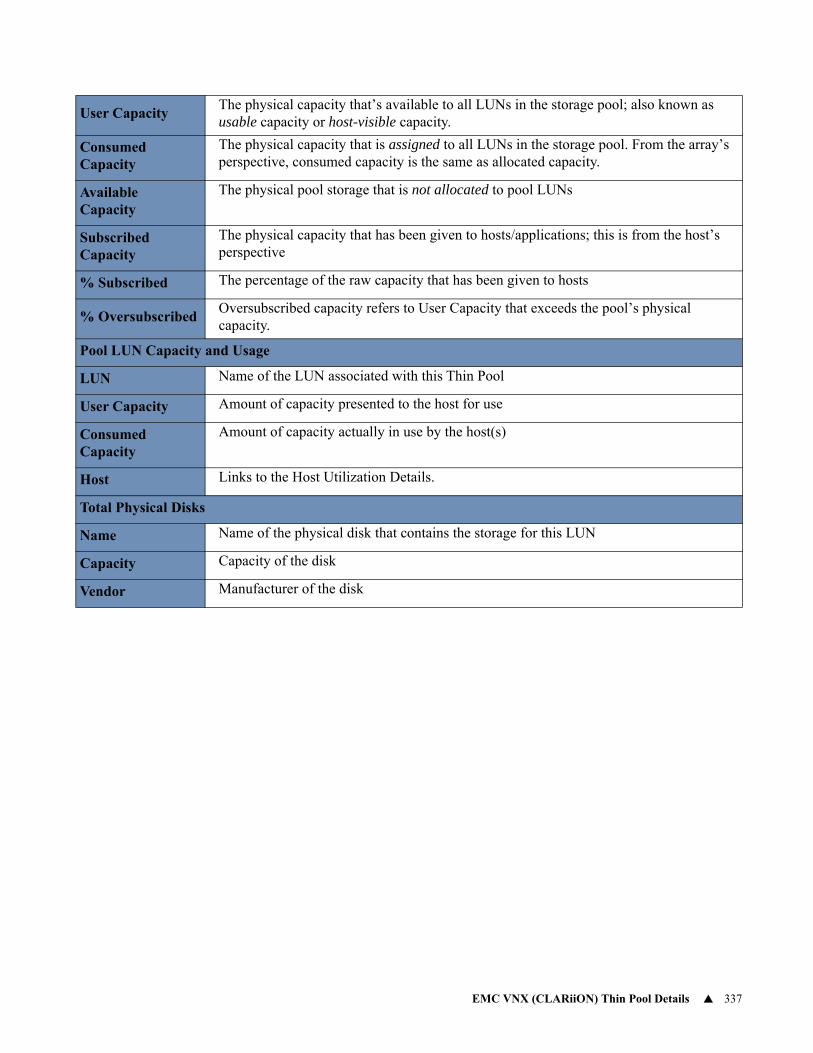
EMC VNX (CLARiiON) Thin Pool Details 337
User CapacityThe physical capacity that’s available to all LUNs in the storage pool; also known as usable capacity or host-visible capacity.
Consumed Capacity
The physical capacity that is assigned to all LUNs in the storage pool. From the array’s perspective, consumed capacity is the same as allocated capacity.
Available Capacity
The physical pool storage that is not allocated to pool LUNs
Subscribed Capacity
The physical capacity that has been given to hosts/applications; this is from the host’s perspective
% Subscribed The percentage of the raw capacity that has been given to hosts
% OversubscribedOversubscribed capacity refers to User Capacity that exceeds the pool’s physical capacity.
Pool LUN Capacity and Usage
LUN Name of the LUN associated with this Thin Pool
User Capacity Amount of capacity presented to the host for use
Consumed Capacity
Amount of capacity actually in use by the host(s)
Host Links to the Host Utilization Details.
Total Physical Disks
Name Name of the physical disk that contains the storage for this LUN
Capacity Capacity of the disk
Vendor Manufacturer of the disk
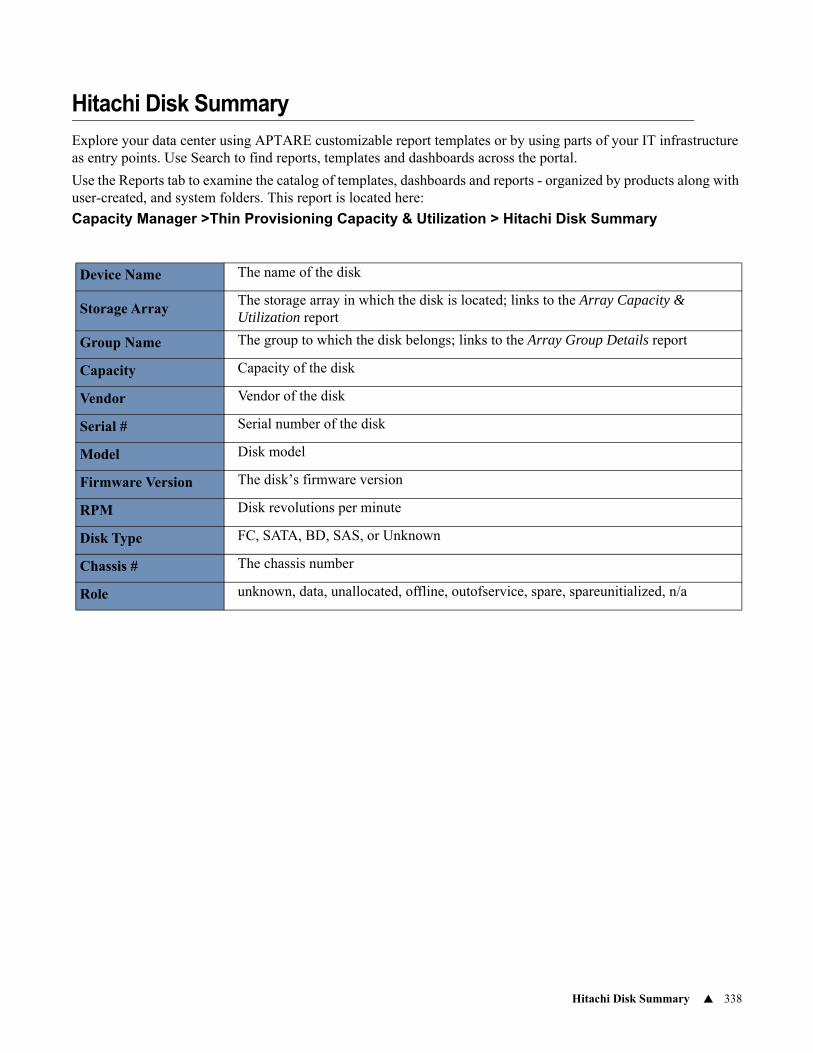
Hitachi Disk Summary 338
Hitachi Disk Summary
Explore your data center using APTARE customizable report templates or by using parts of your IT infrastructure as entry points. Use Search to find reports, templates and dashboards across the portal.
Use the Reports tab to examine the catalog of templates, dashboards and reports - organized by products along with user-created, and system folders. This report is located here:
Capacity Manager >Thin Provisioning Capacity & Utilization > Hitachi Disk Summary
Device Name The name of the disk
Storage ArrayThe storage array in which the disk is located; links to the Array Capacity & Utilization report
Group Name The group to which the disk belongs; links to the Array Group Details report
Capacity Capacity of the disk
Vendor Vendor of the disk
Serial # Serial number of the disk
Model Disk model
Firmware Version The disk’s firmware version
RPM Disk revolutions per minute
Disk Type FC, SATA, BD, SAS, or Unknown
Chassis # The chassis number
Role unknown, data, unallocated, offline, outofservice, spare, spareunitialized, n/a
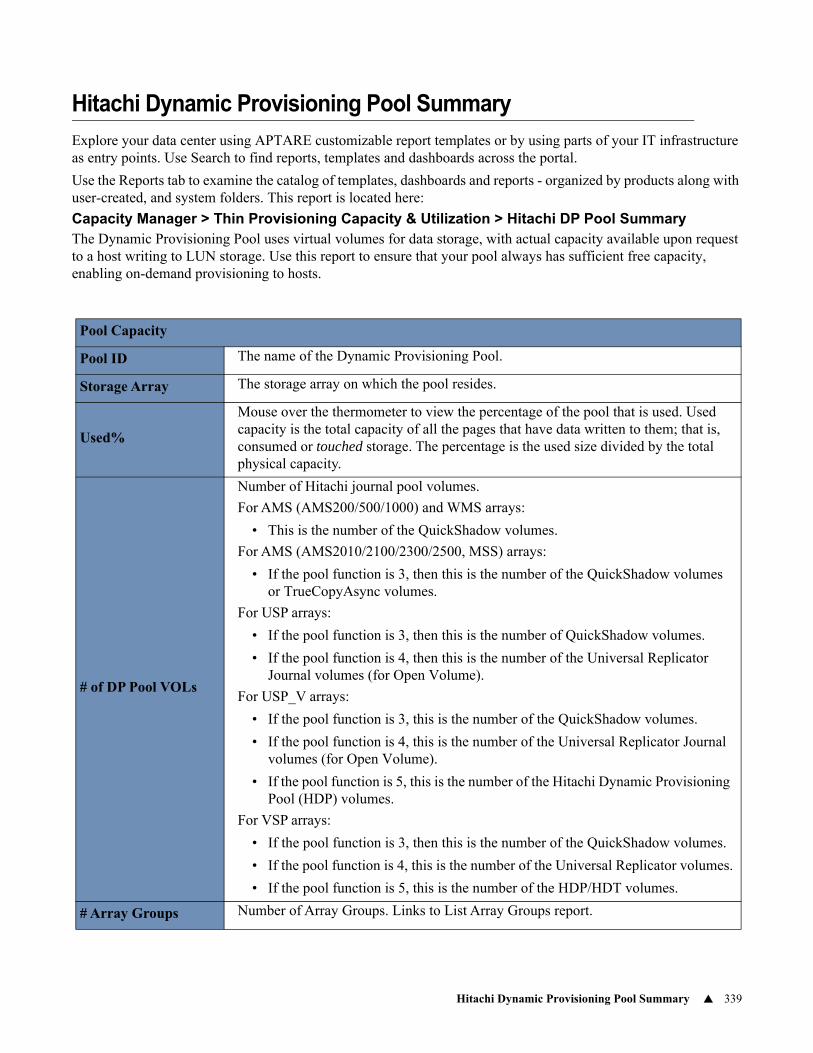
Hitachi Dynamic Provisioning Pool Summary 339
Hitachi Dynamic Provisioning Pool Summary
Explore your data center using APTARE customizable report templates or by using parts of your IT infrastructure as entry points. Use Search to find reports, templates and dashboards across the portal.
Use the Reports tab to examine the catalog of templates, dashboards and reports - organized by products along with user-created, and system folders. This report is located here:
Capacity Manager > Thin Provisioning Capacity & Utilization > Hitachi DP Pool SummaryThe Dynamic Provisioning Pool uses virtual volumes for data storage, with actual capacity available upon request to a host writing to LUN storage. Use this report to ensure that your pool always has sufficient free capacity, enabling on-demand provisioning to hosts.
Pool Capacity
Pool ID The name of the Dynamic Provisioning Pool.
Storage Array The storage array on which the pool resides.
Used%
Mouse over the thermometer to view the percentage of the pool that is used. Used capacity is the total capacity of all the pages that have data written to them; that is, consumed or touched storage. The percentage is the used size divided by the total physical capacity.
# of DP Pool VOLs
Number of Hitachi journal pool volumes.
For AMS (AMS200/500/1000) and WMS arrays:
• This is the number of the QuickShadow volumes.
For AMS (AMS2010/2100/2300/2500, MSS) arrays:
• If the pool function is 3, then this is the number of the QuickShadow volumes or TrueCopyAsync volumes.
For USP arrays:
• If the pool function is 3, then this is the number of QuickShadow volumes.
• If the pool function is 4, then this is the number of the Universal Replicator Journal volumes (for Open Volume).
For USP_V arrays:
• If the pool function is 3, this is the number of the QuickShadow volumes.
• If the pool function is 4, this is the number of the Universal Replicator Journal volumes (for Open Volume).
• If the pool function is 5, this is the number of the Hitachi Dynamic Provisioning Pool (HDP) volumes.
For VSP arrays:
• If the pool function is 3, then this is the number of the QuickShadow volumes.
• If the pool function is 4, this is the number of the Universal Replicator volumes.
• If the pool function is 5, this is the number of the HDP/HDT volumes.
# Array Groups Number of Array Groups. Links to List Array Groups report.
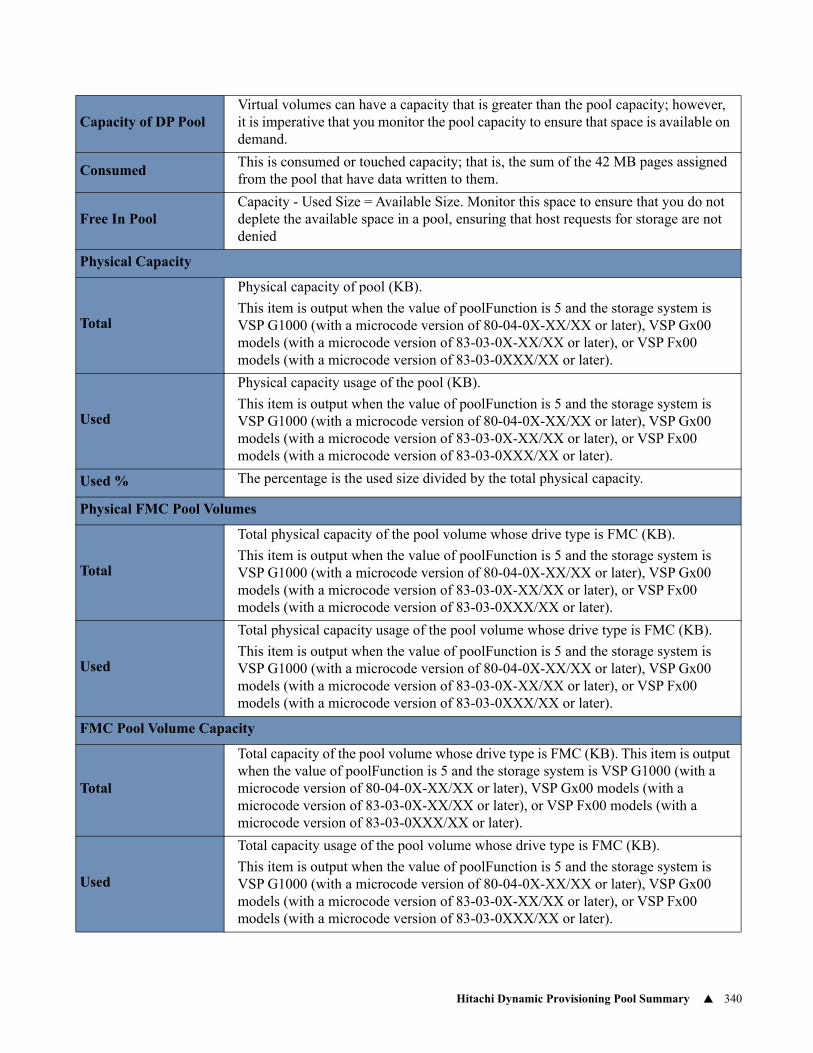
Hitachi Dynamic Provisioning Pool Summary 340
Capacity of DP PoolVirtual volumes can have a capacity that is greater than the pool capacity; however, it is imperative that you monitor the pool capacity to ensure that space is available on demand.
ConsumedThis is consumed or touched capacity; that is, the sum of the 42 MB pages assigned from the pool that have data written to them.
Free In PoolCapacity - Used Size = Available Size. Monitor this space to ensure that you do not deplete the available space in a pool, ensuring that host requests for storage are not denied
Physical Capacity
Total
Physical capacity of pool (KB).
This item is output when the value of poolFunction is 5 and the storage system is VSP G1000 (with a microcode version of 80-04-0X-XX/XX or later), VSP Gx00 models (with a microcode version of 83-03-0X-XX/XX or later), or VSP Fx00 models (with a microcode version of 83-03-0XXX/XX or later).
Used
Physical capacity usage of the pool (KB).
This item is output when the value of poolFunction is 5 and the storage system is VSP G1000 (with a microcode version of 80-04-0X-XX/XX or later), VSP Gx00 models (with a microcode version of 83-03-0X-XX/XX or later), or VSP Fx00 models (with a microcode version of 83-03-0XXX/XX or later).
Used % The percentage is the used size divided by the total physical capacity.
Physical FMC Pool Volumes
Total
Total physical capacity of the pool volume whose drive type is FMC (KB).
This item is output when the value of poolFunction is 5 and the storage system is VSP G1000 (with a microcode version of 80-04-0X-XX/XX or later), VSP Gx00 models (with a microcode version of 83-03-0X-XX/XX or later), or VSP Fx00 models (with a microcode version of 83-03-0XXX/XX or later).
Used
Total physical capacity usage of the pool volume whose drive type is FMC (KB).
This item is output when the value of poolFunction is 5 and the storage system is VSP G1000 (with a microcode version of 80-04-0X-XX/XX or later), VSP Gx00 models (with a microcode version of 83-03-0X-XX/XX or later), or VSP Fx00 models (with a microcode version of 83-03-0XXX/XX or later).
FMC Pool Volume Capacity
Total
Total capacity of the pool volume whose drive type is FMC (KB). This item is output when the value of poolFunction is 5 and the storage system is VSP G1000 (with a microcode version of 80-04-0X-XX/XX or later), VSP Gx00 models (with a microcode version of 83-03-0X-XX/XX or later), or VSP Fx00 models (with a microcode version of 83-03-0XXX/XX or later).
Used
Total capacity usage of the pool volume whose drive type is FMC (KB).
This item is output when the value of poolFunction is 5 and the storage system is VSP G1000 (with a microcode version of 80-04-0X-XX/XX or later), VSP Gx00 models (with a microcode version of 83-03-0X-XX/XX or later), or VSP Fx00 models (with a microcode version of 83-03-0XXX/XX or later).
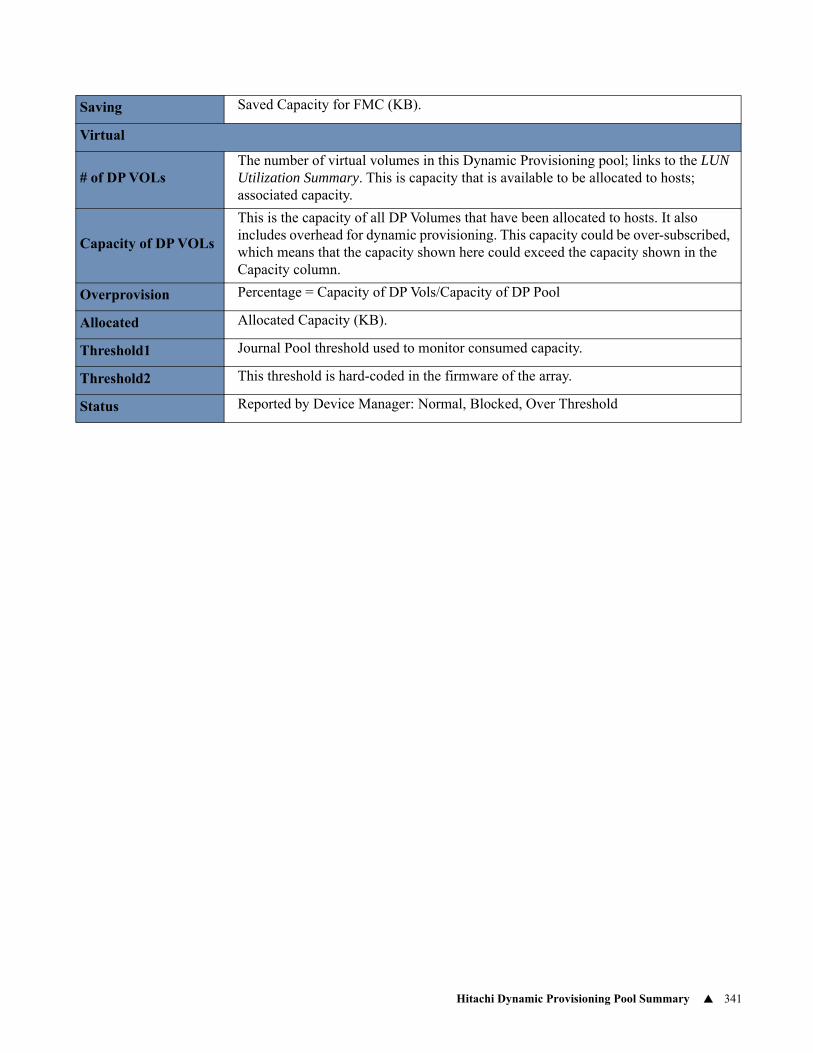
Hitachi Dynamic Provisioning Pool Summary 341
Saving Saved Capacity for FMC (KB).
Virtual
# of DP VOLsThe number of virtual volumes in this Dynamic Provisioning pool; links to the LUN Utilization Summary. This is capacity that is available to be allocated to hosts; associated capacity.
Capacity of DP VOLs
This is the capacity of all DP Volumes that have been allocated to hosts. It also includes overhead for dynamic provisioning. This capacity could be over-subscribed, which means that the capacity shown here could exceed the capacity shown in the Capacity column.
Overprovision Percentage = Capacity of DP Vols/Capacity of DP Pool
Allocated Allocated Capacity (KB).
Threshold1 Journal Pool threshold used to monitor consumed capacity.
Threshold2 This threshold is hard-coded in the firmware of the array.
Status Reported by Device Manager: Normal, Blocked, Over Threshold
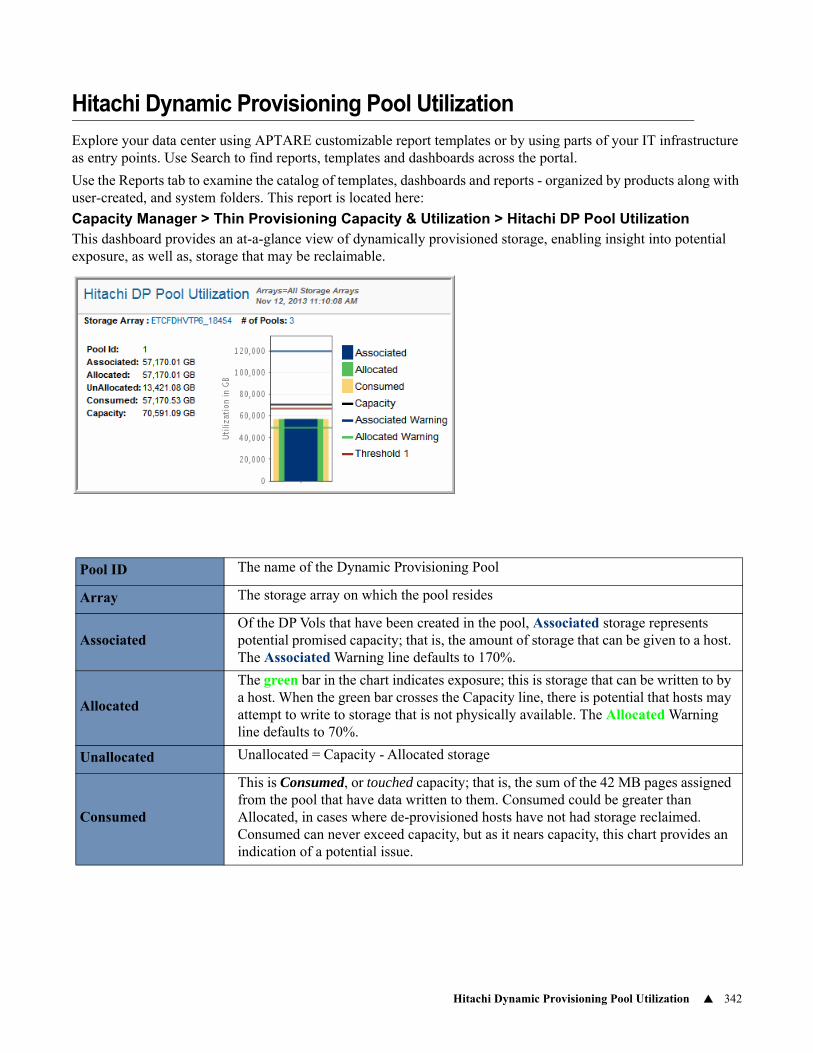
Hitachi Dynamic Provisioning Pool Utilization 342
Hitachi Dynamic Provisioning Pool Utilization
Explore your data center using APTARE customizable report templates or by using parts of your IT infrastructure as entry points. Use Search to find reports, templates and dashboards across the portal.
Use the Reports tab to examine the catalog of templates, dashboards and reports - organized by products along with user-created, and system folders. This report is located here:
Capacity Manager > Thin Provisioning Capacity & Utilization > Hitachi DP Pool UtilizationThis dashboard provides an at-a-glance view of dynamically provisioned storage, enabling insight into potential exposure, as well as, storage that may be reclaimable.
Pool ID The name of the Dynamic Provisioning Pool
Array The storage array on which the pool resides
AssociatedOf the DP Vols that have been created in the pool, Associated storage represents potential promised capacity; that is, the amount of storage that can be given to a host. The Associated Warning line defaults to 170%.
Allocated
The green bar in the chart indicates exposure; this is storage that can be written to by a host. When the green bar crosses the Capacity line, there is potential that hosts may attempt to write to storage that is not physically available. The Allocated Warning line defaults to 70%.
Unallocated Unallocated = Capacity - Allocated storage
Consumed
This is Consumed, or touched capacity; that is, the sum of the 42 MB pages assigned from the pool that have data written to them. Consumed could be greater than Allocated, in cases where de-provisioned hosts have not had storage reclaimed. Consumed can never exceed capacity, but as it nears capacity, this chart provides an indication of a potential issue.
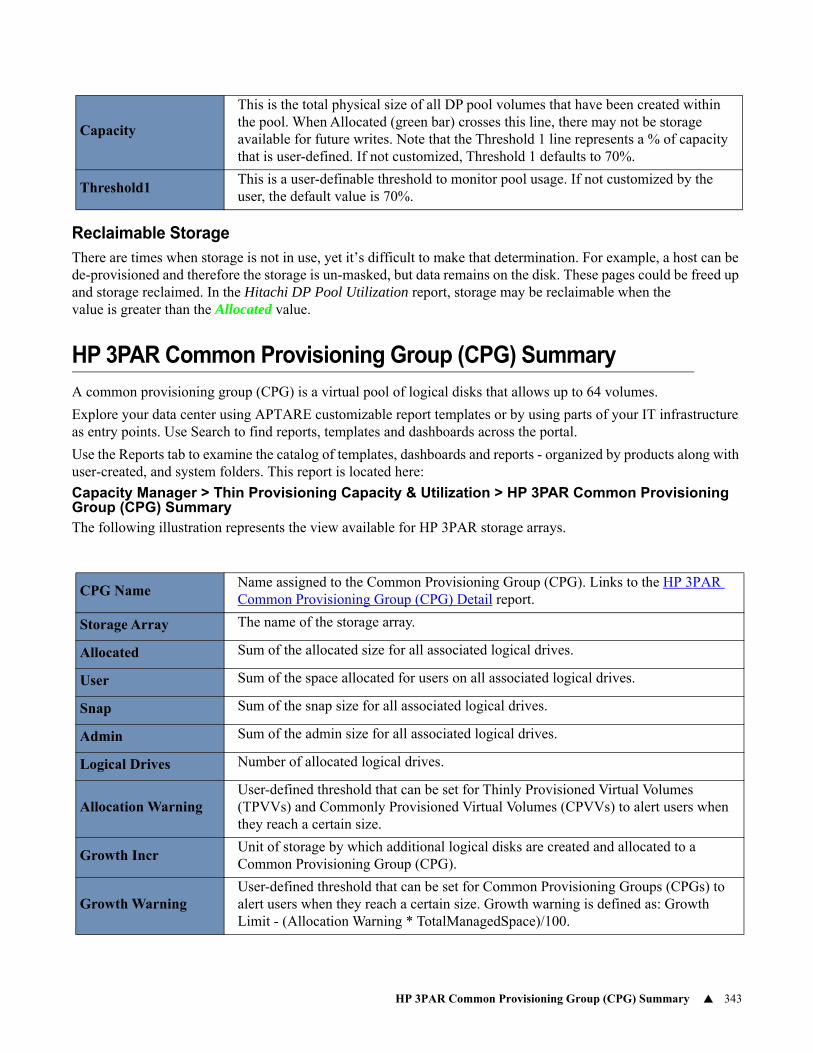
HP 3PAR Common Provisioning Group (CPG) Summary 343
Reclaimable StorageThere are times when storage is not in use, yet it’s difficult to make that determination. For example, a host can be de-provisioned and therefore the storage is un-masked, but data remains on the disk. These pages could be freed up and storage reclaimed. In the Hitachi DP Pool Utilization report, storage may be reclaimable when the Consumed value is greater than the Allocated value.
HP 3PAR Common Provisioning Group (CPG) Summary
A common provisioning group (CPG) is a virtual pool of logical disks that allows up to 64 volumes.
Explore your data center using APTARE customizable report templates or by using parts of your IT infrastructure as entry points. Use Search to find reports, templates and dashboards across the portal.
Use the Reports tab to examine the catalog of templates, dashboards and reports - organized by products along with user-created, and system folders. This report is located here:
Capacity Manager > Thin Provisioning Capacity & Utilization > HP 3PAR Common Provisioning Group (CPG) SummaryThe following illustration represents the view available for HP 3PAR storage arrays.
Capacity
This is the total physical size of all DP pool volumes that have been created within the pool. When Allocated (green bar) crosses this line, there may not be storage available for future writes. Note that the Threshold 1 line represents a % of capacity that is user-defined. If not customized, Threshold 1 defaults to 70%.
Threshold1This is a user-definable threshold to monitor pool usage. If not customized by the user, the default value is 70%.
CPG NameName assigned to the Common Provisioning Group (CPG). Links to the HP 3PAR Common Provisioning Group (CPG) Detail report.
Storage Array The name of the storage array.
Allocated Sum of the allocated size for all associated logical drives.
User Sum of the space allocated for users on all associated logical drives.
Snap Sum of the snap size for all associated logical drives.
Admin Sum of the admin size for all associated logical drives.
Logical Drives Number of allocated logical drives.
Allocation WarningUser-defined threshold that can be set for Thinly Provisioned Virtual Volumes (TPVVs) and Commonly Provisioned Virtual Volumes (CPVVs) to alert users when they reach a certain size.
Growth IncrUnit of storage by which additional logical disks are created and allocated to a Common Provisioning Group (CPG).
Growth WarningUser-defined threshold that can be set for Common Provisioning Groups (CPGs) to alert users when they reach a certain size. Growth warning is defined as: Growth Limit - (Allocation Warning * TotalManagedSpace)/100.
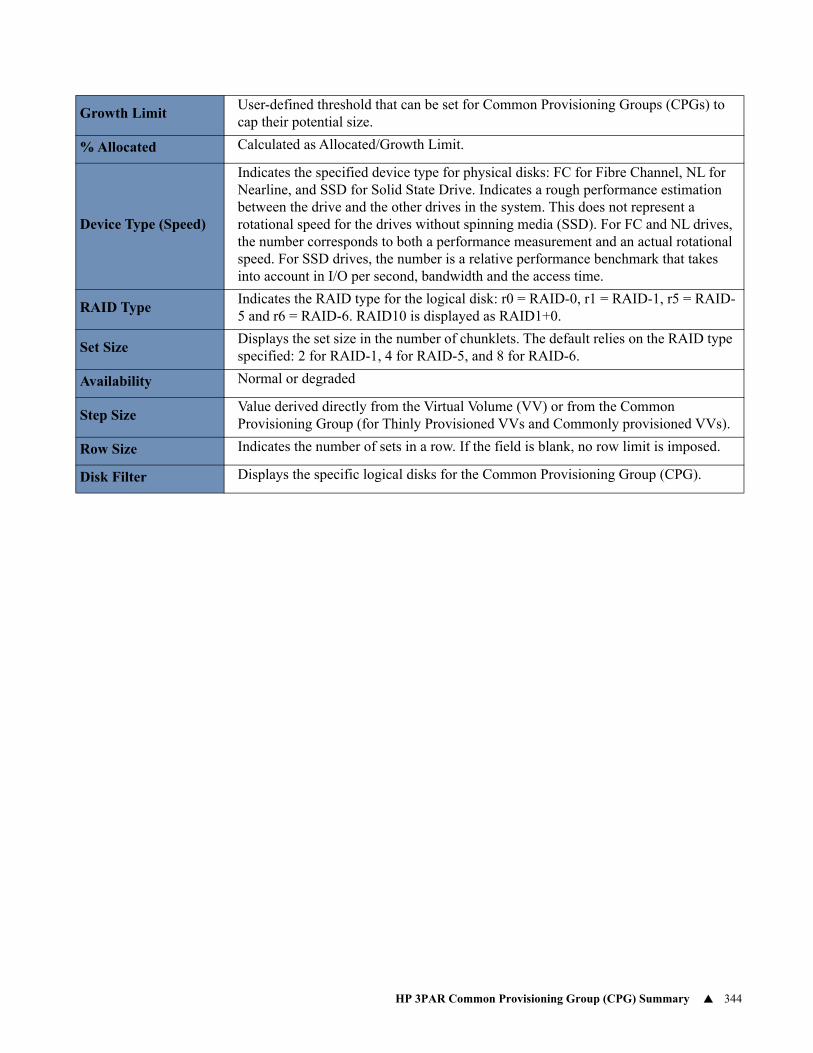
HP 3PAR Common Provisioning Group (CPG) Summary 344
Growth LimitUser-defined threshold that can be set for Common Provisioning Groups (CPGs) to cap their potential size.
% Allocated Calculated as Allocated/Growth Limit.
Device Type (Speed)
Indicates the specified device type for physical disks: FC for Fibre Channel, NL for Nearline, and SSD for Solid State Drive. Indicates a rough performance estimation between the drive and the other drives in the system. This does not represent a rotational speed for the drives without spinning media (SSD). For FC and NL drives, the number corresponds to both a performance measurement and an actual rotational speed. For SSD drives, the number is a relative performance benchmark that takes into account in I/O per second, bandwidth and the access time.
RAID TypeIndicates the RAID type for the logical disk: r0 = RAID-0, r1 = RAID-1, r5 = RAID-5 and r6 = RAID-6. RAID10 is displayed as RAID1+0.
Set SizeDisplays the set size in the number of chunklets. The default relies on the RAID type specified: 2 for RAID-1, 4 for RAID-5, and 8 for RAID-6.
Availability Normal or degraded
Step SizeValue derived directly from the Virtual Volume (VV) or from the Common Provisioning Group (for Thinly Provisioned VVs and Commonly provisioned VVs).
Row Size Indicates the number of sets in a row. If the field is blank, no row limit is imposed.
Disk Filter Displays the specific logical disks for the Common Provisioning Group (CPG).
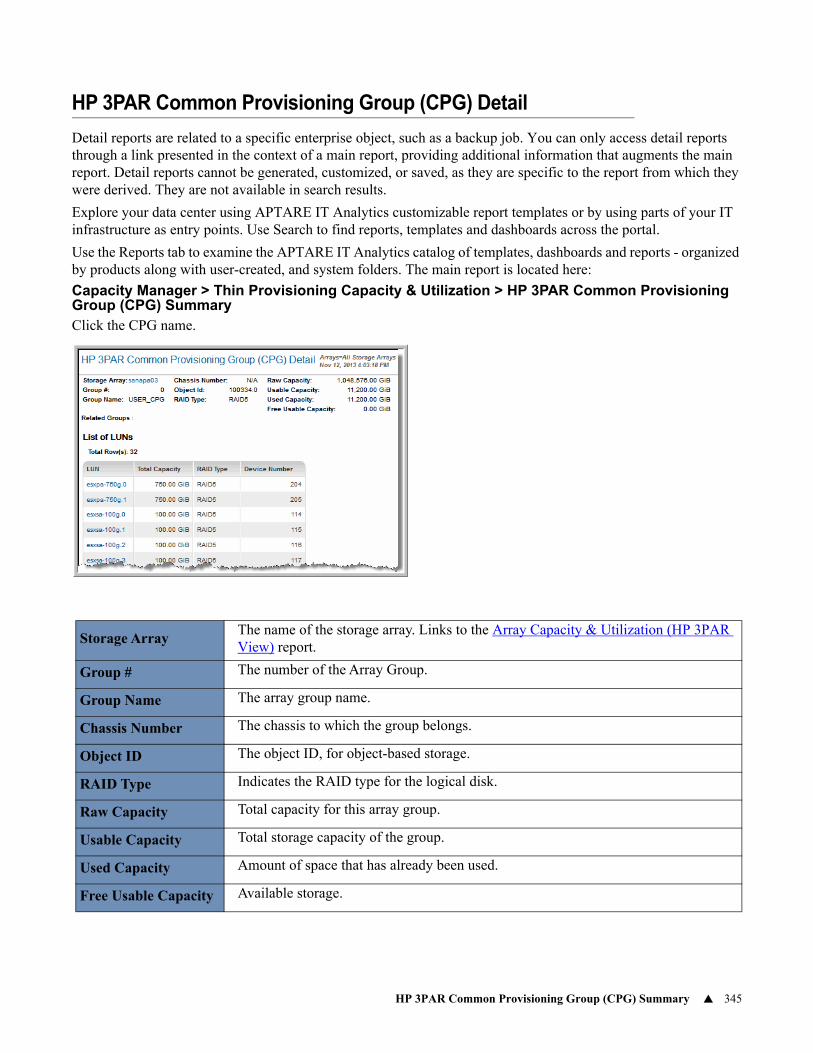
HP 3PAR Common Provisioning Group (CPG) Summary 345
HP 3PAR Common Provisioning Group (CPG) Detail
Detail reports are related to a specific enterprise object, such as a backup job. You can only access detail reports through a link presented in the context of a main report, providing additional information that augments the main report. Detail reports cannot be generated, customized, or saved, as they are specific to the report from which they were derived. They are not available in search results.
Explore your data center using APTARE IT Analytics customizable report templates or by using parts of your IT infrastructure as entry points. Use Search to find reports, templates and dashboards across the portal.
Use the Reports tab to examine the APTARE IT Analytics catalog of templates, dashboards and reports - organized by products along with user-created, and system folders. The main report is located here:
Capacity Manager > Thin Provisioning Capacity & Utilization > HP 3PAR Common Provisioning Group (CPG) SummaryClick the CPG name.
Storage ArrayThe name of the storage array. Links to the Array Capacity & Utilization (HP 3PAR View) report.
Group # The number of the Array Group.
Group Name The array group name.
Chassis Number The chassis to which the group belongs.
Object ID The object ID, for object-based storage.
RAID Type Indicates the RAID type for the logical disk.
Raw Capacity Total capacity for this array group.
Usable Capacity Total storage capacity of the group.
Used Capacity Amount of space that has already been used.
Free Usable Capacity Available storage.
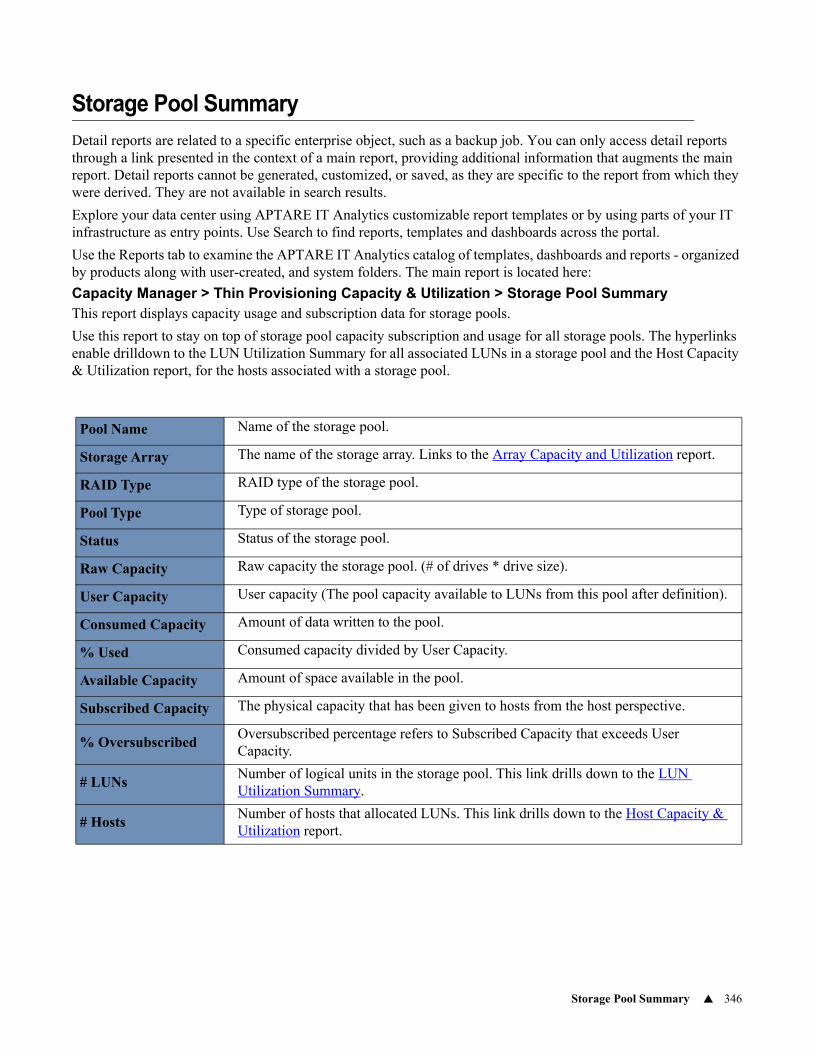
Storage Pool Summary 346
Storage Pool Summary
Detail reports are related to a specific enterprise object, such as a backup job. You can only access detail reports through a link presented in the context of a main report, providing additional information that augments the main report. Detail reports cannot be generated, customized, or saved, as they are specific to the report from which they were derived. They are not available in search results.
Explore your data center using APTARE IT Analytics customizable report templates or by using parts of your IT infrastructure as entry points. Use Search to find reports, templates and dashboards across the portal.
Use the Reports tab to examine the APTARE IT Analytics catalog of templates, dashboards and reports - organized by products along with user-created, and system folders. The main report is located here:
Capacity Manager > Thin Provisioning Capacity & Utilization > Storage Pool SummaryThis report displays capacity usage and subscription data for storage pools.
Use this report to stay on top of storage pool capacity subscription and usage for all storage pools. The hyperlinks enable drilldown to the LUN Utilization Summary for all associated LUNs in a storage pool and the Host Capacity & Utilization report, for the hosts associated with a storage pool.
Pool Name Name of the storage pool.
Storage Array The name of the storage array. Links to the Array Capacity and Utilization report.
RAID Type RAID type of the storage pool.
Pool Type Type of storage pool.
Status Status of the storage pool.
Raw Capacity Raw capacity the storage pool. (# of drives * drive size).
User Capacity User capacity (The pool capacity available to LUNs from this pool after definition).
Consumed Capacity Amount of data written to the pool.
% Used Consumed capacity divided by User Capacity.
Available Capacity Amount of space available in the pool.
Subscribed Capacity The physical capacity that has been given to hosts from the host perspective.
% OversubscribedOversubscribed percentage refers to Subscribed Capacity that exceeds User Capacity.
# LUNsNumber of logical units in the storage pool. This link drills down to the LUN Utilization Summary.
# HostsNumber of hosts that allocated LUNs. This link drills down to the Host Capacity & Utilization report.
Array Capacity Forecast 347
9Chapter 6Capacity Forecasting Reports
This section covers the following topics:
• Array Capacity Forecast
• Data Domain Filesystem Capacity & Forecast
• Data Domain Filesystem Status
• EMC Symmetrix Thin Pool Capacity Forecast
• EMC VNX (CLARiiON) Thin Pool Capacity Forecast
• Object Store Usage Over Time
• Hitachi NAS Storage Pool Capacity Over Time
• Host Capacity Forecast
• Host Volume Growth and Forecast
• Host Storage Usage Over Time
• Storage Capacity Over Time
Array Capacity Forecast
Explore your data center using APTARE customizable report templates or by using parts of your IT infrastructure as entry points. Use Search to find reports, templates and dashboards across the portal.
Use the Reports tab to examine the catalog of templates, dashboards and reports - organized by products along with user-created, and system folders. This report is located here:
Capacity Manager > Storage Capacity & Forecast > Array Capacity ForecastUse the Capacity Forecast report to project growth in storage usage. You can generate the report by the following criteria:
• Historical date range
• Forecast horizon (date range)
• Storage Array Group
• Forecast by Array Capacity or LUN Capacity
In addition, you can choose to generate graphs for each, individual array or instead, display a consolidated graph for all the arrays selected in the scope selector.
Note: This report is limited to a maximum of 50 arrays.
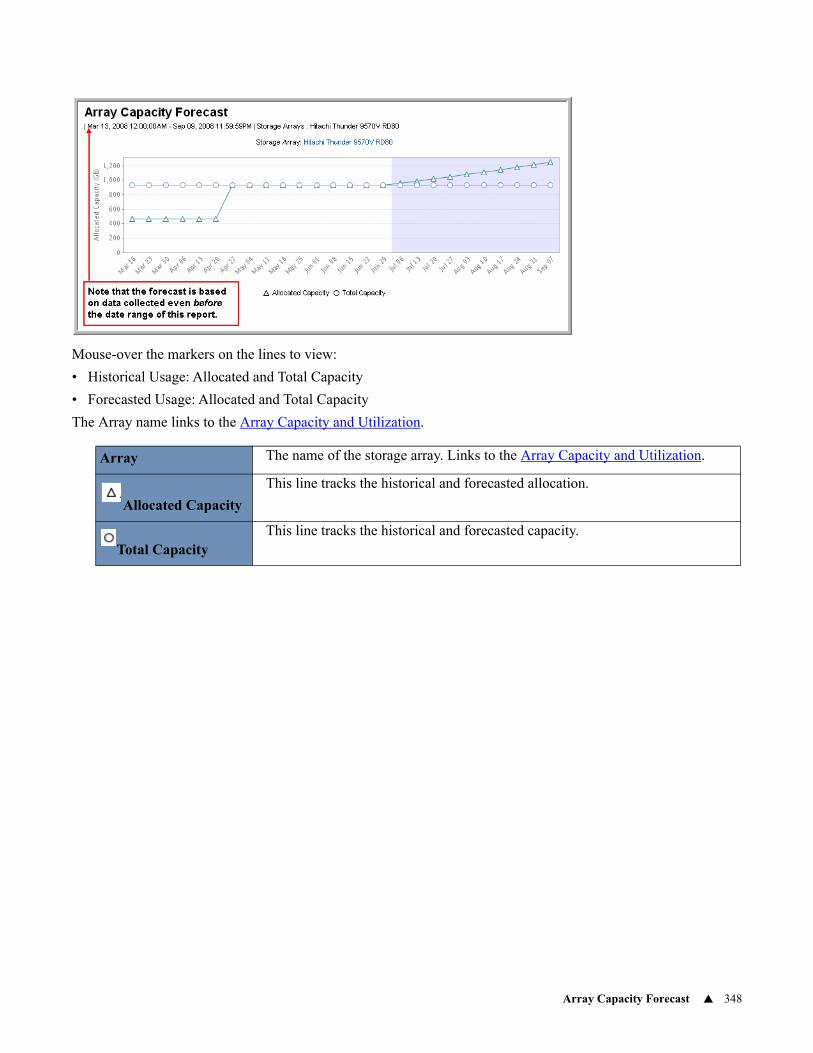
Array Capacity Forecast 348
Mouse-over the markers on the lines to view:
• Historical Usage: Allocated and Total Capacity
• Forecasted Usage: Allocated and Total Capacity
The Array name links to the Array Capacity and Utilization.
Array The name of the storage array. Links to the Array Capacity and Utilization.
Allocated Capacity
This line tracks the historical and forecasted allocation.
Total CapacityThis line tracks the historical and forecasted capacity.

Data Domain Filesystem Capacity & Forecast 349
Data Domain Filesystem Capacity & Forecast
Explore your data center using APTARE customizable report templates or by using parts of your IT infrastructure as entry points. Use Search to find reports, templates and dashboards across the portal.
Use the Reports tab to examine the catalog of templates, dashboards and reports - organized by products along with user-created, and system folders. This report is located here:
Capacity Manager > Forecasting & Capacity Planning > Data Domain Filesystem Capacity & Forecast
This chart shows the total physical disk space, after de-duplication and compression, available for data storage.
The scope selector provides a drop down Filesystem Names list to enable scope selection from the following:
• Data - This is the amount of total physical disk space available for data, the actual physical space used for compressed data, and physical space still available for data storage.
• /ddvar - The approximate amount of space used by and available to log and core files. Storage often can be reclaimed by removing old logs and core files.
• Index - This data is only collected when SNMP is configured for data collection.
• Metadata - This data is only collected when SNMP is configured for data collection.
System The Data Domain system links to Data Domain System Details.
UsedThe percentage of the filesystem capacity that is used; click on this bar to view Data Domain Filesystem Status.
Available Total disk space available for data storage.
Used Forecast Forecast based on past usage.
Available Forecast Forecast based on past usage.

Data Domain Filesystem Status 350
Data Domain Filesystem Status
Detail reports are related to a specific enterprise object, such as a backup job. You can only access detail reports through a link presented in the context of a main report, providing additional information that augments the main report. Detail reports cannot be generated, customized, or saved, as they are specific to the report from which they were derived. They are not available in search results.
Explore your data center using APTARE IT Analytics customizable report templates or by using parts of your IT infrastructure as entry points. Use Search to find reports, templates and dashboards across the portal.
Use the Reports tab to examine the APTARE IT Analytics catalog of templates, dashboards and reports - organized by products along with user-created, and system folders. The main report is located here:
Backup Manager > Forecasting & Capacity Planning > Data Domain Filesystem Capacity & Forecast
Click a bar in the chart.
Filesystem Name data, /ddvar, index, or metadata.
Date Start date of status.
Available Filesystem size.
Used Amount of filesystem that is in use.
Cleanable Potential cleanable space.
Pre-Comp Size Pre-compression size.
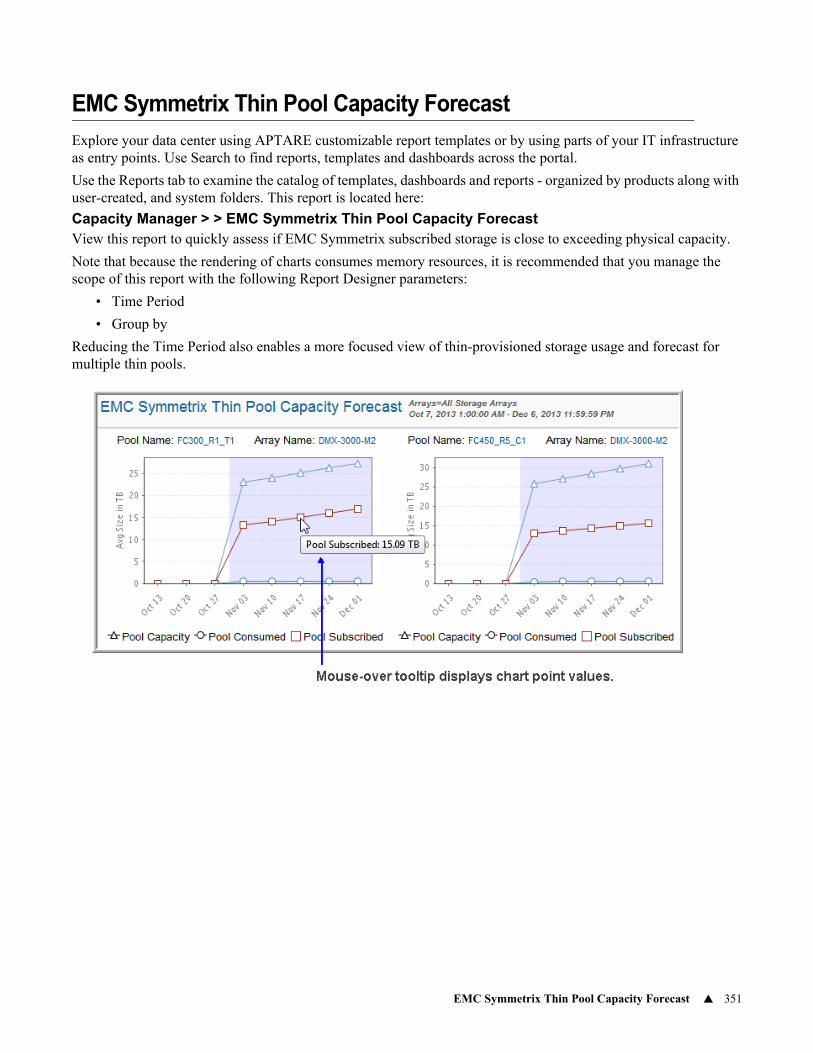
EMC Symmetrix Thin Pool Capacity Forecast 351
EMC Symmetrix Thin Pool Capacity Forecast
Explore your data center using APTARE customizable report templates or by using parts of your IT infrastructure as entry points. Use Search to find reports, templates and dashboards across the portal.
Use the Reports tab to examine the catalog of templates, dashboards and reports - organized by products along with user-created, and system folders. This report is located here:
Capacity Manager > > EMC Symmetrix Thin Pool Capacity ForecastView this report to quickly assess if EMC Symmetrix subscribed storage is close to exceeding physical capacity.
Note that because the rendering of charts consumes memory resources, it is recommended that you manage the scope of this report with the following Report Designer parameters:
• Time Period
• Group by
Reducing the Time Period also enables a more focused view of thin-provisioned storage usage and forecast for multiple thin pools.
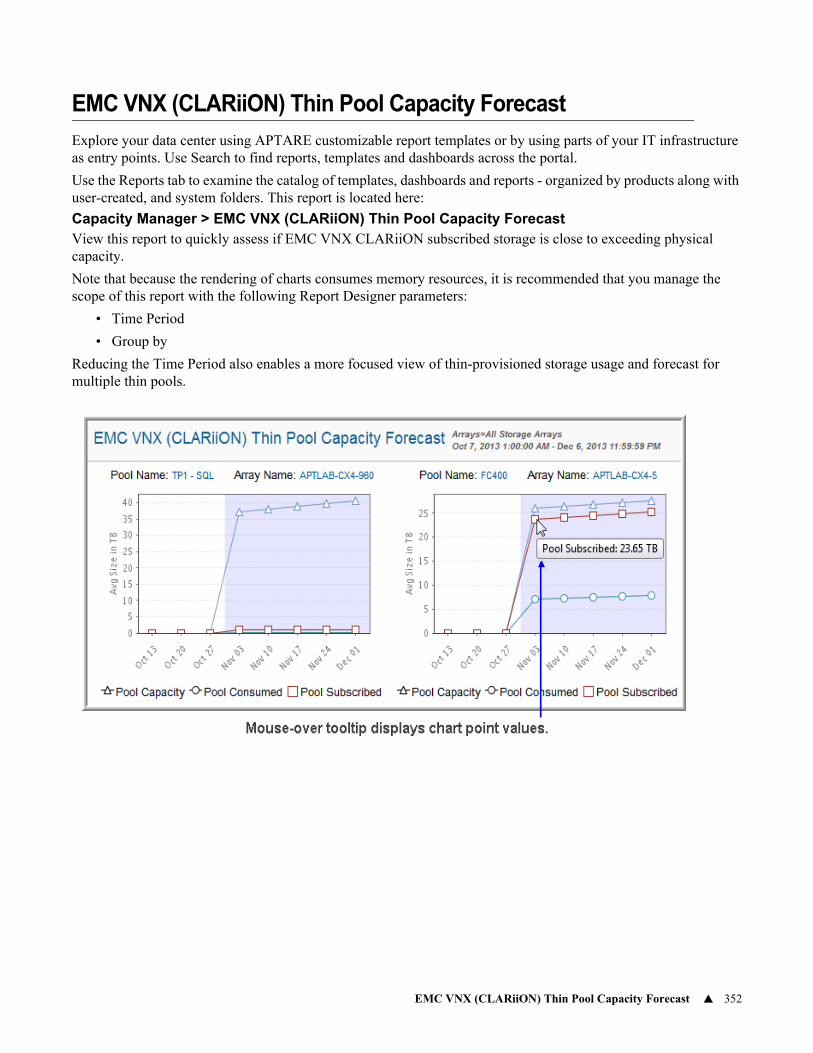
EMC VNX (CLARiiON) Thin Pool Capacity Forecast 352
EMC VNX (CLARiiON) Thin Pool Capacity Forecast
Explore your data center using APTARE customizable report templates or by using parts of your IT infrastructure as entry points. Use Search to find reports, templates and dashboards across the portal.
Use the Reports tab to examine the catalog of templates, dashboards and reports - organized by products along with user-created, and system folders. This report is located here:
Capacity Manager > EMC VNX (CLARiiON) Thin Pool Capacity ForecastView this report to quickly assess if EMC VNX CLARiiON subscribed storage is close to exceeding physical capacity.
Note that because the rendering of charts consumes memory resources, it is recommended that you manage the scope of this report with the following Report Designer parameters:
• Time Period
• Group by
Reducing the Time Period also enables a more focused view of thin-provisioned storage usage and forecast for multiple thin pools.

Object Store Usage Over Time 353
Object Store Usage Over Time
Explore your data center using APTARE customizable report templates or by using parts of your IT infrastructure as entry points. Use Search to find reports, templates and dashboards across the portal.
Use the Reports tab to examine the catalog of templates, dashboards and reports - organized by products along with user-created, and system folders. This report is located here:
Capacity Manager > Storage Capacity & Forecast > Object Store Usage Over TimeGraphically represent object array capacity usage for all nodes, over time. Compare used capacity against total capacity to assess future capacity needs. For example, view Hitachi Content Platform (HCP) used and total capacity.
Total CapacityTotal amount of storage space on all the logical volumes managed by the node. Values are stored as KiB in the database and rendered according to your user profile preferences.
Used CapacityTotal amount of used space on all the logical volumes managed by the node. Values are stored as KiB in the database and rendered according to your user profile preferences.
Log Date The date and time the data was logged in the APTARE IT Analytics database.
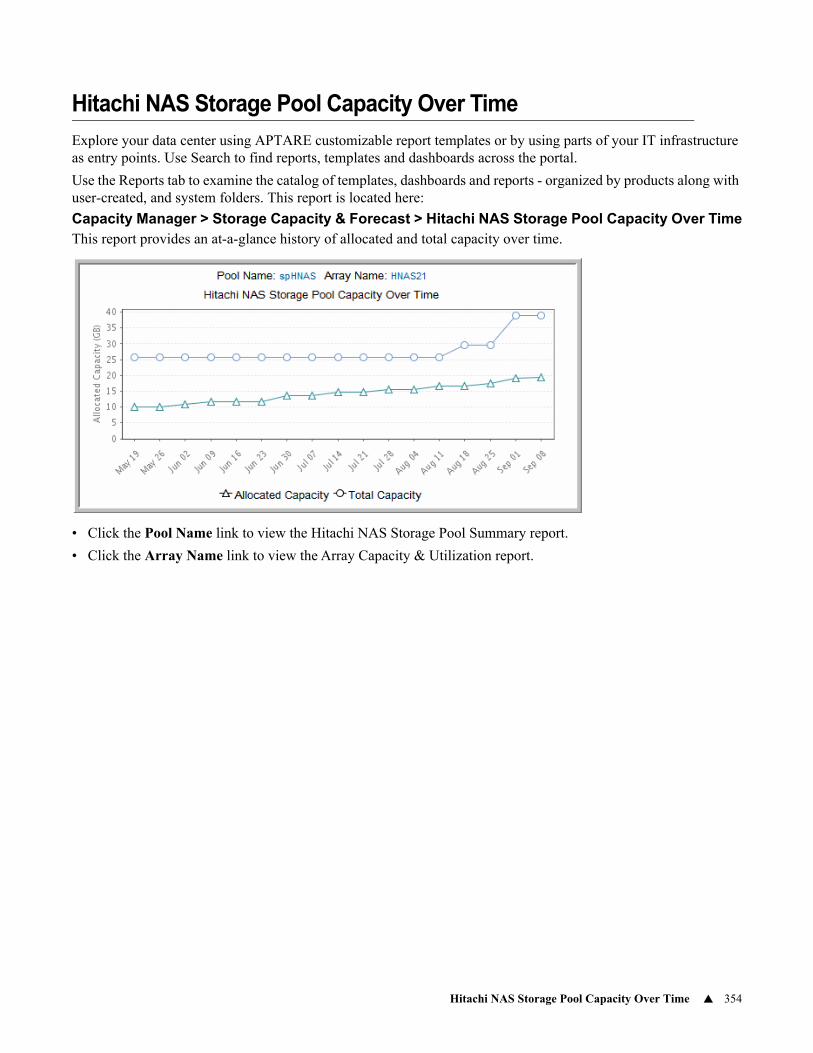
Hitachi NAS Storage Pool Capacity Over Time 354
Hitachi NAS Storage Pool Capacity Over Time
Explore your data center using APTARE customizable report templates or by using parts of your IT infrastructure as entry points. Use Search to find reports, templates and dashboards across the portal.
Use the Reports tab to examine the catalog of templates, dashboards and reports - organized by products along with user-created, and system folders. This report is located here:
Capacity Manager > Storage Capacity & Forecast > Hitachi NAS Storage Pool Capacity Over TimeThis report provides an at-a-glance history of allocated and total capacity over time.
• Click the Pool Name link to view the Hitachi NAS Storage Pool Summary report.
• Click the Array Name link to view the Array Capacity & Utilization report.
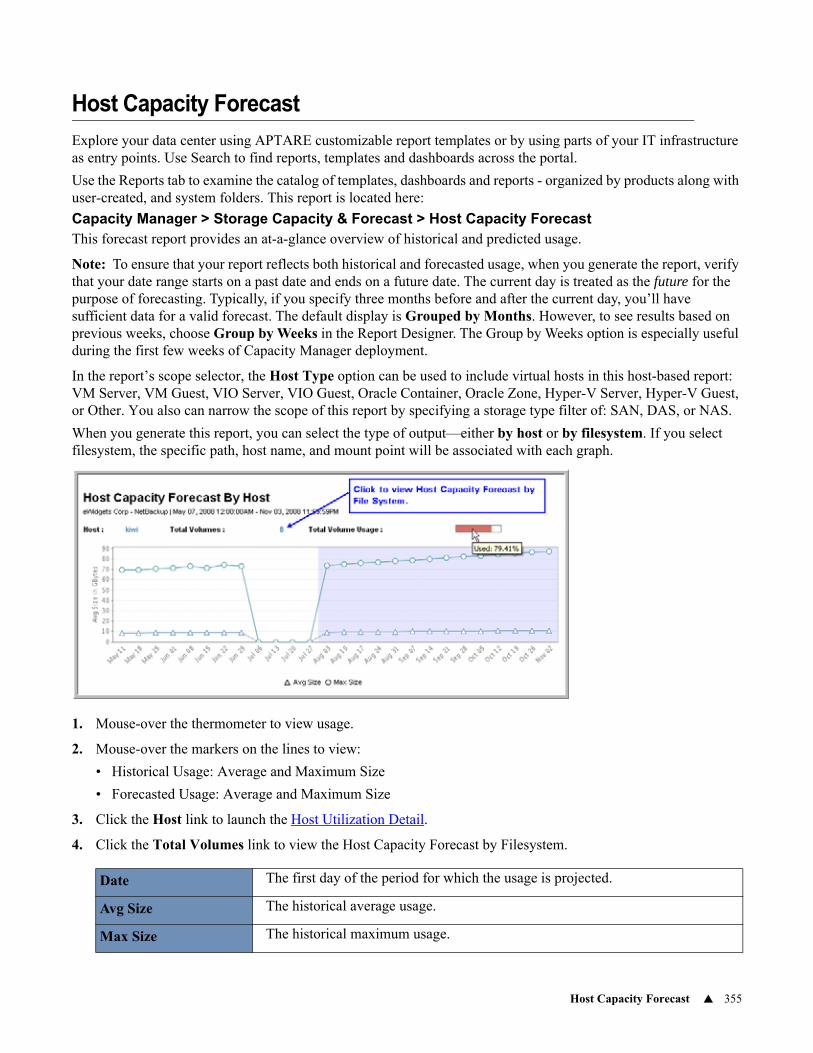
Host Capacity Forecast 355
Host Capacity Forecast
Explore your data center using APTARE customizable report templates or by using parts of your IT infrastructure as entry points. Use Search to find reports, templates and dashboards across the portal.
Use the Reports tab to examine the catalog of templates, dashboards and reports - organized by products along with user-created, and system folders. This report is located here:
Capacity Manager > Storage Capacity & Forecast > Host Capacity ForecastThis forecast report provides an at-a-glance overview of historical and predicted usage.
Note: To ensure that your report reflects both historical and forecasted usage, when you generate the report, verify that your date range starts on a past date and ends on a future date. The current day is treated as the future for the purpose of forecasting. Typically, if you specify three months before and after the current day, you’ll have sufficient data for a valid forecast. The default display is Grouped by Months. However, to see results based on previous weeks, choose Group by Weeks in the Report Designer. The Group by Weeks option is especially useful during the first few weeks of Capacity Manager deployment.
In the report’s scope selector, the Host Type option can be used to include virtual hosts in this host-based report: VM Server, VM Guest, VIO Server, VIO Guest, Oracle Container, Oracle Zone, Hyper-V Server, Hyper-V Guest, or Other. You also can narrow the scope of this report by specifying a storage type filter of: SAN, DAS, or NAS.
When you generate this report, you can select the type of output—either by host or by filesystem. If you select filesystem, the specific path, host name, and mount point will be associated with each graph.
1. Mouse-over the thermometer to view usage.
2. Mouse-over the markers on the lines to view:
• Historical Usage: Average and Maximum Size
• Forecasted Usage: Average and Maximum Size
3. Click the Host link to launch the Host Utilization Detail.
4. Click the Total Volumes link to view the Host Capacity Forecast by Filesystem.
Date The first day of the period for which the usage is projected.
Avg Size The historical average usage.
Max Size The historical maximum usage.
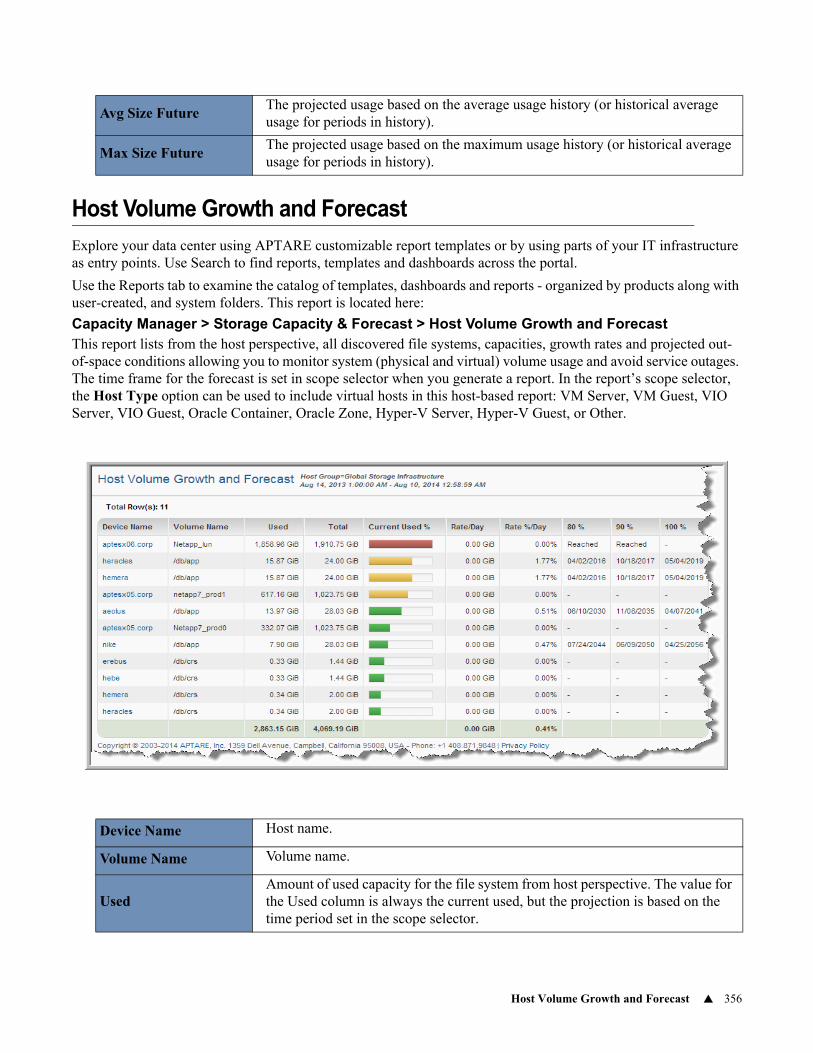
Host Volume Growth and Forecast 356
Host Volume Growth and Forecast
Explore your data center using APTARE customizable report templates or by using parts of your IT infrastructure as entry points. Use Search to find reports, templates and dashboards across the portal.
Use the Reports tab to examine the catalog of templates, dashboards and reports - organized by products along with user-created, and system folders. This report is located here:
Capacity Manager > Storage Capacity & Forecast > Host Volume Growth and ForecastThis report lists from the host perspective, all discovered file systems, capacities, growth rates and projected out-of-space conditions allowing you to monitor system (physical and virtual) volume usage and avoid service outages. The time frame for the forecast is set in scope selector when you generate a report. In the report’s scope selector, the Host Type option can be used to include virtual hosts in this host-based report: VM Server, VM Guest, VIO Server, VIO Guest, Oracle Container, Oracle Zone, Hyper-V Server, Hyper-V Guest, or Other.
Avg Size FutureThe projected usage based on the average usage history (or historical average usage for periods in history).
Max Size FutureThe projected usage based on the maximum usage history (or historical average usage for periods in history).
Device Name Host name.
Volume Name Volume name.
UsedAmount of used capacity for the file system from host perspective. The value for the Used column is always the current used, but the projection is based on the time period set in the scope selector.
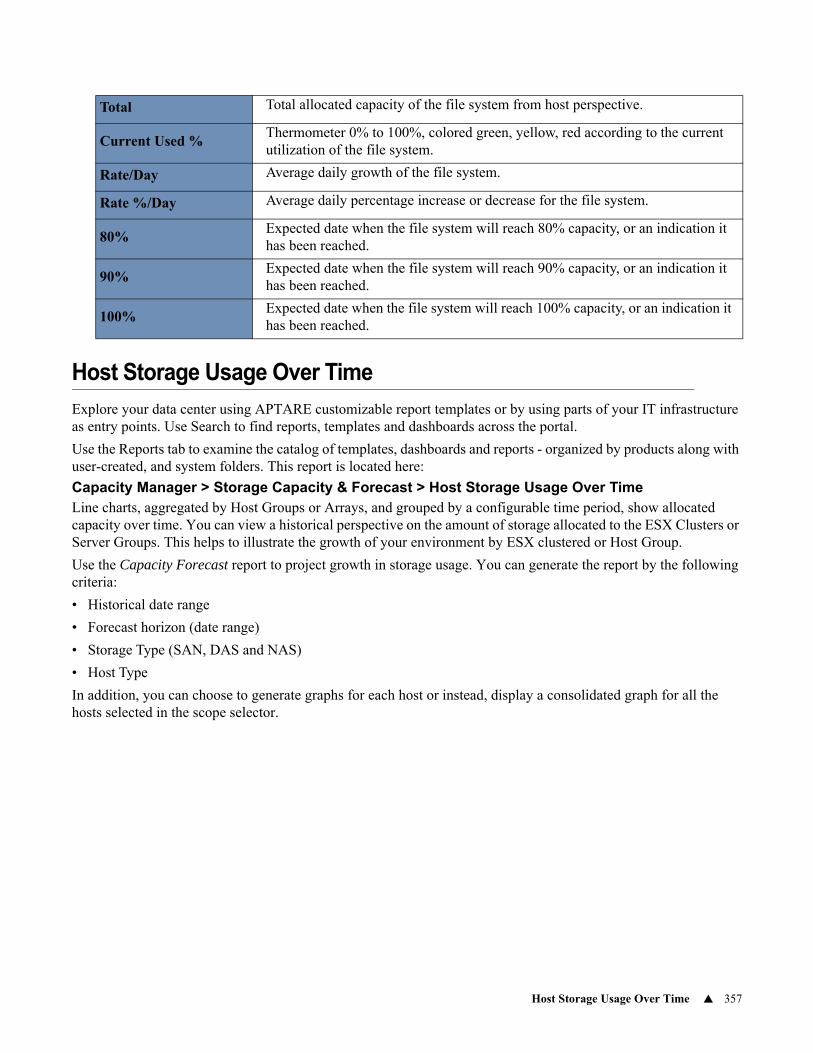
Host Storage Usage Over Time 357
Host Storage Usage Over Time
Explore your data center using APTARE customizable report templates or by using parts of your IT infrastructure as entry points. Use Search to find reports, templates and dashboards across the portal.
Use the Reports tab to examine the catalog of templates, dashboards and reports - organized by products along with user-created, and system folders. This report is located here:
Capacity Manager > Storage Capacity & Forecast > Host Storage Usage Over TimeLine charts, aggregated by Host Groups or Arrays, and grouped by a configurable time period, show allocated capacity over time. You can view a historical perspective on the amount of storage allocated to the ESX Clusters or Server Groups. This helps to illustrate the growth of your environment by ESX clustered or Host Group.
Use the Capacity Forecast report to project growth in storage usage. You can generate the report by the following criteria:
• Historical date range
• Forecast horizon (date range)
• Storage Type (SAN, DAS and NAS)
• Host Type
In addition, you can choose to generate graphs for each host or instead, display a consolidated graph for all the hosts selected in the scope selector.
Total Total allocated capacity of the file system from host perspective.
Current Used %Thermometer 0% to 100%, colored green, yellow, red according to the current utilization of the file system.
Rate/Day Average daily growth of the file system.
Rate %/Day Average daily percentage increase or decrease for the file system.
80%Expected date when the file system will reach 80% capacity, or an indication it has been reached.
90%Expected date when the file system will reach 90% capacity, or an indication it has been reached.
100%Expected date when the file system will reach 100% capacity, or an indication it has been reached.
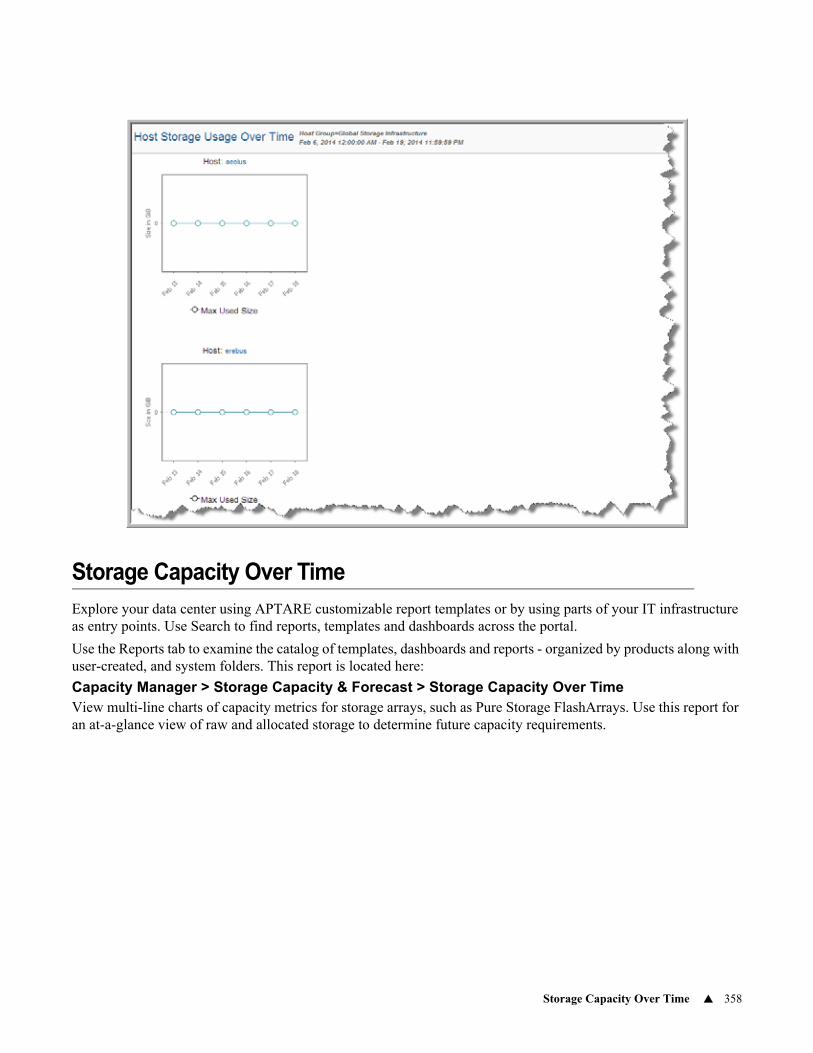
Storage Capacity Over Time 358
Storage Capacity Over Time
Explore your data center using APTARE customizable report templates or by using parts of your IT infrastructure as entry points. Use Search to find reports, templates and dashboards across the portal.
Use the Reports tab to examine the catalog of templates, dashboards and reports - organized by products along with user-created, and system folders. This report is located here:
Capacity Manager > Storage Capacity & Forecast > Storage Capacity Over TimeView multi-line charts of capacity metrics for storage arrays, such as Pure Storage FlashArrays. Use this report for an at-a-glance view of raw and allocated storage to determine future capacity requirements.
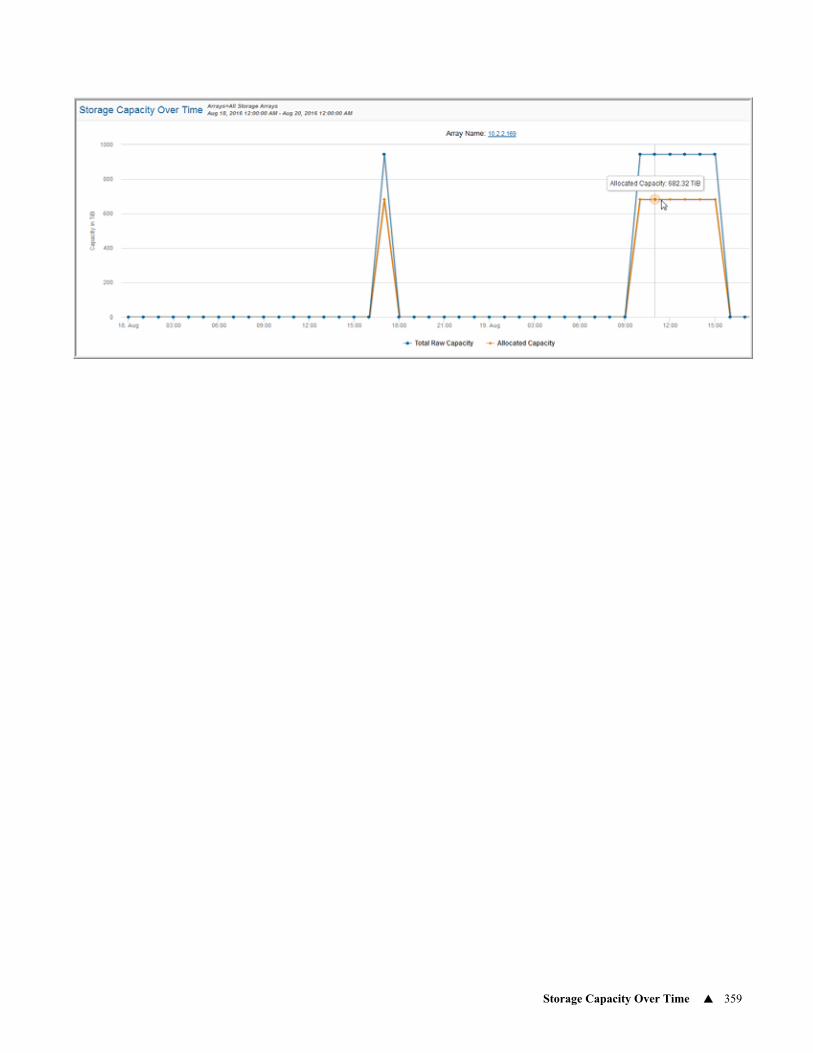
Storage Capacity Over Time 359
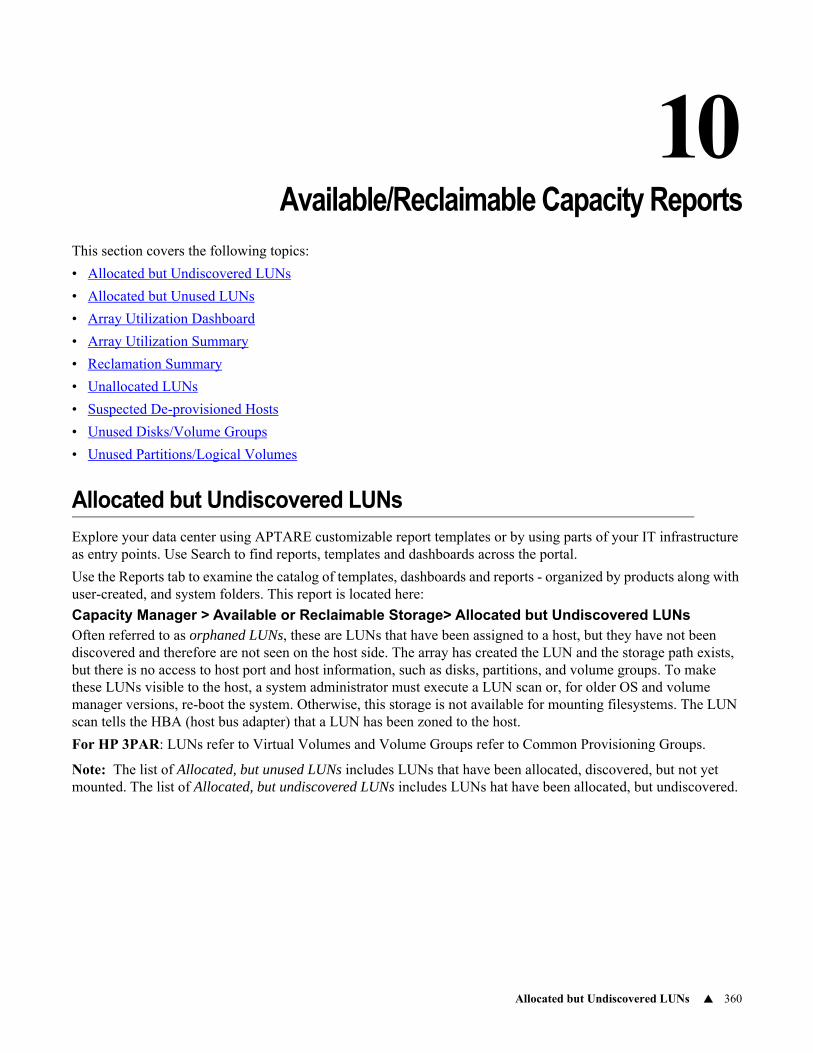
Allocated but Undiscovered LUNs 360
10Chapter 6Available/Reclaimable Capacity Reports
This section covers the following topics:
• Allocated but Undiscovered LUNs
• Allocated but Unused LUNs
• Array Utilization Dashboard
• Array Utilization Summary
• Reclamation Summary
• Unallocated LUNs
• Suspected De-provisioned Hosts
• Unused Disks/Volume Groups
• Unused Partitions/Logical Volumes
Allocated but Undiscovered LUNs
Explore your data center using APTARE customizable report templates or by using parts of your IT infrastructure as entry points. Use Search to find reports, templates and dashboards across the portal.
Use the Reports tab to examine the catalog of templates, dashboards and reports - organized by products along with user-created, and system folders. This report is located here:
Capacity Manager > Available or Reclaimable Storage> Allocated but Undiscovered LUNsOften referred to as orphaned LUNs, these are LUNs that have been assigned to a host, but they have not been discovered and therefore are not seen on the host side. The array has created the LUN and the storage path exists, but there is no access to host port and host information, such as disks, partitions, and volume groups. To make these LUNs visible to the host, a system administrator must execute a LUN scan or, for older OS and volume manager versions, re-boot the system. Otherwise, this storage is not available for mounting filesystems. The LUN scan tells the HBA (host bus adapter) that a LUN has been zoned to the host.
For HP 3PAR: LUNs refer to Virtual Volumes and Volume Groups refer to Common Provisioning Groups.
Note: The list of Allocated, but unused LUNs includes LUNs that have been allocated, discovered, but not yet mounted. The list of Allocated, but undiscovered LUNs includes LUNs hat have been allocated, but undiscovered.
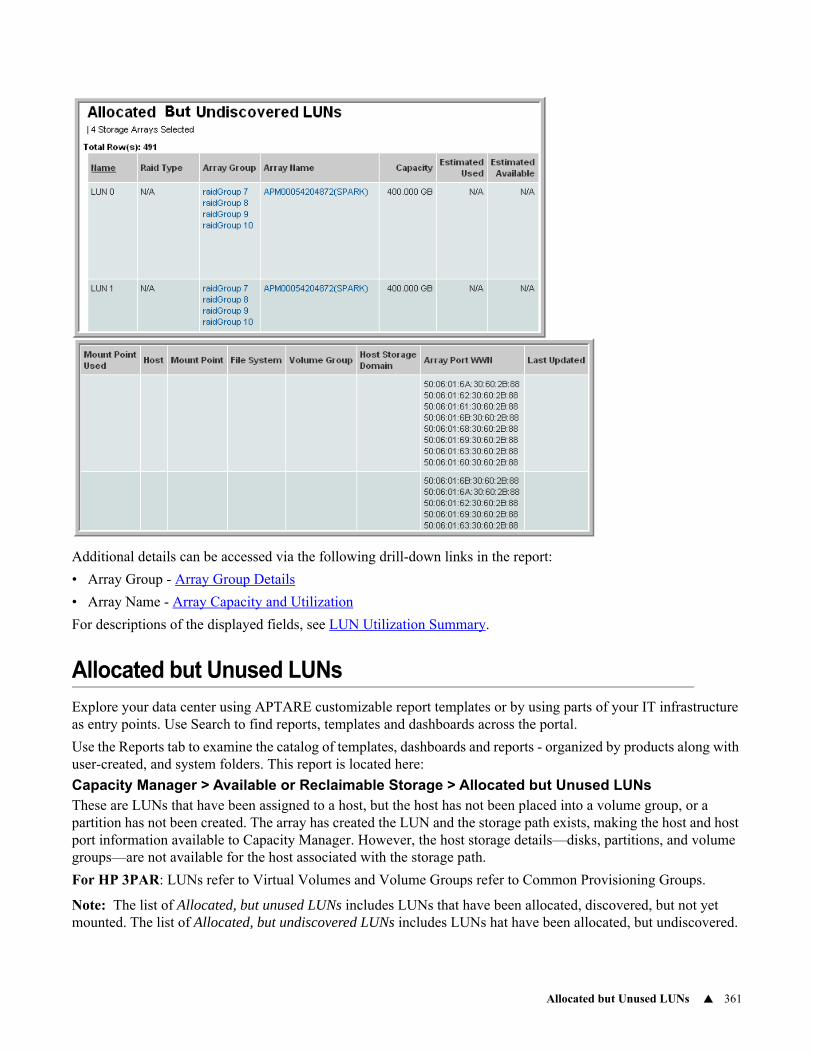
Allocated but Unused LUNs 361
Additional details can be accessed via the following drill-down links in the report:
• Array Group - Array Group Details
• Array Name - Array Capacity and Utilization
For descriptions of the displayed fields, see LUN Utilization Summary.
Allocated but Unused LUNs
Explore your data center using APTARE customizable report templates or by using parts of your IT infrastructure as entry points. Use Search to find reports, templates and dashboards across the portal.
Use the Reports tab to examine the catalog of templates, dashboards and reports - organized by products along with user-created, and system folders. This report is located here:
Capacity Manager > Available or Reclaimable Storage > Allocated but Unused LUNsThese are LUNs that have been assigned to a host, but the host has not been placed into a volume group, or a partition has not been created. The array has created the LUN and the storage path exists, making the host and host port information available to Capacity Manager. However, the host storage details—disks, partitions, and volume groups—are not available for the host associated with the storage path.
For HP 3PAR: LUNs refer to Virtual Volumes and Volume Groups refer to Common Provisioning Groups.
Note: The list of Allocated, but unused LUNs includes LUNs that have been allocated, discovered, but not yet mounted. The list of Allocated, but undiscovered LUNs includes LUNs hat have been allocated, but undiscovered.
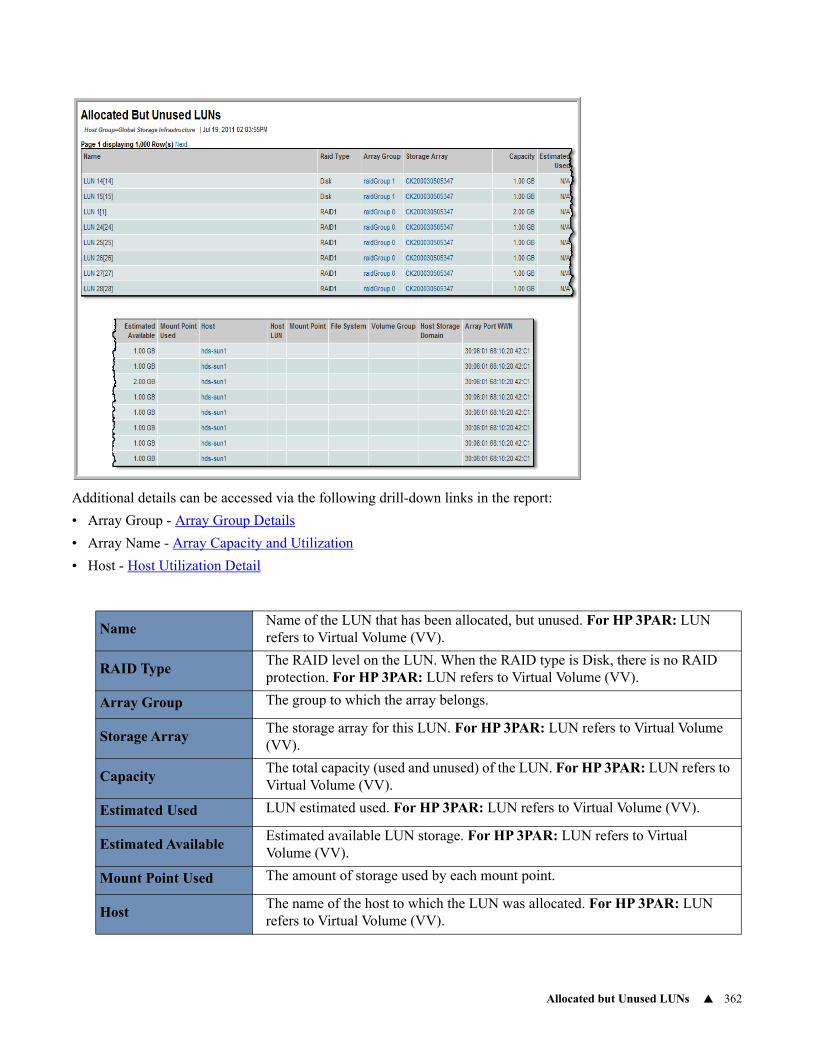
Allocated but Unused LUNs 362
Additional details can be accessed via the following drill-down links in the report:
• Array Group - Array Group Details
• Array Name - Array Capacity and Utilization
• Host - Host Utilization Detail
NameName of the LUN that has been allocated, but unused. For HP 3PAR: LUN refers to Virtual Volume (VV).
RAID TypeThe RAID level on the LUN. When the RAID type is Disk, there is no RAID protection. For HP 3PAR: LUN refers to Virtual Volume (VV).
Array Group The group to which the array belongs.
Storage ArrayThe storage array for this LUN. For HP 3PAR: LUN refers to Virtual Volume (VV).
CapacityThe total capacity (used and unused) of the LUN. For HP 3PAR: LUN refers to Virtual Volume (VV).
Estimated Used LUN estimated used. For HP 3PAR: LUN refers to Virtual Volume (VV).
Estimated AvailableEstimated available LUN storage. For HP 3PAR: LUN refers to Virtual Volume (VV).
Mount Point Used The amount of storage used by each mount point.
HostThe name of the host to which the LUN was allocated. For HP 3PAR: LUN refers to Virtual Volume (VV).
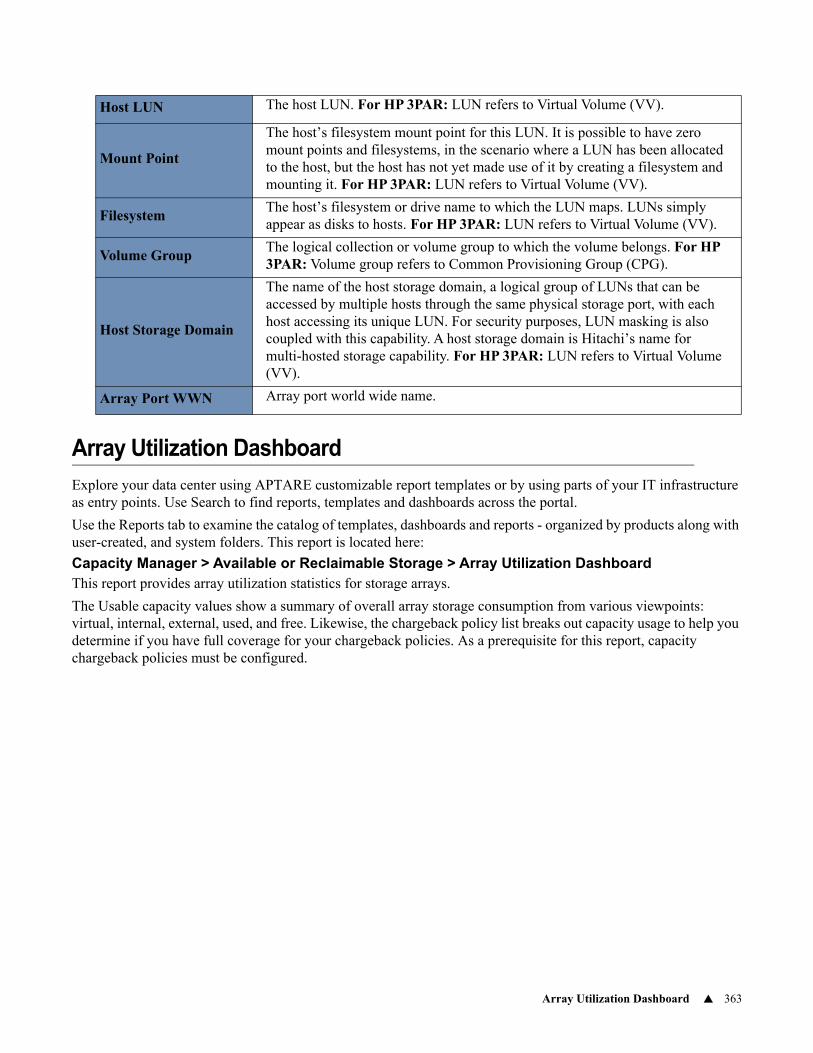
Array Utilization Dashboard 363
Array Utilization Dashboard
Explore your data center using APTARE customizable report templates or by using parts of your IT infrastructure as entry points. Use Search to find reports, templates and dashboards across the portal.
Use the Reports tab to examine the catalog of templates, dashboards and reports - organized by products along with user-created, and system folders. This report is located here:
Capacity Manager > Available or Reclaimable Storage > Array Utilization DashboardThis report provides array utilization statistics for storage arrays.
The Usable capacity values show a summary of overall array storage consumption from various viewpoints: virtual, internal, external, used, and free. Likewise, the chargeback policy list breaks out capacity usage to help you determine if you have full coverage for your chargeback policies. As a prerequisite for this report, capacity chargeback policies must be configured.
Host LUN The host LUN. For HP 3PAR: LUN refers to Virtual Volume (VV).
Mount Point
The host’s filesystem mount point for this LUN. It is possible to have zero mount points and filesystems, in the scenario where a LUN has been allocated to the host, but the host has not yet made use of it by creating a filesystem and mounting it. For HP 3PAR: LUN refers to Virtual Volume (VV).
FilesystemThe host’s filesystem or drive name to which the LUN maps. LUNs simply appear as disks to hosts. For HP 3PAR: LUN refers to Virtual Volume (VV).
Volume GroupThe logical collection or volume group to which the volume belongs. For HP 3PAR: Volume group refers to Common Provisioning Group (CPG).
Host Storage Domain
The name of the host storage domain, a logical group of LUNs that can be accessed by multiple hosts through the same physical storage port, with each host accessing its unique LUN. For security purposes, LUN masking is also coupled with this capability. A host storage domain is Hitachi’s name for multi-hosted storage capability. For HP 3PAR: LUN refers to Virtual Volume (VV).
Array Port WWN Array port world wide name.
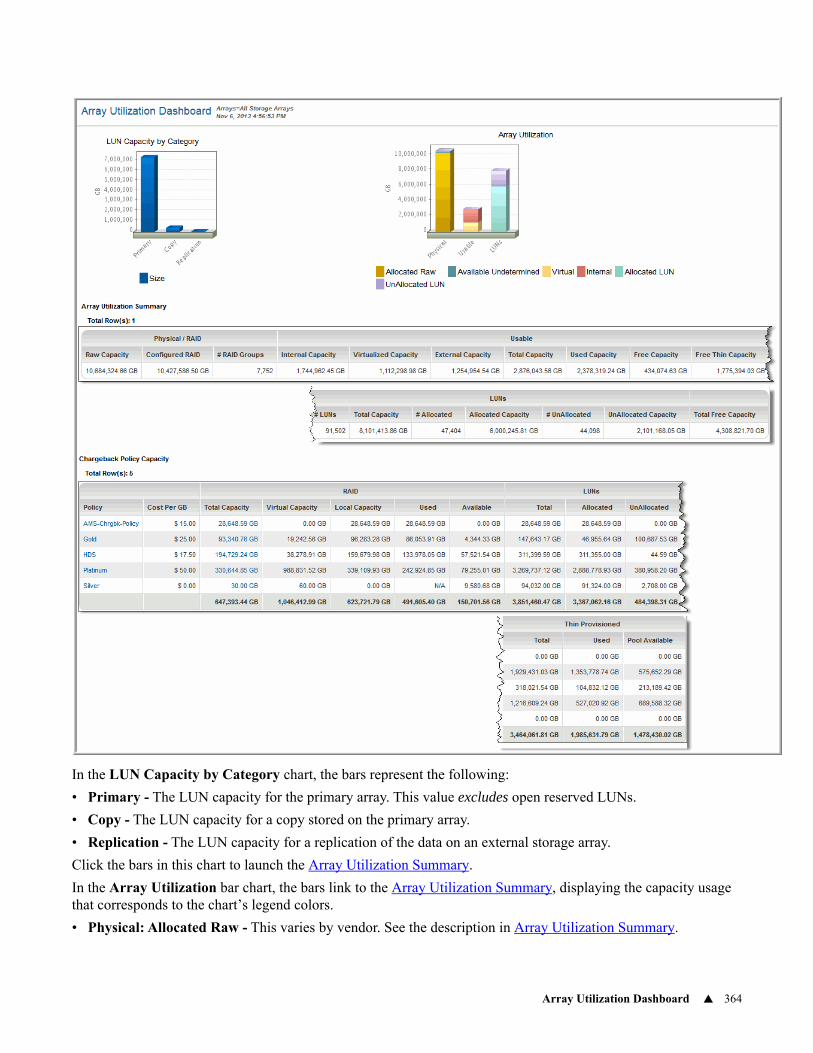
Array Utilization Dashboard 364
In the LUN Capacity by Category chart, the bars represent the following:
• Primary - The LUN capacity for the primary array. This value excludes open reserved LUNs.
• Copy - The LUN capacity for a copy stored on the primary array.
• Replication - The LUN capacity for a replication of the data on an external storage array.
Click the bars in this chart to launch the Array Utilization Summary.
In the Array Utilization bar chart, the bars link to the Array Utilization Summary, displaying the capacity usage that corresponds to the chart’s legend colors.
• Physical: Allocated Raw - This varies by vendor. See the description in Array Utilization Summary.
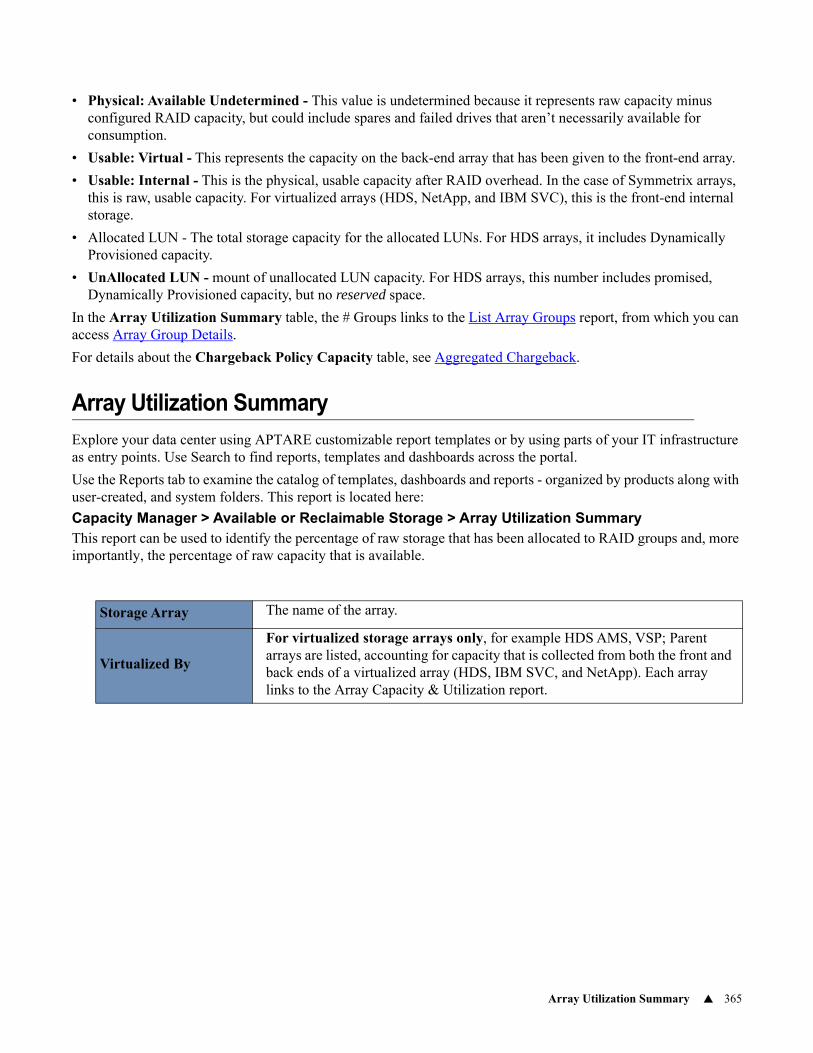
Array Utilization Summary 365
• Physical: Available Undetermined - This value is undetermined because it represents raw capacity minus configured RAID capacity, but could include spares and failed drives that aren’t necessarily available for consumption.
• Usable: Virtual - This represents the capacity on the back-end array that has been given to the front-end array.
• Usable: Internal - This is the physical, usable capacity after RAID overhead. In the case of Symmetrix arrays, this is raw, usable capacity. For virtualized arrays (HDS, NetApp, and IBM SVC), this is the front-end internal storage.
• Allocated LUN - The total storage capacity for the allocated LUNs. For HDS arrays, it includes Dynamically Provisioned capacity.
• UnAllocated LUN - mount of unallocated LUN capacity. For HDS arrays, this number includes promised, Dynamically Provisioned capacity, but no reserved space.
In the Array Utilization Summary table, the # Groups links to the List Array Groups report, from which you can access Array Group Details.
For details about the Chargeback Policy Capacity table, see Aggregated Chargeback.
Array Utilization Summary
Explore your data center using APTARE customizable report templates or by using parts of your IT infrastructure as entry points. Use Search to find reports, templates and dashboards across the portal.
Use the Reports tab to examine the catalog of templates, dashboards and reports - organized by products along with user-created, and system folders. This report is located here:
Capacity Manager > Available or Reclaimable Storage > Array Utilization SummaryThis report can be used to identify the percentage of raw storage that has been allocated to RAID groups and, more importantly, the percentage of raw capacity that is available.
Storage Array The name of the array.
Virtualized By
For virtualized storage arrays only, for example HDS AMS, VSP; Parent arrays are listed, accounting for capacity that is collected from both the front and back ends of a virtualized array (HDS, IBM SVC, and NetApp). Each array links to the Array Capacity & Utilization report.
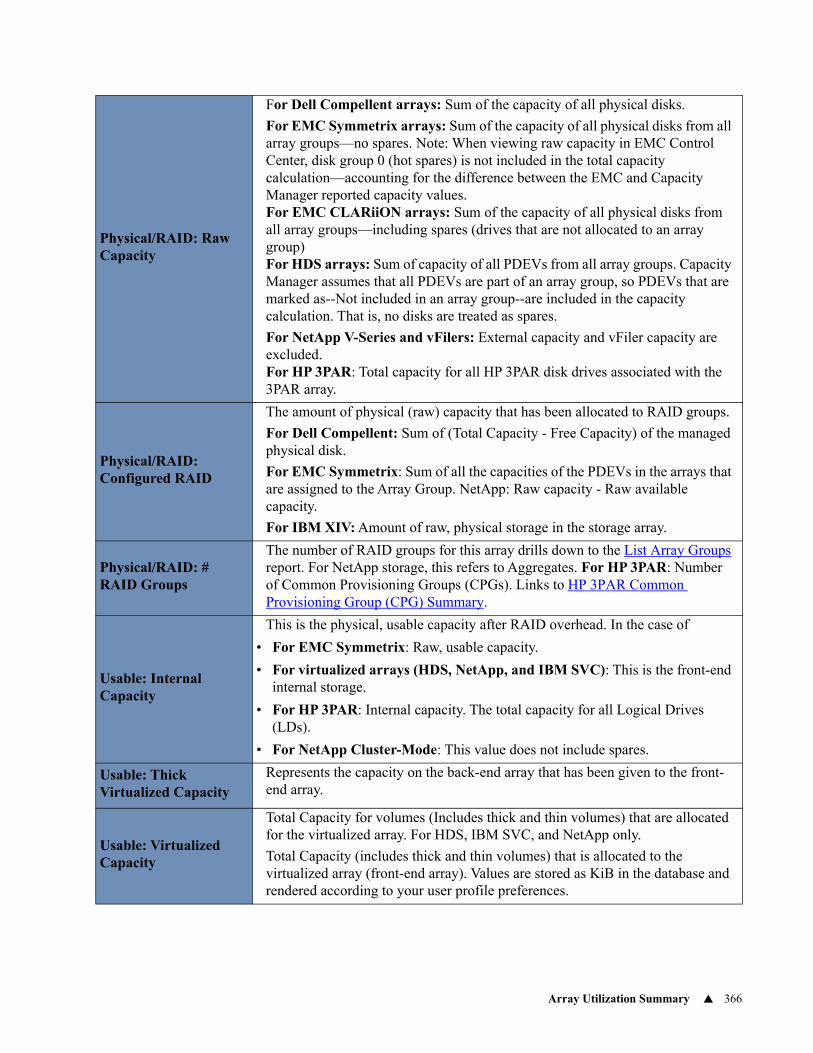
Array Utilization Summary 366
Physical/RAID: Raw Capacity
For Dell Compellent arrays: Sum of the capacity of all physical disks.
For EMC Symmetrix arrays: Sum of the capacity of all physical disks from all array groups—no spares. Note: When viewing raw capacity in EMC Control Center, disk group 0 (hot spares) is not included in the total capacity calculation—accounting for the difference between the EMC and Capacity Manager reported capacity values.For EMC CLARiiON arrays: Sum of the capacity of all physical disks from all array groups—including spares (drives that are not allocated to an array group)For HDS arrays: Sum of capacity of all PDEVs from all array groups. Capacity Manager assumes that all PDEVs are part of an array group, so PDEVs that are marked as--Not included in an array group--are included in the capacity calculation. That is, no disks are treated as spares.
For NetApp V-Series and vFilers: External capacity and vFiler capacity are excluded.For HP 3PAR: Total capacity for all HP 3PAR disk drives associated with the 3PAR array.
Physical/RAID: Configured RAID
The amount of physical (raw) capacity that has been allocated to RAID groups.
For Dell Compellent: Sum of (Total Capacity - Free Capacity) of the managed physical disk.
For EMC Symmetrix: Sum of all the capacities of the PDEVs in the arrays that are assigned to the Array Group. NetApp: Raw capacity - Raw available capacity.
For IBM XIV: Amount of raw, physical storage in the storage array.
Physical/RAID: # RAID Groups
The number of RAID groups for this array drills down to the List Array Groups report. For NetApp storage, this refers to Aggregates. For HP 3PAR: Number of Common Provisioning Groups (CPGs). Links to HP 3PAR Common Provisioning Group (CPG) Summary.
Usable: Internal Capacity
This is the physical, usable capacity after RAID overhead. In the case of
• For EMC Symmetrix: Raw, usable capacity.
• For virtualized arrays (HDS, NetApp, and IBM SVC): This is the front-end internal storage.
• For HP 3PAR: Internal capacity. The total capacity for all Logical Drives (LDs).
• For NetApp Cluster-Mode: This value does not include spares.
Usable: Thick Virtualized Capacity
Represents the capacity on the back-end array that has been given to the front-end array.
Usable: Virtualized Capacity
Total Capacity for volumes (Includes thick and thin volumes) that are allocated for the virtualized array. For HDS, IBM SVC, and NetApp only.
Total Capacity (includes thick and thin volumes) that is allocated to the virtualized array (front-end array). Values are stored as KiB in the database and rendered according to your user profile preferences.
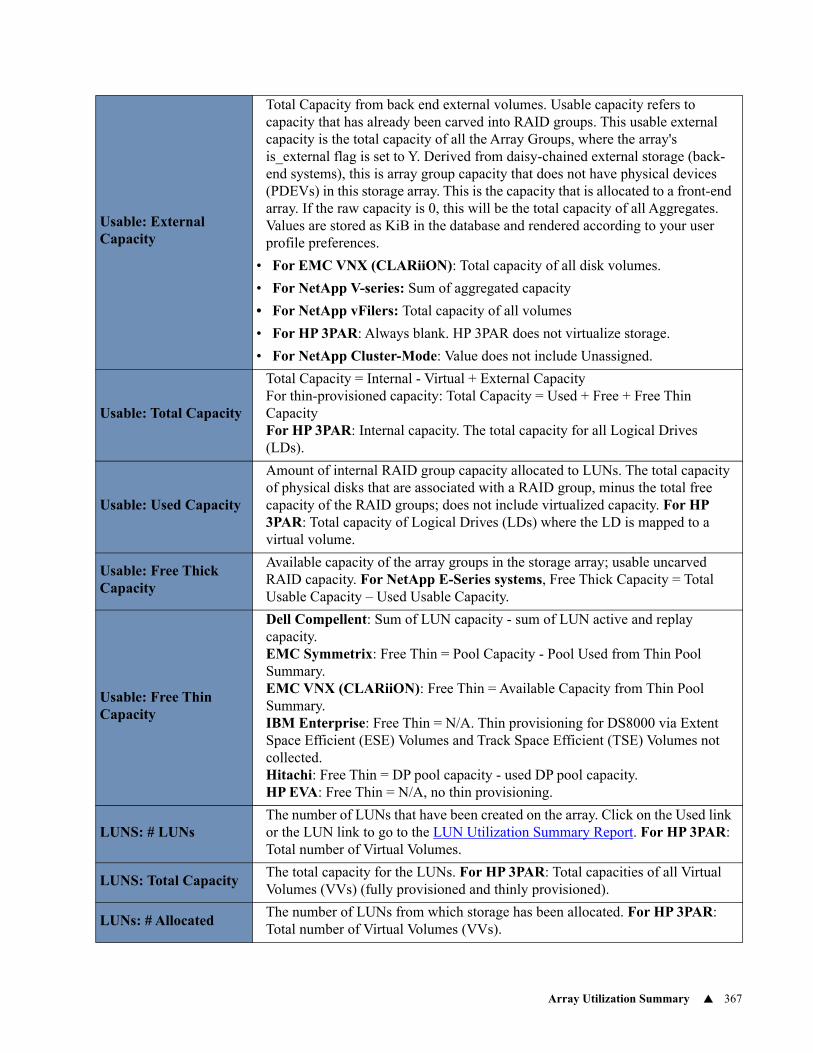
Array Utilization Summary 367
Usable: External Capacity
Total Capacity from back end external volumes. Usable capacity refers to capacity that has already been carved into RAID groups. This usable external capacity is the total capacity of all the Array Groups, where the array's is_external flag is set to Y. Derived from daisy-chained external storage (back-end systems), this is array group capacity that does not have physical devices (PDEVs) in this storage array. This is the capacity that is allocated to a front-end array. If the raw capacity is 0, this will be the total capacity of all Aggregates. Values are stored as KiB in the database and rendered according to your user profile preferences.
• For EMC VNX (CLARiiON): Total capacity of all disk volumes.
• For NetApp V-series: Sum of aggregated capacity
• For NetApp vFilers: Total capacity of all volumes
• For HP 3PAR: Always blank. HP 3PAR does not virtualize storage.
• For NetApp Cluster-Mode: Value does not include Unassigned.
Usable: Total Capacity
Total Capacity = Internal - Virtual + External CapacityFor thin-provisioned capacity: Total Capacity = Used + Free + Free Thin CapacityFor HP 3PAR: Internal capacity. The total capacity for all Logical Drives (LDs).
Usable: Used Capacity
Amount of internal RAID group capacity allocated to LUNs. The total capacity of physical disks that are associated with a RAID group, minus the total free capacity of the RAID groups; does not include virtualized capacity. For HP 3PAR: Total capacity of Logical Drives (LDs) where the LD is mapped to a virtual volume.
Usable: Free Thick Capacity
Available capacity of the array groups in the storage array; usable uncarved RAID capacity. For NetApp E-Series systems, Free Thick Capacity = Total Usable Capacity – Used Usable Capacity.
Usable: Free Thin Capacity
Dell Compellent: Sum of LUN capacity - sum of LUN active and replay capacity.EMC Symmetrix: Free Thin = Pool Capacity - Pool Used from Thin Pool Summary.EMC VNX (CLARiiON): Free Thin = Available Capacity from Thin Pool Summary.IBM Enterprise: Free Thin = N/A. Thin provisioning for DS8000 via Extent Space Efficient (ESE) Volumes and Track Space Efficient (TSE) Volumes not collected.Hitachi: Free Thin = DP pool capacity - used DP pool capacity.HP EVA: Free Thin = N/A, no thin provisioning.
LUNS: # LUNsThe number of LUNs that have been created on the array. Click on the Used link or the LUN link to go to the LUN Utilization Summary Report. For HP 3PAR: Total number of Virtual Volumes.
LUNS: Total CapacityThe total capacity for the LUNs. For HP 3PAR: Total capacities of all Virtual Volumes (VVs) (fully provisioned and thinly provisioned).
LUNs: # AllocatedThe number of LUNs from which storage has been allocated. For HP 3PAR: Total number of Virtual Volumes (VVs).
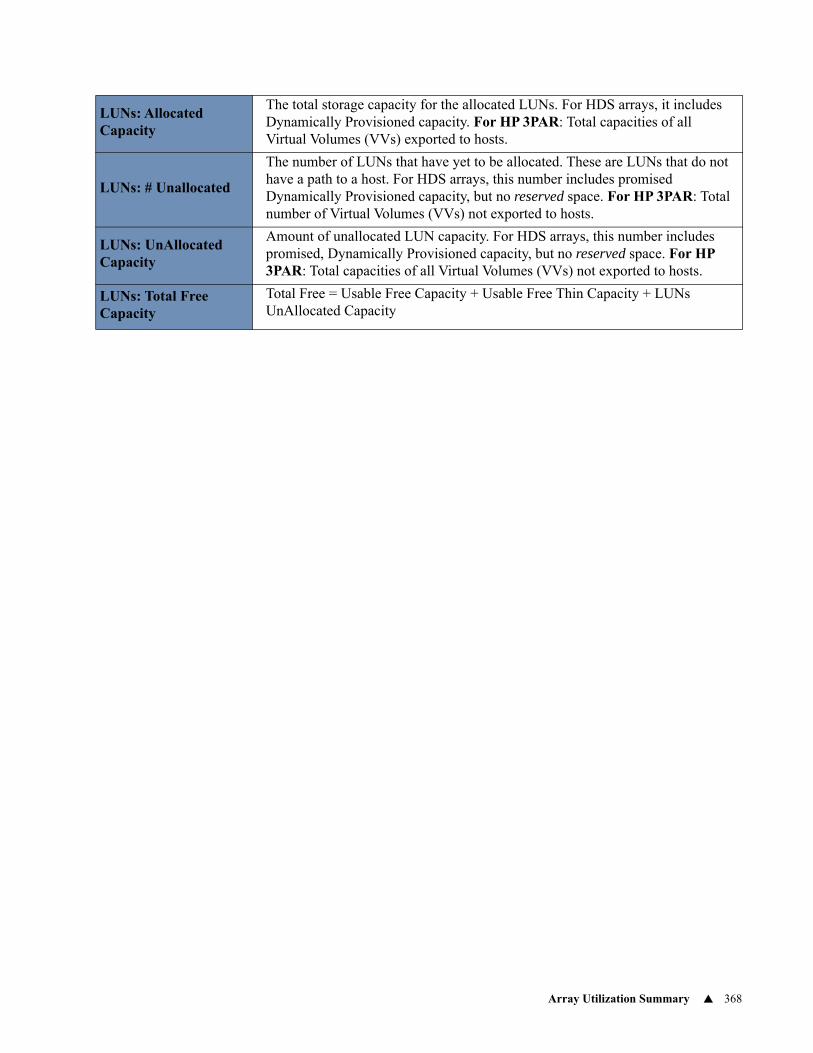
Array Utilization Summary 368
LUNs: Allocated Capacity
The total storage capacity for the allocated LUNs. For HDS arrays, it includes Dynamically Provisioned capacity. For HP 3PAR: Total capacities of all Virtual Volumes (VVs) exported to hosts.
LUNs: # Unallocated
The number of LUNs that have yet to be allocated. These are LUNs that do not have a path to a host. For HDS arrays, this number includes promised Dynamically Provisioned capacity, but no reserved space. For HP 3PAR: Total number of Virtual Volumes (VVs) not exported to hosts.
LUNs: UnAllocated Capacity
Amount of unallocated LUN capacity. For HDS arrays, this number includes promised, Dynamically Provisioned capacity, but no reserved space. For HP 3PAR: Total capacities of all Virtual Volumes (VVs) not exported to hosts.
LUNs: Total Free Capacity
Total Free = Usable Free Capacity + Usable Free Thin Capacity + LUNs UnAllocated Capacity
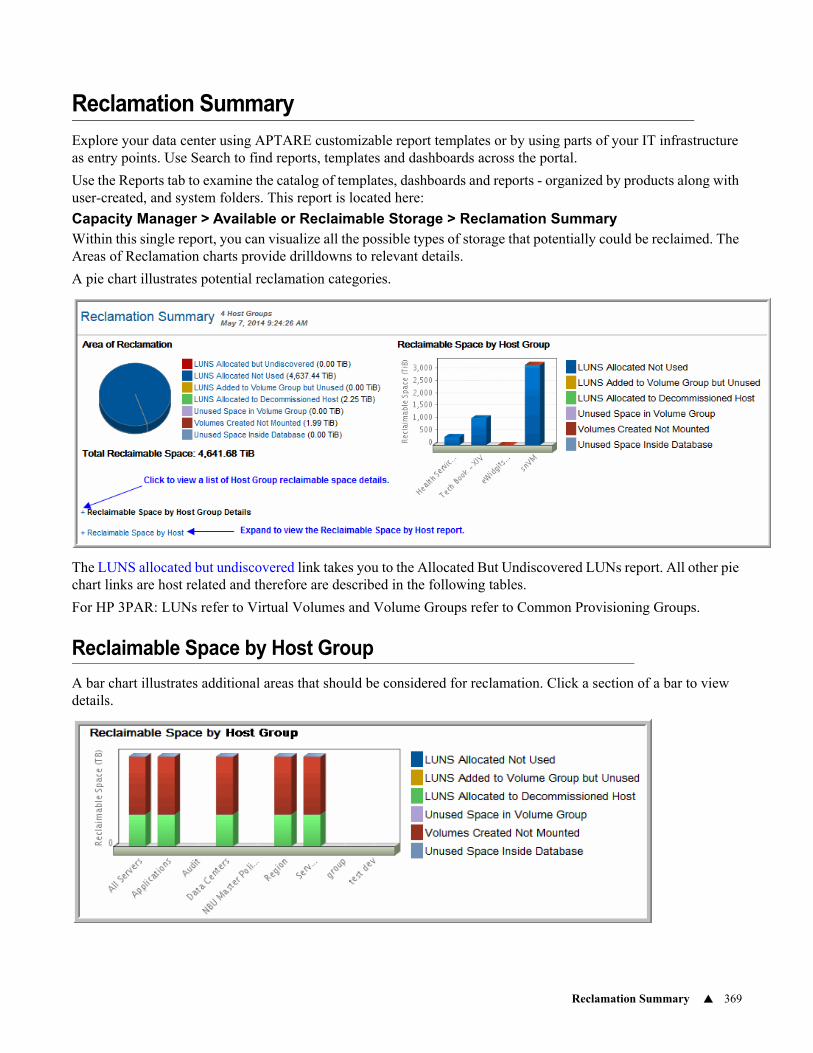
Reclamation Summary 369
Reclamation Summary
Explore your data center using APTARE customizable report templates or by using parts of your IT infrastructure as entry points. Use Search to find reports, templates and dashboards across the portal.
Use the Reports tab to examine the catalog of templates, dashboards and reports - organized by products along with user-created, and system folders. This report is located here:
Capacity Manager > Available or Reclaimable Storage > Reclamation SummaryWithin this single report, you can visualize all the possible types of storage that potentially could be reclaimed. The Areas of Reclamation charts provide drilldowns to relevant details.
A pie chart illustrates potential reclamation categories.
The LUNS allocated but undiscovered link takes you to the Allocated But Undiscovered LUNs report. All other pie chart links are host related and therefore are described in the following tables.
For HP 3PAR: LUNs refer to Virtual Volumes and Volume Groups refer to Common Provisioning Groups.
Reclaimable Space by Host Group
A bar chart illustrates additional areas that should be considered for reclamation. Click a section of a bar to view details.
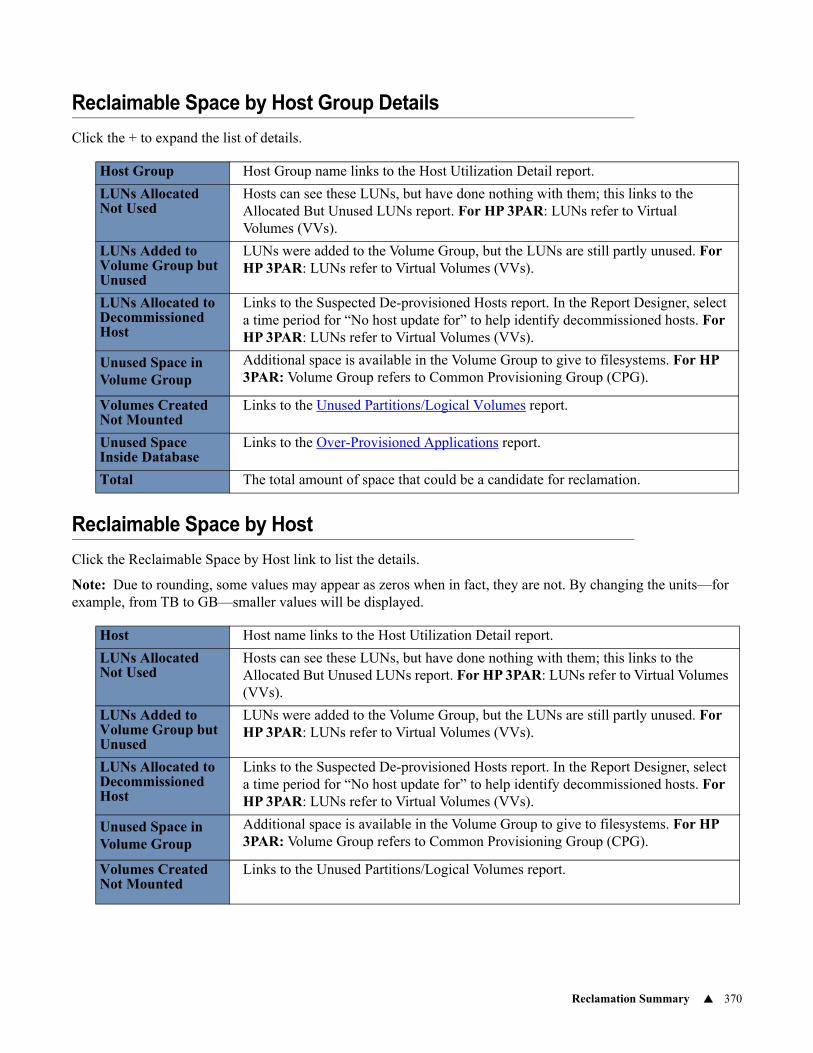
Reclamation Summary 370
Reclaimable Space by Host Group Details
Click the + to expand the list of details.
Reclaimable Space by Host
Click the Reclaimable Space by Host link to list the details.
Note: Due to rounding, some values may appear as zeros when in fact, they are not. By changing the units—for example, from TB to GB—smaller values will be displayed.
Host Group Host Group name links to the Host Utilization Detail report.
LUNs Allocated Not Used
Hosts can see these LUNs, but have done nothing with them; this links to the Allocated But Unused LUNs report. For HP 3PAR: LUNs refer to Virtual Volumes (VVs).
LUNs Added to Volume Group but Unused
LUNs were added to the Volume Group, but the LUNs are still partly unused. For HP 3PAR: LUNs refer to Virtual Volumes (VVs).
LUNs Allocated to Decommissioned Host
Links to the Suspected De-provisioned Hosts report. In the Report Designer, select a time period for “No host update for” to help identify decommissioned hosts. For HP 3PAR: LUNs refer to Virtual Volumes (VVs).
Unused Space in Volume Group
Additional space is available in the Volume Group to give to filesystems. For HP 3PAR: Volume Group refers to Common Provisioning Group (CPG).
Volumes Created Not Mounted
Links to the Unused Partitions/Logical Volumes report.
Unused Space Inside Database
Links to the Over-Provisioned Applications report.
Total The total amount of space that could be a candidate for reclamation.
Host Host name links to the Host Utilization Detail report.
LUNs Allocated Not Used
Hosts can see these LUNs, but have done nothing with them; this links to the Allocated But Unused LUNs report. For HP 3PAR: LUNs refer to Virtual Volumes (VVs).
LUNs Added to Volume Group but Unused
LUNs were added to the Volume Group, but the LUNs are still partly unused. For HP 3PAR: LUNs refer to Virtual Volumes (VVs).
LUNs Allocated to Decommissioned Host
Links to the Suspected De-provisioned Hosts report. In the Report Designer, select a time period for “No host update for” to help identify decommissioned hosts. For HP 3PAR: LUNs refer to Virtual Volumes (VVs).
Unused Space in Volume Group
Additional space is available in the Volume Group to give to filesystems. For HP 3PAR: Volume Group refers to Common Provisioning Group (CPG).
Volumes Created Not Mounted
Links to the Unused Partitions/Logical Volumes report.
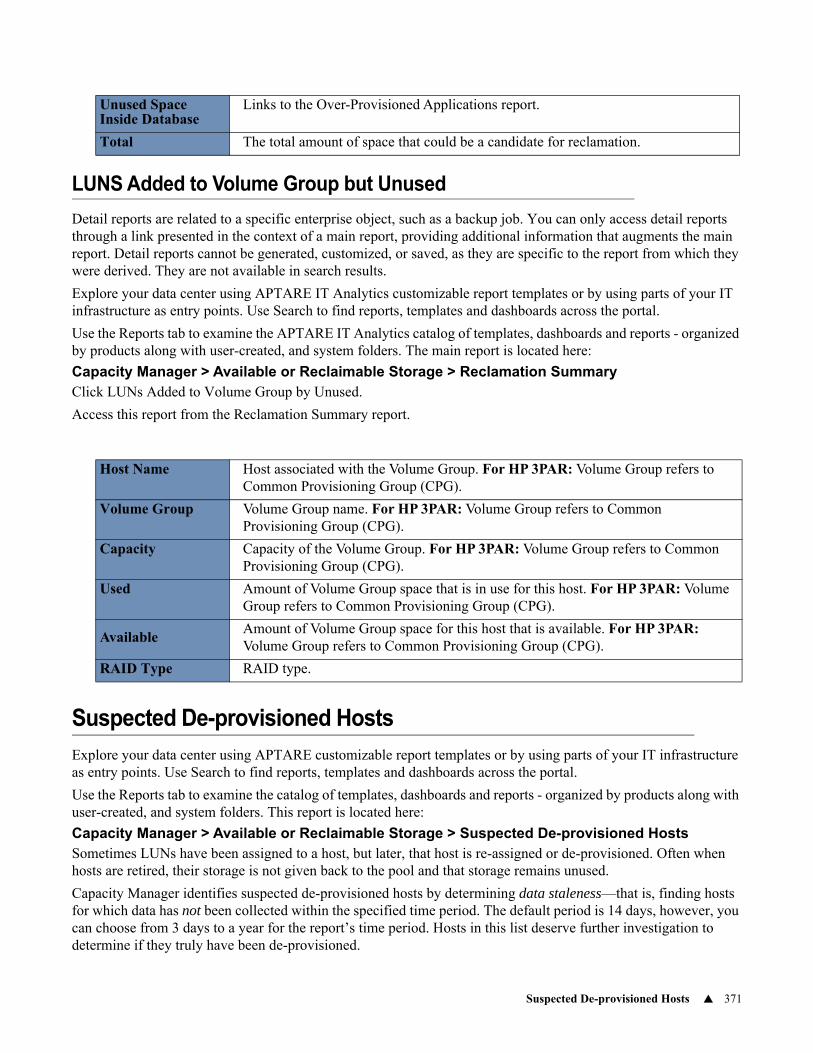
Suspected De-provisioned Hosts 371
LUNS Added to Volume Group but Unused
Detail reports are related to a specific enterprise object, such as a backup job. You can only access detail reports through a link presented in the context of a main report, providing additional information that augments the main report. Detail reports cannot be generated, customized, or saved, as they are specific to the report from which they were derived. They are not available in search results.
Explore your data center using APTARE IT Analytics customizable report templates or by using parts of your IT infrastructure as entry points. Use Search to find reports, templates and dashboards across the portal.
Use the Reports tab to examine the APTARE IT Analytics catalog of templates, dashboards and reports - organized by products along with user-created, and system folders. The main report is located here:
Capacity Manager > Available or Reclaimable Storage > Reclamation SummaryClick LUNs Added to Volume Group by Unused.
Access this report from the Reclamation Summary report.
Suspected De-provisioned Hosts
Explore your data center using APTARE customizable report templates or by using parts of your IT infrastructure as entry points. Use Search to find reports, templates and dashboards across the portal.
Use the Reports tab to examine the catalog of templates, dashboards and reports - organized by products along with user-created, and system folders. This report is located here:
Capacity Manager > Available or Reclaimable Storage > Suspected De-provisioned HostsSometimes LUNs have been assigned to a host, but later, that host is re-assigned or de-provisioned. Often when hosts are retired, their storage is not given back to the pool and that storage remains unused.
Capacity Manager identifies suspected de-provisioned hosts by determining data staleness—that is, finding hosts for which data has not been collected within the specified time period. The default period is 14 days, however, you can choose from 3 days to a year for the report’s time period. Hosts in this list deserve further investigation to determine if they truly have been de-provisioned.
Unused Space Inside Database
Links to the Over-Provisioned Applications report.
Total The total amount of space that could be a candidate for reclamation.
Host Name Host associated with the Volume Group. For HP 3PAR: Volume Group refers to Common Provisioning Group (CPG).
Volume Group Volume Group name. For HP 3PAR: Volume Group refers to Common Provisioning Group (CPG).
Capacity Capacity of the Volume Group. For HP 3PAR: Volume Group refers to Common Provisioning Group (CPG).
Used Amount of Volume Group space that is in use for this host. For HP 3PAR: Volume Group refers to Common Provisioning Group (CPG).
AvailableAmount of Volume Group space for this host that is available. For HP 3PAR: Volume Group refers to Common Provisioning Group (CPG).
RAID Type RAID type.
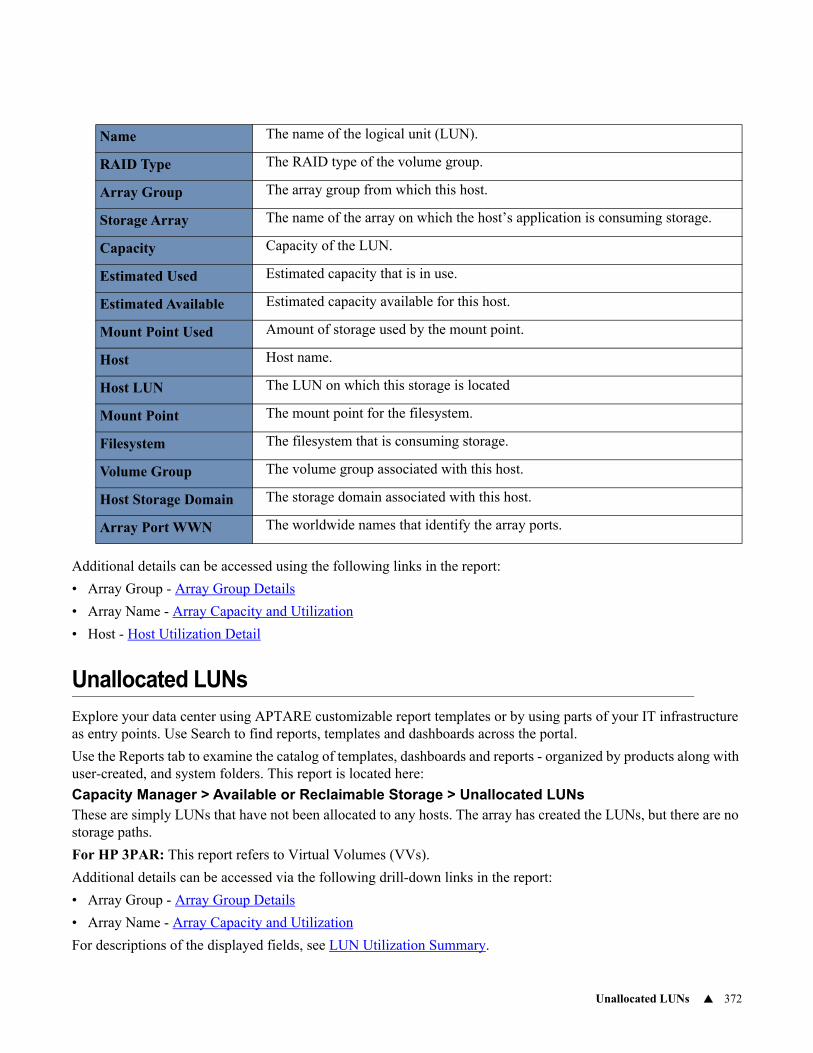
Unallocated LUNs 372
Additional details can be accessed using the following links in the report:
• Array Group - Array Group Details
• Array Name - Array Capacity and Utilization
• Host - Host Utilization Detail
Unallocated LUNs
Explore your data center using APTARE customizable report templates or by using parts of your IT infrastructure as entry points. Use Search to find reports, templates and dashboards across the portal.
Use the Reports tab to examine the catalog of templates, dashboards and reports - organized by products along with user-created, and system folders. This report is located here:
Capacity Manager > Available or Reclaimable Storage > Unallocated LUNsThese are simply LUNs that have not been allocated to any hosts. The array has created the LUNs, but there are no storage paths.
For HP 3PAR: This report refers to Virtual Volumes (VVs).
Additional details can be accessed via the following drill-down links in the report:
• Array Group - Array Group Details
• Array Name - Array Capacity and Utilization
For descriptions of the displayed fields, see LUN Utilization Summary.
Name The name of the logical unit (LUN).
RAID Type The RAID type of the volume group.
Array Group The array group from which this host.
Storage Array The name of the array on which the host’s application is consuming storage.
Capacity Capacity of the LUN.
Estimated Used Estimated capacity that is in use.
Estimated Available Estimated capacity available for this host.
Mount Point Used Amount of storage used by the mount point.
Host Host name.
Host LUN The LUN on which this storage is located
Mount Point The mount point for the filesystem.
Filesystem The filesystem that is consuming storage.
Volume Group The volume group associated with this host.
Host Storage Domain The storage domain associated with this host.
Array Port WWN The worldwide names that identify the array ports.
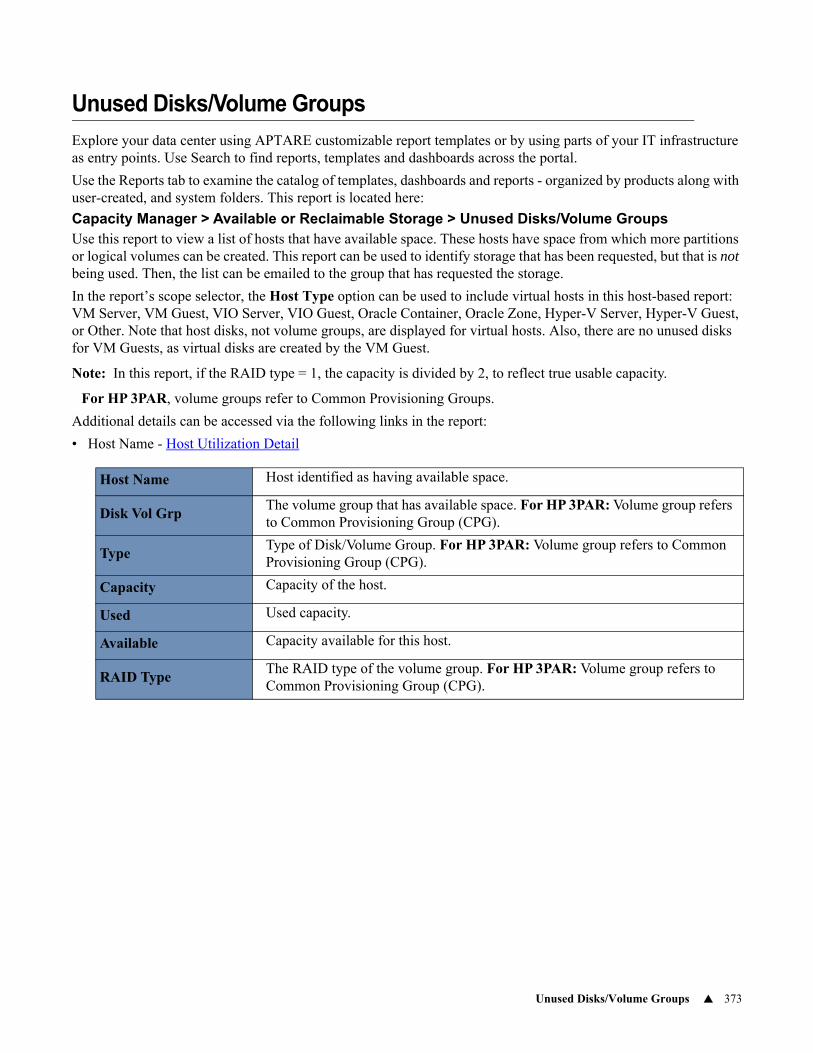
Unused Disks/Volume Groups 373
Unused Disks/Volume Groups
Explore your data center using APTARE customizable report templates or by using parts of your IT infrastructure as entry points. Use Search to find reports, templates and dashboards across the portal.
Use the Reports tab to examine the catalog of templates, dashboards and reports - organized by products along with user-created, and system folders. This report is located here:
Capacity Manager > Available or Reclaimable Storage > Unused Disks/Volume GroupsUse this report to view a list of hosts that have available space. These hosts have space from which more partitions or logical volumes can be created. This report can be used to identify storage that has been requested, but that is not being used. Then, the list can be emailed to the group that has requested the storage.
In the report’s scope selector, the Host Type option can be used to include virtual hosts in this host-based report: VM Server, VM Guest, VIO Server, VIO Guest, Oracle Container, Oracle Zone, Hyper-V Server, Hyper-V Guest, or Other. Note that host disks, not volume groups, are displayed for virtual hosts. Also, there are no unused disks for VM Guests, as virtual disks are created by the VM Guest.
Note: In this report, if the RAID type = 1, the capacity is divided by 2, to reflect true usable capacity.
For HP 3PAR, volume groups refer to Common Provisioning Groups.
Additional details can be accessed via the following links in the report:
• Host Name - Host Utilization Detail
Host Name Host identified as having available space.
Disk Vol GrpThe volume group that has available space. For HP 3PAR: Volume group refers to Common Provisioning Group (CPG).
TypeType of Disk/Volume Group. For HP 3PAR: Volume group refers to Common Provisioning Group (CPG).
Capacity Capacity of the host.
Used Used capacity.
Available Capacity available for this host.
RAID TypeThe RAID type of the volume group. For HP 3PAR: Volume group refers to Common Provisioning Group (CPG).
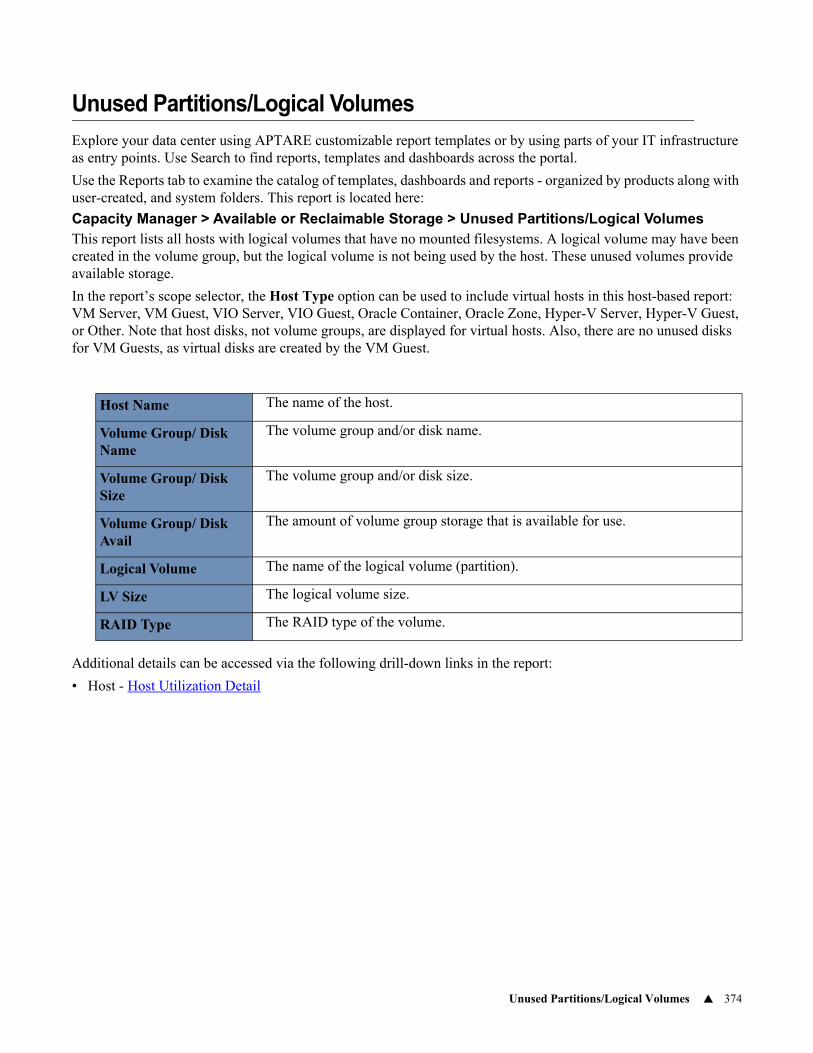
Unused Partitions/Logical Volumes 374
Unused Partitions/Logical Volumes
Explore your data center using APTARE customizable report templates or by using parts of your IT infrastructure as entry points. Use Search to find reports, templates and dashboards across the portal.
Use the Reports tab to examine the catalog of templates, dashboards and reports - organized by products along with user-created, and system folders. This report is located here:
Capacity Manager > Available or Reclaimable Storage > Unused Partitions/Logical VolumesThis report lists all hosts with logical volumes that have no mounted filesystems. A logical volume may have been created in the volume group, but the logical volume is not being used by the host. These unused volumes provide available storage.
In the report’s scope selector, the Host Type option can be used to include virtual hosts in this host-based report: VM Server, VM Guest, VIO Server, VIO Guest, Oracle Container, Oracle Zone, Hyper-V Server, Hyper-V Guest, or Other. Note that host disks, not volume groups, are displayed for virtual hosts. Also, there are no unused disks for VM Guests, as virtual disks are created by the VM Guest.
Additional details can be accessed via the following drill-down links in the report:
• Host - Host Utilization Detail
Host Name The name of the host.
Volume Group/ Disk Name
The volume group and/or disk name.
Volume Group/ Disk Size
The volume group and/or disk size.
Volume Group/ Disk Avail
The amount of volume group storage that is available for use.
Logical Volume The name of the logical volume (partition).
LV Size The logical volume size.
RAID Type The RAID type of the volume.
376
11Chapter 6Storage Performance Reports
This section covers the following topics:
• Performance Profiles Overview
• Storage Viewer for Capacity Array/LUN Performance Data Collection
• Determining Performance States
• Populating Performance States
• Updating Performance Profiles
• Community Performance Profiling
• Aggregated Profiles
• Array Performance by RAID Group
• Array Performance by LUN
• EMC Isilon CPU Performance by Cluster
• EMC Isilon CPU Performance by Node
• EMC Isilon Disk Performance by Cluster
• EMC Isilon Disk Performance by Node
• EMC Isilon File System Performance by Protocol
• EMC Symmetrix Array Performance
• EMC Symmetrix Device Group Performance
• EMC Symmetrix Disk Performance
• EMC Symmetrix FE Director Performance
• EMC Symmetrix Storage Group Performance
• EMC Symmetrix Thin Tier Performance
• EMC VNX (Celerra) Data Mover Performance
• LUN Performance
• Mission Control for Performance Analysis
• NetApp Cluster-Mode CIFS Performance by Cluster
• NetApp Cluster-Mode CIFS Performance by Vserver
• NetApp Cluster-Mode Disk Performance by Cluster
• NetApp Cluster-Mode Disk Performance by Node
• NetApp Cluster-Mode NFS Performance by Cluster
• NetApp Cluster-Mode NFS Performance by Vserver
• NetApp Cluster-Mode Volume Performance by Cluster

377
• NetApp Cluster-Mode Volume Performance by Vserver
• Port Throughput by Array
Performance Profiles Overview 378
Performance Profiles Overview
Data Collection of array performance data is supported for certain vendor storage arrays. See the APTARE Certified Configurations Guide for a complete list of supported arrays. See also, Storage Viewer for Capacity Array/LUN Performance Data Collection.
Performance profiles reflect key performance metrics for groups of LUNs. These profiles are used to assign performance states to LUNs and hosts, as shown in several APTARE IT Analytics array performance reports. APTARE IT Analytics maintains aggregated performance profiles for each collection of RAID groups and thin pools that share common physical characteristics. These performance profiles categorize a host’s performance state, based on LUN performance: Slow, Normal, or Fast. All LUNs are mapped to either a RAID group or thin pool thereby enabling array performance reports to list the associated drives, drive types, and drive speed. See the following reports: Array Performance by RAID Group and Array Performance by LUN.
Performance profiles are derived from previously captured array raw performance statistics. APTARE IT Analytics’s internal procedures examine captured performance metrics for the specified interval and populate profiles with actual ranges of performance and throughput metrics for slow, normal, and fast performance states.
Performance profiles should be based on a typical peak array performance interval. By default, the updating of performance profiles occurs daily and uses an interval of 10:00 a.m. to 11:00 a.m. You should change the default interval to correspond to the peak array performance interval for your environment. When the Data Collector policy is configured, a recurring frequency is selected to set the length of the profile interval. Baseline profiling determines the range of metrics for I/Os, response time, and cache hits. See Determining Performance States and Populating Performance States.
An on-going scheduled daily task profiles collected data. Since certain times of day are more prone to performance issues, the performance profile schedule can be modified for your environment. For Performance Profile Schedule Customization, see Customize the Array Performance Profile Schedule in the System Administrator’s Guide.
Both internal and community profiling can be enabled.
• Internal profiling compares periodic collection cycles within just your environment. Essentially, a library of metrics is maintained for comparisons.
• Community profiling lets contributors securely import/export performance profiles over https, enabling comparisons with a broader community of similar arrays and environments. See Community Performance Profiling and Aggregated Profiles.
Capacity Manager Array/LUN Performance Data Collection
The following array families are supported for block storage LUN performance and port performance data collection.
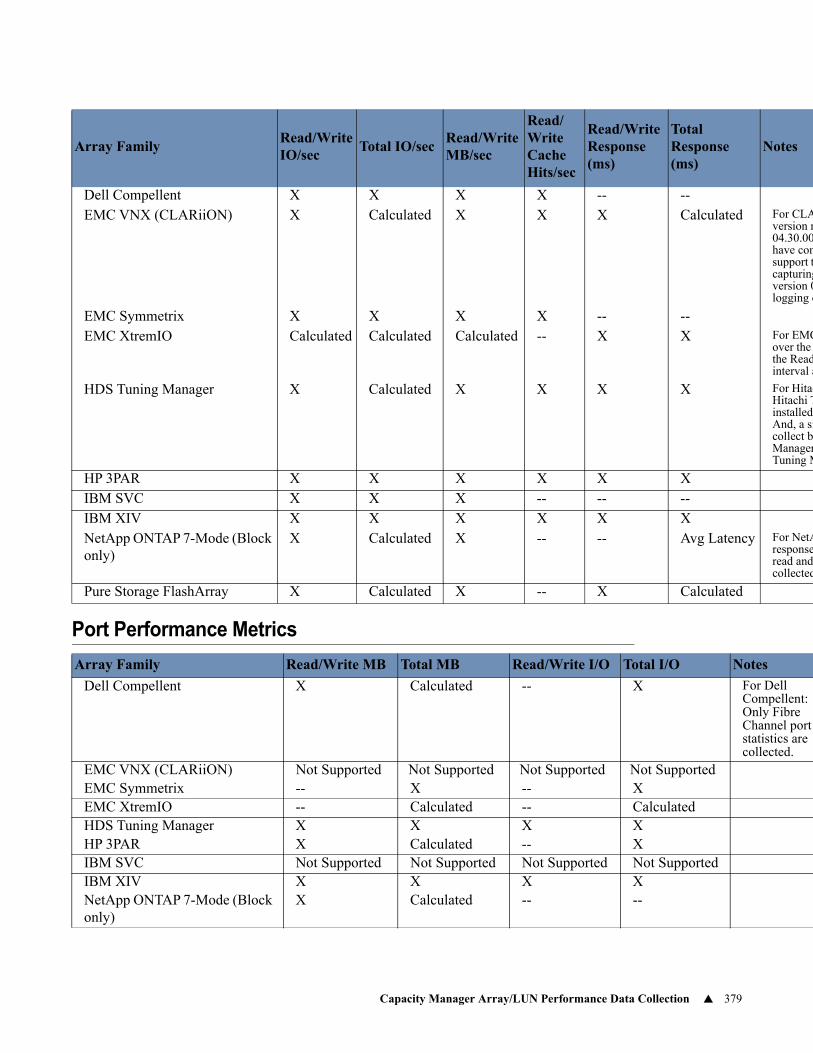
Capacity Manager Array/LUN Performance Data Collection 379
Port Performance Metrics
Array FamilyRead/Write IO/sec
Total IO/secRead/WriteMB/sec
Read/Write Cache Hits/sec
Read/Write Response (ms)
Total Response (ms)
Notes
Dell Compellent X X X X -- --EMC VNX (CLARiiON) X Calculated X X X Calculated For CLA
version r04.30.00have comsupport tcapturingversion 0logging o
EMC Symmetrix X X X X -- --EMC XtremIO Calculated Calculated Calculated -- X X For EMC
over the the Readinterval a
HDS Tuning Manager X Calculated X X X X For HitacHitachi Tinstalled And, a sicollect boManagerTuning M
HP 3PAR X X X X X XIBM SVC X X X -- -- --IBM XIV X X X X X XNetApp ONTAP 7-Mode (Block only)
X Calculated X -- -- Avg Latency For NetAresponseread and collected
Pure Storage FlashArray X Calculated X -- X Calculated
Array Family Read/Write MB Total MB Read/Write I/O Total I/O Notes
Dell Compellent X Calculated -- X For Dell Compellent: Only Fibre Channel port statistics are collected.
EMC VNX (CLARiiON) Not Supported Not Supported Not Supported Not SupportedEMC Symmetrix -- X -- XEMC XtremIO -- Calculated -- CalculatedHDS Tuning Manager X X X XHP 3PAR X Calculated -- XIBM SVC Not Supported Not Supported Not Supported Not SupportedIBM XIV X X X XNetApp ONTAP 7-Mode (Block only)
X Calculated -- --
Determining Performance States 380
Calculated = Calculated from collected data, X = Collected from the array, -- = Not Collected
EMC Isilon Metrics
Isilon performance data (raw, hourly, and daily) is collected from SNMP MIB statistics. For example, collected data includes such metrics as cluster, node, protocols (CIFS, SMB, FTP, HTTP), and disk performance. See the Array Performance Statistics Technical Note for an extensive list of collected metrics.
NetApp Cluster-Mode Metrics
A large variety of NetApp Cluster-Mode performance data (raw, hourly, and daily) is collected. For example, collected data includes such metrics as system, protocols (CIFS and NFS), volume, LUN, and target port performance. See the Array Performance Statistics Technical Note for an extensive list of collected metrics.
EMC Symmetrix Enhanced Performance Metrics
In addition to LUN and Port performance metrics that can be collected from EMC Symmetrix arrays, data collection gathers other performance metrics by accessing storage devices via the EMC Unisphere REST API. See the Array Performance Statistics Technical Note for an extensive list of collected metrics.
Determining Performance States
After performance profiles have been created, future reports will use the performance profiles for determining the performance state of LUNs, hosts, and other objects (in future releases).
Populating Performance States
Performance profiling establishes criteria for deriving a LUN’s performance state, as part of future APTARE IT Analytics reporting. The criteria is established based on actual performance metrics captured from each LUN. Reads and writes are treated independently.
Updating Performance Profiles
Performance profiles are used to characterize response times, I/Os per second, MBs per second, and cache hits per second as Poor, Normal, and Fast. Creation of and updating Performance Profiles establishes the criteria used based on performance and throughput metrics captured within a profile interval, using the following logic:
1. For all LUNs with performance data captured during the specified performance interval, group the data based on common physical attributes: array vendor, array family, array model, RAID type, number of drives in RAID Group, drive type, drive form, and drive speed. Each unique grouping of LUNs based on this criteria represents an individual APTARE IT Analytics Performance reporting profile entry for this Portal.
2. Calculate the average and standard deviation for all captured metrics based on all LUNs with performance data in the specified interval and within a common performance profile. When there is more than one poll to the array during the profile updating interval, averages and standard deviation will be based on only the portion of the interval covered for the polls that return data, ignoring polls that did not capture I/Os or where the response times were zero.

Updating Performance Profiles 381
3. To determine boundaries within the range, subtract one standard deviation from the average. If the standard deviation is larger than the average, divide the average by two. This establishes the low end of the Normal boundary and the high end of the Fast boundary.
4. Add one standard deviation to the average. If the standard deviation is larger than the average, add half of the average to the average. This establishes the high end of the Normal boundary and the low end of the Poor boundary.
Community Performance Profiling 382
Community Performance Profiling
Customers can elect to share their benchmark data with the APTARE, Inc. community of users who share their performance profiles of configured arrays. From the performance profiles, APTARE IT Analytics issues reports of the community’s aggregated performance profiles to those customers who opt-in. These reports enable customers to compare their performance with similarly configured arrays in the broader community, for customers to gauge if their environmental metrics are within a normal performance range.
Performance profiles are securely transmitted (over https) as anonymous and aggregated with other customers’ profile data in Profile Central—the community pool hosted at APTARE, Inc., which is then imported into a customer’s profile for reporting purposes. This import/export task occurs in a single, daily scheduled Portal process. Using the aggregated community profiles, companies can better gauge if the metrics collected in their environments are within a normal performance range. Profile data cannot be associated with any contributor. No company or environment-specific details, such as storage array or host names, are transmitted. No personally identifiable information is collected, used, or disclosed.
The APTARE IT Analytics Administrator can enable participation in two different ways—either will enable participation for the arrays in the specified Domain:
• Configure Community Participation for a Domain: This enables participation in the Cloud community for array performance profiling for the Domain associated with your User ID and Home Group.
• Publish Benchmark Data: This enables a multi-domain organization (such as a Managed Services Provider) to configure participation on a Domain-by-Domain basis, selecting only the Domains that are authorized to participate in community array performance profiling.
Configure Community Performance Profiling
To enable participation in Community Performance Profiling Policies, an authorized representative of your company must opt-in by following these steps:
Using the aggregated community profiles, companies can better gauge if the metrics collected in their environments are within a normal performance range. Profile data cannot be associated with any contributor. No company or environment-specific details, such as storage array or host names, are transmitted. No personally identifiable information is collected, used, or disclosed.
This Publish Benchmark Data feature enables a multi-domain organization (such as a Managed Services Provider) to configure participation on a Domain-by-Domain basis, selecting only the Domains that are authorized to participate in community array performance profiling.
1. In the Portal Toolbar, select Admin > Advanced > Publish Benchmark Data.
2. Check the box for the Domain that will share data with the community, confirming that you are authorized on behalf of your company to opt-in. Typically, only one Domain is listed. Multiple Domains are listed in Managed Services Provider Portals.
**Note that you may opt-out at any time by de-selecting the Domain.**
3. Click Connect Now to verify the connection and to export any existing Performance Profiles, aggregate with the Cloud, and return to the Portal.
Community Performance Profiling 383
Aggregated Profiles
An aggregated array performance profile is maintained at Profile Central—the community pool hosted at APTARE, Inc. This profile takes into account unique configurations: array vendor, array model. RAID configuration, number of data and parity drives, drive size, drive type, and drive speed. In addition, the total MB transferred during a profile interval weights individual profiles with aggregated equivalents in the community profile. As more published profiles are aggregated, the MB transferred will have less impact on the weighting factor.
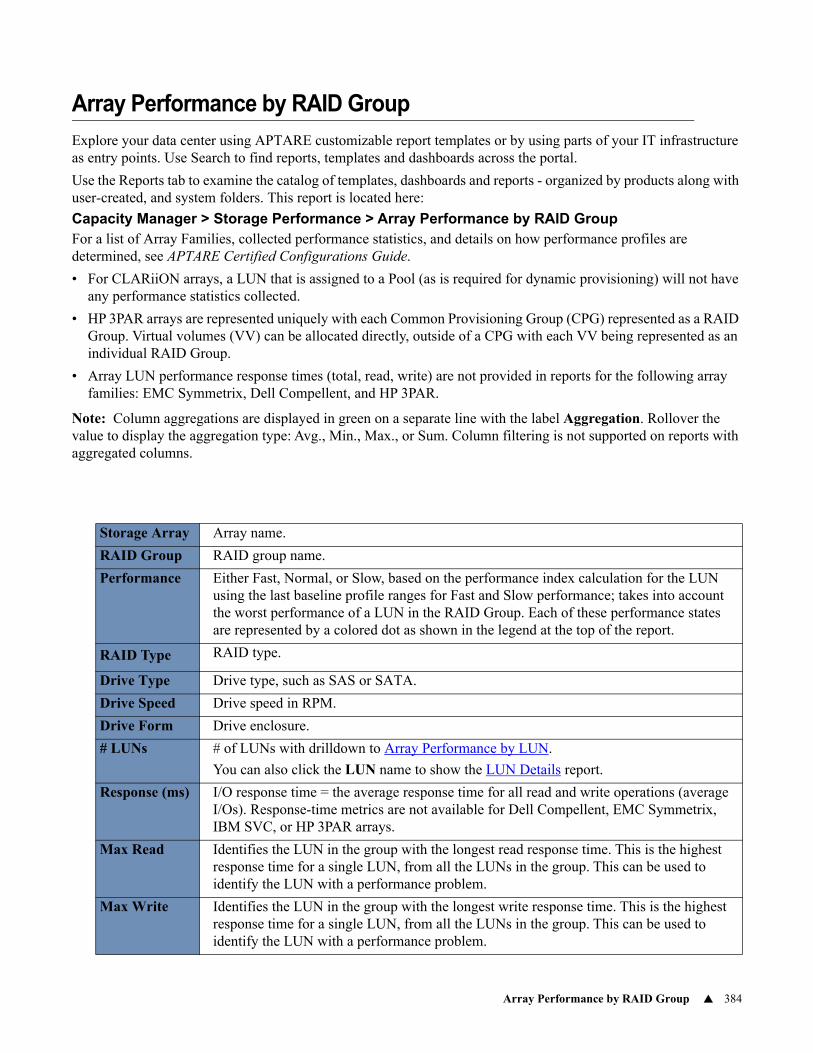
Array Performance by RAID Group 384
Array Performance by RAID Group
Explore your data center using APTARE customizable report templates or by using parts of your IT infrastructure as entry points. Use Search to find reports, templates and dashboards across the portal.
Use the Reports tab to examine the catalog of templates, dashboards and reports - organized by products along with user-created, and system folders. This report is located here:
Capacity Manager > Storage Performance > Array Performance by RAID GroupFor a list of Array Families, collected performance statistics, and details on how performance profiles are determined, see APTARE Certified Configurations Guide.
• For CLARiiON arrays, a LUN that is assigned to a Pool (as is required for dynamic provisioning) will not have any performance statistics collected.
• HP 3PAR arrays are represented uniquely with each Common Provisioning Group (CPG) represented as a RAID Group. Virtual volumes (VV) can be allocated directly, outside of a CPG with each VV being represented as an individual RAID Group.
• Array LUN performance response times (total, read, write) are not provided in reports for the following array families: EMC Symmetrix, Dell Compellent, and HP 3PAR.
Note: Column aggregations are displayed in green on a separate line with the label Aggregation. Rollover the value to display the aggregation type: Avg., Min., Max., or Sum. Column filtering is not supported on reports with aggregated columns.
Storage Array Array name.
RAID Group RAID group name.
Performance Either Fast, Normal, or Slow, based on the performance index calculation for the LUN using the last baseline profile ranges for Fast and Slow performance; takes into account the worst performance of a LUN in the RAID Group. Each of these performance states are represented by a colored dot as shown in the legend at the top of the report.
RAID Type RAID type.
Drive Type Drive type, such as SAS or SATA.
Drive Speed Drive speed in RPM.
Drive Form Drive enclosure.
# LUNs # of LUNs with drilldown to Array Performance by LUN.
You can also click the LUN name to show the LUN Details report.
Response (ms) I/O response time = the average response time for all read and write operations (average I/Os). Response-time metrics are not available for Dell Compellent, EMC Symmetrix, IBM SVC, or HP 3PAR arrays.
Max Read Identifies the LUN in the group with the longest read response time. This is the highest response time for a single LUN, from all the LUNs in the group. This can be used to identify the LUN with a performance problem.
Max Write Identifies the LUN in the group with the longest write response time. This is the highest response time for a single LUN, from all the LUNs in the group. This can be used to identify the LUN with a performance problem.
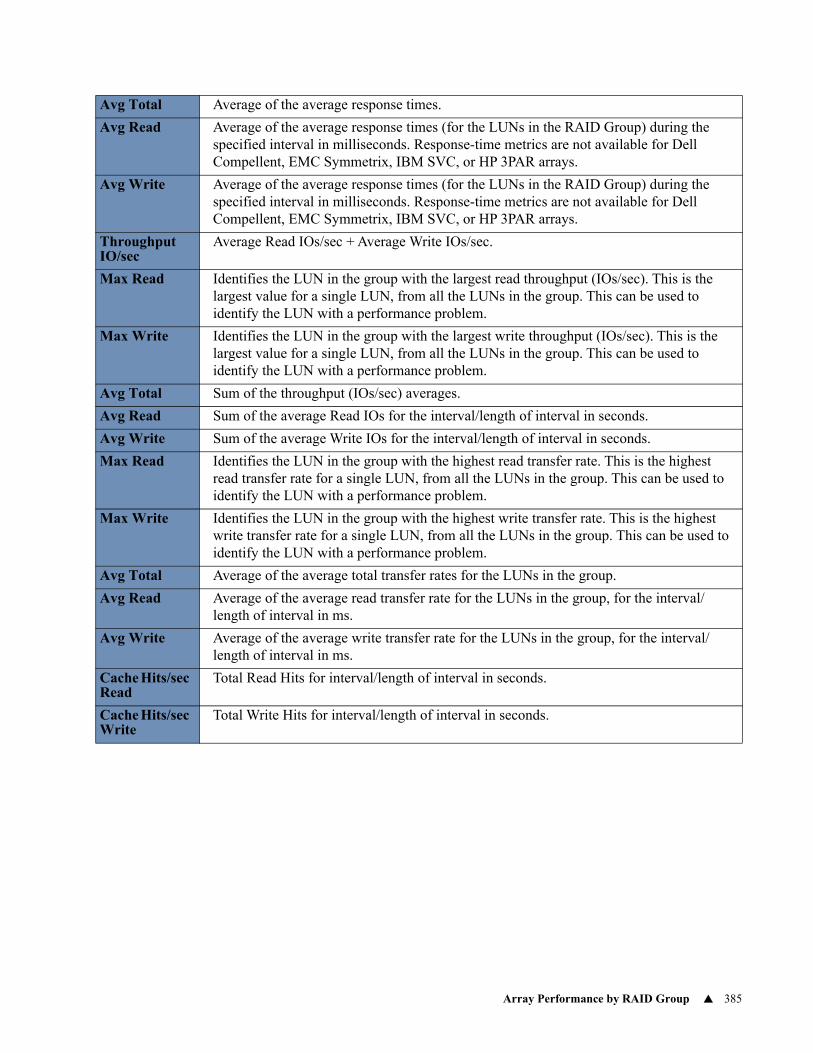
Array Performance by RAID Group 385
Avg Total Average of the average response times.
Avg Read Average of the average response times (for the LUNs in the RAID Group) during the specified interval in milliseconds. Response-time metrics are not available for Dell Compellent, EMC Symmetrix, IBM SVC, or HP 3PAR arrays.
Avg Write Average of the average response times (for the LUNs in the RAID Group) during the specified interval in milliseconds. Response-time metrics are not available for Dell Compellent, EMC Symmetrix, IBM SVC, or HP 3PAR arrays.
Throughput IO/sec
Average Read IOs/sec + Average Write IOs/sec.
Max Read Identifies the LUN in the group with the largest read throughput (IOs/sec). This is the largest value for a single LUN, from all the LUNs in the group. This can be used to identify the LUN with a performance problem.
Max Write Identifies the LUN in the group with the largest write throughput (IOs/sec). This is the largest value for a single LUN, from all the LUNs in the group. This can be used to identify the LUN with a performance problem.
Avg Total Sum of the throughput (IOs/sec) averages.
Avg Read Sum of the average Read IOs for the interval/length of interval in seconds.
Avg Write Sum of the average Write IOs for the interval/length of interval in seconds.
Max Read Identifies the LUN in the group with the highest read transfer rate. This is the highest read transfer rate for a single LUN, from all the LUNs in the group. This can be used to identify the LUN with a performance problem.
Max Write Identifies the LUN in the group with the highest write transfer rate. This is the highest write transfer rate for a single LUN, from all the LUNs in the group. This can be used to identify the LUN with a performance problem.
Avg Total Average of the average total transfer rates for the LUNs in the group.
Avg Read Average of the average read transfer rate for the LUNs in the group, for the interval/length of interval in ms.
Avg Write Average of the average write transfer rate for the LUNs in the group, for the interval/length of interval in ms.
Cache Hits/sec Read
Total Read Hits for interval/length of interval in seconds.
Cache Hits/sec Write
Total Write Hits for interval/length of interval in seconds.
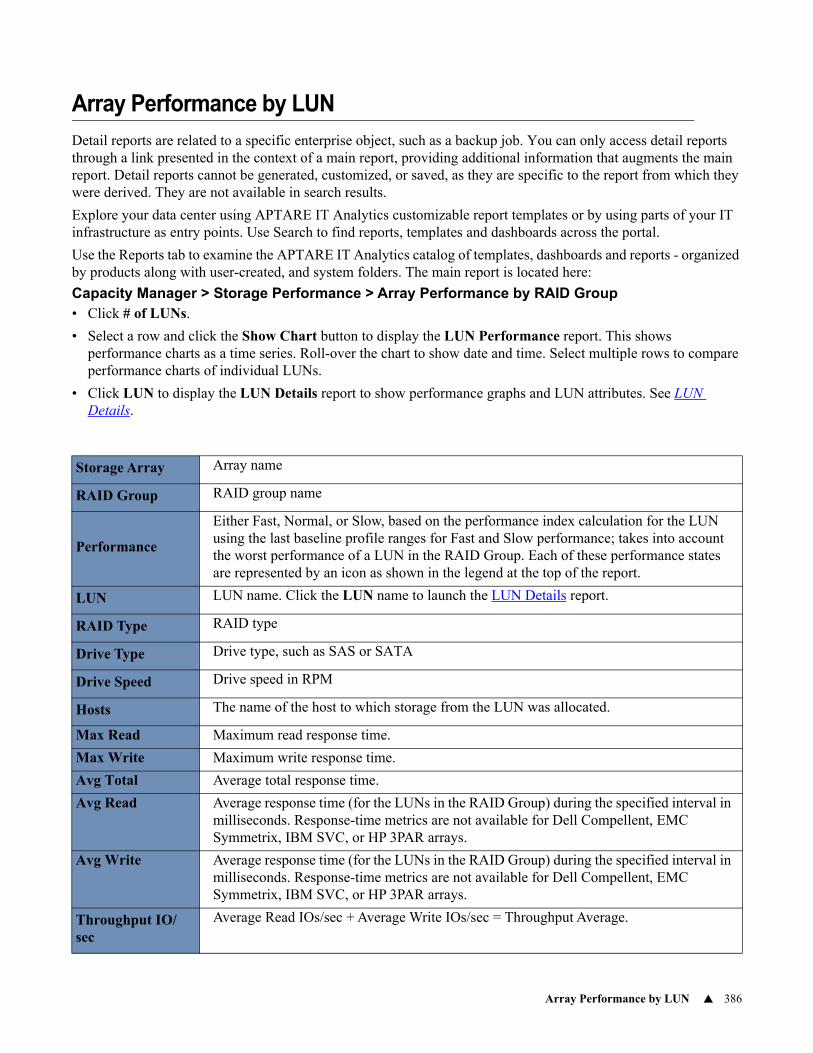
Array Performance by LUN 386
Array Performance by LUN
Detail reports are related to a specific enterprise object, such as a backup job. You can only access detail reports through a link presented in the context of a main report, providing additional information that augments the main report. Detail reports cannot be generated, customized, or saved, as they are specific to the report from which they were derived. They are not available in search results.
Explore your data center using APTARE IT Analytics customizable report templates or by using parts of your IT infrastructure as entry points. Use Search to find reports, templates and dashboards across the portal.
Use the Reports tab to examine the APTARE IT Analytics catalog of templates, dashboards and reports - organized by products along with user-created, and system folders. The main report is located here:
Capacity Manager > Storage Performance > Array Performance by RAID Group• Click # of LUNs.
• Select a row and click the Show Chart button to display the LUN Performance report. This shows performance charts as a time series. Roll-over the chart to show date and time. Select multiple rows to compare performance charts of individual LUNs.
• Click LUN to display the LUN Details report to show performance graphs and LUN attributes. See LUN Details.
Storage Array Array name
RAID Group RAID group name
Performance
Either Fast, Normal, or Slow, based on the performance index calculation for the LUN using the last baseline profile ranges for Fast and Slow performance; takes into account the worst performance of a LUN in the RAID Group. Each of these performance states are represented by an icon as shown in the legend at the top of the report.
LUN LUN name. Click the LUN name to launch the LUN Details report.
RAID Type RAID type
Drive Type Drive type, such as SAS or SATA
Drive Speed Drive speed in RPM
Hosts The name of the host to which storage from the LUN was allocated.
Max Read Maximum read response time.
Max Write Maximum write response time.
Avg Total Average total response time.
Avg Read Average response time (for the LUNs in the RAID Group) during the specified interval in milliseconds. Response-time metrics are not available for Dell Compellent, EMC Symmetrix, IBM SVC, or HP 3PAR arrays.
Avg Write Average response time (for the LUNs in the RAID Group) during the specified interval in milliseconds. Response-time metrics are not available for Dell Compellent, EMC Symmetrix, IBM SVC, or HP 3PAR arrays.
Throughput IO/sec
Average Read IOs/sec + Average Write IOs/sec = Throughput Average.
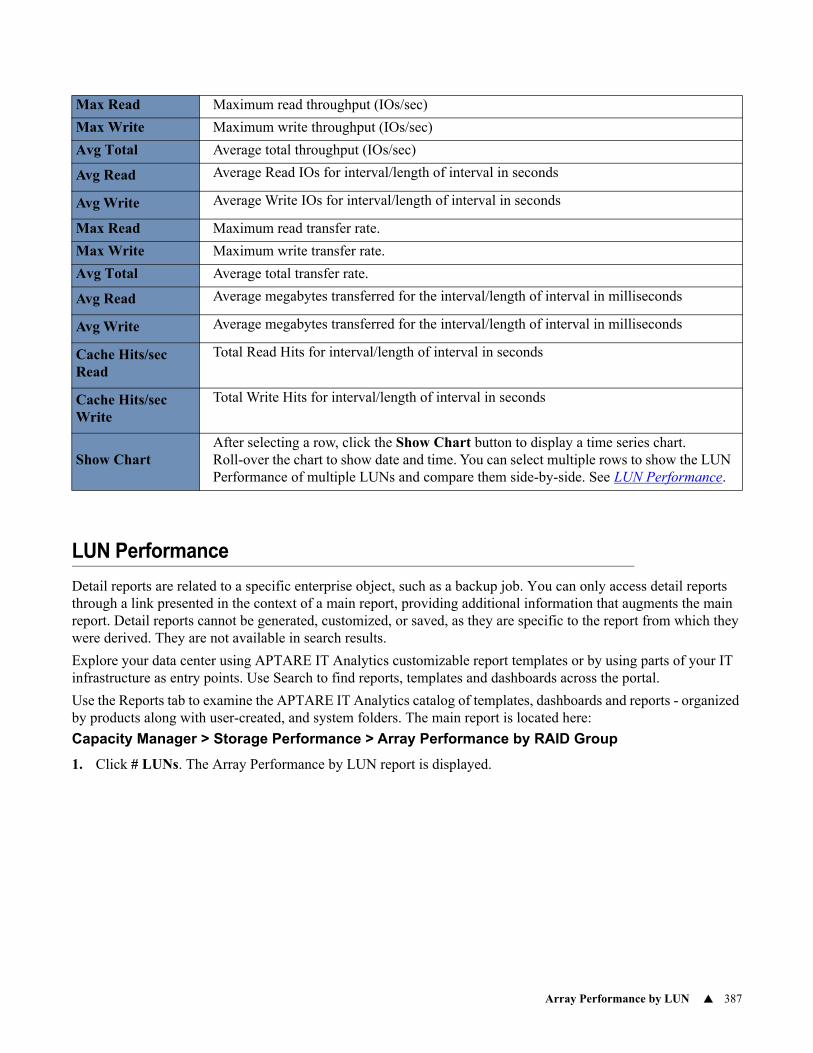
Array Performance by LUN 387
LUN Performance
Detail reports are related to a specific enterprise object, such as a backup job. You can only access detail reports through a link presented in the context of a main report, providing additional information that augments the main report. Detail reports cannot be generated, customized, or saved, as they are specific to the report from which they were derived. They are not available in search results.
Explore your data center using APTARE IT Analytics customizable report templates or by using parts of your IT infrastructure as entry points. Use Search to find reports, templates and dashboards across the portal.
Use the Reports tab to examine the APTARE IT Analytics catalog of templates, dashboards and reports - organized by products along with user-created, and system folders. The main report is located here:
Capacity Manager > Storage Performance > Array Performance by RAID Group
1. Click # LUNs. The Array Performance by LUN report is displayed.
Max Read Maximum read throughput (IOs/sec)
Max Write Maximum write throughput (IOs/sec)
Avg Total Average total throughput (IOs/sec)
Avg Read Average Read IOs for interval/length of interval in seconds
Avg Write Average Write IOs for interval/length of interval in seconds
Max Read Maximum read transfer rate.
Max Write Maximum write transfer rate.
Avg Total Average total transfer rate.
Avg Read Average megabytes transferred for the interval/length of interval in milliseconds
Avg Write Average megabytes transferred for the interval/length of interval in milliseconds
Cache Hits/sec Read
Total Read Hits for interval/length of interval in seconds
Cache Hits/sec Write
Total Write Hits for interval/length of interval in seconds
Show ChartAfter selecting a row, click the Show Chart button to display a time series chart. Roll-over the chart to show date and time. You can select multiple rows to show the LUN Performance of multiple LUNs and compare them side-by-side. See LUN Performance.
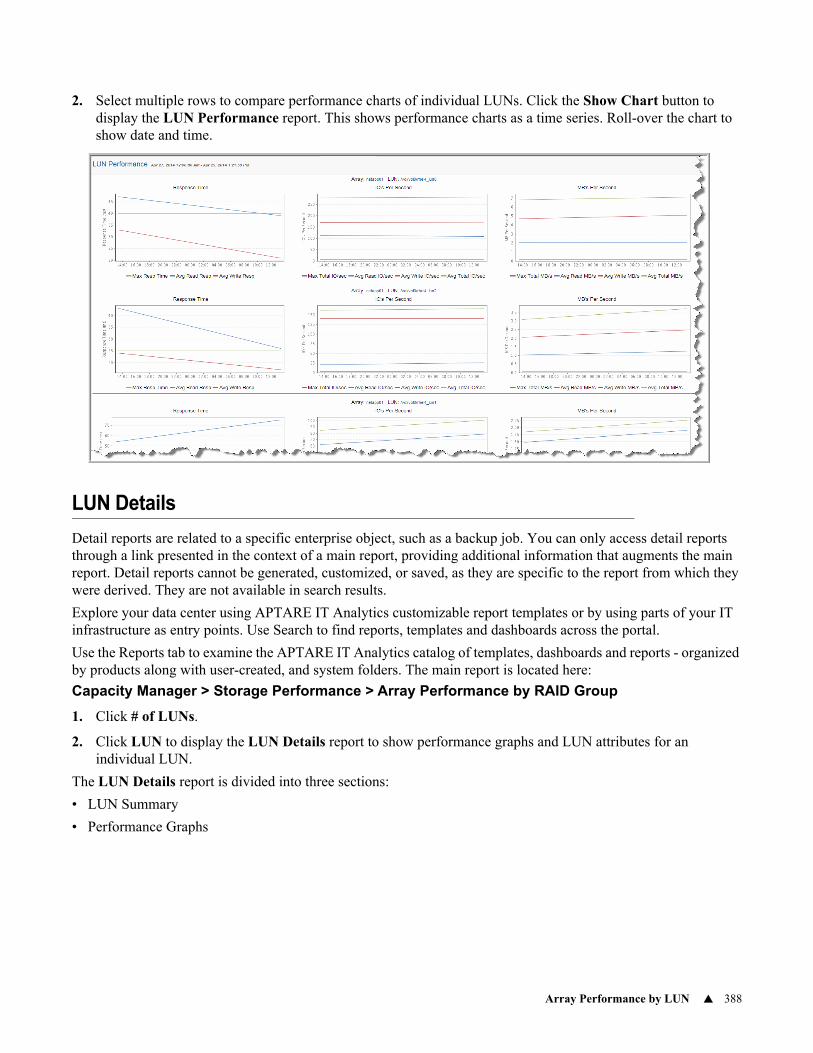
Array Performance by LUN 388
2. Select multiple rows to compare performance charts of individual LUNs. Click the Show Chart button to display the LUN Performance report. This shows performance charts as a time series. Roll-over the chart to show date and time.
LUN Details
Detail reports are related to a specific enterprise object, such as a backup job. You can only access detail reports through a link presented in the context of a main report, providing additional information that augments the main report. Detail reports cannot be generated, customized, or saved, as they are specific to the report from which they were derived. They are not available in search results.
Explore your data center using APTARE IT Analytics customizable report templates or by using parts of your IT infrastructure as entry points. Use Search to find reports, templates and dashboards across the portal.
Use the Reports tab to examine the APTARE IT Analytics catalog of templates, dashboards and reports - organized by products along with user-created, and system folders. The main report is located here:
Capacity Manager > Storage Performance > Array Performance by RAID Group
1. Click # of LUNs.
2. Click LUN to display the LUN Details report to show performance graphs and LUN attributes for an individual LUN.
The LUN Details report is divided into three sections:
• LUN Summary
• Performance Graphs
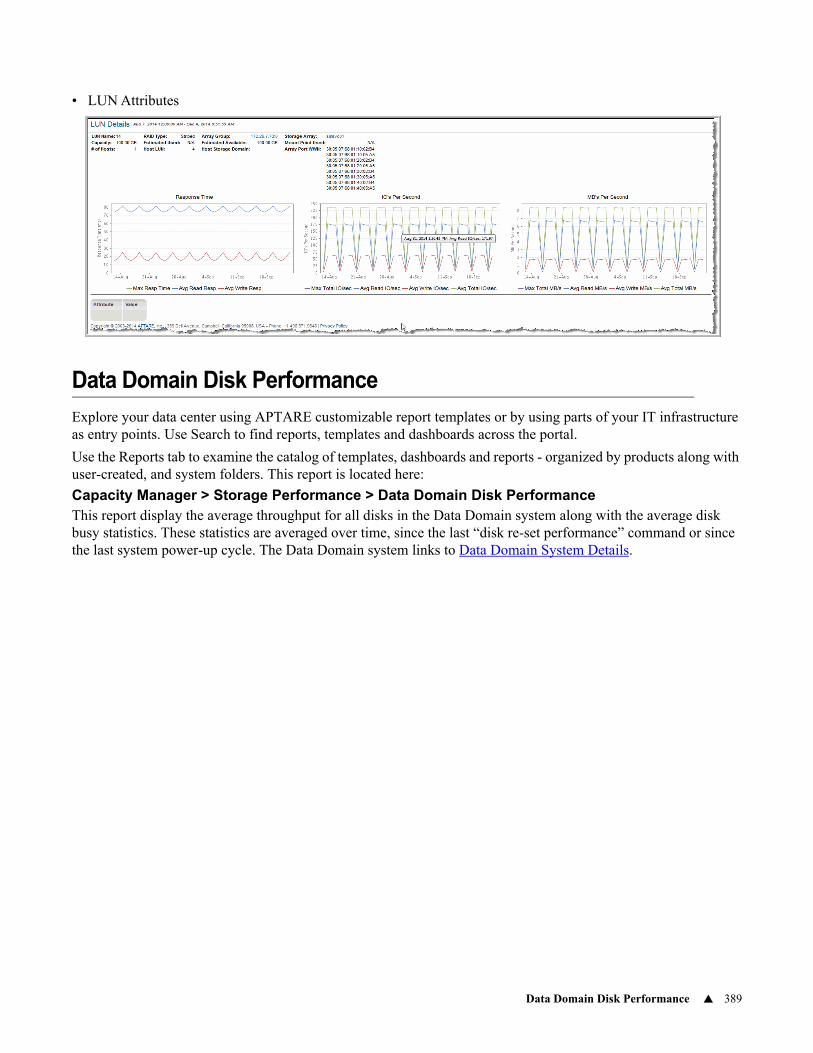
Data Domain Disk Performance 389
• LUN Attributes
Data Domain Disk Performance
Explore your data center using APTARE customizable report templates or by using parts of your IT infrastructure as entry points. Use Search to find reports, templates and dashboards across the portal.
Use the Reports tab to examine the catalog of templates, dashboards and reports - organized by products along with user-created, and system folders. This report is located here:
Capacity Manager > Storage Performance > Data Domain Disk PerformanceThis report display the average throughput for all disks in the Data Domain system along with the average disk busy statistics. These statistics are averaged over time, since the last “disk re-set performance” command or since the last system power-up cycle. The Data Domain system links to Data Domain System Details.
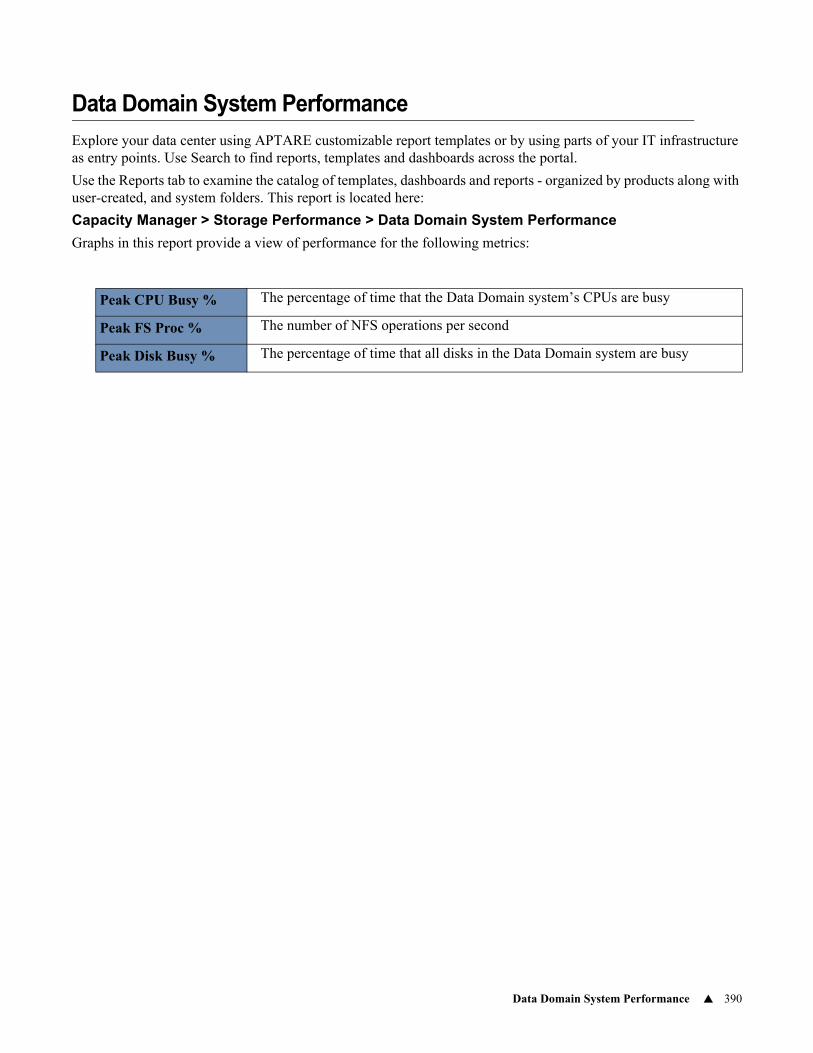
Data Domain System Performance 390
Data Domain System Performance
Explore your data center using APTARE customizable report templates or by using parts of your IT infrastructure as entry points. Use Search to find reports, templates and dashboards across the portal.
Use the Reports tab to examine the catalog of templates, dashboards and reports - organized by products along with user-created, and system folders. This report is located here:
Capacity Manager > Storage Performance > Data Domain System Performance
Graphs in this report provide a view of performance for the following metrics:
Peak CPU Busy % The percentage of time that the Data Domain system’s CPUs are busy
Peak FS Proc % The number of NFS operations per second
Peak Disk Busy % The percentage of time that all disks in the Data Domain system are busy
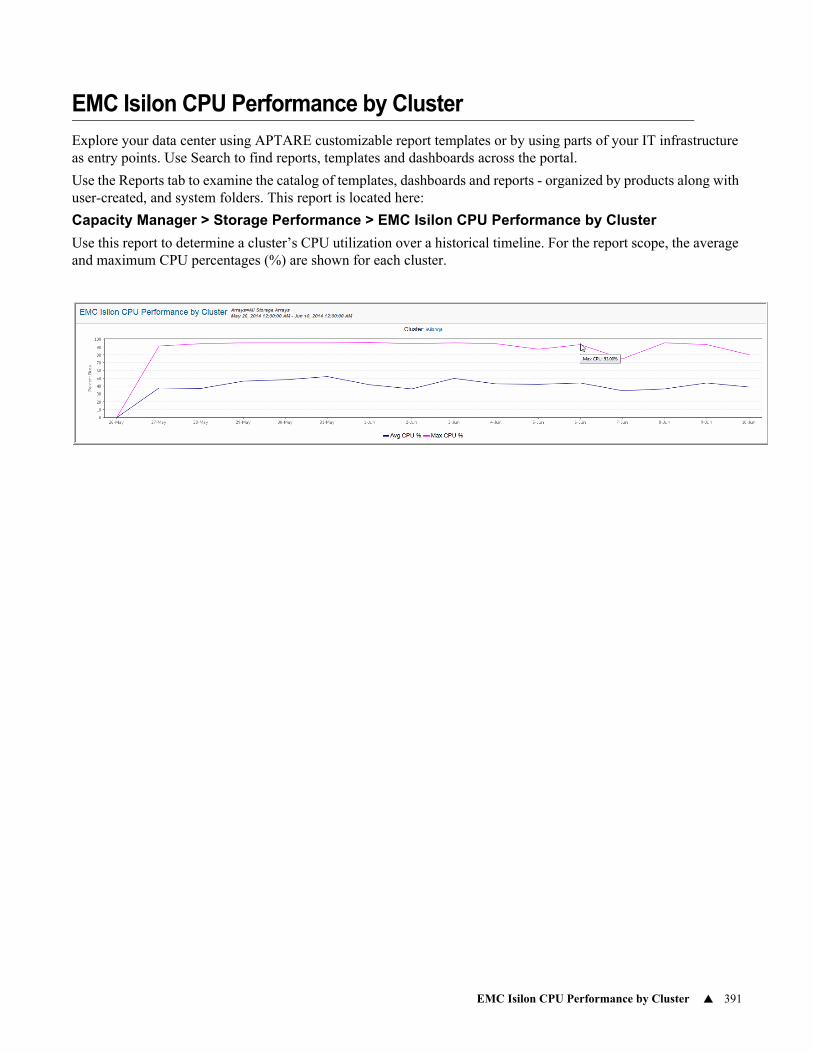
EMC Isilon CPU Performance by Cluster 391
EMC Isilon CPU Performance by Cluster
Explore your data center using APTARE customizable report templates or by using parts of your IT infrastructure as entry points. Use Search to find reports, templates and dashboards across the portal.
Use the Reports tab to examine the catalog of templates, dashboards and reports - organized by products along with user-created, and system folders. This report is located here:
Capacity Manager > Storage Performance > EMC Isilon CPU Performance by Cluster
Use this report to determine a cluster’s CPU utilization over a historical timeline. For the report scope, the average and maximum CPU percentages (%) are shown for each cluster.

EMC Isilon CPU Performance by Node 392
EMC Isilon CPU Performance by Node
Explore your data center using APTARE customizable report templates or by using parts of your IT infrastructure as entry points. Use Search to find reports, templates and dashboards across the portal.
Use the Reports tab to examine the catalog of templates, dashboards and reports - organized by products along with user-created, and system folders. This report is located here:
Capacity Manager > Storage Performance > EMC Isilon CPU Performance by Node
This report displays a node’s CPU utilization over a historical timeline. For the report scope, the average and maximum CPU percentages (%) are shown for each node.
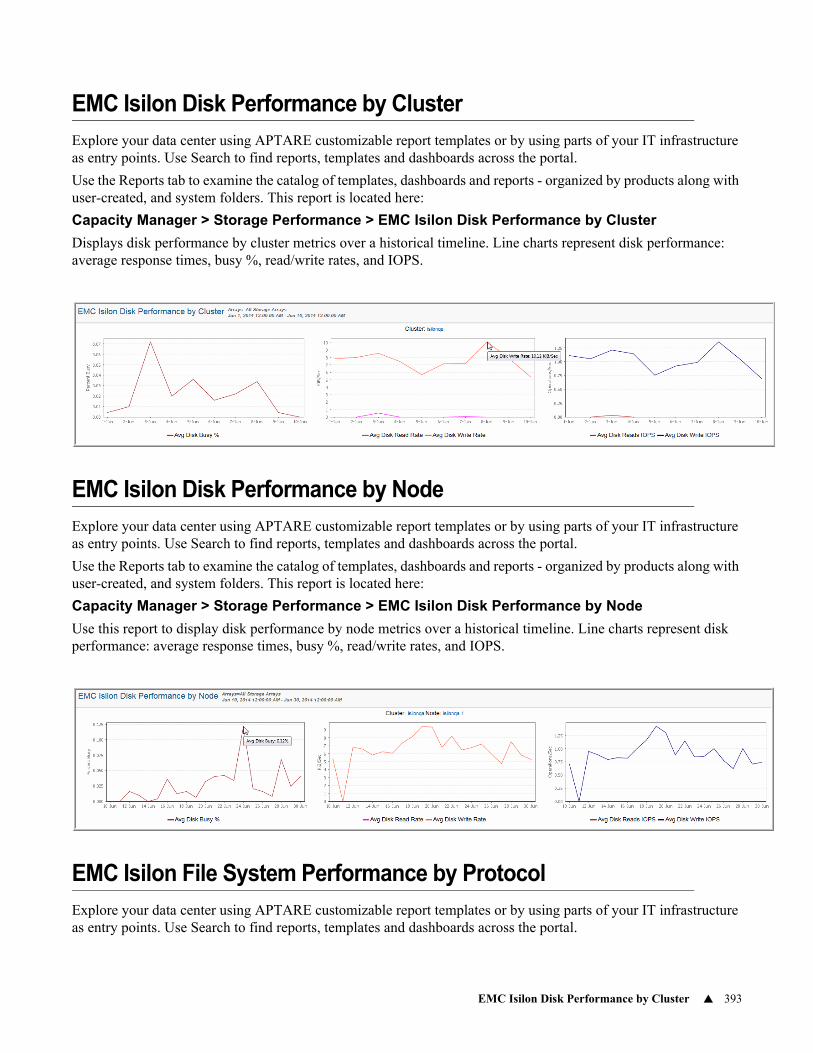
EMC Isilon Disk Performance by Cluster 393
EMC Isilon Disk Performance by Cluster
Explore your data center using APTARE customizable report templates or by using parts of your IT infrastructure as entry points. Use Search to find reports, templates and dashboards across the portal.
Use the Reports tab to examine the catalog of templates, dashboards and reports - organized by products along with user-created, and system folders. This report is located here:
Capacity Manager > Storage Performance > EMC Isilon Disk Performance by Cluster
Displays disk performance by cluster metrics over a historical timeline. Line charts represent disk performance: average response times, busy %, read/write rates, and IOPS.
EMC Isilon Disk Performance by Node
Explore your data center using APTARE customizable report templates or by using parts of your IT infrastructure as entry points. Use Search to find reports, templates and dashboards across the portal.
Use the Reports tab to examine the catalog of templates, dashboards and reports - organized by products along with user-created, and system folders. This report is located here:
Capacity Manager > Storage Performance > EMC Isilon Disk Performance by Node
Use this report to display disk performance by node metrics over a historical timeline. Line charts represent disk performance: average response times, busy %, read/write rates, and IOPS.
EMC Isilon File System Performance by Protocol
Explore your data center using APTARE customizable report templates or by using parts of your IT infrastructure as entry points. Use Search to find reports, templates and dashboards across the portal.
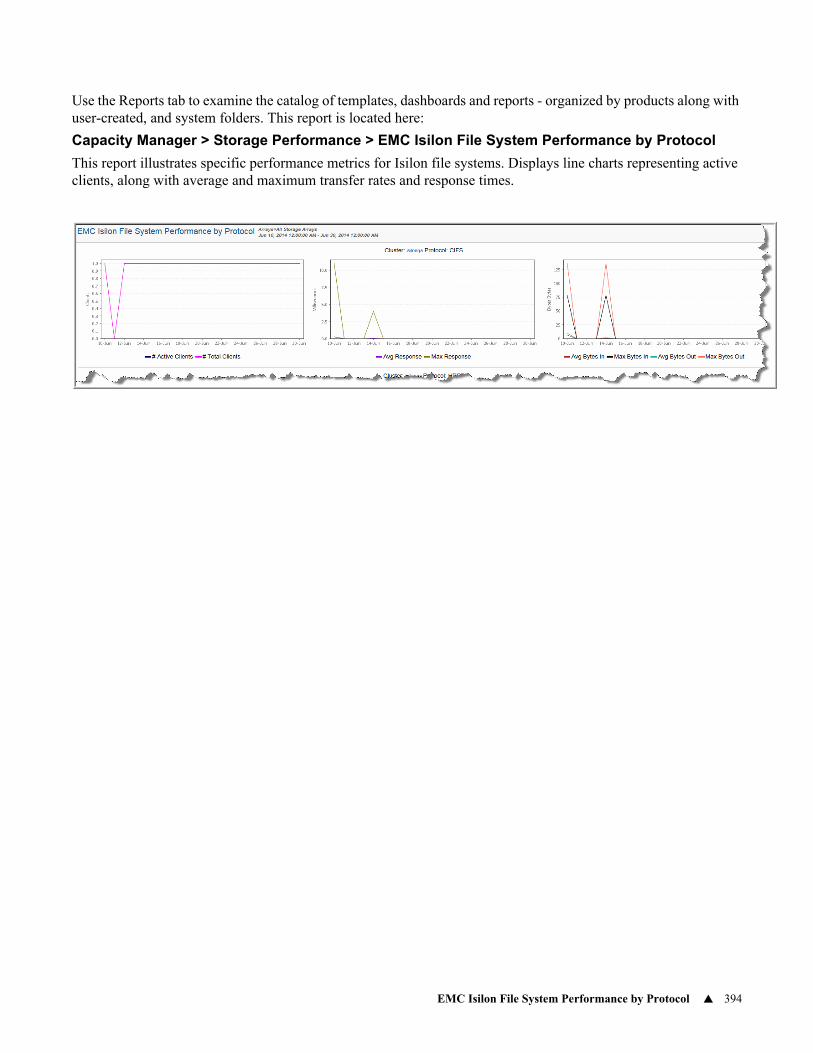
EMC Isilon File System Performance by Protocol 394
Use the Reports tab to examine the catalog of templates, dashboards and reports - organized by products along with user-created, and system folders. This report is located here:
Capacity Manager > Storage Performance > EMC Isilon File System Performance by Protocol
This report illustrates specific performance metrics for Isilon file systems. Displays line charts representing active clients, along with average and maximum transfer rates and response times.
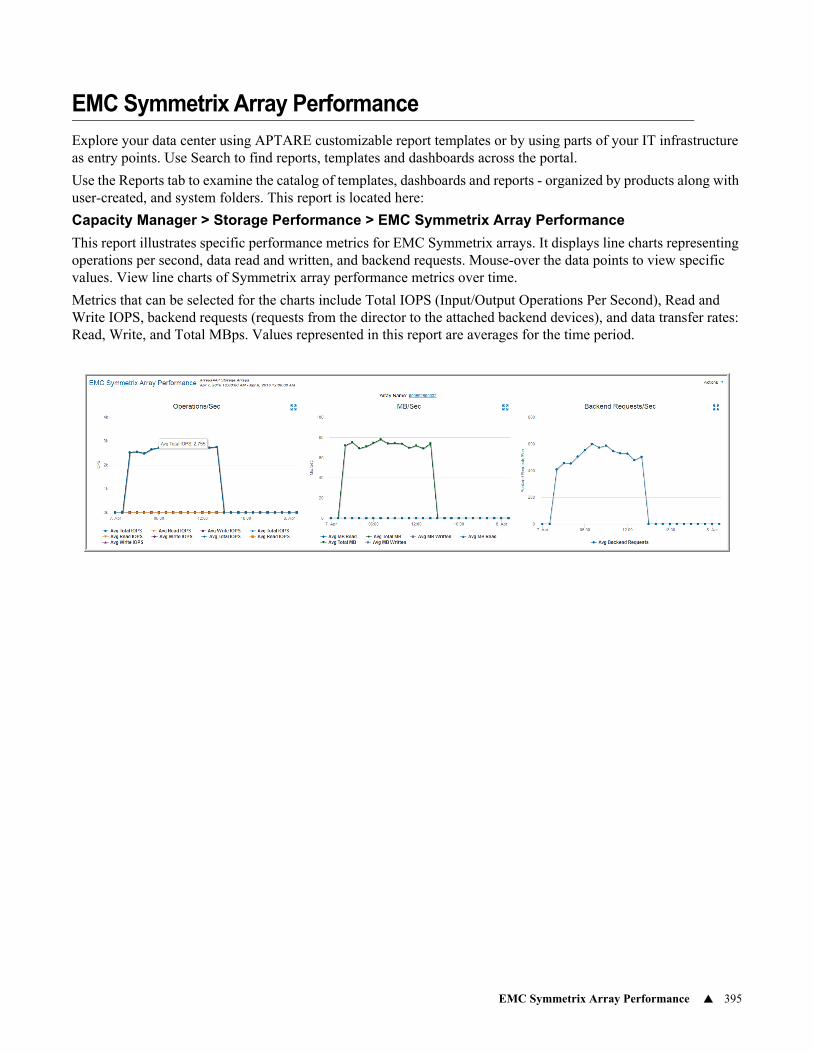
EMC Symmetrix Array Performance 395
EMC Symmetrix Array Performance
Explore your data center using APTARE customizable report templates or by using parts of your IT infrastructure as entry points. Use Search to find reports, templates and dashboards across the portal.
Use the Reports tab to examine the catalog of templates, dashboards and reports - organized by products along with user-created, and system folders. This report is located here:
Capacity Manager > Storage Performance > EMC Symmetrix Array Performance
This report illustrates specific performance metrics for EMC Symmetrix arrays. It displays line charts representing operations per second, data read and written, and backend requests. Mouse-over the data points to view specific values. View line charts of Symmetrix array performance metrics over time.
Metrics that can be selected for the charts include Total IOPS (Input/Output Operations Per Second), Read and Write IOPS, backend requests (requests from the director to the attached backend devices), and data transfer rates: Read, Write, and Total MBps. Values represented in this report are averages for the time period.
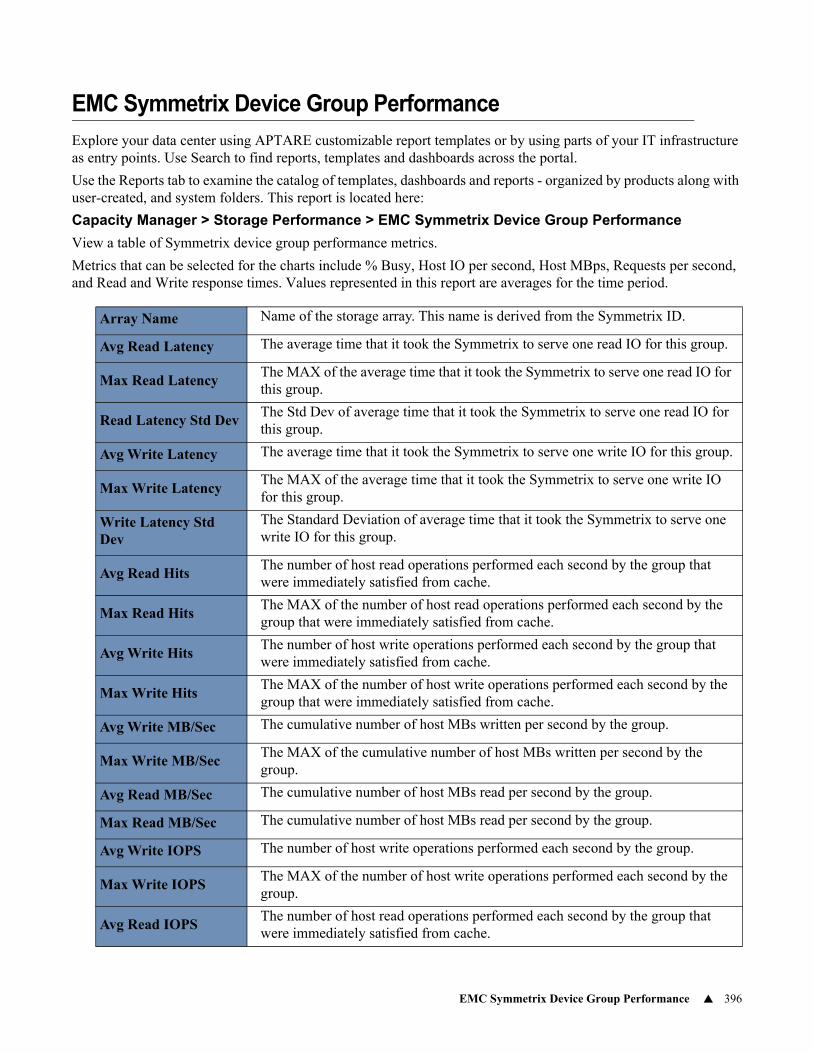
EMC Symmetrix Device Group Performance 396
EMC Symmetrix Device Group Performance
Explore your data center using APTARE customizable report templates or by using parts of your IT infrastructure as entry points. Use Search to find reports, templates and dashboards across the portal.
Use the Reports tab to examine the catalog of templates, dashboards and reports - organized by products along with user-created, and system folders. This report is located here:
Capacity Manager > Storage Performance > EMC Symmetrix Device Group Performance
View a table of Symmetrix device group performance metrics.
Metrics that can be selected for the charts include % Busy, Host IO per second, Host MBps, Requests per second, and Read and Write response times. Values represented in this report are averages for the time period.
Array Name Name of the storage array. This name is derived from the Symmetrix ID.
Avg Read Latency The average time that it took the Symmetrix to serve one read IO for this group.
Max Read LatencyThe MAX of the average time that it took the Symmetrix to serve one read IO for this group.
Read Latency Std DevThe Std Dev of average time that it took the Symmetrix to serve one read IO for this group.
Avg Write Latency The average time that it took the Symmetrix to serve one write IO for this group.
Max Write LatencyThe MAX of the average time that it took the Symmetrix to serve one write IO for this group.
Write Latency Std Dev
The Standard Deviation of average time that it took the Symmetrix to serve one write IO for this group.
Avg Read HitsThe number of host read operations performed each second by the group that were immediately satisfied from cache.
Max Read HitsThe MAX of the number of host read operations performed each second by the group that were immediately satisfied from cache.
Avg Write HitsThe number of host write operations performed each second by the group that were immediately satisfied from cache.
Max Write HitsThe MAX of the number of host write operations performed each second by the group that were immediately satisfied from cache.
Avg Write MB/Sec The cumulative number of host MBs written per second by the group.
Max Write MB/SecThe MAX of the cumulative number of host MBs written per second by the group.
Avg Read MB/Sec The cumulative number of host MBs read per second by the group.
Max Read MB/Sec The cumulative number of host MBs read per second by the group.
Avg Write IOPS The number of host write operations performed each second by the group.
Max Write IOPSThe MAX of the number of host write operations performed each second by the group.
Avg Read IOPSThe number of host read operations performed each second by the group that were immediately satisfied from cache.
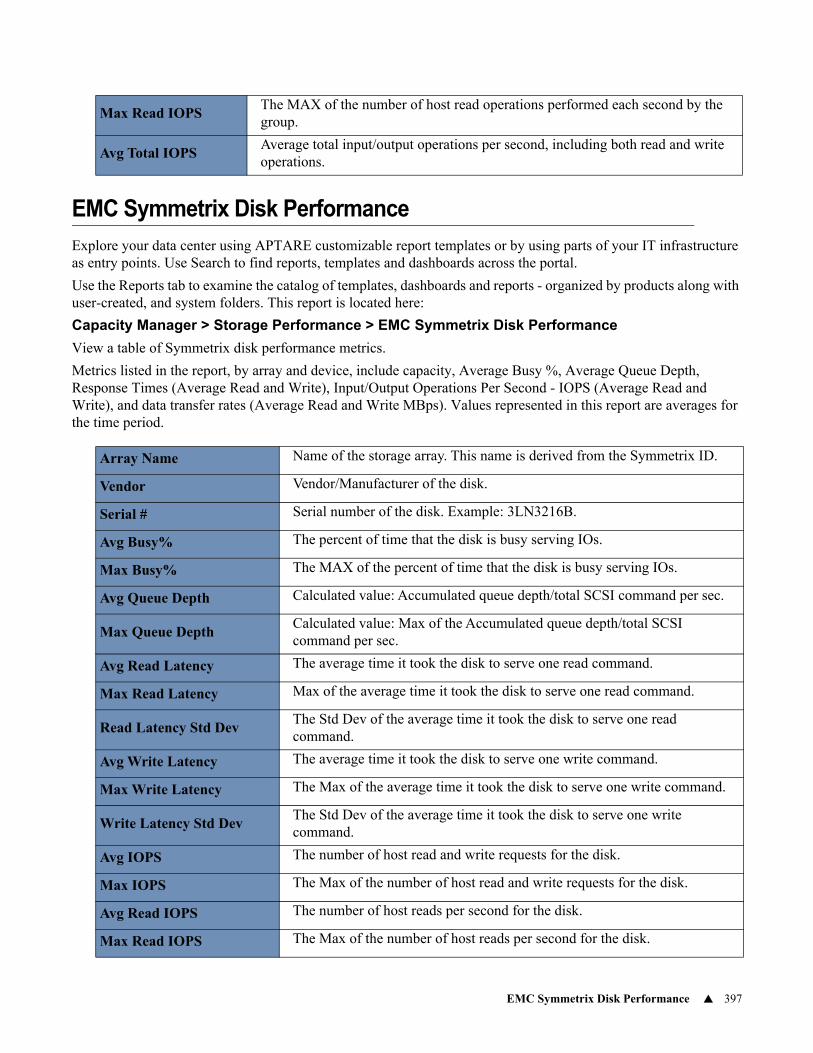
EMC Symmetrix Disk Performance 397
EMC Symmetrix Disk Performance
Explore your data center using APTARE customizable report templates or by using parts of your IT infrastructure as entry points. Use Search to find reports, templates and dashboards across the portal.
Use the Reports tab to examine the catalog of templates, dashboards and reports - organized by products along with user-created, and system folders. This report is located here:
Capacity Manager > Storage Performance > EMC Symmetrix Disk Performance
View a table of Symmetrix disk performance metrics.
Metrics listed in the report, by array and device, include capacity, Average Busy %, Average Queue Depth, Response Times (Average Read and Write), Input/Output Operations Per Second - IOPS (Average Read and Write), and data transfer rates (Average Read and Write MBps). Values represented in this report are averages for the time period.
Max Read IOPSThe MAX of the number of host read operations performed each second by the group.
Avg Total IOPSAverage total input/output operations per second, including both read and write operations.
Array Name Name of the storage array. This name is derived from the Symmetrix ID.
Vendor Vendor/Manufacturer of the disk.
Serial # Serial number of the disk. Example: 3LN3216B.
Avg Busy% The percent of time that the disk is busy serving IOs.
Max Busy% The MAX of the percent of time that the disk is busy serving IOs.
Avg Queue Depth Calculated value: Accumulated queue depth/total SCSI command per sec.
Max Queue DepthCalculated value: Max of the Accumulated queue depth/total SCSI command per sec.
Avg Read Latency The average time it took the disk to serve one read command.
Max Read Latency Max of the average time it took the disk to serve one read command.
Read Latency Std DevThe Std Dev of the average time it took the disk to serve one read command.
Avg Write Latency The average time it took the disk to serve one write command.
Max Write Latency The Max of the average time it took the disk to serve one write command.
Write Latency Std DevThe Std Dev of the average time it took the disk to serve one write command.
Avg IOPS The number of host read and write requests for the disk.
Max IOPS The Max of the number of host read and write requests for the disk.
Avg Read IOPS The number of host reads per second for the disk.
Max Read IOPS The Max of the number of host reads per second for the disk.
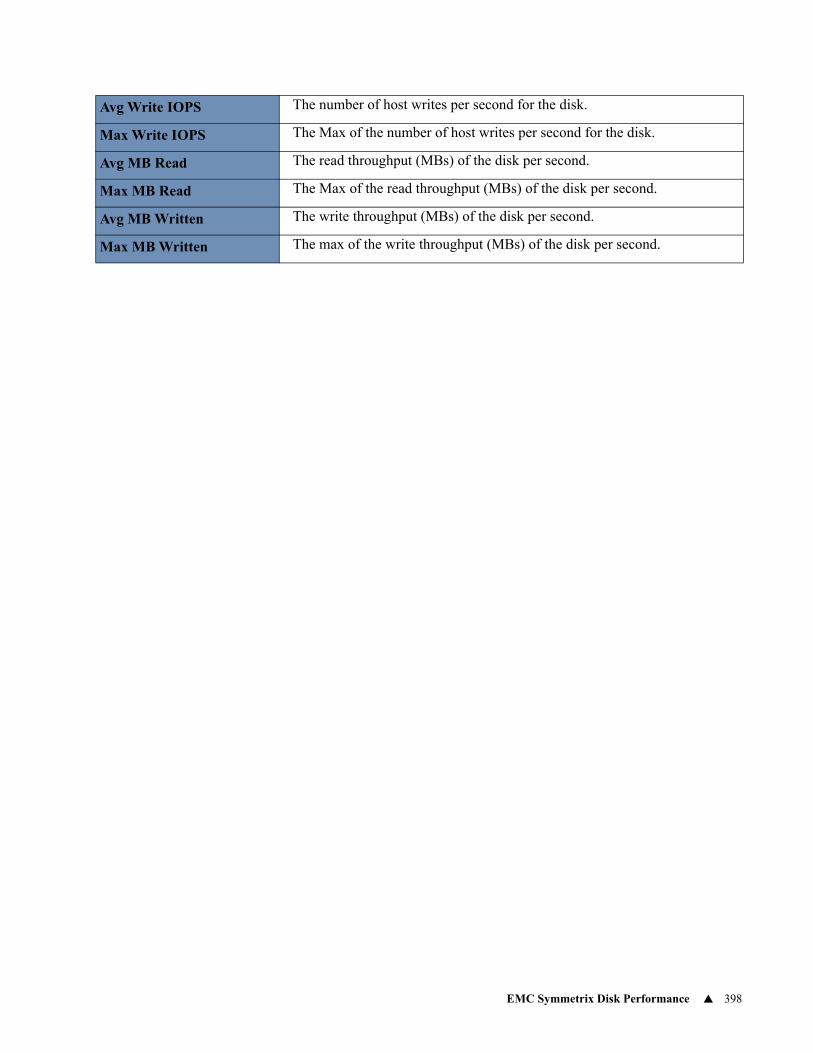
EMC Symmetrix Disk Performance 398
Avg Write IOPS The number of host writes per second for the disk.
Max Write IOPS The Max of the number of host writes per second for the disk.
Avg MB Read The read throughput (MBs) of the disk per second.
Max MB Read The Max of the read throughput (MBs) of the disk per second.
Avg MB Written The write throughput (MBs) of the disk per second.
Max MB Written The max of the write throughput (MBs) of the disk per second.
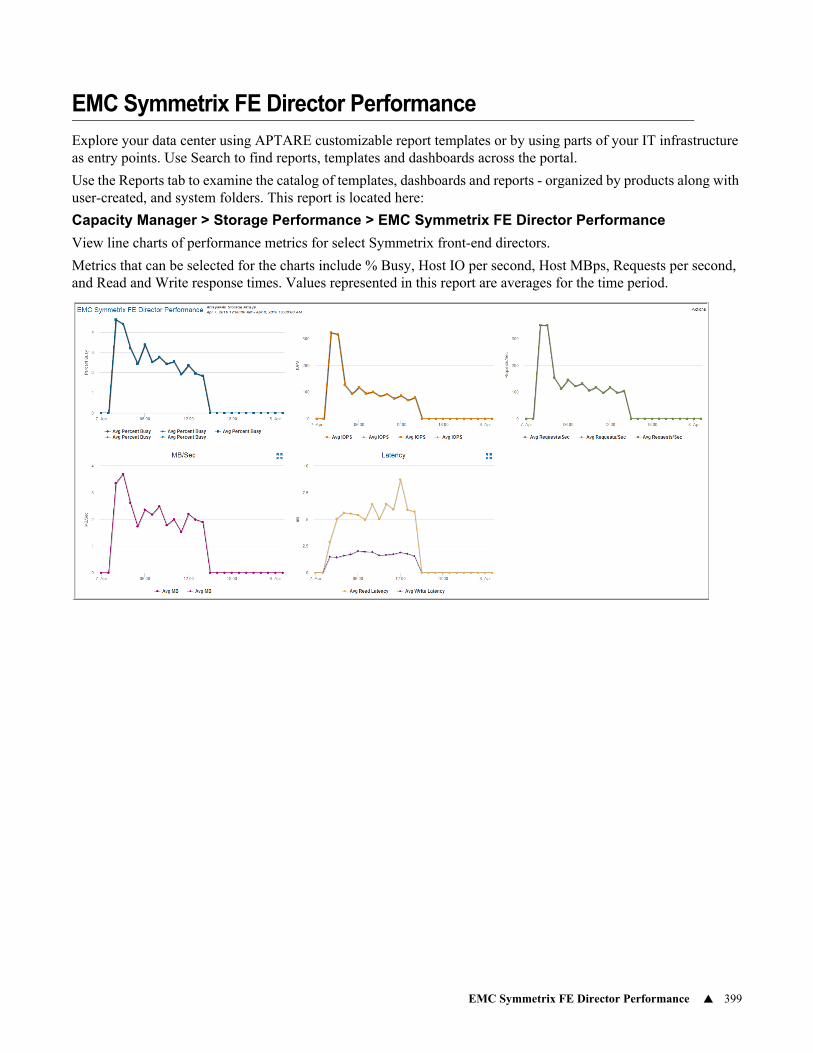
EMC Symmetrix FE Director Performance 399
EMC Symmetrix FE Director Performance
Explore your data center using APTARE customizable report templates or by using parts of your IT infrastructure as entry points. Use Search to find reports, templates and dashboards across the portal.
Use the Reports tab to examine the catalog of templates, dashboards and reports - organized by products along with user-created, and system folders. This report is located here:
Capacity Manager > Storage Performance > EMC Symmetrix FE Director Performance
View line charts of performance metrics for select Symmetrix front-end directors.
Metrics that can be selected for the charts include % Busy, Host IO per second, Host MBps, Requests per second, and Read and Write response times. Values represented in this report are averages for the time period.
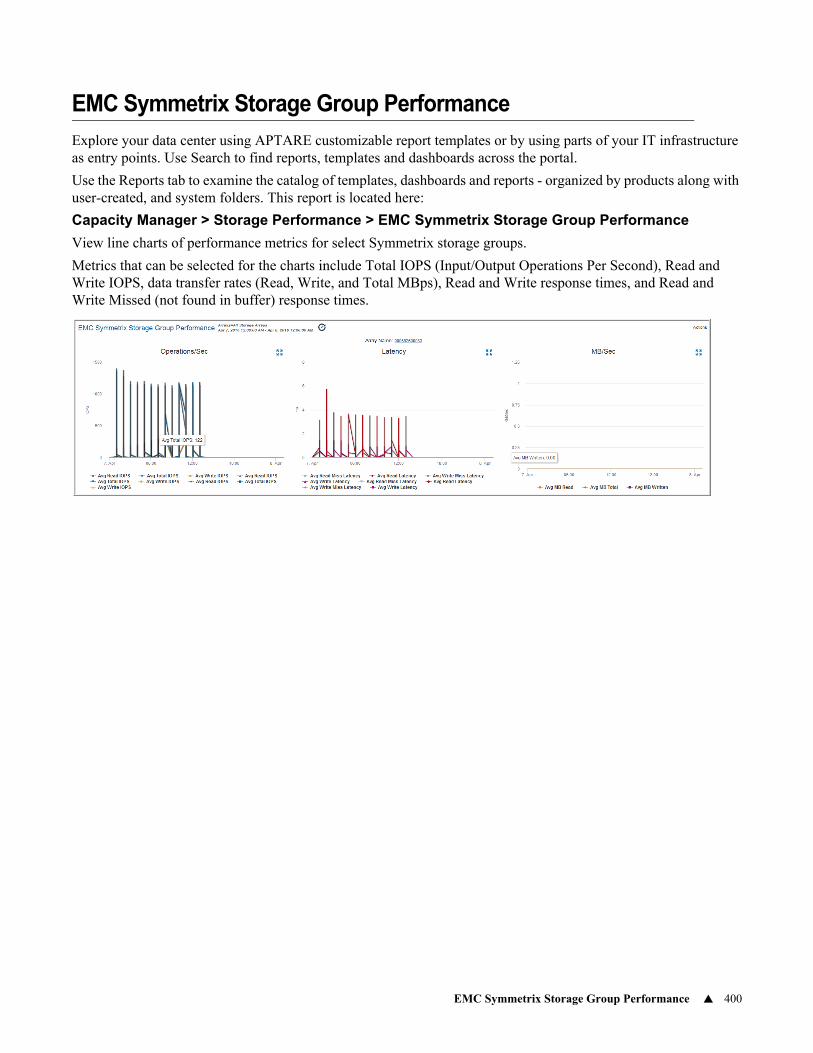
EMC Symmetrix Storage Group Performance 400
EMC Symmetrix Storage Group Performance
Explore your data center using APTARE customizable report templates or by using parts of your IT infrastructure as entry points. Use Search to find reports, templates and dashboards across the portal.
Use the Reports tab to examine the catalog of templates, dashboards and reports - organized by products along with user-created, and system folders. This report is located here:
Capacity Manager > Storage Performance > EMC Symmetrix Storage Group Performance
View line charts of performance metrics for select Symmetrix storage groups.
Metrics that can be selected for the charts include Total IOPS (Input/Output Operations Per Second), Read and Write IOPS, data transfer rates (Read, Write, and Total MBps), Read and Write response times, and Read and Write Missed (not found in buffer) response times.
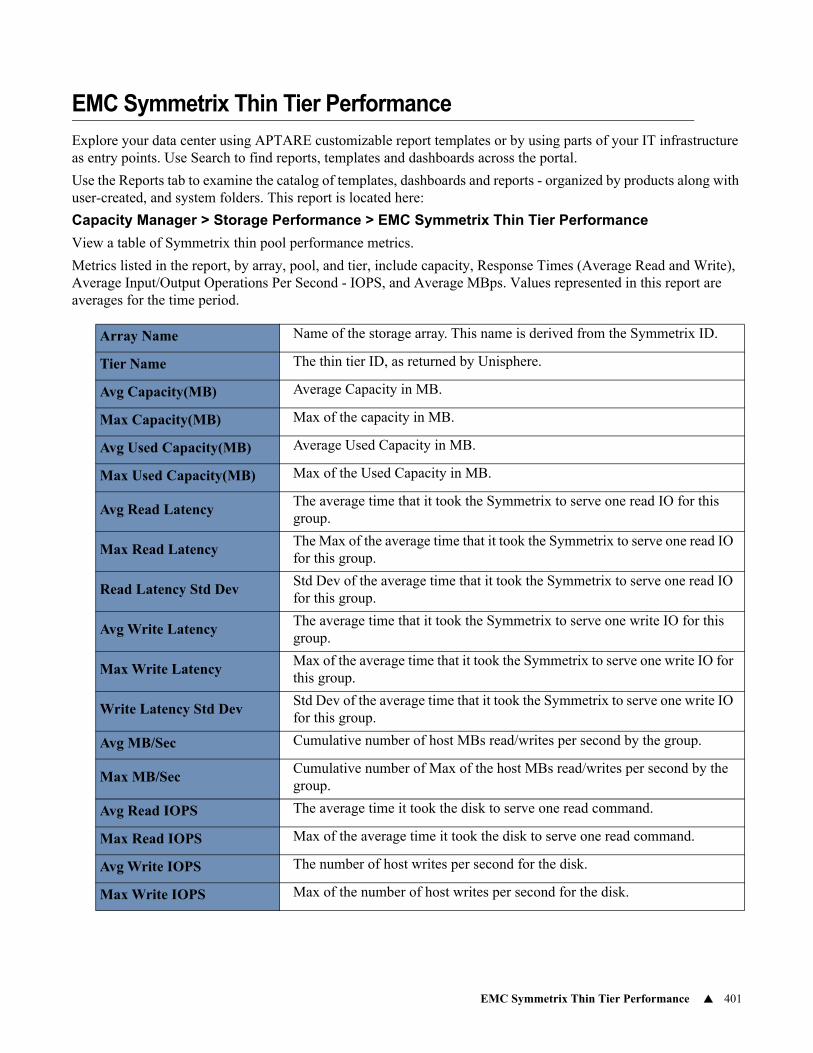
EMC Symmetrix Thin Tier Performance 401
EMC Symmetrix Thin Tier Performance
Explore your data center using APTARE customizable report templates or by using parts of your IT infrastructure as entry points. Use Search to find reports, templates and dashboards across the portal.
Use the Reports tab to examine the catalog of templates, dashboards and reports - organized by products along with user-created, and system folders. This report is located here:
Capacity Manager > Storage Performance > EMC Symmetrix Thin Tier Performance
View a table of Symmetrix thin pool performance metrics.
Metrics listed in the report, by array, pool, and tier, include capacity, Response Times (Average Read and Write), Average Input/Output Operations Per Second - IOPS, and Average MBps. Values represented in this report are averages for the time period.
Array Name Name of the storage array. This name is derived from the Symmetrix ID.
Tier Name The thin tier ID, as returned by Unisphere.
Avg Capacity(MB) Average Capacity in MB.
Max Capacity(MB) Max of the capacity in MB.
Avg Used Capacity(MB) Average Used Capacity in MB.
Max Used Capacity(MB) Max of the Used Capacity in MB.
Avg Read LatencyThe average time that it took the Symmetrix to serve one read IO for this group.
Max Read LatencyThe Max of the average time that it took the Symmetrix to serve one read IO for this group.
Read Latency Std DevStd Dev of the average time that it took the Symmetrix to serve one read IO for this group.
Avg Write LatencyThe average time that it took the Symmetrix to serve one write IO for this group.
Max Write LatencyMax of the average time that it took the Symmetrix to serve one write IO for this group.
Write Latency Std DevStd Dev of the average time that it took the Symmetrix to serve one write IO for this group.
Avg MB/Sec Cumulative number of host MBs read/writes per second by the group.
Max MB/SecCumulative number of Max of the host MBs read/writes per second by the group.
Avg Read IOPS The average time it took the disk to serve one read command.
Max Read IOPS Max of the average time it took the disk to serve one read command.
Avg Write IOPS The number of host writes per second for the disk.
Max Write IOPS Max of the number of host writes per second for the disk.
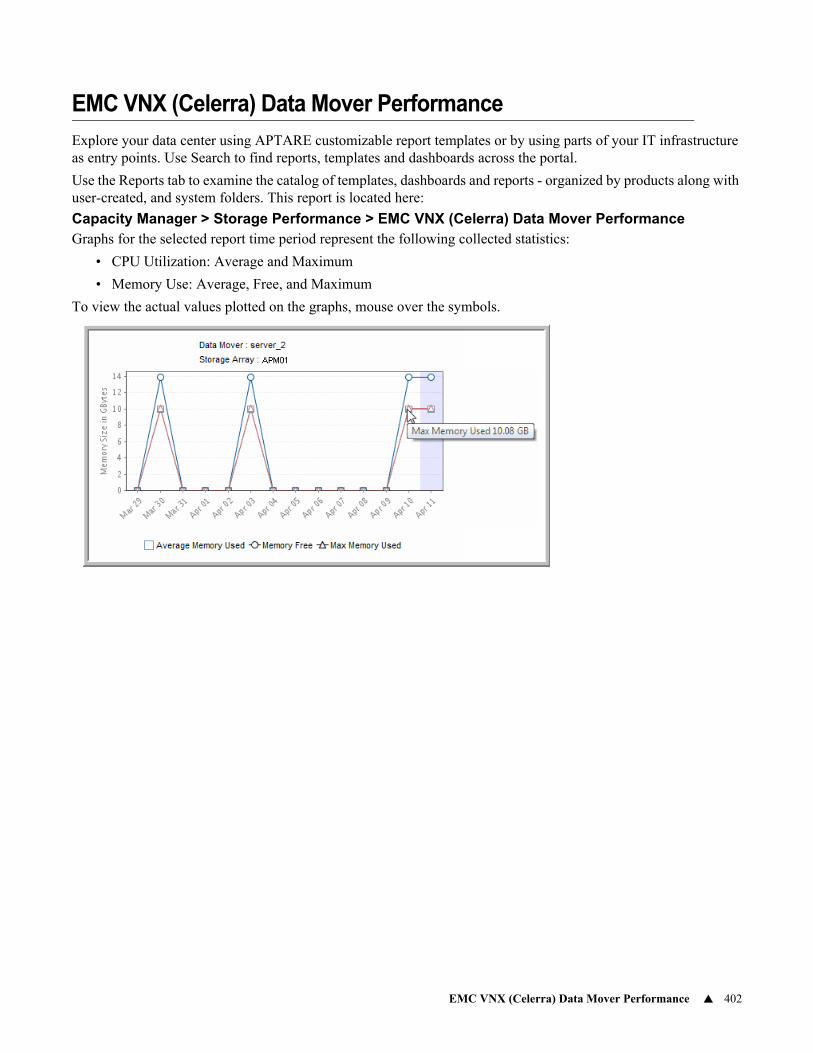
EMC VNX (Celerra) Data Mover Performance 402
EMC VNX (Celerra) Data Mover Performance
Explore your data center using APTARE customizable report templates or by using parts of your IT infrastructure as entry points. Use Search to find reports, templates and dashboards across the portal.
Use the Reports tab to examine the catalog of templates, dashboards and reports - organized by products along with user-created, and system folders. This report is located here:
Capacity Manager > Storage Performance > EMC VNX (Celerra) Data Mover PerformanceGraphs for the selected report time period represent the following collected statistics:
• CPU Utilization: Average and Maximum
• Memory Use: Average, Free, and Maximum
To view the actual values plotted on the graphs, mouse over the symbols.
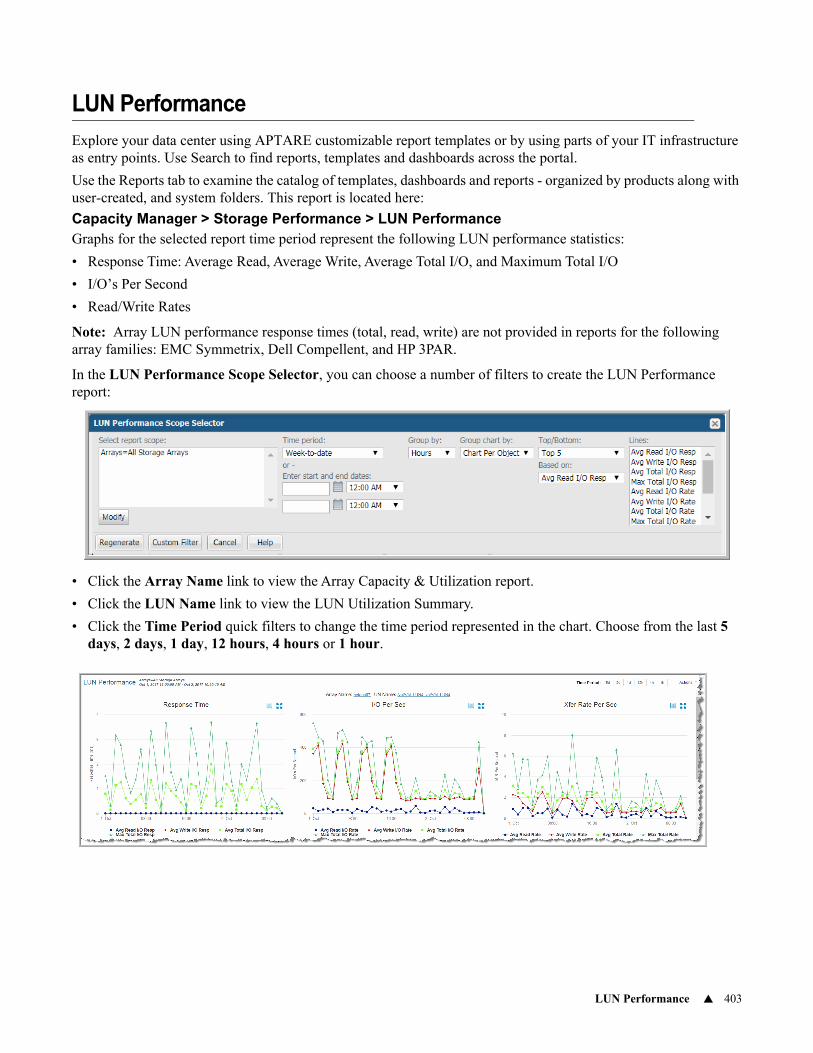
LUN Performance 403
LUN Performance
Explore your data center using APTARE customizable report templates or by using parts of your IT infrastructure as entry points. Use Search to find reports, templates and dashboards across the portal.
Use the Reports tab to examine the catalog of templates, dashboards and reports - organized by products along with user-created, and system folders. This report is located here:
Capacity Manager > Storage Performance > LUN PerformanceGraphs for the selected report time period represent the following LUN performance statistics:
• Response Time: Average Read, Average Write, Average Total I/O, and Maximum Total I/O
• I/O’s Per Second
• Read/Write Rates
Note: Array LUN performance response times (total, read, write) are not provided in reports for the following array families: EMC Symmetrix, Dell Compellent, and HP 3PAR.
In the LUN Performance Scope Selector, you can choose a number of filters to create the LUN Performance report:
• Click the Array Name link to view the Array Capacity & Utilization report.
• Click the LUN Name link to view the LUN Utilization Summary.
• Click the Time Period quick filters to change the time period represented in the chart. Choose from the last 5 days, 2 days, 1 day, 12 hours, 4 hours or 1 hour.
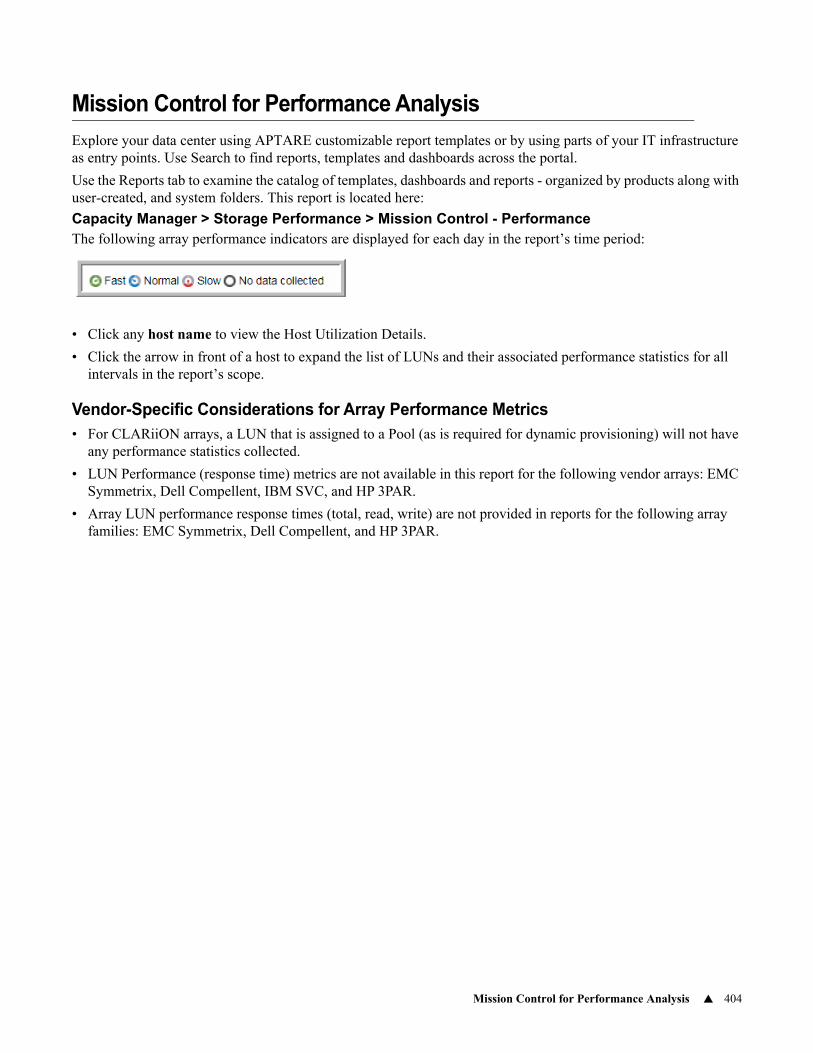
Mission Control for Performance Analysis 404
Mission Control for Performance Analysis
Explore your data center using APTARE customizable report templates or by using parts of your IT infrastructure as entry points. Use Search to find reports, templates and dashboards across the portal.
Use the Reports tab to examine the catalog of templates, dashboards and reports - organized by products along with user-created, and system folders. This report is located here:
Capacity Manager > Storage Performance > Mission Control - PerformanceThe following array performance indicators are displayed for each day in the report’s time period:
• Click any host name to view the Host Utilization Details.
• Click the arrow in front of a host to expand the list of LUNs and their associated performance statistics for all intervals in the report’s scope.
Vendor-Specific Considerations for Array Performance Metrics• For CLARiiON arrays, a LUN that is assigned to a Pool (as is required for dynamic provisioning) will not have
any performance statistics collected.
• LUN Performance (response time) metrics are not available in this report for the following vendor arrays: EMC Symmetrix, Dell Compellent, IBM SVC, and HP 3PAR.
• Array LUN performance response times (total, read, write) are not provided in reports for the following array families: EMC Symmetrix, Dell Compellent, and HP 3PAR.
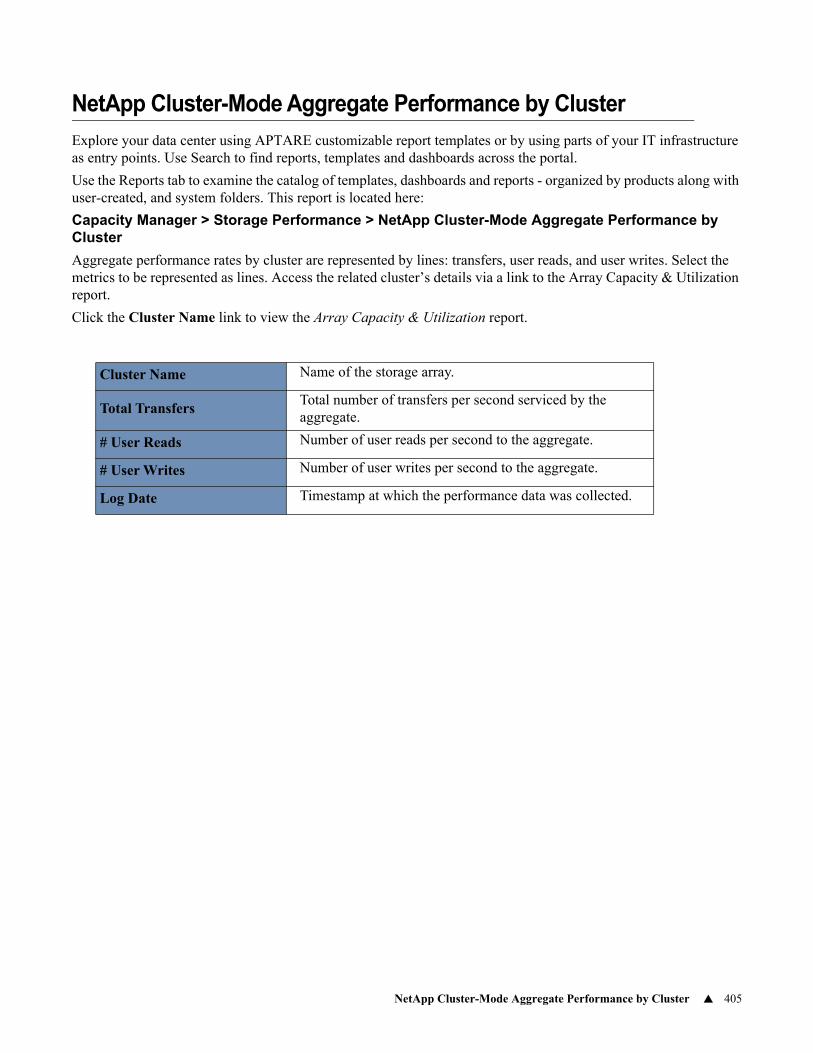
NetApp Cluster-Mode Aggregate Performance by Cluster 405
NetApp Cluster-Mode Aggregate Performance by Cluster
Explore your data center using APTARE customizable report templates or by using parts of your IT infrastructure as entry points. Use Search to find reports, templates and dashboards across the portal.
Use the Reports tab to examine the catalog of templates, dashboards and reports - organized by products along with user-created, and system folders. This report is located here:
Capacity Manager > Storage Performance > NetApp Cluster-Mode Aggregate Performance by Cluster
Aggregate performance rates by cluster are represented by lines: transfers, user reads, and user writes. Select the metrics to be represented as lines. Access the related cluster’s details via a link to the Array Capacity & Utilization report.
Click the Cluster Name link to view the Array Capacity & Utilization report.
Cluster Name Name of the storage array.
Total TransfersTotal number of transfers per second serviced by the aggregate.
# User Reads Number of user reads per second to the aggregate.
# User Writes Number of user writes per second to the aggregate.
Log Date Timestamp at which the performance data was collected.
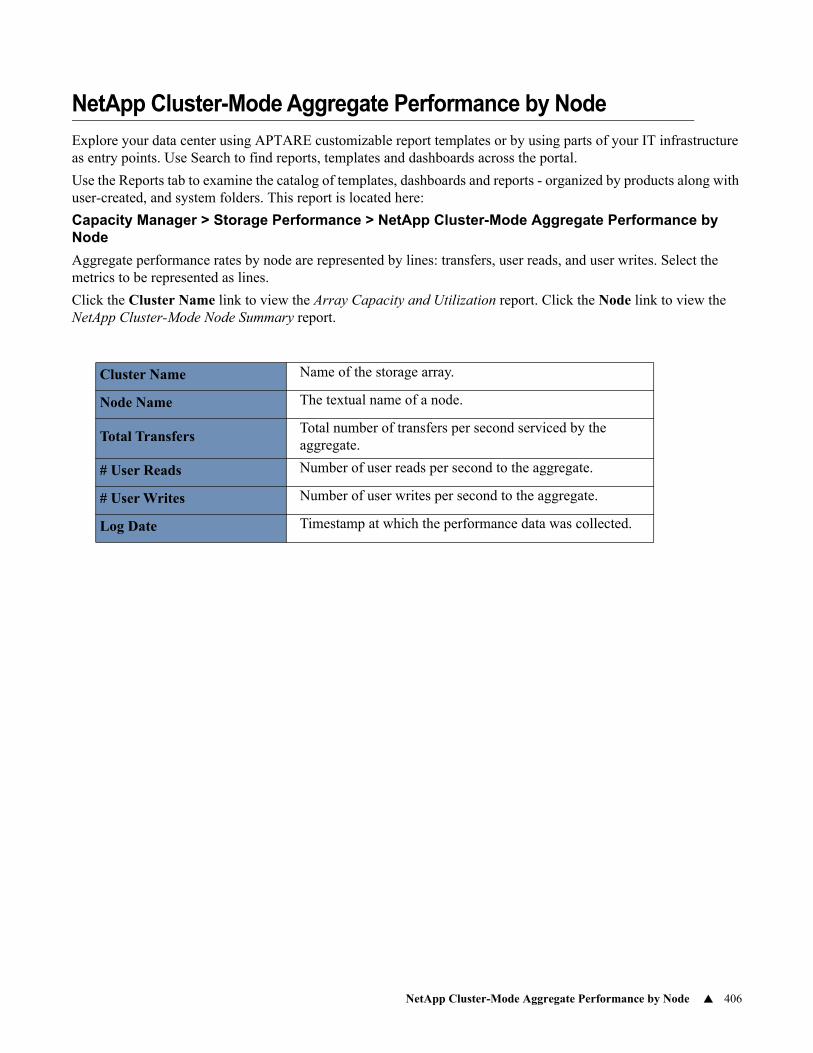
NetApp Cluster-Mode Aggregate Performance by Node 406
NetApp Cluster-Mode Aggregate Performance by Node
Explore your data center using APTARE customizable report templates or by using parts of your IT infrastructure as entry points. Use Search to find reports, templates and dashboards across the portal.
Use the Reports tab to examine the catalog of templates, dashboards and reports - organized by products along with user-created, and system folders. This report is located here:
Capacity Manager > Storage Performance > NetApp Cluster-Mode Aggregate Performance by Node
Aggregate performance rates by node are represented by lines: transfers, user reads, and user writes. Select the metrics to be represented as lines.
Click the Cluster Name link to view the Array Capacity and Utilization report. Click the Node link to view the NetApp Cluster-Mode Node Summary report.
Cluster Name Name of the storage array.
Node Name The textual name of a node.
Total TransfersTotal number of transfers per second serviced by the aggregate.
# User Reads Number of user reads per second to the aggregate.
# User Writes Number of user writes per second to the aggregate.
Log Date Timestamp at which the performance data was collected.
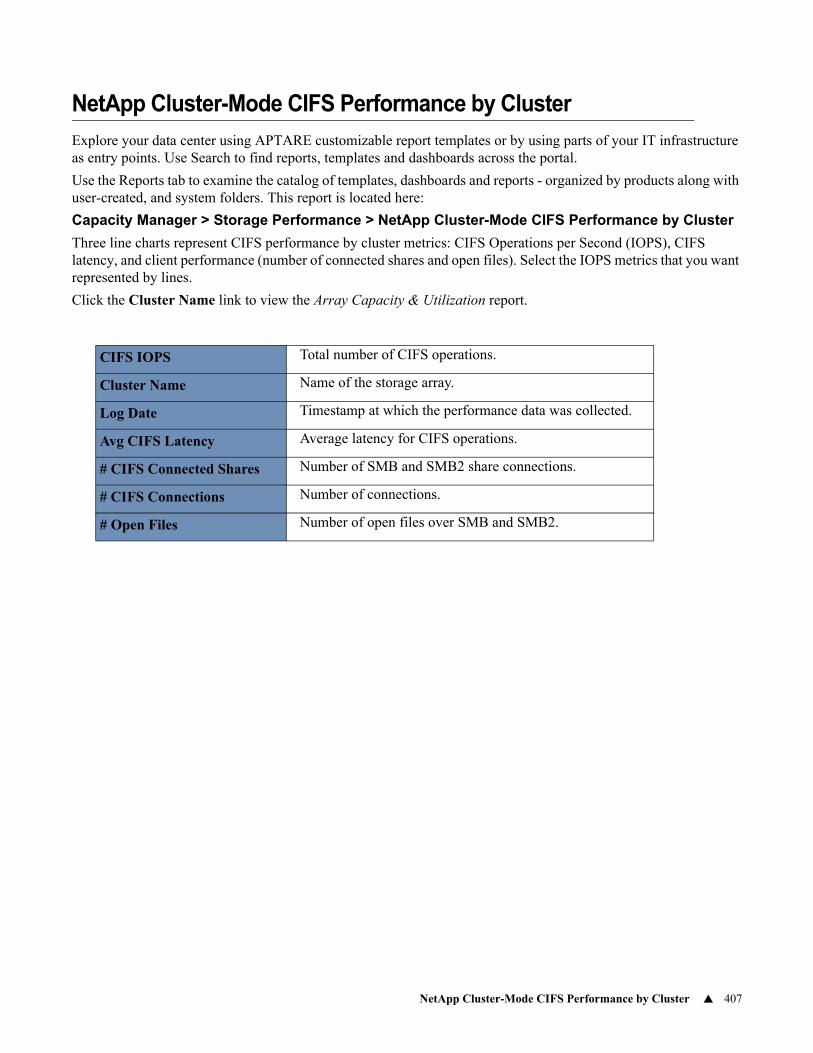
NetApp Cluster-Mode CIFS Performance by Cluster 407
NetApp Cluster-Mode CIFS Performance by Cluster
Explore your data center using APTARE customizable report templates or by using parts of your IT infrastructure as entry points. Use Search to find reports, templates and dashboards across the portal.
Use the Reports tab to examine the catalog of templates, dashboards and reports - organized by products along with user-created, and system folders. This report is located here:
Capacity Manager > Storage Performance > NetApp Cluster-Mode CIFS Performance by Cluster
Three line charts represent CIFS performance by cluster metrics: CIFS Operations per Second (IOPS), CIFS latency, and client performance (number of connected shares and open files). Select the IOPS metrics that you want represented by lines.
Click the Cluster Name link to view the Array Capacity & Utilization report.
CIFS IOPS Total number of CIFS operations.
Cluster Name Name of the storage array.
Log Date Timestamp at which the performance data was collected.
Avg CIFS Latency Average latency for CIFS operations.
# CIFS Connected Shares Number of SMB and SMB2 share connections.
# CIFS Connections Number of connections.
# Open Files Number of open files over SMB and SMB2.

NetApp Cluster-Mode CIFS Performance by Vserver 408
NetApp Cluster-Mode CIFS Performance by Vserver
Explore your data center using APTARE customizable report templates or by using parts of your IT infrastructure as entry points. Use Search to find reports, templates and dashboards across the portal.
Use the Reports tab to examine the catalog of templates, dashboards and reports - organized by products along with user-created, and system folders. This report is located here:
Capacity Manager > Storage Performance > NetApp Cluster-Mode CIFS Performance by Vserver
Three line charts represent CIFS performance by Vserver metrics: CIFS Operations per Second (IOPS), CIFS latency, and client performance (number of connected shares and open files). Select the IOPS metrics that you want represented by lines.
Click the Cluster Name link to view the Array Capacity and Utilization report. Click the Vserver link to view the NetApp Cluster-Mode Vserver Summary report.
CIFS IOPS Total number of CIFS operations.
Cluster Name Name of the storage array.
Vserver NameName of the Vserver. When specified as part of a Vserver-create, this is the name of the Vserver.
Log Date Timestamp at which the performance data was collected.
Avg CIFS Latency Average latency for CIFS operations.
# CIFS Connected Shares Number of SMB and SMB2 share connections.
# CIFS Connections Number of connections.
# Open Files Number of open files over SMB and SMB2.
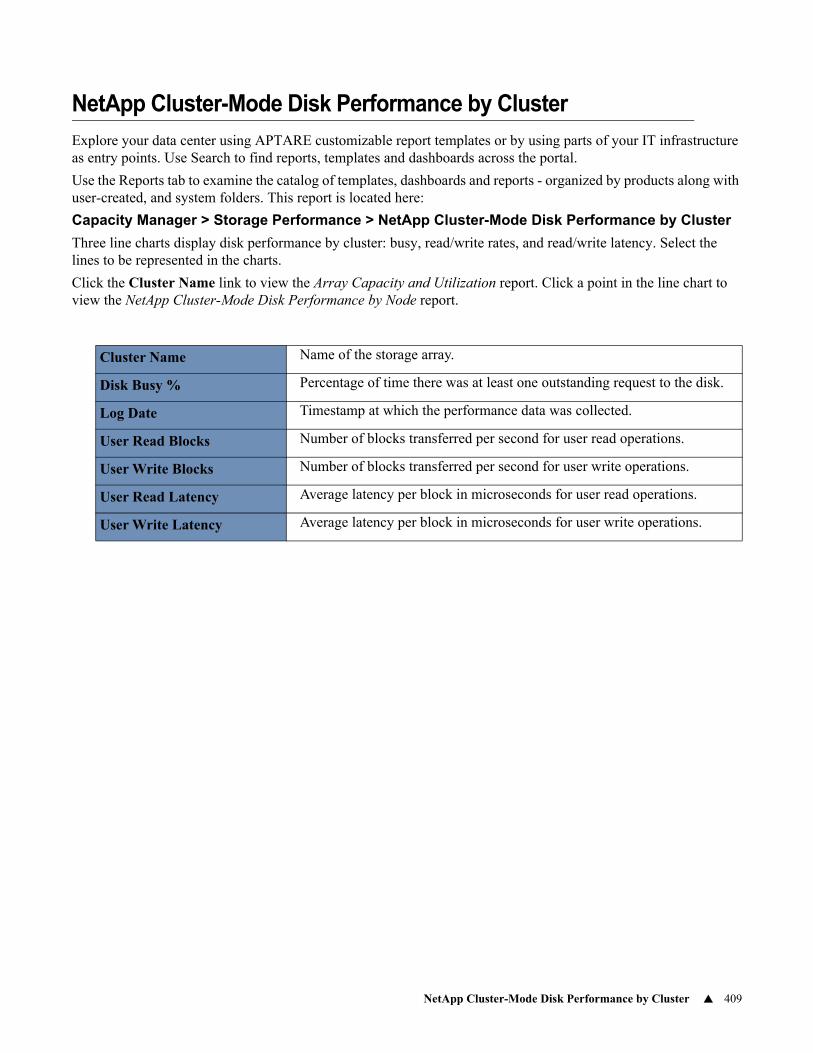
NetApp Cluster-Mode Disk Performance by Cluster 409
NetApp Cluster-Mode Disk Performance by Cluster
Explore your data center using APTARE customizable report templates or by using parts of your IT infrastructure as entry points. Use Search to find reports, templates and dashboards across the portal.
Use the Reports tab to examine the catalog of templates, dashboards and reports - organized by products along with user-created, and system folders. This report is located here:
Capacity Manager > Storage Performance > NetApp Cluster-Mode Disk Performance by Cluster
Three line charts display disk performance by cluster: busy, read/write rates, and read/write latency. Select the lines to be represented in the charts.
Click the Cluster Name link to view the Array Capacity and Utilization report. Click a point in the line chart to view the NetApp Cluster-Mode Disk Performance by Node report.
Cluster Name Name of the storage array.
Disk Busy % Percentage of time there was at least one outstanding request to the disk.
Log Date Timestamp at which the performance data was collected.
User Read Blocks Number of blocks transferred per second for user read operations.
User Write Blocks Number of blocks transferred per second for user write operations.
User Read Latency Average latency per block in microseconds for user read operations.
User Write Latency Average latency per block in microseconds for user write operations.
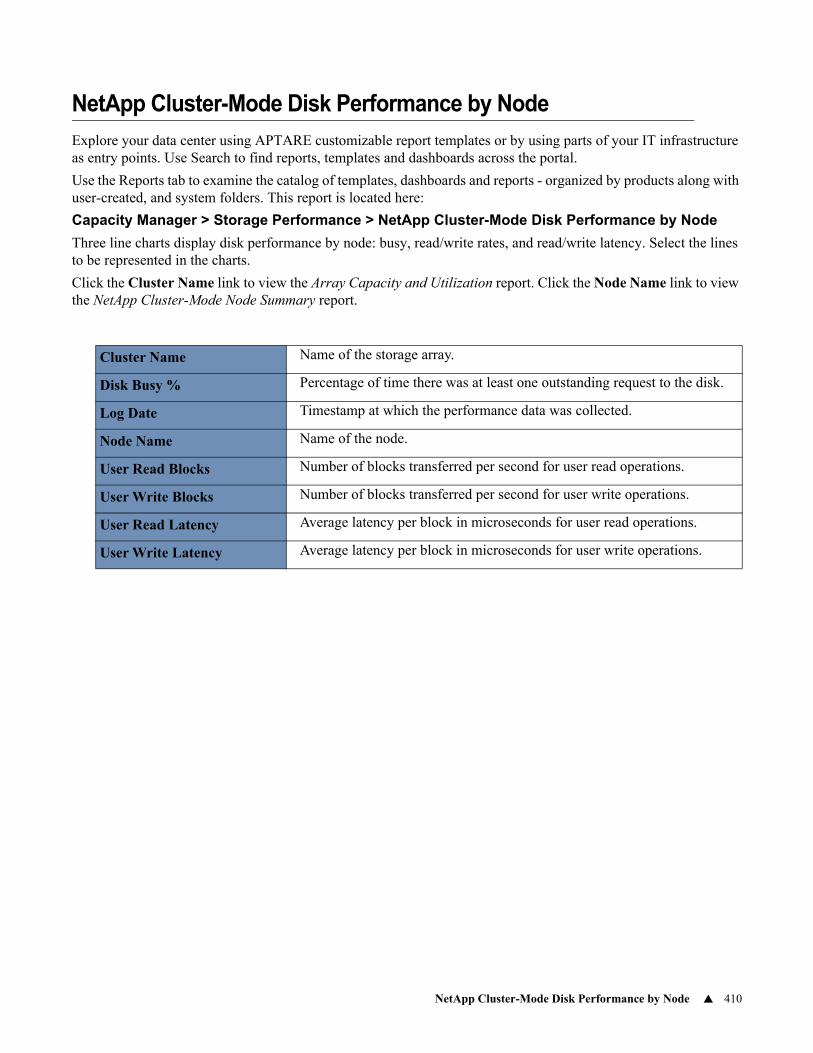
NetApp Cluster-Mode Disk Performance by Node 410
NetApp Cluster-Mode Disk Performance by Node
Explore your data center using APTARE customizable report templates or by using parts of your IT infrastructure as entry points. Use Search to find reports, templates and dashboards across the portal.
Use the Reports tab to examine the catalog of templates, dashboards and reports - organized by products along with user-created, and system folders. This report is located here:
Capacity Manager > Storage Performance > NetApp Cluster-Mode Disk Performance by Node
Three line charts display disk performance by node: busy, read/write rates, and read/write latency. Select the lines to be represented in the charts.
Click the Cluster Name link to view the Array Capacity and Utilization report. Click the Node Name link to view the NetApp Cluster-Mode Node Summary report.
Cluster Name Name of the storage array.
Disk Busy % Percentage of time there was at least one outstanding request to the disk.
Log Date Timestamp at which the performance data was collected.
Node Name Name of the node.
User Read Blocks Number of blocks transferred per second for user read operations.
User Write Blocks Number of blocks transferred per second for user write operations.
User Read Latency Average latency per block in microseconds for user read operations.
User Write Latency Average latency per block in microseconds for user write operations.
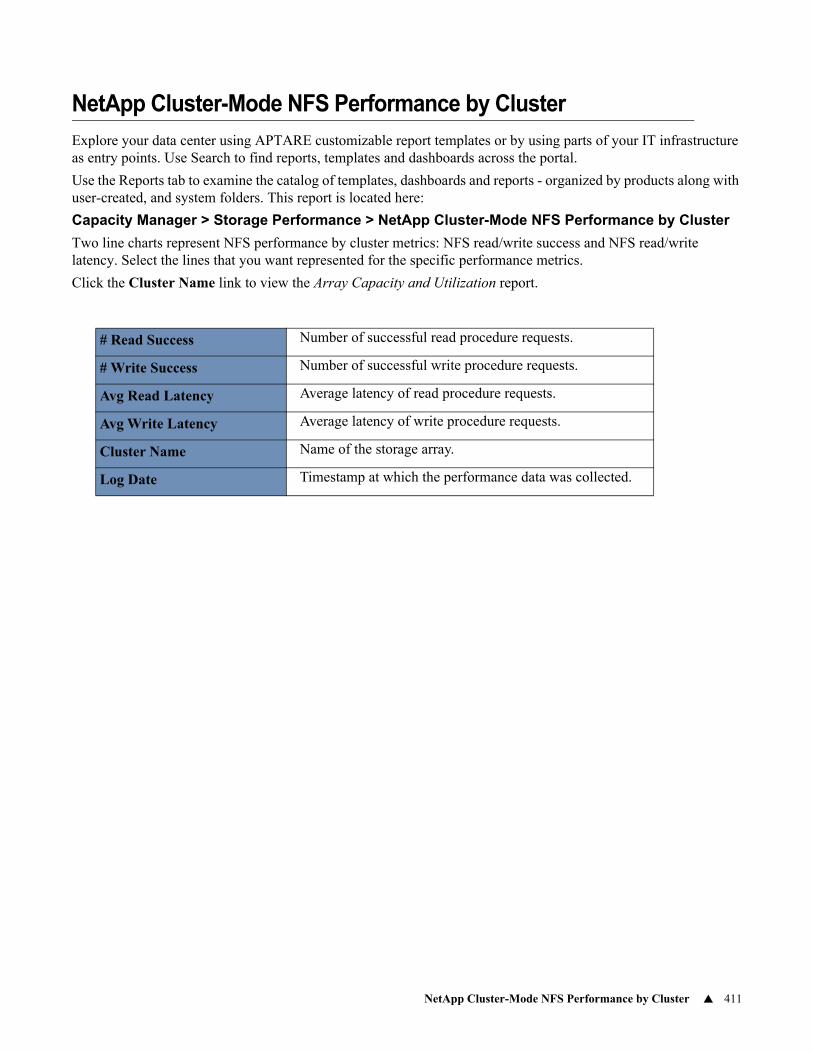
NetApp Cluster-Mode NFS Performance by Cluster 411
NetApp Cluster-Mode NFS Performance by Cluster
Explore your data center using APTARE customizable report templates or by using parts of your IT infrastructure as entry points. Use Search to find reports, templates and dashboards across the portal.
Use the Reports tab to examine the catalog of templates, dashboards and reports - organized by products along with user-created, and system folders. This report is located here:
Capacity Manager > Storage Performance > NetApp Cluster-Mode NFS Performance by Cluster
Two line charts represent NFS performance by cluster metrics: NFS read/write success and NFS read/write latency. Select the lines that you want represented for the specific performance metrics.
Click the Cluster Name link to view the Array Capacity and Utilization report.
# Read Success Number of successful read procedure requests.
# Write Success Number of successful write procedure requests.
Avg Read Latency Average latency of read procedure requests.
Avg Write Latency Average latency of write procedure requests.
Cluster Name Name of the storage array.
Log Date Timestamp at which the performance data was collected.
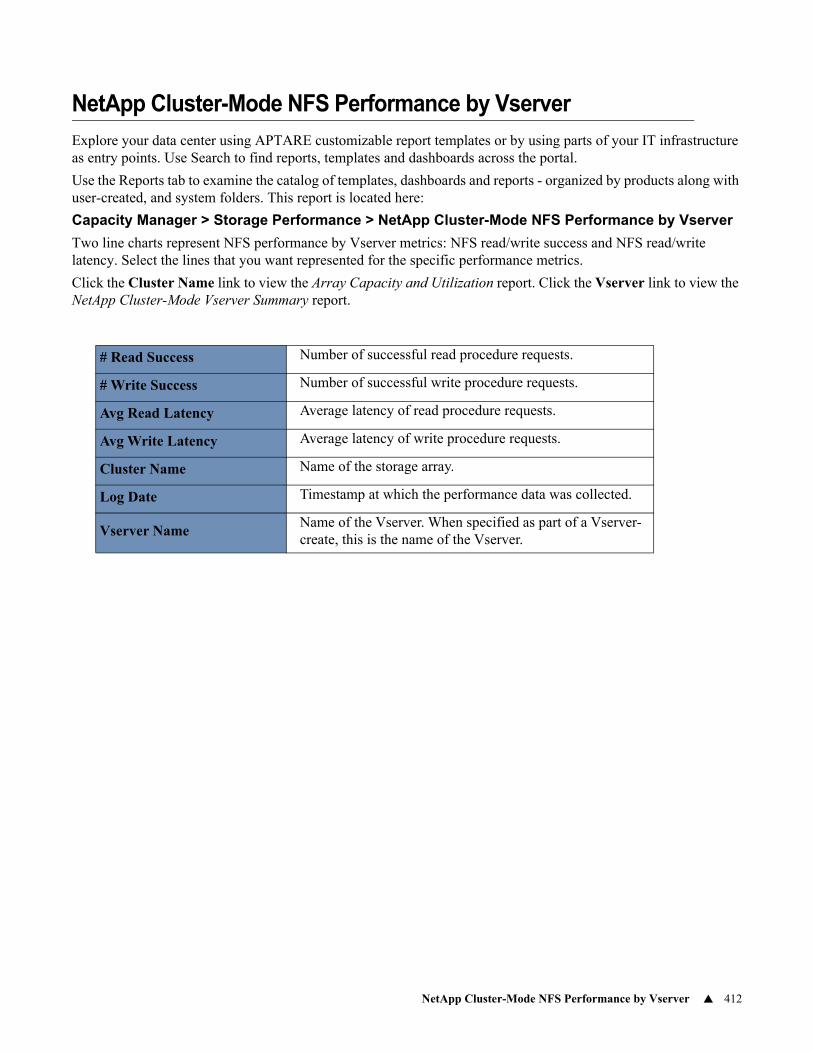
NetApp Cluster-Mode NFS Performance by Vserver 412
NetApp Cluster-Mode NFS Performance by Vserver
Explore your data center using APTARE customizable report templates or by using parts of your IT infrastructure as entry points. Use Search to find reports, templates and dashboards across the portal.
Use the Reports tab to examine the catalog of templates, dashboards and reports - organized by products along with user-created, and system folders. This report is located here:
Capacity Manager > Storage Performance > NetApp Cluster-Mode NFS Performance by Vserver
Two line charts represent NFS performance by Vserver metrics: NFS read/write success and NFS read/write latency. Select the lines that you want represented for the specific performance metrics.
Click the Cluster Name link to view the Array Capacity and Utilization report. Click the Vserver link to view the NetApp Cluster-Mode Vserver Summary report.
# Read Success Number of successful read procedure requests.
# Write Success Number of successful write procedure requests.
Avg Read Latency Average latency of read procedure requests.
Avg Write Latency Average latency of write procedure requests.
Cluster Name Name of the storage array.
Log Date Timestamp at which the performance data was collected.
Vserver NameName of the Vserver. When specified as part of a Vserver-create, this is the name of the Vserver.
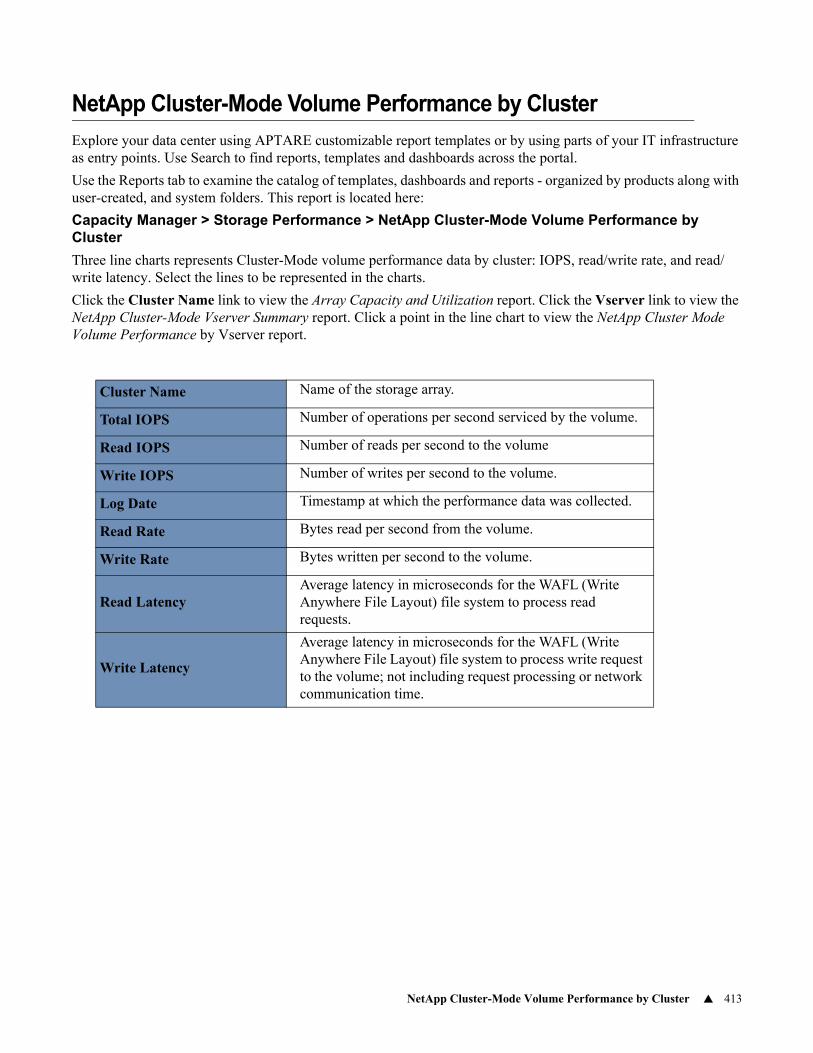
NetApp Cluster-Mode Volume Performance by Cluster 413
NetApp Cluster-Mode Volume Performance by Cluster
Explore your data center using APTARE customizable report templates or by using parts of your IT infrastructure as entry points. Use Search to find reports, templates and dashboards across the portal.
Use the Reports tab to examine the catalog of templates, dashboards and reports - organized by products along with user-created, and system folders. This report is located here:
Capacity Manager > Storage Performance > NetApp Cluster-Mode Volume Performance by Cluster
Three line charts represents Cluster-Mode volume performance data by cluster: IOPS, read/write rate, and read/write latency. Select the lines to be represented in the charts.
Click the Cluster Name link to view the Array Capacity and Utilization report. Click the Vserver link to view the NetApp Cluster-Mode Vserver Summary report. Click a point in the line chart to view the NetApp Cluster Mode Volume Performance by Vserver report.
Cluster Name Name of the storage array.
Total IOPS Number of operations per second serviced by the volume.
Read IOPS Number of reads per second to the volume
Write IOPS Number of writes per second to the volume.
Log Date Timestamp at which the performance data was collected.
Read Rate Bytes read per second from the volume.
Write Rate Bytes written per second to the volume.
Read LatencyAverage latency in microseconds for the WAFL (Write Anywhere File Layout) file system to process read requests.
Write Latency
Average latency in microseconds for the WAFL (Write Anywhere File Layout) file system to process write request to the volume; not including request processing or network communication time.
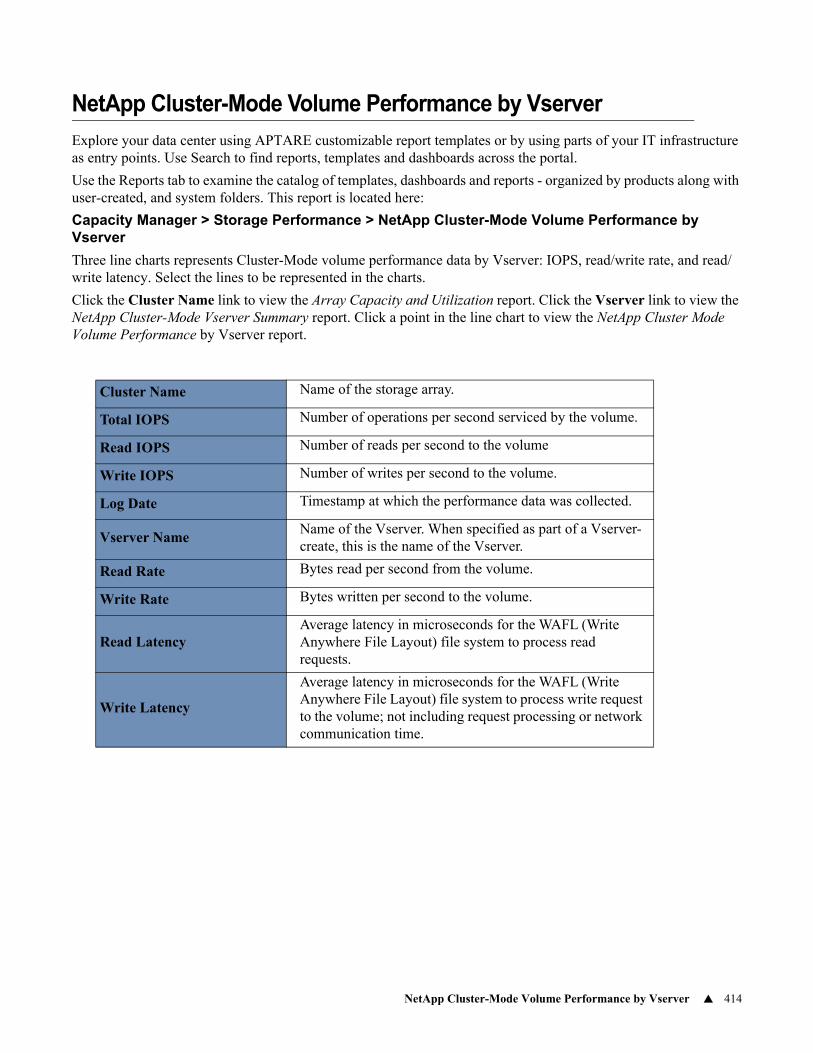
NetApp Cluster-Mode Volume Performance by Vserver 414
NetApp Cluster-Mode Volume Performance by Vserver
Explore your data center using APTARE customizable report templates or by using parts of your IT infrastructure as entry points. Use Search to find reports, templates and dashboards across the portal.
Use the Reports tab to examine the catalog of templates, dashboards and reports - organized by products along with user-created, and system folders. This report is located here:
Capacity Manager > Storage Performance > NetApp Cluster-Mode Volume Performance by Vserver
Three line charts represents Cluster-Mode volume performance data by Vserver: IOPS, read/write rate, and read/write latency. Select the lines to be represented in the charts.
Click the Cluster Name link to view the Array Capacity and Utilization report. Click the Vserver link to view the NetApp Cluster-Mode Vserver Summary report. Click a point in the line chart to view the NetApp Cluster Mode Volume Performance by Vserver report.
Cluster Name Name of the storage array.
Total IOPS Number of operations per second serviced by the volume.
Read IOPS Number of reads per second to the volume
Write IOPS Number of writes per second to the volume.
Log Date Timestamp at which the performance data was collected.
Vserver NameName of the Vserver. When specified as part of a Vserver-create, this is the name of the Vserver.
Read Rate Bytes read per second from the volume.
Write Rate Bytes written per second to the volume.
Read LatencyAverage latency in microseconds for the WAFL (Write Anywhere File Layout) file system to process read requests.
Write Latency
Average latency in microseconds for the WAFL (Write Anywhere File Layout) file system to process write request to the volume; not including request processing or network communication time.
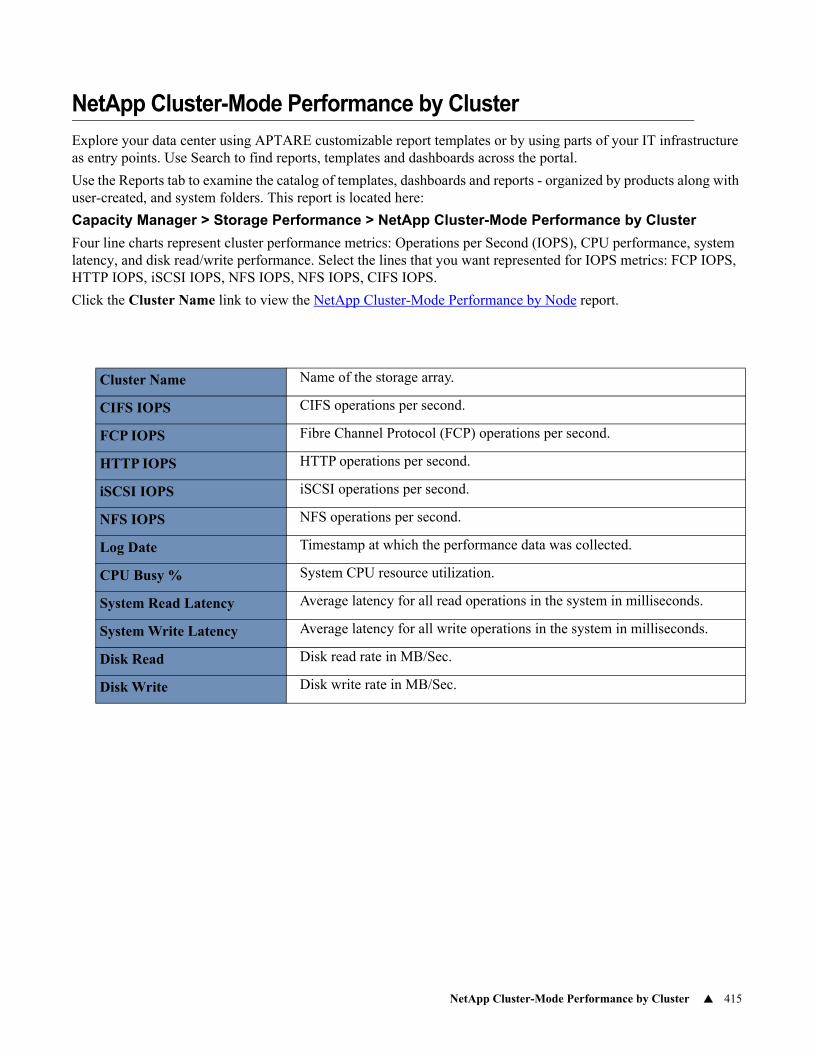
NetApp Cluster-Mode Performance by Cluster 415
NetApp Cluster-Mode Performance by Cluster
Explore your data center using APTARE customizable report templates or by using parts of your IT infrastructure as entry points. Use Search to find reports, templates and dashboards across the portal.
Use the Reports tab to examine the catalog of templates, dashboards and reports - organized by products along with user-created, and system folders. This report is located here:
Capacity Manager > Storage Performance > NetApp Cluster-Mode Performance by Cluster
Four line charts represent cluster performance metrics: Operations per Second (IOPS), CPU performance, system latency, and disk read/write performance. Select the lines that you want represented for IOPS metrics: FCP IOPS, HTTP IOPS, iSCSI IOPS, NFS IOPS, NFS IOPS, CIFS IOPS.
Click the Cluster Name link to view the NetApp Cluster-Mode Performance by Node report.
Cluster Name Name of the storage array.
CIFS IOPS CIFS operations per second.
FCP IOPS Fibre Channel Protocol (FCP) operations per second.
HTTP IOPS HTTP operations per second.
iSCSI IOPS iSCSI operations per second.
NFS IOPS NFS operations per second.
Log Date Timestamp at which the performance data was collected.
CPU Busy % System CPU resource utilization.
System Read Latency Average latency for all read operations in the system in milliseconds.
System Write Latency Average latency for all write operations in the system in milliseconds.
Disk Read Disk read rate in MB/Sec.
Disk Write Disk write rate in MB/Sec.
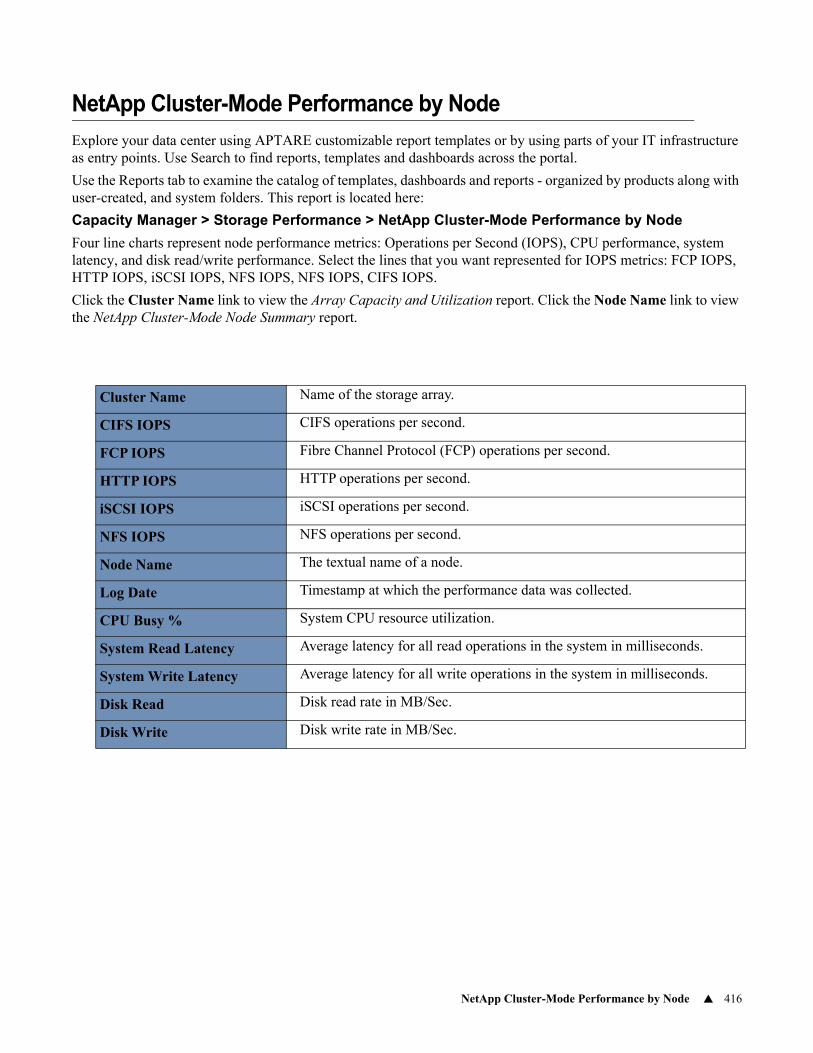
NetApp Cluster-Mode Performance by Node 416
NetApp Cluster-Mode Performance by Node
Explore your data center using APTARE customizable report templates or by using parts of your IT infrastructure as entry points. Use Search to find reports, templates and dashboards across the portal.
Use the Reports tab to examine the catalog of templates, dashboards and reports - organized by products along with user-created, and system folders. This report is located here:
Capacity Manager > Storage Performance > NetApp Cluster-Mode Performance by Node
Four line charts represent node performance metrics: Operations per Second (IOPS), CPU performance, system latency, and disk read/write performance. Select the lines that you want represented for IOPS metrics: FCP IOPS, HTTP IOPS, iSCSI IOPS, NFS IOPS, NFS IOPS, CIFS IOPS.
Click the Cluster Name link to view the Array Capacity and Utilization report. Click the Node Name link to view the NetApp Cluster-Mode Node Summary report.
Cluster Name Name of the storage array.
CIFS IOPS CIFS operations per second.
FCP IOPS Fibre Channel Protocol (FCP) operations per second.
HTTP IOPS HTTP operations per second.
iSCSI IOPS iSCSI operations per second.
NFS IOPS NFS operations per second.
Node Name The textual name of a node.
Log Date Timestamp at which the performance data was collected.
CPU Busy % System CPU resource utilization.
System Read Latency Average latency for all read operations in the system in milliseconds.
System Write Latency Average latency for all write operations in the system in milliseconds.
Disk Read Disk read rate in MB/Sec.
Disk Write Disk write rate in MB/Sec.
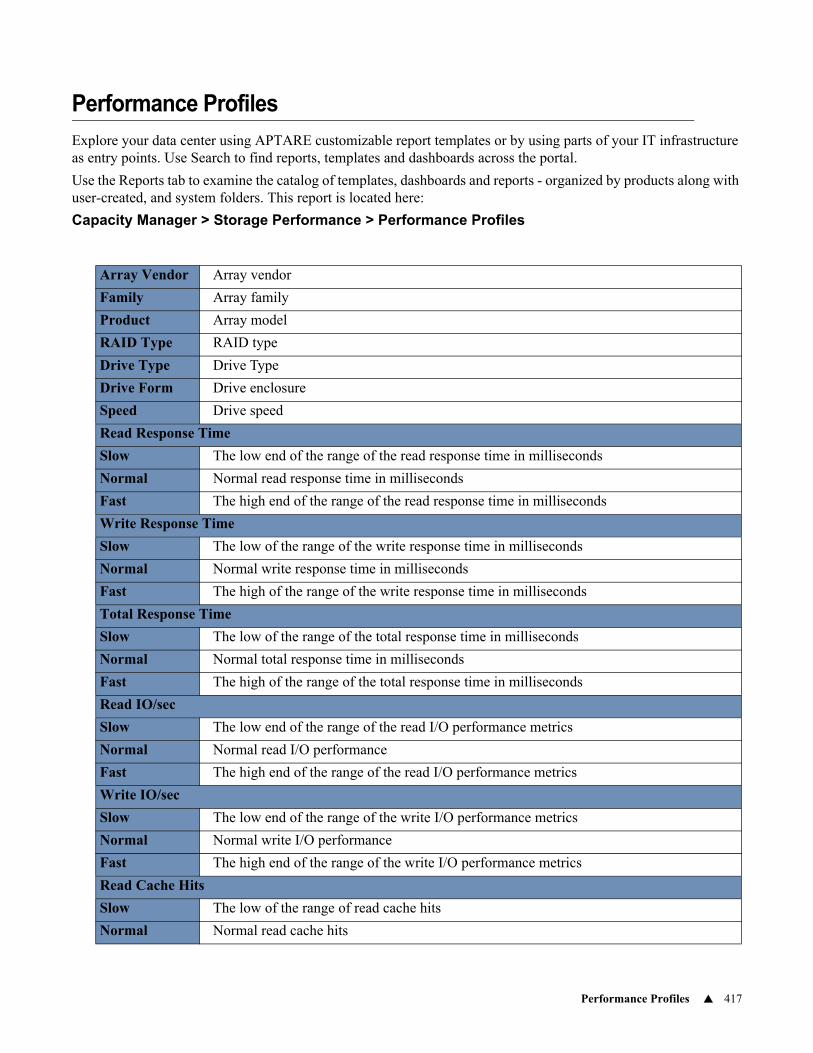
Performance Profiles 417
Performance Profiles
Explore your data center using APTARE customizable report templates or by using parts of your IT infrastructure as entry points. Use Search to find reports, templates and dashboards across the portal.
Use the Reports tab to examine the catalog of templates, dashboards and reports - organized by products along with user-created, and system folders. This report is located here:
Capacity Manager > Storage Performance > Performance Profiles
Array Vendor Array vendor
Family Array family
Product Array model
RAID Type RAID type
Drive Type Drive Type
Drive Form Drive enclosure
Speed Drive speed
Read Response Time
Slow The low end of the range of the read response time in milliseconds
Normal Normal read response time in milliseconds
Fast The high end of the range of the read response time in milliseconds
Write Response Time
Slow The low of the range of the write response time in milliseconds
Normal Normal write response time in milliseconds
Fast The high of the range of the write response time in milliseconds
Total Response Time
Slow The low of the range of the total response time in milliseconds
Normal Normal total response time in milliseconds
Fast The high of the range of the total response time in milliseconds
Read IO/sec
Slow The low end of the range of the read I/O performance metrics
Normal Normal read I/O performance
Fast The high end of the range of the read I/O performance metrics
Write IO/sec
Slow The low end of the range of the write I/O performance metrics
Normal Normal write I/O performance
Fast The high end of the range of the write I/O performance metrics
Read Cache Hits
Slow The low of the range of read cache hits
Normal Normal read cache hits
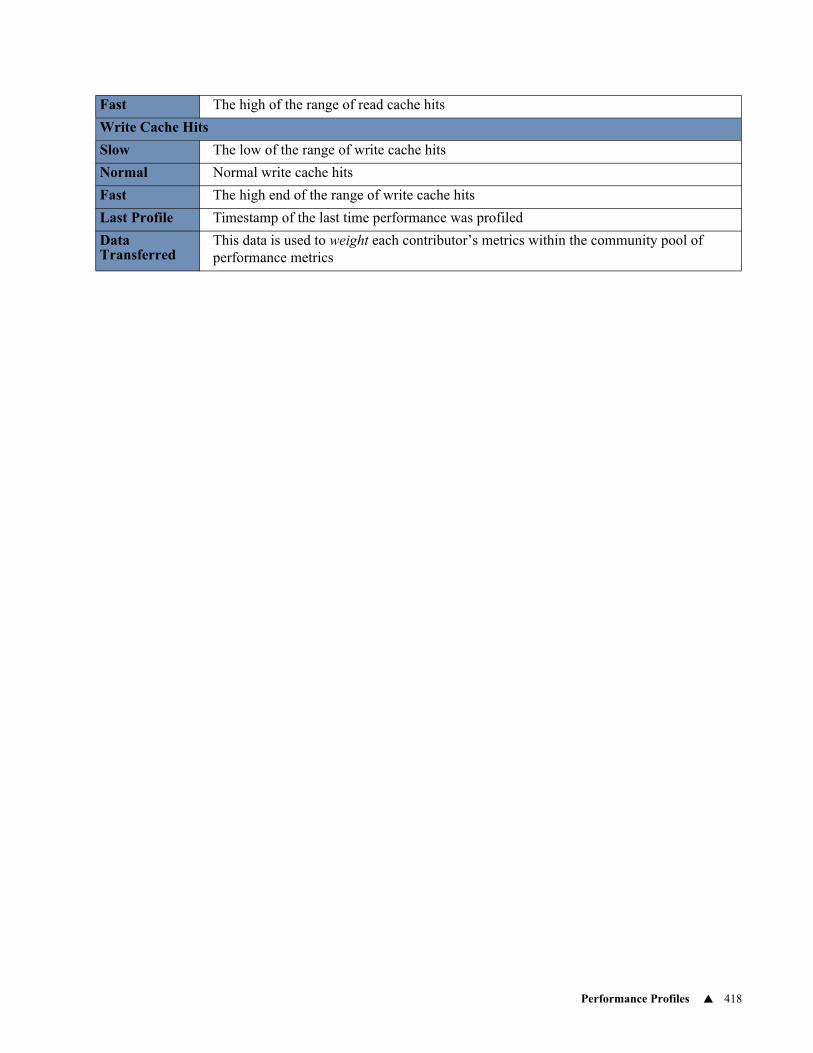
Performance Profiles 418
Fast The high of the range of read cache hits
Write Cache Hits
Slow The low of the range of write cache hits
Normal Normal write cache hits
Fast The high end of the range of write cache hits
Last Profile Timestamp of the last time performance was profiled
Data Transferred
This data is used to weight each contributor’s metrics within the community pool of performance metrics
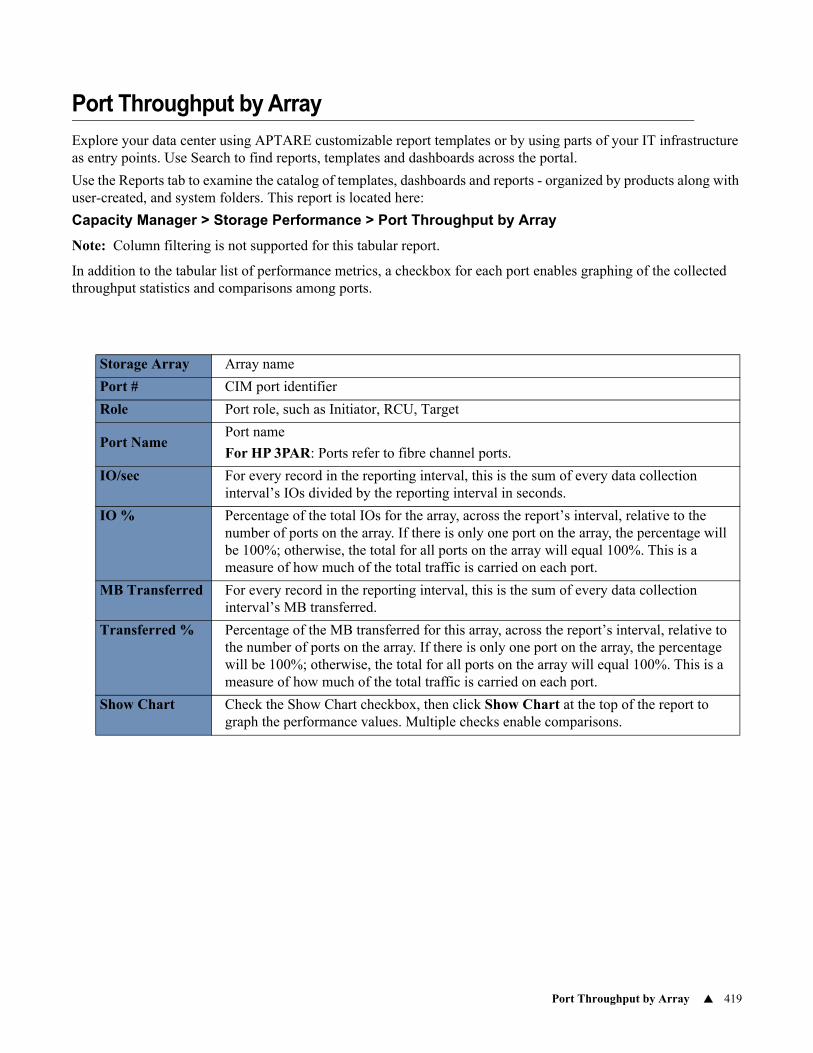
Port Throughput by Array 419
Port Throughput by Array
Explore your data center using APTARE customizable report templates or by using parts of your IT infrastructure as entry points. Use Search to find reports, templates and dashboards across the portal.
Use the Reports tab to examine the catalog of templates, dashboards and reports - organized by products along with user-created, and system folders. This report is located here:
Capacity Manager > Storage Performance > Port Throughput by Array
Note: Column filtering is not supported for this tabular report.
In addition to the tabular list of performance metrics, a checkbox for each port enables graphing of the collected throughput statistics and comparisons among ports.
Storage Array Array name
Port # CIM port identifier
Role Port role, such as Initiator, RCU, Target
Port NamePort name
For HP 3PAR: Ports refer to fibre channel ports.
IO/sec For every record in the reporting interval, this is the sum of every data collection interval’s IOs divided by the reporting interval in seconds.
IO % Percentage of the total IOs for the array, across the report’s interval, relative to the number of ports on the array. If there is only one port on the array, the percentage will be 100%; otherwise, the total for all ports on the array will equal 100%. This is a measure of how much of the total traffic is carried on each port.
MB Transferred For every record in the reporting interval, this is the sum of every data collection interval’s MB transferred.
Transferred % Percentage of the MB transferred for this array, across the report’s interval, relative to the number of ports on the array. If there is only one port on the array, the percentage will be 100%; otherwise, the total for all ports on the array will equal 100%. This is a measure of how much of the total traffic is carried on each port.
Show Chart Check the Show Chart checkbox, then click Show Chart at the top of the report to graph the performance values. Multiple checks enable comparisons.
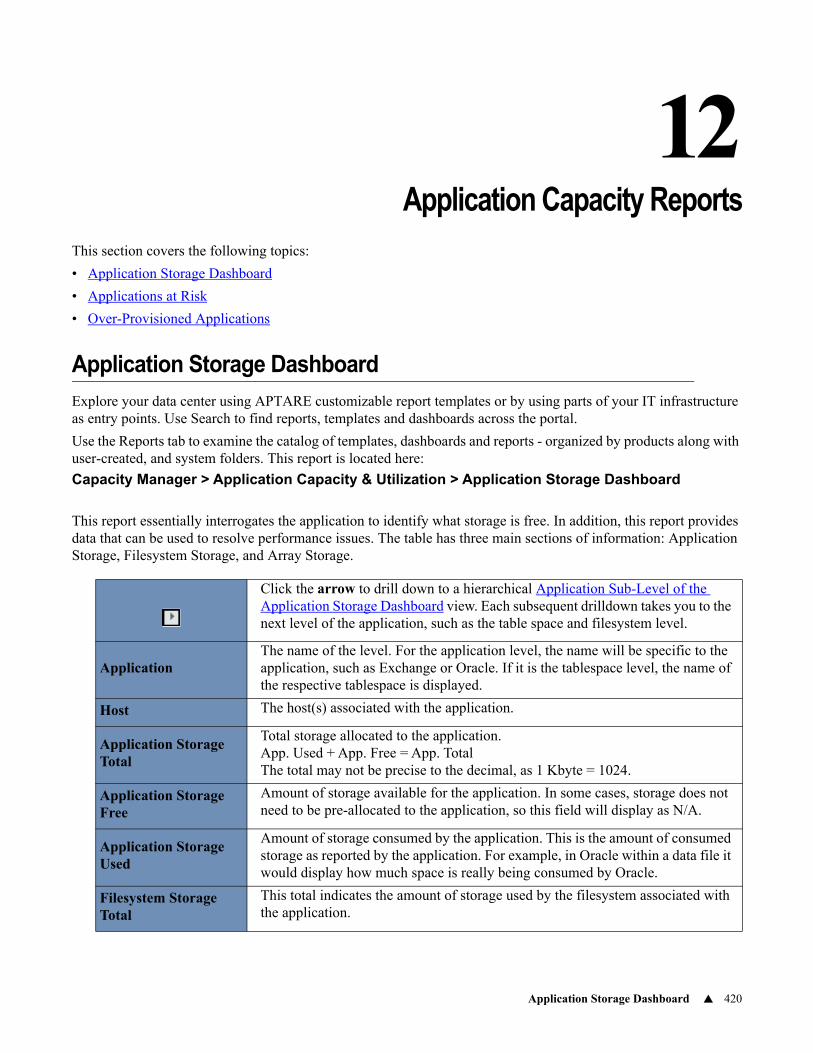
Application Storage Dashboard 420
12Chapter 6Application Capacity Reports
This section covers the following topics:
• Application Storage Dashboard
• Applications at Risk
• Over-Provisioned Applications
Application Storage Dashboard
Explore your data center using APTARE customizable report templates or by using parts of your IT infrastructure as entry points. Use Search to find reports, templates and dashboards across the portal.
Use the Reports tab to examine the catalog of templates, dashboards and reports - organized by products along with user-created, and system folders. This report is located here:
Capacity Manager > Application Capacity & Utilization > Application Storage Dashboard
This report essentially interrogates the application to identify what storage is free. In addition, this report provides data that can be used to resolve performance issues. The table has three main sections of information: Application Storage, Filesystem Storage, and Array Storage.
Click the arrow to drill down to a hierarchical Application Sub-Level of the Application Storage Dashboard view. Each subsequent drilldown takes you to the next level of the application, such as the table space and filesystem level.
ApplicationThe name of the level. For the application level, the name will be specific to the application, such as Exchange or Oracle. If it is the tablespace level, the name of the respective tablespace is displayed.
Host The host(s) associated with the application.
Application Storage Total
Total storage allocated to the application.App. Used + App. Free = App. TotalThe total may not be precise to the decimal, as 1 Kbyte = 1024.
Application Storage Free
Amount of storage available for the application. In some cases, storage does not need to be pre-allocated to the application, so this field will display as N/A.
Application Storage Used
Amount of storage consumed by the application. This is the amount of consumed storage as reported by the application. For example, in Oracle within a data file it would display how much space is really being consumed by Oracle.
Filesystem Storage Total
This total indicates the amount of storage used by the filesystem associated with the application.
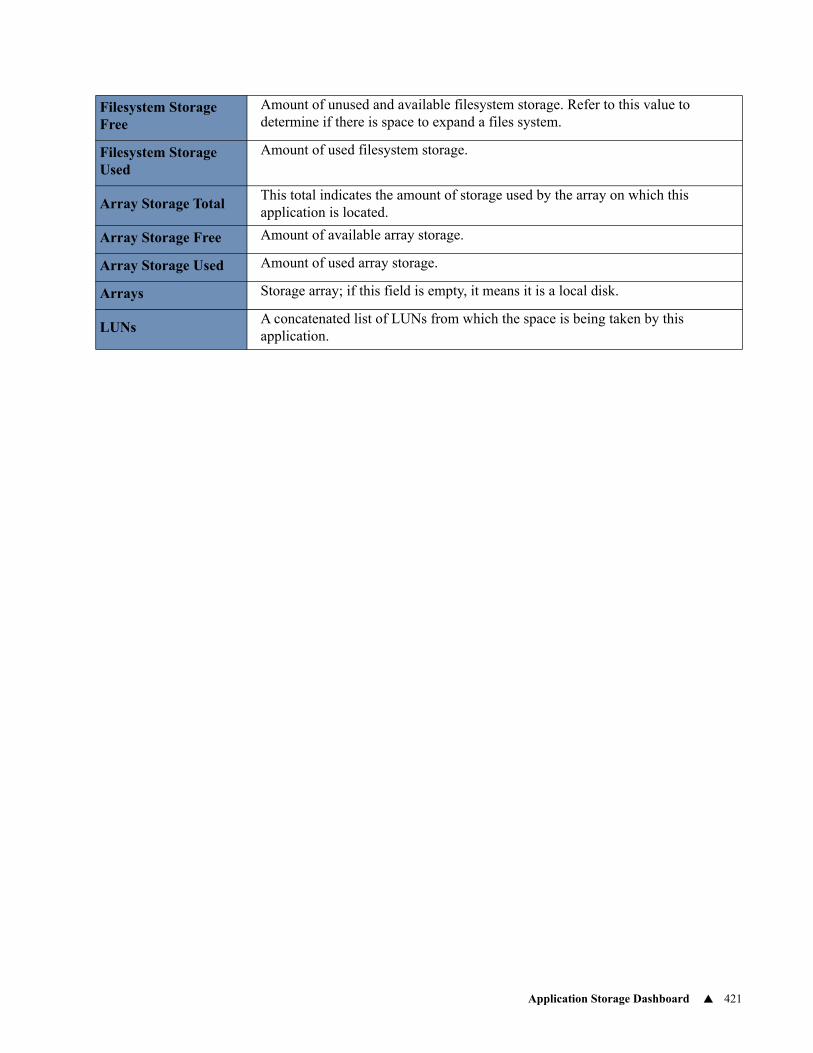
Application Storage Dashboard 421
Filesystem Storage Free
Amount of unused and available filesystem storage. Refer to this value to determine if there is space to expand a files system.
Filesystem Storage Used
Amount of used filesystem storage.
Array Storage TotalThis total indicates the amount of storage used by the array on which this application is located.
Array Storage Free Amount of available array storage.
Array Storage Used Amount of used array storage.
Arrays Storage array; if this field is empty, it means it is a local disk.
LUNsA concatenated list of LUNs from which the space is being taken by this application.
Application Storage Dashboard 422
Application Sub-Level of the Application Storage Dashboard
Detail reports are related to a specific enterprise object, such as a backup job. You can only access detail reports through a link presented in the context of a main report, providing additional information that augments the main report. Detail reports cannot be generated, customized, or saved, as they are specific to the report from which they were derived. They are not available in search results.
Explore your data center using APTARE IT Analytics customizable report templates or by using parts of your IT infrastructure as entry points. Use Search to find reports, templates and dashboards across the portal.
Use the Reports tab to examine the APTARE IT Analytics catalog of templates, dashboards and reports - organized by products along with user-created, and system folders. The main report is located here:
Capacity Manager > Application Capacity & Utilization > Application Storage DashboardClick the arrow to view the Application Level detail.
The data displayed in this window is simply the next level within the application—that is, instance-level reporting, as described in Application Storage Dashboard. At the application sub-level, a host link launches the Host Utilization Detail.
For example, an Oracle Database Administrator may be interested in managing storage at the tablespace level. Using the Application Storage Dashboard, the administrator can expand the Oracle application to view table space and also filesystem usage. In essence, this view provides the physical implementation of the filesystem, including the LUNs allocated to it.
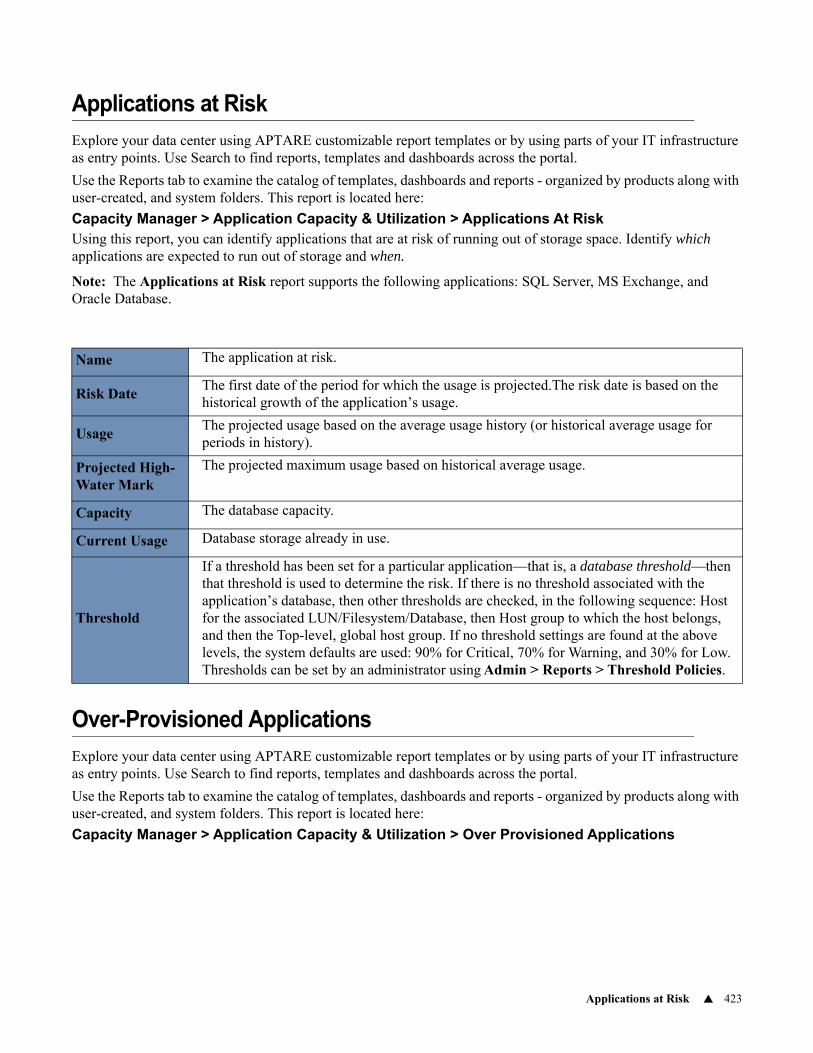
Applications at Risk 423
Applications at Risk
Explore your data center using APTARE customizable report templates or by using parts of your IT infrastructure as entry points. Use Search to find reports, templates and dashboards across the portal.
Use the Reports tab to examine the catalog of templates, dashboards and reports - organized by products along with user-created, and system folders. This report is located here:
Capacity Manager > Application Capacity & Utilization > Applications At RiskUsing this report, you can identify applications that are at risk of running out of storage space. Identify which applications are expected to run out of storage and when.
Note: The Applications at Risk report supports the following applications: SQL Server, MS Exchange, and Oracle Database.
Over-Provisioned Applications
Explore your data center using APTARE customizable report templates or by using parts of your IT infrastructure as entry points. Use Search to find reports, templates and dashboards across the portal.
Use the Reports tab to examine the catalog of templates, dashboards and reports - organized by products along with user-created, and system folders. This report is located here:
Capacity Manager > Application Capacity & Utilization > Over Provisioned Applications
Name The application at risk.
Risk DateThe first date of the period for which the usage is projected.The risk date is based on the historical growth of the application’s usage.
UsageThe projected usage based on the average usage history (or historical average usage for periods in history).
Projected High-Water Mark
The projected maximum usage based on historical average usage.
Capacity The database capacity.
Current Usage Database storage already in use.
Threshold
If a threshold has been set for a particular application—that is, a database threshold—then that threshold is used to determine the risk. If there is no threshold associated with the application’s database, then other thresholds are checked, in the following sequence: Host for the associated LUN/Filesystem/Database, then Host group to which the host belongs, and then the Top-level, global host group. If no threshold settings are found at the above levels, the system defaults are used: 90% for Critical, 70% for Warning, and 30% for Low. Thresholds can be set by an administrator using Admin > Reports > Threshold Policies.
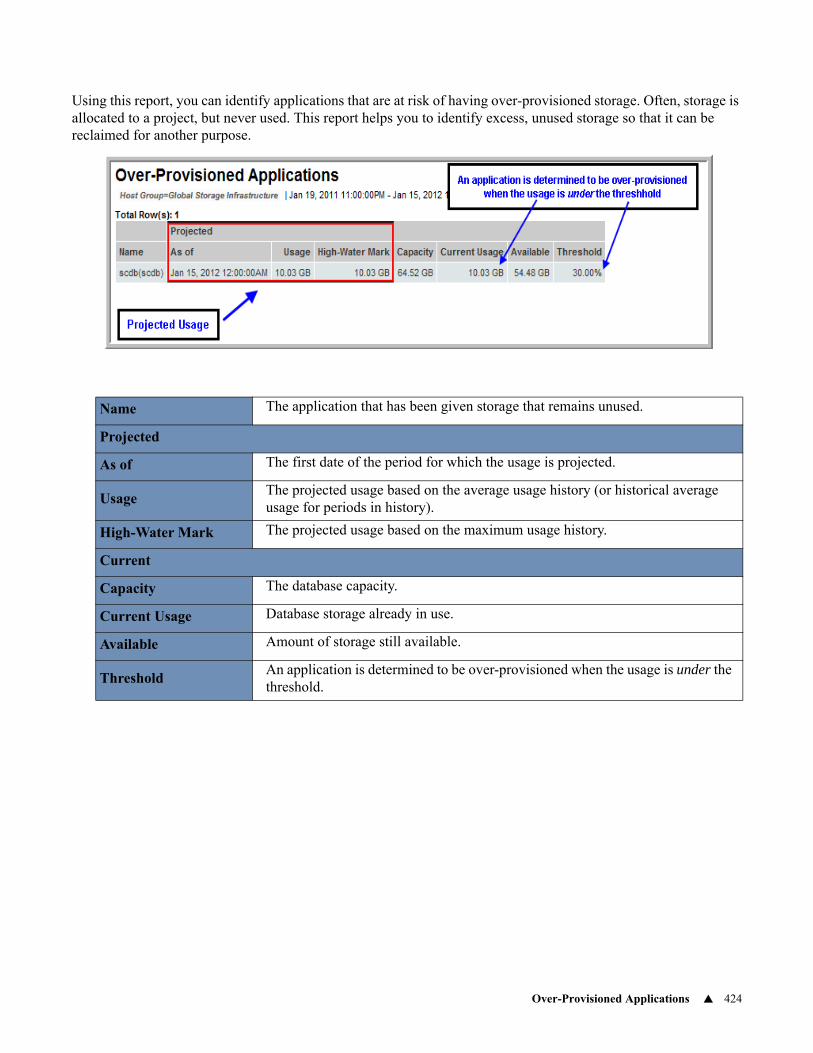
Over-Provisioned Applications 424
Using this report, you can identify applications that are at risk of having over-provisioned storage. Often, storage is allocated to a project, but never used. This report helps you to identify excess, unused storage so that it can be reclaimed for another purpose.
Name The application that has been given storage that remains unused.
Projected
As of The first date of the period for which the usage is projected.
UsageThe projected usage based on the average usage history (or historical average usage for periods in history).
High-Water Mark The projected usage based on the maximum usage history.
Current
Capacity The database capacity.
Current Usage Database storage already in use.
Available Amount of storage still available.
ThresholdAn application is determined to be over-provisioned when the usage is under the threshold.
Aggregated Chargeback 464
15Chapter 6Capacity Chargeback Reports
This section covers the following topics:
• Aggregated Chargeback
• AWS Account Billing Detail
• AWS Account Listing
• AWS Billing Summary Over Time
• AWS Product Summary
• Chargeback Array Capacity
• Chargeback By Host
• Chargeback Policy Capacity
• Microsoft Azure Billing Summary
• Microsoft Azure Resource Group Summary
• Microsoft Azure Subscription Summary
• Object Store Chargeback
Aggregated Chargeback
Explore your data center using APTARE customizable report templates or by using parts of your IT infrastructure as entry points. Use Search to find reports, templates and dashboards across the portal.
Use the Reports tab to examine the catalog of templates, dashboards and reports - organized by products along with user-created, and system folders. This report is located here:
Capacity Manager > Chargeback and Billing > Aggregated Chargeback
Note: This is a host-based report. Host data collection is required before data will appear in this report.
This Capacity Chargeback report enables you to aggregate the data by Host Groups or by a particular host attribute (for example, Department).
The Report Designer provides both a filtering and a grouping mechanism.
• Host Groups are used to filter or narrow the scope and content of the report.
• Host Groups and Attributes are used to aggregate the data—that is, a grouping mechanism. Note that Attributes are from the host’s perspective.
• If you choose only Host Groups (without an Attribute), the report will be filtered on the selected Host Groups and also will be grouped by Host Group.
• Allocate Duplicate Host to All, when checked, reports duplicate host usage in all Host Groups, if hosts are in more than one host group.When unchecked, reports duplicate host usage only in the first alphabetical host group.
Aggregated Chargeback 465
Capacity Chargeback Policies are configured by the APTARE IT Analytics Administrator. The administrator uses these policies to assign a cost-per-GB to hosts in a host group. See examples in Aggregated Chargeback by Host Groups and Aggregated Chargeback by Attribute.
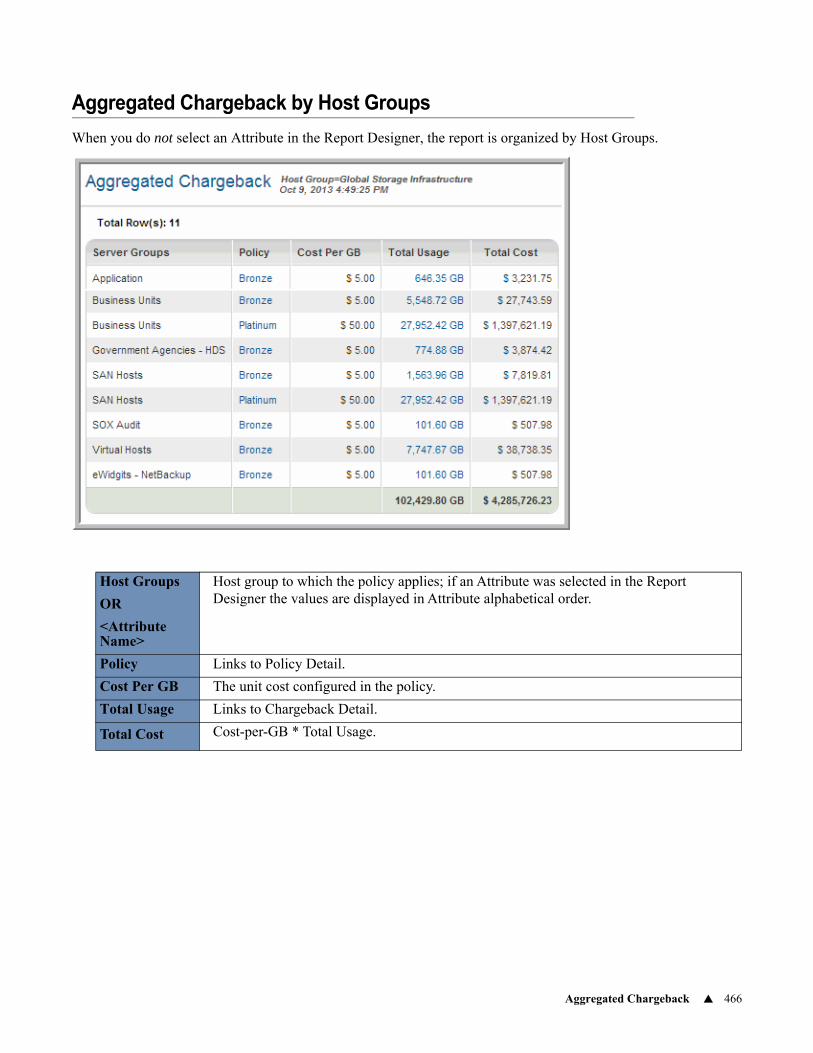
Aggregated Chargeback 466
Aggregated Chargeback by Host Groups
When you do not select an Attribute in the Report Designer, the report is organized by Host Groups.
Host Groups
OR
<Attribute Name>
Host group to which the policy applies; if an Attribute was selected in the Report Designer the values are displayed in Attribute alphabetical order.
Policy Links to Policy Detail.
Cost Per GB The unit cost configured in the policy.
Total Usage Links to Chargeback Detail.
Total Cost Cost-per-GB * Total Usage.
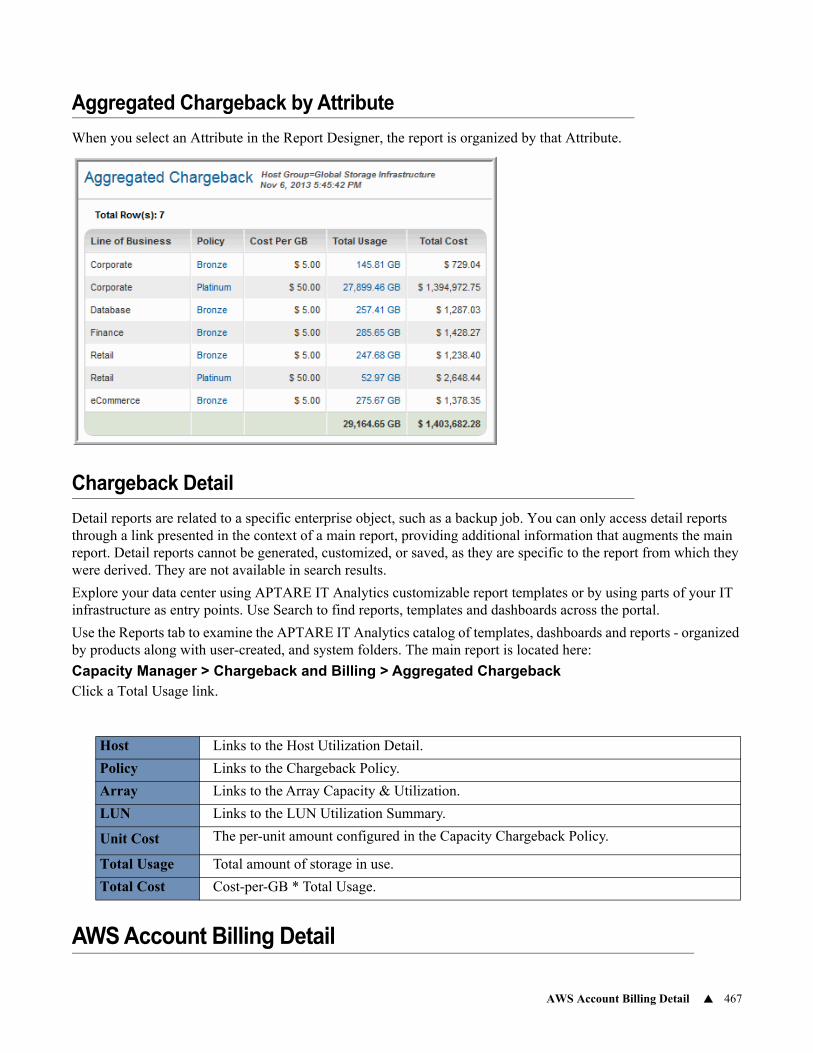
AWS Account Billing Detail 467
Aggregated Chargeback by Attribute
When you select an Attribute in the Report Designer, the report is organized by that Attribute.
Chargeback Detail
Detail reports are related to a specific enterprise object, such as a backup job. You can only access detail reports through a link presented in the context of a main report, providing additional information that augments the main report. Detail reports cannot be generated, customized, or saved, as they are specific to the report from which they were derived. They are not available in search results.
Explore your data center using APTARE IT Analytics customizable report templates or by using parts of your IT infrastructure as entry points. Use Search to find reports, templates and dashboards across the portal.
Use the Reports tab to examine the APTARE IT Analytics catalog of templates, dashboards and reports - organized by products along with user-created, and system folders. The main report is located here:
Capacity Manager > Chargeback and Billing > Aggregated ChargebackClick a Total Usage link.
AWS Account Billing Detail
Host Links to the Host Utilization Detail.
Policy Links to the Chargeback Policy.
Array Links to the Array Capacity & Utilization.
LUN Links to the LUN Utilization Summary.
Unit Cost The per-unit amount configured in the Capacity Chargeback Policy.
Total Usage Total amount of storage in use.
Total Cost Cost-per-GB * Total Usage.
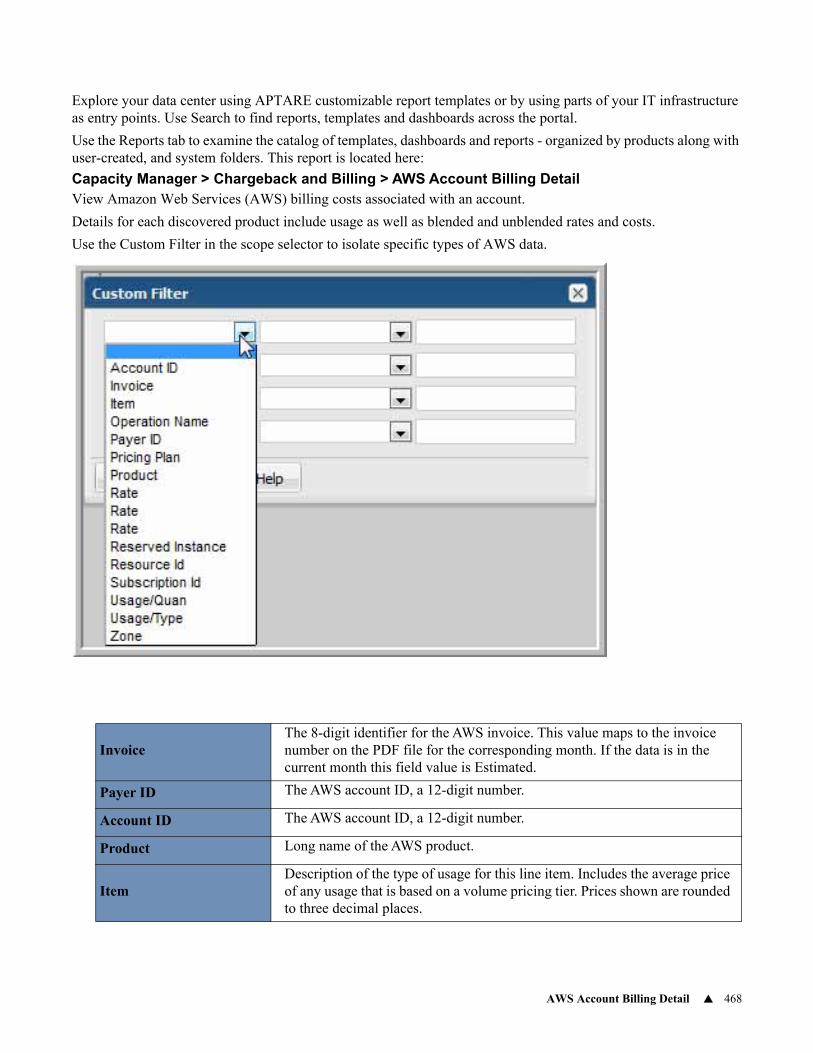
AWS Account Billing Detail 468
Explore your data center using APTARE customizable report templates or by using parts of your IT infrastructure as entry points. Use Search to find reports, templates and dashboards across the portal.
Use the Reports tab to examine the catalog of templates, dashboards and reports - organized by products along with user-created, and system folders. This report is located here:
Capacity Manager > Chargeback and Billing > AWS Account Billing DetailView Amazon Web Services (AWS) billing costs associated with an account.
Details for each discovered product include usage as well as blended and unblended rates and costs.
Use the Custom Filter in the scope selector to isolate specific types of AWS data.
InvoiceThe 8-digit identifier for the AWS invoice. This value maps to the invoice number on the PDF file for the corresponding month. If the data is in the current month this field value is Estimated.
Payer ID The AWS account ID, a 12-digit number.
Account ID The AWS account ID, a 12-digit number.
Product Long name of the AWS product.
ItemDescription of the type of usage for this line item. Includes the average price of any usage that is based on a volume pricing tier. Prices shown are rounded to three decimal places.
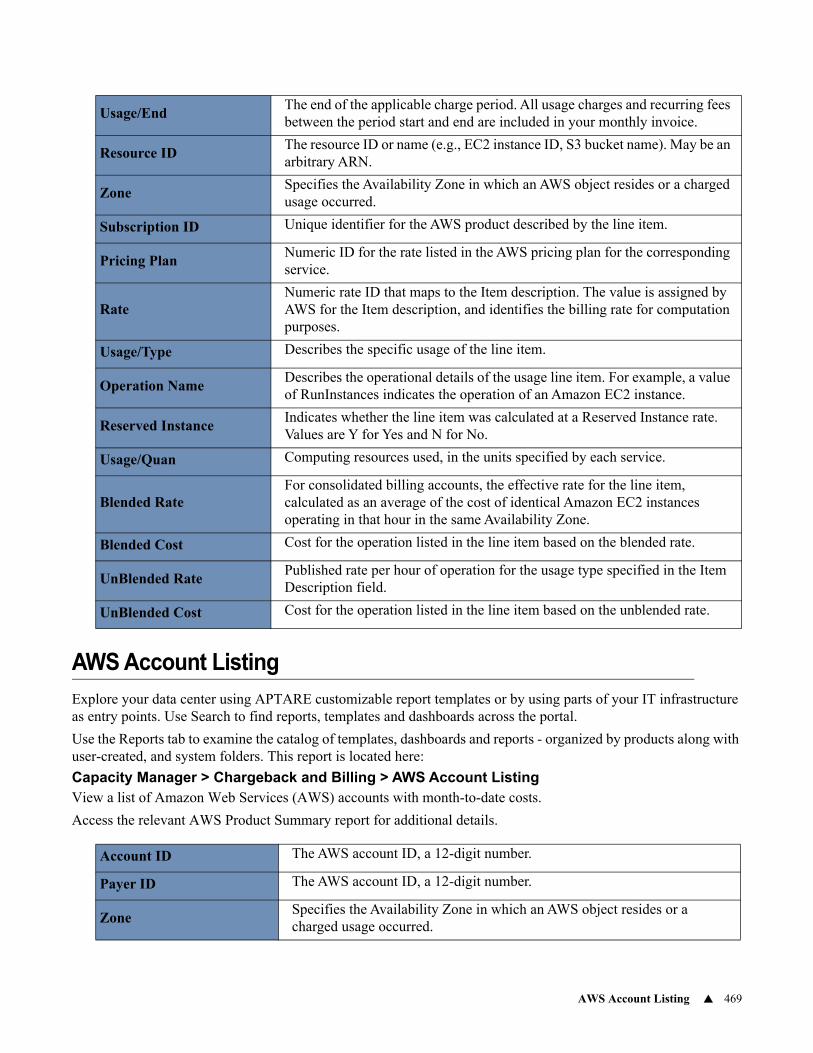
AWS Account Listing 469
AWS Account Listing
Explore your data center using APTARE customizable report templates or by using parts of your IT infrastructure as entry points. Use Search to find reports, templates and dashboards across the portal.
Use the Reports tab to examine the catalog of templates, dashboards and reports - organized by products along with user-created, and system folders. This report is located here:
Capacity Manager > Chargeback and Billing > AWS Account ListingView a list of Amazon Web Services (AWS) accounts with month-to-date costs.
Access the relevant AWS Product Summary report for additional details.
Usage/EndThe end of the applicable charge period. All usage charges and recurring fees between the period start and end are included in your monthly invoice.
Resource IDThe resource ID or name (e.g., EC2 instance ID, S3 bucket name). May be an arbitrary ARN.
ZoneSpecifies the Availability Zone in which an AWS object resides or a charged usage occurred.
Subscription ID Unique identifier for the AWS product described by the line item.
Pricing PlanNumeric ID for the rate listed in the AWS pricing plan for the corresponding service.
RateNumeric rate ID that maps to the Item description. The value is assigned by AWS for the Item description, and identifies the billing rate for computation purposes.
Usage/Type Describes the specific usage of the line item.
Operation Name Describes the operational details of the usage line item. For example, a value of RunInstances indicates the operation of an Amazon EC2 instance.
Reserved InstanceIndicates whether the line item was calculated at a Reserved Instance rate. Values are Y for Yes and N for No.
Usage/Quan Computing resources used, in the units specified by each service.
Blended RateFor consolidated billing accounts, the effective rate for the line item, calculated as an average of the cost of identical Amazon EC2 instances operating in that hour in the same Availability Zone.
Blended Cost Cost for the operation listed in the line item based on the blended rate.
UnBlended RatePublished rate per hour of operation for the usage type specified in the Item Description field.
UnBlended Cost Cost for the operation listed in the line item based on the unblended rate.
Account ID The AWS account ID, a 12-digit number.
Payer ID The AWS account ID, a 12-digit number.
ZoneSpecifies the Availability Zone in which an AWS object resides or a charged usage occurred.
AWS Account Listing 470
Alias The account alias.
Number of ProductsLong name of the AWS product. Click the link to access the AWS Product Summary.
Blended Cost Cost for the operation listed in the line item based on the blended rate. Click the link to access the AWS Account Billing Detail.
Tags Tags associated with the account.
Last Invoice Date Date of the latest Usage Start Date that was collected for this month.
Last Updated Last updated date.
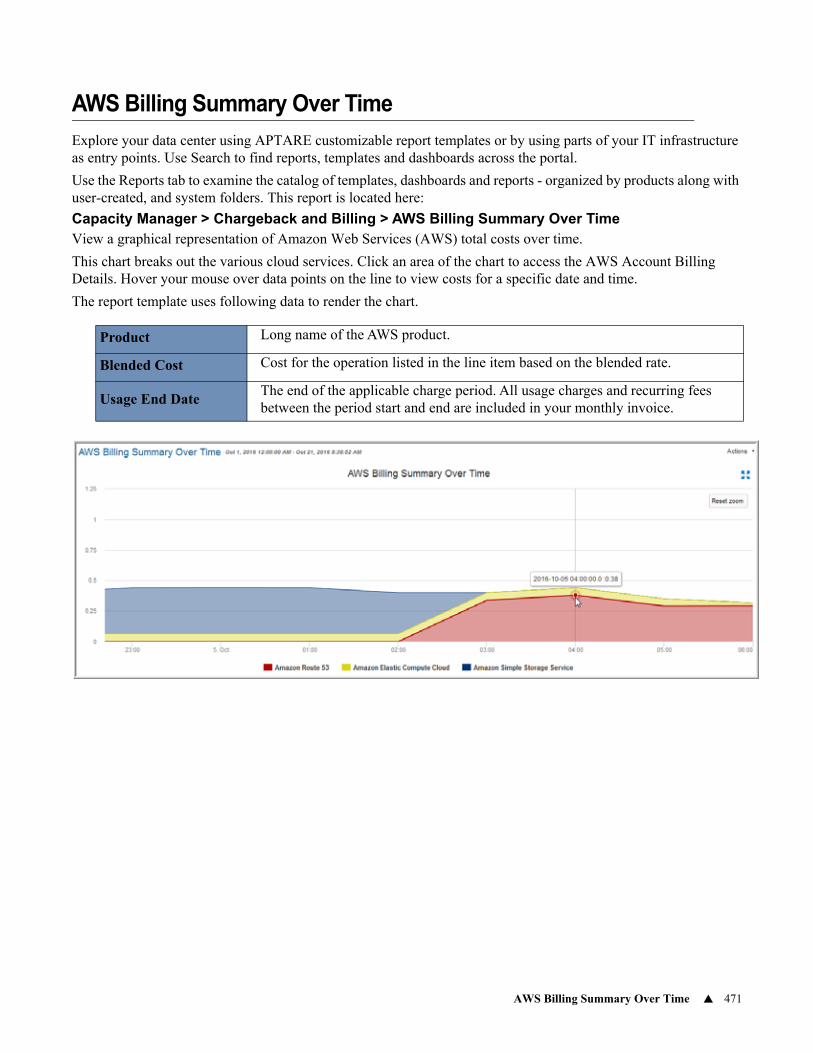
AWS Billing Summary Over Time 471
AWS Billing Summary Over Time
Explore your data center using APTARE customizable report templates or by using parts of your IT infrastructure as entry points. Use Search to find reports, templates and dashboards across the portal.
Use the Reports tab to examine the catalog of templates, dashboards and reports - organized by products along with user-created, and system folders. This report is located here:
Capacity Manager > Chargeback and Billing > AWS Billing Summary Over TimeView a graphical representation of Amazon Web Services (AWS) total costs over time.
This chart breaks out the various cloud services. Click an area of the chart to access the AWS Account Billing Details. Hover your mouse over data points on the line to view costs for a specific date and time.
The report template uses following data to render the chart.
Product Long name of the AWS product.
Blended Cost Cost for the operation listed in the line item based on the blended rate.
Usage End DateThe end of the applicable charge period. All usage charges and recurring fees between the period start and end are included in your monthly invoice.
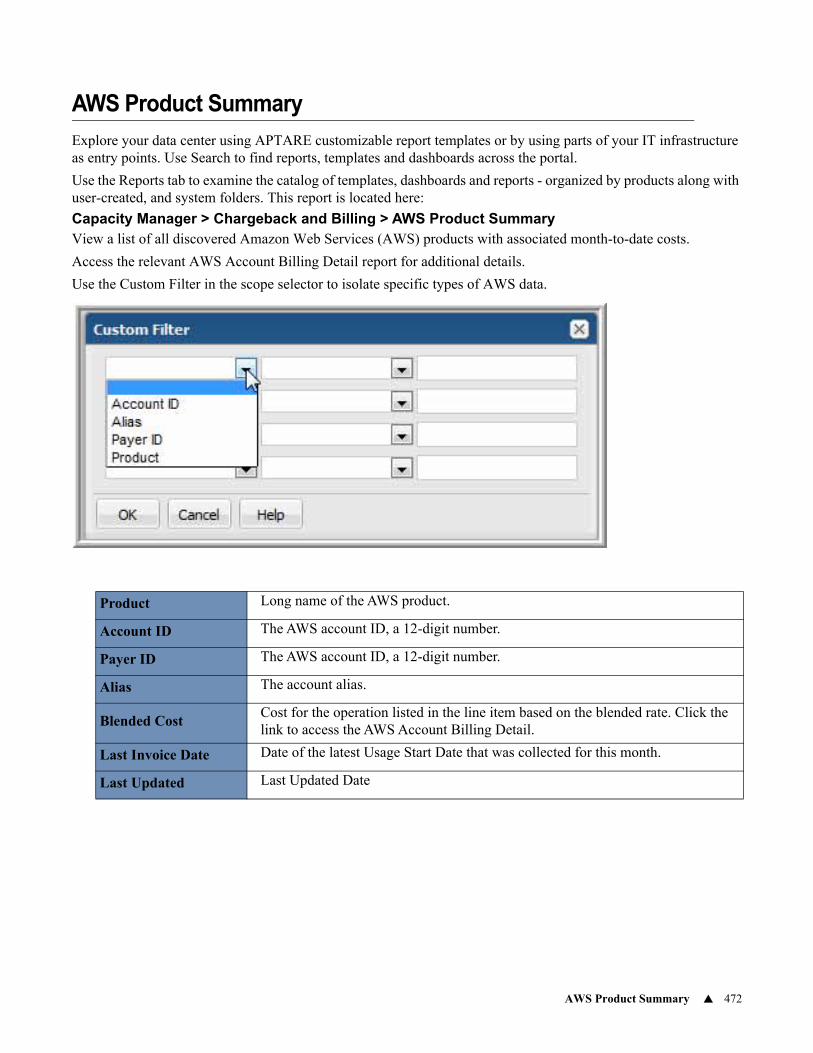
AWS Product Summary 472
AWS Product Summary
Explore your data center using APTARE customizable report templates or by using parts of your IT infrastructure as entry points. Use Search to find reports, templates and dashboards across the portal.
Use the Reports tab to examine the catalog of templates, dashboards and reports - organized by products along with user-created, and system folders. This report is located here:
Capacity Manager > Chargeback and Billing > AWS Product SummaryView a list of all discovered Amazon Web Services (AWS) products with associated month-to-date costs.
Access the relevant AWS Account Billing Detail report for additional details.
Use the Custom Filter in the scope selector to isolate specific types of AWS data.
Product Long name of the AWS product.
Account ID The AWS account ID, a 12-digit number.
Payer ID The AWS account ID, a 12-digit number.
Alias The account alias.
Blended CostCost for the operation listed in the line item based on the blended rate. Click the link to access the AWS Account Billing Detail.
Last Invoice Date Date of the latest Usage Start Date that was collected for this month.
Last Updated Last Updated Date
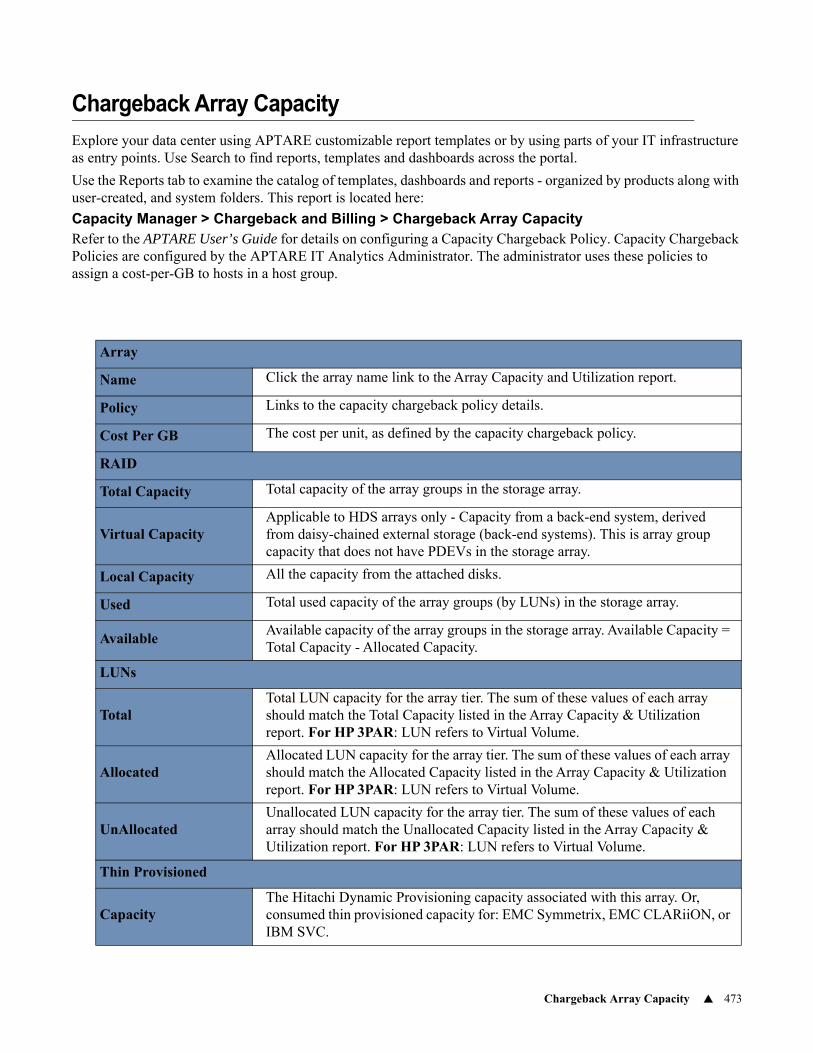
Chargeback Array Capacity 473
Chargeback Array Capacity
Explore your data center using APTARE customizable report templates or by using parts of your IT infrastructure as entry points. Use Search to find reports, templates and dashboards across the portal.
Use the Reports tab to examine the catalog of templates, dashboards and reports - organized by products along with user-created, and system folders. This report is located here:
Capacity Manager > Chargeback and Billing > Chargeback Array CapacityRefer to the APTARE User’s Guide for details on configuring a Capacity Chargeback Policy. Capacity Chargeback Policies are configured by the APTARE IT Analytics Administrator. The administrator uses these policies to assign a cost-per-GB to hosts in a host group.
Array
Name Click the array name link to the Array Capacity and Utilization report.
Policy Links to the capacity chargeback policy details.
Cost Per GB The cost per unit, as defined by the capacity chargeback policy.
RAID
Total Capacity Total capacity of the array groups in the storage array.
Virtual CapacityApplicable to HDS arrays only - Capacity from a back-end system, derived from daisy-chained external storage (back-end systems). This is array group capacity that does not have PDEVs in the storage array.
Local Capacity All the capacity from the attached disks.
Used Total used capacity of the array groups (by LUNs) in the storage array.
AvailableAvailable capacity of the array groups in the storage array. Available Capacity = Total Capacity - Allocated Capacity.
LUNs
TotalTotal LUN capacity for the array tier. The sum of these values of each array should match the Total Capacity listed in the Array Capacity & Utilization report. For HP 3PAR: LUN refers to Virtual Volume.
AllocatedAllocated LUN capacity for the array tier. The sum of these values of each array should match the Allocated Capacity listed in the Array Capacity & Utilization report. For HP 3PAR: LUN refers to Virtual Volume.
UnAllocatedUnallocated LUN capacity for the array tier. The sum of these values of each array should match the Unallocated Capacity listed in the Array Capacity & Utilization report. For HP 3PAR: LUN refers to Virtual Volume.
Thin Provisioned
CapacityThe Hitachi Dynamic Provisioning capacity associated with this array. Or, consumed thin provisioned capacity for: EMC Symmetrix, EMC CLARiiON, or IBM SVC.
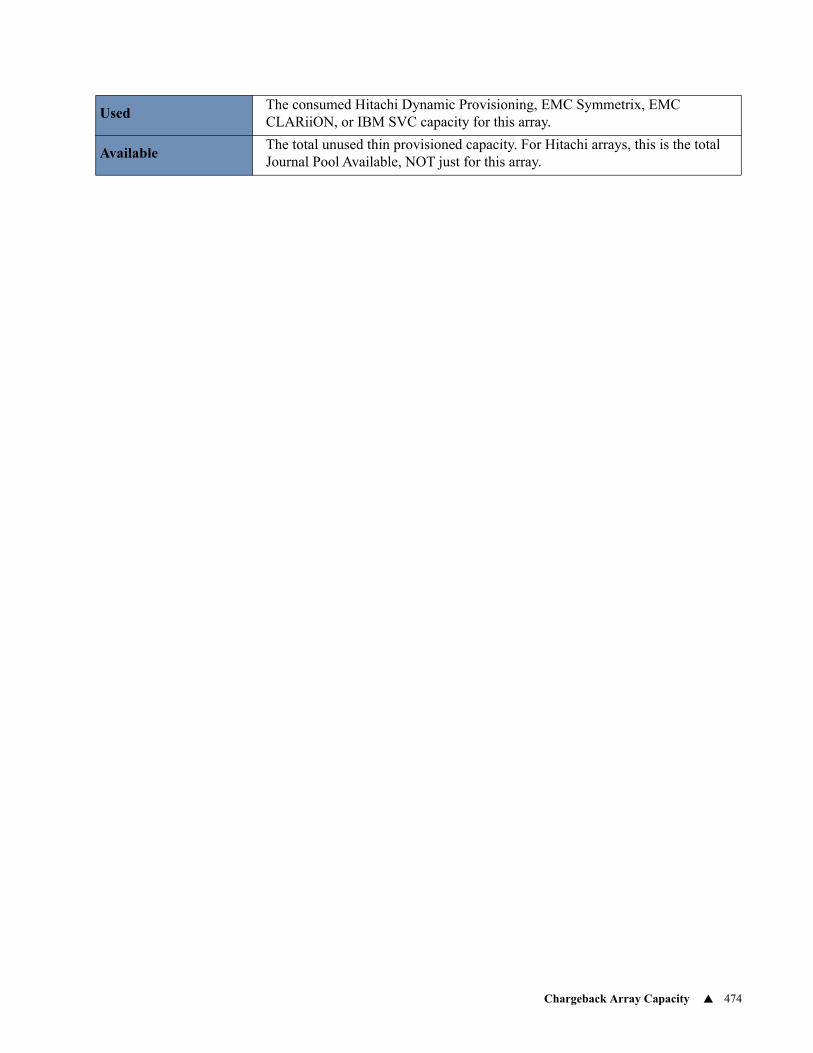
Chargeback Array Capacity 474
UsedThe consumed Hitachi Dynamic Provisioning, EMC Symmetrix, EMC CLARiiON, or IBM SVC capacity for this array.
AvailableThe total unused thin provisioned capacity. For Hitachi arrays, this is the total Journal Pool Available, NOT just for this array.
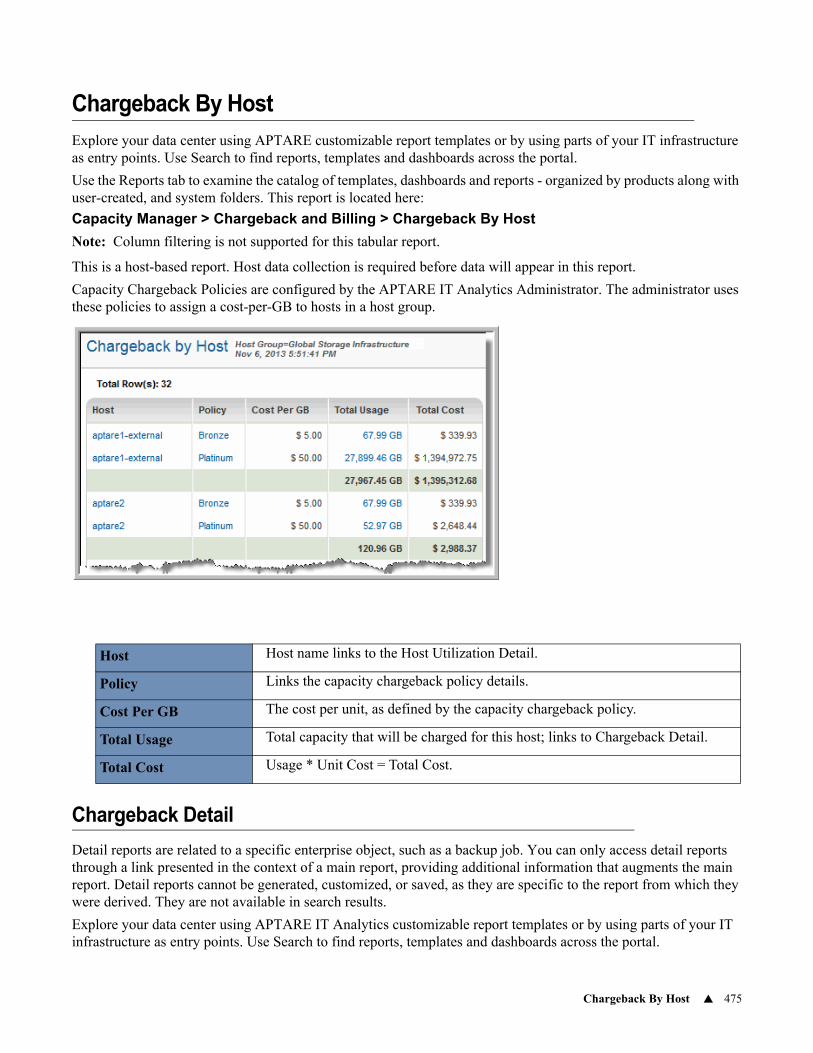
Chargeback By Host 475
Chargeback By Host
Explore your data center using APTARE customizable report templates or by using parts of your IT infrastructure as entry points. Use Search to find reports, templates and dashboards across the portal.
Use the Reports tab to examine the catalog of templates, dashboards and reports - organized by products along with user-created, and system folders. This report is located here:
Capacity Manager > Chargeback and Billing > Chargeback By Host
Note: Column filtering is not supported for this tabular report.
This is a host-based report. Host data collection is required before data will appear in this report.
Capacity Chargeback Policies are configured by the APTARE IT Analytics Administrator. The administrator uses these policies to assign a cost-per-GB to hosts in a host group.
Chargeback Detail
Detail reports are related to a specific enterprise object, such as a backup job. You can only access detail reports through a link presented in the context of a main report, providing additional information that augments the main report. Detail reports cannot be generated, customized, or saved, as they are specific to the report from which they were derived. They are not available in search results.
Explore your data center using APTARE IT Analytics customizable report templates or by using parts of your IT infrastructure as entry points. Use Search to find reports, templates and dashboards across the portal.
Host Host name links to the Host Utilization Detail.
Policy Links the capacity chargeback policy details.
Cost Per GB The cost per unit, as defined by the capacity chargeback policy.
Total Usage Total capacity that will be charged for this host; links to Chargeback Detail.
Total Cost Usage * Unit Cost = Total Cost.
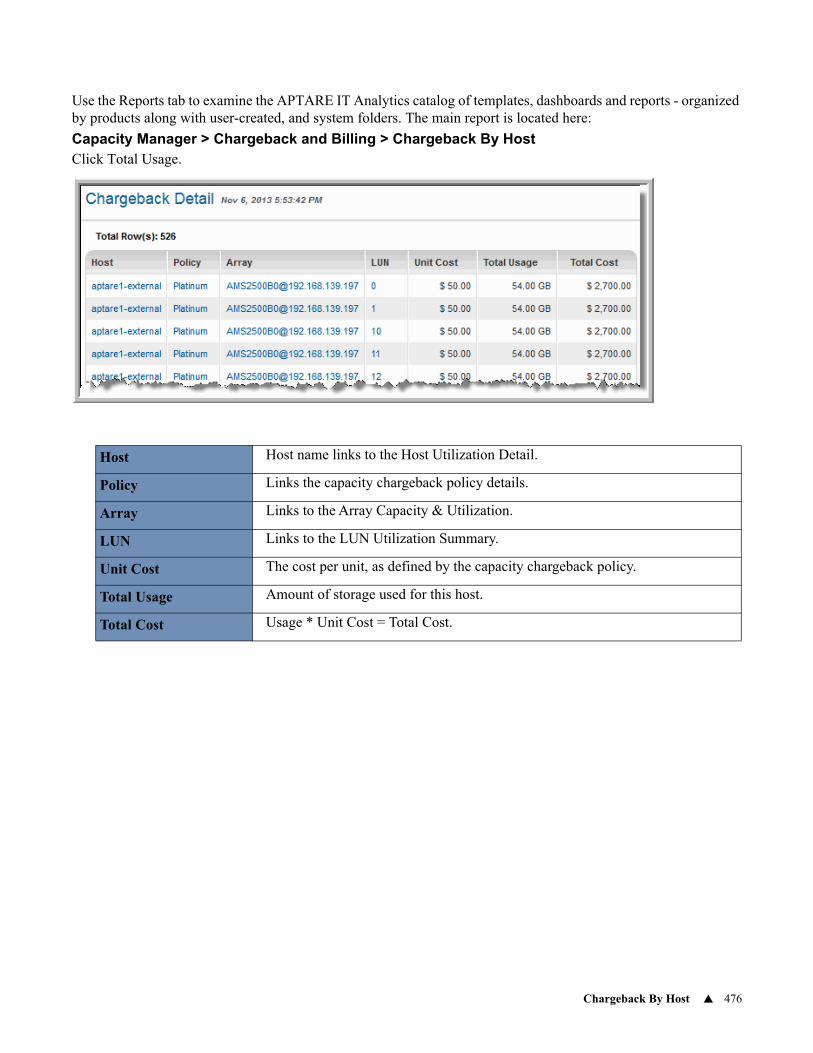
Chargeback By Host 476
Use the Reports tab to examine the APTARE IT Analytics catalog of templates, dashboards and reports - organized by products along with user-created, and system folders. The main report is located here:
Capacity Manager > Chargeback and Billing > Chargeback By HostClick Total Usage.
Host Host name links to the Host Utilization Detail.
Policy Links the capacity chargeback policy details.
Array Links to the Array Capacity & Utilization.
LUN Links to the LUN Utilization Summary.
Unit Cost The cost per unit, as defined by the capacity chargeback policy.
Total Usage Amount of storage used for this host.
Total Cost Usage * Unit Cost = Total Cost.
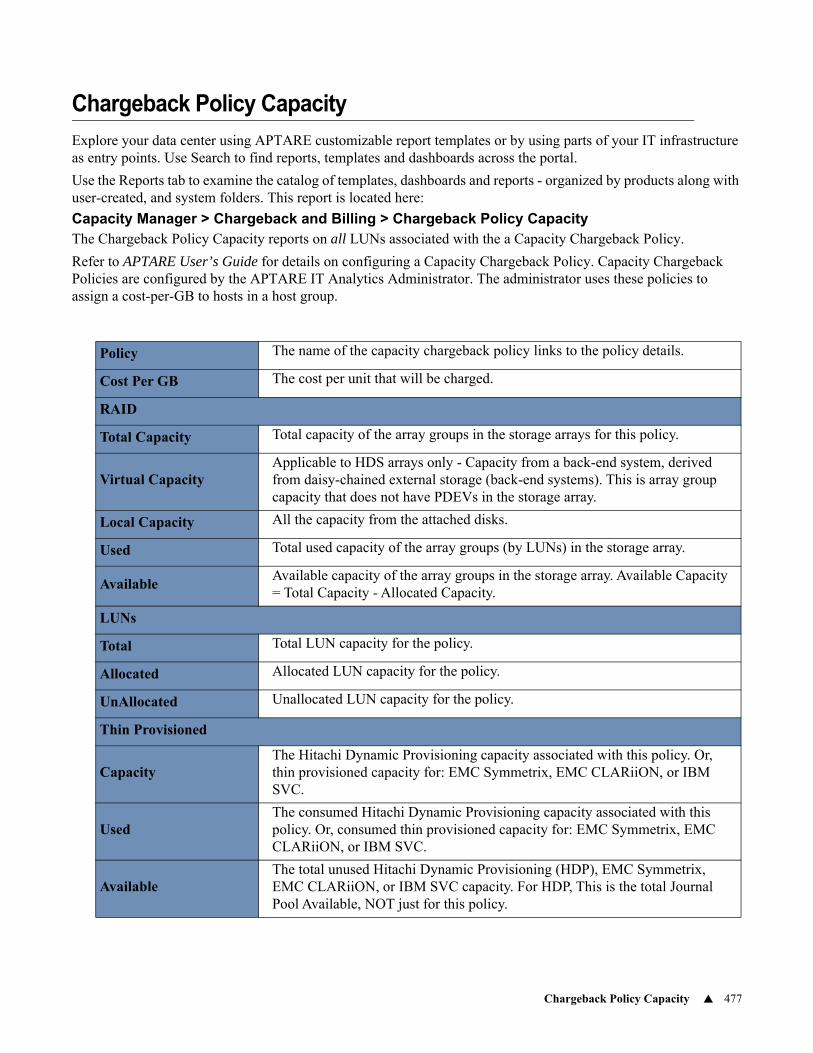
Chargeback Policy Capacity 477
Chargeback Policy Capacity
Explore your data center using APTARE customizable report templates or by using parts of your IT infrastructure as entry points. Use Search to find reports, templates and dashboards across the portal.
Use the Reports tab to examine the catalog of templates, dashboards and reports - organized by products along with user-created, and system folders. This report is located here:
Capacity Manager > Chargeback and Billing > Chargeback Policy CapacityThe Chargeback Policy Capacity reports on all LUNs associated with the a Capacity Chargeback Policy.
Refer to APTARE User’s Guide for details on configuring a Capacity Chargeback Policy. Capacity Chargeback Policies are configured by the APTARE IT Analytics Administrator. The administrator uses these policies to assign a cost-per-GB to hosts in a host group.
Policy The name of the capacity chargeback policy links to the policy details.
Cost Per GB The cost per unit that will be charged.
RAID
Total Capacity Total capacity of the array groups in the storage arrays for this policy.
Virtual CapacityApplicable to HDS arrays only - Capacity from a back-end system, derived from daisy-chained external storage (back-end systems). This is array group capacity that does not have PDEVs in the storage array.
Local Capacity All the capacity from the attached disks.
Used Total used capacity of the array groups (by LUNs) in the storage array.
AvailableAvailable capacity of the array groups in the storage array. Available Capacity = Total Capacity - Allocated Capacity.
LUNs
Total Total LUN capacity for the policy.
Allocated Allocated LUN capacity for the policy.
UnAllocated Unallocated LUN capacity for the policy.
Thin Provisioned
CapacityThe Hitachi Dynamic Provisioning capacity associated with this policy. Or, thin provisioned capacity for: EMC Symmetrix, EMC CLARiiON, or IBM SVC.
UsedThe consumed Hitachi Dynamic Provisioning capacity associated with this policy. Or, consumed thin provisioned capacity for: EMC Symmetrix, EMC CLARiiON, or IBM SVC.
AvailableThe total unused Hitachi Dynamic Provisioning (HDP), EMC Symmetrix, EMC CLARiiON, or IBM SVC capacity. For HDP, This is the total Journal Pool Available, NOT just for this policy.
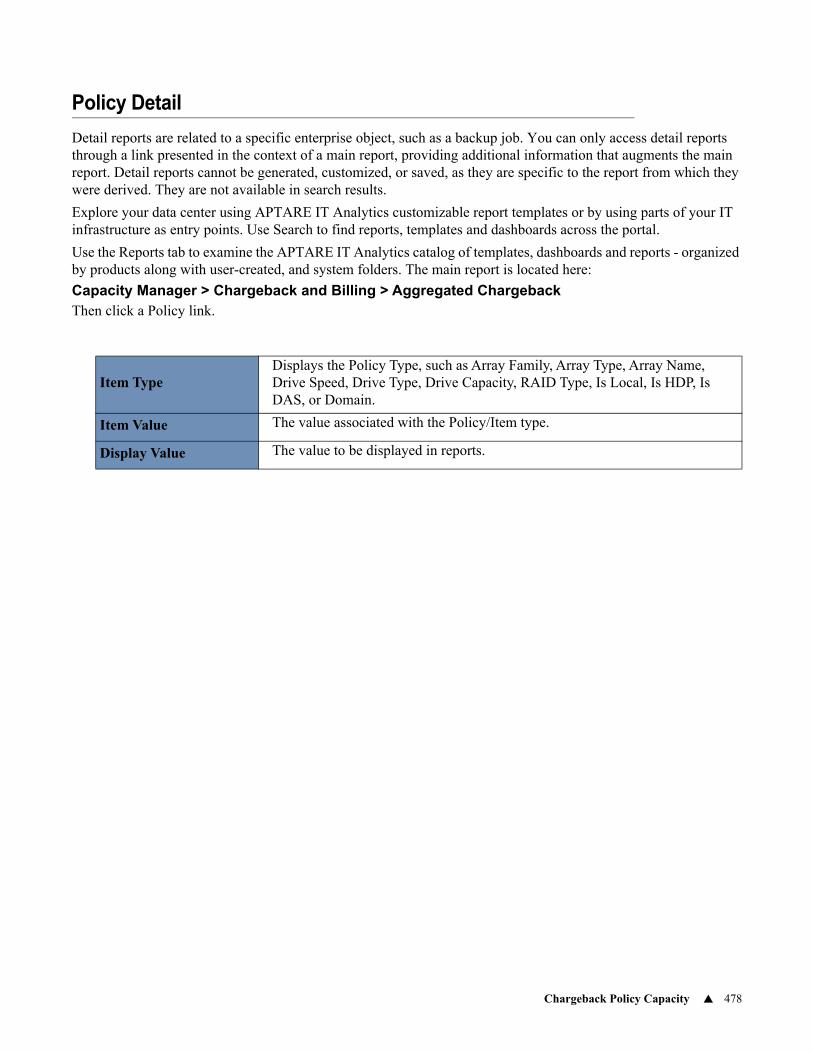
Chargeback Policy Capacity 478
Policy Detail
Detail reports are related to a specific enterprise object, such as a backup job. You can only access detail reports through a link presented in the context of a main report, providing additional information that augments the main report. Detail reports cannot be generated, customized, or saved, as they are specific to the report from which they were derived. They are not available in search results.
Explore your data center using APTARE IT Analytics customizable report templates or by using parts of your IT infrastructure as entry points. Use Search to find reports, templates and dashboards across the portal.
Use the Reports tab to examine the APTARE IT Analytics catalog of templates, dashboards and reports - organized by products along with user-created, and system folders. The main report is located here:
Capacity Manager > Chargeback and Billing > Aggregated Chargeback Then click a Policy link.
Item TypeDisplays the Policy Type, such as Array Family, Array Type, Array Name, Drive Speed, Drive Type, Drive Capacity, RAID Type, Is Local, Is HDP, Is DAS, or Domain.
Item Value The value associated with the Policy/Item type.
Display Value The value to be displayed in reports.
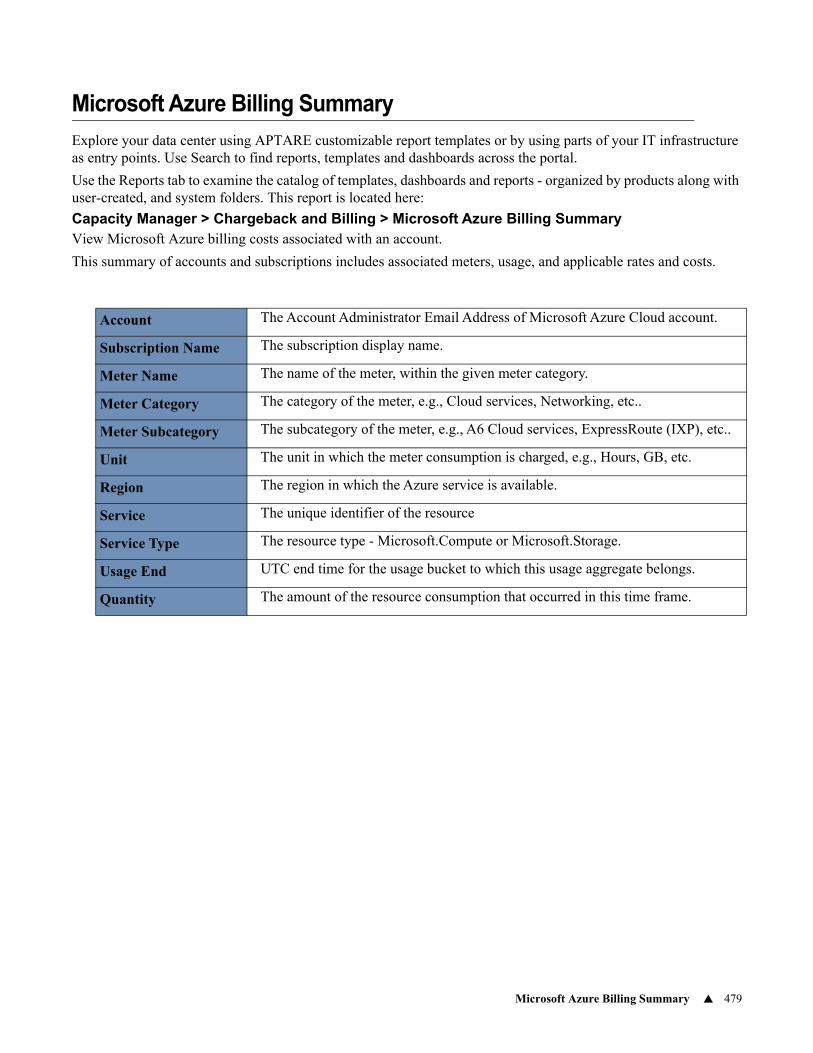
Microsoft Azure Billing Summary 479
Microsoft Azure Billing Summary
Explore your data center using APTARE customizable report templates or by using parts of your IT infrastructure as entry points. Use Search to find reports, templates and dashboards across the portal.
Use the Reports tab to examine the catalog of templates, dashboards and reports - organized by products along with user-created, and system folders. This report is located here:
Capacity Manager > Chargeback and Billing > Microsoft Azure Billing SummaryView Microsoft Azure billing costs associated with an account.
This summary of accounts and subscriptions includes associated meters, usage, and applicable rates and costs.
Account The Account Administrator Email Address of Microsoft Azure Cloud account.
Subscription Name The subscription display name.
Meter Name The name of the meter, within the given meter category.
Meter Category The category of the meter, e.g., Cloud services, Networking, etc..
Meter Subcategory The subcategory of the meter, e.g., A6 Cloud services, ExpressRoute (IXP), etc..
Unit The unit in which the meter consumption is charged, e.g., Hours, GB, etc.
Region The region in which the Azure service is available.
Service The unique identifier of the resource
Service Type The resource type - Microsoft.Compute or Microsoft.Storage.
Usage End UTC end time for the usage bucket to which this usage aggregate belongs.
Quantity The amount of the resource consumption that occurred in this time frame.

Microsoft Azure Resource Group Summary 480
Microsoft Azure Resource Group Summary
Explore your data center using APTARE customizable report templates or by using parts of your IT infrastructure as entry points. Use Search to find reports, templates and dashboards across the portal.
Use the Reports tab to examine the catalog of templates, dashboards and reports - organized by products along with user-created, and system folders. This report is located here:
Capacity Manager > Chargeback and Billing > Microsoft Azure Resource Group SummaryView a list of all discovered Microsoft Azure resource groups and products.
The list of resources includes types such as, storage accounts, IP addresses, VMs, NICs, Vaults, and Security Groups.
Account The Account Administrator Email Address of the Microsoft Azure Cloud account.
Subscription Name The subscription display name.
Subscription ID The subscription ID of Microsoft Azure Cloud account.
Group Name The resource group name.
Resource ID The resource group URI.
Resource Name The unique identifier of the resource.
Resource Type The resource type - Microsoft.Compute or Microsoft.Storage.
Resource Location Resource Group location.
Resource Tags Tags.
Last Updated Last Updated Date.
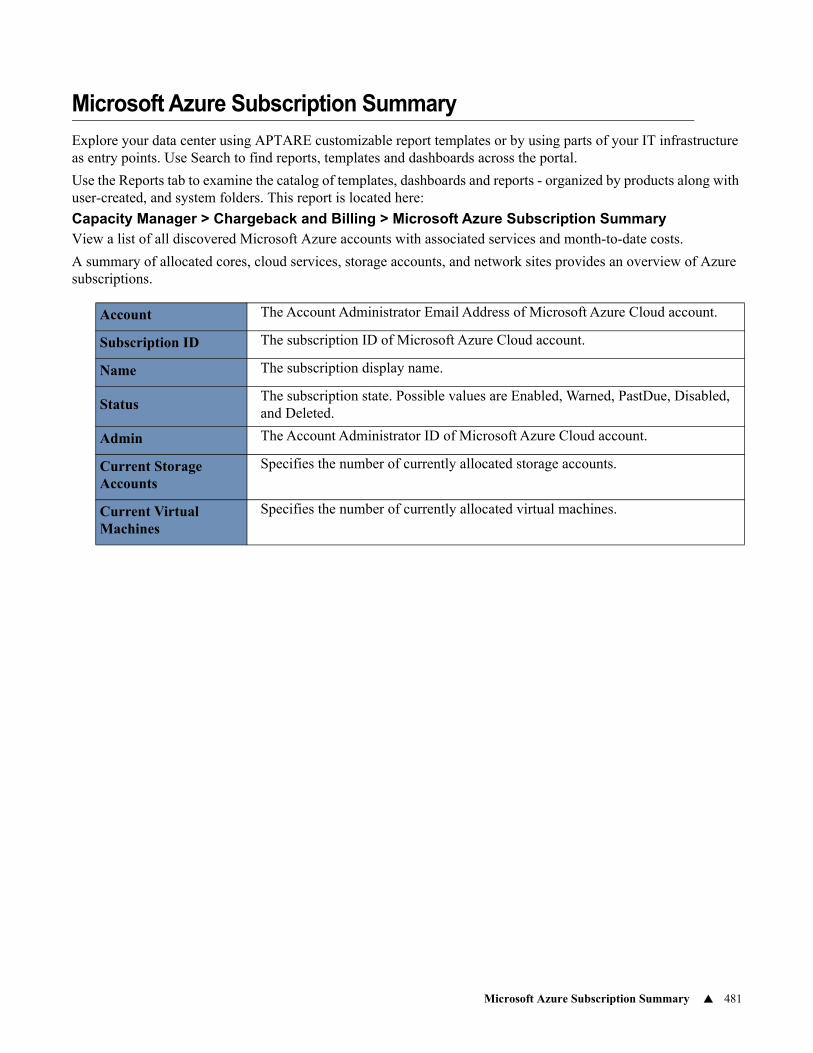
Microsoft Azure Subscription Summary 481
Microsoft Azure Subscription Summary
Explore your data center using APTARE customizable report templates or by using parts of your IT infrastructure as entry points. Use Search to find reports, templates and dashboards across the portal.
Use the Reports tab to examine the catalog of templates, dashboards and reports - organized by products along with user-created, and system folders. This report is located here:
Capacity Manager > Chargeback and Billing > Microsoft Azure Subscription SummaryView a list of all discovered Microsoft Azure accounts with associated services and month-to-date costs.
A summary of allocated cores, cloud services, storage accounts, and network sites provides an overview of Azure subscriptions.
Account The Account Administrator Email Address of Microsoft Azure Cloud account.
Subscription ID The subscription ID of Microsoft Azure Cloud account.
Name The subscription display name.
StatusThe subscription state. Possible values are Enabled, Warned, PastDue, Disabled, and Deleted.
Admin The Account Administrator ID of Microsoft Azure Cloud account.
Current Storage Accounts
Specifies the number of currently allocated storage accounts.
Current Virtual Machines
Specifies the number of currently allocated virtual machines.
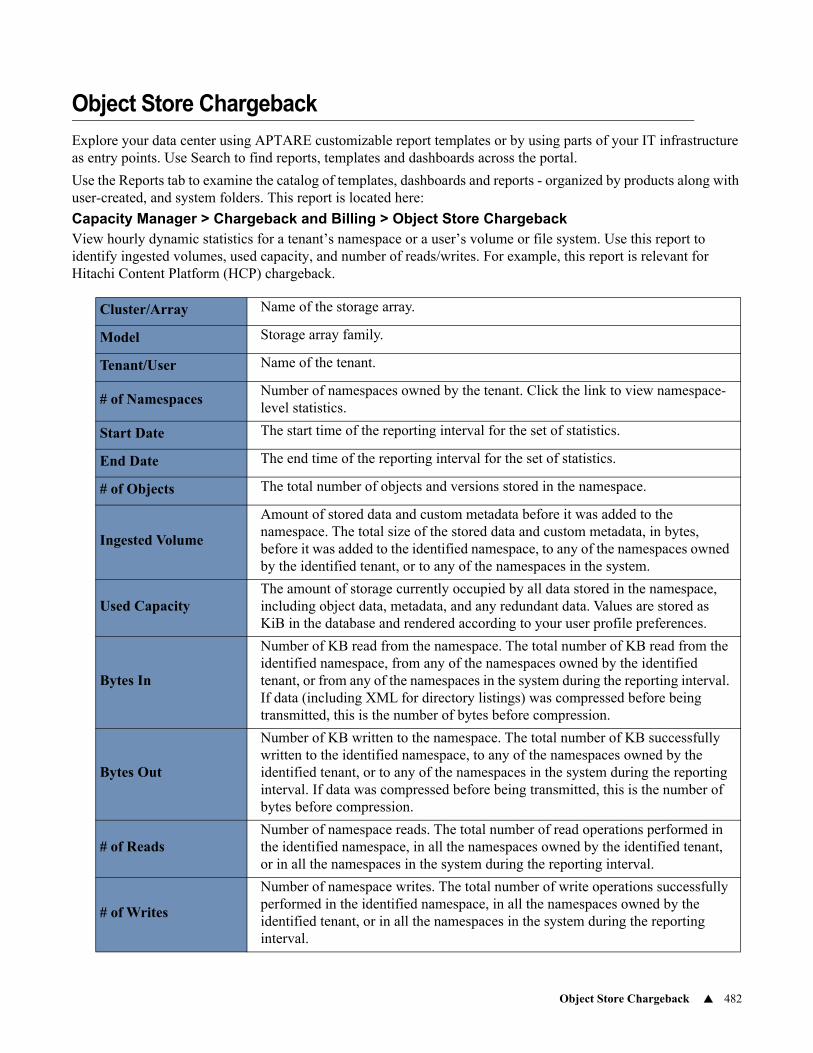
Object Store Chargeback 482
Object Store Chargeback
Explore your data center using APTARE customizable report templates or by using parts of your IT infrastructure as entry points. Use Search to find reports, templates and dashboards across the portal.
Use the Reports tab to examine the catalog of templates, dashboards and reports - organized by products along with user-created, and system folders. This report is located here:
Capacity Manager > Chargeback and Billing > Object Store ChargebackView hourly dynamic statistics for a tenant’s namespace or a user’s volume or file system. Use this report to identify ingested volumes, used capacity, and number of reads/writes. For example, this report is relevant for Hitachi Content Platform (HCP) chargeback.
Cluster/Array Name of the storage array.
Model Storage array family.
Tenant/User Name of the tenant.
# of NamespacesNumber of namespaces owned by the tenant. Click the link to view namespace-level statistics.
Start Date The start time of the reporting interval for the set of statistics.
End Date The end time of the reporting interval for the set of statistics.
# of Objects The total number of objects and versions stored in the namespace.
Ingested Volume
Amount of stored data and custom metadata before it was added to the namespace. The total size of the stored data and custom metadata, in bytes, before it was added to the identified namespace, to any of the namespaces owned by the identified tenant, or to any of the namespaces in the system.
Used CapacityThe amount of storage currently occupied by all data stored in the namespace, including object data, metadata, and any redundant data. Values are stored as KiB in the database and rendered according to your user profile preferences.
Bytes In
Number of KB read from the namespace. The total number of KB read from the identified namespace, from any of the namespaces owned by the identified tenant, or from any of the namespaces in the system during the reporting interval. If data (including XML for directory listings) was compressed before being transmitted, this is the number of bytes before compression.
Bytes Out
Number of KB written to the namespace. The total number of KB successfully written to the identified namespace, to any of the namespaces owned by the identified tenant, or to any of the namespaces in the system during the reporting interval. If data was compressed before being transmitted, this is the number of bytes before compression.
# of ReadsNumber of namespace reads. The total number of read operations performed in the identified namespace, in all the namespaces owned by the identified tenant, or in all the namespaces in the system during the reporting interval.
# of Writes
Number of namespace writes. The total number of write operations successfully performed in the identified namespace, in all the namespaces owned by the identified tenant, or in all the namespaces in the system during the reporting interval.
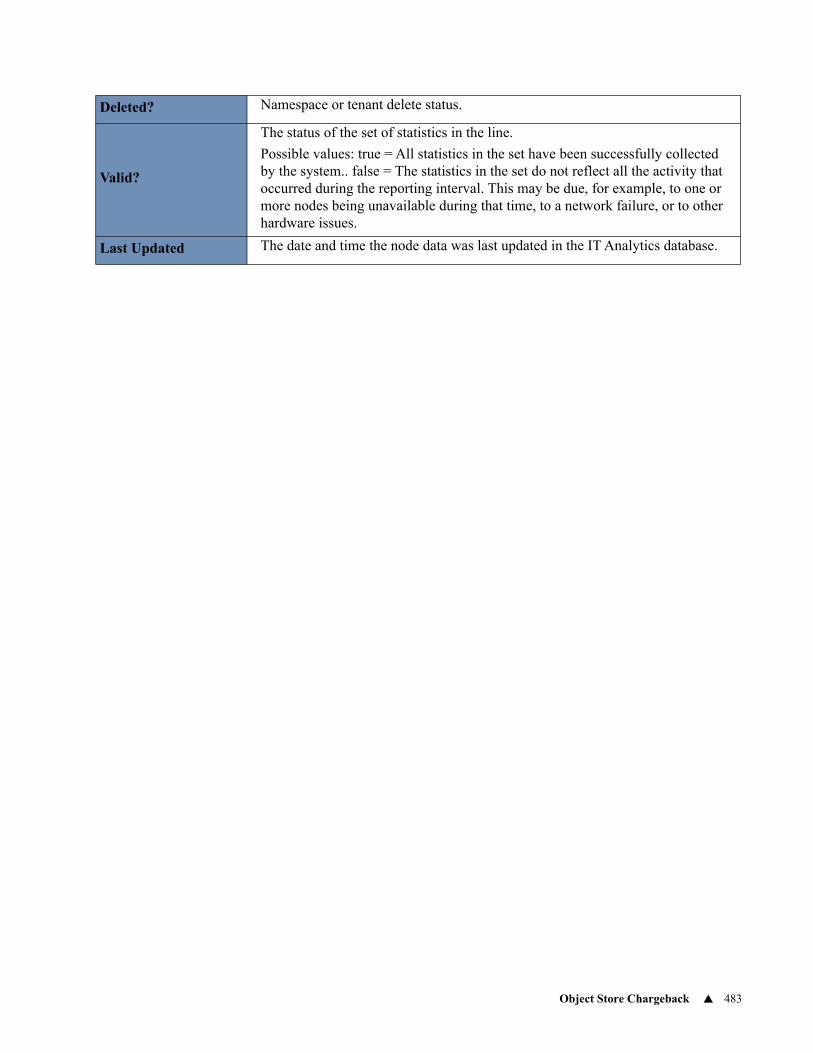
Object Store Chargeback 483
Deleted? Namespace or tenant delete status.
Valid?
The status of the set of statistics in the line.
Possible values: true = All statistics in the set have been successfully collected by the system.. false = The statistics in the set do not reflect all the activity that occurred during the reporting interval. This may be due, for example, to one or more nodes being unavailable during that time, to a network failure, or to other hardware issues.
Last Updated The date and time the node data was last updated in the IT Analytics database.
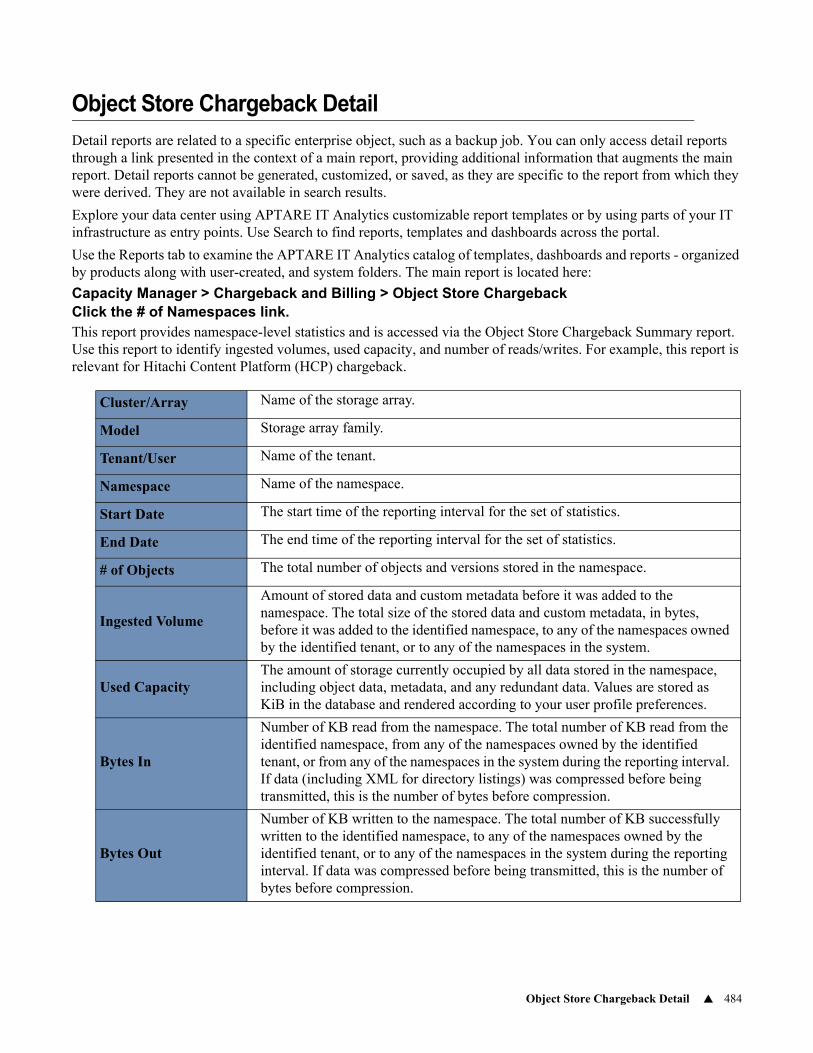
Object Store Chargeback Detail 484
Object Store Chargeback Detail
Detail reports are related to a specific enterprise object, such as a backup job. You can only access detail reports through a link presented in the context of a main report, providing additional information that augments the main report. Detail reports cannot be generated, customized, or saved, as they are specific to the report from which they were derived. They are not available in search results.
Explore your data center using APTARE IT Analytics customizable report templates or by using parts of your IT infrastructure as entry points. Use Search to find reports, templates and dashboards across the portal.
Use the Reports tab to examine the APTARE IT Analytics catalog of templates, dashboards and reports - organized by products along with user-created, and system folders. The main report is located here:
Capacity Manager > Chargeback and Billing > Object Store ChargebackClick the # of Namespaces link.This report provides namespace-level statistics and is accessed via the Object Store Chargeback Summary report. Use this report to identify ingested volumes, used capacity, and number of reads/writes. For example, this report is relevant for Hitachi Content Platform (HCP) chargeback.
Cluster/Array Name of the storage array.
Model Storage array family.
Tenant/User Name of the tenant.
Namespace Name of the namespace.
Start Date The start time of the reporting interval for the set of statistics.
End Date The end time of the reporting interval for the set of statistics.
# of Objects The total number of objects and versions stored in the namespace.
Ingested Volume
Amount of stored data and custom metadata before it was added to the namespace. The total size of the stored data and custom metadata, in bytes, before it was added to the identified namespace, to any of the namespaces owned by the identified tenant, or to any of the namespaces in the system.
Used CapacityThe amount of storage currently occupied by all data stored in the namespace, including object data, metadata, and any redundant data. Values are stored as KiB in the database and rendered according to your user profile preferences.
Bytes In
Number of KB read from the namespace. The total number of KB read from the identified namespace, from any of the namespaces owned by the identified tenant, or from any of the namespaces in the system during the reporting interval. If data (including XML for directory listings) was compressed before being transmitted, this is the number of bytes before compression.
Bytes Out
Number of KB written to the namespace. The total number of KB successfully written to the identified namespace, to any of the namespaces owned by the identified tenant, or to any of the namespaces in the system during the reporting interval. If data was compressed before being transmitted, this is the number of bytes before compression.
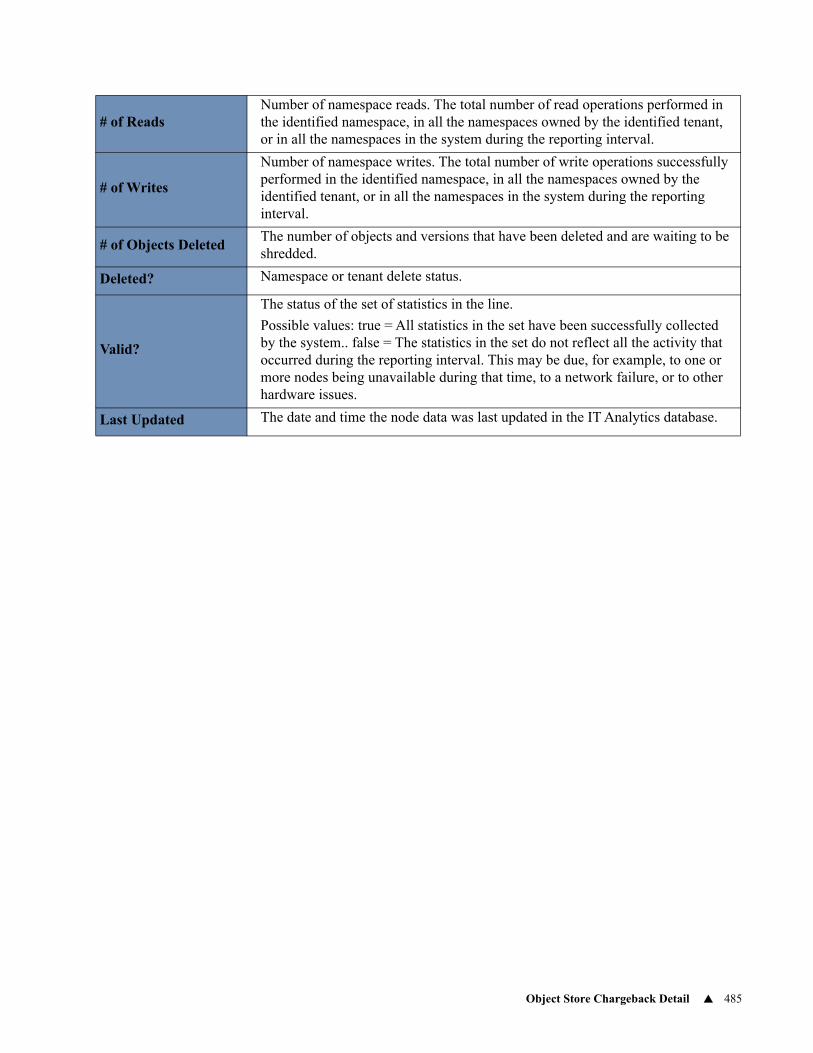
Object Store Chargeback Detail 485
# of ReadsNumber of namespace reads. The total number of read operations performed in the identified namespace, in all the namespaces owned by the identified tenant, or in all the namespaces in the system during the reporting interval.
# of Writes
Number of namespace writes. The total number of write operations successfully performed in the identified namespace, in all the namespaces owned by the identified tenant, or in all the namespaces in the system during the reporting interval.
# of Objects DeletedThe number of objects and versions that have been deleted and are waiting to be shredded.
Deleted? Namespace or tenant delete status.
Valid?
The status of the set of statistics in the line.
Possible values: true = All statistics in the set have been successfully collected by the system.. false = The statistics in the set do not reflect all the activity that occurred during the reporting interval. This may be due, for example, to one or more nodes being unavailable during that time, to a network failure, or to other hardware issues.
Last Updated The date and time the node data was last updated in the IT Analytics database.
Exception Summary 425
13Chapter 6Capacity at Risk Reports
This section covers the following topics:
• Exception Summary
• Hosts at Risk
• LUNs at Risk
• NetApp Aggregates at Risk
• NetApp Cluster-Mode Aggregates at Risk
• NetApp Volumes at Risk
• NetApp Cluster-Mode Volumes at Risk
• Over-Provisioned Hosts
• Over-Provisioned LUNs
Exception Summary
Explore your data center using APTARE customizable report templates or by using parts of your IT infrastructure as entry points. Use Search to find reports, templates and dashboards across the portal.
Use the Reports tab to examine the catalog of templates, dashboards and reports - organized by products along with user-created, and system folders. This report is located here:
Capacity Manager > Capacity at Risk > Exception SummaryThis report provides a list of filesystem mount points that may require attention for one of the following reasons:
• Near Capacity: > 90%
• Over-Provisioned: < 30%
• Empty: < 5% (negative Rate)
• Fast-Growing: > .9%
Note: To provide a realistic forecast, the time span for determining when capacity may be at risk has been limited to five years.
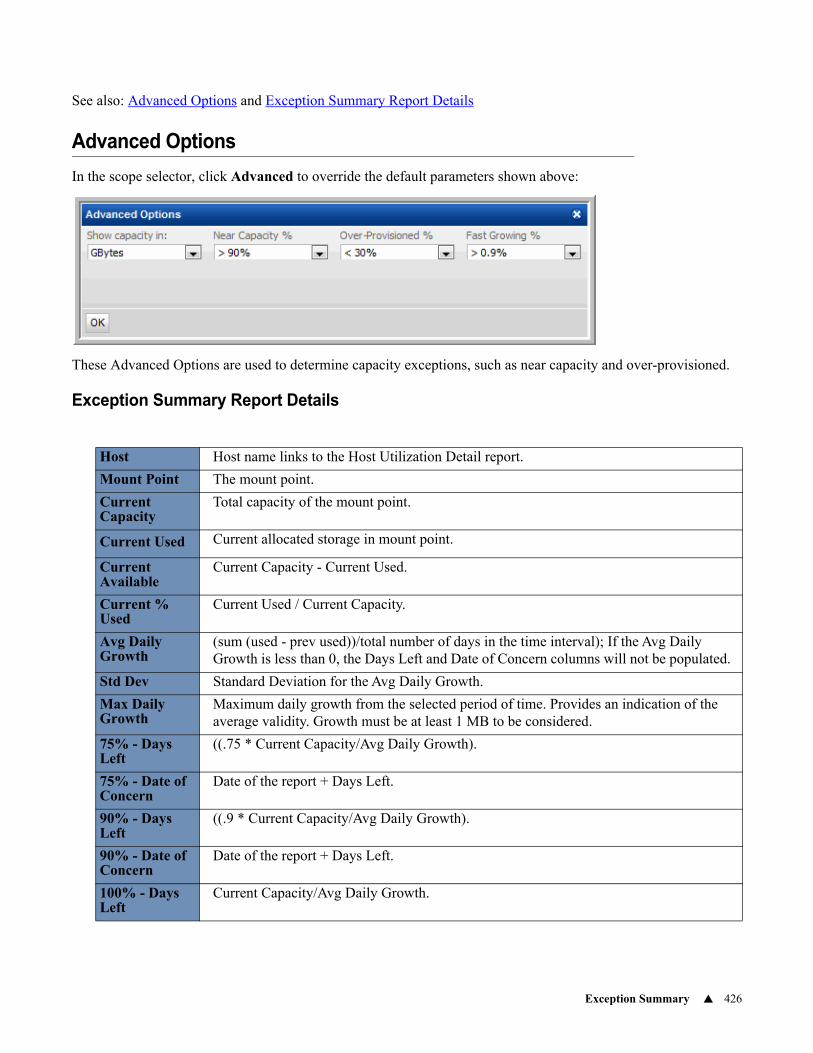
Exception Summary 426
See also: Advanced Options and Exception Summary Report Details
Advanced Options
In the scope selector, click Advanced to override the default parameters shown above:
These Advanced Options are used to determine capacity exceptions, such as near capacity and over-provisioned.
Exception Summary Report Details
Host Host name links to the Host Utilization Detail report.
Mount Point The mount point.
Current Capacity
Total capacity of the mount point.
Current Used Current allocated storage in mount point.
Current Available
Current Capacity - Current Used.
Current % Used
Current Used / Current Capacity.
Avg Daily Growth
(sum (used - prev used))/total number of days in the time interval); If the Avg Daily Growth is less than 0, the Days Left and Date of Concern columns will not be populated.
Std Dev Standard Deviation for the Avg Daily Growth.
Max Daily Growth
Maximum daily growth from the selected period of time. Provides an indication of the average validity. Growth must be at least 1 MB to be considered.
75% - Days Left
((.75 * Current Capacity/Avg Daily Growth).
75% - Date of Concern
Date of the report + Days Left.
90% - Days Left
((.9 * Current Capacity/Avg Daily Growth).
90% - Date of Concern
Date of the report + Days Left.
100% - Days Left
Current Capacity/Avg Daily Growth.
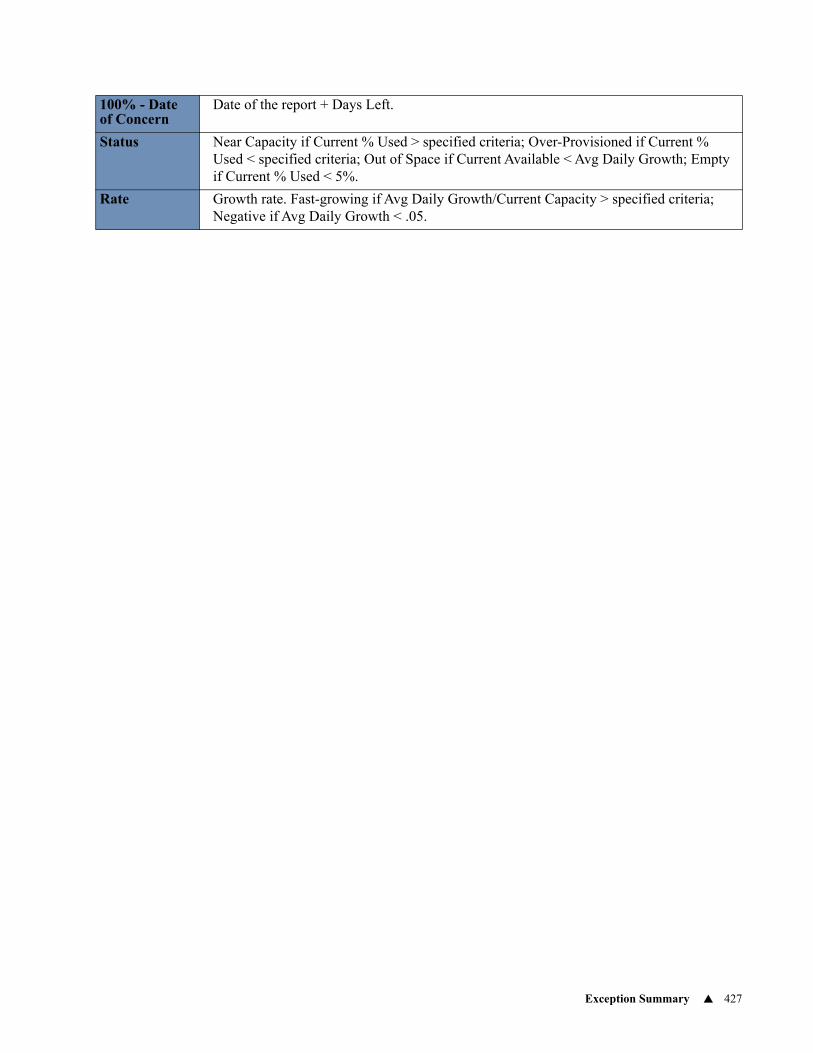
Exception Summary 427
100% - Date of Concern
Date of the report + Days Left.
Status Near Capacity if Current % Used > specified criteria; Over-Provisioned if Current % Used < specified criteria; Out of Space if Current Available < Avg Daily Growth; Empty if Current % Used < 5%.
Rate Growth rate. Fast-growing if Avg Daily Growth/Current Capacity > specified criteria; Negative if Avg Daily Growth < .05.
Hosts at Risk 428
Hosts at Risk
Explore your data center using APTARE customizable report templates or by using parts of your IT infrastructure as entry points. Use Search to find reports, templates and dashboards across the portal.
Use the Reports tab to examine the catalog of templates, dashboards and reports - organized by products along with user-created, and system folders. This report is located here:
Capacity Manager > Capacity At Risk > Hosts At RiskWhen you generate this report, select a capacity threshold: Low, Warning, or Critical. Typically, for at risk reports, you will want to view the Critical hosts—that is, those that are at risk of breaching the critical threshold.
In the report’s scope selector, the Host Type option can be used to include virtual hosts in this host-based report: VM Server, VM Guest, VIO Server, VIO Guest, Oracle Container, Oracle Zone, Hyper-V Server, Hyper-V Guest, or Other.
This report lists only the hosts that require your immediate attention. Use the host link to view details.
Note: When reviewing the values in this report, note that hosts at risk are determined by evaluating current and projected usage.
LUNs at Risk
Pro-actively increase LUN capacity and avoid outages or performance issues associated with insufficient capacity.
Explore your data center using APTARE customizable report templates or by using parts of your IT infrastructure as entry points. Use Search to find reports, templates and dashboards across the portal.
Use the Reports tab to examine the catalog of templates, dashboards and reports - organized by products along with user-created, and system folders. This report is located here:
Capacity Manager > Capacity At Risk > LUNs At Risk
Host Name Click a host name to access details in the Host Utilization Detail.
Risk Date (Projected)The date that the host is projected to exceed its threshold and will no longer be considered over-provisioned.
Usage (Projected) Projected usage associated with the risk date.
High-Water Mark (Projected)
The high-water mark represents the maximum usage for a period. Note that this size may represent temporary usage.
FileSystem Capacity The filesystem capacity
Capacity The host’s storage limit.
Current Usage Storage already consumed.
Threshold
A host becomes at risk when this tolerance threshold is crossed. The default thresholds are set at: Low = 30%; Warning = 70%; Critical = 90%. To modify thresholds for a particular host, go to the Portal’s Admin toolbar: Admin > Threshold Policies.
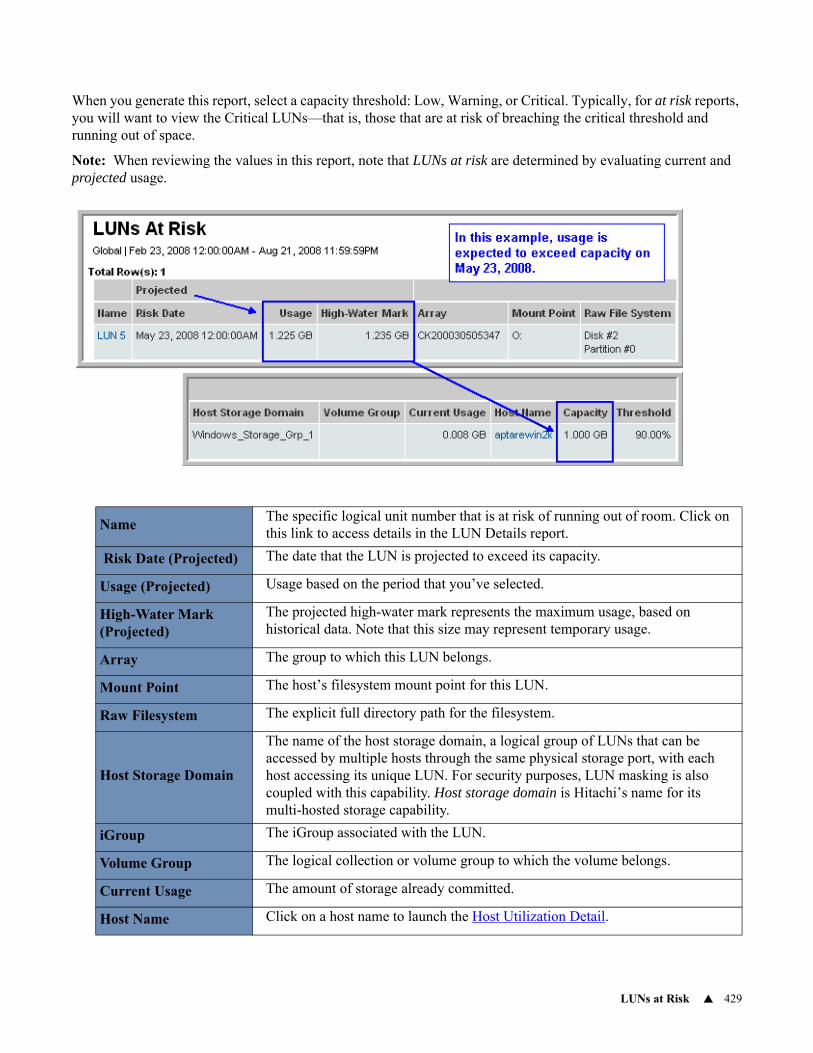
LUNs at Risk 429
When you generate this report, select a capacity threshold: Low, Warning, or Critical. Typically, for at risk reports, you will want to view the Critical LUNs—that is, those that are at risk of breaching the critical threshold and running out of space.
Note: When reviewing the values in this report, note that LUNs at risk are determined by evaluating current and projected usage.
NameThe specific logical unit number that is at risk of running out of room. Click on this link to access details in the LUN Details report.
Risk Date (Projected) The date that the LUN is projected to exceed its capacity.
Usage (Projected) Usage based on the period that you’ve selected.
High-Water Mark (Projected)
The projected high-water mark represents the maximum usage, based on historical data. Note that this size may represent temporary usage.
Array The group to which this LUN belongs.
Mount Point The host’s filesystem mount point for this LUN.
Raw Filesystem The explicit full directory path for the filesystem.
Host Storage Domain
The name of the host storage domain, a logical group of LUNs that can be accessed by multiple hosts through the same physical storage port, with each host accessing its unique LUN. For security purposes, LUN masking is also coupled with this capability. Host storage domain is Hitachi’s name for its multi-hosted storage capability.
iGroup The iGroup associated with the LUN.
Volume Group The logical collection or volume group to which the volume belongs.
Current Usage The amount of storage already committed.
Host Name Click on a host name to launch the Host Utilization Detail.
LUNs at Risk 430
Capacity The total capacity (used and unused) of the LUN.
Threshold
A LUN is determined to be at risk when this tolerance threshold is crossed. The default thresholds are set at: Low = 30%; Warning = 70%; Critical = 90%. To modify thresholds for a particular LUN, go to ADMIN > Reports > Threshold Policies.
NetApp Aggregates at Risk 431
NetApp Aggregates at Risk
Explore your data center using APTARE customizable report templates or by using parts of your IT infrastructure as entry points. Use Search to find reports, templates and dashboards across the portal.
Use the Reports tab to examine the catalog of templates, dashboards and reports - organized by products along with user-created, and system folders. This report is located here:
Capacity Manager > Capacity At Risk > NetApp Aggregates at RiskFor thin provisioning, it’s important to know when host usage is about to exceed the storage that was promised. The details shown in this aggregate report can help you understand the current physical capacity status. When an aggregate is at risk—the amount of used storage in the FlexVol approaches the aggregate’s capacity—it can be re-sized to add physical disk space to the aggregate.
See also, Thin Provisioning Overview.
Note: The Total Capacity value represents the amount of storage that has been committed or promised to hosts. Therefore, host resources data collection must be implemented in order to determine which Aggregates are at risk and an associated host must be at risk in order for the Aggregate to be considered at risk.
When you generate this report, you can select the threshold to report: Low, Warning, or Critical.
Aggregate The Aggregate number/ID link to NetApp Aggregate Detail
Storage Array The NetApp system with which the aggregate is associated, which drills down to NetApp Storage System Detail
Usage Mouse over the usage thermometer to view the % available
Total Capacity The aggregate’s total capacity
Allocated Capacity Amount of capacity that has been allocated for use
Available Capacity Remaining capacity available for use
RAID Type raid0 (mirrored), raid4 (single disk for parity), or raid_dp (double-parity protection)
# Volumes at Risk Links to the NetApp Volumes at Risk
# of Hosts at Risk Number of hosts at risk.
List of Plexes Lists 1 or 2 Plexes—2 if SyncMirror is licensed and enabled. Links to the NetApp Plex Details report.
Risk Date The point at which the aggregate is at risk
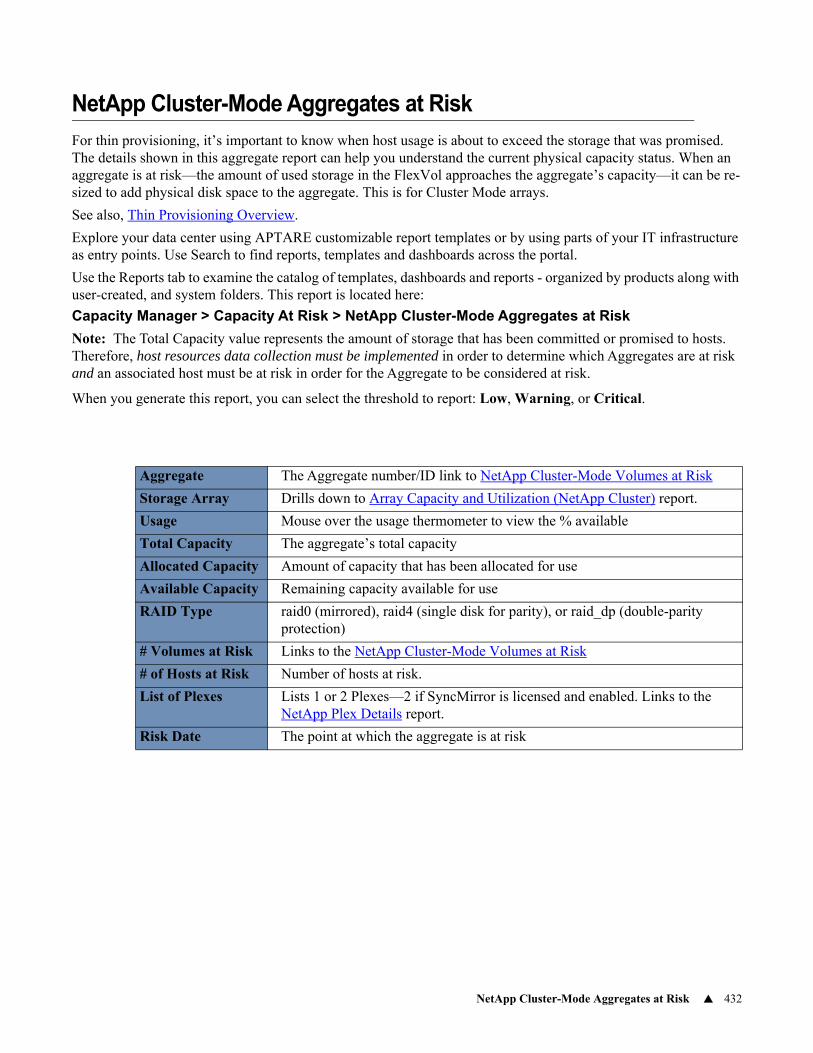
NetApp Cluster-Mode Aggregates at Risk 432
NetApp Cluster-Mode Aggregates at Risk
For thin provisioning, it’s important to know when host usage is about to exceed the storage that was promised. The details shown in this aggregate report can help you understand the current physical capacity status. When an aggregate is at risk—the amount of used storage in the FlexVol approaches the aggregate’s capacity—it can be re-sized to add physical disk space to the aggregate. This is for Cluster Mode arrays.
See also, Thin Provisioning Overview.
Explore your data center using APTARE customizable report templates or by using parts of your IT infrastructure as entry points. Use Search to find reports, templates and dashboards across the portal.
Use the Reports tab to examine the catalog of templates, dashboards and reports - organized by products along with user-created, and system folders. This report is located here:
Capacity Manager > Capacity At Risk > NetApp Cluster-Mode Aggregates at Risk
Note: The Total Capacity value represents the amount of storage that has been committed or promised to hosts. Therefore, host resources data collection must be implemented in order to determine which Aggregates are at risk and an associated host must be at risk in order for the Aggregate to be considered at risk.
When you generate this report, you can select the threshold to report: Low, Warning, or Critical.
Aggregate The Aggregate number/ID link to NetApp Cluster-Mode Volumes at Risk
Storage Array Drills down to Array Capacity and Utilization (NetApp Cluster) report.
Usage Mouse over the usage thermometer to view the % available
Total Capacity The aggregate’s total capacity
Allocated Capacity Amount of capacity that has been allocated for use
Available Capacity Remaining capacity available for use
RAID Type raid0 (mirrored), raid4 (single disk for parity), or raid_dp (double-parity protection)
# Volumes at Risk Links to the NetApp Cluster-Mode Volumes at Risk
# of Hosts at Risk Number of hosts at risk.
List of Plexes Lists 1 or 2 Plexes—2 if SyncMirror is licensed and enabled. Links to the NetApp Plex Details report.
Risk Date The point at which the aggregate is at risk
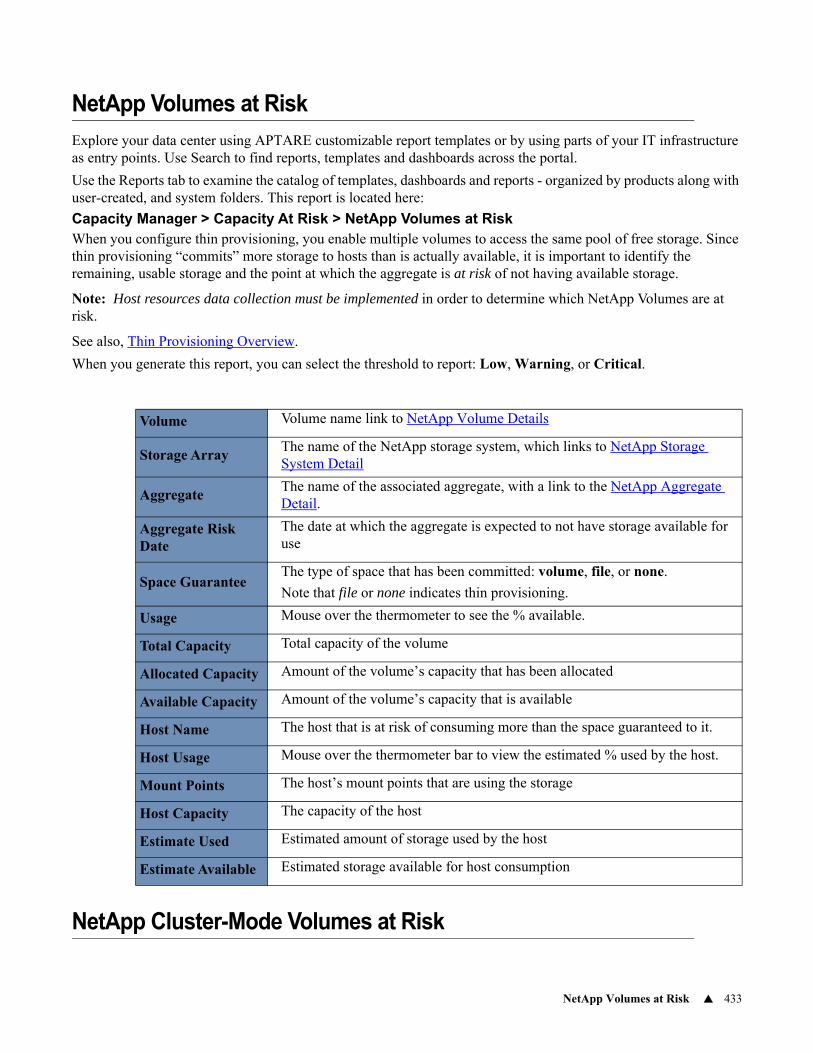
NetApp Volumes at Risk 433
NetApp Volumes at Risk
Explore your data center using APTARE customizable report templates or by using parts of your IT infrastructure as entry points. Use Search to find reports, templates and dashboards across the portal.
Use the Reports tab to examine the catalog of templates, dashboards and reports - organized by products along with user-created, and system folders. This report is located here:
Capacity Manager > Capacity At Risk > NetApp Volumes at RiskWhen you configure thin provisioning, you enable multiple volumes to access the same pool of free storage. Since thin provisioning “commits” more storage to hosts than is actually available, it is important to identify the remaining, usable storage and the point at which the aggregate is at risk of not having available storage.
Note: Host resources data collection must be implemented in order to determine which NetApp Volumes are at risk.
See also, Thin Provisioning Overview.
When you generate this report, you can select the threshold to report: Low, Warning, or Critical.
NetApp Cluster-Mode Volumes at Risk
Volume Volume name link to NetApp Volume Details
Storage ArrayThe name of the NetApp storage system, which links to NetApp Storage System Detail
AggregateThe name of the associated aggregate, with a link to the NetApp Aggregate Detail.
Aggregate Risk Date
The date at which the aggregate is expected to not have storage available for use
Space GuaranteeThe type of space that has been committed: volume, file, or none.
Note that file or none indicates thin provisioning.
Usage Mouse over the thermometer to see the % available.
Total Capacity Total capacity of the volume
Allocated Capacity Amount of the volume’s capacity that has been allocated
Available Capacity Amount of the volume’s capacity that is available
Host Name The host that is at risk of consuming more than the space guaranteed to it.
Host Usage Mouse over the thermometer bar to view the estimated % used by the host.
Mount Points The host’s mount points that are using the storage
Host Capacity The capacity of the host
Estimate Used Estimated amount of storage used by the host
Estimate Available Estimated storage available for host consumption
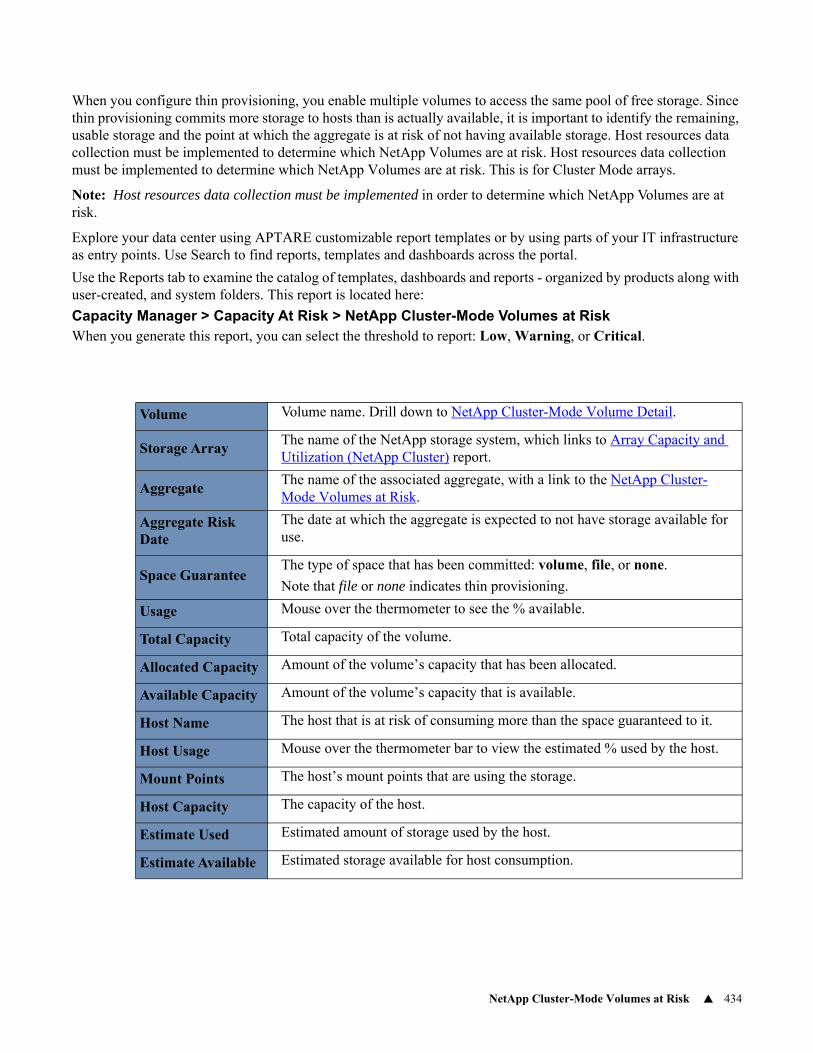
NetApp Cluster-Mode Volumes at Risk 434
When you configure thin provisioning, you enable multiple volumes to access the same pool of free storage. Since thin provisioning commits more storage to hosts than is actually available, it is important to identify the remaining, usable storage and the point at which the aggregate is at risk of not having available storage. Host resources data collection must be implemented to determine which NetApp Volumes are at risk. Host resources data collection must be implemented to determine which NetApp Volumes are at risk. This is for Cluster Mode arrays.
Note: Host resources data collection must be implemented in order to determine which NetApp Volumes are at risk.
Explore your data center using APTARE customizable report templates or by using parts of your IT infrastructure as entry points. Use Search to find reports, templates and dashboards across the portal.
Use the Reports tab to examine the catalog of templates, dashboards and reports - organized by products along with user-created, and system folders. This report is located here:
Capacity Manager > Capacity At Risk > NetApp Cluster-Mode Volumes at RiskWhen you generate this report, you can select the threshold to report: Low, Warning, or Critical.
Volume Volume name. Drill down to NetApp Cluster-Mode Volume Detail.
Storage ArrayThe name of the NetApp storage system, which links to Array Capacity and Utilization (NetApp Cluster) report.
AggregateThe name of the associated aggregate, with a link to the NetApp Cluster-Mode Volumes at Risk.
Aggregate Risk Date
The date at which the aggregate is expected to not have storage available for use.
Space GuaranteeThe type of space that has been committed: volume, file, or none.
Note that file or none indicates thin provisioning.
Usage Mouse over the thermometer to see the % available.
Total Capacity Total capacity of the volume.
Allocated Capacity Amount of the volume’s capacity that has been allocated.
Available Capacity Amount of the volume’s capacity that is available.
Host Name The host that is at risk of consuming more than the space guaranteed to it.
Host Usage Mouse over the thermometer bar to view the estimated % used by the host.
Mount Points The host’s mount points that are using the storage.
Host Capacity The capacity of the host.
Estimate Used Estimated amount of storage used by the host.
Estimate Available Estimated storage available for host consumption.
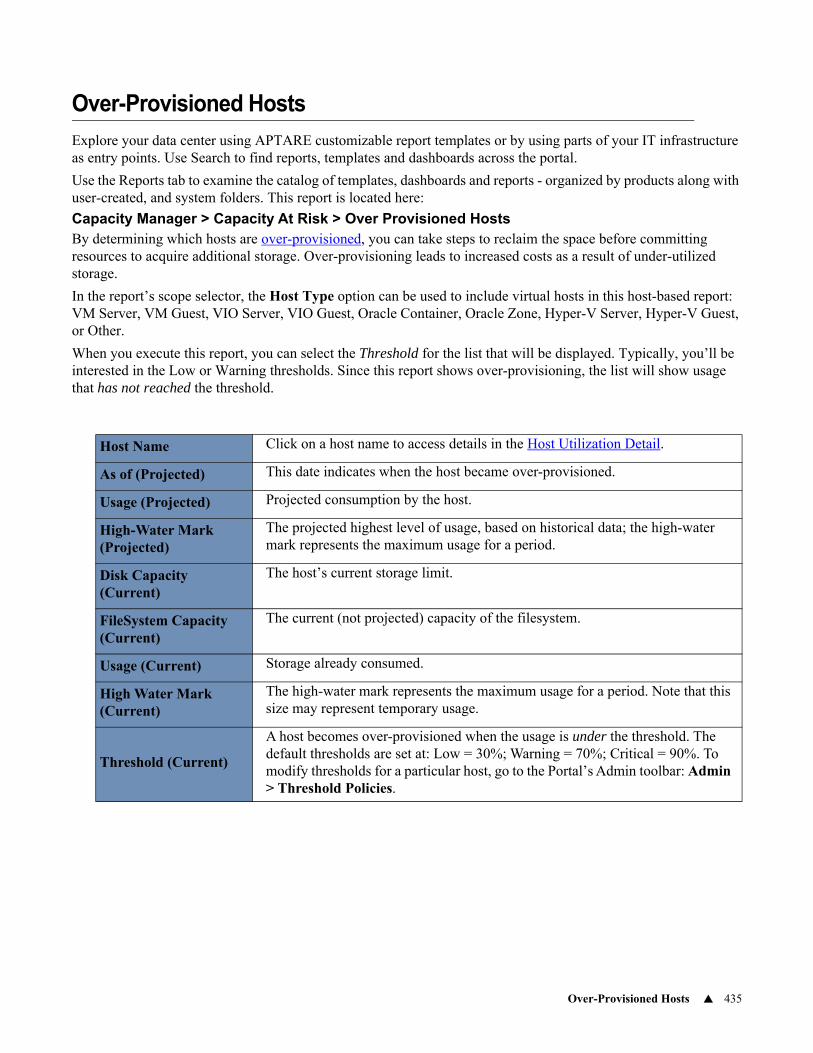
Over-Provisioned Hosts 435
Over-Provisioned Hosts
Explore your data center using APTARE customizable report templates or by using parts of your IT infrastructure as entry points. Use Search to find reports, templates and dashboards across the portal.
Use the Reports tab to examine the catalog of templates, dashboards and reports - organized by products along with user-created, and system folders. This report is located here:
Capacity Manager > Capacity At Risk > Over Provisioned HostsBy determining which hosts are over-provisioned, you can take steps to reclaim the space before committing resources to acquire additional storage. Over-provisioning leads to increased costs as a result of under-utilized storage.
In the report’s scope selector, the Host Type option can be used to include virtual hosts in this host-based report: VM Server, VM Guest, VIO Server, VIO Guest, Oracle Container, Oracle Zone, Hyper-V Server, Hyper-V Guest, or Other.
When you execute this report, you can select the Threshold for the list that will be displayed. Typically, you’ll be interested in the Low or Warning thresholds. Since this report shows over-provisioning, the list will show usage that has not reached the threshold.
Host Name Click on a host name to access details in the Host Utilization Detail.
As of (Projected) This date indicates when the host became over-provisioned.
Usage (Projected) Projected consumption by the host.
High-Water Mark (Projected)
The projected highest level of usage, based on historical data; the high-water mark represents the maximum usage for a period.
Disk Capacity (Current)
The host’s current storage limit.
FileSystem Capacity (Current)
The current (not projected) capacity of the filesystem.
Usage (Current) Storage already consumed.
High Water Mark (Current)
The high-water mark represents the maximum usage for a period. Note that this size may represent temporary usage.
Threshold (Current)
A host becomes over-provisioned when the usage is under the threshold. The default thresholds are set at: Low = 30%; Warning = 70%; Critical = 90%. To modify thresholds for a particular host, go to the Portal’s Admin toolbar: Admin > Threshold Policies.
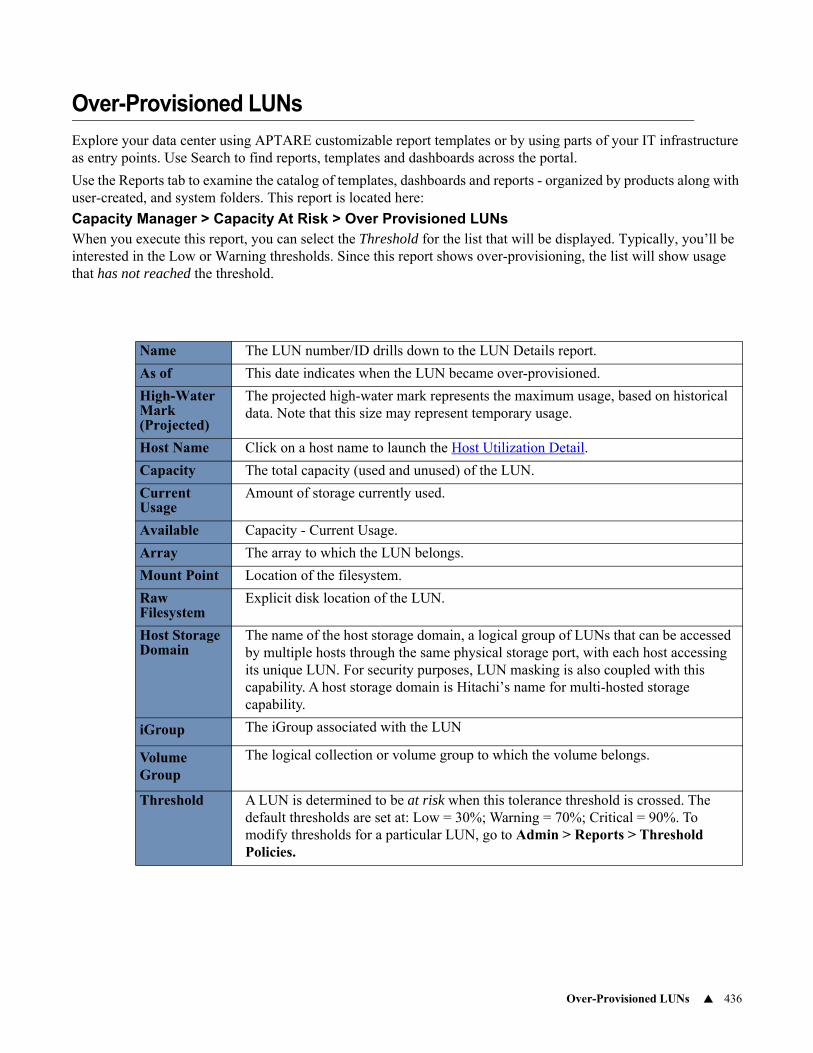
Over-Provisioned LUNs 436
Over-Provisioned LUNs
Explore your data center using APTARE customizable report templates or by using parts of your IT infrastructure as entry points. Use Search to find reports, templates and dashboards across the portal.
Use the Reports tab to examine the catalog of templates, dashboards and reports - organized by products along with user-created, and system folders. This report is located here:
Capacity Manager > Capacity At Risk > Over Provisioned LUNsWhen you execute this report, you can select the Threshold for the list that will be displayed. Typically, you’ll be interested in the Low or Warning thresholds. Since this report shows over-provisioning, the list will show usage that has not reached the threshold.
Name The LUN number/ID drills down to the LUN Details report.
As of This date indicates when the LUN became over-provisioned.
High-Water Mark (Projected)
The projected high-water mark represents the maximum usage, based on historical data. Note that this size may represent temporary usage.
Host Name Click on a host name to launch the Host Utilization Detail.
Capacity The total capacity (used and unused) of the LUN.
Current Usage
Amount of storage currently used.
Available Capacity - Current Usage.
Array The array to which the LUN belongs.
Mount Point Location of the filesystem.
Raw Filesystem
Explicit disk location of the LUN.
Host Storage Domain
The name of the host storage domain, a logical group of LUNs that can be accessed by multiple hosts through the same physical storage port, with each host accessing its unique LUN. For security purposes, LUN masking is also coupled with this capability. A host storage domain is Hitachi’s name for multi-hosted storage capability.
iGroup The iGroup associated with the LUN
Volume Group
The logical collection or volume group to which the volume belongs.
Threshold A LUN is determined to be at risk when this tolerance threshold is crossed. The default thresholds are set at: Low = 30%; Warning = 70%; Critical = 90%. To modify thresholds for a particular LUN, go to Admin > Reports > Threshold Policies.
439
14Chapter 6File Analytics Reports
This section contains the following topics:
• File Analytics Overview
• Capacity Report
• Capacity Forecast
• Capacity Forecast by Device
• Capacity Forecast by Volume/Share
• Host Summary
• Top Candidates for Duplicates
• Volume Summary Report
• Share Summary Report
• New Files Added
• Usage by Owner
• Usage by Owner Forecast
• Usage by Owner Forecast Details
• Duplicate Files (top 50 in each device)
• Deduplication Candidates
• File Categories
• File Sizes
• Largest Files
• Access Dates
• Create Dates
• Modified Dates
File Analytics Overview 440
File Analytics Overview
File Analytics offers a highly optimized, lightweight data collector that uncovers files that are needlessly consuming storage. The bulk of wasted space often can be attributed to unstructured data—that is, files that contain data such as email, word processing documents, presentations, and digital media. Unlike structured data, which is managed by database administrators, unstructured data tends to proliferate with reckless abandon, resulting in stagnant and duplicated data. To assess the value of data files, whether they are critical to operations or are merely forgotten files, File Analytics provides data profiling. This data classification enables aggregation of file types and data growth forecasting. In addition, storage administrators can make archiving decisions based on the age of the data and its relevance to business objectives.
Once data collection completes, a number of reports provide insight into file profiles in your enterprise. Using built-in categorization and also file categories that you can customize, File Analytics becomes part of your arsenal of storage management tools. File Analytics aggregates the data, making it easy for you to identify offenders, such as:
• Deduplication candidates
• File ownership (or lack thereof)
• Largest files
• File Categories (Top file types by volume)

Capacity Report 441
Capacity Report
Explore your data center using APTARE customizable report templates or by using parts of your IT infrastructure as entry points. Use Search to find reports, templates and dashboards across the portal.
Use the Reports tab to examine the catalog of templates, dashboards and reports - organized by products along with user-created, and system folders. This report is located here:
File Analytics > Capacity Management & Chargeback > CapacityThe File Analytics Capacity report can be used as an indicator of storage efficiency. This report lists current capacity and utilization, which aids in maintaining volumes at optimum utilization.
See also: File Analytics Overview.
Host Host name for which volume/share data has been collected
Volume/Share The name of the volume or share
Type Volume or Share
Capacity The available capacity of the volume or NetApp device
% of TotalThe % of the total capacity for volume, share, or NetApp filer capacity, relative to the total capacity
UsedUsed capacity from the OS perspective for volumes (Windows and Linux) and NetApp devices; null for CIFS shares
% of CapacityIndicates the % of the total volume/share capacity that is in use, calculated as Used/Capacity
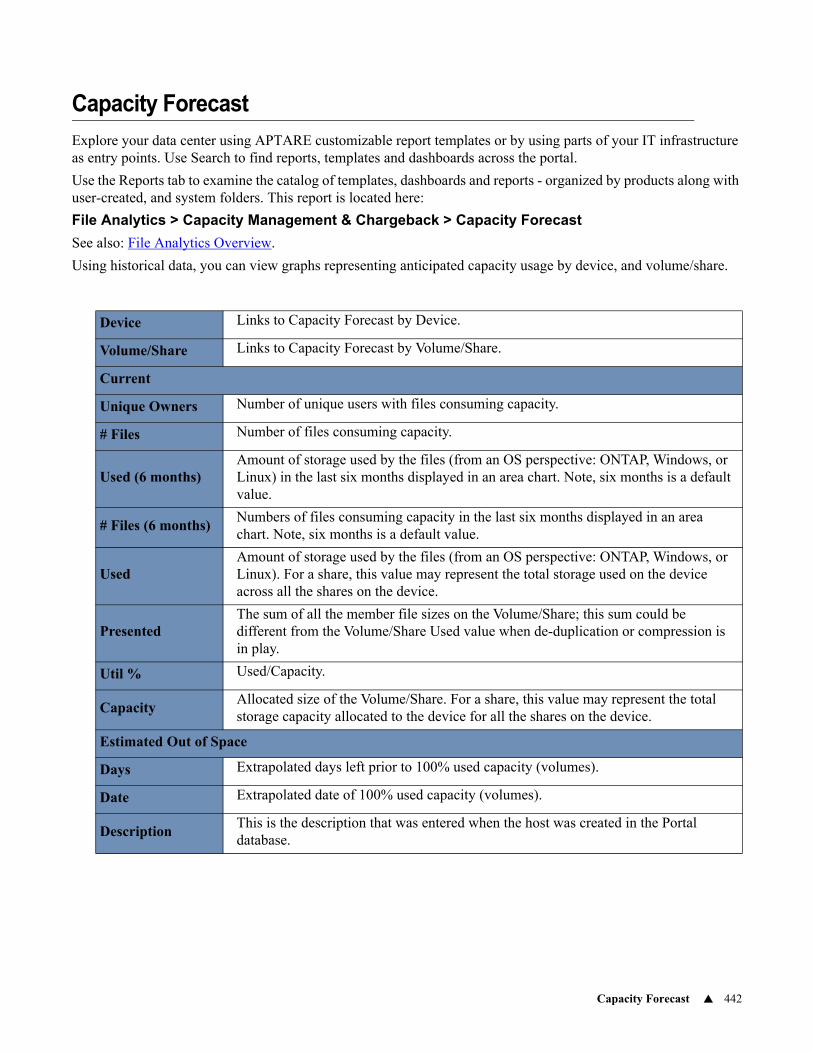
Capacity Forecast 442
Capacity Forecast
Explore your data center using APTARE customizable report templates or by using parts of your IT infrastructure as entry points. Use Search to find reports, templates and dashboards across the portal.
Use the Reports tab to examine the catalog of templates, dashboards and reports - organized by products along with user-created, and system folders. This report is located here:
File Analytics > Capacity Management & Chargeback > Capacity Forecast
See also: File Analytics Overview.
Using historical data, you can view graphs representing anticipated capacity usage by device, and volume/share.
Device Links to Capacity Forecast by Device.
Volume/Share Links to Capacity Forecast by Volume/Share.
Current
Unique Owners Number of unique users with files consuming capacity.
# Files Number of files consuming capacity.
Used (6 months)Amount of storage used by the files (from an OS perspective: ONTAP, Windows, or Linux) in the last six months displayed in an area chart. Note, six months is a default value.
# Files (6 months)Numbers of files consuming capacity in the last six months displayed in an area chart. Note, six months is a default value.
UsedAmount of storage used by the files (from an OS perspective: ONTAP, Windows, or Linux). For a share, this value may represent the total storage used on the device across all the shares on the device.
PresentedThe sum of all the member file sizes on the Volume/Share; this sum could be different from the Volume/Share Used value when de-duplication or compression is in play.
Util % Used/Capacity.
CapacityAllocated size of the Volume/Share. For a share, this value may represent the total storage capacity allocated to the device for all the shares on the device.
Estimated Out of Space
Days Extrapolated days left prior to 100% used capacity (volumes).
Date Extrapolated date of 100% used capacity (volumes).
DescriptionThis is the description that was entered when the host was created in the Portal database.
Capacity Forecast by Device 443
Capacity Forecast by Device
Detail reports are related to a specific enterprise object, such as a backup job. You can only access detail reports through a link presented in the context of a main report, providing additional information that augments the main report. Detail reports cannot be generated, customized, or saved, as they are specific to the report from which they were derived. They are not available in search results.
Explore your data center using APTARE IT Analytics customizable report templates or by using parts of your IT infrastructure as entry points. Use Search to find reports, templates and dashboards across the portal.
Use the Reports tab to examine the APTARE IT Analytics catalog of templates, dashboards and reports - organized by products along with user-created, and system folders. The main report is located here:
File Analytics > Capacity Management & Chargeback > Capacity Forecast
Click a Device link.
Using historical data, this graph represents anticipated capacity usage by device.
See also: File Analytics Overview
Capacity Forecast by Volume/Share
Detail reports are related to a specific enterprise object, such as a backup job. You can only access detail reports through a link presented in the context of a main report, providing additional information that augments the main report. Detail reports cannot be generated, customized, or saved, as they are specific to the report from which they were derived. They are not available in search results.
Explore your data center using APTARE IT Analytics customizable report templates or by using parts of your IT infrastructure as entry points. Use Search to find reports, templates and dashboards across the portal.
Use the Reports tab to examine the APTARE IT Analytics catalog of templates, dashboards and reports - organized by products along with user-created, and system folders. The main report is located here:
File Analytics > Capacity Management & Chargeback >Capacity Forecast
Click a Volume/Share link.
Using historical data, this graph represents anticipated capacity usage by volume or share.
See also: File Analytics Overview
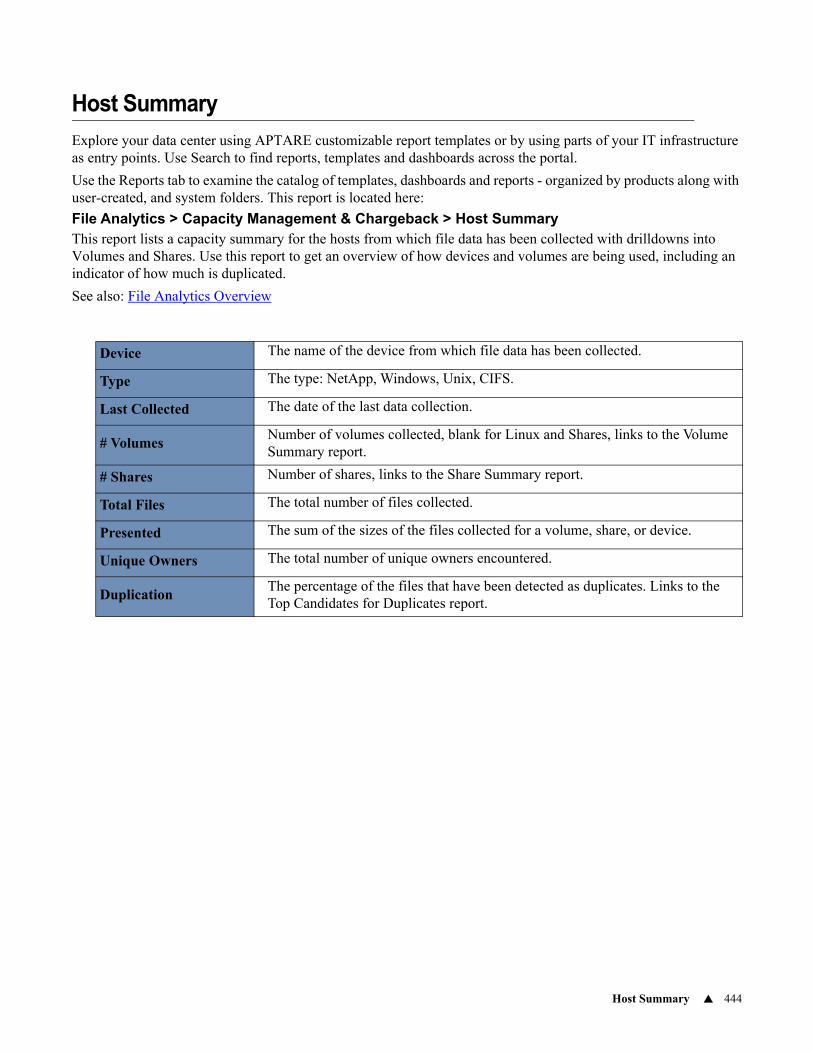
Host Summary 444
Host Summary
Explore your data center using APTARE customizable report templates or by using parts of your IT infrastructure as entry points. Use Search to find reports, templates and dashboards across the portal.
Use the Reports tab to examine the catalog of templates, dashboards and reports - organized by products along with user-created, and system folders. This report is located here:
File Analytics > Capacity Management & Chargeback > Host SummaryThis report lists a capacity summary for the hosts from which file data has been collected with drilldowns into Volumes and Shares. Use this report to get an overview of how devices and volumes are being used, including an indicator of how much is duplicated.
See also: File Analytics Overview
Device The name of the device from which file data has been collected.
Type The type: NetApp, Windows, Unix, CIFS.
Last Collected The date of the last data collection.
# VolumesNumber of volumes collected, blank for Linux and Shares, links to the Volume Summary report.
# Shares Number of shares, links to the Share Summary report.
Total Files The total number of files collected.
Presented The sum of the sizes of the files collected for a volume, share, or device.
Unique Owners The total number of unique owners encountered.
DuplicationThe percentage of the files that have been detected as duplicates. Links to the Top Candidates for Duplicates report.
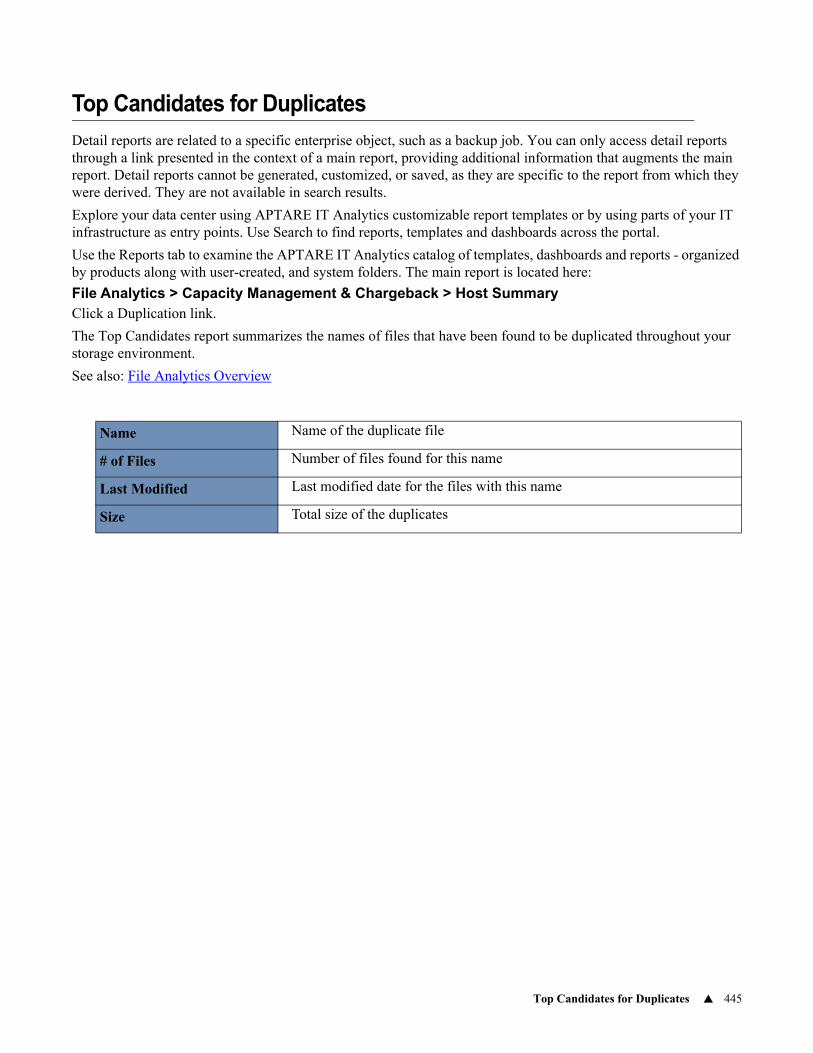
Top Candidates for Duplicates 445
Top Candidates for Duplicates
Detail reports are related to a specific enterprise object, such as a backup job. You can only access detail reports through a link presented in the context of a main report, providing additional information that augments the main report. Detail reports cannot be generated, customized, or saved, as they are specific to the report from which they were derived. They are not available in search results.
Explore your data center using APTARE IT Analytics customizable report templates or by using parts of your IT infrastructure as entry points. Use Search to find reports, templates and dashboards across the portal.
Use the Reports tab to examine the APTARE IT Analytics catalog of templates, dashboards and reports - organized by products along with user-created, and system folders. The main report is located here:
File Analytics > Capacity Management & Chargeback > Host Summary Click a Duplication link.
The Top Candidates report summarizes the names of files that have been found to be duplicated throughout your storage environment.
See also: File Analytics Overview
Name Name of the duplicate file
# of Files Number of files found for this name
Last Modified Last modified date for the files with this name
Size Total size of the duplicates
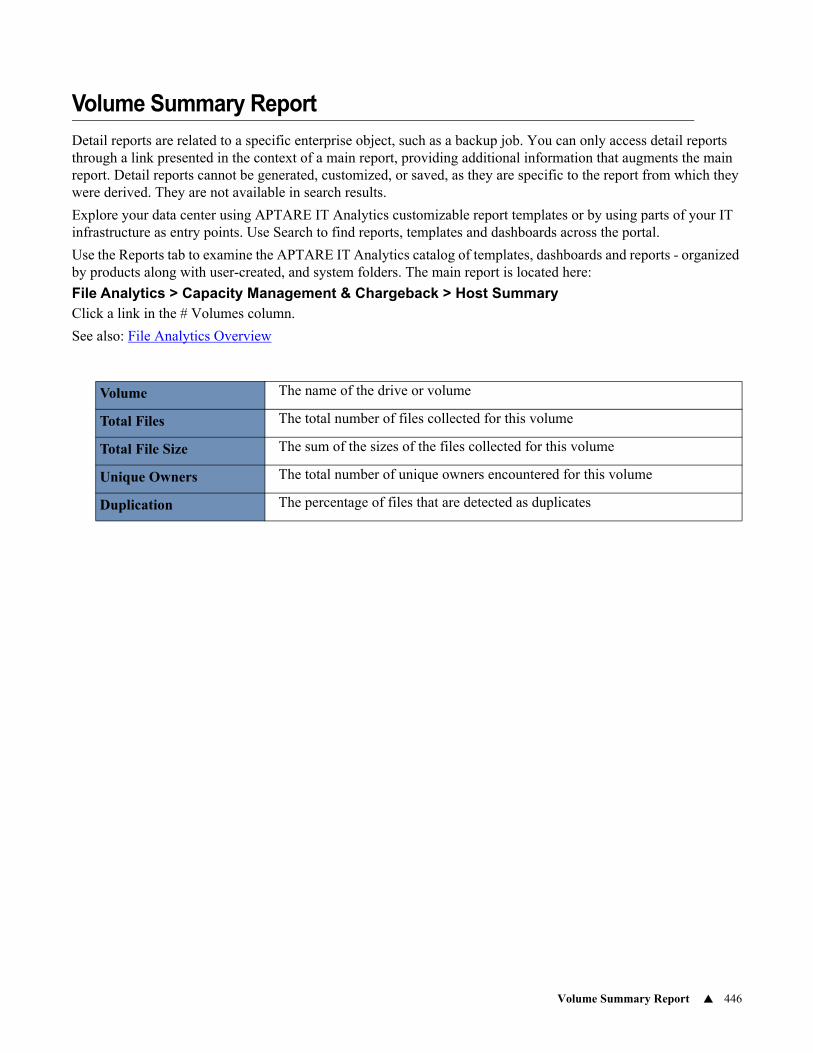
Volume Summary Report 446
Volume Summary Report
Detail reports are related to a specific enterprise object, such as a backup job. You can only access detail reports through a link presented in the context of a main report, providing additional information that augments the main report. Detail reports cannot be generated, customized, or saved, as they are specific to the report from which they were derived. They are not available in search results.
Explore your data center using APTARE IT Analytics customizable report templates or by using parts of your IT infrastructure as entry points. Use Search to find reports, templates and dashboards across the portal.
Use the Reports tab to examine the APTARE IT Analytics catalog of templates, dashboards and reports - organized by products along with user-created, and system folders. The main report is located here:
File Analytics > Capacity Management & Chargeback > Host Summary Click a link in the # Volumes column.
See also: File Analytics Overview
Volume The name of the drive or volume
Total Files The total number of files collected for this volume
Total File Size The sum of the sizes of the files collected for this volume
Unique Owners The total number of unique owners encountered for this volume
Duplication The percentage of files that are detected as duplicates

Share Summary Report 447
Share Summary Report
Detail reports are related to a specific enterprise object, such as a backup job. You can only access detail reports through a link presented in the context of a main report, providing additional information that augments the main report. Detail reports cannot be generated, customized, or saved, as they are specific to the report from which they were derived. They are not available in search results.
Explore your data center using APTARE IT Analytics customizable report templates or by using parts of your IT infrastructure as entry points. Use Search to find reports, templates and dashboards across the portal.
Use the Reports tab to examine the APTARE IT Analytics catalog of templates, dashboards and reports - organized by products along with user-created, and system folders. The main report is located here:
File Analytics > Capacity Management & Chargeback > Host SummaryClick a link in the # Shares column.
See also: File Analytics Overview
Share The name of the share
Total Files The total number of files collected for this share
Total File Size The sum of the sizes of the files collected for this share
Unique Owners The total number of unique owners encountered for this share
Duplication The percentage of files that are detected as duplicates
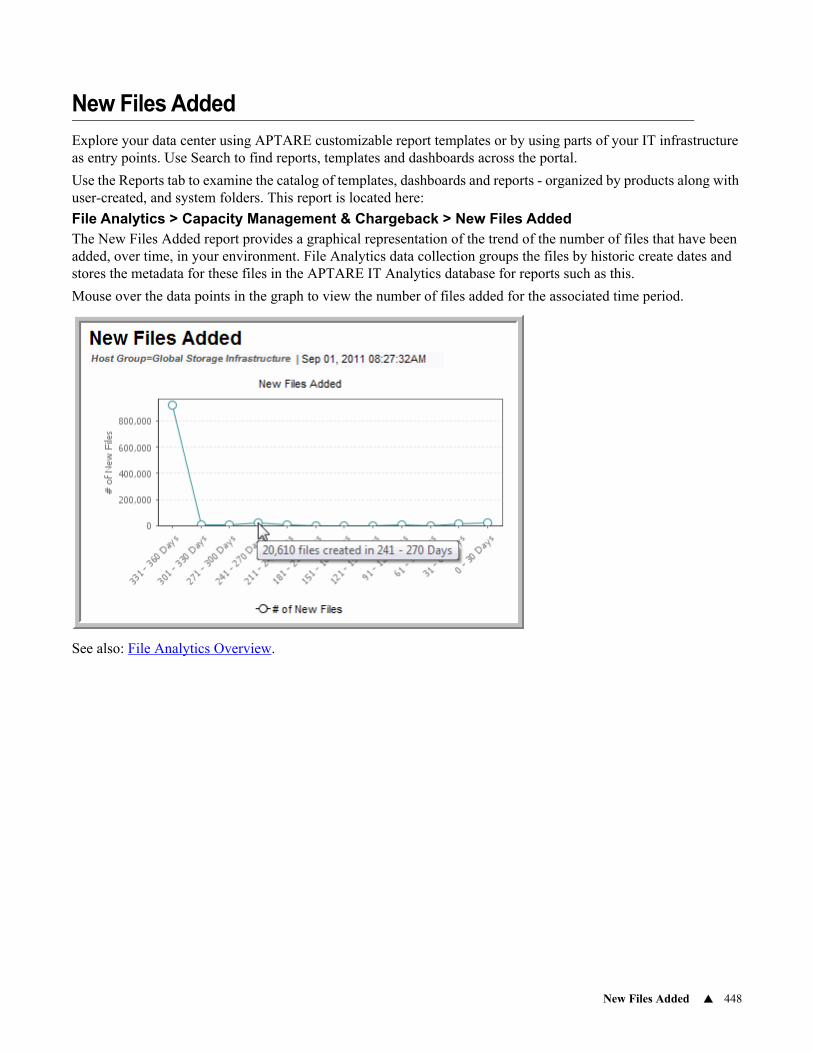
New Files Added 448
New Files Added
Explore your data center using APTARE customizable report templates or by using parts of your IT infrastructure as entry points. Use Search to find reports, templates and dashboards across the portal.
Use the Reports tab to examine the catalog of templates, dashboards and reports - organized by products along with user-created, and system folders. This report is located here:
File Analytics > Capacity Management & Chargeback > New Files AddedThe New Files Added report provides a graphical representation of the trend of the number of files that have been added, over time, in your environment. File Analytics data collection groups the files by historic create dates and stores the metadata for these files in the APTARE IT Analytics database for reports such as this.
Mouse over the data points in the graph to view the number of files added for the associated time period.
See also: File Analytics Overview.
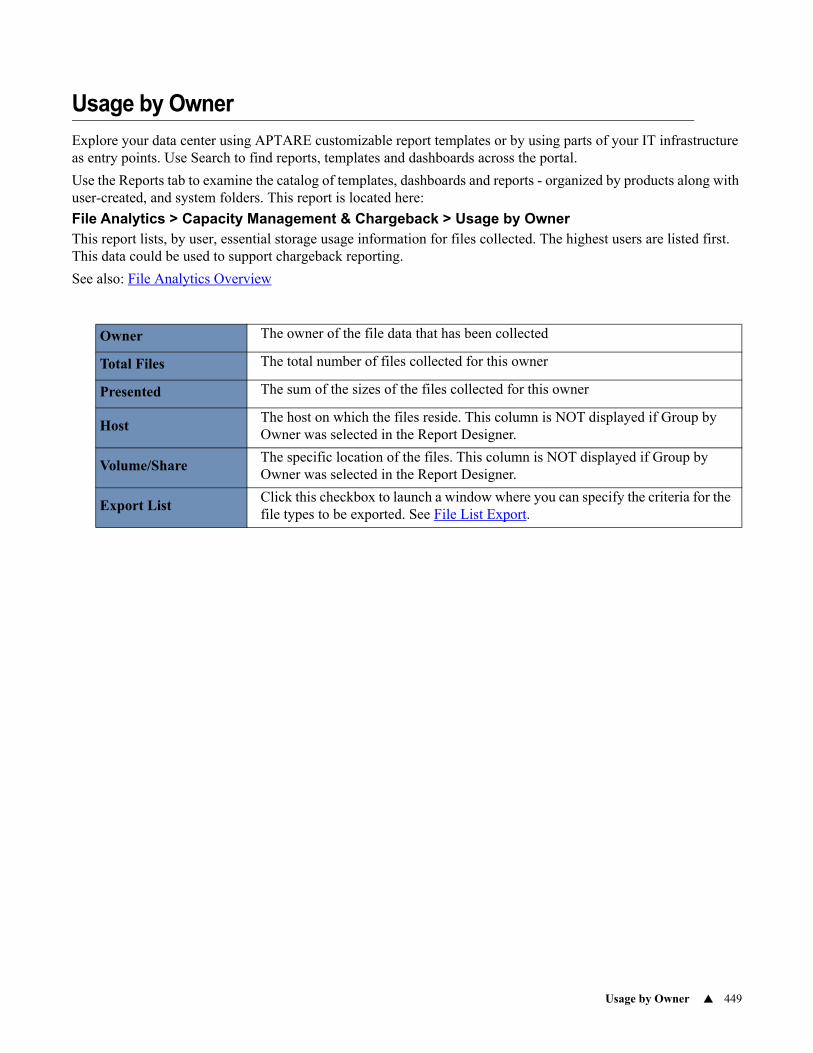
Usage by Owner 449
Usage by Owner
Explore your data center using APTARE customizable report templates or by using parts of your IT infrastructure as entry points. Use Search to find reports, templates and dashboards across the portal.
Use the Reports tab to examine the catalog of templates, dashboards and reports - organized by products along with user-created, and system folders. This report is located here:
File Analytics > Capacity Management & Chargeback > Usage by OwnerThis report lists, by user, essential storage usage information for files collected. The highest users are listed first. This data could be used to support chargeback reporting.
See also: File Analytics Overview
Owner The owner of the file data that has been collected
Total Files The total number of files collected for this owner
Presented The sum of the sizes of the files collected for this owner
HostThe host on which the files reside. This column is NOT displayed if Group by Owner was selected in the Report Designer.
Volume/ShareThe specific location of the files. This column is NOT displayed if Group by Owner was selected in the Report Designer.
Export ListClick this checkbox to launch a window where you can specify the criteria for the file types to be exported. See File List Export.
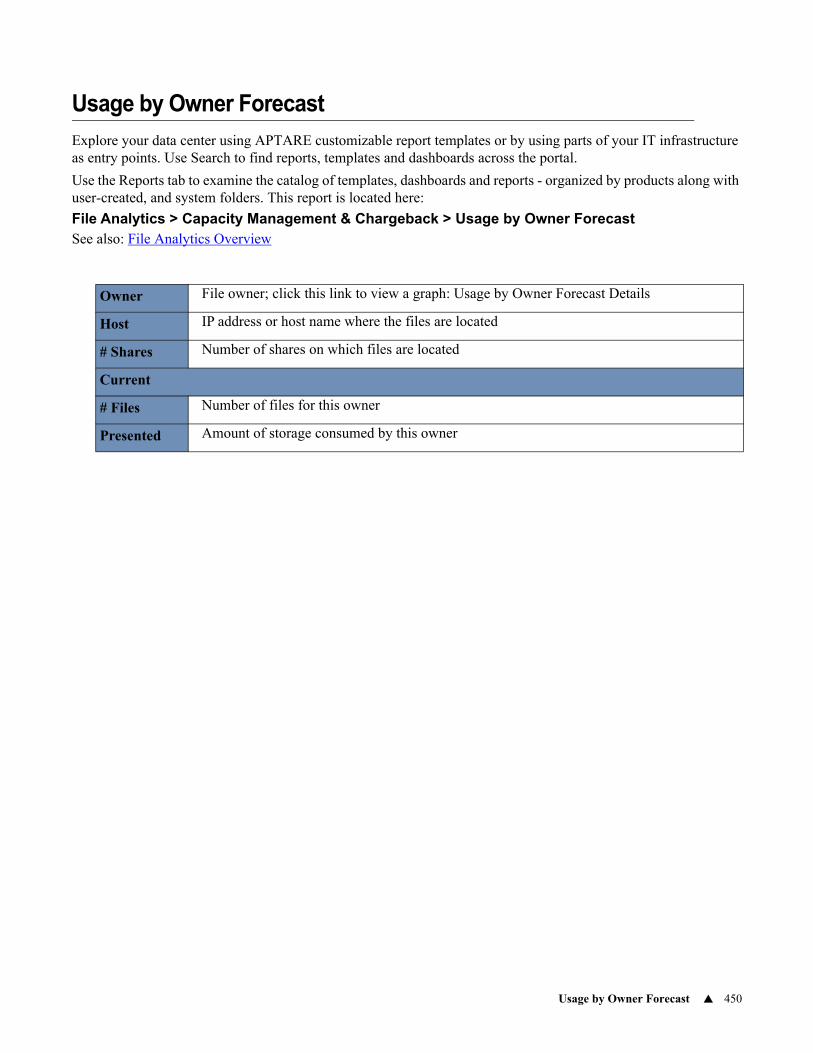
Usage by Owner Forecast 450
Usage by Owner Forecast
Explore your data center using APTARE customizable report templates or by using parts of your IT infrastructure as entry points. Use Search to find reports, templates and dashboards across the portal.
Use the Reports tab to examine the catalog of templates, dashboards and reports - organized by products along with user-created, and system folders. This report is located here:
File Analytics > Capacity Management & Chargeback > Usage by Owner ForecastSee also: File Analytics Overview
Owner File owner; click this link to view a graph: Usage by Owner Forecast Details
Host IP address or host name where the files are located
# Shares Number of shares on which files are located
Current
# Files Number of files for this owner
Presented Amount of storage consumed by this owner
Usage by Owner Forecast Details 451
Usage by Owner Forecast Details
Detail reports are related to a specific enterprise object, such as a backup job. You can only access detail reports through a link presented in the context of a main report, providing additional information that augments the main report. Detail reports cannot be generated, customized, or saved, as they are specific to the report from which they were derived. They are not available in search results.
Explore your data center using APTARE IT Analytics customizable report templates or by using parts of your IT infrastructure as entry points. Use Search to find reports, templates and dashboards across the portal.
Use the Reports tab to examine the APTARE IT Analytics catalog of templates, dashboards and reports - organized by products along with user-created, and system folders. The main report is located here:
File Analytics > Capacity Management & Chargeback > Usage by Owner Forecast
Click a link in the Owner column.
Use this graph to plan storage usage by individual owners. Using historical usage data, this report forecasts anticipated usage over the next six months.
See also: File Analytics Overview
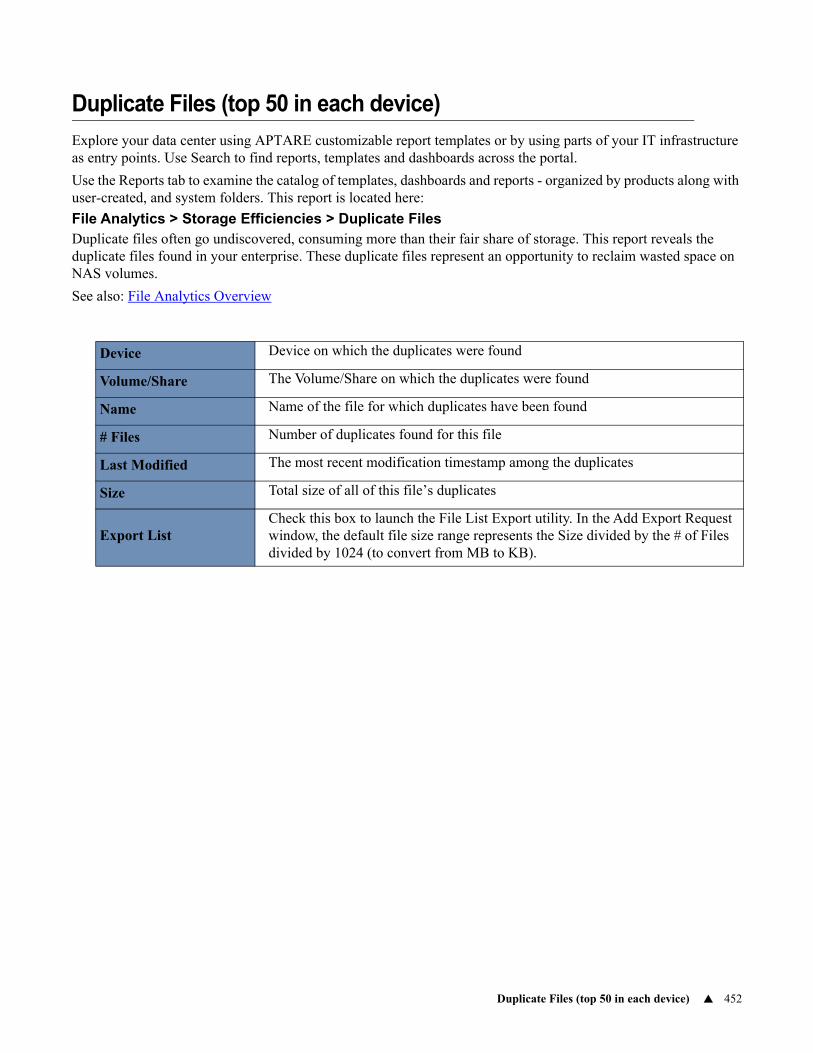
Duplicate Files (top 50 in each device) 452
Duplicate Files (top 50 in each device)
Explore your data center using APTARE customizable report templates or by using parts of your IT infrastructure as entry points. Use Search to find reports, templates and dashboards across the portal.
Use the Reports tab to examine the catalog of templates, dashboards and reports - organized by products along with user-created, and system folders. This report is located here:
File Analytics > Storage Efficiencies > Duplicate FilesDuplicate files often go undiscovered, consuming more than their fair share of storage. This report reveals the duplicate files found in your enterprise. These duplicate files represent an opportunity to reclaim wasted space on NAS volumes.
See also: File Analytics Overview
Device Device on which the duplicates were found
Volume/Share The Volume/Share on which the duplicates were found
Name Name of the file for which duplicates have been found
# Files Number of duplicates found for this file
Last Modified The most recent modification timestamp among the duplicates
Size Total size of all of this file’s duplicates
Export ListCheck this box to launch the File List Export utility. In the Add Export Request window, the default file size range represents the Size divided by the # of Files divided by 1024 (to convert from MB to KB).
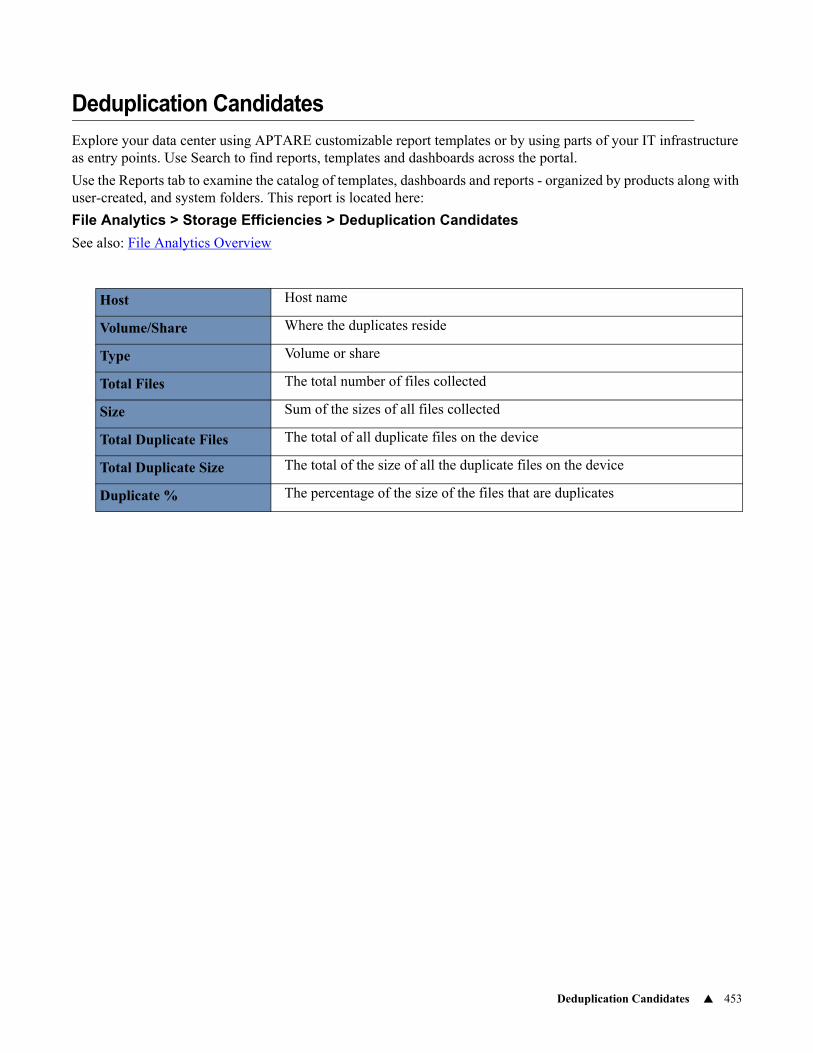
Deduplication Candidates 453
Deduplication Candidates
Explore your data center using APTARE customizable report templates or by using parts of your IT infrastructure as entry points. Use Search to find reports, templates and dashboards across the portal.
Use the Reports tab to examine the catalog of templates, dashboards and reports - organized by products along with user-created, and system folders. This report is located here:
File Analytics > Storage Efficiencies > Deduplication Candidates
See also: File Analytics Overview
Host Host name
Volume/Share Where the duplicates reside
Type Volume or share
Total Files The total number of files collected
Size Sum of the sizes of all files collected
Total Duplicate Files The total of all duplicate files on the device
Total Duplicate Size The total of the size of all the duplicate files on the device
Duplicate % The percentage of the size of the files that are duplicates
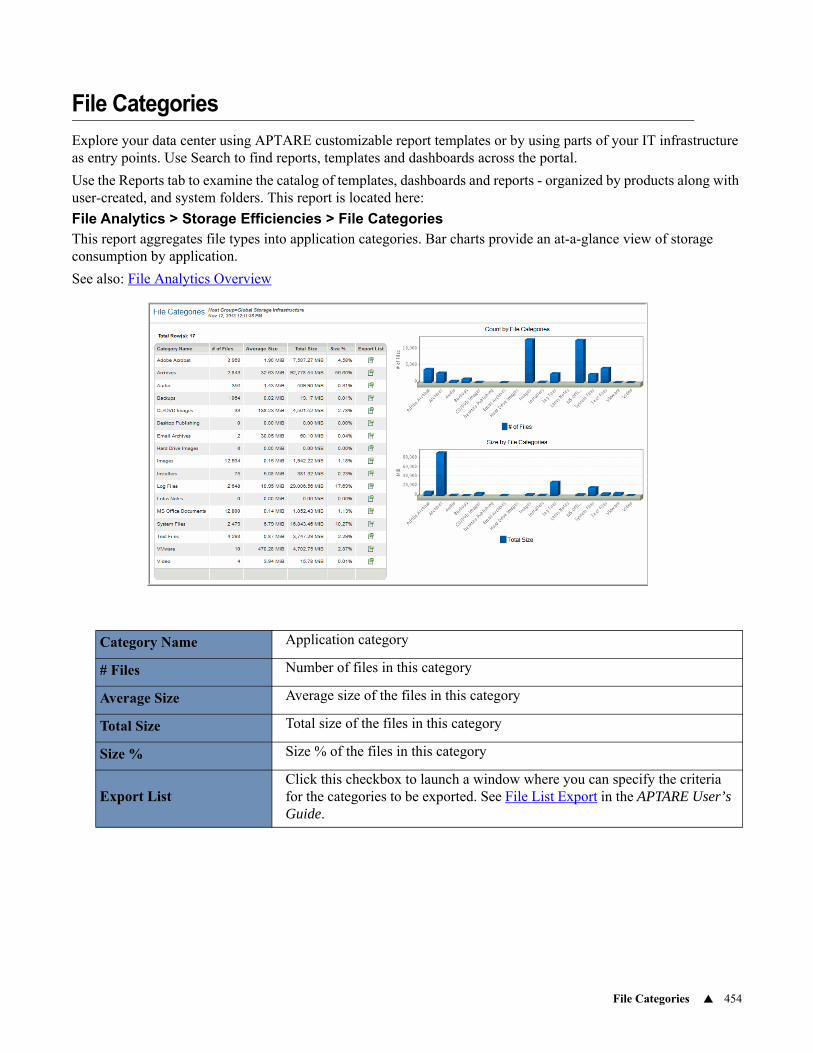
File Categories 454
File Categories
Explore your data center using APTARE customizable report templates or by using parts of your IT infrastructure as entry points. Use Search to find reports, templates and dashboards across the portal.
Use the Reports tab to examine the catalog of templates, dashboards and reports - organized by products along with user-created, and system folders. This report is located here:
File Analytics > Storage Efficiencies > File CategoriesThis report aggregates file types into application categories. Bar charts provide an at-a-glance view of storage consumption by application.
See also: File Analytics Overview
Category Name Application category
# Files Number of files in this category
Average Size Average size of the files in this category
Total Size Total size of the files in this category
Size % Size % of the files in this category
Export ListClick this checkbox to launch a window where you can specify the criteria for the categories to be exported. See File List Export in the APTARE User’s Guide.
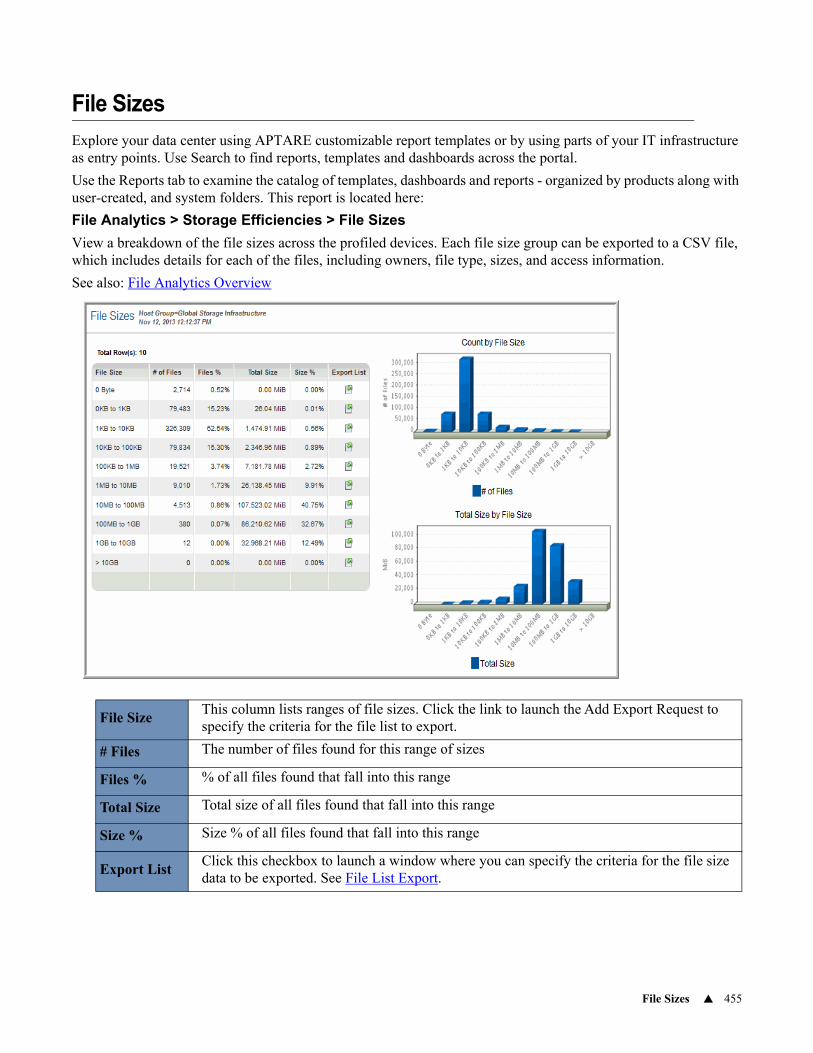
File Sizes 455
File Sizes
Explore your data center using APTARE customizable report templates or by using parts of your IT infrastructure as entry points. Use Search to find reports, templates and dashboards across the portal.
Use the Reports tab to examine the catalog of templates, dashboards and reports - organized by products along with user-created, and system folders. This report is located here:
File Analytics > Storage Efficiencies > File Sizes
View a breakdown of the file sizes across the profiled devices. Each file size group can be exported to a CSV file, which includes details for each of the files, including owners, file type, sizes, and access information.
See also: File Analytics Overview
File SizeThis column lists ranges of file sizes. Click the link to launch the Add Export Request to specify the criteria for the file list to export.
# Files The number of files found for this range of sizes
Files % % of all files found that fall into this range
Total Size Total size of all files found that fall into this range
Size % Size % of all files found that fall into this range
Export ListClick this checkbox to launch a window where you can specify the criteria for the file size data to be exported. See File List Export.
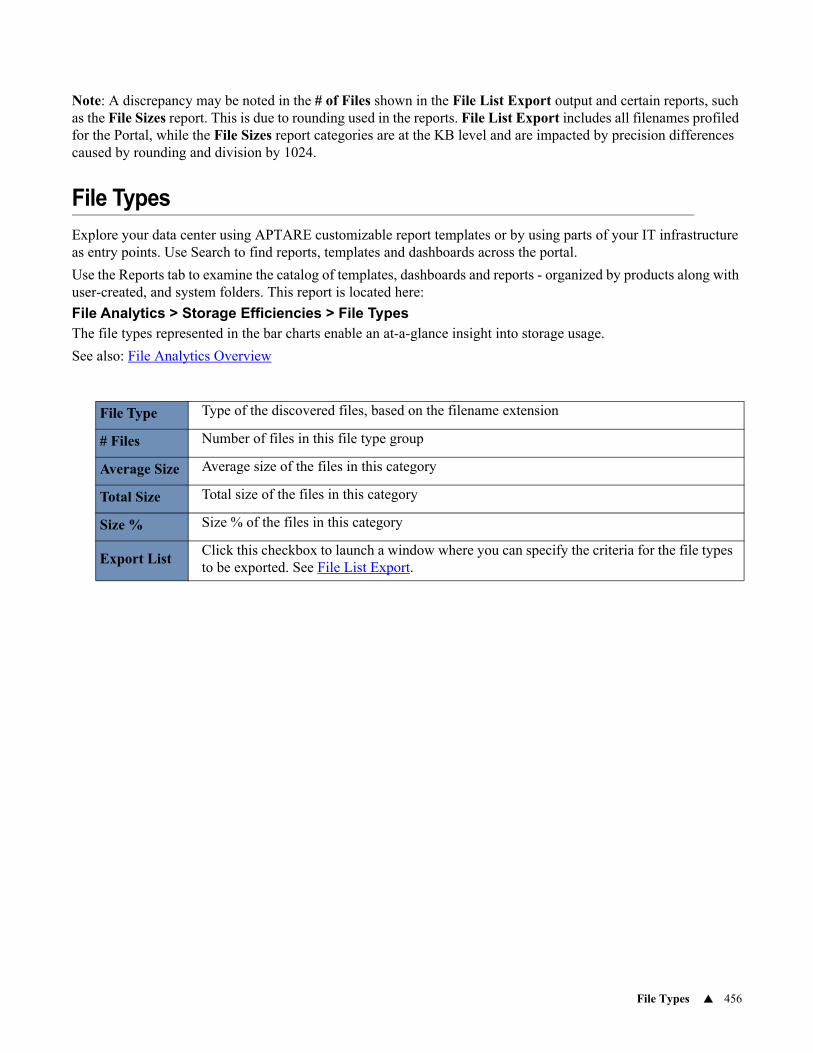
File Types 456
Note: A discrepancy may be noted in the # of Files shown in the File List Export output and certain reports, such as the File Sizes report. This is due to rounding used in the reports. File List Export includes all filenames profiled for the Portal, while the File Sizes report categories are at the KB level and are impacted by precision differences caused by rounding and division by 1024.
File Types
Explore your data center using APTARE customizable report templates or by using parts of your IT infrastructure as entry points. Use Search to find reports, templates and dashboards across the portal.
Use the Reports tab to examine the catalog of templates, dashboards and reports - organized by products along with user-created, and system folders. This report is located here:
File Analytics > Storage Efficiencies > File TypesThe file types represented in the bar charts enable an at-a-glance insight into storage usage.
See also: File Analytics Overview
File Type Type of the discovered files, based on the filename extension
# Files Number of files in this file type group
Average Size Average size of the files in this category
Total Size Total size of the files in this category
Size % Size % of the files in this category
Export ListClick this checkbox to launch a window where you can specify the criteria for the file types to be exported. See File List Export.
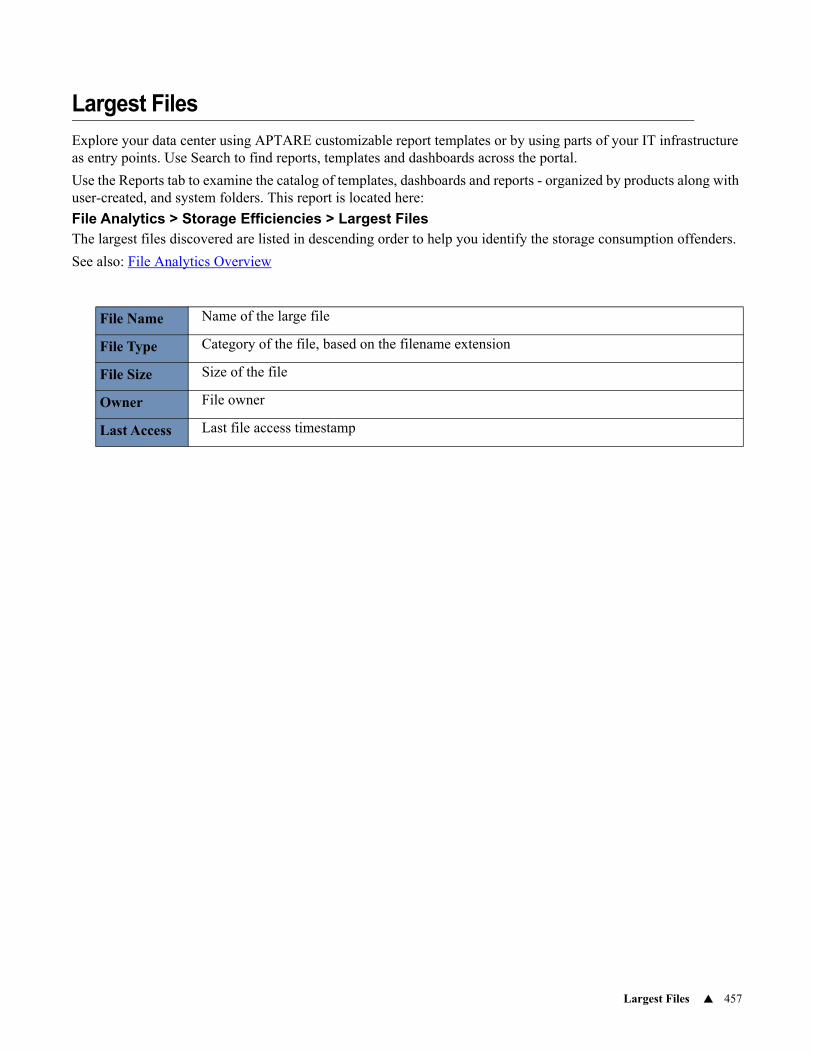
Largest Files 457
Largest Files
Explore your data center using APTARE customizable report templates or by using parts of your IT infrastructure as entry points. Use Search to find reports, templates and dashboards across the portal.
Use the Reports tab to examine the catalog of templates, dashboards and reports - organized by products along with user-created, and system folders. This report is located here:
File Analytics > Storage Efficiencies > Largest FilesThe largest files discovered are listed in descending order to help you identify the storage consumption offenders.
See also: File Analytics Overview
File Name Name of the large file
File Type Category of the file, based on the filename extension
File Size Size of the file
Owner File owner
Last Access Last file access timestamp
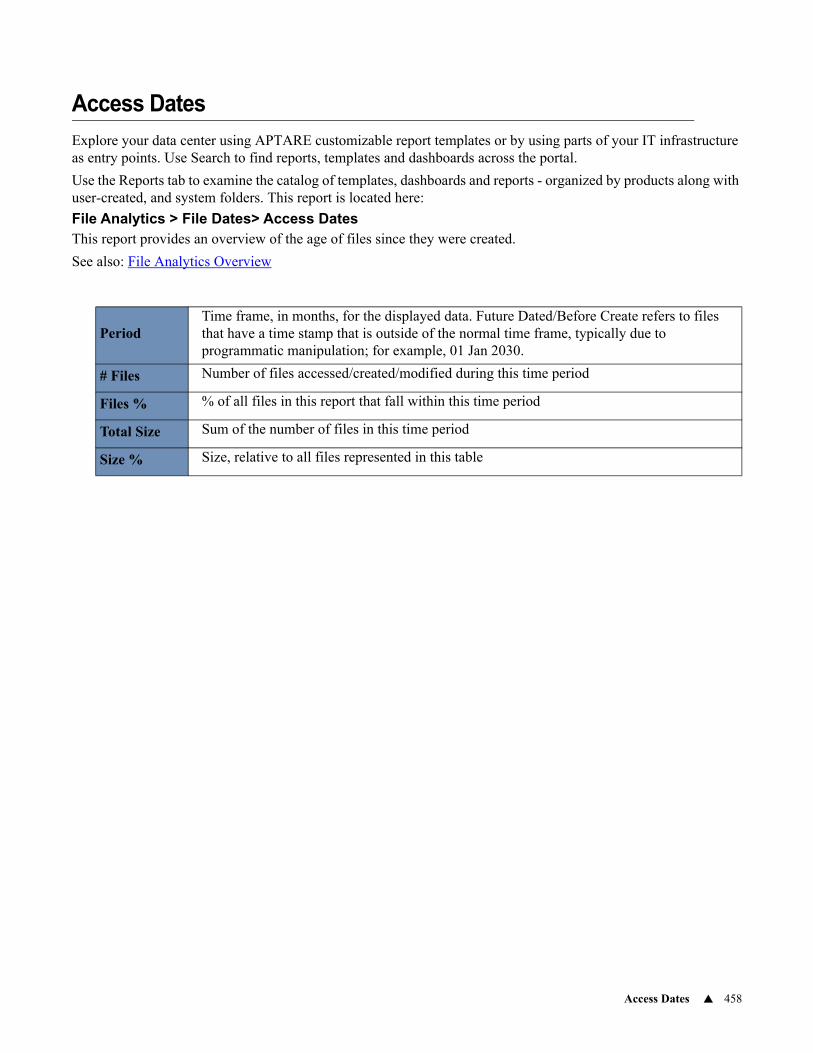
Access Dates 458
Access Dates
Explore your data center using APTARE customizable report templates or by using parts of your IT infrastructure as entry points. Use Search to find reports, templates and dashboards across the portal.
Use the Reports tab to examine the catalog of templates, dashboards and reports - organized by products along with user-created, and system folders. This report is located here:
File Analytics > File Dates> Access DatesThis report provides an overview of the age of files since they were created.
See also: File Analytics Overview
PeriodTime frame, in months, for the displayed data. Future Dated/Before Create refers to files that have a time stamp that is outside of the normal time frame, typically due to programmatic manipulation; for example, 01 Jan 2030.
# Files Number of files accessed/created/modified during this time period
Files % % of all files in this report that fall within this time period
Total Size Sum of the number of files in this time period
Size % Size, relative to all files represented in this table
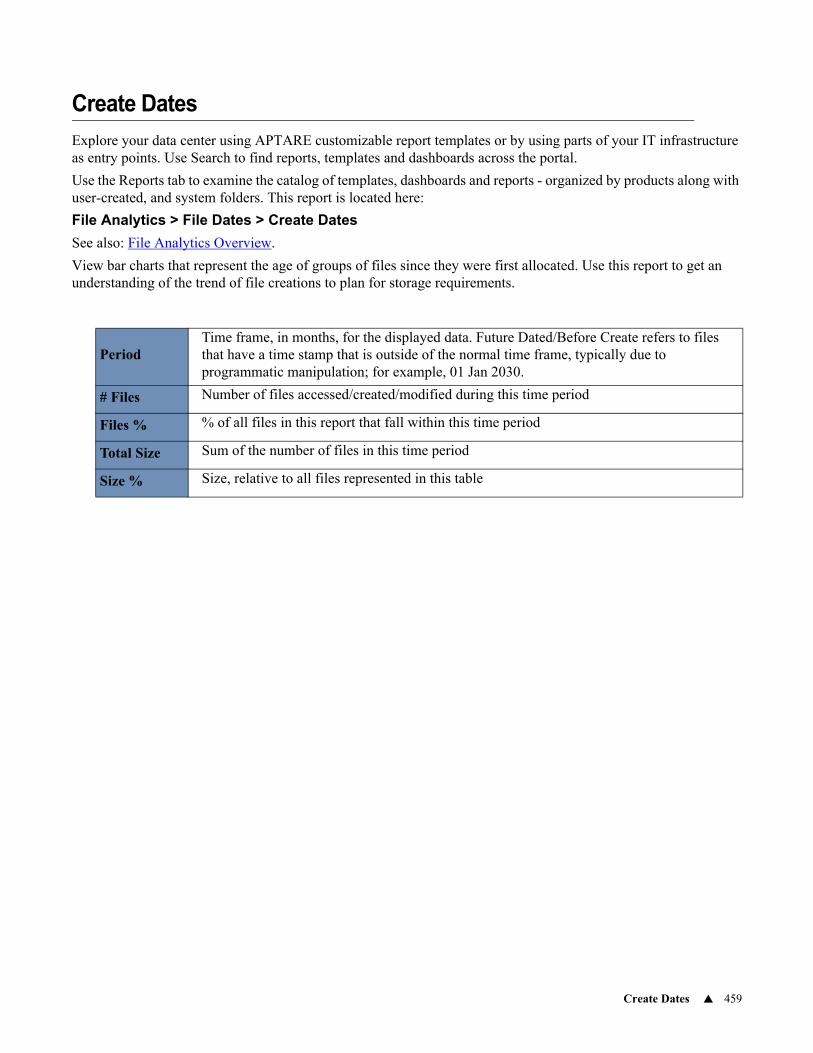
Create Dates 459
Create Dates
Explore your data center using APTARE customizable report templates or by using parts of your IT infrastructure as entry points. Use Search to find reports, templates and dashboards across the portal.
Use the Reports tab to examine the catalog of templates, dashboards and reports - organized by products along with user-created, and system folders. This report is located here:
File Analytics > File Dates > Create Dates
See also: File Analytics Overview.
View bar charts that represent the age of groups of files since they were first allocated. Use this report to get an understanding of the trend of file creations to plan for storage requirements.
PeriodTime frame, in months, for the displayed data. Future Dated/Before Create refers to files that have a time stamp that is outside of the normal time frame, typically due to programmatic manipulation; for example, 01 Jan 2030.
# Files Number of files accessed/created/modified during this time period
Files % % of all files in this report that fall within this time period
Total Size Sum of the number of files in this time period
Size % Size, relative to all files represented in this table
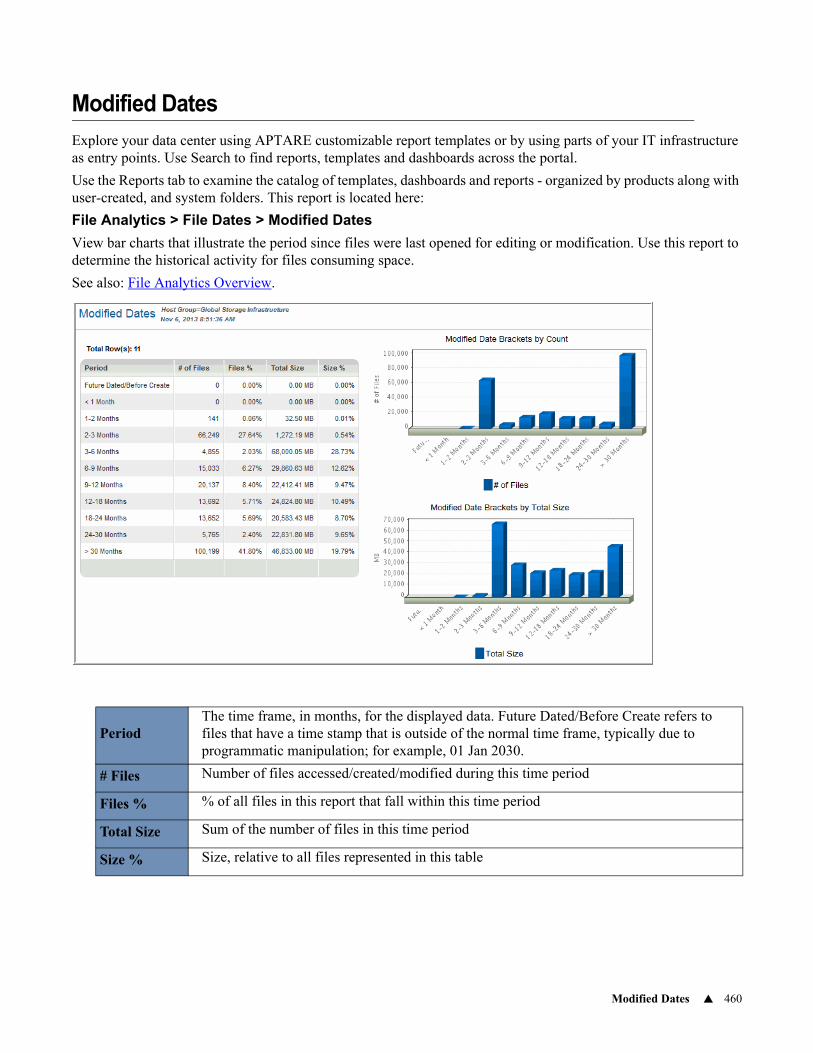
Modified Dates 460
Modified Dates
Explore your data center using APTARE customizable report templates or by using parts of your IT infrastructure as entry points. Use Search to find reports, templates and dashboards across the portal.
Use the Reports tab to examine the catalog of templates, dashboards and reports - organized by products along with user-created, and system folders. This report is located here:
File Analytics > File Dates > Modified Dates
View bar charts that illustrate the period since files were last opened for editing or modification. Use this report to determine the historical activity for files consuming space.
See also: File Analytics Overview.
PeriodThe time frame, in months, for the displayed data. Future Dated/Before Create refers to files that have a time stamp that is outside of the normal time frame, typically due to programmatic manipulation; for example, 01 Jan 2030.
# Files Number of files accessed/created/modified during this time period
Files % % of all files in this report that fall within this time period
Total Size Sum of the number of files in this time period
Size % Size, relative to all files represented in this table
486
16Chapter 6Virtualization Manager Reports
APTARE IT Analytics provides insight into Virtual Machine performance and the capacity utilization of mapped datastores. Virtualization Manager offers reports on storage resource utilization at the file system and virtual disk levels for each VM. In additional, forecasting reports predict future storage capacity needs in virtualized environments.
The data collected on Virtual Machine storage is displayed in the reports described in this section. Using these reports, you can identify unused, reclaimable storage.
This section contains the following topics:• Virtualization Terminology
• Virtualization Manager Overview
• AWS EC2 Instance Summary
• Microsoft Azure Virtual Machine Summary
• VM Cluster Summary
• VM Files Summary
• VM Server Summary
• VM Server Detail
• Microsoft Hyper-V Server Summary
• VM Snapshot Summary
• VM Storage Mapping Summary
• VM Summary
• VM Detail
• Microsoft Hyper-V VM Summary
• VM Detail (Hyper-V)
• VMs Over Time
• Logical Disk Utilization
• Datastore Usage Breakdown
• VM Datastore Overview
• Datastore Utilization Summary
• Datastore Usage History and Performance
• Datastore Detail
• Physical Disk Utilization
• Physical Disk Detail
• Datastore Performance Summary
487
• Physical Disk Performance Over Time
• Physical Disk Performance Summary
• VM Guest to LUN Performance
• VM Performance Over Time
• VM Performance Summary
• Datastore Capacity Forecast
• VM Size Forecast
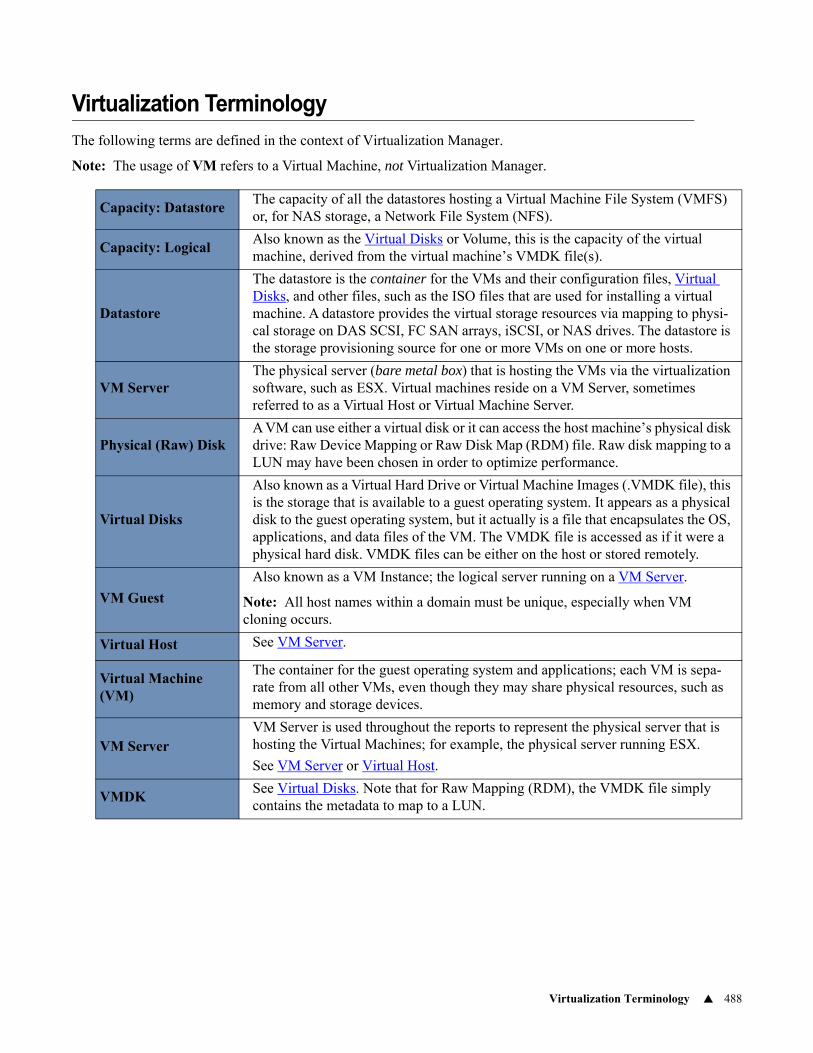
Virtualization Terminology 488
Virtualization Terminology
The following terms are defined in the context of Virtualization Manager.
Note: The usage of VM refers to a Virtual Machine, not Virtualization Manager.
Capacity: DatastoreThe capacity of all the datastores hosting a Virtual Machine File System (VMFS) or, for NAS storage, a Network File System (NFS).
Capacity: LogicalAlso known as the Virtual Disks or Volume, this is the capacity of the virtual machine, derived from the virtual machine’s VMDK file(s).
Datastore
The datastore is the container for the VMs and their configuration files, Virtual Disks, and other files, such as the ISO files that are used for installing a virtual machine. A datastore provides the virtual storage resources via mapping to physi-cal storage on DAS SCSI, FC SAN arrays, iSCSI, or NAS drives. The datastore is the storage provisioning source for one or more VMs on one or more hosts.
VM ServerThe physical server (bare metal box) that is hosting the VMs via the virtualization software, such as ESX. Virtual machines reside on a VM Server, sometimes referred to as a Virtual Host or Virtual Machine Server.
Physical (Raw) DiskA VM can use either a virtual disk or it can access the host machine’s physical disk drive: Raw Device Mapping or Raw Disk Map (RDM) file. Raw disk mapping to a LUN may have been chosen in order to optimize performance.
Virtual Disks
Also known as a Virtual Hard Drive or Virtual Machine Images (.VMDK file), this is the storage that is available to a guest operating system. It appears as a physical disk to the guest operating system, but it actually is a file that encapsulates the OS, applications, and data files of the VM. The VMDK file is accessed as if it were a physical hard disk. VMDK files can be either on the host or stored remotely.
VM Guest
Also known as a VM Instance; the logical server running on a VM Server.
Note: All host names within a domain must be unique, especially when VM cloning occurs.
Virtual Host See VM Server.
Virtual Machine (VM)
The container for the guest operating system and applications; each VM is sepa-rate from all other VMs, even though they may share physical resources, such as memory and storage devices.
VM ServerVM Server is used throughout the reports to represent the physical server that is hosting the Virtual Machines; for example, the physical server running ESX.
See VM Server or Virtual Host.
VMDKSee Virtual Disks. Note that for Raw Mapping (RDM), the VMDK file simply contains the metadata to map to a LUN.
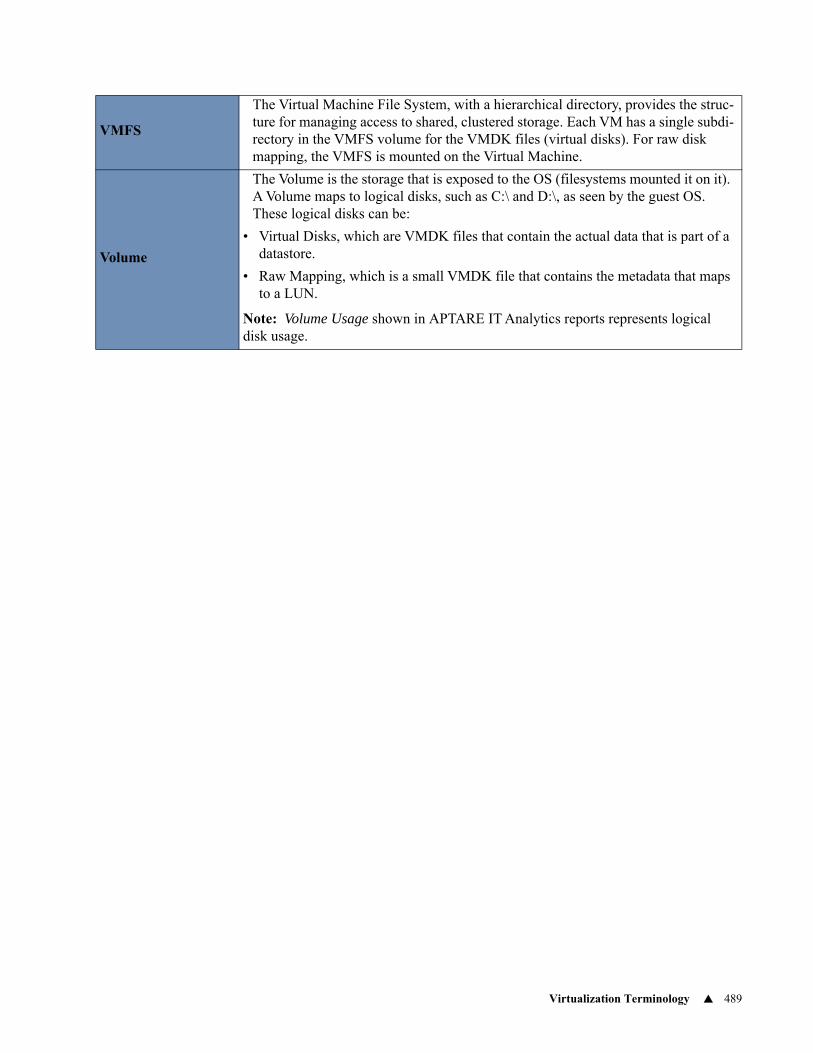
Virtualization Terminology 489
VMFS
The Virtual Machine File System, with a hierarchical directory, provides the struc-ture for managing access to shared, clustered storage. Each VM has a single subdi-rectory in the VMFS volume for the VMDK files (virtual disks). For raw disk mapping, the VMFS is mounted on the Virtual Machine.
Volume
The Volume is the storage that is exposed to the OS (filesystems mounted it on it). A Volume maps to logical disks, such as C:\ and D:\, as seen by the guest OS. These logical disks can be:
• Virtual Disks, which are VMDK files that contain the actual data that is part of a datastore.
• Raw Mapping, which is a small VMDK file that contains the metadata that maps to a LUN.
Note: Volume Usage shown in APTARE IT Analytics reports represents logical disk usage.
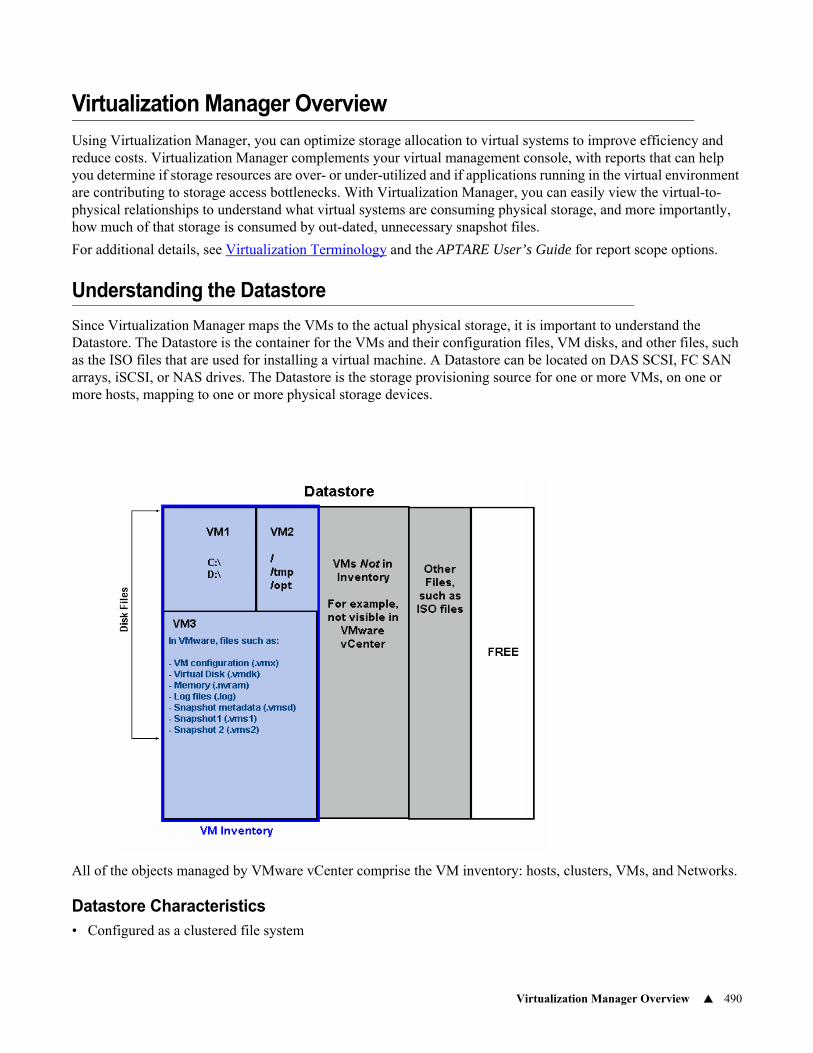
Virtualization Manager Overview 490
Virtualization Manager Overview
Using Virtualization Manager, you can optimize storage allocation to virtual systems to improve efficiency and reduce costs. Virtualization Manager complements your virtual management console, with reports that can help you determine if storage resources are over- or under-utilized and if applications running in the virtual environment are contributing to storage access bottlenecks. With Virtualization Manager, you can easily view the virtual-to-physical relationships to understand what virtual systems are consuming physical storage, and more importantly, how much of that storage is consumed by out-dated, unnecessary snapshot files.
For additional details, see Virtualization Terminology and the APTARE User’s Guide for report scope options.
Understanding the Datastore
Since Virtualization Manager maps the VMs to the actual physical storage, it is important to understand the Datastore. The Datastore is the container for the VMs and their configuration files, VM disks, and other files, such as the ISO files that are used for installing a virtual machine. A Datastore can be located on DAS SCSI, FC SAN arrays, iSCSI, or NAS drives. The Datastore is the storage provisioning source for one or more VMs, on one or more hosts, mapping to one or more physical storage devices.
All of the objects managed by VMware vCenter comprise the VM inventory: hosts, clusters, VMs, and Networks.
Datastore Characteristics• Configured as a clustered file system
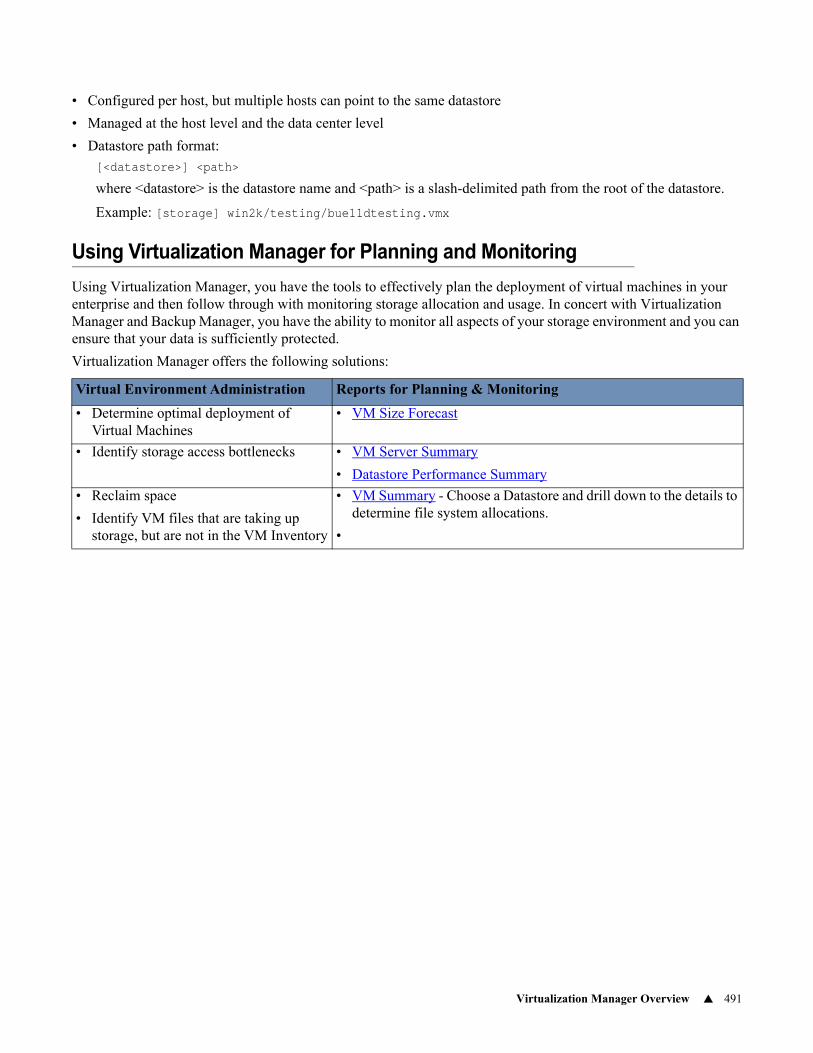
Virtualization Manager Overview 491
• Configured per host, but multiple hosts can point to the same datastore
• Managed at the host level and the data center level
• Datastore path format:
[<datastore>] <path>
where <datastore> is the datastore name and <path> is a slash-delimited path from the root of the datastore.
Example: [storage] win2k/testing/bue11dtesting.vmx
Using Virtualization Manager for Planning and Monitoring
Using Virtualization Manager, you have the tools to effectively plan the deployment of virtual machines in your enterprise and then follow through with monitoring storage allocation and usage. In concert with Virtualization Manager and Backup Manager, you have the ability to monitor all aspects of your storage environment and you can ensure that your data is sufficiently protected.
Virtualization Manager offers the following solutions:
Virtual Environment Administration Reports for Planning & Monitoring
• Determine optimal deployment of Virtual Machines
• VM Size Forecast
• Identify storage access bottlenecks • VM Server Summary
• Datastore Performance Summary
• Reclaim space
• Identify VM files that are taking up storage, but are not in the VM Inventory
• VM Summary - Choose a Datastore and drill down to the details to determine file system allocations.
•
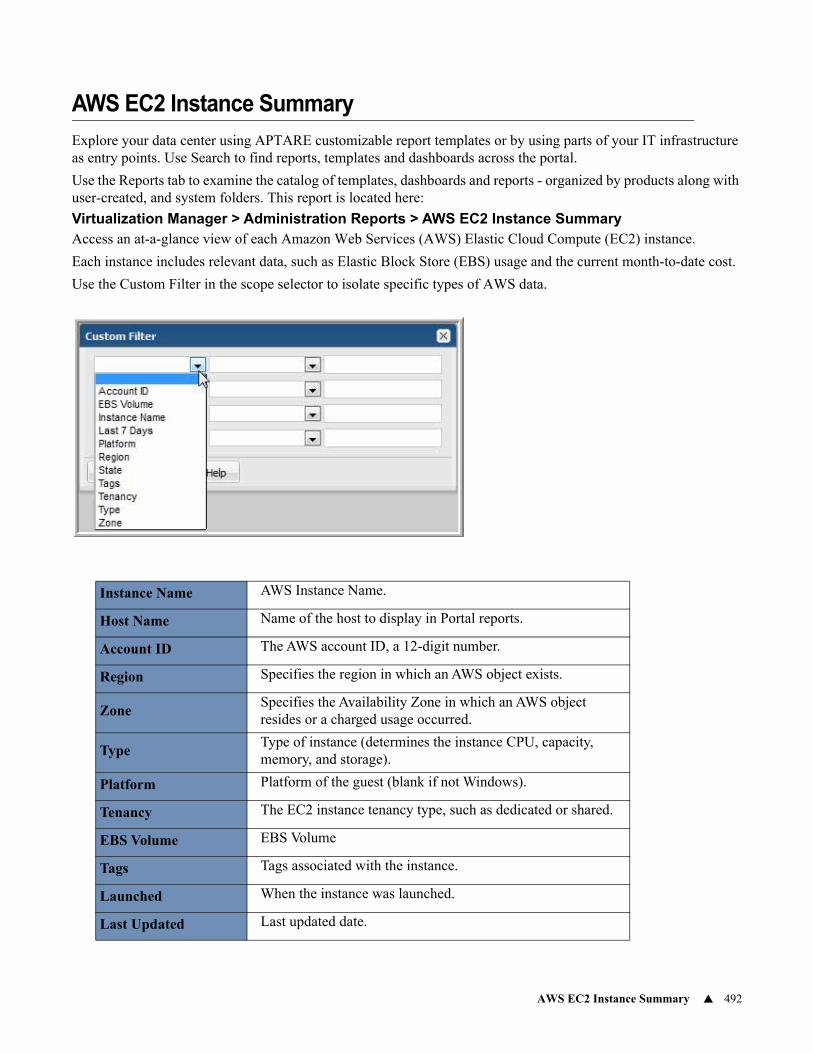
AWS EC2 Instance Summary 492
AWS EC2 Instance Summary
Explore your data center using APTARE customizable report templates or by using parts of your IT infrastructure as entry points. Use Search to find reports, templates and dashboards across the portal.
Use the Reports tab to examine the catalog of templates, dashboards and reports - organized by products along with user-created, and system folders. This report is located here:
Virtualization Manager > Administration Reports > AWS EC2 Instance SummaryAccess an at-a-glance view of each Amazon Web Services (AWS) Elastic Cloud Compute (EC2) instance.
Each instance includes relevant data, such as Elastic Block Store (EBS) usage and the current month-to-date cost.
Use the Custom Filter in the scope selector to isolate specific types of AWS data.
Instance Name AWS Instance Name.
Host Name Name of the host to display in Portal reports.
Account ID The AWS account ID, a 12-digit number.
Region Specifies the region in which an AWS object exists.
ZoneSpecifies the Availability Zone in which an AWS object resides or a charged usage occurred.
Type Type of instance (determines the instance CPU, capacity, memory, and storage).
Platform Platform of the guest (blank if not Windows).
Tenancy The EC2 instance tenancy type, such as dedicated or shared.
EBS Volume EBS Volume
Tags Tags associated with the instance.
Launched When the instance was launched.
Last Updated Last updated date.
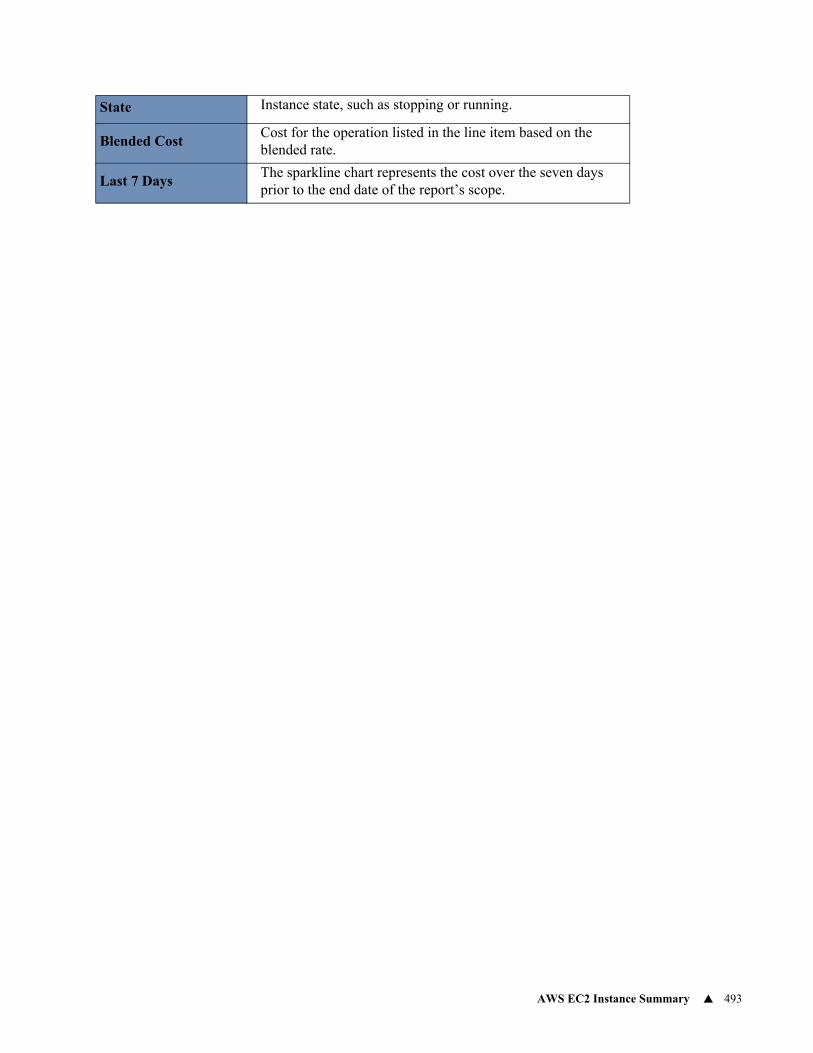
AWS EC2 Instance Summary 493
State Instance state, such as stopping or running.
Blended Cost Cost for the operation listed in the line item based on the blended rate.
Last 7 DaysThe sparkline chart represents the cost over the seven days prior to the end date of the report’s scope.
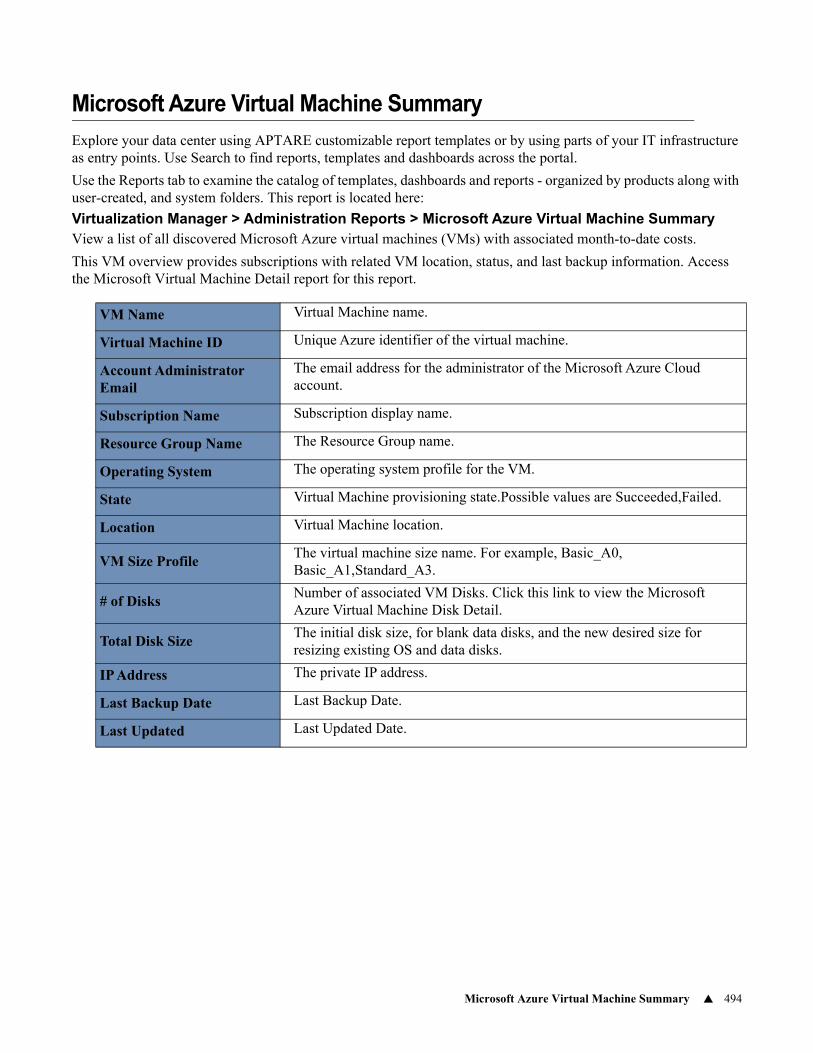
Microsoft Azure Virtual Machine Summary 494
Microsoft Azure Virtual Machine Summary
Explore your data center using APTARE customizable report templates or by using parts of your IT infrastructure as entry points. Use Search to find reports, templates and dashboards across the portal.
Use the Reports tab to examine the catalog of templates, dashboards and reports - organized by products along with user-created, and system folders. This report is located here:
Virtualization Manager > Administration Reports > Microsoft Azure Virtual Machine SummaryView a list of all discovered Microsoft Azure virtual machines (VMs) with associated month-to-date costs.
This VM overview provides subscriptions with related VM location, status, and last backup information. Access the Microsoft Virtual Machine Detail report for this report.
VM Name Virtual Machine name.
Virtual Machine ID Unique Azure identifier of the virtual machine.
Account Administrator Email
The email address for the administrator of the Microsoft Azure Cloud account.
Subscription Name Subscription display name.
Resource Group Name The Resource Group name.
Operating System The operating system profile for the VM.
State Virtual Machine provisioning state.Possible values are Succeeded,Failed.
Location Virtual Machine location.
VM Size ProfileThe virtual machine size name. For example, Basic_A0, Basic_A1,Standard_A3.
# of DisksNumber of associated VM Disks. Click this link to view the Microsoft Azure Virtual Machine Disk Detail.
Total Disk SizeThe initial disk size, for blank data disks, and the new desired size for resizing existing OS and data disks.
IP Address The private IP address.
Last Backup Date Last Backup Date.
Last Updated Last Updated Date.
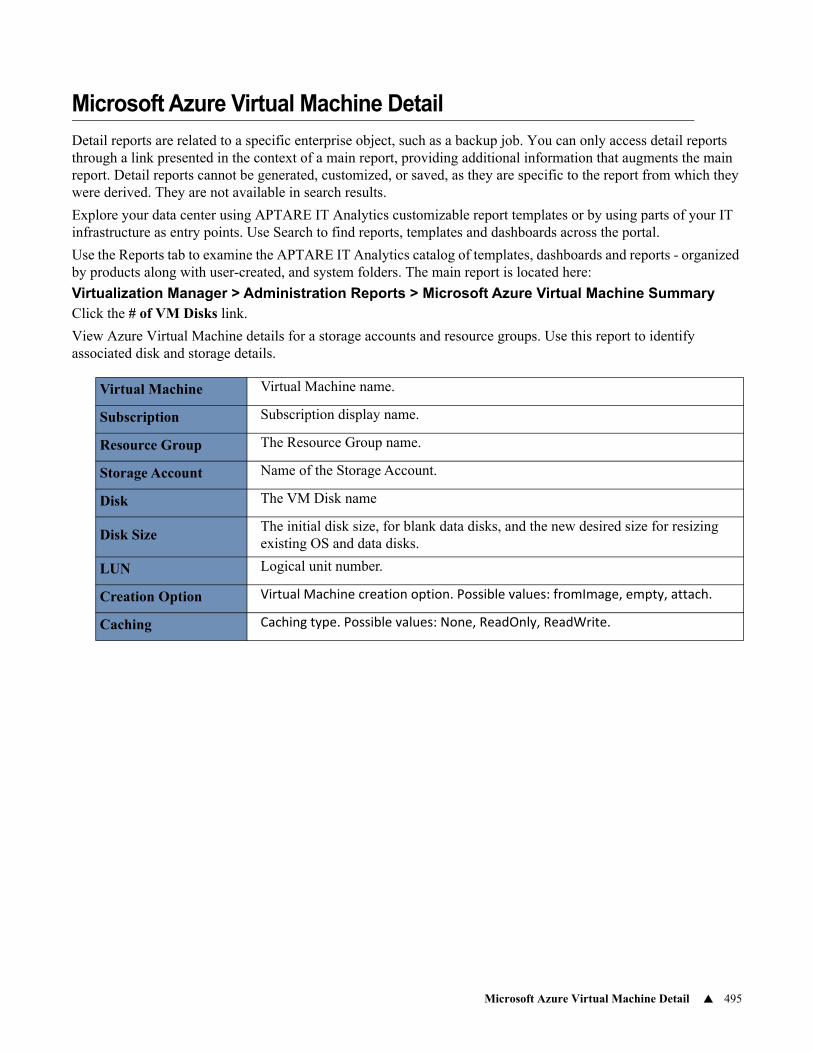
Microsoft Azure Virtual Machine Detail 495
Microsoft Azure Virtual Machine Detail
Detail reports are related to a specific enterprise object, such as a backup job. You can only access detail reports through a link presented in the context of a main report, providing additional information that augments the main report. Detail reports cannot be generated, customized, or saved, as they are specific to the report from which they were derived. They are not available in search results.
Explore your data center using APTARE IT Analytics customizable report templates or by using parts of your IT infrastructure as entry points. Use Search to find reports, templates and dashboards across the portal.
Use the Reports tab to examine the APTARE IT Analytics catalog of templates, dashboards and reports - organized by products along with user-created, and system folders. The main report is located here:
Virtualization Manager > Administration Reports > Microsoft Azure Virtual Machine SummaryClick the # of VM Disks link.
View Azure Virtual Machine details for a storage accounts and resource groups. Use this report to identify associated disk and storage details.
Virtual Machine Virtual Machine name.
Subscription Subscription display name.
Resource Group The Resource Group name.
Storage Account Name of the Storage Account.
Disk The VM Disk name
Disk SizeThe initial disk size, for blank data disks, and the new desired size for resizing existing OS and data disks.
LUN Logical unit number.
Creation Option Virtual Machine creation option. Possible values: fromImage, empty, attach.
Caching Caching type. Possible values: None, ReadOnly, ReadWrite.
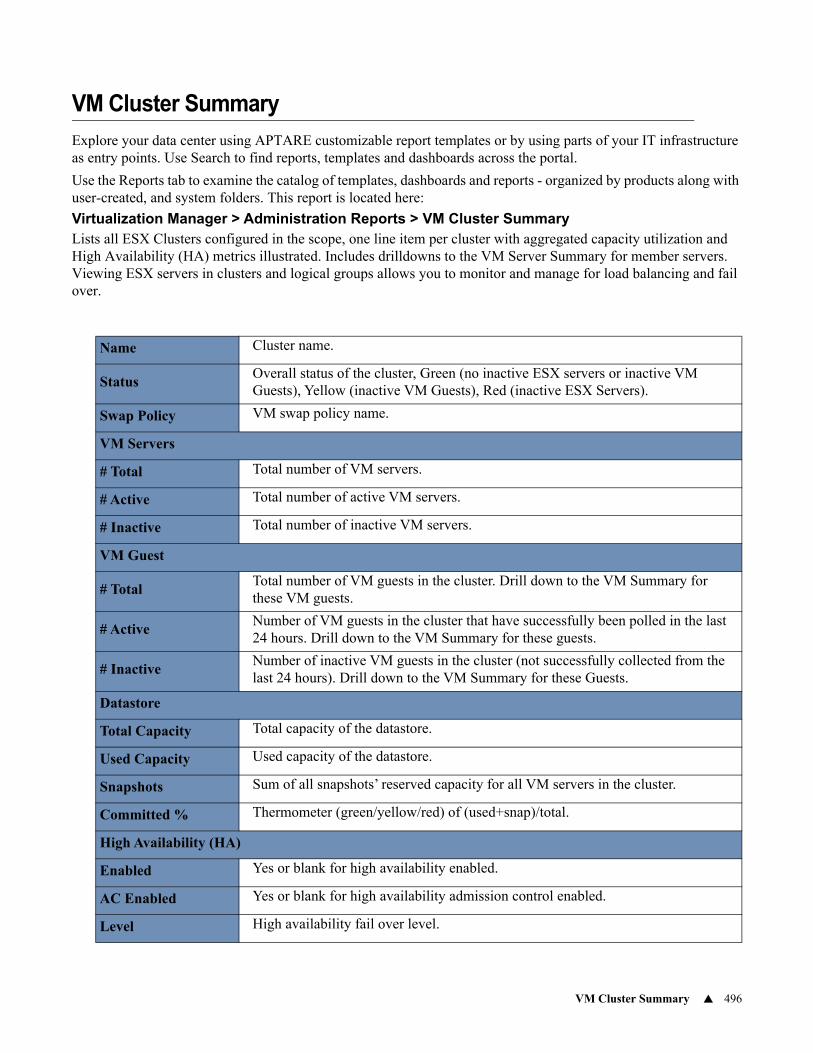
VM Cluster Summary 496
VM Cluster Summary
Explore your data center using APTARE customizable report templates or by using parts of your IT infrastructure as entry points. Use Search to find reports, templates and dashboards across the portal.
Use the Reports tab to examine the catalog of templates, dashboards and reports - organized by products along with user-created, and system folders. This report is located here:
Virtualization Manager > Administration Reports > VM Cluster SummaryLists all ESX Clusters configured in the scope, one line item per cluster with aggregated capacity utilization and High Availability (HA) metrics illustrated. Includes drilldowns to the VM Server Summary for member servers. Viewing ESX servers in clusters and logical groups allows you to monitor and manage for load balancing and fail over.
Name Cluster name.
StatusOverall status of the cluster, Green (no inactive ESX servers or inactive VM Guests), Yellow (inactive VM Guests), Red (inactive ESX Servers).
Swap Policy VM swap policy name.
VM Servers
# Total Total number of VM servers.
# Active Total number of active VM servers.
# Inactive Total number of inactive VM servers.
VM Guest
# TotalTotal number of VM guests in the cluster. Drill down to the VM Summary for these VM guests.
# ActiveNumber of VM guests in the cluster that have successfully been polled in the last 24 hours. Drill down to the VM Summary for these guests.
# InactiveNumber of inactive VM guests in the cluster (not successfully collected from the last 24 hours). Drill down to the VM Summary for these Guests.
Datastore
Total Capacity Total capacity of the datastore.
Used Capacity Used capacity of the datastore.
Snapshots Sum of all snapshots’ reserved capacity for all VM servers in the cluster.
Committed % Thermometer (green/yellow/red) of (used+snap)/total.
High Availability (HA)
Enabled Yes or blank for high availability enabled.
AC Enabled Yes or blank for high availability admission control enabled.
Level High availability fail over level.
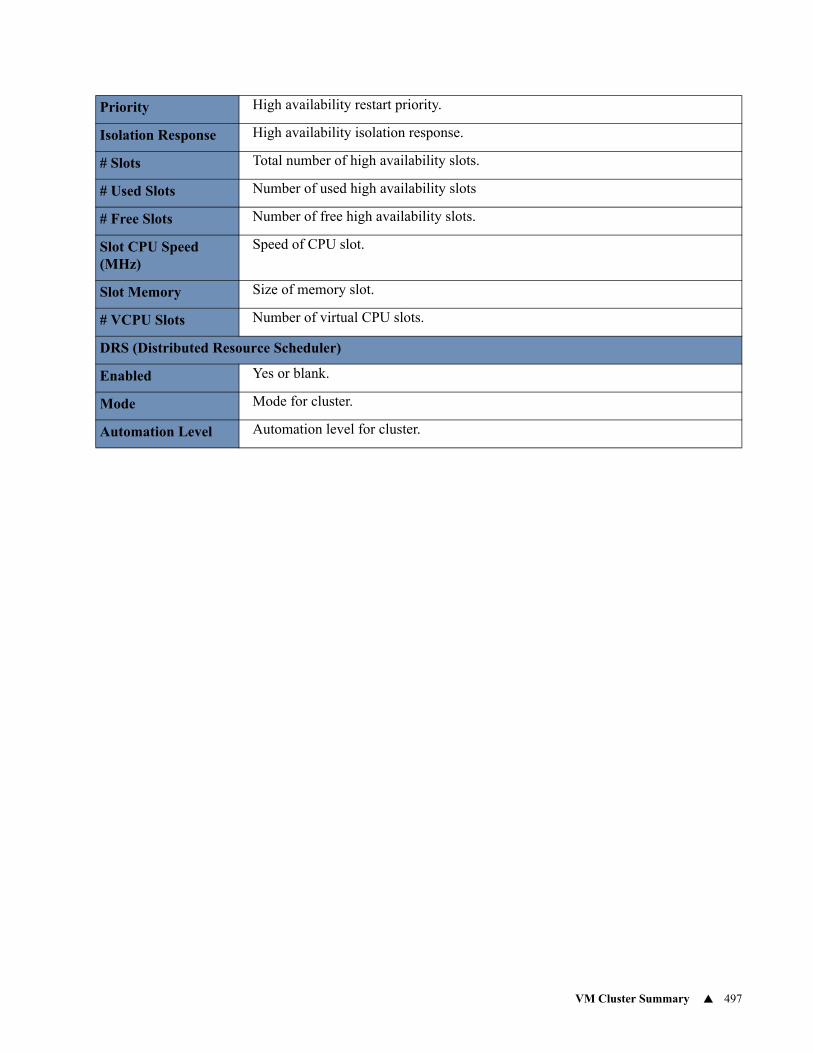
VM Cluster Summary 497
Priority High availability restart priority.
Isolation Response High availability isolation response.
# Slots Total number of high availability slots.
# Used Slots Number of used high availability slots
# Free Slots Number of free high availability slots.
Slot CPU Speed (MHz)
Speed of CPU slot.
Slot Memory Size of memory slot.
# VCPU Slots Number of virtual CPU slots.
DRS (Distributed Resource Scheduler)
Enabled Yes or blank.
Mode Mode for cluster.
Automation Level Automation level for cluster.
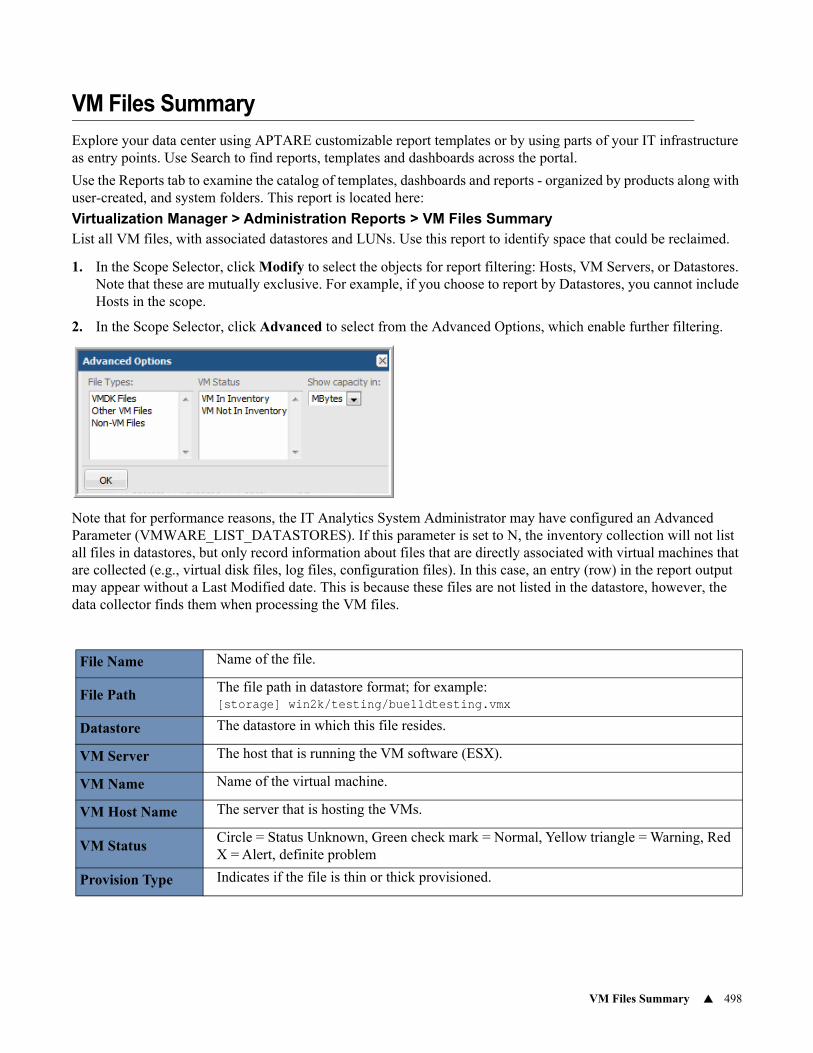
VM Files Summary 498
VM Files Summary
Explore your data center using APTARE customizable report templates or by using parts of your IT infrastructure as entry points. Use Search to find reports, templates and dashboards across the portal.
Use the Reports tab to examine the catalog of templates, dashboards and reports - organized by products along with user-created, and system folders. This report is located here:
Virtualization Manager > Administration Reports > VM Files SummaryList all VM files, with associated datastores and LUNs. Use this report to identify space that could be reclaimed.
1. In the Scope Selector, click Modify to select the objects for report filtering: Hosts, VM Servers, or Datastores. Note that these are mutually exclusive. For example, if you choose to report by Datastores, you cannot include Hosts in the scope.
2. In the Scope Selector, click Advanced to select from the Advanced Options, which enable further filtering.
Note that for performance reasons, the IT Analytics System Administrator may have configured an Advanced Parameter (VMWARE_LIST_DATASTORES). If this parameter is set to N, the inventory collection will not list all files in datastores, but only record information about files that are directly associated with virtual machines that are collected (e.g., virtual disk files, log files, configuration files). In this case, an entry (row) in the report output may appear without a Last Modified date. This is because these files are not listed in the datastore, however, the data collector finds them when processing the VM files.
File Name Name of the file.
File Path The file path in datastore format; for example: [storage] win2k/testing/bue11dtesting.vmx
Datastore The datastore in which this file resides.
VM Server The host that is running the VM software (ESX).
VM Name Name of the virtual machine.
VM Host Name The server that is hosting the VMs.
VM StatusCircle = Status Unknown, Green check mark = Normal, Yellow triangle = Warning, Red X = Alert, definite problem
Provision Type Indicates if the file is thin or thick provisioned.
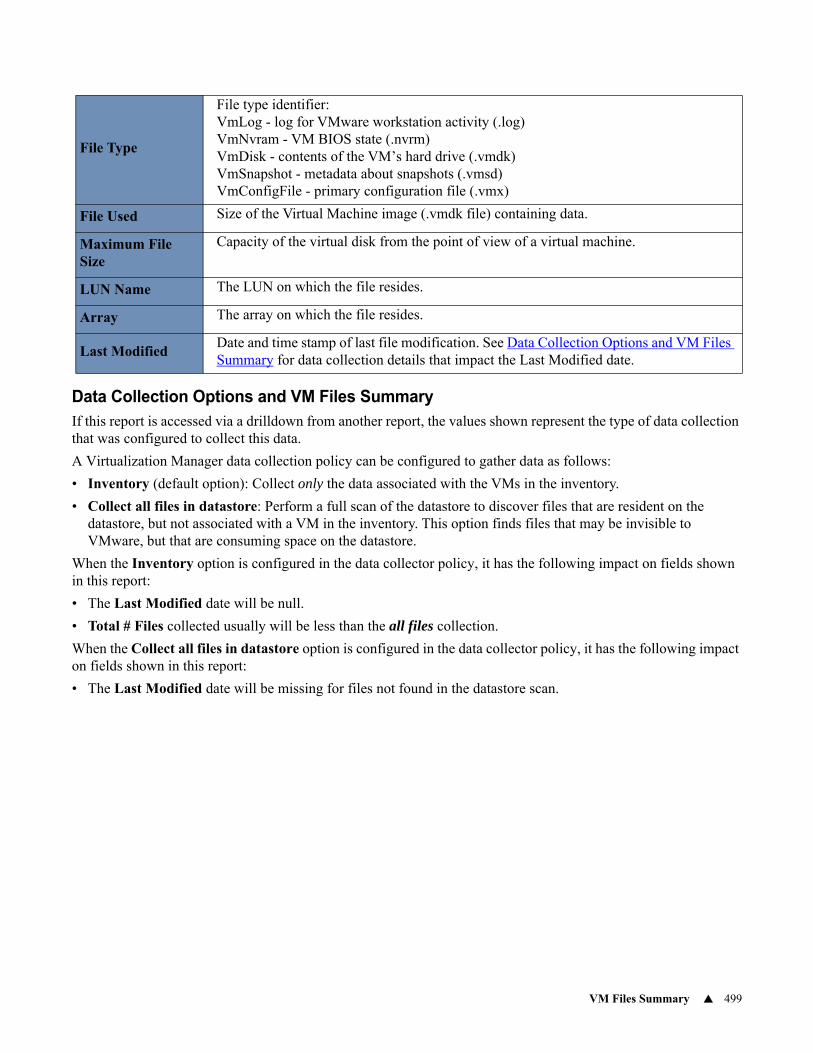
VM Files Summary 499
Data Collection Options and VM Files SummaryIf this report is accessed via a drilldown from another report, the values shown represent the type of data collection that was configured to collect this data.
A Virtualization Manager data collection policy can be configured to gather data as follows:
• Inventory (default option): Collect only the data associated with the VMs in the inventory.
• Collect all files in datastore: Perform a full scan of the datastore to discover files that are resident on the datastore, but not associated with a VM in the inventory. This option finds files that may be invisible to VMware, but that are consuming space on the datastore.
When the Inventory option is configured in the data collector policy, it has the following impact on fields shown in this report:
• The Last Modified date will be null.
• Total # Files collected usually will be less than the all files collection.
When the Collect all files in datastore option is configured in the data collector policy, it has the following impact on fields shown in this report:
• The Last Modified date will be missing for files not found in the datastore scan.
File Type
File type identifier:VmLog - log for VMware workstation activity (.log)VmNvram - VM BIOS state (.nvrm)VmDisk - contents of the VM’s hard drive (.vmdk)VmSnapshot - metadata about snapshots (.vmsd)VmConfigFile - primary configuration file (.vmx)
File Used Size of the Virtual Machine image (.vmdk file) containing data.
Maximum File Size
Capacity of the virtual disk from the point of view of a virtual machine.
LUN Name The LUN on which the file resides.
Array The array on which the file resides.
Last Modified Date and time stamp of last file modification. See Data Collection Options and VM Files Summary for data collection details that impact the Last Modified date.
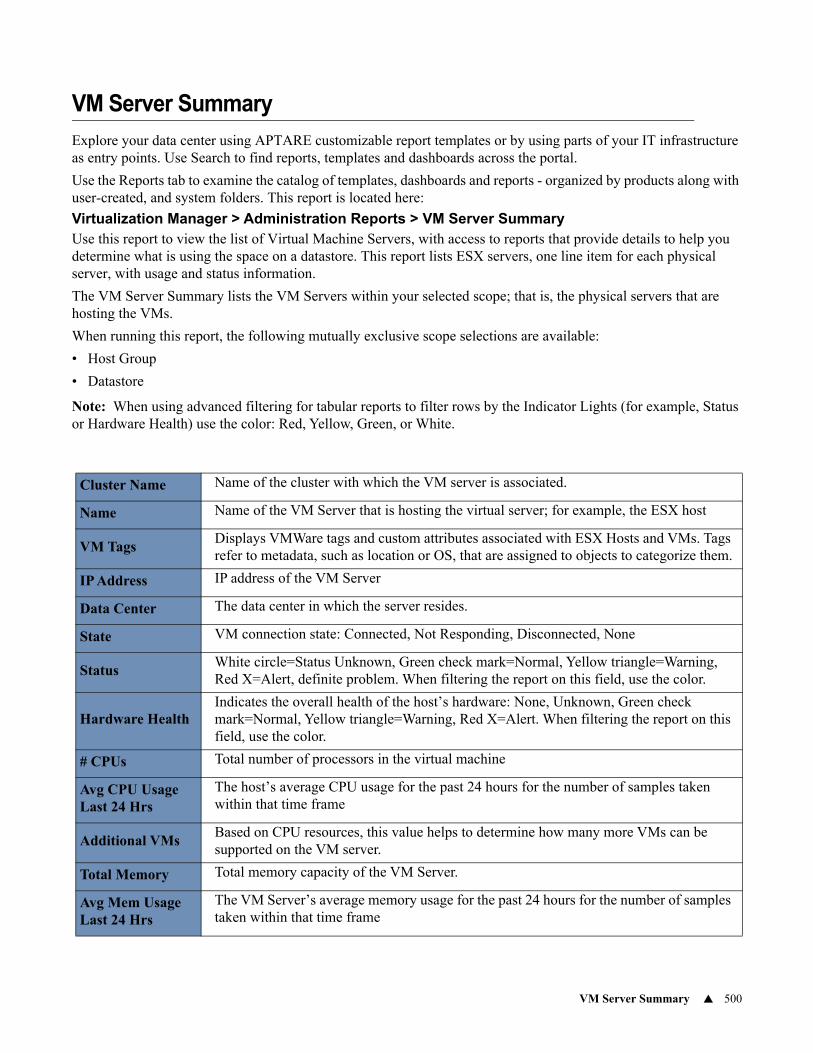
VM Server Summary 500
VM Server Summary
Explore your data center using APTARE customizable report templates or by using parts of your IT infrastructure as entry points. Use Search to find reports, templates and dashboards across the portal.
Use the Reports tab to examine the catalog of templates, dashboards and reports - organized by products along with user-created, and system folders. This report is located here:
Virtualization Manager > Administration Reports > VM Server SummaryUse this report to view the list of Virtual Machine Servers, with access to reports that provide details to help you determine what is using the space on a datastore. This report lists ESX servers, one line item for each physical server, with usage and status information.
The VM Server Summary lists the VM Servers within your selected scope; that is, the physical servers that are hosting the VMs.
When running this report, the following mutually exclusive scope selections are available:
• Host Group
• Datastore
Note: When using advanced filtering for tabular reports to filter rows by the Indicator Lights (for example, Status or Hardware Health) use the color: Red, Yellow, Green, or White.
Cluster Name Name of the cluster with which the VM server is associated.
Name Name of the VM Server that is hosting the virtual server; for example, the ESX host
VM TagsDisplays VMWare tags and custom attributes associated with ESX Hosts and VMs. Tags refer to metadata, such as location or OS, that are assigned to objects to categorize them.
IP Address IP address of the VM Server
Data Center The data center in which the server resides.
State VM connection state: Connected, Not Responding, Disconnected, None
StatusWhite circle=Status Unknown, Green check mark=Normal, Yellow triangle=Warning, Red X=Alert, definite problem. When filtering the report on this field, use the color.
Hardware HealthIndicates the overall health of the host’s hardware: None, Unknown, Green check mark=Normal, Yellow triangle=Warning, Red X=Alert. When filtering the report on this field, use the color.
# CPUs Total number of processors in the virtual machine
Avg CPU Usage Last 24 Hrs
The host’s average CPU usage for the past 24 hours for the number of samples taken within that time frame
Additional VMsBased on CPU resources, this value helps to determine how many more VMs can be supported on the VM server.
Total Memory Total memory capacity of the VM Server.
Avg Mem Usage Last 24 Hrs
The VM Server’s average memory usage for the past 24 hours for the number of samples taken within that time frame
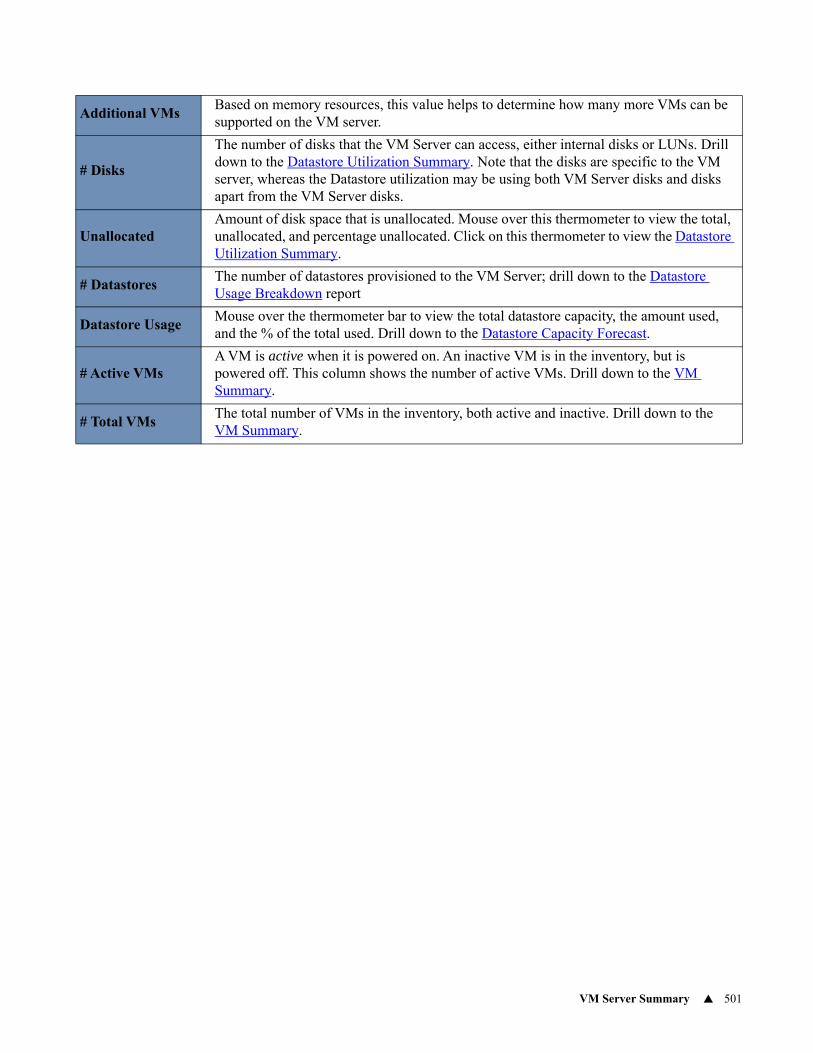
VM Server Summary 501
Additional VMsBased on memory resources, this value helps to determine how many more VMs can be supported on the VM server.
# Disks
The number of disks that the VM Server can access, either internal disks or LUNs. Drill down to the Datastore Utilization Summary. Note that the disks are specific to the VM server, whereas the Datastore utilization may be using both VM Server disks and disks apart from the VM Server disks.
UnallocatedAmount of disk space that is unallocated. Mouse over this thermometer to view the total, unallocated, and percentage unallocated. Click on this thermometer to view the Datastore Utilization Summary.
# DatastoresThe number of datastores provisioned to the VM Server; drill down to the Datastore Usage Breakdown report
Datastore UsageMouse over the thermometer bar to view the total datastore capacity, the amount used, and the % of the total used. Drill down to the Datastore Capacity Forecast.
# Active VMsA VM is active when it is powered on. An inactive VM is in the inventory, but is powered off. This column shows the number of active VMs. Drill down to the VM Summary.
# Total VMsThe total number of VMs in the inventory, both active and inactive. Drill down to the VM Summary.
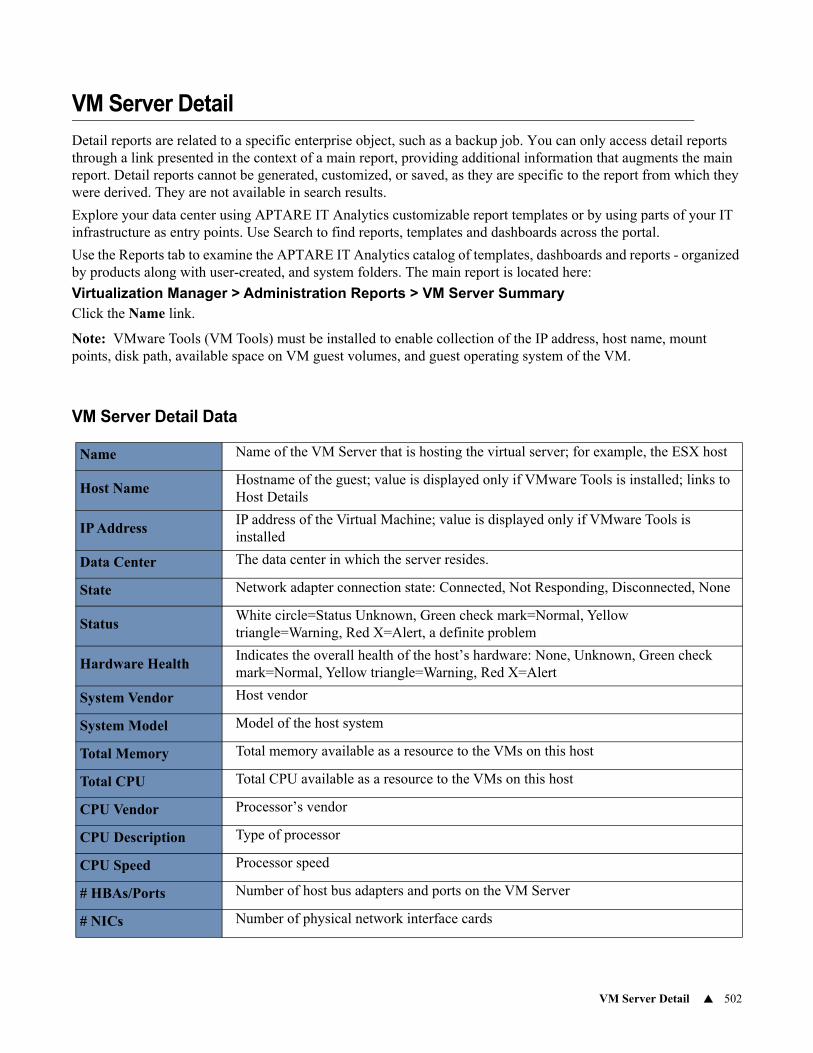
VM Server Detail 502
VM Server Detail
Detail reports are related to a specific enterprise object, such as a backup job. You can only access detail reports through a link presented in the context of a main report, providing additional information that augments the main report. Detail reports cannot be generated, customized, or saved, as they are specific to the report from which they were derived. They are not available in search results.
Explore your data center using APTARE IT Analytics customizable report templates or by using parts of your IT infrastructure as entry points. Use Search to find reports, templates and dashboards across the portal.
Use the Reports tab to examine the APTARE IT Analytics catalog of templates, dashboards and reports - organized by products along with user-created, and system folders. The main report is located here:
Virtualization Manager > Administration Reports > VM Server SummaryClick the Name link.
Note: VMware Tools (VM Tools) must be installed to enable collection of the IP address, host name, mount points, disk path, available space on VM guest volumes, and guest operating system of the VM.
VM Server Detail Data
Name Name of the VM Server that is hosting the virtual server; for example, the ESX host
Host NameHostname of the guest; value is displayed only if VMware Tools is installed; links to Host Details
IP AddressIP address of the Virtual Machine; value is displayed only if VMware Tools is installed
Data Center The data center in which the server resides.
State Network adapter connection state: Connected, Not Responding, Disconnected, None
StatusWhite circle=Status Unknown, Green check mark=Normal, Yellow triangle=Warning, Red X=Alert, a definite problem
Hardware HealthIndicates the overall health of the host’s hardware: None, Unknown, Green check mark=Normal, Yellow triangle=Warning, Red X=Alert
System Vendor Host vendor
System Model Model of the host system
Total Memory Total memory available as a resource to the VMs on this host
Total CPU Total CPU available as a resource to the VMs on this host
CPU Vendor Processor’s vendor
CPU Description Type of processor
CPU Speed Processor speed
# HBAs/Ports Number of host bus adapters and ports on the VM Server
# NICs Number of physical network interface cards
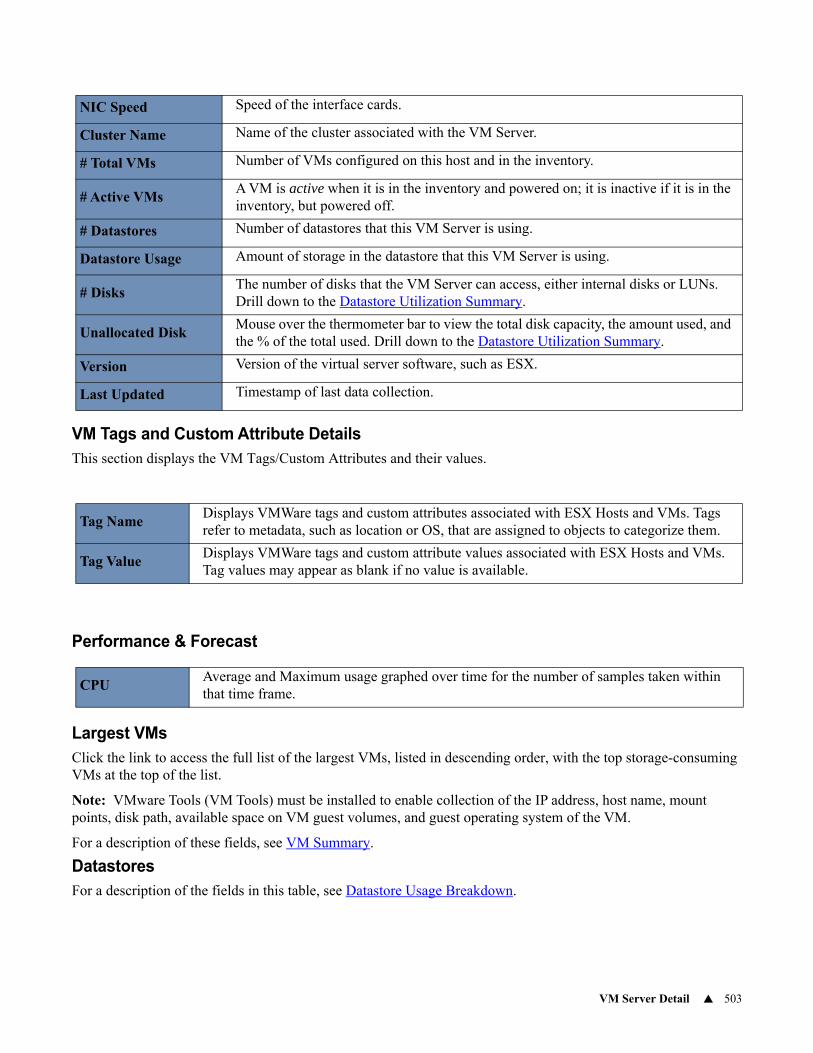
VM Server Detail 503
VM Tags and Custom Attribute DetailsThis section displays the VM Tags/Custom Attributes and their values.
Performance & Forecast
Largest VMsClick the link to access the full list of the largest VMs, listed in descending order, with the top storage-consuming VMs at the top of the list.
Note: VMware Tools (VM Tools) must be installed to enable collection of the IP address, host name, mount points, disk path, available space on VM guest volumes, and guest operating system of the VM.
For a description of these fields, see VM Summary.
DatastoresFor a description of the fields in this table, see Datastore Usage Breakdown.
NIC Speed Speed of the interface cards.
Cluster Name Name of the cluster associated with the VM Server.
# Total VMs Number of VMs configured on this host and in the inventory.
# Active VMsA VM is active when it is in the inventory and powered on; it is inactive if it is in the inventory, but powered off.
# Datastores Number of datastores that this VM Server is using.
Datastore Usage Amount of storage in the datastore that this VM Server is using.
# DisksThe number of disks that the VM Server can access, either internal disks or LUNs. Drill down to the Datastore Utilization Summary.
Unallocated DiskMouse over the thermometer bar to view the total disk capacity, the amount used, and the % of the total used. Drill down to the Datastore Utilization Summary.
Version Version of the virtual server software, such as ESX.
Last Updated Timestamp of last data collection.
Tag NameDisplays VMWare tags and custom attributes associated with ESX Hosts and VMs. Tags refer to metadata, such as location or OS, that are assigned to objects to categorize them.
Tag ValueDisplays VMWare tags and custom attribute values associated with ESX Hosts and VMs. Tag values may appear as blank if no value is available.
CPUAverage and Maximum usage graphed over time for the number of samples taken within that time frame.
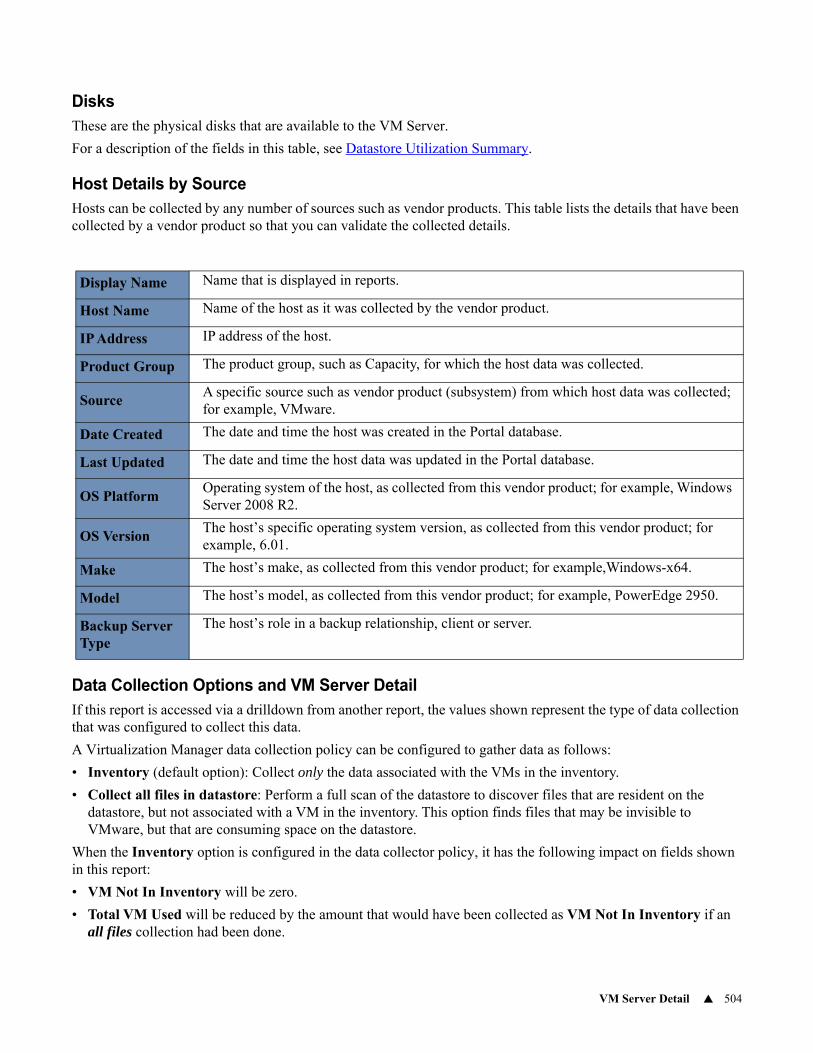
VM Server Detail 504
DisksThese are the physical disks that are available to the VM Server.
For a description of the fields in this table, see Datastore Utilization Summary.
Host Details by SourceHosts can be collected by any number of sources such as vendor products. This table lists the details that have been collected by a vendor product so that you can validate the collected details.
Data Collection Options and VM Server DetailIf this report is accessed via a drilldown from another report, the values shown represent the type of data collection that was configured to collect this data.
A Virtualization Manager data collection policy can be configured to gather data as follows:
• Inventory (default option): Collect only the data associated with the VMs in the inventory.
• Collect all files in datastore: Perform a full scan of the datastore to discover files that are resident on the datastore, but not associated with a VM in the inventory. This option finds files that may be invisible to VMware, but that are consuming space on the datastore.
When the Inventory option is configured in the data collector policy, it has the following impact on fields shown in this report:
• VM Not In Inventory will be zero.
• Total VM Used will be reduced by the amount that would have been collected as VM Not In Inventory if an all files collection had been done.
Display Name Name that is displayed in reports.
Host Name Name of the host as it was collected by the vendor product.
IP Address IP address of the host.
Product Group The product group, such as Capacity, for which the host data was collected.
SourceA specific source such as vendor product (subsystem) from which host data was collected; for example, VMware.
Date Created The date and time the host was created in the Portal database.
Last Updated The date and time the host data was updated in the Portal database.
OS PlatformOperating system of the host, as collected from this vendor product; for example, Windows Server 2008 R2.
OS VersionThe host’s specific operating system version, as collected from this vendor product; for example, 6.01.
Make The host’s make, as collected from this vendor product; for example,Windows-x64.
Model The host’s model, as collected from this vendor product; for example, PowerEdge 2950.
Backup Server Type
The host’s role in a backup relationship, client or server.
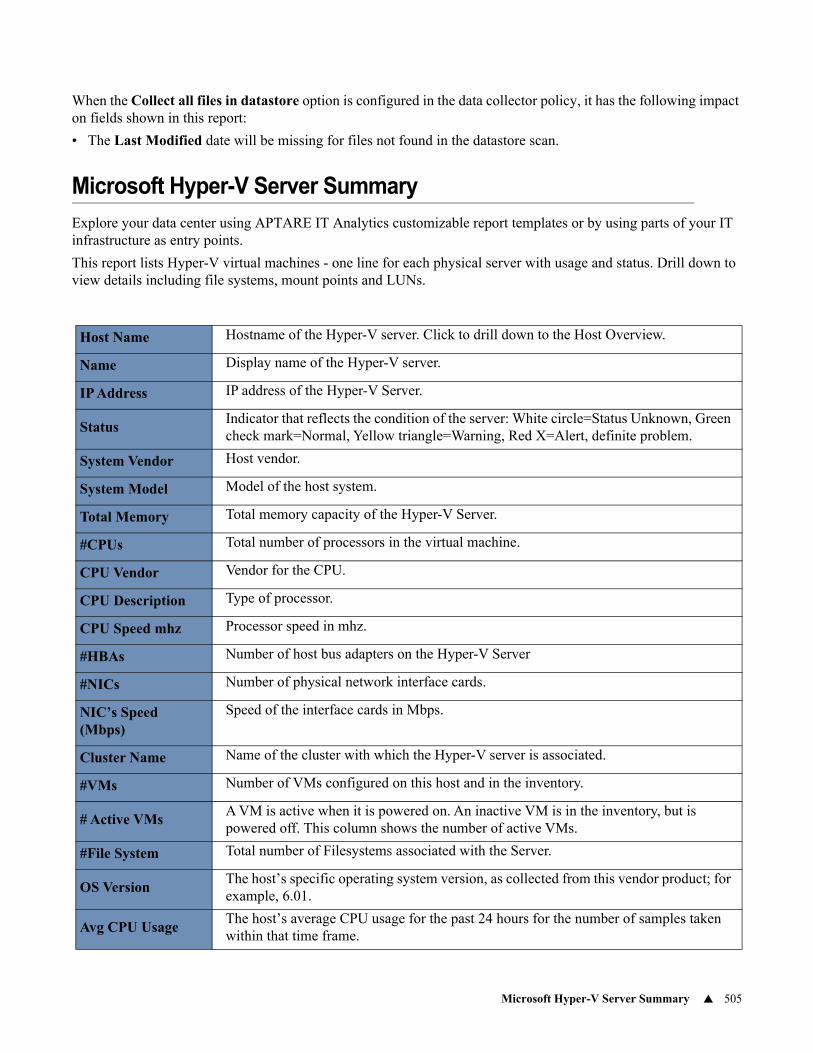
Microsoft Hyper-V Server Summary 505
When the Collect all files in datastore option is configured in the data collector policy, it has the following impact on fields shown in this report:
• The Last Modified date will be missing for files not found in the datastore scan.
Microsoft Hyper-V Server Summary
Explore your data center using APTARE IT Analytics customizable report templates or by using parts of your IT infrastructure as entry points.
This report lists Hyper-V virtual machines - one line for each physical server with usage and status. Drill down to view details including file systems, mount points and LUNs.
Host Name Hostname of the Hyper-V server. Click to drill down to the Host Overview.
Name Display name of the Hyper-V server.
IP Address IP address of the Hyper-V Server.
StatusIndicator that reflects the condition of the server: White circle=Status Unknown, Green check mark=Normal, Yellow triangle=Warning, Red X=Alert, definite problem.
System Vendor Host vendor.
System Model Model of the host system.
Total Memory Total memory capacity of the Hyper-V Server.
#CPUs Total number of processors in the virtual machine.
CPU Vendor Vendor for the CPU.
CPU Description Type of processor.
CPU Speed mhz Processor speed in mhz.
#HBAs Number of host bus adapters on the Hyper-V Server
#NICs Number of physical network interface cards.
NIC’s Speed (Mbps)
Speed of the interface cards in Mbps.
Cluster Name Name of the cluster with which the Hyper-V server is associated.
#VMs Number of VMs configured on this host and in the inventory.
# Active VMsA VM is active when it is powered on. An inactive VM is in the inventory, but is powered off. This column shows the number of active VMs.
#File System Total number of Filesystems associated with the Server.
OS VersionThe host’s specific operating system version, as collected from this vendor product; for example, 6.01.
Avg CPU UsageThe host’s average CPU usage for the past 24 hours for the number of samples taken within that time frame.
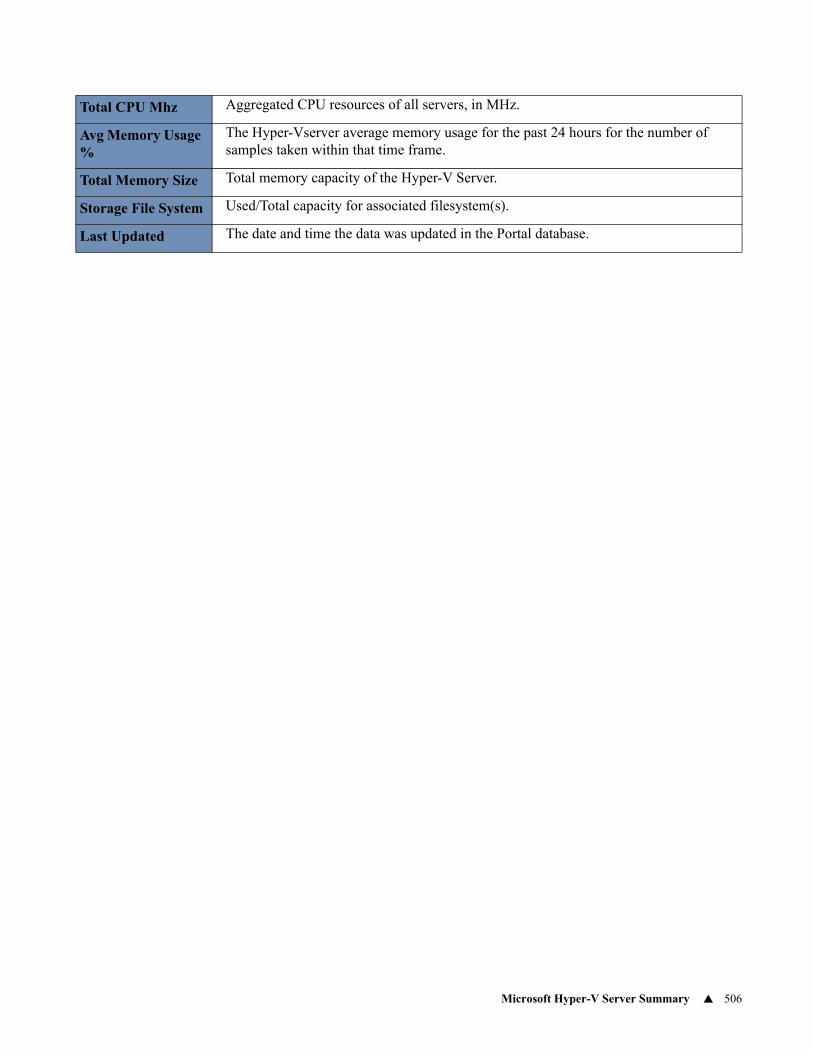
Microsoft Hyper-V Server Summary 506
Total CPU Mhz Aggregated CPU resources of all servers, in MHz.
Avg Memory Usage %
The Hyper-Vserver average memory usage for the past 24 hours for the number of samples taken within that time frame.
Total Memory Size Total memory capacity of the Hyper-V Server.
Storage File System Used/Total capacity for associated filesystem(s).
Last Updated The date and time the data was updated in the Portal database.
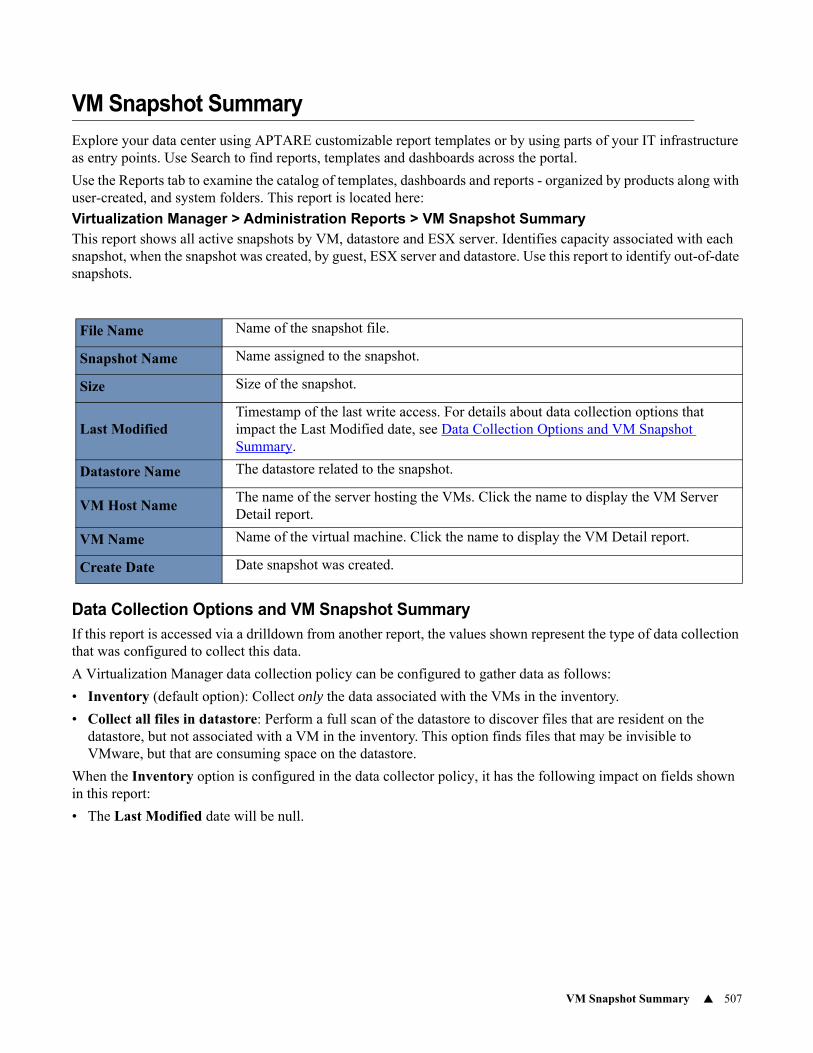
VM Snapshot Summary 507
VM Snapshot Summary
Explore your data center using APTARE customizable report templates or by using parts of your IT infrastructure as entry points. Use Search to find reports, templates and dashboards across the portal.
Use the Reports tab to examine the catalog of templates, dashboards and reports - organized by products along with user-created, and system folders. This report is located here:
Virtualization Manager > Administration Reports > VM Snapshot SummaryThis report shows all active snapshots by VM, datastore and ESX server. Identifies capacity associated with each snapshot, when the snapshot was created, by guest, ESX server and datastore. Use this report to identify out-of-date snapshots.
Data Collection Options and VM Snapshot SummaryIf this report is accessed via a drilldown from another report, the values shown represent the type of data collection that was configured to collect this data.
A Virtualization Manager data collection policy can be configured to gather data as follows:
• Inventory (default option): Collect only the data associated with the VMs in the inventory.
• Collect all files in datastore: Perform a full scan of the datastore to discover files that are resident on the datastore, but not associated with a VM in the inventory. This option finds files that may be invisible to VMware, but that are consuming space on the datastore.
When the Inventory option is configured in the data collector policy, it has the following impact on fields shown in this report:
• The Last Modified date will be null.
File Name Name of the snapshot file.
Snapshot Name Name assigned to the snapshot.
Size Size of the snapshot.
Last ModifiedTimestamp of the last write access. For details about data collection options that impact the Last Modified date, see Data Collection Options and VM Snapshot Summary.
Datastore Name The datastore related to the snapshot.
VM Host NameThe name of the server hosting the VMs. Click the name to display the VM Server Detail report.
VM Name Name of the virtual machine. Click the name to display the VM Detail report.
Create Date Date snapshot was created.
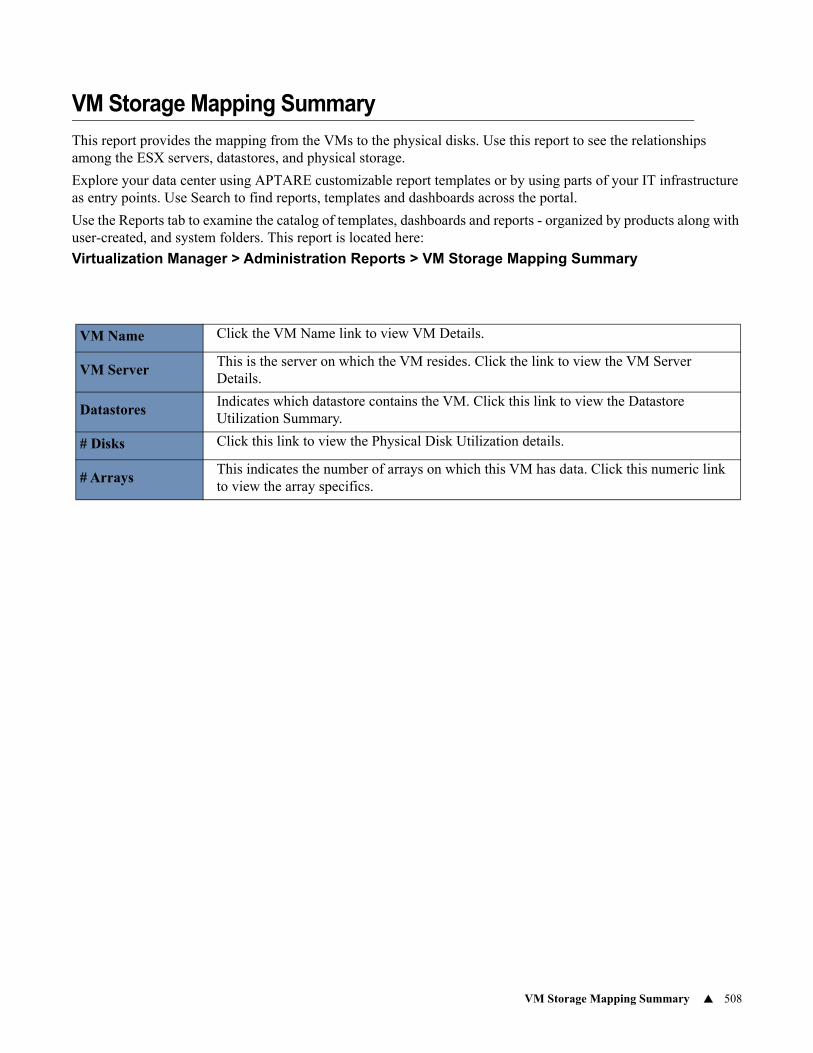
VM Storage Mapping Summary 508
VM Storage Mapping Summary
This report provides the mapping from the VMs to the physical disks. Use this report to see the relationships among the ESX servers, datastores, and physical storage.
Explore your data center using APTARE customizable report templates or by using parts of your IT infrastructure as entry points. Use Search to find reports, templates and dashboards across the portal.
Use the Reports tab to examine the catalog of templates, dashboards and reports - organized by products along with user-created, and system folders. This report is located here:
Virtualization Manager > Administration Reports > VM Storage Mapping Summary
VM Name Click the VM Name link to view VM Details.
VM ServerThis is the server on which the VM resides. Click the link to view the VM Server Details.
DatastoresIndicates which datastore contains the VM. Click this link to view the Datastore Utilization Summary.
# Disks Click this link to view the Physical Disk Utilization details.
# ArraysThis indicates the number of arrays on which this VM has data. Click this numeric link to view the array specifics.
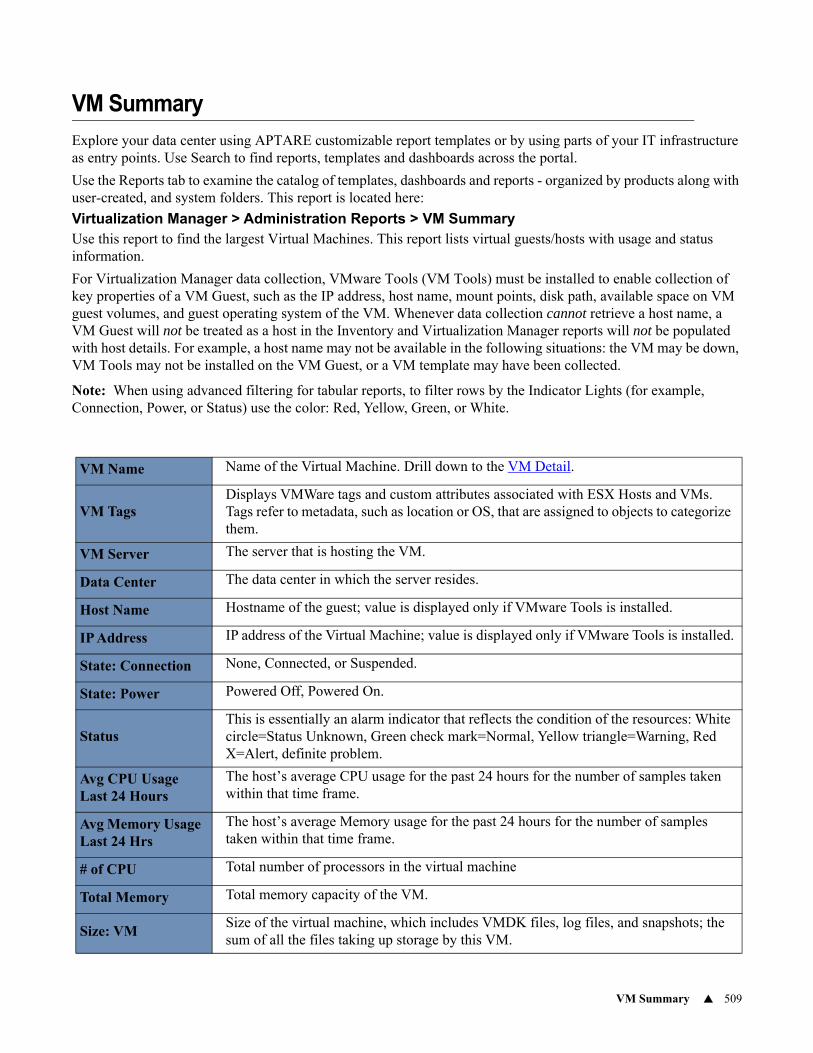
VM Summary 509
VM Summary
Explore your data center using APTARE customizable report templates or by using parts of your IT infrastructure as entry points. Use Search to find reports, templates and dashboards across the portal.
Use the Reports tab to examine the catalog of templates, dashboards and reports - organized by products along with user-created, and system folders. This report is located here:
Virtualization Manager > Administration Reports > VM SummaryUse this report to find the largest Virtual Machines. This report lists virtual guests/hosts with usage and status information.
For Virtualization Manager data collection, VMware Tools (VM Tools) must be installed to enable collection of key properties of a VM Guest, such as the IP address, host name, mount points, disk path, available space on VM guest volumes, and guest operating system of the VM. Whenever data collection cannot retrieve a host name, a VM Guest will not be treated as a host in the Inventory and Virtualization Manager reports will not be populated with host details. For example, a host name may not be available in the following situations: the VM may be down, VM Tools may not be installed on the VM Guest, or a VM template may have been collected.
Note: When using advanced filtering for tabular reports, to filter rows by the Indicator Lights (for example, Connection, Power, or Status) use the color: Red, Yellow, Green, or White.
VM Name Name of the Virtual Machine. Drill down to the VM Detail.
VM TagsDisplays VMWare tags and custom attributes associated with ESX Hosts and VMs. Tags refer to metadata, such as location or OS, that are assigned to objects to categorize them.
VM Server The server that is hosting the VM.
Data Center The data center in which the server resides.
Host Name Hostname of the guest; value is displayed only if VMware Tools is installed.
IP Address IP address of the Virtual Machine; value is displayed only if VMware Tools is installed.
State: Connection None, Connected, or Suspended.
State: Power Powered Off, Powered On.
StatusThis is essentially an alarm indicator that reflects the condition of the resources: White circle=Status Unknown, Green check mark=Normal, Yellow triangle=Warning, Red X=Alert, definite problem.
Avg CPU Usage Last 24 Hours
The host’s average CPU usage for the past 24 hours for the number of samples taken within that time frame.
Avg Memory Usage Last 24 Hrs
The host’s average Memory usage for the past 24 hours for the number of samples taken within that time frame.
# of CPU Total number of processors in the virtual machine
Total Memory Total memory capacity of the VM.
Size: VMSize of the virtual machine, which includes VMDK files, log files, and snapshots; the sum of all the files taking up storage by this VM.
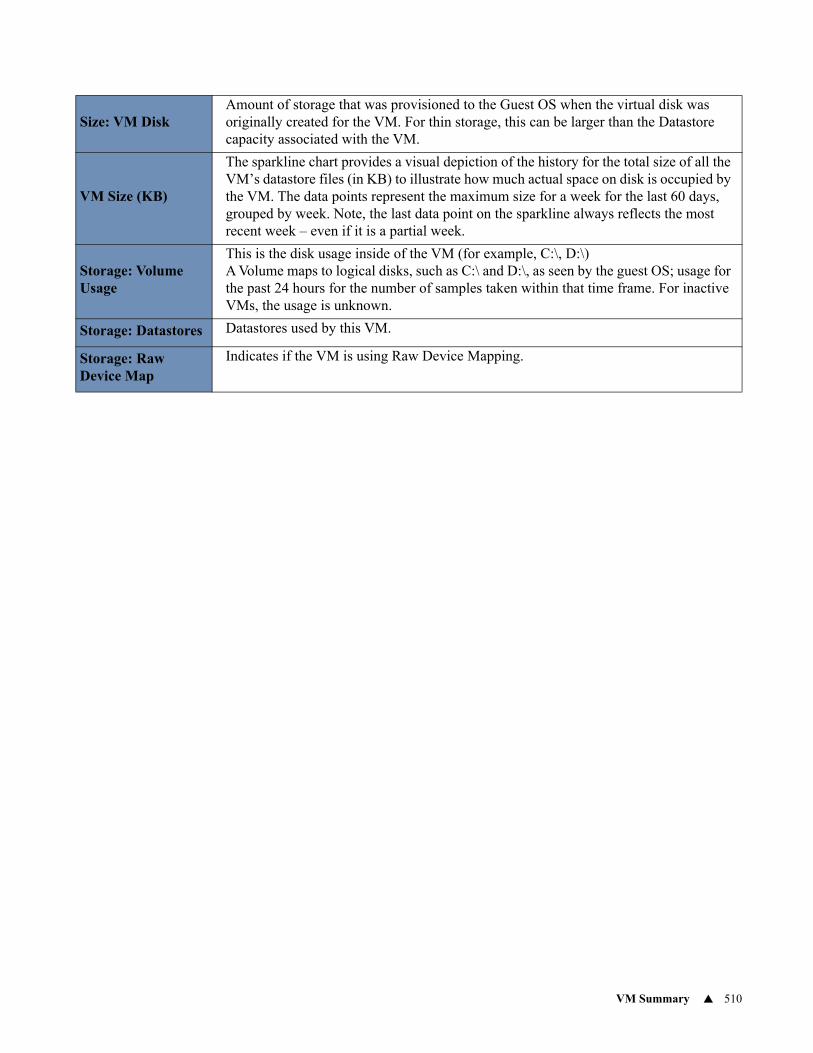
VM Summary 510
Size: VM DiskAmount of storage that was provisioned to the Guest OS when the virtual disk was originally created for the VM. For thin storage, this can be larger than the Datastore capacity associated with the VM.
VM Size (KB)
The sparkline chart provides a visual depiction of the history for the total size of all the VM’s datastore files (in KB) to illustrate how much actual space on disk is occupied by the VM. The data points represent the maximum size for a week for the last 60 days, grouped by week. Note, the last data point on the sparkline always reflects the most recent week – even if it is a partial week.
Storage: Volume Usage
This is the disk usage inside of the VM (for example, C:\, D:\)A Volume maps to logical disks, such as C:\ and D:\, as seen by the guest OS; usage for the past 24 hours for the number of samples taken within that time frame. For inactive VMs, the usage is unknown.
Storage: Datastores Datastores used by this VM.
Storage: Raw Device Map
Indicates if the VM is using Raw Device Mapping.
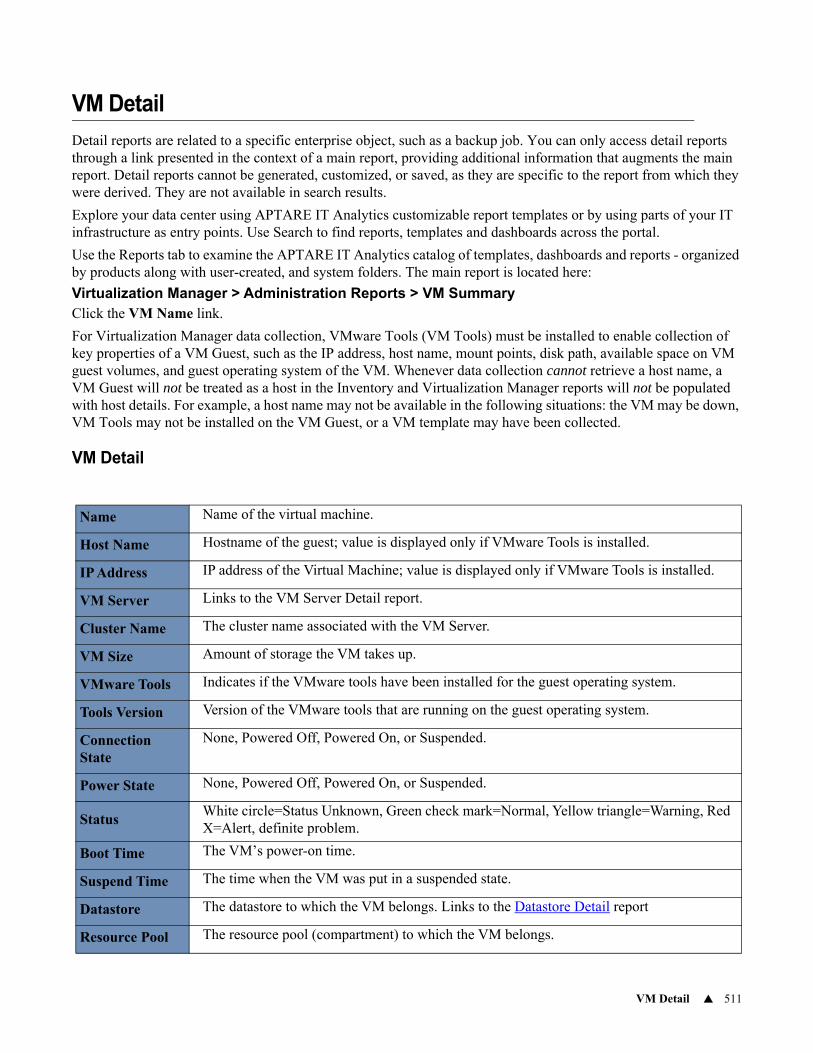
VM Detail 511
VM Detail
Detail reports are related to a specific enterprise object, such as a backup job. You can only access detail reports through a link presented in the context of a main report, providing additional information that augments the main report. Detail reports cannot be generated, customized, or saved, as they are specific to the report from which they were derived. They are not available in search results.
Explore your data center using APTARE IT Analytics customizable report templates or by using parts of your IT infrastructure as entry points. Use Search to find reports, templates and dashboards across the portal.
Use the Reports tab to examine the APTARE IT Analytics catalog of templates, dashboards and reports - organized by products along with user-created, and system folders. The main report is located here:
Virtualization Manager > Administration Reports > VM SummaryClick the VM Name link.
For Virtualization Manager data collection, VMware Tools (VM Tools) must be installed to enable collection of key properties of a VM Guest, such as the IP address, host name, mount points, disk path, available space on VM guest volumes, and guest operating system of the VM. Whenever data collection cannot retrieve a host name, a VM Guest will not be treated as a host in the Inventory and Virtualization Manager reports will not be populated with host details. For example, a host name may not be available in the following situations: the VM may be down, VM Tools may not be installed on the VM Guest, or a VM template may have been collected.
VM Detail
Name Name of the virtual machine.
Host Name Hostname of the guest; value is displayed only if VMware Tools is installed.
IP Address IP address of the Virtual Machine; value is displayed only if VMware Tools is installed.
VM Server Links to the VM Server Detail report.
Cluster Name The cluster name associated with the VM Server.
VM Size Amount of storage the VM takes up.
VMware Tools Indicates if the VMware tools have been installed for the guest operating system.
Tools Version Version of the VMware tools that are running on the guest operating system.
Connection State
None, Powered Off, Powered On, or Suspended.
Power State None, Powered Off, Powered On, or Suspended.
StatusWhite circle=Status Unknown, Green check mark=Normal, Yellow triangle=Warning, Red X=Alert, definite problem.
Boot Time The VM’s power-on time.
Suspend Time The time when the VM was put in a suspended state.
Datastore The datastore to which the VM belongs. Links to the Datastore Detail report
Resource Pool The resource pool (compartment) to which the VM belongs.
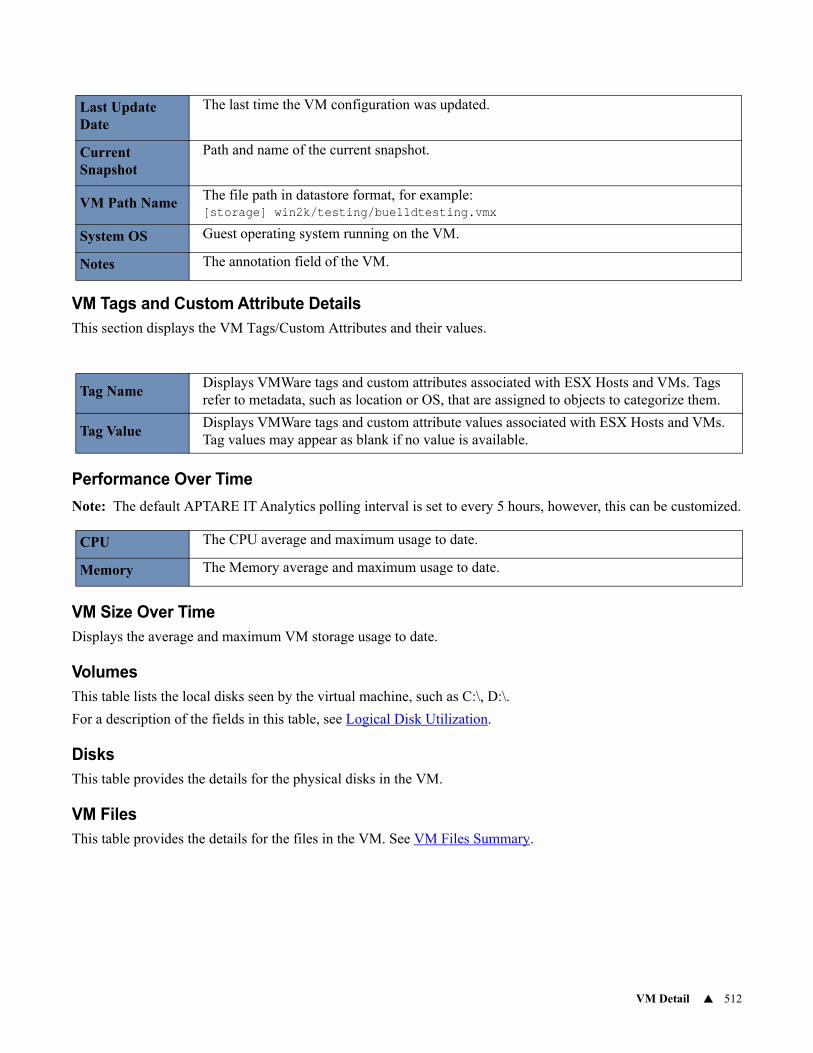
VM Detail 512
VM Tags and Custom Attribute DetailsThis section displays the VM Tags/Custom Attributes and their values.
Performance Over Time
Note: The default APTARE IT Analytics polling interval is set to every 5 hours, however, this can be customized.
VM Size Over TimeDisplays the average and maximum VM storage usage to date.
VolumesThis table lists the local disks seen by the virtual machine, such as C:\, D:\.
For a description of the fields in this table, see Logical Disk Utilization.
DisksThis table provides the details for the physical disks in the VM.
VM FilesThis table provides the details for the files in the VM. See VM Files Summary.
Last Update Date
The last time the VM configuration was updated.
Current Snapshot
Path and name of the current snapshot.
VM Path Name The file path in datastore format, for example:[storage] win2k/testing/bue11dtesting.vmx
System OS Guest operating system running on the VM.
Notes The annotation field of the VM.
Tag NameDisplays VMWare tags and custom attributes associated with ESX Hosts and VMs. Tags refer to metadata, such as location or OS, that are assigned to objects to categorize them.
Tag ValueDisplays VMWare tags and custom attribute values associated with ESX Hosts and VMs. Tag values may appear as blank if no value is available.
CPU The CPU average and maximum usage to date.
Memory The Memory average and maximum usage to date.
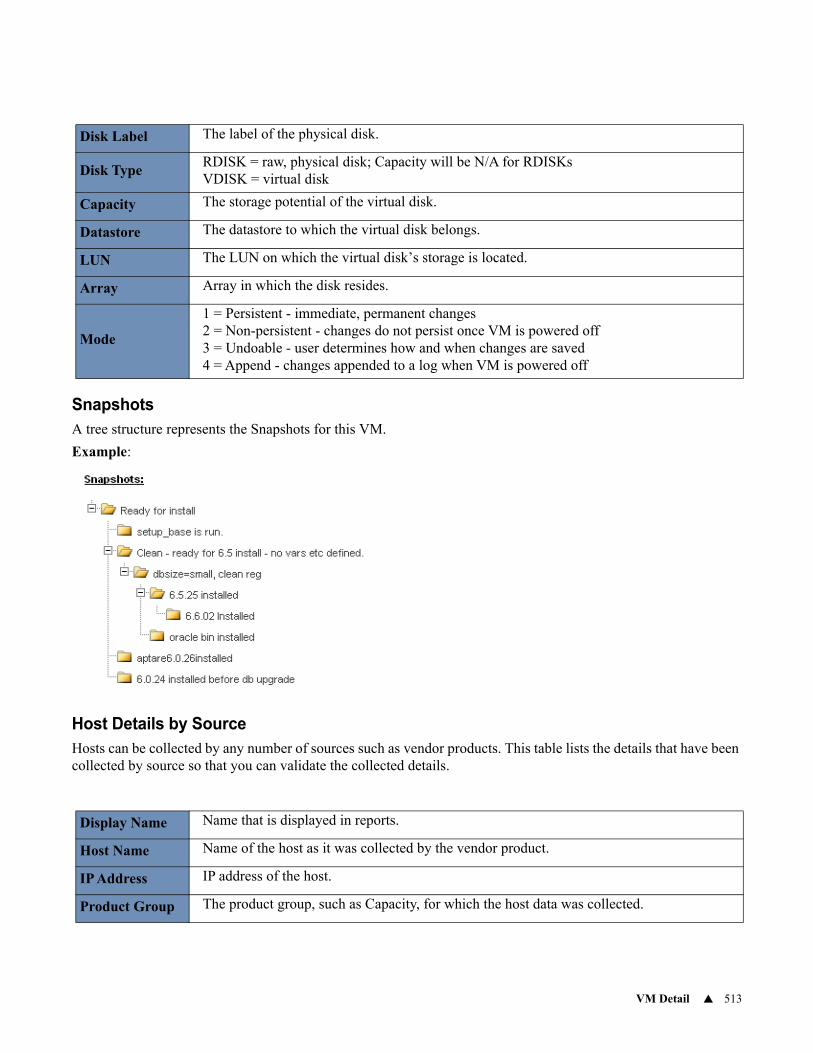
VM Detail 513
SnapshotsA tree structure represents the Snapshots for this VM.
Example:
Host Details by SourceHosts can be collected by any number of sources such as vendor products. This table lists the details that have been collected by source so that you can validate the collected details.
Disk Label The label of the physical disk.
Disk TypeRDISK = raw, physical disk; Capacity will be N/A for RDISKsVDISK = virtual disk
Capacity The storage potential of the virtual disk.
Datastore The datastore to which the virtual disk belongs.
LUN The LUN on which the virtual disk’s storage is located.
Array Array in which the disk resides.
Mode
1 = Persistent - immediate, permanent changes2 = Non-persistent - changes do not persist once VM is powered off3 = Undoable - user determines how and when changes are saved4 = Append - changes appended to a log when VM is powered off
Display Name Name that is displayed in reports.
Host Name Name of the host as it was collected by the vendor product.
IP Address IP address of the host.
Product Group The product group, such as Capacity, for which the host data was collected.
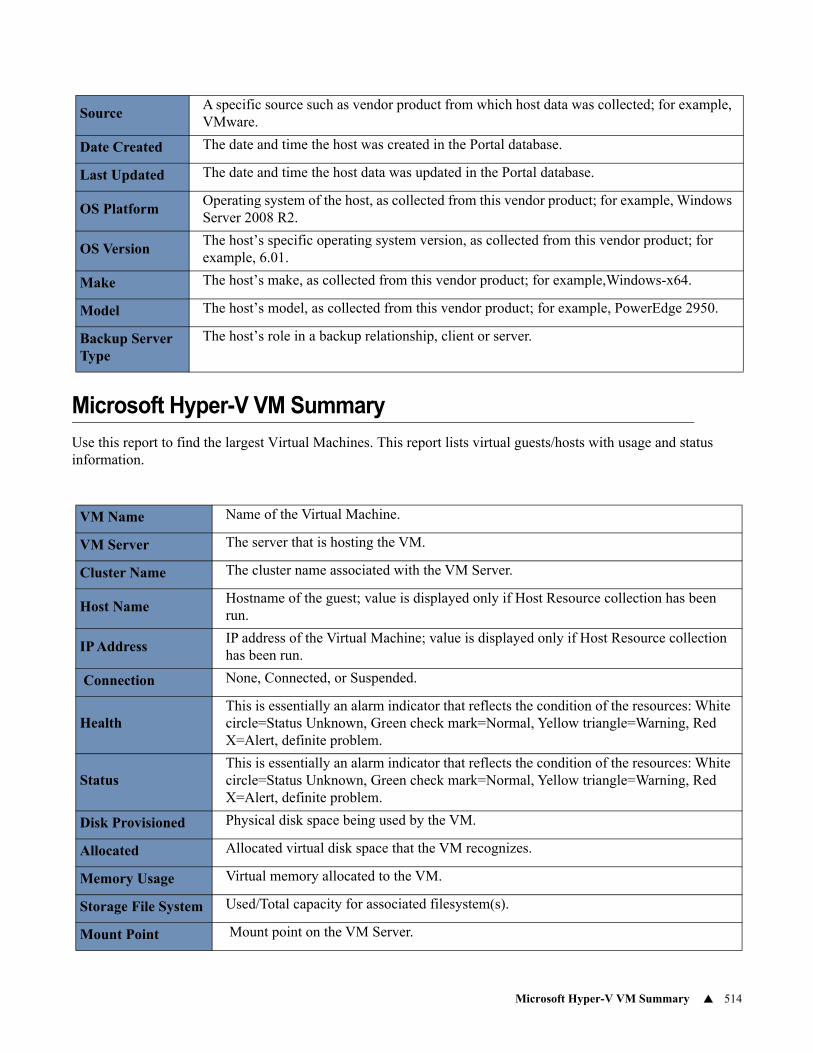
Microsoft Hyper-V VM Summary 514
Microsoft Hyper-V VM Summary
Use this report to find the largest Virtual Machines. This report lists virtual guests/hosts with usage and status information.
SourceA specific source such as vendor product from which host data was collected; for example, VMware.
Date Created The date and time the host was created in the Portal database.
Last Updated The date and time the host data was updated in the Portal database.
OS PlatformOperating system of the host, as collected from this vendor product; for example, Windows Server 2008 R2.
OS VersionThe host’s specific operating system version, as collected from this vendor product; for example, 6.01.
Make The host’s make, as collected from this vendor product; for example,Windows-x64.
Model The host’s model, as collected from this vendor product; for example, PowerEdge 2950.
Backup Server Type
The host’s role in a backup relationship, client or server.
VM Name Name of the Virtual Machine.
VM Server The server that is hosting the VM.
Cluster Name The cluster name associated with the VM Server.
Host NameHostname of the guest; value is displayed only if Host Resource collection has been run.
IP AddressIP address of the Virtual Machine; value is displayed only if Host Resource collection has been run.
Connection None, Connected, or Suspended.
HealthThis is essentially an alarm indicator that reflects the condition of the resources: White circle=Status Unknown, Green check mark=Normal, Yellow triangle=Warning, Red X=Alert, definite problem.
StatusThis is essentially an alarm indicator that reflects the condition of the resources: White circle=Status Unknown, Green check mark=Normal, Yellow triangle=Warning, Red X=Alert, definite problem.
Disk Provisioned Physical disk space being used by the VM.
Allocated Allocated virtual disk space that the VM recognizes.
Memory Usage Virtual memory allocated to the VM.
Storage File System Used/Total capacity for associated filesystem(s).
Mount Point Mount point on the VM Server.
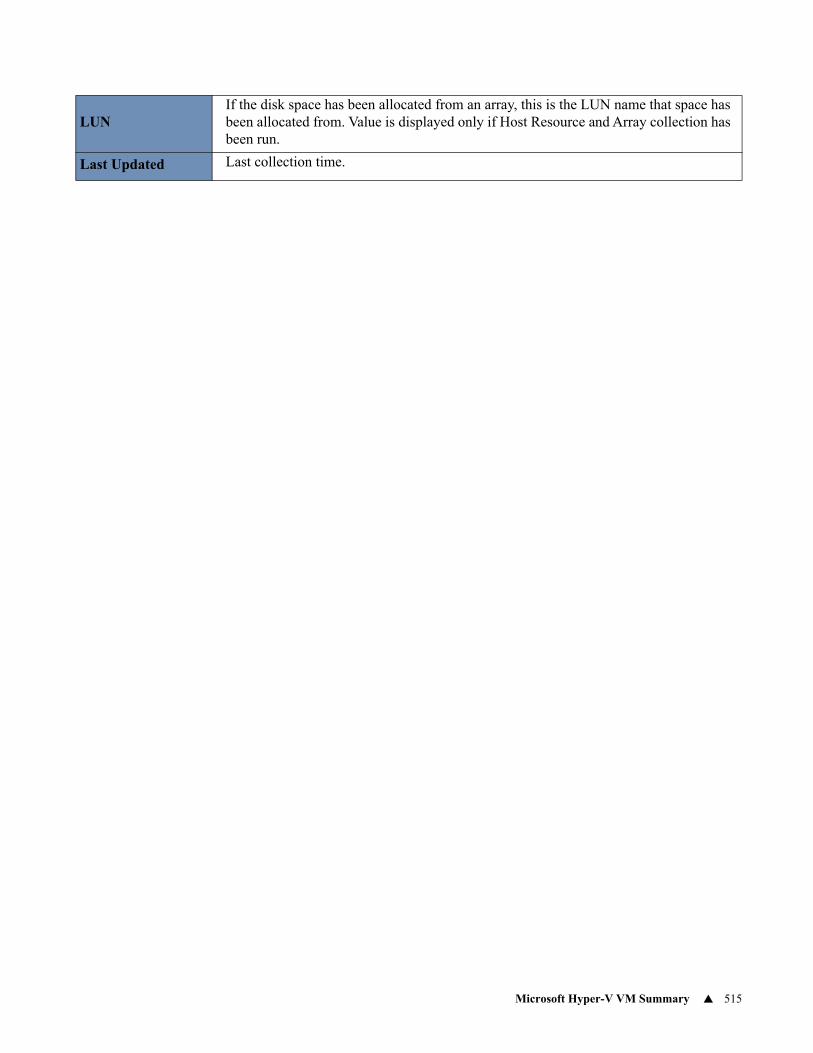
Microsoft Hyper-V VM Summary 515
LUNIf the disk space has been allocated from an array, this is the LUN name that space has been allocated from. Value is displayed only if Host Resource and Array collection has been run.
Last Updated Last collection time.
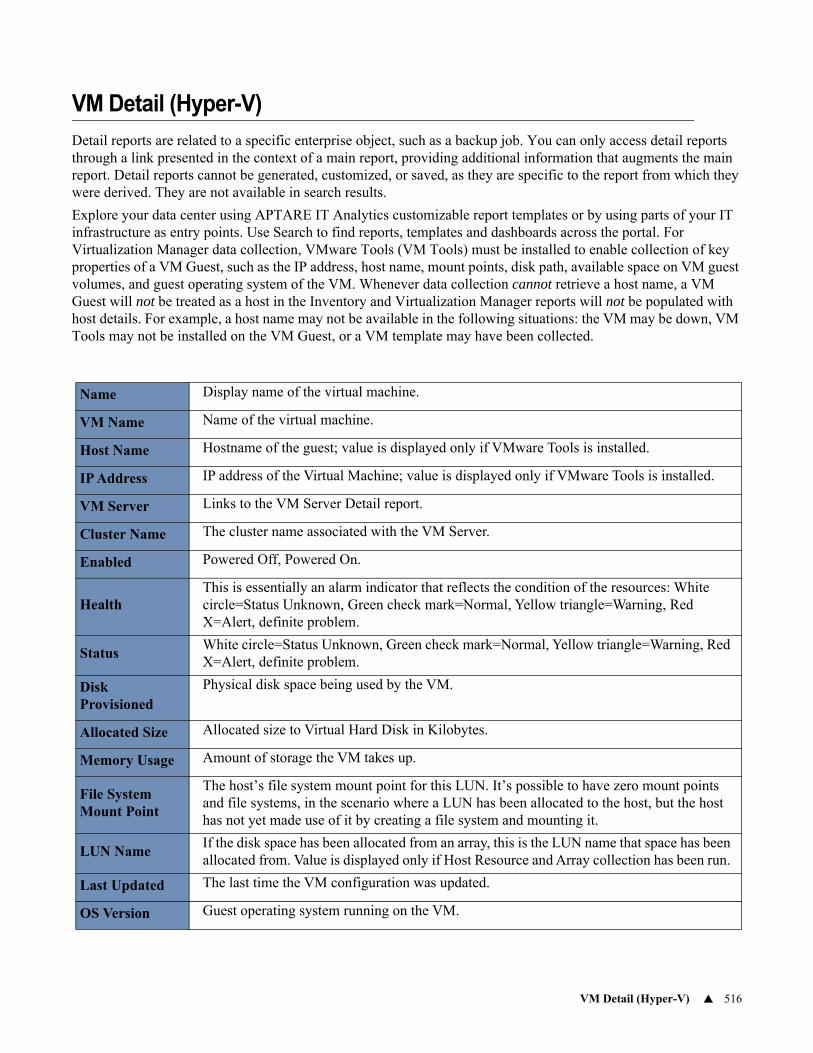
VM Detail (Hyper-V) 516
VM Detail (Hyper-V)
Detail reports are related to a specific enterprise object, such as a backup job. You can only access detail reports through a link presented in the context of a main report, providing additional information that augments the main report. Detail reports cannot be generated, customized, or saved, as they are specific to the report from which they were derived. They are not available in search results.
Explore your data center using APTARE IT Analytics customizable report templates or by using parts of your IT infrastructure as entry points. Use Search to find reports, templates and dashboards across the portal. For Virtualization Manager data collection, VMware Tools (VM Tools) must be installed to enable collection of key properties of a VM Guest, such as the IP address, host name, mount points, disk path, available space on VM guest volumes, and guest operating system of the VM. Whenever data collection cannot retrieve a host name, a VM Guest will not be treated as a host in the Inventory and Virtualization Manager reports will not be populated with host details. For example, a host name may not be available in the following situations: the VM may be down, VM Tools may not be installed on the VM Guest, or a VM template may have been collected.
Name Display name of the virtual machine.
VM Name Name of the virtual machine.
Host Name Hostname of the guest; value is displayed only if VMware Tools is installed.
IP Address IP address of the Virtual Machine; value is displayed only if VMware Tools is installed.
VM Server Links to the VM Server Detail report.
Cluster Name The cluster name associated with the VM Server.
Enabled Powered Off, Powered On.
HealthThis is essentially an alarm indicator that reflects the condition of the resources: White circle=Status Unknown, Green check mark=Normal, Yellow triangle=Warning, Red X=Alert, definite problem.
StatusWhite circle=Status Unknown, Green check mark=Normal, Yellow triangle=Warning, Red X=Alert, definite problem.
Disk Provisioned
Physical disk space being used by the VM.
Allocated Size Allocated size to Virtual Hard Disk in Kilobytes.
Memory Usage Amount of storage the VM takes up.
File System Mount Point
The host’s file system mount point for this LUN. It’s possible to have zero mount points and file systems, in the scenario where a LUN has been allocated to the host, but the host has not yet made use of it by creating a file system and mounting it.
LUN NameIf the disk space has been allocated from an array, this is the LUN name that space has been allocated from. Value is displayed only if Host Resource and Array collection has been run.
Last Updated The last time the VM configuration was updated.
OS Version Guest operating system running on the VM.
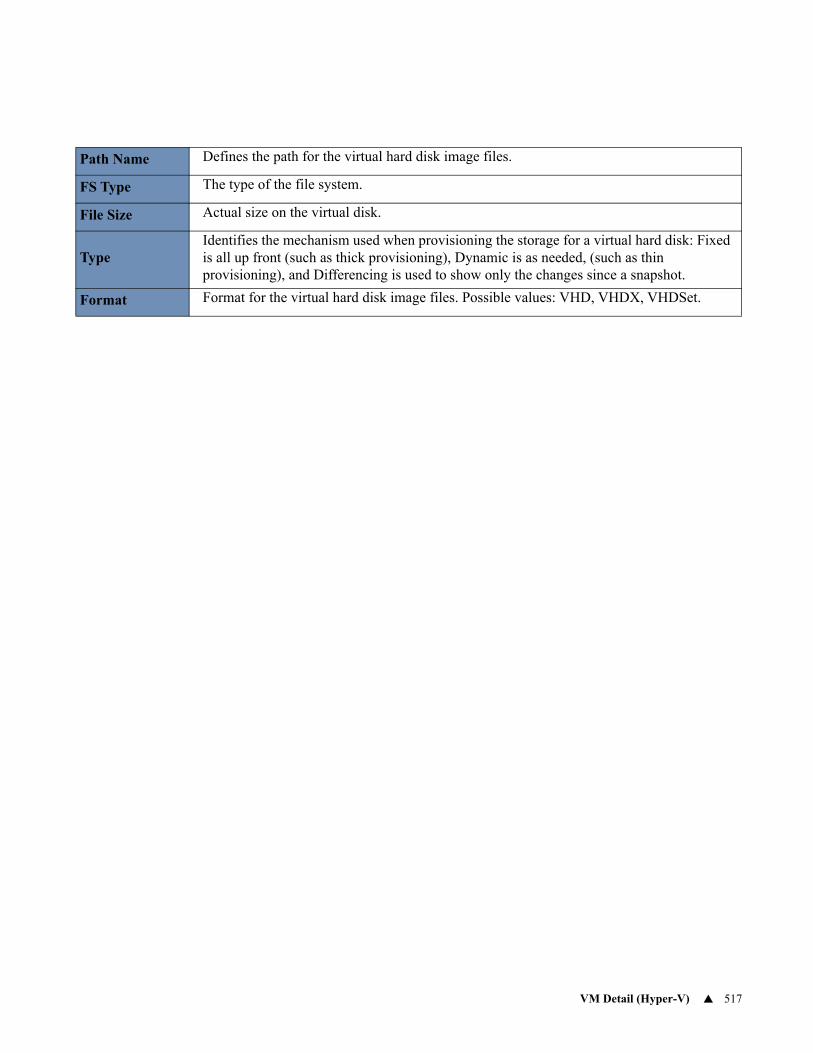
VM Detail (Hyper-V) 517
Path Name Defines the path for the virtual hard disk image files.
FS Type The type of the file system.
File Size Actual size on the virtual disk.
TypeIdentifies the mechanism used when provisioning the storage for a virtual hard disk: Fixed is all up front (such as thick provisioning), Dynamic is as needed, (such as thin provisioning), and Differencing is used to show only the changes since a snapshot.
Format Format for the virtual hard disk image files. Possible values: VHD, VHDX, VHDSet.
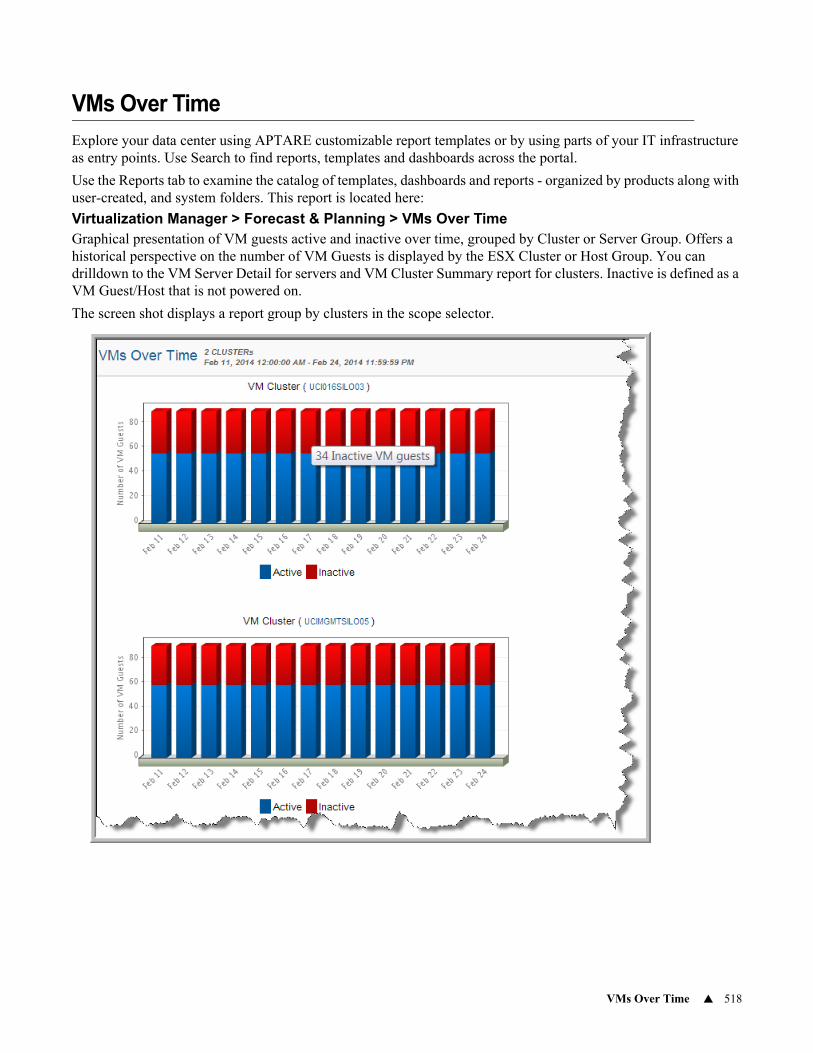
VMs Over Time 518
VMs Over Time
Explore your data center using APTARE customizable report templates or by using parts of your IT infrastructure as entry points. Use Search to find reports, templates and dashboards across the portal.
Use the Reports tab to examine the catalog of templates, dashboards and reports - organized by products along with user-created, and system folders. This report is located here:
Virtualization Manager > Forecast & Planning > VMs Over TimeGraphical presentation of VM guests active and inactive over time, grouped by Cluster or Server Group. Offers a historical perspective on the number of VM Guests is displayed by the ESX Cluster or Host Group. You can drilldown to the VM Server Detail for servers and VM Cluster Summary report for clusters. Inactive is defined as a VM Guest/Host that is not powered on.
The screen shot displays a report group by clusters in the scope selector.
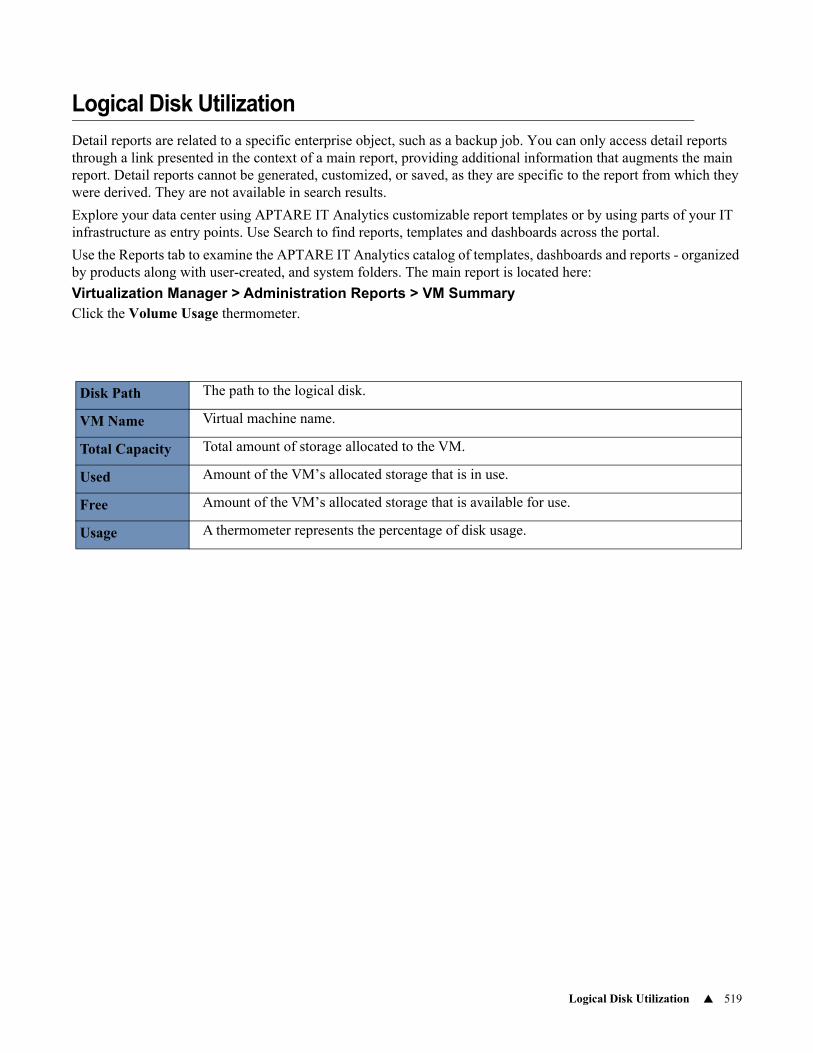
Logical Disk Utilization 519
Logical Disk Utilization
Detail reports are related to a specific enterprise object, such as a backup job. You can only access detail reports through a link presented in the context of a main report, providing additional information that augments the main report. Detail reports cannot be generated, customized, or saved, as they are specific to the report from which they were derived. They are not available in search results.
Explore your data center using APTARE IT Analytics customizable report templates or by using parts of your IT infrastructure as entry points. Use Search to find reports, templates and dashboards across the portal.
Use the Reports tab to examine the APTARE IT Analytics catalog of templates, dashboards and reports - organized by products along with user-created, and system folders. The main report is located here:
Virtualization Manager > Administration Reports > VM SummaryClick the Volume Usage thermometer.
Disk Path The path to the logical disk.
VM Name Virtual machine name.
Total Capacity Total amount of storage allocated to the VM.
Used Amount of the VM’s allocated storage that is in use.
Free Amount of the VM’s allocated storage that is available for use.
Usage A thermometer represents the percentage of disk usage.
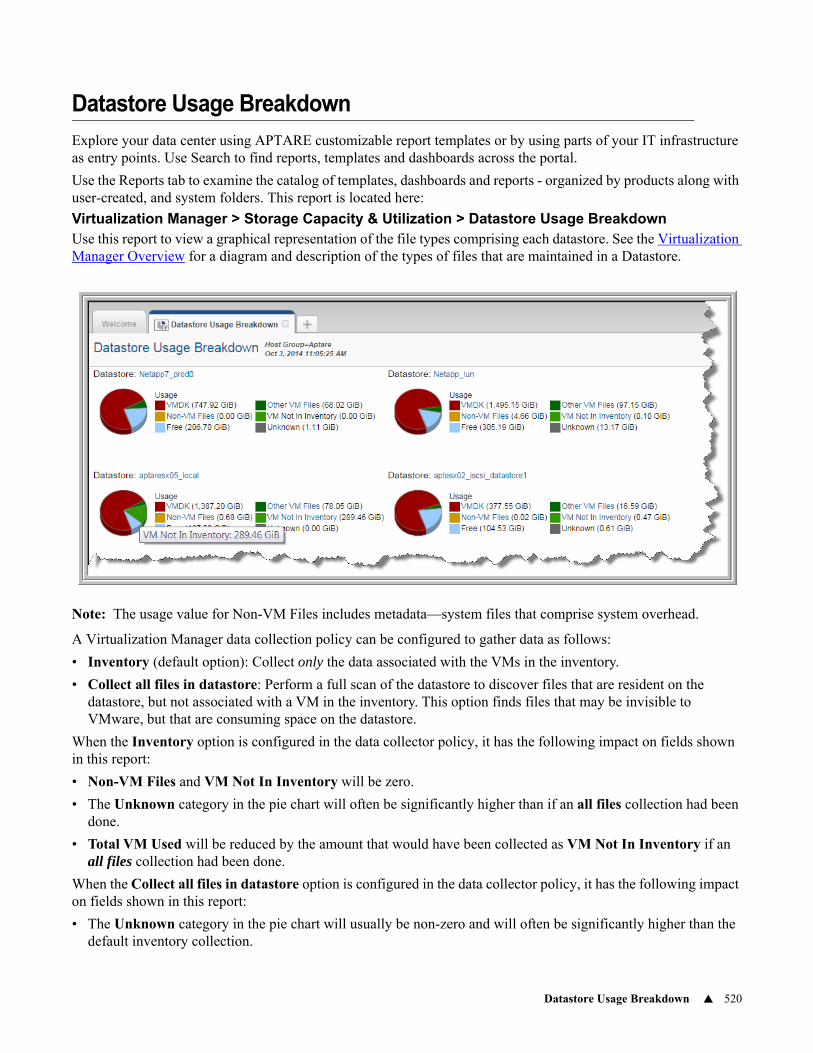
Datastore Usage Breakdown 520
Datastore Usage Breakdown
Explore your data center using APTARE customizable report templates or by using parts of your IT infrastructure as entry points. Use Search to find reports, templates and dashboards across the portal.
Use the Reports tab to examine the catalog of templates, dashboards and reports - organized by products along with user-created, and system folders. This report is located here:
Virtualization Manager > Storage Capacity & Utilization > Datastore Usage BreakdownUse this report to view a graphical representation of the file types comprising each datastore. See the Virtualization Manager Overview for a diagram and description of the types of files that are maintained in a Datastore.
Note: The usage value for Non-VM Files includes metadata—system files that comprise system overhead.
A Virtualization Manager data collection policy can be configured to gather data as follows:
• Inventory (default option): Collect only the data associated with the VMs in the inventory.
• Collect all files in datastore: Perform a full scan of the datastore to discover files that are resident on the datastore, but not associated with a VM in the inventory. This option finds files that may be invisible to VMware, but that are consuming space on the datastore.
When the Inventory option is configured in the data collector policy, it has the following impact on fields shown in this report:
• Non-VM Files and VM Not In Inventory will be zero.
• The Unknown category in the pie chart will often be significantly higher than if an all files collection had been done.
• Total VM Used will be reduced by the amount that would have been collected as VM Not In Inventory if an all files collection had been done.
When the Collect all files in datastore option is configured in the data collector policy, it has the following impact on fields shown in this report:
• The Unknown category in the pie chart will usually be non-zero and will often be significantly higher than the default inventory collection.
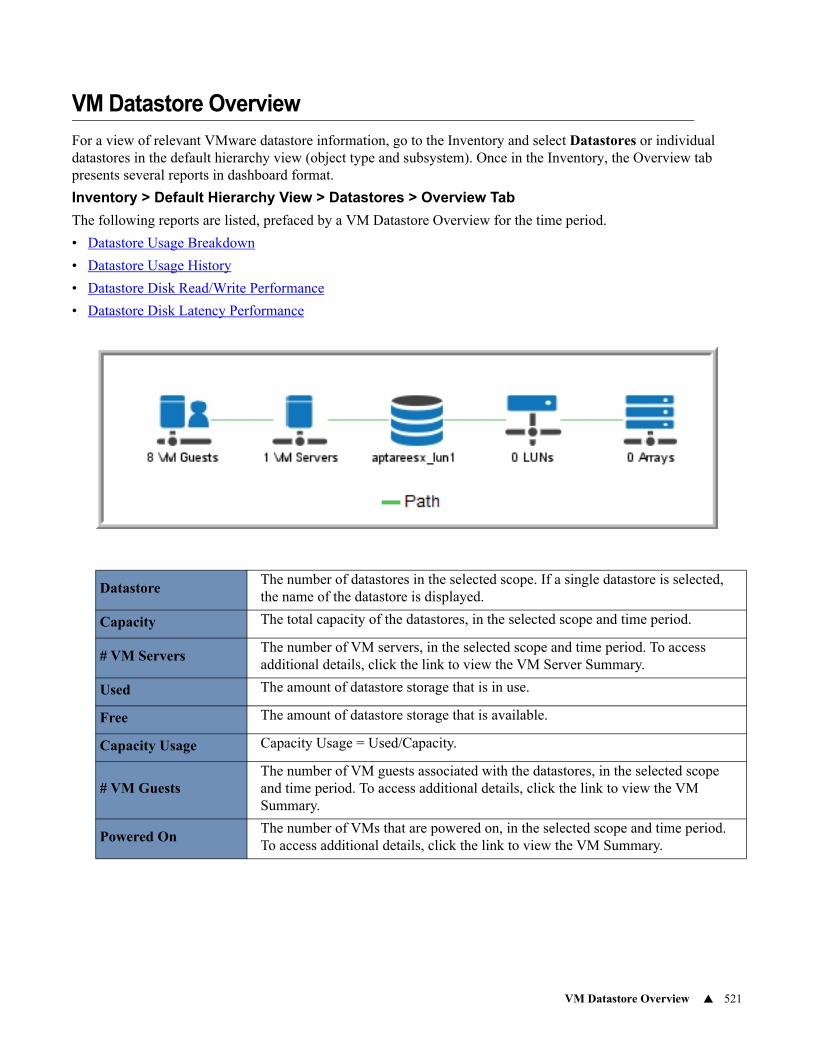
VM Datastore Overview 521
VM Datastore Overview
For a view of relevant VMware datastore information, go to the Inventory and select Datastores or individual datastores in the default hierarchy view (object type and subsystem). Once in the Inventory, the Overview tab presents several reports in dashboard format.
Inventory > Default Hierarchy View > Datastores > Overview Tab
The following reports are listed, prefaced by a VM Datastore Overview for the time period.
• Datastore Usage Breakdown
• Datastore Usage History
• Datastore Disk Read/Write Performance
• Datastore Disk Latency Performance
DatastoreThe number of datastores in the selected scope. If a single datastore is selected, the name of the datastore is displayed.
Capacity The total capacity of the datastores, in the selected scope and time period.
# VM ServersThe number of VM servers, in the selected scope and time period. To access additional details, click the link to view the VM Server Summary.
Used The amount of datastore storage that is in use.
Free The amount of datastore storage that is available.
Capacity Usage Capacity Usage = Used/Capacity.
# VM GuestsThe number of VM guests associated with the datastores, in the selected scope and time period. To access additional details, click the link to view the VM Summary.
Powered OnThe number of VMs that are powered on, in the selected scope and time period. To access additional details, click the link to view the VM Summary.
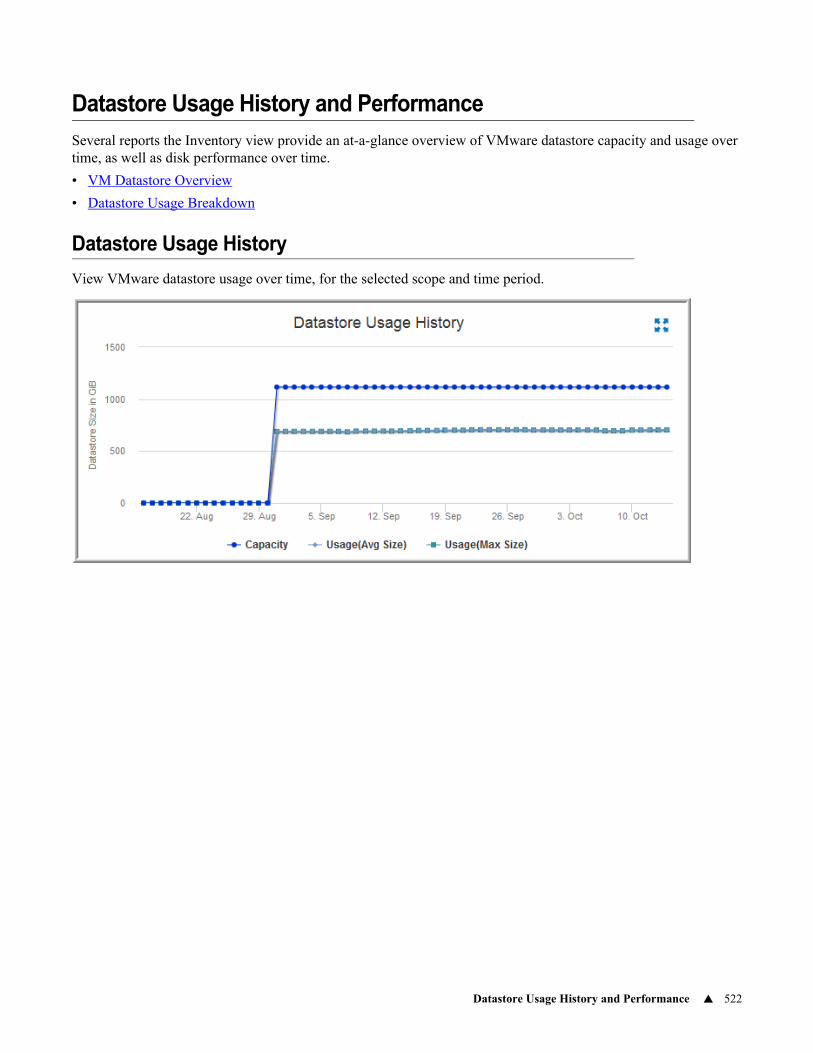
Datastore Usage History and Performance 522
Datastore Usage History and Performance
Several reports the Inventory view provide an at-a-glance overview of VMware datastore capacity and usage over time, as well as disk performance over time.
• VM Datastore Overview
• Datastore Usage Breakdown
Datastore Usage History
View VMware datastore usage over time, for the selected scope and time period.
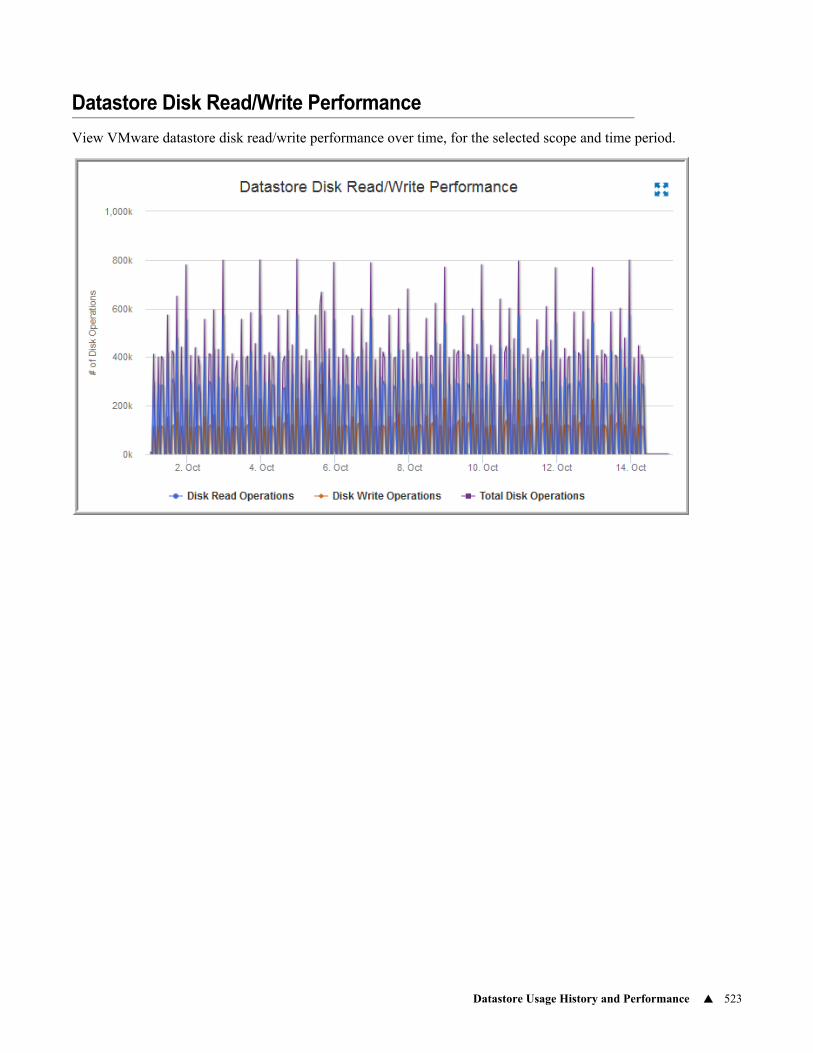
Datastore Usage History and Performance 523
Datastore Disk Read/Write Performance
View VMware datastore disk read/write performance over time, for the selected scope and time period.
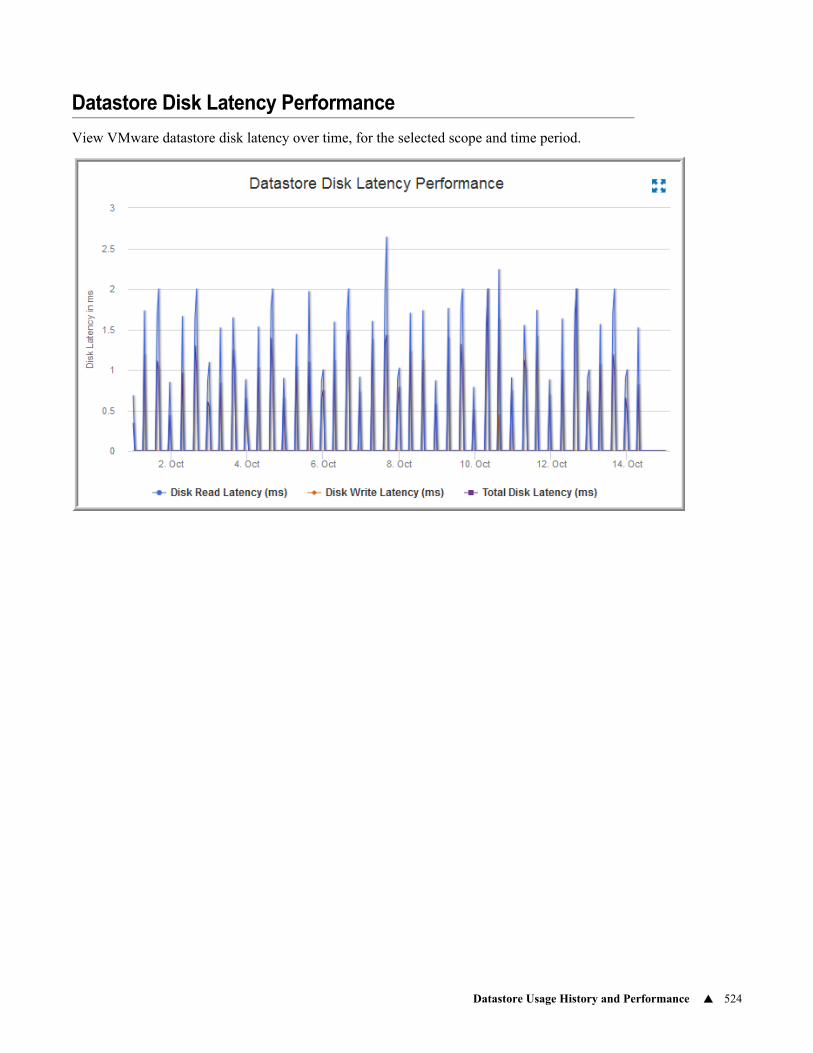
Datastore Usage History and Performance 524
Datastore Disk Latency Performance
View VMware datastore disk latency over time, for the selected scope and time period.
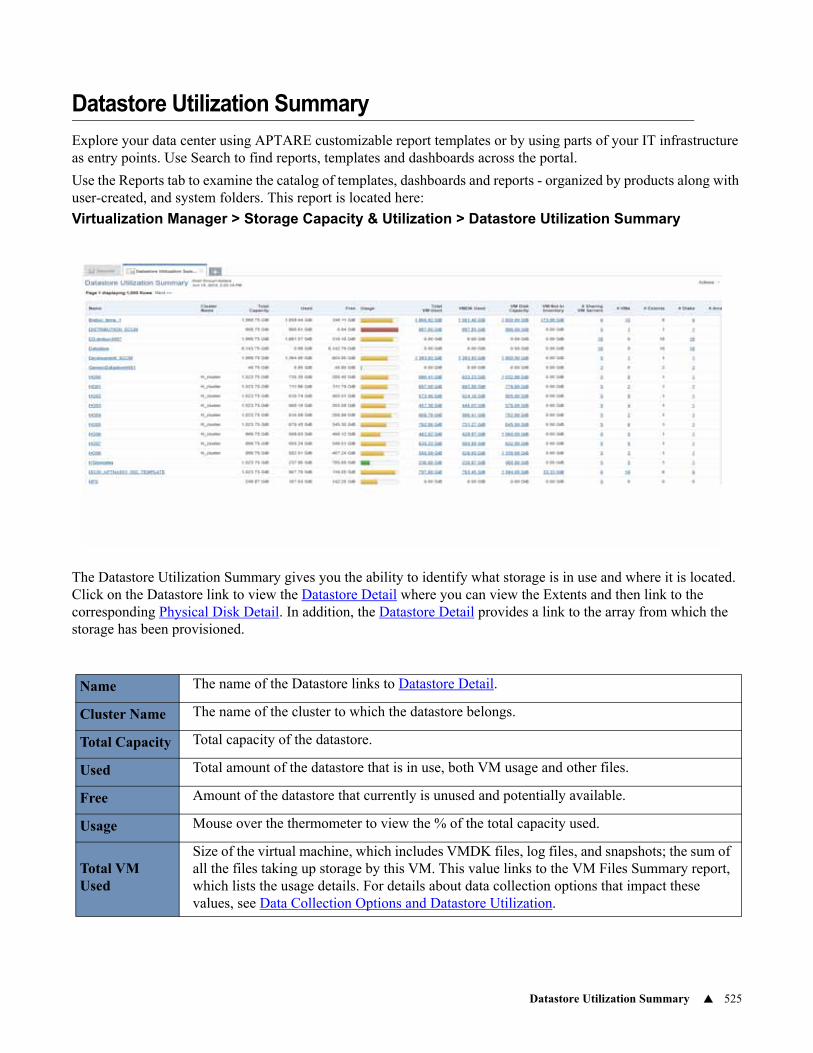
Datastore Utilization Summary 525
Datastore Utilization Summary
Explore your data center using APTARE customizable report templates or by using parts of your IT infrastructure as entry points. Use Search to find reports, templates and dashboards across the portal.
Use the Reports tab to examine the catalog of templates, dashboards and reports - organized by products along with user-created, and system folders. This report is located here:
Virtualization Manager > Storage Capacity & Utilization > Datastore Utilization Summary
The Datastore Utilization Summary gives you the ability to identify what storage is in use and where it is located. Click on the Datastore link to view the Datastore Detail where you can view the Extents and then link to the corresponding Physical Disk Detail. In addition, the Datastore Detail provides a link to the array from which the storage has been provisioned.
Name The name of the Datastore links to Datastore Detail.
Cluster Name The name of the cluster to which the datastore belongs.
Total Capacity Total capacity of the datastore.
Used Total amount of the datastore that is in use, both VM usage and other files.
Free Amount of the datastore that currently is unused and potentially available.
Usage Mouse over the thermometer to view the % of the total capacity used.
Total VM Used
Size of the virtual machine, which includes VMDK files, log files, and snapshots; the sum of all the files taking up storage by this VM. This value links to the VM Files Summary report, which lists the usage details. For details about data collection options that impact these values, see Data Collection Options and Datastore Utilization.
Datastore Detail 526
Data Collection Options and Datastore UtilizationA Virtualization Manager data collection policy can be configured to gather data as follows:
• Inventory (default option): Collect only the data associated with the VMs in the inventory.
• Collect all files in datastore: Perform a full scan of the datastore to discover files that are resident on the datastore, but not associated with a VM in the inventory. This option finds files that may be invisible to VMware, but that are consuming space on the datastore.
When the Inventory option is configured in the data collector policy, it has the following impact on fields shown in this report:
• VM Not In Inventory will be zero.
• Total VM Used will be reduced by the amount that would have been collected as VM Not In Inventory if an all files collection had been done.
Datastore Detail
VMDK Used
The sum of all virtual disks - VMDK (.vmdk files), that are occupying space. This sum does not include snapshot metadata files, however, other outdated snapshot data may be in vmdk files. For this reason, VMDK Used may exceed VM Disk Capacity, the amount that was configured when the VM was created.
VM Disk Capacity
Amount of storage that was provisioned to the Guest OS when the virtual disk was originally created for the VM. For thin storage, this can be larger than the Datastore capacity associated with the VM.
VM Not In Inventory
Indicates VMs that are not currently in the inventory, but are taking up space in the Datastore. These are VMs that are not visible in VMware vCenter. Click this link to view the VM Files Summary. This value will be zero if data collection is configured to collect data from only datastores associated with VMs in the inventory. For details about data collection options that impact these values, see Data Collection Options and Datastore Utilization.
# Sharing VM Servers
The number of hosts configured to access this datastore.
# VMs Number of virtual machines stored on this datastore.
# ExtentsThe number of extents that were added to expand the datastore (up to 32 physical storage extents).
# Disks The number of disks used by this datastore (up to 32 physical disks).
# ArraysThe number of arrays from which this datastore gets physical storage.
Links to Array Capacity and Utilization.
Is Thin
Indicates whether or not the datastore supports thin provisioning on a per file basis. When thin provisioning is used, backing storage is lazily allocated.
This is supported by VMFS3. VMFS2 always allocates storage eagerly. Thus, this value is false for VMFS2. Most NAS systems always use thin provisioning. They do not support configuring this on a per file basis, so for NAS systems this value is also false.
VMDK Max File Size
Some of the capacity of a virtual disk from the point of view of a virtual machine.
Datastore Detail 527
Detail reports are related to a specific enterprise object, such as a backup job. You can only access detail reports through a link presented in the context of a main report, providing additional information that augments the main report. Detail reports cannot be generated, customized, or saved, as they are specific to the report from which they were derived. They are not available in search results.
Explore your data center using APTARE IT Analytics customizable report templates or by using parts of your IT infrastructure as entry points. Use Search to find reports, templates and dashboards across the portal.
Use the Reports tab to examine the APTARE IT Analytics catalog of templates, dashboards and reports - organized by products along with user-created, and system folders. The main report is located here:
Virtualization Manager > Storage Capacity & Utilization > Datastore UtilizationClick a Datastore name.
Name Name of the datastore.
Cluster Name The name of the cluster to which the datastore belongs.
Type Datastore type: a specific NFS file system or NAS.
Server This field is related to Datastore type and will be populated only when the type is NAS.
FolderThe VM folder in which this Datastore is located. This field is related to Datastore type and will be populated only when the type is NAS.
Multiple Host Access
Indicates if this datastore can be shared by multiple hosts: Yes or No.
Last Updated Timestamp of the last write access.
VMDK Max File Size
The capacity of a virtual disk from the point of view of a virtual machine.
# VMsThis number links to the VM Summary report, listing the VMs associated with this Datastore.
# ExtentsThe number of extents that were added to expand the datastore (up to 32 physical storage extents).
# Disks The number of physical disks associated with the datastore.
# ArraysThe number of arrays from which this datastore gets physical storage links to Array Capacity & Utilization.
VMDK Used
The sum of all virtual disks - VMDK (.vmdk files). This sum does not include snapshot metadata files, however, other outdated snapshot data may be in vmdk files. For this reason, VMDK Used may exceed VM Disk Capacity, the amount that was configured when the VM was created.
Total VM Used
Size of the virtual machine, which includes VMDK files, log files, and snapshots; the sum of all the files taking up storage by this VM. This value links to the VM Files Summary report, which lists the usage details. For details about data collection options that impact these values, see Data Collection Options and Datastore Utilization.
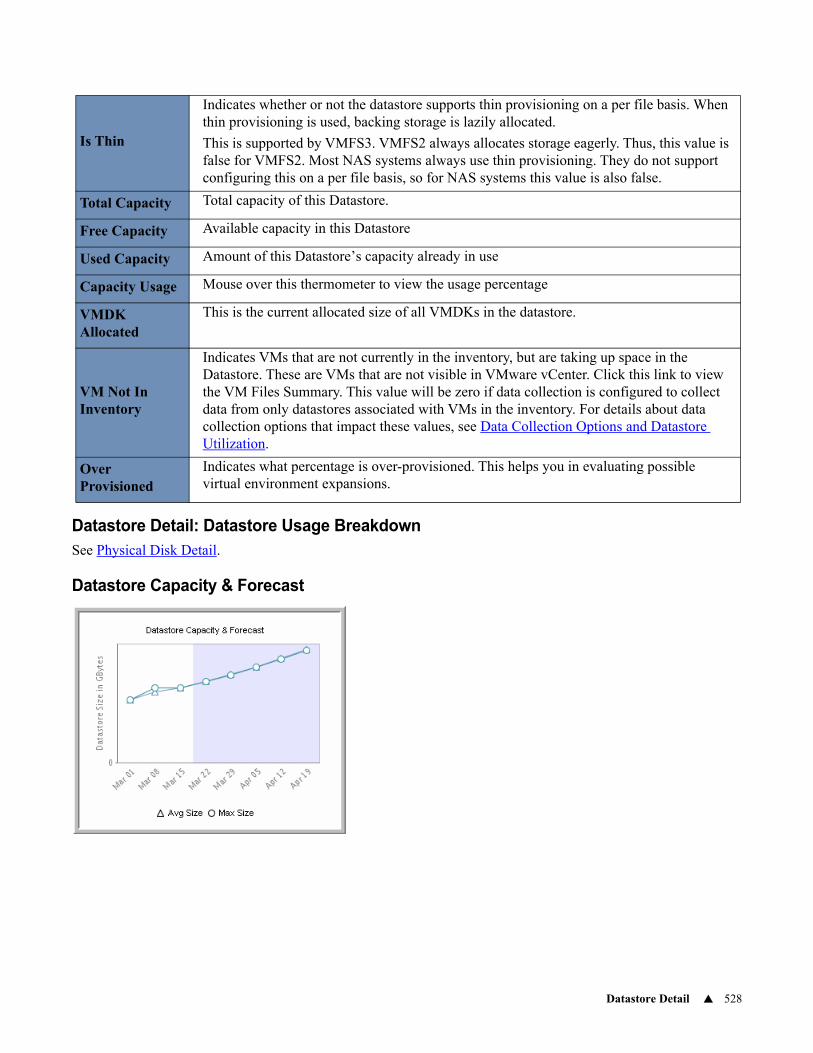
Datastore Detail 528
Datastore Detail: Datastore Usage BreakdownSee Physical Disk Detail.
Datastore Capacity & Forecast
Is Thin
Indicates whether or not the datastore supports thin provisioning on a per file basis. When thin provisioning is used, backing storage is lazily allocated.
This is supported by VMFS3. VMFS2 always allocates storage eagerly. Thus, this value is false for VMFS2. Most NAS systems always use thin provisioning. They do not support configuring this on a per file basis, so for NAS systems this value is also false.
Total Capacity Total capacity of this Datastore.
Free Capacity Available capacity in this Datastore
Used Capacity Amount of this Datastore’s capacity already in use
Capacity Usage Mouse over this thermometer to view the usage percentage
VMDK Allocated
This is the current allocated size of all VMDKs in the datastore.
VM Not In Inventory
Indicates VMs that are not currently in the inventory, but are taking up space in the Datastore. These are VMs that are not visible in VMware vCenter. Click this link to view the VM Files Summary. This value will be zero if data collection is configured to collect data from only datastores associated with VMs in the inventory. For details about data collection options that impact these values, see Data Collection Options and Datastore Utilization.
Over Provisioned
Indicates what percentage is over-provisioned. This helps you in evaluating possible virtual environment expansions.
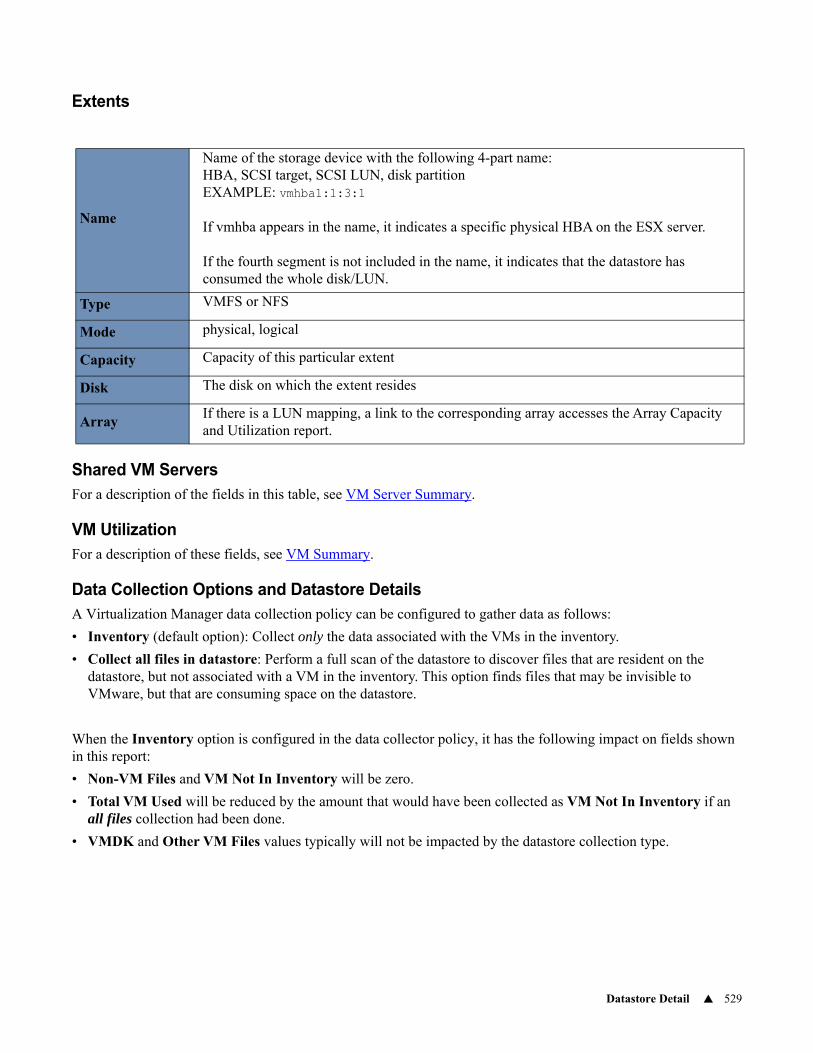
Datastore Detail 529
Extents
Shared VM ServersFor a description of the fields in this table, see VM Server Summary.
VM UtilizationFor a description of these fields, see VM Summary.
Data Collection Options and Datastore DetailsA Virtualization Manager data collection policy can be configured to gather data as follows:
• Inventory (default option): Collect only the data associated with the VMs in the inventory.
• Collect all files in datastore: Perform a full scan of the datastore to discover files that are resident on the datastore, but not associated with a VM in the inventory. This option finds files that may be invisible to VMware, but that are consuming space on the datastore.
When the Inventory option is configured in the data collector policy, it has the following impact on fields shown in this report:
• Non-VM Files and VM Not In Inventory will be zero.
• Total VM Used will be reduced by the amount that would have been collected as VM Not In Inventory if an all files collection had been done.
• VMDK and Other VM Files values typically will not be impacted by the datastore collection type.
Name
Name of the storage device with the following 4-part name:HBA, SCSI target, SCSI LUN, disk partitionEXAMPLE: vmhba1:1:3:1
If vmhba appears in the name, it indicates a specific physical HBA on the ESX server.
If the fourth segment is not included in the name, it indicates that the datastore has consumed the whole disk/LUN.
Type VMFS or NFS
Mode physical, logical
Capacity Capacity of this particular extent
Disk The disk on which the extent resides
ArrayIf there is a LUN mapping, a link to the corresponding array accesses the Array Capacity and Utilization report.
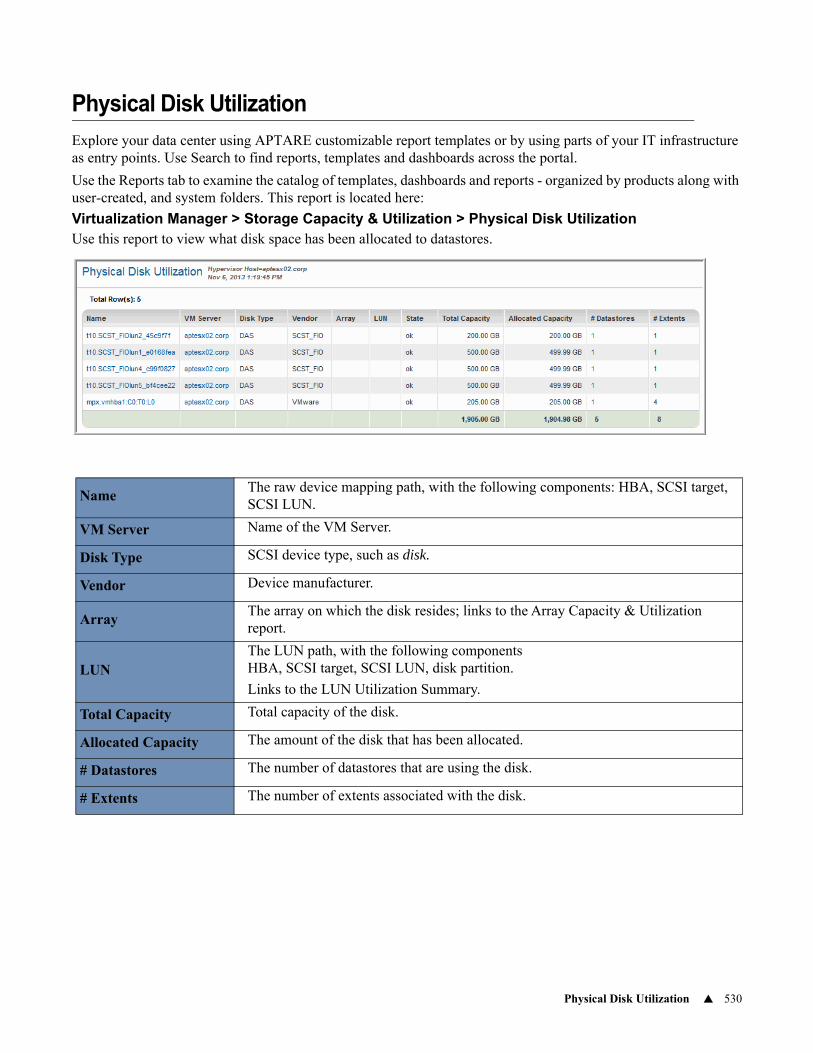
Physical Disk Utilization 530
Physical Disk Utilization
Explore your data center using APTARE customizable report templates or by using parts of your IT infrastructure as entry points. Use Search to find reports, templates and dashboards across the portal.
Use the Reports tab to examine the catalog of templates, dashboards and reports - organized by products along with user-created, and system folders. This report is located here:
Virtualization Manager > Storage Capacity & Utilization > Physical Disk UtilizationUse this report to view what disk space has been allocated to datastores.
NameThe raw device mapping path, with the following components: HBA, SCSI target, SCSI LUN.
VM Server Name of the VM Server.
Disk Type SCSI device type, such as disk.
Vendor Device manufacturer.
ArrayThe array on which the disk resides; links to the Array Capacity & Utilization report.
LUNThe LUN path, with the following components HBA, SCSI target, SCSI LUN, disk partition.
Links to the LUN Utilization Summary.
Total Capacity Total capacity of the disk.
Allocated Capacity The amount of the disk that has been allocated.
# Datastores The number of datastores that are using the disk.
# Extents The number of extents associated with the disk.
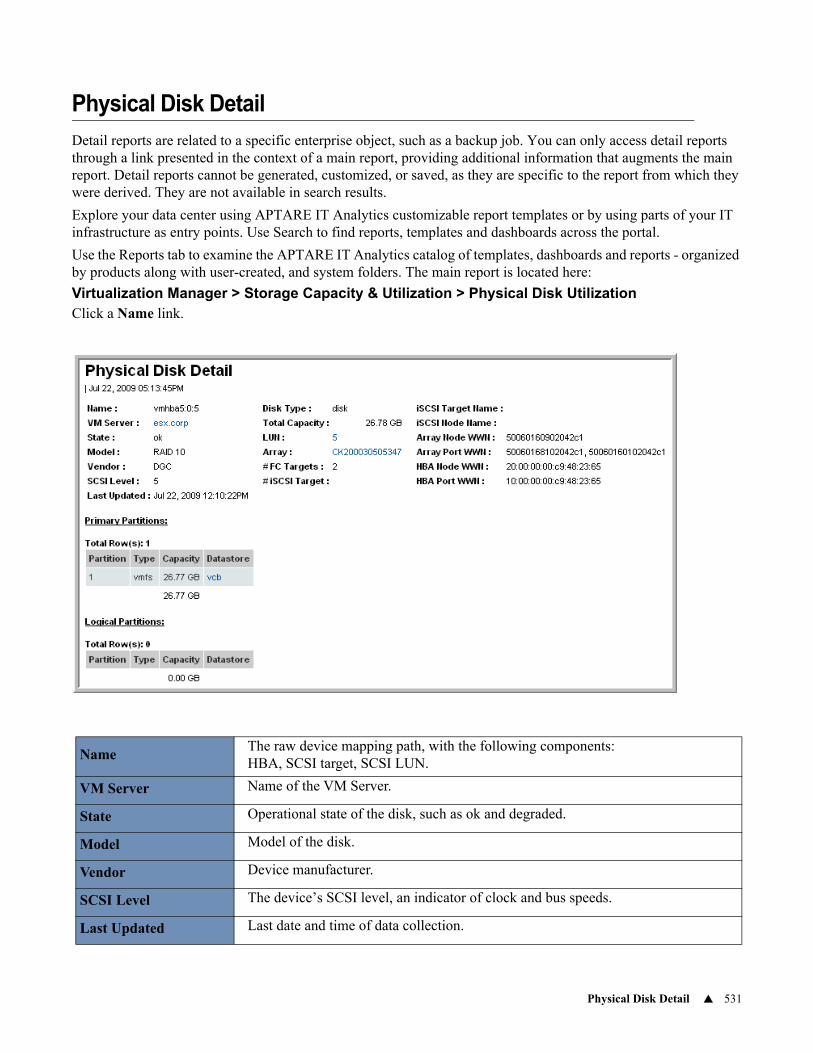
Physical Disk Detail 531
Physical Disk Detail
Detail reports are related to a specific enterprise object, such as a backup job. You can only access detail reports through a link presented in the context of a main report, providing additional information that augments the main report. Detail reports cannot be generated, customized, or saved, as they are specific to the report from which they were derived. They are not available in search results.
Explore your data center using APTARE IT Analytics customizable report templates or by using parts of your IT infrastructure as entry points. Use Search to find reports, templates and dashboards across the portal.
Use the Reports tab to examine the APTARE IT Analytics catalog of templates, dashboards and reports - organized by products along with user-created, and system folders. The main report is located here:
Virtualization Manager > Storage Capacity & Utilization > Physical Disk UtilizationClick a Name link.
NameThe raw device mapping path, with the following components: HBA, SCSI target, SCSI LUN.
VM Server Name of the VM Server.
State Operational state of the disk, such as ok and degraded.
Model Model of the disk.
Vendor Device manufacturer.
SCSI Level The device’s SCSI level, an indicator of clock and bus speeds.
Last Updated Last date and time of data collection.
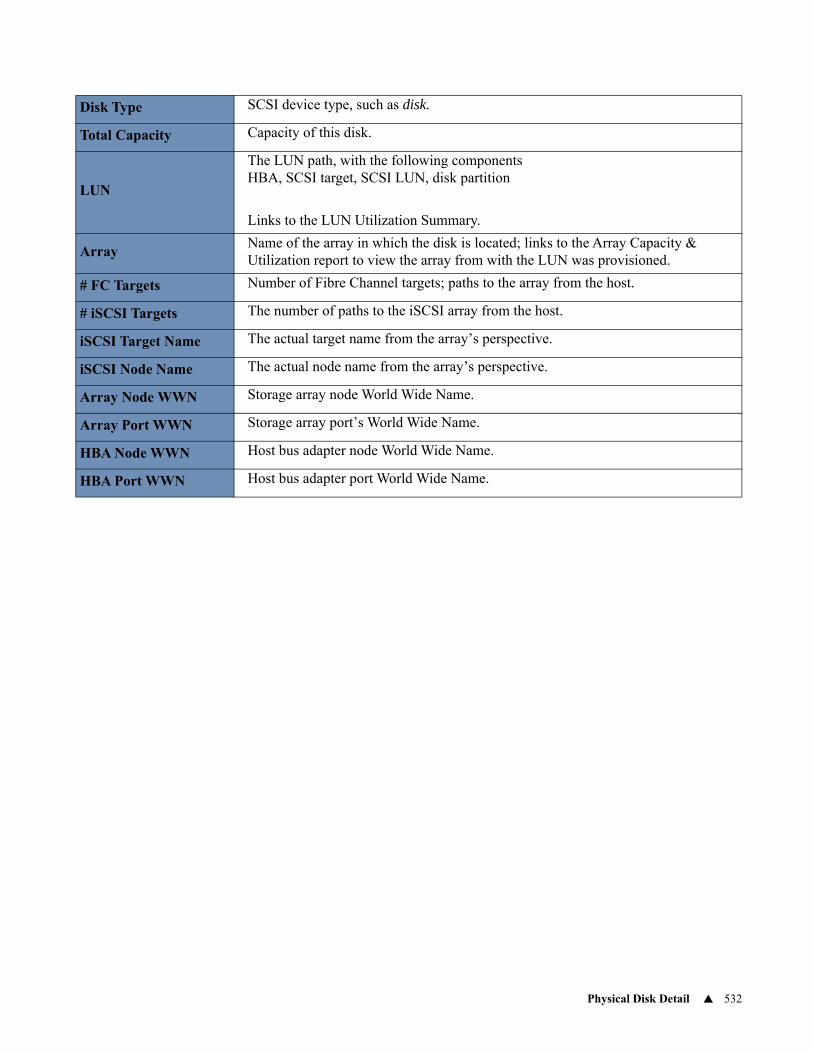
Physical Disk Detail 532
Disk Type SCSI device type, such as disk.
Total Capacity Capacity of this disk.
LUN
The LUN path, with the following components HBA, SCSI target, SCSI LUN, disk partition
Links to the LUN Utilization Summary.
ArrayName of the array in which the disk is located; links to the Array Capacity & Utilization report to view the array from with the LUN was provisioned.
# FC Targets Number of Fibre Channel targets; paths to the array from the host.
# iSCSI Targets The number of paths to the iSCSI array from the host.
iSCSI Target Name The actual target name from the array’s perspective.
iSCSI Node Name The actual node name from the array’s perspective.
Array Node WWN Storage array node World Wide Name.
Array Port WWN Storage array port’s World Wide Name.
HBA Node WWN Host bus adapter node World Wide Name.
HBA Port WWN Host bus adapter port World Wide Name.
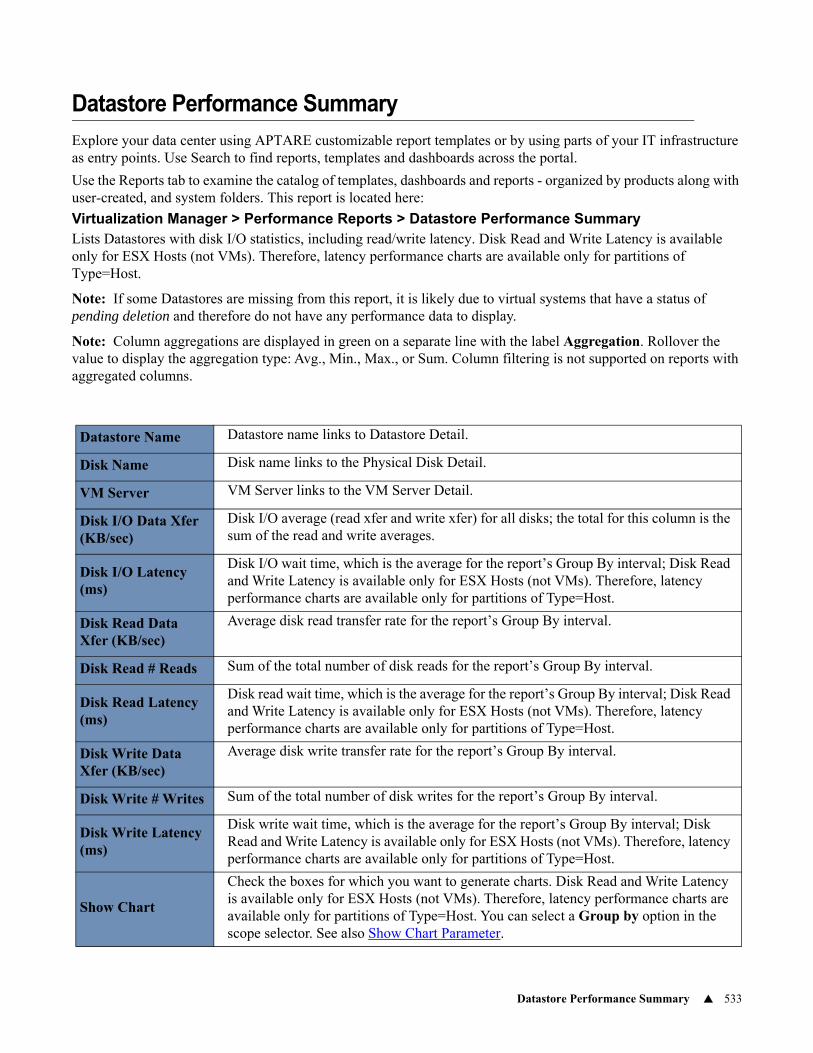
Datastore Performance Summary 533
Datastore Performance Summary
Explore your data center using APTARE customizable report templates or by using parts of your IT infrastructure as entry points. Use Search to find reports, templates and dashboards across the portal.
Use the Reports tab to examine the catalog of templates, dashboards and reports - organized by products along with user-created, and system folders. This report is located here:
Virtualization Manager > Performance Reports > Datastore Performance SummaryLists Datastores with disk I/O statistics, including read/write latency. Disk Read and Write Latency is available only for ESX Hosts (not VMs). Therefore, latency performance charts are available only for partitions of Type=Host.
Note: If some Datastores are missing from this report, it is likely due to virtual systems that have a status of pending deletion and therefore do not have any performance data to display.
Note: Column aggregations are displayed in green on a separate line with the label Aggregation. Rollover the value to display the aggregation type: Avg., Min., Max., or Sum. Column filtering is not supported on reports with aggregated columns.
Datastore Name Datastore name links to Datastore Detail.
Disk Name Disk name links to the Physical Disk Detail.
VM Server VM Server links to the VM Server Detail.
Disk I/O Data Xfer (KB/sec)
Disk I/O average (read xfer and write xfer) for all disks; the total for this column is the sum of the read and write averages.
Disk I/O Latency (ms)
Disk I/O wait time, which is the average for the report’s Group By interval; Disk Read and Write Latency is available only for ESX Hosts (not VMs). Therefore, latency performance charts are available only for partitions of Type=Host.
Disk Read Data Xfer (KB/sec)
Average disk read transfer rate for the report’s Group By interval.
Disk Read # Reads Sum of the total number of disk reads for the report’s Group By interval.
Disk Read Latency (ms)
Disk read wait time, which is the average for the report’s Group By interval; Disk Read and Write Latency is available only for ESX Hosts (not VMs). Therefore, latency performance charts are available only for partitions of Type=Host.
Disk Write Data Xfer (KB/sec)
Average disk write transfer rate for the report’s Group By interval.
Disk Write # Writes Sum of the total number of disk writes for the report’s Group By interval.
Disk Write Latency (ms)
Disk write wait time, which is the average for the report’s Group By interval; Disk Read and Write Latency is available only for ESX Hosts (not VMs). Therefore, latency performance charts are available only for partitions of Type=Host.
Show Chart
Check the boxes for which you want to generate charts. Disk Read and Write Latency is available only for ESX Hosts (not VMs). Therefore, latency performance charts are available only for partitions of Type=Host. You can select a Group by option in the scope selector. See also Show Chart Parameter.

Datastore Performance Summary 534
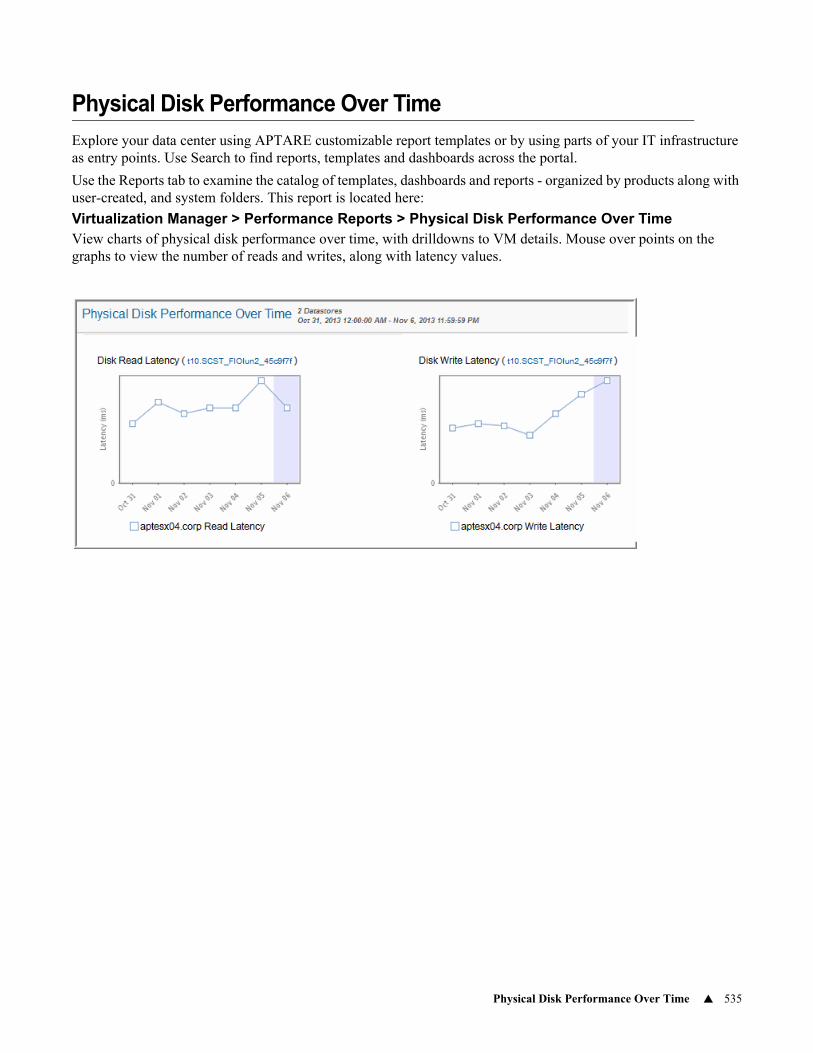
Physical Disk Performance Over Time 535
Physical Disk Performance Over Time
Explore your data center using APTARE customizable report templates or by using parts of your IT infrastructure as entry points. Use Search to find reports, templates and dashboards across the portal.
Use the Reports tab to examine the catalog of templates, dashboards and reports - organized by products along with user-created, and system folders. This report is located here:
Virtualization Manager > Performance Reports > Physical Disk Performance Over TimeView charts of physical disk performance over time, with drilldowns to VM details. Mouse over points on the graphs to view the number of reads and writes, along with latency values.
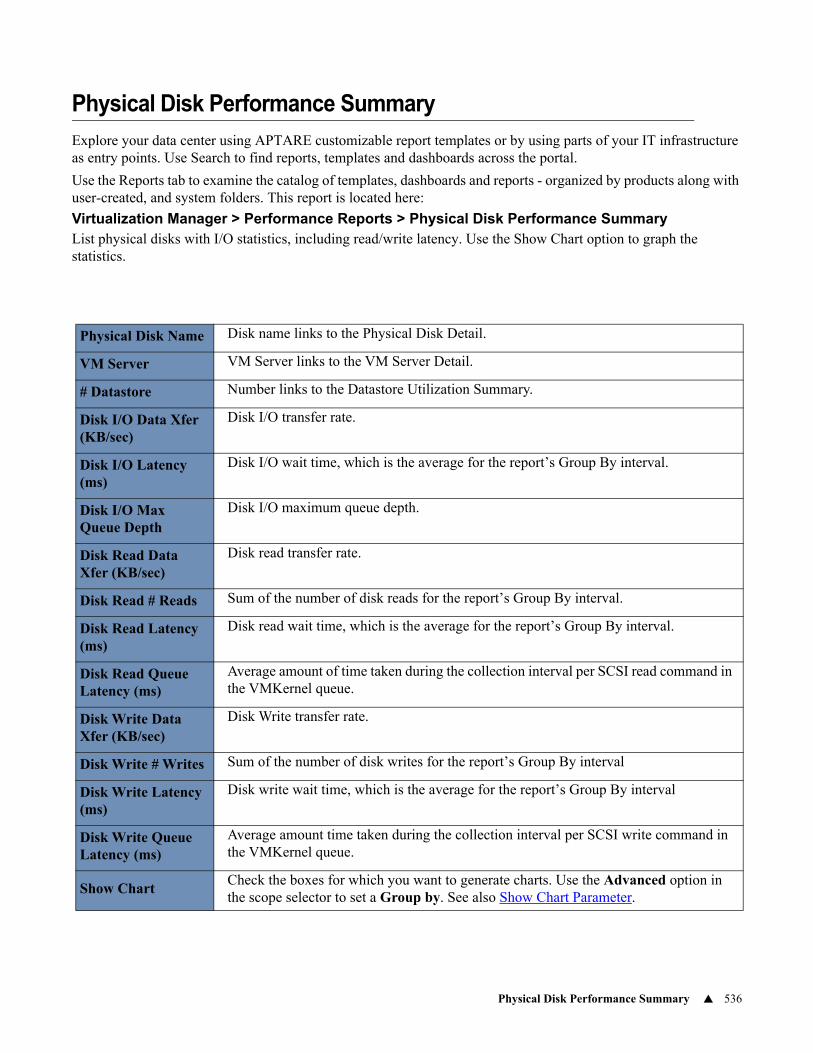
Physical Disk Performance Summary 536
Physical Disk Performance Summary
Explore your data center using APTARE customizable report templates or by using parts of your IT infrastructure as entry points. Use Search to find reports, templates and dashboards across the portal.
Use the Reports tab to examine the catalog of templates, dashboards and reports - organized by products along with user-created, and system folders. This report is located here:
Virtualization Manager > Performance Reports > Physical Disk Performance SummaryList physical disks with I/O statistics, including read/write latency. Use the Show Chart option to graph the statistics.
Physical Disk Name Disk name links to the Physical Disk Detail.
VM Server VM Server links to the VM Server Detail.
# Datastore Number links to the Datastore Utilization Summary.
Disk I/O Data Xfer (KB/sec)
Disk I/O transfer rate.
Disk I/O Latency (ms)
Disk I/O wait time, which is the average for the report’s Group By interval.
Disk I/O Max Queue Depth
Disk I/O maximum queue depth.
Disk Read Data Xfer (KB/sec)
Disk read transfer rate.
Disk Read # Reads Sum of the number of disk reads for the report’s Group By interval.
Disk Read Latency (ms)
Disk read wait time, which is the average for the report’s Group By interval.
Disk Read Queue Latency (ms)
Average amount of time taken during the collection interval per SCSI read command in the VMKernel queue.
Disk Write Data Xfer (KB/sec)
Disk Write transfer rate.
Disk Write # Writes Sum of the number of disk writes for the report’s Group By interval
Disk Write Latency (ms)
Disk write wait time, which is the average for the report’s Group By interval
Disk Write Queue Latency (ms)
Average amount time taken during the collection interval per SCSI write command in the VMKernel queue.
Show ChartCheck the boxes for which you want to generate charts. Use the Advanced option in the scope selector to set a Group by. See also Show Chart Parameter.
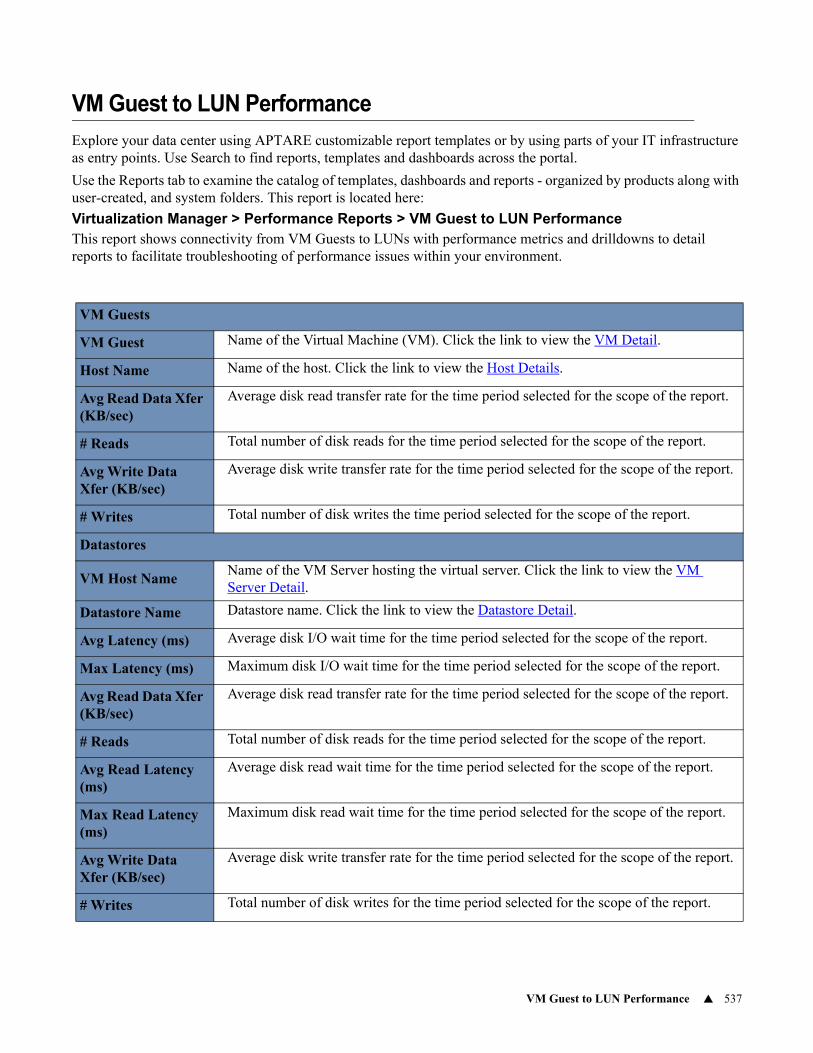
VM Guest to LUN Performance 537
VM Guest to LUN Performance
Explore your data center using APTARE customizable report templates or by using parts of your IT infrastructure as entry points. Use Search to find reports, templates and dashboards across the portal.
Use the Reports tab to examine the catalog of templates, dashboards and reports - organized by products along with user-created, and system folders. This report is located here:
Virtualization Manager > Performance Reports > VM Guest to LUN PerformanceThis report shows connectivity from VM Guests to LUNs with performance metrics and drilldowns to detail reports to facilitate troubleshooting of performance issues within your environment.
VM Guests
VM Guest Name of the Virtual Machine (VM). Click the link to view the VM Detail.
Host Name Name of the host. Click the link to view the Host Details.
Avg Read Data Xfer (KB/sec)
Average disk read transfer rate for the time period selected for the scope of the report.
# Reads Total number of disk reads for the time period selected for the scope of the report.
Avg Write Data Xfer (KB/sec)
Average disk write transfer rate for the time period selected for the scope of the report.
# Writes Total number of disk writes the time period selected for the scope of the report.
Datastores
VM Host NameName of the VM Server hosting the virtual server. Click the link to view the VM Server Detail.
Datastore Name Datastore name. Click the link to view the Datastore Detail.
Avg Latency (ms) Average disk I/O wait time for the time period selected for the scope of the report.
Max Latency (ms) Maximum disk I/O wait time for the time period selected for the scope of the report.
Avg Read Data Xfer (KB/sec)
Average disk read transfer rate for the time period selected for the scope of the report.
# Reads Total number of disk reads for the time period selected for the scope of the report.
Avg Read Latency (ms)
Average disk read wait time for the time period selected for the scope of the report.
Max Read Latency (ms)
Maximum disk read wait time for the time period selected for the scope of the report.
Avg Write Data Xfer (KB/sec)
Average disk write transfer rate for the time period selected for the scope of the report.
# Writes Total number of disk writes for the time period selected for the scope of the report.
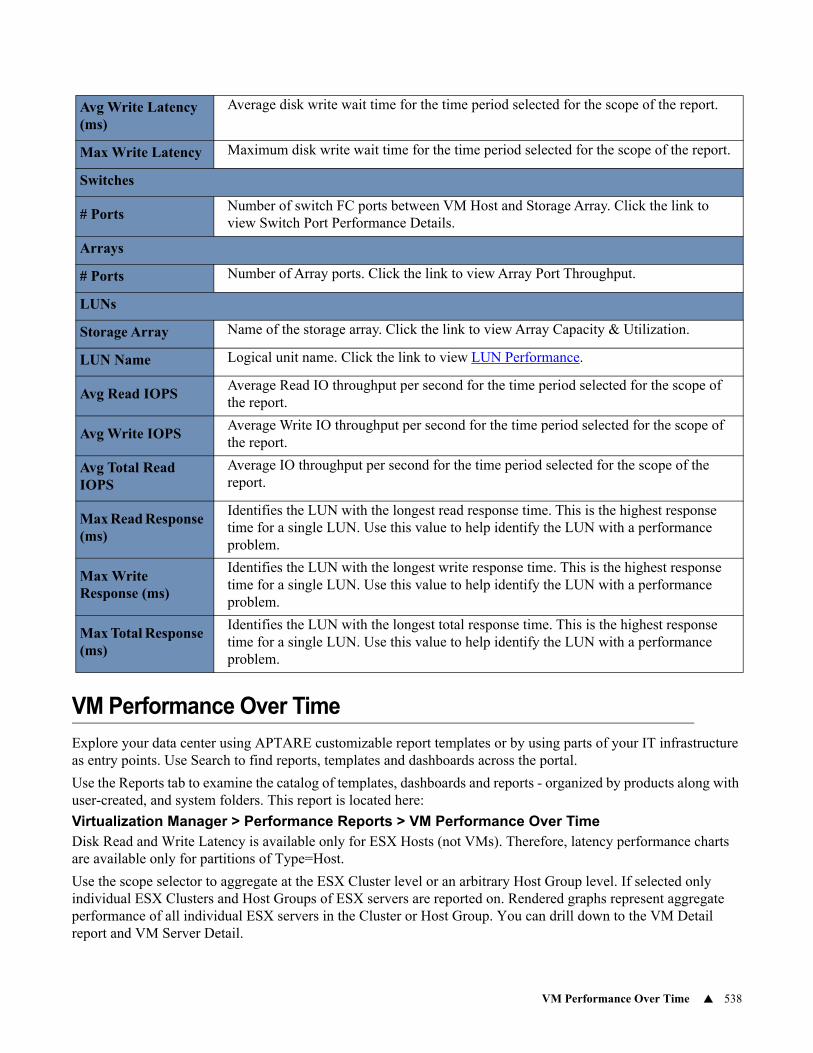
VM Performance Over Time 538
VM Performance Over Time
Explore your data center using APTARE customizable report templates or by using parts of your IT infrastructure as entry points. Use Search to find reports, templates and dashboards across the portal.
Use the Reports tab to examine the catalog of templates, dashboards and reports - organized by products along with user-created, and system folders. This report is located here:
Virtualization Manager > Performance Reports > VM Performance Over TimeDisk Read and Write Latency is available only for ESX Hosts (not VMs). Therefore, latency performance charts are available only for partitions of Type=Host.
Use the scope selector to aggregate at the ESX Cluster level or an arbitrary Host Group level. If selected only individual ESX Clusters and Host Groups of ESX servers are reported on. Rendered graphs represent aggregate performance of all individual ESX servers in the Cluster or Host Group. You can drill down to the VM Detail report and VM Server Detail.
Avg Write Latency (ms)
Average disk write wait time for the time period selected for the scope of the report.
Max Write Latency Maximum disk write wait time for the time period selected for the scope of the report.
Switches
# PortsNumber of switch FC ports between VM Host and Storage Array. Click the link to view Switch Port Performance Details.
Arrays
# Ports Number of Array ports. Click the link to view Array Port Throughput.
LUNs
Storage Array Name of the storage array. Click the link to view Array Capacity & Utilization.
LUN Name Logical unit name. Click the link to view LUN Performance.
Avg Read IOPSAverage Read IO throughput per second for the time period selected for the scope of the report.
Avg Write IOPSAverage Write IO throughput per second for the time period selected for the scope of the report.
Avg Total Read IOPS
Average IO throughput per second for the time period selected for the scope of the report.
Max Read Response (ms)
Identifies the LUN with the longest read response time. This is the highest response time for a single LUN. Use this value to help identify the LUN with a performance problem.
Max Write Response (ms)
Identifies the LUN with the longest write response time. This is the highest response time for a single LUN. Use this value to help identify the LUN with a performance problem.
Max Total Response (ms)
Identifies the LUN with the longest total response time. This is the highest response time for a single LUN. Use this value to help identify the LUN with a performance problem.
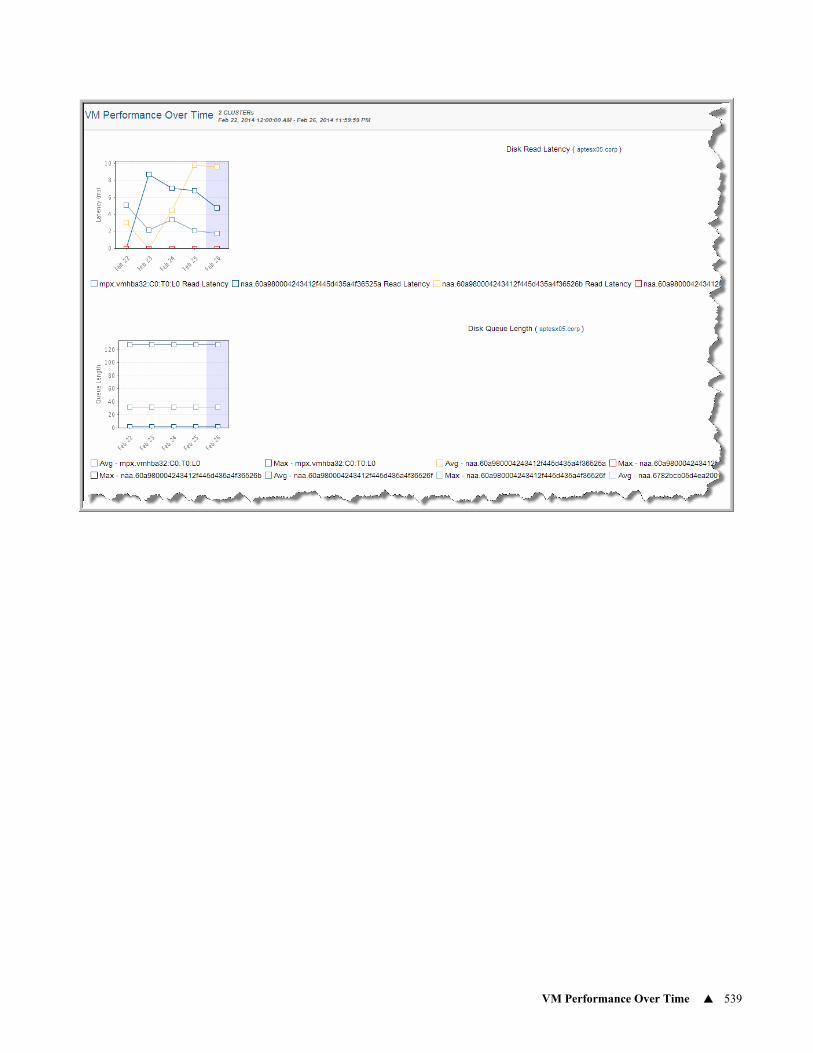
VM Performance Over Time 539
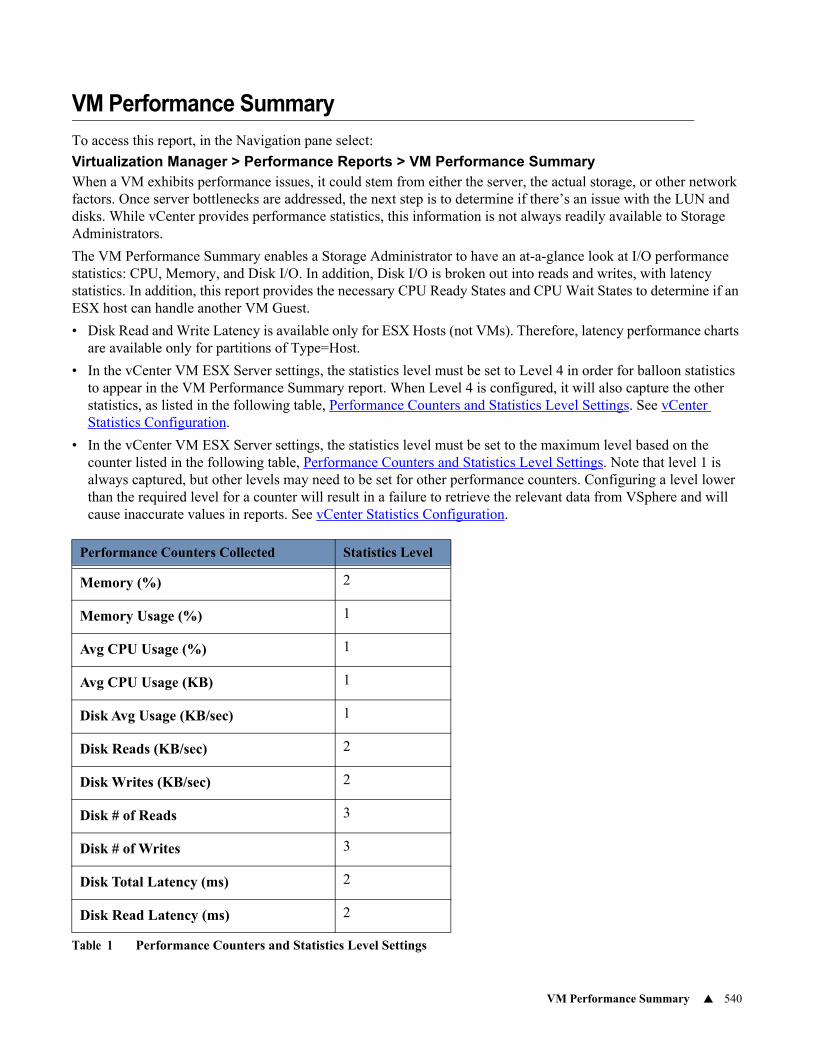
VM Performance Summary 540
VM Performance Summary
To access this report, in the Navigation pane select:
Virtualization Manager > Performance Reports > VM Performance SummaryWhen a VM exhibits performance issues, it could stem from either the server, the actual storage, or other network factors. Once server bottlenecks are addressed, the next step is to determine if there’s an issue with the LUN and disks. While vCenter provides performance statistics, this information is not always readily available to Storage Administrators.
The VM Performance Summary enables a Storage Administrator to have an at-a-glance look at I/O performance statistics: CPU, Memory, and Disk I/O. In addition, Disk I/O is broken out into reads and writes, with latency statistics. In addition, this report provides the necessary CPU Ready States and CPU Wait States to determine if an ESX host can handle another VM Guest.
• Disk Read and Write Latency is available only for ESX Hosts (not VMs). Therefore, latency performance charts are available only for partitions of Type=Host.
• In the vCenter VM ESX Server settings, the statistics level must be set to Level 4 in order for balloon statistics to appear in the VM Performance Summary report. When Level 4 is configured, it will also capture the other statistics, as listed in the following table, Performance Counters and Statistics Level Settings. See vCenter Statistics Configuration.
• In the vCenter VM ESX Server settings, the statistics level must be set to the maximum level based on the counter listed in the following table, Performance Counters and Statistics Level Settings. Note that level 1 is always captured, but other levels may need to be set for other performance counters. Configuring a level lower than the required level for a counter will result in a failure to retrieve the relevant data from VSphere and will cause inaccurate values in reports. See vCenter Statistics Configuration.
Performance Counters Collected Statistics Level
Memory (%) 2
Memory Usage (%) 1
Avg CPU Usage (%) 1
Avg CPU Usage (KB) 1
Disk Avg Usage (KB/sec) 1
Disk Reads (KB/sec) 2
Disk Writes (KB/sec) 2
Disk # of Reads 3
Disk # of Writes 3
Disk Total Latency (ms) 2
Disk Read Latency (ms) 2
Table 1 Performance Counters and Statistics Level Settings
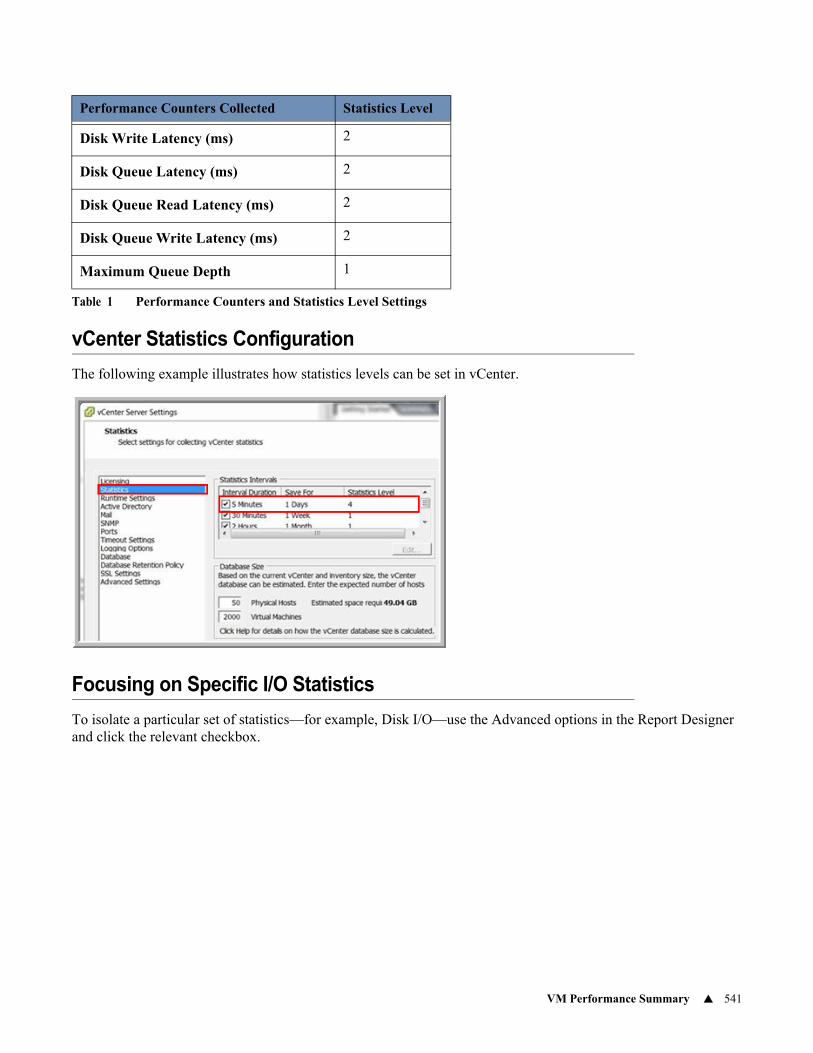
VM Performance Summary 541
vCenter Statistics Configuration
The following example illustrates how statistics levels can be set in vCenter.
Focusing on Specific I/O Statistics
To isolate a particular set of statistics—for example, Disk I/O—use the Advanced options in the Report Designer and click the relevant checkbox.
Disk Write Latency (ms) 2
Disk Queue Latency (ms) 2
Disk Queue Read Latency (ms) 2
Disk Queue Write Latency (ms) 2
Maximum Queue Depth 1
Performance Counters Collected Statistics Level
Table 1 Performance Counters and Statistics Level Settings
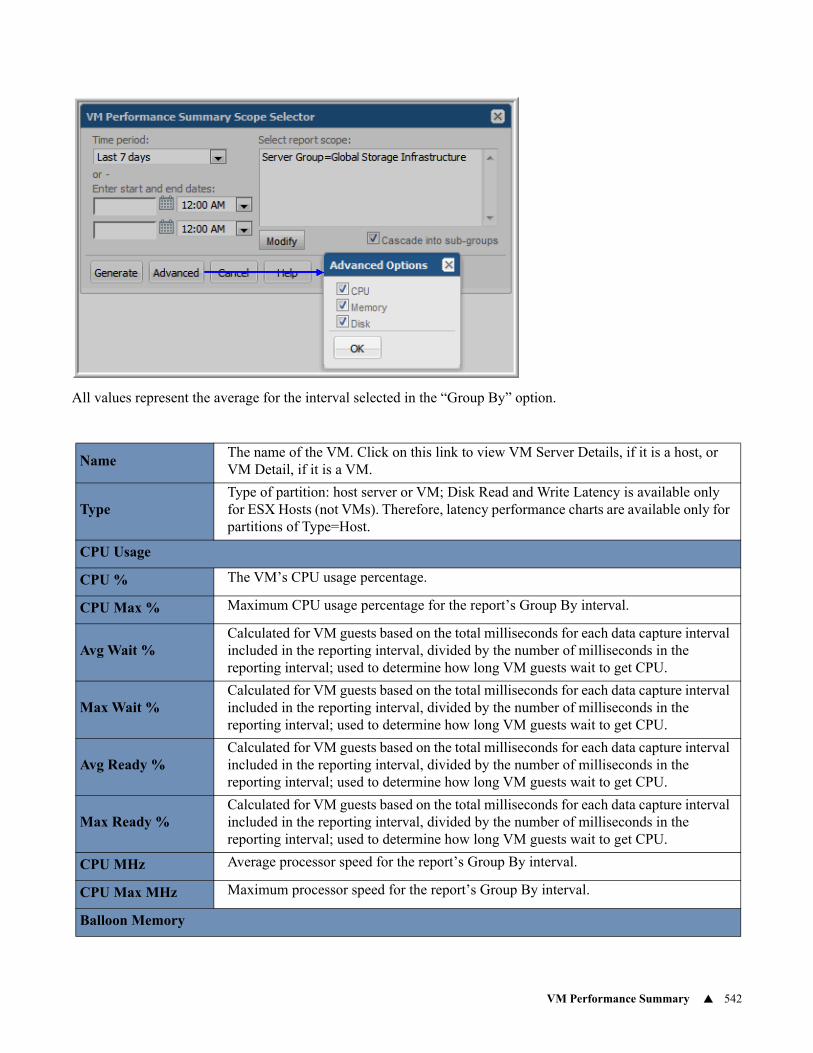
VM Performance Summary 542
All values represent the average for the interval selected in the “Group By” option.
NameThe name of the VM. Click on this link to view VM Server Details, if it is a host, or VM Detail, if it is a VM.
TypeType of partition: host server or VM; Disk Read and Write Latency is available only for ESX Hosts (not VMs). Therefore, latency performance charts are available only for partitions of Type=Host.
CPU Usage
CPU % The VM’s CPU usage percentage.
CPU Max % Maximum CPU usage percentage for the report’s Group By interval.
Avg Wait %Calculated for VM guests based on the total milliseconds for each data capture interval included in the reporting interval, divided by the number of milliseconds in the reporting interval; used to determine how long VM guests wait to get CPU.
Max Wait %Calculated for VM guests based on the total milliseconds for each data capture interval included in the reporting interval, divided by the number of milliseconds in the reporting interval; used to determine how long VM guests wait to get CPU.
Avg Ready %Calculated for VM guests based on the total milliseconds for each data capture interval included in the reporting interval, divided by the number of milliseconds in the reporting interval; used to determine how long VM guests wait to get CPU.
Max Ready %Calculated for VM guests based on the total milliseconds for each data capture interval included in the reporting interval, divided by the number of milliseconds in the reporting interval; used to determine how long VM guests wait to get CPU.
CPU MHz Average processor speed for the report’s Group By interval.
CPU Max MHz Maximum processor speed for the report’s Group By interval.
Balloon Memory
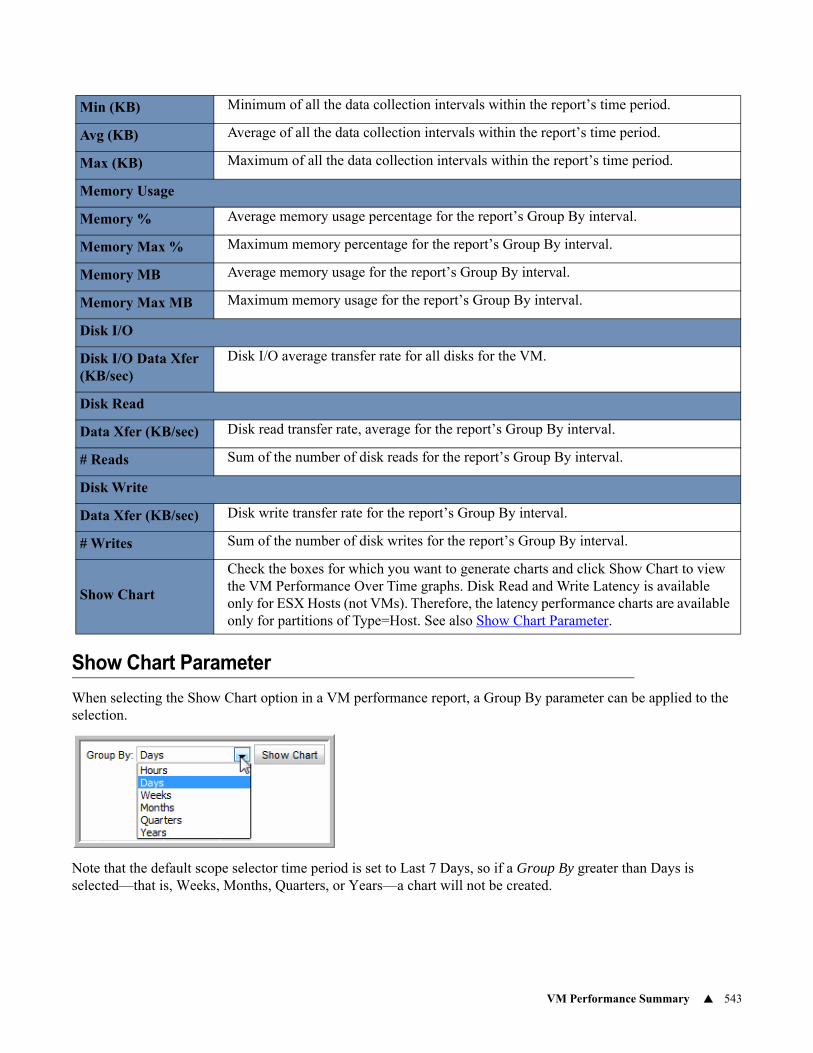
VM Performance Summary 543
Show Chart Parameter
When selecting the Show Chart option in a VM performance report, a Group By parameter can be applied to the selection.
Note that the default scope selector time period is set to Last 7 Days, so if a Group By greater than Days is selected—that is, Weeks, Months, Quarters, or Years—a chart will not be created.
Min (KB) Minimum of all the data collection intervals within the report’s time period.
Avg (KB) Average of all the data collection intervals within the report’s time period.
Max (KB) Maximum of all the data collection intervals within the report’s time period.
Memory Usage
Memory % Average memory usage percentage for the report’s Group By interval.
Memory Max % Maximum memory percentage for the report’s Group By interval.
Memory MB Average memory usage for the report’s Group By interval.
Memory Max MB Maximum memory usage for the report’s Group By interval.
Disk I/O
Disk I/O Data Xfer (KB/sec)
Disk I/O average transfer rate for all disks for the VM.
Disk Read
Data Xfer (KB/sec) Disk read transfer rate, average for the report’s Group By interval.
# Reads Sum of the number of disk reads for the report’s Group By interval.
Disk Write
Data Xfer (KB/sec) Disk write transfer rate for the report’s Group By interval.
# Writes Sum of the number of disk writes for the report’s Group By interval.
Show Chart
Check the boxes for which you want to generate charts and click Show Chart to view the VM Performance Over Time graphs. Disk Read and Write Latency is available only for ESX Hosts (not VMs). Therefore, the latency performance charts are available only for partitions of Type=Host. See also Show Chart Parameter.
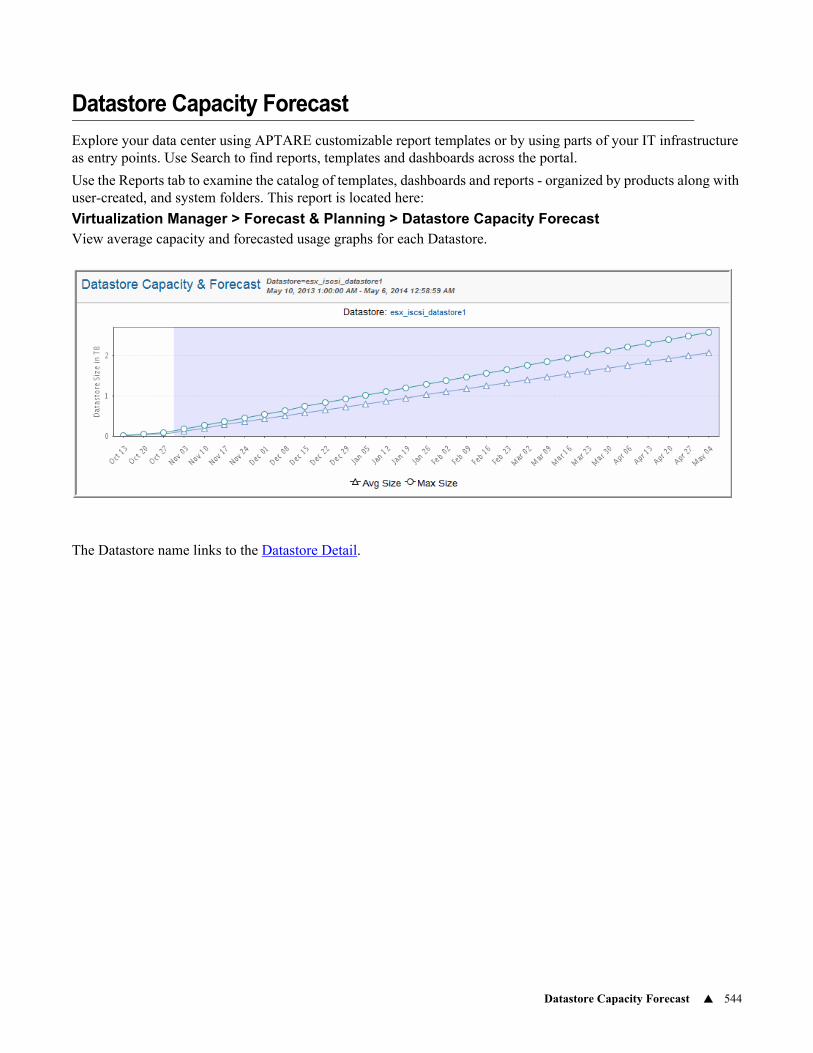
Datastore Capacity Forecast 544
Datastore Capacity Forecast
Explore your data center using APTARE customizable report templates or by using parts of your IT infrastructure as entry points. Use Search to find reports, templates and dashboards across the portal.
Use the Reports tab to examine the catalog of templates, dashboards and reports - organized by products along with user-created, and system folders. This report is located here:
Virtualization Manager > Forecast & Planning > Datastore Capacity ForecastView average capacity and forecasted usage graphs for each Datastore.
The Datastore name links to the Datastore Detail.
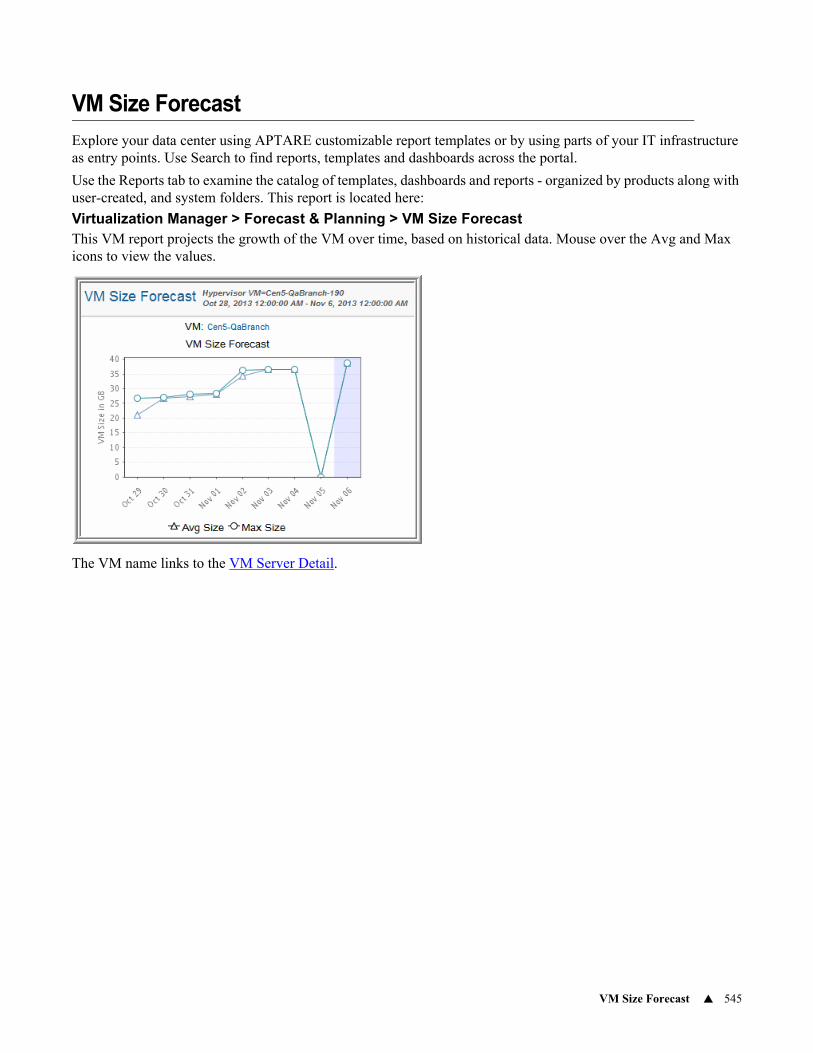
VM Size Forecast 545
VM Size Forecast
Explore your data center using APTARE customizable report templates or by using parts of your IT infrastructure as entry points. Use Search to find reports, templates and dashboards across the portal.
Use the Reports tab to examine the catalog of templates, dashboards and reports - organized by products along with user-created, and system folders. This report is located here:
Virtualization Manager > Forecast & Planning > VM Size ForecastThis VM report projects the growth of the VM over time, based on historical data. Mouse over the Avg and Max icons to view the values.
The VM name links to the VM Server Detail.
550
17Chapter 6Fabric Manager Reports
This section contains the following topics:• Host to Storage Dashboard
• Port Summary
• SAN Fabric Details
• Zone Summary
• Zone Details
• Zone Set Summary
• Zone Members
• Switch Summary
• Switch Details
• Port Summary
• Port Details
• SAN Fabric Summary
• SAN Fabric Details
• Switch Summary
• Switch Details
• Zone Summary
• Zone Details
• Zone Set Summary
• Zone Members
• Bottom Ranking
• Port Distribution
• SAN Resource Utilization
• SAN Fabric Change Status Summary
• SAN Fabric Change Summary
• Port Performance Dashboard
• Port Performance Summary
• Port Performance Details
• SAN Fabric Usage
• Port Utilization Forecast
• Port Error Rate Forecast
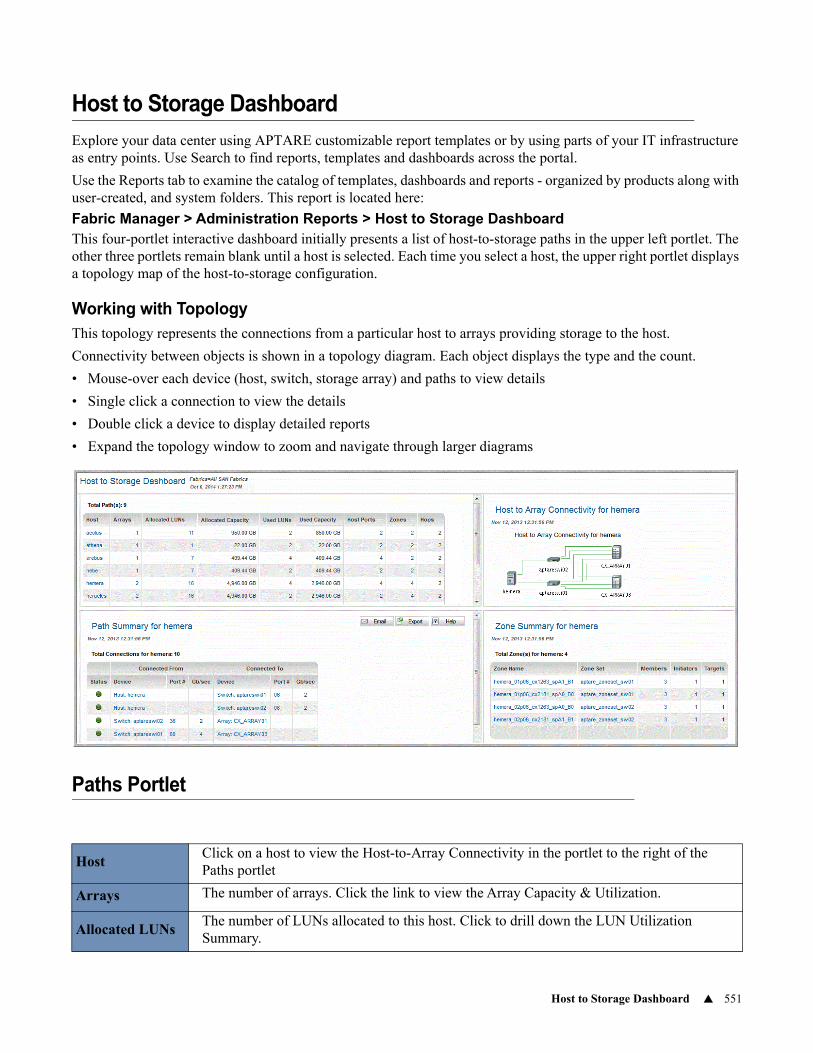
Host to Storage Dashboard 551
Host to Storage Dashboard
Explore your data center using APTARE customizable report templates or by using parts of your IT infrastructure as entry points. Use Search to find reports, templates and dashboards across the portal.
Use the Reports tab to examine the catalog of templates, dashboards and reports - organized by products along with user-created, and system folders. This report is located here:
Fabric Manager > Administration Reports > Host to Storage DashboardThis four-portlet interactive dashboard initially presents a list of host-to-storage paths in the upper left portlet. The other three portlets remain blank until a host is selected. Each time you select a host, the upper right portlet displays a topology map of the host-to-storage configuration.
Working with TopologyThis topology represents the connections from a particular host to arrays providing storage to the host.
Connectivity between objects is shown in a topology diagram. Each object displays the type and the count.
• Mouse-over each device (host, switch, storage array) and paths to view details
• Single click a connection to view the details
• Double click a device to display detailed reports
• Expand the topology window to zoom and navigate through larger diagrams
Paths Portlet
HostClick on a host to view the Host-to-Array Connectivity in the portlet to the right of the Paths portlet
Arrays The number of arrays. Click the link to view the Array Capacity & Utilization.
Allocated LUNsThe number of LUNs allocated to this host. Click to drill down the LUN Utilization Summary.
Port Summary 552
Paths in the Host to Array Connectivity Portlet
Zones in the Host to Array Connectivity Portlet
Port Summary
Allocated Capacity
The total storage capacity allocated.
Used LUNS The number of LUNs being used by this host.
Used Capacity The amount of storage capacity used by this host.
Host Ports The number of HBAs on this host.
Zones The number of zones in this host.
Hops The number of connection made by one or more ISLs between devices.
Status The status of the connection.
Connected From
Device The name of the device from which a connection is made.
Port # The unique identifier of the Port connected from. Click to link to Port Details.
Gb/Sec The port speed.
Connected To
Device The name of the device to which the connection is made.
Port #The number of the Port connected to. This is a string, not a numeric field. Click to link to Port Details.
Gb/Sec The port speed.
Zone Name The name of the zone. Click to link to Zone Details.
Zone Set The name of the zone set.
Members The number of members in each zone.
Initiators The number of initiators that send a request to the node.
Targets The number of receivers of the request.
Port Summary 553
Explore your data center using APTARE customizable report templates or by using parts of your IT infrastructure as entry points. Use Search to find reports, templates and dashboards across the portal.
Use the Reports tab to examine the catalog of templates, dashboards and reports - organized by products along with user-created, and system folders. This report is located here:
Fabric Manager > Administration Reports > Port Summary
Port
#The number of the Port in the SAN Fabric. This is a string, not a numeric field. Click the link to view the Port Details.
Status The status of the port
Switch Name The switch associated with the port. Click the link to view the Switch Details.
Gb/sec Speed of the port
Type The type of port
Licensed Indicates if the port is licensed
WWN The Worldwide name of the port
Connected to
DeviceThe device to which the port is connected. Click the link to view the Array Capacity & Utilization Report.
WWN The Worldwide name of the port to which it is connected
Alias Corresponds to the WWN of the port.
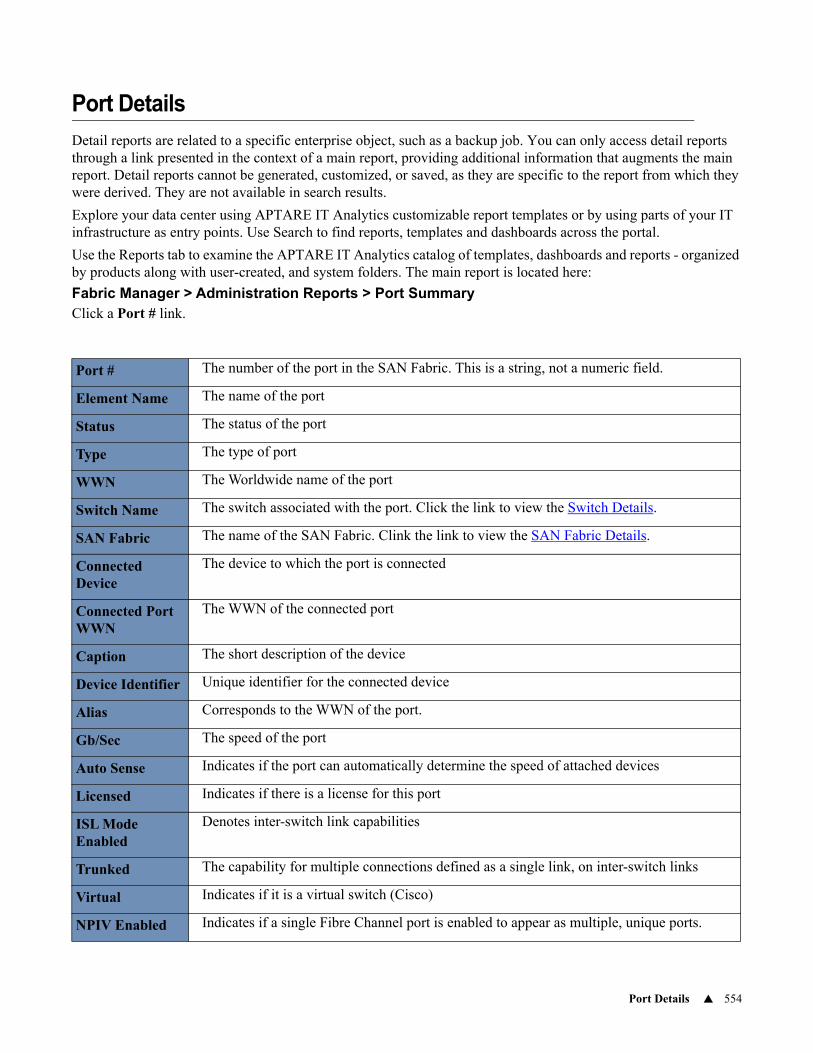
Port Details 554
Port Details
Detail reports are related to a specific enterprise object, such as a backup job. You can only access detail reports through a link presented in the context of a main report, providing additional information that augments the main report. Detail reports cannot be generated, customized, or saved, as they are specific to the report from which they were derived. They are not available in search results.
Explore your data center using APTARE IT Analytics customizable report templates or by using parts of your IT infrastructure as entry points. Use Search to find reports, templates and dashboards across the portal.
Use the Reports tab to examine the APTARE IT Analytics catalog of templates, dashboards and reports - organized by products along with user-created, and system folders. The main report is located here:
Fabric Manager > Administration Reports > Port Summary Click a Port # link.
Port # The number of the port in the SAN Fabric. This is a string, not a numeric field.
Element Name The name of the port
Status The status of the port
Type The type of port
WWN The Worldwide name of the port
Switch Name The switch associated with the port. Click the link to view the Switch Details.
SAN Fabric The name of the SAN Fabric. Clink the link to view the SAN Fabric Details.
Connected Device
The device to which the port is connected
Connected Port WWN
The WWN of the connected port
Caption The short description of the device
Device Identifier Unique identifier for the connected device
Alias Corresponds to the WWN of the port.
Gb/Sec The speed of the port
Auto Sense Indicates if the port can automatically determine the speed of attached devices
Licensed Indicates if there is a license for this port
ISL Mode Enabled
Denotes inter-switch link capabilities
Trunked The capability for multiple connections defined as a single link, on inter-switch links
Virtual Indicates if it is a virtual switch (Cisco)
NPIV Enabled Indicates if a single Fibre Channel port is enabled to appear as multiple, unique ports.
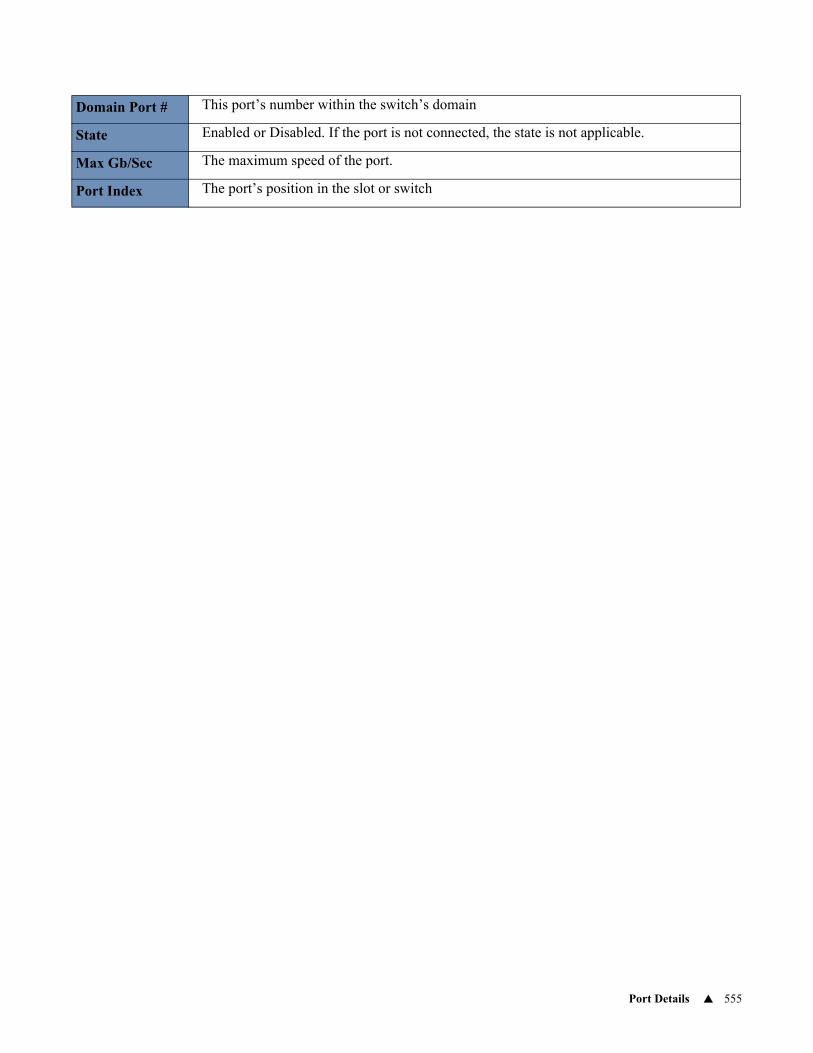
Port Details 555
Domain Port # This port’s number within the switch’s domain
State Enabled or Disabled. If the port is not connected, the state is not applicable.
Max Gb/Sec The maximum speed of the port.
Port Index The port’s position in the slot or switch
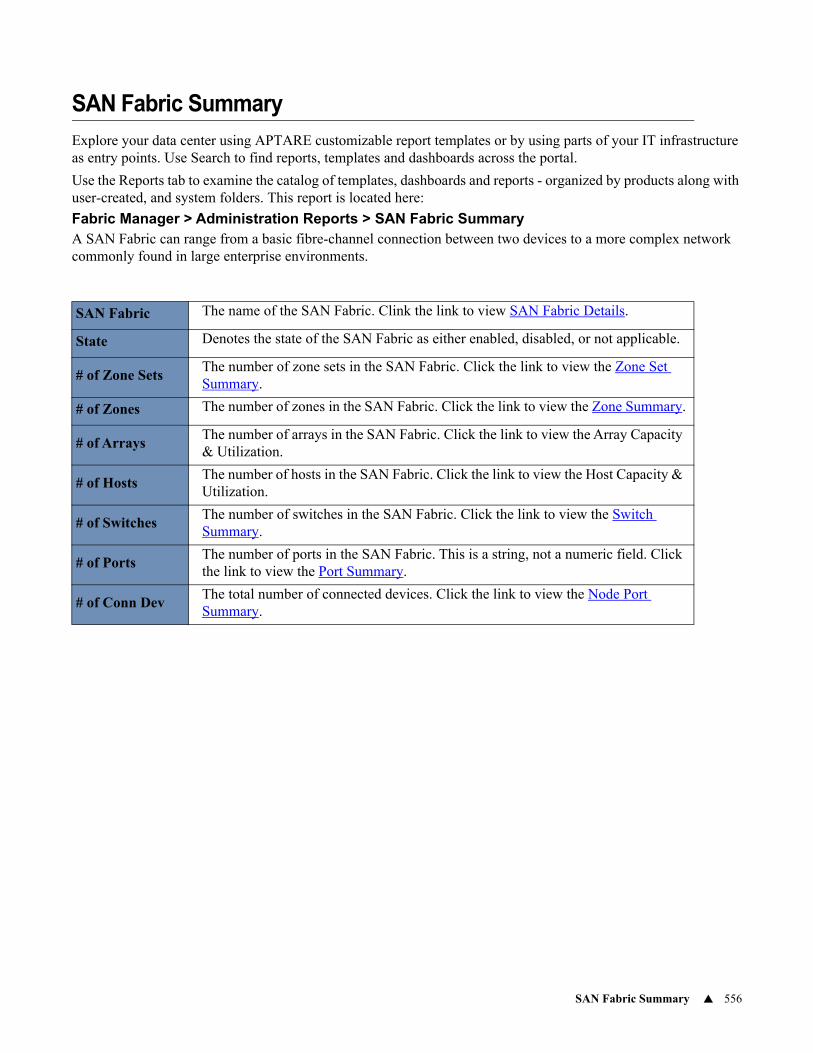
SAN Fabric Summary 556
SAN Fabric Summary
Explore your data center using APTARE customizable report templates or by using parts of your IT infrastructure as entry points. Use Search to find reports, templates and dashboards across the portal.
Use the Reports tab to examine the catalog of templates, dashboards and reports - organized by products along with user-created, and system folders. This report is located here:
Fabric Manager > Administration Reports > SAN Fabric SummaryA SAN Fabric can range from a basic fibre-channel connection between two devices to a more complex network commonly found in large enterprise environments.
SAN Fabric The name of the SAN Fabric. Clink the link to view SAN Fabric Details.
State Denotes the state of the SAN Fabric as either enabled, disabled, or not applicable.
# of Zone SetsThe number of zone sets in the SAN Fabric. Click the link to view the Zone Set Summary.
# of Zones The number of zones in the SAN Fabric. Click the link to view the Zone Summary.
# of ArraysThe number of arrays in the SAN Fabric. Click the link to view the Array Capacity & Utilization.
# of HostsThe number of hosts in the SAN Fabric. Click the link to view the Host Capacity & Utilization.
# of SwitchesThe number of switches in the SAN Fabric. Click the link to view the Switch Summary.
# of PortsThe number of ports in the SAN Fabric. This is a string, not a numeric field. Click the link to view the Port Summary.
# of Conn DevThe total number of connected devices. Click the link to view the Node Port Summary.
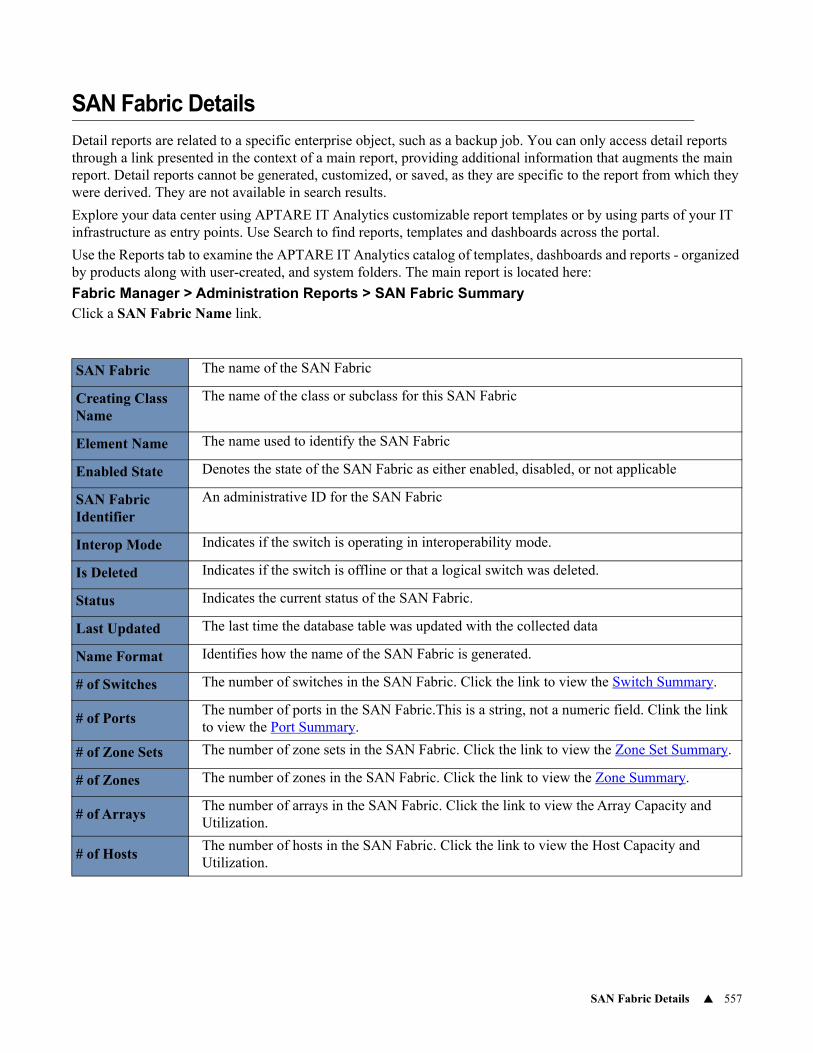
SAN Fabric Details 557
SAN Fabric Details
Detail reports are related to a specific enterprise object, such as a backup job. You can only access detail reports through a link presented in the context of a main report, providing additional information that augments the main report. Detail reports cannot be generated, customized, or saved, as they are specific to the report from which they were derived. They are not available in search results.
Explore your data center using APTARE IT Analytics customizable report templates or by using parts of your IT infrastructure as entry points. Use Search to find reports, templates and dashboards across the portal.
Use the Reports tab to examine the APTARE IT Analytics catalog of templates, dashboards and reports - organized by products along with user-created, and system folders. The main report is located here:
Fabric Manager > Administration Reports > SAN Fabric Summary Click a SAN Fabric Name link.
SAN Fabric The name of the SAN Fabric
Creating Class Name
The name of the class or subclass for this SAN Fabric
Element Name The name used to identify the SAN Fabric
Enabled State Denotes the state of the SAN Fabric as either enabled, disabled, or not applicable
SAN Fabric Identifier
An administrative ID for the SAN Fabric
Interop Mode Indicates if the switch is operating in interoperability mode.
Is Deleted Indicates if the switch is offline or that a logical switch was deleted.
Status Indicates the current status of the SAN Fabric.
Last Updated The last time the database table was updated with the collected data
Name Format Identifies how the name of the SAN Fabric is generated.
# of Switches The number of switches in the SAN Fabric. Click the link to view the Switch Summary.
# of PortsThe number of ports in the SAN Fabric.This is a string, not a numeric field. Clink the link to view the Port Summary.
# of Zone Sets The number of zone sets in the SAN Fabric. Click the link to view the Zone Set Summary.
# of Zones The number of zones in the SAN Fabric. Click the link to view the Zone Summary.
# of ArraysThe number of arrays in the SAN Fabric. Click the link to view the Array Capacity and Utilization.
# of HostsThe number of hosts in the SAN Fabric. Click the link to view the Host Capacity and Utilization.
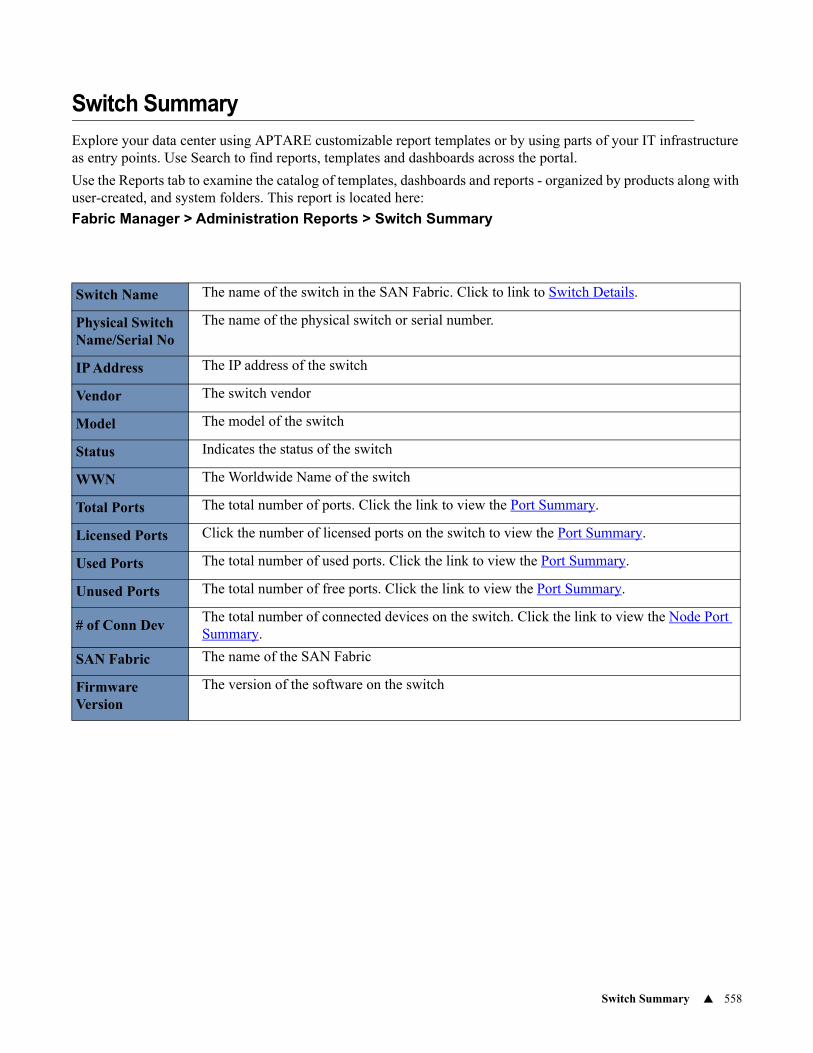
Switch Summary 558
Switch Summary
Explore your data center using APTARE customizable report templates or by using parts of your IT infrastructure as entry points. Use Search to find reports, templates and dashboards across the portal.
Use the Reports tab to examine the catalog of templates, dashboards and reports - organized by products along with user-created, and system folders. This report is located here:
Fabric Manager > Administration Reports > Switch Summary
Switch Name The name of the switch in the SAN Fabric. Click to link to Switch Details.
Physical Switch Name/Serial No
The name of the physical switch or serial number.
IP Address The IP address of the switch
Vendor The switch vendor
Model The model of the switch
Status Indicates the status of the switch
WWN The Worldwide Name of the switch
Total Ports The total number of ports. Click the link to view the Port Summary.
Licensed Ports Click the number of licensed ports on the switch to view the Port Summary.
Used Ports The total number of used ports. Click the link to view the Port Summary.
Unused Ports The total number of free ports. Click the link to view the Port Summary.
# of Conn DevThe total number of connected devices on the switch. Click the link to view the Node Port Summary.
SAN Fabric The name of the SAN Fabric
Firmware Version
The version of the software on the switch
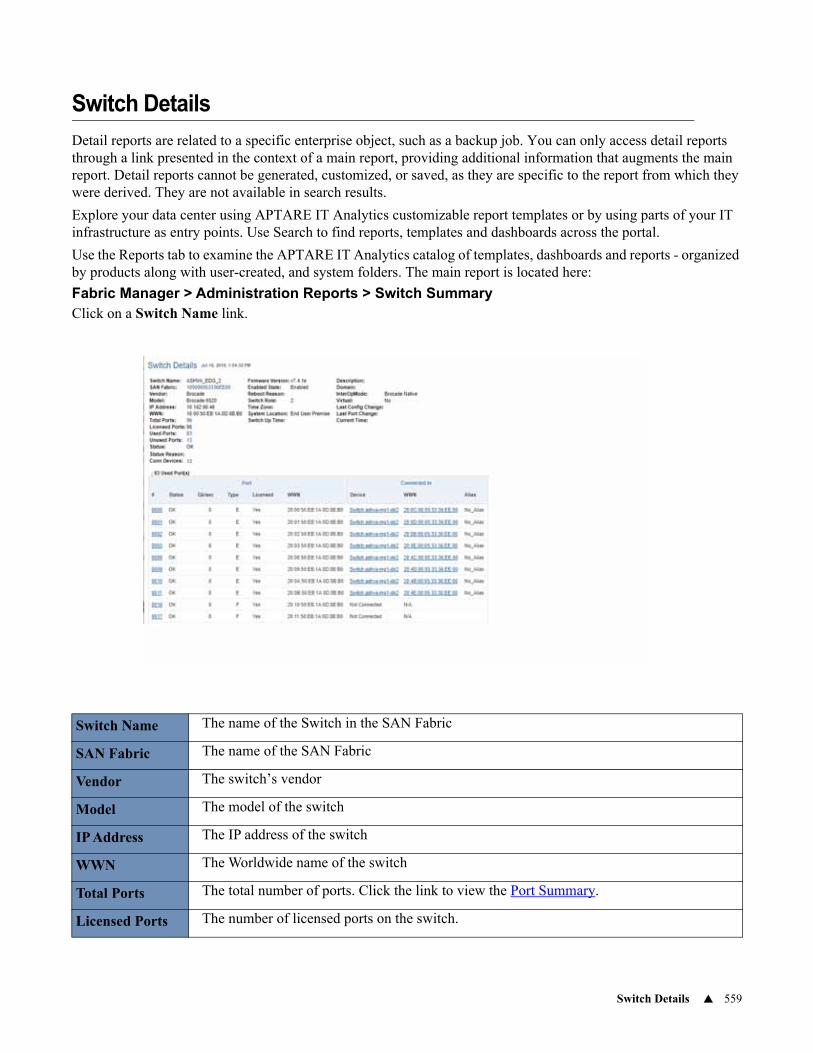
Switch Details 559
Switch Details
Detail reports are related to a specific enterprise object, such as a backup job. You can only access detail reports through a link presented in the context of a main report, providing additional information that augments the main report. Detail reports cannot be generated, customized, or saved, as they are specific to the report from which they were derived. They are not available in search results.
Explore your data center using APTARE IT Analytics customizable report templates or by using parts of your IT infrastructure as entry points. Use Search to find reports, templates and dashboards across the portal.
Use the Reports tab to examine the APTARE IT Analytics catalog of templates, dashboards and reports - organized by products along with user-created, and system folders. The main report is located here:
Fabric Manager > Administration Reports > Switch SummaryClick on a Switch Name link.
Switch Name The name of the Switch in the SAN Fabric
SAN Fabric The name of the SAN Fabric
Vendor The switch’s vendor
Model The model of the switch
IP Address The IP address of the switch
WWN The Worldwide name of the switch
Total Ports The total number of ports. Click the link to view the Port Summary.
Licensed Ports The number of licensed ports on the switch.
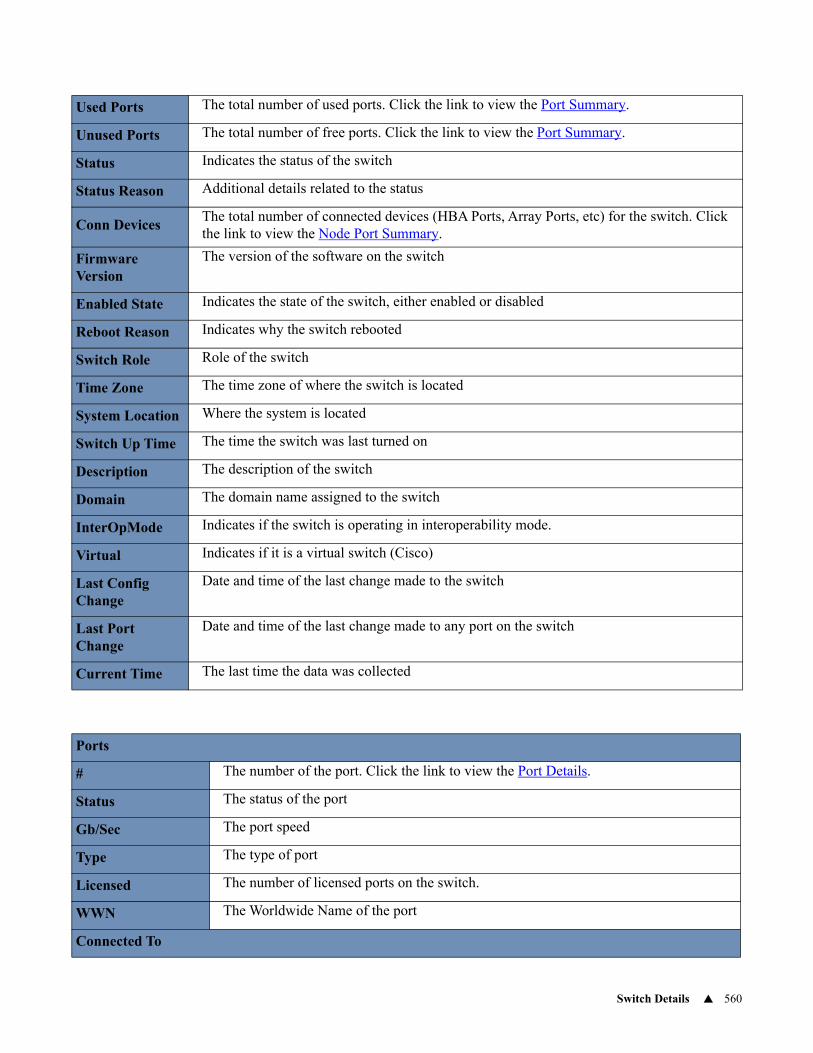
Switch Details 560
Used Ports The total number of used ports. Click the link to view the Port Summary.
Unused Ports The total number of free ports. Click the link to view the Port Summary.
Status Indicates the status of the switch
Status Reason Additional details related to the status
Conn DevicesThe total number of connected devices (HBA Ports, Array Ports, etc) for the switch. Click the link to view the Node Port Summary.
Firmware Version
The version of the software on the switch
Enabled State Indicates the state of the switch, either enabled or disabled
Reboot Reason Indicates why the switch rebooted
Switch Role Role of the switch
Time Zone The time zone of where the switch is located
System Location Where the system is located
Switch Up Time The time the switch was last turned on
Description The description of the switch
Domain The domain name assigned to the switch
InterOpMode Indicates if the switch is operating in interoperability mode.
Virtual Indicates if it is a virtual switch (Cisco)
Last Config Change
Date and time of the last change made to the switch
Last Port Change
Date and time of the last change made to any port on the switch
Current Time The last time the data was collected
Ports
# The number of the port. Click the link to view the Port Details.
Status The status of the port
Gb/Sec The port speed
Type The type of port
Licensed The number of licensed ports on the switch.
WWN The Worldwide Name of the port
Connected To
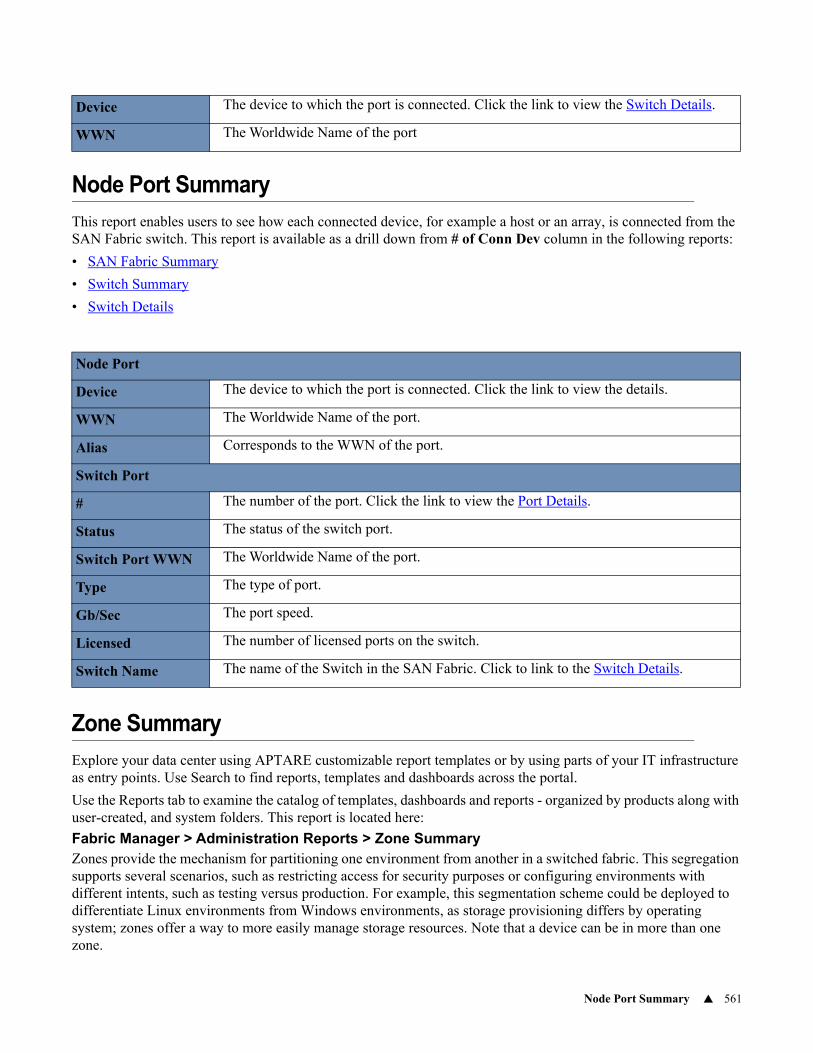
Node Port Summary 561
Node Port Summary
This report enables users to see how each connected device, for example a host or an array, is connected from the SAN Fabric switch. This report is available as a drill down from # of Conn Dev column in the following reports:
• SAN Fabric Summary
• Switch Summary
• Switch Details
Zone Summary
Explore your data center using APTARE customizable report templates or by using parts of your IT infrastructure as entry points. Use Search to find reports, templates and dashboards across the portal.
Use the Reports tab to examine the catalog of templates, dashboards and reports - organized by products along with user-created, and system folders. This report is located here:
Fabric Manager > Administration Reports > Zone SummaryZones provide the mechanism for partitioning one environment from another in a switched fabric. This segregation supports several scenarios, such as restricting access for security purposes or configuring environments with different intents, such as testing versus production. For example, this segmentation scheme could be deployed to differentiate Linux environments from Windows environments, as storage provisioning differs by operating system; zones offer a way to more easily manage storage resources. Note that a device can be in more than one zone.
Device The device to which the port is connected. Click the link to view the Switch Details.
WWN The Worldwide Name of the port
Node Port
Device The device to which the port is connected. Click the link to view the details.
WWN The Worldwide Name of the port.
Alias Corresponds to the WWN of the port.
Switch Port
# The number of the port. Click the link to view the Port Details.
Status The status of the switch port.
Switch Port WWN The Worldwide Name of the port.
Type The type of port.
Gb/Sec The port speed.
Licensed The number of licensed ports on the switch.
Switch Name The name of the Switch in the SAN Fabric. Click to link to the Switch Details.
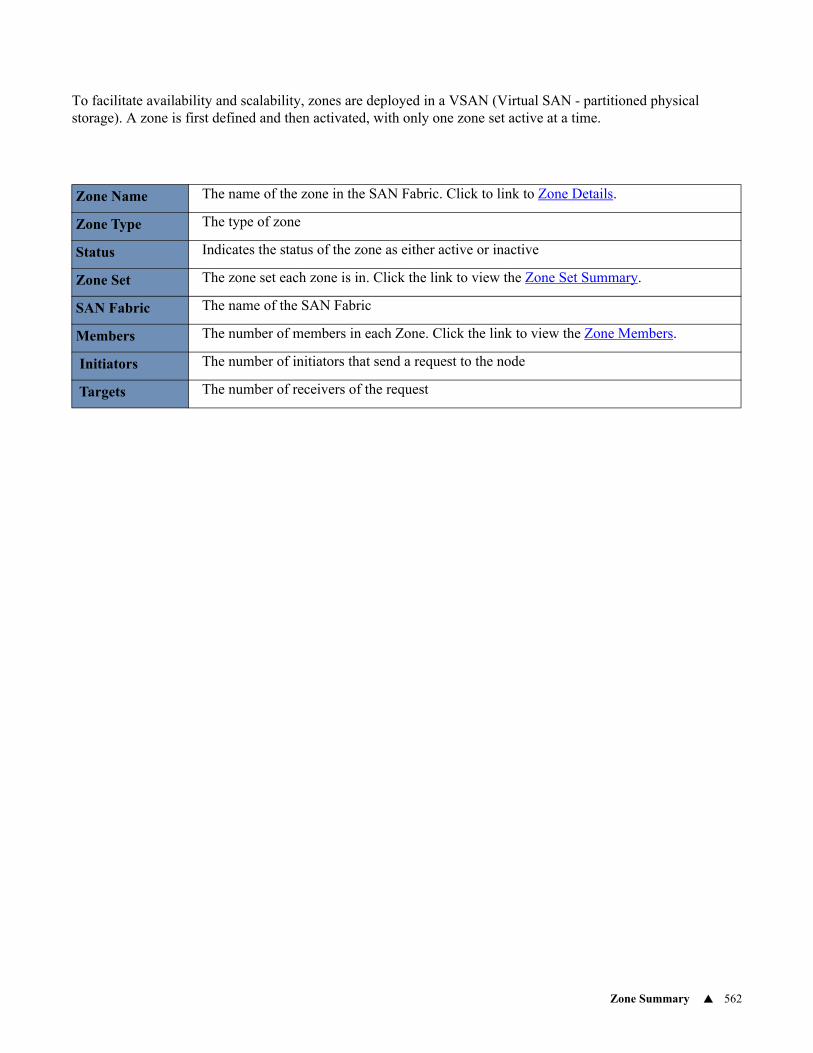
Zone Summary 562
To facilitate availability and scalability, zones are deployed in a VSAN (Virtual SAN - partitioned physical storage). A zone is first defined and then activated, with only one zone set active at a time.
Zone Name The name of the zone in the SAN Fabric. Click to link to Zone Details.
Zone Type The type of zone
Status Indicates the status of the zone as either active or inactive
Zone Set The zone set each zone is in. Click the link to view the Zone Set Summary.
SAN Fabric The name of the SAN Fabric
Members The number of members in each Zone. Click the link to view the Zone Members.
Initiators The number of initiators that send a request to the node
Targets The number of receivers of the request
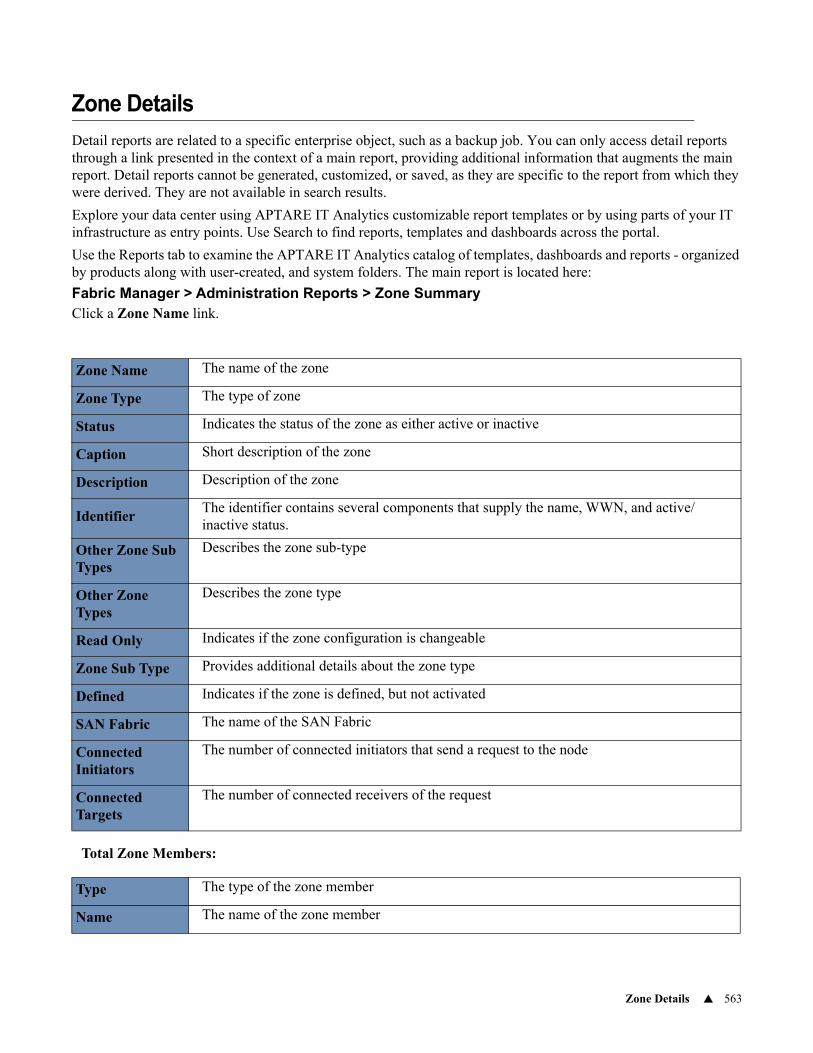
Zone Details 563
Zone Details
Detail reports are related to a specific enterprise object, such as a backup job. You can only access detail reports through a link presented in the context of a main report, providing additional information that augments the main report. Detail reports cannot be generated, customized, or saved, as they are specific to the report from which they were derived. They are not available in search results.
Explore your data center using APTARE IT Analytics customizable report templates or by using parts of your IT infrastructure as entry points. Use Search to find reports, templates and dashboards across the portal.
Use the Reports tab to examine the APTARE IT Analytics catalog of templates, dashboards and reports - organized by products along with user-created, and system folders. The main report is located here:
Fabric Manager > Administration Reports > Zone SummaryClick a Zone Name link.
Total Zone Members:
Zone Name The name of the zone
Zone Type The type of zone
Status Indicates the status of the zone as either active or inactive
Caption Short description of the zone
Description Description of the zone
IdentifierThe identifier contains several components that supply the name, WWN, and active/inactive status.
Other Zone Sub Types
Describes the zone sub-type
Other Zone Types
Describes the zone type
Read Only Indicates if the zone configuration is changeable
Zone Sub Type Provides additional details about the zone type
Defined Indicates if the zone is defined, but not activated
SAN Fabric The name of the SAN Fabric
Connected Initiators
The number of connected initiators that send a request to the node
Connected Targets
The number of connected receivers of the request
Type The type of the zone member
Name The name of the zone member
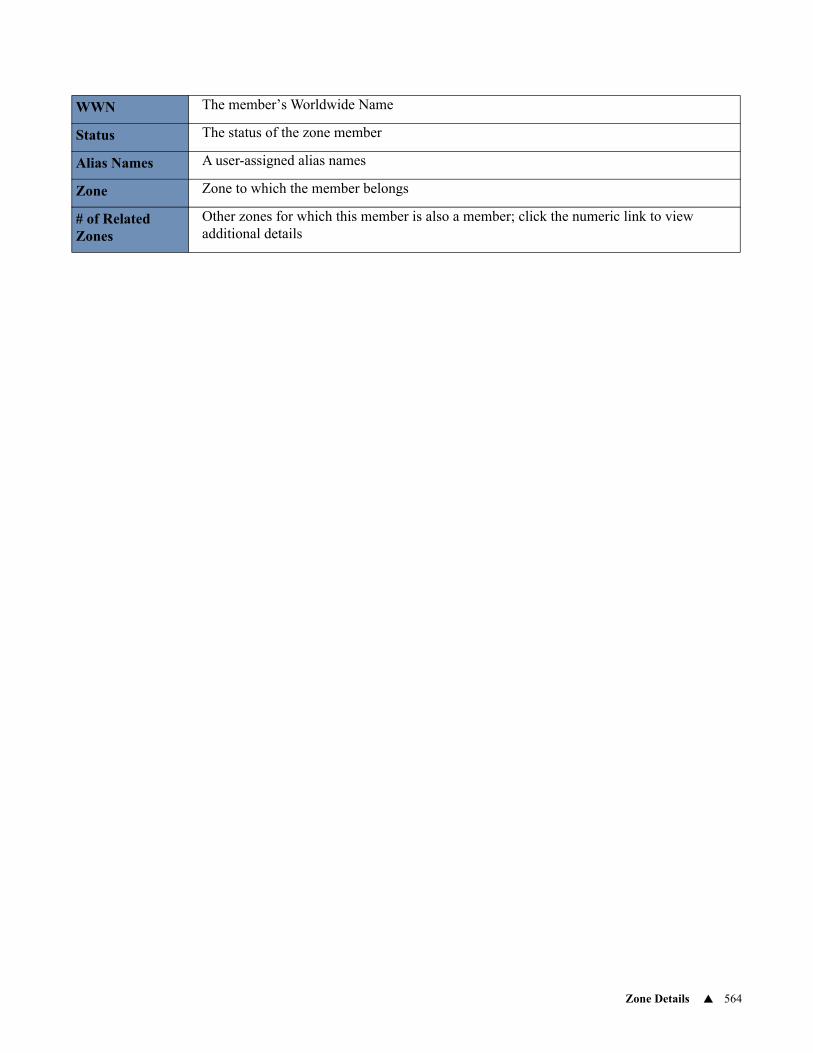
Zone Details 564
WWN The member’s Worldwide Name
Status The status of the zone member
Alias Names A user-assigned alias names
Zone Zone to which the member belongs
# of Related Zones
Other zones for which this member is also a member; click the numeric link to view additional details
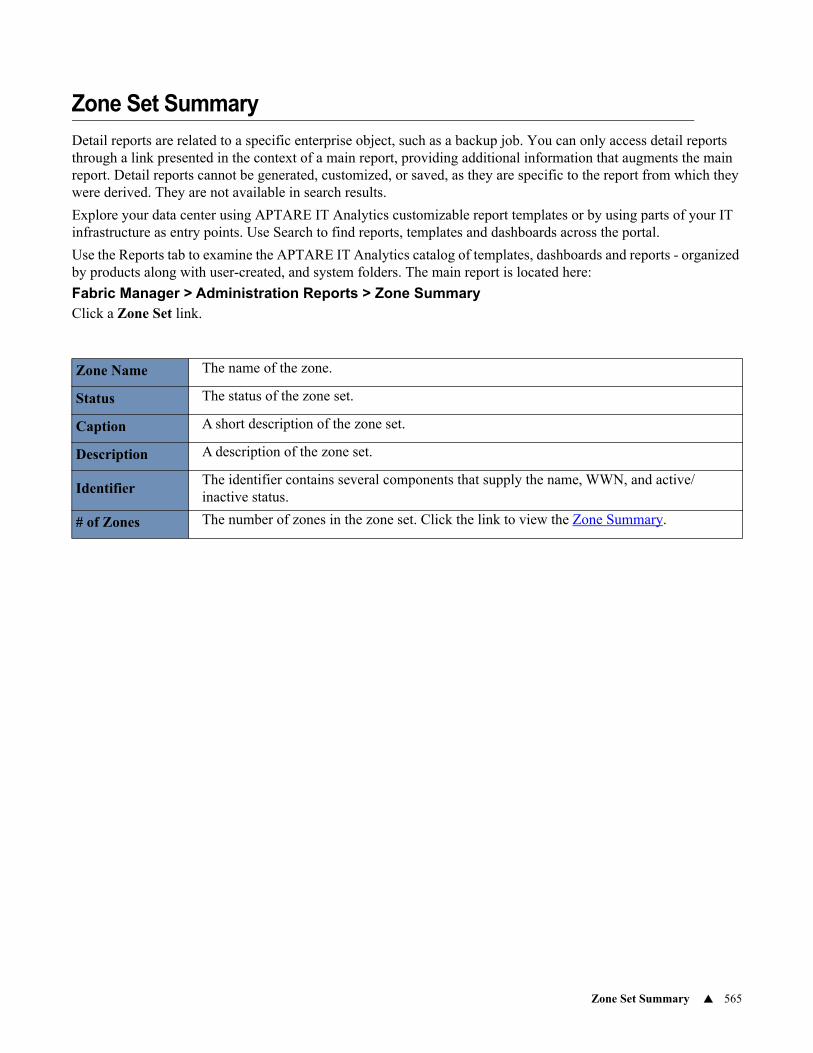
Zone Set Summary 565
Zone Set Summary
Detail reports are related to a specific enterprise object, such as a backup job. You can only access detail reports through a link presented in the context of a main report, providing additional information that augments the main report. Detail reports cannot be generated, customized, or saved, as they are specific to the report from which they were derived. They are not available in search results.
Explore your data center using APTARE IT Analytics customizable report templates or by using parts of your IT infrastructure as entry points. Use Search to find reports, templates and dashboards across the portal.
Use the Reports tab to examine the APTARE IT Analytics catalog of templates, dashboards and reports - organized by products along with user-created, and system folders. The main report is located here:
Fabric Manager > Administration Reports > Zone Summary Click a Zone Set link.
Zone Name The name of the zone.
Status The status of the zone set.
Caption A short description of the zone set.
Description A description of the zone set.
IdentifierThe identifier contains several components that supply the name, WWN, and active/inactive status.
# of Zones The number of zones in the zone set. Click the link to view the Zone Summary.
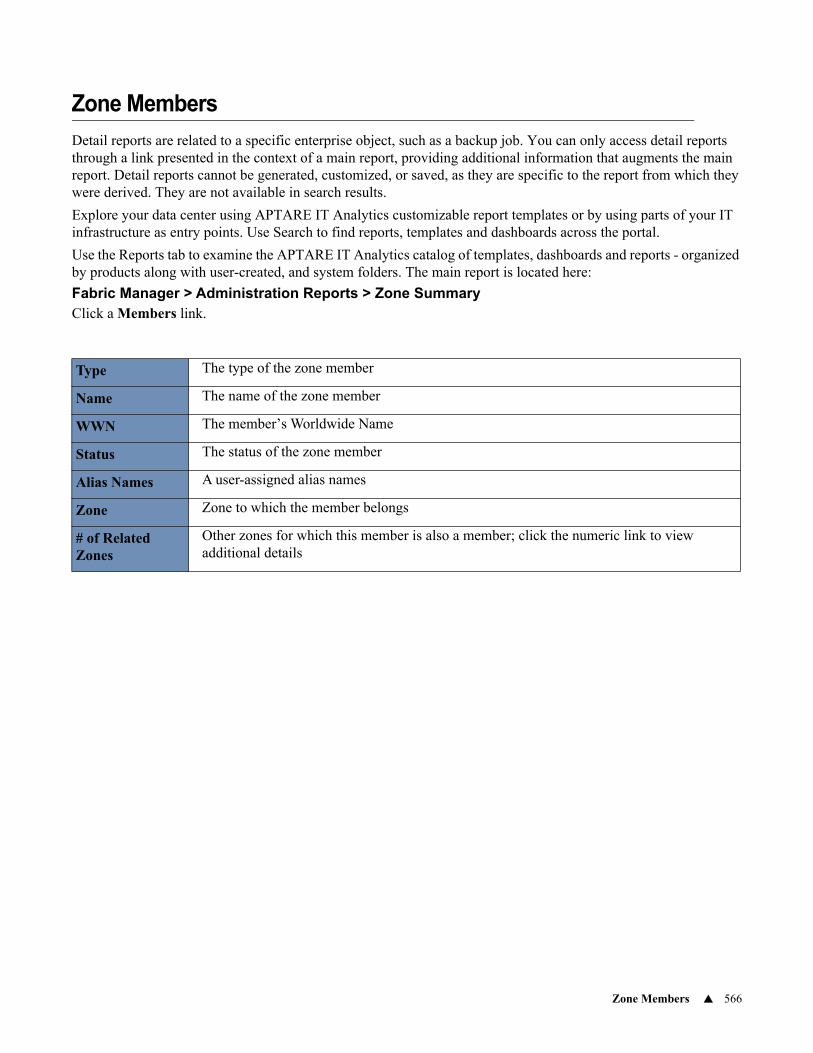
Zone Members 566
Zone Members
Detail reports are related to a specific enterprise object, such as a backup job. You can only access detail reports through a link presented in the context of a main report, providing additional information that augments the main report. Detail reports cannot be generated, customized, or saved, as they are specific to the report from which they were derived. They are not available in search results.
Explore your data center using APTARE IT Analytics customizable report templates or by using parts of your IT infrastructure as entry points. Use Search to find reports, templates and dashboards across the portal.
Use the Reports tab to examine the APTARE IT Analytics catalog of templates, dashboards and reports - organized by products along with user-created, and system folders. The main report is located here:
Fabric Manager > Administration Reports > Zone Summary Click a Members link.
Type The type of the zone member
Name The name of the zone member
WWN The member’s Worldwide Name
Status The status of the zone member
Alias Names A user-assigned alias names
Zone Zone to which the member belongs
# of Related Zones
Other zones for which this member is also a member; click the numeric link to view additional details
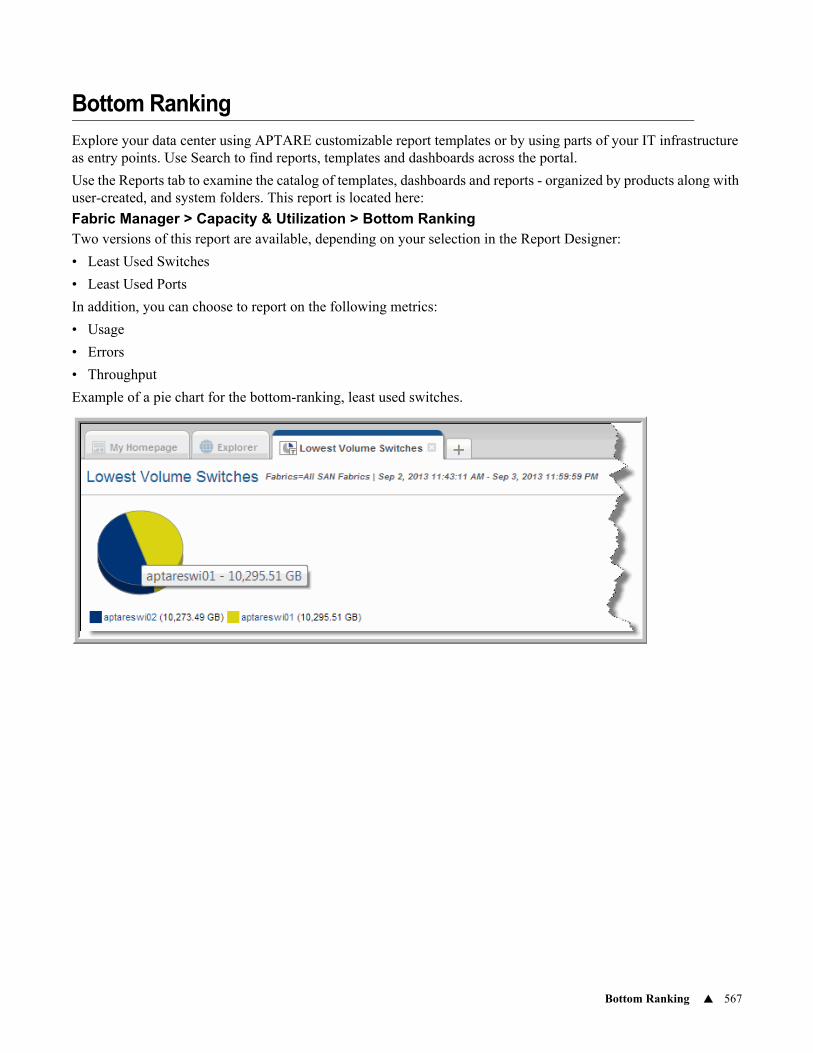
Bottom Ranking 567
Bottom Ranking
Explore your data center using APTARE customizable report templates or by using parts of your IT infrastructure as entry points. Use Search to find reports, templates and dashboards across the portal.
Use the Reports tab to examine the catalog of templates, dashboards and reports - organized by products along with user-created, and system folders. This report is located here:
Fabric Manager > Capacity & Utilization > Bottom RankingTwo versions of this report are available, depending on your selection in the Report Designer:
• Least Used Switches
• Least Used Ports
In addition, you can choose to report on the following metrics:
• Usage
• Errors
• Throughput
Example of a pie chart for the bottom-ranking, least used switches.
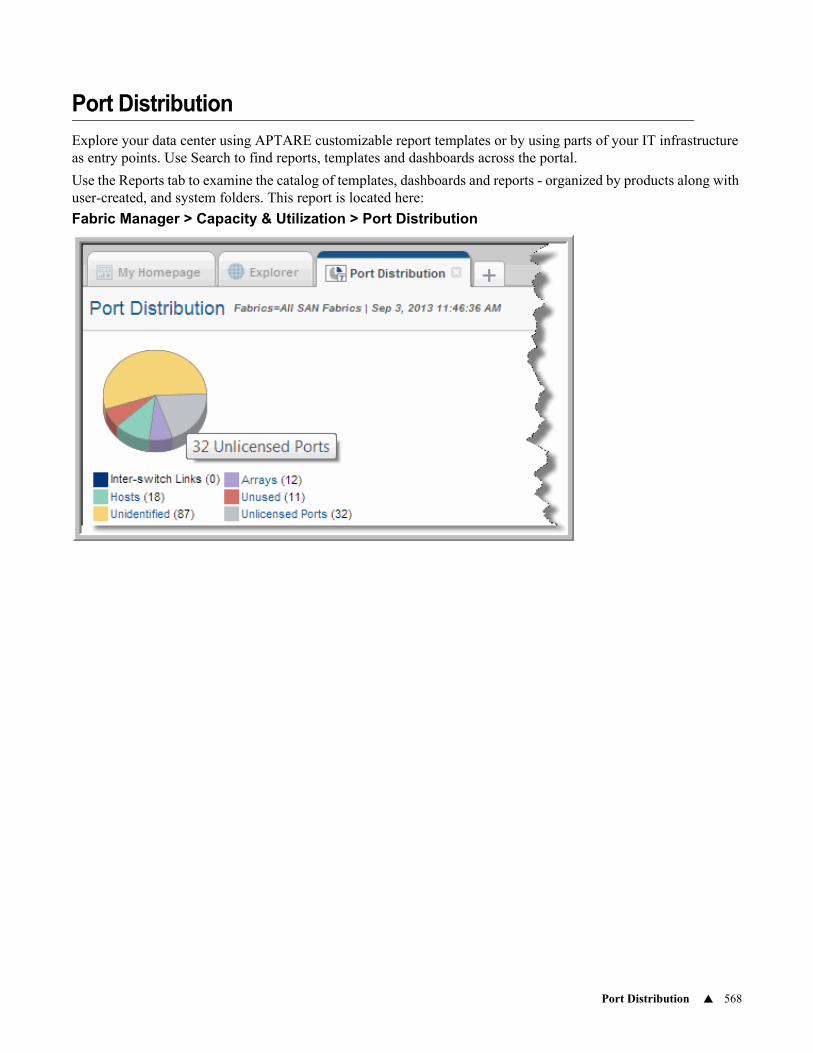
Port Distribution 568
Port Distribution
Explore your data center using APTARE customizable report templates or by using parts of your IT infrastructure as entry points. Use Search to find reports, templates and dashboards across the portal.
Use the Reports tab to examine the catalog of templates, dashboards and reports - organized by products along with user-created, and system folders. This report is located here:
Fabric Manager > Capacity & Utilization > Port Distribution
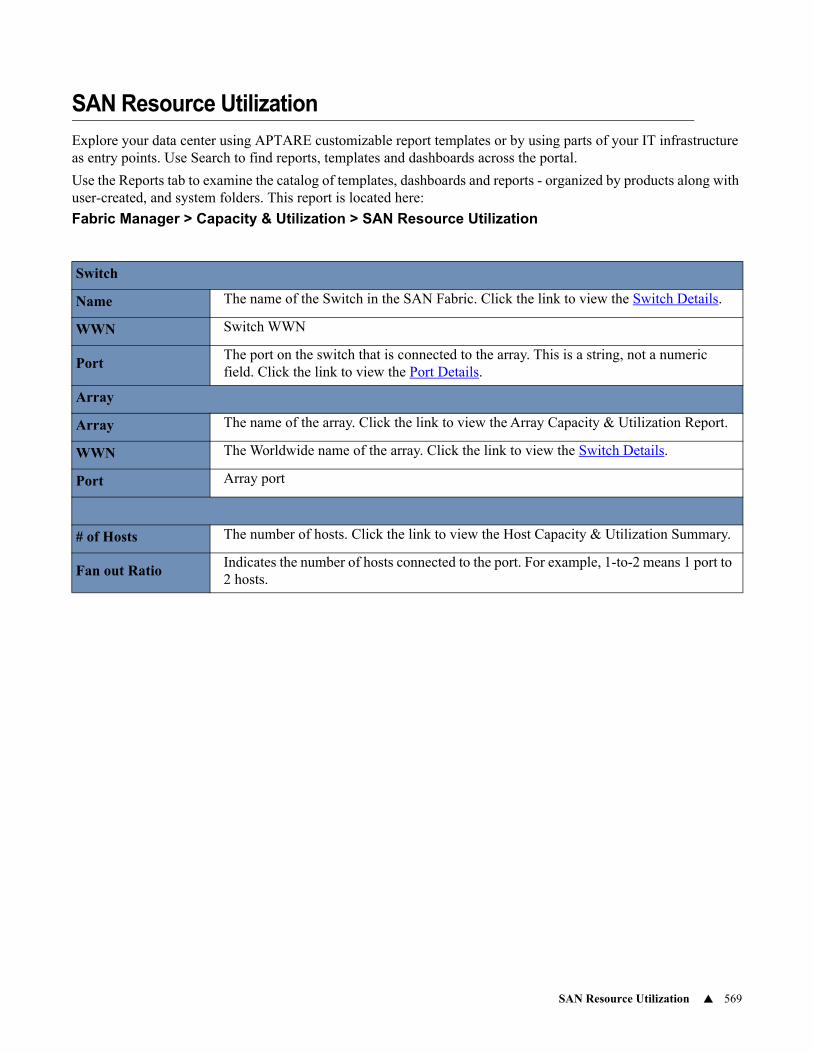
SAN Resource Utilization 569
SAN Resource Utilization
Explore your data center using APTARE customizable report templates or by using parts of your IT infrastructure as entry points. Use Search to find reports, templates and dashboards across the portal.
Use the Reports tab to examine the catalog of templates, dashboards and reports - organized by products along with user-created, and system folders. This report is located here:
Fabric Manager > Capacity & Utilization > SAN Resource Utilization
Switch
Name The name of the Switch in the SAN Fabric. Click the link to view the Switch Details.
WWN Switch WWN
PortThe port on the switch that is connected to the array. This is a string, not a numeric field. Click the link to view the Port Details.
Array
Array The name of the array. Click the link to view the Array Capacity & Utilization Report.
WWN The Worldwide name of the array. Click the link to view the Switch Details.
Port Array port
# of Hosts The number of hosts. Click the link to view the Host Capacity & Utilization Summary.
Fan out RatioIndicates the number of hosts connected to the port. For example, 1-to-2 means 1 port to 2 hosts.
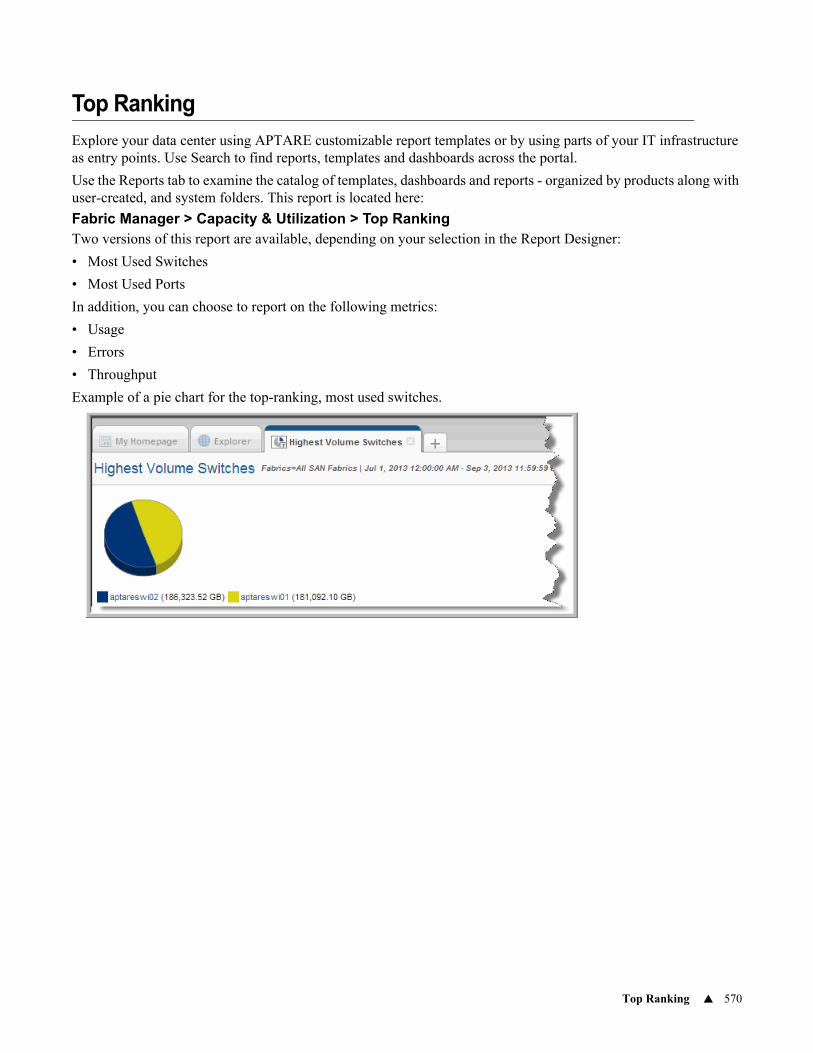
Top Ranking 570
Top Ranking
Explore your data center using APTARE customizable report templates or by using parts of your IT infrastructure as entry points. Use Search to find reports, templates and dashboards across the portal.
Use the Reports tab to examine the catalog of templates, dashboards and reports - organized by products along with user-created, and system folders. This report is located here:
Fabric Manager > Capacity & Utilization > Top RankingTwo versions of this report are available, depending on your selection in the Report Designer:
• Most Used Switches
• Most Used Ports
In addition, you can choose to report on the following metrics:
• Usage
• Errors
• Throughput
Example of a pie chart for the top-ranking, most used switches.
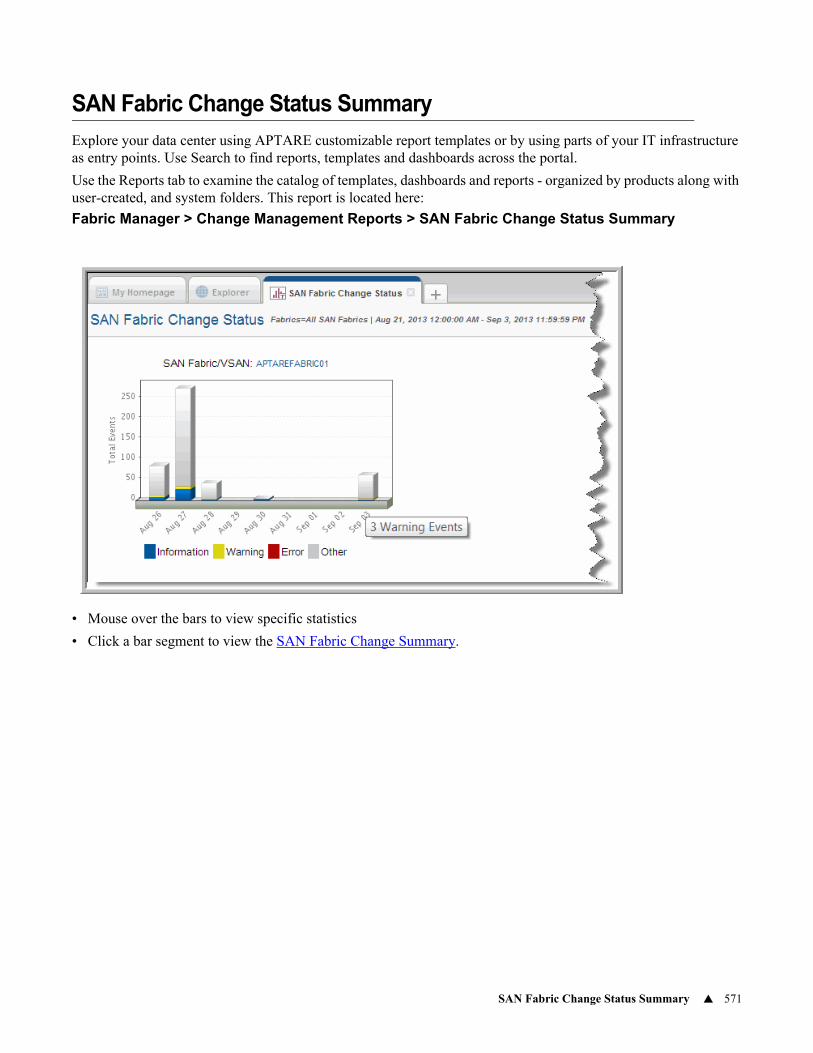
SAN Fabric Change Status Summary 571
SAN Fabric Change Status Summary
Explore your data center using APTARE customizable report templates or by using parts of your IT infrastructure as entry points. Use Search to find reports, templates and dashboards across the portal.
Use the Reports tab to examine the catalog of templates, dashboards and reports - organized by products along with user-created, and system folders. This report is located here:
Fabric Manager > Change Management Reports > SAN Fabric Change Status Summary
• Mouse over the bars to view specific statistics
• Click a bar segment to view the SAN Fabric Change Summary.
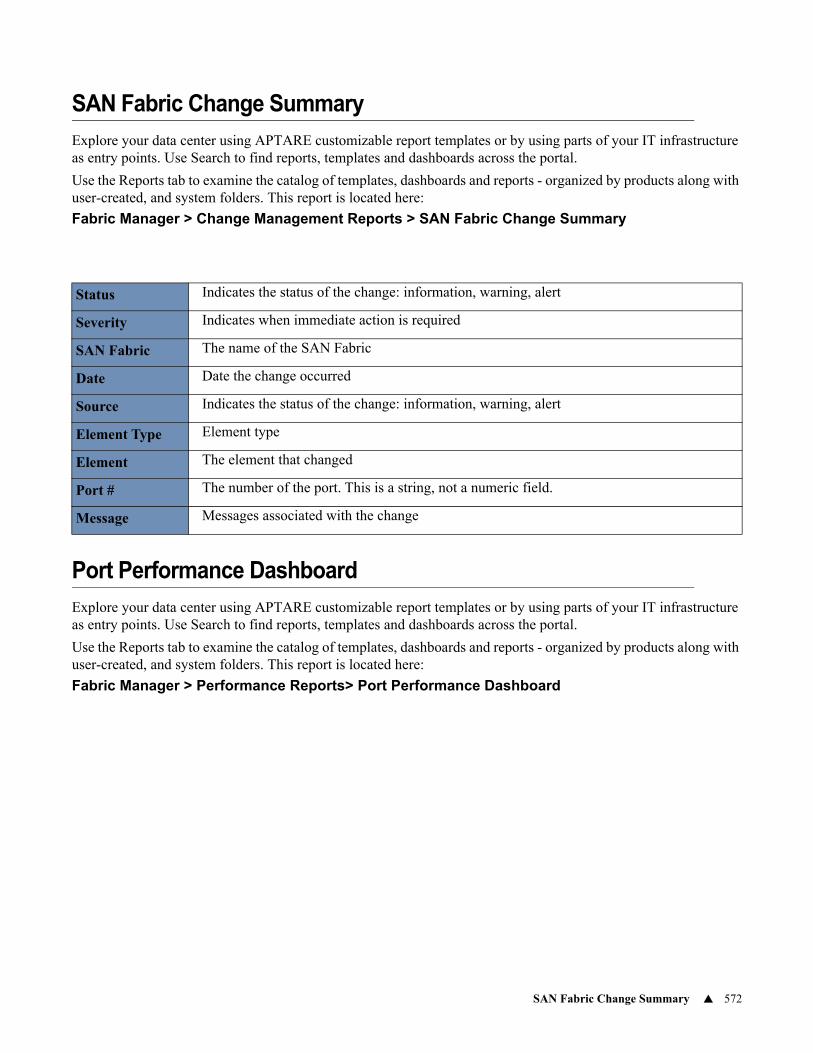
SAN Fabric Change Summary 572
SAN Fabric Change Summary
Explore your data center using APTARE customizable report templates or by using parts of your IT infrastructure as entry points. Use Search to find reports, templates and dashboards across the portal.
Use the Reports tab to examine the catalog of templates, dashboards and reports - organized by products along with user-created, and system folders. This report is located here:
Fabric Manager > Change Management Reports > SAN Fabric Change Summary
Port Performance Dashboard
Explore your data center using APTARE customizable report templates or by using parts of your IT infrastructure as entry points. Use Search to find reports, templates and dashboards across the portal.
Use the Reports tab to examine the catalog of templates, dashboards and reports - organized by products along with user-created, and system folders. This report is located here:
Fabric Manager > Performance Reports> Port Performance Dashboard
Status Indicates the status of the change: information, warning, alert
Severity Indicates when immediate action is required
SAN Fabric The name of the SAN Fabric
Date Date the change occurred
Source Indicates the status of the change: information, warning, alert
Element Type Element type
Element The element that changed
Port # The number of the port. This is a string, not a numeric field.
Message Messages associated with the change
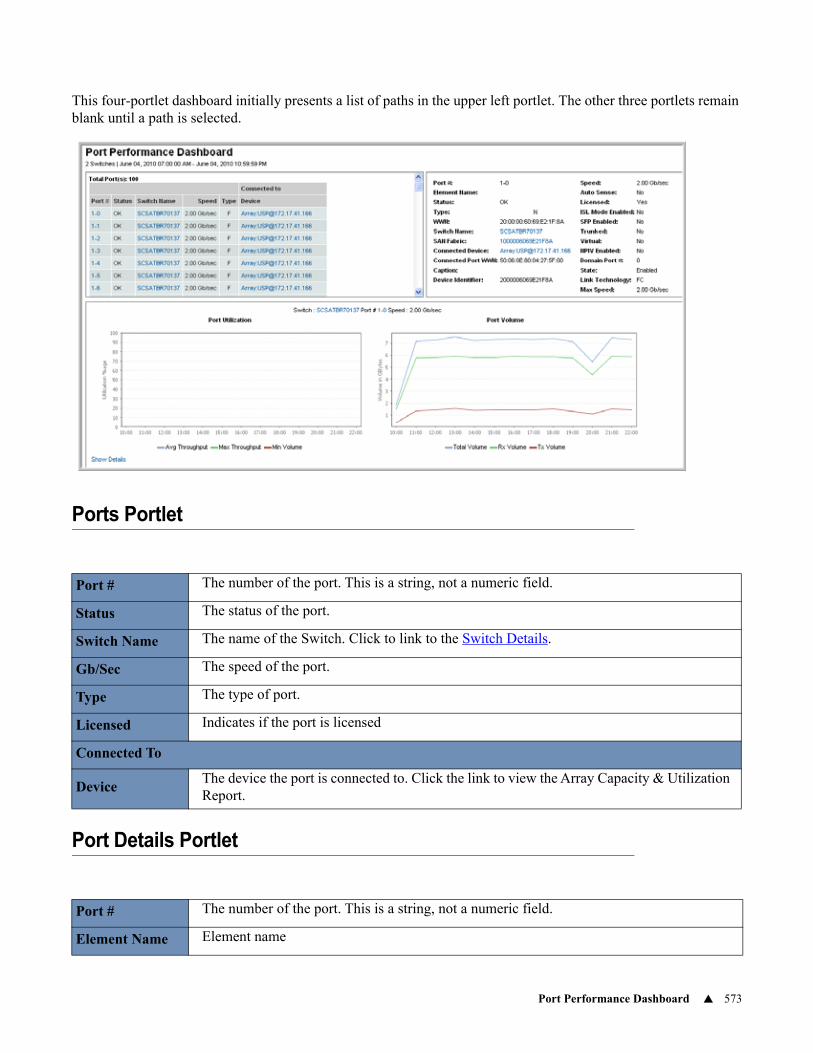
Port Performance Dashboard 573
This four-portlet dashboard initially presents a list of paths in the upper left portlet. The other three portlets remain blank until a path is selected.
Ports Portlet
Port Details Portlet
Port # The number of the port. This is a string, not a numeric field.
Status The status of the port.
Switch Name The name of the Switch. Click to link to the Switch Details.
Gb/Sec The speed of the port.
Type The type of port.
Licensed Indicates if the port is licensed
Connected To
DeviceThe device the port is connected to. Click the link to view the Array Capacity & Utilization Report.
Port # The number of the port. This is a string, not a numeric field.
Element Name Element name
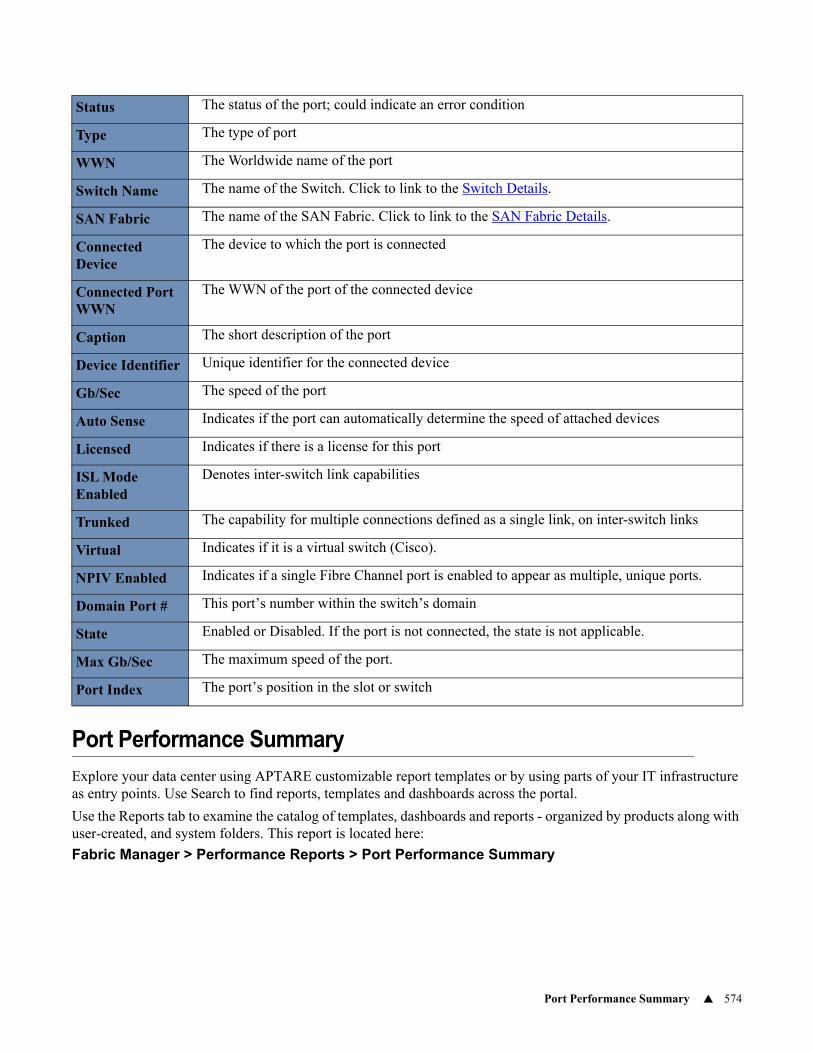
Port Performance Summary 574
Port Performance Summary
Explore your data center using APTARE customizable report templates or by using parts of your IT infrastructure as entry points. Use Search to find reports, templates and dashboards across the portal.
Use the Reports tab to examine the catalog of templates, dashboards and reports - organized by products along with user-created, and system folders. This report is located here:
Fabric Manager > Performance Reports > Port Performance Summary
Status The status of the port; could indicate an error condition
Type The type of port
WWN The Worldwide name of the port
Switch Name The name of the Switch. Click to link to the Switch Details.
SAN Fabric The name of the SAN Fabric. Click to link to the SAN Fabric Details.
Connected Device
The device to which the port is connected
Connected Port WWN
The WWN of the port of the connected device
Caption The short description of the port
Device Identifier Unique identifier for the connected device
Gb/Sec The speed of the port
Auto Sense Indicates if the port can automatically determine the speed of attached devices
Licensed Indicates if there is a license for this port
ISL Mode Enabled
Denotes inter-switch link capabilities
Trunked The capability for multiple connections defined as a single link, on inter-switch links
Virtual Indicates if it is a virtual switch (Cisco).
NPIV Enabled Indicates if a single Fibre Channel port is enabled to appear as multiple, unique ports.
Domain Port # This port’s number within the switch’s domain
State Enabled or Disabled. If the port is not connected, the state is not applicable.
Max Gb/Sec The maximum speed of the port.
Port Index The port’s position in the slot or switch
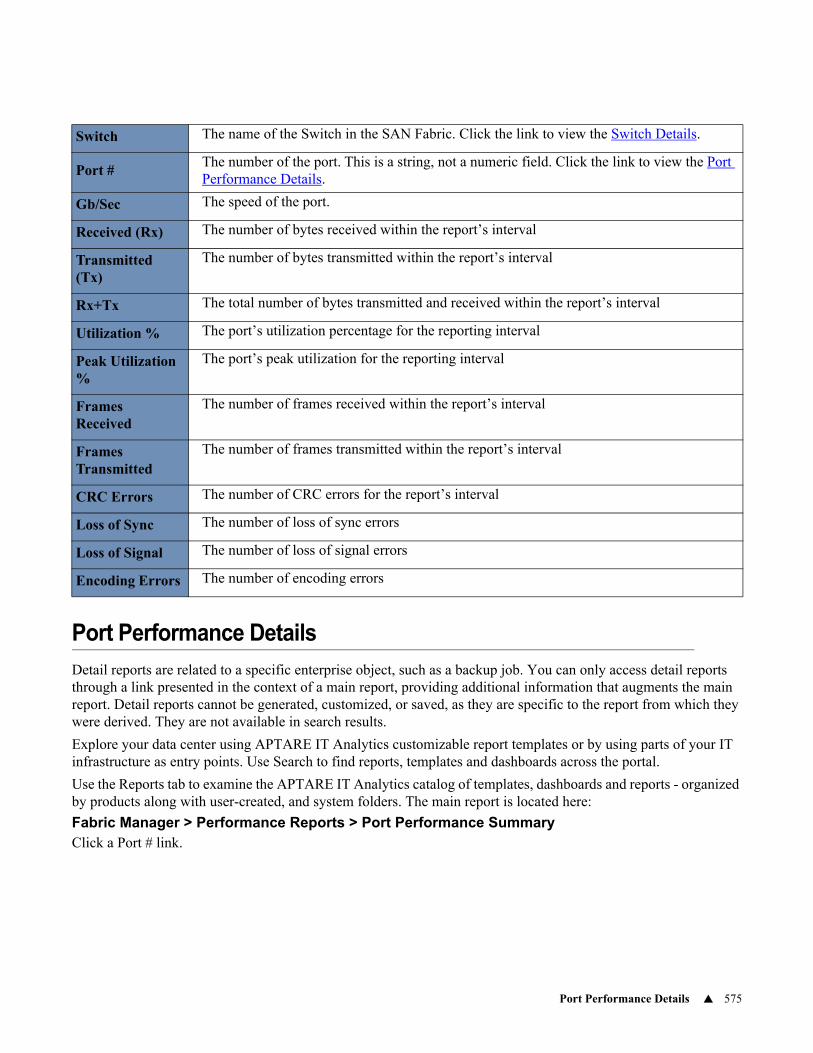
Port Performance Details 575
Port Performance Details
Detail reports are related to a specific enterprise object, such as a backup job. You can only access detail reports through a link presented in the context of a main report, providing additional information that augments the main report. Detail reports cannot be generated, customized, or saved, as they are specific to the report from which they were derived. They are not available in search results.
Explore your data center using APTARE IT Analytics customizable report templates or by using parts of your IT infrastructure as entry points. Use Search to find reports, templates and dashboards across the portal.
Use the Reports tab to examine the APTARE IT Analytics catalog of templates, dashboards and reports - organized by products along with user-created, and system folders. The main report is located here:
Fabric Manager > Performance Reports > Port Performance Summary Click a Port # link.
Switch The name of the Switch in the SAN Fabric. Click the link to view the Switch Details.
Port #The number of the port. This is a string, not a numeric field. Click the link to view the Port Performance Details.
Gb/Sec The speed of the port.
Received (Rx) The number of bytes received within the report’s interval
Transmitted (Tx)
The number of bytes transmitted within the report’s interval
Rx+Tx The total number of bytes transmitted and received within the report’s interval
Utilization % The port’s utilization percentage for the reporting interval
Peak Utilization%
The port’s peak utilization for the reporting interval
Frames Received
The number of frames received within the report’s interval
Frames Transmitted
The number of frames transmitted within the report’s interval
CRC Errors The number of CRC errors for the report’s interval
Loss of Sync The number of loss of sync errors
Loss of Signal The number of loss of signal errors
Encoding Errors The number of encoding errors
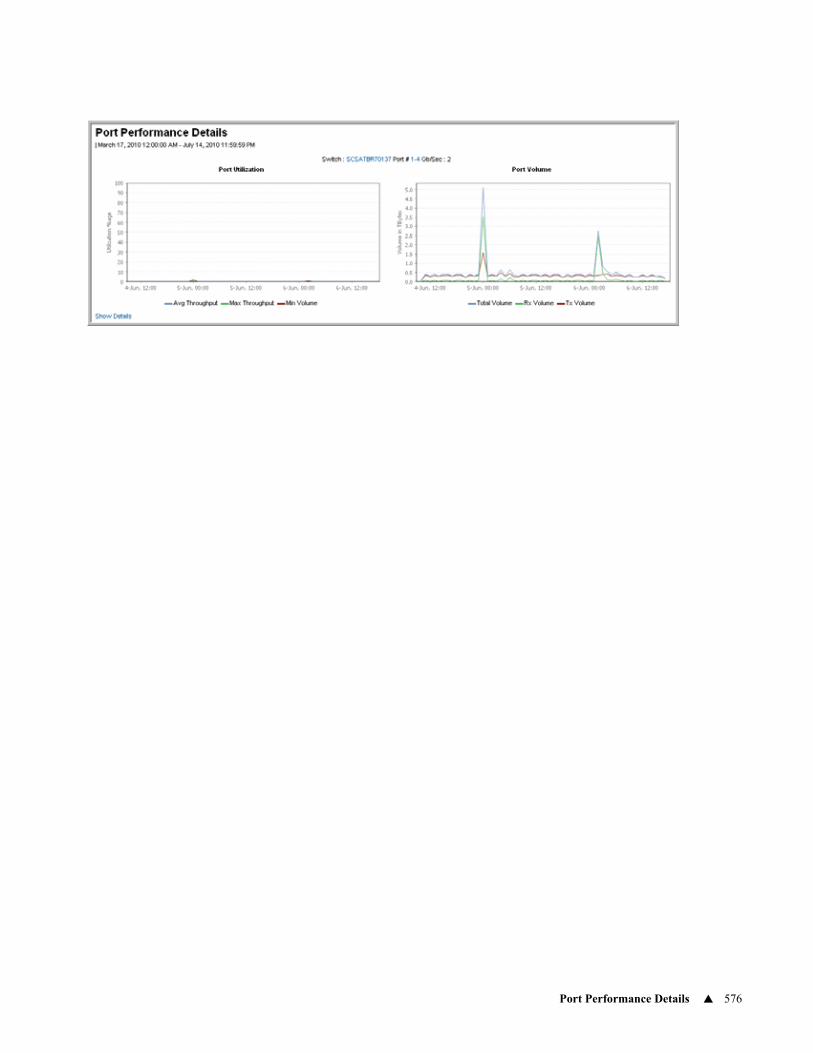
Port Performance Details 576
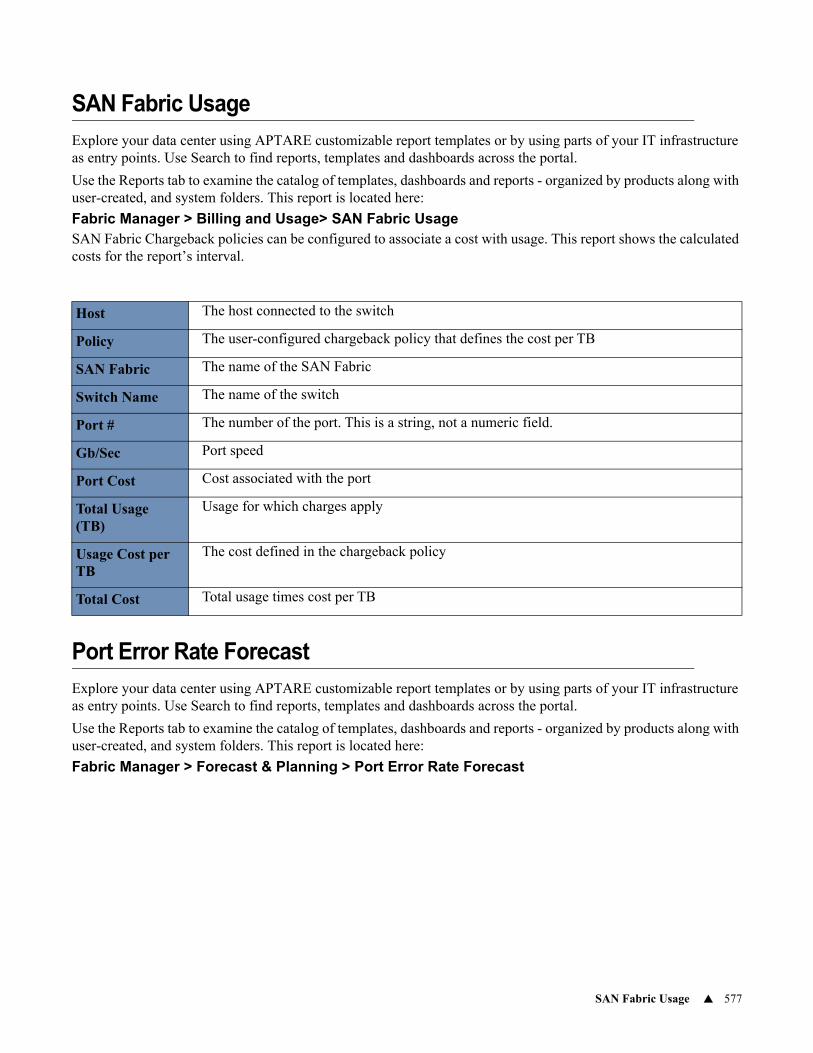
SAN Fabric Usage 577
SAN Fabric Usage
Explore your data center using APTARE customizable report templates or by using parts of your IT infrastructure as entry points. Use Search to find reports, templates and dashboards across the portal.
Use the Reports tab to examine the catalog of templates, dashboards and reports - organized by products along with user-created, and system folders. This report is located here:
Fabric Manager > Billing and Usage> SAN Fabric UsageSAN Fabric Chargeback policies can be configured to associate a cost with usage. This report shows the calculated costs for the report’s interval.
Port Error Rate Forecast
Explore your data center using APTARE customizable report templates or by using parts of your IT infrastructure as entry points. Use Search to find reports, templates and dashboards across the portal.
Use the Reports tab to examine the catalog of templates, dashboards and reports - organized by products along with user-created, and system folders. This report is located here:
Fabric Manager > Forecast & Planning > Port Error Rate Forecast
Host The host connected to the switch
Policy The user-configured chargeback policy that defines the cost per TB
SAN Fabric The name of the SAN Fabric
Switch Name The name of the switch
Port # The number of the port. This is a string, not a numeric field.
Gb/Sec Port speed
Port Cost Cost associated with the port
Total Usage (TB)
Usage for which charges apply
Usage Cost per TB
The cost defined in the chargeback policy
Total Cost Total usage times cost per TB
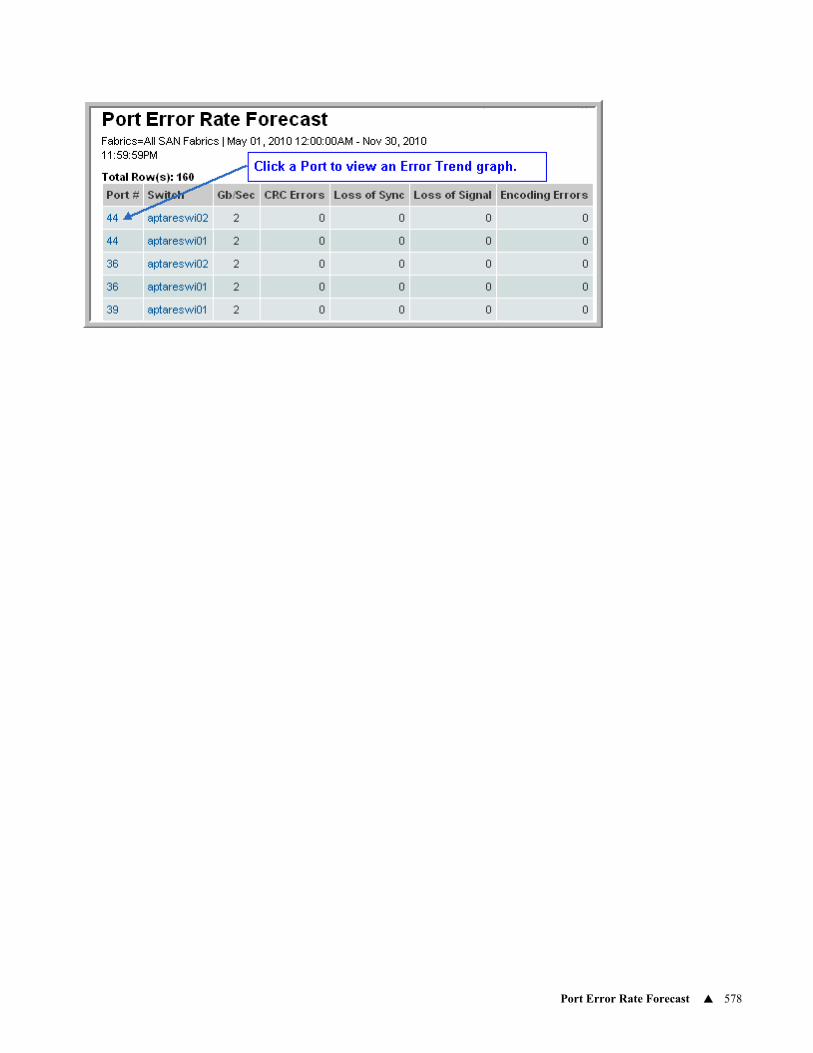
Port Error Rate Forecast 578
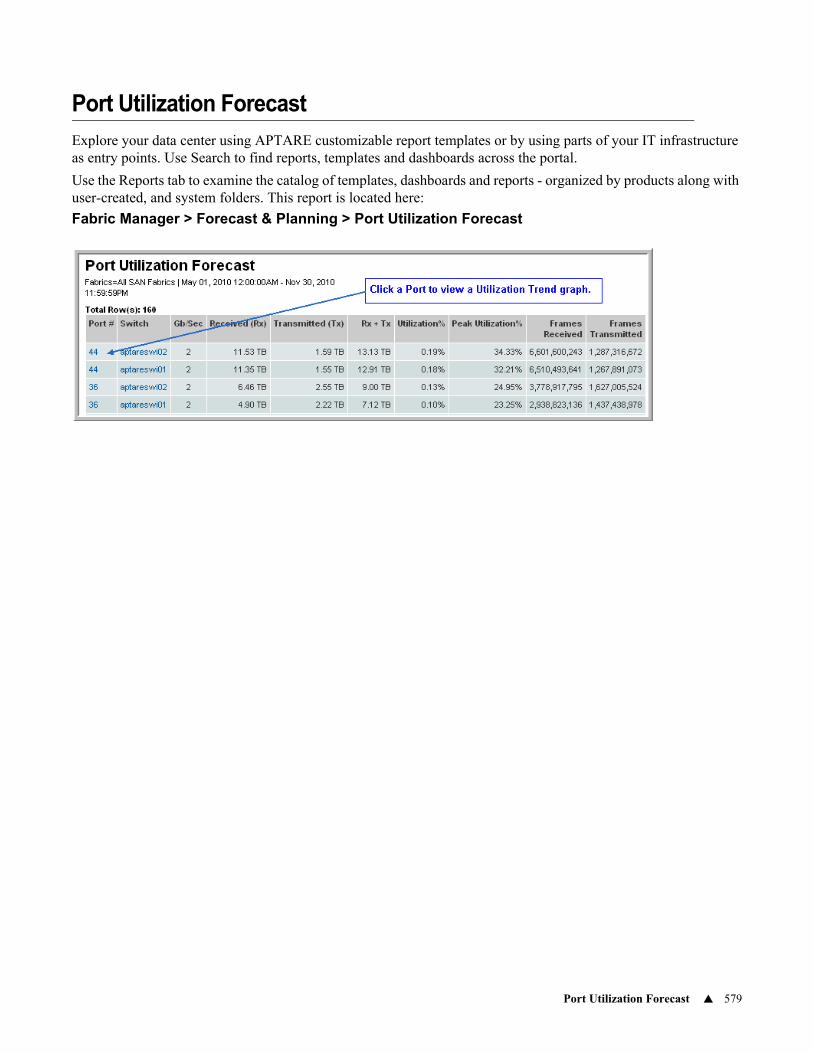
Port Utilization Forecast 579
Port Utilization Forecast
Explore your data center using APTARE customizable report templates or by using parts of your IT infrastructure as entry points. Use Search to find reports, templates and dashboards across the portal.
Use the Reports tab to examine the catalog of templates, dashboards and reports - organized by products along with user-created, and system folders. This report is located here:
Fabric Manager > Forecast & Planning > Port Utilization Forecast
580
18Chapter 6Backup Manager Management Reports
This section contains the following topics:• Using Backup Manager Reports for Analysis
• Backup Executive Summary
• Failed Backup Sources
• Consecutive Errors
• Data Domain Backup Summary
• Data Domain File Compression Detail
• Data Domain File Compression Summary
• Error Log Summary
• HP Data Protector Session Summary
• HP Data Protector Session Details
• Job Duration Report
• Job Error Code
• Job Status Summary
• Job Summary Report
• Job Summary - Heterogeneous Backup Products
• Avamar Job Summary Report (Homogeneous)
• Backup Exec Job Summary Report (Homogeneous)
• Commvault Simpana Job Summary Report (Homogeneous)
• HP Data Protector Job Summary Report (Homogeneous)
• NetBackup Job Summary Report (Homogeneous)
• NetWorker Job Summary Report (Homogeneous)
• IBM Spectrum Protect (TSM) Job Summary Report (Homogeneous)
• Job Details Report
• Avamar Job Details
• Commvault Simpana Job Details
• IBM Spectrum Protect (TSM) Job Details Report
• Veeam and RMAN Job Details Report
• Adding a Note to a Job
• Job Summary by Server
• Job Type Count
• Job Volume Summary Report
• Largest Backup Volume
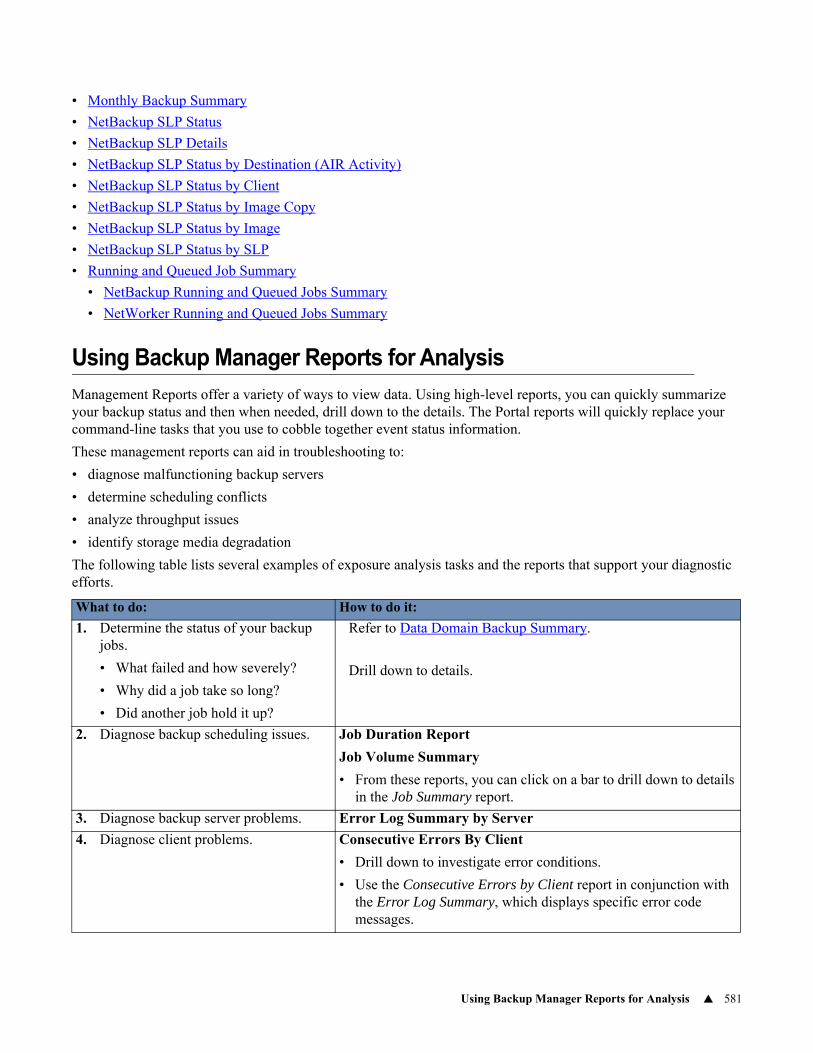
Using Backup Manager Reports for Analysis 581
• Monthly Backup Summary
• NetBackup SLP Status
• NetBackup SLP Details
• NetBackup SLP Status by Destination (AIR Activity)
• NetBackup SLP Status by Client
• NetBackup SLP Status by Image Copy
• NetBackup SLP Status by Image
• NetBackup SLP Status by SLP
• Running and Queued Job Summary
• NetBackup Running and Queued Jobs Summary
• NetWorker Running and Queued Jobs Summary
Using Backup Manager Reports for Analysis
Management Reports offer a variety of ways to view data. Using high-level reports, you can quickly summarize your backup status and then when needed, drill down to the details. The Portal reports will quickly replace your command-line tasks that you use to cobble together event status information.
These management reports can aid in troubleshooting to:
• diagnose malfunctioning backup servers
• determine scheduling conflicts
• analyze throughput issues
• identify storage media degradation
The following table lists several examples of exposure analysis tasks and the reports that support your diagnostic efforts.
What to do: How to do it:
1. Determine the status of your backup jobs.
• What failed and how severely?
• Why did a job take so long?
• Did another job hold it up?
Refer to Data Domain Backup Summary.
Drill down to details.
2. Diagnose backup scheduling issues. Job Duration Report
Job Volume Summary
• From these reports, you can click on a bar to drill down to details in the Job Summary report.
3. Diagnose backup server problems. Error Log Summary by Server
4. Diagnose client problems. Consecutive Errors By Client
• Drill down to investigate error conditions.
• Use the Consecutive Errors by Client report in conjunction with the Error Log Summary, which displays specific error code messages.

Using Backup Manager Reports for Analysis 582
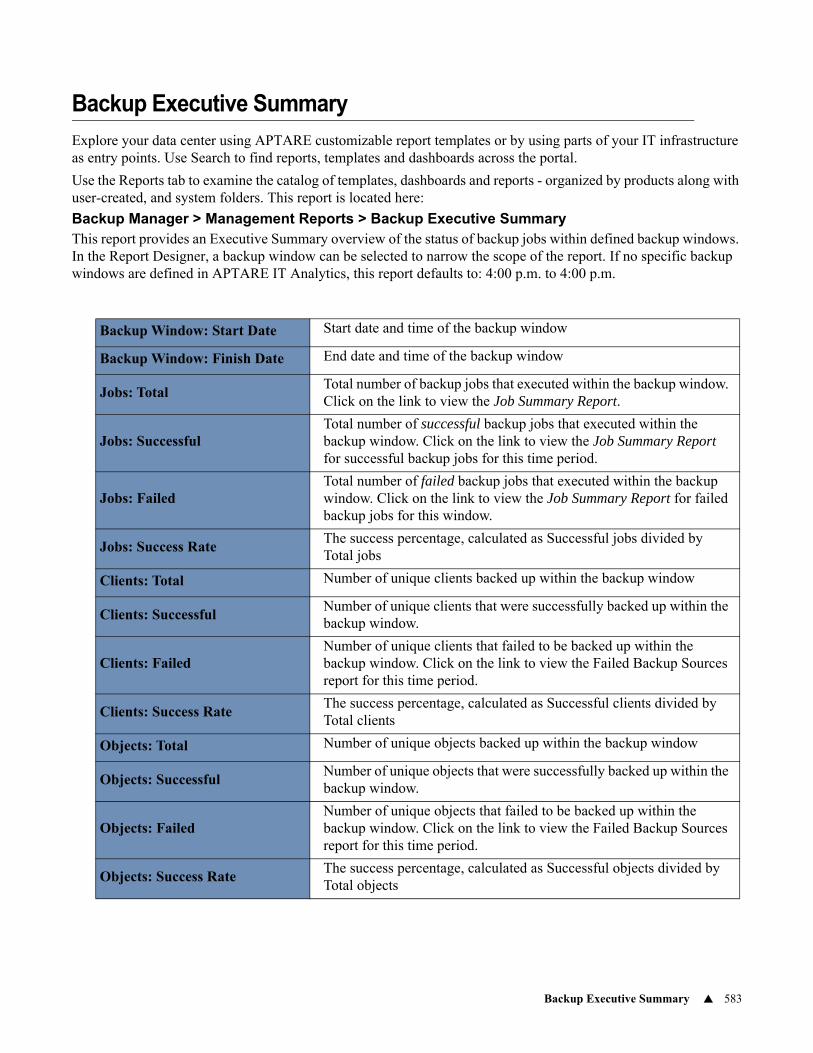
Backup Executive Summary 583
Backup Executive Summary
Explore your data center using APTARE customizable report templates or by using parts of your IT infrastructure as entry points. Use Search to find reports, templates and dashboards across the portal.
Use the Reports tab to examine the catalog of templates, dashboards and reports - organized by products along with user-created, and system folders. This report is located here:
Backup Manager > Management Reports > Backup Executive SummaryThis report provides an Executive Summary overview of the status of backup jobs within defined backup windows. In the Report Designer, a backup window can be selected to narrow the scope of the report. If no specific backup windows are defined in APTARE IT Analytics, this report defaults to: 4:00 p.m. to 4:00 p.m.
Backup Window: Start Date Start date and time of the backup window
Backup Window: Finish Date End date and time of the backup window
Jobs: TotalTotal number of backup jobs that executed within the backup window. Click on the link to view the Job Summary Report.
Jobs: SuccessfulTotal number of successful backup jobs that executed within the backup window. Click on the link to view the Job Summary Report for successful backup jobs for this time period.
Jobs: FailedTotal number of failed backup jobs that executed within the backup window. Click on the link to view the Job Summary Report for failed backup jobs for this window.
Jobs: Success RateThe success percentage, calculated as Successful jobs divided by Total jobs
Clients: Total Number of unique clients backed up within the backup window
Clients: SuccessfulNumber of unique clients that were successfully backed up within the backup window.
Clients: FailedNumber of unique clients that failed to be backed up within the backup window. Click on the link to view the Failed Backup Sources report for this time period.
Clients: Success RateThe success percentage, calculated as Successful clients divided by Total clients
Objects: Total Number of unique objects backed up within the backup window
Objects: SuccessfulNumber of unique objects that were successfully backed up within the backup window.
Objects: FailedNumber of unique objects that failed to be backed up within the backup window. Click on the link to view the Failed Backup Sources report for this time period.
Objects: Success RateThe success percentage, calculated as Successful objects divided by Total objects
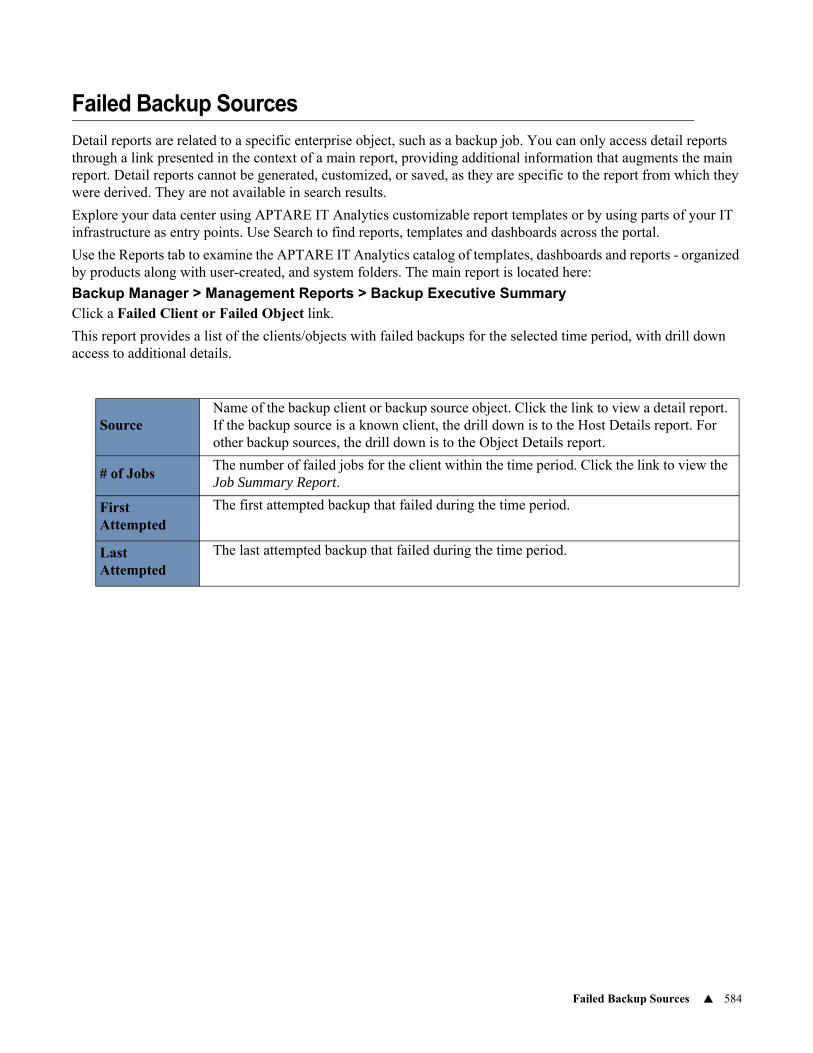
Failed Backup Sources 584
Failed Backup Sources
Detail reports are related to a specific enterprise object, such as a backup job. You can only access detail reports through a link presented in the context of a main report, providing additional information that augments the main report. Detail reports cannot be generated, customized, or saved, as they are specific to the report from which they were derived. They are not available in search results.
Explore your data center using APTARE IT Analytics customizable report templates or by using parts of your IT infrastructure as entry points. Use Search to find reports, templates and dashboards across the portal.
Use the Reports tab to examine the APTARE IT Analytics catalog of templates, dashboards and reports - organized by products along with user-created, and system folders. The main report is located here:
Backup Manager > Management Reports > Backup Executive SummaryClick a Failed Client or Failed Object link.
This report provides a list of the clients/objects with failed backups for the selected time period, with drill down access to additional details.
SourceName of the backup client or backup source object. Click the link to view a detail report. If the backup source is a known client, the drill down is to the Host Details report. For other backup sources, the drill down is to the Object Details report.
# of JobsThe number of failed jobs for the client within the time period. Click the link to view the Job Summary Report.
First Attempted
The first attempted backup that failed during the time period.
Last Attempted
The last attempted backup that failed during the time period.
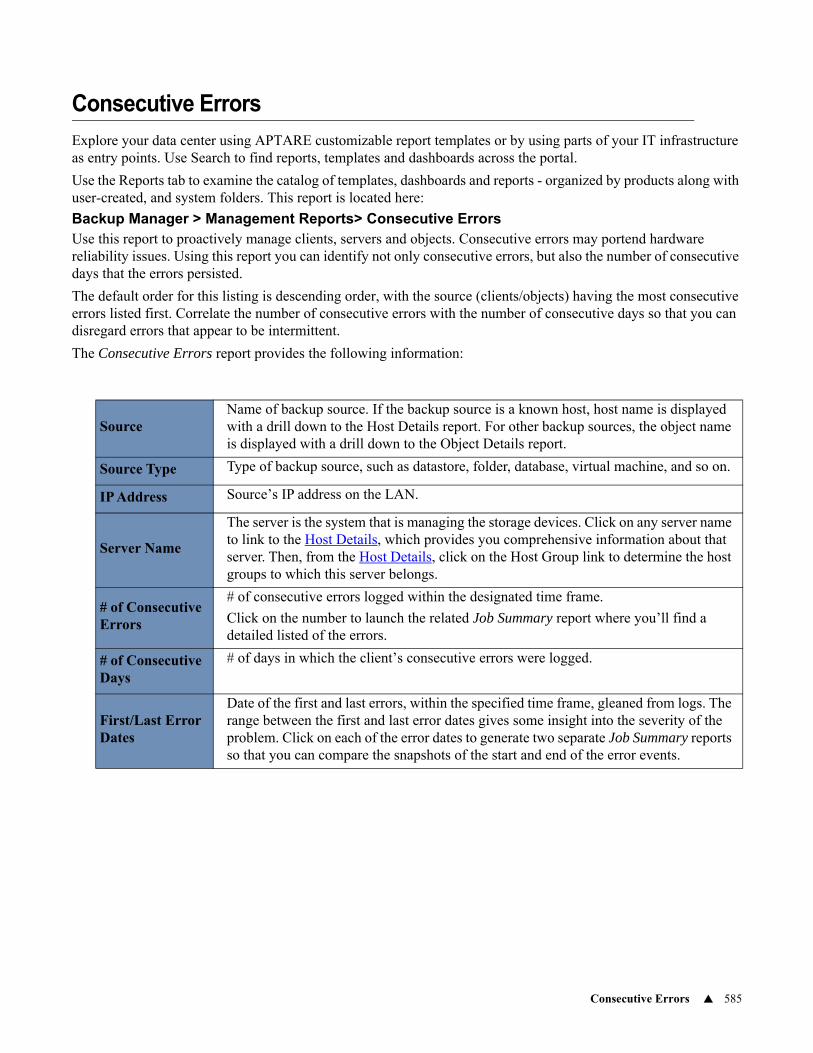
Consecutive Errors 585
Consecutive Errors
Explore your data center using APTARE customizable report templates or by using parts of your IT infrastructure as entry points. Use Search to find reports, templates and dashboards across the portal.
Use the Reports tab to examine the catalog of templates, dashboards and reports - organized by products along with user-created, and system folders. This report is located here:
Backup Manager > Management Reports> Consecutive ErrorsUse this report to proactively manage clients, servers and objects. Consecutive errors may portend hardware reliability issues. Using this report you can identify not only consecutive errors, but also the number of consecutive days that the errors persisted.
The default order for this listing is descending order, with the source (clients/objects) having the most consecutive errors listed first. Correlate the number of consecutive errors with the number of consecutive days so that you can disregard errors that appear to be intermittent.
The Consecutive Errors report provides the following information:
SourceName of backup source. If the backup source is a known host, host name is displayed with a drill down to the Host Details report. For other backup sources, the object name is displayed with a drill down to the Object Details report.
Source Type Type of backup source, such as datastore, folder, database, virtual machine, and so on.
IP Address Source’s IP address on the LAN.
Server Name
The server is the system that is managing the storage devices. Click on any server name to link to the Host Details, which provides you comprehensive information about that server. Then, from the Host Details, click on the Host Group link to determine the host groups to which this server belongs.
# of Consecutive Errors
# of consecutive errors logged within the designated time frame.
Click on the number to launch the related Job Summary report where you’ll find a detailed listed of the errors.
# of Consecutive Days
# of days in which the client’s consecutive errors were logged.
First/Last Error Dates
Date of the first and last errors, within the specified time frame, gleaned from logs. The range between the first and last error dates gives some insight into the severity of the problem. Click on each of the error dates to generate two separate Job Summary reports so that you can compare the snapshots of the start and end of the error events.

Data Domain Backup Summary 586
Data Domain Backup Summary
Explore your data center using APTARE customizable report templates or by using parts of your IT infrastructure as entry points. Use Search to find reports, templates and dashboards across the portal.
Use the Reports tab to examine the catalog of templates, dashboards and reports - organized by products along with user-created, and system folders. This report is located here:
Backup Manager > Management Reports > Data Domain Backup Summary
This report lists the NetBackup systems that have client backup data. The Data Domain system acts as an external disk pool. Note that LSU (logical storage unit) data is collected every six hours. When Data Domain servers are selected for the report scope, the master server clients are also included in the report.
System Name of the Data Domain appliance.
Client Name of the client backed up by the master server.
Server Name of the master server.
LSU Logical storage unit.
Total BackupsTotal number of jobs. Total number of jobs for the client, job type and logical storage unit.
Size of BackupTotal number of kilobytes. Total number of kilobytes for the client, job_type and logical storage unit.
Last Backup Finish date of last backup. Finish date of the last successful or partial backup.
Last Full BackupFinish date of the last full backup. Finish date of the last successful or partial full backup.
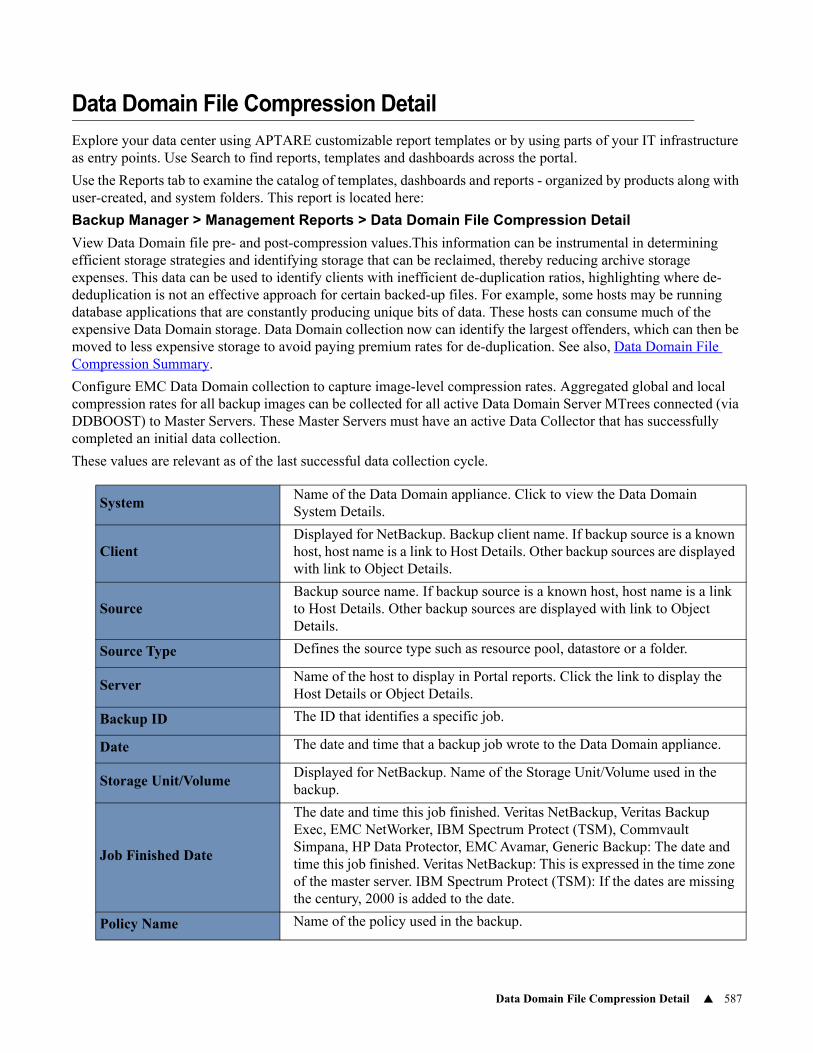
Data Domain File Compression Detail 587
Data Domain File Compression Detail
Explore your data center using APTARE customizable report templates or by using parts of your IT infrastructure as entry points. Use Search to find reports, templates and dashboards across the portal.
Use the Reports tab to examine the catalog of templates, dashboards and reports - organized by products along with user-created, and system folders. This report is located here:
Backup Manager > Management Reports > Data Domain File Compression Detail
View Data Domain file pre- and post-compression values.This information can be instrumental in determining efficient storage strategies and identifying storage that can be reclaimed, thereby reducing archive storage expenses. This data can be used to identify clients with inefficient de-duplication ratios, highlighting where de-deduplication is not an effective approach for certain backed-up files. For example, some hosts may be running database applications that are constantly producing unique bits of data. These hosts can consume much of the expensive Data Domain storage. Data Domain collection now can identify the largest offenders, which can then be moved to less expensive storage to avoid paying premium rates for de-duplication. See also, Data Domain File Compression Summary.
Configure EMC Data Domain collection to capture image-level compression rates. Aggregated global and local compression rates for all backup images can be collected for all active Data Domain Server MTrees connected (via DDBOOST) to Master Servers. These Master Servers must have an active Data Collector that has successfully completed an initial data collection.
These values are relevant as of the last successful data collection cycle.
SystemName of the Data Domain appliance. Click to view the Data Domain System Details.
ClientDisplayed for NetBackup. Backup client name. If backup source is a known host, host name is a link to Host Details. Other backup sources are displayed with link to Object Details.
SourceBackup source name. If backup source is a known host, host name is a link to Host Details. Other backup sources are displayed with link to Object Details.
Source Type Defines the source type such as resource pool, datastore or a folder.
ServerName of the host to display in Portal reports. Click the link to display the Host Details or Object Details.
Backup ID The ID that identifies a specific job.
Date The date and time that a backup job wrote to the Data Domain appliance.
Storage Unit/VolumeDisplayed for NetBackup. Name of the Storage Unit/Volume used in the backup.
Job Finished Date
The date and time this job finished. Veritas NetBackup, Veritas Backup Exec, EMC NetWorker, IBM Spectrum Protect (TSM), Commvault Simpana, HP Data Protector, EMC Avamar, Generic Backup: The date and time this job finished. Veritas NetBackup: This is expressed in the time zone of the master server. IBM Spectrum Protect (TSM): If the dates are missing the century, 2000 is added to the date.
Policy Name Name of the policy used in the backup.
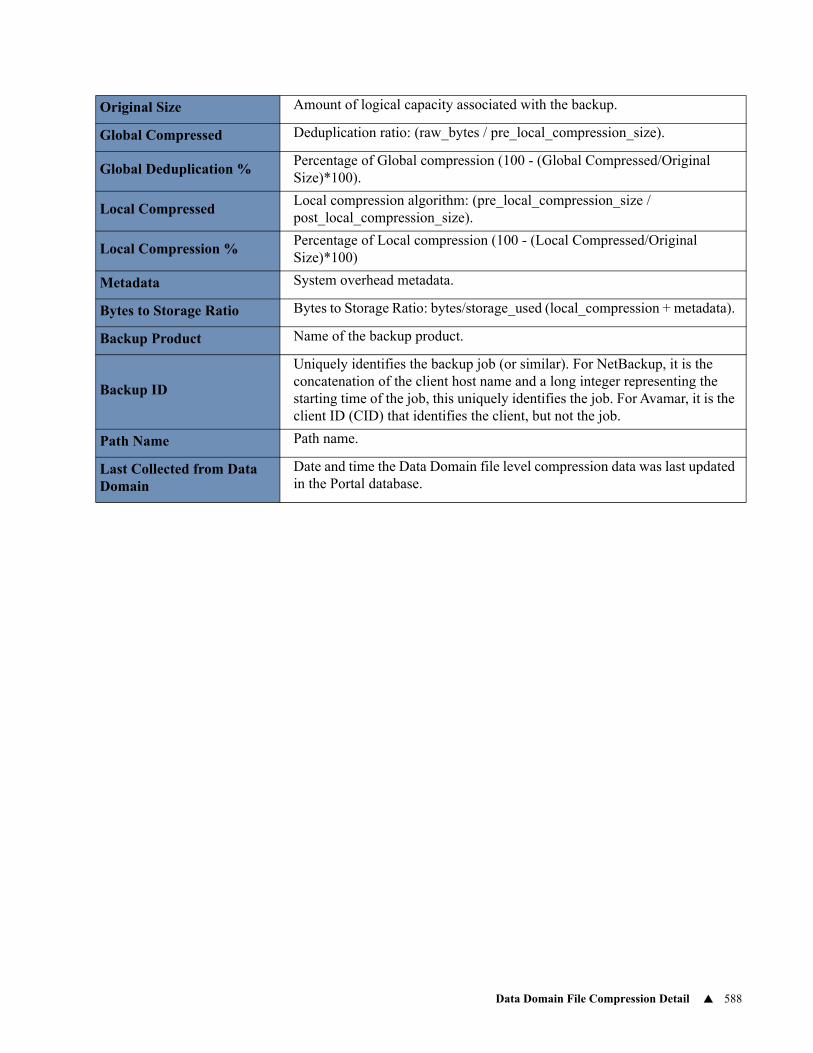
Data Domain File Compression Detail 588
Original Size Amount of logical capacity associated with the backup.
Global Compressed Deduplication ratio: (raw_bytes / pre_local_compression_size).
Global Deduplication %Percentage of Global compression (100 - (Global Compressed/Original Size)*100).
Local CompressedLocal compression algorithm: (pre_local_compression_size / post_local_compression_size).
Local Compression %Percentage of Local compression (100 - (Local Compressed/Original Size)*100)
Metadata System overhead metadata.
Bytes to Storage Ratio Bytes to Storage Ratio: bytes/storage_used (local_compression + metadata).
Backup Product Name of the backup product.
Backup ID
Uniquely identifies the backup job (or similar). For NetBackup, it is the concatenation of the client host name and a long integer representing the starting time of the job, this uniquely identifies the job. For Avamar, it is the client ID (CID) that identifies the client, but not the job.
Path Name Path name.
Last Collected from Data Domain
Date and time the Data Domain file level compression data was last updated in the Portal database.
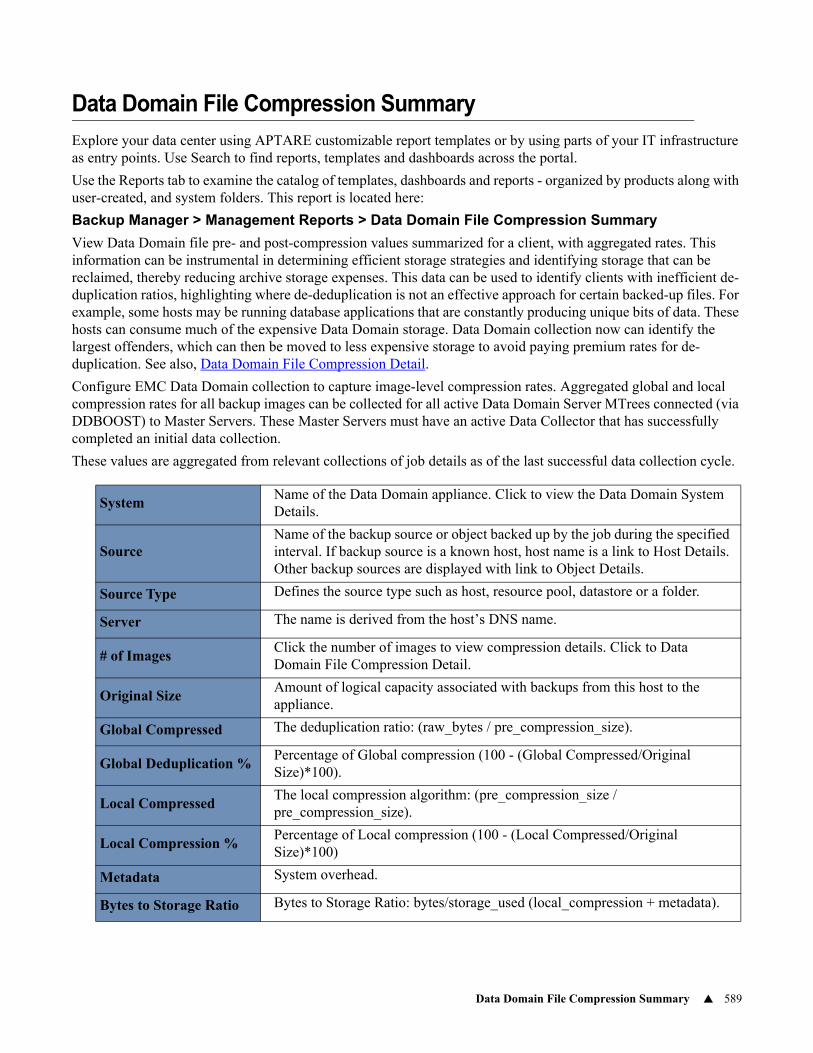
Data Domain File Compression Summary 589
Data Domain File Compression Summary
Explore your data center using APTARE customizable report templates or by using parts of your IT infrastructure as entry points. Use Search to find reports, templates and dashboards across the portal.
Use the Reports tab to examine the catalog of templates, dashboards and reports - organized by products along with user-created, and system folders. This report is located here:
Backup Manager > Management Reports > Data Domain File Compression Summary
View Data Domain file pre- and post-compression values summarized for a client, with aggregated rates. This information can be instrumental in determining efficient storage strategies and identifying storage that can be reclaimed, thereby reducing archive storage expenses. This data can be used to identify clients with inefficient de-duplication ratios, highlighting where de-deduplication is not an effective approach for certain backed-up files. For example, some hosts may be running database applications that are constantly producing unique bits of data. These hosts can consume much of the expensive Data Domain storage. Data Domain collection now can identify the largest offenders, which can then be moved to less expensive storage to avoid paying premium rates for de-duplication. See also, Data Domain File Compression Detail.
Configure EMC Data Domain collection to capture image-level compression rates. Aggregated global and local compression rates for all backup images can be collected for all active Data Domain Server MTrees connected (via DDBOOST) to Master Servers. These Master Servers must have an active Data Collector that has successfully completed an initial data collection.
These values are aggregated from relevant collections of job details as of the last successful data collection cycle.
SystemName of the Data Domain appliance. Click to view the Data Domain System Details.
SourceName of the backup source or object backed up by the job during the specified interval. If backup source is a known host, host name is a link to Host Details. Other backup sources are displayed with link to Object Details.
Source Type Defines the source type such as host, resource pool, datastore or a folder.
Server The name is derived from the host’s DNS name.
# of ImagesClick the number of images to view compression details. Click to Data Domain File Compression Detail.
Original Size Amount of logical capacity associated with backups from this host to the appliance.
Global Compressed The deduplication ratio: (raw_bytes / pre_compression_size).
Global Deduplication %Percentage of Global compression (100 - (Global Compressed/Original Size)*100).
Local CompressedThe local compression algorithm: (pre_compression_size / pre_compression_size).
Local Compression %Percentage of Local compression (100 - (Local Compressed/Original Size)*100)
Metadata System overhead.
Bytes to Storage Ratio Bytes to Storage Ratio: bytes/storage_used (local_compression + metadata).
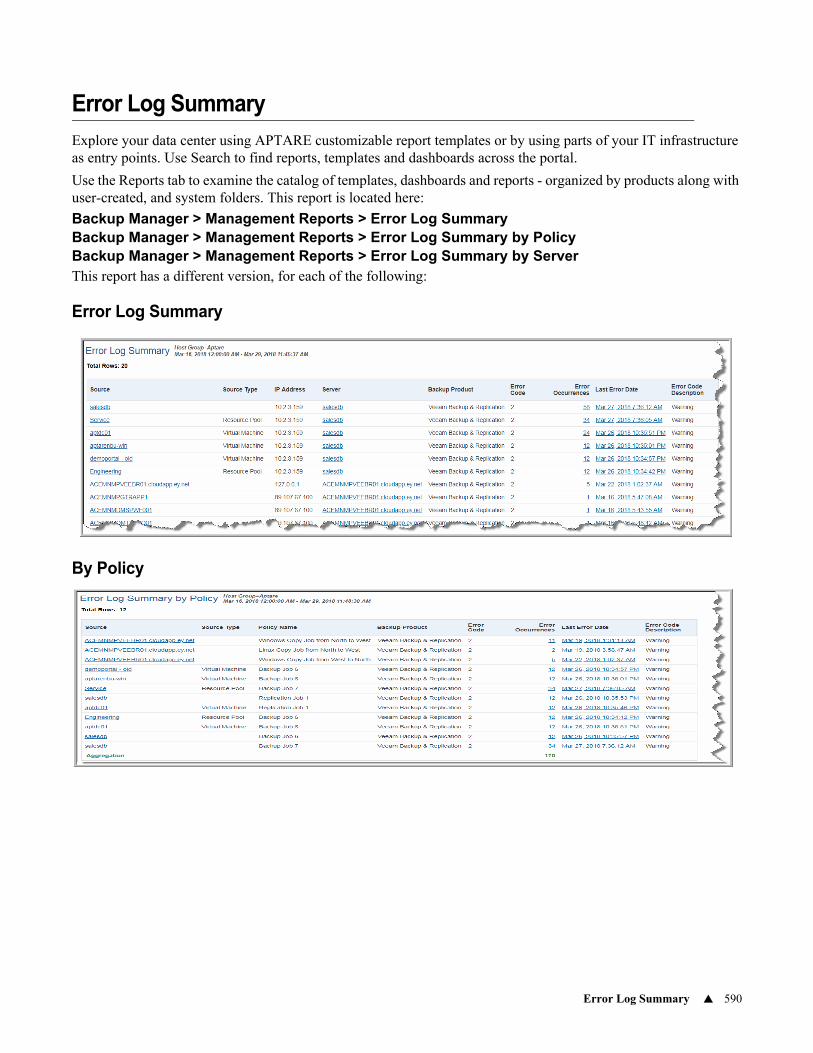
Error Log Summary 590
Error Log Summary
Explore your data center using APTARE customizable report templates or by using parts of your IT infrastructure as entry points. Use Search to find reports, templates and dashboards across the portal.
Use the Reports tab to examine the catalog of templates, dashboards and reports - organized by products along with user-created, and system folders. This report is located here:
Backup Manager > Management Reports > Error Log Summary Backup Manager > Management Reports > Error Log Summary by PolicyBackup Manager > Management Reports > Error Log Summary by ServerThis report has a different version, for each of the following:
Error Log Summary
By Policy
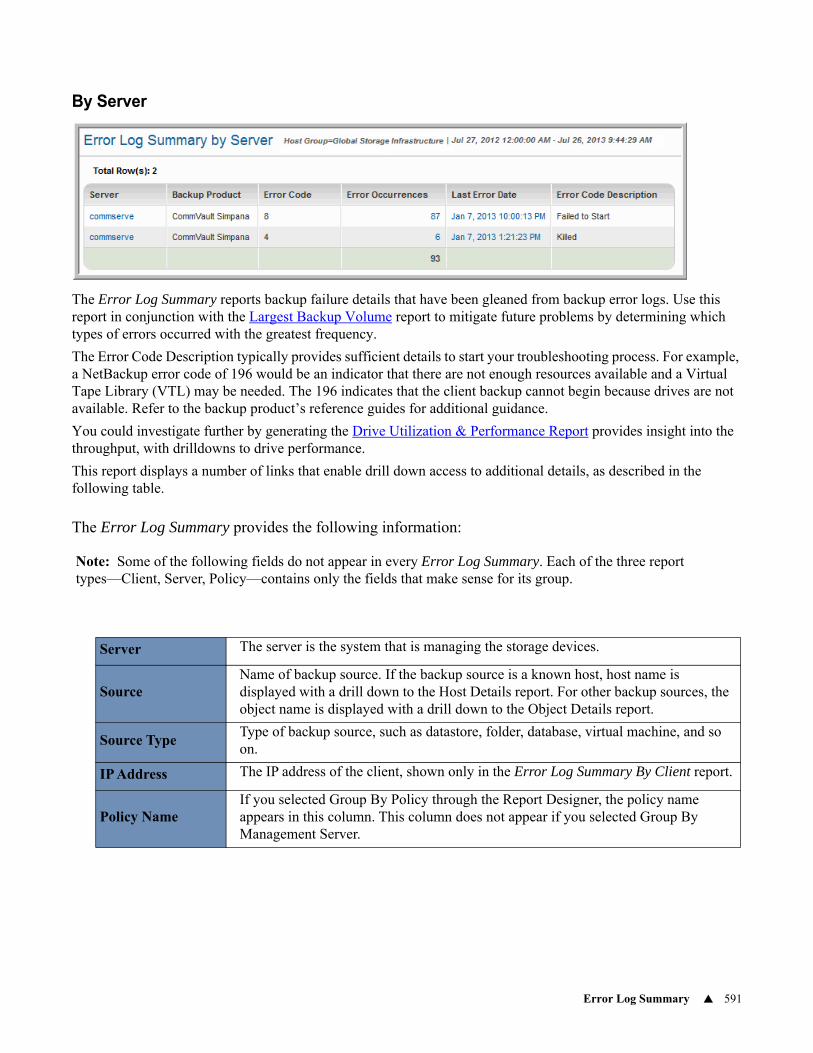
Error Log Summary 591
By Server
The Error Log Summary reports backup failure details that have been gleaned from backup error logs. Use this report in conjunction with the Largest Backup Volume report to mitigate future problems by determining which types of errors occurred with the greatest frequency.
The Error Code Description typically provides sufficient details to start your troubleshooting process. For example, a NetBackup error code of 196 would be an indicator that there are not enough resources available and a Virtual Tape Library (VTL) may be needed. The 196 indicates that the client backup cannot begin because drives are not available. Refer to the backup product’s reference guides for additional guidance.
You could investigate further by generating the Drive Utilization & Performance Report provides insight into the throughput, with drilldowns to drive performance.
This report displays a number of links that enable drill down access to additional details, as described in the following table.
The Error Log Summary provides the following information:
Note: Some of the following fields do not appear in every Error Log Summary. Each of the three report types—Client, Server, Policy—contains only the fields that make sense for its group.
Server The server is the system that is managing the storage devices.
SourceName of backup source. If the backup source is a known host, host name is displayed with a drill down to the Host Details report. For other backup sources, the object name is displayed with a drill down to the Object Details report.
Source TypeType of backup source, such as datastore, folder, database, virtual machine, and so on.
IP Address The IP address of the client, shown only in the Error Log Summary By Client report.
Policy NameIf you selected Group By Policy through the Report Designer, the policy name appears in this column. This column does not appear if you selected Group By Management Server.
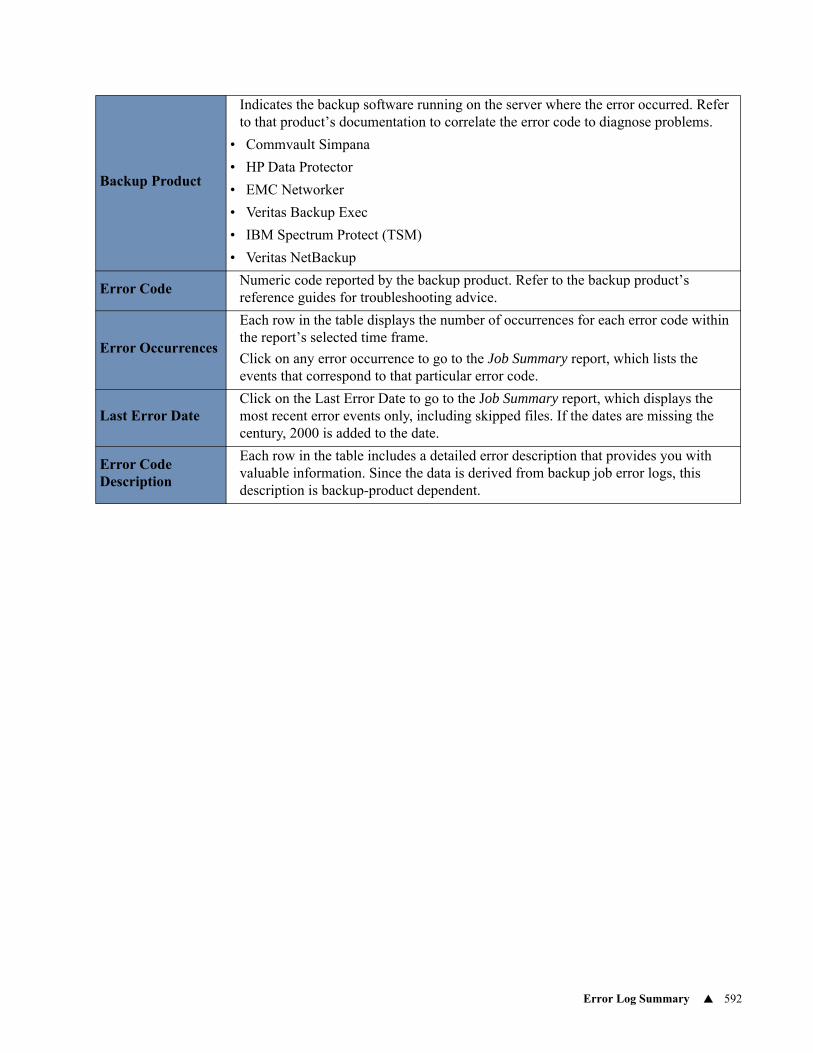
Error Log Summary 592
Backup Product
Indicates the backup software running on the server where the error occurred. Refer to that product’s documentation to correlate the error code to diagnose problems.
• Commvault Simpana
• HP Data Protector
• EMC Networker
• Veritas Backup Exec
• IBM Spectrum Protect (TSM)
• Veritas NetBackup
Error CodeNumeric code reported by the backup product. Refer to the backup product’s reference guides for troubleshooting advice.
Error Occurrences
Each row in the table displays the number of occurrences for each error code within the report’s selected time frame.
Click on any error occurrence to go to the Job Summary report, which lists the events that correspond to that particular error code.
Last Error DateClick on the Last Error Date to go to the Job Summary report, which displays the most recent error events only, including skipped files. If the dates are missing the century, 2000 is added to the date.
Error Code Description
Each row in the table includes a detailed error description that provides you with valuable information. Since the data is derived from backup job error logs, this description is backup-product dependent.
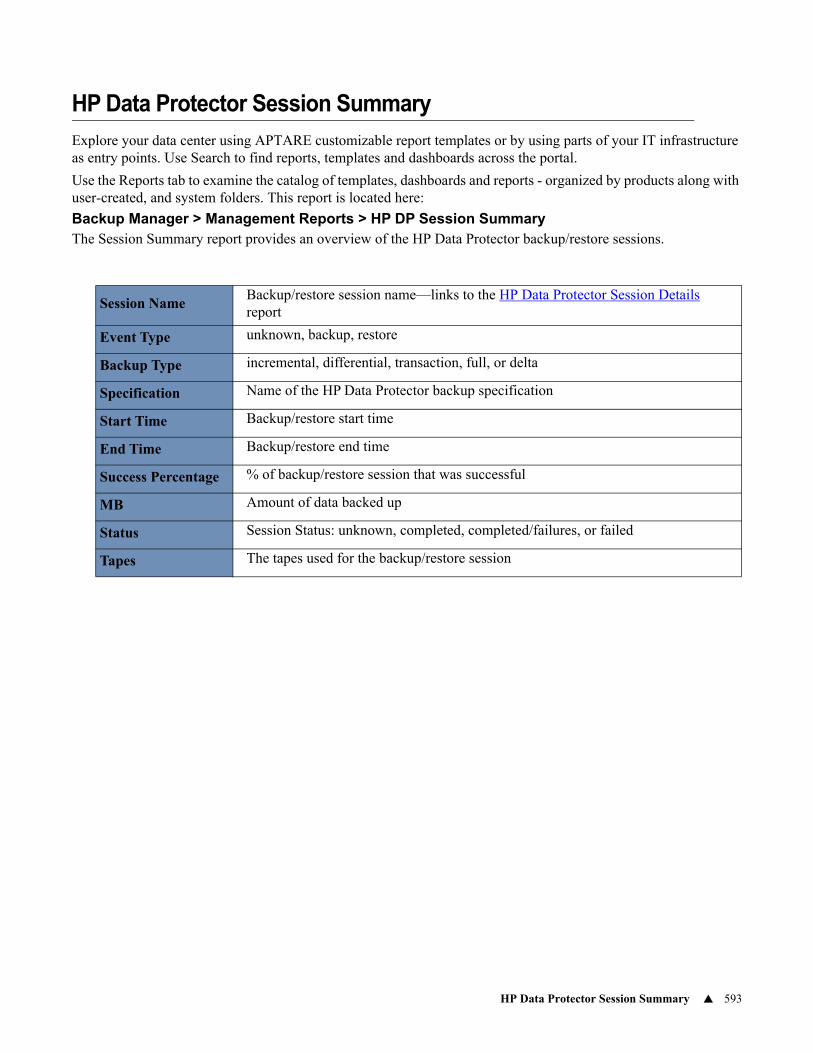
HP Data Protector Session Summary 593
HP Data Protector Session Summary
Explore your data center using APTARE customizable report templates or by using parts of your IT infrastructure as entry points. Use Search to find reports, templates and dashboards across the portal.
Use the Reports tab to examine the catalog of templates, dashboards and reports - organized by products along with user-created, and system folders. This report is located here:
Backup Manager > Management Reports > HP DP Session SummaryThe Session Summary report provides an overview of the HP Data Protector backup/restore sessions.
Session NameBackup/restore session name—links to the HP Data Protector Session Details report
Event Type unknown, backup, restore
Backup Type incremental, differential, transaction, full, or delta
Specification Name of the HP Data Protector backup specification
Start Time Backup/restore start time
End Time Backup/restore end time
Success Percentage % of backup/restore session that was successful
MB Amount of data backed up
Status Session Status: unknown, completed, completed/failures, or failed
Tapes The tapes used for the backup/restore session
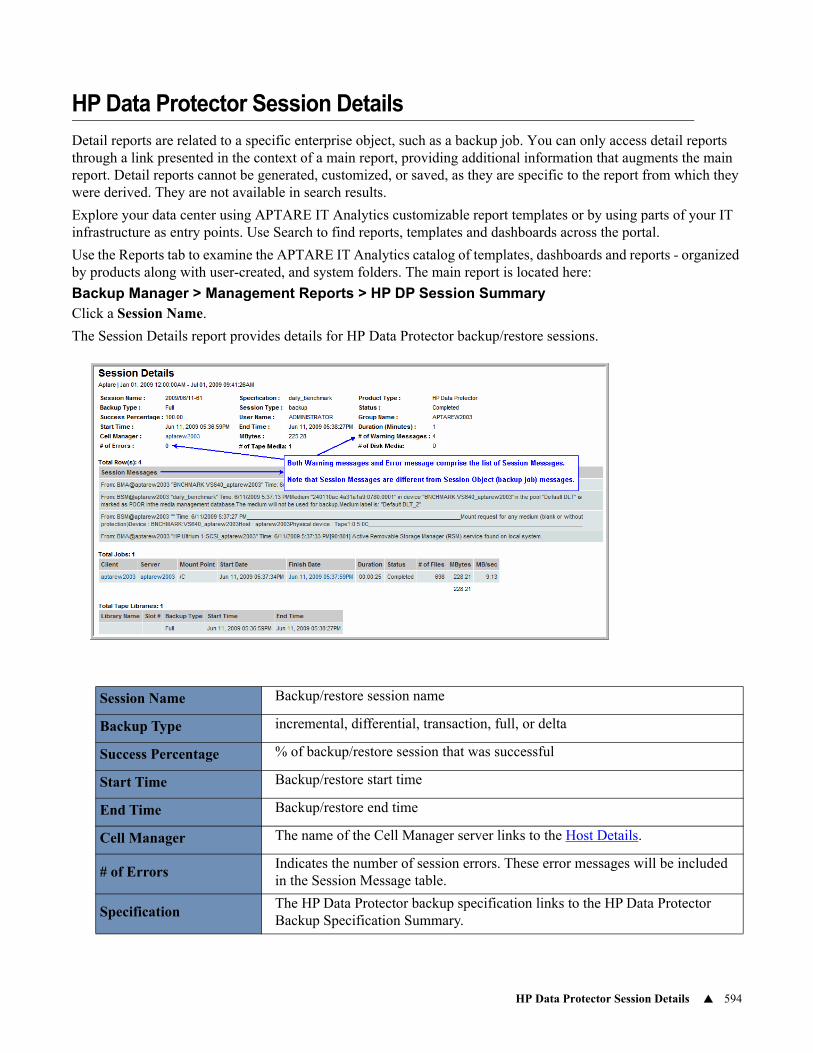
HP Data Protector Session Details 594
HP Data Protector Session Details
Detail reports are related to a specific enterprise object, such as a backup job. You can only access detail reports through a link presented in the context of a main report, providing additional information that augments the main report. Detail reports cannot be generated, customized, or saved, as they are specific to the report from which they were derived. They are not available in search results.
Explore your data center using APTARE IT Analytics customizable report templates or by using parts of your IT infrastructure as entry points. Use Search to find reports, templates and dashboards across the portal.
Use the Reports tab to examine the APTARE IT Analytics catalog of templates, dashboards and reports - organized by products along with user-created, and system folders. The main report is located here:
Backup Manager > Management Reports > HP DP Session SummaryClick a Session Name.
The Session Details report provides details for HP Data Protector backup/restore sessions.
Session Name Backup/restore session name
Backup Type incremental, differential, transaction, full, or delta
Success Percentage % of backup/restore session that was successful
Start Time Backup/restore start time
End Time Backup/restore end time
Cell Manager The name of the Cell Manager server links to the Host Details.
# of ErrorsIndicates the number of session errors. These error messages will be included in the Session Message table.
SpecificationThe HP Data Protector backup specification links to the HP Data Protector Backup Specification Summary.
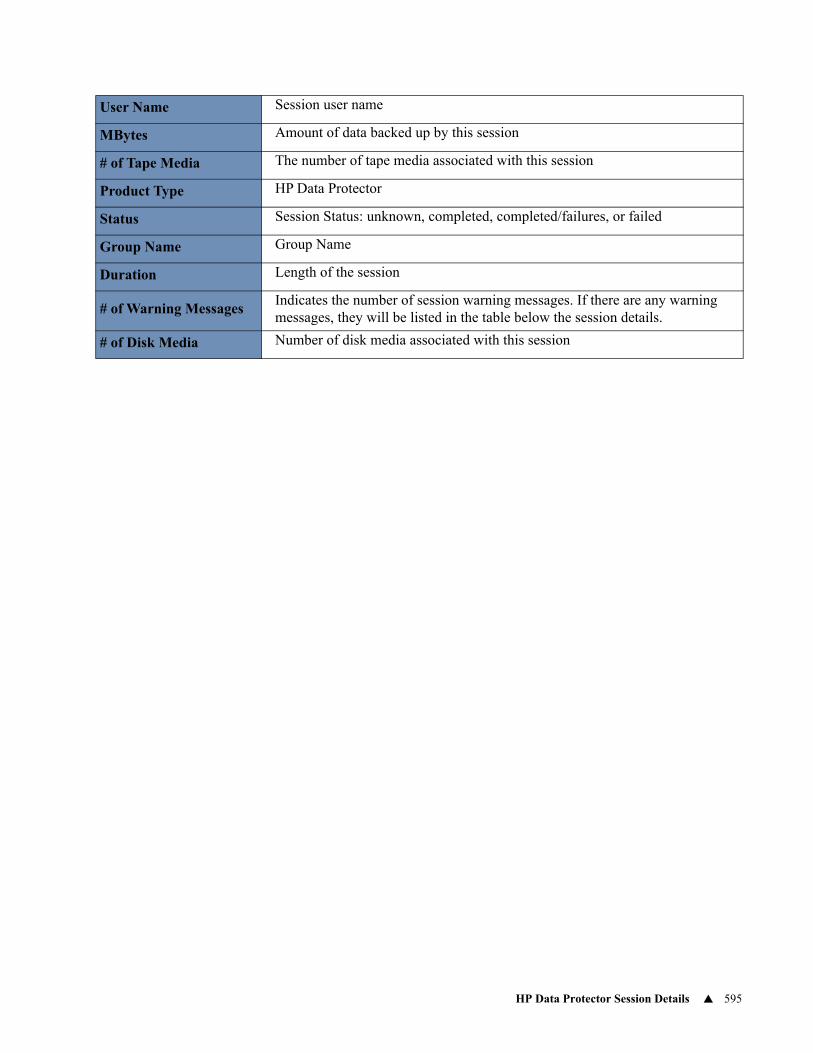
HP Data Protector Session Details 595
User Name Session user name
MBytes Amount of data backed up by this session
# of Tape Media The number of tape media associated with this session
Product Type HP Data Protector
Status Session Status: unknown, completed, completed/failures, or failed
Group Name Group Name
Duration Length of the session
# of Warning MessagesIndicates the number of session warning messages. If there are any warning messages, they will be listed in the table below the session details.
# of Disk Media Number of disk media associated with this session
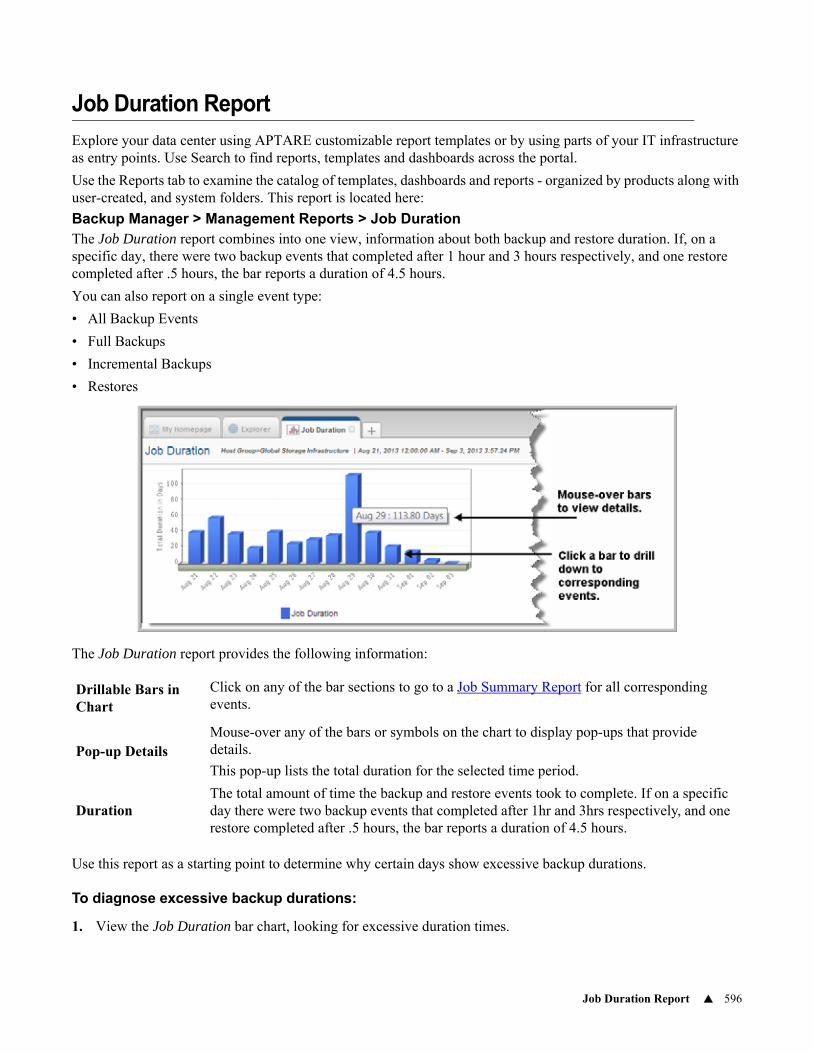
Job Duration Report 596
Job Duration Report
Explore your data center using APTARE customizable report templates or by using parts of your IT infrastructure as entry points. Use Search to find reports, templates and dashboards across the portal.
Use the Reports tab to examine the catalog of templates, dashboards and reports - organized by products along with user-created, and system folders. This report is located here:
Backup Manager > Management Reports > Job DurationThe Job Duration report combines into one view, information about both backup and restore duration. If, on a specific day, there were two backup events that completed after 1 hour and 3 hours respectively, and one restore completed after .5 hours, the bar reports a duration of 4.5 hours.
You can also report on a single event type:
• All Backup Events
• Full Backups
• Incremental Backups
• Restores
The Job Duration report provides the following information:
Use this report as a starting point to determine why certain days show excessive backup durations.
To diagnose excessive backup durations:
1. View the Job Duration bar chart, looking for excessive duration times.
Drillable Bars in Chart
Click on any of the bar sections to go to a Job Summary Report for all corresponding events.
Pop-up DetailsMouse-over any of the bars or symbols on the chart to display pop-ups that provide details.
This pop-up lists the total duration for the selected time period.
DurationThe total amount of time the backup and restore events took to complete. If on a specific day there were two backup events that completed after 1hr and 3hrs respectively, and one restore completed after .5 hours, the bar reports a duration of 4.5 hours.
Job Duration Report 597
2. Click the bar for a troublesome day to launch the Job Summary Report.
3. In the Job Summary Report, click on the Duration column header to sort the data by Duration. Now you’ll see excessive client usage at the top of the list. You might also sort by MBytes/Sec to identify throughput issues.
4. In the Job Summary Report, click on the Finish Date of a suspect job to display the Job Details Report.
By using a combination of reports, you can figure out if some jobs held up others, if there are server problems that require your attention, or if consecutive errors are symptomatic of storage device failure or media degradation.
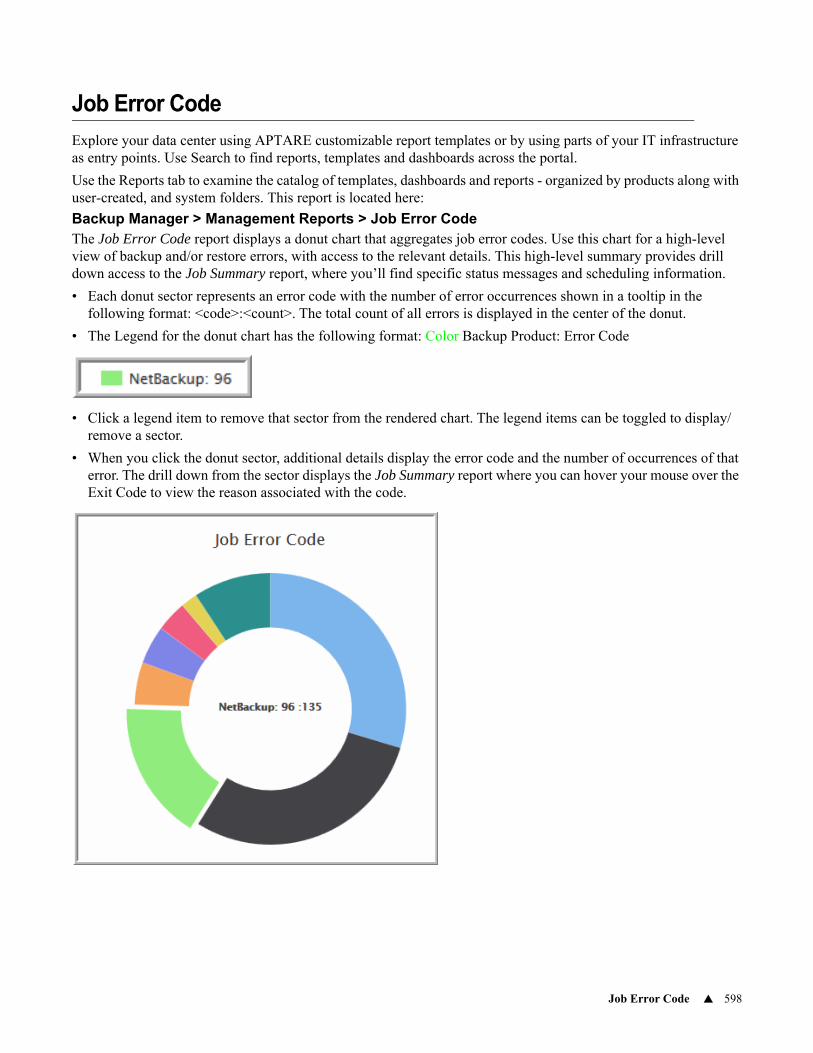
Job Error Code 598
Job Error Code
Explore your data center using APTARE customizable report templates or by using parts of your IT infrastructure as entry points. Use Search to find reports, templates and dashboards across the portal.
Use the Reports tab to examine the catalog of templates, dashboards and reports - organized by products along with user-created, and system folders. This report is located here:
Backup Manager > Management Reports > Job Error CodeThe Job Error Code report displays a donut chart that aggregates job error codes. Use this chart for a high-level view of backup and/or restore errors, with access to the relevant details. This high-level summary provides drill down access to the Job Summary report, where you’ll find specific status messages and scheduling information.
• Each donut sector represents an error code with the number of error occurrences shown in a tooltip in the following format: <code>:<count>. The total count of all errors is displayed in the center of the donut.
• The Legend for the donut chart has the following format: Color Backup Product: Error Code
• Click a legend item to remove that sector from the rendered chart. The legend items can be toggled to display/remove a sector.
• When you click the donut sector, additional details display the error code and the number of occurrences of that error. The drill down from the sector displays the Job Summary report where you can hover your mouse over the Exit Code to view the reason associated with the code.
Job Status Summary 599
Job Status Summary
Explore your data center using APTARE customizable report templates or by using parts of your IT infrastructure as entry points. Use Search to find reports, templates and dashboards across the portal.
Use the Reports tab to examine the catalog of templates, dashboards and reports - organized by products along with user-created, and system folders. This report is located here:
Backup Manager > Management Reports > Job Status SummaryThe Job Status Summary report shows a bar chart that aggregates jobs that succeeded, failed, or produced warning messages. This high-level summary provides drill down access to the Job Summary report, where you’ll find specific status messages and scheduling information.
When you generate this report, several Report Designer options enable you to narrow the scope of the report and also to define how the data will be displayed. Refer to the APTARE User’s Guide for Capacity Manager Primary Settings and Backup Manager Primary Settings. In particular, note the Parent Job Only, Ignore Retries, and Backup Window settings that are available for this report.
Use this procedure to track down backup failure details:
1. View the Job Status Summary report.
2. Click on the top section of a bar in the bar chart to drill down to details.
The top portion of the bar indicates backup error events, the middle section reports event warnings, and the bottom represents successful backups. Note that often the partial backups represent your biggest exposure, so drilling down on the warning events can help you identify and resolve issues.
When you drill down to details, you are launching the Job Summary Report.
3. In the Job Summary report, view the Activity Type column for backup log messages.
4. In the Job Summary report, click on the Finish Date to view the Job Details Report, which shows additional message-log entries. Be sure to scroll down to the bottom of the list to find backup attempts and notes related to the job.
Related reports:
• Job Summary Report. This tabular report provides details related to the data represented in the bars shown in the Job Status Summary chart. You can drill down to the job summary details from the Job Status Summary bar chart.
• Backup Status SLA. In addition to job status, this report provides indicators showing a trend line of event successes.
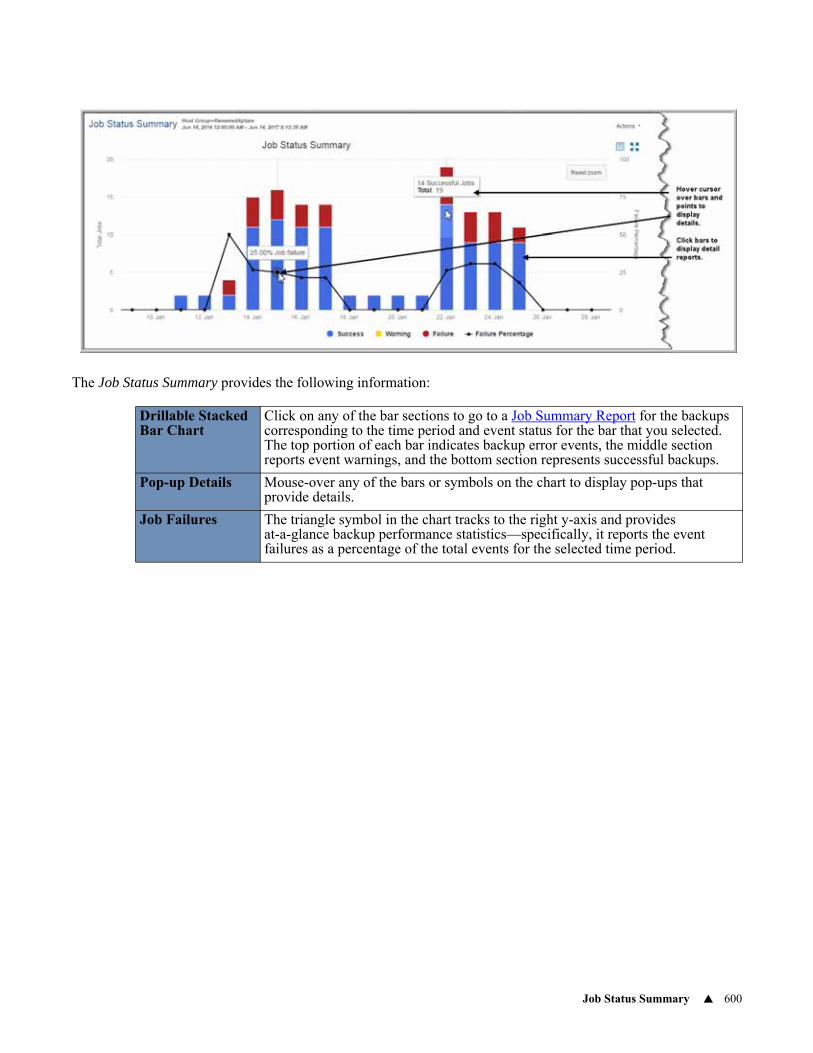
Job Status Summary 600
The Job Status Summary provides the following information:
Drillable Stacked Bar Chart
Click on any of the bar sections to go to a Job Summary Report for the backups corresponding to the time period and event status for the bar that you selected. The top portion of each bar indicates backup error events, the middle section reports event warnings, and the bottom section represents successful backups.
Pop-up Details Mouse-over any of the bars or symbols on the chart to display pop-ups that provide details.
Job Failures The triangle symbol in the chart tracks to the right y-axis and provides at-a-glance backup performance statistics—specifically, it reports the event failures as a percentage of the total events for the selected time period.
Job Summary Report 601
Job Summary Report
Explore your data center using APTARE customizable report templates or by using parts of your IT infrastructure as entry points. Use Search to find reports, templates and dashboards across the portal.
Use the Reports tab to examine the catalog of templates, dashboards and reports - organized by products along with user-created, and system folders. This report is located here:
Backup Manager > Management Reports > Job SummaryWhen you generate this report, several Report Designer options enable you to narrow the scope of the report and also to define how the data will be displayed. Use the Scope Selector to filter the report to just the jobs you want to analyze. In particular, note the Parent Job Only, Ignore Retries, and Backup Window settings that are available for this report. The Backup Policy Name Filter enables you to enter a backup policy name to analyze job status for a specific policy
To view the details available in vendor-specific version of this report, see:
• Job Summary - Heterogeneous Backup Products
• Avamar Job Summary Report (Homogeneous)
• Backup Exec Job Summary Report (Homogeneous)
• Commvault Simpana Job Summary Report (Homogeneous)
• HP Data Protector Job Summary Report (Homogeneous)
• NetBackup Job Summary Report (Homogeneous)
• NetWorker Job Summary Report (Homogeneous)
• IBM Spectrum Protect (TSM) Job Summary Report (Homogeneous)
In the scope selector, use the following options to filter the output:
• Event Type: All Backup & Restore Events, All Backup Events, Full Backups, Incremental Backups, Restores
• Event Status: All Events, Successful Events, Warning Events, Successful or Warning Events, Failed Events
• Not all of the following fields will appear in all Job Summary reports. Many fields are specific to a backup product. For example, NetBackup jobs will display a Policy field that may not be displayed in the Job Summary for other backup products. Also, a job’s result code will be labeled according to the backup product’s standard. For example, NetBackup uses Exit Code, while Backup Exec uses Result Code.
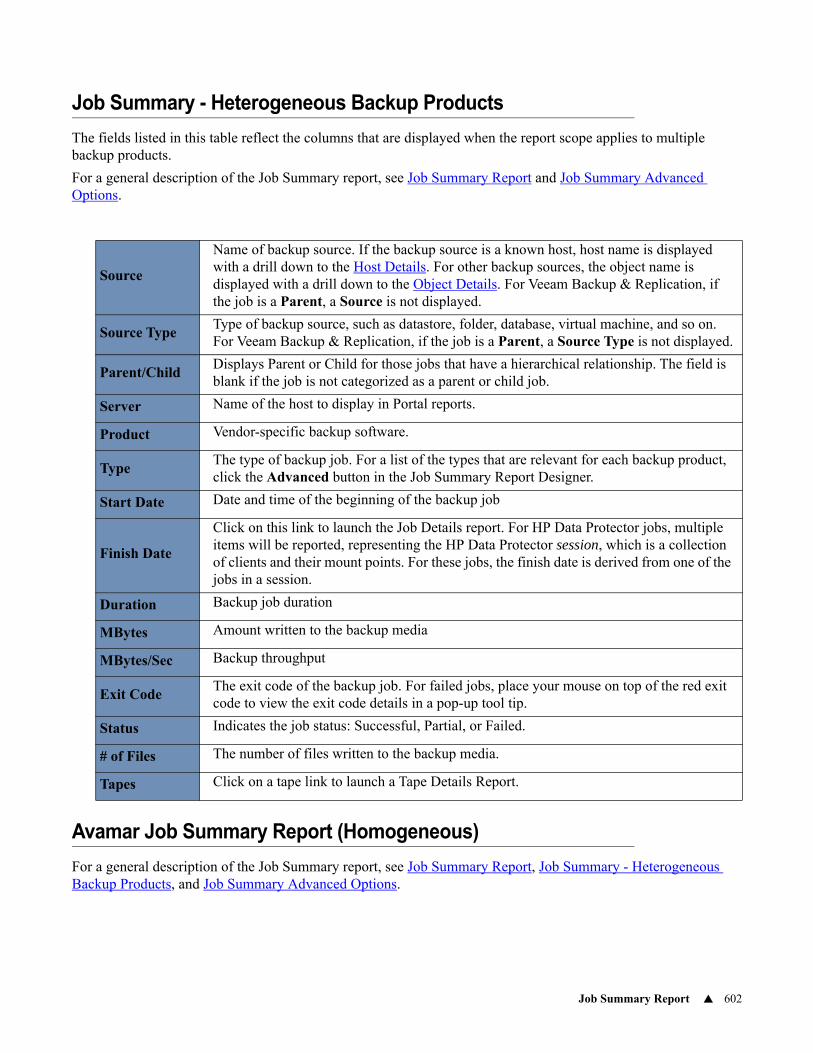
Job Summary Report 602
Job Summary - Heterogeneous Backup Products
The fields listed in this table reflect the columns that are displayed when the report scope applies to multiple backup products.
For a general description of the Job Summary report, see Job Summary Report and Job Summary Advanced Options.
Avamar Job Summary Report (Homogeneous)
For a general description of the Job Summary report, see Job Summary Report, Job Summary - Heterogeneous Backup Products, and Job Summary Advanced Options.
Source
Name of backup source. If the backup source is a known host, host name is displayed with a drill down to the Host Details. For other backup sources, the object name is displayed with a drill down to the Object Details. For Veeam Backup & Replication, if the job is a Parent, a Source is not displayed.
Source TypeType of backup source, such as datastore, folder, database, virtual machine, and so on. For Veeam Backup & Replication, if the job is a Parent, a Source Type is not displayed.
Parent/ChildDisplays Parent or Child for those jobs that have a hierarchical relationship. The field is blank if the job is not categorized as a parent or child job.
Server Name of the host to display in Portal reports.
Product Vendor-specific backup software.
TypeThe type of backup job. For a list of the types that are relevant for each backup product, click the Advanced button in the Job Summary Report Designer.
Start Date Date and time of the beginning of the backup job
Finish Date
Click on this link to launch the Job Details report. For HP Data Protector jobs, multiple items will be reported, representing the HP Data Protector session, which is a collection of clients and their mount points. For these jobs, the finish date is derived from one of the jobs in a session.
Duration Backup job duration
MBytes Amount written to the backup media
MBytes/Sec Backup throughput
Exit CodeThe exit code of the backup job. For failed jobs, place your mouse on top of the red exit code to view the exit code details in a pop-up tool tip.
Status Indicates the job status: Successful, Partial, or Failed.
# of Files The number of files written to the backup media.
Tapes Click on a tape link to launch a Tape Details Report.
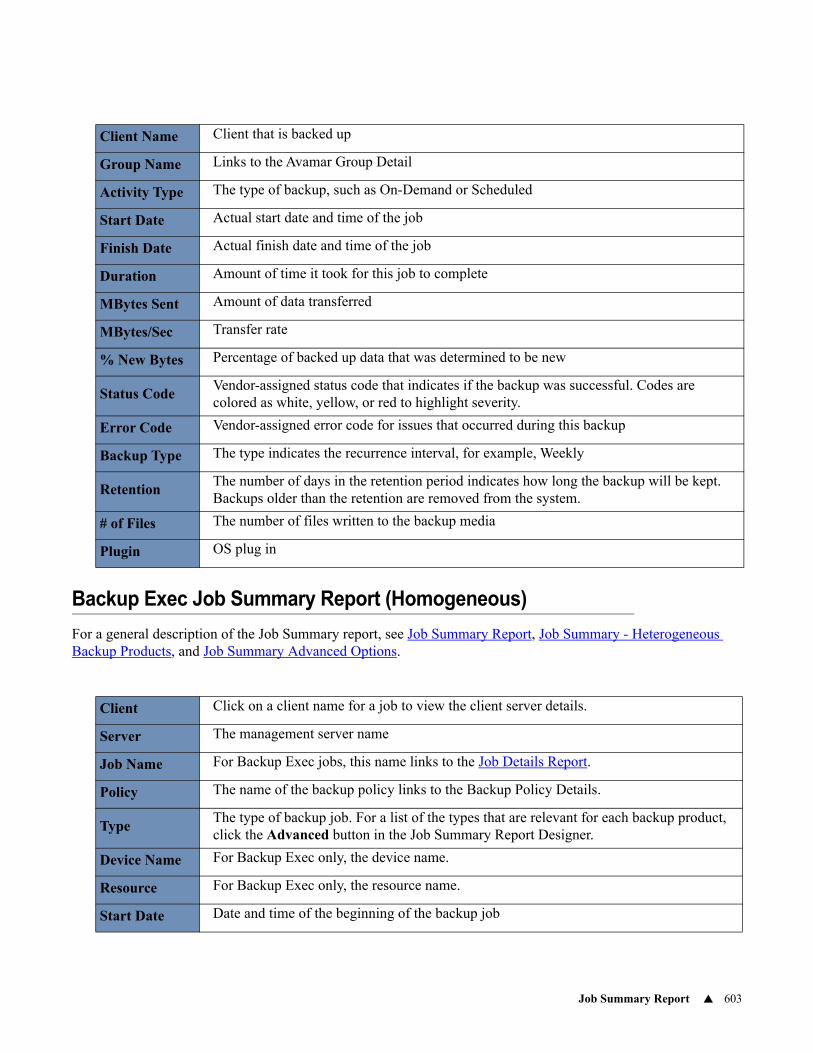
Job Summary Report 603
Backup Exec Job Summary Report (Homogeneous)
For a general description of the Job Summary report, see Job Summary Report, Job Summary - Heterogeneous Backup Products, and Job Summary Advanced Options.
Client Name Client that is backed up
Group Name Links to the Avamar Group Detail
Activity Type The type of backup, such as On-Demand or Scheduled
Start Date Actual start date and time of the job
Finish Date Actual finish date and time of the job
Duration Amount of time it took for this job to complete
MBytes Sent Amount of data transferred
MBytes/Sec Transfer rate
% New Bytes Percentage of backed up data that was determined to be new
Status CodeVendor-assigned status code that indicates if the backup was successful. Codes are colored as white, yellow, or red to highlight severity.
Error Code Vendor-assigned error code for issues that occurred during this backup
Backup Type The type indicates the recurrence interval, for example, Weekly
RetentionThe number of days in the retention period indicates how long the backup will be kept. Backups older than the retention are removed from the system.
# of Files The number of files written to the backup media
Plugin OS plug in
Client Click on a client name for a job to view the client server details.
Server The management server name
Job Name For Backup Exec jobs, this name links to the Job Details Report.
Policy The name of the backup policy links to the Backup Policy Details.
TypeThe type of backup job. For a list of the types that are relevant for each backup product, click the Advanced button in the Job Summary Report Designer.
Device Name For Backup Exec only, the device name.
Resource For Backup Exec only, the resource name.
Start Date Date and time of the beginning of the backup job
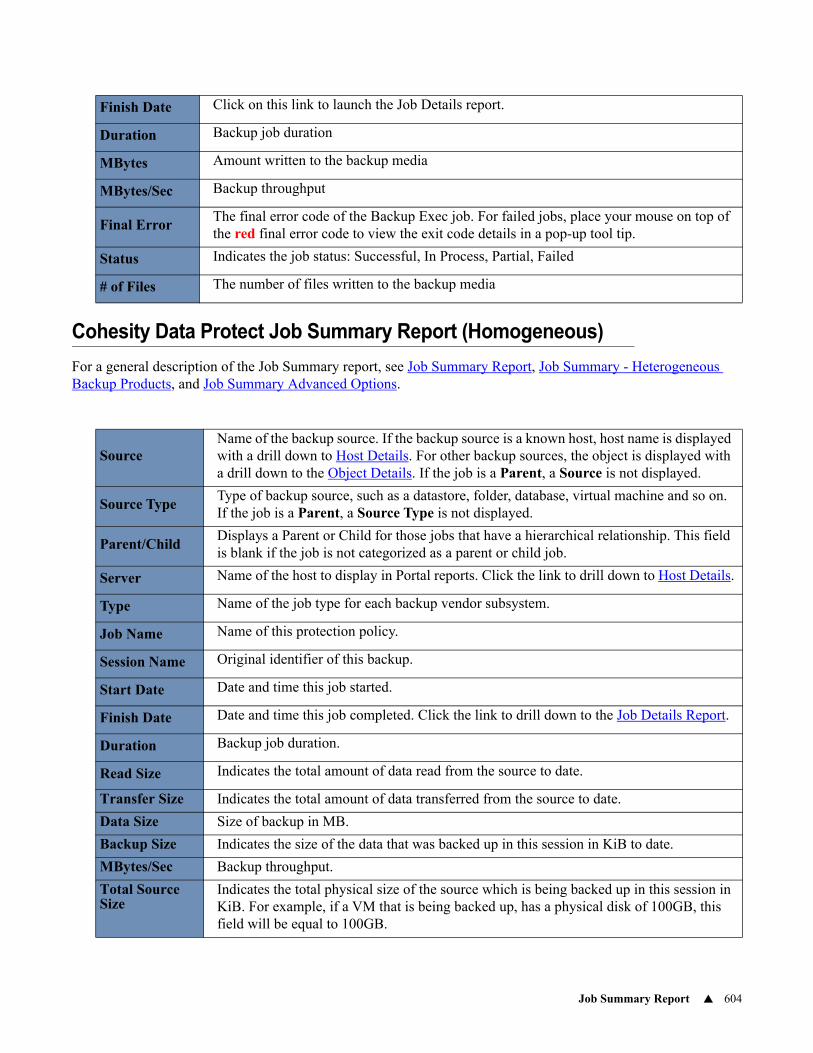
Job Summary Report 604
Cohesity Data Protect Job Summary Report (Homogeneous)
For a general description of the Job Summary report, see Job Summary Report, Job Summary - Heterogeneous Backup Products, and Job Summary Advanced Options.
Finish Date Click on this link to launch the Job Details report.
Duration Backup job duration
MBytes Amount written to the backup media
MBytes/Sec Backup throughput
Final ErrorThe final error code of the Backup Exec job. For failed jobs, place your mouse on top of the red final error code to view the exit code details in a pop-up tool tip.
Status Indicates the job status: Successful, In Process, Partial, Failed
# of Files The number of files written to the backup media
SourceName of the backup source. If the backup source is a known host, host name is displayed with a drill down to Host Details. For other backup sources, the object is displayed with a drill down to the Object Details. If the job is a Parent, a Source is not displayed.
Source TypeType of backup source, such as a datastore, folder, database, virtual machine and so on. If the job is a Parent, a Source Type is not displayed.
Parent/ChildDisplays a Parent or Child for those jobs that have a hierarchical relationship. This field is blank if the job is not categorized as a parent or child job.
Server Name of the host to display in Portal reports. Click the link to drill down to Host Details.
Type Name of the job type for each backup vendor subsystem.
Job Name Name of this protection policy.
Session Name Original identifier of this backup.
Start Date Date and time this job started.
Finish Date Date and time this job completed. Click the link to drill down to the Job Details Report.
Duration Backup job duration.
Read Size Indicates the total amount of data read from the source to date.
Transfer Size Indicates the total amount of data transferred from the source to date.
Data Size Size of backup in MB.
Backup Size Indicates the size of the data that was backed up in this session in KiB to date.
MBytes/Sec Backup throughput.
Total Source Size
Indicates the total physical size of the source which is being backed up in this session in KiB. For example, if a VM that is being backed up, has a physical disk of 100GB, this field will be equal to 100GB.
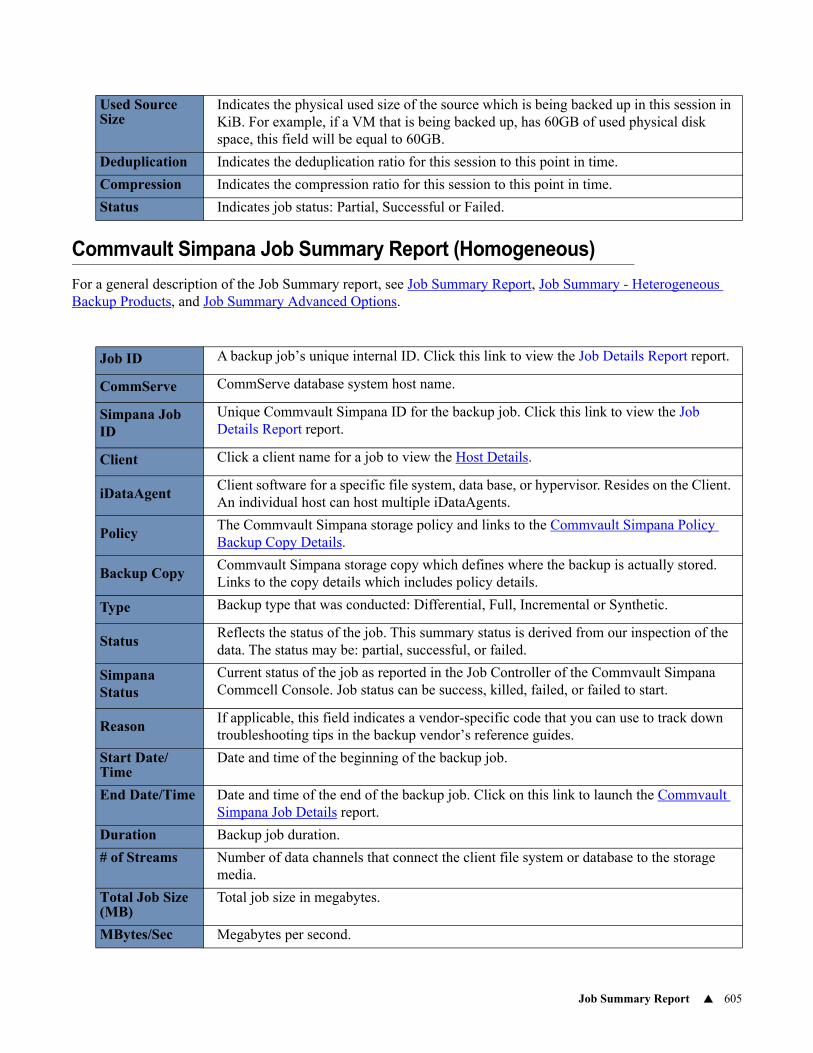
Job Summary Report 605
Commvault Simpana Job Summary Report (Homogeneous)
For a general description of the Job Summary report, see Job Summary Report, Job Summary - Heterogeneous Backup Products, and Job Summary Advanced Options.
Used Source Size
Indicates the physical used size of the source which is being backed up in this session in KiB. For example, if a VM that is being backed up, has 60GB of used physical disk space, this field will be equal to 60GB.
Deduplication Indicates the deduplication ratio for this session to this point in time.
Compression Indicates the compression ratio for this session to this point in time.
Status Indicates job status: Partial, Successful or Failed.
Job ID A backup job’s unique internal ID. Click this link to view the Job Details Report report.
CommServe CommServe database system host name.
Simpana Job ID
Unique Commvault Simpana ID for the backup job. Click this link to view the Job Details Report report.
Client Click a client name for a job to view the Host Details.
iDataAgentClient software for a specific file system, data base, or hypervisor. Resides on the Client. An individual host can host multiple iDataAgents.
PolicyThe Commvault Simpana storage policy and links to the Commvault Simpana Policy Backup Copy Details.
Backup CopyCommvault Simpana storage copy which defines where the backup is actually stored. Links to the copy details which includes policy details.
Type Backup type that was conducted: Differential, Full, Incremental or Synthetic.
StatusReflects the status of the job. This summary status is derived from our inspection of the data. The status may be: partial, successful, or failed.
Simpana Status
Current status of the job as reported in the Job Controller of the Commvault Simpana Commcell Console. Job status can be success, killed, failed, or failed to start.
ReasonIf applicable, this field indicates a vendor-specific code that you can use to track down troubleshooting tips in the backup vendor’s reference guides.
Start Date/Time
Date and time of the beginning of the backup job.
End Date/Time Date and time of the end of the backup job. Click on this link to launch the Commvault Simpana Job Details report.
Duration Backup job duration.
# of Streams Number of data channels that connect the client file system or database to the storage media.
Total Job Size (MB)
Total job size in megabytes.
MBytes/Sec Megabytes per second.
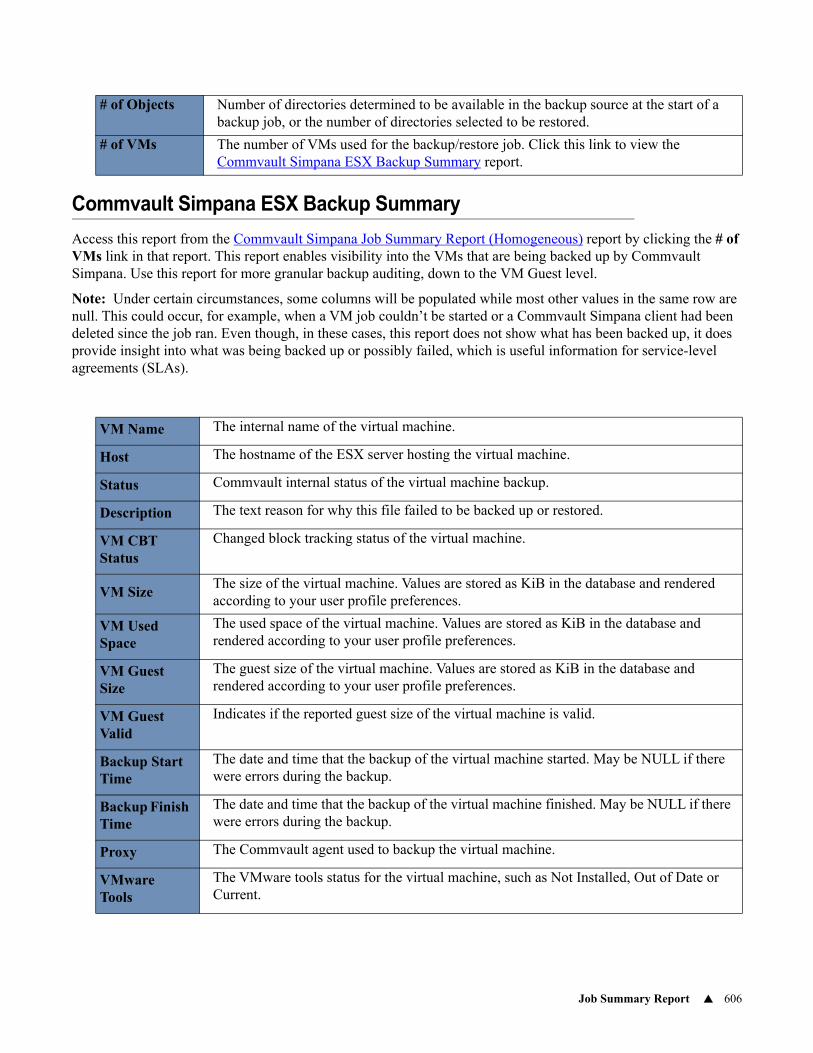
Job Summary Report 606
Commvault Simpana ESX Backup Summary
Access this report from the Commvault Simpana Job Summary Report (Homogeneous) report by clicking the # of VMs link in that report. This report enables visibility into the VMs that are being backed up by Commvault Simpana. Use this report for more granular backup auditing, down to the VM Guest level.
Note: Under certain circumstances, some columns will be populated while most other values in the same row are null. This could occur, for example, when a VM job couldn’t be started or a Commvault Simpana client had been deleted since the job ran. Even though, in these cases, this report does not show what has been backed up, it does provide insight into what was being backed up or possibly failed, which is useful information for service-level agreements (SLAs).
# of Objects Number of directories determined to be available in the backup source at the start of a backup job, or the number of directories selected to be restored.
# of VMs The number of VMs used for the backup/restore job. Click this link to view the Commvault Simpana ESX Backup Summary report.
VM Name The internal name of the virtual machine.
Host The hostname of the ESX server hosting the virtual machine.
Status Commvault internal status of the virtual machine backup.
Description The text reason for why this file failed to be backed up or restored.
VM CBT Status
Changed block tracking status of the virtual machine.
VM SizeThe size of the virtual machine. Values are stored as KiB in the database and rendered according to your user profile preferences.
VM Used Space
The used space of the virtual machine. Values are stored as KiB in the database and rendered according to your user profile preferences.
VM Guest Size
The guest size of the virtual machine. Values are stored as KiB in the database and rendered according to your user profile preferences.
VM Guest Valid
Indicates if the reported guest size of the virtual machine is valid.
Backup Start Time
The date and time that the backup of the virtual machine started. May be NULL if there were errors during the backup.
Backup Finish Time
The date and time that the backup of the virtual machine finished. May be NULL if there were errors during the backup.
Proxy The Commvault agent used to backup the virtual machine.
VMware Tools
The VMware tools status for the virtual machine, such as Not Installed, Out of Date or Current.
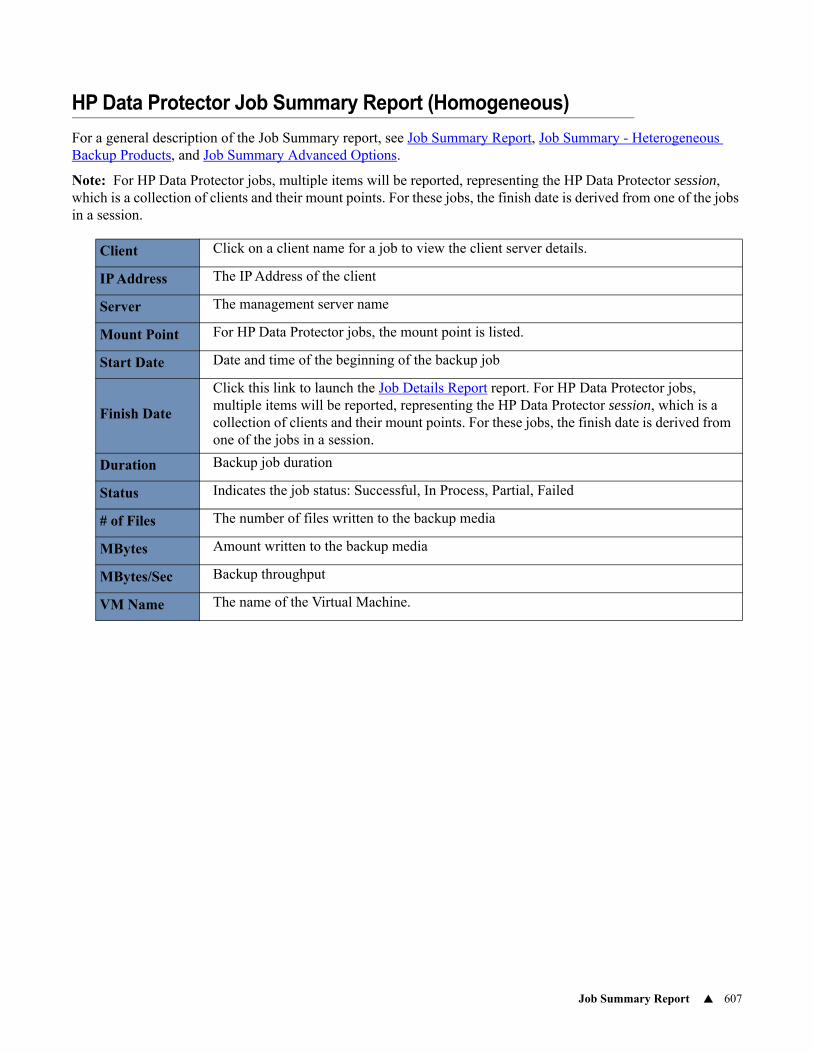
Job Summary Report 607
HP Data Protector Job Summary Report (Homogeneous)
For a general description of the Job Summary report, see Job Summary Report, Job Summary - Heterogeneous Backup Products, and Job Summary Advanced Options.
Note: For HP Data Protector jobs, multiple items will be reported, representing the HP Data Protector session, which is a collection of clients and their mount points. For these jobs, the finish date is derived from one of the jobs in a session.
Client Click on a client name for a job to view the client server details.
IP Address The IP Address of the client
Server The management server name
Mount Point For HP Data Protector jobs, the mount point is listed.
Start Date Date and time of the beginning of the backup job
Finish Date
Click this link to launch the Job Details Report report. For HP Data Protector jobs, multiple items will be reported, representing the HP Data Protector session, which is a collection of clients and their mount points. For these jobs, the finish date is derived from one of the jobs in a session.
Duration Backup job duration
Status Indicates the job status: Successful, In Process, Partial, Failed
# of Files The number of files written to the backup media
MBytes Amount written to the backup media
MBytes/Sec Backup throughput
VM Name The name of the Virtual Machine.
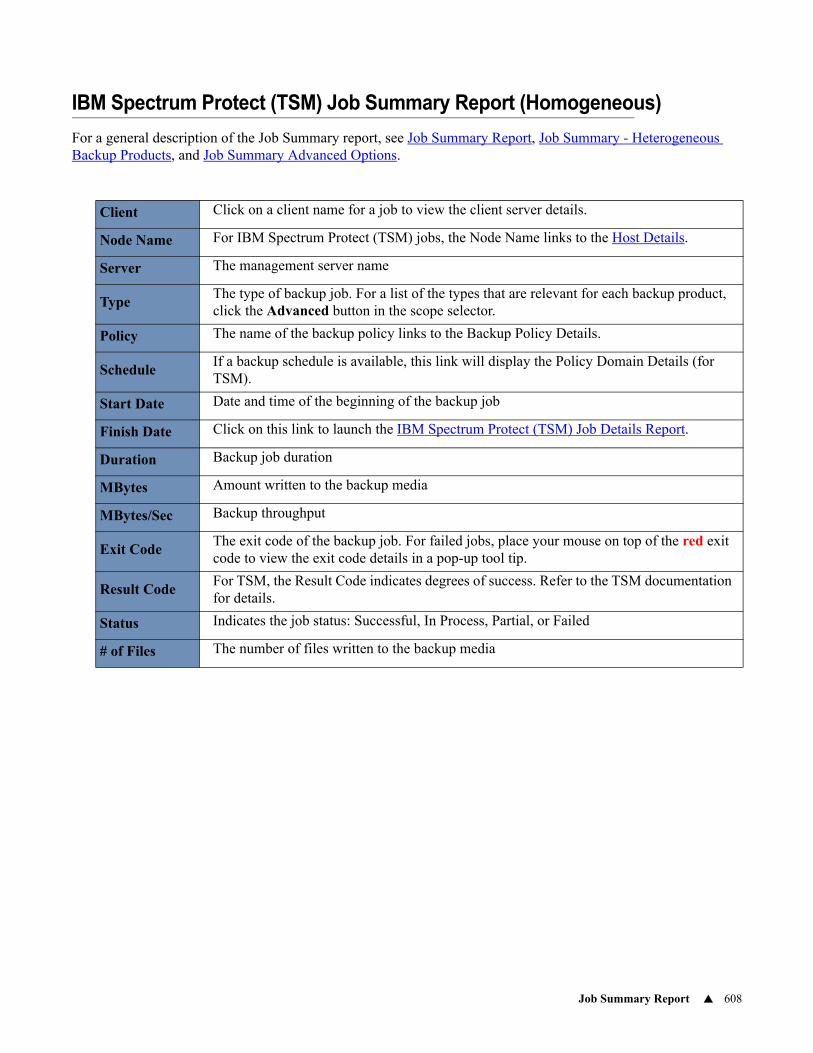
Job Summary Report 608
IBM Spectrum Protect (TSM) Job Summary Report (Homogeneous)
For a general description of the Job Summary report, see Job Summary Report, Job Summary - Heterogeneous Backup Products, and Job Summary Advanced Options.
Client Click on a client name for a job to view the client server details.
Node Name For IBM Spectrum Protect (TSM) jobs, the Node Name links to the Host Details.
Server The management server name
TypeThe type of backup job. For a list of the types that are relevant for each backup product, click the Advanced button in the scope selector.
Policy The name of the backup policy links to the Backup Policy Details.
ScheduleIf a backup schedule is available, this link will display the Policy Domain Details (for TSM).
Start Date Date and time of the beginning of the backup job
Finish Date Click on this link to launch the IBM Spectrum Protect (TSM) Job Details Report.
Duration Backup job duration
MBytes Amount written to the backup media
MBytes/Sec Backup throughput
Exit CodeThe exit code of the backup job. For failed jobs, place your mouse on top of the red exit code to view the exit code details in a pop-up tool tip.
Result CodeFor TSM, the Result Code indicates degrees of success. Refer to the TSM documentation for details.
Status Indicates the job status: Successful, In Process, Partial, or Failed
# of Files The number of files written to the backup media
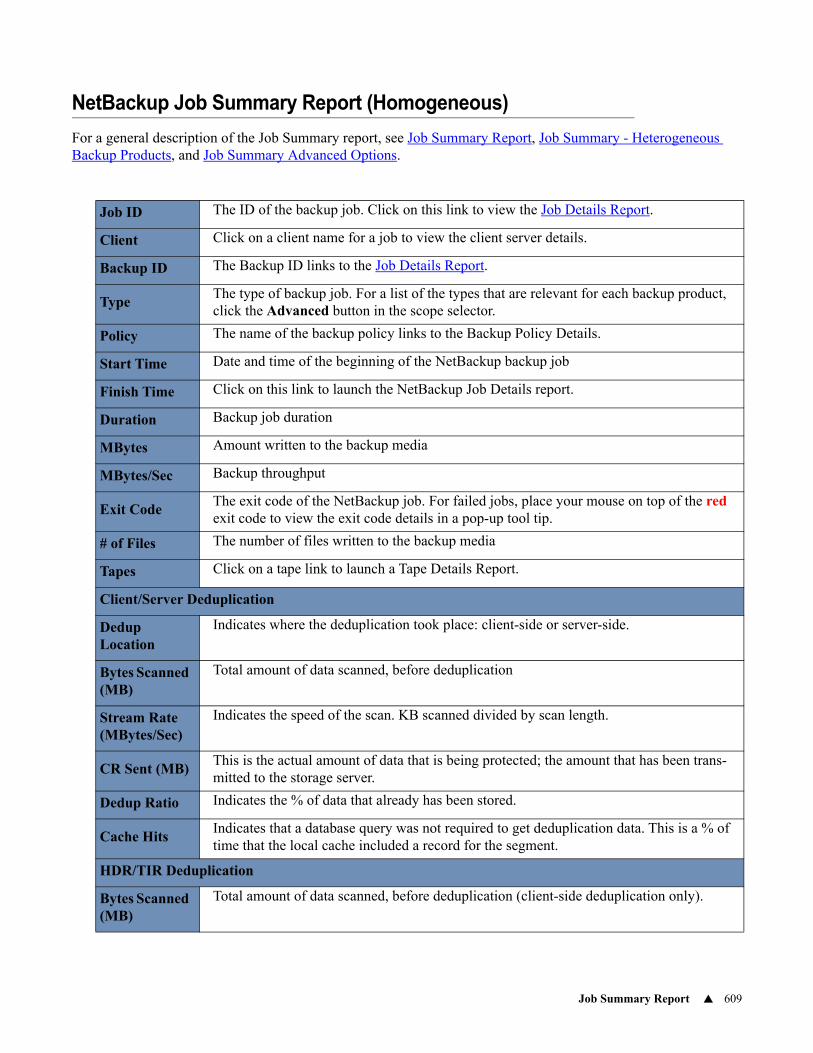
Job Summary Report 609
NetBackup Job Summary Report (Homogeneous)
For a general description of the Job Summary report, see Job Summary Report, Job Summary - Heterogeneous Backup Products, and Job Summary Advanced Options.
Job ID The ID of the backup job. Click on this link to view the Job Details Report.
Client Click on a client name for a job to view the client server details.
Backup ID The Backup ID links to the Job Details Report.
TypeThe type of backup job. For a list of the types that are relevant for each backup product, click the Advanced button in the scope selector.
Policy The name of the backup policy links to the Backup Policy Details.
Start Time Date and time of the beginning of the NetBackup backup job
Finish Time Click on this link to launch the NetBackup Job Details report.
Duration Backup job duration
MBytes Amount written to the backup media
MBytes/Sec Backup throughput
Exit CodeThe exit code of the NetBackup job. For failed jobs, place your mouse on top of the red exit code to view the exit code details in a pop-up tool tip.
# of Files The number of files written to the backup media
Tapes Click on a tape link to launch a Tape Details Report.
Client/Server Deduplication
Dedup Location
Indicates where the deduplication took place: client-side or server-side.
Bytes Scanned (MB)
Total amount of data scanned, before deduplication
Stream Rate (MBytes/Sec)
Indicates the speed of the scan. KB scanned divided by scan length.
CR Sent (MB)This is the actual amount of data that is being protected; the amount that has been trans-mitted to the storage server.
Dedup Ratio Indicates the % of data that already has been stored.
Cache HitsIndicates that a database query was not required to get deduplication data. This is a % of time that the local cache included a record for the segment.
HDR/TIR Deduplication
Bytes Scanned (MB)
Total amount of data scanned, before deduplication (client-side deduplication only).
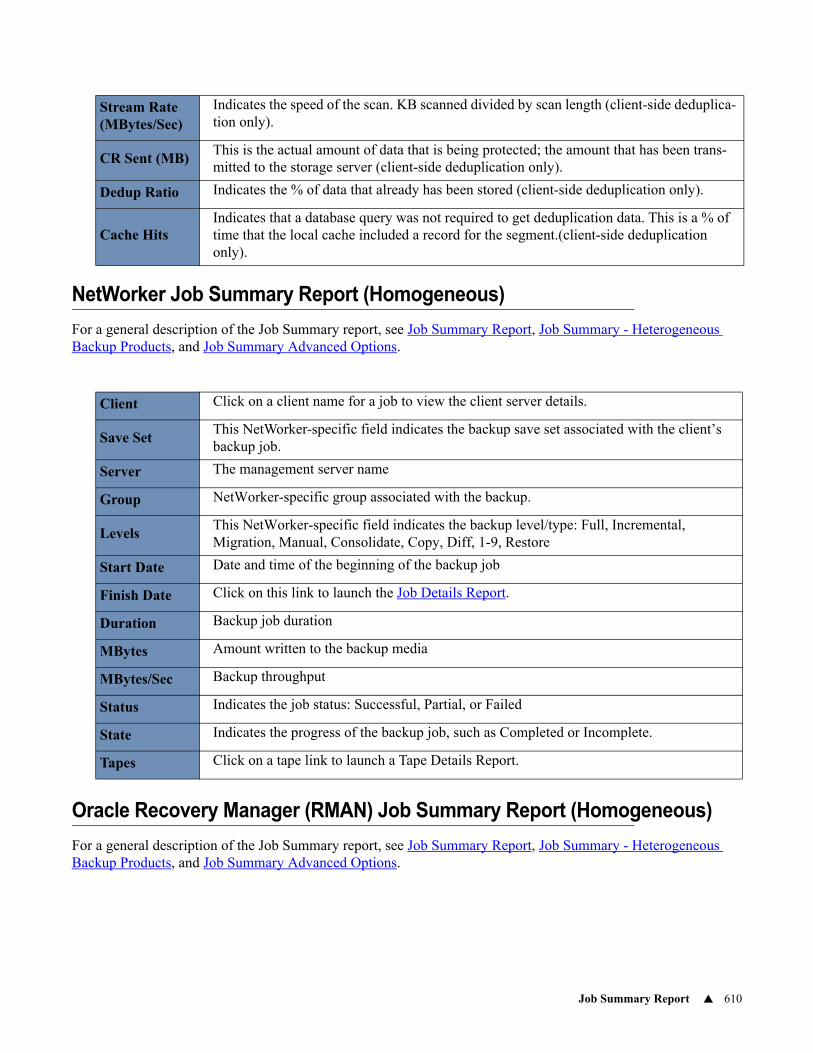
Job Summary Report 610
NetWorker Job Summary Report (Homogeneous)
For a general description of the Job Summary report, see Job Summary Report, Job Summary - Heterogeneous Backup Products, and Job Summary Advanced Options.
Oracle Recovery Manager (RMAN) Job Summary Report (Homogeneous)
For a general description of the Job Summary report, see Job Summary Report, Job Summary - Heterogeneous Backup Products, and Job Summary Advanced Options.
Stream Rate (MBytes/Sec)
Indicates the speed of the scan. KB scanned divided by scan length (client-side deduplica-tion only).
CR Sent (MB)This is the actual amount of data that is being protected; the amount that has been trans-mitted to the storage server (client-side deduplication only).
Dedup Ratio Indicates the % of data that already has been stored (client-side deduplication only).
Cache HitsIndicates that a database query was not required to get deduplication data. This is a % of time that the local cache included a record for the segment.(client-side deduplication only).
Client Click on a client name for a job to view the client server details.
Save SetThis NetWorker-specific field indicates the backup save set associated with the client’s backup job.
Server The management server name
Group NetWorker-specific group associated with the backup.
LevelsThis NetWorker-specific field indicates the backup level/type: Full, Incremental, Migration, Manual, Consolidate, Copy, Diff, 1-9, Restore
Start Date Date and time of the beginning of the backup job
Finish Date Click on this link to launch the Job Details Report.
Duration Backup job duration
MBytes Amount written to the backup media
MBytes/Sec Backup throughput
Status Indicates the job status: Successful, Partial, or Failed
State Indicates the progress of the backup job, such as Completed or Incomplete.
Tapes Click on a tape link to launch a Tape Details Report.
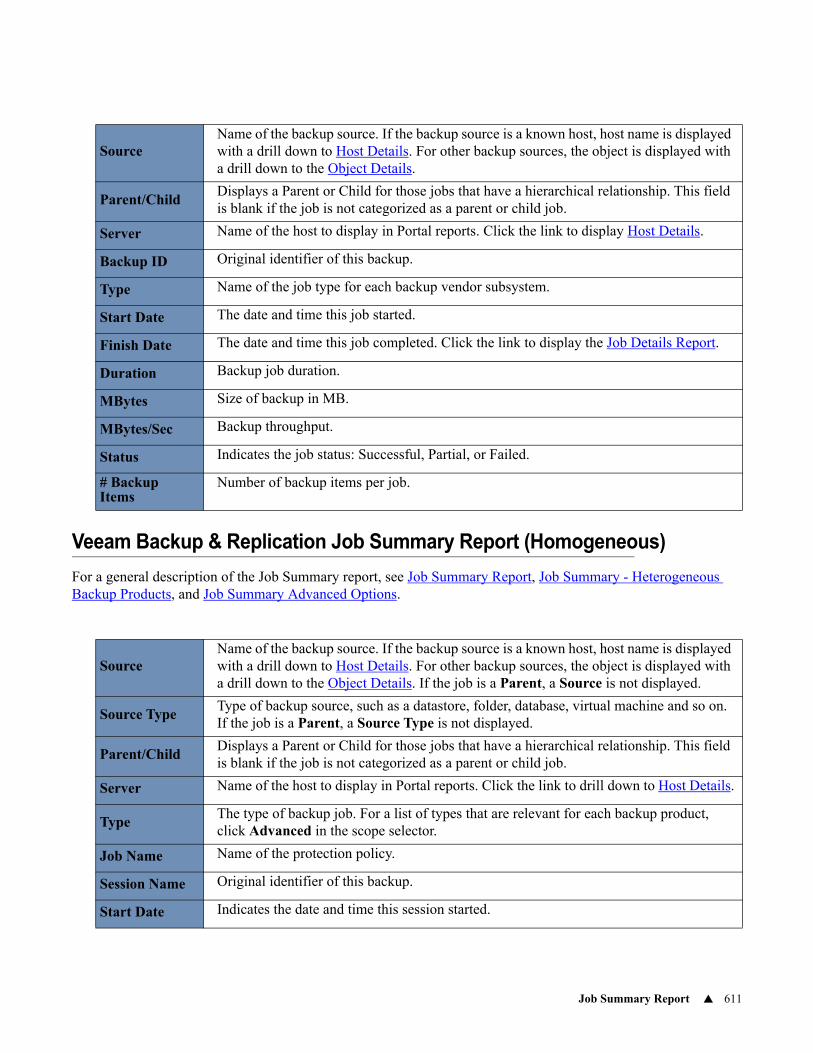
Job Summary Report 611
Veeam Backup & Replication Job Summary Report (Homogeneous)
For a general description of the Job Summary report, see Job Summary Report, Job Summary - Heterogeneous Backup Products, and Job Summary Advanced Options.
SourceName of the backup source. If the backup source is a known host, host name is displayed with a drill down to Host Details. For other backup sources, the object is displayed with a drill down to the Object Details.
Parent/ChildDisplays a Parent or Child for those jobs that have a hierarchical relationship. This field is blank if the job is not categorized as a parent or child job.
Server Name of the host to display in Portal reports. Click the link to display Host Details.
Backup ID Original identifier of this backup.
Type Name of the job type for each backup vendor subsystem.
Start Date The date and time this job started.
Finish Date The date and time this job completed. Click the link to display the Job Details Report.
Duration Backup job duration.
MBytes Size of backup in MB.
MBytes/Sec Backup throughput.
Status Indicates the job status: Successful, Partial, or Failed.
# Backup Items
Number of backup items per job.
SourceName of the backup source. If the backup source is a known host, host name is displayed with a drill down to Host Details. For other backup sources, the object is displayed with a drill down to the Object Details. If the job is a Parent, a Source is not displayed.
Source TypeType of backup source, such as a datastore, folder, database, virtual machine and so on. If the job is a Parent, a Source Type is not displayed.
Parent/ChildDisplays a Parent or Child for those jobs that have a hierarchical relationship. This field is blank if the job is not categorized as a parent or child job.
Server Name of the host to display in Portal reports. Click the link to drill down to Host Details.
TypeThe type of backup job. For a list of types that are relevant for each backup product, click Advanced in the scope selector.
Job Name Name of the protection policy.
Session Name Original identifier of this backup.
Start Date Indicates the date and time this session started.
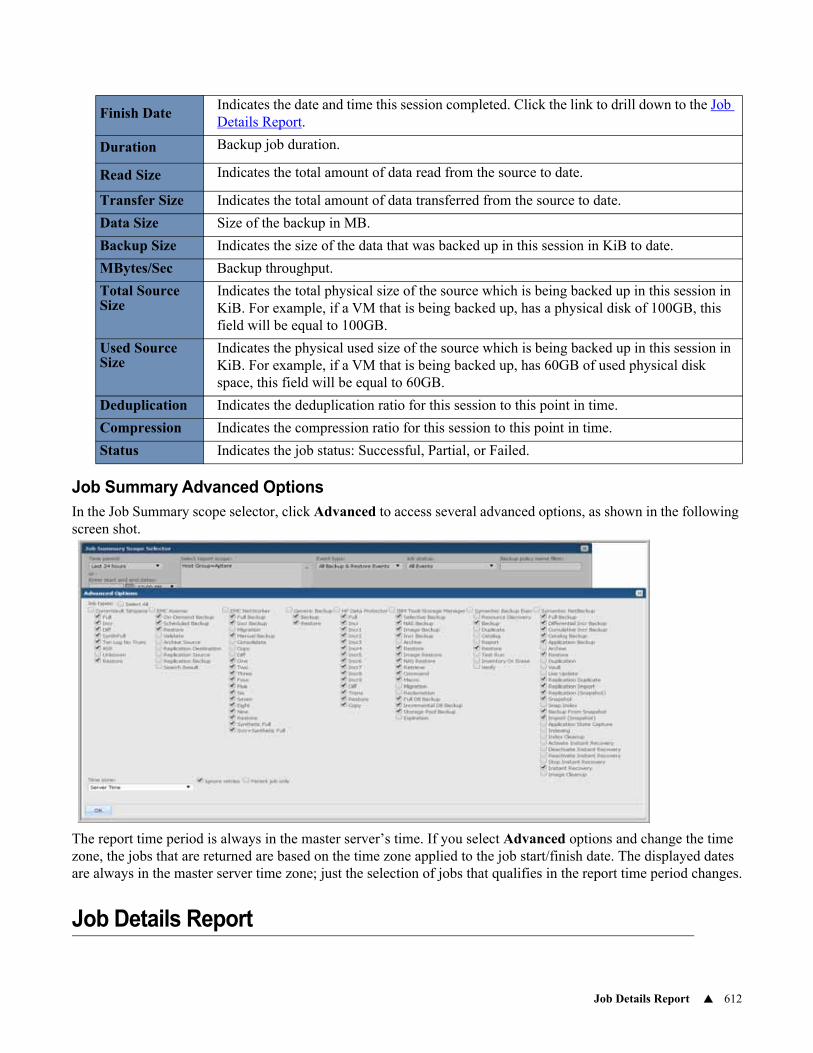
Job Details Report 612
Job Summary Advanced OptionsIn the Job Summary scope selector, click Advanced to access several advanced options, as shown in the following screen shot.
The report time period is always in the master server’s time. If you select Advanced options and change the time zone, the jobs that are returned are based on the time zone applied to the job start/finish date. The displayed dates are always in the master server time zone; just the selection of jobs that qualifies in the report time period changes.
Job Details Report
Finish DateIndicates the date and time this session completed. Click the link to drill down to the Job Details Report.
Duration Backup job duration.
Read Size Indicates the total amount of data read from the source to date.
Transfer Size Indicates the total amount of data transferred from the source to date.
Data Size Size of the backup in MB.
Backup Size Indicates the size of the data that was backed up in this session in KiB to date.
MBytes/Sec Backup throughput.
Total Source Size
Indicates the total physical size of the source which is being backed up in this session in KiB. For example, if a VM that is being backed up, has a physical disk of 100GB, this field will be equal to 100GB.
Used Source Size
Indicates the physical used size of the source which is being backed up in this session in KiB. For example, if a VM that is being backed up, has 60GB of used physical disk space, this field will be equal to 60GB.
Deduplication Indicates the deduplication ratio for this session to this point in time.
Compression Indicates the compression ratio for this session to this point in time.
Status Indicates the job status: Successful, Partial, or Failed.
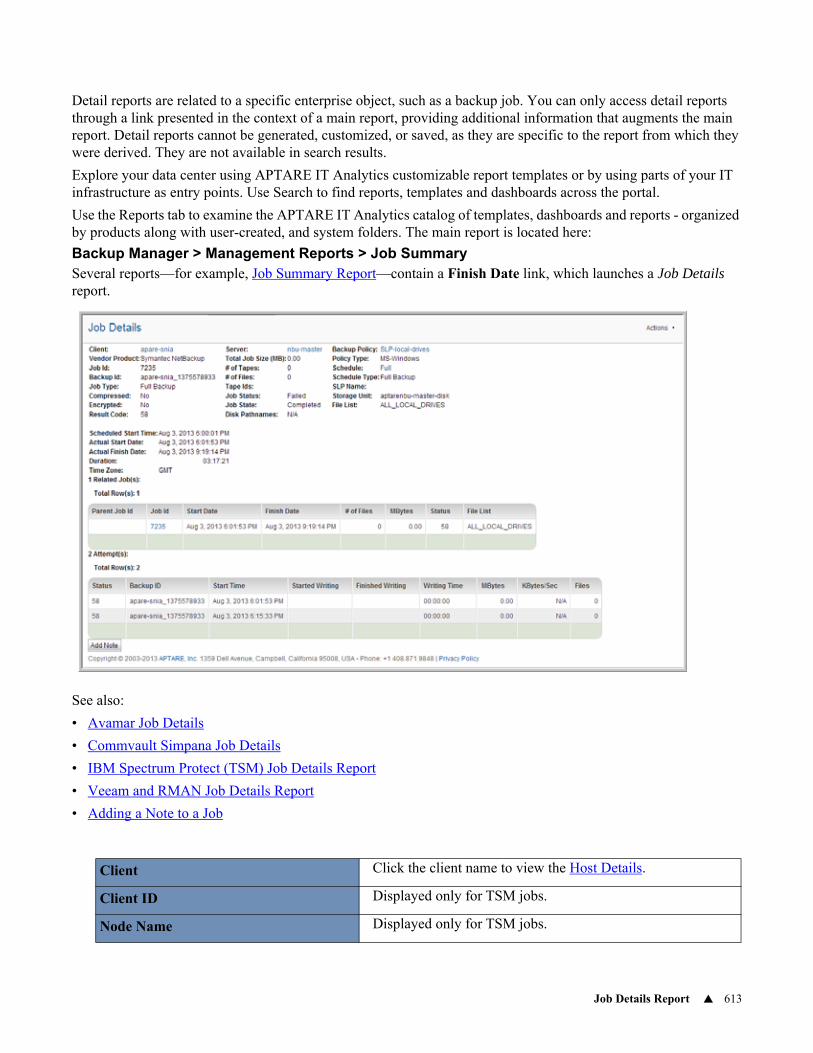
Job Details Report 613
Detail reports are related to a specific enterprise object, such as a backup job. You can only access detail reports through a link presented in the context of a main report, providing additional information that augments the main report. Detail reports cannot be generated, customized, or saved, as they are specific to the report from which they were derived. They are not available in search results.
Explore your data center using APTARE IT Analytics customizable report templates or by using parts of your IT infrastructure as entry points. Use Search to find reports, templates and dashboards across the portal.
Use the Reports tab to examine the APTARE IT Analytics catalog of templates, dashboards and reports - organized by products along with user-created, and system folders. The main report is located here:
Backup Manager > Management Reports > Job SummarySeveral reports—for example, Job Summary Report—contain a Finish Date link, which launches a Job Details report.
See also:
• Avamar Job Details
• Commvault Simpana Job Details
• IBM Spectrum Protect (TSM) Job Details Report
• Veeam and RMAN Job Details Report
• Adding a Note to a Job
Client Click the client name to view the Host Details.
Client ID Displayed only for TSM jobs.
Node Name Displayed only for TSM jobs.
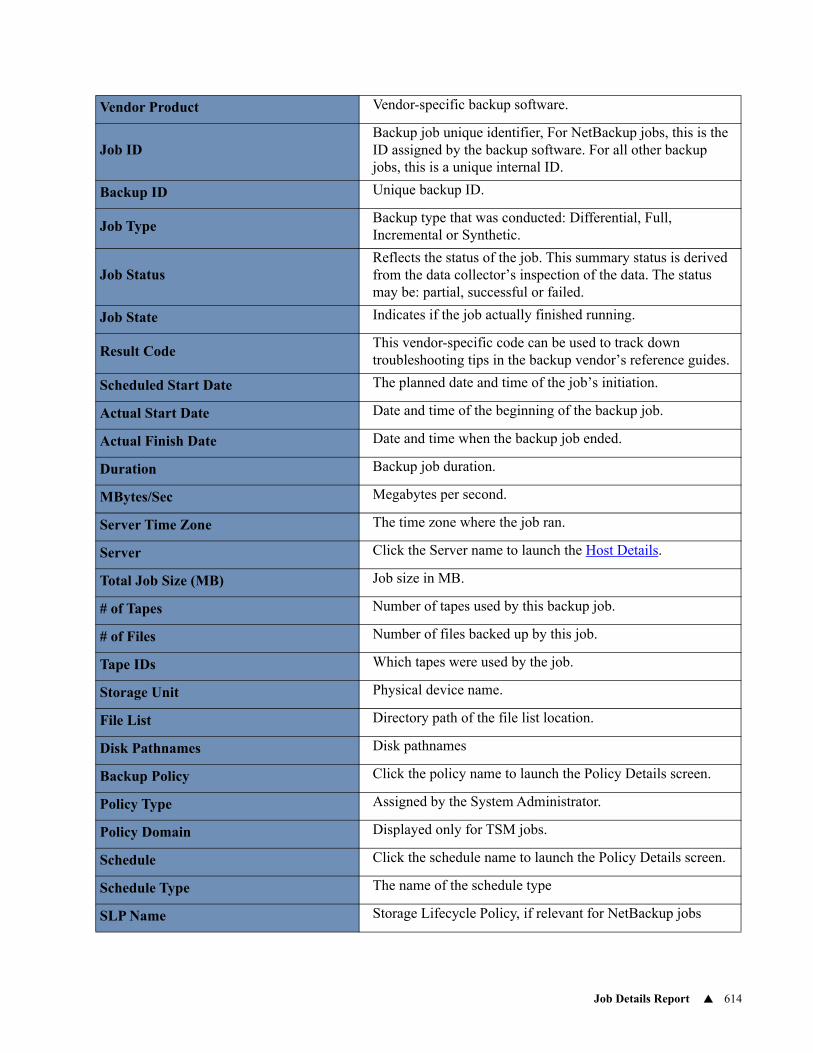
Job Details Report 614
Vendor Product Vendor-specific backup software.
Job IDBackup job unique identifier, For NetBackup jobs, this is the ID assigned by the backup software. For all other backup jobs, this is a unique internal ID.
Backup ID Unique backup ID.
Job TypeBackup type that was conducted: Differential, Full, Incremental or Synthetic.
Job StatusReflects the status of the job. This summary status is derived from the data collector’s inspection of the data. The status may be: partial, successful or failed.
Job State Indicates if the job actually finished running.
Result CodeThis vendor-specific code can be used to track down troubleshooting tips in the backup vendor’s reference guides.
Scheduled Start Date The planned date and time of the job’s initiation.
Actual Start Date Date and time of the beginning of the backup job.
Actual Finish Date Date and time when the backup job ended.
Duration Backup job duration.
MBytes/Sec Megabytes per second.
Server Time Zone The time zone where the job ran.
Server Click the Server name to launch the Host Details.
Total Job Size (MB) Job size in MB.
# of Tapes Number of tapes used by this backup job.
# of Files Number of files backed up by this job.
Tape IDs Which tapes were used by the job.
Storage Unit Physical device name.
File List Directory path of the file list location.
Disk Pathnames Disk pathnames
Backup Policy Click the policy name to launch the Policy Details screen.
Policy Type Assigned by the System Administrator.
Policy Domain Displayed only for TSM jobs.
Schedule Click the schedule name to launch the Policy Details screen.
Schedule Type The name of the schedule type
SLP Name Storage Lifecycle Policy, if relevant for NetBackup jobs
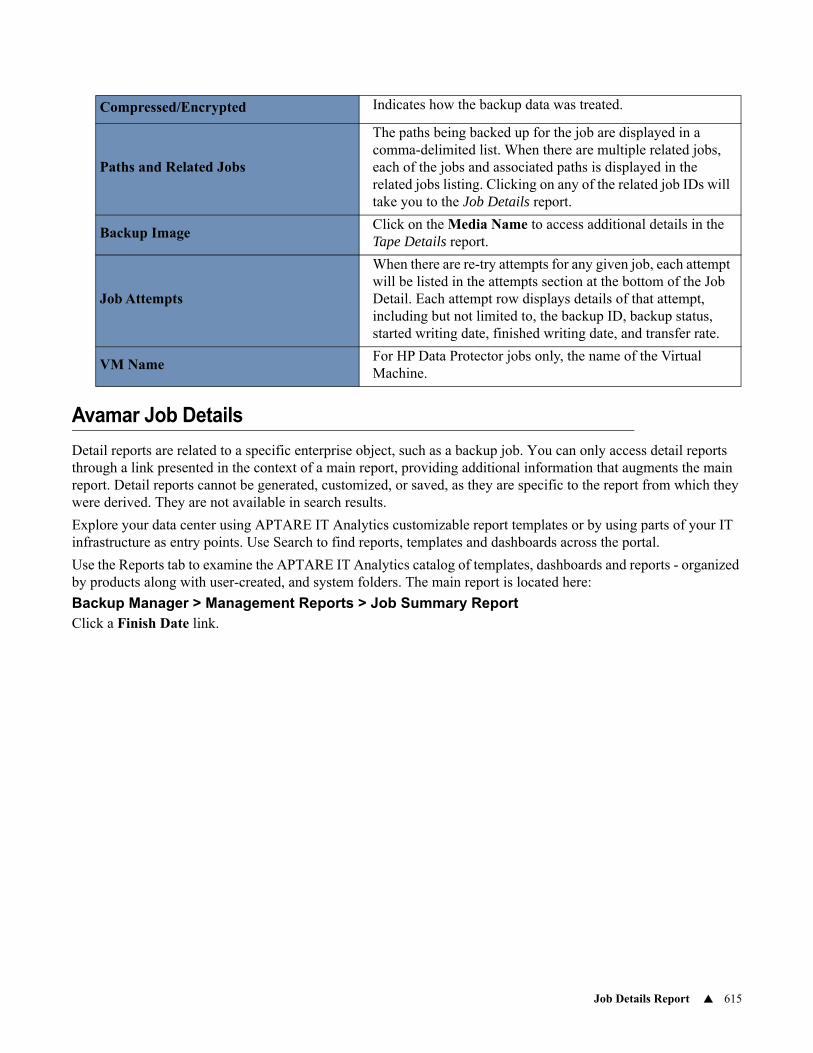
Job Details Report 615
Avamar Job Details
Detail reports are related to a specific enterprise object, such as a backup job. You can only access detail reports through a link presented in the context of a main report, providing additional information that augments the main report. Detail reports cannot be generated, customized, or saved, as they are specific to the report from which they were derived. They are not available in search results.
Explore your data center using APTARE IT Analytics customizable report templates or by using parts of your IT infrastructure as entry points. Use Search to find reports, templates and dashboards across the portal.
Use the Reports tab to examine the APTARE IT Analytics catalog of templates, dashboards and reports - organized by products along with user-created, and system folders. The main report is located here:
Backup Manager > Management Reports > Job Summary Report Click a Finish Date link.
Compressed/Encrypted Indicates how the backup data was treated.
Paths and Related Jobs
The paths being backed up for the job are displayed in a comma-delimited list. When there are multiple related jobs, each of the jobs and associated paths is displayed in the related jobs listing. Clicking on any of the related job IDs will take you to the Job Details report.
Backup ImageClick on the Media Name to access additional details in the Tape Details report.
Job Attempts
When there are re-try attempts for any given job, each attempt will be listed in the attempts section at the bottom of the Job Detail. Each attempt row displays details of that attempt, including but not limited to, the backup ID, backup status, started writing date, finished writing date, and transfer rate.
VM NameFor HP Data Protector jobs only, the name of the Virtual Machine.
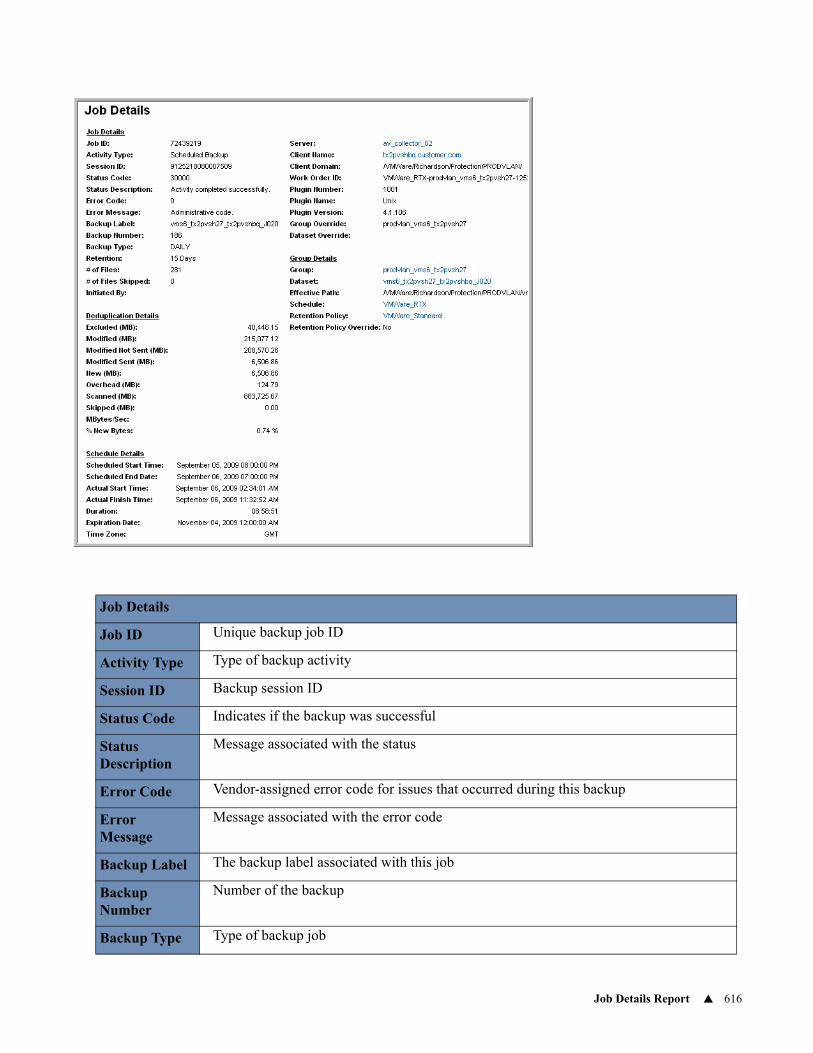
Job Details Report 616
Job Details
Job ID Unique backup job ID
Activity Type Type of backup activity
Session ID Backup session ID
Status Code Indicates if the backup was successful
Status Description
Message associated with the status
Error Code Vendor-assigned error code for issues that occurred during this backup
Error Message
Message associated with the error code
Backup Label The backup label associated with this job
Backup Number
Number of the backup
Backup Type Type of backup job
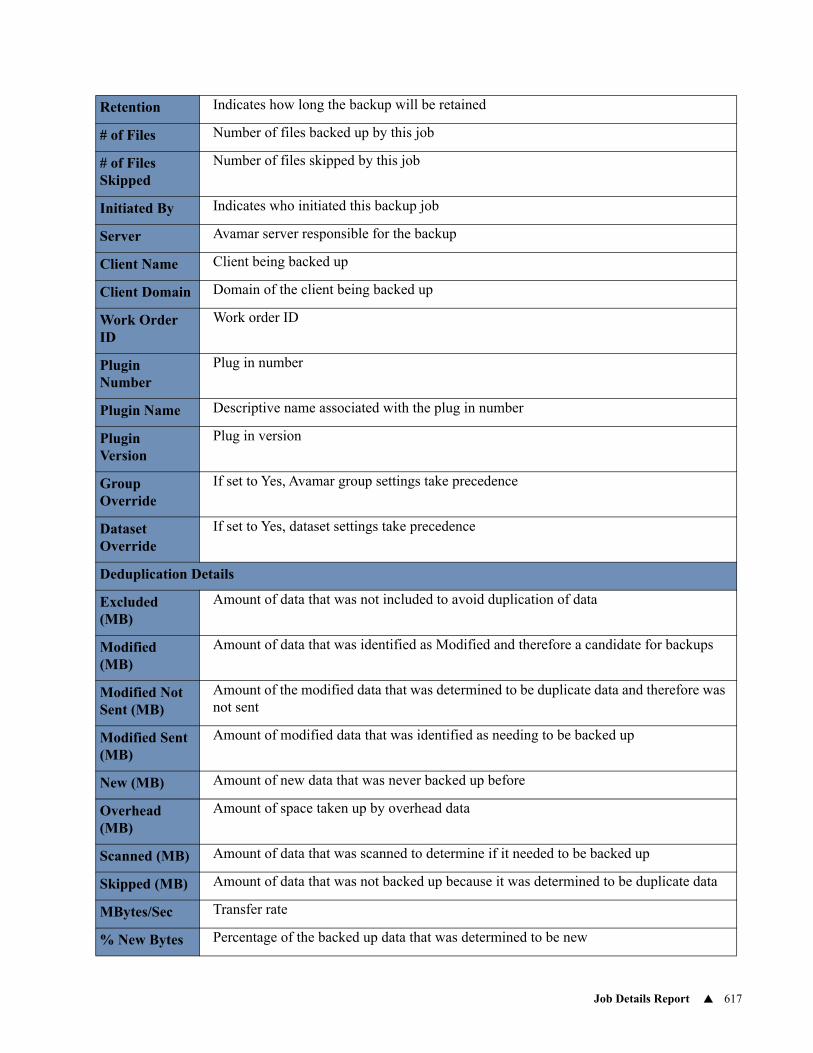
Job Details Report 617
Retention Indicates how long the backup will be retained
# of Files Number of files backed up by this job
# of Files Skipped
Number of files skipped by this job
Initiated By Indicates who initiated this backup job
Server Avamar server responsible for the backup
Client Name Client being backed up
Client Domain Domain of the client being backed up
Work Order ID
Work order ID
Plugin Number
Plug in number
Plugin Name Descriptive name associated with the plug in number
Plugin Version
Plug in version
Group Override
If set to Yes, Avamar group settings take precedence
Dataset Override
If set to Yes, dataset settings take precedence
Deduplication Details
Excluded (MB)
Amount of data that was not included to avoid duplication of data
Modified (MB)
Amount of data that was identified as Modified and therefore a candidate for backups
Modified Not Sent (MB)
Amount of the modified data that was determined to be duplicate data and therefore was not sent
Modified Sent (MB)
Amount of modified data that was identified as needing to be backed up
New (MB) Amount of new data that was never backed up before
Overhead (MB)
Amount of space taken up by overhead data
Scanned (MB) Amount of data that was scanned to determine if it needed to be backed up
Skipped (MB) Amount of data that was not backed up because it was determined to be duplicate data
MBytes/Sec Transfer rate
% New Bytes Percentage of the backed up data that was determined to be new
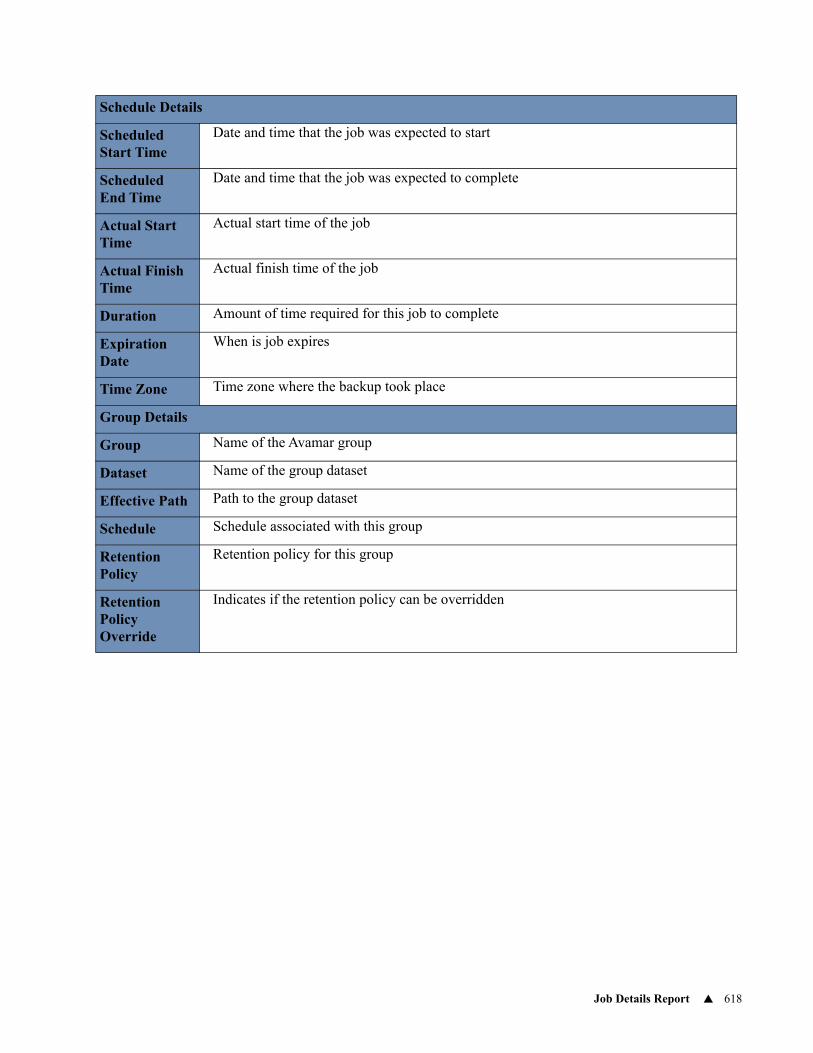
Job Details Report 618
Schedule Details
Scheduled Start Time
Date and time that the job was expected to start
Scheduled End Time
Date and time that the job was expected to complete
Actual Start Time
Actual start time of the job
Actual Finish Time
Actual finish time of the job
Duration Amount of time required for this job to complete
Expiration Date
When is job expires
Time Zone Time zone where the backup took place
Group Details
Group Name of the Avamar group
Dataset Name of the group dataset
Effective Path Path to the group dataset
Schedule Schedule associated with this group
Retention Policy
Retention policy for this group
Retention Policy Override
Indicates if the retention policy can be overridden
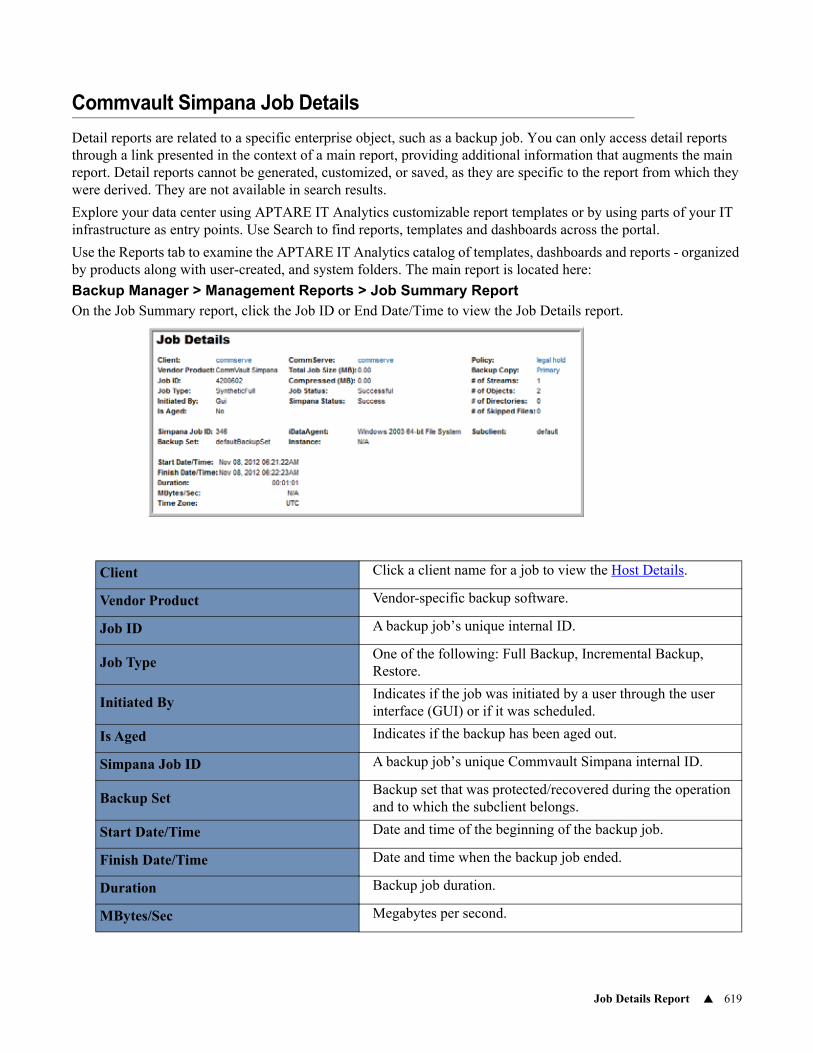
Job Details Report 619
Commvault Simpana Job Details
Detail reports are related to a specific enterprise object, such as a backup job. You can only access detail reports through a link presented in the context of a main report, providing additional information that augments the main report. Detail reports cannot be generated, customized, or saved, as they are specific to the report from which they were derived. They are not available in search results.
Explore your data center using APTARE IT Analytics customizable report templates or by using parts of your IT infrastructure as entry points. Use Search to find reports, templates and dashboards across the portal.
Use the Reports tab to examine the APTARE IT Analytics catalog of templates, dashboards and reports - organized by products along with user-created, and system folders. The main report is located here:
Backup Manager > Management Reports > Job Summary ReportOn the Job Summary report, click the Job ID or End Date/Time to view the Job Details report.
Client Click a client name for a job to view the Host Details.
Vendor Product Vendor-specific backup software.
Job ID A backup job’s unique internal ID.
Job TypeOne of the following: Full Backup, Incremental Backup, Restore.
Initiated ByIndicates if the job was initiated by a user through the user interface (GUI) or if it was scheduled.
Is Aged Indicates if the backup has been aged out.
Simpana Job ID A backup job’s unique Commvault Simpana internal ID.
Backup SetBackup set that was protected/recovered during the operation and to which the subclient belongs.
Start Date/Time Date and time of the beginning of the backup job.
Finish Date/Time Date and time when the backup job ended.
Duration Backup job duration.
MBytes/Sec Megabytes per second.
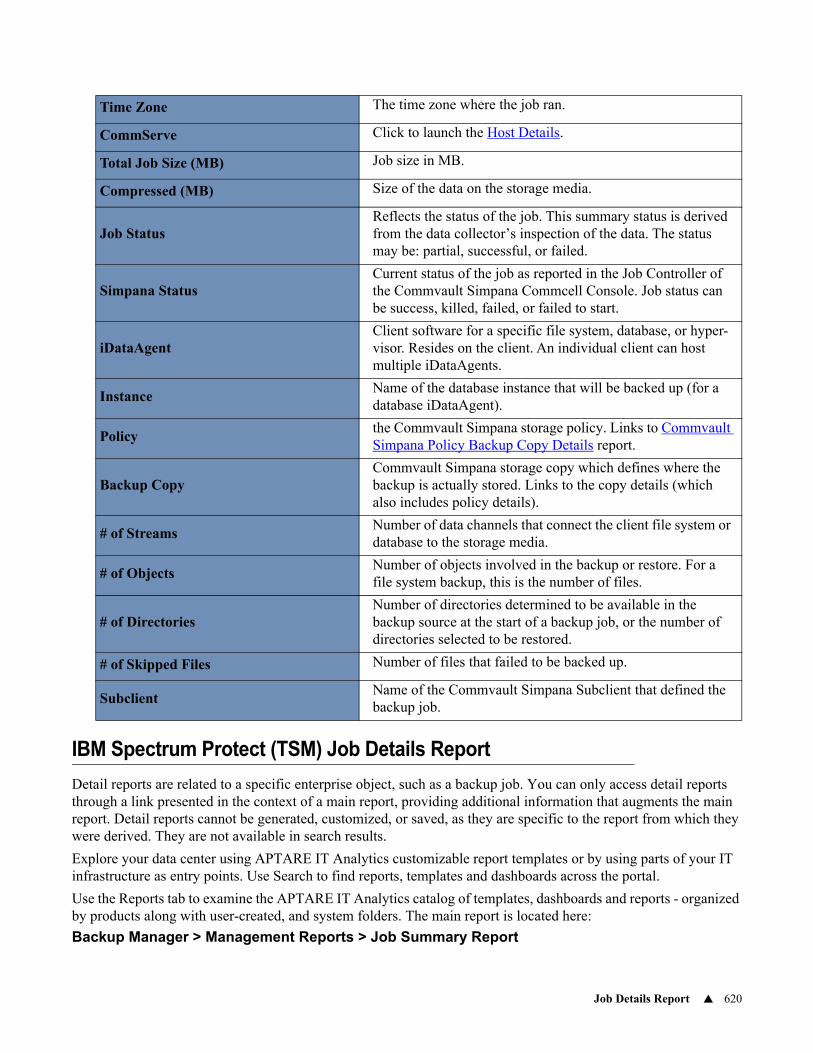
Job Details Report 620
IBM Spectrum Protect (TSM) Job Details Report
Detail reports are related to a specific enterprise object, such as a backup job. You can only access detail reports through a link presented in the context of a main report, providing additional information that augments the main report. Detail reports cannot be generated, customized, or saved, as they are specific to the report from which they were derived. They are not available in search results.
Explore your data center using APTARE IT Analytics customizable report templates or by using parts of your IT infrastructure as entry points. Use Search to find reports, templates and dashboards across the portal.
Use the Reports tab to examine the APTARE IT Analytics catalog of templates, dashboards and reports - organized by products along with user-created, and system folders. The main report is located here:
Backup Manager > Management Reports > Job Summary Report
Time Zone The time zone where the job ran.
CommServe Click to launch the Host Details.
Total Job Size (MB) Job size in MB.
Compressed (MB) Size of the data on the storage media.
Job StatusReflects the status of the job. This summary status is derived from the data collector’s inspection of the data. The status may be: partial, successful, or failed.
Simpana StatusCurrent status of the job as reported in the Job Controller of the Commvault Simpana Commcell Console. Job status can be success, killed, failed, or failed to start.
iDataAgentClient software for a specific file system, database, or hyper-visor. Resides on the client. An individual client can host multiple iDataAgents.
InstanceName of the database instance that will be backed up (for a database iDataAgent).
Policythe Commvault Simpana storage policy. Links to Commvault Simpana Policy Backup Copy Details report.
Backup CopyCommvault Simpana storage copy which defines where the backup is actually stored. Links to the copy details (which also includes policy details).
# of StreamsNumber of data channels that connect the client file system or database to the storage media.
# of ObjectsNumber of objects involved in the backup or restore. For a file system backup, this is the number of files.
# of DirectoriesNumber of directories determined to be available in the backup source at the start of a backup job, or the number of directories selected to be restored.
# of Skipped Files Number of files that failed to be backed up.
SubclientName of the Commvault Simpana Subclient that defined the backup job.
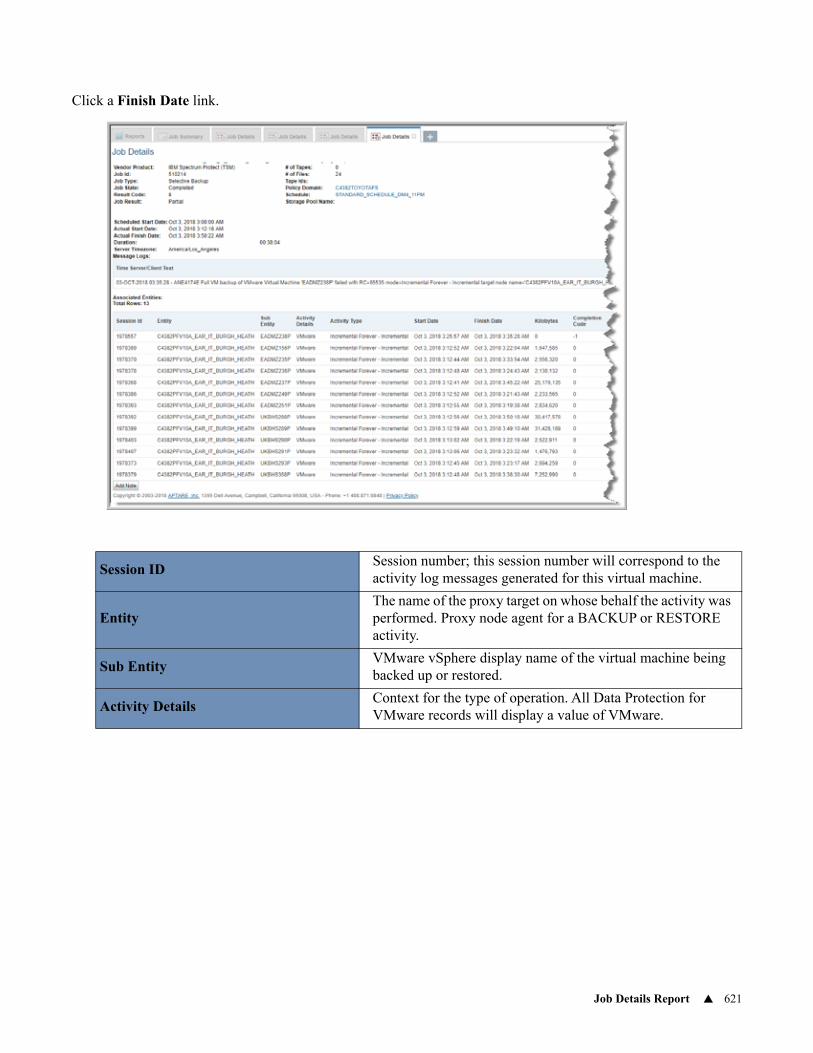
Job Details Report 621
Click a Finish Date link.
Session IDSession number; this session number will correspond to the activity log messages generated for this virtual machine.
EntityThe name of the proxy target on whose behalf the activity was performed. Proxy node agent for a BACKUP or RESTORE activity.
Sub EntityVMware vSphere display name of the virtual machine being backed up or restored.
Activity DetailsContext for the type of operation. All Data Protection for VMware records will display a value of VMware.
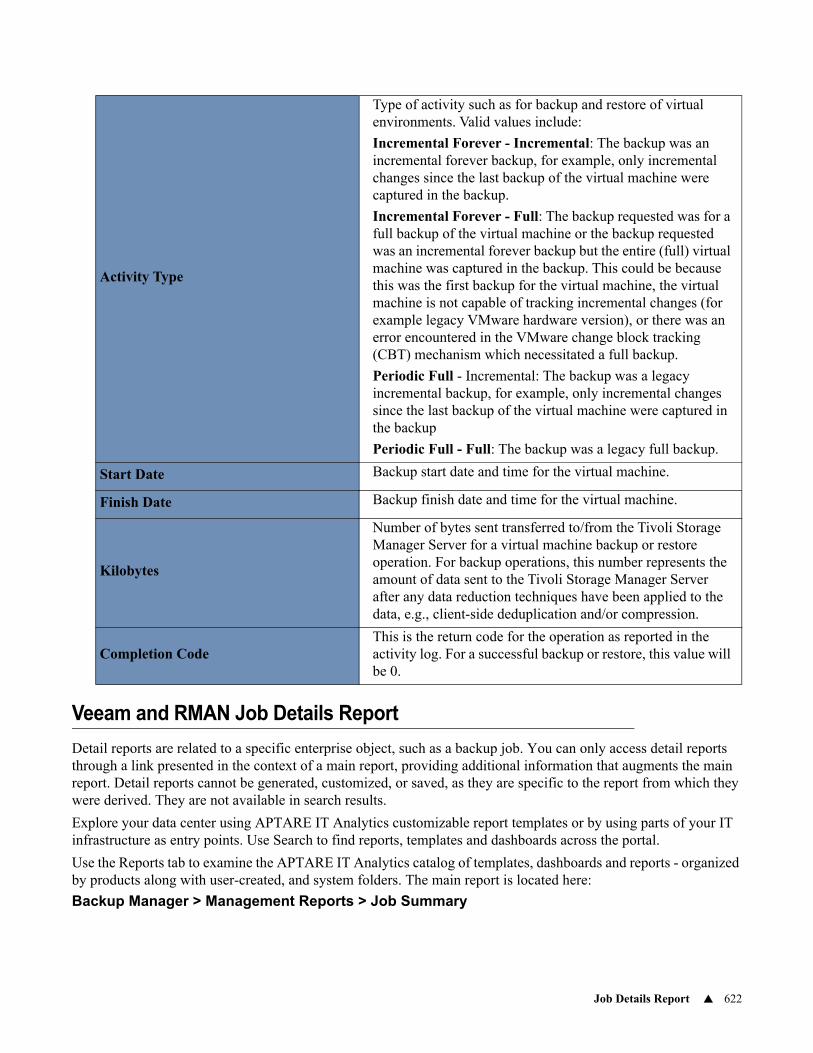
Job Details Report 622
Veeam and RMAN Job Details Report
Detail reports are related to a specific enterprise object, such as a backup job. You can only access detail reports through a link presented in the context of a main report, providing additional information that augments the main report. Detail reports cannot be generated, customized, or saved, as they are specific to the report from which they were derived. They are not available in search results.
Explore your data center using APTARE IT Analytics customizable report templates or by using parts of your IT infrastructure as entry points. Use Search to find reports, templates and dashboards across the portal.
Use the Reports tab to examine the APTARE IT Analytics catalog of templates, dashboards and reports - organized by products along with user-created, and system folders. The main report is located here:
Backup Manager > Management Reports > Job Summary
Activity Type
Type of activity such as for backup and restore of virtual environments. Valid values include:
Incremental Forever - Incremental: The backup was an incremental forever backup, for example, only incremental changes since the last backup of the virtual machine were captured in the backup.
Incremental Forever - Full: The backup requested was for a full backup of the virtual machine or the backup requested was an incremental forever backup but the entire (full) virtual machine was captured in the backup. This could be because this was the first backup for the virtual machine, the virtual machine is not capable of tracking incremental changes (for example legacy VMware hardware version), or there was an error encountered in the VMware change block tracking (CBT) mechanism which necessitated a full backup.
Periodic Full - Incremental: The backup was a legacy incremental backup, for example, only incremental changes since the last backup of the virtual machine were captured in the backup
Periodic Full - Full: The backup was a legacy full backup.
Start Date Backup start date and time for the virtual machine.
Finish Date Backup finish date and time for the virtual machine.
Kilobytes
Number of bytes sent transferred to/from the Tivoli Storage Manager Server for a virtual machine backup or restore operation. For backup operations, this number represents the amount of data sent to the Tivoli Storage Manager Server after any data reduction techniques have been applied to the data, e.g., client-side deduplication and/or compression.
Completion CodeThis is the return code for the operation as reported in the activity log. For a successful backup or restore, this value will be 0.
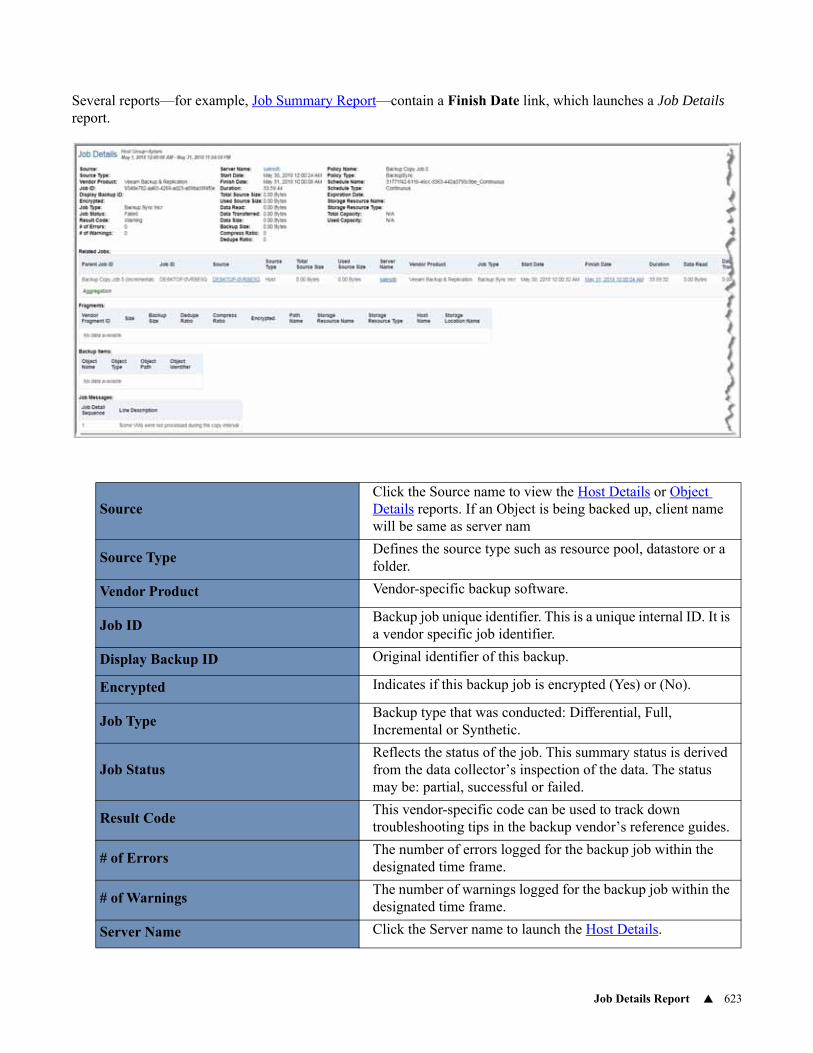
Job Details Report 623
Several reports—for example, Job Summary Report—contain a Finish Date link, which launches a Job Details report.
Source Click the Source name to view the Host Details or Object Details reports. If an Object is being backed up, client name will be same as server nam
Source TypeDefines the source type such as resource pool, datastore or a folder.
Vendor Product Vendor-specific backup software.
Job IDBackup job unique identifier. This is a unique internal ID. It is a vendor specific job identifier.
Display Backup ID Original identifier of this backup.
Encrypted Indicates if this backup job is encrypted (Yes) or (No).
Job TypeBackup type that was conducted: Differential, Full, Incremental or Synthetic.
Job StatusReflects the status of the job. This summary status is derived from the data collector’s inspection of the data. The status may be: partial, successful or failed.
Result CodeThis vendor-specific code can be used to track down troubleshooting tips in the backup vendor’s reference guides.
# of ErrorsThe number of errors logged for the backup job within the designated time frame.
# of WarningsThe number of warnings logged for the backup job within the designated time frame.
Server Name Click the Server name to launch the Host Details.
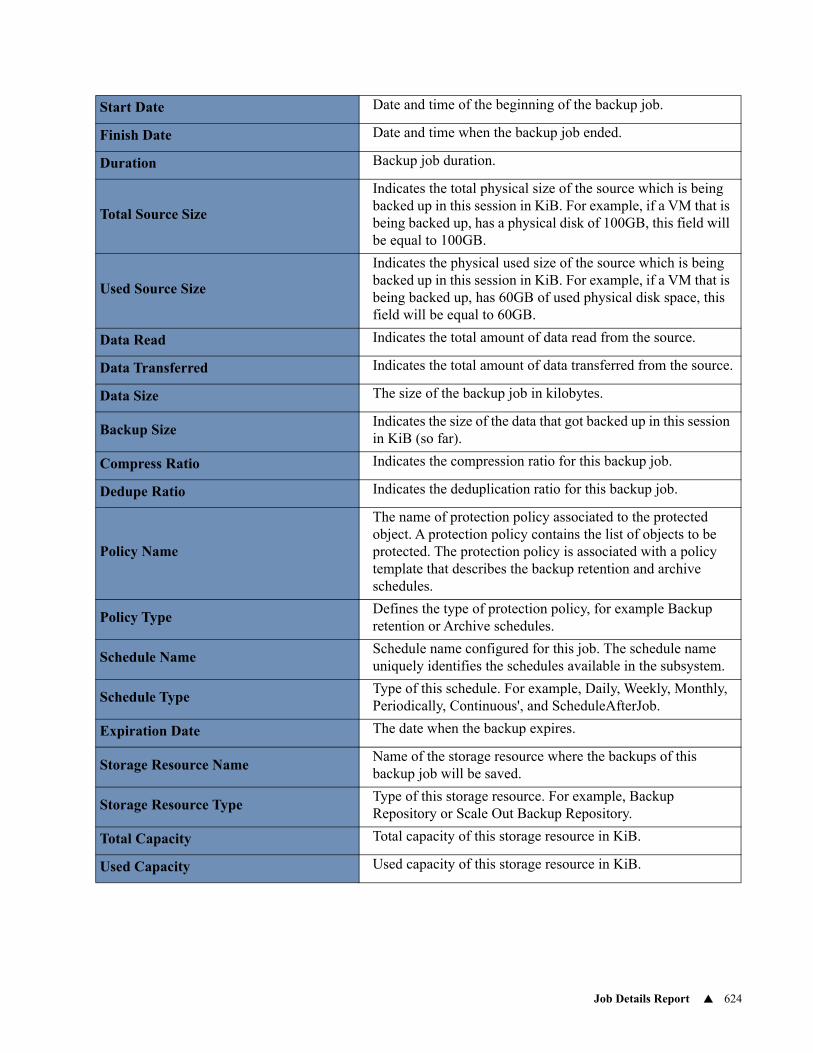
Job Details Report 624
Start Date Date and time of the beginning of the backup job.
Finish Date Date and time when the backup job ended.
Duration Backup job duration.
Total Source Size
Indicates the total physical size of the source which is being backed up in this session in KiB. For example, if a VM that is being backed up, has a physical disk of 100GB, this field will be equal to 100GB.
Used Source Size
Indicates the physical used size of the source which is being backed up in this session in KiB. For example, if a VM that is being backed up, has 60GB of used physical disk space, this field will be equal to 60GB.
Data Read Indicates the total amount of data read from the source.
Data Transferred Indicates the total amount of data transferred from the source.
Data Size The size of the backup job in kilobytes.
Backup SizeIndicates the size of the data that got backed up in this session in KiB (so far).
Compress Ratio Indicates the compression ratio for this backup job.
Dedupe Ratio Indicates the deduplication ratio for this backup job.
Policy Name
The name of protection policy associated to the protected object. A protection policy contains the list of objects to be protected. The protection policy is associated with a policy template that describes the backup retention and archive schedules.
Policy TypeDefines the type of protection policy, for example Backup retention or Archive schedules.
Schedule NameSchedule name configured for this job. The schedule name uniquely identifies the schedules available in the subsystem.
Schedule TypeType of this schedule. For example, Daily, Weekly, Monthly, Periodically, Continuous', and ScheduleAfterJob.
Expiration Date The date when the backup expires.
Storage Resource NameName of the storage resource where the backups of this backup job will be saved.
Storage Resource TypeType of this storage resource. For example, Backup Repository or Scale Out Backup Repository.
Total Capacity Total capacity of this storage resource in KiB.
Used Capacity Used capacity of this storage resource in KiB.
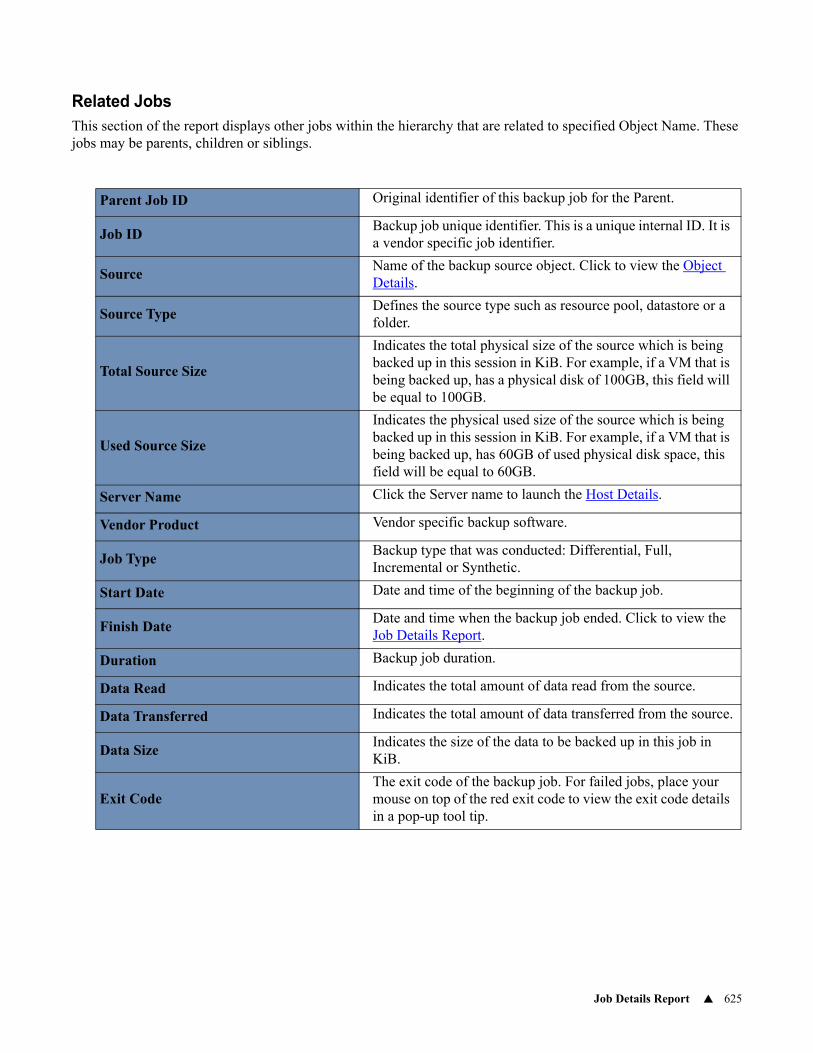
Job Details Report 625
Related JobsThis section of the report displays other jobs within the hierarchy that are related to specified Object Name. These jobs may be parents, children or siblings.
Parent Job ID Original identifier of this backup job for the Parent.
Job IDBackup job unique identifier. This is a unique internal ID. It is a vendor specific job identifier.
SourceName of the backup source object. Click to view the Object Details.
Source TypeDefines the source type such as resource pool, datastore or a folder.
Total Source Size
Indicates the total physical size of the source which is being backed up in this session in KiB. For example, if a VM that is being backed up, has a physical disk of 100GB, this field will be equal to 100GB.
Used Source Size
Indicates the physical used size of the source which is being backed up in this session in KiB. For example, if a VM that is being backed up, has 60GB of used physical disk space, this field will be equal to 60GB.
Server Name Click the Server name to launch the Host Details.
Vendor Product Vendor specific backup software.
Job TypeBackup type that was conducted: Differential, Full, Incremental or Synthetic.
Start Date Date and time of the beginning of the backup job.
Finish DateDate and time when the backup job ended. Click to view the Job Details Report.
Duration Backup job duration.
Data Read Indicates the total amount of data read from the source.
Data Transferred Indicates the total amount of data transferred from the source.
Data SizeIndicates the size of the data to be backed up in this job in KiB.
Exit CodeThe exit code of the backup job. For failed jobs, place your mouse on top of the red exit code to view the exit code details in a pop-up tool tip.
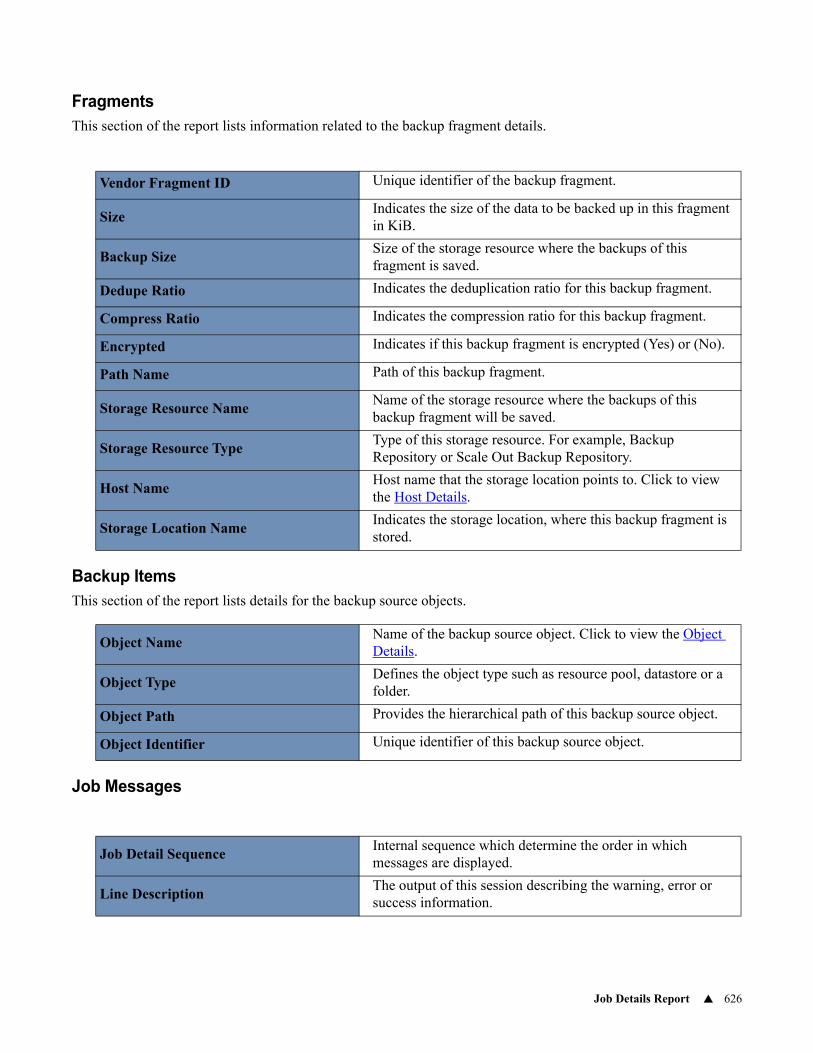
Job Details Report 626
FragmentsThis section of the report lists information related to the backup fragment details.
Backup ItemsThis section of the report lists details for the backup source objects.
Job Messages
Vendor Fragment ID Unique identifier of the backup fragment.
SizeIndicates the size of the data to be backed up in this fragment in KiB.
Backup SizeSize of the storage resource where the backups of this fragment is saved.
Dedupe Ratio Indicates the deduplication ratio for this backup fragment.
Compress Ratio Indicates the compression ratio for this backup fragment.
Encrypted Indicates if this backup fragment is encrypted (Yes) or (No).
Path Name Path of this backup fragment.
Storage Resource NameName of the storage resource where the backups of this backup fragment will be saved.
Storage Resource TypeType of this storage resource. For example, Backup Repository or Scale Out Backup Repository.
Host NameHost name that the storage location points to. Click to view the Host Details.
Storage Location NameIndicates the storage location, where this backup fragment is stored.
Object NameName of the backup source object. Click to view the Object Details.
Object TypeDefines the object type such as resource pool, datastore or a folder.
Object Path Provides the hierarchical path of this backup source object.
Object Identifier Unique identifier of this backup source object.
Job Detail SequenceInternal sequence which determine the order in which messages are displayed.
Line DescriptionThe output of this session describing the warning, error or success information.
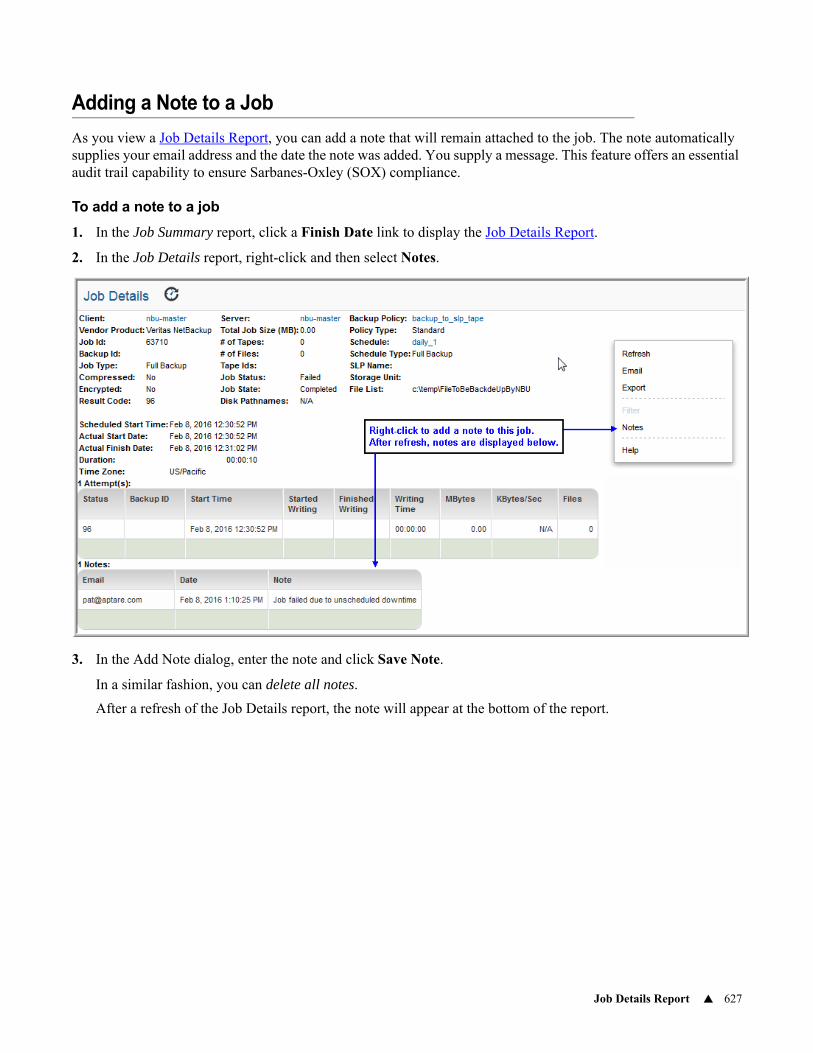
Job Details Report 627
Adding a Note to a Job
As you view a Job Details Report, you can add a note that will remain attached to the job. The note automatically supplies your email address and the date the note was added. You supply a message. This feature offers an essential audit trail capability to ensure Sarbanes-Oxley (SOX) compliance.
To add a note to a job
1. In the Job Summary report, click a Finish Date link to display the Job Details Report.
2. In the Job Details report, right-click and then select Notes.
3. In the Add Note dialog, enter the note and click Save Note.
In a similar fashion, you can delete all notes.
After a refresh of the Job Details report, the note will appear at the bottom of the report.
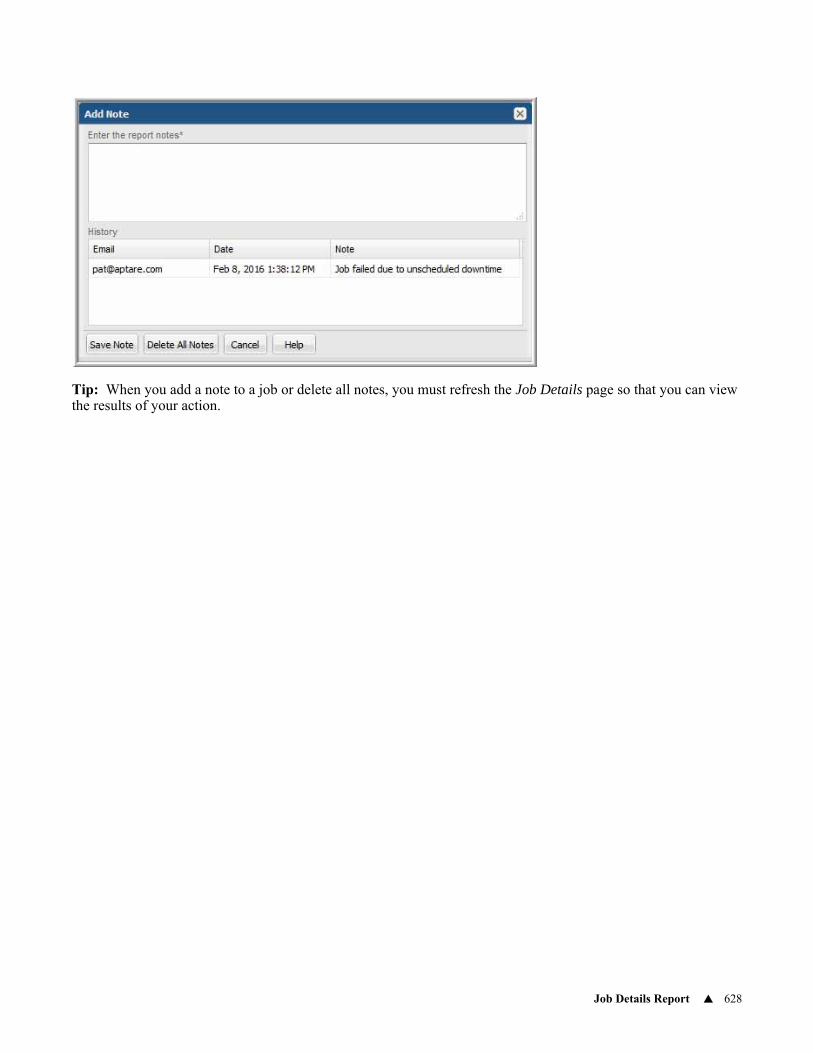
Job Details Report 628
Tip: When you add a note to a job or delete all notes, you must refresh the Job Details page so that you can view the results of your action.
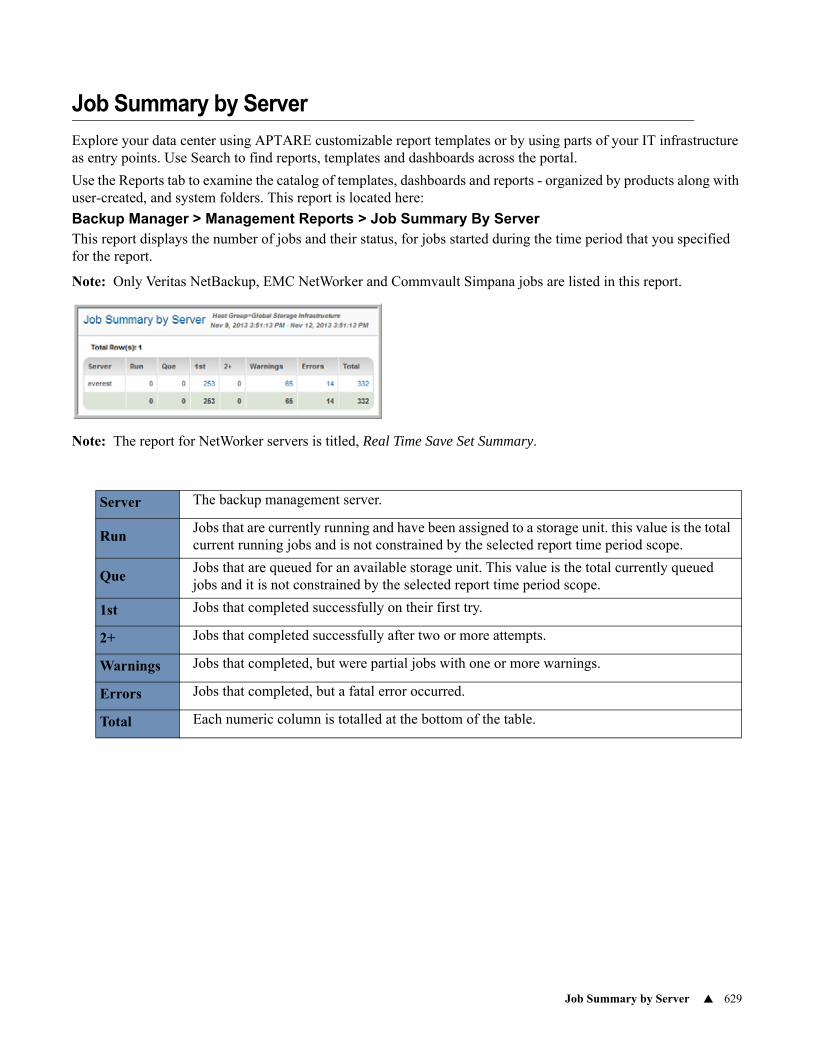
Job Summary by Server 629
Job Summary by Server
Explore your data center using APTARE customizable report templates or by using parts of your IT infrastructure as entry points. Use Search to find reports, templates and dashboards across the portal.
Use the Reports tab to examine the catalog of templates, dashboards and reports - organized by products along with user-created, and system folders. This report is located here:
Backup Manager > Management Reports > Job Summary By ServerThis report displays the number of jobs and their status, for jobs started during the time period that you specified for the report.
Note: Only Veritas NetBackup, EMC NetWorker and Commvault Simpana jobs are listed in this report.
Note: The report for NetWorker servers is titled, Real Time Save Set Summary.
Server The backup management server.
RunJobs that are currently running and have been assigned to a storage unit. this value is the total current running jobs and is not constrained by the selected report time period scope.
QueJobs that are queued for an available storage unit. This value is the total currently queued jobs and it is not constrained by the selected report time period scope.
1st Jobs that completed successfully on their first try.
2+ Jobs that completed successfully after two or more attempts.
Warnings Jobs that completed, but were partial jobs with one or more warnings.
Errors Jobs that completed, but a fatal error occurred.
Total Each numeric column is totalled at the bottom of the table.
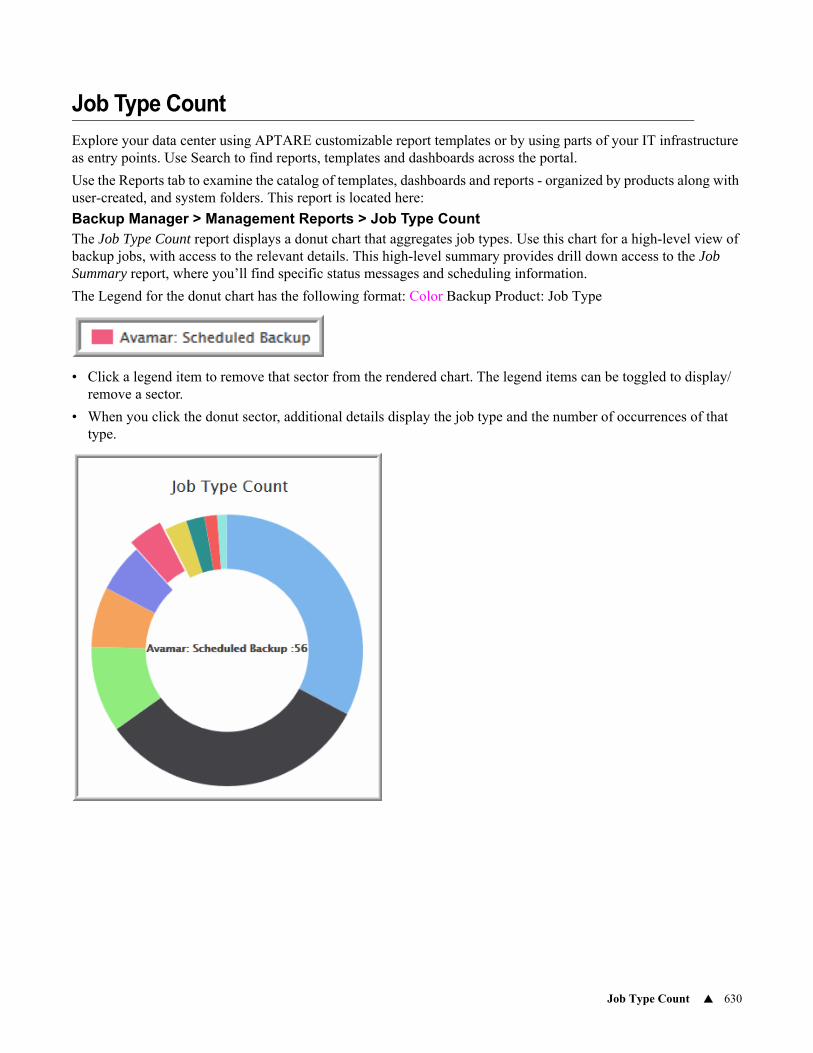
Job Type Count 630
Job Type Count
Explore your data center using APTARE customizable report templates or by using parts of your IT infrastructure as entry points. Use Search to find reports, templates and dashboards across the portal.
Use the Reports tab to examine the catalog of templates, dashboards and reports - organized by products along with user-created, and system folders. This report is located here:
Backup Manager > Management Reports > Job Type CountThe Job Type Count report displays a donut chart that aggregates job types. Use this chart for a high-level view of backup jobs, with access to the relevant details. This high-level summary provides drill down access to the Job Summary report, where you’ll find specific status messages and scheduling information.
The Legend for the donut chart has the following format: Color Backup Product: Job Type
• Click a legend item to remove that sector from the rendered chart. The legend items can be toggled to display/remove a sector.
• When you click the donut sector, additional details display the job type and the number of occurrences of that type.
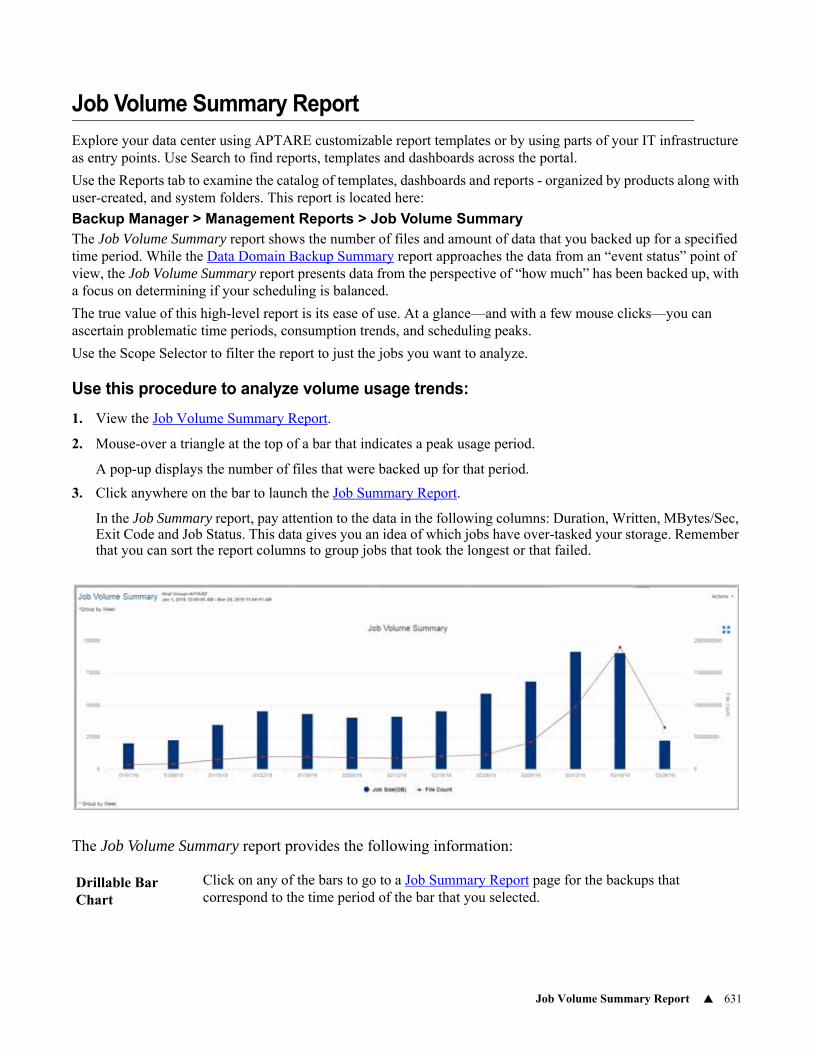
Job Volume Summary Report 631
Job Volume Summary Report
Explore your data center using APTARE customizable report templates or by using parts of your IT infrastructure as entry points. Use Search to find reports, templates and dashboards across the portal.
Use the Reports tab to examine the catalog of templates, dashboards and reports - organized by products along with user-created, and system folders. This report is located here:
Backup Manager > Management Reports > Job Volume SummaryThe Job Volume Summary report shows the number of files and amount of data that you backed up for a specified time period. While the Data Domain Backup Summary report approaches the data from an “event status” point of view, the Job Volume Summary report presents data from the perspective of “how much” has been backed up, with a focus on determining if your scheduling is balanced.
The true value of this high-level report is its ease of use. At a glance—and with a few mouse clicks—you can ascertain problematic time periods, consumption trends, and scheduling peaks.
Use the Scope Selector to filter the report to just the jobs you want to analyze.
Use this procedure to analyze volume usage trends:
1. View the Job Volume Summary Report.
2. Mouse-over a triangle at the top of a bar that indicates a peak usage period.
A pop-up displays the number of files that were backed up for that period.
3. Click anywhere on the bar to launch the Job Summary Report.
In the Job Summary report, pay attention to the data in the following columns: Duration, Written, MBytes/Sec, Exit Code and Job Status. This data gives you an idea of which jobs have over-tasked your storage. Remember that you can sort the report columns to group jobs that took the longest or that failed.
The Job Volume Summary report provides the following information:
Drillable Bar Chart
Click on any of the bars to go to a Job Summary Report page for the backups that correspond to the time period of the bar that you selected.
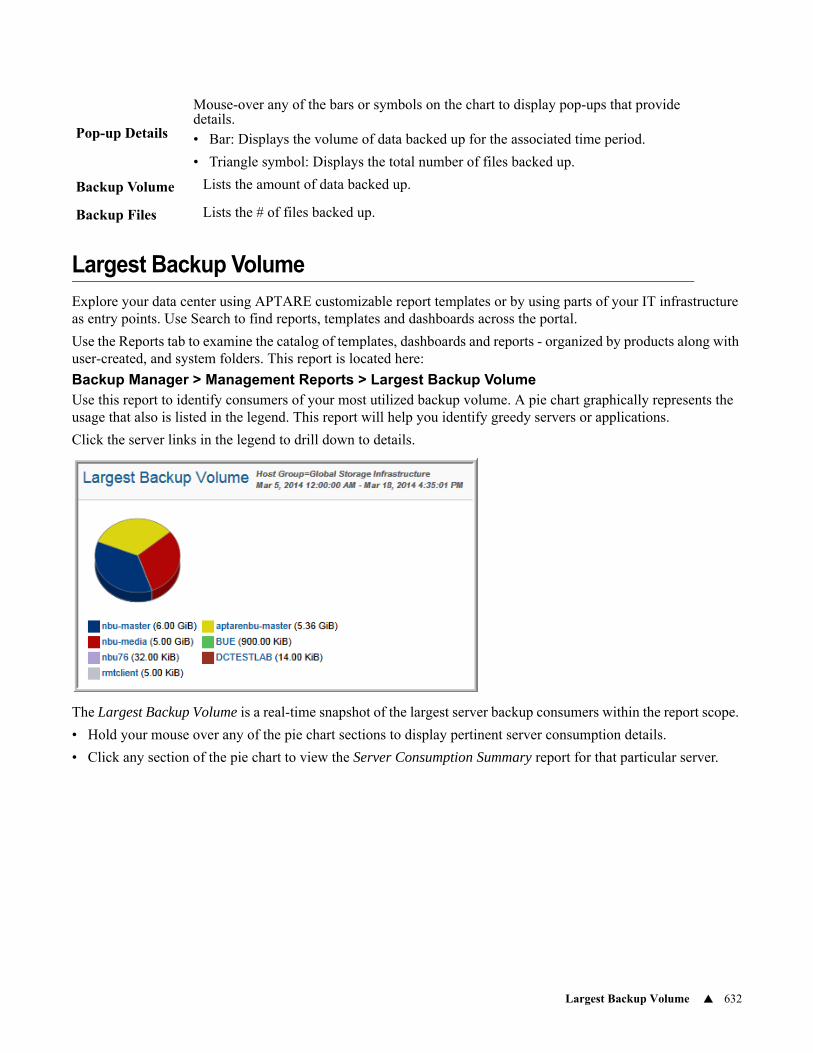
Largest Backup Volume 632
Largest Backup Volume
Explore your data center using APTARE customizable report templates or by using parts of your IT infrastructure as entry points. Use Search to find reports, templates and dashboards across the portal.
Use the Reports tab to examine the catalog of templates, dashboards and reports - organized by products along with user-created, and system folders. This report is located here:
Backup Manager > Management Reports > Largest Backup VolumeUse this report to identify consumers of your most utilized backup volume. A pie chart graphically represents the usage that also is listed in the legend. This report will help you identify greedy servers or applications.
Click the server links in the legend to drill down to details.
The Largest Backup Volume is a real-time snapshot of the largest server backup consumers within the report scope.
• Hold your mouse over any of the pie chart sections to display pertinent server consumption details.
• Click any section of the pie chart to view the Server Consumption Summary report for that particular server.
Pop-up Details
Mouse-over any of the bars or symbols on the chart to display pop-ups that provide details.• Bar: Displays the volume of data backed up for the associated time period.
• Triangle symbol: Displays the total number of files backed up.
Backup Volume Lists the amount of data backed up.
Backup Files Lists the # of files backed up.
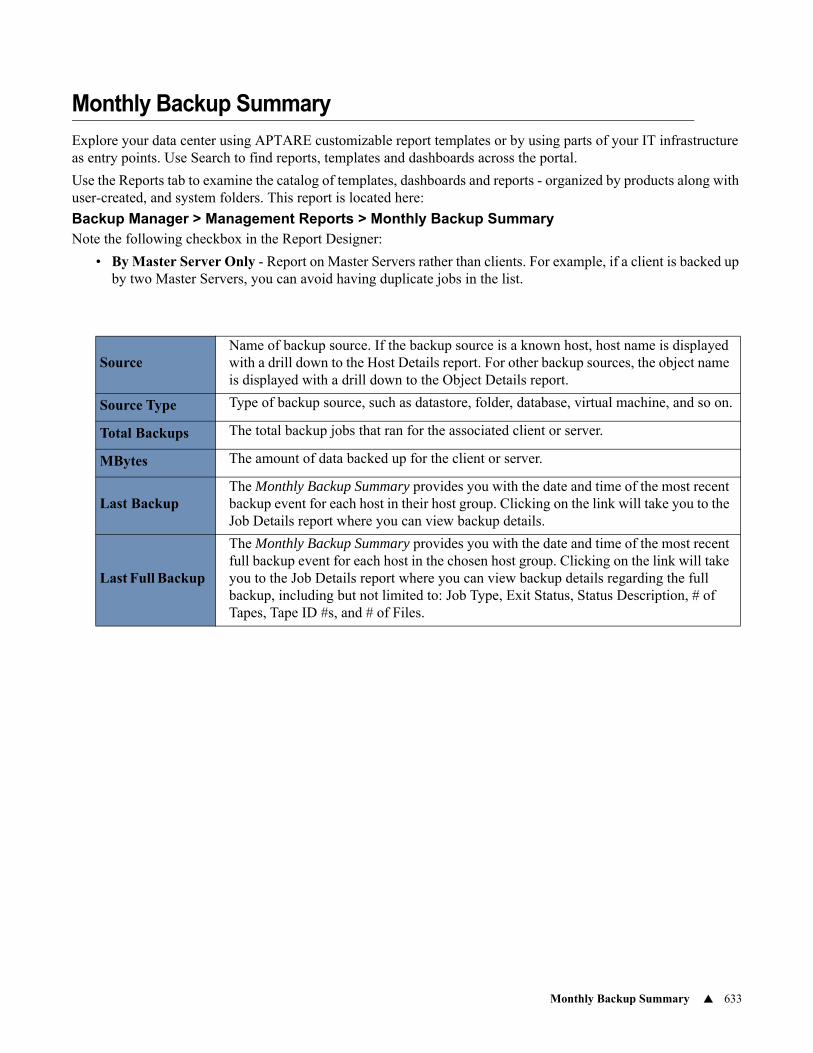
Monthly Backup Summary 633
Monthly Backup Summary
Explore your data center using APTARE customizable report templates or by using parts of your IT infrastructure as entry points. Use Search to find reports, templates and dashboards across the portal.
Use the Reports tab to examine the catalog of templates, dashboards and reports - organized by products along with user-created, and system folders. This report is located here:
Backup Manager > Management Reports > Monthly Backup SummaryNote the following checkbox in the Report Designer:
• By Master Server Only - Report on Master Servers rather than clients. For example, if a client is backed up by two Master Servers, you can avoid having duplicate jobs in the list.
Source Name of backup source. If the backup source is a known host, host name is displayed with a drill down to the Host Details report. For other backup sources, the object name is displayed with a drill down to the Object Details report.
Source Type Type of backup source, such as datastore, folder, database, virtual machine, and so on.
Total Backups The total backup jobs that ran for the associated client or server.
MBytes The amount of data backed up for the client or server.
Last Backup The Monthly Backup Summary provides you with the date and time of the most recent backup event for each host in their host group. Clicking on the link will take you to the Job Details report where you can view backup details.
Last Full Backup
The Monthly Backup Summary provides you with the date and time of the most recent full backup event for each host in the chosen host group. Clicking on the link will take you to the Job Details report where you can view backup details regarding the full backup, including but not limited to: Job Type, Exit Status, Status Description, # of Tapes, Tape ID #s, and # of Files.
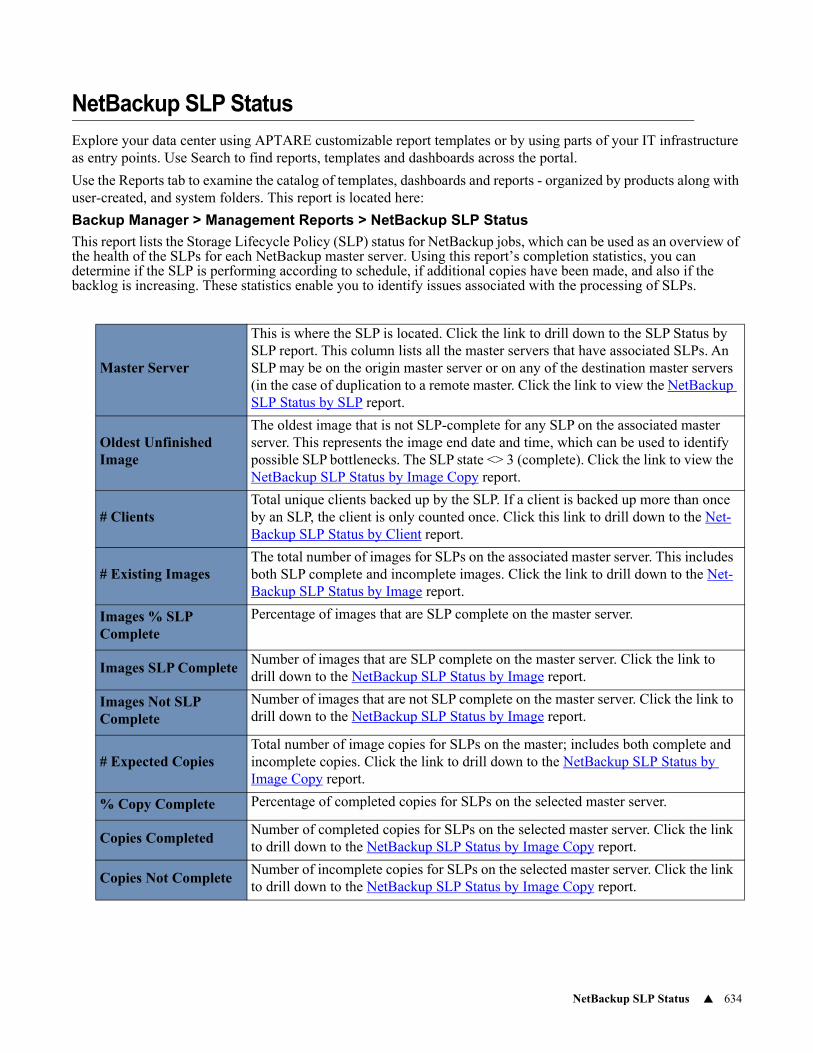
NetBackup SLP Status 634
NetBackup SLP Status
Explore your data center using APTARE customizable report templates or by using parts of your IT infrastructure as entry points. Use Search to find reports, templates and dashboards across the portal.
Use the Reports tab to examine the catalog of templates, dashboards and reports - organized by products along with user-created, and system folders. This report is located here:
Backup Manager > Management Reports > NetBackup SLP Status
This report lists the Storage Lifecycle Policy (SLP) status for NetBackup jobs, which can be used as an overview of the health of the SLPs for each NetBackup master server. Using this report’s completion statistics, you can determine if the SLP is performing according to schedule, if additional copies have been made, and also if the backlog is increasing. These statistics enable you to identify issues associated with the processing of SLPs.
Master Server
This is where the SLP is located. Click the link to drill down to the SLP Status by SLP report. This column lists all the master servers that have associated SLPs. An SLP may be on the origin master server or on any of the destination master servers (in the case of duplication to a remote master. Click the link to view the NetBackup SLP Status by SLP report.
Oldest Unfinished Image
The oldest image that is not SLP-complete for any SLP on the associated master server. This represents the image end date and time, which can be used to identify possible SLP bottlenecks. The SLP state <> 3 (complete). Click the link to view the NetBackup SLP Status by Image Copy report.
# ClientsTotal unique clients backed up by the SLP. If a client is backed up more than once by an SLP, the client is only counted once. Click this link to drill down to the Net-Backup SLP Status by Client report.
# Existing ImagesThe total number of images for SLPs on the associated master server. This includes both SLP complete and incomplete images. Click the link to drill down to the Net-Backup SLP Status by Image report.
Images % SLP Complete
Percentage of images that are SLP complete on the master server.
Images SLP CompleteNumber of images that are SLP complete on the master server. Click the link to drill down to the NetBackup SLP Status by Image report.
Images Not SLP Complete
Number of images that are not SLP complete on the master server. Click the link to drill down to the NetBackup SLP Status by Image report.
# Expected CopiesTotal number of image copies for SLPs on the master; includes both complete and incomplete copies. Click the link to drill down to the NetBackup SLP Status by Image Copy report.
% Copy Complete Percentage of completed copies for SLPs on the selected master server.
Copies CompletedNumber of completed copies for SLPs on the selected master server. Click the link to drill down to the NetBackup SLP Status by Image Copy report.
Copies Not CompleteNumber of incomplete copies for SLPs on the selected master server. Click the link to drill down to the NetBackup SLP Status by Image Copy report.
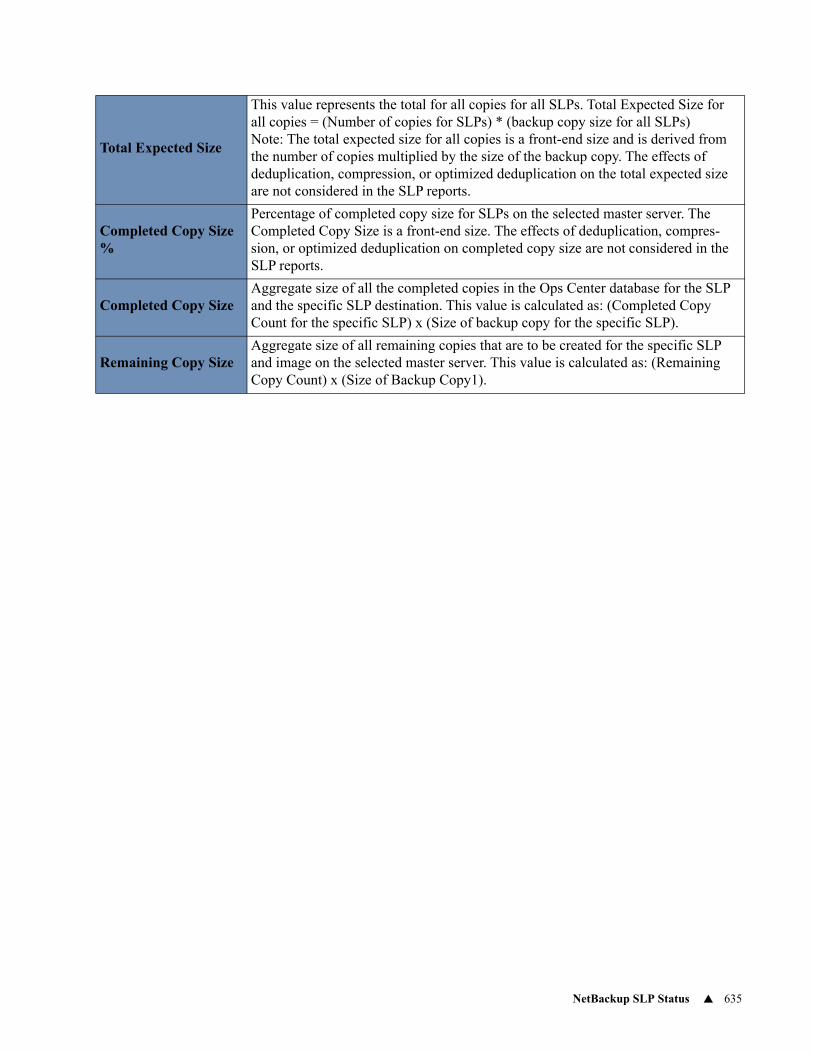
NetBackup SLP Status 635
Total Expected Size
This value represents the total for all copies for all SLPs. Total Expected Size for all copies = (Number of copies for SLPs) * (backup copy size for all SLPs)Note: The total expected size for all copies is a front-end size and is derived from the number of copies multiplied by the size of the backup copy. The effects of deduplication, compression, or optimized deduplication on the total expected size are not considered in the SLP reports.
Completed Copy Size %
Percentage of completed copy size for SLPs on the selected master server. The Completed Copy Size is a front-end size. The effects of deduplication, compres-sion, or optimized deduplication on completed copy size are not considered in the SLP reports.
Completed Copy SizeAggregate size of all the completed copies in the Ops Center database for the SLP and the specific SLP destination. This value is calculated as: (Completed Copy Count for the specific SLP) x (Size of backup copy for the specific SLP).
Remaining Copy SizeAggregate size of all remaining copies that are to be created for the specific SLP and image on the selected master server. This value is calculated as: (Remaining Copy Count) x (Size of Backup Copy1).
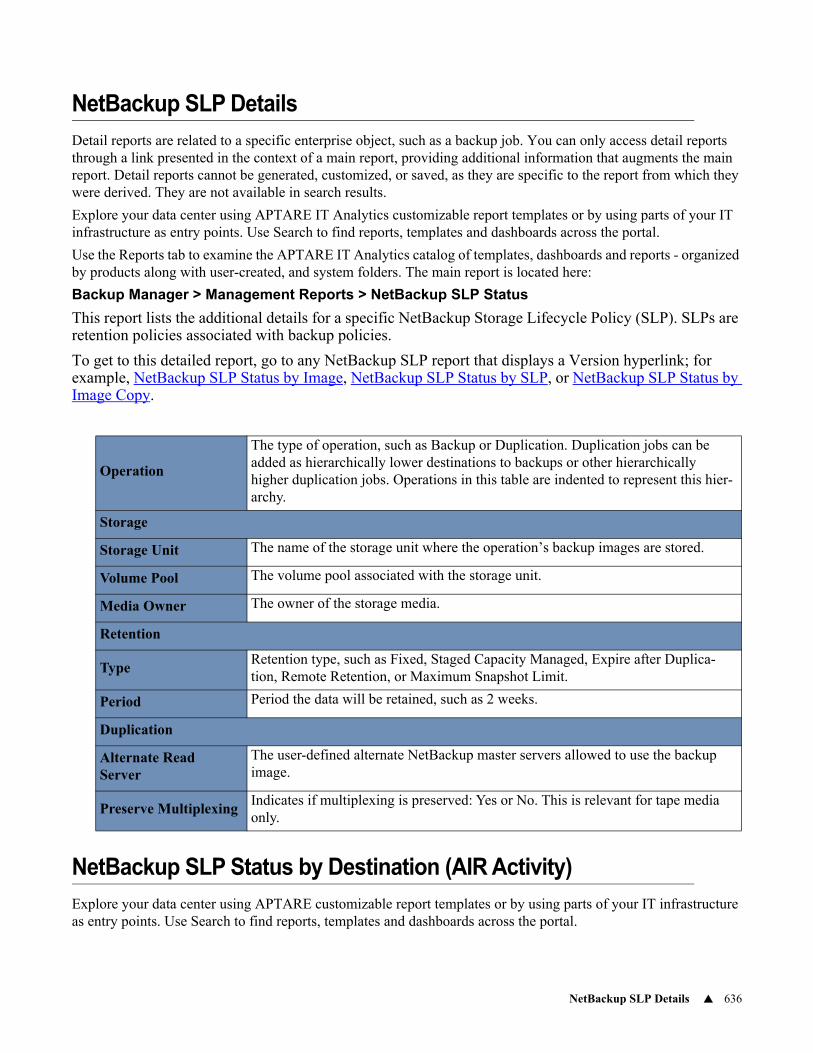
NetBackup SLP Details 636
NetBackup SLP Details
Detail reports are related to a specific enterprise object, such as a backup job. You can only access detail reports through a link presented in the context of a main report, providing additional information that augments the main report. Detail reports cannot be generated, customized, or saved, as they are specific to the report from which they were derived. They are not available in search results.
Explore your data center using APTARE IT Analytics customizable report templates or by using parts of your IT infrastructure as entry points. Use Search to find reports, templates and dashboards across the portal.
Use the Reports tab to examine the APTARE IT Analytics catalog of templates, dashboards and reports - organized by products along with user-created, and system folders. The main report is located here:
Backup Manager > Management Reports > NetBackup SLP Status
This report lists the additional details for a specific NetBackup Storage Lifecycle Policy (SLP). SLPs are retention policies associated with backup policies.
To get to this detailed report, go to any NetBackup SLP report that displays a Version hyperlink; for example, NetBackup SLP Status by Image, NetBackup SLP Status by SLP, or NetBackup SLP Status by Image Copy.
NetBackup SLP Status by Destination (AIR Activity)
Explore your data center using APTARE customizable report templates or by using parts of your IT infrastructure as entry points. Use Search to find reports, templates and dashboards across the portal.
Operation
The type of operation, such as Backup or Duplication. Duplication jobs can be added as hierarchically lower destinations to backups or other hierarchically higher duplication jobs. Operations in this table are indented to represent this hier-archy.
Storage
Storage Unit The name of the storage unit where the operation’s backup images are stored.
Volume Pool The volume pool associated with the storage unit.
Media Owner The owner of the storage media.
Retention
TypeRetention type, such as Fixed, Staged Capacity Managed, Expire after Duplica-tion, Remote Retention, or Maximum Snapshot Limit.
Period Period the data will be retained, such as 2 weeks.
Duplication
Alternate Read Server
The user-defined alternate NetBackup master servers allowed to use the backup image.
Preserve MultiplexingIndicates if multiplexing is preserved: Yes or No. This is relevant for tape media only.
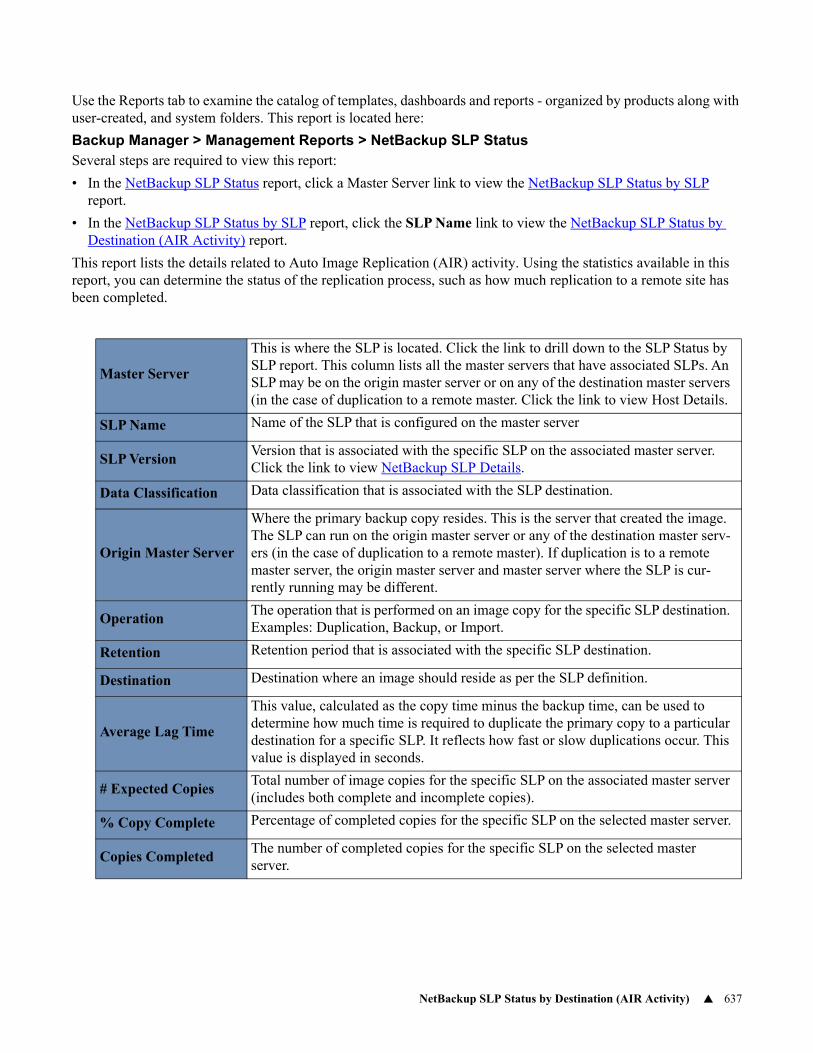
NetBackup SLP Status by Destination (AIR Activity) 637
Use the Reports tab to examine the catalog of templates, dashboards and reports - organized by products along with user-created, and system folders. This report is located here:
Backup Manager > Management Reports > NetBackup SLP StatusSeveral steps are required to view this report:
• In the NetBackup SLP Status report, click a Master Server link to view the NetBackup SLP Status by SLP report.
• In the NetBackup SLP Status by SLP report, click the SLP Name link to view the NetBackup SLP Status by Destination (AIR Activity) report.
This report lists the details related to Auto Image Replication (AIR) activity. Using the statistics available in this report, you can determine the status of the replication process, such as how much replication to a remote site has been completed.
Master Server
This is where the SLP is located. Click the link to drill down to the SLP Status by SLP report. This column lists all the master servers that have associated SLPs. An SLP may be on the origin master server or on any of the destination master servers (in the case of duplication to a remote master. Click the link to view Host Details.
SLP Name Name of the SLP that is configured on the master server
SLP VersionVersion that is associated with the specific SLP on the associated master server. Click the link to view NetBackup SLP Details.
Data Classification Data classification that is associated with the SLP destination.
Origin Master Server
Where the primary backup copy resides. This is the server that created the image. The SLP can run on the origin master server or any of the destination master serv-ers (in the case of duplication to a remote master). If duplication is to a remote master server, the origin master server and master server where the SLP is cur-rently running may be different.
OperationThe operation that is performed on an image copy for the specific SLP destination. Examples: Duplication, Backup, or Import.
Retention Retention period that is associated with the specific SLP destination.
Destination Destination where an image should reside as per the SLP definition.
Average Lag Time
This value, calculated as the copy time minus the backup time, can be used to determine how much time is required to duplicate the primary copy to a particular destination for a specific SLP. It reflects how fast or slow duplications occur. This value is displayed in seconds.
# Expected CopiesTotal number of image copies for the specific SLP on the associated master server (includes both complete and incomplete copies).
% Copy Complete Percentage of completed copies for the specific SLP on the selected master server.
Copies CompletedThe number of completed copies for the specific SLP on the selected master server.
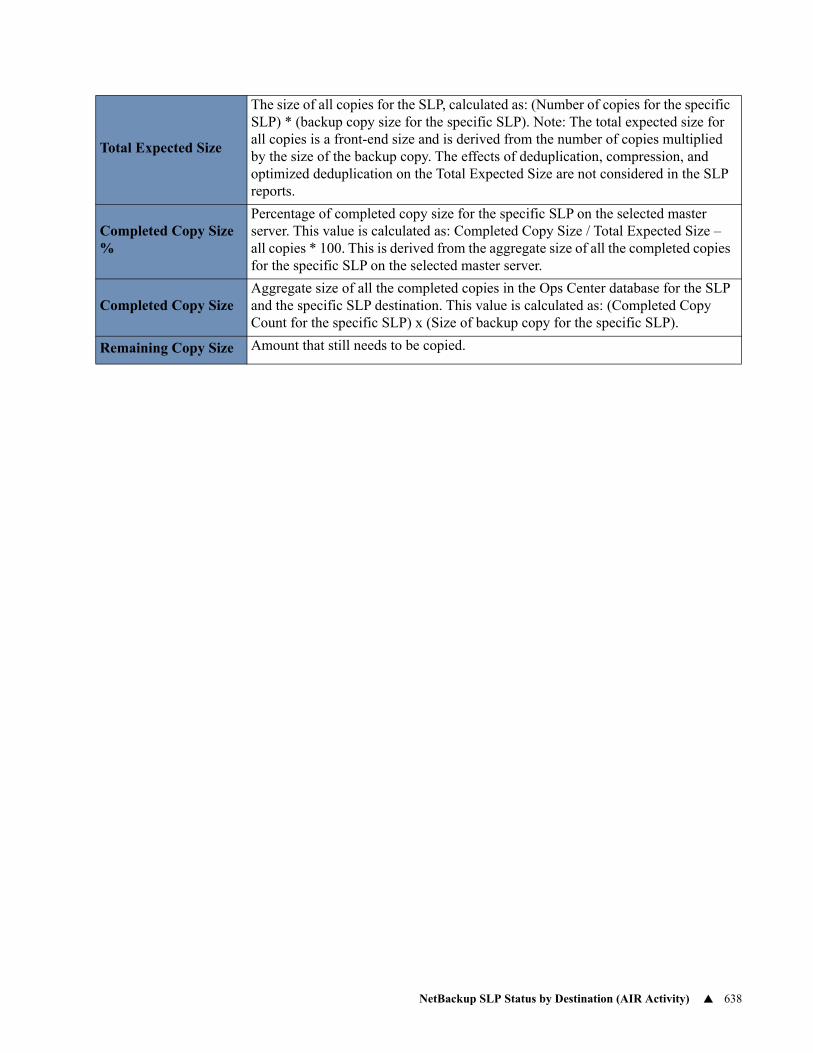
NetBackup SLP Status by Destination (AIR Activity) 638
Total Expected Size
The size of all copies for the SLP, calculated as: (Number of copies for the specific SLP) * (backup copy size for the specific SLP). Note: The total expected size for all copies is a front-end size and is derived from the number of copies multiplied by the size of the backup copy. The effects of deduplication, compression, and optimized deduplication on the Total Expected Size are not considered in the SLP reports.
Completed Copy Size %
Percentage of completed copy size for the specific SLP on the selected master server. This value is calculated as: Completed Copy Size / Total Expected Size – all copies * 100. This is derived from the aggregate size of all the completed copies for the specific SLP on the selected master server.
Completed Copy Size Aggregate size of all the completed copies in the Ops Center database for the SLP and the specific SLP destination. This value is calculated as: (Completed Copy Count for the specific SLP) x (Size of backup copy for the specific SLP).
Remaining Copy Size Amount that still needs to be copied.
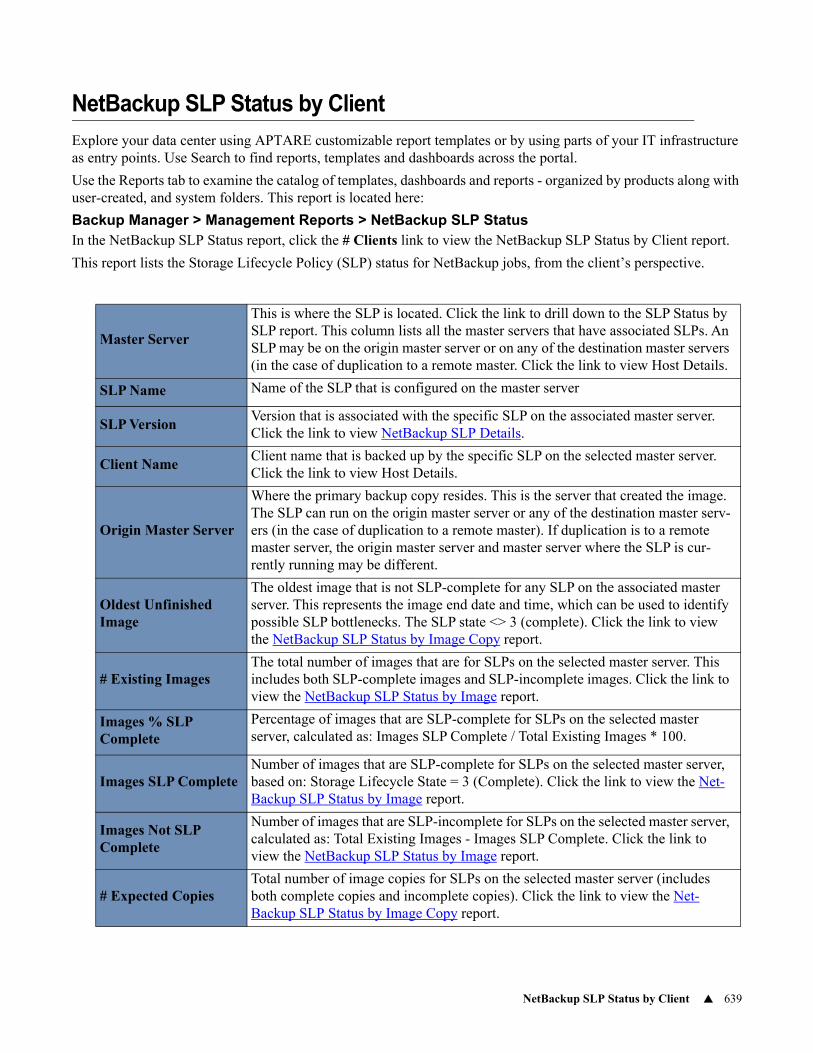
NetBackup SLP Status by Client 639
NetBackup SLP Status by Client
Explore your data center using APTARE customizable report templates or by using parts of your IT infrastructure as entry points. Use Search to find reports, templates and dashboards across the portal.
Use the Reports tab to examine the catalog of templates, dashboards and reports - organized by products along with user-created, and system folders. This report is located here:
Backup Manager > Management Reports > NetBackup SLP StatusIn the NetBackup SLP Status report, click the # Clients link to view the NetBackup SLP Status by Client report.
This report lists the Storage Lifecycle Policy (SLP) status for NetBackup jobs, from the client’s perspective.
Master Server
This is where the SLP is located. Click the link to drill down to the SLP Status by SLP report. This column lists all the master servers that have associated SLPs. An SLP may be on the origin master server or on any of the destination master servers (in the case of duplication to a remote master. Click the link to view Host Details.
SLP Name Name of the SLP that is configured on the master server
SLP VersionVersion that is associated with the specific SLP on the associated master server. Click the link to view NetBackup SLP Details.
Client NameClient name that is backed up by the specific SLP on the selected master server. Click the link to view Host Details.
Origin Master Server
Where the primary backup copy resides. This is the server that created the image. The SLP can run on the origin master server or any of the destination master serv-ers (in the case of duplication to a remote master). If duplication is to a remote master server, the origin master server and master server where the SLP is cur-rently running may be different.
Oldest Unfinished Image
The oldest image that is not SLP-complete for any SLP on the associated master server. This represents the image end date and time, which can be used to identify possible SLP bottlenecks. The SLP state <> 3 (complete). Click the link to view the NetBackup SLP Status by Image Copy report.
# Existing ImagesThe total number of images that are for SLPs on the selected master server. This includes both SLP-complete images and SLP-incomplete images. Click the link to view the NetBackup SLP Status by Image report.
Images % SLP Complete
Percentage of images that are SLP-complete for SLPs on the selected master server, calculated as: Images SLP Complete / Total Existing Images * 100.
Images SLP CompleteNumber of images that are SLP-complete for SLPs on the selected master server, based on: Storage Lifecycle State = 3 (Complete). Click the link to view the Net-Backup SLP Status by Image report.
Images Not SLP Complete
Number of images that are SLP-incomplete for SLPs on the selected master server, calculated as: Total Existing Images - Images SLP Complete. Click the link to view the NetBackup SLP Status by Image report.
# Expected CopiesTotal number of image copies for SLPs on the selected master server (includes both complete copies and incomplete copies). Click the link to view the Net-Backup SLP Status by Image Copy report.
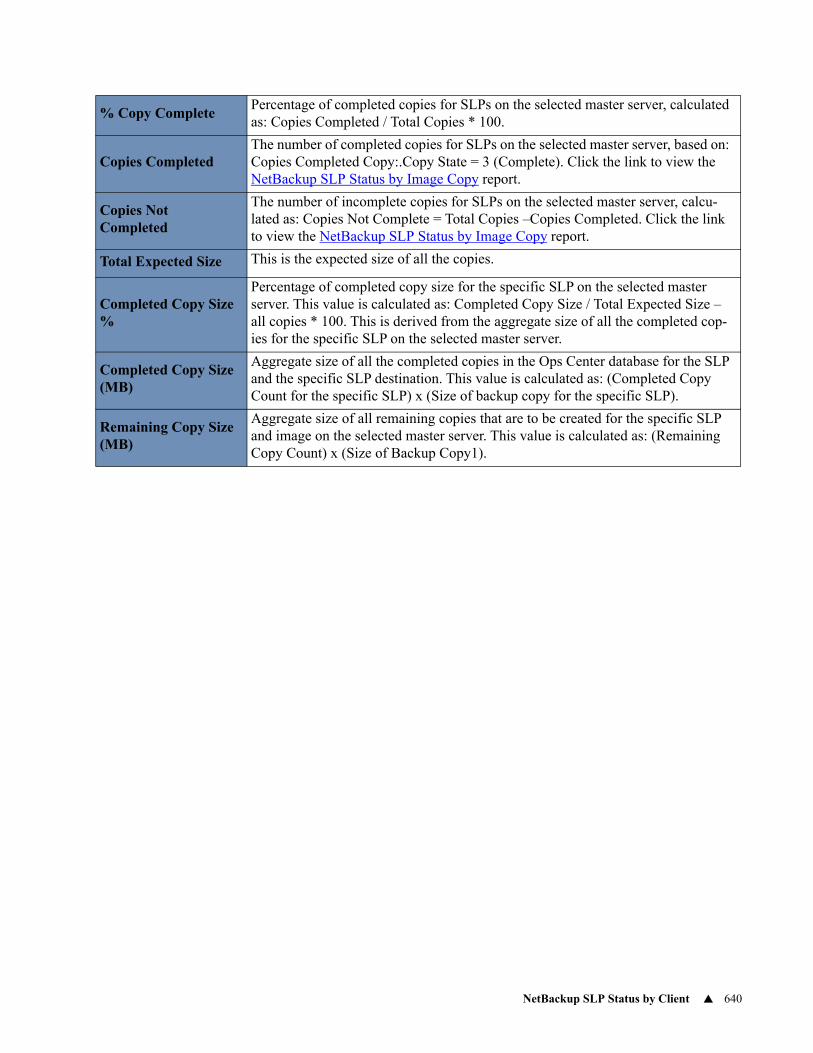
NetBackup SLP Status by Client 640
% Copy CompletePercentage of completed copies for SLPs on the selected master server, calculated as: Copies Completed / Total Copies * 100.
Copies CompletedThe number of completed copies for SLPs on the selected master server, based on: Copies Completed Copy:.Copy State = 3 (Complete). Click the link to view the NetBackup SLP Status by Image Copy report.
Copies Not Completed
The number of incomplete copies for SLPs on the selected master server, calcu-lated as: Copies Not Complete = Total Copies –Copies Completed. Click the link to view the NetBackup SLP Status by Image Copy report.
Total Expected Size This is the expected size of all the copies.
Completed Copy Size %
Percentage of completed copy size for the specific SLP on the selected master server. This value is calculated as: Completed Copy Size / Total Expected Size – all copies * 100. This is derived from the aggregate size of all the completed cop-ies for the specific SLP on the selected master server.
Completed Copy Size (MB)
Aggregate size of all the completed copies in the Ops Center database for the SLP and the specific SLP destination. This value is calculated as: (Completed Copy Count for the specific SLP) x (Size of backup copy for the specific SLP).
Remaining Copy Size (MB)
Aggregate size of all remaining copies that are to be created for the specific SLP and image on the selected master server. This value is calculated as: (Remaining Copy Count) x (Size of Backup Copy1).
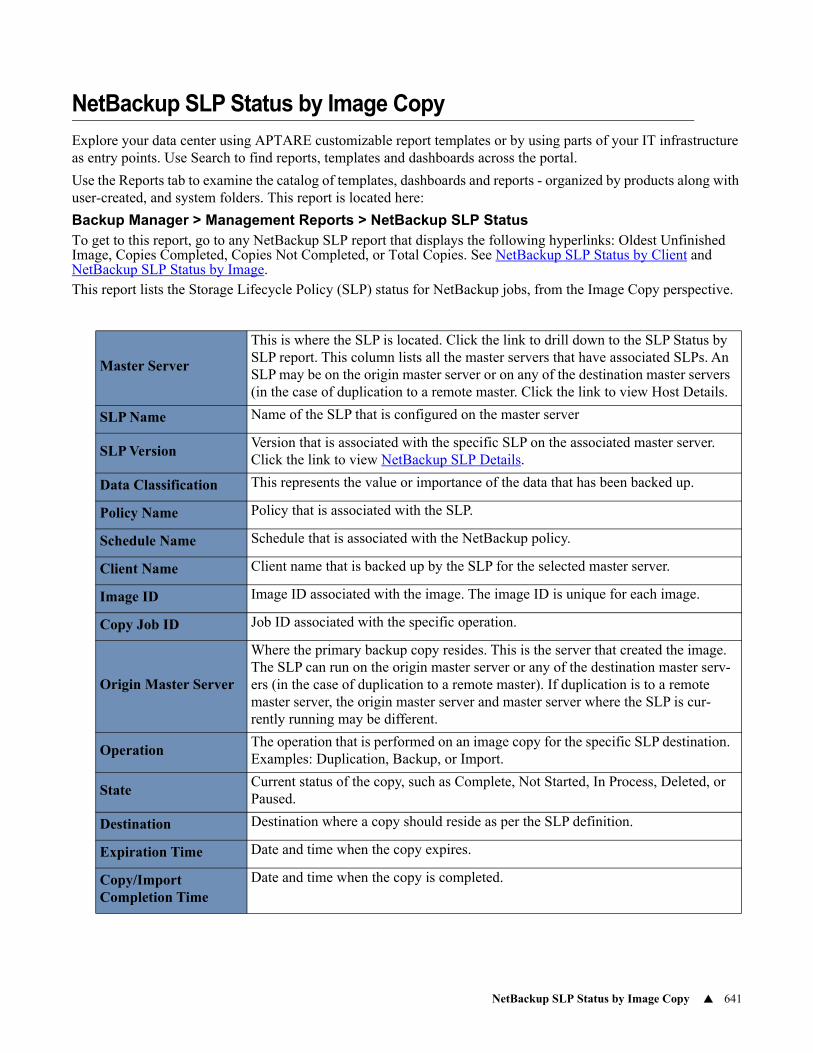
NetBackup SLP Status by Image Copy 641
NetBackup SLP Status by Image Copy
Explore your data center using APTARE customizable report templates or by using parts of your IT infrastructure as entry points. Use Search to find reports, templates and dashboards across the portal.
Use the Reports tab to examine the catalog of templates, dashboards and reports - organized by products along with user-created, and system folders. This report is located here:
Backup Manager > Management Reports > NetBackup SLP StatusTo get to this report, go to any NetBackup SLP report that displays the following hyperlinks: Oldest Unfinished Image, Copies Completed, Copies Not Completed, or Total Copies. See NetBackup SLP Status by Client and NetBackup SLP Status by Image.This report lists the Storage Lifecycle Policy (SLP) status for NetBackup jobs, from the Image Copy perspective.
Master Server
This is where the SLP is located. Click the link to drill down to the SLP Status by SLP report. This column lists all the master servers that have associated SLPs. An SLP may be on the origin master server or on any of the destination master servers (in the case of duplication to a remote master. Click the link to view Host Details.
SLP Name Name of the SLP that is configured on the master server
SLP VersionVersion that is associated with the specific SLP on the associated master server. Click the link to view NetBackup SLP Details.
Data Classification This represents the value or importance of the data that has been backed up.
Policy Name Policy that is associated with the SLP.
Schedule Name Schedule that is associated with the NetBackup policy.
Client Name Client name that is backed up by the SLP for the selected master server.
Image ID Image ID associated with the image. The image ID is unique for each image.
Copy Job ID Job ID associated with the specific operation.
Origin Master Server
Where the primary backup copy resides. This is the server that created the image. The SLP can run on the origin master server or any of the destination master serv-ers (in the case of duplication to a remote master). If duplication is to a remote master server, the origin master server and master server where the SLP is cur-rently running may be different.
OperationThe operation that is performed on an image copy for the specific SLP destination. Examples: Duplication, Backup, or Import.
StateCurrent status of the copy, such as Complete, Not Started, In Process, Deleted, or Paused.
Destination Destination where a copy should reside as per the SLP definition.
Expiration Time Date and time when the copy expires.
Copy/Import Completion Time
Date and time when the copy is completed.
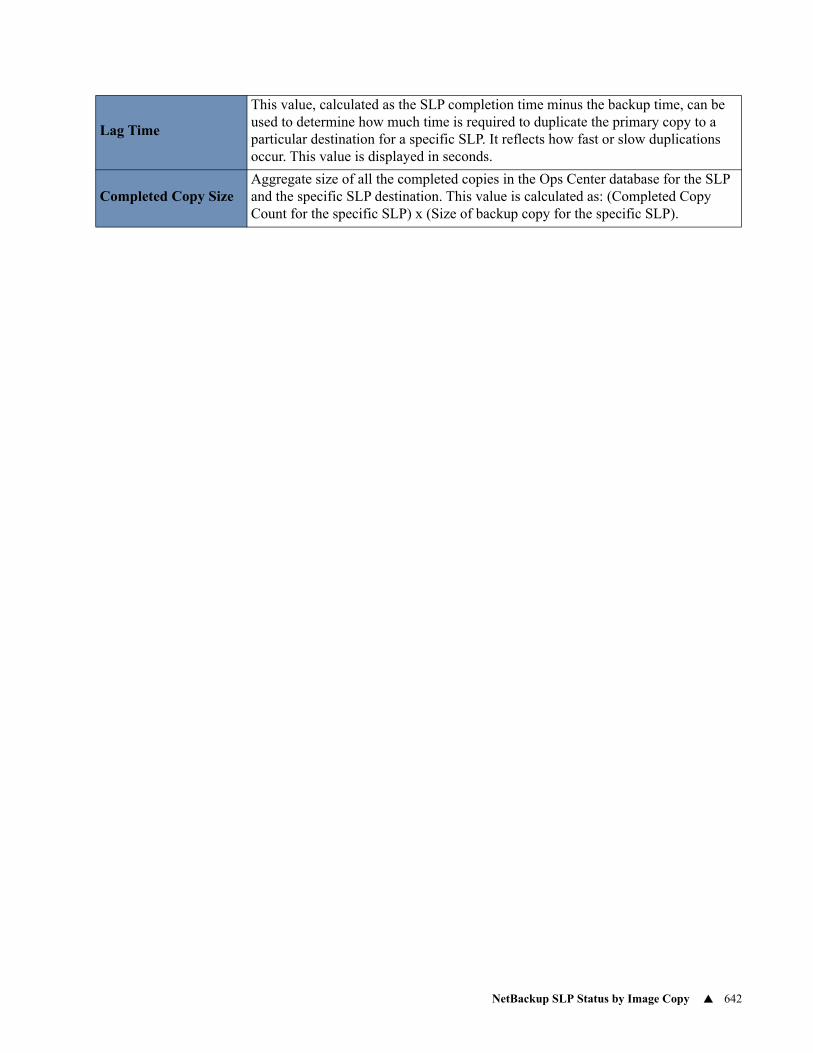
NetBackup SLP Status by Image Copy 642
Lag Time
This value, calculated as the SLP completion time minus the backup time, can be used to determine how much time is required to duplicate the primary copy to a particular destination for a specific SLP. It reflects how fast or slow duplications occur. This value is displayed in seconds.
Completed Copy Size Aggregate size of all the completed copies in the Ops Center database for the SLP and the specific SLP destination. This value is calculated as: (Completed Copy Count for the specific SLP) x (Size of backup copy for the specific SLP).
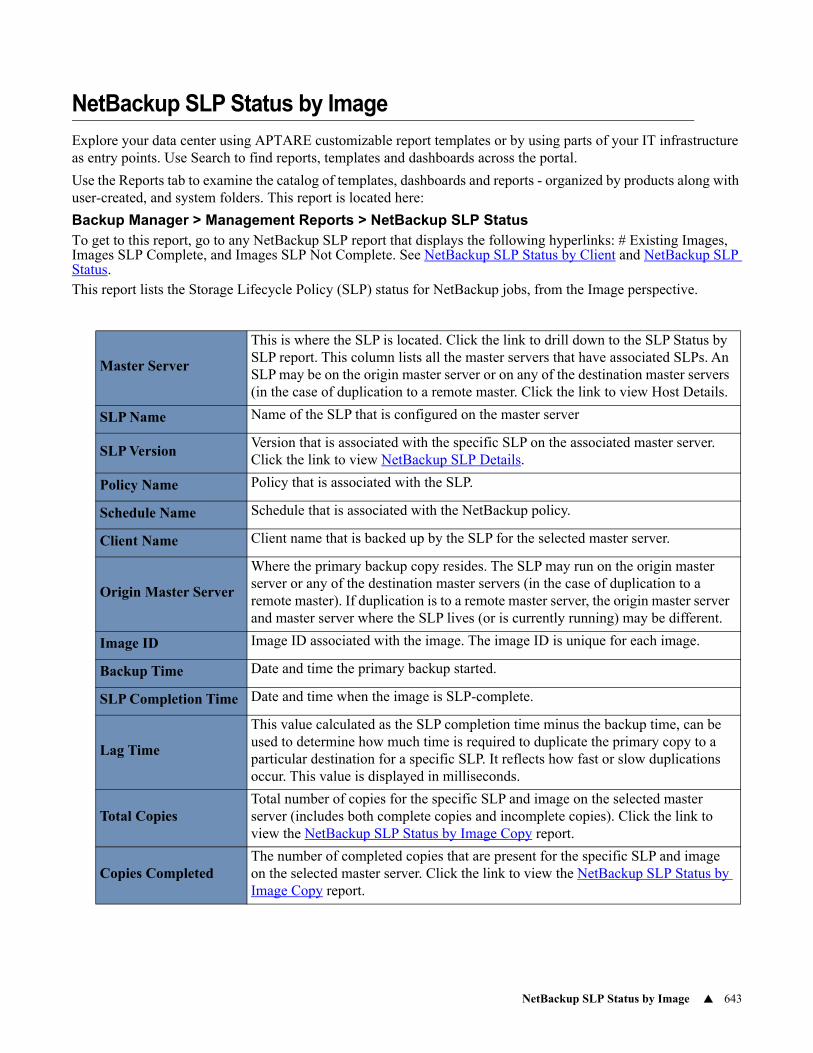
NetBackup SLP Status by Image 643
NetBackup SLP Status by Image
Explore your data center using APTARE customizable report templates or by using parts of your IT infrastructure as entry points. Use Search to find reports, templates and dashboards across the portal.
Use the Reports tab to examine the catalog of templates, dashboards and reports - organized by products along with user-created, and system folders. This report is located here:
Backup Manager > Management Reports > NetBackup SLP StatusTo get to this report, go to any NetBackup SLP report that displays the following hyperlinks: # Existing Images, Images SLP Complete, and Images SLP Not Complete. See NetBackup SLP Status by Client and NetBackup SLP Status.This report lists the Storage Lifecycle Policy (SLP) status for NetBackup jobs, from the Image perspective.
Master Server
This is where the SLP is located. Click the link to drill down to the SLP Status by SLP report. This column lists all the master servers that have associated SLPs. An SLP may be on the origin master server or on any of the destination master servers (in the case of duplication to a remote master. Click the link to view Host Details.
SLP Name Name of the SLP that is configured on the master server
SLP VersionVersion that is associated with the specific SLP on the associated master server. Click the link to view NetBackup SLP Details.
Policy Name Policy that is associated with the SLP.
Schedule Name Schedule that is associated with the NetBackup policy.
Client Name Client name that is backed up by the SLP for the selected master server.
Origin Master Server
Where the primary backup copy resides. The SLP may run on the origin master server or any of the destination master servers (in the case of duplication to a remote master). If duplication is to a remote master server, the origin master server and master server where the SLP lives (or is currently running) may be different.
Image ID Image ID associated with the image. The image ID is unique for each image.
Backup Time Date and time the primary backup started.
SLP Completion Time Date and time when the image is SLP-complete.
Lag Time
This value calculated as the SLP completion time minus the backup time, can be used to determine how much time is required to duplicate the primary copy to a particular destination for a specific SLP. It reflects how fast or slow duplications occur. This value is displayed in milliseconds.
Total CopiesTotal number of copies for the specific SLP and image on the selected master server (includes both complete copies and incomplete copies). Click the link to view the NetBackup SLP Status by Image Copy report.
Copies CompletedThe number of completed copies that are present for the specific SLP and image on the selected master server. Click the link to view the NetBackup SLP Status by Image Copy report.
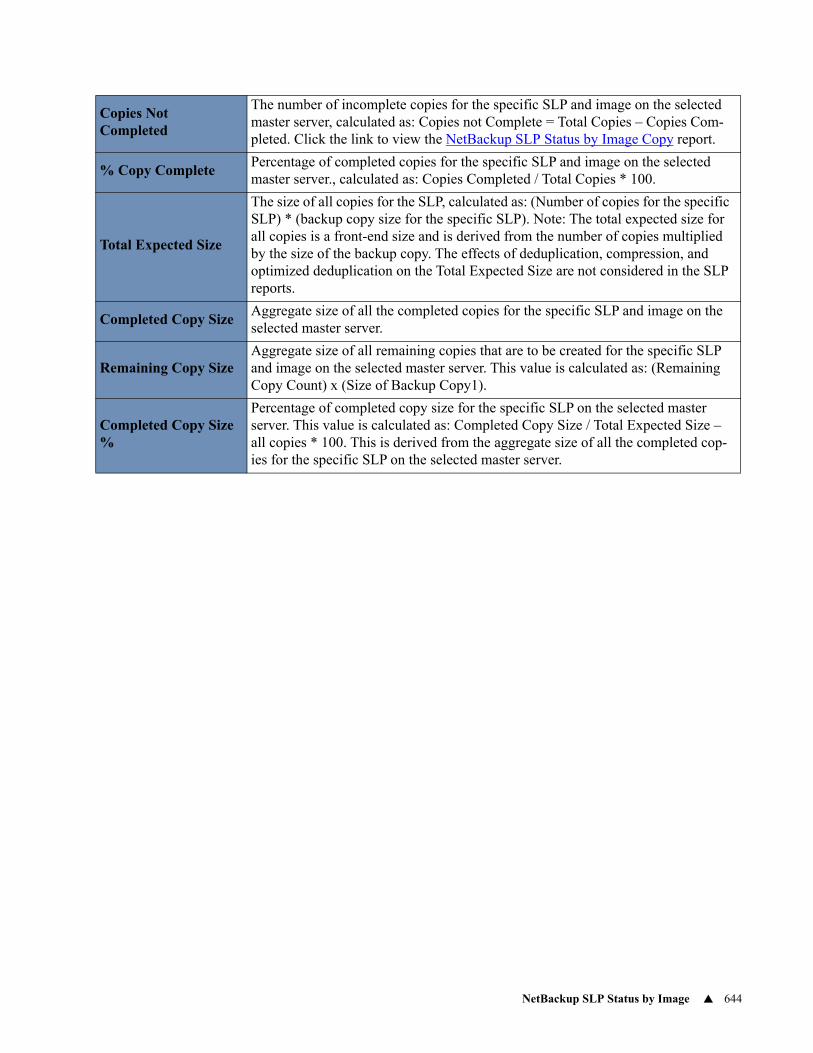
NetBackup SLP Status by Image 644
Copies Not Completed
The number of incomplete copies for the specific SLP and image on the selected master server, calculated as: Copies not Complete = Total Copies – Copies Com-pleted. Click the link to view the NetBackup SLP Status by Image Copy report.
% Copy CompletePercentage of completed copies for the specific SLP and image on the selected master server., calculated as: Copies Completed / Total Copies * 100.
Total Expected Size
The size of all copies for the SLP, calculated as: (Number of copies for the specific SLP) * (backup copy size for the specific SLP). Note: The total expected size for all copies is a front-end size and is derived from the number of copies multiplied by the size of the backup copy. The effects of deduplication, compression, and optimized deduplication on the Total Expected Size are not considered in the SLP reports.
Completed Copy Size Aggregate size of all the completed copies for the specific SLP and image on the selected master server.
Remaining Copy Size Aggregate size of all remaining copies that are to be created for the specific SLP and image on the selected master server. This value is calculated as: (Remaining Copy Count) x (Size of Backup Copy1).
Completed Copy Size %
Percentage of completed copy size for the specific SLP on the selected master server. This value is calculated as: Completed Copy Size / Total Expected Size – all copies * 100. This is derived from the aggregate size of all the completed cop-ies for the specific SLP on the selected master server.
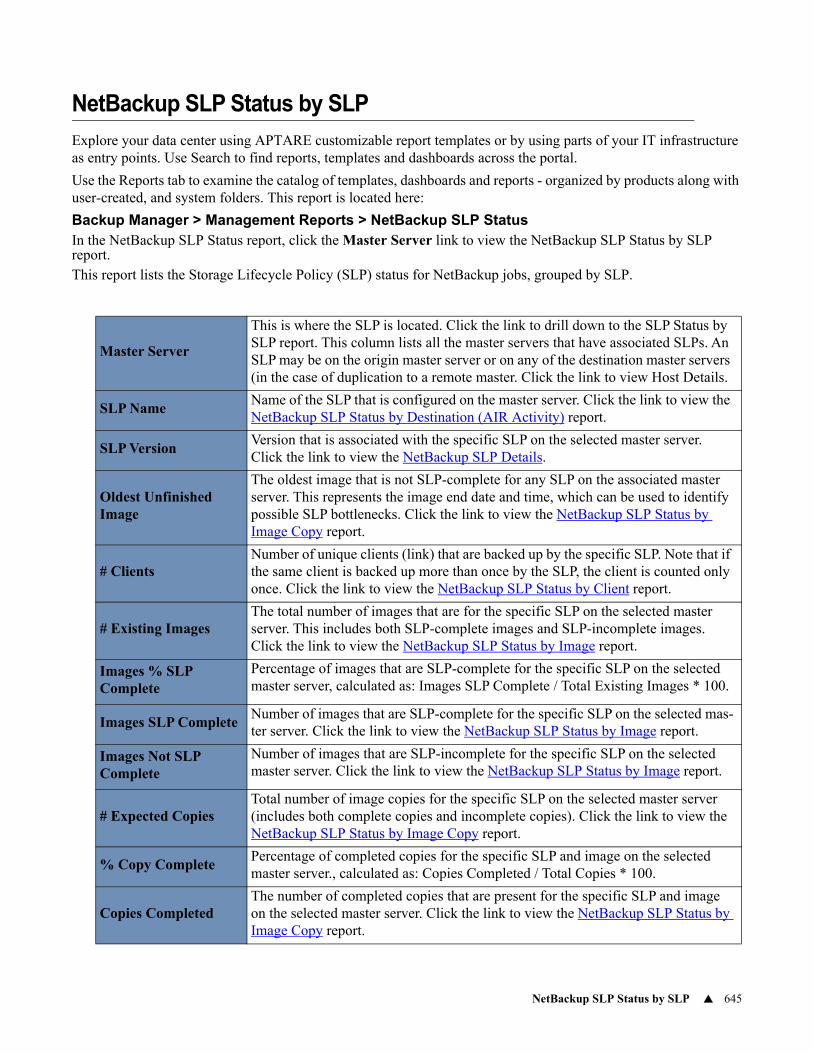
NetBackup SLP Status by SLP 645
NetBackup SLP Status by SLP
Explore your data center using APTARE customizable report templates or by using parts of your IT infrastructure as entry points. Use Search to find reports, templates and dashboards across the portal.
Use the Reports tab to examine the catalog of templates, dashboards and reports - organized by products along with user-created, and system folders. This report is located here:
Backup Manager > Management Reports > NetBackup SLP StatusIn the NetBackup SLP Status report, click the Master Server link to view the NetBackup SLP Status by SLP report.This report lists the Storage Lifecycle Policy (SLP) status for NetBackup jobs, grouped by SLP.
Master Server
This is where the SLP is located. Click the link to drill down to the SLP Status by SLP report. This column lists all the master servers that have associated SLPs. An SLP may be on the origin master server or on any of the destination master servers (in the case of duplication to a remote master. Click the link to view Host Details.
SLP NameName of the SLP that is configured on the master server. Click the link to view the NetBackup SLP Status by Destination (AIR Activity) report.
SLP VersionVersion that is associated with the specific SLP on the selected master server. Click the link to view the NetBackup SLP Details.
Oldest Unfinished Image
The oldest image that is not SLP-complete for any SLP on the associated master server. This represents the image end date and time, which can be used to identify possible SLP bottlenecks. Click the link to view the NetBackup SLP Status by Image Copy report.
# ClientsNumber of unique clients (link) that are backed up by the specific SLP. Note that if the same client is backed up more than once by the SLP, the client is counted only once. Click the link to view the NetBackup SLP Status by Client report.
# Existing ImagesThe total number of images that are for the specific SLP on the selected master server. This includes both SLP-complete images and SLP-incomplete images. Click the link to view the NetBackup SLP Status by Image report.
Images % SLP Complete
Percentage of images that are SLP-complete for the specific SLP on the selected master server, calculated as: Images SLP Complete / Total Existing Images * 100.
Images SLP CompleteNumber of images that are SLP-complete for the specific SLP on the selected mas-ter server. Click the link to view the NetBackup SLP Status by Image report.
Images Not SLP Complete
Number of images that are SLP-incomplete for the specific SLP on the selected master server. Click the link to view the NetBackup SLP Status by Image report.
# Expected CopiesTotal number of image copies for the specific SLP on the selected master server (includes both complete copies and incomplete copies). Click the link to view the NetBackup SLP Status by Image Copy report.
% Copy CompletePercentage of completed copies for the specific SLP and image on the selected master server., calculated as: Copies Completed / Total Copies * 100.
Copies CompletedThe number of completed copies that are present for the specific SLP and image on the selected master server. Click the link to view the NetBackup SLP Status by Image Copy report.
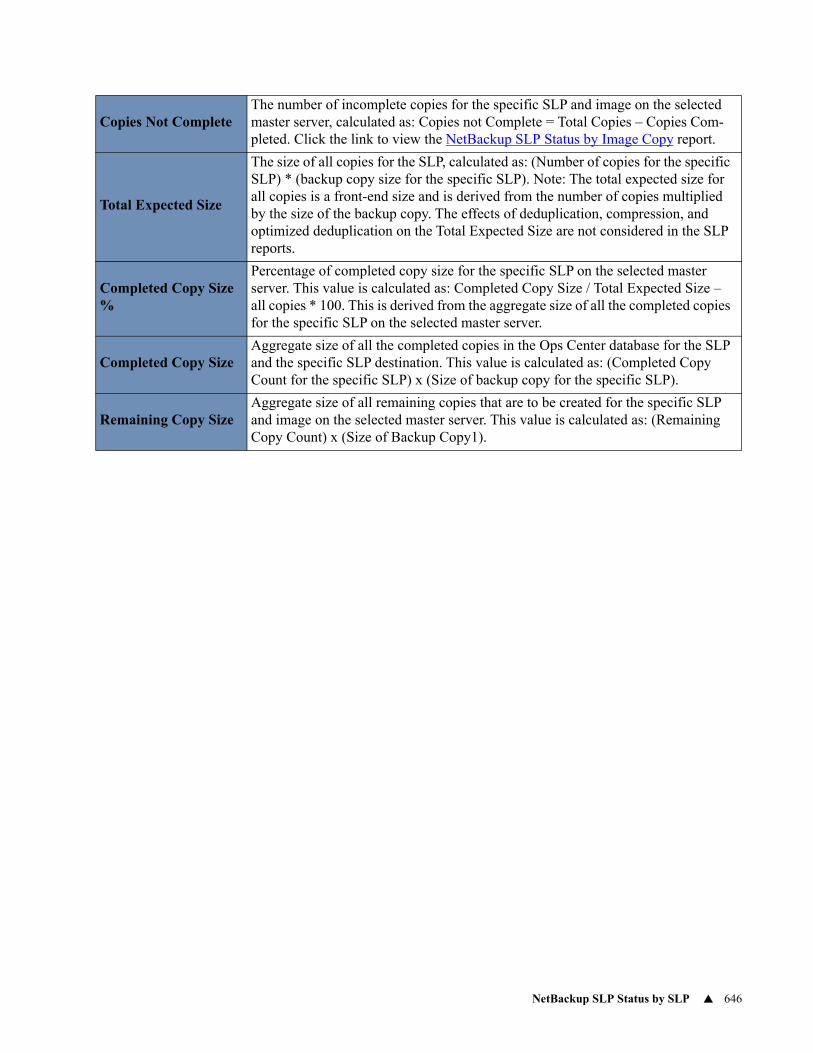
NetBackup SLP Status by SLP 646
Copies Not CompleteThe number of incomplete copies for the specific SLP and image on the selected master server, calculated as: Copies not Complete = Total Copies – Copies Com-pleted. Click the link to view the NetBackup SLP Status by Image Copy report.
Total Expected Size
The size of all copies for the SLP, calculated as: (Number of copies for the specific SLP) * (backup copy size for the specific SLP). Note: The total expected size for all copies is a front-end size and is derived from the number of copies multiplied by the size of the backup copy. The effects of deduplication, compression, and optimized deduplication on the Total Expected Size are not considered in the SLP reports.
Completed Copy Size %
Percentage of completed copy size for the specific SLP on the selected master server. This value is calculated as: Completed Copy Size / Total Expected Size – all copies * 100. This is derived from the aggregate size of all the completed copies for the specific SLP on the selected master server.
Completed Copy Size Aggregate size of all the completed copies in the Ops Center database for the SLP and the specific SLP destination. This value is calculated as: (Completed Copy Count for the specific SLP) x (Size of backup copy for the specific SLP).
Remaining Copy Size Aggregate size of all remaining copies that are to be created for the specific SLP and image on the selected master server. This value is calculated as: (Remaining Copy Count) x (Size of Backup Copy1).
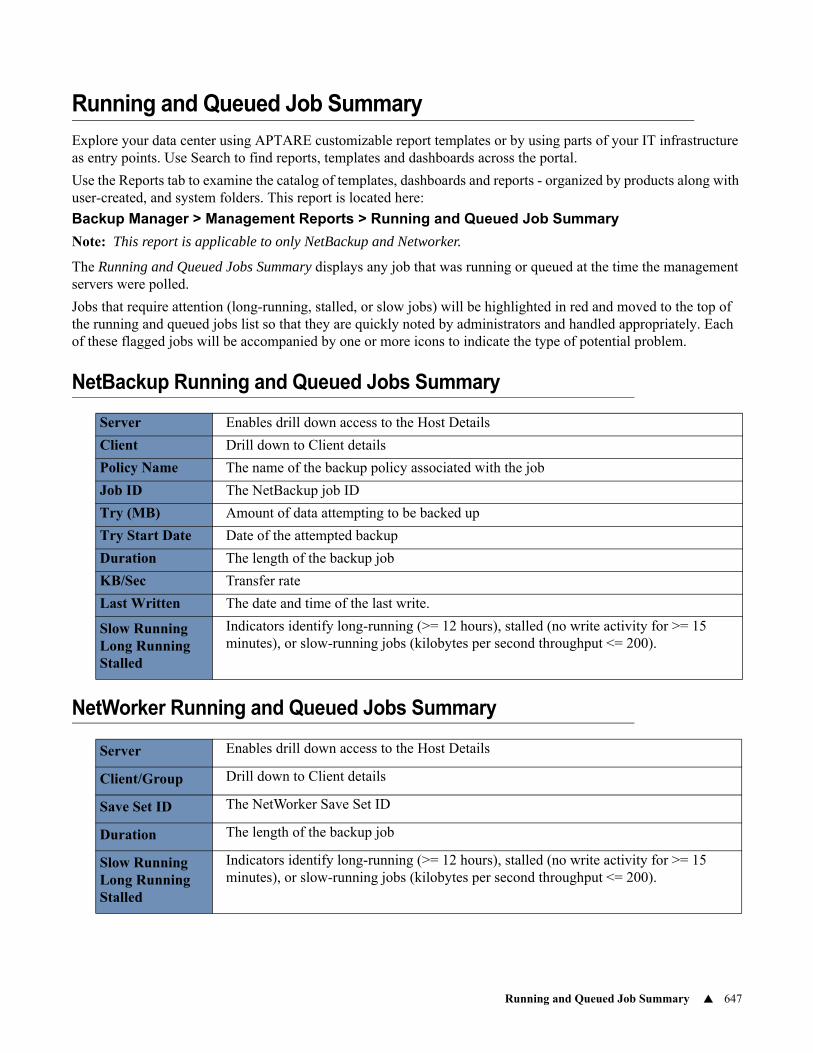
Running and Queued Job Summary 647
Running and Queued Job Summary
Explore your data center using APTARE customizable report templates or by using parts of your IT infrastructure as entry points. Use Search to find reports, templates and dashboards across the portal.
Use the Reports tab to examine the catalog of templates, dashboards and reports - organized by products along with user-created, and system folders. This report is located here:
Backup Manager > Management Reports > Running and Queued Job Summary
Note: This report is applicable to only NetBackup and Networker.
The Running and Queued Jobs Summary displays any job that was running or queued at the time the management servers were polled.
Jobs that require attention (long-running, stalled, or slow jobs) will be highlighted in red and moved to the top of the running and queued jobs list so that they are quickly noted by administrators and handled appropriately. Each of these flagged jobs will be accompanied by one or more icons to indicate the type of potential problem.
NetBackup Running and Queued Jobs Summary
NetWorker Running and Queued Jobs Summary
Server Enables drill down access to the Host Details
Client Drill down to Client details
Policy Name The name of the backup policy associated with the job
Job ID The NetBackup job ID
Try (MB) Amount of data attempting to be backed up
Try Start Date Date of the attempted backup
Duration The length of the backup job
KB/Sec Transfer rate
Last Written The date and time of the last write.
Slow RunningLong RunningStalled
Indicators identify long-running (>= 12 hours), stalled (no write activity for >= 15 minutes), or slow-running jobs (kilobytes per second throughput <= 200).
Server Enables drill down access to the Host Details
Client/Group Drill down to Client details
Save Set ID The NetWorker Save Set ID
Duration The length of the backup job
Slow RunningLong RunningStalled
Indicators identify long-running (>= 12 hours), stalled (no write activity for >= 15 minutes), or slow-running jobs (kilobytes per second throughput <= 200).
649
19Chapter 6Backup Administration Reports
This section contains the following topics:• Avamar Grid Capacity Dashboard
• Job Histogram
• Client Protection Summary
• Operations Dashboard
• Command Center Dashboard
• Data Protection Dashboard
• Message of the Day Report
• Host Details
• Host Group
• Object Details
• Mission Control - Backup
• Operations Dashboard
• IBM Spectrum Protect (TSM) Storage Pools Dashboard
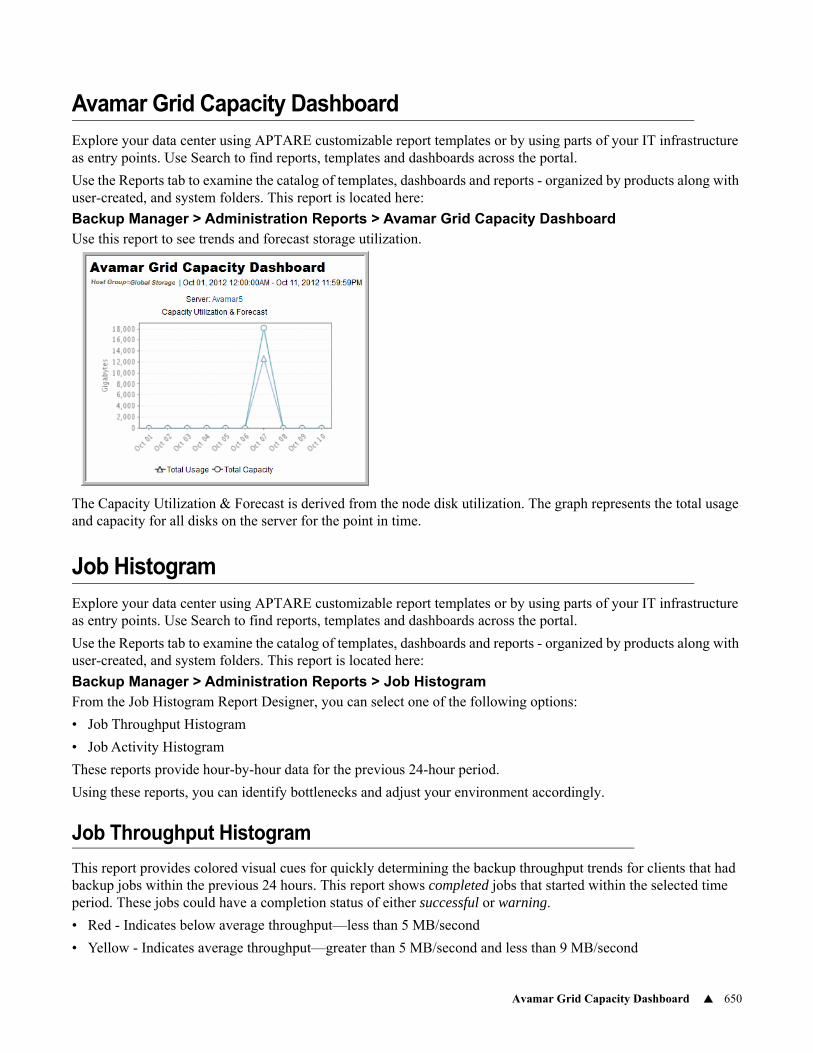
Avamar Grid Capacity Dashboard 650
Avamar Grid Capacity Dashboard
Explore your data center using APTARE customizable report templates or by using parts of your IT infrastructure as entry points. Use Search to find reports, templates and dashboards across the portal.
Use the Reports tab to examine the catalog of templates, dashboards and reports - organized by products along with user-created, and system folders. This report is located here:
Backup Manager > Administration Reports > Avamar Grid Capacity DashboardUse this report to see trends and forecast storage utilization.
The Capacity Utilization & Forecast is derived from the node disk utilization. The graph represents the total usage and capacity for all disks on the server for the point in time.
Job Histogram
Explore your data center using APTARE customizable report templates or by using parts of your IT infrastructure as entry points. Use Search to find reports, templates and dashboards across the portal.
Use the Reports tab to examine the catalog of templates, dashboards and reports - organized by products along with user-created, and system folders. This report is located here:
Backup Manager > Administration Reports > Job HistogramFrom the Job Histogram Report Designer, you can select one of the following options:
• Job Throughput Histogram
• Job Activity Histogram
These reports provide hour-by-hour data for the previous 24-hour period.
Using these reports, you can identify bottlenecks and adjust your environment accordingly.
Job Throughput Histogram
This report provides colored visual cues for quickly determining the backup throughput trends for clients that had backup jobs within the previous 24 hours. This report shows completed jobs that started within the selected time period. These jobs could have a completion status of either successful or warning.
• Red - Indicates below average throughput—less than 5 MB/second
• Yellow - Indicates average throughput—greater than 5 MB/second and less than 9 MB/second
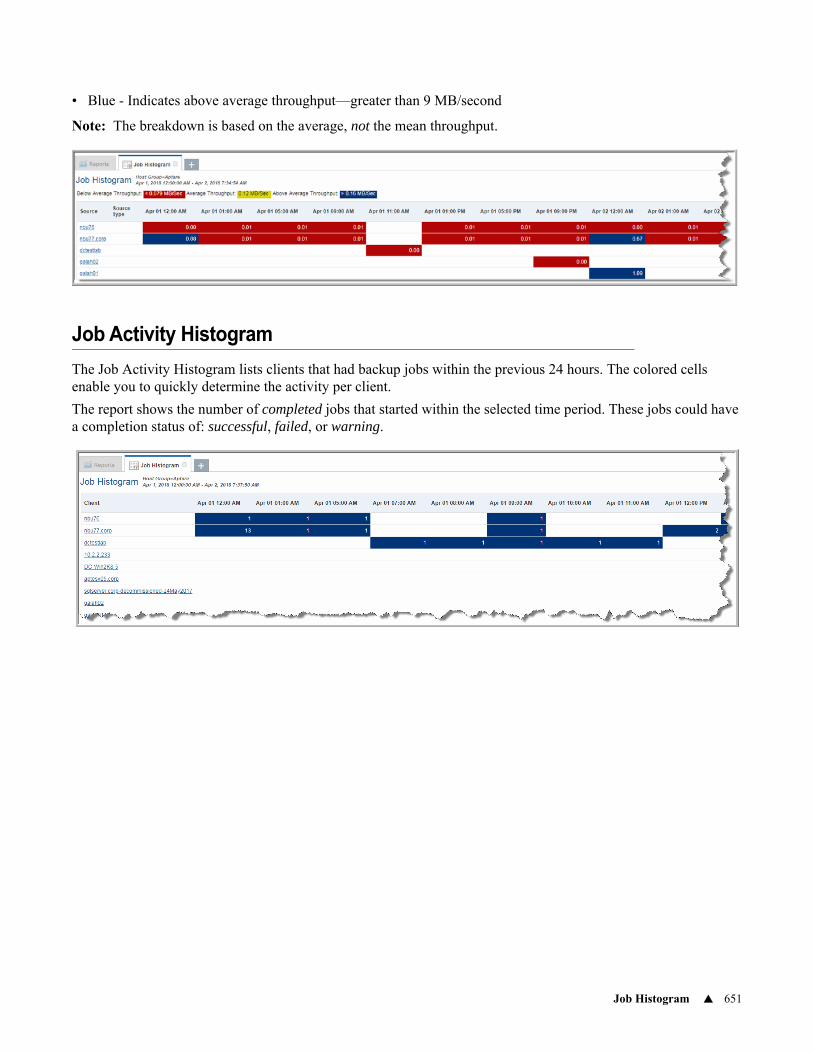
Job Histogram 651
• Blue - Indicates above average throughput—greater than 9 MB/second
Note: The breakdown is based on the average, not the mean throughput.
Job Activity Histogram
The Job Activity Histogram lists clients that had backup jobs within the previous 24 hours. The colored cells enable you to quickly determine the activity per client.
The report shows the number of completed jobs that started within the selected time period. These jobs could have a completion status of: successful, failed, or warning.
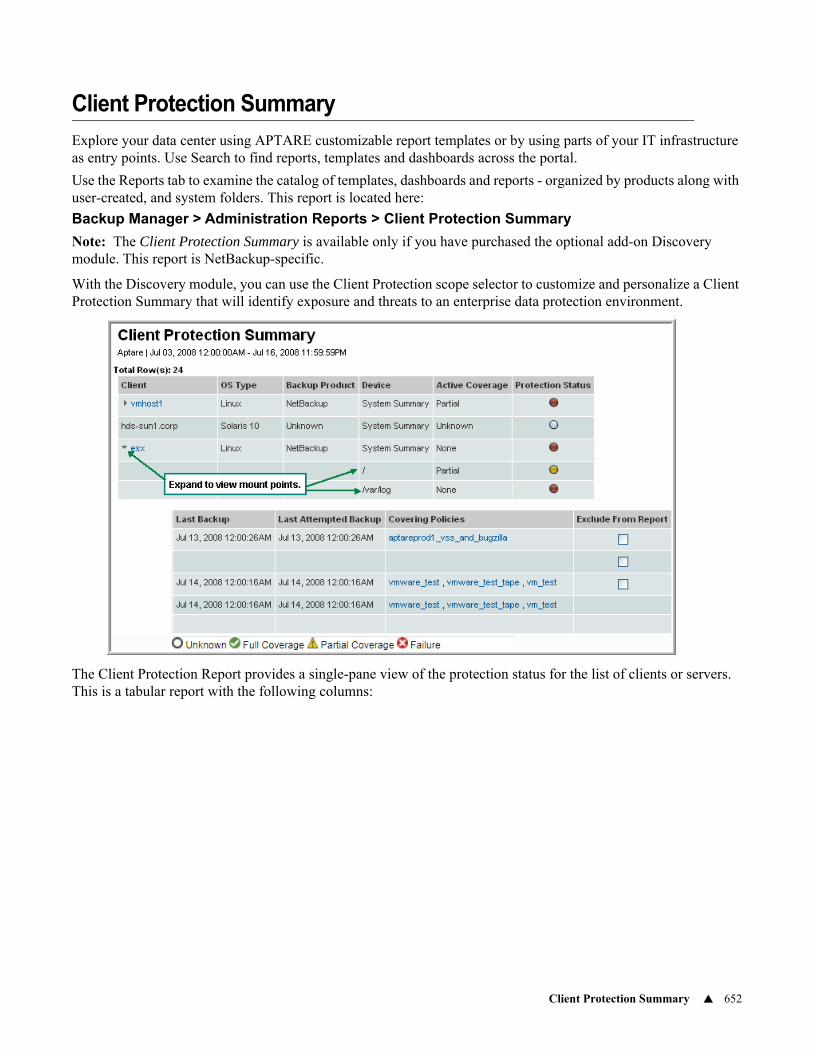
Client Protection Summary 652
Client Protection Summary
Explore your data center using APTARE customizable report templates or by using parts of your IT infrastructure as entry points. Use Search to find reports, templates and dashboards across the portal.
Use the Reports tab to examine the catalog of templates, dashboards and reports - organized by products along with user-created, and system folders. This report is located here:
Backup Manager > Administration Reports > Client Protection Summary
Note: The Client Protection Summary is available only if you have purchased the optional add-on Discovery module. This report is NetBackup-specific.
With the Discovery module, you can use the Client Protection scope selector to customize and personalize a Client Protection Summary that will identify exposure and threats to an enterprise data protection environment.
The Client Protection Report provides a single-pane view of the protection status for the list of clients or servers. This is a tabular report with the following columns:
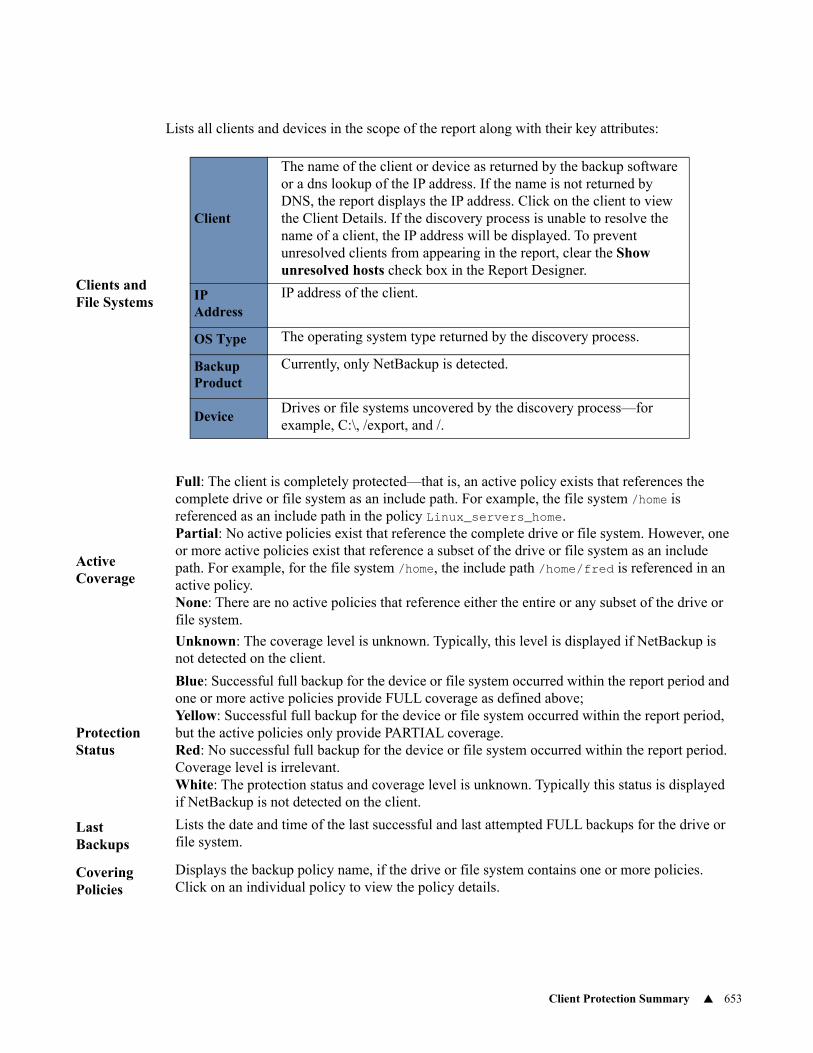
Client Protection Summary 653
Clients and File Systems
Lists all clients and devices in the scope of the report along with their key attributes:
Active Coverage
Full: The client is completely protected—that is, an active policy exists that references the complete drive or file system as an include path. For example, the file system /home is referenced as an include path in the policy Linux_servers_home.Partial: No active policies exist that reference the complete drive or file system. However, one or more active policies exist that reference a subset of the drive or file system as an include path. For example, for the file system /home, the include path /home/fred is referenced in an active policy.None: There are no active policies that reference either the entire or any subset of the drive or file system.
Unknown: The coverage level is unknown. Typically, this level is displayed if NetBackup is not detected on the client.
Protection Status
Blue: Successful full backup for the device or file system occurred within the report period and one or more active policies provide FULL coverage as defined above;Yellow: Successful full backup for the device or file system occurred within the report period, but the active policies only provide PARTIAL coverage.Red: No successful full backup for the device or file system occurred within the report period. Coverage level is irrelevant.White: The protection status and coverage level is unknown. Typically this status is displayed if NetBackup is not detected on the client.
Last Backups
Lists the date and time of the last successful and last attempted FULL backups for the drive or file system.
Covering Policies
Displays the backup policy name, if the drive or file system contains one or more policies. Click on an individual policy to view the policy details.
Client
The name of the client or device as returned by the backup software or a dns lookup of the IP address. If the name is not returned by DNS, the report displays the IP address. Click on the client to view the Client Details. If the discovery process is unable to resolve the name of a client, the IP address will be displayed. To prevent unresolved clients from appearing in the report, clear the Show unresolved hosts check box in the Report Designer.
IP Address
IP address of the client.
OS Type The operating system type returned by the discovery process.
Backup Product
Currently, only NetBackup is detected.
DeviceDrives or file systems uncovered by the discovery process—for example, C:\, /export, and /.
Client Protection Summary 654
Exclude From Report
Select the Exclude check box to exclude specific clients, devices, or file systems from the report. The selected items no longer appear in subsequent reports. For example, you would want to exclude devices such as printers, that you don’t expect to be backed up. To subsequently include/exclude clients, file systems, and unresolved hosts, use the check boxes in the Scope Selector: Show excluded clients, Show excluded file systems, Show unresolved hosts, and Expand all clients.
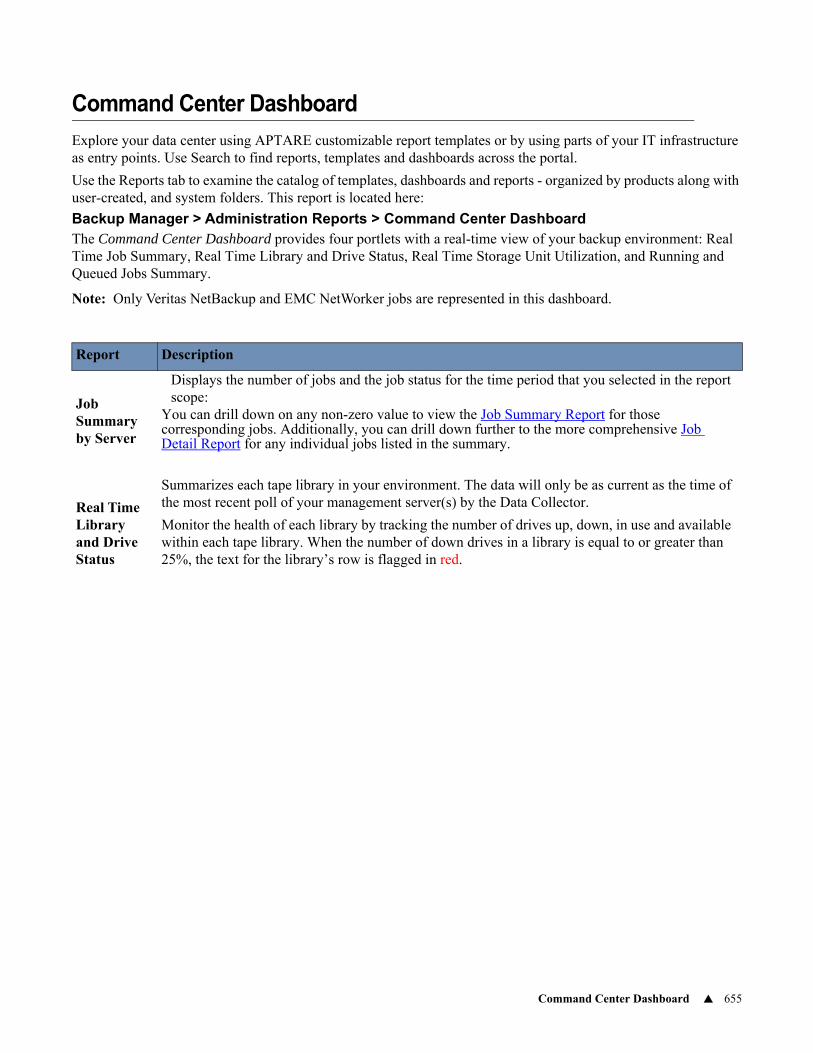
Command Center Dashboard 655
Command Center Dashboard
Explore your data center using APTARE customizable report templates or by using parts of your IT infrastructure as entry points. Use Search to find reports, templates and dashboards across the portal.
Use the Reports tab to examine the catalog of templates, dashboards and reports - organized by products along with user-created, and system folders. This report is located here:
Backup Manager > Administration Reports > Command Center DashboardThe Command Center Dashboard provides four portlets with a real-time view of your backup environment: Real Time Job Summary, Real Time Library and Drive Status, Real Time Storage Unit Utilization, and Running and Queued Jobs Summary.
Note: Only Veritas NetBackup and EMC NetWorker jobs are represented in this dashboard.
Report Description
Job Summary by Server
Displays the number of jobs and the job status for the time period that you selected in the report scope:
You can drill down on any non-zero value to view the Job Summary Report for those corresponding jobs. Additionally, you can drill down further to the more comprehensive Job Detail Report for any individual jobs listed in the summary.
Real Time Library and Drive Status
Summarizes each tape library in your environment. The data will only be as current as the time of the most recent poll of your management server(s) by the Data Collector.
Monitor the health of each library by tracking the number of drives up, down, in use and available within each tape library. When the number of down drives in a library is equal to or greater than 25%, the text for the library’s row is flagged in red.
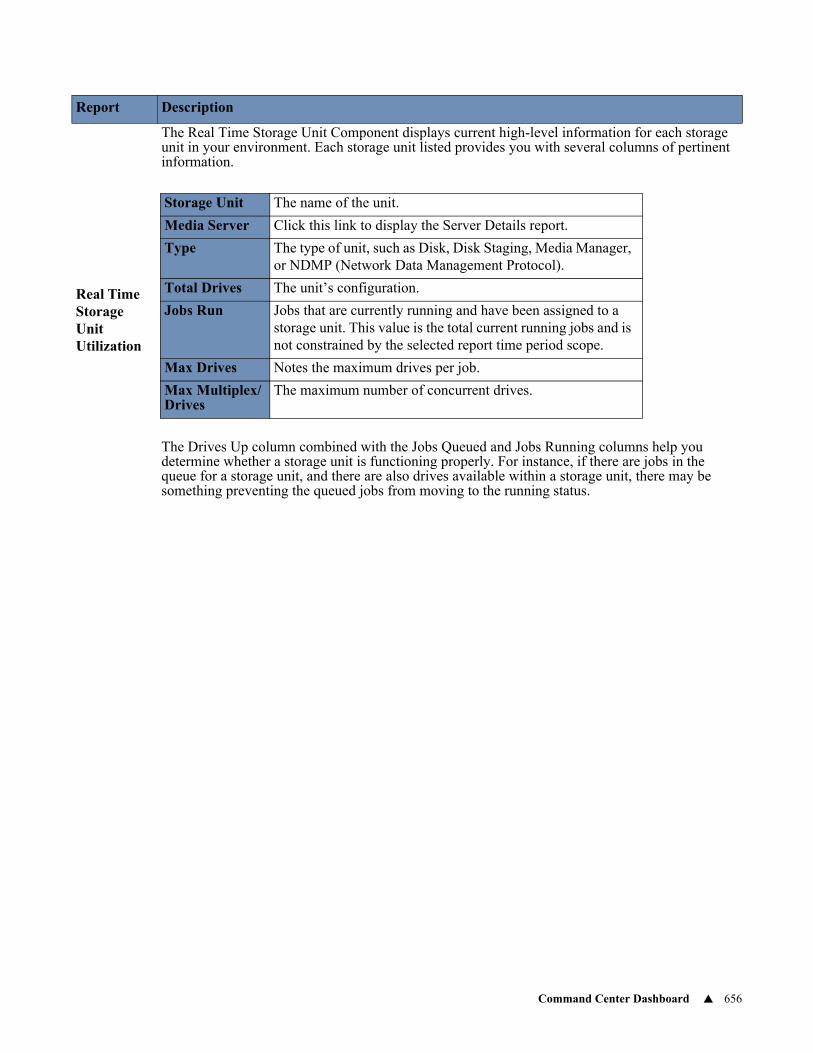
Command Center Dashboard 656
Real Time Storage Unit Utilization
The Real Time Storage Unit Component displays current high-level information for each storage unit in your environment. Each storage unit listed provides you with several columns of pertinent information.
The Drives Up column combined with the Jobs Queued and Jobs Running columns help you determine whether a storage unit is functioning properly. For instance, if there are jobs in the queue for a storage unit, and there are also drives available within a storage unit, there may be something preventing the queued jobs from moving to the running status.
Report Description
Storage Unit The name of the unit.
Media Server Click this link to display the Server Details report.
Type The type of unit, such as Disk, Disk Staging, Media Manager, or NDMP (Network Data Management Protocol).
Total Drives The unit’s configuration.
Jobs Run Jobs that are currently running and have been assigned to a storage unit. This value is the total current running jobs and is not constrained by the selected report time period scope.
Max Drives Notes the maximum drives per job.
Max Multiplex/Drives
The maximum number of concurrent drives.
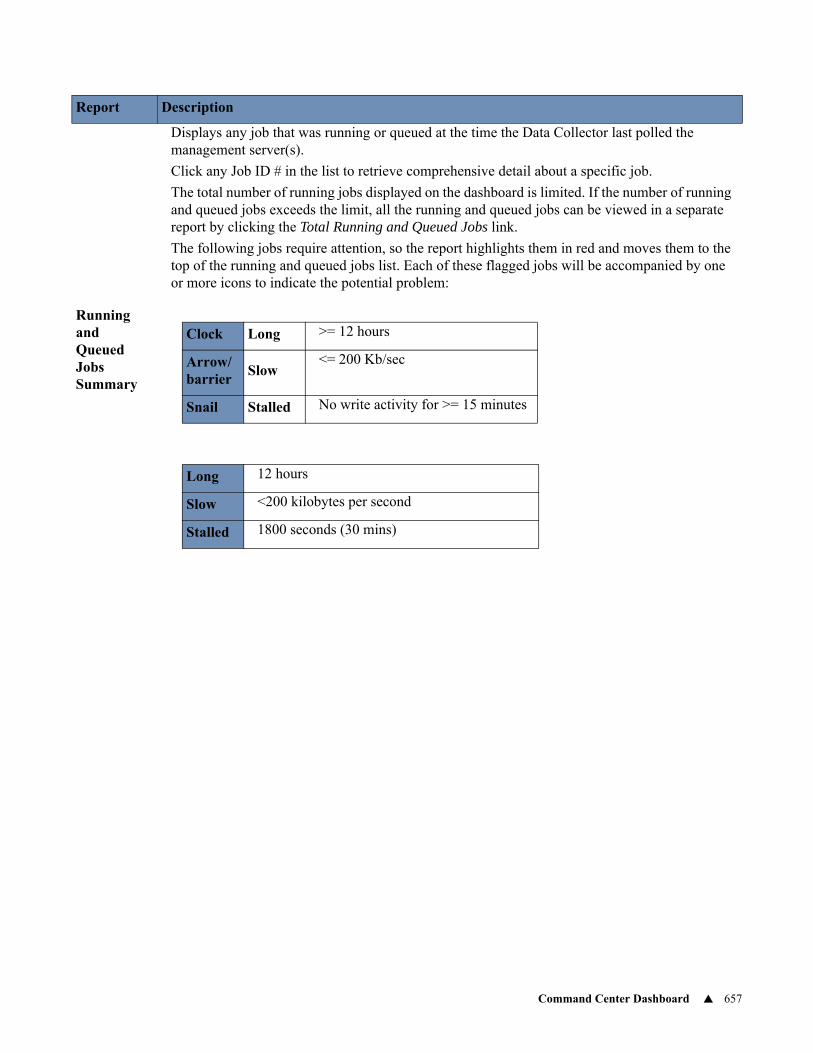
Command Center Dashboard 657
Running and Queued Jobs Summary
Displays any job that was running or queued at the time the Data Collector last polled the management server(s).
Click any Job ID # in the list to retrieve comprehensive detail about a specific job.
The total number of running jobs displayed on the dashboard is limited. If the number of running and queued jobs exceeds the limit, all the running and queued jobs can be viewed in a separate report by clicking the Total Running and Queued Jobs link.
The following jobs require attention, so the report highlights them in red and moves them to the top of the running and queued jobs list. Each of these flagged jobs will be accompanied by one or more icons to indicate the potential problem:
Report Description
Clock Long >= 12 hours
Arrow/barrier
Slow<= 200 Kb/sec
Snail Stalled No write activity for >= 15 minutes
Long 12 hours
Slow <200 kilobytes per second
Stalled 1800 seconds (30 mins)
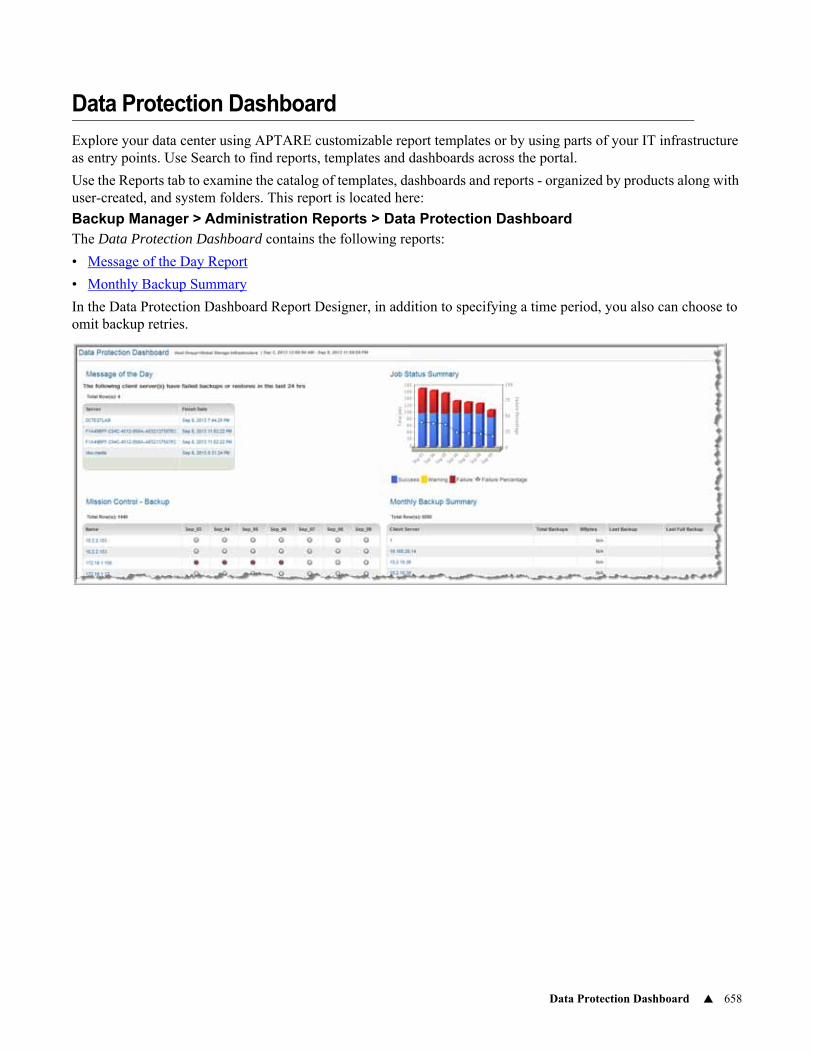
Data Protection Dashboard 658
Data Protection Dashboard
Explore your data center using APTARE customizable report templates or by using parts of your IT infrastructure as entry points. Use Search to find reports, templates and dashboards across the portal.
Use the Reports tab to examine the catalog of templates, dashboards and reports - organized by products along with user-created, and system folders. This report is located here:
Backup Manager > Administration Reports > Data Protection DashboardThe Data Protection Dashboard contains the following reports:
• Message of the Day Report
• Monthly Backup Summary
In the Data Protection Dashboard Report Designer, in addition to specifying a time period, you also can choose to omit backup retries.
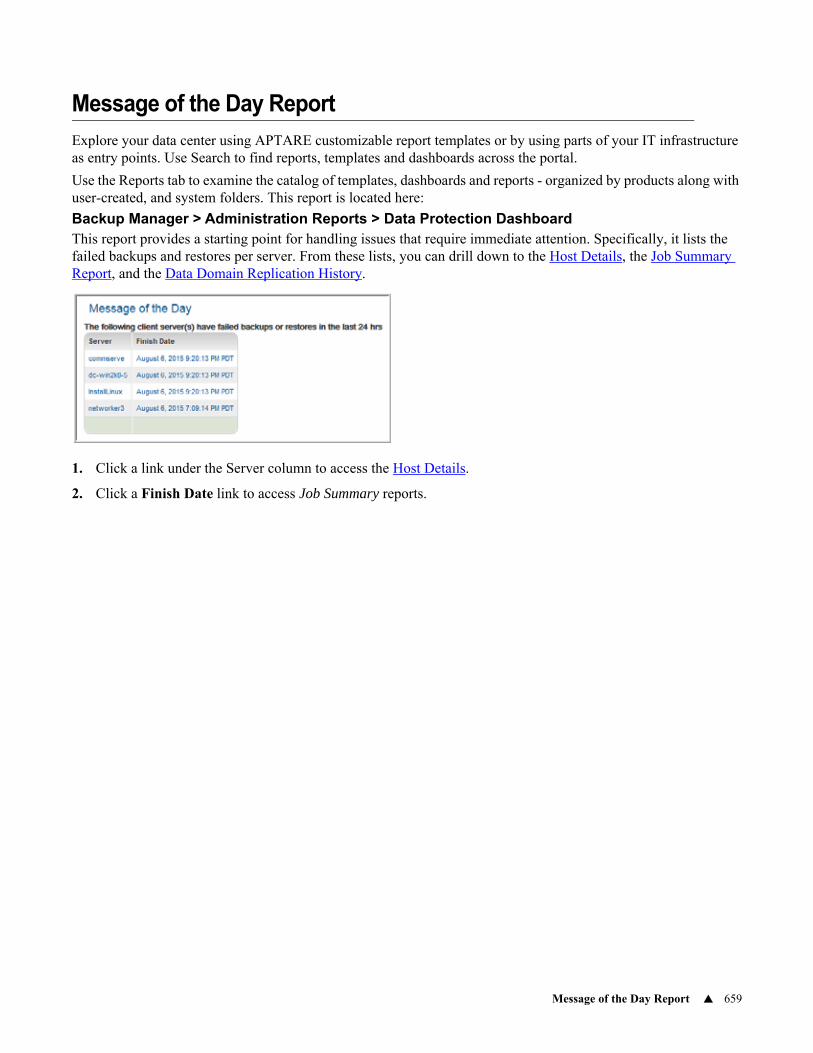
Message of the Day Report 659
Message of the Day Report
Explore your data center using APTARE customizable report templates or by using parts of your IT infrastructure as entry points. Use Search to find reports, templates and dashboards across the portal.
Use the Reports tab to examine the catalog of templates, dashboards and reports - organized by products along with user-created, and system folders. This report is located here:
Backup Manager > Administration Reports > Data Protection DashboardThis report provides a starting point for handling issues that require immediate attention. Specifically, it lists the failed backups and restores per server. From these lists, you can drill down to the Host Details, the Job Summary Report, and the Data Domain Replication History.
1. Click a link under the Server column to access the Host Details.
2. Click a Finish Date link to access Job Summary reports.
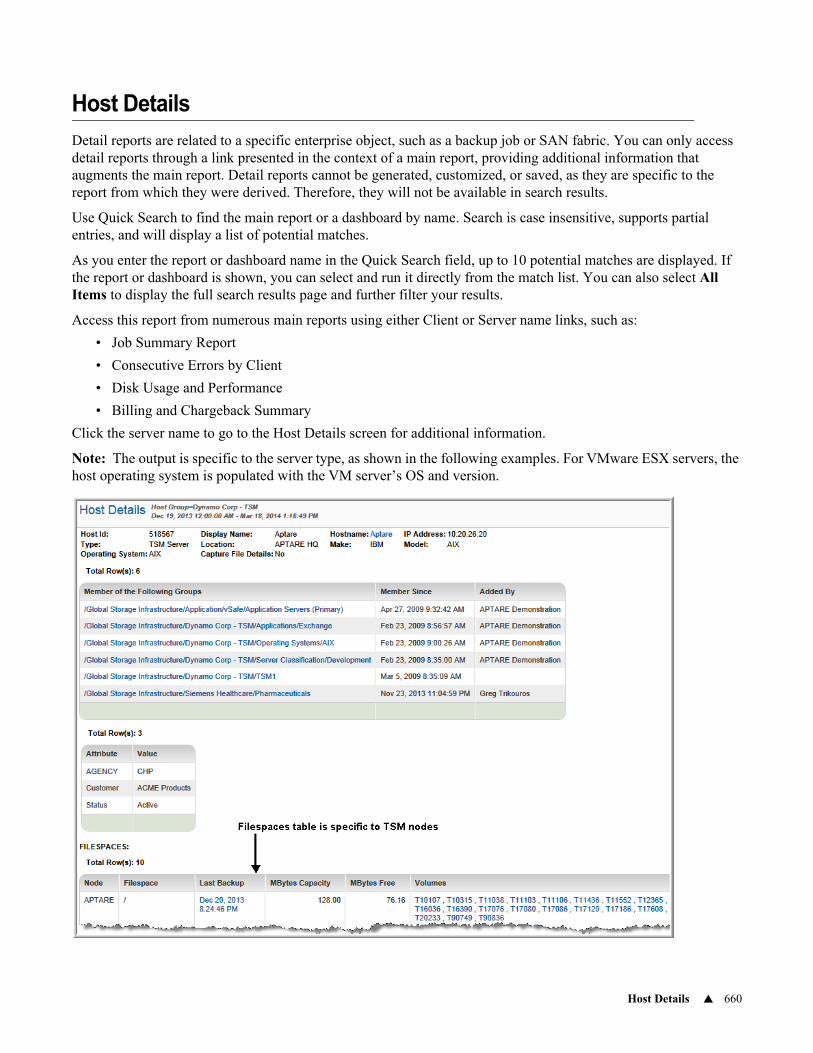
Host Details 660
Host Details
Detail reports are related to a specific enterprise object, such as a backup job or SAN fabric. You can only access detail reports through a link presented in the context of a main report, providing additional information that augments the main report. Detail reports cannot be generated, customized, or saved, as they are specific to the report from which they were derived. Therefore, they will not be available in search results.
Use Quick Search to find the main report or a dashboard by name. Search is case insensitive, supports partial entries, and will display a list of potential matches.
As you enter the report or dashboard name in the Quick Search field, up to 10 potential matches are displayed. If the report or dashboard is shown, you can select and run it directly from the match list. You can also select All Items to display the full search results page and further filter your results.
Access this report from numerous main reports using either Client or Server name links, such as:
• Job Summary Report
• Consecutive Errors by Client
• Disk Usage and Performance
• Billing and Chargeback Summary
Click the server name to go to the Host Details screen for additional information.
Note: The output is specific to the server type, as shown in the following examples. For VMware ESX servers, the host operating system is populated with the VM server’s OS and version.
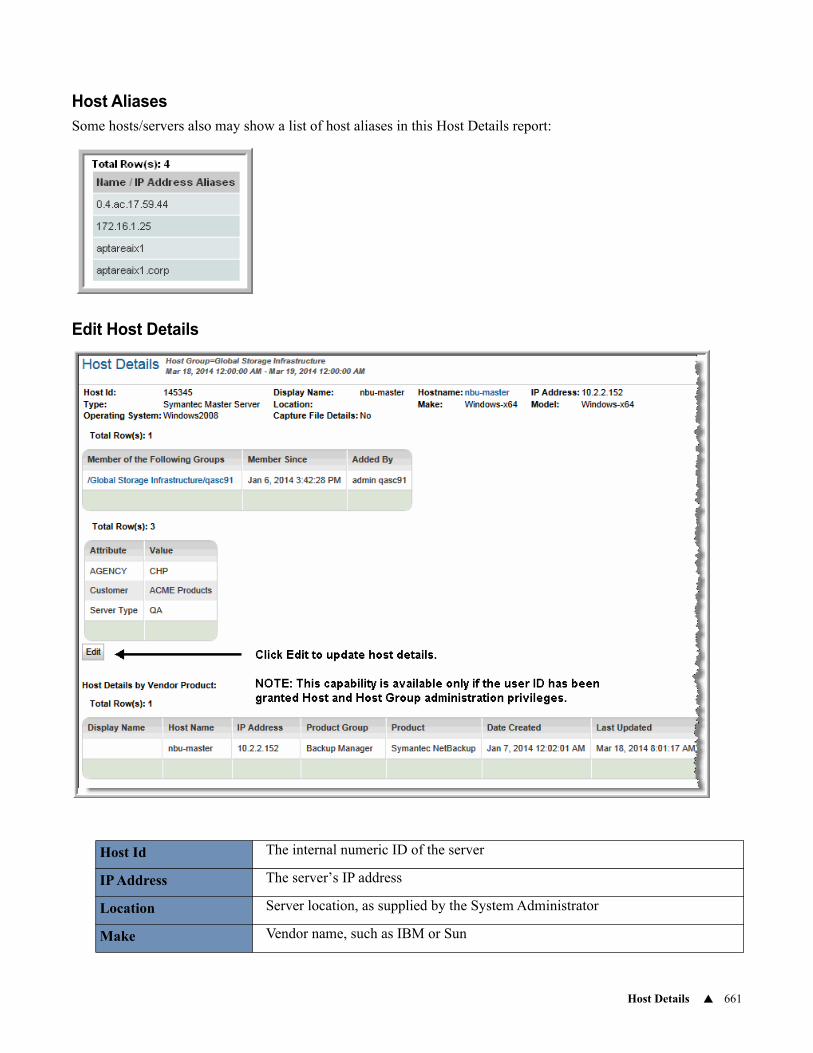
Host Details 661
Host AliasesSome hosts/servers also may show a list of host aliases in this Host Details report:
Edit Host Details
Host Id The internal numeric ID of the server
IP Address The server’s IP address
Location Server location, as supplied by the System Administrator
Make Vendor name, such as IBM or Sun
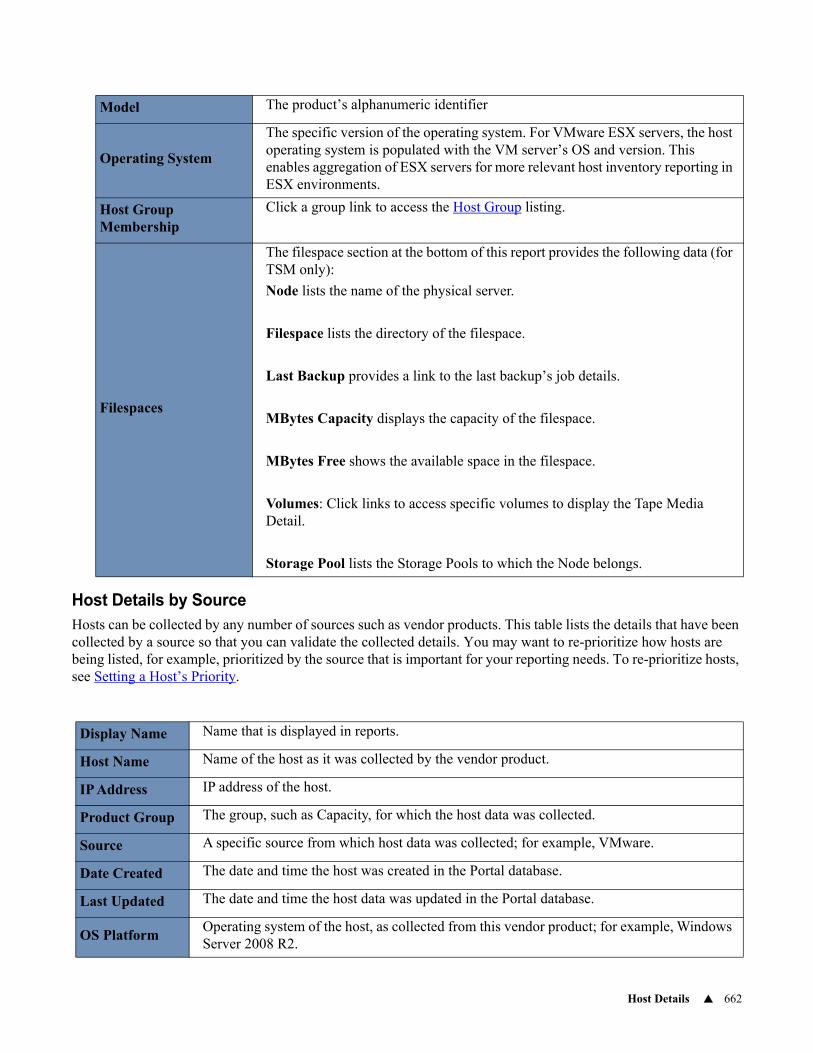
Host Details 662
Host Details by SourceHosts can be collected by any number of sources such as vendor products. This table lists the details that have been collected by a source so that you can validate the collected details. You may want to re-prioritize how hosts are being listed, for example, prioritized by the source that is important for your reporting needs. To re-prioritize hosts, see Setting a Host’s Priority.
Model The product’s alphanumeric identifier
Operating System
The specific version of the operating system. For VMware ESX servers, the host operating system is populated with the VM server’s OS and version. This enables aggregation of ESX servers for more relevant host inventory reporting in ESX environments.
Host Group Membership
Click a group link to access the Host Group listing.
Filespaces
The filespace section at the bottom of this report provides the following data (for TSM only):
Node lists the name of the physical server.
Filespace lists the directory of the filespace.
Last Backup provides a link to the last backup’s job details.
MBytes Capacity displays the capacity of the filespace.
MBytes Free shows the available space in the filespace.
Volumes: Click links to access specific volumes to display the Tape Media Detail.
Storage Pool lists the Storage Pools to which the Node belongs.
Display Name Name that is displayed in reports.
Host Name Name of the host as it was collected by the vendor product.
IP Address IP address of the host.
Product Group The group, such as Capacity, for which the host data was collected.
Source A specific source from which host data was collected; for example, VMware.
Date Created The date and time the host was created in the Portal database.
Last Updated The date and time the host data was updated in the Portal database.
OS PlatformOperating system of the host, as collected from this vendor product; for example, Windows Server 2008 R2.
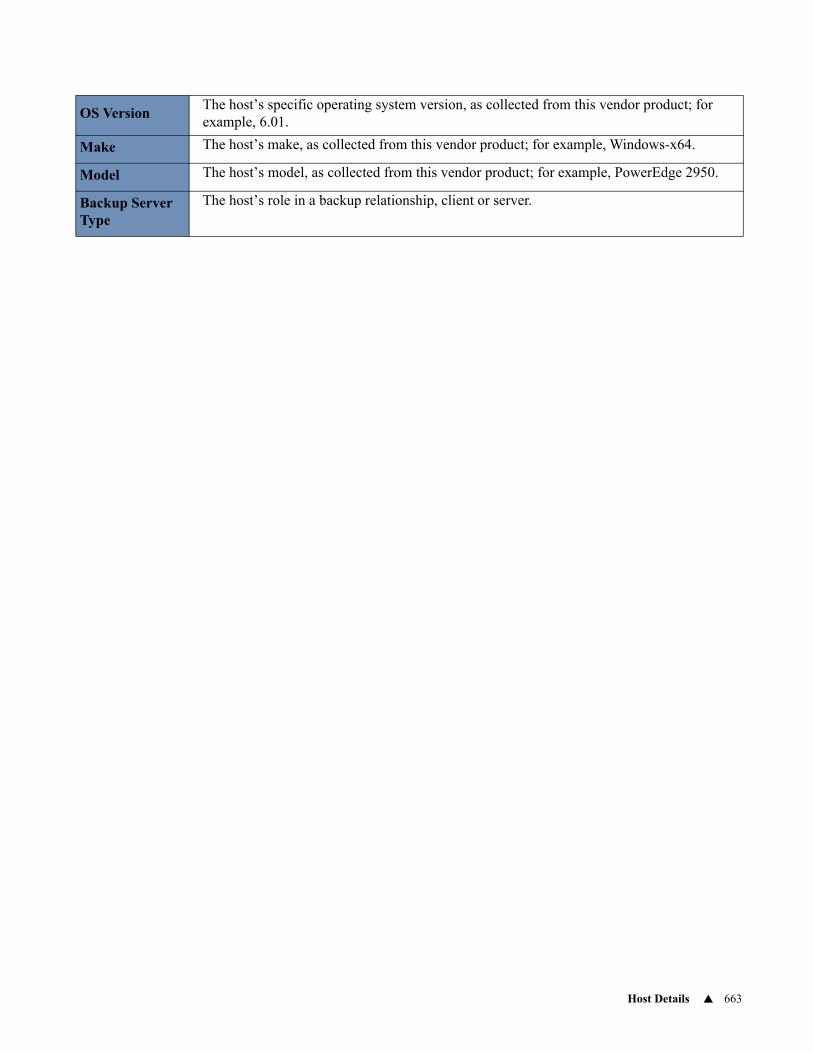
Host Details 663
OS VersionThe host’s specific operating system version, as collected from this vendor product; for example, 6.01.
Make The host’s make, as collected from this vendor product; for example, Windows-x64.
Model The host’s model, as collected from this vendor product; for example, PowerEdge 2950.
Backup Server Type
The host’s role in a backup relationship, client or server.
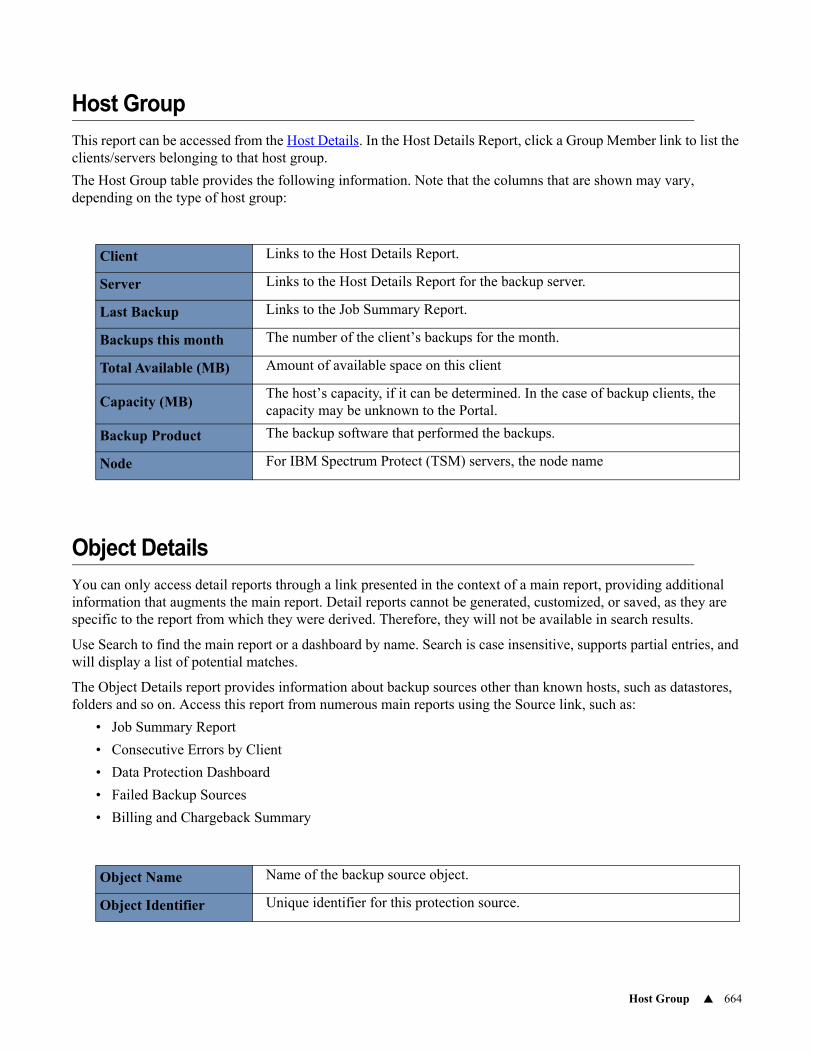
Host Group 664
Host Group
This report can be accessed from the Host Details. In the Host Details Report, click a Group Member link to list the clients/servers belonging to that host group.
The Host Group table provides the following information. Note that the columns that are shown may vary, depending on the type of host group:
Object Details
You can only access detail reports through a link presented in the context of a main report, providing additional information that augments the main report. Detail reports cannot be generated, customized, or saved, as they are specific to the report from which they were derived. Therefore, they will not be available in search results.
Use Search to find the main report or a dashboard by name. Search is case insensitive, supports partial entries, and will display a list of potential matches.
The Object Details report provides information about backup sources other than known hosts, such as datastores, folders and so on. Access this report from numerous main reports using the Source link, such as:
• Job Summary Report
• Consecutive Errors by Client
• Data Protection Dashboard
• Failed Backup Sources
• Billing and Chargeback Summary
Client Links to the Host Details Report.
Server Links to the Host Details Report for the backup server.
Last Backup Links to the Job Summary Report.
Backups this month The number of the client’s backups for the month.
Total Available (MB) Amount of available space on this client
Capacity (MB)The host’s capacity, if it can be determined. In the case of backup clients, the capacity may be unknown to the Portal.
Backup Product The backup software that performed the backups.
Node For IBM Spectrum Protect (TSM) servers, the node name
Object Name Name of the backup source object.
Object Identifier Unique identifier for this protection source.
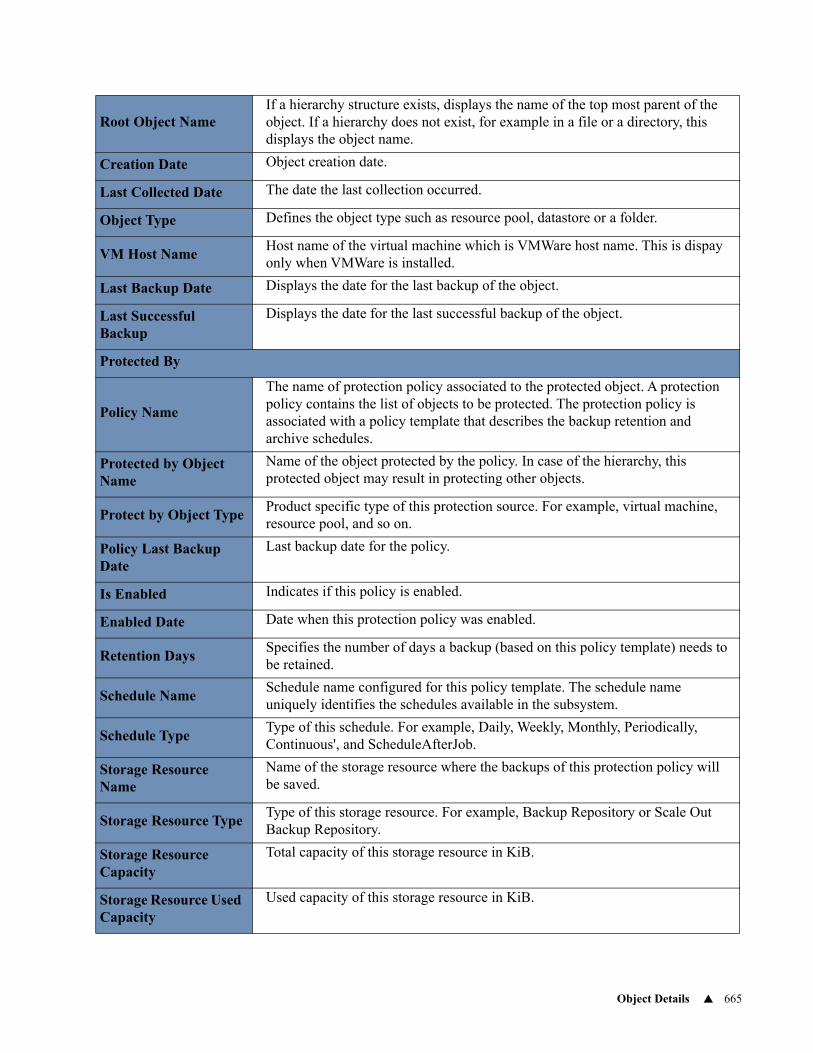
Object Details 665
Root Object NameIf a hierarchy structure exists, displays the name of the top most parent of the object. If a hierarchy does not exist, for example in a file or a directory, this displays the object name.
Creation Date Object creation date.
Last Collected Date The date the last collection occurred.
Object Type Defines the object type such as resource pool, datastore or a folder.
VM Host NameHost name of the virtual machine which is VMWare host name. This is dispay only when VMWare is installed.
Last Backup Date Displays the date for the last backup of the object.
Last Successful Backup
Displays the date for the last successful backup of the object.
Protected By
Policy Name
The name of protection policy associated to the protected object. A protection policy contains the list of objects to be protected. The protection policy is associated with a policy template that describes the backup retention and archive schedules.
Protected by Object Name
Name of the object protected by the policy. In case of the hierarchy, this protected object may result in protecting other objects.
Protect by Object TypeProduct specific type of this protection source. For example, virtual machine, resource pool, and so on.
Policy Last Backup Date
Last backup date for the policy.
Is Enabled Indicates if this policy is enabled.
Enabled Date Date when this protection policy was enabled.
Retention DaysSpecifies the number of days a backup (based on this policy template) needs to be retained.
Schedule NameSchedule name configured for this policy template. The schedule name uniquely identifies the schedules available in the subsystem.
Schedule TypeType of this schedule. For example, Daily, Weekly, Monthly, Periodically, Continuous', and ScheduleAfterJob.
Storage Resource Name
Name of the storage resource where the backups of this protection policy will be saved.
Storage Resource TypeType of this storage resource. For example, Backup Repository or Scale Out Backup Repository.
Storage Resource Capacity
Total capacity of this storage resource in KiB.
Storage Resource Used Capacity
Used capacity of this storage resource in KiB.
Mission Control - Backup 666
Mission Control - Backup
Explore your data center using APTARE customizable report templates or by using parts of your IT infrastructure as entry points. Use Search to find reports, templates and dashboards across the portal.
Use the Reports tab to examine the catalog of templates, dashboards and reports - organized by products along with user-created, and system folders. This report is located here:
Backup Manager > Administration Reports > Mission Control - BackupThe Mission Control report provides you with a comprehensive snapshot of your backup and restore event status. Using this report, you can easily identify the sources (objects or clients) that have had no backups or failed backups. And, you can drill down to ascertain the root cause of unsuccessful backups. Organizations use this report to ensure Sarbanes-Oxley compliance, as it shows ultimate backup success over time.
When you generate this report, the Report Designer prompts you to select scope parameters, including the options to:
• Ignore retries
• Exclude clients with successful backups
• Exclude clients with no backups - Only the sources with at least one “No Jobs” or “Failed” indicator will be shown. Note that if the last column corresponds to the current day and the indicator is “No Jobs” and all other indicators for the row are successful, the row will be considered a “success” and therefore will be excluded from the report.
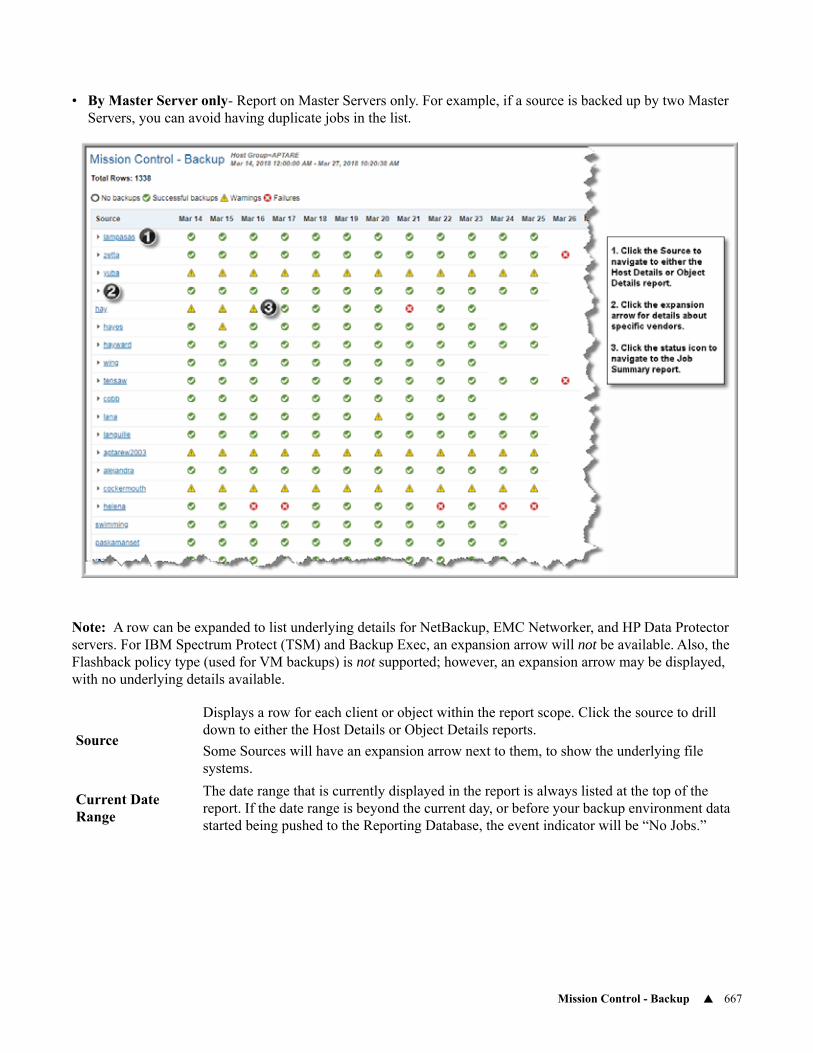
Mission Control - Backup 667
• By Master Server only- Report on Master Servers only. For example, if a source is backed up by two Master Servers, you can avoid having duplicate jobs in the list.
Note: A row can be expanded to list underlying details for NetBackup, EMC Networker, and HP Data Protector servers. For IBM Spectrum Protect (TSM) and Backup Exec, an expansion arrow will not be available. Also, the Flashback policy type (used for VM backups) is not supported; however, an expansion arrow may be displayed, with no underlying details available.
Source
Displays a row for each client or object within the report scope. Click the source to drill down to either the Host Details or Object Details reports.
Some Sources will have an expansion arrow next to them, to show the underlying file systems.
Current Date Range
The date range that is currently displayed in the report is always listed at the top of the report. If the date range is beyond the current day, or before your backup environment data started being pushed to the Reporting Database, the event indicator will be “No Jobs.”
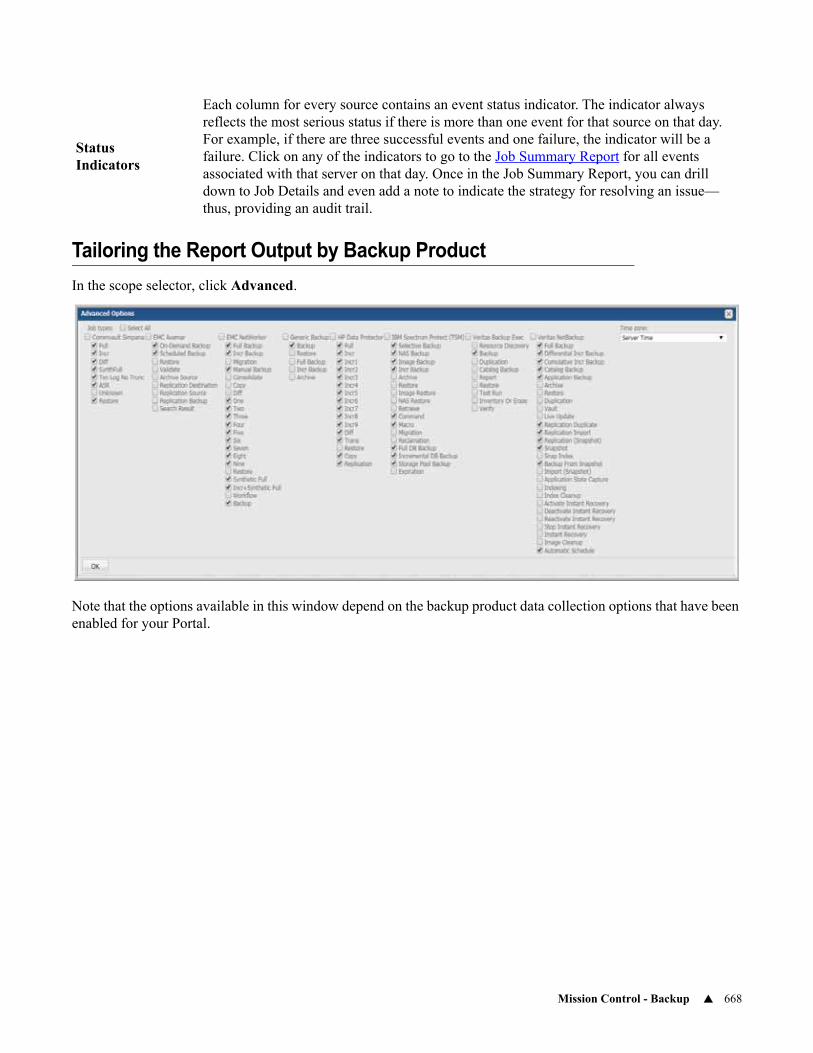
Mission Control - Backup 668
Tailoring the Report Output by Backup Product
In the scope selector, click Advanced.
Note that the options available in this window depend on the backup product data collection options that have been enabled for your Portal.
Status Indicators
Each column for every source contains an event status indicator. The indicator always reflects the most serious status if there is more than one event for that source on that day. For example, if there are three successful events and one failure, the indicator will be a failure. Click on any of the indicators to go to the Job Summary Report for all events associated with that server on that day. Once in the Job Summary Report, you can drill down to Job Details and even add a note to indicate the strategy for resolving an issue—thus, providing an audit trail.
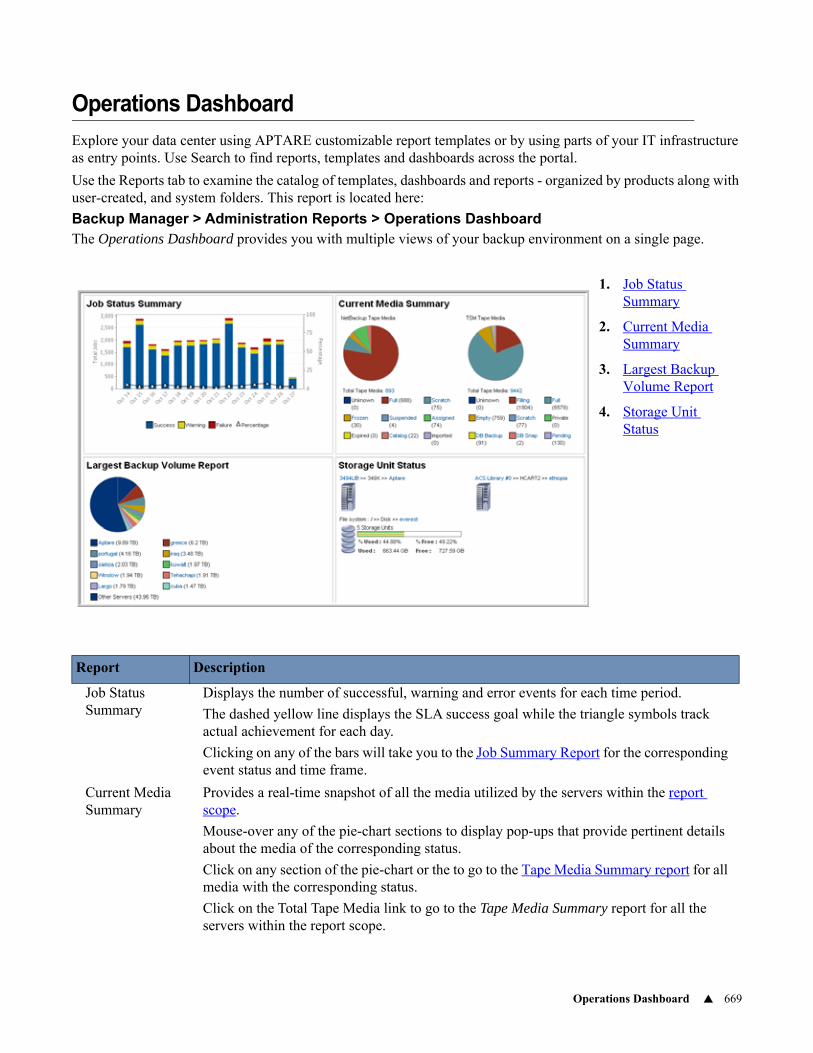
Operations Dashboard 669
Operations Dashboard
Explore your data center using APTARE customizable report templates or by using parts of your IT infrastructure as entry points. Use Search to find reports, templates and dashboards across the portal.
Use the Reports tab to examine the catalog of templates, dashboards and reports - organized by products along with user-created, and system folders. This report is located here:
Backup Manager > Administration Reports > Operations DashboardThe Operations Dashboard provides you with multiple views of your backup environment on a single page.
1. Job Status Summary
2. Current Media Summary
3. Largest Backup Volume Report
4. Storage Unit Status
Report Description
Job Status Summary
Displays the number of successful, warning and error events for each time period.
The dashed yellow line displays the SLA success goal while the triangle symbols track actual achievement for each day.
Clicking on any of the bars will take you to the Job Summary Report for the corresponding event status and time frame.
Current Media Summary
Provides a real-time snapshot of all the media utilized by the servers within the report scope.
Mouse-over any of the pie-chart sections to display pop-ups that provide pertinent details about the media of the corresponding status.
Click on any section of the pie-chart or the to go to the Tape Media Summary report for all media with the corresponding status.
Click on the Total Tape Media link to go to the Tape Media Summary report for all the servers within the report scope.
Operations Dashboard 670
Largest Backup Volume Report
Provides a real-time snapshot of the largest server backup consumers within the report scope.
Mouse-over any of the bars or symbols on the chart to display pop-ups that provide details.Click on any section of the pie-chart to go to the Server Consumption Summary Report for a particular server.
Click on the Total Servers link to go to the Server Consumption Summary report for all the servers within the report scope.
Storage Unit Status
Each file system is identified by the file system path, with its management server displayed above the file system graphic. The total number of Storage Units sharing the same file system is also shown. The display of this report is dependent on the backup products in your environment and the report scope.
Each file system is accompanied by a thermometer, which indicates the percentage of space occupied and available on the file system. The Used value is as reported by the operating system, and includes space occupied by all backup images as well as any other files that may reside on that file system. The Free value also is reported by the operating system.
Used and free values of Unknown indicate the Discovery module has not been configured to probe the media servers’ file systems for their physical characteristics.
Report Description
IBM Spectrum Protect (TSM) Storage Pools Dashboard 671
IBM Spectrum Protect (TSM) Storage Pools Dashboard
Explore your data center using APTARE customizable report templates or by using parts of your IT infrastructure as entry points. Use Search to find reports, templates and dashboards across the portal.
Use the Reports tab to examine the catalog of templates, dashboards and reports - organized by products along with user-created, and system folders. This report is located here:
Backup Manager > Administration Reports > IBM Spectrum Protect (TSM) Storage Pools DashboardThe IBM Spectrum Protect (TSM) Storage Pools Dashboard provides a real-time view into capacity and process status information for the selected list of Storage Pools. In a single pane, you quickly can analyze capacity and process status information for each of the Storage Pools.
Storage Pool CapacityThe pie chart displays the percentage and GBytes used and available for the Storage Pool. The GBytes Used is calculated by multiplying the percentage used by the estimated capacity of the Storage Pool.
IBM Spectrum Protect (TSM) Storage Pools Dashboard 672
Storage Pool Attributes
Storage Pool UtilizationThis historical tracking bar chart displays the history of used and available capacity for the selected storage pool.
Tape Occupancy SummaryThis pie chart displays a summary of the GBytes and number of tapes used by each client/server that occupy this Storage Pool. The chart displays the top eight tape media consumers of this Storage Pool. Click on any of the client/server names to view detailed tape media consumption information
Tape Media SummaryThis pie chart shows a summary of all the tapes assigned to this Storage Pool. This pie chart displays both the percentage of tapes grouped by media status, and the number of tapes grouped by media status:
• Filling, Full, Pending. Empty, Unknown, StgPool, Private, Pending, Questionable
Instance Backup Instance name
Type Primary, Copy
Device Type Sequential, Random
Access Type Read/Write, Read only
Reclaim ThresholdTSM can reclaim volumes that exceed a reclamation threshold—that is, a percentage of unused space on the volume. This threshold value is set by the administrator, within IBM Spectrum Protect (TSM).
Next Storage PoolThe storage pool that is next in line for backups when the current pool reaches capacity—that is, the destination storage pool for migrated data. IBM Spectrum Protect (TSM) automatically requests a storage pool when needed.
Max Scratch
The maximum amount of scratch space allocated to the storage pool. When the number of scratch volumes that IBM Spectrum Protect (TSM) is using for the storage pool exceeds the maximum number of scratch volumes specified, the storage pool can run out of space.
Capacity (GB) Storage pool capacity
% Utilized Percentage used
% Migrated Estimated percentage of storage that can be migrated
Low Mig %The value used by IBM Spectrum Protect (TSM) to start/stop migration. This percentage indicates when the server should stop migrating files to the next available storage pool.
High Mig %The value used by IBM Spectrum Protect (TSM) to start/stop migration. This percentage indicates when the server should start migrating files to the next available storage pool.
Max Size (MB) The maximum size of the storage pool.
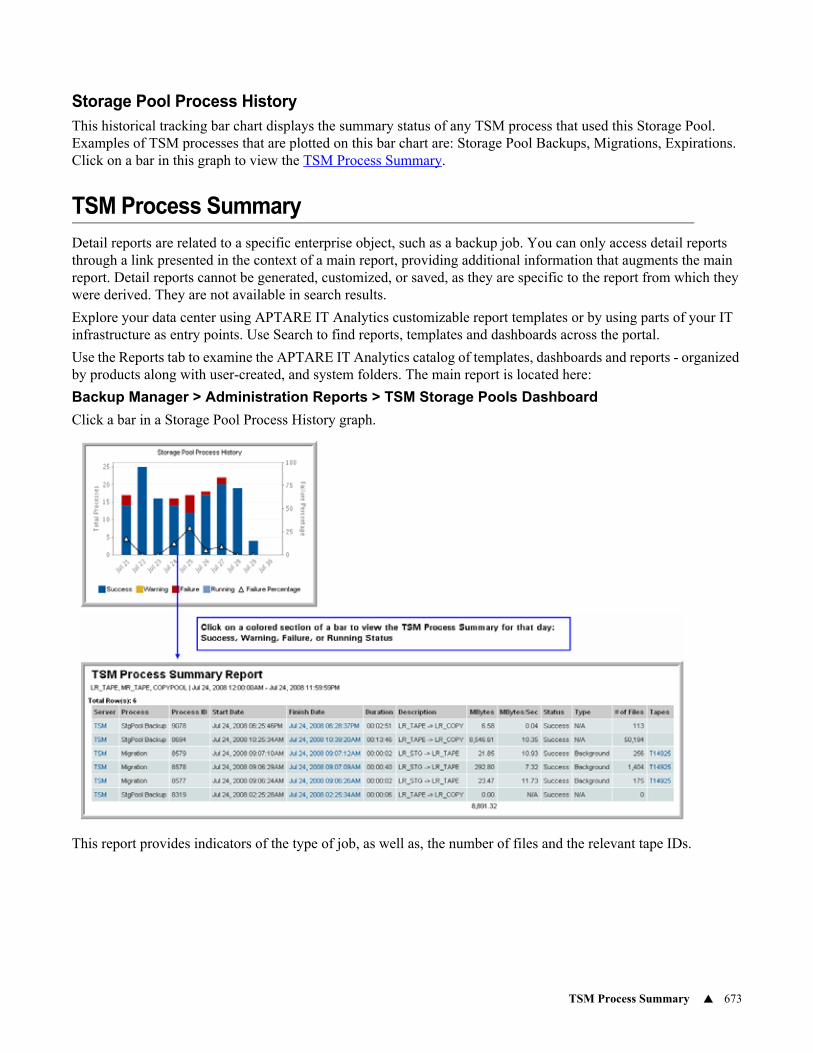
TSM Process Summary 673
Storage Pool Process HistoryThis historical tracking bar chart displays the summary status of any TSM process that used this Storage Pool. Examples of TSM processes that are plotted on this bar chart are: Storage Pool Backups, Migrations, Expirations. Click on a bar in this graph to view the TSM Process Summary.
TSM Process Summary
Detail reports are related to a specific enterprise object, such as a backup job. You can only access detail reports through a link presented in the context of a main report, providing additional information that augments the main report. Detail reports cannot be generated, customized, or saved, as they are specific to the report from which they were derived. They are not available in search results.
Explore your data center using APTARE IT Analytics customizable report templates or by using parts of your IT infrastructure as entry points. Use Search to find reports, templates and dashboards across the portal.
Use the Reports tab to examine the APTARE IT Analytics catalog of templates, dashboards and reports - organized by products along with user-created, and system folders. The main report is located here:
Backup Manager > Administration Reports > TSM Storage Pools Dashboard
Click a bar in a Storage Pool Process History graph.
This report provides indicators of the type of job, as well as, the number of files and the relevant tape IDs.
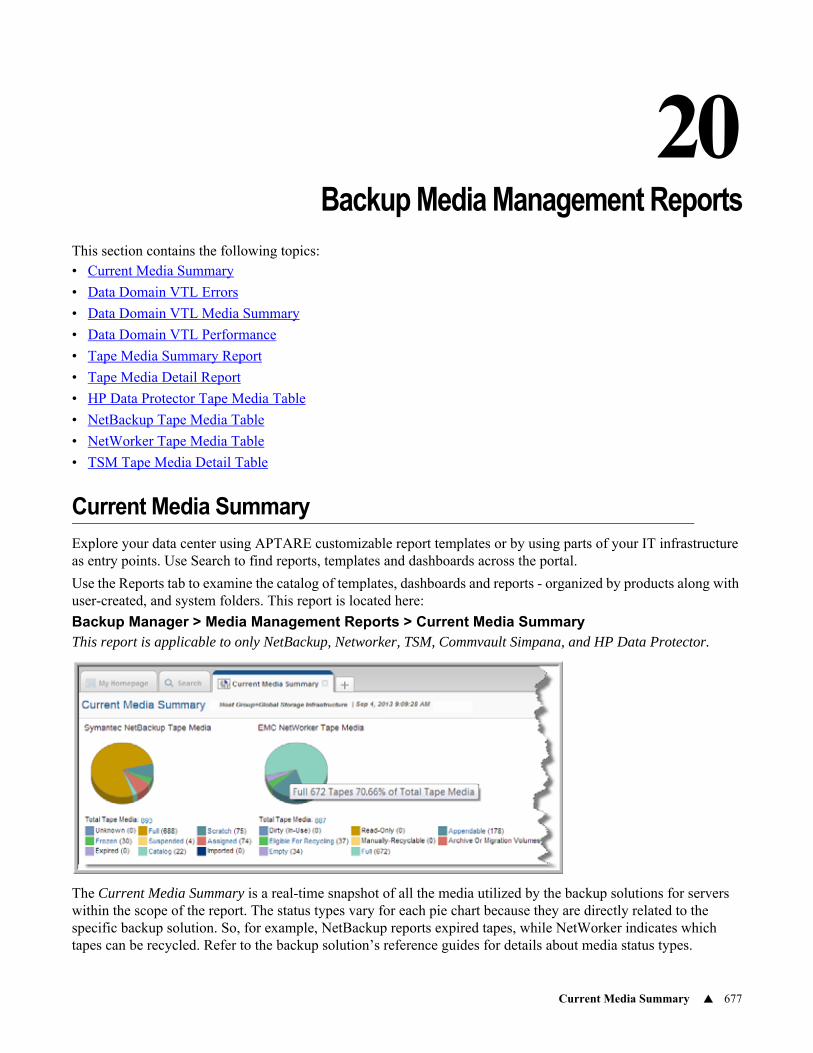
Current Media Summary 677
20Chapter 6Backup Media Management Reports
This section contains the following topics:• Current Media Summary
• Data Domain VTL Errors
• Data Domain VTL Media Summary
• Data Domain VTL Performance
• Tape Media Summary Report
• Tape Media Detail Report
• HP Data Protector Tape Media Table
• NetBackup Tape Media Table
• NetWorker Tape Media Table
• TSM Tape Media Detail Table
Current Media Summary
Explore your data center using APTARE customizable report templates or by using parts of your IT infrastructure as entry points. Use Search to find reports, templates and dashboards across the portal.
Use the Reports tab to examine the catalog of templates, dashboards and reports - organized by products along with user-created, and system folders. This report is located here:
Backup Manager > Media Management Reports > Current Media SummaryThis report is applicable to only NetBackup, Networker, TSM, Commvault Simpana, and HP Data Protector.
The Current Media Summary is a real-time snapshot of all the media utilized by the backup solutions for servers within the scope of the report. The status types vary for each pie chart because they are directly related to the specific backup solution. So, for example, NetBackup reports expired tapes, while NetWorker indicates which tapes can be recycled. Refer to the backup solution’s reference guides for details about media status types.

Current Media Summary 678
• Hold your mouse over any of the pie chart sections and a pop-up will display details about the media of the corresponding status. Similar information is reflected in the chart legend.
• Click any section of the pie chart and/or legend labels to view the Tape Media Summary report.
• Click the Total Tape Media link to view the Tape Media Summary report.
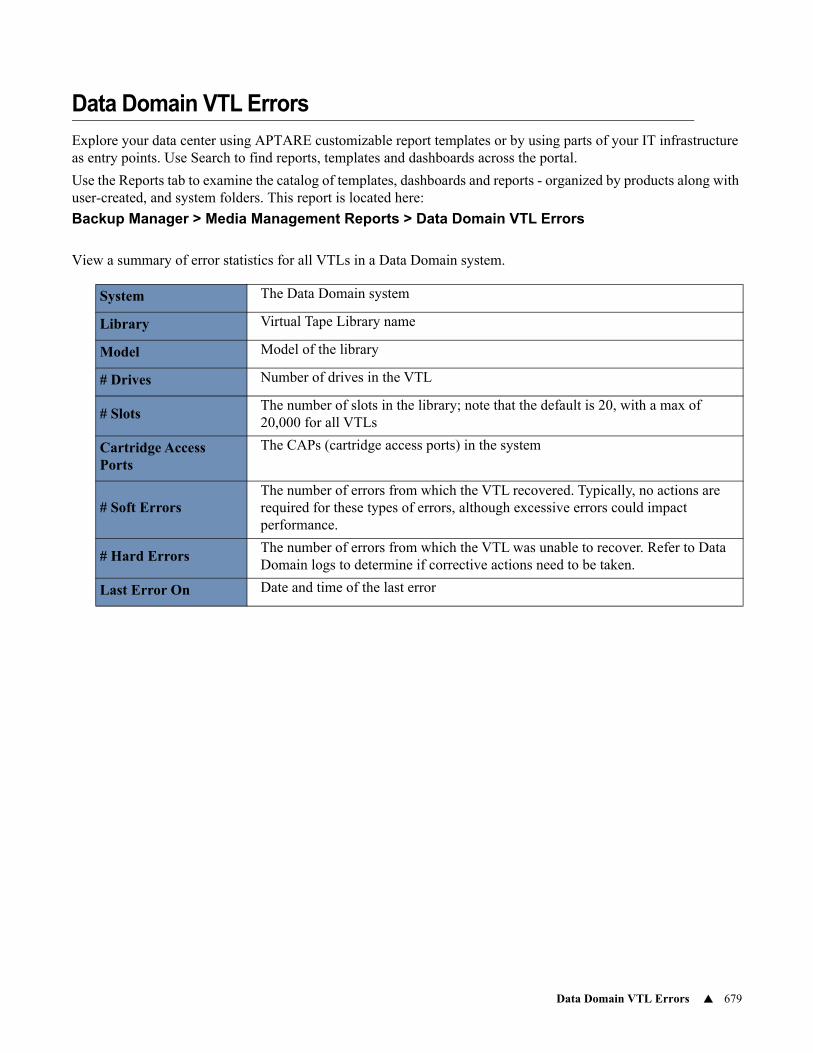
Data Domain VTL Errors 679
Data Domain VTL Errors
Explore your data center using APTARE customizable report templates or by using parts of your IT infrastructure as entry points. Use Search to find reports, templates and dashboards across the portal.
Use the Reports tab to examine the catalog of templates, dashboards and reports - organized by products along with user-created, and system folders. This report is located here:
Backup Manager > Media Management Reports > Data Domain VTL Errors
View a summary of error statistics for all VTLs in a Data Domain system.
System The Data Domain system
Library Virtual Tape Library name
Model Model of the library
# Drives Number of drives in the VTL
# SlotsThe number of slots in the library; note that the default is 20, with a max of 20,000 for all VTLs
Cartridge Access Ports
The CAPs (cartridge access ports) in the system
# Soft ErrorsThe number of errors from which the VTL recovered. Typically, no actions are required for these types of errors, although excessive errors could impact performance.
# Hard ErrorsThe number of errors from which the VTL was unable to recover. Refer to Data Domain logs to determine if corrective actions need to be taken.
Last Error On Date and time of the last error
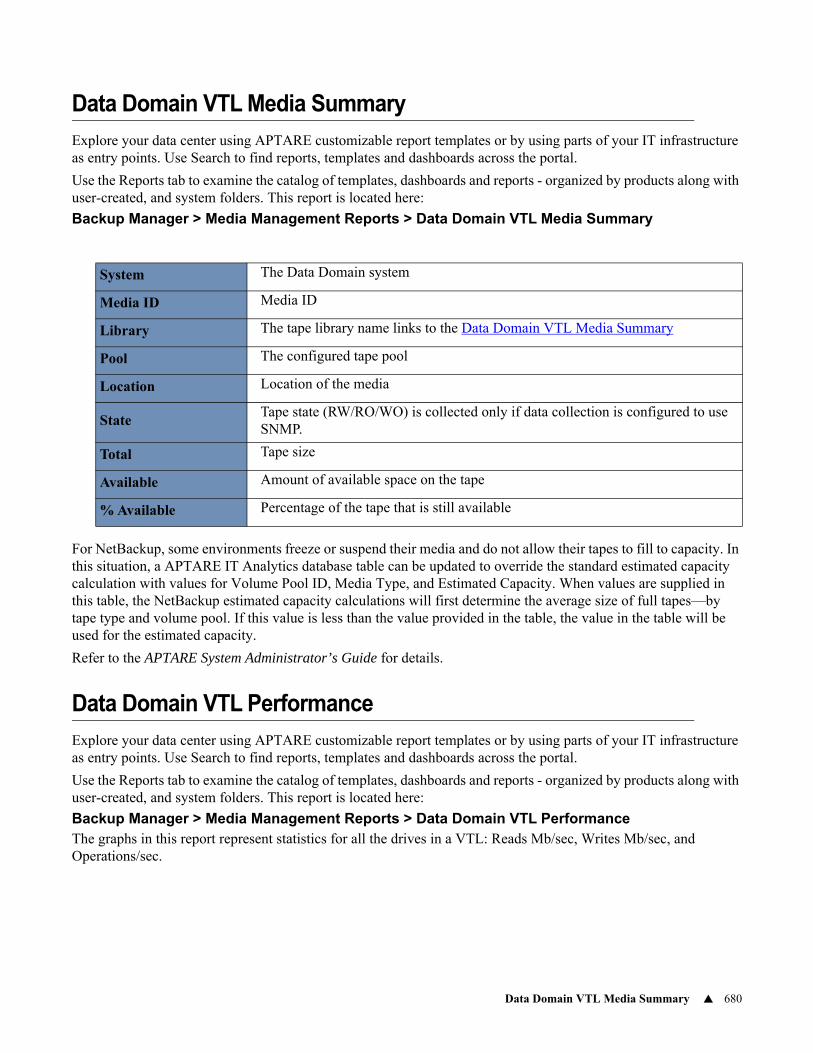
Data Domain VTL Media Summary 680
Data Domain VTL Media Summary
Explore your data center using APTARE customizable report templates or by using parts of your IT infrastructure as entry points. Use Search to find reports, templates and dashboards across the portal.
Use the Reports tab to examine the catalog of templates, dashboards and reports - organized by products along with user-created, and system folders. This report is located here:
Backup Manager > Media Management Reports > Data Domain VTL Media Summary
For NetBackup, some environments freeze or suspend their media and do not allow their tapes to fill to capacity. In this situation, a APTARE IT Analytics database table can be updated to override the standard estimated capacity calculation with values for Volume Pool ID, Media Type, and Estimated Capacity. When values are supplied in this table, the NetBackup estimated capacity calculations will first determine the average size of full tapes—by tape type and volume pool. If this value is less than the value provided in the table, the value in the table will be used for the estimated capacity.
Refer to the APTARE System Administrator’s Guide for details.
Data Domain VTL Performance
Explore your data center using APTARE customizable report templates or by using parts of your IT infrastructure as entry points. Use Search to find reports, templates and dashboards across the portal.
Use the Reports tab to examine the catalog of templates, dashboards and reports - organized by products along with user-created, and system folders. This report is located here:
Backup Manager > Media Management Reports > Data Domain VTL PerformanceThe graphs in this report represent statistics for all the drives in a VTL: Reads Mb/sec, Writes Mb/sec, and Operations/sec.
System The Data Domain system
Media ID Media ID
Library The tape library name links to the Data Domain VTL Media Summary
Pool The configured tape pool
Location Location of the media
StateTape state (RW/RO/WO) is collected only if data collection is configured to use SNMP.
Total Tape size
Available Amount of available space on the tape
% Available Percentage of the tape that is still available
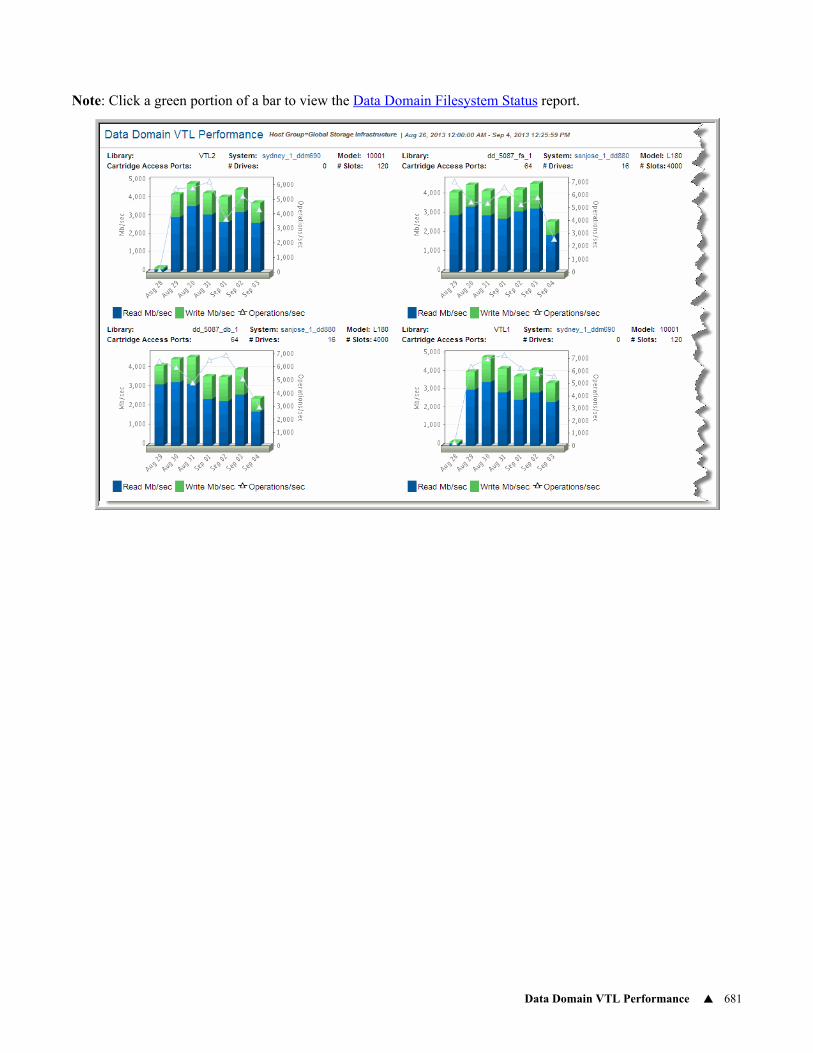
Data Domain VTL Performance 681
Note: Click a green portion of a bar to view the Data Domain Filesystem Status report.
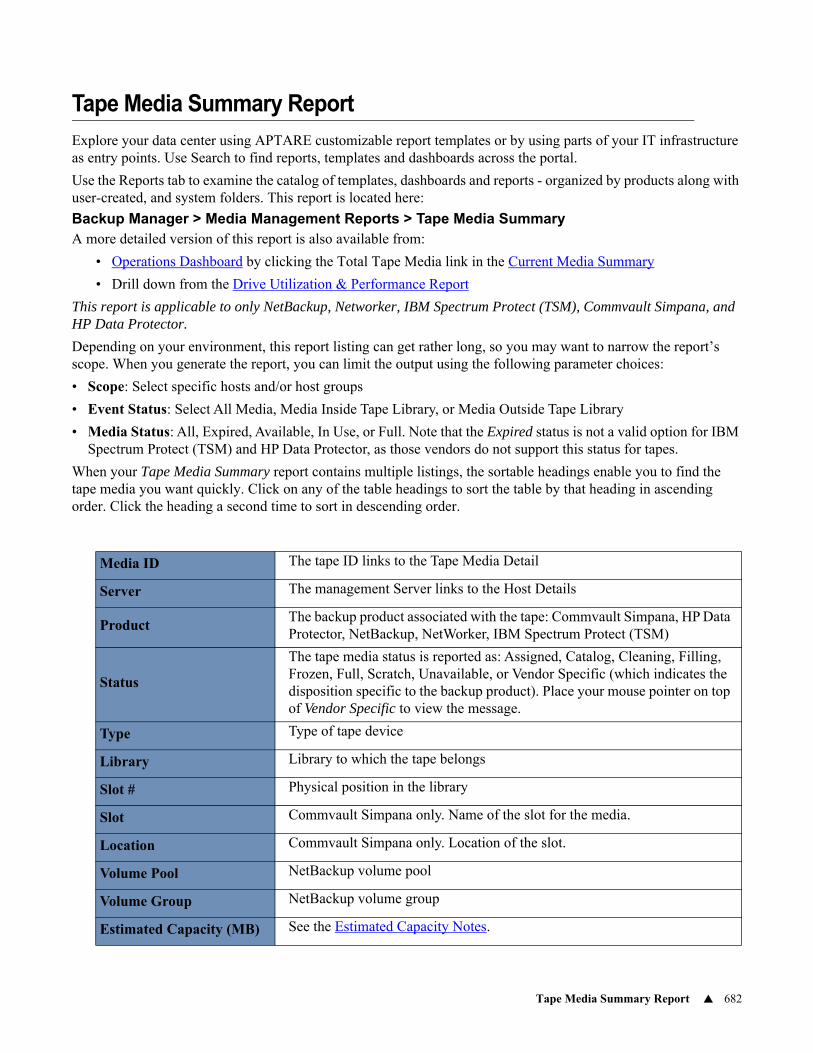
Tape Media Summary Report 682
Tape Media Summary Report
Explore your data center using APTARE customizable report templates or by using parts of your IT infrastructure as entry points. Use Search to find reports, templates and dashboards across the portal.
Use the Reports tab to examine the catalog of templates, dashboards and reports - organized by products along with user-created, and system folders. This report is located here:
Backup Manager > Media Management Reports > Tape Media SummaryA more detailed version of this report is also available from:
• Operations Dashboard by clicking the Total Tape Media link in the Current Media Summary
• Drill down from the Drive Utilization & Performance Report
This report is applicable to only NetBackup, Networker, IBM Spectrum Protect (TSM), Commvault Simpana, and HP Data Protector.
Depending on your environment, this report listing can get rather long, so you may want to narrow the report’s scope. When you generate the report, you can limit the output using the following parameter choices:
• Scope: Select specific hosts and/or host groups
• Event Status: Select All Media, Media Inside Tape Library, or Media Outside Tape Library
• Media Status: All, Expired, Available, In Use, or Full. Note that the Expired status is not a valid option for IBM Spectrum Protect (TSM) and HP Data Protector, as those vendors do not support this status for tapes.
When your Tape Media Summary report contains multiple listings, the sortable headings enable you to find the tape media you want quickly. Click on any of the table headings to sort the table by that heading in ascending order. Click the heading a second time to sort in descending order.
Media ID The tape ID links to the Tape Media Detail
Server The management Server links to the Host Details
ProductThe backup product associated with the tape: Commvault Simpana, HP Data Protector, NetBackup, NetWorker, IBM Spectrum Protect (TSM)
Status
The tape media status is reported as: Assigned, Catalog, Cleaning, Filling, Frozen, Full, Scratch, Unavailable, or Vendor Specific (which indicates the disposition specific to the backup product). Place your mouse pointer on top of Vendor Specific to view the message.
Type Type of tape device
Library Library to which the tape belongs
Slot # Physical position in the library
Slot Commvault Simpana only. Name of the slot for the media.
Location Commvault Simpana only. Location of the slot.
Volume Pool NetBackup volume pool
Volume Group NetBackup volume group
Estimated Capacity (MB) See the Estimated Capacity Notes.
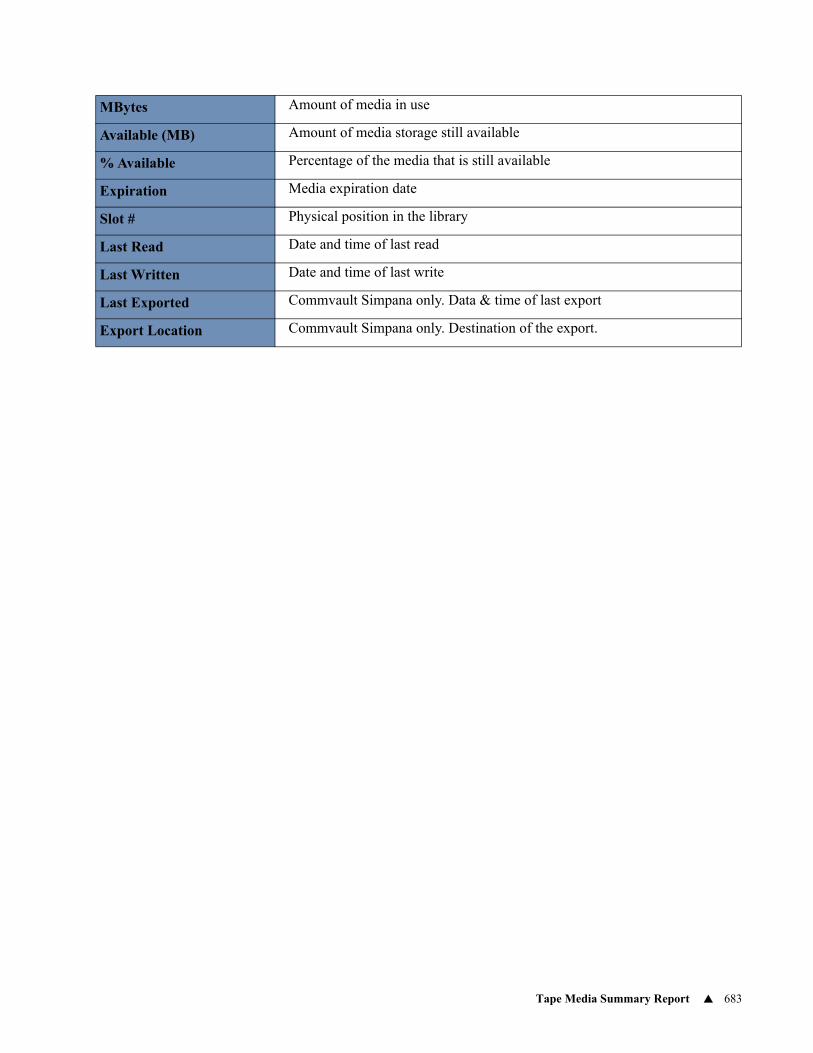
Tape Media Summary Report 683
MBytes Amount of media in use
Available (MB) Amount of media storage still available
% Available Percentage of the media that is still available
Expiration Media expiration date
Slot # Physical position in the library
Last Read Date and time of last read
Last Written Date and time of last write
Last Exported Commvault Simpana only. Data & time of last export
Export Location Commvault Simpana only. Destination of the export.
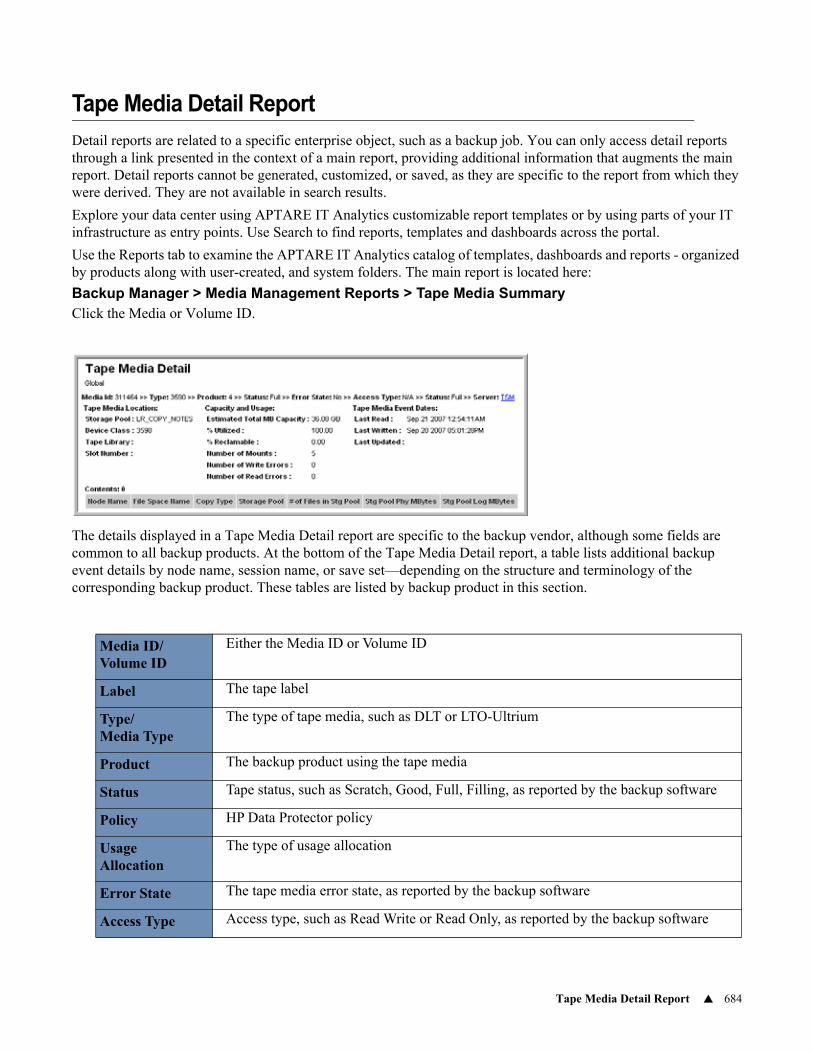
Tape Media Detail Report 684
Tape Media Detail Report
Detail reports are related to a specific enterprise object, such as a backup job. You can only access detail reports through a link presented in the context of a main report, providing additional information that augments the main report. Detail reports cannot be generated, customized, or saved, as they are specific to the report from which they were derived. They are not available in search results.
Explore your data center using APTARE IT Analytics customizable report templates or by using parts of your IT infrastructure as entry points. Use Search to find reports, templates and dashboards across the portal.
Use the Reports tab to examine the APTARE IT Analytics catalog of templates, dashboards and reports - organized by products along with user-created, and system folders. The main report is located here:
Backup Manager > Media Management Reports > Tape Media SummaryClick the Media or Volume ID.
The details displayed in a Tape Media Detail report are specific to the backup vendor, although some fields are common to all backup products. At the bottom of the Tape Media Detail report, a table lists additional backup event details by node name, session name, or save set—depending on the structure and terminology of the corresponding backup product. These tables are listed by backup product in this section.
Media ID/Volume ID
Either the Media ID or Volume ID
Label The tape label
Type/Media Type
The type of tape media, such as DLT or LTO-Ultrium
Product The backup product using the tape media
Status Tape status, such as Scratch, Good, Full, Filling, as reported by the backup software
Policy HP Data Protector policy
Usage Allocation
The type of usage allocation
Error State The tape media error state, as reported by the backup software
Access Type Access type, such as Read Write or Read Only, as reported by the backup software
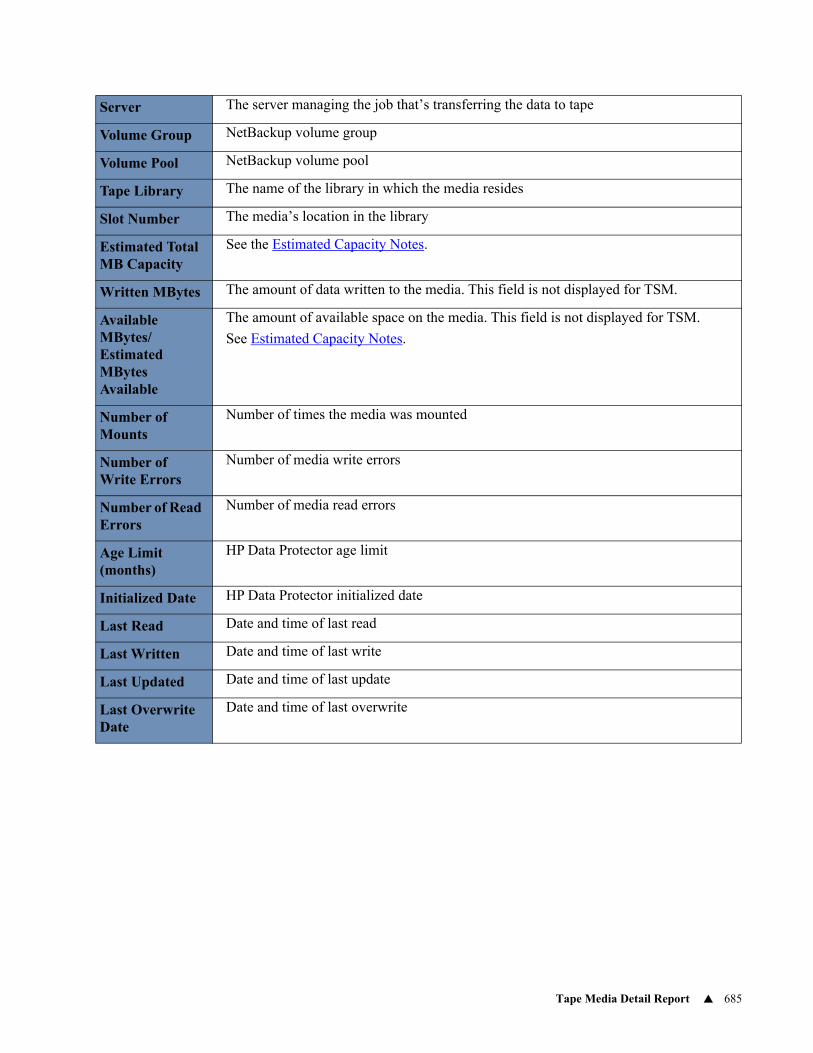
Tape Media Detail Report 685
Server The server managing the job that’s transferring the data to tape
Volume Group NetBackup volume group
Volume Pool NetBackup volume pool
Tape Library The name of the library in which the media resides
Slot Number The media’s location in the library
Estimated Total MB Capacity
See the Estimated Capacity Notes.
Written MBytes The amount of data written to the media. This field is not displayed for TSM.
Available MBytes/Estimated MBytes Available
The amount of available space on the media. This field is not displayed for TSM.
See Estimated Capacity Notes.
Number of Mounts
Number of times the media was mounted
Number of Write Errors
Number of media write errors
Number of Read Errors
Number of media read errors
Age Limit (months)
HP Data Protector age limit
Initialized Date HP Data Protector initialized date
Last Read Date and time of last read
Last Written Date and time of last write
Last Updated Date and time of last update
Last Overwrite Date
Date and time of last overwrite
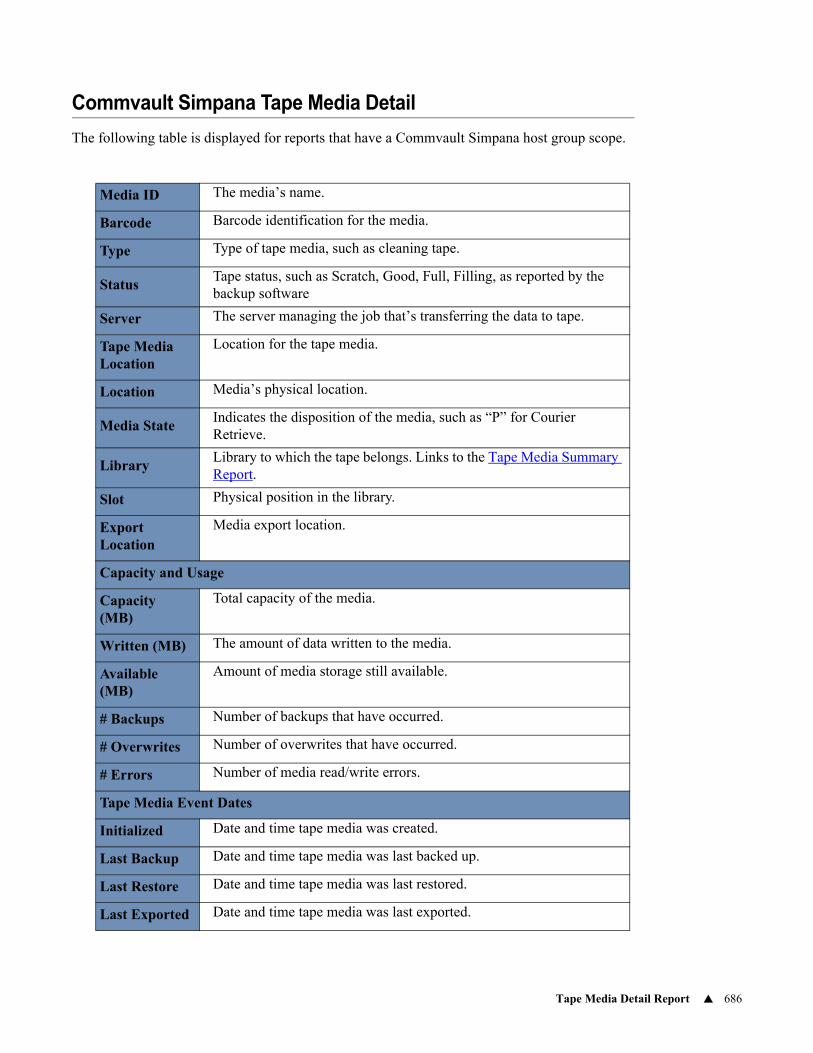
Tape Media Detail Report 686
Commvault Simpana Tape Media Detail
The following table is displayed for reports that have a Commvault Simpana host group scope.
Media ID The media’s name.
Barcode Barcode identification for the media.
Type Type of tape media, such as cleaning tape.
StatusTape status, such as Scratch, Good, Full, Filling, as reported by the backup software
Server The server managing the job that’s transferring the data to tape.
Tape Media Location
Location for the tape media.
Location Media’s physical location.
Media StateIndicates the disposition of the media, such as “P” for Courier Retrieve.
LibraryLibrary to which the tape belongs. Links to the Tape Media Summary Report.
Slot Physical position in the library.
Export Location
Media export location.
Capacity and Usage
Capacity (MB)
Total capacity of the media.
Written (MB) The amount of data written to the media.
Available (MB)
Amount of media storage still available.
# Backups Number of backups that have occurred.
# Overwrites Number of overwrites that have occurred.
# Errors Number of media read/write errors.
Tape Media Event Dates
Initialized Date and time tape media was created.
Last Backup Date and time tape media was last backed up.
Last Restore Date and time tape media was last restored.
Last Exported Date and time tape media was last exported.
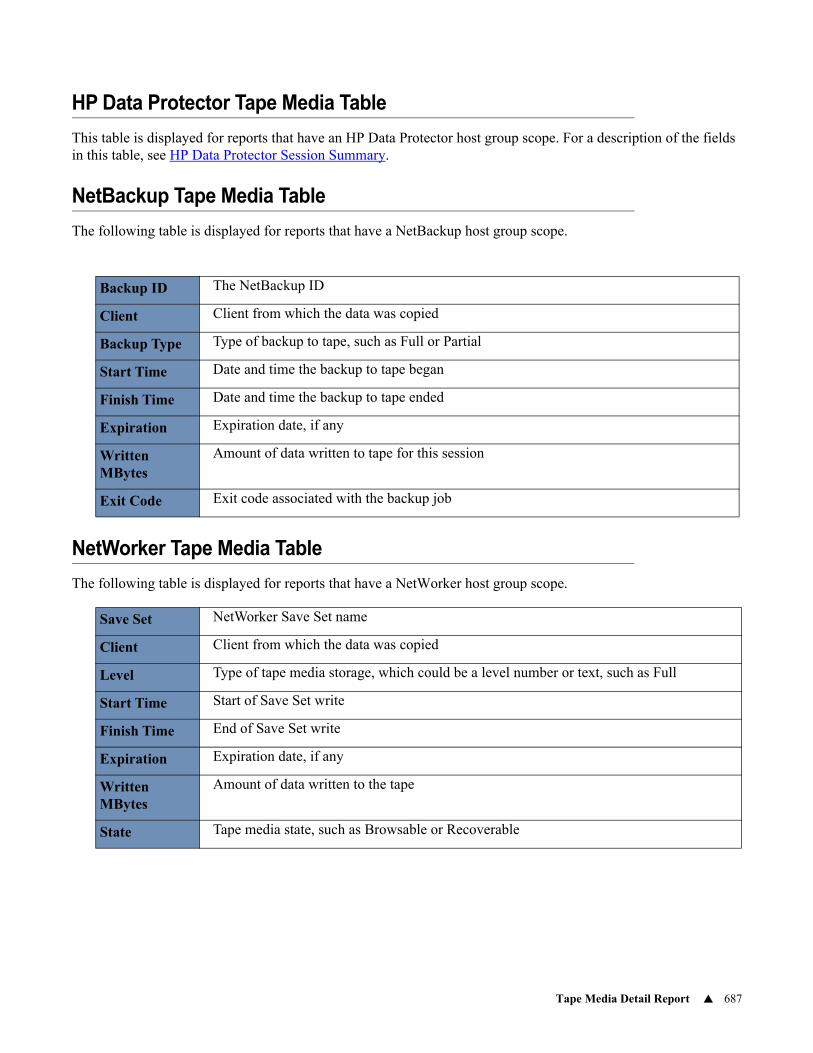
Tape Media Detail Report 687
HP Data Protector Tape Media Table
This table is displayed for reports that have an HP Data Protector host group scope. For a description of the fields in this table, see HP Data Protector Session Summary.
NetBackup Tape Media Table
The following table is displayed for reports that have a NetBackup host group scope.
NetWorker Tape Media Table
The following table is displayed for reports that have a NetWorker host group scope.
Backup ID The NetBackup ID
Client Client from which the data was copied
Backup Type Type of backup to tape, such as Full or Partial
Start Time Date and time the backup to tape began
Finish Time Date and time the backup to tape ended
Expiration Expiration date, if any
Written MBytes
Amount of data written to tape for this session
Exit Code Exit code associated with the backup job
Save Set NetWorker Save Set name
Client Client from which the data was copied
Level Type of tape media storage, which could be a level number or text, such as Full
Start Time Start of Save Set write
Finish Time End of Save Set write
Expiration Expiration date, if any
Written MBytes
Amount of data written to the tape
State Tape media state, such as Browsable or Recoverable
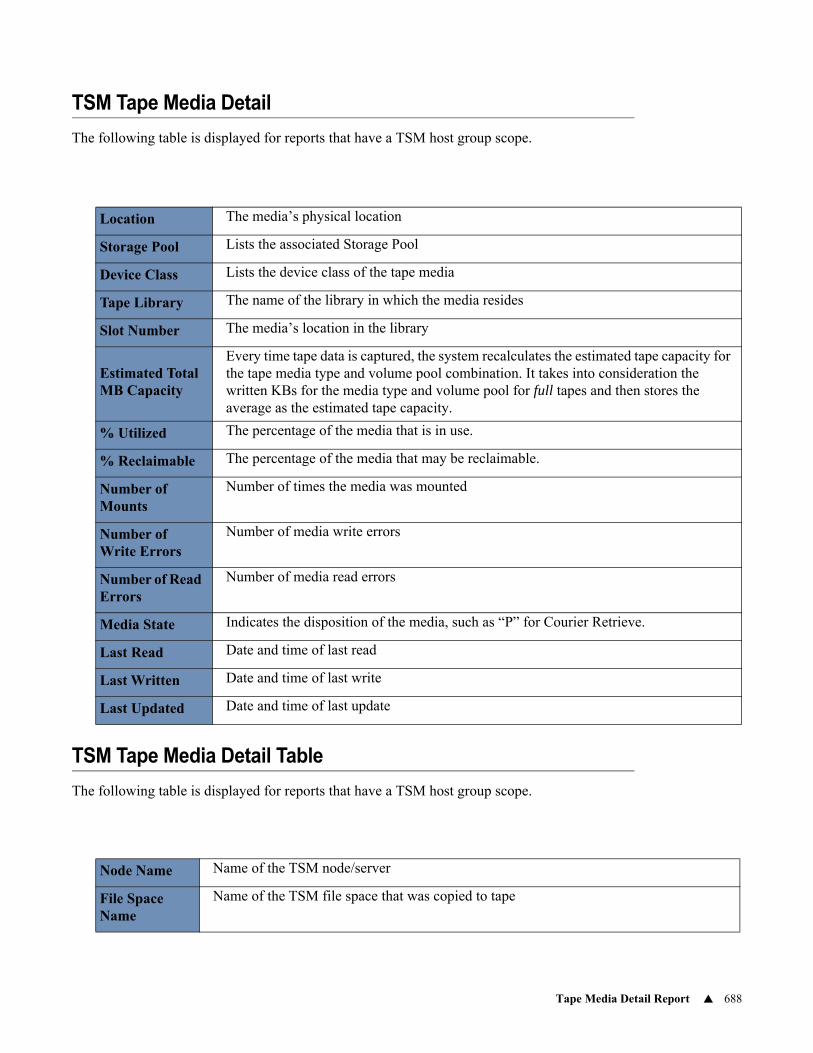
Tape Media Detail Report 688
TSM Tape Media Detail
The following table is displayed for reports that have a TSM host group scope.
TSM Tape Media Detail Table
The following table is displayed for reports that have a TSM host group scope.
Location The media’s physical location
Storage Pool Lists the associated Storage Pool
Device Class Lists the device class of the tape media
Tape Library The name of the library in which the media resides
Slot Number The media’s location in the library
Estimated Total MB Capacity
Every time tape data is captured, the system recalculates the estimated tape capacity for the tape media type and volume pool combination. It takes into consideration the written KBs for the media type and volume pool for full tapes and then stores the average as the estimated tape capacity.
% Utilized The percentage of the media that is in use.
% Reclaimable The percentage of the media that may be reclaimable.
Number of Mounts
Number of times the media was mounted
Number of Write Errors
Number of media write errors
Number of Read Errors
Number of media read errors
Media State Indicates the disposition of the media, such as “P” for Courier Retrieve.
Last Read Date and time of last read
Last Written Date and time of last write
Last Updated Date and time of last update
Node Name Name of the TSM node/server
File Space Name
Name of the TSM file space that was copied to tape
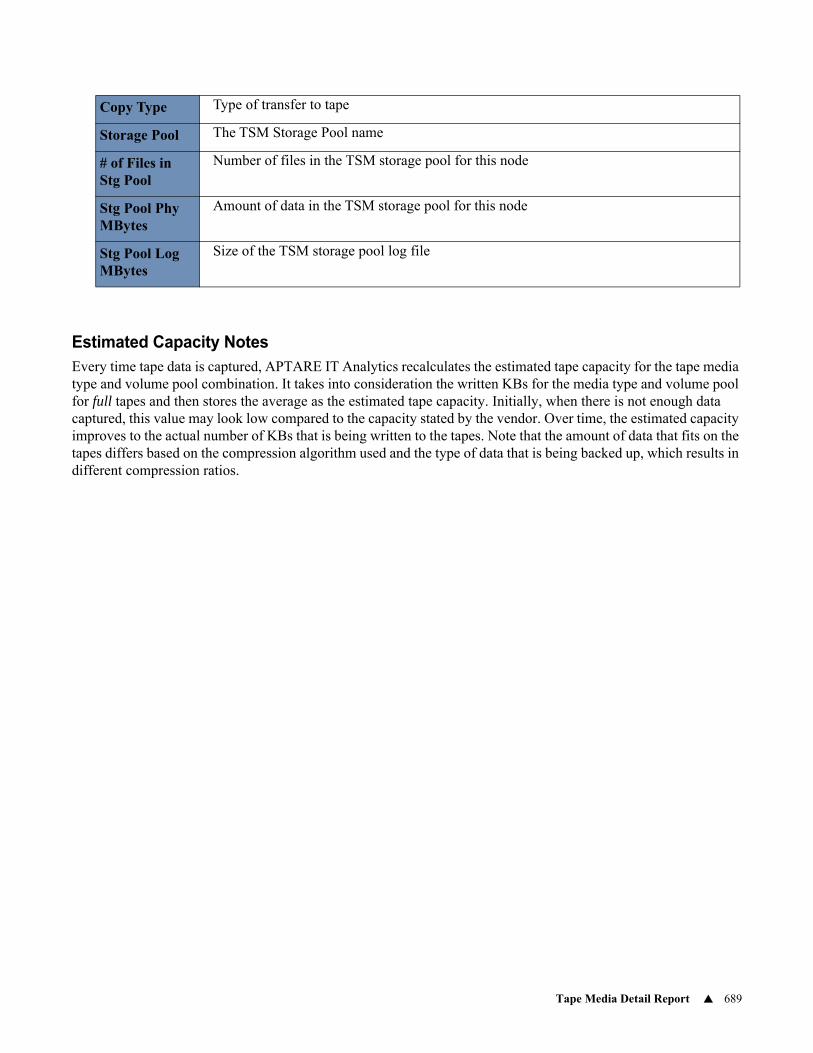
Tape Media Detail Report 689
Estimated Capacity NotesEvery time tape data is captured, APTARE IT Analytics recalculates the estimated tape capacity for the tape media type and volume pool combination. It takes into consideration the written KBs for the media type and volume pool for full tapes and then stores the average as the estimated tape capacity. Initially, when there is not enough data captured, this value may look low compared to the capacity stated by the vendor. Over time, the estimated capacity improves to the actual number of KBs that is being written to the tapes. Note that the amount of data that fits on the tapes differs based on the compression algorithm used and the type of data that is being backed up, which results in different compression ratios.
Copy Type Type of transfer to tape
Storage Pool The TSM Storage Pool name
# of Files in Stg Pool
Number of files in the TSM storage pool for this node
Stg Pool Phy MBytes
Amount of data in the TSM storage pool for this node
Stg Pool Log MBytes
Size of the TSM storage pool log file
Available Service Level Agreement (SLA) Reports 691
21Chapter 6Backup Service Level Agreement (SLA) Reports
This section contains the following topics:• Available Service Level Agreement (SLA) Reports
Backup Start Time Performance
• Backup Start Time SLA
• Determining and Improving Backup Start Time Performance
Backup Success Performance
• Backup Status SLA
• Determining and Improving Backup Success Performance
• Backup Master Server Overview
Backup Duration Performance
• Backup Duration SLA
• Determining and Improving Backup Duration Performance
Available Service Level Agreement (SLA) Reports
Whether you’re an Administrator in an IT department or an Administrator at a Data Center, you commit a specific level of service to your end-users or customers. See Configure a Backup SLA Policy.
Use default SLA reports or create custom reports to provide information that determines if you are satisfying the commitments you made to your users or customers. With access to the Reporting Database, you can configure the metrics upon which the reports are based. Service Level Agreements (SLAs) are typically based on the following metrics:
• Backup Start Time Performance
• Backup Status Performance
• Backup Duration Performance
The reports can provide data to fine-tune your SLA and to determine if you’re meeting your commitments. The more detailed your SLAs, the easier it is to cut costs, in the case of an IT department, or provide competitive SLA pricing, in the case of Data Centers.
Refer to the following SLA reports:
• Backup Start Time
• Backup Status
• Backup Duration
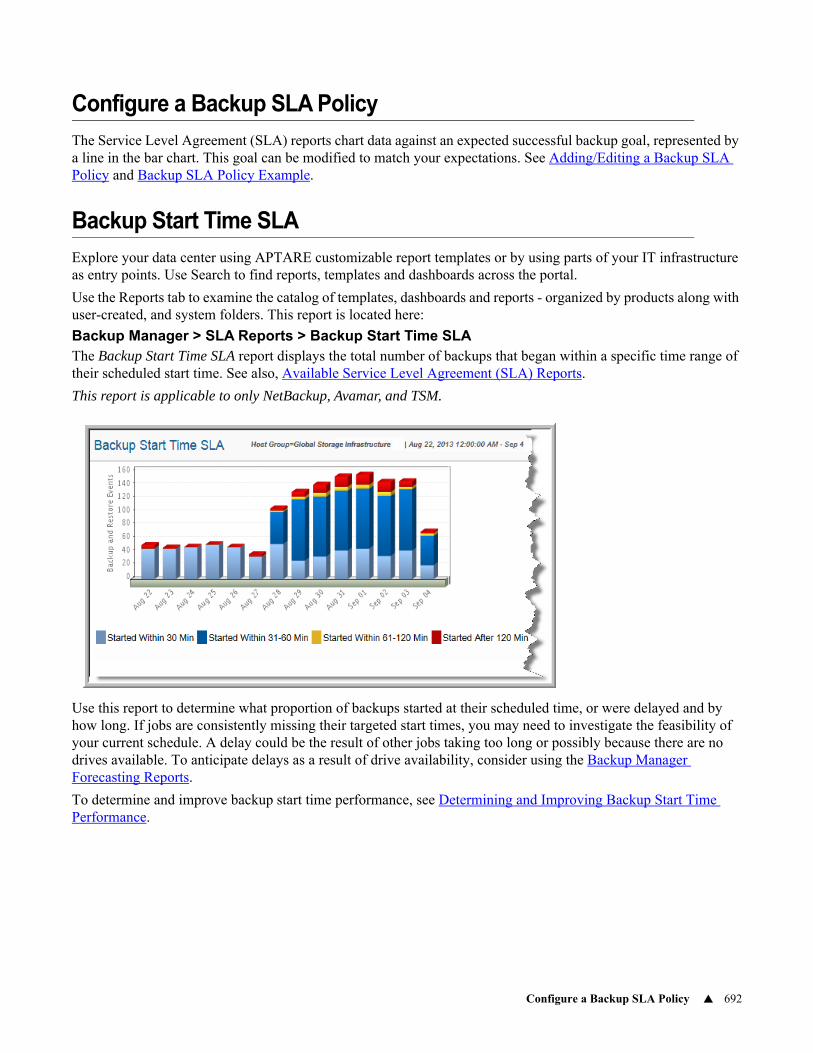
Configure a Backup SLA Policy 692
Configure a Backup SLA Policy
The Service Level Agreement (SLA) reports chart data against an expected successful backup goal, represented by a line in the bar chart. This goal can be modified to match your expectations. See Adding/Editing a Backup SLA Policy and Backup SLA Policy Example.
Backup Start Time SLA
Explore your data center using APTARE customizable report templates or by using parts of your IT infrastructure as entry points. Use Search to find reports, templates and dashboards across the portal.
Use the Reports tab to examine the catalog of templates, dashboards and reports - organized by products along with user-created, and system folders. This report is located here:
Backup Manager > SLA Reports > Backup Start Time SLAThe Backup Start Time SLA report displays the total number of backups that began within a specific time range of their scheduled start time. See also, Available Service Level Agreement (SLA) Reports.
This report is applicable to only NetBackup, Avamar, and TSM.
Use this report to determine what proportion of backups started at their scheduled time, or were delayed and by how long. If jobs are consistently missing their targeted start times, you may need to investigate the feasibility of your current schedule. A delay could be the result of other jobs taking too long or possibly because there are no drives available. To anticipate delays as a result of drive availability, consider using the Backup Manager Forecasting Reports.
To determine and improve backup start time performance, see Determining and Improving Backup Start Time Performance.
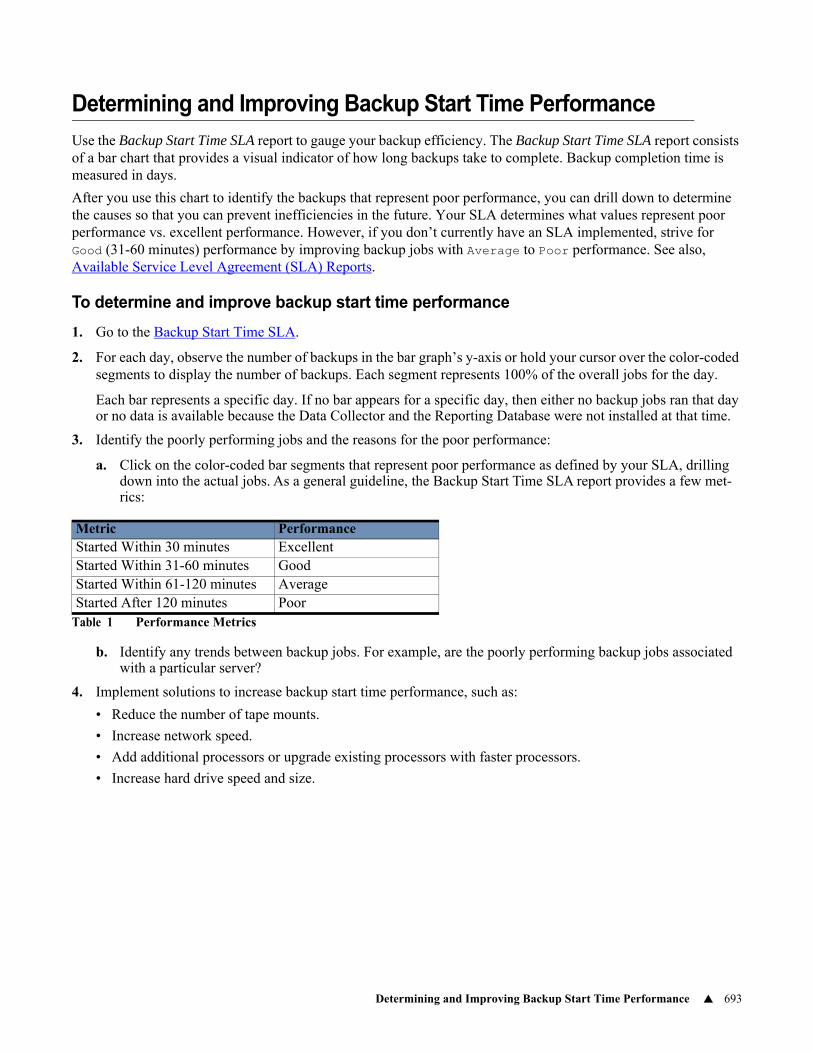
Determining and Improving Backup Start Time Performance 693
Determining and Improving Backup Start Time Performance
Use the Backup Start Time SLA report to gauge your backup efficiency. The Backup Start Time SLA report consists of a bar chart that provides a visual indicator of how long backups take to complete. Backup completion time is measured in days.
After you use this chart to identify the backups that represent poor performance, you can drill down to determine the causes so that you can prevent inefficiencies in the future. Your SLA determines what values represent poor performance vs. excellent performance. However, if you don’t currently have an SLA implemented, strive for Good (31-60 minutes) performance by improving backup jobs with Average to Poor performance. See also, Available Service Level Agreement (SLA) Reports.
To determine and improve backup start time performance
1. Go to the Backup Start Time SLA.
2. For each day, observe the number of backups in the bar graph’s y-axis or hold your cursor over the color-coded segments to display the number of backups. Each segment represents 100% of the overall jobs for the day.
Each bar represents a specific day. If no bar appears for a specific day, then either no backup jobs ran that day or no data is available because the Data Collector and the Reporting Database were not installed at that time.
3. Identify the poorly performing jobs and the reasons for the poor performance:
a. Click on the color-coded bar segments that represent poor performance as defined by your SLA, drilling down into the actual jobs. As a general guideline, the Backup Start Time SLA report provides a few met-rics:
b. Identify any trends between backup jobs. For example, are the poorly performing backup jobs associated with a particular server?
4. Implement solutions to increase backup start time performance, such as:
• Reduce the number of tape mounts.
• Increase network speed.
• Add additional processors or upgrade existing processors with faster processors.
• Increase hard drive speed and size.
Metric PerformanceStarted Within 30 minutes ExcellentStarted Within 31-60 minutes GoodStarted Within 61-120 minutes AverageStarted After 120 minutes Poor
Table 1 Performance Metrics
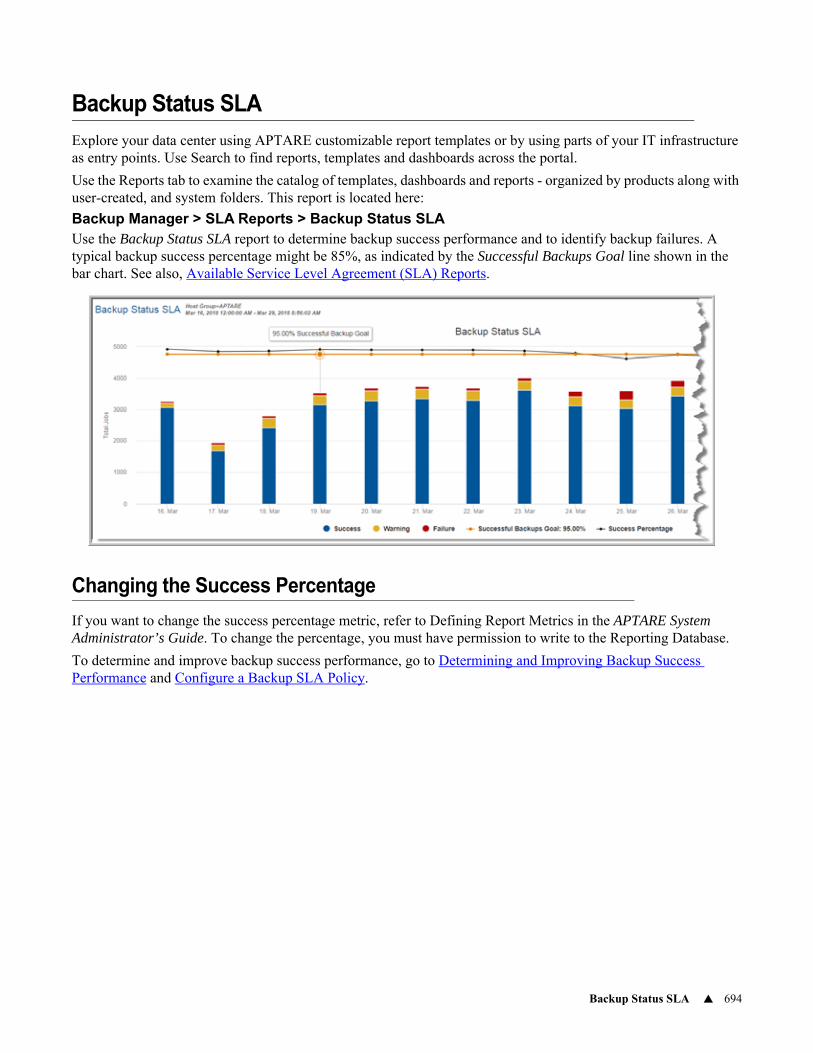
Backup Status SLA 694
Backup Status SLA
Explore your data center using APTARE customizable report templates or by using parts of your IT infrastructure as entry points. Use Search to find reports, templates and dashboards across the portal.
Use the Reports tab to examine the catalog of templates, dashboards and reports - organized by products along with user-created, and system folders. This report is located here:
Backup Manager > SLA Reports > Backup Status SLAUse the Backup Status SLA report to determine backup success performance and to identify backup failures. A typical backup success percentage might be 85%, as indicated by the Successful Backups Goal line shown in the bar chart. See also, Available Service Level Agreement (SLA) Reports.
Changing the Success Percentage
If you want to change the success percentage metric, refer to Defining Report Metrics in the APTARE System Administrator’s Guide. To change the percentage, you must have permission to write to the Reporting Database.
To determine and improve backup success performance, go to Determining and Improving Backup Success Performance and Configure a Backup SLA Policy.
Backup Master Server Overview 695
Backup Master Server Overview
For a view of relevant backup information, go to the Inventory and select Backup Servers or individual backup servers in the default hierarchy view (object type and subsystem). Once in the Inventory, the Overview tab presents several reports in dashboard format.
Inventory > Default Hierarchy View > Backup Servers > Overview Tab
The following reports are listed, prefaced by a Backup Master Server Overview for the time period.
• Backup Status SLA
• Job Type Count
• Backup Executive Summary
# Masters The number of backup Master Servers in the scope of this report.
Total BytesThe total bytes backed up by the Master Servers in the selected scope and time period. This value is represented in GiB.
# FilesThe total number of files backed up to both disk and tape, for the selected scope and time period.
# Clients The number of backup Clients in the scope of this report.
Disk BytesThe number of bytes backed up to disk, for the selected scope and time period. This value is represented in GiB.
Disk # Files The number of files backed up to disk, for the selected scope and time period.
Product(s) A comma-separated list of the backup vendors and products in the selected scope.
Tape BytesThe number of bytes of data backed up to tape, for the selected scope and time period. This value is represented in GiB.
Tape Files The number of files backed up to tape, for the selected scope and time period.
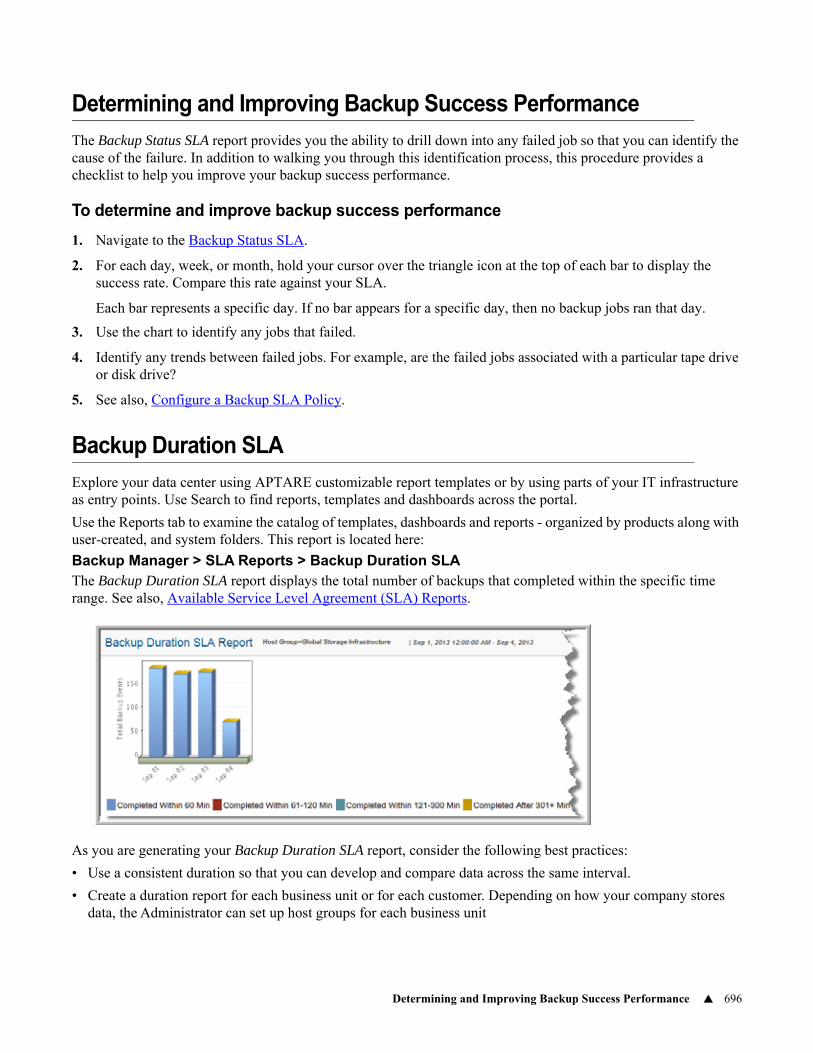
Determining and Improving Backup Success Performance 696
Determining and Improving Backup Success Performance
The Backup Status SLA report provides you the ability to drill down into any failed job so that you can identify the cause of the failure. In addition to walking you through this identification process, this procedure provides a checklist to help you improve your backup success performance.
To determine and improve backup success performance
1. Navigate to the Backup Status SLA.
2. For each day, week, or month, hold your cursor over the triangle icon at the top of each bar to display the success rate. Compare this rate against your SLA.
Each bar represents a specific day. If no bar appears for a specific day, then no backup jobs ran that day.
3. Use the chart to identify any jobs that failed.
4. Identify any trends between failed jobs. For example, are the failed jobs associated with a particular tape drive or disk drive?
5. See also, Configure a Backup SLA Policy.
Backup Duration SLA
Explore your data center using APTARE customizable report templates or by using parts of your IT infrastructure as entry points. Use Search to find reports, templates and dashboards across the portal.
Use the Reports tab to examine the catalog of templates, dashboards and reports - organized by products along with user-created, and system folders. This report is located here:
Backup Manager > SLA Reports > Backup Duration SLAThe Backup Duration SLA report displays the total number of backups that completed within the specific time range. See also, Available Service Level Agreement (SLA) Reports.
As you are generating your Backup Duration SLA report, consider the following best practices:
• Use a consistent duration so that you can develop and compare data across the same interval.
• Create a duration report for each business unit or for each customer. Depending on how your company stores data, the Administrator can set up host groups for each business unit
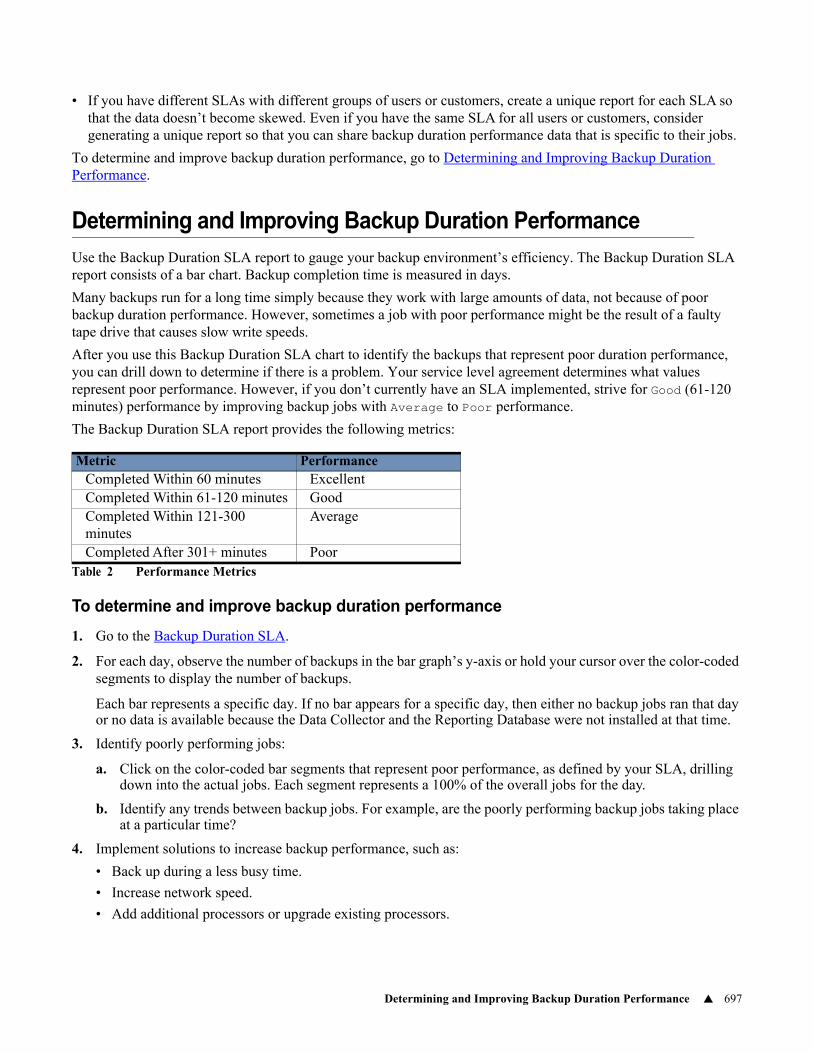
Determining and Improving Backup Duration Performance 697
• If you have different SLAs with different groups of users or customers, create a unique report for each SLA so that the data doesn’t become skewed. Even if you have the same SLA for all users or customers, consider generating a unique report so that you can share backup duration performance data that is specific to their jobs.
To determine and improve backup duration performance, go to Determining and Improving Backup Duration Performance.
Determining and Improving Backup Duration Performance
Use the Backup Duration SLA report to gauge your backup environment’s efficiency. The Backup Duration SLA report consists of a bar chart. Backup completion time is measured in days.
Many backups run for a long time simply because they work with large amounts of data, not because of poor backup duration performance. However, sometimes a job with poor performance might be the result of a faulty tape drive that causes slow write speeds.
After you use this Backup Duration SLA chart to identify the backups that represent poor duration performance, you can drill down to determine if there is a problem. Your service level agreement determines what values represent poor performance. However, if you don’t currently have an SLA implemented, strive for Good (61-120 minutes) performance by improving backup jobs with Average to Poor performance.
The Backup Duration SLA report provides the following metrics:
To determine and improve backup duration performance
1. Go to the Backup Duration SLA.
2. For each day, observe the number of backups in the bar graph’s y-axis or hold your cursor over the color-coded segments to display the number of backups.
Each bar represents a specific day. If no bar appears for a specific day, then either no backup jobs ran that day or no data is available because the Data Collector and the Reporting Database were not installed at that time.
3. Identify poorly performing jobs:
a. Click on the color-coded bar segments that represent poor performance, as defined by your SLA, drilling down into the actual jobs. Each segment represents a 100% of the overall jobs for the day.
b. Identify any trends between backup jobs. For example, are the poorly performing backup jobs taking place at a particular time?
4. Implement solutions to increase backup performance, such as:
• Back up during a less busy time.
• Increase network speed.
• Add additional processors or upgrade existing processors.
Metric PerformanceCompleted Within 60 minutes ExcellentCompleted Within 61-120 minutes GoodCompleted Within 121-300 minutes
Average
Completed After 301+ minutes PoorTable 2 Performance Metrics
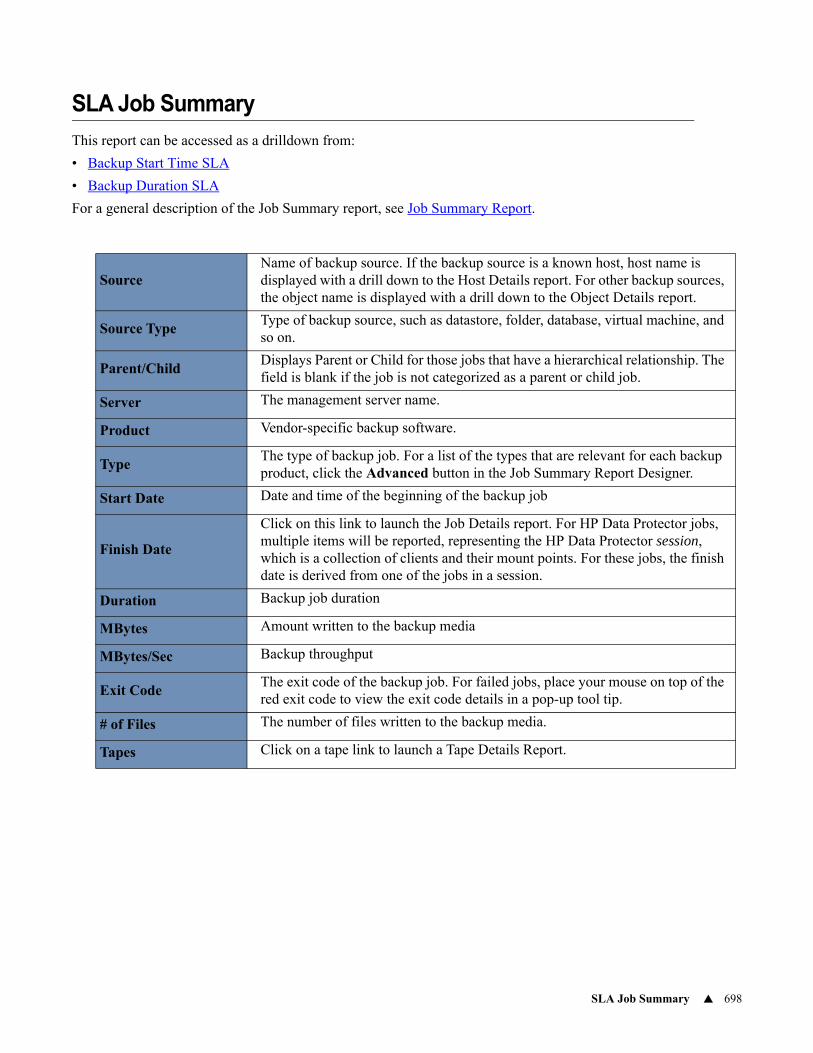
SLA Job Summary 698
SLA Job Summary
This report can be accessed as a drilldown from:
• Backup Start Time SLA
• Backup Duration SLA
For a general description of the Job Summary report, see Job Summary Report.
SourceName of backup source. If the backup source is a known host, host name is displayed with a drill down to the Host Details report. For other backup sources, the object name is displayed with a drill down to the Object Details report.
Source TypeType of backup source, such as datastore, folder, database, virtual machine, and so on.
Parent/ChildDisplays Parent or Child for those jobs that have a hierarchical relationship. The field is blank if the job is not categorized as a parent or child job.
Server The management server name.
Product Vendor-specific backup software.
TypeThe type of backup job. For a list of the types that are relevant for each backup product, click the Advanced button in the Job Summary Report Designer.
Start Date Date and time of the beginning of the backup job
Finish Date
Click on this link to launch the Job Details report. For HP Data Protector jobs, multiple items will be reported, representing the HP Data Protector session, which is a collection of clients and their mount points. For these jobs, the finish date is derived from one of the jobs in a session.
Duration Backup job duration
MBytes Amount written to the backup media
MBytes/Sec Backup throughput
Exit CodeThe exit code of the backup job. For failed jobs, place your mouse on top of the red exit code to view the exit code details in a pop-up tool tip.
# of Files The number of files written to the backup media.
Tapes Click on a tape link to launch a Tape Details Report.

SLA Job Summary 699
Using Storage Utilization Reports 700
22Chapter 6Backup Storage Utilization Reports
This section contains the following topics:• Using Storage Utilization Reports
• Data Domain System Summary - Backup
• Data Domain System Details
• Data Domain Disk Summary
• Disk Usage and Performance Report
• Drive Utilization & Performance Report
• Drive Performance Summary Report
• Storage Unit Detail Report
• NetBackup Storage Unit Summary
• Drive Utilization & Performance Report
• Storage Unit Event Details
• Disk Volume Details
• Tape Library and Drive Utilization
• NetBackup Deduplication Effect
• Storage Unit Detail Report
• Storage Unit Images
• Storage Unit Event Details
• Disk Volume Details
• IBM Spectrum Protect (TSM) Database Utilization
• IBM Spectrum Protect (TSM) Recovery Log Utilization
Using Storage Utilization Reports
To optimize storage utilization and performance, you can:
• Identify duplicate backups.
• Identify free capacity.
• Ensure maximum disk utilization throughput.
• Ensure that jobs start on time.
• Forecast future storage needs.

Using Storage Utilization Reports 701
A number of practices contribute to storage consumption issues, such as over-provisioning storage and neglecting to deallocate resources. Your data protection strategy should include proactive procedures for reclaiming unused storage. The Portal provides reports to assist you in optimizing storage utilization and performance.
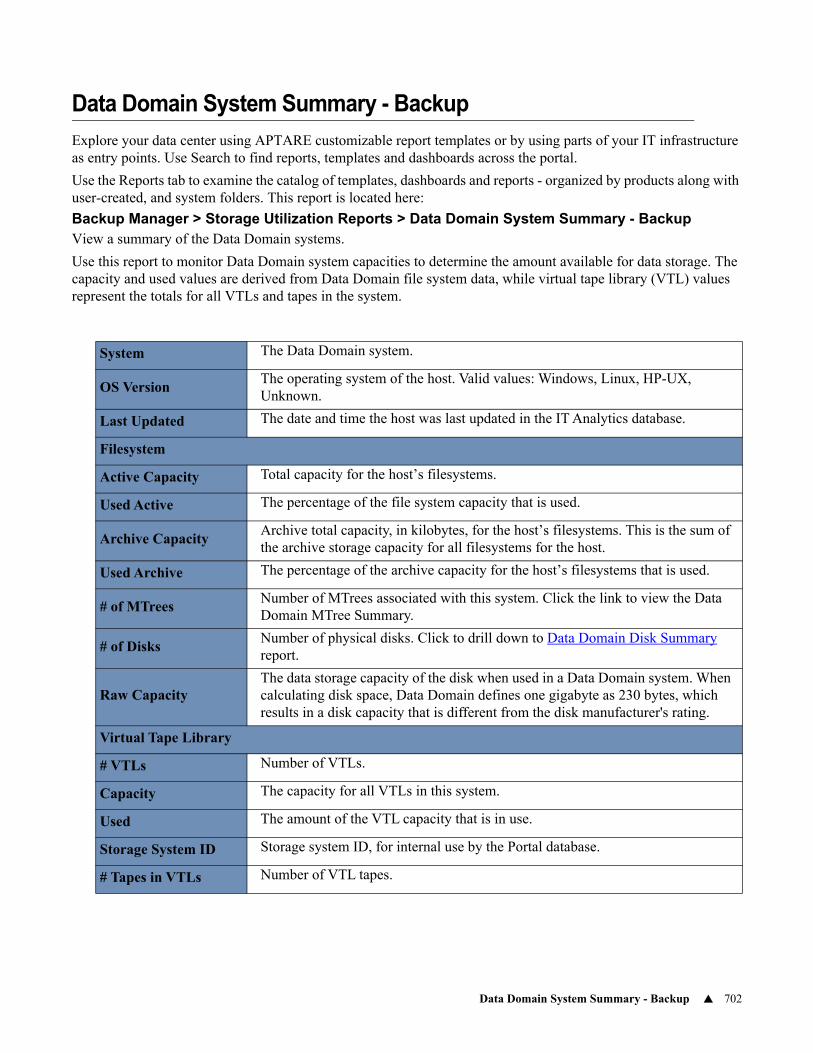
Data Domain System Summary - Backup 702
Data Domain System Summary - Backup
Explore your data center using APTARE customizable report templates or by using parts of your IT infrastructure as entry points. Use Search to find reports, templates and dashboards across the portal.
Use the Reports tab to examine the catalog of templates, dashboards and reports - organized by products along with user-created, and system folders. This report is located here:
Backup Manager > Storage Utilization Reports > Data Domain System Summary - BackupView a summary of the Data Domain systems.
Use this report to monitor Data Domain system capacities to determine the amount available for data storage. The capacity and used values are derived from Data Domain file system data, while virtual tape library (VTL) values represent the totals for all VTLs and tapes in the system.
System The Data Domain system.
OS VersionThe operating system of the host. Valid values: Windows, Linux, HP-UX, Unknown.
Last Updated The date and time the host was last updated in the IT Analytics database.
Filesystem
Active Capacity Total capacity for the host’s filesystems.
Used Active The percentage of the file system capacity that is used.
Archive CapacityArchive total capacity, in kilobytes, for the host’s filesystems. This is the sum of the archive storage capacity for all filesystems for the host.
Used Archive The percentage of the archive capacity for the host’s filesystems that is used.
# of MTreesNumber of MTrees associated with this system. Click the link to view the Data Domain MTree Summary.
# of DisksNumber of physical disks. Click to drill down to Data Domain Disk Summary report.
Raw CapacityThe data storage capacity of the disk when used in a Data Domain system. When calculating disk space, Data Domain defines one gigabyte as 230 bytes, which results in a disk capacity that is different from the disk manufacturer's rating.
Virtual Tape Library
# VTLs Number of VTLs.
Capacity The capacity for all VTLs in this system.
Used The amount of the VTL capacity that is in use.
Storage System ID Storage system ID, for internal use by the Portal database.
# Tapes in VTLs Number of VTL tapes.
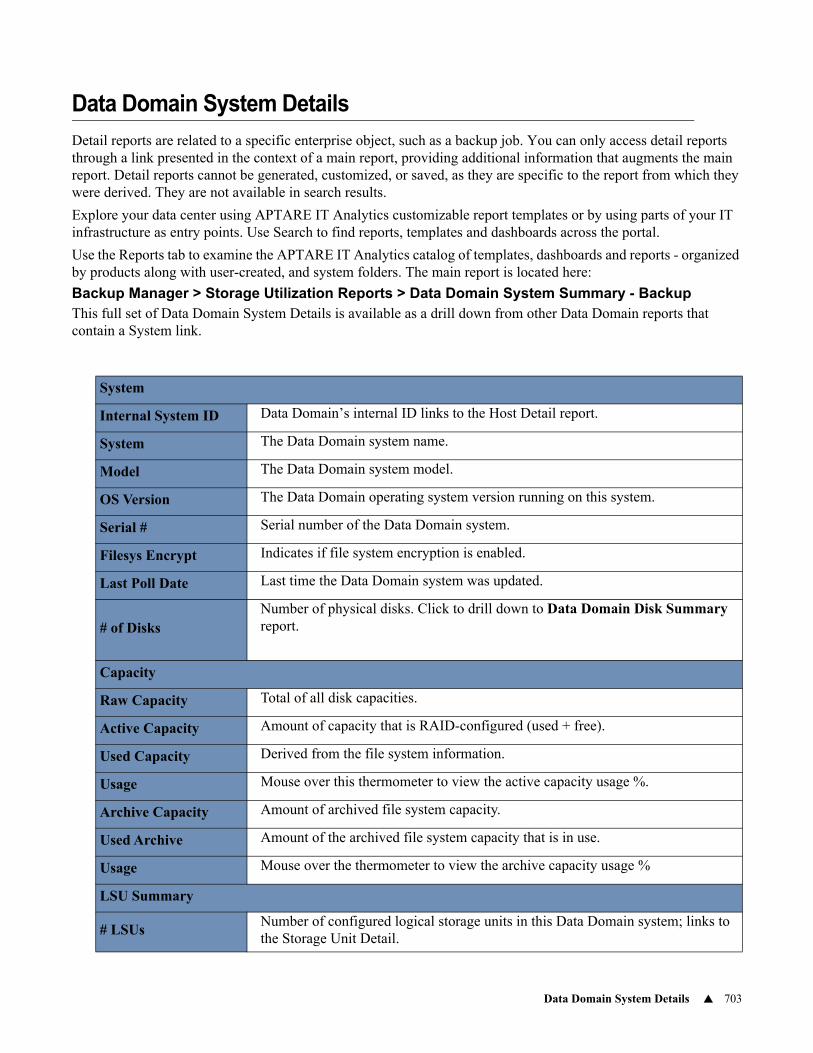
Data Domain System Details 703
Data Domain System Details
Detail reports are related to a specific enterprise object, such as a backup job. You can only access detail reports through a link presented in the context of a main report, providing additional information that augments the main report. Detail reports cannot be generated, customized, or saved, as they are specific to the report from which they were derived. They are not available in search results.
Explore your data center using APTARE IT Analytics customizable report templates or by using parts of your IT infrastructure as entry points. Use Search to find reports, templates and dashboards across the portal.
Use the Reports tab to examine the APTARE IT Analytics catalog of templates, dashboards and reports - organized by products along with user-created, and system folders. The main report is located here:
Backup Manager > Storage Utilization Reports > Data Domain System Summary - BackupThis full set of Data Domain System Details is available as a drill down from other Data Domain reports that contain a System link.
System
Internal System ID Data Domain’s internal ID links to the Host Detail report.
System The Data Domain system name.
Model The Data Domain system model.
OS Version The Data Domain operating system version running on this system.
Serial # Serial number of the Data Domain system.
Filesys Encrypt Indicates if file system encryption is enabled.
Last Poll Date Last time the Data Domain system was updated.
# of DisksNumber of physical disks. Click to drill down to Data Domain Disk Summary report.
Capacity
Raw Capacity Total of all disk capacities.
Active Capacity Amount of capacity that is RAID-configured (used + free).
Used Capacity Derived from the file system information.
Usage Mouse over this thermometer to view the active capacity usage %.
Archive Capacity Amount of archived file system capacity.
Used Archive Amount of the archived file system capacity that is in use.
Usage Mouse over the thermometer to view the archive capacity usage %
LSU Summary
# LSUsNumber of configured logical storage units in this Data Domain system; links to the Storage Unit Detail.
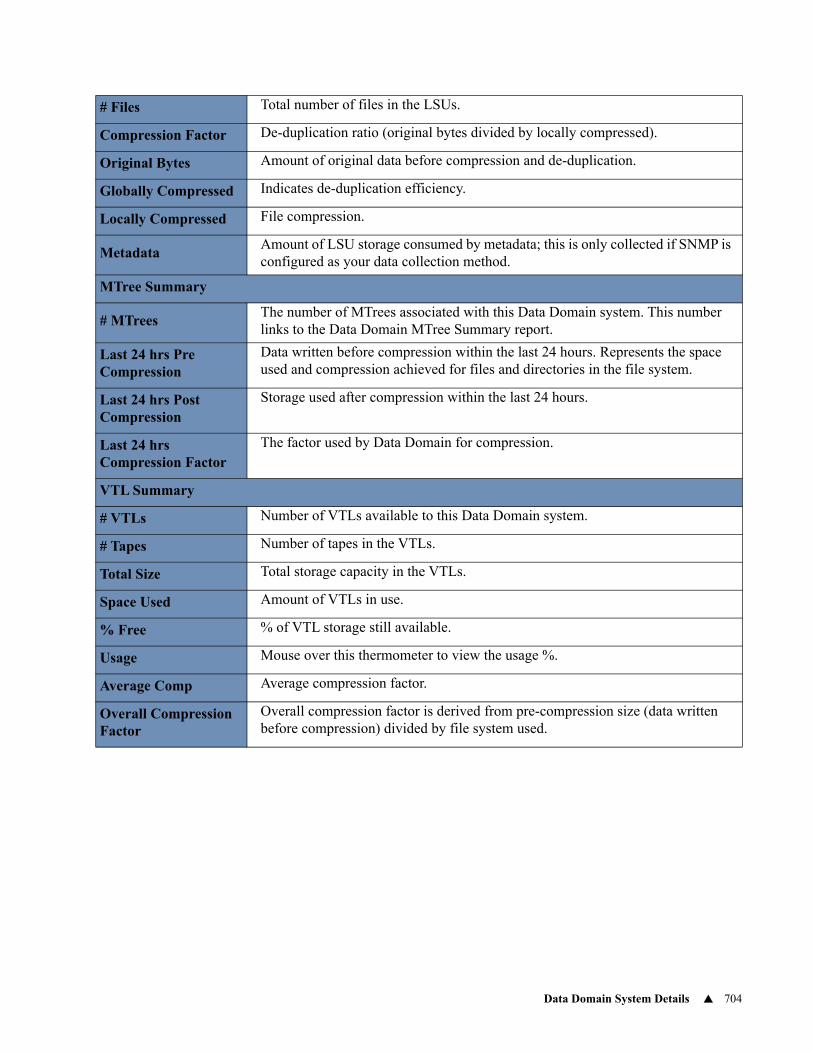
Data Domain System Details 704
# Files Total number of files in the LSUs.
Compression Factor De-duplication ratio (original bytes divided by locally compressed).
Original Bytes Amount of original data before compression and de-duplication.
Globally Compressed Indicates de-duplication efficiency.
Locally Compressed File compression.
MetadataAmount of LSU storage consumed by metadata; this is only collected if SNMP is configured as your data collection method.
MTree Summary
# MTreesThe number of MTrees associated with this Data Domain system. This number links to the Data Domain MTree Summary report.
Last 24 hrs Pre Compression
Data written before compression within the last 24 hours. Represents the space used and compression achieved for files and directories in the file system.
Last 24 hrs Post Compression
Storage used after compression within the last 24 hours.
Last 24 hrs Compression Factor
The factor used by Data Domain for compression.
VTL Summary
# VTLs Number of VTLs available to this Data Domain system.
# Tapes Number of tapes in the VTLs.
Total Size Total storage capacity in the VTLs.
Space Used Amount of VTLs in use.
% Free % of VTL storage still available.
Usage Mouse over this thermometer to view the usage %.
Average Comp Average compression factor.
Overall Compression Factor
Overall compression factor is derived from pre-compression size (data written before compression) divided by file system used.
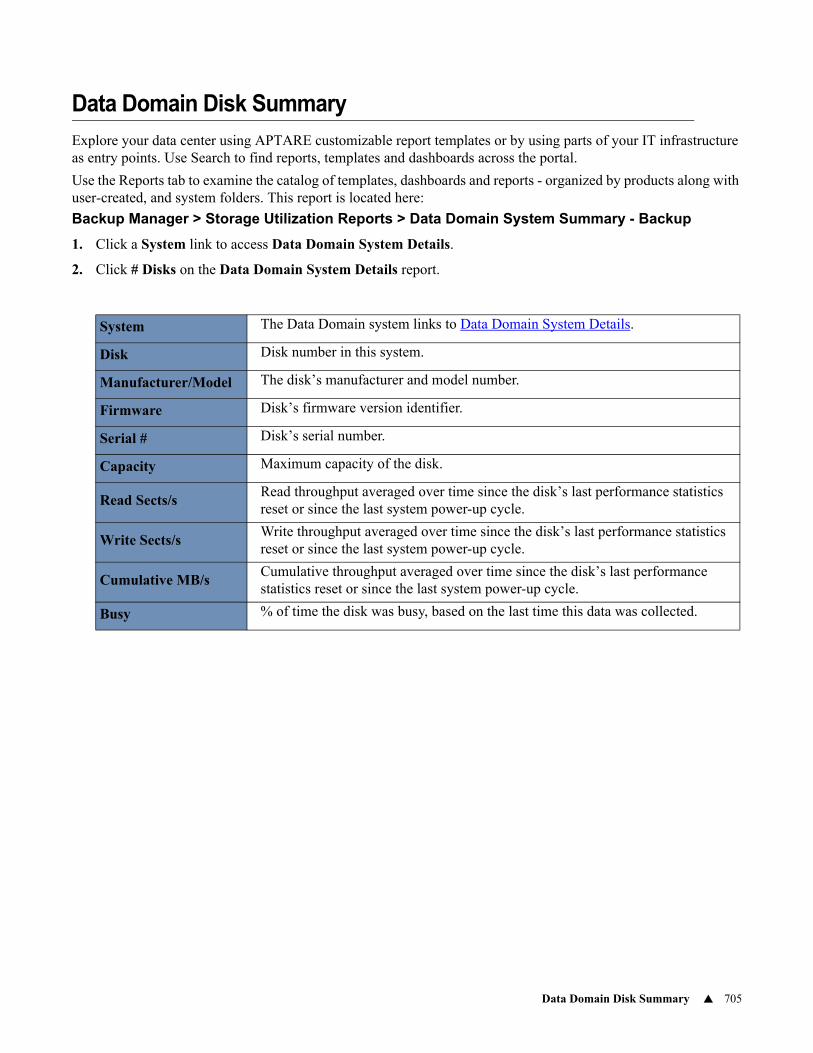
Data Domain Disk Summary 705
Data Domain Disk Summary
Explore your data center using APTARE customizable report templates or by using parts of your IT infrastructure as entry points. Use Search to find reports, templates and dashboards across the portal.
Use the Reports tab to examine the catalog of templates, dashboards and reports - organized by products along with user-created, and system folders. This report is located here:
Backup Manager > Storage Utilization Reports > Data Domain System Summary - Backup
1. Click a System link to access Data Domain System Details.
2. Click # Disks on the Data Domain System Details report.
System The Data Domain system links to Data Domain System Details.
Disk Disk number in this system.
Manufacturer/Model The disk’s manufacturer and model number.
Firmware Disk’s firmware version identifier.
Serial # Disk’s serial number.
Capacity Maximum capacity of the disk.
Read Sects/sRead throughput averaged over time since the disk’s last performance statistics reset or since the last system power-up cycle.
Write Sects/sWrite throughput averaged over time since the disk’s last performance statistics reset or since the last system power-up cycle.
Cumulative MB/sCumulative throughput averaged over time since the disk’s last performance statistics reset or since the last system power-up cycle.
Busy % of time the disk was busy, based on the last time this data was collected.
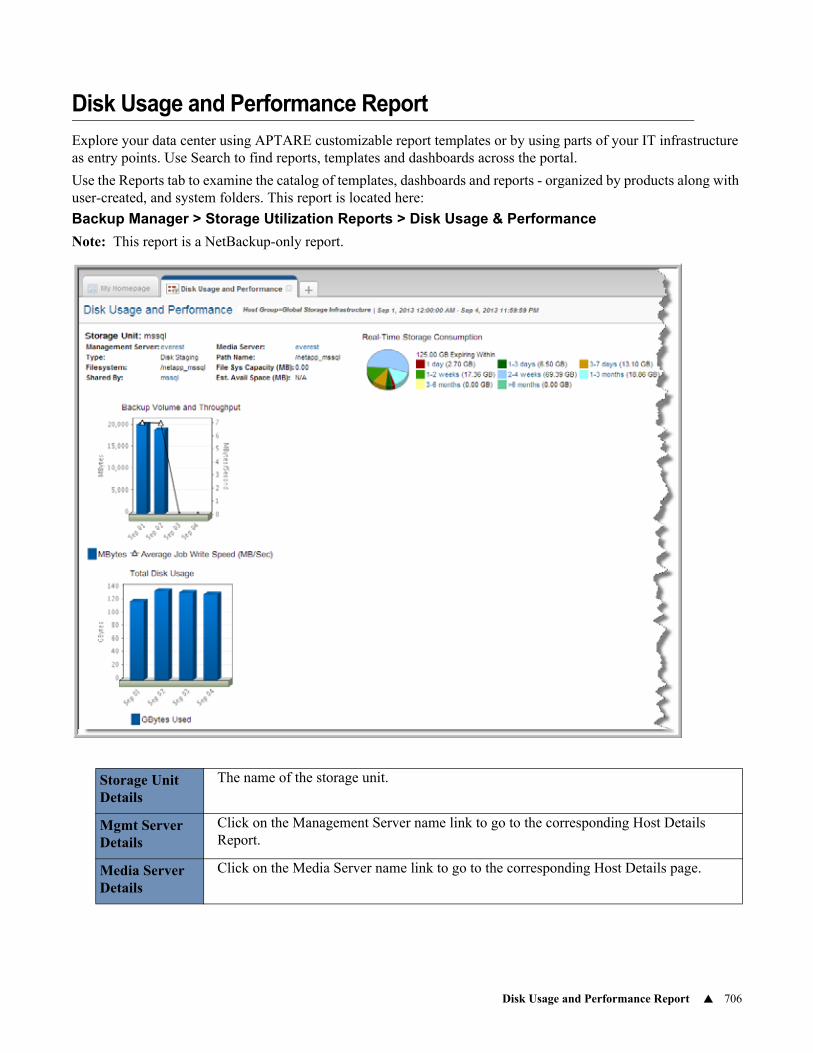
Disk Usage and Performance Report 706
Disk Usage and Performance Report
Explore your data center using APTARE customizable report templates or by using parts of your IT infrastructure as entry points. Use Search to find reports, templates and dashboards across the portal.
Use the Reports tab to examine the catalog of templates, dashboards and reports - organized by products along with user-created, and system folders. This report is located here:
Backup Manager > Storage Utilization Reports > Disk Usage & Performance
Note: This report is a NetBackup-only report.
Storage Unit Details
The name of the storage unit.
Mgmt Server Details
Click on the Management Server name link to go to the corresponding Host Details Report.
Media Server Details
Click on the Media Server name link to go to the corresponding Host Details page.
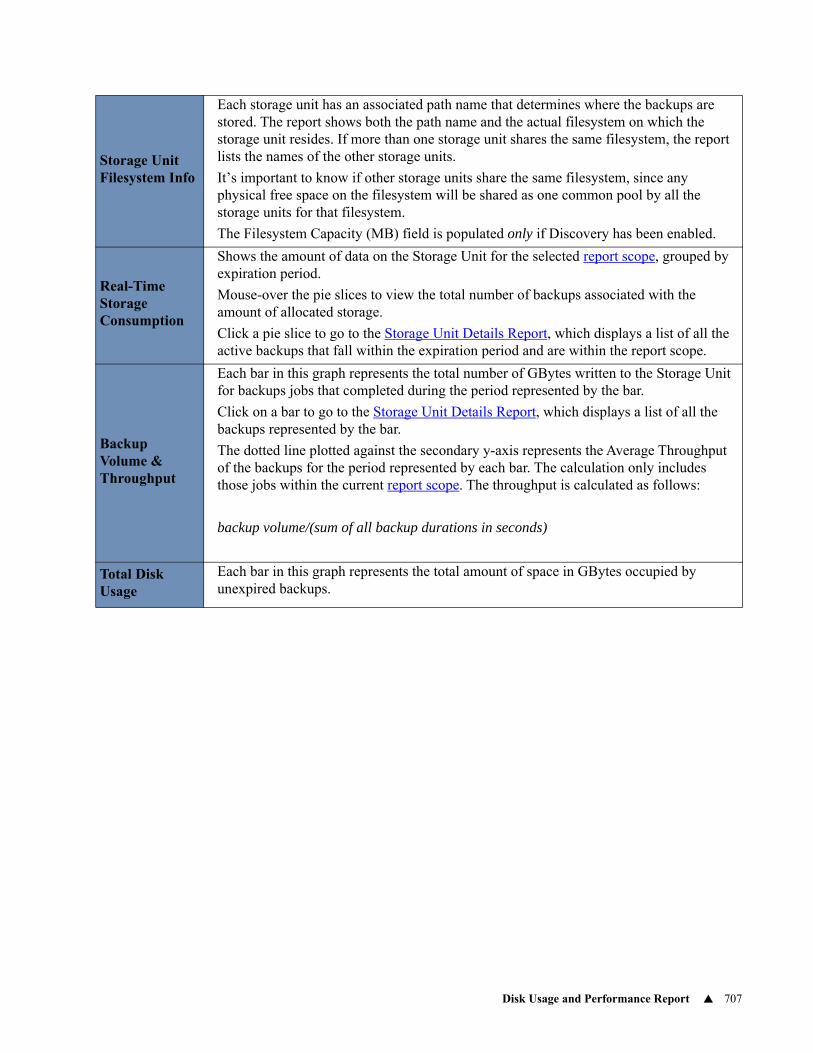
Disk Usage and Performance Report 707
Storage Unit Filesystem Info
Each storage unit has an associated path name that determines where the backups are stored. The report shows both the path name and the actual filesystem on which the storage unit resides. If more than one storage unit shares the same filesystem, the report lists the names of the other storage units.
It’s important to know if other storage units share the same filesystem, since any physical free space on the filesystem will be shared as one common pool by all the storage units for that filesystem.
The Filesystem Capacity (MB) field is populated only if Discovery has been enabled.
Real-Time Storage Consumption
Shows the amount of data on the Storage Unit for the selected report scope, grouped by expiration period.
Mouse-over the pie slices to view the total number of backups associated with the amount of allocated storage.
Click a pie slice to go to the Storage Unit Details Report, which displays a list of all the active backups that fall within the expiration period and are within the report scope.
Backup Volume & Throughput
Each bar in this graph represents the total number of GBytes written to the Storage Unit for backups jobs that completed during the period represented by the bar.
Click on a bar to go to the Storage Unit Details Report, which displays a list of all the backups represented by the bar.
The dotted line plotted against the secondary y-axis represents the Average Throughput of the backups for the period represented by each bar. The calculation only includes those jobs within the current report scope. The throughput is calculated as follows:
backup volume/(sum of all backup durations in seconds)
Total Disk Usage
Each bar in this graph represents the total amount of space in GBytes occupied by unexpired backups.
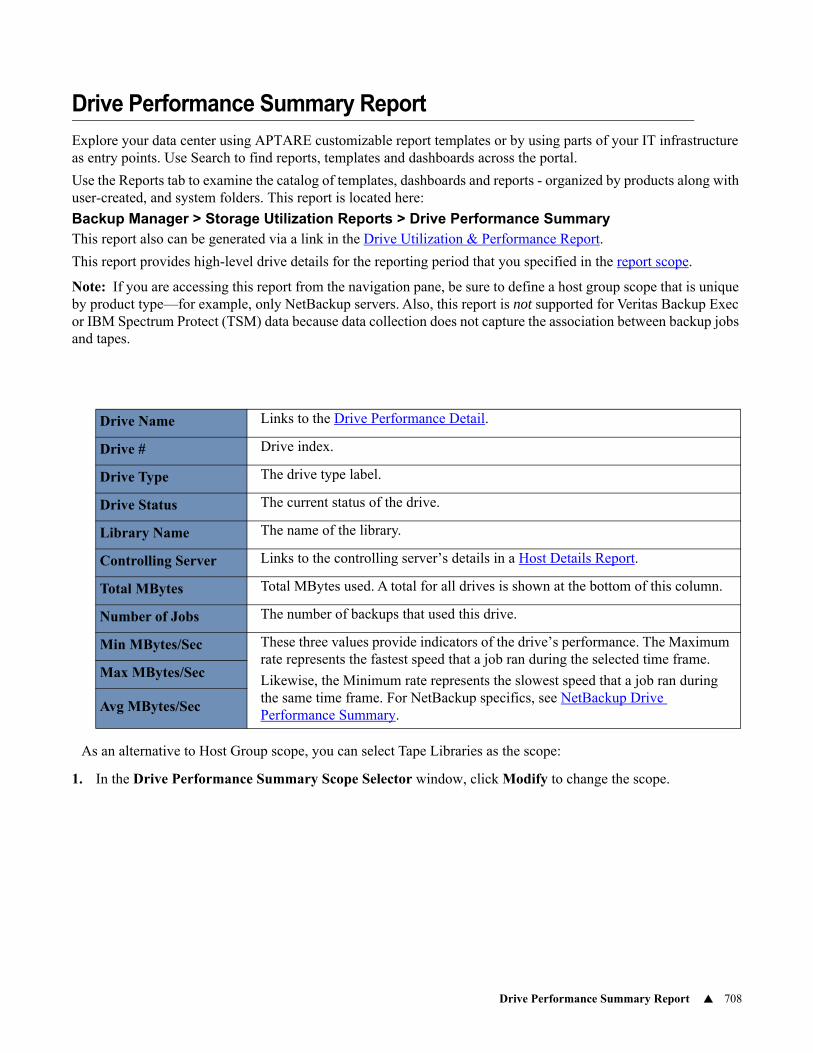
Drive Performance Summary Report 708
Drive Performance Summary Report
Explore your data center using APTARE customizable report templates or by using parts of your IT infrastructure as entry points. Use Search to find reports, templates and dashboards across the portal.
Use the Reports tab to examine the catalog of templates, dashboards and reports - organized by products along with user-created, and system folders. This report is located here:
Backup Manager > Storage Utilization Reports > Drive Performance SummaryThis report also can be generated via a link in the Drive Utilization & Performance Report.
This report provides high-level drive details for the reporting period that you specified in the report scope.
Note: If you are accessing this report from the navigation pane, be sure to define a host group scope that is unique by product type—for example, only NetBackup servers. Also, this report is not supported for Veritas Backup Exec or IBM Spectrum Protect (TSM) data because data collection does not capture the association between backup jobs and tapes.
As an alternative to Host Group scope, you can select Tape Libraries as the scope:
1. In the Drive Performance Summary Scope Selector window, click Modify to change the scope.
Drive Name Links to the Drive Performance Detail.
Drive # Drive index.
Drive Type The drive type label.
Drive Status The current status of the drive.
Library Name The name of the library.
Controlling Server Links to the controlling server’s details in a Host Details Report.
Total MBytes Total MBytes used. A total for all drives is shown at the bottom of this column.
Number of Jobs The number of backups that used this drive.
Min MBytes/Sec These three values provide indicators of the drive’s performance. The Maximum rate represents the fastest speed that a job ran during the selected time frame.
Likewise, the Minimum rate represents the slowest speed that a job ran during the same time frame. For NetBackup specifics, see NetBackup Drive Performance Summary.
Max MBytes/Sec
Avg MBytes/Sec
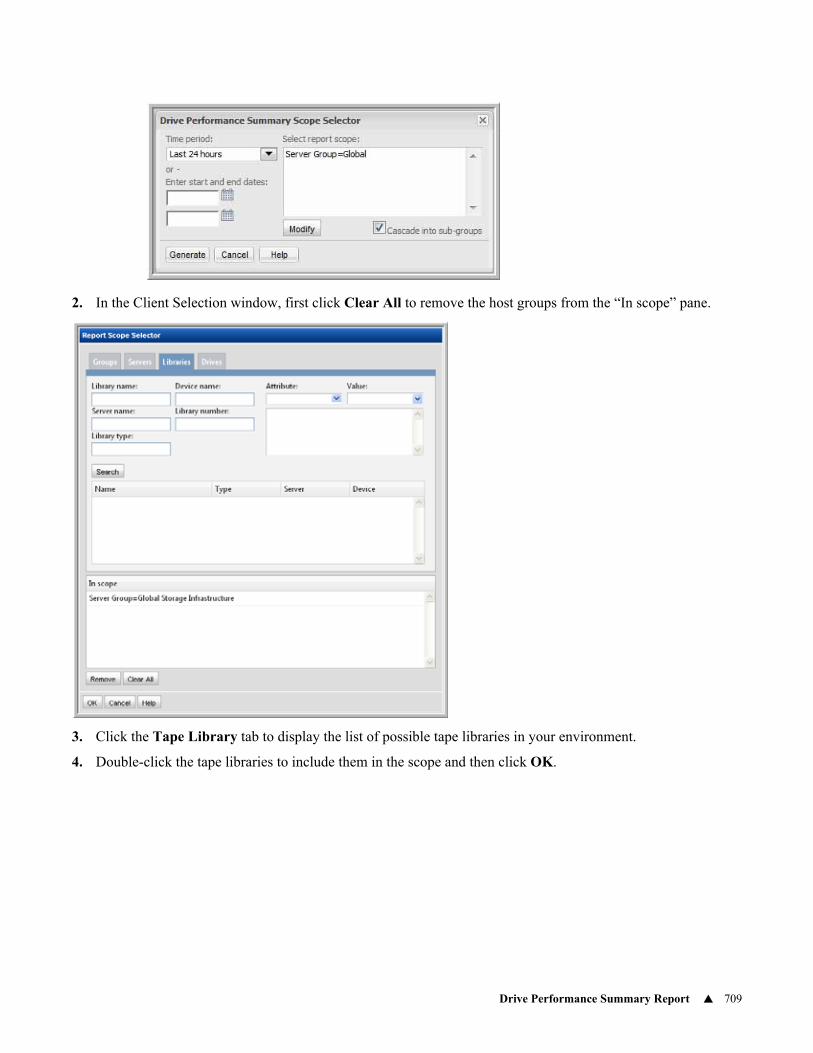
Drive Performance Summary Report 709
2. In the Client Selection window, first click Clear All to remove the host groups from the “In scope” pane.
3. Click the Tape Library tab to display the list of possible tape libraries in your environment.
4. Double-click the tape libraries to include them in the scope and then click OK.
Drive Performance Detail 710
NetBackup Drive Performance Summary
For NetBackup jobs, the drive performance algorithm takes into account the use of multiple tapes, as some backups require the dismounting and re-mounting of several tapes. The Kilobytes/second rate is calculated for each piece of tape media used by the backup job.
mediaKilobytes / ((finishReadWrite - startReadWrite) * SECS_IN_A_DAY * (mediaKilobytes/jobKilobytes))
Where:
• mediaKilobytes is the total kilobytes written to an individual piece of tape media
• jobKilobytes is the total size of the backup job, as reported by bpdbjobs
• startReadWrite is the date/time that the job started writing to the tape
• finishReadWrite is the date/time that the job finished writing to the tape
The Drive Performance Summary report displays the minimum, average, and maximum overall drive performance for all jobs for the reporting period. When you drill down to an individual tape drive, the Drive Performance Detail Report uses this same algorithm to display the performance of each job. If there are multiple rows for a single job, such as when multiple tapes are used by the job, the performance metric is averaged across all the rows returned from the above algorithm.
The details from which drive performance is derived can be viewed via drill down links. In the Drive Performance Detail report, click on the Finish Date for one of the backup jobs to view the Job Details. At the bottom of the Job Details Report, the backup attempts (try records) are displayed.
Drive Performance Detail
Detail reports are related to a specific enterprise object, such as a backup job. You can only access detail reports through a link presented in the context of a main report, providing additional information that augments the main report. Detail reports cannot be generated, customized, or saved, as they are specific to the report from which they were derived. They are not available in search results.
Explore your data center using APTARE IT Analytics customizable report templates or by using parts of your IT infrastructure as entry points. Use Search to find reports, templates and dashboards across the portal.
Use the Reports tab to examine the APTARE IT Analytics catalog of templates, dashboards and reports - organized by products along with user-created, and system folders. The main report is located here:
Backup Manager > Storage Utilization Reports > Drive Performance SummaryClick a Drive Name.
Drive NameThe drive name—this was the link to this report from the Drive Performance Summary report.
Library Name The library name links to the Tape Media Summary report.
Client Links to the client’s Host Details Report.
Start Time When the backup job started.
Finish Time Links to the Job Details Report.
Drive Performance Detail 711
For NetBackup specifics, see NetBackup Drive Performance Summary.
Duration Duration of the job.
Status Status of the job.
# of Files The number of files backed up to this drive.
MBytes Amount of data backed up to this drive.
MBytes/Sec
For NetBackup, this value is calculated using the job write start time and job write end time (not the job start time and job finish time). For example, a job can start, but then it can wait in a queue before the job begins to write to a tape/disk. That queue time is eliminated in this calculation.
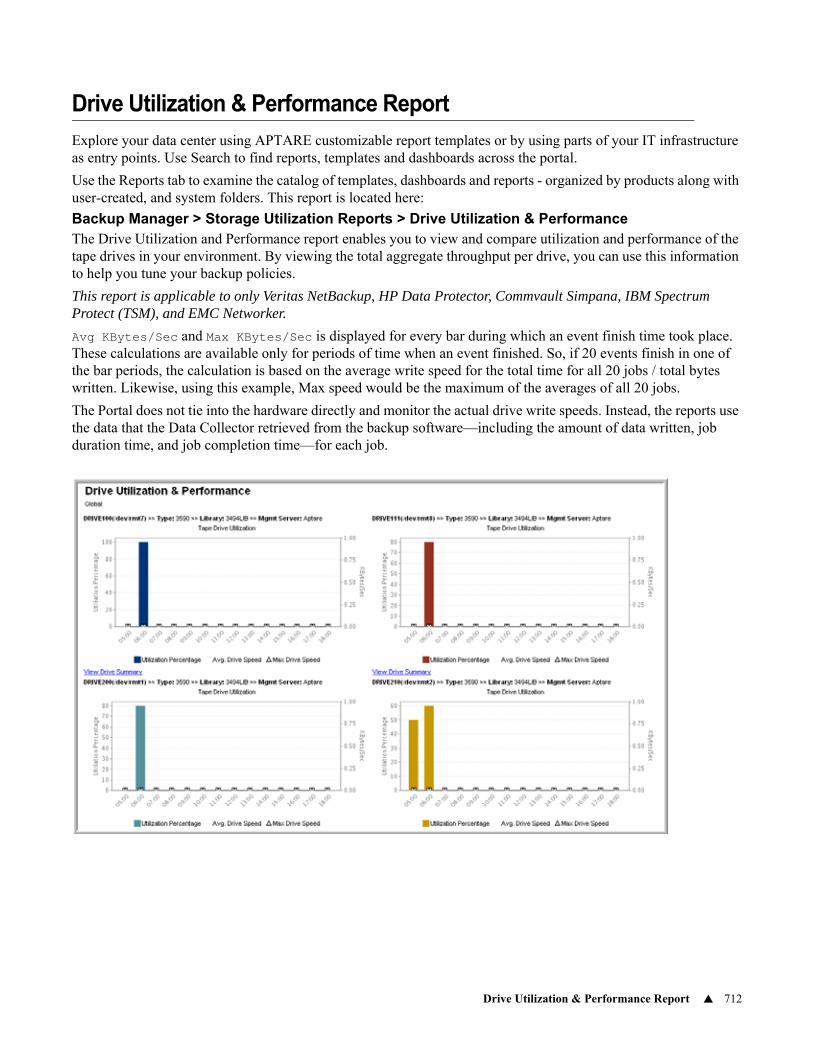
Drive Utilization & Performance Report 712
Drive Utilization & Performance Report
Explore your data center using APTARE customizable report templates or by using parts of your IT infrastructure as entry points. Use Search to find reports, templates and dashboards across the portal.
Use the Reports tab to examine the catalog of templates, dashboards and reports - organized by products along with user-created, and system folders. This report is located here:
Backup Manager > Storage Utilization Reports > Drive Utilization & PerformanceThe Drive Utilization and Performance report enables you to view and compare utilization and performance of the tape drives in your environment. By viewing the total aggregate throughput per drive, you can use this information to help you tune your backup policies.
This report is applicable to only Veritas NetBackup, HP Data Protector, Commvault Simpana, IBM Spectrum Protect (TSM), and EMC Networker.
Avg KBytes/Sec and Max KBytes/Sec is displayed for every bar during which an event finish time took place. These calculations are available only for periods of time when an event finished. So, if 20 events finish in one of the bar periods, the calculation is based on the average write speed for the total time for all 20 jobs / total bytes written. Likewise, using this example, Max speed would be the maximum of the averages of all 20 jobs.
The Portal does not tie into the hardware directly and monitor the actual drive write speeds. Instead, the reports use the data that the Data Collector retrieved from the backup software—including the amount of data written, job duration time, and job completion time—for each job.
Drive Utilization & Performance Report 713
Drive Details
For each drive, listed at the top of each Drive Utilization and Performance Chart:• Drive Name
• Drive Type
• Tape Library Name
• Backup Management ServerClick on the Backup Management Server name to view its Host Details page.
Pop-up Details
Mouse-over any chart bar or line symbol to view the corresponding values.
Drive Summary
Click on the list at the bottom of each chart to go to the Drive Performance Summary Report, which lists all the backup events that took place on that drive for the time period that you specified in the report scope.
Additionally, the min, max, and avg KBytes/Sec for the time period are provided at the bottom of the report.
Avg & Max KBytes/Sec
The Avg KBytes/Sec and Max KBytes/Sec is displayed for every bar during which an event completed.
If the report shows a bar with utilization but does not have accompanying line symbols, either no backups or restores completed during that time period or the drive was being utilized for another purpose, such as copying a tape to be vaulted.
Local Start and End Times
Each chart displays the utilization and performance of one drive in the system. The start and end time for each chart is localized to the time zone where that drive’s management server is located.
For example, if Drive A’s management server is located in the Pacific Standard Time Zone and Drive B’s management server is located in the Eastern Standard Time Zone (3 hours ahead of Drive A’s management server) and you ran the Drive Utilization and Performance Report for the last 12 hours, the Drive A chart’s start and end times would be 3 hours earlier than the chart for Drive B.
This start/end time localization enables real time performance comparison between drives, even if they are located in different parts of the world.
NetBackup Deduplication Effect 714
NetBackup Deduplication Effect
Explore your data center using APTARE customizable report templates or by using parts of your IT infrastructure as entry points. Use Search to find reports, templates and dashboards across the portal.
Use the Reports tab to examine the catalog of templates, dashboards and reports - organized by products along with user-created, and system folders. This report is located here:
Backup Manager > Storage Utilization Reports > NetBackup Deduplication EffectThis report enables you to see the benefits of deduplication.
NetBackup Deduplication Savings 715
NetBackup Deduplication Savings
Explore your data center using APTARE customizable report templates or by using parts of your IT infrastructure as entry points. Use Search to find reports, templates and dashboards across the portal.
Use the Reports tab to examine the catalog of templates, dashboards and reports - organized by products along with user-created, and system folders. This report is located here:
Backup Manager > Storage Utilization Reports > NetBackup Deduplication SavingsUse this report to quickly validate how much storage has been saved because of deduplication. The graph displays the difference between the total data scanned and the total stored.
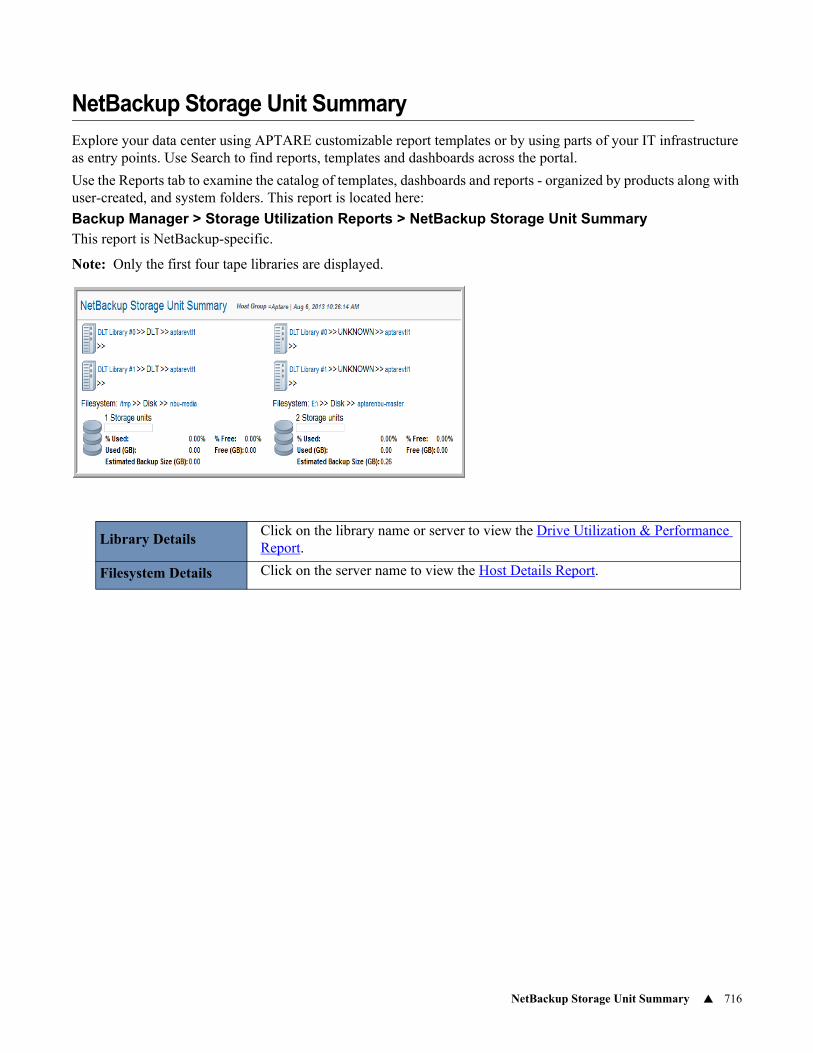
NetBackup Storage Unit Summary 716
NetBackup Storage Unit Summary
Explore your data center using APTARE customizable report templates or by using parts of your IT infrastructure as entry points. Use Search to find reports, templates and dashboards across the portal.
Use the Reports tab to examine the catalog of templates, dashboards and reports - organized by products along with user-created, and system folders. This report is located here:
Backup Manager > Storage Utilization Reports > NetBackup Storage Unit SummaryThis report is NetBackup-specific.
Note: Only the first four tape libraries are displayed.
Library DetailsClick on the library name or server to view the Drive Utilization & Performance Report.
Filesystem Details Click on the server name to view the Host Details Report.
Real Time Library and Drive Status 717
Real Time Library and Drive Status
Explore your data center using APTARE customizable report templates or by using parts of your IT infrastructure as entry points. Use Search to find reports, templates and dashboards across the portal.
Use the Reports tab to examine the catalog of templates, dashboards and reports - organized by products along with user-created, and system folders. This report is located here:
Backup Manager > Storage Utilization Reports > Real Time Library and Drive StatusUse this report to monitor the health of each library. This report displays current high-level information for each tape library in your environment. The data will only be as current as the time of the most recent poll of your management server(s).
This report is applicable to only NetBackup and NetWorker.
Library Library name.
Type The type of library, such as Optical or HCART.
Management Server
Click this link to view Host Details.
Slots The number of slots in the library.
Drives The number of drives in the library.
In Use Number of drives currently in use.
Drives Available
Drives - In Use = Drives Available
Down The number of disabled drives. When this number becomes equal to or greater than 25% of the library’s drives, the library’s row of information will be highlighted in red.
Avail % The percentage of drives in this library that are available.
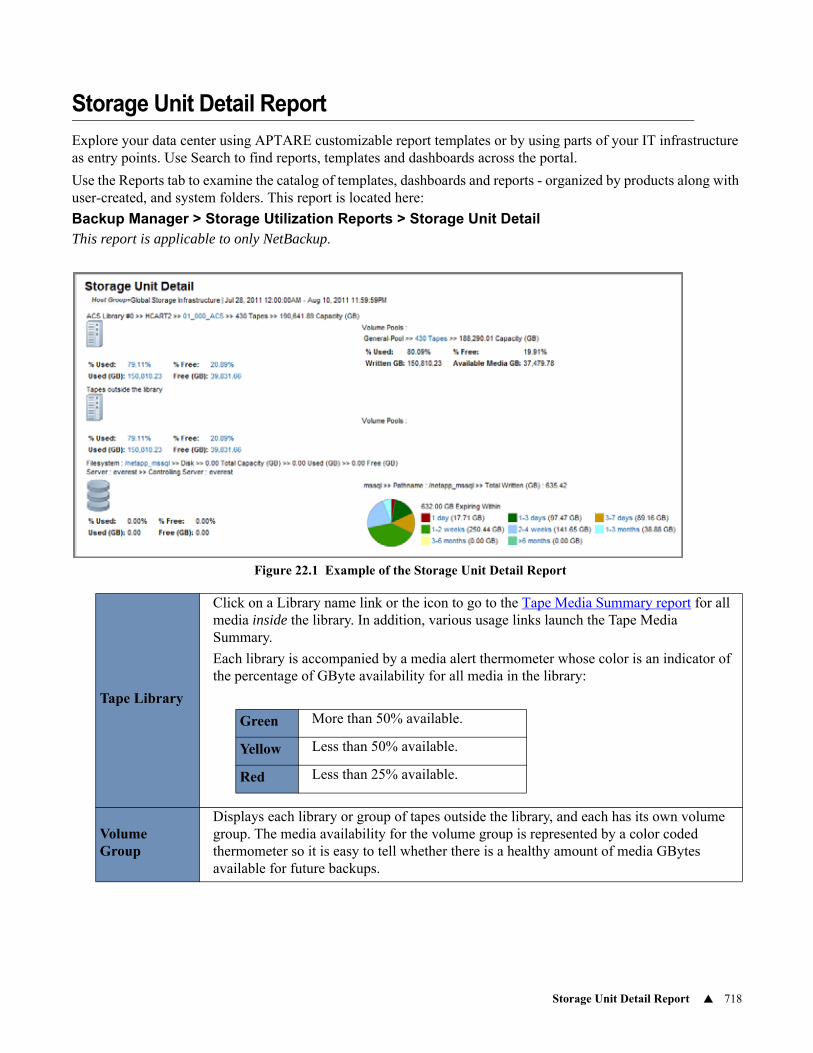
Storage Unit Detail Report 718
Storage Unit Detail Report
Explore your data center using APTARE customizable report templates or by using parts of your IT infrastructure as entry points. Use Search to find reports, templates and dashboards across the portal.
Use the Reports tab to examine the catalog of templates, dashboards and reports - organized by products along with user-created, and system folders. This report is located here:
Backup Manager > Storage Utilization Reports > Storage Unit DetailThis report is applicable to only NetBackup.
Figure 22.1 Example of the Storage Unit Detail Report
Tape Library
Click on a Library name link or the icon to go to the Tape Media Summary report for all media inside the library. In addition, various usage links launch the Tape Media Summary.
Each library is accompanied by a media alert thermometer whose color is an indicator of the percentage of GByte availability for all media in the library:
Volume Group
Displays each library or group of tapes outside the library, and each has its own volume group. The media availability for the volume group is represented by a color coded thermometer so it is easy to tell whether there is a healthy amount of media GBytes available for future backups.
Green More than 50% available.
Yellow Less than 50% available.
Red Less than 25% available.
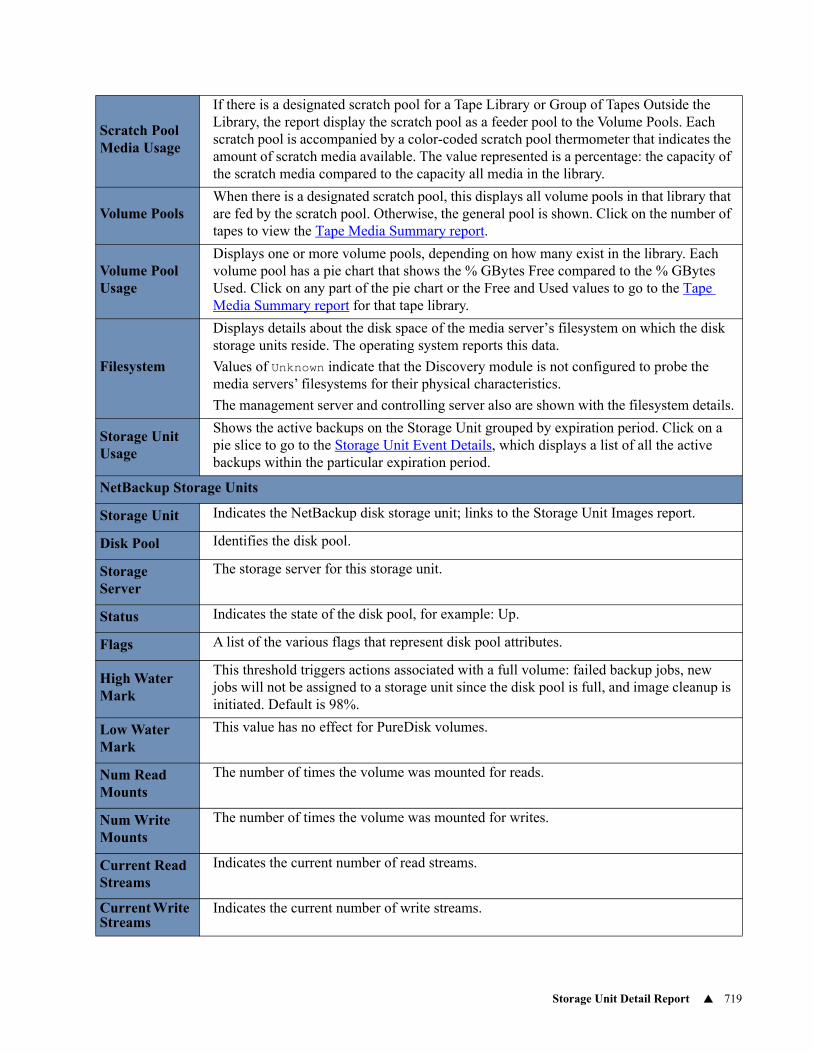
Storage Unit Detail Report 719
Scratch Pool Media Usage
If there is a designated scratch pool for a Tape Library or Group of Tapes Outside the Library, the report display the scratch pool as a feeder pool to the Volume Pools. Each scratch pool is accompanied by a color-coded scratch pool thermometer that indicates the amount of scratch media available. The value represented is a percentage: the capacity of the scratch media compared to the capacity all media in the library.
Volume PoolsWhen there is a designated scratch pool, this displays all volume pools in that library that are fed by the scratch pool. Otherwise, the general pool is shown. Click on the number of tapes to view the Tape Media Summary report.
Volume Pool Usage
Displays one or more volume pools, depending on how many exist in the library. Each volume pool has a pie chart that shows the % GBytes Free compared to the % GBytes Used. Click on any part of the pie chart or the Free and Used values to go to the Tape Media Summary report for that tape library.
Filesystem
Displays details about the disk space of the media server’s filesystem on which the disk storage units reside. The operating system reports this data.
Values of Unknown indicate that the Discovery module is not configured to probe the media servers’ filesystems for their physical characteristics.
The management server and controlling server also are shown with the filesystem details.
Storage Unit Usage
Shows the active backups on the Storage Unit grouped by expiration period. Click on a pie slice to go to the Storage Unit Event Details, which displays a list of all the active backups within the particular expiration period.
NetBackup Storage Units
Storage Unit Indicates the NetBackup disk storage unit; links to the Storage Unit Images report.
Disk Pool Identifies the disk pool.
Storage Server
The storage server for this storage unit.
Status Indicates the state of the disk pool, for example: Up.
Flags A list of the various flags that represent disk pool attributes.
High Water Mark
This threshold triggers actions associated with a full volume: failed backup jobs, new jobs will not be assigned to a storage unit since the disk pool is full, and image cleanup is initiated. Default is 98%.
Low Water Mark
This value has no effect for PureDisk volumes.
Num Read Mounts
The number of times the volume was mounted for reads.
Num Write Mounts
The number of times the volume was mounted for writes.
Current Read Streams
Indicates the current number of read streams.
Current Write Streams
Indicates the current number of write streams.
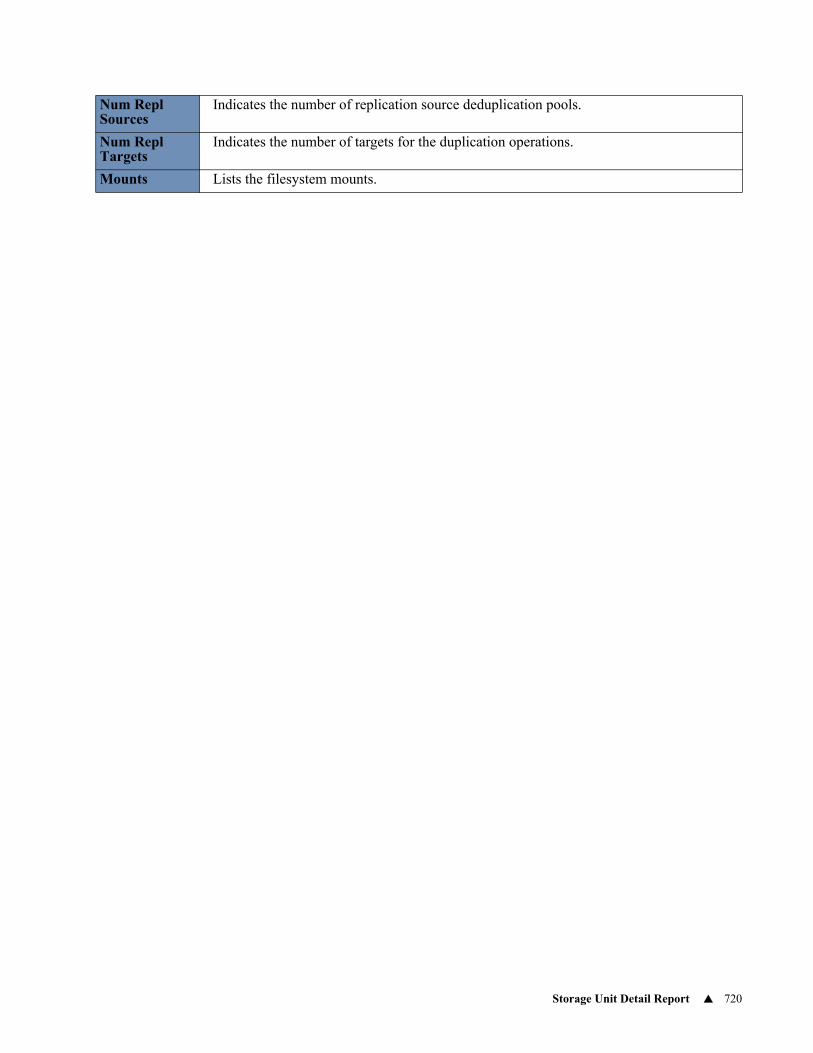
Storage Unit Detail Report 720
Num Repl Sources
Indicates the number of replication source deduplication pools.
Num Repl Targets
Indicates the number of targets for the duplication operations.
Mounts Lists the filesystem mounts.
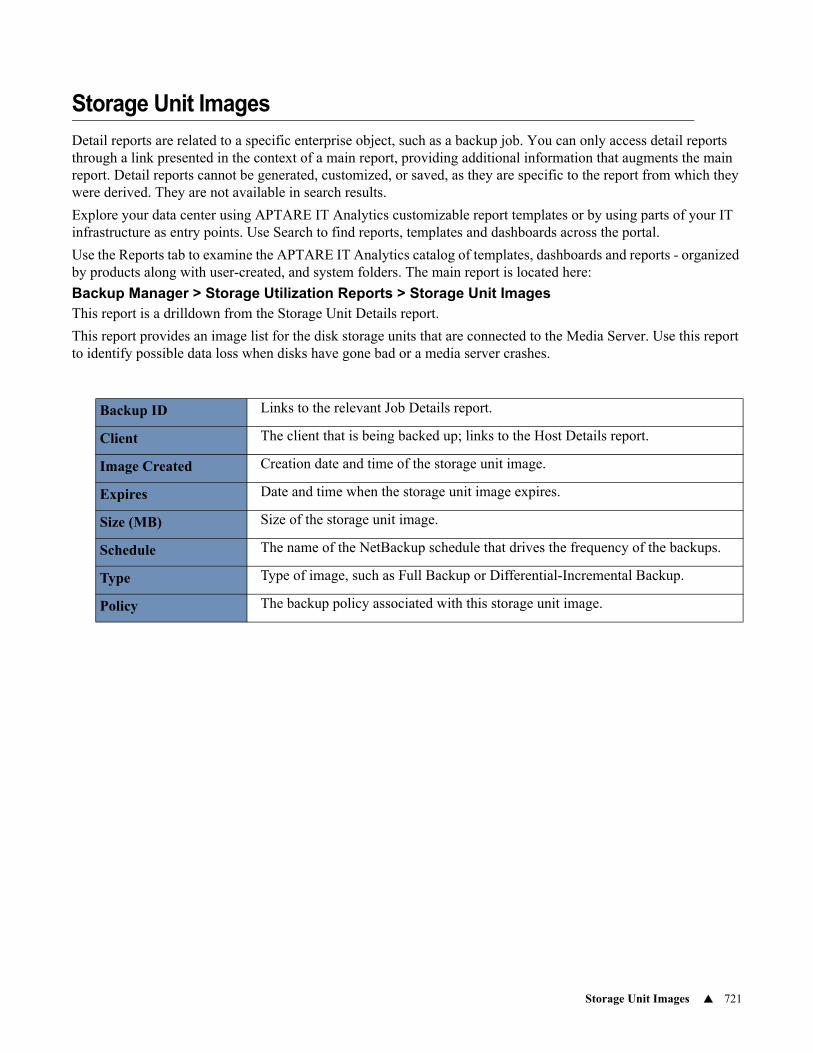
Storage Unit Images 721
Storage Unit Images
Detail reports are related to a specific enterprise object, such as a backup job. You can only access detail reports through a link presented in the context of a main report, providing additional information that augments the main report. Detail reports cannot be generated, customized, or saved, as they are specific to the report from which they were derived. They are not available in search results.
Explore your data center using APTARE IT Analytics customizable report templates or by using parts of your IT infrastructure as entry points. Use Search to find reports, templates and dashboards across the portal.
Use the Reports tab to examine the APTARE IT Analytics catalog of templates, dashboards and reports - organized by products along with user-created, and system folders. The main report is located here:
Backup Manager > Storage Utilization Reports > Storage Unit ImagesThis report is a drilldown from the Storage Unit Details report.
This report provides an image list for the disk storage units that are connected to the Media Server. Use this report to identify possible data loss when disks have gone bad or a media server crashes.
Backup ID Links to the relevant Job Details report.
Client The client that is being backed up; links to the Host Details report.
Image Created Creation date and time of the storage unit image.
Expires Date and time when the storage unit image expires.
Size (MB) Size of the storage unit image.
Schedule The name of the NetBackup schedule that drives the frequency of the backups.
Type Type of image, such as Full Backup or Differential-Incremental Backup.
Policy The backup policy associated with this storage unit image.
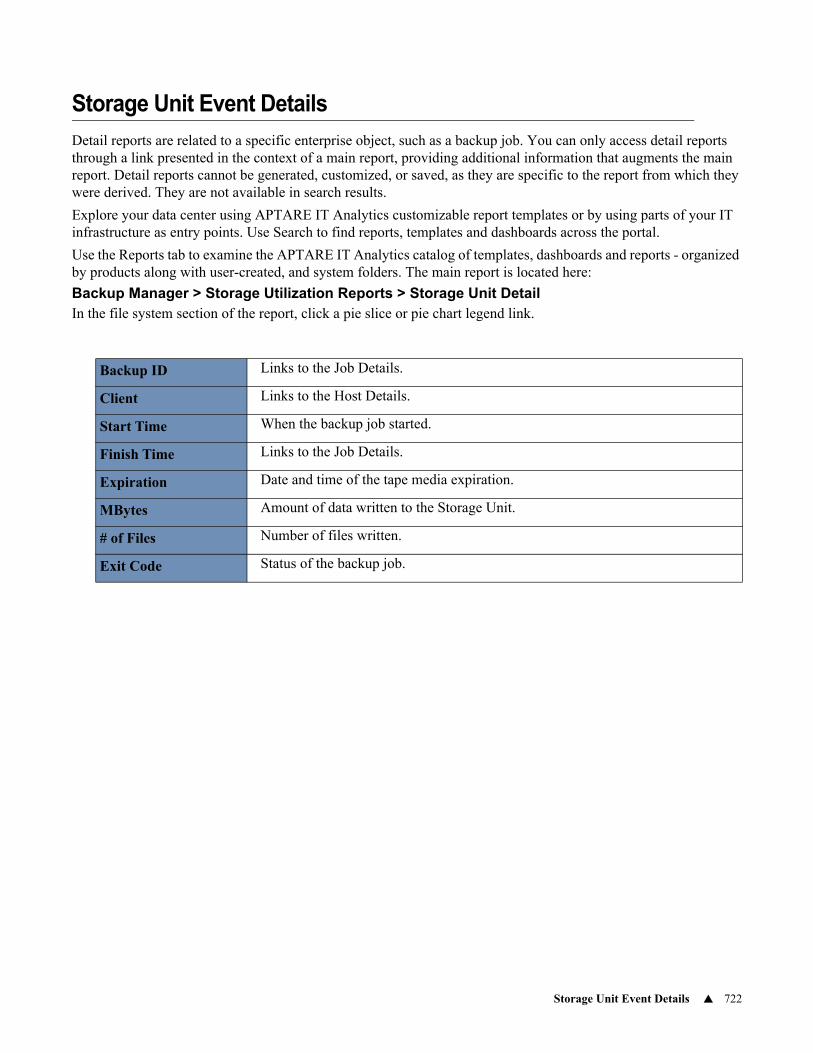
Storage Unit Event Details 722
Storage Unit Event Details
Detail reports are related to a specific enterprise object, such as a backup job. You can only access detail reports through a link presented in the context of a main report, providing additional information that augments the main report. Detail reports cannot be generated, customized, or saved, as they are specific to the report from which they were derived. They are not available in search results.
Explore your data center using APTARE IT Analytics customizable report templates or by using parts of your IT infrastructure as entry points. Use Search to find reports, templates and dashboards across the portal.
Use the Reports tab to examine the APTARE IT Analytics catalog of templates, dashboards and reports - organized by products along with user-created, and system folders. The main report is located here:
Backup Manager > Storage Utilization Reports > Storage Unit DetailIn the file system section of the report, click a pie slice or pie chart legend link.
Backup ID Links to the Job Details.
Client Links to the Host Details.
Start Time When the backup job started.
Finish Time Links to the Job Details.
Expiration Date and time of the tape media expiration.
MBytes Amount of data written to the Storage Unit.
# of Files Number of files written.
Exit Code Status of the backup job.
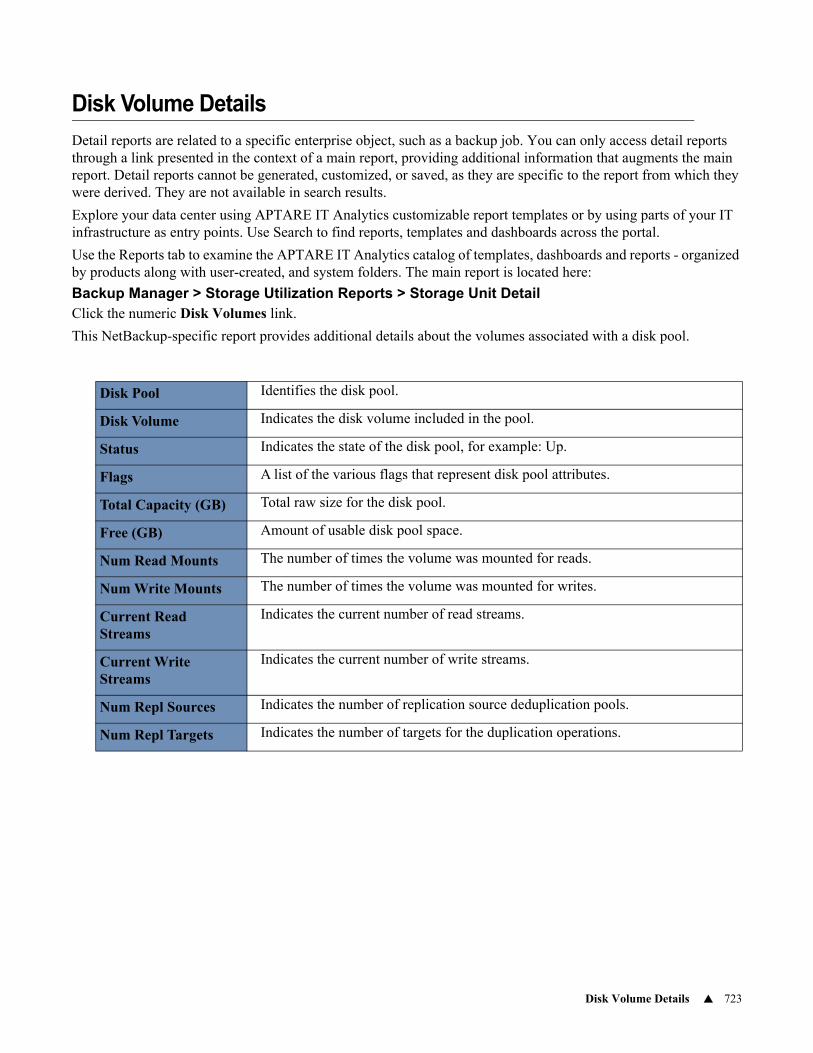
Disk Volume Details 723
Disk Volume Details
Detail reports are related to a specific enterprise object, such as a backup job. You can only access detail reports through a link presented in the context of a main report, providing additional information that augments the main report. Detail reports cannot be generated, customized, or saved, as they are specific to the report from which they were derived. They are not available in search results.
Explore your data center using APTARE IT Analytics customizable report templates or by using parts of your IT infrastructure as entry points. Use Search to find reports, templates and dashboards across the portal.
Use the Reports tab to examine the APTARE IT Analytics catalog of templates, dashboards and reports - organized by products along with user-created, and system folders. The main report is located here:
Backup Manager > Storage Utilization Reports > Storage Unit DetailClick the numeric Disk Volumes link.
This NetBackup-specific report provides additional details about the volumes associated with a disk pool.
Disk Pool Identifies the disk pool.
Disk Volume Indicates the disk volume included in the pool.
Status Indicates the state of the disk pool, for example: Up.
Flags A list of the various flags that represent disk pool attributes.
Total Capacity (GB) Total raw size for the disk pool.
Free (GB) Amount of usable disk pool space.
Num Read Mounts The number of times the volume was mounted for reads.
Num Write Mounts The number of times the volume was mounted for writes.
Current Read Streams
Indicates the current number of read streams.
Current Write Streams
Indicates the current number of write streams.
Num Repl Sources Indicates the number of replication source deduplication pools.
Num Repl Targets Indicates the number of targets for the duplication operations.
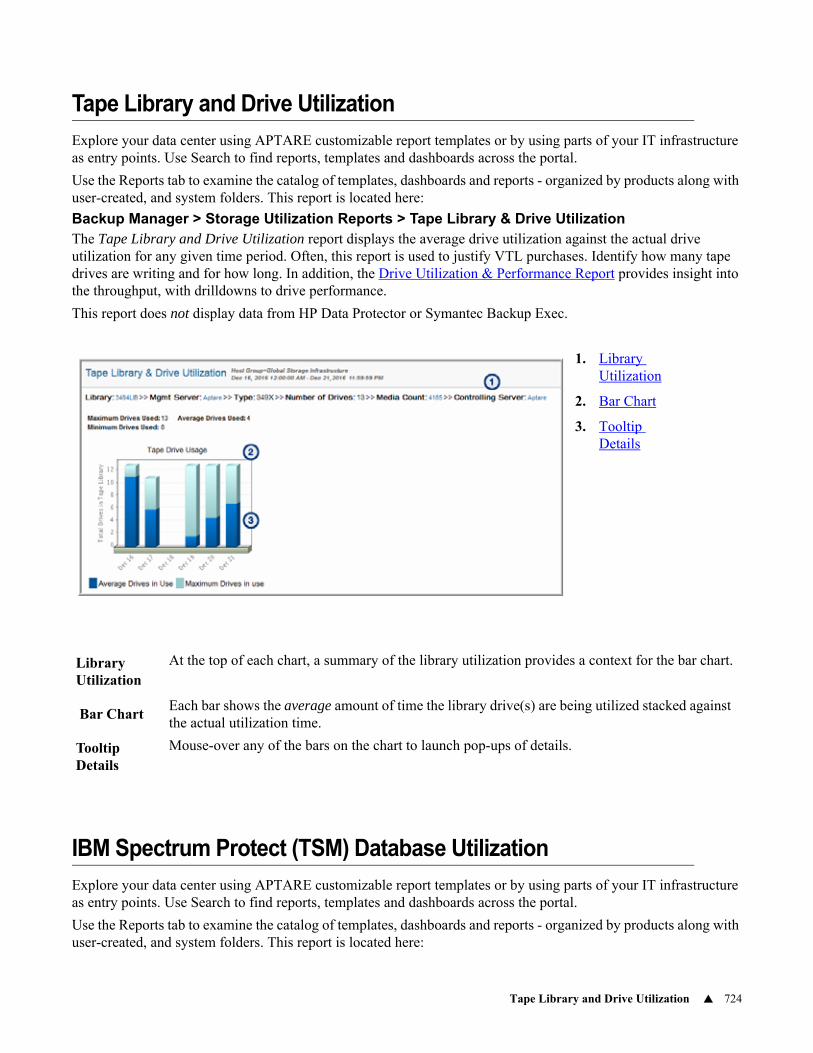
Tape Library and Drive Utilization 724
Tape Library and Drive Utilization
Explore your data center using APTARE customizable report templates or by using parts of your IT infrastructure as entry points. Use Search to find reports, templates and dashboards across the portal.
Use the Reports tab to examine the catalog of templates, dashboards and reports - organized by products along with user-created, and system folders. This report is located here:
Backup Manager > Storage Utilization Reports > Tape Library & Drive UtilizationThe Tape Library and Drive Utilization report displays the average drive utilization against the actual drive utilization for any given time period. Often, this report is used to justify VTL purchases. Identify how many tape drives are writing and for how long. In addition, the Drive Utilization & Performance Report provides insight into the throughput, with drilldowns to drive performance.
This report does not display data from HP Data Protector or Symantec Backup Exec.
IBM Spectrum Protect (TSM) Database Utilization
Explore your data center using APTARE customizable report templates or by using parts of your IT infrastructure as entry points. Use Search to find reports, templates and dashboards across the portal.
Use the Reports tab to examine the catalog of templates, dashboards and reports - organized by products along with user-created, and system folders. This report is located here:
1. Library Utilization
2. Bar Chart
3. Tooltip Details
Library Utilization
At the top of each chart, a summary of the library utilization provides a context for the bar chart.
Bar ChartEach bar shows the average amount of time the library drive(s) are being utilized stacked against the actual utilization time.
Tooltip Details
Mouse-over any of the bars on the chart to launch pop-ups of details.
IBM Spectrum Protect (TSM) Database Utilization 725
Backup Manager > Storage Utilization Reports > IBM Spectrum Protect (TSM) Database UtilizationThe IBM Spectrum Protect (TSM) Database Utilization report provides usage and capacity trending of the database. Using this report, you can determine how much of the allocated database space has been used over the selected report period.
Drillable Stacked Bar Chart
Each bar shows the average amount of time the library drive(s) are being utilized stacked against the actual amount of utilization time. Click on any bar section will to view the Backup Events Report.
Pop-up Details
Mouse-over any of the bars on the chart to display pop-ups including the details of that particular bar section.
Usage & Availability Trending
Shows how much of the allocated database space has been utilized within the TSM database over the time period that you specified in the report scope.
IBM Spectrum Protect (TSM) Recovery Log Utilization 726
IBM Spectrum Protect (TSM) Recovery Log Utilization
Explore your data center using APTARE customizable report templates or by using parts of your IT infrastructure as entry points. Use Search to find reports, templates and dashboards across the portal.
Use the Reports tab to examine the catalog of templates, dashboards and reports - organized by products along with user-created, and system folders. This report is located here:
Backup Manager > Storage Utilization Reports > IBM Spectrum Protect (TSM) Recovery Log UtilizationThis report displays Recovery Log usage—both the maximum used and the available capacity. The Recovery Log contains transactions prior to TSM committing them to the database. Use this report to monitor the size of the log to prevent degradation on the TSM server.
The data can be displayed either as a bar chart or a tabular report. To select a report type, click Advanced in the scope selector.
Forecasting Overview 730
23Chapter 22Backup Manager Forecasting Reports
This section contains the following topics:• Forecasting Overview
• NetBackup Library Capacity Forecast
• Media Availability Forecast
• Media Consumption Forecast
• Media Usage Details
• Scratch Pool Forecast Report
• Tape Drive Usage and Forecast Report
Forecasting Overview
To ensure accurate forecasts, the reports make the following decisions:
• To provide a good statistical sample, when you select a display range, the report uses historical data that is twice that display range.
• If the full range of historical data is unavailable, the data that is available is used. For example, if you want to view data for January of the previous year to December of the current year, the Portal looks for four years worth of historical data.
• Although the report forecasts the current period, the report ignores the current period when it derives statistical calculations. For example, if the current month is July and you request to view the report by months, the bar for July of this year will be forecasted and data for July of this year will be ignored for statistical calculations.
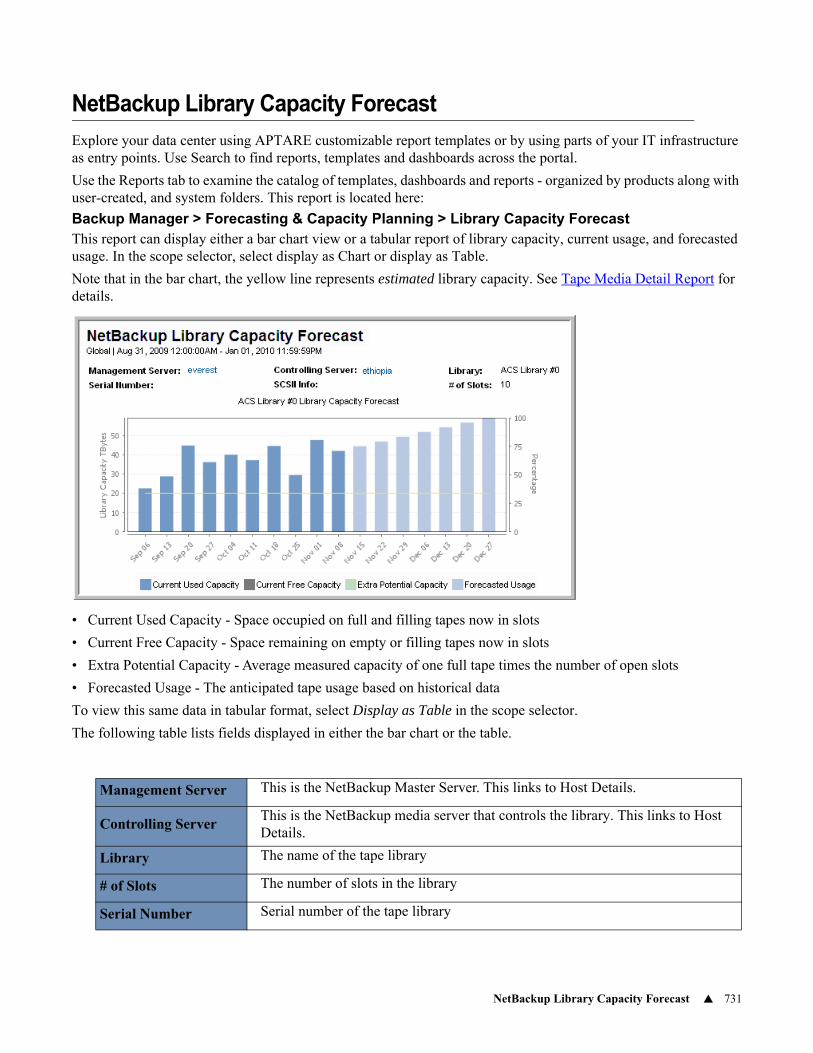
NetBackup Library Capacity Forecast 731
NetBackup Library Capacity Forecast
Explore your data center using APTARE customizable report templates or by using parts of your IT infrastructure as entry points. Use Search to find reports, templates and dashboards across the portal.
Use the Reports tab to examine the catalog of templates, dashboards and reports - organized by products along with user-created, and system folders. This report is located here:
Backup Manager > Forecasting & Capacity Planning > Library Capacity ForecastThis report can display either a bar chart view or a tabular report of library capacity, current usage, and forecasted usage. In the scope selector, select display as Chart or display as Table.
Note that in the bar chart, the yellow line represents estimated library capacity. See Tape Media Detail Report for details.
• Current Used Capacity - Space occupied on full and filling tapes now in slots
• Current Free Capacity - Space remaining on empty or filling tapes now in slots
• Extra Potential Capacity - Average measured capacity of one full tape times the number of open slots
• Forecasted Usage - The anticipated tape usage based on historical data
To view this same data in tabular format, select Display as Table in the scope selector.
The following table lists fields displayed in either the bar chart or the table.
Management Server This is the NetBackup Master Server. This links to Host Details.
Controlling ServerThis is the NetBackup media server that controls the library. This links to Host Details.
Library The name of the tape library
# of Slots The number of slots in the library
Serial Number Serial number of the tape library
NetBackup Library Capacity Forecast 732
SCSII Info The device’s SCII details
Date The date that represents the time period start date
Current Usage Average usage, as of the associated date
Forecasted Usage Forecasted usage, based on the reports start and end dates
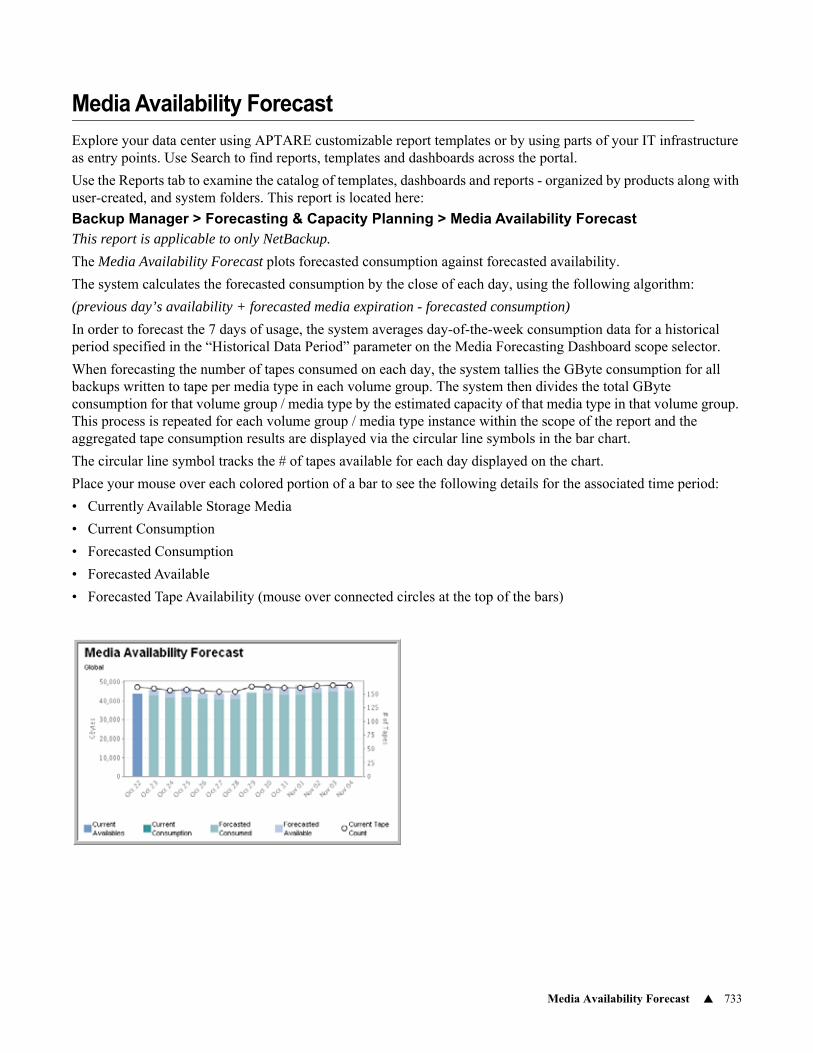
Media Availability Forecast 733
Media Availability Forecast
Explore your data center using APTARE customizable report templates or by using parts of your IT infrastructure as entry points. Use Search to find reports, templates and dashboards across the portal.
Use the Reports tab to examine the catalog of templates, dashboards and reports - organized by products along with user-created, and system folders. This report is located here:
Backup Manager > Forecasting & Capacity Planning > Media Availability ForecastThis report is applicable to only NetBackup.
The Media Availability Forecast plots forecasted consumption against forecasted availability.
The system calculates the forecasted consumption by the close of each day, using the following algorithm:
(previous day’s availability + forecasted media expiration - forecasted consumption)
In order to forecast the 7 days of usage, the system averages day-of-the-week consumption data for a historical period specified in the “Historical Data Period” parameter on the Media Forecasting Dashboard scope selector.
When forecasting the number of tapes consumed on each day, the system tallies the GByte consumption for all backups written to tape per media type in each volume group. The system then divides the total GByte consumption for that volume group / media type by the estimated capacity of that media type in that volume group. This process is repeated for each volume group / media type instance within the scope of the report and the aggregated tape consumption results are displayed via the circular line symbols in the bar chart.
The circular line symbol tracks the # of tapes available for each day displayed on the chart.
Place your mouse over each colored portion of a bar to see the following details for the associated time period:
• Currently Available Storage Media
• Current Consumption
• Forecasted Consumption
• Forecasted Available
• Forecasted Tape Availability (mouse over connected circles at the top of the bars)
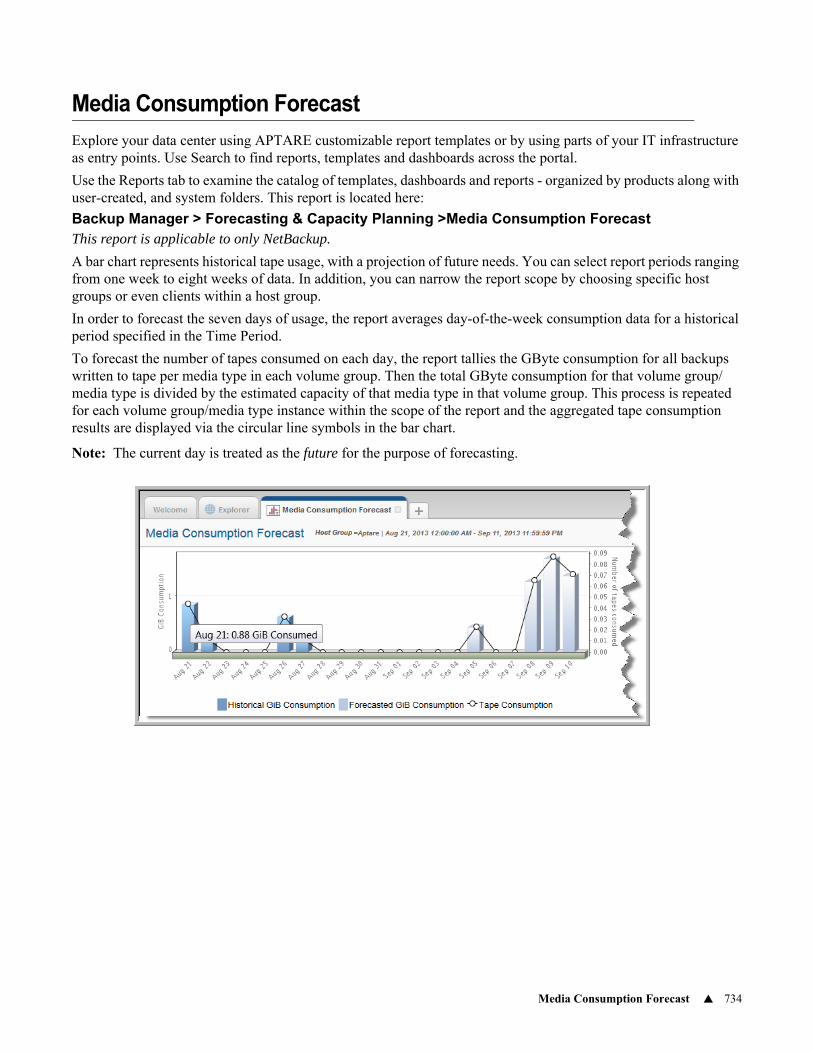
Media Consumption Forecast 734
Media Consumption Forecast
Explore your data center using APTARE customizable report templates or by using parts of your IT infrastructure as entry points. Use Search to find reports, templates and dashboards across the portal.
Use the Reports tab to examine the catalog of templates, dashboards and reports - organized by products along with user-created, and system folders. This report is located here:
Backup Manager > Forecasting & Capacity Planning >Media Consumption ForecastThis report is applicable to only NetBackup.
A bar chart represents historical tape usage, with a projection of future needs. You can select report periods ranging from one week to eight weeks of data. In addition, you can narrow the report scope by choosing specific host groups or even clients within a host group.
In order to forecast the seven days of usage, the report averages day-of-the-week consumption data for a historical period specified in the Time Period.
To forecast the number of tapes consumed on each day, the report tallies the GByte consumption for all backups written to tape per media type in each volume group. Then the total GByte consumption for that volume group/media type is divided by the estimated capacity of that media type in that volume group. This process is repeated for each volume group/media type instance within the scope of the report and the aggregated tape consumption results are displayed via the circular line symbols in the bar chart.
Note: The current day is treated as the future for the purpose of forecasting.
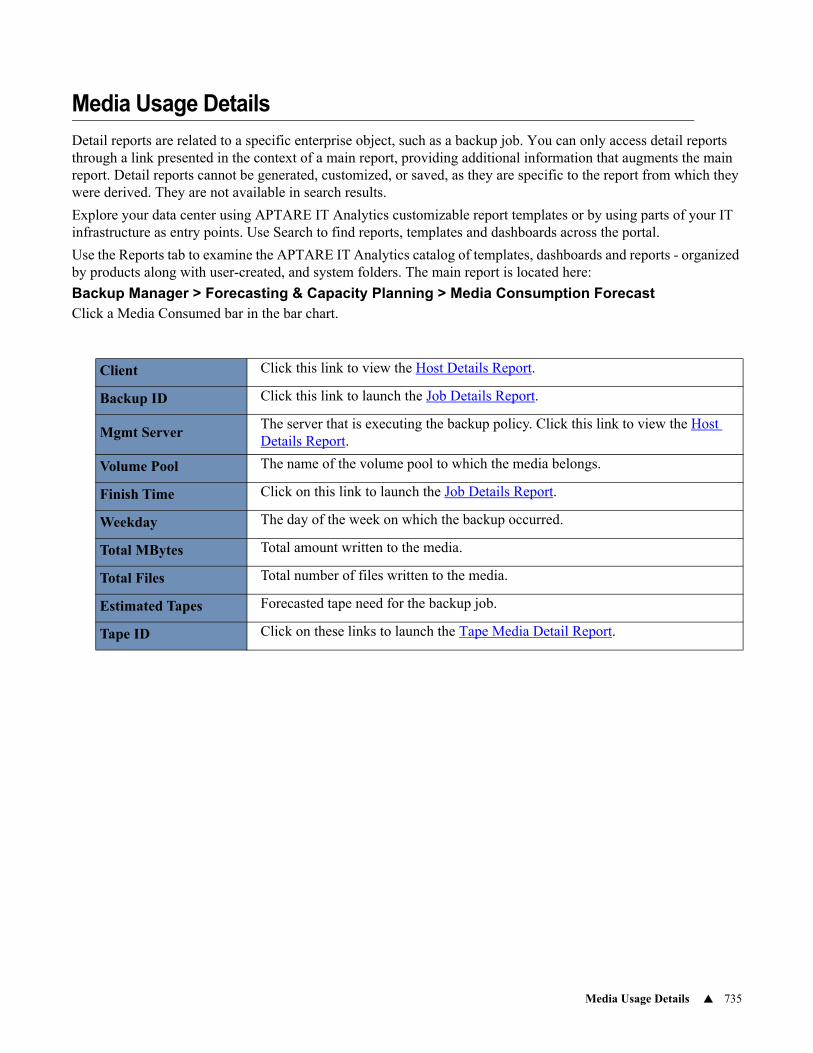
Media Usage Details 735
Media Usage Details
Detail reports are related to a specific enterprise object, such as a backup job. You can only access detail reports through a link presented in the context of a main report, providing additional information that augments the main report. Detail reports cannot be generated, customized, or saved, as they are specific to the report from which they were derived. They are not available in search results.
Explore your data center using APTARE IT Analytics customizable report templates or by using parts of your IT infrastructure as entry points. Use Search to find reports, templates and dashboards across the portal.
Use the Reports tab to examine the APTARE IT Analytics catalog of templates, dashboards and reports - organized by products along with user-created, and system folders. The main report is located here:
Backup Manager > Forecasting & Capacity Planning > Media Consumption ForecastClick a Media Consumed bar in the bar chart.
Client Click this link to view the Host Details Report.
Backup ID Click this link to launch the Job Details Report.
Mgmt ServerThe server that is executing the backup policy. Click this link to view the Host Details Report.
Volume Pool The name of the volume pool to which the media belongs.
Finish Time Click on this link to launch the Job Details Report.
Weekday The day of the week on which the backup occurred.
Total MBytes Total amount written to the media.
Total Files Total number of files written to the media.
Estimated Tapes Forecasted tape need for the backup job.
Tape ID Click on these links to launch the Tape Media Detail Report.
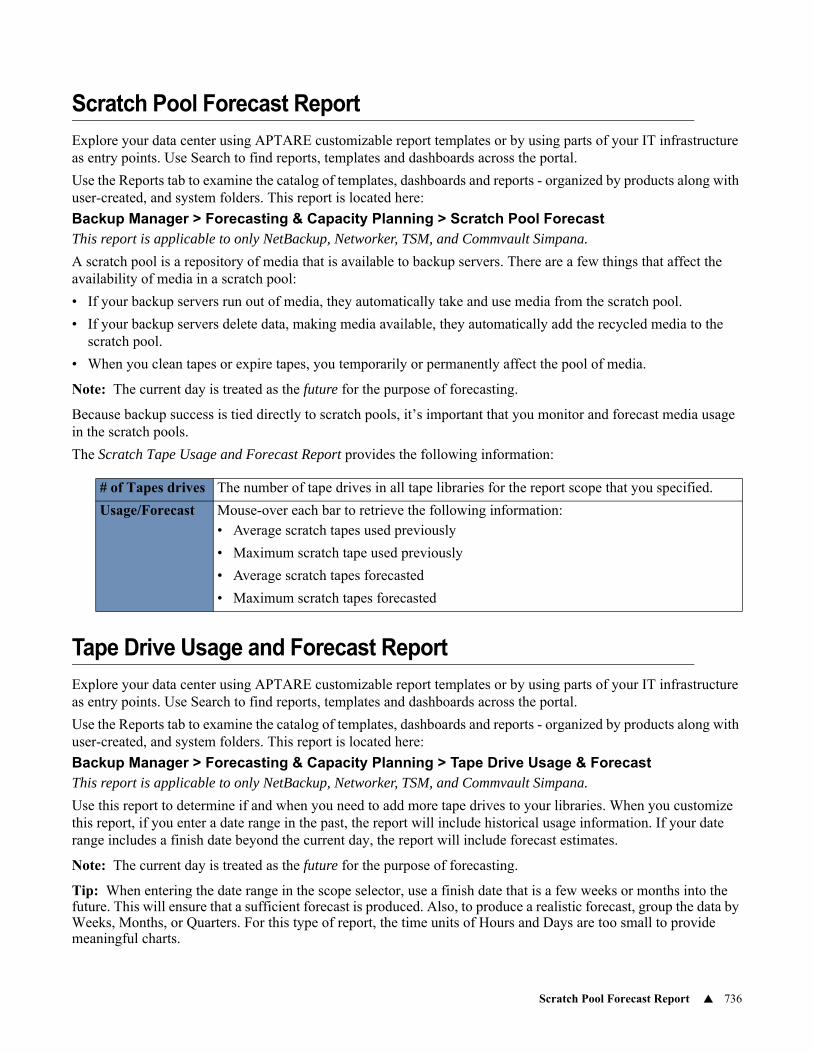
Scratch Pool Forecast Report 736
Scratch Pool Forecast Report
Explore your data center using APTARE customizable report templates or by using parts of your IT infrastructure as entry points. Use Search to find reports, templates and dashboards across the portal.
Use the Reports tab to examine the catalog of templates, dashboards and reports - organized by products along with user-created, and system folders. This report is located here:
Backup Manager > Forecasting & Capacity Planning > Scratch Pool ForecastThis report is applicable to only NetBackup, Networker, TSM, and Commvault Simpana.
A scratch pool is a repository of media that is available to backup servers. There are a few things that affect the availability of media in a scratch pool:
• If your backup servers run out of media, they automatically take and use media from the scratch pool.
• If your backup servers delete data, making media available, they automatically add the recycled media to the scratch pool.
• When you clean tapes or expire tapes, you temporarily or permanently affect the pool of media.
Note: The current day is treated as the future for the purpose of forecasting.
Because backup success is tied directly to scratch pools, it’s important that you monitor and forecast media usage in the scratch pools.
The Scratch Tape Usage and Forecast Report provides the following information:
Tape Drive Usage and Forecast Report
Explore your data center using APTARE customizable report templates or by using parts of your IT infrastructure as entry points. Use Search to find reports, templates and dashboards across the portal.
Use the Reports tab to examine the catalog of templates, dashboards and reports - organized by products along with user-created, and system folders. This report is located here:
Backup Manager > Forecasting & Capacity Planning > Tape Drive Usage & ForecastThis report is applicable to only NetBackup, Networker, TSM, and Commvault Simpana.
Use this report to determine if and when you need to add more tape drives to your libraries. When you customize this report, if you enter a date range in the past, the report will include historical usage information. If your date range includes a finish date beyond the current day, the report will include forecast estimates.
Note: The current day is treated as the future for the purpose of forecasting.
Tip: When entering the date range in the scope selector, use a finish date that is a few weeks or months into the future. This will ensure that a sufficient forecast is produced. Also, to produce a realistic forecast, group the data by Weeks, Months, or Quarters. For this type of report, the time units of Hours and Days are too small to provide meaningful charts.
# of Tapes drives The number of tape drives in all tape libraries for the report scope that you specified.
Usage/Forecast Mouse-over each bar to retrieve the following information:• Average scratch tapes used previously
• Maximum scratch tape used previously
• Average scratch tapes forecasted
• Maximum scratch tapes forecasted
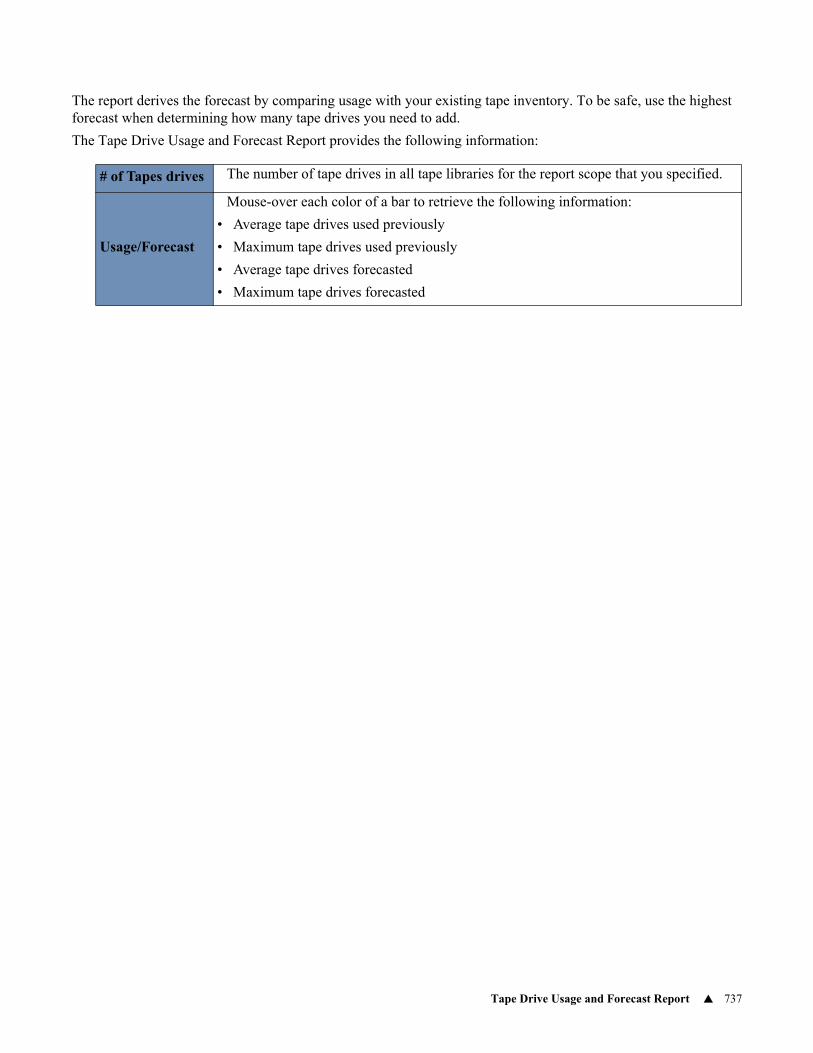
Tape Drive Usage and Forecast Report 737
The report derives the forecast by comparing usage with your existing tape inventory. To be safe, use the highest forecast when determining how many tape drives you need to add.
The Tape Drive Usage and Forecast Report provides the following information:
# of Tapes drives The number of tape drives in all tape libraries for the report scope that you specified.
Usage/Forecast
Mouse-over each color of a bar to retrieve the following information:
• Average tape drives used previously
• Maximum tape drives used previously
• Average tape drives forecasted
• Maximum tape drives forecasted
Available Billing and Usage Reports 740
24Chapter 22Backup Billing and Usage Reports
This section contains the following topics:• Available Billing and Usage Reports
• Determining Media Chargebacks
• Determining Backup Chargebacks
• Billing and Chargeback Summary
• Server Consumption Summary
Available Billing and Usage Reports
The Billing and Usage reports can be used to determine which business units are using your resources. In addition, you can use these reports to calculate chargeback costs.
If you’re in the process of rolling out chargeback policies, consider using these reports as planning tools—to see what impact your policies might have on your business units or customers.
However, you need not charge your business units in order to find the Billing and Usage Reports useful. You simply can use the reports to gauge which business units are consuming the majority of your resources.
The following Billing and Usage reports are provided:
• Billing and Chargeback Summary
• Server Consumption Summary
Determining Media Chargebacks
The Billing and Chargeback Summary report provides a line item of each client’s tape consumption. The Billing Summary Report calculates the chargeback based on billing and usage policies.
The report displays data based on the hosts/servers. This procedure assumes that you know which business units own specific hosts/servers.
There are a couple of limitations to the billing and chargeback reports:
• The report does not consider shared tape usage. If Client A wrote to tapes 1, 2 and 3, the report shows charges for the client for those three tapes. If Client B also wrote to tapes 1 and 2, the report lists charges for that client for those two tapes. Therefore, if both Client A and Client B belong to the same business unit, they are billed twice for two of the three tapes.
• The report always uses the current cost of a tape. If the cost changes and you generate a new report, the report reflects the new cost. However, if you run an old report from a year ago, it would also pick up the new cost and therefore not be the same as the original report. Therefore, before you change the unit cost, generate and export previous reports for comparison.
Determining Backup Chargebacks 741
To determine chargebacks for a business unit or customer
1. Go to the Billing and Chargeback Summary report.
Each client server row contains subtotals for GB and tape consumption.
2. To limit the data to a single business unit or department, modify the scope of the Billing and Chargeback Summary report.
3. Check the value in the Total Cost field, which is displayed at the right of the table. This value is the total charge to the business unit or customer.
4. If you want to itemize your chargebacks for your business unit/customer, consider the individual costs that comprise the total.
If you feel that the chargebacks are not accurate, do the following:
• Verify that the billing and chargeback policies are accurate.
• Ensure that the host group does not contain clients that belong to another business unit or customer.
Determining Backup Chargebacks
The Server Consumption Summary report displays backup consumption and the number of backup files captured for all hosts/servers that you specify. The report includes backups that were successful and those that have warnings. It does not include failed backups.
To determine server consumption chargebacks
1. Go to the Server Consumption Summary report.
Hosts that do not have any consumption or backups for the period that you specified, do not appear in the report.
2. Drill down into the clients, management servers, or backups to get more detail.
3. Export the data to your ERP software if applicable.
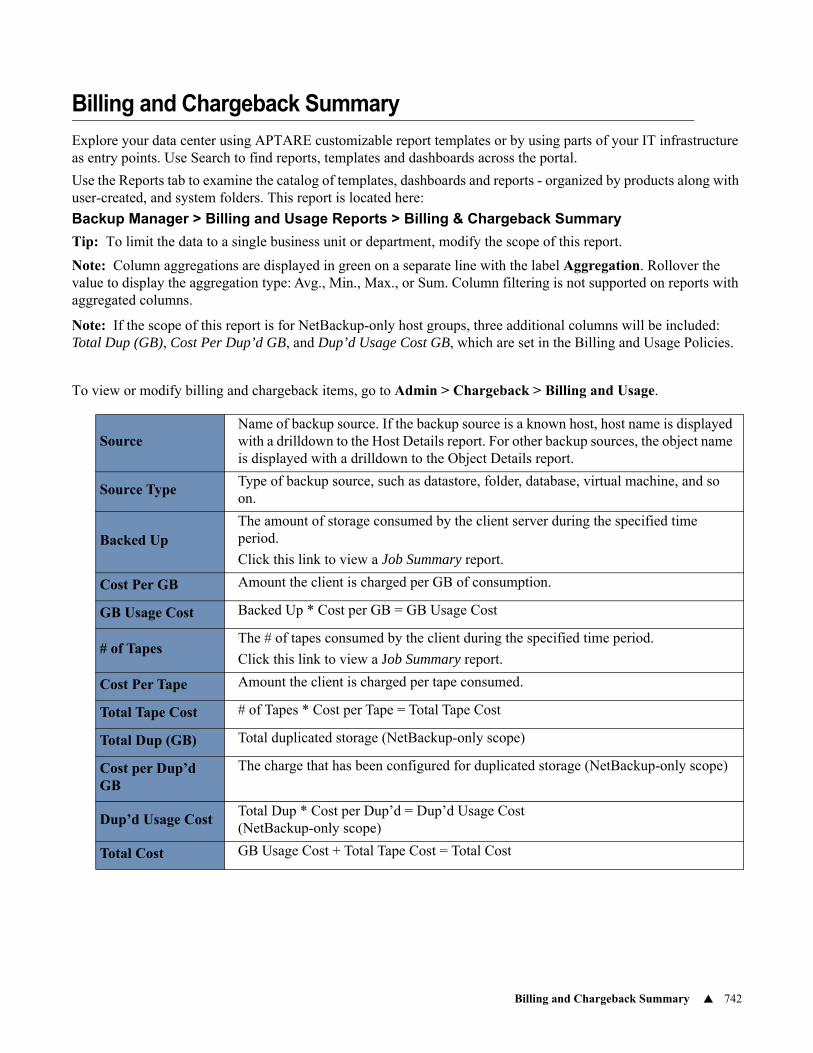
Billing and Chargeback Summary 742
Billing and Chargeback Summary
Explore your data center using APTARE customizable report templates or by using parts of your IT infrastructure as entry points. Use Search to find reports, templates and dashboards across the portal.
Use the Reports tab to examine the catalog of templates, dashboards and reports - organized by products along with user-created, and system folders. This report is located here:
Backup Manager > Billing and Usage Reports > Billing & Chargeback Summary
Tip: To limit the data to a single business unit or department, modify the scope of this report.
Note: Column aggregations are displayed in green on a separate line with the label Aggregation. Rollover the value to display the aggregation type: Avg., Min., Max., or Sum. Column filtering is not supported on reports with aggregated columns.
Note: If the scope of this report is for NetBackup-only host groups, three additional columns will be included: Total Dup (GB), Cost Per Dup’d GB, and Dup’d Usage Cost GB, which are set in the Billing and Usage Policies.
To view or modify billing and chargeback items, go to Admin > Chargeback > Billing and Usage.
Source Name of backup source. If the backup source is a known host, host name is displayed with a drilldown to the Host Details report. For other backup sources, the object name is displayed with a drilldown to the Object Details report.
Source TypeType of backup source, such as datastore, folder, database, virtual machine, and so on.
Backed UpThe amount of storage consumed by the client server during the specified time period.
Click this link to view a Job Summary report.
Cost Per GB Amount the client is charged per GB of consumption.
GB Usage Cost Backed Up * Cost per GB = GB Usage Cost
# of TapesThe # of tapes consumed by the client during the specified time period.
Click this link to view a Job Summary report.
Cost Per Tape Amount the client is charged per tape consumed.
Total Tape Cost # of Tapes * Cost per Tape = Total Tape Cost
Total Dup (GB) Total duplicated storage (NetBackup-only scope)
Cost per Dup’d GB
The charge that has been configured for duplicated storage (NetBackup-only scope)
Dup’d Usage CostTotal Dup * Cost per Dup’d = Dup’d Usage Cost(NetBackup-only scope)
Total Cost GB Usage Cost + Total Tape Cost = Total Cost
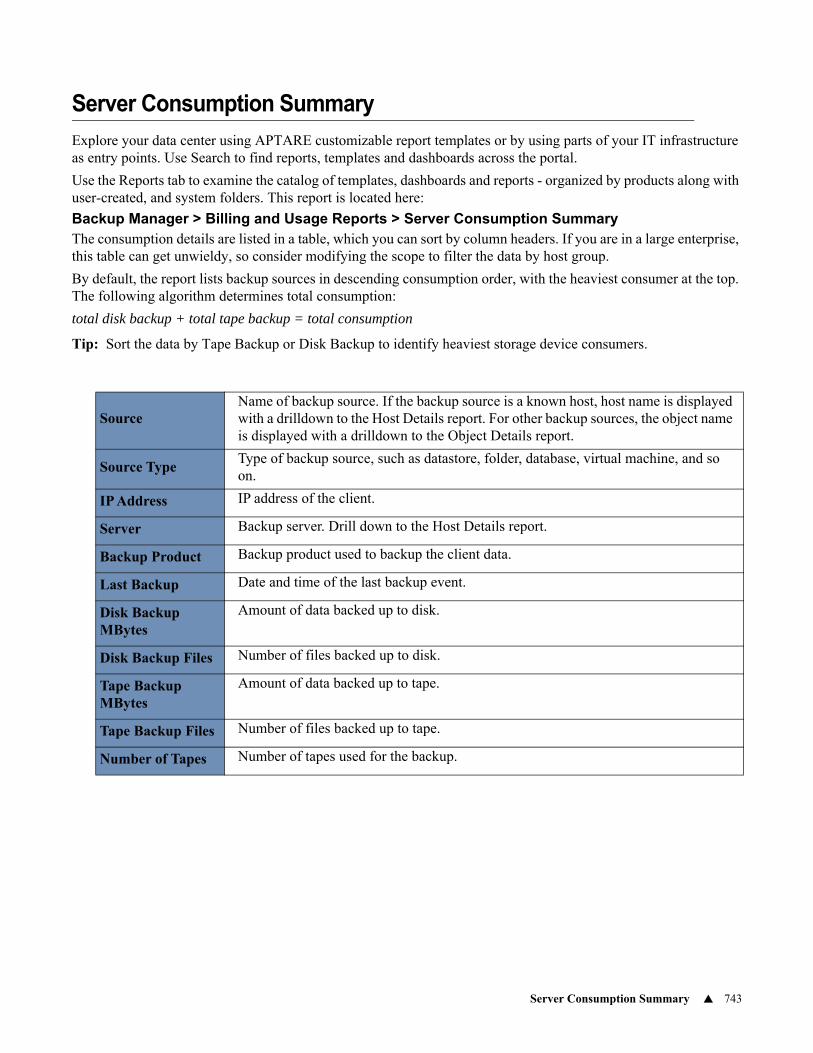
Server Consumption Summary 743
Server Consumption Summary
Explore your data center using APTARE customizable report templates or by using parts of your IT infrastructure as entry points. Use Search to find reports, templates and dashboards across the portal.
Use the Reports tab to examine the catalog of templates, dashboards and reports - organized by products along with user-created, and system folders. This report is located here:
Backup Manager > Billing and Usage Reports > Server Consumption SummaryThe consumption details are listed in a table, which you can sort by column headers. If you are in a large enterprise, this table can get unwieldy, so consider modifying the scope to filter the data by host group.
By default, the report lists backup sources in descending consumption order, with the heaviest consumer at the top. The following algorithm determines total consumption:
total disk backup + total tape backup = total consumption
Tip: Sort the data by Tape Backup or Disk Backup to identify heaviest storage device consumers.
Source Name of backup source. If the backup source is a known host, host name is displayed with a drilldown to the Host Details report. For other backup sources, the object name is displayed with a drilldown to the Object Details report.
Source TypeType of backup source, such as datastore, folder, database, virtual machine, and so on.
IP Address IP address of the client.
Server Backup server. Drill down to the Host Details report.
Backup Product Backup product used to backup the client data.
Last Backup Date and time of the last backup event.
Disk Backup MBytes
Amount of data backed up to disk.
Disk Backup Files Number of files backed up to disk.
Tape Backup MBytes
Amount of data backed up to tape.
Tape Backup Files Number of files backed up to tape.
Number of Tapes Number of tapes used for the backup.
747
25Chapter 22Backup Policies Reports
This section is organized alphabetically by vendor name and contains the following topics:• Commvault Simpana Policy Summary Report
• Commvault Simpana Policy Backup Copy Details
• EMC Avamar Groups
• Avamar Server Detail
• Avamar Group Detail
• Clients for Group
• Avamar Dataset Detail
• Avamar Schedule Detail
• Avamar Retention Policy Detail
• HP Data Protector Backup Specification Summary
• EMC NetWorker Groups
• IBM Spectrum Protect (TSM) Policy Domains
• Veritas NetBackup Policy
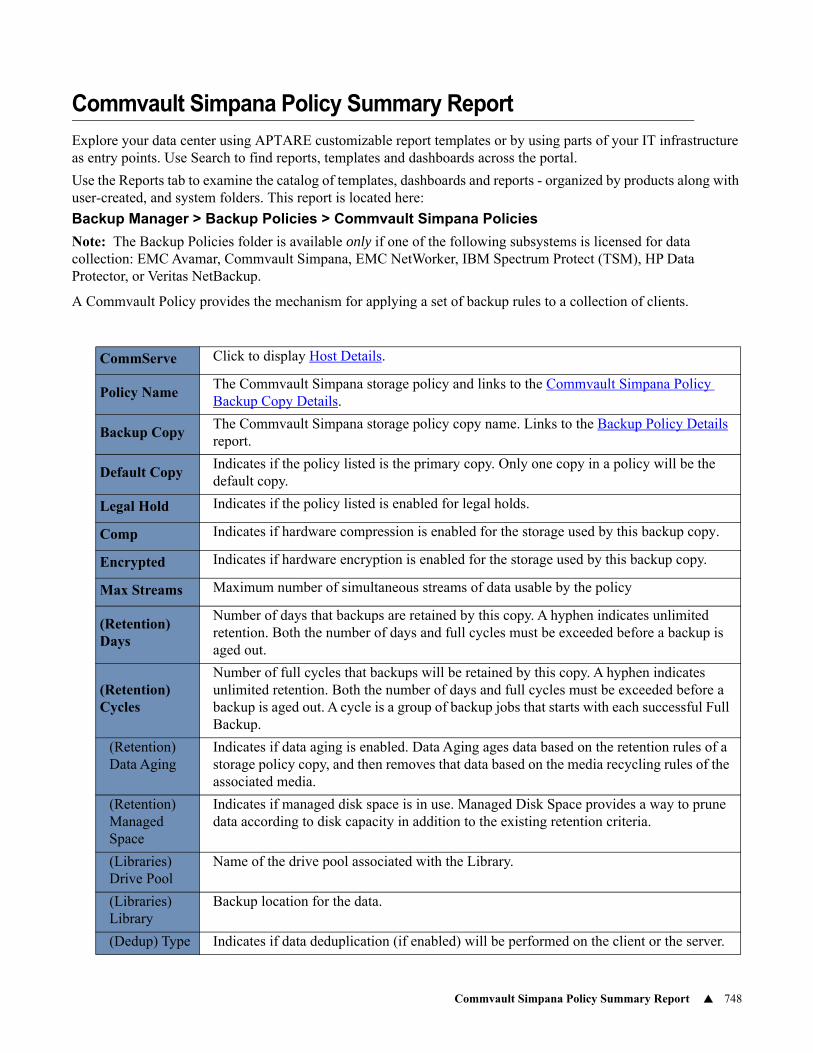
Commvault Simpana Policy Summary Report 748
Commvault Simpana Policy Summary Report
Explore your data center using APTARE customizable report templates or by using parts of your IT infrastructure as entry points. Use Search to find reports, templates and dashboards across the portal.
Use the Reports tab to examine the catalog of templates, dashboards and reports - organized by products along with user-created, and system folders. This report is located here:
Backup Manager > Backup Policies > Commvault Simpana Policies
Note: The Backup Policies folder is available only if one of the following subsystems is licensed for data collection: EMC Avamar, Commvault Simpana, EMC NetWorker, IBM Spectrum Protect (TSM), HP Data Protector, or Veritas NetBackup.
A Commvault Policy provides the mechanism for applying a set of backup rules to a collection of clients.
CommServe Click to display Host Details.
Policy NameThe Commvault Simpana storage policy and links to the Commvault Simpana Policy Backup Copy Details.
Backup CopyThe Commvault Simpana storage policy copy name. Links to the Backup Policy Details report.
Default CopyIndicates if the policy listed is the primary copy. Only one copy in a policy will be the default copy.
Legal Hold Indicates if the policy listed is enabled for legal holds.
Comp Indicates if hardware compression is enabled for the storage used by this backup copy.
Encrypted Indicates if hardware encryption is enabled for the storage used by this backup copy.
Max Streams Maximum number of simultaneous streams of data usable by the policy
(Retention) Days
Number of days that backups are retained by this copy. A hyphen indicates unlimited retention. Both the number of days and full cycles must be exceeded before a backup is aged out.
(Retention) Cycles
Number of full cycles that backups will be retained by this copy. A hyphen indicates unlimited retention. Both the number of days and full cycles must be exceeded before a backup is aged out. A cycle is a group of backup jobs that starts with each successful Full Backup.
(Retention) Data Aging
Indicates if data aging is enabled. Data Aging ages data based on the retention rules of a storage policy copy, and then removes that data based on the media recycling rules of the associated media.
(Retention) Managed Space
Indicates if managed disk space is in use. Managed Disk Space provides a way to prune data according to disk capacity in addition to the existing retention criteria.
(Libraries) Drive Pool
Name of the drive pool associated with the Library.
(Libraries) Library
Backup location for the data.
(Dedup) Type Indicates if data deduplication (if enabled) will be performed on the client or the server.
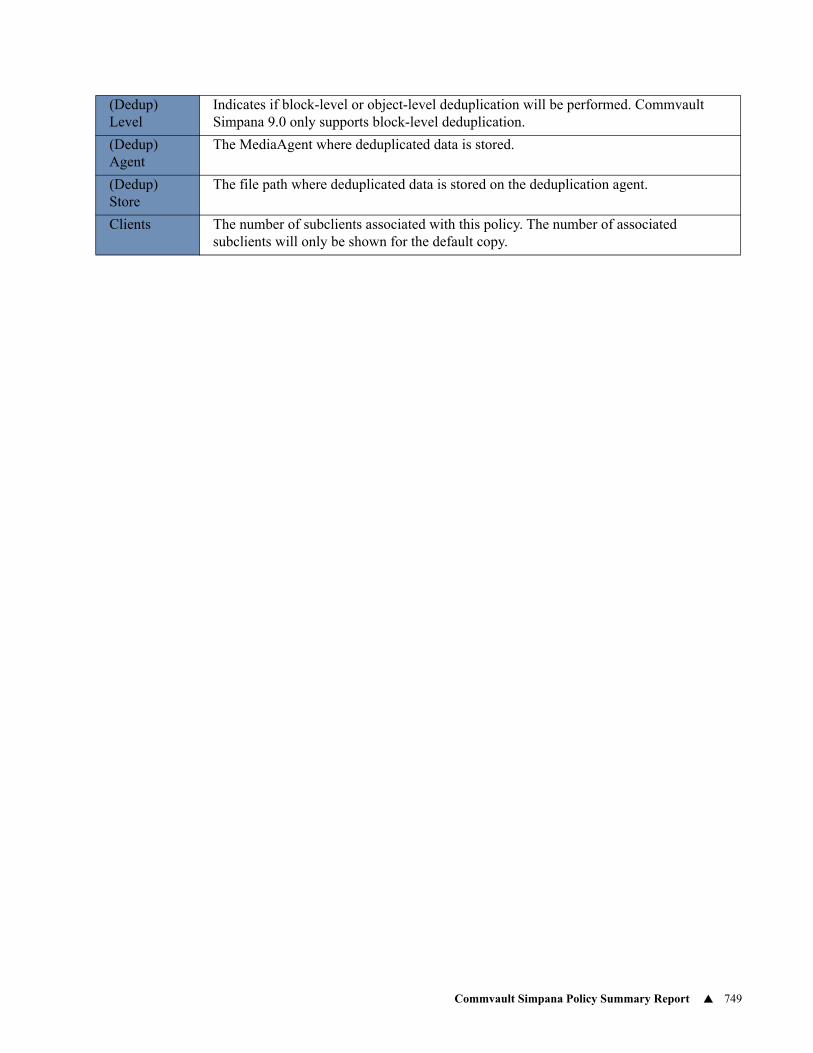
Commvault Simpana Policy Summary Report 749
(Dedup) Level
Indicates if block-level or object-level deduplication will be performed. Commvault Simpana 9.0 only supports block-level deduplication.
(Dedup) Agent
The MediaAgent where deduplicated data is stored.
(Dedup) Store
The file path where deduplicated data is stored on the deduplication agent.
Clients The number of subclients associated with this policy. The number of associated subclients will only be shown for the default copy.
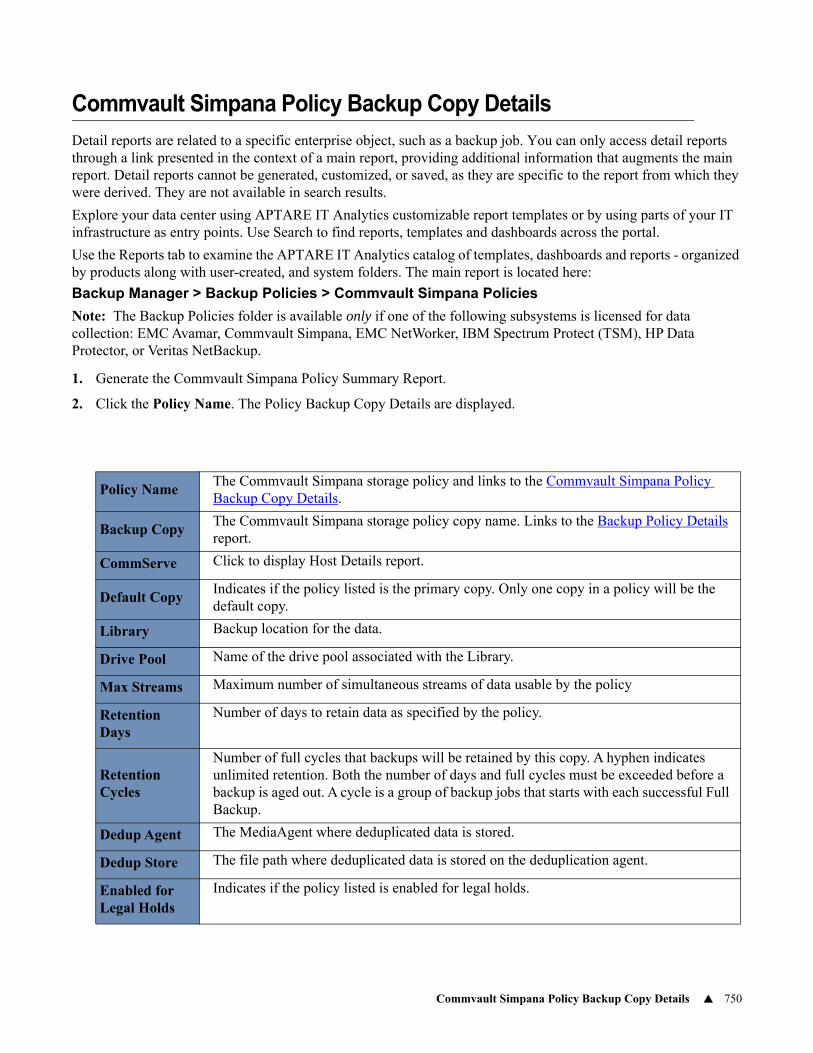
Commvault Simpana Policy Backup Copy Details 750
Commvault Simpana Policy Backup Copy Details
Detail reports are related to a specific enterprise object, such as a backup job. You can only access detail reports through a link presented in the context of a main report, providing additional information that augments the main report. Detail reports cannot be generated, customized, or saved, as they are specific to the report from which they were derived. They are not available in search results.
Explore your data center using APTARE IT Analytics customizable report templates or by using parts of your IT infrastructure as entry points. Use Search to find reports, templates and dashboards across the portal.
Use the Reports tab to examine the APTARE IT Analytics catalog of templates, dashboards and reports - organized by products along with user-created, and system folders. The main report is located here:
Backup Manager > Backup Policies > Commvault Simpana Policies
Note: The Backup Policies folder is available only if one of the following subsystems is licensed for data collection: EMC Avamar, Commvault Simpana, EMC NetWorker, IBM Spectrum Protect (TSM), HP Data Protector, or Veritas NetBackup.
1. Generate the Commvault Simpana Policy Summary Report.
2. Click the Policy Name. The Policy Backup Copy Details are displayed.
Policy NameThe Commvault Simpana storage policy and links to the Commvault Simpana Policy Backup Copy Details.
Backup CopyThe Commvault Simpana storage policy copy name. Links to the Backup Policy Details report.
CommServe Click to display Host Details report.
Default CopyIndicates if the policy listed is the primary copy. Only one copy in a policy will be the default copy.
Library Backup location for the data.
Drive Pool Name of the drive pool associated with the Library.
Max Streams Maximum number of simultaneous streams of data usable by the policy
Retention Days
Number of days to retain data as specified by the policy.
Retention Cycles
Number of full cycles that backups will be retained by this copy. A hyphen indicates unlimited retention. Both the number of days and full cycles must be exceeded before a backup is aged out. A cycle is a group of backup jobs that starts with each successful Full Backup.
Dedup Agent The MediaAgent where deduplicated data is stored.
Dedup Store The file path where deduplicated data is stored on the deduplication agent.
Enabled for Legal Holds
Indicates if the policy listed is enabled for legal holds.
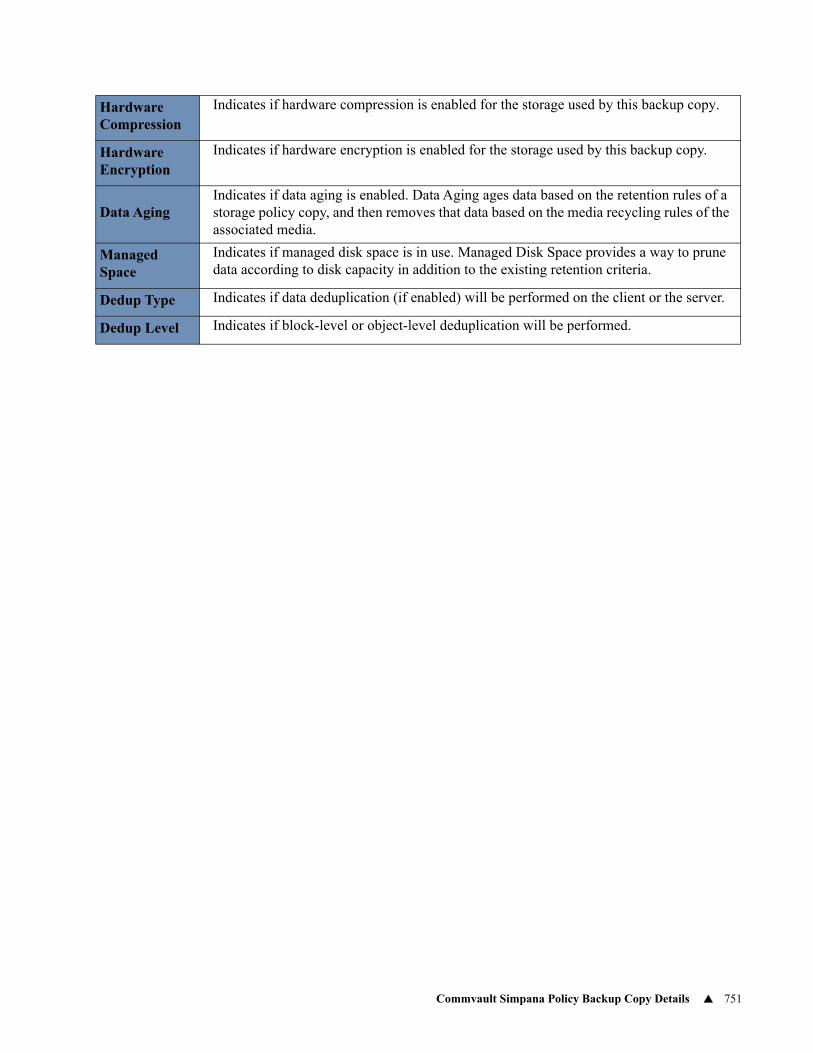
Commvault Simpana Policy Backup Copy Details 751
Hardware Compression
Indicates if hardware compression is enabled for the storage used by this backup copy.
Hardware Encryption
Indicates if hardware encryption is enabled for the storage used by this backup copy.
Data AgingIndicates if data aging is enabled. Data Aging ages data based on the retention rules of a storage policy copy, and then removes that data based on the media recycling rules of the associated media.
Managed Space
Indicates if managed disk space is in use. Managed Disk Space provides a way to prune data according to disk capacity in addition to the existing retention criteria.
Dedup Type Indicates if data deduplication (if enabled) will be performed on the client or the server.
Dedup Level Indicates if block-level or object-level deduplication will be performed.
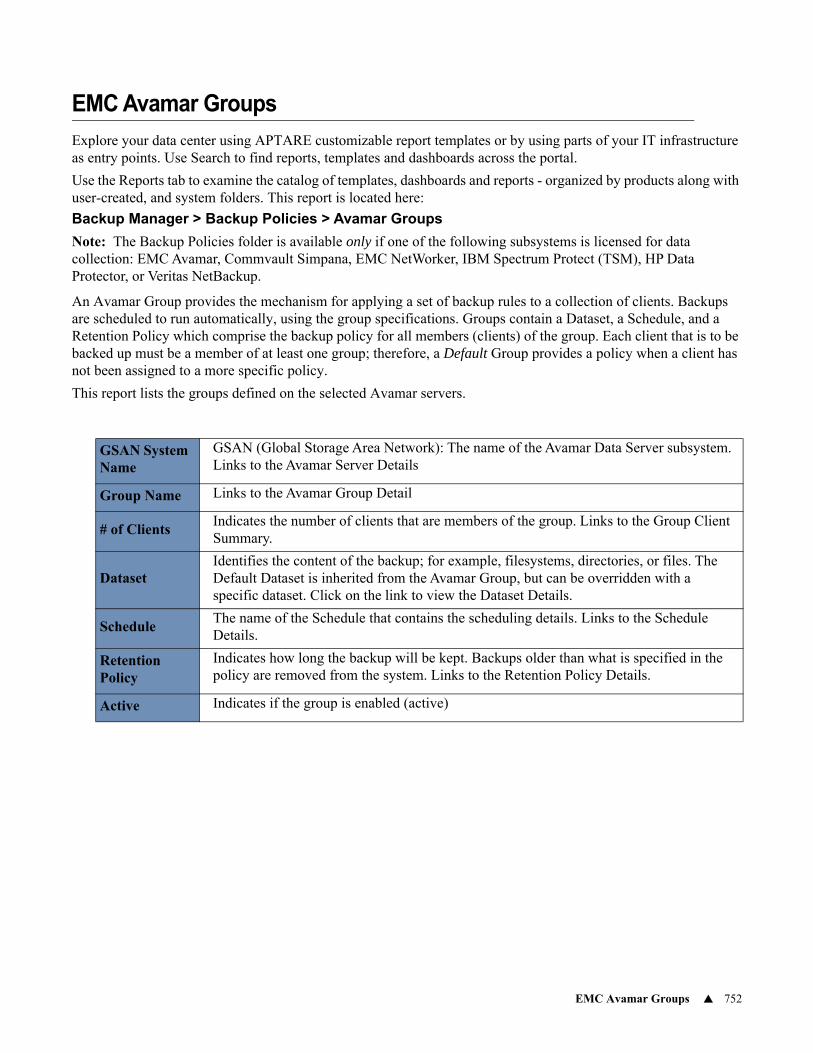
EMC Avamar Groups 752
EMC Avamar Groups
Explore your data center using APTARE customizable report templates or by using parts of your IT infrastructure as entry points. Use Search to find reports, templates and dashboards across the portal.
Use the Reports tab to examine the catalog of templates, dashboards and reports - organized by products along with user-created, and system folders. This report is located here:
Backup Manager > Backup Policies > Avamar Groups
Note: The Backup Policies folder is available only if one of the following subsystems is licensed for data collection: EMC Avamar, Commvault Simpana, EMC NetWorker, IBM Spectrum Protect (TSM), HP Data Protector, or Veritas NetBackup.
An Avamar Group provides the mechanism for applying a set of backup rules to a collection of clients. Backups are scheduled to run automatically, using the group specifications. Groups contain a Dataset, a Schedule, and a Retention Policy which comprise the backup policy for all members (clients) of the group. Each client that is to be backed up must be a member of at least one group; therefore, a Default Group provides a policy when a client has not been assigned to a more specific policy.
This report lists the groups defined on the selected Avamar servers.
GSAN System Name
GSAN (Global Storage Area Network): The name of the Avamar Data Server subsystem. Links to the Avamar Server Details
Group Name Links to the Avamar Group Detail
# of ClientsIndicates the number of clients that are members of the group. Links to the Group Client Summary.
DatasetIdentifies the content of the backup; for example, filesystems, directories, or files. The Default Dataset is inherited from the Avamar Group, but can be overridden with a specific dataset. Click on the link to view the Dataset Details.
ScheduleThe name of the Schedule that contains the scheduling details. Links to the Schedule Details.
Retention Policy
Indicates how long the backup will be kept. Backups older than what is specified in the policy are removed from the system. Links to the Retention Policy Details.
Active Indicates if the group is enabled (active)
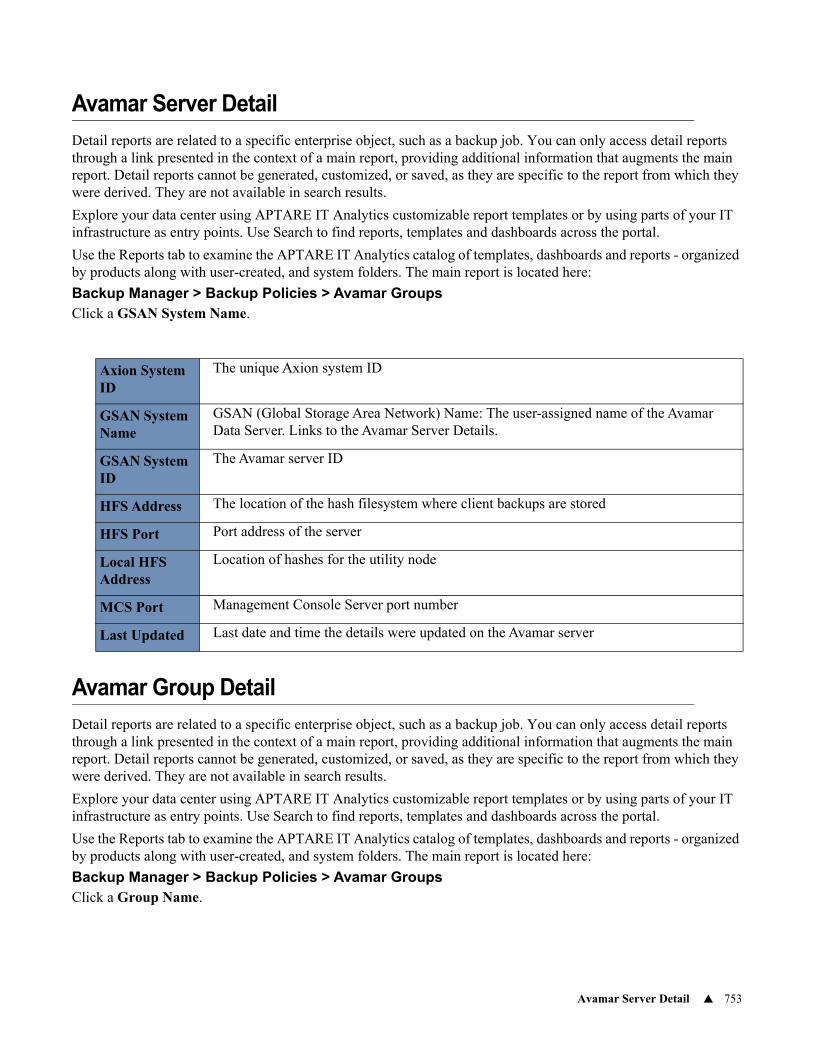
Avamar Server Detail 753
Avamar Server Detail
Detail reports are related to a specific enterprise object, such as a backup job. You can only access detail reports through a link presented in the context of a main report, providing additional information that augments the main report. Detail reports cannot be generated, customized, or saved, as they are specific to the report from which they were derived. They are not available in search results.
Explore your data center using APTARE IT Analytics customizable report templates or by using parts of your IT infrastructure as entry points. Use Search to find reports, templates and dashboards across the portal.
Use the Reports tab to examine the APTARE IT Analytics catalog of templates, dashboards and reports - organized by products along with user-created, and system folders. The main report is located here:
Backup Manager > Backup Policies > Avamar GroupsClick a GSAN System Name.
Avamar Group Detail
Detail reports are related to a specific enterprise object, such as a backup job. You can only access detail reports through a link presented in the context of a main report, providing additional information that augments the main report. Detail reports cannot be generated, customized, or saved, as they are specific to the report from which they were derived. They are not available in search results.
Explore your data center using APTARE IT Analytics customizable report templates or by using parts of your IT infrastructure as entry points. Use Search to find reports, templates and dashboards across the portal.
Use the Reports tab to examine the APTARE IT Analytics catalog of templates, dashboards and reports - organized by products along with user-created, and system folders. The main report is located here:
Backup Manager > Backup Policies > Avamar GroupsClick a Group Name.
Axion System ID
The unique Axion system ID
GSAN System Name
GSAN (Global Storage Area Network) Name: The user-assigned name of the Avamar Data Server. Links to the Avamar Server Details.
GSAN System ID
The Avamar server ID
HFS Address The location of the hash filesystem where client backups are stored
HFS Port Port address of the server
Local HFS Address
Location of hashes for the utility node
MCS Port Management Console Server port number
Last Updated Last date and time the details were updated on the Avamar server
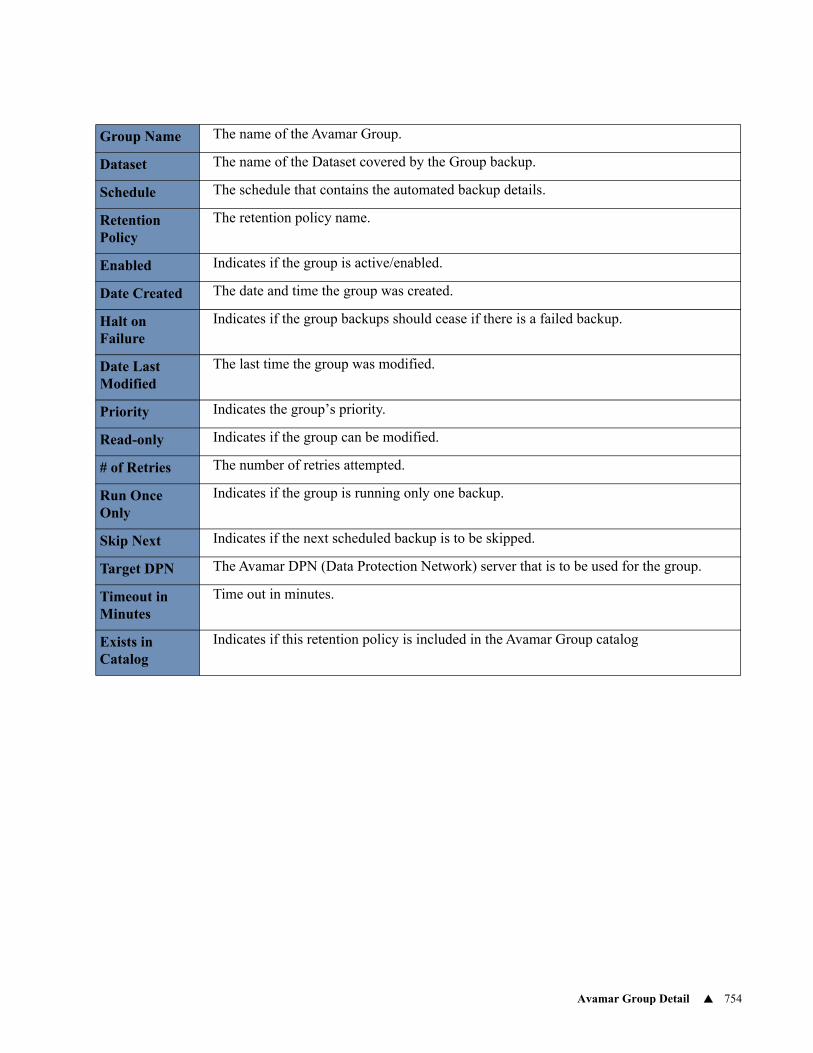
Avamar Group Detail 754
Group Name The name of the Avamar Group.
Dataset The name of the Dataset covered by the Group backup.
Schedule The schedule that contains the automated backup details.
Retention Policy
The retention policy name.
Enabled Indicates if the group is active/enabled.
Date Created The date and time the group was created.
Halt on Failure
Indicates if the group backups should cease if there is a failed backup.
Date Last Modified
The last time the group was modified.
Priority Indicates the group’s priority.
Read-only Indicates if the group can be modified.
# of Retries The number of retries attempted.
Run Once Only
Indicates if the group is running only one backup.
Skip Next Indicates if the next scheduled backup is to be skipped.
Target DPN The Avamar DPN (Data Protection Network) server that is to be used for the group.
Timeout in Minutes
Time out in minutes.
Exists in Catalog
Indicates if this retention policy is included in the Avamar Group catalog
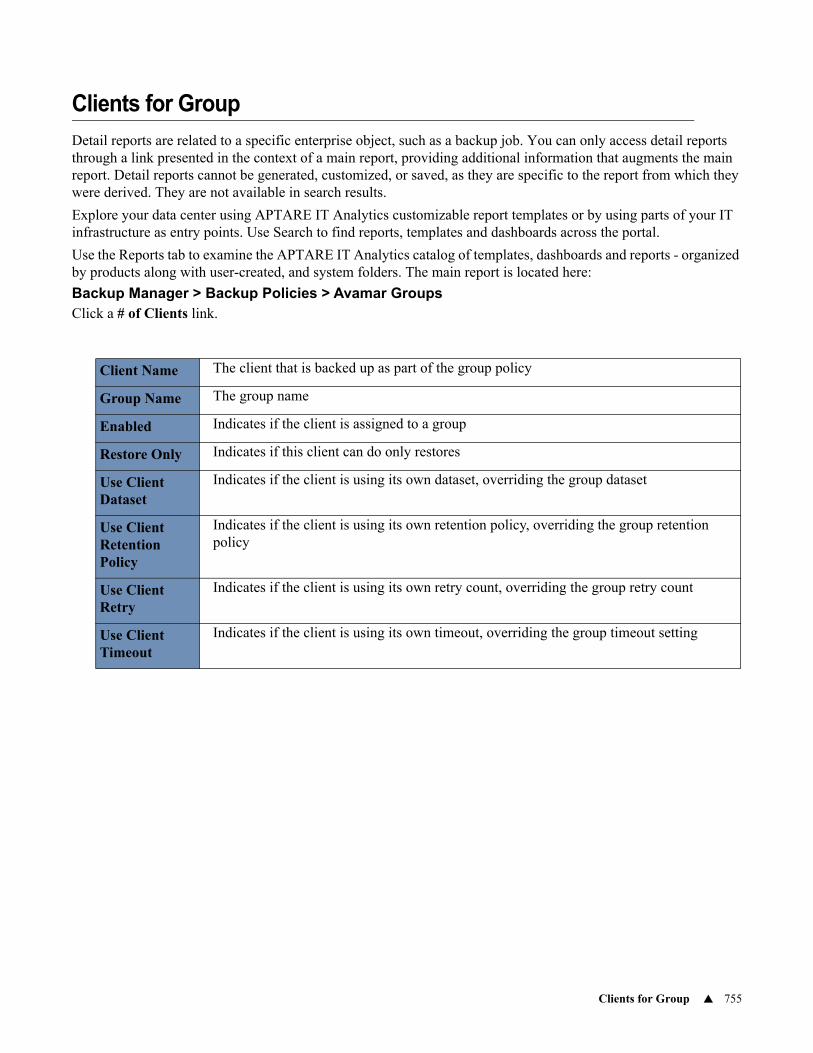
Clients for Group 755
Clients for Group
Detail reports are related to a specific enterprise object, such as a backup job. You can only access detail reports through a link presented in the context of a main report, providing additional information that augments the main report. Detail reports cannot be generated, customized, or saved, as they are specific to the report from which they were derived. They are not available in search results.
Explore your data center using APTARE IT Analytics customizable report templates or by using parts of your IT infrastructure as entry points. Use Search to find reports, templates and dashboards across the portal.
Use the Reports tab to examine the APTARE IT Analytics catalog of templates, dashboards and reports - organized by products along with user-created, and system folders. The main report is located here:
Backup Manager > Backup Policies > Avamar GroupsClick a # of Clients link.
Client Name The client that is backed up as part of the group policy
Group Name The group name
Enabled Indicates if the client is assigned to a group
Restore Only Indicates if this client can do only restores
Use Client Dataset
Indicates if the client is using its own dataset, overriding the group dataset
Use Client Retention Policy
Indicates if the client is using its own retention policy, overriding the group retention policy
Use Client Retry
Indicates if the client is using its own retry count, overriding the group retry count
Use Client Timeout
Indicates if the client is using its own timeout, overriding the group timeout setting
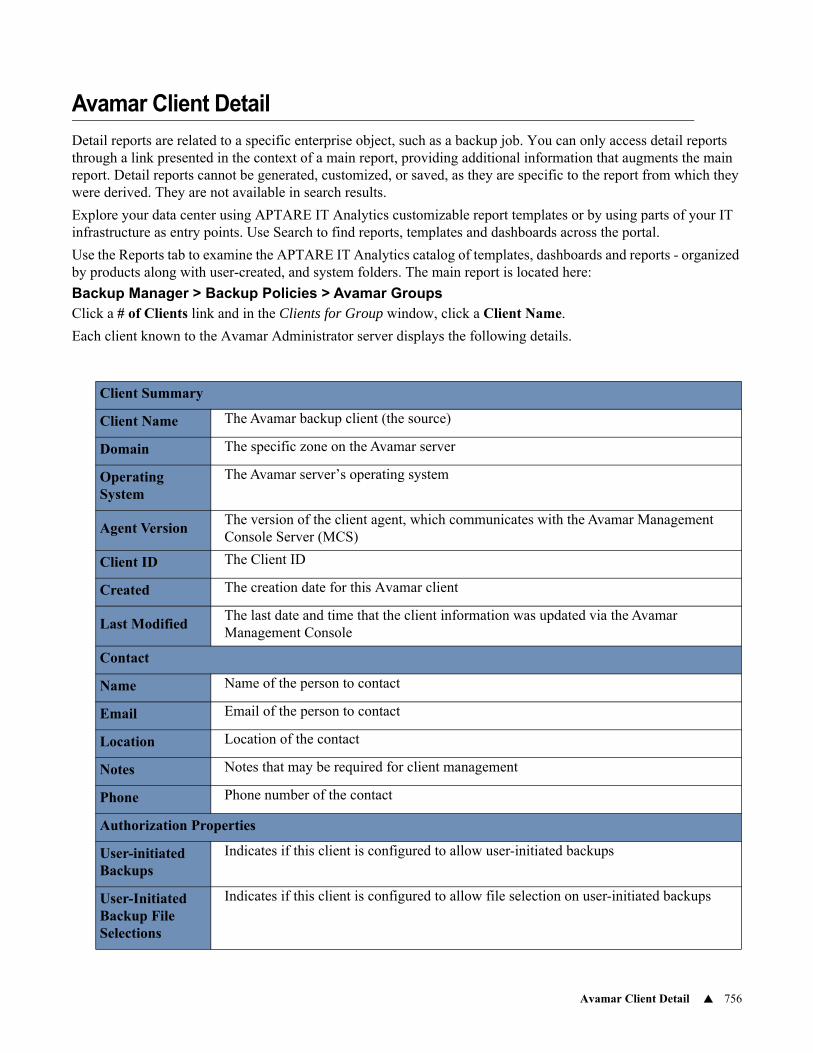
Avamar Client Detail 756
Avamar Client Detail
Detail reports are related to a specific enterprise object, such as a backup job. You can only access detail reports through a link presented in the context of a main report, providing additional information that augments the main report. Detail reports cannot be generated, customized, or saved, as they are specific to the report from which they were derived. They are not available in search results.
Explore your data center using APTARE IT Analytics customizable report templates or by using parts of your IT infrastructure as entry points. Use Search to find reports, templates and dashboards across the portal.
Use the Reports tab to examine the APTARE IT Analytics catalog of templates, dashboards and reports - organized by products along with user-created, and system folders. The main report is located here:
Backup Manager > Backup Policies > Avamar GroupsClick a # of Clients link and in the Clients for Group window, click a Client Name.
Each client known to the Avamar Administrator server displays the following details.
Client Summary
Client Name The Avamar backup client (the source)
Domain The specific zone on the Avamar server
Operating System
The Avamar server’s operating system
Agent VersionThe version of the client agent, which communicates with the Avamar Management Console Server (MCS)
Client ID The Client ID
Created The creation date for this Avamar client
Last ModifiedThe last date and time that the client information was updated via the Avamar Management Console
Contact
Name Name of the person to contact
Email Email of the person to contact
Location Location of the contact
Notes Notes that may be required for client management
Phone Phone number of the contact
Authorization Properties
User-initiated Backups
Indicates if this client is configured to allow user-initiated backups
User-Initiated Backup File Selections
Indicates if this client is configured to allow file selection on user-initiated backups
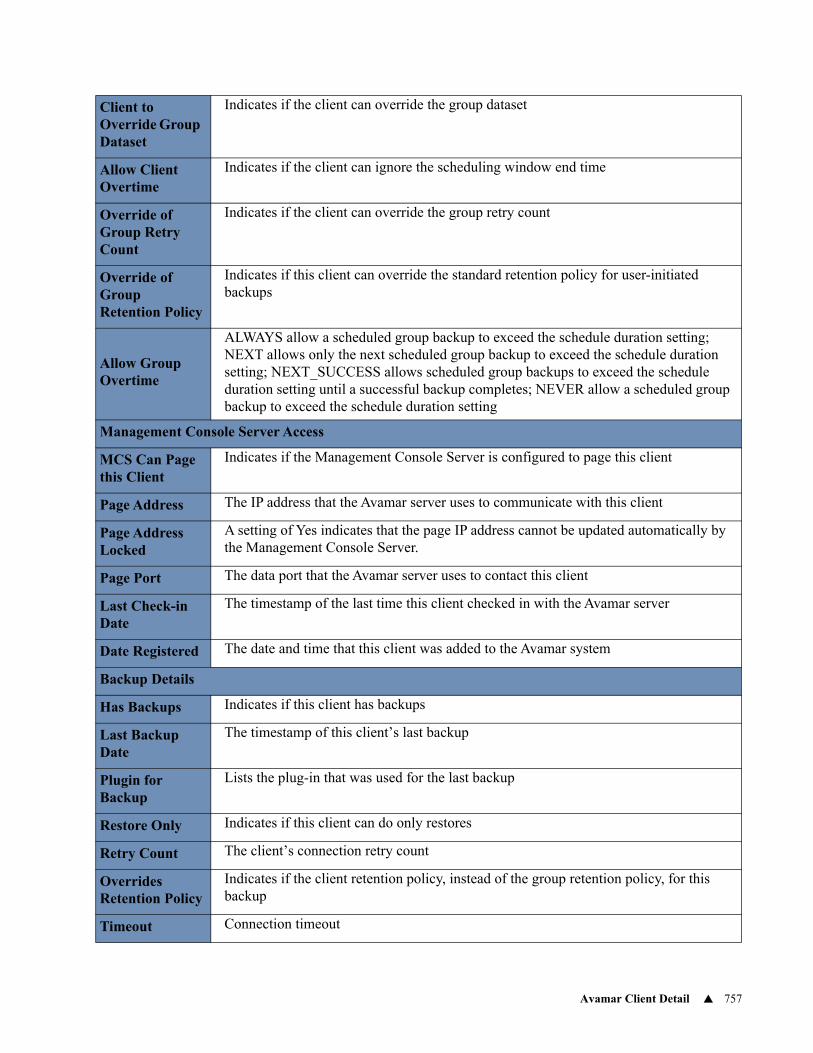
Avamar Client Detail 757
Client to Override Group Dataset
Indicates if the client can override the group dataset
Allow Client Overtime
Indicates if the client can ignore the scheduling window end time
Override of Group Retry Count
Indicates if the client can override the group retry count
Override of Group Retention Policy
Indicates if this client can override the standard retention policy for user-initiated backups
Allow Group Overtime
ALWAYS allow a scheduled group backup to exceed the schedule duration setting; NEXT allows only the next scheduled group backup to exceed the schedule duration setting; NEXT_SUCCESS allows scheduled group backups to exceed the schedule duration setting until a successful backup completes; NEVER allow a scheduled group backup to exceed the schedule duration setting
Management Console Server Access
MCS Can Page this Client
Indicates if the Management Console Server is configured to page this client
Page Address The IP address that the Avamar server uses to communicate with this client
Page Address Locked
A setting of Yes indicates that the page IP address cannot be updated automatically by the Management Console Server.
Page Port The data port that the Avamar server uses to contact this client
Last Check-in Date
The timestamp of the last time this client checked in with the Avamar server
Date Registered The date and time that this client was added to the Avamar system
Backup Details
Has Backups Indicates if this client has backups
Last Backup Date
The timestamp of this client’s last backup
Plugin for Backup
Lists the plug-in that was used for the last backup
Restore Only Indicates if this client can do only restores
Retry Count The client’s connection retry count
Overrides Retention Policy
Indicates if the client retention policy, instead of the group retention policy, for this backup
Timeout Connection timeout

Avamar Client Detail 758
Allows Override Timeout
Indicates if the client can override the group’s timeout setting
EnabledIndicates if the client is enabled in a group, enabling it to be backed up by the Avamar server
Registered Backup is registered
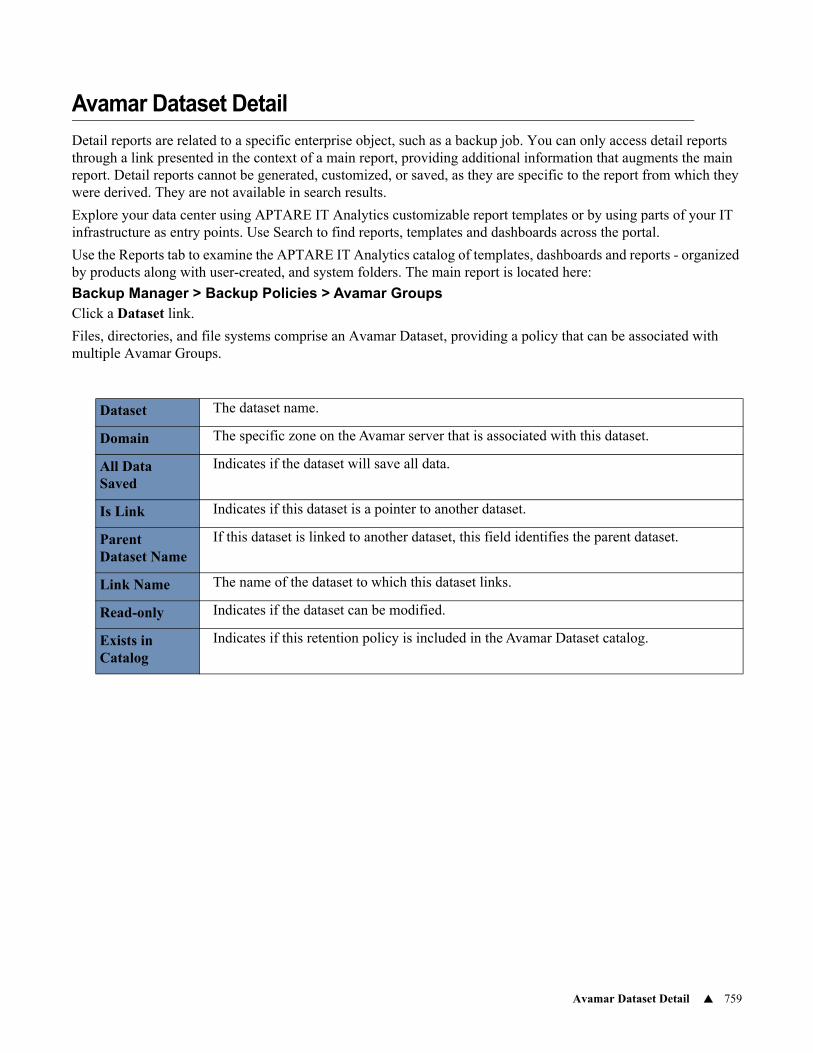
Avamar Dataset Detail 759
Avamar Dataset Detail
Detail reports are related to a specific enterprise object, such as a backup job. You can only access detail reports through a link presented in the context of a main report, providing additional information that augments the main report. Detail reports cannot be generated, customized, or saved, as they are specific to the report from which they were derived. They are not available in search results.
Explore your data center using APTARE IT Analytics customizable report templates or by using parts of your IT infrastructure as entry points. Use Search to find reports, templates and dashboards across the portal.
Use the Reports tab to examine the APTARE IT Analytics catalog of templates, dashboards and reports - organized by products along with user-created, and system folders. The main report is located here:
Backup Manager > Backup Policies > Avamar GroupsClick a Dataset link.
Files, directories, and file systems comprise an Avamar Dataset, providing a policy that can be associated with multiple Avamar Groups.
Dataset The dataset name.
Domain The specific zone on the Avamar server that is associated with this dataset.
All Data Saved
Indicates if the dataset will save all data.
Is Link Indicates if this dataset is a pointer to another dataset.
Parent Dataset Name
If this dataset is linked to another dataset, this field identifies the parent dataset.
Link Name The name of the dataset to which this dataset links.
Read-only Indicates if the dataset can be modified.
Exists in Catalog
Indicates if this retention policy is included in the Avamar Dataset catalog.
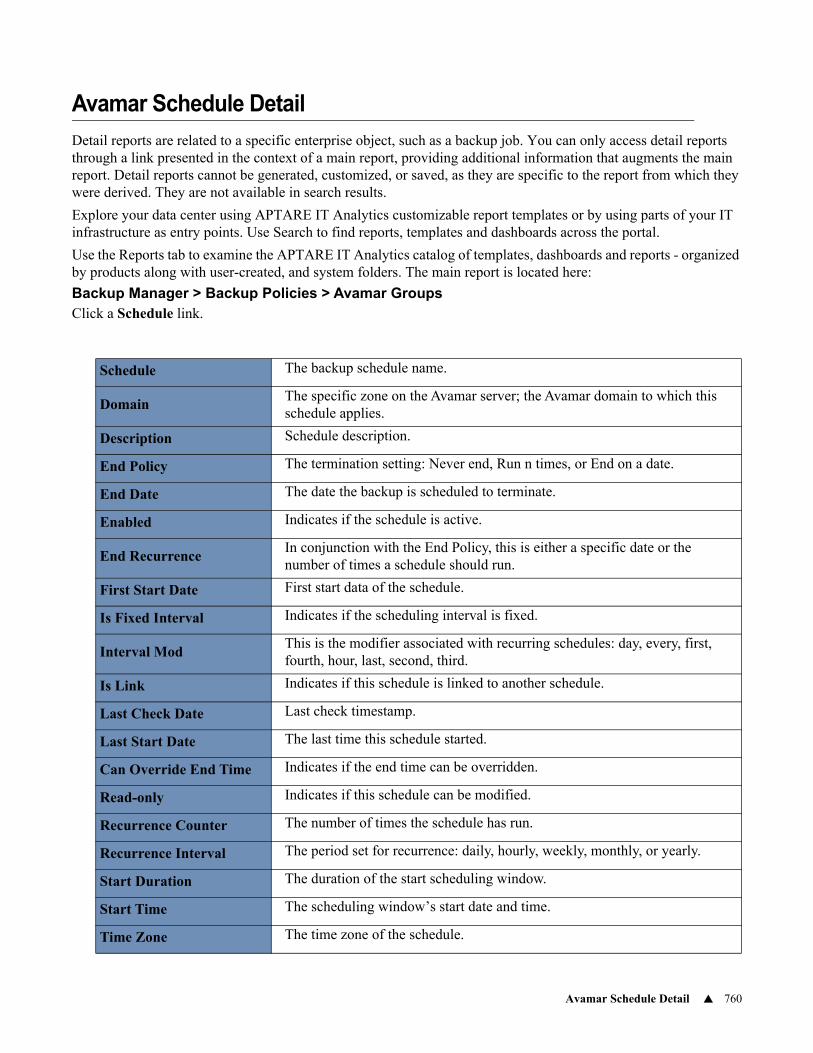
Avamar Schedule Detail 760
Avamar Schedule Detail
Detail reports are related to a specific enterprise object, such as a backup job. You can only access detail reports through a link presented in the context of a main report, providing additional information that augments the main report. Detail reports cannot be generated, customized, or saved, as they are specific to the report from which they were derived. They are not available in search results.
Explore your data center using APTARE IT Analytics customizable report templates or by using parts of your IT infrastructure as entry points. Use Search to find reports, templates and dashboards across the portal.
Use the Reports tab to examine the APTARE IT Analytics catalog of templates, dashboards and reports - organized by products along with user-created, and system folders. The main report is located here:
Backup Manager > Backup Policies > Avamar GroupsClick a Schedule link.
Schedule The backup schedule name.
DomainThe specific zone on the Avamar server; the Avamar domain to which this schedule applies.
Description Schedule description.
End Policy The termination setting: Never end, Run n times, or End on a date.
End Date The date the backup is scheduled to terminate.
Enabled Indicates if the schedule is active.
End RecurrenceIn conjunction with the End Policy, this is either a specific date or the number of times a schedule should run.
First Start Date First start data of the schedule.
Is Fixed Interval Indicates if the scheduling interval is fixed.
Interval ModThis is the modifier associated with recurring schedules: day, every, first, fourth, hour, last, second, third.
Is Link Indicates if this schedule is linked to another schedule.
Last Check Date Last check timestamp.
Last Start Date The last time this schedule started.
Can Override End Time Indicates if the end time can be overridden.
Read-only Indicates if this schedule can be modified.
Recurrence Counter The number of times the schedule has run.
Recurrence Interval The period set for recurrence: daily, hourly, weekly, monthly, or yearly.
Start Duration The duration of the start scheduling window.
Start Time The scheduling window’s start date and time.
Time Zone The time zone of the schedule.
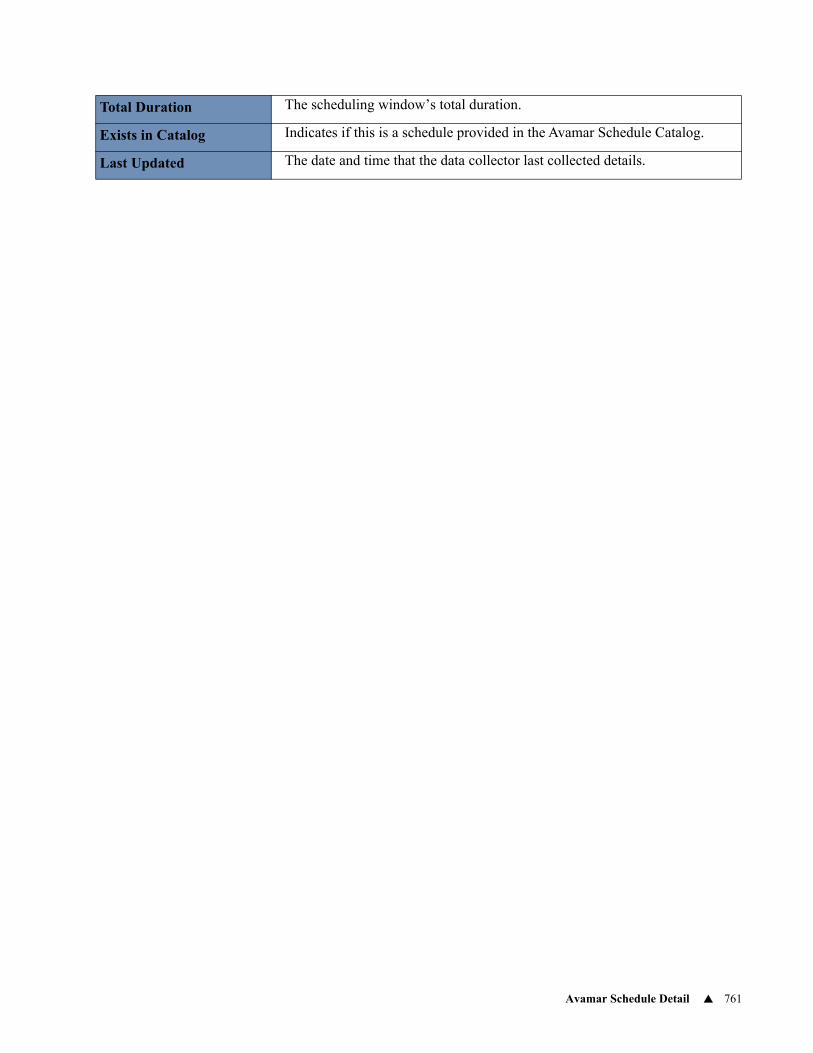
Avamar Schedule Detail 761
Total Duration The scheduling window’s total duration.
Exists in Catalog Indicates if this is a schedule provided in the Avamar Schedule Catalog.
Last Updated The date and time that the data collector last collected details.
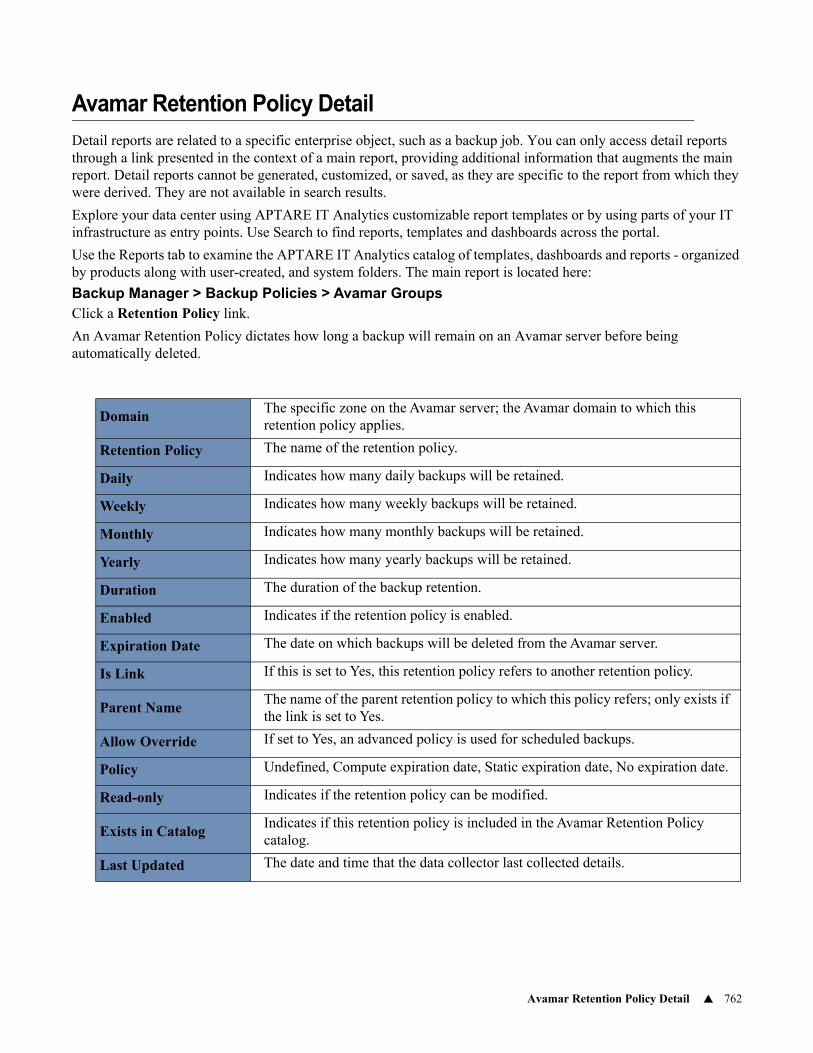
Avamar Retention Policy Detail 762
Avamar Retention Policy Detail
Detail reports are related to a specific enterprise object, such as a backup job. You can only access detail reports through a link presented in the context of a main report, providing additional information that augments the main report. Detail reports cannot be generated, customized, or saved, as they are specific to the report from which they were derived. They are not available in search results.
Explore your data center using APTARE IT Analytics customizable report templates or by using parts of your IT infrastructure as entry points. Use Search to find reports, templates and dashboards across the portal.
Use the Reports tab to examine the APTARE IT Analytics catalog of templates, dashboards and reports - organized by products along with user-created, and system folders. The main report is located here:
Backup Manager > Backup Policies > Avamar GroupsClick a Retention Policy link.
An Avamar Retention Policy dictates how long a backup will remain on an Avamar server before being automatically deleted.
DomainThe specific zone on the Avamar server; the Avamar domain to which this retention policy applies.
Retention Policy The name of the retention policy.
Daily Indicates how many daily backups will be retained.
Weekly Indicates how many weekly backups will be retained.
Monthly Indicates how many monthly backups will be retained.
Yearly Indicates how many yearly backups will be retained.
Duration The duration of the backup retention.
Enabled Indicates if the retention policy is enabled.
Expiration Date The date on which backups will be deleted from the Avamar server.
Is Link If this is set to Yes, this retention policy refers to another retention policy.
Parent NameThe name of the parent retention policy to which this policy refers; only exists if the link is set to Yes.
Allow Override If set to Yes, an advanced policy is used for scheduled backups.
Policy Undefined, Compute expiration date, Static expiration date, No expiration date.
Read-only Indicates if the retention policy can be modified.
Exists in CatalogIndicates if this retention policy is included in the Avamar Retention Policy catalog.
Last Updated The date and time that the data collector last collected details.
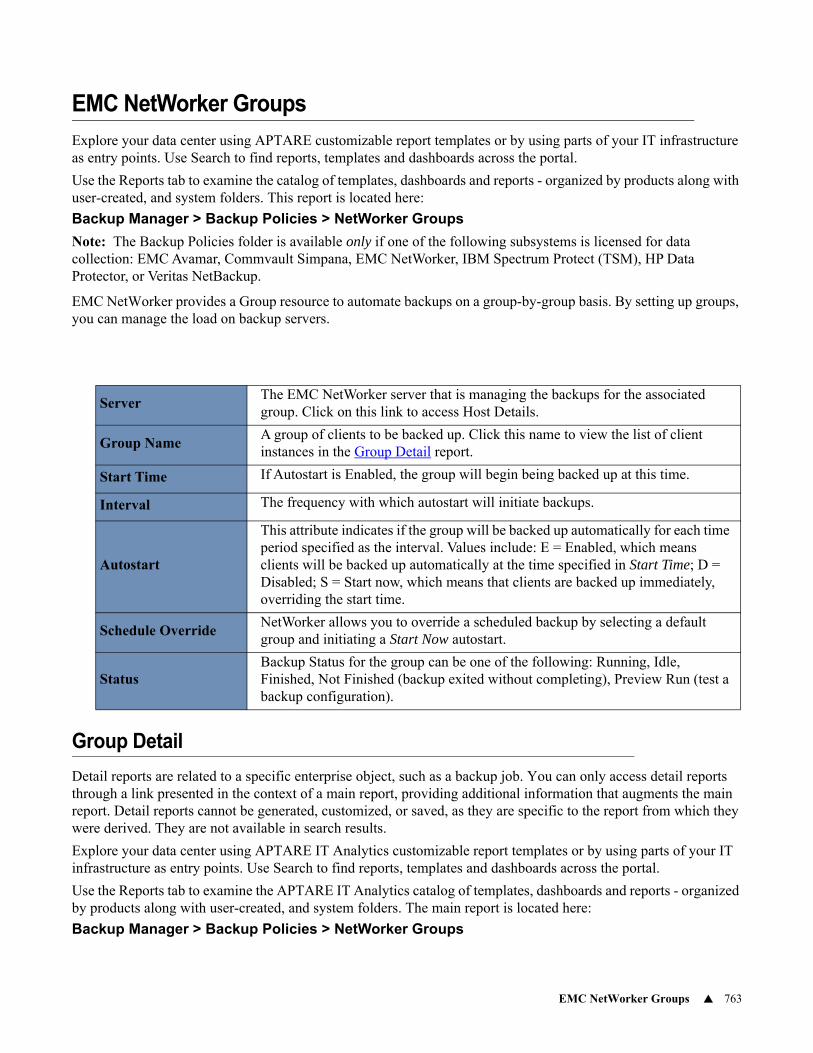
EMC NetWorker Groups 763
EMC NetWorker Groups
Explore your data center using APTARE customizable report templates or by using parts of your IT infrastructure as entry points. Use Search to find reports, templates and dashboards across the portal.
Use the Reports tab to examine the catalog of templates, dashboards and reports - organized by products along with user-created, and system folders. This report is located here:
Backup Manager > Backup Policies > NetWorker Groups
Note: The Backup Policies folder is available only if one of the following subsystems is licensed for data collection: EMC Avamar, Commvault Simpana, EMC NetWorker, IBM Spectrum Protect (TSM), HP Data Protector, or Veritas NetBackup.
EMC NetWorker provides a Group resource to automate backups on a group-by-group basis. By setting up groups, you can manage the load on backup servers.
Group Detail
Detail reports are related to a specific enterprise object, such as a backup job. You can only access detail reports through a link presented in the context of a main report, providing additional information that augments the main report. Detail reports cannot be generated, customized, or saved, as they are specific to the report from which they were derived. They are not available in search results.
Explore your data center using APTARE IT Analytics customizable report templates or by using parts of your IT infrastructure as entry points. Use Search to find reports, templates and dashboards across the portal.
Use the Reports tab to examine the APTARE IT Analytics catalog of templates, dashboards and reports - organized by products along with user-created, and system folders. The main report is located here:
Backup Manager > Backup Policies > NetWorker Groups
ServerThe EMC NetWorker server that is managing the backups for the associated group. Click on this link to access Host Details.
Group NameA group of clients to be backed up. Click this name to view the list of client instances in the Group Detail report.
Start Time If Autostart is Enabled, the group will begin being backed up at this time.
Interval The frequency with which autostart will initiate backups.
Autostart
This attribute indicates if the group will be backed up automatically for each time period specified as the interval. Values include: E = Enabled, which means clients will be backed up automatically at the time specified in Start Time; D = Disabled; S = Start now, which means that clients are backed up immediately, overriding the start time.
Schedule OverrideNetWorker allows you to override a scheduled backup by selecting a default group and initiating a Start Now autostart.
StatusBackup Status for the group can be one of the following: Running, Idle, Finished, Not Finished (backup exited without completing), Preview Run (test a backup configuration).
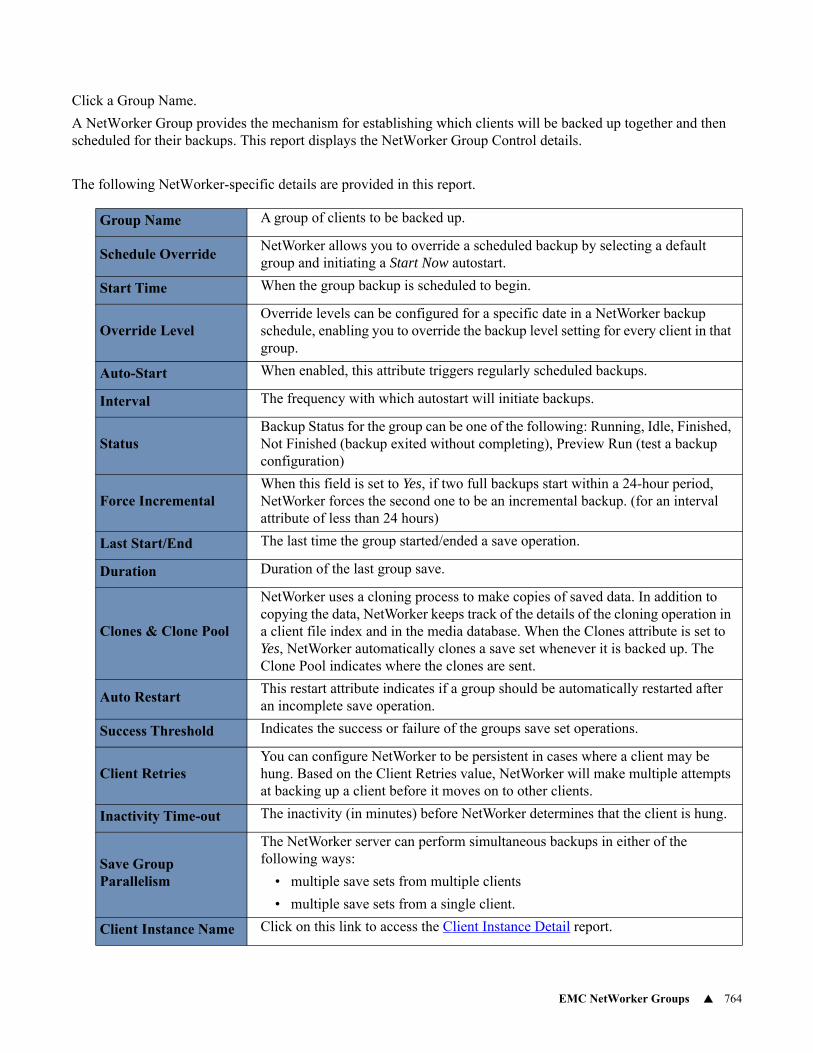
EMC NetWorker Groups 764
Click a Group Name.
A NetWorker Group provides the mechanism for establishing which clients will be backed up together and then scheduled for their backups. This report displays the NetWorker Group Control details.
The following NetWorker-specific details are provided in this report.
Group Name A group of clients to be backed up.
Schedule OverrideNetWorker allows you to override a scheduled backup by selecting a default group and initiating a Start Now autostart.
Start Time When the group backup is scheduled to begin.
Override LevelOverride levels can be configured for a specific date in a NetWorker backup schedule, enabling you to override the backup level setting for every client in that group.
Auto-Start When enabled, this attribute triggers regularly scheduled backups.
Interval The frequency with which autostart will initiate backups.
StatusBackup Status for the group can be one of the following: Running, Idle, Finished, Not Finished (backup exited without completing), Preview Run (test a backup configuration)
Force IncrementalWhen this field is set to Yes, if two full backups start within a 24-hour period, NetWorker forces the second one to be an incremental backup. (for an interval attribute of less than 24 hours)
Last Start/End The last time the group started/ended a save operation.
Duration Duration of the last group save.
Clones & Clone Pool
NetWorker uses a cloning process to make copies of saved data. In addition to copying the data, NetWorker keeps track of the details of the cloning operation in a client file index and in the media database. When the Clones attribute is set to Yes, NetWorker automatically clones a save set whenever it is backed up. The Clone Pool indicates where the clones are sent.
Auto RestartThis restart attribute indicates if a group should be automatically restarted after an incomplete save operation.
Success Threshold Indicates the success or failure of the groups save set operations.
Client RetriesYou can configure NetWorker to be persistent in cases where a client may be hung. Based on the Client Retries value, NetWorker will make multiple attempts at backing up a client before it moves on to other clients.
Inactivity Time-out The inactivity (in minutes) before NetWorker determines that the client is hung.
Save Group Parallelism
The NetWorker server can perform simultaneous backups in either of the following ways:
• multiple save sets from multiple clients
• multiple save sets from a single client.
Client Instance Name Click on this link to access the Client Instance Detail report.
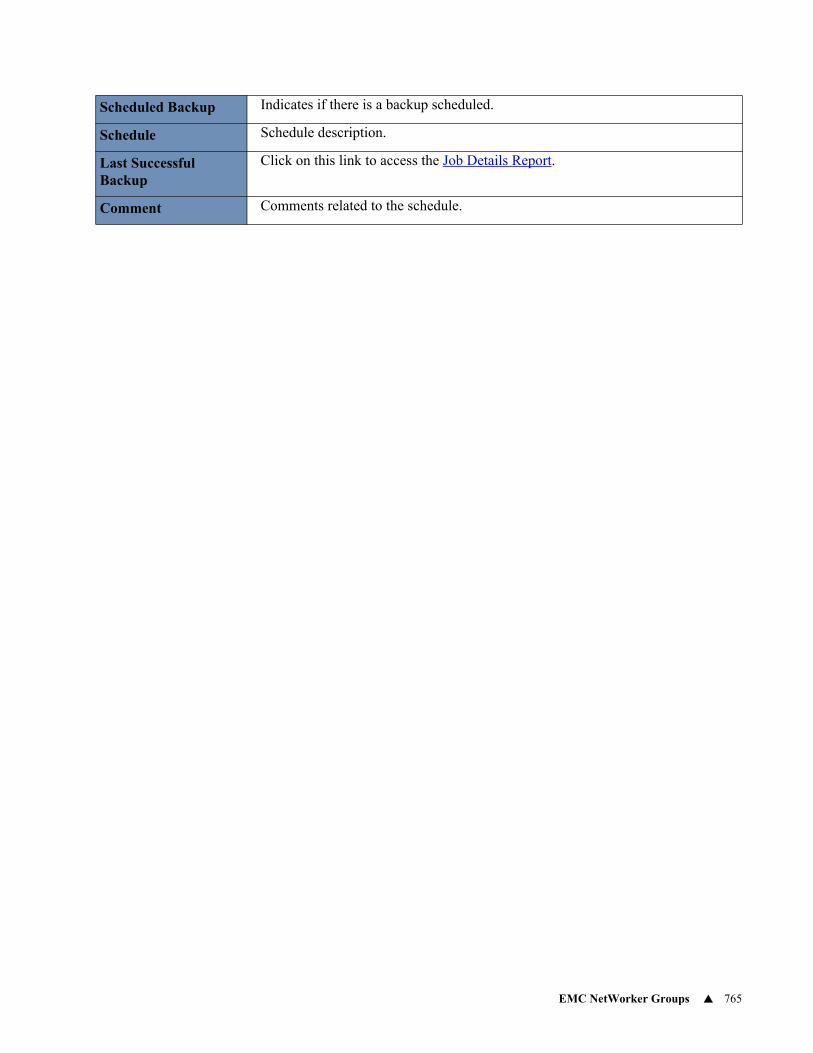
EMC NetWorker Groups 765
Scheduled Backup Indicates if there is a backup scheduled.
Schedule Schedule description.
Last Successful Backup
Click on this link to access the Job Details Report.
Comment Comments related to the schedule.
EMC NetWorker Groups 766
Client Instance Detail
Detail reports are related to a specific enterprise object, such as a backup job. You can only access detail reports through a link presented in the context of a main report, providing additional information that augments the main report. Detail reports cannot be generated, customized, or saved, as they are specific to the report from which they were derived. They are not available in search results.
Explore your data center using APTARE IT Analytics customizable report templates or by using parts of your IT infrastructure as entry points. Use Search to find reports, templates and dashboards across the portal.
Use the Reports tab to examine the APTARE IT Analytics catalog of templates, dashboards and reports - organized by products along with user-created, and system folders. The main report is located here:
Backup Manager > Backup Policies > NetWorker GroupsClick a Group Name and then click a Client Instance Name.

HP Data Protector Backup Specification Summary 767
HP Data Protector Backup Specification Summary
Explore your data center using APTARE customizable report templates or by using parts of your IT infrastructure as entry points. Use Search to find reports, templates and dashboards across the portal.
Use the Reports tab to examine the catalog of templates, dashboards and reports - organized by products along with user-created, and system folders. This report is located here:
Backup Manager > Backup Policies > HP DP Backup Specification
Note: The Backup Policies folder is available only if one of the following subsystems is licensed for data collection: EMC Avamar, Commvault Simpana, EMC NetWorker, IBM Spectrum Protect (TSM), HP Data Protector, or Veritas NetBackup.
The HP Data Protector Backup Specification report lists the Backup Specification, with the objects that are backed up, the servers and the next time the backup will be performed. Note that the objects can be entire disks or volumes, or sub-sets of these, such as directories or the Windows Registry.
Specification Links to the HP Data Protector Backup Specification Detail.
Server Backup server.
Object TypeThe type of data for which the backup specification is configured—database entity or a disk image (raw disk)—for example, filesystem.
# of Clients Number of clients backed up by this backup specification.
Next Backup Mode Full, Incr, Incr 1, Incr 2, Incr 3, Incr 4, Incr 5, Incr 6, Incr 7, Incr 8, Incr 9.
Next Backup Date Date and time of the next backup.
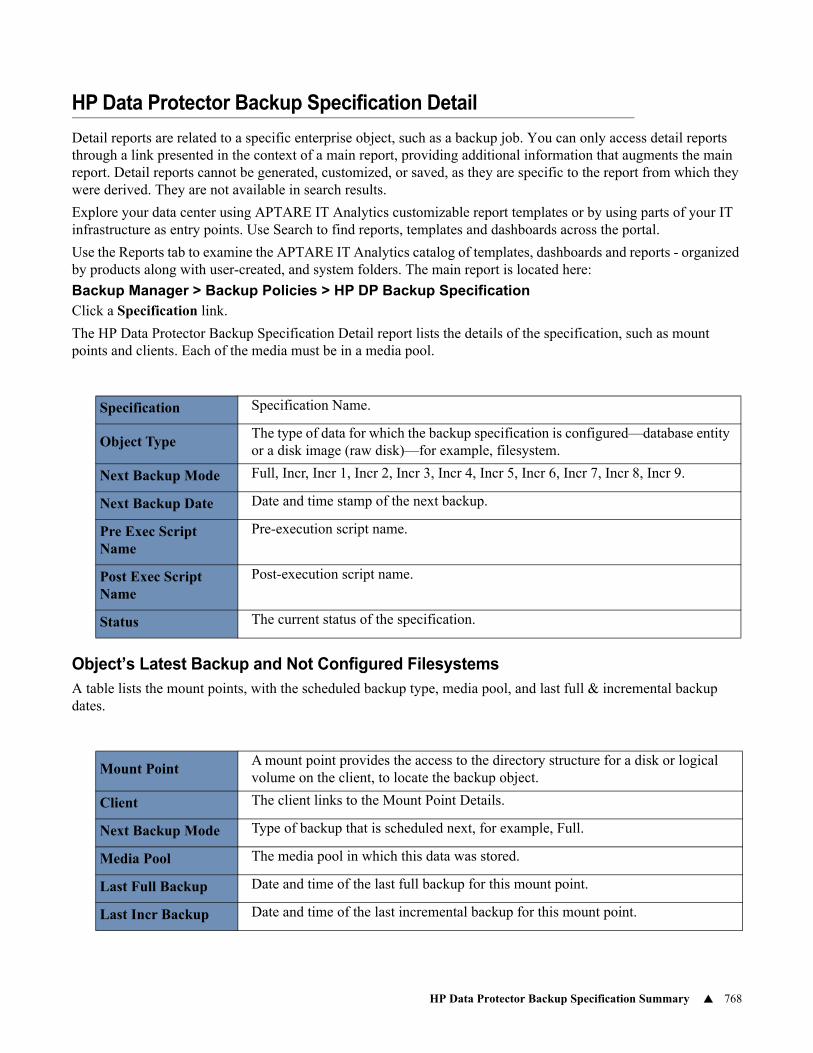
HP Data Protector Backup Specification Summary 768
HP Data Protector Backup Specification Detail
Detail reports are related to a specific enterprise object, such as a backup job. You can only access detail reports through a link presented in the context of a main report, providing additional information that augments the main report. Detail reports cannot be generated, customized, or saved, as they are specific to the report from which they were derived. They are not available in search results.
Explore your data center using APTARE IT Analytics customizable report templates or by using parts of your IT infrastructure as entry points. Use Search to find reports, templates and dashboards across the portal.
Use the Reports tab to examine the APTARE IT Analytics catalog of templates, dashboards and reports - organized by products along with user-created, and system folders. The main report is located here:
Backup Manager > Backup Policies > HP DP Backup SpecificationClick a Specification link.
The HP Data Protector Backup Specification Detail report lists the details of the specification, such as mount points and clients. Each of the media must be in a media pool.
Object’s Latest Backup and Not Configured FilesystemsA table lists the mount points, with the scheduled backup type, media pool, and last full & incremental backup dates.
Specification Specification Name.
Object TypeThe type of data for which the backup specification is configured—database entity or a disk image (raw disk)—for example, filesystem.
Next Backup Mode Full, Incr, Incr 1, Incr 2, Incr 3, Incr 4, Incr 5, Incr 6, Incr 7, Incr 8, Incr 9.
Next Backup Date Date and time stamp of the next backup.
Pre Exec Script Name
Pre-execution script name.
Post Exec Script Name
Post-execution script name.
Status The current status of the specification.
Mount PointA mount point provides the access to the directory structure for a disk or logical volume on the client, to locate the backup object.
Client The client links to the Mount Point Details.
Next Backup Mode Type of backup that is scheduled next, for example, Full.
Media Pool The media pool in which this data was stored.
Last Full Backup Date and time of the last full backup for this mount point.
Last Incr Backup Date and time of the last incremental backup for this mount point.
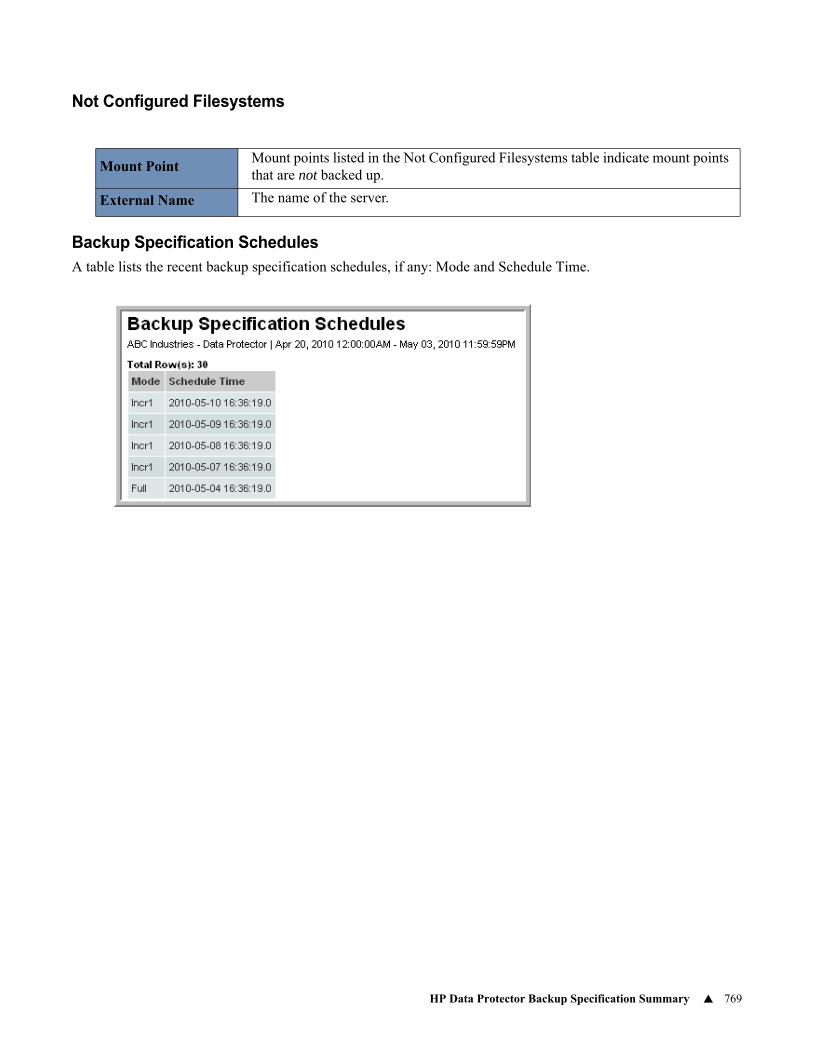
HP Data Protector Backup Specification Summary 769
Not Configured Filesystems
Backup Specification SchedulesA table lists the recent backup specification schedules, if any: Mode and Schedule Time.
Mount PointMount points listed in the Not Configured Filesystems table indicate mount points that are not backed up.
External Name The name of the server.
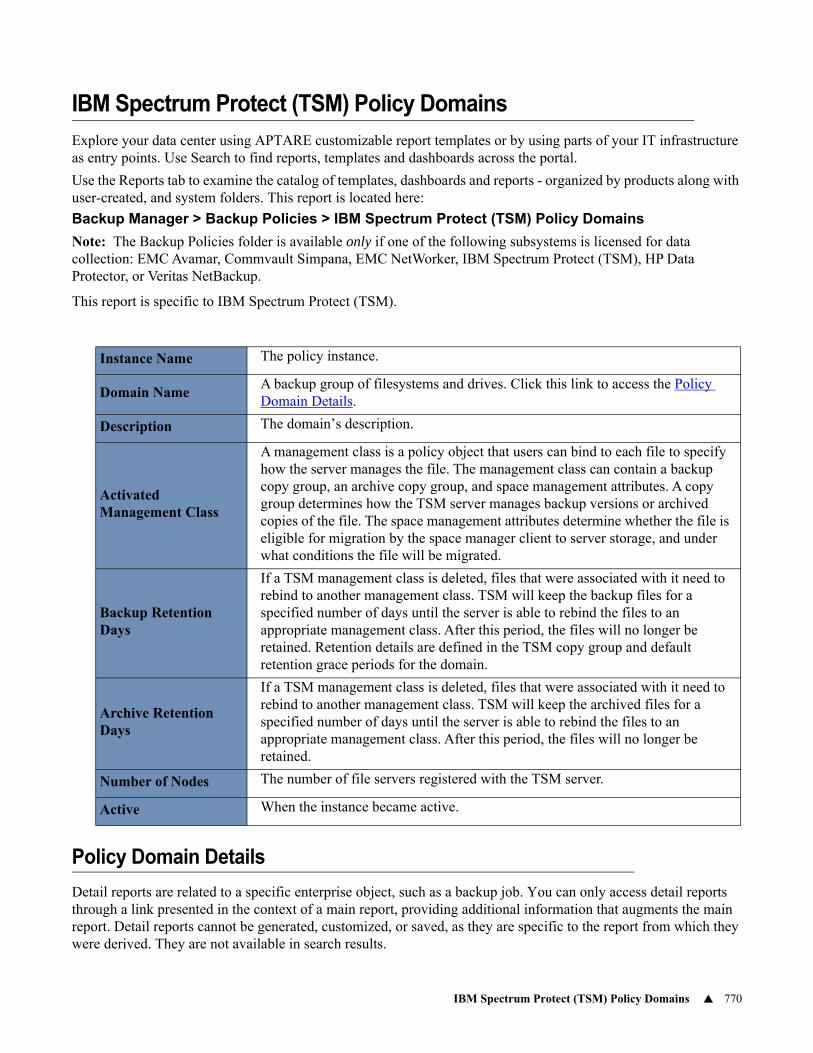
IBM Spectrum Protect (TSM) Policy Domains 770
IBM Spectrum Protect (TSM) Policy Domains
Explore your data center using APTARE customizable report templates or by using parts of your IT infrastructure as entry points. Use Search to find reports, templates and dashboards across the portal.
Use the Reports tab to examine the catalog of templates, dashboards and reports - organized by products along with user-created, and system folders. This report is located here:
Backup Manager > Backup Policies > IBM Spectrum Protect (TSM) Policy Domains
Note: The Backup Policies folder is available only if one of the following subsystems is licensed for data collection: EMC Avamar, Commvault Simpana, EMC NetWorker, IBM Spectrum Protect (TSM), HP Data Protector, or Veritas NetBackup.
This report is specific to IBM Spectrum Protect (TSM).
Policy Domain Details
Detail reports are related to a specific enterprise object, such as a backup job. You can only access detail reports through a link presented in the context of a main report, providing additional information that augments the main report. Detail reports cannot be generated, customized, or saved, as they are specific to the report from which they were derived. They are not available in search results.
Instance Name The policy instance.
Domain NameA backup group of filesystems and drives. Click this link to access the Policy Domain Details.
Description The domain’s description.
Activated Management Class
A management class is a policy object that users can bind to each file to specify how the server manages the file. The management class can contain a backup copy group, an archive copy group, and space management attributes. A copy group determines how the TSM server manages backup versions or archived copies of the file. The space management attributes determine whether the file is eligible for migration by the space manager client to server storage, and under what conditions the file will be migrated.
Backup Retention Days
If a TSM management class is deleted, files that were associated with it need to rebind to another management class. TSM will keep the backup files for a specified number of days until the server is able to rebind the files to an appropriate management class. After this period, the files will no longer be retained. Retention details are defined in the TSM copy group and default retention grace periods for the domain.
Archive Retention Days
If a TSM management class is deleted, files that were associated with it need to rebind to another management class. TSM will keep the archived files for a specified number of days until the server is able to rebind the files to an appropriate management class. After this period, the files will no longer be retained.
Number of Nodes The number of file servers registered with the TSM server.
Active When the instance became active.
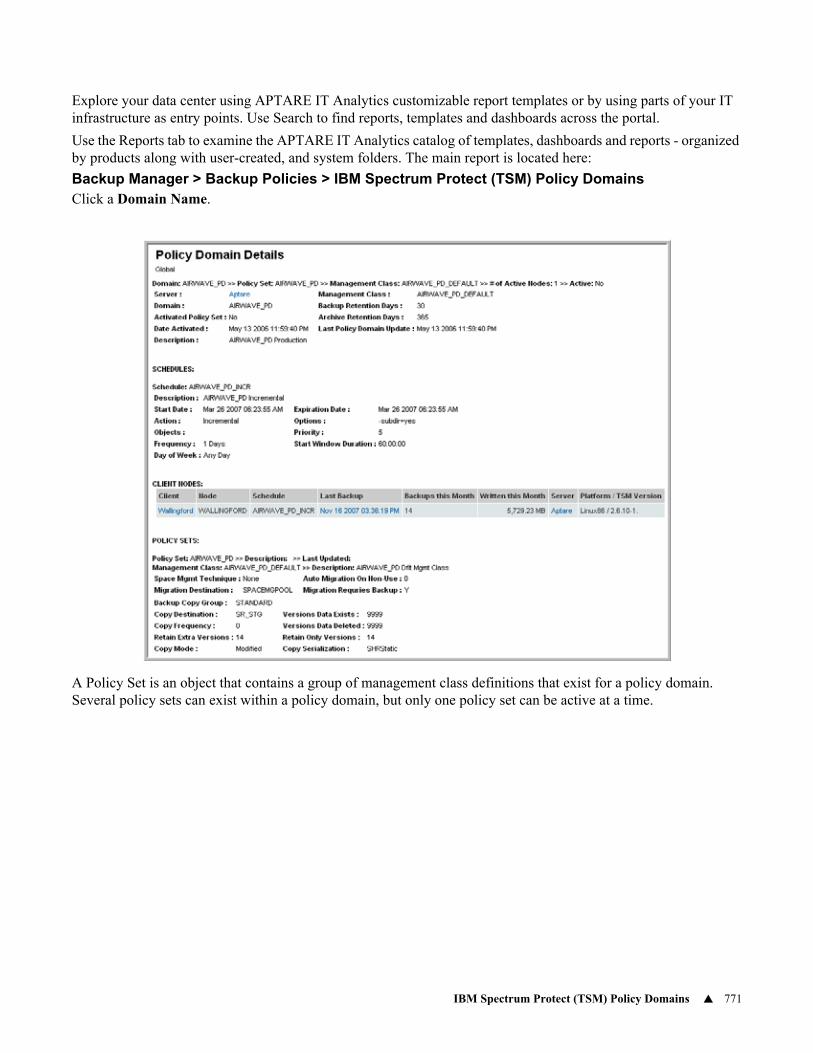
IBM Spectrum Protect (TSM) Policy Domains 771
Explore your data center using APTARE IT Analytics customizable report templates or by using parts of your IT infrastructure as entry points. Use Search to find reports, templates and dashboards across the portal.
Use the Reports tab to examine the APTARE IT Analytics catalog of templates, dashboards and reports - organized by products along with user-created, and system folders. The main report is located here:
Backup Manager > Backup Policies > IBM Spectrum Protect (TSM) Policy DomainsClick a Domain Name.
A Policy Set is an object that contains a group of management class definitions that exist for a policy domain. Several policy sets can exist within a policy domain, but only one policy set can be active at a time.
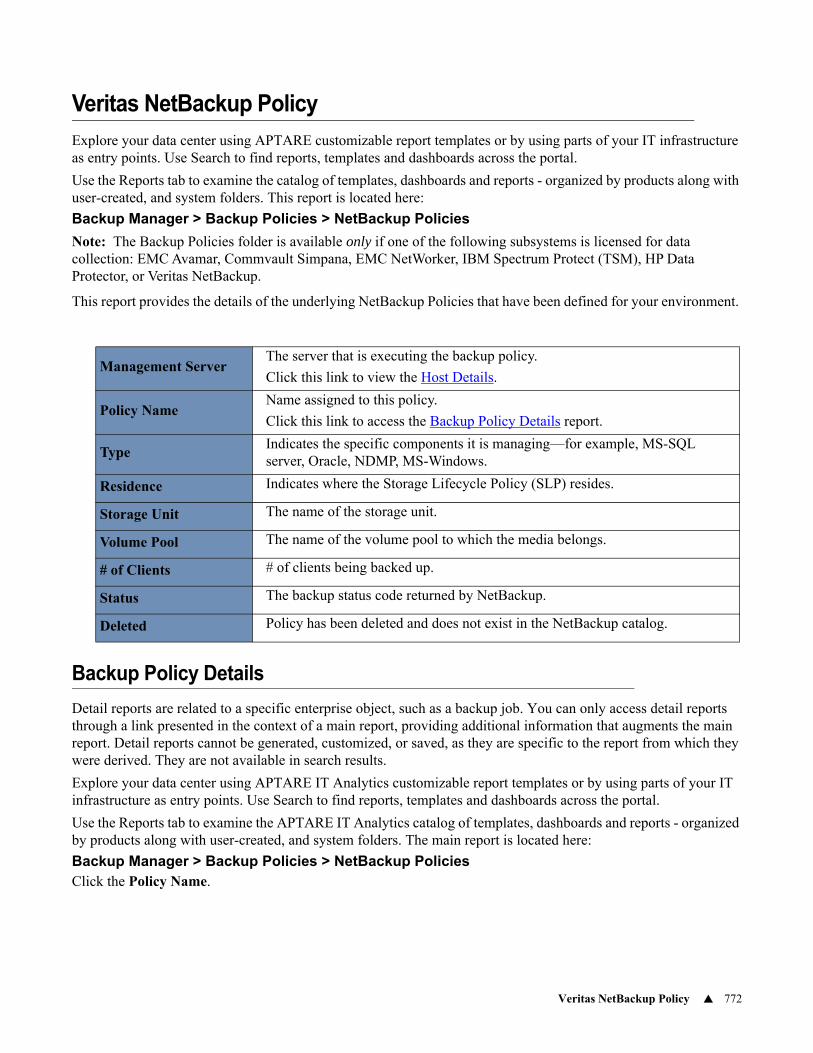
Veritas NetBackup Policy 772
Veritas NetBackup Policy
Explore your data center using APTARE customizable report templates or by using parts of your IT infrastructure as entry points. Use Search to find reports, templates and dashboards across the portal.
Use the Reports tab to examine the catalog of templates, dashboards and reports - organized by products along with user-created, and system folders. This report is located here:
Backup Manager > Backup Policies > NetBackup Policies
Note: The Backup Policies folder is available only if one of the following subsystems is licensed for data collection: EMC Avamar, Commvault Simpana, EMC NetWorker, IBM Spectrum Protect (TSM), HP Data Protector, or Veritas NetBackup.
This report provides the details of the underlying NetBackup Policies that have been defined for your environment.
Backup Policy Details
Detail reports are related to a specific enterprise object, such as a backup job. You can only access detail reports through a link presented in the context of a main report, providing additional information that augments the main report. Detail reports cannot be generated, customized, or saved, as they are specific to the report from which they were derived. They are not available in search results.
Explore your data center using APTARE IT Analytics customizable report templates or by using parts of your IT infrastructure as entry points. Use Search to find reports, templates and dashboards across the portal.
Use the Reports tab to examine the APTARE IT Analytics catalog of templates, dashboards and reports - organized by products along with user-created, and system folders. The main report is located here:
Backup Manager > Backup Policies > NetBackup PoliciesClick the Policy Name.
Management ServerThe server that is executing the backup policy.
Click this link to view the Host Details.
Policy NameName assigned to this policy.
Click this link to access the Backup Policy Details report.
TypeIndicates the specific components it is managing—for example, MS-SQL server, Oracle, NDMP, MS-Windows.
Residence Indicates where the Storage Lifecycle Policy (SLP) resides.
Storage Unit The name of the storage unit.
Volume Pool The name of the volume pool to which the media belongs.
# of Clients # of clients being backed up.
Status The backup status code returned by NetBackup.
Deleted Policy has been deleted and does not exist in the NetBackup catalog.
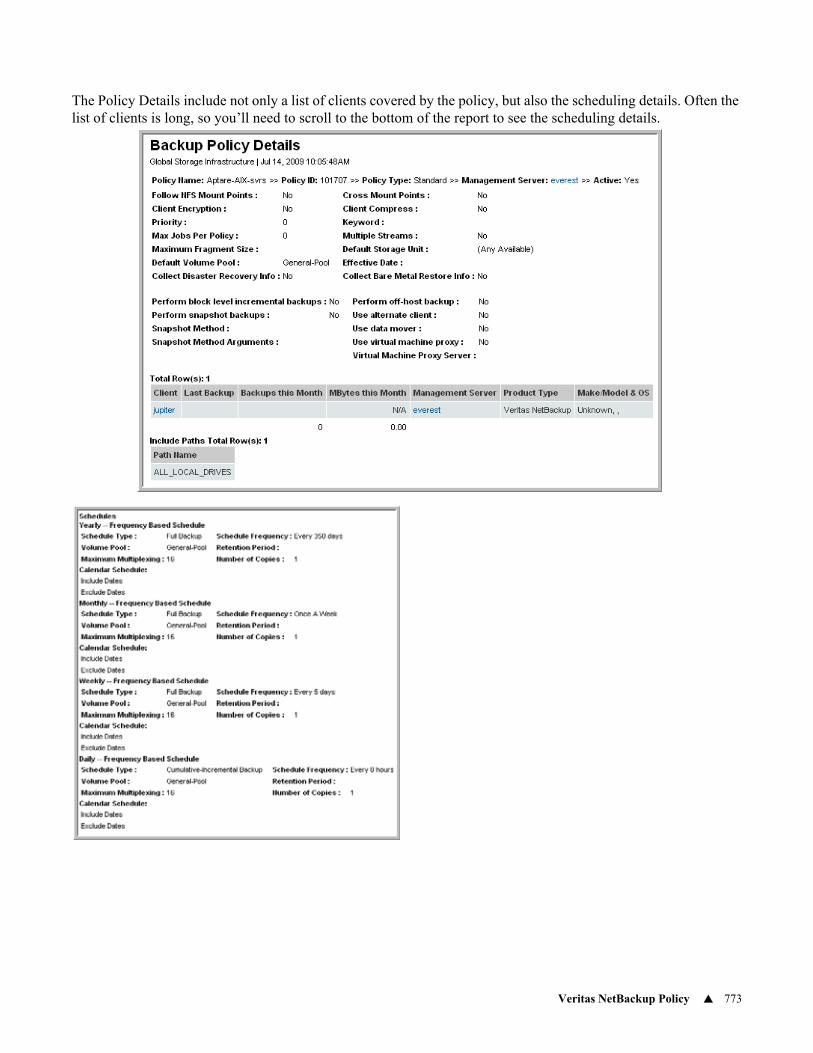
Veritas NetBackup Policy 773
The Policy Details include not only a list of clients covered by the policy, but also the scheduling details. Often the list of clients is long, so you’ll need to scroll to the bottom of the report to see the scheduling details.
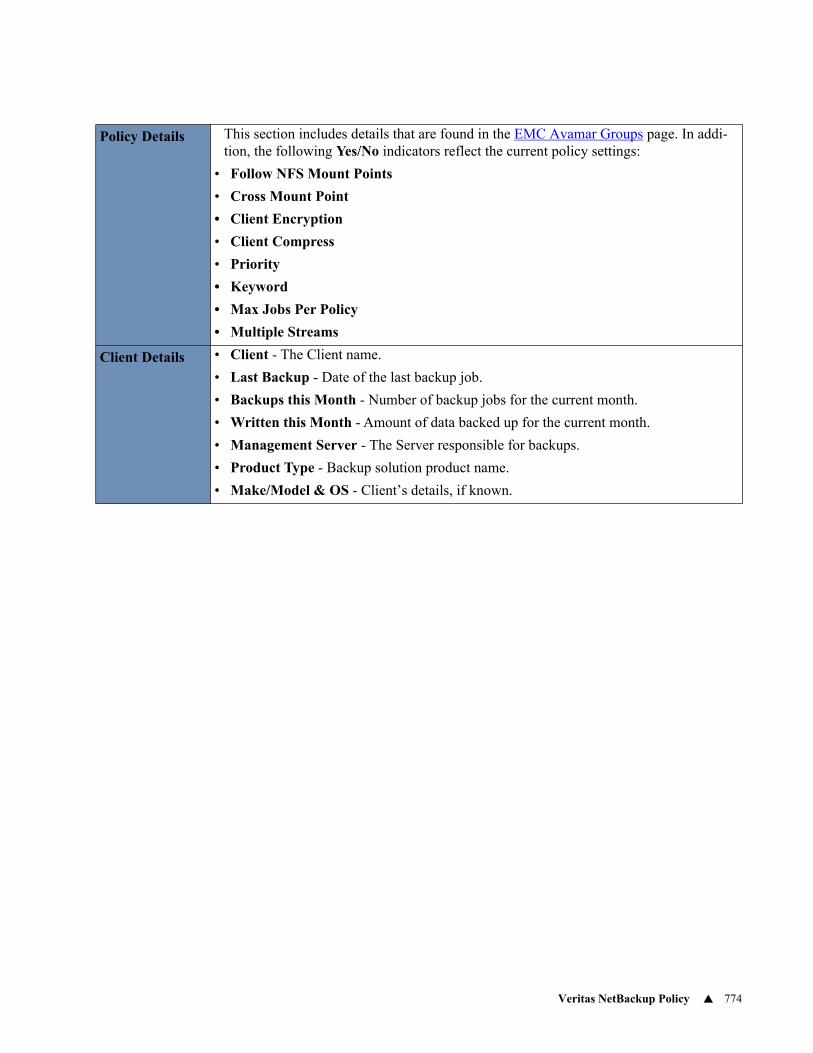
Veritas NetBackup Policy 774
Policy Details This section includes details that are found in the EMC Avamar Groups page. In addi-tion, the following Yes/No indicators reflect the current policy settings:
• Follow NFS Mount Points
• Cross Mount Point
• Client Encryption
• Client Compress
• Priority
• Keyword
• Max Jobs Per Policy
• Multiple Streams
Client Details • Client - The Client name.
• Last Backup - Date of the last backup job.
• Backups this Month - Number of backup jobs for the current month.
• Written this Month - Amount of data backed up for the current month.
• Management Server - The Server responsible for backups.
• Product Type - Backup solution product name.
• Make/Model & OS - Client’s details, if known.
775
26Chapter 22Replication Manager Reports
APTARE IT Analytics reports on SnapVault and SnapMirror data replication details, enabling you to easily identify successful replication, but more importantly, any data protection vulnerability.
This section contains the following topics:• Overview of Replication Manager
• SnapMirror Summary
• SnapMirror Details
• SnapMirror Schedule
• SnapMirror Status Summary
• SnapMirror Data Transfer
• SnapMirror Volumes/QTrees At Risk
• SnapVault Relationship Summary
• SnapMirror Data Protection Dashboard
• FlexClone Summary
• Aggregate Mirror Summary
• SnapVault Secondary Configuration
• SnapVault Summary
• SnapVault Detail
• SnapVault Schedule
• SnapVault Status
• SnapVault Data Transfer
• SnapVault Relationship Summary
• SnapVault Data Protection Dashboard
• SnapVault QTrees at Risk
Overview of Replication Manager 776
Overview of Replication Manager
The APTARE IT Analytics Replication Manager offers a view of your NetApp Data ONTAP SnapMirror, SnapVault, and FlexClone environments. These reports enable quick access to the data replication details to ensure that your business-critical data is protected and has been successfully replicated on schedule.
SnapMirror can replicate data in the following manner:
• Volume to QTree
• Volume to Volume
• QTree to Volume
• QTree to QTree
SnapVault can replicate data in the following manner:
• Volume to QTree
• QTree to QTree
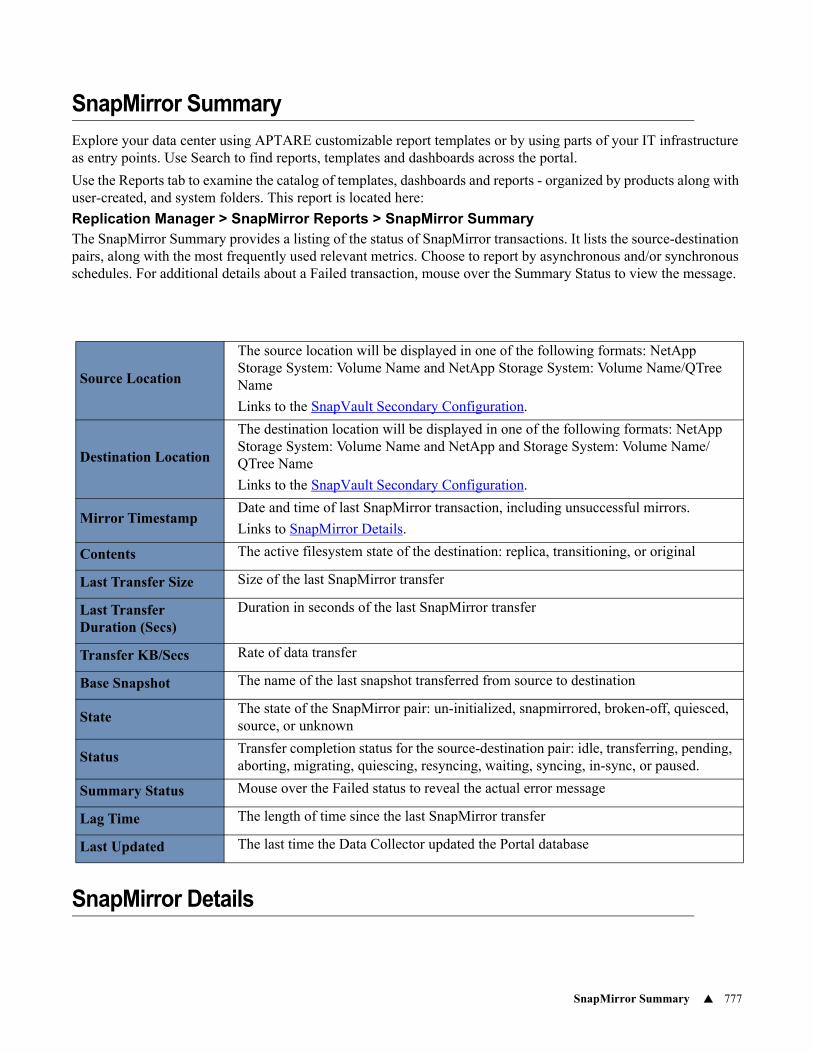
SnapMirror Summary 777
SnapMirror Summary
Explore your data center using APTARE customizable report templates or by using parts of your IT infrastructure as entry points. Use Search to find reports, templates and dashboards across the portal.
Use the Reports tab to examine the catalog of templates, dashboards and reports - organized by products along with user-created, and system folders. This report is located here:
Replication Manager > SnapMirror Reports > SnapMirror SummaryThe SnapMirror Summary provides a listing of the status of SnapMirror transactions. It lists the source-destination pairs, along with the most frequently used relevant metrics. Choose to report by asynchronous and/or synchronous schedules. For additional details about a Failed transaction, mouse over the Summary Status to view the message.
SnapMirror Details
Source Location
The source location will be displayed in one of the following formats: NetApp Storage System: Volume Name and NetApp Storage System: Volume Name/QTree Name
Links to the SnapVault Secondary Configuration.
Destination Location
The destination location will be displayed in one of the following formats: NetApp Storage System: Volume Name and NetApp and Storage System: Volume Name/QTree Name
Links to the SnapVault Secondary Configuration.
Mirror TimestampDate and time of last SnapMirror transaction, including unsuccessful mirrors.
Links to SnapMirror Details.
Contents The active filesystem state of the destination: replica, transitioning, or original
Last Transfer Size Size of the last SnapMirror transfer
Last Transfer Duration (Secs)
Duration in seconds of the last SnapMirror transfer
Transfer KB/Secs Rate of data transfer
Base Snapshot The name of the last snapshot transferred from source to destination
StateThe state of the SnapMirror pair: un-initialized, snapmirrored, broken-off, quiesced, source, or unknown
StatusTransfer completion status for the source-destination pair: idle, transferring, pending, aborting, migrating, quiescing, resyncing, waiting, syncing, in-sync, or paused.
Summary Status Mouse over the Failed status to reveal the actual error message
Lag Time The length of time since the last SnapMirror transfer
Last Updated The last time the Data Collector updated the Portal database
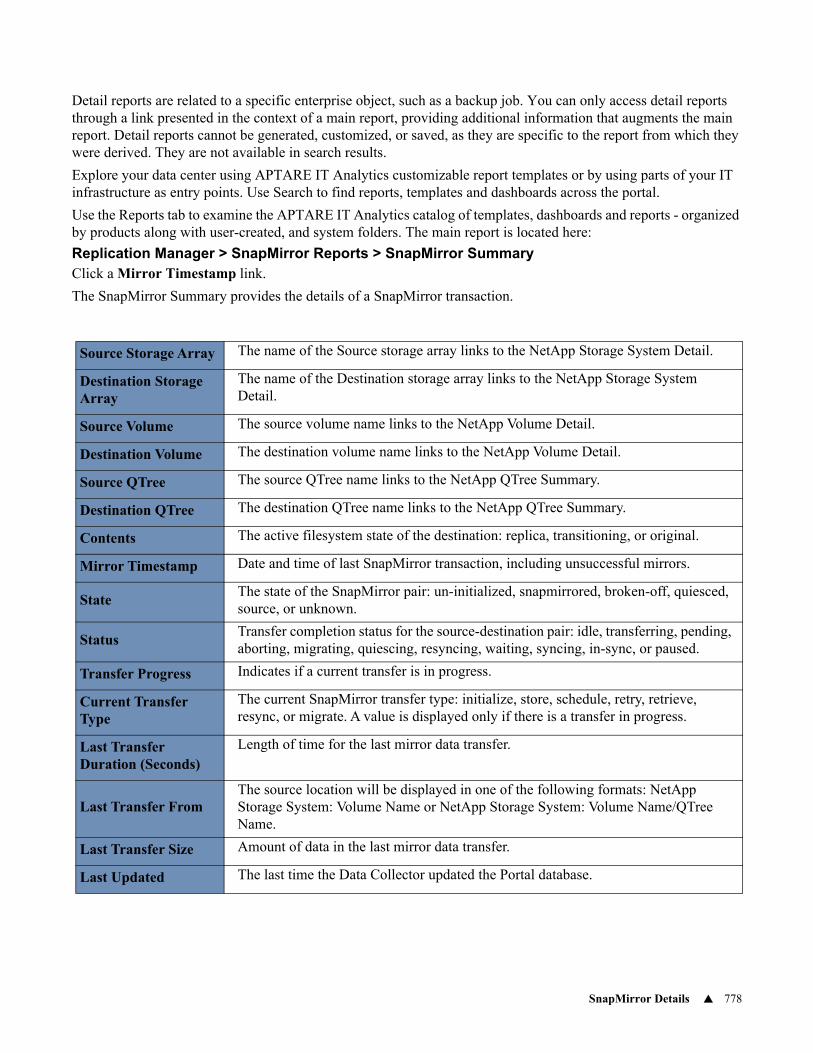
SnapMirror Details 778
Detail reports are related to a specific enterprise object, such as a backup job. You can only access detail reports through a link presented in the context of a main report, providing additional information that augments the main report. Detail reports cannot be generated, customized, or saved, as they are specific to the report from which they were derived. They are not available in search results.
Explore your data center using APTARE IT Analytics customizable report templates or by using parts of your IT infrastructure as entry points. Use Search to find reports, templates and dashboards across the portal.
Use the Reports tab to examine the APTARE IT Analytics catalog of templates, dashboards and reports - organized by products along with user-created, and system folders. The main report is located here:
Replication Manager > SnapMirror Reports > SnapMirror SummaryClick a Mirror Timestamp link.
The SnapMirror Summary provides the details of a SnapMirror transaction.
Source Storage Array The name of the Source storage array links to the NetApp Storage System Detail.
Destination Storage Array
The name of the Destination storage array links to the NetApp Storage System Detail.
Source Volume The source volume name links to the NetApp Volume Detail.
Destination Volume The destination volume name links to the NetApp Volume Detail.
Source QTree The source QTree name links to the NetApp QTree Summary.
Destination QTree The destination QTree name links to the NetApp QTree Summary.
Contents The active filesystem state of the destination: replica, transitioning, or original.
Mirror Timestamp Date and time of last SnapMirror transaction, including unsuccessful mirrors.
StateThe state of the SnapMirror pair: un-initialized, snapmirrored, broken-off, quiesced, source, or unknown.
StatusTransfer completion status for the source-destination pair: idle, transferring, pending, aborting, migrating, quiescing, resyncing, waiting, syncing, in-sync, or paused.
Transfer Progress Indicates if a current transfer is in progress.
Current Transfer Type
The current SnapMirror transfer type: initialize, store, schedule, retry, retrieve, resync, or migrate. A value is displayed only if there is a transfer in progress.
Last Transfer Duration (Seconds)
Length of time for the last mirror data transfer.
Last Transfer FromThe source location will be displayed in one of the following formats: NetApp Storage System: Volume Name or NetApp Storage System: Volume Name/QTree Name.
Last Transfer Size Amount of data in the last mirror data transfer.
Last Updated The last time the Data Collector updated the Portal database.
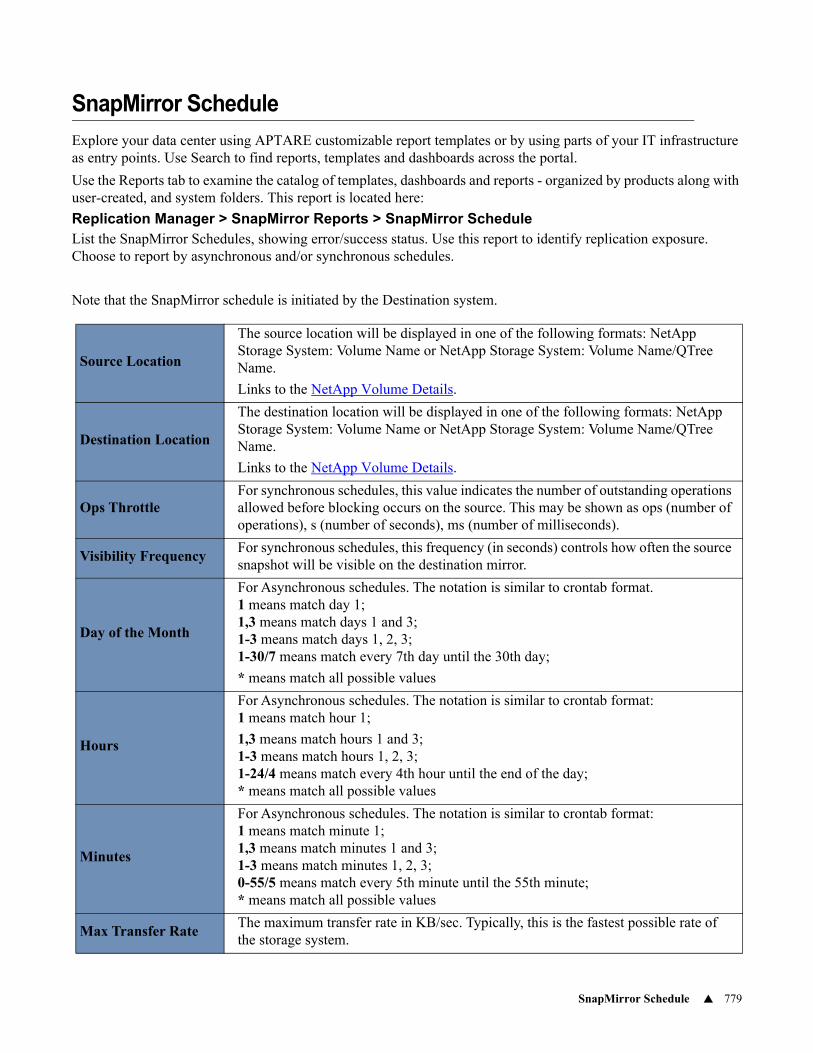
SnapMirror Schedule 779
SnapMirror Schedule
Explore your data center using APTARE customizable report templates or by using parts of your IT infrastructure as entry points. Use Search to find reports, templates and dashboards across the portal.
Use the Reports tab to examine the catalog of templates, dashboards and reports - organized by products along with user-created, and system folders. This report is located here:
Replication Manager > SnapMirror Reports > SnapMirror ScheduleList the SnapMirror Schedules, showing error/success status. Use this report to identify replication exposure. Choose to report by asynchronous and/or synchronous schedules.
Note that the SnapMirror schedule is initiated by the Destination system.
Source Location
The source location will be displayed in one of the following formats: NetApp Storage System: Volume Name or NetApp Storage System: Volume Name/QTree Name.
Links to the NetApp Volume Details.
Destination Location
The destination location will be displayed in one of the following formats: NetApp Storage System: Volume Name or NetApp Storage System: Volume Name/QTree Name.
Links to the NetApp Volume Details.
Ops ThrottleFor synchronous schedules, this value indicates the number of outstanding operations allowed before blocking occurs on the source. This may be shown as ops (number of operations), s (number of seconds), ms (number of milliseconds).
Visibility FrequencyFor synchronous schedules, this frequency (in seconds) controls how often the source snapshot will be visible on the destination mirror.
Day of the Month
For Asynchronous schedules. The notation is similar to crontab format.1 means match day 1; 1,3 means match days 1 and 3; 1-3 means match days 1, 2, 3; 1-30/7 means match every 7th day until the 30th day;
* means match all possible values
Hours
For Asynchronous schedules. The notation is similar to crontab format: 1 means match hour 1;
1,3 means match hours 1 and 3; 1-3 means match hours 1, 2, 3; 1-24/4 means match every 4th hour until the end of the day; * means match all possible values
Minutes
For Asynchronous schedules. The notation is similar to crontab format: 1 means match minute 1; 1,3 means match minutes 1 and 3; 1-3 means match minutes 1, 2, 3; 0-55/5 means match every 5th minute until the 55th minute; * means match all possible values
Max Transfer RateThe maximum transfer rate in KB/sec. Typically, this is the fastest possible rate of the storage system.

SnapMirror Schedule 780
Error Error message displayed only if there is a transfer error
Last SuccessfulDate/timestamp of the last successful SnapMirror transfer
Links to SnapMirror Details.
Last Updated The last time the Data Collector updated the Portal database
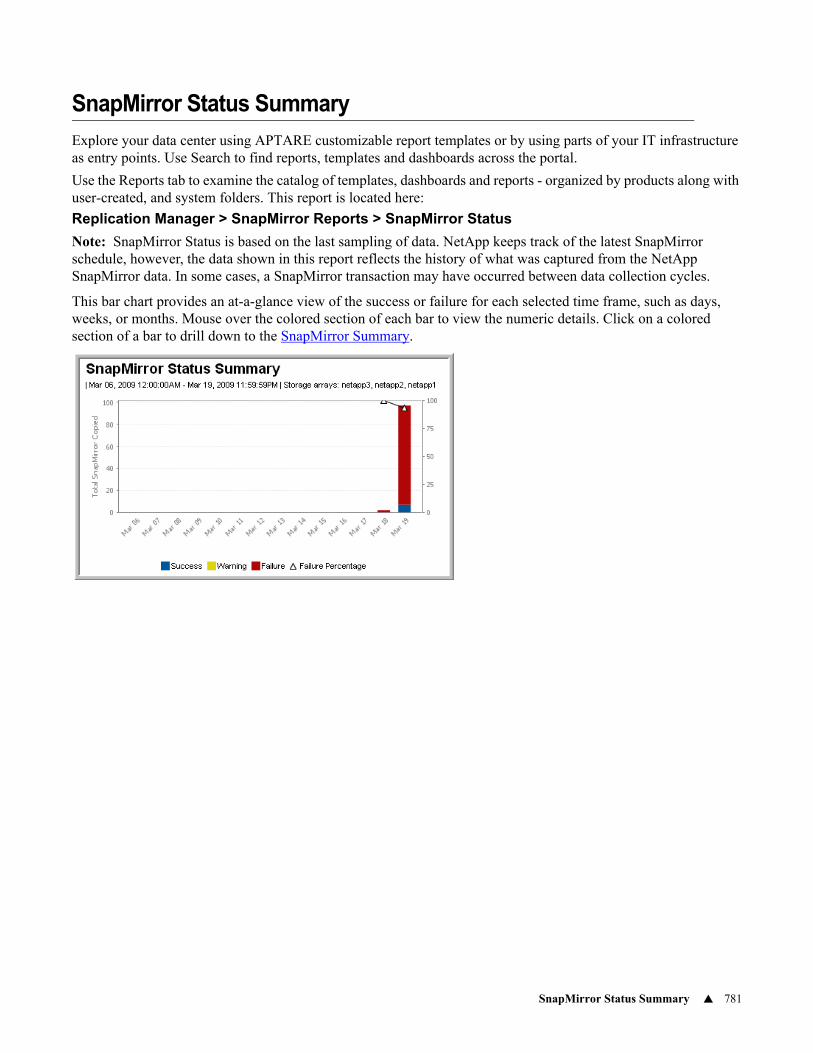
SnapMirror Status Summary 781
SnapMirror Status Summary
Explore your data center using APTARE customizable report templates or by using parts of your IT infrastructure as entry points. Use Search to find reports, templates and dashboards across the portal.
Use the Reports tab to examine the catalog of templates, dashboards and reports - organized by products along with user-created, and system folders. This report is located here:
Replication Manager > SnapMirror Reports > SnapMirror Status
Note: SnapMirror Status is based on the last sampling of data. NetApp keeps track of the latest SnapMirror schedule, however, the data shown in this report reflects the history of what was captured from the NetApp SnapMirror data. In some cases, a SnapMirror transaction may have occurred between data collection cycles.
This bar chart provides an at-a-glance view of the success or failure for each selected time frame, such as days, weeks, or months. Mouse over the colored section of each bar to view the numeric details. Click on a colored section of a bar to drill down to the SnapMirror Summary.
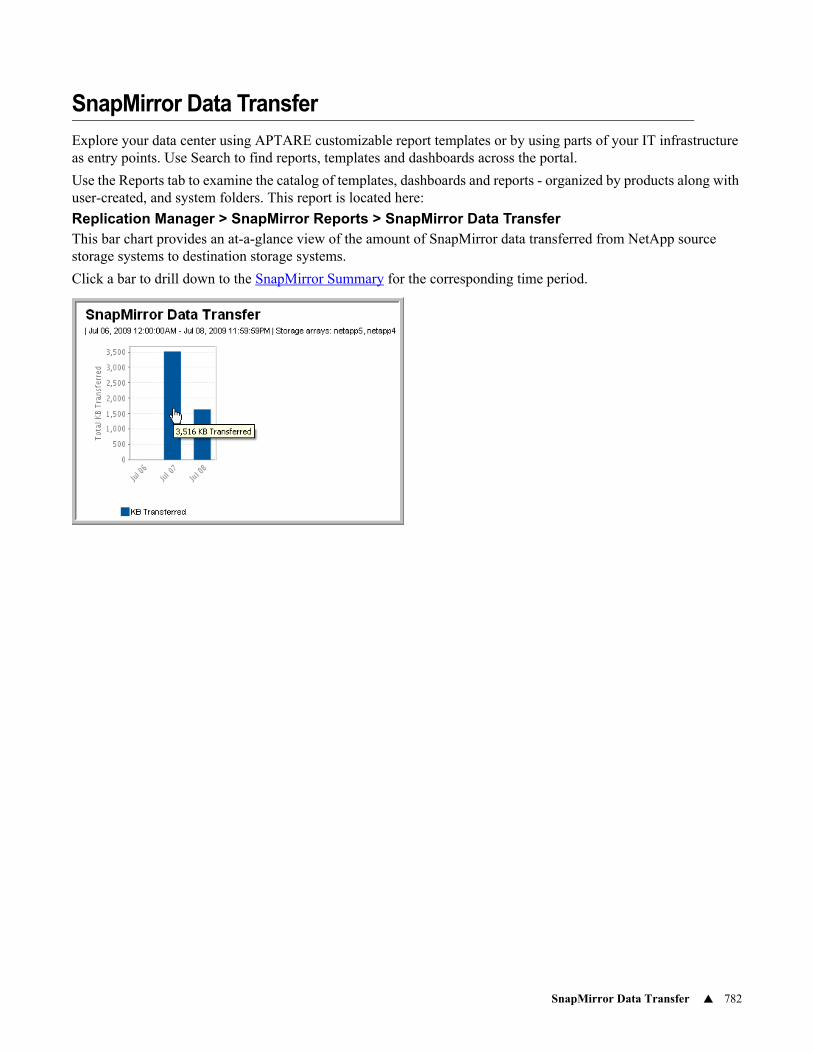
SnapMirror Data Transfer 782
SnapMirror Data Transfer
Explore your data center using APTARE customizable report templates or by using parts of your IT infrastructure as entry points. Use Search to find reports, templates and dashboards across the portal.
Use the Reports tab to examine the catalog of templates, dashboards and reports - organized by products along with user-created, and system folders. This report is located here:
Replication Manager > SnapMirror Reports > SnapMirror Data TransferThis bar chart provides an at-a-glance view of the amount of SnapMirror data transferred from NetApp source storage systems to destination storage systems.
Click a bar to drill down to the SnapMirror Summary for the corresponding time period.
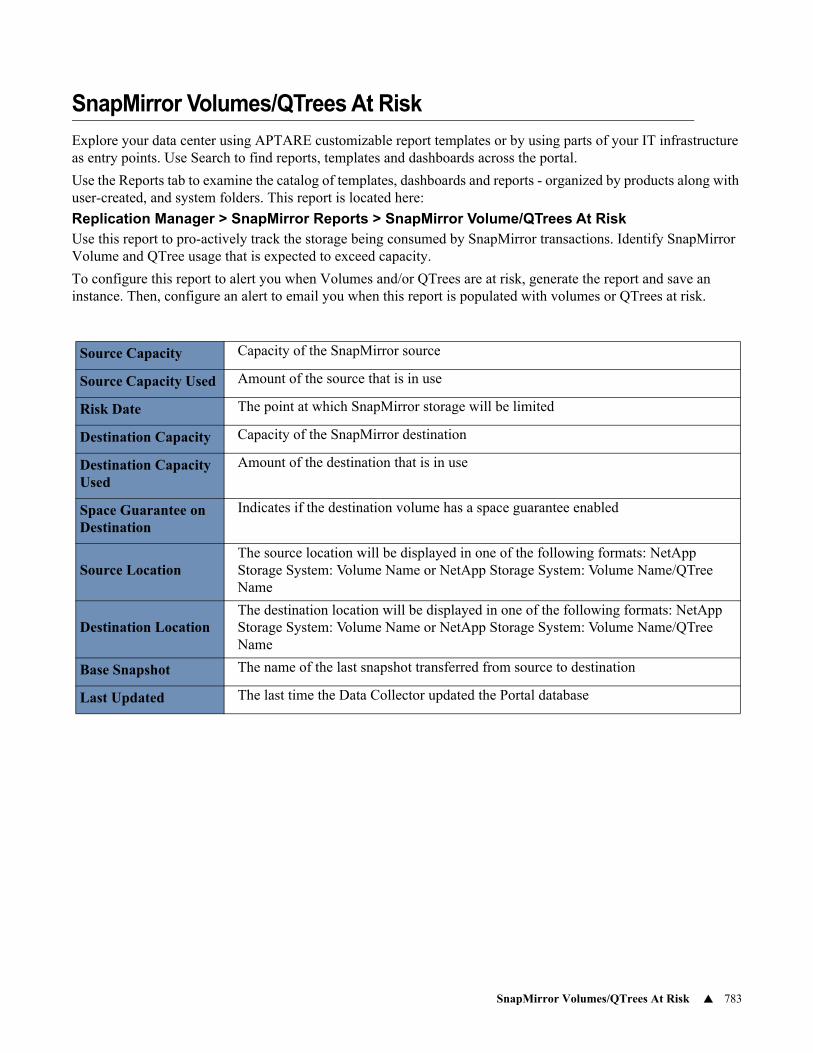
SnapMirror Volumes/QTrees At Risk 783
SnapMirror Volumes/QTrees At Risk
Explore your data center using APTARE customizable report templates or by using parts of your IT infrastructure as entry points. Use Search to find reports, templates and dashboards across the portal.
Use the Reports tab to examine the catalog of templates, dashboards and reports - organized by products along with user-created, and system folders. This report is located here:
Replication Manager > SnapMirror Reports > SnapMirror Volume/QTrees At RiskUse this report to pro-actively track the storage being consumed by SnapMirror transactions. Identify SnapMirror Volume and QTree usage that is expected to exceed capacity.
To configure this report to alert you when Volumes and/or QTrees are at risk, generate the report and save an instance. Then, configure an alert to email you when this report is populated with volumes or QTrees at risk.
Source Capacity Capacity of the SnapMirror source
Source Capacity Used Amount of the source that is in use
Risk Date The point at which SnapMirror storage will be limited
Destination Capacity Capacity of the SnapMirror destination
Destination Capacity Used
Amount of the destination that is in use
Space Guarantee on Destination
Indicates if the destination volume has a space guarantee enabled
Source LocationThe source location will be displayed in one of the following formats: NetApp Storage System: Volume Name or NetApp Storage System: Volume Name/QTree Name
Destination LocationThe destination location will be displayed in one of the following formats: NetApp Storage System: Volume Name or NetApp Storage System: Volume Name/QTree Name
Base Snapshot The name of the last snapshot transferred from source to destination
Last Updated The last time the Data Collector updated the Portal database
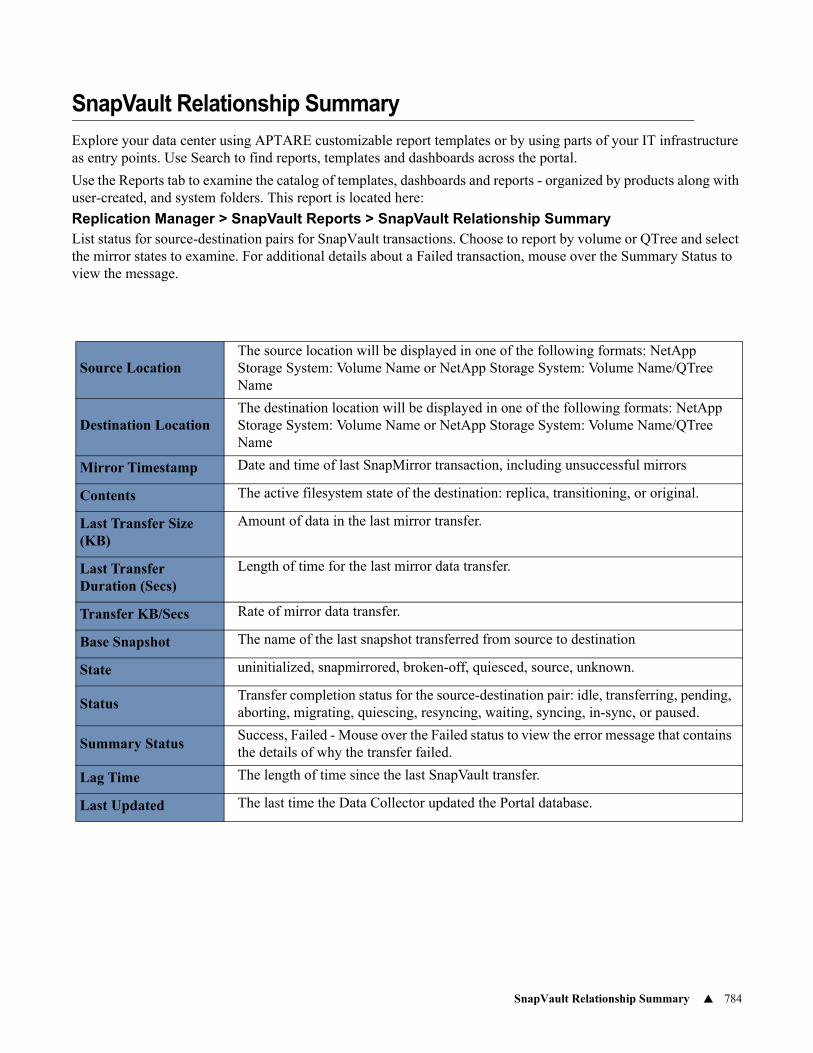
SnapVault Relationship Summary 784
SnapVault Relationship Summary
Explore your data center using APTARE customizable report templates or by using parts of your IT infrastructure as entry points. Use Search to find reports, templates and dashboards across the portal.
Use the Reports tab to examine the catalog of templates, dashboards and reports - organized by products along with user-created, and system folders. This report is located here:
Replication Manager > SnapVault Reports > SnapVault Relationship SummaryList status for source-destination pairs for SnapVault transactions. Choose to report by volume or QTree and select the mirror states to examine. For additional details about a Failed transaction, mouse over the Summary Status to view the message.
Source LocationThe source location will be displayed in one of the following formats: NetApp Storage System: Volume Name or NetApp Storage System: Volume Name/QTree Name
Destination LocationThe destination location will be displayed in one of the following formats: NetApp Storage System: Volume Name or NetApp Storage System: Volume Name/QTree Name
Mirror Timestamp Date and time of last SnapMirror transaction, including unsuccessful mirrors
Contents The active filesystem state of the destination: replica, transitioning, or original.
Last Transfer Size (KB)
Amount of data in the last mirror transfer.
Last Transfer Duration (Secs)
Length of time for the last mirror data transfer.
Transfer KB/Secs Rate of mirror data transfer.
Base Snapshot The name of the last snapshot transferred from source to destination
State uninitialized, snapmirrored, broken-off, quiesced, source, unknown.
StatusTransfer completion status for the source-destination pair: idle, transferring, pending, aborting, migrating, quiescing, resyncing, waiting, syncing, in-sync, or paused.
Summary StatusSuccess, Failed - Mouse over the Failed status to view the error message that contains the details of why the transfer failed.
Lag Time The length of time since the last SnapVault transfer.
Last Updated The last time the Data Collector updated the Portal database.
SnapMirror Data Protection Dashboard 785
SnapMirror Data Protection Dashboard
Explore your data center using APTARE customizable report templates or by using parts of your IT infrastructure as entry points. Use Search to find reports, templates and dashboards across the portal.
Use the Reports tab to examine the catalog of templates, dashboards and reports - organized by products along with user-created, and system folders. This report is located here:
Replication Manager > SnapMirror Reports > SnapMirror Data Protection DashboardThis report provides an at-a-glance view of the status of your SnapMirror data transfers, with drilldowns to details so that you can quickly resolve issues.
Click a status icon to drill down to the SnapMirror Summary.
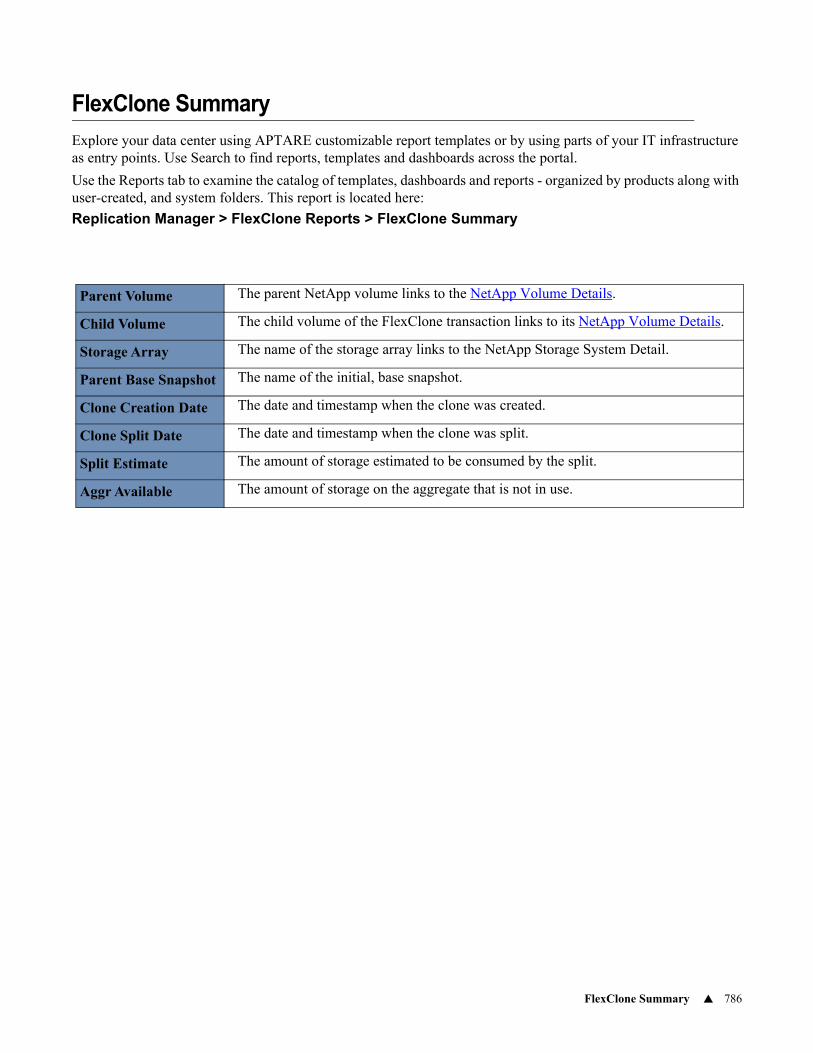
FlexClone Summary 786
FlexClone Summary
Explore your data center using APTARE customizable report templates or by using parts of your IT infrastructure as entry points. Use Search to find reports, templates and dashboards across the portal.
Use the Reports tab to examine the catalog of templates, dashboards and reports - organized by products along with user-created, and system folders. This report is located here:
Replication Manager > FlexClone Reports > FlexClone Summary
Parent Volume The parent NetApp volume links to the NetApp Volume Details.
Child Volume The child volume of the FlexClone transaction links to its NetApp Volume Details.
Storage Array The name of the storage array links to the NetApp Storage System Detail.
Parent Base Snapshot The name of the initial, base snapshot.
Clone Creation Date The date and timestamp when the clone was created.
Clone Split Date The date and timestamp when the clone was split.
Split Estimate The amount of storage estimated to be consumed by the split.
Aggr Available The amount of storage on the aggregate that is not in use.
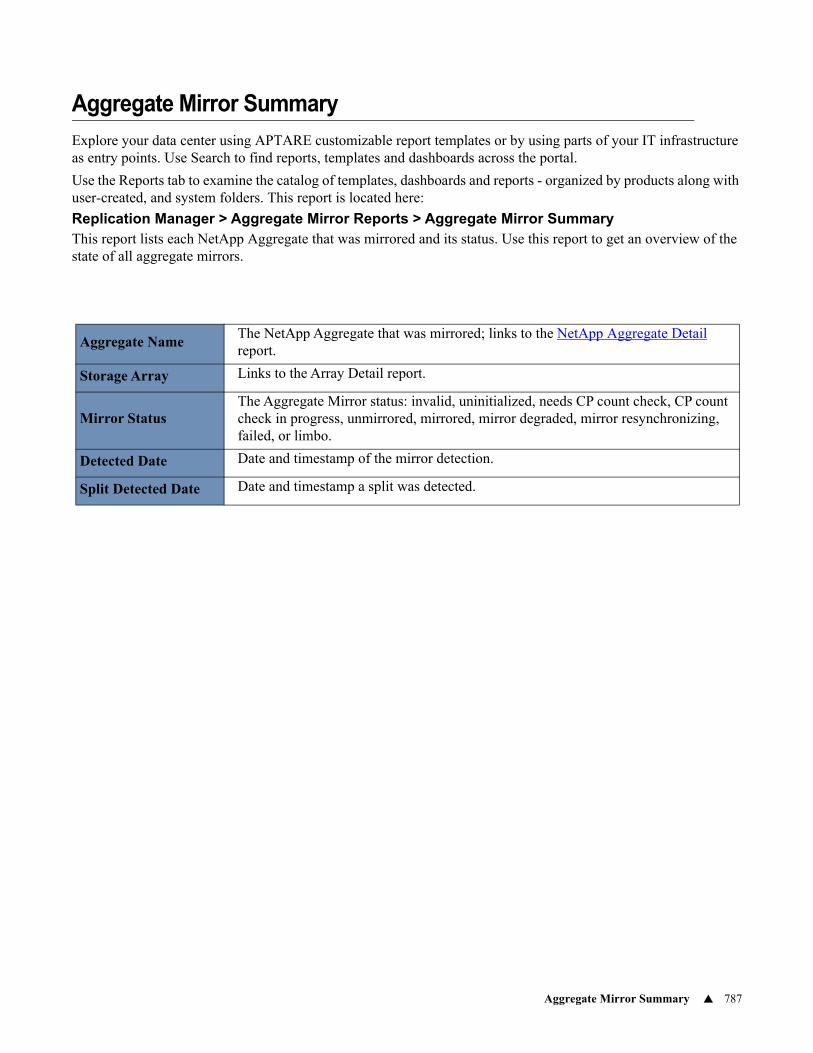
Aggregate Mirror Summary 787
Aggregate Mirror Summary
Explore your data center using APTARE customizable report templates or by using parts of your IT infrastructure as entry points. Use Search to find reports, templates and dashboards across the portal.
Use the Reports tab to examine the catalog of templates, dashboards and reports - organized by products along with user-created, and system folders. This report is located here:
Replication Manager > Aggregate Mirror Reports > Aggregate Mirror SummaryThis report lists each NetApp Aggregate that was mirrored and its status. Use this report to get an overview of the state of all aggregate mirrors.
Aggregate NameThe NetApp Aggregate that was mirrored; links to the NetApp Aggregate Detail report.
Storage Array Links to the Array Detail report.
Mirror StatusThe Aggregate Mirror status: invalid, uninitialized, needs CP count check, CP count check in progress, unmirrored, mirrored, mirror degraded, mirror resynchronizing, failed, or limbo.
Detected Date Date and timestamp of the mirror detection.
Split Detected Date Date and timestamp a split was detected.
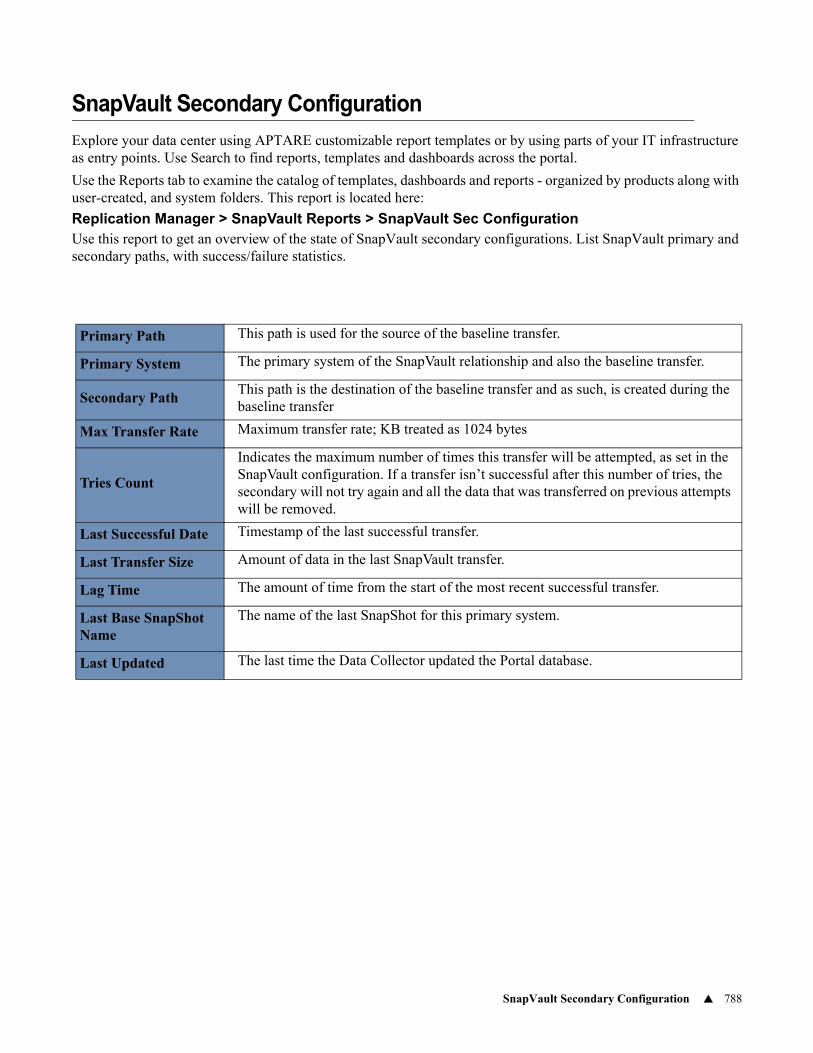
SnapVault Secondary Configuration 788
SnapVault Secondary Configuration
Explore your data center using APTARE customizable report templates or by using parts of your IT infrastructure as entry points. Use Search to find reports, templates and dashboards across the portal.
Use the Reports tab to examine the catalog of templates, dashboards and reports - organized by products along with user-created, and system folders. This report is located here:
Replication Manager > SnapVault Reports > SnapVault Sec ConfigurationUse this report to get an overview of the state of SnapVault secondary configurations. List SnapVault primary and secondary paths, with success/failure statistics.
Primary Path This path is used for the source of the baseline transfer.
Primary System The primary system of the SnapVault relationship and also the baseline transfer.
Secondary PathThis path is the destination of the baseline transfer and as such, is created during the baseline transfer
Max Transfer Rate Maximum transfer rate; KB treated as 1024 bytes
Tries Count
Indicates the maximum number of times this transfer will be attempted, as set in the SnapVault configuration. If a transfer isn’t successful after this number of tries, the secondary will not try again and all the data that was transferred on previous attempts will be removed.
Last Successful Date Timestamp of the last successful transfer.
Last Transfer Size Amount of data in the last SnapVault transfer.
Lag Time The amount of time from the start of the most recent successful transfer.
Last Base SnapShot Name
The name of the last SnapShot for this primary system.
Last Updated The last time the Data Collector updated the Portal database.
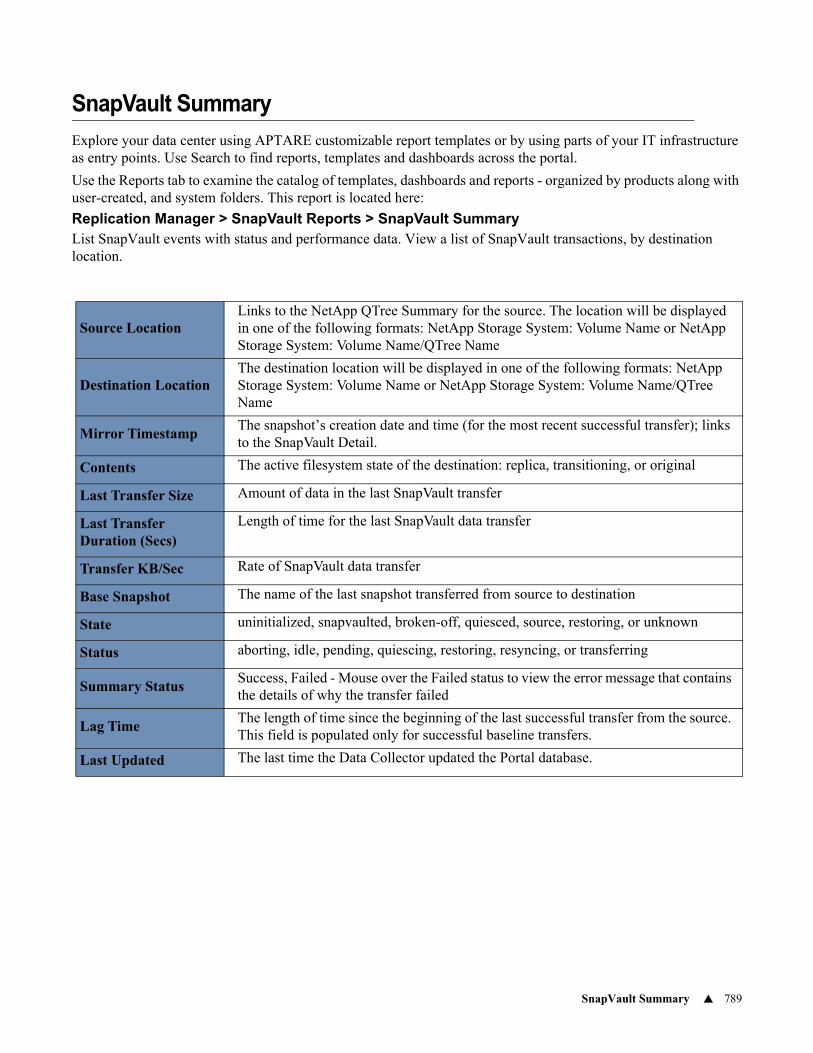
SnapVault Summary 789
SnapVault Summary
Explore your data center using APTARE customizable report templates or by using parts of your IT infrastructure as entry points. Use Search to find reports, templates and dashboards across the portal.
Use the Reports tab to examine the catalog of templates, dashboards and reports - organized by products along with user-created, and system folders. This report is located here:
Replication Manager > SnapVault Reports > SnapVault SummaryList SnapVault events with status and performance data. View a list of SnapVault transactions, by destination location.
Source LocationLinks to the NetApp QTree Summary for the source. The location will be displayed in one of the following formats: NetApp Storage System: Volume Name or NetApp Storage System: Volume Name/QTree Name
Destination LocationThe destination location will be displayed in one of the following formats: NetApp Storage System: Volume Name or NetApp Storage System: Volume Name/QTree Name
Mirror TimestampThe snapshot’s creation date and time (for the most recent successful transfer); links to the SnapVault Detail.
Contents The active filesystem state of the destination: replica, transitioning, or original
Last Transfer Size Amount of data in the last SnapVault transfer
Last Transfer Duration (Secs)
Length of time for the last SnapVault data transfer
Transfer KB/Sec Rate of SnapVault data transfer
Base Snapshot The name of the last snapshot transferred from source to destination
State uninitialized, snapvaulted, broken-off, quiesced, source, restoring, or unknown
Status aborting, idle, pending, quiescing, restoring, resyncing, or transferring
Summary StatusSuccess, Failed - Mouse over the Failed status to view the error message that contains the details of why the transfer failed
Lag TimeThe length of time since the beginning of the last successful transfer from the source. This field is populated only for successful baseline transfers.
Last Updated The last time the Data Collector updated the Portal database.
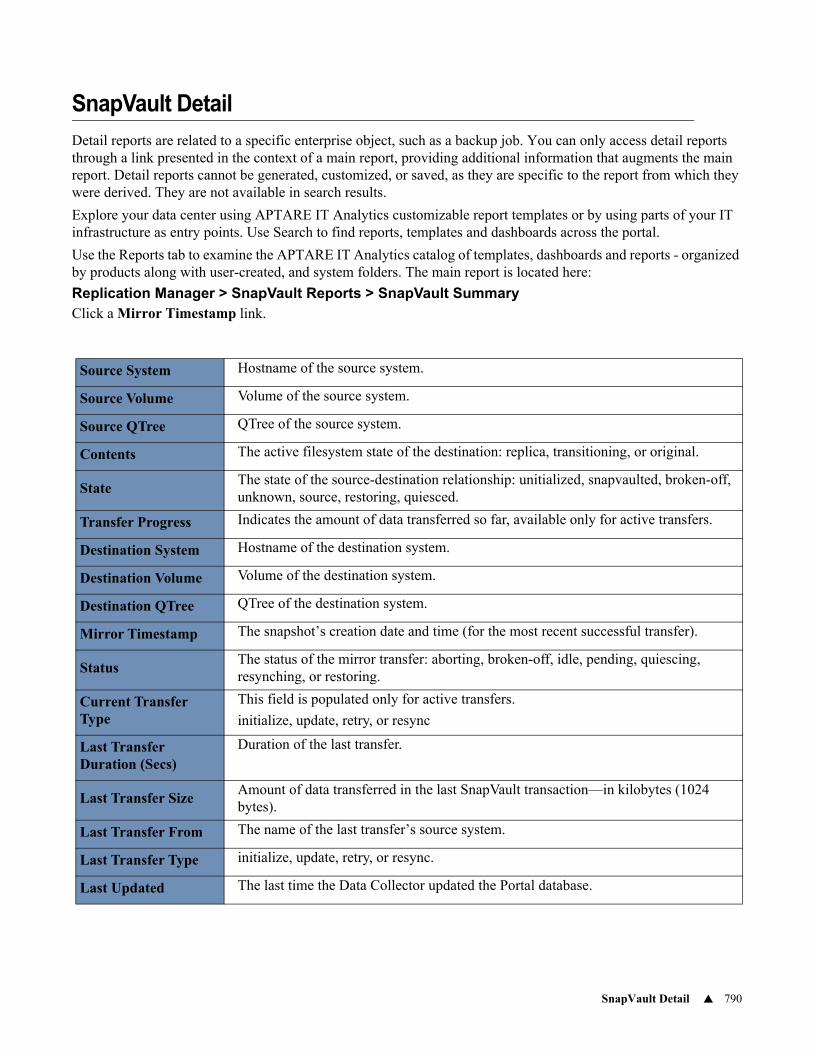
SnapVault Detail 790
SnapVault Detail
Detail reports are related to a specific enterprise object, such as a backup job. You can only access detail reports through a link presented in the context of a main report, providing additional information that augments the main report. Detail reports cannot be generated, customized, or saved, as they are specific to the report from which they were derived. They are not available in search results.
Explore your data center using APTARE IT Analytics customizable report templates or by using parts of your IT infrastructure as entry points. Use Search to find reports, templates and dashboards across the portal.
Use the Reports tab to examine the APTARE IT Analytics catalog of templates, dashboards and reports - organized by products along with user-created, and system folders. The main report is located here:
Replication Manager > SnapVault Reports > SnapVault SummaryClick a Mirror Timestamp link.
Source System Hostname of the source system.
Source Volume Volume of the source system.
Source QTree QTree of the source system.
Contents The active filesystem state of the destination: replica, transitioning, or original.
StateThe state of the source-destination relationship: unitialized, snapvaulted, broken-off, unknown, source, restoring, quiesced.
Transfer Progress Indicates the amount of data transferred so far, available only for active transfers.
Destination System Hostname of the destination system.
Destination Volume Volume of the destination system.
Destination QTree QTree of the destination system.
Mirror Timestamp The snapshot’s creation date and time (for the most recent successful transfer).
StatusThe status of the mirror transfer: aborting, broken-off, idle, pending, quiescing, resynching, or restoring.
Current Transfer Type
This field is populated only for active transfers.
initialize, update, retry, or resync
Last Transfer Duration (Secs)
Duration of the last transfer.
Last Transfer SizeAmount of data transferred in the last SnapVault transaction—in kilobytes (1024 bytes).
Last Transfer From The name of the last transfer’s source system.
Last Transfer Type initialize, update, retry, or resync.
Last Updated The last time the Data Collector updated the Portal database.
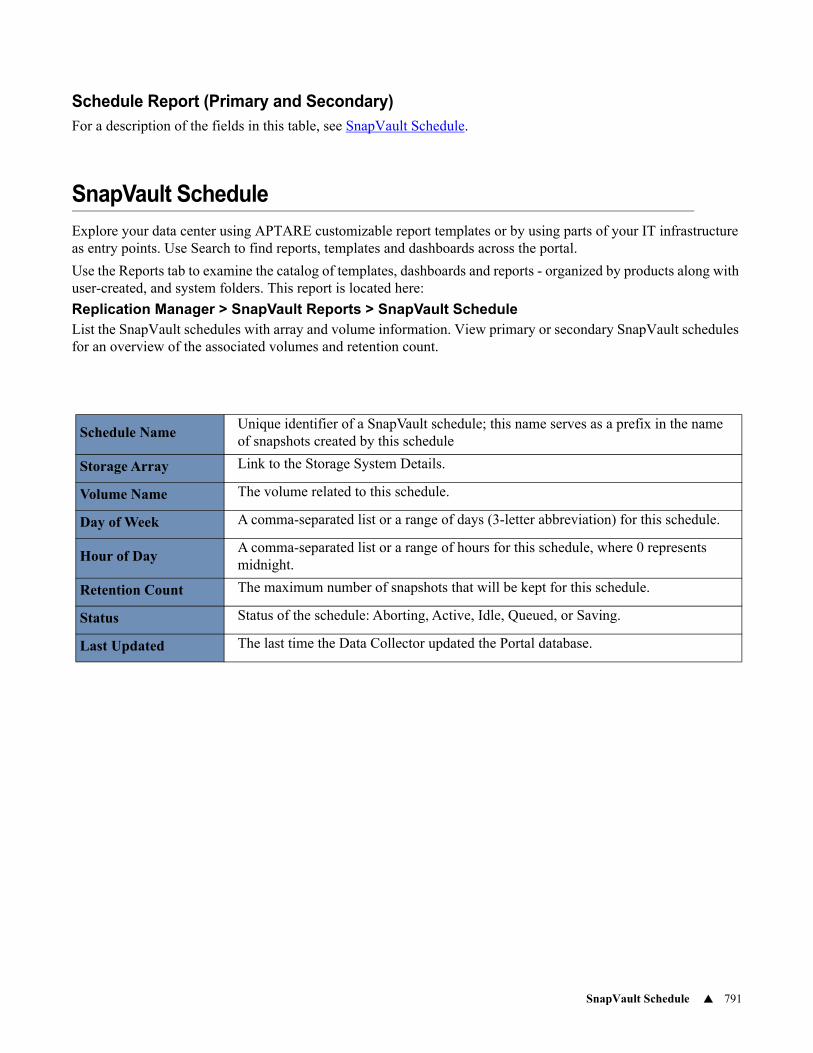
SnapVault Schedule 791
Schedule Report (Primary and Secondary)For a description of the fields in this table, see SnapVault Schedule.
SnapVault Schedule
Explore your data center using APTARE customizable report templates or by using parts of your IT infrastructure as entry points. Use Search to find reports, templates and dashboards across the portal.
Use the Reports tab to examine the catalog of templates, dashboards and reports - organized by products along with user-created, and system folders. This report is located here:
Replication Manager > SnapVault Reports > SnapVault ScheduleList the SnapVault schedules with array and volume information. View primary or secondary SnapVault schedules for an overview of the associated volumes and retention count.
Schedule NameUnique identifier of a SnapVault schedule; this name serves as a prefix in the name of snapshots created by this schedule
Storage Array Link to the Storage System Details.
Volume Name The volume related to this schedule.
Day of Week A comma-separated list or a range of days (3-letter abbreviation) for this schedule.
Hour of DayA comma-separated list or a range of hours for this schedule, where 0 represents midnight.
Retention Count The maximum number of snapshots that will be kept for this schedule.
Status Status of the schedule: Aborting, Active, Idle, Queued, or Saving.
Last Updated The last time the Data Collector updated the Portal database.
SnapVault Status 792
SnapVault Status
Explore your data center using APTARE customizable report templates or by using parts of your IT infrastructure as entry points. Use Search to find reports, templates and dashboards across the portal.
Use the Reports tab to examine the catalog of templates, dashboards and reports - organized by products along with user-created, and system folders. This report is located here:
Replication Manager > SnapVault Reports > SnapVault StatusDisplays a bar chart of SnapVault status, with drilldown access to details. Click a colored section of a bar to drill down to the SnapVault Summary. This at-a-glance view lets you quickly identify warnings and failures that need to be investigated.
SnapVault Data Transfer 793
SnapVault Data Transfer
Explore your data center using APTARE customizable report templates or by using parts of your IT infrastructure as entry points. Use Search to find reports, templates and dashboards across the portal.
Use the Reports tab to examine the catalog of templates, dashboards and reports - organized by products along with user-created, and system folders. This report is located here:
Replication Manager > SnapVault Reports > SnapVault Data TransferDisplays an at-a-glance view of the amount of SnapVault data transferred. Mouse over a bar to view the amount of data transferred. This bar chart represents the amount of data transferred from NetApp source to destination systems.
Click a bar to view the SnapVault Summary.
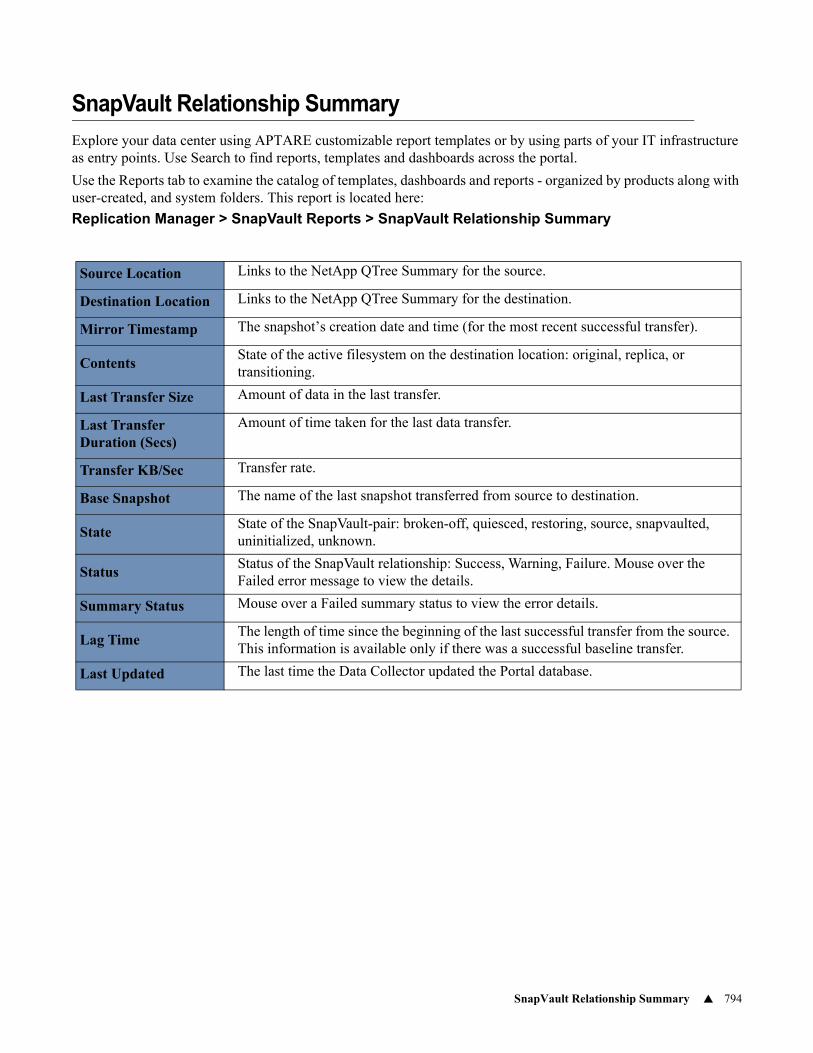
SnapVault Relationship Summary 794
SnapVault Relationship Summary
Explore your data center using APTARE customizable report templates or by using parts of your IT infrastructure as entry points. Use Search to find reports, templates and dashboards across the portal.
Use the Reports tab to examine the catalog of templates, dashboards and reports - organized by products along with user-created, and system folders. This report is located here:
Replication Manager > SnapVault Reports > SnapVault Relationship Summary
Source Location Links to the NetApp QTree Summary for the source.
Destination Location Links to the NetApp QTree Summary for the destination.
Mirror Timestamp The snapshot’s creation date and time (for the most recent successful transfer).
ContentsState of the active filesystem on the destination location: original, replica, or transitioning.
Last Transfer Size Amount of data in the last transfer.
Last Transfer Duration (Secs)
Amount of time taken for the last data transfer.
Transfer KB/Sec Transfer rate.
Base Snapshot The name of the last snapshot transferred from source to destination.
StateState of the SnapVault-pair: broken-off, quiesced, restoring, source, snapvaulted, uninitialized, unknown.
StatusStatus of the SnapVault relationship: Success, Warning, Failure. Mouse over the Failed error message to view the details.
Summary Status Mouse over a Failed summary status to view the error details.
Lag TimeThe length of time since the beginning of the last successful transfer from the source. This information is available only if there was a successful baseline transfer.
Last Updated The last time the Data Collector updated the Portal database.

SnapVault Data Protection Dashboard 795
SnapVault Data Protection Dashboard
Explore your data center using APTARE customizable report templates or by using parts of your IT infrastructure as entry points. Use Search to find reports, templates and dashboards across the portal.
Use the Reports tab to examine the catalog of templates, dashboards and reports - organized by products along with user-created, and system folders. This report is located here:
Replication Manager > SnapVault Reports > SnapVault Data Protection DashboardClick a colored status indicator to view the SnapVault Summary, which lists details about the snapshot transfers.
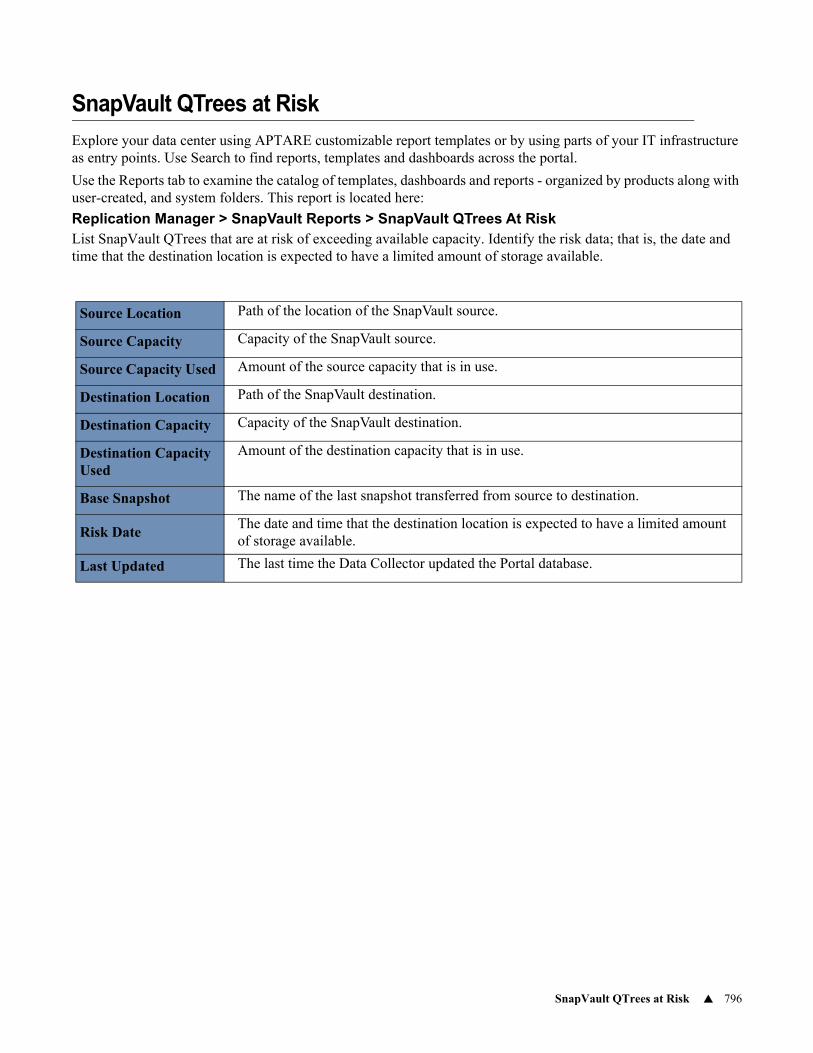
SnapVault QTrees at Risk 796
SnapVault QTrees at Risk
Explore your data center using APTARE customizable report templates or by using parts of your IT infrastructure as entry points. Use Search to find reports, templates and dashboards across the portal.
Use the Reports tab to examine the catalog of templates, dashboards and reports - organized by products along with user-created, and system folders. This report is located here:
Replication Manager > SnapVault Reports > SnapVault QTrees At RiskList SnapVault QTrees that are at risk of exceeding available capacity. Identify the risk data; that is, the date and time that the destination location is expected to have a limited amount of storage available.
Source Location Path of the location of the SnapVault source.
Source Capacity Capacity of the SnapVault source.
Source Capacity Used Amount of the source capacity that is in use.
Destination Location Path of the SnapVault destination.
Destination Capacity Capacity of the SnapVault destination.
Destination Capacity Used
Amount of the destination capacity that is in use.
Base Snapshot The name of the last snapshot transferred from source to destination.
Risk DateThe date and time that the destination location is expected to have a limited amount of storage available.
Last Updated The last time the Data Collector updated the Portal database.
VM Guests Overview 49
14VM Guests Overview
The Inventory provides an accurate picture of objects discovered within your enterprise. This interface displays asset counts from collected data, and provides access to multiple targeted reports that you can select to display. This overview page shows overview information for all collected VM Guests in your data center.
See also Exploring Your Inventory for general information and functionality.
Interacting with Reports on the Overview Page
Many interactive features are available depending on the report type:
• Time series - zoom and reset zoom: On a series of time-based data points, using the mouse, drag select a section of the chart to zoom. Click the Reset zoom button to return to your original settings.
• Time series – zoom and pan: Once you’ve zoomed on a series of time-based data points, you can scroll left and right through the chart. Hold down the shift key when panning.
• Expand to full screen: Charts displayed as components of a dashboard may be hard to read. Click the Expand icon to pop the chart out of the dashboard and have it displayed in the full browser window.
• Configure Portlets: Choose custom attributes for filters and switch positions for portlets on dashboard style displays.
• Show/hide data series: The legend displays the data series in a chart with a symbol and the name of the series. Click a value in the legend to add or remove the data point from the chart. The chart automatically updates based on the addition or removal.
• Column sorting: Click any column header on a tabular chart to sort the table by that column.
• Hyperlink drill downs: Drill down to a more granular level by clinking links in the report. This feature is available for all chart types.
• Time Period Quick Filters: Change the time period represented in the chart without formally editing the scope. Choose from 5 days, 2 days, 1 day, 12 hours, 4 hours or 1 hour.

50APTARE User’s Guide
• Expanding sectors: Click parts of a pie and donut charts to have sections emphasized without changing the data.
See also Working with Dashboards.
Working with the Action Menu in the Inventory View
Many functions available to standard reports and templates are available to the reports in the Inventory Navigator.
• Inventory Reports: Edit Scope - Your selection in the Hierarchy Panel sets the objects which are part of the scope. For some objects and object groups, you can edit additional parameters. Edit Scope is only shown when there are parameters available to change. A default time period is also set for those reports that require one. Use the Hierarchy Panel to revise the scope when the menu item is not displayed. See Report Scope for details.
Report Type Interactive Feature
Tabular
• Hyperlink drill downs
• Column sorting
• Expand to full screen
Bar (all types)
• Time series - zoom and reset zoom
• Time series – zoom and pan
• Expand to full screen
• Show/hide data series
• Hyperlink drill downs
Line
• Time series - zoom and reset zoom
• Time series – zoom and pan
• Expand to full screen
• Show/hide data series
• Hyperlink drill downs
Area
• Time series - zoom and reset zoom
• Time series – zoom and pan
• Expand to full screen
• Show/hide data series
• Hyperlink drill downs
Pie/Donut
• Expand to full screen
• Show/hide data series
• Hyperlink drill downs
• Expand sectors
Gauge • Expand to full screen
VM Guests Overview 51
• Inventory Reports: Save As - When you save a report, you are saving a copy of the report into the Reports tab, not the report output. You can save a version in your Reports. Scope selections are saved with the report. See Saving Reports for details.
Note: Some reports provided by the Inventory are specialized and not available from the Reports tab. Due to the nature of these reports, they function like Detail reports and cannot be customized or saved, as they are specific to the report from which they were derived. Save As is not displayed for these reports.
• Inventory Reports: Email - After you generate a report and it renders, you can choose to instantly email the report. Emailed reports are not derived from the cache. These events are run in real time, so current data is always used. You can email a report to yourself, other individuals, or a distribution list. Scheduling reports to be regularly emailed is not available from the Inventory tab. See Emailing Reports and Dashboards for details.
• Inventory Reports: Export - You can export reports to make them available to external applications, such as Microsoft Excel or if you’d like to generate a hardcopy, you can export them to a file, such as a PDF. Exported reports are not derived from the cache. These events are run in real-time, so current data is always used. See Exporting Reports and Dashboards for details.
• Inventory Reports: Filter - In addition to the filtering that happens with your hierarchy selection, table-formatted reports can be further filtered on Rows and/or Columns, using advanced filtering. You can define the criteria for the data rows displayed in a report. Drop-down lists enable selections from the available columns. Next, you supply the operator—such as equals or does not contain—and a value for that column. Up to 16 selections can be joined to form the filter. See Advanced Filtering for Tabular Reports for details.

52APTARE User’s Guide
VM Servers Overview 53
15VM Servers Overview
The Inventory provides an accurate picture of objects discovered within your enterprise. This interface displays asset counts from collected data, and provides access to multiple targeted reports that you can select to display. This overview page shows overview information for all collected VM Servers in your data center.
VM Server Overview information is visualized through the following reports:
• CPU Utilization displays the total CPU available as a resource to the VMs on this host. The Average and Maximum usage percentage is graphed over time for the number of samples taken within that time frame. The default time range is 4 days and grouped by hour. Click the Show Table icon to display the data in a tabular format.
• Memory Utilization displays total memory available as a resource to the VMs on this host. This time-based series chart visualizes the capacity, average usage and maximum usage size for datastores. You can roll-over the data points to display specific sizes and the related date, plus toggle values using the legend.
You can also click the bars to drill down into details. Click the Show Table icon to display the data in a tabular format.
• Microsoft Hyper-V Server Summary
See also Exploring Your Inventory for general information and functionality.
Interacting with Reports on the Overview Page
Many interactive features are available depending on the report type:
• Time series - zoom and reset zoom: On a series of time-based data points, using the mouse, drag select a section of the chart to zoom. Click the Reset zoom button to return to your original settings.
• Time series – zoom and pan: Once you’ve zoomed on a series of time-based data points, you can scroll left and right through the chart. Hold down the shift key when panning.
• Expand to full screen: Charts displayed as components of a dashboard may be hard to read. Click the Expand icon to pop the chart out of the dashboard and have it displayed in the full browser window.
• Configure Portlets: Choose custom attributes for filters and switch positions for portlets on dashboard style displays.
• Show/hide data series: The legend displays the data series in a chart with a symbol and the name of the series. Click a value in the legend to add or remove the data point from the chart. The chart automatically updates based on the addition or removal.
• Column sorting: Click any column header on a tabular chart to sort the table by that column.
• Hyperlink drill downs: Drill down to a more granular level by clinking links in the report. This feature is available for all chart types.
• Time Period Quick Filters: Change the time period represented in the chart without formally editing the scope. Choose from 5 days, 2 days, 1 day, 12 hours, 4 hours or 1 hour.
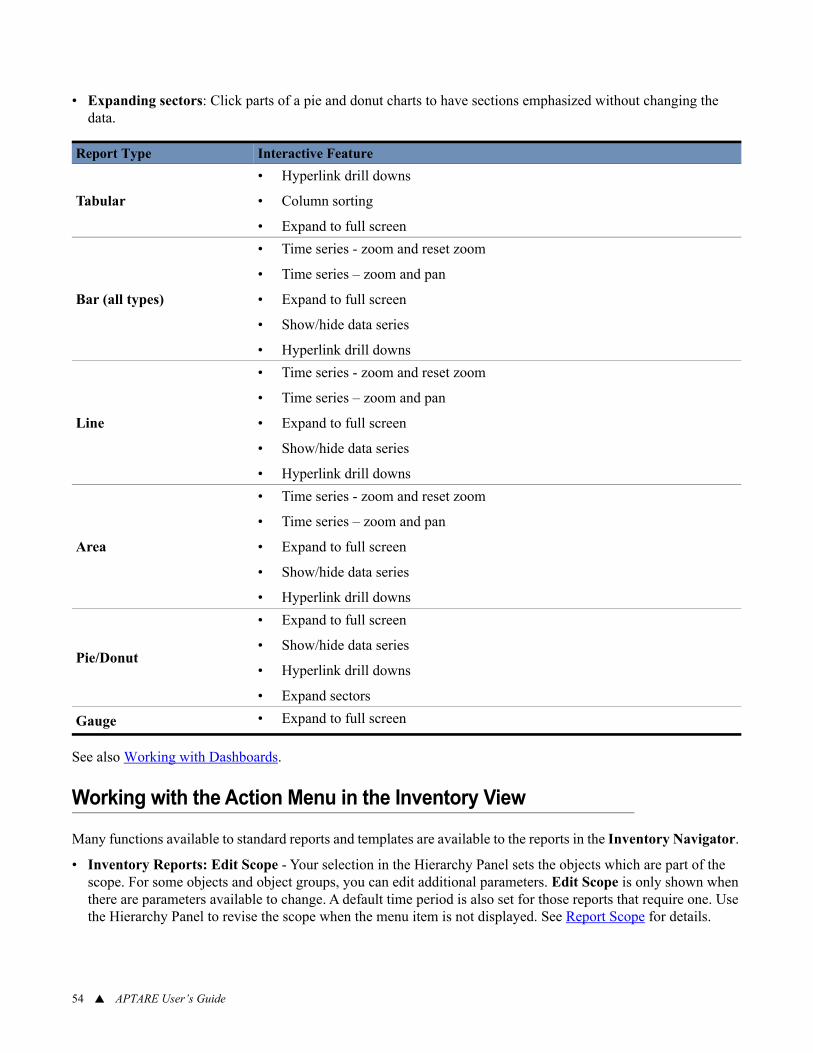
54APTARE User’s Guide
• Expanding sectors: Click parts of a pie and donut charts to have sections emphasized without changing the data.
See also Working with Dashboards.
Working with the Action Menu in the Inventory View
Many functions available to standard reports and templates are available to the reports in the Inventory Navigator.
• Inventory Reports: Edit Scope - Your selection in the Hierarchy Panel sets the objects which are part of the scope. For some objects and object groups, you can edit additional parameters. Edit Scope is only shown when there are parameters available to change. A default time period is also set for those reports that require one. Use the Hierarchy Panel to revise the scope when the menu item is not displayed. See Report Scope for details.
Report Type Interactive Feature
Tabular
• Hyperlink drill downs
• Column sorting
• Expand to full screen
Bar (all types)
• Time series - zoom and reset zoom
• Time series – zoom and pan
• Expand to full screen
• Show/hide data series
• Hyperlink drill downs
Line
• Time series - zoom and reset zoom
• Time series – zoom and pan
• Expand to full screen
• Show/hide data series
• Hyperlink drill downs
Area
• Time series - zoom and reset zoom
• Time series – zoom and pan
• Expand to full screen
• Show/hide data series
• Hyperlink drill downs
Pie/Donut
• Expand to full screen
• Show/hide data series
• Hyperlink drill downs
• Expand sectors
Gauge • Expand to full screen

VM Servers Overview 55
• Inventory Reports: Save As - When you save a report, you are saving a copy of the report into the Reports tab, not the report output. You can save a version in your Reports. Scope selections are saved with the report. See Saving Reports for details.
Note: Some reports provided by the Inventory are specialized and not available from the Reports tab. Due to the nature of these reports, they function like Detail reports and cannot be customized or saved, as they are specific to the report from which they were derived. Save As is not displayed for these reports.
• Inventory Reports: Email - After you generate a report and it renders, you can choose to instantly email the report. Emailed reports are not derived from the cache. These events are run in real time, so current data is always used. You can email a report to yourself, other individuals, or a distribution list. Scheduling reports to be regularly emailed is not available from the Inventory tab. See Emailing Reports and Dashboards for details.
• Inventory Reports: Export - You can export reports to make them available to external applications, such as Microsoft Excel or if you’d like to generate a hardcopy, you can export them to a file, such as a PDF. Exported reports are not derived from the cache. These events are run in real-time, so current data is always used. See Exporting Reports and Dashboards for details.
• Inventory Reports: Filter - In addition to the filtering that happens with your hierarchy selection, table-formatted reports can be further filtered on Rows and/or Columns, using advanced filtering. You can define the criteria for the data rows displayed in a report. Drop-down lists enable selections from the available columns. Next, you supply the operator—such as equals or does not contain—and a value for that column. Up to 16 selections can be joined to form the filter. See Advanced Filtering for Tabular Reports for details.

56APTARE User’s Guide
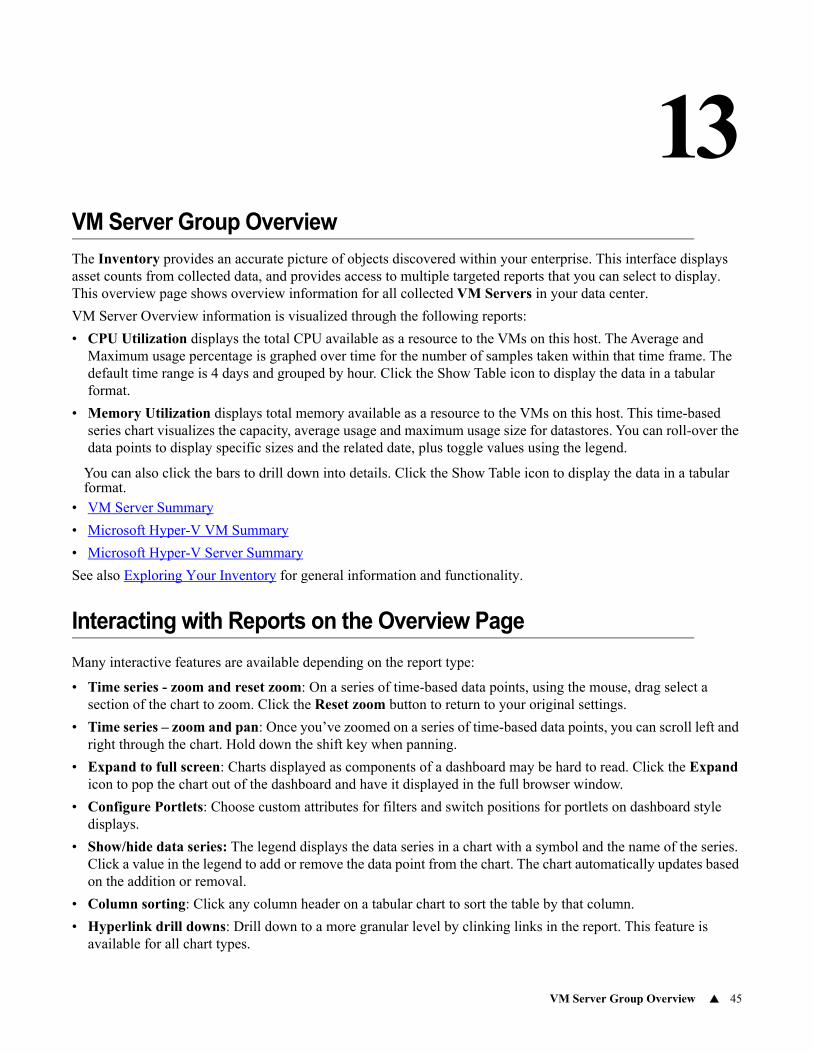
VM Server Group Overview 45
13VM Server Group Overview
The Inventory provides an accurate picture of objects discovered within your enterprise. This interface displays asset counts from collected data, and provides access to multiple targeted reports that you can select to display. This overview page shows overview information for all collected VM Servers in your data center.
VM Server Overview information is visualized through the following reports:
• CPU Utilization displays the total CPU available as a resource to the VMs on this host. The Average and Maximum usage percentage is graphed over time for the number of samples taken within that time frame. The default time range is 4 days and grouped by hour. Click the Show Table icon to display the data in a tabular format.
• Memory Utilization displays total memory available as a resource to the VMs on this host. This time-based series chart visualizes the capacity, average usage and maximum usage size for datastores. You can roll-over the data points to display specific sizes and the related date, plus toggle values using the legend.
You can also click the bars to drill down into details. Click the Show Table icon to display the data in a tabular format.
• VM Server Summary
• Microsoft Hyper-V VM Summary
• Microsoft Hyper-V Server Summary
See also Exploring Your Inventory for general information and functionality.
Interacting with Reports on the Overview Page
Many interactive features are available depending on the report type:
• Time series - zoom and reset zoom: On a series of time-based data points, using the mouse, drag select a section of the chart to zoom. Click the Reset zoom button to return to your original settings.
• Time series – zoom and pan: Once you’ve zoomed on a series of time-based data points, you can scroll left and right through the chart. Hold down the shift key when panning.
• Expand to full screen: Charts displayed as components of a dashboard may be hard to read. Click the Expand icon to pop the chart out of the dashboard and have it displayed in the full browser window.
• Configure Portlets: Choose custom attributes for filters and switch positions for portlets on dashboard style displays.
• Show/hide data series: The legend displays the data series in a chart with a symbol and the name of the series. Click a value in the legend to add or remove the data point from the chart. The chart automatically updates based on the addition or removal.
• Column sorting: Click any column header on a tabular chart to sort the table by that column.
• Hyperlink drill downs: Drill down to a more granular level by clinking links in the report. This feature is available for all chart types.
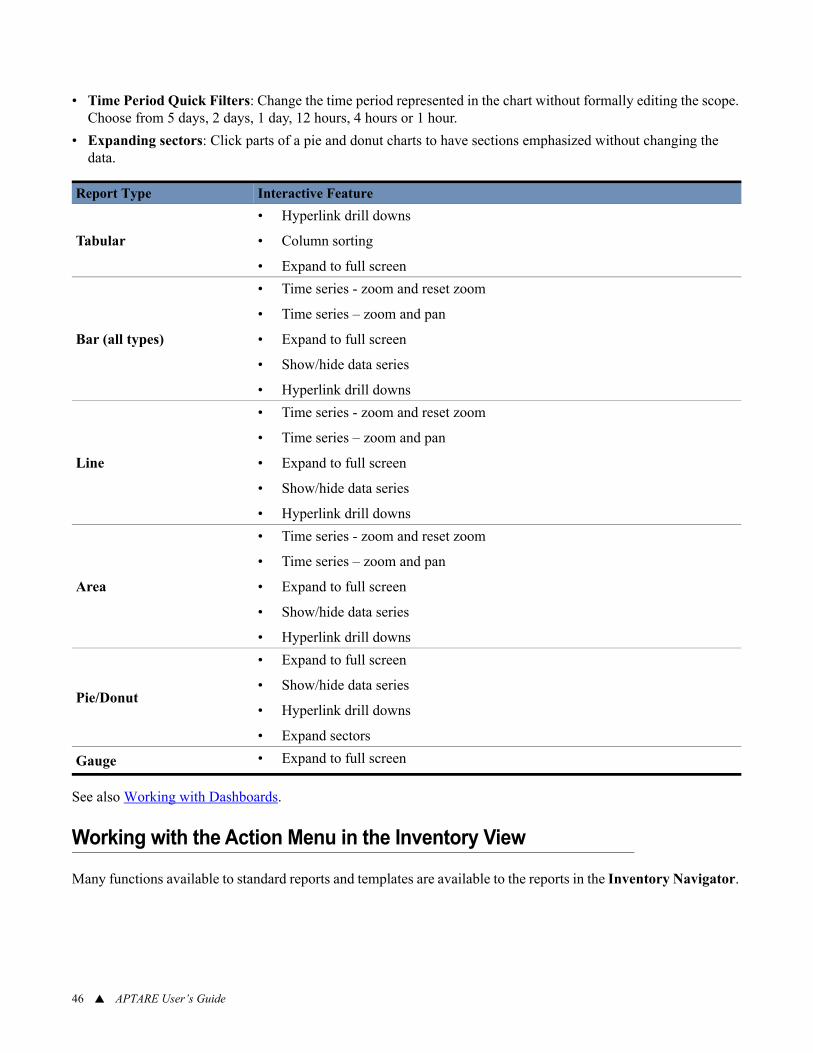
46APTARE User’s Guide
• Time Period Quick Filters: Change the time period represented in the chart without formally editing the scope. Choose from 5 days, 2 days, 1 day, 12 hours, 4 hours or 1 hour.
• Expanding sectors: Click parts of a pie and donut charts to have sections emphasized without changing the data.
See also Working with Dashboards.
Working with the Action Menu in the Inventory View
Many functions available to standard reports and templates are available to the reports in the Inventory Navigator.
Report Type Interactive Feature
Tabular
• Hyperlink drill downs
• Column sorting
• Expand to full screen
Bar (all types)
• Time series - zoom and reset zoom
• Time series – zoom and pan
• Expand to full screen
• Show/hide data series
• Hyperlink drill downs
Line
• Time series - zoom and reset zoom
• Time series – zoom and pan
• Expand to full screen
• Show/hide data series
• Hyperlink drill downs
Area
• Time series - zoom and reset zoom
• Time series – zoom and pan
• Expand to full screen
• Show/hide data series
• Hyperlink drill downs
Pie/Donut
• Expand to full screen
• Show/hide data series
• Hyperlink drill downs
• Expand sectors
Gauge • Expand to full screen
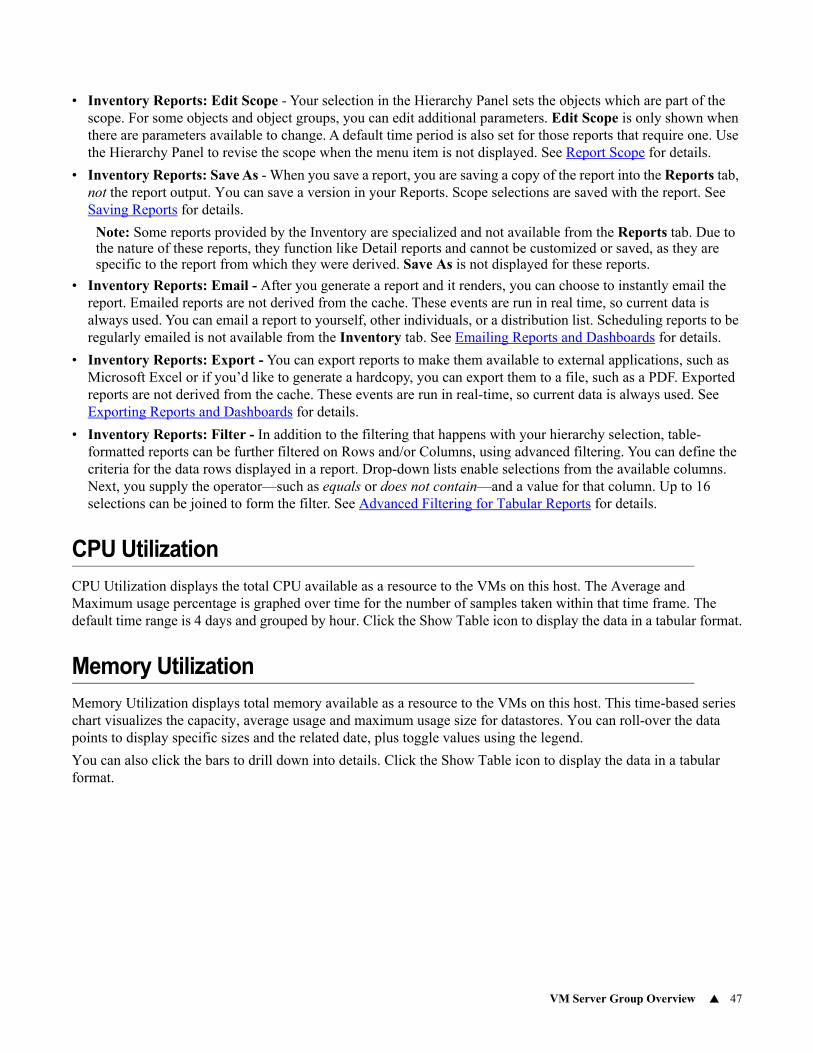
VM Server Group Overview 47
• Inventory Reports: Edit Scope - Your selection in the Hierarchy Panel sets the objects which are part of the scope. For some objects and object groups, you can edit additional parameters. Edit Scope is only shown when there are parameters available to change. A default time period is also set for those reports that require one. Use the Hierarchy Panel to revise the scope when the menu item is not displayed. See Report Scope for details.
• Inventory Reports: Save As - When you save a report, you are saving a copy of the report into the Reports tab, not the report output. You can save a version in your Reports. Scope selections are saved with the report. See Saving Reports for details.
Note: Some reports provided by the Inventory are specialized and not available from the Reports tab. Due to the nature of these reports, they function like Detail reports and cannot be customized or saved, as they are specific to the report from which they were derived. Save As is not displayed for these reports.
• Inventory Reports: Email - After you generate a report and it renders, you can choose to instantly email the report. Emailed reports are not derived from the cache. These events are run in real time, so current data is always used. You can email a report to yourself, other individuals, or a distribution list. Scheduling reports to be regularly emailed is not available from the Inventory tab. See Emailing Reports and Dashboards for details.
• Inventory Reports: Export - You can export reports to make them available to external applications, such as Microsoft Excel or if you’d like to generate a hardcopy, you can export them to a file, such as a PDF. Exported reports are not derived from the cache. These events are run in real-time, so current data is always used. See Exporting Reports and Dashboards for details.
• Inventory Reports: Filter - In addition to the filtering that happens with your hierarchy selection, table-formatted reports can be further filtered on Rows and/or Columns, using advanced filtering. You can define the criteria for the data rows displayed in a report. Drop-down lists enable selections from the available columns. Next, you supply the operator—such as equals or does not contain—and a value for that column. Up to 16 selections can be joined to form the filter. See Advanced Filtering for Tabular Reports for details.
CPU Utilization
CPU Utilization displays the total CPU available as a resource to the VMs on this host. The Average and Maximum usage percentage is graphed over time for the number of samples taken within that time frame. The default time range is 4 days and grouped by hour. Click the Show Table icon to display the data in a tabular format.
Memory Utilization
Memory Utilization displays total memory available as a resource to the VMs on this host. This time-based series chart visualizes the capacity, average usage and maximum usage size for datastores. You can roll-over the data points to display specific sizes and the related date, plus toggle values using the legend.
You can also click the bars to drill down into details. Click the Show Table icon to display the data in a tabular format.

48APTARE User’s Guide