report on the entertainment tax the passengers and goods
TRANSCRIPT

Report on the Entertainment Tax the Passengers and Goods Tax and the Electricity Duty in Bihar
October 1981
of Public 117,
LIBRARY
Acc No....5 ^ $ .i£ • r> c .. k~r
n e w delHI
//
NATIONAL INSTITUTE OF PUBLIC FINANCE AND POLICY
NEW DELHI

Report on tha Entertainment Tax the Passengers and Goods Tax and the Electricity Outy in Bihar
October 1981
National Institute of Public Finance and Policy 12 Rajendra Place Neu Delhi 110008

Study Team
Raja 3. Chelliah
M.G. Rao
C. Gopalakrishnan
Sanjeev V/arma
Project Leader
Member
Research Assistant
Research Investigator

This Report uas prepared on behalf of the
Institute by members of the study team listed in the
facing page. As per agreement uith the Government of
Bihar, the study uas guided and supervised by Dr R. 3,
Chelliah. However, the major part of the field work
and analysis of data uas carried out by Dr. M.G, Rao»
Shri C. Gopalakrishnan, besides rendering research
assistance in relation to the project as a whole,
also carried out part of the analysis relating to the
electricity’ duty.
The final draft of the Report uas jointly
prepared by Drs. Chelliah and Rao.,
R. 3. Chelliah Director
NIPFP
Neu Delhi
October 5, 1981

Pape No.
I. Introduction
1f The Study and Terms of Reference 1
2. Modalities of the Study 4
3. Acknowledgements 5
II Entertainment Tax in Bihar
1. Evolution of the Tax 7
2. Fiscal Importance and Growth 8
3. Analysis of the Tax Base 11
4. Structure of Entertainment Tax in Bihar 21
5. Administration and Enforcement of the Tax 37
6. Information System 43
7. Recommendations 44
III Passengers and Goods Tax in Bihar
1. Introduction 51
2. Evolution of the(Tax 52
3. Fiscal Importance and Growth of the Tax 54
4. The Structure of the Tax 60
5. An Estimate of Evasion of the Tax . 68
6. Recommendations 78
Appendix 111.1 87\
IV- Electricity Duty in Bihar
1. Origin of the Levy 93
2. Fiscal Importance and Growth of the Tax 93
3. Structure of the Electricity Duty in Bihar 99
4. Administrative Issues 108
5. Recommendations 111
Tabia of Contents

(a)
List of Annaxures
Pag a No
I. i Questionnaire 114
1.2 List of Parsons/Organisations Uho Gava Evidanca Bafora tha Study Taam;
119
1.3 List of Persons/Organisations Uho Submitted Written Memoranda to tha Study Taam
120
111.1 Proposad Ratas of Additional Motor Vahiclas Tax in tha Place of Goods Tax ■
121
III.2 Prasant Incidence of Passengar Tax Par Saat Par Quarter and Proposad Rates of Additional Motor,Vahiclas Tax for Passenger Buses
122
IV. 1 Ratas of Discretionary Changes in the Structuro of Electricity Duty in Bihar
123

I”' V ’ Paae Mo.' ' ' ' ‘ ' : : ■
111,1 Rate of Composition Fes Payable by Different 148\l h i d e s .
fl^L2 1 Pasisenge.rs .and Goods: Tax'as ia Proportion of 150Total Tax Revenue in Bihar and :he Neighbouring
: States ' r ■ .
111.3 Per Capita Passehgers and Goods Tax in Bihar 151and the Neighbouring States
111.4 Buoyancy and Elasticity of Passengers and ' ■,152Goods Tax in Bihar and the Neighbouring States 1 (1968-69 to 1977-78)
III. 5 Growth of| Passengers and Goods Tax - Automatic '153and Discretionary Components (1968-69 to 1977-78)
III*6 Yield of Passengers and Goods Tax in Different,, 154States (1977-78) ■ - V‘_v ' '
III. 7 Rates of Passengers and.'Goods tax in Dif/^rent 155States (T978) :V ' • ' T
II,1.8 Compounding Rate per Ysa't; ;in Bihar and the 156Neighbouring States!
*111,9 A Comparative Study of Taxes to be paid and 157the Composition Fee Payable by Buses, Trucks and Autorikshaus
III.10 Comparison of Tax to be Paid at Existing Rates» 159Composition Fee Payable and Actual Tax Accruingto the> State
IV/. 1 Revenue From Electricity Outy as Per Cant of • 160 Tr-al Tax Rev/enue in Plhar and the Neighbouring States ■i ■ . - ■ ' ‘
IV.2 Share; of Electricity Duty in St te Domestic ‘161•Product: in -Bihar and the Neighbouring States
. . (1961-62 to 1.977-78) *
IV.3 Buoyancy and Elasticity of Electricity Outy in 162Bihar and the Neighbouring States i : s *
IV.4 Regression- Results ' .. .1-63
IV, 5 Installed Generating Capacity and Actual 164Generation of Electricity in Bihar1' * : '
IV.6 Average Rate of Duty per Unit of Energy 168
Lifct of Tables (contd...)

Paoe No a
11.1. Entertainment Tax as Per Cent of Total Tax 125Revenue in Bihar and the Neighbouring States
II..2 Share of Entertainment Tax in State Domestic 126Product in Bihar and the Neighbouring States (1961-62 to 1977-78)
11.3 Growth of Entertainment Tax in Bihar and the 127Neighbouring States
11.4 Per Capita Entertainment Tax in Bihar and 128the Neighbouring States (1961-62 to 1978-79)
11* 5 Entertainment Tax Levels in Bihar and tha 129Neighbouring Stakes
11.6 Occupancy Ratios of Cinema Houses Located in 130Cities of Different Population Groups and by Admission Rates in Bihar (1975-76)
11.7 Occupancy Ratios of Cinema Houses Located in 131Citieg of. Different Population Groups and byAdmission Rates in Bihar (1979-80)
.of11.8 Capacity and Occupancy£,Cinema Houses in Diff- 132
erent Groups of Cities in Bihar ’
11.9 Occupancy Ratios in Cinema Houses Located in 133Different Districts of Bihar ,
11*10 Frequency Distribution of Cinema Houses 137According to Occupancy Ratio and Class of Cities in Bihar (1975-76 and 1979-80)
11*11 Number of Permanent Cinema Halls per Lakh of 138Population in Different States in 1975-76
11.12 Planning Standard for Gutting Licence for 139New Cinema Houses in Bihar
11.13 Rate Structure of Entertainment Tax, Cinema 140Show Tax and Betting Tax in Major States !
11.14 Revision of Admission Fee and Tax Rates of 145Cinema Houses in Patna City
11.15 Increases in the Rates of Admission and 146Entertainment Tax (1960-61 to 1978-79)
11.16 Distribution of the Cinema Halls Paying 147Composition Fee
(iii)
List of Tables

IV.7
IV.8
IV.9
IV.1l
IV.1
IV.1
IV. 1
JV.1
Energy Salas to Category-Uise Consumers in Bi ar (1961-62 to 1977 -78)
Stata-Uise Electricity Tariff and Electricity Duty (1979)
Average Cost of Power per Unit Produced Unuwj Various Systems of Power Generation in Bihar
D Installed Capacity and Generation in Selected Industries in Bihar (1978)
1 Rates of Duty for Self-Ganerated Electricity in Differtant States
2 Exemptions from the Levy of Electricity Duty
3 Collection of Electricity Duty in Bihar : Applying All-India Transmission Distribution and Unaccounted Losses
4 Collection of Electricity Duty in Bihar :Applying All-India Utilisation of Installed Capac ity -
(v)
List of Tablas (contd...)
Paoe No.
169
172
174i
175
176
177
179
180

I. INTRODUCTION
1, The Study and Terms of Reference
1*1*1 The Government of Bihar in its resolution No. 3827
of May 8, 1980 entrusted the National Institute of Public
Finance and Policy (NIPFP) with the task of undertaking a
study with a view to rationalising the structure of three
taxes levied under the State Acts, namely* (a) the Bihar
Taxation on Passengers and Goods (carried by Public Service
Motor Vehicles) Act, 1961; (b) the Bihar Entertainment Tax
Act, 1948; and (c) the Bihar Electricity Duty Act, 1948.
1.1,2 The terms of reference for the study of the threei
taxes are as follows:
(a) The Bihar Taxation on Passengers and Goods Act, 1961:
(i) To make a comparative study of the present
rate strqcture of Bihar Passengers and Goods
Tax (PGT) on Public Service Motor Vehicles
vis-a-vis that of other States and suggest
such rate schedule as would ensure the maximum
collection without adversely affecting the
trade and business;
(ii) To study the. administrative set-up of check
points established in the State for the colleo*
tion of Passengers and Goods Tax and to suggest
improvements In their working;
(iii) To study the present provisions regarding
compounding of tax and suggest such amendments
as may be necessary;

- 2 -
(iv) To study the different forms and registers
prescribed under the Act and Rules and
executive instructions and suggest such changes;
as may be necessary;
(v) To study the present system of levy of tax and
suggest such improvements in their working as
to ensure prompt assessment and collection of
tax;
(vi) To conduct selective studies to know the poten
tial PGT revenue in comparison to actual
yield; and
— i i -
(vii) To study and report on any other related and
connected matters.
(b). Bihar Entertainment Tax Act, 1948:
(i) To study the present system of levy of Bihar
Entertainment Tax Act and to suggest such
improvement as to plug the loopholes and
check evasion;
(ii) To make a comparative study of the present rats
structure vis-a-vis other States and to suggest
such rate structure as would ensure optimum
revenue to the State without adversely affect
ing trade and industry;
3
(iii) To study the present system of compounding of
tax and suggest such amendments as may. be
necessary in this regard;
(iv) To study the present provisions for exemptions
from Entertainment Tax and to suggest such
amendments in the existing provisions as may
be necessary;
• ■ ' ■ v -< ■ . ' -
(v) To study the structure of Entertainment .Tax
administration in the State and to suggest such
improvemerrt%.A?-may be necessary;
(vi) To study the registers and forms prescribed
. — -rimder--the Act and suggest such improv ements
as may be-necessary;
(yii) To conduct selective surveys so as to know the
potential entertainment tax revenue in compari
son to actual tax yield; and,
(viii)vCTo study and report on any other related and
connected matters.
(c) Bihar Electricity Duty Act, 1948J
(i) To study the present system of levy of Bihar
Electricity Duty and to suggest such improve
ments as may be felt necessary';

(ii) To study the present rat$ structure for levy of
Bihar Electricity Duty and to suggest such rata
structure as uould ensure the optimum revenue
to the State?
(iii) To study the present provisions for exemptions
from Bihar Electricity Outy and to suggest such
amendments in the existing provisions 6s may be
necessary; and
(iv) To study and report on any other related and
connected matters,
2 4 Modalities' of the Study
} ,
1.2.1 Tha work on the project started from the .first ueek
of Ouly 1980. The study team including the Director of NIPFP
visited Patna at different times in order to collect first
hand information on the structure and operation of these
taxes and to hold discussions uith the officials of the>
Commercial Taxes Department, the Finance Department, and the
representatives of trade and industry.
1.2.2 A questionnaire uas canvassed among the officials of
the Commercial Taxes Department and the representatives of
.Cinema Owners* Association, Transporters’ Association, trade
and industry and certain prominent citizens to elicit their
vieus on the areas where simplification and rationalisation
. of the structure of these taxes should be attempted. A copy
of the questionnaire is given in Annexure I* Ue are happy
to state that the officials, organisations, and the public

volunteered to supply us information on various aspects of
the taxes and to give suggestions on the.areas of reform in
the structure of these taxes* The names of persons/organi
sations who gave evidence before the St-udy- Team and submitted
written memdranda are given, in Annexures II and III,
respectively*
3. Acknowledgements
1*3.1 We wish to express our gratitude to the officials of
the Government of Bihar, who extended to us their unflinching
cooperation, but for which the study could not have been,
completed. The officials of the Finance and Commercial‘Taxes
Departments helped us a great deal by providing information
on the structure of the taxes* Besides, they allowed us to
draw on their rich experiences of administering these taxes
by enlightening us with their views on the areas of reform*
We wish to place on record our deep appreciation of the help
rendered to us by Shri 3.C. Detli, former Commissioner of
Commercial Taxes, whose earnestness to rationalise the tax
structure resulted in the entrusting of the study to us*
Much of the work on the study was done during the tenure of
Shri R*K. Sinha as the Commissioner of Commercial Taxes,
who made our job easy by extending maximum cooperation to us*
Ue are thankful also to Mr. B.P* V/erma., the present Commis-
sioner, who has continued to show the same keen interest in
the study as evinced by his predecessors*

1.3.2 Among the officials of the Commercial Taxes Depart
ment, ue were greatly helped by Mr. V.N. t/agee^sh, Deputy
Commissioner of Commercial Taxes (Headquarters) uho uas the
Liaison Officer with the NIPFP for the purpose of this study*
Mr. Akhileshuar Prasad, Hoint Commissioner of Commercial
Taxes and Mr. R.R.V.P. Singh, Deputy Commissioner of Commer
cial Taxes also extended to us the benefit of their detailed
knowledge of these taxes. Ue are also grateful to the
officials of Transport Department and the Director of Statis
tics and Evaluation for making available to us a good deal
of the information' required for the study.

II. ENTERTAINMENT TAX IN BIHAR
Evolution of the Tax
2.1.1 The States are empowered to levy taxes on luxuries
including taxes on entertainment, amusement, betting and
gambling under Entry 62 of the State list in the Seventh
Schedule to the Constitution. All State governments with
the sole exception of Kerala levy the tax on entertainments.
In Kerala, the power to levy this tax is delegated to the
local authorities. Though the tax covers all forms of enter
tainment, the levy on cinematographic exhibition forms the
most important source in all the States.
2.1.2 In Bihar, the taxes on admission to places of
entertainments such as exhibitions, cinematographic exhibi
tions, stage plays, dramatic performances, musical perfor-
mance, variety entertainment, circus and magic shows are
leviable under the Bihar Entertainments Act, 1948. A tax on
entertainments was levied under the Act at the rate of 25 per
cent of the rate of fee charged for admission in any place
of entertainment. Along with the equal rate of surcharge
already levied under the Entertainment Duty (Uar Surcharge
■Amendment) Act, 1943, the rate-of entertainment tax actually
amounted to 50 per c'ent. This rate remained in force for
almost a decade arid a half until 1st April, 1963 when it was
enhanced to 75 per cent of:the admission fee. In order to
provide partially for the maintenance of the large number of
refugees from erstwhile East Pakistan the State, like others,
levied a surcharge on -the tax at the rate of 10 paise per

- 8 -
ticket from 1st'December, 1971, The surcharge uas later
repealed and the tax rate uas revised upwards to 100 per cent"
at the end of March, 1973, Also, from April, 1973 louer tax
rats at 50 per cent of the admission fee has been levied on ®
circus and magic shows* .While the tax rate on circus and
magic shous has remained unaltered, the rate of tax on all -■ ^
other forms of entertainment uas enhanced again with effect
from 1st December, 1975 to 11Q per cent. The provision for
paying a compounded fee in lieu of the payment of entertain
ment tax on the basis of returns uas introduced in 1970*
2. Fiscal Importance and Grouth
2.2,1 The yield of the entertainment tax increased over*
seven fold from Rs 71 lakh in 1960-61 to Rs 5?,1 crore in
'1977-78, thus registering an annual grouth rate of 13,1 pe r
cent. This is only marginally higher than the grouth of th
State's aggregate tax revenue; in comparison uith the gro^t
of the tax in the neighbouring States, the performance of
Bihar can be regarded as very unsatisfactory• Among the
States compared, Bihar had the louest rate of grouth of
revenue from the entertainment tax. While the grouth rate
uas 13.1 per cent in Bihar, it uas 16.8 per cent in Uttar
Pradesh, 15.8 per cent in Orissa, 15,7 per cent in Madhya
Pradesh, 14.2 per cent in West Bengal and 13,5 per cent ir
A s s am, ^
%2,2.2 The relative importance of this tax has hardly
increased in Bihar. Its ratio to total State taxes incre
from 2.05 per cent in 1961-62 to 2.52 -per cent in 1978-79

(Table 11,1), This increase of 0*47 percentage point is.• ' \
much lower than the increase in the corresponding ratio
during the same period of 2*14 percentage points (from 3*53
per cent to 5.67’per cent) in Uest Bengal, 1.86 percentage
points in Uttar Pradesh (from 2.92 per cent to 4.78 per cent),
0.86 percentage point in Assam (from 2,06 per cent to 2.92
per cent) and 0,87 percentage point in Orissa (from 4.45 per
cent to 2,32 per cent).— ^ The share of the tax in Bihar in
1978-79 did not show any improvement ovet that in 1965-66•
Orissa, which had the lowest share of entertainment taxes in
total State tax revenue in 1961-62, all but caught up with
the share prevailing in Bihar in 1978- 79* Thus, ds of
1978-79, the share of the tax in Bihar uas higher than only
that in Orissa but uas louer than that in all other neigh
bouring States.- It uas less than half the share rif the tax
in Uest Bengal*
2.2.3 The performance of the tax may also be jU0§ed in
terms of the tax-income ratio or uhat is termed as
'effective1 tax rate (Table II*?)* It may be seen that 8ihar
uhich had an entertainment ta*>income ratio higher thart only
that of Orissa among the neighbouring^ States in 1961-62
continued to be in the same relative position even in
1977-78. The ratio in Bihar shoued a slight increase from
0*07 per cent in 1961-62 to 0*11 per cent in 1977-78, but the
increases observed in all the neighbouring States uere much
higher. The ratio of the tax to State Domestic Product (SDP)
in Uttar Pradesh and Uest Bengal in 1977-78 uas more than
tuice that in Bihar. In Assam and Madhya Pradesh too, the
percentage uas higher, Orissa, uhich had a share just about
X/ The percentage increases in the ratio are higher also in the other States,

- 10 -
-half of that'of Bihar in 1961-62, all but caught up uith the
latter in 1977-78 so that it uas only marginally louer.
2.2.4 The estimates of buoyancy and elasticity of the
entertainment tax in Bihar and in the neighbouring States are
•presented in Table.II.3. It may be seen from the table that
in Bihar for a one per cent increase in SOP there uas an
increase of the tax by 1.29 per cent. This coefficient is
the louest among the neighbouring States .except Assaim, Uhen
the responsiveness to income of the tax yield excluding the !
effect of discretionary measures, that is, el.asti'city" is i
estimated, the performance of the tax in Bihar seems to be \1 % . t
even more unsatisfactory. Not only is thei elasticity of the \
,tax in Bihar louer than that in all of the neighbouring
States excepting Uest Bengal, but also it is le*ss than unity,
The estimate of elasticity of the tax in Bihar is only 0.94 1
as compared to 1.36 in Madhya Pradesh, 1*31 in Orissa and
1.03 in Assam.
2.2.5 Thus, the grouth of the entertainment tax in Bihar
both in relation of its oun base as uell as in relation to
the grouth of the tax in the neighbouring States seems to
be clearly unsatisfactory.
2.2.6 ■ • The grouth rate of the tax could be expected to be
louer, ceteris paribus, if the level of taxation is higher
and conversely* Houever, in the case of Bihar not only has
the grouth of the tax been unsatisfactory but also the tax
levels are much louer than the levels prevailing in the
neighbouring States, save in the case of Orissa (Table II.4),

- 11
In 1977-78, the per capita tax in Bihar uas only Rs 0.80 which ♦ tuas only slightly higher than'in Orissa (Rs 0.75) but much
louer than in Uest Bengal (Rs 3.18) , Uttar Pradesh (Rs 2.10),
Madhya Pradesh (Rs 1.62) and Assam (Rs 1.37). As a percentage
of 3DP too, the relative position of Bihar in relation to
this tax among the neighbouring States is not different from
the above (Table II .5) •
2.2.7 Thus, in terms of both the level of the tax and its
grouth, the performance of Bihar leaves much to be desired.
To some extent, this poor performance may perhaps be attri
buted to the general economic backuardness of the Sta'te,
However, there' can be equally, if not more, important reasons
relating to the tax base, rate structure and operations of
the entertainment tax which have retarded the grouth of the
tax. In what follows, we, therefore, turn to the analysis
of the tax base and the structure of the entertainment tax
in Bihar#
3. Analysis of the Tax Base
2.3.1 The increases in the yield of the entertainment tax
from cinema houses over time may be attributed to mainly two
factors (i) increases in the number of cinegoers and (ii)
increases in the rates of admission and rates of tax.
Increases in the number of cinegoers may come about either
due to increases in the number of cinema houses and/or due
to more intensive use of the existing cinema houses resulting, •
in better occupancy ratios. The influence of each of the
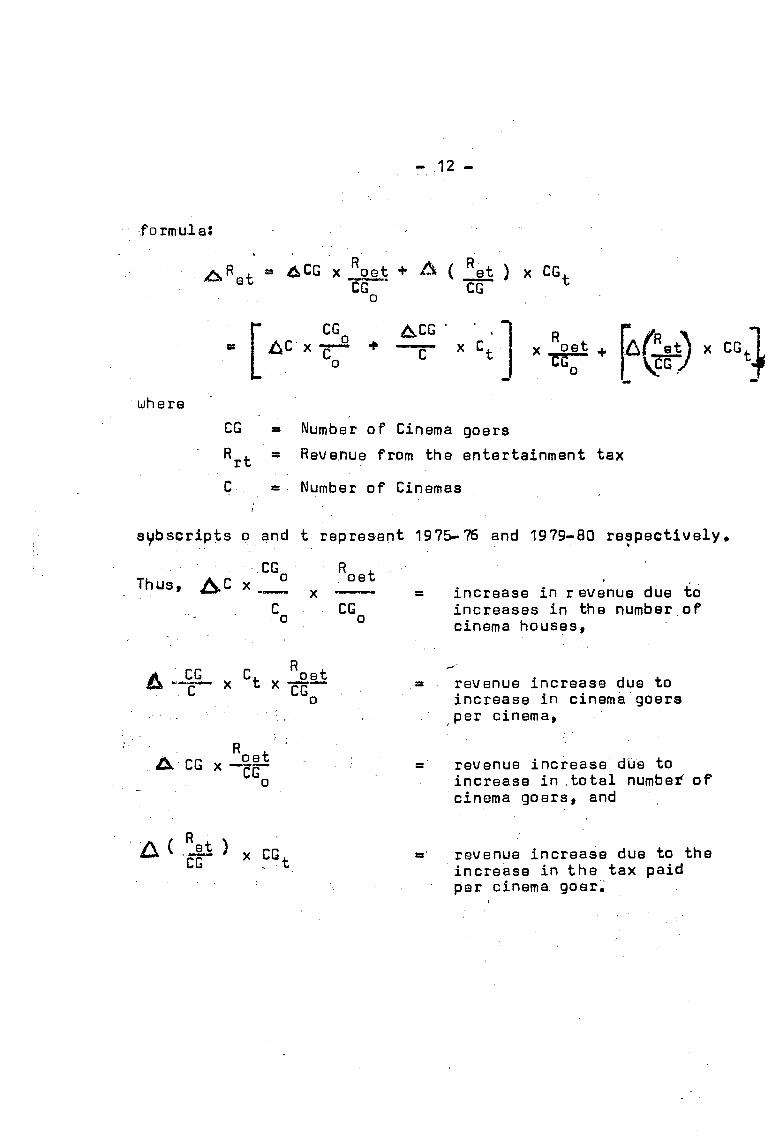
factors can be roughly estimated by employing the following
12 -
f o rmul a:
where
y\R f = 4^CG x oat + A ( et ) x CG.CG ' CG
o
CG
o
A C G
C x CtROu jj j.x oet
CG ■ Number of Cinema goers
^rt * Reve.nue from the entertainment tax
C *■ Number of Cinemas
subscripts o and t represent 1975-76 and 1979-80 respectively
CG Roet
CGincrease in r evenue due to increases in the number of cinema houses,
R
CG revenue increase due to increase in cinema goers per cinema,
A CG xCGo
revenue increase due to increase in .total numbet of cinema goers, and
A < .jjji > x CGt revenue increase due to the increase in the tax paid per cinema goer.

- 13 -
2.3.2 If th8 grouth in the yield of the .tax could be
decomposed in the above manner, it uould be possible to
analyse the major factors responsible for the slou or rapid
grouth of revenue* Houever, the Commercial Taxes Department
does not compile data on the basis of uhich ue can segregate
the effects of these different factors on the tax yield.
Hence ue have attempted to estimate the values of these
different variables for 19 75- 76 and 1979-80 on the basis of
the information obtained through a questionnaire from the
cinema houses uith the help of the Commercial Taxes Departs
ment. The number of cinema houses for uhich the information f
on the variables is available is only 153 in 1975-76 and
141 in 1979-80.
2.3.3 Over the period from .1975-76 to 1979-80, the yield
of the tax has shoun an increase of Rs 104 lakh. Of this, ue
have estimated -.that the increase in yield due to the increase
in the cinema- goers is Rs 30.8 lakh uhich forms only 29.7 per
cent of the total increase. On the other hand, increases in
the rates of admission and the rates of tax seem to have
enhanced the yield by as much as Rs 70.3 lakh, uhich accounts
for 70.3 per cent of the total increase.
2.3.4 It thus appears that the contribution of the increase
in the number of cinegoers to, the yield of the tax is quite
lou. A further examination of the data reveals that the
increase in the number of cinema houses uould have contribu
ted as much as 58.8 per cent of the increase in the yield
uith an unchanged number of cinema goers per cinema*. But
since the net increase in the yield due to. the increase in

14 -
the total number of cinema goers uas of the order of only
29.7 per cent, it appears that the yield of the increase in
the number of cinema houses uas neutralised to a substantial
; extent b^ the fall in the number of visitors per cinemal ‘ ' . •
‘house.
s.
2.3.5 Thus, it appears that the number of cinegoers per
cinema house seems to have shown a fall over the period. To
examine this, ue have competed tuo measures of theI
'occupancy* ratio for the tuo years, namely, (i) ratio of the
number of persons visiting cinema houses to the total ^umber
seats (occupancy ratio 1) and (ii) actual t axes paid as a
proportion of total tax payable if'all seats are occupied
(occupancy ratio 2), lie feel that uhichever of the tuo is
the measure chosen, the occupancy ratio had fallen in Bihar
betueen 197&-76 to 1979-80. Occupancy ratio 1 fell from
27.4 per cent in 1975-76 to 25.2 per cent in 1979-80. Simi
larly, occupancy ratio 2 fell from 25.6 per cent to 24.6 per
cent.
2.3.6 In Tables II.6 and II.7, ue present the trends in
occupancy ratios in cinema houses by seats of different rates
of admission located in places grouped according to popula- |
tion. The rates of admission chosen in the analysis generally
"refer to-3 classes of admission: the upper (dress circle and j
balcony), middle (upper and middle stalls) and louer (louer
stalls). As the rates of admission to these classes varyI
depending upon the population of the city, ue have chosen the• # i'
different rates applicable in the cities having population
over one lakh, touns uith population in the range of 50,000

- 15
to one lakh and smaller towns hav.ing population of less than
50,000* The occupancy ratios according to admission rates in
cinema houses located in different sizes of cities and towns
are summarised in Table II. 7,
2.3.7 Certain important features can be observed from the
Table II.7. Firstly, the occupancy ratios tend to be higher
in bigger cities and louer in smaller cities and. towns.
Secondly, occupancy ratios tend to be higher 1*0r louer classes
of admission than for the higher classes of admission irres
pective of the size of the city uhere the cinema houses are
located. More important from our point of view is the change
in the occupancy ratio betueen the years 1975^76 and 1979-80,
The striking feature of the change is that' whereas the occu
pancy ratios showed a significant increase in the bigger
cities having a population of over 1 lakh, it declined signi*
ficantly both in towns in the population range of 50,000 to
1 lakh and in smaller towns having less than 50^000 popula
tion, The increase in the occupancy ratio in the bigger
cities was observed for all classes of admission. Similarly,
the fall in the ratio in smaller cities and towns is noticed
for almost all classes of admission,
2.3.8 The share of the total seating capacity, percentage
of se^ts occupied, tax payable at full capacity and taxes
actually paid for cinema houses in each of the three classes
of cities and towns and their respective totals are presented
in Table 11*8. It is clearly seen that the share of seating
capacity of cinema,houses in the bigger cities having a popu
lation of over 1 lakh expressed both in terms of percentage

- 16 -
of total seating capacity in the State as well as percentage
of the tax payable has declined steeply between ttre two years.
Correspondingly, the shares of the smaller cities and towns
have shown a substantial increase. Thus, the expansion of
the seating capacity,has come about in smaller cities and
towns at a faster rate than in the bigger cities. At the
same time, it is also seen that the share of cinegoers of
the major cities and smaller towns showed only a marginal
increase and that in the middle group of cities showed a deo-
line. It follows that there was increase in the occupancy
ratio for the bigger cities," whereas in the smaller cities
$nd towns the ratio.declined. For the State as a whole too
the ratio declined over the period,
2.3.9 Ue have examined the trends in occupancy ratio in»
different districts of the State, which are presented in
Table II.9. Of the 31 districts, we do not have any data on ?
the cinema houses located in 8 districts of Nalanda, Nawadah,
Aurangabad, Siwan, East Champaran, Samastipur, Begusarai and
Giridh. Of the remaining 23 districts, increasing trend uas
observed only in the case of 4 districts, namely, Gaya,
Bhojpur, Nadhiban and Monghyr and in the remaining 19 dis
tricts, the ratio showed a decline by varying percentage
points.
2.3.10 On the basis of the occupancy ratio 1, we have
constructed the frequency table of the cinema houses for
19 75- 76 and 1979-80 (vide Table 11.10). It is clearly seen
that over 50 per cent of the cinema houses covered in our
analysis had less than 20 per cent occupancy ratio and over

18 -
person have,not increased much, thereby limiting the grouth -[
of the entertainment tax revenue over the period* Thus, the :
slou grouth of cinema houses is an important factor limiting*
the grouth of the entertainment tax in Bihar* Therefore,
in order to increase the rate of grouth of the entertainment
tax, it is necessary to encourage the construction of neu
cinema halls in the State* In principle, increases in the
yield of entertainment taxes may be achieved either by enhan
cing the rate of tax or by bringing about increases in the
number of cinemagoers. Bringing about-ad hoc changes in the
rate structure to meet the exigencies of revertue may not
ensure productivity in the long run and may even prove to be
counter productive. .It is, therefore, necessary that more •
and more people are brought into the category of cinemagoers,
This can be achieved largely through encouraging the cons-*
truction of cinema houses particularly in the outlying areas
of the State.
' % Ii
2.3.13 In this connection, it is necessary to examine the i
present ptecedure for granting licehces* The procedure for
obtaining licences is laid doun in the Bihar Cinemas (Regula*
tion) Act, 1954, and the Bihar Cinemas (Regulation) ,Rules,
1974 framed under the Bihar Cinemas Act. According to the
provisions thereunder a person desirous of constructing a
permanent cinema is required to submit an application along
uith plan of the building to the District Magistrate# The
District Magistrate on receipt of the application puts up a4r-
notice in prominent places including civil and criminal
courts of local jurisdiction and the office of the Municipal
Body, inviting objections from the general public as regards

- 17 -
75 per cent of the houses had a ratio of less than 30 per
cent in both the years. The frequency distribution of
cinema houses in different classes of cities reveals that
the distribution in bigger cities having population of over
1 lakh is more even whereas in smaller cities and towns the
proportion of cinema houses having louer occupancy ratios
uas even higher. I
2.3.11 An important factor determining the yield of the
entertainment tax is the number of cinema halls. In
Table 11,11 we present a comparative picture of the density
of cinema houses in terms of the number of cinema houses per
lakh of population in all major States of the country in
1975-76, Of the 15 m3 jo r States, four States have ratios
greater than one,, and almost all States have ratios greater
than 0,5 excepting Orissa and 8ihar, In Bihar, the number
of cinema houses per lakh of population is the lowest among
all the States at 0,36, which explains to a large extent the
lou level of entertainment taxes in the State.
2.3.12 Not only has the State the louest concentration of
cinema houses among the major States, but also the grouth
in the number of cinema houses has been very slou. During
the period 196 7-68 1977-78, the compound rate of grouth
of cinema houses in the State uas only 3,1 per cent per year
and even if ue take a someuhat receYit period from 1970-71 to
1977-78, it uorks out to only 4,9 per cent per year for the
State, (Betueen the .intefr-censal years 1961 and 1971 the
number of cinema houses per lakh of population increased only
at a very slou paca,); That is cineman-going facilities per

19 -
the suitability of the site, to tfe submitted within 15 days
of the date of the notice. The application as well as the
objections have to be considered at a meeting of the Cinema
Advisory Committee consisting of the Superintendent of Police,
the Civil Surgeon, the Executive Engineer of the Public Uorks
Department, the Chairman of the Municipal Body of the town
where the licence to build the cinema is sought, the officer
in charge of the Town Planning Organisation and the District
Magistrate. • '
2.3.14 On the basis of the findings of the Committee sub
mitted to him, the District Magistrate, formulates his
recommendations-and sends them to the State government. The
State government takes a decision bn the suitability of
constructing the .cinema house in question, keeping in mind
the recommfflndation of the District Magistrate, On comple
tion of the building to his satisfaction, the District
Magistrate issues the licence for a permanent cinema, uhich
is again subject to the rapproval of the State government.
2.3.15 .The restriction for the selection of the site and
conditions to be observed in the construction are stipulated
in the Bihar Cinemas (Regulation) Rules, 1974 and their
amendments from time to time,
2.3.16 The East Indian Motion Pictures Association have
pointed out to us that the stringent conditions stipulated
under the Bihar Cinemas (Regulation) Act, 1954 and the Bihar
Cinemas (Regulation): Rules, 1974 are mainly responsible for
the lou pace of construction of new cinema houses in the

20 -
Stats, Another hurdle, it is alleged, is the condition
imposed by the Government that the cinema house should be
air-conditioned or air-cooled irrespective of the location
of the cinema house, i.e., even in places where air condi
tioning will not be wanted and would therefore not be
profitable,
2.3.17 1/e have examined the conditions for getting the
licence as laid down in the notification of the Urban Deve
lopment Department (UDD) of the State government which are
summarised in Table 11,12. Ue are of the opinion that laying
down rigid regulations for the granting of licence would
certainly work as a'deterrent to the opening of new cinema
hoi4ses in the State. Uhile it is true that the cinema owners
cannot be allowed to construct the houses without any regard
to public amenities and safety, the objective can be better
achieved by prescribing broad guidelines rather than stipula
ting inflexible conditions. It is necessary that each case
should be judged on its own merits rather than on the basis
of rigidly laid down rules. Furthermore, centralising of
the powers to accord approval to the plan of constructing
the cinema house in the hands of the UDD does not seem to
be appropriate. As the approval will generally be based on
the recommendation of the District Magistrate, giving the
power of final approval to the UDD does not serve much pur
pose but only creates further red-tapism and bureaucratic
delay uhich can be avoided by empowring the District Magis
trate himself to accord the approval and. then report to the
Government, In a review of the approvals from time to time,
the Government may issue fresh guidelines, if found necessaryj
\

2.3,18 A strong representation uas made before us that in
vieu of the exorbitant cost of land and construction,
machinery, fittings and furniture, the neu cinema houses
cannot profitably subsist unless concession by uay of tax
holiday is extended to them* However, ue find that the
occupancy ratio is high in the cities and bigger touns.
Hence, providing tax-holiday for neu cinema houses in these
places does not seem uarranted. Besides, cinema houses are
concentrated in cities and bigger touns, as it is. Granting
these concessions uniformly to all neu cinema houses across
the State uould aggravate the disparities betueen bigger and
smaller places as many of the investors uould be encouraged
to build the cinema houses only in places uhere a higher
occupancy will be assured to take better advantage of the
tax-holiday provisions. Therefore, ue are of the opinion
that construction of neu cinema houses should be encouraged
especially in outlying places of the State. '
4. Structure of Entertainment Tax in Bihar
a. The rate structure• ■ * * ■ . }
2,4.1 In the earlier sections ue have traced the evolu
tion of th8 entertainment tax in Bihar. Briefly, from the
level of 50 per cent of the admission fee in 1948 the rate
of tax uas enhanced to 75 per cent in 1963, 100 per cent in
April, 1973 and 110 per cent in December, 1975. The suiw
charge of 10 pais8 per ticket introduced in 1971-72. to meet
expenditure on the refugees from Bangla Desh uas repealed
by the end of March, 1973. While ail other forms of enter
tainment are currently taxed at 110 per cent of the admission

22
fee, circus and magic shows are taxed at the lower rats of
50 per cent. As regards the cinema houses, the alternative
of paying a compounded fee to the payment of tax on the
basis of fortnightiy returns of collections uas introduced
with effect from 1978,
2.4.2 It may be pertinent to point out that though all
forms of entertainment are taxed, the yield of the tax on
cinemas in Bihar, as in other States, constitutes by far
the most important source forming over 95 per cent of the
total yield. Therefore, ue intend to focus in our study on
the entertainment tax applicable to cinema houses,
i ' '
2.4.3 The rate structure of the entertainment tax in
feihar is rather simple. As stated earlier, all*forms of
entertainment except circus and magic shous are taxed uni
formly at 110 per'cent of the admission fee. The latter
( are taxed at the rate of 50 per cent, As regards the tax
on cinema houses, besides this cinematograph' exhibition tax
at 110 p ir cent, a shou tax is also levied. The rate of the
shou tax is Rs 10 per .shou in Patna, Ranchi, Dhanbad, Oharia,
Damshedpur and Dugsalai and Rs 5 per shou in other pla ces,
2.4.4 Houever, certain salient features of the tax may be
noted. First, unlike in other States, the rate of the tax
is uniform and does not vary uith the rates of admission fee,
Second, the tax rate in the State in comparison uith the
rates prevailing in other States does not seem to be unduly ,
high. Third, though the revision of tax rates has not been
very frequently resorted to, much of the increase in the

23
admission charges has come about not dus to changes in the
admission fee but due to changes in the tax rates. .
2,4.5 The application of a uniform tax rate On the
admission fee rendered the tax merely proportional to the
admission charges so that uhen an aidditional specific sur
charge uas imposed during December, 1971 to March, 1973
the rate structure became regressive. While a single-rate
leVy has the advantage of simplicity, imposing a flat rate
on higher and louer priced tickets would seem justified
neither from the point of vieu of equity nor from the point a
of vieu of revenue. The cinema goers occupying seats of
different classes, like balcony, upper stalls and louer
stalls, belong to different income groups. It is the more
uell-to-do sections of the population that purchase-tickets
of higher denomination. To the poorer sections.uhich
purchase the tickets of louer value, the cinema is a less
important item of consumption than to the cinema goers from
the higher income groups. Therefore, the responsiveness of
demand for this form of entertainment to changes in the
prices (price elasticity), ceteris paribus, is higher for
the poorer sections and is louer for the higher income
groups of people. This means that the price elasticity
of demand uould be higher for the louer stalls and louer
for the upper stalls, and still louer for the balcony.
Therefore, from the point of vieu of revenue, it uould seem
to be appropriate to tax seats subject to less elastic
dan and at higher rates. This uould also serve the cannon
of equity as higher, income groups uould be subjected to
higher rates of taxation.

2.4.6 In this regard, the opinions of the various organi
sations of trade and business are worth noting, particularly
those of the Cinema Owners’ Association. They are unanimous
in asserting that a flat rate should not be applied as at
present, but that the rate should increase progressively'with
increases in the admission fees. This would, they contend,
provide relief to the poorer cinema goers who occupy lower
classes of seats and thus lead to a better occupancy ratio,
2.4.7 It is necessary to examine whether the cinema goers
in Bihar are subjected to higher or lower rates of taxation
than those in the othor major States of the country.
However, comparison of the tax rates is rendered difficult
as ,the structure of taxation as well as rates of admission
differ from State to State, Bihar is the one State besides
Haryana which levies the tax at a flat rate applicable to
all classes of admission. In most of the States, the rates
of tax vary for different classes of admission. In Uttar
Pradesh, there is a basic tax levied at a flat rate, but the
differential surcharge imposed on it introduces differentia
tion in tax rates among the different classes of seats. In
many of the States, there is straightforward progression
with the rate of tax as a percentage of the admission fee
increasing as the latter goes up. In Gujarat, Maharashtra
and Madhya Pradesh the rate of tax is expressed as a percen
tage of the total value of the tickets inclusive of the tax,
whereas in other States the tax-exclusive admission fee is
the base. Besides, in some of the States like Gujarat and
Orissa, the differentiation's done with respect not only to
the classes of admission but also to.tho classoe of cities

- 25 -
and towns where the cinema houses are located,
2.4,8 Though a comparison of the tax rates between Bihar
and other States Is difficult for the reasons stated above,
ue may attempt a comparison of the broad magnitudes. The
rate structures in Bihar and other major States are presented
in Table 11,13. It may be seen that the tax rates on cinema-
g o e r s in Bihar are by no means the highest, contrary to the
I claim made by'the representatives of the Cinema Owners’
I Association, In Haryana, where the tax is levied at a
unifofm rate as in Bihar, for -example, the rate is as high
as 125 per cent as compared to the rate of 110 per cent pre
vailing in B;ihari In Uttar Pradesh, the tax rate including
the surcharge works out to over 125 per cent oven for the
classes of admission having a fee of less than one rupee.
In Punjab, though for the lowest class the tax rate levied
at TOO per cent Is lower than that of Bihar by 10 percentage
points, it is higher by 15 percentage points on all other
classes of admission. In Maharashtra and Gujarat, where the
tax is levied on the gross value of the ticket, the rate
uorks out to be marginally lower for the classes of admission
having a gross value of the ticket less than Rs 2 (approxi
mately the lowest class) but is substantially higher on the * .• - ' ■ .
other classes , However, for some classes of admission,
the tax rate levied in Bihar seems to be higher than those
prevalent in Orissa, Madhya Pradesh, Rajasthan, Karnataka
and Uest Bengal. On examination, it would seem that the tax
* In fact, in Gujarat for some classes of admission the rate of tax works out to as high as 186 per cent of the net admission fees.

- 26 -
rate prevailing in Bihar is on the lou side, particularly
for 'higher* admission classes. Therefore, -it uould be
appropriate to raise the tax rates especially for the
higher classes of admission, Ue uill indicate the proposed
rates later in the report,
2.4.9 Besides the tax on cinematograph exhibition, there
is also a cinema shou tax in most States, A comparative
picture of the rate structures of the cinema shou tax is
presented in Table 11,13, In some of the States the pouer
to levy- the shou tax is vested uith the local bodies but
in many of the States the tax is levied by the State govern
ment itself. In keeping uith the practice of many other „
States, Bihar too levies the tax at higher rates in major»
cities and at louer rates in other places, A comparison of*
the rates betueen Bihar and other States, reveals that the*
rates in Bihar are neither unduly high nor unduly lou,. *
2.4.10 The admission charges to cinema houses vary from
place to place and many times from one cinema house to
another in the same place, Ue present in Table 11,14 the
admission charges and taxes for various classes of admissi
in respect of cinema houses in the city of Patna for the
period 1960-61 to 1978-79, This may be taken broadly to
represent the position in the State, Uhile the extent o |
revision in admission fees has been only marginal, parti
cularly for the higher classes of admission, the extent f
revision in tax rates by contrast has been substantial.
The rate of increase in /the admission charges and taxes
different classes of admission over the period firom 1960
- 27 -
to 1980 are presented in Table 11.15*
2.4.11 It may be inferred from the above that (i) the
rate of increase in taxes has been generally higher than
the rate of increase in the admission charges; (ii) the
rate of increase in both admission charges and taxes has
been higher for lower classes of admission tickets. As a
result, though at any point of time the tax rate that exis
ted was proportional the relative rate differential 'between
lower and upper classes has been substantially reduced over
time. As the cinema goers occupying lower classes of admis
sion belong predominantly to the poorer sections of society,
reduction in the differential between lower and upper clas
ses has tended to be less and less progressiva over the
time period*
b. Exemptions
2.4.12 According to sub-Section (l) of Section (10) of the
Act, the State government can exempt from the entertainment
tax charges for admission to a form of entertainment on any
of the, following grounds : (a) that the entire gross
proceeds of thp entertainment are to be spent for philan
thropic, religious or charitable purposes (b) that the
entertainment is of a wholly educational character (c) that
the entertainment is provided for purposes which are partly
educational, cultural or scientific by an institution not
conducted or established' for profit; or (d) that the enter
tainment is provided by an institutional not conducted for
profit and; established solely for the purpose of promoting

- 28 -
public health or the interests of agriculture or of a maniH
facturing industry and consists solely of an exhibition of
articles uhich aro'of material interest in connection uith
questions relating to public health or agriculture or of the
products of the industry for promoting the. interests of
uhich the institution exists, or of exhibition of the mate
rials, machinery, appliance or foodstuffs used in the
production of these products,
2.4.13 Besides the above, the State government under
sub-Section (2) of Section 10 may, be a general or a special
order, exempt any entertainment or class of entertainment
or any person or class of persons from the liability to pay
the tax** - i
2.4.14 Thus, the selective policy of granting exemptions
by the Government may be classified into (a) those uhose
proceeds are used for educational, philanthropic, religious
or charitable purposes and (b) meritorious kinds of .enter
tainment uhich directly serve thess purposes. In the
former cases, in order to become eligible to get the exemp
tion, the sponsors of the concerned entertainment shous
need only satisfy the Government regarding the purpose for
uhich the proceeds are to be utilised. As this requirement
is easily fulfilled, the system is uorking satisfactorily,
2.4.15 As regards the policy of granting general exemption
for meritorious pictures, some change in policy seems called
for. In the absence of an expert body uhich can carefully
go into the merits of various pictures and recommend the

29 -
granting of exemptions the decisions taken by the Government
are bound to be arbitrary. Such an opinion was expressed
by-the East India Motion Pictures Association in their
memorandum submitted to us* Ue agree with this view*
2,4.16 Besides the above, the State government may under
sub-Section (2) of Section 10, by a special order, exempt
any entertainment or class of entertainment or any person
or class of persons from the liability to pay the tax.
Under this provision the Government has exempted with effect
from 30th October, 1965 all military personnel either in i
uniform or on production of an authorisation certificate
from the concerned Section Officer. Similarly, with
effect from 1st. May, 1574, all personnel of the Border
Security Force and the Bihar Military Police either wearing
uniform or on production an authorisation certificate from
the Commandant or the concerned Station Officer, as the case
may be, are exempted from the payment of the entertainment
tax. In cases where the exemption is claimed by producing
an authorisation certificate, the persons witnessing the
cinema are required to prepare the certificate in tripli
cate one to be kept in the Office of the Section Officer,
Commandant or.the Station House Officer as the case may be,
another copy to be kept with the booking office of the
cinema house and the third copy to be held by the person
witnessing the entertainment.
2.4,17 Though the persons not wearing uniform, claiming
exemption are required to take two cdpies of the authori
sation certificate, many a time, they take only one copy

- 3 0 -
with them. Further, it is difficult to ascertain, the
genuineness of the signatures^pf the officers as they
are not circulated to the cinema houses. Even in the
case of persons wearing uniforms, it is difficult to
ascertain whether these persons.really belong to the
exempted category or not. All these suggest that this
typ-e or mode of exemption can lead to large-scale misuso,
though at present there is no evidence to suggest that
this exemption provision is actually made use of to any
significant extent for ^evading the tax,
... . '. 1" - , J
c, The system of compounding '
2.4.18 As stated earlier, the Act provides for the
payment of compounded fee in lieu of the tax payable. The
proprietor intending to pay the composition sum should apply
in Form IV to the Commissioner or any other officer empo
wered by the State through the Superintendent of the
concerned circle or sub-circle. The Superintendent is
required to forward the application to the Commissioner ori ' ■
any other officer specially empowered for the purpose,,who,
after m a k i n g the necessary inquiry, would permit the pro
prietor to pay the compounded levy,« '
2.4.19 The rule for compounding is that the compounding
fee uould be fixed at a level of 15 per cent higher than'
the average assessed tax of the preceding three years,
Uhile computing the average tax, the tax payable during the
periods of tax-free shows and periods of closure of the
cinema halls are to bs included.
31 -
2.4.20 Though the alternative of compunding tha tax has
been offe.red since 1978, ohly 88 out of the total of 282
cinema houses have so far exercised the option. Thus, it
uould seem that the compounding alternative is not found to
bo sufficiently attractive and many proprietors have conti
nued to bear the compliance cost and pay the taxes at the
prescribed rates by furnishing the fortnightly returns
rather than paying a lump sum amount.
«2.4.21 The distribution of cinema houses opting to pay
the compound fee among tho different types of cities and
touns in various divisions of the State is presented in
Table 11.16. In terms of absolute numbers, touns having
a popula tion betueen 50,000 and 1 lakh have the largest
number of fcinema houses paying the compounded levy. Of
the 88 cinema houses that have opted for compounding, 48
belong to this category of touns, Tirhut division has the
highest number of cinema houses (23) paying the compounded
fee. The tuo divisions of Tirhut and Bhagalpur have in them
almost half the number of. cinema houses paying compounded
fee.
2.4.22 Though the number of cinema houses' paying the
compounded fee is the highest in the touns having a populsn
tion betueen 50,000 and 1 lakh, the percentage of total
cinema houses belonging to the category is not very much
different from the position emerging in other types of
cities and touns. As the grouth in the number of cinema
goers in the bigger cities is likely to be higher due to
the higher educational levels of the population, greater

- 32 -
availability of entertainment and greater demonstration
effect, one should expect a higher p oportion of the cinema
houses, to exercise the option of compounding in the bigger
cities. Contrarily, in the case of Bihar compounding seems
to be more popular in the case of cinema houses located in
places having a population in the range of 50,000 to 1 lakh.
Not merely is the number of- houses opting for compounding
is the highest in this category of touns, but even the
proportion of these houses to total cinema houses in these
touns is higher than the corresponding proportion in the
other categories of cities and touns. It uould seem that
the alternative of compounding is not resorted to much by
the ouners of cinema houses located in the major cities of
the State, Thus, it may be concluded that (i) in general,
the,compounding alternative provided by the State government
has not been found to be sufficiently attractive for uide-
spread adoption of the system and (ii) even uhen adopted
by a limited number of houses, it is not much in vogue in
the major cities of the State,
2.4,23 It is necessary to inquire more fully into the
causes of the lou level of adoption of the system of com
pounding by cinema houses. The Cinema Ouners* Association
*of the State is of the vieu that the formula for compounding
is very unreasonable. Adoption of this system uould be
advantageous only if the grouth in the number of cinema
goBrs is at least 15 per cent higher in every year than the
average of the preceding three years, uhereas, in actuality,
the' grouth in the number of cinema goers from year to year
has been only marginal, Uhile the ouners uould certainly

- 33 -
like to avoid the compulsions and complications of affixing
adhesive stamps, maintaining forms, registers and records,
filling*returns every fortnight, etc. by paying a compoun
ded sum svai -if they have to forego a little over and above
of uhat they uould have paid at the prevailing rates of
taxation, they consider that payment of 15 per cent in
excess of the average of preceding three years is too high
a price for avoiding trouble and possible harassment.
2.4.24 It should be noted that through the provision of
the alternative of compounding, the cinema houses are given
an incentive to enhance th.eir occupancy ratios. In respect
of any increases in revenue over and above 15 per cent of
the average .of the preceding 3 years, though the ouners
continue to collect the tax from the cinema goers, they
need not pay it to the exchequer. On the other hand, the
risk involved in opting for the system of compounding is
that the inability to enhance the occupancy ratios so as to
result in an increase in the tax collected (gross collec
tions) by at least 15 per'-Cent'in excess of the average
of the preceding three years uould place the ouners at a
disadvantage, for in that case the advance lump sum tax
paid uould sooner or later be more than uhat uould actually
be collected from the cinema goers depending upon under
payments in earlier years. By offering better facilities
and shouing better cinemas, the cinema ouners can to some
extent increase the occupancy ratios, but as a large part
of the population is kept out of the ambit of the *cinem&*
going'population due to poverty, illiteracy and ignorance,
particularly in tho more remote parts of the State, the

- 34
increase in .the occupancy ratio that can be brought about
by the deliberate efforts of the ounors may not be very
significant. If that be so, the owner can probably gain
mRr.eby evading the tax through understating the occupancy
ratio, sometimes in collusion uith the officials, and hence
he uould prefer to undergo all the inconvm iences of filling
in fortnightly returns and keeping records and registers
rather than pay the compounded tax uhich uould keep steadily
increasing as it is reckoned at 15 per cent highey than the
average of the preceding three years.
2.4.25 A view has been expressed that the alternative of
compounding should continue to be provided for all the
theatres as at present* but that it should be made more
attractive so as to induce the theatre owners to choosei
this option. This, it is argued, uould mean administra
tive simplicity, ensure certainty of revenue to the State's
exchequer, minimise tax evasion and reduce the cost of
collection to the State and the compliance, cost to the tax
payers.
2*4,26 Undoubtedly, from the administrative point of vieui
the system of compounding seems to hold advantages over the|
system of assessment and payment of tax on the basis of
fortnightly returns. But it should be noted that the ouner
uould opt for the system of compounding only uhen they are
certain of gaining from this and thus compounding might
actually mean loss to the exchequer. As regards certainty,
' certainty in revenue is ensured only uhen all or at least
most of the theatres exercise the option of compounding,

- 35 -
uhich is possible only uhen the formula of compounding is
made vary advantageous to them. Thus certainty is ensured
only at a loss of considerable amount of revenue to the
State* As regards minimising evasion, it must be noted that
tho present formula for compounding is based on the amounts
of the taxes paid in the previous three years, during uhich
the cinema houses uould have understated their occupancy
ratios and they uould continue to enjoy the fruits of their
past violation of the lau at least for some years to come.
2.4.27 Besides, administrative convenience is not the
only consideration nor is it a predominant consideration.
Economic considerations are as important, if not more.
From this point of vieu,- the system of compounding leaves
much to be desired. The base of the tax is expenditure on
entertainment, Houever, uhen the levy is compounded, this
ceases to be the tax base, though.the consumers continue
to pay the tax on their spending on entertainment. In fact,
uith the present formula for compounding the base turns out
to be indirectly the expenditure on entertainment in pre
vious years rather than in the current year. When the
system of compounding is alloued to operate for a long
period, the actual,tax base may become very remote from the
visualised tax base,
2.4.28 Administtative considerations could be given thet
predominant ueight if the system of collecting taxes on the
basis of fortnightly returns can be said to be complicated.
This is far from being so. The administration of the enter
tainment tax in Bihar should not be too difficult, as there

- 36 -
are only about 280 assessees.
2.4.29 It is necessary to point out that providing the
option of payment of the composition fee is not unique to
Bihar, A number of States have successfully tried this
alternative, Uhat is Unique in Bihar is that the option is
provided.to all assessees whereas in the other States, it
is extended only to cinemas in rural areas and smaller towns.
In Karnataka, for instance, cinema houses located in places
having a population of less than 10,000 are required to pay
a lump sum amounting to 12 per cent of the gross collection
capacity of the show. In Tamil Nadu, the cinema houses
located in tjrade-IL and III Municipal Panchayat touns and
’villages can pay a compounded sum ranging for 15 per cent
to 22^ per cent of the gross collection capacity of the
theatre fbr a fixed number of shows ranging from 14 to 20
shows per week. In Uttar Pradesh, the Lakdauala Committee
suggested that the alternative of compounding should be
provided,— ^ but this was not implemented. The Chelliah
Committee has suggested the extension of the facility of .
compounding only to cinemas in smaller touns and outlying 2/
areas,— ''
2.4.30 As borne only by the experience of these States,
from the point of view of administrative ease, it may be
preferable to provide the alternative of payment of a com
pounded fee to the cinema houses located in remoter areas
J/ Government of Uttar Prade.sh (1974), Report of the ~~ Uttar Pradesh Taxation Enquiry Committee. Lucknou,
2/ Government of Gujarat (1980), Report of the Gujarat Taxation Enouiry Commission. Gandhinagar,

- 37
of the State, As it is not feasible to have periodic
inspection of these houses, there can be legitimate appre
hension that large-scale evasion of the tax may come to be
practised. By providing for this alternative, on the basis
of some reasonable occupancy ratio, enforcement of the tax
is rendered easier,, The time of the enforcement staff that
is spent in visiting these remoter places can be better
utilised for improving the enforcement of the levy in major
cities and towns* Moreover, this uould reduce the compli
ance cost of the cinema ouners in remote areas, uhich could
encourage the grouth of the nau cinema houses. Though there
seems to be no valid case for providing the compounding
alternative generally, it uould be beneficial from the vieu-
point of enforcement of the tax and of encouraging the
starting of neu houses in remoter areas, to provide this
alternative to the cinema houses located in places having a
population of less than 20,000,
5, Administration and Enforcement of the Tax
a. Registration* . . ....
2,5.1 Section 6 of the Act requires that the proprietors
of entertainments should: obtain registration certificates.
Application for the registration should be made to the
Superintendent or Assistant Superintendent of the concerned
circle in Form I, u,ho after the necessary verification
and enquiry grants the:certificate of registration in
Form II,
- 38 -
2.5.2 In the event of the sale of the business, disconti
nuance and or change in t h e place of business, the proprie
tor or h i s legal r e p r e s e n t a t i v e should submit a report to the
Superintendent uithin a ueek of such sale, disposal, change,
or discontinuance, uho after satisfying himself, makes the
necessary amendments in the certificate of registration.
Similarly, in the event of the closure of the business, the
proprietor or his authorised agent should make an application
to the Superintendent for the cancellation of the certifi-
cate’of registration. The Superintendent forwards the appli
cation to the Assistant Commissioner along uith his report,
the latter after, making further enquiry that the dues have
been paid, cancels the registration certificate. If the
Superintendent or t h e Assistant Superintendent comes to knou
thyat a proprietor is liable to tax but has,failed to regis
ter, he can, after providing reasonable opportunity of being
heard, make the assessment according to the best of .his
judgement and impose in addition a penalty of a sum not
exceeding one-and-s hhalf times the assessed amount,
2.5.3 According to the Act, the Superintendent may
require the proprietor by an order to deposit as security
an amount not exceeding the total entertainment tax charge
able for the full fortnight calculated uith reference to
the number of shous or Rs 1000, uhichever is. louer. If the
proprietor fails to submit the fortnightly return or pay the
tax uithin the. prescribed time, the security can be forfeited
to the State government. Similarly, in the event of default,
the arrears due or penalty may also be adjusted uith the
amount of security and the proprietor may be asked to make

- 39 -
good th ; adjusted amount before the tax for the next fort
night falls-due*" However, the requirement of the security
is not compulsory and is demanded at the discretion of the
Superintendent of the circle,
2.5*4 It is necessary to inquire uhether the requirement
of security is necessary at all for the purpose of enforcing
the tax* The East India Motion Pictures Associa tion as well
as the Ranchi District Cine Association were of the view
that the system of taking security deposits should be done
away with. We have examined this matter carefully. In the
case of many of the cinema houses, tax is payable in advance
either through the purchase of adhesive stamps or through
the system of compounding. Even in cases where the tax is/
payable in cash along with the fortnightly returns, the
requirement of a security deposit uould not seem uarranted
in the case of permanent cinema halls* In the extreme case
of continuous default, the authority can always cancel the
licence to exhibit films after giving due notice.
b* Payment of tax
2,5.5 All proprietors registered according to the proce
dure described above are liable to pay the entertainment tax,
under Section 3 of the Act, at the prescribed rates, unless
they a re specifically exempted under the Act, The tax is
payable in one of the three following ways. Cinema houses
located within 20 kilometres from a treasury or sub-treasury
are required to pay the'tax through pre-paid adhesive stamps.
Cinema houses located beyond 20 kilometres from a treasury.

- 40 -
or sub-treasury, are required to pay the tax in cash along
uith the returns to be filed every frtnight. Apart from
these tuo methods, the cinema houses uhich have opted for
paying the composition fee in lieu of the tax, have to pay
the fee for the uhole year in advance.
2.5.6 The proprietors of cinema houses other than those
opting to pay the composition fee are required to file
returns every fortnight uith the Assistant Commissioner,
Superintendent, Additional Superintendent or Assistant
Superintendent of the circle a s ,the case may be, uithin
seven days of the close of the fortnight to uhich the
return relates. If uithout reasonable cause the proprieto
fails to furnish the return uithin the prescribed (Hate, he
m^y be required to pay the maximum of Rs 5 for every day of
delay after the prescribed.date.
2.5.7 It has been argued before us that the system of
paying the tax through ore-paid adhesive stamps is both
cumbers-jme and inconvenient„ It is cumbersome because the
proprietors have to keep regular records of the stamps
purchased, details of affixation and the inventory held by
them in the form provided for the purpose. It is inconve
nient because of the difficulties arising from the inade
quate supply of adhesive stamps of proper denomination and
periodic shortages. Therefore, many times, even though the
lau requires that only tuo stamps be affixed to a ticket,
4 to 5 stamps are affixed. Moreover, uhen periodic short
ages arise, the concerned officer of the circle is required
to countersign the first and the last ticket in each of

41 -
bunches and the proprietor is required to pay the tax at the
time of the filing tbe for-tnightly return,,
2.5.8 The problem of periodic shortages of adhesive
stamps has been experienced in many of the States uhere such
a system of paying the tax has been i4 vogue. Therefore,
many of the States have dons auay uith the procedure of
paying the tax ,through pre-paid adhesive stamps. After
examining tjne procedures prevalent in the States uhere the
system of affixing adhesive stamps is not in vogue, ue feel
that the system prevailing in the States of Maharashtra and
Gujarat can be adopted in Bihar also. According to this
system, all tickets are examined by the Entertainment Duty
Inspector uhb countersigns the first and the last tickets.
The tax is paid uhile furnishing the fortnightly returns.
c. Assessment and appeal
2.5.9 On the basis of the returns furnished by the
proprietors, the Assistant Commissioner or the Superinten
dent or Assistant Superintendent makes assessment of the
tax. Houever, if the assessing authority is not satisfied
uith the returns submitted, he may, after serving notice
in Form XI, require the proprietor to be present uith
accounts, registers and documents on a specified date at a
specified place for the purpose of determining the amount
of tax due. If the proprietor fails to furnish the returns,
fails to comply uith all the termsr of the notice or fails
to produce any evidence required, a,fter providing the
proprietor a reasonable opportunity of being heard, the

- 42 -
Assistant Commissioner, Superintendent or Assistant Superi
ntendent may assess the amount of. the tax due according to
best judgement.
2.5.10 If the proprietor is not satisfied uith the assess
ment, uith or''Without penalty, he may, after paying the
admitted tax, appeal against the order of assessment to the
Appellate Assistant Commissioner (if the order has been
passed by the officer not above the rank of Superintendent)
or the Deputy Commissioner uithin 45 days of the receipt of
the demand notice. The appellate authority after giving a
reasonable opportunity to the proprietor uould pass the
order of appeal. In case the proprietor is still not satis-r ,
fied he can apply for revision to the Deputy Commissioner
if the order of appeal uas passed by the Assistant Commis-»
sioner or to the Commercial Taxes Tribunal if the order uas
passed by the Deputy Commissioner. The Commissioner of
Commercial Taxes too has suo moto powers to revise only any
order passed by an authority subordinate to him, uhich can
be revised only-by the judgement of the Tribunal, Ue are
given to understand that though the lau requires the pro
prietor to be present uith accounts, registers and documents,!
only in cases uhere the returns filed do not satisfy the
assessing authority, the proprietors are ordered to be
present as a matter of routine while making assessments.
This uould, besides involving cost to the proprietor,
increases the time taken for. making an assessment uhich can' - ' . i
easily be avoided.
- 43 -
2,5.11 It has also been represented to us that the
absence of any time limit for making assessments has put the
proprietors to a lot of hardship, Many a time, assessments
are kept pending for years; this requires the proprietors
to maintain all the registers, documonts as well as the
accounts of many years increasing their costs in terms of
hardship as well as money, >
6• Information System
2.6.1 A proper administration and effective enforcement
of the tax requires that information relating to the tax
is collected and analysed periodically. Unfortunately, in
Bihar, information necessary for the proper analysis of the
tax has not been collected and assembled properly. Even the
most rudimentary information such as .-.the'number of cinema
houses, their break-up into temporary and permanent houses
and the number of cinema houses opting for compounding are
not readily available* leave alone the data on the seating
capacity in different classes of admission, the rates of
admission, the number of cinema goers- in the different
classes of admission; and the occupancy ratio. :
2.6.2 Ue are of the. opinion that compilation'of informa
tion on a scientific basis is imperative for the adminis
tration of the tax. The Statistical Cell in the Department
should therefore be adequately strengthened tp compile data
on a regular basis. These data may bs tabulated such that
it is possible to make a thorough analysis not only of each
of the cinema houses but also of the various classes of
cities, districts and the State as a whole.

- 44 -
7, Recommendations
2.7.1 Ue have observed that the slou grouth of cinema
houses is an important factor limiting the grouth of the
entertainment tax in Bihar, Further, our analysis reveals
thrt, among other reasons, the procedure for obtaining neu
licences for the construction of cinema houses is partly
responsible for such an outcome, Ue are of the opnion that
laying doun rigid regulations for the granting of licences
uould uork as a deterrent to the grouth of cinema-houses in
the State and that prescribing broad guidelines can achieve
the objectives of public amenities and safety better.
Further, in the interest of efficiency and to avoid red-
tapism and bureaucratic delay, it is preferable to decen
tralise the pouer to accord approvals, Ue therefore
recommend that the District Magistrate should be vested
uith the pouer to issue licences for the construction of
cinema houses instead of requiring it to be accorded by the
UDD as at present,
2.7.2 If the pouer of according approval for construc
ting cinema houses is delegated to the District Magistrates,
there uould be greater scope for considering the merits of
individual cases. The District Magistrate uould be required
to accord approval keeping in vieu of the broad guidelines
prepared by the UDD, He uill take the decision after /
carefully examining the merits of individual cases.
Generally, it should be required that these cases should be
disposed of uithin a period of six months and the Commer
cial Taxes Department should act as a nodal point for

45 -
obtaining clearance from the various Departments*
2.7,3 Ue are of the opinion that in major towns and
cities the UDD could prepare a master plan for the city or
town and the site allotted for the location of cinema
houses could be sold through public auctions. If the
proprietor conforms to the broad guidelines laid down for
the construction of the cinema houses, granting of the
licence for constructing the cinema houses in these sites
should be automatic. If the above recommendations a re
implemented, there would be considerable simplification of
the procedures for obtaining the licence leading to a fas-i
ter growth of cinema houses in the State.
2.7.4 Uith a view to encouraging the construction of
cinema houses, particularly in the outlying areas of the
State, we recommend that the following concession should be
granted:
In the first year (from the date of grant of exhibition licence)
Second year 25 per cent tax to be paid
Third year 50 per cent tax to be paid
Full tax to be paidFourth year and onwards

- ,46 -
(ii) Ci nemas in towns having a population above
20,000 and below 1 lakh:
Tax to be realised
In the first two years Complete tax holiday
Third year 50 per cent tax to be~ paid
Fourth year 75 per cent tax to bepaid
Fifth'year onwards Full tax
(iii) Cinemas in towns and localities having a
population below 20,000: •
' " . . ,i 'There may be complete tax holiday for the first 3
years. Thereafter, they may be requited to pay the tax at
the rate of 25 per cent of the gross amount collected in
that year. They should also be provided with the alterna
tive of compounding. The compounding formula should be
based on the occupancy ratio 5 to 10 percentage points
higher than the ratio observed in these cinema houses in
the last 3 years. If these recommendations are implemented
there would be a boost to investment in this sector and a
number of new cinema houses would be set up in the outlying
areas of the State which in the long run would increase
the elasticity of the tax. ~
2.7*5 Ue have already stated earlier that it would be
more appropriate to levy the cinematography exhibition
tax at progressive rates. From the inter-State comparison
of tho tax rates we have concluded that there is some 1
scope, for upward revision o f the rates of taxation particu
larly on higher classes of admission. Ue, therefore*.:

- 47 -
recommend the following rates of tax on cinematograph
exhibition for all cinema houses located in places having
j- population of more than 20,000S
Rate of Admission Proposed rate of(exclusive of tax) entertainment tax
1. Upto 50 paise- 100 per cent
2. 51 paise to Rs, 1 1 2 5 p e r c e n t
3. Above Rs. 1 150 per cent
2.7.6 As stated earlier, presently, the tax is levied at
50 per cent on circus and magic shows, whereas in respect
of all other forms of entertainment, the rate of tax is
110 per cent. There seems to be no rationale for differen
tiation between circus and magic bhows on the one hand and
various other forms of non-cinematographic entertainment
on the other hand. Moreover, the rate of tax on the latter
seems to be unduly high. Forms of entertainment such as
drama and dance reflect cultural activities and therefore
deserve to be encouraged. It may also be noted that in the
case o. these forms of entertainment it would be difficult
to keep a proper check on all tickets sold.,
2.7.7 Ue recommend that all forms of entertainment other
than cinematograph exhibitions should be treated alike for
taxation purposes and the organisers of all these forms of
entertainment should be required to pay a lump sum fee
instead of-tax a rate applicable to gross receipts. The
lump sum amouht should be calculated on the basis of the
display period, the number of seats and the admission fees
charged. As regards the cinema show tax, we recommend that

- 48 -
2.7.8 As regards granting general exemption for merito
rious pictures, ue recommend that the decision to grant
exemption should be taken after receiving the recommenda
tion of an expert body. The expert body should consist of
an educationist, a social reformer or social uorker, a man
of public image and a government representative. The expert
body should be required to make recommendations to tha
Government after a pre-vieu of the films in respect of
uhich applications for exemption are received.
2.7.9 Uith regard to the granting of exemptions under
special notifications of the State government, ue find
that granting of exemption to military personnel and persorv-»
nel belonging to the Border Security Force may and does
lead to large-scale misuse and therefore recommend that
thi,s facility should be uithdraun..i *
2.7.10 Ue recommend ;hat the alternative of compounding
should be provided only for the cinema halls located in
places having a population less than 20,000. Ue have
already recommended that the rate of compounding should be
based on an occupancy ratio 5 to 10 percentage points
higher than the ratio observed in similar cinemas in the
last three years. The tax payable should be computed at
25 per cent of the admission charges (inclusive of the tax),
The amounts of the compounding fee in the case of every
cinema house should be re-computed uhenever there is a
change in admission charges.
the existing rate may be continued.

- 49 -
2.7.11 After careful consideration, ue feel that the
requirement of taking security depotIt for the purposes of
registration is not really necessary, Ue therefore recom
mend that the system of taking security deposits may be
discontinued in the case of permanent cinema houses.
2.7.12 Ue are of the opinion that as it is not possible
to ensure continuous and adequate supply of adhesive stamps,
it uould be advisable to give up the present procedure and
adopt the system of paying the tax in cash or cheque along
uith fortnightly returns. Such a procedure already prevails
in regard to the cinema houses located beyond 20 kilometres
from a treasury or the sub-treasuty. This procedure could
be applied to all the theatres,
2.7.13 In the interest of avoiding hardship to the asses
sees ue recommend that (i) the proprietor of the cinema
house should be called to be present uhile making assess
ments only uhen it is found that the returns furnished by
him art incomplete and/or incorrect and (ii) the Act should
be amended to include a clause that all assessments rela
ting to a financial year should be completed uithin three
years after the completion of the financial year.
2.7.14 In order to strengthen the information system
ue recommend that the information on the follouing items be
compiled on an annual basis for each of the cinema houses
in the State:
i) seating capacity in different classes of admission,

50 -
ii) rate of admission to the different classes,
iii) number of cinegoers visiting the different classes and the total,,
iv) gross receipts from the different classes and the total,
v) tax receipts from the different classes and the total, and
vi) grouth of cinema houses uith the datas of starting operations.
From the above information received on each of
the cinema houses, aggregate data can be uorked out for
(i) the districts (ii) the different classes of cities and
(iii) for the,State,

III. PASSENGERS AND GOODS TAX IN B
1* Introdu ction
3.1*1 It is often pointed out that road transport is <
subject to very heavy taxation. The Central government levies
excise duty on motor vehicles, tyres, spares and on fuel. At
the State level, besides the 'sales tax on motor vehicles, tyres
fttd .tubes, spares and motor spirit, the motor vehicles tax
ant* the passengers and goods tax are levied. Moreover, at the
local level, octroi and other types of entry taxes add to the
tax burden on road transport. The cumulative burden of all
these taxes is none too light and leads to substantial cost
escalation. Uhile a part of the burden may be considered to
constitute charges collected for the use of road services, a
substantial portion of the burden would constitute the tax
element.
3.1.2 It is not our intention to examine all the taxes on
road transport, though such a study uould bp useful in itself
and has been attempted by many committees and commissions^.
Our terms of reference-require us to examine the structure and
operation of only the passengers and goods tax levied in the
State of Bihar and recommend policy measures to rationalise ' '
its structure and improve its administration. ,
3.1.3 This tax i3 levied in addition to the motor vehicles
tax (originally introduced in India in the form of fees under
the Indian Motor V/ehicles Act of 1914) which is mentioned in
Mention may be made of the Reporteof the Taxation Enquiry Commission (1953), the Road Transport Reorganisation Committee, (the Masani Committee. 1959), the Road Transport Taxation Enquiry Committee (the Keskar Committee,1967-68) and the Indirect Taxation Enquiry Committee (3ha Committee, 1978).

- 52 -
Entry 57. in t ie State List* The tax treatment of road
transport, however, varies among the States: while all the
States cplleet the motor vehicles tax, not every State imposes
a separate tax on passengers and goods*. For example, Uest
Bengal does not levy the passengers and goods tax at all*
Orissa levies the'passengers tax but not the goods tax*
Andhra Pradesh, Tamil Nadu aod Karnataka uhich used to .levy
the passengers and goods tax have now merged the tax wit£v, the
'motor vehicles tax* Maharashtra has converted the goods tax. . I
into an additional motor vehicles tax* The States uhich levy tfc?
passengers and goods tax have provisions for paying a composition
fee in lieu of the tax. Though the formula of compounding is
not uniform in all the States, it is to be noted that, in
effect, the payment of a composition fee is not different from
thd payment of an additional motor vehicles taxi ,
2* Evolution of the Tax
'3*2*1 The tax on passengers and goods uas originally levied!
in Bihar under Part III of the Bihar Finance Act, 1950 at the I
rate of 12.5 per cent of the fares and freights. This Act Was*
replaced by Bihar Taxation of Passengers and Goods (Carried byK
Public Service Motor Vehicles) Act, 1961 uhich uas given retro#
pective effect from 1st April, 1950* The rate of tax uas, houj
ever, unaltered until December 1, 1971 uhen it uas enhanced tol
20 per cent of the fares and freights. Besides, the basic rate*
an additional tax at the rate of 5 per cent uas levied from f
December 1, 1971 for meeting the expenses connected with Bangla
desh refugees. This uas abolished uith effect from April 8, I
1973. The rate of tax on passenger fares was enhanced to 25 K
per cent from April 9, 1973, but the rate of tax o n freights I
has been continued at 20 per cent.

53 -
3*2,2 Section 8 of the Act provides that the Government may,
if it considers necessary, allow the payment of a fixed fee in '
lieu of the tax at the prevailing rates* In accordance uith
this provision, compounding of the tax in respect of public
service motor vehicles has been In vogue since 1966*
3.2.3 In the case of stage carriages the rates of composition
fee:uere originally determined according to seating capacity.
The rates were changed in 1969, 1971, 1972, and 1973* In 1974,
mini buses were charged at two flat rates: Rs 150 per month in
the districts of Dhanbad, Singhbhum, Ranchi, Hazaribagh, Geridih,
Patna and Gaya; and Rs 125 in the remaining districts* By an
amendment uhich came into effect from April 1, 1976, the govern
ment uithdreu the facility of paying composition fee for the
buses and mini buses* However, the facility of compounding
the tax uas again introduced uith effect, from January 1, 1978 to
the ouners of these vehicles. Currently, the composition fee
for all public service buses/mini buses per year is determined• ' 1 •
by multiplying the total number if passenger seats.of the bus
uith the total, number of kilometres to be covered in a day as
per permit* The facility of compoun&ing^ is extended also to
the buses run by the Bihar State Road Transport Corporation.
All contract carriages are required to pay a compounded fee at
the rate of Rs 300 per month. Taxis including tempos and
autorickshaus are required to pay the: composition foe at the
rates of Rs 80 per month and Rs 30 per month, respectively*
3.2*4 As regards the goods vehicles, earlier,- different rates
of composition uere fixed for the trucks permitted to ply south
of the river Ganges and for thoee permitted to ply north of the
river Ganges. This differentiation was done away uith, effec
tive from 1*4*196% and all goods vehicles having permits to ply

54 -
uithin the State uere taxed at uniform rates; but rate differer>|
ciation uas introduced on the basis of laden capacity. The
rates uere revised upuards in l?71i Uith effect from 1st April,f
1976, rate differentiation on the basis of laden capacity uas
done auay uith, but different rates uere applied to the vehicles
registered for a period upto 5 years* for 5 to 10 years and
for more than 10 years* The rates of composition fee uere
enhanced in 1979, but the lengths of the periods of registration
for rate differentiation for the goods vehicles have remained
the same. However, in respect of all goods vehicles registered
in other States but operating in Bihar on the basis of temporar
permits upto one month, lump sum amounts are levied. The
currently prevailing rates of composition .fee are presented In
Table III.1* '
3• Fiscal Importance and Grouth of the Tax
3.3.1 The revenue „from the paissengers and goods tax in the
State has grown,more or Ifss, at the same rate as the total
tax revenue collected by the State during the 12-year period
1965-66 to 1977-78. As a proportion of the latter, it has ri
only marginally from 2.07 per cent.in 1965-66 to 2.17 per cen
in 1977-78. Thus, relatively speaking, this tax has continuec
to be of negligible importance in the pattern of the State tax
• system. By contrast, in the neighbouring States of Uttar Prad
and Madhya Pradesh, the relative revenue significance of this
tax is much greater: as a proportion to bwn tax revenues.it
amounted to 5.48 per cent in the former and 10.93 per cent in
the latter - i.e., more than twice and more than five tinies
respectively, of the proportion in Bihar (TableIII.2). Even
in Orissa, where only the passengers tax is levied, the

- 55 - i
corresponding pooportion uas higher at 2,94 per cent; only in
Assam among the neighbouring States* the relative importance of
this tax uas lower*
3.3*2 Even in per capita terms, the yield of this tax In
Bihar uas lower at Rs 0.73 (1977-78) than in Madhya Pradesh
(Rs 5.77), Uttar PradBsh (Rs 2.60) and Orissa (Rs 0.97)
(Table .111.3) .• . *.
3.3.3 Another Important feature of the trend is that the
yield of the passengers and goods tax in the. State has been
subject .to uide fluctuations. For example, in absolute'terms,
it fell from Rs 147 lakh in 1967-68 to R.s 89 lakh in 1968-69,
but rose to Rs 169 lakh in 1969-70* , As a percentage of State
tax revenue, the fluctuations are.even greater (Table III.2)*
3i3*4 It is clear that from vieupoint of revenue yield,
the passengers and goods tax Is only a minor levy in Bihar.
Aside from that, the uide fluctuations noticed in the yield
from year to year cannot be accounted for in terms of fluctuations
In economic activities in the State p'r of discretionary changes
in the tax base and the rate. Hence, the reasons for them have to
be found in the ueaknesses in the administration and enforcement
of the tax in the State#» .
3.3*5 The fact that the yield from the passengers and goods
tax as a percentage of the State*9 own tax revenue showed
only a marginal increase o v e r time*indicates that the time
rate of, growth, of the tax has been oniy slightly higher than
that of the State1s.total taxes* Uhen a more recent period
of 10 years from 1968-69 to 1977—78 is considered, the
yield of the tax recorded a compound annual grouth rate of

56 -
about 20 pet cent, uhich though higher than what uas recorded
in Assam (13 per cent) and Uttar Pradesh (17.4 per cent) is
much lower than those of Madhya Pradesh (24.5 per cent) and
Orissa (54 per cent). If a larger time period of 16.years
from 1962-63 to 1977-78 is considered, the growth rate of the
tax in Bihar falls sharply to 15 per cent and it is lower than
that of Uttar Pradesh (21 per cent) also*
\
N3.3.6 Even though the total revenue from the passengers and
goods tax grew at an annual rate of 20 per cent, more than
half of the growth may be attributed to changes in the tax
rates and other discretionary measures adopted by the Govern
ment from time 'to time. The yie.ld at tax rates prevailing in
1968-r69 is estimated to have grown only at an annual rate of
■ 9.4 per cent, which is less than half of the rate of growth
observed for the tax at current rates of taxation. This
order of automatic growth of the tax compares very^ unfavourably
with the growth rates observed in all the neighbouring: States
levying the tax.* It is lower than the rates («f automatic
growth) observed in Assam (13 per.cent) Uttar Pradesh (12*2
per cent), and is substantially below the growth rates observed
in Madhya Pradesh (23.7 per cent) and Orissa (31.7 per cent).
• ♦
3.3.7 It is usual to judge the growth of the tax in terms
of buoyancy and elasticity—/. Ue have computed buoyancy and
1 / Buoyancy is defined as the percentage increase in the tax yield at current rates of taxation for a one per cent |increase inithe SDP of the Statej elasticity on the otherhand measures the responsiveness of -the tax yield in terms of the percentage automatic increase in the yield due to the automatic--expansion of the tax base*

57
* Iuticity coefficients of..the passengers and goods tax in '
Slhn and in the neighbouring States for the period from 1968-69
to 1977-78. The results presented in Table 111.4'indicate
tn»t on an average for, a one. per cent increase in SDP, there
M « boon an increase in the tax yield by as much as 1.67
; r cont. But the elasticity of the tax in Bihar is only
;,64. In all the neighbouring States, the observed elastici
ty* are above unity’ and are much higher than that of Bihar*
Thus, the passengers and goods tax in Bihar lacks built-in-
ulasticity and much of the increase in revenue from the tax
has been derived from ad hoc discretionary measures.
3.3.8 It is of interest to study the responsiveness of
the tax yield -o the expansion of the tax base namely the
number of different categories of public service motor vehicles*
For this purpose,, ue! regressed (in a log-linear model), the
f/ield of the tax (Y) on: -the number of public service motor
vehicles (P) (i.e. stage carriages + goods vehicles)', 'the ,
proportion of goods vehicles to total public service motor*
vehicles (G/p) and tuo dummy^ variables (D^ and Og) represen
ting tuo: major discretionary measures. The first dummy
represents discretionary tax changes introduced in 1971-72
ind the* second dummy represents the introduction of check-'
points in 1976-77*. The^ follouing equation uas estimated: v
Log Y = -0*4143+0*7965**: log P-0.5624 log G/P+0.'4436*'D1+0.0862D2
(-0.0375) (1.9252) (-0. 2033) (1.7445) (0.2816)
R2 = 0*8 395' F « 15*3805 : D.U.Stat * 2*883 ..
** Significant at 5 per cent level -
* Significant at 10 per cent level
Figures in parentheses are t'-ratios*

- 58 -
1.3.9 It is seen from the equation that a one per cent
increase in the number of goods vehicles and stage carriages
leads to an increase in the yield by only 0.8 per cent.
Secondly, payment of the tax is not significantly related to
the proportions of goods vehicles and stage carriages#
Finally, contrary to the general feeling, the introduction
of check-points in 1976-77 does not seem to have had a sig
nificant impact on the yield of the tax.
3.3.10 Thus, increases in the yield of the tax in Bihar have
come substantially from discretionary changes and not mainly
through the built-in response to the expansion of the tax bate.
The increases in the revenue over the period 1968-69 to 1977-78,
attributable separately to the automatic expansion of the tax
bases and- discretionary measures, in Bihar and the neighbouring
States, are presented in Table III.5. In Bihar, pf the total
increase in the yield of the tax amounting to Rs 3233 lakh over
the period 1968-69 to 1977-78, the increase due to discretionary
measures is estimated at Rs 1449 lakh forming as m«ch as 45 per
cent of the total increase and the increase from the automatic
expansion of the base is estimated at Rs 1784 lakh forming
55 per cent of the total. Except for the case of Orissa, where
the discretionary component of the total increase in ths yield
is higher at 89 per cent, in no’ other neighbouring State, the
growth of the tax depends so much upon discretionary measures
as in Bihar. In Assam, there uere no discretionary measures
and the Qntire increase in the yield has accrued from the grout
of the tax base. In Madhya Pradesh, the discretionary element
contributed only about three per cent of the total increase In
yield: and in Uttar Pradesh, -it contributed -only 18' per cent.

59 -
3.3.11 Thus, it would seem that (i) the growth of the
s.issengers and goods tax in Bihar in comparison with that
In the neighbouring States is not satisfactory and (ii) nearly
*>ilf of the growth in the tax has come about due to the dis
cretionary measures introduced from time to time.
3.3.12 The growth of the tax could be expected to be rather,
lou if the burden of the tax on the economy is already suffi
ciently high. But this, is far from being so in Bihar. It is
#oon, from Table 111*6, that judged by any .of the indicators,
the level of the tax in Bihar is abysmally low. The yield of
the tax in Bihar in per capita terms, as a per cent of the total
tax yield of the Stats and- as a per cent of SDP, is lowest
among the States levying the tax, with the singular.except ion
of Assam. . Even in Orissa, where only the passengers .tax is
levied, the burden of the tax is higher than the combined
burden of the passengers and goods tax in Bihar* In other
States, the level of the tax is much higher, for instance,
in Uttar Pradesh, which ranks immediately above Bihar in
this respect, the level of the tax is about 3 times that of
Bihar in terms of all the three indicators. In Haryana,
uhich has the highest level among the States' compared, the
par capita yield of the tax is over 20 times, the. percentage
contribution of the tax to States* own tax revenue six times and
tiro ratio of the tax to SDP about 10 times; the corresponding
Indicators in Bihar.
' '' "! ... . - . ,3.3.13 A State can have a low tax level if the-tax base is
not sufficiently wide. The potential base of the passenger?
and goods tax is constituted by the number of passengers and the
distance commuted, the volume of goods and the distance pf
transportation and the fare and freight rates. Ue do not"
have any reliable data on these either for Bihar or for the
other States* Ue do not even have, information on the taxes
paid on passenger vehicles and on goods vehicles separately
in the different States. Ue have, therefore, used a proxy
for the tax base, namely, the number of public service vehicles
(buses and goods vehicles), to examine whether in Bihar the
yield is satisfactory in relation to its tax base. The tax
yield per public service vehicle computed for 1975-76 is
•presented in column 4 of Table III.6. In relation to the tax
base., the tax yield in 8ihar is clearly the lowest, even lower
than that in Assam.- It is half as low as that in Maharashtra,
about a third of that in Rajasthan, Uest Bengal, Madhya Pradesh
Assam and Uttar'Pradesh, a fourth of that in Gu jarat, a- fifth
of that in Punjab and as low as one-fifteenth-, of that in} • • •
Haryana. Certainly, this is a matter which should b,e of great
concern to the State government* This .calls for a thorough
probe into the structure and operations of the tax in the
State. ■ '
4. The- Structure of the Tax
3.4.1 The structure of the tax in Bihar is rather simple.
From 1950, when the tax was introduced, upto December 1971,
the tax rate remained unchanged at, 12.5 per cent of the fares
and freights. From 1st December 1971, the rate was enhanced
to 20 per cent of the fares and freights and with an addition
tax at the rate of 5 per cent, the total burden was 25 per. cer
for both the passengers tax and the goods tax. Uith effect,
from April 1973, the additional tax Was repealed, the basic
passengers tax was enhanced to 25 per cent of the fares and
the basic goods tax rate was continued at 20 per cent. Thus

61 -
currently, th*e tax on passengers is levied at 25 per cent of
the fares and that on goods at .20..per cent of the freight
charges." :
3.4.2 The rates of tax on passengers and goods in Bihar
’.nd other States where the tax is levied are presented i’n-
Tible III.7. The rates of tax levied in Bihar are by no means
the lowest. As regards the passengers tax, the rate in Bihar
is higher than the rates in Assam, Maharashtra, Orissa and Uttar
Pradesh though it is lower than the rates, in Haryana, Punjab
and Rajasthan. Similarly, the rate on the transportation-bf
goods at 20 per cent of the freight-charges is higher than the
corresponding levy in Assam, Gujarat, Madhya Pradesh, Mahara
shtra and Uttar Pradesh and is lower than that in only Haryana,
Punjab and Rajasthan. Thus, .as compared to the tax rates
prevailing in other States, the rate of, the passengers and
goods tax in Bihar is high, and hence low rates certainly
cannot be a factor contributing, to the low level, and slow
growth, of the tax in the State.
3.4.3 Nor can we state that the policy of exemptions adopted
by the State is e reason for ; the unsatisfactory 'level of the
tax yield.. Section 3B of .the! Bihar Taxation of Passengers and
Goods (carried by Public Service Motor Vehicles Act, 1961)
lays down that the State government‘may, by notification in
the official Gazette, grant exemption from the payment of the
tax to any owner or class of owners (i) if the vehicle is
engaged in the carriage of .passengers and goods on specified
routes (ii) if the vehicle is engaged in the carriage of passen
gers and goods in furtherance of educational,, medical, philan
thropic and other similar objects, or (iii) in the case
vehicles carrying passengers and goods having an agreement to
pay the lump sum levy in lieu of the tax. From the point of

view of revenue, only the third category, namely, the exemp
tions due to the agreement to pay the compounded fee ih leiu
of the tax seems to be important and needs to be analysed in
detail. *
3.4.4 As mentioned in an earlier section, in respect of
goods vehicles, the amount of composition fee varies depending
upon the length of the period of registration of?the vehicle
in the State. Vehicles registered for a period u p t o 5 years
under the Motor Vehicles Act are required to pay a fee amounting
to Rs 350 per month. For a period of subsequent 5 years the
amount is Rs 275 per month and for subsequent periods it is
200 per month.; In nominal terms, this compares quite favourably
uith the composition fee prescribed by other States.-. Many of
t h e’states have the registered laden ueight (RLU) o*f the vehicle:
or the unladen ueight of . the vehicles as the. basis of imposing
differential composition fees. The composition fees payable
in different States by tuo standard categories of goods vehi-
cles in different States are given belou:
ComDOsition fee (in Rs) Davable b
StateGoods vehicles having payload of 10 tonnes
(RLU 16.5 tonnes)
Goods vehicles having payload of .12 tonnes (RLU 19.5 tonne
Bihsir i) Less than 5 yrs. old 4200 ii} Betueen 5-10 yrs. old 3300
iii) 10 yrs. and above 2400
420033002400
Gujarat 1350 1440
Madhya Pradesh 2182 2618
Maharashtra 1350 1440
Punjab 1050 1050
Rajasthan 2200 2200
Uttar Pradesh 3600 4320

3.4.5 It Is seen that the composition fee payable in Bihar
is the highest among those, prevailing in all the States
considered with the single exception of Uttar Pradesh* In
Uttar Pradesh', the fee is higher on goods vehicles having a
payload of 12 tonnes (column 2). Even in the case of vehicles
having a payload of 10 tonnes (column, l), Uttar Pradesh has
3 higher composition fee in respect of vehicles that have
been registered for over 5 years. In no other State does
their prevail a composition fee as high as that charged in
Bihar and hence, the poorer revenue performance of the tax in
Bihar cannot be explained on the basis of a lower rate of
composition fee. , .
3.4.6 It is, however, interesting to examine the effective
rate of tax that would result by opting to pay the composition
fee in lieu of the tax. According to the information provided
to us by the Transport Ouners Association In the State, an an
iverage, a goods vehicle plies 300 kms a day and the freight
charges'per payload kilometre (including the tax) is Rs 3
for long routes and Rs 5 for short routes# Accordingly,
assuming that the vehicle will be on the road for 25 days
in a month, it may be expected to cover about .7500 kms a month
The kilonietreage assumed in the study of Mr. Asit Chandmal for
the Indirect Taxation Enquiry Committee (1976-78) is 1,00,000
kms a year for the small fleet owners and 1,20,000 kms a year
for large fleet owners which works out to be in the range.of
8800 kms to 10,000 kms a month. The Report of the Taxation
Enquiry Committee of Uttar Pradesh (1974) gave a very conser
vative estimate at 4000 kms a month. Taking this conservative
estimate and the freight charges of Rs 3 per payload kilometre
the gross earnings per goods vehicle work out to Rs 12,000 a
month, or Rs 1,44,000 a year. The tax at the rate of 20 per

- 64 -
cent of the net freight charges uorks out to Rs 24,000, which
is over 7 times the yield that would have accrued if the
composition fee was paid in lieu of the tax. Even if we take
the composition fee payable at the maximum rate of Rs 350 per
month, it amounts to only 3.5 per cent of the earnings as again
the tax rate of 20 per cent. This would mean that whereas
the users who get their goods transported pay the. tax amounting
to Rs 2,000 a month at the stipulated rate of 20 per cent,
the government receives a maximum of only Rs 350 per month,
the balance being appropriated by this owners of .the goods ve
hicles. Thus, the State gets revenue at low rates of taxation
from the owners of the goods vehicles even though the people
pay the tax at the rate of 20 per cent and this has apparently
resulted in the wide divergence between the statutory tax
rate and the effective rate resulting from paying* the compo
sition fee. Nevertheless, the composition fee in the Stat.e is
higher than in other States as has already been mentioned and
under such a situation it seems preferable to give^the benefit
not • to. the owners of the goods vejiicles but to the people
at large and this can be dine by reducing the rate of tax*
UJe will return to this issue later.
3.4.7 Ue may next examine the formula applicable for
determining the composition fee in lieu of the tax in the
case of passenger buses. The formula which is currently
in force was laid down in notification S .0. 157 of 9th
February, 1978 which is as follows:

65 -
Amount of fixed fee in lieu of tax per annum for a particular vehicle
2/3 x estimated total working days in a year (300)
x estimated rate of-fare per passenger per kilometre (4 ps)
x rate of tax x half of total number of seats
x total kilometres to be covered in a day
2 300 4 25 1 T ,*3 X 1 x 100, X 100 x 2 x 0 1no* of seats x total kilometres ' to be covered in a day (in Rs)
Total number of seats x total kilometres to be covered in a day (in Rs).
3.4.8 If all the seats are occupied,the tax according to the
statutory rate uould be equal to the assumed total working
days in a year x estimated rate of fare per passenger per
kilometre x rate of tax x total number o,f seats x total
kilometres to be covered in a day. The fixed fee payable
uould be only l/3rd of the tax payable according to the
rate if all the seats are filled. . Thus, if all the seats in
the bus are occupied, the effective rate of tax uhen the
option to pay the composition fee is exercised uould’work
out to only 8*3 per bent of grass earnings uhereas the tax is
levied at the rate of 25 per cent of the earnings*
3.4.9 The composition fee uould give a much lower yield
than the t?x payable at- the prescribed rate because (1)
the occupancy ratio assumed in the f 0 rm.ula is only 50 per
cent and (ii) in order to make, the formula attractive only
2/3 of the tax payable at 50 pep cent occOpancy is required
to be paid by way of composition.

66 -
3.4.10 As regards the occupancy ratio, according to the
information available uith the Transport Owners Association,
the buses, on an average, run with 80 to 90 per cent of the
permitted number of seats occupied, uhile the composition fee
is computed assuming that the;buses would run only at 50 per
cent of capacity. Because of this difference alone, the
potential yield of the passengers tax should have been higher
than the actual yield by 60 to 80 per cent. Even this is an
underestimate, as many of the buses are knownto run with loads
much higher than the permitted capacity and to cover more
kilometres than stipulated in the permit.
3.4.11 Besides* .the requirement to pay only 2/3 of the
yieldj computed at 50 per cent occupancy ratio, in order
to make the system of compounding attractive, has jLpwered
the yield of the tax further by 33 per cent. The question
is whether it is necessary to make the effective rate so
much lower in order to make composition attractive at all.
If a transporter opts to pay the composition fee in lied
of the tax, not only is the discharge of the liability to
pay tax rendered simple, because accounts heed not be -
maintained, but also the compliance cost to the transpor
ters is considerably reduced, for he would not be liable
to be assessed on the basis of returns. This alone should
be a strong incentive for opting to pay the composition fee
in lieu of the tax. However, it is true that the under
statement of gross earnings for assessment purposes would
not always *be possible or easy to prove and hence, if the
composition fee is nearly as much as the likely liability
on regular assessment, the transporters would be induded
not to opt for compounding in the hope of paying lower
tax through under-statement. Nevertheless, it does not

67 -
ii'-eir nccessary to. bring down the liability so much to
r tka compounding attractive.'
1.4.12 It should also be noted that the formula assumes
i fire at the rate of 4 paise per passenger kilometre. At the
1 per cent tax rate applicable, the fare' inclusive of the
? ix uould be 5.paise per passenger kilometre. Uhile this is
iqual to the actual fare charged by the ordinary buses, it
is less than the fare of 6 paise (inclusive of tax) per
oossonger kilometre charged by De Luxe buses. For these
categories of buses, the net fare works out to .4,8 paise• t *
and 6,4 paise per passenger kilometre respectively. The
revenue loss on account of assuming a lower fare in respect
of these c a t e g o r i e g of vehicles works o u t t o . 20 per cent in the
cise of express buses and about 60 per cent in the case of
De Luxe buses, Ue do not have information on the number
of express and De, Luxe buses in1 Bihar and :thereforejare
unable to provide the total revenue loss arising from assuming
4 paise per passenger kilometre,
3.4.13 Thus, it is important, to note that the formula for
compounding laid down seems to be too favourable to the
transport operators and has led to considerable loss of
revenue to the State, About 40 per cent loss in revenue
seems to be implied in the conservative estimate of 50 per
cent occupancy ratio used in the formula. The requirement
to pay only 2/3 of the amount payable as tax at prescribed
rates using 50 per cent occupancy ratio increases the revenue
loss to a b o u t 60 per cent assuming 100 per cent occupancy
and 300 working days. Additionally, a significant loss
of revenue could have resulted from not taking into account
the higher fare charged on the express and De_ .Luxe, buses.

- 68 -
3.4.14 Us may now compare the compounding formula prevailing
in Bihar uith those prevailing in the neighbouring States.
Table III.8 presents a comparative picture of the formula
currently in force in the States of Madhya Pradesh, Orissa and
Uttar Pradesh. It is clearly evident that the formula
prevailing in Bihar uould yield much louer revenue than those
prevailing in the neighbouring States. In Madhya Pradesh,
the number of working days considered for compounding is
365 as against 300 in Bihar; on this count alone, ceteris paribus
the yield uould be higher by about 22 per cent. Again, a
minimum of 65 per cent occupancy ratio is taken as the
basis in M.P. ars against 50 per cent in Bihar, uhich uould
make the estimated liability 30 per cent higher. Thuq, the '
formula used in Madhya Pradesh uould yield at least 50 per
cent higher revenue from the passengers tax than the formula• i
adopted in Bihar. Similarly, the formula employed in Orissa1
uould result in 85 per cent higher yield in the case of
ordinary buses, 105 per cent higher yield in the case of
express buses and about 260 per cent higher yield in the case
of 0_e Luxe buses. In Uttar Pradesh too, an occupancy ratio
of 75 per cent is taken as the basis, uhich alone uould render
the yield higher by 50 per cent than if 50 per cent occupancy
ratio uere adopted as in Bihar. It thus seems clear that
if it is necessary to continue the option for the payment of
composition fee in lieu of the tax, the formula for compounding
should be substantially revised.
5. An Estimate of Evasion of the Tax
3.5.1 Evasion represents the difference between uhat
is payable as tax and what is actually paid. In order

69 -
to build an estimate-of evasion, therefore, it is
necessary to obtain the potential yield by applying
the rates;of tax on the available data on the tax base
of the State. Thus, essentially, the estimation of the
tax base is the crux of estimating tax potential and
tax evasion.
3.5^2 It may, houevar, be pointed out that the rates
of tax payable as laid doun in the Act are not relevant
for estimating the tax.payable to the State as almost all
of the transporters of goods and passenger vehicles have
exercised the option of paying the composition fee in lieu
of the tax. Thus, for estimating the tax payable the rates
of composition have to. be applied to the estimated base.
But it uould b'e quite interesting also to examine the
difference betuieen 'the tax payable and the composition fee
in lieu of the tax, because the difference betueen tho tuo,
as pointed out earlier, is appropriated by. the transporters.
3.5.3 Ue have made an attempt to estimate the tax base
in the State on the basis of the information on the
number of goods vehicles and buses and mini buses taxed,
available uith the Transport Department, and on the basis
of certain reasonable assumptions. As regards goods vehicles,
it is assumed that on the average, the.vehicles pay at
the rate of Rs 200 per vehicle per month - the rate of
composition fee prescribed for vehicles having registration
of 5 to 10 years during the years 1975-76 to 1978-79. The
number of goods vehicles multiplied uith this rate of com
position fee gives us an estimate of tax that should be
payable to the State. In order to arrive at the estimate
of tax revenue payable at the tax rata in force ue have •

- 70 -
to estimate the yearly earnings of goods vehicles. For
this, ua hava assumed that (i) payload capacity of tha
vahicles on the average is 10 tonnes, (ii) freight charges
(inclusive of tax) is Rs 3 par payload kilometre^/ and (iii)
a vehicle on an average covers 4000 kilometres a month.
3.5.4 In raspect of passenger vehicles, though the
system of paying the composition fee in lieu of the tax
prevailed in 1975-76, it uas given up during tfie years
1976-77 and 1977-78. However, it was re-introduced in
1978-79. Thus, in 1976-77 and 1977-78, the tax payable
at current rates of taxation is the tax payable to the
State whereas in >19.75-76 and 1978-79 the composition fee
payable is taken to be the tax payable to the State. The
rates of composition, however, were different in 1975-76 andi ,
1978-79 and we have estimated the yield by applying the
different rates applicable in the tuo years. To estimate
the tax yield in 1975-76 in respect of buses, the rata appli
cable to a 50-seated bus (26 paise) is multiplied with tha
total kilometres run in a year, assuming that the vehicle
.performs a journey of 100 kms a day and for 300 working
days in a year. For mini buses, the rate applicable (Rs 125
per month) is used to determine the compounded sum.
3.5.5 To estimate the, tax yield in 1978-79 wo have
worked out the weighted average seating capacity per passen
ger vehicle by assuming that the number of seats in buses
is 50 and that in mini buses is 30. The average seating
capacity (47) is then multiplied with the kilometraga.
3/ According to the Transport Ouners Association, Rs 3 per 1.0-ton payload kilometre is charged for long distances and Rs 5 for short distances.

according to permit (assumed as 100 kms) to arrive at the
estimate of the compounded fee payable in 1978-79, uhich
jhen multiplied uith the number of passenger vehicles gives
us an estimate of *the total yield at compounded rates for
the year.
3.5.6 For estimating the yield at the rates of taxation
In force ue have assumed that (i) occupancy ratio in
passenger vehicles is 90 per cent (ii) fares are collected
at the rate of 5 paise per kilometre (inclusive of tax) and
the vehicle covers 100 kilometres a day and (iii) buses are
run. on 300 days in a year. Total earnings per vehicle thus
irrived atfuhen multiplied uith the number of vehicles^
qIvgs gross earnings of all passenger vehicles* Applying
the tax rate of 20 per cent (equivalent to 25 per cent af
act freight charged), ue derive the estimate of tax payable
it the rate in force*
• i ^
3.5.7 M 0 have also estimated the composition fee payable
cntaxis, tempos and auto-rikshaUs. Separate data on the
number of the paying taxis' and auto-rikshaus are not available.
However, this breakdoun is available for registered vehicles*
By applying the proportions of taxis and auto-rikshaus registered,
cs have arrived at estimates of.’tax paying, taxis and auto-
rikshaus. Applying the relevant rates of composition of. these
numbers, (Rs 30 for auto-rikshaus and Rs 80 for taxis) ue have
irrived at the estimates of tax due from these vehicles*' *
3.5.8 The estimates of yield on the basis of composition
rates and of tax rates for.the years from 1975-76 to 1978-79
are presented in Table 111,9. It is clearly seen that the

- 72 *-
difference between the tax paid by the people and the tax
collectad by the Stats in respect pf both goods vehicles
and passenger vehicles is substantial. A s regards the former,I
exactly a tenth of the tax collected from the people by way
of goods tax is passed on to the Government by the'transpor
ters in the form of composition fee. In 1978-79, for example,
the tax collections from the people are estimated at Rs 61 crore
whereas the composition fee payable was only Rs 6.1.crore. In
respect of the passengers tax,- the tax paid by the people in
three times the composition fee paid by'the transporters in
1978— 79s Whereas the tax collected is estimated at Rs 10
crore, only Rs ,3.8 crore is payable to the State by way of
composition fee. •'T . ... . '
* . j.. »3.,5.9 For all practical purposes, in 1975-76 and 1978— 79,
we may take the composition fee -as the estimate of tax payable
to the. State as almost'"all' the transporters are known to' have
opted to pay the composition fee in lieu of the tax. However,
in 1976-77 and 1977-78, while the yield on the basis of com
position' represents the tax payable in the case of goods vehi
cles', the tax payable at the rate of tax'in force represents
the tax payable in the case of passenger ■ vehicles, as th-e
option of paying composition fee did not exist for those
vehicles during these years.
3.5.10 A'comparison of the actual tax paid with the esti
mated tax payable gives us.an indication of the magnitude of
tax evasion in the State. A s the tax payable is estimated on
the basis of assumptions, which can be considered conservative,
the estimates of evasion also may considered to be on the
conservative side.

- 73 -
T.5.11 In Table III. 10, the estimates: of tax payable,
actual payments, and the magnitude of evasion are preseVited,
If our calculations are even approximately correct, the evasion
of this tax in the State can be said to be practised on a
colossal scale. The extent of evasion uas the hiighest in
IQ77-78 uhen the' amount evaded is estimated to be as much ~
is 63.6 per cent of the .tax payable, • Evasion uas so high
in that year as the ouners of passehgWr vehicles uere not
provided uith the option of paying composition fee and hence
the tax payable uas higher, Uhile this should have been
true also of 1976-77, the establishment of check-points in1
this year seem to have led to better tax collections
rondoring the estimated evasion'louer at 41,2 per cent of the
potential yield. But.it should be noted that the increased
tax collections resulting from the establishment of check
points do not seem to have been sustained in subsequent years,
Tho amount" of evasion uas found to be the louest in 1978-79,‘ . . i ■
jhich is Estimated around Rs 3,6 crore forming '35 per cent of
tho potential yield. In 1975-76, actual collections of the tax
.'ore only Rs 4,1 crore as against the estimated tax payable at
fls 7«1 crore. The difference of about Rs 3 crore formed" as
nuch as 42 per cent of the potential yield in the year,
3.5.12 The analysis of tax evasion in the State uill not
bo complete uithout highlighting an important feature of
revenue collections from this source. The system seems to
have been evolved such that the rates of tax payable do not
have a significant impact on the amounts of tax collected. As
In 1976-77 and 1977-78, the option of paying the composition
fee in lieu of the tax on passenger vehicles uas not in vogue
and as the effect.ive tax rate on these vehicles should have
- 74 -
been higher, one would have expected a significantly higher
yield. The actual collections of the tax that year, however,
do not conform to this expectation. The tax.yield did show
an increase in 1976-77, but this may be attributed to the
establishment of check-points. Subsequently, the yield
declined rather drastically in the succeeding year presumably
because the transporters had adjusted themselves to the new
administrative set-up. Eyen when the effective rate on passen
ger vehicles was reduced due to the provision of the option to
pay the composition fee, the yield instead of showing a decline
increased nail passu with increase in public service motor
vehicle s. .
3.5.13 If one looks at the actual tax payments by the
peopie and the actual tax paid by the transporters to the
Government, one gets an alarming view* Column 6 of
Table 111*10 points to this difference in the years, from
1975-76 to Rs 65 crore in 1978-79. Thus in 1975-76 and
1978-79, the Government collected only about a tenth of what
is estimated to have been paid by the people by way of
passengers and goods tax. In 1977-78, the situation was
even worse as only a twelfth of the estimated tax collections
went to the coffers of the State.
3.5.14 It is difficult to know the extent of evasion of
goods tax and passenger tax separately as we do not have the
actual collections of these taxes separately, H 0wever,. we
have some estimates of these taxes for the year 1976-77*
According to these estimates, the collections of goods tax
amounted to Rs 2*86 crore as against the tax payable of
Rs 4*28 crore* Thus, the extent of evasion of tax was

- 75 -
as much as Rs 1,42 crore >’prming 33,2 par cant of the • •
p-tantial. Similarly>as against tha passenger tax payable
of Rs 6.75 crore, tha actual collections uere estimated at
3s 3.65 crore. The evasion of Rs 3,1 crore formed as much as\
46 par cent of the potential collections, Ue do not hs.ve any
jj^inate to axamine tho'extent of evasion by stage carriages
.r,i taxi-cabs separately. However, we have been told by the
officials in some circles that the extent of evasion is tha
highest among the taxi-cabs and that hardly 5 per cent of
thaso vehicles pay tho passengers tax.
3.5.15 Uhen the tax is payable on the basis of way-bills,
tho usual method of evading the t a x i s to carry passengers
without issuing tickets and to carry goods without giving
proper receipts. But uheh;/the transporters avail themselves
of the option to pay the’composition fee in lieu of the tax, they
aro not liable to be assessed and therefore issuing of tickets
or receipts and maintaining proper records is not required under
tho Act. thus, the system of compounding d'oes not necessitate
day-to-day checking on the dssuing of tickets and the main
taining of accounts, thereby rendering.tho administration of
tha tax easier. But, inspite of the administration of
tha tax. being rendered easier due to compounding, evasion of
tho tax is practised on such a colossal scale. In order to
plug the loopholas which lead to evasion on such a scale,
it is necessary to identify the methods that are usually
rjsortsd to for evading the tax,
*
3.5.16 A major reason for the evasion seams to be tho
dichotomy in the functions betueen the Commercial Taxes
Dapartment and the Transport Department, In States like
— 76 —
Uttar Pradesh uhera the passengers and goods- tax and tha
motor vehicles tax are administered by the Transport Depart
ment, both tha taxes are collected at the time of issuing tha
permit or renewing it. Evan uhen thay are administered by
separate departments, it is possible to properly enforce tha
tax if (i) there is adequate co-operation and exchange -of
information betueen the tuo departments and (ii)' the
Commarcial Taxes Dopartment administering the passengers and
goods tax has tbe necessary information system to enable it
' to locate and identify the defaulting vehicles. • •,
3.5.17 For administering the tax, the Commercial Taxesi
□apartment is totally independent and does not seek, or roly
on, ai*iy information on tha public service motor vehicles,
uhich the Transport Department gets at the time of issuing
. and renewing the permits. For the purpose of obtaining the
permit, the ouners of public service motor vehicles are
required to register uith the Transport Department and pay
'the motor vehicles tax* whereas for paying the passengers and
goods tax th-ey are required t o 1 register- uith the Commercial
Taxes Department. Thus, for getting the permit, payment of
passengers and goods tax is not a pre-condition. Enforcement
of this tax. uould become much easier if the department
administering the tax and issuing the permit should be the
same.
3.5.18 Even if the departments are different, tha
Commercial Taxes Department ean get the details of each of
the public service motor vehicles registered uith the Transpo:
Department in respect of (a) the vehicle number, (b) the namo
and address of the ouner (c) area of operation (d) permitted
kilometreage (e) seating capacity/payload capacity. Then,

- 77
tha Commercial Taxes Department can verify whether these
vahiclas havo been paying the passengers and goods tax from
its own records'and in case of default , c an enforce the t ax
on tho owners This procedure however,has not been followed*
Tha Commercial Taxes Department acts on its own and does not
soak any information from the Transport•Department. Moreover,
tho Commorcial Taxes Department does not havo a prop-er
information system of its own relating to the passengers and
goods tax. In fact, there does not even exist a rudimentary
information system, Ue havebeen informated that it is •
impossible to find out even the yield of the passengers tax
and the goods tax separately, leave alone getting details of
vehicles paying these taxes. There is no system of collating
information available in the circles and keeping it in a ,
central pool. In the absence of such information, it is not
at all possible to have an effective check on defaulting
vehicles. _ ,
. . . ' • * • ’ ,■ • 1 ■ ■ • -• "* f3.5.19 The establishment of check-points' at strategic
places of entry into, and exist from, major cities and towns
of the State would, however, e n s u r e a proper enforcement of
the tax on the vehicles passing through such check-points. But
this does not in any way curb widespread evasion by tha vehicles
which ply within the precincts of a local area and do not pass
through these check-points.
3.5.20 The fact that a, large number of vehicles do not
pay tho tax by simply not registering is borne out by the
substantial increase in revenue in 1976-77 (of about Rs 2,3
crore) over the previous year when the checte-points were •
established. But this increase has not been sustained in

- 78 -
subsequent years and, in fact, ue notice considerable depline
in the revenue. Ue are, therefore, led to believe that the
transporters have adjusted themselves to this set-up and have
formed uays and means to overcome the hurdle. In this conneo-
tion ue cannot rule out the collusion of the officials at the
chec!<-points uith the transport operators. A note on the
uorking of check-points in Bihar is contained in Appendix III.l.\
6 . Rscornm endatio_ns
3.6.1 As indicated earlier, taxation of road transport
could be regarded partly as a charge for services rendered
such as registration, and partly as a ta*x on road transport
services. It could be presumed that the original legal
inteuition uas that the motor vehicles tax' should represent
a service charge, uhile the passengers and goods tax should
constitute the tax element. Houever, the rates of the motor
vehicles tax have been raised considerably making it more
of a tax than a service charge. Hence in fact, in Bihar and
in several other States ue do have tuo taxes falling on the
same object. This seems redundant and has led some observers
to question the need for any State to levy both the taxes.
A single consolidated tax, levied at the appropriate rate,
should serve the purpose equally uell. ,
3.6.2 A justification that is sometimes advanced in favour
of having tuo separate taxes is that the motor vehicles tax
by its very nature has to be a specific levy, u h e r e a s t h e
passengers and goods tax can be and is intended to be an
ad valorem tax. Thus, the imposition of the latter in
addition to th'e former provides the State government uith
a mote elastic source of revenue. But if it is found
79 -
nocassary to provide an option for the payment of a com
pounded faa unrelated to the gross earnings of the
vahiclas and if, in fact, most owners of the vehicles
opt for compounding, then the additional passengers and
g o o d s tax -may be said to lose its raison de<etre. The
experience in many State has shown that it is difficult
administratively to enforce an ad_ valorem tax on vehicles
and that compounding of one kind or another is a necessity.
It is mainly for this reason that Andhra Pradesh, Karnataka,
Kerala and Tamil Nadu have merged the two taxes,
3.6.3 Another point to note is that although the same
assessees (moreor less) pay the two taxes in the States
where they exist, often two different agencies are assigned
to collect them. In Bihar, while the motor vehicles tax is
administered by the Transport Department, the passengers
and goods tax is administered by the Commercial Taxes Depart
ment, It has -been argued that if one agency cpuld collect-
the merged tax, it would make for administrative efficiency
and result in a lower cost of compliance,
3.6.4 Of course, the questions of the agency of collection '
and of merger are in principle separable in the sense that
even if we have two taxes, the same agency can collect them.
Therefore, one has to deal independently with. the. desirability
or otherwise of the. State government levying, two separate
taxes op motor vehicles.
3.6.5 It may be noted that there is wide—spread support
for that view that the two taxes should be merged and
be administered by one and the same agency, Ue shall

80 -
examine here the various considerations involved in deciding
upon a merger in the context of the conditions prevailing in
Bihar,
3.6.6 One important fact that ue have to keep in mind in this
connection is that the collection of the'passengers and goods-
tax on the basis of uaybills has failed. In fact, the Commer
cial Taxes Department has not achieved much success in collec
ting even the compounded fees, though it is claimed that after
the introduction of check-posts in 1976-77, the collections have
perceptibly improved. Ue shall deal uith this claim later. At
least, as far as the goods tax is concerned, it uould seem
that it uould be almost impossible to collect it on the
basis of uaybills. In Bihar, there is no real alternativei
to compounding or merging.
2.6.7 The disadvantage -of the system • of compounding is
that the truck ouner/operator can aluays opt for payment
on the basis of uaybills and evade a substantial part of
the tax through under-reporting. The higher the compounding
fee, the greater is the temptation to resort to evasion
through under-reporting. On the other hand, the disadvantage
of merging is that there uill be only one basis of taxation,
uherea® uith the existence of a separate passengers and
goods tax, there uill be tuo bases because even the
compounding fee can be, and is, arrived at on a basis
different from that of the motor vehicles tax. Even-
though the level of the motor vehicles tax is higher than
uhat uould be justified if it is to be looked upon merely
as a service charge, there is no compulsion to make it\
income elastic; it needs to be raised only* uith the cost

- 81
of administration. But the passengers and goods tax,
being a pure tax, has to be mads income elastic and hence
it has to have a different base,
3.6.8 One of the arguments put forward in Pihar is that
the Transport Department is more efficient in collecting '
taxes and that hence if the passengers and goods tax ist .
merged with the motor vehicles tax and handed over to the
Transport Department, revenues would increase substantially*
But the officials of the Commercial Taxes Department rebut this
argument* They point out that they have been able to achieve
a considerable degree of success in raising revenue after the
establishment of check-posts. Even assuming that the Commer
cial Taxes Department is efficient, that is not an argument
against transferring .the tax to the Transport Department so
long as it is equally efficient. Vehicle ouners have to go
to the latter Department anyhow; so they will find it easier
to pay the passengers and goods tax also to,the same Department.I .
If the passengers and goods tax is to be necessarily paid
on the basis of waybills, it could be argued-that the
Commercial Taxes Department will ;be better equipped to
administer such a tax'. But, if we rule out a uaybills tax,
it might be better to let the Transport Department collect
a merged tax or, if there is no merger, the tuo separate
taxes in order a) to ensure better compliance b) to reduce
the cost of compliance and c) to prevent harassment at
check-posts, etc. In their evidence before us, the Transport
Ouners Association have favoured this solution,
3.6.9 Uhile it is clear that in the conditions prevailing
in Bihar, a uaybills tax, by way of a goods tax, is not feasible,

- 82 -
there are reasons uhy the complete merger of the motor
vehicles tax and the goods tax does not offer the bast
solution. First, through the merger, the Government loses
manoeuvrability for changing rates at tuo points. Secondly,
maintaining tuo taxes creates the possibility of imposing
lGuies on tuo different bases. Third, a complete merger
creates certain practical problems concerning the taxation
of inter-State transport operators. If the tuo taxes are
merged, transport operators from Bihar operating in .
Uttar Pradesh, Orissa, or Uest Bengal, undar•counter-signed
or temporary permits, uill be required to pay a higher
motor vehicles tax in Bihar and also pay, on a proportionate
basist the goods tax in force in those States. At the same
time, operators from those States, operating under similar
circumstances in Bihar, uill need to pay only the mqtor
vehicles tax in the State concerned (uhich uould be much
louer, if no m'erger has been effected there) and no goods\
tax in Bihar. Thus transport operators from Bihar uould be
put to a disadvantage.
3.6,10 Having considered all the issues - theoretical
and practical - ue recommend a via-media, uhich amounts
to a virtual, but not a formal, merger: Ue recommend
that the goods tax be concerted into an additional
motor vehicles tax, uhich uould be a specific levy based
on certain criteria. If this uere done, the State--
government uould reap all the advantages of a merger and
at the same time circumvent the practical problems
concerning inter-State operators of goods vehicles
having zonal or national permits.

- 83 -
3.6.11 Ue have to consider next, the basis of the •
proposed additional motor vehicles tax and the rates
at uhich it is to be levied, Whereas in several
other States the compounding fee is based oh registered
laden ueight (RLU), in Bihar it is the "age11 of the
vehicles, i.e., the period during uhich they have baan ~
in operation after the registration uhich is the basis of
tha compounding formula. Thus vehicles having varying
payloads are required to pay the same amount of compounded
tax if their ages are the same, Nou, the length of the
period of operation of different vehicles has no close
bearing on their earning capacity, which should be the basis
of the tax, RLU is a much better index of earning capacity.
For this reason and for introducing a basis similar to that
prevailing in the neighbouring States, ue recommend that the
RLU of the vehicles should be the basis of the levy of
additional motor vehicles tax,
' ' ' I
3.6.12 In Annexure 11-1,1, ue present the ratas of additional
motor vehicles tax proposed by us. In deciding upon these
rates, ue have taken into consideration the rates prevai
ling in other States as uel‘1 as the need to maintain the
existing level of revenues.
3.6.13 The reasons for uhich a recommendation has been
made for the conversion of the goods tax into an additional
motor vehicles tax hold good also in respect of the- passen
gers tax. Ue notice that the passengers tax is also alloued
to be compounded and that, in fact, ev6n tho Bihar State Road
Transport Corporation has opted to pay the compounded levy. ;
As in the case of tha goods tax, if it is not found feasible

- 84 -
to collect tha passengers tax on the basis of uaybills and
if tha greater part of the revenue is derived through the
payment of a compounded levy, the advantages of an ad valorem
lavy do not acrue to the Government. Hence, ue recommend
that, as in thecase of the goods tax, an additional motor
vehicles tax may be levied in place of the passengers tax.
3.6.14 Our analysis of the passengers tax at present
payable on state carriages shous tha t the amount of the
compensation fee is much louer than the corresponding
amount of the tax payable on the basis of uaybills.
Also tha rata of compensation is substantially lower
than that prevailing in the neighbouring States. It is
obvious that there has to be a substantial upuard revision
in tho rates. •Besides, we feel that it is necessary to
distinguish betueen ordinary, express, and luxury buses
because their earning capacities differ. Us have uorked out
a schedule of rates of tha proposed additional motor vehicles
tax in lieu of the passengers tax, taking earnings at 75 par
cent occupancy ratio for the three types of buses. Tha
schedule is presented in Annexure II1,2.
3.6.15 The recommendation that the ad-valorem goods and
passengers taxes be converted into specific levies leaves
us uith the problem of determining the amount of tax that
should ba alloued to be collected by the transport operators
from the consignors of goods and from the passengers. At
present, according to the tax rates prescribed in the lau,
the transporter collects 20 per cent of tha freight charge
as goods tax and 25 per cent of the fares as the passengers
tax. These rates are distinctly on tha high side as compared

- 85 -
to both tho amount of- tax paid to tha State government on
tho basis of tha compounded formula and the ratas prevailing
in th'3 neighbouring States." Thera is no justification for
maintaining such a large differential between the tax
collected from the users and the tax paid to tho Govern
ment.- Ue recommend that the transporter should be
permitted to collect 15. per cent of the freight charges
from the consignors of goods and 20 per cent of the
fares from the passengers. In working-out the rata
schedules of the additional motor vohicles taxes, ue
have taken these ad. valorem (permissible) charges into
account.
3.6.16 At present the passengers tax is levied also
on taxi-cabs and auto-rickshaws and the goods tax on •
tempos. Ue understand that the yield of the tax ton thasQ:-;
vehicles is insignificant -partly because of wide-spread
evasion and partly also perhaps due to-the limited number
and capacity of such vehicles. It may be noted in this .
connection that no State except Rajasthan imposes the
passengers and goods tax on these vehicles. ’Ue recommend,
that tho passengers and goods tax on these vehicles be
abolished and that the rates of the motor vehicles tax on
them be suitably increased* This would, in fact, maan a
partial merger of tho two taxes,
3.6.17 There still remains the question as to who should
administer the additional motor vehicles, tax, Prlma facie.
administrative convenience as well a s ,the consideration
of minimising the cost of compliance to tha assessees would
dictate that the additional motor vehicles tax, be handed over

- 86 -
to tha Transport Department for enforcement. Ue do not
know uhether tha Government uould like to taka into account
any other consideration in arriving at a decision on this
issue. Uhat ue uould like to point out is that a decision
on tho conversion of the passengers and goods tax into an
additional motor vehicles tax can and should ba taken
uithout- delay and uithout uaiting for a decision on whether
tha tax should ba transferred to the Transport Department.
3.6.18 At present, the transport operator, uho uishes to
avail himsalf of the facility of compounding,- has to
make known his option at the beginning of a quarter and
pay the compounded fee in advance.- Uith tha conversion
of tha passengers and goods tax into an additional motor
vehicles tax, ue feel that it uould be reasonable t o g i v e
the operator the option to pay the tax either monthly or
quarterly. In case the ouner prefers to deposit the tax
in advance for the full year, Government may consider
granting a rabate of 6 per cent of the amount so depo
sited. I
3.6.19 Tha conversion of the passengers and goods tax into
an additional motor vehicles tax, in effect, changes it
into a specific lavy from an ad valorem levy. This uould
moan that if for any abnormal reason the road transport
industry should suffer a serious set-back (say, due to a
shortage of diesel or break-doun of lau and order), the
additional motor vehicles tax uould become unduly burdensome.
Therefore, a provision should be made in the lau for
remission of the additional motor vehicles tax for-such
periods as may be considered necessary in the light of ths
. length of the period during uhich trucks or buses are forced
to remain idle.

APPENDIX III.l
A Note on tha UorkinQ of Check-Points in Bihar
A,3.1 Under tha Bihar Passenger.and Goods Tax Rule No. 19,
tho Commissioner of-Commercial Taxes may, by notification,
3mpouor any parson to realise .and receive the tax or penalty
nr both or the fixed foe in lieu thereof at a notified check
point. Under the Rule, -the Commissioner, in a notification
(S.0*579) issued on 26th March, 1976, specified•the 7 check
points to bo established to function uith effect from 1st
April, 1976, at the sales - tax check-posts located at Mohania,
Oidarganj, Hathidah, Chas, Chirkunda, Masipir.ali and Pardih. •
Subsequently, 11 more check-points uere established at Kursela,
Shahpur, Dimna (notification No. S.O. 419 of 8.4.1978), Oalkola,
Sathnakuti, Araria, Raxaul, Mihijam, Sohnipatti (notification
No. S.O. 494 of 20.12.1978) Manor (notification No. S.O. 36 of
15.1.1979) and Gumla (notification No. S.O. 522 of 20.3.1979).
Thus, at present, there are 18 check-points throughout the
State uhich are authorisec.to collect the tax, penalty or the
composition fee in lieu of the tax.
A,3.2 The procedure adopted for enforcing the payment of tho
tax at the check-points is rather simple. Every public service
motor vehicle passing through a check-point is required to
produce the pass book. (Form VIII), the receipt for the tax
payment (Form XII) and the permit issued under the Motor Vehicles
Act in respect of the vehicle, concerned to the counter officer.
If it is found that tho tax under the Act has been paid up-to-dat
the vehicle uill be immediately^alloued to go. Otherwise,
the vehicle uill be detained until the evidence of up-to-date
payment is produced or the composition fee in lieu of the tax.
is paid either in cash or through crossed bank drafts.

- 88
A.3.3 Tho ouner of tha vehicle saeking to pay the fixed fae
in liau of tha tax is required to apply in Form VI to tha officer
in charge of the check-point. The counter officer at the check
point uill entertain the application if it is in order and
accept the composition fee according to the scale of composition
in force and issue the Pass Book (Form VIII) as a certificate-
of payment, A receipt in Form XII in triplicate is also prepare
and the original is handed over to the payor, Ona copy of the !
receipt is sent to the concerned circle/sub-circle and the third,
copy is retained at the cash collection point,
A,3.4 Every; check-point is provided uith a d o uble—lock iron
cash-chest, The collect ions put”in the cash-chest during the
course of the day are deposited on the follouing morning into
the current account held in the State -Bank-of India or-any othe
bank if a-branch of the State Bank does not function at or neai
the check-point. At the end of every ueek, the cash received
at the check-point is classified according to circles/sub-circ'
uhere tha assesses is registered or is being assessed or has
his place of business. After the total amount for each of thel
circle/sub-circle is thus arrived at, the Bank is instructed
to issue crossed drafts to the officer in charge of each of th
circlss/sub-circles. Along uith the drafts, duplicate copies
of the money receipts, original application for composition
received and permitted and the office copies of the certificai
of composition granted to applicants are sent to the concernet
circles and sub-circles. On receiving the draft along uith
these enclosures, the officer-in-charge of every circle/sub-
circle prepares treasury challans in Form,-.IX.in respect of ea
money receipt and deposits the amount to the government accoi
under the head ”042 - Tax on Passengers and Goods'1,

- 89
A,3.5 Besides sending the money every week through the bank
draft, the officer-in-charge of the check-point is required
also to send a statement in Form U on the 2nd and the 16th of
guery month stating his collections upto 30th of the previous
month and 15th of the current month to the officer-in-charge of
the circle/sub-circle, the 3oint Commissioner of Commercial
Taxes of the concerned division and the Commissioner of Commerci
al Taxes, Patna. The officer-in-charge of the circle/sub-circle
is required to visit the check-points under his jurisdiction
personally and to check the cash-box, verify the cash, tally the
bank account and satisfy himself about the safe custody andi
proper accounting of the funds, from time to time*
A.3.6 The check-points seem to have been established to serve
two objectives, namely, (i) furthering tax compliance for the
payment of the tax and (ii) better enforcement of the tax* The
representatives of the Transport Ouners Association, who gave
evidence before us, were -quite satisfied with, the method of
collecting the tax and, particularly, the functioning of the
check-points,. Further, as the sales tax check-posts themselves
are required to function as PGT check-points also, -the additional
cost of establishing these is only marginal. Besides, the facil
ity of making payment of the composition fee at the check-point,
involving less cumbersome procedures than the usual method of
payisg the tax to the treasury, one would expect, would greatly
contribute to better tax compliance. Also, it is our impression
that the time spent by the' vehicles at-the check-points is not
so long as to result in inordinate delays in the movement of goods
thereby resulting in production losses, Ue were told on our visit
to a check-point that, on an average, a vehicle is detained for
only about 2 minutes and in any case not more than 5 minutes.

- 90 -
It uould appaar that tha introduction of check-points has not
resulted in the detaining of the vehicles for long periods of
time.
A.3.7 It is also claimed that the establishment; of the check
points has contributed to the better enforcement of-the tax.
As the check-points are located at important entry points to
the cities and major touns, most of the public service vehicles
have to pass through one check-point or another uhere the
defaulting vehicle is easily caught and made to pay the tax.
It is officially estimated that the revenue gain due to the
establishment of the check-points is at least a crore of rupees/ •every year.
) . . . . . . v .
»
A.3.8 Ue have examined that claim carefully and are unable
to confirm the vieu that the check-points have really contribut
to the enhancement of the yield substantially, Uhile on the faJ
of it such a claim is shoun to be valid as the yield shoued an
increase of about Rs 2.4 crore. from Rs 4.1 crore in 1975-76 to
Rs 6.5 crore in 1976-77, a more detailed examination does not
support it. Ue have fitted a log-linear equation regressing th
yield of the passengers and goods tax (Y), on the number of pubj
service motor vehicles (P), proportion of goods,vehicles to
total- public service vehicles (G/P) and a dummy variable to
account for the discretionary change introduced in 1971-72
(D^) and a dummy variable to capture the effect of the estab-.
lishment of check-points since 1976-77 (0 2). The paramfiters
are a? , follous:

Log Y = -0.4143+0.7965**Lpg P-0.5624 log G/P+0.4436*0 + 0.086202
(-0.0375)(1.9252) (-0.2033) (1.7445) (0.2816)
R2 = 0.8395 F = 15.3805 D.U. Statistic =2.8830
N.B.: Figures in the parentheses represent 't* statistics.
** indicates significance at 5 per cent level
* indicates significant at 10 per cent level
A.3.9 Ue find that the co-efficient;of Oummy 02 is not signi
ficant. From this,, it is clear that the establishment of the
check-points has not led to a statistically significant increase
in the yield of the*tax. It thus seems that even though the
yield shous a substantial increase in the year immediately after
the establishment of the check-points, the increase might have
bean due to some other cause. In any case, it does not seem to
hays been sustained* In.order to examine uhether the increase
in the yield in 1976-77 uas statistically significant, ue
estimated another equation similar to the above with D2 being
specified as 1 for 1976-77 and zero in other years.. The
estimated parameters are as follows:
Log Y = -5.8747+0.7492**log P+0.7921 log G/P+0.4257^01 + 0.3414D2
(-0.5435)(2.8521) (0.2860) (2.0433) (1.2269)
' R2 » 0.9150 F =18.8313 O.U. Statistic = 2.640
N.8 .: Figures in parentheses indicate *t * statistics.
** significant at 5 per cent level.
Here again the coefficient of 02 turns out to be not significant.
Thus# tho increase in the revenue uhen the effect of incrsasesiin

- 92 -
the number of public service motor vehicles is accounted for is
not ro'ally significant and hence ue do not have any evidence to
support tha claim that the establishment of the check-points has
really contributed to the better enforcement of the tax so that
the yield is raised significantly.
A.3.10 Many reasons can be hypothesised for such a result.
Firstly, a number of vehicles do not pass through the check
points, as they run uithin the precincts of major cities and
touns and hence do not come uithin the purvieu of the enforcement
by the check-points. Secondly, even in respect of those, vehicle:
uhich pass through the check-points, the transporters could have
found uays and means of evading the tax. In this connection, us‘ #
cannot rule out the possibility,of a collution betueen the
transporters and the officials manning the check-points..»
A.3.11 Ue have recommended that the goods tax should be conver
ted into an additional motor vehicles tax uhich should be
administered by the Transport Department. If this recommendatici
is implemented, the check-points uill not have any role to play
in the enforcement of the tax. Houever, ue recommend that until
the goods tax is converted into an additional motor vehicles tax
the check-points may be alloued to operate as nou.

IV. ELECTRICITY DUTY IN BIHAR
1* Oriqin of the Levy
4*1*1 Under Entry 53 in the State List in the Seventh
Schedule to the Constitution, the States are empowered to
levy a tax or duty on the sale and consumption of electri
city* Under the provision, all the States excepting^Andhra
Pradesh have been levying the electricity duty. In Bihar,
the tax uas first levied in 1948 under the Bihar Electricity
Act, 1948* The Act, among other things, stipulated a set
of maximum rates leviable for metered and unmetered consumers*
2* Fiscal Importance and Growth of the Tax
4*2*1 The yield of the electricity duty rose substantially
from Rs* 0*57 crore in 1961-62 to Rs* 12*56 crore in
1979-80, registering an annual grouth rate of 16*3 per cent*
This compares quite favourably uith the growth of electricity
duty observed in Assam (13*6 per cent per ^innum) - though
for a slightly different period (1966-67 to 1978-79) -
Madhya Pradesh (15*7 per cent) and West Bengal (8*1 per cent)
but is louer than that observed in Uttar Pradesh (17*5 ; *
per cent) and Orissa (23*7. per cent)*;
4*2*2 The grouth of electricity duty h a s‘been much faster
than the grouth of the State’s tax revenue as a whole*
Consequently, as may be seen from Table 1V*1, the yield of
electricity duty as a percentage of the S t a t e d oun tax
revenue increased substantially from 1*63 in 1961-62 to
6*47 in 1978-79* However, if ue take the period 1965-66
to 1978-79, we find that the tax is seen to have growh only

- 94 -
at more or less ths same rate as the total tax revenue*
In fact, except for the period 1971-72 to 1973-74, the
percentage contribution of electricity duty to total tax
revenue is much lower than the one observed in 1965-66*
4.2.3 It may also be seen that the relative importance'
of the tax is the highest in Bihar among all the neighbo
uring States excepting Orissa. In 1973-79, the yield of
the tax formed as much as 6.5 per cent of the State’s tax
revenue which was much higher than the corresponding
percentage in Assam (0.76) Madhya Pradesh (4.6) Uttar
Pradesh (1 *3) and Uest Bengal (5.0)..
4»2»4 It may, however, be observed that though in
19*77-78 the yield of the tax as a proportion of the State
tax revenue in Bihar is higher than in some, of. thfe States
as mentioned abave,.as a proportion of the State Vs
Domestic Product (SDP), it is lower at 0*16 per cent than
that obtaining in Madhya Pradesh (.0*19 per cent) and
Uest Bengal (0.26 per cant) as well as Orissa (0.42 per
cent) vide Table IV.2*
4«2»5 Ue have examined tho growth of the tax in Bihar and
in the neighbouring States in terms of its buoyancy and
elasticity. Table IV.3 summarises the comparative perfor
mance of Bihar and the neighbouring States* An important
point that .emerges is that even though the buoyancy of the
tax in the S'tate (l*59) compares quite favourably with
those of the neighbouring States, its elasticity is seen
to be much lower than those obtaining in . all the Sta.tes

95 -
compared except West Bengal. Besides, the elasticity of
the tax in Bihar is much louer than unity.
4.2.6 On a priori ground's, the relationship betueen the
yield of the electricity duty and SDP is rather remote
and the elasticity thus calculated may not be a useful
guide to gauge the performance of the growth of the tax*
Je have therefore related the yield of the tax uith the
base of the tax, namely, the consumption of electricity.
In order to arrive at the correct base, ue have excluded
the consumption of electricity by public utilities such as
public lighting, traction and public uater uorks and
seyage works which are exempted from payment of electricity duty
in the State. The yield of the electricity duty when
related to this explanatory variable - taxable consumption
of electricity - in a log-linear model gives us the
ayerage responsiveness of the tax to its base over the
time period. Uhen the yield adjusted for the discretionary
changes is taken as the dependent variable, we obtain the
automatic responsiveness of the tax to its base. . As the
rate of duty on industrial and agricultural consumption is
lower, ue have taken the proportion of industrial and
agricultural consumption of energy to total consumption as
an additional explanatory variable: in our model. In
another model, we have considered the discretionary changes
exogenously taking them as explanatory variables represented
by two dummy variables for 1964-65 and 1971-72 uhen the tuo
most important discretionary measures uere introduced. The
estimated parameters of the log—linear equations are
summarised in Table I\jf.4*

- 96 -
4.2.7 It may be seen that uhile the buoyancy coefficient
of the variable' taxable electricity consumption is as
high as 1 .99, the elasticity coefficient is around unity
(1*09)* It is also seen that even though industrial and
agricultural consumption of the energy is taxed aft louer
ratas, the changes in the proportion of this consumption
to total consumption do not significantly affect the
revenue from electricity duty.
4 *2.8 On a priori grounds, uhen the effect of differen
tial rates of tax on industrial and agricultural consum
ption of energy is separated, ue should expect the
elasticity uit'h respect to the taxable consumption of
energy around unity. As a major portion of the energy is
sold through the State Electricity Board, the question of
tax evasion (by the Board) does not arise and hence this
cannot be a factor rendering the yield inelastic. Our
exercise yields an elasticity coefficient of 1.09 uhich is
in conformity uith this reasoning.
4.2.9' Houever, uhen the discre.tionary changes are
endogenously considered, ue get an estimate of elasticity
around 0.71 (equation 3)* This louer value may perhaps
be due to the fact that the affect of the discretionary
changes captured by the dummy variables is a little
exaggerated as other factors like greater distribution of
pouor through the public sector leading to more efficient
collections of revenue could have coincided uith the
discretionary rate changes.

97
4»2#10 It may be observed in this connection that the
ralative importance of the pouer supplied by the public
sector agencies of uhich the State Electricity Board has
a major share shows an increasing trend over the period. As
may be .seen from Table IV• 5, the installed capacity of the
public sector increased from 50 per cent in 1961-62 to 67
per cent of total capacity in the State in 1977-78 though
in terms of actual generation, the increase over the period
has been of a lower magnitude: from 54 per cent to 62•per
cent* The share of duty collected from the Electricity Board
also shows an increasing trend, particularly since 1971^72:
it increased from 24 per cent in 1971-72 to about 60 per
cent in 1977-78, but declined rather drastically to‘32 per
cent in 1979-80 due to the poor power supply position of the
Board# In contrast, the source, of duty paid by the captive
pouer units and other private units declined from 76 per cent
in 1971-72 to 54 per cent'in 1977-78# Thus, it could be
reasonably presumed that the channelising of the power supply
increasingly through the Board would have contributed to a
higher degree of efficiency in the collection of electricity
duty uhich might have exaggerated the value of the dummy
variable, thereby underestimating the value of built-in-
elasticity*
4*2*11 The performance of a tax is judged not only by its
growth, but also by its level* Ah important measure of
judging the extent of coverage Is given by the ratio of the
tax yield to its base or uhat is called the effective tax
rate# ya have therefore examined the effective tax rates
98
of electricity duty‘in Bihar, and in the neighbouring
States (Table II/.6 *)
4*2*12 Tuo important features can be discerned from the
trends in effective tax rates.. Firstly, the effective
rate in Bihar, after initially increasing froni '0*5.8. per
cent in 1961-62 to 2*88 per cent in 1 972-73, has shown
a gradual decline. Secondly, the effective rate of tax
in Bihar is higher than the rates in Assam and Uttar
Pradesh and is much louer than those in Orissa, Madhya
Pradesh and yest Bengal.
4s*2*13 Changes in the effective rate of tax may come
about eigher due to discretionary changes’ in the
structure of the tax or due to changes in the consumption
pattern* Our examination of the consumption pattern over
the period 1961-62 to 1977-78, presented in Table IV*7,
indicates that over the period it has been more or less
stable* Domestic and commercial categories together
consumed a little over 7 per cent of the total consumption
throughout the period* The share of small and large scale
industry shoued a decline from 82 per cent in 1961-62 to
73 per cent in 1977-78. Houever, the decline in the
effective rate of tax since 1975-76 may be partially
explained by .the sudden increase in the share of
consumption by the agricultural sector uhich is taxed at
a rate louer by about 10 percentage points* Beyond this
ue do not get any further clue to explain the changes
over time in the effective rate of tax* In order to
probe into this declining trend of effective rate of tax

further, ue have to examine the structure of tax prevailing
in the State, to uhich task ue shall address ourselves in
the next section*
3 * .Structure of „ths Electricity J3u tx JL n ,B i h ar
4*3*1 The rate structure of electricity duty a s i t is
levied in Bihar is marked by simplicity* The nature of
the levy is specific and hence it does not depend upon the
tariff rates* On metered consumers, only tuo categories
of rates are applied* Industrial, mining and agricultural
consumption is taxed at the rate of 2 paise per unit
uhereas domestic and commercial consumption is subjected
to a higher rate at 7 paise per unit* Another feature
of the levy is that the sales to certain basic industries
such as iron and steel and electro-metallurgical
industries are exempted from the levy for a period of 5
years from the commencement of production* The consumption
of'electricity by the Public Uorks Department for lift
irrigation and by local authorities for street lighting
is also exempted by a special notification issued by the
State government*
4*3*2 • A uniform ad valorem levy maintains the relative
rate differences introduced in the tariff schedule. On
the other hand* taxing at differential specific rates
accentuates the differentiation* Thus, in Bihar the
taxing of the electricity at tuo different rates and the
specific nature of the levy bring about a differentiation
in the price of electricity uhich is at variance uith the

- 100 -
differential rates that are intended in the tariff
schedule. This implies that the electricity duty in Bihar,
besides performing the function of raising revenue also
acts as a means to discriminate against particular types
of consumers depending upon social priorities* Strictly
speaking, it should be left to the discretion of the
tariff schedule to bring about the needed degree of -
differentiation*
4*3*3 It may be interesting to make a comparison of the
rates of duty levied in Bihar ^^-a-v_is other States* In
Table IV*8, ue present a comparative position of the tariff
rates and the rates of duty for the different categories of
consumers* It may be seen that the rates of duty applicable
to all the categories in Bihar in comparison uith other
States is neither unduly high nor unduly lou* Houever, if
the comparison is made among the neighbouring States, it
is clear that in respect of domestic consumers, the rate
in the State at 7 paise per unit is the hiighest* It is
quite high also in respect of commercial categories of_
consumers, uhen compared to the rates levied in Assam
(3 paise per unit), Uttar Pradesh (2 paise per unit) and.
L/est Bengal (3 paise per unit),: though Pladhya Pradesh uith
8 paise per unit and Orissa uith 7 *1 2 ' paise per unit- have
even higher rates* As mentioned already, the State levies
a lou rate of tax on agricultural consumption equal to
that on trade and industry and mining but Madhya Pradesh,
Orissa and Uttar Pradesh exempt from the tax consumption1 /by the agricultural sector altogether— . In respect of the
J./ Houever, Uest Bengal imposes the duty on agricultural consumption of energy at 6 paise per unit.*

"...1 °1
consumption of electricity by t. he small 'scale and large
scale industries too, the rate of duty levied in the
States does not seem to be unduly high* Thus, only in
respect of domestic consumption of energy, the rate of
duty levied in the State seems to'be on the higher side*
Similarly, it uould seem that the rate of duty levied on
agricultural consumption of energy is on the low side*
4*3*4 It should* however, be noted that the differences
in the rates of duty gives only a partial picture* As a *
large part of the total sale of electricity is channelled
through the State Electricity Boards in all the States,
the choice of the method of raising revenue either through
the tariff or through the duty ultimately rests uith the
State sector* From the point of vieu of the consumers,
it is the difference in the total price inclusive of tax
paid for a unit of energy consumed in different States that
is relevant* From this point of vieu certain important
features stand'out in the schedule of electricity duty at
present in vogue in the State*
4*3*5 , As may be seen from Table IV*8 , in respeot of the
domestic categories of consumers, both the rate of tariff
and the rate’ of duty are higher in Bihar than in most of
the States so that, the total price charged in the State
for this category of consumers is the highest among all
the States* Similarly, the price charged for commercial
consumption in the State is louer than those charged by
. only Uttar Pradesh and Andhra Pradesh* As regards the
consumption of energy by large industries even though the

- 102 -
rate of duty is lower than what prevails in many of the
States, the tariff itself is so high that tha total price
charged ;is .. the highest in the State. This is also true
of the consumption of energy by small industries. ' Thus,
charging a louer rate of duty for industrial consumption
of energy has not really served the purpose of promoting
industrial growth in the State, since the rate of tariff
plus duty charged in the State is higher than uhat prevails
in other States.' This higher total price may be expected
to act as a strong disincentive measure. In contrast,
although the rate of duty of 2 paise per unit on agricul
tural consumption of energy is higher than the rates
prevailing' in many of the States, the rate of tariff
itselfvis so lou that the total price charged in the State
is the lowest for this category of consumers. As against
this, even if some of the States exempt agricultural
consumption completely from the purview of the electricity
duty, the price charged in these States is*much higher*■i
4 .3 »6 * It needs to ba noted that the rate of duty imposed
on,.the energy consumed from captive generation in Bihar
■ASi not different from that charged on energy supplied by
the State Electricity Board. The representatives of the
Bihar Ch-amber of Commerce and Industry have urged in their
memorandum that the consumption of energy generated from •
the captive units should not be subject to the electricity
duty* The reasons advanced in support of this are two
fold. Firstly, it is claimed that the Electricity Board is
urtable, to meet the'growing demand for energy in the State
on its own and the industries cannot really depend upon the

- 103 -
irregular and erratio supply'of energy from the Board.
In order to meet the demand of the industries adequately,
it is only proper that the units are encouraged to have
their own generating units* The installation of captive
unity promotes steady industrial growth. Secondly, as‘
tha cost per unit of energy generation by the smaller
captive units is higher than the cost of energy generated
by the Electricity Board, adding to this higher cost
through the imposition of electricity duty uou.ld render
energy generation by captive units further uneconomical
and hence .uould not encourage the industries to go in for
such generation.
4*3*7 In this connection it is necessary to note that
the generation of electricity by the industrial units for
self-consumption in Bihar is substantial. As of 1977-78,
the captive units contributed as much as 33 per cent of
the total generating capacity in the State and they
actually generated 38 per cent.of the total generation
during the year j Therefore, total exemption
of these sources from the duty uould result in loss of
revenue to the tune of about Rs. 3 crore. Over time this
uould increase*v ; i
* . \ ‘
4*3*8 Ue have examined the claim that the cost of
generating electricity by the captive pouer units is
higher so that they should be given some relief by not
levying the duty. The average cost of electricity
produced under the various systems from 1971-72 to 1978-79
given in Table IV* 9 - indicates that of the various

- 104 -
systems, 'the unit cost of generating electricity using
steam is the lowest and that of generation using diesel
is the. most expensive# As of 1978-79, the generation of
power using the hydel system is two and a half times more
costs over 40 times the steam system* Thus, if the
captive units generate energy using the diesel system,
which is decisively more expensive, there is really a
case for exempting them.from the electricity duty* In
this connection, we have examined the distribution of
generation of energy by the captive units according to
prime-mover categories* The position as of 1978-79 is
as follows :
Note 5 Figures in parentheses are percentages Of total*
It is thus seen that over 97 per cent of the installed
capacity of the captive power units and over 99 per. cent of
the actual generation is done using the cheapest means of
generating energy.
expensive than the steam system, and the diesel system
Steam 427297(97*4)
1596*08(99*5)
Diese1 11331( 2 *6 )
8*36(0*5)
Total 438628 (100*00)
1604*44(100.0 0 )
105 -
4*3*9 Uhen u e 'analyse the industry—uise generation of
anergy for self-consumption, it is seen that a very high
percentage is generated by the industries operating on a
large scale like Ironand Steel, Fertiliser and. Cement
(Table I\/*1Q)* On these industries generation of energy
using steam could be economically viable* On the other
hand, industries operating on a smaller scale cannot
economically generate electricity using stearn and may have
to go in for the diesel system*
4*3*10 Ue have also examined the practice prevailing in
other States in this connection* In many of the States
as in Bihar, the power generation for seIf-consumption by
the industrial units is.subject to duty at different rates
as power generated by the State Electricity Board* In no
State uhere the electricity duty is levied, the pouer
generated for self-consumption is exempted from the levy of
duty and in some States where a different rate schedule is
in vogue (Table IV*1 l), the rates charged ,are not very much
lower, but are sometimes even higher than the rate charged
for industrial consumption of energy in Bihar.
4*3*11 On these considerations, we are inclined to take
the view that the generation of electricity for self-
'Consumption using the steam system does not really call for
any relief in terms of exemption from electricity duty.
However, for reasons of scale^/economies and higher fixed
costs, many of the units may find the generation of elect
ricity using steam economically unviable and hence may go
in for the diesel system uhichv is" decisively more expensive*

1 06“ -
Some relief in the duty may be considered for those units
Ahe iesjB 1 system is the _only viable alternative.
(ii) Exemptions
4*3*12 The exemptions from electricity duty may be
classified into tuo categories. The first type of exemption
is provided for under articles 287 and 288 of the
Constitution and is uniform for all the States in- the Indian
Union* Under this no duty is leviable in the State on the
consumption of electricity of. the following categories*
i) Consumed by the Government of India, or sold., to the Government 6f India, for consumption by that Government;
j . , •' ii.) Con sumed in the construction, maintenance,
or operation of any railway company operating that railway or. sold to that Government or any such railway company for consumption in the construction, maintenance or operation of any railway;
iii) Consumed by the licensee in the construction, maintenance and operation of electrical undertakings; '
iv) Consumed by the Damodar i/alley Corporation for the generation, transmission or distribution
t of electricity by that corporation*
4*3*13 Besides the above' categories, the State government
under section 9 of the Met is also empowered to grant
exemptions under separate notifications to any person or
class of persons or for any purpose declared under a notifi*
cation as a public purpose* Under this provision, the

tate government has exempted from the payment of electri-
ity duty the electricity consumed by:
i) Public Works Department for lift irrigation;
ii) any local authority for lighting of public streetsj and .
iii) sale or consumption of electricity in iron and steel industry, electro-chemical or electrometallurgical industry for a period of five years from the date of commencement of production*
4*3*14 All the State governments have the discretion of
exempting 'the consumption of electricity for certain. ,
specified purposes from the electricity duty* The exempts »
ions given in the neighbouring States are listed in
Table 1V*12* The exemptions granted in Bihar in comparison
uith those of the neighbouring States are by no means
excessive* In the States of Assam, Uttar Pradesh and
Madhya Pradesh, energy used for agricultural operations
is totally exempted uhereas in Bihar, a duty'is'levied,t
though at a lou rate of 2 paise per unit* As regards the
consumption of energy by industries, in Uttar Pradesh
all smaller industrial units located in backward areas are
exempted from paying the duty* In Assam consumption of
energy exceeding 40,000 units exclusively for industrial
production is exempted* In contrast, in Bihar exemption
is granted in the case of only a feu industries like iron
and steel, electro-chemical and electro-matailurgical
industries for a period of 5 years after the commencementI
of production*

- 108
4*3*15 Although the exemptions granted in the State are
not generally excessive, it is necessary to point out that
in respect of industries, the exemptions are a little
superfluous and do not serve the purpose to the extent
desired* Ue have already pointed out this uhile analysing
tho rate structure* To repeat the argument briefly, the
tariff rats itself is so high in the State that even uith
no duty being levied, the relative cost of pouer in the
State uould be higher and this can act as an important
disincentive for locating industrial projects in the State#
4* Ad m i n i s t r ative Issues
'4*4*1 Ue ha</e already stated earlier that an improvement
in,the revenue from the electricity duty.can come about
mainly through the revision of the structure of electricity
duty* As the administration of the collection of the duty
is largely in the hands of the Electricity Board, the
Commercial Taxes Department can do very little in improving
the yield on this account* However, this should not deter
us from stating that uith a little improvement in efficiency
on the part of the Board, significant increases in tho
generation and consumption of electricity and hence in the
electricity duty could be achieved* Tuo important factors
uhich can lead to a significant enhancement of revenue
are the (i) minimisation of transmission, distribution and
unaccounted losses of electricity and (ii) more satisfact
ory capacity utilisation* Let us analyse these in a little
more, detail*

4*4*2 Ue ha»e examined the transmission, distribution
and ''other11 (unaccounted) losses of generated electricity
in Bihar and compared them uith the figures available for
the country as a whole* Ue cannot but draw attention to
the fact that the losses on this acco nt in Bihar are
rathar excessive and to the possibility that a large part
of them could be simply due to the theft of electricity*
In Table IV*13, ue present the losses on this account
during 1971-72 to 1977-78 in Bihar and the country as a
whole and have computed the additional yield that could
have accrued if the standards prevailing in the country
on-the average prevailed in Bihar* It may be seen that
in all the years, the extent of losses in Bihar have
been of a much higher magnitude that existing in the
country as a uhole*
4 .4.3 The line loss of electricity could be attributed
to the technical factors involved in the transfer, trans
mission and distribution as uell as unaccounted losses
uhich are otheruise called ntheft”•' Thus, uhile some of
these losses are unavoidable, the excessive line loss
uhich are sustained by the Board in Bihar cannot be
justified* If the State Electricity Board had the line;
losses only to the same extent as the average losses
suffered by all the Electricity Boards, the yield of the
electricity duty uould have been much higher* Our estimates
of the potential yield for various years are presented in
the Table IU*13. It is seen that the additional yield that
could have resulted from this uould be Rs* 35 lakh in
1977-78 forming as much as 5 per cent of the actual yield
of the electricity duty*

- 110 -
4*4*4 Another important measure that could result in
a significant improvement in the yield of tiie electricity
duty is the better utilisation of installed capacity*
Given that the situation of excess demand for pouerv
exists in Bihar, better utilisation of capacity in the
State uould result in a substantial improvement in the
revenue *
4*4*5 The feasible degree of capefcity utilisation in
electricity generation should be considered uith care
taking note of several factors* Full utilisation of
capacity in the electricity industries is not possible
owing to the existence of significant divergence betueen
peak load demanld and normal demand and the need for
keeping, standby capacity to meet the demand uhile the
regular units are being rested or at times of emerge'ncy
and for such other reasons. Further, the extent of
possible capacity utilisation also depends upon the
system of generation.
4 *4*6 Ub have considered the capacity utilisation in
the States as a whole as the norm* The extent of
utilisation in each of the systems - hydel, steam and
diesel - averaged for the,States is. applied to the'
generating capacity available in Bihar to determine the
electric power that could have been generated in each
of the systems, if the all-States1 utilisation standards
had prevailed in the State. Applying the line losses at
the prevailing. rates in Bihar, we have arrived at the
potential electricity available for consumption. The

111 -
.differ'ences betueen the postential and the actual is then
arrived at and by applying the effective fate of duty on
this, ue have arrived at the likely loss of yield due to
the shortfall in capacity utilisation# These estimates
are made for the years from 1971-72 to 1,977-78 (Table I\/*14}«
4*4*7 It is seen that the estimated loss in yield due
to this shortfall in capacity utilisation uas the louest
in 1976-77 at Rs* 33*7 lakh forming about 4 per cent of
the actual yield and the highest in 1972-73 at Rs. 81*9
lakh forming as much as 10.5 per cent of actual the
yield* In all other years it uas more than Rs. 50 lakh
and in 1977-78, it uas as much as Rs. 71 lakh uhich uas
over 9 per cent of the yield of the electricity duty*
4 *4*8 The improvement of the yield of the electricity
duty on account of reduction in line losses and better
capacity utilisation is possible only when determined
action in this regard is taken by the State Electricity
Board. The Commercial Taxes Department Can dp very little'
in this regard* This is a matter of great concern not
merely from the point of vieu of securing larger revenue
from the electricity duty,,but, more importantly, from
the point of vieu of the earnings of the Sta.te Electricity
Board and the grouth of the State economy*
5. .Recommend ations , .
4*5*1 As shown in the earlier sections, from the point of
vieu of the price charged to different categories of
consumers, there is a case for .enhancing the rate of duty

1 1 2 -
on agricultural consumption of energy* It does not
seem to be rational,to confer benefits on this category
of consumers twice - once by having the tariff rate at a
very low level and again by charging a very low rate of
electricity duty* On the other hand, the tariff rate on
industrial consumption is already so high that even in..
the absence of electricity duty the orice of electricity
for this category of consumption is higher than the
prevailing prices in tha neighbouring Spates* Thus,
charging louer rates of electricity duty on industrial
consumption to promote industrial grouth does not really
serve the intended purpose unless basic changes are
effected in' the tariff structure itself* Though on this
ground there is no case for enhancing the rate of duty on
industrial consumption, in''the interests of uniformity,'
ue prefer to keep.this on par uith that on agricultural
consumption* Ue, therefore, recommend that the rate of
duty on agricultural and industrial consumption should be
enhanced to 3 paise'per unit from the present level of
2 -paise per unit.
4*5*2 As mentioned in the previous paragraph*
rationalisation of the rates of electricity duty alone
can help very little in attaining the overall objectives*
More important is the need for rationalising the tariff
structure to be in the tune uith the overall objectives
to be pursued. Ue have already mentioned that in Bihar
the rates of tariff on the consumption of energy for
agricultural purposes is much louer than the rates
prevailing in the neighbouring States* On the other.hqnd, tj
rate of tariff on industrial consumption of energy in the Stj
is higher than those in the neighbouring State* Therefore,

AMNEXURE 1.1
QUESTIONNAIRE
Bthar_ Taxation on Passengers and Goods Act,_ 1 _9_61_
1. Uhat, on an average, is the Kilometreage run by the nassenqer buses and goods vehicles?
2 . Uhats is the fare structure for passengers and .freioht structure for goods? -
3. Uhat is the range of gross e>arnings of the trucks of standard capacities? Please give the basis of your calculations.
4 . Uhat is the range of gross earnings of the passenger Buses? Please give the basis of your calculations.
5. Uould you prefer that there should be a separate tax on motor vehicles and another on goods and Dassengers as at present or should there be only
J one tax under a unified Act? If the structure is x to be unified uhat should be the rate structure?
' 6 . Do' you think that the existing structure of taxing Dassengers and goods adversely affects the tradeand business? if so, in uhat wavs?
• /i?• 'Jhat, if any, are the other shortcomings of the
existing structure of tax on passengers and goods?
8 . Uhat alternative Lax structures uould you suggest for,
i) Motor Vehicles;
ii) Goods: and
Iii) Passengers
9. Uould you Drefer an ad, valorem levy on goods uith facility for comooudding to a specific levy based on certain criteria? Please state reasons.
10. Do you consider that the differences in the rates of passengers and goocts tax betueen the States create problems? If any, please enumerate.

- 113 -
uould like to urge tha State government to impress upon the
Electricity Board the need to rationalise the tariff
structure by raising ths rate on agricultural consumption
and lowering it on industrial consumption, so that the
rates in the State are at levels comparable to thoss in
the neighbouring States# This uould, besides helping
the State to improve the performance of the Electricity
Board, prevent the diversion of industries from Bihar~to
other States#
4*5*3 fs regards generation of electricity for self
consumption, our analysis reveals that the unit cost of
generating electricity by bigger industrial units using
the steam generation system is not necessarily high and
therefore there is no case for exemption in respect of pouer
so generated* On the other hand, the smaller units using
the diesel generation system necessarily have to incur a
higher unit cost of generation* It uould therefore appear
that an additional burden by way of duty should not bei
imposed on these units* At the same time, ue have to
avoid any step that uould encourage industrial units to
suitch over to the diesel system* Ue, therefore, recommend
that the State government should determine on the advice
of an expert group as to uhich categories of industrial
units uould find the steam system of generation clearly
uneconomical* In the case of units falling in these
categories and using the diesel system, the rate of
electricity duty may be kept as 1 paise per unit*

11. Do you consider the existing procedure for taxcollection satisfactory? . If not, olease elucidate.
1 2 *. Uhat, if any, are the problems -faced in- the system- of goods tax collection through the check-points?Uhat modifications uould you suggest in the working of check-points?
1,3. To what extent do you think that there is an overlap betueen the taxation of road transport through" passengers and goods tax on the one hand and of petroleum products on the other? If such an overlap is substantial, what methods would you suggest for harmonizing the tuo modes of taxation?
14. Uhat suggestions uould you like to make in respect of maintenance of records by the transport operators of goods-'and passengers, submission of returns and payment of tax9s?Is the present system of verification of accounts of the assessees of goods and passengers tax satisfactory?. Uhat modification would you like to suggest?
15. Uhat are the lacunao in the existing provisions of the lau that lead to evasion of the tax on motor vehicles goods and passengers? Uhat modifications do you suggest to plug them?
16.. Uhat are the common uays through uhich the taxes onmotor vehicles, goods and passengers are evaded?Uhat suggestion uould you like to offer to present such evasion?
17. Please comment on the exemption granted from these taxes. Uhat, in your vieu, should be the principles governing such exemptions?
18. Enumerate the provisions of the Taxation of Passengers and Goods Act, uhich, according to you, are ambiguous or are amenable to different interpretations?
19. Please state uhether the existing taxation laus impose hardships on the assessees and create administrative complexities for the Government in relation to anyof the follouing:
- 11S

iv) .. As^e$smen-L
: !1
\j) XI & r i f* i nni-i nn nf ^nrminf q
i ,
20. U|-ir3t is the. scope. fo.£ simplifying tax laws/rul.es :gnd» procedures to' ensure^ maximum satisfaction and- least inconvenience t o ,the taxpayers keeping in vieu the. need for economy?
21. . Oo you- consider that .the provision relating'to ’penalties are adequate and reasonable? Would you rfecommend stricter penalties to ensure better tax •
. compliance? ' . . ■ •. ; ,.1’ .
22. Are the existing laws, rules and procedures adequate to -guard- against .tax' evasion* if not,' please indicate the possible uays of plugging the loopholes,
23. Do y o u ; consider..-any. of the forms and registers ■ ' *spec i f ied under the rules cumbersome? ‘Uhat changes ''
. leading to. simplification of the form uould you sugge st?
24i Do you have any suggestions to make on any of the .^.issues cT; any of the topics . not covered above?1' - on - «
1. Do you consider that the rate of tax ah ,entertainments is unduly high as compared to 6ther States? Please elaborate.
IX .-■? Bihar Entertainment Tax Act. 1948

- 117 -
2« Do you favour a single rate of tax as prevalent atpresent or rates differing uith the cost of entertainment ?
3. Uould you suggest a Uniform rate or differential rates for different classes of cities. ?, Please give reasons. Also indicate the degree of difference in rates that should be introduced.
4 . Should the compounding alternative be provided only in lesspopulous areas or also in cities and touns .? -
5. Uhat are the common means employed for evading the entertainment tax ? Uhat suggestions do you put forth for preventing such evasion ?
6. Do you consider the existing policy of exemptionssatisfactory ? If not, uhat changes uould you like tosuggest 7 Do you favour the mode of taxation on anet basis as prevailing at present or is it proper to tax on a gross basis ?
■7* '"Are the methods of collection of tax employed at present satisfactory ? Uhat changes do you propose 7
8. Do you think that the system of asking for securitydeposits is necessary ? If not please enumerate how defaulting taxpayers can tie brought to book ?
9* Do you have any suggestions regarding,the provisionspertaining to printing., stamping and approval of the tickets ?
10.- Is the system of verification of returns and assessmentas prevalent at present satisfactory ? Uhat changes uould you suggest ? ' ,
11* Enumerate the provisions of the entertainment tax uhichare ambiguous and are inconsistent uith other provisions.
12* Do you think that any of the registers and forms prescribed ■ under the Act is unnecessary or complicated ? Uhat
improvements uould you like to suggest in this regard ?
13. Uhat measures or incentives would you suggest for thegrouth of neu cinema houses in the State ?
14* Do you have any suggestion to make on any of the .issues• or any of the topics not. covered above 7

- 118 -
III. Bihar Electricity Duty Act. 1948
1. Please enumerate whether the rate differentiation in the levy'of electricity duty ^3 prevailing at present is justified,
2. Uould you prefer an ad_ valorem levy to the specific levy os pruvailing at present ?
3. Is the the rate structure prevailing at present satisfactory? Uhat changes would you like to sugaest?
4. Uhat are your observations on the policy of giving exemptions?
5. Do you consider the existing policy of levying concessional duty ^n certain uses of energy
" justified. If so, are the concessions adequate jind satisfactory?
T6. Uhat, in your vieu, is the extent of evasion/ avoidancc of electricity duty? Uhat are the methods employed for evasion/avoidance of the duty 3nd uhat arc your suggestions for preventing evasion/avoidance of the duty?
"Uhat measures would ypu suggest to render the tax eleastic, particularly in respect of the. revenue from the consumption of unmetered consumers?
.8. 'Do you have any suggestions to make on any of the issues .n^t covered above?

- 1f9
ANNEXURE 1.2
List of Persons/Orqanisatiohs Uho Gave
Evidence Before the Study Team
. 1. Mr. Vinay Kumar, Eastern India Motion Picture Association, Patna
2• Mr. Ajay Sinha, Eastern India Motion Picture , Association, Patna
3. Bihar Chamber of Commerce and Industries3udges Court Road, Patna •
4» Bihar Transport association, Agraual Hotel* Patna
5. Bihar Industries Association, Sinha Library Road,Patna ,
6. Shri R . K. Sinha, former Commissioner of Commercial Taxes, Patna -
7. Shri'V.N. Vageesh, Deputy Commissioner of Commercial Taxes, Patna.
8. Shri Akhileshuar Prasad, Doint Commissioner of < Commercial Taxes, Patna
9. Shri R.R.V.P, Sinha, Deputy Commissioner of > Commercial Taxes, Patna
10. Shri'B.P. Verma, formerly Additional Finance Commissioner and at present, Commissioner,Commercial .Taxes.

- 120 -
ANNEXURE 1.3
List of Persons/Organisations who Submitted D'ritten Memoranda to the
Study "Team 1
1. Eastern India Motion Pictures Association North Congress Maidan, Patna 35
2. Ranchi District Cine Association, Sandhya Cinema Compound, Purulia Road, Ranchi
3. Chotanagpur and 5antha 1 Paragana Transport Owner's Coordination Committee, Ranchi
4. Chotanagpur Chamber of Commerce and Industries, Shardhanand Road, Ranchi
5. Raj kumar Dain, Advocate, Ranchi.

P ro oo s ed, Fates o f
ANNEXURE 111*1
Additional Motor Vehicles Tax
in the Place of Goods Tax
Registered ladsn ueight (quintals)
Proposed Additional Motor Vehicles Tax
Per year Per quarter Per month Per fortnight or part there .thereof
5 200 50 .16.6 7 8.3410 400 100 33.33 16.6 715 600 150 50.00 25.0020 800 200 66.69 33.3425 1000 250 83.33 41.6730 1200 . 300 100.00 50.0035 1400 '• 350 116.6 7 58.3440 1600 400 V 133.33 66.6745 1800 450 150.00 75.0050 2000 500 166.6 7 83.3455 2200 550 183.33 91.6760 2400 600 200.00 100.0065 2600 6 50 216.6 7 108.3470 2800 700 233.33 116.6 775 3000 750 250.00 125.0080 3200 800 266.6 7 133.3485 3400 850 283.33 141.6790 3600 900 300.00 150.0095 3800 950 316.6 7 158.34
100 4000 1000 333.33 166.6 7, 105 4200 1050 350.00 175.00
110 4400 1100 366.6 7 183.34115 46 00 1160 383.33 191.67120 4800 1200 400.00 200.00125 5000 1250 416.6 7 208.34130 5200 1300 433.33 216.67135 5400 1350 450.00 225.00140 56 00 1400 466 . 6 7 233.34145 5800 1450 483,33 241.67150 6000 ' 1500 500.00 250.00155 .6200 1550 516.6 7 258.34160 6 400 1600 533.33 266 .6 716 5 660Q 16 50 550.00 279.00170 6800 1700 566.6 7 283.34175 7000 1750 583.33 291.67180 7200 1800 600.00 300.00185 7400 1850 616.6 7 308.34190 7600 1900 633.33 316.67195 7800 1950 650.00 325.00200 8000 2000 . 666.66 333.33

- 122 -
ANNEXURE III.2
Present Incidence of Passenoer Tax Per Seat Per Quarter and Proposed
Rates of Additional Motor Vehicles ax for Passenger Buses
(in rupees)
Kilometre Kilometrerun per
dayrun per quarter
Gross earnings per quarter Tax payable per quarter Composi-_________ _____________________ ________________________ __________ tion fe8Ordinary Express De luxe Ordinary Express De luxe payable
per- quarter
Proposed rate per seatper q u a r t e r _____
Ordinary Express De luxe
80 7200 36 0 432 576 72 86*4 115.2 20.0 60 70 .. 95
100 9000 450 540 720 90 108.0 144.0 25.0 75 88 119
130 11700 585 702 , 936 117 140.4 187.2 32.5 98 114 154
16 O' 14400 720 86 4 1152 -144 172.8 230.4
o•o120 140 190
200 18000 900 1080 1440 180 216.0 288.0 50.0 150 175 238
240' 21600 ~ 1080 1296 1728 216 259.2 345.6 ' 60.0 180 210 285
280 2 52Q0 1260 1512 2016 252 302.4 . 403.2 70.0 210 245 332
320 288Q0 1440 1728 2304 288 345.6 46 0 .8 80.0 240 280 380
36 0 32400 1620 1944 2592 324 388.8 518.4 90.0 2 70. 315 !: 428400 36 000 1800 2160 2880 36 0 432.0 576 .0 100.0 300 350 475
* At 75 per cent occupancy ratio; the rates fbr a single ticket per kilometre of travel in ordinary, express and de luxe buses are taken as 5 paise, 6 paise and 8 paise, respectively.

Rates o f Discretionary Changes in the Structure o f E le c tr ic ity Duty in Bihar
ANNEXURE IV. 1
Premises 194 8 ^ 1953 19643/ 19714/ 1974'5/
1. In respect o f mines o r industria l undertakings, save in rospect o f it s premises used fo r re s idential o ff ic e purposes
2. In respect I f a l l premises not fa l l in g under se r ia l numbe r (3)
6 pies per un ito f energy
9 pies per unit o f energy
1 paisa per unit o f energy
6 paise per unit o f energy
2 paise fo r unit 2 paise per unit o f energy o f energy
6 paise per unit 7 paise per unit o f energy o f energy
3. In respect o f a l l premises where the supply o f energy is unrretereds
i . Every lamp o f less than 30 watts
2 annas and 6 pies (per mensum)
3 annas and 9 pies (per mensum)
23 paise per unit o f
23 paise mensum
per 23 paise mensum
per
'- .. -• • * energy
i i . Every lamp o f 30 wr i ts o r more but less then 40 watts
3 annas and 9 pies (per mensum)
5 annas and 9 pies (per rrensum)
36 paise unit o f energy
per 36 paise mensum
per 36 paise ■ mensum
per
i i i . Every lemp o f 40 watts o r no re but less then 60 watts
5 annas (per mensum)
7 annas and 6 pies (per mensum)
47 paise unit o f energy
per 47 paise mensum
per 47 paise mensum
per
Cbntd.

Premises 19481/ 19 53 2/ 1964'3/1971i/ 1974 5/
O-V. Every lamp o f 60 watts o r n o re but not exceeding 100 watts
7 annas (p e r mensum) 10 annas and 6 {66 paise per 66 paise per mensum 66 paise per rrensumpies (p e r tan i t o f
energy --
Bv®ry additional .15 2 annas and 6 watts o r fraction P ies (p e rthereof in excess mensum)Of 100 watts in any lamp.
mensum)
and3 annas 9 pie s (per mensum)
t
12 paise per unit o f energy
12 paise per mensum 12 paise per mensum
1/ With e ffe c t from 1st October 19482/ With e ffe c t from 1st A p ril 19 533/ With e ffe c t from 1st January 19 644/ With e f fe c t from 1st September 19715/ With e ffe c t from 1st A p ril 1974
•■^urces The Bihar Gprnmeroial Taxes Manual Volume XV. (Part XI) ^FirJance (Cbmmercial Taxes) Department/ Government o f Bihar. * ' ,
u«i-'rrment of Bihar, Commercial Taxes Department, Patna.
ii) For other States - Budget Documents.

- 1 2 5 -
TABLE II. 1
Ejrtert_ainmant Tax as, Per- Cent of Total Tax Revenue .in
Bihar and the Neighbourij _4 States,
(Per cent)
Yaar Bihar Assam Orissa UttarPradesh
MadhyaPradesh
WestBengal
1961-62 2.05 2.06 1.45 2.92 2.80 3.53
1962-63 1.82 2.09 1.65 2.77 2.82 3.98 "
1963-64 2.33 2.10 1.39 3.25 2.77 3,66
1964-65 2.37 2.08 1.35 2.85 2.77 3.64
1965-66 ' 2.51 2.06 1.52 3.43 3.41 3.38
1966-67 2.38 2.36 1.86 3.99 3.28 3.40
1967-68 2.08 1.87 1.50 3.69 2.81 3.00
1968-69 2.13 2.67 1.49 4.U7 2.84 * 3.27
1969-70 2.29 5.22 1.55 4.31 2.79 3.64
1970-71 2.56 3.11 1.47 5.16 3.03 3.88
1971-72 2.68 3.21 1.75 5.31 2.84 3.81
1972-73 2.73 3.35 1.98 4.96 3.14 4.15
1973-74 2.73 3.48 .1.62 4.70 3.63 ' 3.31
1974-75 2.40 3.65 - 2.29 4.66 3.52 4.02
1975-76 2.53 . 2.68 1.92- 4.48 3.10 3.97
1976-77 2.64 2.97 2.15 4.45 3.18 4.90
1977-78 2.38 ' 3."19 '2.27 ‘ 4.43 3.07 4.80
1978-79 2.52 - 2.92 . 2.32 4.78 3.00 5.67
» _ rjm n a . m ^ t .w •w m m mrm „ ^ ^ m ^ w tm ^ \m m m -mirm ■ ir nr ir —
Source; i) For Bihar - Government of Bihar, CommercialTa^es Department, Patna.
ii) For other States - Budget Documents*

Sj'|.a-r-9- _oJL_E_nt e rt a i n m en t Tax _in_ _St_a_t_e_ Do_m_e_s_t_i_c
Product in Bihar and _th_e_ Neighbouring States
(1961-62 to 1977-78)
_______ _____________________ ____________________ ____________________________________ ____ ________ _________________ ___________ ______________ ___ _ _ (Per cent)
Year Bihar Assam Orissa Uttar Madhya / Uest
T AB L E 1 1.2
1961-62 0.07 0.09 0.04
1962-63 0.07 0.09 0.04
1963-64 0.08 0.09 0.04
1964-65 0.08 0.09 0.04
1965-66 0.07 0.09V
0.05
1966-67 0.08\0.09 0.05
1967-68 0.07 0.07 0.041968-69, 0.08 0.10 0.04
1969-70 0.08 0.15 0.04
1970-71 0.09 0.11 0.05
1971-72 0.10 0.13 0.06
1972-73 0.10 0.14 0.06
1973-74 0.0.9 0.13 0.04
1974-75 0.08 0.11 0.07
1975-76 0.12 0.12 0.08
1976-77 0.13 0.13 0.11
1977-78 0.11 0.15 0.09
Pradesh Pradesh Bengal
0.09 0.09 0,13I0.10 0.10 ’ Oy 16
0.11 ' 0.10 0.15
.0 10 0.11 0.16
0.11 0.15 0.15
0.12 0.14 0.14
. 0.11 0.10 0.12
0.14 0.12 , 0.14
0.15 0.12 0.16
0.19 ' 0.13 0.16
0.19 0.12 0.16
0.16 0.14 0.20
0.17 0.14 0.15
0.18 0.16 0.18
0.25 0.20 0.22
0.25 0.22 0.27
0.23 0.18 0.25
Sourest Same as for Table 11.1.

- 127 -
TABLE II,3
urowth of Entertainmaht Tax in Bihar and
the Neighbouring States
Growth rate (per cent)
Buoyancy Elasticity
Assam 13.471 1.291 1.033
Bihar '13.147 1.294 0.944
Madhya Pradesh 15.710 1.358 0.740
Orissa 15.827 1.502 1.309
Uttar Pradesh 16.755 1.644 1.125 '
West Bengal ' 14.224 1.324 0.910
Note: 1. The reference period- chosen for computing growth rate ‘is from 1961-62 to 1978-79.
2. The reference period ;chosen for computing buoyancy and elasticity is from 1961-62 to 1977-78.
3, All coefficients are significant at 1 per cent level.

TABLE II. 4
'■\p,it_ E.rXt^r_taJjnm^nt__Ta_x_ArL_Syia..r, .and,
the Neighbouring States
(1961-62 . to 1978-79) .
- 128 -
LRufieesl^Year Assam. : , Orissa Uttar Madhya Uest
---- ------------Pradesh Pradesh Bengs
1961 0.27 0.08 0. 23 • 0.25 0.521962 0.27 ' 0.12 0.25 0.27 0.651963 0.30 Oil 2 0.32 0.31 0.69
1964 0.32 0.13 0.35 0.36 0.77
1965 0.34 0.15 0.40 0.45 0.80
1 96 f » 0.39 0.20 0.50 0.46 . 0.83196' 3 0.36 0.18 0.54 0.46 , 0.78
196 7 0.47 0.18 0.64 0.50 0.88
196 2 ■ 0.72 0.20 0.70 0.54 1.07197 5 0.58 0.22 0.89 0.63 . 1.14
197 ‘0 0.67 0.27 0.92 . : 0.63 1.22
1972- 49 0.75 0.34 0.96 0.79 1.55
1973-74 .52 0.79 0.29 1.14 1.03 1.33
1974-75 0.57 0.83 0.48 1.36 . 1.32 1.86
1975-76 0.76 0.92 0.54 1.83 1.52 2.28
1976-77 0.88 1.06 0-70 2.08 1.65 - 3.03
1977-78 0.80 1.37 0.75 2.10 1.62 3.18
1978-79 0.84 1.17 0.79 2.22 1.74 4.48
Source : Same as ..for Table 11.1

I
- .29 -
TABLE II. 5
E n t eirtainment Ta'x ,;L,9tv8ii8: in Bihar and the
Ne-iohbouf ihq States
Per capita Entertainment .entertainment tax as per cant tax, of total tax
Entertainment tax as per cant of state domast ic product
Assam 1.37
Bihar 0.80
Madhya Pradesh 1.62
Orissa V 0.75
Uttar Pradesh 2.10
West Bengal 3.18
3.19
2.38
3.07
2.27
4.43
4.80
0.15
0.11
0,18
0.09
0.23
0.25
Source: Sams as for fable I1.1.
'/

Occupancy Ratios of Cinema Houses Located in Cities of different Population
Groups and by Admission Rates in Bihar
(1975-76)
TABLE IT.6
Population groups Admissionrates
(Rupees)
Seatingcapacity
(inthousands)
Se ats occupied
(in thousands)
Total tax payable (in Rs.
thousand)
Actual tax paid
(in Rs. thousand)
Seats occupied as per cent of seating capacity
Tax paii as a pe cent of
tax payabl
1. Above 1 lakh 1 75 1.00 - 1.74
1 .00 Sub-total -
7088 190 70 8422
34580
256 9 6131 4237
12937
1405327702660148356
5024 7917 2695
156 36
36.25 32.15 50.30 ' 37.41
■'•35. 75 28.58 40.83 33 • 33
2. 50,000 to 1 lakh 1.35
0.75 - 1.34 0.75
Sub- total
11044298731296453881
3061 6 700 3194
12955 _
19316306237557
57496
429168301905
13026
2 7.72 22.43 24.64 24.04
22.2122.3025.2022.66
3. Belou 50,000 1.00 0.75 - 0.99
0. 7 j Sub- total
8847 6082 3849
. 18778
14771033
. m
115825393
20248805273431
16 . 70 16.99 25.84 18,39
16.8916.3224.3916.71
AJ.1 cities 1.001.00
6 426 4 42975
170 74 12323
93927 3246 4
237598334
26 57 28.67
25.30 26 . 49
All classes 10723? 29397 126391 32093 27.41 25.39
Source: Government of Bihar, Commercial Taxes Department, Patna.
Notes The data relate to 153 cinema houses for uhich information could be collected.

TABLE 11f 7
Occupancy Ratios of Cinema Houses Located in Cities of Different Population
Groups and by Admission Rates in Bihar
(1979-80)
Population groups
’ ' ‘ * * '* *
Admission Seating rates capacity
(in . thousands)
(Rupees) , •t '
_ Seats occupied
(in thousands)
I * , ; -
Total tax, payable (in fe.
thousand)
* t
Actual tax. .paid (in Rs.
thousand)
Seats occupied as per cent of
seating capacity ^
Tax paid as a per cent of taxpayable
1. Above 1 lakh >1.75 91.10 3823 >19461 - 8132 41.96 41.781.00 -• 1.74 11008. 5168 * 15180 7009 46.95 ’. 46 . 1 7<1.00 ■ 3026 2038 3193 16 85 53.28 .52.75S ub- to. t al 23944 11029 ■’37834 1b 825 '46 .06 .. 44.47
2. 50 ,000 . to >1.35 14338 2192 27369 3687 15.29 13.471 lakh ’ 0.75 1.34 28335 '5528 32606 6 400 ’19.51 V 19.60 ,
<• 0.75 8891 2305 5938 1490 25.92 ,25.09Sub- total 5156 3 1.0024 65913 ‘11577 19.44 17.56
3. Belou 50,000 < 1 . 0 0 _ 11295 1529 . 16261 1777 13.54 •; -- 10.93• 0.75 - 0.99 4870 - 739 4401 - 592 ~" 15.17 13.46
<0. /5 4041 829 2703 569 20.52; 21.05Sub- total 20206 3097 2336 5 2938 15.33 12.57
4. All cities -1.00 . 6 4735 , 16 548 10226 4 25081 25.56 24.53 .■ . - < 1 . 0 0 _ 30979 . 7603 24848 ,.6259 _ 24.54 25.19
' All classes 95714 24151 1271 12 31340 _• 25.212 4 * 6 1 . —
Source: G o v e r n m e n t of Bihar, Commercial Taxes Department, Patna. x '
Note : The data relate to 141 cinema houses for uhich the information could' be obtained.*

ITABLE II.8
Capacity and Occupancy of Cinema Houses in Different Groups of Cities in Bihar-
•(Percentages)
Population groups Admissionrates
(Rupees)
1975-76 1979-80 ' :,Seating capacity
Seatsoccupied
Tax pay- able if
all seats are
occupied
Taxactually
paid
Seatingcapacity
Seatsoccupied
Tax payable if
all seats are
occupied
T ax actually
paid
1. Above 1 lakh >1.751.00 - 1.74 <0.99 Sub- total
6.6 1 '1 7* 76 7.85
32.24
8.74 . 20.86 14.41 44.01
11.2122.095.26
38.56
15.65 ' 24.67
8.40 .48.72
9.5211.504.00
25.02
15.83 21.40 8.44'
45.6 7 '
15.31 • 11.94 2.51
29.76 '
26.0022.415.38
53.79.-
2. 50,000 to1 lakh
>1.350.75 - 1.34 <0.74 Sub- total
1Q.30 2 7.86 12.09 50.25
10.4122.7910.8744.07
15.4024.286.0345.86
13.3721.285.93
40.86
14.98 29.60 9.29 *
53.87
9.0722.899.54
41.50
21.53 25.66 4.6 7
51.86 ;
11. 78 20.46 4.76
37.or
3. Less than50,000
^1.000.75 - 0.99 <0.74 Sub-total
8.25 5.6 7 3.59
17.51
5.023.523.38
11.92
9.564.301.72
15.58
6.32 2.74 1.6 4
10.70
11.805.094.22
21.11
6.33 3.06 3.44-
- 12.83
12.793.462;1318.38
5.6c1.891.829.39
4. All cities All clafses 100.00 100.00 100.00 100.00 100.00 100.00 100.00 100.00
Source: Tables II.6 and II.7.

* J *Occupancy Ratios in Cinema Houses Located in Different Districts of*Bih^r
‘-------------- 1---- -------------------------- ~------ ------------------ 19 75-76 . ' ~% strict -Number of , Seating Seats Tax payable Tax Seats Tax paid
cinema capacity occupied if all . actually occupied as prohouses ' ' : seats are paid . .... as a p-ro- portion
covered occupied - portion of tax- , /: - • ;• of payable if
. . v; - > capacity ' all' seats- ' '•■■■ ■■: ;..;«* ■ ■■ < are .• ... filled
(Rupees) (Rupees) (Per cent) (Percent'
<1. Patna 14 13171102 6127730 19330514.60 7865880.49 46.52 40;69
2„ Nalanda v 0 0 ;-:0m •• , 0 0 0 0
- 3. Gaya v 9 ,7769191 11848643 8740028.95 19226 51.99 23.79 22.00
4. Nauadah \ 0 0 0 ^ .- . 0 , \ 0 ’ ' 0 . D
• 5, Aurangabad 0 0 0 0 . 0 - 0 0
6. Bhojpur ' 2 2454306 227043 199463B.50 187773.41 9.25 9.41
7. Rohtas ' ’ * 4 2294916 903680 2611025.70 956 883.10 ; 39.38 36.65
8. Saran 4 1677097 '436 598 1211115.10 382858.15 - 26.03 31.61
9. Siuan 0 0 0 0 0 ‘ * 0 0
10. Gopalganj 4 2252191 305992 2362605.50 284886.50 13.59 12.Of
IT. Champaran. (E) 0 . 0 0 , 0 0 , • ’ 0 0
12. Champaran (U) 8 4527261 665929 4418941.70 489921.72 14.71 11.0
13. Muzaffarpur 11 - 9389681 1499894 11392051.50 1428004.70 • 15.97 12.5
14. Uaishali 2 1673734 422057 1808052.10 437514.55 25.22 24.2
15. Sitamarhi 4 2925400 686655 2915347.80 551319.93 20.05 18.i<

- 134 -
TABLE II.9 (Contd...)
istrict1975-76
Number of cinema houses covered
Seatingcapacity
Seatsoccupied
Tax payable if all seats are occupied
(Rupees)
T ax actually paid
(Rupees)
Seats occupied as a proportion
ofcapacity
(Per cent)
Tax paid as .a p,ropoi tion of tax payable if all seats are filled
(Per cent)
: . Darbhanga 3 1909956 399026 2205199.00 452^76; 20 20.89 20.52
7. Samastipur 0 0 0 0 0 0 0
B. Madhubani 3 1985965 445247 % 1911343.80 343322.04 22.42 17.96
9, Begusarai 0 0 0 , " 0 0 0 0
0. . Monghyr 14 6486251 712387 5958309.94 6 56 314.92 . 10.98 11.02
1. Bhagalpur 9 5614039 892370 7065105.75 999287.30 15.90 14.14
2. Santhal Parganas 10 -4952001 818314 i' 3515358.91 • 541258.40 16.52 15.40
3, Saharsa 2 438233 28886 38 7794.50. 24233.70 6.59 6.25
4. Purnea 4 1769704 48526 3 191956 7.21 483392.2 7 27.42 25.18
'5. Kathihar 4 3405658 1392455 3596 562.90 1304059.65 40.89 36.26
6 . Hazaribagh 7 5579316 1545240 6310811.80 1539381.22 27.70 24.39
7. Giridh 0 0 0 0 0 t) 0
8. Dhanbad 16 .... ,‘ 15565147 4503737 20835147.45 5210011.99 28.93 25.01
9. Ranchi 2 • • 184762 41565 9226 5.50 . 17652.78 22.50 19.13
0. Palamu 3 1843588 436 539 2147510.92 50 46 46 . 00 23.14 23.50
1. Singhbhum 14 936 9890 4681521 12661451.93 5508873.22 49.96 43.51
TOTAL 1 53 1 0 7 2 3 9 3 8 9 2 9 3 9 6 771 1 2 5 3 9 0 7 5 1 . 3 6 32092704 .23 27 .41 2 5 .5 9

Istrict
Nu
mb
ero
fcin
em
a
ho
uses
co
vere
d
Seati
ng
cap
acit
yS
eats
occu
pie
d
Tax
pay
ab
le:if
all.
seats
are
occu
pie
d
(Rup
ees)
'
15
43
86
98
0
52
54
91
5
0•,,
;.2
06
54
34
41
12
98
1
17
86
22
4
0
68
08
81
3^
36
10
9
2;,y
t271
81
75
08
40
17
77
43
0
31
86
51
3
"o
19
58
51
1
64
53
92
4
0
23
65
10
57
.05
1.
Patn
a1
40*
2#
Nala
nd
a
3.
Gay
a
0
10
19
94
71
3
0
82
68
29
9.3
0
o•
4.
Naw
ad
ah
00
o•••
>..
5#ft
ura
ng
ab
ad
6.
Bh
ojp
ur
7.
Ro
hta
s
8.
Saran
0 2 4 3
23
77
02
11
63
39
5
13
84
44
0
20
13
98
0.0
0:
51
64
99
4.0
0
21
82
61
5.5
5
0*
9.
Siu
an
10
.G
op
alg
an
j,.
J
o 3-
18
55
7
0
59
42
64
.00
o
11
.C
ham
para
n
12
.C
ham
para
n
(E)
(U)
0 75
03
84
3
91
55
8
44
25
91
1.
69
23
55
75
9.5
0
13
,-M
uzaff
arp
ur
14
,V
ais
hali
15
.S
itarr
.arh
i
116
*D
arb
han
ga
5 3 2 4
33
86
65
V2
83
74
0
35
01
99
~""
0'
22
77
07
3.1
5
21
09
69
5.4
45
19
65
3.0
0
......
o.
h?.
Sam
ast
ipu
r•"
\')B.
Mad
huba
ni0 5
47
876
72
07
72
94
.*1
0
Tax
-
actu
all
yp
aid
Seats
occu
pie
das
ap
ro
po
rtio
n.
of
cap
acit
y
Tax
paid
as
ap
ro
po
rtio
no
ftax
pay
-ab
leif
all
sea
tsa
re
fill
ed
(Per
cen
t)(R
upae
s)jP
flJ^
LA
59
61
93
65
.00
^,
0'
.;'
-
23
33
3B
7.5
5
:•;:-•
-•.0
'';•
••'"!
21
60
89
.4a
13
55
02
1.9
5;
15
52
39
.90
'
0
14
76
^.5
6
o"
45
55
22
.81
845&
4.-7
1
30
44
3.2
.70
67
55
01
.65
50
51
02
.90
0
46
81
31
.35
41
.80
-
"0
•31
.89
'0
.-0
••'
11
*5
1
28
*2
9
'7
.75
0
2-7
2
0
12
.80
4.3
3
19
.34
15
.96
10
.99
0
24
.45
40
.01
'0
'28
.22
,'0
•'
0
'10
.73
*s"
26
.24
•:•••"•
7*
11
'-••o
2*
48
0
10
.29
3.5
9
13
.37
-3
2.0
/
1.1
.If
0
22
.5
Co
ntd
.•••

TABLE I1.9 (Contd...)
1979-80 .
District Number of Seating Seat3 * Tax payable Tax Seats Tax paitcinema capacity occupied if all * actually 'occupied as propchouses , seats are paid • • as a pro- . * tion ofcovered - occupied portion of tax pay
' capacity- if all? .• . * • . seats
(Rupees) (Rupees) (Per cent)filled
(Per ce
19. Begusarai 0 0 0 o
■ nu -i ii j i i . i i _ iij w ■ i i ,r
0 0 0
20. Monghyr 12 5444124. 839474 -v 5929983.23 983157.98 15.42 16.58
21, Bhagalpur 3 1323305 156327✓ 1598764.25 178939.6 5 ‘ 11.81 J 11.19
22. Santhal Parganas 13 5906 79 7 891877 , v 5072453.02 787230.16 15.10 15.52
23. Sah arsa 1 325974 13221 * 3118351.00 14262.55 4.06 .4.48
24. Purnea 4 2808625 40 7198 3054212.04 439247.79 14.50 14.38
25. Kathihar 3 2744883 925975 .. 3625471.55 1017925.50 ; .. 33. 73 20.0
26. Hazaribagh 9 1Z71522 16 26 883 9600444.85 1546893.15 21.49 16.11
-•
CM Giridh o ' 0 . 0 . . .V *;:■■■ ■ •. 0 0 * • 0
hJ CD Dhanbad .. J .15 '12771170 2928374 19983199.57. . 3557334.01 22.93. r17.80
29. Ranchi 4 12226 44 131691 1423848.00 138777.30 10. 77 ; 9.75
30. Pal amu 2 1472310 250687 2178581.10 30 46 39.10 17.03 ' 13*98
31. Singhbhum 13 -9060891 39136 48 14687445.99 6110913.21 ,43*19 . 41.6.1
TOTAL , 141 95713499 24150439. 127112353.00 31276 4 56 . 00 25.21 , 24.61
Source: Government of Bihar, Commercial Taxe s Departm-ent", Patna. ...
Noto! The data relate to 153 cinema houses in 1975-76 and 141 cinema houses in 1979-80.* \ ‘ ^ * r
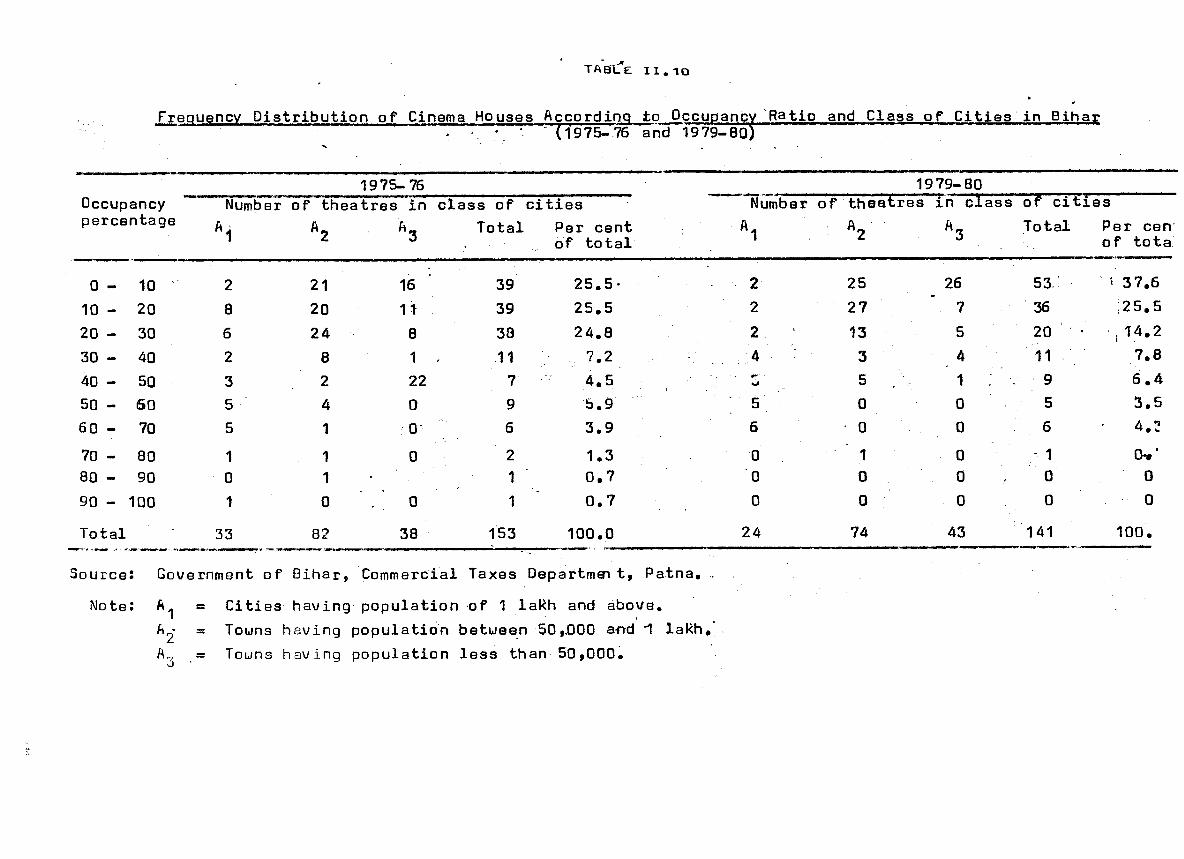
Frequency Distribution of Cinema Houses According to Occupancy Ratio and Class of Cities in Bihar‘ •. • ‘ (19 75- 76 and 1979-80) ' ' '
TABLE 1 1 . 1 0
Occupancypercentage
1975-76Number of theatres in class of cities
‘ITotal Per cent
of total
1979-80Number of theatres in class of cities
1 A. Total
0 - 10 2 21 16 39
in•inCM 2 25 26 53/ s 37.6
10 - 20 8 20 11 39 25.5 2 27 7 36 25.5
20 - 30 6 24 8 38 24.8 2 13 5 20 ,14.2
30 - 40 2 8 1 . 11 V 7 * 24 3 4 11 7.8
40 - 50 3 2 22 7 4.5 .#*'•-o 5 1 9 6.4
50 - 60 5 4 0 9 5.9 5 0 0 5 3.5
60 - 70 5 1 0 6 3.9 6 0 0 6 4.2
70 - 80 1 1 0 2 1.3 0 . 1 0 1 0-*'
80 - 90 0 1 • 1 0.7 0 0 0 , 0 0
90 - 100 1 0 - o 1 0.7 0 0 0 0 0
Total 33 82 38 153 100.0 24 74 43 141 100.
Source : Gov ernment of Bihar, Commercial Taxes Dep artmffi t, Patna. ...
Note : A 1 = Cities having population of 1 lakh and above.
» Towns h aving population between 50 ,JD00 a-nd 1 lakh.'
*3= Towns h av ing population less than 50,000.

- 138 -
TABLE 11.11
Number of Perma^nent c inema Halls per Lakh of
Population in Different States in 1975-76
Name, of State Population Number . Number of(in lakhs ) of - pep- .permanent
manent 'cinema halls/cinema lakh of
. halls : population
1. Andhra Pradesh 447 6 50 i 1 .37,
2. Assam 170 128 i * ‘ 0 .75
3. Bihar 6D8 216 0.36
4. Gujarat 298 243 0.32
5. Haryana 112 100 0.89
6. Karnataka 320 326 1 .02
7. Kerala 236 205 0.87
8. Hadlpya Pradesh 472 407 0.86
9. Maharashtra 555 -559 1’.01
10. Orissa 244 . ioo 0.41.
11 . Punjab 1 50 145 0.97
12. Rajasthan 284* 180* 0.63
13. Tamil Nadu 449 6 54 1.46
14. Uttar Pradesh 9 51 502 0.71
15. West Bengal 490 446 0.71
Source t Government of Uttar Pradesh (1980) Report of the Taxation Inquiry Committee• _ .
* Relates to 1974-75.

table:- i i , 12
Planning Standard for Getting Licence for; New Cinema7 \
Houses in Bihar
Size requirements of plots
(i) Existing build-up area
(a) minimum width
(b) width of the street in front of whichthe cinema house could be s ituated
(ii) Newly developed area
(a) .minimum width '
(b) width of the street-' in front of which the cinema house would be situated
Minimum set back from the property line
(i) front
(ii) side
(iii) rear
Parking space * .
(i) cars
(ii) scooters/motor cycles
(iii) bicycles
In towns with population less than: 5 0 , 0 0 0 ____
20 metres
15 metres
30 metres
20 metres
In towns with population of
50,000, and above
9 metres
4 metres
4 metres
2 per - cent of the number
v; of seats
8
20
ii
n
30 metres
10 metres
45 metres
30 metres
9 metres
6 metres
_ 8 -metres
3.3
10.0
25
*• Parking space for each car, scooter and bicycle shall not be less than 20 sq.metres, 3 sq.metres and 1*4 sq. metres, respectively*
Source i Government of Bihar, Commercial Taxes Department, Patna.

- 140 -
TABLE 11.13
Particulars
Rate Structure of Entertainment Tax, Cinema Show Tax and Betting Tax in Major States
Uttar Pradesh Karnataka Orissa Himachal Pradesh
Entertainment Tax
(a) Cinematograph ' exhibitions
100 ner cent on admission rate (without tax) plus surcharge of twenty five paise on payment for admijsion where the rate of such payment does not exceed Rs 1, and fifty paise when the admission rate exceeds one rupee
Upto 50 paise-20 per cent between 50 paise to Rs 1.50*25 per cent between Rs 1.50 to Rs3.00 - 30 per cent.In addition to these basic rates a surcharge at 100 per cent of the entertainment tax § an additional tax from 10 to 40 paise is also charged.
Upto Rs 1,00-40 per cent 3.00- Re. 1.00 to 60 per cent. More; than Rs 3.00-70 per cent. A sureharge of 10 to 15 paise
is also levied.25 per cent of the tax is levied as an additional tax in specified local area. Cinema show tax ranging from Rs 5 to Rs 10 per show is charged.
75 per cent of the value of admission ticket is levied.
0?) Cinema show tax
(c) Betting tax
Levied by corporations ard municipalities
10 per cent § a surcharge of 10 paise on each payment for admission
Cinema show tax ranging from Rs 4 to Rs 20 per show is charged
Betting tax 7% per cent to 15 per cent totalisator tax 10 to 15 per cent
Nil
Cinema show tax is levied at the rate of Rs 1 to Rs *3 per show per hundred seats occupied according to categories of towns.No betting tax is applicable
- ^41

Entertainment
tax
(a)
Cinematograph
exhibition
(b)
Cinema
show
tax
\
(c)
BettingTax
iift
jrii
iii
ih*nig
iii
TABLE
11.13
Ccontinued)
Gujarat
Upto100paise,
35to40
percent;
Rs1toRs
2,50to55percent;
above
Rs
2.00,60to65per
cent,
Anadditional
duty
atthe
rateof10paiseonevery
paymentforadmissionis
levied
Nil
Nil
Maharashtra
Upto100paise,
32%-37%percent;
Re.
1.00
toRs
2.00,
47%'
to
55per
cent;
onthebalanceoftotalpay
ment,
60to65per
cent.
Asurchargeat5percentupto
Re1.00and10percentinother
cases
is
levied.
Entertainment
dutyattherateof50percent
ofthepayment
foradmission
ischargedforadmissiontoatace
course.
."...
-.
•*
Levied
bycorporations
§f
municipalities
Totalisator
tax
Book-maker
tax
-
per
cent
•15percent
10to
15
MadhyaPradesh
13paisetoRa1.50,
40per
cent;
Rs1.50
and
above,50percent
Nil
Nil

#
Particulars
Entertainment
tax
00
Cin
emat
ogra
phexh
ibit
ion
s
0>)
Cin
eroa
sfvy
wta
x
Cc)
Betting
tax
una—
•142
-
TABLE
H.13
(continued)
Punjab
Entertainment
duty
Lowest
class-
100percent
Other
classes-
125per
cent
West
Bengal
20to
50paise-30
per
cent;
50
to
Rs
1.20
-60
per
cent;
Rs
1,20to
Rs2,25
-90per
cent;
Rs
2.25
§above
-120
percent.
Surchargeat
therate
of10paise
on
each
admissionis
levied
Anadditional
surcharge
ranging
from
25paiseto
Re1.00ischargedon
colour
film
Cinema
show
taxranging
from
Rs
4to
8pershowper
hundred
Occupied
seats
Show
t$x
varies
from
3/4paise
to1%
paise
per
person
admitted
Nobetting
tax
is
levied
Battingtax-
18per
cent;
Totalisator
tax-
22%per
cent;
on
horse
races
conducted
outside
the
State
but
on
which
betting
isdoneinside
West
Bengal-totaiisator
tax
18
r>er
cen
t,b
ett
ing
HM
Andhra
Pradesh
Upto
Rs1.50
-35
per
cent;
more
than
Rs1.50
-45
per
cent.
In
addition
to
entertainment
tax
an
addi
tionaltaxis
also
levied
Upto
50paise-10
paise;
50paisetoRe1.00,20
paise;
Rs
1.00toRs
1.50-
30paise;
Rs
1.50to
2.00-
40
paise;
Rs
2.00to
Rs2.50-50
paise;
Rs2.50to3.00-60paise;
morethan
Rs3.00-70paise
Below25.000population
13to14%percent
ofthe
grosscollectioncapacity
per
show.
25,000to50,000
population.
Rs4
for
every
show;
50,000
and
abovepopu
lation
•-Rs
6for
every
show.
Admission-35
percent
of
thepayment
for
admission;
Bets
with
totalizator
15
percentofthepayment
for
admission;
Betswith
bookmakers
-IS
per
cent
of
the
payment
For
admission
^^^tructureof
Ent e
rtainment
andBet^--
T<^
Ha
rya
na
Entertainment
duty-
125percentofthe
admission
fee
-SK^gajig
Showtaxisbeing
charged
atthe
rate
of10percent
rtheqntertainment
duty
payable
Not
levied

^ ........ - - ........ ------------- nimvri T|., , Rate Structure of Entertainment: and. Betting Tax In Major States
^ i p v i cn these
Particulars Tamil Nadu Rajasthan Assam Kerala Bihar
ntertainraent tax
a) Cinematograpn exhibitions
Uj to 30 paise-25 per c*nt; from 30 paise uj to Rs 1.50-33.3 per cent; and for more than Rs 1.50-40 per cent. An additional surcharge is imposed as follows: upto 25 paise - 5<paise; 25 paise to Re 1.00 - 10 paise;Re 1.00 to Rs 2.00 30 paise; Rs 2.00 to Rs 3.00 - 40 paise; and for more than Rs 3.00 - 50 paise.
Upto Rs 1-60 paise; more than Re 1 100 per cent
Upto Re 1 40 per cent; from Re 1 to Rs 2-80 per cent; for more than Rs 2 100 per cent
Local authorities are empoweredto levy the tax at the rate not less than 15 per cent and not more than 30 per cent on each price of • admission of entertainment.An additional surcharge also is levied at the rate of 60 per cent of the entertainment tax.
110 per cent of th6 admission fee
Cinema . show tax
Ranging from Rs 2.00 to Rs 5.00 per show. Besides, in the city of Madras an additional show tax for air- conditioned theatre of Rs 27.50 and for ethers Rs 17.50 per show 1S levied . An additional surcharge rf Rs 17.50tr>eT show i s levied in Madurai In notified munici- r I x 1? cs th e" ’.UT"- #
charge is Rs 10 nor show; in other auni- . dualities, it is r.s 7 . 5 0 r* c :m d
* For seats not exceeding,300 Re 1 per 100 or part thereof per show jmd for seats exceeding . 300, for the- „ .first 300 seats ..as abov£ and Rs 2 per show for every additional 100, seats or part thereof. But the ' maximum amount of tax should not exceed Rs 10, Rs 6, Rs 3, and Rs 2 in towns where the
A show tax is levied per show at the rate of 10 per cent of the total value of tickets sold net of entertainment tax payable or Rs 10, whichever is less.
Municipalities and Panchayats levy a show tax of Rs 2 and Re 1, respectively, for cinema and Rs 5 and Rs 3 respectively, for other shows.
A show tax is levied at the rate of Rs 1C per show in P Ranchi, Dhanb Jharia, Jamsli and Jugsalai the rate of F in all other

Rate Structure of Entertainment and Betting Tax in Major States
TABLE 11.13 ( Contd. )
Particulars Tamil Nadu Rajasthan Assam Kerala Bihar
(c) Betting tax
In other places it„.. is Rs 5.00 per show :
Hi
I j
effective bettiig tax ranges from 20 to 10 per cent; the iBPximum rate is 25 per cent of every sum paid into the totalisator or on every, sum liable to betting tax. Surcharge of 5 per cent is levied on all betting and totalisator taxes
where the population is above 1 lakh, between 0.5 and 1 lakh, between 15,000 and 50,000 and in other places, respectively
Nil Nil Nil Nil
* U n d a r a d d i t i o n a l ertertaiflment tax ~ Source: (1) Memorandum submitted by various State governmentsto the Seventh Finance Commission

Revision of Admission Fee and Tax Rates of Cinema Houses in Patna City
................. - (in Rupees)
Class From 1960 to 1963 From 1963 to 1973 From 1973 to 1975 From 1975(Entertainment tax (Entertainment tax (Entertainment tax (Entertainment tax 11050 per cent) 75 per cent) 100 per cent) per cent)
- 145 -TABLE 11.14
Admissionfee
Entertainmenttax
Grossadmissionrates
Admissionfee
Entertainmenttax
Grossadmissionrates
Admissionfee
Entertainmenttax
Grossadmissionrates
Admissionfee
Entertainmenttax
Grossadmissionrates
CD (2) (3) (4) (5) (6) (7) (8) . (9) (10) (11) ; (12) (13)
R/S 2.00 1.00 3.00 2.00 1.50 3.50 2.10 2.10 4.20 2.15 2.15 4.55
Balcony 1.50 0.75 2.25 1.60 1.20 2.80 1.75 1.95 3.70 1.95 2.15 4.10
First class 1.00 0.50 1.50 1.00 0.75 3.75 1.10 1.10 2.20 1.20 1.35 2.55 -
Second class 0.50 0.25 0.75 0.60 0.45 1.05 0.80 0.90 1.70 0.80 0.90 1.70
Source: Memorandum submitted by the East India Motion Pictures Association

- 146
TABLE 11.15
Increases in . the Ratos of Ad miss ion, and
Enterta inment Tax;
; (1960-61 to 1978-79)
Class of admission Percentage in- creasa in; admiss ion fee
Percentage increase in | entertainment tax
Percentage increase in gross admission. charges
Rear Stall 7.5 140 52.7
Balcony 30.0 187 82.2
First Cliss 20.0 170 70.0
Second Clcss 60.0 260 125.7
> Source: Table 11.14.

- 147 -
TABLE 11.16
Distributijjn jjf ,the Cinema _ He.1 Is Paying Composition
Fee
Div is ions
1• Patna
2. Gaya
3. Bhagalpur
4« Dharbai ga
5* Ranchi ■
6. Jamshedpur
7» Dhanbad
8. Tirhut
9» Purnea
Total of all divisions
Number.of cinema halls in _____ _ places having population
More than 50,000 to Lass than
Total
1 lakh
1
29
2
1 lakh
9
225
6
1
7
3
• 4
1
3
11
12 48
50,000
3
2
3
23
15
8
3
19
7
7
15
23
14
87
Source : Government of Bihar, Commercial Taxes Department.

148 -
Rate of Composition Fee Payable by Different Vehicles
(Notification dated 31st March 1980, S.0.375)
TABLE 1 1 1 .1
SI.Wo. Descrift ion of vehicles Rate of composition
fee per month
Vehicles, the permits in respectof uhich have been granted by aregional or State TransportAuthority of this State
Truc’<s *•' '
a) For a period upto five years from 1st 3anuary following the date of registration of the vehicle under Motor Vehicles Act as recorded in the certificate of registration
b) For a period of subsequent five years
c) For the subsequent period
a) Public Service Bus/Mini Bus
b) Buses/Mini Buses of Bihar- State Road Transport Corporation
Contract carriages (Buses and Mini Buses) registered in this State .
Rs. 350*00i
,Rs. 275.00
R s • 200•00
Total’ number of seats multiplied by total kilometers to be carried in a day as per permit uill be the amount of fixed fee in. rupees in lieu of tax per annum for a particular vehicle
Rs. 300.00
Contfd»•«•

- 149
TABLE HI.1 vCCont*d)
s t ;Mo • Description of vehicles Rate of composition
v fee per" fnonth
4.
I1---,- ....... • V. ^
Taxis (including tempoes -uaed : f1.- as taxis having sitting capacity;, of four or more than four passengers)
1 ■. * *"■ "■ •
- R.s •.,••80*00
5. • Auto-R ickshau. ( inqltidinig. tejfipos used . as Batiy Taxis) . ’v' RS. 30.00
6. Me h i d e s registered in other Statesr but operating inside Bihar on the basis of temporary permits granted by the State of origin*
' «
Fov a fB riod of 15 days or less
■ j i ii
For a period T o r a period excluding 15 days more than a and upto one month month
(1 V (2) (3)
Rs. f e . -
(a) Trucks 175 350 Rs* 350 per month j.. or part thereof
(b) Taxis and tempos 50 uith capacity four or more passengers .
100 , ! Rs* 100 per month or part thereof
(c) Contract carriages 150 including Mini Buses
.300 Rs. 300 per month ■ or part thereof
N*B* This notification shall remain affective from 1st April 1980*
Source ! Bihar Gazette (extra ordinary 285). dated 31st March, 198'.

- 150 -
table:, ii 1.2
Passenocrs and Goods Tax as a Proportion of Total Tax Revenue
in Bihar and the Neighbouring States
(in per cent)
Years Bihar Assam Madhya Prades h
Orissa UttarPradesh
— T T T " (27 — ~ T s l " ” “■■'(47'“'^ T s T _
196 5-65 2.07 ’ 2.02 . 6.54 0.61 4.49
1966-67 2.49 1 .95 6.45 0.66 5.39
1967-68 • 2.31 2.11 5.59 0.05 5.12
1968-69 1 .21 1 .76 5.86 0.03 5.32
1969-70 ’ 2.1 5 " 2?49 5.73 1.23 •. 5.50
1970-71 ‘ 2.34 1 .63 6.04 2.58 5.73
1971-72 2.38 ’ 0..80 6.10 2.80 ... 6.35
1972-73 • 3.05 ‘1.19 7.13 2.48 . 4.88
'I 973-74 2.99 1 .61 7.14 2.82 *' 5.86
1974-75 2.70 ’ 1.3.7 '' ' 6.23 2.91j i . 5.17
1 975-76 2.22 1.5.7 5.83 ' 2.87 5.94
1976-77 3.1'1 1.88 10.15 2.71 5.80
1977-79 2.17 '1 .55 * 10.93 2.94 5.48
Source • « 1* Government of 'Bihar, Commercial TaxesDepartment
2. State Budgets of Different State governments.

- 151
* ■ '
Per Capita Passengers and Goods Tax in Bihar
and the, Neighbouriha States' .
(in Rs.)
TABLE III.3
Year- • ■ Bihar Assam MadhyaPradesh
Orissa UttarPradesh
. . (1) .. (2) : (3) (4) (5)
1965-66 0.22 0.29 0.86 0.06 0.53
1966-67 0.26 0.32 0.91 0.07 0.67
1967-68 * 0.28 0.37 0.91•, r. ■ 0.01 ... 0.761*968-69 0.16 ' 0.28 . * 1#03 n ... 0.83
1‘969-70 ’ 0*30 ' 0.48 1 .12 ’ 0.16 .. 0.89
1*970-71 ? 0.33 \. 0.31 ... ' 1 .25 0.’39 0.99
1971-72 ' 0*36 0.17 * 1.35 7 0.43 1.10
1972-73 ! 0.55 0.23 ■ 1 .80 ... 0.43 0.95
1 •973-74 ! 0.58 / 0*33 ' 2.03 0.51 1 *421974-75 ! 0.64 . 0..36 ' 2.33 0.61 .1.501975-76 ■ 0.67 0.54 ' 2.86 ' 0.80 2.431976-77 ■ 1.03 0.67 5.25
COGO•O .2.711977-78 0.73
l0.67 ' 5.77 0.97 . . 2.60
Note • n - negligible
Source • 1 Same as for III»2

- 1 52 -
TABLE III.4
Buoyancy and Elasticity of Passengers and Goods Tax in Bihar and the
Neighbouring States
(1968-69 to 1977-78)
States Buoyancy coeff icie nt
E-v dlue R 2 Elasticitycoefficient
E-value R2
B i h ar 1.668 6.846 0.854 0.836 3.207 - 0.562
Assam 1.189 3.213 0.563 1.189 3.213 0.563
Madhya Pradesh 1 .852 6.889 0.856 1.792 6.32 . 0.846
Or issa 4.426 2.626 0.463 2.848 3.001 0.530
Uttar Pradesh 1 .550 7.026 : 0.861 1 .1 06 6.678 0.848
Uest Bungal 2.583 5.618 0.798 . 2.583 5.618 0.798
Source J Budget documents of the State governments.
krst

- 1 53 -
Grouth of Passengers and Good9 Tax - Automatic.
and Discretionary Comporients (l 968-69 to i -
■ '■ 1977-78 ' R .
; TABLE - III.5
'(in Rupees lakh)
State
Total increase . ' iin the yield
;from 1968-69 . • to 1977r78
t * > 0
.Increase in the;-yield due to expansion
of’base |
Increase in the yield due to dis-
: cretionary changes
1* Bihar 3233
. • *
1783.52 1449.48ii ’ (100) (0.55) (0.45)
2. Ass jn 699 66 9 ) 5 0• (1 0 0 )/ (100) (0)
3. Madhya Pradesh 11477 11054.78 373.57(100)
I(0.97) (0.03)
4.1 /
Orissa-**' , 1244.67 139.81 1104*86(100) (0.11) (0.89)
5. Uttar Pradesh • 14499 * * 11900.79 .2598.22H (too) (0.82) (0.18)
6. West Bengal 13517 13517 ; 0(100) (100) : (0)
N.B. : Figures in parentheses indicate;the percentage^of total increase*:;
Only passengers tax? goods tpx is;not levied.

- 1 54 -
TABLE III. 6
Yield of Passengers and Goods Tax in
Different States (1977-78)
S t ate Per capita Per cent Per centpassengers of total of Stateand goods tax domestic
taxN product. __ _______
(l) (2) (3)
Tax per vehicle (trucks and )uses )l 975-76
(4)
1 • Assam 0.67 1 .55 0.074 0.063
2. Bihar 0.73 2.17 0.099 0.020
3. Guj ar at 7.83 • 7.51 . 0.553 0.075
4. Haryana 16.24 12.71 0.990 0.290
5. Madhya Pradesh 5.77 10.93 0.638 0.061
6. Maharashtra/ 5.36 4.40 0.336 0.040
7. Orissa^- 0.97 2.94 0.121 *0.063
8* Punj ab 12.20 8.05 0.627 0.110
9. R aj asthan 3.76 6.57 0.392 0.052
10. Uttar Pradesh 2.60 5.48 0.281 0.066
11 • Uest Bengal 4*74 7.16 0.372 0.054
Notes : 1_/ Only passengers tax-? goods tax is not levied.
2/ Passengers and goods tax in the form levy underCalcutta Improvement Act 1911 and Hourah BridgeAct 1926 for the improvement of Calcutta and Hourah.
Source J1 .Government of Bihar, Commercial Taxes Department, Patna*
2«Government of Bihar, Transport Department, Patna*

Rates bf Passengers and Goods Tax in Different States
(1978) ,
(percentages)
State - Rates of passenger Rates of goods- ' ‘ tax '' ' ' tax
TABLE 111*7 .
Assam 10 1 10
Bihar 25 ; ' 20
Gujarat 25 3< 1 . ' ' '
Haryana ' 60 50
Madhye Pradesh 25* 10
Maharashtra . 17»5* 4*5
Oriss a 15 -
Punjab 35 35
Rajasthan 30 30
Uttar Pradesh 16 10
* inclusive .of- the fare
Source s Memorandum submitted by the State governments to the Seventh Finance Commission*

- 156 -
TABLE. III.8
Compounding Rate per Year in Bihar and the Neighbouring
States
Bihar
Madhya Pradesh Composition fee payable in a year
Number of seats as per permit x total kilometre to be covered in a day as permit
R (F x T ) x 365 x 65 (minimum)1 00
3. Orissa
i) ordinary stage carriage
ii) express stage carriage
4.
iii) Deluxe carriage
Uttar Pradesh
uhere R = Rate of tax
F = Total amount of fare inclusive of tax for the full complement of passengers on the entire route for single one uay trips
T = number of trips permitted on the route per day
1.85 x number of seats as per permit(s) x total kilometre to be covered in a day as per permit (d )
2.05 x S x D
2.60 x 9 X D
F x T x R
uhere F = Fare for the full complement of passengers on the entire route of single one uay trips; T m number of one uay trips during the period and R as Rate of tax * A ‘complement of passengers is determined at 75 per cent occupancy ratio-.
Source: 1. Government of Bihar, Commercial Taxes Department, Patna*
2* Memoranda submitted to the Seventh Finance Commission by the State governments.

- 157 -TABLE III .-9
Cb ropy.be •. -1 ...i ■
ative Study o f Taxes to/Paid and the js itio n FeePayable by Buses. Trucks and Autorlks
Year Total no. o f Total tax. Tax payable goods vehi- payable accordingcles taxes at compo- to ratesiy
unded(Rs lakh) (Rs Lakh)
Total no. o f buses and >»- mini buses *
• -/Tax payable ^ acco rd in g
Cbmpos fee pai by buseid to the tax mini bi ra te j/(Rs la l
Total no. o f au to ricks hr* aws, tempos and scooters
Cbmposition fee payable^/
, (Rs lakh)
(2) (3) (4)
1975-76 16214 30$ Vi 4370
1976-77 1783 5 • ; ■’ 4280.4 509.6
1977-78 21184* 508.4 50 84.2 6728
1978-79 254 $£> 611.7 6117.1 7991
(5& (6) (T) (8)
296.e 550.6
642 . 1 * 642.1
847 .1 84T.1
375 .9* 1007.61
4212
5436
589 5
653 4
,25. 53
32.29
38.80
42.3 6
Note: 1. Cbmposition fee payable fo r trucks is taken as Rs 200 perth per vehicle (Rs 2400 per truck per year)2.. Tax payable fo r trucks at the ex isting rates - Assuming i treight charges o f Rs 3/ km. (inclusive
o f tax) fo r a 10-ton payload vehicle covering 4000 km.a mu tax payable at 20 per cent o f thefre igh t; the tax component is Rs 0.50 per km. run by the pie. Thus the tax payable is Rs 0.5 x 4000 x 12 = Rs 24000 per vehicle per year. - ' 1
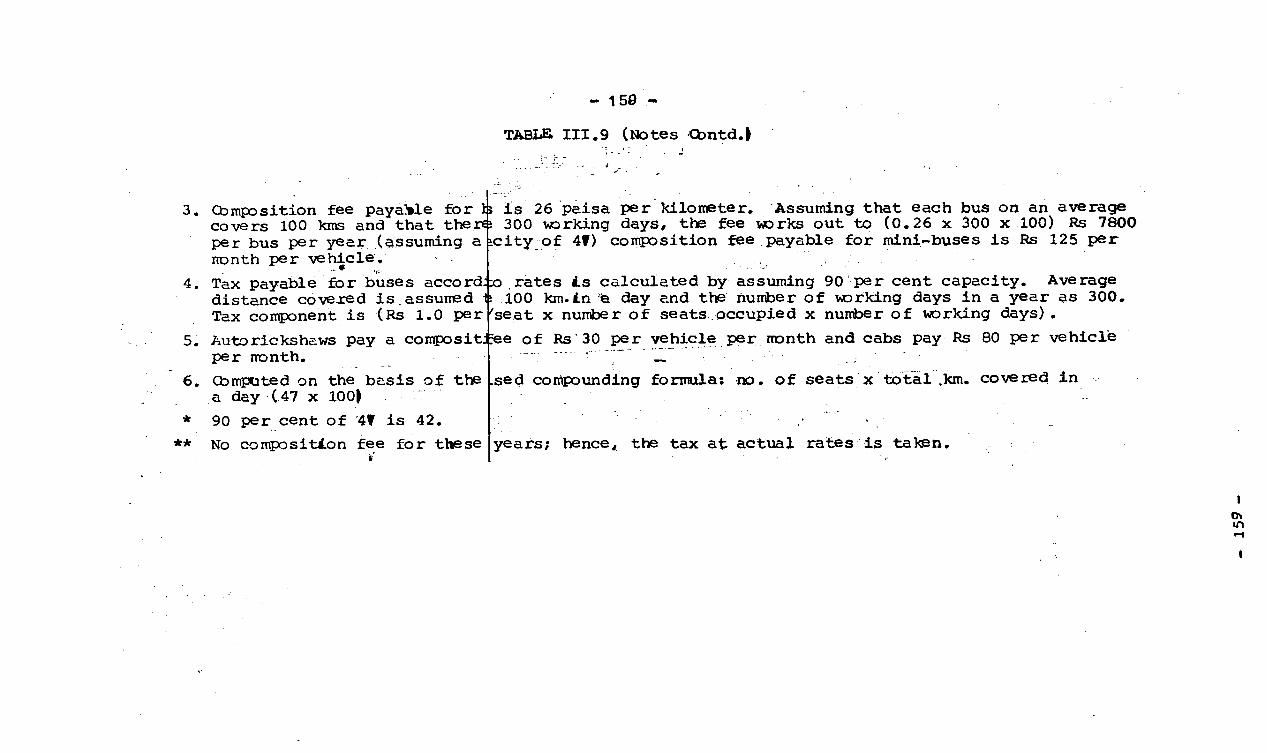
TABLE I I I .9 (Notes -CbntdJ
Composition fee payable fo r ts covers 100 kms and that ther^ per bus per year (assuming a month per vehicle.Tax payable fo r buses accord distance covered is.assumed Tax component is (Rs 1.0 per
Cbmputed on the basis o f the a day (47 x 100)90 per cent o f '4? is 42.No composition fee fo r these
is 26 paisa per kilometer. Assuming that each bus on an average 300 working days# the fee works out to (0.26 x 300 x 100) Rs 7800
c ity o f 4f) composition fee payable fo r mini-buses is Rs 125 per
rates i s calculated by assuming 90 per cent capacity. Average 100 km.in % day and the number o f working days in a year as 300,
seat x number o f seats occupied x number o f working days) .Auto rickshaws pay a composit^ee o f Rs'30 per vehicle per month and cabs pay Rs 80 per vehicle per month.
.sed compounding formula: no. o f seats x to ta l .km. covered in
years; hence* the tax at actual rates is taken.

- 159 -
TABLE I I I . 10
Cbmparison o f Tax to be Paid a t Existing Rates, Composition Fee Payable and Actual Tax Accruing to the State
Year't
Tbtal composition fee payable fo r Buses, Trucks#Au to ric kshaws and Taxicabs
Composition fee payable (Buses, Trucks)
Tax payable at statutory
rates (buses and trucks)
Actualtaxy ie ld
Amount Evaded (1) - (4 )
Difference Difference between tax betv^en tax paid by the paid by the people and people and received by the tax the govern- payable by ment the trans-
po rte rs
Extent o f evasion (5/1 ) (Percent)
CD (2 ) (3 ) (4 ) (5 ) (6 ) (7 ) (8 )
1975-76 711.41 68 5#9*
J4442 .• 413.0 298.43 4029.0 3756 .1 41 .9
1976-77'if
1102. 4^ 1070.1 if > 4922 .5 648.0 454 .4 4274 .5 3852 .4 41 .21977-78 139 4.3 1355 .5 5931.9 468.0 8 8 7 .4 5463.9 4576.4 6 3 .6 „1978-79 1030.0 987 .60 7124.7 670.0 360.00 6454.7 6138.10 35 .0
Notes * fb r the year 1976—77 and 1977—78 there was no composition fee; hence tax paid at statutory rates has been taken fo r buses and mini buses.
I

- 160 -
TABLE IV .1.
R G V/-Ljnue From h.l$.s.tAcity Duty as Per Cent. of Tota 1 Tax
Reve^nue^ in J3 ihar .and _the _IMe ig_h_bo_ur i n_S_t at es
(Percentages)
Ye ar Bihar Ass am Madhya Orissa Uttar UestPradesh Pradesh BengaJ
1961-62 1 .63 0.00 3.45 0.39 1.17 7.891 962-63 1 .59 0.00 3.34 3.90 1 .01 7.611963-64 2.53 o.no 3.03 4.32 0.93 7.931964-65 6.13 0.04 3.25 6.49 0.77 7.891965-66 6.82 0.31 3.43 4.42 0.93 7.42
1966-67 6.11 0.52 3.30 5.21 1 .00 6.361967-68 6.1 3 0.82 3*74 10.50 0 * 84 6.631 96 3-l 9 5.47 0.69 3.75 7.98 0.93 8.051969-70 5.42 0.93 3.59 7.54 1 .02 6.521970-71 5.96 0.6 5 3.6 5 3.40 1 .43 6.77
1971-72- 7.24 0.67 3.80 3.43 2.35 5.841972-73 7.43 0.60 3.98 3.24 2.97 . 6.621973-74 6.53 0.78 4.01 7.30 1.37 ‘ 6.051974-75 5.45 1 .06 4.35 6.84 0.76 ' 4.601975-76 4.62 0.71 3.23 9.83' 2.78 4.50
197S-77 4.25 0.81 3.20 5.84 1 .28 4 *441977-78 3.52 0.74 3*27 10.17 1-36 5.001973-79 6.47 0.76 4.63 10.51 1 .30 4.98
Source (i) Government of Bihar, Commercial!. TaxesDepartment, Patna . •
(ii) Budget docurrtents of the State Governments*

t a b l e: i v . 2
jShare^ ^lectrJL^ijb^ J^ut^.in ^State Domjastic J^joducfc'
ArL-.?.iilaJ. ,a.rl(i .'y?.®.^Aa^^o^urinq ,SJtates
(1961-62 to 1977-78)
(in per cent)
Ye ar 'Bihar Assam Madhya Orissa Uttar Uest
• Pradesh Pr sdesh Pengal
1961-62' ■' 0.06 ' 0.00 0.11 0.01 0.04 ‘ 0.301962-63 0.06 0.00 0.12 0.1 0 0.04 0.311963-64 0.09 0.00 . 0.11 ' 0.14 ' 0.03 0.331964-6 5 . ’ Of 21 ' 0.00 0.12 0.19 ' 0.03 0.34196 5-66 0.20 0.01 ' 0.1 5 0.14 0.03 0.34
1966-67 0.21 0.02 0.16 0.14 0.03 0.291967-68 0.19 0.03 0.13 0.29 0.03 : 0.271968-69 0.20 0.02 0.16 0,22 0.03 0.341969-70 0.19 ,0.03 0.15 0.21 , 0,03 : 0.281970-71 0.20 0.02 0.16 0.27 0.05 0.23
1971-72 0.26 0.03 0.16 0.28 .0,10 0.241972-73 0.28 g.02 •0.18 0,25 0.10 0.321973-74 0.22 0*03 0,16 0.20 0.07 0.271974-75 0.1 9 . 0.03 0.20: 0.21 0.03 0.201975-76 0.21 0.03 0.21 0.39 0.16 0*24
1976-77 0.20 0.Q3 0.22 0.49 0.07 0.251977-78 0.16 Q.,04 0.19 0,4 2 0.07 0.26
Source J Same as for Table IU»1»

- 162 -
TABLE IV.3
Buoyancy and Elasticity of Electricity Duty< u-m -m -m w - •» ** m- -*• o • « * < » ' m- -m - » *. ■ » ' " w «r ■ - M K m * « * <
i d Bihar and ,t he_ _Meiqhbourinq. Statejs
States
Bihar
Assam^
Uttar Pradesh
Madhya Pradesh
Orissa
Uest Bengal
Buoyancycoefficient
1 .590
1.525
1 .689
1 .329
2.370
0.782
t-v alue
3.050
13.985
6.96 0
23.258
7.882
14.439
R- Elasticity t-v/alue coef f icie nt
0.81.
0.94
0.76
0.98
\
0.81
0.93
Note J jV/ 1966-67 to 1977-78
Source* Budget documents of the State governments
0.852
1 .357
1 .352
1 .1 89
2.217
0.461
6.630
11 .185
6.521
31 .504
7.047
7.402
krs
0.75
0.91
0.74
0.99
0.77
0.79

TABLE IV.4
Regression Results
- 163 -
Dependent variable Taxable consumption of electricity
Percentage of industrial and agricultural consumption of electricity
Dummy 1 Dummy 2 Constant I F
1, Electricity duty (Gross•yield)
2. Electricity duty
3. Electricity duty
1.9934 . • *** (8.4835)
1.0927 •/ *£•*(7.6147)
0.7082/ *#•*(3.5205)
-0.0396 - - -9.0146 0.8140
(-0.2416) ' . (-4.6910?*
-0.0338 - - •-3.0201 0.7780
(-0.3380) ’ (-2.5735?*
-0.0072 ' 1.2443 ■ 0.4028 -0.5896 0.9718
(-0.1075) (8.956lf* (2.293?f* (-0.3981)
***36.0043
***29 . 036 7
***138.9623
Source? i) Government of Bihar, Commercial Taxes Department, Patna.
ii) Government of India, Central Electricity Authority. Public Electricity Supply -All India Statistics - General Review (yearly).
Note : Significant at 99 per cent probability level.
** Significant at 95 per cent probability level.

19
61
-62
19
65
-66
19
70
-71
19
71
-T2
19
72
-73
19
73
-74
TA
BL
ET
-1
1/.
5
•i^t
ilit^
G^n
erat
.ina
Cap
acity
and
Act
ual
rDnO
T'4-
•-^
id„^
^nS
^^tu
aljG
ener
.ati
on..
qfJE
JLec
tric
ityin
Bih
ar
bta
teE
llec
tric
ity
••—-
•-.,B
.oa.
rdIn
sta
ll-"
""G
'eTTe
Ya-
edu
tio
ncap
acit
y
21
.93
-••••(
.3.4
4)
59
.54
(14
.42
)
45
8.2
7(5
5.8
3)
55
8.3
3(6
1.0
4)
55
8.
33
(57
.24
)
57
1.9
5(5
6.3
0)
32
.79
(1.2
8)
10
7.3
?(8
.41
)
12
70
.30
_(4
9.7
6)
14
33
.20
(53
.80
)
19
53
.34
(56.
71L
18
85
.99
(53
.33f
—
Go
vern
men
t-—
.Jl
®G.
QTt
men
tIn
sta
ll-
fien
e'ra
"—
VT
otal
ed
cap
acit
y,<
FU
)
29
9,0
0l/
(46
.84
)
0.0
0
(0.0
0)
10
.00
(l»
21
)
9.6
0
(1.0
5)
14
.40
(1.4
8)
15
.00
(1.4
8)
tio
n
Flk
Uh
13
58
.07
.(5
2.8
8)
0.0
0(0
.00
)
0.9
3
(0.0
4)
2.8
0
(0.1
&)
4.3
2(0
.13
)
4.5
9(0
.13
)
—E
'ik
iic_
Sacto
rIn
sta
ll-
~~G
ene"
r"aT
"ed
cap
acit
y(r
iLj)
32
0.9
3(5
0,2
7)
'.
59
.54
(14
.42
)
46
8.2
7(5
7.0
4)
56
7.9
3(6
2.0
9)
57
2.7
3(5
8.7
2)
58
6.9
5..
(57
.79
)
tio
n
Plk
Uh
.
13
90
.86
•(5
4.1
6)
10
.7.8
1(8
.41
)
12
71
.28
(49
.80
)
14
41
.00
(53
.90
)
19
57
.66
(56
.83
)
18
94
.59
(53
.96
)
Priv
ate
——
--
SB
ctO
Tin
sta
ll—
Gen
era
-ed
tio
ncap
acit
y(H
U)
.Fl
kUh
33
.77
(5?2
8)
33
.76
(8.1
7)
30
.84
(3^.
76)
30
..8
4(3
.37
)
30
.84
(3.1
6)
17
.34
(W7
0)
12
9.2
1(5
.03
)
1-0
4.5
9(8
.16
)
10
1.1
3(3
.96
)
95
,99
(3.5
9)
97
.09
(2.8
2)
59
.16
(1.6
8)
To
tal
.U
tili
ties
In
stall
ed
cap
acit
y((
%/)
35
4.7
0(5
5.5
6)
93
.30
(22
.59
)
49
9.1
1(6
0.8
0)
59
8.7
7(6
5.4
6)
60
3.5
7(6
1.8
8)
60
4.2
9(5
9.4
8)
Gen
era
tio
n.
Mk
Uh
15
20
.07
(59
.19
)
21
2.4
0
(16
^5
7)
13
72
.41
(53
.76
)
15
36
.99
•(5
7.4
9)
20
54
.75
(59
.65
)
19
53
.74
(55
.64
).
*~~T
~~~J
zSH
lL,d
j'-?_
.«.»
,'.
IW
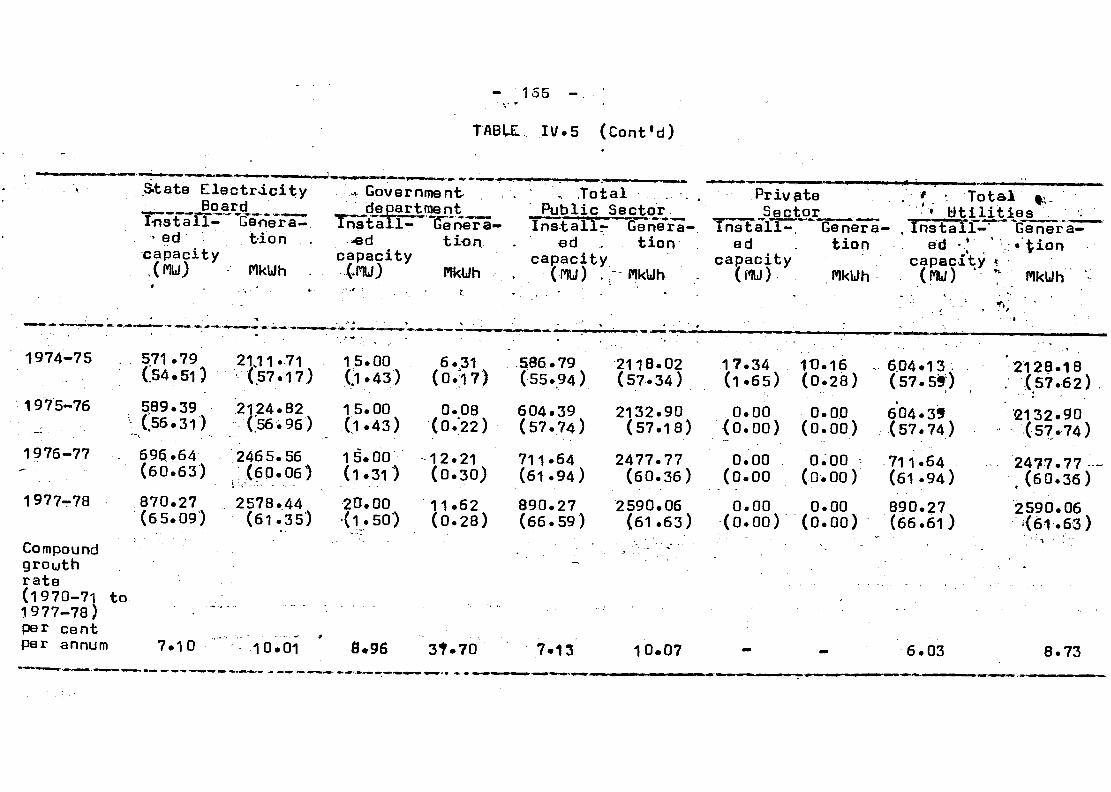
- 155 -
TABU:. IV.5 (Cont'd)
State Electricity__ Board___ _____
In s t a 11 - ~ T^eVier a -* ed t-ion
capacity,(riU) MkUh .
-* Government _n i department __ Install— Genera* -ed tion
capacity (‘HU) MkUh
V Total . . .Public Sector _
Install;- Genera-.ed tion
capacity( MU ) . MkUh
Private Sector
TnsFall-. Genera* ed tion
capacity(MU) MkUh
9 Total♦ Utilities ^
Install- ""'General ed • | ' :< ti°n
capacity «• •(MU) ‘ K MkUh
1974-75 571.79 (.54.51)
2111.71 (57.17)
15.00 Cl .43)
6.31(0.17)
586.79(55.94)
2118.02(57.34)
17.34 (1 *65)
10.16(0.28)
604.13.(57.59J
’ 2128.18 . (57.62)* * ^
1975-76 589.39(56.31)
2124.82 ( 56 .96 )
15.00(1.43)
0.08(0.22)
604.39(57.74)
2132.90(57.18)
0.00(0.00)
0.00(0.00)
604.39(57.74)
2132.90(57*74)
1976-77 696.64(60.63)
2465.56(60.06)* • . i - . .
1 5.00 (l.31 )
12.21(0.30)
711.64(61.94)
2477.77(60.36)
0.00(0.00
0.00 ( 0.00 )
711.64 (61 .94)
2477.77 .(60.36)
1977-78 870.27(65.09)
2578.44(61.35)
20.00 (1.50)
11.62(0.28)
890.27(66.59)
2590.06 (61.63)
0.00(0.00)
0.00(0.00)
890.27(66.61)
2590.06 (61.63)
Compoundgrowthrate(1970-71 to 1977-78)
• * ' '
‘ ■' 1 : "
per cent \ . *- ■ -—- -r $per annum 7.10 ' 10.01 0*96 3t.70 7.13 10,07 - - 6.03 8.73

,G sn e r a t i n g C a p a c i t y _and Jict u a 1 „G_e_n_er_at^ion of E l e c t r i c i t y i n Bihar
- 155 -
TABLE IV.5 ( C o n t’d)
N o n - U t i l i t i l T T ”””*""--------------------— — ----- — ■ ■ — ---—— -— ----— -— ------------------- — Grand
S e l e c t e d Rail w a y s T o tal totali qd u s tries n o n 1-u t i li t Ir q
Installed
capacity( m u )
G e n e r a tion
MkUh
I n s t a l l ed
capacity (MU) .
G e n e r a tion
MkUh
I n s t a l l ed
c a p a city(MU)
Ge nera-
tion
MkUh
Installed
capacity
(MU)
G e n e r a tion
_ MkUh
1961-62 233.68
(44*44 )
* 1 048.11'
(40.81 )
0.00 * (0.00) •
0.00
(0.00)283.68
. (44.44)
1 0 4 8 . 1 1 (40.81 )
638.38 * 568.1 8
196 5-66 319.66 (77.41 ) '
1069.64(83.43)
0.00 • (0.00) _
0.00(o.on)
319,66 . (77.41 )
'. 1069.64 (83.43)
412.96' 1232.04
1970-71 312.93(38.12)
11 70.54 (45.85)
8.85 - ' (1 .08) -
10.08 • - (0.39)
321.78 (39.20)
1180.62(46.24)
820.89 2553.34f
1971-72*
309.48(33.84)
' 1125.88 (42.12)
. 6.42 (0.-70) ’
' 10.47 (0.39)
3 15.90 (34.54)
1 1 36.35(42.51)
914.67 2 6 73. 34
1972-73 36 5.40 (37.46)
1379.41k (40.05)
6.42(0.66)
10.47(0.30)
371,82(38.12)
1389,aa (40.3 5)
975.39 ,. ‘3444.63
1973-74 405*23(39.84)
1546.24 (44.04)
6.34(0.63)
11*16(0.32)
411.62 (40.52)
1557.40• (44.36)
10«1 5.90-- , ■
'♦ 3^11.14
■*.1
Cont *di » . . #

- 167 -
TABLE IV.5 (Cont'd)
N o n - l T t i 1 f t i e s
Se lected industries
Tnstall- . ~ Genera- ed tion
capacity • (<V). nkUh
Railways
Tnstall- Ganera- ed tion,
capacity('nu) ' * NkUh .
Total* __ non-util it i Install-
edcapacity
(MU)
les
Grandtotal
Generation
NkUh
Installedcapacity
(nu)
Generation ' •
MkUh -
1974 -75 435.06( 4 1 . 4 8 )
’ 1554.22 ( 4 2 . 0 8 )
' v * 9 .7 5 ( 0 . 9 3 )
' 11 .29 . ( 0 . 3 0 )
444.81 ( 4 2 . 4 1 ) .
1565.*51 ( 4 2 . 3 8 )
1 Q4'ff. 94«■' • •: 4 } .
3693.69
1975-76 434.52 (41 .51)
* 1585.54 (42.50)
7.87(0.75)
11.81(0.32)
442.39 (4.2 .26 )
1*597’. 35 (42..S2) •
1046.78■'. . 3730.25
1976-77 429.23(37.36)
1617.51(39.40)
8.10(0.70)
9.75 . (0.24;)
437.33(38.06)
1627.26(39.64)
11*48.97 4106.03
1977-7B 438.63 (32.81 )
1604.43(38.17)
8.10(0.60)
8.24(0.20)
446.73 (33.41 )
1612.17(38.37)
1337.00 4202.73
Compoundgrowthrate(1970-71 to I 977-73) per cent per annum 5.62 5.43 ' 1 .90 -1.6 5 5.53 5.38
\ J
5.88 7.31
Mote ;
Source i
1J Inclusive of DVC power houses located in Bihar. 2/ Figures with parantheses ind^.c|jt| parc^n^a^e^
(i) Government of India, Central Electricity Authority, Public Electricity Supply - .All Indja Statistics_- A General Reyiej,/ (Yearly)
i i )* Bihnr^St j j a Els C?t r i c i t y Board, El lei i Roard a -fc a G lanca (. Viiar l v ^ ■ ■ ,

- 158 -
.TABU I \J,6
- Ayer age ate_ jDf_ J)uty per jun_it* of. E nergy
(In paise)- - .......r-— — ~
... Bihar Assam ' Uttar Orissa Madhya Uest.Pradesh pradesh Bengal
— ---------- - -— —-— -— --- —„-- - - w W - m ■»- f
1961-62 0.53 0.63 0.07 1 .74 1.5319-6 5-66 1.75 0.95 0.37 0.90 1 .63 1 .721970-71 -1.78 0.62 0.51 1 .75 1 .68 1 .861971 -72 2.25 0.64 1.02 1 .69 '1 .74 1 .761972-73 2.88 0.56 • 1 .13 1.99 1 .91 2.201 973-?4 ’ * 2.78 0.77 1 .02 2.11 2.02 2.281974-75 2.73 0.96 0.45 2.12 2.70 2.041975-76 2.29 0.96 1 .85 3.21 2.24 2.33197£-77
*1 « * 1
2.17 - Q.96 0.82 3.70 2.14 2.381977-78 1.79 1 .03 0.94 3.74 2.09 3.01
---------- -- ---------------- --------------- ------------------- --------- — -------- --- — ---------------- . . . i i ■ . n. . ~ »~wmm
Source : (i) Government of India, Central Electricity'-Authorityj Public E_lectricity Supply —All India Statistics - General revieu (yearly)
. (ii) State government budgets

- 169 -
TABLE IV. 7
Energy Sales to Cateqory-Uise Co nsumers in Bihar^-^
196.1-62 to 1977-78 • *
- Total energy, sold
Domestic Comm&r- Industr- Industrial cial ial pouer pouer
(lou med— (high v/ol- ium vbl— tage) tage) -
Public' Traction’ light- ,' ing -
(in PTega U )
Agricul- Public Misce*ture uater uor- llane*
ks and se- ous uage pum- "
ping
1961-62 971 .69 47.49(4*89)
25.47(2.62)
55.72(5.73)
746.17(76.79)
3.98(0L.4Q)
61.60x (6.34)
1 8 . 46 (1.90)
12.79(1 .3 3 )
0.00
1962-63 1279.86: 58.71(4.59)
40.61(3.17)
76.45(5.97)
927.39(72.46)
4.73x(0.38)
130.84 . (10.22)
19.99 (1 • 56 )
21 .1 5 (1.65)
0.00
1963-64 1628.16 60.78(3.98)
45.52(2.98)
86.68(5.67)
1133.18(74.15)
4.91(0.32)
• 153.65 • (10. 06)
19.45(1.27)
23.99(1.57)
0.00
1 964-6 5 • /
1742.89 66.22(3.80)
50.21(2.88)
93.26 (5.3 5)
1212.18 ; (69.5-5)
4*92<0*28)
268.05(15.38)
22.35(1.28)
25.69(1.48)
0.00
196 5-66 1932.55 61.09(3.16)
69.35(3.59)
100.42(5.20)
1396.83 (72.28)
4*80(0.25)
343.09(17.75)
29.33(1 .5 2 )
27.64 (1.43 )
0.00
1966-67 2121*89 64.64(3.05)
84.61(3.99)
106.55(5.02)
1393.52(65.67)
4.87(0.23)
388.41 (18.30)
49.25(2.32)
30. 03 (1*42)
0.00
1967-68 2195.40 71 .30 (3.25)
82.50(3.76)
126.43(5.76)
1459.93(66.50)
4.91(0.22)
349.99 ' (1 5.94)
61.05(2.78)
31.80 (1.45)
7.49(0.34)

19
69
-69
19
69
-7
0
19
70
-7
1
19
71
-7
2
19
72
-7
3
19
73
-7
4
19
74
-7
5
19
75
-7
6
To
tal
en
erg
y
so
ld
23
69
.94
25
03
.54
25
85
.27
27
49
.04
«
27
03
.85
26
36
.26
(4.1
1.)
28
31
.17
37
64
.64
-1
—»
--- -
17
0-
TAB
LEIV
.?
(Co
nt'
d)
Do
mesti
cC
om
mer-
In
du
str
ial
In
du
str
ial
Pu
bli
cT
ra-
cia
lp
ou
er(
lou
po
uer
(hiQ
hli
gh
t-cti
on
med
ium
vo
ltag
e)
ing
vo
ltag
e)
73
.92
(3.3
3)
86
.27
(3.4
5)
91
.36
(3.5
3)
97
.33
(3.5
4)
10
3.8
5
(3.8
3)
11
0.5
5(4
.11
),
11
3..
52
(3.9
4)
12
9.7
3(3
.45
)
88
.96
(3.7
5)
98
.50
(3.9
3)
96
.27
(3.7
2)
97
.45
(3.5
4)
11
1.2
3(4
.11
)
11
7.1
3
(4
-36
)
10
6.0
9(3
.S8
)
11
3.7
9(3
.02
)
13
2.5
V(
5.5
9)
13
8.9
4(5
.55
)
15
4.
89
•(5
.99
)
16
6.7
8
.(6
.06
)
17
3.2
3(6
.39
)
41
6.7
4
(15
.51
)
19
5.2
8(6
.78
)
22
1.7
9"
(5.8
9)
15
75
.41
(66
.47
)
16
55
.81
(66
.14
)
17
53
.75
(67
.84
)'
19
07
.07
(69
.37
)
18
26
.85
(67
.44
)
15
89
.36
(59
.17
)
19
93
.27
(69
.18
)
23
75
.69
(63
.13
)
5.0
4
(-0
.21
)
5.4
0
(0.2
2)
5.3
4
(0.2
1)
5.8
0
(0.2
1)
6.3
0
(0.2
3)
6.4
5
(0.2
4)
5.8
7
(0.2
9)
5.9
9
(0.1
6)
38
2.4
1•
(16
.19
)
40
6.6
1(1
6.2
4)
37
1.0
8(1
4.3
5)
37
2.9
7
(13
.57
)
36
4.1
9(1
3.4
5)
32
2.3
7
(12
.01
)
34
0.0
0(1
1.8
0)
39
8.8
3
(10
.59
)
Ag
ricu
ltu
re
67
.88
(2.8
6.)
71
.39
(2.8
5)
69
.13
(2.6
7)
56
.00
(2.0
5)
75
.03
(2.7
7)
73
.81
(2.7
5)
"7
5.1
3(2
.62
)
45
4.1
6~
'(1
2.0
6)
J?
—-
Pu
bli
cM
isce'
uater
uo
r-
llan
e'
ks
sew
ag
eo
us
pu
mp
ing
31
.3
8
(1.3
2)
32
.53
(1.3
0)
7.4
3(0
.32
)
8.0
9
(0.3
2)
34
.96
8.4
9
(1.3
5)
(0.3
4)
37
.29
8.3
5(1
.36
)'
(0.3
0)
40
.65
(1.5
0)
7.4
7(0
.28
)
42
.05
7.8
0
(1.5
6)
(0.2
9)
40
.93
(1.4
2)
11
.06
(0.3
8)
51
.96
11
.70
0.3
8")
(0.3
2)
_-..
.{C
on
t'd
..)

171 -
TABLE IV.? (Cont’d)
Total Domestic energy
sold
Commerci- Industr- Industr- Public Tra-al ial pouer ial pouer. light- ption
(lou medi- (high * ■••"ing um voltage) voltage) '
1976 -77 4095.31 ' 145.56 113.19( 3 . 5 5 ) ' ( 2 . 7 6 )
1977—78 4209.51 ' 168 .47 ' 329.02' ( 4 . 0 0 ) . . ( 3 . 0 6 ) .
Agricul- Public ua- Miscell- ture ter works aneous
•and seuage • ,/pumping
247.21( 6 . 0 4 )
2674 .54 (65 .3 1 )
305 .70 2790.16( 7 . 2 6 ) . ( 6 6 . 2 8 )
5 .58(0.14)
399.54 ' ( 9 . 7 6 )
5.11 428.01(0.1 2 ). (10.1 7 )
2 /449 .37— 48.83(1 0 .9 7 ) . ( 1 . 1 9 )
299.08 50.98( 7 . 1 0 ) - ( -1 .23 )
11 .49 ( 0 . 2 8 )
32 .98( 0 . 7 8 )
Notes* - 2./ Sales by .the Bihar State Electricity Board, Government department•”* 'and the private sector. ..... _,..; : : x . . •
_2/ Includes consumption by the agricultural processing industries also
Figures in parentheses are percentages of the total.
Sources Same as for Table I V . 5 ,

- ]72 -
TABLE I’J.8
State-Uise Electricity Tariff and Electricity Duty
(1979)(in paise per unit)
Domestic lights and Commercial liqhts and Agriculture 10 HP Small industry Large industryState fans 30 kUh/month fans_50 kUh/month
TTate .'TJuCy Total Rate Duty Total Rate ~ Duty ToEal Rate Duty Total Hate ----BUffy ToiTal
AndhraPradesh 43.00- . : - . 43.00 84.00 84.00 17*22 - «• - 17.22 39.00 39.00 34.77 mm ' 34.77Assam 48.00 3.00 51.00 60*00 3.00 63.00 18.00
5.1 5^/
3.00 21.00 25.00 2.00 27.00 24 . 70“ 0.19 24 .89Bihar 46.00 7.00 53.00 66.00 7.00 73.00 2.00 7.15 3 6 . 0 0 ^ 2.00 38.00 36.1 2.00 38.1 5Gu jareft 35.47 6.69 *’'42.16 36.63 8.66 45.29 23.94 1.20 25.14 30.08 0.84 30.92 29.66 4.15 33.81Kerala 38.33 2.50 40.83 38.00 3.80 41 .80 11*22 M.12 12.34 1 5.00 1 .50 16.50 16.23 3.87 20.1 0
PladhyaPradesh 32.50 6.50 39.00 47.00 8.00 55.00 22.12“ «. 22.12
*
27.00 1 .50 23.50 21 .02“ 3.00 24 .82T amil Nadu 38.00 - 38.10 73.00 73.00 14-61 14.61 73.00 mm 73.00 31 .06 3.09 34.15
Mahar a— shtra 33*25 5.00 38.25 42.25 15.00 57.25 1 2.75 *» '■ 12.75 27*25 1 .00
•28.25 18.41-^ 3.50 21 .91
Karnataka 45.00 4*50 49.50 62.00 4.50 66.50 21.51
1 s . o o ^
1.00 22.51 27.51
2 2 . 0 0 ^
4.50 31 .02 20.09 2.25 22.34Orissa 32.00 5.25 37.25 44.50 7.12 51.62 2.50 17.50 3.40 25.40 20.50 7i07 27.57
Punj ab 31.62 10.25 41.87 46.00 8.80 54.80 1 5.30 - 1 5.30 21 .27 4.26 25.53 1 7.84 4.46 22*30
Haryana 29.75 10.25 40.00 40.00 11 .00 51.00 22.45 - 23.45 24.00 .3.60 27.60 21 .16
26 .09!^
6.35 27.51
Raj asthan o 3. 00 6.00 44.00 55.00 6'. 00 61 .00 21 .00 - 21.00 25.00 2.00 27.00 2.00 28.09
UttarPradesh 45.00 2.00 47.00 120.00 2.00 122.00 14.69 _ _ 14.69 35.00 1 .00 36.00 36.38 1 .00 37.38
UestBengal 48.00
!
3.00 51 .00 60.00 3.00 63.00 35.00 6.00 41 *00 37.00 0.33 37.33 26.14-/
Cdnt *d.
1 .50
-)■*
27.64
' I

TABLE IV *8 (Cont'd)
. V (in paisa per unit)
Domestic lights and Commercial lights and Agriculture 10HP Small industry Large industryfans 30 kUh/month fans 50 kUh/month - . •
Hate Duty Total Raite Duty total Rate Duty total Rate Duty Total Rate Duty Total
Himach.alPradesh 37.50 1.50 39.00 48.00 2.00 50.00 ' 9.00 1 .98
'r'10.98 21.84 4.00 25>.84 1*9; 77 " 4.00 23.71
Oammu- and .. Kashmir 28.00 3*08 31 .08 38.00 3.88 41 .88 1 0.00 4- ;1 . 50 *11 . 50 1*8.00 2.78 20.78 16.0b 2.40 18.40
Notes : j / Excluding fuel surcharge
2/ For 9 •months only* “ r '
XSource : Government of India, Central. Electricity Authority (1979), Average-Electric Rates and
Duties in India. Delhi*

- 174 -
TABLE IV.9
Average Cost _of Pouer per Unit Produced Under Various
Systems of Pouer Generaction in Bihar
(in paise)
Year Steam Diesel Hydel
1971-72 8.93 113.34 8.35
1972-73 9.56 213.53 97.06
1973-74. 12.58 138.10 94.47
1974-75 15.42 211.90 90.65
1975-76 16.43 235.50 62.52
1976-77 14.93 233.39 61.83
1 /1-977-78 - 16.23 299.45. 78.SCK-'
1979-79 21.64 887.50 53 . e W
1 / Uith respect to Kosi project alone
Source J Government of Bihar (1978), Materials on• subsidiary points presented to the F inance
'Cornmissi o n Tinance Department, P’atna’.
kra

- 175 -
TABLE, IV. 10
Capacity .and £e nerjation • i
Ind,us t,r i,c?s ArtAiJiarJLlAZS ‘
t it ■%■ » wr Mr • »- m- w m -m*. % • * -m. * -*mr '« r « T « M |
Ins tail Installed Genera Generaed capa capacity tion tion
/
city (per cent) (nkuh) (per ce
Aluminium 4000 0.91 21 .843 1 .36
Cement (primary) • 32144 7.33 11.9.61 9^ ; 7.46
Collieries _ .. . 1 5000 • 3.42 43.597 3.03
Zngihe’ering (elec) 1 000 , , 0.23 0.160 Meg
Fertilizer?
31780 18.64 268.437 .16.73
Heavy engineering - 7 50 0.17 -
Iron and steel (primary) 245000 * 55.86 1000.71 8 62.39
Iron and stael (Secondary) 600 . 0.14 0.14 ' -
3ute 1 500 0.34 6.470 0.40
fineral; oil and petroleum 24000 5.47 107.886 6.72
Mining and quarrying 1 50 0.03 0.037 Meg
Non-ferrous • 9350 2.25 9.970 0.62
Sugar 21971 5.01 20.248 1.26
Miscellaneous 075 0.20 0.449 0.03
TOTAL 433628 100.00 1604.434 100.00
» -m- a -m- W, J L M w, . IL J. rrr-ur -*>: mmw m. f « -wt ~m-- j* - * -j r - tmr-tr
Source J Government of India, Central Electricity Authority, (l977-78;, jj®nej^l J ev ie u Public Electr icity Supply - All Jlnjiia ^Statistics •
krs •

Rates of Duty for Self-Generatorl Electricity in Different States
- 176 -
T AB LE IV/ • 1 1
State Rate
Assam
Gujarat
Dammu & Kashmir
Karnsitaka
Kerala
Punjab
R ajasthan
T amil Nadu ■1/
3 paise per unit
Domest ic Consumption
in rural area in urban area
5 paise per unitupto 20 units - 6 paise per unit next 30 units -10 paise per unit excess of 50 - 15 paise per unit
units
Industrial Consumption
7 paise per unit
Cinema house/theati
10 paise per unit
UttarPradesh
l/ Energy
Sourcai Gov Lev
4 paise per unit •
2*25 paise per unit
1«20 paise per unit
1 *25 paise per unit
2*00 paise per unit -
High Tension Supply Lou Tension Supply
Textile industry: 30 per cent of the price of energy Domestic consumption J 10 per cent on the price ofCement industry 5 15 per cent of the price of energy energyEnergy intensive I 10 per cent of the price of energy Non-domestic consumption! 20 per cent on the price of
' units' energyOther industry 1 35 per cent of the price of energy Public lighting • 20 per cent on the price of
energy
1 paise per unit
generated from captive generating sets using diesel oil is exempted from duty u*e»f» 1»3»1977
srnmont of India, Central Electricity Authority, (December 1979), Electricity Duty Tax'■db;'2, .P!1. ; o "’le and Consumption of Electricity in various of_ Tndia*

Stats
Bihar
Assam
Madhya
TABLE-IV. 12
£*grcgtions .from the Levy of Electricity Duty
Exempted categories of electricity consumption
i) Electricity consumed by Public Uorks Department for lift irrigation,
ii) Any local authority for lighting of public streets, and
iii) Sale for consumption of electricity iniron and steel industry, electro-chemical or electro-metallurgical industry for a period of five years from the date of commencement of production.
i) 0n that part of electrical energy used by industrial concerns in Assam exclusively for industrial production uhich exceeds40,000 units, ;
ii) Electrical 'energy used by vessels (sea-going or inland) ,. and
iii) Electrical energy used for agricultural or horticultural purposes.
Pradesh Energy sold or supplied or consumed by
i) State government,
ii) Agriculture pumping and other operations,
iii) Pouer house anxilieries, and
iv) In excess of 1.5 paise per unit of electrical energy sold by any distributors of electrical energy or producers in respect of the electrical energy sold or supplied to the following consumers: a) small scale industries registered uith the State Industries Department, b) mini steel plants, c) electrode units, d) caustic soda units, o) steel casting units, f) oxygien-nitrogen industries, g) ferrous and non-ferrous alloy units, and h) calcium carbide units.
Contd.....2

- 178 —
TABLE IV. 12 (Contd, * .2)
State
Orissa
Uttar Pra.desh
Uest Bengal
Exempted categories of electricity consumption
Energy consumed by, State government.
or sold to, the
ii)
i)
ii)
iii)
iv)
Energy sold to/consumed by the State government,
Energy consumed by a cultivator in agricultural operations carried on in or near his fields such as for the pumping of water for irrigation, crushing, milling or treating of produce of those fields or chaff cutting,
Energy consumed by any person from his own source of generation installed after Oanuary 2, 1973, and
Energy sold to s.consumer establishing a factory having a capital investment upto Rs 25 lakh in the 36 backward district of the State.
ii)
iii)
iv)
v)
Energy sold to/consumed by
i) State government,
Places of public workship, public burial or burning ground or other-places for disposal of the dead,
Premises declared by the State government to be used exclusively for purposes of public charity,
Any consumer using not more than 25 kUh/ month, and
Local authorities like Municipalities and Corporations.
IGovernment of India, Central Electricity Authority, (19 79). Schedules of Electricity Duty' Tax Leviable on Gen eration. Sale _ and Consumption of Electricity in Various States of India.
Materials on Subsidiary Points submitted to the * Seventh Finance Commission by Stats governments,
' ' K,

TABLE IV. 1 3
- 179 -
Collection of Electricity Duty in Bihar i Applying All-India Transmission.
' Distribution and Unaccounted Losses
Year. Electricity available for sale
(MkUh )
Line loss3*^
(NkUh) (
Line loss Line loss All-India if All-
India percentage is applied
in percent)(in percent)
Difference betueen 2 and 4
( i m m )
Possible— ^collectionof elect-ricy duty
(Rs. lakh )
Possible ection of ctricity as a per of total ection
coll- e le -
duty cent coll-
1971-72 2496.48 610.35 1 8.75 •' 468.09 142.26 32.01 5.18 rA’'::'■
i972-^3 2806.29 970.40 • 19 <►94 . 559.57 310.83 89.52 11 *46
1973-74 2685.90 733.52 20.46 549.54 183.98 ' 51 .15 " 6.85
1974-75 3279.85 829.1.8;,.;-- _ 20.43 671 .71 157.47 42.99 5.46
1975-76 3791.98 926.18 19.42 736.40 189.78 43.46 5.04
1976-77 3967.95 "939 .69 1 9.29 785.26 154.43 33.51 3.78
1977-78 . 3929.16 952.48 • 19.26 756.76 195.72 35.03 4.65
r — w - . - - «r "».■ m - - - m — — — ■ -
Source : 1. Bihar State Electricity Board (1978-79), Electricity Board At A Glance.
2. Government of India,- Central Electricity Authority, (1977-78), General F^evieu - Public Electricity Supply - All India Statistics. —
krs •

- 180 -TABLE IV. 14
Cbllection o f E le c tr ic ity Duty in Bihar Applying A ll-In d ia U tilisa tio n o f In s ta lled Capacity > *
In sta lled Capacity (in MW)
Generation o f E lec tr ic ity ( Mkwh)
Hydel ' The rmal Diesel Ib ta l Hydel Thermal Diesel Tbtal net o faux ilia ryconsumption
19,71-72 9.60 445.00 13.45 . 468.05 2.80 1431.50 3.90 1263.89
1972-73 9.60 545.00 13.45 568.05 4.32 1947.38 1.64 . 1722.00
1973-74'' ~~14.40 545.00 13.45 572.85 4.59 - 1883.29 2.11 1665.30
1974-75 14.40 •. 558.50 12.78 585.68 6.31 2104.30 1.10 1852.11
1975-76 14.40 572.50 16.63 v603 . 53 8.08 2115.55 1.19 1831.35
1976-77 14.40 572.50 16.21 603.11 . 12.21 2452.3 5 1.00 2102.36
1977-78 79.40 682.50 13.58 775.48 42.62 2535.25 0. 57 . 2220.66
Contd........./ -

Co Hellion of Electricity Duty jn Bihar : Applying All-India
Utilisation of Installed Capacity
«» 3TABLET IV.-,4 (Contd.)
*
All India sat ion
capacity utili- A.in precenf)
Potential generation of electricity (MkUh)
Liifp less (in perce
Difference nt)betueen
actual & potent ial gener at i- on net of lime less
Possible collecti-
£« _ r_
Poss ible collec-
Years
Hyde 1 Thermal D iese1 .ydel Thermal Diesel T ot a-1(Potential)
on of ele' ctr ic ity duty
— t io n of ele- ctricity duty as percent of
(Mkyh) (Rs lakh)total
1971-72 48.39 45.61 5.60 40. 54 1617.78 6.32 1664.64 24.45 302.77 68.12 11 .02
1972-73 45.76 48.01 7.17 38.34 2087.64 8.07 2134.05 31.02 284.23 81.86 10.47
1973-74 47.48 45.99 . 5.90 59.66 1990.36 6.57 2056.59 27.31 284.43 79.07 10.59
1974-75 42.26 46.28 6.03 53.05 2048.45 6.48 2107.98 25.28 191.19 52.19 6.63
*n75-76 44.92 46 .1 4 3.01 56.38 2088.59 4.23 2149.20 24.42 240.23 55.01 6.38
1976-77 44.07 49.67 3.26 55.38 2245.89 4 .40 2305.67 23.68 155.17 33.67 4.00
1977-78 43.30 45.51 4.50 299.84 2439.02 5.14 2744.00 24.24 396.48 70.97 9.42
Source: Same as for Table III•13•
^CT/ramesh