relitti_phd_finale.pdf - arts
TRANSCRIPT
Contents ABSTRACT ........................................................................................................................................ 1
RIASSUNTO ...................................................................................................................................... 2
CHAPTER 1 – Introduction ............................................................................................................. 3
1. Introduction.................................................................................................................................... 3
1.1 Anthropogenic impacts in marine coastal areas ..................................................................... 3
1.2 Global anthropogenic impact on carbon cycle ...................................................................... 4
1.3 Ocean carbon sequestration and relevance of organic matter ............................................... 6
2. Objectives and dissertation structure ............................................................................................. 8
References........................................................................................................................................ 10
CHAPTER 2 – Oxygen, carbon, and nutrient exchanges at the sediment–water interface in
the Mar Piccolo of Taranto (Ionian Sea, southern Italy) ............................................................. 14
Abstract ............................................................................................................................................ 15
1. Introduction.................................................................................................................................. 15
2. Methods ....................................................................................................................................... 16
2.1 Study area ............................................................................................................................. 16
2.2 Sediment sampling and porewater collection ....................................................................... 16
2.3 Diffusive fluxes .................................................................................................................... 17
2.4 Benthic flux chamber experiments ....................................................................................... 18
2.5 Analyses................................................................................................................................ 18
3. Results and discussions ............................................................................................................... 19
3.1 Sediment biogeochemistry ................................................................................................... 19
3.2 Porewater chemistry ............................................................................................................. 22
3.3 Diffusive fluxes .................................................................................................................... 24
3.4 Concentration variations in benthic chambers ...................................................................... 25
3.5 In situ benthic fluxes............................................................................................................. 27
4. Summary and conclusion ............................................................................................................. 27
References........................................................................................................................................ 28
CHAPTER 3 – Recent evolution of the physical-chemical characteristics of a Site of National
Interest – the Mar Piccolo of Taranto (Ionian Sea) – and changes over the last 20 years ........ 31
Abstract ............................................................................................................................................ 32
1. Introduction.................................................................................................................................. 32
2. Materials and methods ................................................................................................................. 33
2.1 Study site .............................................................................................................................. 33
2.2 Sampling strategy and analysis ............................................................................................. 34
2.3 Historical datasets (1991–2009) ........................................................................................... 35
2.4 Data elaboration and statistical analyses .............................................................................. 36
3. Results ......................................................................................................................................... 36
3.1 Hydrology ............................................................................................................................. 36
3.2 Biogeochemical properties of the water column .................................................................. 37
4. Discussion .................................................................................................................................... 42
4.1 Spatial and temporal variability of hydrological and biogeochemical characteristics in the
years 2013–2014 ......................................................................................................................... 43
4.2 Comparison of the present situation with the former dataset ............................................... 44
5. Conclusions ................................................................................................................................. 45
References........................................................................................................................................ 45
CHAPTER 4 – Stable carbon isotopes in phytoplankton as a tool to monitor CO2 leakages at
Carbon Capture and Storage sites ................................................................................................. 48
Abstract ............................................................................................................................................ 49
1. Introduction.................................................................................................................................. 49
2. Materials and methods ................................................................................................................. 51
2.1 Experimental setup ............................................................................................................... 51
2.2 Sampling and analyses of carbonate system ......................................................................... 53
2.3 Sampling and analysis of stable isotope of carbon ............................................................... 55
2.4 Calculation of carbonate system parameters and isotopic fractionation .............................. 56
2.5 Statistical analysis................................................................................................................. 56
3. Results ......................................................................................................................................... 57
3.1 Biotic and abiotic parameters ............................................................................................... 57
3.2 Isotope analysis..................................................................................................................... 62
4. Discussion .................................................................................................................................... 65
4.1 Phytoplankton growth and carbon stable isotopes ............................................................... 65
4.2 Carbon isotope fractionation of Thalassiosira rotula........................................................... 69
5. Conclusions ................................................................................................................................. 72
References .......................................................................................................................................... 73
CHAPTER 5 – Assessment of biodegradable dissolved organic matter (BDOM) and nutrients
utilization in coastal seawater using a plug-flow bioreactor ........................................................ 78
Abstract ............................................................................................................................................ 79
1. Introduction.................................................................................................................................. 79
2. Materials and methods ................................................................................................................. 82
2.1 Study area ............................................................................................................................. 82
2.2 Sample collection and station localisation............................................................................ 83
2.3 Experimental design ............................................................................................................. 84
2.4 Analysis ................................................................................................................................ 86
2.5 Statistical analysis................................................................................................................. 87
3. Results ......................................................................................................................................... 87
3.1 Winter experiments (WIN) ................................................................................................... 87
3.2 Summer experiments (SUM) ................................................................................................ 89
4. Discussion .................................................................................................................................... 93
5. Conclusions and experimental set-up criticism ........................................................................... 98
References .......................................................................................................................................... 99
Acknowledgments .......................................................................................................................... 103
1
ABSTRACT
During the past two centuries, human activities have greatly modified the exchange of carbon and
nutrients between land, atmosphere, freshwater bodies, coastal zones and open ocean. This PhD thesis
focuses on different aspects of carbon cycle, considering three case study for the evaluation of the
effects of anthropogenic pressure and of the natural evolution of carbon cycle.
The first case study focuses on anthropogenic impacts on contaminated coastal areas. These
environments connect terrestrial and oceanic systems, and are highly subjected to anthropogenic
pressure. An example of a contaminated coastal area is the Mar Piccolo of Taranto (Ionian Sea) and
the results of two published papers are reported. The evaluation of nutrients and carbon fluxes at
sediment-water interface showed that the multi-contamination of both inorganic and organic
pollutants in the sediments is potentially transferable to the water column and to the aquatic trophic
chain. On the other hand, the analysis of a long time series of chemical-physical characteristics of the
water column has highlighted that the implementation of sewage treatment plants has positively
affected the trophic status of the Mar Piccolo from being relatively eutrophic to moderately
oligotrophic.
The increase of atmospheric CO2 concentration has been recognised as one of the main causes of
climate change, and carbon capture and storage technology (CCS) is expected to play a key role
among mitigation strategies by reducing CO2 emissions into atmosphere from fossil fuel combustion.
Although leakages from storage sites are not expected, the environmental impacts related to potential
CO2 seepages are a major issue for the acceptance of this approach. The second case study here
presented aims to the evaluation of phytoplankton stable carbon isotopes as a tool for effective early
warning of CO2 leakage from CCS, since different carbon sources have specific δ13C values. Two
culture experiments were conducted under controlled conditions for monitoring δ13C changes in the
diatom Thalassiosira rotula. The isotopic composition of microalgae grown in natural seawater
(NAT) was compared to that of diatoms grown in an artificial seawater (ASW) characterised by
strongly 13C-depleted dissolved inorganic carbon values. The uptake of inorganic carbon in ASW
resulted in a rapid and significant change in microalgae δ13C values, whereas in NAT phytoplankton
δ13C did not show important deviations from the starting value, confirming the effectiveness of
phytoplankton δ13C as a tool for detecting different CO2 sources.
The third case study aims at a better understanding of carbon cycle, as the rate of changes not only
depends on human activities, but also on natural biogeochemical processes. Marine dissolved organic
matter plays a crucial role in oceanic carbon storage, and the extent of its contribution on carbon
sequestration depends on its bioavailability. In this study, a plug-flow bioreactor approach has been
tested in order to evaluate dissolved organic carbon (DOC), nitrogen (DON) and phosphorus (DOP)
availability for microbial community in the Gulf of Trieste (Northern Adriatic Sea) and the parallel
nutrient uptake. The bioreactor approach confirmed to be useful for bioavailable DOC assessment,
but further research is needed for confirming its effectiveness for defining DON and DOP
bioavailability and nutrients utilisation.
2
RIASSUNTO
A partire dalla rivoluzione industriale, le attività umane hanno profondamente alterato i naturali
scambi di carbonio e nutrienti tra i comparti ambientali. I tre casi studio riportati in questa tesi di
dottorato hanno come obiettivo l’approfondimento di diversi aspetti del ciclo del carbonio, al fine di
valutarne la naturale evoluzione e gli effetti dell’impatto antropico.
Il primo caso studio è inerente alla valutazione degli impatti antropici in aree costiere. Tali aree
costituiscono zone di transizione tra ambiente terrestre e marino, e sono soggette a una forte pressione
antropica. Si riportano i risultati pubblicati in due articoli di ricerca relativi a indagini svolte nell’area
costiera contaminata del Mar Piccolo di Taranto (Mar Ionio). L’analisi dei flussi di carbonio e
nutrienti all’interfaccia acqua-sedimento ha evidenziato che la contaminazione dei sedimenti da parte
di composti sia organici che inorganici è potenzialmente trasferibile alla colonna d’acqua e alla catena
trofica. Tuttavia, l’analisi della serie storica dei parametri chimico-fisici della colonna d’acqua ha
evidenziato l’efficacia dei trattamenti di purificazione delle acque reflue. Lo stato trofico del Mar
Piccolo è infatti passato da una condizione relativamente eutrofica a una moderatamente oligotrofica.
L’aumento della concentrazione di CO2 in atmosfera è stato riconosciuto come una delle principali
cause del cambiamento climatico, e le tecniche di confinamento geologico di CO2 (CCS) rientrano
tra le più promettenti strategie per ridurne le emissioni in atmosfera. Tuttavia, sebbene un’adeguata
progettazione di tali siti di stoccaggio non preveda rilascio di CO2, eventuali fuoriuscite potrebbero
avere importanti ripercussioni ambientali. Dal momento che diverse fonti di CO2 hanno una differente
composizione isotopica, il secondo caso studio si propone di valutare se il δ13C del fitoplancton possa
costituire uno strumento utile all’identificazione precoce di fuoriuscite di CO2 da CCS. La
composizione isotopica della diatomea Thalassiosira rotula è stata determinata in due diversi mezzi
di coltura tramite due esperimenti in condizioni controllate. I valori di δ13C delle microalghe cresciute
in acqua naturale (NAT) sono stati confrontati con quelli delle diatomee cresciute in acqua artificiale
(ASW), caratterizzata da valori di carbonio inorganico disciolto fortemente impoveriti in 13C.
L’utilizzo del carbonio inorganico in ASW è risultato in un rapido e significativo cambiamento dei
valori di δ13C, confermando l’efficacia dell’analisi della composizione isotopica del fitoplancton
come strumento utile a identificare diverse fonti di CO2.
Obiettivo del terzo caso studio è l’approfondimento delle conoscenze del ciclo del carbonio, in quanto
le variazioni a cui questo è soggetto non dipendono solo dall’impatto antropico ma anche dai naturali
processi biogeochimici. La sostanza organica disciolta (DOM) ricopre un ruolo chiave nel sequestro
oceanico del carbonio. L’efficacia del sequestro all’interno del pool di DOM è funzione della
biodisponibilità della sostanza organica. Nello studio presentato, la biodisponibilità di DOM per la
comunità microbica nel Golfo di Trieste (Nord Adriatico) è stata analizzata tramite un bioreattore a
flusso controllato, valutando la degradazione di carbonio (DOC), azoto (DON) e fosforo (DOP)
organici disciolti e l’utilizzo di nutrienti. Il bioreattore è risultato idoneo per la valutazione della
biodisponibilità del DOC. Tuttavia, sono necessari ulteriori approfondimenti per stabilirne l’efficacia
anche nella stima della biodisponibilità di DON e DOP e dell’utilizzo di nutrienti.
3
CHAPTER 1
1. Introduction
During the past two centuries, human activities have greatly modified the exchange of carbon and
nutrients between land, atmosphere, freshwater bodies, coastal zones and open ocean (Regnier et al.
2013). Industrialisation, energy production, land use change, population growth, pollution and
production of new materials have resulted in strong and often irreversible alterations of natural
element cycling. The rapid and widespread changes due to human perturbations will persist and
intensify in the future, and have already been sufficient to produce a stratigraphic signature in
sediments and ice, distinct from that of the Holocene epoch, that has suggested the definition of a
new epoch, the Anthropocene (Waters et al. 2016).
Human activities have considerably altered the global carbon cycle, especially by significantly
increasing carbon dioxide concentration (CO2) in atmosphere (Sarmiento & Gruber 2002). Oceans
play a key role in the global carbon budget in the regulation of atmospheric CO2 concentration, but
the responses to human perturbations in a long-time scale are not already fully understood (Libes
2009). Given the present trends, atmospheric CO2 concentration seems destined to increase
throughout the next century (Falkowski et al. 2000). The understanding of the consequences of human
pressure in the alteration of carbon cycle is critical for establishing effective policies for the
prevention of ecosystem damages and for the establishment of recovery actions. Changes in carbon
cycle are not only completely depending on anthropogenic pressure, but also on natural
biogeochemical processes (Falkowski et al. 2000). It is however difficult to differentiate between
natural and anthropogenic drivers, especially in coastal environments. Thus, major uncertainties still
remain in our understanding of natural and undisturbed carbon cycle (Bauer et al. 2013), hence the
need of more research effort in this field for predicting, and hopefully mitigating, future impacts of
anthropogenic pressure (Sarmiento & Gruber 2002).
1.1. Anthropogenic impacts in marine coastal areas
Despite occupying only 7-10% of global ocean area, coastal regions are one of the most
biogeochemically active environments in the biosphere and represent a crucial link between land,
open ocean, and atmosphere (Bauer et al. 2013; Gattuso et al. 1998; Borges et al. 2005; Liu et al.
2010). Coastal zones offer a wide variety of valuable habitats and ecosystem services that have always
4
attracted humans and human activities. Today, approximately half of the human population lives
within 200 km from a coastline, and this trend is likely to double by 2025 (Creel 2003). The intensive
concentration of population and excessive exploitation of natural resources determine massive
pressure on coastal ecosystems, leading to biodiversity loss, habitat destruction, pollution,
eutrophication and alteration of natural cycles. One recent estimate found that at least 40% of the
global oceans are heavily affected by human activities (IOC/UNESCO et al. 2011). These changes
are threatening marine ecosystems resilience, and thus its capacity to provide ecosystem services.
Carbon fluxes within and between coastal systems and their alteration by climate and anthropogenic
changes are substantial. It is therefore of primary importance to safeguard coastal ecosystem diversity
and complexity and, on the other hand, there is a urgent need to understand their natural functioning
in order to allow better interpretation of changes and to establish mitigation and preventing strategies
for their protection (Bauer et al. 2013; Falkowski et al. 2000).
One of the worldwide largest issues caused by the increase of anthropogenic inputs is eutrophication,
especially in areas with limited water exchange, as estuaries, salt marshes and lagoons (Kralj et al.
2016 and references therein). Indeed, increased terrestrial export of nutrients and carbon by rivers
due to agricultural activities and land-use change has led to excess primary production and organic
carbon accumulation in estuarine and shelf waters and sediments. The enhanced microbial
degradation activity can lead to a change in sediment status by lowering oxygen levels in bottom
waters, and eventually resulting in anoxic conditions (De Vittor et al. 2012). Many other
biogeochemical cycles are controlled by oxygen, and the change of redox status could enhance release
of contaminants eventually accumulated in sediments because of human activities (e.g., mercury,
iron, sulfur) (Santos-Escheandia et al. 2009; Covelli et al. 2011; Emili et al. 2011; De Vittor et al.
2012). Ecosystem status is hence a balance between respiration of riverine organic matter and in situ
autotrophic production stimulated by nutrient inputs. Anthropogenic nutrient supply could therefore
alter the CO2 sink–source balance of coastal systems (Jiang et al. 2008; Reigner et al. 2013; Gruber
2015) by the shift from net autotrophic to net heterotrophic conditions, with still poorly understood
implication in the global carbon budget (Bauer et al. 2013).
1.2. Global anthropogenic impact on carbon cycle
A valuable indicator of global carbon cycle is represented by atmospheric CO2 concentration, as this
relatively small reservoir acts as a conveyor for the exchange of carbon between terrestrial and marine
ecosystems. Because atmospheric CO2 exchanges rapidly with oceans and terrestrial systems, it is
expected to react sensitively to changes in the global carbon cycle (Sarmiento & Gruber 2006).
5
Biogeochemical analysis of ice cores has allowed the reconstruction of past atmospheric CO2
concentration, revealing oscillations between 180 ppmv and 280 ppmv during the 100,000-year
cycles of glacial-interglacial transitions (Falkowski et al. 2000). Atmospheric CO2 concentration has
increased over 40% since the beginning of industrial revolution, and now exceeds 400 ppmv (407.27
ppmv on 23rd December 2017; see the Keeling Curve at http://keelingcurve.ucsd.edu/). The alteration
of CO2 concentration by human activities has been 10 and possibly 100 times faster than any other
time (Falkowski et al. 2000; Doney & Schimel, 2007), and it is superimposing over natural variations,
resulting in climate changes by enhanced greenhouse effect (IPCC, 2007, 2013; Libes 2009;
Sarmiento & Gruber 2002; Sarmiento & Gruber 2006). Oceans play a key role in regulating
atmospheric CO2 concentrations and currently take up about 25% of annual anthropogenic carbon
emissions to the atmosphere (Heinze et al. 2015, Le Quéré et al. 2014; Le Quéré et al. 2009, 2010;
McKinley et al. 2011). Since the beginning of the 19th century, the oceans are estimated to have taken
up about 50% of fossil fuel emissions and about 30% of anthropogenic emissions, thus significantly
reducing the accumulation of atmospheric CO2 (Jiao et al. 2015). This effect mitigates human-driven
climate change but, on the other hand, oceans are experiencing significant variations. The increase in
atmospheric temperature has increased heat transfer towards oceans, leading to stronger thermal
stratification, and contributing to the global sea level rise because of ice melting (IPCC, 2013).
Moreover, higher sea temperatures have the potential to produce more intense storms and to increase
evaporation that could even lead to alteration in the global water circulation (Libes 2009). Increasing
concentrations of atmospheric CO2 have also influenced the chemistry of ocean waters, leading to a
growing inventory of inorganic carbon. Indeed, when CO2 dissolves in seawater it reacts forming
carbonic acid (H2CO3), a weak acid that then partially dissociates lowering ocean pH and altering
carbonate chemistry balance. From a mean global pH of about 8.2 at the pre-industrial time, pH has
decreased by about 0.1 (Royal Society, 2005) and with continuing combustion of fossil fuels may fall
another 0.25 units by the end of the century (Orr et al. 2005). Acidification has been recognised as
one of the main problems related to the increase of atmospheric CO2 because of the consequences on
marine organisms. Of particular concern is the impact of acidification on biocalcification and burial
rates of sedimentary carbon (Libes 2009). By now, there is good evidence that corals, gastropods, and
calcifying microalgae will suffer from ocean acidification (Kroeker et al. 2010) because of inhibition
of shell formation. Moreover, lower pH could favour dissolution and desorption of metals that once
mobilized can accumulate in marine organisms inhibiting growth or even causing death. Planktonic
and benthic communities could be altered in composition and metabolic activity (Lichtschlag et al.
2015 and references therein; Noble et al. 2012; Jones et al. 2015), and photosynthetic activity might
be altered by lower pH levels as well (Jones et al. 2015; Tait et al. 2015 and references therein).
6
Although we do not fully understand the global carbon cycle and how it is modified by human
pressure, there is common agreement on the need of limiting CO2 emissions and of establishing
mitigation actions. The only method that can guarantee to mitigate the expected increase in CO2
concentration is the reduction of fossil fuel combustion. Several different methods have been studied
in order to reduce CO2 levels in atmosphere, and, among these, carbon capture and storage technology
(CCS) is one of the most promising mitigation strategies studied so far (De Coninck & Benson 2014;
IPCC 2005) by trapping and storing carbon dioxide either on-shore or off-shore. However, research
is still needed in order to gain deeper insights on the long-term effects of these approaches, especially
because CO2 leakages from storage sites would severely affect the surrounding environment
(Blackford et al. 2015; Jones et al. 2015; Noble et al. 2012).
1.3. Ocean carbon sequestration and relevance of organic matter
Investigation of natural variability might offer new insights into how marine carbon cycle responds
to changes in the Earth climate. Oceans represent the single largest biologically active reservoir in
the global carbon cycle. Total dissolved carbon in oceans is 50 times that of the atmosphere and
therefore it exerts a controlling influence on the other reservoirs (Falkwoski et al. 2000; Libes 2009).
The key role of oceans in global carbon cycle is driven by two independent processes, the solubility
pump and the biological carbon pump. The solubility pump depends on physical processes associated
with gas solubility and water circulation. As all atmospheric gases, CO2 dissolves in water, and
solubility increases with decreasing seawater temperature. It follows that the cold waters sinking to
depths during deep water formation at high latitudes are CO2-rich relative to average oceanic surface
water. The efficiency of this pump is therefore controlled by oceanic water circulation, the effect of
temperature on solubility and the chemical reactions that CO2 undergoes in seawater. Once CO2
dissolves in water, it forms a weak acid that reacts with carbonate and water to form bicarbonate, the
most abundant species among dissolved inorganic carbon (DIC). Ocean buffer capacity therefore
depends on the presence of cations, which in turn is related to the relatively slow weathering of rocks.
The rate of anthropogenic CO2 emissions is significantly greater than the supply of mineral cations,
thus the ability of oceans to absorb CO2 will decrease as CO2 atmospheric concentration increases
(Falkowski et al. 2000) and will be also negatively influenced by water circulation modification due
to global warming. About one-third of the surface-to-depth gradient of dissolved carbon is generated
by solubility pump, and the other two-thirds are related to the biological carbon pump (Passow &
Carlson 2012; Turner 2015). The biological pump is the set of processes by which photosynthetically
produced organic matter in the ocean sinks to depth, and includes the carbonate pump and the soft-
7
tissue pump (Passow & Carlson 2012; Turner 2015). The carbonate pump is associated with the
precipitation of CaCO3 by calcifying plankton (mainly coccolithophores and foraminifera) in surface
water, and the following settling of carbonate particles across the water column, and their burial in
sediments (Volk and Hoffert, 1985). The soft-tissue pump is driven by photosynthetic fixation of CO2
into organic matter, which is exported to deep regions by gravitational sinking of particulate organic
matter (POM) and by mixing and advection of dissolved organic matter (DOM) and zooplankton
migration. During vertical migration, much of POM is remineralized, and the re-solubilised carbon
is removed from interactions with atmosphere until it is trapped below the termocline (i.e. for less
than a thousand of years). Some particles can be buried in sediments and therefore effectively be
removed from atmosphere interactions over much longer time scales. IPCC (2007) stipulated that
long-term sequestration of carbon requires the removal from atmosphere for over 100 years, and this
criterion is generally met after carbon is transported below 1000 m (Primeau 2005). The biological
pump is relatively inefficient as only about 5-25% of primary production is exported from the
euphotic zone (De La Rocha & Passow 2007 and references therein) for a long-term storage. The
majority of primary production is consumed or respired in water column, with approximately 15%
being processed by bacteria and the rest by micro- (30-70%) and meso- (20-35%) zooplankton
(Turner 2015 and references therein). The relevance of microbial processes in the biological pump
has recently prompted the definition of another carbon ocean pump: the microbial carbon pump
(Legendre et al. 2015). Heterotrophic bacteria are the main responsible of degradation of dissolved
organic matter (DOM). Despite dissolved organic carbon (DOC) accounts for about 2% of total
oceanic carbon, it is one of the major active reservoirs of the global carbon cycle as it represents the
largest pool of reduced carbon in ocean (Hansell et al. 2009). Approximately 95% of DOM is not
available as food for many marine organisms, constituting the refractory fraction of DOM (RDOM),
with a turnover time of centuries to millennia (Hansell & Carlson 2015, and references therein).
Spatial and temporal variations in DOM production and removal affect the long-term carbon storage
(Santinelli et al. 2010; Hansell 2013; Hansell & Carlson 2015), RDOM then plays a critical role in
carbon sequestration and changes in its lability could influence the global carbon cycle (Hansell &
Carlson 2015) and the whole marine ecosystem (Santinelli et al. 2013). The origin of RDOM in the
ocean and the processes and mechanisms of its production, utilisation and degradation are still largely
unknown (Legendre et al. 2015), and it is therefore hard to foresee how it would be affected by CO2
increase and related climate change. Biological responses to increasing temperature, ocean
stratification, nutrient availability and ocean acidification are frequently taxa-and ecosystem-specific,
thus the results of synergistic effects are challenging to predict (Passow & Carlson 2012; Turner 2015;
8
Legendre et al. 2015). A better understanding of the efficiency and dynamics of the present biological
pump is therefore critical for predicting future effects of global warming on the ocean.
2. Objectives and dissertation structure
Carbon cycle is driven by complex and dynamic processes involving the whole Earth system. Despite
carbon cycle has been studies for long, still knowledge gaps exist, both on the natural evolution and
in the response to anthropogenic pressure.
This PhD thesis focuses on different aspects of carbon cycle, considering three case study presented
in four research papers:
The first case study aims to define anthropogenic pressure on a contaminated coastal system,
the Mar Piccolo of Taranto (Ionian Sea). The effects of anthropogenic activities in this area
have been investigated in two research papers published in the journal Environmental Science
and Pollution Research.
Carbon and nutrient fluxes at the sediment water interface were evaluated, as these
processes are strongly related to contaminant cycling. Chapter 2 – De Vittor C, Relitti
F, Kralj M, Covelli S, Emili A. Oxygen, carbon, and nutrient exchanges at the
sediment–water interface in the Mar Piccolo of Taranto (Ionian Sea, southern Italy),
doi: 10.1007/s11356-015-4999-0.
The effectiveness of treatment plants and of the relocation of the sewage discharges
was evaluated in order to identify improvement of water quality, as the Mar Piccolo
of Taranto has experienced severe eutrophication events. Chapter 3 – Kralj M, De
Vittor C, Comici C, Relitti F, Auriemma R, Alabiso G, Del Negro P. Recent evolution
of the physical-chemical characteristics of a Site of National Interest – the Mar Piccolo
of Taranto (Ionian Sea) – and changes over the last 20 years, doi: 10.1007/s11356-
015-5198-8.
9
The second case study purpose is the identification of a useful tool for the evaluation of CO2
leakages from carbon storage sites (CCS). In Chapter 4 the results of two diatom culture
experiments are reported with the aim of evaluating changes in phytoplankton isotopic
composition in relation to the uptake of different CO2 source (natural and anthropogenic). The
study has been submitted for publication to Environmental Science and Pollution Research,
and it is still under review. Relitti F, Ogrinc N, Giani M, Cerino F, De Vittor C, Urbini L,
Krajnc B, Del Negro P. Stable carbon isotopes in phytoplankton as a tool to monitor CO2
leakages at Carbon Capture and Storage sites.
The third case study aims to evaluate dissolved organic matter bioavailability in seawater, as
this information would give important insights on long-term carbon storage. Chapter 5
reports the results of different experiments for defining the effectiveness of plug-flow
bioreactors for the assessment of bioavailable dissolved organic carbon, and to verify its
functionality for the evaluation of dissolved organic nitrogen and phosphorus degradation and
inorganic nutrient uptake. A paper describing these results is in preparation for submission.
Relitti F, De Vittor C, Del Negro P. Assessment of biodegradable dissolved organic matter
(BDOM) and nutrients utilization in coastal seawater using a plug-flow bioreactor.
10
References
Bauer JE, Cai WJ, Raymond PA, Bianchi TS, Hopkinson CS, Reigner PAG (2013) The changing
carbon cycle of the coastal ocean. Nature 504:61–70. doi:10.1038/nature12857.
Blackford J, Bull JM, Cevatoglu M, Connelly D, Hauton C, James RH, Lichtschlag A, Stahl H,
Widdicombe S, Wright IC (2015) Marine baseline and monitoring strategies for carbon
dioxide capture and storage (CCS). Int J Greenh Gas Control 38:221–229.
doi:10.1016/j.ijggc.2014.10.004.
Borges AV, Delille B, Frankignoulle M (2005) Budgeting sinks and sources of CO2 in the coastal
ocean: diversity of ecosystems counts. Geophys Res Lett 32:L14601.
Covelli S, Emili A, Acquavita A, Koron N, Faganeli J (2011) Benthic biogeochemical cycling of
mercury in two contaminated northern Adriatic coastal lagoons. Cont Shelf Res 31:1777–
1789.
Creel, L (2003) Ripple effects: population and coastal regions (pp. 1-7). Washington, DC: Population
Reference Bureau.
De Coninck H, Benson SM (2014) Carbon dioxide capture and storage: issues and prospects. Annu
Rev Environ Resour 39:243–270. doi:10.1146/annurev-environ-032112-095222.
De La Rocha C, Passow U (2007) Factors influencing the sinking of POM and the efficiency of the
global carbon pump. Deep Sea Res II 54:639–658.
De Vittor C, Faganeli J, Emili A, Covelli S, Predonzani S, Acquavita A (2012) Benthic fluxes of
oxygen, carbon and nutrients in the Marano and Grado lagoon (Northern Adriatic sea, Italy).
Estuar Coast Shelf Sci 113:57–70.
Doney SC, Schimel DS (2007) Carbon and climate system coupling on timescales from the
Precambrian to the Anthropocene, Annu Rev Environ Resour 32:31–66.
Emili A, Koron N, Covelli S, Faganeli J, Acquavita A, Predonzani S, De Vittor C (2011) Does anoxia
affect mercury cycling at the sediment–water interface in the Gulf of Trieste (northern Adriatic
Sea)? Incubation experiments using benthic flux chambers. Appl Geochem 26:194–204.
Falkowski P, Scholes RJ, Boyle E, Canadell J, Canfield D, Elser J, Gruber N, Hibbard K, Högberg
P, Linder S, Mackenzie FT, Moore III B, Pedersen T, Rosenthal Y, Seitzinger S, Smetacek V,
Steffen W (2000) The global carbon cycle: a test of our knowledge of earth as a system.
Science 290:291–296. doi:10.1126/science.290.5490.291.
Gattuso JP, Frankignoulle M, Wollast R (1998) Carbon and carbonate metabolism in coastal aquatic
ecosystems. Annu Rev Ecol Syst 29:405-434.
Gruber N (2015) Carbon at the coastal interface. Nature 517:148–149.
Hansell DA, Carlson CA, Repeta DJ, Schlitzer R (2009) Dissolved organic matter in the ocean: a
controversy stimulates new insights. Oceanography 22:202–211.
Hansell DA (2013) Recalcitrant Dissolved Organic Carbon Fractions. Annu Rev Mar Sci 5:421–45.
doi:10.1146/annurev-marine-120710-100757.
Hansell DA, Carlson CA (2015) Biogeochemistry of marine dissolved organic matter. 2nd Ed.
Elsevier Science, USA.
Heinze C, Meyer S, Goris N, Anderson L, Steinfeldt R, Chang N, Le Quéré C, Bakker DCE (2015)
The ocean carbon sink – impacts, vulnerabilities and challenges. Earth Syst Dynam 6:327–
358. doi:10.5194/esd-6-327-2015.
IOC/UNESCO, FAO, UNDP (2011) A Blueprint for Ocean and Coastal Sustainability.
11
IPCC (2005) IPCC special report on carbon dioxide capture and storage. Prepared by Working Group
III of the Intergovernmental Panel on Climate Change [Metz B, Davidson O, de Coninck HC,
Loos M, Meyer LA (eds.)]. Cambridge University Press, Cambridge, United Kingdom and
New York, NY, USA.
IPCC (2007) Climate change 2007: the physical science basis. In: Solomon, S., Qin, D., Manning,
M., Chen, Z., Marquis, M., Avery, K.B., Tignor, M., Miller, H.L. (Eds.), Contribution of
Working Group I to the Fourth Assessment Report of the Intergovernmental Panel on Climate
Change. Cambridge University Press, New York, 996 pp.
IPCC (2013) Climate change 2013: the physical science basis. In: Solomon, S., Quin, D., Manning,
M., Chen, Z., Marquis, M., Averyt, K.B., Tignor, M., Miller, H.L. (Eds.), Contribution of
Working Group I to the Fifth Assessment Report of the Intergovernmental Panel on Climate
Change. Cambridge University Press, New York, 1535 pp.
Jiang LQ, Cai WJ, Wanninkhof R, Wang Y, Lüger H (2008) Air–sea CO2 fluxes on the U.S. South
Atlantic Bight: spatial and seasonal variability. J Geophys Res 13:C07019.
Jiao N-Z, Chen D-K, Luo Y-M, Huang X-P, Zhang R, Zhang H-B, Jiang Z-J, Zhang F (2015) Climate
change and anthropogenic impacts on marine ecosystems and countermeasures in China.
Advances in Climate Change Research 6:118–125.
Jones DG, Beaubien SE, Blackford JC, Foekema EM, Lions J, De Vittor C, West JM, Widdicombe
S, Hauton C, Queirós AM (2015) Developments since 2005 in understanding potential
environmental impacts of CO2 leakage from geological storage. Int J Greenh Gas Control
40:350–377. doi:10.1016/j.ijggc.2015.05.032.
Kralj M, De Vittor C, Comici C, Relitti F, Auriemma R, Alabiso G, Del Negro P (2016) Recent
evolution of the physical–chemical characteristics of a Site of National Interest –the Mar
Piccolo of Taranto (Ionian Sea) – and changes over the last 20 years. Environ Sci Pollut Res
Int 23:12675–12690. doi:10.1007/s11356-015-5198-8.
Kroeker KJ, Kordas RL, Crim RN, Singh GG (2010) Meta-analysis reveals negative yet variable
effects of ocean acidification on marine organisms. Ecol Lett 13:1419–1434.
Le Quéré C, Raupach MR, Canadell JG, Marland G, Bopp L, Ciais P, Conway TJ, Doney SC, Feely
RA, Foster P, Friedlingstein P, Gurney K, Houghton RA, House JI, Huntingford C, Levy PE,
Lomas MR, Majkut J, Metzl N, Ometto JP, Peters GP, Prentice IC, Randerson JT, Running
SW, Sarmiento JL, Schuster U, Sitch S, Takahashi T, Viovy N, van der Werf GR, Woodward
FI (2009) Trends in the sources and sinks of carbon dioxide. Nat Geosci 2:831–836.
doi:10.1038/ngeo689.
Le Quéré C, Takahashi T, Buitenhuis ET, Rödenbeck C, Sutherland SC (2010) Impact of climate
change and variability on the global oceanic sink of CO2. Global Biogeochem Cycles
24:GB4007.
Le Quéré C, Moriarty R, Andrew RM, Peters GP, Ciais P, Friedlingstein P, Jones SD, Sitch S, Tans
P, Arneth A, Boden TA, Bopp L, Bozec Y, Canadell JG, Chevallier F, Cosca CE, Harris I,
Hoppema M, Houghton RA, House JI, Jain A, Johannessen T, Kato E, Keeling RF, Kitidis V,
Goldewijk KK, Koven C, Landa CS, Landschützer P, Lenton A, Lima ID, Marland G, Mathis
T, Metzl N, Nojiri Y, Olsen A, Ono T, Peters W, Pfeil B, Poulter B, Raupach MR, Regnier P,
Rödenbeck C, Saito S, Salisbury JE, Schuster U, Schwinger J, Séférian R, Segschneider J,
Steinho T, Stocker BD, Sutton AJ, Takahashi T, Tilbrook B, van der Werf GR, Viovy N,
Wang YP, Wanninkhof R, Wiltshire A, Zeng N (2014) Global carbon budget 2014. Earth Syst
12
Sci Data Discuss 7:521–610. doi: 10.5194/essdd-7-521-2014.
Legendre L, Rivkin RB, Weinbauer MG, Guidi L, Uitz J (2015) The microbial carbon pump concept:
potential biogeochemical significance in the globally changing ocean. Prog Oceanogr
134:432–450. doi:10.1016/j.pocean.2015.01.008.
Libes SM (2009) Introduction to marine biogeochemistry. Academic press, 2nd Ed., 928pp.
Lichtschlag A, James RH, Stahl H, Connelly D (2015) Effect of a controlled sub-seabed release of
CO2 on the biogeochemistry of shallow marine sediments, their pore waters, and the overlying
water column. Int J Greenh Gas Control 38:80–92. doi: 10.1016/j.ijggc.2014.10.008.
Liu K-K, Atkinson L, Quiñones R, Talaue-McManus L (2010) Biogeochemistry of continental
margins in a global context, in: Liu K-K, Atkinson L, Quiñones R, Talaue- McManus L (Eds.),
Carbon and Nutrient Fluxes in Continental Margins: A Global Synthesis IGBP Book Series,
Berlin, Springer, pp. 3–24.
McKinley GA, Fay AR, Takahashi T, Metzl N (2011) Convergence of atmospheric and North
Atlantic carbon dioxide trends on multidecadal timescales, Nat Geosci 4:606–610.
doi:10.1038/Ngeo1193.
Noble RRP, Stalker L, Wakelin SA, Pejcic B, Leybourne MI, Hortle AL, Michael K (2012) Biological
monitoring for carbon capture and storage – A review and potential future developments. Int
J Greenh Gas Control 10:520–535. doi:10.1016/j.ijggc.2012.07.022.
Orr JC, Fabry VJ, Aumont O, Bopp L, Doney SC, Feely RA, Gnanadesikan A, Gruber N, Ishida A,
Joos F, Key RM, Lindsay K, Maier-Reimer E, Matear R, Monfray P, Mouchet A, Najjar RG,
Plattner G-K, Rodgers KB, Sabine CL, Sarmiento JL, Schlitzer R, Slater RD, Totterdell IJ,
Weirig M-F, Yamanaka Y, Yool A (2005) Anthropogenic ocean acidification over the twenty-
first century and its impact on calcifying organisms. Nature 437:681–686.
Passow U, Carlson CA (2012) The biological pump in a high CO2 world. Mar Ecol Prog Ser 470:249–
271. doi:10.3354/meps09985.
Primeau F (2005) Characterizing transport between the surface mixed-layer and the ocean interior
with a forward and adjoint global ocean transport model. J Phys Oceanogr 35:545–564.
Regnier P, Friedlingstein P, Ciais P, Mackenzie FT, Gruber N, Janssens IA, Laruelle GG, Lauerwald
R, Luyssaert S, Andersson AJ, Arndt S, Arnosti C, Borges AV, Dale AW, Gallego-Sala A,
Goddéris Y, Goossens N, Hartmann J, Heinze C, Ilyina T, Joos F, LaRowe DE, Leifeld J,
Meysman FJR, Munhoven G, Raymond PA, Spahni R, Suntharalingam P, Thullner M (2013)
Anthropogenic perturbation of the carbon fluxes from land to ocean. Nat Geosci 6:597–607.
doi:10.1038/NGEO1830.
Royal Society (2005) Ocean acidification due to increasing carbon dioxide. Clyvedon Press, Cardiff,
UK, Policy Document 12/05, 68 pp.
Santinelli C, Nannicini L, Seritti A (2010) DOC dynamics in the meso and bathy pelagic layers of
the Mediterranean Sea. Deep Sea Res II 57: 1446–1459. doi:10.1016/j.dsr2.2010.02.014
Santinelli C, Hansell DA, d’Alcalà MR (2013) Influence of stratification on marine dissolved organic
carbon (DOC) dynamics: The Mediterranean Sea case. Prog Oceanogr 119:68–77.
doi:10.1016/j.pocean.2013.06.001
Santos-Escheandia J, Prego R, Cobelo-García A, Millward GE (2009) Porewater geochemistry in a
Galician Ria (NW Iberian Peninsula): implications for benthic fluxes of dissolved trace
elements (Co, Cu, Ni, Pb, V, Zn). Mar Chem 117:77–87
Sarmiento JL, Gruber N (2002) Sinks for anthropogenic carbon. Phys today 55:30–36.
13
Sarmiento JL, Gruber N (2006) Ocean biogeochemical dynamics. Princeton University Press, 528pp.
Tait K, Stahl H, Taylor P,Widdicombe S (2015) Rapid response of the active microbial community
to CO2 exposure from a controlled sub-seabed CO2 leak in Ardmucknish Bay (Oban,
Scotland). Int J Greenh Gas Control 38:171–181. doi:10.1016/j.ijggc.2014.11.021
Turner JT (2015) Zooplankton fecal pellets, marine snow, phytodetritus and the ocean’s biological
pump. Prog Oceanogr 130:205–248. doi:10.1016/j.pocean.2014.08.005
Volk T, Hoffert MI (1985) Ocean carbon pumps: Analysis of relative strengths and efficiencies in
ocean-driven atmospheric CO2 changes. Geophysical Monograph Series 32:99–110.
Waters CN, Zalasiewicz J, Summerhayes C, Barnosky AD, Poirier C, Gałuszka A, Cearreta A,
Edgeworth M, Ellis EC, Ellis M, Jeandel C, Leinfelder R, McNeill JR, Richter D deB, Steffen
W, Syvitski J, Vidas D, Wagreich M, Williams M, Zhisheng A, Grinevald J, Odada E, Oreskes
N, Wolfe AP (2016) The anthropocene is functionally and stratigraphically distinct from the
Holocene. Science 351:aad2622. doi:10.1126/science.aad2622.
14
CHAPTER 2
Oxygen, carbon, and nutrient exchanges at the sediment–water
interface in the Mar Piccolo of Taranto (Ionian Sea, southern Italy)
Cinzia De Vittor1*, Federica Relitti1,3, Martina Kralj1, Stefano Covelli2,4, Andrea Emili2
1 Oceanography Division, OGS (Istituto Nazionale di Oceanografia e di Geofisica Sperimentale), Trieste, Italy
2 Department of Mathematics and Geosciences, University of Trieste, Trieste, Italy
3 Department of Life Science, University of Trieste, Trieste, Italy
4 Co.N.I.S.Ma. Consorzio Nazionale Interuniversitario per le Scienze del Mare
*Corresponding author: Cinzia De Vittor
OGS (Istituto Nazionale di Oceanografia e di Geofisica Sperimentale), Oceanography Division
Via A. Piccard 54, 34151 Trieste, Italy
Tel.: +39 040 2249723
email: [email protected]
Published in Environmental Science and Pollution Research
DOI 10.1007/s11356-015-4999-0
INTEGRATED ENVIRONMENTAL CHARACTERIZATION OF THE CONTAMINATED MARINE COASTAL AREA OF TARANTO, IONIAN SEA (SOUTHERN ITALY) - THE RITMARE PROJECT
Oxygen, carbon, and nutrient exchanges at the sediment–waterinterface in the Mar Piccolo of Taranto(Ionian Sea, southern Italy)
Cinzia De Vittor1 & Federica Relitti1,3 & Martina Kralj1 & Stefano Covelli2,4 &
Andrea Emili2
Received: 2 April 2015 /Accepted: 30 June 2015 /Published online: 9 July 2015# Springer-Verlag Berlin Heidelberg 2015
Abstract In the shallow environment, the nutrient and carbonexchanges at the sediment–water interface contribute signifi-cantly to determine the trophic status of the whole water col-umn. The intensity of the allochthonous input in a coastalenvironment subjected to strong anthropogenic pressures de-termines an increase in the benthic oxygen demand leading todepressed oxygen levels in the bottom waters. Anoxic condi-tions resulting from organic enrichment can enhance the ex-change of nutrients between sediments and the overlying wa-ter. In the present study, carbon and nutrient fluxes at thesediment–water interface were measured at two experimentalsites, one highly and one moderately contaminated, as refer-ence point. In situ benthic flux measurements of dissolvedspecies (O2, DIC, DOC, N-NO3
−, N-NO2−, N-NH4
+, P-PO43
−, Si-Si(OH)4, H2S) were conducted using benthic chambers.Furthermore, undisturbed sediment cores were collected foranalyses of total and organic C, total N, and biopolymericcarbon (carbohydrates, proteins, and lipids) as well as of dis-solved species in porewaters and supernatant in order to cal-culate the diffusive fluxes. The sediments were characterized
by suboxic to anoxic conditions with redox values more neg-ative in the highly contaminated site, which was also charac-terized by higher biopolymeric carbon content (most of alllipids), lower C/N ratios and generally higher diffusive fluxes,which could result in a higher release of contaminants. A greatdifference was observed between diffusive and in situ benthicfluxes suggesting the enhancing of fluxes by bioturbation andthe occurrence of biogeochemically important processes at thesediment–water interface. The multi-contamination of bothinorganic and organic pollutants, in the sediments of the MarPiccolo of Taranto (declared SIN in 1998), potentially trans-ferable to the water column and to the aquatic trophic chain, isof serious concern for its ecological relevance, also consider-ing the widespread fishing and mussel farming activities in thearea.
Keywords Benthic fluxes . Nutrients . Sediment–waterinterface . DOC . DIC .Mar Piccolo of Taranto
Introduction
In shallow coastal ecosystems, nutrient regeneration at thesediment–water interface (SWI) plays a significant role inmaintaining high primary production in the water columnvia benthic–pelagic coupling (Hyun et al. 2013). In fact, insystems receiving sufficient light to maintain a phytobenthiccommunity, benthic microalgae have an important role as fil-ter in the flux of dissolved nutrients by transforming, storing,and removing nutrients from the overlaying water (Sundbäcket al. 2000; Grenz et al. 2000; McGlathery et al. 2007). Thus,the autotrophic metabolism influences fluxes at the SWI bythe uptake and temporary retention of nutrients, burial of re-calcitrant organic matter and indirectly by oxygenating sur-face sediment (McGlathery et al. 2001). Sediments can
Responsible editor: Philippe Garrigues
* Cinzia De [email protected]
1 OGS (Istituto Nazionale di Oceanografia e di GeofisicaSperimentale), Sezione Oceanografia, Via A. Piccard 54,34151 Trieste, Italy
2 Dipartimento di Matematica e Geoscienze, Università degli Studi diTrieste, Via Weiss 2, 34128 Trieste, Italy
3 Dipartimento di Scienze della Vita, Università degli Studi di Trieste,Via Licio Giorgieri 5, 34128 Trieste, Italy
4 Co.N.I.S.Ma. Consorzio Nazionale Interuniversitario per le Scienzedel Mare, Piazzale Flaminio 9, 00196 Roma, Italy
Environ Sci Pollut Res (2016) 23:12566–12581DOI 10.1007/s11356-015-4999-0
15
therefore constitute either a source or a sink of nutrients, be-coming the main factor in controlling the trophic level inaquatic systems (Spagnoli and Bergamini 1997). Benthic–pe-lagic coupling works in both directions, as the release of nu-trients from sediments enhances primary production in thewater column, and the organic matter produced in pelagicsystem sinks to the surface sediment providing labile substrateto be regenerated (Grenz et al. 2000). It has been reported(Kelly and Nixon 1984) that up to 80 % of annual carbonand nitrogen deposition may be remineralized and returnedto the overlying water, thus supporting primary pelagicproduction.
Coastal areas are often subjected to a severe expositionto urban, industrial, and agricultural wastewaters that influ-ence the volume and quality of water inputs. Rivers are thegreatest contributors to coastal areas of organic materials,nutrients, heavy metals, and sediments, usually untreatedand unfiltered (Dunn et al. 2013 and references therein;Ortega et al. 2008). This organic material is extremely re-active and induces higher rates of microbial processes,sometimes resulting in eutrophication of the receiving waterbody. The enhanced microbial activity can lead to a changein sediment status from oxic to hypoxic or even anoxic,and reduces oxygen levels in bottom waters (De Vittoret al. 2012). Hypoxia is a global key stressor affecting ahuge portion of coastal zones and the persistence of theseepisodes could result in changes in ecosystem functioning(Emili et al. 2011), especially in the increase of nutrientand dissolved organic carbon exchange between sedimentsand water column (De Vittor et al. 2012; Dunn et al. 2013).
Establishing the magnitude of benthic exchanges, especial-ly in conditions of hypoxia/anoxia, is important because dis-solved oxygen is a key regulator for many biogeochemicalcycles, such as sulfur, nitrogen, and heavy metals; therefore,changes in sediment redox status could enhance the release ofcontaminants (e.g., mercury, iron, sulfur) (Santos-Escheandiaet al. 2009; Covelli et al. 2011; Emili et al. 2011; De Vittoret al. 2012). Hence, the study of nutrient and carbon fluxes atthe SWI is fundamental to define the functionality of coastalecosystems and to provide indications for managing conser-vation and development land uses.
The present study has been conducted with the aim of eval-uating benthic metabolism, and carbon and nutrient exchangeat the SWI of the Mar Piccolo of Taranto (Southern Italy), anexample of a marine ecosystem contaminated by waste wa-ters. As these processes are strongly related to contaminantcycling, the study was associated with simultaneous measure-ments of major and trace element fluxes using the same ben-thic chambers (Emili et al. 2015). In situ benthic chamberexperiments were performed in two experimental sites, onehighly and one moderately contaminated, as reference point.In parallel, sediments as well as supernatant and porewaterswere characterized.
Methods
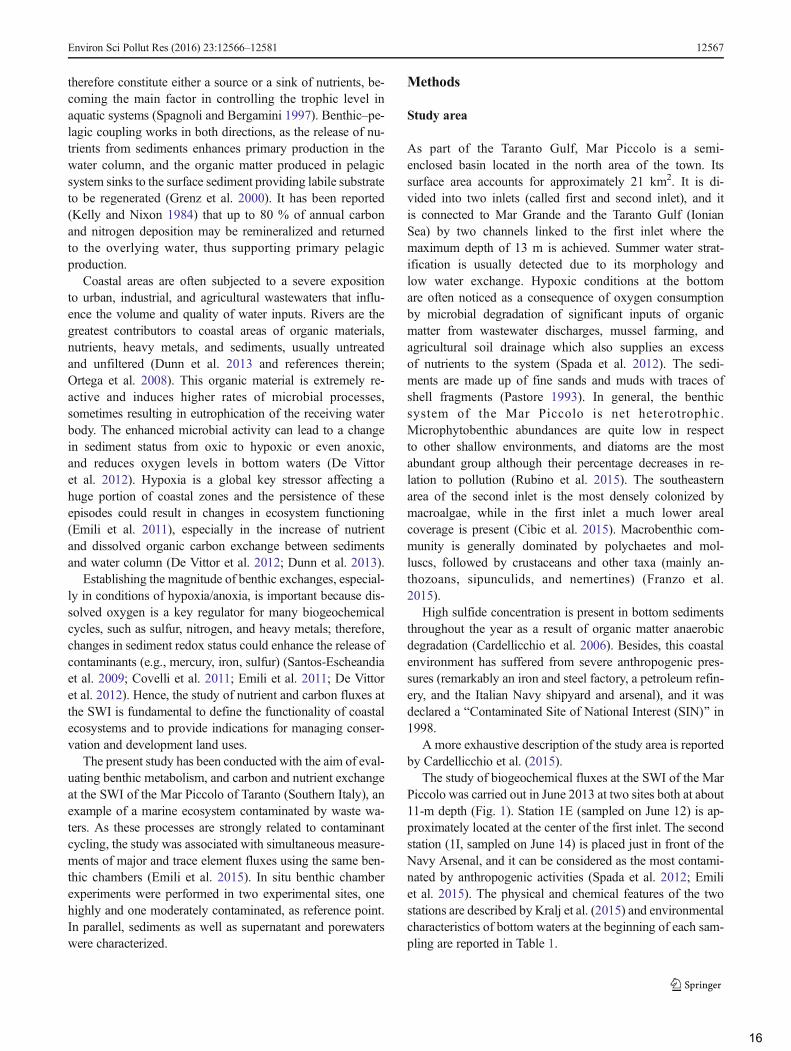
Study area
As part of the Taranto Gulf, Mar Piccolo is a semi-enclosed basin located in the north area of the town. Itssurface area accounts for approximately 21 km2. It is di-vided into two inlets (called first and second inlet), and itis connected to Mar Grande and the Taranto Gulf (IonianSea) by two channels linked to the first inlet where themaximum depth of 13 m is achieved. Summer water strat-ification is usually detected due to its morphology andlow water exchange. Hypoxic conditions at the bottomare often noticed as a consequence of oxygen consumptionby microbial degradation of significant inputs of organicmatter from wastewater discharges, mussel farming, andagricultural soil drainage which also supplies an excessof nutrients to the system (Spada et al. 2012). The sedi-ments are made up of fine sands and muds with traces ofshell fragments (Pastore 1993). In general, the benthicsystem of the Mar Piccolo is net heterotrophic.Microphytobenthic abundances are quite low in respectto other shallow environments, and diatoms are the mostabundant group although their percentage decreases in re-lation to pollution (Rubino et al. 2015). The southeasternarea of the second inlet is the most densely colonized bymacroalgae, while in the first inlet a much lower arealcoverage is present (Cibic et al. 2015). Macrobenthic com-munity is generally dominated by polychaetes and mol-luscs, followed by crustaceans and other taxa (mainly an-thozoans, sipunculids, and nemertines) (Franzo et al.2015).
High sulfide concentration is present in bottom sedimentsthroughout the year as a result of organic matter anaerobicdegradation (Cardellicchio et al. 2006). Besides, this coastalenvironment has suffered from severe anthropogenic pres-sures (remarkably an iron and steel factory, a petroleum refin-ery, and the Italian Navy shipyard and arsenal), and it wasdeclared a BContaminated Site of National Interest (SIN)^ in1998.
A more exhaustive description of the study area is reportedby Cardellicchio et al. (2015).
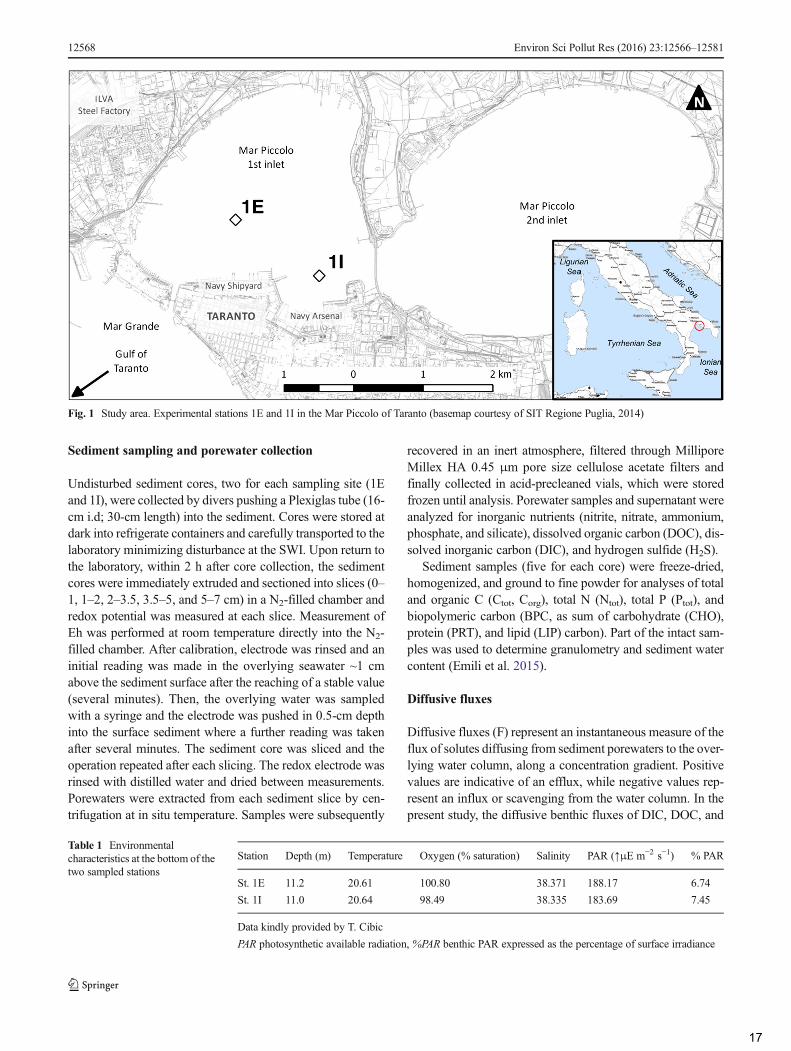
The study of biogeochemical fluxes at the SWI of the MarPiccolo was carried out in June 2013 at two sites both at about11-m depth (Fig. 1). Station 1E (sampled on June 12) is ap-proximately located at the center of the first inlet. The secondstation (1I, sampled on June 14) is placed just in front of theNavy Arsenal, and it can be considered as the most contami-nated by anthropogenic activities (Spada et al. 2012; Emiliet al. 2015). The physical and chemical features of the twostations are described by Kralj et al. (2015) and environmentalcharacteristics of bottom waters at the beginning of each sam-pling are reported in Table 1.
Environ Sci Pollut Res (2016) 23:12566–12581 12567
16
Sediment sampling and porewater collection
Undisturbed sediment cores, two for each sampling site (1Eand 1I), were collected by divers pushing a Plexiglas tube (16-cm i.d; 30-cm length) into the sediment. Cores were stored atdark into refrigerate containers and carefully transported to thelaboratory minimizing disturbance at the SWI. Upon return tothe laboratory, within 2 h after core collection, the sedimentcores were immediately extruded and sectioned into slices (0–1, 1–2, 2–3.5, 3.5–5, and 5–7 cm) in a N2-filled chamber andredox potential was measured at each slice. Measurement ofEh was performed at room temperature directly into the N2-filled chamber. After calibration, electrode was rinsed and aninitial reading was made in the overlying seawater ~1 cmabove the sediment surface after the reaching of a stable value(several minutes). Then, the overlying water was sampledwith a syringe and the electrode was pushed in 0.5-cm depthinto the surface sediment where a further reading was takenafter several minutes. The sediment core was sliced and theoperation repeated after each slicing. The redox electrode wasrinsed with distilled water and dried between measurements.Porewaters were extracted from each sediment slice by cen-trifugation at in situ temperature. Samples were subsequently
recovered in an inert atmosphere, filtered through MilliporeMillex HA 0.45 μm pore size cellulose acetate filters andfinally collected in acid-precleaned vials, which were storedfrozen until analysis. Porewater samples and supernatant wereanalyzed for inorganic nutrients (nitrite, nitrate, ammonium,phosphate, and silicate), dissolved organic carbon (DOC), dis-solved inorganic carbon (DIC), and hydrogen sulfide (H2S).
Sediment samples (five for each core) were freeze-dried,homogenized, and ground to fine powder for analyses of totaland organic C (Ctot, Corg), total N (Ntot), total P (Ptot), andbiopolymeric carbon (BPC, as sum of carbohydrate (CHO),protein (PRT), and lipid (LIP) carbon). Part of the intact sam-ples was used to determine granulometry and sediment watercontent (Emili et al. 2015).
Diffusive fluxes
Diffusive fluxes (F) represent an instantaneous measure of theflux of solutes diffusing from sediment porewaters to the over-lying water column, along a concentration gradient. Positivevalues are indicative of an efflux, while negative values rep-resent an influx or scavenging from the water column. In thepresent study, the diffusive benthic fluxes of DIC, DOC, and
Fig. 1 Study area. Experimental stations 1E and 1I in the Mar Piccolo of Taranto (basemap courtesy of SIT Regione Puglia, 2014)
Table 1 Environmentalcharacteristics at the bottom of thetwo sampled stations
Station Depth (m) Temperature Oxygen (% saturation) Salinity PAR (↑μE m−2 s−1) % PAR
St. 1E 11.2 20.61 100.80 38.371 188.17 6.74
St. 1I 11.0 20.64 98.49 38.335 183.69 7.45
Data kindly provided by T. Cibic
PAR photosynthetic available radiation, %PAR benthic PAR expressed as the percentage of surface irradiance
12568 Environ Sci Pollut Res (2016) 23:12566–12581
17
N, P, Si nutrients and H2S were calculated by application ofFick’s first law as reported by De Vittor et al. (2012). In theabsence of bioirrigation, Fick’s first law can be expressed asfollows:
F ¼ −ΦDw
θ2
� �∂C∂x
where F is the flux of a solute with concentration C at depth xand ∂ C/∂x is the concentration gradient of chemical speciesbetween porewater at the depth of 1 cm and the overlyingwater,Φ the sediment porosity (0.75), θ the tortuosity (dimen-sionless), and Dw is the diffusion coefficient of the solute inwater (Ullman and Aller 1982; Alperin et al. 1994) in theabsence of the sediment matrix.
Benthic flux chamber experiments
In situ benthic flux measurements were conducted using ben-thic chambers already tested in the Gulf of Trieste (Bertuzzi
et al. 1997; Covelli et al. 1999) and in the Marano and GradoLagoon (Covelli et al. 2008; De Vittor et al. 2012). The cham-ber, consisting of a transparent Plexiglas box, covers a sedi-ment area of 0.25m2 containing ~53 L of seawater. The cham-ber waters were homogenized using a magnetic stirring mech-anism, coupled to a rotating propeller on the chamber topside.Samples were periodically (t=0 and every ≅2 h for a total offive samplings) collected at sites 1E and 1I using 50-mL poly-propylene syringes during day deployments of about 8 h. Thevolume removed from the chamber was replaced by in situwater flowing into the chamber from a valve. Flux rates cal-culated from concentration data were not corrected for dilu-tion because of the low ratio of the sample to total chambervolume (0.2 %). The hourly metabolism rates were scaled tothe number of light hours for each experiment to calculatediurnal net metabolism (McGlathery et al. 2001). In situ fluxrates of solutes across the SWI were calculated on squaremeter basis adapting Rizzo (1990) and Nixon et al. (1976)protocols.
Diurnal nutrients=DOC flux ¼ mean hourly chamber nutrients change � photoperiodð Þ
Daily net production as O2productionð Þ ¼ mean hourly chamber oxygen change � photoperiodð Þ
Daily net production as CO2uptakeð Þ ¼ mean hourly chamber DIC change � photoperiodð Þ
Unfortunately, as a consequence of the sampling scheduleand the lack of overnight samples, daily respiration could notbe estimated; furthermore, also nutrients and DOC fluxes re-flect only daylight processes.
Analyses
Analyses of Ctot and Ntot in freeze-dried and homogenizedsediment samples were performed using a Perkin Elmer2400 CHNS/O Elemental Analyser. Corg was determined afteracidification of samples with 1 M HCl (Hedges and Stern1984) at a combustion temperature of 975 °C. Ptot was ana-lyzed by extraction from freeze-dried and homogenized sedi-ment with 1 M HCl after ignition at 550 °C (Aspila et al.1976). Dissolved phosphate in extracts was determined usingthe same method described for inorganic nutrients in overly-ing and porewaters (see at the end of the paragraph). Theprecision of Ctot, Corg, Ntot, and Ptot was about 3 %.
Two different CHO fractions (water soluble, CHOH2O andEDTA-extractable, CHOEDTA) were determined followingBlasutto et al. (2005). The carbohydrate fractions were mea-sured spectrophotometrically using the phenol-sulfuric acidassay (Dubois et al. 1956), modified by Gerchacov and
Hatcher (1972) for sediment samples. CHO concentrationswere calculated from calibration curves of D-glucose. CHOconcentrations, obtained as equivalent-glucose, were trans-formed into carbon using a conversion factor of 0.49 gC g−1 (Fabiano et al. 1995).
PRT analyses were carried out on lyophilized sedimentsamples after extractions with NaOH (0.5 M, 4 h). PRT weredetermined according to Hartree (1972) modified by Rice(1982) to compensate for phenol interference. PRT concentra-tions were calculated from calibration curves of serum albu-min. Even if determination could be affected by the interfer-ence of humics (Rice 1982), this method was chosen due to itsease and high sensitivity. Moreover, the wide application ofthis protocol makes our results comparable with other studies(Fabiano et al. 1995; Fabiano et al. 2001; Pusceddu et al.2009). Concentrations obtained as albumin equivalents weretransformed into carbon using a conversion factor of 0.50 gC g−1 (Fichez 1991). Total LIP were extracted by direct elu-tion with chloroform and methanol following the procedure ofBligh and Dyer (1959) and analyzed according to Marsh andWenstein (1966). LIP concentrations were calculated fromcalibration curves of tripalmitine. Concentrations obtained astripalmitine equivalents were transformed into carbon using a
Environ Sci Pollut Res (2016) 23:12566–12581 12569
18
conversion factor of 0.75 g C g−1 (Fichez 1991). All biochem-ical analyses were carried out in three to five replicates, withstandard deviation lower than 5 %.
The sum of the carbon equivalents of CHO, PRT and LIPwas referred as BPC (sensu Fichez 1991).
Dissolved O2 (DO) was analyzed by the Winkler method(Grasshoff et al. 1983) using an automated titration system(Mettler Toledo, DL 21). The reproducibility of the methodswas 5 %. DIC and DOC were determined using the ShimadzuTOC-V CSH analyzer. For DIC, samples were injected intothe instrument port and directly acidified with H3PO4 (25 %).For DOC analysis, water samples were previously acidified(automatically into instrument syringe, 2 %—6 M HCl) andafter CO2 elimination, the concentration was determined usinga high temperature catalytic method (Sugimura and Suzuki1988). Phosphoric acidification for DIC and combustion con-ducted at 680 °C on a catalyst bed for DOC, generated CO2
that was carried to a nondispersive infrared detector (NDIR).Analysis showed a variation coefficient <2 %. The reproduc-ibility of the method was between 1.5 and 3 %. Nutrient anal-yses, including nitrate (N-NO3
−) and nitrite (N-NO2−), ammo-
nium (N-NH4+), phosphate (P-PO4
3−), and silicate (Si-Si(OH)4), were performed with a segmented flow Bran+Luebbe AutoAnalyzer 3 following standard colorimetricmethods (Hansen and Koroleff 1999). The precision was3 %. Aliquots of 2.5 ml of overlying or porewater and storedin a dark place until analysis. Samples for hydrogen sulfidedetermination were preserved by adding zinc acetate and mea-sured spectrophotometrically using a VARIAN CARY 100Scan spectrophotometer at 670 nm according to Fonselius(1983).
To test if the concentrations of the biochemical compoundsdiffered significantly between the two stations (1E and 1I), ananalysis of variance (ANOVA) test was performed using theOneway Analysis Platform analysis. To highlight relation-ships between analyzed biochemical variables, the nonpara-metric Spearman’s rank correlation analysis was applied.
In order to verify the differences between impacted andcontrol sites, principal component analysis (PCA) was appliedon solid phase and porewater data.
All analyses were performed using the JMP 11 Pro statis-tics software package (SAS Institute Inc.).
Results and discussion
Sediment biogeochemistry
Surface sediment grain size at both stations was ratheruniform over the 0–7-cm depth layers sampled, and itlargely consisted of fine particles (<63 μm). Grain sizedistribution at station 1E (average 13.9 % sand, 72.6 %silt, and 13.5 % clay) lightly differed from station 1I
characterized, on average, by 13.5 % sand, 76.7 % silt,and 9.8 % clay proportion (Emili et al. 2015).
The porewater oxygen penetration depth was between 0.16and 0.29 cm (Rubino et al. 2015), indicating that the uppersample for porewater extraction and solid analyses includedthe whole oxic zone and the top of the anoxic sediment(Anschutz et al. 2007).
The redox potential (Eh) along sediment cores varied from−150 to −418 mVat station 1E and from −272 to −400 mVat1I and are similar to those reported by Spada et al. (2012) whofound values ranging from −348 to −457 mV in the surfacesediments of the Mar Piccolo basin. Matijević et al. (2007)reported that the transition from suboxic to anoxic conditions(presence of HS− or S2−) takes place at potentials from 0 to to150 mV. Thus, Eh values measured along the sediment coresindicate the presence of anoxic conditions, sulfate reductionand anaerobic organic matter degradation (Matijević et al.2013). Vertical profiles displayed a clear decrease in Ehdowncore at 1E while 1I, more subjected to anthropogenicinputs and characterized by more negative potential, showedan irregular trend (Fig. 2).
Similar Ctot contents (average 8.0±0.2 vs 7.7±0.3 %) anduniform trends with depth were encountered at sites 1E and 1I,while higher Corg contents (average 3.8±0.1 vs 4.2±0.3 %),with the exception of the surface layer, and Ntot contents (av-erage 0.27±0.01 vs 0.39±0.03 %) were found at 1I (Fig. 2).
The ratio of total organic carbon to total nitrogen (Corg/Ntot)is widely applied for inferring the origin of organic matter(OM) in marine sediments. According to Goñi et al. (2003),Corg/Ntot (molar) ratios >14 are characteristic of vascularplant-derived OM dominated by carbon-rich (and nitrogen-poor) biochemical classes (i.e., lignin and cellulose), whileCorg/Ntot (molar) values <10 may be defined as of autochtho-nous marine origin (from phytoplankton and bacterioplanktoncharacterized by higher N content) (Ogrinc et al. 2003). TheCorg/Ntot ratios (molar) were rather constant along sedimentdepth at site 1E, varying from 15.2 to 16.9 (average 16.3±0.7)while at 1I a wide range of variation was observed, from 8.9 to14.4 (average 12.6±2.2), with a net increase with depth, main-ly as a consequence of the decreasing Ntot trend downcore.The ratio in surface sediments (0–1 cm) found at 1E was twicehigher (16.9) than at 1I (8.9), suggesting that OM is predom-inantly of marine origin at this station while 1E could beinfluenced by some terrestrial input. Concentrations of Ptotdecreased slightly with depth from 809±4 μg g−1 (average0–2 cm) to 761 μg g−1 at 1E and from 724 to 679 μg g−1 at1I (Fig. 2), suggesting a recent enrichment in the surface sed-iment most likely due to urban and/or aquaculture inputs(Anschutz et al. 2007). Corg/Ptot ratio (Fig. 2) was quite con-stant along sediments of 1E with values, on average, of 123±1.4, typical of suboxic and intermittently anoxic environments(Algeo and Ingall 2007). At 1I, similar conditions (Corg/Ptot=115) were found only in surface sediments (0–1 cm) while in
12570 Environ Sci Pollut Res (2016) 23:12566–12581
19
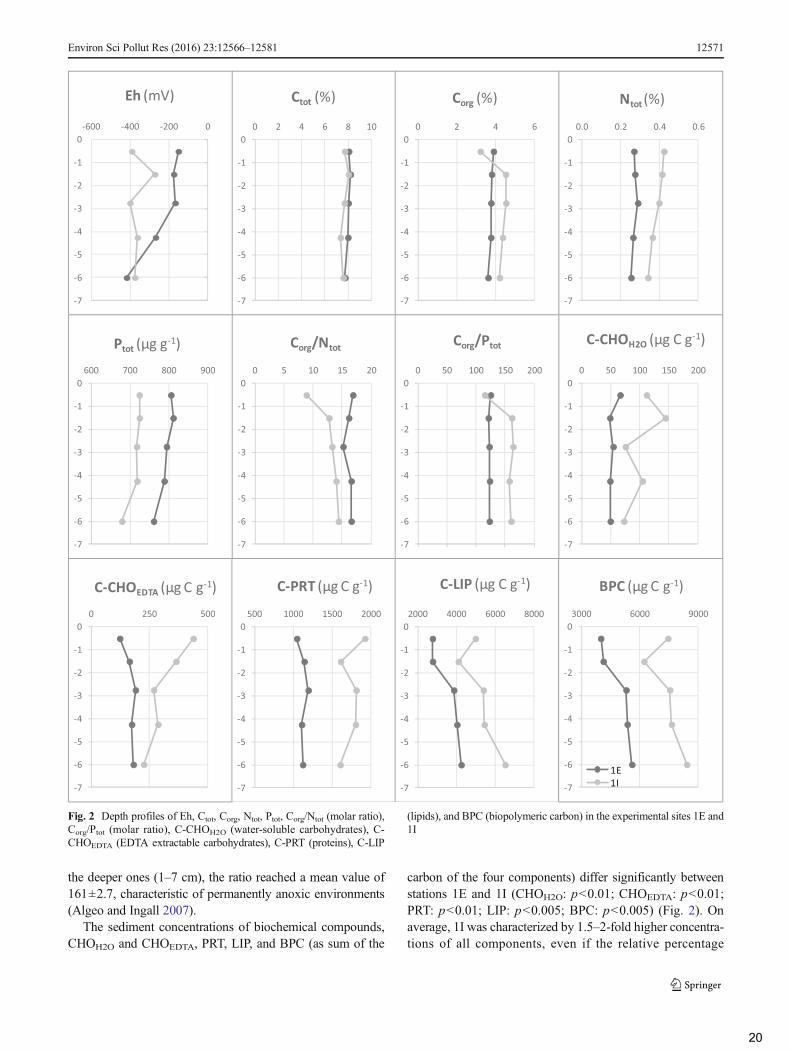
the deeper ones (1–7 cm), the ratio reached a mean value of161±2.7, characteristic of permanently anoxic environments(Algeo and Ingall 2007).
The sediment concentrations of biochemical compounds,CHOH2O and CHOEDTA, PRT, LIP, and BPC (as sum of the
carbon of the four components) differ significantly betweenstations 1E and 1I (CHOH2O: p<0.01; CHOEDTA: p<0.01;PRT: p<0.01; LIP: p<0.005; BPC: p<0.005) (Fig. 2). Onaverage, 1I was characterized by 1.5–2-fold higher concentra-tions of all components, even if the relative percentage
-7
-6
-5
-4
-3
-2
-1
0-600 -400 -200 0
Eh (mV)
-7
-6
-5
-4
-3
-2
-1
00 2 4 6 8 10
Ctot (%)
-7
-6
-5
-4
-3
-2
-1
00 2 4 6
Corg (%)
-7
-6
-5
-4
-3
-2
-1
00.0 0.2 0.4 0.6
Ntot (%)
-7
-6
-5
-4
-3
-2
-1
0600 700 800 900
Ptot (µg g-1)
-7
-6
-5
-4
-3
-2
-1
00 5 10 15 20
Corg/Ntot
-7
-6
-5
-4
-3
-2
-1
00 50 100 150 200
Corg/Ptot
-7
-6
-5
-4
-3
-2
-1
00 50 100 150 200
C-CHOH2O (µg C g-1)
-7
-6
-5
-4
-3
-2
-1
00 250 500
C-CHOEDTA (µg C g-1)
-7
-6
-5
-4
-3
-2
-1
03000 6000 9000
BPC (µg C g-1)
1E1I-7
-6
-5
-4
-3
-2
-1
0500 1000 1500 2000
C-PRT (µg C g-1)
-7
-6
-5
-4
-3
-2
-1
02000 4000 6000 8000
C-LIP (µg C g-1)
Fig. 2 Depth profiles of Eh, Ctot, Corg, Ntot, Ptot, Corg/Ntot (molar ratio),Corg/Ptot (molar ratio), C-CHOH2O (water-soluble carbohydrates), C-CHOEDTA (EDTA extractable carbohydrates), C-PRT (proteins), C-LIP
(lipids), and BPC (biopolymeric carbon) in the experimental sites 1E and1I
Environ Sci Pollut Res (2016) 23:12566–12581 12571
20
composition is similar between the two stations. At both sta-tions, the BPCwas dominated by LIP (67–77% of total BPC),followed by PRT (20–28%) and CHOEDTA (3–6%). CHOH2O
contributed only for 1–2 % to total BPC. At 1E, LIP rangedfrom 2758 to 4244 μg C g−1 showing an increasing gradientwith depth, PRT ranged from 1045 to 1193 μg C g−1 with auniform trend along depth, CHOEDTAvaried between 123 and190 μg C g−1 increasing slightly with depth, while CHOH2O
profile was quite uniformwith concentrations ranging from 49to 66 μg C g−1. At 1I, LIP ranged from 4099 to 6523 μg C g−1
(maximum was reached at the deepest sediment layer of 5–7 cm), PRT varied between 1607 and 1927 μg C g−1
displaying an irregular vertical profile, CHOEDTA decreasedwith depth from 439 to 226 μg C g−1, while CHOH2O showeda highly variable profile with a concentrations range of 73–144 μg C g−1.
LIP concentrations found in our study, especially those ofsite 1I, are definitely higher than those reported worldwide formarine sediments (for a review, see Pusceddu et al. 2009).However, they are comparable to those measured by Cibicet al. (2012) at 2–6-cm sediment depth of an Adriatic lagoon,contaminated by hydrocarbon and heavy metal and byPusceddu et al. (1999) in the top sediments (0–1 cm) at astation of the Marsala lagoon (Mediterranean Sea) character-ized by Posidonia oceanica (and detritus of Posidonia) cov-erage. Similar concentrations with a maximum of more than20,000 μg g−1 (lipid carbon=15,400 μg C g−1) were alsoreported by Neira et al. (2001) in an upwelling region offCentral Chile. The high lipid contribution to BPC (lipids arealways the dominant component, up to 77 %) found in ourstudy is the highest ever reported in the literature (for a review,see Pusceddu et al. 2009, 2010). Generally, the composition ofthe sedimentary organic detritus shows a dominance of carbo-hydrates or proteins (Pusceddu et al. 2009, 2010; Cibic et al.2012) depending on its origin (primary organic carbon frommicroalgae vs aged and/or nonliving organic matter). Thecause of the high concentration of lipids found especially at
site 1I remains unknown. Although one possibility could bethe natural production from diatoms like Coscinodiscus, oneof the most important phytoplanktonic taxa in Mar Piccolo ofTaranto (Caroppo and Cardellicchio 1995; Caroppo et al.2006), deposited shortly before sampling (Neira et al. 2001),we believe that they derive from anthropogenic sources (e.g.,untreated sewage discharges and petroleum-relatedcompounds).
BPC vertical profiles reflected patterns observed for lipidsconcentrations. The BPC represented, on average, the 13.0±2.4 % of Corg at station 1E and its contribution to Corg in-creased regularly with depth. At station 1I, the biopolymericavailable fraction of total organic carbon constituted, on aver-age, the 18.2±3.6 % of Corg showing the highest value of23.2 % at the uppermost layer of sediment (0–1 cm), a cleardecrease at 1–2 cm and then a regular increase up to the bot-tom layers (Fig. 2). Increasing accumulation of BPC in marinesediments is associated even in highly productive systems(such as estuaries, ponds, and fish farm sediments) with lowalgal carbon contributions to BPC. This suggests that, in eu-trophic sediments characterized by high BPC concentrationsand benthic algal biomass, algal carbon is progressively dilut-ed in a complex and heterogeneous organic matrix (Puscedduet al. 2009).
A PCA was performed on the correlation matrix of vari-ables describing the solid phase of the two sediment cores tohighlight differences between the two stations (Fig. 3). Thefirst two eigenvalues explain 81.3 % of the original data var-iance. By plotting the original datapoints (each pointrepresenting a single sediment layer) onto a biplot with thefirst two principal components as the axes, two groups canclearly be distinguished, corresponding to the two stations.Principal component 1 is responsible for this separation, andit is well correlated with all original variables, except for Corg
(factor loading<0.5). The highest loadings (>|0.94|) were as-sociated with variables Ptot, BPC, and PRT. Differencesamong the different sediment layers in the same core are
Fig. 3 Principal componentanalysis (PCA) score plot (left)and biplot (right) of solid phasesamples (red: station 1E; blue:station 1I). Numbers inparentheses refer to thepercentage of total varianceexplained by the principalcomponents
12572 Environ Sci Pollut Res (2016) 23:12566–12581
21
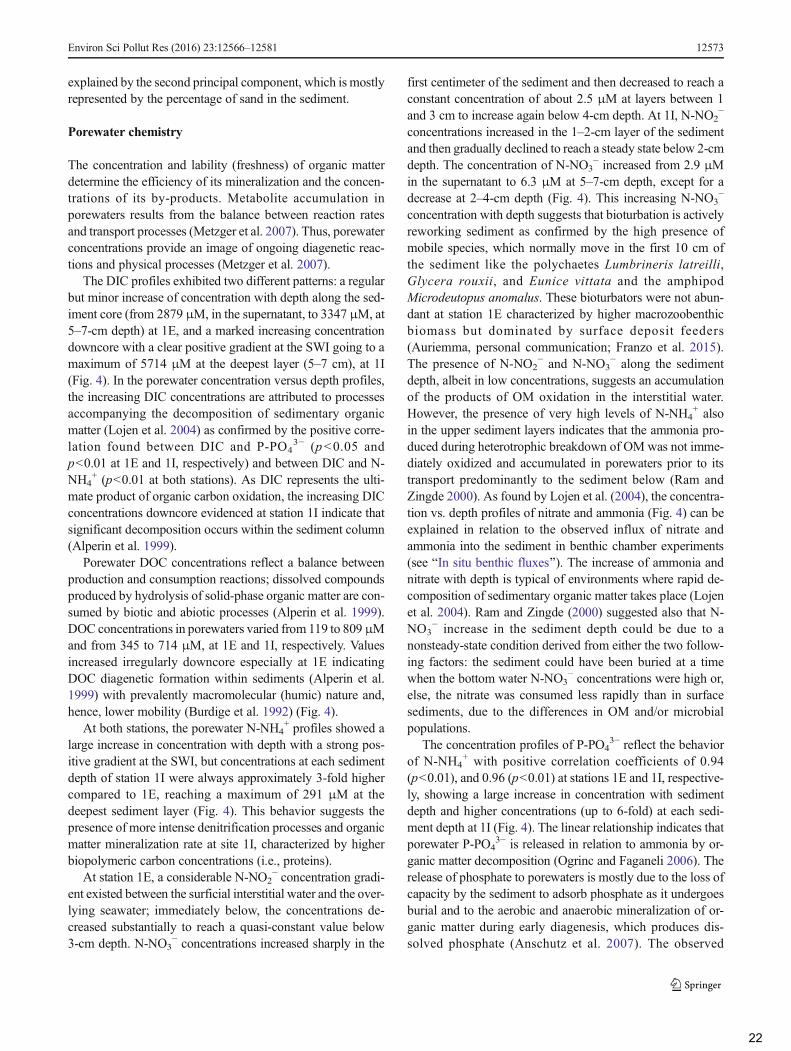
explained by the second principal component, which is mostlyrepresented by the percentage of sand in the sediment.
Porewater chemistry
The concentration and lability (freshness) of organic matterdetermine the efficiency of its mineralization and the concen-trations of its by-products. Metabolite accumulation inporewaters results from the balance between reaction ratesand transport processes (Metzger et al. 2007). Thus, porewaterconcentrations provide an image of ongoing diagenetic reac-tions and physical processes (Metzger et al. 2007).
The DIC profiles exhibited two different patterns: a regularbut minor increase of concentration with depth along the sed-iment core (from 2879 μM, in the supernatant, to 3347 μM, at5–7-cm depth) at 1E, and a marked increasing concentrationdowncore with a clear positive gradient at the SWI going to amaximum of 5714 μM at the deepest layer (5–7 cm), at 1I(Fig. 4). In the porewater concentration versus depth profiles,the increasing DIC concentrations are attributed to processesaccompanying the decomposition of sedimentary organicmatter (Lojen et al. 2004) as confirmed by the positive corre-lation found between DIC and P-PO4
3− (p<0.05 andp<0.01 at 1E and 1I, respectively) and between DIC and N-NH4
+ (p<0.01 at both stations). As DIC represents the ulti-mate product of organic carbon oxidation, the increasing DICconcentrations downcore evidenced at station 1I indicate thatsignificant decomposition occurs within the sediment column(Alperin et al. 1999).
Porewater DOC concentrations reflect a balance betweenproduction and consumption reactions; dissolved compoundsproduced by hydrolysis of solid-phase organic matter are con-sumed by biotic and abiotic processes (Alperin et al. 1999).DOC concentrations in porewaters varied from 119 to 809μMand from 345 to 714 μM, at 1E and 1I, respectively. Valuesincreased irregularly downcore especially at 1E indicatingDOC diagenetic formation within sediments (Alperin et al.1999) with prevalently macromolecular (humic) nature and,hence, lower mobility (Burdige et al. 1992) (Fig. 4).
At both stations, the porewater N-NH4+ profiles showed a
large increase in concentration with depth with a strong pos-itive gradient at the SWI, but concentrations at each sedimentdepth of station 1I were always approximately 3-fold highercompared to 1E, reaching a maximum of 291 μM at thedeepest sediment layer (Fig. 4). This behavior suggests thepresence of more intense denitrification processes and organicmatter mineralization rate at site 1I, characterized by higherbiopolymeric carbon concentrations (i.e., proteins).
At station 1E, a considerable N-NO2− concentration gradi-
ent existed between the surficial interstitial water and the over-lying seawater; immediately below, the concentrations de-creased substantially to reach a quasi-constant value below3-cm depth. N-NO3
− concentrations increased sharply in the
first centimeter of the sediment and then decreased to reach aconstant concentration of about 2.5 μM at layers between 1and 3 cm to increase again below 4-cm depth. At 1I, N-NO2
−
concentrations increased in the 1–2-cm layer of the sedimentand then gradually declined to reach a steady state below 2-cmdepth. The concentration of N-NO3
− increased from 2.9 μMin the supernatant to 6.3 μM at 5–7-cm depth, except for adecrease at 2–4-cm depth (Fig. 4). This increasing N-NO3
−
concentration with depth suggests that bioturbation is activelyreworking sediment as confirmed by the high presence ofmobile species, which normally move in the first 10 cm ofthe sediment like the polychaetes Lumbrineris latreilli,Glycera rouxii, and Eunice vittata and the amphipodMicrodeutopus anomalus. These bioturbators were not abun-dant at station 1E characterized by higher macrozoobenthicbiomass but dominated by surface deposit feeders(Auriemma, personal communication; Franzo et al. 2015).The presence of N-NO2
− and N-NO3− along the sediment
depth, albeit in low concentrations, suggests an accumulationof the products of OM oxidation in the interstitial water.However, the presence of very high levels of N-NH4
+ alsoin the upper sediment layers indicates that the ammonia pro-duced during heterotrophic breakdown of OM was not imme-diately oxidized and accumulated in porewaters prior to itstransport predominantly to the sediment below (Ram andZingde 2000). As found by Lojen et al. (2004), the concentra-tion vs. depth profiles of nitrate and ammonia (Fig. 4) can beexplained in relation to the observed influx of nitrate andammonia into the sediment in benthic chamber experiments(see BIn situ benthic fluxes^). The increase of ammonia andnitrate with depth is typical of environments where rapid de-composition of sedimentary organic matter takes place (Lojenet al. 2004). Ram and Zingde (2000) suggested also that N-NO3
− increase in the sediment depth could be due to anonsteady-state condition derived from either the two follow-ing factors: the sediment could have been buried at a timewhen the bottom water N-NO3
− concentrations were high or,else, the nitrate was consumed less rapidly than in surfacesediments, due to the differences in OM and/or microbialpopulations.
The concentration profiles of P-PO43− reflect the behavior
of N-NH4+ with positive correlation coefficients of 0.94
(p<0.01), and 0.96 (p<0.01) at stations 1E and 1I, respective-ly, showing a large increase in concentration with sedimentdepth and higher concentrations (up to 6-fold) at each sedi-ment depth at 1I (Fig. 4). The linear relationship indicates thatporewater P-PO4
3− is released in relation to ammonia by or-ganic matter decomposition (Ogrinc and Faganeli 2006). Therelease of phosphate to porewaters is mostly due to the loss ofcapacity by the sediment to adsorb phosphate as it undergoesburial and to the aerobic and anaerobic mineralization of or-ganic matter during early diagenesis, which produces dis-solved phosphate (Anschutz et al. 2007). The observed
Environ Sci Pollut Res (2016) 23:12566–12581 12573
22
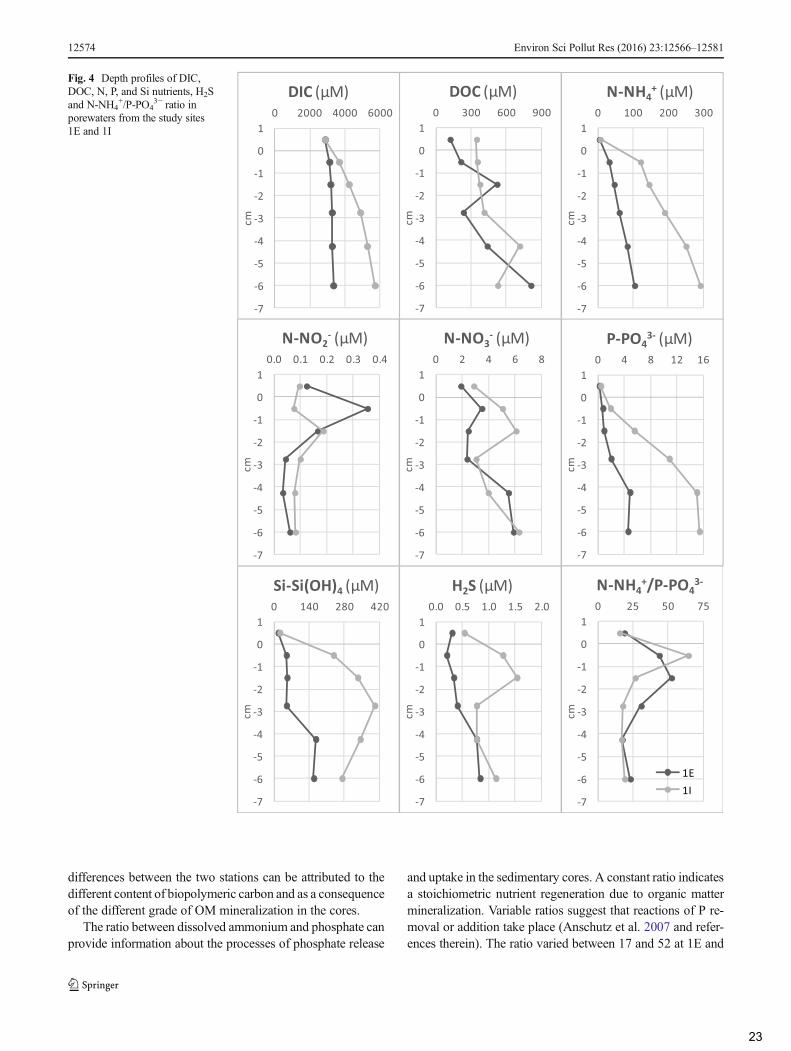
differences between the two stations can be attributed to thedifferent content of biopolymeric carbon and as a consequenceof the different grade of OM mineralization in the cores.
The ratio between dissolved ammonium and phosphate canprovide information about the processes of phosphate release
and uptake in the sedimentary cores. A constant ratio indicatesa stoichiometric nutrient regeneration due to organic mattermineralization. Variable ratios suggest that reactions of P re-moval or addition take place (Anschutz et al. 2007 and refer-ences therein). The ratio varied between 17 and 52 at 1E and
-7
-6
-5
-4
-3
-2
-1
0
10 2000 4000 6000
cm
DIC (µM)
-7
-6
-5
-4
-3
-2
-1
0
10 300 600 900
cm
DOC (µM)
-7
-6
-5
-4
-3
-2
-1
0
10 140 280 420
cm
Si-Si(OH)4 (µM)
-7
-6
-5
-4
-3
-2
-1
0
10.0 0.5 1.0 1.5 2.0
cm
H2S (µM)
-7
-6
-5
-4
-3
-2
-1
0
10 100 200 300
cm
N-NH4+ (µM)
-7
-6
-5
-4
-3
-2
-1
0
10.0 0.1 0.2 0.3 0.4
cm
N-NO2- (µM)
-7
-6
-5
-4
-3
-2
-1
0
10 2 4 6 8
cm
N-NO3- (µM)
-7
-6
-5
-4
-3
-2
-1
0
10 4 8 12 16
cm
P-PO43- (µM)
-7
-6
-5
-4
-3
-2
-1
0
10 25 50 75
cmN-NH4
+/P-PO43-
1E1I
Fig. 4 Depth profiles of DIC,DOC, N, P, and Si nutrients, H2Sand N-NH4
+/P-PO43− ratio in
porewaters from the study sites1E and 1I
12574 Environ Sci Pollut Res (2016) 23:12566–12581
23
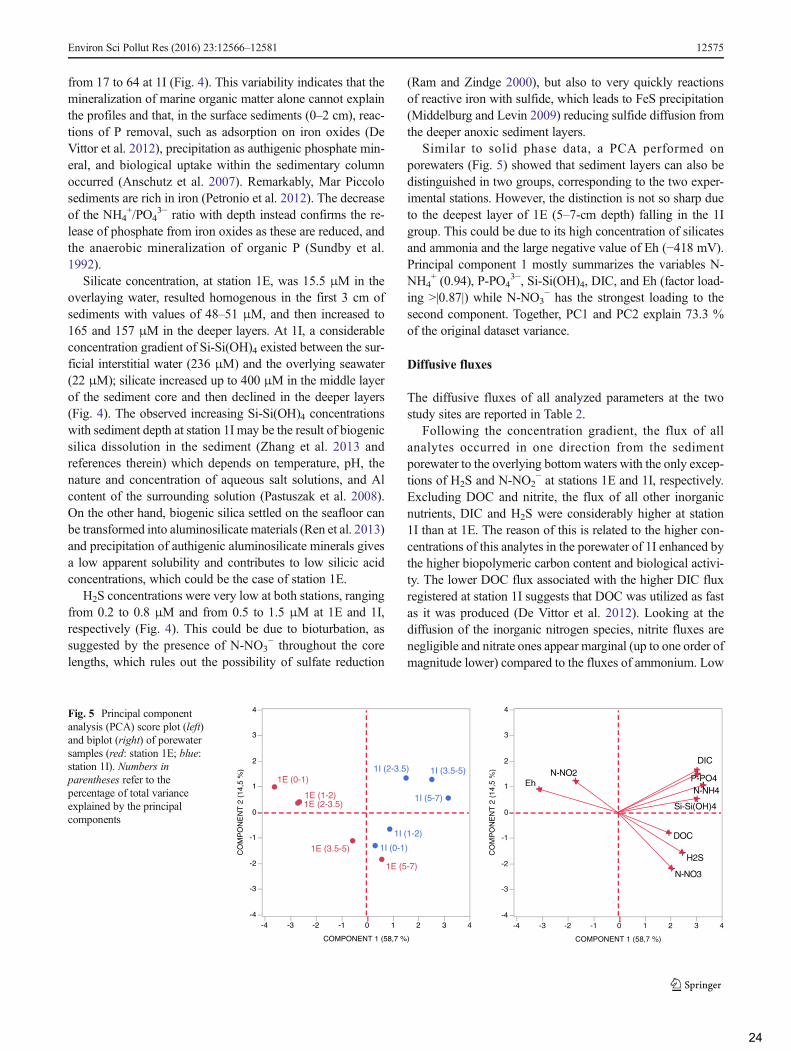
from 17 to 64 at 1I (Fig. 4). This variability indicates that themineralization of marine organic matter alone cannot explainthe profiles and that, in the surface sediments (0–2 cm), reac-tions of P removal, such as adsorption on iron oxides (DeVittor et al. 2012), precipitation as authigenic phosphate min-eral, and biological uptake within the sedimentary columnoccurred (Anschutz et al. 2007). Remarkably, Mar Piccolosediments are rich in iron (Petronio et al. 2012). The decreaseof the NH4
+/PO43− ratio with depth instead confirms the re-
lease of phosphate from iron oxides as these are reduced, andthe anaerobic mineralization of organic P (Sundby et al.1992).
Silicate concentration, at station 1E, was 15.5 μM in theoverlaying water, resulted homogenous in the first 3 cm ofsediments with values of 48–51 μM, and then increased to165 and 157 μM in the deeper layers. At 1I, a considerableconcentration gradient of Si-Si(OH)4 existed between the sur-ficial interstitial water (236 μM) and the overlying seawater(22 μM); silicate increased up to 400 μM in the middle layerof the sediment core and then declined in the deeper layers(Fig. 4). The observed increasing Si-Si(OH)4 concentrationswith sediment depth at station 1I may be the result of biogenicsilica dissolution in the sediment (Zhang et al. 2013 andreferences therein) which depends on temperature, pH, thenature and concentration of aqueous salt solutions, and Alcontent of the surrounding solution (Pastuszak et al. 2008).On the other hand, biogenic silica settled on the seafloor canbe transformed into aluminosilicate materials (Ren et al. 2013)and precipitation of authigenic aluminosilicate minerals givesa low apparent solubility and contributes to low silicic acidconcentrations, which could be the case of station 1E.
H2S concentrations were very low at both stations, rangingfrom 0.2 to 0.8 μM and from 0.5 to 1.5 μM at 1E and 1I,respectively (Fig. 4). This could be due to bioturbation, assuggested by the presence of N-NO3
− throughout the corelengths, which rules out the possibility of sulfate reduction
(Ram and Zindge 2000), but also to very quickly reactionsof reactive iron with sulfide, which leads to FeS precipitation(Middelburg and Levin 2009) reducing sulfide diffusion fromthe deeper anoxic sediment layers.
Similar to solid phase data, a PCA performed onporewaters (Fig. 5) showed that sediment layers can also bedistinguished in two groups, corresponding to the two exper-imental stations. However, the distinction is not so sharp dueto the deepest layer of 1E (5–7-cm depth) falling in the 1Igroup. This could be due to its high concentration of silicatesand ammonia and the large negative value of Eh (−418 mV).Principal component 1 mostly summarizes the variables N-NH4
+ (0.94), P-PO43−, Si-Si(OH)4, DIC, and Eh (factor load-
ing >|0.87|) while N-NO3− has the strongest loading to the
second component. Together, PC1 and PC2 explain 73.3 %of the original dataset variance.
Diffusive fluxes
The diffusive fluxes of all analyzed parameters at the twostudy sites are reported in Table 2.
Following the concentration gradient, the flux of allanalytes occurred in one direction from the sedimentporewater to the overlying bottomwaters with the only excep-tions of H2S and N-NO2
− at stations 1E and 1I, respectively.Excluding DOC and nitrite, the flux of all other inorganicnutrients, DIC and H2S were considerably higher at station1I than at 1E. The reason of this is related to the higher con-centrations of this analytes in the porewater of 1I enhanced bythe higher biopolymeric carbon content and biological activi-ty. The lower DOC flux associated with the higher DIC fluxregistered at station 1I suggests that DOC was utilized as fastas it was produced (De Vittor et al. 2012). Looking at thediffusion of the inorganic nitrogen species, nitrite fluxes arenegligible and nitrate ones appear marginal (up to one order ofmagnitude lower) compared to the fluxes of ammonium. Low
Fig. 5 Principal componentanalysis (PCA) score plot (left)and biplot (right) of porewatersamples (red: station 1E; blue:station 1I). Numbers inparentheses refer to thepercentage of total varianceexplained by the principalcomponents
Environ Sci Pollut Res (2016) 23:12566–12581 12575
24
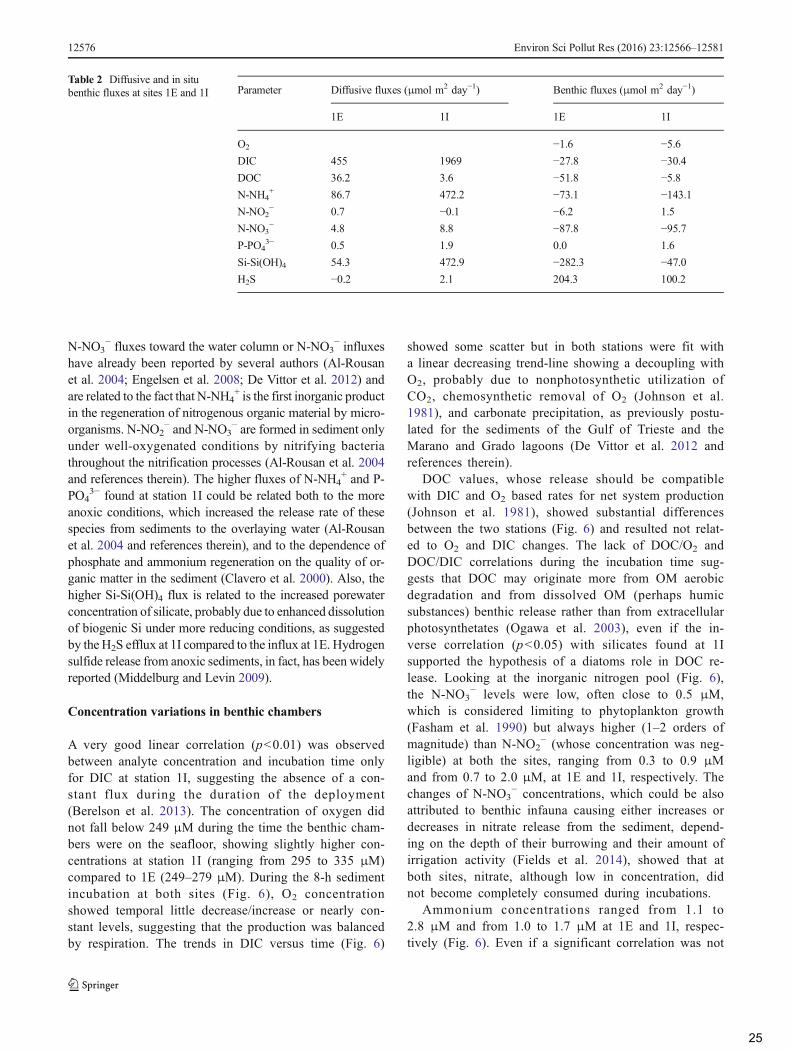
N-NO3− fluxes toward the water column or N-NO3
− influxeshave already been reported by several authors (Al-Rousanet al. 2004; Engelsen et al. 2008; De Vittor et al. 2012) andare related to the fact that N-NH4
+ is the first inorganic productin the regeneration of nitrogenous organic material by micro-organisms. N-NO2
− and N-NO3− are formed in sediment only
under well-oxygenated conditions by nitrifying bacteriathroughout the nitrification processes (Al-Rousan et al. 2004and references therein). The higher fluxes of N-NH4
+ and P-PO4
3− found at station 1I could be related both to the moreanoxic conditions, which increased the release rate of thesespecies from sediments to the overlaying water (Al-Rousanet al. 2004 and references therein), and to the dependence ofphosphate and ammonium regeneration on the quality of or-ganic matter in the sediment (Clavero et al. 2000). Also, thehigher Si-Si(OH)4 flux is related to the increased porewaterconcentration of silicate, probably due to enhanced dissolutionof biogenic Si under more reducing conditions, as suggestedby the H2S efflux at 1I compared to the influx at 1E. Hydrogensulfide release from anoxic sediments, in fact, has been widelyreported (Middelburg and Levin 2009).
Concentration variations in benthic chambers
A very good linear correlation (p<0.01) was observedbetween analyte concentration and incubation time onlyfor DIC at station 1I, suggesting the absence of a con-stant flux during the duration of the deployment(Berelson et al. 2013). The concentration of oxygen didnot fall below 249 μM during the time the benthic cham-bers were on the seafloor, showing slightly higher con-centrations at station 1I (ranging from 295 to 335 μM)compared to 1E (249–279 μM). During the 8-h sedimentincubation at both sites (Fig. 6), O2 concentrationshowed temporal little decrease/increase or nearly con-stant levels, suggesting that the production was balancedby respiration. The trends in DIC versus time (Fig. 6)
showed some scatter but in both stations were fit witha linear decreasing trend-line showing a decoupling withO2, probably due to nonphotosynthetic utilization ofCO2, chemosynthetic removal of O2 (Johnson et al.1981), and carbonate precipitation, as previously postu-lated for the sediments of the Gulf of Trieste and theMarano and Grado lagoons (De Vittor et al. 2012 andreferences therein).
DOC values, whose release should be compatiblewith DIC and O2 based rates for net system production(Johnson et al. 1981), showed substantial differencesbetween the two stations (Fig. 6) and resulted not relat-ed to O2 and DIC changes. The lack of DOC/O2 andDOC/DIC correlations during the incubation time sug-gests that DOC may originate more from OM aerobicdegradation and from dissolved OM (perhaps humicsubstances) benthic release rather than from extracellularphotosynthetates (Ogawa et al. 2003), even if the in-verse correlation (p<0.05) with silicates found at 1Isupported the hypothesis of a diatoms role in DOC re-lease. Looking at the inorganic nitrogen pool (Fig. 6),the N-NO3
− levels were low, often close to 0.5 μM,which is considered limiting to phytoplankton growth(Fasham et al. 1990) but always higher (1–2 orders ofmagnitude) than N-NO2
− (whose concentration was neg-ligible) at both the sites, ranging from 0.3 to 0.9 μMand from 0.7 to 2.0 μM, at 1E and 1I, respectively. Thechanges of N-NO3
− concentrations, which could be alsoattributed to benthic infauna causing either increases ordecreases in nitrate release from the sediment, depend-ing on the depth of their burrowing and their amount ofirrigation activity (Fields et al. 2014), showed that atboth sites, nitrate, although low in concentration, didnot become completely consumed during incubations.
Ammonium concentrations ranged from 1.1 to2.8 μM and from 1.0 to 1.7 μM at 1E and 1I, respec-tively (Fig. 6). Even if a significant correlation was not
Table 2 Diffusive and in situbenthic fluxes at sites 1E and 1I Parameter Diffusive fluxes (μmol m2 day−1) Benthic fluxes (μmol m2 day−1)
1E 1I 1E 1I
O2 −1.6 −5.6DIC 455 1969 −27.8 −30.4DOC 36.2 3.6 −51.8 −5.8N-NH4
+ 86.7 472.2 −73.1 −143.1N-NO2
− 0.7 −0.1 −6.2 1.5
N-NO3− 4.8 8.8 −87.8 −95.7
P-PO43− 0.5 1.9 0.0 1.6
Si-Si(OH)4 54.3 472.9 −282.3 −47.0H2S −0.2 2.1 204.3 100.2
12576 Environ Sci Pollut Res (2016) 23:12566–12581
25
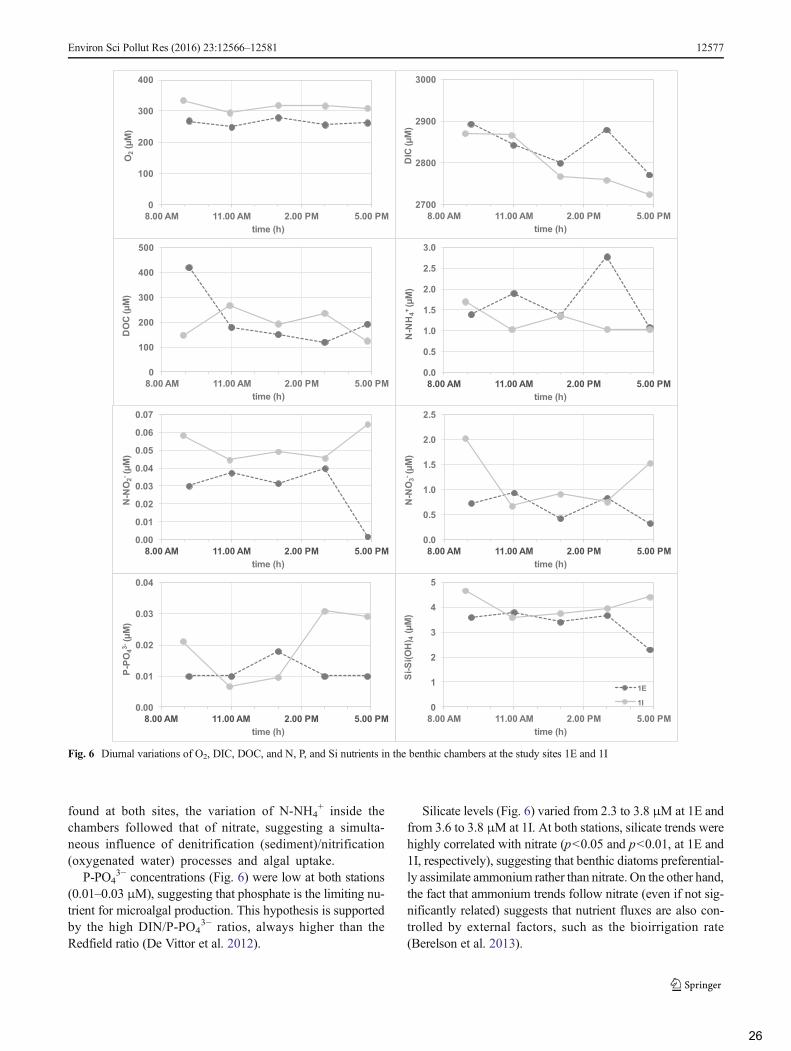
found at both sites, the variation of N-NH4+ inside the
chambers followed that of nitrate, suggesting a simulta-neous influence of denitrification (sediment)/nitrification(oxygenated water) processes and algal uptake.
P-PO43− concentrations (Fig. 6) were low at both stations
(0.01–0.03 μM), suggesting that phosphate is the limiting nu-trient for microalgal production. This hypothesis is supportedby the high DIN/P-PO4
3− ratios, always higher than theRedfield ratio (De Vittor et al. 2012).
Silicate levels (Fig. 6) varied from 2.3 to 3.8 μM at 1E andfrom 3.6 to 3.8 μM at 1I. At both stations, silicate trends werehighly correlated with nitrate (p<0.05 and p<0.01, at 1E and1I, respectively), suggesting that benthic diatoms preferential-ly assimilate ammonium rather than nitrate. On the other hand,the fact that ammonium trends follow nitrate (even if not sig-nificantly related) suggests that nutrient fluxes are also con-trolled by external factors, such as the bioirrigation rate(Berelson et al. 2013).
0
100
200
300
400
8.00 AM 11.00 AM 2.00 PM 5.00 PM
O2
(µM
)
time (h)
2700
2800
2900
3000
8.00 AM 11.00 AM 2.00 PM 5.00 PM
DIC
(µM
)
time (h)
0
100
200
300
400
500
8.00 AM 11.00 AM 2.00 PM 5.00 PM
DO
C (µ
M)
time (h)
0
1
2
3
4
5
8.00 AM 11.00 AM 2.00 PM 5.00 PM
Si-S
i(OH
) 4(µ
M)
time (h)
1E
1I
0.0
0.5
1.0
1.5
2.0
2.5
3.0
8.00 AM 11.00 AM 2.00 PM 5.00 PM
N-N
H4+
(µM
)time (h)
0.00
0.01
0.02
0.03
0.04
0.05
0.06
0.07
8.00 AM 11.00 AM 2.00 PM 5.00 PM
N-N
O2- (
µM)
time (h)
0.0
0.5
1.0
1.5
2.0
2.5
8.00 AM 11.00 AM 2.00 PM 5.00 PM
N-N
O3- (
µM)
time (h)
0.00
0.01
0.02
0.03
0.04
8.00 AM 11.00 AM 2.00 PM 5.00 PM
P-PO
43-(µ
M)
time (h)
Fig. 6 Diurnal variations of O2, DIC, DOC, and N, P, and Si nutrients in the benthic chambers at the study sites 1E and 1I
Environ Sci Pollut Res (2016) 23:12566–12581 12577
26
In situ benthic fluxes
Fluxes calculated from chamber incubations, which representthe total fluxes (Rasheed et al. 2006) differed substantiallyfrom diffusive ones (Table 2). Unexpectedly, the flux of al-most all analytes were negative, i.e., directed to the sedimentporewater, with the only exceptions of P-PO4
3− at both sta-tions and N-NO2
− at station 1I. This great difference suggeststhe enhancement of fluxes by bioturbation and thatbiogeochemically important processes occur at the SWI (DeVittor et al. 2012). Furthermore, total fluxes, in addition todiffusive fluxes, may include fluxes from advective porewaterexchange (out of the chamber) although in mud sediments,like those of our study, this contribution can be minor(Rasheed et al. 2006). In our study, the discrepancy betweenbenthic and diffusive fluxes is also due to the lack of data fromovernight samples; thus, our calculations only reflect daylightprocesses without taking into account night respiration andfluxes, which generally differ substantially from the daylightones. Several authors, in fact, have reported differences innight and day fluxes or during light and dark incubations(Rizzo 1990; Billerbeck et al. 2007; De Vittor et al. 2012;Dunn et al. 2013; Sospedra et al. 2015).
During the 8 h of diurnal incubation experiments, the oxy-gen uptake rate of −1.6 and −5.6 mmol m−2day−1 at sites 1Eand 1I, respectively, showing daily net negative production,suggested that sediments were more heterotrophic at 1I, due tothe increased respiratory demands for decomposition of thehigher quantity of organic matter. On the other hand, the ap-parent community production measured from DIC reachedhighly negative values of −27.8 and −30.4 mmol m−2day−1,at 1E and 1I, respectively, thus suggesting that respirationprocesses exceeded the primary production but also that car-bonate precipitation could have occurred.
The diurnal DOC influx was one order of magnitude higherat 1E (−51.8 mmol m−2day−1) than at 1I (−5.8 mmol m−2day−1),suggesting that larger amounts of DOC are removed at 1E,during daylight by biotic and abiotic pathways. For example,the photolysis of complex organic compounds may producelabile DOC from biologically less reactive riverine and marineDOC (Moran and Zepp 1997). On the other hand, the lack ofnew production of reactive DOC and different sources of organ-ic matter, not equivalent in terms of biodegradability for hetero-trophic bacteria, could have differently affected the functionalperformance of bacterial communities between the two stations.In addition, irrigation may be an important mass transfer pro-cess. Nevertheless, it seems that at both stations DOCutilization,within incubation time, exceeds DOC production. Differencesbetween benthic and diffusive fluxes, whichwere directed out ofthe sediments, also suggest that the majority of porewater DOCwas resistant towards microbial oxidative degradation and/orthat porewater DOC differs in terms of molecular composition(i.e., different molecular weight with different diffusion
coefficient) from bottom-water DOC; thus, the diffusive fluxescould have been overestimated.
Diurnal influxes of nitrate (nitrite fluxes were negligible)reached similar values at the two stations while the ammoni-um flux was double at station 1I. This behavior could be theconsequence of intense autotrophic and heterotrophic assimi-lation but also of nitrification processes. Our data also supportthe idea that benthic microalgal community can function as aBfilter^ that controls the flux of dissolved nutrients at thesediment/water interface through assimilation and photosyn-thetic oxygenation of the sediment surface Sundbäck et al.(2000). Phosphate release, whose regeneration from sedi-ments is a slow process (Liu et al. 2004) and whose exchangesare largely controlled by the oxygen status of the sediment(Rizzo 1990), was observed only at 1I probably due to degra-dation of higher content of sedimentary organic P. The mea-sured influx of silicate was 6-fold greater at 1E suggesting ahigher uptake by microphytobenthos as confirmed by the def-initely higher abundance of benthic diatoms evidenced at thisstation (43,186±8861 cells cm−3 at 1E vs 9576±1732cells cm−3 at 1I; Rubino et al. 2015). The differences indiffusive and benthic flux of silicate likely depend also onthe remineralization of moribund, i.e., not activelyphotosynthesizing diatoms at the SWI (Warnken et al. 2007).
Summary and conclusion
1. In the Mar Piccolo of Taranto, the station 1I, placed just infront of the Navy Arsenal and more contaminated by an-thropogenic activities, is characterized by more negativeredox potential, higher biopolymeric carbon content(most of all lipids), and lower C/N ratios.
2. Steep near-surface gradients of porewater concentrationswere observed for almost all analytes with stronger gradi-ent again localized at 1I where diffusive fluxes were, withthe exception of DOC and N-NO2
−, always higher. Theseresults highlight the role of the higher contaminated site inenhancing benthic fluxes.
PCA clearly emphasized the differences between impactedand control sites in relation of their different solid phase andporewater contents characteristics.
The higher content of DIC, nutrients, and H2S in theporewater of station 1I suggest the presence of higher diage-netic activities enhancing the release of this analytes whichcould result in a higher release of contaminants as alreadyreported by several authors (Emili et al. 2012; Dang et al.2014).
3. At both stations, diurnal benthic fluxes of O2, DIC, DOC,N-NH4
+, N-NO3−, and Si-Si(OH)4 were negative while P-
PO43− efflux was negligible at 1E and low at 1I. Based on
12578 Environ Sci Pollut Res (2016) 23:12566–12581
27
oxygen diurnal influx, station 1I seems more heterotro-phic with respect to 1E.
4. The low release of P-PO43−, evidenced both by diffusive
and benthic fluxes, suggests P to be a limiting nutrient forprimary production in the Mar Piccolo of Taranto.
The great difference observed between diffusive and in situbenthic fluxes could be due to the lack of data from overnightsamples during benthic incubation, but also suggests an im-portant role of biological activity at or near the SWI.
5. The severe anthropogenic pressures suffered by the MarPiccolo of Taranto (declared SIN in 1998), which caused amulti-contamination of both inorganic and organic pollut-ants in the sediments potentially transferable to the watercolumn and to the aquatic trophic chain is of serious con-cern for its ecological relevance, also considering thewidespread fishing and mussel farming activities in thearea.
More research effort toward detailed analysis of the mobil-ity and biogeochemical fate of dissolved porewater com-pounds in relation to contaminants (focusing in a larger studyarea and on seasonal variability) are needed to obtain a betterunderstanding on the role of the sediment of the Mar Piccoloof Taranto as source of pollutants/nutrients toward the seawa-ter column.
Acknowledgments The activities described in this publication werefunded by the Project Bandiera RITMARE - La Ricerca Italiana per ilMare coordinated by the National Research Council and funded by theMinistry for Education, University and Research within the NationalResearch Programme 2011–2013. The authors are warmly grateful toNicola Cardellicchio and the team of the IAMC institute, section of Ta-ranto, for their logistical support and hospitality. Thanks are due to M.Bussi and C. Landucci from DMG Trieste for their help in grain-size andCHN analyses and to T. Cibic for environmental data reported in Table 1.We are also grateful to three anonymous reviewers for their valuablesuggestions.
References
Algeo TJ, Ingall E (2007) Sedimentary Corg:P ratios, paleocean ventila-tion and phanerozic atmospheric pO2. Palaeogeogr Palaeocl 256:130–155
Alperin MJ, Albert DB, Martens CS (1994) Seasonal variations in pro-duction and consumption rates of dissolved organic carbon in anorganic-rich coastal sediment. Geochim Cosmochim Ac 58:4909–4930
Alperin MJ, Martens CS, Albert DB, Suayah IB, Benninger LK, BlairNE, Jahnke RA (1999) Benthic fluxes and porewater concentrationprofiles of dissolved organic carbon in sediments from the NorthCarolina continental slope. Geochim Cosmochim Ac 63:427–448
Al-Rousan S, Rasheed M, Badran M (2004) Nutrient diffusive fluxesfrom sediments in the northern Gulf of Aqaba, Red Sea. Sci Mar68(4):483–490
Anschutz P, Chaillou G, Lecroart P (2007) Phosphorus diagenesis insediment of the Thau Lagoon. Estuar Coast Shelf Sci 72:447–456
Aspila KI, Agemian H, Chau AS (1976) A semi-automated method forthe determination of inorganic, organic and total phosphate in sedi-ments. Analyst 101:187–197
Berelson WM, McManus J, Severmann S, Reimers CE (2013) Benthicflux of oxygen and nutrients across Oregon/California shelf sedi-ments. Cont Shelf Res 55:66–75
Bertuzzi A, Faganeli J, Welker C, Brambati A (1997) Benthic fluxes ofdissolved inorganic carbon, nutrients and oxygen in the Gulf ofTrieste (Northern Adriatic). Water Air Soil Poll 99:305–314
Billerbeck M, Røy H, Bosselmann K, Huettel M (2007) Benthic photo-synthesis in submerged Wadden Sea intertidal flats. Estuar CoastShelf Sci 71:704–716
Blasutto O, Cibic T, De Vittor C, Fonda Umani S (2005)Microphytobenthic primary production and sedimentary carbohy-drates along salinity gradients in the lagoons of Grado and Marano(Northern Adriatic sea). Hydrobiologia 550:47–55
Bligh EG, Dyer W (1959) A rapid method for total lipid extraction andpurification. Can J Biochem Phys 37:911–917
Burdige DJ, Alperin MJ, Homstead J, Martens CS (1992) The role ofbenthic fluxes of dissolved organic carbon in oceanic and sedimen-tary carbon cycling. Geophys Res Lett 19:1851–1854
Cardellicchio N, Buccolieri A, Di LeoA, Spada L (2006) Heavymetals inmarine sediments from the Mar Piccolo of Taranto (Ionian Sea,Southern Italy). Ann Chim-Rome 96:727–741
Cardellicchio N, Annicchiarico C, Di Leo A, Giandomenico S, Spada L(2015) TheMar Piccolo of Taranto: an interesting marine ecosystemfor the environmental problems studies. Environ Sci Pollu R, in thisissue
Caroppo C, Cardellicchio N (1995) Preliminary study on phytoplanktoncommunities ofMar Piccolo in Taranto (Jonian sea). Oebalia 21:61–76
Caroppo C, Turicchia S, Margheri MC (2006) Phytoplankton assem-blages in coastal waters of the northern Ionian Sea (easternMediterranean), with special reference to cyanobacteria. J MarBiol Assoc UK 86:927–937
Cibic T, Franzo A, Celussi M, Fabbro C, Del Negro P (2012) Benthicecosystem functioning in hydrocarbon and heavy-metal contaminat-ed sediments of an Adriatic lagoon. Mar Ecol Prog Ser 458:69–87.doi:10.3354/meps09741
Cibic T, Bongiorni L, Borfecchia F, Di Leo A, Franzo A, GiandomenicoS, Karuza A, Micheli C, Rogelja M, Del Negro P (2015) Ecosystemfunctioning nearby the largest steelworks in Europe and the mainItalian naval base: the study case of the Mar Piccolo of Taranto.Environ Sci Pollu R, in this issue
Clavero V, Izquierdo JJ, Fernández NFX (2000) Seasonal fluxes of phos-phate and ammonium across the sediment-water interface in a shal-low small estuary (Palmones River, southern Spain). Mar Ecol ProgSer 198:51–60
Covelli S, Faganeli J, Horvat M, Brambati A (1999) Porewater distribu-tion and benthic flux of mercury and methylmercury in the Gulf ofTrieste (northern Adriatic Sea). Estuar Coast Shelf Sci 48:415–428
Covelli S, Faganeli J, De Vittor C, Predonzani S, Acquavita A, Horvat M(2008) Benthic fluxes of mercury species in a lagoon environment(Grado Lagoon, northern Adriatic Sea, Italy). Appl Geochem 23:529–546
Covelli S, Emili A, Acquavita A, Koron N, Faganeli J (2011) Benthicbiogeochemical cycling of mercury in two contaminated northernAdriatic coastal lagoons. Cont Shelf Res 31:1777–1789
Dang DH, Lenoble V, Durrieu G, Mullot JU, Mounier S, Garnier C(2014) Sedimentary dynamics of coastal organic matter: an assess-ment of the porewater size/reactivity model by spectroscopic tech-niques. Estuar Coast Shelf Sci 151:100–111
De Vittor C, Faganeli J, Emili A, Covelli S, Predonzani S, Acquavita A(2012) Benthic fluxes of oxygen, carbon and nutrients in theMarano
Environ Sci Pollut Res (2016) 23:12566–12581 12579
28
and Grado lagoon (Northern Adriatic sea, Italy). Estuar Coast ShelfSci 113:57–70
Dubois M, Gilles KA, Hamilton JK, Rebers P, Smith F (1956)Colorimetric method for determination of sugars and related sub-stances. Anal Chem 28(3):350–356
Dunn RJK, Robertson D, Teasdale PR, Walthman NJ (2013) Benthicmetabolism and nitrogen dynamics in an urbanized tidal creek: dom-ination of DNRA over denitrification as a nitrate reduction pathway.Estuar Coast Shelf Sci 131:271–281
Emili A, Koron N, Covelli S, Faganeli J, Acquavita A, Predonzani S, DeVittor C (2011) Does anoxia affect mercury cycling at the sediment–water interface in the Gulf of Trieste (northern Adriatic Sea)?Incubation experiments using benthic flux chambers. ApplGeochem 26:194–204
Emili A, Acquavita A, Koron N, Covelli S, Faganeli J, Horvat M, ŽižekS, Fajon V (2012) Benthic flux measurements of Hg species in anorthern Adriatic lagoon environment (Marano & Grado Lagoon,Italy). Estuar Coast Shelf Sci 113:71–84
Emili A, Acquavita A, Covelli S, Spada L, Di Leo A, Giandomenico S,Cardellicchio N (2015) Water-sediment interactions controllingheavy metals mobility in a contaminated coastal environment(Taranto, Italy). Environ Sci Pollut R in this issue
Engelsen A, Hulth S, Pihl L, Sundbäck K (2008) Benthic trophic statusand nutrient fluxes in shallow-water sediments. Estuar Coast ShelfSci 78:783–795
Fabiano M, Danovaro R, Fraschetti S (1995) A three-year time series ofelemental and biochemical composition of organic matter in subtidalsandy sediments of the Ligurian Sea (North-westernMediterranean). Cont Shelf Res 15:1453–1469
Fasham MJR, Ducklow HW, McKelvie SM (1990) A nitrogen basedmodel of plankton dynamics in the oceanic mixed layer. J Mar Res48:591–639
Fichez R (1991) Composition and fate of organic matter in submarinecave sediments; implications for the biogeochemical cycle of organ-ic carbon. Oceanol Acta 14:369–377
Fields L, Nixon SW, Oviatt C, Fulweiler RW (2014) Benthic metabolismand nutrient regeneration in hydrographically different regions onthe inner continental shelf of Southern New England. Estuar CoastShelf Sci 148:14–26
Fonselius SH (1983) Determination of hydrogen sulphide. In: GrasshofK, EhrhardtM, Kremling K (eds) Methods of seawater analysis, 2ndedn. Weinheim, Verlag Chemie, pp 73–80
Franzo A, Auriemma R, Nasi F, Vojvoda J, Pallavicini A, Cibic T, DelNegro P (2015) Benthic ecosystem functioning in the severely con-taminated Mar Piccolo of Taranto (Ionian Sea, Italy): focus on het-erotrophic pathways. Environ Sci Pollu R, in this issue
Gerchacov SM, Hatcher PG (1972) Improved technique for analysis ofcarbohydrates in sediments. Limnol Oceanogr 17:938–943
Goñi MA, Teixeira MJ, Perkey DW (2003) Sources and distribution oforganic matter in a river-dominated estuary (Winyah Bay, SC,USA). Estuar Coast Shelf Sci 57:1023–1048
Grasshoff K, Ehrhardt M, Kremling K (1983) Methods of seawater anal-ysis, 2nd edn. Weinheim, Verlag Chemie
Grenz C, Cloern JE, Hager SW, Cole BE (2000) Dynamics of nutrientcycling and related benthic nutrient and oxygen fluxes during aspring phytoplankton bloom in South San Francisco Bay (USA).Mar Ecol Prog Ser 197:67–80
Hansen HP, Koroleff F (1999) Determination of nutrients. In: GrasshoffK, Kremling K, Ehrhardt M (eds) Methods of seawater analysis, 3rdedn. Wiley-VCH, Weinheim, pp 159–228
Hartree EF (1972) Determination of proteins: a modification of the Lowrymethod that give a linear photometric response. Anal Biochem 48:422–427
Hedges JI, Stern JH (1984) Carbon and nitrogen determinations ofcarbonate-containing solids. Limnol Oceanogr 29:657–663
Hyun JH, Kim SH, Mok JS, Lee JS, An SU, Lee WC, Jung RH (2013)Impacts of long-line aquaculture of Pacific oysters (Crassostreagigas) on sulfate reduction and diffusive nutrient flux in the coastalsediments of Jinhae–Tongyeong, Korea. Mar Pollut Bull 74:187–198
Johnson KM, Burney CMMN, Sieburth J (1981) Enigmatic ma-rine ecosystem metabolism by direct diel CO2 and O2 flux inconjunction with DOC release and uptake. Mar Biol 65:49–60
Kelly JR, Nixon SW (1984) Experimental studies of the effect of organicdeposition on the metabolism of a coastal marine bottom communi-ty. Mar Ecol Prog Ser 17:157–169
Kralj M, De Vittor C, Comici C, Relitti F, Alabiso G, Del Negro P(2015) Recent evolution of the physical-chemical characteristicsof a Site of National Interest - the Mar Piccolo of Taranto (IonianSea) - and changes over the last 20 years. Environ Sci Pollu R,in this issue
Liu SM, Zhang J, Li DJ (2004) Phosphorus cycling in sedimentsof the Bohai and Yellow Seas. Estuar Coast Shelf Sci 59:209–218
Lojen S, Ogrinc N, Dolenec T, Vokal B, Szaran J, MihelčićG, Branica M(2004) Nutrient fluxes and sulfur cycling in the organic-rich sedi-ment of Makirina Bay (Central Dalmatia, Croatia). Sci TotalEnviron 327:265–284
Marsh JB, Weinstein WJ (1966) A simple charring method for determi-nation of lipids. J Lipid Res 7:574–576
Matijević S, Kušpilić G, Kljaković-Gašpić Z (2007) The redox potentialof sediment from the Middle Adriatic region. Acta Adriat 48(2):191–204
Matijević S, Bogner D, Bojanić N, Žuljević A, Despalatović M, AntolićB, Nikolić V, Bilić J (2013) Biogeochemical characteristics of sed-iments under the canopy of invasive alga Caulerpa racemosa var.cylindracea (Pelješac peninsula, Adriatic Sea). Fresen Environ Bull22(10a):3030–3040
McGlathery KJ, Anderson IC, Tyler AC (2001) Magnitude and variabil-ity of benthic and pelagic metabolism in a temperate coastal lagoon.Mar Ecol Prog Ser 216:1–15
McGlathery KJ, Sundbäck K, Anderson IC (2007) Eutrophication inshallow coastal bays and lagoons: the role of plants in the coastalfilter. Mar Ecol Prog Ser 348:1–18
Metzger E, Simonucci C, Viollier E, Sarazin G, Prévot F,Jézéquel D (2007) Benthic response to shellfish farming inThau lagoon: pore water signature. Estuar Coast Mar S 72:406–419
Middelburg JJ, Levin LA (2009) Coastal hypoxia and sediment biogeo-chemistry. Biogeosciences 6:1273–1293
Moran MA, Zepp RG (1997) Role of photoreactions in the formations ofbiologically labile compounds from dissolved organic matter.Limnol Oceanogr 42:1307–1316
Neira C, Sellanes J, Soto A, Gutiérrez D, Gallardo VA (2001) Meiofaunaand sedimentary organic matter off Central Chile: response tochanges caused by the 1997–1998 El Niño. Oceanol Acta 24:313–328
Nixon SW, Oviatt CA, Garber J, Lee V (1976) Diel metabolism andnutrient dynamics in a salt marsh embayment. Ecology 57:740–750
Ogawa H, Usui T, Koike I (2003) Distribution of dissolved organic car-bon in the East China Sea. Deep-Sea Res Pt II 5:353–366
Ogrinc N, Faganeli J (2006) Phosphorus regeneration and burial in near-shore marine sediments (the Gulf of Trieste, northern Adriatic Sea).Estuar Coast Shelf Sci 67:579–588
Ogrinc N, Faganeli J, Pezdic J (2003) Determination of organic carbonremineralization in near-shore marine sediments (Gulf of Trieste,Northern Adriatic) using stable carbon isotopes. Org Geochem 34:681–692
12580 Environ Sci Pollut Res (2016) 23:12566–12581
29
Ortega T, Ponce R, Forja J, Gómez-Parra A (2008) Benthic fluxes ofdissolved inorganic carbon in the Tinto-Odiel system (SW ofSpain). Cont Shelf Res 28:458–469
Pastore M (1993) Mar Piccolo. Nuova Eolitrice Apulia, Martina Franca(In Italian)
Pastuszak M, Conley DJ, Humborg C, Witek Z, Sitek S (2008) Silicondynamics in the Oder estuary, Baltic Sea. J Mar Syst 73:250–262
Petronio BM, Cardellicchio N, Calace N, Pietroletti M, Pietrantonio M,Caliandro L (2012) Spatial and temporal heavy metal concentration(Cu, Pb, Zn, Hg, Fe, Mn, Hg) in sediments of the Mar Piccolo inTaranto (Ionian Sea, Italy). Water Air Soil Poll 223:863–875
Pusceddu A, Sarà G, Armeni M, Fabiano M, Mazzola A (1999) Seasonaland spatial changes in the sediment organic matter of a semi-enclosed marine system (W-Mediterranean Sea). Hydrobiologia397:59–70
Pusceddu A, Dell’Anno A, Fabiano M, Danovaro R (2009) Quantity andbioavailability of sediment organic matter as signatures of benthictrophic status. Mar Ecol Prog Ser 375:41–52
Pusceddu A, Bianchelli S, Canals M, Sanchez-Vidal A, De-Madron XD,Eussner S, Lykousis V, de-Stigter H, Trincardi F, Danovaro R (2010)Organic matter in sediments of canyons and open slopes of thePortuguese, Catalan, Southern Adriatic and Cretan Sea margins.Deep-Sea Res I 57:441–457
Ram A, Zingde MD (2000) Interstitial water chemistry and nutrientsfluxes from tropical intertidal sediment. Indian J Mar Sci 29:310–318
Rasheed M, Al-Rousan S, Manasrah R, Al-Horani F (2006) Nutrientfluxes from deep sediment support nutrient budget in the oligotro-phic waters of the Gulf of Aqaba. J Oceanogr 62:83–89
Ren H, Brunelle BG, Sigman DM, Robinson RS (2013) Diagenetic alu-minum uptake into diatom frustules and the preservation of diatom-bound organic nitrogen. Mar Chem 155:92–101
Rice DL (1982) The detritus nitrogen problem: new observations andperspectives from organic geochemistry. Mar Ecol Prog Ser 9:153–162
Rizzo WM (1990) Nutrient exchange between the water column and thesubtidal benthic microalgal community. Estuaries 13:219–226
Rubino F, Cibic T, Belmonte M, Rogelja M, Del Negro P (2015) Themicrobenthic community structure and the trophic status of sedi-ments in Mar Piccolo of Taranto (Ionian Sea). Environ Sci PolluR, in this issue
Santos-Escheandia J, Prego R, Cobelo-García A, Millward GE (2009)Porewater geochemistry in a Galician Ria (NW Iberian Peninsula):implications for benthic fluxes of dissolved trace elements (Co, Cu,Ni, Pb, V, Zn). Mar Chem 117:77–87
Sospedra J, Falco S, Morata T, Gadea I, Rodilla M (2015) Benthic fluxesof oxygen and nutrients in sublittoral fine sands in a north-westernMediterranean coastal area. Cont Shelf Res 97:32–42
Spada L, Annicchiarico C, Cardellicchio N, Giandomenico S, Di Leo A(2012) Mercury and methylmercury concentrations inMediterranean seafood and surface sediments, intake evaluationand risk for consumers. Int J Hyg Envir Heal 215:418–426
Spagnoli F, Bergamini MC (1997) Water-sediment exchange ofnutrients during early diagenesis and resuspension of anoxicsediments from the Northern Adriatic Sea shelf. Water AirSoil Poll 99:541–556
Sugimura Y, Suzuki Y (1988) A high temperature catalytic oxidationmethod for the determination of non-volatile dissolved organic car-bon in seawater by direct injection of liquid sample. Mar Chem 24:105–131
Sundbäck K, Miles A, Göransson E (2000) Nitrogen fluxes, denitrifica-tion and the role of microphytobenthos in microtidal shallow-watersediments: an annual study. Mar Ecol Prog Ser 200:59–76
Sundby B, Gobeil C, Silverberg N, Mucci A (1992) The phosphoruscycle in coastal marine sediments. Limnol Oceanogr 37(6):1129–1145
Ullman WJ, Aller RC (1982) Diffusion coefficients in nearshore marinesediments. Limnol Oceanogr 27:552–556
Warnken KW, Santschi PH, Roberts LA, Gill GA (2007) The cycling andoxidation pathways of organic carbon in a shallow estuary along theTexas Gulf Coast. Estuar Coast Shelf Sci 76(1):69–84
Zhang L, Wang L, Yin K, Lü Y, Zhang D, Yang Y, Huang X (2013) Porewater nutrient characteristics and the fluxes across the sediment inthe Pearl River estuary and adjacent waters, China. Estuar CoastShelf Sci 133:182–192
Environ Sci Pollut Res (2016) 23:12566–12581 12581
30
31
CHAPTER 3
Recent evolution of the physical–chemical characteristics of a Site of
National Interest—the Mar Piccolo of Taranto (Ionian Sea)— and
changes over the last 20 years
Martina Kralj1*, Cinzia De Vittor1, Cinzia Comici1, Federica Relitti1,2, Rocco Auriemma1,
Giorgio Alabiso3, Paola Del Negro1
1 Oceanography Division, OGS (Istituto Nazionale di Oceanografia e di Geofisica Sperimentale), Trieste, Italy
2 Department of Life Science, University of Trieste, Trieste, Italy
3 Consiglio Nazionale delle Ricerche, Istituto Ambiente Marino Costiero (IAMC)
*Corresponding author: Martina Kralj
OGS (Istituto Nazionale di Oceanografia e di Geofisica Sperimentale), Oceanography Division
Via A. Piccard 54, 34151 Trieste, Italy
Tel.: +39 040 2249746
email: [email protected]
Published in Environmental Science and Pollution Research
DOI 10.1007/s11356-015-5198-8
INTEGRATED ENVIRONMENTAL CHARACTERIZATION OF THE CONTAMINATEDMARINE COASTAL AREA OF TARANTO, IONIAN SEA (SOUTHERN ITALY) - THE RITMARE PROJECT
Recent evolution of the physical–chemical characteristics of a Siteof National Interest—the Mar Piccolo of Taranto (Ionian Sea)—and changes over the last 20 years
Martina Kralj1 & Cinzia De Vittor1 & Cinzia Comici1 & Federica Relitti1,2 &
Rocco Auriemma1 & Giorgio Alabiso3 & Paola Del Negro1
Received: 9 April 2015 /Accepted: 10 August 2015 /Published online: 26 August 2015# Springer-Verlag Berlin Heidelberg 2015
Abstract The Mar Piccolo of Taranto, classified as a ‘Site ofNational Interest’ (SIN), is a semi-enclosed basin divided intotwo inlets with lagoon features and sea influences, seriouslyaffected by anthropic activities. In the framework of theRITMARE project, a study has been carried out to evaluatethe functionality of this ecosystem. As part of this work, mea-surements of the water abiotic parameters were performed inorder to assess the physical–chemical features of this area afterthe activation, in the last decade, of treatment plants for vari-ous urban and industrial dumping. Seawater intrusions andcontinental inputs, as well as several submarine freshwatersprings, clearly affect physical–chemical characteristics ofthe water column in the two inlets. This finding suggests thatsmall-scale patterns in water circulation have the potential toinfluence the chemical properties of the seawater. The com-parison with a 20-year dataset reveals a drastic decrease innutrient concentrations after the year 2000, validating thefunctionality of the treatment plants. The reduction of nutrientinputs into the basin (up to −90 % in the first inlet character-ized by lower hydraulic residence time) has changed the bio-geochemical characteristics of the Mar Piccolo from beingrelatively eutrophic to moderately oligotrophic.
Keywords Mar Piccolo of Taranto . Site of National Interest .
Long-termmonitoring . Nutrients . Chlorophyll a . Dissolvedand particulate carbon
Introduction
Coastal areas, lagoons and transitional areas form unique tran-sitional systems as they are closely linked to both marine andterrestrial factors. The increase of municipal and industrialwaters discharge, as consequence of the growth of humanpopulation and the development of agriculture, aquacultureand industrial activities, has led to environmental degradationto both water column and benthic habitats in these fragileareas. One of the worldwide largest issues caused by the in-crease of anthropogenic inputs is eutrophication, especially inareas with limited water exchange and restricted flushing, asestuaries (Cerco and Noel 2007; Mallin et al. 2005; Lopeset al. 2007), salt marshes and lagoons (Magni et al. 2008;Souchu et al. 1998; Velasco et al. 2006). Several studies haveprovided evidence of the sensitivity of marine systems tochanges in nutrient loading and it has been highlighted thatthe intensity and frequency of eutrophication-related waterquality problems are often (but not always) correlated withthe supply rates of N and P to the receiving waters (Smithet al. 2006 and references therein). As reported for variouscoastal systems within the past four decades (Pinckney et al.2001; Kemp et al. 2005; Cloern and Dufford 2005), alsomanyItalian estuarine and coastal waters have changed from bal-anced and productive ecosystems to ones experiencing suddentrophic changes, biochemical alterations and a deterioration inthe quality of natural habitats.
The identification of this problem has prompted manage-ment of discharges, through the construction, implementationor relocation (e.g. in the New River Estuary, North Carolina,
Responsible editor: Philippe Garrigues
* Martina [email protected]
1 Sezione Oceanografia, OGS (Istituto Nazionale di Oceanografia eGeofisica Sperimentale), Via A. Piccard 54, 34151 Trieste, Italy
2 Department of Life Sciences, University of Trieste, Via L. Giorgieri10, 34127 Trieste, Italy
3 Consiglio Nazionale delle Ricerche, Istituto Ambiente MarinoCostiero (IAMC), Via Roma 3, 74123 Taranto, Italy
Environ Sci Pollut Res (2016) 23:12675–12690DOI 10.1007/s11356-015-5198-8
32
Mallin et al. 2005; in Massachusetts Bay, Oviatt et al. 2007; inthe Boston Harbor, Taylor et al. 2011) of treatment plants andhas allowed the reduction of organic matter and nutrient inputs(Conley et al. 2002).
This is the case of the area of Taranto, which during the1960s was inundated by an intense industrialization process,with the construction of a large industrial district thatcompletely changed the inner natural marine and land envi-ronment. The Mar Piccolo basin, in addition to the inlets ofwaters from the inland high-cultivated region and the munic-ipality sewage pipes, became affected by numerous industrialand military wastewater discharges. Also the extensive fishingand aquaculture (Cardellicchio et al. 2006), in particular mus-sel culture, have led to the reduction of the environmentalquality. Indeed, Mar Piccolo houses the biggest mussel farmin Italy, with plants widely distributed in both the inlets cov-ering the 61 % of the total surface producing about 30,000 tons year−1 (Cardellicchio et al. 2015). Even if the exten-sive mussel cultivation is considered to have low impactscompared to fish farming, as it does not require any inputsof feeds, and bivalves can act as a buffer against eutrophica-tion processes by controlling the phytoplankton biomasses,the intense filtration, coupled with the production and thesubsequent deposition of faeces and pseudofaeces, increasesinputs of labile organic matter to the superficial sediment. Thisorganic matter load, which can be two to three times higherunderneath the mussel farm compared to ambient outside thefarm, fuels mineralisation processes, stimulating both aerobicand anaerobic metabolism, and nutrient recycling back to thewater column by enhancing benthic fluxes (Nizzoli et al.2005; Souchu et al. 2001; Christensen et al. 2003). Further-more, the use of the waters in the cooling system of the steelfactory quickened the circulation and reduced the flushingtimes of the waters in the basin to 2–3 weeks and increasedthe salinity due to the input of waters from the Mar Grande(Caroppo et al. 2012; Umgiesser et al. 2007). These numerousanthropogenic activities influenced the biogeochemical char-acteristics of waters and sediments, making the area seriouslypolluted by heavy metals and organics (Cardellicchio et al.2007; Petronio et al. 2012). Moreover, the increase in the rateof supply of organic matter, the nutrients loading and thescarce hydrodynamism (De Serio et al. 2007) determinedstrong eutrophication events in the area (Alabiso et al. 1997,2005; Caroppo and Cardellicchio 1995).
In 1998, with the Italian Legislative decree 426, the area ofMar Piccolo was declared a Site of National Interest for itshigh pollution. Under this initiative, the Italian Governmentenacted laws, in September 2001, in order to plan the remedi-ation and environmental cleaning up. Since then, 7 of the 14municipal discharges were fitted out with treatment plants orrelocated to the Gulf of Taranto, with the consequent loweringof nutrient discharges and the improvement of the waterquality.
Numerous studies have been done on the Mar Piccolo ba-sin to estimate the impact of the anthropic activities on itsphysical–chemical characteristics up to the year 2009 (Alabisoet al. 1997, 2005, 2006; Caroppo and Cardellicchio 1995;Cavallo et al. 1999; Giacomini and Alabiso 2006; Umgiesseret al. 2007; Zaccone et al. 2005).
In order to evaluate the effectiveness of the treatment plantsand the relocation of the sewage discharges for the reductionof eutrophication and the improvement of water quality of theMar Piccolo of Taranto, two surveys in 2013 and two in 2014have been performed, and data obtained were comparedwith a20-year dataset. The aim was to achieve an overall physical–chemical evaluation of the environmental conditions of thisarea, useful for the planning of integrate long-term remedia-tion actions required by the Water Framework Directive(WFD 2000/60/EC), which addresses all surface waters andgroundwaters, and the Marine Strategy Framework Directive(MSFD 2008/56/EC), which establishes a framework for ma-rine environmental policy.
Materials and methods
Study site
The Mar Piccolo of Taranto is an inner and semi-enclosedshallow sea located in the northern area of the Taranto Town(Fig. 1). It has a surface area of 20.72 km2 and is divided by apromontory in two smaller basins named First and SecondInlet (FI and SI). The area is characterized by shallow waters;maximum depths are reached in the centre of the FI (15m) andin the central part of the SI (10 m) (Pastore 1993).
The FI is directly connected with Mar Grande through twoconnection channels: the Navigabile channel and the PortaNapoli channel. The fluxes of water through these inlets aregenerally weak and depend on the difference of density be-tween the two basins. Most of the water inputs derive fromnumerous small surface watercourses and 34 submarine fresh-water springs, called ‘Citri’, which influence the salinity andthe temperature of both inlets (Vatova 1972). The two mostimportant ‘Citri’ for the freshwater discharges are CitroGaleso in the FI (0.6 m3 s−1) and Citro Copre in the SI (0.1–1.2 m3 s−1) (Umgiesser et al. 2007). As more than 80 % of theprovince of Taranto is used for farming, in particular for thecultivation of wheat, cereal crops and fodder (Calabrese et al.2014), freshwater inputs carry chemicals drained from thesurrounding agricultural soils in the basin (Caroppo et al.2008; Di Leo et al. 2010). Furthermore, until the year 2000,the discharges of 14 sewage pipes from the nearby townsamounted to 0.21 m3 s−1, whereof 85 % in the SI (Caroppoet al. 2008).
The basin is generally characterized by low velocity cur-rents (about 5–10 cm s−1) driven by the sea tides, with the
12676 Environ Sci Pollut Res (2016) 23:12675–12690
33
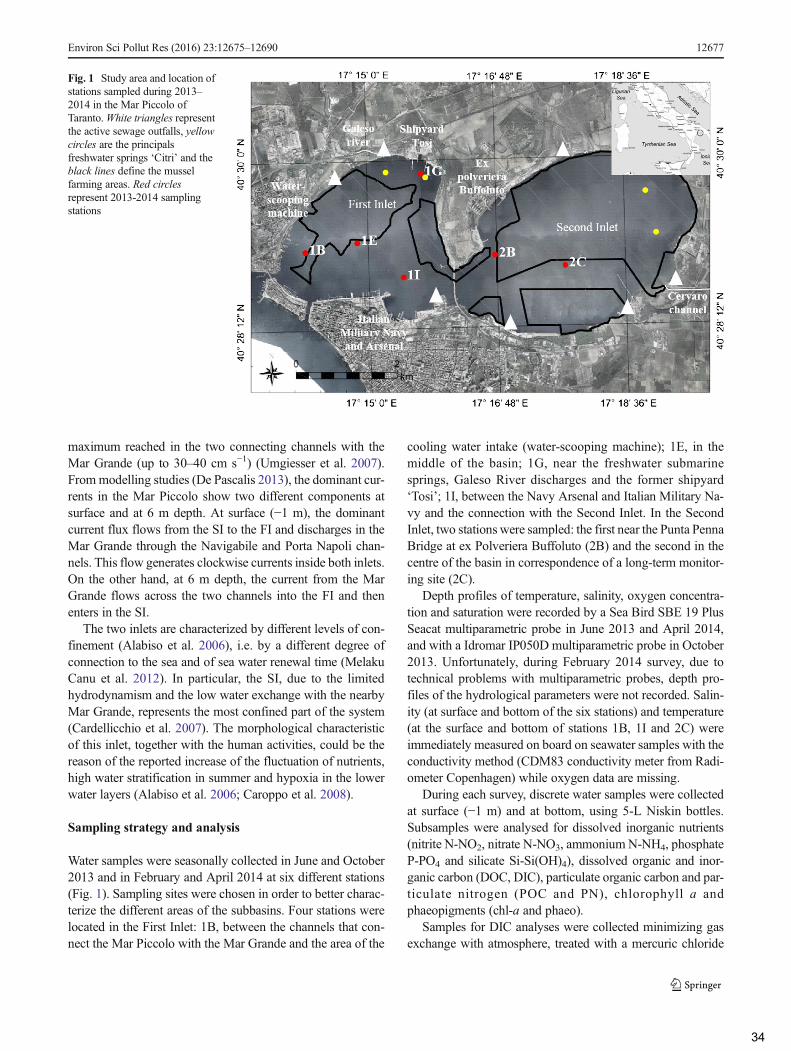
maximum reached in the two connecting channels with theMar Grande (up to 30–40 cm s−1) (Umgiesser et al. 2007).Frommodelling studies (De Pascalis 2013), the dominant cur-rents in the Mar Piccolo show two different components atsurface and at 6 m depth. At surface (−1 m), the dominantcurrent flux flows from the SI to the FI and discharges in theMar Grande through the Navigabile and Porta Napoli chan-nels. This flow generates clockwise currents inside both inlets.On the other hand, at 6 m depth, the current from the MarGrande flows across the two channels into the FI and thenenters in the SI.
The two inlets are characterized by different levels of con-finement (Alabiso et al. 2006), i.e. by a different degree ofconnection to the sea and of sea water renewal time (MelakuCanu et al. 2012). In particular, the SI, due to the limitedhydrodynamism and the low water exchange with the nearbyMar Grande, represents the most confined part of the system(Cardellicchio et al. 2007). The morphological characteristicof this inlet, together with the human activities, could be thereason of the reported increase of the fluctuation of nutrients,high water stratification in summer and hypoxia in the lowerwater layers (Alabiso et al. 2006; Caroppo et al. 2008).
Sampling strategy and analysis
Water samples were seasonally collected in June and October2013 and in February and April 2014 at six different stations(Fig. 1). Sampling sites were chosen in order to better charac-terize the different areas of the subbasins. Four stations werelocated in the First Inlet: 1B, between the channels that con-nect the Mar Piccolo with the Mar Grande and the area of the
cooling water intake (water-scooping machine); 1E, in themiddle of the basin; 1G, near the freshwater submarinesprings, Galeso River discharges and the former shipyard‘Tosi’; 1I, between the Navy Arsenal and Italian Military Na-vy and the connection with the Second Inlet. In the SecondInlet, two stations were sampled: the first near the Punta PennaBridge at ex Polveriera Buffoluto (2B) and the second in thecentre of the basin in correspondence of a long-term monitor-ing site (2C).
Depth profiles of temperature, salinity, oxygen concentra-tion and saturation were recorded by a Sea Bird SBE 19 PlusSeacat multiparametric probe in June 2013 and April 2014,and with a Idromar IP050D multiparametric probe in October2013. Unfortunately, during February 2014 survey, due totechnical problems with multiparametric probes, depth pro-files of the hydrological parameters were not recorded. Salin-ity (at surface and bottom of the six stations) and temperature(at the surface and bottom of stations 1B, 1I and 2C) wereimmediately measured on board on seawater samples with theconductivity method (CDM83 conductivity meter from Radi-ometer Copenhagen) while oxygen data are missing.
During each survey, discrete water samples were collectedat surface (−1 m) and at bottom, using 5-L Niskin bottles.Subsamples were analysed for dissolved inorganic nutrients(nitrite N-NO2, nitrate N-NO3, ammoniumN-NH4, phosphateP-PO4 and silicate Si-Si(OH)4), dissolved organic and inor-ganic carbon (DOC, DIC), particulate organic carbon and par-ticulate nitrogen (POC and PN), chlorophyll a andphaeopigments (chl-a and phaeo).
Samples for DIC analyses were collected minimizing gasexchange with atmosphere, treated with a mercuric chloride
Fig. 1 Study area and location ofstations sampled during 2013–2014 in the Mar Piccolo ofTaranto.White triangles representthe active sewage outfalls, yellowcircles are the principalsfreshwater springs ‘Citri’ and theblack lines define the musselfarming areas. Red circlesrepresent 2013-2014 samplingstations
Environ Sci Pollut Res (2016) 23:12675–12690 12677
34
solution in order to prevent biological activity and stored re-frigerated until analyses. Samples for dissolved inorganic nu-trients and DOC were filtered on board on pre-combustedWhatman GF/F filters and kept frozen (−20 °C) until labora-tory analysis. Dissolved inorganic nutrients were determinedwith a segmented flow Bran+Luebbe AutoAnalyzer 3 follow-ing standard colorimetric methods (Hansen and Koroleff1999). The detection limits of nutrient concentrations reportedby the analytical methods are 0.02, 0.02, 0.04, 0.02 and0.02 μM, respectively, for N-NO2, N-NO3, N-NH4, P-PO4
and Si-Si(OH)4. The accuracy and precision of the analyticalprocedures at low concentrations are checked annuallythrough the quality assurance programme QUASIMEMEand the relative coefficient of variation for five replicateswas less than 5 %. Internal quality control samples were usedduring each analysis.
DIC and DOC were determined using the Shimadzu TOC-V CSH analyser. For DIC, samples were injected into theinstrument port and directly acidified with phosphoric acid(25 %). For DOC analysis, water samples were previouslyacidified (automatically into instrument syringe, 2 %–6 MHCl) and after CO2 elimination, the concentration was deter-mined using a high temperature catalytic method (Sugimuraand Suzuki 1988). Phosphoric acidification for DIC and com-bustion conducted at 680 °C on a catalyst bed for DOC, gen-erated CO2 that was carried to a non-dispersive infrared de-tector (NDIR). Analysis from a minimum of three injectionsshowed a variation coefficient <2 % and the reproducibility ofthe method tested with replicate field sampling was between1.5 and 3 %. DOC results are periodically referenced againstthe international community of DOC analysts by using con-sensus reference material (CRM—University of Miami). Theinstrumental limit of detection (with high sensitivity measure-ment kit) is 0.33 μM, while it was 1–2 μM defined frommeasurement of certificated low carbon water (University ofMiami) treated in the same way as samples. Analytical resultsfrom certified reference seawater of Quasimeme LaboratoryPerformance Study indicated a good agreement between de-termined concentrations and the certified values.
Subsamples for chlorophyll a analysis were stored in thedark and kept at 4 °C until filtration through 47 mmWhatmanGF/F filters that were then stored frozen (−20 °C) until labo-ratory analysis. Pigments were extracted overnight (4 °C) with90 % acetone from the homogenate filter and determinedspectrofluorometrically according to Lorenzen and Jeffrey(1980). The measurements of chl-a and phaeo were per-formed, respectively, before and after acidification with twodrops of HCl 1N using JASCO FP 6500 spectrofluorometer.The coefficient of variation for three replicate samples waslower than 5 %, and the detection limit, defined as twice thestandard deviation of three blank filters treated in the sameway as samples, was 0.002 and 0.068 μg L−1 for chl-a andphaeo, respectively. The procedures were quality controlled
and monitored by participation in the QUASIMEME intercal-ibration programme.
POC and PN were measured using an elemental analyserCHNO-S Costech mod. ECS 4010 applying the methods per-formed by Pella and Colombo (1973) and Sharp (1974). Twosubsamples of about 0.5 L each were filtered on 25-mmWhatman GF/F pre-combusted filters and were stored frozenat −20 °C. Before analysis, the filter was treated with theaddition of 200 μl of HCl 1N to remove the carbonate andthen dried in oven at 60 °C for about 1 h with the similarmethod of Lorrain et al. (2003). Before the analysis, the filterwas inserted in a 10×10-mm tin capsule. Known amounts ofstandard acetanilide (C8H9NO—Carlo Erba; assay≥99.5 %)were used to calibrate the instrument. The detection limit forPN and POC, defined as twice the standard deviation of theblank (5–10 blank 25-mm filters), were 0.01 μmol-N L−1 and0.001 μmol-C L−1, respectively. The relative standard devia-tions for three replicates of internal quality control samplereplicates were lower than 10 %. The accuracy of the methodis verified periodically against the certified marine sedimentreference material PACS-2 (National Research CouncilCanada).
Historical datasets (1991–2009)
The data obtained during the four-season surveys in the years2013–2014 were compared with older data collected in thearea in the periods between 1991 and 2009. This historicaldata are available from separate datasets deriving from differ-ent projects (with different sampling points) on hydro-biochemical and plankton distribution in the Mar Piccolo.
& March 1991–February 1992, surface and bottom monthlydata from one station in each inlet of the basin (Caroppoand Cardellicchio 1995).
& June 1993–July 1994, monthly surface data from four sta-tions in the FI and three stations in the SI (Alabiso et al.1997).
& January 1996–December 2004, surface and bottom data atseven stations (four in the FI and three in the SI) (Alabisoet al. 2005, 2006; Giacomini and Alabiso 2006).
& January 2005–October 2009, surface samples of the sameseven stations (Alabiso, unpublished data)
As, starting from 2000, the number of sewage pipes hasbeen progressively reduced (Caroppo et al. 2010), the wholedataset was subdivided in two sampling periods: 1991–2000and 2001–2009. Only the surface data were considered in theelaboration of the dataset because there was too little data frombottom depth.
The monthly evolution of the two groups of data for eachinlet is represented by a graphical depiction, using box andwhisker plots. This kind of plot represents the distribution of
12678 Environ Sci Pollut Res (2016) 23:12675–12690
35
data around the median, symbolized by the central line, thebox gives the interval between 25 and 75 % percentiles, thesegment indicates the range and the points the outliers. For the2013–2014 dataset, the surface data were averaged for eachinlet and graphically drawn as red diamonds in the secondgroup of data.
Data elaboration and statistical analyses
Graphical representations and statistical analyses were per-formed using Golden Software Grapher 9, R statistical soft-ware (R Development Core Team 2011) and Primer-E Soft-ware package v7.0 (Plymouth Marine Laboratory, UK) ac-cording with Clarke and Warwick (2001). Different statisticalanalyses were performed on data in order to define trends andsignificant differences in the study area among the investigat-ed periods and between inlets. The normality of the data wasassessed with the Shapiro–Wilk test. Due to their non-normaldistribution, a non-parametric approach was adopted. Spear-man rank correlation analyses were performed on all the mea-sured parameters, in order to examine significant relationshipsbetween the variables. Statistically significant differencesamong surveys and inlets for each parameter were tested withthe ANOVA Kruskal–Wallis rank sum test. Principal compo-nent analysis (PCA), used to investigate patterns in the relativecommon variables over the stations and to compare the pres-ent situation with the former datasets, was performed on nor-malized variables after z-standardization. Tests for significantdifferences between the inlets and the surveys for the moni-tored variables were performed using the two-way crossedanalysis of similarities (ANOSIM) test, which was performedconsidering all the studied variables, except for the parametersBDepth^ and BTemperature^ which could influence thestatistics.
In order to assess the differences in water characteristics inresponse to the implementation of the treatment plants, aANOSIM test was performed. The statistics was applied forthe evaluation of the differences between the period 1991–2000 and 2001–2009 and between these two datasets andthe data collected on 2013–2014.
R statistics for PCA andANOSIMwere interpreted accord-ing to Clarke and Warwick (2015): R<0.25=no differences invariables pattern; 0.25<R<0.50=variables among the stationsare overlapping but differ to a certain degree; R>0.50=param-eters among the stations are different.
Results
Hydrology
Even if some data from February 2014 survey are lacking,general trends of hydrological parameters can be inferred.
During 2013–2014, temperature, as expected, showed amarked dependency on seasonal conditions (Fig. 2). Surfacemaxima were registered in June in the SI (24.25±0.98 °C)while at the bottom the highest temperatures were measured,at both inlets, in October (23.91±0.33 °C). Minima werereached, at both inlets, in February, with values of 12.09±0.14 and 13.06±0.22 °C, at surface and bottom, respectively.In June, the water column was generally characterized bythermal stratification favoured by the increasing air tempera-ture, with surface values in the FI lower than in the SI, andsimilar temperature at the bottom waters of both inlets. In thesame month, the maximum surface–bottom gradient (2.5 °C)was registered at the SI. During October, a seasonal reversethermocline developed in both inlets at depths varyingfrom 4 to 7 m. In April, a strong decrease of tempera-ture was detected in both inlets, and the water columnresulted quite homogeneous but SI showed weaklyhigher values than FI.
At each survey, vertical profile of salinity (only surface andbottom data for February survey) showed a positive surface–bottom gradient (Fig. 2). Both at surface and bottom, the max-imum of salinity was reached in October (37.60 and 39.04,respectively) and the minimum in February (34.32 and 35.71,respectively).
In June, due to the different influence of freshwatersprings in the area, the two inlets were characterized bya wide range of salinity values and by marked stratifi-cation. The halocline depth was quite variable: from 3to 8 m, in the FI, and at 4 m, in the SI. In October, thefirst 4–5 m of the water column was homogenous(∼37.5), while the variability persisted in the deeperwaters, where the halocline was still present. In Febru-ary, the surface mean salinity lowered to 35.12±0.68with the minimum at St. 1E and the maximum at St.1I. The bottom average salinity was 37.10±1.07, withthe minimum in the St. 1G and the maximum in 1I.Water column stratification weakened in April when,with the exception of St. 1B (S=35.10), the surfacesalinity averaged 35.69±0.13, even if vertical profilesshowed a slight increase.
In June, dissolved oxygen (DO) concentrations (Fig. 2)varied from ∼5 to ∼6 mL L−1 with the exceptions of the strongdepletion evidenced at surface of St. 1B (3.99 mL L−1) and ofthe strong increase up to 7.79 mL L−1 in the deeper layer of St.2B. In October, the two inlets were definitely more oxygenat-ed with DO mean concentrations of 7.43±1.29 mL L−1. Ver-tical profiles resulted homogeneous in all stations with theonly exception of the St. 1I, characterized by waters enrichedin DO at surface and depleted at bottom. In April, the studyarea showed a general decrease in DO concentrations widelyranging from 4.80 mL L−1, at surface of St. 1G, to7.03 mL L−1 at bottom of St. 2B. No occurrence of anoxiawas evidenced during the studied period. Unfortunately,
Environ Sci Pollut Res (2016) 23:12675–12690 12679
36
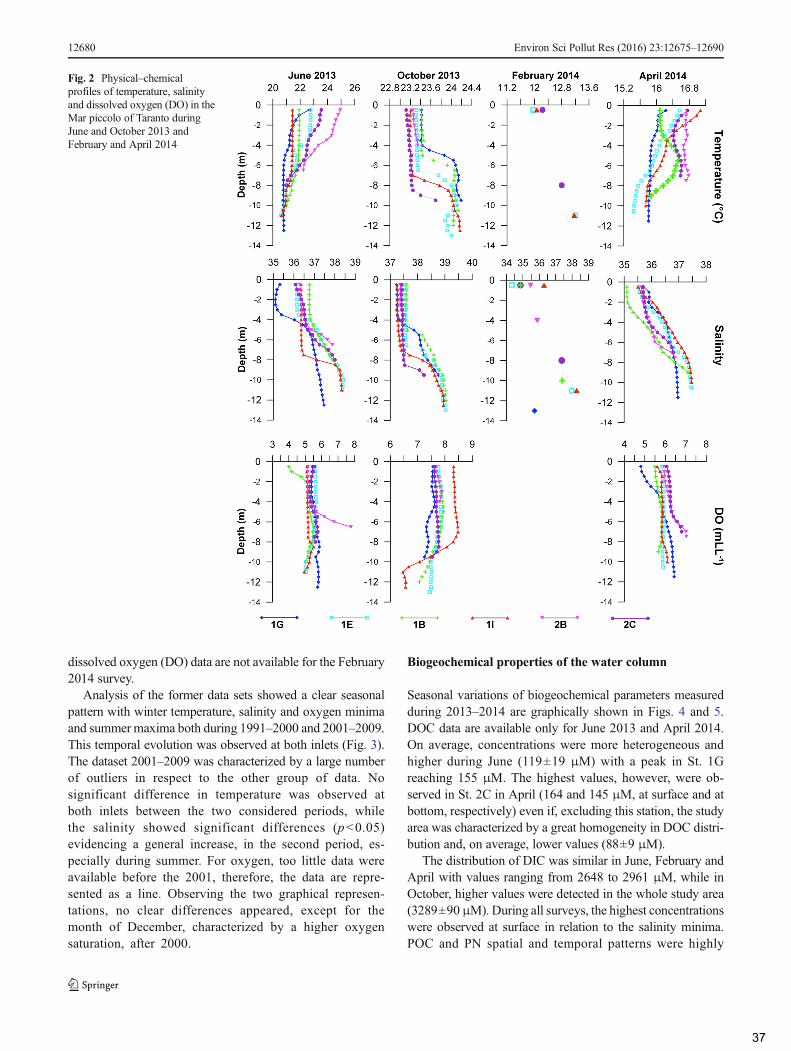
dissolved oxygen (DO) data are not available for the February2014 survey.
Analysis of the former data sets showed a clear seasonalpattern with winter temperature, salinity and oxygen minimaand summer maxima both during 1991–2000 and 2001–2009.This temporal evolution was observed at both inlets (Fig. 3).The dataset 2001–2009 was characterized by a large numberof outliers in respect to the other group of data. Nosignificant difference in temperature was observed atboth inlets between the two considered periods, whilethe salinity showed significant differences (p<0.05)evidencing a general increase, in the second period, es-pecially during summer. For oxygen, too little data wereavailable before the 2001, therefore, the data are repre-sented as a line. Observing the two graphical represen-tations, no clear differences appeared, except for themonth of December, characterized by a higher oxygensaturation, after 2000.
Biogeochemical properties of the water column
Seasonal variations of biogeochemical parameters measuredduring 2013–2014 are graphically shown in Figs. 4 and 5.DOC data are available only for June 2013 and April 2014.On average, concentrations were more heterogeneous andhigher during June (119±19 μM) with a peak in St. 1Greaching 155 μM. The highest values, however, were ob-served in St. 2C in April (164 and 145 μM, at surface and atbottom, respectively) even if, excluding this station, the studyarea was characterized by a great homogeneity in DOC distri-bution and, on average, lower values (88±9 μM).
The distribution of DIC was similar in June, February andApril with values ranging from 2648 to 2961 μM, while inOctober, higher values were detected in the whole study area(3289±90μM). During all surveys, the highest concentrationswere observed at surface in relation to the salinity minima.POC and PN spatial and temporal patterns were highly
Fig. 2 Physical–chemicalprofiles of temperature, salinityand dissolved oxygen (DO) in theMar piccolo of Taranto duringJune and October 2013 andFebruary and April 2014
12680 Environ Sci Pollut Res (2016) 23:12675–12690
37
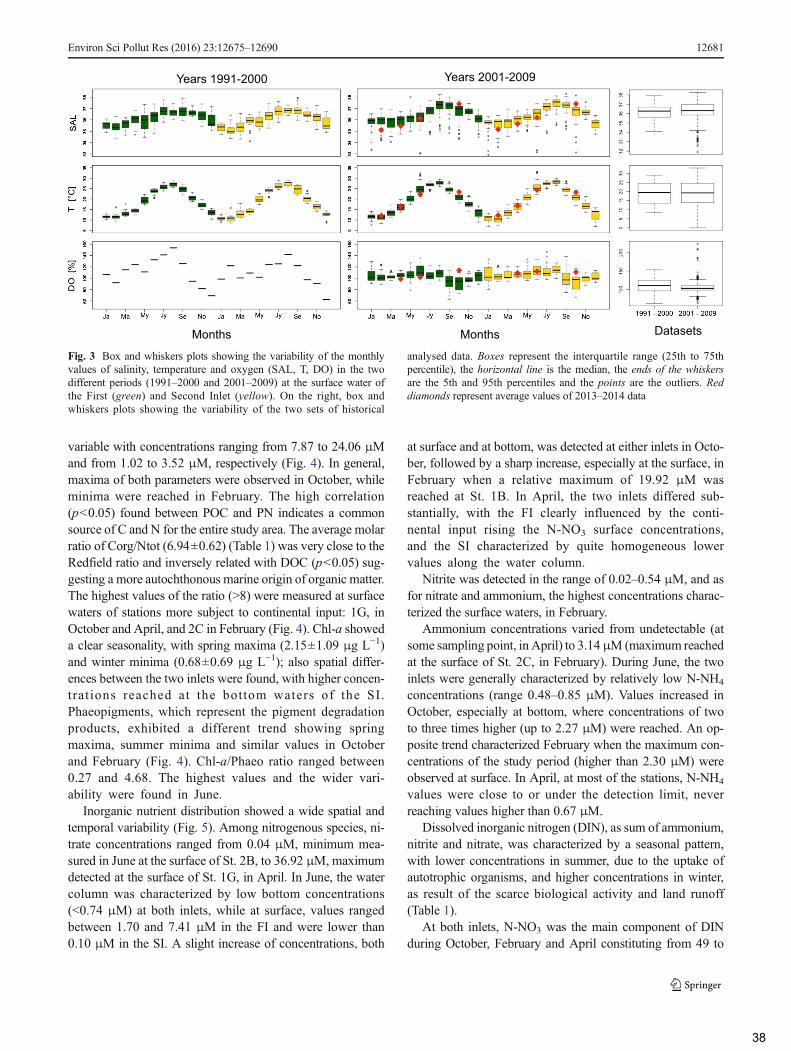
variable with concentrations ranging from 7.87 to 24.06 μMand from 1.02 to 3.52 μM, respectively (Fig. 4). In general,maxima of both parameters were observed in October, whileminima were reached in February. The high correlation(p<0.05) found between POC and PN indicates a commonsource of C and N for the entire study area. The average molarratio of Corg/Ntot (6.94±0.62) (Table 1) was very close to theRedfield ratio and inversely related with DOC (p<0.05) sug-gesting a more autochthonous marine origin of organic matter.The highest values of the ratio (>8) were measured at surfacewaters of stations more subject to continental input: 1G, inOctober and April, and 2C in February (Fig. 4). Chl-a showeda clear seasonality, with spring maxima (2.15±1.09 μg L−1)and winter minima (0.68±0.69 μg L−1); also spatial differ-ences between the two inlets were found, with higher concen-trat ions reached at the bottom waters of the SI.Phaeopigments, which represent the pigment degradationproducts, exhibited a different trend showing springmaxima, summer minima and similar values in Octoberand February (Fig. 4). Chl-a/Phaeo ratio ranged between0.27 and 4.68. The highest values and the wider vari-ability were found in June.
Inorganic nutrient distribution showed a wide spatial andtemporal variability (Fig. 5). Among nitrogenous species, ni-trate concentrations ranged from 0.04 μM, minimum mea-sured in June at the surface of St. 2B, to 36.92 μM, maximumdetected at the surface of St. 1G, in April. In June, the watercolumn was characterized by low bottom concentrations(<0.74 μM) at both inlets, while at surface, values rangedbetween 1.70 and 7.41 μM in the FI and were lower than0.10 μM in the SI. A slight increase of concentrations, both
at surface and at bottom, was detected at either inlets in Octo-ber, followed by a sharp increase, especially at the surface, inFebruary when a relative maximum of 19.92 μM wasreached at St. 1B. In April, the two inlets differed sub-stantially, with the FI clearly influenced by the conti-nental input rising the N-NO3 surface concentrations,and the SI characterized by quite homogeneous lowervalues along the water column.
Nitrite was detected in the range of 0.02–0.54 μM, and asfor nitrate and ammonium, the highest concentrations charac-terized the surface waters, in February.
Ammonium concentrations varied from undetectable (atsome sampling point, in April) to 3.14μM (maximum reachedat the surface of St. 2C, in February). During June, the twoinlets were generally characterized by relatively low N-NH4
concentrations (range 0.48–0.85 μM). Values increased inOctober, especially at bottom, where concentrations of twoto three times higher (up to 2.27 μM) were reached. An op-posite trend characterized February when the maximum con-centrations of the study period (higher than 2.30 μM) wereobserved at surface. In April, at most of the stations, N-NH4
values were close to or under the detection limit, neverreaching values higher than 0.67 μM.
Dissolved inorganic nitrogen (DIN), as sum of ammonium,nitrite and nitrate, was characterized by a seasonal pattern,with lower concentrations in summer, due to the uptake ofautotrophic organisms, and higher concentrations in winter,as result of the scarce biological activity and land runoff(Table 1).
At both inlets, N-NO3 was the main component of DINduring October, February and April constituting from 49 to
Years 1991-2000 Years 2001-2009
MonthsMonths Datasets
Fig. 3 Box and whiskers plots showing the variability of the monthlyvalues of salinity, temperature and oxygen (SAL, T, DO) in the twodifferent periods (1991–2000 and 2001–2009) at the surface water ofthe First (green) and Second Inlet (yellow). On the right, box andwhiskers plots showing the variability of the two sets of historical
analysed data. Boxes represent the interquartile range (25th to 75thpercentile), the horizontal line is the median, the ends of the whiskersare the 5th and 95th percentiles and the points are the outliers. Reddiamonds represent average values of 2013–2014 data
Environ Sci Pollut Res (2016) 23:12675–12690 12681
38
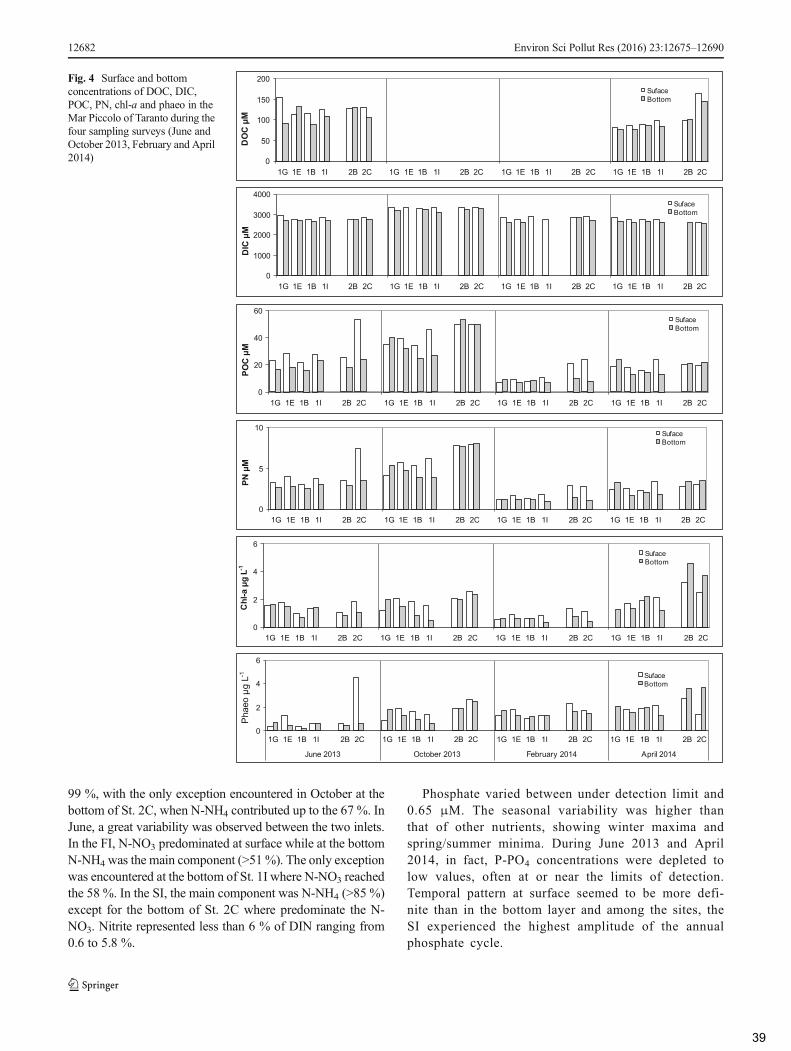
99 %, with the only exception encountered in October at thebottom of St. 2C, when N-NH4 contributed up to the 67 %. InJune, a great variability was observed between the two inlets.In the FI, N-NO3 predominated at surface while at the bottomN-NH4 was the main component (>51%). The only exceptionwas encountered at the bottom of St. 1I where N-NO3 reachedthe 58 %. In the SI, the main component was N-NH4 (>85 %)except for the bottom of St. 2C where predominate the N-NO3. Nitrite represented less than 6 % of DIN ranging from0.6 to 5.8 %.
Phosphate varied between under detection limit and0.65 μM. The seasonal variability was higher thanthat of other nutrients, showing winter maxima andspring/summer minima. During June 2013 and April2014, in fact, P-PO4 concentrations were depleted tolow values, often at or near the limits of detection.Temporal pattern at surface seemed to be more defi-nite than in the bottom layer and among the sites, theSI experienced the highest amplitude of the annualphosphate cycle.
DO
C µ
M
0
50
100
150
200
1G 1E 1B 1I 2B 2C 1G 1E 1B 1I 2B 2C 1G 1E 1B 1I 2B 2C 1G 1E 1B 1I 2B 2C
Suface
Bottom
DIC
µM
0
1000
2000
3000
4000
1G 1E 1B 1I 2B 2C 1G 1E 1B 1I 2B 2C 1G 1E 1B 1I 2B 2C 1G 1E 1B 1I 2B 2C
Suface
Bottom
PO
C µ
M
0
20
40
60
1G 1E 1B 1I 2B 2C 1G 1E 1B 1I 2B 2C 1G 1E 1B 1I 2B 2C 1G 1E 1B 1I 2B 2C
Suface
Bottom
PN
µM
0
5
10
1G 1E 1B 1I 2B 2C 1G 1E 1B 1I 2B 2C 1G 1E 1B 1I 2B 2C 1G 1E 1B 1I 2B 2C
Suface
Bottom
Chl
-a µ
g L-1
0
2
4
6
1G 1E 1B 1I 2B 2C 1G 1E 1B 1I 2B 2C 1G 1E 1B 1I 2B 2C 1G 1E 1B 1I 2B 2C
Suface
Bottom
0
2
4
6
1G 1E 1B 1I 2B 2C 1G 1E 1B 1I 2B 2C 1G 1E 1B 1I 2B 2C 1G 1E 1B 1I 2B 2C
June 2013 October 2013 February 2014 April 2014
Phaeo µ
g L
-1
Suface
Bottom
Fig. 4 Surface and bottomconcentrations of DOC, DIC,POC, PN, chl-a and phaeo in theMar Piccolo of Taranto during thefour sampling surveys (June andOctober 2013, February and April2014)
12682 Environ Sci Pollut Res (2016) 23:12675–12690
39
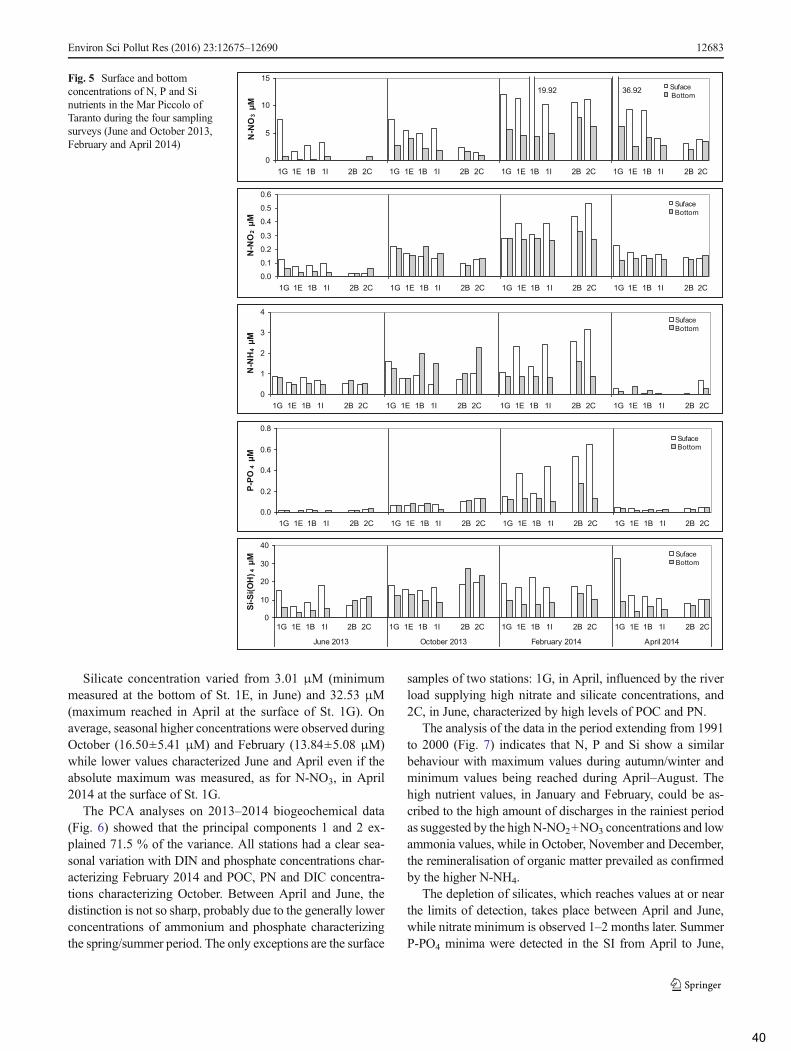
Silicate concentration varied from 3.01 μM (minimummeasured at the bottom of St. 1E, in June) and 32.53 μM(maximum reached in April at the surface of St. 1G). Onaverage, seasonal higher concentrations were observed duringOctober (16.50±5.41 μM) and February (13.84±5.08 μM)while lower values characterized June and April even if theabsolute maximum was measured, as for N-NO3, in April2014 at the surface of St. 1G.
The PCA analyses on 2013–2014 biogeochemical data(Fig. 6) showed that the principal components 1 and 2 ex-plained 71.5 % of the variance. All stations had a clear sea-sonal variation with DIN and phosphate concentrations char-acterizing February 2014 and POC, PN and DIC concentra-tions characterizing October. Between April and June, thedistinction is not so sharp, probably due to the generally lowerconcentrations of ammonium and phosphate characterizingthe spring/summer period. The only exceptions are the surface
samples of two stations: 1G, in April, influenced by the riverload supplying high nitrate and silicate concentrations, and2C, in June, characterized by high levels of POC and PN.
The analysis of the data in the period extending from 1991to 2000 (Fig. 7) indicates that N, P and Si show a similarbehaviour with maximum values during autumn/winter andminimum values being reached during April–August. Thehigh nutrient values, in January and February, could be as-cribed to the high amount of discharges in the rainiest periodas suggested by the highN-NO2+NO3 concentrations and lowammonia values, while in October, November and December,the remineralisation of organic matter prevailed as confirmedby the higher N-NH4.
The depletion of silicates, which reaches values at or nearthe limits of detection, takes place between April and June,while nitrate minimum is observed 1–2 months later. SummerP-PO4 minima were detected in the SI from April to June,
Fig. 5 Surface and bottomconcentrations of N, P and Sinutrients in the Mar Piccolo ofTaranto during the four samplingsurveys (June and October 2013,February and April 2014)
Environ Sci Pollut Res (2016) 23:12675–12690 12683
40
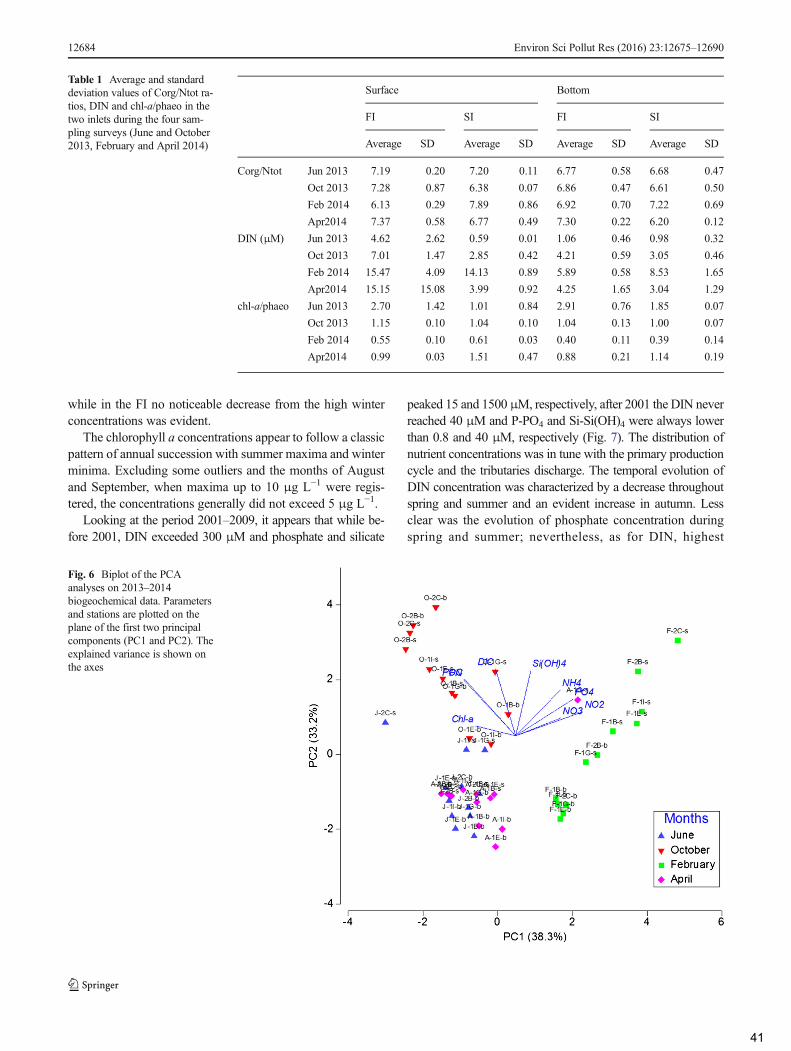
while in the FI no noticeable decrease from the high winterconcentrations was evident.
The chlorophyll a concentrations appear to follow a classicpattern of annual succession with summer maxima and winterminima. Excluding some outliers and the months of Augustand September, when maxima up to 10 μg L−1 were regis-tered, the concentrations generally did not exceed 5 μg L−1.
Looking at the period 2001–2009, it appears that while be-fore 2001, DIN exceeded 300 μM and phosphate and silicate
peaked 15 and 1500 μM, respectively, after 2001 the DIN neverreached 40 μM and P-PO4 and Si-Si(OH)4 were always lowerthan 0.8 and 40 μM, respectively (Fig. 7). The distribution ofnutrient concentrations was in tune with the primary productioncycle and the tributaries discharge. The temporal evolution ofDIN concentration was characterized by a decrease throughoutspring and summer and an evident increase in autumn. Lessclear was the evolution of phosphate concentration duringspring and summer; nevertheless, as for DIN, highest
Fig. 6 Biplot of the PCAanalyses on 2013–2014biogeochemical data. Parametersand stations are plotted on theplane of the first two principalcomponents (PC1 and PC2). Theexplained variance is shown onthe axes
Table 1 Average and standarddeviation values of Corg/Ntot ra-tios, DIN and chl-a/phaeo in thetwo inlets during the four sam-pling surveys (June and October2013, February and April 2014)
Surface Bottom
FI SI FI SI
Average SD Average SD Average SD Average SD
Corg/Ntot Jun 2013 7.19 0.20 7.20 0.11 6.77 0.58 6.68 0.47
Oct 2013 7.28 0.87 6.38 0.07 6.86 0.47 6.61 0.50
Feb 2014 6.13 0.29 7.89 0.86 6.92 0.70 7.22 0.69
Apr2014 7.37 0.58 6.77 0.49 7.30 0.22 6.20 0.12
DIN (μM) Jun 2013 4.62 2.62 0.59 0.01 1.06 0.46 0.98 0.32
Oct 2013 7.01 1.47 2.85 0.42 4.21 0.59 3.05 0.46
Feb 2014 15.47 4.09 14.13 0.89 5.89 0.58 8.53 1.65
Apr2014 15.15 15.08 3.99 0.92 4.25 1.65 3.04 1.29
chl-a/phaeo Jun 2013 2.70 1.42 1.01 0.84 2.91 0.76 1.85 0.07
Oct 2013 1.15 0.10 1.04 0.10 1.04 0.13 1.00 0.07
Feb 2014 0.55 0.10 0.61 0.03 0.40 0.11 0.39 0.14
Apr2014 0.99 0.03 1.51 0.47 0.88 0.21 1.14 0.19
12684 Environ Sci Pollut Res (2016) 23:12675–12690
41
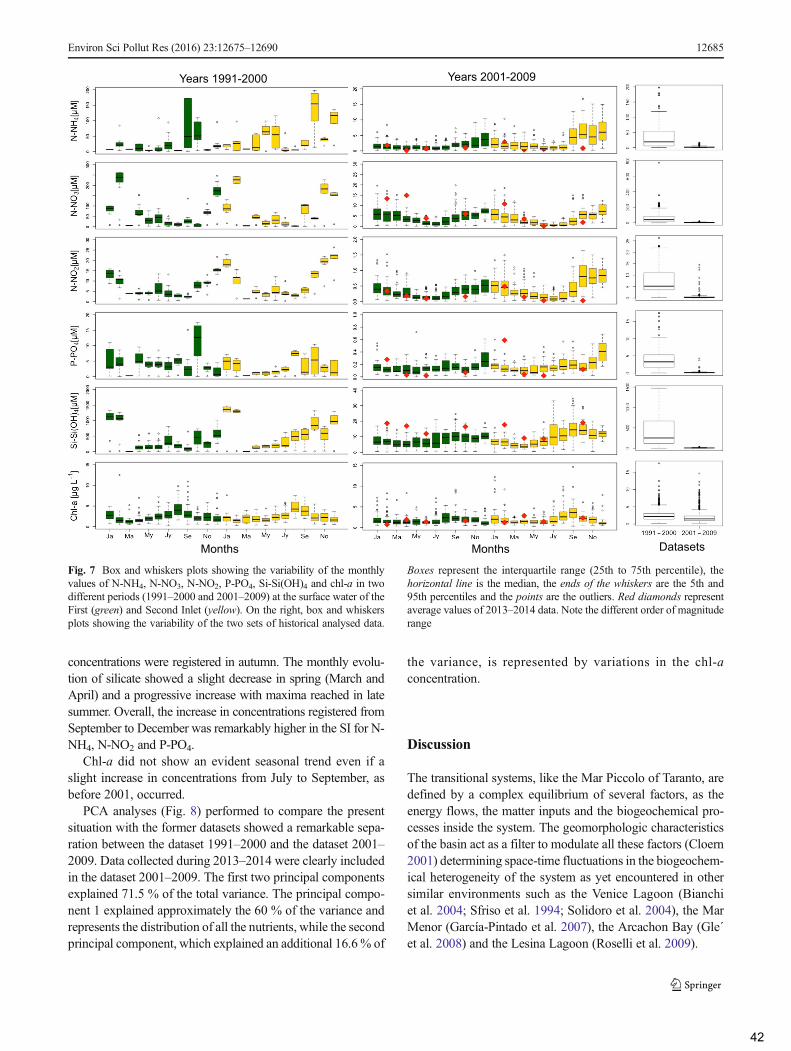
concentrations were registered in autumn. The monthly evolu-tion of silicate showed a slight decrease in spring (March andApril) and a progressive increase with maxima reached in latesummer. Overall, the increase in concentrations registered fromSeptember to December was remarkably higher in the SI for N-NH4, N-NO2 and P-PO4.
Chl-a did not show an evident seasonal trend even if aslight increase in concentrations from July to September, asbefore 2001, occurred.
PCA analyses (Fig. 8) performed to compare the presentsituation with the former datasets showed a remarkable sepa-ration between the dataset 1991–2000 and the dataset 2001–2009. Data collected during 2013–2014 were clearly includedin the dataset 2001–2009. The first two principal componentsexplained 71.5 % of the total variance. The principal compo-nent 1 explained approximately the 60 % of the variance andrepresents the distribution of all the nutrients, while the secondprincipal component, which explained an additional 16.6% of
the variance, is represented by variations in the chl-aconcentration.
Discussion
The transitional systems, like the Mar Piccolo of Taranto, aredefined by a complex equilibrium of several factors, as theenergy flows, the matter inputs and the biogeochemical pro-cesses inside the system. The geomorphologic characteristicsof the basin act as a filter to modulate all these factors (Cloern2001) determining space-time fluctuations in the biogeochem-ical heterogeneity of the system as yet encountered in othersimilar environments such as the Venice Lagoon (Bianchiet al. 2004; Sfriso et al. 1994; Solidoro et al. 2004), the MarMenor (García-Pintado et al. 2007), the Arcachon Bay (Gle´et al. 2008) and the Lesina Lagoon (Roselli et al. 2009).
Years 1991-2000 Years 2001-2009
MonthsMonths Datasets
Fig. 7 Box and whiskers plots showing the variability of the monthlyvalues of N-NH4, N-NO3, N-NO2, P-PO4, Si-Si(OH)4 and chl-a in twodifferent periods (1991–2000 and 2001–2009) at the surface water of theFirst (green) and Second Inlet (yellow). On the right, box and whiskersplots showing the variability of the two sets of historical analysed data.
Boxes represent the interquartile range (25th to 75th percentile), thehorizontal line is the median, the ends of the whiskers are the 5th and95th percentiles and the points are the outliers. Red diamonds representaverage values of 2013–2014 data. Note the different order of magnituderange
Environ Sci Pollut Res (2016) 23:12675–12690 12685
42
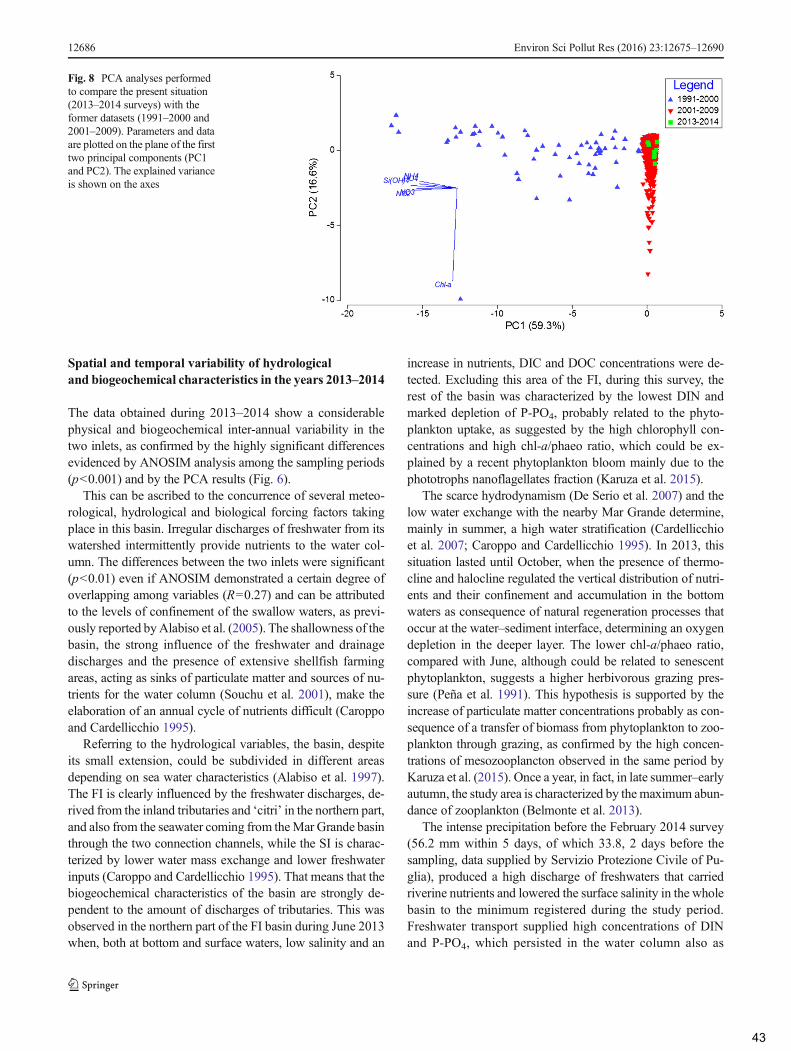
Spatial and temporal variability of hydrologicaland biogeochemical characteristics in the years 2013–2014
The data obtained during 2013–2014 show a considerablephysical and biogeochemical inter-annual variability in thetwo inlets, as confirmed by the highly significant differencesevidenced by ANOSIM analysis among the sampling periods(p<0.001) and by the PCA results (Fig. 6).
This can be ascribed to the concurrence of several meteo-rological, hydrological and biological forcing factors takingplace in this basin. Irregular discharges of freshwater from itswatershed intermittently provide nutrients to the water col-umn. The differences between the two inlets were significant(p<0.01) even if ANOSIM demonstrated a certain degree ofoverlapping among variables (R=0.27) and can be attributedto the levels of confinement of the swallow waters, as previ-ously reported byAlabiso et al. (2005). The shallowness of thebasin, the strong influence of the freshwater and drainagedischarges and the presence of extensive shellfish farmingareas, acting as sinks of particulate matter and sources of nu-trients for the water column (Souchu et al. 2001), make theelaboration of an annual cycle of nutrients difficult (Caroppoand Cardellicchio 1995).
Referring to the hydrological variables, the basin, despiteits small extension, could be subdivided in different areasdepending on sea water characteristics (Alabiso et al. 1997).The FI is clearly influenced by the freshwater discharges, de-rived from the inland tributaries and ‘citri’ in the northern part,and also from the seawater coming from theMar Grande basinthrough the two connection channels, while the SI is charac-terized by lower water mass exchange and lower freshwaterinputs (Caroppo and Cardellicchio 1995). That means that thebiogeochemical characteristics of the basin are strongly de-pendent to the amount of discharges of tributaries. This wasobserved in the northern part of the FI basin during June 2013when, both at bottom and surface waters, low salinity and an
increase in nutrients, DIC and DOC concentrations were de-tected. Excluding this area of the FI, during this survey, therest of the basin was characterized by the lowest DIN andmarked depletion of P-PO4, probably related to the phyto-plankton uptake, as suggested by the high chlorophyll con-centrations and high chl-a/phaeo ratio, which could be ex-plained by a recent phytoplankton bloom mainly due to thephototrophs nanoflagellates fraction (Karuza et al. 2015).
The scarce hydrodynamism (De Serio et al. 2007) and thelow water exchange with the nearby Mar Grande determine,mainly in summer, a high water stratification (Cardellicchioet al. 2007; Caroppo and Cardellicchio 1995). In 2013, thissituation lasted until October, when the presence of thermo-cline and halocline regulated the vertical distribution of nutri-ents and their confinement and accumulation in the bottomwaters as consequence of natural regeneration processes thatoccur at the water–sediment interface, determining an oxygendepletion in the deeper layer. The lower chl-a/phaeo ratio,compared with June, although could be related to senescentphytoplankton, suggests a higher herbivorous grazing pres-sure (Peña et al. 1991). This hypothesis is supported by theincrease of particulate matter concentrations probably as con-sequence of a transfer of biomass from phytoplankton to zoo-plankton through grazing, as confirmed by the high concen-trations of mesozooplancton observed in the same period byKaruza et al. (2015). Once a year, in fact, in late summer–earlyautumn, the study area is characterized by the maximum abun-dance of zooplankton (Belmonte et al. 2013).
The intense precipitation before the February 2014 survey(56.2 mm within 5 days, of which 33.8, 2 days before thesampling, data supplied by Servizio Protezione Civile of Pu-glia), produced a high discharge of freshwaters that carriedriverine nutrients and lowered the surface salinity in the wholebasin to the minimum registered during the study period.Freshwater transport supplied high concentrations of DINand P-PO4, which persisted in the water column also as
Fig. 8 PCA analyses performedto compare the present situation(2013–2014 surveys) with theformer datasets (1991–2000 and2001–2009). Parameters and dataare plotted on the plane of the firsttwo principal components (PC1and PC2). The explained varianceis shown on the axes
12686 Environ Sci Pollut Res (2016) 23:12675–12690
43
consequence of the scarce uptake from the phytoplanktoniccommunity, reaching the lowest abundances during the wintermonths (Caroppo and Cardellicchio 1995), as evidenced bythe low chl-a concentrations and chl-a/phaeo ratios. Theseresults have been confirmed also by Karuza et al. (2015).The concentrations of reduced nitrogen forms and of P-PO4
were higher in the SI, probably enhanced by the wide musselrope community that covers the 61 % of the basin, whichrepresents a large source of DIN (La Rosa et al. 2002) andphosphorus to the water column (Nizzoli et al. 2005).
Also in April 2014, the sampling was performed 4 daysafter an intense rainfall event (31.4 mm within four days),but the nutrient loads resulted quite different both quantitative-ly and qualitatively. Evidence of the freshwater input waspresent particularly in the northern area of the FI characterizedby extremely high concentrations of nitrate and silicate but ofreally low phosphate. This could be due to the concurrence ofother severe forcing factors such as the onset of intense bio-logical processes, i.e. phytoplankton bloom (Caroppo et al.2015) which, in shallow basins, may deeply modify the con-centration and the coupling among the nutrients. The highchlorophyll a concentration detected especially in the SI sup-ports the hypothesis of a crucial role of phytoplankton in P-PO4 depletion. On the whole, these observations indicate thatriverine loads of nutrients are, in early spring, an importantfactor for the rapid trigger of early phytoplankton blooms inthe basin, even when other environmental conditions such astemperature and total irradiance are still close to the wintervalues.
In this study, even during intense discharge of freshwater,the dissolved pool was always deficient in phosphorous rela-tive to nitrogen, and the highest DIN:P-PO4 ratio were en-countered in April straight after one of this events. Theseresults suggest that the variability of nutrient loads is mainlylinked to the runoff and to the concomitant presence of pointand diffuse sources of nutrients ascribing to different levels ofanthropogenic pressure.
Comparison of the present situation with the formerdataset
The anthropogenic pressures that have taken place in the MarPiccolo basin have caused significant alterations in its hydro-logical and chemical states and have probably influenced thebiological communities (Caroppo and Cardellicchio 1995;Caroppo et al. 2008). Uninterrupted series of monitoring inmultiple points of the basin and at different depths are lacking.Keeping in mind these difficulties, we tried to make prelimi-nary considerations, with the aim to stress or to excludethe changes in the water quality of the Mar Piccoloafter the closure of some sewage channels and the in-stallation of depuration systems for the waters comingfrom the inland.
For what concerns the hydrological parameters, signifi-cant differences (p<0.05) were observed between the twoclimatological datasets (1991–2000 and 2001–2009) onlyfor salinity.
The comparison between the climatological dataset (2001–2009) and the data collected during 2013–2014 and represent-ed with red diamonds in the Fig. 3 shows that during February2014, the observed salinity in the FI was slightly lower thanthe climatological values, but always in the range of variabil-ity, while there were no substantial differences in temperature.In June 2013 and April 2014, T, DO and SAL fell within thehistorical dataset, while in October 2013, these parameterswere slightly higher with respect to the climatology even ifalways comprised between the 5th to 95th percentile. The onlyexception was the dissolved oxygenmean concentration in theFI, which exceeds the 95th percentile indicating the presenceofmore oxygenatedwaters. It was observed that October 2013averaged data matched more with the September climatology(Fig. 3), suggesting that the basin still maintained summerenvironmental characteristics.
Differently, the analysis of the available biogeochemicaldata demonstrated the improvement of the water quality inthe Mar Piccolo of Taranto after the treatment plant installa-tion. As shown in the Fig. 7, nutrient concentrations werehighly variable between the two inlets, and drastic changesin concentrations were found between the two analysed timeseries. The significant (p<0.01) lowering of the nutrient con-centrations, evidenced by the ANOSIM test and confirmed bythe PCA analysis (Fig. 8), suggests that an external causedetermined the changes in the input regime, that is, the instal-lation of the treatment plants (Taylor et al. 2011). The load ofnutrients associated with inputs carrying inadequately treatedwaste waters from the inland, in the period before 2001, leadto concentrations of 1 order of magnitude higher than after2001.
The 1991–2000 chl-a dataset significantly differed(p<0.01) from 2001–2009 ones due to a general reductionof chlorophyll concentration after the treatment plant installa-tion. Nevertheless, high concentration values of chl-a wereoften reached also during 2001–2009, even if a drastic reduc-tion of the total microphytoplankton and particularly of dia-tom abundance was observed (Caroppo et al. 2010, 2015).This could be due to a shift of the ecosystem towards a lowertrophic level (Caroppo et al. 2010) as confirmed by the obser-vations of Karuza et al. (2015) and in other systems tending tooligotrophication (Mozetič et al. 2010). The drastic reductionof diatom could explain the less marked spring chl-a peak,while the mean lower chl-a concentrations of July–Septembercould be due to a reduction of dinoflagellates, which generallyprevailed during summer (Caroppo et al. 2010).
Data collected during 2013–2014 and represented with reddiamonds in the Fig. 7 were generally in the range of variabil-ity of the 2001–2009 climatology as evidenced also by the
Environ Sci Pollut Res (2016) 23:12675–12690 12687
44
PCA plot (Fig. 8). Values out of the 5th–95th percentiles wereobserved in February 2014, for P-PO4 and Si-Si(OH)4, in theSI; during April 2014, for nitrate and silicate, in the FI (asconsequence of the extremely high concentrations detectedat the St. 1G) and in October for nitrate, in the SI. This dataconfirms the lowering of the nutrient concentrations after thetreatment plant installation yet observed in the 2001–2009dataset.
Similar abrupt decrease in nutrient, up to −65 and −66% ofDIN and DIP, respectively, and −80 % of N-NH4, were foundalso in other coastal systems, such as the Boston Harbor andthe Kaneohe Bay, that have experienced decreases in nutrientloadings, while lower system responses were observed inareas with higher water residence time (Taylor et al. 2011and references therein).
Conclusions
Coastal lagoon and basins with growing population densitiesand activities have undergone many environmental changes.In the Mar Piccolo of Taranto, several concurrent human ac-tions have led to the alteration of the weak equilibrium char-acteristic of this transitional system and the increase of nutri-ents is among the main consequences because this coastalsystem acts as a trap for rivers and streams loadings duringthe high runoff periods. In the basin, the biological processes(production and mineralisation) affecting the nutrient budgetsare largely influenced also by the intensive mussel culture(Cardellicchio et al. 2006), which by filtration and productionand deposition of faeces and pseudofaeces, increases inputs oflabile organic matter to the superficial sediment. Faeces andpseudofaeces are, in fact, characterized by a large bioavailabil-ity to microbial assemblages and by rapid degradation rates,which contribute to a rapid turnover of the organic biodepositsand to the massive release of nutrients at the water–sedimentinterface, which, in turn, can modify the nutrient budgets (LaRosa et al. 2002).
While relationships between anthropogenic nutrient loadsand eutrophication processes in Mar Piccolo of Taranto havebeen previously demonstrated (Caroppo and Cardellicchio1995), this is, in our knowledge, the first study that analysesand compares long-term seasonal variation of hydrologicaldata and nutrient concentrations before and after the remedia-tion and environmental cleaning up planned by the ItalianGovernment.
The 20-year dataset analysis evidenced that the reductionof nutrient inputs into the basin from 1991 to 2009 haschanged the biogeochemical characteristics of theMar Piccolofrom being relatively eutrophic before 2001, to moderatelyoligotrophic after 2001 when treatment plants began to beoperational and phosphorous appeared to be the potential lim-iting nutrient for phytoplankton production in spring. The
comparison between the two datasets shows that since 2001,an abrupt decrease in nutrient concentrations has occurred andthat the response was higher, up to −90 % in the first inletcharacterized by lower hydraulic residence time.
Our results, which represent a contribution to the charac-terization of the waters of the Mar Piccolo and an update of itsclimatology, demonstrate that, even if this costal ecosystem isstill severely impacted by anthropogenic activities, the controlof the point sources through depuration systems has been suc-cessful for the decrease in nutrient concentrations. Conclu-sions obtained from this study could be useful in the perspec-tive of the water quality management for an overall under-standing of the mechanistic linkages between man-made al-terations of hydrologic and nutrients regimes, in order to planintegrate short and long-term remediation actions.
Acknowledgments The activities described in this publication werefunded by the Project Bandiera RITMARE - La Ricerca Italiana per ilMare coordinated by the National Research Council and funded by theMinistry for Education, University and Research within the NationalResearch Programme 2011–2013. The authors are warmly grateful toNicola Cardellicchio and the team of the IAMC institute, section of Ta-ranto, for their logistical support and hospitality. We would like to thankGianmarco Ingrosso for helping in statistical elaborations and theServizio Protezione Civile of Puglia (http://www.protezionecivile.puglia.it/centro-funzionale) for rainfall data supply. Four anonymousreviewers are warmly acknowledged for their helpful suggestions,which improved the manuscript.
References
Alabiso G, Cannalire M, Ghionda D, Milillo M, Leone G, Caciorgna O(1997) Particulate matter and chemical-physical conditions of aninner sea: the Mar Piccolo in Taranto. A new statistical approach.Mar Chem 58:373–388
Alabiso G, Giacomini M, Milillo M, Ricci P (2005) The Taranto seasystem: 8 years of chemical–physical measurements. Biol MarMedit 12:369–373
Alabiso G, Giacomini M, Milillo M, Ricci P (2006) Chemical-physicalconditions in the Taranto sea system from 2002 to 2004. Biol MarMedit 13:1055–1058
Belmonte G, Vaglio I, Rubino F, Alabiso G (2013) Zooplankton compo-sition along the confinement gradient of the Taranto Sea System(Ionian Sea, South-eastern Italy). J Marine Syst 128:222–238
Bianchi F, Ravagnan E, Acri F, Bernardi-Aubry F, Boldrin A, Camatti E,Cassin D, Turchetto M (2004) Variability and fluxes of hydrology,nutrients and particulate matter between the Venice Lagoon and theAdriatic Sea. Preliminary results (years 2001–2002). J Marine Syst51:49–64
Calabrese A, Massarelli C, Uricchio VF, Campanale C (2014)Safeguarding drinking water: use and quality of water, case studyof Taranto Province. Procedia Engineering 89:232–238
Cardellicchio N, Buccolieri A, Di LeoA, Spada L (2006) Heavymetals inmarine sediments from the Mar Piccolo of Taranto (Ionian Sea,southern Italy). Annali di Chimica 96:727–741
Cardellicchio N, Buccolieri A, Giandomenico S, Lopez L, Pizzulli F,Spada L (2007) Organic pollutants (PAHs, PCBs) in sediments fromthe Mar Piccolo in Taranto (Ionian Sea, Southern Italy). Mar PollutBull 55:451–458
12688 Environ Sci Pollut Res (2016) 23:12675–12690
45
Cardellicchio N, Annicchiarico C, Di Leo A, Giandomenico S, Spada L(2015) TheMar Piccolo of Taranto: an interesting marine ecosystemfor the environmental problems studies. Environ Sci Pollu R.This issue
Caroppo C, Cardellicchio N (1995) Preliminary study on phytoplanktoncommunities of Mar Piccolo in Taranto (Jonian Sea). Oebalia XXI:61–76
Caroppo C, Rubino F, Giordano L, Trono A, Forleo M, Petrocelli A,Bellio G, Colella R, Palmieri N, Sclafani P, Siano R (2008)System design for SSA14 Mar Piccolo of Taranto (Southern Italy)Spicosa annual report. Available at http://www.academia.edu/1550097/System_Design_for_SSA14_Mar_Piccolo_of_Taranto_Southern_Italy_
Caroppo C, Giordano L, Rubino F, Bisci AP, Hopkins TS (2010)Phytoplankton communities as indicators of ecological change inthe anthropogenically impacted Mar Piccolo of Taranto (IonianSea). Biol Mar Medit 17(1):102–105
Caroppo C, Giordano L, Bellio G, Bisci AP, Palmieri N, Portacci G,Sclafani P, Hopkins TS (2012) Progress toward sustainable musselaquaculture in Mar Piccolo, Italy. Ecol Soc 17(3):10
Caroppo C, Cerino F, Auriemma R, Cibic T (2015) Phytoplankton dy-namics with a special emphasis on harmful algal blooms in the MarPiccolo of Taranto (Ionian Sea, Italy). This issue
Cavallo RA, Rizzi C, Vozza T, Stabili L (1999) Viable heterotrophicbacteria in water and sediment in ‘Mar Piccolo’ of Taranto (IonianSea, Italy). J Appl Microbiol 86:906–916
Cerco CF, Noel MR (2007) Can oyster restoration reverse cultural eutro-phication in Chesapeake Bay? Estuaries Coasts 30(2):331–343
Christensen PB, Glud RN, Dalsgaard PG (2003) Impacts of longlinemussel farming on oxygen and nitrogen dynamics and biologicalcommunities of coastal sediments. Aquaculture 218:567–588
Clarke KR, Warwick RM (2001) Change in marine communities: anapproach to statistical analysis and interpretation. Primer-E- Ltd,Plymouth
Clarke KR, Warwick RM (2015) PRIMER v7: user manual/tutorial.PRIMER-E Ltd, Plymouth, p 296
Cloern JE (2001) Our evolving conceptual model of the coastal eutrophi-cation problem. Mar Ecol-Prog Ser 210:223–253
Cloern JE, Dufford R (2005) Phytoplankton community ecology: princi-ples applied in San Francisco Bay. Mar Ecol Prog Ser 285:11–28
Conley DJ, Markager S, Andersen J, Ellermann T, Svendsen LM (2002)Coastal eutrophication and the Danish National Aquatic Monitoringand Assessment Program. Estuaries 25:848–861
De Pascalis F (2013) Correnti e T/S nei mari di Taranto. CNR Report 09/2013 SP3_WP4_AZ5_UO01_D01 RITMARE La Ricerca Italianaper il MARE (in Italian)
De Serio F, Malcangio D,MossaM (2007) Circulation in a Southern Italycoastal basin: modeling and field measurements. Cont Shelf Res27(6):779–797
Di Leo A, Cardellicchio N, Giandomenico S, Spada L (2010) Mercuryandmethylmercury contamination inMytilus galloprovincialis fromTaranto Gulf (Ionian Sea, southern Italy): risk evaluation for con-sumers. Food Chem Toxicol 48:3131–3136
García-Pintado J, Martínez-Mena M, Barberá GG, Albaladejo J, CastilloVM (2007) Anthropogenic nutrient sources and loads from aMediterranean catchment into a coastal lagoon: Mar Menor, Spain.Sci Total Environ 373:220–239
Giacomini M, Alabiso G (2006) Temperature study in the Mar Piccolo ofTaranto (Italy, Mediterranean Sea). Biol Mar Medit 13:242–245
Gle´ C, Del Amo Y, Sautour B, Laborde P, Chardy P (2008) Variability ofnutrients and phytoplankton primary production in a shallowmacrotidal coastal ecosystem (Arcachon Bay, France). EstuarCoast Shelf S 76:642–656
Hansen HP, Koroleff F (1999) Determination of nutrients. In: GrasshoffK, Kremling K, Ehrhardt M (eds) Methods of seawater analysis, 3rdedn. Wiley-VCH, Weinheim, pp 159–228
Karuza A, Caroppo C, Camatti E, Di Poi E, Monti M, Stabili L, PanseraM, Cibic T, Del Negro P (2015) End to end planktonic trophic weband its implications for the mussel farms in the Mar Piccolo ofTaranto (Ionian Sea, Italy). This issue
KempWM, BoyntonWR, Adolf JE, Boesch DF, Boicourt WC, Brush G,Cornwell JC, Fisher TR, Glibert PM, Hagy JD, Harding LW, HoudeED, Kimmel DG, Miller WD, Newell RIE, RomanMR, Smith EM,Stevenson JC (2005) Eutrophication of Chesapeake Bay: historicaltrends and ecological interactions. Mar Ecol Prog Ser 303:1–29
La Rosa T, Mirto S, Favaloro E, Savona B, Sarà G, Danovaro R,MazzolaA (2002) Impact on the water column biogeochemistry of aMediterranean mussel and fish farm. Water Res 36:713–721
Lopes CB, Lillebø AI, Dias JM, Pereira E, Vale C, Duarte AC (2007)Nutrient dynamics and seasonal succession of phytoplankton assem-blages in a Southern European Estuary: Ria de Aveiro, Portugal.Estuar Coast Shelf S 71:480–490
Lorenzen CJ, Jeffrey SW (1980) Determination of chlorophyll in seawa-ter. UNESCO Tech Pap Mar Sci 35:1–20
Lorrain A, Savoye N, Chauvaud L, Paulet YM, Naulet N (2003)Decarbonation and preservation method for the analysis of organicC and N contents and stable isotope ratio of low-carbonatedsuspended particulate material. Anal Chim Acta 491:125–133
Magni P, Como S, Cucco A, De Falco G, Domenici P, Ghezzo M,Lefrançois C, Simeone S, Perilli A (2008) A multidisciplinary andecosystemic approach in the Oristano Lagoon-Gulf System(Sardinia, Italy) as a tool in management plans. Transit WatersBull 2:41–62
Mallin MA, Mciver MR, Wells HA, Parsons DC, Johnson VL (2005)Reversal of eutrophication following sewage treatment upgrades inthe New River Estuary, North Carolina. Estuaries 28:750–760
Melaku Canu D, Solidoro C, Umgiesser G, Cucco A, Ferrarin C (2012)Assessing confinement in coastal lagoons. Mar Poll Bull 64:2391–2398
Mozetič P, Solidoro C, Cossarini G, Socal G, Precali R, Francé J, BianchiF, De Vittor C, Smodlaka N, Fonda Umani S (2010) Recent trendstowards oligotrophication of the Northern Adriatic: evidence fromchlorophyll a time series. Estuar Coasts 33:362–375
Nizzoli D, Welsh DT, Bartoli M, Viaroli P (2005) Impacts of mussel(Mytilus galloprovincialis) farming on oxygen consumption andnutrient recycling in a eutrophic coastal lagoon. Hydrobiologia550:183–198
Oviatt CA, Hyde KJW, Keller AA, Turner JT (2007) Production patternsin Massachusetts with outfall relocation. Estuaries Coast 30:35–46
Pastore M (1993) Mar Piccolo. Nuova Editrice Apulia, Martina Franca,Taranto (in Italian)
Pella E, Colombo B (1973) Study of carbon, hydrogen and nitrogendetermination by combustion-gas chromatography. MikrochimActa 5:697–719
PeñaMA, LewisMR, HarrisonWG (1991) Particulate organic matter andchlorophyll in the surface layer of the Equatorial Pacific Oceanalong 135 degree W. Mar Ecol-Prog Ser 72:179–188
Petronio BM, Cardellicchio N, Calace N, Pietroletti M,Pietrantonio M, Caliandro L (2012) Spatial and temporalheavy metal concentration (Cu, Pb, Zn, Hg, Fe, Mn, Hg) insediments of the Mar Piccolo in Taranto (Ionian Sea, Italy).Water Air Soil Poll 223:863–875
Pinckney JL, Paerl HW, Tester P, Richardson TL (2001) The role ofnutrient loading and eutrophication in estuarine ecology. EnvironHealth Persp 109:699–706
R Development Core Team (2011) R: a language and environment forstatistical computing. R Foundation for Statistical Computing,Vienna, Austria
Roselli L, Fabbro A, Manzo C, D’Adamo R (2009) Hydrological hetero-geneity, nutrient dynamics and water quality of a non-tidal lenticecosystem (Lesina Lagoon, Italy). Estuar Coast Shelf S 84:539–552
Environ Sci Pollut Res (2016) 23:12675–12690 12689
46
Sfriso A, Marcomini A, Pavoni B (1994) Annual nutrient exchangesbetween the central lagoon of Venice and the northern AdriaticSea. Sci Total Environ 156:77–92
Sharp JH (1974) Improved analysis for Bparticulate^ organic carbon andnitrogen from seawater. Limnol Oceanogr 19(6):984–989
Smith VH, Joye SB, Hawarth RW (2006) Eutrophication of freshwaterand marine ecosystems. Limnol Oceanogr 51:351–355
Solidoro C, Pastres R, Cossarini G, Ciavatta S (2004) Seasonal and spa-tial variability of water quality parameters in the lagoon of Venice. JMarine Syst 51:7–18
Souchu P, Gasc A, Collos Y, Vaquer A, Tournier H, Bibent B, Deslous-Paoli J-M (1998) Biogeochemical aspects of bottom anoxia in aMediterranean lagoon (Thau, France). Mar Ecol-Prog Ser 164:135–146
Souchu P, Vaquer A, Collos Y, Landrein S, Deslous-Paoli J-M, Bibent B(2001) Influence of shellfish farming activities on the biogeochem-ical composition of the water column in Thau Lagoon. Mar Ecol-Prog Ser 218:141–152
Sugimura Y, Suzuki Y (1988) A high temperature catalytic oxidation meth-od for the determination of non-volatile dissolved organic carbon inseawater by direct injection of liquid sample. Mar Chem 24:105–131
Taylor DI, Oviatt CA, Borkman DG (2011) Non-linear responses of acoastal aquatic ecosystem to large decreases in nutrient and organicloadings. Estuar Coast 34:745–757
Umgiesser G, Scroccaro I, Alabiso G (2007) Mass exchange mechanismsin the Taranto Sea. Transit Water Bull 2:59–71
Vatova A (1972) Osservazioni fisico-chimiche periodiche nel Mar grandee nel Mar Piccolo di Taranto (1962–1969). Boll Pesca, PiscicIdrobiol 27:43–79 (in Italian)
Velasco J, Lloret J, Millan A, Marin A, Barahona J, Abellan P, Sanchez-Fernandez D (2006) Nutrient and particulate inputs into the MarMenor lagoon (SE Spain) from an intensive agricultural watershed.Water Air Soil Poll 176:37–56
Zaccone R, Mancuso M, Modica A, Zampino D (2005) Microbiologicalindicators for aquaculture impact in Mar Piccolo (Taranto, Italy).Aquacult Int 13:167–173
12690 Environ Sci Pollut Res (2016) 23:12675–12690
47
48
CHAPTER 4
Stable carbon isotopes in phytoplankton as a tool to monitor CO2
leakages at Carbon Capture and Storage sites
Federica Relitti1,2*, Nives Ogrinc3, Michele Giani1, Federica Cerino1, Cinzia De Vittor1,
Lidia Urbini1, Bor Krajnc3, Paola Del Negro1
1 Oceanography Division, OGS (Istituto Nazionale di Oceanografia e di Geofisica Sperimentale), Trieste, Italy
2 Department of Life Science, University of Trieste, Trieste, Italy
3 Department of Environmental Sciences, Jožef Stefan Institute, Ljubljana, Slovenia
*Corresponding author: Federica Relitti
OGS (Istituto Nazionale di Oceanografia e di Geofisica Sperimentale), Oceanography Division
Via A. Piccard 54, 34151 Trieste, Italy
Tel.: +39 040 2249741
email: [email protected]
Under review at Environmental Science and Pollution Research
49
Abstract
Carbon capture and storage technology (CCS) is expected to play a key role in climate change
mitigation strategies by reducing CO2 emissions into atmosphere from fossil fuel combustion.
Although leakages from well-engineered storage sites are not expected, the environmental impacts
related to potential CO2 seepages are a major issue for the acceptance of this approach. This study
aims to the evaluation of phytoplankton stable carbon isotopes as a tool for effective early warning
of CO2 migration from CCS, since different carbon sources have specific δ13C values. Two culture
experiments were conducted under controlled conditions for monitoring δ13C changes in the diatom
Thalassiosira rotula during growth in two different media; one prepared with natural seawater (NAT)
and the other with artificial seawater (ASW). Carbonate system in ASW was derived from
anthropogenic CO2 and resulted in strongly 13C-depleted dissolved inorganic carbon values (−44.7 ±
0.8‰). The uptake of inorganic carbon in ASW resulted in a rapid and significant change in
microalgae δ13C values (until −44.4‰), whereas in NAT phytoplankton δ13C did not show important
deviations from the starting value (−24.4 ± 0.3‰). The experiment results confirm the effectiveness
of phytoplankton δ13C as a tool for detecting different CO2 sources.
Keywords
13C; diatoms; CO2 leakage; 13C carbon fixation; Carbon Capture and Storage; Phytoplankton; CCS
1. Introduction
The global emissions of carbon dioxide (CO2) from fossil fuels have been increasing by 2.7%
annually since the past decade (Le Quéré et al. 2013). The increase of CO2 concentration in
atmosphere has been recognised as one of the main causes of climate change, resulting in strong
impacts on natural and human systems on all continents and across the oceans (IPCC 2014). In order
to prevent the adverse effects of climate change, several approaches have been studied for reducing
CO2 concentration in atmosphere. Among these, carbon capture and storage (CCS) technology has
emerged as a promising option among the mitigation actions for the stabilization of atmospheric
greenhouse gas concentrations (De Coninck & Benson 2014; IPCC 2005), by storing carbon dioxide
either on-shore or off-shore. Although a well-engineered storage site is not expected to leak, the risk
of failure of CO2 containment and the subsequent environmental impact is a major issue for the
acceptance of this approach. Monitoring strategies have been established in order to detect leakages
from storage sites, including biological and chemical-physical approaches (Blackford et al. 2015;
50
Jones et al. 2015; Mayer et al. 2015; Noble et al. 2012). In off-shore sites, CO2 released from CCS
could impact marine environment in several different ways, mainly as a consequence of lower
seawater pH because of CO2 dissolution. Among the main adverse effects, shell formation in
calcifying organisms could be inhibited, dissolution and desorption of metals could be enhanced and
once mobilized they can accumulate in marine organisms inhibiting growth or even causing death.
Moreover, microbial and faunal community could be altered in composition and metabolic activity
(Lichtschlag et al. 2015 and references therein; Noble et al. 2012; Jones et al. 2015). With regards to
primary producers, except from calcareous organisms which are detrimentally affected by the
dissolution of CO2, contradictory effects have been reported. CO2 leakages seem not to affect
phytoplankton and seaweed species. Indeed, these species seem to benefit from high CO2 levels, by
enhancing carbon and nitrogen fixation and stimulating photosynthesis (Jones et al. 2015; Tait et al.
2015 and references therein). However, as reviewed by Kim et al. (2016), lower pH could affect the
physiological processes of some phytoplankton species, including photosynthesis, uptake rates of
trace metals and toxin production of some harmful algal species. Moreover, natural phytoplankton
assemblages and community composition could be modified by high dissolved CO2 concentrations
(Kim et al. 2016). Therefore, an effective management of storage sites is required in order to early
detect leakages and prevent risks for the surrounding environment. Given the natural heterogeneity
of sediment and water column chemistry and biology, a robust knowledge of the baseline of the site
is required for characterising spatial and temporal dynamics, thus avoiding false positive and/or
negative results (Blackford et al. 2015).
Stable isotopes have been largely applied to estimate the effects of anthropogenic pressures on natural
ecosystems (Mancinelli & Vizzini 2015, and references therein) and carbon isotope analysis is
considered a suitable tool for tracing the fate of CO2 in the reservoir and for detecting leakages from
storage sites, provided that the isotope composition of injected CO2 is different from that of the
surrounding environment (Mayer et al. 2015). The isotope composition (δ13C) of CO2 stored in CCS
ranges from −51 to −4.7‰ (Flude et al. 2016) depending on the feed-stock used and on the
combustion process. Most of the CO2 injected in CCS derives from fossil fuels and its δ13C is usually
13C-depleted, similar to the isotope composition of the bulk coal (from −28.5 to −23.9‰, Warwick
& Ruppert 2016). Atmospheric δ13CCO2 has changed significantly since the 19th century, from a value
of about −6.5‰ to a present-day value below −8.0‰ as a consequence of the addition of 13C-depleted
carbon from fossil fuel and land-use changes (the so-called Suess effect) (Hellevang & Aagaard
2015). δ13C of total dissolved carbon in ocean ranges from 0 to −2‰ (Zeebe & Wolf-Gladrow 2001),
because of biological activity and fractionation occurring during CO2 dissolution in seawater. The
difference between the isotope composition of combustion CO2 and the natural baseline makes δ13C
51
the most widely analysed tracer, as it allows leakage monitoring with minimal economic and
environmental impact compared to other tracers (Flude et al. 2016). Most of the applications of carbon
stable isotope analysis is related to the monitoring of the movement of injected CO2 inside the
reservoir (Mayer et al. 2015; Mayer et al. 2013; Jeandel et al. 2010; Becker et al. 2011). To our
knowledge, stable carbon isotope analysis has not yet been applied in the assessment of potential
impact of CO2 release on the environment surrounding a CCS site.
The present study aims to evaluate carbon stable isotope analysis as a tool for detecting CO2 migration
from CCS by the analysis of the variation of δ13C of phytoplankton after the exposure to combustion
CO2. The performed experiments have been designed in a model case approach, considering the
extreme case in which the isotope composition of the whole carbonate chemistry has been modified
by a massive anthropogenic CO2 sub-seabed leakage. A weak leakage does not alter the whole
carbonate system and the anthropogenic CO2 released from a storage site mixes and equilibrates in
the environment, therefore the effects of a leakage may not be detectable unless sampling is
simultaneous to CO2 emissions. In the case of a strong CO2 leakage, pH tends to decrease as CO2
dissolves, and conditions that are not favourable for phytoplankton could be reached. The resulting
stressful environment could hence alter carbon uptake and isotope fractionation. The purpose of the
performed experiments is to verify how phytoplankton isotope composition changes when only the
δ13C of the carbon source is modified, but the whole carbonate system remains comparable to natural
conditions in terms of concentrations of carbonate species. The only change of isotope composition
of CO2 in the medium should not alter algal metabolism and thus the interpretation of isotope results
could not be affected by other factors than the δ13C of the source of inorganic carbon.
2. Material and methods
2.1. Experimental setup
Two culture experiments (I and II) were conducted within 2L-photobioreactors (Kbiotech®) under
controlled conditions of light (light/dark cycle: 14:10, intensity 100 µE m2 s1) and temperature (20
± 0.02 °C) (Figure 1). Clonal cultures of the diatom Thalassiosira rotula were established in
September 2012 from a sample collected in the Gulf of Trieste (North Adriatic Sea) (45°42.06’ N,
13°42.60’ E). The strain was maintained in 100 mL glass Erlenmeyer flasks filled with modified L1
medium obtained from sterile-filtered Adriatic Sea water (0.2 µm pore size). The medium was
supplemented with nutrients (nitrate, NaNO3, 5.49 104 M, phosphate, NaH2PO4 ∙ H2O, 2.24 105 M
and silicate, Na2SiO3 ∙ 9H2O, 1.06 104 M, final concentrations), metals and vitamins. The culture
52
was grown at 15 ± 2 °C and at a light intensity of about 53 μE m2 sec1, under a light/dark regime
(14:10). Before starting the experiments, cells were transferred within sterilized 2L glass Erlenmeyer
flasks to allow growth until the exponential phase for the inoculation.
In each experiment, microalgae were grown simultaneously in two different media; one prepared with
natural seawater (NAT) and the other with artificial seawater (ASW). Natural seawater was collected
at 1174 m depth in the South Adriatic Sea (March 2015, 41°44.53’ N, 17°41.35’ E), whereas artificial
seawater was prepared according to Andersen (2005) except for the sodium carbonate, that was
artificially created by bubbling CO2 into a solution of NaOH. CO2 was supplied to the ASW medium
by mixing carbon dioxide from cylinder with CO2-free air, until typical marine pH value was reached
(8.078.19). An industrial compressed CO2 supply was used after verifying its different value from
natural atmospheric CO2, and after ensuring that no changes due to Rayleigh process occurred (δ13C
value was 48.3 ± 0.1‰ as average of the measurements performed during the two experiments).
Both media were supplied with the same amount of nutrients and microelements proposed by
Andersen (2005) and were added to the photobioreactors by filtration (hydrophilic PTFE filter,
nominal pore size 0.2 µm, Merk), with the purpose of minimizing bacterial interference, and in an
attempt to prevent gas exchange with the atmosphere. During experiments, variations of pH,
temperature and dissolved oxygen were monitored and recorded by on-line probes (Figure 1). An
intermittent CO2-free air flow was maintained (on/off cycle: 10:50 min) in both conditions, and a
continuous gentle stirring prevented stratification and favoured medium mixing. At the beginning of
the experiments (0 h), diatoms were inoculated in the same concentration in both conditions (250 cell
mL1 in I and 1000 cell mL1 in II). The first culture experiment lasted 96 h, while the second 140 h,
and periodic samplings were performed by means of a peristaltic pump in order to minimize
atmospheric gas exchange.
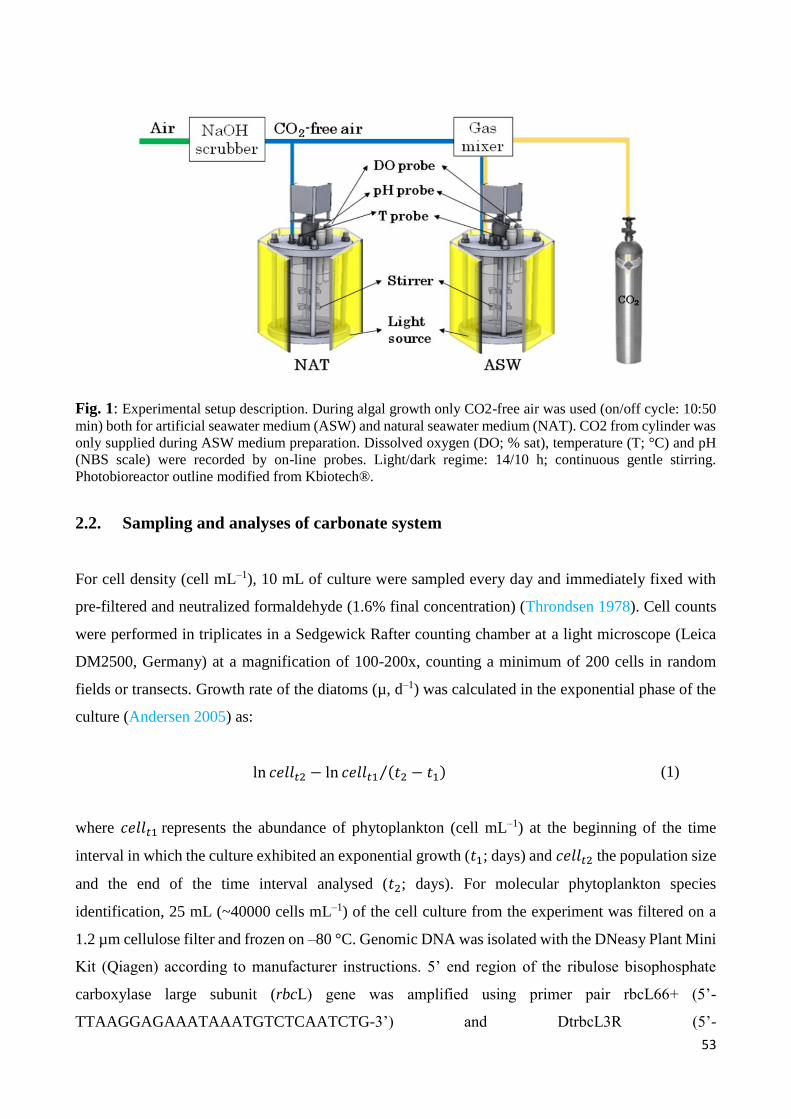
53
Fig. 1: Experimental setup description. During algal growth only CO2-free air was used (on/off cycle: 10:50
min) both for artificial seawater medium (ASW) and natural seawater medium (NAT). CO2 from cylinder was
only supplied during ASW medium preparation. Dissolved oxygen (DO; % sat), temperature (T; °C) and pH
(NBS scale) were recorded by on-line probes. Light/dark regime: 14/10 h; continuous gentle stirring.
Photobioreactor outline modified from Kbiotech®.
2.2. Sampling and analyses of carbonate system
For cell density (cell mL–1), 10 mL of culture were sampled every day and immediately fixed with
pre-filtered and neutralized formaldehyde (1.6% final concentration) (Throndsen 1978). Cell counts
were performed in triplicates in a Sedgewick Rafter counting chamber at a light microscope (Leica
DM2500, Germany) at a magnification of 100-200x, counting a minimum of 200 cells in random
fields or transects. Growth rate of the diatoms (µ, d–1) was calculated in the exponential phase of the
culture (Andersen 2005) as:
ln 𝑐𝑒𝑙𝑙𝑡2 − ln 𝑐𝑒𝑙𝑙𝑡1 (𝑡2 − 𝑡1)⁄ (1)
where 𝑐𝑒𝑙𝑙𝑡1 represents the abundance of phytoplankton (cell mL–1) at the beginning of the time
interval in which the culture exhibited an exponential growth (𝑡1; days) and 𝑐𝑒𝑙𝑙𝑡2 the population size
and the end of the time interval analysed (𝑡2; days). For molecular phytoplankton species
identification, 25 mL (~40000 cells mL–1) of the cell culture from the experiment was filtered on a
1.2 µm cellulose filter and frozen on –80 °C. Genomic DNA was isolated with the DNeasy Plant Mini
Kit (Qiagen) according to manufacturer instructions. 5’ end region of the ribulose bisophosphate
carboxylase large subunit (rbcL) gene was amplified using primer pair rbcL66+ (5’-
TTAAGGAGAAATAAATGTCTCAATCTG-3’) and DtrbcL3R (5’-
54
ACACCWGACATACGCATCCA-3’) according to Alverson (2008) and MacGillivary &
Kaczmarska (2011) and sequenced at the Macrogen Inc. The resulting sequences (from both ends)
were aligned using Geneious 7.1.7 software (Kearse et al. 2012). BLAST (Altschul et al. 1997) was
used for searches and comparisons of the NCBI GenBank database (Clark et al. 2016).
The abundance of prokaryotes (cell mL–1) was estimated by a FACSCanto II (Becton Dickinson) flow
cytometer, equipped with an air-cooled laser at 488nm and standard filter setup. Samples were treated
according to Marie et al. (1999) as described in Celussi et al. (2015).
To measure total alkalinity (AT, µmol kgSW–1), samples of 100 mL culture suspension were filtered
over pre-combusted Whatman GF/F filters (450 °C for 4 h) to remove phytoplankton cells (Gattuso
et al. 2010). Each bottle was poisoned with 50 μL of saturated mercuric chloride (HgCl2) to halt
biological activity and stored at 4 °C in the dark until analysis. Total alkalinity was determined by
potentiometric titration in an open cell (SOP 3b, Dickson et al. 2007) as described in Ingrosso et al.
(2016).
pH (NBS scale) was continuously recorded by on-line probes (Hamilton EasyFerm BIO Arc 225)
previously calibrated on the National Bureau of Standards (NBS) scale with certified buffer solutions
of pH 7 ± 0.02 and 9 ± 0.03 (at 25 °C, Certipur®).
Samples for dissolved inorganic nutrients (nitrite - NO2, nitrate - NO3, ammonium - NH4, phosphate
- PO4, and silicate - SiO4) were filtered over pre-combusted Whatman GF/F filters (450 °C for 4 h)
in acid washed polyethylene vials and kept frozen (20 °C) until laboratory analysis. Inorganic
nutrient concentrations were determined colorimetrically with a QuAAtro Seal Analiytical
autoanalyser according to Hansen & Koroleff (1999). Detection limits reported by the analytical
methods were 0.02 μM, 0.02 μM, 0.04 μM, 0.02 μM, and 0.02 μM for NO2, NO3, NH4, PO4, and
SiO4, respectively. The accuracy and precision of the analytical procedures are annually checked
through the quality assurance program QUASIMEME (AQ1) and the relative coefficient of variation
for five replicates was less than 5%. Internal quality control samples were used during each analysis.
Dissolved oxygen (DO) was continuously recorded by on-line probes (Hamilton OxyFerm FDA Arc
225), previously calibrated with 0% DO and 100% DO solutions. In order to convert probe values in
µmol L1, discrete samples were collected during the experiments (I: 0 h, 24 h, 96 h; II: 0 h, 140 h)
and DO concentration was determined following the Winkler method (Hansen 1999) using the
automated titration system Mettler Toledo G20 with potentiometric end-point detection (Oudot et al.
1988).
55
2.3. Sampling and analysis of stable isotope of carbon
Samples for the analysis of stable carbon isotopes of CO2(gas) and DIC were collected in 12 mL
Exetainer® evacuated glass tubes, preventing gas exchange with atmosphere. Stable carbon isotope
composition of CO2(gas) (δ13CCO2(gas)
) was determined with an isotope ratio mass spectrometer (IRMS)
Europa Scientific 20-20 with ANCA-TG preparation module for trace gas samples.
Samples for stable isotope composition of dissolved inorganic carbon (δ13CDIC) were filtered over
pre-combusted Whatman GF/F filters (450 °C for 4 h) to remove phytoplankton cells and analysis
was performed by injecting aliquots of sample into evacuated septum tubes with phosphoric acid.
Released CO2(gas) was then analysed with continuous-flow IRMS Europa 20-20 with ANCA TG trace
gas separation module. In order to determine the optimal extraction procedure for water samples, a
standard Na2CO3 solution was prepared with a known δ13C value of 10.8 ± 0.2‰.
Bulk particulate organic matter isotope composition (δ13CPOC) was determined by filtering aliquots
of culture suspension (~20 mL) over pre-combusted (450 °C for 4 h) Whatman GF/F filters (nominal
porosity 0.7 µm, ø 25 mm). In order to estimate the potential influence of bacteria isotope composition
on the bulk δ13CPOC value (δ13CPOC<10µm), other aliquots of culture suspension (~20 mL) were filtered
over pre-combusted Whatman GF/F filters after a pre-filtration on a 10 µm mesh in order to remove
phytoplankton cells. The dimension of the mesh was chosen according to the average Thalassiosira
rotula cell dimension of 20 µM (Hasle & Syvertson 1997). Samples for δ13CPOC and δ13CPOC<10µm
analysis were collected in duplicate, rinsed with deionised water, oven-dried at 60 °C for 30 min and
stored in desiccators until analysis. Before the analysis, filters for δ13CPOC and δ13CPOC<10µm were
treated with 1 M HCl to remove carbonate minerals and inserted into tin capsules for further analysis.
Measurements were performed on a Europa Scientific 20-20 IRMS with an ANCA-SL preparation
module for solid and liquid samples.
All stable isotope values are given conventionally in δ-notation in per mil deviation (‰) from the
Vienna Peed Dee Belemnite (VPDB) standard. IRMS was calibrated against reference materials:
IAEA-CH-6 and IAEA-CH-7 for δ13CPOC analysis and “CO2 ISO-TOP, High” with δ13C value of 4.3
± 0.2‰ for δ13CCO2. The precision based on replicate analysis was ±0.2‰ for all stable isotope
analysis (δ13CCO2(gas), δ13CDIC, δ13CPOC and δ13CPOC<10µm).
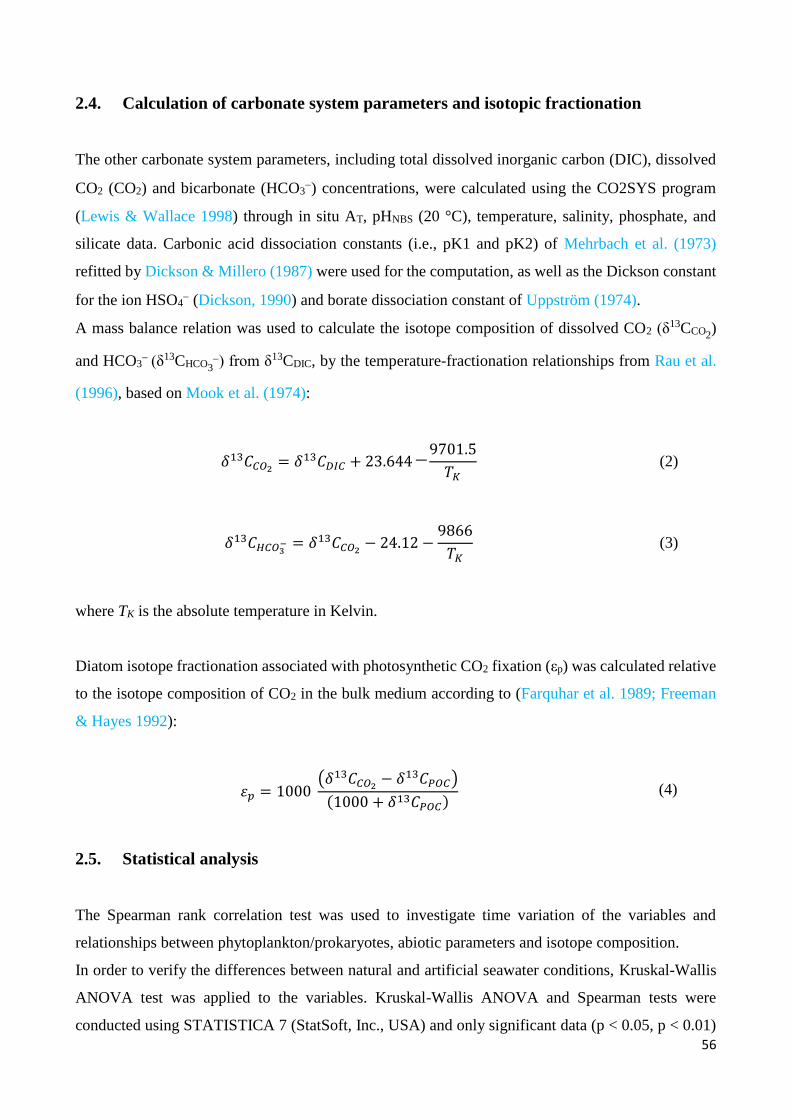
56
2.4. Calculation of carbonate system parameters and isotopic fractionation
The other carbonate system parameters, including total dissolved inorganic carbon (DIC), dissolved
CO2 (CO2) and bicarbonate (HCO3) concentrations, were calculated using the CO2SYS program
(Lewis & Wallace 1998) through in situ AT, pHNBS (20 °C), temperature, salinity, phosphate, and
silicate data. Carbonic acid dissociation constants (i.e., pK1 and pK2) of Mehrbach et al. (1973)
refitted by Dickson & Millero (1987) were used for the computation, as well as the Dickson constant
for the ion HSO4 (Dickson, 1990) and borate dissociation constant of Uppström (1974).
A mass balance relation was used to calculate the isotope composition of dissolved CO2 (δ13CCO2
)
and HCO3 (δ13CHCO3
) from δ13CDIC, by the temperature-fractionation relationships from Rau et al.
(1996), based on Mook et al. (1974):
𝛿13𝐶𝐶𝑂2= 𝛿13𝐶𝐷𝐼𝐶 + 23.644 ─
9701.5
𝑇𝐾 (2)
𝛿13𝐶𝐻𝐶𝑂3− = 𝛿13𝐶𝐶𝑂2
− 24.12 −9866
𝑇𝐾 (3)
where TK is the absolute temperature in Kelvin.
Diatom isotope fractionation associated with photosynthetic CO2 fixation (εp) was calculated relative
to the isotope composition of CO2 in the bulk medium according to (Farquhar et al. 1989; Freeman
& Hayes 1992):
휀𝑝 = 1000 (𝛿13𝐶𝐶𝑂2
− 𝛿13𝐶𝑃𝑂𝐶)
(1000 + 𝛿13𝐶𝑃𝑂𝐶) (4)
2.5. Statistical analysis
The Spearman rank correlation test was used to investigate time variation of the variables and
relationships between phytoplankton/prokaryotes, abiotic parameters and isotope composition.
In order to verify the differences between natural and artificial seawater conditions, Kruskal-Wallis
ANOVA test was applied to the variables. Kruskal-Wallis ANOVA and Spearman tests were
conducted using STATISTICA 7 (StatSoft, Inc., USA) and only significant data (p < 0.05, p < 0.01)
57
are presented. Multivariate analysis was performed in order to verify the overall difference between
the two conditions applying a non-metric multidimensional scaling analysis (nMDS) ordination
model. nMDS was based on z-normalised data and phytoplankton abundance data were first square-
root transformed because of the wide distribution of values that could have affected analysis. One-
way ANOSIM was also performed for the analysis of similarity between the two conditions. nMDS
and ANOSIM analysis were performed using PRIMER 7 (PRIMER-E Ltd., Plymouth, UK) software
(Clarke et al. 2014).
3. Results
3.1. Biotic and abiotic parameters
Species identity was confirmed as Thalassiosira rotula by molecular analysis, using rbcL gene as a
DNA barcode. New Thalassiosira rbcL nucleotide sequence was deposited in GenBank under
accession number: MG214782.
T. rotula nearly followed a typical exponential growth in both experiments and conditions (Figure 2).
Despite the same inoculation abundance in both medium (I: 250 cell L1; II: 1000 cell L1), in NAT
microalgae started to decrease after reaching the highest abundances at 48 h and 72 h, respectively in
the I experiment (4.24 103 cell L1) and II experiment (2.04 104 cell L1). At the end of the first
experiment, in the natural seawater condition, an abundance lower than the inoculation was reached
(196 cell L1). On the contrary, in the artificial seawater condition, the maximum abundances of
microalgae were detected at the end of the experiments (1.50 104 cell L1 and 4.17 104 cell L1
respectively in I and II).
As diatom abundances started to increase earlier in NAT than in ASW, and as a consequence of the
different inoculation abundance between I and II, the exponential phase of culture was not coincident
in the two conditions and experiments. Therefore, growth rates (µ) were not calculated in the same
time interval however, no significant differences were detected among all conditions. T. rotula
exponential growth in NAT was detected in the first two days of culture in both experiments, and
growth rate was 1.3 d1. In the artificial seawater condition, the exponential phase was detected in the
last period of the culture (24 h – 96 h in I; 72 h – 140 h in II), and diatom growth rate was 1.2 d1 in
I and 1.0 d1 in II.
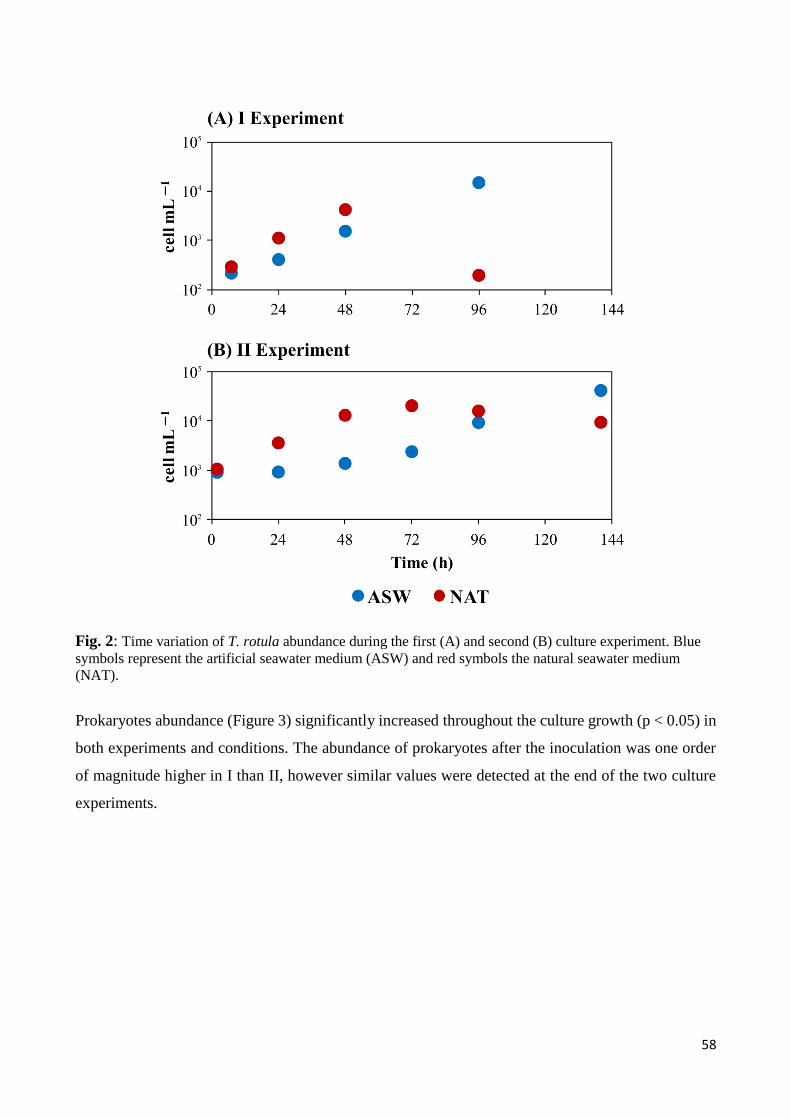
58
Fig. 2: Time variation of T. rotula abundance during the first (A) and second (B) culture experiment. Blue
symbols represent the artificial seawater medium (ASW) and red symbols the natural seawater medium
(NAT).
Prokaryotes abundance (Figure 3) significantly increased throughout the culture growth (p < 0.05) in
both experiments and conditions. The abundance of prokaryotes after the inoculation was one order
of magnitude higher in I than II, however similar values were detected at the end of the two culture
experiments.
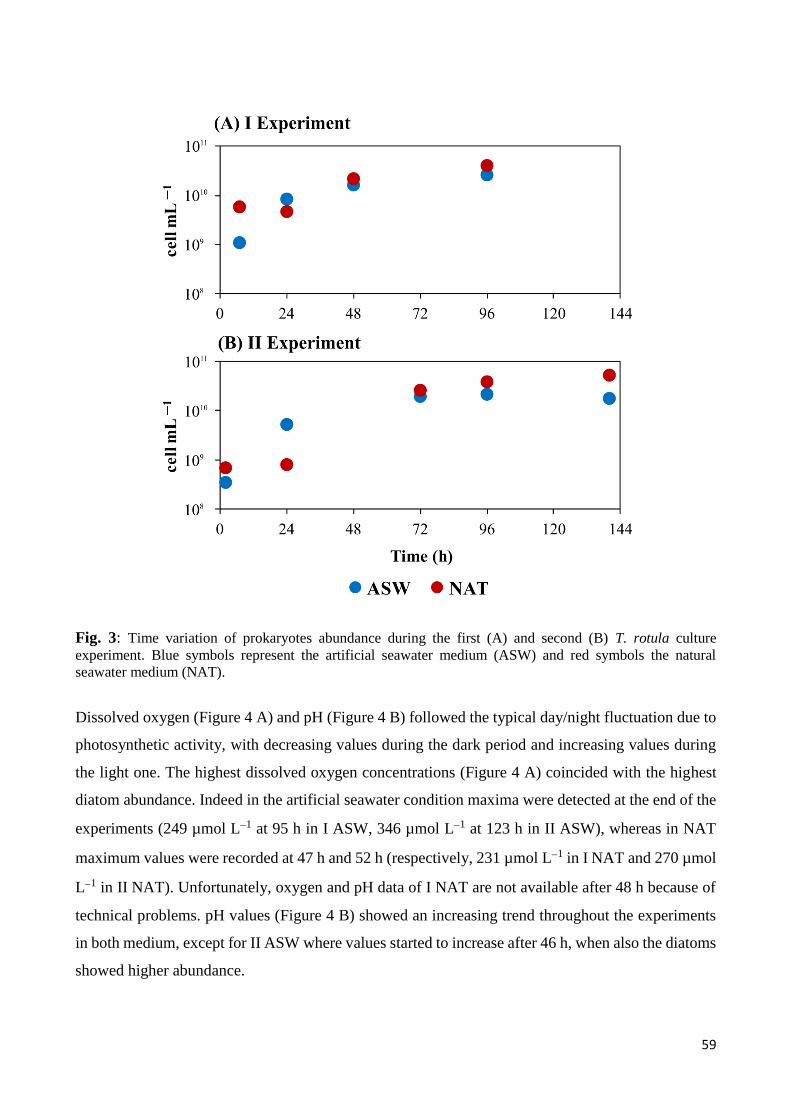
59
Fig. 3: Time variation of prokaryotes abundance during the first (A) and second (B) T. rotula culture
experiment. Blue symbols represent the artificial seawater medium (ASW) and red symbols the natural
seawater medium (NAT).
Dissolved oxygen (Figure 4 A) and pH (Figure 4 B) followed the typical day/night fluctuation due to
photosynthetic activity, with decreasing values during the dark period and increasing values during
the light one. The highest dissolved oxygen concentrations (Figure 4 A) coincided with the highest
diatom abundance. Indeed in the artificial seawater condition maxima were detected at the end of the
experiments (249 µmol L1 at 95 h in I ASW, 346 µmol L1 at 123 h in II ASW), whereas in NAT
maximum values were recorded at 47 h and 52 h (respectively, 231 µmol L1 in I NAT and 270 µmol
L1 in II NAT). Unfortunately, oxygen and pH data of I NAT are not available after 48 h because of
technical problems. pH values (Figure 4 B) showed an increasing trend throughout the experiments
in both medium, except for II ASW where values started to increase after 46 h, when also the diatoms
showed higher abundance.
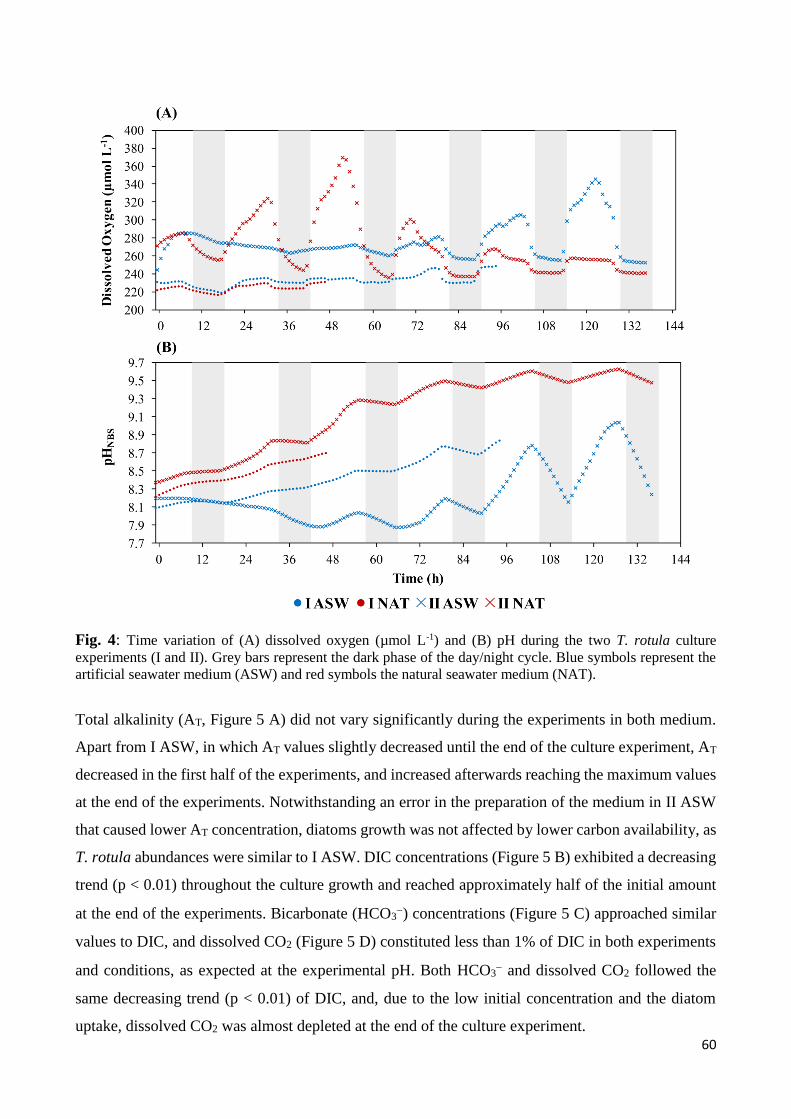
60
Fig. 4: Time variation of (A) dissolved oxygen (µmol L-1) and (B) pH during the two T. rotula culture
experiments (I and II). Grey bars represent the dark phase of the day/night cycle. Blue symbols represent the
artificial seawater medium (ASW) and red symbols the natural seawater medium (NAT).
Total alkalinity (AT, Figure 5 A) did not vary significantly during the experiments in both medium.
Apart from I ASW, in which AT values slightly decreased until the end of the culture experiment, AT
decreased in the first half of the experiments, and increased afterwards reaching the maximum values
at the end of the experiments. Notwithstanding an error in the preparation of the medium in II ASW
that caused lower AT concentration, diatoms growth was not affected by lower carbon availability, as
T. rotula abundances were similar to I ASW. DIC concentrations (Figure 5 B) exhibited a decreasing
trend (p < 0.01) throughout the culture growth and reached approximately half of the initial amount
at the end of the experiments. Bicarbonate (HCO3) concentrations (Figure 5 C) approached similar
values to DIC, and dissolved CO2 (Figure 5 D) constituted less than 1% of DIC in both experiments
and conditions, as expected at the experimental pH. Both HCO3 and dissolved CO2 followed the
same decreasing trend (p < 0.01) of DIC, and, due to the low initial concentration and the diatom
uptake, dissolved CO2 was almost depleted at the end of the culture experiment.
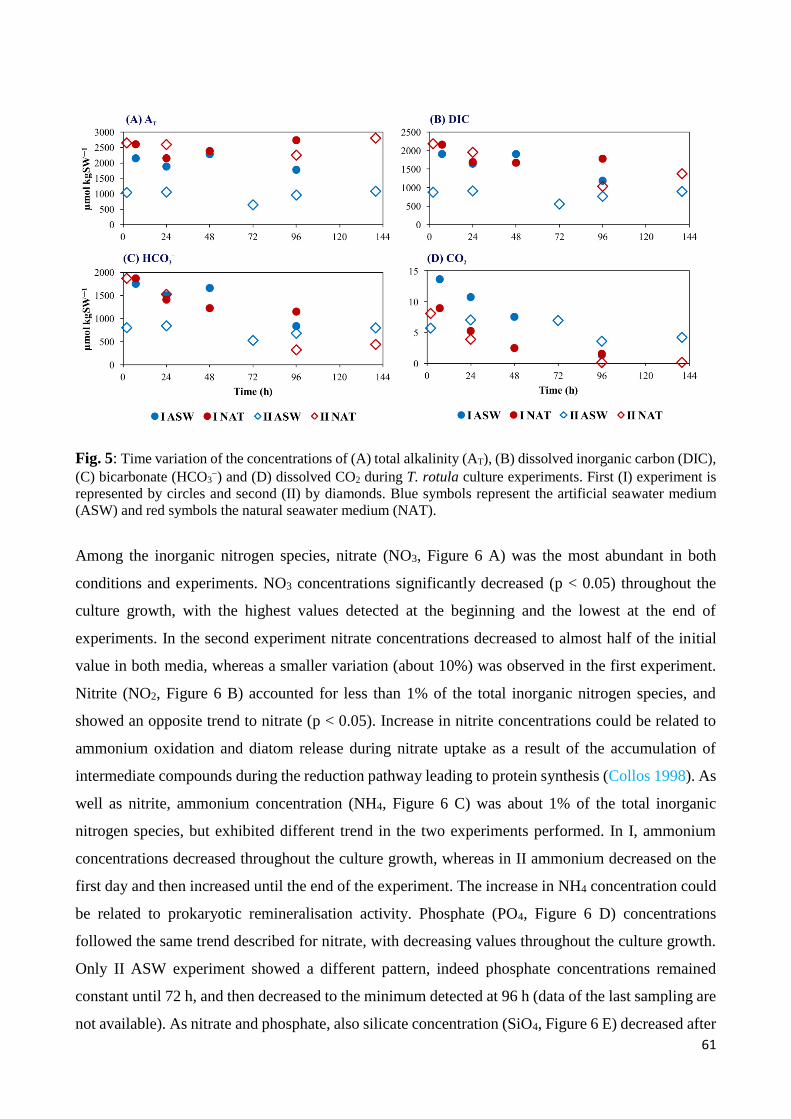
61
Fig. 5: Time variation of the concentrations of (A) total alkalinity (AT), (B) dissolved inorganic carbon (DIC),
(C) bicarbonate (HCO3) and (D) dissolved CO2 during T. rotula culture experiments. First (I) experiment is
represented by circles and second (II) by diamonds. Blue symbols represent the artificial seawater medium
(ASW) and red symbols the natural seawater medium (NAT).
Among the inorganic nitrogen species, nitrate (NO3, Figure 6 A) was the most abundant in both
conditions and experiments. NO3 concentrations significantly decreased (p < 0.05) throughout the
culture growth, with the highest values detected at the beginning and the lowest at the end of
experiments. In the second experiment nitrate concentrations decreased to almost half of the initial
value in both media, whereas a smaller variation (about 10%) was observed in the first experiment.
Nitrite (NO2, Figure 6 B) accounted for less than 1% of the total inorganic nitrogen species, and
showed an opposite trend to nitrate (p < 0.05). Increase in nitrite concentrations could be related to
ammonium oxidation and diatom release during nitrate uptake as a result of the accumulation of
intermediate compounds during the reduction pathway leading to protein synthesis (Collos 1998). As
well as nitrite, ammonium concentration (NH4, Figure 6 C) was about 1% of the total inorganic
nitrogen species, but exhibited different trend in the two experiments performed. In I, ammonium
concentrations decreased throughout the culture growth, whereas in II ammonium decreased on the
first day and then increased until the end of the experiment. The increase in NH4 concentration could
be related to prokaryotic remineralisation activity. Phosphate (PO4, Figure 6 D) concentrations
followed the same trend described for nitrate, with decreasing values throughout the culture growth.
Only II ASW experiment showed a different pattern, indeed phosphate concentrations remained
constant until 72 h, and then decreased to the minimum detected at 96 h (data of the last sampling are
not available). As nitrate and phosphate, also silicate concentration (SiO4, Figure 6 E) decreased after
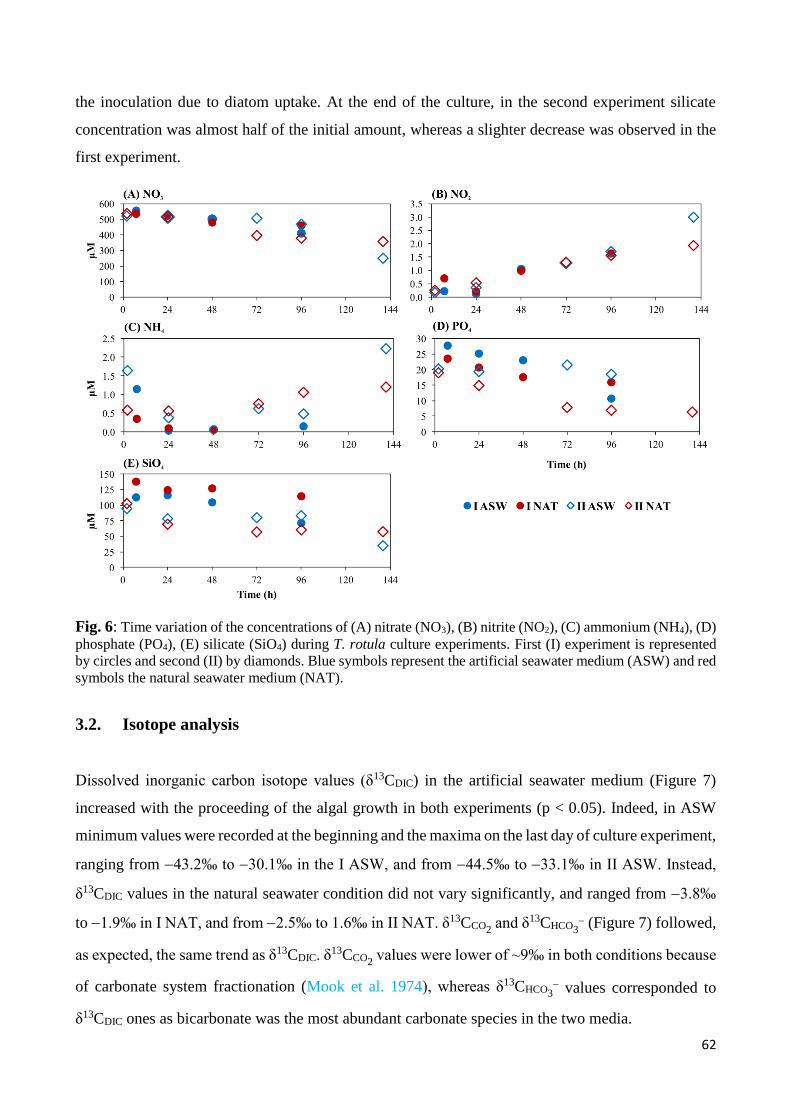
62
the inoculation due to diatom uptake. At the end of the culture, in the second experiment silicate
concentration was almost half of the initial amount, whereas a slighter decrease was observed in the
first experiment.
Fig. 6: Time variation of the concentrations of (A) nitrate (NO3), (B) nitrite (NO2), (C) ammonium (NH4), (D)
phosphate (PO4), (E) silicate (SiO4) during T. rotula culture experiments. First (I) experiment is represented
by circles and second (II) by diamonds. Blue symbols represent the artificial seawater medium (ASW) and red
symbols the natural seawater medium (NAT).
3.2. Isotope analysis
Dissolved inorganic carbon isotope values (δ13CDIC) in the artificial seawater medium (Figure 7)
increased with the proceeding of the algal growth in both experiments (p < 0.05). Indeed, in ASW
minimum values were recorded at the beginning and the maxima on the last day of culture experiment,
ranging from 43.2‰ to 30.1‰ in the I ASW, and from 44.5‰ to 33.1‰ in II ASW. Instead,
δ13CDIC values in the natural seawater condition did not vary significantly, and ranged from 3.8‰
to 1.9‰ in I NAT, and from 2.5‰ to 1.6‰ in II NAT. δ13CCO2 and δ13CHCO3
(Figure 7) followed,
as expected, the same trend as δ13CDIC. δ13CCO2 values were lower of ~9‰ in both conditions because
of carbonate system fractionation (Mook et al. 1974), whereas δ13CHCO3 values corresponded to
δ13CDIC ones as bicarbonate was the most abundant carbonate species in the two media.
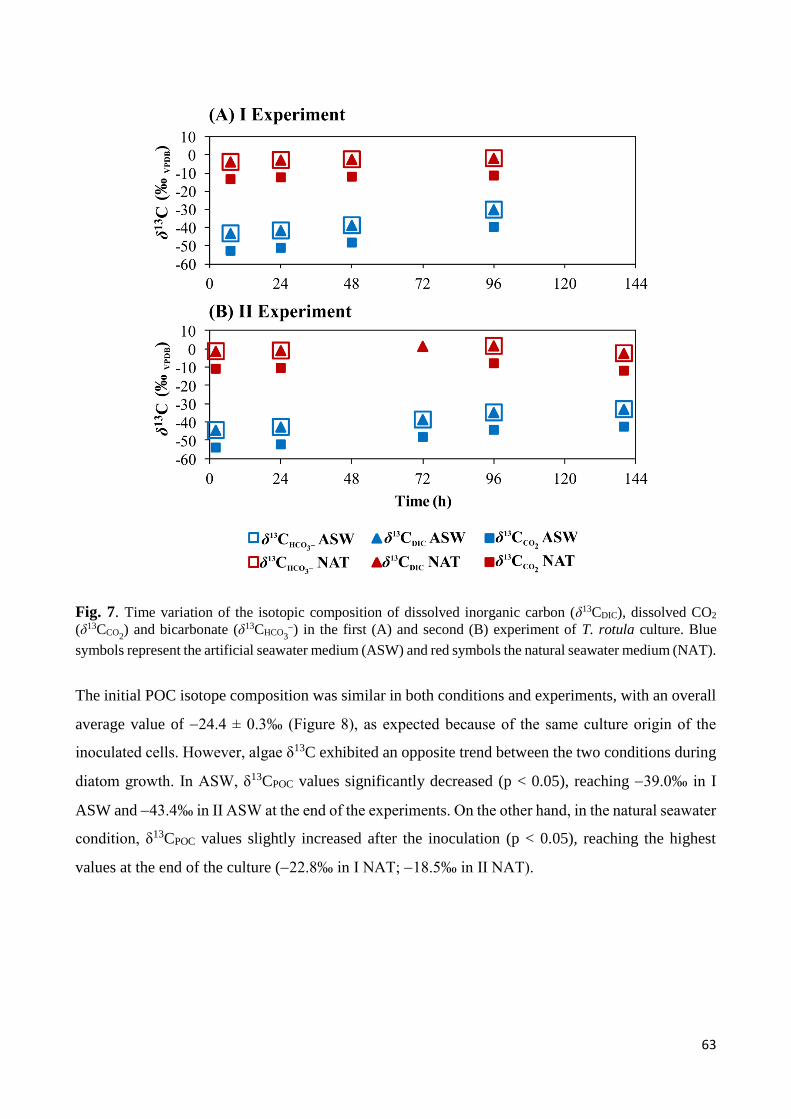
63
Fig. 7. Time variation of the isotopic composition of dissolved inorganic carbon (δ13CDIC), dissolved CO2
(δ13CCO2) and bicarbonate (δ13CHCO3
) in the first (A) and second (B) experiment of T. rotula culture. Blue
symbols represent the artificial seawater medium (ASW) and red symbols the natural seawater medium (NAT).
The initial POC isotope composition was similar in both conditions and experiments, with an overall
average value of 24.4 ± 0.3‰ (Figure 8), as expected because of the same culture origin of the
inoculated cells. However, algae δ13C exhibited an opposite trend between the two conditions during
diatom growth. In ASW, δ13CPOC values significantly decreased (p < 0.05), reaching 39.0‰ in I
ASW and 43.4‰ in II ASW at the end of the experiments. On the other hand, in the natural seawater
condition, δ13CPOC values slightly increased after the inoculation (p < 0.05), reaching the highest
values at the end of the culture (22.8‰ in I NAT; 18.5‰ in II NAT).
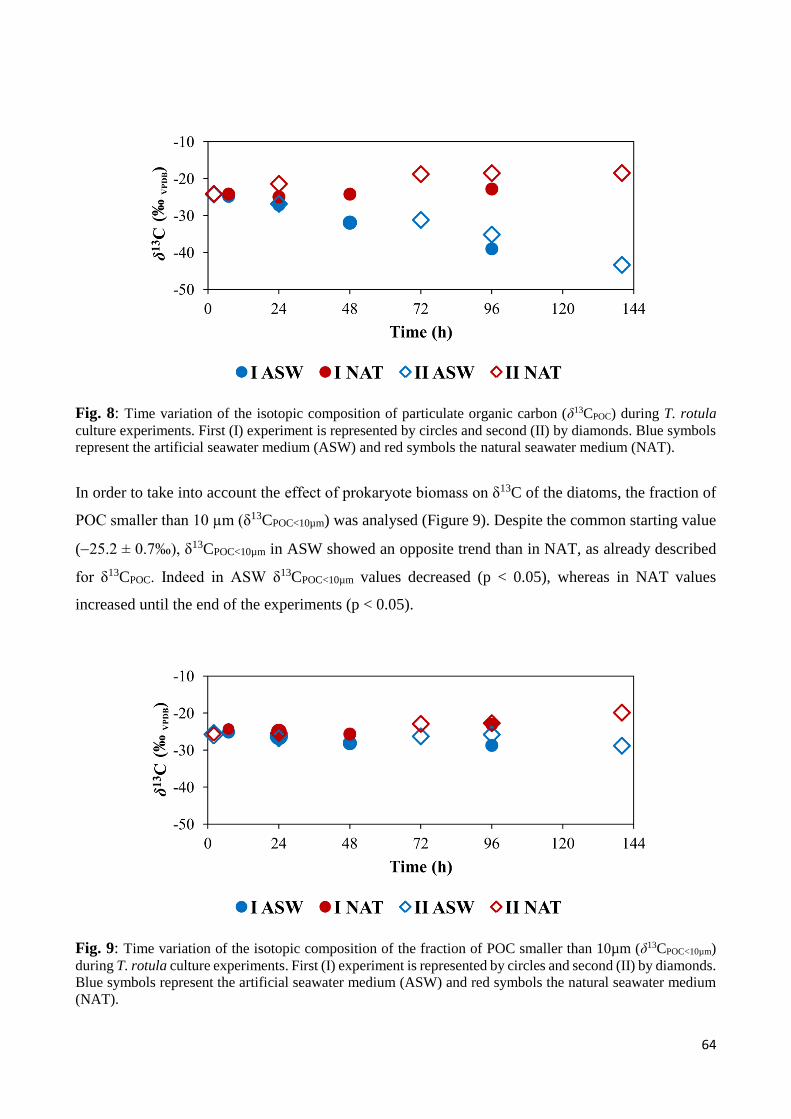
64
Fig. 8: Time variation of the isotopic composition of particulate organic carbon (δ13CPOC) during T. rotula
culture experiments. First (I) experiment is represented by circles and second (II) by diamonds. Blue symbols
represent the artificial seawater medium (ASW) and red symbols the natural seawater medium (NAT).
In order to take into account the effect of prokaryote biomass on δ13C of the diatoms, the fraction of
POC smaller than 10 µm (δ13CPOC<10µm) was analysed (Figure 9). Despite the common starting value
(25.2 ± 0.7‰), δ13CPOC<10µm in ASW showed an opposite trend than in NAT, as already described
for δ13CPOC. Indeed in ASW δ13CPOC<10µm values decreased (p < 0.05), whereas in NAT values
increased until the end of the experiments (p < 0.05).
Fig. 9: Time variation of the isotopic composition of the fraction of POC smaller than 10µm (δ13CPOC<10µm)
during T. rotula culture experiments. First (I) experiment is represented by circles and second (II) by diamonds.
Blue symbols represent the artificial seawater medium (ASW) and red symbols the natural seawater medium
(NAT).
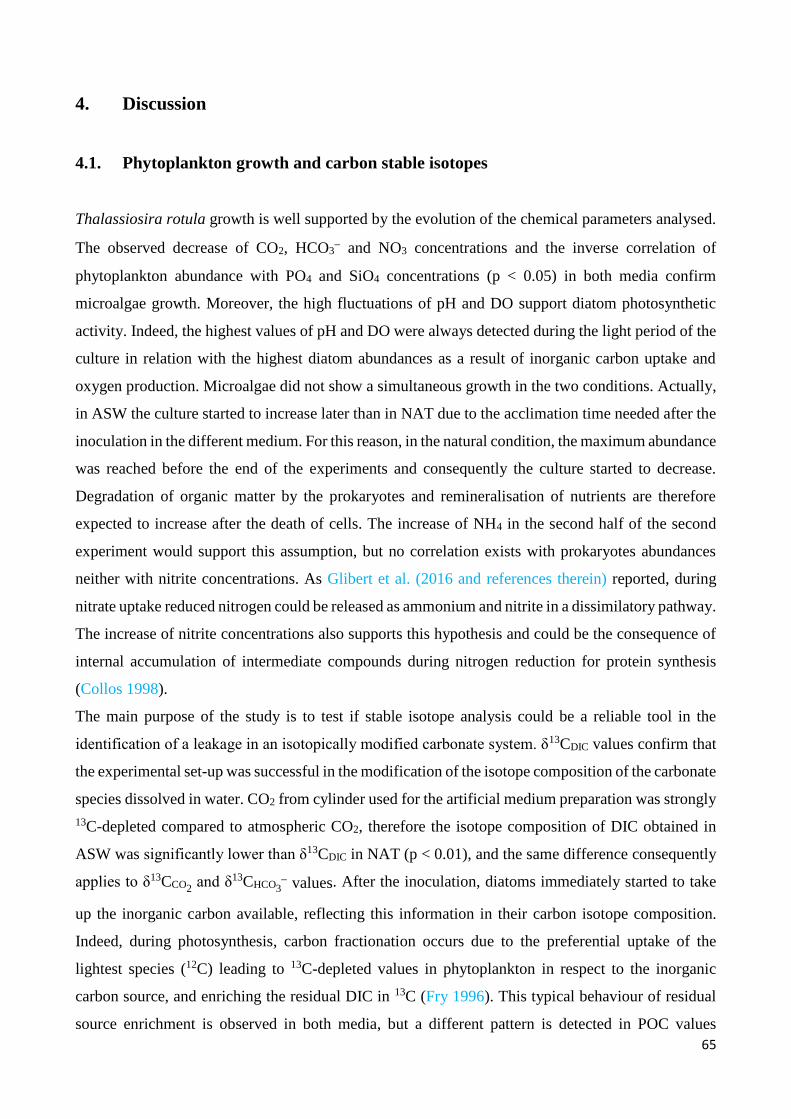
65
4. Discussion
4.1. Phytoplankton growth and carbon stable isotopes
Thalassiosira rotula growth is well supported by the evolution of the chemical parameters analysed.
The observed decrease of CO2, HCO3 and NO3 concentrations and the inverse correlation of
phytoplankton abundance with PO4 and SiO4 concentrations (p < 0.05) in both media confirm
microalgae growth. Moreover, the high fluctuations of pH and DO support diatom photosynthetic
activity. Indeed, the highest values of pH and DO were always detected during the light period of the
culture in relation with the highest diatom abundances as a result of inorganic carbon uptake and
oxygen production. Microalgae did not show a simultaneous growth in the two conditions. Actually,
in ASW the culture started to increase later than in NAT due to the acclimation time needed after the
inoculation in the different medium. For this reason, in the natural condition, the maximum abundance
was reached before the end of the experiments and consequently the culture started to decrease.
Degradation of organic matter by the prokaryotes and remineralisation of nutrients are therefore
expected to increase after the death of cells. The increase of NH4 in the second half of the second
experiment would support this assumption, but no correlation exists with prokaryotes abundances
neither with nitrite concentrations. As Glibert et al. (2016 and references therein) reported, during
nitrate uptake reduced nitrogen could be released as ammonium and nitrite in a dissimilatory pathway.
The increase of nitrite concentrations also supports this hypothesis and could be the consequence of
internal accumulation of intermediate compounds during nitrogen reduction for protein synthesis
(Collos 1998).
The main purpose of the study is to test if stable isotope analysis could be a reliable tool in the
identification of a leakage in an isotopically modified carbonate system. δ13CDIC values confirm that
the experimental set-up was successful in the modification of the isotope composition of the carbonate
species dissolved in water. CO2 from cylinder used for the artificial medium preparation was strongly
13C-depleted compared to atmospheric CO2, therefore the isotope composition of DIC obtained in
ASW was significantly lower than δ13CDIC in NAT (p < 0.01), and the same difference consequently
applies to δ13CCO2 and δ13CHCO3
values. After the inoculation, diatoms immediately started to take
up the inorganic carbon available, reflecting this information in their carbon isotope composition.
Indeed, during photosynthesis, carbon fractionation occurs due to the preferential uptake of the
lightest species (12C) leading to 13C-depleted values in phytoplankton in respect to the inorganic
carbon source, and enriching the residual DIC in 13C (Fry 1996). This typical behaviour of residual
source enrichment is observed in both media, but a different pattern is detected in POC values
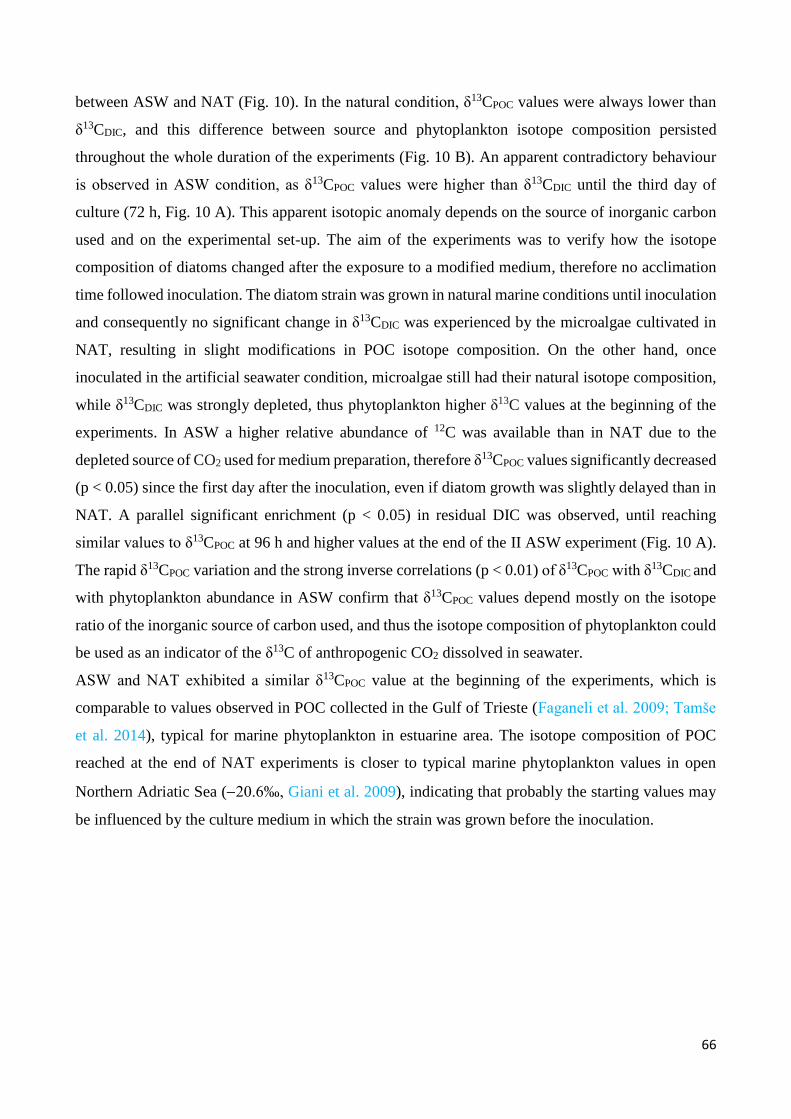
66
between ASW and NAT (Fig. 10). In the natural condition, δ13CPOC values were always lower than
δ13CDIC, and this difference between source and phytoplankton isotope composition persisted
throughout the whole duration of the experiments (Fig. 10 B). An apparent contradictory behaviour
is observed in ASW condition, as δ13CPOC values were higher than δ13CDIC until the third day of
culture (72 h, Fig. 10 A). This apparent isotopic anomaly depends on the source of inorganic carbon
used and on the experimental set-up. The aim of the experiments was to verify how the isotope
composition of diatoms changed after the exposure to a modified medium, therefore no acclimation
time followed inoculation. The diatom strain was grown in natural marine conditions until inoculation
and consequently no significant change in δ13CDIC was experienced by the microalgae cultivated in
NAT, resulting in slight modifications in POC isotope composition. On the other hand, once
inoculated in the artificial seawater condition, microalgae still had their natural isotope composition,
while δ13CDIC was strongly depleted, thus phytoplankton higher δ13C values at the beginning of the
experiments. In ASW a higher relative abundance of 12C was available than in NAT due to the
depleted source of CO2 used for medium preparation, therefore δ13CPOC values significantly decreased
(p < 0.05) since the first day after the inoculation, even if diatom growth was slightly delayed than in
NAT. A parallel significant enrichment (p < 0.05) in residual DIC was observed, until reaching
similar values to δ13CPOC at 96 h and higher values at the end of the II ASW experiment (Fig. 10 A).
The rapid δ13CPOC variation and the strong inverse correlations (p < 0.01) of δ13CPOC with δ13CDIC and
with phytoplankton abundance in ASW confirm that δ13CPOC values depend mostly on the isotope
ratio of the inorganic source of carbon used, and thus the isotope composition of phytoplankton could
be used as an indicator of the δ13C of anthropogenic CO2 dissolved in seawater.
ASW and NAT exhibited a similar δ13CPOC value at the beginning of the experiments, which is
comparable to values observed in POC collected in the Gulf of Trieste (Faganeli et al. 2009; Tamše
et al. 2014), typical for marine phytoplankton in estuarine area. The isotope composition of POC
reached at the end of NAT experiments is closer to typical marine phytoplankton values in open
Northern Adriatic Sea (20.6‰, Giani et al. 2009), indicating that probably the starting values may
be influenced by the culture medium in which the strain was grown before the inoculation.
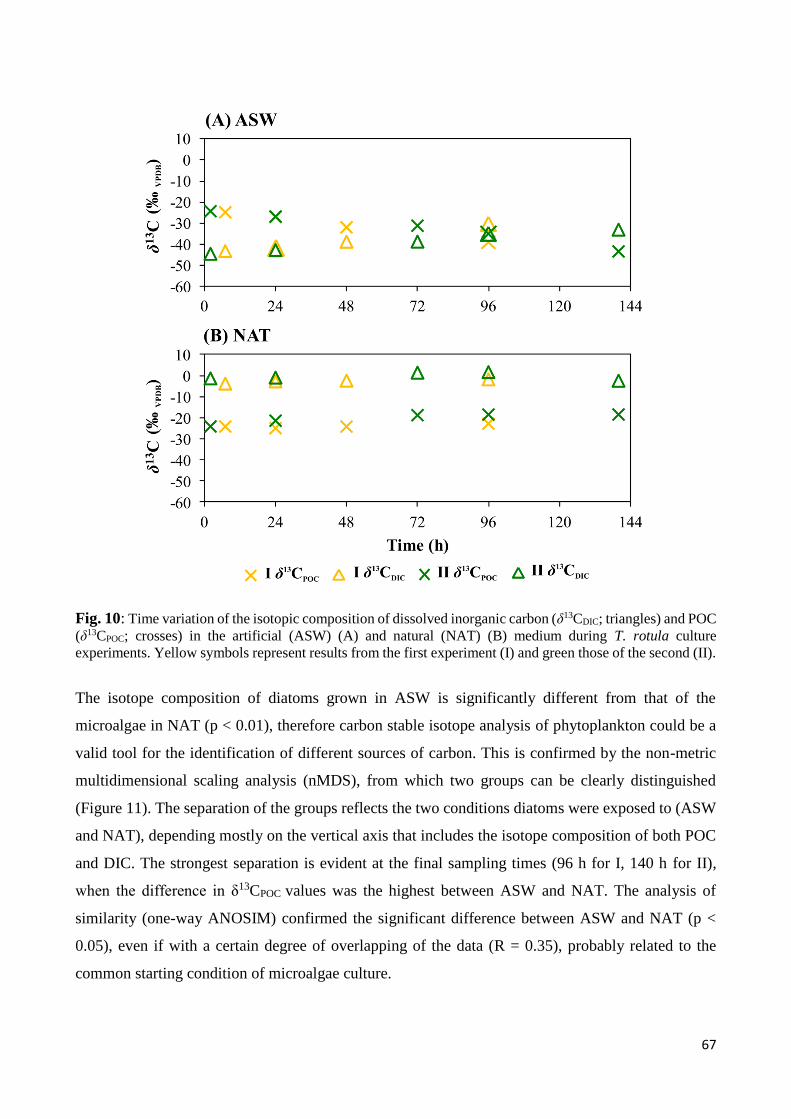
67
Fig. 10: Time variation of the isotopic composition of dissolved inorganic carbon (δ13CDIC; triangles) and POC
(δ13CPOC; crosses) in the artificial (ASW) (A) and natural (NAT) (B) medium during T. rotula culture
experiments. Yellow symbols represent results from the first experiment (I) and green those of the second (II).
The isotope composition of diatoms grown in ASW is significantly different from that of the
microalgae in NAT (p < 0.01), therefore carbon stable isotope analysis of phytoplankton could be a
valid tool for the identification of different sources of carbon. This is confirmed by the non-metric
multidimensional scaling analysis (nMDS), from which two groups can be clearly distinguished
(Figure 11). The separation of the groups reflects the two conditions diatoms were exposed to (ASW
and NAT), depending mostly on the vertical axis that includes the isotope composition of both POC
and DIC. The strongest separation is evident at the final sampling times (96 h for I, 140 h for II),
when the difference in δ13CPOC values was the highest between ASW and NAT. The analysis of
similarity (one-way ANOSIM) confirmed the significant difference between ASW and NAT (p <
0.05), even if with a certain degree of overlapping of the data (R = 0.35), probably related to the
common starting condition of microalgae culture.
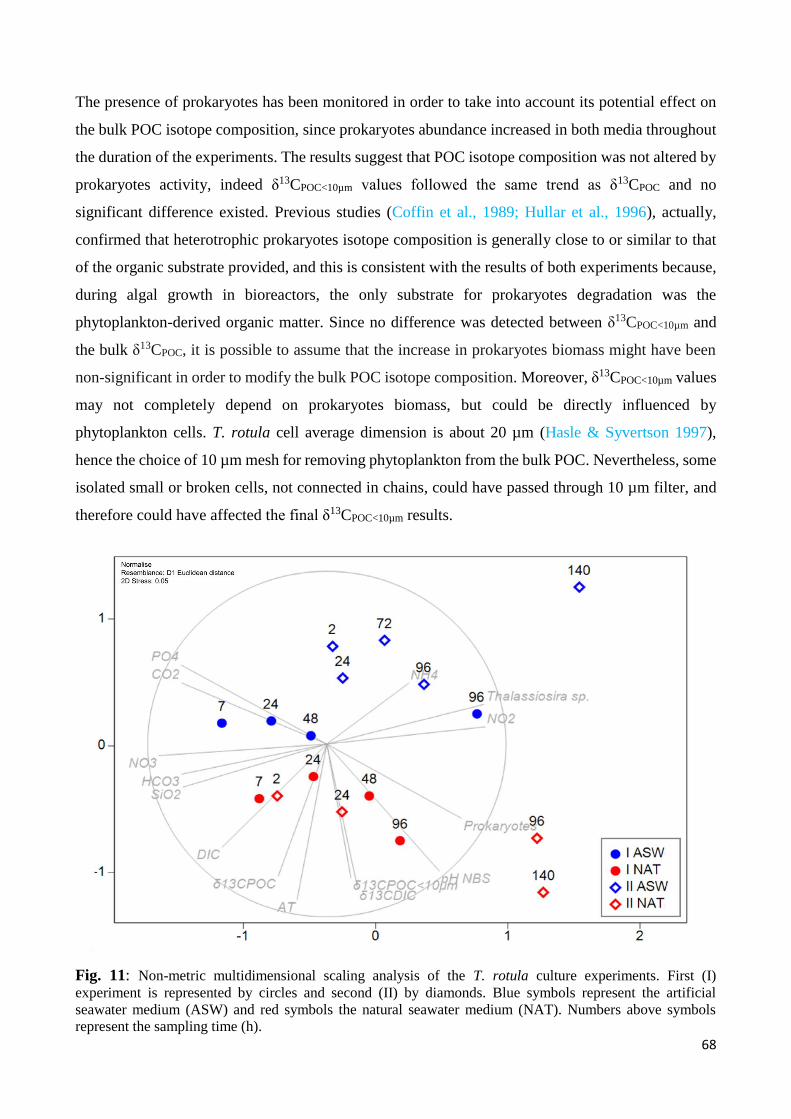
68
The presence of prokaryotes has been monitored in order to take into account its potential effect on
the bulk POC isotope composition, since prokaryotes abundance increased in both media throughout
the duration of the experiments. The results suggest that POC isotope composition was not altered by
prokaryotes activity, indeed δ13CPOC<10µm values followed the same trend as δ13CPOC and no
significant difference existed. Previous studies (Coffin et al., 1989; Hullar et al., 1996), actually,
confirmed that heterotrophic prokaryotes isotope composition is generally close to or similar to that
of the organic substrate provided, and this is consistent with the results of both experiments because,
during algal growth in bioreactors, the only substrate for prokaryotes degradation was the
phytoplankton-derived organic matter. Since no difference was detected between δ13CPOC<10µm and
the bulk δ13CPOC, it is possible to assume that the increase in prokaryotes biomass might have been
non-significant in order to modify the bulk POC isotope composition. Moreover, δ13CPOC<10µm values
may not completely depend on prokaryotes biomass, but could be directly influenced by
phytoplankton cells. T. rotula cell average dimension is about 20 µm (Hasle & Syvertson 1997),
hence the choice of 10 µm mesh for removing phytoplankton from the bulk POC. Nevertheless, some
isolated small or broken cells, not connected in chains, could have passed through 10 µm filter, and
therefore could have affected the final δ13CPOC<10µm results.
Fig. 11: Non-metric multidimensional scaling analysis of the T. rotula culture experiments. First (I)
experiment is represented by circles and second (II) by diamonds. Blue symbols represent the artificial
seawater medium (ASW) and red symbols the natural seawater medium (NAT). Numbers above symbols
represent the sampling time (h).
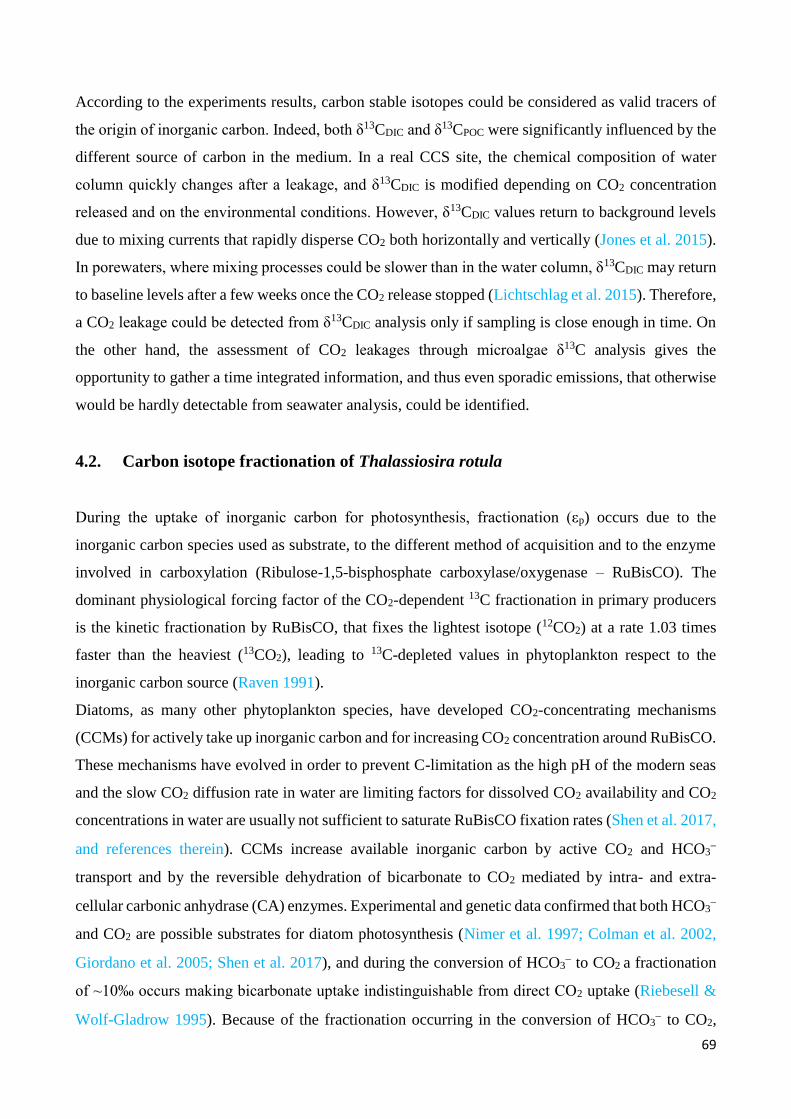
69
According to the experiments results, carbon stable isotopes could be considered as valid tracers of
the origin of inorganic carbon. Indeed, both δ13CDIC and δ13CPOC were significantly influenced by the
different source of carbon in the medium. In a real CCS site, the chemical composition of water
column quickly changes after a leakage, and δ13CDIC is modified depending on CO2 concentration
released and on the environmental conditions. However, δ13CDIC values return to background levels
due to mixing currents that rapidly disperse CO2 both horizontally and vertically (Jones et al. 2015).
In porewaters, where mixing processes could be slower than in the water column, δ13CDIC may return
to baseline levels after a few weeks once the CO2 release stopped (Lichtschlag et al. 2015). Therefore,
a CO2 leakage could be detected from δ13CDIC analysis only if sampling is close enough in time. On
the other hand, the assessment of CO2 leakages through microalgae δ13C analysis gives the
opportunity to gather a time integrated information, and thus even sporadic emissions, that otherwise
would be hardly detectable from seawater analysis, could be identified.
4.2. Carbon isotope fractionation of Thalassiosira rotula
During the uptake of inorganic carbon for photosynthesis, fractionation (εp) occurs due to the
inorganic carbon species used as substrate, to the different method of acquisition and to the enzyme
involved in carboxylation (Ribulose-1,5-bisphosphate carboxylase/oxygenase – RuBisCO). The
dominant physiological forcing factor of the CO2-dependent 13C fractionation in primary producers
is the kinetic fractionation by RuBisCO, that fixes the lightest isotope (12CO2) at a rate 1.03 times
faster than the heaviest (13CO2), leading to 13C-depleted values in phytoplankton respect to the
inorganic carbon source (Raven 1991).
Diatoms, as many other phytoplankton species, have developed CO2-concentrating mechanisms
(CCMs) for actively take up inorganic carbon and for increasing CO2 concentration around RuBisCO.
These mechanisms have evolved in order to prevent C-limitation as the high pH of the modern seas
and the slow CO2 diffusion rate in water are limiting factors for dissolved CO2 availability and CO2
concentrations in water are usually not sufficient to saturate RuBisCO fixation rates (Shen et al. 2017,
and references therein). CCMs increase available inorganic carbon by active CO2 and HCO3
transport and by the reversible dehydration of bicarbonate to CO2 mediated by intra- and extra-
cellular carbonic anhydrase (CA) enzymes. Experimental and genetic data confirmed that both HCO3
and CO2 are possible substrates for diatom photosynthesis (Nimer et al. 1997; Colman et al. 2002,
Giordano et al. 2005; Shen et al. 2017), and during the conversion of HCO3 to CO2 a fractionation
of ~10‰ occurs making bicarbonate uptake indistinguishable from direct CO2 uptake (Riebesell &
Wolf-Gladrow 1995). Because of the fractionation occurring in the conversion of HCO3 to CO2,
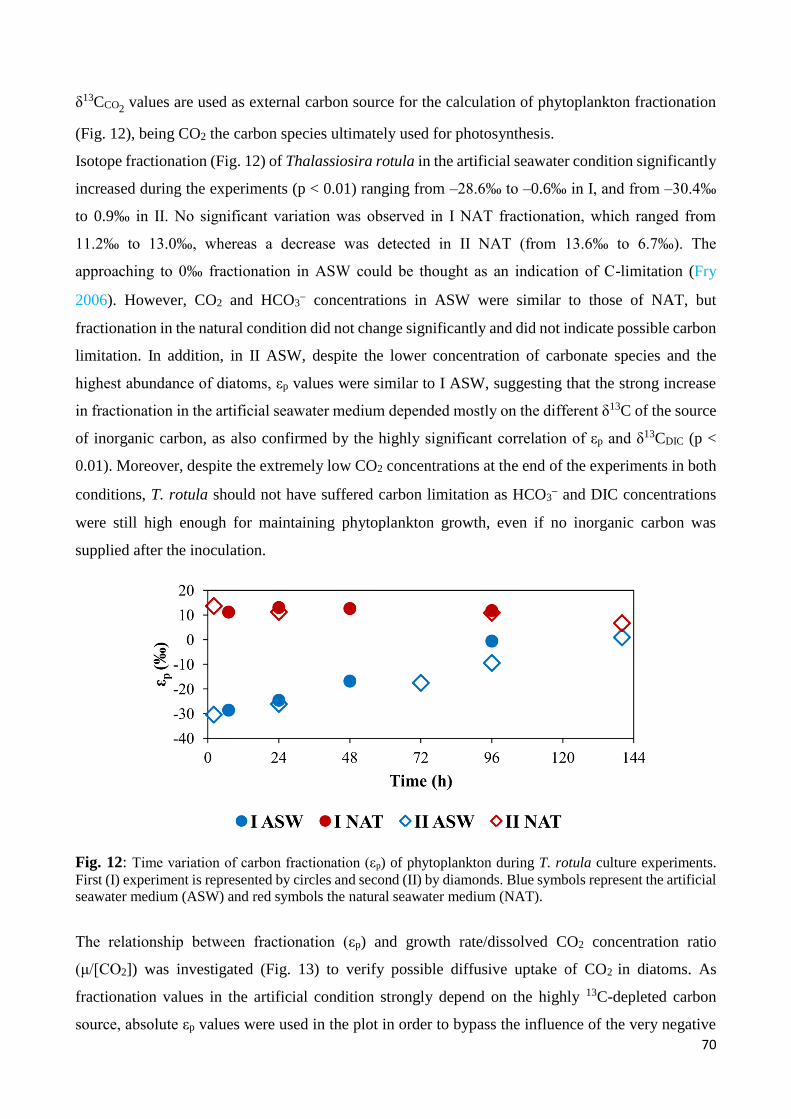
70
δ13CCO2 values are used as external carbon source for the calculation of phytoplankton fractionation
(Fig. 12), being CO2 the carbon species ultimately used for photosynthesis.
Isotope fractionation (Fig. 12) of Thalassiosira rotula in the artificial seawater condition significantly
increased during the experiments (p < 0.01) ranging from –28.6‰ to –0.6‰ in I, and from –30.4‰
to 0.9‰ in II. No significant variation was observed in I NAT fractionation, which ranged from
11.2‰ to 13.0‰, whereas a decrease was detected in II NAT (from 13.6‰ to 6.7‰). The
approaching to 0‰ fractionation in ASW could be thought as an indication of C-limitation (Fry
2006). However, CO2 and HCO3 concentrations in ASW were similar to those of NAT, but
fractionation in the natural condition did not change significantly and did not indicate possible carbon
limitation. In addition, in II ASW, despite the lower concentration of carbonate species and the
highest abundance of diatoms, εp values were similar to I ASW, suggesting that the strong increase
in fractionation in the artificial seawater medium depended mostly on the different δ13C of the source
of inorganic carbon, as also confirmed by the highly significant correlation of εp and δ13CDIC (p <
0.01). Moreover, despite the extremely low CO2 concentrations at the end of the experiments in both
conditions, T. rotula should not have suffered carbon limitation as HCO3 and DIC concentrations
were still high enough for maintaining phytoplankton growth, even if no inorganic carbon was
supplied after the inoculation.
Fig. 12: Time variation of carbon fractionation (εp) of phytoplankton during T. rotula culture experiments.
First (I) experiment is represented by circles and second (II) by diamonds. Blue symbols represent the artificial
seawater medium (ASW) and red symbols the natural seawater medium (NAT).
The relationship between fractionation (εp) and growth rate/dissolved CO2 concentration ratio
(μ/[CO2]) was investigated (Fig. 13) to verify possible diffusive uptake of CO2 in diatoms. As
fractionation values in the artificial condition strongly depend on the highly 13C-depleted carbon
source, absolute εp values were used in the plot in order to bypass the influence of the very negative
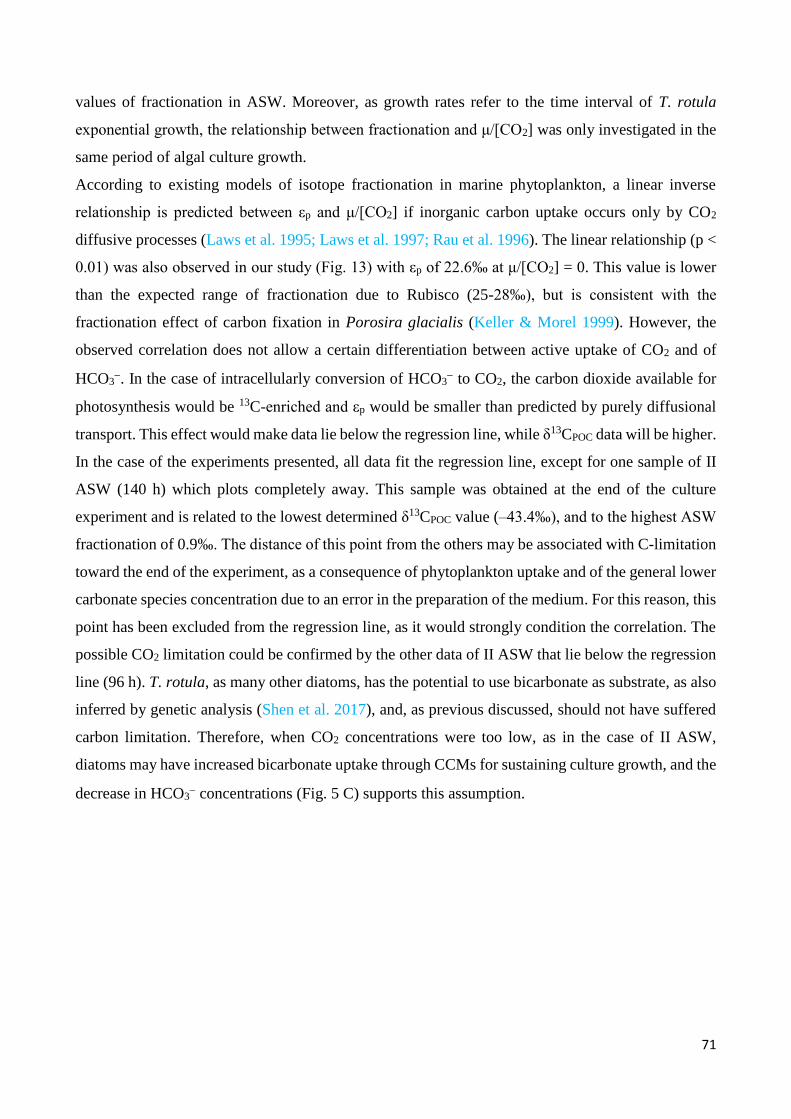
71
values of fractionation in ASW. Moreover, as growth rates refer to the time interval of T. rotula
exponential growth, the relationship between fractionation and μ/[CO2] was only investigated in the
same period of algal culture growth.
According to existing models of isotope fractionation in marine phytoplankton, a linear inverse
relationship is predicted between εp and μ/[CO2] if inorganic carbon uptake occurs only by CO2
diffusive processes (Laws et al. 1995; Laws et al. 1997; Rau et al. 1996). The linear relationship (p <
0.01) was also observed in our study (Fig. 13) with εp of 22.6‰ at μ/[CO2] = 0. This value is lower
than the expected range of fractionation due to Rubisco (25-28‰), but is consistent with the
fractionation effect of carbon fixation in Porosira glacialis (Keller & Morel 1999). However, the
observed correlation does not allow a certain differentiation between active uptake of CO2 and of
HCO3. In the case of intracellularly conversion of HCO3
to CO2, the carbon dioxide available for
photosynthesis would be 13C-enriched and εp would be smaller than predicted by purely diffusional
transport. This effect would make data lie below the regression line, while δ13CPOC data will be higher.
In the case of the experiments presented, all data fit the regression line, except for one sample of II
ASW (140 h) which plots completely away. This sample was obtained at the end of the culture
experiment and is related to the lowest determined δ13CPOC value (–43.4‰), and to the highest ASW
fractionation of 0.9‰. The distance of this point from the others may be associated with C-limitation
toward the end of the experiment, as a consequence of phytoplankton uptake and of the general lower
carbonate species concentration due to an error in the preparation of the medium. For this reason, this
point has been excluded from the regression line, as it would strongly condition the correlation. The
possible CO2 limitation could be confirmed by the other data of II ASW that lie below the regression
line (96 h). T. rotula, as many other diatoms, has the potential to use bicarbonate as substrate, as also
inferred by genetic analysis (Shen et al. 2017), and, as previous discussed, should not have suffered
carbon limitation. Therefore, when CO2 concentrations were too low, as in the case of II ASW,
diatoms may have increased bicarbonate uptake through CCMs for sustaining culture growth, and the
decrease in HCO3 concentrations (Fig. 5 C) supports this assumption.
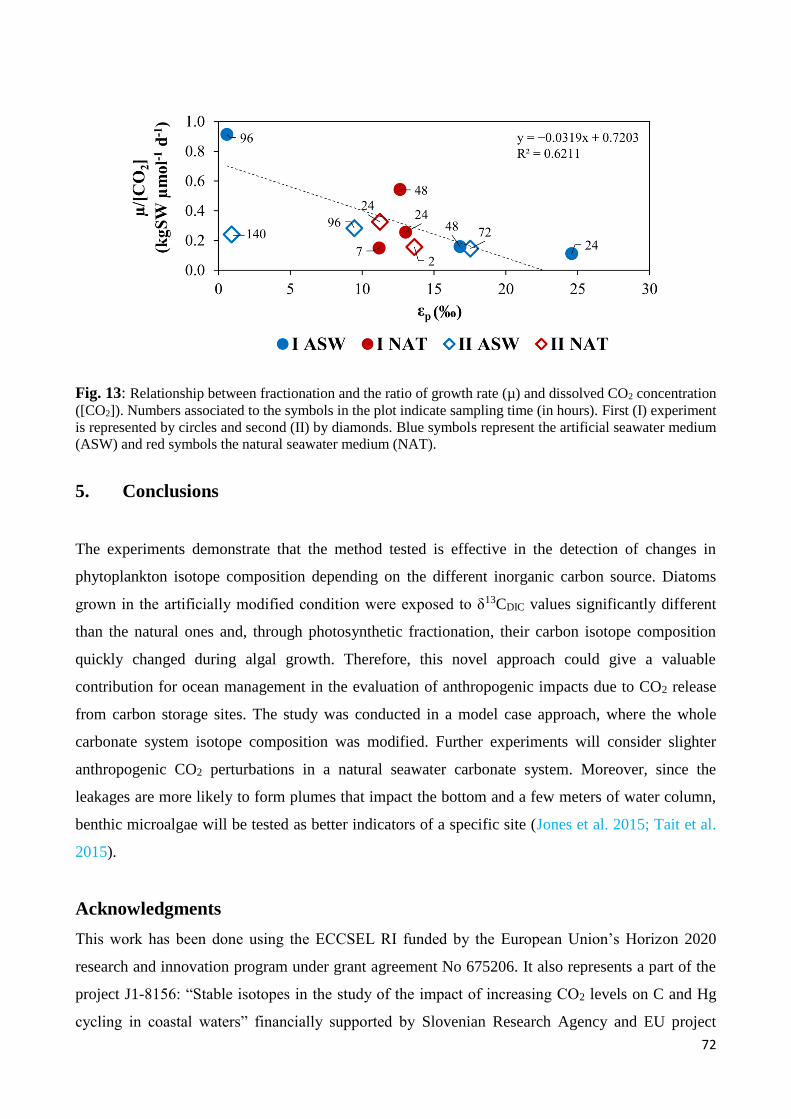
72
Fig. 13: Relationship between fractionation and the ratio of growth rate (µ) and dissolved CO2 concentration
([CO2]). Numbers associated to the symbols in the plot indicate sampling time (in hours). First (I) experiment
is represented by circles and second (II) by diamonds. Blue symbols represent the artificial seawater medium
(ASW) and red symbols the natural seawater medium (NAT).
5. Conclusions
The experiments demonstrate that the method tested is effective in the detection of changes in
phytoplankton isotope composition depending on the different inorganic carbon source. Diatoms
grown in the artificially modified condition were exposed to δ13CDIC values significantly different
than the natural ones and, through photosynthetic fractionation, their carbon isotope composition
quickly changed during algal growth. Therefore, this novel approach could give a valuable
contribution for ocean management in the evaluation of anthropogenic impacts due to CO2 release
from carbon storage sites. The study was conducted in a model case approach, where the whole
carbonate system isotope composition was modified. Further experiments will consider slighter
anthropogenic CO2 perturbations in a natural seawater carbonate system. Moreover, since the
leakages are more likely to form plumes that impact the bottom and a few meters of water column,
benthic microalgae will be tested as better indicators of a specific site (Jones et al. 2015; Tait et al.
2015).
Acknowledgments
This work has been done using the ECCSEL RI funded by the European Union’s Horizon 2020
research and innovation program under grant agreement No 675206. It also represents a part of the
project J1-8156: “Stable isotopes in the study of the impact of increasing CO2 levels on C and Hg
cycling in coastal waters” financially supported by Slovenian Research Agency and EU project
73
MASSTWIN - Spreading excellence and widening participation in support of mass spectrometry and
related techniques in health, the environment and food analysis (H2020, grant agreement No 692241).
We would like to thank Mirta Smodlaka Tankovic and Ana Baričević of the Ruđer Bošković Institute
(Rovinj, Croatia) for performing genetic analysis, Sergio Predonzani and Matteo Bazzaro for the
valuable help in the experiments set-up and sampling, Martina Kralj for nutrients analysis, Mauro
Celussi for prokaryotes analysis and Alfred Beran for providing the culture and for the experiment
preparation support.
References
Altschul SF, Madden TL, Schäffer AA, Zhang J, Zhang Z, Miller W, Lipman DJ (1997) Gapped
BLAST and PSI-BLAST: a new generation of protein database search programs. Nucleic
Acids Res 25:3389–402.
Alverson AJ (2008) Molecular systematics and the diatom species. Protist 159, 339–353.
doi:10.1016/j.protis.2008.04.001.
Andersen RA (2005) Algal Culturing Techniques, 1st ed. Elsevier Academic Press, Burlington, Mass.
Becker V, Myrttinen A, Blum P, Van Geldern R, Barth JAC (2011) Predicting δ13CDIC dynamics in
CCS: A scheme based on review on inorganic carbon chemistry under elevated pressures and
temperatures. Int J Greenh Gas Control 5:1250–1258. doi:10.1016/j.ijggc.2011.05.001.
Blackford J, Bull JM, Cevatoglu M, Connelly D, Hauton C, James RH, Lichtschlag A, Stahl H,
Widdicombe S, Wright IC (2015) Marine baseline and monitoring strategies for carbon
dioxide capture and storage (CCS). Int J Greenh Gas Control 38:221–229.
https://doi.org/10.1016/j.ijggc.2014.10.004.
Celussi M, Malfatti F, Franzo A, Gazeau F, Giannakourou A, Pitta P, Tsiola A, Del Negro P, (2015)
Ocean acidification effect on prokaryotic metabolism tested in two diverse trophic regimes in
the Mediterranean Sea. Estuar Coast Shelf Sci 186:125-138.
https://doi.org/10.1016/j.ecss.2015.08.015.
Clark K, Karsch-Mizrachi I, Lipman DJ, Ostell J, Sayers EW (2016) GenBank. Nucleic Acids Res.
44:D67-72. doi: 10.1093/nar/gkv1276.
Clarke KR, Gorley RN, Somerfield PJ, Warwick RM (2014) Change in marine communities: An
approach to statistical analysis and interpretation, 3rd ed. PRIMER-E, Plymouth, UK.
Coffin RB, Fry B, Wright RT (1989) Carbon isotopic compositions of estuarine bacteria. Limnol
Oceanogr 34:1305–1310.
Collos Y (1998) Nitrate uptake, nitrite release and uptake, and new production estimates. Mar Ecol
Prog Ser 171:293–301. doi: 10.3354/meps171293.
Colman B, Huertas E, Bhatti S, Dason JS (2002) The diversity of inorganic carbon acquisition
mechanisms in eukaryotic microalgae. Funct Plant Biol 29:261–270. doi: 10.1071/PP01184.
De Coninck H, Benson SM (2014) Carbon dioxide capture and storage: issues and prospects. Annu
Rev Environ Resour 39:243–270. 10.1146/annurev-environ-032112-095222.
74
Dickson AG (1990) Standard potential of the reaction: AgCl(s) + 1/2 H2(g) = Ag(s) + HCl(aq), and the
standard acidity constant of the ion HSO4– in synthetic sea water from 273.15 to 318.15 K. J
Chem Thermodyn 22:113-127. doi: 10.1016/0021-9614(90)90074-z.
Dickson AG, Millero FJ (1987) A comparison of the equilibrium constants for the dissociation of
carbonic acid in seawater media. Deep-Sea Res A, Oceanogr Res Pap 34:1733–1743.
Dickson AG, Sabine CL, Christian JR (2007) Guide to best practices for ocean CO2 measurements.
PICES Special Publication 3, 191 pp. Standard operating procedure (SOP) 3b, Determination
of total alkalinity in sea water using an open-cell titration.
Faganeli J, Ogrinc N, Kovac N, Kukovec K, Falnoga I, Mozetič P, Bajt O (2009) Carbon and nitrogen
isotope composition of particulate organic matter in relation to mucilage formation in the
northern Adriatic Sea. Mar Chem 114:102–109. doi:10.1016/j.marchem.2009.04.005.
Farquhar GD, Ehleringer JR, Hubick KT, City SL (1989) Carbon isotope discrimination and
photosynthesis. Annu Rev Plant Physiol 40:503–537.
doi:10.1146/annurev.pp.40.060189.002443.
Flude S, Johnson G, Gilfillan SMV, Haszeldine RS (2016) Inherent tracers for carbon capture and
storage in sedimentary formations: composition and applications. Environ Sci Technol
50:7939-7955. doi: 10.1021/acs.est.6b01548.
Freeman KH, Hayes JM (1992) Fractionation of carbon isotopes by phytoplankton and estimates of
ancient CO2 levels. Global Biogeochem Cycles 6:185–198.
Fry B (1996) 13C/12C fractionation by marine diatoms. Mar Ecol Prog Ser 134:283-294.
Fry B (2006) Stable isotope ecology, 1st ed., Springer, New York.
Gattuso JP, Gao K, Lee K, Rost B, Schulz KG (2010) Approaches and tools to manipulate the
carbonate chemistry, in: Riebesell U, Fabry VJ, Hansson L, Gattuso JP (Eds.), Guide for best
practices in ocean acidification research and data reporting. Office for official publications of
the European Union, Luxembourg.
Giani M, Berto D, Rampazzo F, Savelli F, Alvisi F, Giordano P, Ravaioli M, Frascari F (2009) Origin
of sedimentary organic matter in the north-western Adriatic Sea. Estuar Coast Shelf Sci
84:573-583.8
Giordano M, Beardall J, Raven JA (2005) CO2 concentrating mechanisms in algae: mechanisms,
environmental modulation, and evolution. Annu Rev Plant Biol 56:99–131. doi:
10.1146/annurev.arplant.56.032604.144052.
Glibert PM, Wilkerson FP, Dugdale RC, Raven JA, Dupont CL, Leavitt PR, Parker AE, Burkholder
JM, Kana TM (2016) Pluses and minuses of ammonium and nitrate uptake and assimilation
by phytoplankton and implications for productivity and community composition, with
emphasis on nitrogen-enriched conditions. Limnol Oceanogr 61:165–197.
doi:10.1002/lno.10203.
Hansen HP (1999) Determination of oxygen. In: Grasshoff K, Kremling K, Ehrhardt M (Eds.),
Methods of seawater analysis, 3rd ed. Wiley-VCH, Weinheim.
Hansen HP, Koroleff F (1999) Determination of nutrients. In: Grasshoff K, Kremling K, Ehrhardt M
(Eds.), Methods of seawater analysis, 3rd ed. Wiley-VCH, Weinheim.
Hasle GR, Syvertson EE (1997) Marine Diatoms. In: Tomas CR (Ed.) Identifying marine
phytoplankton, 1st ed. Academic Press, USA.
Hellevang H, Aagaar P (2015) Constraints on natural global atmospheric CO2 fluxes from 1860 to
2010 using a simplified explicit forward model. Sci Rep 5:17352; doi: 10.1038/srep17352.
75
Hullar MAJ Fry B, Peterson BJ, Wright RT (1996) Microbial utilization of estuarine dissolved
organic carbon: a stable isotope tracer approach tested by mass balance. Appl Environ
Microbiol 62: 2489–2493.
Ingrosso G, Giani M, Cibic T, Karuza A, Kralj M, Del Negro P (2016) Carbonate chemistry dynamics
and biological processes along a river–sea gradient (Gulf of Trieste, northern Adriatic Sea). J
Mar Syst 155:35–49. https://doi.org/10.1016/j.jmarsys.2015.10.013.
IPCC (2005) IPCC special report on carbon dioxide capture and storage. Prepared by Working Group
III of the Intergovernmental Panel on Climate Change [Metz B, Davidson O, de Coninck HC,
Loos M, Meyer LA (eds.)]. Cambridge University Press, Cambridge, United Kingdom and
New York, NY, USA.
IPCC (2014) Climate Change 2014: Impacts, Adaptation, and Vulnerability. Part A: Global and
Sectoral Aspects. Contribution of Working Group II to the Fifth Assessment Report of the
Intergovernmental Panel on Climate Change [Field CB, Barros VR, Dokken DJ, Mach KJ,
Mastrandrea MD, Bilir TE, Chatterjee M, Ebi KL, Estrada YO, Genova RC, Girma B, Kissel
ES, Levy AN, MacCracken S, Mastrandrea PR, White LL (eds.)]. Cambridge University
Press, Cambridge, United Kingdom and New York, NY, USA.
Jeandel E, Battani A, Sarda P (2010) Lessons learned from natural and industrial analogues for
storage of carbon dioxide. Int J Greenh Gas Control 4:890–909.
doi:10.1016/j.ijggc.2010.06.005.
Jones DG, Beaubien SE, Blackford JC, Foekema EM, Lions J, De Vittor C, West JM, Widdicombe
S, Hauton C, Queirós AM (2015) Developments since 2005 in understanding potential
environmental impacts of CO2 leakage from geological storage. Int J Greenh Gas Control
40:350–377. http://dx.doi.org/10.1016/j.ijggc.2015.05.032.
Kim H, Kim YH, Kang SG, Park YG (2016) Development of environmental impact monitoring
protocol for offshore capture and storage (CCS): A biological perspective. Environ Impact
Asses Rev 57:139–150. http://dx.doi.org/10.1016/j.eiar.2015.11.004.
Kearse M, Moir R, Wilson A, Stones-Havas S, Cheung M, Sturrock S, Buxton S, Cooper A,
Markowitz S, Duran C, Thierer T, Ashton B, Meintjes P, Drummond A (2012) Geneious
Basic: an integrated and extendable desktop software platform for the organization and
analysis of sequence data. Bioinformatics 28:1647–9. doi:10.1093/bioinformatics/bts199.
Keller K, Morel FMM (1999) A model of carbon isotopic fractionation and active carbon uptake in
phytoplankton. Mar Ecol Prog Ser 182:295–298.
Laws EA, Popp BN, Bidigare RR, Kennicutt MC, Macko SA (1995) Dependence of phytoplankton
carbon isotopic composition on growth rate and [CO2]aq: theoretical considerations and
experimental results. Geochim Cosmochim Acta 59:1131–1138.
Laws EA, Bidigare RR, Popp BN (1997) Effects of growth rate and CO2 concentration on carbon
isotopic fractionation by the marine diatom Phaeodactylum tricornutum. Limnol Oceanogr
42:1552–1560.
Le Quéré C, Peters GP, Andres RJ, Andrew RM, Boden T, Ciais P, Friedlingstein P, Houghton RA,
Marland G, Moriarty R, Sitch S, Tans P, Arneth A, Arvanitis A, Bakker DCE, Bopp L,
Canadell JG, Chini LP, Doney SC, Harper A, Harris I, House JI, Jain AK, Jones SD, Kato E,
Keeling RF, Goldewijk K, Körtzinger A, Koven C, Lefèvre N, Omar A, Ono T, Park GH,
Pfeil B, Poulter B, Raupach MR, Regnier P, Rödenbeck C, Saito S, Schwinger J, Segschneider
76
J, Stocker BD, Tilbrook B, van Heuven S, Viovy N, Wanninkhof R, Wiltshire A, Zaehle S,
Yue C (2013) Global carbon budget 2013. Earth Syst Sci Data Disc 6:689–760.
Lewis E, Wallace DWR (1998) Program developed for CO2 System calculations, ORNL/CDIAC-
105, Carbon Dioxide Information Analysis Center, Oak Ridge National Laboratory, U.S.
Department of Energy, Oak Ridge, Tennessee.
Lichtschlag A, James RH, Stahl H, Connelly D (2015) Effect of a controlled sub-seabed release of
CO2 on the biogeochemistry of shallow marine sediments, their pore waters, and the overlying
water column. Int J Greenh Gas Control 38:80–92.
http://dx.doi.org/10.1016/j.ijggc.2014.10.008.
MacGillivary ML, Kaczmarska I (2011) Survey of the efficacy of a short fragment of the rbcL gene
as a supplemental DNA barcode for diatoms. J Eukaryot Microbiol 58:529–536. doi:
10.1111/j.1550-7408.2011.00585.x.
Mancinelli G, Vizzini S (2015) Assessing anthropogenic pressures on coastal marine ecosystems
using stable CNS isotopes: State of the art, knowledge gaps, and community-scale
perspectives. Estuar Coast Shelf Sci 156:195–204.
Marie D, Brussaard CPD, Thyrhaug R, Bratbak G, Vaulot D (1999) Enumeration of marine viruses
in culture and natural samples by flow cytometry. Appl Environ Microb 65:45–52.
Mayer B, Shevalier M, Nightingale M, Kwon JS, Johnson G, Raistrick M, Hutcheon I, Perkins E
(2013) Tracing the movement and the fate of injected CO2 at the IEA GHG Weyburn-Midale
CO2 Monitoring and Storage project (Saskatchewan, Canada) using carbon isotope ratios. Int
J Greenh Gas Control 16S:S177–S184. http://dx.doi.org/10.1016/j.ijggc.2013.01.035.
Mayer B, Humez P, Becker V, Dalkhaa C, Rock L, Myrttinen A, Barth JAC (2015) Assessing the
usefulness of the isotopic composition of CO2 for leakage monitoring at CO2 storage sites: A
review. Int J Greenh Gas Control 37:46–60. https://doi.org/10.1016/j.ijggc.2015.02.021.
Mehrbach C, Culberson CH, Hawley JE, Pytkowics RM (1973) Measurement of the apparent
dissociation constants of carbonic acid in seawater at atmospheric pressure. Limnol
Oceaneanogr 18:897–907.
Mook WG, Bommerson JC, Staverman WH (1974) Carbon isotope fractionation between dissolved
bicarbonate and gaseous carbon dioxide. Earth Planet Sci Lett 22:169–176. doi:10.1016/0012-
821X(74)90078-8.
Nimer NA, Iglesias-Rodriguez MD, Merrett MJ (1997) Bicarbonate utilization by marine
phytoplankton species. J Phycol 33:625–631.
Noble RRP, Stalker L, Wakelin SA, Pejcic B, Leybourne MI, Hortle AL, Michael K (2012) Biological
monitoring for carbon capture and storage – A review and potential future developments. Int
J Greenh Gas Control 10:520–535. http://dx.doi.org/10.1016/j.ijggc.2012.07.022.
Oudot C, Gerard R, Morin P (1988) Precise shipboard determination of dissolved oxygen (Winkler
procedure) for productivity studies with commercial system. Limnol Oceanogr 33:146-150.
doi: 10.4319/lo.1988.33.1.0146.
Rau GH, Riebesell U, Wolf-Gladrow DA (1996) A model of photosynthetic 13C fractionation by
marine phytoplankton based on diffusive molecular CO2 uptake. Mar Ecol Prog Ser 133:275–
285. doi:10.3354/meps133275.
Raven JA (1991) Physiology of inorganic C acquisition and implications for resource use efficiency
by marine phytoplankton: relation to increased CO2 and temperature. Plant Cell Environ
14:779–794. doi:10.1111/j.1365-3040.1991.tb01442.x.
77
Riebesell U, Wolf-Gladrow DA (1995) Growth Limits on Phytoplankton. Nature. 373:28.
doi:10.1038/373028b0.
Shen C, Dupont CL, Hopkinson BM (2017) The diversity of carbon dioxide-concentrating
mechanisms in marine diatoms as inferred from their genetic content. J Exp Bot 68:3937–
3948. doi:10.1093/jxb/erx163.
Tait K, Stahl H, Taylor P, Widdicombe S (2015) Rapid response of the active microbial community
to CO2 exposure from a controlled sub-seabed CO2 leak in Ardmucknish Bay (Oban,
Scotland). Int J Greenh Gas Control 38:171–181.
http://dx.doi.org/10.1016/j.ijggc.2014.11.021.
Tamše S, Mozetič P, Francé J, Ogrinc N (2014) Stable isotopes as a tool for nitrogen source
identification and cycling in the Gulf of Trieste (Northern Adriatic). Cont Shelf Res 91:145–
157. http://dx.doi.org/10.1016/j.csr.2014.09.009.
Throndsen J (1978) Preservation and Storage, pp 69-74. In: Sournia, A. (Eds.), Phytoplankton
Manual. Monographs on oceanographic methodology 6. UNESCO, Paris.
Uppström LR (1974) The boron/chlorinity ratio of the deep-sea water from the Pacific Ocean. Deep-
Sea Res Oceanogr Abstr 21:161–162. doi: https://doi.org/10.1016/0011-7471(74)90074-6.
Warwick PD, Ruppert LF (2016) Carbon and oxygen isotopic composition of coal and carbon dioxide
derived from laboratory coal combustion: A preliminary study. Int J Coal Geol 166:128–135.
https://doi.org/10.1016/j.coal.2016.06.009.
Zeebe RE, Wolf-Gladrow DA (2001) CO2 in Seawater: Equilibrium, Kinetics, Isotopes, 2nd ed.
Elsevier Oceanographic Series, Amsterdam.
78
CHAPTER 5
Assessment of biodegradable dissolved organic matter (BDOM) and
nutrients utilization in coastal seawater using a plug-flow bioreactor
Federica Relitti1,2*, Cinzia De Vittor1, Paola Del Negro1
1 Oceanography Division, OGS (Istituto Nazionale di Oceanografia e di Geofisica Sperimentale), Trieste, Italy
2 Department of Life Science, University of Trieste, Trieste, Italy
*Corresponding author: Federica Relitti
OGS (Istituto Nazionale di Oceanografia e di Geofisica Sperimentale), Oceanography Division
Via A. Piccard 54, 34151 Trieste, Italy
Tel.: +39 040 2249741
email: [email protected]
In preparation for submission
79
Abstract
Marine dissolved organic matter (DOM) is one of the major active reservoirs of the global carbon
cycle. It is a complex mixture of poorly characterized compounds of carbon (DOC), nitrogen (DON),
phosphorous (DOP) and the ability of heterotrophic bacteria to use DOM defines the biodegradable
fraction (BDOM). It this study a plug-flow bioreactor is used for the evaluation of DOM
bioavailability in seawater, in order to confirm the effectiveness of this tool for the assessment of
bioavailable DOC (BDOC), and to verify its functionality for the evaluation of DON and DOP
degradation and inorganic nutrient uptake in a P-limited system (Gulf of Trieste, Northern Adriatic
Sea). Bioreactor colonisation was performed using 1.0 µm filtered seawater, and after functionality
tests several experiments were conducted. A first series of experiments was performed in February-
March 2017 (WIN) on samples collected in the coastal station OGS-1; a second series was collected
in August-September 2017 (SUM) in 4 different stations, one inside a marine protected area (C1) and
the others at different distance of the diffusional zone of the sewage duct (SS-1, SS-2, SS-3). During
WIN, the influence of freshwater was also tested (OGS-2 station) and in SUM a parallel series of
experiments (SUM+NUT) was conducted after the addition of inorganic nutrients in order to
investigate the effect on DOM microbial degradation. The results suggest a high variability in DOM
composition in the area as DOM pool did not show any relationship with inorganic nutrient, and this
was confirmed by the treatment of nitrate and phosphate addition (SUM+NUT). The supply of low-
salinity water (OGS-2) supported the presence of differently specialised communities inside the
bioreactor, as all DOM species were released because of osmotic stress, but uptake of all inorganic
nutrients was clearly observed. The results confirm bioreactor as a valid tool for BDOC analysis, but
further research is needed in order to define its effectiveness for the evaluation of DON and DOP
bioavailability and nutrient utilisation.
Keywords
LDOM, BDOC, BDON, BDOP, Nutrients, Plug-flow bioreactor, Coastal seawater
1. Introduction
Marine dissolved organic matter (DOM) is one of the major active reservoirs of the global carbon
cycle as it represents the largest pool of reduced carbon in ocean (662 PgC; Hansell et al. 2009), that
is comparable to the atmospheric reservoir of inorganic carbon (Hedges 1992). DOM is a complex
mixture of poorly characterized compounds of carbon (DOC), nitrogen (DON), phosphorous (DOP)
80
(Kujawinski et al. 2011), and has a crucial role in the functioning of marine ecosystems. In coastal
areas, DOM largely derives from phytoplankton biomass, zooplankton grazing activities (e.g. sloppy
feeding, dissolution of faecal pellets), viral lysis and advection of organic matter of terrestrial origin
through rivers (Hansell & Carlson 2015; De Vittor et al. 2008; Dinasquet et al. 2013). An important
portion of DOM is processed and consumed by heterotrophic bacteria in the microbial loop (Azam et
al. 1983), thus energy and nutrients are delivered to higher trophic levels and part of DOM is
remineralized back to its inorganic constituents (Hansell & Carlson 2015). About 50% or more of
carbon fixed by phytoplankton is released as DOM and processed by heterotrophic bacteria, however
an important fraction accumulates in surface waters and is resistant to rapid microbial degradation
(Hansell & Carlson 2015). DOM is divided into three fractions in function of its lability (Hansell &
Carlson 2015, and references therein): (1) a labile fraction (LDOM), with turnover time of minutes
to days; (2) a semi-labile fraction (SLDOM), with turnover time of months to years; (3) a refractory
fraction (RDOM), with a turnover time of centuries to millennia. The turnover of DOM depends on
both biological and abiotic processes, and the ability of heterotrophic bacteria to use DOM as both a
carbon source and an electron donor (Hansen & Carlson 2015) defines the biodegradable fraction of
DOM (BDOM). Spatial and temporal variations in DOM production and removal affect the long-
term carbon storage (Santinelli et al. 2010; Hansell 2013; Hansell & Carlson 2015), RDOM then
plays a critical role in carbon sequestration and changes in its lability could influence the global
carbon cycle (Hansell & Carlson 2015) and the whole marine ecosystem (Santinelli et al. 2013). The
biogeochemical processes involved in the mineralisation and persistence of DOM are still not known,
hence the significance of gaining insights into heterotrophic bacteria processing of DOM for better
understand global carbon cycle and prevent the adverse effects of climate change (Letscher et al.
2015; Dinasquet et al. 2013). DOM production and degradation should be tightly coupled since
phytoplankton-derived organic matter sustains bacterial production, however, several factors are
involved in the uncoupling of these processes resulting on DOM accumulation (Malfatti et al. 2014;
Larato et al. 2010). Heterotrophic prokaryotes are the only marine organisms capable of both
releasing inorganic nutrients through organic matter mineralization and of using inorganic nutrients
in order to balance their N and P needs (Santinelli et al. 2012), therefore nutrient limitation could
severely affect DOM degradation. Indeed, according to Fajon et al. (1999), the ability of bacteria to
use the C-rich substrate is limited when P is lacking and Thingstad et al. (1997) noticed that, in
nutrient limited conditions, bacteria cannot consume all the degradable DOC released from the food
web as fast as it is produced possibly leading to its accumulation in some marine environments (Fonda
Umani et al. 2007). Therefore, the coupling of the processes related to carbon and nutrient cycling is
of particular interest as they regulate the carbon sequestration in DOM pool (Malfatti et al. 2014;
81
Lipizer et al. 2012). Though stoichiometry drives the key role that DOM plays in marine
biogeochemical cycles, currently the main improvement in knowledge is on DOC dynamics, whereas
information on DON and DOP is still scarce in both the oceans and the Mediterranean Sea (Santinelli
et al. 2012 and references therein).
As DOM availability to heterotrophic prokaryotes is controlled by several factors (e.g. chemical
composition, inorganic nutrient, microbial community structure, and expression of enzymes (Hansell
& Carlson 2015)), a direct evaluation of BDOM is difficult and different methods have been applied
for an indirect estimation of its amount. Biological availability of DOC has been generally assessed
by batch culture experiments, with long incubation periods of 10-30 days (Søndergaard et al. 2000;
Kragh & Søndergaard 2009; Zwifel et al. 1993) or even more (Hopkinson et al. 2002; Lønborg et al.
2009; Lønborg & Søndergaard 2009; Lønborg & Álvarez-Salgado 2012 and references therein;
Knudsen-Leerbeck et al. 2017; Lønborg et al. 2010), and analysis of bacteria carbon demand and
bacterial growth efficiency have been frequently used as an evaluation of DOC consumption (Hansell
& Carlson 2015). All these methods require long analysis period time, thus it is hard to use these
approaches for the evaluation of temporal variability in the distribution of BDOM, which instead
would be an important information especially in coastal systems where riverine DOM can quickly
change composition of marine organic matter and favour phytoplankton bloom or microbial
degradation. Faster methods have been developed (De Vittor et al. 2009 and references therein) by
means of bioreactors and the use of entrapped microbial cells in order to accelerate colonisation and
increase microbial abundance. De Vittor et al. (2009) demonstrated that the application of plug-flow
bioreactors for the assessment of BDOC in seawater allows to get reliable BDOC results, comparable
to those obtained by batch culture experiments, and significantly reducing the experimental time (a
few hours instead than 20-30 days). Moreover, bioreactors capability of DOC degradation is even
higher than batch culture (20% more) (Søndergaard & Worm 2001). This broad metabolic capability
results from the unidirectional supply of DOM and inorganic nutrients, guaranteed by the continuous
water flow that generates a longitudinal gradient of diminishing DOC quantity and quality within the
reactor. Indeed, in the bioreactor the more labile molecules would be consumed first while the more
recalcitrant (semilabile DOC) would be metabolised over progressively longer residence time (i.e.
distance from inlet). This gradient, clearly visible by the different colour of inert support, allows the
establishment of multiple niches and selects diverse communities of bacteria capable of metabolise
gradually more recalcitrant compounds otherwise difficult to be degraded in batch cultures with a less
diverse environment (Søndergaard & Worm 2001; De Vittor et al. 2009; Volk et al. 1997).
Bioreactors have been already used for the evaluation of DOC biovailability in different environments
(Søndergaard & Worm 2001; De Vittor et al. 2009), but only in a few studies this approach has been
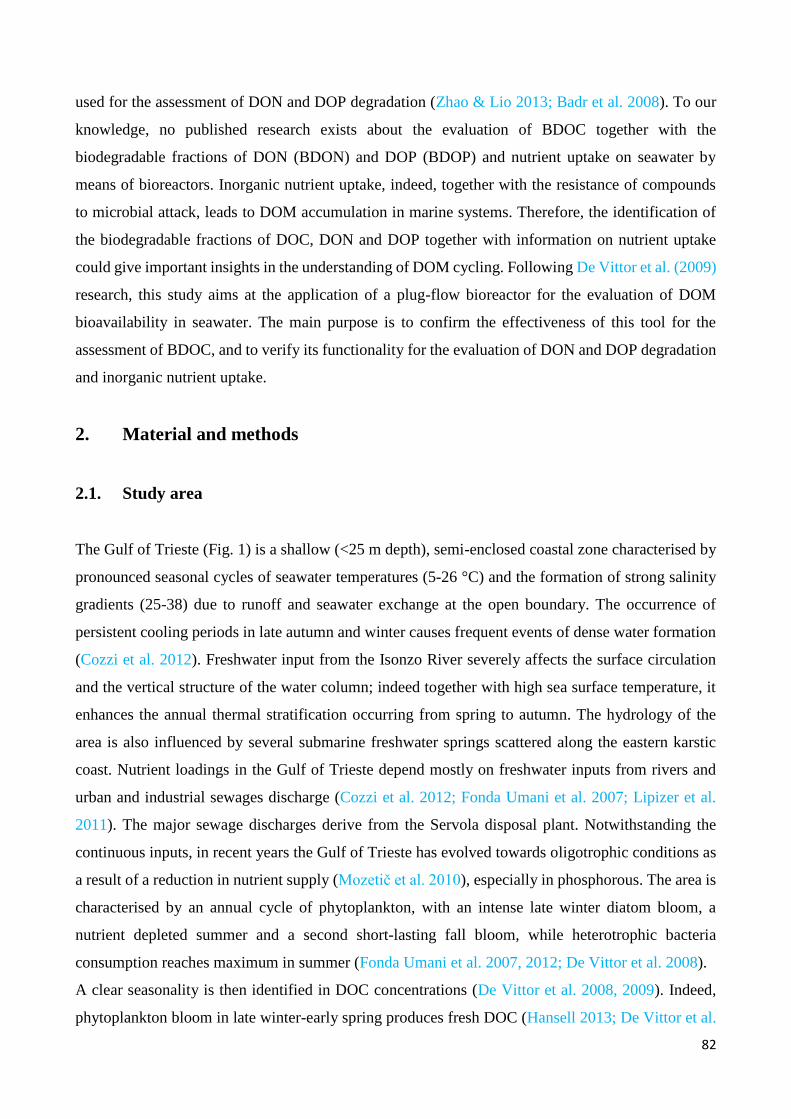
82
used for the assessment of DON and DOP degradation (Zhao & Lio 2013; Badr et al. 2008). To our
knowledge, no published research exists about the evaluation of BDOC together with the
biodegradable fractions of DON (BDON) and DOP (BDOP) and nutrient uptake on seawater by
means of bioreactors. Inorganic nutrient uptake, indeed, together with the resistance of compounds
to microbial attack, leads to DOM accumulation in marine systems. Therefore, the identification of
the biodegradable fractions of DOC, DON and DOP together with information on nutrient uptake
could give important insights in the understanding of DOM cycling. Following De Vittor et al. (2009)
research, this study aims at the application of a plug-flow bioreactor for the evaluation of DOM
bioavailability in seawater. The main purpose is to confirm the effectiveness of this tool for the
assessment of BDOC, and to verify its functionality for the evaluation of DON and DOP degradation
and inorganic nutrient uptake.
2. Material and methods
2.1. Study area
The Gulf of Trieste (Fig. 1) is a shallow (<25 m depth), semi-enclosed coastal zone characterised by
pronounced seasonal cycles of seawater temperatures (5-26 °C) and the formation of strong salinity
gradients (25-38) due to runoff and seawater exchange at the open boundary. The occurrence of
persistent cooling periods in late autumn and winter causes frequent events of dense water formation
(Cozzi et al. 2012). Freshwater input from the Isonzo River severely affects the surface circulation
and the vertical structure of the water column; indeed together with high sea surface temperature, it
enhances the annual thermal stratification occurring from spring to autumn. The hydrology of the
area is also influenced by several submarine freshwater springs scattered along the eastern karstic
coast. Nutrient loadings in the Gulf of Trieste depend mostly on freshwater inputs from rivers and
urban and industrial sewages discharge (Cozzi et al. 2012; Fonda Umani et al. 2007; Lipizer et al.
2011). The major sewage discharges derive from the Servola disposal plant. Notwithstanding the
continuous inputs, in recent years the Gulf of Trieste has evolved towards oligotrophic conditions as
a result of a reduction in nutrient supply (Mozetič et al. 2010), especially in phosphorous. The area is
characterised by an annual cycle of phytoplankton, with an intense late winter diatom bloom, a
nutrient depleted summer and a second short-lasting fall bloom, while heterotrophic bacteria
consumption reaches maximum in summer (Fonda Umani et al. 2007, 2012; De Vittor et al. 2008).
A clear seasonality is then identified in DOC concentrations (De Vittor et al. 2008, 2009). Indeed,
phytoplankton bloom in late winter-early spring produces fresh DOC (Hansell 2013; De Vittor et al.
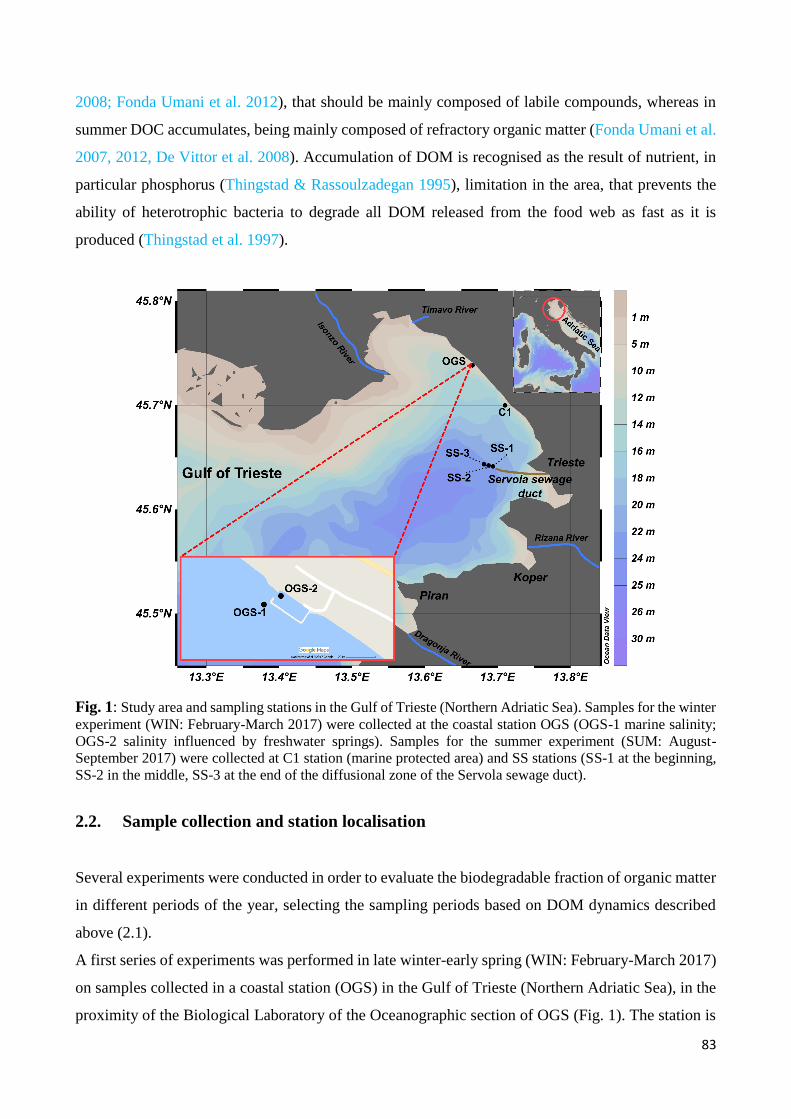
83
2008; Fonda Umani et al. 2012), that should be mainly composed of labile compounds, whereas in
summer DOC accumulates, being mainly composed of refractory organic matter (Fonda Umani et al.
2007, 2012, De Vittor et al. 2008). Accumulation of DOM is recognised as the result of nutrient, in
particular phosphorus (Thingstad & Rassoulzadegan 1995), limitation in the area, that prevents the
ability of heterotrophic bacteria to degrade all DOM released from the food web as fast as it is
produced (Thingstad et al. 1997).
Fig. 1: Study area and sampling stations in the Gulf of Trieste (Northern Adriatic Sea). Samples for the winter
experiment (WIN: February-March 2017) were collected at the coastal station OGS (OGS-1 marine salinity;
OGS-2 salinity influenced by freshwater springs). Samples for the summer experiment (SUM: August-
September 2017) were collected at C1 station (marine protected area) and SS stations (SS-1 at the beginning,
SS-2 in the middle, SS-3 at the end of the diffusional zone of the Servola sewage duct).
2.2. Sample collection and station localisation
Several experiments were conducted in order to evaluate the biodegradable fraction of organic matter
in different periods of the year, selecting the sampling periods based on DOM dynamics described
above (2.1).
A first series of experiments was performed in late winter-early spring (WIN: February-March 2017)
on samples collected in a coastal station (OGS) in the Gulf of Trieste (Northern Adriatic Sea), in the
proximity of the Biological Laboratory of the Oceanographic section of OGS (Fig. 1). The station is
84
influenced by freshwater springs and is set in the proximity of a quay that favours freshwater
accumulation. All samples were collected on the sea side of the quay (OGS-1; 45°44'27.4"N;
13°40'07.4"E) on 23 February (OGS-1A), 20 March (OGS-1B) and 22 March (OGS-1C). In order to
investigate the effect of low salinity on DOM degradation, on 21 March seawater was collected inside
the quay (OGS-2; 45°44'27.9"N 13°40'08.5"E).
The second series of experiments was conducted in summer (SUM: August-September 2017) in 4
different stations in the Gulf of Trieste (Northern Adriatic Sea). On 22 August, seawater was collected
inside a marine protected area (LTER C1 station, 45°42.050’ N, 13°42.600’ E; Fig. 1). On 24 August
and 20 September seawater for the experiments was collected in three stations placed at different
distance of the diffusional zone of the Servola sewage duct (SS; Fig. 1) (Auriemma et al. 2016) in
order to investigate the bioavailability of organic matter in areas subjected to different anthropogenic
contamination: at the beginning of the diffusional zone of the pipe (SS-1; 45°38'28.53" N;
13°41'36.67" E; 20 September), in the middle (SS-2; 45°38'32.41"N; 13°41'14.70" E; 22 August), ad
at the end (SS-3; 45°38'36.30"N; 13°40'51.70"E; 22 August). In order to investigate the effect of
higher concentration of inorganic nitrogen and phosphorous on DOM microbial degradation, a
parallel series of experiments (SUM+NUT) was conducted during SUM after the addition of
inorganic nutrients to water samples. For each station considered for SUM, nitrate (NaNO3) and
phosphate (NaH2PO4 ∙ H2O), prepared according to Andersen (2005), were added to raw water
samples to reach the final concentration of 10.9 µM and 0.45 µM respectively.
2.3. Experimental design
The evaluation of the biodegradable fraction of organic matter (BDOM) was performed by means of
a bioreactor, built following the design of Søndergaard & Worm (2001) modified by De Vittor et al.
(2009) for the application of the method to seawater samples. The bioreactor consisted in a darkened
glass chromatographic column filled with acid-washed and combusted (450 °C for 4 h) sintered glass
spheres. A continuous water flux was maintained by a peristaltic pump connected to the bioreactor
with Tygon tubes (Fig. 2; more technical details in De Vittor et al. 2009). The flow rate was 1 ± 0.1
mL min1, and the residence time of the bioreactor, determined measuring the variation of
conductivity at the outlet after the addition of NaCl solution at the inlet, was 2.25 h. Microbial
colonisation was achieved using 1.0 µm filtered seawater collected in the coastal station OGS-1 (Fig.
1). At the experimental conditions, microbial colonisation was carried out in two months, judging
from the stabilisation of DOC utilisation. As microbial community cannot maintain itself (even for
short periods) without a suitable supply of nutrients (De Vittor et al. 2009), the bioreactor was
85
maintained with the same water used for colonisation collected weekly and stored in acid-washed
glass tanks (10 L) at 20±2 °C. After the colonisation and the stabilisation of the microbial community,
the bioreactor degradation efficiency was tested by adding known amount of labile compounds to
filtered (GF/F 0.7 µm) seawater.
DOC degradation was verified from the consumption of a solution of D(+)-Glucose (67 µM DOC
added to reach final concentration 138 µM). DON and DOP degradation was separately evaluated by
the consumption of a solution of AMP (adenosine 5'-monophosphate; addition of 15 µM DON and
2.8 µM DOP to reach final concentrations 21.7 µM and 2.9 µM, respectively). The bioreactor
confirmed the capability to immediately react to an increase in BDOM. Indeed, the added glucose
was almost completely metabolised (94.9% of C consumption), and most of AMP was also consumed,
as 100% of DOP and 84% of DON were degraded. During AMP test, DOC degradation was also
evaluated and 100% of carbon supplied was consumed, probably due to the lower carbon addition
compared to glucose test (38 µM added to reach final concentration 106 µM).
Fig. 2: Plug-flow bioreactor experimental set-up.
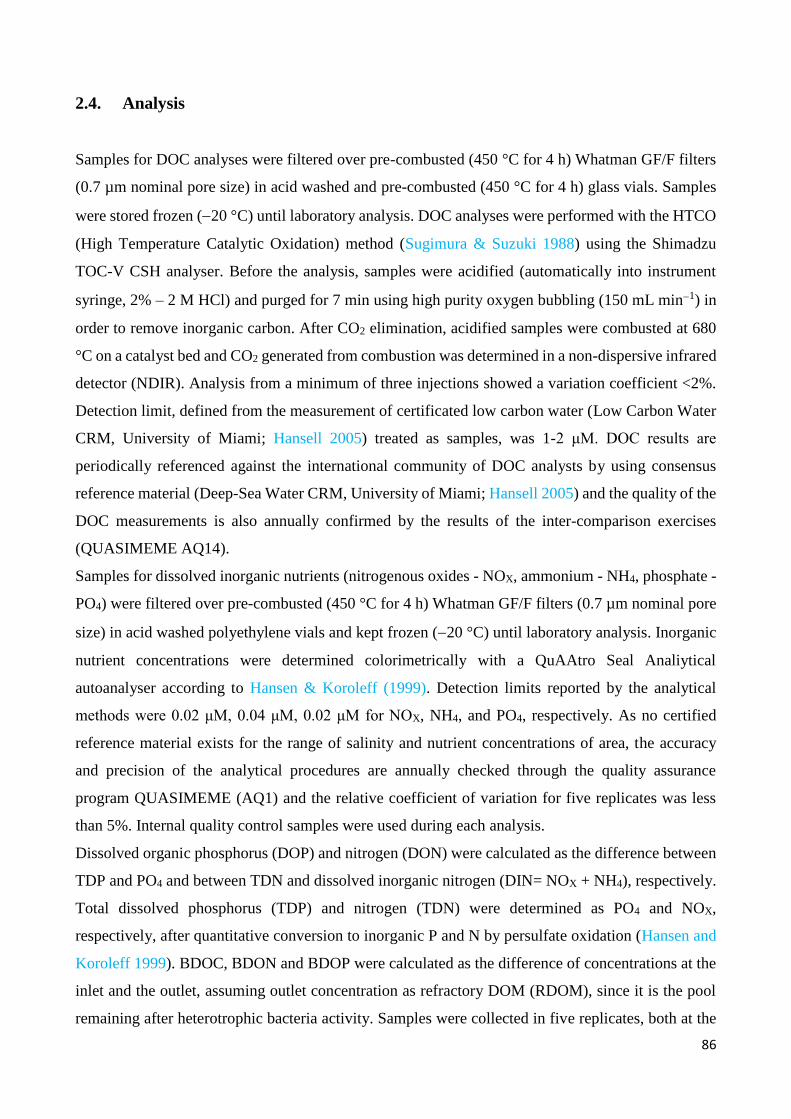
86
2.4. Analysis
Samples for DOC analyses were filtered over pre-combusted (450 °C for 4 h) Whatman GF/F filters
(0.7 µm nominal pore size) in acid washed and pre-combusted (450 °C for 4 h) glass vials. Samples
were stored frozen (20 °C) until laboratory analysis. DOC analyses were performed with the HTCO
(High Temperature Catalytic Oxidation) method (Sugimura & Suzuki 1988) using the Shimadzu
TOC-V CSH analyser. Before the analysis, samples were acidified (automatically into instrument
syringe, 2% – 2 M HCl) and purged for 7 min using high purity oxygen bubbling (150 mL min1) in
order to remove inorganic carbon. After CO2 elimination, acidified samples were combusted at 680
°C on a catalyst bed and CO2 generated from combustion was determined in a non-dispersive infrared
detector (NDIR). Analysis from a minimum of three injections showed a variation coefficient <2%.
Detection limit, defined from the measurement of certificated low carbon water (Low Carbon Water
CRM, University of Miami; Hansell 2005) treated as samples, was 1-2 μM. DOC results are
periodically referenced against the international community of DOC analysts by using consensus
reference material (Deep-Sea Water CRM, University of Miami; Hansell 2005) and the quality of the
DOC measurements is also annually confirmed by the results of the inter-comparison exercises
(QUASIMEME AQ14).
Samples for dissolved inorganic nutrients (nitrogenous oxides - NOX, ammonium - NH4, phosphate -
PO4) were filtered over pre-combusted (450 °C for 4 h) Whatman GF/F filters (0.7 µm nominal pore
size) in acid washed polyethylene vials and kept frozen (20 °C) until laboratory analysis. Inorganic
nutrient concentrations were determined colorimetrically with a QuAAtro Seal Analiytical
autoanalyser according to Hansen & Koroleff (1999). Detection limits reported by the analytical
methods were 0.02 μM, 0.04 μM, 0.02 μM for NOX, NH4, and PO4, respectively. As no certified
reference material exists for the range of salinity and nutrient concentrations of area, the accuracy
and precision of the analytical procedures are annually checked through the quality assurance
program QUASIMEME (AQ1) and the relative coefficient of variation for five replicates was less
than 5%. Internal quality control samples were used during each analysis.
Dissolved organic phosphorus (DOP) and nitrogen (DON) were calculated as the difference between
TDP and PO4 and between TDN and dissolved inorganic nitrogen (DIN= NOX + NH4), respectively.
Total dissolved phosphorus (TDP) and nitrogen (TDN) were determined as PO4 and NOX,
respectively, after quantitative conversion to inorganic P and N by persulfate oxidation (Hansen and
Koroleff 1999). BDOC, BDON and BDOP were calculated as the difference of concentrations at the
inlet and the outlet, assuming outlet concentration as refractory DOM (RDOM), since it is the pool
remaining after heterotrophic bacteria activity. Samples were collected in five replicates, both at the
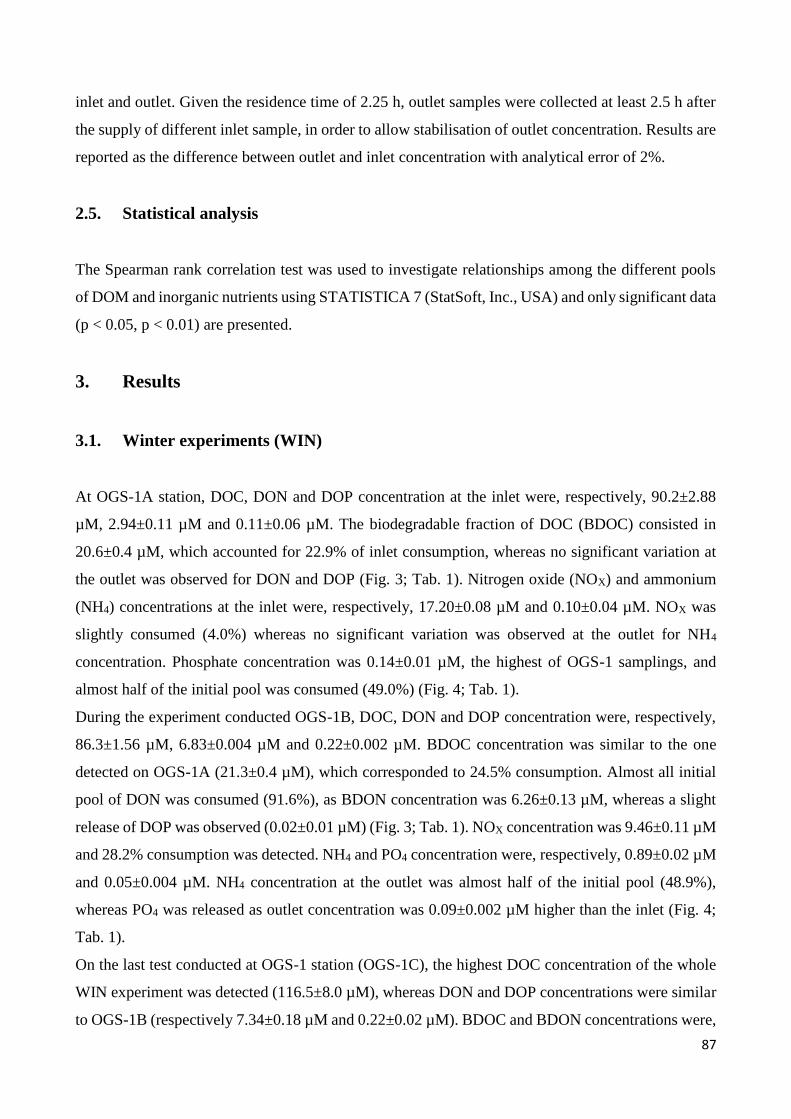
87
inlet and outlet. Given the residence time of 2.25 h, outlet samples were collected at least 2.5 h after
the supply of different inlet sample, in order to allow stabilisation of outlet concentration. Results are
reported as the difference between outlet and inlet concentration with analytical error of 2%.
2.5. Statistical analysis
The Spearman rank correlation test was used to investigate relationships among the different pools
of DOM and inorganic nutrients using STATISTICA 7 (StatSoft, Inc., USA) and only significant data
(p < 0.05, p < 0.01) are presented.
3. Results
3.1. Winter experiments (WIN)
At OGS-1A station, DOC, DON and DOP concentration at the inlet were, respectively, 90.2±2.88
µM, 2.94±0.11 µM and 0.11±0.06 µM. The biodegradable fraction of DOC (BDOC) consisted in
20.6±0.4 µM, which accounted for 22.9% of inlet consumption, whereas no significant variation at
the outlet was observed for DON and DOP (Fig. 3; Tab. 1). Nitrogen oxide (NOX) and ammonium
(NH4) concentrations at the inlet were, respectively, 17.20±0.08 µM and 0.10±0.04 µM. NOX was
slightly consumed (4.0%) whereas no significant variation was observed at the outlet for NH4
concentration. Phosphate concentration was 0.14±0.01 µM, the highest of OGS-1 samplings, and
almost half of the initial pool was consumed (49.0%) (Fig. 4; Tab. 1).
During the experiment conducted OGS-1B, DOC, DON and DOP concentration were, respectively,
86.3±1.56 µM, 6.83±0.004 µM and 0.22±0.002 µM. BDOC concentration was similar to the one
detected on OGS-1A (21.3±0.4 µM), which corresponded to 24.5% consumption. Almost all initial
pool of DON was consumed (91.6%), as BDON concentration was 6.26±0.13 µM, whereas a slight
release of DOP was observed (0.02±0.01 µM) (Fig. 3; Tab. 1). NOX concentration was 9.46±0.11 µM
and 28.2% consumption was detected. NH4 and PO4 concentration were, respectively, 0.89±0.02 µM
and 0.05±0.004 µM. NH4 concentration at the outlet was almost half of the initial pool (48.9%),
whereas PO4 was released as outlet concentration was 0.09±0.002 µM higher than the inlet (Fig. 4;
Tab. 1).
On the last test conducted at OGS-1 station (OGS-1C), the highest DOC concentration of the whole
WIN experiment was detected (116.5±8.0 µM), whereas DON and DOP concentrations were similar
to OGS-1B (respectively 7.34±0.18 µM and 0.22±0.02 µM). BDOC and BDON concentrations were,
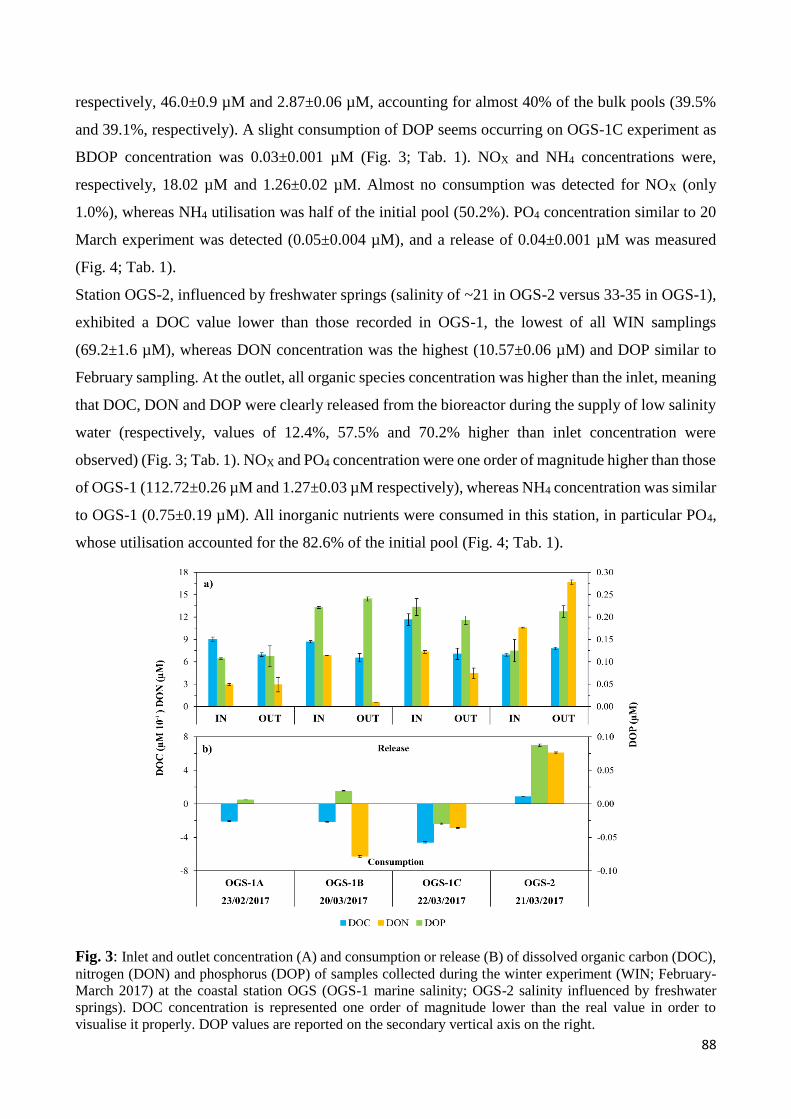
88
respectively, 46.0±0.9 µM and 2.87±0.06 µM, accounting for almost 40% of the bulk pools (39.5%
and 39.1%, respectively). A slight consumption of DOP seems occurring on OGS-1C experiment as
BDOP concentration was 0.03±0.001 µM (Fig. 3; Tab. 1). NOX and NH4 concentrations were,
respectively, 18.02 µM and 1.26±0.02 µM. Almost no consumption was detected for NOX (only
1.0%), whereas NH4 utilisation was half of the initial pool (50.2%). PO4 concentration similar to 20
March experiment was detected (0.05±0.004 µM), and a release of 0.04±0.001 µM was measured
(Fig. 4; Tab. 1).
Station OGS-2, influenced by freshwater springs (salinity of ~21 in OGS-2 versus 33-35 in OGS-1),
exhibited a DOC value lower than those recorded in OGS-1, the lowest of all WIN samplings
(69.2±1.6 µM), whereas DON concentration was the highest (10.57±0.06 µM) and DOP similar to
February sampling. At the outlet, all organic species concentration was higher than the inlet, meaning
that DOC, DON and DOP were clearly released from the bioreactor during the supply of low salinity
water (respectively, values of 12.4%, 57.5% and 70.2% higher than inlet concentration were
observed) (Fig. 3; Tab. 1). NOX and PO4 concentration were one order of magnitude higher than those
of OGS-1 (112.72±0.26 µM and 1.27±0.03 µM respectively), whereas NH4 concentration was similar
to OGS-1 (0.75±0.19 µM). All inorganic nutrients were consumed in this station, in particular PO4,
whose utilisation accounted for the 82.6% of the initial pool (Fig. 4; Tab. 1).
Fig. 3: Inlet and outlet concentration (A) and consumption or release (B) of dissolved organic carbon (DOC),
nitrogen (DON) and phosphorus (DOP) of samples collected during the winter experiment (WIN; February-
March 2017) at the coastal station OGS (OGS-1 marine salinity; OGS-2 salinity influenced by freshwater
springs). DOC concentration is represented one order of magnitude lower than the real value in order to
visualise it properly. DOP values are reported on the secondary vertical axis on the right.
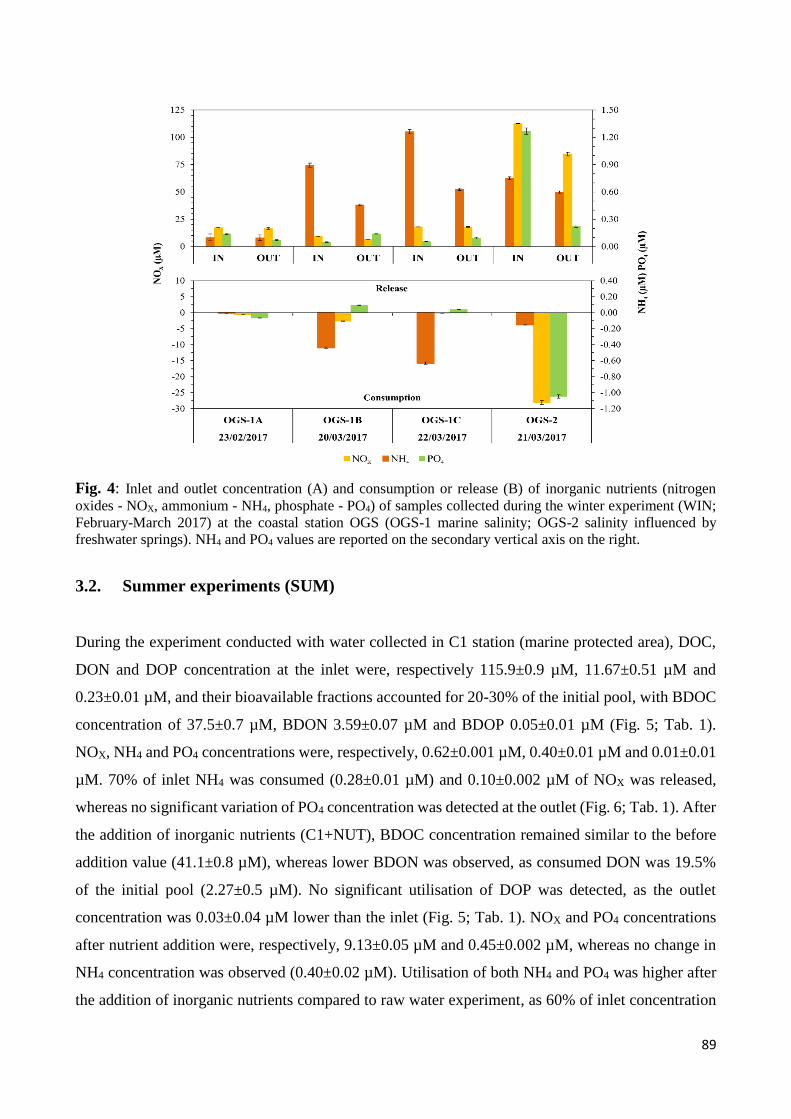
89
Fig. 4: Inlet and outlet concentration (A) and consumption or release (B) of inorganic nutrients (nitrogen
oxides - NOX, ammonium - NH4, phosphate - PO4) of samples collected during the winter experiment (WIN;
February-March 2017) at the coastal station OGS (OGS-1 marine salinity; OGS-2 salinity influenced by
freshwater springs). NH4 and PO4 values are reported on the secondary vertical axis on the right.
3.2. Summer experiments (SUM)
During the experiment conducted with water collected in C1 station (marine protected area), DOC,
DON and DOP concentration at the inlet were, respectively 115.9±0.9 µM, 11.67±0.51 µM and
0.23±0.01 µM, and their bioavailable fractions accounted for 20-30% of the initial pool, with BDOC
concentration of 37.5±0.7 µM, BDON 3.59±0.07 µM and BDOP 0.05±0.01 µM (Fig. 5; Tab. 1).
NOX, NH4 and PO4 concentrations were, respectively, 0.62±0.001 µM, 0.40±0.01 µM and 0.01±0.01
µM. 70% of inlet NH4 was consumed (0.28±0.01 µM) and 0.10±0.002 µM of NOX was released,
whereas no significant variation of PO4 concentration was detected at the outlet (Fig. 6; Tab. 1). After
the addition of inorganic nutrients (C1+NUT), BDOC concentration remained similar to the before
addition value (41.1±0.8 µM), whereas lower BDON was observed, as consumed DON was 19.5%
of the initial pool (2.27±0.5 µM). No significant utilisation of DOP was detected, as the outlet
concentration was 0.03±0.04 µM lower than the inlet (Fig. 5; Tab. 1). NOX and PO4 concentrations
after nutrient addition were, respectively, 9.13±0.05 µM and 0.45±0.002 µM, whereas no change in
NH4 concentration was observed (0.40±0.02 µM). Utilisation of both NH4 and PO4 was higher after
the addition of inorganic nutrients compared to raw water experiment, as 60% of inlet concentration
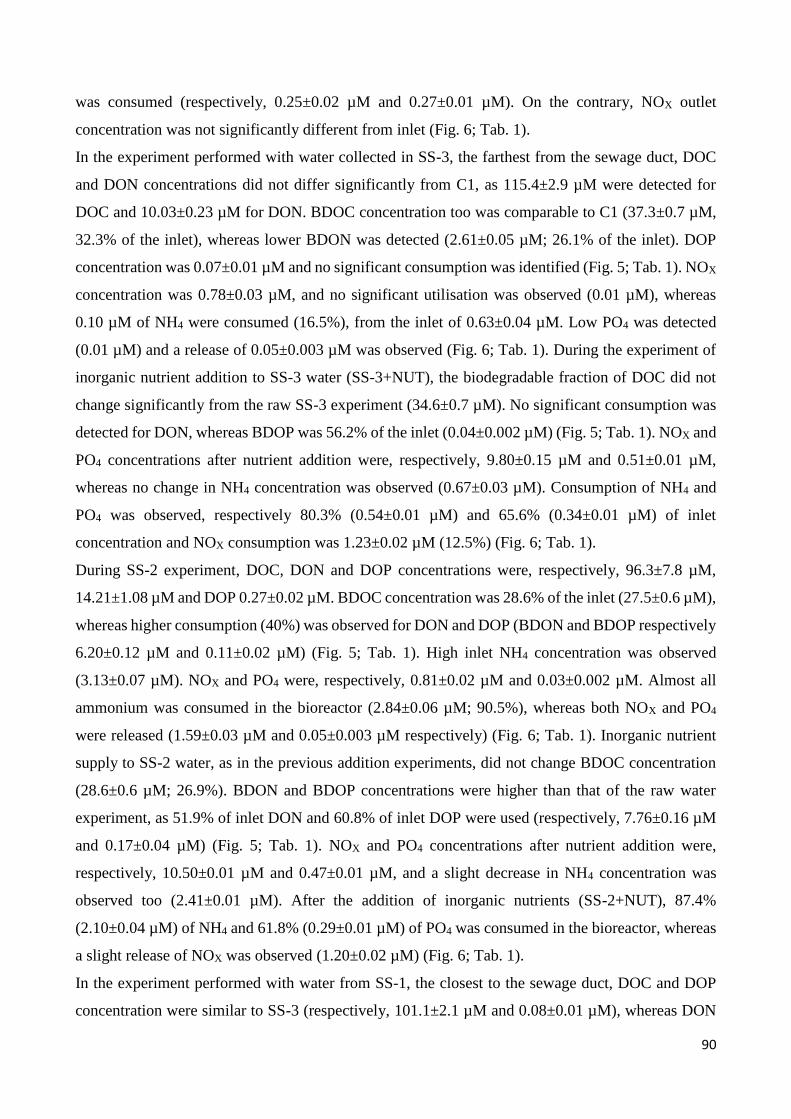
90
was consumed (respectively, 0.25±0.02 µM and 0.27±0.01 µM). On the contrary, NOX outlet
concentration was not significantly different from inlet (Fig. 6; Tab. 1).
In the experiment performed with water collected in SS-3, the farthest from the sewage duct, DOC
and DON concentrations did not differ significantly from C1, as 115.4±2.9 µM were detected for
DOC and 10.03±0.23 µM for DON. BDOC concentration too was comparable to C1 (37.3±0.7 µM,
32.3% of the inlet), whereas lower BDON was detected (2.61±0.05 µM; 26.1% of the inlet). DOP
concentration was 0.07±0.01 µM and no significant consumption was identified (Fig. 5; Tab. 1). NOX
concentration was 0.78±0.03 µM, and no significant utilisation was observed (0.01 µM), whereas
0.10 µM of NH4 were consumed (16.5%), from the inlet of 0.63±0.04 µM. Low PO4 was detected
(0.01 µM) and a release of 0.05±0.003 µM was observed (Fig. 6; Tab. 1). During the experiment of
inorganic nutrient addition to SS-3 water (SS-3+NUT), the biodegradable fraction of DOC did not
change significantly from the raw SS-3 experiment (34.6±0.7 µM). No significant consumption was
detected for DON, whereas BDOP was 56.2% of the inlet (0.04±0.002 µM) (Fig. 5; Tab. 1). NOX and
PO4 concentrations after nutrient addition were, respectively, 9.80±0.15 µM and 0.51±0.01 µM,
whereas no change in NH4 concentration was observed (0.67±0.03 µM). Consumption of NH4 and
PO4 was observed, respectively 80.3% (0.54±0.01 µM) and 65.6% (0.34±0.01 µM) of inlet
concentration and NOX consumption was 1.23±0.02 µM (12.5%) (Fig. 6; Tab. 1).
During SS-2 experiment, DOC, DON and DOP concentrations were, respectively, 96.3±7.8 µM,
14.21±1.08 µM and DOP 0.27±0.02 µM. BDOC concentration was 28.6% of the inlet (27.5±0.6 µM),
whereas higher consumption (40%) was observed for DON and DOP (BDON and BDOP respectively
6.20±0.12 µM and 0.11±0.02 µM) (Fig. 5; Tab. 1). High inlet NH4 concentration was observed
(3.13±0.07 µM). NOX and PO4 were, respectively, 0.81±0.02 µM and 0.03±0.002 µM. Almost all
ammonium was consumed in the bioreactor (2.84±0.06 µM; 90.5%), whereas both NOX and PO4
were released (1.59±0.03 µM and 0.05±0.003 µM respectively) (Fig. 6; Tab. 1). Inorganic nutrient
supply to SS-2 water, as in the previous addition experiments, did not change BDOC concentration
(28.6±0.6 µM; 26.9%). BDON and BDOP concentrations were higher than that of the raw water
experiment, as 51.9% of inlet DON and 60.8% of inlet DOP were used (respectively, 7.76±0.16 µM
and 0.17±0.04 µM) (Fig. 5; Tab. 1). NOX and PO4 concentrations after nutrient addition were,
respectively, 10.50±0.01 µM and 0.47±0.01 µM, and a slight decrease in NH4 concentration was
observed too (2.41±0.01 µM). After the addition of inorganic nutrients (SS-2+NUT), 87.4%
(2.10±0.04 µM) of NH4 and 61.8% (0.29±0.01 µM) of PO4 was consumed in the bioreactor, whereas
a slight release of NOX was observed (1.20±0.02 µM) (Fig. 6; Tab. 1).
In the experiment performed with water from SS-1, the closest to the sewage duct, DOC and DOP
concentration were similar to SS-3 (respectively, 101.1±2.1 µM and 0.08±0.01 µM), whereas DON
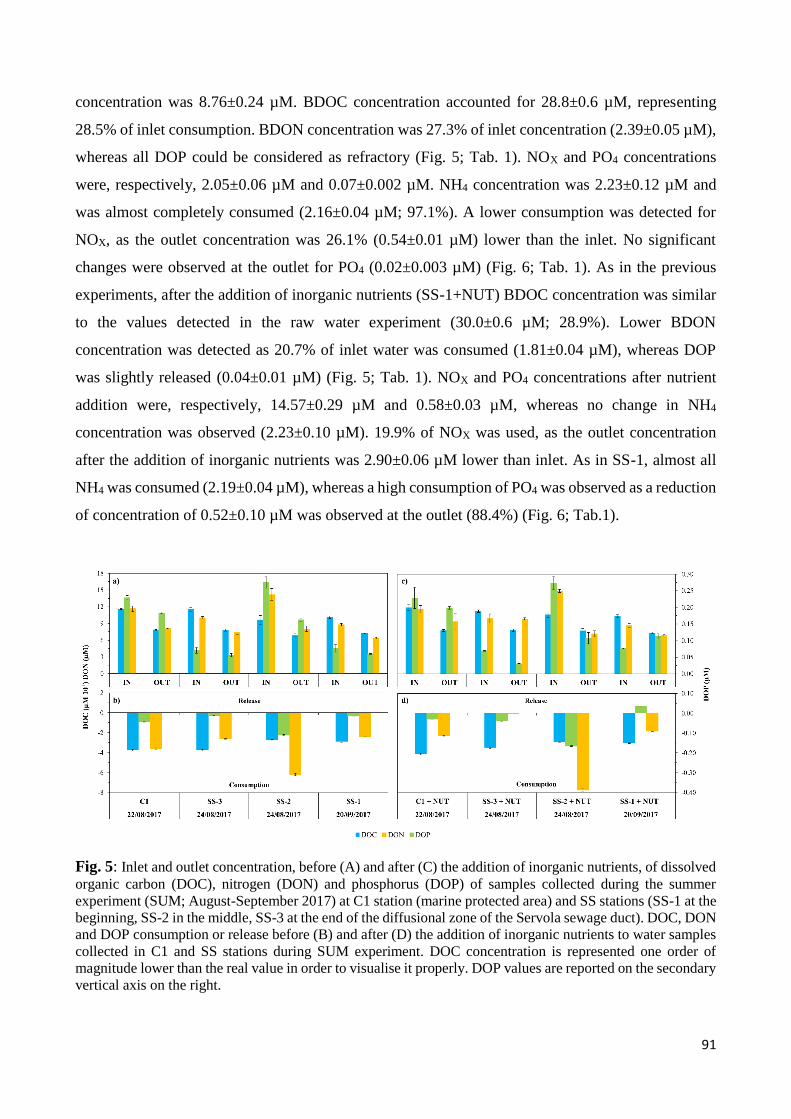
91
concentration was 8.76±0.24 µM. BDOC concentration accounted for 28.8±0.6 µM, representing
28.5% of inlet consumption. BDON concentration was 27.3% of inlet concentration (2.39±0.05 µM),
whereas all DOP could be considered as refractory (Fig. 5; Tab. 1). NOX and PO4 concentrations
were, respectively, 2.05±0.06 µM and 0.07±0.002 µM. NH4 concentration was 2.23±0.12 µM and
was almost completely consumed (2.16±0.04 µM; 97.1%). A lower consumption was detected for
NOX, as the outlet concentration was 26.1% (0.54±0.01 µM) lower than the inlet. No significant
changes were observed at the outlet for PO4 (0.02±0.003 µM) (Fig. 6; Tab. 1). As in the previous
experiments, after the addition of inorganic nutrients (SS-1+NUT) BDOC concentration was similar
to the values detected in the raw water experiment (30.0±0.6 µM; 28.9%). Lower BDON
concentration was detected as 20.7% of inlet water was consumed (1.81±0.04 µM), whereas DOP
was slightly released (0.04±0.01 µM) (Fig. 5; Tab. 1). NOX and PO4 concentrations after nutrient
addition were, respectively, 14.57±0.29 µM and 0.58±0.03 µM, whereas no change in NH4
concentration was observed (2.23±0.10 µM). 19.9% of NOX was used, as the outlet concentration
after the addition of inorganic nutrients was 2.90±0.06 µM lower than inlet. As in SS-1, almost all
NH4 was consumed (2.19±0.04 µM), whereas a high consumption of PO4 was observed as a reduction
of concentration of 0.52±0.10 µM was observed at the outlet (88.4%) (Fig. 6; Tab.1).
Fig. 5: Inlet and outlet concentration, before (A) and after (C) the addition of inorganic nutrients, of dissolved
organic carbon (DOC), nitrogen (DON) and phosphorus (DOP) of samples collected during the summer
experiment (SUM; August-September 2017) at C1 station (marine protected area) and SS stations (SS-1 at the
beginning, SS-2 in the middle, SS-3 at the end of the diffusional zone of the Servola sewage duct). DOC, DON
and DOP consumption or release before (B) and after (D) the addition of inorganic nutrients to water samples
collected in C1 and SS stations during SUM experiment. DOC concentration is represented one order of
magnitude lower than the real value in order to visualise it properly. DOP values are reported on the secondary
vertical axis on the right.
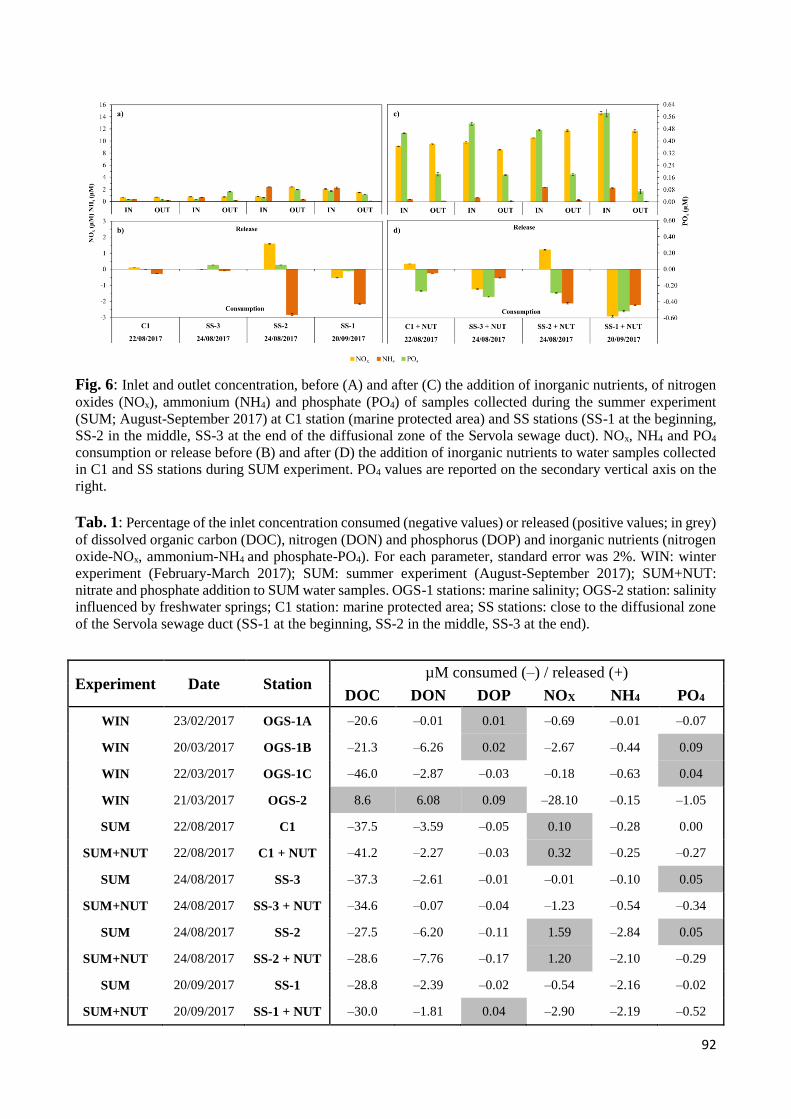
92
Fig. 6: Inlet and outlet concentration, before (A) and after (C) the addition of inorganic nutrients, of nitrogen
oxides (NOx), ammonium (NH4) and phosphate (PO4) of samples collected during the summer experiment
(SUM; August-September 2017) at C1 station (marine protected area) and SS stations (SS-1 at the beginning,
SS-2 in the middle, SS-3 at the end of the diffusional zone of the Servola sewage duct). NOx, NH4 and PO4
consumption or release before (B) and after (D) the addition of inorganic nutrients to water samples collected
in C1 and SS stations during SUM experiment. PO4 values are reported on the secondary vertical axis on the
right.
Tab. 1: Percentage of the inlet concentration consumed (negative values) or released (positive values; in grey)
of dissolved organic carbon (DOC), nitrogen (DON) and phosphorus (DOP) and inorganic nutrients (nitrogen
oxide-NOx, ammonium-NH4 and phosphate-PO4). For each parameter, standard error was 2%. WIN: winter
experiment (February-March 2017); SUM: summer experiment (August-September 2017); SUM+NUT:
nitrate and phosphate addition to SUM water samples. OGS-1 stations: marine salinity; OGS-2 station: salinity
influenced by freshwater springs; C1 station: marine protected area; SS stations: close to the diffusional zone
of the Servola sewage duct (SS-1 at the beginning, SS-2 in the middle, SS-3 at the end).
Experiment Date Station µM consumed (–) / released (+)
DOC DON DOP NOX NH4 PO4
WIN 23/02/2017 OGS-1A –20.6 –0.01 0.01 –0.69 –0.01 –0.07
WIN 20/03/2017 OGS-1B –21.3 –6.26 0.02 –2.67 –0.44 0.09
WIN 22/03/2017 OGS-1C –46.0 –2.87 –0.03 –0.18 –0.63 0.04
WIN 21/03/2017 OGS-2 8.6 6.08 0.09 –28.10 –0.15 –1.05
SUM 22/08/2017 C1 –37.5 –3.59 –0.05 0.10 –0.28 0.00
SUM+NUT 22/08/2017 C1 + NUT –41.2 –2.27 –0.03 0.32 –0.25 –0.27
SUM 24/08/2017 SS-3 –37.3 –2.61 –0.01 –0.01 –0.10 0.05
SUM+NUT 24/08/2017 SS-3 + NUT –34.6 –0.07 –0.04 –1.23 –0.54 –0.34
SUM 24/08/2017 SS-2 –27.5 –6.20 –0.11 1.59 –2.84 0.05
SUM+NUT 24/08/2017 SS-2 + NUT –28.6 –7.76 –0.17 1.20 –2.10 –0.29
SUM 20/09/2017 SS-1 –28.8 –2.39 –0.02 –0.54 –2.16 –0.02
SUM+NUT 20/09/2017 SS-1 + NUT –30.0 –1.81 0.04 –2.90 –2.19 –0.52
93
4. Discussion
In order to evaluate BDOM and nutrient uptake in natural conditions, the experiments performed will
be first discussed considering only the typical marine conditions (OGS-1 and SUM experiments). The
effect of low salinity (OGS-2 experiment) and of the increase in inorganic nutrient content
(SUM+NUT experiments) will be then discussed.
The biodegradable fraction of DOC ranged from 20.6±0.4 µM (OGS-1A) to 46.0±0.9 µM (OGS-1C),
and is similar to BDOC concentration measured by De Vittor et al. (2009) in the Gulf of Trieste using
a plug-flow bioreactor. However, De Vittor et al. (2009) found lower winter concentrations (on
February) than those detected in OGS-1 experiments. Indeed, in the present work, BDOC highest
concentration was found in OGS-1C, and accounted for 39% of degradation of the inlet DOC
concentration (116.5±8.0 µM). On the other OGS-1 experiments, BDOC accounted for about 22-25%
of the initial pool. During SUM experiments, the biodegradable fraction of DOC increased, as a
higher percentage of inlet pool was consumed, ranging between 28.5% and 32.3%, and BDOC
concentration ranged between 27.5±0.6 µM (SS-2) and 37.5±0.7 µM (C1). As in other
biodegradability studies (Lønborg et al. 2009; Lønborg et al. 2010; De Vittor et al. 2009), a positive
linear relationship is found between BDOC and DOC concentrations (p <0.01), therefore the bulk
DOC pool directly depends on BDOC concentration. The slope of the linear regression of 1.30
indicates that the seasonal variation of DOC depends on BDOC, as previously suggested (Lønborg et
al. 2009), and the intercept indicates the residual DOC concentration (i.e. the refractory portion in the
experimental design). Refractory DOC derived by linear regression is 62.5 µM and is comparable to
the experimental RDOC detected at the outlet of bioreactor (71.9±4.8 µM). Both experimental and
calculated RDOC values are higher than deep-sea DOC concentration (35-45 µM; Hansell & Carslon
1998) which is generally considered resistant to bacterial degradation. The higher value of calculated
RDOC compared to deep-sea concentration could imply that the experimental approach is not able to
degrade the whole pool of labile and semi-labile organic carbon. Indeed, in natural systems, during
the transport of coastal DOM to the deep-sea, other processes that affect its degradation have to be
considered, e.g. the degradation of the semi-labile pool, the dilution in the ocean and photo-
degradation of DOM (Lønborg & Søndeergard 2009). RDOC value observed in the experiments
performed, is however similar to Lønborg et al. (2009, 2010) after long incubation experiments (70
days maximum in Lønborg et al. (2010) and 150 days in Lønborg et al. (2009)), confirming the
bioreactor approach as a suitable tool for rapid evaluation of BDOC, as the time required for its
estimation is about 4h.
94
BDON concentration ranged between 2.39±0.05 µM (SS-1) and 6.26±0.13 µM (OGS-1B), and is
similar to values detected by Lønborg et al. (2009) after 150-day incubation experiment in a temperate
Scottish fjord. The degradation values obtained fall within the BDON range reviewed by Lønborg
and Álvarez-Salgado (2012) in coastal oceans, nevertheless, a high variability in DON degradation
was observed. In OGS-1A experiment, DON can be considered as completely refractory, as no
significant difference was detected at the outlet, while in the other samplings degradation ranged from
26.1% (SS-3) and 91.6% (OGS-1B). This broad variation does not directly depend on the bulk DON
pool. Differently to Lønborg et al. (2009), no relationship exists between inlet concentrations and the
bioavailable fractions, but a strong correlation (p < 0.01) was observed between inlet DON and the
residual DON concentration detected at the outlet, assumed as refractory DON. At the experimental
conditions, except for the lowest value detected in OGS-1B (0.58±0.01 µM), RDON concentration
was always higher than the deep-sea DON (<3 µM; Bronk 2002), especially in SUM experiments,
when also higher DON inlet concentrations were detected. This could imply that the increase in the
bulk DON pool is mainly due to a higher concentration of less bioavailable compounds, and other
factors than the total DON amount affect its bioavailability. DOM consumption by bacteria depends
on numerous factors, including temperature, nutrient availability, bacterial community composition,
DOM chemical composition, and length of the experiments (Wiegner et al. 2006). During the
experiments performed, bioreactor temperature did not change, the same initial bacterial community
was always maintained, the bioreactor was kept in the dark, and test duration was similar among the
different experiments, thus the variability of DON consumption has to be addressed to some nutrient
limiting and/or different chemical composition of the bioavailable DOM. No correlation was found
between DON pools and inorganic nutrients, thus consumption of DON is affected by its chemical
composition, and not by inorganic nutrient availability. Polimene et al. (2017) demonstrated that a
substantial fraction (60%) of diatom derived DON is resistant to degradation. Polimene et al. (2017)
study, however, was only focussed on degradation by a single bacterial cell line (Alteromonas sp.),
while inside bioreactors, similar to the one used in the experiment described, different species of the
bacterial community operate in succession and synergy (Søndeergard & Worm 2001), and DOM
degradation could be higher than that operated by a single species. In the Gulf of Trieste, however,
diatoms represent the major contributors to primary production (Fonda Umani et al. 2007, 2012), and
the high degradation range could depend mostly on the different chemical composition of compounds
released by phytoplankton. Moreover, it should be also taken into account that not all available DON
could have been consumed, as bioreactor DON degradation efficiency, assessed by AMP
consumption, was 84%.
95
Concerning inorganic nitrogen species, independently to inlet concentration, ammonium uptake
seemed to be preferred to NOX, as it is the inorganic nitrogen species always consumed. NH4 uptake
is generally recognised as an important source of inorganic nitrogen for heterotrophic bacteria.
Indeed, NOX uptake is energetically demanding, requiring intracellular reduction to NH4 prior to
assimilation. Heterotrophic bacteria have very efficient systems for ammonium uptake, and the
proportion of total uptake tends to increase at decreasing NH4 concentrations (Church 2008 and
references therein). DON degradation should be connected to inorganic nitrogen regeneration;
however, NOX released was coupled with DON degradation only in SS-2. The absence of the
expected correlation between DON and DIN may depend on a continuous flux of uptake and
regeneration inside the bioreactor, directly related to the chemical composition of DOM. As already
described above, inside the bioreactor different niches and communities are selected in a longitudinal
gradient of gradually more recalcitrant organic matter (Søndergaard & Worm 2001). Nutrients
regenerated by the first communities of the bioreactor might be immediately consumed by following
species, especially if most of DON available is difficult to degrade.
Similarly as BDON, DOP bioavailability exhibited a high variability. BDOP ranged between
0.03±0.01 µM (SS-1) and 0.11±0.02 µM (SS-2), and, as for BDOC and BDON, this range is
consistent with values observed by Lønborg et al. (2009). However, all DOP seemed to be refractory
on OGS-1A, SS-3 and SS-1, while a slight release was observed at OGS-1B. On the other hand, a
variable consumption from 13.3% (OGS-1C) to 40.9% (SS-2) was observed in the other experiments.
As for BDON, neither BDOP broad variation directly depends on the bulk DOM pool, as no
relationship exists between inlet concentrations and the bioavailable fractions. Moreover, in other
studies DOP is generally ≥80% degraded (Lønborg et al. 2009, 2010; Hopkinson et al. 2002; Lønborg
& Álvarez-Salgado 2012), as it represents the DOM pool that is preferentially consumed over DON
and DOC, whereas in the present study DOP seems less available. Indeed, residual DOP
concentration, which ranged from 0.06±0.001 µM (SS-1) to 0.24±0.005 µM (OGS-1B), was higher
than the deep-sea DOP value (0.02 µM; Karl & Björkman 2002) and also than residual DOP found
in other studies (Lønborg et al. 2009, 2010; Hopkinson et al. 2002). In addition, contrary to what
generally observed (Karl & Björkman 2015), no overall relationship exists with inorganic nutrients,
especially between consumed DOP and released PO4, which is strange as the area is P-limited
(Thingstad & Rassoulzadegan 1995). On the other hand, focusing on each experiment, some
connections between BDOP and PO4 exist, e.g. in OGS-1C and SS-2 DOP consumption was
associated to PO4 release, and in OGS-1A all DOP was refractory and half of PO4 pool was used.
Degradation and release, however, vary independently to inlet concentrations. This complex patter of
DOP and PO4 consumption might depend on a different chemical composition of organic matter,
96
considering that the bioreactor demonstrated the capability to completely degrade labile DOP, as in
AMP test 100% of inlet DOP was consumed. The absence of the expected correlation between DOP
consumed and PO4 released may depend, as already described for DON, on a continuous flux of
uptake and regeneration inside the bioreactor. Microbial community colonising the inert support is
typical of the P-limited area, therefore should have evolved several mechanisms for a more efficient
P uptake. In the case of high concentrations of less labile inlet DOP, all PO4 released by
remineralisation from the first bacterial community in the bioreactor would be preferentially
consumed by the following communities before DOP degradation. In addition, large DOP compounds
need to be enzymatically hydrolysed for the assimilation of the released inorganic phosphorus (Karl
& Björkman 2015). Moreover, DOP production by healthy microorganisms has been recognised as a
wide phenomenon, and may be released by heterotrophic bacteria colonising bioreactor.
The presence of differently specialised communities inside the bioreactor could also be inferred by
the low salinity experiment (OGS-2). When bioreactor was supplied with low-salinity water (~21),
all DOM species were released because of osmotic stress. On the other hand, uptake of all inorganic
nutrient was clearly observed, especially PO4 (82.6% of the inlet pool). Osmotic stress might have
caused the lysis of non-resistant species resulting in DOM release, and thus only the activity of species
resistant to salinity changes is detectable. Moreover, a higher concentration of inorganic nutrients was
available, while DOM could have been more refractory as OGS-2 station is strongly influenced by
freshwater springs. Hence, when low salinity water was supplied, only more resistant heterotrophic
bacteria communities could have survived to osmotic stress, and they preferentially utilised inorganic
nutrients due to the highest availability. Furthermore, eventual DOM consumption could have been
hidden by the high release of DOM after cellular lysis.
Several studies have found that bacterial growth and DOM bioavailability can be limited by inorganic
nutrients (Church 2008 and references therein; Pinhassi et al. 2006; Lønborg & Søndergaard 2009).
However, none of DOM pool show any relationship with inorganic nutrient, and this was also
confirmed by the treatment of nitrate and phosphate addition done on SUM experiments
(SUM+NUT). Indeed, DOC consumption was not affected by the higher availability of nutrients,
whereas differences were found in DON and DOP degradation, but no common variation pattern
could be identified. The addition of phosphate resulted in increased uptake by heterotrophic bacteria
in the bioreactor. PO4 consumption was higher than in the raw water samples for all stations, even in
those where a release was observed, confirming phosphate uptake as an important substrate (Karl &
Björkman 2015) for microbial community of the area. No relationship, however, seems to exist with
DOP. Indeed, in SS-3+NUT and SS-2+NUT DOP degradation increased, while in C1+NUT lower
97
BDOP values were detected and in SS-1+NUT a slight release of DOP was observed. Concerning
nitrogen species, no homogeneous patter could be identified for NOX. In C1+NUT and SS-1+NUT
no significant changes were detected comparing to the raw water samples, NOX consumption
increased in SS-3+NUT, and a lower production was measured in SS-2+NUT. NH4 consumption did
not change significantly, except for SS-3+NUT where NH4 utilisation increased to 80%. Similarly to
inorganic nitrogen, DON did not exhibit a homogenous trend after nutrient addition. As for DOP,
DON degradation in C1+NUT decreased, whereas in SS-2+NUT DON bioavailability increased. In
SS-3+NUT almost no DON was consumed, while SS-1+NUT BDON concentration did not change
from the raw value. The insignificant effect of inorganic nutrient addition on biodegradable DOC
amounts suggests that DOC degradation in the experiments was not limited by inorganic nitrogen or
phosphorus availability. This is in contrast to a commonly observed stimulation of heterotrophic DOC
utilization by addition of inorganic nutrients (e.g. Kuparinen & Heinänen 1993; Zweifel et al. 1995),
but is consistent with Asmala et al. (2013) experiments in Baltic Sea. However, the different patterns
found for DON and DOP suggest a high variability in DOM composition in the area. Indeed, no
common DOM degradation trend was identified even in samplings performed on the same day in SS
stations. Nutrient limitation can, indeed, affect quantity and quality of DOM produced, and especially
P-limitation has resulted in several experiments to produce refractory DOM (Carlson & Hansell 2015
and references therein).
Concluding, overall, BDOM ranged from 20.6 µM to 46.0 µM for C, from 2.39 µM to 6.26 µM for
N and from 0.02 µM to 0.11 µM for P, and represented 30±6% of DOC, 43±25% of DON and
25±14% of DOP. Bioavailability seemed highest for DON, followed by DOC and DOP. However,
the high variability of DON and DOP consumption among the experiments performed makes difficult
to establish a clear pattern of preferential consumption of DOM components, despite the general
consensus that DON and DOP are selectively mineralised with respect to DOC (Aminot & Kérouel
2004; Lønborg et al. 2009; Lønborg et al. 2010; Knudsen-Leerbeck et al. 2017). Focussing on each
single experiment performed, DOC is the easiest to degrade component of DOM in OGS-1A, OGS-
1C, C1, SS-1 and SS-3, whereas in OGS-1B and SS-2 DON is the preferred DOM consumed fraction.
Nutrient addition does not change C1 and SS-1 selectivity, but in SS-3 and SS-2 DOP becomes DOM
fraction preferentially degraded.
98
5. Conclusions and experimental set-up criticism
The plug-flow bioreactor tested confirmed its functionality for BDOC evaluation in the Gulf of
Trieste, as values similar to previous studies were obtained. However, the experimental approach
applied seemed to be not effective for DON and DOP degradation and for nutrient uptake evaluation,
as it was not possible to identify any specific relationship between DOM bioavailability and other
factors. Nevertheless, to our knowledge, this work represents the first attempt for the simultaneous
evaluation of all DOM components degradation and nutrient uptake in seawater by means of a plug-
flow bioreactor, and further research is needed. In this study, no batch experiment was conducted for
comparing bioreactor performance in DON and DOP degradation and nutrient uptake. AMP test
showed good performance for both DON and DOP degradation, however, a parallel test would be
useful in order to confirm these results, especially for evaluating if the lower DON degradation
efficiency (84%) has to be addressed to the experimental set-up or to the composition of DOM tested.
De Vittor et al. (2009) verified that no interaction with inert support affected DOC degradation in
seawater condition, but no abiotic test has been previously conducted to verify possible physical DON
and DOP release/retention, neither is it known the effect of any physical disturbance by biofilm.
Indeed, Zhao & Liu (2013), in a study on estuarine environment, hypothesized that refractory DOP
(as phytic acid) might have displaced PO4 on biofilm surface, resulting in phosphate release.
Considering that the Gulf of Trieste is a P-limited environment, the interference of RDOP with PO4
might have hidden inorganic phosphorus uptake. Moreover, in the same study, Zhao & Liu (2013)
found that 30%-38% of glucose-6-phosphate was hydrolysed in abiotic conditions, resulting in PO4
release from the bioreactor. More research is needed to verify Zhao & Liu (2013) results focusing on
marine water; however, if their findings were confirmed bioreactor would not be a useful tool in P-
limited systems. In addition, considering the low P concentration in both organic and inorganic
compartment, it is difficult to verify the significance of small variations between inlet and outlet.
Abiotic and biofilm interferences should also be verified for DON. Badr et al. (2008) tested a plug-
flow bioreactor performance for estuarine waters, but they did not perform any test to verify abiotic
interaction, assuming it to be minor on the basis of previous works focussed on DOC (e.g. Kaplan &
Newbold 1995). However, considering that DON mineralisation involves several complex processes,
it should be useful to perform abiotic tests and parallel batch cultures in order to verify the
effectiveness of bioreactors approach for BDON evaluation.
The experiments performed have highlighted the relevance of the establishment of specialised
communities inside the bioreactor for the degradation of gradually more recalcitrant organic matter.
For this reason, other studies should deal with the identification of the different communities forming
99
the longitudinal gradient in order to gain insights on DOM dynamics inside the bioreactor. The
identification of heterotrophic bacteria should also be combined with the evaluation of virus activity,
as viral lysis is one of the main causes of DOM release (Hansell & Carlson 2015).
Acknowledgments
We are thankful to Fondo Trieste for having financially supported this PhD research project. We
would like to thank Lidia Urbini and Martina Kralj for nutrient analysis, and Sergio Predonzani for
the help provided in the bioreactor set-up.
References
Aminot A, Kérouel R (2004) Dissolved organic carbon, nitrogen and phosphorus in the N-E Atlantic
and the N-W Mediterranean with particular reference to non-refractory fractions and
degradation. Deep Sea Res I 51:1975–1999. doi:10.1016/j.dsr.2004.07.016.
Andersen RA (2005) Algal Culturing Techniques, 1st ed. Elsevier Academic Press, Burlington, Mass.
Asmala E, Autio R, Kaartokallio H, Pitkänen, Stedmon CA, Thomas DN (2013) Bioavailability of
riverine dissolved organic matter in three Baltic Sea estuaries and the effect of catchment land
use. Biogeosciences 10:6969–6986. doi:10.5194/bg-10-6969-2013.
Auriemma R, Nasi F, Del Negro P (2016) The macrozoobenthic fauna of the bottoms nearby the
underwater swage duct of Trieste (Northern Adriatic Sea). Biol Mar Mediterr 23: 90–93.
Azam F, Fenchel T, Field JG, Gray JS, Meyerreil LA, Thingstad F (1983) The ecological role of
water column microbes in the Sea. Mar Ecol Prog Ser 10: 257–263.
Badr E-SA, Tappin AD, Achterberg EP (2008) Distribution and seasonal variability of dissolved
organic nitrogen in two estuaries in SW England. Mar Chem 110:153–164.
Bronk DA (2002) Dynamics of dissolved organic nitrogen. In: Hansell DA, Carlson CA (Eds.),
Biogeochemistry of Marine Dissolved Organic Matter. 1st Ed. Academic Press, USA, pp. 153–
247.
Church MJ (2008) Resource control of bacterial dynamics in the sea. In Kirchman DL (Eds),
Microbial ecology of the oceans. 2nd Ed. Jhon Wiley & Sons, Inc.
Cozzi S, Falconi C, Comici C, Cermelj B, Kovac N, Turk V, Giani M (2012) Recent evolution of
river discharges in the Gulf of Trieste and their potential response to climate changes and
anthropogenic pressure. Estuar Coast Shelf Sci 115:14–24. doi:10.1016/j.ecss.2012.03.005.
De Vittor C, Paoli A, Fonda Umani S (2008) Dissolved organic carbon variability in a shallow coastal
marine system (Gulf of Trieste, northern Adriatic Sea). Estuar Coast Shelf Sci 78:280–290
De Vittor C, Larato C, Fonda Umani S (2009) The application of a plug-flow reactor to measure the
biodegradable dissolved organic carbon (BDOC) in seawater. Bioresour Technol 100:5721–
5728.
Dinasquet J, Kragh T, Schrøter ML, Søndergaard M, Riemann L (2013) Functional and compositional
succession of bacterioplankton in response to a gradient in bioavailable dissolved organic
carbon. Environ Microbiol 15:2616–2628. doi:10.1111/1462-2920.12178
100
Fajon C, Cauwet G, Lebaron P, Terzic S, Ahel M, Malej A, Mozetič P, Turk V (1999) The
accumulation and release of polysaccharides by planktonic cells and the subsequent bacterial
response during a controlled experiment. FEMS Microbiol Ecol 29:351–363.
Fonda Umani S, Del Negro P, Larato C, De Vittor C, Cabrini M, Celio M, Falconi C, Tamberlich F,
Azam F (2007) Major inter-annual variations in microbial dynamics in the Gulf of Trieste
(northern Adriatic Sea) and their ecosystem implications. Aquat Microb Ecol 46:163–175.
Fonda Umani S, Malfatti F, Del Negro P (2012) Carbon fluxes in the pelagic ecosystem of the Gulf
of Trieste (Northern Adriatic Sea). Estuar Coast Shelf Sci 115:170–185.
Hansell DA, Carlson CA (1998) Deep-ocean gradients in the concentration of dissolved organic
carbon. Nature 395:263–266.
Hansell DA (2005) Dissolved organic carbon reference material program. Eos Trans AGU 86:318.
Hansell DA, Carlson CA, Repeta DJ, Schlitzer R (2009) Dissolved organic matter in the ocean: a
controversy stimulates new insights. Oceanography 22:202–211.
Hansell DA (2013) Recalcitrant Dissolved Organic Carbon Fractions. Annu Rev Mar Sci 5:421–45.
doi:10.1146/annurev-marine-120710-100757
Hansell DA, Carlson CA (2015) Biogeochemistry of marine dissolved organic matter. 2nd Ed.
Elsevier Science, USA.
Hansen HP, Koroleff F (1999) Determination of nutrients. In: Grasshoff K, Kremling K, Ehrhardt M
(Eds.), Methods of seawater analysis, 3rd ed. Wiley-VCH, Weinheim.
Hedges JI (1992) Global biogeochemical cycles: progress and problems. Mar Chem 39:67–93.
Hopkinson Jr CS, Vallino JJ, Nolin A (2002) Decomposition of dissolved organic matter from the
continental margin. Deep Sea Res II 49:4461–4478.
Kaplan LA, Newbold JD (1995) Measurement of streamwater biodegradable dissolved organic
carbon with a plug-flow bioreactor. Water Res 29:2696–2706.
Karl DM, Björkmann K (2015) Dynamics of dissolved organic phosphorus. In Hansell DA, Carlson
CA, 2015. Biogeochemistry of marine dissolved organic matter. 2nd Ed. Elsevier Science,
USA.
Knudsen-Leerbeck H, Mantikci M, Bentzon-Tilia M, Traving SJ, Riemann L, Hansen JLS, Markager
S (2017) Seasonal dynamics and bioavailability of dissolved organic matter in two contrasting
temperate estuaries. Biogeochemistry 134:217–236. doi:10.1007/s10533-017-0357-2.
Kragh T, Søndergaard M (2009) Production and decomposition of new DOC by marine plankton
communities: carbohydrates, refractory components and nutrient limitation. Biogeochemistry
96:177–187.
Kujawinski EB (2011) The impact of microbial metabolism on marine dissolved organic matter.
Annu Rev Mar Sci 3:567–99. doi:10.1146/annurev-marine-120308-081003.
Kuparinen J and Heinänen A (1993) Inorganic nutrient and carbon controlled bacterioplankton
growth in the Baltic Sea. Estuar Coast Shelf Sci 37:271–285.
Larato C, Celussi M, Virgilio D, Karuza A, Falconi C, De Vittor C, Del Negro P, Fonda Umani S
(2010) Production and utilization of organic matter in different P-availability conditions: A
mesocosm experiment in the Northern Adriatic Sea. J Exp Mar Biol Ecol 391:131–142.
Letscher RT, Knapp AN, James AK, Carlson CA, Santoro AE, Hansell DA (2015) Microbial
community composition and nitrogen availability influence DOC remineralization in the
South Pacific Gyre. Mar Chem 177: 325–334.
101
Lipizer M, Cossarini G, Falconi C, Solidoro C, Fonda Umani S (2011) Impact of different forcing
factors on N:P balance in a semi-enclosed bay: The Gulf of Trieste (North Adriatic Sea). Cont
Shelf Res 31:1651–1662. doi:10.1016/j.csr.2011.06.004
Lipizer M, De Vittor C, Falconi C, Comici C, Tamberlich F, Giani M (2012) Effects of intense
physical and biological forcing factors on CNP pools in coastal waters (Gulf of Trieste,
Northern Adriatic Sea). Estuar Coast Shelf Sci 115:40–50. doi:10.1016/j.ecss.2012.03.024.
Lønborg C, Álvarez-Salgado XA (2012) Recycling versus export of bioavailable dissolved organic
matter in the coastal ocean and efficiency of the continental shelf pump. Global Biogeochem
Cycles 26:Gb3018. doi:10.1029/2012gb004353.
Lønborg C, Davidson K, Álvarez-Salgado XA, Miller AEJ (2009) Bioavailability and bacterial
degradation rates of dissolved organic matter in a temperate coastal area during an annual
cycle. Mar Chem 133:219–226. doi:10.1016/j.marchem.2009.02.003
Lønborg C, Søndeergard M (2009) Microbial availability and degradation of dissolved organic carbon
and nitrogen in two coastal areas. Estuar Coast Shelf Sci 81:513–520.
Lønborg C, Álvarez-Salgado XA, Martínez-Garcia S, Miller AEJ, Teira E (2010) Stoichiometry of
dissolved organic matter and the kinetics of its microbial degradation in a coastal upwelling
system. Aquat Microb Ecol 58:117–126. doi:10.3354/ame01364.
Malfatti F, Turk V, Tinta T, Mozetič P, Manganelli M, Samo TJ, Ugalde JA, Kovač N, Stefanelli M,
Antonioli M, Fonda Umani S, Del Negro P, Cataletto B, Hozić A, Ivošević De Nardis N, Žutić
V, Svetličić V, Mišić Radić T, Radić T, Fuks D, Azam F (2014) Microbial mechanisms
coupling carbon and phosphorus cycles in phosphorus-limited northern Adriatic Sea. Sci Total
Environ 470–471:1173–1183. doi:10.1016/j.scitotenv.2013.10.040
Mozetič P, Solidoro C, Cossarini G, Socal G, Precali R, Francé J, Bianchi F, De Vittor C, Smodlaka
N, Fonda Umani S (2010) Recent trends towards oligotrophication of the Northern Adriatic:
evidence from chlorophyll a time series. Estuar Coasts 33:362–375. doi:10.1007/s12237-009-
9191-7.
Pinhassi J, Gomez-Consarnau L, Alonso-Saez L, Sala MM, Vidal M, Pedros-Alio C, Gasol JM (2006)
Seasonal changes in bacterioplankton nutrient limitation and their effects on bacterial
community composition in the NW Mediterranean Sea. Aquat Microb Ecol 44:241–252.
Polimene L, Clark D, Kimmance S, McCormack P (2017) A substantial fraction of phytoplankton-
derived DON is resistant to degradation by a metabolically versatile, widely distributed
marine bacterium. PLOS ONE 12:e0171391. doi:10.1371/journal.pone.0171391.
Santinelli C, Nannicini L, Seritti A (2010) DOC dynamics in the meso and bathy pelagic layers of
the Mediterranean Sea. Deep Sea Res II 57:1446–1459. doi:10.1016/j.dsr2.2010.02.014
Santinelli C, Ibello V, Lavezza R, Civitarese G, Seritti A (2012) New insights into C, N and P
stoichiometry in the Mediterranean Sea: The Adriatic Sea case. Cont Shelf Res 44:83–93.
Santinelli C, Hansell DA, d’Alcalà MR (2013) Influence of stratification on marine dissolved organic
carbon (DOC) dynamics: The Mediterranean Sea case. Prog Oceanogr 119:68–77.
doi:10.1016/j.pocean.2013.06.001.
Søndergaard M, Borch NH, Riemann B (2000) Dynamics of biodegradable DOC produced by
freshwater plankton communities. Aquat Microb Ecol 10:69–85.
Søndergaard M, Worm J (2001) Measurement of biodegradable dissolved organic carbon (BDOC) in
lake water with a bioreactor. Water Res 35:2505–2513.
102
Sugimura Y, Suzuki Y (1988) A high temperature catalytic oxidation method for the determination
of non-volatile dissolved organic carbon in seawater by direct injection of liquid sample. Mar
Chem 24:105–131.
Thingstad TF, Hagström Å, Rassoulzadegan F (1997) Accumulation of degradable DOC in surface
waters: is it caused by a malfunctioning microbial loop? Limnol Oceanogr 42:398–404.
Thingstad TF, Rassoulzadegan F (1995) Nutrient limitations, microbial food webs, and ‘biological
C-pumps’: suggested interactions in a P-limited Mediterranean. Mar Ecol Prog Ser 117:299–
306.
Volk CJ, Volk CB, Kaplan LA (1997) Chemical composition of biodegradable dissolved organic
matter in streamwater. Limnol Oceanogr 42:39–44.
Wiegner TN, Seitzinger SP, GlibertPM, Bronk DA (2006). Bioavailability of dissolved organic
nitrogen and carbon from nine rivers in the eastern United States. Aquat Microb Ecol 43:277–
287.
Zhao J, Liu X (2013) Organic and inorganic phosphorous uptake by bacteria in a plug-flow
microcosm. Front Environ Sci Eng 7:173–184.
Zweifel UL, Norrman B, Hagström A (1993) Consumption of dissolved organic carbon by marine
bacteria and demand for inorganic nutrients. Mar Ecol Prog Ser 101:23–32.
Zweifel UL, Wikner J, Hagström Å, Lundberg E, Norrman B (1995) Dynamics of dissolved organic
carbon in a coastal ecosystem. Limnol Oceanogr 40:299–305.
103
Acknowledgments
I wish to express all my gratitude to my supervisors, Dr. Paola Del Negro and Dr. Cinzia De Vittor,
for the confidence they showed in me, for the great support provided and for the always interesting
and challenging opportunities they have given me.
I also want to thank Dr. Michele Giani for the fundamental scientific help and for the stimulating
professional chances provided during these years.
Special thanks goes to Nives Ogrinc for the valuable support during experiments and field activities,
and for having hosted me in Ljubljana to help me writing the paper. I also want to thank all the
students and technicians of the Jožef Stefan Institute for their kind hospitality and for the analysis
performed.
I am thankful to Dr. Daniela Berto and Dr. Christian Millo for their availability to review this thesis
and for their suggestions that have really helped me in improving the manuscript.
I really want to thank all my past and present colleagues of OGS for their support and encouragement
and principally for making the time spent in the institute always pleasant. Thanks in particular to my
“chemical brothers” for unloading me from laboratory activities, especially during the last period of
thesis writing, even if they always have a lot to do.
I wish to thank “Fondo Trieste” for having financially supported this PhD research project.