relationship between optical coherence tomography–measured central retinal thickness and visual...
TRANSCRIPT

The Relationship between OCT-measured Central RetinalThickness and Visual Acuity in Diabetic Macular Edema
Diabetic Retinopathy Clinical Research Network*
AbstractObjective—To compare optical coherence tomography (OCT)-measured retinal thickness andvisual acuity in eyes with diabetic macular edema (DME) both before and after macular laserphotocoagulation.
Design—Cross-sectional and longitudinal study.
Participants—210 subjects (251 eyes) with DME enrolled in a randomized clinical trial of lasertechniques.
Methods—Retinal thickness was measured with OCT and visual acuity was measured with theelectronic-ETDRS procedure.
Main Outcome Measures—OCT-measured center point thickness and visual acuity
Results—The correlation coefficients for visual acuity versus OCT center point thickness were0.52 at baseline and 0.49, 0.36, and 0.38 at 3.5, 8, and 12 months post-laser photocoagulation. Theslope of the best fit line to the baseline data was approximately 4.4 letters (95% C.I.: 3.5, 5.3) bettervisual acuity for every 100 microns decrease in center point thickness at baseline with no importantdifference at follow-up visits. Approximately one-third of the variation in visual acuity could bepredicted by a linear regression model that incorporated OCT center point thickness, age, hemoglobinA1C, and severity of fluorescein leakage in the center and inner subfields. The correlation betweenchange in visual acuity and change in OCT center point thickening 3.5 months after laser treatmentwas 0.44 with no important difference at the other follow-up times. A subset of eyes showedparadoxical improvements in visual acuity with increased center point thickening (7–17% at the threetime points) or paradoxical worsening of visual acuity with a decrease in center point thickening(18%–26% at the three time points).
Conclusions—There is modest correlation between OCT-measured center point thickness andvisual acuity, and modest correlation of changes in retinal thickening and visual acuity followingfocal laser treatment for DME. However, a wide range of visual acuity may be observed for a givendegree of retinal edema and paradoxical increases in center point thickening with increases in visualacuity as well as paradoxical decreases in center point thickening with decreases in visual acuitywere not uncommon. Thus, although OCT measurements of retinal thickness represent an important
Corresponding author: David J. Browning, M.D., c/o Jaeb Center for Health Research, 15310 Amberly Drive, Suite 350, Tampa, FL33647; Phone: (813) 975-8690, Fax: (800) 816-7601, E-mail: [email protected].*The writing committee and a list of the members of the Diabetic Retinopathy Clinical Research Network (DRCR.net) participating inthe trial appear in the acknowledgements.There are no conflicts of interest.An address for reprints will not be provided.Publisher's Disclaimer: This is a PDF file of an unedited manuscript that has been accepted for publication. As a service to our customerswe are providing this early version of the manuscript. The manuscript will undergo copyediting, typesetting, and review of the resultingproof before it is published in its final citable form. Please note that during the production process errors may be discovered which couldaffect the content, and all legal disclaimers that apply to the journal pertain.
NIH Public AccessAuthor ManuscriptOphthalmology. Author manuscript; available in PMC 2008 November 20.
Published in final edited form as:Ophthalmology. 2007 March ; 114(3): 525–536. doi:10.1016/j.ophtha.2006.06.052.
NIH
-PA Author Manuscript
NIH
-PA Author Manuscript
NIH
-PA Author Manuscript

tool in clinical evaluation, they cannot reliably substitute as a surrogate for visual acuity at a givenpoint in time. This study does not address whether short-term changes on OCT are predictive of long-term effects on visual acuity.
IntroductionOphthalmologists have associated diabetic macular edema (DME) and a reduction in visualacuity for decades.1–4 It is well established that treatments that reduce DME can improve orstabilize visual acuity. 3, 5, 6 Using optical coherence tomography (OCT), it is now possibleto measure objectively macular thickness and investigate quantitatively the relationship ofDME and visual acuity.7–9 Previous studies have reported different degrees of correlationbetween OCT-measured retinal thickness and visual acuity ranging from 0.28 to 0.73.7–8,10–16 If the correlation between OCT-measured macular thickness and vision wereparticularly strong, one might be able to consider the OCT measurement as a surrogate measureof visual function in clinical trials of DME. A surrogate outcome in a clinical trial is usedbecause it predates or predicts the actual measure of interest. In this case, changes in retinalthickening would be a surrogate for changes in visual acuity. For this surrogate outcome to bemeaningful and appropriate, it must be well correlated with the measure of primary interest.A surrogate outcome can be valuable if it is easier or less expensive to measure than the variableof primary interest or shows earlier changes that predict longer term changes in the variable ofprimary interest. From a clinical trial design perspective, use of a surrogate outcome couldresult in the need for shorter follow up or a smaller sample size or both.
Standardized OCT measurements and best corrected visual acuity were obtained during amulticenter clinical trial of two laser techniques for treatment of DME. In this report, weevaluate those eyes without other concurrent macular disease and describe the relationshipsbetween macular thickness and visual acuity, both at baseline and following laserphotocoagulation.
MethodsThis study analyzes data collected from a multi-center randomized clinical trial comparingmodified-ETDRS laser photocoagulation with a modified macular grid approach for thetreatment of DME (protocol available at http://public.drcr.net, accession date May 13, 2006).The study, funded by the National Eye Institute of the National Institutes of Health, U.S.Department of Health and Human Services, was conducted by the Diabetic RetinopathyClinical Research Network (DRCR.net) at 79 clinical sites across 30 U.S. states. The protocoland informed consent forms were approved by the respective institutional review boards. Eachsubject gave written informed consent to participate in the study. Study oversight was providedby an independent data and safety monitoring committee.
Study PopulationParticipants were at least 18 years old with type 1 or type 2 diabetes, had no history of renalfailure requiring dialysis or renal transplant, and had one or both eyes meeting the followingcriteria: (1) best corrected electronic-ETDRS visual acuity17 letter score ≥ 19 (approximately20/400 or better), (2) definite excess retinal thickness due to previously untreated DME (andnot primarily due to vitreo-retinal interface disease) within 500 microns of the macular centeron clinical examination, and (3) OCT retinal thickness ≥ 250 microns in the central subfieldand/or ≥300 microns in at least one of the four inner subfields. Eyes were not eligible if theyneeded or had received panretinal scatter photocoagulation within the prior 4 months, YAGcapsulotomy within the prior 2 months, or major ocular surgery including cataract extractionwithin the prior 6 months. For purposes of this paper, eyes were not included if, at enrollment,there was an ocular abnormality other than DME that in the investigator’s judgment was
Page 2
Ophthalmology. Author manuscript; available in PMC 2008 November 20.
NIH
-PA Author Manuscript
NIH
-PA Author Manuscript
NIH
-PA Author Manuscript

decreasing acuity by three or more lines or if the red reflex photographs graded by the ReadingCenter showed a moderate or greater lens or posterior capsule opacity.
Study ProceduresVisual acuity was measured by a certified tester using the electronic-ETDRS (E-ETDRS)procedure17 following a standardized refraction. E-ETDRS testing was conducted using theelectronic visual acuity tester (EVA), which uses a programmed Palm (Palm, Inc., Santa Clara,California, USA) hand-held device communicating with a personal computer and 17-inchmonitor at a test distance of 3 meters. A visual acuity score is obtained that is comparable toa standard ETDRS chart score.
OCT images were obtained from each eye following pupil dilation by a certified operator usingthe OCT2 (9 eyes) or OCT3 (242 eyes) system. For the 9 eyes using OCT2 at baseline, 8switched to OCT3 during the study. For all other eyes, the same OCT version was used for theduration of the study. Scans were sent to the DRCR.net Reading Center at the University ofWisconsin-Madison where the scans were visually inspected. Scans in which the ReadingCenter considered the measurement of central retinal thickness to be unreliable [172/1195(14%) OCT images] were not included in this study. Retinal morphology was assessed usinga five-level grading scale for cystic spaces, and a three-level grading scale for the presence orabsence of central subretinal fluid.
Fluorescein angiograms were obtained at baseline and 12 months. They were graded by theReading Center for capillary loss, fluorescein leakage and cystoid abnormalities. Ninety-threepercent of eyes at baseline had gradable fluorescein images for fluorescein leakage, but only68% of eyes at baseline could be graded on capillary loss, a technical consequence of the factthat early frames in the angiogram can be obtained from only one eye.
Treatment and Follow-upEach study eye received either modified-ETDRS or mild macular grid laser photocoagulationfor DME. Follow-up visits occurred at 3.5, 8, and 12 months. Evaluation at each visit includedmeasurement of best corrected E-ETDRS acuity and OCT measurement of retinal thickness.Macular laser photocoagulation was repeated if DME persisted. Of the 176 eyes in this reportwith 12-month follow-up data, 38% had only initial laser treatment, while 34% received oneadditional treatment, and 28% received two additional treatments.
Statistical MethodsCenter point thickness was used as the OCT measurement of foveal thickness. Results werevirtually identical using central subfield mean thickness since the two variables are highlycorrelated. At baseline, the correlation of central subfield mean thickness and center pointthickness was 0.98 (N=251). At 12 months follow-up, the correlation of absolute change incentral subfield mean thickness and absolute change in center point thickness was also 0.98(N=176). We present only the analysis based on center point thickness under the assumptionthat center point thickness, a foveal measure, may be associated more closely with visual acuitythan central subfield which includes contributions from the parafoveal region.
Analyses were based on parametric approaches utilizing least squares regression. Correlationsand the coefficient of determination (r2) were calculated in repeated measures models (toaccount for the correlation within subjects with two study eyes) based on the likelihood ratioas defined by Magee.18 Distributions of center point thickness and visual acuity were slightlyskewed; however, truncating outliers at ± 3 standard deviations from the mean gave similarresults (data not shown). Subgroup analysis on OCT quality (good versus fair) as determined
Page 3
Ophthalmology. Author manuscript; available in PMC 2008 November 20.
NIH
-PA Author Manuscript
NIH
-PA Author Manuscript
NIH
-PA Author Manuscript

by the Reading Center was performed by adding an interaction term to the model with centerpoint thickness.
Repeated measures least squares models were fit using visual acuity letter score as thedependent variable. Multivariate models using clinical and demographic factors as theindependent variables were constructed using backward elimination (P<0.05 to stay in themodel). Median values were imputed for missing predictor variables (<10% of eyes for eachvariable). To reduce potential collinearity, highly correlated variables (r ≥ 0.90) were notincluded in the same model.
For the primary predictive factor, center point thickness, residuals were slightly skewed andthere was suggestive evidence of larger variance with increasing thickness (assessed byregressing the squared residual on the center point thickness; p=0.07). A transformation, takingthe square root of the difference of the maximum letter score and the observed letter score,corrected both of these problems and gave results similar to those of the untransformed visualacuity letter score (data not shown). Linearity was examined by testing for higher orderpolynomial terms for each continuous variable in the final multivariate model. For center pointthickness there was some suggestion of a convex quadratic effect (p=0.05), but this wasprimarily due to one influential point (p=0.18 when this point is removed). Subgroup analysesat follow-up were done based on method of laser treatment and no differences were found;thus the data from both treatment groups were pooled for analysis in this report.
Eyes were included in the analyses of change from baseline when there was no ocular causefor decreased acuity identified at the follow-up exam and there was a gradable OCT scan(referred to as eligible eyes). Change analyses on OCT variables were performed on absoluteand relative changes in retinal thickening (excess thickness). Retinal thickening was definedas observed thickness minus mean normal thickness (defined as 171 microns for center pointbased on unpublished data provided by Carl Zeiss Meditec from a study of 260 nondiabeticeyes with a normal macula). Therefore, relative change in thickening following laser wascalculated as (post-treatment thickness − pre-treatment thickness)/(pre-treatment thickness −mean normal thickness). Statistical analyses were performed using SAS software version 9.1.
ResultsThe study included 210 subjects, of whom 41 (20%) had two study eyes and 169 (80%) hadone study eye for a total of 251 eyes. Baseline characteristics of the subjects and of the studyeyes are provided in Table 1.
Relationship of OCT Center Point Thickness to Visual AcuityFigure 1 shows baseline (pre-laser) visual acuity plotted against baseline OCT center pointthickness. The correlation coefficient was 0.52. The slope of the best fit line to the data wasapproximately 4.4 letters (95% C.I.: 3.5, 5.3) better visual acuity for every 100 micronsdecrease in center point thickness. There was a trend for stronger association for eyes withgood quality OCT (slope = 4.6 letters better for every 100 microns decrease in center pointthickness, n=182) than for those with fair quality OCT (slope = 3.5 letters, n=69, P=0.28). Forany OCT center point thickness, a wide range of visual acuities was observed. In Figure 2,OCT center point thickness has been divided into 4 subgroups and frequency distributions ofobserved visual acuities for each subgroup are shown. For smaller center point thicknesses, agreater percentage of eyes have better visual acuity than observed with larger center pointthicknesses, although a wide range of acuities are evident at all thicknesses.
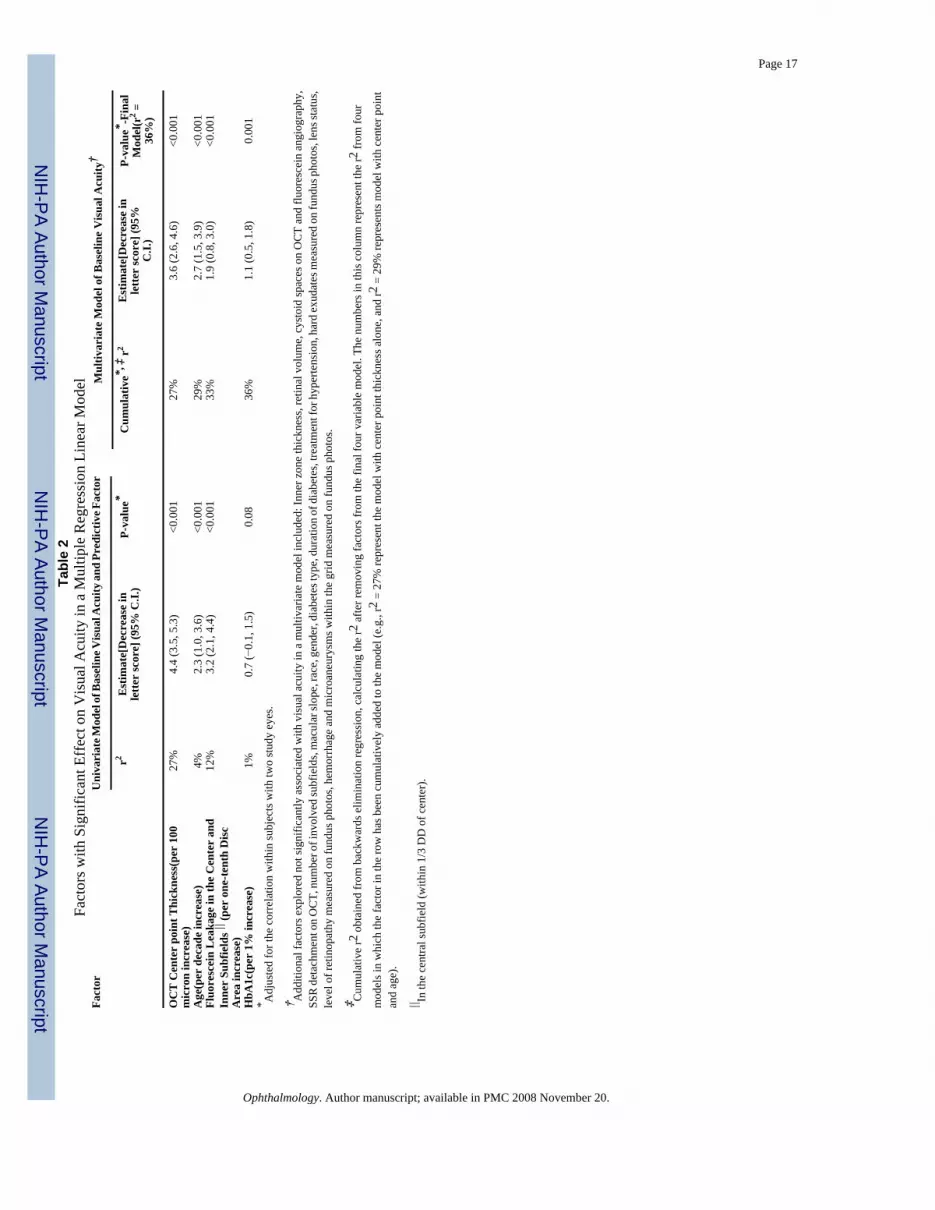
Table 2 lists the factors examined in multiple regression models for their effect on baselinevisual acuity. OCT center point thickness was the most predictive factor, accounting for 27%
Page 4
Ophthalmology. Author manuscript; available in PMC 2008 November 20.
NIH
-PA Author Manuscript
NIH
-PA Author Manuscript
NIH
-PA Author Manuscript
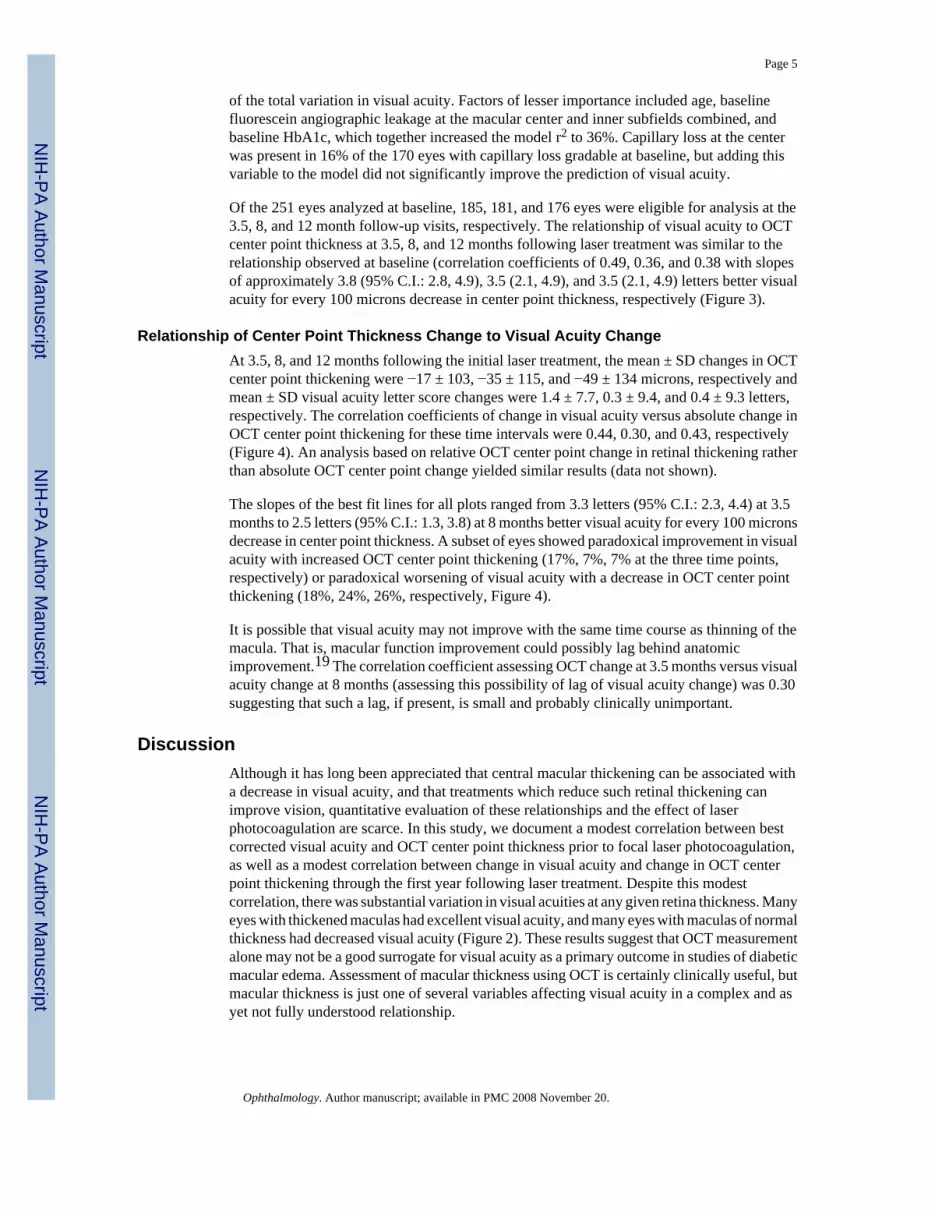
of the total variation in visual acuity. Factors of lesser importance included age, baselinefluorescein angiographic leakage at the macular center and inner subfields combined, andbaseline HbA1c, which together increased the model r2 to 36%. Capillary loss at the centerwas present in 16% of the 170 eyes with capillary loss gradable at baseline, but adding thisvariable to the model did not significantly improve the prediction of visual acuity.
Of the 251 eyes analyzed at baseline, 185, 181, and 176 eyes were eligible for analysis at the3.5, 8, and 12 month follow-up visits, respectively. The relationship of visual acuity to OCTcenter point thickness at 3.5, 8, and 12 months following laser treatment was similar to therelationship observed at baseline (correlation coefficients of 0.49, 0.36, and 0.38 with slopesof approximately 3.8 (95% C.I.: 2.8, 4.9), 3.5 (2.1, 4.9), and 3.5 (2.1, 4.9) letters better visualacuity for every 100 microns decrease in center point thickness, respectively (Figure 3).
Relationship of Center Point Thickness Change to Visual Acuity ChangeAt 3.5, 8, and 12 months following the initial laser treatment, the mean ± SD changes in OCTcenter point thickening were −17 ± 103, −35 ± 115, and −49 ± 134 microns, respectively andmean ± SD visual acuity letter score changes were 1.4 ± 7.7, 0.3 ± 9.4, and 0.4 ± 9.3 letters,respectively. The correlation coefficients of change in visual acuity versus absolute change inOCT center point thickening for these time intervals were 0.44, 0.30, and 0.43, respectively(Figure 4). An analysis based on relative OCT center point change in retinal thickening ratherthan absolute OCT center point change yielded similar results (data not shown).
The slopes of the best fit lines for all plots ranged from 3.3 letters (95% C.I.: 2.3, 4.4) at 3.5months to 2.5 letters (95% C.I.: 1.3, 3.8) at 8 months better visual acuity for every 100 micronsdecrease in center point thickness. A subset of eyes showed paradoxical improvement in visualacuity with increased OCT center point thickening (17%, 7%, 7% at the three time points,respectively) or paradoxical worsening of visual acuity with a decrease in OCT center pointthickening (18%, 24%, 26%, respectively, Figure 4).
It is possible that visual acuity may not improve with the same time course as thinning of themacula. That is, macular function improvement could possibly lag behind anatomicimprovement.19 The correlation coefficient assessing OCT change at 3.5 months versus visualacuity change at 8 months (assessing this possibility of lag of visual acuity change) was 0.30suggesting that such a lag, if present, is small and probably clinically unimportant.
DiscussionAlthough it has long been appreciated that central macular thickening can be associated witha decrease in visual acuity, and that treatments which reduce such retinal thickening canimprove vision, quantitative evaluation of these relationships and the effect of laserphotocoagulation are scarce. In this study, we document a modest correlation between bestcorrected visual acuity and OCT center point thickness prior to focal laser photocoagulation,as well as a modest correlation between change in visual acuity and change in OCT centerpoint thickening through the first year following laser treatment. Despite this modestcorrelation, there was substantial variation in visual acuities at any given retina thickness. Manyeyes with thickened maculas had excellent visual acuity, and many eyes with maculas of normalthickness had decreased visual acuity (Figure 2). These results suggest that OCT measurementalone may not be a good surrogate for visual acuity as a primary outcome in studies of diabeticmacular edema. Assessment of macular thickness using OCT is certainly clinically useful, butmacular thickness is just one of several variables affecting visual acuity in a complex and asyet not fully understood relationship.
Page 5
Ophthalmology. Author manuscript; available in PMC 2008 November 20.
NIH
-PA Author Manuscript
NIH
-PA Author Manuscript
NIH
-PA Author Manuscript

The subjects included in this study were seen in diverse settings and are probably representativeof subjects with DME seen throughout the United States. The demographics of this studypopulation are similar to those of other large studies of diabetic macular edema both in theUnited States and Great Britain.20–23 However, unlike the ETDRS, which excluded subjectsolder than 70 years of age,24 the present study did not. With 15% of the subjects over 70 yearsof age, the findings reported here also apply to this older age group. The current results shouldnot necessarily be extrapolated to subjects with renal failure or other processes that affect visualacuity in addition to macular edema, because such subjects were specifically excluded fromthis study. In addition, post-baseline analysis was only among eyes receiving laserphotocoagulation for DME. These results may or may not be similar when assessing othertreatments for DME. Likewise, the results may or may not be similar for other macular disorderssuch as age-related macular degeneration. The relationship of visual acuity and OCT-measuredcentral retinal thickness before intervention is roughly linear. Other studies have found similarresults; however, the strengths of correlation have varied widely (Table 3).7–8, 10–16 Someof these studies have used the central subfield mean thickness instead of center point thickness.However, since correlation of the two measures is 0.98, results of these studies can becompared. The coefficient of determination (r2) of 0.27 in the current study is in the middle ofthe previously reported range of 0.08–0.54, and may represent the current best estimate giventhe size of this study and the prospective, tightly regulated fashion in which the data weregathered. On average, visual acuity at baseline was better by 4.4 (95% C.I.: 3.5, 5.3) letters forevery 100 microns decrease in center point thickness. This finding is consistent with previousreports of better visual acuity by 2.9–11.7 letters per 100 microns less thickness.
The current report, and those of other studies, demonstrates a nearly linear relationship betweencenter point thickness and visual acuity without evidence for a plateau effect whereby thechange in visual acuity per unit of retinal thickness decreases with a thicker macula. In contrast,some other diseases associated with macular edema such as retinal vein occlusion and retinitispigmentosa fit a nonlinear model (Michael S. Ip, M.D., personal communication).25
The variance of ETDRS letters read at any given observed center point thickness is large, andthere may be a tendency for a greater spread in letters read in thicker maculas. Most eyes withDME have center point thicknesses less than 400 microns (74%). In this group, the standarddeviation in letters read for any given center point value is 9.7 (approximately two ETDRSlines), illustrating how crude OCT center point thickness is as a surrogate index for visualacuity. For the very edematous eyes, the spread is even greater.
Although center point thickness was the most predictive factor for both baseline and follow-up visual acuity, it only explained 27% of the variation in baseline and similar amounts atsubsequent visual acuity measurements. Addition of baseline HbA1c, age, and fluoresceinangiographic leakage at the macular center and inner subfields combined accounted for 36%of the variation in baseline visual acuity. These data suggest that additional factors other thanthose evaluated here also contribute to visual acuity.
The correlation between retinal thickness and visual acuity held relatively stable across allfollow-up periods. However, a subset of eyes showed paradoxical improvement in visual acuitywith increased center point thickening (7–17%) or paradoxical worsening of visual acuity withreduced center point thickening (18–26%). Thus the predictive value of change in retinalthickening for change in visual acuity in a particular eye is low. Over the follow-up intervalswe examined, we did not observe any increase in the slope of the visual acuity change versusfoveal thickness change which would have suggested a lag in acuity response.
This study has substantial design strengths including its prospective nature, large number ofsubjects, use of rigorous ETDRS visual acuity measurement, centralized reading center
Page 6
Ophthalmology. Author manuscript; available in PMC 2008 November 20.
NIH
-PA Author Manuscript
NIH
-PA Author Manuscript
NIH
-PA Author Manuscript

interpretation of OCT and fundus photography, and multicenter recruitment from bothcommunity and university based sites. A weakness is the lack of information on duration ofexisting edema at baseline and incompleteness of the data set regarding degree of macularischemia, both of which may affect edema and vision. Although OCT measured macularthickness is the best clinically available estimate for true macular thickness, it mayunderestimate true macular thickness by a tendency to exclude outer photoreceptor segments.26
In summary, there is a modest correlation of OCT-measured center point thickness with visualacuity, and modest correlation of changes in retinal thickening and visual acuity followingfocal laser treatment for DME. However, confidence intervals are large and a wide range ofvisual acuity may be observed for a given degree of retinal edema. In addition, paradoxicalchanges in visual acuity and retinal thickening may be observed in up to 26% of eyes. Indeed,retinal thickness only accounts for up to 27% of variability in concurrently measured visualacuity suggesting that other factors are important determinants of visual acuity in the presenceof diabetic macular edema. Thus, although OCT measurements of retinal thickness representan important tool in clinical evaluation, they cannot reliably substitute as a surrogate for visualacuity at a given point in time. However, this study does not address whether short-term changeson OCT are predictive of long-term effects on visual acuity.
AcknowledgementsSupported through a cooperative agreement from the National Eye Institute EY14231, EY14269, EY14229
Writing Committee: Lead Authors: David J. Browning, Adam R. Glassman. Additional Writing CommitteeMembers: Lloyd Paul Aiello, Roy W. Beck, David M. Brown, Donald S. Fong, Neil M. Bressler, Ronald P. Danis,James L. Kinyoun, Quan Dong Nguyen, Abdhish R. Bhavsar, Justin Gottlieb, Dante J. Pieramici, Michael E. Rauser,Rajendra S. Apte, Jennifer I. Lim, Päivi H. Miskala
The Diabetic Retinopathy Clinical Research Network
Clinical Sites that Participated in this Protocol
Sites are listed in order by number of subjects randomized into the study. The number of subjects randomized is notedin parenthesis preceded by the site location and the site name. Personnel are listed as (I) for Investigator, (C) forCoordinator, (V) for Visual Acuity Tester, and (P) for Photographer.
Baltimore, MD - Wilmer Ophthalmological Institute at Johns Hopkins (7): Sharon D. Solomon (I); Susan Bressler(I); Daniel Finkelstein (I); Peter L. Gehlbach (I); Quan Dong Nguyen (I); Jennifer U. Sung (I); Ingrid Zimmer-Galler(I); Warren Doll (C); Deborah Donohue (V); Robert Jurao (V); Siobhan E. Sheehan (V); Judith Belt (P); Boston, MA- Joslin Diabetes Center (5): George S. Sharuk (I); Paul G. Arrigg (I); Deborah K. Schlossman (I); Sabera T. Shah(I); Ann Kopple (C); Margaret E. Stockman (C); Leila Bestourous (V); Richard M. Calderon (V); Jerry D. Cavallerano(V); Tak Chau (V); Robert W. Cavicchi (P); James Strong (P); Columbia, SC - Palmetto Retina Center (5): JohnA. Wells (I); W. Lloyd Clark (I); Ruth T. Bearden (C); Mallie M. Taylor (C); Robbin Spivey (V); Mark A. Evans (P);Marsha L. Stone (P); Hershey, PA - Penn State College of Medicine (5): Thomas W. Gardner (I); Kimberly A. Neely(I); Susan M. Chobanoff (C); Mary L. Frawley (V); Kathleen C. Ringenbach (V); Ernesto Rodriguez (V); Timothy J.Bennett (P); Aiea, HI - The Retina Center at Pali Momi (4): Gregg T. Kokame (I); Jacqueline Shen (C); Sheila M.Chamian (C); Andrew Yuen (V, P); Arlington, TX - Texas Retina Associates (4): David G. Callanan (I); Wayne A.Solley (I); Glenda Janay Elmore (C); Bob Boleman (P); Jodi Creighton (V); Keith Gray (P); Austin, TX - AustinRetina Associates (4): Jose A. Martinez (I); James W. Dooner (I); Clio Armitage Harper (I); Chris A. Montesclaros(C); Carrie E. Odean (C); Ian Cadena (P); Richard A. Sabo (P); Austin, TX - Brian B. Berger, M.D. (4): Brian B.Berger (I); Margaret Rodriguez (C); Jeni Rathman (C); Bobbi Gallia (V); Ben Ostrander (P); Baltimore, MD - ElmanRetina Group, P.A. (4): Michael J. Elman (I); Robert Z. Raden (I); Michelle D. Sloan (C); JoAnn Starr (C); DenaSalfer-Firestone (V); Terri Cain (P); Peter Sotirakos (P); Bethesda, MD - National Eye Institute/National Institutesof Health (4): Emily Y. Chew (I); Hanna Rodriguez Coleman (I); Ruby Lerner (C); Gregory L. Short (V); DeniseCunningham (P); Guy E. Foster (P); Ernest M. Kuehl (P); Marilois Palmer (P); Charlotte, NC - Charlotte Eye, Ear,Nose and Throat Assoc., PA (4): David J. Browning (I); Andrew N. Antoszyk (I); Jennifer V. Helms (C); Angela K.Price (C); Lisa B. Chatari (V); Heather L. Murphy (V); Robert M. Bowen (P); Brian Lutman (P); Michael D. McOwen(P); Columbia, SC - Carolina Retina Center (4): Jeffrey G. Gross (I); Barron C. Fishburne (I); Peggy W. Cummings(C); Jennifer C. Enlow (C); Regina A. Gabriel (V); Heidi K. Lovit (V); Randall L. Price (P); Dallas, TX - TexasRetina Associates (4): Gary E. Fish (I); Jean Arnwine (C); Sally Arceneaux (V); Brenda Sanchez (V); Hank Aguado
Page 7
Ophthalmology. Author manuscript; available in PMC 2008 November 20.
NIH
-PA Author Manuscript
NIH
-PA Author Manuscript
NIH
-PA Author Manuscript

(P); Penny Ellenich (P); Keith Gray (P); Kimberly Cummings (P); Diana Jaramillo (P); Denver, CO - Denver HealthMedical Center (4): Antonio P. Ciardella (I); Graciela C. Gallardo (C); Dorothy L. Thomas (C); Rosemary C. Rhodes(V); Colleen J. Smith (V); Janelle Dane Zapata (V); Debbie M. Brown (P); Detroit, MI - Henry Ford Health System,Dept of Ophthalmology and Eye Care Services (4): Paul Andrew Edwards (I); Janet Murphy (C); Sheila M. Rock(C); James P. Bryant (V); Barbara Millsap (V); George Ponka (V); Mark Croswell (P); Lisa M. Schillace (P); TracyA. Troszak (P); Detroit, MI - Kresge Eye Institute (4): Gary W. Abrams (I); Dean Eliott (I); Raymond Iezzi (I);Patrick L. Murphy (I); James E. Puklin (I); Laura L. Schulz (C); Susan Loomis (C); Cheryl Milanovic (C); JeannineM. Gartner (V); Vicki R. Krzeminski (V); Kyohei Abe (P); Kenneth W. Christopherson (P); Zlatan Sodikovic (P);Dublin, OH - Retinal Consultants, Inc. (4): Frederick H. Davidorf (I); Robert B. Chambers (I); Louis J. Chorich,III (I); Jill D. Milliron (C); Chhanda G. Chaudhuri (V); Jerilyn G. Perry (V); Michael J. Keating (P); Scott J. Savage(P); Fort Myers, FL - Retina Consultants of Southwest Florida (4): Glenn Wing (I); A. Thomas Ghuman (I); PaulA. Raskauskas (I); Joseph P. Walker (I); Cheryl Kiesel (C); Danielle Dyshanowitz (V); Eileen Knips (P); Dixie L.McGuire (P); Ft. Lauderdale, FL - Retina Vitreous Consultants (4): Ronald J. Glatzer (I); W. Scott Thompson (I);Jaclyn A. Lopez (C); Alicia A. Tardif (C); Janet Benton-Murray (V); Michelle Earl (P); Galveston, TX - Universityof Texas Medical Branch, Dept of Ophthalmology and Visual Sciences (4): Helen K. Li (I); Susan K. Busch (C);Wiline Jean (C); Adol Esquivel (P); John Horna (P); Zbigniew Krason (P); Grand Rapids, MI - Associated RetinalConsultants (4): Thomas M. Aaberg, Jr. (I); Sandy Kronlein (C); Verla M. Zuiderveen (C); Debra Markus (V); JoanM. Videtich (V); Sandra Lewis (P); Houston, TX - Charles A. Garcia, P.A and Associates (4): Charles A. Garcia(I); John McCrary (I); Penelope Villeda (C); Elizabeth Garibay (C); Otila Martinez (C); Daniel Banda (V); Juan P.Montoya (V); Ben Livas (P); Angela Ramirez (P); Shadi Qassim Al-Khatib (V); Houston, TX - Retina and Vitreousof Texas (4): H. Michael Lambert (I); Roberto Diaz-Rohena (I); Joseph A. Khawly (I); Arthur W. Willis (I); SusanK. Busch (C); Mikki O’Neal (C); Debbie Fredrickson (V); Maritza F. Gorrin (V); Joseph A. Morales (P); Houston,TX - Vitreoretinal Consultants (4): David M. Brown (I); Rosa Y. Kim (I); Tien P. Wong (I); Rebecca De La Garza(C); Amanda Faszholz (V); Eric N. Kegley (P); Karin A. Mutz (V); Indianapolis, IN - Midwest Eye Institute (4):Raj K. Maturi (I); Thomas A. Ciulla (I); John T. Minturn (I); Donna Agugliaro (C); Laura A. Bleau (C); Stephanie J.Morrow (V); Denise L. Samaniego (V); Thomas Steele (P); Lakeland, FL - Central Florida Retina Institute (4):Scott M. Friedman (I); Steve Carlton (C); Vickie D. Bassford (V); Damanda A. Fagan (V); Virginia Gregory (V);Lawrenceville, NJ - Delaware Valley Retina Associates (4): Darma Ie (I); Susan Lilienfield (C); Morgan Harper(V); Lydia Polanco (V); Linda McCall (P); Louisville, CO - Eldorado Retina Associates, P.C. (4): Mary Lansing(I); Lauren B. Hatch (C); Jeanne Ross (V); Kimberly A. Alexander (P); Ramona Smith (P); Madison, WI - Universityof Wisconsin-Madison, Dept of Ophthalmology/Retina Service (4): Justin Gottlieb (I); Barbara A. Blodi (I); T.Michael Nork (I); Kathryn F. Burke (C); Shelly R. Olson (V); Alyson J. Pohlman (V); Erika D. Soderling (V); BarbaraH. Soderling (V); Gene E. Knutson (P); Denise A. Krolnik (P); John C. Peterson (P); Minneapolis, MN - Universityof Minnesota (4): Timothy W. Olsen (I); Sally Cook (C); Ann M. Holleschau (C); Pamela K. Patterson (V); DavePhiliph (V); Sabrina M. Rolfer (V); Mark J. Cohen (P); Pat Stanaitis Harvey (P); Nashville, TN - VanderbiltUniversity Medical Center (4): Franco M. Recchia (I); Anita Agarwal (I); Sandy Owings (C); Genise G. Mofield(V); Tony Adkins (P); Cynthia C. Recchia (P); Oklahoma City, OK - Dean A. McGee Eye Institute (4): Ronald M.Kingsley (I); Robert E. Leonard (I); Lisa M. Ogilbee (C); Misty D. Youngberg (C); Sara L. M. Ceresa (V); Connie J.Dwiggins (V); Russ Burris (P); William R. Richmond (P); Paducah, KY - Paducah Retinal Center (4): Carl W.Baker (I); Tracey M. Caldwell (C); Lynnette F. Lambert (V); Dawn D. Smith (P); Peabody, MA - Lahey Clinic, Inc./The Eye Institute (4): Jeffrey L. Marx (I); Fleming D. Wertz (I); Avon P. Stewart (C); Steve M. Kelly (C); Patti-AnnL. Morse (C); Michael R. Johnson (V); Tracy Scrivano (V); Ellen L. Casazza (P); Richard Selter (P); Philadelphia,PA - University of Pennsylvania Scheie Eye Institute (4): Alexander J. Brucker (I); Robert A. Stoltz (I); Joan C.DuPont (C); Sheri Drossner (C); Tanya Metelitsina (V); Tomas S. Aleman (P); Cheryl Devine (P); William Nyberg(P); Laurel Weeney (P); Elizabeth A. Windsor (P); Portland, OR - Casey Eye Institute (4): Andreas K. Lauer (I);Christina J. Flaxel (I); Shelley A. Hanel (C); Susan K. Nolte (V); Jessica M. Gaultney (P); Chris S. Howell (P); EllenF. Redenbo (P); Peter N. Steinkamp (P); Patrick R. Wallace (P); Salt Lake City, UT - Rocky Mountain RetinaConsultants (4): Roy A. Goodart (I); David W. Faber (I); Hollie J. Murphy (C); Donna Knight (P); Richard W.Osguthorpe (P); San Francisco, CA - West Coast Retina Medical Group, Inc. (4): J. Michael Jumper (I); ArthurD. Fu (I); Robert N. Johnson (I); H. Richard McDonald (I); Margaret Stolarczuk (C); Brandi Teske (C); Silvia C.Linares (V); Rona Lyn Esquejo (P); Sean T. Grout (P); Sarah Huggans (P); Jeremy Miller (P); Sarasota, FL - SarasotaRetina Institute (4): Keye L. Wong (I); John H. Niffenegger (I); Christine Holland (C); Karen Hagin (V); HasseemaR. Shelton (V); Rosa Miller (P); Charlotte Rodman (P); Mark Sneath (P); Seattle, WA - University of WashingtonMedical Center (4): James L. Kinyoun (I); Susan A. Rath (C); Patricia K. Ernst (V); Betty S. Lawrence (V); JuliPettingill (V); Brad C. Clifton (P); James D. Leslie (P); Chuck Stephens (P); Slingerlands, NY - The New Lions EyeInstitute, Retina Consultants, PLLC (4): Paul M. Beer (I); Naomi Falk (I); Eugenia Olmeda (C); Denise Garza (C);Robert Davis (P); Joe Fischer (P); St. Louis, MO - St. Louis University Eye Institute (4): Stephen S. Feman (I);Levent Akduman (I); Kevin L. Anderson (C); Patrick Burke (V); Thomas I. Porter (V); Joshua S. Anderson (P);Christopher J. Kleber (P); Syracuse, NY - Retina-Vitreous Surgeons of Central New York, PC (4): G. RobertHampton (I); Samuel C. Spalding (I); Cindy J. Grinnell (C); Lynn M. Kwasniewski (V); Jeanne L. Burke (P); LynnA. Capone (P); Peter B. Hay (P); Mark E. Zalewski (P); Tampa, FL - International Eye Center (4): Don John PerezOrtiz (I); Madelyn Alvarez (C); Rita L. Johnson (C); Sandra E. Montoya (C); Ross Jarrett (P); Tampa, FL - Universityof South Florida (4): P. Reed Pavan (I); Burton Goldstein (I); Sue Sherouse (C); Amy L. Kimball (C); Sonya Edison(V); Wyatt Saxon (P); Winston-Salem, NC - Wake Forest University Eye Center (4): Craig Michael Greven (I);Nicholas Engelbrecht (I); M. Madison Slusher (I); Joan Fish (C); Frances Ledbetter (C); David T. Miller (P); MarshallTyler (P); Augusta, GA - Medical College of Georgia (3): Julian Nussbaum (I); Dennis M. Marcus (I); Judy Ann
Page 8
Ophthalmology. Author manuscript; available in PMC 2008 November 20.
NIH
-PA Author Manuscript
NIH
-PA Author Manuscript
NIH
-PA Author Manuscript

Johnson (C); June Benson (C); Sandra A. Grubisa (C); Ashley J. Goodwin (V); Judith Hendrickson (V); Mike Stanley(P); Beachwood, OH - Retina Associates of Cleveland, Inc. (3): Lawrence J. Singerman (I); David G. Miller (I);Diane E. Weiss (C); Maureen Cunningham (V); Kimberly A. Dubois (V); Vivian Tanner (V); John C. DuBois (P);Gregg A. Greanoff (P); Chapel Hill, NC - University of North Carolina, Dept of Ophthalmology (3): MaryElizabeth R. Hartnett (I); Travis A. Meredith (I); Cassandra M. Barnhart (C); Carrie D. Vallar (V); Teresa Hawks (P);Kelly D. Shields (P); Charlotte, NC - Horizon Eye Care, PA (3): Miriam E. Ridley (I); Frederick H. D. Weidman(I); Mara-Leigh Schafer (C); Amy A. Brogdon (V); Crystal L. Tingle (V); Jennifer T. Lummis (P); David C. Peterson(P); Grand Rapids, MI - Vitreo-Retinal Associates (3): Frank W. Garber (I); Landine K. Litts (C); Christine E.Feehan (V); Brenda K. Kilbourne (V); Angela D. Listerman (V); Donald E. Kuitula (P); Sue Weatherbee (P);Greenbelt, MD - The Retina Group of Washington (3): William B. Phillips, II (I); Richard Garfinkel (I); ManfredA. Von Fricken (I); Joulia C. Haziminas (C); Heather A. McManus (C); Mike Flory (P); Honolulu, HI - RetinaAssociates of Hawaii, Inc. (3): John H. Drouilhet (I); Susan Pelke (C); Deborah Nobler (P); Kingsport, TN -Southeastern Retina Associates, PC (3): Howard L. Cummings (I); D. Allan Couch (I); Gail Darnell (C); DeannaJo Long (C); Stacy Carpenter (V); Rachel Mallard (V); Julie P. Berry (P); Melissa Sturgill (P); Los Angeles, CA -Doheny Eye Institute (3): Jennifer I. Lim (I); Christina J. Flaxel (I); Margaret Padilla (C); Jesus M. Garcia (V);Frances Walonker (V); Len S. Richine (P); Lori Levin (P); Minneapolis, MN - Retina Center, PA (3): Abdhish R.Bhavsar (I); Tanya M. Pierce (C); Shelly A. Ellard (C); William B. Carli (V); Melinda Spike-Kivel (V); Jef Jodell(P); Carmen W. Chan (P); Laura Taylor-Reetz (P); Rochester, NY - University of Rochester (3): David AllenDiLoreto (I); Mina M. Chung (I); Nancy Fedick (C); Dorothea Castillo (V); Terrance Schaefer (V); William S. Fischer(P); Julie Howell (P); Rockford, IL - Northern Illinois Retina, Ltd. (3): Susan M. Fowell (I); James P. Watson (C);Nancy L. Mercurio (C); Maureen L. Cain (P); Jacquie S. Button (P); Chris M. Gomez (P); Santa Ana, CA - SouthernCalifornia Permanente Medical Group (3): Keith J. Pince (I); Paula Chase (C); Marie O. Haas (V); Bruce A. Moore(V); Abilene, TX - West Texas Retina Consultants P.A. (2): Sunil S. Patel (I); S. Young Lee (I); Brandi L. Dunn(C); Kristen L. Garcia (V); Gwyn R. Nafe (V); Birmingham, AL - Retina Consultants of Alabama (2): John O.Mason (I); Tracy L. Emond (C); Tonya Davis (V); Denise Iovino (P); Buddy Skellie (P); Chicago, IL - RushUniversity Medical Center (2): Mathew W. MacCumber (I); Pauline T. Merrill (I); Sarah J. Levine (C); Nisha D.Sheth (C); Sarice R. Smith (C); Bruce I. Gaynes (V); Pamela Hulvey (P); Frank Morini (P); Loreen Pappas (P);Durham, NC - Duke University Eye Center (2): Srilaxmi Bearelly (I); Michael J. Cooney (I); Glenn J. Jaffe (I);Brooks W. McCuen (I); Malcolm Anderson (C); Neeru Sarin (V); Russell E. Burns (P); Gregory C. Hoffmeyer (P);Jeffrey M. Napoli (P); Irvine, CA - University of California, Irvine (2): Baruch D. Kuppermann (I); Jeff Grijalva(C); Rosie Magallon (V); Bret Trump (P); Lexington, KY - University of Kentucky (2): Andrew Pearson (I); MicheleReg (C); Susie Craig (V); Philip Moss (V); Toni Scoggins (V); Phyllis Gillespie (P); Michael Hanson (P); LomaLinda, CA - Loma Linda University Health Care, Department of Ophthalmology (2): Joseph T. Fan (I); MichaelE. Rauser (I); Arun K. Chakrabarty (C); William H. Kiernan (V); Gene Saldana (P); Los Angeles, CA - Jules SteinEye Institute (2): Steven D. Schwartz (I); Christine R. Gonzales (I); Anurag Gupta (I); Rosaleen Ostrick (C); MelissaChun (V); Jennie Kageyama (V); Bita Shokouh (V); David L. Le Beck (P); Mirella Tetreault (P); Joel Moral (P);Milwaukee, WI - Medical College of Wisconsin (2): Judy E. Kim (I); Dennis P. Han (I); Troy S. Drescher (C);Christine Y. Lange (C); Kelly Reiter (C); Vicki Barwick (V); Joseph R. Beringer (P); Richmond, VA - RichmondRetinal Associates/Virginia Eye Institute (2): George Sanborn (I); Byron S. Ladd (I); Melissa Vaughan (C); RobinM. Driver (V); Karen E. Sullivan (V); Megan E. Bicknell (P); Michael Palczynski (P); Mark E. Zalewski (P); RoyalOak, MI - Associated Retinal Consultants, PC (2): Michael T. Trese (I); Alan J. Ruby (I); Mary Zajechowski (C);Beth L. Mitchell (C); Cindy Huckabone (V); Patricia Streasick (P); Lynette D. Szydlowski (P); Santa Barbara, CA- California Retina Consultants (2): Dante J. Pieramici (I); Tamara A. Norton (C); Elizabeth A. Robbins (C); KellyAvery (V); Liz Tramel (V); Karen Boyer (P); Matthew Giust (P); Melissa Kruzel (P); St. Louis, MO - Barnes RetinaInstitute (2): Rajendra S. Apte (I); Ginny S. Nobel (C); Lynda K. Boyd (V); Carolyn L. Walters (V); Matt L. Raeber(P); Jarrod Wehmeier (P); Towson, MD - Retina Specialists (2): Raymond N. Sjaarda (I); John T. Thompson (I);Maryanth Constantine (C); Janette L. Herron (V); Marcia A. Sentz (V); Leslie G. Russel (P); John L. Davis (V);Ventura, CA - Miramar Eye Specialist Medical Group (2): Joel M. Corwin (I); Donald A. Frambach (I); Lisa Jue(C); Claudia P. Acosta (C); Mark A. Brunette (V); Michael Feldman (P); Andrea M. Ferrari (P); Chicago, IL -Northwestern Medical Faculty Foundation (1): Alice T. Lyon (I); Jeevan R. Mathura (I); Lori Kaminski (C); AnnieMunana (C); Jonathan Shankle (P); Portland, OR - Retina Northwest, PC (1): Mark A. Peters (I); Colin Ma (I);Stephen Hobbs (C); Patricia A. Bartholomew (C); Katie J. Reichenberger (C); Marcia Kopfer (V); Milt Johnson (P);Joe Logan (P); Harry Wohlsein (P); Providence, RI - Retina Consultants (1): Robert H. Janigian (I); Emiliya German(C); Erika Banalewicz (V); Sandra Henriques (V); Mark Hamel (P); Washington, DC - The George WashingtonUniversity, Department of Ophthalmology (1): B. Eric Jones (I); Ronald J. Olszowy (C); Abdul Habib (V); BertrandP. Miskell (P); Columbia, SC - Columbia Eye Clinic, PA (0): W. Lloyd Clark (I); Ruth T. Bearden (C); Mary P.Thompson (V); Marsha L. Stone (P)
DRCR.net Coordinating Center – Tampa, FL: Roy W. Beck (Executive Director), Kimberly E. McLeod (DRCR.netAssociate Director), Kelly A. Blackmer, Brian B. Dale, Adam R. Glassman, Nicola B. Hill, Paula A. Johnson, CraigR. Kollman, Alisha N. Lawson, Brenda L. Loggins, Ana C. Perez, Apryl C. Quillen, Cynthia R. Stockdale, SamaraStrauber
DRCR.net Chairman’s Office – Boston, MA: Neil M. Bressler – Baltimore, MD (Network Chair), Lloyd P. Aiello– Boston, MA (Network Chair 2002 – 2005), Kia Graves
Page 9
Ophthalmology. Author manuscript; available in PMC 2008 November 20.
NIH
-PA Author Manuscript
NIH
-PA Author Manuscript
NIH
-PA Author Manuscript

Fundus Photograph Reading Center – Madison, WI: Matthew D. Davis (Director Emeritus), Ronald P. Danis(Director), James Reimers (Lead Color Photography Evaluator), Dawn Myers (Lead OCT Evaluator), Julee Elledge(Lead Angiography Evaluator), Larry Hubbard (Associate Director)
Data and Safety Monitoring Committee: John Connett (Chair), Harry W. Flynn, Jr., Robert N. Frank, Saul Genuth,Lee Jampol, Jeanette Resnick, Stephen Wisniewski National Eye Institute: Päivi H. Miskala, Donald F. Everett (2002– 2004) DRCR.net Executive Committee: Lloyd P. Aiello (Chair 2002 – 2005), Roy W. Beck, Neil M. Bressler(Chair), David M. Brown, David J. Browning, Ronald P. Danis, Matthew D. Davis, Michael J. Elman, Frederick L.Ferris, Adam R. Glassman, Kimberly E. McLeod, Päivi H. Miskala
Laser Photocoagulation Study Steering Committee: Lloyd P. Aiello, Roy W. Beck, Neil M. Bressler, AlexanderJ. Brucker, Steve Carlton, Emily Y. Chew, Ronald P. Danis, Frederick L. Ferris, Don S. Fong (Protocol Chair), AdamGlassman, Jeffrey G. Gross, Julia A. Haller, Helen K. Li, Kimberly McLeod, Päivi H. Miskala
References1. Meyer-Scwickerath GRE, Schott K. Diabetic retinopathy and photocoagulation. Am J Ophthalmol
1968;66:597–603. [PubMed: 5729579]2. Patz A, Schatz H, Berkow JW, et al. Macular edema-an overlooked complication of diabetic
retinopathy. Trans Am Acad Ophthalmol Otolaryngol 1973;77:34–41.3. Early Treatment Diabetic Retinopathy Study Research Group. Photocoagulation for diabetic macular
edema. Early treatment diabetic retinopathy study report number 1. Arch Ophthalmol 1985;103:1796–1806. [PubMed: 2866759]
4. Browning DJ. Diabetic macular edema: a critical review of the early treatment diabetic retinopathystudy (ETDRS) series and subsequent studies. Comp Ophthalmol Update 2000;1:69–83.
5. Patelli F, Fasolino G, Radice P, et al. Time course of changes in retinal thickness and visual acuityafter intravitreal triamcinolone acetonide for diffuse diabetic macular edema with and without previousmacular laser treatment. Retina 2005;25:840–5. [PubMed: 16205561]
6. Knudsen LL. Retrobulbar injection of methylprednisolone in diffuse diabetic macular edema. Retina2004;24:905–9. [PubMed: 15579988]
7. Hee MR, Puliafito CA, Wong C, et al. Quantitative assessment of macular edema with optical coherencetomography. Arch Ophthalmol 1995;113:1019–29. [PubMed: 7639652]
8. Goebel W, Kretzchmar-Gross T. Retinal thickness in diabetic retinopathy. A study using opticalcoherence tomography (OCT) Retina 2002;22:759–67.
9. Otani T, Kishi S, Maruyama Y. Patterns of diabetic macular edema with optical coherence tomography.Am J Ophthalmol 1999;127:688–93. [PubMed: 10372879]
10. Bandello F, Polito A, Del Borrello M, et al. “Light” versus “classic” laser treatment for clinicallysignificant diabetic macular oedema. Br J Ophthalmol 2005;89:864–70. [PubMed: 15965168]
11. Otani T, Kishi S. Tomographic findings of foveal hard exudates in diabetic macular edema. Am JOphthalmol 2001;131:50–4. [PubMed: 11162979]
12. Martidis A, Duker JS, Greenberg PB, et al. Intravitreal triamcinolone for refractory diabetic macularedema. Ophthalmology 2002;109:920–7. [PubMed: 11986098]
13. Laursen ML, Moeller F, Sander B, et al. Subthreshold micropulse diode laser treatment in diabeticmacular edema. Br J Ophthalmol 2004;88:1173–9. [PubMed: 15317711]
14. Catier A, Tadayoni R, Paques M, et al. Characterization of macular edema from various etiologiesby optical coherence tomography. Am J Ophthalmol 2005;140:200–6. [PubMed: 15992752]
15. Ozdemir H, Karacorlu M, Karacorlu SA. Regression of serous macular detachment after intravitrealtriamcinolone acetonide in patients with diabetic macular edema. Am J Ophthalmol 2005;140:251–5. [PubMed: 15992756]
16. Massin P, Duguid G, Erginay A, et al. Optical coherence tomography for evaluating diabetic macularedema before and after vitrectomy. Am J Ophthalmol 2003;135:169–77. [PubMed: 12566020]
17. Beck RW, Moke PS, Turpin AH, et al. A computerized method of visual acuity testing: adaptationof the early treatment of diabetic retinopathy study testing protocol. Am J Ophthalmol 2003;135:194–205. [PubMed: 12566024]
18. Magee L. R2 measures based on Wald and likelihood ratio joint significance tests. Amer Stat1990;44:250–3.
Page 10
Ophthalmology. Author manuscript; available in PMC 2008 November 20.
NIH
-PA Author Manuscript
NIH
-PA Author Manuscript
NIH
-PA Author Manuscript

19. Terasaki H, Kojima T, Niwa H, et al. Changes in focal macular electroretinograms and fovealthickness after vitrectomy for diabetic macular edema. Invest Ophthalmol Vis Sci 2003;44:4465–72.[PubMed: 14507894]
20. Browning DJ, Zhang Z, Benfield JM, et al. The effect of patient characteristics on response to focallaser treatment for diabetic macular edema. Ophthalmology 1997;104:466–72. [PubMed: 9082274]
21. Akduman L, Olk RJ. Laser photocoagulation of diabetic macular edema. Ophthalmic Surg Lasers1997;28:387–408. [PubMed: 9150523]
22. Lee CM, Olk RJ. Modified grid laser photocoagulation for diffuse diabetic macular edema. Long-term visual results Ophthalmology 1991;98:1594–1602.
23. Bailey CC, Sparrow JM, Grey RHB, et al. The national diabetic retinopathy laser treatment audit. I.Maculopathy. Eye 1998;12:69–76. [PubMed: 9614521]
24. Early Treatment Diabetic Retinopathy Study Research Group. Early treatment diabetic retinopathystudy design and baseline patient characteristics. ETDRS report number 7. Ophthalmology1991;98:741–56. [PubMed: 2062510]
25. Sandberg MA, Brockhurst RJ, Gaudio AR, et al. The association between visual acuity and centralretinal thickness in retinitis pigmentosa. Invest Ophthalmol Vis Sci 2005;46:3349–54. [PubMed:16123439]
26. Costa RA, Calucci D, Cardillo JA, et al. Optical coherence tomography 3: automatic delineation ofthe outer neural boundary and its influence on retinal thickness measurements. Invest OphthalmolVis Sci 2004;45:2399–2406.1. [PubMed: 15223823]
Page 11
Ophthalmology. Author manuscript; available in PMC 2008 November 20.
NIH
-PA Author Manuscript
NIH
-PA Author Manuscript
NIH
-PA Author Manuscript

Figure 1. Comparison of OCT Center Point Thickness and Visual Acuity at BaselineThe solid line represents the regression line and the dotted lines represent the 95% confidenceinterval for the mean.
Page 12
Ophthalmology. Author manuscript; available in PMC 2008 November 20.
NIH
-PA Author Manuscript
NIH
-PA Author Manuscript
NIH
-PA Author Manuscript

Figure 2. Distribution of Visual Acuity Measurements in Categories Based on OCT Center PointThickness at BaselineBox-whisker plot demonstrating mean (dashed horizontal line), median (solid horizontal line),25 – 75th percentiles (extremes of the box), 10–90th percentiles (whiskers), and 5–95th
percentiles (solid circles) of visual acuity at baseline.
Page 13
Ophthalmology. Author manuscript; available in PMC 2008 November 20.
NIH
-PA Author Manuscript
NIH
-PA Author Manuscript
NIH
-PA Author Manuscript

Figure 3. Comparison of OCT Center Point Thickness and Visual Acuity at 3.5 MonthsThe solid line represents the regression line and the dotted lines represent the 95% confidenceinterval for the mean. Graphs at 8 months and 12 months appeared similar.
Page 14
Ophthalmology. Author manuscript; available in PMC 2008 November 20.
NIH
-PA Author Manuscript
NIH
-PA Author Manuscript
NIH
-PA Author Manuscript

Figure 4. Comparison of Change in OCT Center Point Thickening and Change in Visual Acuityfrom Baseline to 3.5 MonthsThe solid line represents the regression line and the dotted lines represent the 95% confidenceinterval for the mean. Graphs at 8 months and 12 months appeared similar.
Page 15
Ophthalmology. Author manuscript; available in PMC 2008 November 20.
NIH
-PA Author Manuscript
NIH
-PA Author Manuscript
NIH
-PA Author Manuscript

NIH
-PA Author Manuscript
NIH
-PA Author Manuscript
NIH
-PA Author Manuscript
Page 16
Table 1Baseline Demographics and Clinical Characteristics
Subject-level Factors N = 210 subjectsAge (yrs) - Mean ± SD 58 ± 11Gender: Women - N (%) 86 (41%)Race/Ethnicity - N (%) White - Non Hispanic 138 (66%) Black/African-American 37 (18%) Hispanic or Latino 19 (9%) Other 16 (8%)Diabetes Type - N (%)* Type 1 16 (8%) Type 2 194 (92%)Duration of Diabetes (yrs) - Mean ± SD 14 ± 9HbA1c% - Mean ± SD † 8.2 ± 1.9Eye-level Factors N = 251 eyesVisual Acuity (approximate Snellen equivalent from letter score) - N (%) 20/20 or better 67 (27%) 20/25 to 20/40 131 (52%) 20/50 to 20/100 45 (18%) Worse than 20/100 8 (3%) Mean ± SD – Letters 75 ± 12 Mean ± SD - Snellen Equivalent 20/32 ± 2.4 linesLens Status - N (%) Phakic 223 (89%) Pseudophakic 28 (11%) Aphakic 0 (0%)OCT Center Point Thickness - N (%) < 225 microns 72 (29%) 225–299 microns 65 (26%) 300–399 microns 48 (19%) 400–499 microns 40 (16%) ≥ 500 microns 26 (10%) Mean ± SD – microns 317 ± 136Cystoid Spaces Present on OCT-N (%) 99 (39%)Subretinal Fluid Present on OCT-N (%) 16 (6%)*Type 1 diabetes is defined as insulin dependency prior to age 30.
†N = 203 baseline HbA1c results.
Ophthalmology. Author manuscript; available in PMC 2008 November 20.
NIH
-PA Author Manuscript
NIH
-PA Author Manuscript
NIH
-PA Author Manuscript
Page 17Ta
ble
2Fa
ctor
s with
Sig
nific
ant E
ffec
t on
Vis
ual A
cuity
in a
Mul
tiple
Reg
ress
ion
Line
ar M
odel
Fact
orU
niva
riat
e Mod
el o
f Bas
elin
e Vis
ual A
cuity
and
Pre
dict
ive F
acto
rM
ultiv
aria
te M
odel
of B
asel
ine
Vis
ual A
cuity
†
r2E
stim
ate[
Dec
reas
e in
lette
r sc
ore]
(95%
C.I.
)P-
valu
e*C
umul
ativ
e*, ‡
r2
Est
imat
e[D
ecre
ase
inle
tter
scor
e] (9
5%C
.I.)
P-va
lue* -F
inal
Mod
el(r
2 =36
%)
OC
T C
ente
r po
int T
hick
ness
(per
100
mic
ron
incr
ease
)27
%4.
4 (3
.5, 5
.3)
<0.0
0127
%3.
6 (2
.6, 4
.6)
<0.0
01
Age
(per
dec
ade
incr
ease
)4%
2.3
(1.0
, 3.6
)<0
.001
29%
2.7
(1.5
, 3.9
)<0
.001
Fluo
resc
ein
Lea
kage
in th
e C
ente
r an
dIn
ner
Subf
ield
s || (per
one
-tent
h D
isc
Are
a in
crea
se)
12%
3.2
(2.1
, 4.4
)<0
.001
33%
1.9
(0.8
, 3.0
)<0
.001
HbA
1c(p
er 1
% in
crea
se)
1%0.
7 (−
0.1,
1.5
)0.
0836
%1.
1 (0
.5, 1
.8)
0.00
1* A
djus
ted
for t
he c
orre
latio
n w
ithin
subj
ects
with
two
stud
y ey
es.
† Add
ition
al fa
ctor
s exp
lore
d no
t sig
nific
antly
ass
ocia
ted
with
vis
ual a
cuity
in a
mul
tivar
iate
mod
el in
clud
ed: I
nner
zon
e th
ickn
ess,
retin
al v
olum
e, c
ysto
id sp
aces
on
OC
T an
d flu
ores
cein
ang
iogr
aphy
,SS
R d
etac
hmen
t on
OC
T, n
umbe
r of i
nvol
ved
subf
ield
s, m
acul
ar sl
ope,
race
, gen
der,
diab
etes
type
, dur
atio
n of
dia
bete
s, tre
atm
ent f
or h
yper
tens
ion,
har
d ex
udat
es m
easu
red
on fu
ndus
pho
tos,
lens
stat
us,
leve
l of r
etin
opat
hy m
easu
red
on fu
ndus
pho
tos,
hem
orrh
age
and
mic
roan
eury
sms w
ithin
the
grid
mea
sure
d on
fund
us p
hoto
s.
‡ Cum
ulat
ive
r2 o
btai
ned
from
bac
kwar
ds e
limin
atio
n re
gres
sion
, cal
cula
ting
the
r2 a
fter r
emov
ing
fact
ors f
rom
the
final
four
var
iabl
e m
odel
. The
num
bers
in th
is c
olum
n re
pres
ent t
he r2
from
four
mod
els i
n w
hich
the
fact
or in
the
row
has
bee
n cu
mul
ativ
ely
adde
d to
the
mod
el (e
.g.,
r2 =
27%
repr
esen
t the
mod
el w
ith c
ente
r poi
nt th
ickn
ess a
lone
, and
r2 =
29%
repr
esen
ts m
odel
with
cen
ter p
oint
and
age)
.
|| In th
e ce
ntra
l sub
field
(with
in 1
/3 D
D o
f cen
ter)
.
Ophthalmology. Author manuscript; available in PMC 2008 November 20.

NIH
-PA Author Manuscript
NIH
-PA Author Manuscript
NIH
-PA Author Manuscript
Page 18Ta
ble
3V
isua
l Acu
ity v
ersu
s OC
T M
acul
ar T
hick
ness
Stu
dies
Stud
yD
epen
dent
Var
iabl
eN
r2*Sl
ope†
P-va
lue
Pres
ent S
tudy
Vis
ual A
cuity
251
0.27
−.04
4<0
.001
Ban
dello
‡ , 200
510V
isua
l Acu
ity28
0.33
−.04
5.0
01O
tani
‡ , 200
111V
isua
l Acu
ity11
0.34
−.05
80.
06M
artid
is‡ , 2
00212
Vis
ual A
cuity
160.
15−.
062
.14
Laur
sen‡ , 2
00413
Vis
ual A
cuity
230.
08−.
038
.20
Cat
ier || 2
00514
Vis
ual A
cuity
270.
30−.
07.0
03O
zdem
ir‡ , 200
515V
isua
l Acu
ity20
0.54
−.11
7<.
001
Mas
sin‡ , 2
00316
Vis
ual A
cuity
150.
13−.
029
.19
Goe
bel || 2
0028
OC
T13
60.
15−.
30<.
001
Hee
, 199
57O
CT
750.
45D
NS
DN
S* r2
is th
e co
effic
ient
of d
eter
min
atio
n fo
r the
line
ar re
gres
sion
of t
he D
epen
dent
var
iabl
e (e
ither
VA
or O
CT
mac
ular
thic
knes
s) v
ersu
s the
Inde
pend
ent v
aria
ble
(eith
er O
CT
mac
ular
thic
knes
s or V
A).
† Cha
nge
in th
e in
depe
nden
t var
iabl
e (e
ither
OC
T or
VA
) per
one
uni
t cha
nge
in th
e de
pend
ent v
aria
ble
(eith
er m
icro
ns o
r let
ter s
core
)
‡ R2 ,
slop
e, a
nd p
-val
ue c
alcu
late
d ba
sed
on d
ata
prov
ided
.
|| Slop
e in
terp
olat
ed fr
om g
raph
pro
vide
d.
DN
S =
data
not
show
n.
Ophthalmology. Author manuscript; available in PMC 2008 November 20.